Vanguard Investment Series plc
1057
Vanguard Investment Series plc Annual Report | 31 December 2019
-
Upload
khangminh22 -
Category
Documents
-
view
0 -
download
0
Transcript of Vanguard Investment Series plc

Vanguard Investment Series plc
Annual Report | 31 December 2019
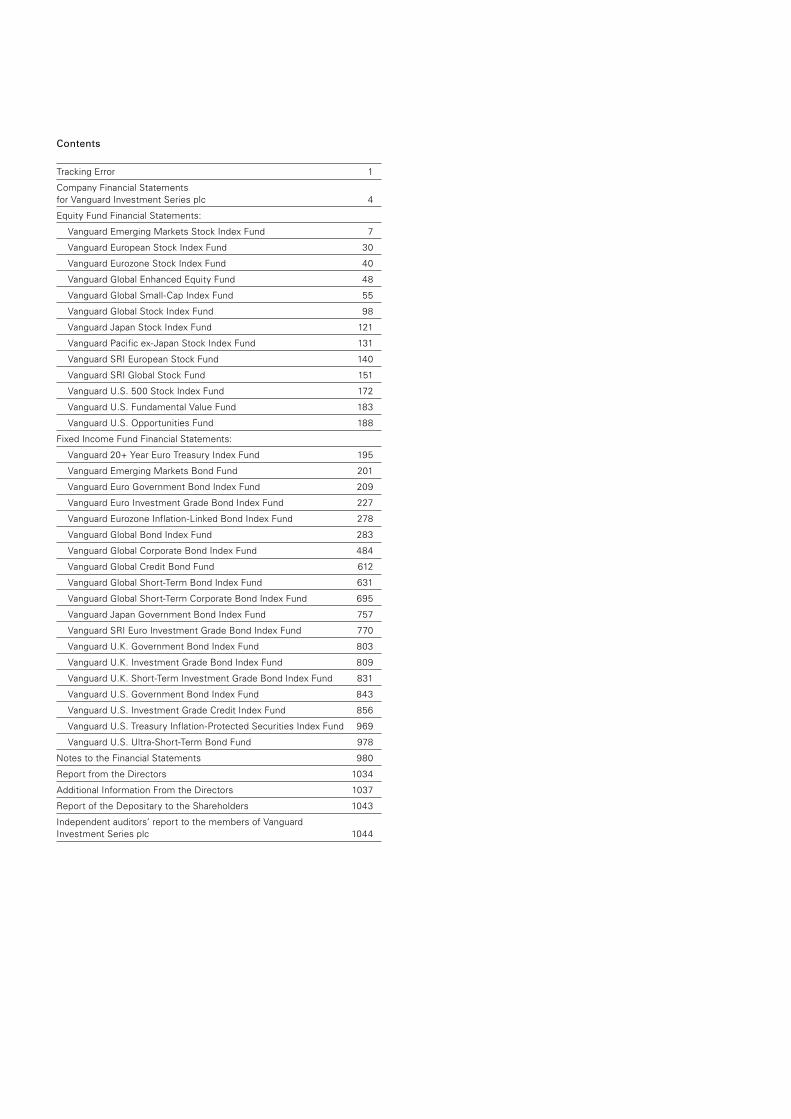
Contents
Tracking Error 1
Company Financial Statements for Vanguard Investment Series plc 4
Equity Fund Financial Statements:
Vanguard Emerging Markets Stock Index Fund 7
Vanguard European Stock Index Fund 30
Vanguard Eurozone Stock Index Fund 40
Vanguard Global Enhanced Equity Fund 48
Vanguard Global Small-Cap Index Fund 55
Vanguard Global Stock Index Fund 98
Vanguard Japan Stock Index Fund 121
Vanguard Pacific ex-Japan Stock Index Fund 131
Vanguard SRI European Stock Fund 140
Vanguard SRI Global Stock Fund 151
Vanguard U.S. 500 Stock Index Fund 172
Vanguard U.S. Fundamental Value Fund 183
Vanguard U.S. Opportunities Fund 188
Fixed Income Fund Financial Statements:
Vanguard 20+ Year Euro Treasury Index Fund 195
Vanguard Emerging Markets Bond Fund 201
Vanguard Euro Government Bond Index Fund 209
Vanguard Euro Investment Grade Bond Index Fund 227
Vanguard Eurozone Inflation-Linked Bond Index Fund 278
Vanguard Global Bond Index Fund 283
Vanguard Global Corporate Bond Index Fund 484
Vanguard Global Credit Bond Fund 612
Vanguard Global Short-Term Bond Index Fund 631
Vanguard Global Short-Term Corporate Bond Index Fund 695
Vanguard Japan Government Bond Index Fund 757
Vanguard SRI Euro Investment Grade Bond Index Fund 770
Vanguard U.K. Government Bond Index Fund 803
Vanguard U.K. Investment Grade Bond Index Fund 809
Vanguard U.K. Short-Term Investment Grade Bond Index Fund 831
Vanguard U.S. Government Bond Index Fund 843
Vanguard U.S. Investment Grade Credit Index Fund 856
Vanguard U.S. Treasury Inflation-Protected Securities Index Fund 969
Vanguard U.S. Ultra-Short-Term Bond Fund 978
Notes to the Financial Statements 980
Report from the Directors 1034
Additional Information From the Directors 1037
Report of the Depositary to the Shareholders 1043
Independent auditors’ report to the members of Vanguard Investment Series plc 1044
1
Tracking Error
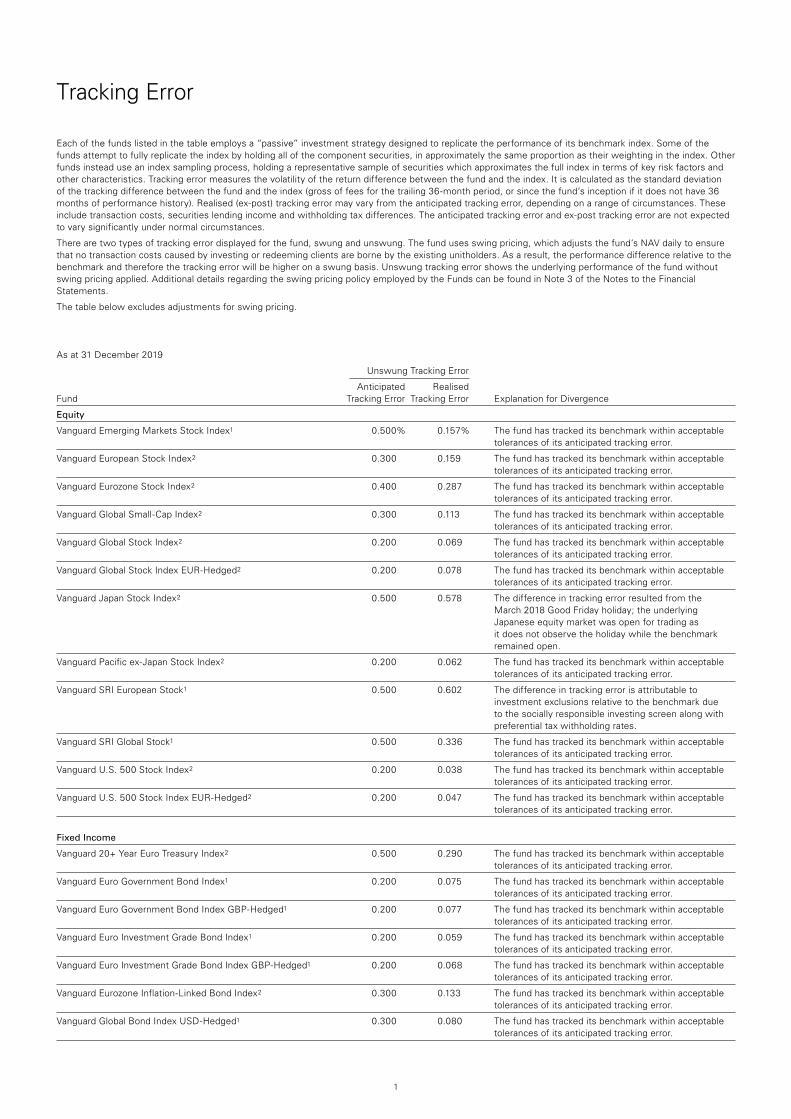
Each of the funds listed in the table employs a “passive” investment strategy designed to replicate the performance of its benchmark index. Some of the funds attempt to fully replicate the index by holding all of the component securities, in approximately the same proportion as their weighting in the index. Other funds instead use an index sampling process, holding a representative sample of securities which approximates the full index in terms of key risk factors and other characteristics. Tracking error measures the volatility of the return difference between the fund and the index. It is calculated as the standard deviation of the tracking difference between the fund and the index (gross of fees for the trailing 36-month period, or since the fund’s inception if it does not have 36 months of performance history). Realised (ex-post) tracking error may vary from the anticipated tracking error, depending on a range of circumstances. These include transaction costs, securities lending income and withholding tax differences. The anticipated tracking error and ex-post tracking error are not expected to vary significantly under normal circumstances.
There are two types of tracking error displayed for the fund, swung and unswung. The fund uses swing pricing, which adjusts the fund’s NAV daily to ensure that no transaction costs caused by investing or redeeming clients are borne by the existing unitholders. As a result, the performance difference relative to the benchmark and therefore the tracking error will be higher on a swung basis. Unswung tracking error shows the underlying performance of the fund without swing pricing applied. Additional details regarding the swing pricing policy employed by the Funds can be found in Note 3 of the Notes to the Financial Statements.
The table below excludes adjustments for swing pricing.
As at 31 December 2019
Unswung Tracking Error
Anticipated Realised Fund Tracking Error Tracking Error Explanation for Divergence
Equity
Vanguard Emerging Markets Stock Index1 0.500% 0.157% The fund has tracked its benchmark within acceptable tolerances of its anticipated tracking error.
Vanguard European Stock Index2 0.300 0.159 The fund has tracked its benchmark within acceptable tolerances of its anticipated tracking error.
Vanguard Eurozone Stock Index2 0.400 0.287 The fund has tracked its benchmark within acceptable tolerances of its anticipated tracking error.
Vanguard Global Small-Cap Index2 0.300 0.113 The fund has tracked its benchmark within acceptable tolerances of its anticipated tracking error.
Vanguard Global Stock Index2 0.200 0.069 The fund has tracked its benchmark within acceptable tolerances of its anticipated tracking error.
Vanguard Global Stock Index EUR-Hedged2 0.200 0.078 The fund has tracked its benchmark within acceptable tolerances of its anticipated tracking error.
Vanguard Japan Stock Index2 0.500 0.578 The difference in tracking error resulted from the March 2018 Good Friday holiday; the underlying Japanese equity market was open for trading as it does not observe the holiday while the benchmark remained open.
Vanguard Pacific ex-Japan Stock Index2 0.200 0.062 The fund has tracked its benchmark within acceptable tolerances of its anticipated tracking error.
Vanguard SRI European Stock1 0.500 0.602 The difference in tracking error is attributable to investment exclusions relative to the benchmark due to the socially responsible investing screen along with preferential tax withholding rates.
Vanguard SRI Global Stock1 0.500 0.336 The fund has tracked its benchmark within acceptable tolerances of its anticipated tracking error.
Vanguard U.S. 500 Stock Index2 0.200 0.038 The fund has tracked its benchmark within acceptable tolerances of its anticipated tracking error.
Vanguard U.S. 500 Stock Index EUR-Hedged2 0.200 0.047 The fund has tracked its benchmark within acceptable tolerances of its anticipated tracking error.
Fixed Income
Vanguard 20+ Year Euro Treasury Index2 0.500 0.290 The fund has tracked its benchmark within acceptable tolerances of its anticipated tracking error.
Vanguard Euro Government Bond Index1 0.200 0.075 The fund has tracked its benchmark within acceptable tolerances of its anticipated tracking error.
Vanguard Euro Government Bond Index GBP-Hedged1 0.200 0.077 The fund has tracked its benchmark within acceptable tolerances of its anticipated tracking error.
Vanguard Euro Investment Grade Bond Index1 0.200 0.059 The fund has tracked its benchmark within acceptable tolerances of its anticipated tracking error.
Vanguard Euro Investment Grade Bond Index GBP-Hedged1 0.200 0.068 The fund has tracked its benchmark within acceptable tolerances of its anticipated tracking error.
Vanguard Eurozone Inflation-Linked Bond Index2 0.300 0.133 The fund has tracked its benchmark within acceptable tolerances of its anticipated tracking error.
Vanguard Global Bond Index USD-Hedged1 0.300 0.080 The fund has tracked its benchmark within acceptable tolerances of its anticipated tracking error.
2
1 The fund attempts to select those securities that will create the representative sample that tracks the performance of the index as closely as possible.2 The fund seeks to replicate the index by investing all, or substantially all, of its assets in the securities that make up the index, holding each in approximately the same proportion as its
weighting in the index.
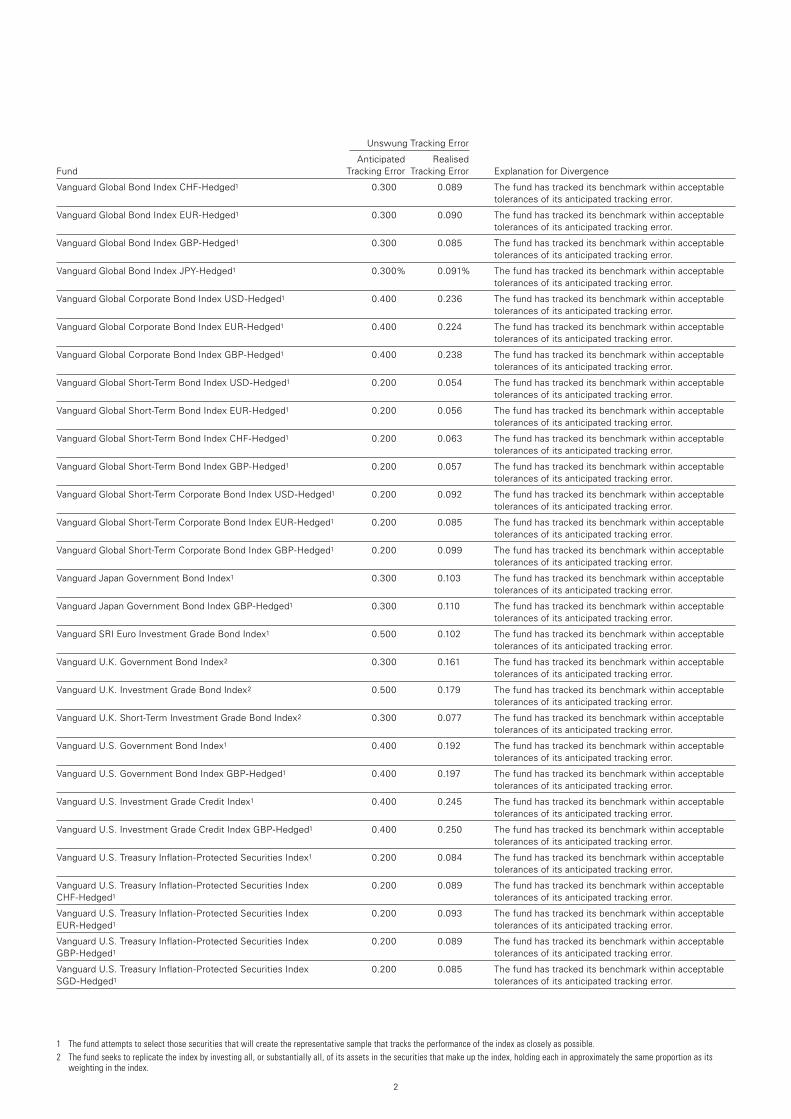
Unswung Tracking Error
Anticipated Realised Fund Tracking Error Tracking Error Explanation for Divergence
Vanguard Global Bond Index CHF-Hedged1 0.300 0.089 The fund has tracked its benchmark within acceptable tolerances of its anticipated tracking error.
Vanguard Global Bond Index EUR-Hedged1 0.300 0.090 The fund has tracked its benchmark within acceptable tolerances of its anticipated tracking error.
Vanguard Global Bond Index GBP-Hedged1 0.300 0.085 The fund has tracked its benchmark within acceptable tolerances of its anticipated tracking error.
Vanguard Global Bond Index JPY-Hedged1 0.300% 0.091% The fund has tracked its benchmark within acceptable tolerances of its anticipated tracking error.
Vanguard Global Corporate Bond Index USD-Hedged1 0.400 0.236 The fund has tracked its benchmark within acceptable tolerances of its anticipated tracking error.
Vanguard Global Corporate Bond Index EUR-Hedged1 0.400 0.224 The fund has tracked its benchmark within acceptable tolerances of its anticipated tracking error.
Vanguard Global Corporate Bond Index GBP-Hedged1 0.400 0.238 The fund has tracked its benchmark within acceptable tolerances of its anticipated tracking error.
Vanguard Global Short-Term Bond Index USD-Hedged1 0.200 0.054 The fund has tracked its benchmark within acceptable tolerances of its anticipated tracking error.
Vanguard Global Short-Term Bond Index EUR-Hedged1 0.200 0.056 The fund has tracked its benchmark within acceptable tolerances of its anticipated tracking error.
Vanguard Global Short-Term Bond Index CHF-Hedged1 0.200 0.063 The fund has tracked its benchmark within acceptable tolerances of its anticipated tracking error.
Vanguard Global Short-Term Bond Index GBP-Hedged1 0.200 0.057 The fund has tracked its benchmark within acceptable tolerances of its anticipated tracking error.
Vanguard Global Short-Term Corporate Bond Index USD-Hedged1 0.200 0.092 The fund has tracked its benchmark within acceptable tolerances of its anticipated tracking error.
Vanguard Global Short-Term Corporate Bond Index EUR-Hedged1 0.200 0.085 The fund has tracked its benchmark within acceptable tolerances of its anticipated tracking error.
Vanguard Global Short-Term Corporate Bond Index GBP-Hedged1 0.200 0.099 The fund has tracked its benchmark within acceptable tolerances of its anticipated tracking error.
Vanguard Japan Government Bond Index1 0.300 0.103 The fund has tracked its benchmark within acceptable tolerances of its anticipated tracking error.
Vanguard Japan Government Bond Index GBP-Hedged1 0.300 0.110 The fund has tracked its benchmark within acceptable tolerances of its anticipated tracking error.
Vanguard SRI Euro Investment Grade Bond Index1 0.500 0.102 The fund has tracked its benchmark within acceptable tolerances of its anticipated tracking error.
Vanguard U.K. Government Bond Index2 0.300 0.161 The fund has tracked its benchmark within acceptable tolerances of its anticipated tracking error.
Vanguard U.K. Investment Grade Bond Index2 0.500 0.179 The fund has tracked its benchmark within acceptable tolerances of its anticipated tracking error.
Vanguard U.K. Short-Term Investment Grade Bond Index2 0.300 0.077 The fund has tracked its benchmark within acceptable tolerances of its anticipated tracking error.
Vanguard U.S. Government Bond Index1 0.400 0.192 The fund has tracked its benchmark within acceptable tolerances of its anticipated tracking error.
Vanguard U.S. Government Bond Index GBP-Hedged1 0.400 0.197 The fund has tracked its benchmark within acceptable tolerances of its anticipated tracking error.
Vanguard U.S. Investment Grade Credit Index1 0.400 0.245 The fund has tracked its benchmark within acceptable tolerances of its anticipated tracking error.
Vanguard U.S. Investment Grade Credit Index GBP-Hedged1 0.400 0.250 The fund has tracked its benchmark within acceptable tolerances of its anticipated tracking error.
Vanguard U.S. Treasury Inflation-Protected Securities Index1 0.200 0.084 The fund has tracked its benchmark within acceptable tolerances of its anticipated tracking error.
Vanguard U.S. Treasury Inflation-Protected Securities Index 0.200 0.089 The fund has tracked its benchmark within acceptable CHF-Hedged1 tolerances of its anticipated tracking error.
Vanguard U.S. Treasury Inflation-Protected Securities Index 0.200 0.093 The fund has tracked its benchmark within acceptable EUR-Hedged1 tolerances of its anticipated tracking error.
Vanguard U.S. Treasury Inflation-Protected Securities Index 0.200 0.089 The fund has tracked its benchmark within acceptable GBP-Hedged1 tolerances of its anticipated tracking error.
Vanguard U.S. Treasury Inflation-Protected Securities Index 0.200 0.085 The fund has tracked its benchmark within acceptable SGD-Hedged1 tolerances of its anticipated tracking error.
3
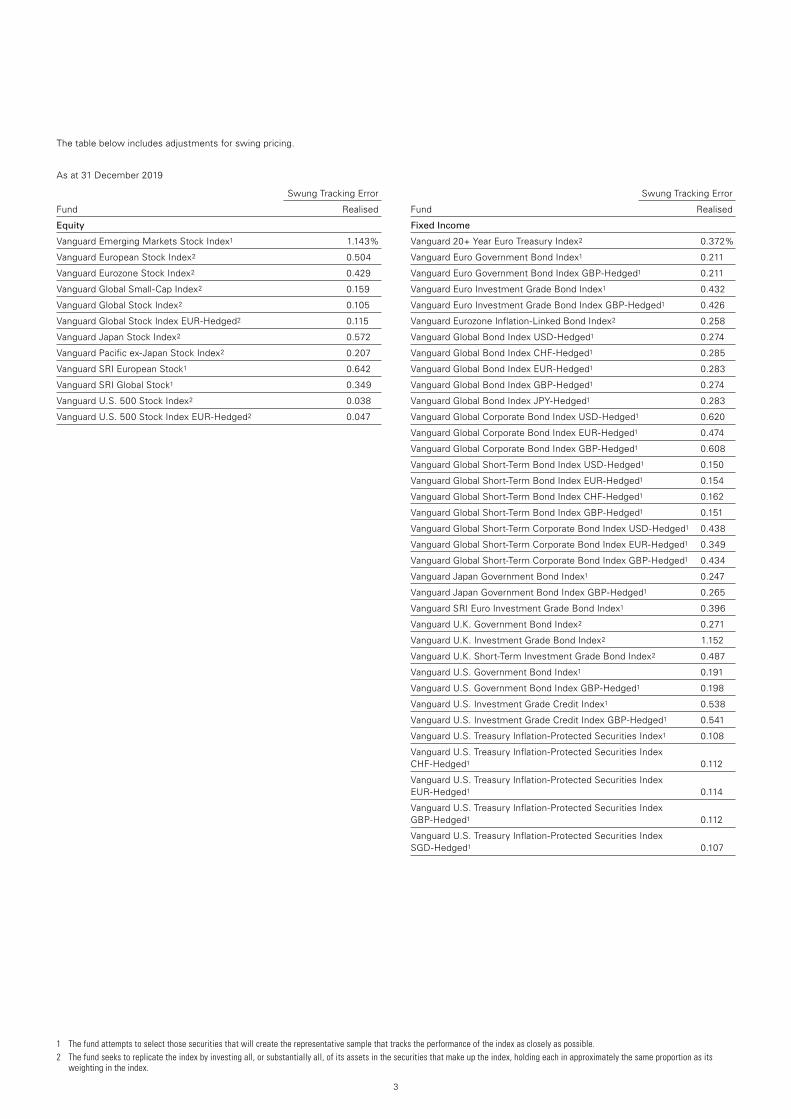
1 The fund attempts to select those securities that will create the representative sample that tracks the performance of the index as closely as possible.2 The fund seeks to replicate the index by investing all, or substantially all, of its assets in the securities that make up the index, holding each in approximately the same proportion as its
weighting in the index.
The table below includes adjustments for swing pricing.
As at 31 December 2019
Swung Tracking Error
Fund Realised
Equity
Vanguard Emerging Markets Stock Index1 1.143%
Vanguard European Stock Index2 0.504
Vanguard Eurozone Stock Index2 0.429
Vanguard Global Small-Cap Index2 0.159
Vanguard Global Stock Index2 0.105
Vanguard Global Stock Index EUR-Hedged2 0.115
Vanguard Japan Stock Index2 0.572
Vanguard Pacific ex-Japan Stock Index2 0.207
Vanguard SRI European Stock1 0.642
Vanguard SRI Global Stock1 0.349
Vanguard U.S. 500 Stock Index2 0.038
Vanguard U.S. 500 Stock Index EUR-Hedged2 0.047
Swung Tracking Error
Fund Realised
Fixed Income
Vanguard 20+ Year Euro Treasury Index2 0.372%
Vanguard Euro Government Bond Index1 0.211
Vanguard Euro Government Bond Index GBP-Hedged1 0.211
Vanguard Euro Investment Grade Bond Index1 0.432
Vanguard Euro Investment Grade Bond Index GBP-Hedged1 0.426
Vanguard Eurozone Inflation-Linked Bond Index2 0.258
Vanguard Global Bond Index USD-Hedged1 0.274
Vanguard Global Bond Index CHF-Hedged1 0.285
Vanguard Global Bond Index EUR-Hedged1 0.283
Vanguard Global Bond Index GBP-Hedged1 0.274
Vanguard Global Bond Index JPY-Hedged1 0.283
Vanguard Global Corporate Bond Index USD-Hedged1 0.620
Vanguard Global Corporate Bond Index EUR-Hedged1 0.474
Vanguard Global Corporate Bond Index GBP-Hedged1 0.608
Vanguard Global Short-Term Bond Index USD-Hedged1 0.150
Vanguard Global Short-Term Bond Index EUR-Hedged1 0.154
Vanguard Global Short-Term Bond Index CHF-Hedged1 0.162
Vanguard Global Short-Term Bond Index GBP-Hedged1 0.151
Vanguard Global Short-Term Corporate Bond Index USD-Hedged1 0.438
Vanguard Global Short-Term Corporate Bond Index EUR-Hedged1 0.349
Vanguard Global Short-Term Corporate Bond Index GBP-Hedged1 0.434
Vanguard Japan Government Bond Index1 0.247
Vanguard Japan Government Bond Index GBP-Hedged1 0.265
Vanguard SRI Euro Investment Grade Bond Index1 0.396
Vanguard U.K. Government Bond Index2 0.271
Vanguard U.K. Investment Grade Bond Index2 1.152
Vanguard U.K. Short-Term Investment Grade Bond Index2 0.487
Vanguard U.S. Government Bond Index1 0.191
Vanguard U.S. Government Bond Index GBP-Hedged1 0.198
Vanguard U.S. Investment Grade Credit Index1 0.538
Vanguard U.S. Investment Grade Credit Index GBP-Hedged1 0.541
Vanguard U.S. Treasury Inflation-Protected Securities Index1 0.108
Vanguard U.S. Treasury Inflation-Protected Securities Index CHF-Hedged1 0.112
Vanguard U.S. Treasury Inflation-Protected Securities Index EUR-Hedged1 0.114
Vanguard U.S. Treasury Inflation-Protected Securities Index GBP-Hedged1 0.112
Vanguard U.S. Treasury Inflation-Protected Securities Index SGD-Hedged1 0.107
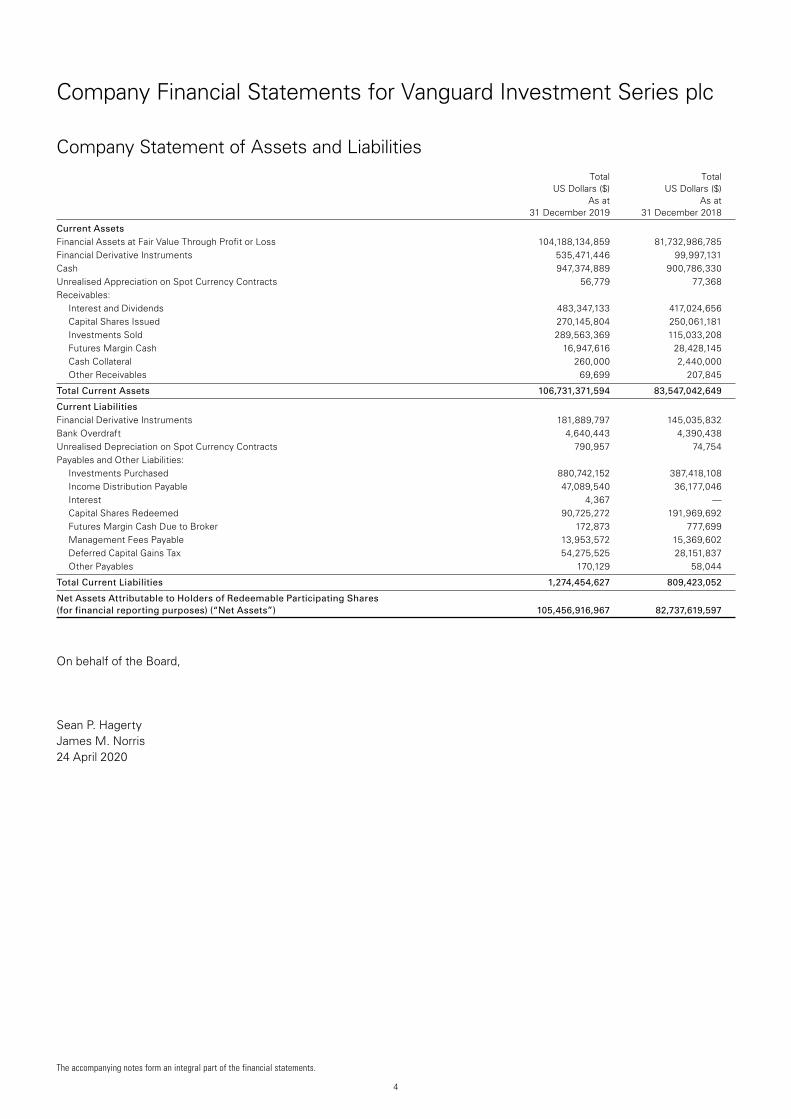
Company Financial Statements for Vanguard Investment Series plc
Company Statement of Assets and Liabilities Total Total US Dollars ($) US Dollars ($) As at As at 31 December 2019 31 December 2018
Current Assets Financial Assets at Fair Value Through Profit or Loss 104,188,134,859 81,732,986,785Financial Derivative Instruments 535,471,446 99,997,131Cash 947,374,889 900,786,330Unrealised Appreciation on Spot Currency Contracts 56,779 77,368Receivables:
Interest and Dividends 483,347,133 417,024,656Capital Shares Issued 270,145,804 250,061,181Investments Sold 289,563,369 115,033,208Futures Margin Cash 16,947,616 28,428,145Cash Collateral 260,000 2,440,000Other Receivables 69,699 207,845
Total Current Assets 106,731,371,594 83,547,042,649
Current Liabilities Financial Derivative Instruments 181,889,797 145,035,832Bank Overdraft 4,640,443 4,390,438Unrealised Depreciation on Spot Currency Contracts 790,957 74,754Payables and Other Liabilities:
Investments Purchased 880,742,152 387,418,108Income Distribution Payable 47,089,540 36,177,046Interest 4,367 —Capital Shares Redeemed 90,725,272 191,969,692Futures Margin Cash Due to Broker 172,873 777,699Management Fees Payable 13,953,572 15,369,602Deferred Capital Gains Tax 54,275,525 28,151,837Other Payables 170,129 58,044
Total Current Liabilities 1,274,454,627 809,423,052
Net Assets Attributable to Holders of Redeemable Participating Shares (for financial reporting purposes) (“Net Assets”) 105,456,916,967 82,737,619,597
On behalf of the Board,
Sean P. Hagerty James M. Norris 24 April 2020
The accompanying notes form an integral part of the financial statements.
4
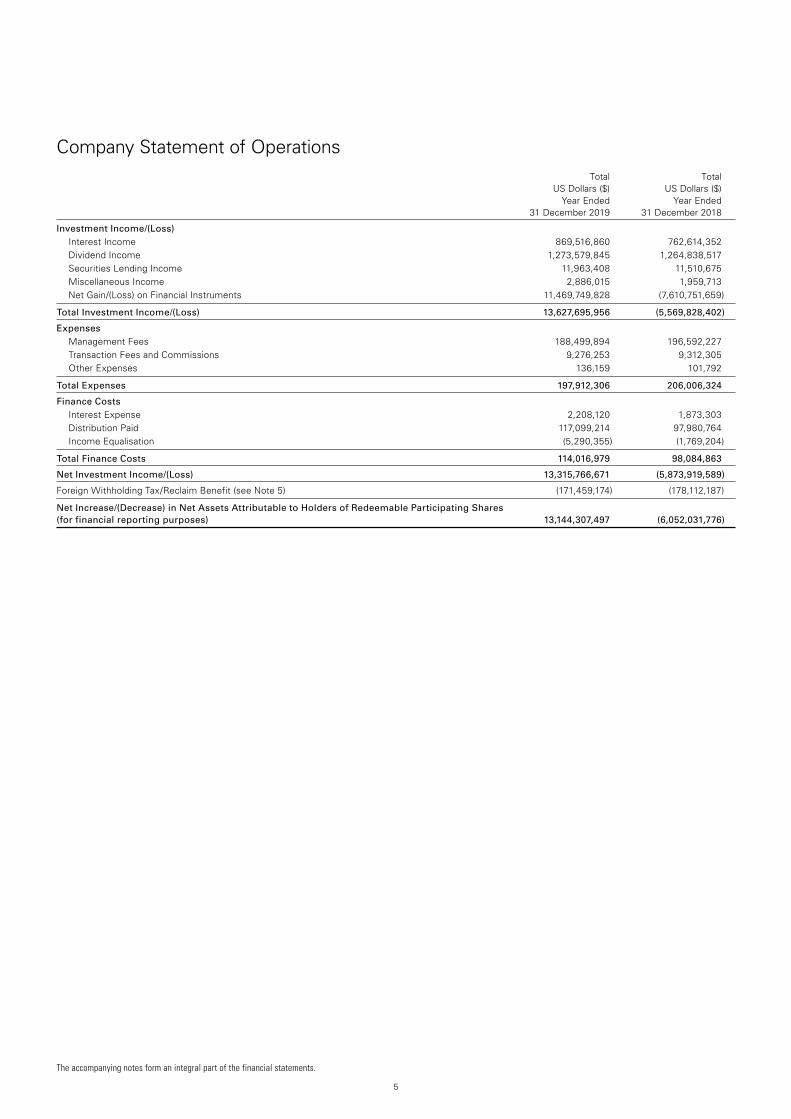
Company Statement of Operations Total Total US Dollars ($) US Dollars ($) Year Ended Year Ended 31 December 2019 31 December 2018
Investment Income/(Loss) Interest Income 869,516,860 762,614,352Dividend Income 1,273,579,845 1,264,838,517Securities Lending Income 11,963,408 11,510,675Miscellaneous Income 2,886,015 1,959,713Net Gain/(Loss) on Financial Instruments 11,469,749,828 (7,610,751,659)
Total Investment Income/(Loss) 13,627,695,956 (5,569,828,402)
Expenses Management Fees 188,499,894 196,592,227Transaction Fees and Commissions 9,276,253 9,312,305Other Expenses 136,159 101,792
Total Expenses 197,912,306 206,006,324
Finance Costs Interest Expense 2,208,120 1,873,303Distribution Paid 117,099,214 97,980,764Income Equalisation (5,290,355) (1,769,204)
Total Finance Costs 114,016,979 98,084,863
Net Investment Income/(Loss) 13,315,766,671 (5,873,919,589)
Foreign Withholding Tax/Reclaim Benefit (see Note 5) (171,459,174) (178,112,187)
Net Increase/(Decrease) in Net Assets Attributable to Holders of Redeemable Participating Shares (for financial reporting purposes) 13,144,307,497 (6,052,031,776)
The accompanying notes form an integral part of the financial statements.
5
6
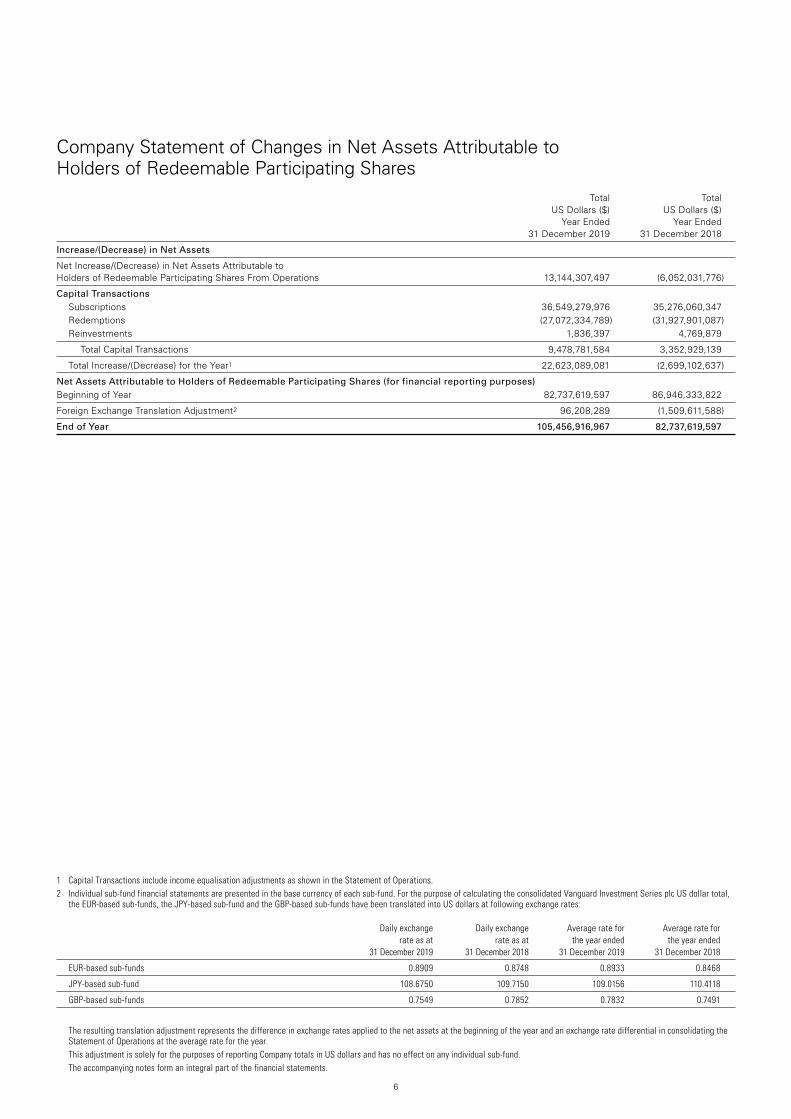
1 Capital Transactions include income equalisation adjustments as shown in the Statement of Operations.2 Individual sub-fund financial statements are presented in the base currency of each sub-fund. For the purpose of calculating the consolidated Vanguard Investment Series plc US dollar total,
the EUR-based sub-funds, the JPY-based sub-fund and the GBP-based sub-funds have been translated into US dollars at following exchange rates: Daily exchange Daily exchange Average rate for Average rate for rate as at rate as at the year ended the year ended 31 December 2019 31 December 2018 31 December 2019 31 December 2018
EUR-based sub-funds 0.8909 0.8748 0.8933 0.8468
JPY-based sub-fund 108.6750 109.7150 109.0156 110.4118
GBP-based sub-funds 0.7549 0.7852 0.7832 0.7491
The resulting translation adjustment represents the difference in exchange rates applied to the net assets at the beginning of the year and an exchange rate differential in consolidating the
Statement of Operations at the average rate for the year. This adjustment is solely for the purposes of reporting Company totals in US dollars and has no effect on any individual sub-fund. The accompanying notes form an integral part of the financial statements.
Company Statement of Changes in Net Assets Attributable to Holders of Redeemable Participating Shares Total Total US Dollars ($) US Dollars ($) Year Ended Year Ended 31 December 2019 31 December 2018
Increase/(Decrease) in Net Assets
Net Increase/(Decrease) in Net Assets Attributable to Holders of Redeemable Participating Shares From Operations 13,144,307,497 (6,052,031,776)
Capital Transactions Subscriptions 36,549,279,976 35,276,060,347Redemptions (27,072,334,789) (31,927,901,087)Reinvestments 1,836,397 4,769,879
Total Capital Transactions 9,478,781,584 3,352,929,139
Total Increase/(Decrease) for the Year1 22,623,089,081 (2,699,102,637)
Net Assets Attributable to Holders of Redeemable Participating Shares (for financial reporting purposes) Beginning of Year 82,737,619,597 86,946,333,822
Foreign Exchange Translation Adjustment2 96,208,289 (1,509,611,588)
End of Year 105,456,916,967 82,737,619,597
7
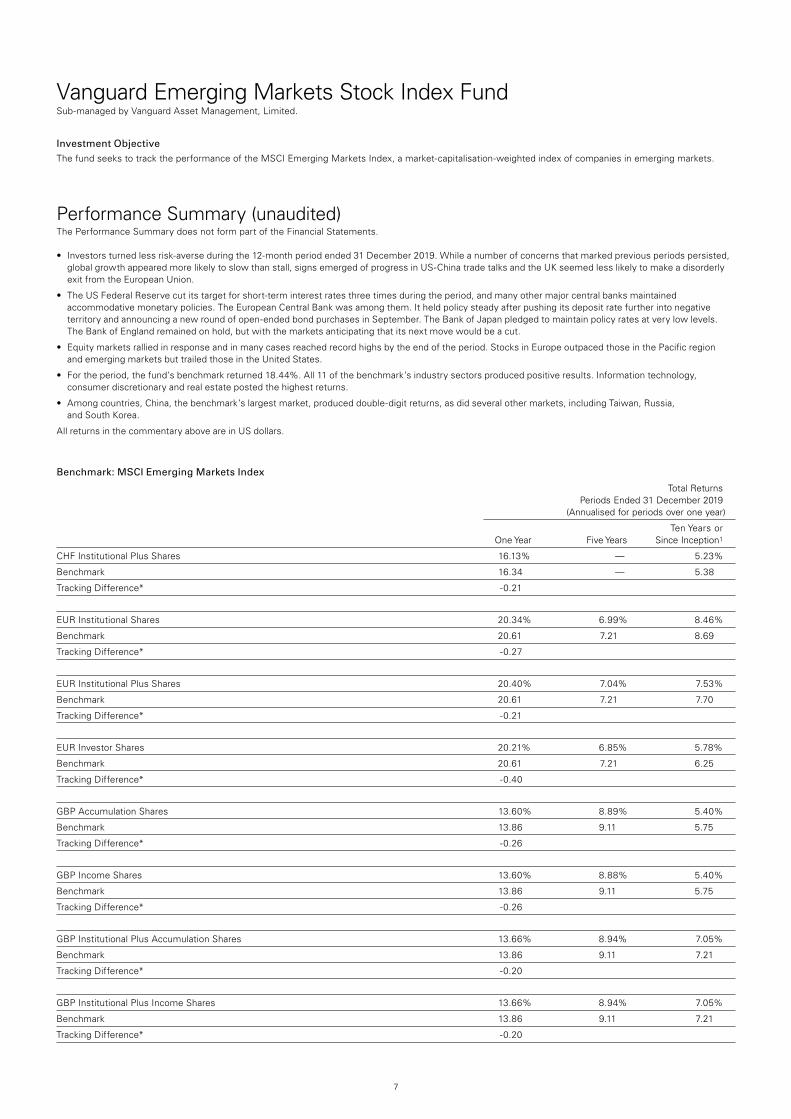
Vanguard Emerging Markets Stock Index FundSub-managed by Vanguard Asset Management, Limited.
Investment ObjectiveThe fund seeks to track the performance of the MSCI Emerging Markets Index, a market-capitalisation-weighted index of companies in emerging markets.
Performance Summary (unaudited)The Performance Summary does not form part of the Financial Statements.
• Investorsturnedlessrisk-averseduringthe12-monthperiodended31December2019.Whileanumberofconcernsthatmarkedpreviousperiodspersisted,global growth appeared more likely to slow than stall, signs emerged of progress in US-China trade talks and the UK seemed less likely to make a disorderly exit from the European Union.
• TheUSFederalReservecutitstargetforshort-terminterestratesthreetimesduringtheperiod,andmanyothermajorcentralbanksmaintainedaccommodative monetary policies. The European Central Bank was among them. It held policy steady after pushing its deposit rate further into negative territory and announcing a new round of open-ended bond purchases in September. The Bank of Japan pledged to maintain policy rates at very low levels. The Bank of England remained on hold, but with the markets anticipating that its next move would be a cut.
• Equitymarketsralliedinresponseandinmanycasesreachedrecordhighsbytheendoftheperiod.StocksinEuropeoutpacedthoseinthePacificregion and emerging markets but trailed those in the United States.
• Fortheperiod,thefund’sbenchmarkreturned18.44%.All11ofthebenchmark’sindustrysectorsproducedpositiveresults.Informationtechnology,consumer discretionary and real estate posted the highest returns.
• Amongcountries,China,thebenchmark’slargestmarket,produceddouble-digitreturns,asdidseveralothermarkets,includingTaiwan,Russia, and South Korea.
All returns in the commentary above are in US dollars.
Benchmark: MSCI Emerging Markets Index
Total Returns Periods Ended 31 December 2019 (Annualised for periods over one year)
Ten Years or One Year Five Years Since Inception1
CHF Institutional Plus Shares 16.13% — 5.23%
Benchmark 16.34 — 5.38
Tracking Difference* -0.21
EUR Institutional Shares 20.34% 6.99% 8.46%
Benchmark 20.61 7.21 8.69
Tracking Difference* -0.27
EUR Institutional Plus Shares 20.40% 7.04% 7.53%
Benchmark 20.61 7.21 7.70
Tracking Difference* -0.21
EUR Investor Shares 20.21% 6.85% 5.78%
Benchmark 20.61 7.21 6.25
Tracking Difference* -0.40
GBP Accumulation Shares 13.60% 8.89% 5.40%
Benchmark 13.86 9.11 5.75
Tracking Difference* -0.26
GBP Income Shares 13.60% 8.88% 5.40%
Benchmark 13.86 9.11 5.75
Tracking Difference* -0.26
GBP Institutional Plus Accumulation Shares 13.66% 8.94% 7.05%
Benchmark 13.86 9.11 7.21
Tracking Difference* -0.20
GBP Institutional Plus Income Shares 13.66% 8.94% 7.05%
Benchmark 13.86 9.11 7.21
Tracking Difference* -0.20
8
Vanguard Emerging Markets Stock Index Fund
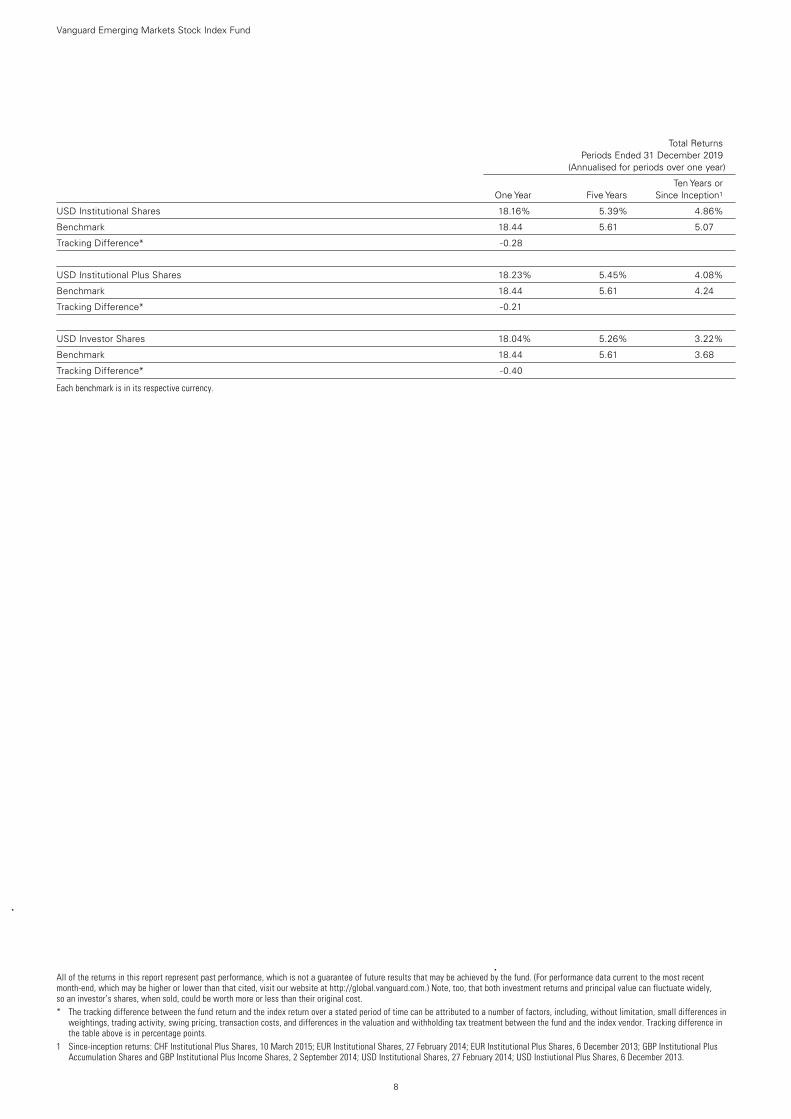
All of the returns in this report represent past performance, which is not a guarantee of future results that may be achieved by the fund. (For performance data current to the most recent month-end, which may be higher or lower than that cited, visit our website at http://global.vanguard.com.) Note, too, that both investment returns and principal value can fluctuate widely, so an investor’s shares, when sold, could be worth more or less than their original cost.* The tracking difference between the fund return and the index return over a stated period of time can be attributed to a number of factors, including, without limitation, small differences in
weightings, trading activity, swing pricing, transaction costs, and differences in the valuation and withholding tax treatment between the fund and the index vendor. Tracking difference in the table above is in percentage points.
1 Since-inception returns: CHF Institutional Plus Shares, 10 March 2015; EUR Institutional Shares, 27 February 2014; EUR Institutional Plus Shares, 6 December 2013; GBP Institutional Plus Accumulation Shares and GBP Institutional Plus Income Shares, 2 September 2014; USD Institutional Shares, 27 February 2014; USD Instiutional Plus Shares, 6 December 2013.
Total Returns Periods Ended 31 December 2019 (Annualised for periods over one year)
Ten Years or One Year Five Years Since Inception1
USD Institutional Shares 18.16% 5.39% 4.86%
Benchmark 18.44 5.61 5.07
Tracking Difference* -0.28
USD Institutional Plus Shares 18.23% 5.45% 4.08%
Benchmark 18.44 5.61 4.24
Tracking Difference* -0.21
USD Investor Shares 18.04% 5.26% 3.22%
Benchmark 18.44 5.61 3.68
Tracking Difference* -0.40
Each benchmark is in its respective currency.
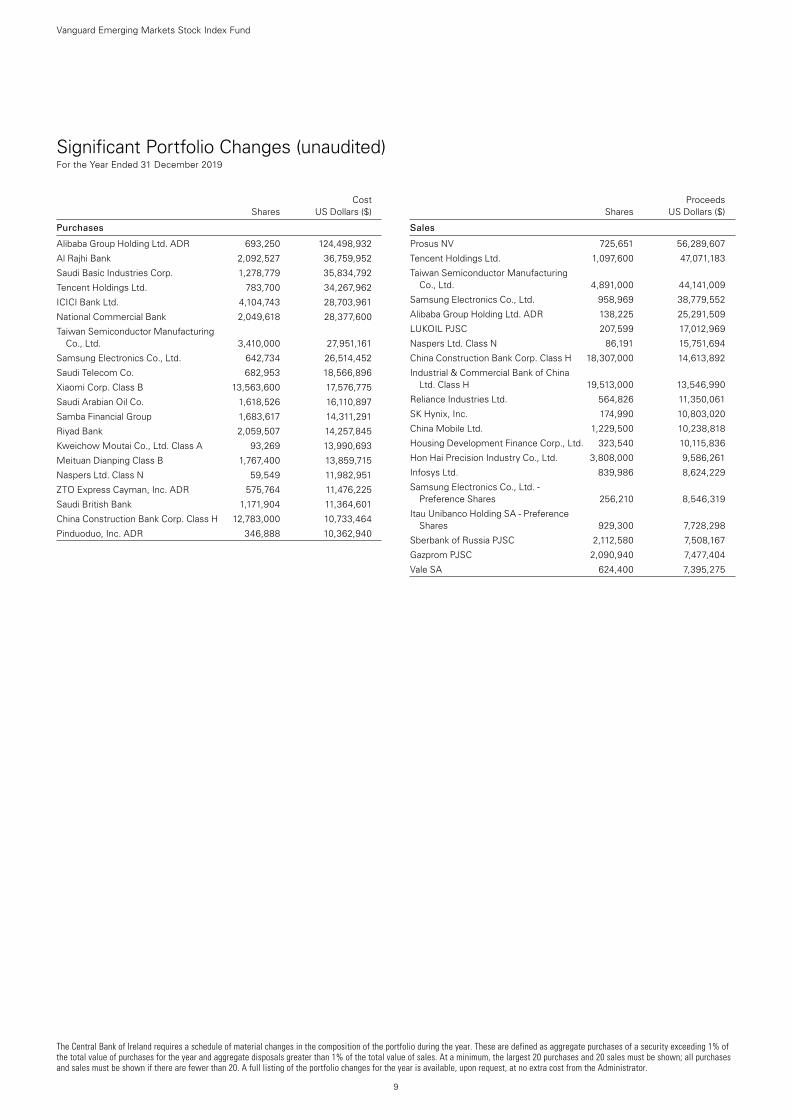
The Central Bank of Ireland requires a schedule of material changes in the composition of the portfolio during the year. These are defined as aggregate purchases of a security exceeding 1% of the total value of purchases for the year and aggregate disposals greater than 1% of the total value of sales. At a minimum, the largest 20 purchases and 20 sales must be shown; all purchases and sales must be shown if there are fewer than 20. A full listing of the portfolio changes for the year is available, upon request, at no extra cost from the Administrator.
9
Vanguard Emerging Markets Stock Index Fund
Significant Portfolio Changes (unaudited) For the Year Ended 31 December 2019
Cost Shares US Dollars ($)
Purchases
Alibaba Group Holding Ltd. ADR 693,250 124,498,932
Al Rajhi Bank 2,092,527 36,759,952
Saudi Basic Industries Corp. 1,278,779 35,834,792
Tencent Holdings Ltd. 783,700 34,267,962
ICICI Bank Ltd. 4,104,743 28,703,961
National Commercial Bank 2,049,618 28,377,600
Taiwan Semiconductor Manufacturing Co., Ltd. 3,410,000 27,951,161
Samsung Electronics Co., Ltd. 642,734 26,514,452
Saudi Telecom Co. 682,953 18,566,896
Xiaomi Corp. Class B 13,563,600 17,576,775
Saudi Arabian Oil Co. 1,618,526 16,110,897
Samba Financial Group 1,683,617 14,311,291
Riyad Bank 2,059,507 14,257,845
Kweichow Moutai Co., Ltd. Class A 93,269 13,990,693
Meituan Dianping Class B 1,767,400 13,859,715
Naspers Ltd. Class N 59,549 11,982,951
ZTO Express Cayman, Inc. ADR 575,764 11,476,225
Saudi British Bank 1,171,904 11,364,601
China Construction Bank Corp. Class H 12,783,000 10,733,464
Pinduoduo, Inc. ADR 346,888 10,362,940
Proceeds Shares US Dollars ($)
Sales
Prosus NV 725,651 56,289,607
Tencent Holdings Ltd. 1,097,600 47,071,183
Taiwan Semiconductor Manufacturing Co., Ltd. 4,891,000 44,141,009
Samsung Electronics Co., Ltd. 958,969 38,779,552
Alibaba Group Holding Ltd. ADR 138,225 25,291,509
LUKOIL PJSC 207,599 17,012,969
Naspers Ltd. Class N 86,191 15,751,694
China Construction Bank Corp. Class H 18,307,000 14,613,892
Industrial & Commercial Bank of China Ltd. Class H 19,513,000 13,546,990
Reliance Industries Ltd. 564,826 11,350,061
SK Hynix, Inc. 174,990 10,803,020
China Mobile Ltd. 1,229,500 10,238,818
Housing Development Finance Corp., Ltd. 323,540 10,115,836
Hon Hai Precision Industry Co., Ltd. 3,808,000 9,586,261
Infosys Ltd. 839,986 8,624,229
Samsung Electronics Co., Ltd. - Preference Shares 256,210 8,546,319
Itau Unibanco Holding SA - Preference Shares 929,300 7,728,298
Sberbank of Russia PJSC 2,112,580 7,508,167
Gazprom PJSC 2,090,940 7,477,404
Vale SA 624,400 7,395,275
10
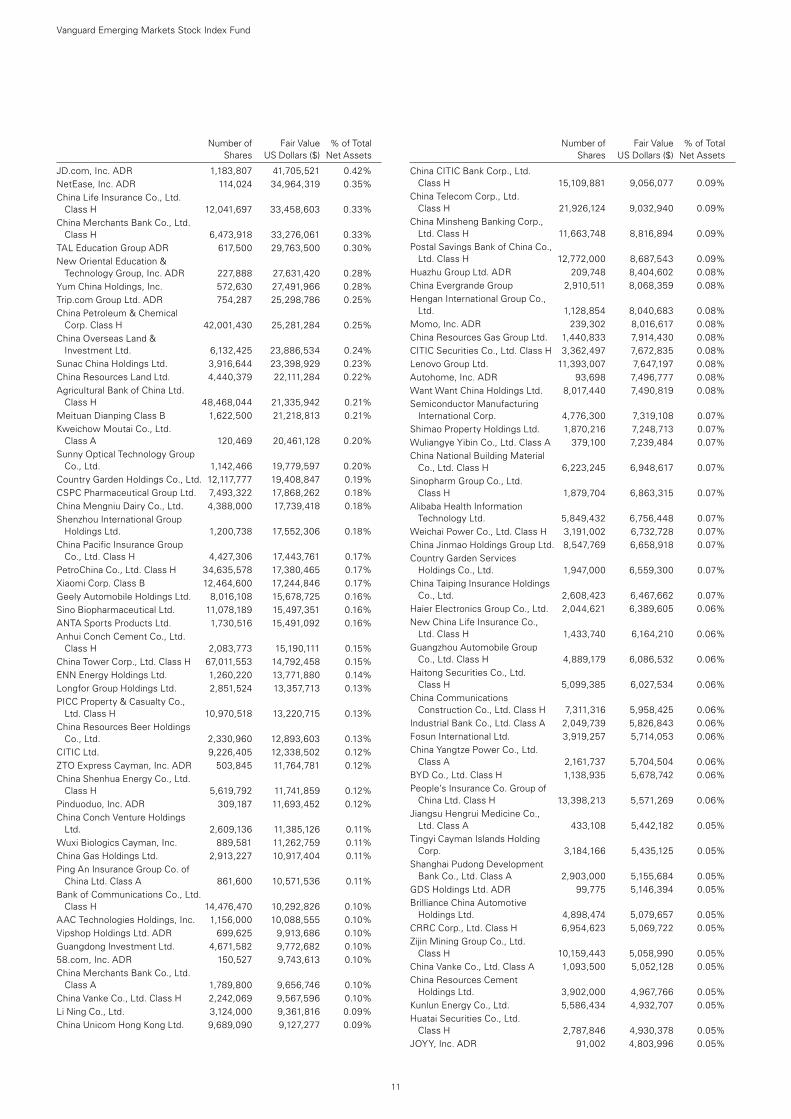
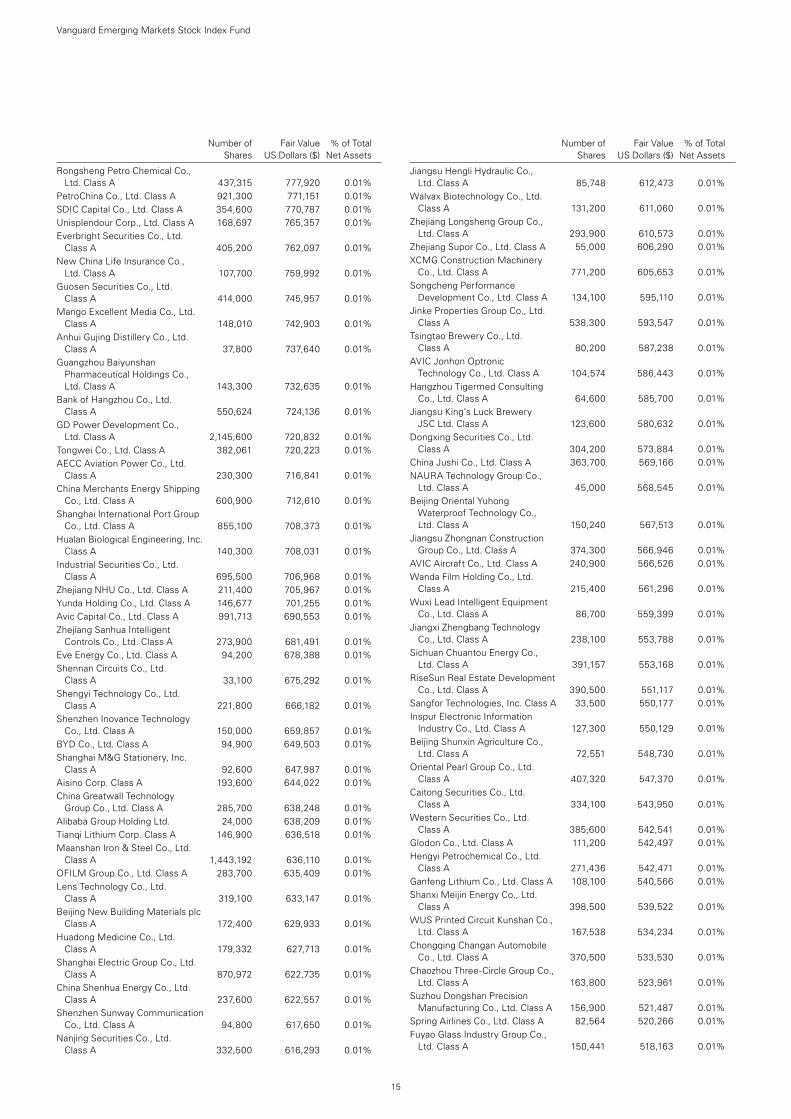
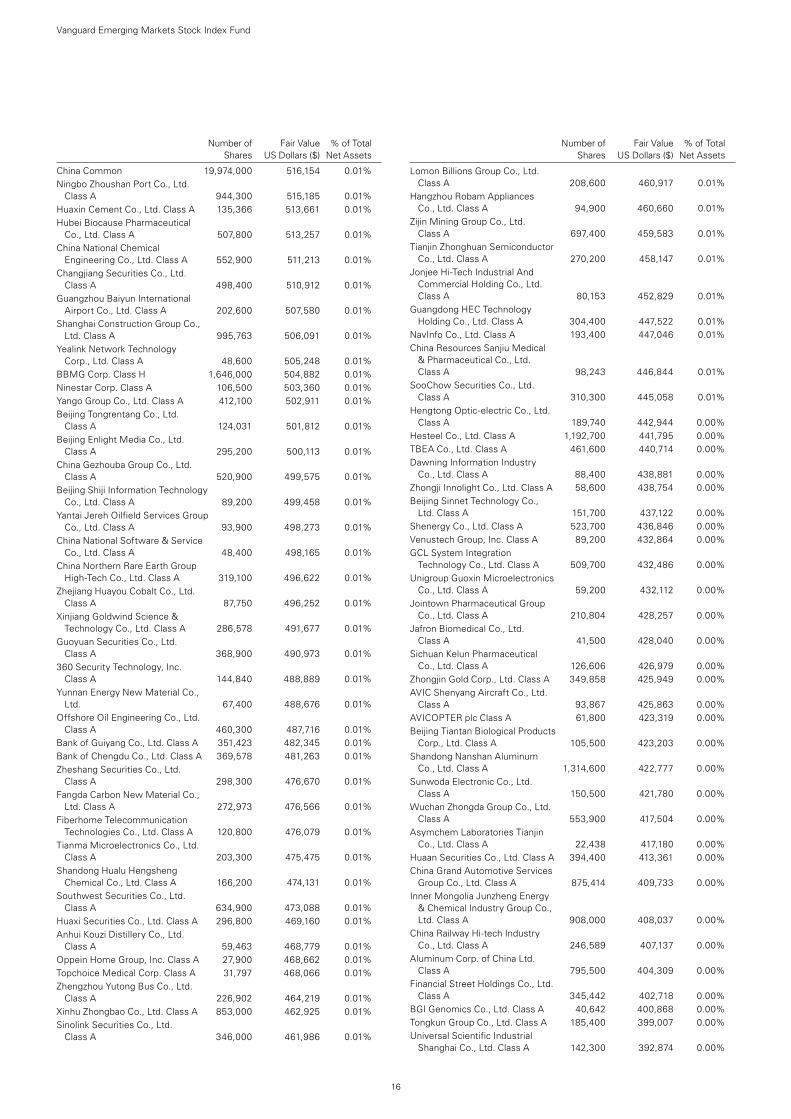
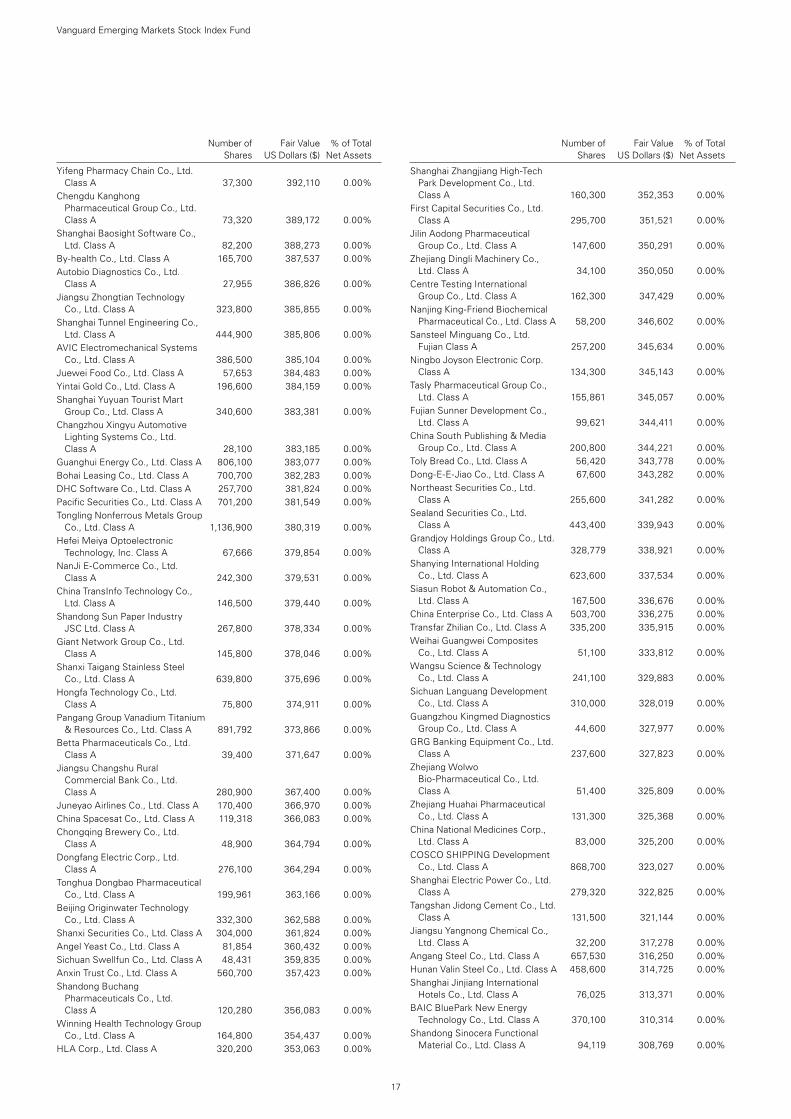
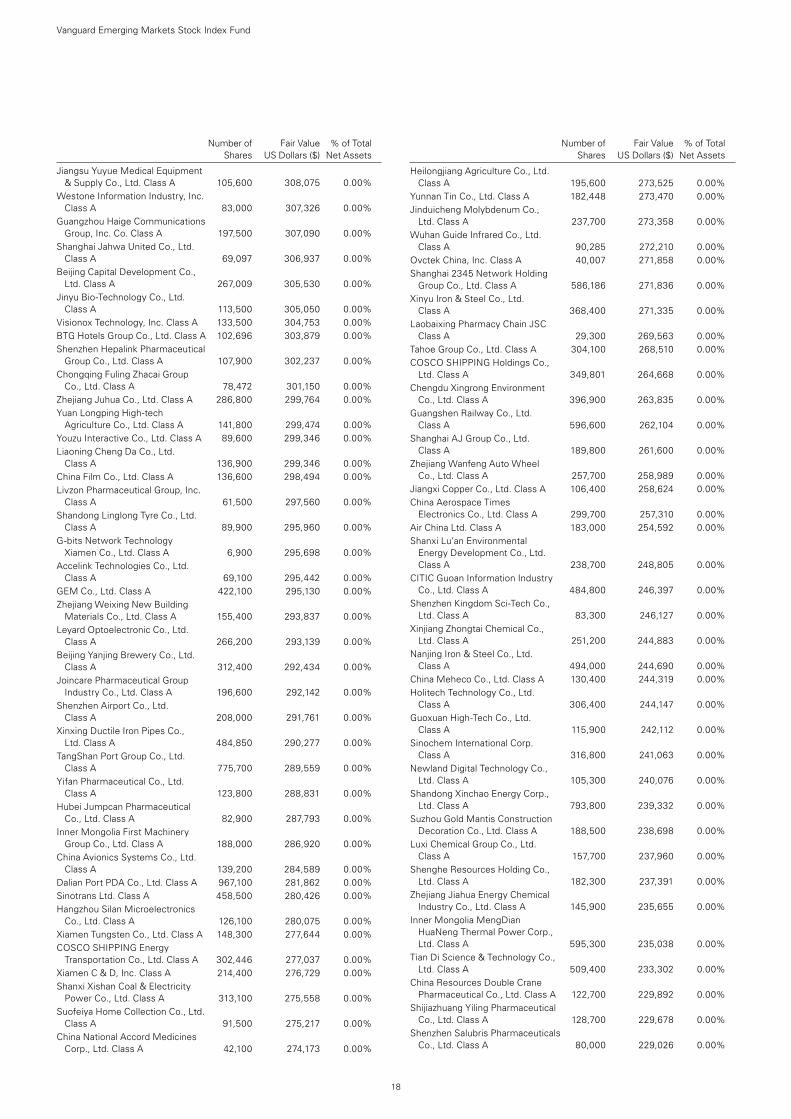
Vanguard Emerging Markets Stock Index Fund
Number of Fair Value % of Total Shares US Dollars ($) Net Assets
Number of Fair Value % of Total Shares US Dollars ($) Net Assets
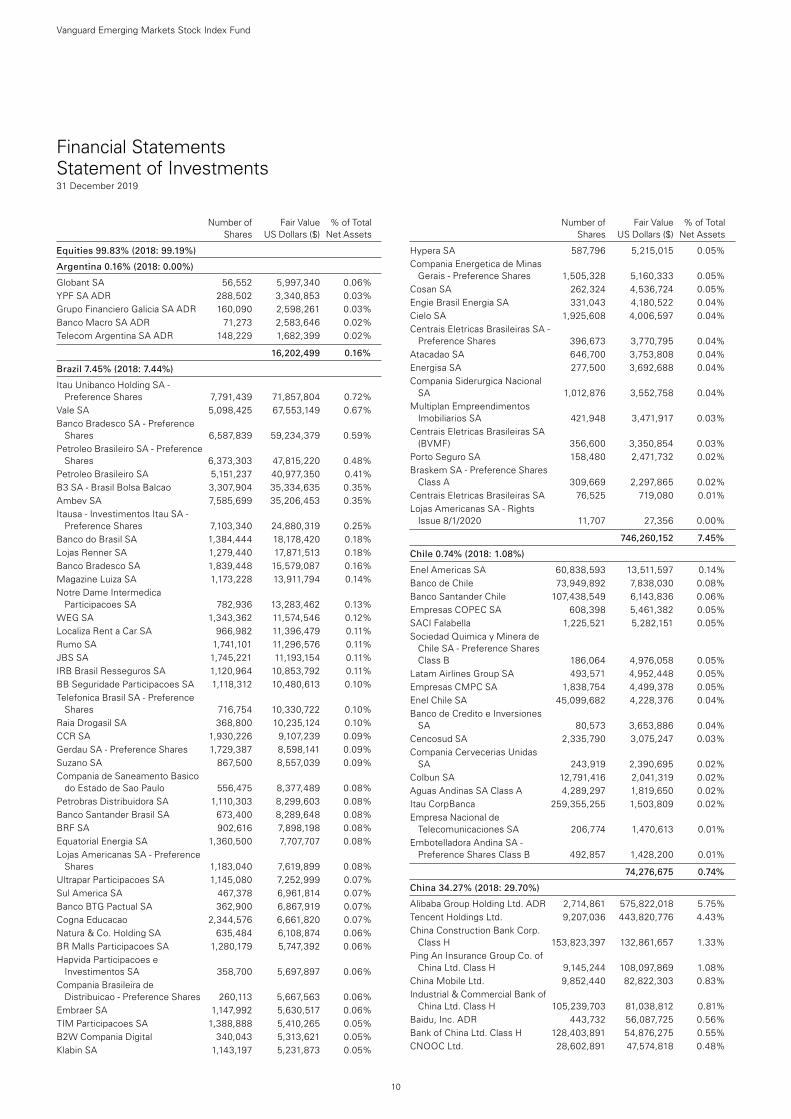
Equities 99.83% (2018: 99.19%)
Argentina 0.16% (2018: 0.00%)
Globant SA 56,552 5,997,340 0.06%YPF SA ADR 288,502 3,340,853 0.03%Grupo Financiero Galicia SA ADR 160,090 2,598,261 0.03%Banco Macro SA ADR 71,273 2,583,646 0.02%Telecom Argentina SA ADR 148,229 1,682,399 0.02%
16,202,499 0.16%
Brazil 7.45% (2018: 7.44%)
Itau Unibanco Holding SA - Preference Shares 7,791,439 71,857,804 0.72%
Vale SA 5,098,425 67,553,149 0.67%Banco Bradesco SA - Preference
Shares 6,587,839 59,234,379 0.59%Petroleo Brasileiro SA - Preference
Shares 6,373,303 47,815,220 0.48%Petroleo Brasileiro SA 5,151,237 40,977,350 0.41%B3 SA - Brasil Bolsa Balcao 3,307,904 35,334,635 0.35%Ambev SA 7,585,699 35,206,453 0.35%Itausa - Investimentos Itau SA -
Preference Shares 7,103,340 24,880,319 0.25%Banco do Brasil SA 1,384,444 18,178,420 0.18%Lojas Renner SA 1,279,440 17,871,513 0.18%Banco Bradesco SA 1,839,448 15,579,087 0.16%Magazine Luiza SA 1,173,228 13,911,794 0.14%Notre Dame Intermedica
Participacoes SA 782,936 13,283,462 0.13%WEG SA 1,343,362 11,574,546 0.12%Localiza Rent a Car SA 966,982 11,396,479 0.11%Rumo SA 1,741,101 11,296,576 0.11%JBS SA 1,745,221 11,193,154 0.11%IRB Brasil Resseguros SA 1,120,964 10,853,792 0.11%BB Seguridade Participacoes SA 1,118,312 10,480,613 0.10%Telefonica Brasil SA - Preference
Shares 716,754 10,330,722 0.10%Raia Drogasil SA 368,800 10,235,124 0.10%CCR SA 1,930,226 9,107,239 0.09%Gerdau SA - Preference Shares 1,729,387 8,598,141 0.09%Suzano SA 867,500 8,557,039 0.09%Compania de Saneamento Basico
do Estado de Sao Paulo 556,475 8,377,489 0.08%Petrobras Distribuidora SA 1,110,303 8,299,603 0.08%Banco Santander Brasil SA 673,400 8,289,648 0.08%BRF SA 902,616 7,898,198 0.08%Equatorial Energia SA 1,360,500 7,707,707 0.08%Lojas Americanas SA - Preference
Shares 1,183,040 7,619,899 0.08%Ultrapar Participacoes SA 1,145,080 7,252,999 0.07%Sul America SA 467,378 6,961,814 0.07%Banco BTG Pactual SA 362,900 6,867,919 0.07%Cogna Educacao 2,344,576 6,661,820 0.07%Natura & Co. Holding SA 635,484 6,108,874 0.06%BR Malls Participacoes SA 1,280,179 5,747,392 0.06%Hapvida Participacoes e
Investimentos SA 358,700 5,697,897 0.06%Compania Brasileira de
Distribuicao - Preference Shares 260,113 5,667,563 0.06%Embraer SA 1,147,992 5,630,517 0.06%TIM Participacoes SA 1,388,888 5,410,265 0.05%B2W Compania Digital 340,043 5,313,621 0.05%Klabin SA 1,143,197 5,231,873 0.05%
Hypera SA 587,796 5,215,015 0.05%Compania Energetica de Minas
Gerais - Preference Shares 1,505,328 5,160,333 0.05%Cosan SA 262,324 4,536,724 0.05%Engie Brasil Energia SA 331,043 4,180,522 0.04%Cielo SA 1,925,608 4,006,597 0.04%Centrais Eletricas Brasileiras SA -
Preference Shares 396,673 3,770,795 0.04%Atacadao SA 646,700 3,753,808 0.04%Energisa SA 277,500 3,692,688 0.04%Compania Siderurgica Nacional
SA 1,012,876 3,552,758 0.04%Multiplan Empreendimentos
Imobiliarios SA 421,948 3,471,917 0.03%Centrais Eletricas Brasileiras SA
(BVMF) 356,600 3,350,854 0.03%Porto Seguro SA 158,480 2,471,732 0.02%Braskem SA - Preference Shares
Class A 309,669 2,297,865 0.02%Centrais Eletricas Brasileiras SA 76,525 719,080 0.01%Lojas Americanas SA - Rights
Issue 8/1/2020 11,707 27,356 0.00%
746,260,152 7.45%
Chile 0.74% (2018: 1.08%)
Enel Americas SA 60,838,593 13,511,597 0.14%Banco de Chile 73,949,892 7,838,030 0.08%Banco Santander Chile 107,438,549 6,143,836 0.06%Empresas COPEC SA 608,398 5,461,382 0.05%SACI Falabella 1,225,521 5,282,151 0.05%Sociedad Quimica y Minera de
Chile SA - Preference Shares Class B 186,064 4,976,058 0.05%
Latam Airlines Group SA 493,571 4,952,448 0.05%Empresas CMPC SA 1,838,754 4,499,378 0.05%Enel Chile SA 45,099,682 4,228,376 0.04%Banco de Credito e Inversiones
SA 80,573 3,653,886 0.04%Cencosud SA 2,335,790 3,075,247 0.03%Compania Cervecerias Unidas
SA 243,919 2,390,695 0.02%Colbun SA 12,791,416 2,041,319 0.02%Aguas Andinas SA Class A 4,289,297 1,819,650 0.02%Itau CorpBanca 259,355,255 1,503,809 0.02%Empresa Nacional de
Telecomunicaciones SA 206,774 1,470,613 0.01%Embotelladora Andina SA -
Preference Shares Class B 492,857 1,428,200 0.01%
74,276,675 0.74%
China 34.27% (2018: 29.70%)
Alibaba Group Holding Ltd. ADR 2,714,861 575,822,018 5.75%Tencent Holdings Ltd. 9,207,036 443,820,776 4.43%China Construction Bank Corp.
Class H 153,823,397 132,861,657 1.33%Ping An Insurance Group Co. of
China Ltd. Class H 9,145,244 108,097,869 1.08%China Mobile Ltd. 9,852,440 82,822,303 0.83%Industrial & Commercial Bank of
China Ltd. Class H 105,239,703 81,038,812 0.81%Baidu, Inc. ADR 443,732 56,087,725 0.56%Bank of China Ltd. Class H 128,403,891 54,876,275 0.55%CNOOC Ltd. 28,602,891 47,574,818 0.48%
Financial Statements Statement of Investments31 December 2019
11
Number of Fair Value % of Total Shares US Dollars ($) Net Assets
JD.com, Inc. ADR 1,183,807 41,705,521 0.42%NetEase, Inc. ADR 114,024 34,964,319 0.35%China Life Insurance Co., Ltd.
Class H 12,041,697 33,458,603 0.33%China Merchants Bank Co., Ltd.
Class H 6,473,918 33,276,061 0.33%TAL Education Group ADR 617,500 29,763,500 0.30%New Oriental Education &
Technology Group, Inc. ADR 227,888 27,631,420 0.28%Yum China Holdings, Inc. 572,630 27,491,966 0.28%Trip.com Group Ltd. ADR 754,287 25,298,786 0.25%China Petroleum & Chemical
Corp. Class H 42,001,430 25,281,284 0.25%China Overseas Land &
Investment Ltd. 6,132,425 23,886,534 0.24%Sunac China Holdings Ltd. 3,916,644 23,398,929 0.23%China Resources Land Ltd. 4,440,379 22,111,284 0.22%Agricultural Bank of China Ltd.
Class H 48,468,044 21,335,942 0.21%Meituan Dianping Class B 1,622,500 21,218,813 0.21%Kweichow Moutai Co., Ltd.
Class A 120,469 20,461,128 0.20%Sunny Optical Technology Group
Co., Ltd. 1,142,466 19,779,597 0.20%Country Garden Holdings Co., Ltd. 12,117,777 19,408,847 0.19%CSPC Pharmaceutical Group Ltd. 7,493,322 17,868,262 0.18%China Mengniu Dairy Co., Ltd. 4,388,000 17,739,418 0.18%Shenzhou International Group
Holdings Ltd. 1,200,738 17,552,306 0.18%China Pacific Insurance Group
Co., Ltd. Class H 4,427,306 17,443,761 0.17%PetroChina Co., Ltd. Class H 34,635,578 17,380,465 0.17%Xiaomi Corp. Class B 12,464,600 17,244,846 0.17%Geely Automobile Holdings Ltd. 8,016,108 15,678,725 0.16%Sino Biopharmaceutical Ltd. 11,078,189 15,497,351 0.16%ANTA Sports Products Ltd. 1,730,516 15,491,092 0.16%Anhui Conch Cement Co., Ltd.
Class H 2,083,773 15,190,111 0.15%China Tower Corp., Ltd. Class H 67,011,553 14,792,458 0.15%ENN Energy Holdings Ltd. 1,260,220 13,771,880 0.14%Longfor Group Holdings Ltd. 2,851,524 13,357,713 0.13%PICC Property & Casualty Co.,
Ltd. Class H 10,970,518 13,220,715 0.13%China Resources Beer Holdings
Co., Ltd. 2,330,960 12,893,603 0.13%CITIC Ltd. 9,226,405 12,338,502 0.12%ZTO Express Cayman, Inc. ADR 503,845 11,764,781 0.12%China Shenhua Energy Co., Ltd.
Class H 5,619,792 11,741,859 0.12%Pinduoduo, Inc. ADR 309,187 11,693,452 0.12%China Conch Venture Holdings
Ltd. 2,609,136 11,385,126 0.11%Wuxi Biologics Cayman, Inc. 889,581 11,262,759 0.11%China Gas Holdings Ltd. 2,913,227 10,917,404 0.11%Ping An Insurance Group Co. of
China Ltd. Class A 861,600 10,571,536 0.11%Bank of Communications Co., Ltd.
Class H 14,476,470 10,292,826 0.10%AAC Technologies Holdings, Inc. 1,156,000 10,088,555 0.10%Vipshop Holdings Ltd. ADR 699,625 9,913,686 0.10%Guangdong Investment Ltd. 4,671,582 9,772,682 0.10%58.com, Inc. ADR 150,527 9,743,613 0.10%China Merchants Bank Co., Ltd.
Class A 1,789,800 9,656,746 0.10%China Vanke Co., Ltd. Class H 2,242,069 9,567,596 0.10%Li Ning Co., Ltd. 3,124,000 9,361,816 0.09%China Unicom Hong Kong Ltd. 9,689,090 9,127,277 0.09%
China CITIC Bank Corp., Ltd. Class H 15,109,881 9,056,077 0.09%
China Telecom Corp., Ltd. Class H 21,926,124 9,032,940 0.09%
China Minsheng Banking Corp., Ltd. Class H 11,663,748 8,816,894 0.09%
Postal Savings Bank of China Co., Ltd. Class H 12,772,000 8,687,543 0.09%
Huazhu Group Ltd. ADR 209,748 8,404,602 0.08%China Evergrande Group 2,910,511 8,068,359 0.08%Hengan International Group Co.,
Ltd. 1,128,854 8,040,683 0.08%Momo, Inc. ADR 239,302 8,016,617 0.08%China Resources Gas Group Ltd. 1,440,833 7,914,430 0.08%CITIC Securities Co., Ltd. Class H 3,362,497 7,672,835 0.08%Lenovo Group Ltd. 11,393,007 7,647,197 0.08%Autohome, Inc. ADR 93,698 7,496,777 0.08%Want Want China Holdings Ltd. 8,017,440 7,490,819 0.08%Semiconductor Manufacturing
International Corp. 4,776,300 7,319,108 0.07%Shimao Property Holdings Ltd. 1,870,216 7,248,713 0.07%Wuliangye Yibin Co., Ltd. Class A 379,100 7,239,484 0.07%China National Building Material
Co., Ltd. Class H 6,223,245 6,948,617 0.07%Sinopharm Group Co., Ltd.
Class H 1,879,704 6,863,315 0.07%Alibaba Health Information
Technology Ltd. 5,849,432 6,756,448 0.07%Weichai Power Co., Ltd. Class H 3,191,002 6,732,728 0.07%China Jinmao Holdings Group Ltd. 8,547,769 6,658,918 0.07%Country Garden Services
Holdings Co., Ltd. 1,947,000 6,559,300 0.07%China Taiping Insurance Holdings
Co., Ltd. 2,608,423 6,467,662 0.07%Haier Electronics Group Co., Ltd. 2,044,621 6,389,605 0.06%New China Life Insurance Co.,
Ltd. Class H 1,433,740 6,164,210 0.06%Guangzhou Automobile Group
Co., Ltd. Class H 4,889,179 6,086,532 0.06%Haitong Securities Co., Ltd.
Class H 5,099,385 6,027,534 0.06%China Communications
Construction Co., Ltd. Class H 7,311,316 5,958,425 0.06%Industrial Bank Co., Ltd. Class A 2,049,739 5,826,843 0.06%Fosun International Ltd. 3,919,257 5,714,053 0.06%China Yangtze Power Co., Ltd.
Class A 2,161,737 5,704,504 0.06%BYD Co., Ltd. Class H 1,138,935 5,678,742 0.06%People’s Insurance Co. Group of
China Ltd. Class H 13,398,213 5,571,269 0.06%Jiangsu Hengrui Medicine Co.,
Ltd. Class A 433,108 5,442,182 0.05%Tingyi Cayman Islands Holding
Corp. 3,184,166 5,435,125 0.05%Shanghai Pudong Development
Bank Co., Ltd. Class A 2,903,000 5,155,684 0.05%GDS Holdings Ltd. ADR 99,775 5,146,394 0.05%Brilliance China Automotive
Holdings Ltd. 4,898,474 5,079,657 0.05%CRRC Corp., Ltd. Class H 6,954,623 5,069,722 0.05%Zijin Mining Group Co., Ltd.
Class H 10,159,443 5,058,990 0.05%China Vanke Co., Ltd. Class A 1,093,500 5,052,128 0.05%China Resources Cement
Holdings Ltd. 3,902,000 4,967,766 0.05%Kunlun Energy Co., Ltd. 5,586,434 4,932,707 0.05%Huatai Securities Co., Ltd.
Class H 2,787,846 4,930,378 0.05%JOYY, Inc. ADR 91,002 4,803,996 0.05%
Number of Fair Value % of Total Shares US Dollars ($) Net Assets
Vanguard Emerging Markets Stock Index Fund
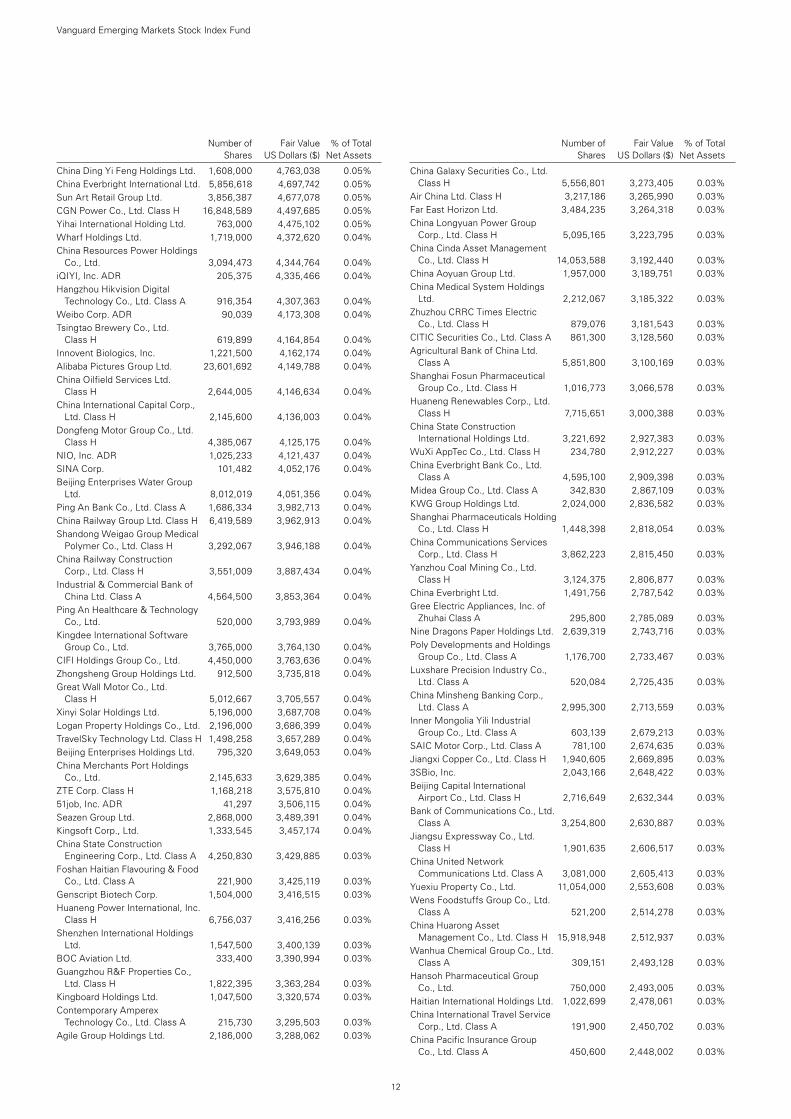
12
Number of Fair Value % of Total Shares US Dollars ($) Net Assets
China Ding Yi Feng Holdings Ltd. 1,608,000 4,763,038 0.05%China Everbright International Ltd. 5,856,618 4,697,742 0.05%Sun Art Retail Group Ltd. 3,856,387 4,677,078 0.05%CGN Power Co., Ltd. Class H 16,848,589 4,497,685 0.05%Yihai International Holding Ltd. 763,000 4,475,102 0.05%Wharf Holdings Ltd. 1,719,000 4,372,620 0.04%China Resources Power Holdings
Co., Ltd. 3,094,473 4,344,764 0.04%iQIYI, Inc. ADR 205,375 4,335,466 0.04%Hangzhou Hikvision Digital
Technology Co., Ltd. Class A 916,354 4,307,363 0.04%Weibo Corp. ADR 90,039 4,173,308 0.04%Tsingtao Brewery Co., Ltd.
Class H 619,899 4,164,854 0.04%Innovent Biologics, Inc. 1,221,500 4,162,174 0.04%Alibaba Pictures Group Ltd. 23,601,692 4,149,788 0.04%China Oilfield Services Ltd.
Class H 2,644,005 4,146,634 0.04%China International Capital Corp.,
Ltd. Class H 2,145,600 4,136,003 0.04%Dongfeng Motor Group Co., Ltd.
Class H 4,385,067 4,125,175 0.04%NIO, Inc. ADR 1,025,233 4,121,437 0.04%SINA Corp. 101,482 4,052,176 0.04%Beijing Enterprises Water Group
Ltd. 8,012,019 4,051,356 0.04%Ping An Bank Co., Ltd. Class A 1,686,334 3,982,713 0.04%China Railway Group Ltd. Class H 6,419,589 3,962,913 0.04%Shandong Weigao Group Medical
Polymer Co., Ltd. Class H 3,292,067 3,946,188 0.04%China Railway Construction
Corp., Ltd. Class H 3,551,009 3,887,434 0.04%Industrial & Commercial Bank of
China Ltd. Class A 4,564,500 3,853,364 0.04%Ping An Healthcare & Technology
Co., Ltd. 520,000 3,793,989 0.04%Kingdee International Software
Group Co., Ltd. 3,765,000 3,764,130 0.04%CIFI Holdings Group Co., Ltd. 4,450,000 3,763,636 0.04%Zhongsheng Group Holdings Ltd. 912,500 3,735,818 0.04%Great Wall Motor Co., Ltd.
Class H 5,012,667 3,705,557 0.04%Xinyi Solar Holdings Ltd. 5,196,000 3,687,708 0.04%Logan Property Holdings Co., Ltd. 2,196,000 3,686,399 0.04%TravelSky Technology Ltd. Class H 1,498,258 3,657,289 0.04%Beijing Enterprises Holdings Ltd. 795,320 3,649,053 0.04%China Merchants Port Holdings
Co., Ltd. 2,145,633 3,629,385 0.04%ZTE Corp. Class H 1,168,218 3,575,810 0.04%51job, Inc. ADR 41,297 3,506,115 0.04%Seazen Group Ltd. 2,868,000 3,489,391 0.04%Kingsoft Corp., Ltd. 1,333,545 3,457,174 0.04%China State Construction
Engineering Corp., Ltd. Class A 4,250,830 3,429,885 0.03%Foshan Haitian Flavouring & Food
Co., Ltd. Class A 221,900 3,425,119 0.03%Genscript Biotech Corp. 1,504,000 3,416,515 0.03%Huaneng Power International, Inc.
Class H 6,756,037 3,416,256 0.03%Shenzhen International Holdings
Ltd. 1,547,500 3,400,139 0.03%BOC Aviation Ltd. 333,400 3,390,994 0.03%Guangzhou R&F Properties Co.,
Ltd. Class H 1,822,395 3,363,284 0.03%Kingboard Holdings Ltd. 1,047,500 3,320,574 0.03%Contemporary Amperex
Technology Co., Ltd. Class A 215,730 3,295,503 0.03%Agile Group Holdings Ltd. 2,186,000 3,288,062 0.03%
China Galaxy Securities Co., Ltd. Class H 5,556,801 3,273,405 0.03%
Air China Ltd. Class H 3,217,186 3,265,990 0.03%Far East Horizon Ltd. 3,484,235 3,264,318 0.03%China Longyuan Power Group
Corp., Ltd. Class H 5,095,165 3,223,795 0.03%China Cinda Asset Management
Co., Ltd. Class H 14,053,588 3,192,440 0.03%China Aoyuan Group Ltd. 1,957,000 3,189,751 0.03%China Medical System Holdings
Ltd. 2,212,067 3,185,322 0.03%Zhuzhou CRRC Times Electric
Co., Ltd. Class H 879,076 3,181,543 0.03%CITIC Securities Co., Ltd. Class A 861,300 3,128,560 0.03%Agricultural Bank of China Ltd.
Class A 5,851,800 3,100,169 0.03%Shanghai Fosun Pharmaceutical
Group Co., Ltd. Class H 1,016,773 3,066,578 0.03%Huaneng Renewables Corp., Ltd.
Class H 7,715,651 3,000,388 0.03%China State Construction
International Holdings Ltd. 3,221,692 2,927,383 0.03%WuXi AppTec Co., Ltd. Class H 234,780 2,912,227 0.03%China Everbright Bank Co., Ltd.
Class A 4,595,100 2,909,398 0.03%Midea Group Co., Ltd. Class A 342,830 2,867,109 0.03%KWG Group Holdings Ltd. 2,024,000 2,836,582 0.03%Shanghai Pharmaceuticals Holding
Co., Ltd. Class H 1,448,398 2,818,054 0.03%China Communications Services
Corp., Ltd. Class H 3,862,223 2,815,450 0.03%Yanzhou Coal Mining Co., Ltd.
Class H 3,124,375 2,806,877 0.03%China Everbright Ltd. 1,491,756 2,787,542 0.03%Gree Electric Appliances, Inc. of
Zhuhai Class A 295,800 2,785,089 0.03%Nine Dragons Paper Holdings Ltd. 2,639,319 2,743,716 0.03%Poly Developments and Holdings
Group Co., Ltd. Class A 1,176,700 2,733,467 0.03%Luxshare Precision Industry Co.,
Ltd. Class A 520,084 2,725,435 0.03%China Minsheng Banking Corp.,
Ltd. Class A 2,995,300 2,713,559 0.03%Inner Mongolia Yili Industrial
Group Co., Ltd. Class A 603,139 2,679,213 0.03%SAIC Motor Corp., Ltd. Class A 781,100 2,674,635 0.03%Jiangxi Copper Co., Ltd. Class H 1,940,605 2,669,895 0.03%3SBio, Inc. 2,043,166 2,648,422 0.03%Beijing Capital International
Airport Co., Ltd. Class H 2,716,649 2,632,344 0.03%Bank of Communications Co., Ltd.
Class A 3,254,800 2,630,887 0.03%Jiangsu Expressway Co., Ltd.
Class H 1,901,635 2,606,517 0.03%China United Network
Communications Ltd. Class A 3,081,000 2,605,413 0.03%Yuexiu Property Co., Ltd. 11,054,000 2,553,608 0.03%Wens Foodstuffs Group Co., Ltd.
Class A 521,200 2,514,278 0.03%China Huarong Asset
Management Co., Ltd. Class H 15,918,948 2,512,937 0.03%Wanhua Chemical Group Co., Ltd.
Class A 309,151 2,493,128 0.03%Hansoh Pharmaceutical Group
Co., Ltd. 750,000 2,493,005 0.03%Haitian International Holdings Ltd. 1,022,699 2,478,061 0.03%China International Travel Service
Corp., Ltd. Class A 191,900 2,450,702 0.03%China Pacific Insurance Group
Co., Ltd. Class A 450,600 2,448,002 0.03%
Number of Fair Value % of Total Shares US Dollars ($) Net Assets
Vanguard Emerging Markets Stock Index Fund
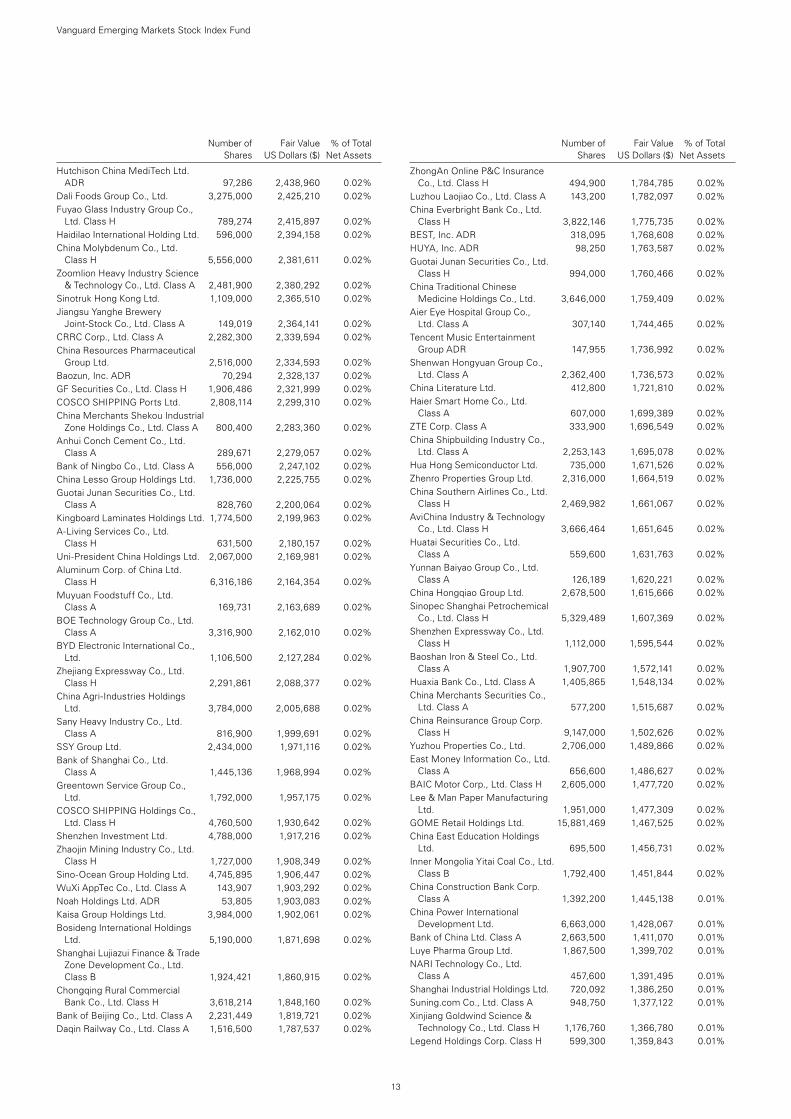
13
Number of Fair Value % of Total Shares US Dollars ($) Net Assets
Hutchison China MediTech Ltd. ADR 97,286 2,438,960 0.02%
Dali Foods Group Co., Ltd. 3,275,000 2,425,210 0.02%Fuyao Glass Industry Group Co.,
Ltd. Class H 789,274 2,415,897 0.02%Haidilao International Holding Ltd. 596,000 2,394,158 0.02%China Molybdenum Co., Ltd.
Class H 5,556,000 2,381,611 0.02%Zoomlion Heavy Industry Science
& Technology Co., Ltd. Class A 2,481,900 2,380,292 0.02%Sinotruk Hong Kong Ltd. 1,109,000 2,365,510 0.02%Jiangsu Yanghe Brewery
Joint-Stock Co., Ltd. Class A 149,019 2,364,141 0.02%CRRC Corp., Ltd. Class A 2,282,300 2,339,594 0.02%China Resources Pharmaceutical
Group Ltd. 2,516,000 2,334,593 0.02%Baozun, Inc. ADR 70,294 2,328,137 0.02%GF Securities Co., Ltd. Class H 1,906,486 2,321,999 0.02%COSCO SHIPPING Ports Ltd. 2,808,114 2,299,310 0.02%China Merchants Shekou Industrial
Zone Holdings Co., Ltd. Class A 800,400 2,283,360 0.02%Anhui Conch Cement Co., Ltd.
Class A 289,671 2,279,057 0.02%Bank of Ningbo Co., Ltd. Class A 556,000 2,247,102 0.02%China Lesso Group Holdings Ltd. 1,736,000 2,225,755 0.02%Guotai Junan Securities Co., Ltd.
Class A 828,760 2,200,064 0.02%Kingboard Laminates Holdings Ltd. 1,774,500 2,199,963 0.02%A-Living Services Co., Ltd.
Class H 631,500 2,180,157 0.02%Uni-President China Holdings Ltd. 2,067,000 2,169,981 0.02%Aluminum Corp. of China Ltd.
Class H 6,316,186 2,164,354 0.02%Muyuan Foodstuff Co., Ltd.
Class A 169,731 2,163,689 0.02%BOE Technology Group Co., Ltd.
Class A 3,316,900 2,162,010 0.02%BYD Electronic International Co.,
Ltd. 1,106,500 2,127,284 0.02%Zhejiang Expressway Co., Ltd.
Class H 2,291,861 2,088,377 0.02%China Agri-Industries Holdings
Ltd. 3,784,000 2,005,688 0.02%Sany Heavy Industry Co., Ltd.
Class A 816,900 1,999,691 0.02%SSY Group Ltd. 2,434,000 1,971,116 0.02%Bank of Shanghai Co., Ltd.
Class A 1,445,136 1,968,994 0.02%Greentown Service Group Co.,
Ltd. 1,792,000 1,957,175 0.02%COSCO SHIPPING Holdings Co.,
Ltd. Class H 4,760,500 1,930,642 0.02%Shenzhen Investment Ltd. 4,788,000 1,917,216 0.02%Zhaojin Mining Industry Co., Ltd.
Class H 1,727,000 1,908,349 0.02%Sino-Ocean Group Holding Ltd. 4,745,895 1,906,447 0.02%WuXi AppTec Co., Ltd. Class A 143,907 1,903,292 0.02%Noah Holdings Ltd. ADR 53,805 1,903,083 0.02%Kaisa Group Holdings Ltd. 3,984,000 1,902,061 0.02%Bosideng International Holdings
Ltd. 5,190,000 1,871,698 0.02%Shanghai Lujiazui Finance & Trade
Zone Development Co., Ltd. Class B 1,924,421 1,860,915 0.02%
Chongqing Rural Commercial Bank Co., Ltd. Class H 3,618,214 1,848,160 0.02%
Bank of Beijing Co., Ltd. Class A 2,231,449 1,819,721 0.02%Daqin Railway Co., Ltd. Class A 1,516,500 1,787,537 0.02%
ZhongAn Online P&C Insurance Co., Ltd. Class H 494,900 1,784,785 0.02%
Luzhou Laojiao Co., Ltd. Class A 143,200 1,782,097 0.02%China Everbright Bank Co., Ltd.
Class H 3,822,146 1,775,735 0.02%BEST, Inc. ADR 318,095 1,768,608 0.02%HUYA, Inc. ADR 98,250 1,763,587 0.02%Guotai Junan Securities Co., Ltd.
Class H 994,000 1,760,466 0.02%China Traditional Chinese
Medicine Holdings Co., Ltd. 3,646,000 1,759,409 0.02%Aier Eye Hospital Group Co.,
Ltd. Class A 307,140 1,744,465 0.02%Tencent Music Entertainment
Group ADR 147,955 1,736,992 0.02%Shenwan Hongyuan Group Co.,
Ltd. Class A 2,362,400 1,736,573 0.02%China Literature Ltd. 412,800 1,721,810 0.02%Haier Smart Home Co., Ltd.
Class A 607,000 1,699,389 0.02%ZTE Corp. Class A 333,900 1,696,549 0.02%China Shipbuilding Industry Co.,
Ltd. Class A 2,253,143 1,695,078 0.02%Hua Hong Semiconductor Ltd. 735,000 1,671,526 0.02%Zhenro Properties Group Ltd. 2,316,000 1,664,519 0.02%China Southern Airlines Co., Ltd.
Class H 2,469,982 1,661,067 0.02%AviChina Industry & Technology
Co., Ltd. Class H 3,666,464 1,651,645 0.02%Huatai Securities Co., Ltd.
Class A 559,600 1,631,763 0.02%Yunnan Baiyao Group Co., Ltd.
Class A 126,189 1,620,221 0.02%China Hongqiao Group Ltd. 2,678,500 1,615,666 0.02%Sinopec Shanghai Petrochemical
Co., Ltd. Class H 5,329,489 1,607,369 0.02%Shenzhen Expressway Co., Ltd.
Class H 1,112,000 1,595,544 0.02%Baoshan Iron & Steel Co., Ltd.
Class A 1,907,700 1,572,141 0.02%Huaxia Bank Co., Ltd. Class A 1,405,865 1,548,134 0.02%China Merchants Securities Co.,
Ltd. Class A 577,200 1,515,687 0.02%China Reinsurance Group Corp.
Class H 9,147,000 1,502,626 0.02%Yuzhou Properties Co., Ltd. 2,706,000 1,489,866 0.02%East Money Information Co., Ltd.
Class A 656,600 1,486,627 0.02%BAIC Motor Corp., Ltd. Class H 2,605,000 1,477,720 0.02%Lee & Man Paper Manufacturing
Ltd. 1,951,000 1,477,309 0.02%GOME Retail Holdings Ltd. 15,881,469 1,467,525 0.02%China East Education Holdings
Ltd. 695,500 1,456,731 0.02%Inner Mongolia Yitai Coal Co., Ltd.
Class B 1,792,400 1,451,844 0.02%China Construction Bank Corp.
Class A 1,392,200 1,445,138 0.01%China Power International
Development Ltd. 6,663,000 1,428,067 0.01%Bank of China Ltd. Class A 2,663,500 1,411,070 0.01%Luye Pharma Group Ltd. 1,867,500 1,399,702 0.01%NARI Technology Co., Ltd.
Class A 457,600 1,391,495 0.01%Shanghai Industrial Holdings Ltd. 720,092 1,386,250 0.01%Suning.com Co., Ltd. Class A 948,750 1,377,122 0.01%Xinjiang Goldwind Science &
Technology Co., Ltd. Class H 1,176,760 1,366,780 0.01%Legend Holdings Corp. Class H 599,300 1,359,843 0.01%
Number of Fair Value % of Total Shares US Dollars ($) Net Assets
Vanguard Emerging Markets Stock Index Fund
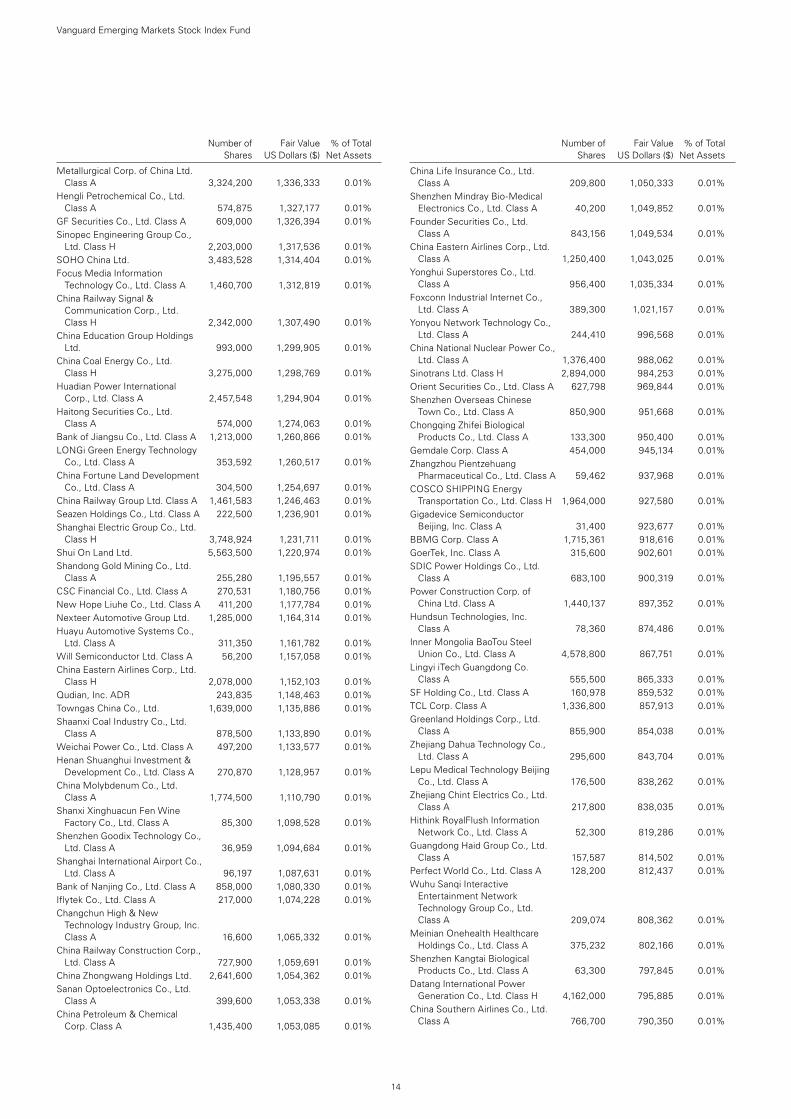
14
Number of Fair Value % of Total Shares US Dollars ($) Net Assets
Metallurgical Corp. of China Ltd. Class A 3,324,200 1,336,333 0.01%
Hengli Petrochemical Co., Ltd. Class A 574,875 1,327,177 0.01%
GF Securities Co., Ltd. Class A 609,000 1,326,394 0.01%Sinopec Engineering Group Co.,
Ltd. Class H 2,203,000 1,317,536 0.01%SOHO China Ltd. 3,483,528 1,314,404 0.01%Focus Media Information
Technology Co., Ltd. Class A 1,460,700 1,312,819 0.01%China Railway Signal &
Communication Corp., Ltd. Class H 2,342,000 1,307,490 0.01%
China Education Group Holdings Ltd. 993,000 1,299,905 0.01%
China Coal Energy Co., Ltd. Class H 3,275,000 1,298,769 0.01%
Huadian Power International Corp., Ltd. Class A 2,457,548 1,294,904 0.01%
Haitong Securities Co., Ltd. Class A 574,000 1,274,063 0.01%
Bank of Jiangsu Co., Ltd. Class A 1,213,000 1,260,866 0.01%LONGi Green Energy Technology
Co., Ltd. Class A 353,592 1,260,517 0.01%China Fortune Land Development
Co., Ltd. Class A 304,500 1,254,697 0.01%China Railway Group Ltd. Class A 1,461,583 1,246,463 0.01%Seazen Holdings Co., Ltd. Class A 222,500 1,236,901 0.01%Shanghai Electric Group Co., Ltd.
Class H 3,748,924 1,231,711 0.01%Shui On Land Ltd. 5,563,500 1,220,974 0.01%Shandong Gold Mining Co., Ltd.
Class A 255,280 1,195,557 0.01%CSC Financial Co., Ltd. Class A 270,531 1,180,756 0.01%New Hope Liuhe Co., Ltd. Class A 411,200 1,177,784 0.01%Nexteer Automotive Group Ltd. 1,285,000 1,164,314 0.01%Huayu Automotive Systems Co.,
Ltd. Class A 311,350 1,161,782 0.01%Will Semiconductor Ltd. Class A 56,200 1,157,058 0.01%China Eastern Airlines Corp., Ltd.
Class H 2,078,000 1,152,103 0.01%Qudian, Inc. ADR 243,835 1,148,463 0.01%Towngas China Co., Ltd. 1,639,000 1,135,886 0.01%Shaanxi Coal Industry Co., Ltd.
Class A 878,500 1,133,890 0.01%Weichai Power Co., Ltd. Class A 497,200 1,133,577 0.01%Henan Shuanghui Investment &
Development Co., Ltd. Class A 270,870 1,128,957 0.01%China Molybdenum Co., Ltd.
Class A 1,774,500 1,110,790 0.01%Shanxi Xinghuacun Fen Wine
Factory Co., Ltd. Class A 85,300 1,098,528 0.01%Shenzhen Goodix Technology Co.,
Ltd. Class A 36,959 1,094,684 0.01%Shanghai International Airport Co.,
Ltd. Class A 96,197 1,087,631 0.01%Bank of Nanjing Co., Ltd. Class A 858,000 1,080,330 0.01%Iflytek Co., Ltd. Class A 217,000 1,074,228 0.01%Changchun High & New
Technology Industry Group, Inc. Class A 16,600 1,065,332 0.01%
China Railway Construction Corp., Ltd. Class A 727,900 1,059,691 0.01%
China Zhongwang Holdings Ltd. 2,641,600 1,054,362 0.01%Sanan Optoelectronics Co., Ltd.
Class A 399,600 1,053,338 0.01%China Petroleum & Chemical
Corp. Class A 1,435,400 1,053,085 0.01%
China Life Insurance Co., Ltd. Class A 209,800 1,050,333 0.01%
Shenzhen Mindray Bio-Medical Electronics Co., Ltd. Class A 40,200 1,049,852 0.01%
Founder Securities Co., Ltd. Class A 843,156 1,049,534 0.01%
China Eastern Airlines Corp., Ltd. Class A 1,250,400 1,043,025 0.01%
Yonghui Superstores Co., Ltd. Class A 956,400 1,035,334 0.01%
Foxconn Industrial Internet Co., Ltd. Class A 389,300 1,021,157 0.01%
Yonyou Network Technology Co., Ltd. Class A 244,410 996,568 0.01%
China National Nuclear Power Co., Ltd. Class A 1,376,400 988,062 0.01%
Sinotrans Ltd. Class H 2,894,000 984,253 0.01%Orient Securities Co., Ltd. Class A 627,798 969,844 0.01%Shenzhen Overseas Chinese
Town Co., Ltd. Class A 850,900 951,668 0.01%Chongqing Zhifei Biological
Products Co., Ltd. Class A 133,300 950,400 0.01%Gemdale Corp. Class A 454,000 945,134 0.01%Zhangzhou Pientzehuang
Pharmaceutical Co., Ltd. Class A 59,462 937,968 0.01%COSCO SHIPPING Energy
Transportation Co., Ltd. Class H 1,964,000 927,580 0.01%Gigadevice Semiconductor
Beijing, Inc. Class A 31,400 923,677 0.01%BBMG Corp. Class A 1,715,361 918,616 0.01%GoerTek, Inc. Class A 315,600 902,601 0.01%SDIC Power Holdings Co., Ltd.
Class A 683,100 900,319 0.01%Power Construction Corp. of
China Ltd. Class A 1,440,137 897,352 0.01%Hundsun Technologies, Inc.
Class A 78,360 874,486 0.01%Inner Mongolia BaoTou Steel
Union Co., Ltd. Class A 4,578,800 867,751 0.01%Lingyi iTech Guangdong Co.
Class A 555,500 865,333 0.01%SF Holding Co., Ltd. Class A 160,978 859,532 0.01%TCL Corp. Class A 1,336,800 857,913 0.01%Greenland Holdings Corp., Ltd.
Class A 855,900 854,038 0.01%Zhejiang Dahua Technology Co.,
Ltd. Class A 295,600 843,704 0.01%Lepu Medical Technology Beijing
Co., Ltd. Class A 176,500 838,262 0.01%Zhejiang Chint Electrics Co., Ltd.
Class A 217,800 838,035 0.01%Hithink RoyalFlush Information
Network Co., Ltd. Class A 52,300 819,286 0.01%Guangdong Haid Group Co., Ltd.
Class A 157,587 814,502 0.01%Perfect World Co., Ltd. Class A 128,200 812,437 0.01%Wuhu Sanqi Interactive
Entertainment Network Technology Group Co., Ltd. Class A 209,074 808,362 0.01%
Meinian Onehealth Healthcare Holdings Co., Ltd. Class A 375,232 802,166 0.01%
Shenzhen Kangtai Biological Products Co., Ltd. Class A 63,300 797,845 0.01%
Datang International Power Generation Co., Ltd. Class H 4,162,000 795,885 0.01%
China Southern Airlines Co., Ltd. Class A 766,700 790,350 0.01%
Number of Fair Value % of Total Shares US Dollars ($) Net Assets
Vanguard Emerging Markets Stock Index Fund
15
Number of Fair Value % of Total Shares US Dollars ($) Net Assets
Rongsheng Petro Chemical Co., Ltd. Class A 437,315 777,920 0.01%
PetroChina Co., Ltd. Class A 921,300 771,151 0.01%SDIC Capital Co., Ltd. Class A 354,600 770,787 0.01%Unisplendour Corp., Ltd. Class A 168,697 765,357 0.01%Everbright Securities Co., Ltd.
Class A 405,200 762,097 0.01%New China Life Insurance Co.,
Ltd. Class A 107,700 759,992 0.01%Guosen Securities Co., Ltd.
Class A 414,000 745,957 0.01%Mango Excellent Media Co., Ltd.
Class A 148,010 742,903 0.01%Anhui Gujing Distillery Co., Ltd.
Class A 37,800 737,640 0.01%Guangzhou Baiyunshan
Pharmaceutical Holdings Co., Ltd. Class A 143,300 732,635 0.01%
Bank of Hangzhou Co., Ltd. Class A 550,624 724,136 0.01%
GD Power Development Co., Ltd. Class A 2,145,600 720,832 0.01%
Tongwei Co., Ltd. Class A 382,061 720,223 0.01%AECC Aviation Power Co., Ltd.
Class A 230,300 716,841 0.01%China Merchants Energy Shipping
Co., Ltd. Class A 600,900 712,610 0.01%Shanghai International Port Group
Co., Ltd. Class A 855,100 708,373 0.01%Hualan Biological Engineering, Inc.
Class A 140,300 708,031 0.01%Industrial Securities Co., Ltd.
Class A 695,500 706,968 0.01%Zhejiang NHU Co., Ltd. Class A 211,400 705,967 0.01%Yunda Holding Co., Ltd. Class A 146,677 701,255 0.01%Avic Capital Co., Ltd. Class A 991,713 690,553 0.01%Zhejiang Sanhua Intelligent
Controls Co., Ltd. Class A 273,900 681,491 0.01%Eve Energy Co., Ltd. Class A 94,200 678,388 0.01%Shennan Circuits Co., Ltd.
Class A 33,100 675,292 0.01%Shengyi Technology Co., Ltd.
Class A 221,800 666,182 0.01%Shenzhen Inovance Technology
Co., Ltd. Class A 150,000 659,857 0.01%BYD Co., Ltd. Class A 94,900 649,503 0.01%Shanghai M&G Stationery, Inc.
Class A 92,600 647,987 0.01%Aisino Corp. Class A 193,600 644,022 0.01%China Greatwall Technology
Group Co., Ltd. Class A 285,700 638,248 0.01%Alibaba Group Holding Ltd. 24,000 638,209 0.01%Tianqi Lithium Corp. Class A 146,900 636,518 0.01%Maanshan Iron & Steel Co., Ltd.
Class A 1,443,192 636,110 0.01%OFILM Group Co., Ltd. Class A 283,700 635,409 0.01%Lens Technology Co., Ltd.
Class A 319,100 633,147 0.01%Beijing New Building Materials plc
Class A 172,400 629,933 0.01%Huadong Medicine Co., Ltd.
Class A 179,332 627,713 0.01%Shanghai Electric Group Co., Ltd.
Class A 870,972 622,735 0.01%China Shenhua Energy Co., Ltd.
Class A 237,600 622,557 0.01%Shenzhen Sunway Communication
Co., Ltd. Class A 94,800 617,650 0.01%Nanjing Securities Co., Ltd.
Class A 332,500 616,293 0.01%
Jiangsu Hengli Hydraulic Co., Ltd. Class A 85,748 612,473 0.01%
Walvax Biotechnology Co., Ltd. Class A 131,200 611,060 0.01%
Zhejiang Longsheng Group Co., Ltd. Class A 293,900 610,573 0.01%
Zhejiang Supor Co., Ltd. Class A 55,000 606,290 0.01%XCMG Construction Machinery
Co., Ltd. Class A 771,200 605,653 0.01%Songcheng Performance
Development Co., Ltd. Class A 134,100 595,110 0.01%Jinke Properties Group Co., Ltd.
Class A 538,300 593,547 0.01%Tsingtao Brewery Co., Ltd.
Class A 80,200 587,238 0.01%AVIC Jonhon Optronic
Technology Co., Ltd. Class A 104,574 586,443 0.01%Hangzhou Tigermed Consulting
Co., Ltd. Class A 64,600 585,700 0.01%Jiangsu King’s Luck Brewery
JSC Ltd. Class A 123,600 580,632 0.01%Dongxing Securities Co., Ltd.
Class A 304,200 573,884 0.01%China Jushi Co., Ltd. Class A 363,700 569,166 0.01%NAURA Technology Group Co.,
Ltd. Class A 45,000 568,545 0.01%Beijing Oriental Yuhong
Waterproof Technology Co., Ltd. Class A 150,240 567,513 0.01%
Jiangsu Zhongnan Construction Group Co., Ltd. Class A 374,300 566,946 0.01%
AVIC Aircraft Co., Ltd. Class A 240,900 566,526 0.01%Wanda Film Holding Co., Ltd.
Class A 215,400 561,296 0.01%Wuxi Lead Intelligent Equipment
Co., Ltd. Class A 86,700 559,399 0.01%Jiangxi Zhengbang Technology
Co., Ltd. Class A 238,100 553,788 0.01%Sichuan Chuantou Energy Co.,
Ltd. Class A 391,157 553,168 0.01%RiseSun Real Estate Development
Co., Ltd. Class A 390,500 551,117 0.01%Sangfor Technologies, Inc. Class A 33,500 550,177 0.01%Inspur Electronic Information
Industry Co., Ltd. Class A 127,300 550,129 0.01%Beijing Shunxin Agriculture Co.,
Ltd. Class A 72,551 548,730 0.01%Oriental Pearl Group Co., Ltd.
Class A 407,320 547,370 0.01%Caitong Securities Co., Ltd.
Class A 334,100 543,950 0.01%Western Securities Co., Ltd.
Class A 385,600 542,541 0.01%Glodon Co., Ltd. Class A 111,200 542,497 0.01%Hengyi Petrochemical Co., Ltd.
Class A 271,436 542,471 0.01%Ganfeng Lithium Co., Ltd. Class A 108,100 540,566 0.01%Shanxi Meijin Energy Co., Ltd.
Class A 398,500 539,522 0.01%WUS Printed Circuit Kunshan Co.,
Ltd. Class A 167,538 534,234 0.01%Chongqing Changan Automobile
Co., Ltd. Class A 370,500 533,530 0.01%Chaozhou Three-Circle Group Co.,
Ltd. Class A 163,800 523,961 0.01%Suzhou Dongshan Precision
Manufacturing Co., Ltd. Class A 156,900 521,487 0.01%Spring Airlines Co., Ltd. Class A 82,564 520,266 0.01%Fuyao Glass Industry Group Co.,
Ltd. Class A 150,441 518,163 0.01%
Number of Fair Value % of Total Shares US Dollars ($) Net Assets
Vanguard Emerging Markets Stock Index Fund
16
Number of Fair Value % of Total Shares US Dollars ($) Net Assets
China Common 19,974,000 516,154 0.01%Ningbo Zhoushan Port Co., Ltd.
Class A 944,300 515,185 0.01%Huaxin Cement Co., Ltd. Class A 135,366 513,661 0.01%Hubei Biocause Pharmaceutical
Co., Ltd. Class A 507,800 513,257 0.01%China National Chemical
Engineering Co., Ltd. Class A 552,900 511,213 0.01%Changjiang Securities Co., Ltd.
Class A 498,400 510,912 0.01%Guangzhou Baiyun International
Airport Co., Ltd. Class A 202,600 507,580 0.01%Shanghai Construction Group Co.,
Ltd. Class A 995,763 506,091 0.01%Yealink Network Technology
Corp., Ltd. Class A 48,600 505,248 0.01%BBMG Corp. Class H 1,646,000 504,882 0.01%Ninestar Corp. Class A 106,500 503,360 0.01%Yango Group Co., Ltd. Class A 412,100 502,911 0.01%Beijing Tongrentang Co., Ltd.
Class A 124,031 501,812 0.01%Beijing Enlight Media Co., Ltd.
Class A 295,200 500,113 0.01%China Gezhouba Group Co., Ltd.
Class A 520,900 499,575 0.01%Beijing Shiji Information Technology
Co., Ltd. Class A 89,200 499,458 0.01%Yantai Jereh Oilfield Services Group
Co., Ltd. Class A 93,900 498,273 0.01%China National Software & Service
Co., Ltd. Class A 48,400 498,165 0.01%China Northern Rare Earth Group
High-Tech Co., Ltd. Class A 319,100 496,622 0.01%Zhejiang Huayou Cobalt Co., Ltd.
Class A 87,750 496,252 0.01%Xinjiang Goldwind Science &
Technology Co., Ltd. Class A 286,578 491,677 0.01%Guoyuan Securities Co., Ltd.
Class A 368,900 490,973 0.01%360 Security Technology, Inc.
Class A 144,840 488,889 0.01%Yunnan Energy New Material Co.,
Ltd. 67,400 488,676 0.01%Offshore Oil Engineering Co., Ltd.
Class A 460,300 487,716 0.01%Bank of Guiyang Co., Ltd. Class A 351,423 482,345 0.01%Bank of Chengdu Co., Ltd. Class A 369,578 481,263 0.01%Zheshang Securities Co., Ltd.
Class A 298,300 476,670 0.01%Fangda Carbon New Material Co.,
Ltd. Class A 272,973 476,566 0.01%Fiberhome Telecommunication
Technologies Co., Ltd. Class A 120,800 476,079 0.01%Tianma Microelectronics Co., Ltd.
Class A 203,300 475,475 0.01%Shandong Hualu Hengsheng
Chemical Co., Ltd. Class A 166,200 474,131 0.01%Southwest Securities Co., Ltd.
Class A 634,900 473,088 0.01%Huaxi Securities Co., Ltd. Class A 296,800 469,160 0.01%Anhui Kouzi Distillery Co., Ltd.
Class A 59,463 468,779 0.01%Oppein Home Group, Inc. Class A 27,900 468,662 0.01%Topchoice Medical Corp. Class A 31,797 468,066 0.01%Zhengzhou Yutong Bus Co., Ltd.
Class A 226,902 464,219 0.01%Xinhu Zhongbao Co., Ltd. Class A 853,000 462,925 0.01%Sinolink Securities Co., Ltd.
Class A 346,000 461,986 0.01%
Lomon Billions Group Co., Ltd. Class A 208,600 460,917 0.01%
Hangzhou Robam Appliances Co., Ltd. Class A 94,900 460,660 0.01%
Zijin Mining Group Co., Ltd. Class A 697,400 459,583 0.01%
Tianjin Zhonghuan Semiconductor Co., Ltd. Class A 270,200 458,147 0.01%
Jonjee Hi-Tech Industrial And Commercial Holding Co., Ltd. Class A 80,153 452,829 0.01%
Guangdong HEC Technology Holding Co., Ltd. Class A 304,400 447,522 0.01%
NavInfo Co., Ltd. Class A 193,400 447,046 0.01%China Resources Sanjiu Medical
& Pharmaceutical Co., Ltd. Class A 98,243 446,844 0.01%
SooChow Securities Co., Ltd. Class A 310,300 445,058 0.01%
Hengtong Optic-electric Co., Ltd. Class A 189,740 442,944 0.00%
Hesteel Co., Ltd. Class A 1,192,700 441,795 0.00%TBEA Co., Ltd. Class A 461,600 440,714 0.00%Dawning Information Industry
Co., Ltd. Class A 88,400 438,881 0.00%Zhongji Innolight Co., Ltd. Class A 58,600 438,754 0.00%Beijing Sinnet Technology Co.,
Ltd. Class A 151,700 437,122 0.00%Shenergy Co., Ltd. Class A 523,700 436,846 0.00%Venustech Group, Inc. Class A 89,200 432,864 0.00%GCL System Integration
Technology Co., Ltd. Class A 509,700 432,486 0.00%Unigroup Guoxin Microelectronics
Co., Ltd. Class A 59,200 432,112 0.00%Jointown Pharmaceutical Group
Co., Ltd. Class A 210,804 428,257 0.00%Jafron Biomedical Co., Ltd.
Class A 41,500 428,040 0.00%Sichuan Kelun Pharmaceutical
Co., Ltd. Class A 126,606 426,979 0.00%Zhongjin Gold Corp., Ltd. Class A 349,858 425,949 0.00%AVIC Shenyang Aircraft Co., Ltd.
Class A 93,867 425,863 0.00%AVICOPTER plc Class A 61,800 423,319 0.00%Beijing Tiantan Biological Products
Corp., Ltd. Class A 105,500 423,203 0.00%Shandong Nanshan Aluminum
Co., Ltd. Class A 1,314,600 422,777 0.00%Sunwoda Electronic Co., Ltd.
Class A 150,500 421,780 0.00%Wuchan Zhongda Group Co., Ltd.
Class A 553,900 417,504 0.00%Asymchem Laboratories Tianjin
Co., Ltd. Class A 22,438 417,180 0.00%Huaan Securities Co., Ltd. Class A 394,400 413,361 0.00%China Grand Automotive Services
Group Co., Ltd. Class A 875,414 409,733 0.00%Inner Mongolia Junzheng Energy
& Chemical Industry Group Co., Ltd. Class A 908,000 408,037 0.00%
China Railway Hi-tech Industry Co., Ltd. Class A 246,589 407,137 0.00%
Aluminum Corp. of China Ltd. Class A 795,500 404,309 0.00%
Financial Street Holdings Co., Ltd. Class A 345,442 402,718 0.00%
BGI Genomics Co., Ltd. Class A 40,642 400,868 0.00%Tongkun Group Co., Ltd. Class A 185,400 399,007 0.00%Universal Scientific Industrial
Shanghai Co., Ltd. Class A 142,300 392,874 0.00%
Number of Fair Value % of Total Shares US Dollars ($) Net Assets
Vanguard Emerging Markets Stock Index Fund
17
Number of Fair Value % of Total Shares US Dollars ($) Net Assets
Yifeng Pharmacy Chain Co., Ltd. Class A 37,300 392,110 0.00%
Chengdu Kanghong Pharmaceutical Group Co., Ltd. Class A 73,320 389,172 0.00%
Shanghai Baosight Software Co., Ltd. Class A 82,200 388,273 0.00%
By-health Co., Ltd. Class A 165,700 387,537 0.00%Autobio Diagnostics Co., Ltd.
Class A 27,955 386,826 0.00%Jiangsu Zhongtian Technology
Co., Ltd. Class A 323,800 385,855 0.00%Shanghai Tunnel Engineering Co.,
Ltd. Class A 444,900 385,806 0.00%AVIC Electromechanical Systems
Co., Ltd. Class A 386,500 385,104 0.00%Juewei Food Co., Ltd. Class A 57,653 384,483 0.00%Yintai Gold Co., Ltd. Class A 196,600 384,159 0.00%Shanghai Yuyuan Tourist Mart
Group Co., Ltd. Class A 340,600 383,381 0.00%Changzhou Xingyu Automotive
Lighting Systems Co., Ltd. Class A 28,100 383,185 0.00%
Guanghui Energy Co., Ltd. Class A 806,100 383,077 0.00%Bohai Leasing Co., Ltd. Class A 700,700 382,283 0.00%DHC Software Co., Ltd. Class A 257,700 381,824 0.00%Pacific Securities Co., Ltd. Class A 701,200 381,549 0.00%Tongling Nonferrous Metals Group
Co., Ltd. Class A 1,136,900 380,319 0.00%Hefei Meiya Optoelectronic
Technology, Inc. Class A 67,666 379,854 0.00%NanJi E-Commerce Co., Ltd.
Class A 242,300 379,531 0.00%China TransInfo Technology Co.,
Ltd. Class A 146,500 379,440 0.00%Shandong Sun Paper Industry
JSC Ltd. Class A 267,800 378,334 0.00%Giant Network Group Co., Ltd.
Class A 145,800 378,046 0.00%Shanxi Taigang Stainless Steel
Co., Ltd. Class A 639,800 375,696 0.00%Hongfa Technology Co., Ltd.
Class A 75,800 374,911 0.00%Pangang Group Vanadium Titanium
& Resources Co., Ltd. Class A 891,792 373,866 0.00%Betta Pharmaceuticals Co., Ltd.
Class A 39,400 371,647 0.00%Jiangsu Changshu Rural
Commercial Bank Co., Ltd. Class A 280,900 367,400 0.00%
Juneyao Airlines Co., Ltd. Class A 170,400 366,970 0.00%China Spacesat Co., Ltd. Class A 119,318 366,083 0.00%Chongqing Brewery Co., Ltd.
Class A 48,900 364,794 0.00%Dongfang Electric Corp., Ltd.
Class A 276,100 364,294 0.00%Tonghua Dongbao Pharmaceutical
Co., Ltd. Class A 199,961 363,166 0.00%Beijing Originwater Technology
Co., Ltd. Class A 332,300 362,588 0.00%Shanxi Securities Co., Ltd. Class A 304,000 361,824 0.00%Angel Yeast Co., Ltd. Class A 81,854 360,432 0.00%Sichuan Swellfun Co., Ltd. Class A 48,431 359,835 0.00%Anxin Trust Co., Ltd. Class A 560,700 357,423 0.00%Shandong Buchang
Pharmaceuticals Co., Ltd. Class A 120,280 356,083 0.00%
Winning Health Technology Group Co., Ltd. Class A 164,800 354,437 0.00%
HLA Corp., Ltd. Class A 320,200 353,063 0.00%
Shanghai Zhangjiang High-Tech Park Development Co., Ltd. Class A 160,300 352,353 0.00%
First Capital Securities Co., Ltd. Class A 295,700 351,521 0.00%
Jilin Aodong Pharmaceutical Group Co., Ltd. Class A 147,600 350,291 0.00%
Zhejiang Dingli Machinery Co., Ltd. Class A 34,100 350,050 0.00%
Centre Testing International Group Co., Ltd. Class A 162,300 347,429 0.00%
Nanjing King-Friend Biochemical Pharmaceutical Co., Ltd. Class A 58,200 346,602 0.00%
Sansteel Minguang Co., Ltd. Fujian Class A 257,200 345,634 0.00%
Ningbo Joyson Electronic Corp. Class A 134,300 345,143 0.00%
Tasly Pharmaceutical Group Co., Ltd. Class A 155,861 345,057 0.00%
Fujian Sunner Development Co., Ltd. Class A 99,621 344,411 0.00%
China South Publishing & Media Group Co., Ltd. Class A 200,800 344,221 0.00%
Toly Bread Co., Ltd. Class A 56,420 343,778 0.00%Dong-E-E-Jiao Co., Ltd. Class A 67,600 343,282 0.00%Northeast Securities Co., Ltd.
Class A 255,600 341,282 0.00%Sealand Securities Co., Ltd.
Class A 443,400 339,943 0.00%Grandjoy Holdings Group Co., Ltd.
Class A 328,779 338,921 0.00%Shanying International Holding
Co., Ltd. Class A 623,600 337,534 0.00%Siasun Robot & Automation Co.,
Ltd. Class A 167,500 336,676 0.00%China Enterprise Co., Ltd. Class A 503,700 336,275 0.00%Transfar Zhilian Co., Ltd. Class A 335,200 335,915 0.00%Weihai Guangwei Composites
Co., Ltd. Class A 51,100 333,812 0.00%Wangsu Science & Technology
Co., Ltd. Class A 241,100 329,883 0.00%Sichuan Languang Development
Co., Ltd. Class A 310,000 328,019 0.00%Guangzhou Kingmed Diagnostics
Group Co., Ltd. Class A 44,600 327,977 0.00%GRG Banking Equipment Co., Ltd.
Class A 237,600 327,823 0.00%Zhejiang Wolwo
Bio-Pharmaceutical Co., Ltd. Class A 51,400 325,809 0.00%
Zhejiang Huahai Pharmaceutical Co., Ltd. Class A 131,300 325,368 0.00%
China National Medicines Corp., Ltd. Class A 83,000 325,200 0.00%
COSCO SHIPPING Development Co., Ltd. Class A 868,700 323,027 0.00%
Shanghai Electric Power Co., Ltd. Class A 279,320 322,825 0.00%
Tangshan Jidong Cement Co., Ltd. Class A 131,500 321,144 0.00%
Jiangsu Yangnong Chemical Co., Ltd. Class A 32,200 317,278 0.00%
Angang Steel Co., Ltd. Class A 657,530 316,250 0.00%Hunan Valin Steel Co., Ltd. Class A 458,600 314,725 0.00%Shanghai Jinjiang International
Hotels Co., Ltd. Class A 76,025 313,371 0.00%BAIC BluePark New Energy
Technology Co., Ltd. Class A 370,100 310,314 0.00%Shandong Sinocera Functional
Material Co., Ltd. Class A 94,119 308,769 0.00%
Number of Fair Value % of Total Shares US Dollars ($) Net Assets
Vanguard Emerging Markets Stock Index Fund
18
Number of Fair Value % of Total Shares US Dollars ($) Net Assets
Jiangsu Yuyue Medical Equipment & Supply Co., Ltd. Class A 105,600 308,075 0.00%
Westone Information Industry, Inc. Class A 83,000 307,326 0.00%
Guangzhou Haige Communications Group, Inc. Co. Class A 197,500 307,090 0.00%
Shanghai Jahwa United Co., Ltd. Class A 69,097 306,937 0.00%
Beijing Capital Development Co., Ltd. Class A 267,009 305,530 0.00%
Jinyu Bio-Technology Co., Ltd. Class A 113,500 305,050 0.00%
Visionox Technology, Inc. Class A 133,500 304,753 0.00%BTG Hotels Group Co., Ltd. Class A 102,696 303,879 0.00%Shenzhen Hepalink Pharmaceutical
Group Co., Ltd. Class A 107,900 302,237 0.00%Chongqing Fuling Zhacai Group
Co., Ltd. Class A 78,472 301,150 0.00%Zhejiang Juhua Co., Ltd. Class A 286,800 299,764 0.00%Yuan Longping High-tech
Agriculture Co., Ltd. Class A 141,800 299,474 0.00%Youzu Interactive Co., Ltd. Class A 89,600 299,346 0.00%Liaoning Cheng Da Co., Ltd.
Class A 136,900 299,346 0.00%China Film Co., Ltd. Class A 136,600 298,494 0.00%Livzon Pharmaceutical Group, Inc.
Class A 61,500 297,560 0.00%Shandong Linglong Tyre Co., Ltd.
Class A 89,900 295,960 0.00%G-bits Network Technology
Xiamen Co., Ltd. Class A 6,900 295,698 0.00%Accelink Technologies Co., Ltd.
Class A 69,100 295,442 0.00%GEM Co., Ltd. Class A 422,100 295,130 0.00%Zhejiang Weixing New Building
Materials Co., Ltd. Class A 155,400 293,837 0.00%Leyard Optoelectronic Co., Ltd.
Class A 266,200 293,139 0.00%Beijing Yanjing Brewery Co., Ltd.
Class A 312,400 292,434 0.00%Joincare Pharmaceutical Group
Industry Co., Ltd. Class A 196,600 292,142 0.00%Shenzhen Airport Co., Ltd.
Class A 208,000 291,761 0.00%Xinxing Ductile Iron Pipes Co.,
Ltd. Class A 484,850 290,277 0.00%TangShan Port Group Co., Ltd.
Class A 775,700 289,559 0.00%Yifan Pharmaceutical Co., Ltd.
Class A 123,800 288,831 0.00%Hubei Jumpcan Pharmaceutical
Co., Ltd. Class A 82,900 287,793 0.00%Inner Mongolia First Machinery
Group Co., Ltd. Class A 188,000 286,920 0.00%China Avionics Systems Co., Ltd.
Class A 139,200 284,589 0.00%Dalian Port PDA Co., Ltd. Class A 967,100 281,862 0.00%Sinotrans Ltd. Class A 458,500 280,426 0.00%Hangzhou Silan Microelectronics
Co., Ltd. Class A 126,100 280,075 0.00%Xiamen Tungsten Co., Ltd. Class A 148,300 277,644 0.00%COSCO SHIPPING Energy
Transportation Co., Ltd. Class A 302,446 277,037 0.00%Xiamen C & D, Inc. Class A 214,400 276,729 0.00%Shanxi Xishan Coal & Electricity
Power Co., Ltd. Class A 313,100 275,558 0.00%Suofeiya Home Collection Co., Ltd.
Class A 91,500 275,217 0.00%China National Accord Medicines
Corp., Ltd. Class A 42,100 274,173 0.00%
Heilongjiang Agriculture Co., Ltd. Class A 195,600 273,525 0.00%
Yunnan Tin Co., Ltd. Class A 182,448 273,470 0.00%Jinduicheng Molybdenum Co.,
Ltd. Class A 237,700 273,358 0.00%Wuhan Guide Infrared Co., Ltd.
Class A 90,285 272,210 0.00%Ovctek China, Inc. Class A 40,007 271,858 0.00%Shanghai 2345 Network Holding
Group Co., Ltd. Class A 586,186 271,836 0.00%Xinyu Iron & Steel Co., Ltd.
Class A 368,400 271,335 0.00%Laobaixing Pharmacy Chain JSC
Class A 29,300 269,563 0.00%Tahoe Group Co., Ltd. Class A 304,100 268,510 0.00%COSCO SHIPPING Holdings Co.,
Ltd. Class A 349,801 264,668 0.00%Chengdu Xingrong Environment
Co., Ltd. Class A 396,900 263,835 0.00%Guangshen Railway Co., Ltd.
Class A 596,600 262,104 0.00%Shanghai AJ Group Co., Ltd.
Class A 189,800 261,600 0.00%Zhejiang Wanfeng Auto Wheel
Co., Ltd. Class A 257,700 258,989 0.00%Jiangxi Copper Co., Ltd. Class A 106,400 258,624 0.00%China Aerospace Times
Electronics Co., Ltd. Class A 299,700 257,310 0.00%Air China Ltd. Class A 183,000 254,592 0.00%Shanxi Lu’an Environmental
Energy Development Co., Ltd. Class A 238,700 248,805 0.00%
CITIC Guoan Information Industry Co., Ltd. Class A 484,800 246,397 0.00%
Shenzhen Kingdom Sci-Tech Co., Ltd. Class A 83,300 246,127 0.00%
Xinjiang Zhongtai Chemical Co., Ltd. Class A 251,200 244,883 0.00%
Nanjing Iron & Steel Co., Ltd. Class A 494,000 244,690 0.00%
China Meheco Co., Ltd. Class A 130,400 244,319 0.00%Holitech Technology Co., Ltd.
Class A 306,400 244,147 0.00%Guoxuan High-Tech Co., Ltd.
Class A 115,900 242,112 0.00%Sinochem International Corp.
Class A 316,800 241,063 0.00%Newland Digital Technology Co.,
Ltd. Class A 105,300 240,076 0.00%Shandong Xinchao Energy Corp.,
Ltd. Class A 793,800 239,332 0.00%Suzhou Gold Mantis Construction
Decoration Co., Ltd. Class A 188,500 238,698 0.00%Luxi Chemical Group Co., Ltd.
Class A 157,700 237,960 0.00%Shenghe Resources Holding Co.,
Ltd. Class A 182,300 237,391 0.00%Zhejiang Jiahua Energy Chemical
Industry Co., Ltd. Class A 145,900 235,655 0.00%Inner Mongolia MengDian
HuaNeng Thermal Power Corp., Ltd. Class A 595,300 235,038 0.00%
Tian Di Science & Technology Co., Ltd. Class A 509,400 233,302 0.00%
China Resources Double Crane Pharmaceutical Co., Ltd. Class A 122,700 229,892 0.00%
Shijiazhuang Yiling Pharmaceutical Co., Ltd. Class A 128,700 229,678 0.00%
Shenzhen Salubris Pharmaceuticals Co., Ltd. Class A 80,000 229,026 0.00%
Number of Fair Value % of Total Shares US Dollars ($) Net Assets
Vanguard Emerging Markets Stock Index Fund
19
Number of Fair Value % of Total Shares US Dollars ($) Net Assets
Shenzhen Energy Group Co., Ltd. Class A 255,800 228,067 0.00%
Zhejiang Conba Pharmaceutical Co., Ltd. Class A 257,625 227,474 0.00%
Shanghai Fosun Pharmaceutical Group Co., Ltd. Class A 59,400 226,849 0.00%
Guangzhou Automobile Group Co., Ltd. Class A 134,500 225,739 0.00%
Chinese Universe Publishing & Media Group Co., Ltd. Class A 115,100 224,907 0.00%
Tus Environmental Science And Technology Development Co., Ltd. Class A 169,500 223,399 0.00%
Beijing Sanju Environmental Protection & New Material Co., Ltd. Class A 245,100 222,398 0.00%
Beijing SL Pharmaceutical Co., Ltd. Class A 117,600 222,025 0.00%
Weifu High-Technology Group Co., Ltd. Class A 80,500 220,171 0.00%
Hytera Communications Corp., Ltd. Class A 182,100 219,875 0.00%
AECC Aero-Engine Control Co., Ltd. Class A 117,100 219,736 0.00%
Hubei Energy Group Co., Ltd. Class A 365,800 219,003 0.00%
Shanghai Pharmaceuticals Holding Co., Ltd. Class A 81,800 215,741 0.00%
Shanghai Waigaoqiao Free Trade Zone Group Co., Ltd. Class A 85,200 212,476 0.00%
Sichuan Hebang Biotechnology Co., Ltd. Class A 984,800 209,257 0.00%
Shenzhen Zhongjin Lingnan Nonfemet Co., Ltd. Class A 328,700 202,926 0.00%
Tech-Bank Food Co., Ltd. Class A 111,500 200,904 0.00%Wanxiang Qianchao Co., Ltd.
Class A 254,100 195,906 0.00%Shanghai Mechanical & Electrical
Industry Co., Ltd. Class A 82,300 195,791 0.00%Sinopec Shanghai Petrochemical
Co., Ltd. Class A 351,400 195,246 0.00%Beijing Dabeinong Technology
Group Co., Ltd. Class A 272,400 194,763 0.00%Hubei Kaile Science & Technology
Co., Ltd. Class A 98,500 191,905 0.00%Metallurgical Corp. of China Ltd.
Class H 846,000 190,007 0.00%Zhejiang Semir Garment Co., Ltd.
Class A 133,800 189,602 0.00%Visual China Group Co., Ltd.
Class A 74,000 183,163 0.00%Guizhou Bailing Group
Pharmaceutical Co., Ltd. Class A 144,400 180,574 0.00%Tunghsu Optoelectronic
Technology Co., Ltd. Class A 357,800 172,603 0.00%China Communications
Construction Co., Ltd. Class A 130,400 171,492 0.00%China First Capital Group Ltd. 4,812,000 166,745 0.00%China International Marine
Containers Group Co., Ltd. Class A 111,998 157,903 0.00%
Oceanwide Holdings Co., Ltd. Class A 236,159 154,271 0.00%
Tianqi Lithium - Rights Issue 16/3/2020 33,900 104,302 0.00%
Shanghai Industrial Urban Development Group Ltd. 451,092 56,735 0.00%
Huadian Power International Corp., Ltd. Class H 30,000 11,397 0.00%
China Huishan Dairy Holdings Co., Ltd. 7,428,000 10 0.00%
Legend Holdings Corp. - Rights Issue 8/5/2020 53,630 — 0.00%
3,431,015,055 34.27%
Colombia 0.37% (2018: 0.40%)
Bancolombia SA - Preference Shares 721,838 10,074,716 0.10%
Ecopetrol SA 7,734,790 7,813,753 0.08%Bancolombia SA 373,705 5,010,824 0.05%Interconexion Electrica SA ESP 720,864 4,305,633 0.04%Grupo de Inversiones
Suramericana SA 379,855 3,935,721 0.04%Grupo Aval Acciones y Valores
SA - Preference Shares 6,388,424 2,842,328 0.03%Grupo Argos SA 473,098 2,566,249 0.03%Grupo de Inversiones
Suramericana SA - Preference Shares 3,162 28,233 0.00%
36,577,457 0.37%
Czech Republic 0.13% (2018: 0.17%)
CEZ A.S. 254,749 5,732,839 0.06%Komercni banka A.S. 123,970 4,541,988 0.04%Moneta Money Bank A.S. 828,030 3,108,694 0.03%
13,383,521 0.13%
Egypt 0.14% (2018: 0.12%)
Commercial International Bank Egypt SAE GDR 2,211,775 11,437,839 0.12%
Eastern Co. SAE 1,469,493 1,384,345 0.01%ElSewedy Electric Co. 1,225,759 856,122 0.01%
13,678,306 0.14%
Greece 0.29% (2018: 0.22%)
Hellenic Telecommunications Organization SA 376,527 6,027,011 0.06%
Alpha Bank AE 2,170,216 4,684,558 0.05%Eurobank Ergasias SA 4,023,479 4,155,047 0.04%OPAP SA 312,916 4,070,967 0.04%JUMBO SA 168,313 3,504,676 0.04%National Bank of Greece SA 847,602 2,873,328 0.03%Motor Oil Hellas Corinth
Refineries SA 100,301 2,321,562 0.02%Titan Cement International SA 61,548 1,309,902 0.01%FF Group 65,807 354,568 0.00%
29,301,619 0.29%
Hungary 0.30% (2018: 0.33%)
OTP Bank Nyrt 360,337 18,871,821 0.19%MOL Hungarian Oil & Gas plc 645,845 6,444,878 0.06%Richter Gedeon Nyrt 227,032 4,943,366 0.05%
30,260,065 0.30%
India 8.60% (2018: 9.30%)
Reliance Industries Ltd. 4,581,520 97,306,869 0.97%Housing Development Finance
Corp., Ltd. 2,632,199 88,985,604 0.89%ICICI Bank Ltd. 7,673,809 57,909,840 0.58%Infosys Ltd. 5,470,890 56,105,285 0.56%Tata Consultancy Services Ltd. 1,446,206 43,865,468 0.44%Axis Bank Ltd. 3,355,968 35,380,098 0.35%Hindustan Unilever Ltd. 1,042,107 28,036,004 0.28%Bharti Airtel Ltd. 3,295,486 21,053,244 0.21%ITC Ltd. 5,463,479 18,201,863 0.18%Maruti Suzuki India Ltd. 169,679 17,519,846 0.18%Bajaj Finance Ltd. 278,850 16,505,629 0.16%Larsen & Toubro Ltd. 759,664 13,888,865 0.14%HCL Technologies Ltd. 1,739,685 13,868,120 0.14%State Bank of India 2,863,359 13,390,502 0.13%Asian Paints Ltd. 460,074 11,538,888 0.12%
Number of Fair Value % of Total Shares US Dollars ($) Net Assets
Vanguard Emerging Markets Stock Index Fund
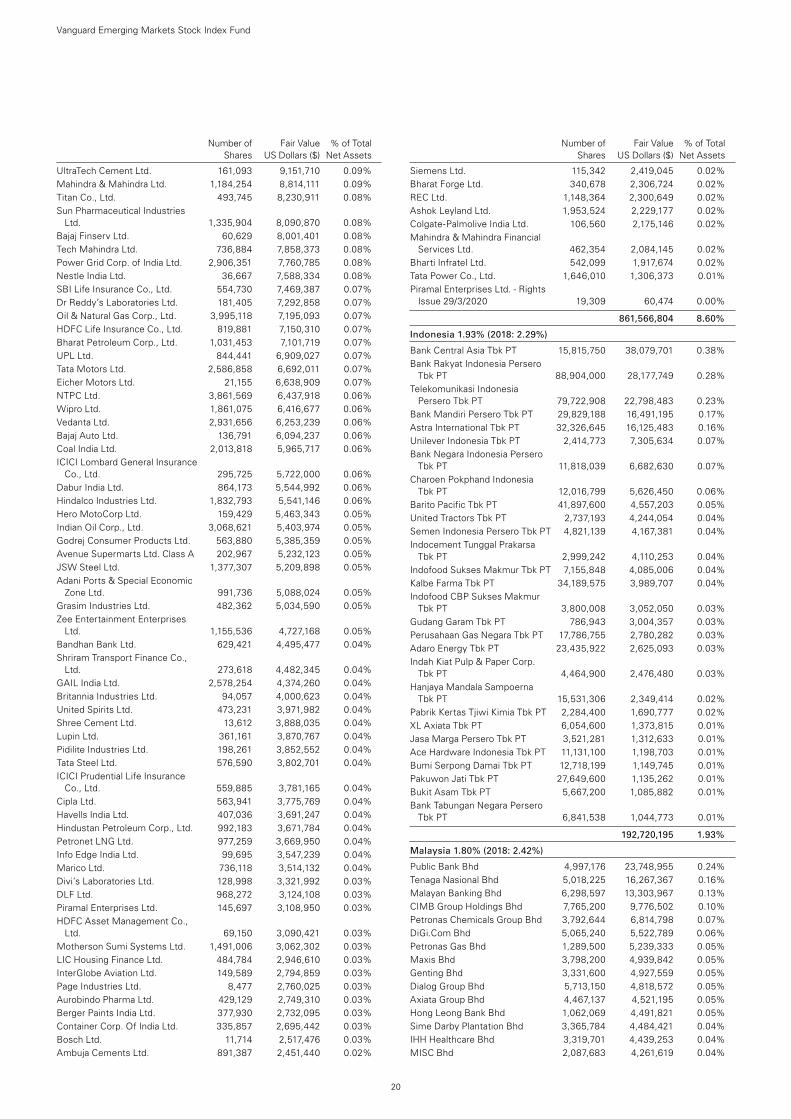
20
Number of Fair Value % of Total Shares US Dollars ($) Net Assets
UltraTech Cement Ltd. 161,093 9,151,710 0.09%Mahindra & Mahindra Ltd. 1,184,254 8,814,111 0.09%Titan Co., Ltd. 493,745 8,230,911 0.08%Sun Pharmaceutical Industries
Ltd. 1,335,904 8,090,870 0.08%Bajaj Finserv Ltd. 60,629 8,001,401 0.08%Tech Mahindra Ltd. 736,884 7,858,373 0.08%Power Grid Corp. of India Ltd. 2,906,351 7,760,785 0.08%Nestle India Ltd. 36,667 7,588,334 0.08%SBI Life Insurance Co., Ltd. 554,730 7,469,387 0.07%Dr Reddy’s Laboratories Ltd. 181,405 7,292,858 0.07%Oil & Natural Gas Corp., Ltd. 3,995,118 7,195,093 0.07%HDFC Life Insurance Co., Ltd. 819,881 7,150,310 0.07%Bharat Petroleum Corp., Ltd. 1,031,453 7,101,719 0.07%UPL Ltd. 844,441 6,909,027 0.07%Tata Motors Ltd. 2,586,858 6,692,011 0.07%Eicher Motors Ltd. 21,155 6,638,909 0.07%NTPC Ltd. 3,861,569 6,437,918 0.06%Wipro Ltd. 1,861,075 6,416,677 0.06%Vedanta Ltd. 2,931,656 6,253,239 0.06%Bajaj Auto Ltd. 136,791 6,094,237 0.06%Coal India Ltd. 2,013,818 5,965,717 0.06%ICICI Lombard General Insurance
Co., Ltd. 295,725 5,722,000 0.06%Dabur India Ltd. 864,173 5,544,992 0.06%Hindalco Industries Ltd. 1,832,793 5,541,146 0.06%Hero MotoCorp Ltd. 159,429 5,463,343 0.05%Indian Oil Corp., Ltd. 3,068,621 5,403,974 0.05%Godrej Consumer Products Ltd. 563,880 5,385,359 0.05%Avenue Supermarts Ltd. Class A 202,967 5,232,123 0.05%JSW Steel Ltd. 1,377,307 5,209,898 0.05%Adani Ports & Special Economic
Zone Ltd. 991,736 5,088,024 0.05%Grasim Industries Ltd. 482,362 5,034,590 0.05%Zee Entertainment Enterprises
Ltd. 1,155,536 4,727,168 0.05%Bandhan Bank Ltd. 629,421 4,495,477 0.04%Shriram Transport Finance Co.,
Ltd. 273,618 4,482,345 0.04%GAIL India Ltd. 2,578,254 4,374,260 0.04%Britannia Industries Ltd. 94,057 4,000,623 0.04%United Spirits Ltd. 473,231 3,971,982 0.04%Shree Cement Ltd. 13,612 3,888,035 0.04%Lupin Ltd. 361,161 3,870,767 0.04%Pidilite Industries Ltd. 198,261 3,852,552 0.04%Tata Steel Ltd. 576,590 3,802,701 0.04%ICICI Prudential Life Insurance
Co., Ltd. 559,885 3,781,165 0.04%Cipla Ltd. 563,941 3,775,769 0.04%Havells India Ltd. 407,036 3,691,247 0.04%Hindustan Petroleum Corp., Ltd. 992,183 3,671,784 0.04%Petronet LNG Ltd. 977,259 3,669,950 0.04%Info Edge India Ltd. 99,695 3,547,239 0.04%Marico Ltd. 736,118 3,514,132 0.04%Divi’s Laboratories Ltd. 128,998 3,321,992 0.03%DLF Ltd. 968,272 3,124,108 0.03%Piramal Enterprises Ltd. 145,697 3,108,950 0.03%HDFC Asset Management Co.,
Ltd. 69,150 3,090,421 0.03%Motherson Sumi Systems Ltd. 1,491,006 3,062,302 0.03%LIC Housing Finance Ltd. 484,784 2,946,610 0.03%InterGlobe Aviation Ltd. 149,589 2,794,859 0.03%Page Industries Ltd. 8,477 2,760,025 0.03%Aurobindo Pharma Ltd. 429,129 2,749,310 0.03%Berger Paints India Ltd. 377,930 2,732,095 0.03%Container Corp. Of India Ltd. 335,857 2,695,442 0.03%Bosch Ltd. 11,714 2,517,476 0.03%Ambuja Cements Ltd. 891,387 2,451,440 0.02%
Siemens Ltd. 115,342 2,419,045 0.02%Bharat Forge Ltd. 340,678 2,306,724 0.02%REC Ltd. 1,148,364 2,300,649 0.02%Ashok Leyland Ltd. 1,953,524 2,229,177 0.02%Colgate-Palmolive India Ltd. 106,560 2,175,146 0.02%Mahindra & Mahindra Financial
Services Ltd. 462,354 2,084,145 0.02%Bharti Infratel Ltd. 542,099 1,917,674 0.02%Tata Power Co., Ltd. 1,646,010 1,306,373 0.01%Piramal Enterprises Ltd. - Rights
Issue 29/3/2020 19,309 60,474 0.00%
861,566,804 8.60%
Indonesia 1.93% (2018: 2.29%)
Bank Central Asia Tbk PT 15,815,750 38,079,701 0.38%Bank Rakyat Indonesia Persero
Tbk PT 88,904,000 28,177,749 0.28%Telekomunikasi Indonesia
Persero Tbk PT 79,722,908 22,798,483 0.23%Bank Mandiri Persero Tbk PT 29,829,188 16,491,195 0.17%Astra International Tbk PT 32,326,645 16,125,483 0.16%Unilever Indonesia Tbk PT 2,414,773 7,305,634 0.07%Bank Negara Indonesia Persero
Tbk PT 11,818,039 6,682,630 0.07%Charoen Pokphand Indonesia
Tbk PT 12,016,799 5,626,450 0.06%Barito Pacific Tbk PT 41,897,600 4,557,203 0.05%United Tractors Tbk PT 2,737,193 4,244,054 0.04%Semen Indonesia Persero Tbk PT 4,821,139 4,167,381 0.04%Indocement Tunggal Prakarsa
Tbk PT 2,999,242 4,110,253 0.04%Indofood Sukses Makmur Tbk PT 7,155,848 4,085,006 0.04%Kalbe Farma Tbk PT 34,189,575 3,989,707 0.04%Indofood CBP Sukses Makmur
Tbk PT 3,800,008 3,052,050 0.03%Gudang Garam Tbk PT 786,943 3,004,357 0.03%Perusahaan Gas Negara Tbk PT 17,786,755 2,780,282 0.03%Adaro Energy Tbk PT 23,435,922 2,625,093 0.03%Indah Kiat Pulp & Paper Corp.
Tbk PT 4,464,900 2,476,480 0.03%Hanjaya Mandala Sampoerna
Tbk PT 15,531,306 2,349,414 0.02%Pabrik Kertas Tjiwi Kimia Tbk PT 2,284,400 1,690,777 0.02%XL Axiata Tbk PT 6,054,600 1,373,815 0.01%Jasa Marga Persero Tbk PT 3,521,281 1,312,633 0.01%Ace Hardware Indonesia Tbk PT 11,131,100 1,198,703 0.01%Bumi Serpong Damai Tbk PT 12,718,199 1,149,745 0.01%Pakuwon Jati Tbk PT 27,649,600 1,135,262 0.01%Bukit Asam Tbk PT 5,667,200 1,085,882 0.01%Bank Tabungan Negara Persero
Tbk PT 6,841,538 1,044,773 0.01%
192,720,195 1.93%
Malaysia 1.80% (2018: 2.42%)
Public Bank Bhd 4,997,176 23,748,955 0.24%Tenaga Nasional Bhd 5,018,225 16,267,367 0.16%Malayan Banking Bhd 6,298,597 13,303,967 0.13%CIMB Group Holdings Bhd 7,765,200 9,776,502 0.10%Petronas Chemicals Group Bhd 3,792,644 6,814,798 0.07%DiGi.Com Bhd 5,065,240 5,522,789 0.06%Petronas Gas Bhd 1,289,500 5,239,333 0.05%Maxis Bhd 3,798,200 4,939,842 0.05%Genting Bhd 3,331,600 4,927,559 0.05%Dialog Group Bhd 5,713,150 4,818,572 0.05%Axiata Group Bhd 4,467,137 4,521,195 0.05%Hong Leong Bank Bhd 1,062,069 4,491,821 0.05%Sime Darby Plantation Bhd 3,365,784 4,484,421 0.04%IHH Healthcare Bhd 3,319,701 4,439,253 0.04%MISC Bhd 2,087,683 4,261,619 0.04%
Number of Fair Value % of Total Shares US Dollars ($) Net Assets
Vanguard Emerging Markets Stock Index Fund

21
Number of Fair Value % of Total Shares US Dollars ($) Net Assets
PPB Group Bhd 921,080 4,242,305 0.04%Kuala Lumpur Kepong Bhd 695,450 4,216,394 0.04%Nestle Malaysia Bhd 113,700 4,086,029 0.04%Genting Malaysia Bhd 4,818,500 3,875,532 0.04%IOI Corp. Bhd 3,070,250 3,460,177 0.03%Hartalega Holdings Bhd 2,457,300 3,292,019 0.03%Malaysia Airports Holdings Bhd 1,623,060 3,015,586 0.03%RHB Bank Bhd 2,125,700 3,003,678 0.03%Top Glove Corp. Bhd 2,507,400 2,881,012 0.03%Petronas Dagangan Bhd 485,600 2,742,296 0.03%Gamuda Bhd 2,796,300 2,666,073 0.03%Press Metal Aluminium Holdings
Bhd 2,330,800 2,649,608 0.03%AMMB Holdings Bhd 2,697,300 2,578,277 0.03%HAP Seng Consolidated Bhd 1,015,400 2,477,372 0.02%Sime Darby Bhd 4,447,184 2,413,580 0.02%IJM Corp. Bhd 4,443,980 2,357,520 0.02%QL Resources Bhd 1,052,200 2,091,281 0.02%Fraser & Neave Holdings Bhd 238,900 2,034,782 0.02%Telekom Malaysia Bhd 1,843,600 1,721,685 0.02%Hong Leong Financial Group Bhd 385,623 1,593,211 0.02%Westports Holdings Bhd 1,377,100 1,417,331 0.01%YTL Corp. Bhd 4,492,448 1,076,298 0.01%AirAsia Group Bhd 2,513,500 1,044,603 0.01%Genting Plantations Bhd 395,681 1,023,421 0.01%British American Tobacco
Malaysia Bhd 238,383 878,821 0.01%RHB Capital Bhd 1,161,678 3 0.00%
180,396,887 1.80%
Mexico 2.28% (2018: 2.76%)
America Movil SAB de CV 53,999,181 43,178,756 0.43%Fomento Economico Mexicano
SAB de CV 3,109,497 29,364,361 0.29%Wal-Mart de Mexico SAB de CV 8,423,584 24,212,674 0.24%Grupo Financiero Banorte SAB
de CV Class O 4,166,107 23,288,194 0.23%Grupo Mexico SAB de CV 5,616,381 15,459,621 0.16%Cemex SAB de CV - Preference
Shares 24,148,967 9,053,944 0.09%Grupo Televisa SAB 3,834,853 9,002,279 0.09%Fibra Uno Administracion SA de
CV REIT 5,086,548 7,886,789 0.08%Grupo Aeroportuario del Pacifico
SAB de CV Class B 581,230 6,917,573 0.07%Grupo Aeroportuario del Sureste
SAB de CV Class B 328,522 6,162,658 0.06%Coca-Cola Femsa SAB de CV 813,966 4,948,279 0.05%Kimberly-Clark de Mexico SAB
de CV Class A 2,479,834 4,941,546 0.05%Grupo Bimbo SAB de CV 2,654,690 4,842,940 0.05%Grupo Financiero Inbursa SAB
de CV Class O 3,785,819 4,651,080 0.05%Infraestructura Energetica Nova
SAB de CV 875,658 4,116,761 0.04%Alfa SAB de CV Class A 4,927,817 4,086,508 0.04%Promotora y Operadora de
Infraestructura SAB de CV 371,237 3,804,373 0.04%Arca Continental SAB de CV 718,078 3,802,954 0.04%Orbia Advance Corp. SAB de CV 1,708,189 3,647,224 0.04%Gruma SAB de CV Class B 339,366 3,482,617 0.04%Grupo Carso SAB de CV 747,042 2,764,815 0.03%Industrias Penoles SAB de CV 231,043 2,422,746 0.02%Alsea SAB de CV 887,800 2,342,675 0.02%Megacable Holdings SAB de CV 486,800 1,996,282 0.02%El Puerto de Liverpool SAB de CV 280,344 1,392,516 0.01%
227,770,165 2.28%
Pakistan 0.03% (2018: 0.03%)
Oil & Gas Development Co., Ltd. 1,062,100 975,240 0.01%MCB Bank Ltd. 661,600 901,415 0.01%Habib Bank Ltd. 876,400 898,669 0.01%
2,775,324 0.03%
Peru 0.34% (2018: 0.42%)
Credicorp Ltd. 108,520 23,128,868 0.23%Southern Copper Corp. 137,819 5,854,551 0.06%Compania de Minas Buenaventura
SAA ADR 351,138 5,302,184 0.05%
34,285,603 0.34%
Philippines 0.95% (2018: 1.10%)
SM Prime Holdings, Inc. 16,128,167 13,406,967 0.13%Ayala Land, Inc. 11,751,200 10,557,401 0.11%BDO Unibank, Inc. 3,146,509 9,816,338 0.10%SM Investments Corp. 382,830 7,884,128 0.08%JG Summit Holdings, Inc. 4,542,460 7,247,127 0.07%Ayala Corp. 444,570 6,895,246 0.07%International Container Terminal
Services, Inc. 1,636,030 4,154,279 0.04%Universal Robina Corp. 1,435,040 4,108,615 0.04%Metropolitan Bank & Trust Co. 2,930,303 3,836,096 0.04%Aboitiz Equity Ventures, Inc. 3,221,450 3,275,835 0.03%Jollibee Foods Corp. 711,380 3,034,023 0.03%PLDT, Inc. 140,340 2,737,801 0.03%GT Capital Holdings, Inc. 157,999 2,642,416 0.03%Bank of the Philippine Islands 1,466,486 2,545,249 0.03%Manila Electric Co. 377,360 2,361,993 0.02%Globe Telecom, Inc. 55,860 2,228,003 0.02%Robinsons Land Corp. 3,385,219 1,841,500 0.02%Aboitiz Power Corp. 2,381,809 1,608,409 0.02%Metro Pacific Investments Corp. 23,071,300 1,585,312 0.02%Megaworld Corp. 18,573,000 1,470,584 0.01%Security Bank Corp. 365,270 1,406,410 0.01%Altus San Nicolas Corp. 65,177 6,684 0.00%
94,650,416 0.95%
Poland 0.88% (2018: 1.25%)
Powszechna Kasa Oszczednosci Bank Polski SA 1,401,416 12,751,246 0.13%
Polski Koncern Naftowy ORLEN SA 478,674 10,846,725 0.11%
Powszechny Zaklad Ubezpieczen SA 964,971 10,199,295 0.10%
CD Projekt SA 106,590 7,866,265 0.08%Bank Polska Kasa Opieki SA 269,904 7,158,624 0.07%KGHM Polska Miedz SA 220,370 5,561,472 0.06%LPP SA 2,029 4,725,208 0.05%Santander Bank Polska SA 58,211 4,724,754 0.05%Grupa Lotos SA 150,713 3,326,009 0.03%Polskie Gornictwo Naftowe i
Gazownictwo SA 2,844,999 3,251,170 0.03%Cyfrowy Polsat SA 415,455 3,064,931 0.03%Dino Polska SA 79,528 3,023,798 0.03%PGE Polska Grupa Energetyczna
SA 1,375,679 2,891,349 0.03%mBank SA 24,754 2,545,140 0.02%Orange Polska SA 1,057,928 1,988,870 0.02%Bank Millennium SA 1,038,595 1,604,251 0.02%AmRest Holdings SE 124,296 1,421,070 0.01%CCC SA 46,743 1,357,624 0.01%
88,307,801 0.88%
Qatar 0.92% (2018: 1.09%)
Qatar National Bank QPSC 7,267,114 41,095,819 0.41%Industries Qatar QSC 2,893,757 8,170,234 0.08%Qatar Islamic Bank SAQ 1,837,514 7,736,635 0.08%
Number of Fair Value % of Total Shares US Dollars ($) Net Assets
Vanguard Emerging Markets Stock Index Fund
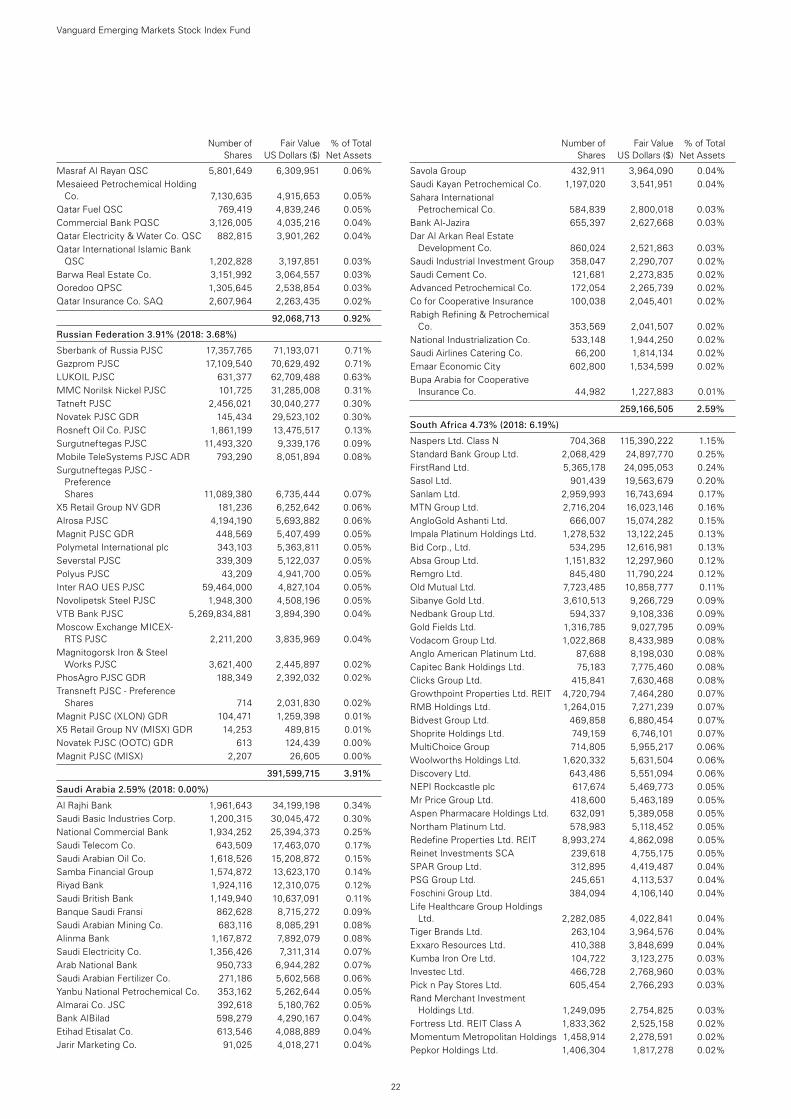
22
Number of Fair Value % of Total Shares US Dollars ($) Net Assets
Masraf Al Rayan QSC 5,801,649 6,309,951 0.06%Mesaieed Petrochemical Holding
Co. 7,130,635 4,915,653 0.05%Qatar Fuel QSC 769,419 4,839,246 0.05%Commercial Bank PQSC 3,126,005 4,035,216 0.04%Qatar Electricity & Water Co. QSC 882,815 3,901,262 0.04%Qatar International Islamic Bank
QSC 1,202,828 3,197,851 0.03%Barwa Real Estate Co. 3,151,992 3,064,557 0.03%Ooredoo QPSC 1,305,645 2,538,854 0.03%Qatar Insurance Co. SAQ 2,607,964 2,263,435 0.02%
92,068,713 0.92%
Russian Federation 3.91% (2018: 3.68%)
Sberbank of Russia PJSC 17,357,765 71,193,071 0.71%Gazprom PJSC 17,109,540 70,629,492 0.71%LUKOIL PJSC 631,377 62,709,488 0.63%MMC Norilsk Nickel PJSC 101,725 31,285,008 0.31%Tatneft PJSC 2,456,021 30,040,277 0.30%Novatek PJSC GDR 145,434 29,523,102 0.30%Rosneft Oil Co. PJSC 1,861,199 13,475,517 0.13%Surgutneftegas PJSC 11,493,320 9,339,176 0.09%Mobile TeleSystems PJSC ADR 793,290 8,051,894 0.08%Surgutneftegas PJSC -
Preference Shares 11,089,380 6,735,444 0.07%
X5 Retail Group NV GDR 181,236 6,252,642 0.06%Alrosa PJSC 4,194,190 5,693,882 0.06%Magnit PJSC GDR 448,569 5,407,499 0.05%Polymetal International plc 343,103 5,363,811 0.05%Severstal PJSC 339,309 5,122,037 0.05%Polyus PJSC 43,209 4,941,700 0.05%Inter RAO UES PJSC 59,464,000 4,827,104 0.05%Novolipetsk Steel PJSC 1,948,300 4,508,196 0.05%VTB Bank PJSC 5,269,834,881 3,894,390 0.04%Moscow Exchange MICEX-
RTS PJSC 2,211,200 3,835,969 0.04%Magnitogorsk Iron & Steel
Works PJSC 3,621,400 2,445,897 0.02%PhosAgro PJSC GDR 188,349 2,392,032 0.02%Transneft PJSC - Preference
Shares 714 2,031,830 0.02%Magnit PJSC (XLON) GDR 104,471 1,259,398 0.01%X5 Retail Group NV (MISX) GDR 14,253 489,815 0.01%Novatek PJSC (OOTC) GDR 613 124,439 0.00%Magnit PJSC (MISX) 2,207 26,605 0.00%
391,599,715 3.91%
Saudi Arabia 2.59% (2018: 0.00%)
Al Rajhi Bank 1,961,643 34,199,198 0.34%Saudi Basic Industries Corp. 1,200,315 30,045,472 0.30%National Commercial Bank 1,934,252 25,394,373 0.25%Saudi Telecom Co. 643,509 17,463,070 0.17%Saudi Arabian Oil Co. 1,618,526 15,208,872 0.15%Samba Financial Group 1,574,872 13,623,170 0.14%Riyad Bank 1,924,116 12,310,075 0.12%Saudi British Bank 1,149,940 10,637,091 0.11%Banque Saudi Fransi 862,628 8,715,272 0.09%Saudi Arabian Mining Co. 683,116 8,085,291 0.08%Alinma Bank 1,167,872 7,892,079 0.08%Saudi Electricity Co. 1,356,426 7,311,314 0.07%Arab National Bank 950,733 6,944,282 0.07%Saudi Arabian Fertilizer Co. 271,186 5,602,568 0.06%Yanbu National Petrochemical Co. 353,162 5,262,644 0.05%Almarai Co. JSC 392,618 5,180,762 0.05%Bank AlBilad 598,279 4,290,167 0.04%Etihad Etisalat Co. 613,546 4,088,889 0.04%Jarir Marketing Co. 91,025 4,018,271 0.04%
Savola Group 432,911 3,964,090 0.04%Saudi Kayan Petrochemical Co. 1,197,020 3,541,951 0.04%Sahara International
Petrochemical Co. 584,839 2,800,018 0.03%Bank Al-Jazira 655,397 2,627,668 0.03%Dar Al Arkan Real Estate
Development Co. 860,024 2,521,863 0.03%Saudi Industrial Investment Group 358,047 2,290,707 0.02%Saudi Cement Co. 121,681 2,273,835 0.02%Advanced Petrochemical Co. 172,054 2,265,739 0.02%Co for Cooperative Insurance 100,038 2,045,401 0.02%Rabigh Refining & Petrochemical
Co. 353,569 2,041,507 0.02%National Industrialization Co. 533,148 1,944,250 0.02%Saudi Airlines Catering Co. 66,200 1,814,134 0.02%Emaar Economic City 602,800 1,534,599 0.02%Bupa Arabia for Cooperative
Insurance Co. 44,982 1,227,883 0.01%
259,166,505 2.59%
South Africa 4.73% (2018: 6.19%)
Naspers Ltd. Class N 704,368 115,390,222 1.15%Standard Bank Group Ltd. 2,068,429 24,897,770 0.25%FirstRand Ltd. 5,365,178 24,095,053 0.24%Sasol Ltd. 901,439 19,563,679 0.20%Sanlam Ltd. 2,959,993 16,743,694 0.17%MTN Group Ltd. 2,716,204 16,023,146 0.16%AngloGold Ashanti Ltd. 666,007 15,074,282 0.15%Impala Platinum Holdings Ltd. 1,278,532 13,122,245 0.13%Bid Corp., Ltd. 534,295 12,616,981 0.13%Absa Group Ltd. 1,151,832 12,297,960 0.12%Remgro Ltd. 845,480 11,790,224 0.12%Old Mutual Ltd. 7,723,485 10,858,777 0.11%Sibanye Gold Ltd. 3,610,513 9,266,729 0.09%Nedbank Group Ltd. 594,337 9,108,336 0.09%Gold Fields Ltd. 1,316,785 9,027,795 0.09%Vodacom Group Ltd. 1,022,868 8,433,989 0.08%Anglo American Platinum Ltd. 87,688 8,198,030 0.08%Capitec Bank Holdings Ltd. 75,183 7,775,460 0.08%Clicks Group Ltd. 415,841 7,630,468 0.08%Growthpoint Properties Ltd. REIT 4,720,794 7,464,280 0.07%RMB Holdings Ltd. 1,264,015 7,271,239 0.07%Bidvest Group Ltd. 469,858 6,880,454 0.07%Shoprite Holdings Ltd. 749,159 6,746,101 0.07%MultiChoice Group 714,805 5,955,217 0.06%Woolworths Holdings Ltd. 1,620,332 5,631,504 0.06%Discovery Ltd. 643,486 5,551,094 0.06%NEPI Rockcastle plc 617,674 5,469,773 0.05%Mr Price Group Ltd. 418,600 5,463,189 0.05%Aspen Pharmacare Holdings Ltd. 632,091 5,389,058 0.05%Northam Platinum Ltd. 578,983 5,118,452 0.05%Redefine Properties Ltd. REIT 8,993,274 4,862,098 0.05%Reinet Investments SCA 239,618 4,755,175 0.05%SPAR Group Ltd. 312,895 4,419,487 0.04%PSG Group Ltd. 245,651 4,113,537 0.04%Foschini Group Ltd. 384,094 4,106,140 0.04%Life Healthcare Group Holdings
Ltd. 2,282,085 4,022,841 0.04%Tiger Brands Ltd. 263,104 3,964,576 0.04%Exxaro Resources Ltd. 410,388 3,848,699 0.04%Kumba Iron Ore Ltd. 104,722 3,123,275 0.03%Investec Ltd. 466,728 2,768,960 0.03%Pick n Pay Stores Ltd. 605,454 2,766,293 0.03%Rand Merchant Investment
Holdings Ltd. 1,249,095 2,754,825 0.03%Fortress Ltd. REIT Class A 1,833,362 2,525,158 0.02%Momentum Metropolitan Holdings 1,458,914 2,278,591 0.02%Pepkor Holdings Ltd. 1,406,304 1,817,278 0.02%
Number of Fair Value % of Total Shares US Dollars ($) Net Assets
Vanguard Emerging Markets Stock Index Fund
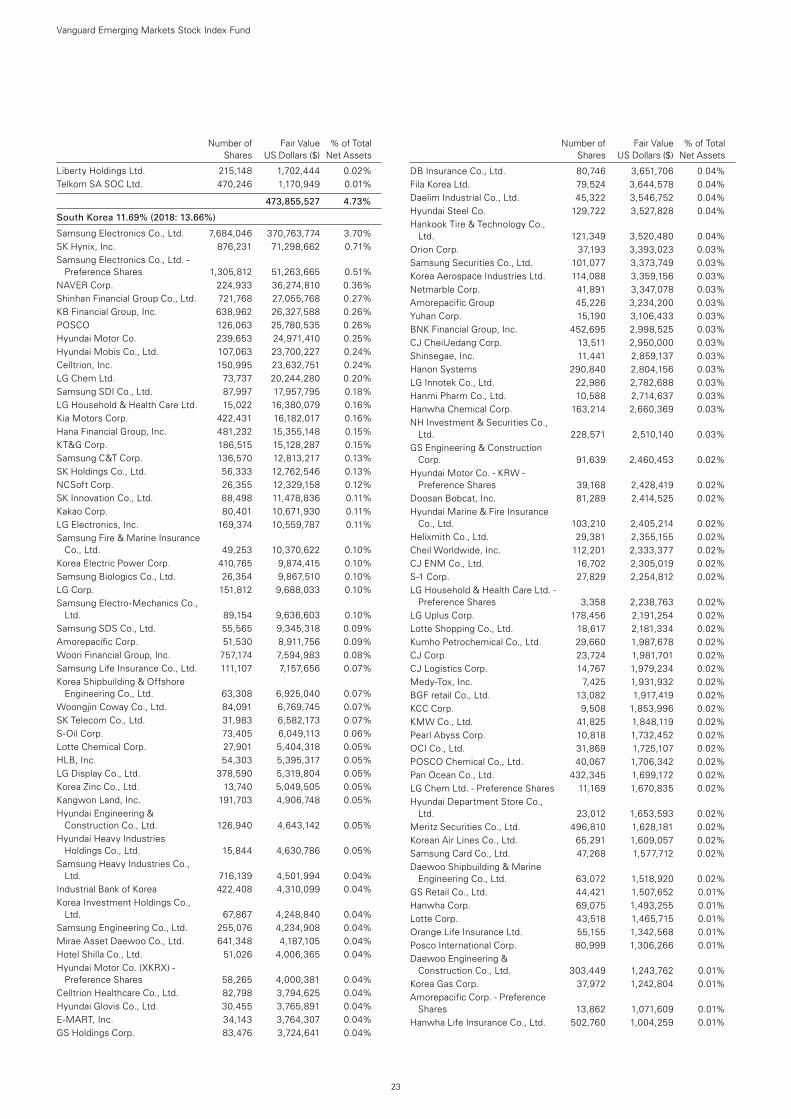
Number of Fair Value % of Total Shares US Dollars ($) Net Assets
Liberty Holdings Ltd. 215,148 1,702,444 0.02%Telkom SA SOC Ltd. 470,246 1,170,949 0.01%
473,855,527 4.73%
South Korea 11.69% (2018: 13.66%)
Samsung Electronics Co., Ltd. 7,684,046 370,763,774 3.70%SK Hynix, Inc. 876,231 71,298,662 0.71%Samsung Electronics Co., Ltd. -
Preference Shares 1,305,812 51,263,665 0.51%NAVER Corp. 224,933 36,274,810 0.36%Shinhan Financial Group Co., Ltd. 721,768 27,055,768 0.27%KB Financial Group, Inc. 638,962 26,327,588 0.26%POSCO 126,063 25,780,535 0.26%Hyundai Motor Co. 239,653 24,971,410 0.25%Hyundai Mobis Co., Ltd. 107,063 23,700,227 0.24%Celltrion, Inc. 150,995 23,632,751 0.24%LG Chem Ltd. 73,737 20,244,280 0.20%Samsung SDI Co., Ltd. 87,997 17,957,795 0.18%LG Household & Health Care Ltd. 15,022 16,380,079 0.16%Kia Motors Corp. 422,431 16,182,017 0.16%Hana Financial Group, Inc. 481,232 15,355,148 0.15%KT&G Corp. 186,515 15,128,287 0.15%Samsung C&T Corp. 136,570 12,813,217 0.13%SK Holdings Co., Ltd. 56,333 12,762,546 0.13%NCSoft Corp. 26,355 12,329,158 0.12%SK Innovation Co., Ltd. 88,498 11,478,836 0.11%Kakao Corp. 80,401 10,671,930 0.11%LG Electronics, Inc. 169,374 10,559,787 0.11%Samsung Fire & Marine Insurance
Co., Ltd. 49,253 10,370,622 0.10%Korea Electric Power Corp. 410,765 9,874,415 0.10%Samsung Biologics Co., Ltd. 26,354 9,867,510 0.10%LG Corp. 151,812 9,688,033 0.10%Samsung Electro-Mechanics Co.,
Ltd. 89,154 9,636,603 0.10%Samsung SDS Co., Ltd. 55,565 9,345,318 0.09%Amorepacific Corp. 51,530 8,911,756 0.09%Woori Financial Group, Inc. 757,174 7,594,983 0.08%Samsung Life Insurance Co., Ltd. 111,107 7,157,656 0.07%Korea Shipbuilding & Offshore
Engineering Co., Ltd. 63,308 6,925,040 0.07%Woongjin Coway Co., Ltd. 84,091 6,769,745 0.07%SK Telecom Co., Ltd. 31,983 6,582,173 0.07%S-Oil Corp. 73,405 6,049,113 0.06%Lotte Chemical Corp. 27,901 5,404,318 0.05%HLB, Inc. 54,303 5,395,317 0.05%LG Display Co., Ltd. 378,590 5,319,804 0.05%Korea Zinc Co., Ltd. 13,740 5,049,505 0.05%Kangwon Land, Inc. 191,703 4,906,748 0.05%Hyundai Engineering &
Construction Co., Ltd. 126,940 4,643,142 0.05%Hyundai Heavy Industries
Holdings Co., Ltd. 15,844 4,630,786 0.05%Samsung Heavy Industries Co.,
Ltd. 716,139 4,501,994 0.04%Industrial Bank of Korea 422,408 4,310,099 0.04%Korea Investment Holdings Co.,
Ltd. 67,867 4,248,840 0.04%Samsung Engineering Co., Ltd. 255,076 4,234,908 0.04%Mirae Asset Daewoo Co., Ltd. 641,348 4,187,105 0.04%Hotel Shilla Co., Ltd. 51,026 4,006,365 0.04%Hyundai Motor Co. (XKRX) -
Preference Shares 58,265 4,000,381 0.04%Celltrion Healthcare Co., Ltd. 82,798 3,794,625 0.04%Hyundai Glovis Co., Ltd. 30,455 3,765,891 0.04%E-MART, Inc. 34,143 3,764,307 0.04%GS Holdings Corp. 83,476 3,724,641 0.04%
DB Insurance Co., Ltd. 80,746 3,651,706 0.04%Fila Korea Ltd. 79,524 3,644,578 0.04%Daelim Industrial Co., Ltd. 45,322 3,546,752 0.04%Hyundai Steel Co. 129,722 3,527,828 0.04%Hankook Tire & Technology Co.,
Ltd. 121,349 3,520,480 0.04%Orion Corp. 37,193 3,393,023 0.03%Samsung Securities Co., Ltd. 101,077 3,373,749 0.03%Korea Aerospace Industries Ltd. 114,088 3,359,156 0.03%Netmarble Corp. 41,891 3,347,078 0.03%Amorepacific Group 45,226 3,234,200 0.03%Yuhan Corp. 15,190 3,106,433 0.03%BNK Financial Group, Inc. 452,695 2,998,525 0.03%CJ CheilJedang Corp. 13,511 2,950,000 0.03%Shinsegae, Inc. 11,441 2,859,137 0.03%Hanon Systems 290,840 2,804,156 0.03%LG Innotek Co., Ltd. 22,986 2,782,688 0.03%Hanmi Pharm Co., Ltd. 10,588 2,714,637 0.03%Hanwha Chemical Corp. 163,214 2,660,369 0.03%NH Investment & Securities Co.,
Ltd. 228,571 2,510,140 0.03%GS Engineering & Construction
Corp. 91,639 2,460,453 0.02%Hyundai Motor Co. - KRW -
Preference Shares 39,168 2,428,419 0.02%Doosan Bobcat, Inc. 81,289 2,414,525 0.02%Hyundai Marine & Fire Insurance
Co., Ltd. 103,210 2,405,214 0.02%Helixmith Co., Ltd. 29,381 2,355,155 0.02%Cheil Worldwide, Inc. 112,201 2,333,377 0.02%CJ ENM Co., Ltd. 16,702 2,305,019 0.02%S-1 Corp. 27,829 2,254,812 0.02%LG Household & Health Care Ltd. -
Preference Shares 3,358 2,238,763 0.02%LG Uplus Corp. 178,456 2,191,254 0.02%Lotte Shopping Co., Ltd. 18,617 2,181,334 0.02%Kumho Petrochemical Co., Ltd. 29,660 1,987,678 0.02%CJ Corp. 23,724 1,981,701 0.02%CJ Logistics Corp. 14,767 1,979,234 0.02%Medy-Tox, Inc. 7,425 1,931,932 0.02%BGF retail Co., Ltd. 13,082 1,917,419 0.02%KCC Corp. 9,508 1,853,996 0.02%KMW Co., Ltd. 41,825 1,848,119 0.02%Pearl Abyss Corp. 10,818 1,732,452 0.02%OCI Co., Ltd. 31,869 1,725,107 0.02%POSCO Chemical Co., Ltd. 40,067 1,706,342 0.02%Pan Ocean Co., Ltd. 432,345 1,699,172 0.02%LG Chem Ltd. - Preference Shares 11,169 1,670,835 0.02%Hyundai Department Store Co.,
Ltd. 23,012 1,653,593 0.02%Meritz Securities Co., Ltd. 496,810 1,628,181 0.02%Korean Air Lines Co., Ltd. 65,291 1,609,057 0.02%Samsung Card Co., Ltd. 47,268 1,577,712 0.02%Daewoo Shipbuilding & Marine
Engineering Co., Ltd. 63,072 1,518,920 0.02%GS Retail Co., Ltd. 44,421 1,507,652 0.01%Hanwha Corp. 69,075 1,493,255 0.01%Lotte Corp. 43,518 1,465,715 0.01%Orange Life Insurance Ltd. 55,155 1,342,568 0.01%Posco International Corp. 80,999 1,306,266 0.01%Daewoo Engineering &
Construction Co., Ltd. 303,449 1,243,762 0.01%Korea Gas Corp. 37,972 1,242,804 0.01%Amorepacific Corp. - Preference
Shares 13,862 1,071,609 0.01%Hanwha Life Insurance Co., Ltd. 502,760 1,004,259 0.01%
Number of Fair Value % of Total Shares US Dollars ($) Net Assets
23
Vanguard Emerging Markets Stock Index Fund
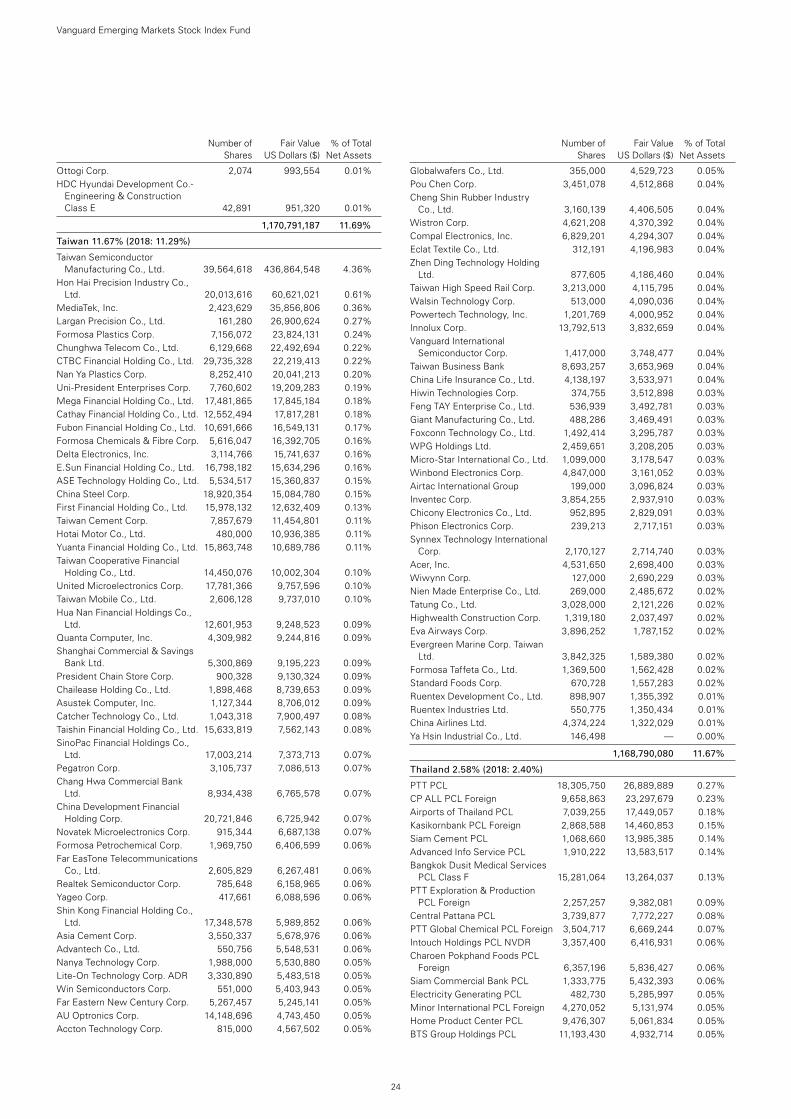
Number of Fair Value % of Total Shares US Dollars ($) Net Assets
Ottogi Corp. 2,074 993,554 0.01%HDC Hyundai Development Co.-
Engineering & Construction Class E 42,891 951,320 0.01%
1,170,791,187 11.69%
Taiwan 11.67% (2018: 11.29%)
Taiwan Semiconductor Manufacturing Co., Ltd. 39,564,618 436,864,548 4.36%
Hon Hai Precision Industry Co., Ltd. 20,013,616 60,621,021 0.61%
MediaTek, Inc. 2,423,629 35,856,806 0.36%Largan Precision Co., Ltd. 161,280 26,900,624 0.27%Formosa Plastics Corp. 7,156,072 23,824,131 0.24%Chunghwa Telecom Co., Ltd. 6,129,668 22,492,694 0.22%CTBC Financial Holding Co., Ltd. 29,735,328 22,219,413 0.22%Nan Ya Plastics Corp. 8,252,410 20,041,213 0.20%Uni-President Enterprises Corp. 7,760,602 19,209,283 0.19%Mega Financial Holding Co., Ltd. 17,481,865 17,845,184 0.18%Cathay Financial Holding Co., Ltd. 12,552,494 17,817,281 0.18%Fubon Financial Holding Co., Ltd. 10,691,666 16,549,131 0.17%Formosa Chemicals & Fibre Corp. 5,616,047 16,392,705 0.16%Delta Electronics, Inc. 3,114,766 15,741,637 0.16%E.Sun Financial Holding Co., Ltd. 16,798,182 15,634,296 0.16%ASE Technology Holding Co., Ltd. 5,534,517 15,360,837 0.15%China Steel Corp. 18,920,354 15,084,780 0.15%First Financial Holding Co., Ltd. 15,978,132 12,632,409 0.13%Taiwan Cement Corp. 7,857,679 11,454,801 0.11%Hotai Motor Co., Ltd. 480,000 10,936,385 0.11%Yuanta Financial Holding Co., Ltd. 15,863,748 10,689,786 0.11%Taiwan Cooperative Financial
Holding Co., Ltd. 14,450,076 10,002,304 0.10%United Microelectronics Corp. 17,781,366 9,757,596 0.10%Taiwan Mobile Co., Ltd. 2,606,128 9,737,010 0.10%Hua Nan Financial Holdings Co.,
Ltd. 12,601,953 9,248,523 0.09%Quanta Computer, Inc. 4,309,982 9,244,816 0.09%Shanghai Commercial & Savings
Bank Ltd. 5,300,869 9,195,223 0.09%President Chain Store Corp. 900,328 9,130,324 0.09%Chailease Holding Co., Ltd. 1,898,468 8,739,653 0.09%Asustek Computer, Inc. 1,127,344 8,706,012 0.09%Catcher Technology Co., Ltd. 1,043,318 7,900,497 0.08%Taishin Financial Holding Co., Ltd. 15,633,819 7,562,143 0.08%SinoPac Financial Holdings Co.,
Ltd. 17,003,214 7,373,713 0.07%Pegatron Corp. 3,105,737 7,086,513 0.07%Chang Hwa Commercial Bank
Ltd. 8,934,438 6,765,578 0.07%China Development Financial
Holding Corp. 20,721,846 6,725,942 0.07%Novatek Microelectronics Corp. 915,344 6,687,138 0.07%Formosa Petrochemical Corp. 1,969,750 6,406,599 0.06%Far EasTone Telecommunications
Co., Ltd. 2,605,829 6,267,481 0.06%Realtek Semiconductor Corp. 785,648 6,158,965 0.06%Yageo Corp. 417,661 6,088,596 0.06%Shin Kong Financial Holding Co.,
Ltd. 17,348,578 5,989,852 0.06%Asia Cement Corp. 3,550,337 5,678,976 0.06%Advantech Co., Ltd. 550,756 5,548,531 0.06%Nanya Technology Corp. 1,988,000 5,530,880 0.05%Lite-On Technology Corp. ADR 3,330,890 5,483,518 0.05%Win Semiconductors Corp. 551,000 5,403,943 0.05%Far Eastern New Century Corp. 5,267,457 5,245,141 0.05%AU Optronics Corp. 14,148,696 4,743,450 0.05%Accton Technology Corp. 815,000 4,567,502 0.05%
Globalwafers Co., Ltd. 355,000 4,529,723 0.05%Pou Chen Corp. 3,451,078 4,512,868 0.04%Cheng Shin Rubber Industry
Co., Ltd. 3,160,139 4,406,505 0.04%Wistron Corp. 4,621,208 4,370,392 0.04%Compal Electronics, Inc. 6,829,201 4,294,307 0.04%Eclat Textile Co., Ltd. 312,191 4,196,983 0.04%Zhen Ding Technology Holding
Ltd. 877,605 4,186,460 0.04%Taiwan High Speed Rail Corp. 3,213,000 4,115,795 0.04%Walsin Technology Corp. 513,000 4,090,036 0.04%Powertech Technology, Inc. 1,201,769 4,000,952 0.04%Innolux Corp. 13,792,513 3,832,659 0.04%Vanguard International
Semiconductor Corp. 1,417,000 3,748,477 0.04%Taiwan Business Bank 8,693,257 3,653,969 0.04%China Life Insurance Co., Ltd. 4,138,197 3,533,971 0.04%Hiwin Technologies Corp. 374,755 3,512,898 0.03%Feng TAY Enterprise Co., Ltd. 536,939 3,492,781 0.03%Giant Manufacturing Co., Ltd. 488,286 3,469,491 0.03%Foxconn Technology Co., Ltd. 1,492,414 3,295,787 0.03%WPG Holdings Ltd. 2,459,651 3,208,205 0.03%Micro-Star International Co., Ltd. 1,099,000 3,178,547 0.03%Winbond Electronics Corp. 4,847,000 3,161,052 0.03%Airtac International Group 199,000 3,096,824 0.03%Inventec Corp. 3,854,255 2,937,910 0.03%Chicony Electronics Co., Ltd. 952,895 2,829,091 0.03%Phison Electronics Corp. 239,213 2,717,151 0.03%Synnex Technology International
Corp. 2,170,127 2,714,740 0.03%Acer, Inc. 4,531,650 2,698,400 0.03%Wiwynn Corp. 127,000 2,690,229 0.03%Nien Made Enterprise Co., Ltd. 269,000 2,485,672 0.02%Tatung Co., Ltd. 3,028,000 2,121,226 0.02%Highwealth Construction Corp. 1,319,180 2,037,497 0.02%Eva Airways Corp. 3,896,252 1,787,152 0.02%Evergreen Marine Corp. Taiwan
Ltd. 3,842,325 1,589,380 0.02%Formosa Taffeta Co., Ltd. 1,369,500 1,562,428 0.02%Standard Foods Corp. 670,728 1,557,283 0.02%Ruentex Development Co., Ltd. 898,907 1,355,392 0.01%Ruentex Industries Ltd. 550,775 1,350,434 0.01%China Airlines Ltd. 4,374,224 1,322,029 0.01%Ya Hsin Industrial Co., Ltd. 146,498 — 0.00%
1,168,790,080 11.67%
Thailand 2.58% (2018: 2.40%)
PTT PCL 18,305,750 26,889,889 0.27%CP ALL PCL Foreign 9,658,863 23,297,679 0.23%Airports of Thailand PCL 7,039,255 17,449,057 0.18%Kasikornbank PCL Foreign 2,868,588 14,460,853 0.15%Siam Cement PCL 1,068,660 13,985,385 0.14%Advanced Info Service PCL 1,910,222 13,583,517 0.14%Bangkok Dusit Medical Services
PCL Class F 15,281,064 13,264,037 0.13%PTT Exploration & Production
PCL Foreign 2,257,257 9,382,081 0.09%Central Pattana PCL 3,739,877 7,772,227 0.08%PTT Global Chemical PCL Foreign 3,504,717 6,669,244 0.07%Intouch Holdings PCL NVDR 3,357,400 6,416,931 0.06%Charoen Pokphand Foods PCL
Foreign 6,357,196 5,836,427 0.06%Siam Commercial Bank PCL 1,333,775 5,432,393 0.06%Electricity Generating PCL 482,730 5,285,997 0.05%Minor International PCL Foreign 4,270,052 5,131,974 0.05%Home Product Center PCL 9,476,307 5,061,834 0.05%BTS Group Holdings PCL 11,193,430 4,932,714 0.05%
Number of Fair Value % of Total Shares US Dollars ($) Net Assets
24
Vanguard Emerging Markets Stock Index Fund
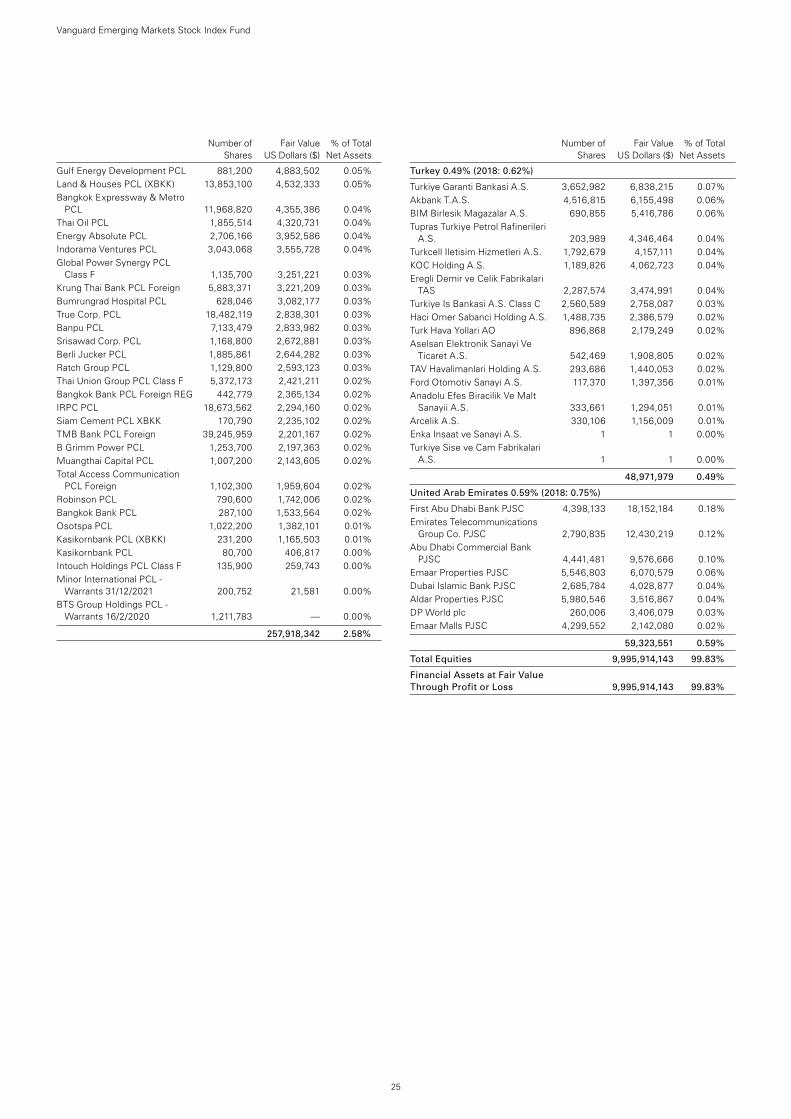
Number of Fair Value % of Total Shares US Dollars ($) Net Assets
Gulf Energy Development PCL 881,200 4,883,502 0.05%Land & Houses PCL (XBKK) 13,853,100 4,532,333 0.05%Bangkok Expressway & Metro
PCL 11,968,820 4,355,386 0.04%Thai Oil PCL 1,855,514 4,320,731 0.04%Energy Absolute PCL 2,706,166 3,952,586 0.04%Indorama Ventures PCL 3,043,068 3,555,728 0.04%Global Power Synergy PCL
Class F 1,135,700 3,251,221 0.03%Krung Thai Bank PCL Foreign 5,883,371 3,221,209 0.03%Bumrungrad Hospital PCL 628,046 3,082,177 0.03%True Corp. PCL 18,482,119 2,838,301 0.03%Banpu PCL 7,133,479 2,833,982 0.03%Srisawad Corp. PCL 1,168,800 2,672,881 0.03%Berli Jucker PCL 1,885,861 2,644,282 0.03%Ratch Group PCL 1,129,800 2,593,123 0.03%Thai Union Group PCL Class F 5,372,173 2,421,211 0.02%Bangkok Bank PCL Foreign REG 442,779 2,365,134 0.02%IRPC PCL 18,673,562 2,294,160 0.02%Siam Cement PCL XBKK 170,790 2,235,102 0.02%TMB Bank PCL Foreign 39,245,959 2,201,167 0.02%B Grimm Power PCL 1,253,700 2,197,363 0.02%Muangthai Capital PCL 1,007,200 2,143,605 0.02%Total Access Communication
PCL Foreign 1,102,300 1,959,604 0.02%Robinson PCL 790,600 1,742,006 0.02%Bangkok Bank PCL 287,100 1,533,564 0.02%Osotspa PCL 1,022,200 1,382,101 0.01%Kasikornbank PCL (XBKK) 231,200 1,165,503 0.01%Kasikornbank PCL 80,700 406,817 0.00%Intouch Holdings PCL Class F 135,900 259,743 0.00%Minor International PCL -
Warrants 31/12/2021 200,752 21,581 0.00%BTS Group Holdings PCL -
Warrants 16/2/2020 1,211,783 — 0.00%
257,918,342 2.58%
Turkey 0.49% (2018: 0.62%)
Turkiye Garanti Bankasi A.S. 3,652,982 6,838,215 0.07%Akbank T.A.S. 4,516,815 6,155,498 0.06%BIM Birlesik Magazalar A.S. 690,855 5,416,786 0.06%Tupras Turkiye Petrol Rafinerileri
A.S. 203,989 4,346,464 0.04%Turkcell Iletisim Hizmetleri A.S. 1,792,679 4,157,111 0.04%KOC Holding A.S. 1,189,826 4,062,723 0.04%Eregli Demir ve Celik Fabrikalari
TAS 2,287,574 3,474,991 0.04%Turkiye Is Bankasi A.S. Class C 2,560,589 2,758,087 0.03%Haci Omer Sabanci Holding A.S. 1,488,735 2,386,579 0.02%Turk Hava Yollari AO 896,868 2,179,249 0.02%Aselsan Elektronik Sanayi Ve
Ticaret A.S. 542,469 1,908,805 0.02%TAV Havalimanlari Holding A.S. 293,686 1,440,053 0.02%Ford Otomotiv Sanayi A.S. 117,370 1,397,356 0.01%Anadolu Efes Biracilik Ve Malt
Sanayii A.S. 333,661 1,294,051 0.01%Arcelik A.S. 330,106 1,156,009 0.01%Enka Insaat ve Sanayi A.S. 1 1 0.00%Turkiye Sise ve Cam Fabrikalari
A.S. 1 1 0.00%
48,971,979 0.49%
United Arab Emirates 0.59% (2018: 0.75%)
First Abu Dhabi Bank PJSC 4,398,133 18,152,184 0.18%Emirates Telecommunications
Group Co. PJSC 2,790,835 12,430,219 0.12%Abu Dhabi Commercial Bank
PJSC 4,441,481 9,576,666 0.10%Emaar Properties PJSC 5,546,803 6,070,579 0.06%Dubai Islamic Bank PJSC 2,685,784 4,028,877 0.04%Aldar Properties PJSC 5,980,546 3,516,867 0.04%DP World plc 260,006 3,406,079 0.03%Emaar Malls PJSC 4,299,552 2,142,080 0.02%
59,323,551 0.59%
Total Equities 9,995,914,143 99.83%
Financial Assets at Fair Value Through Profit or Loss 9,995,914,143 99.83%
Number of Fair Value % of Total Shares US Dollars ($) Net Assets
25
Vanguard Emerging Markets Stock Index Fund
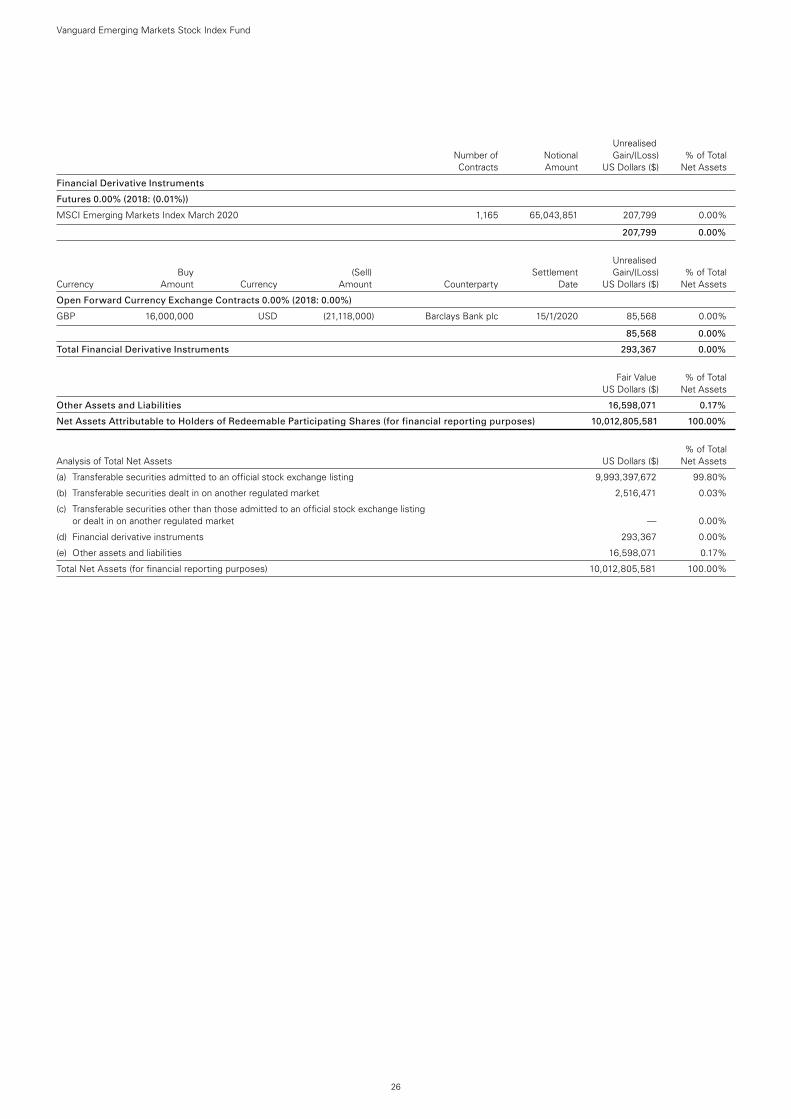
26
Vanguard Emerging Markets Stock Index Fund
Unrealised Number of Notional Gain/(Loss) % of Total Contracts Amount US Dollars ($) Net Assets
Financial Derivative Instruments
Futures 0.00% (2018: (0.01%))
MSCI Emerging Markets Index March 2020 1,165 65,043,851 207,799 0.00%
207,799 0.00%
Unrealised Buy (Sell) Settlement Gain/(Loss) % of Total Currency Amount Currency Amount Counterparty Date US Dollars ($) Net Assets
Open Forward Currency Exchange Contracts 0.00% (2018: 0.00%)
GBP 16,000,000 USD (21,118,000) Barclays Bank plc 15/1/2020 85,568 0.00%
85,568 0.00%
Total Financial Derivative Instruments 293,367 0.00%
Fair Value % of Total US Dollars ($) Net Assets
Other Assets and Liabilities 16,598,071 0.17%
Net Assets Attributable to Holders of Redeemable Participating Shares (for financial reporting purposes) 10,012,805,581 100.00%
% of Total Analysis of Total Net Assets US Dollars ($) Net Assets
(a) Transferable securities admitted to an official stock exchange listing 9,993,397,672 99.80%
(b) Transferable securities dealt in on another regulated market 2,516,471 0.03%
(c) Transferable securities other than those admitted to an official stock exchange listing or dealt in on another regulated market — 0.00%
(d) Financial derivative instruments 293,367 0.00%
(e) Other assets and liabilities 16,598,071 0.17%
Total Net Assets (for financial reporting purposes) 10,012,805,581 100.00%
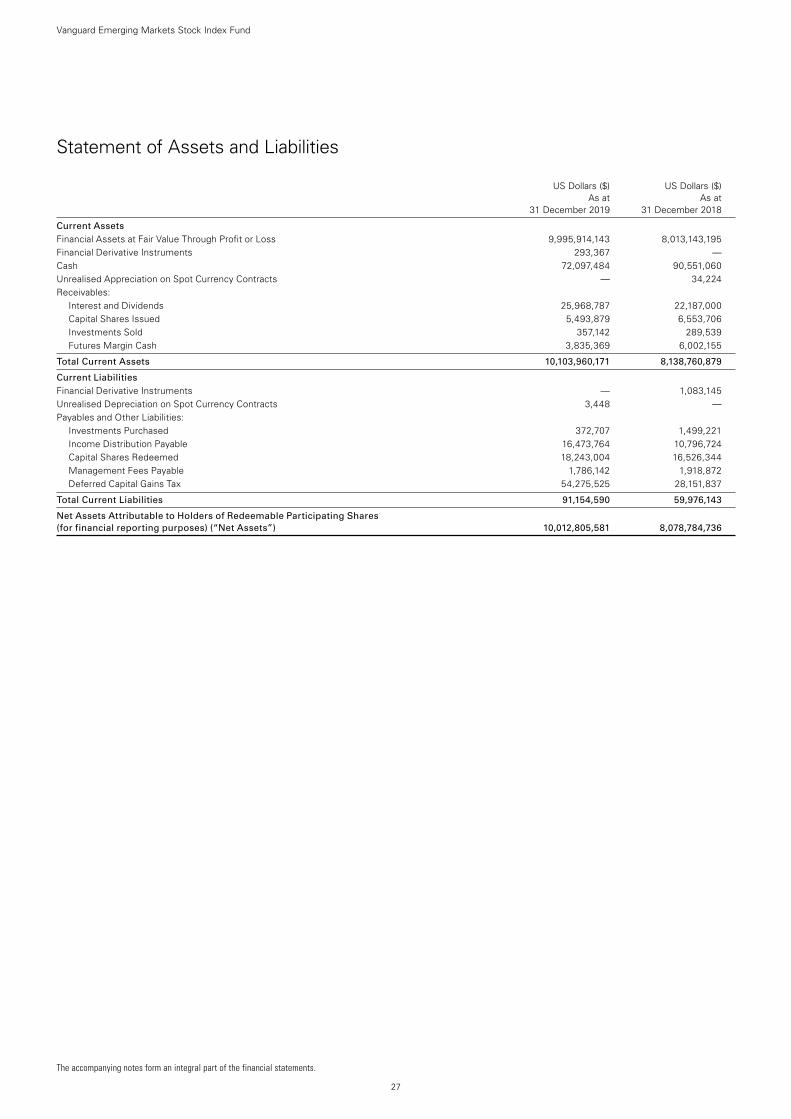
The accompanying notes form an integral part of the financial statements.
27
Vanguard Emerging Markets Stock Index Fund
Statement of Assets and Liabilities
US Dollars ($) US Dollars ($) As at As at 31 December 2019 31 December 2018
Current Assets Financial Assets at Fair Value Through Profit or Loss 9,995,914,143 8,013,143,195Financial Derivative Instruments 293,367 —Cash 72,097,484 90,551,060Unrealised Appreciation on Spot Currency Contracts — 34,224Receivables:
Interest and Dividends 25,968,787 22,187,000Capital Shares Issued 5,493,879 6,553,706Investments Sold 357,142 289,539Futures Margin Cash 3,835,369 6,002,155
Total Current Assets 10,103,960,171 8,138,760,879
Current Liabilities Financial Derivative Instruments — 1,083,145Unrealised Depreciation on Spot Currency Contracts 3,448 —Payables and Other Liabilities:
Investments Purchased 372,707 1,499,221Income Distribution Payable 16,473,764 10,796,724Capital Shares Redeemed 18,243,004 16,526,344Management Fees Payable 1,786,142 1,918,872Deferred Capital Gains Tax 54,275,525 28,151,837
Total Current Liabilities 91,154,590 59,976,143
Net Assets Attributable to Holders of Redeemable Participating Shares (for financial reporting purposes) (“Net Assets”) 10,012,805,581 8,078,784,736
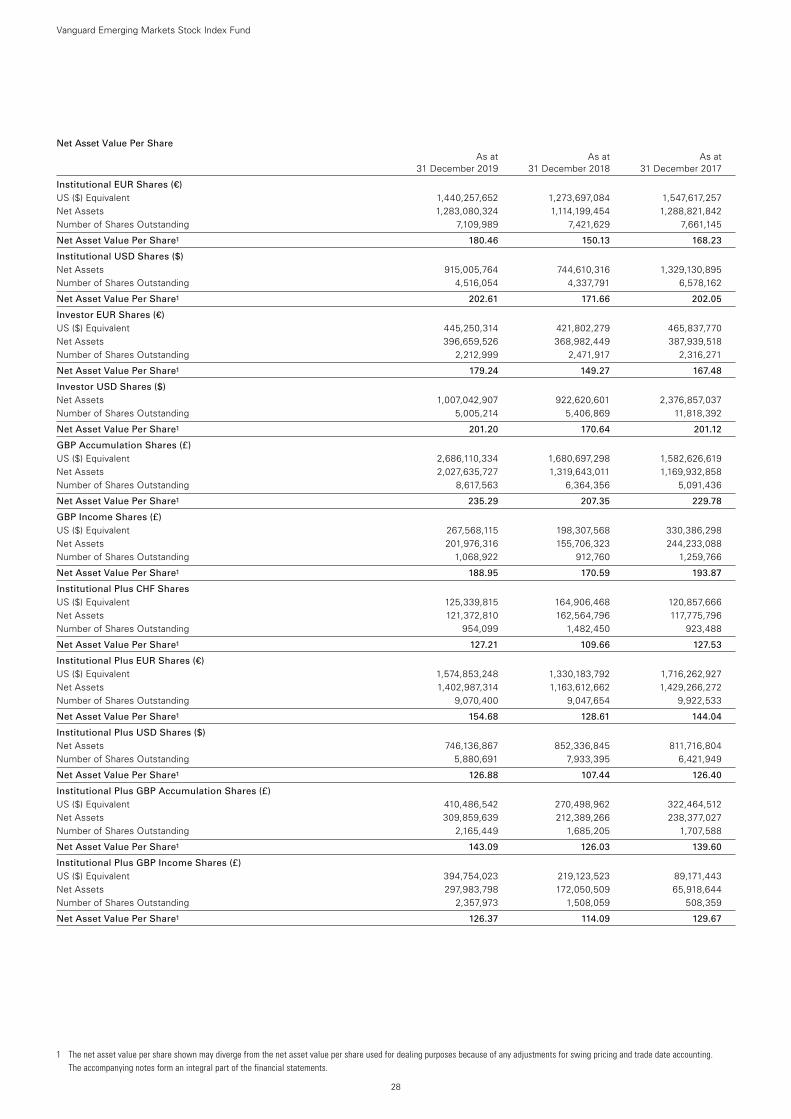
1 The net asset value per share shown may diverge from the net asset value per share used for dealing purposes because of any adjustments for swing pricing and trade date accounting. The accompanying notes form an integral part of the financial statements.
28
Net Asset Value Per Share As at As at As at 31 December 2019 31 December 2018 31 December 2017
Institutional EUR Shares (€) US ($) Equivalent 1,440,257,652 1,273,697,084 1,547,617,257Net Assets 1,283,080,324 1,114,199,454 1,288,821,842Number of Shares Outstanding 7,109,989 7,421,629 7,661,145
Net Asset Value Per Share1 180.46 150.13 168.23
Institutional USD Shares ($) Net Assets 915,005,764 744,610,316 1,329,130,895Number of Shares Outstanding 4,516,054 4,337,791 6,578,162
Net Asset Value Per Share1 202.61 171.66 202.05
Investor EUR Shares (€) US ($) Equivalent 445,250,314 421,802,279 465,837,770Net Assets 396,659,526 368,982,449 387,939,518Number of Shares Outstanding 2,212,999 2,471,917 2,316,271
Net Asset Value Per Share1 179.24 149.27 167.48
Investor USD Shares ($) Net Assets 1,007,042,907 922,620,601 2,376,857,037Number of Shares Outstanding 5,005,214 5,406,869 11,818,392
Net Asset Value Per Share1 201.20 170.64 201.12
GBP Accumulation Shares (£) US ($) Equivalent 2,686,110,334 1,680,697,298 1,582,626,619Net Assets 2,027,635,727 1,319,643,011 1,169,932,858Number of Shares Outstanding 8,617,563 6,364,356 5,091,436
Net Asset Value Per Share1 235.29 207.35 229.78
GBP Income Shares (£) US ($) Equivalent 267,568,115 198,307,568 330,386,298Net Assets 201,976,316 155,706,323 244,233,088Number of Shares Outstanding 1,068,922 912,760 1,259,766
Net Asset Value Per Share1 188.95 170.59 193.87
Institutional Plus CHF Shares US ($) Equivalent 125,339,815 164,906,468 120,857,666Net Assets 121,372,810 162,564,796 117,775,796Number of Shares Outstanding 954,099 1,482,450 923,488
Net Asset Value Per Share1 127.21 109.66 127.53
Institutional Plus EUR Shares (€) US ($) Equivalent 1,574,853,248 1,330,183,792 1,716,262,927Net Assets 1,402,987,314 1,163,612,662 1,429,266,272Number of Shares Outstanding 9,070,400 9,047,654 9,922,533
Net Asset Value Per Share1 154.68 128.61 144.04
Institutional Plus USD Shares ($) Net Assets 746,136,867 852,336,845 811,716,804Number of Shares Outstanding 5,880,691 7,933,395 6,421,949
Net Asset Value Per Share1 126.88 107.44 126.40
Institutional Plus GBP Accumulation Shares (£) US ($) Equivalent 410,486,542 270,498,962 322,464,512Net Assets 309,859,639 212,389,266 238,377,027Number of Shares Outstanding 2,165,449 1,685,205 1,707,588
Net Asset Value Per Share1 143.09 126.03 139.60
Institutional Plus GBP Income Shares (£) US ($) Equivalent 394,754,023 219,123,523 89,171,443Net Assets 297,983,798 172,050,509 65,918,644Number of Shares Outstanding 2,357,973 1,508,059 508,359
Net Asset Value Per Share1 126.37 114.09 129.67
Vanguard Emerging Markets Stock Index Fund
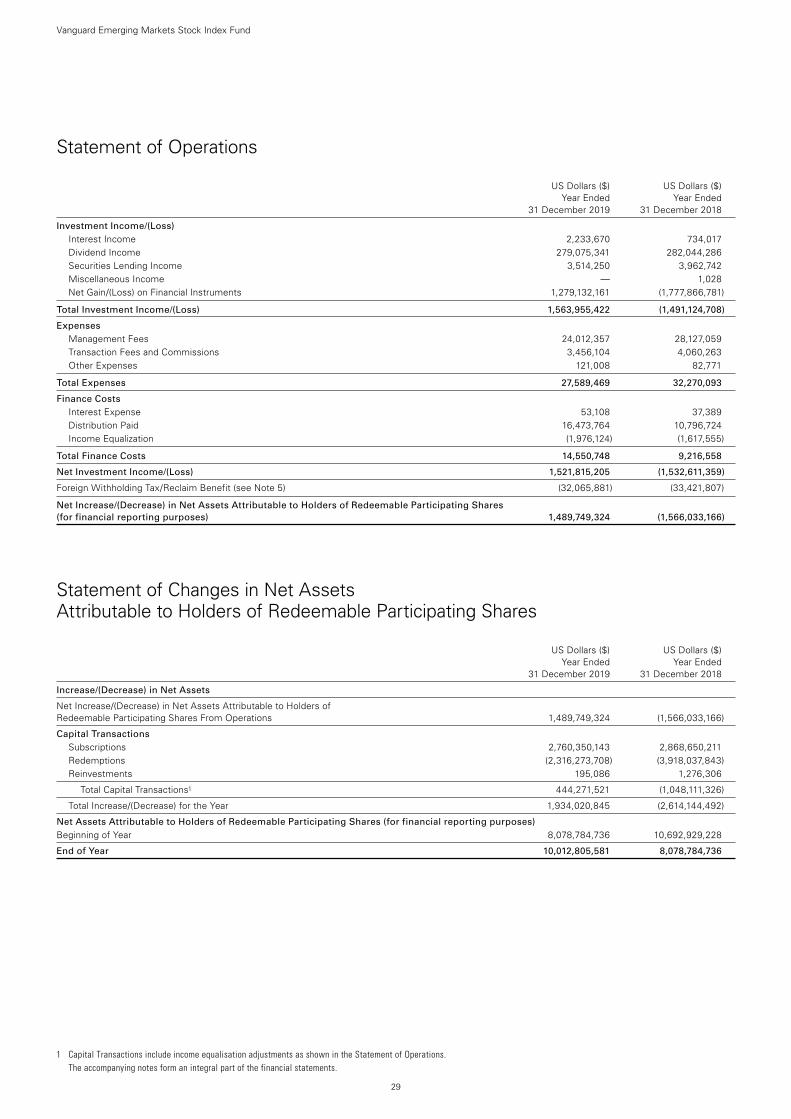
29
Vanguard Emerging Markets Stock Index Fund
Statement of Operations
US Dollars ($) US Dollars ($) Year Ended Year Ended 31 December 2019 31 December 2018
Investment Income/(Loss) Interest Income 2,233,670 734,017Dividend Income 279,075,341 282,044,286Securities Lending Income 3,514,250 3,962,742Miscellaneous Income — 1,028Net Gain/(Loss) on Financial Instruments 1,279,132,161 (1,777,866,781)
Total Investment Income/(Loss) 1,563,955,422 (1,491,124,708)
Expenses Management Fees 24,012,357 28,127,059Transaction Fees and Commissions 3,456,104 4,060,263Other Expenses 121,008 82,771
Total Expenses 27,589,469 32,270,093
Finance Costs Interest Expense 53,108 37,389Distribution Paid 16,473,764 10,796,724Income Equalization (1,976,124) (1,617,555)
Total Finance Costs 14,550,748 9,216,558
Net Investment Income/(Loss) 1,521,815,205 (1,532,611,359)
Foreign Withholding Tax/Reclaim Benefit (see Note 5) (32,065,881) (33,421,807)
Net Increase/(Decrease) in Net Assets Attributable to Holders of Redeemable Participating Shares (for financial reporting purposes) 1,489,749,324 (1,566,033,166)
Statement of Changes in Net Assets Attributable to Holders of Redeemable Participating Shares
US Dollars ($) US Dollars ($) Year Ended Year Ended 31 December 2019 31 December 2018
Increase/(Decrease) in Net Assets
Net Increase/(Decrease) in Net Assets Attributable to Holders of Redeemable Participating Shares From Operations 1,489,749,324 (1,566,033,166)
Capital Transactions Subscriptions 2,760,350,143 2,868,650,211Redemptions (2,316,273,708) (3,918,037,843)Reinvestments 195,086 1,276,306
Total Capital Transactions1 444,271,521 (1,048,111,326)
Total Increase/(Decrease) for the Year 1,934,020,845 (2,614,144,492)
Net Assets Attributable to Holders of Redeemable Participating Shares (for financial reporting purposes) Beginning of Year 8,078,784,736 10,692,929,228
End of Year 10,012,805,581 8,078,784,736
1 Capital Transactions include income equalisation adjustments as shown in the Statement of Operations. The accompanying notes form an integral part of the financial statements.
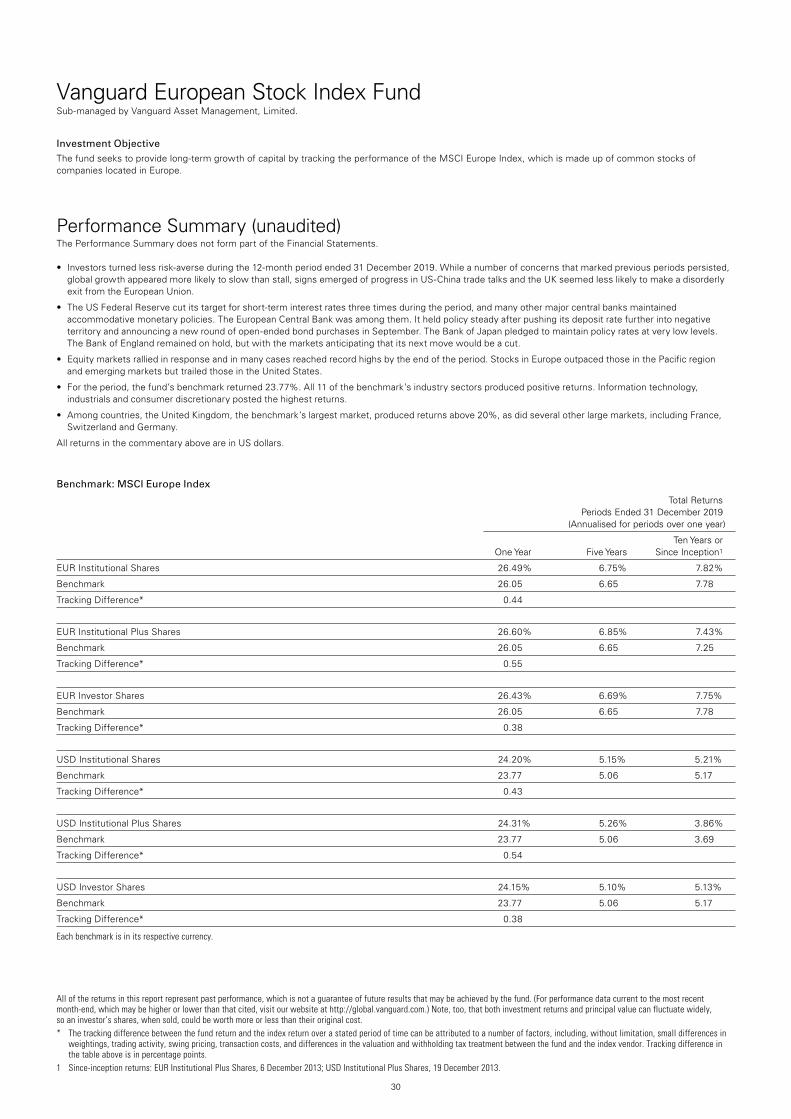
30
Vanguard European Stock Index Fund Sub-managed by Vanguard Asset Management, Limited.
All of the returns in this report represent past performance, which is not a guarantee of future results that may be achieved by the fund. (For performance data current to the most recent month-end, which may be higher or lower than that cited, visit our website at http://global.vanguard.com.) Note, too, that both investment returns and principal value can fluctuate widely, so an investor’s shares, when sold, could be worth more or less than their original cost.* The tracking difference between the fund return and the index return over a stated period of time can be attributed to a number of factors, including, without limitation, small differences in
weightings, trading activity, swing pricing, transaction costs, and differences in the valuation and withholding tax treatment between the fund and the index vendor. Tracking difference in the table above is in percentage points.
1 Since-inception returns: EUR Institutional Plus Shares, 6 December 2013; USD Institutional Plus Shares, 19 December 2013.
Investment ObjectiveThe fund seeks to provide long-term growth of capital by tracking the performance of the MSCI Europe Index, which is made up of common stocks of companies located in Europe.
Performance Summary (unaudited)The Performance Summary does not form part of the Financial Statements.
• Investorsturnedlessrisk-averseduringthe12-monthperiodended31December2019.Whileanumberofconcernsthatmarkedpreviousperiodspersisted,global growth appeared more likely to slow than stall, signs emerged of progress in US-China trade talks and the UK seemed less likely to make a disorderly exit from the European Union.
• TheUSFederalReservecutitstargetforshort-terminterestratesthreetimesduringtheperiod,andmanyothermajorcentralbanksmaintainedaccommodative monetary policies. The European Central Bank was among them. It held policy steady after pushing its deposit rate further into negative territory and announcing a new round of open-ended bond purchases in September. The Bank of Japan pledged to maintain policy rates at very low levels. The Bank of England remained on hold, but with the markets anticipating that its next move would be a cut.
• Equitymarketsralliedinresponseandinmanycasesreachedrecordhighsbytheendoftheperiod.StocksinEuropeoutpacedthoseinthePacificregion and emerging markets but trailed those in the United States.
• Fortheperiod,thefund’sbenchmarkreturned23.77%.All11ofthebenchmark’sindustrysectorsproducedpositivereturns.Informationtechnology,industrials and consumer discretionary posted the highest returns.
• Amongcountries,theUnitedKingdom,thebenchmark’slargestmarket,producedreturnsabove20%,asdidseveralotherlargemarkets,includingFrance,Switzerland and Germany.
All returns in the commentary above are in US dollars.
Benchmark: MSCI Europe Index
Total Returns Periods Ended 31 December 2019 (Annualised for periods over one year)
Ten Years or One Year Five Years Since Inception1
EUR Institutional Shares 26.49% 6.75% 7.82%
Benchmark 26.05 6.65 7.78
Tracking Difference* 0.44
EUR Institutional Plus Shares 26.60% 6.85% 7.43%
Benchmark 26.05 6.65 7.25
Tracking Difference* 0.55
EUR Investor Shares 26.43% 6.69% 7.75%
Benchmark 26.05 6.65 7.78
Tracking Difference* 0.38
USD Institutional Shares 24.20% 5.15% 5.21%
Benchmark 23.77 5.06 5.17
Tracking Difference* 0.43
USD Institutional Plus Shares 24.31% 5.26% 3.86%
Benchmark 23.77 5.06 3.69
Tracking Difference* 0.54
USD Investor Shares 24.15% 5.10% 5.13%
Benchmark 23.77 5.06 5.17
Tracking Difference* 0.38
Each benchmark is in its respective currency.
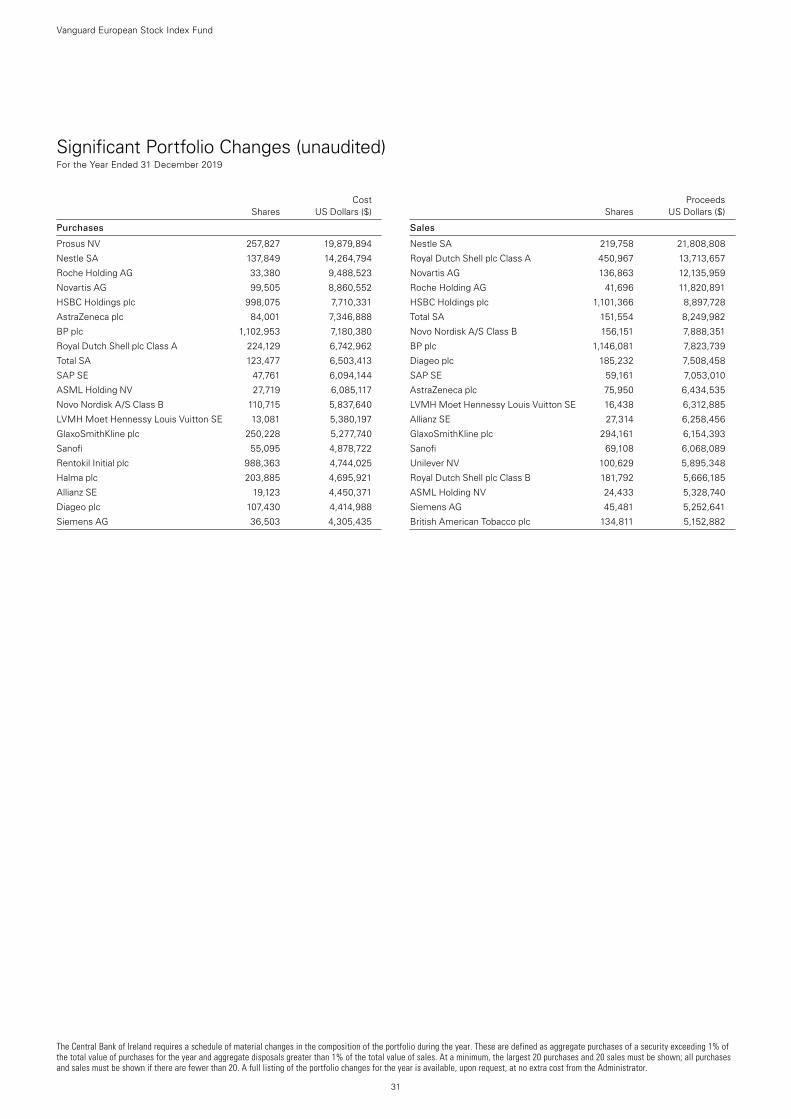
The Central Bank of Ireland requires a schedule of material changes in the composition of the portfolio during the year. These are defined as aggregate purchases of a security exceeding 1% of the total value of purchases for the year and aggregate disposals greater than 1% of the total value of sales. At a minimum, the largest 20 purchases and 20 sales must be shown; all purchases and sales must be shown if there are fewer than 20. A full listing of the portfolio changes for the year is available, upon request, at no extra cost from the Administrator.
31
Vanguard European Stock Index Fund
Significant Portfolio Changes (unaudited) For the Year Ended 31 December 2019
Cost Shares US Dollars ($)
Purchases
Prosus NV 257,827 19,879,894
Nestle SA 137,849 14,264,794
Roche Holding AG 33,380 9,488,523
Novartis AG 99,505 8,860,552
HSBC Holdings plc 998,075 7,710,331
AstraZeneca plc 84,001 7,346,888
BP plc 1,102,953 7,180,380
Royal Dutch Shell plc Class A 224,129 6,742,962
Total SA 123,477 6,503,413
SAP SE 47,761 6,094,144
ASML Holding NV 27,719 6,085,117
Novo Nordisk A/S Class B 110,715 5,837,640
LVMH Moet Hennessy Louis Vuitton SE 13,081 5,380,197
GlaxoSmithKline plc 250,228 5,277,740
Sanofi 55,095 4,878,722
Rentokil Initial plc 988,363 4,744,025
Halma plc 203,885 4,695,921
Allianz SE 19,123 4,450,371
Diageo plc 107,430 4,414,988
Siemens AG 36,503 4,305,435
Proceeds Shares US Dollars ($)
Sales
Nestle SA 219,758 21,808,808
Royal Dutch Shell plc Class A 450,967 13,713,657
Novartis AG 136,863 12,135,959
Roche Holding AG 41,696 11,820,891
HSBC Holdings plc 1,101,366 8,897,728
Total SA 151,554 8,249,982
Novo Nordisk A/S Class B 156,151 7,888,351
BP plc 1,146,081 7,823,739
Diageo plc 185,232 7,508,458
SAP SE 59,161 7,053,010
AstraZeneca plc 75,950 6,434,535
LVMH Moet Hennessy Louis Vuitton SE 16,438 6,312,885
Allianz SE 27,314 6,258,456
GlaxoSmithKline plc 294,161 6,154,393
Sanofi 69,108 6,068,089
Unilever NV 100,629 5,895,348
Royal Dutch Shell plc Class B 181,792 5,666,185
ASML Holding NV 24,433 5,328,740
Siemens AG 45,481 5,252,641
British American Tobacco plc 134,811 5,152,882
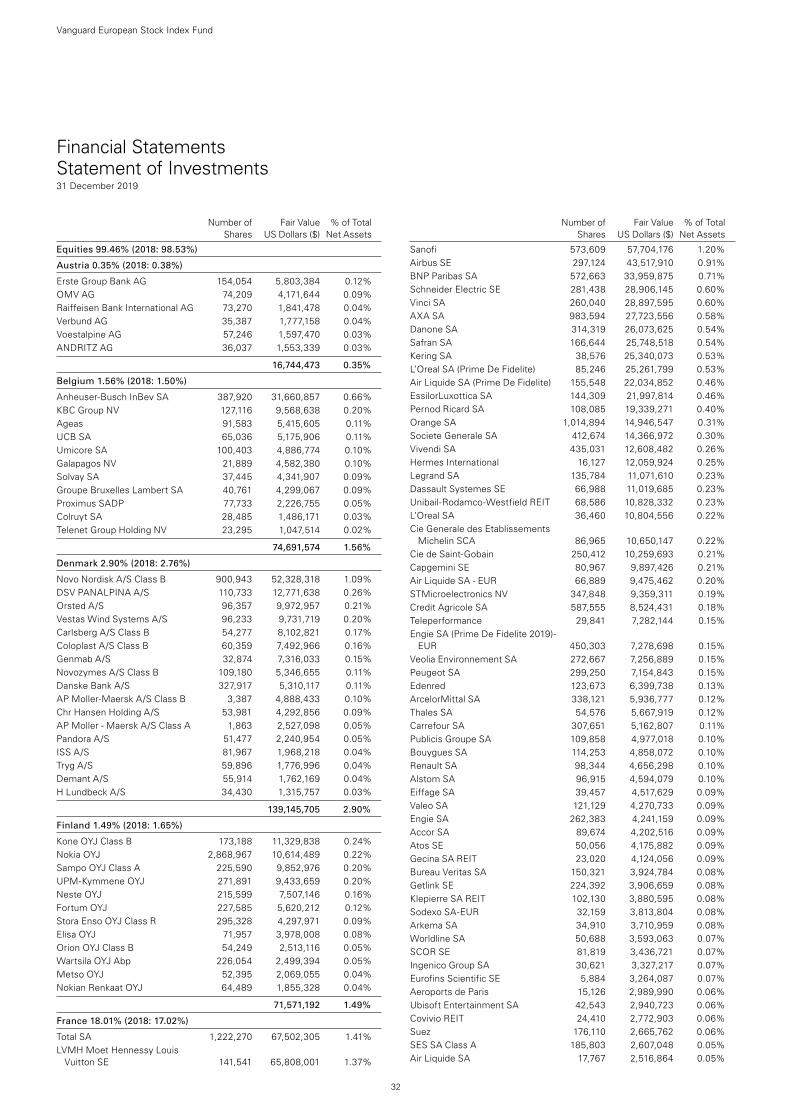
32
Vanguard European Stock Index Fund
Number of Fair Value % of Total Shares US Dollars ($) Net Assets
Number of Fair Value % of Total Shares US Dollars ($) Net Assets
Equities 99.46% (2018: 98.53%)
Austria 0.35% (2018: 0.38%)
Erste Group Bank AG 154,054 5,803,384 0.12%OMV AG 74,209 4,171,644 0.09%Raiffeisen Bank International AG 73,270 1,841,478 0.04%Verbund AG 35,387 1,777,158 0.04%Voestalpine AG 57,246 1,597,470 0.03%ANDRITZ AG 36,037 1,553,339 0.03%
16,744,473 0.35%
Belgium 1.56% (2018: 1.50%)
Anheuser-Busch InBev SA 387,920 31,660,857 0.66%KBC Group NV 127,116 9,568,638 0.20%Ageas 91,583 5,415,605 0.11%UCB SA 65,036 5,175,906 0.11%Umicore SA 100,403 4,886,774 0.10%Galapagos NV 21,889 4,582,380 0.10%Solvay SA 37,445 4,341,907 0.09%Groupe Bruxelles Lambert SA 40,761 4,299,067 0.09%Proximus SADP 77,733 2,226,755 0.05%Colruyt SA 28,485 1,486,171 0.03%Telenet Group Holding NV 23,295 1,047,514 0.02%
74,691,574 1.56%
Denmark 2.90% (2018: 2.76%)
Novo Nordisk A/S Class B 900,943 52,328,318 1.09%DSV PANALPINA A/S 110,733 12,771,638 0.26%Orsted A/S 96,357 9,972,957 0.21%Vestas Wind Systems A/S 96,233 9,731,719 0.20%Carlsberg A/S Class B 54,277 8,102,821 0.17%Coloplast A/S Class B 60,359 7,492,966 0.16%Genmab A/S 32,874 7,316,033 0.15%Novozymes A/S Class B 109,180 5,346,655 0.11%Danske Bank A/S 327,917 5,310,117 0.11%AP Moller-Maersk A/S Class B 3,387 4,888,433 0.10%Chr Hansen Holding A/S 53,981 4,292,856 0.09%AP Moller - Maersk A/S Class A 1,863 2,527,098 0.05%Pandora A/S 51,477 2,240,954 0.05%ISS A/S 81,967 1,968,218 0.04%Tryg A/S 59,896 1,776,996 0.04%Demant A/S 55,914 1,762,169 0.04%H Lundbeck A/S 34,430 1,315,757 0.03%
139,145,705 2.90%
Finland 1.49% (2018: 1.65%)
Kone OYJ Class B 173,188 11,329,838 0.24%Nokia OYJ 2,868,967 10,614,489 0.22%Sampo OYJ Class A 225,590 9,852,976 0.20%UPM-Kymmene OYJ 271,891 9,433,659 0.20%Neste OYJ 215,599 7,507,146 0.16%Fortum OYJ 227,585 5,620,212 0.12%Stora Enso OYJ Class R 295,328 4,297,971 0.09%Elisa OYJ 71,957 3,978,008 0.08%Orion OYJ Class B 54,249 2,513,116 0.05%Wartsila OYJ Abp 226,054 2,499,394 0.05%Metso OYJ 52,395 2,069,055 0.04%Nokian Renkaat OYJ 64,489 1,855,328 0.04%
71,571,192 1.49%
France 18.01% (2018: 17.02%)
Total SA 1,222,270 67,502,305 1.41%LVMH Moet Hennessy Louis
Vuitton SE 141,541 65,808,001 1.37%
Sanofi 573,609 57,704,176 1.20%Airbus SE 297,124 43,517,910 0.91%BNP Paribas SA 572,663 33,959,875 0.71%Schneider Electric SE 281,438 28,906,145 0.60%Vinci SA 260,040 28,897,595 0.60%AXA SA 983,594 27,723,556 0.58%Danone SA 314,319 26,073,625 0.54%Safran SA 166,644 25,748,518 0.54%Kering SA 38,576 25,340,073 0.53%L’Oreal SA (Prime De Fidelite) 85,246 25,261,799 0.53%Air Liquide SA (Prime De Fidelite) 155,548 22,034,852 0.46%EssilorLuxottica SA 144,309 21,997,814 0.46%Pernod Ricard SA 108,085 19,339,271 0.40%Orange SA 1,014,894 14,946,547 0.31%Societe Generale SA 412,674 14,366,972 0.30%Vivendi SA 435,031 12,608,482 0.26%Hermes International 16,127 12,059,924 0.25%Legrand SA 135,784 11,071,610 0.23%Dassault Systemes SE 66,988 11,019,685 0.23%Unibail-Rodamco-Westfield REIT 68,586 10,828,332 0.23%L’Oreal SA 36,460 10,804,556 0.22%Cie Generale des Etablissements
Michelin SCA 86,965 10,650,147 0.22%Cie de Saint-Gobain 250,412 10,259,693 0.21%Capgemini SE 80,967 9,897,426 0.21%Air Liquide SA - EUR 66,889 9,475,462 0.20%STMicroelectronics NV 347,848 9,359,311 0.19%Credit Agricole SA 587,555 8,524,431 0.18%Teleperformance 29,841 7,282,144 0.15%Engie SA (Prime De Fidelite 2019)-
EUR 450,303 7,278,698 0.15%Veolia Environnement SA 272,667 7,256,889 0.15%Peugeot SA 299,250 7,154,843 0.15%Edenred 123,673 6,399,738 0.13%ArcelorMittal SA 338,121 5,936,777 0.12%Thales SA 54,576 5,667,919 0.12%Carrefour SA 307,651 5,162,807 0.11%Publicis Groupe SA 109,858 4,977,018 0.10%Bouygues SA 114,253 4,858,072 0.10%Renault SA 98,344 4,656,298 0.10%Alstom SA 96,915 4,594,079 0.10%Eiffage SA 39,457 4,517,629 0.09%Valeo SA 121,129 4,270,733 0.09%Engie SA 262,383 4,241,159 0.09%Accor SA 89,674 4,202,516 0.09%Atos SE 50,056 4,175,882 0.09%Gecina SA REIT 23,020 4,124,056 0.09%Bureau Veritas SA 150,321 3,924,784 0.08%Getlink SE 224,392 3,906,659 0.08%Klepierre SA REIT 102,130 3,880,595 0.08%Sodexo SA-EUR 32,159 3,813,804 0.08%Arkema SA 34,910 3,710,959 0.08%Worldline SA 50,688 3,593,063 0.07%SCOR SE 81,819 3,436,721 0.07%Ingenico Group SA 30,621 3,327,217 0.07%Eurofins Scientific SE 5,884 3,264,087 0.07%Aeroports de Paris 15,126 2,989,990 0.06%Ubisoft Entertainment SA 42,543 2,940,723 0.06%Covivio REIT 24,410 2,772,903 0.06%Suez 176,110 2,665,762 0.06%SES SA Class A 185,803 2,607,048 0.05%Air Liquide SA 17,767 2,516,864 0.05%
Financial Statements Statement of Investments31 December 2019
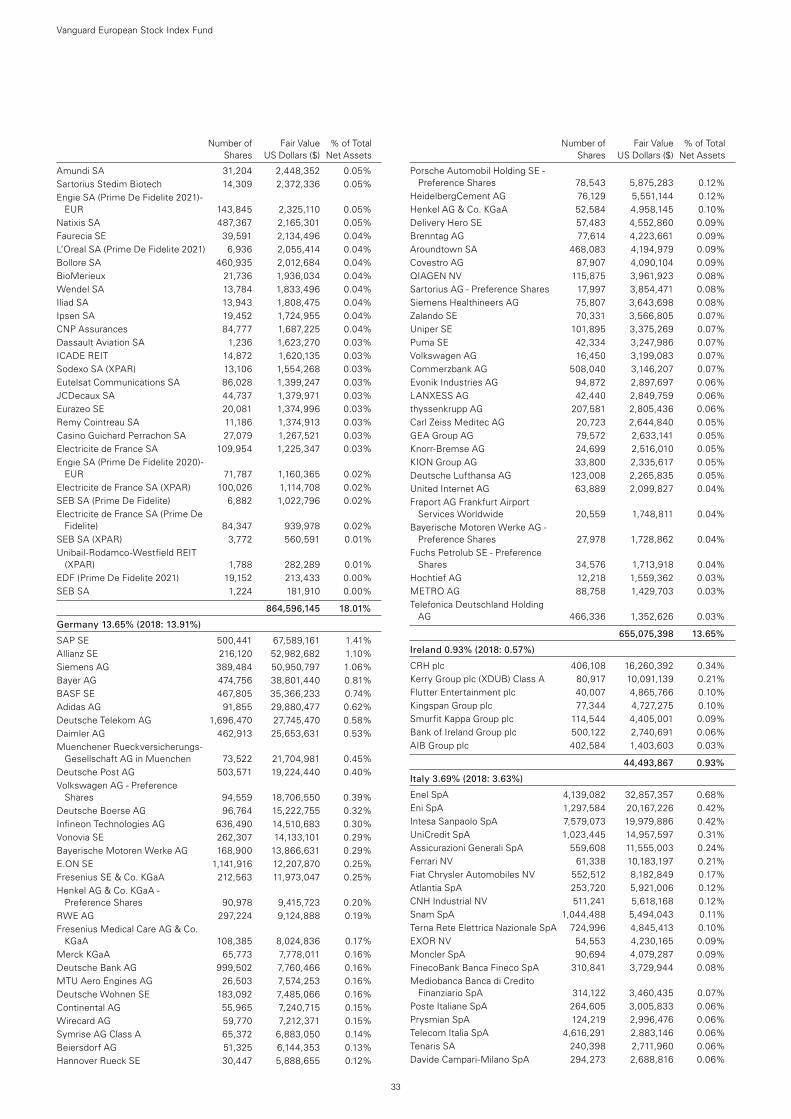
33
Number of Fair Value % of Total Shares US Dollars ($) Net Assets
Amundi SA 31,204 2,448,352 0.05%Sartorius Stedim Biotech 14,309 2,372,336 0.05%Engie SA (Prime De Fidelite 2021)-
EUR 143,845 2,325,110 0.05%Natixis SA 487,367 2,165,301 0.05%Faurecia SE 39,591 2,134,496 0.04%L’Oreal SA (Prime De Fidelite 2021) 6,936 2,055,414 0.04%Bollore SA 460,935 2,012,684 0.04%BioMerieux 21,736 1,936,034 0.04%Wendel SA 13,784 1,833,496 0.04%Iliad SA 13,943 1,808,475 0.04%Ipsen SA 19,452 1,724,955 0.04%CNP Assurances 84,777 1,687,225 0.04%Dassault Aviation SA 1,236 1,623,270 0.03%ICADE REIT 14,872 1,620,135 0.03%Sodexo SA (XPAR) 13,106 1,554,268 0.03%Eutelsat Communications SA 86,028 1,399,247 0.03%JCDecaux SA 44,737 1,379,971 0.03%Eurazeo SE 20,081 1,374,996 0.03%Remy Cointreau SA 11,186 1,374,913 0.03%Casino Guichard Perrachon SA 27,079 1,267,521 0.03%Electricite de France SA 109,954 1,225,347 0.03%Engie SA (Prime De Fidelite 2020)-
EUR 71,787 1,160,365 0.02%Electricite de France SA (XPAR) 100,026 1,114,708 0.02%SEB SA (Prime De Fidelite) 6,882 1,022,796 0.02%Electricite de France SA (Prime De
Fidelite) 84,347 939,978 0.02%SEB SA (XPAR) 3,772 560,591 0.01%Unibail-Rodamco-Westfield REIT
(XPAR) 1,788 282,289 0.01%EDF (Prime De Fidelite 2021) 19,152 213,433 0.00%SEB SA 1,224 181,910 0.00%
864,596,145 18.01%
Germany 13.65% (2018: 13.91%)
SAP SE 500,441 67,589,161 1.41%Allianz SE 216,120 52,982,682 1.10%Siemens AG 389,484 50,950,797 1.06%Bayer AG 474,756 38,801,440 0.81%BASF SE 467,805 35,366,233 0.74%Adidas AG 91,855 29,880,477 0.62%Deutsche Telekom AG 1,696,470 27,745,470 0.58%Daimler AG 462,913 25,653,631 0.53%Muenchener Rueckversicherungs-
Gesellschaft AG in Muenchen 73,522 21,704,981 0.45%Deutsche Post AG 503,571 19,224,440 0.40%Volkswagen AG - Preference
Shares 94,559 18,706,550 0.39%Deutsche Boerse AG 96,764 15,222,755 0.32%Infineon Technologies AG 636,490 14,510,683 0.30%Vonovia SE 262,307 14,133,101 0.29%Bayerische Motoren Werke AG 168,900 13,866,631 0.29%E.ON SE 1,141,916 12,207,870 0.25%Fresenius SE & Co. KGaA 212,563 11,973,047 0.25%Henkel AG & Co. KGaA -
Preference Shares 90,978 9,415,723 0.20%RWE AG 297,224 9,124,888 0.19%Fresenius Medical Care AG & Co.
KGaA 108,385 8,024,836 0.17%Merck KGaA 65,773 7,778,011 0.16%Deutsche Bank AG 999,502 7,760,466 0.16%MTU Aero Engines AG 26,503 7,574,253 0.16%Deutsche Wohnen SE 183,092 7,485,066 0.16%Continental AG 55,965 7,240,715 0.15%Wirecard AG 59,770 7,212,371 0.15%Symrise AG Class A 65,372 6,883,050 0.14%Beiersdorf AG 51,325 6,144,353 0.13%Hannover Rueck SE 30,447 5,888,655 0.12%
Porsche Automobil Holding SE - Preference Shares 78,543 5,875,283 0.12%
HeidelbergCement AG 76,129 5,551,144 0.12%Henkel AG & Co. KGaA 52,584 4,958,145 0.10%Delivery Hero SE 57,483 4,552,860 0.09%Brenntag AG 77,614 4,223,661 0.09%Aroundtown SA 468,083 4,194,979 0.09%Covestro AG 87,907 4,090,104 0.09%QIAGEN NV 115,875 3,961,923 0.08%Sartorius AG - Preference Shares 17,997 3,854,471 0.08%Siemens Healthineers AG 75,807 3,643,698 0.08%Zalando SE 70,331 3,566,805 0.07%Uniper SE 101,895 3,375,269 0.07%Puma SE 42,334 3,247,986 0.07%Volkswagen AG 16,450 3,199,083 0.07%Commerzbank AG 508,040 3,146,207 0.07%Evonik Industries AG 94,872 2,897,697 0.06%LANXESS AG 42,440 2,849,759 0.06%thyssenkrupp AG 207,581 2,805,436 0.06%Carl Zeiss Meditec AG 20,723 2,644,840 0.05%GEA Group AG 79,572 2,633,141 0.05%Knorr-Bremse AG 24,699 2,516,010 0.05%KION Group AG 33,800 2,335,617 0.05%Deutsche Lufthansa AG 123,008 2,265,835 0.05%United Internet AG 63,889 2,099,827 0.04%Fraport AG Frankfurt Airport
Services Worldwide 20,559 1,748,811 0.04%Bayerische Motoren Werke AG -
Preference Shares 27,978 1,728,862 0.04%Fuchs Petrolub SE - Preference
Shares 34,576 1,713,918 0.04%Hochtief AG 12,218 1,559,362 0.03%METRO AG 88,758 1,429,703 0.03%Telefonica Deutschland Holding
AG 466,336 1,352,626 0.03%
655,075,398 13.65%
Ireland 0.93% (2018: 0.57%)
CRH plc 406,108 16,260,392 0.34%Kerry Group plc (XDUB) Class A 80,917 10,091,139 0.21%Flutter Entertainment plc 40,007 4,865,766 0.10%Kingspan Group plc 77,344 4,727,275 0.10%Smurfit Kappa Group plc 114,544 4,405,001 0.09%Bank of Ireland Group plc 500,122 2,740,691 0.06%AIB Group plc 402,584 1,403,603 0.03%
44,493,867 0.93%
Italy 3.69% (2018: 3.63%)
Enel SpA 4,139,082 32,857,357 0.68%Eni SpA 1,297,584 20,167,226 0.42%Intesa Sanpaolo SpA 7,579,073 19,979,886 0.42%UniCredit SpA 1,023,445 14,957,597 0.31%Assicurazioni Generali SpA 559,608 11,555,003 0.24%Ferrari NV 61,338 10,183,197 0.21%Fiat Chrysler Automobiles NV 552,512 8,182,849 0.17%Atlantia SpA 253,720 5,921,006 0.12%CNH Industrial NV 511,241 5,618,168 0.12%Snam SpA 1,044,488 5,494,043 0.11%Terna Rete Elettrica Nazionale SpA 724,996 4,845,413 0.10%EXOR NV 54,553 4,230,165 0.09%Moncler SpA 90,694 4,079,287 0.09%FinecoBank Banca Fineco SpA 310,841 3,729,944 0.08%Mediobanca Banca di Credito
Finanziario SpA 314,122 3,460,435 0.07%Poste Italiane SpA 264,605 3,005,833 0.06%Prysmian SpA 124,219 2,996,476 0.06%Telecom Italia SpA 4,616,291 2,883,146 0.06%Tenaris SA 240,398 2,711,960 0.06%Davide Campari-Milano SpA 294,273 2,688,816 0.06%
Number of Fair Value % of Total Shares US Dollars ($) Net Assets
Vanguard European Stock Index Fund
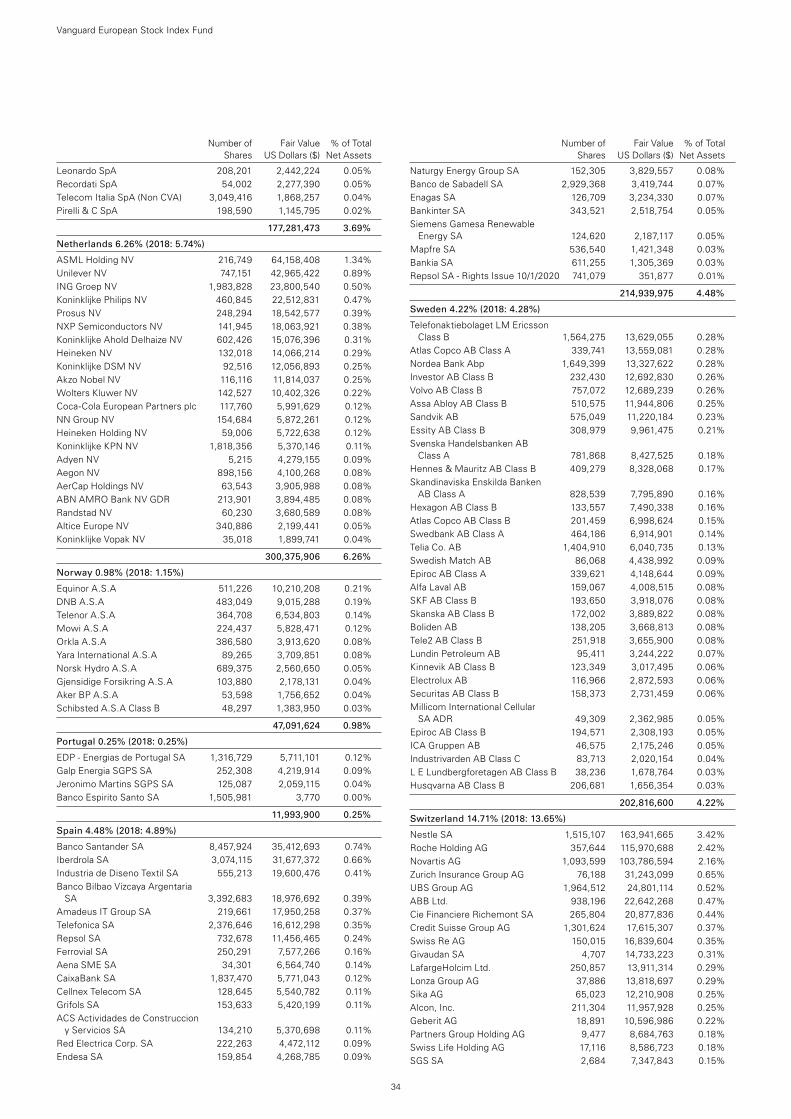
34
Number of Fair Value % of Total Shares US Dollars ($) Net Assets
Leonardo SpA 208,201 2,442,224 0.05%Recordati SpA 54,002 2,277,390 0.05%Telecom Italia SpA (Non CVA) 3,049,416 1,868,257 0.04%Pirelli & C SpA 198,590 1,145,795 0.02%
177,281,473 3.69%
Netherlands 6.26% (2018: 5.74%)
ASML Holding NV 216,749 64,158,408 1.34%Unilever NV 747,151 42,965,422 0.89%ING Groep NV 1,983,828 23,800,540 0.50%Koninklijke Philips NV 460,845 22,512,831 0.47%Prosus NV 248,294 18,542,577 0.39%NXP Semiconductors NV 141,945 18,063,921 0.38%Koninklijke Ahold Delhaize NV 602,426 15,076,396 0.31%Heineken NV 132,018 14,066,214 0.29%Koninklijke DSM NV 92,516 12,056,893 0.25%Akzo Nobel NV 116,116 11,814,037 0.25%Wolters Kluwer NV 142,527 10,402,326 0.22%Coca-Cola European Partners plc 117,760 5,991,629 0.12%NN Group NV 154,684 5,872,261 0.12%Heineken Holding NV 59,006 5,722,638 0.12%Koninklijke KPN NV 1,818,356 5,370,146 0.11%Adyen NV 5,215 4,279,155 0.09%Aegon NV 898,156 4,100,268 0.08%AerCap Holdings NV 63,543 3,905,988 0.08%ABN AMRO Bank NV GDR 213,901 3,894,485 0.08%Randstad NV 60,230 3,680,589 0.08%Altice Europe NV 340,886 2,199,441 0.05%Koninklijke Vopak NV 35,018 1,899,741 0.04%
300,375,906 6.26%
Norway 0.98% (2018: 1.15%)
Equinor A.S.A 511,226 10,210,208 0.21%DNB A.S.A 483,049 9,015,288 0.19%Telenor A.S.A 364,708 6,534,803 0.14%Mowi A.S.A 224,437 5,828,471 0.12%Orkla A.S.A 386,580 3,913,620 0.08%Yara International A.S.A 89,265 3,709,851 0.08%Norsk Hydro A.S.A 689,375 2,560,650 0.05%Gjensidige Forsikring A.S.A 103,880 2,178,131 0.04%Aker BP A.S.A 53,598 1,756,652 0.04%Schibsted A.S.A Class B 48,297 1,383,950 0.03%
47,091,624 0.98%
Portugal 0.25% (2018: 0.25%)
EDP - Energias de Portugal SA 1,316,729 5,711,101 0.12%Galp Energia SGPS SA 252,308 4,219,914 0.09%Jeronimo Martins SGPS SA 125,087 2,059,115 0.04%Banco Espirito Santo SA 1,505,981 3,770 0.00%
11,993,900 0.25%
Spain 4.48% (2018: 4.89%)
Banco Santander SA 8,457,924 35,412,693 0.74%Iberdrola SA 3,074,115 31,677,372 0.66%Industria de Diseno Textil SA 555,213 19,600,476 0.41%Banco Bilbao Vizcaya Argentaria
SA 3,392,683 18,976,692 0.39%Amadeus IT Group SA 219,661 17,950,258 0.37%Telefonica SA 2,376,646 16,612,298 0.35%Repsol SA 732,678 11,456,465 0.24%Ferrovial SA 250,291 7,577,266 0.16%Aena SME SA 34,301 6,564,740 0.14%CaixaBank SA 1,837,470 5,771,043 0.12%Cellnex Telecom SA 128,645 5,540,782 0.11%Grifols SA 153,633 5,420,199 0.11%ACS Actividades de Construccion
y Servicios SA 134,210 5,370,698 0.11%Red Electrica Corp. SA 222,263 4,472,112 0.09%Endesa SA 159,854 4,268,785 0.09%
Naturgy Energy Group SA 152,305 3,829,557 0.08%Banco de Sabadell SA 2,929,368 3,419,744 0.07%Enagas SA 126,709 3,234,330 0.07%Bankinter SA 343,521 2,518,754 0.05%Siemens Gamesa Renewable
Energy SA 124,620 2,187,117 0.05%Mapfre SA 536,540 1,421,348 0.03%Bankia SA 611,255 1,305,369 0.03%Repsol SA - Rights Issue 10/1/2020 741,079 351,877 0.01%
214,939,975 4.48%
Sweden 4.22% (2018: 4.28%)
Telefonaktiebolaget LM Ericsson Class B 1,564,275 13,629,055 0.28%
Atlas Copco AB Class A 339,741 13,559,081 0.28%Nordea Bank Abp 1,649,399 13,327,622 0.28%Investor AB Class B 232,430 12,692,830 0.26%Volvo AB Class B 757,072 12,689,239 0.26%Assa Abloy AB Class B 510,575 11,944,806 0.25%Sandvik AB 575,049 11,220,184 0.23%Essity AB Class B 308,979 9,961,475 0.21%Svenska Handelsbanken AB
Class A 781,868 8,427,525 0.18%Hennes & Mauritz AB Class B 409,279 8,328,068 0.17%Skandinaviska Enskilda Banken
AB Class A 828,539 7,795,890 0.16%Hexagon AB Class B 133,557 7,490,338 0.16%Atlas Copco AB Class B 201,459 6,998,624 0.15%Swedbank AB Class A 464,186 6,914,901 0.14%Telia Co. AB 1,404,910 6,040,735 0.13%Swedish Match AB 86,068 4,438,992 0.09%Epiroc AB Class A 339,621 4,148,644 0.09%Alfa Laval AB 159,067 4,008,515 0.08%SKF AB Class B 193,650 3,918,076 0.08%Skanska AB Class B 172,002 3,889,822 0.08%Boliden AB 138,205 3,668,813 0.08%Tele2 AB Class B 251,918 3,655,900 0.08%Lundin Petroleum AB 95,411 3,244,222 0.07%Kinnevik AB Class B 123,349 3,017,495 0.06%Electrolux AB 116,966 2,872,593 0.06%Securitas AB Class B 158,373 2,731,459 0.06%Millicom International Cellular
SA ADR 49,309 2,362,985 0.05%Epiroc AB Class B 194,571 2,308,193 0.05%ICA Gruppen AB 46,575 2,175,246 0.05%Industrivarden AB Class C 83,713 2,020,154 0.04%L E Lundbergforetagen AB Class B 38,236 1,678,764 0.03%Husqvarna AB Class B 206,681 1,656,354 0.03%
202,816,600 4.22%
Switzerland 14.71% (2018: 13.65%)
Nestle SA 1,515,107 163,941,665 3.42%Roche Holding AG 357,644 115,970,688 2.42%Novartis AG 1,093,599 103,786,594 2.16%Zurich Insurance Group AG 76,188 31,243,099 0.65%UBS Group AG 1,964,512 24,801,114 0.52%ABB Ltd. 938,196 22,642,268 0.47%Cie Financiere Richemont SA 265,804 20,877,836 0.44%Credit Suisse Group AG 1,301,624 17,615,307 0.37%Swiss Re AG 150,015 16,839,604 0.35%Givaudan SA 4,707 14,733,223 0.31%LafargeHolcim Ltd. 250,857 13,911,314 0.29%Lonza Group AG 37,886 13,818,697 0.29%Sika AG 65,023 12,210,908 0.25%Alcon, Inc. 211,304 11,957,928 0.25%Geberit AG 18,891 10,596,986 0.22%Partners Group Holding AG 9,477 8,684,763 0.18%Swiss Life Holding AG 17,116 8,586,723 0.18%SGS SA 2,684 7,347,843 0.15%
Number of Fair Value % of Total Shares US Dollars ($) Net Assets
Vanguard European Stock Index Fund
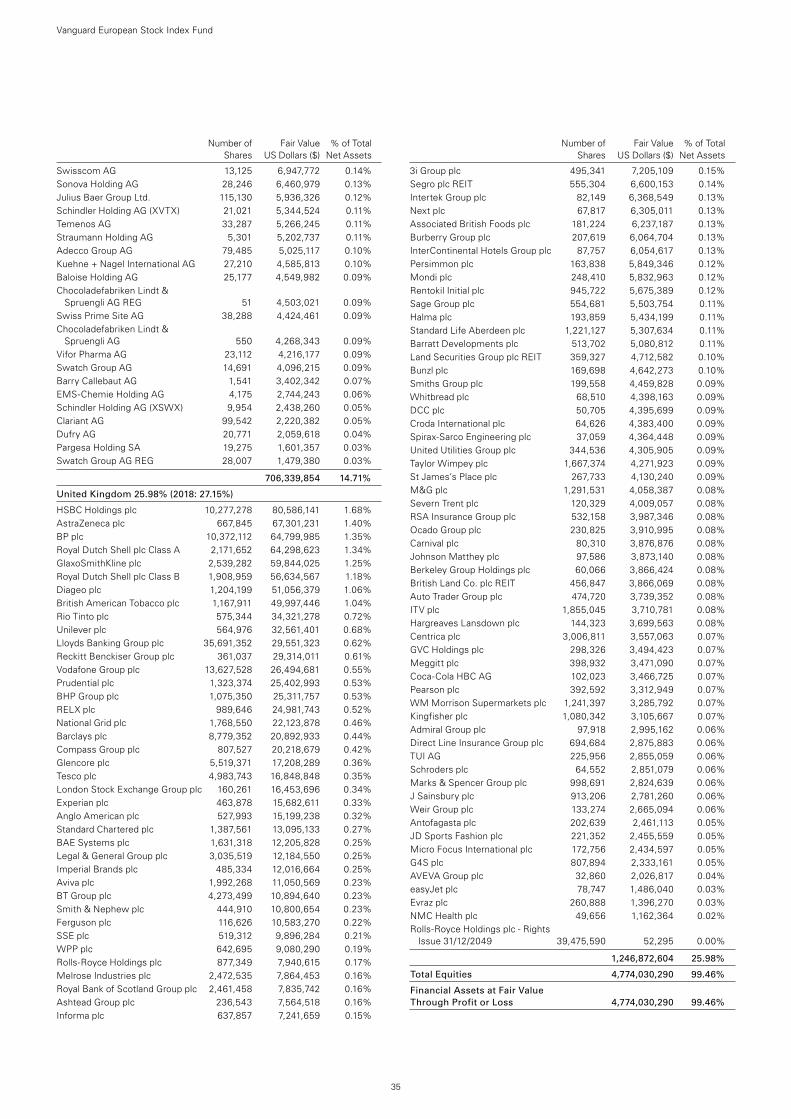
35
Number of Fair Value % of Total Shares US Dollars ($) Net Assets
Swisscom AG 13,125 6,947,772 0.14%Sonova Holding AG 28,246 6,460,979 0.13%Julius Baer Group Ltd. 115,130 5,936,326 0.12%Schindler Holding AG (XVTX) 21,021 5,344,524 0.11%Temenos AG 33,287 5,266,245 0.11%Straumann Holding AG 5,301 5,202,737 0.11%Adecco Group AG 79,485 5,025,117 0.10%Kuehne + Nagel International AG 27,210 4,585,813 0.10%Baloise Holding AG 25,177 4,549,982 0.09%Chocoladefabriken Lindt &
Spruengli AG REG 51 4,503,021 0.09%Swiss Prime Site AG 38,288 4,424,461 0.09%Chocoladefabriken Lindt &
Spruengli AG 550 4,268,343 0.09%Vifor Pharma AG 23,112 4,216,177 0.09%Swatch Group AG 14,691 4,096,215 0.09%Barry Callebaut AG 1,541 3,402,342 0.07%EMS-Chemie Holding AG 4,175 2,744,243 0.06%Schindler Holding AG (XSWX) 9,954 2,438,260 0.05%Clariant AG 99,542 2,220,382 0.05%Dufry AG 20,771 2,059,618 0.04%Pargesa Holding SA 19,275 1,601,357 0.03%Swatch Group AG REG 28,007 1,479,380 0.03%
706,339,854 14.71%
United Kingdom 25.98% (2018: 27.15%)
HSBC Holdings plc 10,277,278 80,586,141 1.68%AstraZeneca plc 667,845 67,301,231 1.40%BP plc 10,372,112 64,799,985 1.35%Royal Dutch Shell plc Class A 2,171,652 64,298,623 1.34%GlaxoSmithKline plc 2,539,282 59,844,025 1.25%Royal Dutch Shell plc Class B 1,908,959 56,634,567 1.18%Diageo plc 1,204,199 51,056,379 1.06%British American Tobacco plc 1,167,911 49,997,446 1.04%Rio Tinto plc 575,344 34,321,278 0.72%Unilever plc 564,976 32,561,401 0.68%Lloyds Banking Group plc 35,691,352 29,551,323 0.62%Reckitt Benckiser Group plc 361,037 29,314,011 0.61%Vodafone Group plc 13,627,528 26,494,681 0.55%Prudential plc 1,323,374 25,402,993 0.53%BHP Group plc 1,075,350 25,311,757 0.53%RELX plc 989,646 24,981,743 0.52%National Grid plc 1,768,550 22,123,878 0.46%Barclays plc 8,779,352 20,892,933 0.44%Compass Group plc 807,527 20,218,679 0.42%Glencore plc 5,519,371 17,208,289 0.36%Tesco plc 4,983,743 16,848,848 0.35%London Stock Exchange Group plc 160,261 16,453,696 0.34%Experian plc 463,878 15,682,611 0.33%Anglo American plc 527,993 15,199,238 0.32%Standard Chartered plc 1,387,561 13,095,133 0.27%BAE Systems plc 1,631,318 12,205,828 0.25%Legal & General Group plc 3,035,519 12,184,550 0.25%Imperial Brands plc 485,334 12,016,664 0.25%Aviva plc 1,992,268 11,050,569 0.23%BT Group plc 4,273,499 10,894,640 0.23%Smith & Nephew plc 444,910 10,800,654 0.23%Ferguson plc 116,626 10,583,270 0.22%SSE plc 519,312 9,896,284 0.21%WPP plc 642,695 9,080,290 0.19%Rolls-Royce Holdings plc 877,349 7,940,615 0.17%Melrose Industries plc 2,472,535 7,864,453 0.16%Royal Bank of Scotland Group plc 2,461,458 7,835,742 0.16%Ashtead Group plc 236,543 7,564,518 0.16%Informa plc 637,857 7,241,659 0.15%
3i Group plc 495,341 7,205,109 0.15%Segro plc REIT 555,304 6,600,153 0.14%Intertek Group plc 82,149 6,368,549 0.13%Next plc 67,817 6,305,011 0.13%Associated British Foods plc 181,224 6,237,187 0.13%Burberry Group plc 207,619 6,064,704 0.13%InterContinental Hotels Group plc 87,757 6,054,617 0.13%Persimmon plc 163,838 5,849,346 0.12%Mondi plc 248,410 5,832,963 0.12%Rentokil Initial plc 945,722 5,675,389 0.12%Sage Group plc 554,681 5,503,754 0.11%Halma plc 193,859 5,434,199 0.11%Standard Life Aberdeen plc 1,221,127 5,307,634 0.11%Barratt Developments plc 513,702 5,080,812 0.11%Land Securities Group plc REIT 359,327 4,712,582 0.10%Bunzl plc 169,698 4,642,273 0.10%Smiths Group plc 199,558 4,459,828 0.09%Whitbread plc 68,510 4,398,163 0.09%DCC plc 50,705 4,395,699 0.09%Croda International plc 64,626 4,383,400 0.09%Spirax-Sarco Engineering plc 37,059 4,364,448 0.09%United Utilities Group plc 344,536 4,305,905 0.09%Taylor Wimpey plc 1,667,374 4,271,923 0.09%St James’s Place plc 267,733 4,130,240 0.09%M&G plc 1,291,531 4,058,387 0.08%Severn Trent plc 120,329 4,009,057 0.08%RSA Insurance Group plc 532,158 3,987,346 0.08%Ocado Group plc 230,825 3,910,995 0.08%Carnival plc 80,310 3,876,876 0.08%Johnson Matthey plc 97,586 3,873,140 0.08%Berkeley Group Holdings plc 60,066 3,866,424 0.08%British Land Co. plc REIT 456,847 3,866,069 0.08%Auto Trader Group plc 474,720 3,739,352 0.08%ITV plc 1,855,045 3,710,781 0.08%Hargreaves Lansdown plc 144,323 3,699,563 0.08%Centrica plc 3,006,811 3,557,063 0.07%GVC Holdings plc 298,326 3,494,423 0.07%Meggitt plc 398,932 3,471,090 0.07%Coca-Cola HBC AG 102,023 3,466,725 0.07%Pearson plc 392,592 3,312,949 0.07%WM Morrison Supermarkets plc 1,241,397 3,285,792 0.07%Kingfisher plc 1,080,342 3,105,667 0.07%Admiral Group plc 97,918 2,995,162 0.06%Direct Line Insurance Group plc 694,684 2,875,883 0.06%TUI AG 225,956 2,855,059 0.06%Schroders plc 64,552 2,851,079 0.06%Marks & Spencer Group plc 998,691 2,824,639 0.06%J Sainsbury plc 913,206 2,781,260 0.06%Weir Group plc 133,274 2,665,094 0.06%Antofagasta plc 202,639 2,461,113 0.05%JD Sports Fashion plc 221,352 2,455,559 0.05%Micro Focus International plc 172,756 2,434,597 0.05%G4S plc 807,894 2,333,161 0.05%AVEVA Group plc 32,860 2,026,817 0.04%easyJet plc 78,747 1,486,040 0.03%Evraz plc 260,888 1,396,270 0.03%NMC Health plc 49,656 1,162,364 0.02%Rolls-Royce Holdings plc - Rights
Issue 31/12/2049 39,475,590 52,295 0.00%
1,246,872,604 25.98%
Total Equities 4,774,030,290 99.46%
Financial Assets at Fair Value Through Profit or Loss 4,774,030,290 99.46%
Number of Fair Value % of Total Shares US Dollars ($) Net Assets
Vanguard European Stock Index Fund
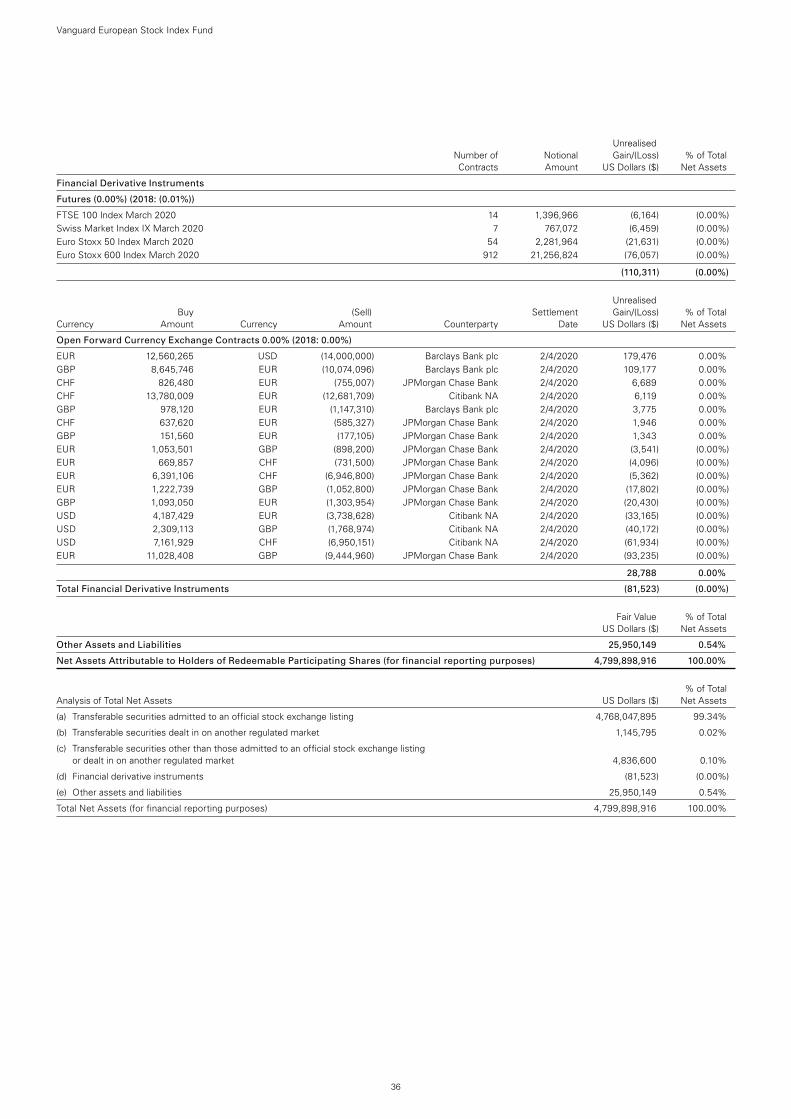
36
Vanguard European Stock Index Fund
Unrealised Number of Notional Gain/(Loss) % of Total Contracts Amount US Dollars ($) Net Assets
Financial Derivative Instruments
Futures (0.00%) (2018: (0.01%))
FTSE 100 Index March 2020 14 1,396,966 (6,164) (0.00%)Swiss Market Index IX March 2020 7 767,072 (6,459) (0.00%)Euro Stoxx 50 Index March 2020 54 2,281,964 (21,631) (0.00%)Euro Stoxx 600 Index March 2020 912 21,256,824 (76,057) (0.00%)
(110,311) (0.00%)
Unrealised Buy (Sell) Settlement Gain/(Loss) % of Total Currency Amount Currency Amount Counterparty Date US Dollars ($) Net Assets
Open Forward Currency Exchange Contracts 0.00% (2018: 0.00%)
EUR 12,560,265 USD (14,000,000) Barclays Bank plc 2/4/2020 179,476 0.00%GBP 8,645,746 EUR (10,074,096) Barclays Bank plc 2/4/2020 109,177 0.00%CHF 826,480 EUR (755,007) JPMorgan Chase Bank 2/4/2020 6,689 0.00%CHF 13,780,009 EUR (12,681,709) Citibank NA 2/4/2020 6,119 0.00%GBP 978,120 EUR (1,147,310) Barclays Bank plc 2/4/2020 3,775 0.00%CHF 637,620 EUR (585,327) JPMorgan Chase Bank 2/4/2020 1,946 0.00%GBP 151,560 EUR (177,105) JPMorgan Chase Bank 2/4/2020 1,343 0.00%EUR 1,053,501 GBP (898,200) JPMorgan Chase Bank 2/4/2020 (3,541) (0.00%)EUR 669,857 CHF (731,500) JPMorgan Chase Bank 2/4/2020 (4,096) (0.00%)EUR 6,391,106 CHF (6,946,800) JPMorgan Chase Bank 2/4/2020 (5,362) (0.00%)EUR 1,222,739 GBP (1,052,800) JPMorgan Chase Bank 2/4/2020 (17,802) (0.00%)GBP 1,093,050 EUR (1,303,954) JPMorgan Chase Bank 2/4/2020 (20,430) (0.00%)USD 4,187,429 EUR (3,738,628) Citibank NA 2/4/2020 (33,165) (0.00%)USD 2,309,113 GBP (1,768,974) Citibank NA 2/4/2020 (40,172) (0.00%)USD 7,161,929 CHF (6,950,151) Citibank NA 2/4/2020 (61,934) (0.00%)EUR 11,028,408 GBP (9,444,960) JPMorgan Chase Bank 2/4/2020 (93,235) (0.00%)
28,788 0.00%
Total Financial Derivative Instruments (81,523) (0.00%)
Fair Value % of Total US Dollars ($) Net Assets
Other Assets and Liabilities 25,950,149 0.54%
Net Assets Attributable to Holders of Redeemable Participating Shares (for financial reporting purposes) 4,799,898,916 100.00%
% of Total Analysis of Total Net Assets US Dollars ($) Net Assets
(a) Transferable securities admitted to an official stock exchange listing 4,768,047,895 99.34%
(b) Transferable securities dealt in on another regulated market 1,145,795 0.02%
(c) Transferable securities other than those admitted to an official stock exchange listing or dealt in on another regulated market 4,836,600 0.10%
(d) Financial derivative instruments (81,523) (0.00%)
(e) Other assets and liabilities 25,950,149 0.54%
Total Net Assets (for financial reporting purposes) 4,799,898,916 100.00%
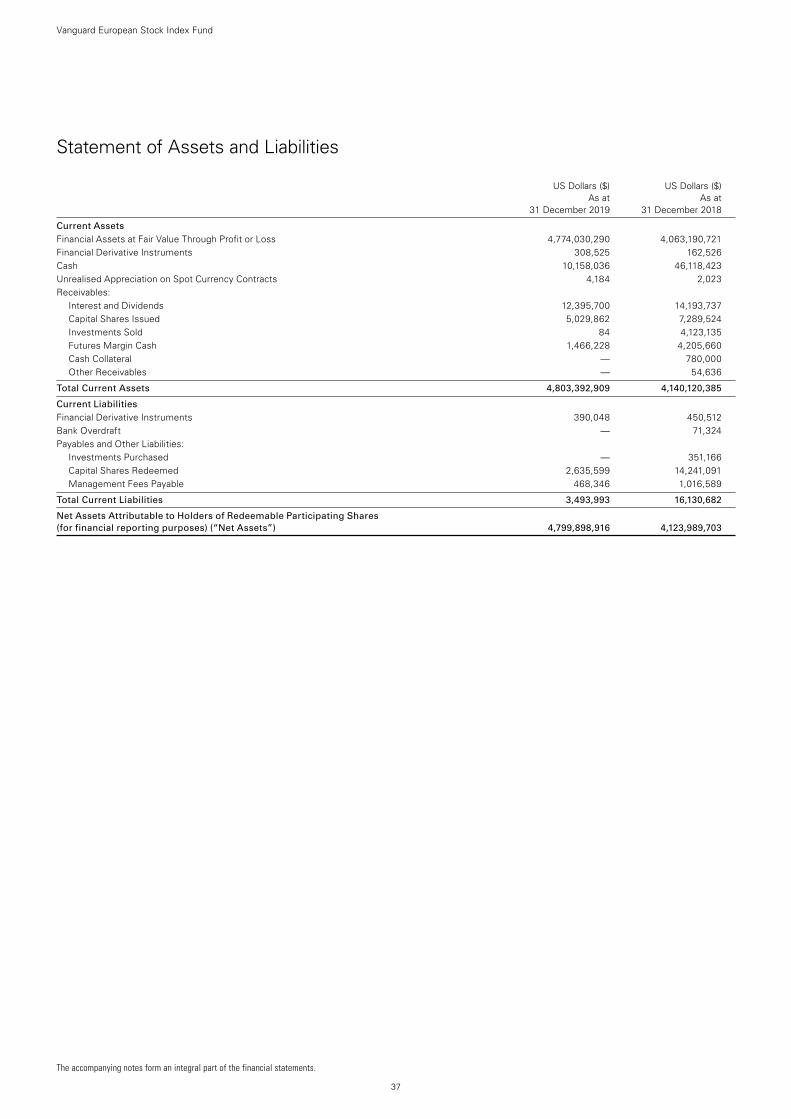
The accompanying notes form an integral part of the financial statements.
37
Vanguard European Stock Index Fund
Statement of Assets and Liabilities
US Dollars ($) US Dollars ($) As at As at 31 December 2019 31 December 2018
Current Assets Financial Assets at Fair Value Through Profit or Loss 4,774,030,290 4,063,190,721Financial Derivative Instruments 308,525 162,526Cash 10,158,036 46,118,423Unrealised Appreciation on Spot Currency Contracts 4,184 2,023Receivables:
Interest and Dividends 12,395,700 14,193,737Capital Shares Issued 5,029,862 7,289,524Investments Sold 84 4,123,135Futures Margin Cash 1,466,228 4,205,660Cash Collateral — 780,000Other Receivables — 54,636
Total Current Assets 4,803,392,909 4,140,120,385
Current Liabilities Financial Derivative Instruments 390,048 450,512Bank Overdraft — 71,324Payables and Other Liabilities:
Investments Purchased — 351,166Capital Shares Redeemed 2,635,599 14,241,091Management Fees Payable 468,346 1,016,589
Total Current Liabilities 3,493,993 16,130,682
Net Assets Attributable to Holders of Redeemable Participating Shares (for financial reporting purposes) (“Net Assets”) 4,799,898,916 4,123,989,703
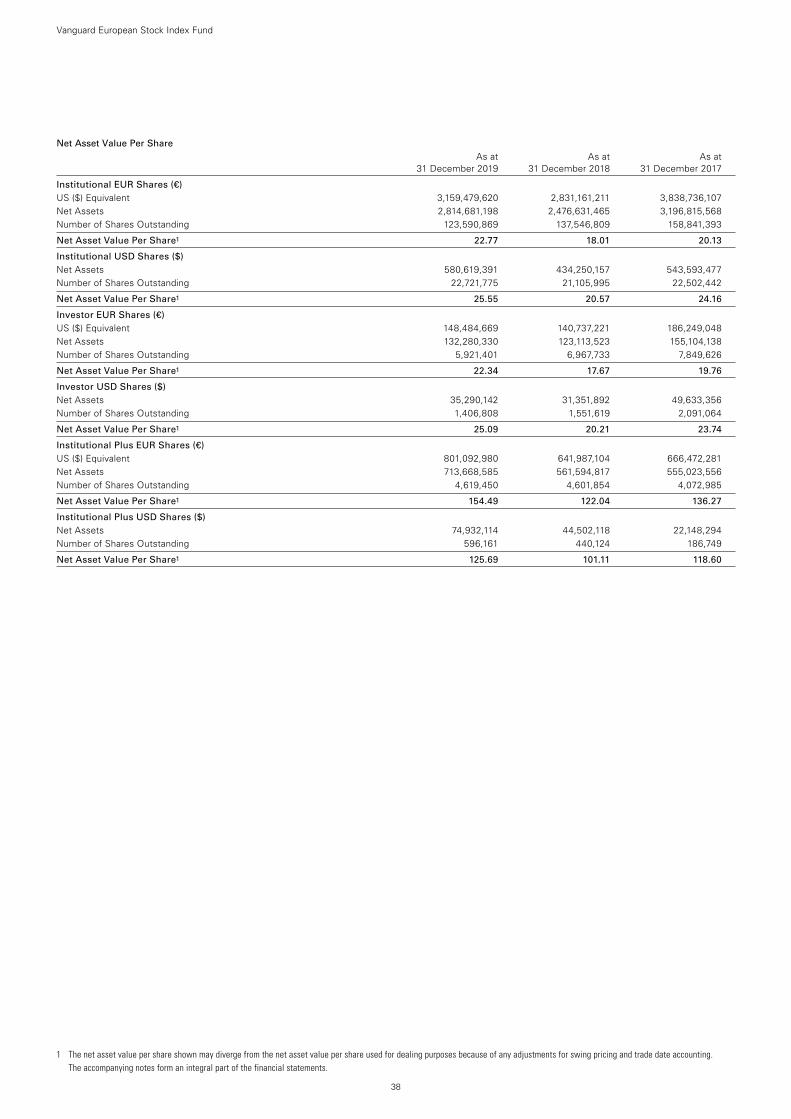
1 The net asset value per share shown may diverge from the net asset value per share used for dealing purposes because of any adjustments for swing pricing and trade date accounting. The accompanying notes form an integral part of the financial statements.
38
Net Asset Value Per Share As at As at As at 31 December 2019 31 December 2018 31 December 2017
Institutional EUR Shares (€) US ($) Equivalent 3,159,479,620 2,831,161,211 3,838,736,107Net Assets 2,814,681,198 2,476,631,465 3,196,815,568Number of Shares Outstanding 123,590,869 137,546,809 158,841,393
Net Asset Value Per Share1 22.77 18.01 20.13
Institutional USD Shares ($) Net Assets 580,619,391 434,250,157 543,593,477Number of Shares Outstanding 22,721,775 21,105,995 22,502,442
Net Asset Value Per Share1 25.55 20.57 24.16
Investor EUR Shares (€) US ($) Equivalent 148,484,669 140,737,221 186,249,048Net Assets 132,280,330 123,113,523 155,104,138Number of Shares Outstanding 5,921,401 6,967,733 7,849,626
Net Asset Value Per Share1 22.34 17.67 19.76
Investor USD Shares ($) Net Assets 35,290,142 31,351,892 49,633,356Number of Shares Outstanding 1,406,808 1,551,619 2,091,064
Net Asset Value Per Share1 25.09 20.21 23.74
Institutional Plus EUR Shares (€) US ($) Equivalent 801,092,980 641,987,104 666,472,281Net Assets 713,668,585 561,594,817 555,023,556Number of Shares Outstanding 4,619,450 4,601,854 4,072,985
Net Asset Value Per Share1 154.49 122.04 136.27
Institutional Plus USD Shares ($) Net Assets 74,932,114 44,502,118 22,148,294Number of Shares Outstanding 596,161 440,124 186,749
Net Asset Value Per Share1 125.69 101.11 118.60
Vanguard European Stock Index Fund
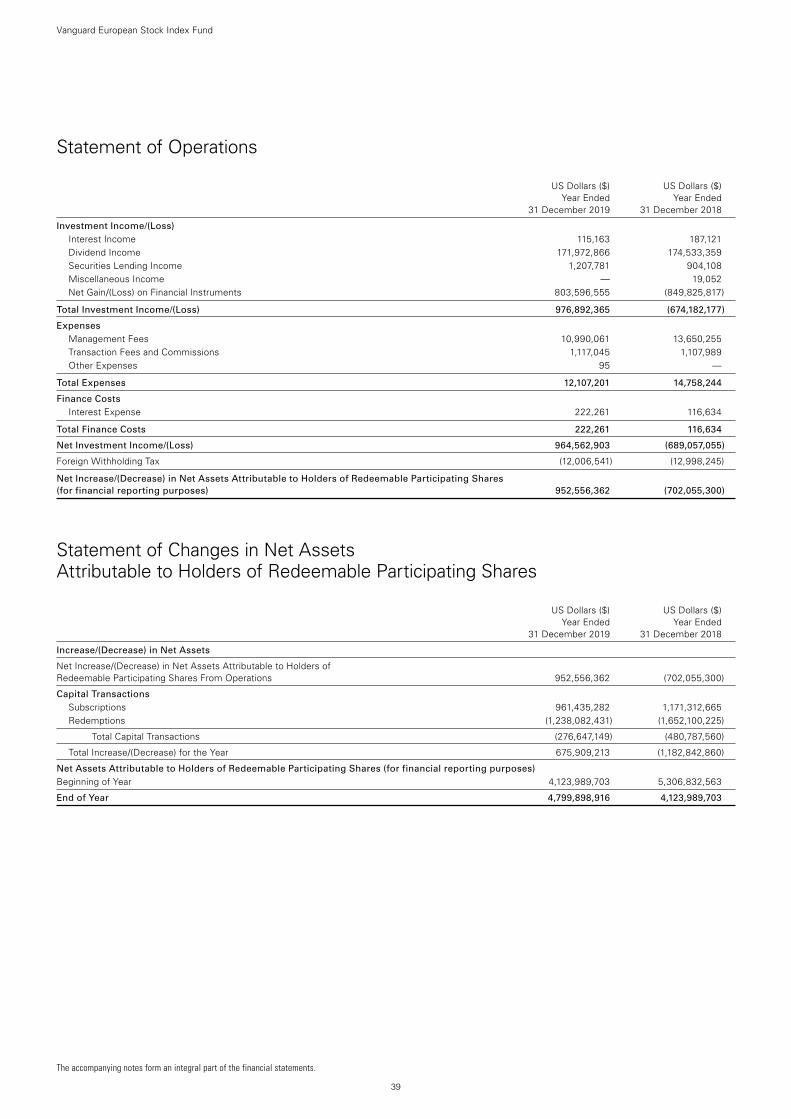
39
Vanguard European Stock Index Fund
Statement of Operations
US Dollars ($) US Dollars ($) Year Ended Year Ended 31 December 2019 31 December 2018
Investment Income/(Loss) Interest Income 115,163 187,121Dividend Income 171,972,866 174,533,359Securities Lending Income 1,207,781 904,108Miscellaneous Income — 19,052Net Gain/(Loss) on Financial Instruments 803,596,555 (849,825,817)
Total Investment Income/(Loss) 976,892,365 (674,182,177)
Expenses Management Fees 10,990,061 13,650,255Transaction Fees and Commissions 1,117,045 1,107,989Other Expenses 95 —
Total Expenses 12,107,201 14,758,244
Finance Costs Interest Expense 222,261 116,634
Total Finance Costs 222,261 116,634
Net Investment Income/(Loss) 964,562,903 (689,057,055)
Foreign Withholding Tax (12,006,541) (12,998,245)
Net Increase/(Decrease) in Net Assets Attributable to Holders of Redeemable Participating Shares (for financial reporting purposes) 952,556,362 (702,055,300)
Statement of Changes in Net Assets Attributable to Holders of Redeemable Participating Shares
US Dollars ($) US Dollars ($) Year Ended Year Ended 31 December 2019 31 December 2018
Increase/(Decrease) in Net Assets
Net Increase/(Decrease) in Net Assets Attributable to Holders of Redeemable Participating Shares From Operations 952,556,362 (702,055,300)
Capital Transactions Subscriptions 961,435,282 1,171,312,665Redemptions (1,238,082,431) (1,652,100,225)
Total Capital Transactions (276,647,149) (480,787,560)
Total Increase/(Decrease) for the Year 675,909,213 (1,182,842,860)
Net Assets Attributable to Holders of Redeemable Participating Shares (for financial reporting purposes) Beginning of Year 4,123,989,703 5,306,832,563
End of Year 4,799,898,916 4,123,989,703
The accompanying notes form an integral part of the financial statements.
40
Vanguard Eurozone Stock Index FundSub-managed by Vanguard Asset Management, Limited.
All of the returns in this report represent past performance, which is not a guarantee of future results that may be achieved by the fund. (For performance data current to the most recent month-end, which may be higher or lower than that cited, visit our website at http://global.vanguard.com.) Note, too, that both investment returns and principal value can fluctuate widely, so an investor’s shares, when sold, could be worth more or less than their original cost.* The tracking difference between the fund return and the index return over a stated period of time can be attributed to a number of factors, including, without limitation, small differences in
weightings, trading activity, swing pricing, transaction costs, and differences in the valuation and withholding tax treatment between the fund and the index vendor. Tracking difference in the table above is in percentage points.
1 Since-inception returns: EUR Institutional Plus Shares, 2 September 2014; EUR Investor Shares, 5 January 2010; USD Institutional Shares, USD Institutional Plus Shares and USD Investor Shares, 27 February 2014.
Investment ObjectiveThe fund seeks to provide long-term growth of capital by tracking the performance of the MSCI EMU Index, a market-capitalisation-weighted index of common stocks designed to capture 85% of the underlying euro zone countries’ market capitalisation.
Performance Summary (unaudited)The Performance Summary does not form part of the Financial Statements.
• Investorsturnedlessrisk-averseduringthe12-monthperiodended31December2019.Whileanumberofconcernsthatmarkedpreviousperiodspersisted,global growth appeared more likely to slow than stall, signs emerged of progress in US-China trade talks and the UK seemed less likely to make a disorderly exit from the European Union.
• TheUSFederalReservecutitstargetforshort-terminterestratesthreetimesduringtheperiod,andmanyothermajorcentralbanksmaintainedaccommodative monetary policies. The European Central Bank was among them. It held policy steady after pushing its deposit rate further into negative territory and announcing a new round of open-ended bond purchases in September. The Bank of Japan pledged to maintain policy rates at very low levels. The Bank of England remained on hold, but with the markets anticipating that its next move would be a cut.
• Equitymarketsralliedinresponseandinmanycasesreachedrecordhighsbytheendoftheperiod.StocksinEuropeoutpacedthoseinthePacificregion and emerging markets but trailed those in the United States.
• Fortheperiod,thefund’sbenchmarkreturned25.47%.All11ofthebenchmark’sindustrysectorsproducedpositivereturns.Informationtechnology,industrials and consumer discretionary posted the highest returns.
• Amongcountries,France,GermanyandtheNetherlands,thebenchmark’slargestmarkets,allproducedreturnsabove20%.
All returns in the commentary above are in euros.
Benchmark: MSCI EMU Index
Total Returns Periods Ended 31 December 2019 (Annualised for periods over one year)
Ten Years or One Year Five Years Since Inception1
EUR Institutional Shares 26.36% 7.52% 6.90%
Benchmark 25.47 7.15 6.57
Tracking Difference* 0.89
EUR Institutional Plus Shares 26.47% 7.62% 7.23%
Benchmark 25.47 7.15 6.77
Tracking Difference* 1.00
EUR Investor Shares 26.31% 7.47% 6.63%
Benchmark 25.47 7.15 6.38
Tracking Difference* 0.84
USD Institutional Shares 24.08% 5.92% 3.33%
Benchmark 23.20 5.55 2.95
Tracking Difference* 0.88
USD Institutional Plus Shares 24.19% 6.02% 3.42%
Benchmark 23.20 5.55 2.95
Tracking Difference* 0.99
USD Investor Shares 24.03% 5.87% 3.28%
Benchmark 23.20 5.55 2.95
Tracking Difference* 0.83
Each benchmark is in its respective currency.
The Central Bank of Ireland requires a schedule of material changes in the composition of the portfolio during the year. These are defined as aggregate purchases of a security exceeding 1% of the total value of purchases for the year and aggregate disposals greater than 1% of the total value of sales. At a minimum, the largest 20 purchases and 20 sales must be shown; all purchases and sales must be shown if there are fewer than 20. A full listing of the portfolio changes for the year is available, upon request, at no extra cost from the Administrator.
41
Vanguard Eurozone Stock Index Fund
Significant Portfolio Changes (unaudited)For the Year Ended 31 December 2019
Cost Shares Euro (€)
Purchases
Prosus NV 219,778 15,466,846
Total SA 261,757 12,901,396
SAP SE 104,888 11,976,411
LVMH Moet Hennessy Louis Vuitton SE 29,605 10,785,444
Allianz SE 45,231 9,586,864
ASML Holding NV 50,875 9,364,454
Sanofi 119,993 9,156,951
Siemens AG 81,329 8,306,996
Banco Santander SA (XMAD) 1,995,351 8,179,521
Airbus SE 62,708 7,822,827
L’Oreal SA 27,077 6,651,192
BASF SE 97,761 6,225,489
Anheuser-Busch InBev SA 80,897 6,211,096
Bayer AG 99,137 5,992,951
Unilever NV 104,255 5,663,482
Air Liquide SA - EUR 46,534 5,583,981
Iberdrola SA 638,219 5,353,150
Enel SpA 856,398 5,306,847
Deutsche Telekom AG 353,318 5,286,035
BNP Paribas SA 119,997 5,253,903
Vinci SA 55,449 5,093,180
Adidas AG 19,253 5,054,320
AXA SA 208,201 4,876,687
Danone SA 66,024 4,817,099
Daimler AG 97,186 4,772,998
Proceeds Shares Euro (€)
Sales
Total SA 105,806 5,112,786
SAP SE 41,266 4,598,661
LVMH Moet Hennessy Louis Vuitton SE 11,542 4,135,937
Allianz SE 19,770 4,089,307
Sanofi 47,013 3,798,527
ASML Holding NV 17,515 3,631,062
NXP Semiconductors NV 38,100 3,331,277
Siemens AG 31,866 3,311,685
Unilever NV 59,729 3,175,491
Iberdrola SA 362,779 3,112,843
Banco Santander SA (XMAD) 794,654 3,083,933
Airbus SE 24,495 2,952,827
Vivendi SA 115,170 2,797,399
Adidas AG 10,490 2,587,393
L’Oreal SA 10,503 2,573,928
BASF SE 38,267 2,487,988
Bayer AG 38,861 2,475,364
Anheuser-Busch InBev SA 31,653 2,393,123
Air Liquide SA - EUR 19,950 2,358,964
Koninklijke Philips NV 56,682 2,191,913
BNP Paribas SA 47,355 2,160,416
Deutsche Telekom AG 137,849 2,087,306
Enel SpA 331,504 2,083,742
Safran SA 15,397 2,014,444
AXA SA 85,853 1,994,209
Vinci SA 21,193 1,950,591
42
Vanguard Eurozone Stock Index Fund
Number of Fair Value % of Total Shares Euro (€) Net Assets
Number of Fair Value % of Total Shares Euro (€) Net Assets
Equities 99.42% (2018: 99.46%)
Austria 0.69% (2018: 0.75%)
Erste Group Bank AG 130,290 4,372,532 0.23%OMV AG 63,795 3,194,854 0.17%Raiffeisen Bank International AG 65,067 1,456,850 0.08%Verbund AG 29,033 1,298,936 0.07%Voestalpine AG 51,046 1,269,004 0.07%ANDRITZ AG 32,116 1,233,254 0.07%
12,825,430 0.69%
Belgium 3.06% (2018: 2.98%)
Anheuser-Busch InBev SA 330,360 24,020,476 1.30%KBC Group NV 108,223 7,257,434 0.39%Ageas 77,388 4,076,800 0.22%UCB SA 54,769 3,883,122 0.21%Umicore SA 85,453 3,705,242 0.20%Galapagos NV 18,803 3,506,759 0.19%Solvay SA 32,119 3,317,893 0.18%Groupe Bruxelles Lambert SA 34,959 3,284,748 0.18%Proximus SADP 65,188 1,663,598 0.09%Colruyt SA 24,331 1,130,905 0.06%Telenet Group Holding NV 20,591 824,875 0.04%
56,671,852 3.06%
Finland 2.93% (2018: 3.28%)
Kone OYJ Class B 147,324 8,586,043 0.46%Nokia OYJ 2,443,102 8,052,464 0.43%Sampo OYJ Class A 192,075 7,473,638 0.40%UPM-Kymmene OYJ 231,419 7,153,161 0.39%Neste OYJ 183,385 5,688,603 0.31%Fortum OYJ 192,519 4,235,418 0.23%Stora Enso OYJ Class R 252,147 3,269,086 0.18%Elisa OYJ 61,638 3,035,672 0.16%Wartsila OYJ Abp 194,341 1,914,259 0.10%Orion OYJ Class B 45,853 1,892,353 0.10%Metso OYJ 45,112 1,587,040 0.09%Nokian Renkaat OYJ 54,675 1,401,320 0.08%
54,289,057 2.93%
France 35.34% (2018: 33.80%)
Total SA 1,040,513 51,193,240 2.76%LVMH Moet Hennessy Louis
Vuitton SE 120,536 49,926,011 2.69%Sanofi 488,555 43,784,299 2.36%Airbus SE 253,004 33,011,962 1.78%BNP Paribas SA 487,700 25,765,191 1.39%Schneider Electric SE 239,711 21,933,556 1.18%Vinci SA 221,451 21,923,649 1.18%AXA SA 837,791 21,036,932 1.13%Danone SA 267,725 19,784,877 1.07%Safran SA 141,875 19,529,094 1.05%Kering SA 32,851 19,224,405 1.04%EssilorLuxottica SA 122,895 16,689,141 0.90%Pernod Ricard SA 92,058 14,674,045 0.79%L’Oreal SA (Prime De Fidelite) 47,166 12,451,824 0.67%L’Oreal SA 43,530 11,491,920 0.62%Orange SA 864,815 11,346,373 0.61%Air Liquide SA (Prime De Fidelite) 88,878 11,216,404 0.60%Societe Generale SA 351,448 10,900,160 0.59%Air Liquide SA - EUR 77,284 9,753,241 0.53%Vivendi SA 370,157 9,557,454 0.51%Hermes International 13,733 9,148,925 0.49%
Legrand SA 115,671 8,402,341 0.45%Dassault Systemes SE 57,004 8,353,936 0.45%Unibail-Rodamco-Westfield REIT 59,203 8,326,902 0.45%Cie Generale des Etablissements
Michelin SCA 74,076 8,081,692 0.44%Cie de Saint-Gobain 213,252 7,783,698 0.42%Capgemini SE 68,902 7,503,428 0.40%STMicroelectronics NV 296,139 7,098,452 0.38%Credit Agricole SA 500,338 6,466,869 0.35%Veolia Environnement SA 233,241 5,530,144 0.30%Teleperformance 25,404 5,522,830 0.30%Peugeot SA 254,955 5,430,541 0.29%Edenred 105,434 4,860,507 0.26%Engie SA 315,023 4,536,331 0.24%ArcelorMittal SA 287,880 4,503,019 0.24%Thales SA 46,146 4,269,428 0.23%Engie SA (Prime De Fidelite 2019)-
EUR 273,556 3,939,206 0.21%Carrefour SA 262,312 3,921,564 0.21%Publicis Groupe SA 93,747 3,783,629 0.20%Bouygues SA 96,700 3,662,996 0.20%Renault SA 83,298 3,513,510 0.19%Alstom SA 82,632 3,489,549 0.19%L’Oreal SA (Prime De Fidelite 2021) 13,158 3,473,712 0.19%Eiffage SA 33,987 3,466,674 0.19%Air Liquide SA 27,410 3,459,142 0.19%Valeo SA 104,484 3,281,842 0.18%Accor SA 76,043 3,174,795 0.17%Gecina SA REIT 19,846 3,167,422 0.17%Atos SE 42,609 3,166,701 0.17%Bureau Veritas SA 127,375 2,962,742 0.16%Getlink SE 190,763 2,958,734 0.16%Klepierre SA REIT 85,821 2,905,041 0.16%Arkema SA 29,833 2,825,185 0.15%Worldline SA 43,556 2,750,561 0.15%SCOR SE 68,622 2,567,835 0.14%Ingenico Group SA 26,232 2,539,258 0.14%Eurofins Scientific SE 5,009 2,475,448 0.13%Aeroports de Paris 12,843 2,261,652 0.12%Ubisoft Entertainment SA 36,607 2,254,259 0.12%Covivio REIT 20,664 2,091,197 0.11%Suez 147,465 1,988,566 0.11%SES SA Class A 157,861 1,973,262 0.11%Sodexo SA (Prime De Fidelite 2022) 17,491 1,847,924 0.10%Amundi SA 25,961 1,814,674 0.10%Sartorius Stedim Biotech 12,148 1,794,260 0.10%Natixis SA 404,143 1,599,598 0.09%Engie SA (Prime De Fidelite 2020)-
EUR 110,576 1,592,294 0.09%Faurecia SE 32,613 1,566,402 0.08%L’Oreal SA (Prime De Fidelite 2020) 5,707 1,506,648 0.08%Bollore SA 385,890 1,501,112 0.08%BioMerieux 18,169 1,441,710 0.08%Wendel SA 11,732 1,390,242 0.07%Air Liquide SA (France) 10,948 1,381,638 0.07%Iliad SA 11,653 1,346,504 0.07%Engie SA (Prime De Fidelite 2021)-
EUR 92,924 1,338,106 0.07%CNP Assurances 75,187 1,333,066 0.07%Ipsen SA 16,488 1,302,552 0.07%Dassault Aviation SA 1,104 1,291,680 0.07%ICADE REIT 13,102 1,271,549 0.07%
Financial Statements Statement of Investments31 December 2019
43
Number of Fair Value % of Total Shares Euro (€) Net Assets
Electricite de France SA 114,937 1,141,095 0.06%Eutelsat Communications SA 76,743 1,112,006 0.06%Sodexo SA (XPAR) 10,484 1,107,635 0.06%Electricite de France SA (XPAR) 111,476 1,106,734 0.06%Sodexo SA 10,370 1,095,590 0.06%Remy Cointreau SA 9,908 1,084,926 0.06%Eurazeo SE 16,932 1,032,852 0.06%JCDecaux SA 36,121 992,605 0.05%Casino Guichard Perrachon SA 23,467 978,574 0.05%SEB SA (Prime De Fidelite) 4,249 562,568 0.03%SEB SA (XPAR) 4,107 543,767 0.03%EDF (Prime De Fidelite 2021) 37,964 376,907 0.02%SEB SA 1,037 137,299 0.01%Unibail-Rodamco-Westfield (XPAR)
REIT 779 109,566 0.01%SEB SA (Prime De Fidelite 2020) 481 63,684 0.00%
655,833,070 35.34%
Germany 26.78% (2018: 27.81%)
SAP SE 426,134 51,272,443 2.76%Allianz SE 184,052 40,196,957 2.17%Siemens AG 331,691 38,655,269 2.08%Bayer AG 404,326 29,438,976 1.59%BASF SE 398,243 26,821,666 1.45%Adidas AG 78,213 22,666,127 1.22%Deutsche Telekom AG 1,445,185 21,056,345 1.13%Daimler AG 394,270 19,465,110 1.05%Muenchener Rueckversicherungs-
Gesellschaft AG in Muenchen 62,593 16,461,959 0.89%Deutsche Post AG 428,892 14,586,617 0.79%Volkswagen AG - Preference
Shares 80,468 14,181,680 0.76%Deutsche Boerse AG 82,390 11,546,959 0.62%Infineon Technologies AG 541,991 11,007,837 0.59%Vonovia SE 223,382 10,722,336 0.58%Bayerische Motoren Werke AG 143,470 10,493,396 0.57%E.ON SE 973,689 9,273,414 0.50%Fresenius SE & Co. KGaA 181,159 9,090,559 0.49%Henkel AG & Co. KGaA -
Preference Shares 77,371 7,133,606 0.38%RWE AG 253,315 6,928,165 0.37%Fresenius Medical Care AG & Co.
KGaA 92,365 6,092,395 0.33%Merck KGaA 56,022 5,901,918 0.32%Deutsche Bank AG 851,156 5,887,446 0.32%MTU Aero Engines AG 22,540 5,738,684 0.31%Deutsche Wohnen SE 155,939 5,679,298 0.31%Continental AG 47,670 5,494,444 0.30%Wirecard AG 50,889 5,470,568 0.29%Symrise AG Class A 55,800 5,234,040 0.28%Beiersdorf AG 43,702 4,660,818 0.25%Hannover Rueck SE 26,171 4,509,263 0.24%Porsche Automobil Holding SE -
Preference Shares 66,411 4,425,629 0.24%HeidelbergCement AG 64,522 4,191,349 0.23%Henkel AG & Co. KGaA 44,911 3,772,524 0.20%Delivery Hero SE 49,114 3,465,484 0.19%Brenntag AG 66,969 3,246,657 0.17%Aroundtown SA 397,952 3,177,249 0.17%Covestro AG 75,341 3,122,884 0.17%QIAGEN NV 98,394 2,997,081 0.16%Sartorius AG - Preference Shares 15,338 2,926,490 0.16%Siemens Healthineers AG 65,036 2,784,842 0.15%Zalando SE 60,032 2,712,246 0.15%Uniper SE 87,297 2,576,134 0.14%Puma SE 35,933 2,456,021 0.13%Volkswagen AG 14,081 2,439,533 0.13%Commerzbank AG 430,881 2,377,171 0.13%
Evonik Industries AG 79,995 2,176,664 0.12%LANXESS AG 35,939 2,149,871 0.12%thyssenkrupp AG 175,194 2,109,336 0.11%Carl Zeiss Meditec AG 17,378 1,975,879 0.11%GEA Group AG 66,260 1,953,345 0.11%Knorr-Bremse AG 20,711 1,879,523 0.10%KION Group AG 27,793 1,710,937 0.09%Deutsche Lufthansa AG 101,676 1,668,503 0.09%United Internet AG 52,961 1,550,698 0.08%Fraport AG Frankfurt Airport
Services Worldwide 18,300 1,386,774 0.07%Fuchs Petrolub SE - Preference
Shares 30,574 1,350,148 0.07%Bayerische Motoren Werke AG -
Preference Shares 24,445 1,345,697 0.07%Hochtief AG 10,878 1,236,829 0.07%METRO AG 79,230 1,136,951 0.06%Telefonica Deutschland Holding AG 393,229 1,016,104 0.05%
496,986,848 26.78%
Ireland 1.82% (2018: 1.15%)
CRH plc 345,613 12,328,016 0.66%Kerry Group plc (XDUB) Class A 68,860 7,650,346 0.41%Flutter Entertainment plc 33,907 3,673,823 0.20%Kingspan Group plc 66,619 3,627,404 0.20%Smurfit Kappa Group plc 97,930 3,355,082 0.18%Bank of Ireland Group plc - EUR 415,155 2,026,787 0.11%AIB Group plc (XDUB) 358,298 1,112,874 0.06%
33,774,332 1.82%
Italy 7.25% (2018: 7.22%)
Enel SpA 3,526,900 24,942,237 1.34%Eni SpA 1,102,467 15,264,758 0.82%Intesa Sanpaolo SpA 6,451,971 15,152,454 0.82%UniCredit SpA 871,413 11,345,797 0.61%Assicurazioni Generali SpA 476,368 8,762,789 0.47%Ferrari NV 52,264 7,729,846 0.42%Fiat Chrysler Automobiles NV 470,562 6,208,595 0.34%Atlantia SpA 214,798 4,465,650 0.24%CNH Industrial NV 439,131 4,299,093 0.23%Snam SpA 883,197 4,138,661 0.22%Terna Rete Elettrica Nazionale SpA 609,949 3,631,636 0.20%EXOR NV 47,025 3,248,487 0.18%Moncler SpA 78,284 3,136,840 0.17%FinecoBank Banca Fineco SpA 263,884 2,820,920 0.15%Mediobanca Banca di Credito
Finanziario SpA 269,121 2,641,154 0.14%Poste Italiane SpA 226,141 2,288,547 0.12%Prysmian SpA 104,467 2,244,996 0.12%Telecom Italia SpA 3,970,556 2,209,217 0.12%Tenaris SA 206,886 2,079,204 0.11%Davide Campari-Milano SpA 250,820 2,041,675 0.11%Leonardo SpA 177,555 1,855,450 0.10%Recordati SpA 44,778 1,682,309 0.09%Telecom Italia SpA (Non CVA) 2,594,847 1,416,268 0.08%Pirelli & C SpA 176,439 906,896 0.05%
134,513,479 7.25%
Netherlands 12.28% (2018: 11.43%)
ASML Holding NV 184,570 48,671,109 2.62%Unilever NV 636,263 32,595,754 1.76%ING Groep NV 1,689,302 18,055,260 0.97%Koninklijke Philips NV 392,530 17,082,906 0.92%Prosus NV 211,304 14,058,055 0.76%NXP Semiconductors NV 120,821 13,697,711 0.74%Koninklijke Ahold Delhaize NV 513,163 11,440,969 0.62%Heineken NV 112,397 10,668,723 0.57%Koninklijke DSM NV 78,693 9,136,257 0.49%
Number of Fair Value % of Total Shares Euro (€) Net Assets
Vanguard Eurozone Stock Index Fund
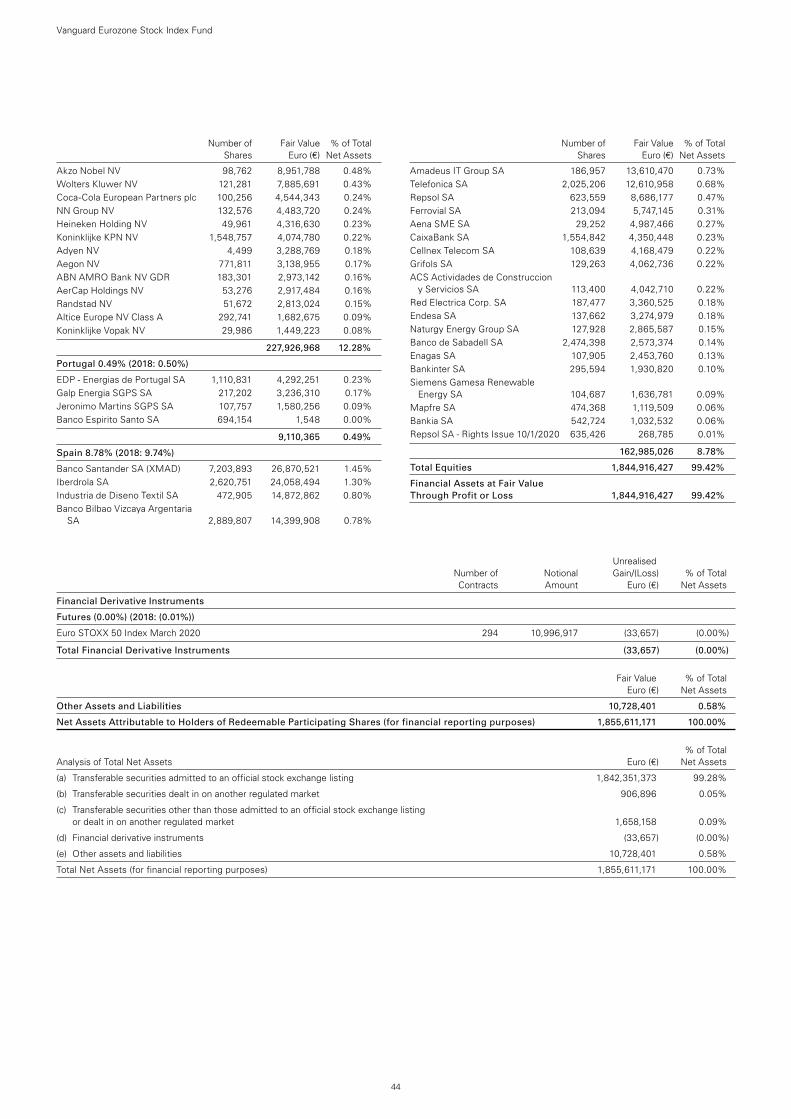
44
Akzo Nobel NV 98,762 8,951,788 0.48%Wolters Kluwer NV 121,281 7,885,691 0.43%Coca-Cola European Partners plc 100,256 4,544,343 0.24%NN Group NV 132,576 4,483,720 0.24%Heineken Holding NV 49,961 4,316,630 0.23%Koninklijke KPN NV 1,548,757 4,074,780 0.22%Adyen NV 4,499 3,288,769 0.18%Aegon NV 771,811 3,138,955 0.17%ABN AMRO Bank NV GDR 183,301 2,973,142 0.16%AerCap Holdings NV 53,276 2,917,484 0.16%Randstad NV 51,672 2,813,024 0.15%Altice Europe NV Class A 292,741 1,682,675 0.09%Koninklijke Vopak NV 29,986 1,449,223 0.08%
227,926,968 12.28%
Portugal 0.49% (2018: 0.50%)
EDP - Energias de Portugal SA 1,110,831 4,292,251 0.23%Galp Energia SGPS SA 217,202 3,236,310 0.17%Jeronimo Martins SGPS SA 107,757 1,580,256 0.09%Banco Espirito Santo SA 694,154 1,548 0.00%
9,110,365 0.49%
Spain 8.78% (2018: 9.74%)
Banco Santander SA (XMAD) 7,203,893 26,870,521 1.45%Iberdrola SA 2,620,751 24,058,494 1.30%Industria de Diseno Textil SA 472,905 14,872,862 0.80%Banco Bilbao Vizcaya Argentaria
SA 2,889,807 14,399,908 0.78%
Amadeus IT Group SA 186,957 13,610,470 0.73%Telefonica SA 2,025,206 12,610,958 0.68%Repsol SA 623,559 8,686,177 0.47%Ferrovial SA 213,094 5,747,145 0.31%Aena SME SA 29,252 4,987,466 0.27%CaixaBank SA 1,554,842 4,350,448 0.23%Cellnex Telecom SA 108,639 4,168,479 0.22%Grifols SA 129,263 4,062,736 0.22%ACS Actividades de Construccion
y Servicios SA 113,400 4,042,710 0.22%Red Electrica Corp. SA 187,477 3,360,525 0.18%Endesa SA 137,662 3,274,979 0.18%Naturgy Energy Group SA 127,928 2,865,587 0.15%Banco de Sabadell SA 2,474,398 2,573,374 0.14%Enagas SA 107,905 2,453,760 0.13%Bankinter SA 295,594 1,930,820 0.10%Siemens Gamesa Renewable
Energy SA 104,687 1,636,781 0.09%Mapfre SA 474,368 1,119,509 0.06%Bankia SA 542,724 1,032,532 0.06%Repsol SA - Rights Issue 10/1/2020 635,426 268,785 0.01%
162,985,026 8.78%
Total Equities 1,844,916,427 99.42%
Financial Assets at Fair Value Through Profit or Loss 1,844,916,427 99.42%
Vanguard Eurozone Stock Index Fund
Number of Fair Value % of Total Shares Euro (€) Net Assets
Number of Fair Value % of Total Shares Euro (€) Net Assets
Unrealised Number of Notional Gain/(Loss) % of Total Contracts Amount Euro (€) Net Assets
Financial Derivative Instruments
Futures (0.00%) (2018: (0.01%))
Euro STOXX 50 Index March 2020 294 10,996,917 (33,657) (0.00%)
Total Financial Derivative Instruments (33,657) (0.00%)
Fair Value % of Total Euro (€) Net Assets
Other Assets and Liabilities 10,728,401 0.58%
Net Assets Attributable to Holders of Redeemable Participating Shares (for financial reporting purposes) 1,855,611,171 100.00%
% of Total Analysis of Total Net Assets Euro (€) Net Assets
(a) Transferable securities admitted to an official stock exchange listing 1,842,351,373 99.28%
(b) Transferable securities dealt in on another regulated market 906,896 0.05%
(c) Transferable securities other than those admitted to an official stock exchange listing or dealt in on another regulated market 1,658,158 0.09%
(d) Financial derivative instruments (33,657) (0.00%)
(e) Other assets and liabilities 10,728,401 0.58%
Total Net Assets (for financial reporting purposes) 1,855,611,171 100.00%
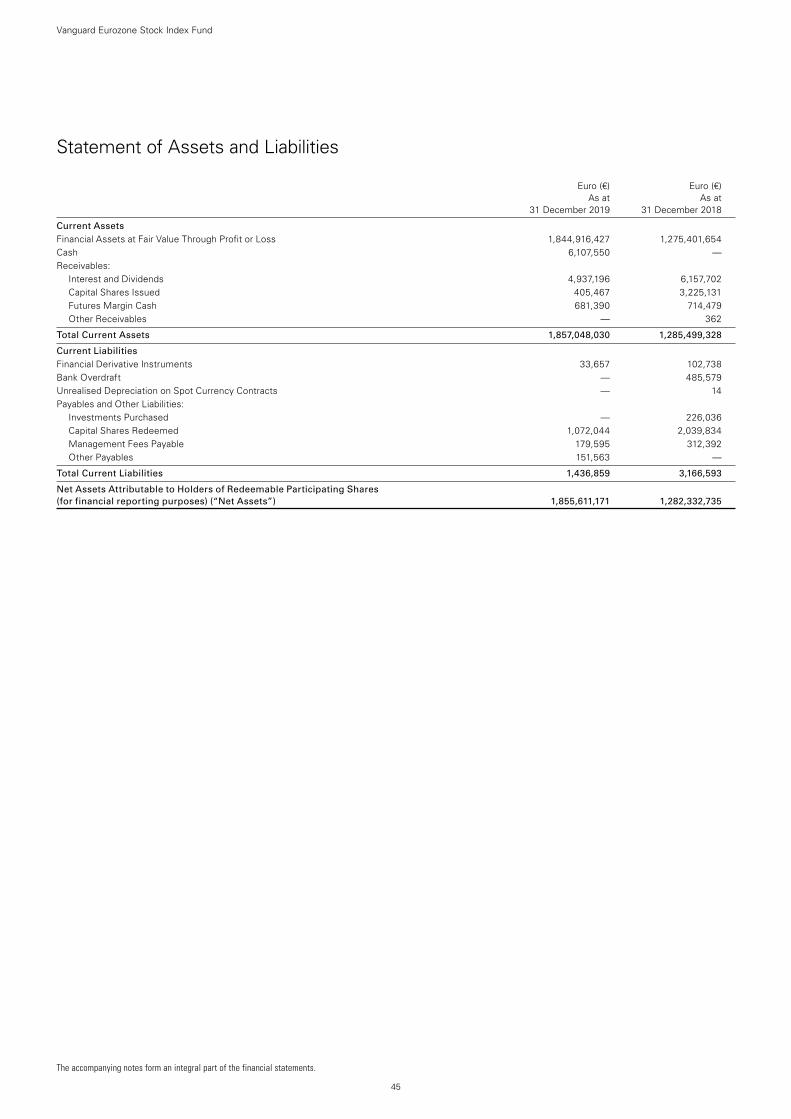
The accompanying notes form an integral part of the financial statements.
45
Vanguard Eurozone Stock Index Fund
Statement of Assets and Liabilities
Euro (€) Euro (€) As at As at 31 December 2019 31 December 2018
Current Assets Financial Assets at Fair Value Through Profit or Loss 1,844,916,427 1,275,401,654Cash 6,107,550 —Receivables:
Interest and Dividends 4,937,196 6,157,702Capital Shares Issued 405,467 3,225,131Futures Margin Cash 681,390 714,479Other Receivables — 362
Total Current Assets 1,857,048,030 1,285,499,328
Current Liabilities Financial Derivative Instruments 33,657 102,738Bank Overdraft — 485,579Unrealised Depreciation on Spot Currency Contracts — 14Payables and Other Liabilities:
Investments Purchased — 226,036Capital Shares Redeemed 1,072,044 2,039,834Management Fees Payable 179,595 312,392Other Payables 151,563 —
Total Current Liabilities 1,436,859 3,166,593
Net Assets Attributable to Holders of Redeemable Participating Shares (for financial reporting purposes) (“Net Assets”) 1,855,611,171 1,282,332,735
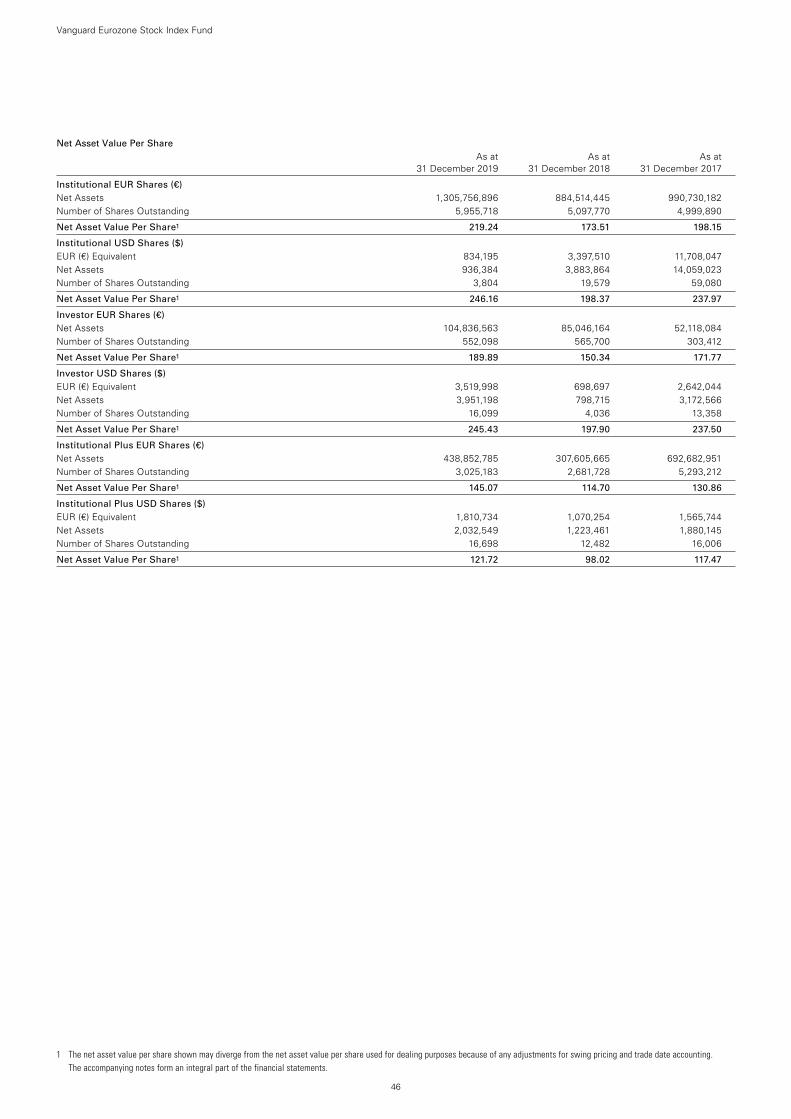
1 The net asset value per share shown may diverge from the net asset value per share used for dealing purposes because of any adjustments for swing pricing and trade date accounting. The accompanying notes form an integral part of the financial statements.
46
Net Asset Value Per Share As at As at As at 31 December 2019 31 December 2018 31 December 2017
Institutional EUR Shares (€) Net Assets 1,305,756,896 884,514,445 990,730,182Number of Shares Outstanding 5,955,718 5,097,770 4,999,890
Net Asset Value Per Share1 219.24 173.51 198.15
Institutional USD Shares ($) EUR (€) Equivalent 834,195 3,397,510 11,708,047Net Assets 936,384 3,883,864 14,059,023Number of Shares Outstanding 3,804 19,579 59,080
Net Asset Value Per Share1 246.16 198.37 237.97
Investor EUR Shares (€) Net Assets 104,836,563 85,046,164 52,118,084Number of Shares Outstanding 552,098 565,700 303,412
Net Asset Value Per Share1 189.89 150.34 171.77
Investor USD Shares ($) EUR (€) Equivalent 3,519,998 698,697 2,642,044Net Assets 3,951,198 798,715 3,172,566Number of Shares Outstanding 16,099 4,036 13,358
Net Asset Value Per Share1 245.43 197.90 237.50
Institutional Plus EUR Shares (€) Net Assets 438,852,785 307,605,665 692,682,951Number of Shares Outstanding 3,025,183 2,681,728 5,293,212
Net Asset Value Per Share1 145.07 114.70 130.86
Institutional Plus USD Shares ($) EUR (€) Equivalent 1,810,734 1,070,254 1,565,744Net Assets 2,032,549 1,223,461 1,880,145Number of Shares Outstanding 16,698 12,482 16,006
Net Asset Value Per Share1 121.72 98.02 117.47
Vanguard Eurozone Stock Index Fund

47
Vanguard Eurozone Stock Index Fund
Statement of Operations
Euro (€) Euro (€) Year Ended Year Ended 31 December 2019 31 December 2018
Investment Income/(Loss) Interest Income 778 1,701Dividend Income 55,749,936 54,485,150Securities Lending Income 379,668 206,583Miscellaneous Income 19,799 —Net Gain/(Loss) on Financial Instruments 301,934,932 (227,432,318)
Total Investment Income/(Loss) 358,085,113 (172,738,884)
Expenses Management Fees 3,930,039 4,261,308Transaction Fees and Commissions 636,183 523,249
Total Expenses 4,566,222 4,784,557
Finance Costs Interest Expense 36,805 28,477
Total Finance Costs 36,805 28,477
Net Investment Income/(Loss) 353,482,086 (177,551,918)
Foreign Withholding Tax/Reclaim Benefit (See note 5) 571,463 (3,776,223)
Net Increase/(Decrease) in Net Assets Attributable to Holders of Redeemable Participating Shares (for financial reporting purposes) 354,053,549 (181,328,141)
Statement of Changes in Net Assets Attributable to Holders of Redeemable Participating Shares
Euro (€) Euro (€) Year Ended Year Ended 31 December 2019 31 December 2018
Increase/(Decrease) in Net Assets
Net Increase/(Decrease) in Net Assets Attributable to Holders of Redeemable Participating Shares From Operations 354,053,549 (181,328,141)
Capital Transactions Subscriptions 580,235,844 509,553,907Redemptions (361,010,957) (797,340,083)
Total Capital Transactions 219,224,887 (287,786,176)
Total Increase/(Decrease) for the Year 573,278,436 (469,114,317)
Net Assets Attributable to Holders of Redeemable Participating Shares (for financial reporting purposes) Beginning of Year 1,282,332,735 1,751,447,052
End of Year 1,855,611,171 1,282,332,735
The accompanying notes form an integral part of the financial statements.
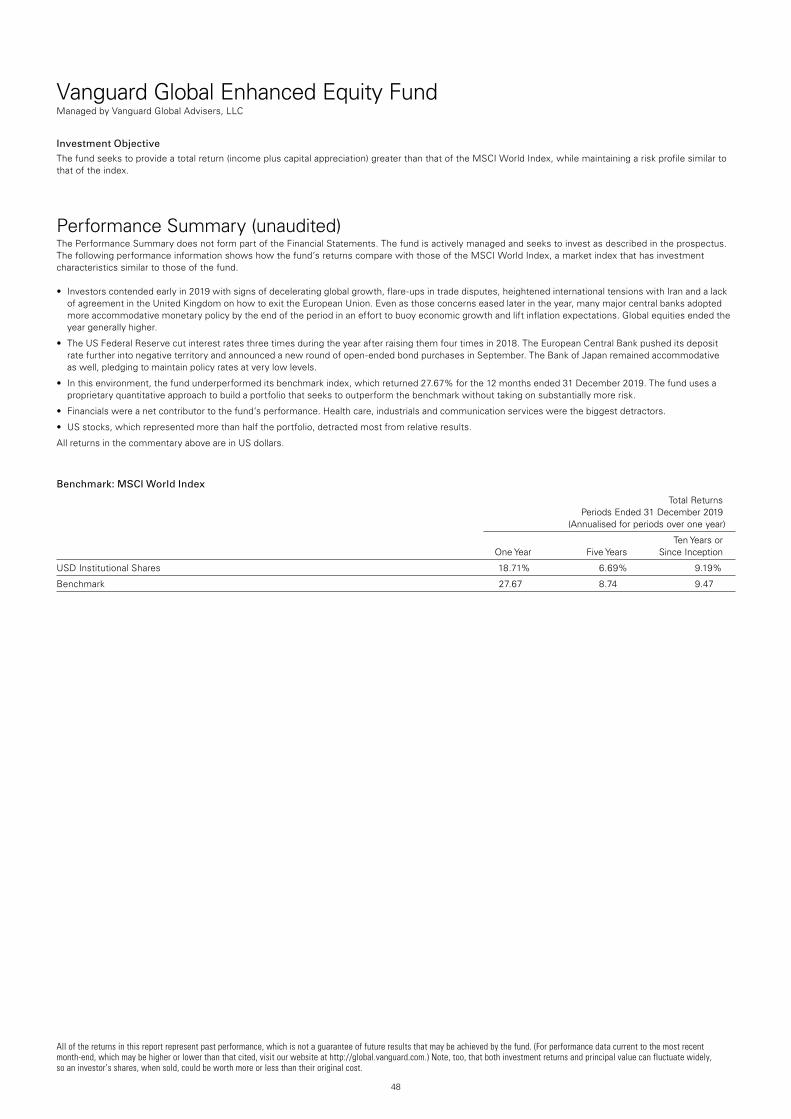
48
Vanguard Global Enhanced Equity FundManaged by Vanguard Global Advisers, LLC
All of the returns in this report represent past performance, which is not a guarantee of future results that may be achieved by the fund. (For performance data current to the most recent month-end, which may be higher or lower than that cited, visit our website at http://global.vanguard.com.) Note, too, that both investment returns and principal value can fluctuate widely, so an investor’s shares, when sold, could be worth more or less than their original cost.
Investment ObjectiveThe fund seeks to provide a total return (income plus capital appreciation) greater than that of the MSCI World Index, while maintaining a risk profile similar to that of the index.
Performance Summary (unaudited)The Performance Summary does not form part of the Financial Statements. The fund is actively managed and seeks to invest as described in the prospectus. The following performance information shows how the fund’s returns compare with those of the MSCI World Index, a market index that has investment characteristics similar to those of the fund.
• Investorscontendedearlyin2019withsignsofdeceleratingglobalgrowth,flare-upsintradedisputes,heightenedinternationaltensionswithIranandalackof agreement in the United Kingdom on how to exit the European Union. Even as those concerns eased later in the year, many major central banks adopted more accommodative monetary policy by the end of the period in an effort to buoy economic growth and lift inflation expectations. Global equities ended the year generally higher.
• TheUSFederalReservecutinterestratesthreetimesduringtheyearafterraisingthemfourtimesin2018.TheEuropeanCentralBankpusheditsdepositrate further into negative territory and announced a new round of open-ended bond purchases in September. The Bank of Japan remained accommodative as well, pledging to maintain policy rates at very low levels.
• Inthisenvironment,thefundunderperformeditsbenchmarkindex,whichreturned27.67%forthe12monthsended31December2019.Thefundusesaproprietary quantitative approach to build a portfolio that seeks to outperform the benchmark without taking on substantially more risk.
• Financialswereanetcontributortothefund’sperformance.Healthcare,industrialsandcommunicationserviceswerethebiggestdetractors.
• USstocks,whichrepresentedmorethanhalftheportfolio,detractedmostfromrelativeresults.
All returns in the commentary above are in US dollars.
Benchmark: MSCI World Index
Total Returns Periods Ended 31 December 2019 (Annualised for periods over one year)
Ten Years or One Year Five Years Since Inception
USD Institutional Shares 18.71% 6.69% 9.19%
Benchmark 27.67 8.74 9.47
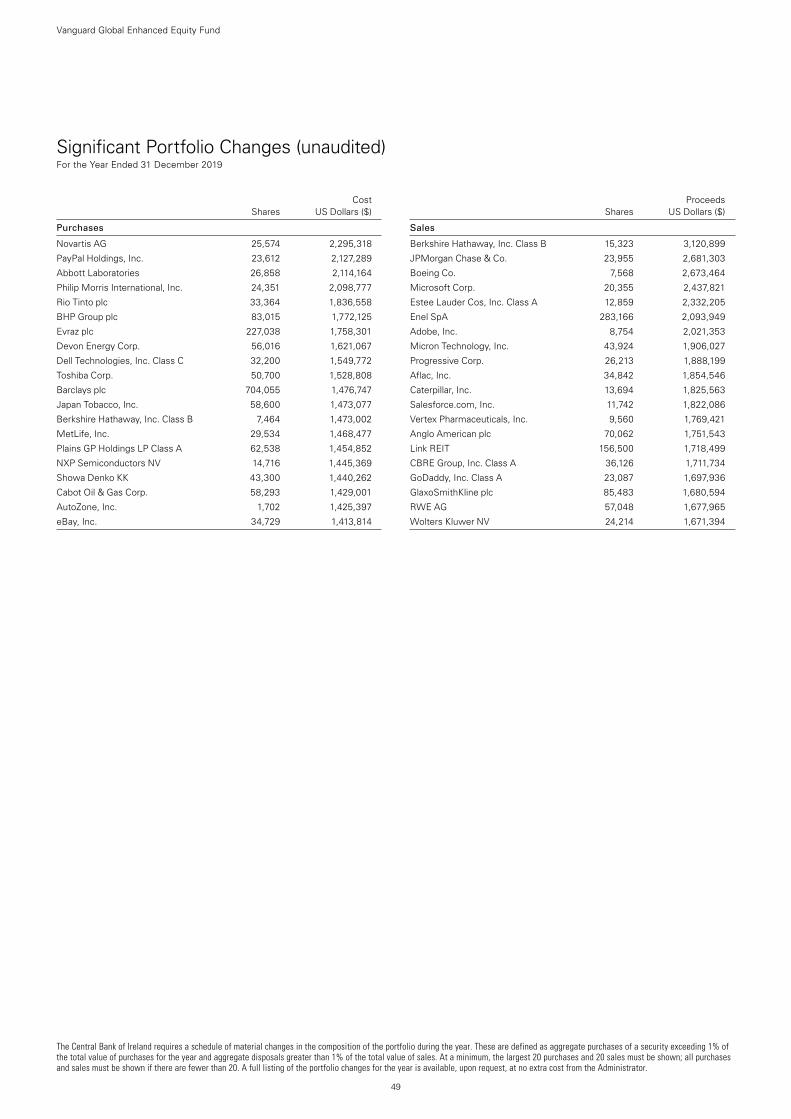
The Central Bank of Ireland requires a schedule of material changes in the composition of the portfolio during the year. These are defined as aggregate purchases of a security exceeding 1% of the total value of purchases for the year and aggregate disposals greater than 1% of the total value of sales. At a minimum, the largest 20 purchases and 20 sales must be shown; all purchases and sales must be shown if there are fewer than 20. A full listing of the portfolio changes for the year is available, upon request, at no extra cost from the Administrator.
49
Vanguard Global Enhanced Equity Fund
Significant Portfolio Changes (unaudited) For the Year Ended 31 December 2019
Cost Shares US Dollars ($)
Purchases
Novartis AG 25,574 2,295,318
PayPal Holdings, Inc. 23,612 2,127,289
Abbott Laboratories 26,858 2,114,164
Philip Morris International, Inc. 24,351 2,098,777
Rio Tinto plc 33,364 1,836,558
BHP Group plc 83,015 1,772,125
Evraz plc 227,038 1,758,301
Devon Energy Corp. 56,016 1,621,067
Dell Technologies, Inc. Class C 32,200 1,549,772
Toshiba Corp. 50,700 1,528,808
Barclays plc 704,055 1,476,747
Japan Tobacco, Inc. 58,600 1,473,077
Berkshire Hathaway, Inc. Class B 7,464 1,473,002
MetLife, Inc. 29,534 1,468,477
Plains GP Holdings LP Class A 62,538 1,454,852
NXP Semiconductors NV 14,716 1,445,369
Showa Denko KK 43,300 1,440,262
Cabot Oil & Gas Corp. 58,293 1,429,001
AutoZone, Inc. 1,702 1,425,397
eBay, Inc. 34,729 1,413,814
Proceeds Shares US Dollars ($)
Sales
Berkshire Hathaway, Inc. Class B 15,323 3,120,899
JPMorgan Chase & Co. 23,955 2,681,303
Boeing Co. 7,568 2,673,464
Microsoft Corp. 20,355 2,437,821
Estee Lauder Cos, Inc. Class A 12,859 2,332,205
Enel SpA 283,166 2,093,949
Adobe, Inc. 8,754 2,021,353
Micron Technology, Inc. 43,924 1,906,027
Progressive Corp. 26,213 1,888,199
Aflac, Inc. 34,842 1,854,546
Caterpillar, Inc. 13,694 1,825,563
Salesforce.com, Inc. 11,742 1,822,086
Vertex Pharmaceuticals, Inc. 9,560 1,769,421
Anglo American plc 70,062 1,751,543
Link REIT 156,500 1,718,499
CBRE Group, Inc. Class A 36,126 1,711,734
GoDaddy, Inc. Class A 23,087 1,697,936
GlaxoSmithKline plc 85,483 1,680,594
RWE AG 57,048 1,677,965
Wolters Kluwer NV 24,214 1,671,394
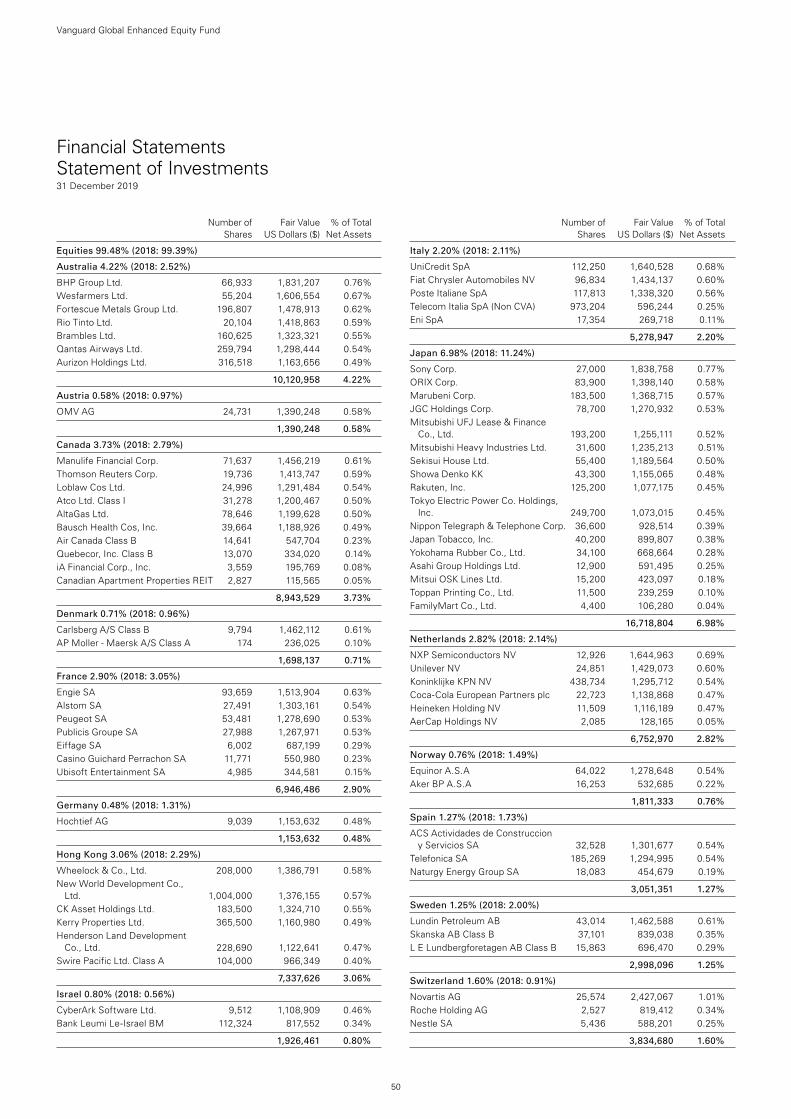
50
Vanguard Global Enhanced Equity Fund
Number of Fair Value % of Total Shares US Dollars ($) Net Assets
Number of Fair Value % of Total Shares US Dollars ($) Net Assets
Equities 99.48% (2018: 99.39%)
Australia 4.22% (2018: 2.52%)
BHP Group Ltd. 66,933 1,831,207 0.76%Wesfarmers Ltd. 55,204 1,606,554 0.67%Fortescue Metals Group Ltd. 196,807 1,478,913 0.62%Rio Tinto Ltd. 20,104 1,418,863 0.59%Brambles Ltd. 160,625 1,323,321 0.55%Qantas Airways Ltd. 259,794 1,298,444 0.54%Aurizon Holdings Ltd. 316,518 1,163,656 0.49%
10,120,958 4.22%
Austria 0.58% (2018: 0.97%)
OMV AG 24,731 1,390,248 0.58%
1,390,248 0.58%
Canada 3.73% (2018: 2.79%)
Manulife Financial Corp. 71,637 1,456,219 0.61%Thomson Reuters Corp. 19,736 1,413,747 0.59%Loblaw Cos Ltd. 24,996 1,291,484 0.54%Atco Ltd. Class I 31,278 1,200,467 0.50%AltaGas Ltd. 78,646 1,199,628 0.50%Bausch Health Cos, Inc. 39,664 1,188,926 0.49%Air Canada Class B 14,641 547,704 0.23%Quebecor, Inc. Class B 13,070 334,020 0.14%iA Financial Corp., Inc. 3,559 195,769 0.08%Canadian Apartment Properties REIT 2,827 115,565 0.05%
8,943,529 3.73%
Denmark 0.71% (2018: 0.96%)
Carlsberg A/S Class B 9,794 1,462,112 0.61%AP Moller - Maersk A/S Class A 174 236,025 0.10%
1,698,137 0.71%
France 2.90% (2018: 3.05%)
Engie SA 93,659 1,513,904 0.63%Alstom SA 27,491 1,303,161 0.54%Peugeot SA 53,481 1,278,690 0.53%Publicis Groupe SA 27,988 1,267,971 0.53%Eiffage SA 6,002 687,199 0.29%Casino Guichard Perrachon SA 11,771 550,980 0.23%Ubisoft Entertainment SA 4,985 344,581 0.15%
6,946,486 2.90%
Germany 0.48% (2018: 1.31%)
Hochtief AG 9,039 1,153,632 0.48%
1,153,632 0.48%
Hong Kong 3.06% (2018: 2.29%)
Wheelock & Co., Ltd. 208,000 1,386,791 0.58%New World Development Co.,
Ltd. 1,004,000 1,376,155 0.57%CK Asset Holdings Ltd. 183,500 1,324,710 0.55%Kerry Properties Ltd. 365,500 1,160,980 0.49%Henderson Land Development
Co., Ltd. 228,690 1,122,641 0.47%Swire Pacific Ltd. Class A 104,000 966,349 0.40%
7,337,626 3.06%
Israel 0.80% (2018: 0.56%)
CyberArk Software Ltd. 9,512 1,108,909 0.46%Bank Leumi Le-Israel BM 112,324 817,552 0.34%
1,926,461 0.80%
Italy 2.20% (2018: 2.11%)
UniCredit SpA 112,250 1,640,528 0.68%Fiat Chrysler Automobiles NV 96,834 1,434,137 0.60%Poste Italiane SpA 117,813 1,338,320 0.56%Telecom Italia SpA (Non CVA) 973,204 596,244 0.25%Eni SpA 17,354 269,718 0.11%
5,278,947 2.20%
Japan 6.98% (2018: 11.24%)
Sony Corp. 27,000 1,838,758 0.77%ORIX Corp. 83,900 1,398,140 0.58%Marubeni Corp. 183,500 1,368,715 0.57%JGC Holdings Corp. 78,700 1,270,932 0.53%Mitsubishi UFJ Lease & Finance
Co., Ltd. 193,200 1,255,111 0.52%Mitsubishi Heavy Industries Ltd. 31,600 1,235,213 0.51%Sekisui House Ltd. 55,400 1,189,564 0.50%Showa Denko KK 43,300 1,155,065 0.48%Rakuten, Inc. 125,200 1,077,175 0.45%Tokyo Electric Power Co. Holdings,
Inc. 249,700 1,073,015 0.45%Nippon Telegraph & Telephone Corp. 36,600 928,514 0.39%Japan Tobacco, Inc. 40,200 899,807 0.38%Yokohama Rubber Co., Ltd. 34,100 668,664 0.28%Asahi Group Holdings Ltd. 12,900 591,495 0.25%Mitsui OSK Lines Ltd. 15,200 423,097 0.18%Toppan Printing Co., Ltd. 11,500 239,259 0.10%FamilyMart Co., Ltd. 4,400 106,280 0.04%
16,718,804 6.98%
Netherlands 2.82% (2018: 2.14%)
NXP Semiconductors NV 12,926 1,644,963 0.69%Unilever NV 24,851 1,429,073 0.60%Koninklijke KPN NV 438,734 1,295,712 0.54%Coca-Cola European Partners plc 22,723 1,138,868 0.47%Heineken Holding NV 11,509 1,116,189 0.47%AerCap Holdings NV 2,085 128,165 0.05%
6,752,970 2.82%
Norway 0.76% (2018: 1.49%)
Equinor A.S.A 64,022 1,278,648 0.54%Aker BP A.S.A 16,253 532,685 0.22%
1,811,333 0.76%
Spain 1.27% (2018: 1.73%)
ACS Actividades de Construccion y Servicios SA 32,528 1,301,677 0.54%
Telefonica SA 185,269 1,294,995 0.54%Naturgy Energy Group SA 18,083 454,679 0.19%
3,051,351 1.27%
Sweden 1.25% (2018: 2.00%)
Lundin Petroleum AB 43,014 1,462,588 0.61%Skanska AB Class B 37,101 839,038 0.35%L E Lundbergforetagen AB Class B 15,863 696,470 0.29%
2,998,096 1.25%
Switzerland 1.60% (2018: 0.91%)
Novartis AG 25,574 2,427,067 1.01%Roche Holding AG 2,527 819,412 0.34%Nestle SA 5,436 588,201 0.25%
3,834,680 1.60%
Financial Statements Statement of Investments31 December 2019
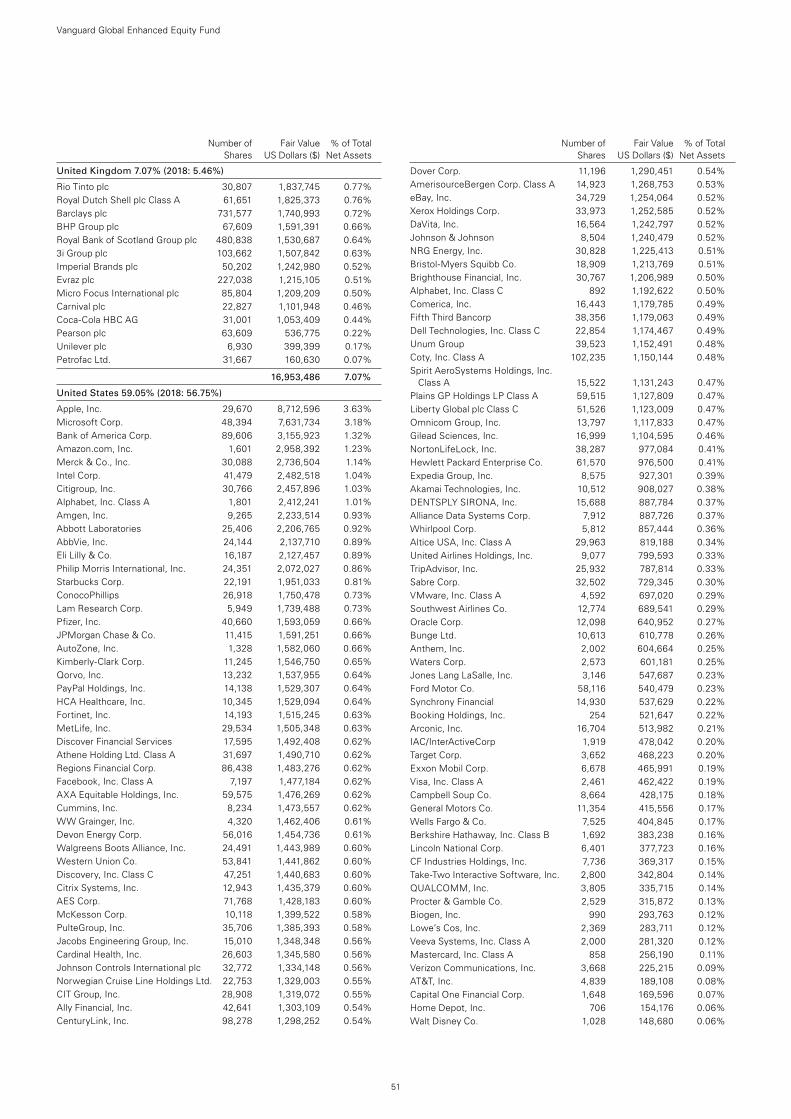
51
Number of Fair Value % of Total Shares US Dollars ($) Net Assets
United Kingdom 7.07% (2018: 5.46%)
Rio Tinto plc 30,807 1,837,745 0.77%Royal Dutch Shell plc Class A 61,651 1,825,373 0.76%Barclays plc 731,577 1,740,993 0.72%BHP Group plc 67,609 1,591,391 0.66%Royal Bank of Scotland Group plc 480,838 1,530,687 0.64%3i Group plc 103,662 1,507,842 0.63%Imperial Brands plc 50,202 1,242,980 0.52%Evraz plc 227,038 1,215,105 0.51%Micro Focus International plc 85,804 1,209,209 0.50%Carnival plc 22,827 1,101,948 0.46%Coca-Cola HBC AG 31,001 1,053,409 0.44%Pearson plc 63,609 536,775 0.22%Unilever plc 6,930 399,399 0.17%Petrofac Ltd. 31,667 160,630 0.07%
16,953,486 7.07%
United States 59.05% (2018: 56.75%)
Apple, Inc. 29,670 8,712,596 3.63%Microsoft Corp. 48,394 7,631,734 3.18%Bank of America Corp. 89,606 3,155,923 1.32%Amazon.com, Inc. 1,601 2,958,392 1.23%Merck & Co., Inc. 30,088 2,736,504 1.14%Intel Corp. 41,479 2,482,518 1.04%Citigroup, Inc. 30,766 2,457,896 1.03%Alphabet, Inc. Class A 1,801 2,412,241 1.01%Amgen, Inc. 9,265 2,233,514 0.93%Abbott Laboratories 25,406 2,206,765 0.92%AbbVie, Inc. 24,144 2,137,710 0.89%Eli Lilly & Co. 16,187 2,127,457 0.89%Philip Morris International, Inc. 24,351 2,072,027 0.86%Starbucks Corp. 22,191 1,951,033 0.81%ConocoPhillips 26,918 1,750,478 0.73%Lam Research Corp. 5,949 1,739,488 0.73%Pfizer, Inc. 40,660 1,593,059 0.66%JPMorgan Chase & Co. 11,415 1,591,251 0.66%AutoZone, Inc. 1,328 1,582,060 0.66%Kimberly-Clark Corp. 11,245 1,546,750 0.65%Qorvo, Inc. 13,232 1,537,955 0.64%PayPal Holdings, Inc. 14,138 1,529,307 0.64%HCA Healthcare, Inc. 10,345 1,529,094 0.64%Fortinet, Inc. 14,193 1,515,245 0.63%MetLife, Inc. 29,534 1,505,348 0.63%Discover Financial Services 17,595 1,492,408 0.62%Athene Holding Ltd. Class A 31,697 1,490,710 0.62%Regions Financial Corp. 86,438 1,483,276 0.62%Facebook, Inc. Class A 7,197 1,477,184 0.62%AXA Equitable Holdings, Inc. 59,575 1,476,269 0.62%Cummins, Inc. 8,234 1,473,557 0.62%WW Grainger, Inc. 4,320 1,462,406 0.61%Devon Energy Corp. 56,016 1,454,736 0.61%Walgreens Boots Alliance, Inc. 24,491 1,443,989 0.60%Western Union Co. 53,841 1,441,862 0.60%Discovery, Inc. Class C 47,251 1,440,683 0.60%Citrix Systems, Inc. 12,943 1,435,379 0.60%AES Corp. 71,768 1,428,183 0.60%McKesson Corp. 10,118 1,399,522 0.58%PulteGroup, Inc. 35,706 1,385,393 0.58%Jacobs Engineering Group, Inc. 15,010 1,348,348 0.56%Cardinal Health, Inc. 26,603 1,345,580 0.56%Johnson Controls International plc 32,772 1,334,148 0.56%Norwegian Cruise Line Holdings Ltd. 22,753 1,329,003 0.55%CIT Group, Inc. 28,908 1,319,072 0.55%Ally Financial, Inc. 42,641 1,303,109 0.54%CenturyLink, Inc. 98,278 1,298,252 0.54%
Dover Corp. 11,196 1,290,451 0.54%AmerisourceBergen Corp. Class A 14,923 1,268,753 0.53%eBay, Inc. 34,729 1,254,064 0.52%Xerox Holdings Corp. 33,973 1,252,585 0.52%DaVita, Inc. 16,564 1,242,797 0.52%Johnson & Johnson 8,504 1,240,479 0.52%NRG Energy, Inc. 30,828 1,225,413 0.51%Bristol-Myers Squibb Co. 18,909 1,213,769 0.51%Brighthouse Financial, Inc. 30,767 1,206,989 0.50%Alphabet, Inc. Class C 892 1,192,622 0.50%Comerica, Inc. 16,443 1,179,785 0.49%Fifth Third Bancorp 38,356 1,179,063 0.49%Dell Technologies, Inc. Class C 22,854 1,174,467 0.49%Unum Group 39,523 1,152,491 0.48%Coty, Inc. Class A 102,235 1,150,144 0.48%Spirit AeroSystems Holdings, Inc.
Class A 15,522 1,131,243 0.47%Plains GP Holdings LP Class A 59,515 1,127,809 0.47%Liberty Global plc Class C 51,526 1,123,009 0.47%Omnicom Group, Inc. 13,797 1,117,833 0.47%Gilead Sciences, Inc. 16,999 1,104,595 0.46%NortonLifeLock, Inc. 38,287 977,084 0.41%Hewlett Packard Enterprise Co. 61,570 976,500 0.41%Expedia Group, Inc. 8,575 927,301 0.39%Akamai Technologies, Inc. 10,512 908,027 0.38%DENTSPLY SIRONA, Inc. 15,688 887,784 0.37%Alliance Data Systems Corp. 7,912 887,726 0.37%Whirlpool Corp. 5,812 857,444 0.36%Altice USA, Inc. Class A 29,963 819,188 0.34%United Airlines Holdings, Inc. 9,077 799,593 0.33%TripAdvisor, Inc. 25,932 787,814 0.33%Sabre Corp. 32,502 729,345 0.30%VMware, Inc. Class A 4,592 697,020 0.29%Southwest Airlines Co. 12,774 689,541 0.29%Oracle Corp. 12,098 640,952 0.27%Bunge Ltd. 10,613 610,778 0.26%Anthem, Inc. 2,002 604,664 0.25%Waters Corp. 2,573 601,181 0.25%Jones Lang LaSalle, Inc. 3,146 547,687 0.23%Ford Motor Co. 58,116 540,479 0.23%Synchrony Financial 14,930 537,629 0.22%Booking Holdings, Inc. 254 521,647 0.22%Arconic, Inc. 16,704 513,982 0.21%IAC/InterActiveCorp 1,919 478,042 0.20%Target Corp. 3,652 468,223 0.20%Exxon Mobil Corp. 6,678 465,991 0.19%Visa, Inc. Class A 2,461 462,422 0.19%Campbell Soup Co. 8,664 428,175 0.18%General Motors Co. 11,354 415,556 0.17%Wells Fargo & Co. 7,525 404,845 0.17%Berkshire Hathaway, Inc. Class B 1,692 383,238 0.16%Lincoln National Corp. 6,401 377,723 0.16%CF Industries Holdings, Inc. 7,736 369,317 0.15%Take-Two Interactive Software, Inc. 2,800 342,804 0.14%QUALCOMM, Inc. 3,805 335,715 0.14%Procter & Gamble Co. 2,529 315,872 0.13%Biogen, Inc. 990 293,763 0.12%Lowe’s Cos, Inc. 2,369 283,711 0.12%Veeva Systems, Inc. Class A 2,000 281,320 0.12%Mastercard, Inc. Class A 858 256,190 0.11%Verizon Communications, Inc. 3,668 225,215 0.09%AT&T, Inc. 4,839 189,108 0.08%Capital One Financial Corp. 1,648 169,596 0.07%Home Depot, Inc. 706 154,176 0.06%Walt Disney Co. 1,028 148,680 0.06%
Number of Fair Value % of Total Shares US Dollars ($) Net Assets
Vanguard Global Enhanced Equity Fund
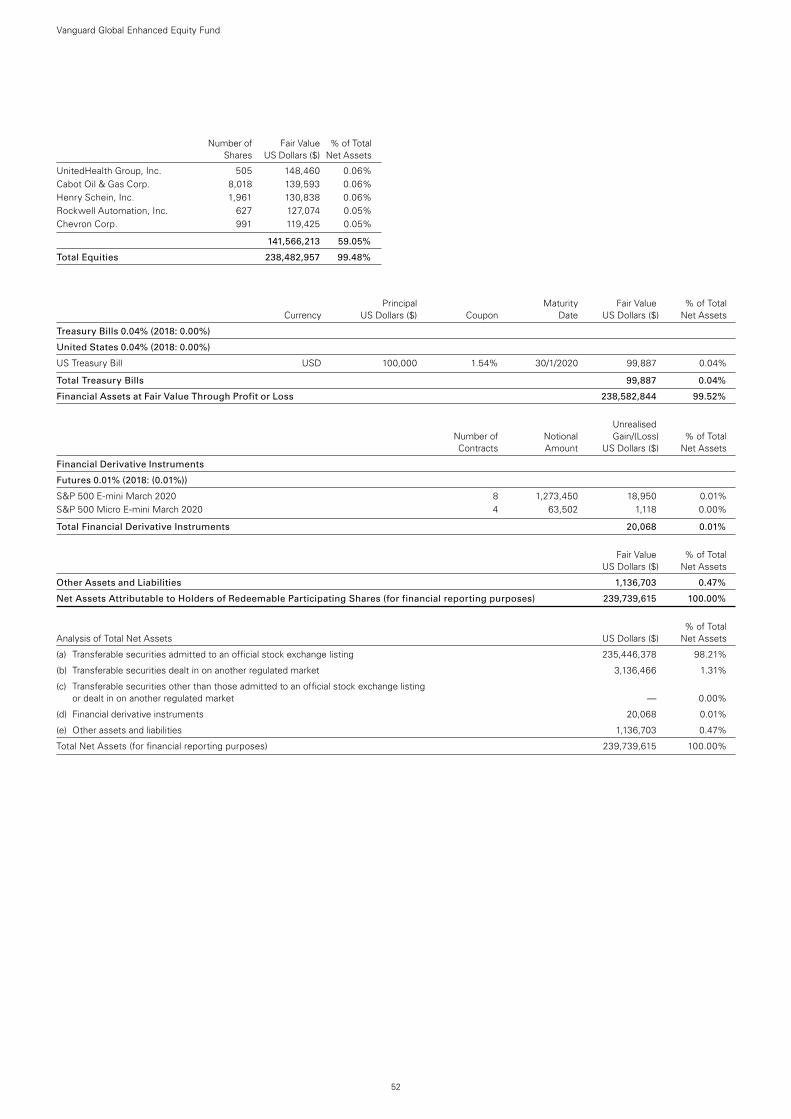
52
Number of Fair Value % of Total Shares US Dollars ($) Net Assets
UnitedHealth Group, Inc. 505 148,460 0.06%Cabot Oil & Gas Corp. 8,018 139,593 0.06%Henry Schein, Inc. 1,961 130,838 0.06%Rockwell Automation, Inc. 627 127,074 0.05%Chevron Corp. 991 119,425 0.05%
141,566,213 59.05%
Total Equities 238,482,957 99.48%
Vanguard Global Enhanced Equity Fund
Principal Maturity Fair Value % of Total Currency US Dollars ($) Coupon Date US Dollars ($) Net Assets
Treasury Bills 0.04% (2018: 0.00%)
United States 0.04% (2018: 0.00%)
US Treasury Bill USD 100,000 1.54% 30/1/2020 99,887 0.04%
Total Treasury Bills 99,887 0.04%
Financial Assets at Fair Value Through Profit or Loss 238,582,844 99.52%
Unrealised Number of Notional Gain/(Loss) % of Total Contracts Amount US Dollars ($) Net Assets
Financial Derivative Instruments
Futures 0.01% (2018: (0.01%))
S&P 500 E-mini March 2020 8 1,273,450 18,950 0.01%S&P 500 Micro E-mini March 2020 4 63,502 1,118 0.00%
Total Financial Derivative Instruments 20,068 0.01%
Fair Value % of Total US Dollars ($) Net Assets
Other Assets and Liabilities 1,136,703 0.47%
Net Assets Attributable to Holders of Redeemable Participating Shares (for financial reporting purposes) 239,739,615 100.00%
% of Total Analysis of Total Net Assets US Dollars ($) Net Assets
(a) Transferable securities admitted to an official stock exchange listing 235,446,378 98.21%
(b) Transferable securities dealt in on another regulated market 3,136,466 1.31%
(c) Transferable securities other than those admitted to an official stock exchange listing or dealt in on another regulated market — 0.00%
(d) Financial derivative instruments 20,068 0.01%
(e) Other assets and liabilities 1,136,703 0.47%
Total Net Assets (for financial reporting purposes) 239,739,615 100.00%
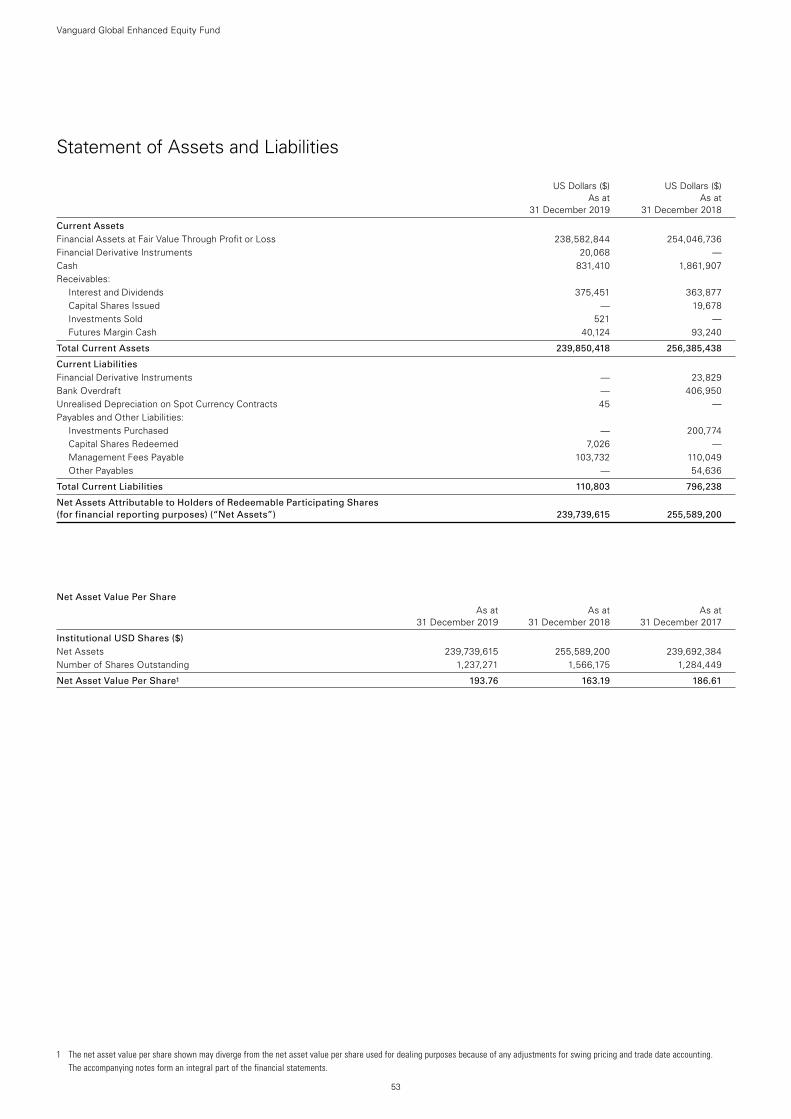
1 The net asset value per share shown may diverge from the net asset value per share used for dealing purposes because of any adjustments for swing pricing and trade date accounting. The accompanying notes form an integral part of the financial statements.
53
Vanguard Global Enhanced Equity Fund
Statement of Assets and Liabilities
US Dollars ($) US Dollars ($) As at As at 31 December 2019 31 December 2018
Current Assets Financial Assets at Fair Value Through Profit or Loss 238,582,844 254,046,736Financial Derivative Instruments 20,068 —Cash 831,410 1,861,907Receivables:
Interest and Dividends 375,451 363,877Capital Shares Issued — 19,678Investments Sold 521 —Futures Margin Cash 40,124 93,240
Total Current Assets 239,850,418 256,385,438
Current Liabilities Financial Derivative Instruments — 23,829Bank Overdraft — 406,950Unrealised Depreciation on Spot Currency Contracts 45 —Payables and Other Liabilities:
Investments Purchased — 200,774Capital Shares Redeemed 7,026 —Management Fees Payable 103,732 110,049Other Payables — 54,636
Total Current Liabilities 110,803 796,238
Net Assets Attributable to Holders of Redeemable Participating Shares (for financial reporting purposes) (“Net Assets”) 239,739,615 255,589,200
Net Asset Value Per Share As at As at As at 31 December 2019 31 December 2018 31 December 2017
Institutional USD Shares ($) Net Assets 239,739,615 255,589,200 239,692,384Number of Shares Outstanding 1,237,271 1,566,175 1,284,449
Net Asset Value Per Share1 193.76 163.19 186.61
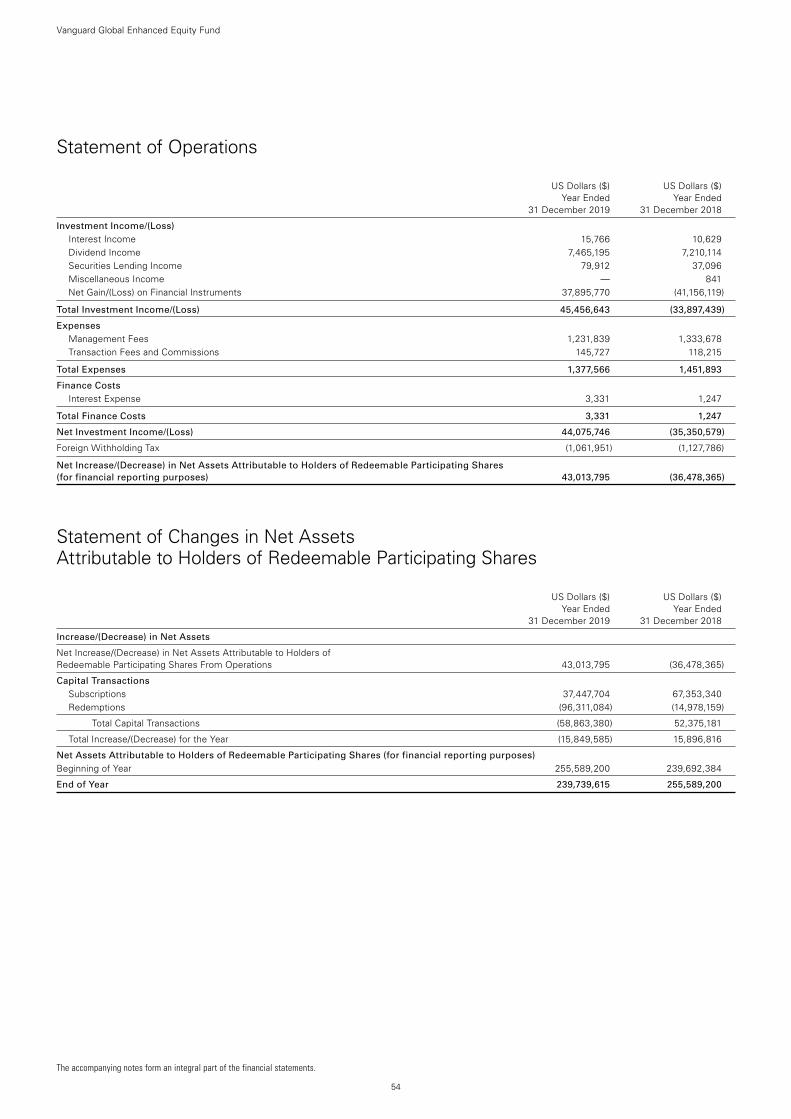
54
Vanguard Global Enhanced Equity Fund
Statement of Operations
US Dollars ($) US Dollars ($) Year Ended Year Ended 31 December 2019 31 December 2018
Investment Income/(Loss) Interest Income 15,766 10,629Dividend Income 7,465,195 7,210,114Securities Lending Income 79,912 37,096Miscellaneous Income — 841Net Gain/(Loss) on Financial Instruments 37,895,770 (41,156,119)
Total Investment Income/(Loss) 45,456,643 (33,897,439)
Expenses Management Fees 1,231,839 1,333,678Transaction Fees and Commissions 145,727 118,215
Total Expenses 1,377,566 1,451,893
Finance Costs Interest Expense 3,331 1,247
Total Finance Costs 3,331 1,247
Net Investment Income/(Loss) 44,075,746 (35,350,579)
Foreign Withholding Tax (1,061,951) (1,127,786)
Net Increase/(Decrease) in Net Assets Attributable to Holders of Redeemable Participating Shares (for financial reporting purposes) 43,013,795 (36,478,365)
Statement of Changes in Net Assets Attributable to Holders of Redeemable Participating Shares
US Dollars ($) US Dollars ($) Year Ended Year Ended 31 December 2019 31 December 2018
Increase/(Decrease) in Net Assets
Net Increase/(Decrease) in Net Assets Attributable to Holders of Redeemable Participating Shares From Operations 43,013,795 (36,478,365)
Capital Transactions Subscriptions 37,447,704 67,353,340Redemptions (96,311,084) (14,978,159)
Total Capital Transactions (58,863,380) 52,375,181
Total Increase/(Decrease) for the Year (15,849,585) 15,896,816
Net Assets Attributable to Holders of Redeemable Participating Shares (for financial reporting purposes) Beginning of Year 255,589,200 239,692,384
End of Year 239,739,615 255,589,200
The accompanying notes form an integral part of the financial statements.
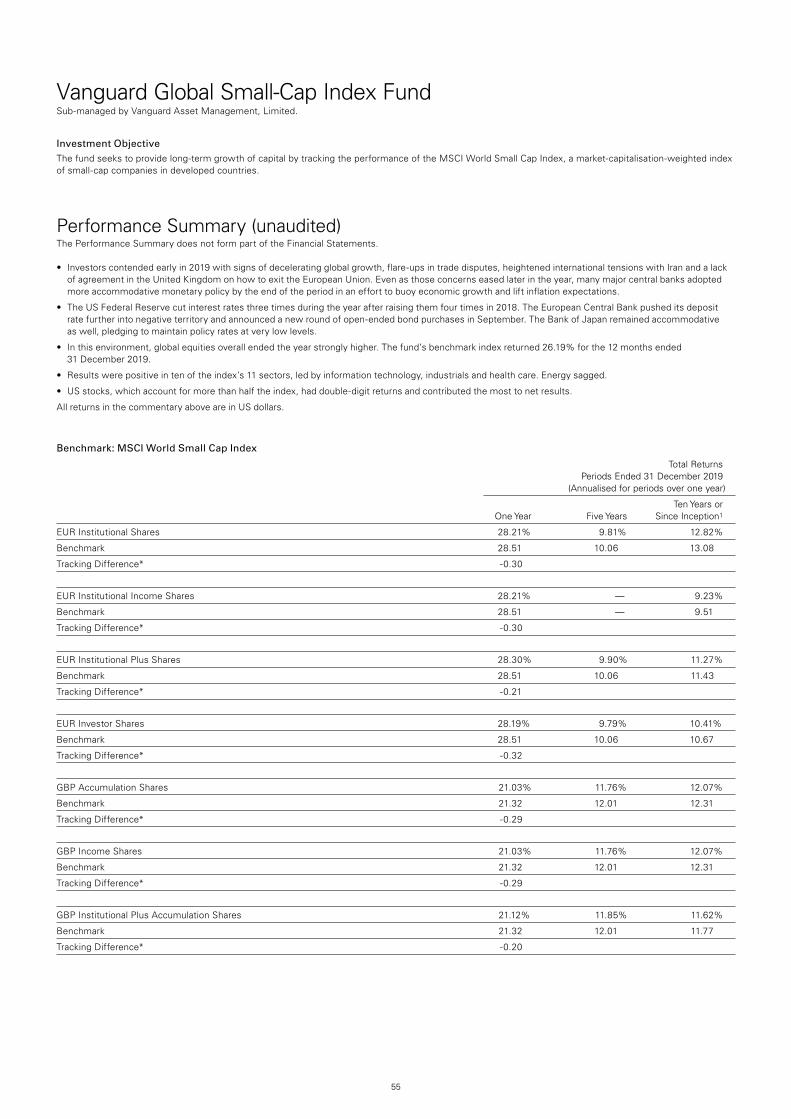
55
Vanguard Global Small-Cap Index FundSub-managed by Vanguard Asset Management, Limited.
Investment ObjectiveThe fund seeks to provide long-term growth of capital by tracking the performance of the MSCI World Small Cap Index, a market-capitalisation-weighted index of small-cap companies in developed countries.
Performance Summary (unaudited)The Performance Summary does not form part of the Financial Statements.
• Investorscontendedearlyin2019withsignsofdeceleratingglobalgrowth,flare-upsintradedisputes,heightenedinternationaltensionswithIranandalackof agreement in the United Kingdom on how to exit the European Union. Even as those concerns eased later in the year, many major central banks adopted more accommodative monetary policy by the end of the period in an effort to buoy economic growth and lift inflation expectations.
• TheUSFederalReservecutinterestratesthreetimesduringtheyearafterraisingthemfourtimesin2018.TheEuropeanCentralBankpusheditsdepositrate further into negative territory and announced a new round of open-ended bond purchases in September. The Bank of Japan remained accommodative as well, pledging to maintain policy rates at very low levels.
• Inthisenvironment,globalequitiesoverallendedtheyearstronglyhigher.Thefund’sbenchmarkindexreturned26.19%forthe12monthsended 31 December 2019.
• Resultswerepositiveintenoftheindex’s11sectors,ledbyinformationtechnology,industrialsandhealthcare.Energysagged.
• USstocks,whichaccountformorethanhalftheindex,haddouble-digitreturnsandcontributedthemosttonetresults.
All returns in the commentary above are in US dollars.
Benchmark: MSCI World Small Cap Index
Total Returns Periods Ended 31 December 2019 (Annualised for periods over one year)
Ten Years or One Year Five Years Since Inception1
EUR Institutional Shares 28.21% 9.81% 12.82%
Benchmark 28.51 10.06 13.08
Tracking Difference* -0.30
EUR Institutional Income Shares 28.21% — 9.23%
Benchmark 28.51 — 9.51
Tracking Difference* -0.30
EUR Institutional Plus Shares 28.30% 9.90% 11.27%
Benchmark 28.51 10.06 11.43
Tracking Difference* -0.21
EUR Investor Shares 28.19% 9.79% 10.41%
Benchmark 28.51 10.06 10.67
Tracking Difference* -0.32
GBP Accumulation Shares 21.03% 11.76% 12.07%
Benchmark 21.32 12.01 12.31
Tracking Difference* -0.29
GBP Income Shares 21.03% 11.76% 12.07%
Benchmark 21.32 12.01 12.31
Tracking Difference* -0.29
GBP Institutional Plus Accumulation Shares 21.12% 11.85% 11.62%
Benchmark 21.32 12.01 11.77
Tracking Difference* -0.20
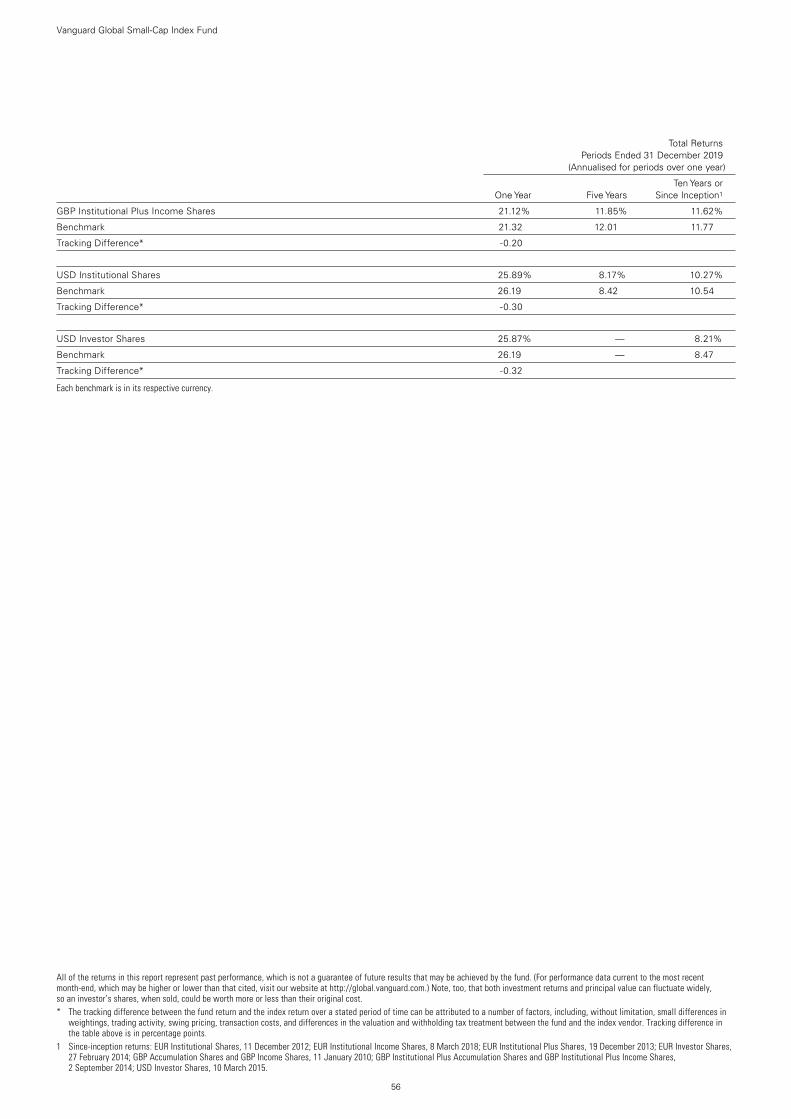
Vanguard Global Small-Cap Index Fund
56
All of the returns in this report represent past performance, which is not a guarantee of future results that may be achieved by the fund. (For performance data current to the most recent month-end, which may be higher or lower than that cited, visit our website at http://global.vanguard.com.) Note, too, that both investment returns and principal value can fluctuate widely, so an investor’s shares, when sold, could be worth more or less than their original cost.* The tracking difference between the fund return and the index return over a stated period of time can be attributed to a number of factors, including, without limitation, small differences in
weightings, trading activity, swing pricing, transaction costs, and differences in the valuation and withholding tax treatment between the fund and the index vendor. Tracking difference in the table above is in percentage points.
1 Since-inception returns: EUR Institutional Shares, 11 December 2012; EUR Institutional Income Shares, 8 March 2018; EUR Institutional Plus Shares, 19 December 2013; EUR Investor Shares, 27 February 2014; GBP Accumulation Shares and GBP Income Shares, 11 January 2010; GBP Institutional Plus Accumulation Shares and GBP Institutional Plus Income Shares, 2 September 2014; USD Investor Shares, 10 March 2015.
Total Returns Periods Ended 31 December 2019 (Annualised for periods over one year)
Ten Years or One Year Five Years Since Inception1
GBP Institutional Plus Income Shares 21.12% 11.85% 11.62%
Benchmark 21.32 12.01 11.77
Tracking Difference* -0.20
USD Institutional Shares 25.89% 8.17% 10.27%
Benchmark 26.19 8.42 10.54
Tracking Difference* -0.30
USD Investor Shares 25.87% — 8.21%
Benchmark 26.19 — 8.47
Tracking Difference* -0.32
Each benchmark is in its respective currency.
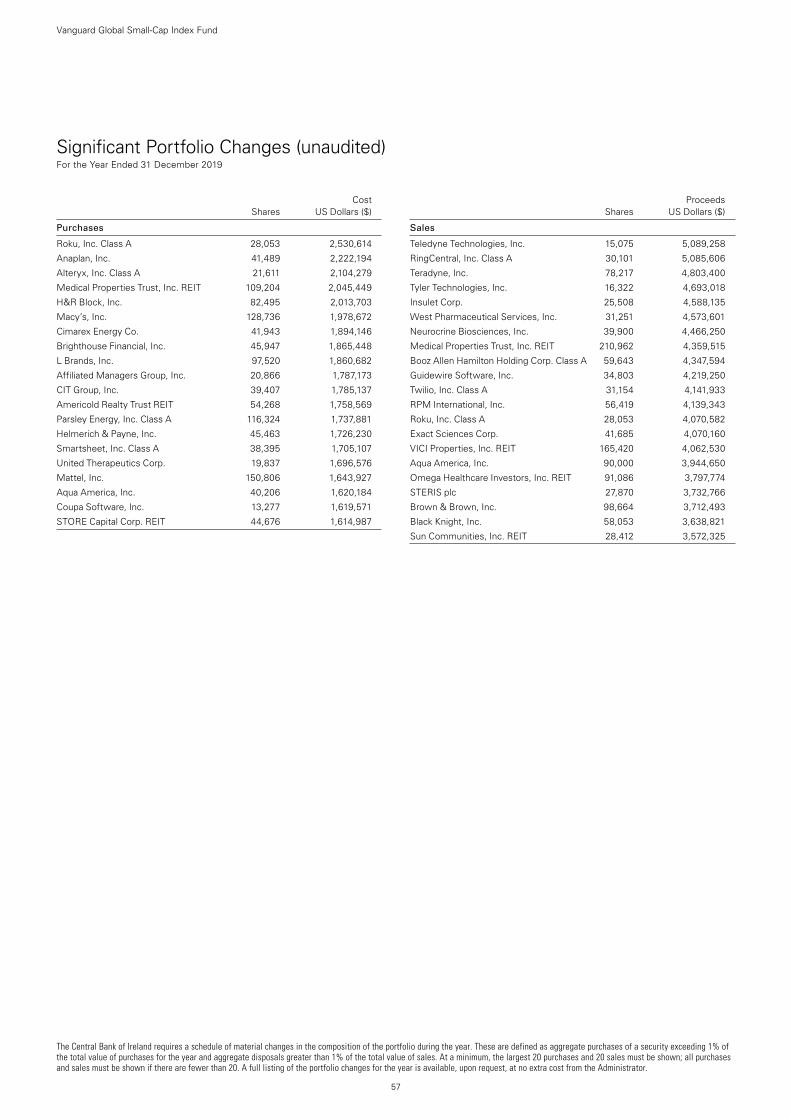
The Central Bank of Ireland requires a schedule of material changes in the composition of the portfolio during the year. These are defined as aggregate purchases of a security exceeding 1% of the total value of purchases for the year and aggregate disposals greater than 1% of the total value of sales. At a minimum, the largest 20 purchases and 20 sales must be shown; all purchases and sales must be shown if there are fewer than 20. A full listing of the portfolio changes for the year is available, upon request, at no extra cost from the Administrator.
57
Vanguard Global Small-Cap Index Fund
Significant Portfolio Changes (unaudited) For the Year Ended 31 December 2019
Cost Shares US Dollars ($)
Purchases
Roku, Inc. Class A 28,053 2,530,614
Anaplan, Inc. 41,489 2,222,194
Alteryx, Inc. Class A 21,611 2,104,279
Medical Properties Trust, Inc. REIT 109,204 2,045,449
H&R Block, Inc. 82,495 2,013,703
Macy’s, Inc. 128,736 1,978,672
Cimarex Energy Co. 41,943 1,894,146
Brighthouse Financial, Inc. 45,947 1,865,448
L Brands, Inc. 97,520 1,860,682
Affiliated Managers Group, Inc. 20,866 1,787,173
CIT Group, Inc. 39,407 1,785,137
Americold Realty Trust REIT 54,268 1,758,569
Parsley Energy, Inc. Class A 116,324 1,737,881
Helmerich & Payne, Inc. 45,463 1,726,230
Smartsheet, Inc. Class A 38,395 1,705,107
United Therapeutics Corp. 19,837 1,696,576
Mattel, Inc. 150,806 1,643,927
Aqua America, Inc. 40,206 1,620,184
Coupa Software, Inc. 13,277 1,619,571
STORE Capital Corp. REIT 44,676 1,614,987
Proceeds Shares US Dollars ($)
Sales
Teledyne Technologies, Inc. 15,075 5,089,258
RingCentral, Inc. Class A 30,101 5,085,606
Teradyne, Inc. 78,217 4,803,400
Tyler Technologies, Inc. 16,322 4,693,018
Insulet Corp. 25,508 4,588,135
West Pharmaceutical Services, Inc. 31,251 4,573,601
Neurocrine Biosciences, Inc. 39,900 4,466,250
Medical Properties Trust, Inc. REIT 210,962 4,359,515
Booz Allen Hamilton Holding Corp. Class A 59,643 4,347,594
Guidewire Software, Inc. 34,803 4,219,250
Twilio, Inc. Class A 31,154 4,141,933
RPM International, Inc. 56,419 4,139,343
Roku, Inc. Class A 28,053 4,070,582
Exact Sciences Corp. 41,685 4,070,160
VICI Properties, Inc. REIT 165,420 4,062,530
Aqua America, Inc. 90,000 3,944,650
Omega Healthcare Investors, Inc. REIT 91,086 3,797,774
STERIS plc 27,870 3,732,766
Brown & Brown, Inc. 98,664 3,712,493
Black Knight, Inc. 58,053 3,638,821
Sun Communities, Inc. REIT 28,412 3,572,325
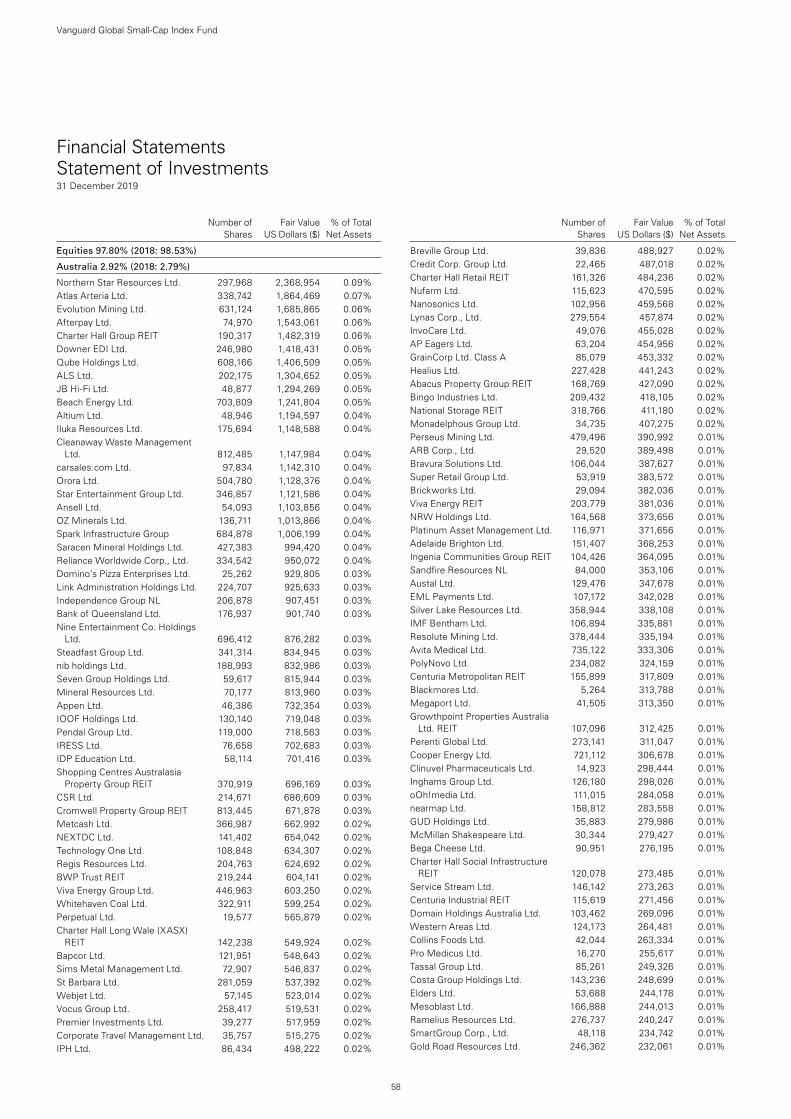
58
Vanguard Global Small-Cap Index Fund
Number of Fair Value % of Total Shares US Dollars ($) Net Assets
Number of Fair Value % of Total Shares US Dollars ($) Net Assets
Equities 97.80% (2018: 98.53%)
Australia 2.92% (2018: 2.79%)
Northern Star Resources Ltd. 297,968 2,368,954 0.09%Atlas Arteria Ltd. 338,742 1,864,469 0.07%Evolution Mining Ltd. 631,124 1,685,865 0.06%Afterpay Ltd. 74,970 1,543,061 0.06%Charter Hall Group REIT 190,317 1,482,319 0.06%Downer EDI Ltd. 246,980 1,418,431 0.05%Qube Holdings Ltd. 608,166 1,406,509 0.05%ALS Ltd. 202,175 1,304,652 0.05%JB Hi-Fi Ltd. 48,877 1,294,269 0.05%Beach Energy Ltd. 703,809 1,241,804 0.05%Altium Ltd. 48,946 1,194,597 0.04%Iluka Resources Ltd. 175,694 1,148,588 0.04%Cleanaway Waste Management
Ltd. 812,485 1,147,984 0.04%carsales.com Ltd. 97,834 1,142,310 0.04%Orora Ltd. 504,780 1,128,376 0.04%Star Entertainment Group Ltd. 346,857 1,121,586 0.04%Ansell Ltd. 54,093 1,103,856 0.04%OZ Minerals Ltd. 136,711 1,013,866 0.04%Spark Infrastructure Group 684,878 1,006,199 0.04%Saracen Mineral Holdings Ltd. 427,383 994,420 0.04%Reliance Worldwide Corp., Ltd. 334,542 950,072 0.04%Domino’s Pizza Enterprises Ltd. 25,262 929,805 0.03%Link Administration Holdings Ltd. 224,707 925,633 0.03%Independence Group NL 206,878 907,451 0.03%Bank of Queensland Ltd. 176,937 901,740 0.03%Nine Entertainment Co. Holdings
Ltd. 696,412 876,282 0.03%Steadfast Group Ltd. 341,314 834,945 0.03%nib holdings Ltd. 188,993 832,986 0.03%Seven Group Holdings Ltd. 59,617 815,944 0.03%Mineral Resources Ltd. 70,177 813,960 0.03%Appen Ltd. 46,386 732,354 0.03%IOOF Holdings Ltd. 130,140 719,048 0.03%Pendal Group Ltd. 119,000 718,563 0.03%IRESS Ltd. 76,658 702,683 0.03%IDP Education Ltd. 58,114 701,416 0.03%Shopping Centres Australasia
Property Group REIT 370,919 696,169 0.03%CSR Ltd. 214,671 686,609 0.03%Cromwell Property Group REIT 813,445 671,878 0.03%Metcash Ltd. 366,987 662,992 0.02%NEXTDC Ltd. 141,402 654,042 0.02%Technology One Ltd. 108,848 634,307 0.02%Regis Resources Ltd. 204,763 624,692 0.02%BWP Trust REIT 219,244 604,141 0.02%Viva Energy Group Ltd. 446,963 603,250 0.02%Whitehaven Coal Ltd. 322,911 599,254 0.02%Perpetual Ltd. 19,577 565,879 0.02%Charter Hall Long Wale (XASX)
REIT 142,238 549,924 0.02%Bapcor Ltd. 121,951 548,643 0.02%Sims Metal Management Ltd. 72,907 546,837 0.02%St Barbara Ltd. 281,059 537,392 0.02%Webjet Ltd. 57,145 523,014 0.02%Vocus Group Ltd. 258,417 519,531 0.02%Premier Investments Ltd. 39,277 517,959 0.02%Corporate Travel Management Ltd. 35,757 515,275 0.02%IPH Ltd. 86,434 498,222 0.02%
Breville Group Ltd. 39,836 488,927 0.02%Credit Corp. Group Ltd. 22,465 487,018 0.02%Charter Hall Retail REIT 161,326 484,236 0.02%Nufarm Ltd. 115,623 470,595 0.02%Nanosonics Ltd. 102,956 459,568 0.02%Lynas Corp., Ltd. 279,554 457,874 0.02%InvoCare Ltd. 49,076 455,028 0.02%AP Eagers Ltd. 63,204 454,956 0.02%GrainCorp Ltd. Class A 85,079 453,332 0.02%Healius Ltd. 227,428 441,243 0.02%Abacus Property Group REIT 168,769 427,090 0.02%Bingo Industries Ltd. 209,432 418,105 0.02%National Storage REIT 318,766 411,180 0.02%Monadelphous Group Ltd. 34,735 407,275 0.02%Perseus Mining Ltd. 479,496 390,992 0.01%ARB Corp., Ltd. 29,520 389,498 0.01%Bravura Solutions Ltd. 106,044 387,627 0.01%Super Retail Group Ltd. 53,919 383,572 0.01%Brickworks Ltd. 29,094 382,036 0.01%Viva Energy REIT 203,779 381,036 0.01%NRW Holdings Ltd. 164,568 373,656 0.01%Platinum Asset Management Ltd. 116,971 371,656 0.01%Adelaide Brighton Ltd. 151,407 368,253 0.01%Ingenia Communities Group REIT 104,426 364,095 0.01%Sandfire Resources NL 84,000 353,106 0.01%Austal Ltd. 129,476 347,678 0.01%EML Payments Ltd. 107,172 342,028 0.01%Silver Lake Resources Ltd. 358,944 338,108 0.01%IMF Bentham Ltd. 106,894 335,881 0.01%Resolute Mining Ltd. 378,444 335,194 0.01%Avita Medical Ltd. 735,122 333,306 0.01%PolyNovo Ltd. 234,082 324,159 0.01%Centuria Metropolitan REIT 155,899 317,809 0.01%Blackmores Ltd. 5,264 313,788 0.01%Megaport Ltd. 41,505 313,350 0.01%Growthpoint Properties Australia
Ltd. REIT 107,096 312,425 0.01%Perenti Global Ltd. 273,141 311,047 0.01%Cooper Energy Ltd. 721,112 306,678 0.01%Clinuvel Pharmaceuticals Ltd. 14,923 298,444 0.01%Inghams Group Ltd. 126,180 298,026 0.01%oOh!media Ltd. 111,015 284,058 0.01%nearmap Ltd. 158,812 283,558 0.01%GUD Holdings Ltd. 35,883 279,986 0.01%McMillan Shakespeare Ltd. 30,344 279,427 0.01%Bega Cheese Ltd. 90,951 276,195 0.01%Charter Hall Social Infrastructure
REIT 120,078 273,485 0.01%Service Stream Ltd. 146,142 273,263 0.01%Centuria Industrial REIT 115,619 271,456 0.01%Domain Holdings Australia Ltd. 103,462 269,096 0.01%Western Areas Ltd. 124,173 264,481 0.01%Collins Foods Ltd. 42,044 263,334 0.01%Pro Medicus Ltd. 16,270 255,617 0.01%Tassal Group Ltd. 85,261 249,326 0.01%Costa Group Holdings Ltd. 143,236 248,699 0.01%Elders Ltd. 53,688 244,178 0.01%Mesoblast Ltd. 166,888 244,013 0.01%Ramelius Resources Ltd. 276,737 240,247 0.01%SmartGroup Corp., Ltd. 48,118 234,742 0.01%Gold Road Resources Ltd. 246,362 232,061 0.01%
Financial Statements Statement of Investments31 December 2019
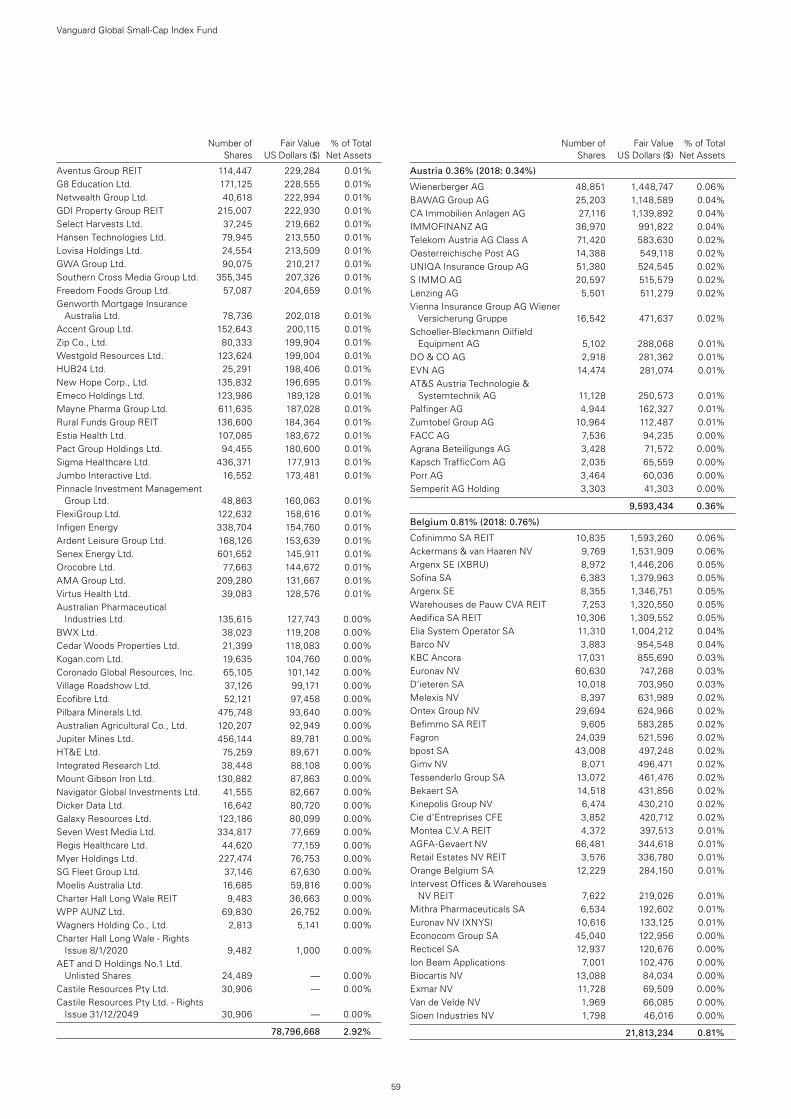
59
Number of Fair Value % of Total Shares US Dollars ($) Net Assets
Aventus Group REIT 114,447 229,284 0.01%G8 Education Ltd. 171,125 228,555 0.01%Netwealth Group Ltd. 40,618 222,994 0.01%GDI Property Group REIT 215,007 222,930 0.01%Select Harvests Ltd. 37,245 219,662 0.01%Hansen Technologies Ltd. 79,945 213,550 0.01%Lovisa Holdings Ltd. 24,554 213,509 0.01%GWA Group Ltd. 90,075 210,217 0.01%Southern Cross Media Group Ltd. 355,345 207,326 0.01%Freedom Foods Group Ltd. 57,087 204,659 0.01%Genworth Mortgage Insurance
Australia Ltd. 78,736 202,018 0.01%Accent Group Ltd. 152,643 200,115 0.01%Zip Co., Ltd. 80,333 199,904 0.01%Westgold Resources Ltd. 123,624 199,004 0.01%HUB24 Ltd. 25,291 198,406 0.01%New Hope Corp., Ltd. 135,832 196,695 0.01%Emeco Holdings Ltd. 123,986 189,128 0.01%Mayne Pharma Group Ltd. 611,635 187,028 0.01%Rural Funds Group REIT 136,600 184,364 0.01%Estia Health Ltd. 107,085 183,672 0.01%Pact Group Holdings Ltd. 94,455 180,600 0.01%Sigma Healthcare Ltd. 436,371 177,913 0.01%Jumbo Interactive Ltd. 16,552 173,481 0.01%Pinnacle Investment Management
Group Ltd. 48,863 160,063 0.01%FlexiGroup Ltd. 122,632 158,616 0.01%Infigen Energy 338,704 154,760 0.01%Ardent Leisure Group Ltd. 168,126 153,639 0.01%Senex Energy Ltd. 601,652 145,911 0.01%Orocobre Ltd. 77,663 144,672 0.01%AMA Group Ltd. 209,280 131,667 0.01%Virtus Health Ltd. 39,083 128,576 0.01%Australian Pharmaceutical
Industries Ltd. 135,615 127,743 0.00%BWX Ltd. 38,023 119,208 0.00%Cedar Woods Properties Ltd. 21,399 118,083 0.00%Kogan.com Ltd. 19,635 104,760 0.00%Coronado Global Resources, Inc. 65,105 101,142 0.00%Village Roadshow Ltd. 37,126 99,171 0.00%Ecofibre Ltd. 52,121 97,458 0.00%Pilbara Minerals Ltd. 475,748 93,640 0.00%Australian Agricultural Co., Ltd. 120,207 92,949 0.00%Jupiter Mines Ltd. 456,144 89,781 0.00%HT&E Ltd. 75,259 89,671 0.00%Integrated Research Ltd. 38,448 88,108 0.00%Mount Gibson Iron Ltd. 130,882 87,863 0.00%Navigator Global Investments Ltd. 41,555 82,667 0.00%Dicker Data Ltd. 16,642 80,720 0.00%Galaxy Resources Ltd. 123,186 80,099 0.00%Seven West Media Ltd. 334,817 77,669 0.00%Regis Healthcare Ltd. 44,620 77,159 0.00%Myer Holdings Ltd. 227,474 76,753 0.00%SG Fleet Group Ltd. 37,146 67,630 0.00%Moelis Australia Ltd. 16,685 59,816 0.00%Charter Hall Long Wale REIT 9,483 36,663 0.00%WPP AUNZ Ltd. 69,830 26,752 0.00%Wagners Holding Co., Ltd. 2,813 5,141 0.00%Charter Hall Long Wale - Rights
Issue 8/1/2020 9,482 1,000 0.00%AET and D Holdings No.1 Ltd.
Unlisted Shares 24,489 — 0.00%Castile Resources Pty Ltd. 30,906 — 0.00%Castile Resources Pty Ltd. - Rights
Issue 31/12/2049 30,906 — 0.00%
78,796,668 2.92%
Austria 0.36% (2018: 0.34%)
Wienerberger AG 48,851 1,448,747 0.06%BAWAG Group AG 25,203 1,148,589 0.04%CA Immobilien Anlagen AG 27,116 1,139,892 0.04%IMMOFINANZ AG 36,970 991,822 0.04%Telekom Austria AG Class A 71,420 583,630 0.02%Oesterreichische Post AG 14,388 549,118 0.02%UNIQA Insurance Group AG 51,380 524,545 0.02%S IMMO AG 20,597 515,579 0.02%Lenzing AG 5,501 511,279 0.02%Vienna Insurance Group AG Wiener
Versicherung Gruppe 16,542 471,637 0.02%Schoeller-Bleckmann Oilfield
Equipment AG 5,102 288,068 0.01%DO & CO AG 2,918 281,362 0.01%EVN AG 14,474 281,074 0.01%AT&S Austria Technologie &
Systemtechnik AG 11,128 250,573 0.01%Palfinger AG 4,944 162,327 0.01%Zumtobel Group AG 10,964 112,487 0.01%FACC AG 7,536 94,235 0.00%Agrana Beteiligungs AG 3,428 71,572 0.00%Kapsch TrafficCom AG 2,035 65,559 0.00%Porr AG 3,464 60,036 0.00%Semperit AG Holding 3,303 41,303 0.00%
9,593,434 0.36%
Belgium 0.81% (2018: 0.76%)
Cofinimmo SA REIT 10,835 1,593,260 0.06%Ackermans & van Haaren NV 9,769 1,531,909 0.06%Argenx SE (XBRU) 8,972 1,446,206 0.05%Sofina SA 6,383 1,379,963 0.05%Argenx SE 8,355 1,346,751 0.05%Warehouses de Pauw CVA REIT 7,253 1,320,550 0.05%Aedifica SA REIT 10,306 1,309,552 0.05%Elia System Operator SA 11,310 1,004,212 0.04%Barco NV 3,883 954,548 0.04%KBC Ancora 17,031 855,690 0.03%Euronav NV 60,630 747,268 0.03%D’ieteren SA 10,018 703,950 0.03%Melexis NV 8,397 631,989 0.02%Ontex Group NV 29,694 624,966 0.02%Befimmo SA REIT 9,605 583,285 0.02%Fagron 24,039 521,596 0.02%bpost SA 43,008 497,248 0.02%Gimv NV 8,071 496,471 0.02%Tessenderlo Group SA 13,072 461,476 0.02%Bekaert SA 14,518 431,856 0.02%Kinepolis Group NV 6,474 430,210 0.02%Cie d’Entreprises CFE 3,852 420,712 0.02%Montea C.V.A REIT 4,372 397,513 0.01%AGFA-Gevaert NV 66,481 344,618 0.01%Retail Estates NV REIT 3,576 336,780 0.01%Orange Belgium SA 12,229 284,150 0.01%Intervest Offices & Warehouses
NV REIT 7,622 219,026 0.01%Mithra Pharmaceuticals SA 6,534 192,602 0.01%Euronav NV (XNYS) 10,616 133,125 0.01%Econocom Group SA 45,040 122,956 0.00%Recticel SA 12,937 120,676 0.00%Ion Beam Applications 7,001 102,476 0.00%Biocartis NV 13,088 84,034 0.00%Exmar NV 11,728 69,509 0.00%Van de Velde NV 1,969 66,085 0.00%Sioen Industries NV 1,798 46,016 0.00%
21,813,234 0.81%
Number of Fair Value % of Total Shares US Dollars ($) Net Assets
Vanguard Global Small-Cap Index Fund
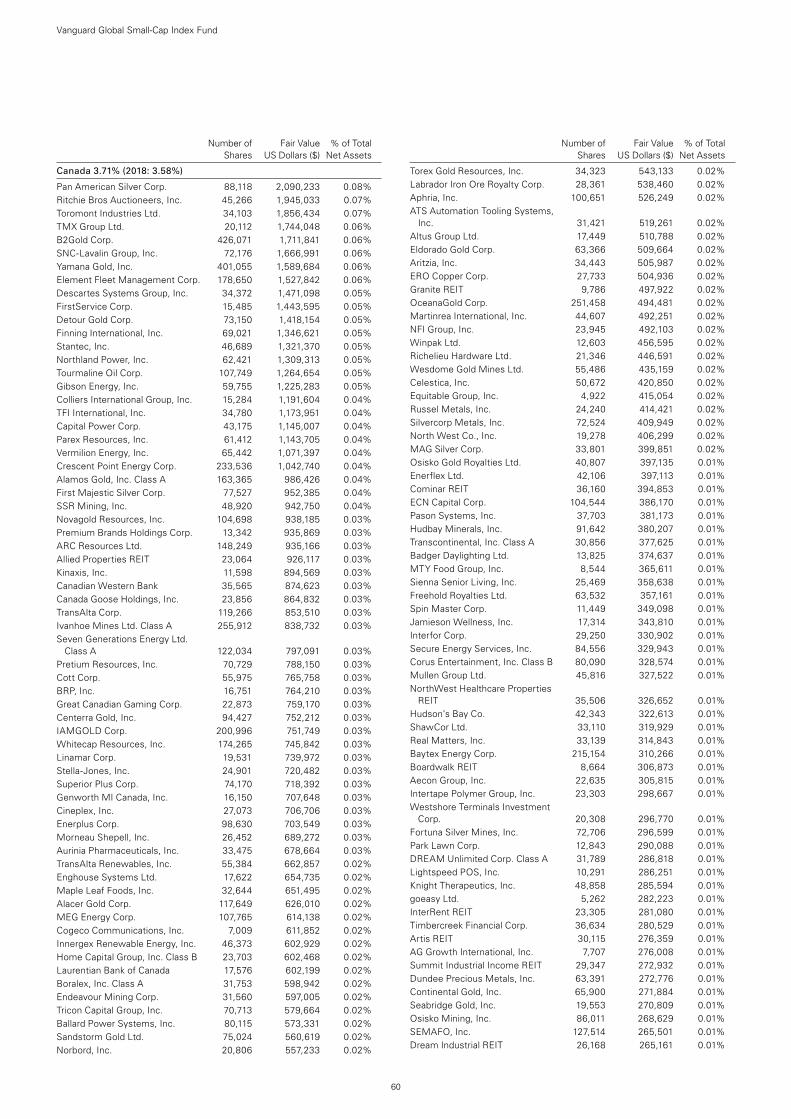
60
Number of Fair Value % of Total Shares US Dollars ($) Net Assets
Canada 3.71% (2018: 3.58%)
Pan American Silver Corp. 88,118 2,090,233 0.08%Ritchie Bros Auctioneers, Inc. 45,266 1,945,033 0.07%Toromont Industries Ltd. 34,103 1,856,434 0.07%TMX Group Ltd. 20,112 1,744,048 0.06%B2Gold Corp. 426,071 1,711,841 0.06%SNC-Lavalin Group, Inc. 72,176 1,666,991 0.06%Yamana Gold, Inc. 401,055 1,589,684 0.06%Element Fleet Management Corp. 178,650 1,527,842 0.06%Descartes Systems Group, Inc. 34,372 1,471,098 0.05%FirstService Corp. 15,485 1,443,595 0.05%Detour Gold Corp. 73,150 1,418,154 0.05%Finning International, Inc. 69,021 1,346,621 0.05%Stantec, Inc. 46,689 1,321,370 0.05%Northland Power, Inc. 62,421 1,309,313 0.05%Tourmaline Oil Corp. 107,749 1,264,654 0.05%Gibson Energy, Inc. 59,755 1,225,283 0.05%Colliers International Group, Inc. 15,284 1,191,604 0.04%TFI International, Inc. 34,780 1,173,951 0.04%Capital Power Corp. 43,175 1,145,007 0.04%Parex Resources, Inc. 61,412 1,143,705 0.04%Vermilion Energy, Inc. 65,442 1,071,397 0.04%Crescent Point Energy Corp. 233,536 1,042,740 0.04%Alamos Gold, Inc. Class A 163,365 986,426 0.04%First Majestic Silver Corp. 77,527 952,385 0.04%SSR Mining, Inc. 48,920 942,750 0.04%Novagold Resources, Inc. 104,698 938,185 0.03%Premium Brands Holdings Corp. 13,342 935,869 0.03%ARC Resources Ltd. 148,249 935,166 0.03%Allied Properties REIT 23,064 926,117 0.03%Kinaxis, Inc. 11,598 894,569 0.03%Canadian Western Bank 35,565 874,623 0.03%Canada Goose Holdings, Inc. 23,856 864,832 0.03%TransAlta Corp. 119,266 853,510 0.03%Ivanhoe Mines Ltd. Class A 255,912 838,732 0.03%Seven Generations Energy Ltd.
Class A 122,034 797,091 0.03%Pretium Resources, Inc. 70,729 788,150 0.03%Cott Corp. 55,975 765,758 0.03%BRP, Inc. 16,751 764,210 0.03%Great Canadian Gaming Corp. 22,873 759,170 0.03%Centerra Gold, Inc. 94,427 752,212 0.03%IAMGOLD Corp. 200,996 751,749 0.03%Whitecap Resources, Inc. 174,265 745,842 0.03%Linamar Corp. 19,531 739,972 0.03%Stella-Jones, Inc. 24,901 720,482 0.03%Superior Plus Corp. 74,170 718,392 0.03%Genworth MI Canada, Inc. 16,150 707,648 0.03%Cineplex, Inc. 27,073 706,706 0.03%Enerplus Corp. 98,630 703,549 0.03%Morneau Shepell, Inc. 26,452 689,272 0.03%Aurinia Pharmaceuticals, Inc. 33,475 678,664 0.03%TransAlta Renewables, Inc. 55,384 662,857 0.02%Enghouse Systems Ltd. 17,622 654,735 0.02%Maple Leaf Foods, Inc. 32,644 651,495 0.02%Alacer Gold Corp. 117,649 626,010 0.02%MEG Energy Corp. 107,765 614,138 0.02%Cogeco Communications, Inc. 7,009 611,852 0.02%Innergex Renewable Energy, Inc. 46,373 602,929 0.02%Home Capital Group, Inc. Class B 23,703 602,468 0.02%Laurentian Bank of Canada 17,576 602,199 0.02%Boralex, Inc. Class A 31,753 598,942 0.02%Endeavour Mining Corp. 31,560 597,005 0.02%Tricon Capital Group, Inc. 70,713 579,664 0.02%Ballard Power Systems, Inc. 80,115 573,331 0.02%Sandstorm Gold Ltd. 75,024 560,619 0.02%Norbord, Inc. 20,806 557,233 0.02%
Torex Gold Resources, Inc. 34,323 543,133 0.02%Labrador Iron Ore Royalty Corp. 28,361 538,460 0.02%Aphria, Inc. 100,651 526,249 0.02%ATS Automation Tooling Systems,
Inc. 31,421 519,261 0.02%Altus Group Ltd. 17,449 510,788 0.02%Eldorado Gold Corp. 63,366 509,664 0.02%Aritzia, Inc. 34,443 505,987 0.02%ERO Copper Corp. 27,733 504,936 0.02%Granite REIT 9,786 497,922 0.02%OceanaGold Corp. 251,458 494,481 0.02%Martinrea International, Inc. 44,607 492,251 0.02%NFI Group, Inc. 23,945 492,103 0.02%Winpak Ltd. 12,603 456,595 0.02%Richelieu Hardware Ltd. 21,346 446,591 0.02%Wesdome Gold Mines Ltd. 55,486 435,159 0.02%Celestica, Inc. 50,672 420,850 0.02%Equitable Group, Inc. 4,922 415,054 0.02%Russel Metals, Inc. 24,240 414,421 0.02%Silvercorp Metals, Inc. 72,524 409,949 0.02%North West Co., Inc. 19,278 406,299 0.02%MAG Silver Corp. 33,801 399,851 0.02%Osisko Gold Royalties Ltd. 40,807 397,135 0.01%Enerflex Ltd. 42,106 397,113 0.01%Cominar REIT 36,160 394,853 0.01%ECN Capital Corp. 104,544 386,170 0.01%Pason Systems, Inc. 37,703 381,173 0.01%Hudbay Minerals, Inc. 91,642 380,207 0.01%Transcontinental, Inc. Class A 30,856 377,625 0.01%Badger Daylighting Ltd. 13,825 374,637 0.01%MTY Food Group, Inc. 8,544 365,611 0.01%Sienna Senior Living, Inc. 25,469 358,638 0.01%Freehold Royalties Ltd. 63,532 357,161 0.01%Spin Master Corp. 11,449 349,098 0.01%Jamieson Wellness, Inc. 17,314 343,810 0.01%Interfor Corp. 29,250 330,902 0.01%Secure Energy Services, Inc. 84,556 329,943 0.01%Corus Entertainment, Inc. Class B 80,090 328,574 0.01%Mullen Group Ltd. 45,816 327,522 0.01%NorthWest Healthcare Properties
REIT 35,506 326,652 0.01%Hudson’s Bay Co. 42,343 322,613 0.01%ShawCor Ltd. 33,110 319,929 0.01%Real Matters, Inc. 33,139 314,843 0.01%Baytex Energy Corp. 215,154 310,266 0.01%Boardwalk REIT 8,664 306,873 0.01%Aecon Group, Inc. 22,635 305,815 0.01%Intertape Polymer Group, Inc. 23,303 298,667 0.01%Westshore Terminals Investment
Corp. 20,308 296,770 0.01%Fortuna Silver Mines, Inc. 72,706 296,599 0.01%Park Lawn Corp. 12,843 290,088 0.01%DREAM Unlimited Corp. Class A 31,789 286,818 0.01%Lightspeed POS, Inc. 10,291 286,251 0.01%Knight Therapeutics, Inc. 48,858 285,594 0.01%goeasy Ltd. 5,262 282,223 0.01%InterRent REIT 23,305 281,080 0.01%Timbercreek Financial Corp. 36,634 280,529 0.01%Artis REIT 30,115 276,359 0.01%AG Growth International, Inc. 7,707 276,008 0.01%Summit Industrial Income REIT 29,347 272,932 0.01%Dundee Precious Metals, Inc. 63,391 272,776 0.01%Continental Gold, Inc. 65,900 271,884 0.01%Seabridge Gold, Inc. 19,553 270,809 0.01%Osisko Mining, Inc. 86,011 268,629 0.01%SEMAFO, Inc. 127,514 265,501 0.01%Dream Industrial REIT 26,168 265,161 0.01%
Number of Fair Value % of Total Shares US Dollars ($) Net Assets
Vanguard Global Small-Cap Index Fund
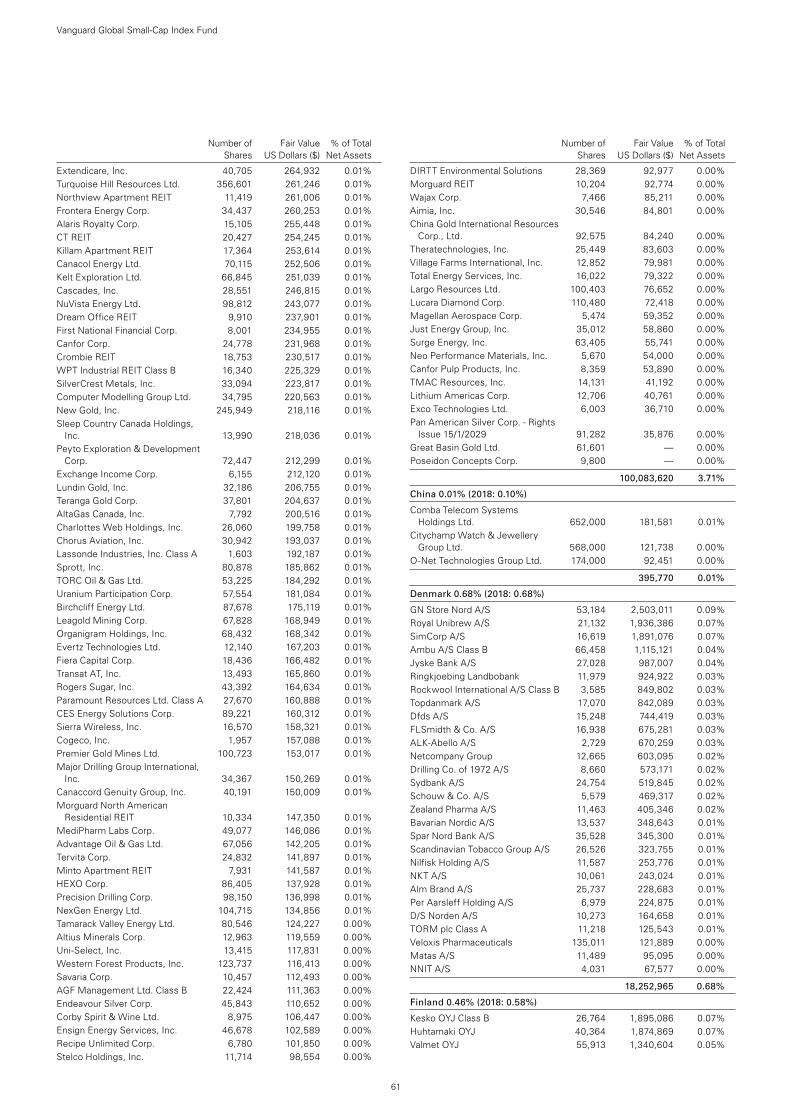
61
Number of Fair Value % of Total Shares US Dollars ($) Net Assets
Extendicare, Inc. 40,705 264,932 0.01%Turquoise Hill Resources Ltd. 356,601 261,246 0.01%Northview Apartment REIT 11,419 261,006 0.01%Frontera Energy Corp. 34,437 260,253 0.01%Alaris Royalty Corp. 15,105 255,448 0.01%CT REIT 20,427 254,245 0.01%Killam Apartment REIT 17,364 253,614 0.01%Canacol Energy Ltd. 70,115 252,506 0.01%Kelt Exploration Ltd. 66,845 251,039 0.01%Cascades, Inc. 28,551 246,815 0.01%NuVista Energy Ltd. 98,812 243,077 0.01%Dream Office REIT 9,910 237,901 0.01%First National Financial Corp. 8,001 234,955 0.01%Canfor Corp. 24,778 231,968 0.01%Crombie REIT 18,753 230,517 0.01%WPT Industrial REIT Class B 16,340 225,329 0.01%SilverCrest Metals, Inc. 33,094 223,817 0.01%Computer Modelling Group Ltd. 34,795 220,563 0.01%New Gold, Inc. 245,949 218,116 0.01%Sleep Country Canada Holdings,
Inc. 13,990 218,036 0.01%Peyto Exploration & Development
Corp. 72,447 212,299 0.01%Exchange Income Corp. 6,155 212,120 0.01%Lundin Gold, Inc. 32,186 206,755 0.01%Teranga Gold Corp. 37,801 204,637 0.01%AltaGas Canada, Inc. 7,792 200,516 0.01%Charlottes Web Holdings, Inc. 26,060 199,758 0.01%Chorus Aviation, Inc. 30,942 193,037 0.01%Lassonde Industries, Inc. Class A 1,603 192,187 0.01%Sprott, Inc. 80,878 185,862 0.01%TORC Oil & Gas Ltd. 53,225 184,292 0.01%Uranium Participation Corp. 57,554 181,084 0.01%Birchcliff Energy Ltd. 87,678 175,119 0.01%Leagold Mining Corp. 67,828 168,949 0.01%Organigram Holdings, Inc. 68,432 168,342 0.01%Evertz Technologies Ltd. 12,140 167,203 0.01%Fiera Capital Corp. 18,436 166,482 0.01%Transat AT, Inc. 13,493 165,860 0.01%Rogers Sugar, Inc. 43,392 164,634 0.01%Paramount Resources Ltd. Class A 27,670 160,888 0.01%CES Energy Solutions Corp. 89,221 160,312 0.01%Sierra Wireless, Inc. 16,570 158,321 0.01%Cogeco, Inc. 1,957 157,088 0.01%Premier Gold Mines Ltd. 100,723 153,017 0.01%Major Drilling Group International,
Inc. 34,367 150,269 0.01%Canaccord Genuity Group, Inc. 40,191 150,009 0.01%Morguard North American
Residential REIT 10,334 147,350 0.01%MediPharm Labs Corp. 49,077 146,086 0.01%Advantage Oil & Gas Ltd. 67,056 142,205 0.01%Tervita Corp. 24,832 141,897 0.01%Minto Apartment REIT 7,931 141,587 0.01%HEXO Corp. 86,405 137,928 0.01%Precision Drilling Corp. 98,150 136,998 0.01%NexGen Energy Ltd. 104,715 134,856 0.01%Tamarack Valley Energy Ltd. 80,546 124,227 0.00%Altius Minerals Corp. 12,963 119,559 0.00%Uni-Select, Inc. 13,415 117,831 0.00%Western Forest Products, Inc. 123,737 116,413 0.00%Savaria Corp. 10,457 112,493 0.00%AGF Management Ltd. Class B 22,424 111,363 0.00%Endeavour Silver Corp. 45,843 110,652 0.00%Corby Spirit & Wine Ltd. 8,975 106,447 0.00%Ensign Energy Services, Inc. 46,678 102,589 0.00%Recipe Unlimited Corp. 6,780 101,850 0.00%Stelco Holdings, Inc. 11,714 98,554 0.00%
DIRTT Environmental Solutions 28,369 92,977 0.00%Morguard REIT 10,204 92,774 0.00%Wajax Corp. 7,466 85,211 0.00%Aimia, Inc. 30,546 84,801 0.00%China Gold International Resources
Corp., Ltd. 92,575 84,240 0.00%Theratechnologies, Inc. 25,449 83,603 0.00%Village Farms International, Inc. 12,852 79,981 0.00%Total Energy Services, Inc. 16,022 79,322 0.00%Largo Resources Ltd. 100,403 76,652 0.00%Lucara Diamond Corp. 110,480 72,418 0.00%Magellan Aerospace Corp. 5,474 59,352 0.00%Just Energy Group, Inc. 35,012 58,860 0.00%Surge Energy, Inc. 63,405 55,741 0.00%Neo Performance Materials, Inc. 5,670 54,000 0.00%Canfor Pulp Products, Inc. 8,359 53,890 0.00%TMAC Resources, Inc. 14,131 41,192 0.00%Lithium Americas Corp. 12,706 40,761 0.00%Exco Technologies Ltd. 6,003 36,710 0.00%Pan American Silver Corp. - Rights
Issue 15/1/2029 91,282 35,876 0.00%Great Basin Gold Ltd. 61,601 — 0.00%Poseidon Concepts Corp. 9,800 — 0.00%
100,083,620 3.71%
China 0.01% (2018: 0.10%)
Comba Telecom Systems Holdings Ltd. 652,000 181,581 0.01%
Citychamp Watch & Jewellery Group Ltd. 568,000 121,738 0.00%
O-Net Technologies Group Ltd. 174,000 92,451 0.00%
395,770 0.01%
Denmark 0.68% (2018: 0.68%)
GN Store Nord A/S 53,184 2,503,011 0.09%Royal Unibrew A/S 21,132 1,936,386 0.07%SimCorp A/S 16,619 1,891,076 0.07%Ambu A/S Class B 66,458 1,115,121 0.04%Jyske Bank A/S 27,028 987,007 0.04%Ringkjoebing Landbobank 11,979 924,922 0.03%Rockwool International A/S Class B 3,585 849,802 0.03%Topdanmark A/S 17,070 842,089 0.03%Dfds A/S 15,248 744,419 0.03%FLSmidth & Co. A/S 16,938 675,281 0.03%ALK-Abello A/S 2,729 670,259 0.03%Netcompany Group 12,665 603,095 0.02%Drilling Co. of 1972 A/S 8,660 573,171 0.02%Sydbank A/S 24,754 519,845 0.02%Schouw & Co. A/S 5,579 469,317 0.02%Zealand Pharma A/S 11,463 405,346 0.02%Bavarian Nordic A/S 13,537 348,643 0.01%Spar Nord Bank A/S 35,528 345,300 0.01%Scandinavian Tobacco Group A/S 26,526 323,755 0.01%Nilfisk Holding A/S 11,587 253,776 0.01%NKT A/S 10,061 243,024 0.01%Alm Brand A/S 25,737 228,683 0.01%Per Aarsleff Holding A/S 6,979 224,875 0.01%D/S Norden A/S 10,273 164,658 0.01%TORM plc Class A 11,218 125,543 0.01%Veloxis Pharmaceuticals 135,011 121,889 0.00%Matas A/S 11,489 95,095 0.00%NNIT A/S 4,031 67,577 0.00%
18,252,965 0.68%
Finland 0.46% (2018: 0.58%)
Kesko OYJ Class B 26,764 1,895,086 0.07%Huhtamaki OYJ 40,364 1,874,869 0.07%Valmet OYJ 55,913 1,340,604 0.05%
Number of Fair Value % of Total Shares US Dollars ($) Net Assets
Vanguard Global Small-Cap Index Fund
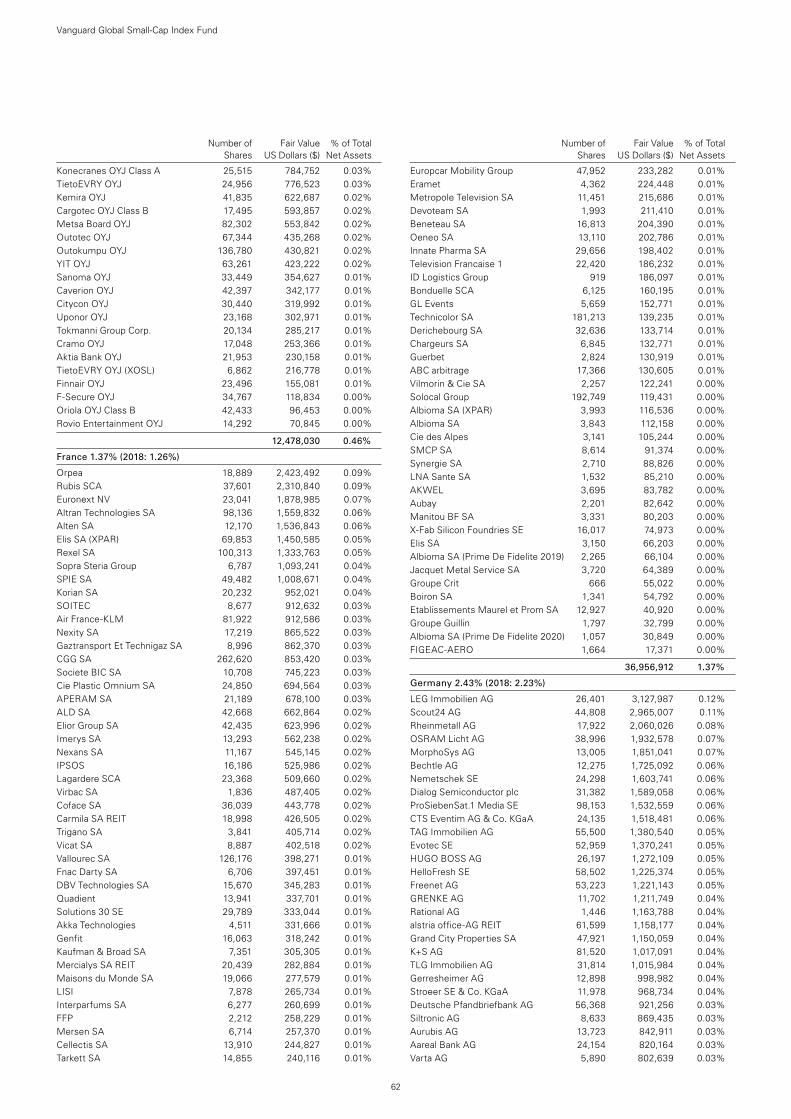
62
Number of Fair Value % of Total Shares US Dollars ($) Net Assets
Konecranes OYJ Class A 25,515 784,752 0.03%TietoEVRY OYJ 24,956 776,523 0.03%Kemira OYJ 41,835 622,687 0.02%Cargotec OYJ Class B 17,495 593,857 0.02%Metsa Board OYJ 82,302 553,842 0.02%Outotec OYJ 67,344 435,268 0.02%Outokumpu OYJ 136,780 430,821 0.02%YIT OYJ 63,261 423,222 0.02%Sanoma OYJ 33,449 354,627 0.01%Caverion OYJ 42,397 342,177 0.01%Citycon OYJ 30,440 319,992 0.01%Uponor OYJ 23,168 302,971 0.01%Tokmanni Group Corp. 20,134 285,217 0.01%Cramo OYJ 17,048 253,366 0.01%Aktia Bank OYJ 21,953 230,158 0.01%TietoEVRY OYJ (XOSL) 6,862 216,778 0.01%Finnair OYJ 23,496 155,081 0.01%F-Secure OYJ 34,767 118,834 0.00%Oriola OYJ Class B 42,433 96,453 0.00%Rovio Entertainment OYJ 14,292 70,845 0.00%
12,478,030 0.46%
France 1.37% (2018: 1.26%)
Orpea 18,889 2,423,492 0.09%Rubis SCA 37,601 2,310,840 0.09%Euronext NV 23,041 1,878,985 0.07%Altran Technologies SA 98,136 1,559,832 0.06%Alten SA 12,170 1,536,843 0.06%Elis SA (XPAR) 69,853 1,450,585 0.05%Rexel SA 100,313 1,333,763 0.05%Sopra Steria Group 6,787 1,093,241 0.04%SPIE SA 49,482 1,008,671 0.04%Korian SA 20,232 952,021 0.04%SOITEC 8,677 912,632 0.03%Air France-KLM 81,922 912,586 0.03%Nexity SA 17,219 865,522 0.03%Gaztransport Et Technigaz SA 8,996 862,370 0.03%CGG SA 262,620 853,420 0.03%Societe BIC SA 10,708 745,223 0.03%Cie Plastic Omnium SA 24,850 694,564 0.03%APERAM SA 21,189 678,100 0.03%ALD SA 42,668 662,864 0.02%Elior Group SA 42,435 623,996 0.02%Imerys SA 13,293 562,238 0.02%Nexans SA 11,167 545,145 0.02%IPSOS 16,186 525,986 0.02%Lagardere SCA 23,368 509,660 0.02%Virbac SA 1,836 487,405 0.02%Coface SA 36,039 443,778 0.02%Carmila SA REIT 18,998 426,505 0.02%Trigano SA 3,841 405,714 0.02%Vicat SA 8,887 402,518 0.02%Vallourec SA 126,176 398,271 0.01%Fnac Darty SA 6,706 397,451 0.01%DBV Technologies SA 15,670 345,283 0.01%Quadient 13,941 337,701 0.01%Solutions 30 SE 29,789 333,044 0.01%Akka Technologies 4,511 331,666 0.01%Genfit 16,063 318,242 0.01%Kaufman & Broad SA 7,351 305,305 0.01%Mercialys SA REIT 20,439 282,884 0.01%Maisons du Monde SA 19,066 277,579 0.01%LISI 7,878 265,734 0.01%Interparfums SA 6,277 260,699 0.01%FFP 2,212 258,229 0.01%Mersen SA 6,714 257,370 0.01%Cellectis SA 13,910 244,827 0.01%Tarkett SA 14,855 240,116 0.01%
Europcar Mobility Group 47,952 233,282 0.01%Eramet 4,362 224,448 0.01%Metropole Television SA 11,451 215,686 0.01%Devoteam SA 1,993 211,410 0.01%Beneteau SA 16,813 204,390 0.01%Oeneo SA 13,110 202,786 0.01%Innate Pharma SA 29,656 198,402 0.01%Television Francaise 1 22,420 186,232 0.01%ID Logistics Group 919 186,097 0.01%Bonduelle SCA 6,125 160,195 0.01%GL Events 5,659 152,771 0.01%Technicolor SA 181,213 139,235 0.01%Derichebourg SA 32,636 133,714 0.01%Chargeurs SA 6,845 132,771 0.01%Guerbet 2,824 130,919 0.01%ABC arbitrage 17,366 130,605 0.01%Vilmorin & Cie SA 2,257 122,241 0.00%Solocal Group 192,749 119,431 0.00%Albioma SA (XPAR) 3,993 116,536 0.00%Albioma SA 3,843 112,158 0.00%Cie des Alpes 3,141 105,244 0.00%SMCP SA 8,614 91,374 0.00%Synergie SA 2,710 88,826 0.00%LNA Sante SA 1,532 85,210 0.00%AKWEL 3,695 83,782 0.00%Aubay 2,201 82,642 0.00%Manitou BF SA 3,331 80,203 0.00%X-Fab Silicon Foundries SE 16,017 74,973 0.00%Elis SA 3,150 66,203 0.00%Albioma SA (Prime De Fidelite 2019) 2,265 66,104 0.00%Jacquet Metal Service SA 3,720 64,389 0.00%Groupe Crit 666 55,022 0.00%Boiron SA 1,341 54,792 0.00%Etablissements Maurel et Prom SA 12,927 40,920 0.00%Groupe Guillin 1,797 32,799 0.00%Albioma SA (Prime De Fidelite 2020) 1,057 30,849 0.00%FIGEAC-AERO 1,664 17,371 0.00%
36,956,912 1.37%
Germany 2.43% (2018: 2.23%)
LEG Immobilien AG 26,401 3,127,987 0.12%Scout24 AG 44,808 2,965,007 0.11%Rheinmetall AG 17,922 2,060,026 0.08%OSRAM Licht AG 38,996 1,932,578 0.07%MorphoSys AG 13,005 1,851,041 0.07%Bechtle AG 12,275 1,725,092 0.06%Nemetschek SE 24,298 1,603,741 0.06%Dialog Semiconductor plc 31,382 1,589,058 0.06%ProSiebenSat.1 Media SE 98,153 1,532,559 0.06%CTS Eventim AG & Co. KGaA 24,135 1,518,481 0.06%TAG Immobilien AG 55,500 1,380,540 0.05%Evotec SE 52,959 1,370,241 0.05%HUGO BOSS AG 26,197 1,272,109 0.05%HelloFresh SE 58,502 1,225,374 0.05%Freenet AG 53,223 1,221,143 0.05%GRENKE AG 11,702 1,211,749 0.04%Rational AG 1,446 1,163,788 0.04%alstria office-AG REIT 61,599 1,158,177 0.04%Grand City Properties SA 47,921 1,150,059 0.04%K+S AG 81,520 1,017,091 0.04%TLG Immobilien AG 31,814 1,015,984 0.04%Gerresheimer AG 12,898 998,982 0.04%Stroeer SE & Co. KGaA 11,978 968,734 0.04%Deutsche Pfandbriefbank AG 56,368 921,256 0.03%Siltronic AG 8,633 869,435 0.03%Aurubis AG 13,723 842,911 0.03%Aareal Bank AG 24,154 820,164 0.03%Varta AG 5,890 802,639 0.03%
Number of Fair Value % of Total Shares US Dollars ($) Net Assets
Vanguard Global Small-Cap Index Fund
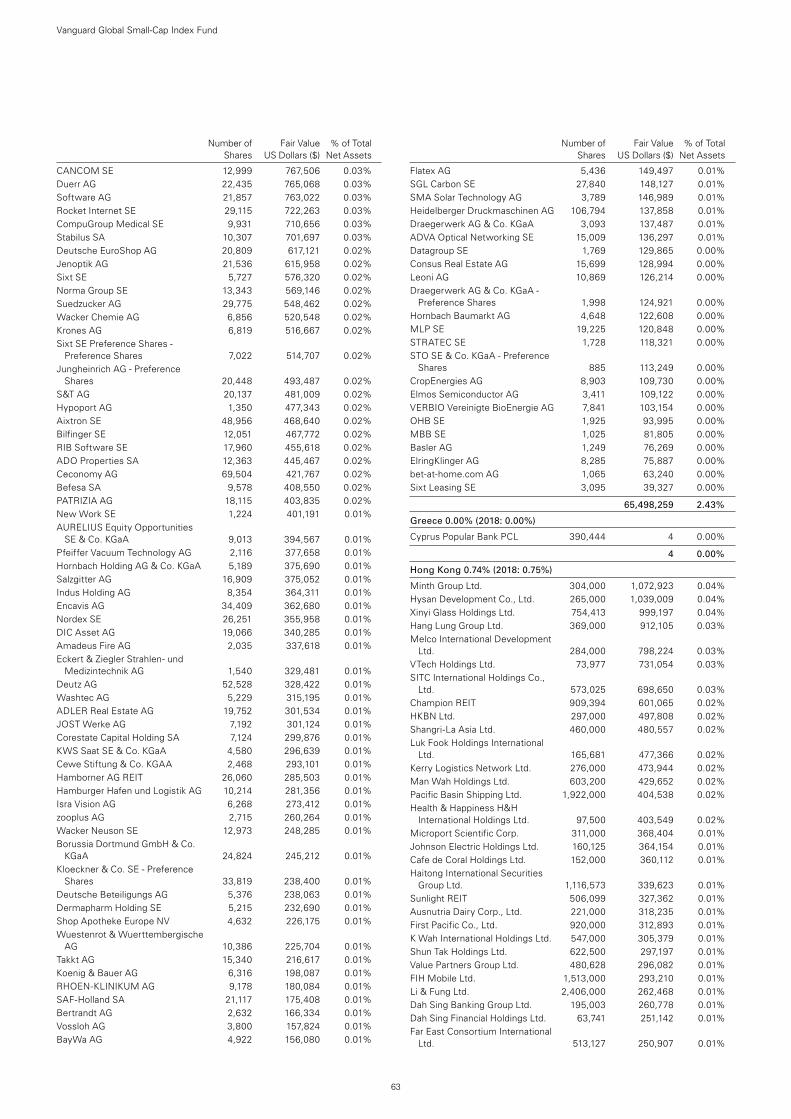
63
Number of Fair Value % of Total Shares US Dollars ($) Net Assets
CANCOM SE 12,999 767,506 0.03%Duerr AG 22,435 765,068 0.03%Software AG 21,857 763,022 0.03%Rocket Internet SE 29,115 722,263 0.03%CompuGroup Medical SE 9,931 710,656 0.03%Stabilus SA 10,307 701,697 0.03%Deutsche EuroShop AG 20,809 617,121 0.02%Jenoptik AG 21,536 615,958 0.02%Sixt SE 5,727 576,320 0.02%Norma Group SE 13,343 569,146 0.02%Suedzucker AG 29,775 548,462 0.02%Wacker Chemie AG 6,856 520,548 0.02%Krones AG 6,819 516,667 0.02%Sixt SE Preference Shares -
Preference Shares 7,022 514,707 0.02%Jungheinrich AG - Preference
Shares 20,448 493,487 0.02%S&T AG 20,137 481,009 0.02%Hypoport AG 1,350 477,343 0.02%Aixtron SE 48,956 468,640 0.02%Bilfinger SE 12,051 467,772 0.02%RIB Software SE 17,960 455,618 0.02%ADO Properties SA 12,363 445,467 0.02%Ceconomy AG 69,504 421,767 0.02%Befesa SA 9,578 408,550 0.02%PATRIZIA AG 18,115 403,835 0.02%New Work SE 1,224 401,191 0.01%AURELIUS Equity Opportunities
SE & Co. KGaA 9,013 394,567 0.01%Pfeiffer Vacuum Technology AG 2,116 377,658 0.01%Hornbach Holding AG & Co. KGaA 5,189 375,690 0.01%Salzgitter AG 16,909 375,052 0.01%Indus Holding AG 8,354 364,311 0.01%Encavis AG 34,409 362,680 0.01%Nordex SE 26,251 355,958 0.01%DIC Asset AG 19,066 340,285 0.01%Amadeus Fire AG 2,035 337,618 0.01%Eckert & Ziegler Strahlen- und
Medizintechnik AG 1,540 329,481 0.01%Deutz AG 52,528 328,422 0.01%Washtec AG 5,229 315,195 0.01%ADLER Real Estate AG 19,752 301,534 0.01%JOST Werke AG 7,192 301,124 0.01%Corestate Capital Holding SA 7,124 299,876 0.01%KWS Saat SE & Co. KGaA 4,580 296,639 0.01%Cewe Stiftung & Co. KGAA 2,468 293,101 0.01%Hamborner AG REIT 26,060 285,503 0.01%Hamburger Hafen und Logistik AG 10,214 281,356 0.01%Isra Vision AG 6,268 273,412 0.01%zooplus AG 2,715 260,264 0.01%Wacker Neuson SE 12,973 248,285 0.01%Borussia Dortmund GmbH & Co.
KGaA 24,824 245,212 0.01%Kloeckner & Co. SE - Preference
Shares 33,819 238,400 0.01%Deutsche Beteiligungs AG 5,376 238,063 0.01%Dermapharm Holding SE 5,215 232,690 0.01%Shop Apotheke Europe NV 4,632 226,175 0.01%Wuestenrot & Wuerttembergische
AG 10,386 225,704 0.01%Takkt AG 15,340 216,617 0.01%Koenig & Bauer AG 6,316 198,087 0.01%RHOEN-KLINIKUM AG 9,178 180,084 0.01%SAF-Holland SA 21,117 175,408 0.01%Bertrandt AG 2,632 166,334 0.01%Vossloh AG 3,800 157,824 0.01%BayWa AG 4,922 156,080 0.01%
Flatex AG 5,436 149,497 0.01%SGL Carbon SE 27,840 148,127 0.01%SMA Solar Technology AG 3,789 146,989 0.01%Heidelberger Druckmaschinen AG 106,794 137,858 0.01%Draegerwerk AG & Co. KGaA 3,093 137,487 0.01%ADVA Optical Networking SE 15,009 136,297 0.01%Datagroup SE 1,769 129,865 0.00%Consus Real Estate AG 15,699 128,994 0.00%Leoni AG 10,869 126,214 0.00%Draegerwerk AG & Co. KGaA -
Preference Shares 1,998 124,921 0.00%Hornbach Baumarkt AG 4,648 122,608 0.00%MLP SE 19,225 120,848 0.00%STRATEC SE 1,728 118,321 0.00%STO SE & Co. KGaA - Preference
Shares 885 113,249 0.00%CropEnergies AG 8,903 109,730 0.00%Elmos Semiconductor AG 3,411 109,122 0.00%VERBIO Vereinigte BioEnergie AG 7,841 103,154 0.00%OHB SE 1,925 93,995 0.00%MBB SE 1,025 81,805 0.00%Basler AG 1,249 76,269 0.00%ElringKlinger AG 8,285 75,887 0.00%bet-at-home.com AG 1,065 63,240 0.00%Sixt Leasing SE 3,095 39,327 0.00%
65,498,259 2.43%
Greece 0.00% (2018: 0.00%)
Cyprus Popular Bank PCL 390,444 4 0.00%
4 0.00%
Hong Kong 0.74% (2018: 0.75%)
Minth Group Ltd. 304,000 1,072,923 0.04%Hysan Development Co., Ltd. 265,000 1,039,009 0.04%Xinyi Glass Holdings Ltd. 754,413 999,197 0.04%Hang Lung Group Ltd. 369,000 912,105 0.03%Melco International Development
Ltd. 284,000 798,224 0.03%VTech Holdings Ltd. 73,977 731,054 0.03%SITC International Holdings Co.,
Ltd. 573,025 698,650 0.03%Champion REIT 909,394 601,065 0.02%HKBN Ltd. 297,000 497,808 0.02%Shangri-La Asia Ltd. 460,000 480,557 0.02%Luk Fook Holdings International
Ltd. 165,681 477,366 0.02%Kerry Logistics Network Ltd. 276,000 473,944 0.02%Man Wah Holdings Ltd. 603,200 429,652 0.02%Pacific Basin Shipping Ltd. 1,922,000 404,538 0.02%Health & Happiness H&H
International Holdings Ltd. 97,500 403,549 0.02%Microport Scientific Corp. 311,000 368,404 0.01%Johnson Electric Holdings Ltd. 160,125 364,154 0.01%Cafe de Coral Holdings Ltd. 152,000 360,112 0.01%Haitong International Securities
Group Ltd. 1,116,573 339,623 0.01%Sunlight REIT 506,099 327,362 0.01%Ausnutria Dairy Corp., Ltd. 221,000 318,235 0.01%First Pacific Co., Ltd. 920,000 312,893 0.01%K Wah International Holdings Ltd. 547,000 305,379 0.01%Shun Tak Holdings Ltd. 622,500 297,197 0.01%Value Partners Group Ltd. 480,628 296,082 0.01%FIH Mobile Ltd. 1,513,000 293,210 0.01%Li & Fung Ltd. 2,406,000 262,468 0.01%Dah Sing Banking Group Ltd. 195,003 260,778 0.01%Dah Sing Financial Holdings Ltd. 63,741 251,142 0.01%Far East Consortium International
Ltd. 513,127 250,907 0.01%
Number of Fair Value % of Total Shares US Dollars ($) Net Assets
Vanguard Global Small-Cap Index Fund
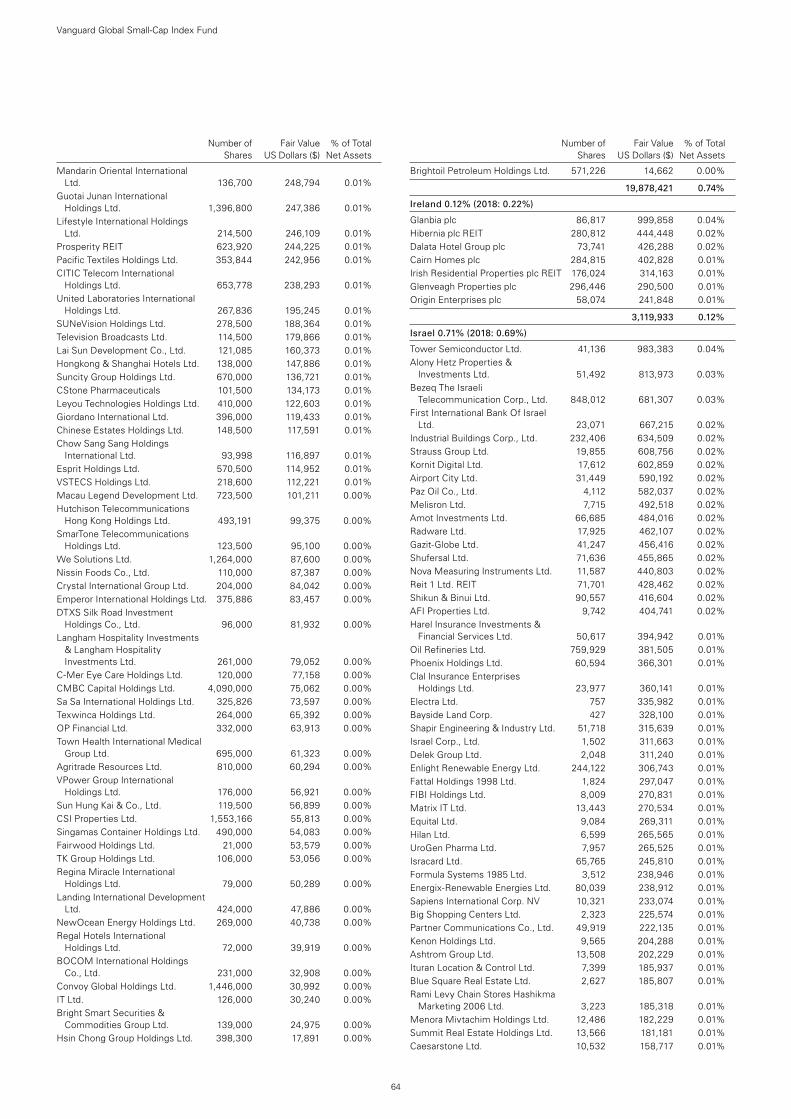
64
Number of Fair Value % of Total Shares US Dollars ($) Net Assets
Mandarin Oriental International Ltd. 136,700 248,794 0.01%
Guotai Junan International Holdings Ltd. 1,396,800 247,386 0.01%
Lifestyle International Holdings Ltd. 214,500 246,109 0.01%
Prosperity REIT 623,920 244,225 0.01%Pacific Textiles Holdings Ltd. 353,844 242,956 0.01%CITIC Telecom International
Holdings Ltd. 653,778 238,293 0.01%United Laboratories International
Holdings Ltd. 267,836 195,245 0.01%SUNeVision Holdings Ltd. 278,500 188,364 0.01%Television Broadcasts Ltd. 114,500 179,866 0.01%Lai Sun Development Co., Ltd. 121,085 160,373 0.01%Hongkong & Shanghai Hotels Ltd. 138,000 147,886 0.01%Suncity Group Holdings Ltd. 670,000 136,721 0.01%CStone Pharmaceuticals 101,500 134,173 0.01%Leyou Technologies Holdings Ltd. 410,000 122,603 0.01%Giordano International Ltd. 396,000 119,433 0.01%Chinese Estates Holdings Ltd. 148,500 117,591 0.01%Chow Sang Sang Holdings
International Ltd. 93,998 116,897 0.01%Esprit Holdings Ltd. 570,500 114,952 0.01%VSTECS Holdings Ltd. 218,600 112,221 0.01%Macau Legend Development Ltd. 723,500 101,211 0.00%Hutchison Telecommunications
Hong Kong Holdings Ltd. 493,191 99,375 0.00%SmarTone Telecommunications
Holdings Ltd. 123,500 95,100 0.00%We Solutions Ltd. 1,264,000 87,600 0.00%Nissin Foods Co., Ltd. 110,000 87,387 0.00%Crystal International Group Ltd. 204,000 84,042 0.00%Emperor International Holdings Ltd. 375,886 83,457 0.00%DTXS Silk Road Investment
Holdings Co., Ltd. 96,000 81,932 0.00%Langham Hospitality Investments
& Langham Hospitality Investments Ltd. 261,000 79,052 0.00%
C-Mer Eye Care Holdings Ltd. 120,000 77,158 0.00%CMBC Capital Holdings Ltd. 4,090,000 75,062 0.00%Sa Sa International Holdings Ltd. 325,826 73,597 0.00%Texwinca Holdings Ltd. 264,000 65,392 0.00%OP Financial Ltd. 332,000 63,913 0.00%Town Health International Medical
Group Ltd. 695,000 61,323 0.00%Agritrade Resources Ltd. 810,000 60,294 0.00%VPower Group International
Holdings Ltd. 176,000 56,921 0.00%Sun Hung Kai & Co., Ltd. 119,500 56,899 0.00%CSI Properties Ltd. 1,553,166 55,813 0.00%Singamas Container Holdings Ltd. 490,000 54,083 0.00%Fairwood Holdings Ltd. 21,000 53,579 0.00%TK Group Holdings Ltd. 106,000 53,056 0.00%Regina Miracle International
Holdings Ltd. 79,000 50,289 0.00%Landing International Development
Ltd. 424,000 47,886 0.00%NewOcean Energy Holdings Ltd. 269,000 40,738 0.00%Regal Hotels International
Holdings Ltd. 72,000 39,919 0.00%BOCOM International Holdings
Co., Ltd. 231,000 32,908 0.00%Convoy Global Holdings Ltd. 1,446,000 30,992 0.00%IT Ltd. 126,000 30,240 0.00%Bright Smart Securities &
Commodities Group Ltd. 139,000 24,975 0.00%Hsin Chong Group Holdings Ltd. 398,300 17,891 0.00%
Brightoil Petroleum Holdings Ltd. 571,226 14,662 0.00%
19,878,421 0.74%
Ireland 0.12% (2018: 0.22%)
Glanbia plc 86,817 999,858 0.04%Hibernia plc REIT 280,812 444,448 0.02%Dalata Hotel Group plc 73,741 426,288 0.02%Cairn Homes plc 284,815 402,828 0.01%Irish Residential Properties plc REIT 176,024 314,163 0.01%Glenveagh Properties plc 296,446 290,500 0.01%Origin Enterprises plc 58,074 241,848 0.01%
3,119,933 0.12%
Israel 0.71% (2018: 0.69%)
Tower Semiconductor Ltd. 41,136 983,383 0.04%Alony Hetz Properties &
Investments Ltd. 51,492 813,973 0.03%Bezeq The Israeli
Telecommunication Corp., Ltd. 848,012 681,307 0.03%First International Bank Of Israel
Ltd. 23,071 667,215 0.02%Industrial Buildings Corp., Ltd. 232,406 634,509 0.02%Strauss Group Ltd. 19,855 608,756 0.02%Kornit Digital Ltd. 17,612 602,859 0.02%Airport City Ltd. 31,449 590,192 0.02%Paz Oil Co., Ltd. 4,112 582,037 0.02%Melisron Ltd. 7,715 492,518 0.02%Amot Investments Ltd. 66,685 484,016 0.02%Radware Ltd. 17,925 462,107 0.02%Gazit-Globe Ltd. 41,247 456,416 0.02%Shufersal Ltd. 71,636 455,865 0.02%Nova Measuring Instruments Ltd. 11,587 440,803 0.02%Reit 1 Ltd. REIT 71,701 428,462 0.02%Shikun & Binui Ltd. 90,557 416,604 0.02%AFI Properties Ltd. 9,742 404,741 0.02%Harel Insurance Investments &
Financial Services Ltd. 50,617 394,942 0.01%Oil Refineries Ltd. 759,929 381,505 0.01%Phoenix Holdings Ltd. 60,594 366,301 0.01%Clal Insurance Enterprises
Holdings Ltd. 23,977 360,141 0.01%Electra Ltd. 757 335,982 0.01%Bayside Land Corp. 427 328,100 0.01%Shapir Engineering & Industry Ltd. 51,718 315,639 0.01%Israel Corp., Ltd. 1,502 311,663 0.01%Delek Group Ltd. 2,048 311,240 0.01%Enlight Renewable Energy Ltd. 244,122 306,743 0.01%Fattal Holdings 1998 Ltd. 1,824 297,047 0.01%FIBI Holdings Ltd. 8,009 270,831 0.01%Matrix IT Ltd. 13,443 270,534 0.01%Equital Ltd. 9,084 269,311 0.01%Hilan Ltd. 6,599 265,565 0.01%UroGen Pharma Ltd. 7,957 265,525 0.01%Isracard Ltd. 65,765 245,810 0.01%Formula Systems 1985 Ltd. 3,512 238,946 0.01%Energix-Renewable Energies Ltd. 80,039 238,912 0.01%Sapiens International Corp. NV 10,321 233,074 0.01%Big Shopping Centers Ltd. 2,323 225,574 0.01%Partner Communications Co., Ltd. 49,919 222,135 0.01%Kenon Holdings Ltd. 9,565 204,288 0.01%Ashtrom Group Ltd. 13,508 202,229 0.01%Ituran Location & Control Ltd. 7,399 185,937 0.01%Blue Square Real Estate Ltd. 2,627 185,807 0.01%Rami Levy Chain Stores Hashikma
Marketing 2006 Ltd. 3,223 185,318 0.01%Menora Mivtachim Holdings Ltd. 12,486 182,229 0.01%Summit Real Estate Holdings Ltd. 13,566 181,181 0.01%Caesarstone Ltd. 10,532 158,717 0.01%
Number of Fair Value % of Total Shares US Dollars ($) Net Assets
Vanguard Global Small-Cap Index Fund
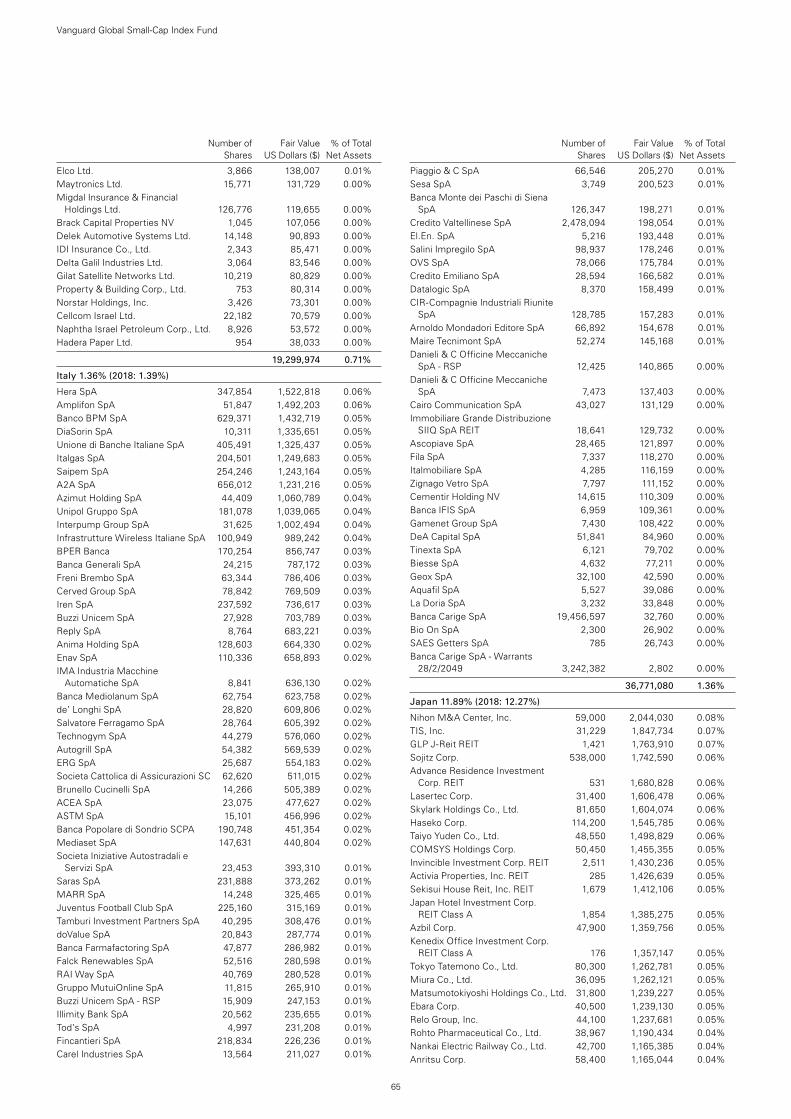
65
Number of Fair Value % of Total Shares US Dollars ($) Net Assets
Elco Ltd. 3,866 138,007 0.01%Maytronics Ltd. 15,771 131,729 0.00%Migdal Insurance & Financial
Holdings Ltd. 126,776 119,655 0.00%Brack Capital Properties NV 1,045 107,056 0.00%Delek Automotive Systems Ltd. 14,148 90,893 0.00%IDI Insurance Co., Ltd. 2,343 85,471 0.00%Delta Galil Industries Ltd. 3,064 83,546 0.00%Gilat Satellite Networks Ltd. 10,219 80,829 0.00%Property & Building Corp., Ltd. 753 80,314 0.00%Norstar Holdings, Inc. 3,426 73,301 0.00%Cellcom Israel Ltd. 22,182 70,579 0.00%Naphtha Israel Petroleum Corp., Ltd. 8,926 53,572 0.00%Hadera Paper Ltd. 954 38,033 0.00%
19,299,974 0.71%
Italy 1.36% (2018: 1.39%)
Hera SpA 347,854 1,522,818 0.06%Amplifon SpA 51,847 1,492,203 0.06%Banco BPM SpA 629,371 1,432,719 0.05%DiaSorin SpA 10,311 1,335,651 0.05%Unione di Banche Italiane SpA 405,491 1,325,437 0.05%Italgas SpA 204,501 1,249,683 0.05%Saipem SpA 254,246 1,243,164 0.05%A2A SpA 656,012 1,231,216 0.05%Azimut Holding SpA 44,409 1,060,789 0.04%Unipol Gruppo SpA 181,078 1,039,065 0.04%Interpump Group SpA 31,625 1,002,494 0.04%Infrastrutture Wireless Italiane SpA 100,949 989,242 0.04%BPER Banca 170,254 856,747 0.03%Banca Generali SpA 24,215 787,172 0.03%Freni Brembo SpA 63,344 786,406 0.03%Cerved Group SpA 78,842 769,509 0.03%Iren SpA 237,592 736,617 0.03%Buzzi Unicem SpA 27,928 703,789 0.03%Reply SpA 8,764 683,221 0.03%Anima Holding SpA 128,603 664,330 0.02%Enav SpA 110,336 658,893 0.02%IMA Industria Macchine
Automatiche SpA 8,841 636,130 0.02%Banca Mediolanum SpA 62,754 623,758 0.02%de’ Longhi SpA 28,820 609,806 0.02%Salvatore Ferragamo SpA 28,764 605,392 0.02%Technogym SpA 44,279 576,060 0.02%Autogrill SpA 54,382 569,539 0.02%ERG SpA 25,687 554,183 0.02%Societa Cattolica di Assicurazioni SC 62,620 511,015 0.02%Brunello Cucinelli SpA 14,266 505,389 0.02%ACEA SpA 23,075 477,627 0.02%ASTM SpA 15,101 456,996 0.02%Banca Popolare di Sondrio SCPA 190,748 451,354 0.02%Mediaset SpA 147,631 440,804 0.02%Societa Iniziative Autostradali e
Servizi SpA 23,453 393,310 0.01%Saras SpA 231,888 373,262 0.01%MARR SpA 14,248 325,465 0.01%Juventus Football Club SpA 225,160 315,169 0.01%Tamburi Investment Partners SpA 40,295 308,476 0.01%doValue SpA 20,843 287,774 0.01%Banca Farmafactoring SpA 47,877 286,982 0.01%Falck Renewables SpA 52,516 280,598 0.01%RAI Way SpA 40,769 280,528 0.01%Gruppo MutuiOnline SpA 11,815 265,910 0.01%Buzzi Unicem SpA - RSP 15,909 247,153 0.01%Illimity Bank SpA 20,562 235,655 0.01%Tod’s SpA 4,997 231,208 0.01%Fincantieri SpA 218,834 226,236 0.01%Carel Industries SpA 13,564 211,027 0.01%
Piaggio & C SpA 66,546 205,270 0.01%Sesa SpA 3,749 200,523 0.01%Banca Monte dei Paschi di Siena
SpA 126,347 198,271 0.01%Credito Valtellinese SpA 2,478,094 198,054 0.01%El.En. SpA 5,216 193,448 0.01%Salini Impregilo SpA 98,937 178,246 0.01%OVS SpA 78,066 175,784 0.01%Credito Emiliano SpA 28,594 166,582 0.01%Datalogic SpA 8,370 158,499 0.01%CIR-Compagnie Industriali Riunite
SpA 128,785 157,283 0.01%Arnoldo Mondadori Editore SpA 66,892 154,678 0.01%Maire Tecnimont SpA 52,274 145,168 0.01%Danieli & C Officine Meccaniche
SpA - RSP 12,425 140,865 0.00%Danieli & C Officine Meccaniche
SpA 7,473 137,403 0.00%Cairo Communication SpA 43,027 131,129 0.00%Immobiliare Grande Distribuzione
SIIQ SpA REIT 18,641 129,732 0.00%Ascopiave SpA 28,465 121,897 0.00%Fila SpA 7,337 118,270 0.00%Italmobiliare SpA 4,285 116,159 0.00%Zignago Vetro SpA 7,797 111,152 0.00%Cementir Holding NV 14,615 110,309 0.00%Banca IFIS SpA 6,959 109,361 0.00%Gamenet Group SpA 7,430 108,422 0.00%DeA Capital SpA 51,841 84,960 0.00%Tinexta SpA 6,121 79,702 0.00%Biesse SpA 4,632 77,211 0.00%Geox SpA 32,100 42,590 0.00%Aquafil SpA 5,527 39,086 0.00%La Doria SpA 3,232 33,848 0.00%Banca Carige SpA 19,456,597 32,760 0.00%Bio On SpA 2,300 26,902 0.00%SAES Getters SpA 785 26,743 0.00%Banca Carige SpA - Warrants
28/2/2049 3,242,382 2,802 0.00%
36,771,080 1.36%
Japan 11.89% (2018: 12.27%)
Nihon M&A Center, Inc. 59,000 2,044,030 0.08%TIS, Inc. 31,229 1,847,734 0.07%GLP J-Reit REIT 1,421 1,763,910 0.07%Sojitz Corp. 538,000 1,742,590 0.06%Advance Residence Investment
Corp. REIT 531 1,680,828 0.06%Lasertec Corp. 31,400 1,606,478 0.06%Skylark Holdings Co., Ltd. 81,650 1,604,074 0.06%Haseko Corp. 114,200 1,545,785 0.06%Taiyo Yuden Co., Ltd. 48,550 1,498,829 0.06%COMSYS Holdings Corp. 50,450 1,455,355 0.05%Invincible Investment Corp. REIT 2,511 1,430,236 0.05%Activia Properties, Inc. REIT 285 1,426,639 0.05%Sekisui House Reit, Inc. REIT 1,679 1,412,106 0.05%Japan Hotel Investment Corp.
REIT Class A 1,854 1,385,275 0.05%Azbil Corp. 47,900 1,359,756 0.05%Kenedix Office Investment Corp.
REIT Class A 176 1,357,147 0.05%Tokyo Tatemono Co., Ltd. 80,300 1,262,781 0.05%Miura Co., Ltd. 36,095 1,262,121 0.05%Matsumotokiyoshi Holdings Co., Ltd. 31,800 1,239,227 0.05%Ebara Corp. 40,500 1,239,130 0.05%Relo Group, Inc. 44,100 1,237,681 0.05%Rohto Pharmaceutical Co., Ltd. 38,967 1,190,434 0.04%Nankai Electric Railway Co., Ltd. 42,700 1,165,385 0.04%Anritsu Corp. 58,400 1,165,044 0.04%
Number of Fair Value % of Total Shares US Dollars ($) Net Assets
Vanguard Global Small-Cap Index Fund
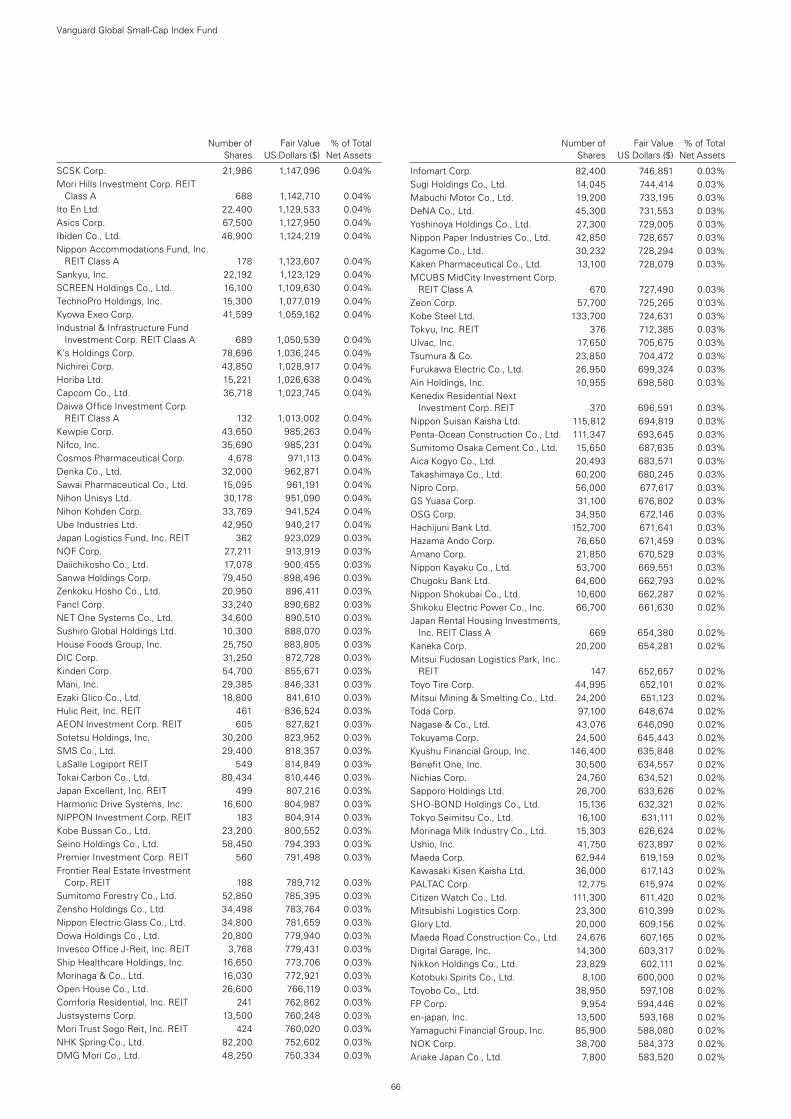
66
Number of Fair Value % of Total Shares US Dollars ($) Net Assets
SCSK Corp. 21,986 1,147,096 0.04%Mori Hills Investment Corp. REIT
Class A 688 1,142,710 0.04%Ito En Ltd. 22,400 1,129,533 0.04%Asics Corp. 67,500 1,127,950 0.04%Ibiden Co., Ltd. 46,900 1,124,219 0.04%Nippon Accommodations Fund, Inc.
REIT Class A 178 1,123,607 0.04%Sankyu, Inc. 22,192 1,123,129 0.04%SCREEN Holdings Co., Ltd. 16,100 1,109,630 0.04%TechnoPro Holdings, Inc. 15,300 1,077,019 0.04%Kyowa Exeo Corp. 41,599 1,059,162 0.04%Industrial & Infrastructure Fund
Investment Corp. REIT Class A 689 1,050,539 0.04%K’s Holdings Corp. 78,696 1,036,245 0.04%Nichirei Corp. 43,850 1,028,917 0.04%Horiba Ltd. 15,221 1,026,638 0.04%Capcom Co., Ltd. 36,718 1,023,745 0.04%Daiwa Office Investment Corp.
REIT Class A 132 1,013,002 0.04%Kewpie Corp. 43,650 985,263 0.04%Nifco, Inc. 35,690 985,231 0.04%Cosmos Pharmaceutical Corp. 4,678 971,113 0.04%Denka Co., Ltd. 32,000 962,871 0.04%Sawai Pharmaceutical Co., Ltd. 15,095 961,191 0.04%Nihon Unisys Ltd. 30,178 951,090 0.04%Nihon Kohden Corp. 33,769 941,524 0.04%Ube Industries Ltd. 42,950 940,217 0.04%Japan Logistics Fund, Inc. REIT 362 923,029 0.03%NOF Corp. 27,211 913,919 0.03%Daiichikosho Co., Ltd. 17,078 900,455 0.03%Sanwa Holdings Corp. 79,450 898,496 0.03%Zenkoku Hosho Co., Ltd. 20,950 896,411 0.03%Fancl Corp. 33,240 890,682 0.03%NET One Systems Co., Ltd. 34,600 890,510 0.03%Sushiro Global Holdings Ltd. 10,300 888,070 0.03%House Foods Group, Inc. 25,750 883,805 0.03%DIC Corp. 31,250 872,728 0.03%Kinden Corp. 54,700 855,671 0.03%Mani, Inc. 29,385 846,331 0.03%Ezaki Glico Co., Ltd. 18,800 841,610 0.03%Hulic Reit, Inc. REIT 461 836,524 0.03%AEON Investment Corp. REIT 605 827,821 0.03%Sotetsu Holdings, Inc. 30,200 823,952 0.03%SMS Co., Ltd. 29,400 818,357 0.03%LaSalle Logiport REIT 549 814,849 0.03%Tokai Carbon Co., Ltd. 80,434 810,446 0.03%Japan Excellent, Inc. REIT 499 807,216 0.03%Harmonic Drive Systems, Inc. 16,600 804,987 0.03%NIPPON Investment Corp. REIT 183 804,914 0.03%Kobe Bussan Co., Ltd. 23,200 800,552 0.03%Seino Holdings Co., Ltd. 58,450 794,393 0.03%Premier Investment Corp. REIT 560 791,498 0.03%Frontier Real Estate Investment
Corp. REIT 188 789,712 0.03%Sumitomo Forestry Co., Ltd. 52,850 785,395 0.03%Zensho Holdings Co., Ltd. 34,498 783,764 0.03%Nippon Electric Glass Co., Ltd. 34,800 781,659 0.03%Dowa Holdings Co., Ltd. 20,800 779,940 0.03%Invesco Office J-Reit, Inc. REIT 3,768 779,431 0.03%Ship Healthcare Holdings, Inc. 16,650 773,706 0.03%Morinaga & Co., Ltd. 16,030 772,921 0.03%Open House Co., Ltd. 26,600 766,119 0.03%Comforia Residential, Inc. REIT 241 762,862 0.03%Justsystems Corp. 13,500 760,248 0.03%Mori Trust Sogo Reit, Inc. REIT 424 760,020 0.03%NHK Spring Co., Ltd. 82,200 752,602 0.03%DMG Mori Co., Ltd. 48,250 750,334 0.03%
Infomart Corp. 82,400 746,851 0.03%Sugi Holdings Co., Ltd. 14,045 744,414 0.03%Mabuchi Motor Co., Ltd. 19,200 733,195 0.03%DeNA Co., Ltd. 45,300 731,553 0.03%Yoshinoya Holdings Co., Ltd. 27,300 729,005 0.03%Nippon Paper Industries Co., Ltd. 42,850 728,657 0.03%Kagome Co., Ltd. 30,232 728,294 0.03%Kaken Pharmaceutical Co., Ltd. 13,100 728,079 0.03%MCUBS MidCity Investment Corp.
REIT Class A 670 727,490 0.03%Zeon Corp. 57,700 725,265 0.03%Kobe Steel Ltd. 133,700 724,631 0.03%Tokyu, Inc. REIT 376 712,385 0.03%Ulvac, Inc. 17,650 705,675 0.03%Tsumura & Co. 23,850 704,472 0.03%Furukawa Electric Co., Ltd. 26,950 699,324 0.03%Ain Holdings, Inc. 10,955 698,580 0.03%Kenedix Residential Next
Investment Corp. REIT 370 696,591 0.03%Nippon Suisan Kaisha Ltd. 115,812 694,819 0.03%Penta-Ocean Construction Co., Ltd. 111,347 693,645 0.03%Sumitomo Osaka Cement Co., Ltd. 15,650 687,635 0.03%Aica Kogyo Co., Ltd. 20,493 683,571 0.03%Takashimaya Co., Ltd. 60,200 680,245 0.03%Nipro Corp. 56,000 677,617 0.03%GS Yuasa Corp. 31,100 676,802 0.03%OSG Corp. 34,950 672,146 0.03%Hachijuni Bank Ltd. 152,700 671,641 0.03%Hazama Ando Corp. 76,650 671,459 0.03%Amano Corp. 21,850 670,529 0.03%Nippon Kayaku Co., Ltd. 53,700 669,551 0.03%Chugoku Bank Ltd. 64,600 662,793 0.02%Nippon Shokubai Co., Ltd. 10,600 662,287 0.02%Shikoku Electric Power Co., Inc. 66,700 661,630 0.02%Japan Rental Housing Investments,
Inc. REIT Class A 669 654,380 0.02%Kaneka Corp. 20,200 654,281 0.02%Mitsui Fudosan Logistics Park, Inc.
REIT 147 652,657 0.02%Toyo Tire Corp. 44,995 652,101 0.02%Mitsui Mining & Smelting Co., Ltd. 24,200 651,123 0.02%Toda Corp. 97,100 648,674 0.02%Nagase & Co., Ltd. 43,076 646,090 0.02%Tokuyama Corp. 24,500 645,443 0.02%Kyushu Financial Group, Inc. 146,400 635,848 0.02%Benefit One, Inc. 30,500 634,557 0.02%Nichias Corp. 24,760 634,521 0.02%Sapporo Holdings Ltd. 26,700 633,626 0.02%SHO-BOND Holdings Co., Ltd. 15,136 632,321 0.02%Tokyo Seimitsu Co., Ltd. 16,100 631,111 0.02%Morinaga Milk Industry Co., Ltd. 15,303 626,624 0.02%Ushio, Inc. 41,750 623,897 0.02%Maeda Corp. 62,944 619,159 0.02%Kawasaki Kisen Kaisha Ltd. 36,000 617,143 0.02%PALTAC Corp. 12,775 615,974 0.02%Citizen Watch Co., Ltd. 111,300 611,420 0.02%Mitsubishi Logistics Corp. 23,300 610,399 0.02%Glory Ltd. 20,000 609,156 0.02%Maeda Road Construction Co., Ltd. 24,676 607,165 0.02%Digital Garage, Inc. 14,300 603,317 0.02%Nikkon Holdings Co., Ltd. 23,829 602,111 0.02%Kotobuki Spirits Co., Ltd. 8,100 600,000 0.02%Toyobo Co., Ltd. 38,950 597,108 0.02%FP Corp. 9,954 594,446 0.02%en-japan, Inc. 13,500 593,168 0.02%Yamaguchi Financial Group, Inc. 85,900 588,080 0.02%NOK Corp. 38,700 584,373 0.02%Ariake Japan Co., Ltd. 7,800 583,520 0.02%
Number of Fair Value % of Total Shares US Dollars ($) Net Assets
Vanguard Global Small-Cap Index Fund

67
Number of Fair Value % of Total Shares US Dollars ($) Net Assets
Nishi-Nippon Railroad Co., Ltd. 25,100 582,029 0.02%Kyoritsu Maintenance Co., Ltd. 12,184 580,751 0.02%Meitec Corp. 10,250 580,055 0.02%Topcon Corp. 44,276 579,754 0.02%Shochiku Co., Ltd. 3,803 576,705 0.02%Iyo Bank Ltd. 100,500 573,361 0.02%Nisshinbo Holdings, Inc. 59,531 572,440 0.02%NTN Corp. 180,100 571,746 0.02%Fujitsu General Ltd. 25,224 570,746 0.02%Colowide Co., Ltd. 27,376 569,562 0.02%Goldwin, Inc. 7,700 568,245 0.02%Nishimatsu Construction Co., Ltd. 25,000 568,208 0.02%Cosmo Energy Holdings Co., Ltd. 24,500 566,989 0.02%Resorttrust, Inc. 33,194 566,596 0.02%OKUMA Corp. 10,600 565,724 0.02%Milbon Co., Ltd. 9,900 564,803 0.02%Sumitomo Bakelite Co., Ltd. 14,900 564,191 0.02%As One Corp. 6,000 563,699 0.02%Sosei Group Corp. 28,200 563,351 0.02%Takara Holdings, Inc. 60,350 558,102 0.02%Nakanishi, Inc. 29,100 557,499 0.02%Rengo Co., Ltd. 72,581 557,005 0.02%Fuji Oil Holdings, Inc. 20,531 554,672 0.02%Ichigo Office Investment REIT 530 550,117 0.02%GMO internet, Inc. 28,739 548,732 0.02%Izumi Co., Ltd. 15,150 548,565 0.02%Miraca Holdings, Inc. 22,200 548,080 0.02%Tokyo Ohka Kogyo Co., Ltd. 13,870 546,249 0.02%Kyudenko Corp. 18,099 538,765 0.02%TS Tech Co., Ltd. 17,048 537,285 0.02%Nippon Light Metal Holdings Co.,
Ltd. 246,950 536,280 0.02%Fuyo General Lease Co., Ltd. 7,891 535,143 0.02%Jafco Co., Ltd. 13,500 534,162 0.02%Hokuhoku Financial Group, Inc. 50,100 531,081 0.02%Global One Real Estate Investment
Corp. REIT 410 530,444 0.02%Kokuyo Co., Ltd. 35,050 527,000 0.02%Hokuriku Electric Power Co. 71,700 525,173 0.02%Kenedix Retail Corp. REIT 206 524,122 0.02%Gunma Bank Ltd. 147,400 523,546 0.02%Bic Camera, Inc. 45,650 523,395 0.02%Unizo Holdings Co., Ltd. 11,100 522,954 0.02%Canon Marketing Japan, Inc. 22,250 520,037 0.02%Daido Steel Co., Ltd. 11,700 517,309 0.02%Hitachi Capital Corp. 19,450 515,266 0.02%Toagosei Co., Ltd. 43,952 513,633 0.02%Kenedix, Inc. 98,050 513,370 0.02%Koei Tecmo Holdings Co., Ltd. 19,476 511,295 0.02%Hiroshima Bank Ltd. 103,500 510,476 0.02%Japan Steel Works Ltd. 25,700 510,098 0.02%Nippo Corp. 23,376 506,346 0.02%Fukuoka Corp. REIT 296 503,888 0.02%Hitachi Transport System Ltd. 17,793 503,460 0.02%Autobacs Seven Co., Ltd. 31,640 500,767 0.02%Hoshino Resorts, Inc. REIT 97 500,732 0.02%Seria Co., Ltd. 18,100 494,658 0.02%ADEKA Corp. 32,388 493,531 0.02%Heiwa Corp. 23,350 491,172 0.02%Toshiba Plant Systems & Services
Corp. 20,041 490,168 0.02%Outsourcing, Inc. 45,900 489,093 0.02%Iwatani Corp. 14,283 488,257 0.02%Fuji Corp. 26,227 485,323 0.02%Inaba Denki Sangyo Co., Ltd. 18,952 484,808 0.02%JCR Pharmaceuticals Co., Ltd. 5,900 481,012 0.02%cocokara fine, Inc. 8,236 480,481 0.02%
Mandom Corp. 17,338 478,620 0.02%Wacoal Holdings Corp. 17,700 478,352 0.02%Nippon Gas Co., Ltd. 14,750 475,719 0.02%NSD Co., Ltd. 28,718 475,132 0.02%Tomy Co., Ltd. 36,150 471,355 0.02%Heiwa Real Estate, Inc. REIT 374 467,349 0.02%Jeol Ltd. 15,249 466,556 0.02%Daiseki Co., Ltd. 15,990 465,685 0.02%Mirait Holdings Corp. 30,643 465,531 0.02%Toho Holdings Co., Ltd. 20,639 460,923 0.02%Kumagai Gumi Co., Ltd. 14,950 458,095 0.02%Maruha Nichiro Corp. 17,777 457,205 0.02%NS Solutions Corp. 13,800 457,143 0.02%Katitas Co., Ltd. 10,300 456,356 0.02%H2O Retailing Corp. 40,407 456,217 0.02%Nomura Co., Ltd. 33,900 453,872 0.02%Daiwabo Holdings Co., Ltd. 7,311 452,754 0.02%Oki Electric Industry Co., Ltd. 32,350 452,171 0.02%Nishi-Nippon Financial Holdings, Inc. 57,300 451,862 0.02%Makino Milling Machine Co., Ltd. 9,691 447,654 0.02%Pilot Corp. 11,000 447,389 0.02%Fuji Seal International, Inc. 19,954 444,891 0.02%EDION Corp. 39,750 443,678 0.02%Sakata Seed Corp. 13,071 440,812 0.02%Fukuyama Transporting Co., Ltd. 12,000 440,580 0.02%Tokai Rika Co., Ltd. 22,200 438,587 0.02%Megmilk Snow Brand Co., Ltd. 19,083 437,588 0.02%Toshiba TEC Corp. 10,500 436,715 0.02%Ichigo, Inc. 102,800 436,078 0.02%Systena Corp. 26,600 434,705 0.02%Shimachu Co., Ltd. 15,800 433,691 0.02%Daishi Hokuetsu Financial Group, Inc. 15,414 432,599 0.02%Showa Corp. 20,691 432,574 0.02%Nihon Parkerizing Co., Ltd. 39,973 432,558 0.02%Trusco Nakayama Corp. 16,642 429,086 0.02%Shiga Bank Ltd. 16,700 428,276 0.02%GNI Group Ltd. 17,700 427,373 0.02%Duskin Co., Ltd. 15,286 425,490 0.02%Kusuri no Aoki Holdings Co., Ltd. 6,750 424,845 0.02%Iriso Electronics Co., Ltd. 9,500 423,096 0.02%Mochida Pharmaceutical Co., Ltd. 10,400 422,029 0.02%Fujitec Co., Ltd. 25,763 421,738 0.02%Menicon Co., Ltd. 10,000 421,440 0.02%Keihin Corp. 17,780 419,652 0.02%Itoham Yonekyu Holdings, Inc. 64,655 419,432 0.02%Sanrio Co., Ltd. 21,200 419,221 0.02%Lintec Corp. 18,500 416,048 0.02%Sumitomo Mitsui Construction Co.,
Ltd. 70,840 413,926 0.02%Japan Material Co., Ltd. 24,600 413,565 0.02%Toei Co., Ltd. 2,766 413,341 0.02%KYORIN Holdings, Inc. 23,407 411,171 0.02%Dip Corp. 13,800 410,794 0.02%Nitto Boseki Co., Ltd. 9,586 410,167 0.02%Takara Bio, Inc. 21,650 409,791 0.02%KOMEDA Holdings Co., Ltd. 20,900 408,865 0.02%Japan Aviation Electronics Industry
Ltd. 20,017 408,537 0.02%Toyota Boshoku Corp. 25,150 408,463 0.02%Kanematsu Corp. 29,970 406,219 0.02%Kato Sangyo Co., Ltd. 12,221 405,961 0.02%Yaoko Co., Ltd. 7,900 405,631 0.02%Fujikura Ltd. 97,000 403,441 0.02%Hanwa Co., Ltd. 15,239 403,429 0.02%GungHo Online Entertainment, Inc. 18,860 401,930 0.02%Daio Paper Corp. 29,089 400,166 0.02%OBIC Business Consultants Co., Ltd. 8,400 398,841 0.01%
Number of Fair Value % of Total Shares US Dollars ($) Net Assets
Vanguard Global Small-Cap Index Fund
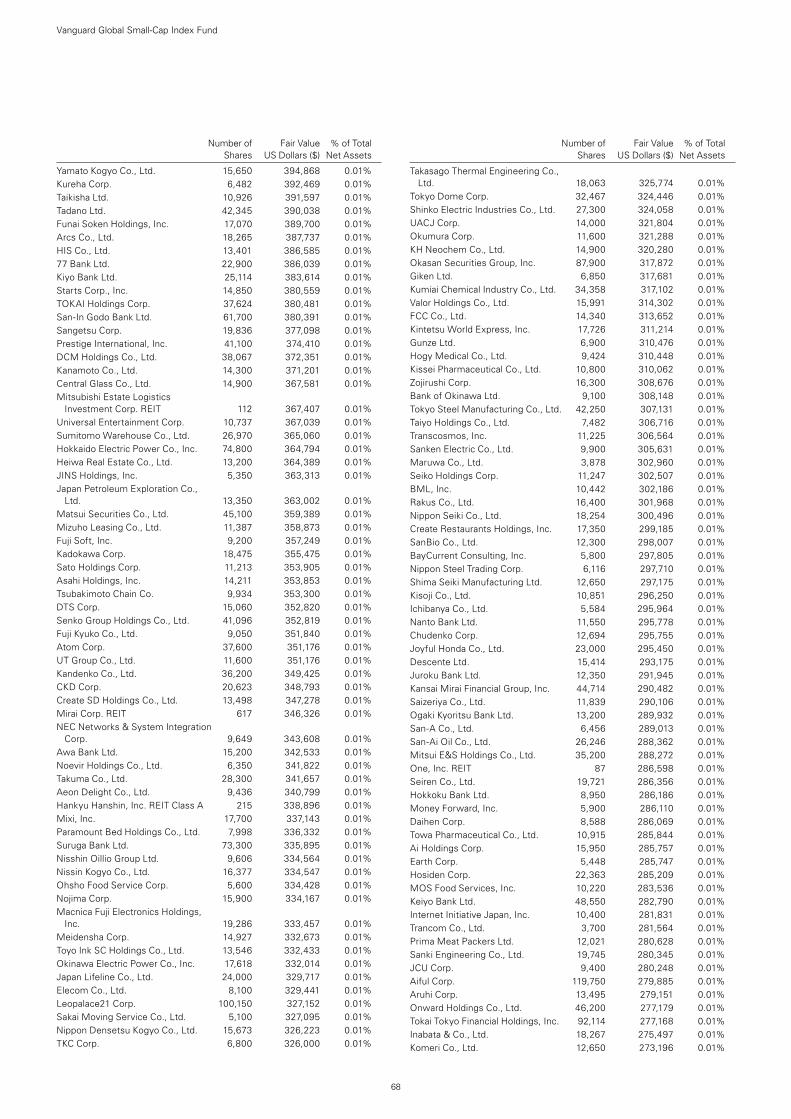
68
Number of Fair Value % of Total Shares US Dollars ($) Net Assets
Yamato Kogyo Co., Ltd. 15,650 394,868 0.01%Kureha Corp. 6,482 392,469 0.01%Taikisha Ltd. 10,926 391,597 0.01%Tadano Ltd. 42,345 390,038 0.01%Funai Soken Holdings, Inc. 17,070 389,700 0.01%Arcs Co., Ltd. 18,265 387,737 0.01%HIS Co., Ltd. 13,401 386,585 0.01%77 Bank Ltd. 22,900 386,039 0.01%Kiyo Bank Ltd. 25,114 383,614 0.01%Starts Corp., Inc. 14,850 380,559 0.01%TOKAI Holdings Corp. 37,624 380,481 0.01%San-In Godo Bank Ltd. 61,700 380,391 0.01%Sangetsu Corp. 19,836 377,098 0.01%Prestige International, Inc. 41,100 374,410 0.01%DCM Holdings Co., Ltd. 38,067 372,351 0.01%Kanamoto Co., Ltd. 14,300 371,201 0.01%Central Glass Co., Ltd. 14,900 367,581 0.01%Mitsubishi Estate Logistics
Investment Corp. REIT 112 367,407 0.01%Universal Entertainment Corp. 10,737 367,039 0.01%Sumitomo Warehouse Co., Ltd. 26,970 365,060 0.01%Hokkaido Electric Power Co., Inc. 74,800 364,794 0.01%Heiwa Real Estate Co., Ltd. 13,200 364,389 0.01%JINS Holdings, Inc. 5,350 363,313 0.01%Japan Petroleum Exploration Co.,
Ltd. 13,350 363,002 0.01%Matsui Securities Co., Ltd. 45,100 359,389 0.01%Mizuho Leasing Co., Ltd. 11,387 358,873 0.01%Fuji Soft, Inc. 9,200 357,249 0.01%Kadokawa Corp. 18,475 355,475 0.01%Sato Holdings Corp. 11,213 353,905 0.01%Asahi Holdings, Inc. 14,211 353,853 0.01%Tsubakimoto Chain Co. 9,934 353,300 0.01%DTS Corp. 15,060 352,820 0.01%Senko Group Holdings Co., Ltd. 41,096 352,819 0.01%Fuji Kyuko Co., Ltd. 9,050 351,840 0.01%Atom Corp. 37,600 351,176 0.01%UT Group Co., Ltd. 11,600 351,176 0.01%Kandenko Co., Ltd. 36,200 349,425 0.01%CKD Corp. 20,623 348,793 0.01%Create SD Holdings Co., Ltd. 13,498 347,278 0.01%Mirai Corp. REIT 617 346,326 0.01%NEC Networks & System Integration
Corp. 9,649 343,608 0.01%Awa Bank Ltd. 15,200 342,533 0.01%Noevir Holdings Co., Ltd. 6,350 341,822 0.01%Takuma Co., Ltd. 28,300 341,657 0.01%Aeon Delight Co., Ltd. 9,436 340,799 0.01%Hankyu Hanshin, Inc. REIT Class A 215 338,896 0.01%Mixi, Inc. 17,700 337,143 0.01%Paramount Bed Holdings Co., Ltd. 7,998 336,332 0.01%Suruga Bank Ltd. 73,300 335,895 0.01%Nisshin Oillio Group Ltd. 9,606 334,564 0.01%Nissin Kogyo Co., Ltd. 16,377 334,547 0.01%Ohsho Food Service Corp. 5,600 334,428 0.01%Nojima Corp. 15,900 334,167 0.01%Macnica Fuji Electronics Holdings,
Inc. 19,286 333,457 0.01%Meidensha Corp. 14,927 332,673 0.01%Toyo Ink SC Holdings Co., Ltd. 13,546 332,433 0.01%Okinawa Electric Power Co., Inc. 17,618 332,014 0.01%Japan Lifeline Co., Ltd. 24,000 329,717 0.01%Elecom Co., Ltd. 8,100 329,441 0.01%Leopalace21 Corp. 100,150 327,152 0.01%Sakai Moving Service Co., Ltd. 5,100 327,095 0.01%Nippon Densetsu Kogyo Co., Ltd. 15,673 326,223 0.01%TKC Corp. 6,800 326,000 0.01%
Takasago Thermal Engineering Co., Ltd. 18,063 325,774 0.01%
Tokyo Dome Corp. 32,467 324,446 0.01%Shinko Electric Industries Co., Ltd. 27,300 324,058 0.01%UACJ Corp. 14,000 321,804 0.01%Okumura Corp. 11,600 321,288 0.01%KH Neochem Co., Ltd. 14,900 320,280 0.01%Okasan Securities Group, Inc. 87,900 317,872 0.01%Giken Ltd. 6,850 317,681 0.01%Kumiai Chemical Industry Co., Ltd. 34,358 317,102 0.01%Valor Holdings Co., Ltd. 15,991 314,302 0.01%FCC Co., Ltd. 14,340 313,652 0.01%Kintetsu World Express, Inc. 17,726 311,214 0.01%Gunze Ltd. 6,900 310,476 0.01%Hogy Medical Co., Ltd. 9,424 310,448 0.01%Kissei Pharmaceutical Co., Ltd. 10,800 310,062 0.01%Zojirushi Corp. 16,300 308,676 0.01%Bank of Okinawa Ltd. 9,100 308,148 0.01%Tokyo Steel Manufacturing Co., Ltd. 42,250 307,131 0.01%Taiyo Holdings Co., Ltd. 7,482 306,716 0.01%Transcosmos, Inc. 11,225 306,564 0.01%Sanken Electric Co., Ltd. 9,900 305,631 0.01%Maruwa Co., Ltd. 3,878 302,960 0.01%Seiko Holdings Corp. 11,247 302,507 0.01%BML, Inc. 10,442 302,186 0.01%Rakus Co., Ltd. 16,400 301,968 0.01%Nippon Seiki Co., Ltd. 18,254 300,496 0.01%Create Restaurants Holdings, Inc. 17,350 299,185 0.01%SanBio Co., Ltd. 12,300 298,007 0.01%BayCurrent Consulting, Inc. 5,800 297,805 0.01%Nippon Steel Trading Corp. 6,116 297,710 0.01%Shima Seiki Manufacturing Ltd. 12,650 297,175 0.01%Kisoji Co., Ltd. 10,851 296,250 0.01%Ichibanya Co., Ltd. 5,584 295,964 0.01%Nanto Bank Ltd. 11,550 295,778 0.01%Chudenko Corp. 12,694 295,755 0.01%Joyful Honda Co., Ltd. 23,000 295,450 0.01%Descente Ltd. 15,414 293,175 0.01%Juroku Bank Ltd. 12,350 291,945 0.01%Kansai Mirai Financial Group, Inc. 44,714 290,482 0.01%Saizeriya Co., Ltd. 11,839 290,106 0.01%Ogaki Kyoritsu Bank Ltd. 13,200 289,932 0.01%San-A Co., Ltd. 6,456 289,013 0.01%San-Ai Oil Co., Ltd. 26,246 288,362 0.01%Mitsui E&S Holdings Co., Ltd. 35,200 288,272 0.01%One, Inc. REIT 87 286,598 0.01%Seiren Co., Ltd. 19,721 286,356 0.01%Hokkoku Bank Ltd. 8,950 286,186 0.01%Money Forward, Inc. 5,900 286,110 0.01%Daihen Corp. 8,588 286,069 0.01%Towa Pharmaceutical Co., Ltd. 10,915 285,844 0.01%Ai Holdings Corp. 15,950 285,757 0.01%Earth Corp. 5,448 285,747 0.01%Hosiden Corp. 22,363 285,209 0.01%MOS Food Services, Inc. 10,220 283,536 0.01%Keiyo Bank Ltd. 48,550 282,790 0.01%Internet Initiative Japan, Inc. 10,400 281,831 0.01%Trancom Co., Ltd. 3,700 281,564 0.01%Prima Meat Packers Ltd. 12,021 280,628 0.01%Sanki Engineering Co., Ltd. 19,745 280,345 0.01%JCU Corp. 9,400 280,248 0.01%Aiful Corp. 119,750 279,885 0.01%Aruhi Corp. 13,495 279,151 0.01%Onward Holdings Co., Ltd. 46,200 277,179 0.01%Tokai Tokyo Financial Holdings, Inc. 92,114 277,168 0.01%Inabata & Co., Ltd. 18,267 275,497 0.01%Komeri Co., Ltd. 12,650 273,196 0.01%
Number of Fair Value % of Total Shares US Dollars ($) Net Assets
Vanguard Global Small-Cap Index Fund
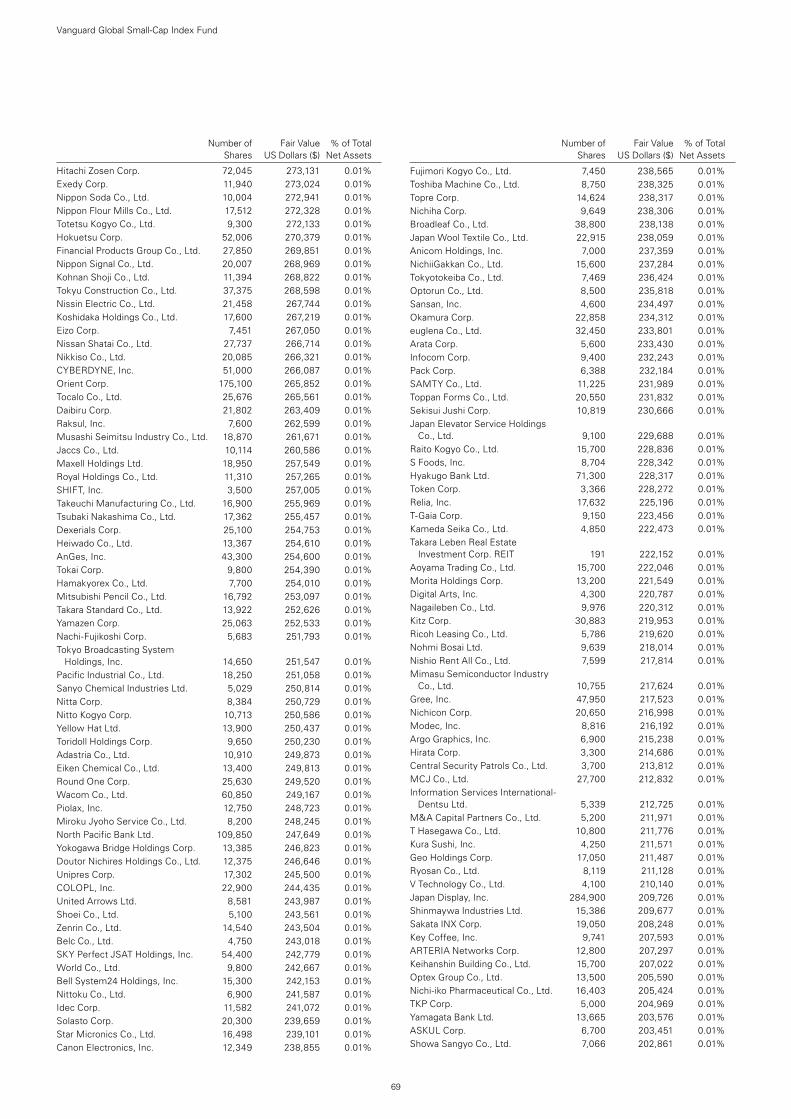
69
Number of Fair Value % of Total Shares US Dollars ($) Net Assets
Hitachi Zosen Corp. 72,045 273,131 0.01%Exedy Corp. 11,940 273,024 0.01%Nippon Soda Co., Ltd. 10,004 272,941 0.01%Nippon Flour Mills Co., Ltd. 17,512 272,328 0.01%Totetsu Kogyo Co., Ltd. 9,300 272,133 0.01%Hokuetsu Corp. 52,006 270,379 0.01%Financial Products Group Co., Ltd. 27,850 269,851 0.01%Nippon Signal Co., Ltd. 20,007 268,969 0.01%Kohnan Shoji Co., Ltd. 11,394 268,822 0.01%Tokyu Construction Co., Ltd. 37,375 268,598 0.01%Nissin Electric Co., Ltd. 21,458 267,744 0.01%Koshidaka Holdings Co., Ltd. 17,600 267,219 0.01%Eizo Corp. 7,451 267,050 0.01%Nissan Shatai Co., Ltd. 27,737 266,714 0.01%Nikkiso Co., Ltd. 20,085 266,321 0.01%CYBERDYNE, Inc. 51,000 266,087 0.01%Orient Corp. 175,100 265,852 0.01%Tocalo Co., Ltd. 25,676 265,561 0.01%Daibiru Corp. 21,802 263,409 0.01%Raksul, Inc. 7,600 262,599 0.01%Musashi Seimitsu Industry Co., Ltd. 18,870 261,671 0.01%Jaccs Co., Ltd. 10,114 260,586 0.01%Maxell Holdings Ltd. 18,950 257,549 0.01%Royal Holdings Co., Ltd. 11,310 257,265 0.01%SHIFT, Inc. 3,500 257,005 0.01%Takeuchi Manufacturing Co., Ltd. 16,900 255,969 0.01%Tsubaki Nakashima Co., Ltd. 17,362 255,457 0.01%Dexerials Corp. 25,100 254,753 0.01%Heiwado Co., Ltd. 13,367 254,610 0.01%AnGes, Inc. 43,300 254,600 0.01%Tokai Corp. 9,800 254,390 0.01%Hamakyorex Co., Ltd. 7,700 254,010 0.01%Mitsubishi Pencil Co., Ltd. 16,792 253,097 0.01%Takara Standard Co., Ltd. 13,922 252,626 0.01%Yamazen Corp. 25,063 252,533 0.01%Nachi-Fujikoshi Corp. 5,683 251,793 0.01%Tokyo Broadcasting System
Holdings, Inc. 14,650 251,547 0.01%Pacific Industrial Co., Ltd. 18,250 251,058 0.01%Sanyo Chemical Industries Ltd. 5,029 250,814 0.01%Nitta Corp. 8,384 250,729 0.01%Nitto Kogyo Corp. 10,713 250,586 0.01%Yellow Hat Ltd. 13,900 250,437 0.01%Toridoll Holdings Corp. 9,650 250,230 0.01%Adastria Co., Ltd. 10,910 249,873 0.01%Eiken Chemical Co., Ltd. 13,400 249,813 0.01%Round One Corp. 25,630 249,520 0.01%Wacom Co., Ltd. 60,850 249,167 0.01%Piolax, Inc. 12,750 248,723 0.01%Miroku Jyoho Service Co., Ltd. 8,200 248,245 0.01%North Pacific Bank Ltd. 109,850 247,649 0.01%Yokogawa Bridge Holdings Corp. 13,385 246,823 0.01%Doutor Nichires Holdings Co., Ltd. 12,375 246,646 0.01%Unipres Corp. 17,302 245,500 0.01%COLOPL, Inc. 22,900 244,435 0.01%United Arrows Ltd. 8,581 243,987 0.01%Shoei Co., Ltd. 5,100 243,561 0.01%Zenrin Co., Ltd. 14,540 243,504 0.01%Belc Co., Ltd. 4,750 243,018 0.01%SKY Perfect JSAT Holdings, Inc. 54,400 242,779 0.01%World Co., Ltd. 9,800 242,667 0.01%Bell System24 Holdings, Inc. 15,300 242,153 0.01%Nittoku Co., Ltd. 6,900 241,587 0.01%Idec Corp. 11,582 241,072 0.01%Solasto Corp. 20,300 239,659 0.01%Star Micronics Co., Ltd. 16,498 239,101 0.01%Canon Electronics, Inc. 12,349 238,855 0.01%
Fujimori Kogyo Co., Ltd. 7,450 238,565 0.01%Toshiba Machine Co., Ltd. 8,750 238,325 0.01%Topre Corp. 14,624 238,317 0.01%Nichiha Corp. 9,649 238,306 0.01%Broadleaf Co., Ltd. 38,800 238,138 0.01%Japan Wool Textile Co., Ltd. 22,915 238,059 0.01%Anicom Holdings, Inc. 7,000 237,359 0.01%NichiiGakkan Co., Ltd. 15,600 237,284 0.01%Tokyotokeiba Co., Ltd. 7,469 236,424 0.01%Optorun Co., Ltd. 8,500 235,818 0.01%Sansan, Inc. 4,600 234,497 0.01%Okamura Corp. 22,858 234,312 0.01%euglena Co., Ltd. 32,450 233,801 0.01%Arata Corp. 5,600 233,430 0.01%Infocom Corp. 9,400 232,243 0.01%Pack Corp. 6,388 232,184 0.01%SAMTY Co., Ltd. 11,225 231,989 0.01%Toppan Forms Co., Ltd. 20,550 231,832 0.01%Sekisui Jushi Corp. 10,819 230,666 0.01%Japan Elevator Service Holdings
Co., Ltd. 9,100 229,688 0.01%Raito Kogyo Co., Ltd. 15,700 228,836 0.01%S Foods, Inc. 8,704 228,342 0.01%Hyakugo Bank Ltd. 71,300 228,317 0.01%Token Corp. 3,366 228,272 0.01%Relia, Inc. 17,632 225,196 0.01%T-Gaia Corp. 9,150 223,456 0.01%Kameda Seika Co., Ltd. 4,850 222,473 0.01%Takara Leben Real Estate
Investment Corp. REIT 191 222,152 0.01%Aoyama Trading Co., Ltd. 15,700 222,046 0.01%Morita Holdings Corp. 13,200 221,549 0.01%Digital Arts, Inc. 4,300 220,787 0.01%Nagaileben Co., Ltd. 9,976 220,312 0.01%Kitz Corp. 30,883 219,953 0.01%Ricoh Leasing Co., Ltd. 5,786 219,620 0.01%Nohmi Bosai Ltd. 9,639 218,014 0.01%Nishio Rent All Co., Ltd. 7,599 217,814 0.01%Mimasu Semiconductor Industry
Co., Ltd. 10,755 217,624 0.01%Gree, Inc. 47,950 217,523 0.01%Nichicon Corp. 20,650 216,998 0.01%Modec, Inc. 8,816 216,192 0.01%Argo Graphics, Inc. 6,900 215,238 0.01%Hirata Corp. 3,300 214,686 0.01%Central Security Patrols Co., Ltd. 3,700 213,812 0.01%MCJ Co., Ltd. 27,700 212,832 0.01%Information Services International-
Dentsu Ltd. 5,339 212,725 0.01%M&A Capital Partners Co., Ltd. 5,200 211,971 0.01%T Hasegawa Co., Ltd. 10,800 211,776 0.01%Kura Sushi, Inc. 4,250 211,571 0.01%Geo Holdings Corp. 17,050 211,487 0.01%Ryosan Co., Ltd. 8,119 211,128 0.01%V Technology Co., Ltd. 4,100 210,140 0.01%Japan Display, Inc. 284,900 209,726 0.01%Shinmaywa Industries Ltd. 15,386 209,677 0.01%Sakata INX Corp. 19,050 208,248 0.01%Key Coffee, Inc. 9,741 207,593 0.01%ARTERIA Networks Corp. 12,800 207,297 0.01%Keihanshin Building Co., Ltd. 15,700 207,022 0.01%Optex Group Co., Ltd. 13,500 205,590 0.01%Nichi-iko Pharmaceutical Co., Ltd. 16,403 205,424 0.01%TKP Corp. 5,000 204,969 0.01%Yamagata Bank Ltd. 13,665 203,576 0.01%ASKUL Corp. 6,700 203,451 0.01%Showa Sangyo Co., Ltd. 7,066 202,861 0.01%
Number of Fair Value % of Total Shares US Dollars ($) Net Assets
Vanguard Global Small-Cap Index Fund
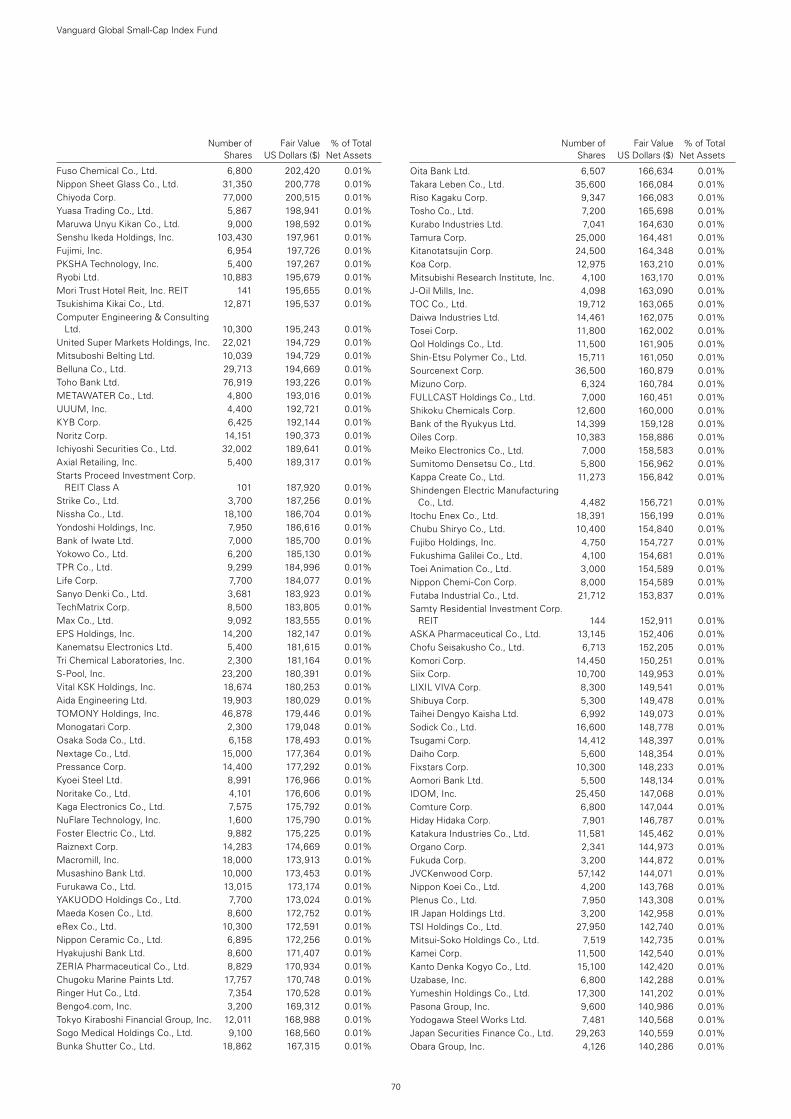
70
Number of Fair Value % of Total Shares US Dollars ($) Net Assets
Fuso Chemical Co., Ltd. 6,800 202,420 0.01%Nippon Sheet Glass Co., Ltd. 31,350 200,778 0.01%Chiyoda Corp. 77,000 200,515 0.01%Yuasa Trading Co., Ltd. 5,867 198,941 0.01%Maruwa Unyu Kikan Co., Ltd. 9,000 198,592 0.01%Senshu Ikeda Holdings, Inc. 103,430 197,961 0.01%Fujimi, Inc. 6,954 197,726 0.01%PKSHA Technology, Inc. 5,400 197,267 0.01%Ryobi Ltd. 10,883 195,679 0.01%Mori Trust Hotel Reit, Inc. REIT 141 195,655 0.01%Tsukishima Kikai Co., Ltd. 12,871 195,537 0.01%Computer Engineering & Consulting
Ltd. 10,300 195,243 0.01%United Super Markets Holdings, Inc. 22,021 194,729 0.01%Mitsuboshi Belting Ltd. 10,039 194,729 0.01%Belluna Co., Ltd. 29,713 194,669 0.01%Toho Bank Ltd. 76,919 193,226 0.01%METAWATER Co., Ltd. 4,800 193,016 0.01%UUUM, Inc. 4,400 192,721 0.01%KYB Corp. 6,425 192,144 0.01%Noritz Corp. 14,151 190,373 0.01%Ichiyoshi Securities Co., Ltd. 32,002 189,641 0.01%Axial Retailing, Inc. 5,400 189,317 0.01%Starts Proceed Investment Corp.
REIT Class A 101 187,920 0.01%Strike Co., Ltd. 3,700 187,256 0.01%Nissha Co., Ltd. 18,100 186,704 0.01%Yondoshi Holdings, Inc. 7,950 186,616 0.01%Bank of Iwate Ltd. 7,000 185,700 0.01%Yokowo Co., Ltd. 6,200 185,130 0.01%TPR Co., Ltd. 9,299 184,996 0.01%Life Corp. 7,700 184,077 0.01%Sanyo Denki Co., Ltd. 3,681 183,923 0.01%TechMatrix Corp. 8,500 183,805 0.01%Max Co., Ltd. 9,092 183,555 0.01%EPS Holdings, Inc. 14,200 182,147 0.01%Kanematsu Electronics Ltd. 5,400 181,615 0.01%Tri Chemical Laboratories, Inc. 2,300 181,164 0.01%S-Pool, Inc. 23,200 180,391 0.01%Vital KSK Holdings, Inc. 18,674 180,253 0.01%Aida Engineering Ltd. 19,903 180,029 0.01%TOMONY Holdings, Inc. 46,878 179,446 0.01%Monogatari Corp. 2,300 179,048 0.01%Osaka Soda Co., Ltd. 6,158 178,493 0.01%Nextage Co., Ltd. 15,000 177,364 0.01%Pressance Corp. 14,400 177,292 0.01%Kyoei Steel Ltd. 8,991 176,966 0.01%Noritake Co., Ltd. 4,101 176,606 0.01%Kaga Electronics Co., Ltd. 7,575 175,792 0.01%NuFlare Technology, Inc. 1,600 175,790 0.01%Foster Electric Co., Ltd. 9,882 175,225 0.01%Raiznext Corp. 14,283 174,669 0.01%Macromill, Inc. 18,000 173,913 0.01%Musashino Bank Ltd. 10,000 173,453 0.01%Furukawa Co., Ltd. 13,015 173,174 0.01%YAKUODO Holdings Co., Ltd. 7,700 173,024 0.01%Maeda Kosen Co., Ltd. 8,600 172,752 0.01%eRex Co., Ltd. 10,300 172,591 0.01%Nippon Ceramic Co., Ltd. 6,895 172,256 0.01%Hyakujushi Bank Ltd. 8,600 171,407 0.01%ZERIA Pharmaceutical Co., Ltd. 8,829 170,934 0.01%Chugoku Marine Paints Ltd. 17,757 170,748 0.01%Ringer Hut Co., Ltd. 7,354 170,528 0.01%Bengo4.com, Inc. 3,200 169,312 0.01%Tokyo Kiraboshi Financial Group, Inc. 12,011 168,988 0.01%Sogo Medical Holdings Co., Ltd. 9,100 168,560 0.01%Bunka Shutter Co., Ltd. 18,862 167,315 0.01%
Oita Bank Ltd. 6,507 166,634 0.01%Takara Leben Co., Ltd. 35,600 166,084 0.01%Riso Kagaku Corp. 9,347 166,083 0.01%Tosho Co., Ltd. 7,200 165,698 0.01%Kurabo Industries Ltd. 7,041 164,630 0.01%Tamura Corp. 25,000 164,481 0.01%Kitanotatsujin Corp. 24,500 164,348 0.01%Koa Corp. 12,975 163,210 0.01%Mitsubishi Research Institute, Inc. 4,100 163,170 0.01%J-Oil Mills, Inc. 4,098 163,090 0.01%TOC Co., Ltd. 19,712 163,065 0.01%Daiwa Industries Ltd. 14,461 162,075 0.01%Tosei Corp. 11,800 162,002 0.01%Qol Holdings Co., Ltd. 11,500 161,905 0.01%Shin-Etsu Polymer Co., Ltd. 15,711 161,050 0.01%Sourcenext Corp. 36,500 160,879 0.01%Mizuno Corp. 6,324 160,784 0.01%FULLCAST Holdings Co., Ltd. 7,000 160,451 0.01%Shikoku Chemicals Corp. 12,600 160,000 0.01%Bank of the Ryukyus Ltd. 14,399 159,128 0.01%Oiles Corp. 10,383 158,886 0.01%Meiko Electronics Co., Ltd. 7,000 158,583 0.01%Sumitomo Densetsu Co., Ltd. 5,800 156,962 0.01%Kappa Create Co., Ltd. 11,273 156,842 0.01%Shindengen Electric Manufacturing
Co., Ltd. 4,482 156,721 0.01%Itochu Enex Co., Ltd. 18,391 156,199 0.01%Chubu Shiryo Co., Ltd. 10,400 154,840 0.01%Fujibo Holdings, Inc. 4,750 154,727 0.01%Fukushima Galilei Co., Ltd. 4,100 154,681 0.01%Toei Animation Co., Ltd. 3,000 154,589 0.01%Nippon Chemi-Con Corp. 8,000 154,589 0.01%Futaba Industrial Co., Ltd. 21,712 153,837 0.01%Samty Residential Investment Corp.
REIT 144 152,911 0.01%ASKA Pharmaceutical Co., Ltd. 13,145 152,406 0.01%Chofu Seisakusho Co., Ltd. 6,713 152,205 0.01%Komori Corp. 14,450 150,251 0.01%Siix Corp. 10,700 149,953 0.01%LIXIL VIVA Corp. 8,300 149,541 0.01%Shibuya Corp. 5,300 149,478 0.01%Taihei Dengyo Kaisha Ltd. 6,992 149,073 0.01%Sodick Co., Ltd. 16,600 148,778 0.01%Tsugami Corp. 14,412 148,397 0.01%Daiho Corp. 5,600 148,354 0.01%Fixstars Corp. 10,300 148,233 0.01%Aomori Bank Ltd. 5,500 148,134 0.01%IDOM, Inc. 25,450 147,068 0.01%Comture Corp. 6,800 147,044 0.01%Hiday Hidaka Corp. 7,901 146,787 0.01%Katakura Industries Co., Ltd. 11,581 145,462 0.01%Organo Corp. 2,341 144,973 0.01%Fukuda Corp. 3,200 144,872 0.01%JVCKenwood Corp. 57,142 144,071 0.01%Nippon Koei Co., Ltd. 4,200 143,768 0.01%Plenus Co., Ltd. 7,950 143,308 0.01%IR Japan Holdings Ltd. 3,200 142,958 0.01%TSI Holdings Co., Ltd. 27,950 142,740 0.01%Mitsui-Soko Holdings Co., Ltd. 7,519 142,735 0.01%Kamei Corp. 11,500 142,540 0.01%Kanto Denka Kogyo Co., Ltd. 15,100 142,420 0.01%Uzabase, Inc. 6,800 142,288 0.01%Yumeshin Holdings Co., Ltd. 17,300 141,202 0.01%Pasona Group, Inc. 9,600 140,986 0.01%Yodogawa Steel Works Ltd. 7,481 140,568 0.01%Japan Securities Finance Co., Ltd. 29,263 140,559 0.01%Obara Group, Inc. 4,126 140,286 0.01%
Number of Fair Value % of Total Shares US Dollars ($) Net Assets
Vanguard Global Small-Cap Index Fund
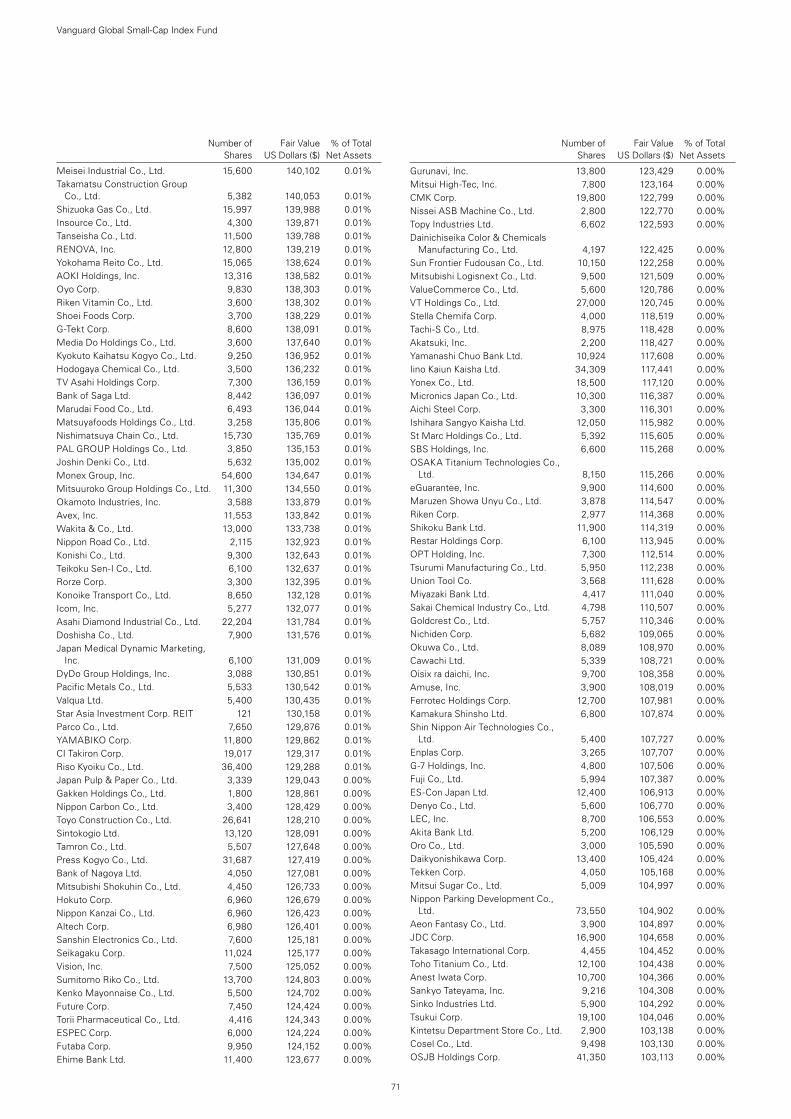
71
Number of Fair Value % of Total Shares US Dollars ($) Net Assets
Meisei Industrial Co., Ltd. 15,600 140,102 0.01%Takamatsu Construction Group
Co., Ltd. 5,382 140,053 0.01%Shizuoka Gas Co., Ltd. 15,997 139,988 0.01%Insource Co., Ltd. 4,300 139,871 0.01%Tanseisha Co., Ltd. 11,500 139,788 0.01%RENOVA, Inc. 12,800 139,219 0.01%Yokohama Reito Co., Ltd. 15,065 138,624 0.01%AOKI Holdings, Inc. 13,316 138,582 0.01%Oyo Corp. 9,830 138,303 0.01%Riken Vitamin Co., Ltd. 3,600 138,302 0.01%Shoei Foods Corp. 3,700 138,229 0.01%G-Tekt Corp. 8,600 138,091 0.01%Media Do Holdings Co., Ltd. 3,600 137,640 0.01%Kyokuto Kaihatsu Kogyo Co., Ltd. 9,250 136,952 0.01%Hodogaya Chemical Co., Ltd. 3,500 136,232 0.01%TV Asahi Holdings Corp. 7,300 136,159 0.01%Bank of Saga Ltd. 8,442 136,097 0.01%Marudai Food Co., Ltd. 6,493 136,044 0.01%Matsuyafoods Holdings Co., Ltd. 3,258 135,806 0.01%Nishimatsuya Chain Co., Ltd. 15,730 135,769 0.01%PAL GROUP Holdings Co., Ltd. 3,850 135,153 0.01%Joshin Denki Co., Ltd. 5,632 135,002 0.01%Monex Group, Inc. 54,600 134,647 0.01%Mitsuuroko Group Holdings Co., Ltd. 11,300 134,550 0.01%Okamoto Industries, Inc. 3,588 133,879 0.01%Avex, Inc. 11,553 133,842 0.01%Wakita & Co., Ltd. 13,000 133,738 0.01%Nippon Road Co., Ltd. 2,115 132,923 0.01%Konishi Co., Ltd. 9,300 132,643 0.01%Teikoku Sen-I Co., Ltd. 6,100 132,637 0.01%Rorze Corp. 3,300 132,395 0.01%Konoike Transport Co., Ltd. 8,650 132,128 0.01%Icom, Inc. 5,277 132,077 0.01%Asahi Diamond Industrial Co., Ltd. 22,204 131,784 0.01%Doshisha Co., Ltd. 7,900 131,576 0.01%Japan Medical Dynamic Marketing,
Inc. 6,100 131,009 0.01%DyDo Group Holdings, Inc. 3,088 130,851 0.01%Pacific Metals Co., Ltd. 5,533 130,542 0.01%Valqua Ltd. 5,400 130,435 0.01%Star Asia Investment Corp. REIT 121 130,158 0.01%Parco Co., Ltd. 7,650 129,876 0.01%YAMABIKO Corp. 11,800 129,862 0.01%CI Takiron Corp. 19,017 129,317 0.01%Riso Kyoiku Co., Ltd. 36,400 129,288 0.01%Japan Pulp & Paper Co., Ltd. 3,339 129,043 0.00%Gakken Holdings Co., Ltd. 1,800 128,861 0.00%Nippon Carbon Co., Ltd. 3,400 128,429 0.00%Toyo Construction Co., Ltd. 26,641 128,210 0.00%Sintokogio Ltd. 13,120 128,091 0.00%Tamron Co., Ltd. 5,507 127,648 0.00%Press Kogyo Co., Ltd. 31,687 127,419 0.00%Bank of Nagoya Ltd. 4,050 127,081 0.00%Mitsubishi Shokuhin Co., Ltd. 4,450 126,733 0.00%Hokuto Corp. 6,960 126,679 0.00%Nippon Kanzai Co., Ltd. 6,960 126,423 0.00%Altech Corp. 6,980 126,401 0.00%Sanshin Electronics Co., Ltd. 7,600 125,181 0.00%Seikagaku Corp. 11,024 125,177 0.00%Vision, Inc. 7,500 125,052 0.00%Sumitomo Riko Co., Ltd. 13,700 124,803 0.00%Kenko Mayonnaise Co., Ltd. 5,500 124,702 0.00%Future Corp. 7,450 124,424 0.00%Torii Pharmaceutical Co., Ltd. 4,416 124,343 0.00%ESPEC Corp. 6,000 124,224 0.00%Futaba Corp. 9,950 124,152 0.00%Ehime Bank Ltd. 11,400 123,677 0.00%
Gurunavi, Inc. 13,800 123,429 0.00%Mitsui High-Tec, Inc. 7,800 123,164 0.00%CMK Corp. 19,800 122,799 0.00%Nissei ASB Machine Co., Ltd. 2,800 122,770 0.00%Topy Industries Ltd. 6,602 122,593 0.00%Dainichiseika Color & Chemicals
Manufacturing Co., Ltd. 4,197 122,425 0.00%Sun Frontier Fudousan Co., Ltd. 10,150 122,258 0.00%Mitsubishi Logisnext Co., Ltd. 9,500 121,509 0.00%ValueCommerce Co., Ltd. 5,600 120,786 0.00%VT Holdings Co., Ltd. 27,000 120,745 0.00%Stella Chemifa Corp. 4,000 118,519 0.00%Tachi-S Co., Ltd. 8,975 118,428 0.00%Akatsuki, Inc. 2,200 118,427 0.00%Yamanashi Chuo Bank Ltd. 10,924 117,608 0.00%Iino Kaiun Kaisha Ltd. 34,309 117,441 0.00%Yonex Co., Ltd. 18,500 117,120 0.00%Micronics Japan Co., Ltd. 10,300 116,387 0.00%Aichi Steel Corp. 3,300 116,301 0.00%Ishihara Sangyo Kaisha Ltd. 12,050 115,982 0.00%St Marc Holdings Co., Ltd. 5,392 115,605 0.00%SBS Holdings, Inc. 6,600 115,268 0.00%OSAKA Titanium Technologies Co.,
Ltd. 8,150 115,266 0.00%eGuarantee, Inc. 9,900 114,600 0.00%Maruzen Showa Unyu Co., Ltd. 3,878 114,547 0.00%Riken Corp. 2,977 114,368 0.00%Shikoku Bank Ltd. 11,900 114,319 0.00%Restar Holdings Corp. 6,100 113,945 0.00%OPT Holding, Inc. 7,300 112,514 0.00%Tsurumi Manufacturing Co., Ltd. 5,950 112,238 0.00%Union Tool Co. 3,568 111,628 0.00%Miyazaki Bank Ltd. 4,417 111,040 0.00%Sakai Chemical Industry Co., Ltd. 4,798 110,507 0.00%Goldcrest Co., Ltd. 5,757 110,346 0.00%Nichiden Corp. 5,682 109,065 0.00%Okuwa Co., Ltd. 8,089 108,970 0.00%Cawachi Ltd. 5,339 108,721 0.00%Oisix ra daichi, Inc. 9,700 108,358 0.00%Amuse, Inc. 3,900 108,019 0.00%Ferrotec Holdings Corp. 12,700 107,981 0.00%Kamakura Shinsho Ltd. 6,800 107,874 0.00%Shin Nippon Air Technologies Co.,
Ltd. 5,400 107,727 0.00%Enplas Corp. 3,265 107,707 0.00%G-7 Holdings, Inc. 4,800 107,506 0.00%Fuji Co., Ltd. 5,994 107,387 0.00%ES-Con Japan Ltd. 12,400 106,913 0.00%Denyo Co., Ltd. 5,600 106,770 0.00%LEC, Inc. 8,700 106,553 0.00%Akita Bank Ltd. 5,200 106,129 0.00%Oro Co., Ltd. 3,000 105,590 0.00%Daikyonishikawa Corp. 13,400 105,424 0.00%Tekken Corp. 4,050 105,168 0.00%Mitsui Sugar Co., Ltd. 5,009 104,997 0.00%Nippon Parking Development Co.,
Ltd. 73,550 104,902 0.00%Aeon Fantasy Co., Ltd. 3,900 104,897 0.00%JDC Corp. 16,900 104,658 0.00%Takasago International Corp. 4,455 104,452 0.00%Toho Titanium Co., Ltd. 12,100 104,438 0.00%Anest Iwata Corp. 10,700 104,366 0.00%Sankyo Tateyama, Inc. 9,216 104,308 0.00%Sinko Industries Ltd. 5,900 104,292 0.00%Tsukui Corp. 19,100 104,046 0.00%Kintetsu Department Store Co., Ltd. 2,900 103,138 0.00%Cosel Co., Ltd. 9,498 103,130 0.00%OSJB Holdings Corp. 41,350 103,113 0.00%
Number of Fair Value % of Total Shares US Dollars ($) Net Assets
Vanguard Global Small-Cap Index Fund
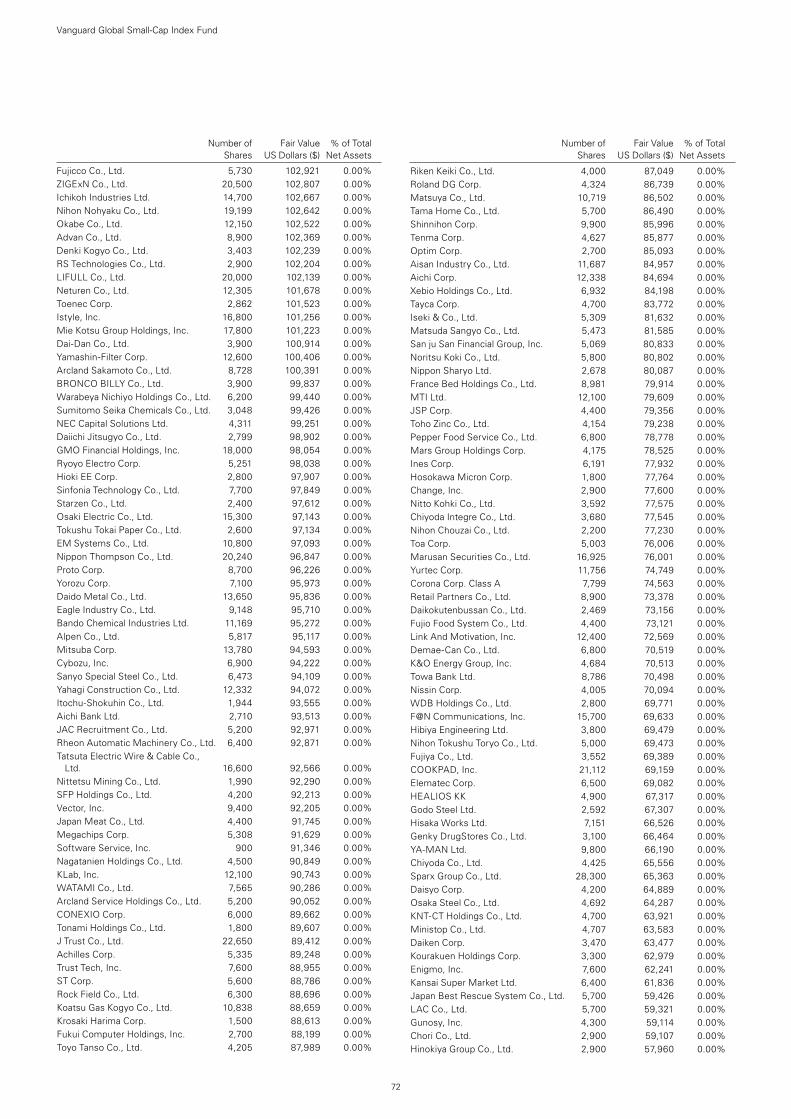
72
Number of Fair Value % of Total Shares US Dollars ($) Net Assets
Fujicco Co., Ltd. 5,730 102,921 0.00%ZIGExN Co., Ltd. 20,500 102,807 0.00%Ichikoh Industries Ltd. 14,700 102,667 0.00%Nihon Nohyaku Co., Ltd. 19,199 102,642 0.00%Okabe Co., Ltd. 12,150 102,522 0.00%Advan Co., Ltd. 8,900 102,369 0.00%Denki Kogyo Co., Ltd. 3,403 102,239 0.00%RS Technologies Co., Ltd. 2,900 102,204 0.00%LIFULL Co., Ltd. 20,000 102,139 0.00%Neturen Co., Ltd. 12,305 101,678 0.00%Toenec Corp. 2,862 101,523 0.00%Istyle, Inc. 16,800 101,256 0.00%Mie Kotsu Group Holdings, Inc. 17,800 101,223 0.00%Dai-Dan Co., Ltd. 3,900 100,914 0.00%Yamashin-Filter Corp. 12,600 100,406 0.00%Arcland Sakamoto Co., Ltd. 8,728 100,391 0.00%BRONCO BILLY Co., Ltd. 3,900 99,837 0.00%Warabeya Nichiyo Holdings Co., Ltd. 6,200 99,440 0.00%Sumitomo Seika Chemicals Co., Ltd. 3,048 99,426 0.00%NEC Capital Solutions Ltd. 4,311 99,251 0.00%Daiichi Jitsugyo Co., Ltd. 2,799 98,902 0.00%GMO Financial Holdings, Inc. 18,000 98,054 0.00%Ryoyo Electro Corp. 5,251 98,038 0.00%Hioki EE Corp. 2,800 97,907 0.00%Sinfonia Technology Co., Ltd. 7,700 97,849 0.00%Starzen Co., Ltd. 2,400 97,612 0.00%Osaki Electric Co., Ltd. 15,300 97,143 0.00%Tokushu Tokai Paper Co., Ltd. 2,600 97,134 0.00%EM Systems Co., Ltd. 10,800 97,093 0.00%Nippon Thompson Co., Ltd. 20,240 96,847 0.00%Proto Corp. 8,700 96,226 0.00%Yorozu Corp. 7,100 95,973 0.00%Daido Metal Co., Ltd. 13,650 95,836 0.00%Eagle Industry Co., Ltd. 9,148 95,710 0.00%Bando Chemical Industries Ltd. 11,169 95,272 0.00%Alpen Co., Ltd. 5,817 95,117 0.00%Mitsuba Corp. 13,780 94,593 0.00%Cybozu, Inc. 6,900 94,222 0.00%Sanyo Special Steel Co., Ltd. 6,473 94,109 0.00%Yahagi Construction Co., Ltd. 12,332 94,072 0.00%Itochu-Shokuhin Co., Ltd. 1,944 93,555 0.00%Aichi Bank Ltd. 2,710 93,513 0.00%JAC Recruitment Co., Ltd. 5,200 92,971 0.00%Rheon Automatic Machinery Co., Ltd. 6,400 92,871 0.00%Tatsuta Electric Wire & Cable Co.,
Ltd. 16,600 92,566 0.00%Nittetsu Mining Co., Ltd. 1,990 92,290 0.00%SFP Holdings Co., Ltd. 4,200 92,213 0.00%Vector, Inc. 9,400 92,205 0.00%Japan Meat Co., Ltd. 4,400 91,745 0.00%Megachips Corp. 5,308 91,629 0.00%Software Service, Inc. 900 91,346 0.00%Nagatanien Holdings Co., Ltd. 4,500 90,849 0.00%KLab, Inc. 12,100 90,743 0.00%WATAMI Co., Ltd. 7,565 90,286 0.00%Arcland Service Holdings Co., Ltd. 5,200 90,052 0.00%CONEXIO Corp. 6,000 89,662 0.00%Tonami Holdings Co., Ltd. 1,800 89,607 0.00%J Trust Co., Ltd. 22,650 89,412 0.00%Achilles Corp. 5,335 89,248 0.00%Trust Tech, Inc. 7,600 88,955 0.00%ST Corp. 5,600 88,786 0.00%Rock Field Co., Ltd. 6,300 88,696 0.00%Koatsu Gas Kogyo Co., Ltd. 10,838 88,659 0.00%Krosaki Harima Corp. 1,500 88,613 0.00%Fukui Computer Holdings, Inc. 2,700 88,199 0.00%Toyo Tanso Co., Ltd. 4,205 87,989 0.00%
Riken Keiki Co., Ltd. 4,000 87,049 0.00%Roland DG Corp. 4,324 86,739 0.00%Matsuya Co., Ltd. 10,719 86,502 0.00%Tama Home Co., Ltd. 5,700 86,490 0.00%Shinnihon Corp. 9,900 85,996 0.00%Tenma Corp. 4,627 85,877 0.00%Optim Corp. 2,700 85,093 0.00%Aisan Industry Co., Ltd. 11,687 84,957 0.00%Aichi Corp. 12,338 84,694 0.00%Xebio Holdings Co., Ltd. 6,932 84,198 0.00%Tayca Corp. 4,700 83,772 0.00%Iseki & Co., Ltd. 5,309 81,632 0.00%Matsuda Sangyo Co., Ltd. 5,473 81,585 0.00%San ju San Financial Group, Inc. 5,069 80,833 0.00%Noritsu Koki Co., Ltd. 5,800 80,802 0.00%Nippon Sharyo Ltd. 2,678 80,087 0.00%France Bed Holdings Co., Ltd. 8,981 79,914 0.00%MTI Ltd. 12,100 79,609 0.00%JSP Corp. 4,400 79,356 0.00%Toho Zinc Co., Ltd. 4,154 79,238 0.00%Pepper Food Service Co., Ltd. 6,800 78,778 0.00%Mars Group Holdings Corp. 4,175 78,525 0.00%Ines Corp. 6,191 77,932 0.00%Hosokawa Micron Corp. 1,800 77,764 0.00%Change, Inc. 2,900 77,600 0.00%Nitto Kohki Co., Ltd. 3,592 77,575 0.00%Chiyoda Integre Co., Ltd. 3,680 77,545 0.00%Nihon Chouzai Co., Ltd. 2,200 77,230 0.00%Toa Corp. 5,003 76,006 0.00%Marusan Securities Co., Ltd. 16,925 76,001 0.00%Yurtec Corp. 11,756 74,749 0.00%Corona Corp. Class A 7,799 74,563 0.00%Retail Partners Co., Ltd. 8,900 73,378 0.00%Daikokutenbussan Co., Ltd. 2,469 73,156 0.00%Fujio Food System Co., Ltd. 4,400 73,121 0.00%Link And Motivation, Inc. 12,400 72,569 0.00%Demae-Can Co., Ltd. 6,800 70,519 0.00%K&O Energy Group, Inc. 4,684 70,513 0.00%Towa Bank Ltd. 8,786 70,498 0.00%Nissin Corp. 4,005 70,094 0.00%WDB Holdings Co., Ltd. 2,800 69,771 0.00%F@N Communications, Inc. 15,700 69,633 0.00%Hibiya Engineering Ltd. 3,800 69,479 0.00%Nihon Tokushu Toryo Co., Ltd. 5,000 69,473 0.00%Fujiya Co., Ltd. 3,552 69,389 0.00%COOKPAD, Inc. 21,112 69,159 0.00%Elematec Corp. 6,500 69,082 0.00%HEALIOS KK 4,900 67,317 0.00%Godo Steel Ltd. 2,592 67,307 0.00%Hisaka Works Ltd. 7,151 66,526 0.00%Genky DrugStores Co., Ltd. 3,100 66,464 0.00%YA-MAN Ltd. 9,800 66,190 0.00%Chiyoda Co., Ltd. 4,425 65,556 0.00%Sparx Group Co., Ltd. 28,300 65,363 0.00%Daisyo Corp. 4,200 64,889 0.00%Osaka Steel Co., Ltd. 4,692 64,287 0.00%KNT-CT Holdings Co., Ltd. 4,700 63,921 0.00%Ministop Co., Ltd. 4,707 63,583 0.00%Daiken Corp. 3,470 63,477 0.00%Kourakuen Holdings Corp. 3,300 62,979 0.00%Enigmo, Inc. 7,600 62,241 0.00%Kansai Super Market Ltd. 6,400 61,836 0.00%Japan Best Rescue System Co., Ltd. 5,700 59,426 0.00%LAC Co., Ltd. 5,700 59,321 0.00%Gunosy, Inc. 4,300 59,114 0.00%Chori Co., Ltd. 2,900 59,107 0.00%Hinokiya Group Co., Ltd. 2,900 57,960 0.00%
Number of Fair Value % of Total Shares US Dollars ($) Net Assets
Vanguard Global Small-Cap Index Fund
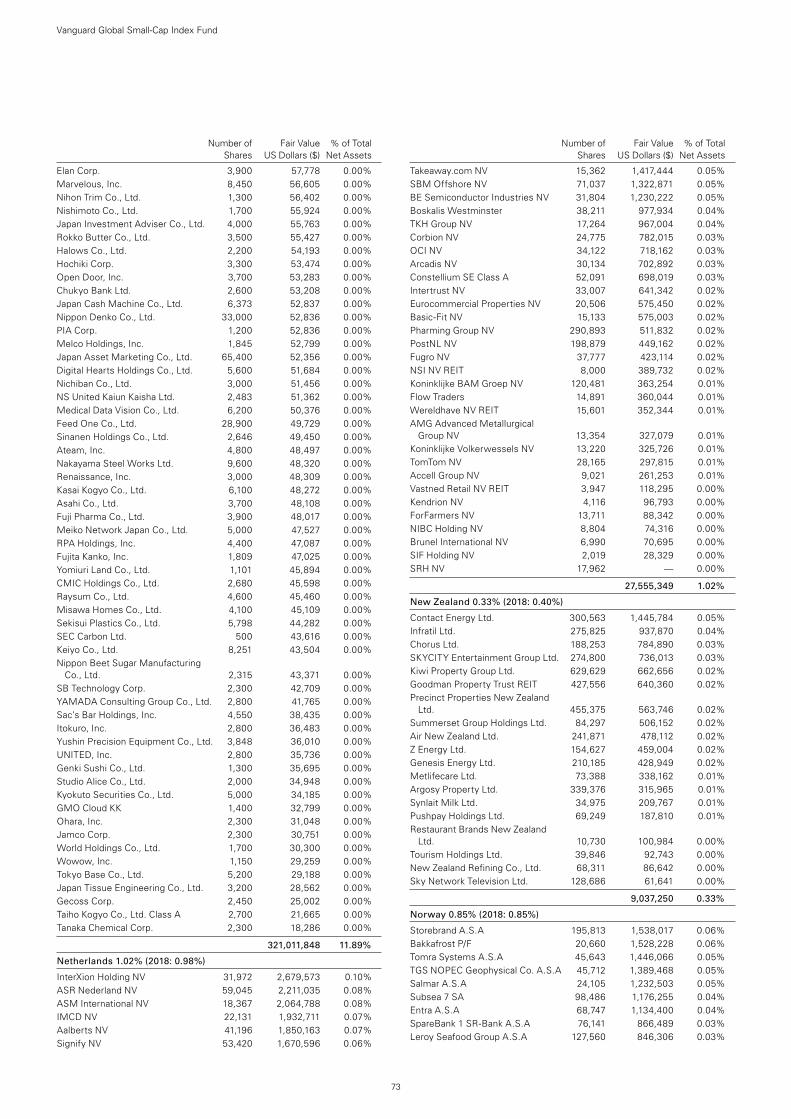
73
Number of Fair Value % of Total Shares US Dollars ($) Net Assets
Elan Corp. 3,900 57,778 0.00%Marvelous, Inc. 8,450 56,605 0.00%Nihon Trim Co., Ltd. 1,300 56,402 0.00%Nishimoto Co., Ltd. 1,700 55,924 0.00%Japan Investment Adviser Co., Ltd. 4,000 55,763 0.00%Rokko Butter Co., Ltd. 3,500 55,427 0.00%Halows Co., Ltd. 2,200 54,193 0.00%Hochiki Corp. 3,300 53,474 0.00%Open Door, Inc. 3,700 53,283 0.00%Chukyo Bank Ltd. 2,600 53,208 0.00%Japan Cash Machine Co., Ltd. 6,373 52,837 0.00%Nippon Denko Co., Ltd. 33,000 52,836 0.00%PIA Corp. 1,200 52,836 0.00%Melco Holdings, Inc. 1,845 52,799 0.00%Japan Asset Marketing Co., Ltd. 65,400 52,356 0.00%Digital Hearts Holdings Co., Ltd. 5,600 51,684 0.00%Nichiban Co., Ltd. 3,000 51,456 0.00%NS United Kaiun Kaisha Ltd. 2,483 51,362 0.00%Medical Data Vision Co., Ltd. 6,200 50,376 0.00%Feed One Co., Ltd. 28,900 49,729 0.00%Sinanen Holdings Co., Ltd. 2,646 49,450 0.00%Ateam, Inc. 4,800 48,497 0.00%Nakayama Steel Works Ltd. 9,600 48,320 0.00%Renaissance, Inc. 3,000 48,309 0.00%Kasai Kogyo Co., Ltd. 6,100 48,272 0.00%Asahi Co., Ltd. 3,700 48,108 0.00%Fuji Pharma Co., Ltd. 3,900 48,017 0.00%Meiko Network Japan Co., Ltd. 5,000 47,527 0.00%RPA Holdings, Inc. 4,400 47,087 0.00%Fujita Kanko, Inc. 1,809 47,025 0.00%Yomiuri Land Co., Ltd. 1,101 45,894 0.00%CMIC Holdings Co., Ltd. 2,680 45,598 0.00%Raysum Co., Ltd. 4,600 45,460 0.00%Misawa Homes Co., Ltd. 4,100 45,109 0.00%Sekisui Plastics Co., Ltd. 5,798 44,282 0.00%SEC Carbon Ltd. 500 43,616 0.00%Keiyo Co., Ltd. 8,251 43,504 0.00%Nippon Beet Sugar Manufacturing
Co., Ltd. 2,315 43,371 0.00%SB Technology Corp. 2,300 42,709 0.00%YAMADA Consulting Group Co., Ltd. 2,800 41,765 0.00%Sac’s Bar Holdings, Inc. 4,550 38,435 0.00%Itokuro, Inc. 2,800 36,483 0.00%Yushin Precision Equipment Co., Ltd. 3,848 36,010 0.00%UNITED, Inc. 2,800 35,736 0.00%Genki Sushi Co., Ltd. 1,300 35,695 0.00%Studio Alice Co., Ltd. 2,000 34,948 0.00%Kyokuto Securities Co., Ltd. 5,000 34,185 0.00%GMO Cloud KK 1,400 32,799 0.00%Ohara, Inc. 2,300 31,048 0.00%Jamco Corp. 2,300 30,751 0.00%World Holdings Co., Ltd. 1,700 30,300 0.00%Wowow, Inc. 1,150 29,259 0.00%Tokyo Base Co., Ltd. 5,200 29,188 0.00%Japan Tissue Engineering Co., Ltd. 3,200 28,562 0.00%Gecoss Corp. 2,450 25,002 0.00%Taiho Kogyo Co., Ltd. Class A 2,700 21,665 0.00%Tanaka Chemical Corp. 2,300 18,286 0.00%
321,011,848 11.89%
Netherlands 1.02% (2018: 0.98%)
InterXion Holding NV 31,972 2,679,573 0.10%ASR Nederland NV 59,045 2,211,035 0.08%ASM International NV 18,367 2,064,788 0.08%IMCD NV 22,131 1,932,711 0.07%Aalberts NV 41,196 1,850,163 0.07%Signify NV 53,420 1,670,596 0.06%
Takeaway.com NV 15,362 1,417,444 0.05%SBM Offshore NV 71,037 1,322,871 0.05%BE Semiconductor Industries NV 31,804 1,230,222 0.05%Boskalis Westminster 38,211 977,934 0.04%TKH Group NV 17,264 967,004 0.04%Corbion NV 24,775 782,015 0.03%OCI NV 34,122 718,162 0.03%Arcadis NV 30,134 702,892 0.03%Constellium SE Class A 52,091 698,019 0.03%Intertrust NV 33,007 641,342 0.02%Eurocommercial Properties NV 20,506 575,450 0.02%Basic-Fit NV 15,133 575,003 0.02%Pharming Group NV 290,893 511,832 0.02%PostNL NV 198,879 449,162 0.02%Fugro NV 37,777 423,114 0.02%NSI NV REIT 8,000 389,732 0.02%Koninklijke BAM Groep NV 120,481 363,254 0.01%Flow Traders 14,891 360,044 0.01%Wereldhave NV REIT 15,601 352,344 0.01%AMG Advanced Metallurgical
Group NV 13,354 327,079 0.01%Koninklijke Volkerwessels NV 13,220 325,726 0.01%TomTom NV 28,165 297,815 0.01%Accell Group NV 9,021 261,253 0.01%Vastned Retail NV REIT 3,947 118,295 0.00%Kendrion NV 4,116 96,793 0.00%ForFarmers NV 13,711 88,342 0.00%NIBC Holding NV 8,804 74,316 0.00%Brunel International NV 6,990 70,695 0.00%SIF Holding NV 2,019 28,329 0.00%SRH NV 17,962 — 0.00%
27,555,349 1.02%
New Zealand 0.33% (2018: 0.40%)
Contact Energy Ltd. 300,563 1,445,784 0.05%Infratil Ltd. 275,825 937,870 0.04%Chorus Ltd. 188,253 784,890 0.03%SKYCITY Entertainment Group Ltd. 274,800 736,013 0.03%Kiwi Property Group Ltd. 629,629 662,656 0.02%Goodman Property Trust REIT 427,556 640,360 0.02%Precinct Properties New Zealand
Ltd. 455,375 563,746 0.02%Summerset Group Holdings Ltd. 84,297 506,152 0.02%Air New Zealand Ltd. 241,871 478,112 0.02%Z Energy Ltd. 154,627 459,004 0.02%Genesis Energy Ltd. 210,185 428,949 0.02%Metlifecare Ltd. 73,388 338,162 0.01%Argosy Property Ltd. 339,376 315,965 0.01%Synlait Milk Ltd. 34,975 209,767 0.01%Pushpay Holdings Ltd. 69,249 187,810 0.01%Restaurant Brands New Zealand
Ltd. 10,730 100,984 0.00%Tourism Holdings Ltd. 39,846 92,743 0.00%New Zealand Refining Co., Ltd. 68,311 86,642 0.00%Sky Network Television Ltd. 128,686 61,641 0.00%
9,037,250 0.33%
Norway 0.85% (2018: 0.85%)
Storebrand A.S.A 195,813 1,538,017 0.06%Bakkafrost P/F 20,660 1,528,228 0.06%Tomra Systems A.S.A 45,643 1,446,066 0.05%TGS NOPEC Geophysical Co. A.S.A 45,712 1,389,468 0.05%Salmar A.S.A 24,105 1,232,503 0.05%Subsea 7 SA 98,486 1,176,255 0.04%Entra A.S.A 68,747 1,134,400 0.04%SpareBank 1 SR-Bank A.S.A 76,141 866,489 0.03%Leroy Seafood Group A.S.A 127,560 846,306 0.03%
Number of Fair Value % of Total Shares US Dollars ($) Net Assets
Vanguard Global Small-Cap Index Fund
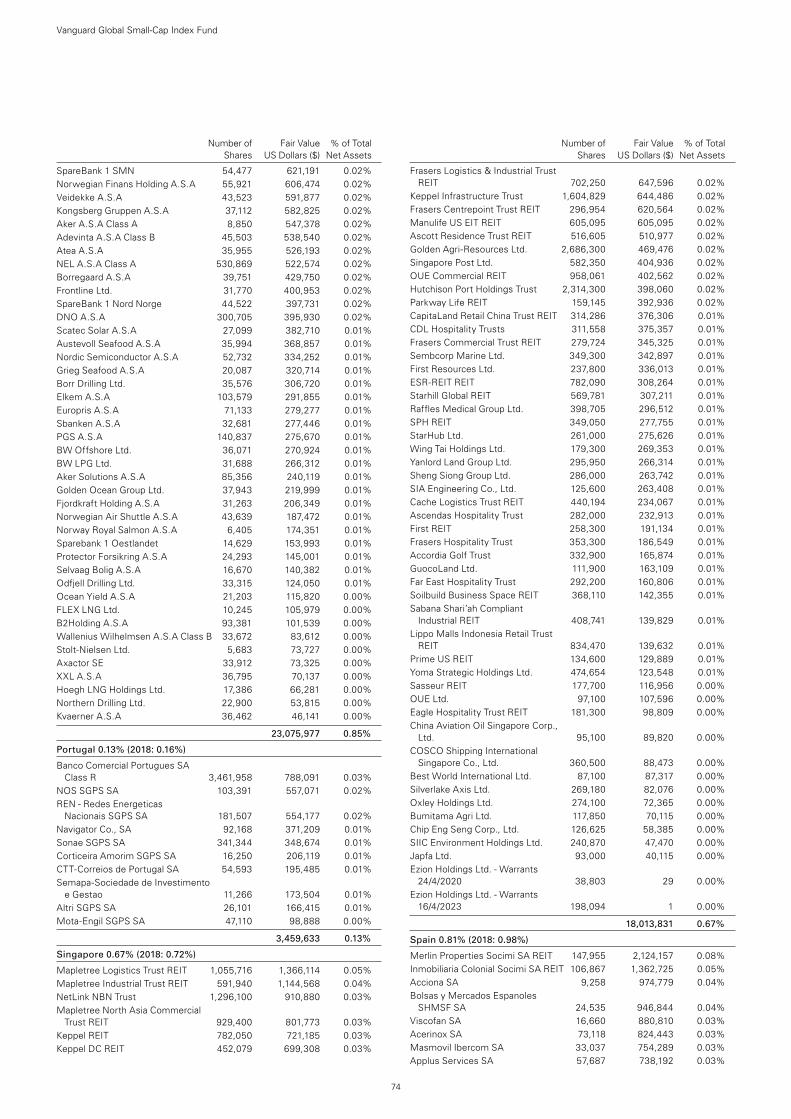
74
Number of Fair Value % of Total Shares US Dollars ($) Net Assets
SpareBank 1 SMN 54,477 621,191 0.02%Norwegian Finans Holding A.S.A 55,921 606,474 0.02%Veidekke A.S.A 43,523 591,877 0.02%Kongsberg Gruppen A.S.A 37,112 582,825 0.02%Aker A.S.A Class A 8,850 547,378 0.02%Adevinta A.S.A Class B 45,503 538,540 0.02%Atea A.S.A 35,955 526,193 0.02%NEL A.S.A Class A 530,869 522,574 0.02%Borregaard A.S.A 39,751 429,750 0.02%Frontline Ltd. 31,770 400,953 0.02%SpareBank 1 Nord Norge 44,522 397,731 0.02%DNO A.S.A 300,705 395,930 0.02%Scatec Solar A.S.A 27,099 382,710 0.01%Austevoll Seafood A.S.A 35,994 368,857 0.01%Nordic Semiconductor A.S.A 52,732 334,252 0.01%Grieg Seafood A.S.A 20,087 320,714 0.01%Borr Drilling Ltd. 35,576 306,720 0.01%Elkem A.S.A 103,579 291,855 0.01%Europris A.S.A 71,133 279,277 0.01%Sbanken A.S.A 32,681 277,446 0.01%PGS A.S.A 140,837 275,670 0.01%BW Offshore Ltd. 36,071 270,924 0.01%BW LPG Ltd. 31,688 266,312 0.01%Aker Solutions A.S.A 85,356 240,119 0.01%Golden Ocean Group Ltd. 37,943 219,999 0.01%Fjordkraft Holding A.S.A 31,263 206,349 0.01%Norwegian Air Shuttle A.S.A 43,639 187,472 0.01%Norway Royal Salmon A.S.A 6,405 174,351 0.01%Sparebank 1 Oestlandet 14,629 153,993 0.01%Protector Forsikring A.S.A 24,293 145,001 0.01%Selvaag Bolig A.S.A 16,670 140,382 0.01%Odfjell Drilling Ltd. 33,315 124,050 0.01%Ocean Yield A.S.A 21,203 115,820 0.00%FLEX LNG Ltd. 10,245 105,979 0.00%B2Holding A.S.A 93,381 101,539 0.00%Wallenius Wilhelmsen A.S.A Class B 33,672 83,612 0.00%Stolt-Nielsen Ltd. 5,683 73,727 0.00%Axactor SE 33,912 73,325 0.00%XXL A.S.A 36,795 70,137 0.00%Hoegh LNG Holdings Ltd. 17,386 66,281 0.00%Northern Drilling Ltd. 22,900 53,815 0.00%Kvaerner A.S.A 36,462 46,141 0.00%
23,075,977 0.85%
Portugal 0.13% (2018: 0.16%)
Banco Comercial Portugues SA Class R 3,461,958 788,091 0.03%
NOS SGPS SA 103,391 557,071 0.02%REN - Redes Energeticas
Nacionais SGPS SA 181,507 554,177 0.02%Navigator Co., SA 92,168 371,209 0.01%Sonae SGPS SA 341,344 348,674 0.01%Corticeira Amorim SGPS SA 16,250 206,119 0.01%CTT-Correios de Portugal SA 54,593 195,485 0.01%Semapa-Sociedade de Investimento
e Gestao 11,266 173,504 0.01%Altri SGPS SA 26,101 166,415 0.01%Mota-Engil SGPS SA 47,110 98,888 0.00%
3,459,633 0.13%
Singapore 0.67% (2018: 0.72%)
Mapletree Logistics Trust REIT 1,055,716 1,366,114 0.05%Mapletree Industrial Trust REIT 591,940 1,144,568 0.04%NetLink NBN Trust 1,296,100 910,880 0.03%Mapletree North Asia Commercial
Trust REIT 929,400 801,773 0.03%Keppel REIT 782,050 721,185 0.03%Keppel DC REIT 452,079 699,308 0.03%
Frasers Logistics & Industrial Trust REIT 702,250 647,596 0.02%
Keppel Infrastructure Trust 1,604,829 644,486 0.02%Frasers Centrepoint Trust REIT 296,954 620,564 0.02%Manulife US EIT REIT 605,095 605,095 0.02%Ascott Residence Trust REIT 516,605 510,977 0.02%Golden Agri-Resources Ltd. 2,686,300 469,476 0.02%Singapore Post Ltd. 582,350 404,936 0.02%OUE Commercial REIT 958,061 402,562 0.02%Hutchison Port Holdings Trust 2,314,300 398,060 0.02%Parkway Life REIT 159,145 392,936 0.02%CapitaLand Retail China Trust REIT 314,286 376,306 0.01%CDL Hospitality Trusts 311,558 375,357 0.01%Frasers Commercial Trust REIT 279,724 345,325 0.01%Sembcorp Marine Ltd. 349,300 342,897 0.01%First Resources Ltd. 237,800 336,013 0.01%ESR-REIT REIT 782,090 308,264 0.01%Starhill Global REIT 569,781 307,211 0.01%Raffles Medical Group Ltd. 398,705 296,512 0.01%SPH REIT 349,050 277,755 0.01%StarHub Ltd. 261,000 275,626 0.01%Wing Tai Holdings Ltd. 179,300 269,353 0.01%Yanlord Land Group Ltd. 295,950 266,314 0.01%Sheng Siong Group Ltd. 286,000 263,742 0.01%SIA Engineering Co., Ltd. 125,600 263,408 0.01%Cache Logistics Trust REIT 440,194 234,067 0.01%Ascendas Hospitality Trust 282,000 232,913 0.01%First REIT 258,300 191,134 0.01%Frasers Hospitality Trust 353,300 186,549 0.01%Accordia Golf Trust 332,900 165,874 0.01%GuocoLand Ltd. 111,900 163,109 0.01%Far East Hospitality Trust 292,200 160,806 0.01%Soilbuild Business Space REIT 368,110 142,355 0.01%Sabana Shari’ah Compliant
Industrial REIT 408,741 139,829 0.01%Lippo Malls Indonesia Retail Trust
REIT 834,470 139,632 0.01%Prime US REIT 134,600 129,889 0.01%Yoma Strategic Holdings Ltd. 474,654 123,548 0.01%Sasseur REIT 177,700 116,956 0.00%OUE Ltd. 97,100 107,596 0.00%Eagle Hospitality Trust REIT 181,300 98,809 0.00%China Aviation Oil Singapore Corp.,
Ltd. 95,100 89,820 0.00%COSCO Shipping International
Singapore Co., Ltd. 360,500 88,473 0.00%Best World International Ltd. 87,100 87,317 0.00%Silverlake Axis Ltd. 269,180 82,076 0.00%Oxley Holdings Ltd. 274,100 72,365 0.00%Bumitama Agri Ltd. 117,850 70,115 0.00%Chip Eng Seng Corp., Ltd. 126,625 58,385 0.00%SIIC Environment Holdings Ltd. 240,870 47,470 0.00%Japfa Ltd. 93,000 40,115 0.00%Ezion Holdings Ltd. - Warrants
24/4/2020 38,803 29 0.00%Ezion Holdings Ltd. - Warrants
16/4/2023 198,094 1 0.00%
18,013,831 0.67%
Spain 0.81% (2018: 0.98%)
Merlin Properties Socimi SA REIT 147,955 2,124,157 0.08%Inmobiliaria Colonial Socimi SA REIT 106,867 1,362,725 0.05%Acciona SA 9,258 974,779 0.04%Bolsas y Mercados Espanoles
SHMSF SA 24,535 946,844 0.04%Viscofan SA 16,660 880,810 0.03%Acerinox SA 73,118 824,443 0.03%Masmovil Ibercom SA 33,037 754,289 0.03%Applus Services SA 57,687 738,192 0.03%
Number of Fair Value % of Total Shares US Dollars ($) Net Assets
Vanguard Global Small-Cap Index Fund
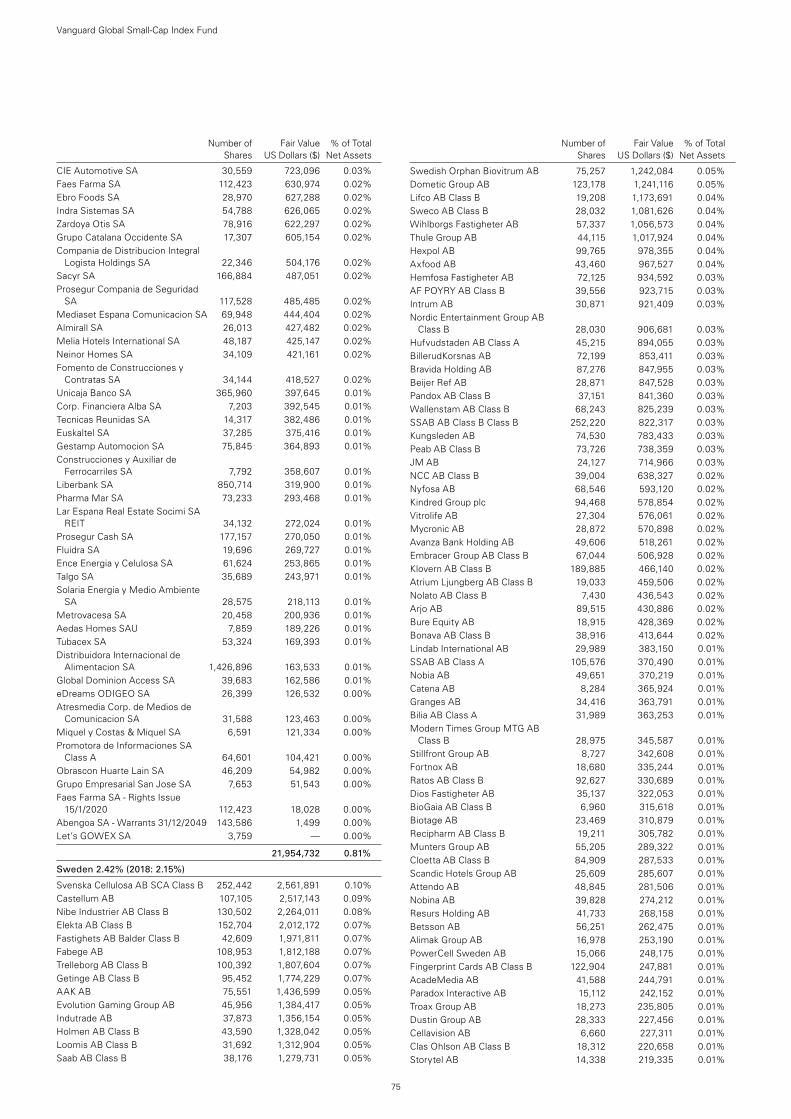
75
Number of Fair Value % of Total Shares US Dollars ($) Net Assets
CIE Automotive SA 30,559 723,096 0.03%Faes Farma SA 112,423 630,974 0.02%Ebro Foods SA 28,970 627,288 0.02%Indra Sistemas SA 54,788 626,065 0.02%Zardoya Otis SA 78,916 622,297 0.02%Grupo Catalana Occidente SA 17,307 605,154 0.02%Compania de Distribucion Integral
Logista Holdings SA 22,346 504,176 0.02%Sacyr SA 166,884 487,051 0.02%Prosegur Compania de Seguridad
SA 117,528 485,485 0.02%Mediaset Espana Comunicacion SA 69,948 444,404 0.02%Almirall SA 26,013 427,482 0.02%Melia Hotels International SA 48,187 425,147 0.02%Neinor Homes SA 34,109 421,161 0.02%Fomento de Construcciones y
Contratas SA 34,144 418,527 0.02%Unicaja Banco SA 365,960 397,645 0.01%Corp. Financiera Alba SA 7,203 392,545 0.01%Tecnicas Reunidas SA 14,317 382,486 0.01%Euskaltel SA 37,285 375,416 0.01%Gestamp Automocion SA 75,845 364,893 0.01%Construcciones y Auxiliar de
Ferrocarriles SA 7,792 358,607 0.01%Liberbank SA 850,714 319,900 0.01%Pharma Mar SA 73,233 293,468 0.01%Lar Espana Real Estate Socimi SA
REIT 34,132 272,024 0.01%Prosegur Cash SA 177,157 270,050 0.01%Fluidra SA 19,696 269,727 0.01%Ence Energia y Celulosa SA 61,624 253,865 0.01%Talgo SA 35,689 243,971 0.01%Solaria Energia y Medio Ambiente
SA 28,575 218,113 0.01%Metrovacesa SA 20,458 200,936 0.01%Aedas Homes SAU 7,859 189,226 0.01%Tubacex SA 53,324 169,393 0.01%Distribuidora Internacional de
Alimentacion SA 1,426,896 163,533 0.01%Global Dominion Access SA 39,683 162,586 0.01%eDreams ODIGEO SA 26,399 126,532 0.00%Atresmedia Corp. de Medios de
Comunicacion SA 31,588 123,463 0.00%Miquel y Costas & Miquel SA 6,591 121,334 0.00%Promotora de Informaciones SA
Class A 64,601 104,421 0.00%Obrascon Huarte Lain SA 46,209 54,982 0.00%Grupo Empresarial San Jose SA 7,653 51,543 0.00%Faes Farma SA - Rights Issue
15/1/2020 112,423 18,028 0.00%Abengoa SA - Warrants 31/12/2049 143,586 1,499 0.00%Let’s GOWEX SA 3,759 — 0.00%
21,954,732 0.81%
Sweden 2.42% (2018: 2.15%)
Svenska Cellulosa AB SCA Class B 252,442 2,561,891 0.10%Castellum AB 107,105 2,517,143 0.09%Nibe Industrier AB Class B 130,502 2,264,011 0.08%Elekta AB Class B 152,704 2,012,172 0.07%Fastighets AB Balder Class B 42,609 1,971,811 0.07%Fabege AB 108,953 1,812,188 0.07%Trelleborg AB Class B 100,392 1,807,604 0.07%Getinge AB Class B 95,452 1,774,229 0.07%AAK AB 75,551 1,436,599 0.05%Evolution Gaming Group AB 45,956 1,384,417 0.05%Indutrade AB 37,873 1,356,154 0.05%Holmen AB Class B 43,590 1,328,042 0.05%Loomis AB Class B 31,692 1,312,904 0.05%Saab AB Class B 38,176 1,279,731 0.05%
Swedish Orphan Biovitrum AB 75,257 1,242,084 0.05%Dometic Group AB 123,178 1,241,116 0.05%Lifco AB Class B 19,208 1,173,691 0.04%Sweco AB Class B 28,032 1,081,626 0.04%Wihlborgs Fastigheter AB 57,337 1,056,573 0.04%Thule Group AB 44,115 1,017,924 0.04%Hexpol AB 99,765 978,355 0.04%Axfood AB 43,460 967,527 0.04%Hemfosa Fastigheter AB 72,125 934,592 0.03%AF POYRY AB Class B 39,556 923,715 0.03%Intrum AB 30,871 921,409 0.03%Nordic Entertainment Group AB
Class B 28,030 906,681 0.03%Hufvudstaden AB Class A 45,215 894,055 0.03%BillerudKorsnas AB 72,199 853,411 0.03%Bravida Holding AB 87,276 847,955 0.03%Beijer Ref AB 28,871 847,528 0.03%Pandox AB Class B 37,151 841,360 0.03%Wallenstam AB Class B 68,243 825,239 0.03%SSAB AB Class B Class B 252,220 822,317 0.03%Kungsleden AB 74,530 783,433 0.03%Peab AB Class B 73,726 738,359 0.03%JM AB 24,127 714,966 0.03%NCC AB Class B 39,004 638,327 0.02%Nyfosa AB 68,546 593,120 0.02%Kindred Group plc 94,468 578,854 0.02%Vitrolife AB 27,304 576,061 0.02%Mycronic AB 28,872 570,898 0.02%Avanza Bank Holding AB 49,606 518,261 0.02%Embracer Group AB Class B 67,044 506,928 0.02%Klovern AB Class B 189,885 466,140 0.02%Atrium Ljungberg AB Class B 19,033 459,506 0.02%Nolato AB Class B 7,430 436,543 0.02%Arjo AB 89,515 430,886 0.02%Bure Equity AB 18,915 428,369 0.02%Bonava AB Class B 38,916 413,644 0.02%Lindab International AB 29,989 383,150 0.01%SSAB AB Class A 105,576 370,490 0.01%Nobia AB 49,651 370,219 0.01%Catena AB 8,284 365,924 0.01%Granges AB 34,416 363,791 0.01%Bilia AB Class A 31,989 363,253 0.01%Modern Times Group MTG AB
Class B 28,975 345,587 0.01%Stillfront Group AB 8,727 342,608 0.01%Fortnox AB 18,680 335,244 0.01%Ratos AB Class B 92,627 330,689 0.01%Dios Fastigheter AB 35,137 322,053 0.01%BioGaia AB Class B 6,960 315,618 0.01%Biotage AB 23,469 310,879 0.01%Recipharm AB Class B 19,211 305,782 0.01%Munters Group AB 55,205 289,322 0.01%Cloetta AB Class B 84,909 287,533 0.01%Scandic Hotels Group AB 25,609 285,607 0.01%Attendo AB 48,845 281,506 0.01%Nobina AB 39,828 274,212 0.01%Resurs Holding AB 41,733 268,158 0.01%Betsson AB 56,251 262,475 0.01%Alimak Group AB 16,978 253,190 0.01%PowerCell Sweden AB 15,066 248,175 0.01%Fingerprint Cards AB Class B 122,904 247,881 0.01%AcadeMedia AB 41,588 244,791 0.01%Paradox Interactive AB 15,112 242,152 0.01%Troax Group AB 18,273 235,805 0.01%Dustin Group AB 28,333 227,456 0.01%Cellavision AB 6,660 227,311 0.01%Clas Ohlson AB Class B 18,312 220,658 0.01%Storytel AB 14,338 219,335 0.01%
Number of Fair Value % of Total Shares US Dollars ($) Net Assets
Vanguard Global Small-Cap Index Fund
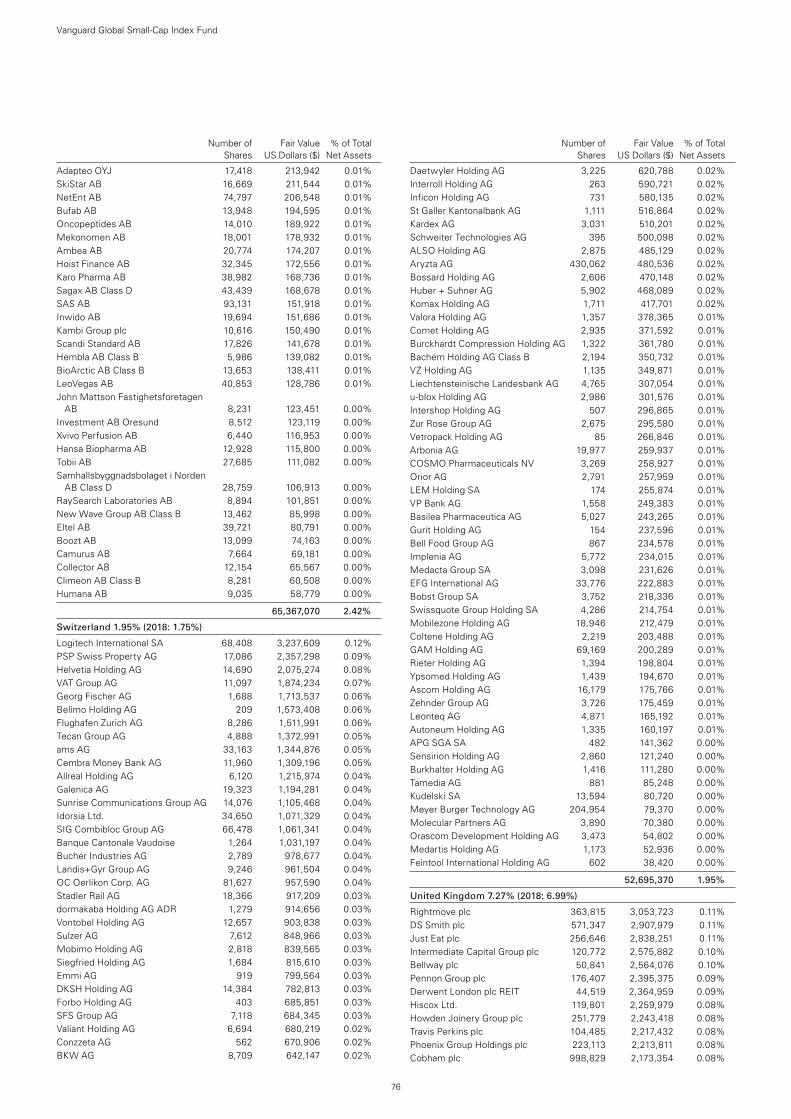
76
Number of Fair Value % of Total Shares US Dollars ($) Net Assets
Adapteo OYJ 17,418 213,942 0.01%SkiStar AB 16,669 211,544 0.01%NetEnt AB 74,797 206,548 0.01%Bufab AB 13,948 194,595 0.01%Oncopeptides AB 14,010 189,922 0.01%Mekonomen AB 18,001 178,932 0.01%Ambea AB 20,774 174,207 0.01%Hoist Finance AB 32,345 172,556 0.01%Karo Pharma AB 38,982 168,736 0.01%Sagax AB Class D 43,439 168,678 0.01%SAS AB 93,131 151,918 0.01%Inwido AB 19,694 151,686 0.01%Kambi Group plc 10,616 150,490 0.01%Scandi Standard AB 17,826 141,678 0.01%Hembla AB Class B 5,986 139,082 0.01%BioArctic AB Class B 13,653 138,411 0.01%LeoVegas AB 40,853 128,786 0.01%John Mattson Fastighetsforetagen
AB 8,231 123,451 0.00%Investment AB Oresund 8,512 123,119 0.00%Xvivo Perfusion AB 6,440 116,953 0.00%Hansa Biopharma AB 12,928 115,800 0.00%Tobii AB 27,685 111,082 0.00%Samhallsbyggnadsbolaget i Norden
AB Class D 28,759 106,913 0.00%RaySearch Laboratories AB 8,894 101,851 0.00%New Wave Group AB Class B 13,462 85,998 0.00%Eltel AB 39,721 80,791 0.00%Boozt AB 13,099 74,163 0.00%Camurus AB 7,664 69,181 0.00%Collector AB 12,154 65,567 0.00%Climeon AB Class B 8,281 60,508 0.00%Humana AB 9,035 58,779 0.00%
65,367,070 2.42%
Switzerland 1.95% (2018: 1.75%)
Logitech International SA 68,408 3,237,609 0.12%PSP Swiss Property AG 17,086 2,357,298 0.09%Helvetia Holding AG 14,690 2,075,274 0.08%VAT Group AG 11,097 1,874,234 0.07%Georg Fischer AG 1,688 1,713,537 0.06%Belimo Holding AG 209 1,573,408 0.06%Flughafen Zurich AG 8,286 1,511,991 0.06%Tecan Group AG 4,888 1,372,991 0.05%ams AG 33,163 1,344,876 0.05%Cembra Money Bank AG 11,960 1,309,196 0.05%Allreal Holding AG 6,120 1,215,974 0.04%Galenica AG 19,323 1,194,281 0.04%Sunrise Communications Group AG 14,076 1,105,468 0.04%Idorsia Ltd. 34,650 1,071,329 0.04%SIG Combibloc Group AG 66,478 1,061,341 0.04%Banque Cantonale Vaudoise 1,264 1,031,197 0.04%Bucher Industries AG 2,789 978,677 0.04%Landis+Gyr Group AG 9,246 961,504 0.04%OC Oerlikon Corp. AG 81,627 957,590 0.04%Stadler Rail AG 18,366 917,209 0.03%dormakaba Holding AG ADR 1,279 914,656 0.03%Vontobel Holding AG 12,657 903,838 0.03%Sulzer AG 7,612 848,966 0.03%Mobimo Holding AG 2,818 839,565 0.03%Siegfried Holding AG 1,684 815,610 0.03%Emmi AG 919 799,564 0.03%DKSH Holding AG 14,384 782,813 0.03%Forbo Holding AG 403 685,851 0.03%SFS Group AG 7,118 684,345 0.03%Valiant Holding AG 6,694 680,219 0.02%Conzzeta AG 562 670,906 0.02%BKW AG 8,709 642,147 0.02%
Daetwyler Holding AG 3,225 620,788 0.02%Interroll Holding AG 263 590,721 0.02%Inficon Holding AG 731 580,135 0.02%St Galler Kantonalbank AG 1,111 516,864 0.02%Kardex AG 3,031 510,201 0.02%Schweiter Technologies AG 395 500,098 0.02%ALSO Holding AG 2,875 485,129 0.02%Aryzta AG 430,062 480,536 0.02%Bossard Holding AG 2,606 470,148 0.02%Huber + Suhner AG 5,902 468,089 0.02%Komax Holding AG 1,711 417,701 0.02%Valora Holding AG 1,357 378,365 0.01%Comet Holding AG 2,935 371,592 0.01%Burckhardt Compression Holding AG 1,322 361,780 0.01%Bachem Holding AG Class B 2,194 350,732 0.01%VZ Holding AG 1,135 349,871 0.01%Liechtensteinische Landesbank AG 4,765 307,054 0.01%u-blox Holding AG 2,986 301,576 0.01%Intershop Holding AG 507 296,865 0.01%Zur Rose Group AG 2,675 295,580 0.01%Vetropack Holding AG 85 266,846 0.01%Arbonia AG 19,977 259,937 0.01%COSMO Pharmaceuticals NV 3,269 258,927 0.01%Orior AG 2,791 257,959 0.01%LEM Holding SA 174 255,874 0.01%VP Bank AG 1,558 249,383 0.01%Basilea Pharmaceutica AG 5,027 243,265 0.01%Gurit Holding AG 154 237,596 0.01%Bell Food Group AG 867 234,578 0.01%Implenia AG 5,772 234,015 0.01%Medacta Group SA 3,098 231,626 0.01%EFG International AG 33,776 222,883 0.01%Bobst Group SA 3,752 218,336 0.01%Swissquote Group Holding SA 4,286 214,754 0.01%Mobilezone Holding AG 18,946 212,479 0.01%Coltene Holding AG 2,219 203,488 0.01%GAM Holding AG 69,169 200,289 0.01%Rieter Holding AG 1,394 198,804 0.01%Ypsomed Holding AG 1,439 194,670 0.01%Ascom Holding AG 16,179 175,766 0.01%Zehnder Group AG 3,726 175,459 0.01%Leonteq AG 4,871 165,192 0.01%Autoneum Holding AG 1,335 160,197 0.01%APG SGA SA 482 141,362 0.00%Sensirion Holding AG 2,860 121,240 0.00%Burkhalter Holding AG 1,416 111,280 0.00%Tamedia AG 881 85,248 0.00%Kudelski SA 13,594 80,720 0.00%Meyer Burger Technology AG 204,954 79,370 0.00%Molecular Partners AG 3,890 70,380 0.00%Orascom Development Holding AG 3,473 54,802 0.00%Medartis Holding AG 1,173 52,936 0.00%Feintool International Holding AG 602 38,420 0.00%
52,695,370 1.95%
United Kingdom 7.27% (2018: 6.99%)
Rightmove plc 363,815 3,053,723 0.11%DS Smith plc 571,347 2,907,979 0.11%Just Eat plc 256,646 2,838,251 0.11%Intermediate Capital Group plc 120,772 2,575,882 0.10%Bellway plc 50,841 2,564,076 0.10%Pennon Group plc 176,407 2,395,375 0.09%Derwent London plc REIT 44,519 2,364,959 0.09%Hiscox Ltd. 119,801 2,259,979 0.08%Howden Joinery Group plc 251,779 2,243,418 0.08%Travis Perkins plc 104,485 2,217,432 0.08%Phoenix Group Holdings plc 223,113 2,213,811 0.08%Cobham plc 998,829 2,173,354 0.08%
Number of Fair Value % of Total Shares US Dollars ($) Net Assets
Vanguard Global Small-Cap Index Fund
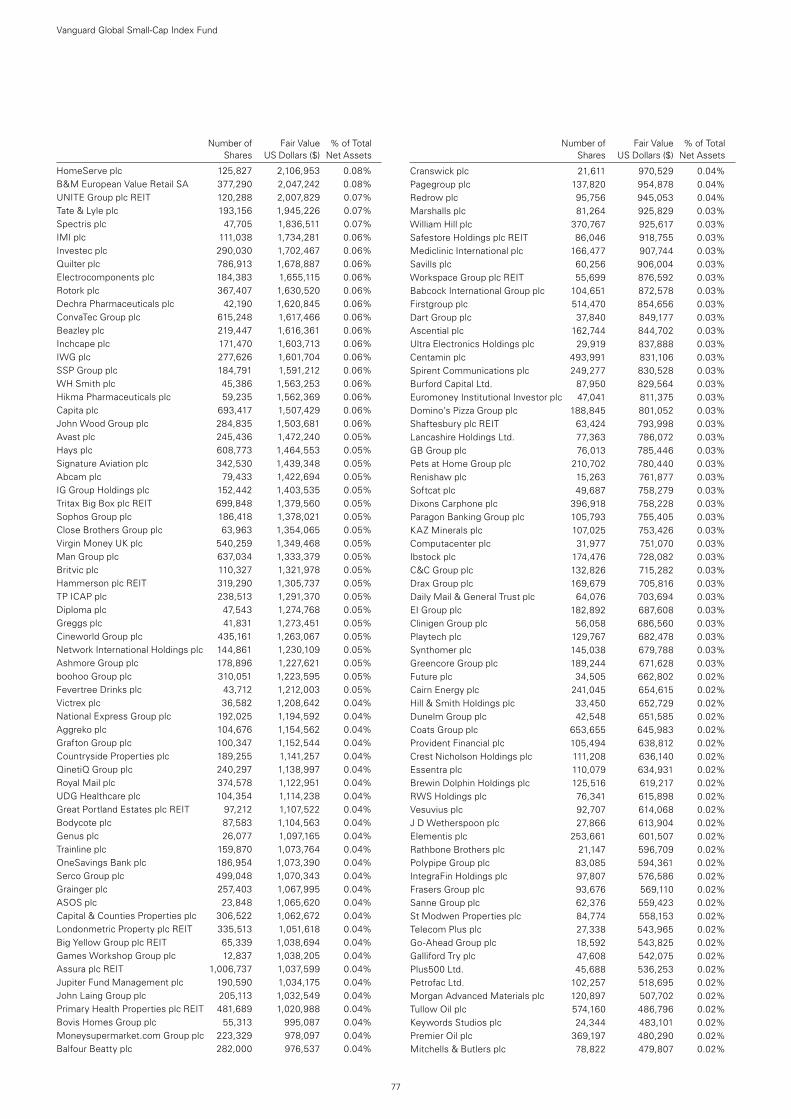
77
Number of Fair Value % of Total Shares US Dollars ($) Net Assets
HomeServe plc 125,827 2,106,953 0.08%B&M European Value Retail SA 377,290 2,047,242 0.08%UNITE Group plc REIT 120,288 2,007,829 0.07%Tate & Lyle plc 193,156 1,945,226 0.07%Spectris plc 47,705 1,836,511 0.07%IMI plc 111,038 1,734,281 0.06%Investec plc 290,030 1,702,467 0.06%Quilter plc 786,913 1,678,887 0.06%Electrocomponents plc 184,383 1,655,115 0.06%Rotork plc 367,407 1,630,520 0.06%Dechra Pharmaceuticals plc 42,190 1,620,845 0.06%ConvaTec Group plc 615,248 1,617,466 0.06%Beazley plc 219,447 1,616,361 0.06%Inchcape plc 171,470 1,603,713 0.06%IWG plc 277,626 1,601,704 0.06%SSP Group plc 184,791 1,591,212 0.06%WH Smith plc 45,386 1,563,253 0.06%Hikma Pharmaceuticals plc 59,235 1,562,369 0.06%Capita plc 693,417 1,507,429 0.06%John Wood Group plc 284,835 1,503,681 0.06%Avast plc 245,436 1,472,240 0.05%Hays plc 608,773 1,464,553 0.05%Signature Aviation plc 342,530 1,439,348 0.05%Abcam plc 79,433 1,422,694 0.05%IG Group Holdings plc 152,442 1,403,535 0.05%Tritax Big Box plc REIT 699,848 1,379,560 0.05%Sophos Group plc 186,418 1,378,021 0.05%Close Brothers Group plc 63,963 1,354,065 0.05%Virgin Money UK plc 540,259 1,349,468 0.05%Man Group plc 637,034 1,333,379 0.05%Britvic plc 110,327 1,321,978 0.05%Hammerson plc REIT 319,290 1,305,737 0.05%TP ICAP plc 238,513 1,291,370 0.05%Diploma plc 47,543 1,274,768 0.05%Greggs plc 41,831 1,273,451 0.05%Cineworld Group plc 435,161 1,263,067 0.05%Network International Holdings plc 144,861 1,230,109 0.05%Ashmore Group plc 178,896 1,227,621 0.05%boohoo Group plc 310,051 1,223,595 0.05%Fevertree Drinks plc 43,712 1,212,003 0.05%Victrex plc 36,582 1,208,642 0.04%National Express Group plc 192,025 1,194,592 0.04%Aggreko plc 104,676 1,154,562 0.04%Grafton Group plc 100,347 1,152,544 0.04%Countryside Properties plc 189,255 1,141,257 0.04%QinetiQ Group plc 240,297 1,138,997 0.04%Royal Mail plc 374,578 1,122,951 0.04%UDG Healthcare plc 104,354 1,114,238 0.04%Great Portland Estates plc REIT 97,212 1,107,522 0.04%Bodycote plc 87,583 1,104,563 0.04%Genus plc 26,077 1,097,165 0.04%Trainline plc 159,870 1,073,764 0.04%OneSavings Bank plc 186,954 1,073,390 0.04%Serco Group plc 499,048 1,070,343 0.04%Grainger plc 257,403 1,067,995 0.04%ASOS plc 23,848 1,065,620 0.04%Capital & Counties Properties plc 306,522 1,062,672 0.04%Londonmetric Property plc REIT 335,513 1,051,618 0.04%Big Yellow Group plc REIT 65,339 1,038,694 0.04%Games Workshop Group plc 12,837 1,038,205 0.04%Assura plc REIT 1,006,737 1,037,599 0.04%Jupiter Fund Management plc 190,590 1,034,175 0.04%John Laing Group plc 205,113 1,032,549 0.04%Primary Health Properties plc REIT 481,689 1,020,988 0.04%Bovis Homes Group plc 55,313 995,087 0.04%Moneysupermarket.com Group plc 223,329 978,097 0.04%Balfour Beatty plc 282,000 976,537 0.04%
Cranswick plc 21,611 970,529 0.04%Pagegroup plc 137,820 954,878 0.04%Redrow plc 95,756 945,053 0.04%Marshalls plc 81,264 925,829 0.03%William Hill plc 370,767 925,617 0.03%Safestore Holdings plc REIT 86,046 918,755 0.03%Mediclinic International plc 166,477 907,744 0.03%Savills plc 60,256 906,004 0.03%Workspace Group plc REIT 55,699 876,592 0.03%Babcock International Group plc 104,651 872,578 0.03%Firstgroup plc 514,470 854,656 0.03%Dart Group plc 37,840 849,177 0.03%Ascential plc 162,744 844,702 0.03%Ultra Electronics Holdings plc 29,919 837,888 0.03%Centamin plc 493,991 831,106 0.03%Spirent Communications plc 249,277 830,528 0.03%Burford Capital Ltd. 87,950 829,564 0.03%Euromoney Institutional Investor plc 47,041 811,375 0.03%Domino’s Pizza Group plc 188,845 801,052 0.03%Shaftesbury plc REIT 63,424 793,998 0.03%Lancashire Holdings Ltd. 77,363 786,072 0.03%GB Group plc 76,013 785,446 0.03%Pets at Home Group plc 210,702 780,440 0.03%Renishaw plc 15,263 761,877 0.03%Softcat plc 49,687 758,279 0.03%Dixons Carphone plc 396,918 758,228 0.03%Paragon Banking Group plc 105,793 755,405 0.03%KAZ Minerals plc 107,025 753,426 0.03%Computacenter plc 31,977 751,070 0.03%Ibstock plc 174,476 728,082 0.03%C&C Group plc 132,826 715,282 0.03%Drax Group plc 169,679 705,816 0.03%Daily Mail & General Trust plc 64,076 703,694 0.03%EI Group plc 182,892 687,608 0.03%Clinigen Group plc 56,058 686,560 0.03%Playtech plc 129,767 682,478 0.03%Synthomer plc 145,038 679,788 0.03%Greencore Group plc 189,244 671,628 0.03%Future plc 34,505 662,802 0.02%Cairn Energy plc 241,045 654,615 0.02%Hill & Smith Holdings plc 33,450 652,729 0.02%Dunelm Group plc 42,548 651,585 0.02%Coats Group plc 653,655 645,983 0.02%Provident Financial plc 105,494 638,812 0.02%Crest Nicholson Holdings plc 111,208 636,140 0.02%Essentra plc 110,079 634,931 0.02%Brewin Dolphin Holdings plc 125,516 619,217 0.02%RWS Holdings plc 76,341 615,898 0.02%Vesuvius plc 92,707 614,068 0.02%J D Wetherspoon plc 27,866 613,904 0.02%Elementis plc 253,661 601,507 0.02%Rathbone Brothers plc 21,147 596,709 0.02%Polypipe Group plc 83,085 594,361 0.02%IntegraFin Holdings plc 97,807 576,586 0.02%Frasers Group plc 93,676 569,110 0.02%Sanne Group plc 62,376 559,423 0.02%St Modwen Properties plc 84,774 558,153 0.02%Telecom Plus plc 27,338 543,965 0.02%Go-Ahead Group plc 18,592 543,825 0.02%Galliford Try plc 47,608 542,075 0.02%Plus500 Ltd. 45,688 536,253 0.02%Petrofac Ltd. 102,257 518,695 0.02%Morgan Advanced Materials plc 120,897 507,702 0.02%Tullow Oil plc 574,160 486,796 0.02%Keywords Studios plc 24,344 483,101 0.02%Premier Oil plc 369,197 480,290 0.02%Mitchells & Butlers plc 78,822 479,807 0.02%
Number of Fair Value % of Total Shares US Dollars ($) Net Assets
Vanguard Global Small-Cap Index Fund
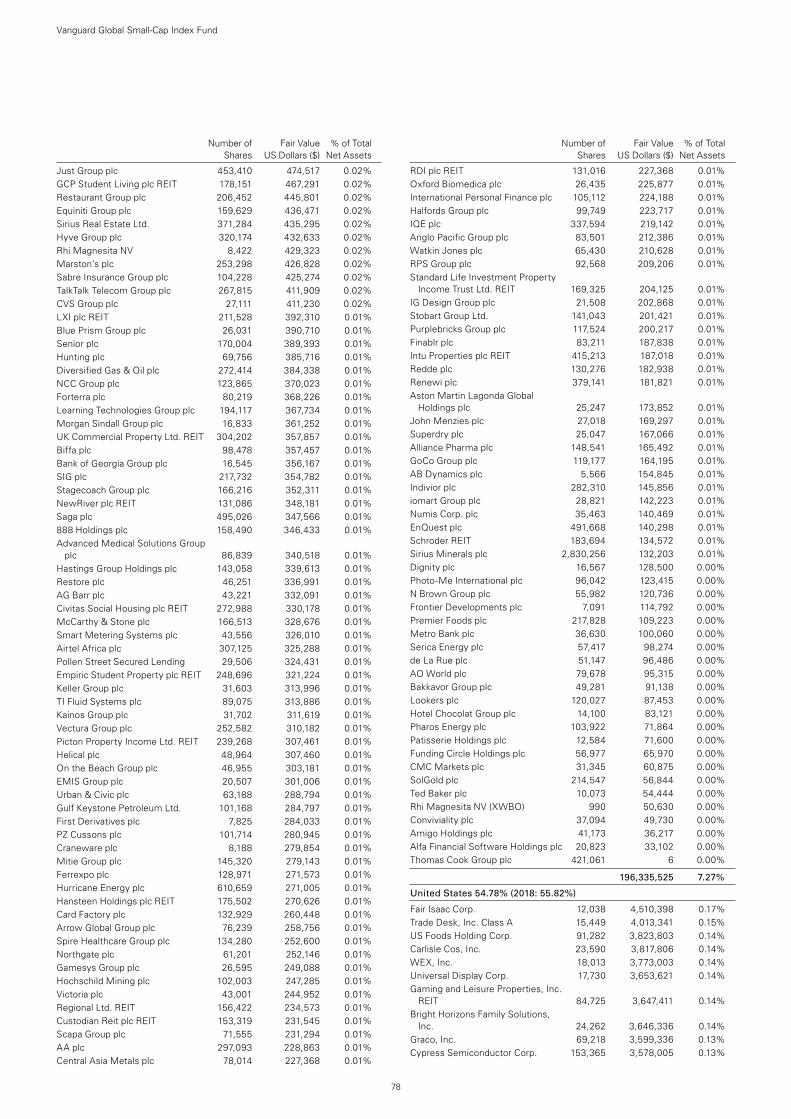
78
Number of Fair Value % of Total Shares US Dollars ($) Net Assets
Just Group plc 453,410 474,517 0.02%GCP Student Living plc REIT 178,151 467,291 0.02%Restaurant Group plc 206,452 445,801 0.02%Equiniti Group plc 159,629 436,471 0.02%Sirius Real Estate Ltd. 371,284 435,295 0.02%Hyve Group plc 320,174 432,633 0.02%Rhi Magnesita NV 8,422 429,323 0.02%Marston’s plc 253,298 426,828 0.02%Sabre Insurance Group plc 104,228 425,274 0.02%TalkTalk Telecom Group plc 267,815 411,909 0.02%CVS Group plc 27,111 411,230 0.02%LXI plc REIT 211,528 392,310 0.01%Blue Prism Group plc 26,031 390,710 0.01%Senior plc 170,004 389,393 0.01%Hunting plc 69,756 385,716 0.01%Diversified Gas & Oil plc 272,414 384,338 0.01%NCC Group plc 123,865 370,023 0.01%Forterra plc 80,219 368,226 0.01%Learning Technologies Group plc 194,117 367,734 0.01%Morgan Sindall Group plc 16,833 361,252 0.01%UK Commercial Property Ltd. REIT 304,202 357,857 0.01%Biffa plc 98,478 357,457 0.01%Bank of Georgia Group plc 16,545 356,167 0.01%SIG plc 217,732 354,782 0.01%Stagecoach Group plc 166,216 352,311 0.01%NewRiver plc REIT 131,086 348,181 0.01%Saga plc 495,026 347,566 0.01%888 Holdings plc 158,490 346,433 0.01%Advanced Medical Solutions Group
plc 86,839 340,518 0.01%Hastings Group Holdings plc 143,058 339,613 0.01%Restore plc 46,251 336,991 0.01%AG Barr plc 43,221 332,091 0.01%Civitas Social Housing plc REIT 272,988 330,178 0.01%McCarthy & Stone plc 166,513 328,676 0.01%Smart Metering Systems plc 43,556 326,010 0.01%Airtel Africa plc 307,125 325,288 0.01%Pollen Street Secured Lending 29,506 324,431 0.01%Empiric Student Property plc REIT 248,696 321,224 0.01%Keller Group plc 31,603 313,996 0.01%TI Fluid Systems plc 89,075 313,886 0.01%Kainos Group plc 31,702 311,619 0.01%Vectura Group plc 252,582 310,182 0.01%Picton Property Income Ltd. REIT 239,268 307,461 0.01%Helical plc 48,964 307,460 0.01%On the Beach Group plc 46,955 303,181 0.01%EMIS Group plc 20,507 301,006 0.01%Urban & Civic plc 63,188 288,794 0.01%Gulf Keystone Petroleum Ltd. 101,168 284,797 0.01%First Derivatives plc 7,825 284,033 0.01%PZ Cussons plc 101,714 280,945 0.01%Craneware plc 8,188 279,854 0.01%Mitie Group plc 145,320 279,143 0.01%Ferrexpo plc 128,971 271,573 0.01%Hurricane Energy plc 610,659 271,005 0.01%Hansteen Holdings plc REIT 175,502 270,626 0.01%Card Factory plc 132,929 260,448 0.01%Arrow Global Group plc 76,239 258,756 0.01%Spire Healthcare Group plc 134,280 252,600 0.01%Northgate plc 61,201 252,146 0.01%Gamesys Group plc 26,595 249,088 0.01%Hochschild Mining plc 102,003 247,285 0.01%Victoria plc 43,001 244,952 0.01%Regional Ltd. REIT 156,422 234,573 0.01%Custodian Reit plc REIT 153,319 231,545 0.01%Scapa Group plc 71,555 231,294 0.01%AA plc 297,093 228,863 0.01%Central Asia Metals plc 78,014 227,368 0.01%
RDI plc REIT 131,016 227,368 0.01%Oxford Biomedica plc 26,435 225,877 0.01%International Personal Finance plc 105,112 224,188 0.01%Halfords Group plc 99,749 223,717 0.01%IQE plc 337,594 219,142 0.01%Anglo Pacific Group plc 83,501 212,386 0.01%Watkin Jones plc 65,430 210,628 0.01%RPS Group plc 92,568 209,206 0.01%Standard Life Investment Property
Income Trust Ltd. REIT 169,325 204,125 0.01%IG Design Group plc 21,508 202,868 0.01%Stobart Group Ltd. 141,043 201,421 0.01%Purplebricks Group plc 117,524 200,217 0.01%Finablr plc 83,211 187,838 0.01%Intu Properties plc REIT 415,213 187,018 0.01%Redde plc 130,276 182,938 0.01%Renewi plc 379,141 181,821 0.01%Aston Martin Lagonda Global
Holdings plc 25,247 173,852 0.01%John Menzies plc 27,018 169,297 0.01%Superdry plc 25,047 167,066 0.01%Alliance Pharma plc 148,541 165,492 0.01%GoCo Group plc 119,177 164,195 0.01%AB Dynamics plc 5,566 154,845 0.01%Indivior plc 282,310 145,856 0.01%iomart Group plc 28,821 142,223 0.01%Numis Corp. plc 35,463 140,469 0.01%EnQuest plc 491,668 140,298 0.01%Schroder REIT 183,694 134,572 0.01%Sirius Minerals plc 2,830,256 132,203 0.01%Dignity plc 16,567 128,500 0.00%Photo-Me International plc 96,042 123,415 0.00%N Brown Group plc 55,982 120,736 0.00%Frontier Developments plc 7,091 114,792 0.00%Premier Foods plc 217,828 109,223 0.00%Metro Bank plc 36,630 100,060 0.00%Serica Energy plc 57,417 98,274 0.00%de La Rue plc 51,147 96,486 0.00%AO World plc 79,678 95,315 0.00%Bakkavor Group plc 49,281 91,138 0.00%Lookers plc 120,027 87,453 0.00%Hotel Chocolat Group plc 14,100 83,121 0.00%Pharos Energy plc 103,922 71,864 0.00%Patisserie Holdings plc 12,584 71,600 0.00%Funding Circle Holdings plc 56,977 65,970 0.00%CMC Markets plc 31,345 60,875 0.00%SolGold plc 214,547 56,844 0.00%Ted Baker plc 10,073 54,444 0.00%Rhi Magnesita NV (XWBO) 990 50,630 0.00%Conviviality plc 37,094 49,730 0.00%Amigo Holdings plc 41,173 36,217 0.00%Alfa Financial Software Holdings plc 20,823 33,102 0.00%Thomas Cook Group plc 421,061 6 0.00%
196,335,525 7.27%
United States 54.78% (2018: 55.82%)
Fair Isaac Corp. 12,038 4,510,398 0.17%Trade Desk, Inc. Class A 15,449 4,013,341 0.15%US Foods Holding Corp. 91,282 3,823,803 0.14%Carlisle Cos, Inc. 23,590 3,817,806 0.14%WEX, Inc. 18,013 3,773,003 0.14%Universal Display Corp. 17,730 3,653,621 0.14%Gaming and Leisure Properties, Inc.
REIT 84,725 3,647,411 0.14%Bright Horizons Family Solutions,
Inc. 24,262 3,646,336 0.14%Graco, Inc. 69,218 3,599,336 0.13%Cypress Semiconductor Corp. 153,365 3,578,005 0.13%
Number of Fair Value % of Total Shares US Dollars ($) Net Assets
Vanguard Global Small-Cap Index Fund
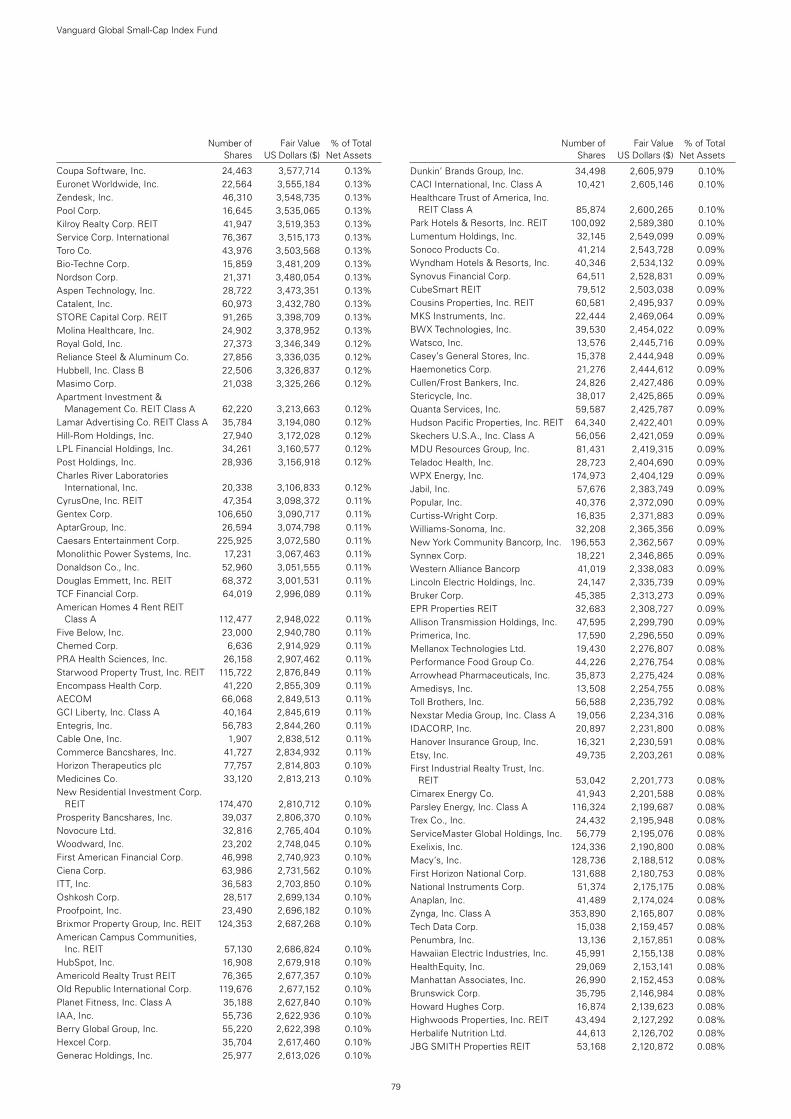
79
Number of Fair Value % of Total Shares US Dollars ($) Net Assets
Coupa Software, Inc. 24,463 3,577,714 0.13%Euronet Worldwide, Inc. 22,564 3,555,184 0.13%Zendesk, Inc. 46,310 3,548,735 0.13%Pool Corp. 16,645 3,535,065 0.13%Kilroy Realty Corp. REIT 41,947 3,519,353 0.13%Service Corp. International 76,367 3,515,173 0.13%Toro Co. 43,976 3,503,568 0.13%Bio-Techne Corp. 15,859 3,481,209 0.13%Nordson Corp. 21,371 3,480,054 0.13%Aspen Technology, Inc. 28,722 3,473,351 0.13%Catalent, Inc. 60,973 3,432,780 0.13%STORE Capital Corp. REIT 91,265 3,398,709 0.13%Molina Healthcare, Inc. 24,902 3,378,952 0.13%Royal Gold, Inc. 27,373 3,346,349 0.12%Reliance Steel & Aluminum Co. 27,856 3,336,035 0.12%Hubbell, Inc. Class B 22,506 3,326,837 0.12%Masimo Corp. 21,038 3,325,266 0.12%Apartment Investment &
Management Co. REIT Class A 62,220 3,213,663 0.12%Lamar Advertising Co. REIT Class A 35,784 3,194,080 0.12%Hill-Rom Holdings, Inc. 27,940 3,172,028 0.12%LPL Financial Holdings, Inc. 34,261 3,160,577 0.12%Post Holdings, Inc. 28,936 3,156,918 0.12%Charles River Laboratories
International, Inc. 20,338 3,106,833 0.12%CyrusOne, Inc. REIT 47,354 3,098,372 0.11%Gentex Corp. 106,650 3,090,717 0.11%AptarGroup, Inc. 26,594 3,074,798 0.11%Caesars Entertainment Corp. 225,925 3,072,580 0.11%Monolithic Power Systems, Inc. 17,231 3,067,463 0.11%Donaldson Co., Inc. 52,960 3,051,555 0.11%Douglas Emmett, Inc. REIT 68,372 3,001,531 0.11%TCF Financial Corp. 64,019 2,996,089 0.11%American Homes 4 Rent REIT
Class A 112,477 2,948,022 0.11%Five Below, Inc. 23,000 2,940,780 0.11%Chemed Corp. 6,636 2,914,929 0.11%PRA Health Sciences, Inc. 26,158 2,907,462 0.11%Starwood Property Trust, Inc. REIT 115,722 2,876,849 0.11%Encompass Health Corp. 41,220 2,855,309 0.11%AECOM 66,068 2,849,513 0.11%GCI Liberty, Inc. Class A 40,164 2,845,619 0.11%Entegris, Inc. 56,783 2,844,260 0.11%Cable One, Inc. 1,907 2,838,512 0.11%Commerce Bancshares, Inc. 41,727 2,834,932 0.11%Horizon Therapeutics plc 77,757 2,814,803 0.10%Medicines Co. 33,120 2,813,213 0.10%New Residential Investment Corp.
REIT 174,470 2,810,712 0.10%Prosperity Bancshares, Inc. 39,037 2,806,370 0.10%Novocure Ltd. 32,816 2,765,404 0.10%Woodward, Inc. 23,202 2,748,045 0.10%First American Financial Corp. 46,998 2,740,923 0.10%Ciena Corp. 63,986 2,731,562 0.10%ITT, Inc. 36,583 2,703,850 0.10%Oshkosh Corp. 28,517 2,699,134 0.10%Proofpoint, Inc. 23,490 2,696,182 0.10%Brixmor Property Group, Inc. REIT 124,353 2,687,268 0.10%American Campus Communities,
Inc. REIT 57,130 2,686,824 0.10%HubSpot, Inc. 16,908 2,679,918 0.10%Americold Realty Trust REIT 76,365 2,677,357 0.10%Old Republic International Corp. 119,676 2,677,152 0.10%Planet Fitness, Inc. Class A 35,188 2,627,840 0.10%IAA, Inc. 55,736 2,622,936 0.10%Berry Global Group, Inc. 55,220 2,622,398 0.10%Hexcel Corp. 35,704 2,617,460 0.10%Generac Holdings, Inc. 25,977 2,613,026 0.10%
Dunkin’ Brands Group, Inc. 34,498 2,605,979 0.10%CACI International, Inc. Class A 10,421 2,605,146 0.10%Healthcare Trust of America, Inc.
REIT Class A 85,874 2,600,265 0.10%Park Hotels & Resorts, Inc. REIT 100,092 2,589,380 0.10%Lumentum Holdings, Inc. 32,145 2,549,099 0.09%Sonoco Products Co. 41,214 2,543,728 0.09%Wyndham Hotels & Resorts, Inc. 40,346 2,534,132 0.09%Synovus Financial Corp. 64,511 2,528,831 0.09%CubeSmart REIT 79,512 2,503,038 0.09%Cousins Properties, Inc. REIT 60,581 2,495,937 0.09%MKS Instruments, Inc. 22,444 2,469,064 0.09%BWX Technologies, Inc. 39,530 2,454,022 0.09%Watsco, Inc. 13,576 2,445,716 0.09%Casey’s General Stores, Inc. 15,378 2,444,948 0.09%Haemonetics Corp. 21,276 2,444,612 0.09%Cullen/Frost Bankers, Inc. 24,826 2,427,486 0.09%Stericycle, Inc. 38,017 2,425,865 0.09%Quanta Services, Inc. 59,587 2,425,787 0.09%Hudson Pacific Properties, Inc. REIT 64,340 2,422,401 0.09%Skechers U.S.A., Inc. Class A 56,056 2,421,059 0.09%MDU Resources Group, Inc. 81,431 2,419,315 0.09%Teladoc Health, Inc. 28,723 2,404,690 0.09%WPX Energy, Inc. 174,973 2,404,129 0.09%Jabil, Inc. 57,676 2,383,749 0.09%Popular, Inc. 40,376 2,372,090 0.09%Curtiss-Wright Corp. 16,835 2,371,883 0.09%Williams-Sonoma, Inc. 32,208 2,365,356 0.09%New York Community Bancorp, Inc. 196,553 2,362,567 0.09%Synnex Corp. 18,221 2,346,865 0.09%Western Alliance Bancorp 41,019 2,338,083 0.09%Lincoln Electric Holdings, Inc. 24,147 2,335,739 0.09%Bruker Corp. 45,385 2,313,273 0.09%EPR Properties REIT 32,683 2,308,727 0.09%Allison Transmission Holdings, Inc. 47,595 2,299,790 0.09%Primerica, Inc. 17,590 2,296,550 0.09%Mellanox Technologies Ltd. 19,430 2,276,807 0.08%Performance Food Group Co. 44,226 2,276,754 0.08%Arrowhead Pharmaceuticals, Inc. 35,873 2,275,424 0.08%Amedisys, Inc. 13,508 2,254,755 0.08%Toll Brothers, Inc. 56,588 2,235,792 0.08%Nexstar Media Group, Inc. Class A 19,056 2,234,316 0.08%IDACORP, Inc. 20,897 2,231,800 0.08%Hanover Insurance Group, Inc. 16,321 2,230,591 0.08%Etsy, Inc. 49,735 2,203,261 0.08%First Industrial Realty Trust, Inc.
REIT 53,042 2,201,773 0.08%Cimarex Energy Co. 41,943 2,201,588 0.08%Parsley Energy, Inc. Class A 116,324 2,199,687 0.08%Trex Co., Inc. 24,432 2,195,948 0.08%ServiceMaster Global Holdings, Inc. 56,779 2,195,076 0.08%Exelixis, Inc. 124,336 2,190,800 0.08%Macy’s, Inc. 128,736 2,188,512 0.08%First Horizon National Corp. 131,688 2,180,753 0.08%National Instruments Corp. 51,374 2,175,175 0.08%Anaplan, Inc. 41,489 2,174,024 0.08%Zynga, Inc. Class A 353,890 2,165,807 0.08%Tech Data Corp. 15,038 2,159,457 0.08%Penumbra, Inc. 13,136 2,157,851 0.08%Hawaiian Electric Industries, Inc. 45,991 2,155,138 0.08%HealthEquity, Inc. 29,069 2,153,141 0.08%Manhattan Associates, Inc. 26,990 2,152,453 0.08%Brunswick Corp. 35,795 2,146,984 0.08%Howard Hughes Corp. 16,874 2,139,623 0.08%Highwoods Properties, Inc. REIT 43,494 2,127,292 0.08%Herbalife Nutrition Ltd. 44,613 2,126,702 0.08%JBG SMITH Properties REIT 53,168 2,120,872 0.08%
Number of Fair Value % of Total Shares US Dollars ($) Net Assets
Vanguard Global Small-Cap Index Fund
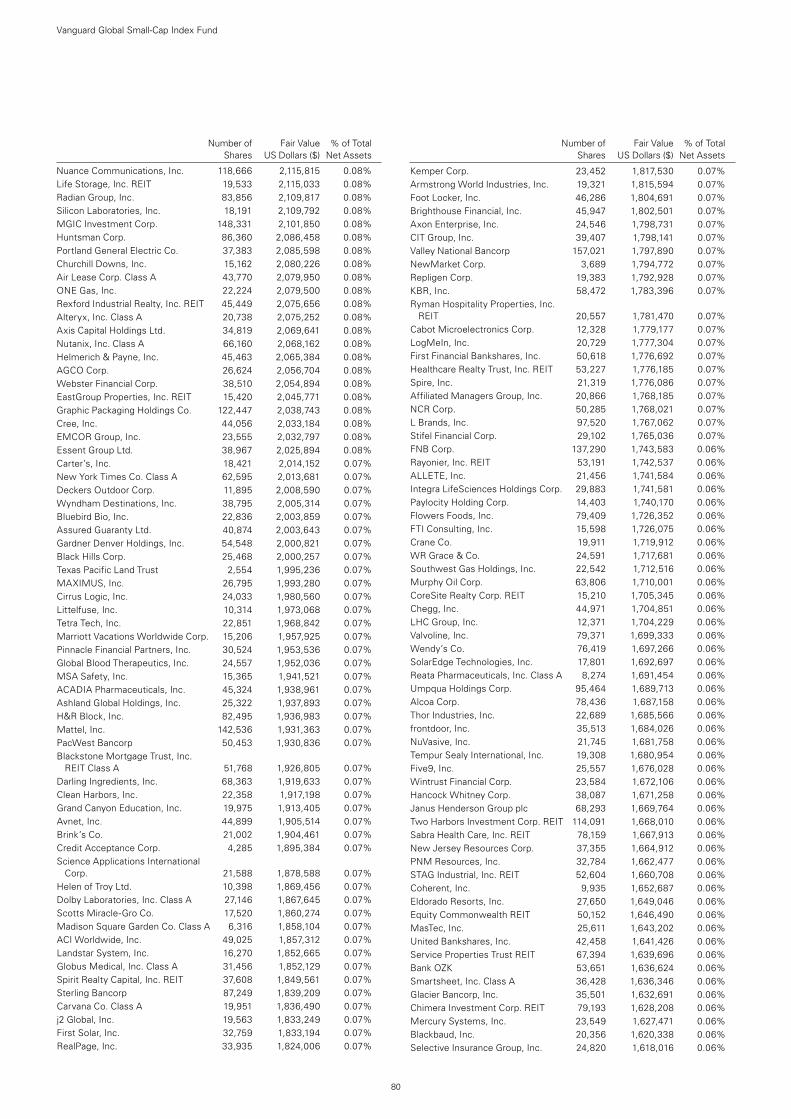
80
Number of Fair Value % of Total Shares US Dollars ($) Net Assets
Nuance Communications, Inc. 118,666 2,115,815 0.08%Life Storage, Inc. REIT 19,533 2,115,033 0.08%Radian Group, Inc. 83,856 2,109,817 0.08%Silicon Laboratories, Inc. 18,191 2,109,792 0.08%MGIC Investment Corp. 148,331 2,101,850 0.08%Huntsman Corp. 86,360 2,086,458 0.08%Portland General Electric Co. 37,383 2,085,598 0.08%Churchill Downs, Inc. 15,162 2,080,226 0.08%Air Lease Corp. Class A 43,770 2,079,950 0.08%ONE Gas, Inc. 22,224 2,079,500 0.08%Rexford Industrial Realty, Inc. REIT 45,449 2,075,656 0.08%Alteryx, Inc. Class A 20,738 2,075,252 0.08%Axis Capital Holdings Ltd. 34,819 2,069,641 0.08%Nutanix, Inc. Class A 66,160 2,068,162 0.08%Helmerich & Payne, Inc. 45,463 2,065,384 0.08%AGCO Corp. 26,624 2,056,704 0.08%Webster Financial Corp. 38,510 2,054,894 0.08%EastGroup Properties, Inc. REIT 15,420 2,045,771 0.08%Graphic Packaging Holdings Co. 122,447 2,038,743 0.08%Cree, Inc. 44,056 2,033,184 0.08%EMCOR Group, Inc. 23,555 2,032,797 0.08%Essent Group Ltd. 38,967 2,025,894 0.08%Carter’s, Inc. 18,421 2,014,152 0.07%New York Times Co. Class A 62,595 2,013,681 0.07%Deckers Outdoor Corp. 11,895 2,008,590 0.07%Wyndham Destinations, Inc. 38,795 2,005,314 0.07%Bluebird Bio, Inc. 22,836 2,003,859 0.07%Assured Guaranty Ltd. 40,874 2,003,643 0.07%Gardner Denver Holdings, Inc. 54,548 2,000,821 0.07%Black Hills Corp. 25,468 2,000,257 0.07%Texas Pacific Land Trust 2,554 1,995,236 0.07%MAXIMUS, Inc. 26,795 1,993,280 0.07%Cirrus Logic, Inc. 24,033 1,980,560 0.07%Littelfuse, Inc. 10,314 1,973,068 0.07%Tetra Tech, Inc. 22,851 1,968,842 0.07%Marriott Vacations Worldwide Corp. 15,206 1,957,925 0.07%Pinnacle Financial Partners, Inc. 30,524 1,953,536 0.07%Global Blood Therapeutics, Inc. 24,557 1,952,036 0.07%MSA Safety, Inc. 15,365 1,941,521 0.07%ACADIA Pharmaceuticals, Inc. 45,324 1,938,961 0.07%Ashland Global Holdings, Inc. 25,322 1,937,893 0.07%H&R Block, Inc. 82,495 1,936,983 0.07%Mattel, Inc. 142,536 1,931,363 0.07%PacWest Bancorp 50,453 1,930,836 0.07%Blackstone Mortgage Trust, Inc.
REIT Class A 51,768 1,926,805 0.07%Darling Ingredients, Inc. 68,363 1,919,633 0.07%Clean Harbors, Inc. 22,358 1,917,198 0.07%Grand Canyon Education, Inc. 19,975 1,913,405 0.07%Avnet, Inc. 44,899 1,905,514 0.07%Brink’s Co. 21,002 1,904,461 0.07%Credit Acceptance Corp. 4,285 1,895,384 0.07%Science Applications International
Corp. 21,588 1,878,588 0.07%Helen of Troy Ltd. 10,398 1,869,456 0.07%Dolby Laboratories, Inc. Class A 27,146 1,867,645 0.07%Scotts Miracle-Gro Co. 17,520 1,860,274 0.07%Madison Square Garden Co. Class A 6,316 1,858,104 0.07%ACI Worldwide, Inc. 49,025 1,857,312 0.07%Landstar System, Inc. 16,270 1,852,665 0.07%Globus Medical, Inc. Class A 31,456 1,852,129 0.07%Spirit Realty Capital, Inc. REIT 37,608 1,849,561 0.07%Sterling Bancorp 87,249 1,839,209 0.07%Carvana Co. Class A 19,951 1,836,490 0.07%j2 Global, Inc. 19,563 1,833,249 0.07%First Solar, Inc. 32,759 1,833,194 0.07%RealPage, Inc. 33,935 1,824,006 0.07%
Kemper Corp. 23,452 1,817,530 0.07%Armstrong World Industries, Inc. 19,321 1,815,594 0.07%Foot Locker, Inc. 46,286 1,804,691 0.07%Brighthouse Financial, Inc. 45,947 1,802,501 0.07%Axon Enterprise, Inc. 24,546 1,798,731 0.07%CIT Group, Inc. 39,407 1,798,141 0.07%Valley National Bancorp 157,021 1,797,890 0.07%NewMarket Corp. 3,689 1,794,772 0.07%Repligen Corp. 19,383 1,792,928 0.07%KBR, Inc. 58,472 1,783,396 0.07%Ryman Hospitality Properties, Inc.
REIT 20,557 1,781,470 0.07%Cabot Microelectronics Corp. 12,328 1,779,177 0.07%LogMeIn, Inc. 20,729 1,777,304 0.07%First Financial Bankshares, Inc. 50,618 1,776,692 0.07%Healthcare Realty Trust, Inc. REIT 53,227 1,776,185 0.07%Spire, Inc. 21,319 1,776,086 0.07%Affiliated Managers Group, Inc. 20,866 1,768,185 0.07%NCR Corp. 50,285 1,768,021 0.07%L Brands, Inc. 97,520 1,767,062 0.07%Stifel Financial Corp. 29,102 1,765,036 0.07%FNB Corp. 137,290 1,743,583 0.06%Rayonier, Inc. REIT 53,191 1,742,537 0.06%ALLETE, Inc. 21,456 1,741,584 0.06%Integra LifeSciences Holdings Corp. 29,883 1,741,581 0.06%Paylocity Holding Corp. 14,403 1,740,170 0.06%Flowers Foods, Inc. 79,409 1,726,352 0.06%FTI Consulting, Inc. 15,598 1,726,075 0.06%Crane Co. 19,911 1,719,912 0.06%WR Grace & Co. 24,591 1,717,681 0.06%Southwest Gas Holdings, Inc. 22,542 1,712,516 0.06%Murphy Oil Corp. 63,806 1,710,001 0.06%CoreSite Realty Corp. REIT 15,210 1,705,345 0.06%Chegg, Inc. 44,971 1,704,851 0.06%LHC Group, Inc. 12,371 1,704,229 0.06%Valvoline, Inc. 79,371 1,699,333 0.06%Wendy’s Co. 76,419 1,697,266 0.06%SolarEdge Technologies, Inc. 17,801 1,692,697 0.06%Reata Pharmaceuticals, Inc. Class A 8,274 1,691,454 0.06%Umpqua Holdings Corp. 95,464 1,689,713 0.06%Alcoa Corp. 78,436 1,687,158 0.06%Thor Industries, Inc. 22,689 1,685,566 0.06%frontdoor, Inc. 35,513 1,684,026 0.06%NuVasive, Inc. 21,745 1,681,758 0.06%Tempur Sealy International, Inc. 19,308 1,680,954 0.06%Five9, Inc. 25,557 1,676,028 0.06%Wintrust Financial Corp. 23,584 1,672,106 0.06%Hancock Whitney Corp. 38,087 1,671,258 0.06%Janus Henderson Group plc 68,293 1,669,764 0.06%Two Harbors Investment Corp. REIT 114,091 1,668,010 0.06%Sabra Health Care, Inc. REIT 78,159 1,667,913 0.06%New Jersey Resources Corp. 37,355 1,664,912 0.06%PNM Resources, Inc. 32,784 1,662,477 0.06%STAG Industrial, Inc. REIT 52,604 1,660,708 0.06%Coherent, Inc. 9,935 1,652,687 0.06%Eldorado Resorts, Inc. 27,650 1,649,046 0.06%Equity Commonwealth REIT 50,152 1,646,490 0.06%MasTec, Inc. 25,611 1,643,202 0.06%United Bankshares, Inc. 42,458 1,641,426 0.06%Service Properties Trust REIT 67,394 1,639,696 0.06%Bank OZK 53,651 1,636,624 0.06%Smartsheet, Inc. Class A 36,428 1,636,346 0.06%Glacier Bancorp, Inc. 35,501 1,632,691 0.06%Chimera Investment Corp. REIT 79,193 1,628,208 0.06%Mercury Systems, Inc. 23,549 1,627,471 0.06%Blackbaud, Inc. 20,356 1,620,338 0.06%Selective Insurance Group, Inc. 24,820 1,618,016 0.06%
Number of Fair Value % of Total Shares US Dollars ($) Net Assets
Vanguard Global Small-Cap Index Fund
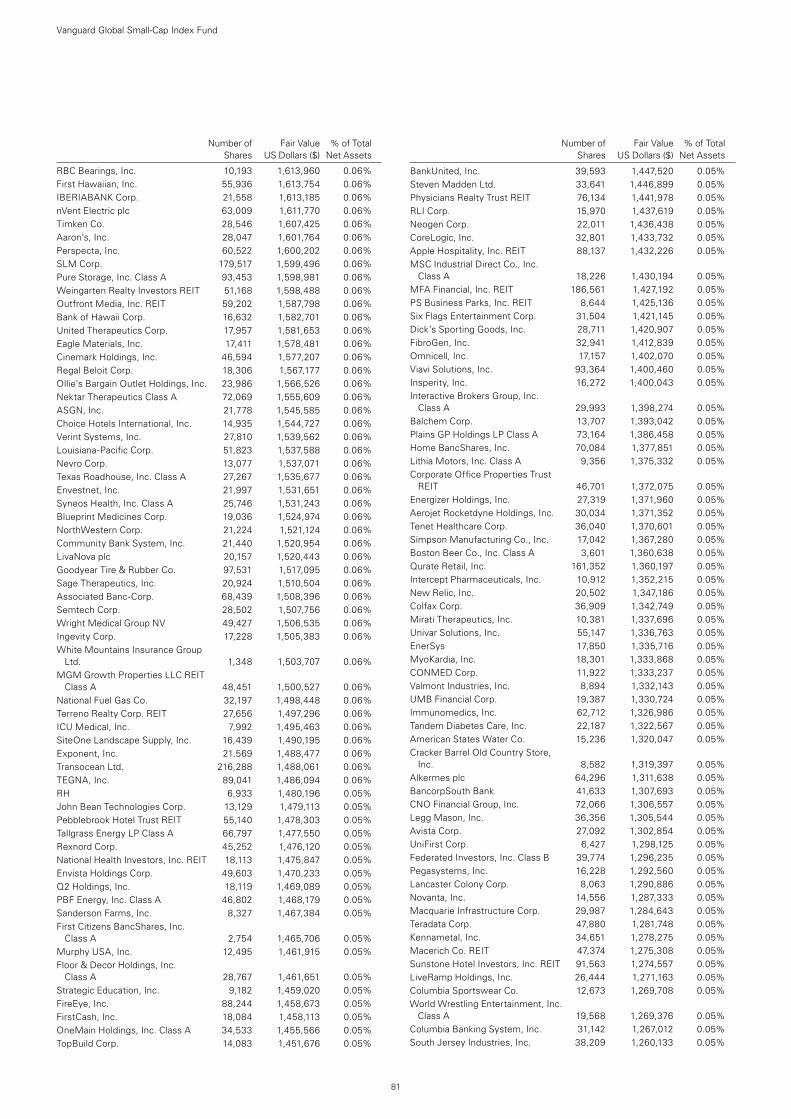
81
Number of Fair Value % of Total Shares US Dollars ($) Net Assets
RBC Bearings, Inc. 10,193 1,613,960 0.06%First Hawaiian, Inc. 55,936 1,613,754 0.06%IBERIABANK Corp. 21,558 1,613,185 0.06%nVent Electric plc 63,009 1,611,770 0.06%Timken Co. 28,546 1,607,425 0.06%Aaron’s, Inc. 28,047 1,601,764 0.06%Perspecta, Inc. 60,522 1,600,202 0.06%SLM Corp. 179,517 1,599,496 0.06%Pure Storage, Inc. Class A 93,453 1,598,981 0.06%Weingarten Realty Investors REIT 51,168 1,598,488 0.06%Outfront Media, Inc. REIT 59,202 1,587,798 0.06%Bank of Hawaii Corp. 16,632 1,582,701 0.06%United Therapeutics Corp. 17,957 1,581,653 0.06%Eagle Materials, Inc. 17,411 1,578,481 0.06%Cinemark Holdings, Inc. 46,594 1,577,207 0.06%Regal Beloit Corp. 18,306 1,567,177 0.06%Ollie’s Bargain Outlet Holdings, Inc. 23,986 1,566,526 0.06%Nektar Therapeutics Class A 72,069 1,555,609 0.06%ASGN, Inc. 21,778 1,545,585 0.06%Choice Hotels International, Inc. 14,935 1,544,727 0.06%Verint Systems, Inc. 27,810 1,539,562 0.06%Louisiana-Pacific Corp. 51,823 1,537,588 0.06%Nevro Corp. 13,077 1,537,071 0.06%Texas Roadhouse, Inc. Class A 27,267 1,535,677 0.06%Envestnet, Inc. 21,997 1,531,651 0.06%Syneos Health, Inc. Class A 25,746 1,531,243 0.06%Blueprint Medicines Corp. 19,036 1,524,974 0.06%NorthWestern Corp. 21,224 1,521,124 0.06%Community Bank System, Inc. 21,440 1,520,954 0.06%LivaNova plc 20,157 1,520,443 0.06%Goodyear Tire & Rubber Co. 97,531 1,517,095 0.06%Sage Therapeutics, Inc. 20,924 1,510,504 0.06%Associated Banc-Corp. 68,439 1,508,396 0.06%Semtech Corp. 28,502 1,507,756 0.06%Wright Medical Group NV 49,427 1,506,535 0.06%Ingevity Corp. 17,228 1,505,383 0.06%White Mountains Insurance Group
Ltd. 1,348 1,503,707 0.06%MGM Growth Properties LLC REIT
Class A 48,451 1,500,527 0.06%National Fuel Gas Co. 32,197 1,498,448 0.06%Terreno Realty Corp. REIT 27,656 1,497,296 0.06%ICU Medical, Inc. 7,992 1,495,463 0.06%SiteOne Landscape Supply, Inc. 16,439 1,490,195 0.06%Exponent, Inc. 21,569 1,488,477 0.06%Transocean Ltd. 216,288 1,488,061 0.06%TEGNA, Inc. 89,041 1,486,094 0.06%RH 6,933 1,480,196 0.05%John Bean Technologies Corp. 13,129 1,479,113 0.05%Pebblebrook Hotel Trust REIT 55,140 1,478,303 0.05%Tallgrass Energy LP Class A 66,797 1,477,550 0.05%Rexnord Corp. 45,252 1,476,120 0.05%National Health Investors, Inc. REIT 18,113 1,475,847 0.05%Envista Holdings Corp. 49,603 1,470,233 0.05%Q2 Holdings, Inc. 18,119 1,469,089 0.05%PBF Energy, Inc. Class A 46,802 1,468,179 0.05%Sanderson Farms, Inc. 8,327 1,467,384 0.05%First Citizens BancShares, Inc.
Class A 2,754 1,465,706 0.05%Murphy USA, Inc. 12,495 1,461,915 0.05%Floor & Decor Holdings, Inc.
Class A 28,767 1,461,651 0.05%Strategic Education, Inc. 9,182 1,459,020 0.05%FireEye, Inc. 88,244 1,458,673 0.05%FirstCash, Inc. 18,084 1,458,113 0.05%OneMain Holdings, Inc. Class A 34,533 1,455,566 0.05%TopBuild Corp. 14,083 1,451,676 0.05%
BankUnited, Inc. 39,593 1,447,520 0.05%Steven Madden Ltd. 33,641 1,446,899 0.05%Physicians Realty Trust REIT 76,134 1,441,978 0.05%RLI Corp. 15,970 1,437,619 0.05%Neogen Corp. 22,011 1,436,438 0.05%CoreLogic, Inc. 32,801 1,433,732 0.05%Apple Hospitality, Inc. REIT 88,137 1,432,226 0.05%MSC Industrial Direct Co., Inc.
Class A 18,226 1,430,194 0.05%MFA Financial, Inc. REIT 186,561 1,427,192 0.05%PS Business Parks, Inc. REIT 8,644 1,425,136 0.05%Six Flags Entertainment Corp. 31,504 1,421,145 0.05%Dick’s Sporting Goods, Inc. 28,711 1,420,907 0.05%FibroGen, Inc. 32,941 1,412,839 0.05%Omnicell, Inc. 17,157 1,402,070 0.05%Viavi Solutions, Inc. 93,364 1,400,460 0.05%Insperity, Inc. 16,272 1,400,043 0.05%Interactive Brokers Group, Inc.
Class A 29,993 1,398,274 0.05%Balchem Corp. 13,707 1,393,042 0.05%Plains GP Holdings LP Class A 73,164 1,386,458 0.05%Home BancShares, Inc. 70,084 1,377,851 0.05%Lithia Motors, Inc. Class A 9,356 1,375,332 0.05%Corporate Office Properties Trust
REIT 46,701 1,372,075 0.05%Energizer Holdings, Inc. 27,319 1,371,960 0.05%Aerojet Rocketdyne Holdings, Inc. 30,034 1,371,352 0.05%Tenet Healthcare Corp. 36,040 1,370,601 0.05%Simpson Manufacturing Co., Inc. 17,042 1,367,280 0.05%Boston Beer Co., Inc. Class A 3,601 1,360,638 0.05%Qurate Retail, Inc. 161,352 1,360,197 0.05%Intercept Pharmaceuticals, Inc. 10,912 1,352,215 0.05%New Relic, Inc. 20,502 1,347,186 0.05%Colfax Corp. 36,909 1,342,749 0.05%Mirati Therapeutics, Inc. 10,381 1,337,696 0.05%Univar Solutions, Inc. 55,147 1,336,763 0.05%EnerSys 17,850 1,335,716 0.05%MyoKardia, Inc. 18,301 1,333,868 0.05%CONMED Corp. 11,922 1,333,237 0.05%Valmont Industries, Inc. 8,894 1,332,143 0.05%UMB Financial Corp. 19,387 1,330,724 0.05%Immunomedics, Inc. 62,712 1,326,986 0.05%Tandem Diabetes Care, Inc. 22,187 1,322,567 0.05%American States Water Co. 15,236 1,320,047 0.05%Cracker Barrel Old Country Store,
Inc. 8,582 1,319,397 0.05%Alkermes plc 64,296 1,311,638 0.05%BancorpSouth Bank 41,633 1,307,693 0.05%CNO Financial Group, Inc. 72,066 1,306,557 0.05%Legg Mason, Inc. 36,356 1,305,544 0.05%Avista Corp. 27,092 1,302,854 0.05%UniFirst Corp. 6,427 1,298,125 0.05%Federated Investors, Inc. Class B 39,774 1,296,235 0.05%Pegasystems, Inc. 16,228 1,292,560 0.05%Lancaster Colony Corp. 8,063 1,290,886 0.05%Novanta, Inc. 14,556 1,287,333 0.05%Macquarie Infrastructure Corp. 29,987 1,284,643 0.05%Teradata Corp. 47,880 1,281,748 0.05%Kennametal, Inc. 34,651 1,278,275 0.05%Macerich Co. REIT 47,374 1,275,308 0.05%Sunstone Hotel Investors, Inc. REIT 91,563 1,274,557 0.05%LiveRamp Holdings, Inc. 26,444 1,271,163 0.05%Columbia Sportswear Co. 12,673 1,269,708 0.05%World Wrestling Entertainment, Inc.
Class A 19,568 1,269,376 0.05%Columbia Banking System, Inc. 31,142 1,267,012 0.05%South Jersey Industries, Inc. 38,209 1,260,133 0.05%
Number of Fair Value % of Total Shares US Dollars ($) Net Assets
Vanguard Global Small-Cap Index Fund
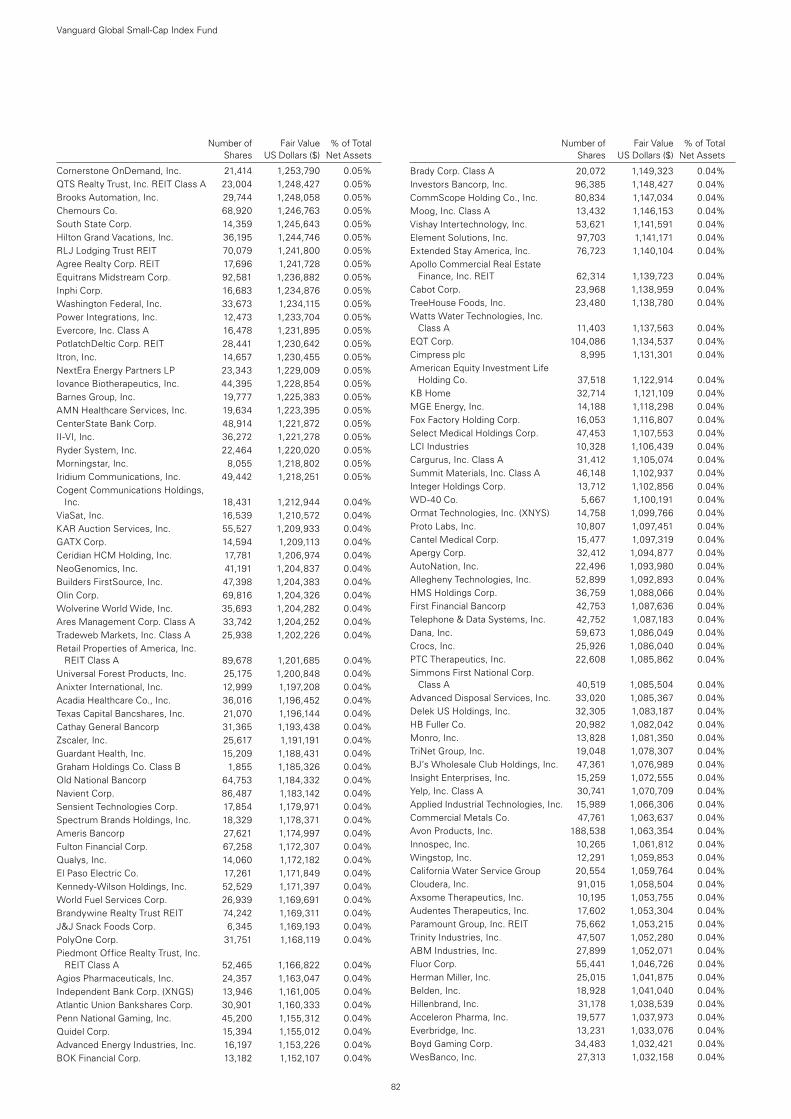
82
Number of Fair Value % of Total Shares US Dollars ($) Net Assets
Cornerstone OnDemand, Inc. 21,414 1,253,790 0.05%QTS Realty Trust, Inc. REIT Class A 23,004 1,248,427 0.05%Brooks Automation, Inc. 29,744 1,248,058 0.05%Chemours Co. 68,920 1,246,763 0.05%South State Corp. 14,359 1,245,643 0.05%Hilton Grand Vacations, Inc. 36,195 1,244,746 0.05%RLJ Lodging Trust REIT 70,079 1,241,800 0.05%Agree Realty Corp. REIT 17,696 1,241,728 0.05%Equitrans Midstream Corp. 92,581 1,236,882 0.05%Inphi Corp. 16,683 1,234,876 0.05%Washington Federal, Inc. 33,673 1,234,115 0.05%Power Integrations, Inc. 12,473 1,233,704 0.05%Evercore, Inc. Class A 16,478 1,231,895 0.05%PotlatchDeltic Corp. REIT 28,441 1,230,642 0.05%Itron, Inc. 14,657 1,230,455 0.05%NextEra Energy Partners LP 23,343 1,229,009 0.05%Iovance Biotherapeutics, Inc. 44,395 1,228,854 0.05%Barnes Group, Inc. 19,777 1,225,383 0.05%AMN Healthcare Services, Inc. 19,634 1,223,395 0.05%CenterState Bank Corp. 48,914 1,221,872 0.05%II-VI, Inc. 36,272 1,221,278 0.05%Ryder System, Inc. 22,464 1,220,020 0.05%Morningstar, Inc. 8,055 1,218,802 0.05%Iridium Communications, Inc. 49,442 1,218,251 0.05%Cogent Communications Holdings,
Inc. 18,431 1,212,944 0.04%ViaSat, Inc. 16,539 1,210,572 0.04%KAR Auction Services, Inc. 55,527 1,209,933 0.04%GATX Corp. 14,594 1,209,113 0.04%Ceridian HCM Holding, Inc. 17,781 1,206,974 0.04%NeoGenomics, Inc. 41,191 1,204,837 0.04%Builders FirstSource, Inc. 47,398 1,204,383 0.04%Olin Corp. 69,816 1,204,326 0.04%Wolverine World Wide, Inc. 35,693 1,204,282 0.04%Ares Management Corp. Class A 33,742 1,204,252 0.04%Tradeweb Markets, Inc. Class A 25,938 1,202,226 0.04%Retail Properties of America, Inc.
REIT Class A 89,678 1,201,685 0.04%Universal Forest Products, Inc. 25,175 1,200,848 0.04%Anixter International, Inc. 12,999 1,197,208 0.04%Acadia Healthcare Co., Inc. 36,016 1,196,452 0.04%Texas Capital Bancshares, Inc. 21,070 1,196,144 0.04%Cathay General Bancorp 31,365 1,193,438 0.04%Zscaler, Inc. 25,617 1,191,191 0.04%Guardant Health, Inc. 15,209 1,188,431 0.04%Graham Holdings Co. Class B 1,855 1,185,326 0.04%Old National Bancorp 64,753 1,184,332 0.04%Navient Corp. 86,487 1,183,142 0.04%Sensient Technologies Corp. 17,854 1,179,971 0.04%Spectrum Brands Holdings, Inc. 18,329 1,178,371 0.04%Ameris Bancorp 27,621 1,174,997 0.04%Fulton Financial Corp. 67,258 1,172,307 0.04%Qualys, Inc. 14,060 1,172,182 0.04%El Paso Electric Co. 17,261 1,171,849 0.04%Kennedy-Wilson Holdings, Inc. 52,529 1,171,397 0.04%World Fuel Services Corp. 26,939 1,169,691 0.04%Brandywine Realty Trust REIT 74,242 1,169,311 0.04%J&J Snack Foods Corp. 6,345 1,169,193 0.04%PolyOne Corp. 31,751 1,168,119 0.04%Piedmont Office Realty Trust, Inc.
REIT Class A 52,465 1,166,822 0.04%Agios Pharmaceuticals, Inc. 24,357 1,163,047 0.04%Independent Bank Corp. (XNGS) 13,946 1,161,005 0.04%Atlantic Union Bankshares Corp. 30,901 1,160,333 0.04%Penn National Gaming, Inc. 45,200 1,155,312 0.04%Quidel Corp. 15,394 1,155,012 0.04%Advanced Energy Industries, Inc. 16,197 1,153,226 0.04%BOK Financial Corp. 13,182 1,152,107 0.04%
Brady Corp. Class A 20,072 1,149,323 0.04%Investors Bancorp, Inc. 96,385 1,148,427 0.04%CommScope Holding Co., Inc. 80,834 1,147,034 0.04%Moog, Inc. Class A 13,432 1,146,153 0.04%Vishay Intertechnology, Inc. 53,621 1,141,591 0.04%Element Solutions, Inc. 97,703 1,141,171 0.04%Extended Stay America, Inc. 76,723 1,140,104 0.04%Apollo Commercial Real Estate
Finance, Inc. REIT 62,314 1,139,723 0.04%Cabot Corp. 23,968 1,138,959 0.04%TreeHouse Foods, Inc. 23,480 1,138,780 0.04%Watts Water Technologies, Inc.
Class A 11,403 1,137,563 0.04%EQT Corp. 104,086 1,134,537 0.04%Cimpress plc 8,995 1,131,301 0.04%American Equity Investment Life
Holding Co. 37,518 1,122,914 0.04%KB Home 32,714 1,121,109 0.04%MGE Energy, Inc. 14,188 1,118,298 0.04%Fox Factory Holding Corp. 16,053 1,116,807 0.04%Select Medical Holdings Corp. 47,453 1,107,553 0.04%LCI Industries 10,328 1,106,439 0.04%Cargurus, Inc. Class A 31,412 1,105,074 0.04%Summit Materials, Inc. Class A 46,148 1,102,937 0.04%Integer Holdings Corp. 13,712 1,102,856 0.04%WD-40 Co. 5,667 1,100,191 0.04%Ormat Technologies, Inc. (XNYS) 14,758 1,099,766 0.04%Proto Labs, Inc. 10,807 1,097,451 0.04%Cantel Medical Corp. 15,477 1,097,319 0.04%Apergy Corp. 32,412 1,094,877 0.04%AutoNation, Inc. 22,496 1,093,980 0.04%Allegheny Technologies, Inc. 52,899 1,092,893 0.04%HMS Holdings Corp. 36,759 1,088,066 0.04%First Financial Bancorp 42,753 1,087,636 0.04%Telephone & Data Systems, Inc. 42,752 1,087,183 0.04%Dana, Inc. 59,673 1,086,049 0.04%Crocs, Inc. 25,926 1,086,040 0.04%PTC Therapeutics, Inc. 22,608 1,085,862 0.04%Simmons First National Corp.
Class A 40,519 1,085,504 0.04%Advanced Disposal Services, Inc. 33,020 1,085,367 0.04%Delek US Holdings, Inc. 32,305 1,083,187 0.04%HB Fuller Co. 20,982 1,082,042 0.04%Monro, Inc. 13,828 1,081,350 0.04%TriNet Group, Inc. 19,048 1,078,307 0.04%BJ’s Wholesale Club Holdings, Inc. 47,361 1,076,989 0.04%Insight Enterprises, Inc. 15,259 1,072,555 0.04%Yelp, Inc. Class A 30,741 1,070,709 0.04%Applied Industrial Technologies, Inc. 15,989 1,066,306 0.04%Commercial Metals Co. 47,761 1,063,637 0.04%Avon Products, Inc. 188,538 1,063,354 0.04%Innospec, Inc. 10,265 1,061,812 0.04%Wingstop, Inc. 12,291 1,059,853 0.04%California Water Service Group 20,554 1,059,764 0.04%Cloudera, Inc. 91,015 1,058,504 0.04%Axsome Therapeutics, Inc. 10,195 1,053,755 0.04%Audentes Therapeutics, Inc. 17,602 1,053,304 0.04%Paramount Group, Inc. REIT 75,662 1,053,215 0.04%Trinity Industries, Inc. 47,507 1,052,280 0.04%ABM Industries, Inc. 27,899 1,052,071 0.04%Fluor Corp. 55,441 1,046,726 0.04%Herman Miller, Inc. 25,015 1,041,875 0.04%Belden, Inc. 18,928 1,041,040 0.04%Hillenbrand, Inc. 31,178 1,038,539 0.04%Acceleron Pharma, Inc. 19,577 1,037,973 0.04%Everbridge, Inc. 13,231 1,033,076 0.04%Boyd Gaming Corp. 34,483 1,032,421 0.04%WesBanco, Inc. 27,313 1,032,158 0.04%
Number of Fair Value % of Total Shares US Dollars ($) Net Assets
Vanguard Global Small-Cap Index Fund
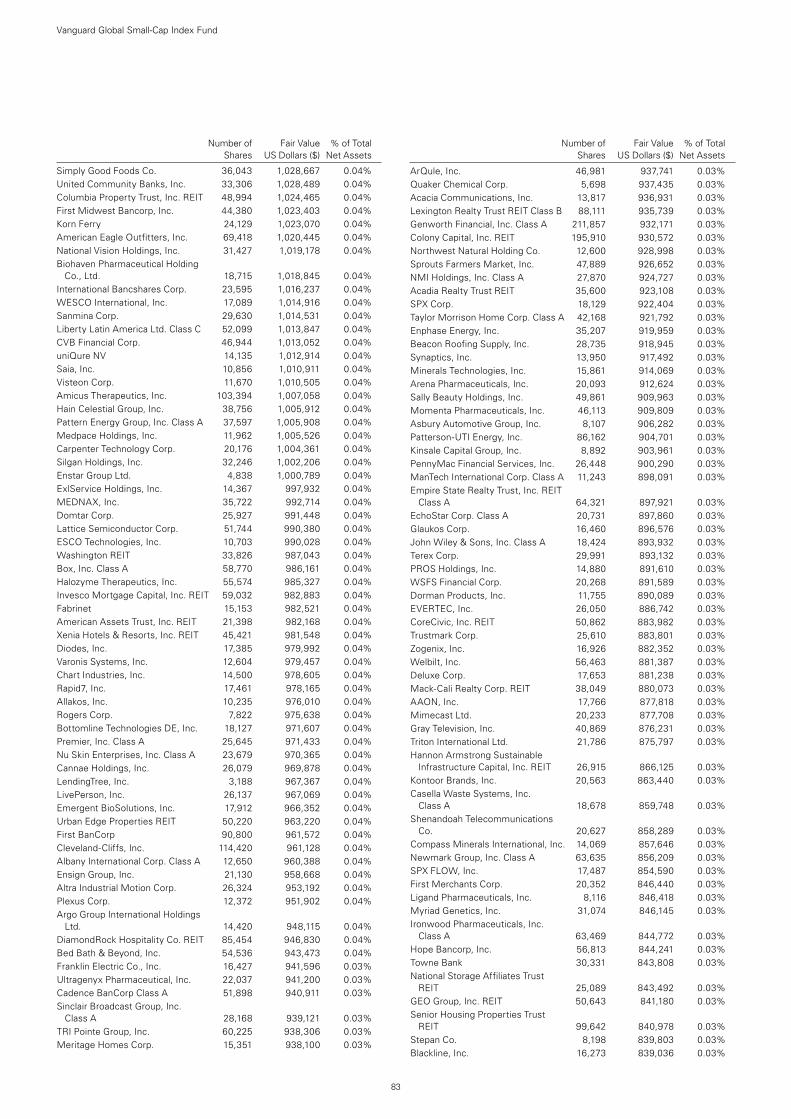
83
Number of Fair Value % of Total Shares US Dollars ($) Net Assets
Simply Good Foods Co. 36,043 1,028,667 0.04%United Community Banks, Inc. 33,306 1,028,489 0.04%Columbia Property Trust, Inc. REIT 48,994 1,024,465 0.04%First Midwest Bancorp, Inc. 44,380 1,023,403 0.04%Korn Ferry 24,129 1,023,070 0.04%American Eagle Outfitters, Inc. 69,418 1,020,445 0.04%National Vision Holdings, Inc. 31,427 1,019,178 0.04%Biohaven Pharmaceutical Holding
Co., Ltd. 18,715 1,018,845 0.04%International Bancshares Corp. 23,595 1,016,237 0.04%WESCO International, Inc. 17,089 1,014,916 0.04%Sanmina Corp. 29,630 1,014,531 0.04%Liberty Latin America Ltd. Class C 52,099 1,013,847 0.04%CVB Financial Corp. 46,944 1,013,052 0.04%uniQure NV 14,135 1,012,914 0.04%Saia, Inc. 10,856 1,010,911 0.04%Visteon Corp. 11,670 1,010,505 0.04%Amicus Therapeutics, Inc. 103,394 1,007,058 0.04%Hain Celestial Group, Inc. 38,756 1,005,912 0.04%Pattern Energy Group, Inc. Class A 37,597 1,005,908 0.04%Medpace Holdings, Inc. 11,962 1,005,526 0.04%Carpenter Technology Corp. 20,176 1,004,361 0.04%Silgan Holdings, Inc. 32,246 1,002,206 0.04%Enstar Group Ltd. 4,838 1,000,789 0.04%ExlService Holdings, Inc. 14,367 997,932 0.04%MEDNAX, Inc. 35,722 992,714 0.04%Domtar Corp. 25,927 991,448 0.04%Lattice Semiconductor Corp. 51,744 990,380 0.04%ESCO Technologies, Inc. 10,703 990,028 0.04%Washington REIT 33,826 987,043 0.04%Box, Inc. Class A 58,770 986,161 0.04%Halozyme Therapeutics, Inc. 55,574 985,327 0.04%Invesco Mortgage Capital, Inc. REIT 59,032 982,883 0.04%Fabrinet 15,153 982,521 0.04%American Assets Trust, Inc. REIT 21,398 982,168 0.04%Xenia Hotels & Resorts, Inc. REIT 45,421 981,548 0.04%Diodes, Inc. 17,385 979,992 0.04%Varonis Systems, Inc. 12,604 979,457 0.04%Chart Industries, Inc. 14,500 978,605 0.04%Rapid7, Inc. 17,461 978,165 0.04%Allakos, Inc. 10,235 976,010 0.04%Rogers Corp. 7,822 975,638 0.04%Bottomline Technologies DE, Inc. 18,127 971,607 0.04%Premier, Inc. Class A 25,645 971,433 0.04%Nu Skin Enterprises, Inc. Class A 23,679 970,365 0.04%Cannae Holdings, Inc. 26,079 969,878 0.04%LendingTree, Inc. 3,188 967,367 0.04%LivePerson, Inc. 26,137 967,069 0.04%Emergent BioSolutions, Inc. 17,912 966,352 0.04%Urban Edge Properties REIT 50,220 963,220 0.04%First BanCorp 90,800 961,572 0.04%Cleveland-Cliffs, Inc. 114,420 961,128 0.04%Albany International Corp. Class A 12,650 960,388 0.04%Ensign Group, Inc. 21,130 958,668 0.04%Altra Industrial Motion Corp. 26,324 953,192 0.04%Plexus Corp. 12,372 951,902 0.04%Argo Group International Holdings
Ltd. 14,420 948,115 0.04%DiamondRock Hospitality Co. REIT 85,454 946,830 0.04%Bed Bath & Beyond, Inc. 54,536 943,473 0.04%Franklin Electric Co., Inc. 16,427 941,596 0.03%Ultragenyx Pharmaceutical, Inc. 22,037 941,200 0.03%Cadence BanCorp Class A 51,898 940,911 0.03%Sinclair Broadcast Group, Inc.
Class A 28,168 939,121 0.03%TRI Pointe Group, Inc. 60,225 938,306 0.03%Meritage Homes Corp. 15,351 938,100 0.03%
ArQule, Inc. 46,981 937,741 0.03%Quaker Chemical Corp. 5,698 937,435 0.03%Acacia Communications, Inc. 13,817 936,931 0.03%Lexington Realty Trust REIT Class B 88,111 935,739 0.03%Genworth Financial, Inc. Class A 211,857 932,171 0.03%Colony Capital, Inc. REIT 195,910 930,572 0.03%Northwest Natural Holding Co. 12,600 928,998 0.03%Sprouts Farmers Market, Inc. 47,889 926,652 0.03%NMI Holdings, Inc. Class A 27,870 924,727 0.03%Acadia Realty Trust REIT 35,600 923,108 0.03%SPX Corp. 18,129 922,404 0.03%Taylor Morrison Home Corp. Class A 42,168 921,792 0.03%Enphase Energy, Inc. 35,207 919,959 0.03%Beacon Roofing Supply, Inc. 28,735 918,945 0.03%Synaptics, Inc. 13,950 917,492 0.03%Minerals Technologies, Inc. 15,861 914,069 0.03%Arena Pharmaceuticals, Inc. 20,093 912,624 0.03%Sally Beauty Holdings, Inc. 49,861 909,963 0.03%Momenta Pharmaceuticals, Inc. 46,113 909,809 0.03%Asbury Automotive Group, Inc. 8,107 906,282 0.03%Patterson-UTI Energy, Inc. 86,162 904,701 0.03%Kinsale Capital Group, Inc. 8,892 903,961 0.03%PennyMac Financial Services, Inc. 26,448 900,290 0.03%ManTech International Corp. Class A 11,243 898,091 0.03%Empire State Realty Trust, Inc. REIT
Class A 64,321 897,921 0.03%EchoStar Corp. Class A 20,731 897,860 0.03%Glaukos Corp. 16,460 896,576 0.03%John Wiley & Sons, Inc. Class A 18,424 893,932 0.03%Terex Corp. 29,991 893,132 0.03%PROS Holdings, Inc. 14,880 891,610 0.03%WSFS Financial Corp. 20,268 891,589 0.03%Dorman Products, Inc. 11,755 890,089 0.03%EVERTEC, Inc. 26,050 886,742 0.03%CoreCivic, Inc. REIT 50,862 883,982 0.03%Trustmark Corp. 25,610 883,801 0.03%Zogenix, Inc. 16,926 882,352 0.03%Welbilt, Inc. 56,463 881,387 0.03%Deluxe Corp. 17,653 881,238 0.03%Mack-Cali Realty Corp. REIT 38,049 880,073 0.03%AAON, Inc. 17,766 877,818 0.03%Mimecast Ltd. 20,233 877,708 0.03%Gray Television, Inc. 40,869 876,231 0.03%Triton International Ltd. 21,786 875,797 0.03%Hannon Armstrong Sustainable
Infrastructure Capital, Inc. REIT 26,915 866,125 0.03%Kontoor Brands, Inc. 20,563 863,440 0.03%Casella Waste Systems, Inc.
Class A 18,678 859,748 0.03%Shenandoah Telecommunications
Co. 20,627 858,289 0.03%Compass Minerals International, Inc. 14,069 857,646 0.03%Newmark Group, Inc. Class A 63,635 856,209 0.03%SPX FLOW, Inc. 17,487 854,590 0.03%First Merchants Corp. 20,352 846,440 0.03%Ligand Pharmaceuticals, Inc. 8,116 846,418 0.03%Myriad Genetics, Inc. 31,074 846,145 0.03%Ironwood Pharmaceuticals, Inc.
Class A 63,469 844,772 0.03%Hope Bancorp, Inc. 56,813 844,241 0.03%Towne Bank 30,331 843,808 0.03%National Storage Affiliates Trust
REIT 25,089 843,492 0.03%GEO Group, Inc. REIT 50,643 841,180 0.03%Senior Housing Properties Trust
REIT 99,642 840,978 0.03%Stepan Co. 8,198 839,803 0.03%Blackline, Inc. 16,273 839,036 0.03%
Number of Fair Value % of Total Shares US Dollars ($) Net Assets
Vanguard Global Small-Cap Index Fund
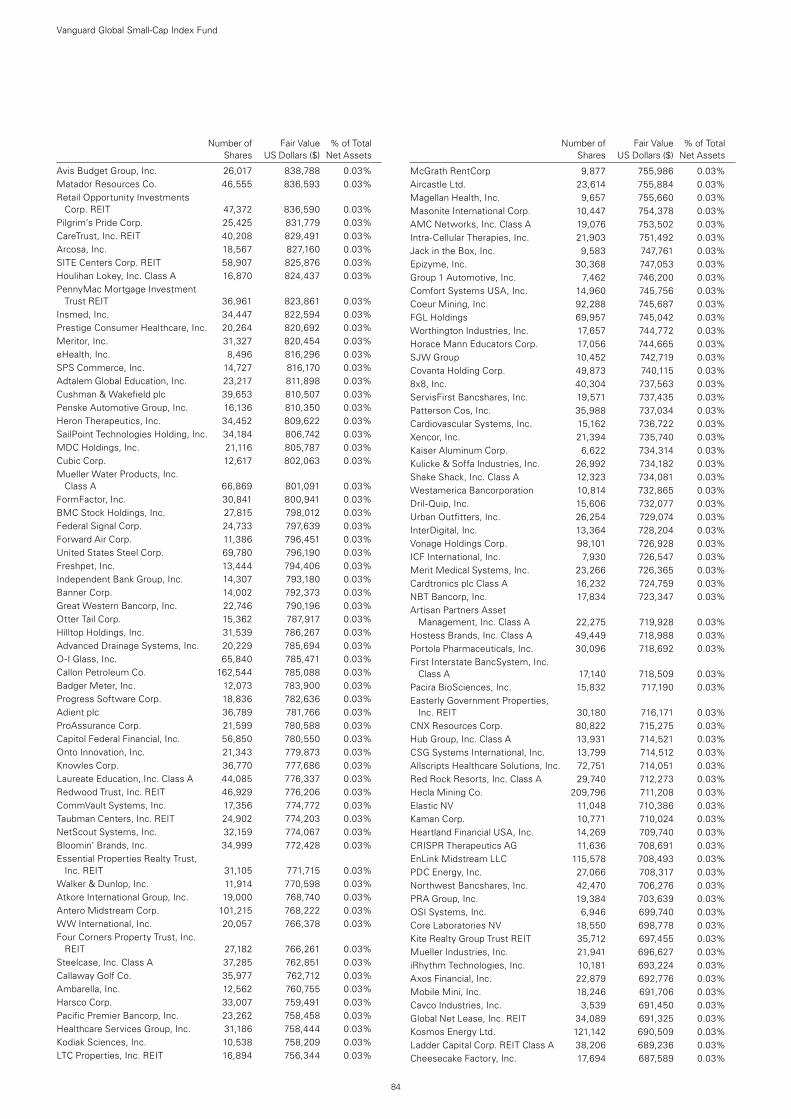
84
Number of Fair Value % of Total Shares US Dollars ($) Net Assets
Avis Budget Group, Inc. 26,017 838,788 0.03%Matador Resources Co. 46,555 836,593 0.03%Retail Opportunity Investments
Corp. REIT 47,372 836,590 0.03%Pilgrim’s Pride Corp. 25,425 831,779 0.03%CareTrust, Inc. REIT 40,208 829,491 0.03%Arcosa, Inc. 18,567 827,160 0.03%SITE Centers Corp. REIT 58,907 825,876 0.03%Houlihan Lokey, Inc. Class A 16,870 824,437 0.03%PennyMac Mortgage Investment
Trust REIT 36,961 823,861 0.03%Insmed, Inc. 34,447 822,594 0.03%Prestige Consumer Healthcare, Inc. 20,264 820,692 0.03%Meritor, Inc. 31,327 820,454 0.03%eHealth, Inc. 8,496 816,296 0.03%SPS Commerce, Inc. 14,727 816,170 0.03%Adtalem Global Education, Inc. 23,217 811,898 0.03%Cushman & Wakefield plc 39,653 810,507 0.03%Penske Automotive Group, Inc. 16,136 810,350 0.03%Heron Therapeutics, Inc. 34,452 809,622 0.03%SailPoint Technologies Holding, Inc. 34,184 806,742 0.03%MDC Holdings, Inc. 21,116 805,787 0.03%Cubic Corp. 12,617 802,063 0.03%Mueller Water Products, Inc.
Class A 66,869 801,091 0.03%FormFactor, Inc. 30,841 800,941 0.03%BMC Stock Holdings, Inc. 27,815 798,012 0.03%Federal Signal Corp. 24,733 797,639 0.03%Forward Air Corp. 11,386 796,451 0.03%United States Steel Corp. 69,780 796,190 0.03%Freshpet, Inc. 13,444 794,406 0.03%Independent Bank Group, Inc. 14,307 793,180 0.03%Banner Corp. 14,002 792,373 0.03%Great Western Bancorp, Inc. 22,746 790,196 0.03%Otter Tail Corp. 15,362 787,917 0.03%Hilltop Holdings, Inc. 31,539 786,267 0.03%Advanced Drainage Systems, Inc. 20,229 785,694 0.03%O-I Glass, Inc. 65,840 785,471 0.03%Callon Petroleum Co. 162,544 785,088 0.03%Badger Meter, Inc. 12,073 783,900 0.03%Progress Software Corp. 18,836 782,636 0.03%Adient plc 36,789 781,766 0.03%ProAssurance Corp. 21,599 780,588 0.03%Capitol Federal Financial, Inc. 56,850 780,550 0.03%Onto Innovation, Inc. 21,343 779,873 0.03%Knowles Corp. 36,770 777,686 0.03%Laureate Education, Inc. Class A 44,085 776,337 0.03%Redwood Trust, Inc. REIT 46,929 776,206 0.03%CommVault Systems, Inc. 17,356 774,772 0.03%Taubman Centers, Inc. REIT 24,902 774,203 0.03%NetScout Systems, Inc. 32,159 774,067 0.03%Bloomin’ Brands, Inc. 34,999 772,428 0.03%Essential Properties Realty Trust,
Inc. REIT 31,105 771,715 0.03%Walker & Dunlop, Inc. 11,914 770,598 0.03%Atkore International Group, Inc. 19,000 768,740 0.03%Antero Midstream Corp. 101,215 768,222 0.03%WW International, Inc. 20,057 766,378 0.03%Four Corners Property Trust, Inc.
REIT 27,182 766,261 0.03%Steelcase, Inc. Class A 37,285 762,851 0.03%Callaway Golf Co. 35,977 762,712 0.03%Ambarella, Inc. 12,562 760,755 0.03%Harsco Corp. 33,007 759,491 0.03%Pacific Premier Bancorp, Inc. 23,262 758,458 0.03%Healthcare Services Group, Inc. 31,186 758,444 0.03%Kodiak Sciences, Inc. 10,538 758,209 0.03%LTC Properties, Inc. REIT 16,894 756,344 0.03%
McGrath RentCorp 9,877 755,986 0.03%Aircastle Ltd. 23,614 755,884 0.03%Magellan Health, Inc. 9,657 755,660 0.03%Masonite International Corp. 10,447 754,378 0.03%AMC Networks, Inc. Class A 19,076 753,502 0.03%Intra-Cellular Therapies, Inc. 21,903 751,492 0.03%Jack in the Box, Inc. 9,583 747,761 0.03%Epizyme, Inc. 30,368 747,053 0.03%Group 1 Automotive, Inc. 7,462 746,200 0.03%Comfort Systems USA, Inc. 14,960 745,756 0.03%Coeur Mining, Inc. 92,288 745,687 0.03%FGL Holdings 69,957 745,042 0.03%Worthington Industries, Inc. 17,657 744,772 0.03%Horace Mann Educators Corp. 17,056 744,665 0.03%SJW Group 10,452 742,719 0.03%Covanta Holding Corp. 49,873 740,115 0.03%8x8, Inc. 40,304 737,563 0.03%ServisFirst Bancshares, Inc. 19,571 737,435 0.03%Patterson Cos, Inc. 35,988 737,034 0.03%Cardiovascular Systems, Inc. 15,162 736,722 0.03%Xencor, Inc. 21,394 735,740 0.03%Kaiser Aluminum Corp. 6,622 734,314 0.03%Kulicke & Soffa Industries, Inc. 26,992 734,182 0.03%Shake Shack, Inc. Class A 12,323 734,081 0.03%Westamerica Bancorporation 10,814 732,865 0.03%Dril-Quip, Inc. 15,606 732,077 0.03%Urban Outfitters, Inc. 26,254 729,074 0.03%InterDigital, Inc. 13,364 728,204 0.03%Vonage Holdings Corp. 98,101 726,928 0.03%ICF International, Inc. 7,930 726,547 0.03%Merit Medical Systems, Inc. 23,266 726,365 0.03%Cardtronics plc Class A 16,232 724,759 0.03%NBT Bancorp, Inc. 17,834 723,347 0.03%Artisan Partners Asset
Management, Inc. Class A 22,275 719,928 0.03%Hostess Brands, Inc. Class A 49,449 718,988 0.03%Portola Pharmaceuticals, Inc. 30,096 718,692 0.03%First Interstate BancSystem, Inc.
Class A 17,140 718,509 0.03%Pacira BioSciences, Inc. 15,832 717,190 0.03%Easterly Government Properties,
Inc. REIT 30,180 716,171 0.03%CNX Resources Corp. 80,822 715,275 0.03%Hub Group, Inc. Class A 13,931 714,521 0.03%CSG Systems International, Inc. 13,799 714,512 0.03%Allscripts Healthcare Solutions, Inc. 72,751 714,051 0.03%Red Rock Resorts, Inc. Class A 29,740 712,273 0.03%Hecla Mining Co. 209,796 711,208 0.03%Elastic NV 11,048 710,386 0.03%Kaman Corp. 10,771 710,024 0.03%Heartland Financial USA, Inc. 14,269 709,740 0.03%CRISPR Therapeutics AG 11,636 708,691 0.03%EnLink Midstream LLC 115,578 708,493 0.03%PDC Energy, Inc. 27,066 708,317 0.03%Northwest Bancshares, Inc. 42,470 706,276 0.03%PRA Group, Inc. 19,384 703,639 0.03%OSI Systems, Inc. 6,946 699,740 0.03%Core Laboratories NV 18,550 698,778 0.03%Kite Realty Group Trust REIT 35,712 697,455 0.03%Mueller Industries, Inc. 21,941 696,627 0.03%iRhythm Technologies, Inc. 10,181 693,224 0.03%Axos Financial, Inc. 22,879 692,776 0.03%Mobile Mini, Inc. 18,246 691,706 0.03%Cavco Industries, Inc. 3,539 691,450 0.03%Global Net Lease, Inc. REIT 34,089 691,325 0.03%Kosmos Energy Ltd. 121,142 690,509 0.03%Ladder Capital Corp. REIT Class A 38,206 689,236 0.03%Cheesecake Factory, Inc. 17,694 687,589 0.03%
Number of Fair Value % of Total Shares US Dollars ($) Net Assets
Vanguard Global Small-Cap Index Fund
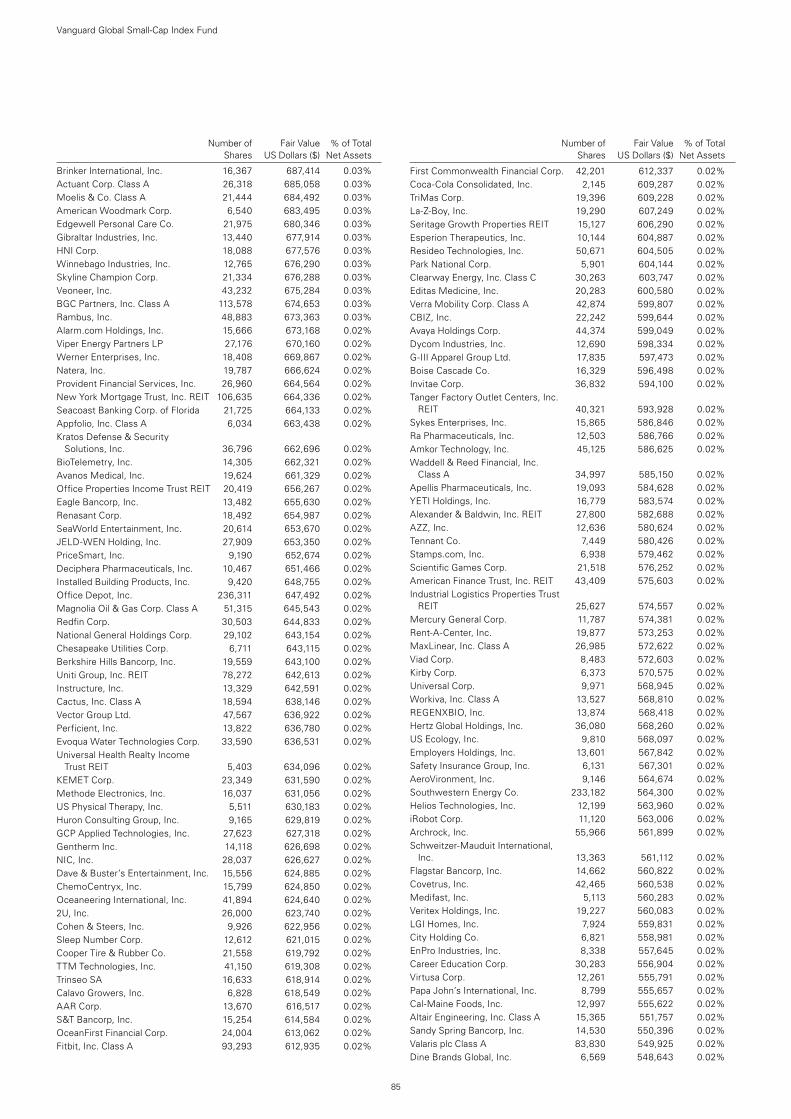
85
Number of Fair Value % of Total Shares US Dollars ($) Net Assets
Brinker International, Inc. 16,367 687,414 0.03%Actuant Corp. Class A 26,318 685,058 0.03%Moelis & Co. Class A 21,444 684,492 0.03%American Woodmark Corp. 6,540 683,495 0.03%Edgewell Personal Care Co. 21,975 680,346 0.03%Gibraltar Industries, Inc. 13,440 677,914 0.03%HNI Corp. 18,088 677,576 0.03%Winnebago Industries, Inc. 12,765 676,290 0.03%Skyline Champion Corp. 21,334 676,288 0.03%Veoneer, Inc. 43,232 675,284 0.03%BGC Partners, Inc. Class A 113,578 674,653 0.03%Rambus, Inc. 48,883 673,363 0.03%Alarm.com Holdings, Inc. 15,666 673,168 0.02%Viper Energy Partners LP 27,176 670,160 0.02%Werner Enterprises, Inc. 18,408 669,867 0.02%Natera, Inc. 19,787 666,624 0.02%Provident Financial Services, Inc. 26,960 664,564 0.02%New York Mortgage Trust, Inc. REIT 106,635 664,336 0.02%Seacoast Banking Corp. of Florida 21,725 664,133 0.02%Appfolio, Inc. Class A 6,034 663,438 0.02%Kratos Defense & Security
Solutions, Inc. 36,796 662,696 0.02%BioTelemetry, Inc. 14,305 662,321 0.02%Avanos Medical, Inc. 19,624 661,329 0.02%Office Properties Income Trust REIT 20,419 656,267 0.02%Eagle Bancorp, Inc. 13,482 655,630 0.02%Renasant Corp. 18,492 654,987 0.02%SeaWorld Entertainment, Inc. 20,614 653,670 0.02%JELD-WEN Holding, Inc. 27,909 653,350 0.02%PriceSmart, Inc. 9,190 652,674 0.02%Deciphera Pharmaceuticals, Inc. 10,467 651,466 0.02%Installed Building Products, Inc. 9,420 648,755 0.02%Office Depot, Inc. 236,311 647,492 0.02%Magnolia Oil & Gas Corp. Class A 51,315 645,543 0.02%Redfin Corp. 30,503 644,833 0.02%National General Holdings Corp. 29,102 643,154 0.02%Chesapeake Utilities Corp. 6,711 643,115 0.02%Berkshire Hills Bancorp, Inc. 19,559 643,100 0.02%Uniti Group, Inc. REIT 78,272 642,613 0.02%Instructure, Inc. 13,329 642,591 0.02%Cactus, Inc. Class A 18,594 638,146 0.02%Vector Group Ltd. 47,567 636,922 0.02%Perficient, Inc. 13,822 636,780 0.02%Evoqua Water Technologies Corp. 33,590 636,531 0.02%Universal Health Realty Income
Trust REIT 5,403 634,096 0.02%KEMET Corp. 23,349 631,590 0.02%Methode Electronics, Inc. 16,037 631,056 0.02%US Physical Therapy, Inc. 5,511 630,183 0.02%Huron Consulting Group, Inc. 9,165 629,819 0.02%GCP Applied Technologies, Inc. 27,623 627,318 0.02%Gentherm Inc. 14,118 626,698 0.02%NIC, Inc. 28,037 626,627 0.02%Dave & Buster’s Entertainment, Inc. 15,556 624,885 0.02%ChemoCentryx, Inc. 15,799 624,850 0.02%Oceaneering International, Inc. 41,894 624,640 0.02%2U, Inc. 26,000 623,740 0.02%Cohen & Steers, Inc. 9,926 622,956 0.02%Sleep Number Corp. 12,612 621,015 0.02%Cooper Tire & Rubber Co. 21,558 619,792 0.02%TTM Technologies, Inc. 41,150 619,308 0.02%Trinseo SA 16,633 618,914 0.02%Calavo Growers, Inc. 6,828 618,549 0.02%AAR Corp. 13,670 616,517 0.02%S&T Bancorp, Inc. 15,254 614,584 0.02%OceanFirst Financial Corp. 24,004 613,062 0.02%Fitbit, Inc. Class A 93,293 612,935 0.02%
First Commonwealth Financial Corp. 42,201 612,337 0.02%Coca-Cola Consolidated, Inc. 2,145 609,287 0.02%TriMas Corp. 19,396 609,228 0.02%La-Z-Boy, Inc. 19,290 607,249 0.02%Seritage Growth Properties REIT 15,127 606,290 0.02%Esperion Therapeutics, Inc. 10,144 604,887 0.02%Resideo Technologies, Inc. 50,671 604,505 0.02%Park National Corp. 5,901 604,144 0.02%Clearway Energy, Inc. Class C 30,263 603,747 0.02%Editas Medicine, Inc. 20,283 600,580 0.02%Verra Mobility Corp. Class A 42,874 599,807 0.02%CBIZ, Inc. 22,242 599,644 0.02%Avaya Holdings Corp. 44,374 599,049 0.02%Dycom Industries, Inc. 12,690 598,334 0.02%G-III Apparel Group Ltd. 17,835 597,473 0.02%Boise Cascade Co. 16,329 596,498 0.02%Invitae Corp. 36,832 594,100 0.02%Tanger Factory Outlet Centers, Inc.
REIT 40,321 593,928 0.02%Sykes Enterprises, Inc. 15,865 586,846 0.02%Ra Pharmaceuticals, Inc. 12,503 586,766 0.02%Amkor Technology, Inc. 45,125 586,625 0.02%Waddell & Reed Financial, Inc.
Class A 34,997 585,150 0.02%Apellis Pharmaceuticals, Inc. 19,093 584,628 0.02%YETI Holdings, Inc. 16,779 583,574 0.02%Alexander & Baldwin, Inc. REIT 27,800 582,688 0.02%AZZ, Inc. 12,636 580,624 0.02%Tennant Co. 7,449 580,426 0.02%Stamps.com, Inc. 6,938 579,462 0.02%Scientific Games Corp. 21,518 576,252 0.02%American Finance Trust, Inc. REIT 43,409 575,603 0.02%Industrial Logistics Properties Trust
REIT 25,627 574,557 0.02%Mercury General Corp. 11,787 574,381 0.02%Rent-A-Center, Inc. 19,877 573,253 0.02%MaxLinear, Inc. Class A 26,985 572,622 0.02%Viad Corp. 8,483 572,603 0.02%Kirby Corp. 6,373 570,575 0.02%Universal Corp. 9,971 568,945 0.02%Workiva, Inc. Class A 13,527 568,810 0.02%REGENXBIO, Inc. 13,874 568,418 0.02%Hertz Global Holdings, Inc. 36,080 568,260 0.02%US Ecology, Inc. 9,810 568,097 0.02%Employers Holdings, Inc. 13,601 567,842 0.02%Safety Insurance Group, Inc. 6,131 567,301 0.02%AeroVironment, Inc. 9,146 564,674 0.02%Southwestern Energy Co. 233,182 564,300 0.02%Helios Technologies, Inc. 12,199 563,960 0.02%iRobot Corp. 11,120 563,006 0.02%Archrock, Inc. 55,966 561,899 0.02%Schweitzer-Mauduit International,
Inc. 13,363 561,112 0.02%Flagstar Bancorp, Inc. 14,662 560,822 0.02%Covetrus, Inc. 42,465 560,538 0.02%Medifast, Inc. 5,113 560,283 0.02%Veritex Holdings, Inc. 19,227 560,083 0.02%LGI Homes, Inc. 7,924 559,831 0.02%City Holding Co. 6,821 558,981 0.02%EnPro Industries, Inc. 8,338 557,645 0.02%Career Education Corp. 30,283 556,904 0.02%Virtusa Corp. 12,261 555,791 0.02%Papa John’s International, Inc. 8,799 555,657 0.02%Cal-Maine Foods, Inc. 12,997 555,622 0.02%Altair Engineering, Inc. Class A 15,365 551,757 0.02%Sandy Spring Bancorp, Inc. 14,530 550,396 0.02%Valaris plc Class A 83,830 549,925 0.02%Dine Brands Global, Inc. 6,569 548,643 0.02%
Number of Fair Value % of Total Shares US Dollars ($) Net Assets
Vanguard Global Small-Cap Index Fund
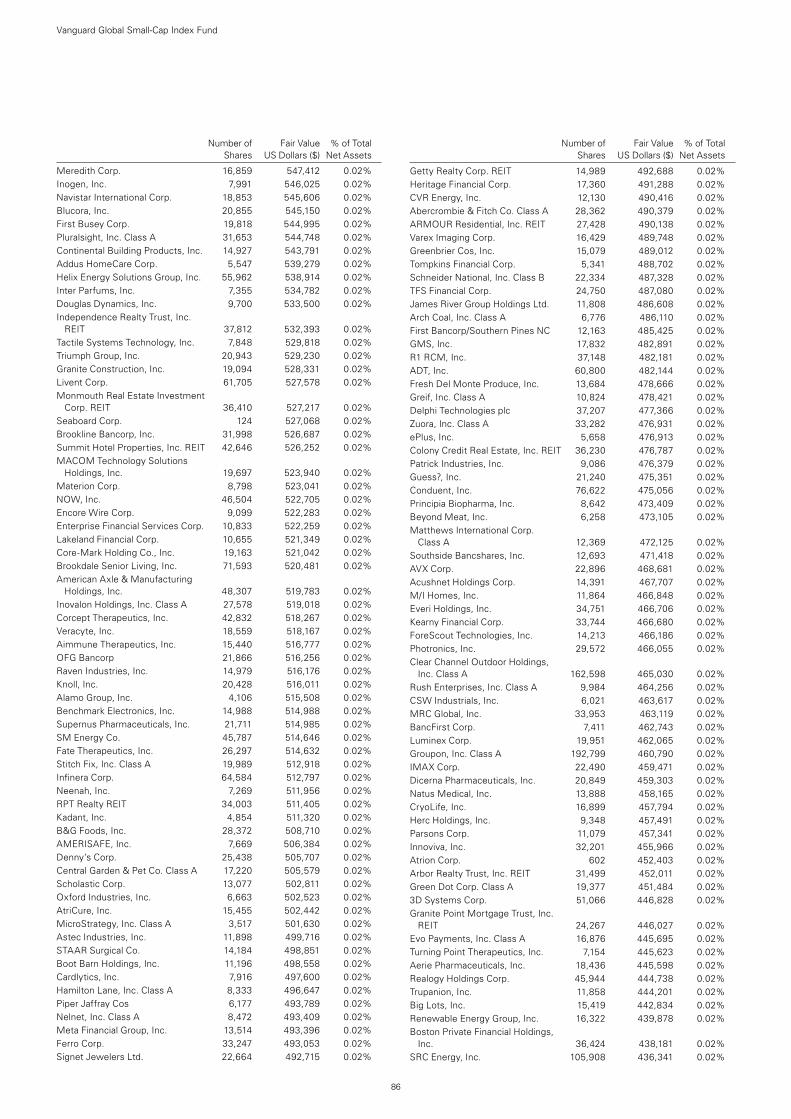
86
Number of Fair Value % of Total Shares US Dollars ($) Net Assets
Meredith Corp. 16,859 547,412 0.02%Inogen, Inc. 7,991 546,025 0.02%Navistar International Corp. 18,853 545,606 0.02%Blucora, Inc. 20,855 545,150 0.02%First Busey Corp. 19,818 544,995 0.02%Pluralsight, Inc. Class A 31,653 544,748 0.02%Continental Building Products, Inc. 14,927 543,791 0.02%Addus HomeCare Corp. 5,547 539,279 0.02%Helix Energy Solutions Group, Inc. 55,962 538,914 0.02%Inter Parfums, Inc. 7,355 534,782 0.02%Douglas Dynamics, Inc. 9,700 533,500 0.02%Independence Realty Trust, Inc.
REIT 37,812 532,393 0.02%Tactile Systems Technology, Inc. 7,848 529,818 0.02%Triumph Group, Inc. 20,943 529,230 0.02%Granite Construction, Inc. 19,094 528,331 0.02%Livent Corp. 61,705 527,578 0.02%Monmouth Real Estate Investment
Corp. REIT 36,410 527,217 0.02%Seaboard Corp. 124 527,068 0.02%Brookline Bancorp, Inc. 31,998 526,687 0.02%Summit Hotel Properties, Inc. REIT 42,646 526,252 0.02%MACOM Technology Solutions
Holdings, Inc. 19,697 523,940 0.02%Materion Corp. 8,798 523,041 0.02%NOW, Inc. 46,504 522,705 0.02%Encore Wire Corp. 9,099 522,283 0.02%Enterprise Financial Services Corp. 10,833 522,259 0.02%Lakeland Financial Corp. 10,655 521,349 0.02%Core-Mark Holding Co., Inc. 19,163 521,042 0.02%Brookdale Senior Living, Inc. 71,593 520,481 0.02%American Axle & Manufacturing
Holdings, Inc. 48,307 519,783 0.02%Inovalon Holdings, Inc. Class A 27,578 519,018 0.02%Corcept Therapeutics, Inc. 42,832 518,267 0.02%Veracyte, Inc. 18,559 518,167 0.02%Aimmune Therapeutics, Inc. 15,440 516,777 0.02%OFG Bancorp 21,866 516,256 0.02%Raven Industries, Inc. 14,979 516,176 0.02%Knoll, Inc. 20,428 516,011 0.02%Alamo Group, Inc. 4,106 515,508 0.02%Benchmark Electronics, Inc. 14,988 514,988 0.02%Supernus Pharmaceuticals, Inc. 21,711 514,985 0.02%SM Energy Co. 45,787 514,646 0.02%Fate Therapeutics, Inc. 26,297 514,632 0.02%Stitch Fix, Inc. Class A 19,989 512,918 0.02%Infinera Corp. 64,584 512,797 0.02%Neenah, Inc. 7,269 511,956 0.02%RPT Realty REIT 34,003 511,405 0.02%Kadant, Inc. 4,854 511,320 0.02%B&G Foods, Inc. 28,372 508,710 0.02%AMERISAFE, Inc. 7,669 506,384 0.02%Denny’s Corp. 25,438 505,707 0.02%Central Garden & Pet Co. Class A 17,220 505,579 0.02%Scholastic Corp. 13,077 502,811 0.02%Oxford Industries, Inc. 6,663 502,523 0.02%AtriCure, Inc. 15,455 502,442 0.02%MicroStrategy, Inc. Class A 3,517 501,630 0.02%Astec Industries, Inc. 11,898 499,716 0.02%STAAR Surgical Co. 14,184 498,851 0.02%Boot Barn Holdings, Inc. 11,196 498,558 0.02%Cardlytics, Inc. 7,916 497,600 0.02%Hamilton Lane, Inc. Class A 8,333 496,647 0.02%Piper Jaffray Cos 6,177 493,789 0.02%Nelnet, Inc. Class A 8,472 493,409 0.02%Meta Financial Group, Inc. 13,514 493,396 0.02%Ferro Corp. 33,247 493,053 0.02%Signet Jewelers Ltd. 22,664 492,715 0.02%
Getty Realty Corp. REIT 14,989 492,688 0.02%Heritage Financial Corp. 17,360 491,288 0.02%CVR Energy, Inc. 12,130 490,416 0.02%Abercrombie & Fitch Co. Class A 28,362 490,379 0.02%ARMOUR Residential, Inc. REIT 27,428 490,138 0.02%Varex Imaging Corp. 16,429 489,748 0.02%Greenbrier Cos, Inc. 15,079 489,012 0.02%Tompkins Financial Corp. 5,341 488,702 0.02%Schneider National, Inc. Class B 22,334 487,328 0.02%TFS Financial Corp. 24,750 487,080 0.02%James River Group Holdings Ltd. 11,808 486,608 0.02%Arch Coal, Inc. Class A 6,776 486,110 0.02%First Bancorp/Southern Pines NC 12,163 485,425 0.02%GMS, Inc. 17,832 482,891 0.02%R1 RCM, Inc. 37,148 482,181 0.02%ADT, Inc. 60,800 482,144 0.02%Fresh Del Monte Produce, Inc. 13,684 478,666 0.02%Greif, Inc. Class A 10,824 478,421 0.02%Delphi Technologies plc 37,207 477,366 0.02%Zuora, Inc. Class A 33,282 476,931 0.02%ePlus, Inc. 5,658 476,913 0.02%Colony Credit Real Estate, Inc. REIT 36,230 476,787 0.02%Patrick Industries, Inc. 9,086 476,379 0.02%Guess?, Inc. 21,240 475,351 0.02%Conduent, Inc. 76,622 475,056 0.02%Principia Biopharma, Inc. 8,642 473,409 0.02%Beyond Meat, Inc. 6,258 473,105 0.02%Matthews International Corp.
Class A 12,369 472,125 0.02%Southside Bancshares, Inc. 12,693 471,418 0.02%AVX Corp. 22,896 468,681 0.02%Acushnet Holdings Corp. 14,391 467,707 0.02%M/I Homes, Inc. 11,864 466,848 0.02%Everi Holdings, Inc. 34,751 466,706 0.02%Kearny Financial Corp. 33,744 466,680 0.02%ForeScout Technologies, Inc. 14,213 466,186 0.02%Photronics, Inc. 29,572 466,055 0.02%Clear Channel Outdoor Holdings,
Inc. Class A 162,598 465,030 0.02%Rush Enterprises, Inc. Class A 9,984 464,256 0.02%CSW Industrials, Inc. 6,021 463,617 0.02%MRC Global, Inc. 33,953 463,119 0.02%BancFirst Corp. 7,411 462,743 0.02%Luminex Corp. 19,951 462,065 0.02%Groupon, Inc. Class A 192,799 460,790 0.02%IMAX Corp. 22,490 459,471 0.02%Dicerna Pharmaceuticals, Inc. 20,849 459,303 0.02%Natus Medical, Inc. 13,888 458,165 0.02%CryoLife, Inc. 16,899 457,794 0.02%Herc Holdings, Inc. 9,348 457,491 0.02%Parsons Corp. 11,079 457,341 0.02%Innoviva, Inc. 32,201 455,966 0.02%Atrion Corp. 602 452,403 0.02%Arbor Realty Trust, Inc. REIT 31,499 452,011 0.02%Green Dot Corp. Class A 19,377 451,484 0.02%3D Systems Corp. 51,066 446,828 0.02%Granite Point Mortgage Trust, Inc.
REIT 24,267 446,027 0.02%Evo Payments, Inc. Class A 16,876 445,695 0.02%Turning Point Therapeutics, Inc. 7,154 445,623 0.02%Aerie Pharmaceuticals, Inc. 18,436 445,598 0.02%Realogy Holdings Corp. 45,944 444,738 0.02%Trupanion, Inc. 11,858 444,201 0.02%Big Lots, Inc. 15,419 442,834 0.02%Renewable Energy Group, Inc. 16,322 439,878 0.02%Boston Private Financial Holdings,
Inc. 36,424 438,181 0.02%SRC Energy, Inc. 105,908 436,341 0.02%
Number of Fair Value % of Total Shares US Dollars ($) Net Assets
Vanguard Global Small-Cap Index Fund
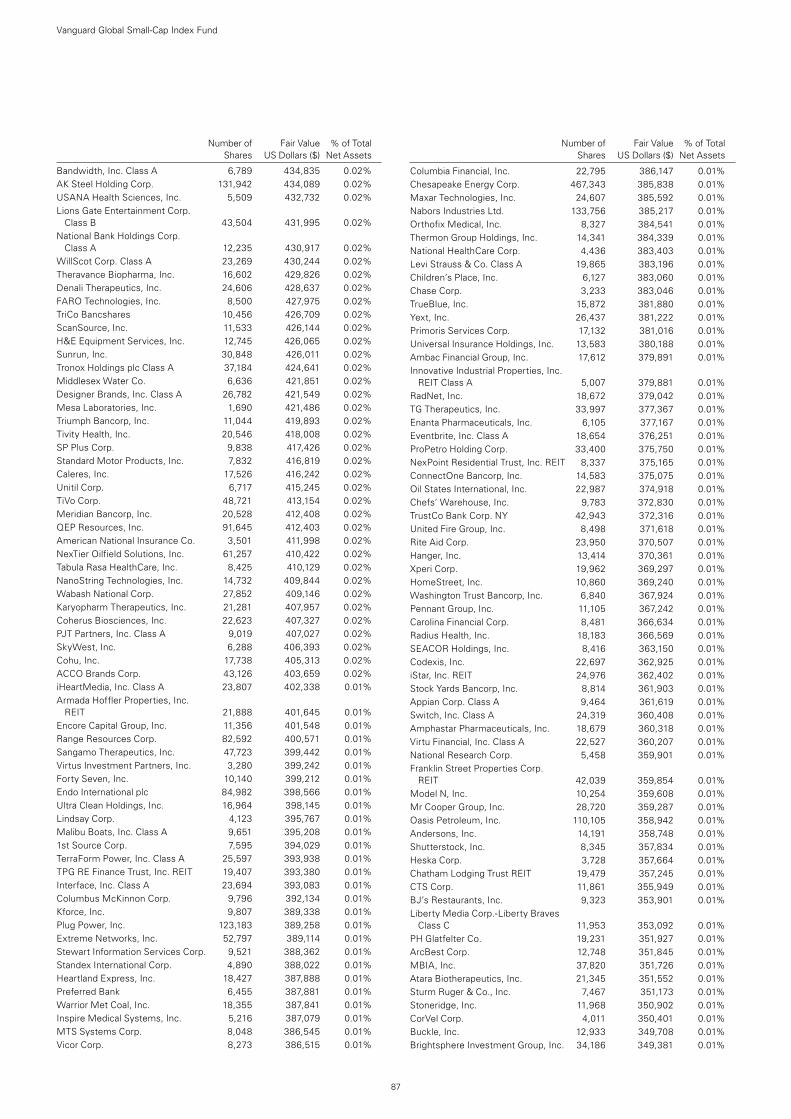
87
Number of Fair Value % of Total Shares US Dollars ($) Net Assets
Bandwidth, Inc. Class A 6,789 434,835 0.02%AK Steel Holding Corp. 131,942 434,089 0.02%USANA Health Sciences, Inc. 5,509 432,732 0.02%Lions Gate Entertainment Corp.
Class B 43,504 431,995 0.02%National Bank Holdings Corp.
Class A 12,235 430,917 0.02%WillScot Corp. Class A 23,269 430,244 0.02%Theravance Biopharma, Inc. 16,602 429,826 0.02%Denali Therapeutics, Inc. 24,606 428,637 0.02%FARO Technologies, Inc. 8,500 427,975 0.02%TriCo Bancshares 10,456 426,709 0.02%ScanSource, Inc. 11,533 426,144 0.02%H&E Equipment Services, Inc. 12,745 426,065 0.02%Sunrun, Inc. 30,848 426,011 0.02%Tronox Holdings plc Class A 37,184 424,641 0.02%Middlesex Water Co. 6,636 421,851 0.02%Designer Brands, Inc. Class A 26,782 421,549 0.02%Mesa Laboratories, Inc. 1,690 421,486 0.02%Triumph Bancorp, Inc. 11,044 419,893 0.02%Tivity Health, Inc. 20,546 418,008 0.02%SP Plus Corp. 9,838 417,426 0.02%Standard Motor Products, Inc. 7,832 416,819 0.02%Caleres, Inc. 17,526 416,242 0.02%Unitil Corp. 6,717 415,245 0.02%TiVo Corp. 48,721 413,154 0.02%Meridian Bancorp, Inc. 20,528 412,408 0.02%QEP Resources, Inc. 91,645 412,403 0.02%American National Insurance Co. 3,501 411,998 0.02%NexTier Oilfield Solutions, Inc. 61,257 410,422 0.02%Tabula Rasa HealthCare, Inc. 8,425 410,129 0.02%NanoString Technologies, Inc. 14,732 409,844 0.02%Wabash National Corp. 27,852 409,146 0.02%Karyopharm Therapeutics, Inc. 21,281 407,957 0.02%Coherus Biosciences, Inc. 22,623 407,327 0.02%PJT Partners, Inc. Class A 9,019 407,027 0.02%SkyWest, Inc. 6,288 406,393 0.02%Cohu, Inc. 17,738 405,313 0.02%ACCO Brands Corp. 43,126 403,659 0.02%iHeartMedia, Inc. Class A 23,807 402,338 0.01%Armada Hoffler Properties, Inc.
REIT 21,888 401,645 0.01%Encore Capital Group, Inc. 11,356 401,548 0.01%Range Resources Corp. 82,592 400,571 0.01%Sangamo Therapeutics, Inc. 47,723 399,442 0.01%Virtus Investment Partners, Inc. 3,280 399,242 0.01%Forty Seven, Inc. 10,140 399,212 0.01%Endo International plc 84,982 398,566 0.01%Ultra Clean Holdings, Inc. 16,964 398,145 0.01%Lindsay Corp. 4,123 395,767 0.01%Malibu Boats, Inc. Class A 9,651 395,208 0.01%1st Source Corp. 7,595 394,029 0.01%TerraForm Power, Inc. Class A 25,597 393,938 0.01%TPG RE Finance Trust, Inc. REIT 19,407 393,380 0.01%Interface, Inc. Class A 23,694 393,083 0.01%Columbus McKinnon Corp. 9,796 392,134 0.01%Kforce, Inc. 9,807 389,338 0.01%Plug Power, Inc. 123,183 389,258 0.01%Extreme Networks, Inc. 52,797 389,114 0.01%Stewart Information Services Corp. 9,521 388,362 0.01%Standex International Corp. 4,890 388,022 0.01%Heartland Express, Inc. 18,427 387,888 0.01%Preferred Bank 6,455 387,881 0.01%Warrior Met Coal, Inc. 18,355 387,841 0.01%Inspire Medical Systems, Inc. 5,216 387,079 0.01%MTS Systems Corp. 8,048 386,545 0.01%Vicor Corp. 8,273 386,515 0.01%
Columbia Financial, Inc. 22,795 386,147 0.01%Chesapeake Energy Corp. 467,343 385,838 0.01%Maxar Technologies, Inc. 24,607 385,592 0.01%Nabors Industries Ltd. 133,756 385,217 0.01%Orthofix Medical, Inc. 8,327 384,541 0.01%Thermon Group Holdings, Inc. 14,341 384,339 0.01%National HealthCare Corp. 4,436 383,403 0.01%Levi Strauss & Co. Class A 19,865 383,196 0.01%Children’s Place, Inc. 6,127 383,060 0.01%Chase Corp. 3,233 383,046 0.01%TrueBlue, Inc. 15,872 381,880 0.01%Yext, Inc. 26,437 381,222 0.01%Primoris Services Corp. 17,132 381,016 0.01%Universal Insurance Holdings, Inc. 13,583 380,188 0.01%Ambac Financial Group, Inc. 17,612 379,891 0.01%Innovative Industrial Properties, Inc.
REIT Class A 5,007 379,881 0.01%RadNet, Inc. 18,672 379,042 0.01%TG Therapeutics, Inc. 33,997 377,367 0.01%Enanta Pharmaceuticals, Inc. 6,105 377,167 0.01%Eventbrite, Inc. Class A 18,654 376,251 0.01%ProPetro Holding Corp. 33,400 375,750 0.01%NexPoint Residential Trust, Inc. REIT 8,337 375,165 0.01%ConnectOne Bancorp, Inc. 14,583 375,075 0.01%Oil States International, Inc. 22,987 374,918 0.01%Chefs’ Warehouse, Inc. 9,783 372,830 0.01%TrustCo Bank Corp. NY 42,943 372,316 0.01%United Fire Group, Inc. 8,498 371,618 0.01%Rite Aid Corp. 23,950 370,507 0.01%Hanger, Inc. 13,414 370,361 0.01%Xperi Corp. 19,962 369,297 0.01%HomeStreet, Inc. 10,860 369,240 0.01%Washington Trust Bancorp, Inc. 6,840 367,924 0.01%Pennant Group, Inc. 11,105 367,242 0.01%Carolina Financial Corp. 8,481 366,634 0.01%Radius Health, Inc. 18,183 366,569 0.01%SEACOR Holdings, Inc. 8,416 363,150 0.01%Codexis, Inc. 22,697 362,925 0.01%iStar, Inc. REIT 24,976 362,402 0.01%Stock Yards Bancorp, Inc. 8,814 361,903 0.01%Appian Corp. Class A 9,464 361,619 0.01%Switch, Inc. Class A 24,319 360,408 0.01%Amphastar Pharmaceuticals, Inc. 18,679 360,318 0.01%Virtu Financial, Inc. Class A 22,527 360,207 0.01%National Research Corp. 5,458 359,901 0.01%Franklin Street Properties Corp.
REIT 42,039 359,854 0.01%Model N, Inc. 10,254 359,608 0.01%Mr Cooper Group, Inc. 28,720 359,287 0.01%Oasis Petroleum, Inc. 110,105 358,942 0.01%Andersons, Inc. 14,191 358,748 0.01%Shutterstock, Inc. 8,345 357,834 0.01%Heska Corp. 3,728 357,664 0.01%Chatham Lodging Trust REIT 19,479 357,245 0.01%CTS Corp. 11,861 355,949 0.01%BJ’s Restaurants, Inc. 9,323 353,901 0.01%Liberty Media Corp.-Liberty Braves
Class C 11,953 353,092 0.01%PH Glatfelter Co. 19,231 351,927 0.01%ArcBest Corp. 12,748 351,845 0.01%MBIA, Inc. 37,820 351,726 0.01%Atara Biotherapeutics, Inc. 21,345 351,552 0.01%Sturm Ruger & Co., Inc. 7,467 351,173 0.01%Stoneridge, Inc. 11,968 350,902 0.01%CorVel Corp. 4,011 350,401 0.01%Buckle, Inc. 12,933 349,708 0.01%Brightsphere Investment Group, Inc. 34,186 349,381 0.01%
Number of Fair Value % of Total Shares US Dollars ($) Net Assets
Vanguard Global Small-Cap Index Fund
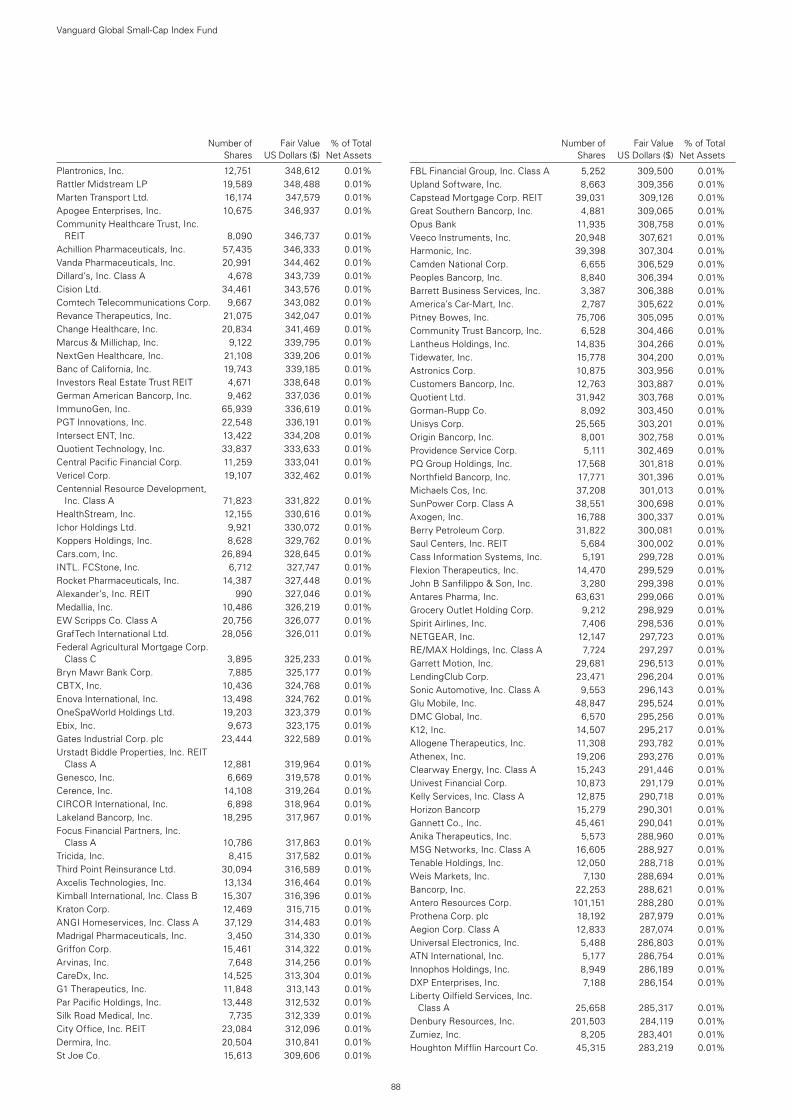
88
Number of Fair Value % of Total Shares US Dollars ($) Net Assets
Plantronics, Inc. 12,751 348,612 0.01%Rattler Midstream LP 19,589 348,488 0.01%Marten Transport Ltd. 16,174 347,579 0.01%Apogee Enterprises, Inc. 10,675 346,937 0.01%Community Healthcare Trust, Inc.
REIT 8,090 346,737 0.01%Achillion Pharmaceuticals, Inc. 57,435 346,333 0.01%Vanda Pharmaceuticals, Inc. 20,991 344,462 0.01%Dillard’s, Inc. Class A 4,678 343,739 0.01%Cision Ltd. 34,461 343,576 0.01%Comtech Telecommunications Corp. 9,667 343,082 0.01%Revance Therapeutics, Inc. 21,075 342,047 0.01%Change Healthcare, Inc. 20,834 341,469 0.01%Marcus & Millichap, Inc. 9,122 339,795 0.01%NextGen Healthcare, Inc. 21,108 339,206 0.01%Banc of California, Inc. 19,743 339,185 0.01%Investors Real Estate Trust REIT 4,671 338,648 0.01%German American Bancorp, Inc. 9,462 337,036 0.01%ImmunoGen, Inc. 65,939 336,619 0.01%PGT Innovations, Inc. 22,548 336,191 0.01%Intersect ENT, Inc. 13,422 334,208 0.01%Quotient Technology, Inc. 33,837 333,633 0.01%Central Pacific Financial Corp. 11,259 333,041 0.01%Vericel Corp. 19,107 332,462 0.01%Centennial Resource Development,
Inc. Class A 71,823 331,822 0.01%HealthStream, Inc. 12,155 330,616 0.01%Ichor Holdings Ltd. 9,921 330,072 0.01%Koppers Holdings, Inc. 8,628 329,762 0.01%Cars.com, Inc. 26,894 328,645 0.01%INTL. FCStone, Inc. 6,712 327,747 0.01%Rocket Pharmaceuticals, Inc. 14,387 327,448 0.01%Alexander’s, Inc. REIT 990 327,046 0.01%Medallia, Inc. 10,486 326,219 0.01%EW Scripps Co. Class A 20,756 326,077 0.01%GrafTech International Ltd. 28,056 326,011 0.01%Federal Agricultural Mortgage Corp.
Class C 3,895 325,233 0.01%Bryn Mawr Bank Corp. 7,885 325,177 0.01%CBTX, Inc. 10,436 324,768 0.01%Enova International, Inc. 13,498 324,762 0.01%OneSpaWorld Holdings Ltd. 19,203 323,379 0.01%Ebix, Inc. 9,673 323,175 0.01%Gates Industrial Corp. plc 23,444 322,589 0.01%Urstadt Biddle Properties, Inc. REIT
Class A 12,881 319,964 0.01%Genesco, Inc. 6,669 319,578 0.01%Cerence, Inc. 14,108 319,264 0.01%CIRCOR International, Inc. 6,898 318,964 0.01%Lakeland Bancorp, Inc. 18,295 317,967 0.01%Focus Financial Partners, Inc.
Class A 10,786 317,863 0.01%Tricida, Inc. 8,415 317,582 0.01%Third Point Reinsurance Ltd. 30,094 316,589 0.01%Axcelis Technologies, Inc. 13,134 316,464 0.01%Kimball International, Inc. Class B 15,307 316,396 0.01%Kraton Corp. 12,469 315,715 0.01%ANGI Homeservices, Inc. Class A 37,129 314,483 0.01%Madrigal Pharmaceuticals, Inc. 3,450 314,330 0.01%Griffon Corp. 15,461 314,322 0.01%Arvinas, Inc. 7,648 314,256 0.01%CareDx, Inc. 14,525 313,304 0.01%G1 Therapeutics, Inc. 11,848 313,143 0.01%Par Pacific Holdings, Inc. 13,448 312,532 0.01%Silk Road Medical, Inc. 7,735 312,339 0.01%City Office, Inc. REIT 23,084 312,096 0.01%Dermira, Inc. 20,504 310,841 0.01%St Joe Co. 15,613 309,606 0.01%
FBL Financial Group, Inc. Class A 5,252 309,500 0.01%Upland Software, Inc. 8,663 309,356 0.01%Capstead Mortgage Corp. REIT 39,031 309,126 0.01%Great Southern Bancorp, Inc. 4,881 309,065 0.01%Opus Bank 11,935 308,758 0.01%Veeco Instruments, Inc. 20,948 307,621 0.01%Harmonic, Inc. 39,398 307,304 0.01%Camden National Corp. 6,655 306,529 0.01%Peoples Bancorp, Inc. 8,840 306,394 0.01%Barrett Business Services, Inc. 3,387 306,388 0.01%America’s Car-Mart, Inc. 2,787 305,622 0.01%Pitney Bowes, Inc. 75,706 305,095 0.01%Community Trust Bancorp, Inc. 6,528 304,466 0.01%Lantheus Holdings, Inc. 14,835 304,266 0.01%Tidewater, Inc. 15,778 304,200 0.01%Astronics Corp. 10,875 303,956 0.01%Customers Bancorp, Inc. 12,763 303,887 0.01%Quotient Ltd. 31,942 303,768 0.01%Gorman-Rupp Co. 8,092 303,450 0.01%Unisys Corp. 25,565 303,201 0.01%Origin Bancorp, Inc. 8,001 302,758 0.01%Providence Service Corp. 5,111 302,469 0.01%PQ Group Holdings, Inc. 17,568 301,818 0.01%Northfield Bancorp, Inc. 17,771 301,396 0.01%Michaels Cos, Inc. 37,208 301,013 0.01%SunPower Corp. Class A 38,551 300,698 0.01%Axogen, Inc. 16,788 300,337 0.01%Berry Petroleum Corp. 31,822 300,081 0.01%Saul Centers, Inc. REIT 5,684 300,002 0.01%Cass Information Systems, Inc. 5,191 299,728 0.01%Flexion Therapeutics, Inc. 14,470 299,529 0.01%John B Sanfilippo & Son, Inc. 3,280 299,398 0.01%Antares Pharma, Inc. 63,631 299,066 0.01%Grocery Outlet Holding Corp. 9,212 298,929 0.01%Spirit Airlines, Inc. 7,406 298,536 0.01%NETGEAR, Inc. 12,147 297,723 0.01%RE/MAX Holdings, Inc. Class A 7,724 297,297 0.01%Garrett Motion, Inc. 29,681 296,513 0.01%LendingClub Corp. 23,471 296,204 0.01%Sonic Automotive, Inc. Class A 9,553 296,143 0.01%Glu Mobile, Inc. 48,847 295,524 0.01%DMC Global, Inc. 6,570 295,256 0.01%K12, Inc. 14,507 295,217 0.01%Allogene Therapeutics, Inc. 11,308 293,782 0.01%Athenex, Inc. 19,206 293,276 0.01%Clearway Energy, Inc. Class A 15,243 291,446 0.01%Univest Financial Corp. 10,873 291,179 0.01%Kelly Services, Inc. Class A 12,875 290,718 0.01%Horizon Bancorp 15,279 290,301 0.01%Gannett Co., Inc. 45,461 290,041 0.01%Anika Therapeutics, Inc. 5,573 288,960 0.01%MSG Networks, Inc. Class A 16,605 288,927 0.01%Tenable Holdings, Inc. 12,050 288,718 0.01%Weis Markets, Inc. 7,130 288,694 0.01%Bancorp, Inc. 22,253 288,621 0.01%Antero Resources Corp. 101,151 288,280 0.01%Prothena Corp. plc 18,192 287,979 0.01%Aegion Corp. Class A 12,833 287,074 0.01%Universal Electronics, Inc. 5,488 286,803 0.01%ATN International, Inc. 5,177 286,754 0.01%Innophos Holdings, Inc. 8,949 286,189 0.01%DXP Enterprises, Inc. 7,188 286,154 0.01%Liberty Oilfield Services, Inc.
Class A 25,658 285,317 0.01%Denbury Resources, Inc. 201,503 284,119 0.01%Zumiez, Inc. 8,205 283,401 0.01%Houghton Mifflin Harcourt Co. 45,315 283,219 0.01%
Number of Fair Value % of Total Shares US Dollars ($) Net Assets
Vanguard Global Small-Cap Index Fund
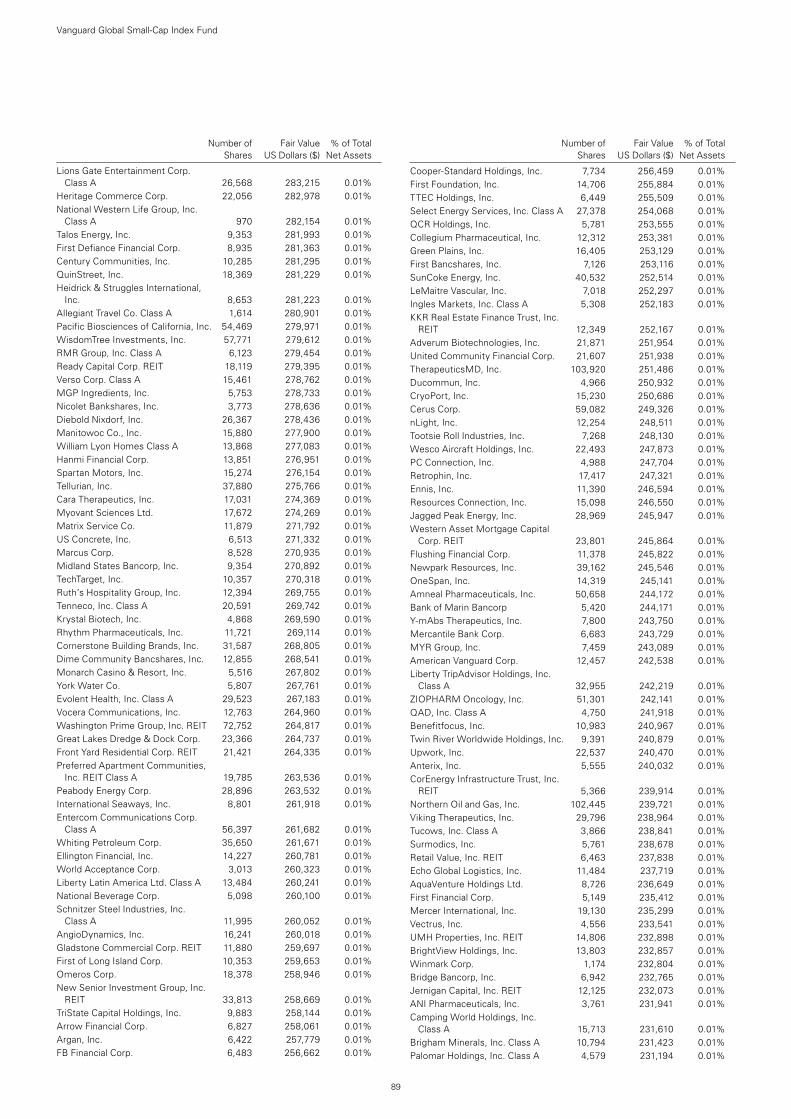
89
Number of Fair Value % of Total Shares US Dollars ($) Net Assets
Lions Gate Entertainment Corp. Class A 26,568 283,215 0.01%
Heritage Commerce Corp. 22,056 282,978 0.01%National Western Life Group, Inc.
Class A 970 282,154 0.01%Talos Energy, Inc. 9,353 281,993 0.01%First Defiance Financial Corp. 8,935 281,363 0.01%Century Communities, Inc. 10,285 281,295 0.01%QuinStreet, Inc. 18,369 281,229 0.01%Heidrick & Struggles International,
Inc. 8,653 281,223 0.01%Allegiant Travel Co. Class A 1,614 280,901 0.01%Pacific Biosciences of California, Inc. 54,469 279,971 0.01%WisdomTree Investments, Inc. 57,771 279,612 0.01%RMR Group, Inc. Class A 6,123 279,454 0.01%Ready Capital Corp. REIT 18,119 279,395 0.01%Verso Corp. Class A 15,461 278,762 0.01%MGP Ingredients, Inc. 5,753 278,733 0.01%Nicolet Bankshares, Inc. 3,773 278,636 0.01%Diebold Nixdorf, Inc. 26,367 278,436 0.01%Manitowoc Co., Inc. 15,880 277,900 0.01%William Lyon Homes Class A 13,868 277,083 0.01%Hanmi Financial Corp. 13,851 276,951 0.01%Spartan Motors, Inc. 15,274 276,154 0.01%Tellurian, Inc. 37,880 275,766 0.01%Cara Therapeutics, Inc. 17,031 274,369 0.01%Myovant Sciences Ltd. 17,672 274,269 0.01%Matrix Service Co. 11,879 271,792 0.01%US Concrete, Inc. 6,513 271,332 0.01%Marcus Corp. 8,528 270,935 0.01%Midland States Bancorp, Inc. 9,354 270,892 0.01%TechTarget, Inc. 10,357 270,318 0.01%Ruth’s Hospitality Group, Inc. 12,394 269,755 0.01%Tenneco, Inc. Class A 20,591 269,742 0.01%Krystal Biotech, Inc. 4,868 269,590 0.01%Rhythm Pharmaceuticals, Inc. 11,721 269,114 0.01%Cornerstone Building Brands, Inc. 31,587 268,805 0.01%Dime Community Bancshares, Inc. 12,855 268,541 0.01%Monarch Casino & Resort, Inc. 5,516 267,802 0.01%York Water Co. 5,807 267,761 0.01%Evolent Health, Inc. Class A 29,523 267,183 0.01%Vocera Communications, Inc. 12,763 264,960 0.01%Washington Prime Group, Inc. REIT 72,752 264,817 0.01%Great Lakes Dredge & Dock Corp. 23,366 264,737 0.01%Front Yard Residential Corp. REIT 21,421 264,335 0.01%Preferred Apartment Communities,
Inc. REIT Class A 19,785 263,536 0.01%Peabody Energy Corp. 28,896 263,532 0.01%International Seaways, Inc. 8,801 261,918 0.01%Entercom Communications Corp.
Class A 56,397 261,682 0.01%Whiting Petroleum Corp. 35,650 261,671 0.01%Ellington Financial, Inc. 14,227 260,781 0.01%World Acceptance Corp. 3,013 260,323 0.01%Liberty Latin America Ltd. Class A 13,484 260,241 0.01%National Beverage Corp. 5,098 260,100 0.01%Schnitzer Steel Industries, Inc.
Class A 11,995 260,052 0.01%AngioDynamics, Inc. 16,241 260,018 0.01%Gladstone Commercial Corp. REIT 11,880 259,697 0.01%First of Long Island Corp. 10,353 259,653 0.01%Omeros Corp. 18,378 258,946 0.01%New Senior Investment Group, Inc.
REIT 33,813 258,669 0.01%TriState Capital Holdings, Inc. 9,883 258,144 0.01%Arrow Financial Corp. 6,827 258,061 0.01%Argan, Inc. 6,422 257,779 0.01%FB Financial Corp. 6,483 256,662 0.01%
Cooper-Standard Holdings, Inc. 7,734 256,459 0.01%First Foundation, Inc. 14,706 255,884 0.01%TTEC Holdings, Inc. 6,449 255,509 0.01%Select Energy Services, Inc. Class A 27,378 254,068 0.01%QCR Holdings, Inc. 5,781 253,555 0.01%Collegium Pharmaceutical, Inc. 12,312 253,381 0.01%Green Plains, Inc. 16,405 253,129 0.01%First Bancshares, Inc. 7,126 253,116 0.01%SunCoke Energy, Inc. 40,532 252,514 0.01%LeMaitre Vascular, Inc. 7,018 252,297 0.01%Ingles Markets, Inc. Class A 5,308 252,183 0.01%KKR Real Estate Finance Trust, Inc.
REIT 12,349 252,167 0.01%Adverum Biotechnologies, Inc. 21,871 251,954 0.01%United Community Financial Corp. 21,607 251,938 0.01%TherapeuticsMD, Inc. 103,920 251,486 0.01%Ducommun, Inc. 4,966 250,932 0.01%CryoPort, Inc. 15,230 250,686 0.01%Cerus Corp. 59,082 249,326 0.01%nLight, Inc. 12,254 248,511 0.01%Tootsie Roll Industries, Inc. 7,268 248,130 0.01%Wesco Aircraft Holdings, Inc. 22,493 247,873 0.01%PC Connection, Inc. 4,988 247,704 0.01%Retrophin, Inc. 17,417 247,321 0.01%Ennis, Inc. 11,390 246,594 0.01%Resources Connection, Inc. 15,098 246,550 0.01%Jagged Peak Energy, Inc. 28,969 245,947 0.01%Western Asset Mortgage Capital
Corp. REIT 23,801 245,864 0.01%Flushing Financial Corp. 11,378 245,822 0.01%Newpark Resources, Inc. 39,162 245,546 0.01%OneSpan, Inc. 14,319 245,141 0.01%Amneal Pharmaceuticals, Inc. 50,658 244,172 0.01%Bank of Marin Bancorp 5,420 244,171 0.01%Y-mAbs Therapeutics, Inc. 7,800 243,750 0.01%Mercantile Bank Corp. 6,683 243,729 0.01%MYR Group, Inc. 7,459 243,089 0.01%American Vanguard Corp. 12,457 242,538 0.01%Liberty TripAdvisor Holdings, Inc.
Class A 32,955 242,219 0.01%ZIOPHARM Oncology, Inc. 51,301 242,141 0.01%QAD, Inc. Class A 4,750 241,918 0.01%Benefitfocus, Inc. 10,983 240,967 0.01%Twin River Worldwide Holdings, Inc. 9,391 240,879 0.01%Upwork, Inc. 22,537 240,470 0.01%Anterix, Inc. 5,555 240,032 0.01%CorEnergy Infrastructure Trust, Inc.
REIT 5,366 239,914 0.01%Northern Oil and Gas, Inc. 102,445 239,721 0.01%Viking Therapeutics, Inc. 29,796 238,964 0.01%Tucows, Inc. Class A 3,866 238,841 0.01%Surmodics, Inc. 5,761 238,678 0.01%Retail Value, Inc. REIT 6,463 237,838 0.01%Echo Global Logistics, Inc. 11,484 237,719 0.01%AquaVenture Holdings Ltd. 8,726 236,649 0.01%First Financial Corp. 5,149 235,412 0.01%Mercer International, Inc. 19,130 235,299 0.01%Vectrus, Inc. 4,556 233,541 0.01%UMH Properties, Inc. REIT 14,806 232,898 0.01%BrightView Holdings, Inc. 13,803 232,857 0.01%Winmark Corp. 1,174 232,804 0.01%Bridge Bancorp, Inc. 6,942 232,765 0.01%Jernigan Capital, Inc. REIT 12,125 232,073 0.01%ANI Pharmaceuticals, Inc. 3,761 231,941 0.01%Camping World Holdings, Inc.
Class A 15,713 231,610 0.01%Brigham Minerals, Inc. Class A 10,794 231,423 0.01%Palomar Holdings, Inc. Class A 4,579 231,194 0.01%
Number of Fair Value % of Total Shares US Dollars ($) Net Assets
Vanguard Global Small-Cap Index Fund
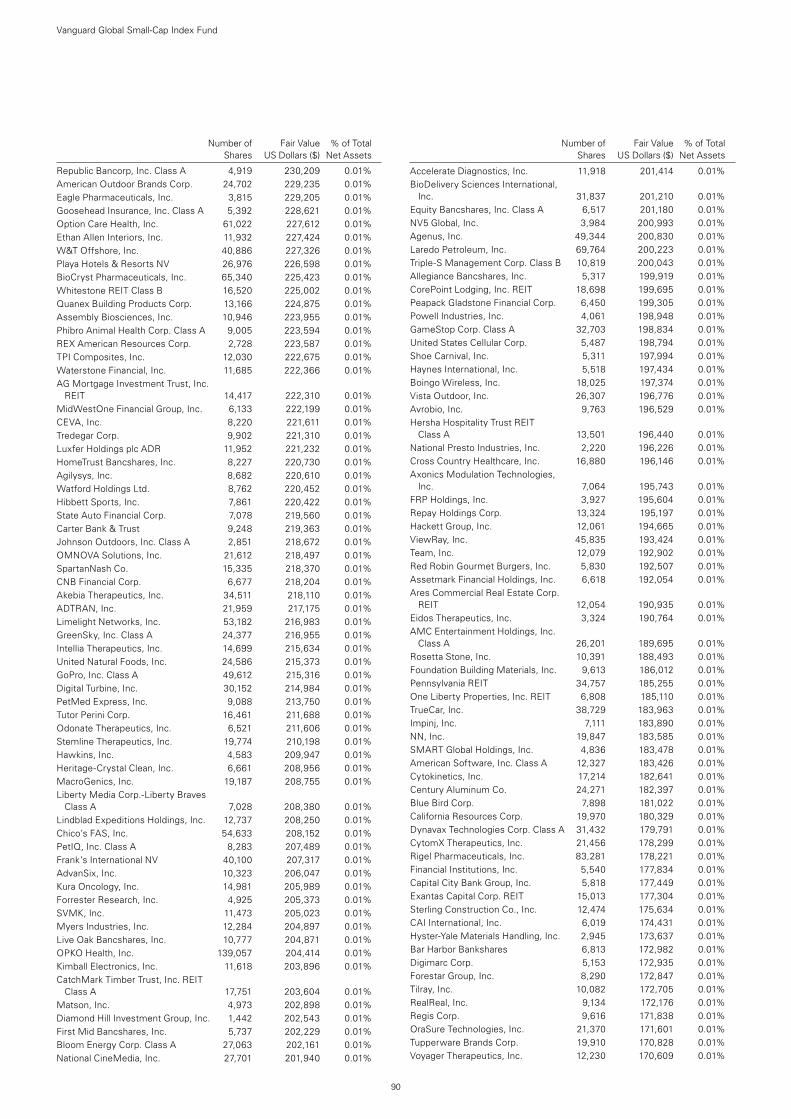
90
Number of Fair Value % of Total Shares US Dollars ($) Net Assets
Republic Bancorp, Inc. Class A 4,919 230,209 0.01%American Outdoor Brands Corp. 24,702 229,235 0.01%Eagle Pharmaceuticals, Inc. 3,815 229,205 0.01%Goosehead Insurance, Inc. Class A 5,392 228,621 0.01%Option Care Health, Inc. 61,022 227,612 0.01%Ethan Allen Interiors, Inc. 11,932 227,424 0.01%W&T Offshore, Inc. 40,886 227,326 0.01%Playa Hotels & Resorts NV 26,976 226,598 0.01%BioCryst Pharmaceuticals, Inc. 65,340 225,423 0.01%Whitestone REIT Class B 16,520 225,002 0.01%Quanex Building Products Corp. 13,166 224,875 0.01%Assembly Biosciences, Inc. 10,946 223,955 0.01%Phibro Animal Health Corp. Class A 9,005 223,594 0.01%REX American Resources Corp. 2,728 223,587 0.01%TPI Composites, Inc. 12,030 222,675 0.01%Waterstone Financial, Inc. 11,685 222,366 0.01%AG Mortgage Investment Trust, Inc.
REIT 14,417 222,310 0.01%MidWestOne Financial Group, Inc. 6,133 222,199 0.01%CEVA, Inc. 8,220 221,611 0.01%Tredegar Corp. 9,902 221,310 0.01%Luxfer Holdings plc ADR 11,952 221,232 0.01%HomeTrust Bancshares, Inc. 8,227 220,730 0.01%Agilysys, Inc. 8,682 220,610 0.01%Watford Holdings Ltd. 8,762 220,452 0.01%Hibbett Sports, Inc. 7,861 220,422 0.01%State Auto Financial Corp. 7,078 219,560 0.01%Carter Bank & Trust 9,248 219,363 0.01%Johnson Outdoors, Inc. Class A 2,851 218,672 0.01%OMNOVA Solutions, Inc. 21,612 218,497 0.01%SpartanNash Co. 15,335 218,370 0.01%CNB Financial Corp. 6,677 218,204 0.01%Akebia Therapeutics, Inc. 34,511 218,110 0.01%ADTRAN, Inc. 21,959 217,175 0.01%Limelight Networks, Inc. 53,182 216,983 0.01%GreenSky, Inc. Class A 24,377 216,955 0.01%Intellia Therapeutics, Inc. 14,699 215,634 0.01%United Natural Foods, Inc. 24,586 215,373 0.01%GoPro, Inc. Class A 49,612 215,316 0.01%Digital Turbine, Inc. 30,152 214,984 0.01%PetMed Express, Inc. 9,088 213,750 0.01%Tutor Perini Corp. 16,461 211,688 0.01%Odonate Therapeutics, Inc. 6,521 211,606 0.01%Stemline Therapeutics, Inc. 19,774 210,198 0.01%Hawkins, Inc. 4,583 209,947 0.01%Heritage-Crystal Clean, Inc. 6,661 208,956 0.01%MacroGenics, Inc. 19,187 208,755 0.01%Liberty Media Corp.-Liberty Braves
Class A 7,028 208,380 0.01%Lindblad Expeditions Holdings, Inc. 12,737 208,250 0.01%Chico’s FAS, Inc. 54,633 208,152 0.01%PetIQ, Inc. Class A 8,283 207,489 0.01%Frank’s International NV 40,100 207,317 0.01%AdvanSix, Inc. 10,323 206,047 0.01%Kura Oncology, Inc. 14,981 205,989 0.01%Forrester Research, Inc. 4,925 205,373 0.01%SVMK, Inc. 11,473 205,023 0.01%Myers Industries, Inc. 12,284 204,897 0.01%Live Oak Bancshares, Inc. 10,777 204,871 0.01%OPKO Health, Inc. 139,057 204,414 0.01%Kimball Electronics, Inc. 11,618 203,896 0.01%CatchMark Timber Trust, Inc. REIT
Class A 17,751 203,604 0.01%Matson, Inc. 4,973 202,898 0.01%Diamond Hill Investment Group, Inc. 1,442 202,543 0.01%First Mid Bancshares, Inc. 5,737 202,229 0.01%Bloom Energy Corp. Class A 27,063 202,161 0.01%National CineMedia, Inc. 27,701 201,940 0.01%
Accelerate Diagnostics, Inc. 11,918 201,414 0.01%BioDelivery Sciences International,
Inc. 31,837 201,210 0.01%Equity Bancshares, Inc. Class A 6,517 201,180 0.01%NV5 Global, Inc. 3,984 200,993 0.01%Agenus, Inc. 49,344 200,830 0.01%Laredo Petroleum, Inc. 69,764 200,223 0.01%Triple-S Management Corp. Class B 10,819 200,043 0.01%Allegiance Bancshares, Inc. 5,317 199,919 0.01%CorePoint Lodging, Inc. REIT 18,698 199,695 0.01%Peapack Gladstone Financial Corp. 6,450 199,305 0.01%Powell Industries, Inc. 4,061 198,948 0.01%GameStop Corp. Class A 32,703 198,834 0.01%United States Cellular Corp. 5,487 198,794 0.01%Shoe Carnival, Inc. 5,311 197,994 0.01%Haynes International, Inc. 5,518 197,434 0.01%Boingo Wireless, Inc. 18,025 197,374 0.01%Vista Outdoor, Inc. 26,307 196,776 0.01%Avrobio, Inc. 9,763 196,529 0.01%Hersha Hospitality Trust REIT
Class A 13,501 196,440 0.01%National Presto Industries, Inc. 2,220 196,226 0.01%Cross Country Healthcare, Inc. 16,880 196,146 0.01%Axonics Modulation Technologies,
Inc. 7,064 195,743 0.01%FRP Holdings, Inc. 3,927 195,604 0.01%Repay Holdings Corp. 13,324 195,197 0.01%Hackett Group, Inc. 12,061 194,665 0.01%ViewRay, Inc. 45,835 193,424 0.01%Team, Inc. 12,079 192,902 0.01%Red Robin Gourmet Burgers, Inc. 5,830 192,507 0.01%Assetmark Financial Holdings, Inc. 6,618 192,054 0.01%Ares Commercial Real Estate Corp.
REIT 12,054 190,935 0.01%Eidos Therapeutics, Inc. 3,324 190,764 0.01%AMC Entertainment Holdings, Inc.
Class A 26,201 189,695 0.01%Rosetta Stone, Inc. 10,391 188,493 0.01%Foundation Building Materials, Inc. 9,613 186,012 0.01%Pennsylvania REIT 34,757 185,255 0.01%One Liberty Properties, Inc. REIT 6,808 185,110 0.01%TrueCar, Inc. 38,729 183,963 0.01%Impinj, Inc. 7,111 183,890 0.01%NN, Inc. 19,847 183,585 0.01%SMART Global Holdings, Inc. 4,836 183,478 0.01%American Software, Inc. Class A 12,327 183,426 0.01%Cytokinetics, Inc. 17,214 182,641 0.01%Century Aluminum Co. 24,271 182,397 0.01%Blue Bird Corp. 7,898 181,022 0.01%California Resources Corp. 19,970 180,329 0.01%Dynavax Technologies Corp. Class A 31,432 179,791 0.01%CytomX Therapeutics, Inc. 21,456 178,299 0.01%Rigel Pharmaceuticals, Inc. 83,281 178,221 0.01%Financial Institutions, Inc. 5,540 177,834 0.01%Capital City Bank Group, Inc. 5,818 177,449 0.01%Exantas Capital Corp. REIT 15,013 177,304 0.01%Sterling Construction Co., Inc. 12,474 175,634 0.01%CAI International, Inc. 6,019 174,431 0.01%Hyster-Yale Materials Handling, Inc. 2,945 173,637 0.01%Bar Harbor Bankshares 6,813 172,982 0.01%Digimarc Corp. 5,153 172,935 0.01%Forestar Group, Inc. 8,290 172,847 0.01%Tilray, Inc. 10,082 172,705 0.01%RealReal, Inc. 9,134 172,176 0.01%Regis Corp. 9,616 171,838 0.01%OraSure Technologies, Inc. 21,370 171,601 0.01%Tupperware Brands Corp. 19,910 170,828 0.01%Voyager Therapeutics, Inc. 12,230 170,609 0.01%
Number of Fair Value % of Total Shares US Dollars ($) Net Assets
Vanguard Global Small-Cap Index Fund
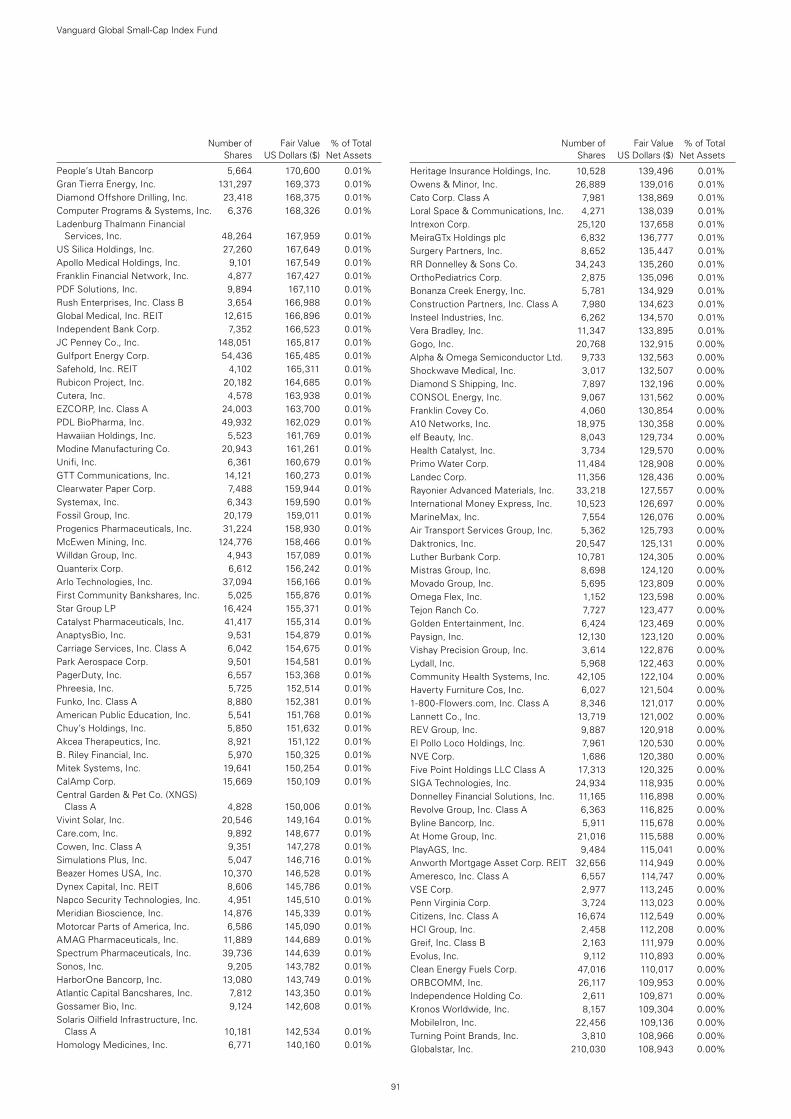
91
Number of Fair Value % of Total Shares US Dollars ($) Net Assets
People’s Utah Bancorp 5,664 170,600 0.01%Gran Tierra Energy, Inc. 131,297 169,373 0.01%Diamond Offshore Drilling, Inc. 23,418 168,375 0.01%Computer Programs & Systems, Inc. 6,376 168,326 0.01%Ladenburg Thalmann Financial
Services, Inc. 48,264 167,959 0.01%US Silica Holdings, Inc. 27,260 167,649 0.01%Apollo Medical Holdings, Inc. 9,101 167,549 0.01%Franklin Financial Network, Inc. 4,877 167,427 0.01%PDF Solutions, Inc. 9,894 167,110 0.01%Rush Enterprises, Inc. Class B 3,654 166,988 0.01%Global Medical, Inc. REIT 12,615 166,896 0.01%Independent Bank Corp. 7,352 166,523 0.01%JC Penney Co., Inc. 148,051 165,817 0.01%Gulfport Energy Corp. 54,436 165,485 0.01%Safehold, Inc. REIT 4,102 165,311 0.01%Rubicon Project, Inc. 20,182 164,685 0.01%Cutera, Inc. 4,578 163,938 0.01%EZCORP, Inc. Class A 24,003 163,700 0.01%PDL BioPharma, Inc. 49,932 162,029 0.01%Hawaiian Holdings, Inc. 5,523 161,769 0.01%Modine Manufacturing Co. 20,943 161,261 0.01%Unifi, Inc. 6,361 160,679 0.01%GTT Communications, Inc. 14,121 160,273 0.01%Clearwater Paper Corp. 7,488 159,944 0.01%Systemax, Inc. 6,343 159,590 0.01%Fossil Group, Inc. 20,179 159,011 0.01%Progenics Pharmaceuticals, Inc. 31,224 158,930 0.01%McEwen Mining, Inc. 124,776 158,466 0.01%Willdan Group, Inc. 4,943 157,089 0.01%Quanterix Corp. 6,612 156,242 0.01%Arlo Technologies, Inc. 37,094 156,166 0.01%First Community Bankshares, Inc. 5,025 155,876 0.01%Star Group LP 16,424 155,371 0.01%Catalyst Pharmaceuticals, Inc. 41,417 155,314 0.01%AnaptysBio, Inc. 9,531 154,879 0.01%Carriage Services, Inc. Class A 6,042 154,675 0.01%Park Aerospace Corp. 9,501 154,581 0.01%PagerDuty, Inc. 6,557 153,368 0.01%Phreesia, Inc. 5,725 152,514 0.01%Funko, Inc. Class A 8,880 152,381 0.01%American Public Education, Inc. 5,541 151,768 0.01%Chuy’s Holdings, Inc. 5,850 151,632 0.01%Akcea Therapeutics, Inc. 8,921 151,122 0.01%B. Riley Financial, Inc. 5,970 150,325 0.01%Mitek Systems, Inc. 19,641 150,254 0.01%CalAmp Corp. 15,669 150,109 0.01%Central Garden & Pet Co. (XNGS)
Class A 4,828 150,006 0.01%Vivint Solar, Inc. 20,546 149,164 0.01%Care.com, Inc. 9,892 148,677 0.01%Cowen, Inc. Class A 9,351 147,278 0.01%Simulations Plus, Inc. 5,047 146,716 0.01%Beazer Homes USA, Inc. 10,370 146,528 0.01%Dynex Capital, Inc. REIT 8,606 145,786 0.01%Napco Security Technologies, Inc. 4,951 145,510 0.01%Meridian Bioscience, Inc. 14,876 145,339 0.01%Motorcar Parts of America, Inc. 6,586 145,090 0.01%AMAG Pharmaceuticals, Inc. 11,889 144,689 0.01%Spectrum Pharmaceuticals, Inc. 39,736 144,639 0.01%Sonos, Inc. 9,205 143,782 0.01%HarborOne Bancorp, Inc. 13,080 143,749 0.01%Atlantic Capital Bancshares, Inc. 7,812 143,350 0.01%Gossamer Bio, Inc. 9,124 142,608 0.01%Solaris Oilfield Infrastructure, Inc.
Class A 10,181 142,534 0.01%Homology Medicines, Inc. 6,771 140,160 0.01%
Heritage Insurance Holdings, Inc. 10,528 139,496 0.01%Owens & Minor, Inc. 26,889 139,016 0.01%Cato Corp. Class A 7,981 138,869 0.01%Loral Space & Communications, Inc. 4,271 138,039 0.01%Intrexon Corp. 25,120 137,658 0.01%MeiraGTx Holdings plc 6,832 136,777 0.01%Surgery Partners, Inc. 8,652 135,447 0.01%RR Donnelley & Sons Co. 34,243 135,260 0.01%OrthoPediatrics Corp. 2,875 135,096 0.01%Bonanza Creek Energy, Inc. 5,781 134,929 0.01%Construction Partners, Inc. Class A 7,980 134,623 0.01%Insteel Industries, Inc. 6,262 134,570 0.01%Vera Bradley, Inc. 11,347 133,895 0.01%Gogo, Inc. 20,768 132,915 0.00%Alpha & Omega Semiconductor Ltd. 9,733 132,563 0.00%Shockwave Medical, Inc. 3,017 132,507 0.00%Diamond S Shipping, Inc. 7,897 132,196 0.00%CONSOL Energy, Inc. 9,067 131,562 0.00%Franklin Covey Co. 4,060 130,854 0.00%A10 Networks, Inc. 18,975 130,358 0.00%elf Beauty, Inc. 8,043 129,734 0.00%Health Catalyst, Inc. 3,734 129,570 0.00%Primo Water Corp. 11,484 128,908 0.00%Landec Corp. 11,356 128,436 0.00%Rayonier Advanced Materials, Inc. 33,218 127,557 0.00%International Money Express, Inc. 10,523 126,697 0.00%MarineMax, Inc. 7,554 126,076 0.00%Air Transport Services Group, Inc. 5,362 125,793 0.00%Daktronics, Inc. 20,547 125,131 0.00%Luther Burbank Corp. 10,781 124,305 0.00%Mistras Group, Inc. 8,698 124,120 0.00%Movado Group, Inc. 5,695 123,809 0.00%Omega Flex, Inc. 1,152 123,598 0.00%Tejon Ranch Co. 7,727 123,477 0.00%Golden Entertainment, Inc. 6,424 123,469 0.00%Paysign, Inc. 12,130 123,120 0.00%Vishay Precision Group, Inc. 3,614 122,876 0.00%Lydall, Inc. 5,968 122,463 0.00%Community Health Systems, Inc. 42,105 122,104 0.00%Haverty Furniture Cos, Inc. 6,027 121,504 0.00%1-800-Flowers.com, Inc. Class A 8,346 121,017 0.00%Lannett Co., Inc. 13,719 121,002 0.00%REV Group, Inc. 9,887 120,918 0.00%El Pollo Loco Holdings, Inc. 7,961 120,530 0.00%NVE Corp. 1,686 120,380 0.00%Five Point Holdings LLC Class A 17,313 120,325 0.00%SIGA Technologies, Inc. 24,934 118,935 0.00%Donnelley Financial Solutions, Inc. 11,165 116,898 0.00%Revolve Group, Inc. Class A 6,363 116,825 0.00%Byline Bancorp, Inc. 5,911 115,678 0.00%At Home Group, Inc. 21,016 115,588 0.00%PlayAGS, Inc. 9,484 115,041 0.00%Anworth Mortgage Asset Corp. REIT 32,656 114,949 0.00%Ameresco, Inc. Class A 6,557 114,747 0.00%VSE Corp. 2,977 113,245 0.00%Penn Virginia Corp. 3,724 113,023 0.00%Citizens, Inc. Class A 16,674 112,549 0.00%HCI Group, Inc. 2,458 112,208 0.00%Greif, Inc. Class B 2,163 111,979 0.00%Evolus, Inc. 9,112 110,893 0.00%Clean Energy Fuels Corp. 47,016 110,017 0.00%ORBCOMM, Inc. 26,117 109,953 0.00%Independence Holding Co. 2,611 109,871 0.00%Kronos Worldwide, Inc. 8,157 109,304 0.00%MobileIron, Inc. 22,456 109,136 0.00%Turning Point Brands, Inc. 3,810 108,966 0.00%Globalstar, Inc. 210,030 108,943 0.00%
Number of Fair Value % of Total Shares US Dollars ($) Net Assets
Vanguard Global Small-Cap Index Fund
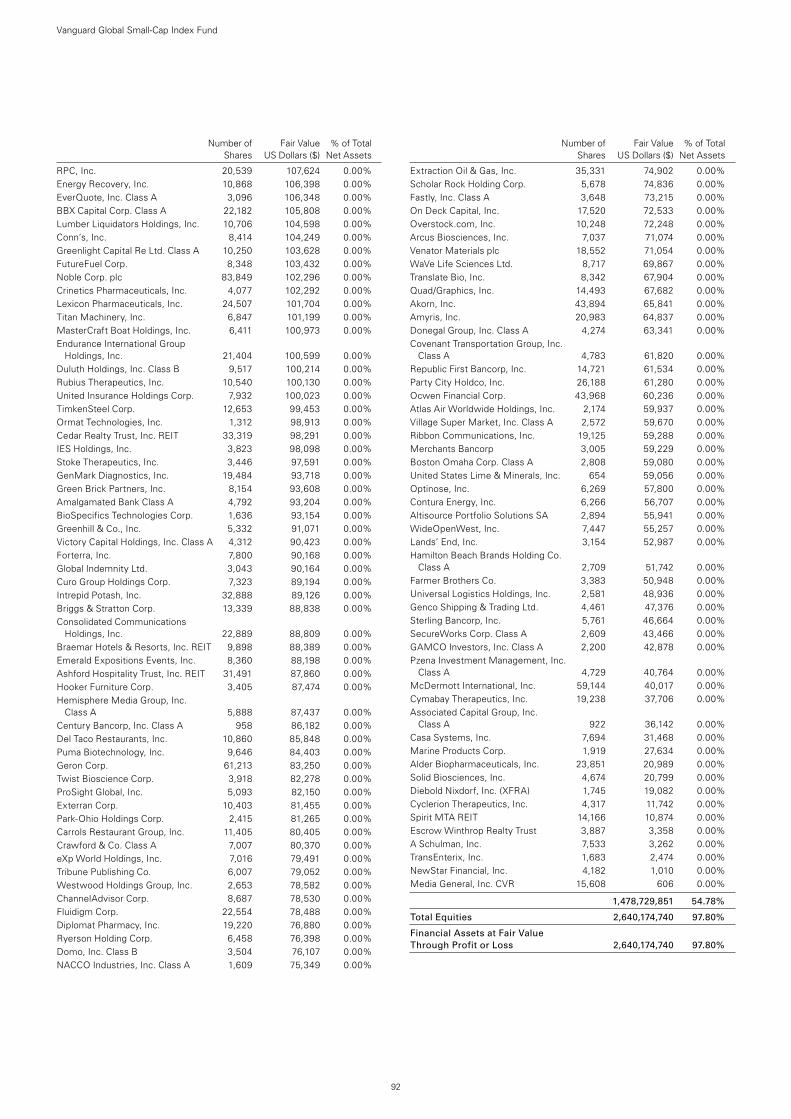
92
Number of Fair Value % of Total Shares US Dollars ($) Net Assets
RPC, Inc. 20,539 107,624 0.00%Energy Recovery, Inc. 10,868 106,398 0.00%EverQuote, Inc. Class A 3,096 106,348 0.00%BBX Capital Corp. Class A 22,182 105,808 0.00%Lumber Liquidators Holdings, Inc. 10,706 104,598 0.00%Conn’s, Inc. 8,414 104,249 0.00%Greenlight Capital Re Ltd. Class A 10,250 103,628 0.00%FutureFuel Corp. 8,348 103,432 0.00%Noble Corp. plc 83,849 102,296 0.00%Crinetics Pharmaceuticals, Inc. 4,077 102,292 0.00%Lexicon Pharmaceuticals, Inc. 24,507 101,704 0.00%Titan Machinery, Inc. 6,847 101,199 0.00%MasterCraft Boat Holdings, Inc. 6,411 100,973 0.00%Endurance International Group
Holdings, Inc. 21,404 100,599 0.00%Duluth Holdings, Inc. Class B 9,517 100,214 0.00%Rubius Therapeutics, Inc. 10,540 100,130 0.00%United Insurance Holdings Corp. 7,932 100,023 0.00%TimkenSteel Corp. 12,653 99,453 0.00%Ormat Technologies, Inc. 1,312 98,913 0.00%Cedar Realty Trust, Inc. REIT 33,319 98,291 0.00%IES Holdings, Inc. 3,823 98,098 0.00%Stoke Therapeutics, Inc. 3,446 97,591 0.00%GenMark Diagnostics, Inc. 19,484 93,718 0.00%Green Brick Partners, Inc. 8,154 93,608 0.00%Amalgamated Bank Class A 4,792 93,204 0.00%BioSpecifics Technologies Corp. 1,636 93,154 0.00%Greenhill & Co., Inc. 5,332 91,071 0.00%Victory Capital Holdings, Inc. Class A 4,312 90,423 0.00%Forterra, Inc. 7,800 90,168 0.00%Global Indemnity Ltd. 3,043 90,164 0.00%Curo Group Holdings Corp. 7,323 89,194 0.00%Intrepid Potash, Inc. 32,888 89,126 0.00%Briggs & Stratton Corp. 13,339 88,838 0.00%Consolidated Communications
Holdings, Inc. 22,889 88,809 0.00%Braemar Hotels & Resorts, Inc. REIT 9,898 88,389 0.00%Emerald Expositions Events, Inc. 8,360 88,198 0.00%Ashford Hospitality Trust, Inc. REIT 31,491 87,860 0.00%Hooker Furniture Corp. 3,405 87,474 0.00%Hemisphere Media Group, Inc.
Class A 5,888 87,437 0.00%Century Bancorp, Inc. Class A 958 86,182 0.00%Del Taco Restaurants, Inc. 10,860 85,848 0.00%Puma Biotechnology, Inc. 9,646 84,403 0.00%Geron Corp. 61,213 83,250 0.00%Twist Bioscience Corp. 3,918 82,278 0.00%ProSight Global, Inc. 5,093 82,150 0.00%Exterran Corp. 10,403 81,455 0.00%Park-Ohio Holdings Corp. 2,415 81,265 0.00%Carrols Restaurant Group, Inc. 11,405 80,405 0.00%Crawford & Co. Class A 7,007 80,370 0.00%eXp World Holdings, Inc. 7,016 79,491 0.00%Tribune Publishing Co. 6,007 79,052 0.00%Westwood Holdings Group, Inc. 2,653 78,582 0.00%ChannelAdvisor Corp. 8,687 78,530 0.00%Fluidigm Corp. 22,554 78,488 0.00%Diplomat Pharmacy, Inc. 19,220 76,880 0.00%Ryerson Holding Corp. 6,458 76,398 0.00%Domo, Inc. Class B 3,504 76,107 0.00%NACCO Industries, Inc. Class A 1,609 75,349 0.00%
Extraction Oil & Gas, Inc. 35,331 74,902 0.00%Scholar Rock Holding Corp. 5,678 74,836 0.00%Fastly, Inc. Class A 3,648 73,215 0.00%On Deck Capital, Inc. 17,520 72,533 0.00%Overstock.com, Inc. 10,248 72,248 0.00%Arcus Biosciences, Inc. 7,037 71,074 0.00%Venator Materials plc 18,552 71,054 0.00%WaVe Life Sciences Ltd. 8,717 69,867 0.00%Translate Bio, Inc. 8,342 67,904 0.00%Quad/Graphics, Inc. 14,493 67,682 0.00%Akorn, Inc. 43,894 65,841 0.00%Amyris, Inc. 20,983 64,837 0.00%Donegal Group, Inc. Class A 4,274 63,341 0.00%Covenant Transportation Group, Inc.
Class A 4,783 61,820 0.00%Republic First Bancorp, Inc. 14,721 61,534 0.00%Party City Holdco, Inc. 26,188 61,280 0.00%Ocwen Financial Corp. 43,968 60,236 0.00%Atlas Air Worldwide Holdings, Inc. 2,174 59,937 0.00%Village Super Market, Inc. Class A 2,572 59,670 0.00%Ribbon Communications, Inc. 19,125 59,288 0.00%Merchants Bancorp 3,005 59,229 0.00%Boston Omaha Corp. Class A 2,808 59,080 0.00%United States Lime & Minerals, Inc. 654 59,056 0.00%Optinose, Inc. 6,269 57,800 0.00%Contura Energy, Inc. 6,266 56,707 0.00%Altisource Portfolio Solutions SA 2,894 55,941 0.00%WideOpenWest, Inc. 7,447 55,257 0.00%Lands’ End, Inc. 3,154 52,987 0.00%Hamilton Beach Brands Holding Co.
Class A 2,709 51,742 0.00%Farmer Brothers Co. 3,383 50,948 0.00%Universal Logistics Holdings, Inc. 2,581 48,936 0.00%Genco Shipping & Trading Ltd. 4,461 47,376 0.00%Sterling Bancorp, Inc. 5,761 46,664 0.00%SecureWorks Corp. Class A 2,609 43,466 0.00%GAMCO Investors, Inc. Class A 2,200 42,878 0.00%Pzena Investment Management, Inc.
Class A 4,729 40,764 0.00%McDermott International, Inc. 59,144 40,017 0.00%Cymabay Therapeutics, Inc. 19,238 37,706 0.00%Associated Capital Group, Inc.
Class A 922 36,142 0.00%Casa Systems, Inc. 7,694 31,468 0.00%Marine Products Corp. 1,919 27,634 0.00%Alder Biopharmaceuticals, Inc. 23,851 20,989 0.00%Solid Biosciences, Inc. 4,674 20,799 0.00%Diebold Nixdorf, Inc. (XFRA) 1,745 19,082 0.00%Cyclerion Therapeutics, Inc. 4,317 11,742 0.00%Spirit MTA REIT 14,166 10,874 0.00%Escrow Winthrop Realty Trust 3,887 3,358 0.00%A Schulman, Inc. 7,533 3,262 0.00%TransEnterix, Inc. 1,683 2,474 0.00%NewStar Financial, Inc. 4,182 1,010 0.00%Media General, Inc. CVR 15,608 606 0.00%
1,478,729,851 54.78%
Total Equities 2,640,174,740 97.80%
Financial Assets at Fair Value Through Profit or Loss 2,640,174,740 97.80%
Number of Fair Value % of Total Shares US Dollars ($) Net Assets
Vanguard Global Small-Cap Index Fund
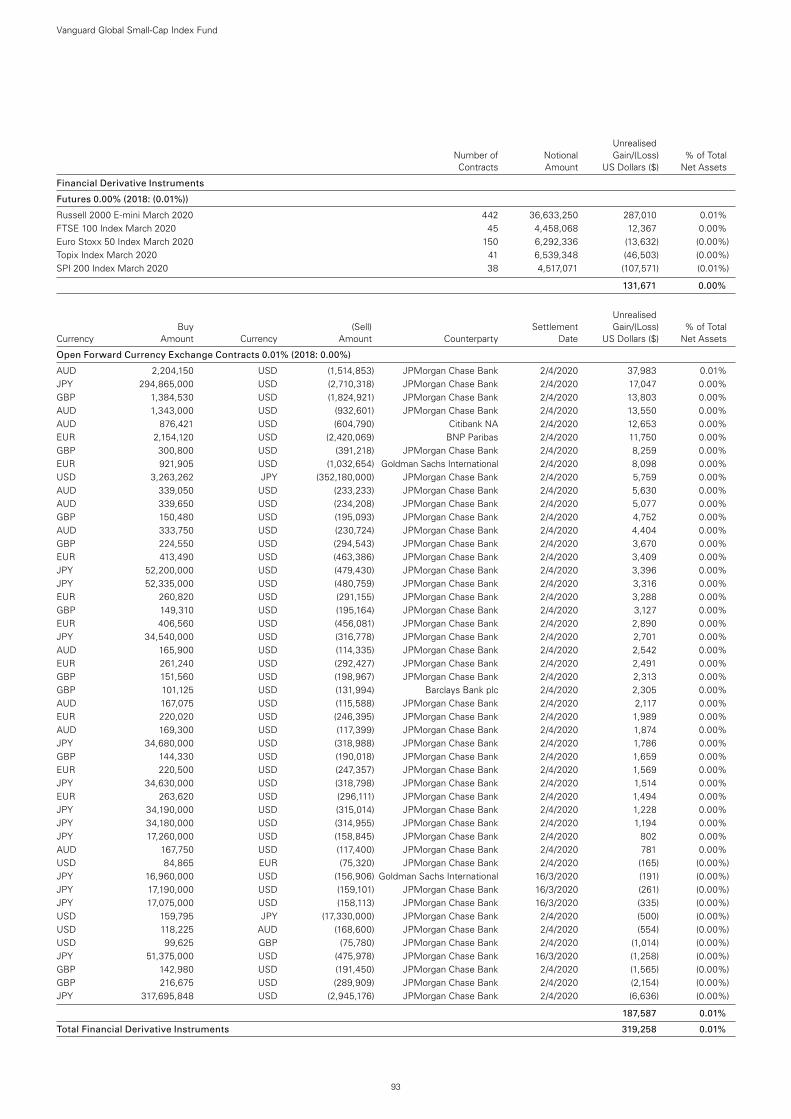
93
Vanguard Global Small-Cap Index Fund
Unrealised Number of Notional Gain/(Loss) % of Total Contracts Amount US Dollars ($) Net Assets
Financial Derivative Instruments
Futures 0.00% (2018: (0.01%))
Russell 2000 E-mini March 2020 442 36,633,250 287,010 0.01%FTSE 100 Index March 2020 45 4,458,068 12,367 0.00%Euro Stoxx 50 Index March 2020 150 6,292,336 (13,632) (0.00%)Topix Index March 2020 41 6,539,348 (46,503) (0.00%)SPI 200 Index March 2020 38 4,517,071 (107,571) (0.01%)
131,671 0.00%
Unrealised Buy (Sell) Settlement Gain/(Loss) % of Total Currency Amount Currency Amount Counterparty Date US Dollars ($) Net Assets
Open Forward Currency Exchange Contracts 0.01% (2018: 0.00%)
AUD 2,204,150 USD (1,514,853) JPMorgan Chase Bank 2/4/2020 37,983 0.01%JPY 294,865,000 USD (2,710,318) JPMorgan Chase Bank 2/4/2020 17,047 0.00%GBP 1,384,530 USD (1,824,921) JPMorgan Chase Bank 2/4/2020 13,803 0.00%AUD 1,343,000 USD (932,601) JPMorgan Chase Bank 2/4/2020 13,550 0.00%AUD 876,421 USD (604,790) Citibank NA 2/4/2020 12,653 0.00%EUR 2,154,120 USD (2,420,069) BNP Paribas 2/4/2020 11,750 0.00%GBP 300,800 USD (391,218) JPMorgan Chase Bank 2/4/2020 8,259 0.00%EUR 921,905 USD (1,032,654) Goldman Sachs International 2/4/2020 8,098 0.00%USD 3,263,262 JPY (352,180,000) JPMorgan Chase Bank 2/4/2020 5,759 0.00%AUD 339,050 USD (233,233) JPMorgan Chase Bank 2/4/2020 5,630 0.00%AUD 339,650 USD (234,208) JPMorgan Chase Bank 2/4/2020 5,077 0.00%GBP 150,480 USD (195,093) JPMorgan Chase Bank 2/4/2020 4,752 0.00%AUD 333,750 USD (230,724) JPMorgan Chase Bank 2/4/2020 4,404 0.00%GBP 224,550 USD (294,543) JPMorgan Chase Bank 2/4/2020 3,670 0.00%EUR 413,490 USD (463,386) JPMorgan Chase Bank 2/4/2020 3,409 0.00%JPY 52,200,000 USD (479,430) JPMorgan Chase Bank 2/4/2020 3,396 0.00%JPY 52,335,000 USD (480,759) JPMorgan Chase Bank 2/4/2020 3,316 0.00%EUR 260,820 USD (291,155) JPMorgan Chase Bank 2/4/2020 3,288 0.00%GBP 149,310 USD (195,164) JPMorgan Chase Bank 2/4/2020 3,127 0.00%EUR 406,560 USD (456,081) JPMorgan Chase Bank 2/4/2020 2,890 0.00%JPY 34,540,000 USD (316,778) JPMorgan Chase Bank 2/4/2020 2,701 0.00%AUD 165,900 USD (114,335) JPMorgan Chase Bank 2/4/2020 2,542 0.00%EUR 261,240 USD (292,427) JPMorgan Chase Bank 2/4/2020 2,491 0.00%GBP 151,560 USD (198,967) JPMorgan Chase Bank 2/4/2020 2,313 0.00%GBP 101,125 USD (131,994) Barclays Bank plc 2/4/2020 2,305 0.00%AUD 167,075 USD (115,588) JPMorgan Chase Bank 2/4/2020 2,117 0.00%EUR 220,020 USD (246,395) JPMorgan Chase Bank 2/4/2020 1,989 0.00%AUD 169,300 USD (117,399) JPMorgan Chase Bank 2/4/2020 1,874 0.00%JPY 34,680,000 USD (318,988) JPMorgan Chase Bank 2/4/2020 1,786 0.00%GBP 144,330 USD (190,018) JPMorgan Chase Bank 2/4/2020 1,659 0.00%EUR 220,500 USD (247,357) JPMorgan Chase Bank 2/4/2020 1,569 0.00%JPY 34,630,000 USD (318,798) JPMorgan Chase Bank 2/4/2020 1,514 0.00%EUR 263,620 USD (296,111) JPMorgan Chase Bank 2/4/2020 1,494 0.00%JPY 34,190,000 USD (315,014) JPMorgan Chase Bank 2/4/2020 1,228 0.00%JPY 34,180,000 USD (314,955) JPMorgan Chase Bank 2/4/2020 1,194 0.00%JPY 17,260,000 USD (158,845) JPMorgan Chase Bank 2/4/2020 802 0.00%AUD 167,750 USD (117,400) JPMorgan Chase Bank 2/4/2020 781 0.00%USD 84,865 EUR (75,320) JPMorgan Chase Bank 2/4/2020 (165) (0.00%)JPY 16,960,000 USD (156,906) Goldman Sachs International 16/3/2020 (191) (0.00%)JPY 17,190,000 USD (159,101) JPMorgan Chase Bank 16/3/2020 (261) (0.00%)JPY 17,075,000 USD (158,113) JPMorgan Chase Bank 16/3/2020 (335) (0.00%)USD 159,795 JPY (17,330,000) JPMorgan Chase Bank 2/4/2020 (500) (0.00%)USD 118,225 AUD (168,600) JPMorgan Chase Bank 2/4/2020 (554) (0.00%)USD 99,625 GBP (75,780) JPMorgan Chase Bank 2/4/2020 (1,014) (0.00%)JPY 51,375,000 USD (475,978) JPMorgan Chase Bank 16/3/2020 (1,258) (0.00%)GBP 142,980 USD (191,450) JPMorgan Chase Bank 2/4/2020 (1,565) (0.00%)GBP 216,675 USD (289,909) JPMorgan Chase Bank 2/4/2020 (2,154) (0.00%)JPY 317,695,848 USD (2,945,176) JPMorgan Chase Bank 2/4/2020 (6,636) (0.00%)
187,587 0.01%
Total Financial Derivative Instruments 319,258 0.01%
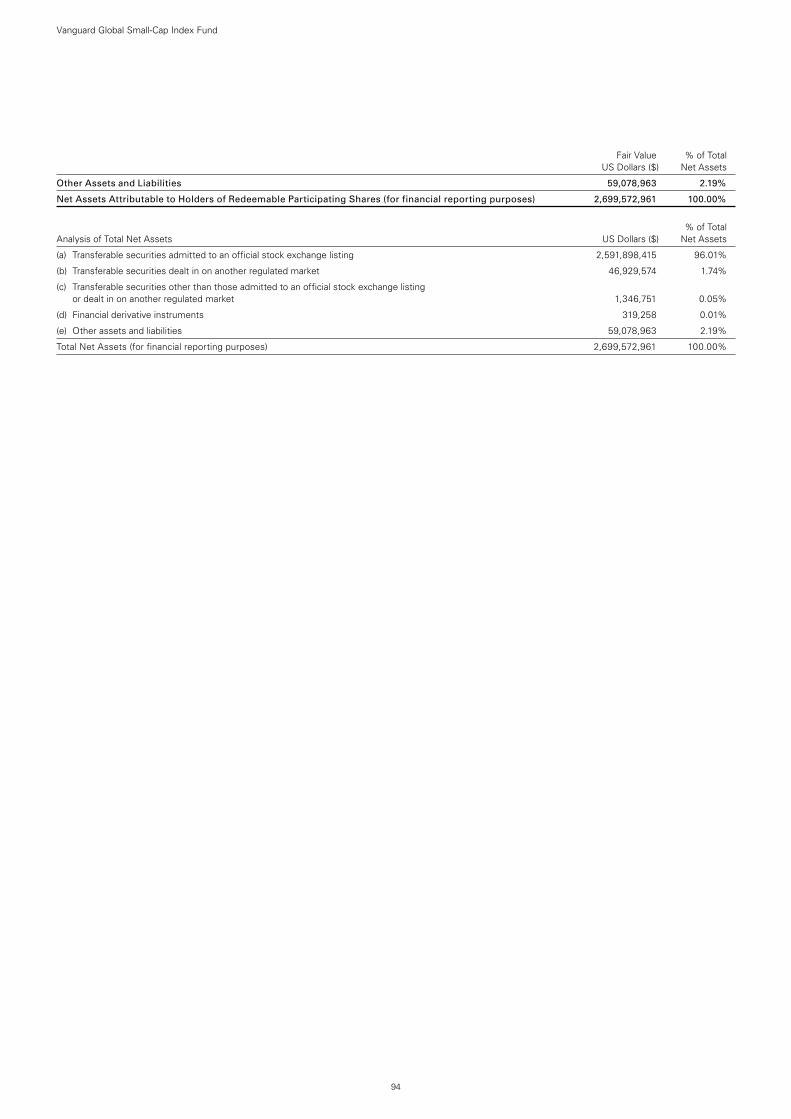
94
Vanguard Global Small-Cap Index Fund
Fair Value % of Total US Dollars ($) Net Assets
Other Assets and Liabilities 59,078,963 2.19%
Net Assets Attributable to Holders of Redeemable Participating Shares (for financial reporting purposes) 2,699,572,961 100.00%
% of Total Analysis of Total Net Assets US Dollars ($) Net Assets
(a) Transferable securities admitted to an official stock exchange listing 2,591,898,415 96.01%
(b) Transferable securities dealt in on another regulated market 46,929,574 1.74%
(c) Transferable securities other than those admitted to an official stock exchange listing or dealt in on another regulated market 1,346,751 0.05%
(d) Financial derivative instruments 319,258 0.01%
(e) Other assets and liabilities 59,078,963 2.19%
Total Net Assets (for financial reporting purposes) 2,699,572,961 100.00%
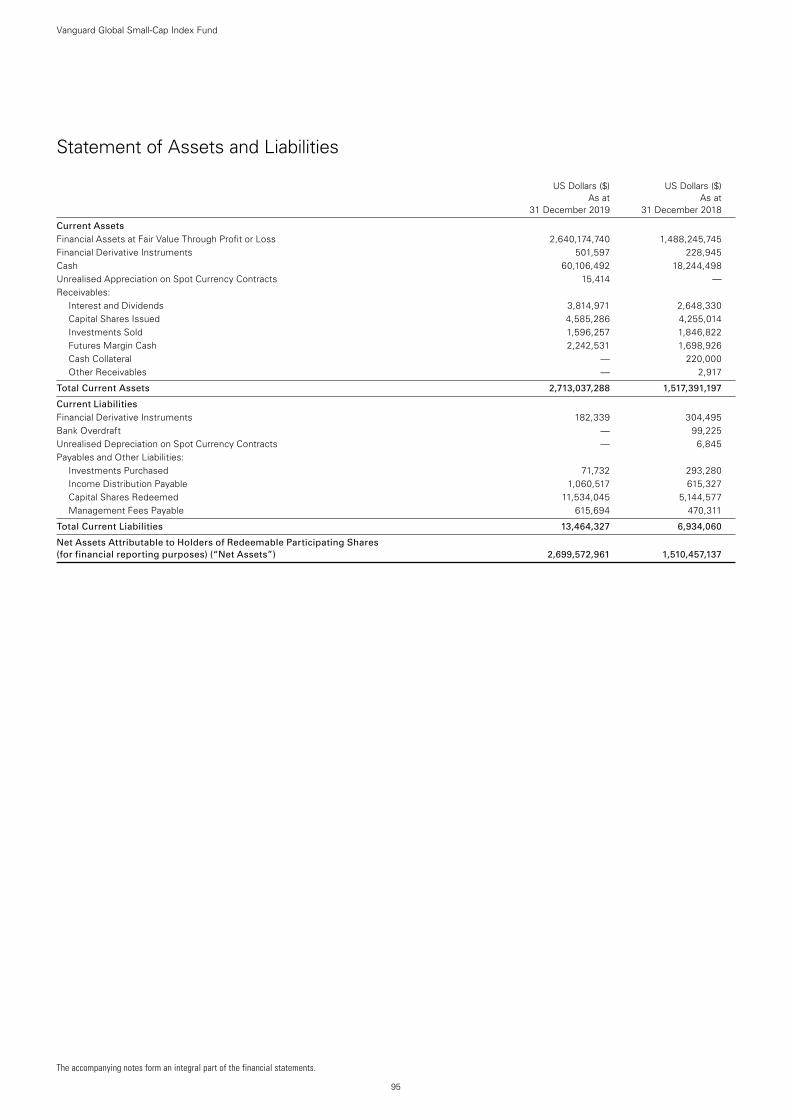
The accompanying notes form an integral part of the financial statements.
95
Vanguard Global Small-Cap Index Fund
Statement of Assets and Liabilities
US Dollars ($) US Dollars ($) As at As at 31 December 2019 31 December 2018
Current Assets Financial Assets at Fair Value Through Profit or Loss 2,640,174,740 1,488,245,745Financial Derivative Instruments 501,597 228,945Cash 60,106,492 18,244,498Unrealised Appreciation on Spot Currency Contracts 15,414 —Receivables:
Interest and Dividends 3,814,971 2,648,330Capital Shares Issued 4,585,286 4,255,014Investments Sold 1,596,257 1,846,822Futures Margin Cash 2,242,531 1,698,926Cash Collateral — 220,000Other Receivables — 2,917
Total Current Assets 2,713,037,288 1,517,391,197
Current Liabilities Financial Derivative Instruments 182,339 304,495Bank Overdraft — 99,225Unrealised Depreciation on Spot Currency Contracts — 6,845Payables and Other Liabilities:
Investments Purchased 71,732 293,280Income Distribution Payable 1,060,517 615,327Capital Shares Redeemed 11,534,045 5,144,577Management Fees Payable 615,694 470,311
Total Current Liabilities 13,464,327 6,934,060
Net Assets Attributable to Holders of Redeemable Participating Shares (for financial reporting purposes) (“Net Assets”) 2,699,572,961 1,510,457,137
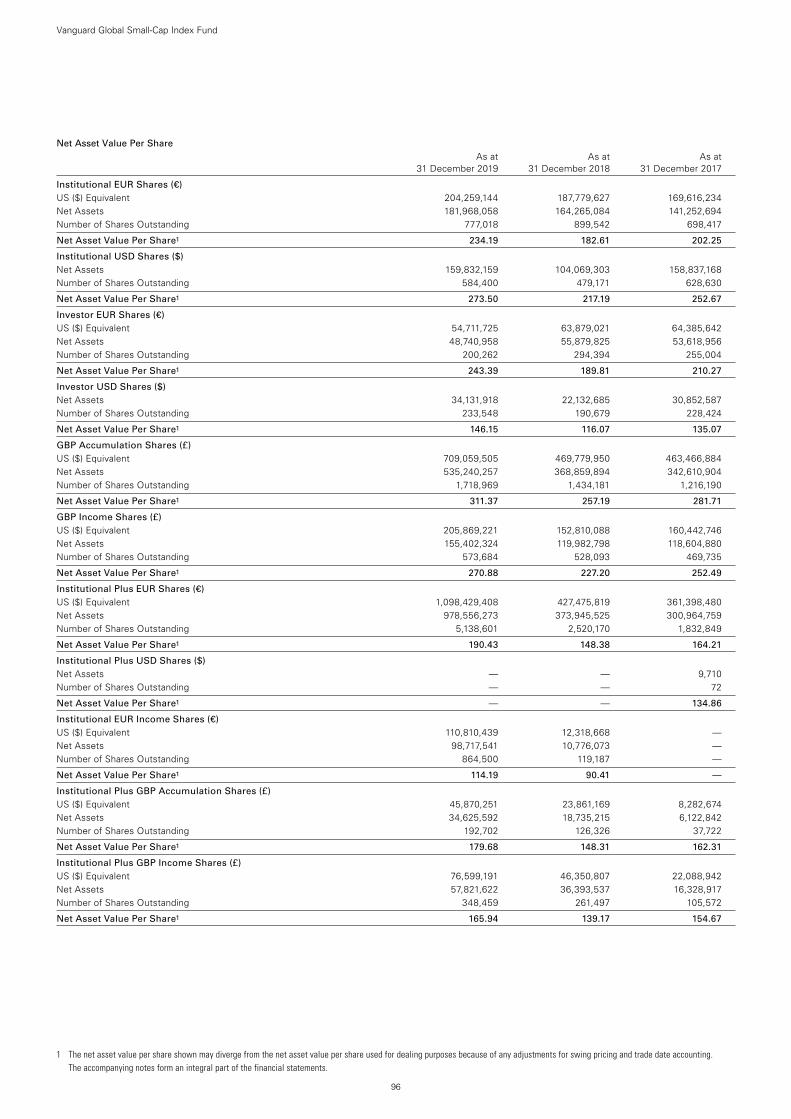
1 The net asset value per share shown may diverge from the net asset value per share used for dealing purposes because of any adjustments for swing pricing and trade date accounting. The accompanying notes form an integral part of the financial statements.
96
Net Asset Value Per Share As at As at As at 31 December 2019 31 December 2018 31 December 2017
Institutional EUR Shares (€) US ($) Equivalent 204,259,144 187,779,627 169,616,234Net Assets 181,968,058 164,265,084 141,252,694Number of Shares Outstanding 777,018 899,542 698,417
Net Asset Value Per Share1 234.19 182.61 202.25
Institutional USD Shares ($) Net Assets 159,832,159 104,069,303 158,837,168Number of Shares Outstanding 584,400 479,171 628,630
Net Asset Value Per Share1 273.50 217.19 252.67
Investor EUR Shares (€) US ($) Equivalent 54,711,725 63,879,021 64,385,642Net Assets 48,740,958 55,879,825 53,618,956Number of Shares Outstanding 200,262 294,394 255,004
Net Asset Value Per Share1 243.39 189.81 210.27
Investor USD Shares ($) Net Assets 34,131,918 22,132,685 30,852,587Number of Shares Outstanding 233,548 190,679 228,424
Net Asset Value Per Share1 146.15 116.07 135.07
GBP Accumulation Shares (£) US ($) Equivalent 709,059,505 469,779,950 463,466,884Net Assets 535,240,257 368,859,894 342,610,904Number of Shares Outstanding 1,718,969 1,434,181 1,216,190
Net Asset Value Per Share1 311.37 257.19 281.71
GBP Income Shares (£) US ($) Equivalent 205,869,221 152,810,088 160,442,746Net Assets 155,402,324 119,982,798 118,604,880Number of Shares Outstanding 573,684 528,093 469,735
Net Asset Value Per Share1 270.88 227.20 252.49
Institutional Plus EUR Shares (€) US ($) Equivalent 1,098,429,408 427,475,819 361,398,480Net Assets 978,556,273 373,945,525 300,964,759Number of Shares Outstanding 5,138,601 2,520,170 1,832,849
Net Asset Value Per Share1 190.43 148.38 164.21
Institutional Plus USD Shares ($) Net Assets — — 9,710Number of Shares Outstanding — — 72
Net Asset Value Per Share1 — — 134.86
Institutional EUR Income Shares (€) US ($) Equivalent 110,810,439 12,318,668 —Net Assets 98,717,541 10,776,073 —Number of Shares Outstanding 864,500 119,187 —
Net Asset Value Per Share1 114.19 90.41 —
Institutional Plus GBP Accumulation Shares (£) US ($) Equivalent 45,870,251 23,861,169 8,282,674Net Assets 34,625,592 18,735,215 6,122,842Number of Shares Outstanding 192,702 126,326 37,722
Net Asset Value Per Share1 179.68 148.31 162.31
Institutional Plus GBP Income Shares (£) US ($) Equivalent 76,599,191 46,350,807 22,088,942Net Assets 57,821,622 36,393,537 16,328,917Number of Shares Outstanding 348,459 261,497 105,572
Net Asset Value Per Share1 165.94 139.17 154.67
Vanguard Global Small-Cap Index Fund

97
Vanguard Global Small-Cap Index Fund
Statement of Operations
US Dollars ($) US Dollars ($) Year Ended Year Ended 31 December 2019 31 December 2018
Investment Income/(Loss) Interest Income 464,641 225,240Dividend Income 44,903,246 32,845,105Securities Lending Income 1,841,565 1,443,094Miscellaneous Income 16,205 2,309Net Gain/(Loss) on Financial Instruments 427,888,645 (268,663,020)
Total Investment Income/(Loss) 475,114,302 (234,147,272)
Expenses Management Fees 6,737,827 5,676,396Transaction Fees and Commissions 645,077 346,748Other Expenses 9,664 —
Total Expenses 7,392,568 6,023,144
Finance Costs Interest Expense 20,091 10,545Distribution Paid 4,360,098 3,046,880Income Equalisation (144,198) (35,700)
Total Finance Costs 4,235,991 3,021,725
Net Investment Income/(Loss) 463,485,743 (243,192,141)
Foreign Withholding Tax (8,170,665) (5,957,479)
Net Increase/(Decrease) in Net Assets Attributable to Holders of Redeemable Participating Shares (for financial reporting purposes) 455,315,078 (249,149,620)
Statement of Changes in Net Assets Attributable to Holders of Redeemable Participating Shares
US Dollars ($) US Dollars ($) Year Ended Year Ended 31 December 2019 31 December 2018
Increase/(Decrease) in Net Assets
Net Increase/(Decrease) in Net Assets Attributable to Holders of Redeemable Participating Shares From Operations 455,315,078 (249,149,620)
Capital Transactions Subscriptions 1,314,348,314 758,579,665Redemptions (580,564,764) (438,504,047)Reinvestments 17,196 150,072
Total Capital Transactions1 733,800,746 320,225,690
Total Increase/(Decrease) for the Year 1,189,115,824 71,076,070
Net Assets Attributable to Holders of Redeemable Participating Shares (for financial reporting purposes) Beginning of Year 1,510,457,137 1,439,381,067
End of Year 2,699,572,961 1,510,457,137
1 Capital Transactions include income equalisation adjustments as shown in the Statement of Operations. The accompanying notes form an integral part of the financial statements.
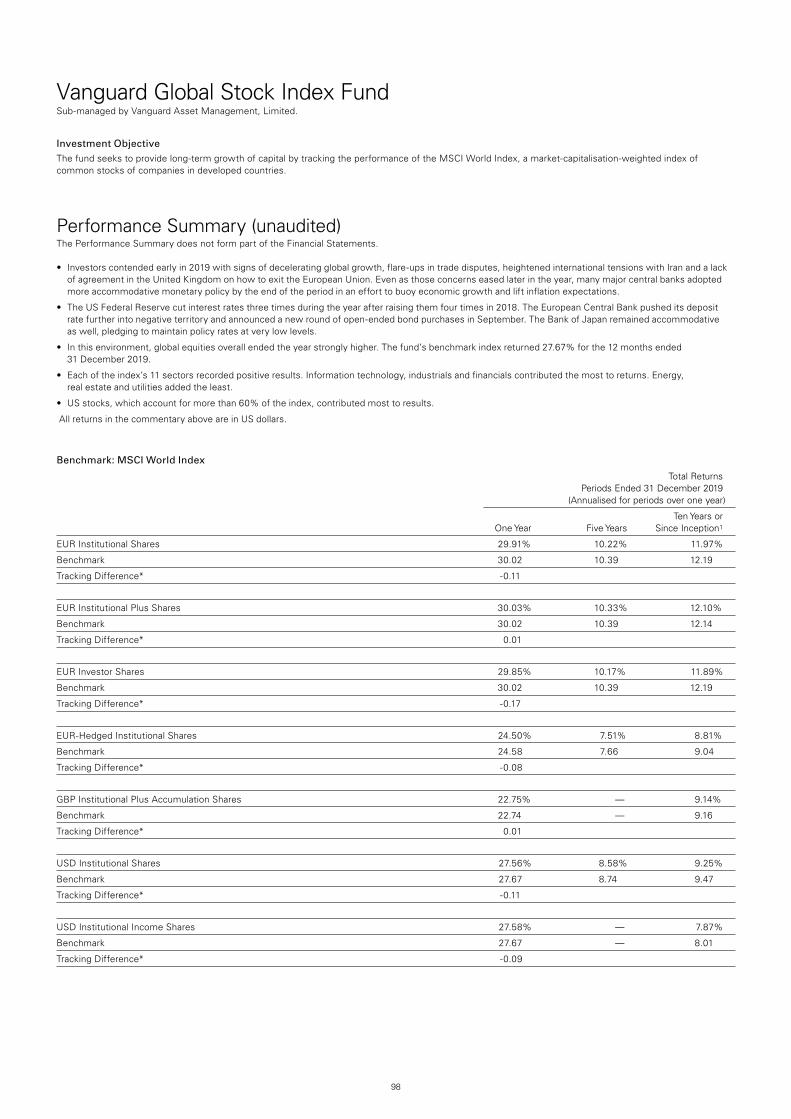
98
Vanguard Global Stock Index FundSub-managed by Vanguard Asset Management, Limited.
Investment ObjectiveThe fund seeks to provide long-term growth of capital by tracking the performance of the MSCI World Index, a market-capitalisation-weighted index of common stocks of companies in developed countries.
Performance Summary (unaudited)The Performance Summary does not form part of the Financial Statements.
• Investorscontendedearlyin2019withsignsofdeceleratingglobalgrowth,flare-upsintradedisputes,heightenedinternationaltensionswithIranandalackof agreement in the United Kingdom on how to exit the European Union. Even as those concerns eased later in the year, many major central banks adopted more accommodative monetary policy by the end of the period in an effort to buoy economic growth and lift inflation expectations.
• TheUSFederalReservecutinterestratesthreetimesduringtheyearafterraisingthemfourtimesin2018.TheEuropeanCentralBankpusheditsdepositrate further into negative territory and announced a new round of open-ended bond purchases in September. The Bank of Japan remained accommodative as well, pledging to maintain policy rates at very low levels.
• Inthisenvironment,globalequitiesoverallendedtheyearstronglyhigher.Thefund’sbenchmarkindexreturned27.67%forthe12monthsended 31 December 2019.
• Eachoftheindex’s11sectorsrecordedpositiveresults.Informationtechnology,industrialsandfinancialscontributedthemosttoreturns.Energy, real estate and utilities added the least.
• USstocks,whichaccountformorethan60%oftheindex,contributedmosttoresults.
All returns in the commentary above are in US dollars.
Benchmark: MSCI World Index
Total Returns Periods Ended 31 December 2019 (Annualised for periods over one year)
Ten Years or One Year Five Years Since Inception1
EUR Institutional Shares 29.91% 10.22% 11.97%
Benchmark 30.02 10.39 12.19
Tracking Difference* -0.11
EUR Institutional Plus Shares 30.03% 10.33% 12.10%
Benchmark 30.02 10.39 12.14
Tracking Difference* 0.01
EUR Investor Shares 29.85% 10.17% 11.89%
Benchmark 30.02 10.39 12.19
Tracking Difference* -0.17
EUR-Hedged Institutional Shares 24.50% 7.51% 8.81%
Benchmark 24.58 7.66 9.04
Tracking Difference* -0.08
GBP Institutional Plus Accumulation Shares 22.75% — 9.14%
Benchmark 22.74 — 9.16
Tracking Difference* 0.01
USD Institutional Shares 27.56% 8.58% 9.25%
Benchmark 27.67 8.74 9.47
Tracking Difference* -0.11
USD Institutional Income Shares 27.58% — 7.87%
Benchmark 27.67 — 8.01
Tracking Difference* -0.09
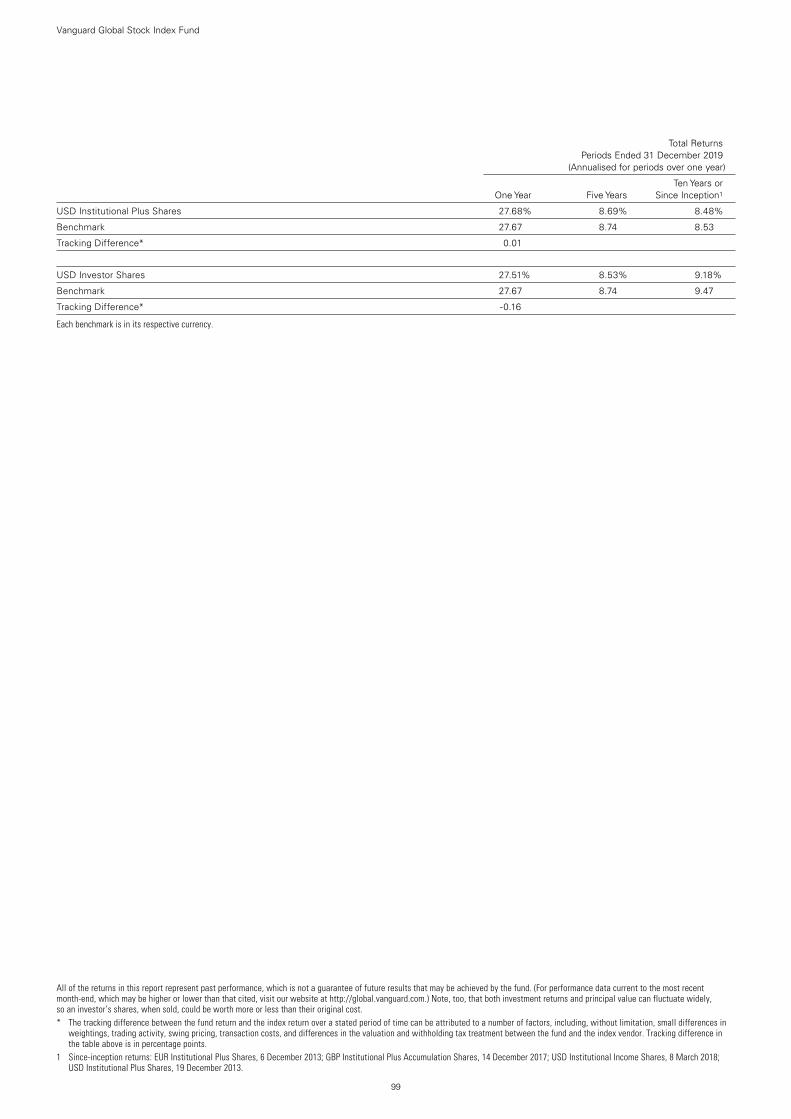
Vanguard Global Stock Index Fund
99
All of the returns in this report represent past performance, which is not a guarantee of future results that may be achieved by the fund. (For performance data current to the most recent month-end, which may be higher or lower than that cited, visit our website at http://global.vanguard.com.) Note, too, that both investment returns and principal value can fluctuate widely, so an investor’s shares, when sold, could be worth more or less than their original cost.* The tracking difference between the fund return and the index return over a stated period of time can be attributed to a number of factors, including, without limitation, small differences in
weightings, trading activity, swing pricing, transaction costs, and differences in the valuation and withholding tax treatment between the fund and the index vendor. Tracking difference in the table above is in percentage points.
1 Since-inception returns: EUR Institutional Plus Shares, 6 December 2013; GBP Institutional Plus Accumulation Shares, 14 December 2017; USD Institutional Income Shares, 8 March 2018; USD Institutional Plus Shares, 19 December 2013.
Total Returns Periods Ended 31 December 2019 (Annualised for periods over one year)
Ten Years or One Year Five Years Since Inception1
USD Institutional Plus Shares 27.68% 8.69% 8.48%
Benchmark 27.67 8.74 8.53
Tracking Difference* 0.01
USD Investor Shares 27.51% 8.53% 9.18%
Benchmark 27.67 8.74 9.47
Tracking Difference* -0.16
Each benchmark is in its respective currency.
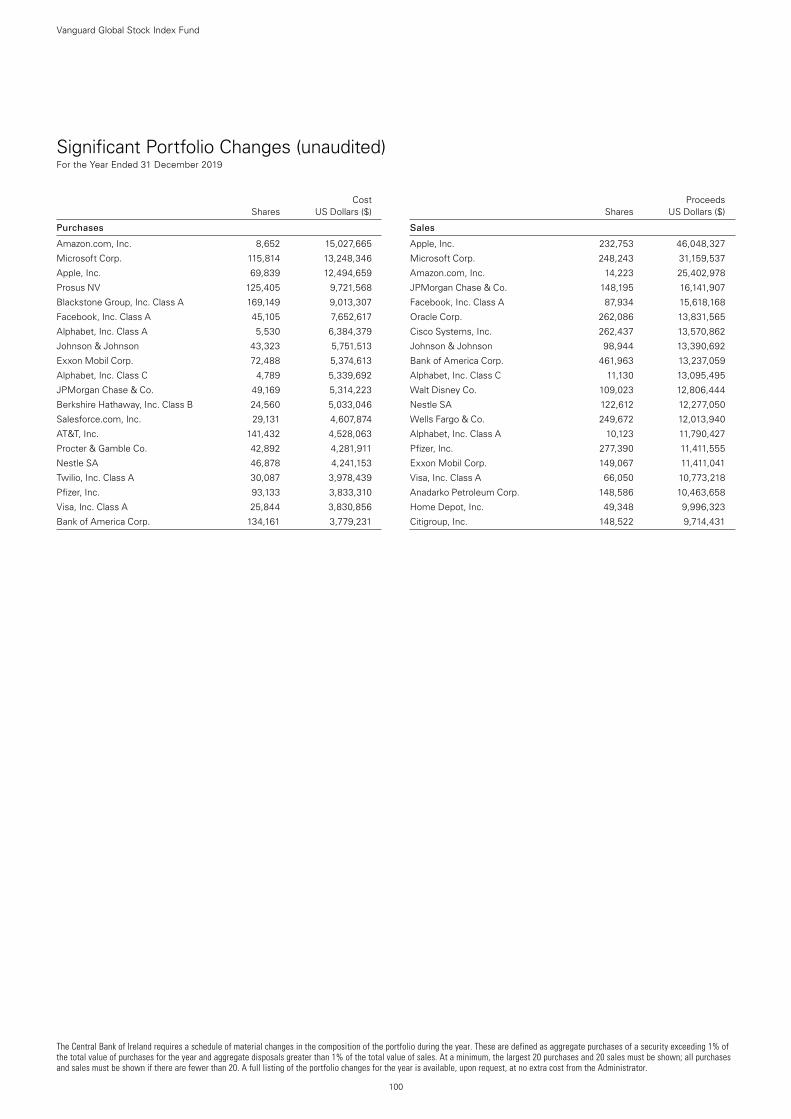
The Central Bank of Ireland requires a schedule of material changes in the composition of the portfolio during the year. These are defined as aggregate purchases of a security exceeding 1% of the total value of purchases for the year and aggregate disposals greater than 1% of the total value of sales. At a minimum, the largest 20 purchases and 20 sales must be shown; all purchases and sales must be shown if there are fewer than 20. A full listing of the portfolio changes for the year is available, upon request, at no extra cost from the Administrator.
100
Vanguard Global Stock Index Fund
Significant Portfolio Changes (unaudited) For the Year Ended 31 December 2019
Cost Shares US Dollars ($)
Purchases
Amazon.com, Inc. 8,652 15,027,665
Microsoft Corp. 115,814 13,248,346
Apple, Inc. 69,839 12,494,659
Prosus NV 125,405 9,721,568
Blackstone Group, Inc. Class A 169,149 9,013,307
Facebook, Inc. Class A 45,105 7,652,617
Alphabet, Inc. Class A 5,530 6,384,379
Johnson & Johnson 43,323 5,751,513
Exxon Mobil Corp. 72,488 5,374,613
Alphabet, Inc. Class C 4,789 5,339,692
JPMorgan Chase & Co. 49,169 5,314,223
Berkshire Hathaway, Inc. Class B 24,560 5,033,046
Salesforce.com, Inc. 29,131 4,607,874
AT&T, Inc. 141,432 4,528,063
Procter & Gamble Co. 42,892 4,281,911
Nestle SA 46,878 4,241,153
Twilio, Inc. Class A 30,087 3,978,439
Pfizer, Inc. 93,133 3,833,310
Visa, Inc. Class A 25,844 3,830,856
Bank of America Corp. 134,161 3,779,231
Proceeds Shares US Dollars ($)
Sales
Apple, Inc. 232,753 46,048,327
Microsoft Corp. 248,243 31,159,537
Amazon.com, Inc. 14,223 25,402,978
JPMorgan Chase & Co. 148,195 16,141,907
Facebook, Inc. Class A 87,934 15,618,168
Oracle Corp. 262,086 13,831,565
Cisco Systems, Inc. 262,437 13,570,862
Johnson & Johnson 98,944 13,390,692
Bank of America Corp. 461,963 13,237,059
Alphabet, Inc. Class C 11,130 13,095,495
Walt Disney Co. 109,023 12,806,444
Nestle SA 122,612 12,277,050
Wells Fargo & Co. 249,672 12,013,940
Alphabet, Inc. Class A 10,123 11,790,427
Pfizer, Inc. 277,390 11,411,555
Exxon Mobil Corp. 149,067 11,411,041
Visa, Inc. Class A 66,050 10,773,218
Anadarko Petroleum Corp. 148,586 10,463,658
Home Depot, Inc. 49,348 9,996,323
Citigroup, Inc. 148,522 9,714,431
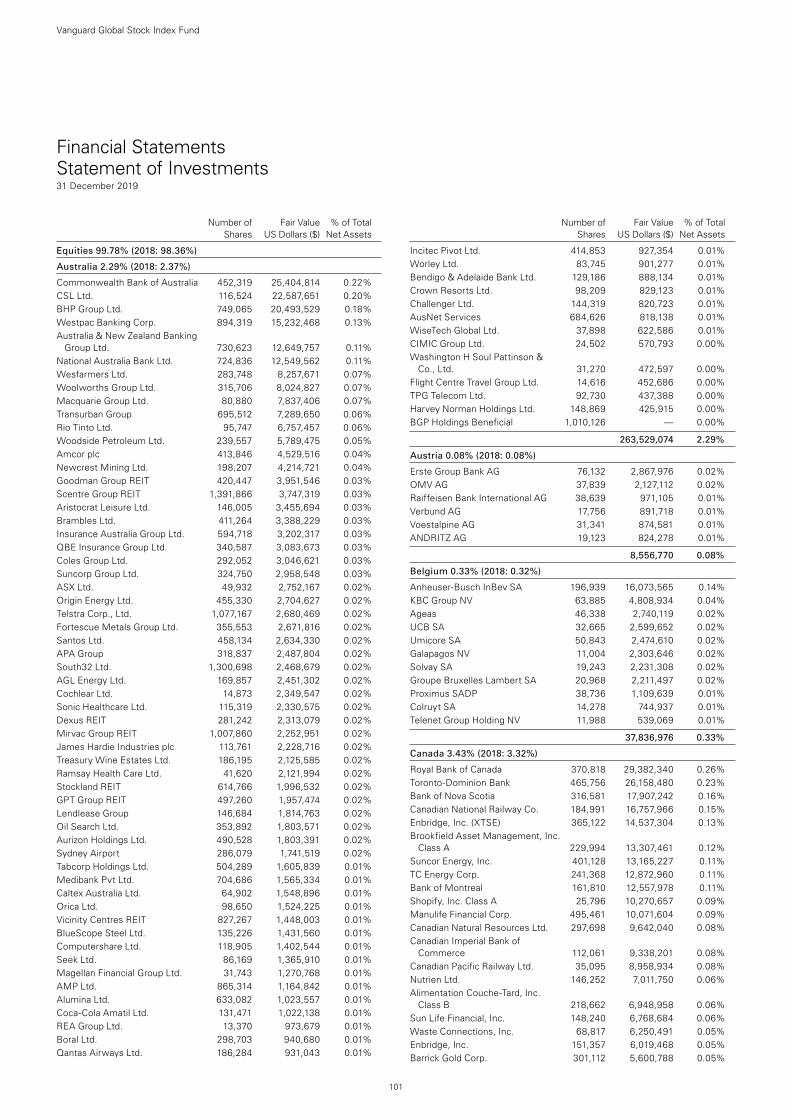
101
Vanguard Global Stock Index Fund
Number of Fair Value % of Total Shares US Dollars ($) Net Assets
Number of Fair Value % of Total Shares US Dollars ($) Net Assets
Equities 99.78% (2018: 98.36%)
Australia 2.29% (2018: 2.37%)
Commonwealth Bank of Australia 452,319 25,404,814 0.22%CSL Ltd. 116,524 22,587,651 0.20%BHP Group Ltd. 749,065 20,493,529 0.18%Westpac Banking Corp. 894,319 15,232,468 0.13%Australia & New Zealand Banking
Group Ltd. 730,623 12,649,757 0.11%National Australia Bank Ltd. 724,836 12,549,562 0.11%Wesfarmers Ltd. 283,748 8,257,671 0.07%Woolworths Group Ltd. 315,706 8,024,827 0.07%Macquarie Group Ltd. 80,880 7,837,406 0.07%Transurban Group 695,512 7,289,650 0.06%Rio Tinto Ltd. 95,747 6,757,457 0.06%Woodside Petroleum Ltd. 239,557 5,789,475 0.05%Amcor plc 413,846 4,529,516 0.04%Newcrest Mining Ltd. 198,207 4,214,721 0.04%Goodman Group REIT 420,447 3,951,546 0.03%Scentre Group REIT 1,391,866 3,747,319 0.03%Aristocrat Leisure Ltd. 146,005 3,455,694 0.03%Brambles Ltd. 411,264 3,388,229 0.03%Insurance Australia Group Ltd. 594,718 3,202,317 0.03%QBE Insurance Group Ltd. 340,587 3,083,673 0.03%Coles Group Ltd. 292,052 3,046,621 0.03%Suncorp Group Ltd. 324,750 2,958,548 0.03%ASX Ltd. 49,932 2,752,167 0.02%Origin Energy Ltd. 455,330 2,704,627 0.02%Telstra Corp., Ltd. 1,077,167 2,680,469 0.02%Fortescue Metals Group Ltd. 355,553 2,671,816 0.02%Santos Ltd. 458,134 2,634,330 0.02%APA Group 318,837 2,487,804 0.02%South32 Ltd. 1,300,698 2,468,679 0.02%AGL Energy Ltd. 169,857 2,451,302 0.02%Cochlear Ltd. 14,873 2,349,547 0.02%Sonic Healthcare Ltd. 115,319 2,330,575 0.02%Dexus REIT 281,242 2,313,079 0.02%Mirvac Group REIT 1,007,860 2,252,951 0.02%James Hardie Industries plc 113,761 2,228,716 0.02%Treasury Wine Estates Ltd. 186,195 2,125,585 0.02%Ramsay Health Care Ltd. 41,620 2,121,994 0.02%Stockland REIT 614,766 1,996,532 0.02%GPT Group REIT 497,260 1,957,474 0.02%Lendlease Group 146,684 1,814,763 0.02%Oil Search Ltd. 353,892 1,803,571 0.02%Aurizon Holdings Ltd. 490,528 1,803,391 0.02%Sydney Airport 286,079 1,741,519 0.02%Tabcorp Holdings Ltd. 504,289 1,605,839 0.01%Medibank Pvt Ltd. 704,686 1,565,334 0.01%Caltex Australia Ltd. 64,902 1,548,896 0.01%Orica Ltd. 98,650 1,524,225 0.01%Vicinity Centres REIT 827,267 1,448,003 0.01%BlueScope Steel Ltd. 135,226 1,431,560 0.01%Computershare Ltd. 118,905 1,402,544 0.01%Seek Ltd. 86,169 1,365,910 0.01%Magellan Financial Group Ltd. 31,743 1,270,768 0.01%AMP Ltd. 865,314 1,164,842 0.01%Alumina Ltd. 633,082 1,023,557 0.01%Coca-Cola Amatil Ltd. 131,471 1,022,138 0.01%REA Group Ltd. 13,370 973,679 0.01%Boral Ltd. 298,703 940,680 0.01%Qantas Airways Ltd. 186,284 931,043 0.01%
Incitec Pivot Ltd. 414,853 927,354 0.01%Worley Ltd. 83,745 901,277 0.01%Bendigo & Adelaide Bank Ltd. 129,186 888,134 0.01%Crown Resorts Ltd. 98,209 829,123 0.01%Challenger Ltd. 144,319 820,723 0.01%AusNet Services 684,626 818,138 0.01%WiseTech Global Ltd. 37,898 622,586 0.01%CIMIC Group Ltd. 24,502 570,793 0.00%Washington H Soul Pattinson &
Co., Ltd. 31,270 472,597 0.00%Flight Centre Travel Group Ltd. 14,616 452,686 0.00%TPG Telecom Ltd. 92,730 437,388 0.00%Harvey Norman Holdings Ltd. 148,869 425,915 0.00%BGP Holdings Beneficial 1,010,126 — 0.00%
263,529,074 2.29%
Austria 0.08% (2018: 0.08%)
Erste Group Bank AG 76,132 2,867,976 0.02%OMV AG 37,839 2,127,112 0.02%Raiffeisen Bank International AG 38,639 971,105 0.01%Verbund AG 17,756 891,718 0.01%Voestalpine AG 31,341 874,581 0.01%ANDRITZ AG 19,123 824,278 0.01%
8,556,770 0.08%
Belgium 0.33% (2018: 0.32%)
Anheuser-Busch InBev SA 196,939 16,073,565 0.14%KBC Group NV 63,885 4,808,934 0.04%Ageas 46,338 2,740,119 0.02%UCB SA 32,665 2,599,652 0.02%Umicore SA 50,843 2,474,610 0.02%Galapagos NV 11,004 2,303,646 0.02%Solvay SA 19,243 2,231,308 0.02%Groupe Bruxelles Lambert SA 20,968 2,211,497 0.02%Proximus SADP 38,736 1,109,639 0.01%Colruyt SA 14,278 744,937 0.01%Telenet Group Holding NV 11,988 539,069 0.01%
37,836,976 0.33%
Canada 3.43% (2018: 3.32%)
Royal Bank of Canada 370,818 29,382,340 0.26%Toronto-Dominion Bank 465,756 26,158,480 0.23%Bank of Nova Scotia 316,581 17,907,242 0.16%Canadian National Railway Co. 184,991 16,757,966 0.15%Enbridge, Inc. (XTSE) 365,122 14,537,304 0.13%Brookfield Asset Management, Inc.
Class A 229,994 13,307,461 0.12%Suncor Energy, Inc. 401,128 13,165,227 0.11%TC Energy Corp. 241,368 12,872,960 0.11%Bank of Montreal 161,810 12,557,978 0.11%Shopify, Inc. Class A 25,796 10,270,657 0.09%Manulife Financial Corp. 495,461 10,071,604 0.09%Canadian Natural Resources Ltd. 297,698 9,642,040 0.08%Canadian Imperial Bank of
Commerce 112,061 9,338,201 0.08%Canadian Pacific Railway Ltd. 35,095 8,958,934 0.08%Nutrien Ltd. 146,252 7,011,750 0.06%Alimentation Couche-Tard, Inc.
Class B 218,662 6,948,958 0.06%Sun Life Financial, Inc. 148,240 6,768,684 0.06%Waste Connections, Inc. 68,817 6,250,491 0.05%Enbridge, Inc. 151,357 6,019,468 0.05%Barrick Gold Corp. 301,112 5,600,788 0.05%
Financial Statements Statement of Investments31 December 2019

102
Number of Fair Value % of Total Shares US Dollars ($) Net Assets
CGI, Inc. 63,394 5,312,532 0.05%Pembina Pipeline Corp. 140,510 5,215,150 0.05%Constellation Software, Inc. 5,246 5,102,021 0.04%Franco-Nevada Corp. 48,397 5,004,476 0.04%Fortis, Inc. 118,207 4,911,504 0.04%National Bank of Canada 86,887 4,829,624 0.04%Rogers Communications, Inc.
Class B 89,058 4,428,348 0.04%Restaurant Brands International, Inc. 68,411 4,367,120 0.04%Magna International, Inc. 79,154 4,346,069 0.04%Intact Financial Corp. 35,970 3,895,051 0.03%Agnico Eagle Mines Ltd. 60,748 3,746,771 0.03%Thomson Reuters Corp. 51,536 3,691,675 0.03%Wheaton Precious Metals Corp. 115,603 3,444,689 0.03%Fairfax Financial Holdings Ltd. 7,091 3,334,233 0.03%Open Text Corp. 69,261 3,056,190 0.03%Cenovus Energy, Inc. 270,464 2,753,133 0.02%Metro, Inc. 65,994 2,727,294 0.02%Barrick Gold Corp. (XLON) 146,124 2,720,542 0.02%Emera, Inc. 62,125 2,672,800 0.02%Dollarama, Inc. 77,010 2,650,439 0.02%Loblaw Cos Ltd. 47,667 2,462,841 0.02%Bausch Health Cos, Inc. 81,495 2,442,807 0.02%Shaw Communications, Inc.
Class B 120,077 2,439,968 0.02%Kirkland Lake Gold Ltd. 51,539 2,274,989 0.02%Teck Resources Ltd. Class B 129,760 2,253,476 0.02%Telus Corp. 54,156 2,099,837 0.02%Algonquin Power & Utilities Corp. 141,712 2,007,518 0.02%Power Corp. of Canada 77,567 2,000,861 0.02%Saputo, Inc. 60,782 1,884,277 0.02%Power Financial Corp. 68,572 1,847,623 0.02%BCE, Inc. 39,741 1,843,700 0.02%Great-West Lifeco, Inc. 71,748 1,840,246 0.02%Inter Pipeline Ltd. 105,135 1,827,448 0.02%First Quantum Minerals Ltd. 179,804 1,826,118 0.02%CAE, Inc. 68,327 1,811,515 0.02%Imperial Oil Ltd. 67,109 1,777,670 0.02%WSP Global, Inc. 25,644 1,753,502 0.01%CCL Industries, Inc. Class B 38,580 1,645,842 0.01%Hydro One Ltd. 85,058 1,645,078 0.01%Canadian Tire Corp., Ltd. Class A 15,186 1,636,586 0.01%George Weston Ltd. 20,022 1,590,643 0.01%Encana Corp. 335,517 1,573,120 0.01%Gildan Activewear, Inc. Class A 53,082 1,571,481 0.01%Stars Group, Inc. 59,576 1,556,993 0.01%iA Financial Corp., Inc. 27,726 1,525,117 0.01%Kinross Gold Corp. - CAD 315,387 1,498,195 0.01%Parkland Fuel Corp. 39,424 1,450,487 0.01%Keyera Corp. 53,738 1,409,807 0.01%Onex Corp. 21,397 1,355,845 0.01%Air Canada Class B 33,318 1,246,390 0.01%Quebecor, Inc. Class B 45,583 1,164,928 0.01%Canopy Growth Corp. 53,271 1,121,906 0.01%AltaGas Ltd. 71,435 1,089,635 0.01%Empire Co., Ltd. 45,340 1,065,014 0.01%Lundin Mining Corp. 165,956 993,112 0.01%CI Financial Corp. 59,171 990,632 0.01%Canadian Utilities Ltd. Class A 32,321 976,297 0.01%Cameco Corp. 98,697 878,321 0.01%BlackBerry Ltd. 133,451 859,314 0.01%Canadian Apartment Properties
REIT 20,544 839,821 0.01%Bombardier, Inc. Class B 547,942 815,522 0.01%RioCan REIT 39,508 815,295 0.01%Husky Energy, Inc. 89,388 718,275 0.01%Atco Ltd. Class I 18,581 713,149 0.01%First Capital 42,597 678,990 0.01%
PrairieSky Royalty Ltd. 55,297 649,449 0.01%IGM Financial, Inc. 22,135 636,355 0.01%West Fraser Timber Co., Ltd. 13,929 615,271 0.01%H&R REIT 36,060 586,748 0.00%Methanex Corp. 15,112 584,436 0.00%SmartCentres REIT 20,951 504,246 0.00%Aurora Cannabis, Inc. 176,714 380,206 0.00%Cronos Group, Inc. 46,457 357,182 0.00%Canadian Natural Resources Ltd.
(XNYS) 1,676 54,219 0.00%Kinross Gold Corp. 7,438 35,256 0.00%
393,961,753 3.43%
Denmark 0.61% (2018: 0.60%)
Novo Nordisk A/S Class B 455,567 26,460,114 0.23%DSV PANALPINA A/S 56,647 6,533,509 0.06%Orsted A/S 49,582 5,131,741 0.04%Vestas Wind Systems A/S 48,855 4,940,542 0.04%Carlsberg A/S Class B 27,604 4,120,904 0.04%Coloplast A/S Class B 30,689 3,809,733 0.03%Genmab A/S 16,802 3,739,246 0.03%Danske Bank A/S 167,244 2,708,262 0.02%Novozymes A/S Class B 55,008 2,693,797 0.02%AP Moller-Maersk A/S Class B 1,679 2,423,289 0.02%Chr Hansen Holding A/S 26,623 2,117,202 0.02%AP Moller - Maersk A/S Class A 974 1,321,199 0.01%Pandora A/S 25,818 1,123,938 0.01%Tryg A/S 31,772 942,612 0.01%Demant A/S 28,599 901,317 0.01%ISS A/S 36,627 879,499 0.01%H Lundbeck A/S 18,055 689,979 0.01%
70,536,883 0.61%
Finland 0.31% (2018: 0.36%)
Kone OYJ Class B 87,704 5,737,534 0.05%Nokia OYJ 1,409,062 5,213,191 0.05%Sampo OYJ Class A 115,519 5,045,463 0.04%UPM-Kymmene OYJ 137,346 4,765,422 0.04%Neste OYJ 108,759 3,786,983 0.03%Fortum OYJ 113,697 2,807,748 0.02%Stora Enso OYJ Class R 150,019 2,183,258 0.02%Elisa OYJ 36,800 2,034,419 0.02%Wartsila OYJ Abp 114,850 1,269,854 0.01%Orion OYJ Class B 27,328 1,265,985 0.01%Metso OYJ 27,577 1,089,003 0.01%Nokian Renkaat OYJ 32,468 934,094 0.01%
36,132,954 0.31%
France 3.80% (2018: 3.73%)
Total SA 617,463 34,100,629 0.30%LVMH Moet Hennessy Louis
Vuitton SE 70,960 32,992,107 0.29%Sanofi 290,442 29,218,015 0.25%Airbus SE 150,114 21,986,267 0.19%BNP Paribas SA 284,324 16,860,889 0.15%Vinci SA 131,982 14,666,830 0.13%Schneider Electric SE 139,512 14,329,103 0.12%AXA SA 490,922 13,837,115 0.12%Danone SA 159,283 13,212,963 0.11%Safran SA 84,243 13,016,565 0.11%Kering SA 19,573 12,857,249 0.11%EssilorLuxottica SA 73,305 11,174,284 0.10%L’Oreal SA (Prime De Fidelite) 36,286 10,752,993 0.09%Pernod Ricard SA 54,693 9,786,027 0.09%Air Liquide SA (Prime De Fidelite) 66,557 9,428,431 0.08%Orange SA 500,876 7,376,501 0.06%Societe Generale SA 203,088 7,070,374 0.06%Vivendi SA 228,436 6,620,749 0.06%
Number of Fair Value % of Total Shares US Dollars ($) Net Assets
Vanguard Global Stock Index Fund
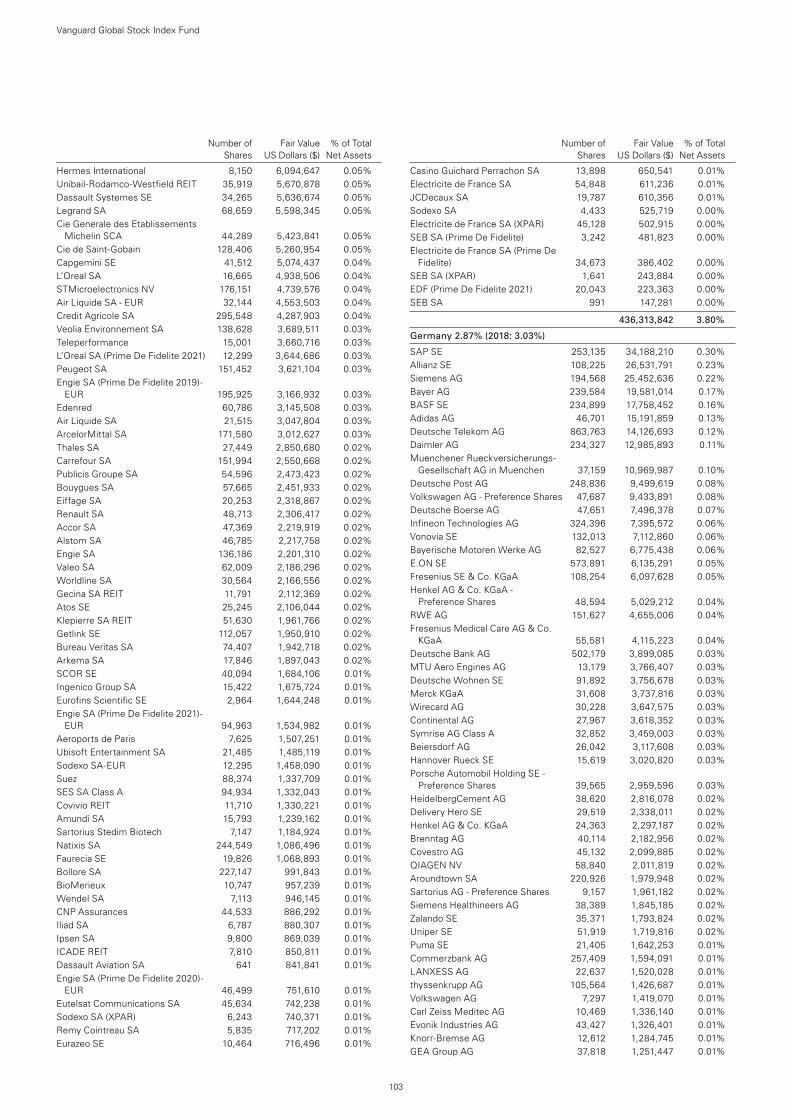
103
Number of Fair Value % of Total Shares US Dollars ($) Net Assets
Hermes International 8,150 6,094,647 0.05%Unibail-Rodamco-Westfield REIT 35,919 5,670,878 0.05%Dassault Systemes SE 34,265 5,636,674 0.05%Legrand SA 68,659 5,598,345 0.05%Cie Generale des Etablissements
Michelin SCA 44,289 5,423,841 0.05%Cie de Saint-Gobain 128,406 5,260,954 0.05%Capgemini SE 41,512 5,074,437 0.04%L’Oreal SA 16,665 4,938,506 0.04%STMicroelectronics NV 176,151 4,739,576 0.04%Air Liquide SA - EUR 32,144 4,553,503 0.04%Credit Agricole SA 295,548 4,287,903 0.04%Veolia Environnement SA 138,628 3,689,511 0.03%Teleperformance 15,001 3,660,716 0.03%L’Oreal SA (Prime De Fidelite 2021) 12,299 3,644,686 0.03%Peugeot SA 151,452 3,621,104 0.03%Engie SA (Prime De Fidelite 2019)-
EUR 195,925 3,166,932 0.03%Edenred 60,786 3,145,508 0.03%Air Liquide SA 21,515 3,047,804 0.03%ArcelorMittal SA 171,580 3,012,627 0.03%Thales SA 27,449 2,850,680 0.02%Carrefour SA 151,994 2,550,668 0.02%Publicis Groupe SA 54,596 2,473,423 0.02%Bouygues SA 57,665 2,451,933 0.02%Eiffage SA 20,253 2,318,867 0.02%Renault SA 48,713 2,306,417 0.02%Accor SA 47,369 2,219,919 0.02%Alstom SA 46,785 2,217,758 0.02%Engie SA 136,186 2,201,310 0.02%Valeo SA 62,009 2,186,296 0.02%Worldline SA 30,564 2,166,556 0.02%Gecina SA REIT 11,791 2,112,369 0.02%Atos SE 25,245 2,106,044 0.02%Klepierre SA REIT 51,630 1,961,766 0.02%Getlink SE 112,057 1,950,910 0.02%Bureau Veritas SA 74,407 1,942,718 0.02%Arkema SA 17,846 1,897,043 0.02%SCOR SE 40,094 1,684,106 0.01%Ingenico Group SA 15,422 1,675,724 0.01%Eurofins Scientific SE 2,964 1,644,248 0.01%Engie SA (Prime De Fidelite 2021)-
EUR 94,963 1,534,982 0.01%Aeroports de Paris 7,625 1,507,251 0.01%Ubisoft Entertainment SA 21,485 1,485,119 0.01%Sodexo SA-EUR 12,295 1,458,090 0.01%Suez 88,374 1,337,709 0.01%SES SA Class A 94,934 1,332,043 0.01%Covivio REIT 11,710 1,330,221 0.01%Amundi SA 15,793 1,239,162 0.01%Sartorius Stedim Biotech 7,147 1,184,924 0.01%Natixis SA 244,549 1,086,496 0.01%Faurecia SE 19,826 1,068,893 0.01%Bollore SA 227,147 991,843 0.01%BioMerieux 10,747 957,239 0.01%Wendel SA 7,113 946,145 0.01%CNP Assurances 44,533 886,292 0.01%Iliad SA 6,787 880,307 0.01%Ipsen SA 9,800 869,039 0.01%ICADE REIT 7,810 850,811 0.01%Dassault Aviation SA 641 841,841 0.01%Engie SA (Prime De Fidelite 2020)-
EUR 46,499 751,610 0.01%Eutelsat Communications SA 45,634 742,238 0.01%Sodexo SA (XPAR) 6,243 740,371 0.01%Remy Cointreau SA 5,835 717,202 0.01%Eurazeo SE 10,464 716,496 0.01%
Casino Guichard Perrachon SA 13,898 650,541 0.01%Electricite de France SA 54,848 611,236 0.01%JCDecaux SA 19,787 610,356 0.01%Sodexo SA 4,433 525,719 0.00%Electricite de France SA (XPAR) 45,128 502,915 0.00%SEB SA (Prime De Fidelite) 3,242 481,823 0.00%Electricite de France SA (Prime De
Fidelite) 34,673 386,402 0.00%SEB SA (XPAR) 1,641 243,884 0.00%EDF (Prime De Fidelite 2021) 20,043 223,363 0.00%SEB SA 991 147,281 0.00%
436,313,842 3.80%
Germany 2.87% (2018: 3.03%)
SAP SE 253,135 34,188,210 0.30%Allianz SE 108,225 26,531,791 0.23%Siemens AG 194,568 25,452,636 0.22%Bayer AG 239,584 19,581,014 0.17%BASF SE 234,899 17,758,452 0.16%Adidas AG 46,701 15,191,859 0.13%Deutsche Telekom AG 863,763 14,126,693 0.12%Daimler AG 234,327 12,985,893 0.11%Muenchener Rueckversicherungs-
Gesellschaft AG in Muenchen 37,159 10,969,987 0.10%Deutsche Post AG 248,836 9,499,619 0.08%Volkswagen AG - Preference Shares 47,687 9,433,891 0.08%Deutsche Boerse AG 47,651 7,496,378 0.07%Infineon Technologies AG 324,396 7,395,572 0.06%Vonovia SE 132,013 7,112,860 0.06%Bayerische Motoren Werke AG 82,527 6,775,438 0.06%E.ON SE 573,891 6,135,291 0.05%Fresenius SE & Co. KGaA 108,254 6,097,628 0.05%Henkel AG & Co. KGaA -
Preference Shares 48,594 5,029,212 0.04%RWE AG 151,627 4,655,006 0.04%Fresenius Medical Care AG & Co.
KGaA 55,581 4,115,223 0.04%Deutsche Bank AG 502,179 3,899,085 0.03%MTU Aero Engines AG 13,179 3,766,407 0.03%Deutsche Wohnen SE 91,892 3,756,678 0.03%Merck KGaA 31,608 3,737,816 0.03%Wirecard AG 30,228 3,647,575 0.03%Continental AG 27,967 3,618,352 0.03%Symrise AG Class A 32,852 3,459,003 0.03%Beiersdorf AG 26,042 3,117,608 0.03%Hannover Rueck SE 15,619 3,020,820 0.03%Porsche Automobil Holding SE -
Preference Shares 39,565 2,959,596 0.03%HeidelbergCement AG 38,620 2,816,078 0.02%Delivery Hero SE 29,519 2,338,011 0.02%Henkel AG & Co. KGaA 24,363 2,297,187 0.02%Brenntag AG 40,114 2,182,956 0.02%Covestro AG 45,132 2,099,885 0.02%QIAGEN NV 58,840 2,011,819 0.02%Aroundtown SA 220,926 1,979,948 0.02%Sartorius AG - Preference Shares 9,157 1,961,182 0.02%Siemens Healthineers AG 38,389 1,845,185 0.02%Zalando SE 35,371 1,793,824 0.02%Uniper SE 51,919 1,719,816 0.02%Puma SE 21,405 1,642,253 0.01%Commerzbank AG 257,409 1,594,091 0.01%LANXESS AG 22,637 1,520,028 0.01%thyssenkrupp AG 105,564 1,426,687 0.01%Volkswagen AG 7,297 1,419,070 0.01%Carl Zeiss Meditec AG 10,469 1,336,140 0.01%Evonik Industries AG 43,427 1,326,401 0.01%Knorr-Bremse AG 12,612 1,284,745 0.01%GEA Group AG 37,818 1,251,447 0.01%
Number of Fair Value % of Total Shares US Dollars ($) Net Assets
Vanguard Global Stock Index Fund
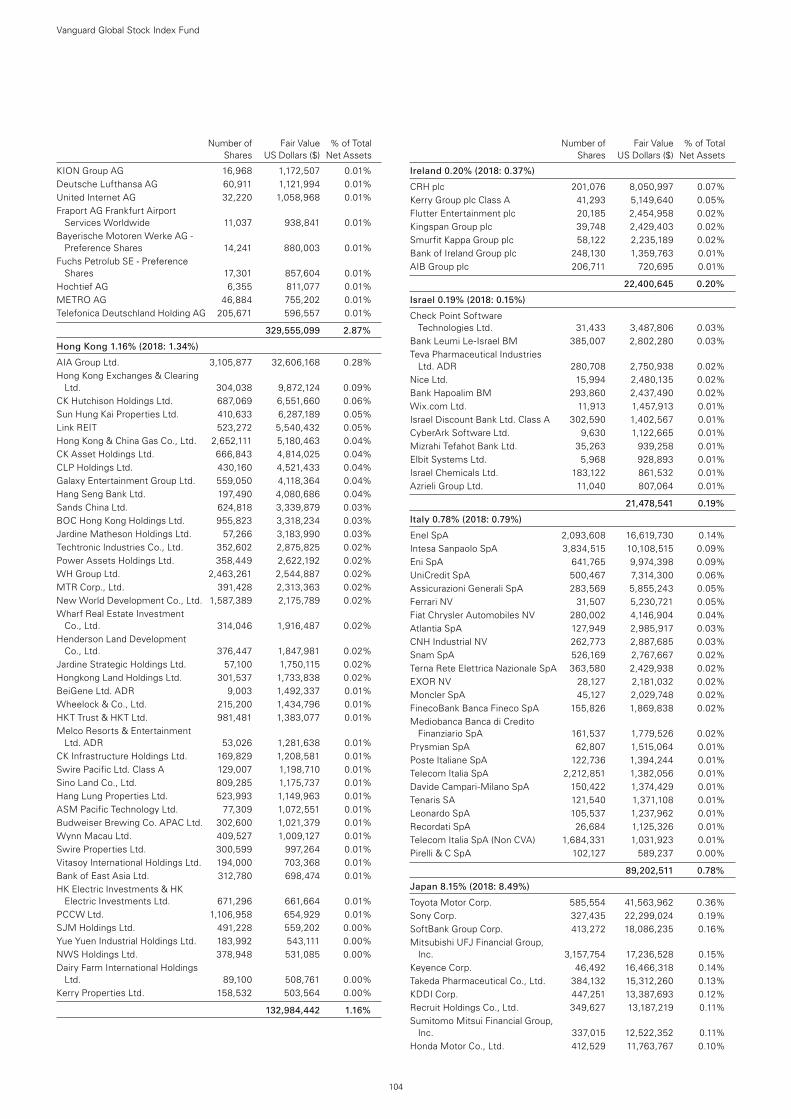
104
Number of Fair Value % of Total Shares US Dollars ($) Net Assets
KION Group AG 16,968 1,172,507 0.01%Deutsche Lufthansa AG 60,911 1,121,994 0.01%United Internet AG 32,220 1,058,968 0.01%Fraport AG Frankfurt Airport
Services Worldwide 11,037 938,841 0.01%Bayerische Motoren Werke AG -
Preference Shares 14,241 880,003 0.01%Fuchs Petrolub SE - Preference
Shares 17,301 857,604 0.01%Hochtief AG 6,355 811,077 0.01%METRO AG 46,884 755,202 0.01%Telefonica Deutschland Holding AG 205,671 596,557 0.01%
329,555,099 2.87%
Hong Kong 1.16% (2018: 1.34%)
AIA Group Ltd. 3,105,877 32,606,168 0.28%Hong Kong Exchanges & Clearing
Ltd. 304,038 9,872,124 0.09%CK Hutchison Holdings Ltd. 687,069 6,551,660 0.06%Sun Hung Kai Properties Ltd. 410,633 6,287,189 0.05%Link REIT 523,272 5,540,432 0.05%Hong Kong & China Gas Co., Ltd. 2,652,111 5,180,463 0.04%CK Asset Holdings Ltd. 666,843 4,814,025 0.04%CLP Holdings Ltd. 430,160 4,521,433 0.04%Galaxy Entertainment Group Ltd. 559,050 4,118,364 0.04%Hang Seng Bank Ltd. 197,490 4,080,686 0.04%Sands China Ltd. 624,818 3,339,879 0.03%BOC Hong Kong Holdings Ltd. 955,823 3,318,234 0.03%Jardine Matheson Holdings Ltd. 57,266 3,183,990 0.03%Techtronic Industries Co., Ltd. 352,602 2,875,825 0.02%Power Assets Holdings Ltd. 358,449 2,622,192 0.02%WH Group Ltd. 2,463,261 2,544,887 0.02%MTR Corp., Ltd. 391,428 2,313,363 0.02%New World Development Co., Ltd. 1,587,389 2,175,789 0.02%Wharf Real Estate Investment
Co., Ltd. 314,046 1,916,487 0.02%Henderson Land Development
Co., Ltd. 376,447 1,847,981 0.02%Jardine Strategic Holdings Ltd. 57,100 1,750,115 0.02%Hongkong Land Holdings Ltd. 301,537 1,733,838 0.02%BeiGene Ltd. ADR 9,003 1,492,337 0.01%Wheelock & Co., Ltd. 215,200 1,434,796 0.01%HKT Trust & HKT Ltd. 981,481 1,383,077 0.01%Melco Resorts & Entertainment
Ltd. ADR 53,026 1,281,638 0.01%CK Infrastructure Holdings Ltd. 169,829 1,208,581 0.01%Swire Pacific Ltd. Class A 129,007 1,198,710 0.01%Sino Land Co., Ltd. 809,285 1,175,737 0.01%Hang Lung Properties Ltd. 523,993 1,149,963 0.01%ASM Pacific Technology Ltd. 77,309 1,072,551 0.01%Budweiser Brewing Co. APAC Ltd. 302,600 1,021,379 0.01%Wynn Macau Ltd. 409,527 1,009,127 0.01%Swire Properties Ltd. 300,599 997,264 0.01%Vitasoy International Holdings Ltd. 194,000 703,368 0.01%Bank of East Asia Ltd. 312,780 698,474 0.01%HK Electric Investments & HK
Electric Investments Ltd. 671,296 661,664 0.01%PCCW Ltd. 1,106,958 654,929 0.01%SJM Holdings Ltd. 491,228 559,202 0.00%Yue Yuen Industrial Holdings Ltd. 183,992 543,111 0.00%NWS Holdings Ltd. 378,948 531,085 0.00%Dairy Farm International Holdings
Ltd. 89,100 508,761 0.00%Kerry Properties Ltd. 158,532 503,564 0.00%
132,984,442 1.16%
Ireland 0.20% (2018: 0.37%)
CRH plc 201,076 8,050,997 0.07%Kerry Group plc Class A 41,293 5,149,640 0.05%Flutter Entertainment plc 20,185 2,454,958 0.02%Kingspan Group plc 39,748 2,429,403 0.02%Smurfit Kappa Group plc 58,122 2,235,189 0.02%Bank of Ireland Group plc 248,130 1,359,763 0.01%AIB Group plc 206,711 720,695 0.01%
22,400,645 0.20%
Israel 0.19% (2018: 0.15%)
Check Point Software Technologies Ltd. 31,433 3,487,806 0.03%
Bank Leumi Le-Israel BM 385,007 2,802,280 0.03%Teva Pharmaceutical Industries
Ltd. ADR 280,708 2,750,938 0.02%Nice Ltd. 15,994 2,480,135 0.02%Bank Hapoalim BM 293,860 2,437,490 0.02%Wix.com Ltd. 11,913 1,457,913 0.01%Israel Discount Bank Ltd. Class A 302,590 1,402,567 0.01%CyberArk Software Ltd. 9,630 1,122,665 0.01%Mizrahi Tefahot Bank Ltd. 35,263 939,258 0.01%Elbit Systems Ltd. 5,968 928,893 0.01%Israel Chemicals Ltd. 183,122 861,532 0.01%Azrieli Group Ltd. 11,040 807,064 0.01%
21,478,541 0.19%
Italy 0.78% (2018: 0.79%)
Enel SpA 2,093,608 16,619,730 0.14%Intesa Sanpaolo SpA 3,834,515 10,108,515 0.09%Eni SpA 641,765 9,974,398 0.09%UniCredit SpA 500,467 7,314,300 0.06%Assicurazioni Generali SpA 283,569 5,855,243 0.05%Ferrari NV 31,507 5,230,721 0.05%Fiat Chrysler Automobiles NV 280,002 4,146,904 0.04%Atlantia SpA 127,949 2,985,917 0.03%CNH Industrial NV 262,773 2,887,685 0.03%Snam SpA 526,169 2,767,667 0.02%Terna Rete Elettrica Nazionale SpA 363,580 2,429,938 0.02%EXOR NV 28,127 2,181,032 0.02%Moncler SpA 45,127 2,029,748 0.02%FinecoBank Banca Fineco SpA 155,826 1,869,838 0.02%Mediobanca Banca di Credito
Finanziario SpA 161,537 1,779,526 0.02%Prysmian SpA 62,807 1,515,064 0.01%Poste Italiane SpA 122,736 1,394,244 0.01%Telecom Italia SpA 2,212,851 1,382,056 0.01%Davide Campari-Milano SpA 150,422 1,374,429 0.01%Tenaris SA 121,540 1,371,108 0.01%Leonardo SpA 105,537 1,237,962 0.01%Recordati SpA 26,684 1,125,326 0.01%Telecom Italia SpA (Non CVA) 1,684,331 1,031,923 0.01%Pirelli & C SpA 102,127 589,237 0.00%
89,202,511 0.78%
Japan 8.15% (2018: 8.49%)
Toyota Motor Corp. 585,554 41,563,962 0.36%Sony Corp. 327,435 22,299,024 0.19%SoftBank Group Corp. 413,272 18,086,235 0.16%Mitsubishi UFJ Financial Group,
Inc. 3,157,754 17,236,528 0.15%Keyence Corp. 46,492 16,466,318 0.14%Takeda Pharmaceutical Co., Ltd. 384,132 15,312,260 0.13%KDDI Corp. 447,251 13,387,693 0.12%Recruit Holdings Co., Ltd. 349,627 13,187,219 0.11%Sumitomo Mitsui Financial Group,
Inc. 337,015 12,522,352 0.11%Honda Motor Co., Ltd. 412,529 11,763,767 0.10%
Number of Fair Value % of Total Shares US Dollars ($) Net Assets
Vanguard Global Stock Index Fund
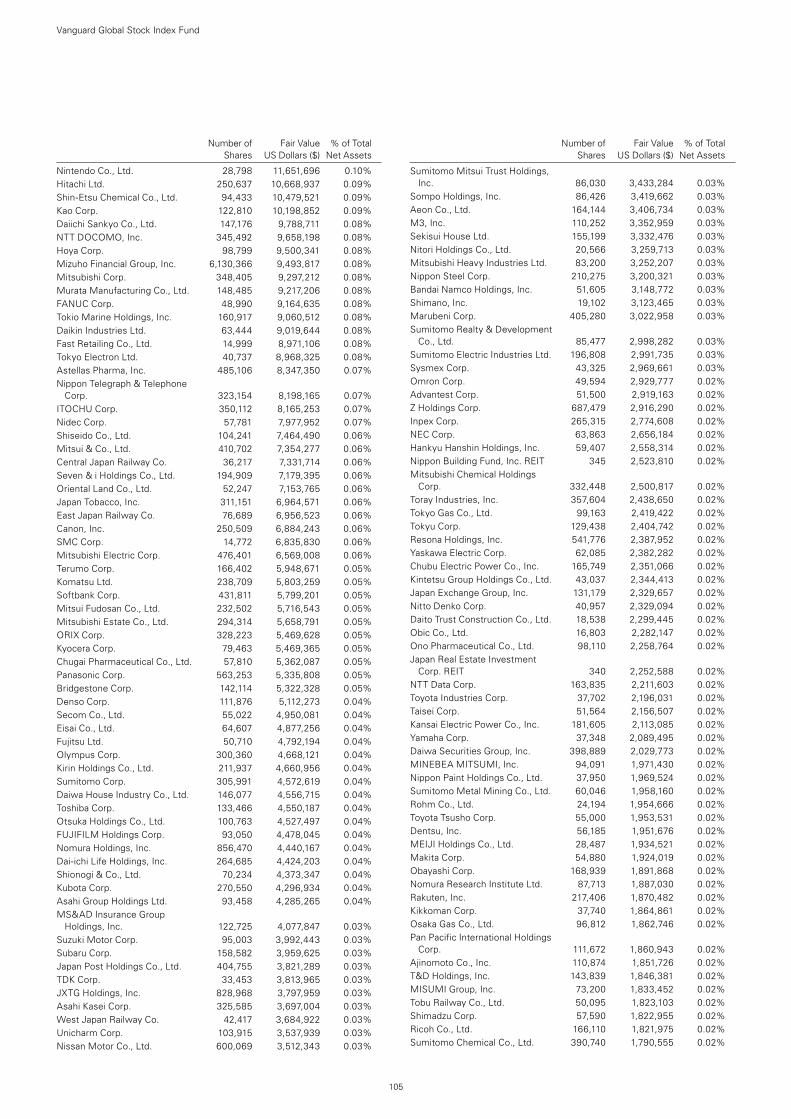
105
Number of Fair Value % of Total Shares US Dollars ($) Net Assets
Nintendo Co., Ltd. 28,798 11,651,696 0.10%Hitachi Ltd. 250,637 10,668,937 0.09%Shin-Etsu Chemical Co., Ltd. 94,433 10,479,521 0.09%Kao Corp. 122,810 10,198,852 0.09%Daiichi Sankyo Co., Ltd. 147,176 9,788,711 0.08%NTT DOCOMO, Inc. 345,492 9,658,198 0.08%Hoya Corp. 98,799 9,500,341 0.08%Mizuho Financial Group, Inc. 6,130,366 9,493,817 0.08%Mitsubishi Corp. 348,405 9,297,212 0.08%Murata Manufacturing Co., Ltd. 148,485 9,217,206 0.08%FANUC Corp. 48,990 9,164,635 0.08%Tokio Marine Holdings, Inc. 160,917 9,060,512 0.08%Daikin Industries Ltd. 63,444 9,019,644 0.08%Fast Retailing Co., Ltd. 14,999 8,971,106 0.08%Tokyo Electron Ltd. 40,737 8,968,325 0.08%Astellas Pharma, Inc. 485,106 8,347,350 0.07%Nippon Telegraph & Telephone
Corp. 323,154 8,198,165 0.07%ITOCHU Corp. 350,112 8,165,253 0.07%Nidec Corp. 57,781 7,977,952 0.07%Shiseido Co., Ltd. 104,241 7,464,490 0.06%Mitsui & Co., Ltd. 410,702 7,354,277 0.06%Central Japan Railway Co. 36,217 7,331,714 0.06%Seven & i Holdings Co., Ltd. 194,909 7,179,395 0.06%Oriental Land Co., Ltd. 52,247 7,153,765 0.06%Japan Tobacco, Inc. 311,151 6,964,571 0.06%East Japan Railway Co. 76,689 6,956,523 0.06%Canon, Inc. 250,509 6,884,243 0.06%SMC Corp. 14,772 6,835,830 0.06%Mitsubishi Electric Corp. 476,401 6,569,008 0.06%Terumo Corp. 166,402 5,948,671 0.05%Komatsu Ltd. 238,709 5,803,259 0.05%Softbank Corp. 431,811 5,799,201 0.05%Mitsui Fudosan Co., Ltd. 232,502 5,716,543 0.05%Mitsubishi Estate Co., Ltd. 294,314 5,658,791 0.05%ORIX Corp. 328,223 5,469,628 0.05%Kyocera Corp. 79,463 5,469,365 0.05%Chugai Pharmaceutical Co., Ltd. 57,810 5,362,087 0.05%Panasonic Corp. 563,253 5,335,808 0.05%Bridgestone Corp. 142,114 5,322,328 0.05%Denso Corp. 111,876 5,112,273 0.04%Secom Co., Ltd. 55,022 4,950,081 0.04%Eisai Co., Ltd. 64,607 4,877,256 0.04%Fujitsu Ltd. 50,710 4,792,194 0.04%Olympus Corp. 300,360 4,668,121 0.04%Kirin Holdings Co., Ltd. 211,937 4,660,956 0.04%Sumitomo Corp. 305,991 4,572,619 0.04%Daiwa House Industry Co., Ltd. 146,077 4,556,715 0.04%Toshiba Corp. 133,466 4,550,187 0.04%Otsuka Holdings Co., Ltd. 100,763 4,527,497 0.04%FUJIFILM Holdings Corp. 93,050 4,478,045 0.04%Nomura Holdings, Inc. 856,470 4,440,167 0.04%Dai-ichi Life Holdings, Inc. 264,685 4,424,203 0.04%Shionogi & Co., Ltd. 70,234 4,373,347 0.04%Kubota Corp. 270,550 4,296,934 0.04%Asahi Group Holdings Ltd. 93,458 4,285,265 0.04%MS&AD Insurance Group
Holdings, Inc. 122,725 4,077,847 0.03%Suzuki Motor Corp. 95,003 3,992,443 0.03%Subaru Corp. 158,582 3,959,625 0.03%Japan Post Holdings Co., Ltd. 404,755 3,821,289 0.03%TDK Corp. 33,453 3,813,965 0.03%JXTG Holdings, Inc. 828,968 3,797,959 0.03%Asahi Kasei Corp. 325,585 3,697,004 0.03%West Japan Railway Co. 42,417 3,684,922 0.03%Unicharm Corp. 103,915 3,537,939 0.03%Nissan Motor Co., Ltd. 600,069 3,512,343 0.03%
Sumitomo Mitsui Trust Holdings, Inc. 86,030 3,433,284 0.03%
Sompo Holdings, Inc. 86,426 3,419,662 0.03%Aeon Co., Ltd. 164,144 3,406,734 0.03%M3, Inc. 110,252 3,352,959 0.03%Sekisui House Ltd. 155,199 3,332,476 0.03%Nitori Holdings Co., Ltd. 20,566 3,259,713 0.03%Mitsubishi Heavy Industries Ltd. 83,200 3,252,207 0.03%Nippon Steel Corp. 210,275 3,200,321 0.03%Bandai Namco Holdings, Inc. 51,605 3,148,772 0.03%Shimano, Inc. 19,102 3,123,465 0.03%Marubeni Corp. 405,280 3,022,958 0.03%Sumitomo Realty & Development
Co., Ltd. 85,477 2,998,282 0.03%Sumitomo Electric Industries Ltd. 196,808 2,991,735 0.03%Sysmex Corp. 43,325 2,969,661 0.03%Omron Corp. 49,594 2,929,777 0.02%Advantest Corp. 51,500 2,919,163 0.02%Z Holdings Corp. 687,479 2,916,290 0.02%Inpex Corp. 265,315 2,774,608 0.02%NEC Corp. 63,863 2,656,184 0.02%Hankyu Hanshin Holdings, Inc. 59,407 2,558,314 0.02%Nippon Building Fund, Inc. REIT 345 2,523,810 0.02%Mitsubishi Chemical Holdings
Corp. 332,448 2,500,817 0.02%Toray Industries, Inc. 357,604 2,438,650 0.02%Tokyo Gas Co., Ltd. 99,163 2,419,422 0.02%Tokyu Corp. 129,438 2,404,742 0.02%Resona Holdings, Inc. 541,776 2,387,952 0.02%Yaskawa Electric Corp. 62,085 2,382,282 0.02%Chubu Electric Power Co., Inc. 165,749 2,351,066 0.02%Kintetsu Group Holdings Co., Ltd. 43,037 2,344,413 0.02%Japan Exchange Group, Inc. 131,179 2,329,657 0.02%Nitto Denko Corp. 40,957 2,329,094 0.02%Daito Trust Construction Co., Ltd. 18,538 2,299,445 0.02%Obic Co., Ltd. 16,803 2,282,147 0.02%Ono Pharmaceutical Co., Ltd. 98,110 2,258,764 0.02%Japan Real Estate Investment
Corp. REIT 340 2,252,588 0.02%NTT Data Corp. 163,835 2,211,603 0.02%Toyota Industries Corp. 37,702 2,196,031 0.02%Taisei Corp. 51,564 2,156,507 0.02%Kansai Electric Power Co., Inc. 181,605 2,113,085 0.02%Yamaha Corp. 37,348 2,089,495 0.02%Daiwa Securities Group, Inc. 398,889 2,029,773 0.02%MINEBEA MITSUMI, Inc. 94,091 1,971,430 0.02%Nippon Paint Holdings Co., Ltd. 37,950 1,969,524 0.02%Sumitomo Metal Mining Co., Ltd. 60,046 1,958,160 0.02%Rohm Co., Ltd. 24,194 1,954,666 0.02%Toyota Tsusho Corp. 55,000 1,953,531 0.02%Dentsu, Inc. 56,185 1,951,676 0.02%MEIJI Holdings Co., Ltd. 28,487 1,934,521 0.02%Makita Corp. 54,880 1,924,019 0.02%Obayashi Corp. 168,939 1,891,868 0.02%Nomura Research Institute Ltd. 87,713 1,887,030 0.02%Rakuten, Inc. 217,406 1,870,482 0.02%Kikkoman Corp. 37,740 1,864,861 0.02%Osaka Gas Co., Ltd. 96,812 1,862,746 0.02%Pan Pacific International Holdings
Corp. 111,672 1,860,943 0.02%Ajinomoto Co., Inc. 110,874 1,851,726 0.02%T&D Holdings, Inc. 143,839 1,846,381 0.02%MISUMI Group, Inc. 73,200 1,833,452 0.02%Tobu Railway Co., Ltd. 50,095 1,823,103 0.02%Shimadzu Corp. 57,590 1,822,955 0.02%Ricoh Co., Ltd. 166,110 1,821,975 0.02%Sumitomo Chemical Co., Ltd. 390,740 1,790,555 0.02%
Number of Fair Value % of Total Shares US Dollars ($) Net Assets
Vanguard Global Stock Index Fund
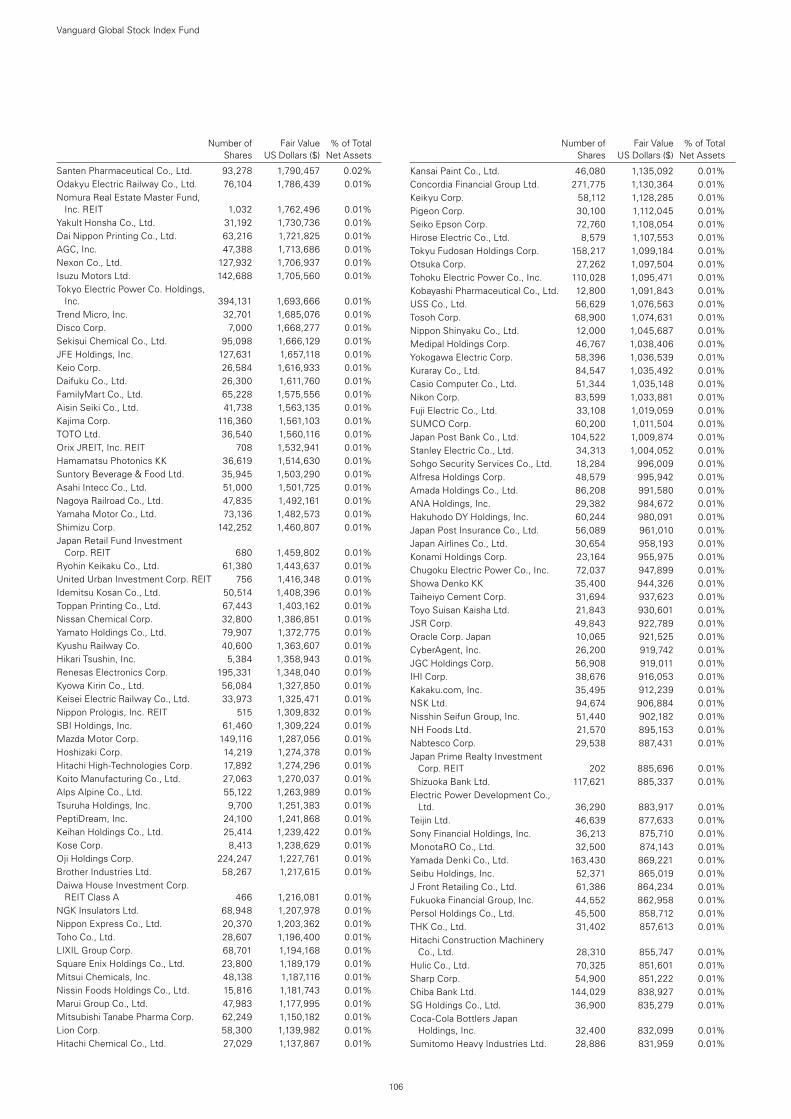
106
Number of Fair Value % of Total Shares US Dollars ($) Net Assets
Santen Pharmaceutical Co., Ltd. 93,278 1,790,457 0.02%Odakyu Electric Railway Co., Ltd. 76,104 1,786,439 0.01%Nomura Real Estate Master Fund,
Inc. REIT 1,032 1,762,496 0.01%Yakult Honsha Co., Ltd. 31,192 1,730,736 0.01%Dai Nippon Printing Co., Ltd. 63,216 1,721,825 0.01%AGC, Inc. 47,388 1,713,686 0.01%Nexon Co., Ltd. 127,932 1,706,937 0.01%Isuzu Motors Ltd. 142,688 1,705,560 0.01%Tokyo Electric Power Co. Holdings,
Inc. 394,131 1,693,666 0.01%Trend Micro, Inc. 32,701 1,685,076 0.01%Disco Corp. 7,000 1,668,277 0.01%Sekisui Chemical Co., Ltd. 95,098 1,666,129 0.01%JFE Holdings, Inc. 127,631 1,657,118 0.01%Keio Corp. 26,584 1,616,933 0.01%Daifuku Co., Ltd. 26,300 1,611,760 0.01%FamilyMart Co., Ltd. 65,228 1,575,556 0.01%Aisin Seiki Co., Ltd. 41,738 1,563,135 0.01%Kajima Corp. 116,360 1,561,103 0.01%TOTO Ltd. 36,540 1,560,116 0.01%Orix JREIT, Inc. REIT 708 1,532,941 0.01%Hamamatsu Photonics KK 36,619 1,514,630 0.01%Suntory Beverage & Food Ltd. 35,945 1,503,290 0.01%Asahi Intecc Co., Ltd. 51,000 1,501,725 0.01%Nagoya Railroad Co., Ltd. 47,835 1,492,161 0.01%Yamaha Motor Co., Ltd. 73,136 1,482,573 0.01%Shimizu Corp. 142,252 1,460,807 0.01%Japan Retail Fund Investment
Corp. REIT 680 1,459,802 0.01%Ryohin Keikaku Co., Ltd. 61,380 1,443,637 0.01%United Urban Investment Corp. REIT 756 1,416,348 0.01%Idemitsu Kosan Co., Ltd. 50,514 1,408,396 0.01%Toppan Printing Co., Ltd. 67,443 1,403,162 0.01%Nissan Chemical Corp. 32,800 1,386,851 0.01%Yamato Holdings Co., Ltd. 79,907 1,372,775 0.01%Kyushu Railway Co. 40,600 1,363,607 0.01%Hikari Tsushin, Inc. 5,384 1,358,943 0.01%Renesas Electronics Corp. 195,331 1,348,040 0.01%Kyowa Kirin Co., Ltd. 56,084 1,327,850 0.01%Keisei Electric Railway Co., Ltd. 33,973 1,325,471 0.01%Nippon Prologis, Inc. REIT 515 1,309,832 0.01%SBI Holdings, Inc. 61,460 1,309,224 0.01%Mazda Motor Corp. 149,116 1,287,056 0.01%Hoshizaki Corp. 14,219 1,274,378 0.01%Hitachi High-Technologies Corp. 17,892 1,274,296 0.01%Koito Manufacturing Co., Ltd. 27,063 1,270,037 0.01%Alps Alpine Co., Ltd. 55,122 1,263,989 0.01%Tsuruha Holdings, Inc. 9,700 1,251,383 0.01%PeptiDream, Inc. 24,100 1,241,868 0.01%Keihan Holdings Co., Ltd. 25,414 1,239,422 0.01%Kose Corp. 8,413 1,238,629 0.01%Oji Holdings Corp. 224,247 1,227,761 0.01%Brother Industries Ltd. 58,267 1,217,615 0.01%Daiwa House Investment Corp.
REIT Class A 466 1,216,081 0.01%NGK Insulators Ltd. 68,948 1,207,978 0.01%Nippon Express Co., Ltd. 20,370 1,203,362 0.01%Toho Co., Ltd. 28,607 1,196,400 0.01%LIXIL Group Corp. 68,701 1,194,168 0.01%Square Enix Holdings Co., Ltd. 23,800 1,189,179 0.01%Mitsui Chemicals, Inc. 48,138 1,187,116 0.01%Nissin Foods Holdings Co., Ltd. 15,816 1,181,743 0.01%Marui Group Co., Ltd. 47,983 1,177,995 0.01%Mitsubishi Tanabe Pharma Corp. 62,249 1,150,182 0.01%Lion Corp. 58,300 1,139,982 0.01%Hitachi Chemical Co., Ltd. 27,029 1,137,867 0.01%
Kansai Paint Co., Ltd. 46,080 1,135,092 0.01%Concordia Financial Group Ltd. 271,775 1,130,364 0.01%Keikyu Corp. 58,112 1,128,285 0.01%Pigeon Corp. 30,100 1,112,045 0.01%Seiko Epson Corp. 72,760 1,108,054 0.01%Hirose Electric Co., Ltd. 8,579 1,107,553 0.01%Tokyu Fudosan Holdings Corp. 158,217 1,099,184 0.01%Otsuka Corp. 27,262 1,097,504 0.01%Tohoku Electric Power Co., Inc. 110,028 1,095,471 0.01%Kobayashi Pharmaceutical Co., Ltd. 12,800 1,091,843 0.01%USS Co., Ltd. 56,629 1,076,563 0.01%Tosoh Corp. 68,900 1,074,631 0.01%Nippon Shinyaku Co., Ltd. 12,000 1,045,687 0.01%Medipal Holdings Corp. 46,767 1,038,406 0.01%Yokogawa Electric Corp. 58,396 1,036,539 0.01%Kuraray Co., Ltd. 84,547 1,035,492 0.01%Casio Computer Co., Ltd. 51,344 1,035,148 0.01%Nikon Corp. 83,599 1,033,881 0.01%Fuji Electric Co., Ltd. 33,108 1,019,059 0.01%SUMCO Corp. 60,200 1,011,504 0.01%Japan Post Bank Co., Ltd. 104,522 1,009,874 0.01%Stanley Electric Co., Ltd. 34,313 1,004,052 0.01%Sohgo Security Services Co., Ltd. 18,284 996,009 0.01%Alfresa Holdings Corp. 48,579 995,942 0.01%Amada Holdings Co., Ltd. 86,208 991,580 0.01%ANA Holdings, Inc. 29,382 984,672 0.01%Hakuhodo DY Holdings, Inc. 60,244 980,091 0.01%Japan Post Insurance Co., Ltd. 56,089 961,010 0.01%Japan Airlines Co., Ltd. 30,654 958,193 0.01%Konami Holdings Corp. 23,164 955,975 0.01%Chugoku Electric Power Co., Inc. 72,037 947,899 0.01%Showa Denko KK 35,400 944,326 0.01%Taiheiyo Cement Corp. 31,694 937,623 0.01%Toyo Suisan Kaisha Ltd. 21,843 930,601 0.01%JSR Corp. 49,843 922,789 0.01%Oracle Corp. Japan 10,065 921,525 0.01%CyberAgent, Inc. 26,200 919,742 0.01%JGC Holdings Corp. 56,908 919,011 0.01%IHI Corp. 38,676 916,053 0.01%Kakaku.com, Inc. 35,495 912,239 0.01%NSK Ltd. 94,674 906,884 0.01%Nisshin Seifun Group, Inc. 51,440 902,182 0.01%NH Foods Ltd. 21,570 895,153 0.01%Nabtesco Corp. 29,538 887,431 0.01%Japan Prime Realty Investment
Corp. REIT 202 885,696 0.01%Shizuoka Bank Ltd. 117,621 885,337 0.01%Electric Power Development Co.,
Ltd. 36,290 883,917 0.01%Teijin Ltd. 46,639 877,633 0.01%Sony Financial Holdings, Inc. 36,213 875,710 0.01%MonotaRO Co., Ltd. 32,500 874,143 0.01%Yamada Denki Co., Ltd. 163,430 869,221 0.01%Seibu Holdings, Inc. 52,371 865,019 0.01%J Front Retailing Co., Ltd. 61,386 864,234 0.01%Fukuoka Financial Group, Inc. 44,552 862,958 0.01%Persol Holdings Co., Ltd. 45,500 858,712 0.01%THK Co., Ltd. 31,402 857,613 0.01%Hitachi Construction Machinery
Co., Ltd. 28,310 855,747 0.01%Hulic Co., Ltd. 70,325 851,601 0.01%Sharp Corp. 54,900 851,222 0.01%Chiba Bank Ltd. 144,029 838,927 0.01%SG Holdings Co., Ltd. 36,900 835,279 0.01%Coca-Cola Bottlers Japan
Holdings, Inc. 32,400 832,099 0.01%Sumitomo Heavy Industries Ltd. 28,886 831,959 0.01%
Number of Fair Value % of Total Shares US Dollars ($) Net Assets
Vanguard Global Stock Index Fund
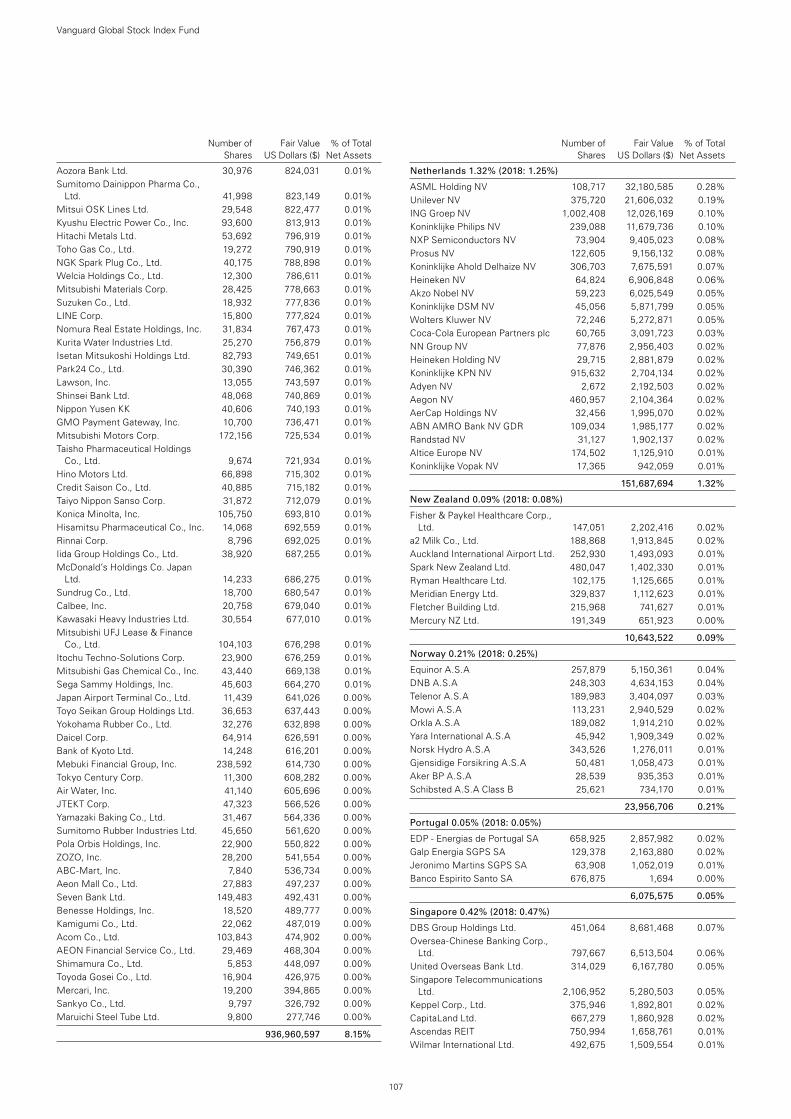
107
Number of Fair Value % of Total Shares US Dollars ($) Net Assets
Aozora Bank Ltd. 30,976 824,031 0.01%Sumitomo Dainippon Pharma Co.,
Ltd. 41,998 823,149 0.01%Mitsui OSK Lines Ltd. 29,548 822,477 0.01%Kyushu Electric Power Co., Inc. 93,600 813,913 0.01%Hitachi Metals Ltd. 53,692 796,919 0.01%Toho Gas Co., Ltd. 19,272 790,919 0.01%NGK Spark Plug Co., Ltd. 40,175 788,898 0.01%Welcia Holdings Co., Ltd. 12,300 786,611 0.01%Mitsubishi Materials Corp. 28,425 778,663 0.01%Suzuken Co., Ltd. 18,932 777,836 0.01%LINE Corp. 15,800 777,824 0.01%Nomura Real Estate Holdings, Inc. 31,834 767,473 0.01%Kurita Water Industries Ltd. 25,270 756,879 0.01%Isetan Mitsukoshi Holdings Ltd. 82,793 749,651 0.01%Park24 Co., Ltd. 30,390 746,362 0.01%Lawson, Inc. 13,055 743,597 0.01%Shinsei Bank Ltd. 48,068 740,869 0.01%Nippon Yusen KK 40,606 740,193 0.01%GMO Payment Gateway, Inc. 10,700 736,471 0.01%Mitsubishi Motors Corp. 172,156 725,534 0.01%Taisho Pharmaceutical Holdings
Co., Ltd. 9,674 721,934 0.01%Hino Motors Ltd. 66,898 715,302 0.01%Credit Saison Co., Ltd. 40,885 715,182 0.01%Taiyo Nippon Sanso Corp. 31,872 712,079 0.01%Konica Minolta, Inc. 105,750 693,810 0.01%Hisamitsu Pharmaceutical Co., Inc. 14,068 692,559 0.01%Rinnai Corp. 8,796 692,025 0.01%Iida Group Holdings Co., Ltd. 38,920 687,255 0.01%McDonald’s Holdings Co. Japan
Ltd. 14,233 686,275 0.01%Sundrug Co., Ltd. 18,700 680,547 0.01%Calbee, Inc. 20,758 679,040 0.01%Kawasaki Heavy Industries Ltd. 30,554 677,010 0.01%Mitsubishi UFJ Lease & Finance
Co., Ltd. 104,103 676,298 0.01%Itochu Techno-Solutions Corp. 23,900 676,259 0.01%Mitsubishi Gas Chemical Co., Inc. 43,440 669,138 0.01%Sega Sammy Holdings, Inc. 45,603 664,270 0.01%Japan Airport Terminal Co., Ltd. 11,439 641,026 0.00%Toyo Seikan Group Holdings Ltd. 36,653 637,443 0.00%Yokohama Rubber Co., Ltd. 32,276 632,898 0.00%Daicel Corp. 64,914 626,591 0.00%Bank of Kyoto Ltd. 14,248 616,201 0.00%Mebuki Financial Group, Inc. 238,592 614,730 0.00%Tokyo Century Corp. 11,300 608,282 0.00%Air Water, Inc. 41,140 605,696 0.00%JTEKT Corp. 47,323 566,526 0.00%Yamazaki Baking Co., Ltd. 31,467 564,336 0.00%Sumitomo Rubber Industries Ltd. 45,650 561,620 0.00%Pola Orbis Holdings, Inc. 22,900 550,822 0.00%ZOZO, Inc. 28,200 541,554 0.00%ABC-Mart, Inc. 7,840 536,734 0.00%Aeon Mall Co., Ltd. 27,883 497,237 0.00%Seven Bank Ltd. 149,483 492,431 0.00%Benesse Holdings, Inc. 18,520 489,777 0.00%Kamigumi Co., Ltd. 22,062 487,019 0.00%Acom Co., Ltd. 103,843 474,902 0.00%AEON Financial Service Co., Ltd. 29,469 468,304 0.00%Shimamura Co., Ltd. 5,853 448,097 0.00%Toyoda Gosei Co., Ltd. 16,904 426,975 0.00%Mercari, Inc. 19,200 394,865 0.00%Sankyo Co., Ltd. 9,797 326,792 0.00%Maruichi Steel Tube Ltd. 9,800 277,746 0.00%
936,960,597 8.15%
Netherlands 1.32% (2018: 1.25%)
ASML Holding NV 108,717 32,180,585 0.28%Unilever NV 375,720 21,606,032 0.19%ING Groep NV 1,002,408 12,026,169 0.10%Koninklijke Philips NV 239,088 11,679,736 0.10%NXP Semiconductors NV 73,904 9,405,023 0.08%Prosus NV 122,605 9,156,132 0.08%Koninklijke Ahold Delhaize NV 306,703 7,675,591 0.07%Heineken NV 64,824 6,906,848 0.06%Akzo Nobel NV 59,223 6,025,549 0.05%Koninklijke DSM NV 45,056 5,871,799 0.05%Wolters Kluwer NV 72,246 5,272,871 0.05%Coca-Cola European Partners plc 60,765 3,091,723 0.03%NN Group NV 77,876 2,956,403 0.02%Heineken Holding NV 29,715 2,881,879 0.02%Koninklijke KPN NV 915,632 2,704,134 0.02%Adyen NV 2,672 2,192,503 0.02%Aegon NV 460,957 2,104,364 0.02%AerCap Holdings NV 32,456 1,995,070 0.02%ABN AMRO Bank NV GDR 109,034 1,985,177 0.02%Randstad NV 31,127 1,902,137 0.02%Altice Europe NV 174,502 1,125,910 0.01%Koninklijke Vopak NV 17,365 942,059 0.01%
151,687,694 1.32%
New Zealand 0.09% (2018: 0.08%)
Fisher & Paykel Healthcare Corp., Ltd. 147,051 2,202,416 0.02%
a2 Milk Co., Ltd. 188,868 1,913,845 0.02%Auckland International Airport Ltd. 252,930 1,493,093 0.01%Spark New Zealand Ltd. 480,047 1,402,330 0.01%Ryman Healthcare Ltd. 102,175 1,125,665 0.01%Meridian Energy Ltd. 329,837 1,112,623 0.01%Fletcher Building Ltd. 215,968 741,627 0.01%Mercury NZ Ltd. 191,349 651,923 0.00%
10,643,522 0.09%
Norway 0.21% (2018: 0.25%)
Equinor A.S.A 257,879 5,150,361 0.04%DNB A.S.A 248,303 4,634,153 0.04%Telenor A.S.A 189,983 3,404,097 0.03%Mowi A.S.A 113,231 2,940,529 0.02%Orkla A.S.A 189,082 1,914,210 0.02%Yara International A.S.A 45,942 1,909,349 0.02%Norsk Hydro A.S.A 343,526 1,276,011 0.01%Gjensidige Forsikring A.S.A 50,481 1,058,473 0.01%Aker BP A.S.A 28,539 935,353 0.01%Schibsted A.S.A Class B 25,621 734,170 0.01%
23,956,706 0.21%
Portugal 0.05% (2018: 0.05%)
EDP - Energias de Portugal SA 658,925 2,857,982 0.02%Galp Energia SGPS SA 129,378 2,163,880 0.02%Jeronimo Martins SGPS SA 63,908 1,052,019 0.01%Banco Espirito Santo SA 676,875 1,694 0.00%
6,075,575 0.05%
Singapore 0.42% (2018: 0.47%)
DBS Group Holdings Ltd. 451,064 8,681,468 0.07%Oversea-Chinese Banking Corp.,
Ltd. 797,667 6,513,504 0.06%United Overseas Bank Ltd. 314,029 6,167,780 0.05%Singapore Telecommunications
Ltd. 2,106,952 5,280,503 0.05%Keppel Corp., Ltd. 375,946 1,892,801 0.02%CapitaLand Ltd. 667,279 1,860,928 0.02%Ascendas REIT 750,994 1,658,761 0.01%Wilmar International Ltd. 492,675 1,509,554 0.01%
Number of Fair Value % of Total Shares US Dollars ($) Net Assets
Vanguard Global Stock Index Fund
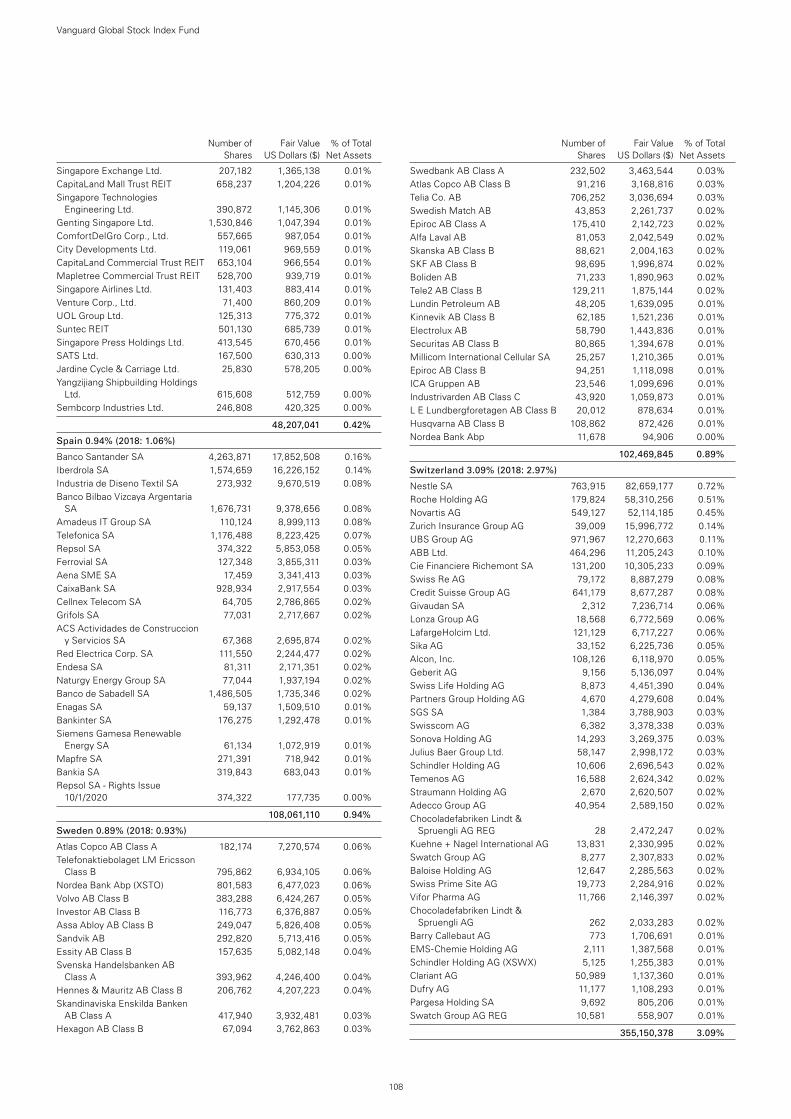
108
Number of Fair Value % of Total Shares US Dollars ($) Net Assets
Singapore Exchange Ltd. 207,182 1,365,138 0.01%CapitaLand Mall Trust REIT 658,237 1,204,226 0.01%Singapore Technologies
Engineering Ltd. 390,872 1,145,306 0.01%Genting Singapore Ltd. 1,530,846 1,047,394 0.01%ComfortDelGro Corp., Ltd. 557,665 987,054 0.01%City Developments Ltd. 119,061 969,559 0.01%CapitaLand Commercial Trust REIT 653,104 966,554 0.01%Mapletree Commercial Trust REIT 528,700 939,719 0.01%Singapore Airlines Ltd. 131,403 883,414 0.01%Venture Corp., Ltd. 71,400 860,209 0.01%UOL Group Ltd. 125,313 775,372 0.01%Suntec REIT 501,130 685,739 0.01%Singapore Press Holdings Ltd. 413,545 670,456 0.01%SATS Ltd. 167,500 630,313 0.00%Jardine Cycle & Carriage Ltd. 25,830 578,205 0.00%Yangzijiang Shipbuilding Holdings
Ltd. 615,608 512,759 0.00%Sembcorp Industries Ltd. 246,808 420,325 0.00%
48,207,041 0.42%
Spain 0.94% (2018: 1.06%)
Banco Santander SA 4,263,871 17,852,508 0.16%Iberdrola SA 1,574,659 16,226,152 0.14%Industria de Diseno Textil SA 273,932 9,670,519 0.08%Banco Bilbao Vizcaya Argentaria
SA 1,676,731 9,378,656 0.08%Amadeus IT Group SA 110,124 8,999,113 0.08%Telefonica SA 1,176,488 8,223,425 0.07%Repsol SA 374,322 5,853,058 0.05%Ferrovial SA 127,348 3,855,311 0.03%Aena SME SA 17,459 3,341,413 0.03%CaixaBank SA 928,934 2,917,554 0.03%Cellnex Telecom SA 64,705 2,786,865 0.02%Grifols SA 77,031 2,717,667 0.02%ACS Actividades de Construccion
y Servicios SA 67,368 2,695,874 0.02%Red Electrica Corp. SA 111,550 2,244,477 0.02%Endesa SA 81,311 2,171,351 0.02%Naturgy Energy Group SA 77,044 1,937,194 0.02%Banco de Sabadell SA 1,486,505 1,735,346 0.02%Enagas SA 59,137 1,509,510 0.01%Bankinter SA 176,275 1,292,478 0.01%Siemens Gamesa Renewable
Energy SA 61,134 1,072,919 0.01%Mapfre SA 271,391 718,942 0.01%Bankia SA 319,843 683,043 0.01%Repsol SA - Rights Issue
10/1/2020 374,322 177,735 0.00%
108,061,110 0.94%
Sweden 0.89% (2018: 0.93%)
Atlas Copco AB Class A 182,174 7,270,574 0.06%Telefonaktiebolaget LM Ericsson
Class B 795,862 6,934,105 0.06%Nordea Bank Abp (XSTO) 801,583 6,477,023 0.06%Volvo AB Class B 383,288 6,424,267 0.05%Investor AB Class B 116,773 6,376,887 0.05%Assa Abloy AB Class B 249,047 5,826,408 0.05%Sandvik AB 292,820 5,713,416 0.05%Essity AB Class B 157,635 5,082,148 0.04%Svenska Handelsbanken AB
Class A 393,962 4,246,400 0.04%Hennes & Mauritz AB Class B 206,762 4,207,223 0.04%Skandinaviska Enskilda Banken
AB Class A 417,940 3,932,481 0.03%Hexagon AB Class B 67,094 3,762,863 0.03%
Swedbank AB Class A 232,502 3,463,544 0.03%Atlas Copco AB Class B 91,216 3,168,816 0.03%Telia Co. AB 706,252 3,036,694 0.03%Swedish Match AB 43,853 2,261,737 0.02%Epiroc AB Class A 175,410 2,142,723 0.02%Alfa Laval AB 81,053 2,042,549 0.02%Skanska AB Class B 88,621 2,004,163 0.02%SKF AB Class B 98,695 1,996,874 0.02%Boliden AB 71,233 1,890,963 0.02%Tele2 AB Class B 129,211 1,875,144 0.02%Lundin Petroleum AB 48,205 1,639,095 0.01%Kinnevik AB Class B 62,185 1,521,236 0.01%Electrolux AB 58,790 1,443,836 0.01%Securitas AB Class B 80,865 1,394,678 0.01%Millicom International Cellular SA 25,257 1,210,365 0.01%Epiroc AB Class B 94,251 1,118,098 0.01%ICA Gruppen AB 23,546 1,099,696 0.01%Industrivarden AB Class C 43,920 1,059,873 0.01%L E Lundbergforetagen AB Class B 20,012 878,634 0.01%Husqvarna AB Class B 108,862 872,426 0.01%Nordea Bank Abp 11,678 94,906 0.00%
102,469,845 0.89%
Switzerland 3.09% (2018: 2.97%)
Nestle SA 763,915 82,659,177 0.72%Roche Holding AG 179,824 58,310,256 0.51%Novartis AG 549,127 52,114,185 0.45%Zurich Insurance Group AG 39,009 15,996,772 0.14%UBS Group AG 971,967 12,270,663 0.11%ABB Ltd. 464,296 11,205,243 0.10%Cie Financiere Richemont SA 131,200 10,305,233 0.09%Swiss Re AG 79,172 8,887,279 0.08%Credit Suisse Group AG 641,179 8,677,287 0.08%Givaudan SA 2,312 7,236,714 0.06%Lonza Group AG 18,568 6,772,569 0.06%LafargeHolcim Ltd. 121,129 6,717,227 0.06%Sika AG 33,152 6,225,736 0.05%Alcon, Inc. 108,126 6,118,970 0.05%Geberit AG 9,156 5,136,097 0.04%Swiss Life Holding AG 8,873 4,451,390 0.04%Partners Group Holding AG 4,670 4,279,608 0.04%SGS SA 1,384 3,788,903 0.03%Swisscom AG 6,382 3,378,338 0.03%Sonova Holding AG 14,293 3,269,375 0.03%Julius Baer Group Ltd. 58,147 2,998,172 0.03%Schindler Holding AG 10,606 2,696,543 0.02%Temenos AG 16,588 2,624,342 0.02%Straumann Holding AG 2,670 2,620,507 0.02%Adecco Group AG 40,954 2,589,150 0.02%Chocoladefabriken Lindt &
Spruengli AG REG 28 2,472,247 0.02%Kuehne + Nagel International AG 13,831 2,330,995 0.02%Swatch Group AG 8,277 2,307,833 0.02%Baloise Holding AG 12,647 2,285,563 0.02%Swiss Prime Site AG 19,773 2,284,916 0.02%Vifor Pharma AG 11,766 2,146,397 0.02%Chocoladefabriken Lindt &
Spruengli AG 262 2,033,283 0.02%Barry Callebaut AG 773 1,706,691 0.01%EMS-Chemie Holding AG 2,111 1,387,568 0.01%Schindler Holding AG (XSWX) 5,125 1,255,383 0.01%Clariant AG 50,989 1,137,360 0.01%Dufry AG 11,177 1,108,293 0.01%Pargesa Holding SA 9,692 805,206 0.01%Swatch Group AG REG 10,581 558,907 0.01%
355,150,378 3.09%
Number of Fair Value % of Total Shares US Dollars ($) Net Assets
Vanguard Global Stock Index Fund
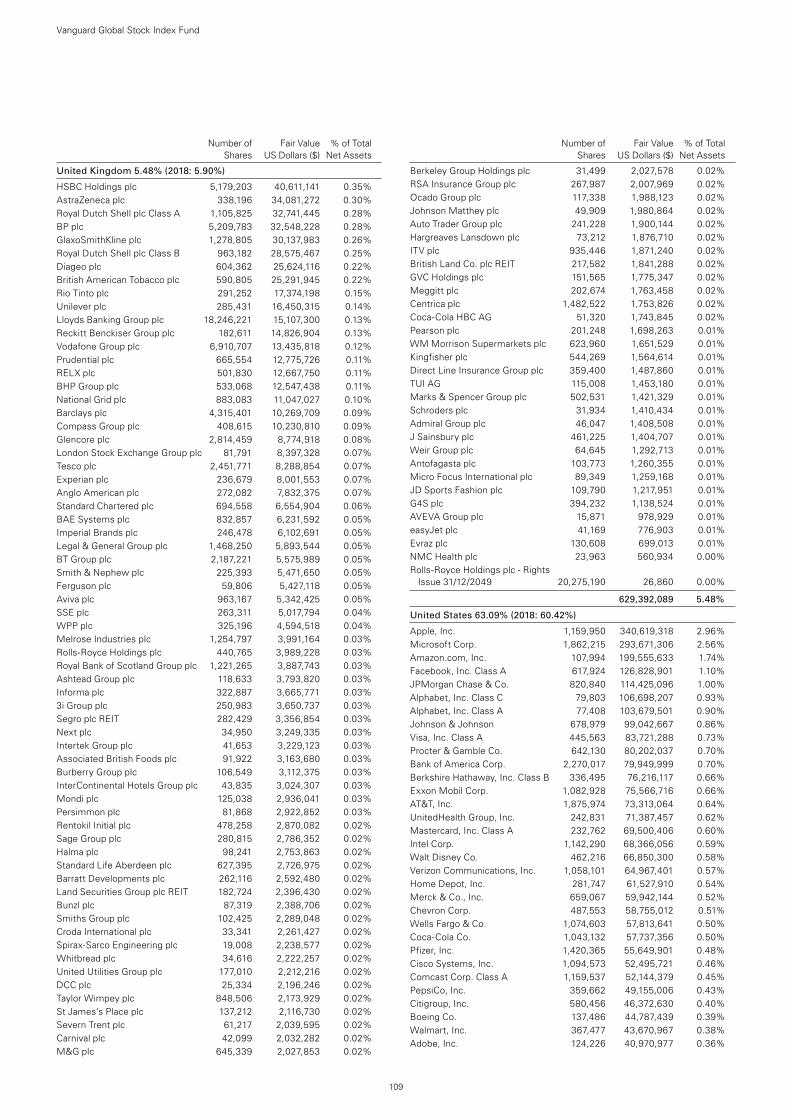
109
Number of Fair Value % of Total Shares US Dollars ($) Net Assets
United Kingdom 5.48% (2018: 5.90%)
HSBC Holdings plc 5,179,203 40,611,141 0.35%AstraZeneca plc 338,196 34,081,272 0.30%Royal Dutch Shell plc Class A 1,105,825 32,741,445 0.28%BP plc 5,209,783 32,548,228 0.28%GlaxoSmithKline plc 1,278,805 30,137,983 0.26%Royal Dutch Shell plc Class B 963,182 28,575,467 0.25%Diageo plc 604,362 25,624,116 0.22%British American Tobacco plc 590,805 25,291,945 0.22%Rio Tinto plc 291,252 17,374,198 0.15%Unilever plc 285,431 16,450,315 0.14%Lloyds Banking Group plc 18,246,221 15,107,300 0.13%Reckitt Benckiser Group plc 182,611 14,826,904 0.13%Vodafone Group plc 6,910,707 13,435,818 0.12%Prudential plc 665,554 12,775,726 0.11%RELX plc 501,830 12,667,750 0.11%BHP Group plc 533,068 12,547,438 0.11%National Grid plc 883,083 11,047,027 0.10%Barclays plc 4,315,401 10,269,709 0.09%Compass Group plc 408,615 10,230,810 0.09%Glencore plc 2,814,459 8,774,918 0.08%London Stock Exchange Group plc 81,791 8,397,328 0.07%Tesco plc 2,451,771 8,288,854 0.07%Experian plc 236,679 8,001,553 0.07%Anglo American plc 272,082 7,832,375 0.07%Standard Chartered plc 694,558 6,554,904 0.06%BAE Systems plc 832,857 6,231,592 0.05%Imperial Brands plc 246,478 6,102,691 0.05%Legal & General Group plc 1,468,250 5,893,544 0.05%BT Group plc 2,187,221 5,575,989 0.05%Smith & Nephew plc 225,393 5,471,650 0.05%Ferguson plc 59,806 5,427,118 0.05%Aviva plc 963,167 5,342,425 0.05%SSE plc 263,311 5,017,794 0.04%WPP plc 325,196 4,594,518 0.04%Melrose Industries plc 1,254,797 3,991,164 0.03%Rolls-Royce Holdings plc 440,765 3,989,228 0.03%Royal Bank of Scotland Group plc 1,221,265 3,887,743 0.03%Ashtead Group plc 118,633 3,793,820 0.03%Informa plc 322,887 3,665,771 0.03%3i Group plc 250,983 3,650,737 0.03%Segro plc REIT 282,429 3,356,854 0.03%Next plc 34,950 3,249,335 0.03%Intertek Group plc 41,653 3,229,123 0.03%Associated British Foods plc 91,922 3,163,680 0.03%Burberry Group plc 106,549 3,112,375 0.03%InterContinental Hotels Group plc 43,835 3,024,307 0.03%Mondi plc 125,038 2,936,041 0.03%Persimmon plc 81,868 2,922,852 0.03%Rentokil Initial plc 478,258 2,870,082 0.02%Sage Group plc 280,815 2,786,352 0.02%Halma plc 98,241 2,753,863 0.02%Standard Life Aberdeen plc 627,395 2,726,975 0.02%Barratt Developments plc 262,116 2,592,480 0.02%Land Securities Group plc REIT 182,724 2,396,430 0.02%Bunzl plc 87,319 2,388,706 0.02%Smiths Group plc 102,425 2,289,048 0.02%Croda International plc 33,341 2,261,427 0.02%Spirax-Sarco Engineering plc 19,008 2,238,577 0.02%Whitbread plc 34,616 2,222,257 0.02%United Utilities Group plc 177,010 2,212,216 0.02%DCC plc 25,334 2,196,246 0.02%Taylor Wimpey plc 848,506 2,173,929 0.02%St James’s Place plc 137,212 2,116,730 0.02%Severn Trent plc 61,217 2,039,595 0.02%Carnival plc 42,099 2,032,282 0.02%M&G plc 645,339 2,027,853 0.02%
Berkeley Group Holdings plc 31,499 2,027,578 0.02%RSA Insurance Group plc 267,987 2,007,969 0.02%Ocado Group plc 117,338 1,988,123 0.02%Johnson Matthey plc 49,909 1,980,864 0.02%Auto Trader Group plc 241,228 1,900,144 0.02%Hargreaves Lansdown plc 73,212 1,876,710 0.02%ITV plc 935,446 1,871,240 0.02%British Land Co. plc REIT 217,582 1,841,288 0.02%GVC Holdings plc 151,565 1,775,347 0.02%Meggitt plc 202,674 1,763,458 0.02%Centrica plc 1,482,522 1,753,826 0.02%Coca-Cola HBC AG 51,320 1,743,845 0.02%Pearson plc 201,248 1,698,263 0.01%WM Morrison Supermarkets plc 623,960 1,651,529 0.01%Kingfisher plc 544,269 1,564,614 0.01%Direct Line Insurance Group plc 359,400 1,487,860 0.01%TUI AG 115,008 1,453,180 0.01%Marks & Spencer Group plc 502,531 1,421,329 0.01%Schroders plc 31,934 1,410,434 0.01%Admiral Group plc 46,047 1,408,508 0.01%J Sainsbury plc 461,225 1,404,707 0.01%Weir Group plc 64,645 1,292,713 0.01%Antofagasta plc 103,773 1,260,355 0.01%Micro Focus International plc 89,349 1,259,168 0.01%JD Sports Fashion plc 109,790 1,217,951 0.01%G4S plc 394,232 1,138,524 0.01%AVEVA Group plc 15,871 978,929 0.01%easyJet plc 41,169 776,903 0.01%Evraz plc 130,608 699,013 0.01%NMC Health plc 23,963 560,934 0.00%Rolls-Royce Holdings plc - Rights
Issue 31/12/2049 20,275,190 26,860 0.00%
629,392,089 5.48%
United States 63.09% (2018: 60.42%)
Apple, Inc. 1,159,950 340,619,318 2.96%Microsoft Corp. 1,862,215 293,671,306 2.56%Amazon.com, Inc. 107,994 199,555,633 1.74%Facebook, Inc. Class A 617,924 126,828,901 1.10%JPMorgan Chase & Co. 820,840 114,425,096 1.00%Alphabet, Inc. Class C 79,803 106,698,207 0.93%Alphabet, Inc. Class A 77,408 103,679,501 0.90%Johnson & Johnson 678,979 99,042,667 0.86%Visa, Inc. Class A 445,563 83,721,288 0.73%Procter & Gamble Co. 642,130 80,202,037 0.70%Bank of America Corp. 2,270,017 79,949,999 0.70%Berkshire Hathaway, Inc. Class B 336,495 76,216,117 0.66%Exxon Mobil Corp. 1,082,928 75,566,716 0.66%AT&T, Inc. 1,875,974 73,313,064 0.64%UnitedHealth Group, Inc. 242,831 71,387,457 0.62%Mastercard, Inc. Class A 232,762 69,500,406 0.60%Intel Corp. 1,142,290 68,366,056 0.59%Walt Disney Co. 462,216 66,850,300 0.58%Verizon Communications, Inc. 1,058,101 64,967,401 0.57%Home Depot, Inc. 281,747 61,527,910 0.54%Merck & Co., Inc. 659,067 59,942,144 0.52%Chevron Corp. 487,553 58,755,012 0.51%Wells Fargo & Co. 1,074,603 57,813,641 0.50%Coca-Cola Co. 1,043,132 57,737,356 0.50%Pfizer, Inc. 1,420,365 55,649,901 0.48%Cisco Systems, Inc. 1,094,573 52,495,721 0.46%Comcast Corp. Class A 1,159,537 52,144,379 0.45%PepsiCo, Inc. 359,662 49,155,006 0.43%Citigroup, Inc. 580,456 46,372,630 0.40%Boeing Co. 137,486 44,787,439 0.39%Walmart, Inc. 367,477 43,670,967 0.38%Adobe, Inc. 124,226 40,970,977 0.36%
Number of Fair Value % of Total Shares US Dollars ($) Net Assets
Vanguard Global Stock Index Fund
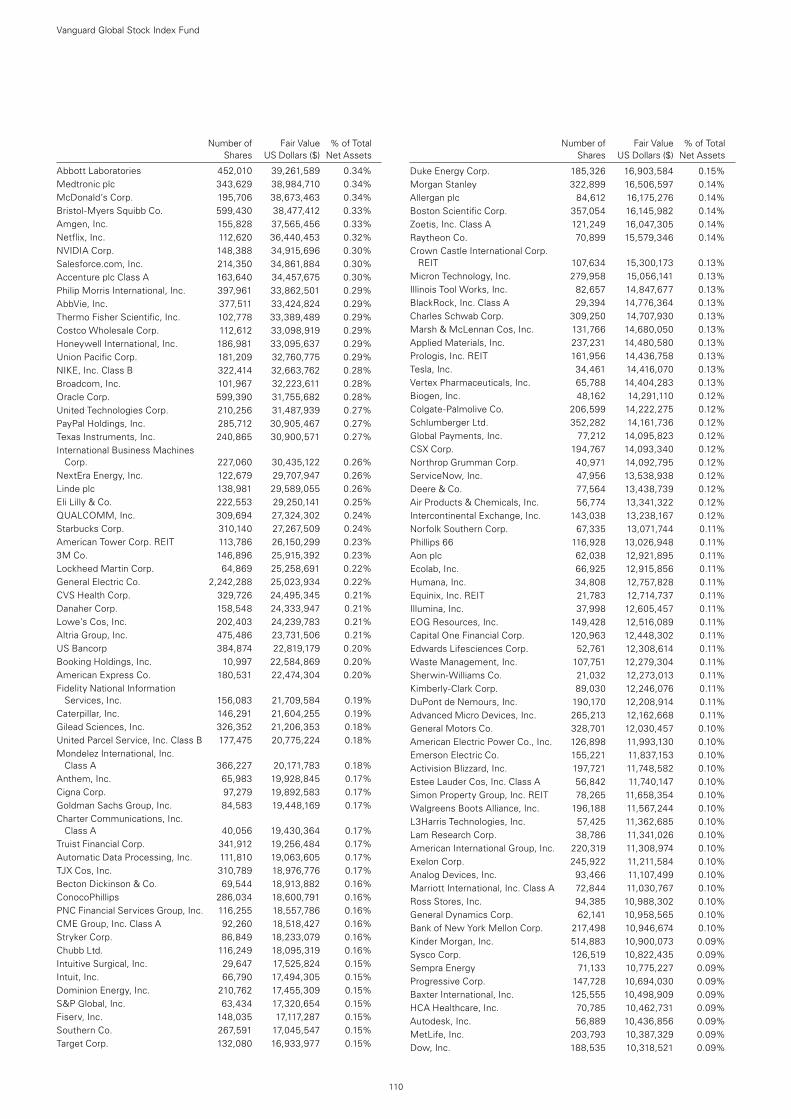
110
Number of Fair Value % of Total Shares US Dollars ($) Net Assets
Abbott Laboratories 452,010 39,261,589 0.34%Medtronic plc 343,629 38,984,710 0.34%McDonald’s Corp. 195,706 38,673,463 0.34%Bristol-Myers Squibb Co. 599,430 38,477,412 0.33%Amgen, Inc. 155,828 37,565,456 0.33%Netflix, Inc. 112,620 36,440,453 0.32%NVIDIA Corp. 148,388 34,915,696 0.30%Salesforce.com, Inc. 214,350 34,861,884 0.30%Accenture plc Class A 163,640 34,457,675 0.30%Philip Morris International, Inc. 397,961 33,862,501 0.29%AbbVie, Inc. 377,511 33,424,824 0.29%Thermo Fisher Scientific, Inc. 102,778 33,389,489 0.29%Costco Wholesale Corp. 112,612 33,098,919 0.29%Honeywell International, Inc. 186,981 33,095,637 0.29%Union Pacific Corp. 181,209 32,760,775 0.29%NIKE, Inc. Class B 322,414 32,663,762 0.28%Broadcom, Inc. 101,967 32,223,611 0.28%Oracle Corp. 599,390 31,755,682 0.28%United Technologies Corp. 210,256 31,487,939 0.27%PayPal Holdings, Inc. 285,712 30,905,467 0.27%Texas Instruments, Inc. 240,865 30,900,571 0.27%International Business Machines
Corp. 227,060 30,435,122 0.26%NextEra Energy, Inc. 122,679 29,707,947 0.26%Linde plc 138,981 29,589,055 0.26%Eli Lilly & Co. 222,553 29,250,141 0.25%QUALCOMM, Inc. 309,694 27,324,302 0.24%Starbucks Corp. 310,140 27,267,509 0.24%American Tower Corp. REIT 113,786 26,150,299 0.23%3M Co. 146,896 25,915,392 0.23%Lockheed Martin Corp. 64,869 25,258,691 0.22%General Electric Co. 2,242,288 25,023,934 0.22%CVS Health Corp. 329,726 24,495,345 0.21%Danaher Corp. 158,548 24,333,947 0.21%Lowe’s Cos, Inc. 202,403 24,239,783 0.21%Altria Group, Inc. 475,486 23,731,506 0.21%US Bancorp 384,874 22,819,179 0.20%Booking Holdings, Inc. 10,997 22,584,869 0.20%American Express Co. 180,531 22,474,304 0.20%Fidelity National Information
Services, Inc. 156,083 21,709,584 0.19%Caterpillar, Inc. 146,291 21,604,255 0.19%Gilead Sciences, Inc. 326,352 21,206,353 0.18%United Parcel Service, Inc. Class B 177,475 20,775,224 0.18%Mondelez International, Inc.
Class A 366,227 20,171,783 0.18%Anthem, Inc. 65,983 19,928,845 0.17%Cigna Corp. 97,279 19,892,583 0.17%Goldman Sachs Group, Inc. 84,583 19,448,169 0.17%Charter Communications, Inc.
Class A 40,056 19,430,364 0.17%Truist Financial Corp. 341,912 19,256,484 0.17%Automatic Data Processing, Inc. 111,810 19,063,605 0.17%TJX Cos, Inc. 310,789 18,976,776 0.17%Becton Dickinson & Co. 69,544 18,913,882 0.16%ConocoPhillips 286,034 18,600,791 0.16%PNC Financial Services Group, Inc. 116,255 18,557,786 0.16%CME Group, Inc. Class A 92,260 18,518,427 0.16%Stryker Corp. 86,849 18,233,079 0.16%Chubb Ltd. 116,249 18,095,319 0.16%Intuitive Surgical, Inc. 29,647 17,525,824 0.15%Intuit, Inc. 66,790 17,494,305 0.15%Dominion Energy, Inc. 210,762 17,455,309 0.15%S&P Global, Inc. 63,434 17,320,654 0.15%Fiserv, Inc. 148,035 17,117,287 0.15%Southern Co. 267,591 17,045,547 0.15%Target Corp. 132,080 16,933,977 0.15%
Duke Energy Corp. 185,326 16,903,584 0.15%Morgan Stanley 322,899 16,506,597 0.14%Allergan plc 84,612 16,175,276 0.14%Boston Scientific Corp. 357,054 16,145,982 0.14%Zoetis, Inc. Class A 121,249 16,047,305 0.14%Raytheon Co. 70,899 15,579,346 0.14%Crown Castle International Corp.
REIT 107,634 15,300,173 0.13%Micron Technology, Inc. 279,958 15,056,141 0.13%Illinois Tool Works, Inc. 82,657 14,847,677 0.13%BlackRock, Inc. Class A 29,394 14,776,364 0.13%Charles Schwab Corp. 309,250 14,707,930 0.13%Marsh & McLennan Cos, Inc. 131,766 14,680,050 0.13%Applied Materials, Inc. 237,231 14,480,580 0.13%Prologis, Inc. REIT 161,956 14,436,758 0.13%Tesla, Inc. 34,461 14,416,070 0.13%Vertex Pharmaceuticals, Inc. 65,788 14,404,283 0.13%Biogen, Inc. 48,162 14,291,110 0.12%Colgate-Palmolive Co. 206,599 14,222,275 0.12%Schlumberger Ltd. 352,282 14,161,736 0.12%Global Payments, Inc. 77,212 14,095,823 0.12%CSX Corp. 194,767 14,093,340 0.12%Northrop Grumman Corp. 40,971 14,092,795 0.12%ServiceNow, Inc. 47,956 13,538,938 0.12%Deere & Co. 77,564 13,438,739 0.12%Air Products & Chemicals, Inc. 56,774 13,341,322 0.12%Intercontinental Exchange, Inc. 143,038 13,238,167 0.12%Norfolk Southern Corp. 67,335 13,071,744 0.11%Phillips 66 116,928 13,026,948 0.11%Aon plc 62,038 12,921,895 0.11%Ecolab, Inc. 66,925 12,915,856 0.11%Humana, Inc. 34,808 12,757,828 0.11%Equinix, Inc. REIT 21,783 12,714,737 0.11%Illumina, Inc. 37,998 12,605,457 0.11%EOG Resources, Inc. 149,428 12,516,089 0.11%Capital One Financial Corp. 120,963 12,448,302 0.11%Edwards Lifesciences Corp. 52,761 12,308,614 0.11%Waste Management, Inc. 107,751 12,279,304 0.11%Sherwin-Williams Co. 21,032 12,273,013 0.11%Kimberly-Clark Corp. 89,030 12,246,076 0.11%DuPont de Nemours, Inc. 190,170 12,208,914 0.11%Advanced Micro Devices, Inc. 265,213 12,162,668 0.11%General Motors Co. 328,701 12,030,457 0.10%American Electric Power Co., Inc. 126,898 11,993,130 0.10%Emerson Electric Co. 155,221 11,837,153 0.10%Activision Blizzard, Inc. 197,721 11,748,582 0.10%Estee Lauder Cos, Inc. Class A 56,842 11,740,147 0.10%Simon Property Group, Inc. REIT 78,265 11,658,354 0.10%Walgreens Boots Alliance, Inc. 196,188 11,567,244 0.10%L3Harris Technologies, Inc. 57,425 11,362,685 0.10%Lam Research Corp. 38,786 11,341,026 0.10%American International Group, Inc. 220,319 11,308,974 0.10%Exelon Corp. 245,922 11,211,584 0.10%Analog Devices, Inc. 93,466 11,107,499 0.10%Marriott International, Inc. Class A 72,844 11,030,767 0.10%Ross Stores, Inc. 94,385 10,988,302 0.10%General Dynamics Corp. 62,141 10,958,565 0.10%Bank of New York Mellon Corp. 217,498 10,946,674 0.10%Kinder Morgan, Inc. 514,883 10,900,073 0.09%Sysco Corp. 126,519 10,822,435 0.09%Sempra Energy 71,133 10,775,227 0.09%Progressive Corp. 147,728 10,694,030 0.09%Baxter International, Inc. 125,555 10,498,909 0.09%HCA Healthcare, Inc. 70,785 10,462,731 0.09%Autodesk, Inc. 56,889 10,436,856 0.09%MetLife, Inc. 203,793 10,387,329 0.09%Dow, Inc. 188,535 10,318,521 0.09%
Number of Fair Value % of Total Shares US Dollars ($) Net Assets
Vanguard Global Stock Index Fund
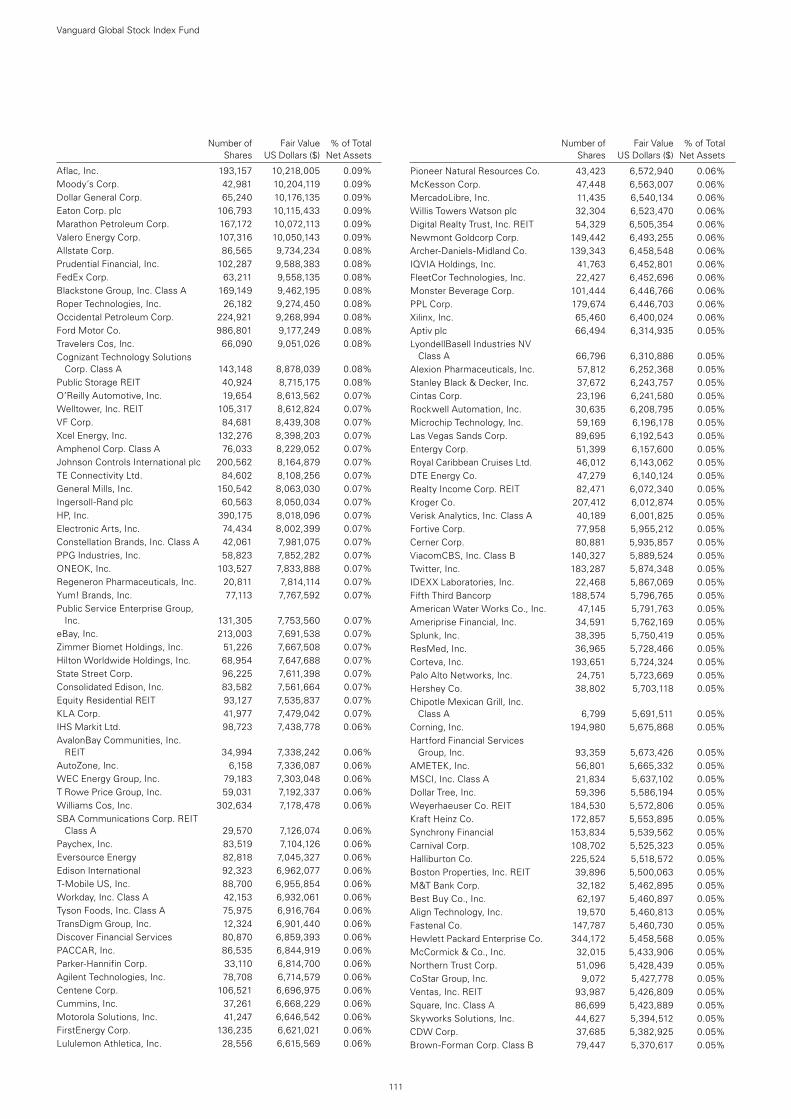
111
Number of Fair Value % of Total Shares US Dollars ($) Net Assets
Aflac, Inc. 193,157 10,218,005 0.09%Moody’s Corp. 42,981 10,204,119 0.09%Dollar General Corp. 65,240 10,176,135 0.09%Eaton Corp. plc 106,793 10,115,433 0.09%Marathon Petroleum Corp. 167,172 10,072,113 0.09%Valero Energy Corp. 107,316 10,050,143 0.09%Allstate Corp. 86,565 9,734,234 0.08%Prudential Financial, Inc. 102,287 9,588,383 0.08%FedEx Corp. 63,211 9,558,135 0.08%Blackstone Group, Inc. Class A 169,149 9,462,195 0.08%Roper Technologies, Inc. 26,182 9,274,450 0.08%Occidental Petroleum Corp. 224,921 9,268,994 0.08%Ford Motor Co. 986,801 9,177,249 0.08%Travelers Cos, Inc. 66,090 9,051,026 0.08%Cognizant Technology Solutions
Corp. Class A 143,148 8,878,039 0.08%Public Storage REIT 40,924 8,715,175 0.08%O’Reilly Automotive, Inc. 19,654 8,613,562 0.07%Welltower, Inc. REIT 105,317 8,612,824 0.07%VF Corp. 84,681 8,439,308 0.07%Xcel Energy, Inc. 132,276 8,398,203 0.07%Amphenol Corp. Class A 76,033 8,229,052 0.07%Johnson Controls International plc 200,562 8,164,879 0.07%TE Connectivity Ltd. 84,602 8,108,256 0.07%General Mills, Inc. 150,542 8,063,030 0.07%Ingersoll-Rand plc 60,563 8,050,034 0.07%HP, Inc. 390,175 8,018,096 0.07%Electronic Arts, Inc. 74,434 8,002,399 0.07%Constellation Brands, Inc. Class A 42,061 7,981,075 0.07%PPG Industries, Inc. 58,823 7,852,282 0.07%ONEOK, Inc. 103,527 7,833,888 0.07%Regeneron Pharmaceuticals, Inc. 20,811 7,814,114 0.07%Yum! Brands, Inc. 77,113 7,767,592 0.07%Public Service Enterprise Group,
Inc. 131,305 7,753,560 0.07%eBay, Inc. 213,003 7,691,538 0.07%Zimmer Biomet Holdings, Inc. 51,226 7,667,508 0.07%Hilton Worldwide Holdings, Inc. 68,954 7,647,688 0.07%State Street Corp. 96,225 7,611,398 0.07%Consolidated Edison, Inc. 83,582 7,561,664 0.07%Equity Residential REIT 93,127 7,535,837 0.07%KLA Corp. 41,977 7,479,042 0.07%IHS Markit Ltd. 98,723 7,438,778 0.06%AvalonBay Communities, Inc.
REIT 34,994 7,338,242 0.06%AutoZone, Inc. 6,158 7,336,087 0.06%WEC Energy Group, Inc. 79,183 7,303,048 0.06%T Rowe Price Group, Inc. 59,031 7,192,337 0.06%Williams Cos, Inc. 302,634 7,178,478 0.06%SBA Communications Corp. REIT
Class A 29,570 7,126,074 0.06%Paychex, Inc. 83,519 7,104,126 0.06%Eversource Energy 82,818 7,045,327 0.06%Edison International 92,323 6,962,077 0.06%T-Mobile US, Inc. 88,700 6,955,854 0.06%Workday, Inc. Class A 42,153 6,932,061 0.06%Tyson Foods, Inc. Class A 75,975 6,916,764 0.06%TransDigm Group, Inc. 12,324 6,901,440 0.06%Discover Financial Services 80,870 6,859,393 0.06%PACCAR, Inc. 86,535 6,844,919 0.06%Parker-Hannifin Corp. 33,110 6,814,700 0.06%Agilent Technologies, Inc. 78,708 6,714,579 0.06%Centene Corp. 106,521 6,696,975 0.06%Cummins, Inc. 37,261 6,668,229 0.06%Motorola Solutions, Inc. 41,247 6,646,542 0.06%FirstEnergy Corp. 136,235 6,621,021 0.06%Lululemon Athletica, Inc. 28,556 6,615,569 0.06%
Pioneer Natural Resources Co. 43,423 6,572,940 0.06%McKesson Corp. 47,448 6,563,007 0.06%MercadoLibre, Inc. 11,435 6,540,134 0.06%Willis Towers Watson plc 32,304 6,523,470 0.06%Digital Realty Trust, Inc. REIT 54,329 6,505,354 0.06%Newmont Goldcorp Corp. 149,442 6,493,255 0.06%Archer-Daniels-Midland Co. 139,343 6,458,548 0.06%IQVIA Holdings, Inc. 41,763 6,452,801 0.06%FleetCor Technologies, Inc. 22,427 6,452,696 0.06%Monster Beverage Corp. 101,444 6,446,766 0.06%PPL Corp. 179,674 6,446,703 0.06%Xilinx, Inc. 65,460 6,400,024 0.06%Aptiv plc 66,494 6,314,935 0.05%LyondellBasell Industries NV
Class A 66,796 6,310,886 0.05%Alexion Pharmaceuticals, Inc. 57,812 6,252,368 0.05%Stanley Black & Decker, Inc. 37,672 6,243,757 0.05%Cintas Corp. 23,196 6,241,580 0.05%Rockwell Automation, Inc. 30,635 6,208,795 0.05%Microchip Technology, Inc. 59,169 6,196,178 0.05%Las Vegas Sands Corp. 89,695 6,192,543 0.05%Entergy Corp. 51,399 6,157,600 0.05%Royal Caribbean Cruises Ltd. 46,012 6,143,062 0.05%DTE Energy Co. 47,279 6,140,124 0.05%Realty Income Corp. REIT 82,471 6,072,340 0.05%Kroger Co. 207,412 6,012,874 0.05%Verisk Analytics, Inc. Class A 40,189 6,001,825 0.05%Fortive Corp. 77,958 5,955,212 0.05%Cerner Corp. 80,881 5,935,857 0.05%ViacomCBS, Inc. Class B 140,327 5,889,524 0.05%Twitter, Inc. 183,287 5,874,348 0.05%IDEXX Laboratories, Inc. 22,468 5,867,069 0.05%Fifth Third Bancorp 188,574 5,796,765 0.05%American Water Works Co., Inc. 47,145 5,791,763 0.05%Ameriprise Financial, Inc. 34,591 5,762,169 0.05%Splunk, Inc. 38,395 5,750,419 0.05%ResMed, Inc. 36,965 5,728,466 0.05%Corteva, Inc. 193,651 5,724,324 0.05%Palo Alto Networks, Inc. 24,751 5,723,669 0.05%Hershey Co. 38,802 5,703,118 0.05%Chipotle Mexican Grill, Inc.
Class A 6,799 5,691,511 0.05%Corning, Inc. 194,980 5,675,868 0.05%Hartford Financial Services
Group, Inc. 93,359 5,673,426 0.05%AMETEK, Inc. 56,801 5,665,332 0.05%MSCI, Inc. Class A 21,834 5,637,102 0.05%Dollar Tree, Inc. 59,396 5,586,194 0.05%Weyerhaeuser Co. REIT 184,530 5,572,806 0.05%Kraft Heinz Co. 172,857 5,553,895 0.05%Synchrony Financial 153,834 5,539,562 0.05%Carnival Corp. 108,702 5,525,323 0.05%Halliburton Co. 225,524 5,518,572 0.05%Boston Properties, Inc. REIT 39,896 5,500,063 0.05%M&T Bank Corp. 32,182 5,462,895 0.05%Best Buy Co., Inc. 62,197 5,460,897 0.05%Align Technology, Inc. 19,570 5,460,813 0.05%Fastenal Co. 147,787 5,460,730 0.05%Hewlett Packard Enterprise Co. 344,172 5,458,568 0.05%McCormick & Co., Inc. 32,015 5,433,906 0.05%Northern Trust Corp. 51,096 5,428,439 0.05%CoStar Group, Inc. 9,072 5,427,778 0.05%Ventas, Inc. REIT 93,987 5,426,809 0.05%Square, Inc. Class A 86,699 5,423,889 0.05%Skyworks Solutions, Inc. 44,627 5,394,512 0.05%CDW Corp. 37,685 5,382,925 0.05%Brown-Forman Corp. Class B 79,447 5,370,617 0.05%
Number of Fair Value % of Total Shares US Dollars ($) Net Assets
Vanguard Global Stock Index Fund
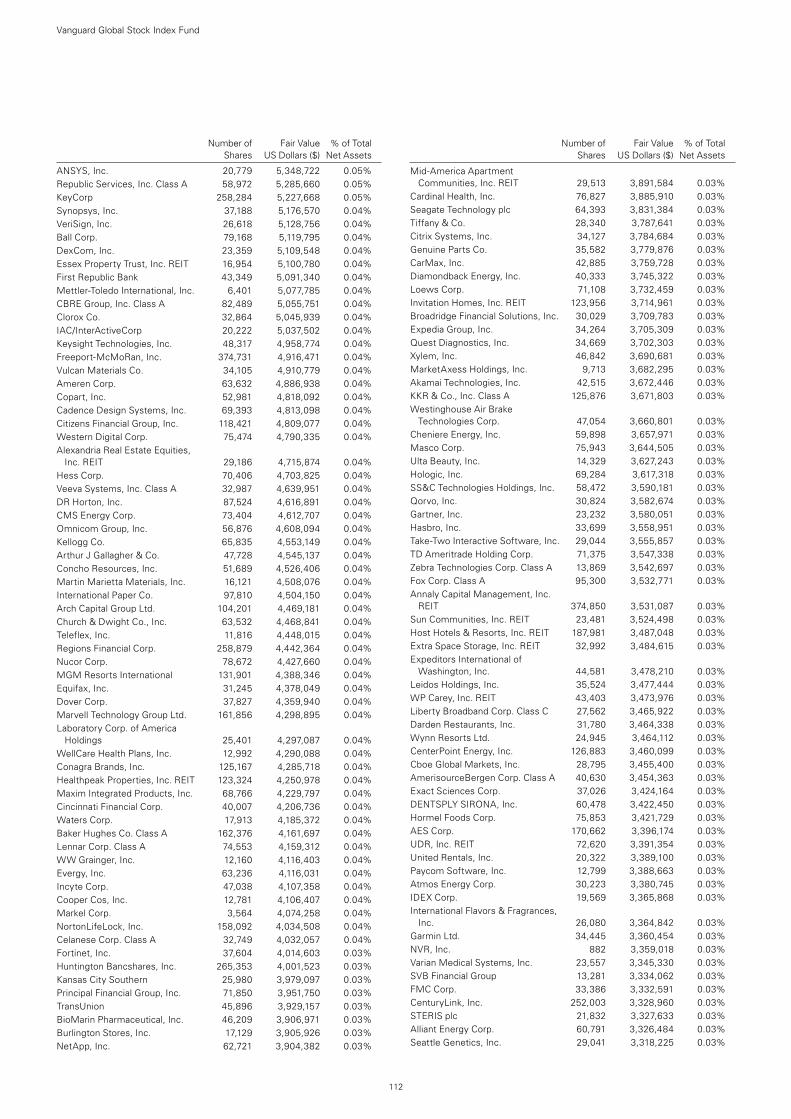
112
Number of Fair Value % of Total Shares US Dollars ($) Net Assets
ANSYS, Inc. 20,779 5,348,722 0.05%Republic Services, Inc. Class A 58,972 5,285,660 0.05%KeyCorp 258,284 5,227,668 0.05%Synopsys, Inc. 37,188 5,176,570 0.04%VeriSign, Inc. 26,618 5,128,756 0.04%Ball Corp. 79,168 5,119,795 0.04%DexCom, Inc. 23,359 5,109,548 0.04%Essex Property Trust, Inc. REIT 16,954 5,100,780 0.04%First Republic Bank 43,349 5,091,340 0.04%Mettler-Toledo International, Inc. 6,401 5,077,785 0.04%CBRE Group, Inc. Class A 82,489 5,055,751 0.04%Clorox Co. 32,864 5,045,939 0.04%IAC/InterActiveCorp 20,222 5,037,502 0.04%Keysight Technologies, Inc. 48,317 4,958,774 0.04%Freeport-McMoRan, Inc. 374,731 4,916,471 0.04%Vulcan Materials Co. 34,105 4,910,779 0.04%Ameren Corp. 63,632 4,886,938 0.04%Copart, Inc. 52,981 4,818,092 0.04%Cadence Design Systems, Inc. 69,393 4,813,098 0.04%Citizens Financial Group, Inc. 118,421 4,809,077 0.04%Western Digital Corp. 75,474 4,790,335 0.04%Alexandria Real Estate Equities,
Inc. REIT 29,186 4,715,874 0.04%Hess Corp. 70,406 4,703,825 0.04%Veeva Systems, Inc. Class A 32,987 4,639,951 0.04%DR Horton, Inc. 87,524 4,616,891 0.04%CMS Energy Corp. 73,404 4,612,707 0.04%Omnicom Group, Inc. 56,876 4,608,094 0.04%Kellogg Co. 65,835 4,553,149 0.04%Arthur J Gallagher & Co. 47,728 4,545,137 0.04%Concho Resources, Inc. 51,689 4,526,406 0.04%Martin Marietta Materials, Inc. 16,121 4,508,076 0.04%International Paper Co. 97,810 4,504,150 0.04%Arch Capital Group Ltd. 104,201 4,469,181 0.04%Church & Dwight Co., Inc. 63,532 4,468,841 0.04%Teleflex, Inc. 11,816 4,448,015 0.04%Regions Financial Corp. 258,879 4,442,364 0.04%Nucor Corp. 78,672 4,427,660 0.04%MGM Resorts International 131,901 4,388,346 0.04%Equifax, Inc. 31,245 4,378,049 0.04%Dover Corp. 37,827 4,359,940 0.04%Marvell Technology Group Ltd. 161,856 4,298,895 0.04%Laboratory Corp. of America
Holdings 25,401 4,297,087 0.04%WellCare Health Plans, Inc. 12,992 4,290,088 0.04%Conagra Brands, Inc. 125,167 4,285,718 0.04%Healthpeak Properties, Inc. REIT 123,324 4,250,978 0.04%Maxim Integrated Products, Inc. 68,766 4,229,797 0.04%Cincinnati Financial Corp. 40,007 4,206,736 0.04%Waters Corp. 17,913 4,185,372 0.04%Baker Hughes Co. Class A 162,376 4,161,697 0.04%Lennar Corp. Class A 74,553 4,159,312 0.04%WW Grainger, Inc. 12,160 4,116,403 0.04%Evergy, Inc. 63,236 4,116,031 0.04%Incyte Corp. 47,038 4,107,358 0.04%Cooper Cos, Inc. 12,781 4,106,407 0.04%Markel Corp. 3,564 4,074,258 0.04%NortonLifeLock, Inc. 158,092 4,034,508 0.04%Celanese Corp. Class A 32,749 4,032,057 0.04%Fortinet, Inc. 37,604 4,014,603 0.03%Huntington Bancshares, Inc. 265,353 4,001,523 0.03%Kansas City Southern 25,980 3,979,097 0.03%Principal Financial Group, Inc. 71,850 3,951,750 0.03%TransUnion 45,896 3,929,157 0.03%BioMarin Pharmaceutical, Inc. 46,209 3,906,971 0.03%Burlington Stores, Inc. 17,129 3,905,926 0.03%NetApp, Inc. 62,721 3,904,382 0.03%
Mid-America Apartment Communities, Inc. REIT 29,513 3,891,584 0.03%
Cardinal Health, Inc. 76,827 3,885,910 0.03%Seagate Technology plc 64,393 3,831,384 0.03%Tiffany & Co. 28,340 3,787,641 0.03%Citrix Systems, Inc. 34,127 3,784,684 0.03%Genuine Parts Co. 35,582 3,779,876 0.03%CarMax, Inc. 42,885 3,759,728 0.03%Diamondback Energy, Inc. 40,333 3,745,322 0.03%Loews Corp. 71,108 3,732,459 0.03%Invitation Homes, Inc. REIT 123,956 3,714,961 0.03%Broadridge Financial Solutions, Inc. 30,029 3,709,783 0.03%Expedia Group, Inc. 34,264 3,705,309 0.03%Quest Diagnostics, Inc. 34,669 3,702,303 0.03%Xylem, Inc. 46,842 3,690,681 0.03%MarketAxess Holdings, Inc. 9,713 3,682,295 0.03%Akamai Technologies, Inc. 42,515 3,672,446 0.03%KKR & Co., Inc. Class A 125,876 3,671,803 0.03%Westinghouse Air Brake
Technologies Corp. 47,054 3,660,801 0.03%Cheniere Energy, Inc. 59,898 3,657,971 0.03%Masco Corp. 75,943 3,644,505 0.03%Ulta Beauty, Inc. 14,329 3,627,243 0.03%Hologic, Inc. 69,284 3,617,318 0.03%SS&C Technologies Holdings, Inc. 58,472 3,590,181 0.03%Qorvo, Inc. 30,824 3,582,674 0.03%Gartner, Inc. 23,232 3,580,051 0.03%Hasbro, Inc. 33,699 3,558,951 0.03%Take-Two Interactive Software, Inc. 29,044 3,555,857 0.03%TD Ameritrade Holding Corp. 71,375 3,547,338 0.03%Zebra Technologies Corp. Class A 13,869 3,542,697 0.03%Fox Corp. Class A 95,300 3,532,771 0.03%Annaly Capital Management, Inc.
REIT 374,850 3,531,087 0.03%Sun Communities, Inc. REIT 23,481 3,524,498 0.03%Host Hotels & Resorts, Inc. REIT 187,981 3,487,048 0.03%Extra Space Storage, Inc. REIT 32,992 3,484,615 0.03%Expeditors International of
Washington, Inc. 44,581 3,478,210 0.03%Leidos Holdings, Inc. 35,524 3,477,444 0.03%WP Carey, Inc. REIT 43,403 3,473,976 0.03%Liberty Broadband Corp. Class C 27,562 3,465,922 0.03%Darden Restaurants, Inc. 31,780 3,464,338 0.03%Wynn Resorts Ltd. 24,945 3,464,112 0.03%CenterPoint Energy, Inc. 126,883 3,460,099 0.03%Cboe Global Markets, Inc. 28,795 3,455,400 0.03%AmerisourceBergen Corp. Class A 40,630 3,454,363 0.03%Exact Sciences Corp. 37,026 3,424,164 0.03%DENTSPLY SIRONA, Inc. 60,478 3,422,450 0.03%Hormel Foods Corp. 75,853 3,421,729 0.03%AES Corp. 170,662 3,396,174 0.03%UDR, Inc. REIT 72,620 3,391,354 0.03%United Rentals, Inc. 20,322 3,389,100 0.03%Paycom Software, Inc. 12,799 3,388,663 0.03%Atmos Energy Corp. 30,223 3,380,745 0.03%IDEX Corp. 19,569 3,365,868 0.03%International Flavors & Fragrances,
Inc. 26,080 3,364,842 0.03%Garmin Ltd. 34,445 3,360,454 0.03%NVR, Inc. 882 3,359,018 0.03%Varian Medical Systems, Inc. 23,557 3,345,330 0.03%SVB Financial Group 13,281 3,334,062 0.03%FMC Corp. 33,386 3,332,591 0.03%CenturyLink, Inc. 252,003 3,328,960 0.03%STERIS plc 21,832 3,327,633 0.03%Alliant Energy Corp. 60,791 3,326,484 0.03%Seattle Genetics, Inc. 29,041 3,318,225 0.03%
Number of Fair Value % of Total Shares US Dollars ($) Net Assets
Vanguard Global Stock Index Fund
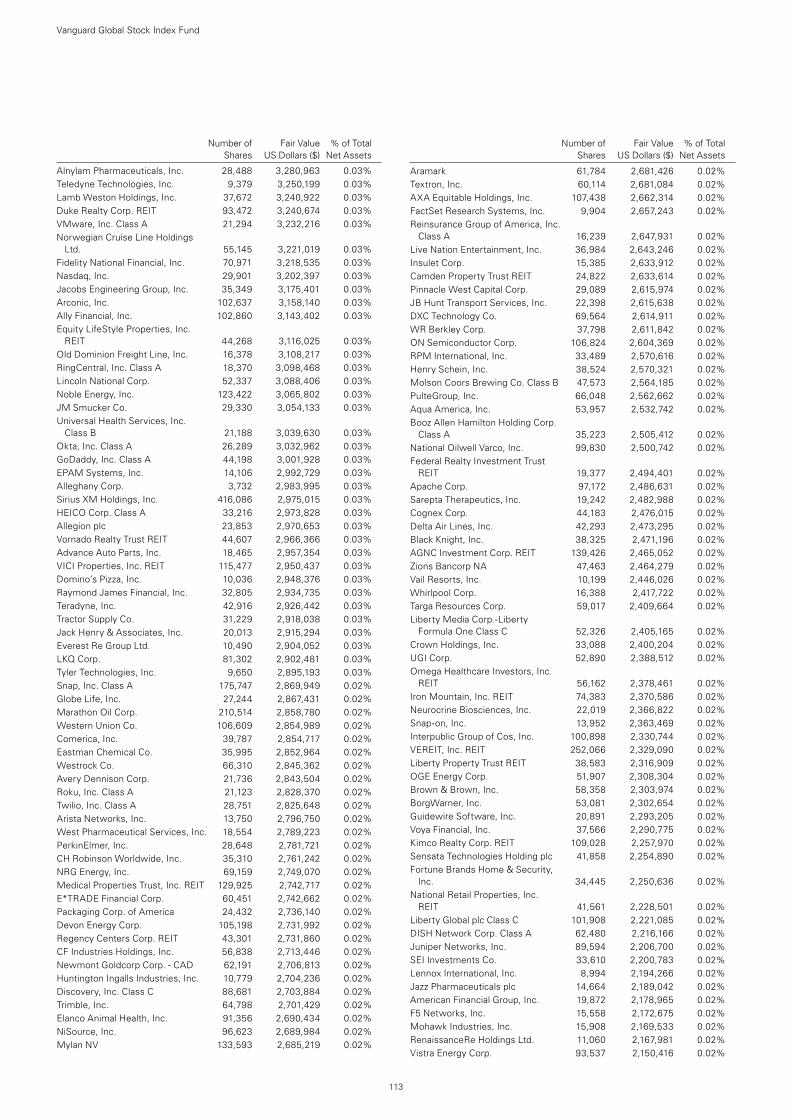
113
Number of Fair Value % of Total Shares US Dollars ($) Net Assets
Alnylam Pharmaceuticals, Inc. 28,488 3,280,963 0.03%Teledyne Technologies, Inc. 9,379 3,250,199 0.03%Lamb Weston Holdings, Inc. 37,672 3,240,922 0.03%Duke Realty Corp. REIT 93,472 3,240,674 0.03%VMware, Inc. Class A 21,294 3,232,216 0.03%Norwegian Cruise Line Holdings
Ltd. 55,145 3,221,019 0.03%Fidelity National Financial, Inc. 70,971 3,218,535 0.03%Nasdaq, Inc. 29,901 3,202,397 0.03%Jacobs Engineering Group, Inc. 35,349 3,175,401 0.03%Arconic, Inc. 102,637 3,158,140 0.03%Ally Financial, Inc. 102,860 3,143,402 0.03%Equity LifeStyle Properties, Inc.
REIT 44,268 3,116,025 0.03%Old Dominion Freight Line, Inc. 16,378 3,108,217 0.03%RingCentral, Inc. Class A 18,370 3,098,468 0.03%Lincoln National Corp. 52,337 3,088,406 0.03%Noble Energy, Inc. 123,422 3,065,802 0.03%JM Smucker Co. 29,330 3,054,133 0.03%Universal Health Services, Inc.
Class B 21,188 3,039,630 0.03%Okta, Inc. Class A 26,289 3,032,962 0.03%GoDaddy, Inc. Class A 44,198 3,001,928 0.03%EPAM Systems, Inc. 14,106 2,992,729 0.03%Alleghany Corp. 3,732 2,983,995 0.03%Sirius XM Holdings, Inc. 416,086 2,975,015 0.03%HEICO Corp. Class A 33,216 2,973,828 0.03%Allegion plc 23,853 2,970,653 0.03%Vornado Realty Trust REIT 44,607 2,966,366 0.03%Advance Auto Parts, Inc. 18,465 2,957,354 0.03%VICI Properties, Inc. REIT 115,477 2,950,437 0.03%Domino’s Pizza, Inc. 10,036 2,948,376 0.03%Raymond James Financial, Inc. 32,805 2,934,735 0.03%Teradyne, Inc. 42,916 2,926,442 0.03%Tractor Supply Co. 31,229 2,918,038 0.03%Jack Henry & Associates, Inc. 20,013 2,915,294 0.03%Everest Re Group Ltd. 10,490 2,904,052 0.03%LKQ Corp. 81,302 2,902,481 0.03%Tyler Technologies, Inc. 9,650 2,895,193 0.03%Snap, Inc. Class A 175,747 2,869,949 0.02%Globe Life, Inc. 27,244 2,867,431 0.02%Marathon Oil Corp. 210,514 2,858,780 0.02%Western Union Co. 106,609 2,854,989 0.02%Comerica, Inc. 39,787 2,854,717 0.02%Eastman Chemical Co. 35,995 2,852,964 0.02%Westrock Co. 66,310 2,845,362 0.02%Avery Dennison Corp. 21,736 2,843,504 0.02%Roku, Inc. Class A 21,123 2,828,370 0.02%Twilio, Inc. Class A 28,751 2,825,648 0.02%Arista Networks, Inc. 13,750 2,796,750 0.02%West Pharmaceutical Services, Inc. 18,554 2,789,223 0.02%PerkinElmer, Inc. 28,648 2,781,721 0.02%CH Robinson Worldwide, Inc. 35,310 2,761,242 0.02%NRG Energy, Inc. 69,159 2,749,070 0.02%Medical Properties Trust, Inc. REIT 129,925 2,742,717 0.02%E*TRADE Financial Corp. 60,451 2,742,662 0.02%Packaging Corp. of America 24,432 2,736,140 0.02%Devon Energy Corp. 105,198 2,731,992 0.02%Regency Centers Corp. REIT 43,301 2,731,860 0.02%CF Industries Holdings, Inc. 56,838 2,713,446 0.02%Newmont Goldcorp Corp. - CAD 62,191 2,706,813 0.02%Huntington Ingalls Industries, Inc. 10,779 2,704,236 0.02%Discovery, Inc. Class C 88,681 2,703,884 0.02%Trimble, Inc. 64,798 2,701,429 0.02%Elanco Animal Health, Inc. 91,356 2,690,434 0.02%NiSource, Inc. 96,623 2,689,984 0.02%Mylan NV 133,593 2,685,219 0.02%
Aramark 61,784 2,681,426 0.02%Textron, Inc. 60,114 2,681,084 0.02%AXA Equitable Holdings, Inc. 107,438 2,662,314 0.02%FactSet Research Systems, Inc. 9,904 2,657,243 0.02%Reinsurance Group of America, Inc.
Class A 16,239 2,647,931 0.02%Live Nation Entertainment, Inc. 36,984 2,643,246 0.02%Insulet Corp. 15,385 2,633,912 0.02%Camden Property Trust REIT 24,822 2,633,614 0.02%Pinnacle West Capital Corp. 29,089 2,615,974 0.02%JB Hunt Transport Services, Inc. 22,398 2,615,638 0.02%DXC Technology Co. 69,564 2,614,911 0.02%WR Berkley Corp. 37,798 2,611,842 0.02%ON Semiconductor Corp. 106,824 2,604,369 0.02%RPM International, Inc. 33,489 2,570,616 0.02%Henry Schein, Inc. 38,524 2,570,321 0.02%Molson Coors Brewing Co. Class B 47,573 2,564,185 0.02%PulteGroup, Inc. 66,048 2,562,662 0.02%Aqua America, Inc. 53,957 2,532,742 0.02%Booz Allen Hamilton Holding Corp.
Class A 35,223 2,505,412 0.02%National Oilwell Varco, Inc. 99,830 2,500,742 0.02%Federal Realty Investment Trust
REIT 19,377 2,494,401 0.02%Apache Corp. 97,172 2,486,631 0.02%Sarepta Therapeutics, Inc. 19,242 2,482,988 0.02%Cognex Corp. 44,183 2,476,015 0.02%Delta Air Lines, Inc. 42,293 2,473,295 0.02%Black Knight, Inc. 38,325 2,471,196 0.02%AGNC Investment Corp. REIT 139,426 2,465,052 0.02%Zions Bancorp NA 47,463 2,464,279 0.02%Vail Resorts, Inc. 10,199 2,446,026 0.02%Whirlpool Corp. 16,388 2,417,722 0.02%Targa Resources Corp. 59,017 2,409,664 0.02%Liberty Media Corp.-Liberty
Formula One Class C 52,326 2,405,165 0.02%Crown Holdings, Inc. 33,088 2,400,204 0.02%UGI Corp. 52,890 2,388,512 0.02%Omega Healthcare Investors, Inc.
REIT 56,162 2,378,461 0.02%Iron Mountain, Inc. REIT 74,383 2,370,586 0.02%Neurocrine Biosciences, Inc. 22,019 2,366,822 0.02%Snap-on, Inc. 13,952 2,363,469 0.02%Interpublic Group of Cos, Inc. 100,898 2,330,744 0.02%VEREIT, Inc. REIT 252,066 2,329,090 0.02%Liberty Property Trust REIT 38,583 2,316,909 0.02%OGE Energy Corp. 51,907 2,308,304 0.02%Brown & Brown, Inc. 58,358 2,303,974 0.02%BorgWarner, Inc. 53,081 2,302,654 0.02%Guidewire Software, Inc. 20,891 2,293,205 0.02%Voya Financial, Inc. 37,566 2,290,775 0.02%Kimco Realty Corp. REIT 109,028 2,257,970 0.02%Sensata Technologies Holding plc 41,858 2,254,890 0.02%Fortune Brands Home & Security,
Inc. 34,445 2,250,636 0.02%National Retail Properties, Inc.
REIT 41,561 2,228,501 0.02%Liberty Global plc Class C 101,908 2,221,085 0.02%DISH Network Corp. Class A 62,480 2,216,166 0.02%Juniper Networks, Inc. 89,594 2,206,700 0.02%SEI Investments Co. 33,610 2,200,783 0.02%Lennox International, Inc. 8,994 2,194,266 0.02%Jazz Pharmaceuticals plc 14,664 2,189,042 0.02%American Financial Group, Inc. 19,872 2,178,965 0.02%F5 Networks, Inc. 15,558 2,172,675 0.02%Mohawk Industries, Inc. 15,908 2,169,533 0.02%RenaissanceRe Holdings Ltd. 11,060 2,167,981 0.02%Vistra Energy Corp. 93,537 2,150,416 0.02%
Number of Fair Value % of Total Shares US Dollars ($) Net Assets
Vanguard Global Stock Index Fund
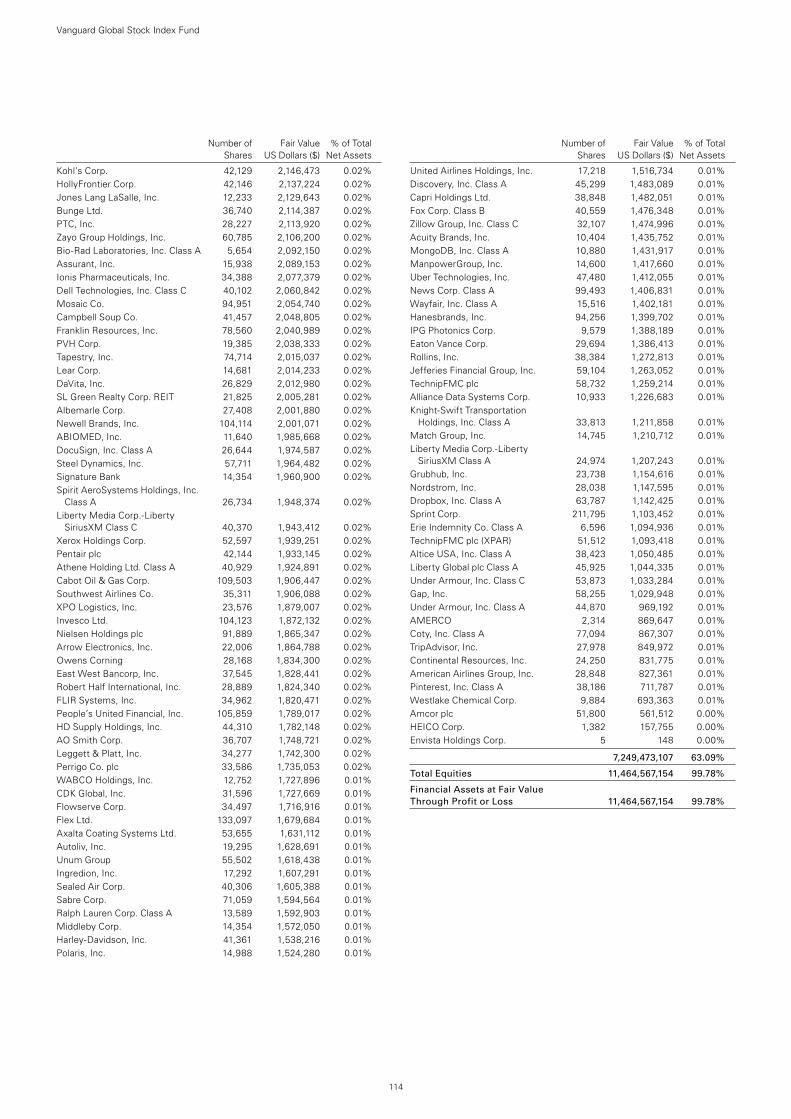
114
Number of Fair Value % of Total Shares US Dollars ($) Net Assets
Kohl’s Corp. 42,129 2,146,473 0.02%HollyFrontier Corp. 42,146 2,137,224 0.02%Jones Lang LaSalle, Inc. 12,233 2,129,643 0.02%Bunge Ltd. 36,740 2,114,387 0.02%PTC, Inc. 28,227 2,113,920 0.02%Zayo Group Holdings, Inc. 60,785 2,106,200 0.02%Bio-Rad Laboratories, Inc. Class A 5,654 2,092,150 0.02%Assurant, Inc. 15,938 2,089,153 0.02%Ionis Pharmaceuticals, Inc. 34,388 2,077,379 0.02%Dell Technologies, Inc. Class C 40,102 2,060,842 0.02%Mosaic Co. 94,951 2,054,740 0.02%Campbell Soup Co. 41,457 2,048,805 0.02%Franklin Resources, Inc. 78,560 2,040,989 0.02%PVH Corp. 19,385 2,038,333 0.02%Tapestry, Inc. 74,714 2,015,037 0.02%Lear Corp. 14,681 2,014,233 0.02%DaVita, Inc. 26,829 2,012,980 0.02%SL Green Realty Corp. REIT 21,825 2,005,281 0.02%Albemarle Corp. 27,408 2,001,880 0.02%Newell Brands, Inc. 104,114 2,001,071 0.02%ABIOMED, Inc. 11,640 1,985,668 0.02%DocuSign, Inc. Class A 26,644 1,974,587 0.02%Steel Dynamics, Inc. 57,711 1,964,482 0.02%Signature Bank 14,354 1,960,900 0.02%Spirit AeroSystems Holdings, Inc.
Class A 26,734 1,948,374 0.02%Liberty Media Corp.-Liberty
SiriusXM Class C 40,370 1,943,412 0.02%Xerox Holdings Corp. 52,597 1,939,251 0.02%Pentair plc 42,144 1,933,145 0.02%Athene Holding Ltd. Class A 40,929 1,924,891 0.02%Cabot Oil & Gas Corp. 109,503 1,906,447 0.02%Southwest Airlines Co. 35,311 1,906,088 0.02%XPO Logistics, Inc. 23,576 1,879,007 0.02%Invesco Ltd. 104,123 1,872,132 0.02%Nielsen Holdings plc 91,889 1,865,347 0.02%Arrow Electronics, Inc. 22,006 1,864,788 0.02%Owens Corning 28,168 1,834,300 0.02%East West Bancorp, Inc. 37,545 1,828,441 0.02%Robert Half International, Inc. 28,889 1,824,340 0.02%FLIR Systems, Inc. 34,962 1,820,471 0.02%People’s United Financial, Inc. 105,859 1,789,017 0.02%HD Supply Holdings, Inc. 44,310 1,782,148 0.02%AO Smith Corp. 36,707 1,748,721 0.02%Leggett & Platt, Inc. 34,277 1,742,300 0.02%Perrigo Co. plc 33,586 1,735,053 0.02%WABCO Holdings, Inc. 12,752 1,727,896 0.01%CDK Global, Inc. 31,596 1,727,669 0.01%Flowserve Corp. 34,497 1,716,916 0.01%Flex Ltd. 133,097 1,679,684 0.01%Axalta Coating Systems Ltd. 53,655 1,631,112 0.01%Autoliv, Inc. 19,295 1,628,691 0.01%Unum Group 55,502 1,618,438 0.01%Ingredion, Inc. 17,292 1,607,291 0.01%Sealed Air Corp. 40,306 1,605,388 0.01%Sabre Corp. 71,059 1,594,564 0.01%Ralph Lauren Corp. Class A 13,589 1,592,903 0.01%Middleby Corp. 14,354 1,572,050 0.01%Harley-Davidson, Inc. 41,361 1,538,216 0.01%Polaris, Inc. 14,988 1,524,280 0.01%
United Airlines Holdings, Inc. 17,218 1,516,734 0.01%Discovery, Inc. Class A 45,299 1,483,089 0.01%Capri Holdings Ltd. 38,848 1,482,051 0.01%Fox Corp. Class B 40,559 1,476,348 0.01%Zillow Group, Inc. Class C 32,107 1,474,996 0.01%Acuity Brands, Inc. 10,404 1,435,752 0.01%MongoDB, Inc. Class A 10,880 1,431,917 0.01%ManpowerGroup, Inc. 14,600 1,417,660 0.01%Uber Technologies, Inc. 47,480 1,412,055 0.01%News Corp. Class A 99,493 1,406,831 0.01%Wayfair, Inc. Class A 15,516 1,402,181 0.01%Hanesbrands, Inc. 94,256 1,399,702 0.01%IPG Photonics Corp. 9,579 1,388,189 0.01%Eaton Vance Corp. 29,694 1,386,413 0.01%Rollins, Inc. 38,384 1,272,813 0.01%Jefferies Financial Group, Inc. 59,104 1,263,052 0.01%TechnipFMC plc 58,732 1,259,214 0.01%Alliance Data Systems Corp. 10,933 1,226,683 0.01%Knight-Swift Transportation
Holdings, Inc. Class A 33,813 1,211,858 0.01%Match Group, Inc. 14,745 1,210,712 0.01%Liberty Media Corp.-Liberty
SiriusXM Class A 24,974 1,207,243 0.01%Grubhub, Inc. 23,738 1,154,616 0.01%Nordstrom, Inc. 28,038 1,147,595 0.01%Dropbox, Inc. Class A 63,787 1,142,425 0.01%Sprint Corp. 211,795 1,103,452 0.01%Erie Indemnity Co. Class A 6,596 1,094,936 0.01%TechnipFMC plc (XPAR) 51,512 1,093,418 0.01%Altice USA, Inc. Class A 38,423 1,050,485 0.01%Liberty Global plc Class A 45,925 1,044,335 0.01%Under Armour, Inc. Class C 53,873 1,033,284 0.01%Gap, Inc. 58,255 1,029,948 0.01%Under Armour, Inc. Class A 44,870 969,192 0.01%AMERCO 2,314 869,647 0.01%Coty, Inc. Class A 77,094 867,307 0.01%TripAdvisor, Inc. 27,978 849,972 0.01%Continental Resources, Inc. 24,250 831,775 0.01%American Airlines Group, Inc. 28,848 827,361 0.01%Pinterest, Inc. Class A 38,186 711,787 0.01%Westlake Chemical Corp. 9,884 693,363 0.01%Amcor plc 51,800 561,512 0.00%HEICO Corp. 1,382 157,755 0.00%Envista Holdings Corp. 5 148 0.00%
7,249,473,107 63.09%
Total Equities 11,464,567,154 99.78%
Financial Assets at Fair Value Through Profit or Loss 11,464,567,154 99.78%
Number of Fair Value % of Total Shares US Dollars ($) Net Assets
Vanguard Global Stock Index Fund
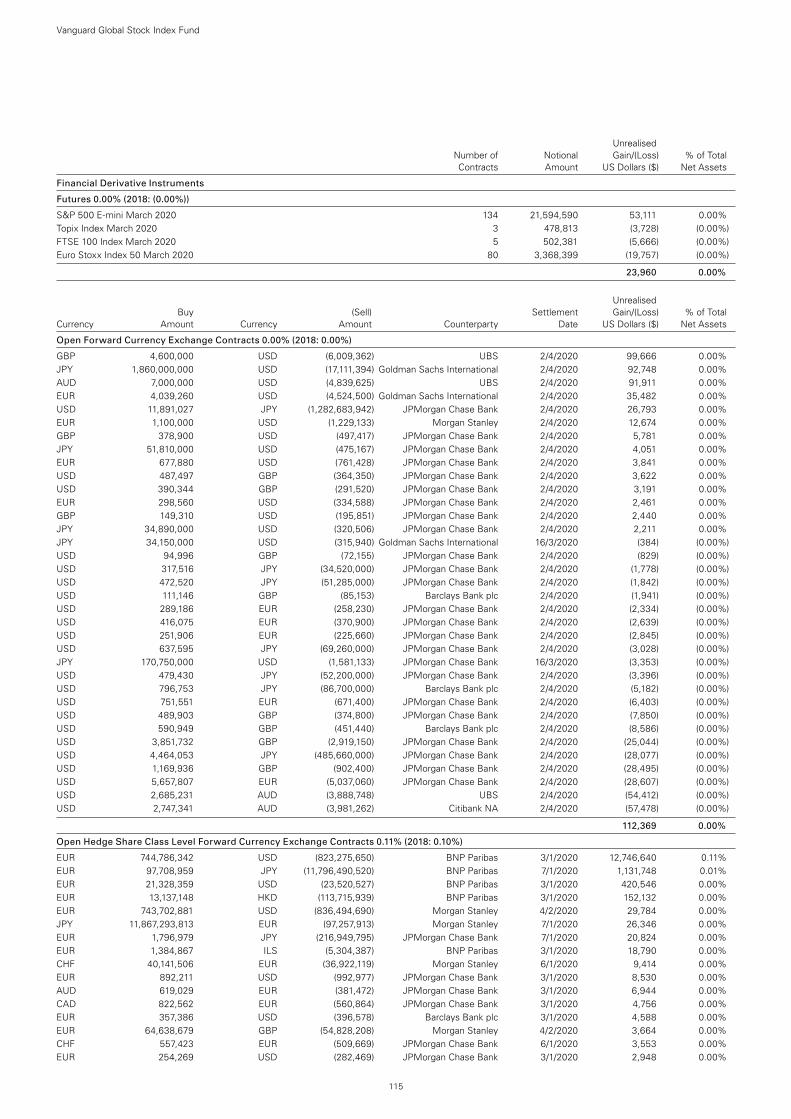
115
Vanguard Global Stock Index Fund
Unrealised Number of Notional Gain/(Loss) % of Total Contracts Amount US Dollars ($) Net Assets
Financial Derivative Instruments
Futures 0.00% (2018: (0.00%))
S&P 500 E-mini March 2020 134 21,594,590 53,111 0.00%Topix Index March 2020 3 478,813 (3,728) (0.00%)FTSE 100 Index March 2020 5 502,381 (5,666) (0.00%)Euro Stoxx Index 50 March 2020 80 3,368,399 (19,757) (0.00%)
23,960 0.00%
Unrealised Buy (Sell) Settlement Gain/(Loss) % of Total Currency Amount Currency Amount Counterparty Date US Dollars ($) Net Assets
Open Forward Currency Exchange Contracts 0.00% (2018: 0.00%)
GBP 4,600,000 USD (6,009,362) UBS 2/4/2020 99,666 0.00%JPY 1,860,000,000 USD (17,111,394) Goldman Sachs International 2/4/2020 92,748 0.00%AUD 7,000,000 USD (4,839,625) UBS 2/4/2020 91,911 0.00%EUR 4,039,260 USD (4,524,500) Goldman Sachs International 2/4/2020 35,482 0.00%USD 11,891,027 JPY (1,282,683,942) JPMorgan Chase Bank 2/4/2020 26,793 0.00%EUR 1,100,000 USD (1,229,133) Morgan Stanley 2/4/2020 12,674 0.00%GBP 378,900 USD (497,417) JPMorgan Chase Bank 2/4/2020 5,781 0.00%JPY 51,810,000 USD (475,167) JPMorgan Chase Bank 2/4/2020 4,051 0.00%EUR 677,880 USD (761,428) JPMorgan Chase Bank 2/4/2020 3,841 0.00%USD 487,497 GBP (364,350) JPMorgan Chase Bank 2/4/2020 3,622 0.00%USD 390,344 GBP (291,520) JPMorgan Chase Bank 2/4/2020 3,191 0.00%EUR 298,560 USD (334,588) JPMorgan Chase Bank 2/4/2020 2,461 0.00%GBP 149,310 USD (195,851) JPMorgan Chase Bank 2/4/2020 2,440 0.00%JPY 34,890,000 USD (320,506) JPMorgan Chase Bank 2/4/2020 2,211 0.00%JPY 34,150,000 USD (315,940) Goldman Sachs International 16/3/2020 (384) (0.00%)USD 94,996 GBP (72,155) JPMorgan Chase Bank 2/4/2020 (829) (0.00%)USD 317,516 JPY (34,520,000) JPMorgan Chase Bank 2/4/2020 (1,778) (0.00%)USD 472,520 JPY (51,285,000) JPMorgan Chase Bank 2/4/2020 (1,842) (0.00%)USD 111,146 GBP (85,153) Barclays Bank plc 2/4/2020 (1,941) (0.00%)USD 289,186 EUR (258,230) JPMorgan Chase Bank 2/4/2020 (2,334) (0.00%)USD 416,075 EUR (370,900) JPMorgan Chase Bank 2/4/2020 (2,639) (0.00%)USD 251,906 EUR (225,660) JPMorgan Chase Bank 2/4/2020 (2,845) (0.00%)USD 637,595 JPY (69,260,000) JPMorgan Chase Bank 2/4/2020 (3,028) (0.00%)JPY 170,750,000 USD (1,581,133) JPMorgan Chase Bank 16/3/2020 (3,353) (0.00%)USD 479,430 JPY (52,200,000) JPMorgan Chase Bank 2/4/2020 (3,396) (0.00%)USD 796,753 JPY (86,700,000) Barclays Bank plc 2/4/2020 (5,182) (0.00%)USD 751,551 EUR (671,400) JPMorgan Chase Bank 2/4/2020 (6,403) (0.00%)USD 489,903 GBP (374,800) JPMorgan Chase Bank 2/4/2020 (7,850) (0.00%)USD 590,949 GBP (451,440) Barclays Bank plc 2/4/2020 (8,586) (0.00%)USD 3,851,732 GBP (2,919,150) JPMorgan Chase Bank 2/4/2020 (25,044) (0.00%)USD 4,464,053 JPY (485,660,000) JPMorgan Chase Bank 2/4/2020 (28,077) (0.00%)USD 1,169,936 GBP (902,400) JPMorgan Chase Bank 2/4/2020 (28,495) (0.00%)USD 5,657,807 EUR (5,037,060) JPMorgan Chase Bank 2/4/2020 (28,607) (0.00%)USD 2,685,231 AUD (3,888,748) UBS 2/4/2020 (54,412) (0.00%)USD 2,747,341 AUD (3,981,262) Citibank NA 2/4/2020 (57,478) (0.00%)
112,369 0.00%
Open Hedge Share Class Level Forward Currency Exchange Contracts 0.11% (2018: 0.10%)
EUR 744,786,342 USD (823,275,650) BNP Paribas 3/1/2020 12,746,640 0.11%EUR 97,708,959 JPY (11,796,490,520) BNP Paribas 7/1/2020 1,131,748 0.01%EUR 21,328,359 USD (23,520,527) BNP Paribas 3/1/2020 420,546 0.00%EUR 13,137,148 HKD (113,715,939) BNP Paribas 3/1/2020 152,132 0.00%EUR 743,702,881 USD (836,494,690) Morgan Stanley 4/2/2020 29,784 0.00%JPY 11,867,293,813 EUR (97,257,913) Morgan Stanley 7/1/2020 26,346 0.00%EUR 1,796,979 JPY (216,949,795) JPMorgan Chase Bank 7/1/2020 20,824 0.00%EUR 1,384,867 ILS (5,304,387) BNP Paribas 3/1/2020 18,790 0.00%CHF 40,141,506 EUR (36,922,119) Morgan Stanley 6/1/2020 9,414 0.00%EUR 892,211 USD (992,977) JPMorgan Chase Bank 3/1/2020 8,530 0.00%AUD 619,029 EUR (381,472) JPMorgan Chase Bank 3/1/2020 6,944 0.00%CAD 822,562 EUR (560,864) JPMorgan Chase Bank 3/1/2020 4,756 0.00%EUR 357,386 USD (396,578) Barclays Bank plc 3/1/2020 4,588 0.00%EUR 64,638,679 GBP (54,828,208) Morgan Stanley 4/2/2020 3,664 0.00%CHF 557,423 EUR (509,669) JPMorgan Chase Bank 6/1/2020 3,553 0.00%EUR 254,269 USD (282,469) JPMorgan Chase Bank 3/1/2020 2,948 0.00%
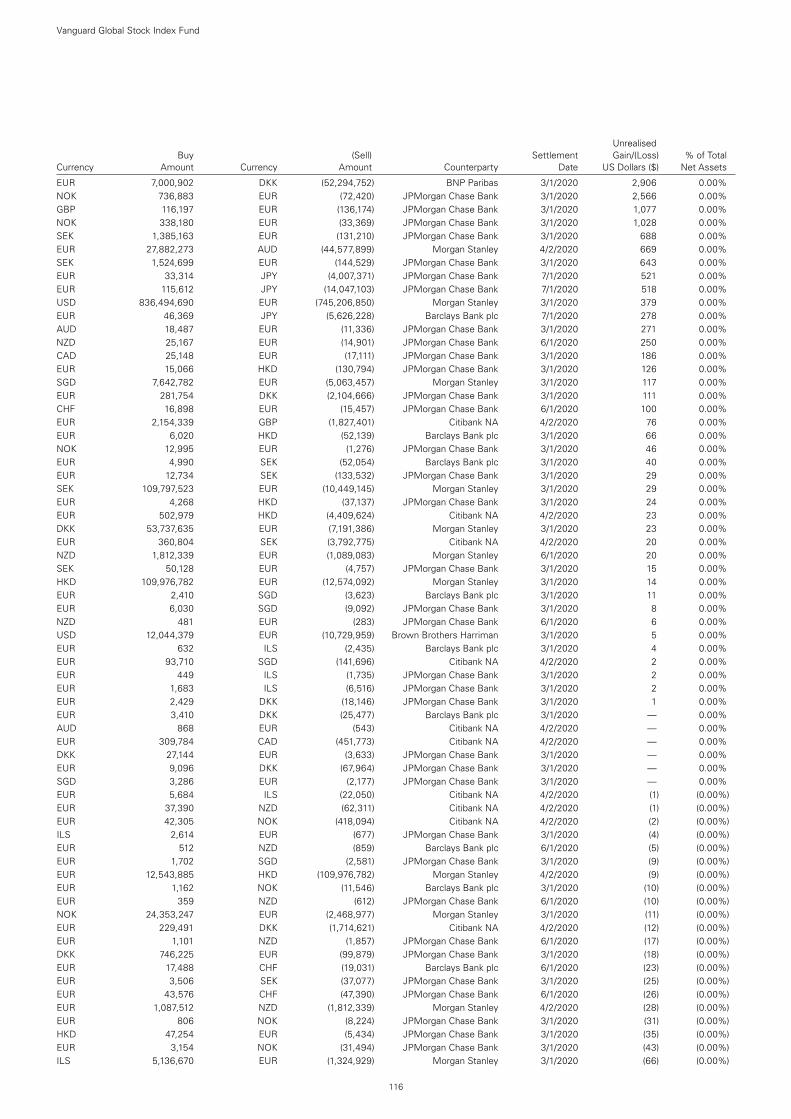
116
Unrealised Buy (Sell) Settlement Gain/(Loss) % of Total Currency Amount Currency Amount Counterparty Date US Dollars ($) Net Assets
EUR 7,000,902 DKK (52,294,752) BNP Paribas 3/1/2020 2,906 0.00%NOK 736,883 EUR (72,420) JPMorgan Chase Bank 3/1/2020 2,566 0.00%GBP 116,197 EUR (136,174) JPMorgan Chase Bank 3/1/2020 1,077 0.00%NOK 338,180 EUR (33,369) JPMorgan Chase Bank 3/1/2020 1,028 0.00%SEK 1,385,163 EUR (131,210) JPMorgan Chase Bank 3/1/2020 688 0.00%EUR 27,882,273 AUD (44,577,899) Morgan Stanley 4/2/2020 669 0.00%SEK 1,524,699 EUR (144,529) JPMorgan Chase Bank 3/1/2020 643 0.00%EUR 33,314 JPY (4,007,371) JPMorgan Chase Bank 7/1/2020 521 0.00%EUR 115,612 JPY (14,047,103) JPMorgan Chase Bank 7/1/2020 518 0.00%USD 836,494,690 EUR (745,206,850) Morgan Stanley 3/1/2020 379 0.00%EUR 46,369 JPY (5,626,228) Barclays Bank plc 7/1/2020 278 0.00%AUD 18,487 EUR (11,336) JPMorgan Chase Bank 3/1/2020 271 0.00%NZD 25,167 EUR (14,901) JPMorgan Chase Bank 6/1/2020 250 0.00%CAD 25,148 EUR (17,111) JPMorgan Chase Bank 3/1/2020 186 0.00%EUR 15,066 HKD (130,794) JPMorgan Chase Bank 3/1/2020 126 0.00%SGD 7,642,782 EUR (5,063,457) Morgan Stanley 3/1/2020 117 0.00%EUR 281,754 DKK (2,104,666) JPMorgan Chase Bank 3/1/2020 111 0.00%CHF 16,898 EUR (15,457) JPMorgan Chase Bank 6/1/2020 100 0.00%EUR 2,154,339 GBP (1,827,401) Citibank NA 4/2/2020 76 0.00%EUR 6,020 HKD (52,139) Barclays Bank plc 3/1/2020 66 0.00%NOK 12,995 EUR (1,276) JPMorgan Chase Bank 3/1/2020 46 0.00%EUR 4,990 SEK (52,054) Barclays Bank plc 3/1/2020 40 0.00%EUR 12,734 SEK (133,532) JPMorgan Chase Bank 3/1/2020 29 0.00%SEK 109,797,523 EUR (10,449,145) Morgan Stanley 3/1/2020 29 0.00%EUR 4,268 HKD (37,137) JPMorgan Chase Bank 3/1/2020 24 0.00%EUR 502,979 HKD (4,409,624) Citibank NA 4/2/2020 23 0.00%DKK 53,737,635 EUR (7,191,386) Morgan Stanley 3/1/2020 23 0.00%EUR 360,804 SEK (3,792,775) Citibank NA 4/2/2020 20 0.00%NZD 1,812,339 EUR (1,089,083) Morgan Stanley 6/1/2020 20 0.00%SEK 50,128 EUR (4,757) JPMorgan Chase Bank 3/1/2020 15 0.00%HKD 109,976,782 EUR (12,574,092) Morgan Stanley 3/1/2020 14 0.00%EUR 2,410 SGD (3,623) Barclays Bank plc 3/1/2020 11 0.00%EUR 6,030 SGD (9,092) JPMorgan Chase Bank 3/1/2020 8 0.00%NZD 481 EUR (283) JPMorgan Chase Bank 6/1/2020 6 0.00%USD 12,044,379 EUR (10,729,959) Brown Brothers Harriman 3/1/2020 5 0.00%EUR 632 ILS (2,435) Barclays Bank plc 3/1/2020 4 0.00%EUR 93,710 SGD (141,696) Citibank NA 4/2/2020 2 0.00%EUR 449 ILS (1,735) JPMorgan Chase Bank 3/1/2020 2 0.00%EUR 1,683 ILS (6,516) JPMorgan Chase Bank 3/1/2020 2 0.00%EUR 2,429 DKK (18,146) JPMorgan Chase Bank 3/1/2020 1 0.00%EUR 3,410 DKK (25,477) Barclays Bank plc 3/1/2020 — 0.00%AUD 868 EUR (543) Citibank NA 4/2/2020 — 0.00%EUR 309,784 CAD (451,773) Citibank NA 4/2/2020 — 0.00%DKK 27,144 EUR (3,633) JPMorgan Chase Bank 3/1/2020 — 0.00%EUR 9,096 DKK (67,964) JPMorgan Chase Bank 3/1/2020 — 0.00%SGD 3,286 EUR (2,177) JPMorgan Chase Bank 3/1/2020 — 0.00%EUR 5,684 ILS (22,050) Citibank NA 4/2/2020 (1) (0.00%)EUR 37,390 NZD (62,311) Citibank NA 4/2/2020 (1) (0.00%)EUR 42,305 NOK (418,094) Citibank NA 4/2/2020 (2) (0.00%)ILS 2,614 EUR (677) JPMorgan Chase Bank 3/1/2020 (4) (0.00%)EUR 512 NZD (859) Barclays Bank plc 6/1/2020 (5) (0.00%)EUR 1,702 SGD (2,581) JPMorgan Chase Bank 3/1/2020 (9) (0.00%)EUR 12,543,885 HKD (109,976,782) Morgan Stanley 4/2/2020 (9) (0.00%)EUR 1,162 NOK (11,546) Barclays Bank plc 3/1/2020 (10) (0.00%)EUR 359 NZD (612) JPMorgan Chase Bank 6/1/2020 (10) (0.00%)NOK 24,353,247 EUR (2,468,977) Morgan Stanley 3/1/2020 (11) (0.00%)EUR 229,491 DKK (1,714,621) Citibank NA 4/2/2020 (12) (0.00%)EUR 1,101 NZD (1,857) JPMorgan Chase Bank 6/1/2020 (17) (0.00%)DKK 746,225 EUR (99,879) JPMorgan Chase Bank 3/1/2020 (18) (0.00%)EUR 17,488 CHF (19,031) Barclays Bank plc 6/1/2020 (23) (0.00%)EUR 3,506 SEK (37,077) JPMorgan Chase Bank 3/1/2020 (25) (0.00%)EUR 43,576 CHF (47,390) JPMorgan Chase Bank 6/1/2020 (26) (0.00%)EUR 1,087,512 NZD (1,812,339) Morgan Stanley 4/2/2020 (28) (0.00%)EUR 806 NOK (8,224) JPMorgan Chase Bank 3/1/2020 (31) (0.00%)HKD 47,254 EUR (5,434) JPMorgan Chase Bank 3/1/2020 (35) (0.00%)EUR 3,154 NOK (31,494) JPMorgan Chase Bank 3/1/2020 (43) (0.00%)ILS 5,136,670 EUR (1,324,929) Morgan Stanley 3/1/2020 (66) (0.00%)
Vanguard Global Stock Index Fund
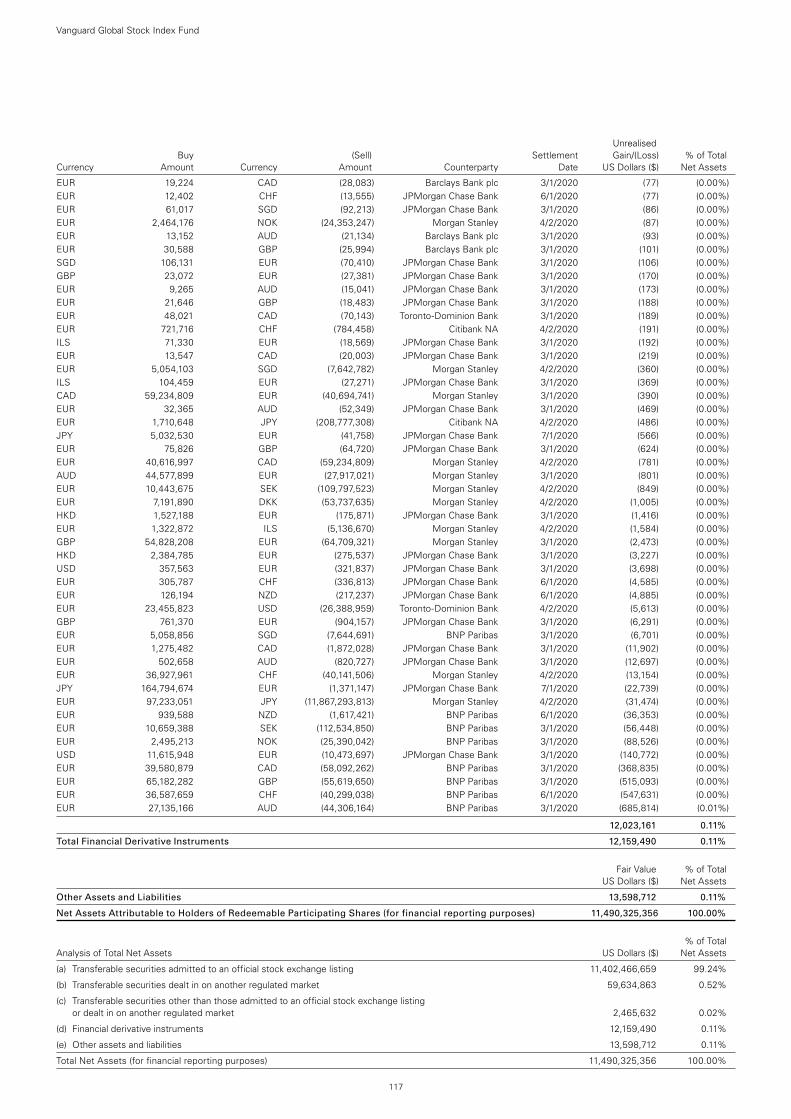
117
Unrealised Buy (Sell) Settlement Gain/(Loss) % of Total Currency Amount Currency Amount Counterparty Date US Dollars ($) Net Assets
EUR 19,224 CAD (28,083) Barclays Bank plc 3/1/2020 (77) (0.00%)EUR 12,402 CHF (13,555) JPMorgan Chase Bank 6/1/2020 (77) (0.00%)EUR 61,017 SGD (92,213) JPMorgan Chase Bank 3/1/2020 (86) (0.00%)EUR 2,464,176 NOK (24,353,247) Morgan Stanley 4/2/2020 (87) (0.00%)EUR 13,152 AUD (21,134) Barclays Bank plc 3/1/2020 (93) (0.00%)EUR 30,588 GBP (25,994) Barclays Bank plc 3/1/2020 (101) (0.00%)SGD 106,131 EUR (70,410) JPMorgan Chase Bank 3/1/2020 (106) (0.00%)GBP 23,072 EUR (27,381) JPMorgan Chase Bank 3/1/2020 (170) (0.00%)EUR 9,265 AUD (15,041) JPMorgan Chase Bank 3/1/2020 (173) (0.00%)EUR 21,646 GBP (18,483) JPMorgan Chase Bank 3/1/2020 (188) (0.00%)EUR 48,021 CAD (70,143) Toronto-Dominion Bank 3/1/2020 (189) (0.00%)EUR 721,716 CHF (784,458) Citibank NA 4/2/2020 (191) (0.00%)ILS 71,330 EUR (18,569) JPMorgan Chase Bank 3/1/2020 (192) (0.00%)EUR 13,547 CAD (20,003) JPMorgan Chase Bank 3/1/2020 (219) (0.00%)EUR 5,054,103 SGD (7,642,782) Morgan Stanley 4/2/2020 (360) (0.00%)ILS 104,459 EUR (27,271) JPMorgan Chase Bank 3/1/2020 (369) (0.00%)CAD 59,234,809 EUR (40,694,741) Morgan Stanley 3/1/2020 (390) (0.00%)EUR 32,365 AUD (52,349) JPMorgan Chase Bank 3/1/2020 (469) (0.00%)EUR 1,710,648 JPY (208,777,308) Citibank NA 4/2/2020 (486) (0.00%)JPY 5,032,530 EUR (41,758) JPMorgan Chase Bank 7/1/2020 (566) (0.00%)EUR 75,826 GBP (64,720) JPMorgan Chase Bank 3/1/2020 (624) (0.00%)EUR 40,616,997 CAD (59,234,809) Morgan Stanley 4/2/2020 (781) (0.00%)AUD 44,577,899 EUR (27,917,021) Morgan Stanley 3/1/2020 (801) (0.00%)EUR 10,443,675 SEK (109,797,523) Morgan Stanley 4/2/2020 (849) (0.00%)EUR 7,191,890 DKK (53,737,635) Morgan Stanley 4/2/2020 (1,005) (0.00%)HKD 1,527,188 EUR (175,871) JPMorgan Chase Bank 3/1/2020 (1,416) (0.00%)EUR 1,322,872 ILS (5,136,670) Morgan Stanley 4/2/2020 (1,584) (0.00%)GBP 54,828,208 EUR (64,709,321) Morgan Stanley 3/1/2020 (2,473) (0.00%)HKD 2,384,785 EUR (275,537) JPMorgan Chase Bank 3/1/2020 (3,227) (0.00%)USD 357,563 EUR (321,837) JPMorgan Chase Bank 3/1/2020 (3,698) (0.00%)EUR 305,787 CHF (336,813) JPMorgan Chase Bank 6/1/2020 (4,585) (0.00%)EUR 126,194 NZD (217,237) JPMorgan Chase Bank 6/1/2020 (4,885) (0.00%)EUR 23,455,823 USD (26,388,959) Toronto-Dominion Bank 4/2/2020 (5,613) (0.00%)GBP 761,370 EUR (904,157) JPMorgan Chase Bank 3/1/2020 (6,291) (0.00%)EUR 5,058,856 SGD (7,644,691) BNP Paribas 3/1/2020 (6,701) (0.00%)EUR 1,275,482 CAD (1,872,028) JPMorgan Chase Bank 3/1/2020 (11,902) (0.00%)EUR 502,658 AUD (820,727) JPMorgan Chase Bank 3/1/2020 (12,697) (0.00%)EUR 36,927,961 CHF (40,141,506) Morgan Stanley 4/2/2020 (13,154) (0.00%)JPY 164,794,674 EUR (1,371,147) JPMorgan Chase Bank 7/1/2020 (22,739) (0.00%)EUR 97,233,051 JPY (11,867,293,813) Morgan Stanley 4/2/2020 (31,474) (0.00%)EUR 939,588 NZD (1,617,421) BNP Paribas 6/1/2020 (36,353) (0.00%)EUR 10,659,388 SEK (112,534,850) BNP Paribas 3/1/2020 (56,448) (0.00%)EUR 2,495,213 NOK (25,390,042) BNP Paribas 3/1/2020 (88,526) (0.00%)USD 11,615,948 EUR (10,473,697) JPMorgan Chase Bank 3/1/2020 (140,772) (0.00%)EUR 39,580,879 CAD (58,092,262) BNP Paribas 3/1/2020 (368,835) (0.00%)EUR 65,182,282 GBP (55,619,650) BNP Paribas 3/1/2020 (515,093) (0.00%)EUR 36,587,659 CHF (40,299,038) BNP Paribas 6/1/2020 (547,631) (0.00%)EUR 27,135,166 AUD (44,306,164) BNP Paribas 3/1/2020 (685,814) (0.01%)
12,023,161 0.11%
Total Financial Derivative Instruments 12,159,490 0.11%
Fair Value % of Total US Dollars ($) Net Assets
Other Assets and Liabilities 13,598,712 0.11%
Net Assets Attributable to Holders of Redeemable Participating Shares (for financial reporting purposes) 11,490,325,356 100.00%
% of Total Analysis of Total Net Assets US Dollars ($) Net Assets
(a) Transferable securities admitted to an official stock exchange listing 11,402,466,659 99.24%
(b) Transferable securities dealt in on another regulated market 59,634,863 0.52%
(c) Transferable securities other than those admitted to an official stock exchange listing or dealt in on another regulated market 2,465,632 0.02%
(d) Financial derivative instruments 12,159,490 0.11%
(e) Other assets and liabilities 13,598,712 0.11%
Total Net Assets (for financial reporting purposes) 11,490,325,356 100.00%
Vanguard Global Stock Index Fund

The accompanying notes form an integral part of the financial statements.
118
Vanguard Global Stock Index Fund
Statement of Assets and Liabilities
US Dollars ($) US Dollars ($) As at As at 31 December 2019 31 December 2018
Current Assets Financial Assets at Fair Value Through Profit or Loss 11,464,567,154 9,798,684,267Financial Derivative Instruments 15,044,090 16,234,098Cash 3,022,886 85,268,148Receivables:
Interest and Dividends 14,096,680 14,468,652Capital Shares Issued 3,717,070 72,740,025Investments Sold 34,387 360,601Futures Margin Cash 596,116 8,287,364Cash Collateral 120,000 1,440,000Other Receivables — 2,259
Total Current Assets 11,501,198,383 9,997,485,414
Current Liabilities Financial Derivative Instruments 2,884,600 5,965,781Bank Overdraft 3,565,113 359,709Unrealised Depreciation on Spot Currency Contracts 9,279 11,661Payables and Other Liabilities:
Investments Purchased — 5,012,022Income Distribution Payable 550 16Capital Shares Redeemed 2,724,775 21,836,809Management Fees Payable 1,688,710 2,074,935
Total Current Liabilities 10,873,027 35,260,933
Net Assets Attributable to Holders of Redeemable Participating Shares (for financial reporting purposes) (“Net Assets”) 11,490,325,356 9,962,224,481
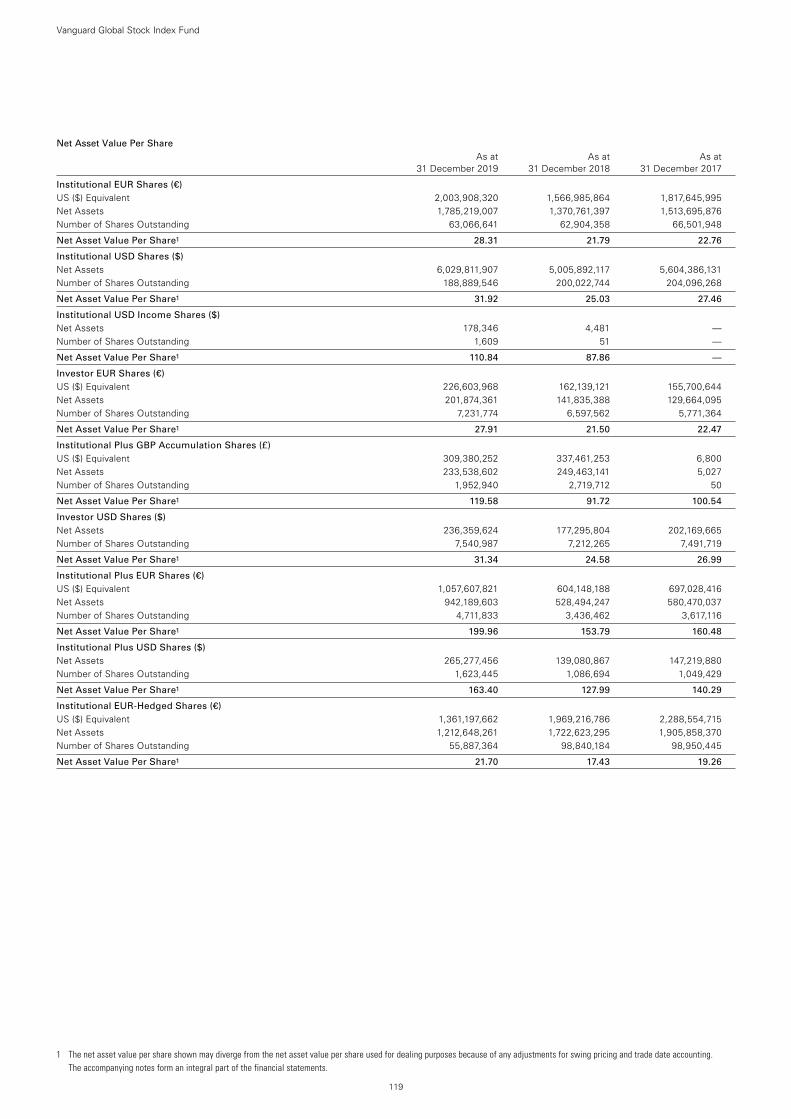
1 The net asset value per share shown may diverge from the net asset value per share used for dealing purposes because of any adjustments for swing pricing and trade date accounting. The accompanying notes form an integral part of the financial statements.
119
Net Asset Value Per Share As at As at As at 31 December 2019 31 December 2018 31 December 2017
Institutional EUR Shares (€) US ($) Equivalent 2,003,908,320 1,566,985,864 1,817,645,995Net Assets 1,785,219,007 1,370,761,397 1,513,695,876Number of Shares Outstanding 63,066,641 62,904,358 66,501,948
Net Asset Value Per Share1 28.31 21.79 22.76
Institutional USD Shares ($) Net Assets 6,029,811,907 5,005,892,117 5,604,386,131Number of Shares Outstanding 188,889,546 200,022,744 204,096,268
Net Asset Value Per Share1 31.92 25.03 27.46
Institutional USD Income Shares ($) Net Assets 178,346 4,481 —Number of Shares Outstanding 1,609 51 —
Net Asset Value Per Share1 110.84 87.86 —
Investor EUR Shares (€) US ($) Equivalent 226,603,968 162,139,121 155,700,644Net Assets 201,874,361 141,835,388 129,664,095Number of Shares Outstanding 7,231,774 6,597,562 5,771,364
Net Asset Value Per Share1 27.91 21.50 22.47
Institutional Plus GBP Accumulation Shares (£) US ($) Equivalent 309,380,252 337,461,253 6,800Net Assets 233,538,602 249,463,141 5,027Number of Shares Outstanding 1,952,940 2,719,712 50
Net Asset Value Per Share1 119.58 91.72 100.54
Investor USD Shares ($) Net Assets 236,359,624 177,295,804 202,169,665Number of Shares Outstanding 7,540,987 7,212,265 7,491,719
Net Asset Value Per Share1 31.34 24.58 26.99
Institutional Plus EUR Shares (€) US ($) Equivalent 1,057,607,821 604,148,188 697,028,416Net Assets 942,189,603 528,494,247 580,470,037Number of Shares Outstanding 4,711,833 3,436,462 3,617,116
Net Asset Value Per Share1 199.96 153.79 160.48
Institutional Plus USD Shares ($) Net Assets 265,277,456 139,080,867 147,219,880Number of Shares Outstanding 1,623,445 1,086,694 1,049,429
Net Asset Value Per Share1 163.40 127.99 140.29
Institutional EUR-Hedged Shares (€) US ($) Equivalent 1,361,197,662 1,969,216,786 2,288,554,715Net Assets 1,212,648,261 1,722,623,295 1,905,858,370Number of Shares Outstanding 55,887,364 98,840,184 98,950,445
Net Asset Value Per Share1 21.70 17.43 19.26
Vanguard Global Stock Index Fund
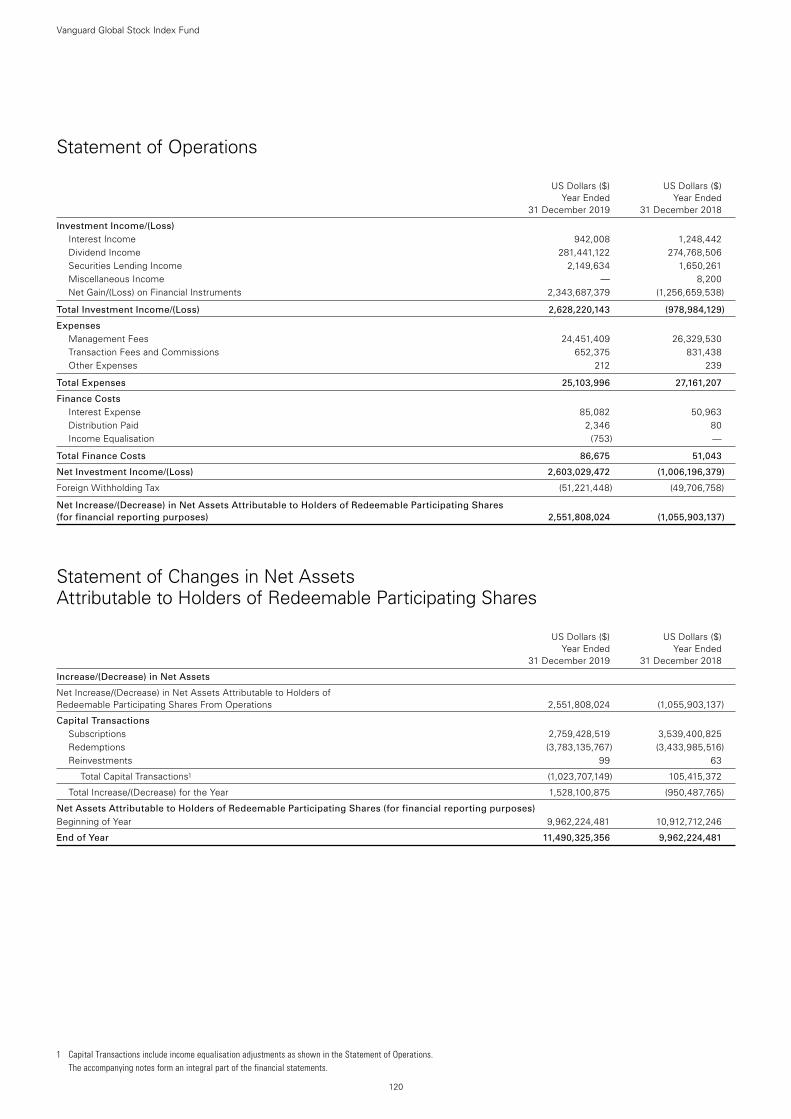
120
Vanguard Global Stock Index Fund
Statement of Operations
US Dollars ($) US Dollars ($) Year Ended Year Ended 31 December 2019 31 December 2018
Investment Income/(Loss) Interest Income 942,008 1,248,442Dividend Income 281,441,122 274,768,506Securities Lending Income 2,149,634 1,650,261Miscellaneous Income — 8,200Net Gain/(Loss) on Financial Instruments 2,343,687,379 (1,256,659,538)
Total Investment Income/(Loss) 2,628,220,143 (978,984,129)
Expenses Management Fees 24,451,409 26,329,530Transaction Fees and Commissions 652,375 831,438Other Expenses 212 239
Total Expenses 25,103,996 27,161,207
Finance Costs Interest Expense 85,082 50,963Distribution Paid 2,346 80Income Equalisation (753) —
Total Finance Costs 86,675 51,043
Net Investment Income/(Loss) 2,603,029,472 (1,006,196,379)
Foreign Withholding Tax (51,221,448) (49,706,758)
Net Increase/(Decrease) in Net Assets Attributable to Holders of Redeemable Participating Shares (for financial reporting purposes) 2,551,808,024 (1,055,903,137)
Statement of Changes in Net Assets Attributable to Holders of Redeemable Participating Shares
US Dollars ($) US Dollars ($) Year Ended Year Ended 31 December 2019 31 December 2018
Increase/(Decrease) in Net Assets
Net Increase/(Decrease) in Net Assets Attributable to Holders of Redeemable Participating Shares From Operations 2,551,808,024 (1,055,903,137)
Capital Transactions Subscriptions 2,759,428,519 3,539,400,825Redemptions (3,783,135,767) (3,433,985,516)Reinvestments 99 63
Total Capital Transactions1 (1,023,707,149) 105,415,372
Total Increase/(Decrease) for the Year 1,528,100,875 (950,487,765)
Net Assets Attributable to Holders of Redeemable Participating Shares (for financial reporting purposes) Beginning of Year 9,962,224,481 10,912,712,246
End of Year 11,490,325,356 9,962,224,481
1 Capital Transactions include income equalisation adjustments as shown in the Statement of Operations. The accompanying notes form an integral part of the financial statements.
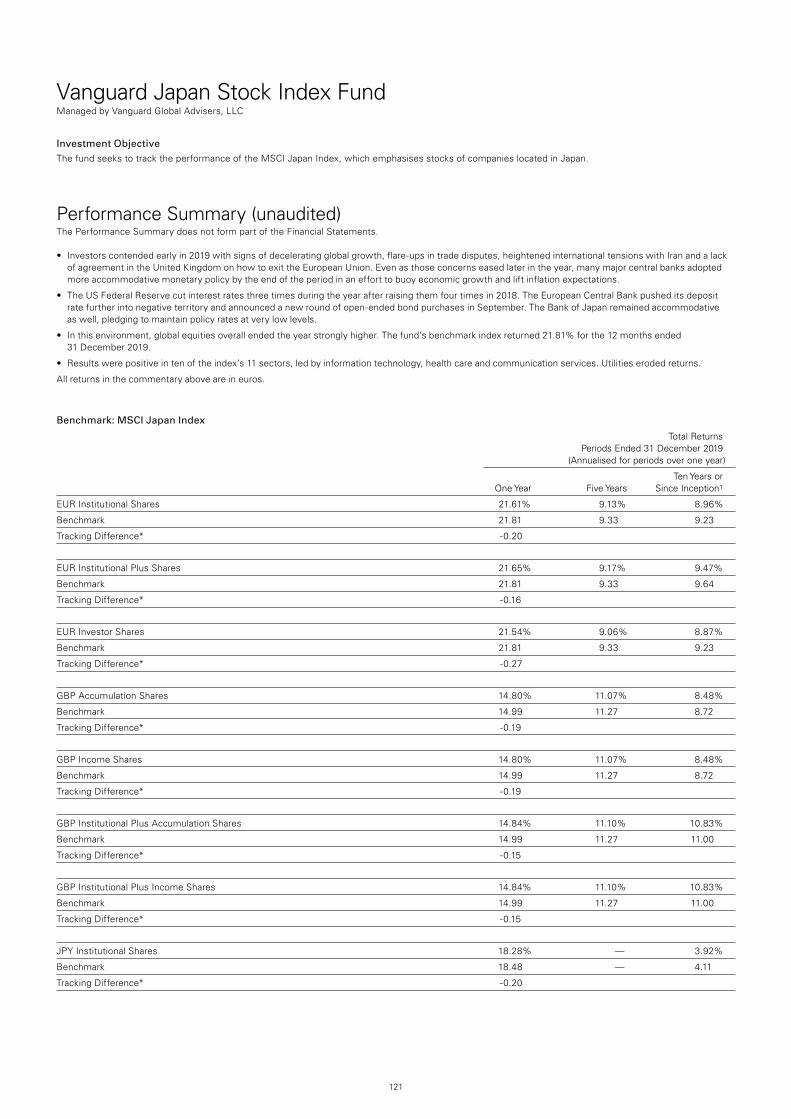
121
Vanguard Japan Stock Index FundManaged by Vanguard Global Advisers, LLC
Investment ObjectiveThe fund seeks to track the performance of the MSCI Japan Index, which emphasises stocks of companies located in Japan.
Performance Summary (unaudited)The Performance Summary does not form part of the Financial Statements.
• Investorscontendedearlyin2019withsignsofdeceleratingglobalgrowth,flare-upsintradedisputes,heightenedinternationaltensionswithIranandalackof agreement in the United Kingdom on how to exit the European Union. Even as those concerns eased later in the year, many major central banks adopted more accommodative monetary policy by the end of the period in an effort to buoy economic growth and lift inflation expectations.
• TheUSFederalReservecutinterestratesthreetimesduringtheyearafterraisingthemfourtimesin2018.TheEuropeanCentralBankpusheditsdepositrate further into negative territory and announced a new round of open-ended bond purchases in September. The Bank of Japan remained accommodative as well, pledging to maintain policy rates at very low levels.
• Inthisenvironment,globalequitiesoverallendedtheyearstronglyhigher.Thefund’sbenchmarkindexreturned21.81%forthe12monthsended 31 December 2019.
• Resultswerepositiveintenoftheindex’s11sectors,ledbyinformationtechnology,healthcareandcommunicationservices.Utilitieserodedreturns.
All returns in the commentary above are in euros.
Benchmark: MSCI Japan Index
Total Returns Periods Ended 31 December 2019 (Annualised for periods over one year)
Ten Years or One Year Five Years Since Inception1
EUR Institutional Shares 21.61% 9.13% 8.96%
Benchmark 21.81 9.33 9.23
Tracking Difference* -0.20
EUR Institutional Plus Shares 21.65% 9.17% 9.47%
Benchmark 21.81 9.33 9.64
Tracking Difference* -0.16
EUR Investor Shares 21.54% 9.06% 8.87%
Benchmark 21.81 9.33 9.23
Tracking Difference* -0.27
GBP Accumulation Shares 14.80% 11.07% 8.48%
Benchmark 14.99 11.27 8.72
Tracking Difference* -0.19
GBP Income Shares 14.80% 11.07% 8.48%
Benchmark 14.99 11.27 8.72
Tracking Difference* -0.19
GBP Institutional Plus Accumulation Shares 14.84% 11.10% 10.83%
Benchmark 14.99 11.27 11.00
Tracking Difference* -0.15
GBP Institutional Plus Income Shares 14.84% 11.10% 10.83%
Benchmark 14.99 11.27 11.00
Tracking Difference* -0.15
JPY Institutional Shares 18.28% — 3.92%
Benchmark 18.48 — 4.11
Tracking Difference* -0.20
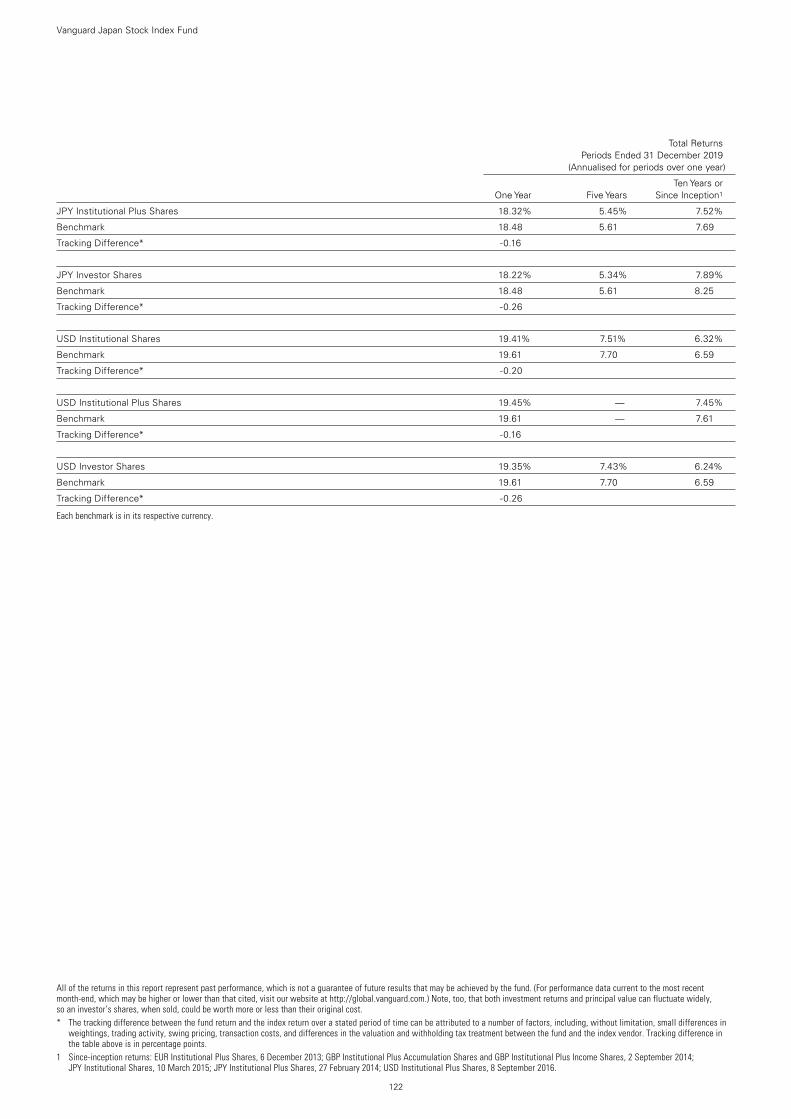
Vanguard Japan Stock Index Fund
122
All of the returns in this report represent past performance, which is not a guarantee of future results that may be achieved by the fund. (For performance data current to the most recent month-end, which may be higher or lower than that cited, visit our website at http://global.vanguard.com.) Note, too, that both investment returns and principal value can fluctuate widely, so an investor’s shares, when sold, could be worth more or less than their original cost.* The tracking difference between the fund return and the index return over a stated period of time can be attributed to a number of factors, including, without limitation, small differences in
weightings, trading activity, swing pricing, transaction costs, and differences in the valuation and withholding tax treatment between the fund and the index vendor. Tracking difference in the table above is in percentage points.
1 Since-inception returns: EUR Institutional Plus Shares, 6 December 2013; GBP Institutional Plus Accumulation Shares and GBP Institutional Plus Income Shares, 2 September 2014; JPY Institutional Shares, 10 March 2015; JPY Institutional Plus Shares, 27 February 2014; USD Institutional Plus Shares, 8 September 2016.
Total Returns Periods Ended 31 December 2019 (Annualised for periods over one year)
Ten Years or One Year Five Years Since Inception1
JPY Institutional Plus Shares 18.32% 5.45% 7.52%
Benchmark 18.48 5.61 7.69
Tracking Difference* -0.16
JPY Investor Shares 18.22% 5.34% 7.89%
Benchmark 18.48 5.61 8.25
Tracking Difference* -0.26
USD Institutional Shares 19.41% 7.51% 6.32%
Benchmark 19.61 7.70 6.59
Tracking Difference* -0.20
USD Institutional Plus Shares 19.45% — 7.45%
Benchmark 19.61 — 7.61
Tracking Difference* -0.16
USD Investor Shares 19.35% 7.43% 6.24%
Benchmark 19.61 7.70 6.59
Tracking Difference* -0.26
Each benchmark is in its respective currency.
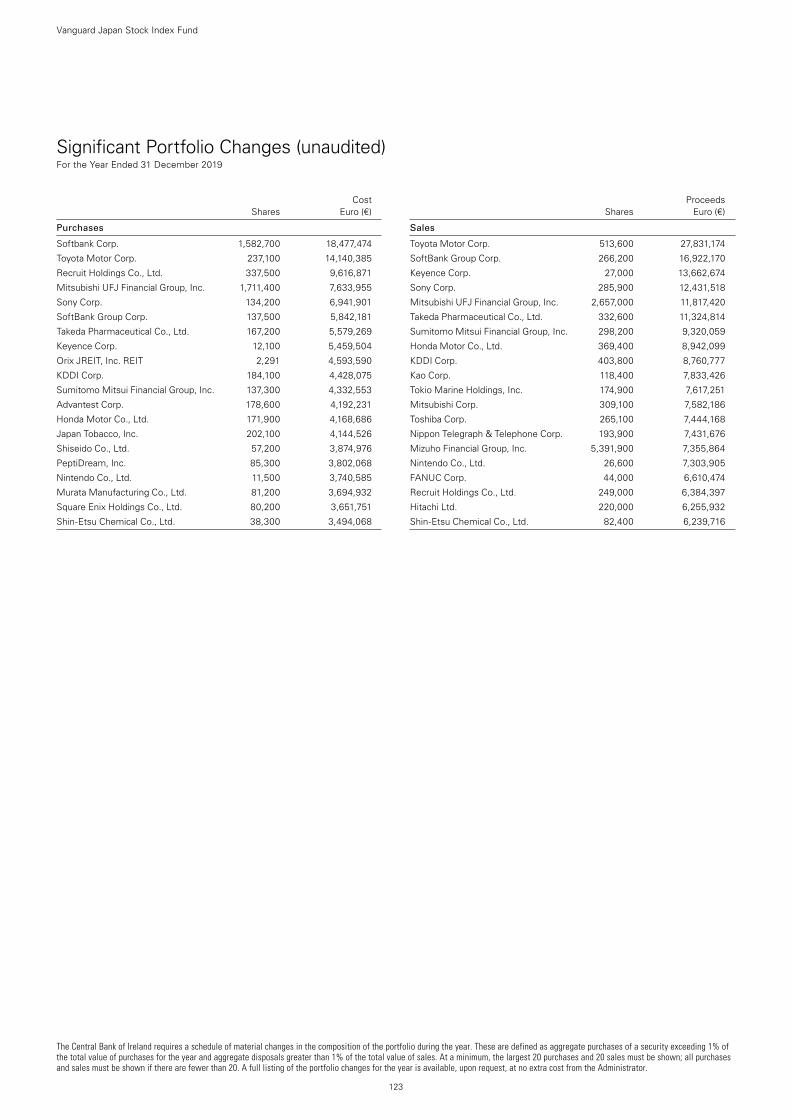
The Central Bank of Ireland requires a schedule of material changes in the composition of the portfolio during the year. These are defined as aggregate purchases of a security exceeding 1% of the total value of purchases for the year and aggregate disposals greater than 1% of the total value of sales. At a minimum, the largest 20 purchases and 20 sales must be shown; all purchases and sales must be shown if there are fewer than 20. A full listing of the portfolio changes for the year is available, upon request, at no extra cost from the Administrator.
123
Vanguard Japan Stock Index Fund
Significant Portfolio Changes (unaudited) For the Year Ended 31 December 2019
Cost Shares Euro (€)
Purchases
Softbank Corp. 1,582,700 18,477,474
Toyota Motor Corp. 237,100 14,140,385
Recruit Holdings Co., Ltd. 337,500 9,616,871
Mitsubishi UFJ Financial Group, Inc. 1,711,400 7,633,955
Sony Corp. 134,200 6,941,901
SoftBank Group Corp. 137,500 5,842,181
Takeda Pharmaceutical Co., Ltd. 167,200 5,579,269
Keyence Corp. 12,100 5,459,504
Orix JREIT, Inc. REIT 2,291 4,593,590
KDDI Corp. 184,100 4,428,075
Sumitomo Mitsui Financial Group, Inc. 137,300 4,332,553
Advantest Corp. 178,600 4,192,231
Honda Motor Co., Ltd. 171,900 4,168,686
Japan Tobacco, Inc. 202,100 4,144,526
Shiseido Co., Ltd. 57,200 3,874,976
PeptiDream, Inc. 85,300 3,802,068
Nintendo Co., Ltd. 11,500 3,740,585
Murata Manufacturing Co., Ltd. 81,200 3,694,932
Square Enix Holdings Co., Ltd. 80,200 3,651,751
Shin-Etsu Chemical Co., Ltd. 38,300 3,494,068
Proceeds Shares Euro (€)
Sales
Toyota Motor Corp. 513,600 27,831,174
SoftBank Group Corp. 266,200 16,922,170
Keyence Corp. 27,000 13,662,674
Sony Corp. 285,900 12,431,518
Mitsubishi UFJ Financial Group, Inc. 2,657,000 11,817,420
Takeda Pharmaceutical Co., Ltd. 332,600 11,324,814
Sumitomo Mitsui Financial Group, Inc. 298,200 9,320,059
Honda Motor Co., Ltd. 369,400 8,942,099
KDDI Corp. 403,800 8,760,777
Kao Corp. 118,400 7,833,426
Tokio Marine Holdings, Inc. 174,900 7,617,251
Mitsubishi Corp. 309,100 7,582,186
Toshiba Corp. 265,100 7,444,168
Nippon Telegraph & Telephone Corp. 193,900 7,431,676
Mizuho Financial Group, Inc. 5,391,900 7,355,864
Nintendo Co., Ltd. 26,600 7,303,905
FANUC Corp. 44,000 6,610,474
Recruit Holdings Co., Ltd. 249,000 6,384,397
Hitachi Ltd. 220,000 6,255,932
Shin-Etsu Chemical Co., Ltd. 82,400 6,239,716

124
Vanguard Japan Stock Index Fund
Number of Fair Value % of Total Shares Euro (€) Net Assets
Number of Fair Value % of Total Shares Euro (€) Net Assets
Equities 98.39% (2018: 99.34%)
Communication Services 8.40% (2018: 7.54%)
SoftBank Group Corp. 1,367,922 53,331,915 1.85%KDDI Corp. 1,541,885 41,116,870 1.43%Nintendo Co., Ltd. 97,631 35,190,724 1.22%NTT DOCOMO, Inc. 1,164,661 29,004,895 1.01%Nippon Telegraph & Telephone
Corp. 1,123,706 25,396,476 0.88%Softbank Corp. 1,462,834 17,501,817 0.61%Z Holdings Corp. 2,313,603 8,743,267 0.30%Dentsu, Inc. 188,665 5,838,379 0.20%Nexon Co., Ltd. 432,002 5,134,968 0.18%Toho Co., Ltd. 99,179 3,695,197 0.13%Square Enix Holdings Co., Ltd. 80,200 3,569,918 0.12%Konami Holdings Corp. 82,087 3,018,011 0.10%Hakuhodo DY Holdings, Inc. 204,133 2,958,554 0.10%CyberAgent, Inc. 87,800 2,745,826 0.10%Kakaku.com, Inc. 119,203 2,729,243 0.09%LINE Corp. 52,032 2,281,961 0.08%
242,258,021 8.40%
Consumer Discretionary 18.07% (2018: 18.93%)
Toyota Motor Corp. 1,993,654 126,070,484 4.37%Sony Corp. 1,109,966 67,341,700 2.34%Honda Motor Co., Ltd. 1,422,847 36,146,294 1.25%Fast Retailing Co., Ltd. 50,894 27,118,392 0.94%Oriental Land Co., Ltd. 174,592 21,296,649 0.74%Bridgestone Corp. 498,559 16,633,934 0.58%Panasonic Corp. 1,926,726 16,260,366 0.56%Denso Corp. 378,266 15,398,840 0.53%Suzuki Motor Corp. 321,397 12,032,526 0.42%Subaru Corp. 537,092 11,947,100 0.41%Nissan Motor Co., Ltd. 2,024,888 10,558,699 0.37%Sekisui House Ltd. 542,666 10,380,647 0.36%Nitori Holdings Co., Ltd. 69,998 9,883,912 0.34%Bandai Namco Holdings, Inc. 174,462 9,483,396 0.33%Shimano, Inc. 64,749 9,432,015 0.33%Sumitomo Electric Industries Ltd. 658,372 8,915,904 0.31%Toyota Industries Corp. 128,183 6,651,478 0.23%Yamaha Corp. 125,482 6,254,160 0.22%Rakuten, Inc. 750,937 5,755,713 0.20%Pan Pacific International Holdings
Corp. 387,040 5,745,903 0.20%Isuzu Motors Ltd. 482,764 5,140,768 0.18%Sekisui Chemical Co., Ltd. 319,097 4,980,508 0.17%Aisin Seiki Co., Ltd. 141,391 4,717,373 0.16%Yamaha Motor Co., Ltd. 242,709 4,383,130 0.15%Ryohin Keikaku Co., Ltd. 208,280 4,364,077 0.15%Hikari Tsushin, Inc. 18,288 4,112,217 0.14%Mazda Motor Corp. 496,911 3,820,898 0.13%Koito Manufacturing Co., Ltd. 91,233 3,814,223 0.13%Marui Group Co., Ltd. 164,485 3,597,461 0.13%USS Co., Ltd. 190,786 3,231,178 0.11%Nikon Corp. 278,729 3,070,898 0.11%Casio Computer Co., Ltd. 168,553 3,027,352 0.11%Stanley Electric Co., Ltd. 114,109 2,974,617 0.10%Yamada Denki Co., Ltd. 552,013 2,615,539 0.09%Sharp Corp. 187,051 2,583,711 0.09%J Front Retailing Co., Ltd. 202,731 2,542,703 0.09%McDonald’s Holdings Co. Japan Ltd. 58,400 2,508,581 0.09%NGK Spark Plug Co., Ltd. 138,093 2,415,739 0.08%Isetan Mitsukoshi Holdings Ltd. 295,750 2,385,634 0.08%
Mitsubishi Motors Corp. 592,029 2,222,759 0.08%Iida Group Holdings Co., Ltd. 130,120 2,046,930 0.07%Rinnai Corp. 28,908 2,026,134 0.07%Sega Sammy Holdings, Inc. 148,653 1,929,028 0.07%Yokohama Rubber Co., Ltd. 102,065 1,782,971 0.06%ABC-Mart, Inc. 28,493 1,737,781 0.06%ZOZO, Inc. 94,888 1,623,371 0.06%Sumitomo Rubber Industries Ltd. 146,262 1,603,049 0.06%Benesse Holdings, Inc. 62,190 1,465,181 0.05%Shimamura Co., Ltd. 18,955 1,292,799 0.05%Toyoda Gosei Co., Ltd. 56,096 1,262,287 0.04%Mercari, Inc. 65,100 1,192,731 0.04%Sankyo Co., Ltd. 38,887 1,155,571 0.04%
520,935,311 18.07%
Consumer Staples 7.63% (2018: 9.02%)
Kao Corp. 420,818 31,133,326 1.08%Shiseido Co., Ltd. 349,160 22,274,077 0.77%Seven & i Holdings Co., Ltd. 657,504 21,575,854 0.75%Japan Tobacco, Inc. 1,047,275 20,883,226 0.72%Kirin Holdings Co., Ltd. 718,025 14,067,647 0.49%Asahi Group Holdings Ltd. 316,559 12,930,924 0.45%Unicharm Corp. 352,206 10,682,735 0.37%Aeon Co., Ltd. 570,674 10,551,517 0.37%MEIJI Holdings Co., Ltd. 99,882 6,042,652 0.21%Ajinomoto Co., Inc. 383,428 5,704,853 0.20%Kikkoman Corp. 126,845 5,583,823 0.19%Yakult Honsha Co., Ltd. 104,764 5,178,612 0.18%FamilyMart Co., Ltd. 222,608 4,790,205 0.17%Suntory Beverage & Food Ltd. 120,453 4,487,821 0.16%Kose Corp. 28,912 3,792,120 0.13%Tsuruha Holdings, Inc. 32,341 3,716,939 0.13%Nissin Foods Holdings Co., Ltd. 55,400 3,687,651 0.13%Lion Corp. 196,472 3,422,501 0.12%Pigeon Corp. 101,200 3,330,811 0.11%Kobayashi Pharmaceutical Co., Ltd. 42,700 3,244,827 0.11%Toyo Suisan Kaisha Ltd. 77,536 2,942,852 0.10%Nisshin Seifun Group, Inc. 173,722 2,714,324 0.09%NH Foods Ltd. 71,406 2,639,947 0.09%Coca-Cola Bottlers Japan Holdings,
Inc. 108,643 2,485,682 0.09%Welcia Holdings Co., Ltd. 41,800 2,381,470 0.08%Lawson, Inc. 44,374 2,251,662 0.08%Calbee, Inc. 70,905 2,066,334 0.07%Sundrug Co., Ltd. 61,770 2,002,664 0.07%Yamazaki Baking Co., Ltd. 107,913 1,724,128 0.06%Pola Orbis Holdings, Inc. 78,707 1,686,564 0.06%
219,977,748 7.63%
Energy 0.83% (2018: 1.08%)
JXTG Holdings, Inc. 2,760,580 11,267,471 0.39%Inpex Corp. 893,331 8,322,731 0.29%Idemitsu Kosan Co., Ltd. 170,225 4,228,146 0.15%
23,818,348 0.83%
Financials 10.58% (2018: 11.55%)
Mitsubishi UFJ Financial Group, Inc. 10,735,837 52,206,076 1.81%
Sumitomo Mitsui Financial Group, Inc. 1,160,463 38,413,299 1.33%
Mizuho Financial Group, Inc. 21,055,687 29,049,424 1.01%Tokio Marine Holdings, Inc. 557,731 27,976,233 0.97%ORIX Corp. 1,156,096 17,163,124 0.60%
Financial Statements Statement of Investments31 December 2019
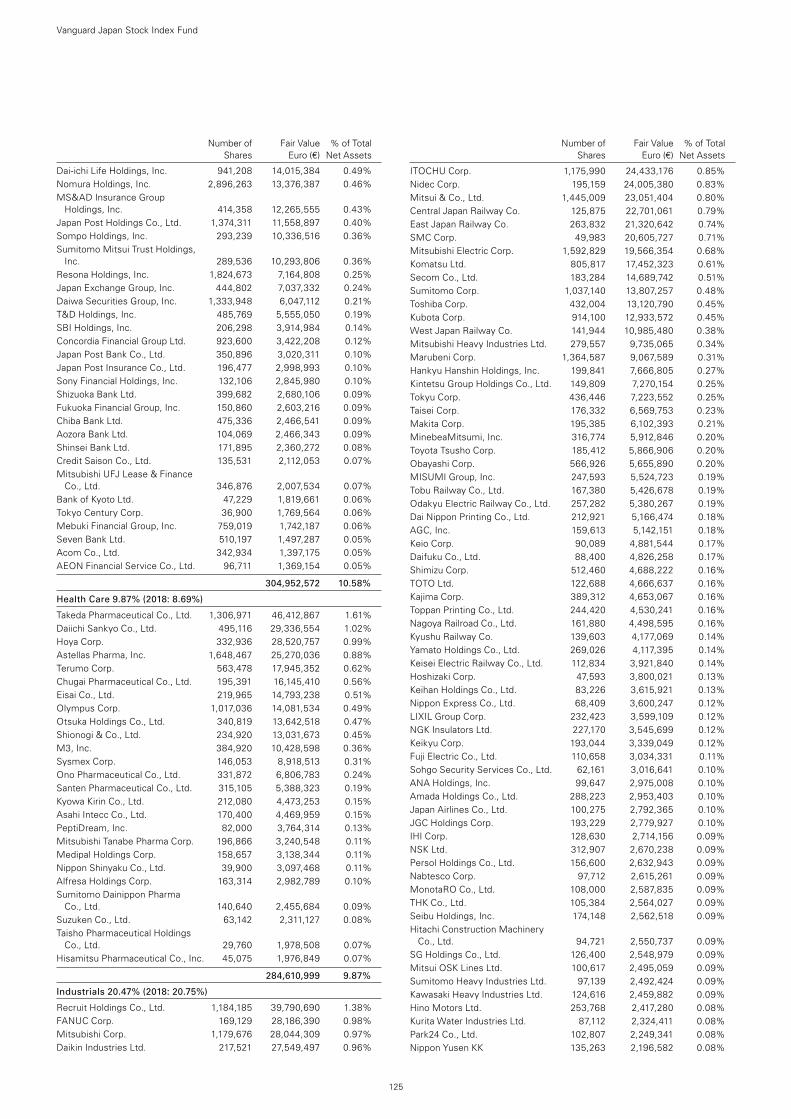
125
Number of Fair Value % of Total Shares Euro (€) Net Assets
Dai-ichi Life Holdings, Inc. 941,208 14,015,384 0.49%Nomura Holdings, Inc. 2,896,263 13,376,387 0.46%MS&AD Insurance Group
Holdings, Inc. 414,358 12,265,555 0.43%Japan Post Holdings Co., Ltd. 1,374,311 11,558,897 0.40%Sompo Holdings, Inc. 293,239 10,336,516 0.36%Sumitomo Mitsui Trust Holdings,
Inc. 289,536 10,293,806 0.36%Resona Holdings, Inc. 1,824,673 7,164,808 0.25%Japan Exchange Group, Inc. 444,802 7,037,332 0.24%Daiwa Securities Group, Inc. 1,333,948 6,047,112 0.21%T&D Holdings, Inc. 485,769 5,555,050 0.19%SBI Holdings, Inc. 206,298 3,914,984 0.14%Concordia Financial Group Ltd. 923,600 3,422,208 0.12%Japan Post Bank Co., Ltd. 350,896 3,020,311 0.10%Japan Post Insurance Co., Ltd. 196,477 2,998,993 0.10%Sony Financial Holdings, Inc. 132,106 2,845,980 0.10%Shizuoka Bank Ltd. 399,682 2,680,106 0.09%Fukuoka Financial Group, Inc. 150,860 2,603,216 0.09%Chiba Bank Ltd. 475,336 2,466,541 0.09%Aozora Bank Ltd. 104,069 2,466,343 0.09%Shinsei Bank Ltd. 171,895 2,360,272 0.08%Credit Saison Co., Ltd. 135,531 2,112,053 0.07%Mitsubishi UFJ Lease & Finance
Co., Ltd. 346,876 2,007,534 0.07%Bank of Kyoto Ltd. 47,229 1,819,661 0.06%Tokyo Century Corp. 36,900 1,769,564 0.06%Mebuki Financial Group, Inc. 759,019 1,742,187 0.06%Seven Bank Ltd. 510,197 1,497,287 0.05%Acom Co., Ltd. 342,934 1,397,175 0.05%AEON Financial Service Co., Ltd. 96,711 1,369,154 0.05%
304,952,572 10.58%
Health Care 9.87% (2018: 8.69%)
Takeda Pharmaceutical Co., Ltd. 1,306,971 46,412,867 1.61%Daiichi Sankyo Co., Ltd. 495,116 29,336,554 1.02%Hoya Corp. 332,936 28,520,757 0.99%Astellas Pharma, Inc. 1,648,467 25,270,036 0.88%Terumo Corp. 563,478 17,945,352 0.62%Chugai Pharmaceutical Co., Ltd. 195,391 16,145,410 0.56%Eisai Co., Ltd. 219,965 14,793,238 0.51%Olympus Corp. 1,017,036 14,081,534 0.49%Otsuka Holdings Co., Ltd. 340,819 13,642,518 0.47%Shionogi & Co., Ltd. 234,920 13,031,673 0.45%M3, Inc. 384,920 10,428,598 0.36%Sysmex Corp. 146,053 8,918,513 0.31%Ono Pharmaceutical Co., Ltd. 331,872 6,806,783 0.24%Santen Pharmaceutical Co., Ltd. 315,105 5,388,323 0.19%Kyowa Kirin Co., Ltd. 212,080 4,473,253 0.15%Asahi Intecc Co., Ltd. 170,400 4,469,959 0.15%PeptiDream, Inc. 82,000 3,764,314 0.13%Mitsubishi Tanabe Pharma Corp. 196,866 3,240,548 0.11%Medipal Holdings Corp. 158,657 3,138,344 0.11%Nippon Shinyaku Co., Ltd. 39,900 3,097,468 0.11%Alfresa Holdings Corp. 163,314 2,982,789 0.10%Sumitomo Dainippon Pharma
Co., Ltd. 140,640 2,455,684 0.09%Suzuken Co., Ltd. 63,142 2,311,127 0.08%Taisho Pharmaceutical Holdings
Co., Ltd. 29,760 1,978,508 0.07%Hisamitsu Pharmaceutical Co., Inc. 45,075 1,976,849 0.07%
284,610,999 9.87%
Industrials 20.47% (2018: 20.75%)
Recruit Holdings Co., Ltd. 1,184,185 39,790,690 1.38%FANUC Corp. 169,129 28,186,390 0.98%Mitsubishi Corp. 1,179,676 28,044,309 0.97%Daikin Industries Ltd. 217,521 27,549,497 0.96%
ITOCHU Corp. 1,175,990 24,433,176 0.85%Nidec Corp. 195,159 24,005,380 0.83%Mitsui & Co., Ltd. 1,445,009 23,051,404 0.80%Central Japan Railway Co. 125,875 22,701,061 0.79%East Japan Railway Co. 263,832 21,320,642 0.74%SMC Corp. 49,983 20,605,727 0.71%Mitsubishi Electric Corp. 1,592,829 19,566,354 0.68%Komatsu Ltd. 805,817 17,452,323 0.61%Secom Co., Ltd. 183,284 14,689,742 0.51%Sumitomo Corp. 1,037,140 13,807,257 0.48%Toshiba Corp. 432,004 13,120,790 0.45%Kubota Corp. 914,100 12,933,572 0.45%West Japan Railway Co. 141,944 10,985,480 0.38%Mitsubishi Heavy Industries Ltd. 279,557 9,735,065 0.34%Marubeni Corp. 1,364,587 9,067,589 0.31%Hankyu Hanshin Holdings, Inc. 199,841 7,666,805 0.27%Kintetsu Group Holdings Co., Ltd. 149,809 7,270,154 0.25%Tokyu Corp. 436,446 7,223,552 0.25%Taisei Corp. 176,332 6,569,753 0.23%Makita Corp. 195,385 6,102,393 0.21%MinebeaMitsumi, Inc. 316,774 5,912,846 0.20%Toyota Tsusho Corp. 185,412 5,866,906 0.20%Obayashi Corp. 566,926 5,655,890 0.20%MISUMI Group, Inc. 247,593 5,524,723 0.19%Tobu Railway Co., Ltd. 167,380 5,426,678 0.19%Odakyu Electric Railway Co., Ltd. 257,282 5,380,267 0.19%Dai Nippon Printing Co., Ltd. 212,921 5,166,474 0.18%AGC, Inc. 159,613 5,142,151 0.18%Keio Corp. 90,089 4,881,544 0.17%Daifuku Co., Ltd. 88,400 4,826,258 0.17%Shimizu Corp. 512,460 4,688,222 0.16%TOTO Ltd. 122,688 4,666,637 0.16%Kajima Corp. 389,312 4,653,067 0.16%Toppan Printing Co., Ltd. 244,420 4,530,241 0.16%Nagoya Railroad Co., Ltd. 161,880 4,498,595 0.16%Kyushu Railway Co. 139,603 4,177,069 0.14%Yamato Holdings Co., Ltd. 269,026 4,117,395 0.14%Keisei Electric Railway Co., Ltd. 112,834 3,921,840 0.14%Hoshizaki Corp. 47,593 3,800,021 0.13%Keihan Holdings Co., Ltd. 83,226 3,615,921 0.13%Nippon Express Co., Ltd. 68,409 3,600,247 0.12%LIXIL Group Corp. 232,423 3,599,109 0.12%NGK Insulators Ltd. 227,170 3,545,699 0.12%Keikyu Corp. 193,044 3,339,049 0.12%Fuji Electric Co., Ltd. 110,658 3,034,331 0.11%Sohgo Security Services Co., Ltd. 62,161 3,016,641 0.10%ANA Holdings, Inc. 99,647 2,975,008 0.10%Amada Holdings Co., Ltd. 288,223 2,953,403 0.10%Japan Airlines Co., Ltd. 100,275 2,792,365 0.10%JGC Holdings Corp. 193,229 2,779,927 0.10%IHI Corp. 128,630 2,714,156 0.09%NSK Ltd. 312,907 2,670,238 0.09%Persol Holdings Co., Ltd. 156,600 2,632,943 0.09%Nabtesco Corp. 97,712 2,615,261 0.09%MonotaRO Co., Ltd. 108,000 2,587,835 0.09%THK Co., Ltd. 105,384 2,564,027 0.09%Seibu Holdings, Inc. 174,148 2,562,518 0.09%Hitachi Construction Machinery
Co., Ltd. 94,721 2,550,737 0.09%SG Holdings Co., Ltd. 126,400 2,548,979 0.09%Mitsui OSK Lines Ltd. 100,617 2,495,059 0.09%Sumitomo Heavy Industries Ltd. 97,139 2,492,424 0.09%Kawasaki Heavy Industries Ltd. 124,616 2,459,882 0.09%Hino Motors Ltd. 253,768 2,417,280 0.08%Kurita Water Industries Ltd. 87,112 2,324,411 0.08%Park24 Co., Ltd. 102,807 2,249,341 0.08%Nippon Yusen KK 135,263 2,196,582 0.08%
Number of Fair Value % of Total Shares Euro (€) Net Assets
Vanguard Japan Stock Index Fund
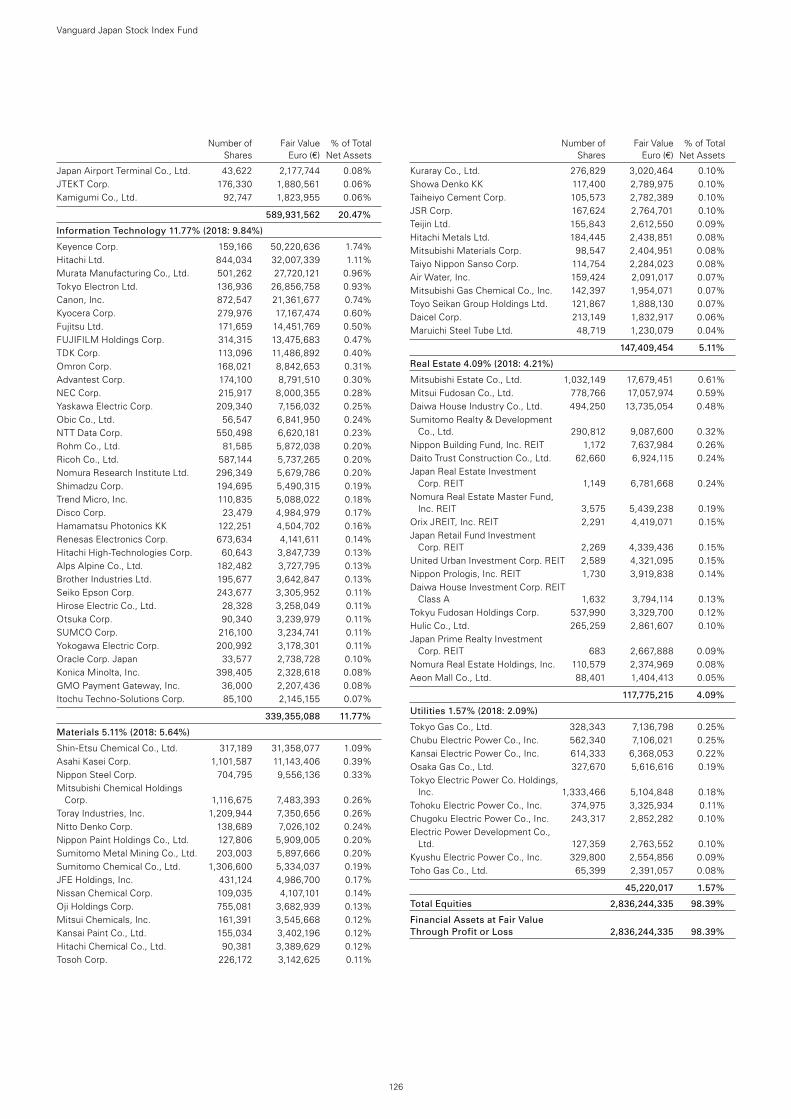
126
Number of Fair Value % of Total Shares Euro (€) Net Assets
Japan Airport Terminal Co., Ltd. 43,622 2,177,744 0.08%JTEKT Corp. 176,330 1,880,561 0.06%Kamigumi Co., Ltd. 92,747 1,823,955 0.06%
589,931,562 20.47%
Information Technology 11.77% (2018: 9.84%)
Keyence Corp. 159,166 50,220,636 1.74%Hitachi Ltd. 844,034 32,007,339 1.11%Murata Manufacturing Co., Ltd. 501,262 27,720,121 0.96%Tokyo Electron Ltd. 136,936 26,856,758 0.93%Canon, Inc. 872,547 21,361,677 0.74%Kyocera Corp. 279,976 17,167,474 0.60%Fujitsu Ltd. 171,659 14,451,769 0.50%FUJIFILM Holdings Corp. 314,315 13,475,683 0.47%TDK Corp. 113,096 11,486,892 0.40%Omron Corp. 168,021 8,842,653 0.31%Advantest Corp. 174,100 8,791,510 0.30%NEC Corp. 215,917 8,000,355 0.28%Yaskawa Electric Corp. 209,340 7,156,032 0.25%Obic Co., Ltd. 56,547 6,841,950 0.24%NTT Data Corp. 550,498 6,620,181 0.23%Rohm Co., Ltd. 81,585 5,872,038 0.20%Ricoh Co., Ltd. 587,144 5,737,265 0.20%Nomura Research Institute Ltd. 296,349 5,679,786 0.20%Shimadzu Corp. 194,695 5,490,315 0.19%Trend Micro, Inc. 110,835 5,088,022 0.18%Disco Corp. 23,479 4,984,979 0.17%Hamamatsu Photonics KK 122,251 4,504,702 0.16%Renesas Electronics Corp. 673,634 4,141,611 0.14%Hitachi High-Technologies Corp. 60,643 3,847,739 0.13%Alps Alpine Co., Ltd. 182,482 3,727,795 0.13%Brother Industries Ltd. 195,677 3,642,847 0.13%Seiko Epson Corp. 243,677 3,305,952 0.11%Hirose Electric Co., Ltd. 28,328 3,258,049 0.11%Otsuka Corp. 90,340 3,239,979 0.11%SUMCO Corp. 216,100 3,234,741 0.11%Yokogawa Electric Corp. 200,992 3,178,301 0.11%Oracle Corp. Japan 33,577 2,738,728 0.10%Konica Minolta, Inc. 398,405 2,328,618 0.08%GMO Payment Gateway, Inc. 36,000 2,207,436 0.08%Itochu Techno-Solutions Corp. 85,100 2,145,155 0.07%
339,355,088 11.77%
Materials 5.11% (2018: 5.64%)
Shin-Etsu Chemical Co., Ltd. 317,189 31,358,077 1.09%Asahi Kasei Corp. 1,101,587 11,143,406 0.39%Nippon Steel Corp. 704,795 9,556,136 0.33%Mitsubishi Chemical Holdings
Corp. 1,116,675 7,483,393 0.26%Toray Industries, Inc. 1,209,944 7,350,656 0.26%Nitto Denko Corp. 138,689 7,026,102 0.24%Nippon Paint Holdings Co., Ltd. 127,806 5,909,005 0.20%Sumitomo Metal Mining Co., Ltd. 203,003 5,897,666 0.20%Sumitomo Chemical Co., Ltd. 1,306,600 5,334,037 0.19%JFE Holdings, Inc. 431,124 4,986,700 0.17%Nissan Chemical Corp. 109,035 4,107,101 0.14%Oji Holdings Corp. 755,081 3,682,939 0.13%Mitsui Chemicals, Inc. 161,391 3,545,668 0.12%Kansai Paint Co., Ltd. 155,034 3,402,196 0.12%Hitachi Chemical Co., Ltd. 90,381 3,389,629 0.12%Tosoh Corp. 226,172 3,142,625 0.11%
Kuraray Co., Ltd. 276,829 3,020,464 0.10%Showa Denko KK 117,400 2,789,975 0.10%Taiheiyo Cement Corp. 105,573 2,782,389 0.10%JSR Corp. 167,624 2,764,701 0.10%Teijin Ltd. 155,843 2,612,550 0.09%Hitachi Metals Ltd. 184,445 2,438,851 0.08%Mitsubishi Materials Corp. 98,547 2,404,951 0.08%Taiyo Nippon Sanso Corp. 114,754 2,284,023 0.08%Air Water, Inc. 159,424 2,091,017 0.07%Mitsubishi Gas Chemical Co., Inc. 142,397 1,954,071 0.07%Toyo Seikan Group Holdings Ltd. 121,867 1,888,130 0.07%Daicel Corp. 213,149 1,832,917 0.06%Maruichi Steel Tube Ltd. 48,719 1,230,079 0.04%
147,409,454 5.11%
Real Estate 4.09% (2018: 4.21%)
Mitsubishi Estate Co., Ltd. 1,032,149 17,679,451 0.61%Mitsui Fudosan Co., Ltd. 778,766 17,057,974 0.59%Daiwa House Industry Co., Ltd. 494,250 13,735,054 0.48%Sumitomo Realty & Development
Co., Ltd. 290,812 9,087,600 0.32%Nippon Building Fund, Inc. REIT 1,172 7,637,984 0.26%Daito Trust Construction Co., Ltd. 62,660 6,924,115 0.24%Japan Real Estate Investment
Corp. REIT 1,149 6,781,668 0.24%Nomura Real Estate Master Fund,
Inc. REIT 3,575 5,439,238 0.19%Orix JREIT, Inc. REIT 2,291 4,419,071 0.15%Japan Retail Fund Investment
Corp. REIT 2,269 4,339,436 0.15%United Urban Investment Corp. REIT 2,589 4,321,095 0.15%Nippon Prologis, Inc. REIT 1,730 3,919,838 0.14%Daiwa House Investment Corp. REIT
Class A 1,632 3,794,114 0.13%Tokyu Fudosan Holdings Corp. 537,990 3,329,700 0.12%Hulic Co., Ltd. 265,259 2,861,607 0.10%Japan Prime Realty Investment
Corp. REIT 683 2,667,888 0.09%Nomura Real Estate Holdings, Inc. 110,579 2,374,969 0.08%Aeon Mall Co., Ltd. 88,401 1,404,413 0.05%
117,775,215 4.09%
Utilities 1.57% (2018: 2.09%)
Tokyo Gas Co., Ltd. 328,343 7,136,798 0.25%Chubu Electric Power Co., Inc. 562,340 7,106,021 0.25%Kansai Electric Power Co., Inc. 614,333 6,368,053 0.22%Osaka Gas Co., Ltd. 327,670 5,616,616 0.19%Tokyo Electric Power Co. Holdings,
Inc. 1,333,466 5,104,848 0.18%Tohoku Electric Power Co., Inc. 374,975 3,325,934 0.11%Chugoku Electric Power Co., Inc. 243,317 2,852,282 0.10%Electric Power Development Co.,
Ltd. 127,359 2,763,552 0.10%Kyushu Electric Power Co., Inc. 329,800 2,554,856 0.09%Toho Gas Co., Ltd. 65,399 2,391,057 0.08%
45,220,017 1.57%
Total Equities 2,836,244,335 98.39%
Financial Assets at Fair Value Through Profit or Loss 2,836,244,335 98.39%
Number of Fair Value % of Total Shares Euro (€) Net Assets
Vanguard Japan Stock Index Fund
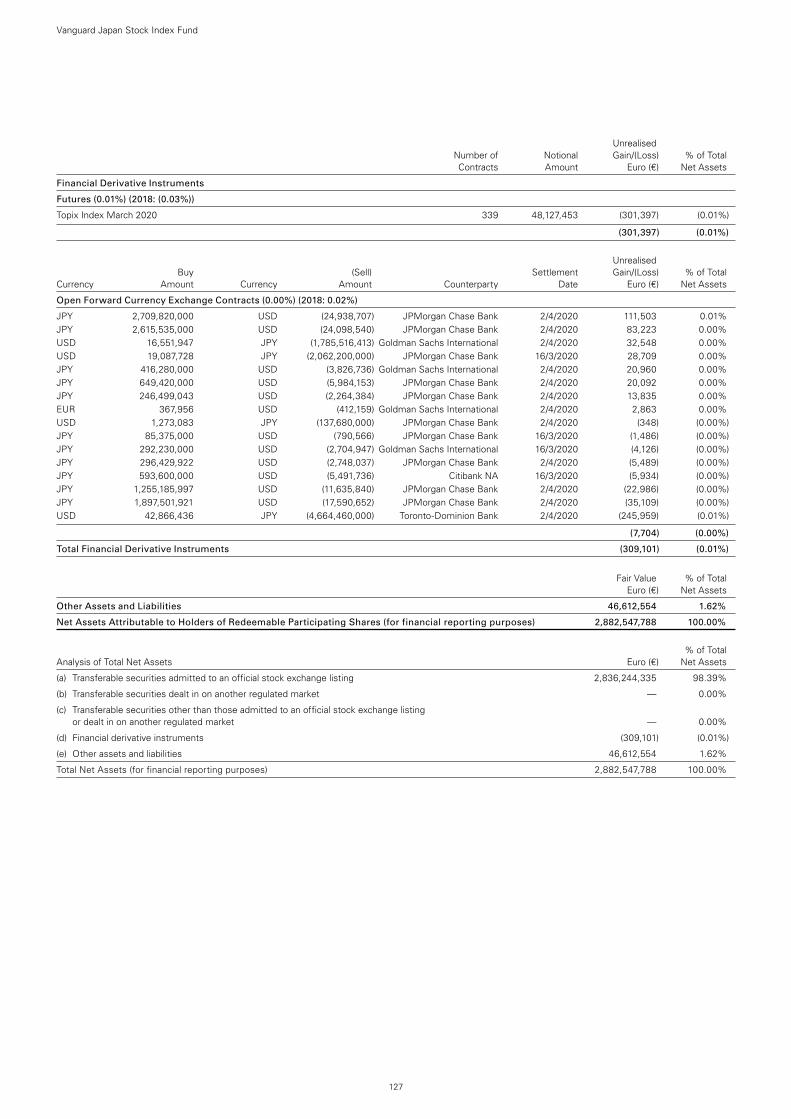
127
Vanguard Japan Stock Index Fund
Unrealised Number of Notional Gain/(Loss) % of Total Contracts Amount Euro (€) Net Assets
Financial Derivative Instruments
Futures (0.01%) (2018: (0.03%))
Topix Index March 2020 339 48,127,453 (301,397) (0.01%)
(301,397) (0.01%)
Unrealised Buy (Sell) Settlement Gain/(Loss) % of Total Currency Amount Currency Amount Counterparty Date Euro (€) Net Assets
Open Forward Currency Exchange Contracts (0.00%) (2018: 0.02%)
JPY 2,709,820,000 USD (24,938,707) JPMorgan Chase Bank 2/4/2020 111,503 0.01%JPY 2,615,535,000 USD (24,098,540) JPMorgan Chase Bank 2/4/2020 83,223 0.00%USD 16,551,947 JPY (1,785,516,413) Goldman Sachs International 2/4/2020 32,548 0.00%USD 19,087,728 JPY (2,062,200,000) JPMorgan Chase Bank 16/3/2020 28,709 0.00%JPY 416,280,000 USD (3,826,736) Goldman Sachs International 2/4/2020 20,960 0.00%JPY 649,420,000 USD (5,984,153) JPMorgan Chase Bank 2/4/2020 20,092 0.00%JPY 246,499,043 USD (2,264,384) JPMorgan Chase Bank 2/4/2020 13,835 0.00%EUR 367,956 USD (412,159) Goldman Sachs International 2/4/2020 2,863 0.00%USD 1,273,083 JPY (137,680,000) JPMorgan Chase Bank 2/4/2020 (348) (0.00%)JPY 85,375,000 USD (790,566) JPMorgan Chase Bank 16/3/2020 (1,486) (0.00%)JPY 292,230,000 USD (2,704,947) Goldman Sachs International 16/3/2020 (4,126) (0.00%)JPY 296,429,922 USD (2,748,037) JPMorgan Chase Bank 2/4/2020 (5,489) (0.00%)JPY 593,600,000 USD (5,491,736) Citibank NA 16/3/2020 (5,934) (0.00%)JPY 1,255,185,997 USD (11,635,840) JPMorgan Chase Bank 2/4/2020 (22,986) (0.00%)JPY 1,897,501,921 USD (17,590,652) JPMorgan Chase Bank 2/4/2020 (35,109) (0.00%)USD 42,866,436 JPY (4,664,460,000) Toronto-Dominion Bank 2/4/2020 (245,959) (0.01%)
(7,704) (0.00%)
Total Financial Derivative Instruments (309,101) (0.01%)
Fair Value % of Total Euro (€) Net Assets
Other Assets and Liabilities 46,612,554 1.62%
Net Assets Attributable to Holders of Redeemable Participating Shares (for financial reporting purposes) 2,882,547,788 100.00%
% of Total Analysis of Total Net Assets Euro (€) Net Assets
(a) Transferable securities admitted to an official stock exchange listing 2,836,244,335 98.39%
(b) Transferable securities dealt in on another regulated market — 0.00%
(c) Transferable securities other than those admitted to an official stock exchange listing or dealt in on another regulated market — 0.00%
(d) Financial derivative instruments (309,101) (0.01%)
(e) Other assets and liabilities 46,612,554 1.62%
Total Net Assets (for financial reporting purposes) 2,882,547,788 100.00%
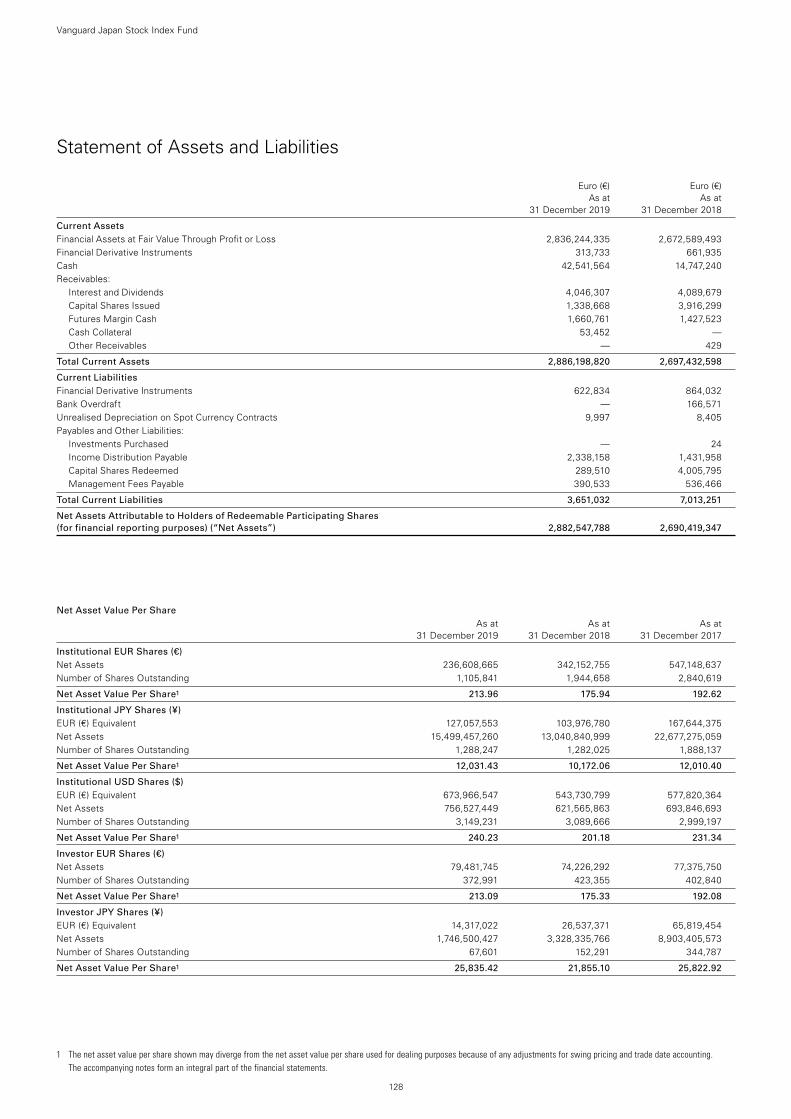
1 The net asset value per share shown may diverge from the net asset value per share used for dealing purposes because of any adjustments for swing pricing and trade date accounting. The accompanying notes form an integral part of the financial statements.
128
Vanguard Japan Stock Index Fund
Statement of Assets and Liabilities
Euro (€) Euro (€) As at As at 31 December 2019 31 December 2018
Current Assets Financial Assets at Fair Value Through Profit or Loss 2,836,244,335 2,672,589,493Financial Derivative Instruments 313,733 661,935Cash 42,541,564 14,747,240Receivables:
Interest and Dividends 4,046,307 4,089,679Capital Shares Issued 1,338,668 3,916,299Futures Margin Cash 1,660,761 1,427,523Cash Collateral 53,452 —Other Receivables — 429
Total Current Assets 2,886,198,820 2,697,432,598
Current Liabilities Financial Derivative Instruments 622,834 864,032Bank Overdraft — 166,571Unrealised Depreciation on Spot Currency Contracts 9,997 8,405Payables and Other Liabilities:
Investments Purchased — 24Income Distribution Payable 2,338,158 1,431,958Capital Shares Redeemed 289,510 4,005,795Management Fees Payable 390,533 536,466
Total Current Liabilities 3,651,032 7,013,251
Net Assets Attributable to Holders of Redeemable Participating Shares (for financial reporting purposes) (“Net Assets”) 2,882,547,788 2,690,419,347
Net Asset Value Per Share As at As at As at 31 December 2019 31 December 2018 31 December 2017
Institutional EUR Shares (€) Net Assets 236,608,665 342,152,755 547,148,637Number of Shares Outstanding 1,105,841 1,944,658 2,840,619
Net Asset Value Per Share1 213.96 175.94 192.62
Institutional JPY Shares (¥) EUR (€) Equivalent 127,057,553 103,976,780 167,644,375Net Assets 15,499,457,260 13,040,840,999 22,677,275,059Number of Shares Outstanding 1,288,247 1,282,025 1,888,137
Net Asset Value Per Share1 12,031.43 10,172.06 12,010.40
Institutional USD Shares ($) EUR (€) Equivalent 673,966,547 543,730,799 577,820,364Net Assets 756,527,449 621,565,863 693,846,693Number of Shares Outstanding 3,149,231 3,089,666 2,999,197
Net Asset Value Per Share1 240.23 201.18 231.34
Investor EUR Shares (€) Net Assets 79,481,745 74,226,292 77,375,750Number of Shares Outstanding 372,991 423,355 402,840
Net Asset Value Per Share1 213.09 175.33 192.08
Investor JPY Shares (¥) EUR (€) Equivalent 14,317,022 26,537,371 65,819,454Net Assets 1,746,500,427 3,328,335,766 8,903,405,573Number of Shares Outstanding 67,601 152,291 344,787
Net Asset Value Per Share1 25,835.42 21,855.10 25,822.92
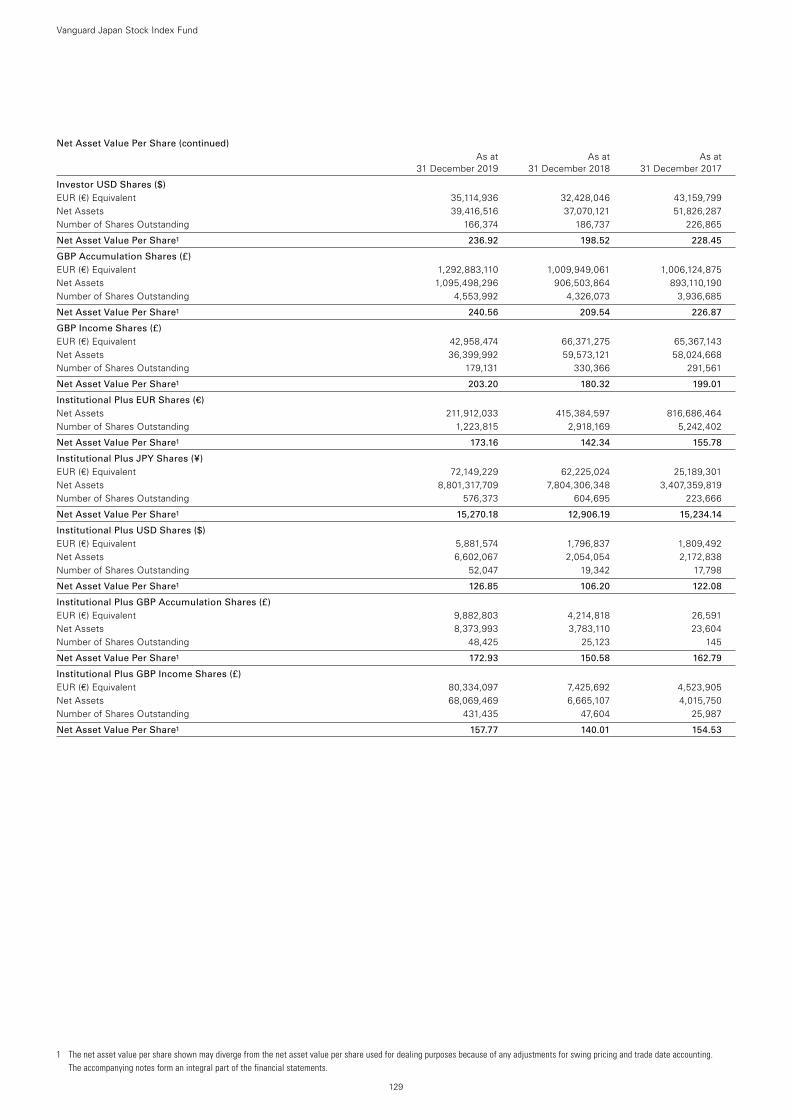
1 The net asset value per share shown may diverge from the net asset value per share used for dealing purposes because of any adjustments for swing pricing and trade date accounting. The accompanying notes form an integral part of the financial statements.
129
Net Asset Value Per Share (continued) As at As at As at 31 December 2019 31 December 2018 31 December 2017
Investor USD Shares ($) EUR (€) Equivalent 35,114,936 32,428,046 43,159,799Net Assets 39,416,516 37,070,121 51,826,287Number of Shares Outstanding 166,374 186,737 226,865
Net Asset Value Per Share1 236.92 198.52 228.45
GBP Accumulation Shares (£) EUR (€) Equivalent 1,292,883,110 1,009,949,061 1,006,124,875Net Assets 1,095,498,296 906,503,864 893,110,190Number of Shares Outstanding 4,553,992 4,326,073 3,936,685
Net Asset Value Per Share1 240.56 209.54 226.87
GBP Income Shares (£) EUR (€) Equivalent 42,958,474 66,371,275 65,367,143Net Assets 36,399,992 59,573,121 58,024,668Number of Shares Outstanding 179,131 330,366 291,561
Net Asset Value Per Share1 203.20 180.32 199.01
Institutional Plus EUR Shares (€) Net Assets 211,912,033 415,384,597 816,686,464Number of Shares Outstanding 1,223,815 2,918,169 5,242,402
Net Asset Value Per Share1 173.16 142.34 155.78
Institutional Plus JPY Shares (¥) EUR (€) Equivalent 72,149,229 62,225,024 25,189,301Net Assets 8,801,317,709 7,804,306,348 3,407,359,819Number of Shares Outstanding 576,373 604,695 223,666
Net Asset Value Per Share1 15,270.18 12,906.19 15,234.14
Institutional Plus USD Shares ($) EUR (€) Equivalent 5,881,574 1,796,837 1,809,492Net Assets 6,602,067 2,054,054 2,172,838Number of Shares Outstanding 52,047 19,342 17,798
Net Asset Value Per Share1 126.85 106.20 122.08
Institutional Plus GBP Accumulation Shares (£) EUR (€) Equivalent 9,882,803 4,214,818 26,591Net Assets 8,373,993 3,783,110 23,604Number of Shares Outstanding 48,425 25,123 145
Net Asset Value Per Share1 172.93 150.58 162.79
Institutional Plus GBP Income Shares (£) EUR (€) Equivalent 80,334,097 7,425,692 4,523,905Net Assets 68,069,469 6,665,107 4,015,750Number of Shares Outstanding 431,435 47,604 25,987
Net Asset Value Per Share1 157.77 140.01 154.53
Vanguard Japan Stock Index Fund
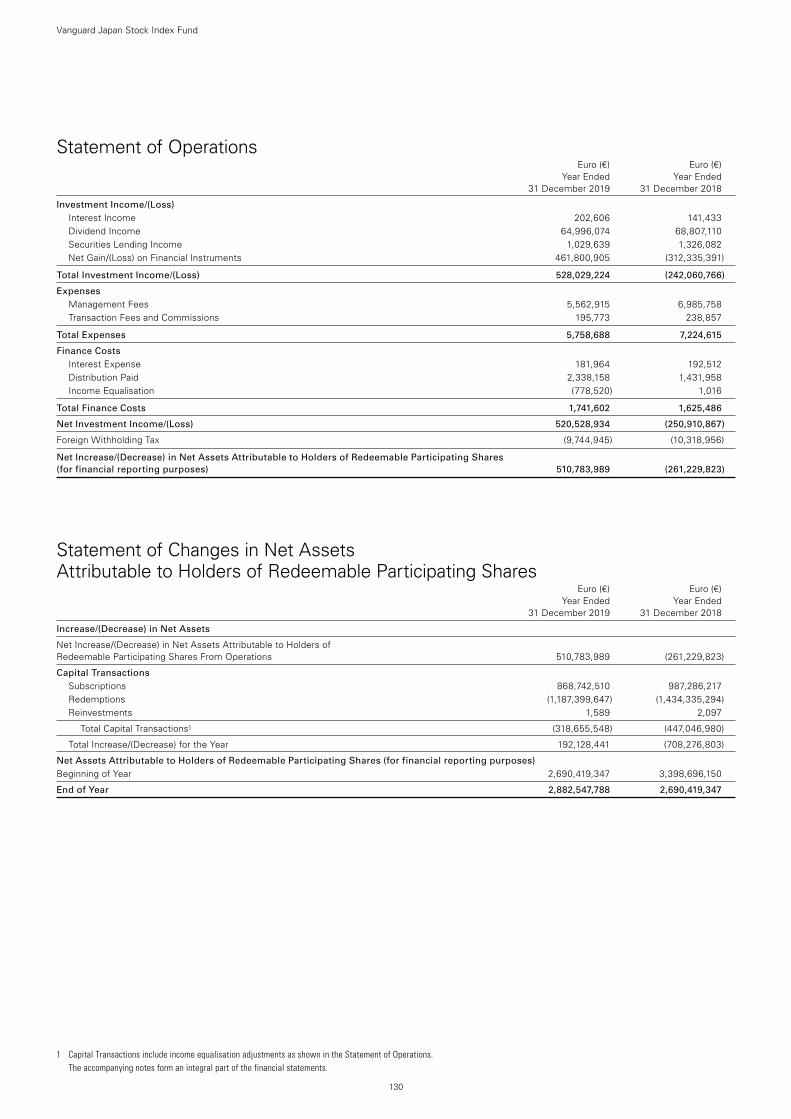
130
Vanguard Japan Stock Index Fund
Statement of Operations Euro (€) Euro (€) Year Ended Year Ended 31 December 2019 31 December 2018
Investment Income/(Loss) Interest Income 202,606 141,433Dividend Income 64,996,074 68,807,110Securities Lending Income 1,029,639 1,326,082Net Gain/(Loss) on Financial Instruments 461,800,905 (312,335,391)
Total Investment Income/(Loss) 528,029,224 (242,060,766)
Expenses Management Fees 5,562,915 6,985,758Transaction Fees and Commissions 195,773 238,857
Total Expenses 5,758,688 7,224,615
Finance Costs Interest Expense 181,964 192,512Distribution Paid 2,338,158 1,431,958Income Equalisation (778,520) 1,016
Total Finance Costs 1,741,602 1,625,486
Net Investment Income/(Loss) 520,528,934 (250,910,867)
Foreign Withholding Tax (9,744,945) (10,318,956)
Net Increase/(Decrease) in Net Assets Attributable to Holders of Redeemable Participating Shares (for financial reporting purposes) 510,783,989 (261,229,823)
Statement of Changes in Net Assets Attributable to Holders of Redeemable Participating Shares Euro (€) Euro (€) Year Ended Year Ended 31 December 2019 31 December 2018
Increase/(Decrease) in Net Assets
Net Increase/(Decrease) in Net Assets Attributable to Holders of Redeemable Participating Shares From Operations 510,783,989 (261,229,823)
Capital Transactions Subscriptions 868,742,510 987,286,217Redemptions (1,187,399,647) (1,434,335,294)Reinvestments 1,589 2,097
Total Capital Transactions1 (318,655,548) (447,046,980)
Total Increase/(Decrease) for the Year 192,128,441 (708,276,803)
Net Assets Attributable to Holders of Redeemable Participating Shares (for financial reporting purposes) Beginning of Year 2,690,419,347 3,398,696,150
End of Year 2,882,547,788 2,690,419,347
1 Capital Transactions include income equalisation adjustments as shown in the Statement of Operations. The accompanying notes form an integral part of the financial statements.
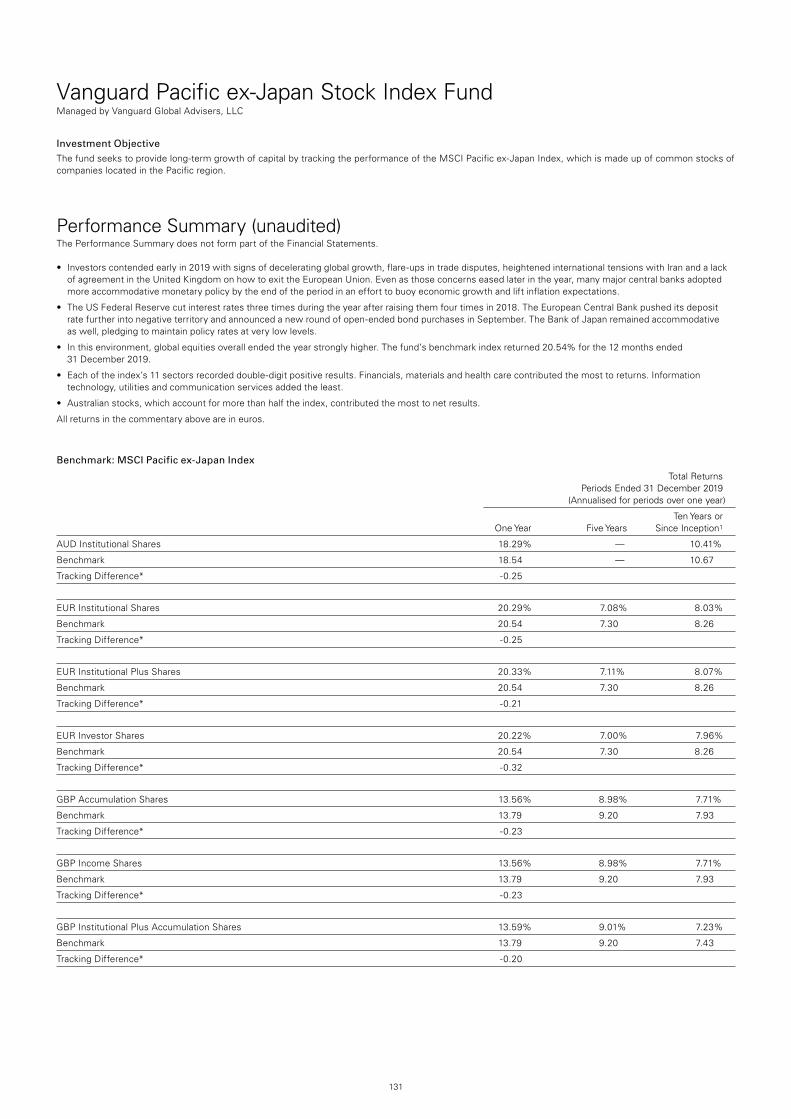
131
Vanguard Pacific ex-Japan Stock Index FundManaged by Vanguard Global Advisers, LLC
Investment ObjectiveThe fund seeks to provide long-term growth of capital by tracking the performance of the MSCI Pacific ex-Japan Index, which is made up of common stocks of companies located in the Pacific region.
Performance Summary (unaudited)The Performance Summary does not form part of the Financial Statements.
• Investorscontendedearlyin2019withsignsofdeceleratingglobalgrowth,flare-upsintradedisputes,heightenedinternationaltensionswithIranandalackof agreement in the United Kingdom on how to exit the European Union. Even as those concerns eased later in the year, many major central banks adopted more accommodative monetary policy by the end of the period in an effort to buoy economic growth and lift inflation expectations.
• TheUSFederalReservecutinterestratesthreetimesduringtheyearafterraisingthemfourtimesin2018.TheEuropeanCentralBankpusheditsdepositrate further into negative territory and announced a new round of open-ended bond purchases in September. The Bank of Japan remained accommodative as well, pledging to maintain policy rates at very low levels.
• Inthisenvironment,globalequitiesoverallendedtheyearstronglyhigher.Thefund’sbenchmarkindexreturned20.54%forthe12monthsended 31 December 2019.
• Eachoftheindex’s11sectorsrecordeddouble-digitpositiveresults.Financials,materialsandhealthcarecontributedthemosttoreturns.Informationtechnology, utilities and communication services added the least.
• Australianstocks,whichaccountformorethanhalftheindex,contributedthemosttonetresults.
All returns in the commentary above are in euros.
Benchmark: MSCI Pacific ex-Japan Index
Total Returns Periods Ended 31 December 2019 (Annualised for periods over one year)
Ten Years or One Year Five Years Since Inception1
AUD Institutional Shares 18.29% — 10.41%
Benchmark 18.54 — 10.67
Tracking Difference* -0.25
EUR Institutional Shares 20.29% 7.08% 8.03%
Benchmark 20.54 7.30 8.26
Tracking Difference* -0.25
EUR Institutional Plus Shares 20.33% 7.11% 8.07%
Benchmark 20.54 7.30 8.26
Tracking Difference* -0.21
EUR Investor Shares 20.22% 7.00% 7.96%
Benchmark 20.54 7.30 8.26
Tracking Difference* -0.32
GBP Accumulation Shares 13.56% 8.98% 7.71%
Benchmark 13.79 9.20 7.93
Tracking Difference* -0.23
GBP Income Shares 13.56% 8.98% 7.71%
Benchmark 13.79 9.20 7.93
Tracking Difference* -0.23
GBP Institutional Plus Accumulation Shares 13.59% 9.01% 7.23%
Benchmark 13.79 9.20 7.43
Tracking Difference* -0.20
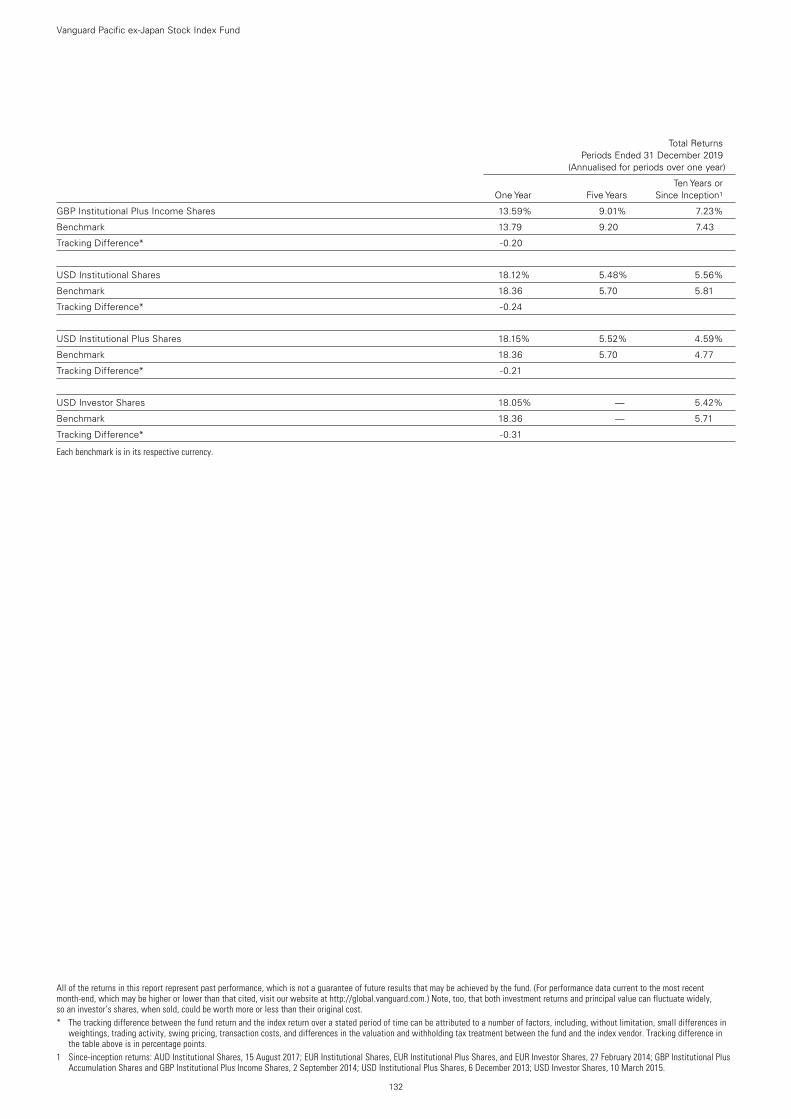
Vanguard Pacific ex-Japan Stock Index Fund
132
All of the returns in this report represent past performance, which is not a guarantee of future results that may be achieved by the fund. (For performance data current to the most recent month-end, which may be higher or lower than that cited, visit our website at http://global.vanguard.com.) Note, too, that both investment returns and principal value can fluctuate widely, so an investor’s shares, when sold, could be worth more or less than their original cost.* The tracking difference between the fund return and the index return over a stated period of time can be attributed to a number of factors, including, without limitation, small differences in
weightings, trading activity, swing pricing, transaction costs, and differences in the valuation and withholding tax treatment between the fund and the index vendor. Tracking difference in the table above is in percentage points.
1 Since-inception returns: AUD Institutional Shares, 15 August 2017; EUR Institutional Shares, EUR Institutional Plus Shares, and EUR Investor Shares, 27 February 2014; GBP Institutional Plus Accumulation Shares and GBP Institutional Plus Income Shares, 2 September 2014; USD Institutional Plus Shares, 6 December 2013; USD Investor Shares, 10 March 2015.
Total Returns Periods Ended 31 December 2019 (Annualised for periods over one year)
Ten Years or One Year Five Years Since Inception1
GBP Institutional Plus Income Shares 13.59% 9.01% 7.23%
Benchmark 13.79 9.20 7.43
Tracking Difference* -0.20
USD Institutional Shares 18.12% 5.48% 5.56%
Benchmark 18.36 5.70 5.81
Tracking Difference* -0.24
USD Institutional Plus Shares 18.15% 5.52% 4.59%
Benchmark 18.36 5.70 4.77
Tracking Difference* -0.21
USD Investor Shares 18.05% — 5.42%
Benchmark 18.36 — 5.71
Tracking Difference* -0.31
Each benchmark is in its respective currency.
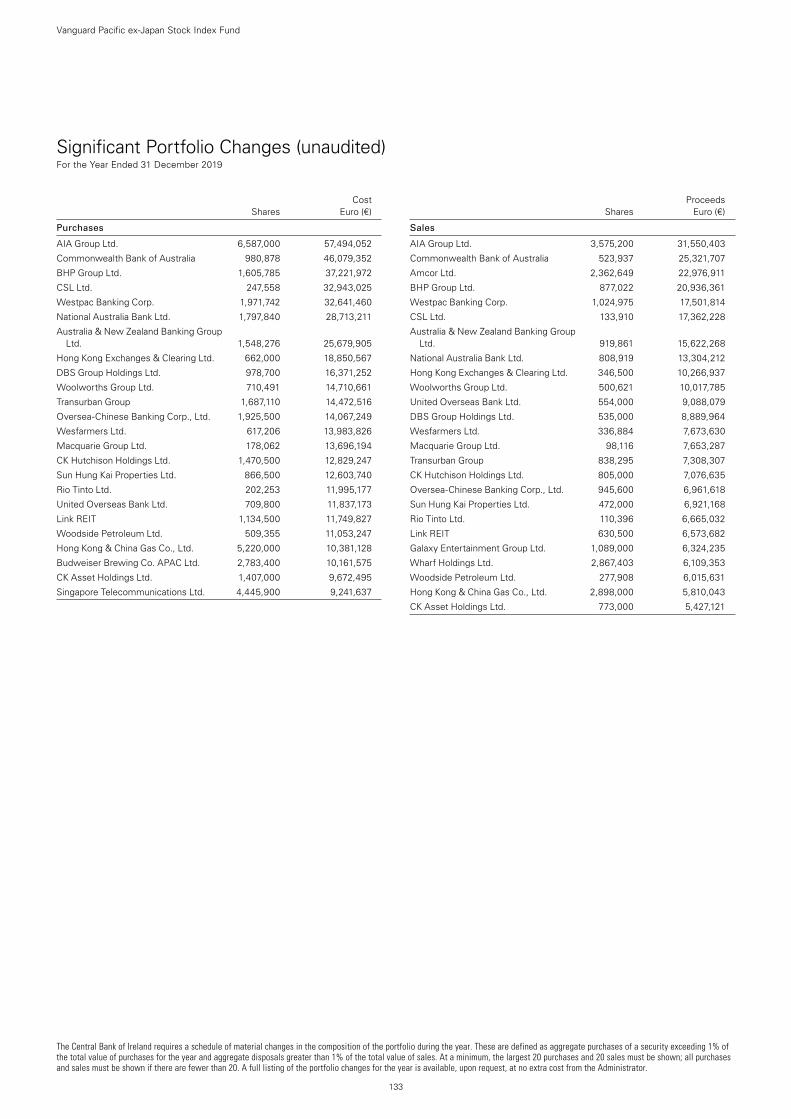
The Central Bank of Ireland requires a schedule of material changes in the composition of the portfolio during the year. These are defined as aggregate purchases of a security exceeding 1% of the total value of purchases for the year and aggregate disposals greater than 1% of the total value of sales. At a minimum, the largest 20 purchases and 20 sales must be shown; all purchases and sales must be shown if there are fewer than 20. A full listing of the portfolio changes for the year is available, upon request, at no extra cost from the Administrator.
133
Vanguard Pacific ex-Japan Stock Index Fund
Significant Portfolio Changes (unaudited) For the Year Ended 31 December 2019
Cost Shares Euro (€)
Purchases
AIA Group Ltd. 6,587,000 57,494,052
Commonwealth Bank of Australia 980,878 46,079,352
BHP Group Ltd. 1,605,785 37,221,972
CSL Ltd. 247,558 32,943,025
Westpac Banking Corp. 1,971,742 32,641,460
National Australia Bank Ltd. 1,797,840 28,713,211
Australia & New Zealand Banking Group Ltd. 1,548,276 25,679,905
Hong Kong Exchanges & Clearing Ltd. 662,000 18,850,567
DBS Group Holdings Ltd. 978,700 16,371,252
Woolworths Group Ltd. 710,491 14,710,661
Transurban Group 1,687,110 14,472,516
Oversea-Chinese Banking Corp., Ltd. 1,925,500 14,067,249
Wesfarmers Ltd. 617,206 13,983,826
Macquarie Group Ltd. 178,062 13,696,194
CK Hutchison Holdings Ltd. 1,470,500 12,829,247
Sun Hung Kai Properties Ltd. 866,500 12,603,740
Rio Tinto Ltd. 202,253 11,995,177
United Overseas Bank Ltd. 709,800 11,837,173
Link REIT 1,134,500 11,749,827
Woodside Petroleum Ltd. 509,355 11,053,247
Hong Kong & China Gas Co., Ltd. 5,220,000 10,381,128
Budweiser Brewing Co. APAC Ltd. 2,783,400 10,161,575
CK Asset Holdings Ltd. 1,407,000 9,672,495
Singapore Telecommunications Ltd. 4,445,900 9,241,637
Proceeds Shares Euro (€)
Sales
AIA Group Ltd. 3,575,200 31,550,403
Commonwealth Bank of Australia 523,937 25,321,707
Amcor Ltd. 2,362,649 22,976,911
BHP Group Ltd. 877,022 20,936,361
Westpac Banking Corp. 1,024,975 17,501,814
CSL Ltd. 133,910 17,362,228
Australia & New Zealand Banking Group Ltd. 919,861 15,622,268
National Australia Bank Ltd. 808,919 13,304,212
Hong Kong Exchanges & Clearing Ltd. 346,500 10,266,937
Woolworths Group Ltd. 500,621 10,017,785
United Overseas Bank Ltd. 554,000 9,088,079
DBS Group Holdings Ltd. 535,000 8,889,964
Wesfarmers Ltd. 336,884 7,673,630
Macquarie Group Ltd. 98,116 7,653,287
Transurban Group 838,295 7,308,307
CK Hutchison Holdings Ltd. 805,000 7,076,635
Oversea-Chinese Banking Corp., Ltd. 945,600 6,961,618
Sun Hung Kai Properties Ltd. 472,000 6,921,168
Rio Tinto Ltd. 110,396 6,665,032
Link REIT 630,500 6,573,682
Galaxy Entertainment Group Ltd. 1,089,000 6,324,235
Wharf Holdings Ltd. 2,867,403 6,109,353
Woodside Petroleum Ltd. 277,908 6,015,631
Hong Kong & China Gas Co., Ltd. 2,898,000 5,810,043
CK Asset Holdings Ltd. 773,000 5,427,121
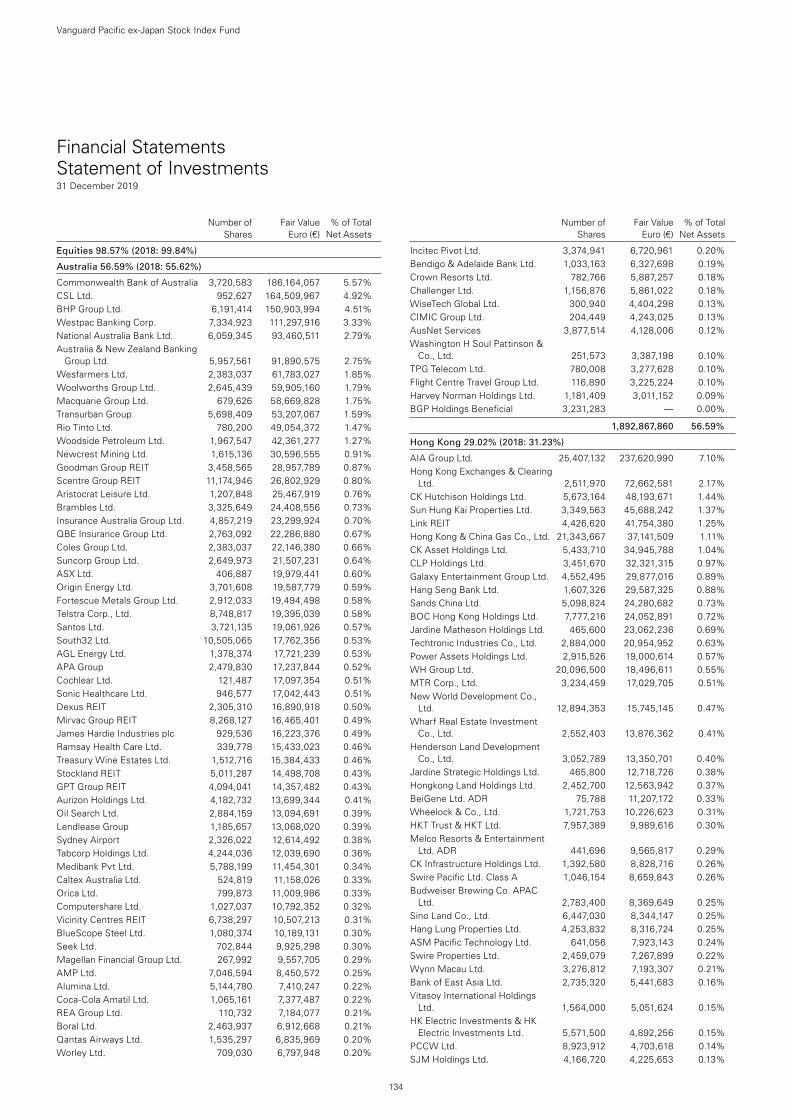
134
Vanguard Pacific ex-Japan Stock Index Fund
Number of Fair Value % of Total Shares Euro (€) Net Assets
Number of Fair Value % of Total Shares Euro (€) Net Assets
Equities 98.57% (2018: 99.84%)
Australia 56.59% (2018: 55.62%)
Commonwealth Bank of Australia 3,720,583 186,164,057 5.57%CSL Ltd. 952,627 164,509,967 4.92%BHP Group Ltd. 6,191,414 150,903,994 4.51%Westpac Banking Corp. 7,334,923 111,297,916 3.33%National Australia Bank Ltd. 6,059,345 93,460,511 2.79%Australia & New Zealand Banking
Group Ltd. 5,957,561 91,890,575 2.75%Wesfarmers Ltd. 2,383,037 61,783,027 1.85%Woolworths Group Ltd. 2,645,439 59,905,160 1.79%Macquarie Group Ltd. 679,626 58,669,828 1.75%Transurban Group 5,698,409 53,207,067 1.59%Rio Tinto Ltd. 780,200 49,054,372 1.47%Woodside Petroleum Ltd. 1,967,547 42,361,277 1.27%Newcrest Mining Ltd. 1,615,136 30,596,555 0.91%Goodman Group REIT 3,458,565 28,957,789 0.87%Scentre Group REIT 11,174,946 26,802,929 0.80%Aristocrat Leisure Ltd. 1,207,848 25,467,919 0.76%Brambles Ltd. 3,325,649 24,408,556 0.73%Insurance Australia Group Ltd. 4,857,219 23,299,924 0.70%QBE Insurance Group Ltd. 2,763,092 22,286,880 0.67%Coles Group Ltd. 2,383,037 22,146,380 0.66%Suncorp Group Ltd. 2,649,973 21,507,231 0.64%ASX Ltd. 406,887 19,979,441 0.60%Origin Energy Ltd. 3,701,608 19,587,779 0.59%Fortescue Metals Group Ltd. 2,912,033 19,494,498 0.58%Telstra Corp., Ltd. 8,748,817 19,395,039 0.58%Santos Ltd. 3,721,135 19,061,926 0.57%South32 Ltd. 10,505,065 17,762,356 0.53%AGL Energy Ltd. 1,378,374 17,721,239 0.53%APA Group 2,479,830 17,237,844 0.52%Cochlear Ltd. 121,487 17,097,354 0.51%Sonic Healthcare Ltd. 946,577 17,042,443 0.51%Dexus REIT 2,305,310 16,890,918 0.50%Mirvac Group REIT 8,268,127 16,465,401 0.49%James Hardie Industries plc 929,536 16,223,376 0.49%Ramsay Health Care Ltd. 339,778 15,433,023 0.46%Treasury Wine Estates Ltd. 1,512,716 15,384,433 0.46%Stockland REIT 5,011,287 14,498,708 0.43%GPT Group REIT 4,094,041 14,357,482 0.43%Aurizon Holdings Ltd. 4,182,732 13,699,344 0.41%Oil Search Ltd. 2,884,159 13,094,691 0.39%Lendlease Group 1,185,657 13,068,020 0.39%Sydney Airport 2,326,022 12,614,492 0.38%Tabcorp Holdings Ltd. 4,244,036 12,039,690 0.36%Medibank Pvt Ltd. 5,788,199 11,454,301 0.34%Caltex Australia Ltd. 524,819 11,158,026 0.33%Orica Ltd. 799,873 11,009,986 0.33%Computershare Ltd. 1,027,037 10,792,352 0.32%Vicinity Centres REIT 6,738,297 10,507,213 0.31%BlueScope Steel Ltd. 1,080,374 10,189,131 0.30%Seek Ltd. 702,844 9,925,298 0.30%Magellan Financial Group Ltd. 267,992 9,557,705 0.29%AMP Ltd. 7,046,594 8,450,572 0.25%Alumina Ltd. 5,144,780 7,410,247 0.22%Coca-Cola Amatil Ltd. 1,065,161 7,377,487 0.22%REA Group Ltd. 110,732 7,184,077 0.21%Boral Ltd. 2,463,937 6,912,668 0.21%Qantas Airways Ltd. 1,535,297 6,835,969 0.20%Worley Ltd. 709,030 6,797,948 0.20%
Incitec Pivot Ltd. 3,374,941 6,720,961 0.20%Bendigo & Adelaide Bank Ltd. 1,033,163 6,327,698 0.19%Crown Resorts Ltd. 782,766 5,887,257 0.18%Challenger Ltd. 1,156,876 5,861,022 0.18%WiseTech Global Ltd. 300,940 4,404,298 0.13%CIMIC Group Ltd. 204,449 4,243,025 0.13%AusNet Services 3,877,514 4,128,006 0.12%Washington H Soul Pattinson &
Co., Ltd. 251,573 3,387,198 0.10%TPG Telecom Ltd. 780,008 3,277,628 0.10%Flight Centre Travel Group Ltd. 116,890 3,225,224 0.10%Harvey Norman Holdings Ltd. 1,181,409 3,011,152 0.09%BGP Holdings Beneficial 3,231,283 — 0.00%
1,892,867,860 56.59%
Hong Kong 29.02% (2018: 31.23%)
AIA Group Ltd. 25,407,132 237,620,990 7.10%Hong Kong Exchanges & Clearing
Ltd. 2,511,970 72,662,581 2.17%CK Hutchison Holdings Ltd. 5,673,164 48,193,671 1.44%Sun Hung Kai Properties Ltd. 3,349,563 45,688,242 1.37%Link REIT 4,426,620 41,754,380 1.25%Hong Kong & China Gas Co., Ltd. 21,343,667 37,141,509 1.11%CK Asset Holdings Ltd. 5,433,710 34,945,788 1.04%CLP Holdings Ltd. 3,451,670 32,321,315 0.97%Galaxy Entertainment Group Ltd. 4,552,495 29,877,016 0.89%Hang Seng Bank Ltd. 1,607,326 29,587,325 0.88%Sands China Ltd. 5,098,824 24,280,682 0.73%BOC Hong Kong Holdings Ltd. 7,777,216 24,052,891 0.72%Jardine Matheson Holdings Ltd. 465,600 23,062,236 0.69%Techtronic Industries Co., Ltd. 2,884,000 20,954,952 0.63%Power Assets Holdings Ltd. 2,915,526 19,000,614 0.57%WH Group Ltd. 20,096,500 18,496,611 0.55%MTR Corp., Ltd. 3,234,459 17,029,705 0.51%New World Development Co.,
Ltd. 12,894,353 15,745,145 0.47%Wharf Real Estate Investment
Co., Ltd. 2,552,403 13,876,362 0.41%Henderson Land Development
Co., Ltd. 3,052,789 13,350,701 0.40%Jardine Strategic Holdings Ltd. 465,800 12,718,726 0.38%Hongkong Land Holdings Ltd. 2,452,700 12,563,942 0.37%BeiGene Ltd. ADR 75,788 11,207,172 0.33%Wheelock & Co., Ltd. 1,721,753 10,226,623 0.31%HKT Trust & HKT Ltd. 7,957,389 9,989,616 0.30%Melco Resorts & Entertainment
Ltd. ADR 441,696 9,565,817 0.29%CK Infrastructure Holdings Ltd. 1,392,580 8,828,716 0.26%Swire Pacific Ltd. Class A 1,046,154 8,659,843 0.26%Budweiser Brewing Co. APAC
Ltd. 2,783,400 8,369,649 0.25%Sino Land Co., Ltd. 6,447,030 8,344,147 0.25%Hang Lung Properties Ltd. 4,253,832 8,316,724 0.25%ASM Pacific Technology Ltd. 641,056 7,923,143 0.24%Swire Properties Ltd. 2,459,079 7,267,899 0.22%Wynn Macau Ltd. 3,276,812 7,193,307 0.21%Bank of East Asia Ltd. 2,735,320 5,441,683 0.16%Vitasoy International Holdings
Ltd. 1,564,000 5,051,624 0.15%HK Electric Investments & HK
Electric Investments Ltd. 5,571,500 4,892,256 0.15%PCCW Ltd. 8,923,912 4,703,618 0.14%SJM Holdings Ltd. 4,166,720 4,225,653 0.13%
Financial Statements Statement of Investments31 December 2019
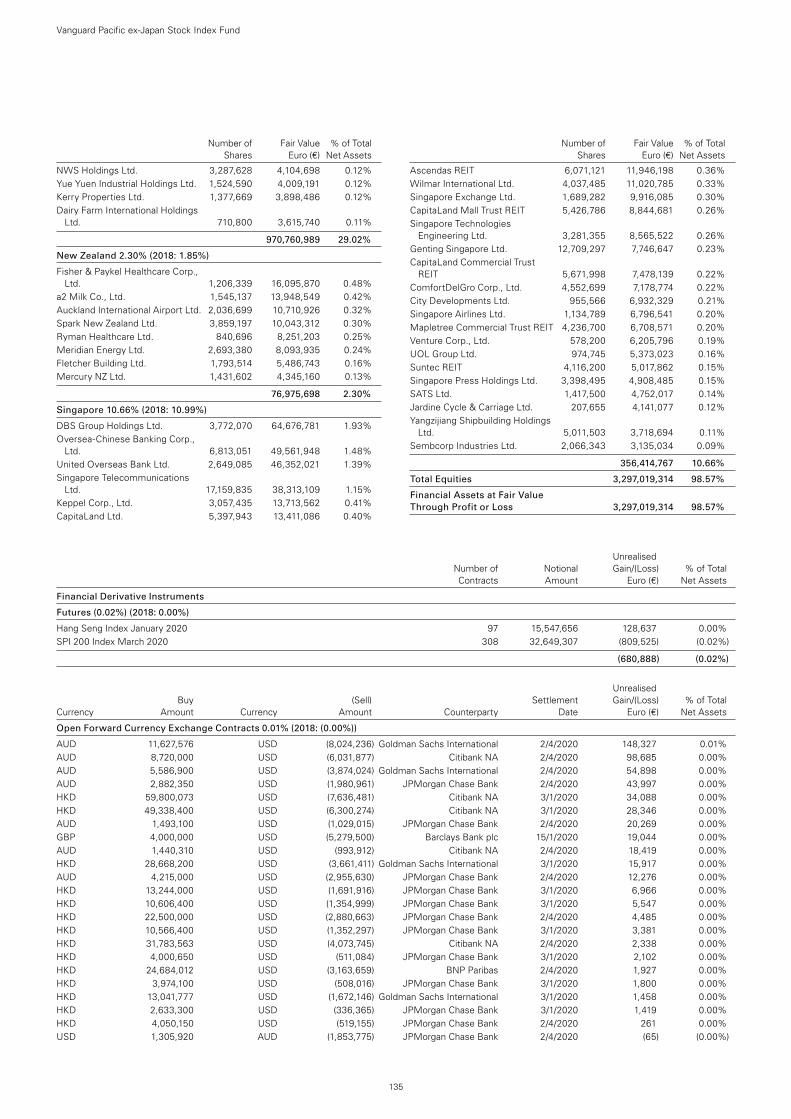
135
Number of Fair Value % of Total Shares Euro (€) Net Assets
NWS Holdings Ltd. 3,287,628 4,104,698 0.12%Yue Yuen Industrial Holdings Ltd. 1,524,590 4,009,191 0.12%Kerry Properties Ltd. 1,377,669 3,898,486 0.12%Dairy Farm International Holdings
Ltd. 710,800 3,615,740 0.11%
970,760,989 29.02%
New Zealand 2.30% (2018: 1.85%)
Fisher & Paykel Healthcare Corp., Ltd. 1,206,339 16,095,870 0.48%
a2 Milk Co., Ltd. 1,545,137 13,948,549 0.42%Auckland International Airport Ltd. 2,036,699 10,710,926 0.32%Spark New Zealand Ltd. 3,859,197 10,043,312 0.30%Ryman Healthcare Ltd. 840,696 8,251,203 0.25%Meridian Energy Ltd. 2,693,380 8,093,935 0.24%Fletcher Building Ltd. 1,793,514 5,486,743 0.16%Mercury NZ Ltd. 1,431,602 4,345,160 0.13%
76,975,698 2.30%
Singapore 10.66% (2018: 10.99%)
DBS Group Holdings Ltd. 3,772,070 64,676,781 1.93%Oversea-Chinese Banking Corp.,
Ltd. 6,813,051 49,561,948 1.48%United Overseas Bank Ltd. 2,649,085 46,352,021 1.39%Singapore Telecommunications
Ltd. 17,159,835 38,313,109 1.15%Keppel Corp., Ltd. 3,057,435 13,713,562 0.41%CapitaLand Ltd. 5,397,943 13,411,086 0.40%
Ascendas REIT 6,071,121 11,946,198 0.36%Wilmar International Ltd. 4,037,485 11,020,785 0.33%Singapore Exchange Ltd. 1,689,282 9,916,085 0.30%CapitaLand Mall Trust REIT 5,426,786 8,844,681 0.26%Singapore Technologies
Engineering Ltd. 3,281,355 8,565,522 0.26%Genting Singapore Ltd. 12,709,297 7,746,647 0.23%CapitaLand Commercial Trust
REIT 5,671,998 7,478,139 0.22%ComfortDelGro Corp., Ltd. 4,552,699 7,178,774 0.22%City Developments Ltd. 955,566 6,932,329 0.21%Singapore Airlines Ltd. 1,134,789 6,796,541 0.20%Mapletree Commercial Trust REIT 4,236,700 6,708,571 0.20%Venture Corp., Ltd. 578,200 6,205,796 0.19%UOL Group Ltd. 974,745 5,373,023 0.16%Suntec REIT 4,116,200 5,017,862 0.15%Singapore Press Holdings Ltd. 3,398,495 4,908,485 0.15%SATS Ltd. 1,417,500 4,752,017 0.14%Jardine Cycle & Carriage Ltd. 207,655 4,141,077 0.12%Yangzijiang Shipbuilding Holdings
Ltd. 5,011,503 3,718,694 0.11%Sembcorp Industries Ltd. 2,066,343 3,135,034 0.09%
356,414,767 10.66%
Total Equities 3,297,019,314 98.57%
Financial Assets at Fair Value Through Profit or Loss 3,297,019,314 98.57%
Number of Fair Value % of Total Shares Euro (€) Net Assets
Vanguard Pacific ex-Japan Stock Index Fund
Unrealised Number of Notional Gain/(Loss) % of Total Contracts Amount Euro (€) Net Assets
Financial Derivative Instruments
Futures (0.02%) (2018: 0.00%)
Hang Seng Index January 2020 97 15,547,656 128,637 0.00%SPI 200 Index March 2020 308 32,649,307 (809,525) (0.02%)
(680,888) (0.02%)
Unrealised Buy (Sell) Settlement Gain/(Loss) % of Total Currency Amount Currency Amount Counterparty Date Euro (€) Net Assets
Open Forward Currency Exchange Contracts 0.01% (2018: (0.00%))
AUD 11,627,576 USD (8,024,236) Goldman Sachs International 2/4/2020 148,327 0.01%AUD 8,720,000 USD (6,031,877) Citibank NA 2/4/2020 98,685 0.00%AUD 5,586,900 USD (3,874,024) Goldman Sachs International 2/4/2020 54,898 0.00%AUD 2,882,350 USD (1,980,961) JPMorgan Chase Bank 2/4/2020 43,997 0.00%HKD 59,800,073 USD (7,636,481) Citibank NA 3/1/2020 34,088 0.00%HKD 49,338,400 USD (6,300,274) Citibank NA 3/1/2020 28,346 0.00%AUD 1,493,100 USD (1,029,015) JPMorgan Chase Bank 2/4/2020 20,269 0.00%GBP 4,000,000 USD (5,279,500) Barclays Bank plc 15/1/2020 19,044 0.00%AUD 1,440,310 USD (993,912) Citibank NA 2/4/2020 18,419 0.00%HKD 28,668,200 USD (3,661,411) Goldman Sachs International 3/1/2020 15,917 0.00%AUD 4,215,000 USD (2,955,630) JPMorgan Chase Bank 2/4/2020 12,276 0.00%HKD 13,244,000 USD (1,691,916) JPMorgan Chase Bank 3/1/2020 6,966 0.00%HKD 10,606,400 USD (1,354,999) JPMorgan Chase Bank 3/1/2020 5,547 0.00%HKD 22,500,000 USD (2,880,663) JPMorgan Chase Bank 2/4/2020 4,485 0.00%HKD 10,566,400 USD (1,352,297) JPMorgan Chase Bank 3/1/2020 3,381 0.00%HKD 31,783,563 USD (4,073,745) Citibank NA 2/4/2020 2,338 0.00%HKD 4,000,650 USD (511,084) JPMorgan Chase Bank 3/1/2020 2,102 0.00%HKD 24,684,012 USD (3,163,659) BNP Paribas 2/4/2020 1,927 0.00%HKD 3,974,100 USD (508,016) JPMorgan Chase Bank 3/1/2020 1,800 0.00%HKD 13,041,777 USD (1,672,146) Goldman Sachs International 3/1/2020 1,458 0.00%HKD 2,633,300 USD (336,365) JPMorgan Chase Bank 3/1/2020 1,419 0.00%HKD 4,050,150 USD (519,155) JPMorgan Chase Bank 2/4/2020 261 0.00%USD 1,305,920 AUD (1,853,775) JPMorgan Chase Bank 2/4/2020 (65) (0.00%)
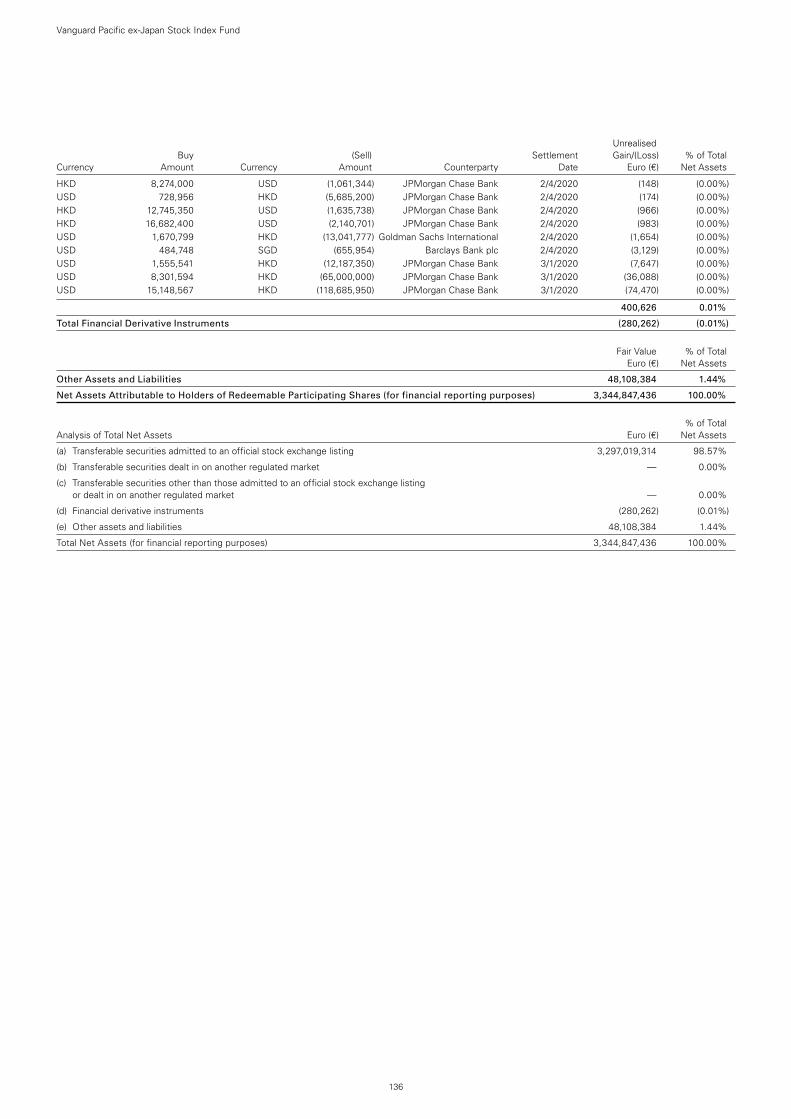
136
Unrealised Buy (Sell) Settlement Gain/(Loss) % of Total Currency Amount Currency Amount Counterparty Date Euro (€) Net Assets
Vanguard Pacific ex-Japan Stock Index Fund
HKD 8,274,000 USD (1,061,344) JPMorgan Chase Bank 2/4/2020 (148) (0.00%)USD 728,956 HKD (5,685,200) JPMorgan Chase Bank 2/4/2020 (174) (0.00%)HKD 12,745,350 USD (1,635,738) JPMorgan Chase Bank 2/4/2020 (966) (0.00%)HKD 16,682,400 USD (2,140,701) JPMorgan Chase Bank 2/4/2020 (983) (0.00%)USD 1,670,799 HKD (13,041,777) Goldman Sachs International 2/4/2020 (1,654) (0.00%)USD 484,748 SGD (655,954) Barclays Bank plc 2/4/2020 (3,129) (0.00%)USD 1,555,541 HKD (12,187,350) JPMorgan Chase Bank 3/1/2020 (7,647) (0.00%)USD 8,301,594 HKD (65,000,000) JPMorgan Chase Bank 3/1/2020 (36,088) (0.00%)USD 15,148,567 HKD (118,685,950) JPMorgan Chase Bank 3/1/2020 (74,470) (0.00%)
400,626 0.01%
Total Financial Derivative Instruments (280,262) (0.01%)
Fair Value % of Total Euro (€) Net Assets
Other Assets and Liabilities 48,108,384 1.44%
Net Assets Attributable to Holders of Redeemable Participating Shares (for financial reporting purposes) 3,344,847,436 100.00%
% of Total Analysis of Total Net Assets Euro (€) Net Assets
(a) Transferable securities admitted to an official stock exchange listing 3,297,019,314 98.57%
(b) Transferable securities dealt in on another regulated market — 0.00%
(c) Transferable securities other than those admitted to an official stock exchange listing or dealt in on another regulated market — 0.00%
(d) Financial derivative instruments (280,262) (0.01%)
(e) Other assets and liabilities 48,108,384 1.44%
Total Net Assets (for financial reporting purposes) 3,344,847,436 100.00%

The accompanying notes form an integral part of the financial statements.
137
Vanguard Pacific ex-Japan Stock Index Fund
Statement of Assets and Liabilities
Euro (€) Euro (€) As at As at 31 December 2019 31 December 2018
Current Assets Financial Assets at Fair Value Through Profit or Loss 3,297,019,314 2,517,742,232Financial Derivative Instruments 654,587 25,501Cash 43,612,432 2,314,578Receivables:
Interest and Dividends 3,565,645 2,955,730Capital Shares Issued 3,506,124 2,299,617Futures Margin Cash 2,550,816 644,634Cash Collateral 71,270 —Other Receivables — 123
Total Current Assets 3,350,980,188 2,525,982,415
Current Liabilities Financial Derivative Instruments 934,849 67,133Bank Overdraft — 8,989Unrealised Depreciation on Spot Currency Contracts 6,327 1,756Payables and Other Liabilities:
Investments Purchased 12,464 8,402Income Distribution Payable 3,611,784 2,049,428Capital Shares Redeemed 1,129,507 1,713,072Management Fees Payable 437,821 481,445
Total Current Liabilities 6,132,752 4,330,225
Net Assets Attributable to Holders of Redeemable Participating Shares (for financial reporting purposes) (“Net Assets”) 3,344,847,436 2,521,652,190
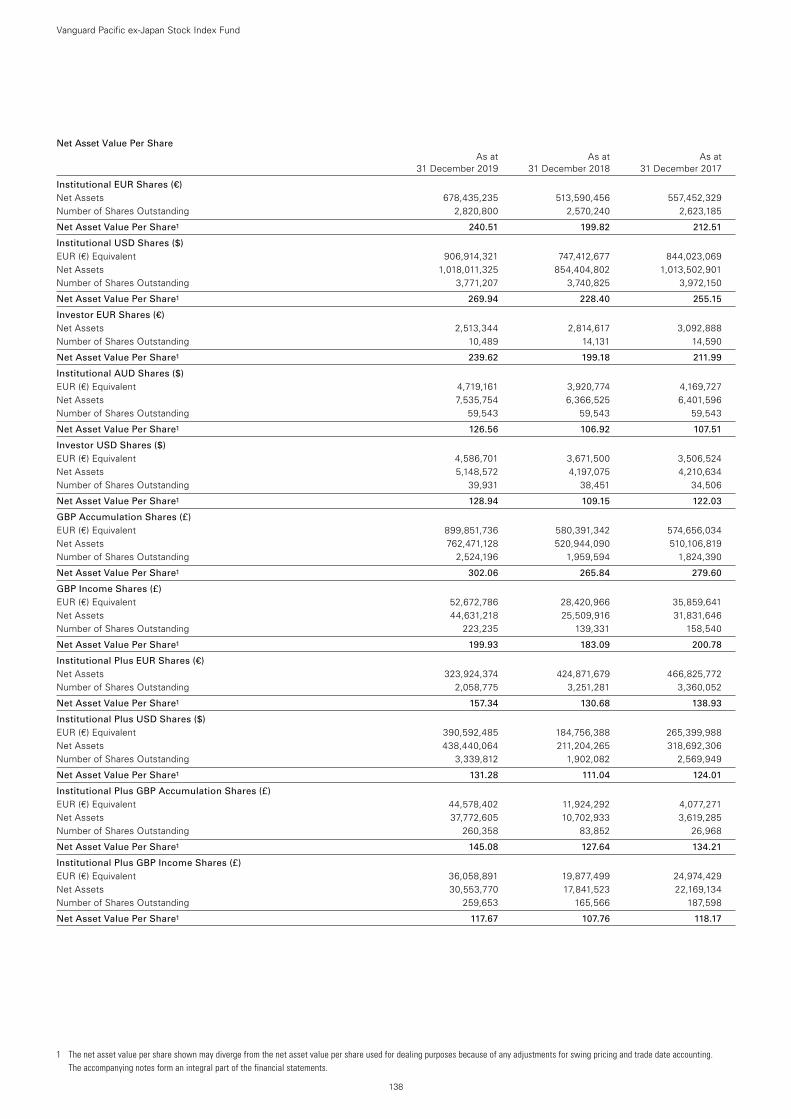
1 The net asset value per share shown may diverge from the net asset value per share used for dealing purposes because of any adjustments for swing pricing and trade date accounting. The accompanying notes form an integral part of the financial statements.
138
Net Asset Value Per Share As at As at As at 31 December 2019 31 December 2018 31 December 2017
Institutional EUR Shares (€) Net Assets 678,435,235 513,590,456 557,452,329Number of Shares Outstanding 2,820,800 2,570,240 2,623,185
Net Asset Value Per Share1 240.51 199.82 212.51
Institutional USD Shares ($) EUR (€) Equivalent 906,914,321 747,412,677 844,023,069Net Assets 1,018,011,325 854,404,802 1,013,502,901Number of Shares Outstanding 3,771,207 3,740,825 3,972,150
Net Asset Value Per Share1 269.94 228.40 255.15
Investor EUR Shares (€) Net Assets 2,513,344 2,814,617 3,092,888Number of Shares Outstanding 10,489 14,131 14,590
Net Asset Value Per Share1 239.62 199.18 211.99
Institutional AUD Shares ($) EUR (€) Equivalent 4,719,161 3,920,774 4,169,727Net Assets 7,535,754 6,366,525 6,401,596Number of Shares Outstanding 59,543 59,543 59,543
Net Asset Value Per Share1 126.56 106.92 107.51
Investor USD Shares ($) EUR (€) Equivalent 4,586,701 3,671,500 3,506,524Net Assets 5,148,572 4,197,075 4,210,634Number of Shares Outstanding 39,931 38,451 34,506
Net Asset Value Per Share1 128.94 109.15 122.03
GBP Accumulation Shares (£) EUR (€) Equivalent 899,851,736 580,391,342 574,656,034Net Assets 762,471,128 520,944,090 510,106,819Number of Shares Outstanding 2,524,196 1,959,594 1,824,390
Net Asset Value Per Share1 302.06 265.84 279.60
GBP Income Shares (£) EUR (€) Equivalent 52,672,786 28,420,966 35,859,641Net Assets 44,631,218 25,509,916 31,831,646Number of Shares Outstanding 223,235 139,331 158,540
Net Asset Value Per Share1 199.93 183.09 200.78
Institutional Plus EUR Shares (€) Net Assets 323,924,374 424,871,679 466,825,772Number of Shares Outstanding 2,058,775 3,251,281 3,360,052
Net Asset Value Per Share1 157.34 130.68 138.93
Institutional Plus USD Shares ($) EUR (€) Equivalent 390,592,485 184,756,388 265,399,988Net Assets 438,440,064 211,204,265 318,692,306Number of Shares Outstanding 3,339,812 1,902,082 2,569,949
Net Asset Value Per Share1 131.28 111.04 124.01
Institutional Plus GBP Accumulation Shares (£) EUR (€) Equivalent 44,578,402 11,924,292 4,077,271Net Assets 37,772,605 10,702,933 3,619,285Number of Shares Outstanding 260,358 83,852 26,968
Net Asset Value Per Share1 145.08 127.64 134.21
Institutional Plus GBP Income Shares (£) EUR (€) Equivalent 36,058,891 19,877,499 24,974,429Net Assets 30,553,770 17,841,523 22,169,134Number of Shares Outstanding 259,653 165,566 187,598
Net Asset Value Per Share1 117.67 107.76 118.17
Vanguard Pacific ex-Japan Stock Index Fund
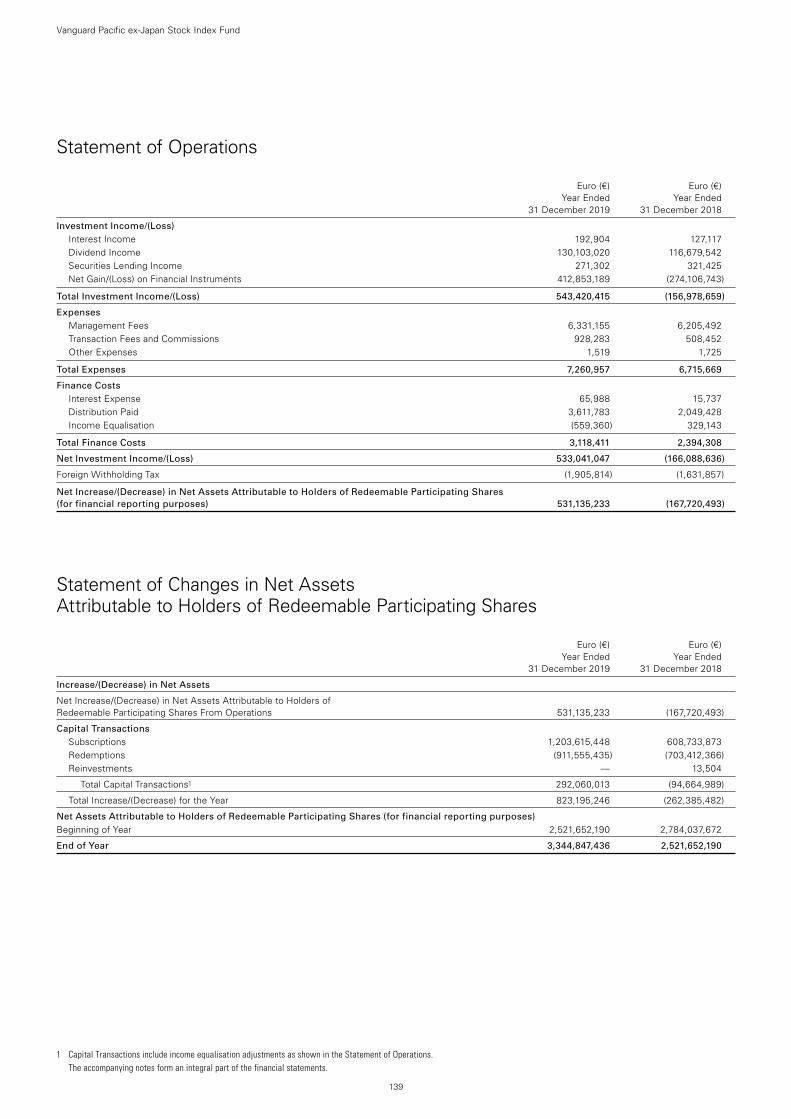
139
Vanguard Pacific ex-Japan Stock Index Fund
Statement of Operations
Euro (€) Euro (€) Year Ended Year Ended 31 December 2019 31 December 2018
Investment Income/(Loss) Interest Income 192,904 127,117Dividend Income 130,103,020 116,679,542Securities Lending Income 271,302 321,425Net Gain/(Loss) on Financial Instruments 412,853,189 (274,106,743)
Total Investment Income/(Loss) 543,420,415 (156,978,659)
Expenses Management Fees 6,331,155 6,205,492Transaction Fees and Commissions 928,283 508,452Other Expenses 1,519 1,725
Total Expenses 7,260,957 6,715,669
Finance Costs Interest Expense 65,988 15,737Distribution Paid 3,611,783 2,049,428Income Equalisation (559,360) 329,143
Total Finance Costs 3,118,411 2,394,308
Net Investment Income/(Loss) 533,041,047 (166,088,636)
Foreign Withholding Tax (1,905,814) (1,631,857)
Net Increase/(Decrease) in Net Assets Attributable to Holders of Redeemable Participating Shares (for financial reporting purposes) 531,135,233 (167,720,493)
Statement of Changes in Net Assets Attributable to Holders of Redeemable Participating Shares
Euro (€) Euro (€) Year Ended Year Ended 31 December 2019 31 December 2018
Increase/(Decrease) in Net Assets
Net Increase/(Decrease) in Net Assets Attributable to Holders of Redeemable Participating Shares From Operations 531,135,233 (167,720,493)
Capital Transactions Subscriptions 1,203,615,448 608,733,873Redemptions (911,555,435) (703,412,366)Reinvestments — 13,504
Total Capital Transactions1 292,060,013 (94,664,989)
Total Increase/(Decrease) for the Year 823,195,246 (262,385,482)
Net Assets Attributable to Holders of Redeemable Participating Shares (for financial reporting purposes) Beginning of Year 2,521,652,190 2,784,037,672
End of Year 3,344,847,436 2,521,652,190
1 Capital Transactions include income equalisation adjustments as shown in the Statement of Operations. The accompanying notes form an integral part of the financial statements.
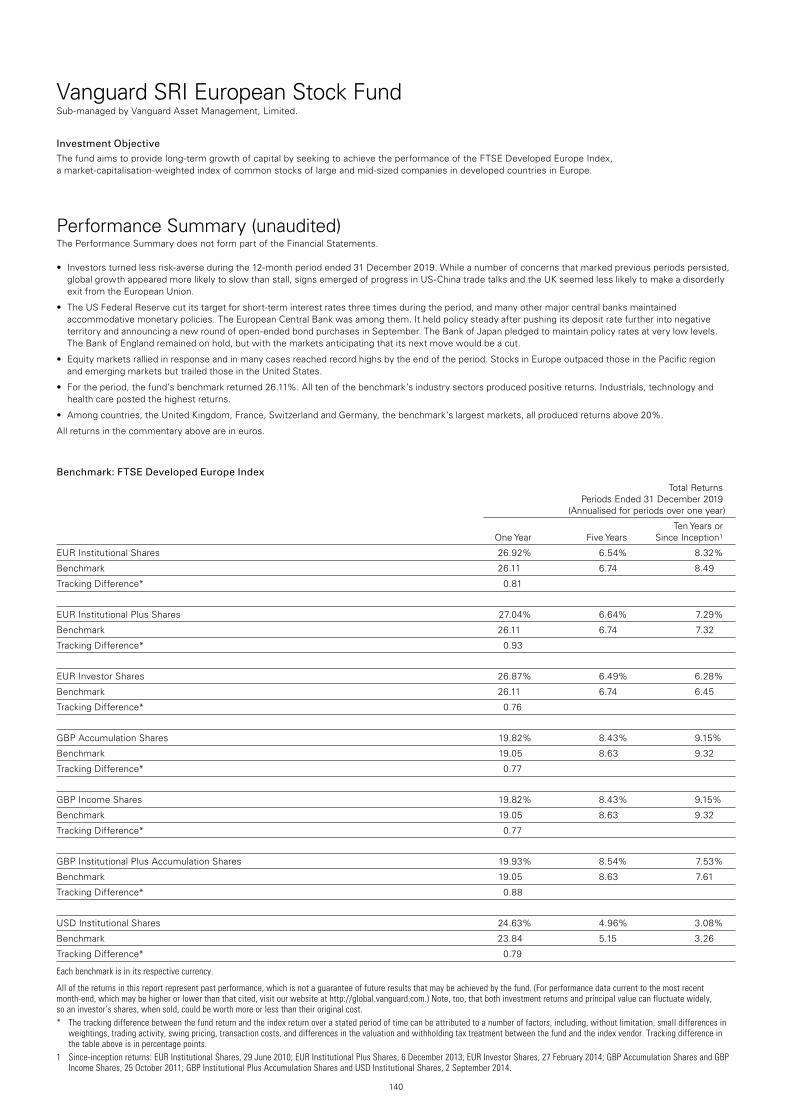
140
Vanguard SRI European Stock FundSub-managed by Vanguard Asset Management, Limited.
All of the returns in this report represent past performance, which is not a guarantee of future results that may be achieved by the fund. (For performance data current to the most recent month-end, which may be higher or lower than that cited, visit our website at http://global.vanguard.com.) Note, too, that both investment returns and principal value can fluctuate widely, so an investor’s shares, when sold, could be worth more or less than their original cost.* The tracking difference between the fund return and the index return over a stated period of time can be attributed to a number of factors, including, without limitation, small differences in
weightings, trading activity, swing pricing, transaction costs, and differences in the valuation and withholding tax treatment between the fund and the index vendor. Tracking difference in the table above is in percentage points.
1 Since-inception returns: EUR Institutional Shares, 29 June 2010; EUR Institutional Plus Shares, 6 December 2013; EUR Investor Shares, 27 February 2014; GBP Accumulation Shares and GBP Income Shares, 25 October 2011; GBP Institutional Plus Accumulation Shares and USD Institutional Shares, 2 September 2014.
Investment ObjectiveThe fund aims to provide long-term growth of capital by seeking to achieve the performance of the FTSE Developed Europe Index, a market-capitalisation-weighted index of common stocks of large and mid-sized companies in developed countries in Europe.
Performance Summary (unaudited)The Performance Summary does not form part of the Financial Statements.
• Investorsturnedlessrisk-averseduringthe12-monthperiodended31December2019.Whileanumberofconcernsthatmarkedpreviousperiodspersisted,global growth appeared more likely to slow than stall, signs emerged of progress in US-China trade talks and the UK seemed less likely to make a disorderly exit from the European Union.
• TheUSFederalReservecutitstargetforshort-terminterestratesthreetimesduringtheperiod,andmanyothermajorcentralbanksmaintainedaccommodative monetary policies. The European Central Bank was among them. It held policy steady after pushing its deposit rate further into negative territory and announcing a new round of open-ended bond purchases in September. The Bank of Japan pledged to maintain policy rates at very low levels. The Bank of England remained on hold, but with the markets anticipating that its next move would be a cut.
• Equitymarketsralliedinresponseandinmanycasesreachedrecordhighsbytheendoftheperiod.StocksinEuropeoutpacedthoseinthePacificregion and emerging markets but trailed those in the United States.
• Fortheperiod,thefund’sbenchmarkreturned26.11%.Alltenofthebenchmark’sindustrysectorsproducedpositivereturns.Industrials,technologyandhealth care posted the highest returns.
• Amongcountries,theUnitedKingdom,France,SwitzerlandandGermany,thebenchmark’slargestmarkets,allproducedreturnsabove20%.
All returns in the commentary above are in euros.
Benchmark: FTSE Developed Europe Index
Total Returns Periods Ended 31 December 2019 (Annualised for periods over one year)
Ten Years or One Year Five Years Since Inception1
EUR Institutional Shares 26.92% 6.54% 8.32%
Benchmark 26.11 6.74 8.49
Tracking Difference* 0.81
EUR Institutional Plus Shares 27.04% 6.64% 7.29%
Benchmark 26.11 6.74 7.32
Tracking Difference* 0.93
EUR Investor Shares 26.87% 6.49% 6.28%
Benchmark 26.11 6.74 6.45
Tracking Difference* 0.76
GBP Accumulation Shares 19.82% 8.43% 9.15%
Benchmark 19.05 8.63 9.32
Tracking Difference* 0.77
GBP Income Shares 19.82% 8.43% 9.15%
Benchmark 19.05 8.63 9.32
Tracking Difference* 0.77
GBP Institutional Plus Accumulation Shares 19.93% 8.54% 7.53%
Benchmark 19.05 8.63 7.61
Tracking Difference* 0.88
USD Institutional Shares 24.63% 4.96% 3.08%
Benchmark 23.84 5.15 3.26
Tracking Difference* 0.79
Each benchmark is in its respective currency.
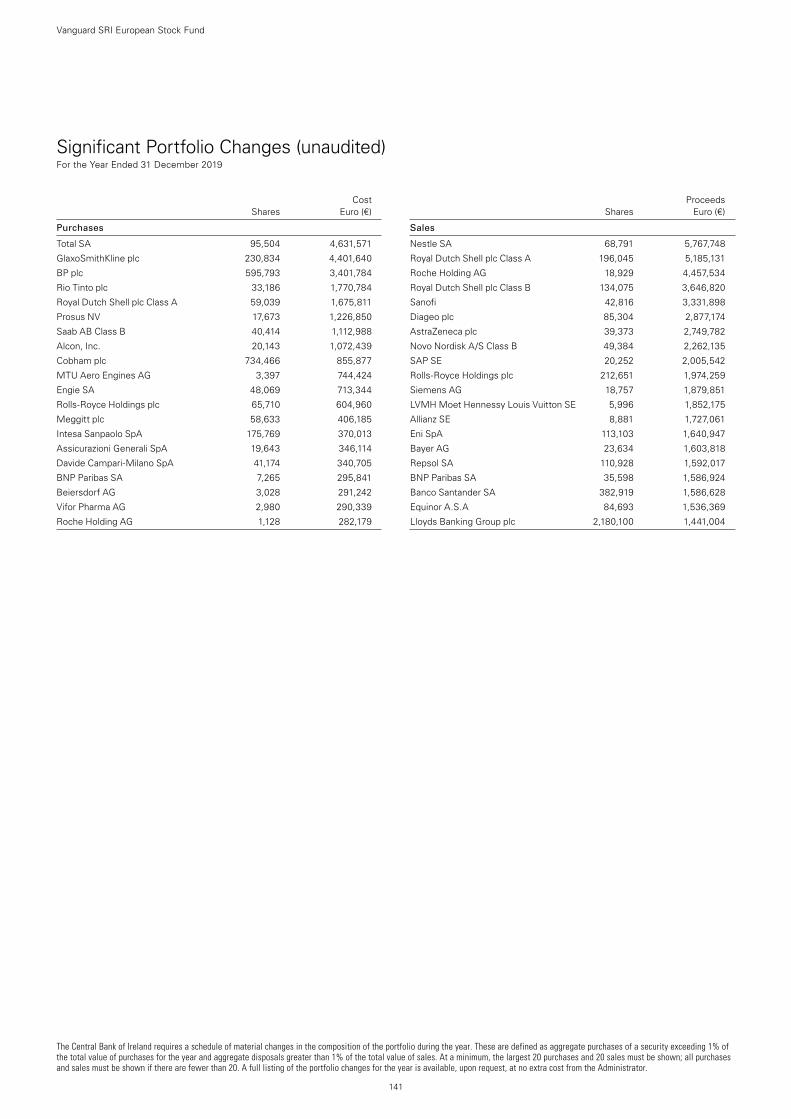
The Central Bank of Ireland requires a schedule of material changes in the composition of the portfolio during the year. These are defined as aggregate purchases of a security exceeding 1% of the total value of purchases for the year and aggregate disposals greater than 1% of the total value of sales. At a minimum, the largest 20 purchases and 20 sales must be shown; all purchases and sales must be shown if there are fewer than 20. A full listing of the portfolio changes for the year is available, upon request, at no extra cost from the Administrator.
141
Vanguard SRI European Stock Fund
Significant Portfolio Changes (unaudited) For the Year Ended 31 December 2019
Cost Shares Euro (€)
Purchases
Total SA 95,504 4,631,571
GlaxoSmithKline plc 230,834 4,401,640
BP plc 595,793 3,401,784
Rio Tinto plc 33,186 1,770,784
Royal Dutch Shell plc Class A 59,039 1,675,811
Prosus NV 17,673 1,226,850
Saab AB Class B 40,414 1,112,988
Alcon, Inc. 20,143 1,072,439
Cobham plc 734,466 855,877
MTU Aero Engines AG 3,397 744,424
Engie SA 48,069 713,344
Rolls-Royce Holdings plc 65,710 604,960
Meggitt plc 58,633 406,185
Intesa Sanpaolo SpA 175,769 370,013
Assicurazioni Generali SpA 19,643 346,114
Davide Campari-Milano SpA 41,174 340,705
BNP Paribas SA 7,265 295,841
Beiersdorf AG 3,028 291,242
Vifor Pharma AG 2,980 290,339
Roche Holding AG 1,128 282,179
Proceeds Shares Euro (€)
Sales
Nestle SA 68,791 5,767,748
Royal Dutch Shell plc Class A 196,045 5,185,131
Roche Holding AG 18,929 4,457,534
Royal Dutch Shell plc Class B 134,075 3,646,820
Sanofi 42,816 3,331,898
Diageo plc 85,304 2,877,174
AstraZeneca plc 39,373 2,749,782
Novo Nordisk A/S Class B 49,384 2,262,135
SAP SE 20,252 2,005,542
Rolls-Royce Holdings plc 212,651 1,974,259
Siemens AG 18,757 1,879,851
LVMH Moet Hennessy Louis Vuitton SE 5,996 1,852,175
Allianz SE 8,881 1,727,061
Eni SpA 113,103 1,640,947
Bayer AG 23,634 1,603,818
Repsol SA 110,928 1,592,017
BNP Paribas SA 35,598 1,586,924
Banco Santander SA 382,919 1,586,628
Equinor A.S.A 84,693 1,536,369
Lloyds Banking Group plc 2,180,100 1,441,004
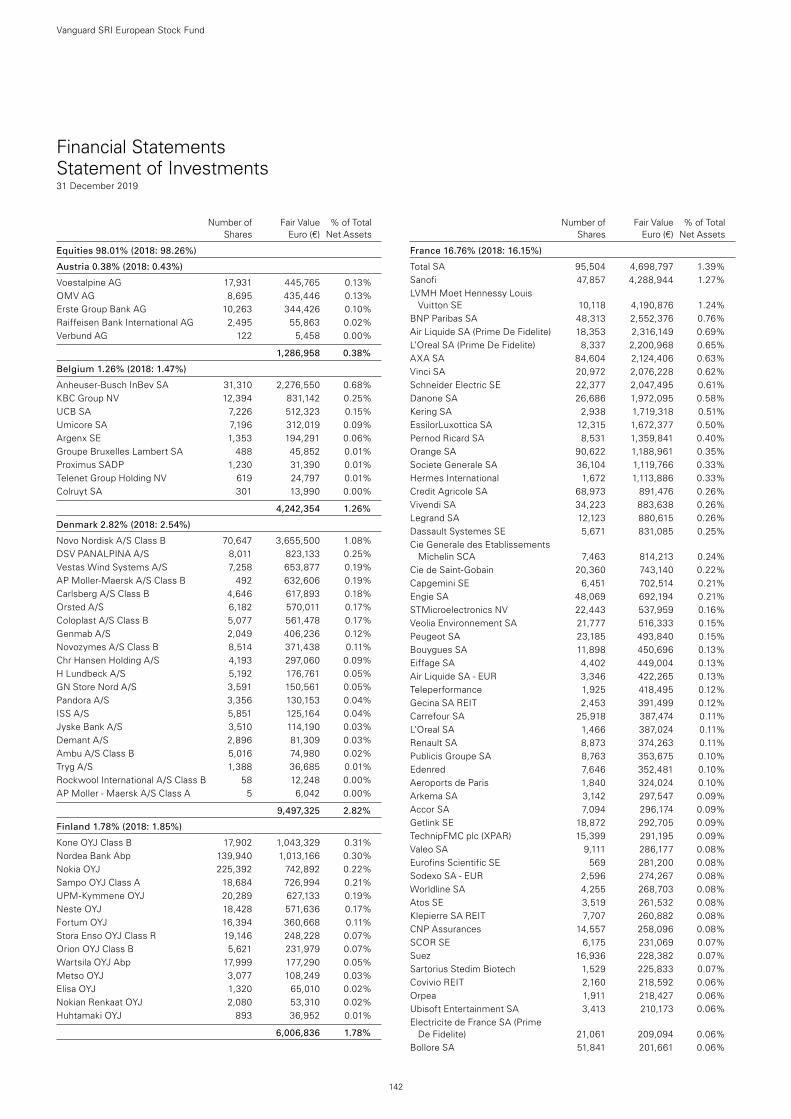
142
Vanguard SRI European Stock Fund
Number of Fair Value % of Total Shares Euro (€) Net Assets
Number of Fair Value % of Total Shares Euro (€) Net Assets
Equities 98.01% (2018: 98.26%)
Austria 0.38% (2018: 0.43%)
Voestalpine AG 17,931 445,765 0.13%OMV AG 8,695 435,446 0.13%Erste Group Bank AG 10,263 344,426 0.10%Raiffeisen Bank International AG 2,495 55,863 0.02%Verbund AG 122 5,458 0.00%
1,286,958 0.38%
Belgium 1.26% (2018: 1.47%)
Anheuser-Busch InBev SA 31,310 2,276,550 0.68%KBC Group NV 12,394 831,142 0.25%UCB SA 7,226 512,323 0.15%Umicore SA 7,196 312,019 0.09%Argenx SE 1,353 194,291 0.06%Groupe Bruxelles Lambert SA 488 45,852 0.01%Proximus SADP 1,230 31,390 0.01%Telenet Group Holding NV 619 24,797 0.01%Colruyt SA 301 13,990 0.00%
4,242,354 1.26%
Denmark 2.82% (2018: 2.54%)
Novo Nordisk A/S Class B 70,647 3,655,500 1.08%DSV PANALPINA A/S 8,011 823,133 0.25%Vestas Wind Systems A/S 7,258 653,877 0.19%AP Moller-Maersk A/S Class B 492 632,606 0.19%Carlsberg A/S Class B 4,646 617,893 0.18%Orsted A/S 6,182 570,011 0.17%Coloplast A/S Class B 5,077 561,478 0.17%Genmab A/S 2,049 406,236 0.12%Novozymes A/S Class B 8,514 371,438 0.11%Chr Hansen Holding A/S 4,193 297,060 0.09%H Lundbeck A/S 5,192 176,761 0.05%GN Store Nord A/S 3,591 150,561 0.05%Pandora A/S 3,356 130,153 0.04%ISS A/S 5,851 125,164 0.04%Jyske Bank A/S 3,510 114,190 0.03%Demant A/S 2,896 81,309 0.03%Ambu A/S Class B 5,016 74,980 0.02%Tryg A/S 1,388 36,685 0.01%Rockwool International A/S Class B 58 12,248 0.00%AP Moller - Maersk A/S Class A 5 6,042 0.00%
9,497,325 2.82%
Finland 1.78% (2018: 1.85%)
Kone OYJ Class B 17,902 1,043,329 0.31%Nordea Bank Abp 139,940 1,013,166 0.30%Nokia OYJ 225,392 742,892 0.22%Sampo OYJ Class A 18,684 726,994 0.21%UPM-Kymmene OYJ 20,289 627,133 0.19%Neste OYJ 18,428 571,636 0.17%Fortum OYJ 16,394 360,668 0.11%Stora Enso OYJ Class R 19,146 248,228 0.07%Orion OYJ Class B 5,621 231,979 0.07%Wartsila OYJ Abp 17,999 177,290 0.05%Metso OYJ 3,077 108,249 0.03%Elisa OYJ 1,320 65,010 0.02%Nokian Renkaat OYJ 2,080 53,310 0.02%Huhtamaki OYJ 893 36,952 0.01%
6,006,836 1.78%
France 16.76% (2018: 16.15%)
Total SA 95,504 4,698,797 1.39%Sanofi 47,857 4,288,944 1.27%LVMH Moet Hennessy Louis
Vuitton SE 10,118 4,190,876 1.24%BNP Paribas SA 48,313 2,552,376 0.76%Air Liquide SA (Prime De Fidelite) 18,353 2,316,149 0.69%L’Oreal SA (Prime De Fidelite) 8,337 2,200,968 0.65%AXA SA 84,604 2,124,406 0.63%Vinci SA 20,972 2,076,228 0.62%Schneider Electric SE 22,377 2,047,495 0.61%Danone SA 26,686 1,972,095 0.58%Kering SA 2,938 1,719,318 0.51%EssilorLuxottica SA 12,315 1,672,377 0.50%Pernod Ricard SA 8,531 1,359,841 0.40%Orange SA 90,622 1,188,961 0.35%Societe Generale SA 36,104 1,119,766 0.33%Hermes International 1,672 1,113,886 0.33%Credit Agricole SA 68,973 891,476 0.26%Vivendi SA 34,223 883,638 0.26%Legrand SA 12,123 880,615 0.26%Dassault Systemes SE 5,671 831,085 0.25%Cie Generale des Etablissements
Michelin SCA 7,463 814,213 0.24%Cie de Saint-Gobain 20,360 743,140 0.22%Capgemini SE 6,451 702,514 0.21%Engie SA 48,069 692,194 0.21%STMicroelectronics NV 22,443 537,959 0.16%Veolia Environnement SA 21,777 516,333 0.15%Peugeot SA 23,185 493,840 0.15%Bouygues SA 11,898 450,696 0.13%Eiffage SA 4,402 449,004 0.13%Air Liquide SA - EUR 3,346 422,265 0.13%Teleperformance 1,925 418,495 0.12%Gecina SA REIT 2,453 391,499 0.12%Carrefour SA 25,918 387,474 0.11%L’Oreal SA 1,466 387,024 0.11%Renault SA 8,873 374,263 0.11%Publicis Groupe SA 8,763 353,675 0.10%Edenred 7,646 352,481 0.10%Aeroports de Paris 1,840 324,024 0.10%Arkema SA 3,142 297,547 0.09%Accor SA 7,094 296,174 0.09%Getlink SE 18,872 292,705 0.09%TechnipFMC plc (XPAR) 15,399 291,195 0.09%Valeo SA 9,111 286,177 0.08%Eurofins Scientific SE 569 281,200 0.08%Sodexo SA - EUR 2,596 274,267 0.08%Worldline SA 4,255 268,703 0.08%Atos SE 3,519 261,532 0.08%Klepierre SA REIT 7,707 260,882 0.08%CNP Assurances 14,557 258,096 0.08%SCOR SE 6,175 231,069 0.07%Suez 16,936 228,382 0.07%Sartorius Stedim Biotech 1,529 225,833 0.07%Covivio REIT 2,160 218,592 0.06%Orpea 1,911 218,427 0.06%Ubisoft Entertainment SA 3,413 210,173 0.06%Electricite de France SA (Prime
De Fidelite) 21,061 209,094 0.06%Bollore SA 51,841 201,661 0.06%
Financial Statements Statement of Investments31 December 2019
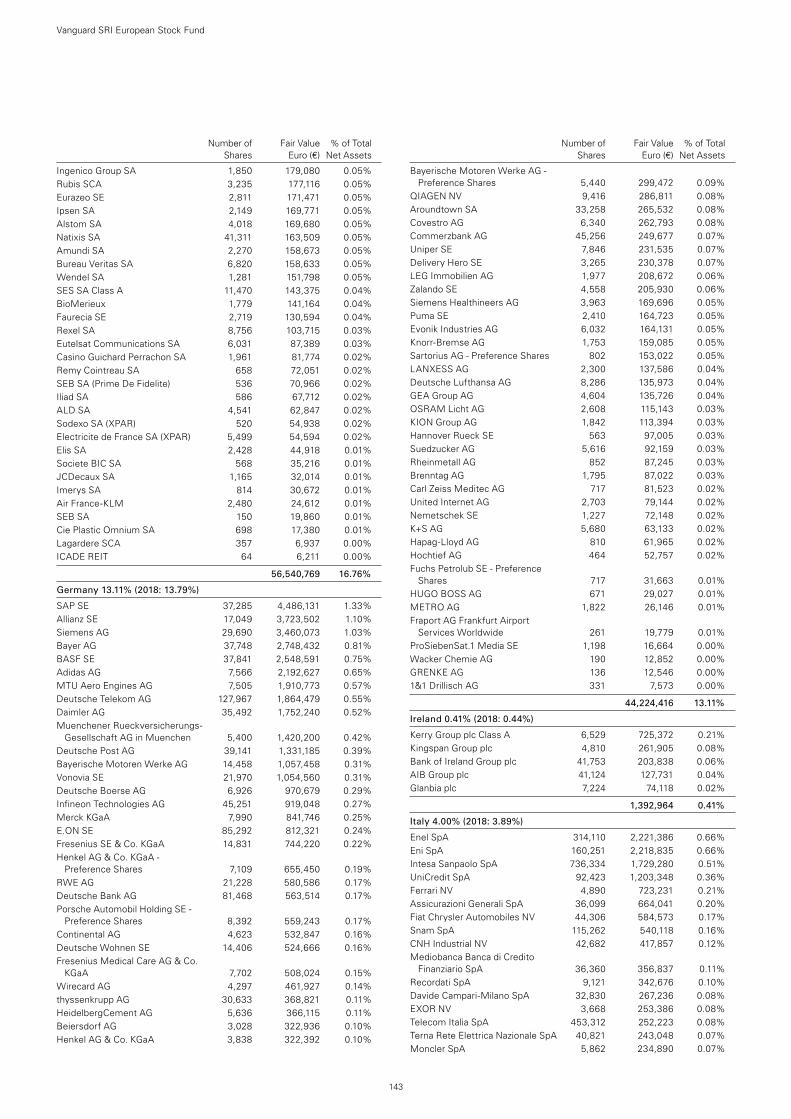
143
Number of Fair Value % of Total Shares Euro (€) Net Assets
Ingenico Group SA 1,850 179,080 0.05%Rubis SCA 3,235 177,116 0.05%Eurazeo SE 2,811 171,471 0.05%Ipsen SA 2,149 169,771 0.05%Alstom SA 4,018 169,680 0.05%Natixis SA 41,311 163,509 0.05%Amundi SA 2,270 158,673 0.05%Bureau Veritas SA 6,820 158,633 0.05%Wendel SA 1,281 151,798 0.05%SES SA Class A 11,470 143,375 0.04%BioMerieux 1,779 141,164 0.04%Faurecia SE 2,719 130,594 0.04%Rexel SA 8,756 103,715 0.03%Eutelsat Communications SA 6,031 87,389 0.03%Casino Guichard Perrachon SA 1,961 81,774 0.02%Remy Cointreau SA 658 72,051 0.02%SEB SA (Prime De Fidelite) 536 70,966 0.02%Iliad SA 586 67,712 0.02%ALD SA 4,541 62,847 0.02%Sodexo SA (XPAR) 520 54,938 0.02%Electricite de France SA (XPAR) 5,499 54,594 0.02%Elis SA 2,428 44,918 0.01%Societe BIC SA 568 35,216 0.01%JCDecaux SA 1,165 32,014 0.01%Imerys SA 814 30,672 0.01%Air France-KLM 2,480 24,612 0.01%SEB SA 150 19,860 0.01%Cie Plastic Omnium SA 698 17,380 0.01%Lagardere SCA 357 6,937 0.00%ICADE REIT 64 6,211 0.00%
56,540,769 16.76%
Germany 13.11% (2018: 13.79%)
SAP SE 37,285 4,486,131 1.33%Allianz SE 17,049 3,723,502 1.10%Siemens AG 29,690 3,460,073 1.03%Bayer AG 37,748 2,748,432 0.81%BASF SE 37,841 2,548,591 0.75%Adidas AG 7,566 2,192,627 0.65%MTU Aero Engines AG 7,505 1,910,773 0.57%Deutsche Telekom AG 127,967 1,864,479 0.55%Daimler AG 35,492 1,752,240 0.52%Muenchener Rueckversicherungs-
Gesellschaft AG in Muenchen 5,400 1,420,200 0.42%Deutsche Post AG 39,141 1,331,185 0.39%Bayerische Motoren Werke AG 14,458 1,057,458 0.31%Vonovia SE 21,970 1,054,560 0.31%Deutsche Boerse AG 6,926 970,679 0.29%Infineon Technologies AG 45,251 919,048 0.27%Merck KGaA 7,990 841,746 0.25%E.ON SE 85,292 812,321 0.24%Fresenius SE & Co. KGaA 14,831 744,220 0.22%Henkel AG & Co. KGaA -
Preference Shares 7,109 655,450 0.19%RWE AG 21,228 580,586 0.17%Deutsche Bank AG 81,468 563,514 0.17%Porsche Automobil Holding SE -
Preference Shares 8,392 559,243 0.17%Continental AG 4,623 532,847 0.16%Deutsche Wohnen SE 14,406 524,666 0.16%Fresenius Medical Care AG & Co.
KGaA 7,702 508,024 0.15%Wirecard AG 4,297 461,927 0.14%thyssenkrupp AG 30,633 368,821 0.11%HeidelbergCement AG 5,636 366,115 0.11%Beiersdorf AG 3,028 322,936 0.10%Henkel AG & Co. KGaA 3,838 322,392 0.10%
Bayerische Motoren Werke AG - Preference Shares 5,440 299,472 0.09%
QIAGEN NV 9,416 286,811 0.08%Aroundtown SA 33,258 265,532 0.08%Covestro AG 6,340 262,793 0.08%Commerzbank AG 45,256 249,677 0.07%Uniper SE 7,846 231,535 0.07%Delivery Hero SE 3,265 230,378 0.07%LEG Immobilien AG 1,977 208,672 0.06%Zalando SE 4,558 205,930 0.06%Siemens Healthineers AG 3,963 169,696 0.05%Puma SE 2,410 164,723 0.05%Evonik Industries AG 6,032 164,131 0.05%Knorr-Bremse AG 1,753 159,085 0.05%Sartorius AG - Preference Shares 802 153,022 0.05%LANXESS AG 2,300 137,586 0.04%Deutsche Lufthansa AG 8,286 135,973 0.04%GEA Group AG 4,604 135,726 0.04%OSRAM Licht AG 2,608 115,143 0.03%KION Group AG 1,842 113,394 0.03%Hannover Rueck SE 563 97,005 0.03%Suedzucker AG 5,616 92,159 0.03%Rheinmetall AG 852 87,245 0.03%Brenntag AG 1,795 87,022 0.03%Carl Zeiss Meditec AG 717 81,523 0.02%United Internet AG 2,703 79,144 0.02%Nemetschek SE 1,227 72,148 0.02%K+S AG 5,680 63,133 0.02%Hapag-Lloyd AG 810 61,965 0.02%Hochtief AG 464 52,757 0.02%Fuchs Petrolub SE - Preference
Shares 717 31,663 0.01%HUGO BOSS AG 671 29,027 0.01%METRO AG 1,822 26,146 0.01%Fraport AG Frankfurt Airport
Services Worldwide 261 19,779 0.01%ProSiebenSat.1 Media SE 1,198 16,664 0.00%Wacker Chemie AG 190 12,852 0.00%GRENKE AG 136 12,546 0.00%1&1 Drillisch AG 331 7,573 0.00%
44,224,416 13.11%
Ireland 0.41% (2018: 0.44%)
Kerry Group plc Class A 6,529 725,372 0.21%Kingspan Group plc 4,810 261,905 0.08%Bank of Ireland Group plc 41,753 203,838 0.06%AIB Group plc 41,124 127,731 0.04%Glanbia plc 7,224 74,118 0.02%
1,392,964 0.41%
Italy 4.00% (2018: 3.89%)
Enel SpA 314,110 2,221,386 0.66%Eni SpA 160,251 2,218,835 0.66%Intesa Sanpaolo SpA 736,334 1,729,280 0.51%UniCredit SpA 92,423 1,203,348 0.36%Ferrari NV 4,890 723,231 0.21%Assicurazioni Generali SpA 36,099 664,041 0.20%Fiat Chrysler Automobiles NV 44,306 584,573 0.17%Snam SpA 115,262 540,118 0.16%CNH Industrial NV 42,682 417,857 0.12%Mediobanca Banca di Credito
Finanziario SpA 36,360 356,837 0.11%Recordati SpA 9,121 342,676 0.10%Davide Campari-Milano SpA 32,830 267,236 0.08%EXOR NV 3,668 253,386 0.08%Telecom Italia SpA 453,312 252,223 0.08%Terna Rete Elettrica Nazionale SpA 40,821 243,048 0.07%Moncler SpA 5,862 234,890 0.07%
Number of Fair Value % of Total Shares Euro (€) Net Assets
Vanguard SRI European Stock Fund
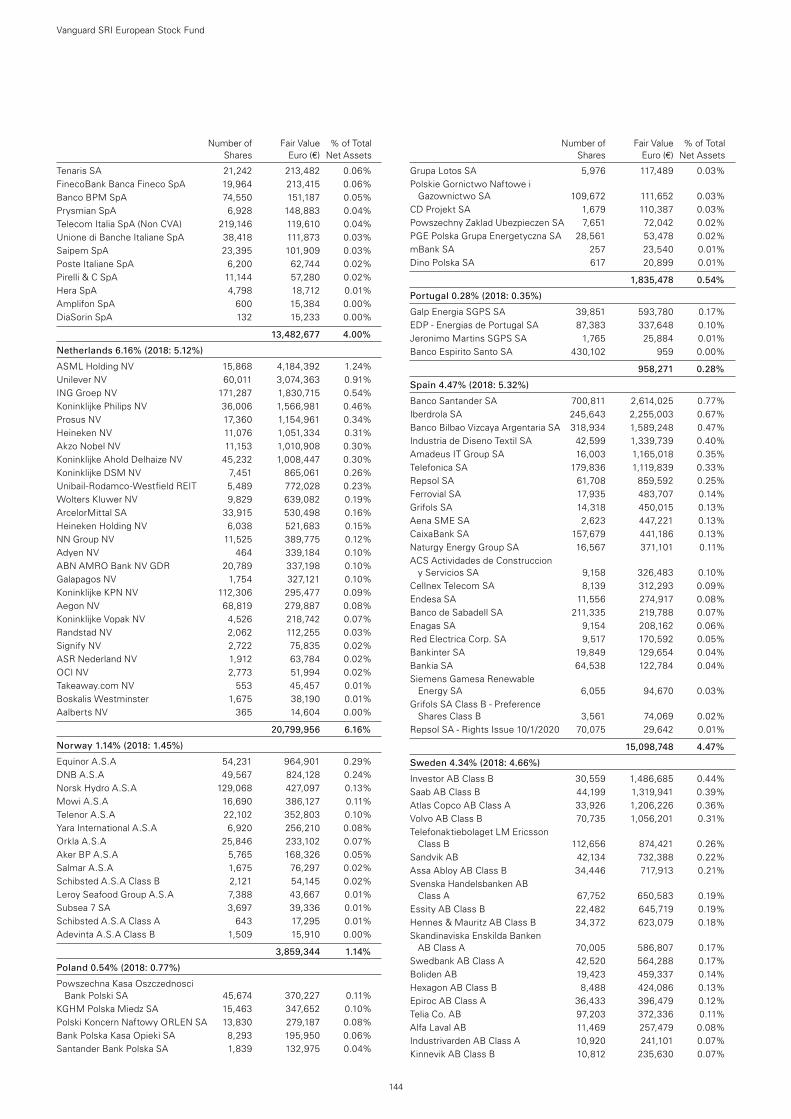
144
Number of Fair Value % of Total Shares Euro (€) Net Assets
Tenaris SA 21,242 213,482 0.06%FinecoBank Banca Fineco SpA 19,964 213,415 0.06%Banco BPM SpA 74,550 151,187 0.05%Prysmian SpA 6,928 148,883 0.04%Telecom Italia SpA (Non CVA) 219,146 119,610 0.04%Unione di Banche Italiane SpA 38,418 111,873 0.03%Saipem SpA 23,395 101,909 0.03%Poste Italiane SpA 6,200 62,744 0.02%Pirelli & C SpA 11,144 57,280 0.02%Hera SpA 4,798 18,712 0.01%Amplifon SpA 600 15,384 0.00%DiaSorin SpA 132 15,233 0.00%
13,482,677 4.00%
Netherlands 6.16% (2018: 5.12%)
ASML Holding NV 15,868 4,184,392 1.24%Unilever NV 60,011 3,074,363 0.91%ING Groep NV 171,287 1,830,715 0.54%Koninklijke Philips NV 36,006 1,566,981 0.46%Prosus NV 17,360 1,154,961 0.34%Heineken NV 11,076 1,051,334 0.31%Akzo Nobel NV 11,153 1,010,908 0.30%Koninklijke Ahold Delhaize NV 45,232 1,008,447 0.30%Koninklijke DSM NV 7,451 865,061 0.26%Unibail-Rodamco-Westfield REIT 5,489 772,028 0.23%Wolters Kluwer NV 9,829 639,082 0.19%ArcelorMittal SA 33,915 530,498 0.16%Heineken Holding NV 6,038 521,683 0.15%NN Group NV 11,525 389,775 0.12%Adyen NV 464 339,184 0.10%ABN AMRO Bank NV GDR 20,789 337,198 0.10%Galapagos NV 1,754 327,121 0.10%Koninklijke KPN NV 112,306 295,477 0.09%Aegon NV 68,819 279,887 0.08%Koninklijke Vopak NV 4,526 218,742 0.07%Randstad NV 2,062 112,255 0.03%Signify NV 2,722 75,835 0.02%ASR Nederland NV 1,912 63,784 0.02%OCI NV 2,773 51,994 0.02%Takeaway.com NV 553 45,457 0.01%Boskalis Westminster 1,675 38,190 0.01%Aalberts NV 365 14,604 0.00%
20,799,956 6.16%
Norway 1.14% (2018: 1.45%)
Equinor A.S.A 54,231 964,901 0.29%DNB A.S.A 49,567 824,128 0.24%Norsk Hydro A.S.A 129,068 427,097 0.13%Mowi A.S.A 16,690 386,127 0.11%Telenor A.S.A 22,102 352,803 0.10%Yara International A.S.A 6,920 256,210 0.08%Orkla A.S.A 25,846 233,102 0.07%Aker BP A.S.A 5,765 168,326 0.05%Salmar A.S.A 1,675 76,297 0.02%Schibsted A.S.A Class B 2,121 54,145 0.02%Leroy Seafood Group A.S.A 7,388 43,667 0.01%Subsea 7 SA 3,697 39,336 0.01%Schibsted A.S.A Class A 643 17,295 0.01%Adevinta A.S.A Class B 1,509 15,910 0.00%
3,859,344 1.14%
Poland 0.54% (2018: 0.77%)
Powszechna Kasa Oszczednosci Bank Polski SA 45,674 370,227 0.11%
KGHM Polska Miedz SA 15,463 347,652 0.10%Polski Koncern Naftowy ORLEN SA 13,830 279,187 0.08%Bank Polska Kasa Opieki SA 8,293 195,950 0.06%Santander Bank Polska SA 1,839 132,975 0.04%
Grupa Lotos SA 5,976 117,489 0.03%Polskie Gornictwo Naftowe i
Gazownictwo SA 109,672 111,652 0.03%CD Projekt SA 1,679 110,387 0.03%Powszechny Zaklad Ubezpieczen SA 7,651 72,042 0.02%PGE Polska Grupa Energetyczna SA 28,561 53,478 0.02%mBank SA 257 23,540 0.01%Dino Polska SA 617 20,899 0.01%
1,835,478 0.54%
Portugal 0.28% (2018: 0.35%)
Galp Energia SGPS SA 39,851 593,780 0.17%EDP - Energias de Portugal SA 87,383 337,648 0.10%Jeronimo Martins SGPS SA 1,765 25,884 0.01%Banco Espirito Santo SA 430,102 959 0.00%
958,271 0.28%
Spain 4.47% (2018: 5.32%)
Banco Santander SA 700,811 2,614,025 0.77%Iberdrola SA 245,643 2,255,003 0.67%Banco Bilbao Vizcaya Argentaria SA 318,934 1,589,248 0.47%Industria de Diseno Textil SA 42,599 1,339,739 0.40%Amadeus IT Group SA 16,003 1,165,018 0.35%Telefonica SA 179,836 1,119,839 0.33%Repsol SA 61,708 859,592 0.25%Ferrovial SA 17,935 483,707 0.14%Grifols SA 14,318 450,015 0.13%Aena SME SA 2,623 447,221 0.13%CaixaBank SA 157,679 441,186 0.13%Naturgy Energy Group SA 16,567 371,101 0.11%ACS Actividades de Construccion
y Servicios SA 9,158 326,483 0.10%Cellnex Telecom SA 8,139 312,293 0.09%Endesa SA 11,556 274,917 0.08%Banco de Sabadell SA 211,335 219,788 0.07%Enagas SA 9,154 208,162 0.06%Red Electrica Corp. SA 9,517 170,592 0.05%Bankinter SA 19,849 129,654 0.04%Bankia SA 64,538 122,784 0.04%Siemens Gamesa Renewable
Energy SA 6,055 94,670 0.03%Grifols SA Class B - Preference
Shares Class B 3,561 74,069 0.02%Repsol SA - Rights Issue 10/1/2020 70,075 29,642 0.01%
15,098,748 4.47%
Sweden 4.34% (2018: 4.66%)
Investor AB Class B 30,559 1,486,685 0.44%Saab AB Class B 44,199 1,319,941 0.39%Atlas Copco AB Class A 33,926 1,206,226 0.36%Volvo AB Class B 70,735 1,056,201 0.31%Telefonaktiebolaget LM Ericsson
Class B 112,656 874,421 0.26%Sandvik AB 42,134 732,388 0.22%Assa Abloy AB Class B 34,446 717,913 0.21%Svenska Handelsbanken AB
Class A 67,752 650,583 0.19%Essity AB Class B 22,482 645,719 0.19%Hennes & Mauritz AB Class B 34,372 623,079 0.18%Skandinaviska Enskilda Banken
AB Class A 70,005 586,807 0.17%Swedbank AB Class A 42,520 564,288 0.17%Boliden AB 19,423 459,337 0.14%Hexagon AB Class B 8,488 424,086 0.13%Epiroc AB Class A 36,433 396,479 0.12%Telia Co. AB 97,203 372,336 0.11%Alfa Laval AB 11,469 257,479 0.08%Industrivarden AB Class A 10,920 241,101 0.07%Kinnevik AB Class B 10,812 235,630 0.07%
Number of Fair Value % of Total Shares Euro (€) Net Assets
Vanguard SRI European Stock Fund
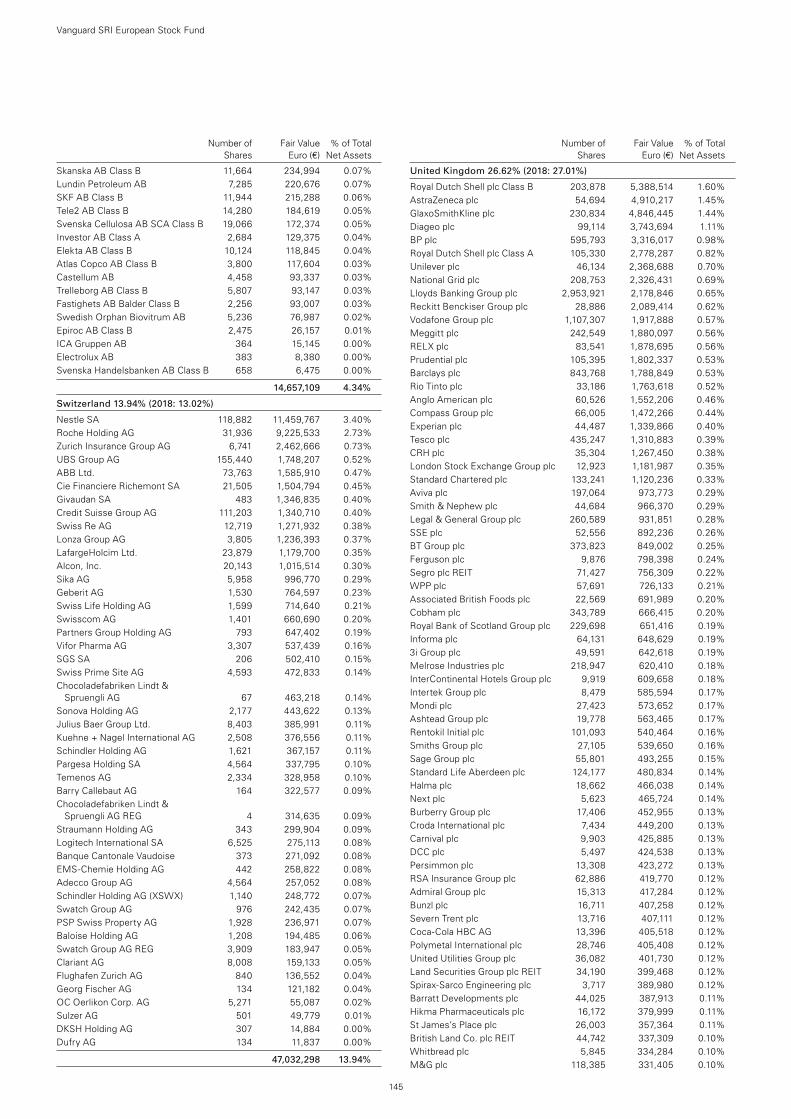
145
Number of Fair Value % of Total Shares Euro (€) Net Assets
Skanska AB Class B 11,664 234,994 0.07%Lundin Petroleum AB 7,285 220,676 0.07%SKF AB Class B 11,944 215,288 0.06%Tele2 AB Class B 14,280 184,619 0.05%Svenska Cellulosa AB SCA Class B 19,066 172,374 0.05%Investor AB Class A 2,684 129,375 0.04%Elekta AB Class B 10,124 118,845 0.04%Atlas Copco AB Class B 3,800 117,604 0.03%Castellum AB 4,458 93,337 0.03%Trelleborg AB Class B 5,807 93,147 0.03%Fastighets AB Balder Class B 2,256 93,007 0.03%Swedish Orphan Biovitrum AB 5,236 76,987 0.02%Epiroc AB Class B 2,475 26,157 0.01%ICA Gruppen AB 364 15,145 0.00%Electrolux AB 383 8,380 0.00%Svenska Handelsbanken AB Class B 658 6,475 0.00%
14,657,109 4.34%
Switzerland 13.94% (2018: 13.02%)
Nestle SA 118,882 11,459,767 3.40%Roche Holding AG 31,936 9,225,533 2.73%Zurich Insurance Group AG 6,741 2,462,666 0.73%UBS Group AG 155,440 1,748,207 0.52%ABB Ltd. 73,763 1,585,910 0.47%Cie Financiere Richemont SA 21,505 1,504,794 0.45%Givaudan SA 483 1,346,835 0.40%Credit Suisse Group AG 111,203 1,340,710 0.40%Swiss Re AG 12,719 1,271,932 0.38%Lonza Group AG 3,805 1,236,393 0.37%LafargeHolcim Ltd. 23,879 1,179,700 0.35%Alcon, Inc. 20,143 1,015,514 0.30%Sika AG 5,958 996,770 0.29%Geberit AG 1,530 764,597 0.23%Swiss Life Holding AG 1,599 714,640 0.21%Swisscom AG 1,401 660,690 0.20%Partners Group Holding AG 793 647,402 0.19%Vifor Pharma AG 3,307 537,439 0.16%SGS SA 206 502,410 0.15%Swiss Prime Site AG 4,593 472,833 0.14%Chocoladefabriken Lindt &
Spruengli AG 67 463,218 0.14%Sonova Holding AG 2,177 443,622 0.13%Julius Baer Group Ltd. 8,403 385,991 0.11%Kuehne + Nagel International AG 2,508 376,556 0.11%Schindler Holding AG 1,621 367,157 0.11%Pargesa Holding SA 4,564 337,795 0.10%Temenos AG 2,334 328,958 0.10%Barry Callebaut AG 164 322,577 0.09%Chocoladefabriken Lindt &
Spruengli AG REG 4 314,635 0.09%Straumann Holding AG 343 299,904 0.09%Logitech International SA 6,525 275,113 0.08%Banque Cantonale Vaudoise 373 271,092 0.08%EMS-Chemie Holding AG 442 258,822 0.08%Adecco Group AG 4,564 257,052 0.08%Schindler Holding AG (XSWX) 1,140 248,772 0.07%Swatch Group AG 976 242,435 0.07%PSP Swiss Property AG 1,928 236,971 0.07%Baloise Holding AG 1,208 194,485 0.06%Swatch Group AG REG 3,909 183,947 0.05%Clariant AG 8,008 159,133 0.05%Flughafen Zurich AG 840 136,552 0.04%Georg Fischer AG 134 121,182 0.04%OC Oerlikon Corp. AG 5,271 55,087 0.02%Sulzer AG 501 49,779 0.01%DKSH Holding AG 307 14,884 0.00%Dufry AG 134 11,837 0.00%
47,032,298 13.94%
United Kingdom 26.62% (2018: 27.01%)
Royal Dutch Shell plc Class B 203,878 5,388,514 1.60%AstraZeneca plc 54,694 4,910,217 1.45%GlaxoSmithKline plc 230,834 4,846,445 1.44%Diageo plc 99,114 3,743,694 1.11%BP plc 595,793 3,316,017 0.98%Royal Dutch Shell plc Class A 105,330 2,778,287 0.82%Unilever plc 46,134 2,368,688 0.70%National Grid plc 208,753 2,326,431 0.69%Lloyds Banking Group plc 2,953,921 2,178,846 0.65%Reckitt Benckiser Group plc 28,886 2,089,414 0.62%Vodafone Group plc 1,107,307 1,917,888 0.57%Meggitt plc 242,549 1,880,097 0.56%RELX plc 83,541 1,878,695 0.56%Prudential plc 105,395 1,802,337 0.53%Barclays plc 843,768 1,788,849 0.53%Rio Tinto plc 33,186 1,763,618 0.52%Anglo American plc 60,526 1,552,206 0.46%Compass Group plc 66,005 1,472,266 0.44%Experian plc 44,487 1,339,866 0.40%Tesco plc 435,247 1,310,883 0.39%CRH plc 35,304 1,267,450 0.38%London Stock Exchange Group plc 12,923 1,181,987 0.35%Standard Chartered plc 133,241 1,120,236 0.33%Aviva plc 197,064 973,773 0.29%Smith & Nephew plc 44,684 966,370 0.29%Legal & General Group plc 260,589 931,851 0.28%SSE plc 52,556 892,236 0.26%BT Group plc 373,823 849,002 0.25%Ferguson plc 9,876 798,398 0.24%Segro plc REIT 71,427 756,309 0.22%WPP plc 57,691 726,133 0.21%Associated British Foods plc 22,569 691,989 0.20%Cobham plc 343,789 666,415 0.20%Royal Bank of Scotland Group plc 229,698 651,416 0.19%Informa plc 64,131 648,629 0.19%3i Group plc 49,591 642,618 0.19%Melrose Industries plc 218,947 620,410 0.18%InterContinental Hotels Group plc 9,919 609,658 0.18%Intertek Group plc 8,479 585,594 0.17%Mondi plc 27,423 573,652 0.17%Ashtead Group plc 19,778 563,465 0.17%Rentokil Initial plc 101,093 540,464 0.16%Smiths Group plc 27,105 539,650 0.16%Sage Group plc 55,801 493,255 0.15%Standard Life Aberdeen plc 124,177 480,834 0.14%Halma plc 18,662 466,038 0.14%Next plc 5,623 465,724 0.14%Burberry Group plc 17,406 452,955 0.13%Croda International plc 7,434 449,200 0.13%Carnival plc 9,903 425,885 0.13%DCC plc 5,497 424,538 0.13%Persimmon plc 13,308 423,272 0.13%RSA Insurance Group plc 62,886 419,770 0.12%Admiral Group plc 15,313 417,284 0.12%Bunzl plc 16,711 407,258 0.12%Severn Trent plc 13,716 407,111 0.12%Coca-Cola HBC AG 13,396 405,518 0.12%Polymetal International plc 28,746 405,408 0.12%United Utilities Group plc 36,082 401,730 0.12%Land Securities Group plc REIT 34,190 399,468 0.12%Spirax-Sarco Engineering plc 3,717 389,980 0.12%Barratt Developments plc 44,025 387,913 0.11%Hikma Pharmaceuticals plc 16,172 379,999 0.11%St James’s Place plc 26,003 357,364 0.11%British Land Co. plc REIT 44,742 337,309 0.10%Whitbread plc 5,845 334,284 0.10%M&G plc 118,385 331,405 0.10%
Number of Fair Value % of Total Shares Euro (€) Net Assets
Vanguard SRI European Stock Fund
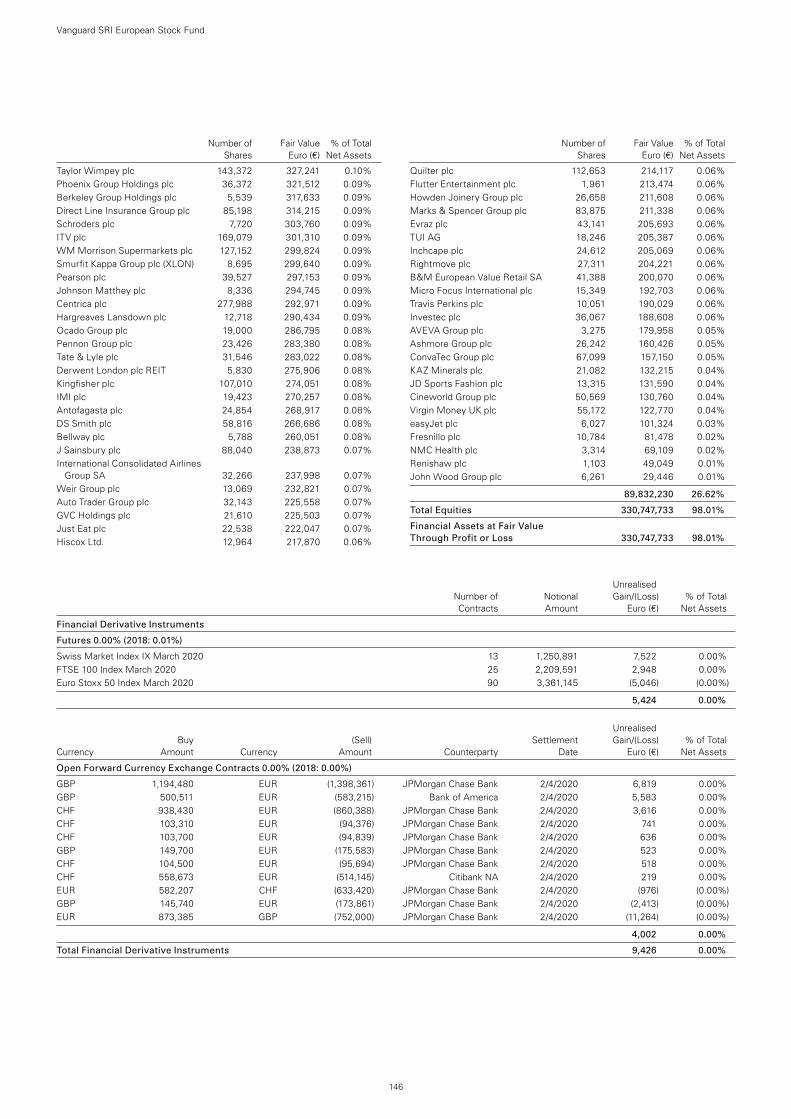
146
Number of Fair Value % of Total Shares Euro (€) Net Assets
Taylor Wimpey plc 143,372 327,241 0.10%Phoenix Group Holdings plc 36,372 321,512 0.09%Berkeley Group Holdings plc 5,539 317,633 0.09%Direct Line Insurance Group plc 85,198 314,215 0.09%Schroders plc 7,720 303,760 0.09%ITV plc 169,079 301,310 0.09%WM Morrison Supermarkets plc 127,152 299,824 0.09%Smurfit Kappa Group plc (XLON) 8,695 299,640 0.09%Pearson plc 39,527 297,153 0.09%Johnson Matthey plc 8,336 294,745 0.09%Centrica plc 277,988 292,971 0.09%Hargreaves Lansdown plc 12,718 290,434 0.09%Ocado Group plc 19,000 286,795 0.08%Pennon Group plc 23,426 283,380 0.08%Tate & Lyle plc 31,546 283,022 0.08%Derwent London plc REIT 5,830 275,906 0.08%Kingfisher plc 107,010 274,051 0.08%IMI plc 19,423 270,257 0.08%Antofagasta plc 24,854 268,917 0.08%DS Smith plc 58,816 266,686 0.08%Bellway plc 5,788 260,051 0.08%J Sainsbury plc 88,040 238,873 0.07%International Consolidated Airlines
Group SA 32,266 237,998 0.07%Weir Group plc 13,069 232,821 0.07%Auto Trader Group plc 32,143 225,558 0.07%GVC Holdings plc 21,610 225,503 0.07%Just Eat plc 22,538 222,047 0.07%Hiscox Ltd. 12,964 217,870 0.06%
Quilter plc 112,653 214,117 0.06%Flutter Entertainment plc 1,961 213,474 0.06%Howden Joinery Group plc 26,658 211,608 0.06%Marks & Spencer Group plc 83,875 211,338 0.06%Evraz plc 43,141 205,693 0.06%TUI AG 18,246 205,387 0.06%Inchcape plc 24,612 205,069 0.06%Rightmove plc 27,311 204,221 0.06%B&M European Value Retail SA 41,388 200,070 0.06%Micro Focus International plc 15,349 192,703 0.06%Travis Perkins plc 10,051 190,029 0.06%Investec plc 36,067 188,608 0.06%AVEVA Group plc 3,275 179,958 0.05%Ashmore Group plc 26,242 160,426 0.05%ConvaTec Group plc 67,099 157,150 0.05%KAZ Minerals plc 21,082 132,215 0.04%JD Sports Fashion plc 13,315 131,590 0.04%Cineworld Group plc 50,569 130,760 0.04%Virgin Money UK plc 55,172 122,770 0.04%easyJet plc 6,027 101,324 0.03%Fresnillo plc 10,784 81,478 0.02%NMC Health plc 3,314 69,109 0.02%Renishaw plc 1,103 49,049 0.01%John Wood Group plc 6,261 29,446 0.01%
89,832,230 26.62%
Total Equities 330,747,733 98.01%
Financial Assets at Fair Value Through Profit or Loss 330,747,733 98.01%
Number of Fair Value % of Total Shares Euro (€) Net Assets
Vanguard SRI European Stock Fund
Unrealised Number of Notional Gain/(Loss) % of Total Contracts Amount Euro (€) Net Assets
Financial Derivative Instruments
Futures 0.00% (2018: 0.01%)
Swiss Market Index IX March 2020 13 1,250,891 7,522 0.00%FTSE 100 Index March 2020 25 2,209,591 2,948 0.00%Euro Stoxx 50 Index March 2020 90 3,361,145 (5,046) (0.00%)
5,424 0.00%
Unrealised Buy (Sell) Settlement Gain/(Loss) % of Total Currency Amount Currency Amount Counterparty Date Euro (€) Net Assets
Open Forward Currency Exchange Contracts 0.00% (2018: 0.00%)
GBP 1,194,480 EUR (1,398,361) JPMorgan Chase Bank 2/4/2020 6,819 0.00%GBP 500,511 EUR (583,215) Bank of America 2/4/2020 5,583 0.00%CHF 938,430 EUR (860,388) JPMorgan Chase Bank 2/4/2020 3,616 0.00%CHF 103,310 EUR (94,376) JPMorgan Chase Bank 2/4/2020 741 0.00%CHF 103,700 EUR (94,839) JPMorgan Chase Bank 2/4/2020 636 0.00%GBP 149,700 EUR (175,583) JPMorgan Chase Bank 2/4/2020 523 0.00%CHF 104,500 EUR (95,694) JPMorgan Chase Bank 2/4/2020 518 0.00%CHF 558,673 EUR (514,145) Citibank NA 2/4/2020 219 0.00%EUR 582,207 CHF (633,420) JPMorgan Chase Bank 2/4/2020 (976) (0.00%)GBP 145,740 EUR (173,861) JPMorgan Chase Bank 2/4/2020 (2,413) (0.00%)EUR 873,385 GBP (752,000) JPMorgan Chase Bank 2/4/2020 (11,264) (0.00%)
4,002 0.00%
Total Financial Derivative Instruments 9,426 0.00%
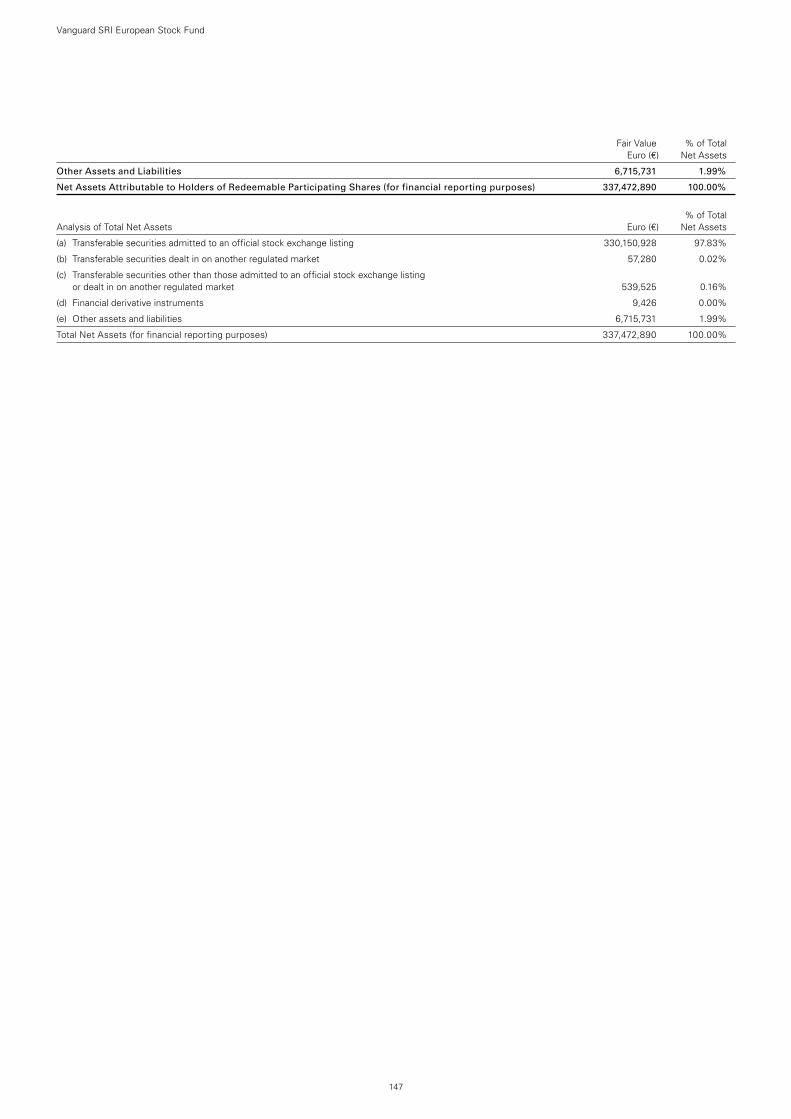
147
Vanguard SRI European Stock Fund
Fair Value % of Total Euro (€) Net Assets
Other Assets and Liabilities 6,715,731 1.99%
Net Assets Attributable to Holders of Redeemable Participating Shares (for financial reporting purposes) 337,472,890 100.00%
% of Total Analysis of Total Net Assets Euro (€) Net Assets
(a) Transferable securities admitted to an official stock exchange listing 330,150,928 97.83%
(b) Transferable securities dealt in on another regulated market 57,280 0.02%
(c) Transferable securities other than those admitted to an official stock exchange listing or dealt in on another regulated market 539,525 0.16%
(d) Financial derivative instruments 9,426 0.00%
(e) Other assets and liabilities 6,715,731 1.99%
Total Net Assets (for financial reporting purposes) 337,472,890 100.00%

The accompanying notes form an integral part of the financial statements.
148
Vanguard SRI European Stock Fund
Statement of Assets and Liabilities
Euro (€) Euro (€) As at As at 31 December 2019 31 December 2018
Current Assets Financial Assets at Fair Value Through Profit or Loss 330,747,733 392,244,225Financial Derivative Instruments 29,125 30,276Cash 4,979,805 1,359,088Receivables:
Interest and Dividends 1,363,470 1,708,625Capital Shares Issued 151,857 3,550,768Investments Sold — 13,473Futures Margin Cash 320,023 488,865Other Receivables — 406
Total Current Assets 337,592,013 399,395,726
Current Liabilities Financial Derivative Instruments 19,699 —Bank Overdraft — 11Unrealised Depreciation on Spot Currency Contracts 969 92Payables and Other Liabilities:
Investments Purchased 6,542 4Income Distribution Payable 24,576 18,214Capital Shares Redeemed 21,710 87,910Management Fees Payable 45,627 103,075
Total Current Liabilities 119,123 209,306
Net Assets Attributable to Holders of Redeemable Participating Shares (for financial reporting purposes) (“Net Assets”) 337,472,890 399,186,420
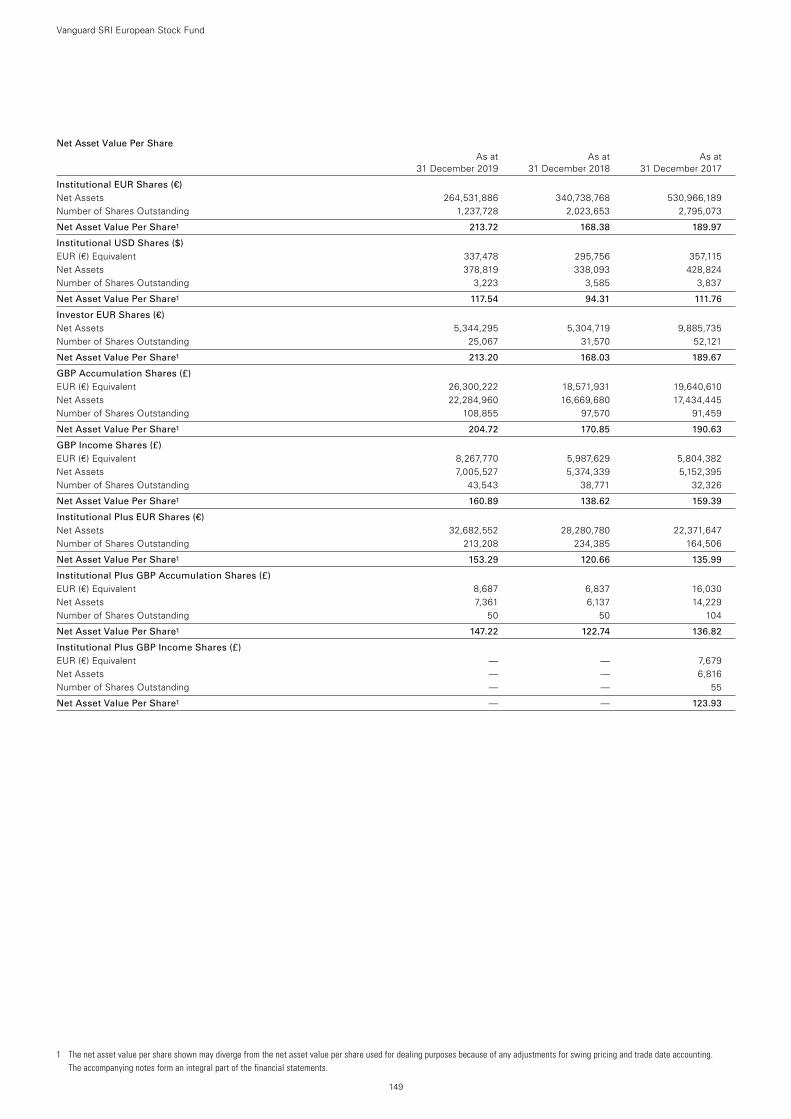
1 The net asset value per share shown may diverge from the net asset value per share used for dealing purposes because of any adjustments for swing pricing and trade date accounting. The accompanying notes form an integral part of the financial statements.
149
Net Asset Value Per Share As at As at As at 31 December 2019 31 December 2018 31 December 2017
Institutional EUR Shares (€) Net Assets 264,531,886 340,738,768 530,966,189Number of Shares Outstanding 1,237,728 2,023,653 2,795,073
Net Asset Value Per Share1 213.72 168.38 189.97
Institutional USD Shares ($) EUR (€) Equivalent 337,478 295,756 357,115Net Assets 378,819 338,093 428,824Number of Shares Outstanding 3,223 3,585 3,837
Net Asset Value Per Share1 117.54 94.31 111.76
Investor EUR Shares (€) Net Assets 5,344,295 5,304,719 9,885,735Number of Shares Outstanding 25,067 31,570 52,121
Net Asset Value Per Share1 213.20 168.03 189.67
GBP Accumulation Shares (£) EUR (€) Equivalent 26,300,222 18,571,931 19,640,610Net Assets 22,284,960 16,669,680 17,434,445Number of Shares Outstanding 108,855 97,570 91,459
Net Asset Value Per Share1 204.72 170.85 190.63
GBP Income Shares (£) EUR (€) Equivalent 8,267,770 5,987,629 5,804,382Net Assets 7,005,527 5,374,339 5,152,395Number of Shares Outstanding 43,543 38,771 32,326
Net Asset Value Per Share1 160.89 138.62 159.39
Institutional Plus EUR Shares (€) Net Assets 32,682,552 28,280,780 22,371,647Number of Shares Outstanding 213,208 234,385 164,506
Net Asset Value Per Share1 153.29 120.66 135.99
Institutional Plus GBP Accumulation Shares (£) EUR (€) Equivalent 8,687 6,837 16,030Net Assets 7,361 6,137 14,229Number of Shares Outstanding 50 50 104
Net Asset Value Per Share1 147.22 122.74 136.82
Institutional Plus GBP Income Shares (£) EUR (€) Equivalent — — 7,679Net Assets — — 6,816Number of Shares Outstanding — — 55
Net Asset Value Per Share1 — — 123.93
Vanguard SRI European Stock Fund
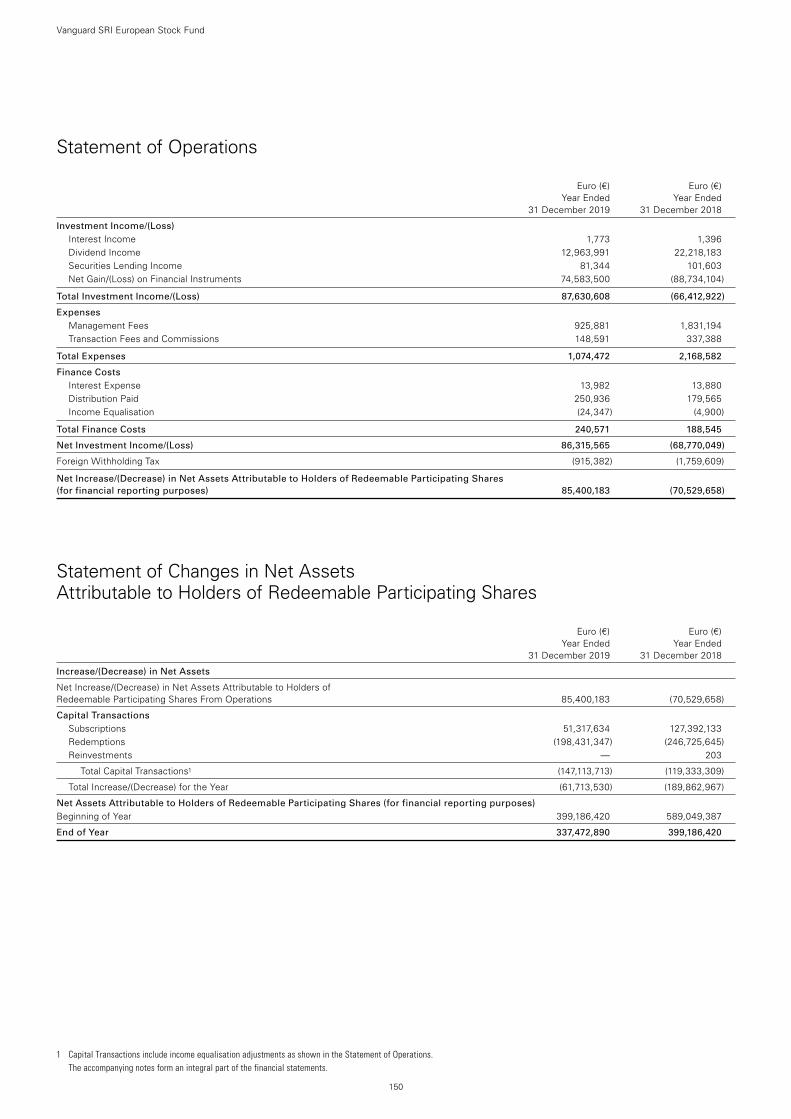
150
Vanguard SRI European Stock Fund
Statement of Operations
Euro (€) Euro (€) Year Ended Year Ended 31 December 2019 31 December 2018
Investment Income/(Loss) Interest Income 1,773 1,396Dividend Income 12,963,991 22,218,183Securities Lending Income 81,344 101,603Net Gain/(Loss) on Financial Instruments 74,583,500 (88,734,104)
Total Investment Income/(Loss) 87,630,608 (66,412,922)
Expenses Management Fees 925,881 1,831,194Transaction Fees and Commissions 148,591 337,388
Total Expenses 1,074,472 2,168,582
Finance Costs Interest Expense 13,982 13,880Distribution Paid 250,936 179,565Income Equalisation (24,347) (4,900)
Total Finance Costs 240,571 188,545
Net Investment Income/(Loss) 86,315,565 (68,770,049)
Foreign Withholding Tax (915,382) (1,759,609)
Net Increase/(Decrease) in Net Assets Attributable to Holders of Redeemable Participating Shares (for financial reporting purposes) 85,400,183 (70,529,658)
Statement of Changes in Net Assets Attributable to Holders of Redeemable Participating Shares
Euro (€) Euro (€) Year Ended Year Ended 31 December 2019 31 December 2018
Increase/(Decrease) in Net Assets
Net Increase/(Decrease) in Net Assets Attributable to Holders of Redeemable Participating Shares From Operations 85,400,183 (70,529,658)
Capital Transactions Subscriptions 51,317,634 127,392,133Redemptions (198,431,347) (246,725,645)Reinvestments — 203
Total Capital Transactions1 (147,113,713) (119,333,309)
Total Increase/(Decrease) for the Year (61,713,530) (189,862,967)
Net Assets Attributable to Holders of Redeemable Participating Shares (for financial reporting purposes) Beginning of Year 399,186,420 589,049,387
End of Year 337,472,890 399,186,420
1 Capital Transactions include income equalisation adjustments as shown in the Statement of Operations. The accompanying notes form an integral part of the financial statements.
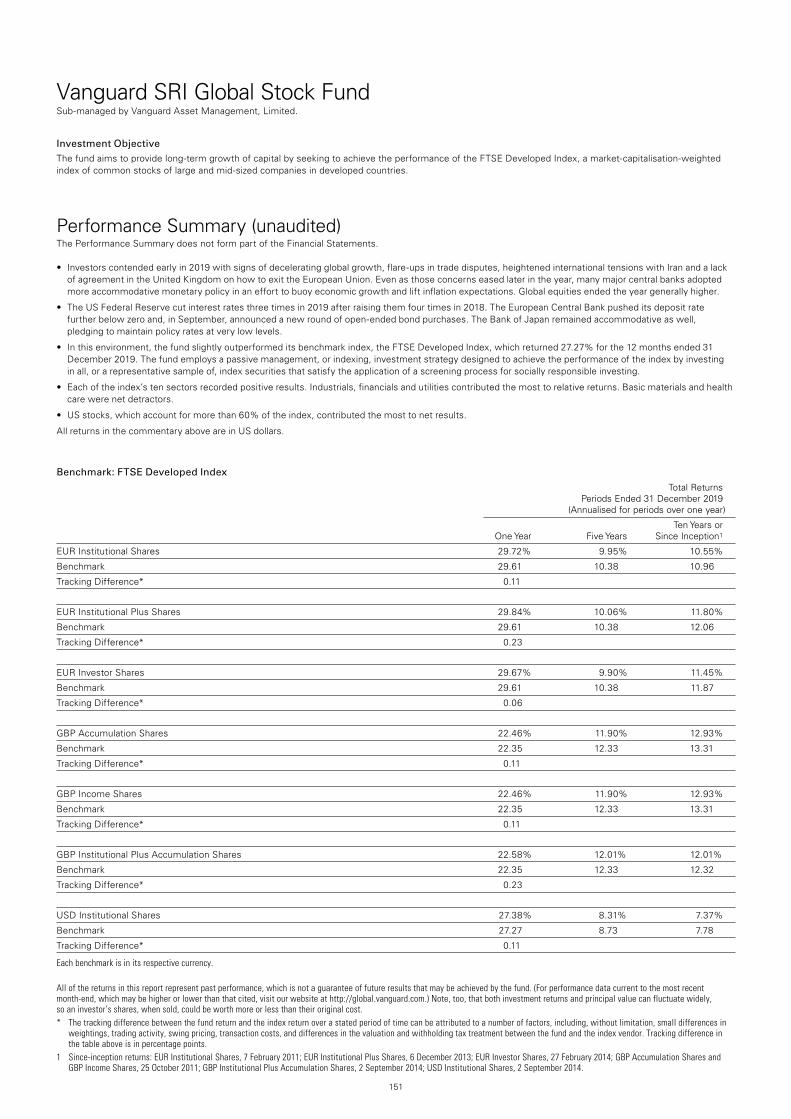
151
Vanguard SRI Global Stock FundSub-managed by Vanguard Asset Management, Limited.
All of the returns in this report represent past performance, which is not a guarantee of future results that may be achieved by the fund. (For performance data current to the most recent month-end, which may be higher or lower than that cited, visit our website at http://global.vanguard.com.) Note, too, that both investment returns and principal value can fluctuate widely, so an investor’s shares, when sold, could be worth more or less than their original cost.* The tracking difference between the fund return and the index return over a stated period of time can be attributed to a number of factors, including, without limitation, small differences in
weightings, trading activity, swing pricing, transaction costs, and differences in the valuation and withholding tax treatment between the fund and the index vendor. Tracking difference in the table above is in percentage points.
1 Since-inception returns: EUR Institutional Shares, 7 February 2011; EUR Institutional Plus Shares, 6 December 2013; EUR Investor Shares, 27 February 2014; GBP Accumulation Shares and GBP Income Shares, 25 October 2011; GBP Institutional Plus Accumulation Shares, 2 September 2014; USD Institutional Shares, 2 September 2014.
Investment ObjectiveThe fund aims to provide long-term growth of capital by seeking to achieve the performance of the FTSE Developed Index, a market-capitalisation-weighted index of common stocks of large and mid-sized companies in developed countries.
Performance Summary (unaudited)The Performance Summary does not form part of the Financial Statements.
• Investorscontendedearlyin2019withsignsofdeceleratingglobalgrowth,flare-upsintradedisputes,heightenedinternationaltensionswithIranandalackof agreement in the United Kingdom on how to exit the European Union. Even as those concerns eased later in the year, many major central banks adopted more accommodative monetary policy in an effort to buoy economic growth and lift inflation expectations. Global equities ended the year generally higher.
• TheUSFederalReservecutinterestratesthreetimesin2019afterraisingthemfourtimesin2018.TheEuropeanCentralBankpusheditsdepositratefurther below zero and, in September, announced a new round of open-ended bond purchases. The Bank of Japan remained accommodative as well, pledging to maintain policy rates at very low levels.
• Inthisenvironment,thefundslightlyoutperformeditsbenchmarkindex,theFTSEDevelopedIndex,whichreturned27.27%forthe12monthsended31December 2019. The fund employs a passive management, or indexing, investment strategy designed to achieve the performance of the index by investing in all, or a representative sample of, index securities that satisfy the application of a screening process for socially responsible investing.
• Eachoftheindex’stensectorsrecordedpositiveresults.Industrials,financialsandutilitiescontributedthemosttorelativereturns.Basicmaterialsandhealthcare were net detractors.
• USstocks,whichaccountformorethan60%oftheindex,contributedthemosttonetresults.
All returns in the commentary above are in US dollars.
Benchmark: FTSE Developed Index
Total Returns Periods Ended 31 December 2019 (Annualised for periods over one year)
Ten Years or One Year Five Years Since Inception1
EUR Institutional Shares 29.72% 9.95% 10.55%
Benchmark 29.61 10.38 10.96
Tracking Difference* 0.11
EUR Institutional Plus Shares 29.84% 10.06% 11.80%
Benchmark 29.61 10.38 12.06
Tracking Difference* 0.23
EUR Investor Shares 29.67% 9.90% 11.45%
Benchmark 29.61 10.38 11.87
Tracking Difference* 0.06
GBP Accumulation Shares 22.46% 11.90% 12.93%
Benchmark 22.35 12.33 13.31
Tracking Difference* 0.11
GBP Income Shares 22.46% 11.90% 12.93%
Benchmark 22.35 12.33 13.31
Tracking Difference* 0.11
GBP Institutional Plus Accumulation Shares 22.58% 12.01% 12.01%
Benchmark 22.35 12.33 12.32
Tracking Difference* 0.23
USD Institutional Shares 27.38% 8.31% 7.37%
Benchmark 27.27 8.73 7.78
Tracking Difference* 0.11
Each benchmark is in its respective currency.
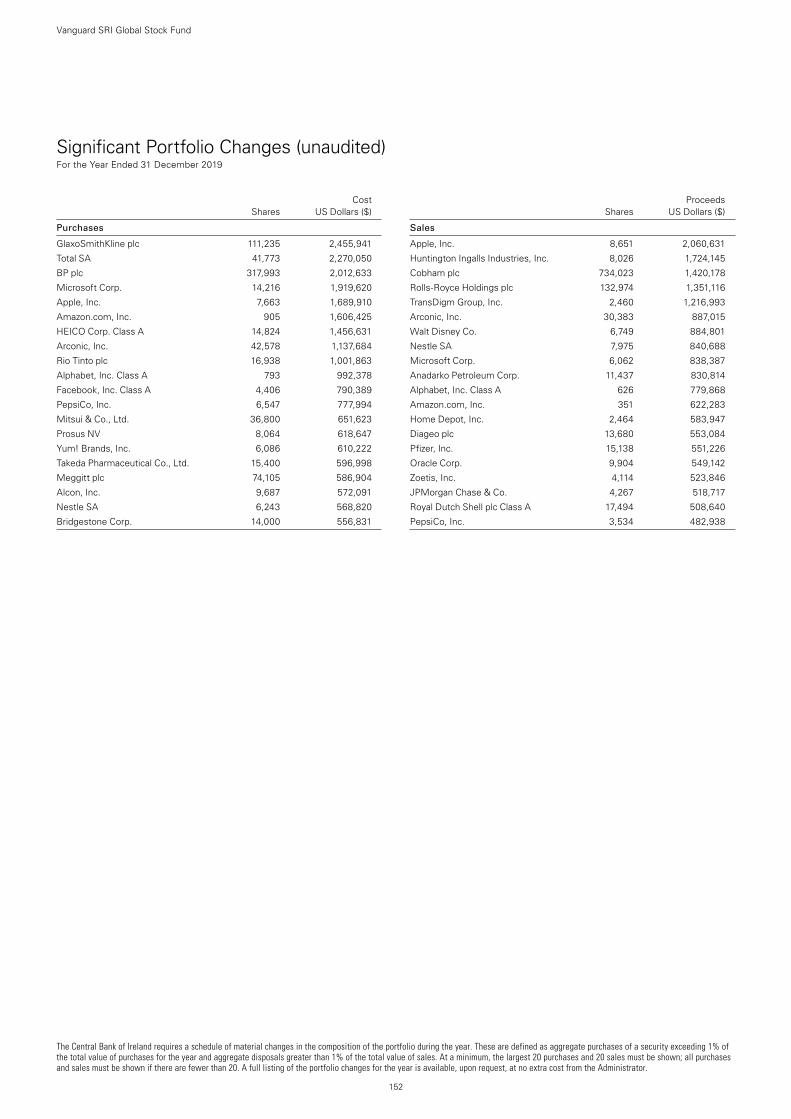
The Central Bank of Ireland requires a schedule of material changes in the composition of the portfolio during the year. These are defined as aggregate purchases of a security exceeding 1% of the total value of purchases for the year and aggregate disposals greater than 1% of the total value of sales. At a minimum, the largest 20 purchases and 20 sales must be shown; all purchases and sales must be shown if there are fewer than 20. A full listing of the portfolio changes for the year is available, upon request, at no extra cost from the Administrator.
152
Vanguard SRI Global Stock Fund
Significant Portfolio Changes (unaudited) For the Year Ended 31 December 2019
Cost Shares US Dollars ($)
Purchases
GlaxoSmithKline plc 111,235 2,455,941
Total SA 41,773 2,270,050
BP plc 317,993 2,012,633
Microsoft Corp. 14,216 1,919,620
Apple, Inc. 7,663 1,689,910
Amazon.com, Inc. 905 1,606,425
HEICO Corp. Class A 14,824 1,456,631
Arconic, Inc. 42,578 1,137,684
Rio Tinto plc 16,938 1,001,863
Alphabet, Inc. Class A 793 992,378
Facebook, Inc. Class A 4,406 790,389
PepsiCo, Inc. 6,547 777,994
Mitsui & Co., Ltd. 36,800 651,623
Prosus NV 8,064 618,647
Yum! Brands, Inc. 6,086 610,222
Takeda Pharmaceutical Co., Ltd. 15,400 596,998
Meggitt plc 74,105 586,904
Alcon, Inc. 9,687 572,091
Nestle SA 6,243 568,820
Bridgestone Corp. 14,000 556,831
Proceeds Shares US Dollars ($)
Sales
Apple, Inc. 8,651 2,060,631
Huntington Ingalls Industries, Inc. 8,026 1,724,145
Cobham plc 734,023 1,420,178
Rolls-Royce Holdings plc 132,974 1,351,116
TransDigm Group, Inc. 2,460 1,216,993
Arconic, Inc. 30,383 887,015
Walt Disney Co. 6,749 884,801
Nestle SA 7,975 840,688
Microsoft Corp. 6,062 838,387
Anadarko Petroleum Corp. 11,437 830,814
Alphabet, Inc. Class A 626 779,868
Amazon.com, Inc. 351 622,283
Home Depot, Inc. 2,464 583,947
Diageo plc 13,680 553,084
Pfizer, Inc. 15,138 551,226
Oracle Corp. 9,904 549,142
Zoetis, Inc. 4,114 523,846
JPMorgan Chase & Co. 4,267 518,717
Royal Dutch Shell plc Class A 17,494 508,640
PepsiCo, Inc. 3,534 482,938
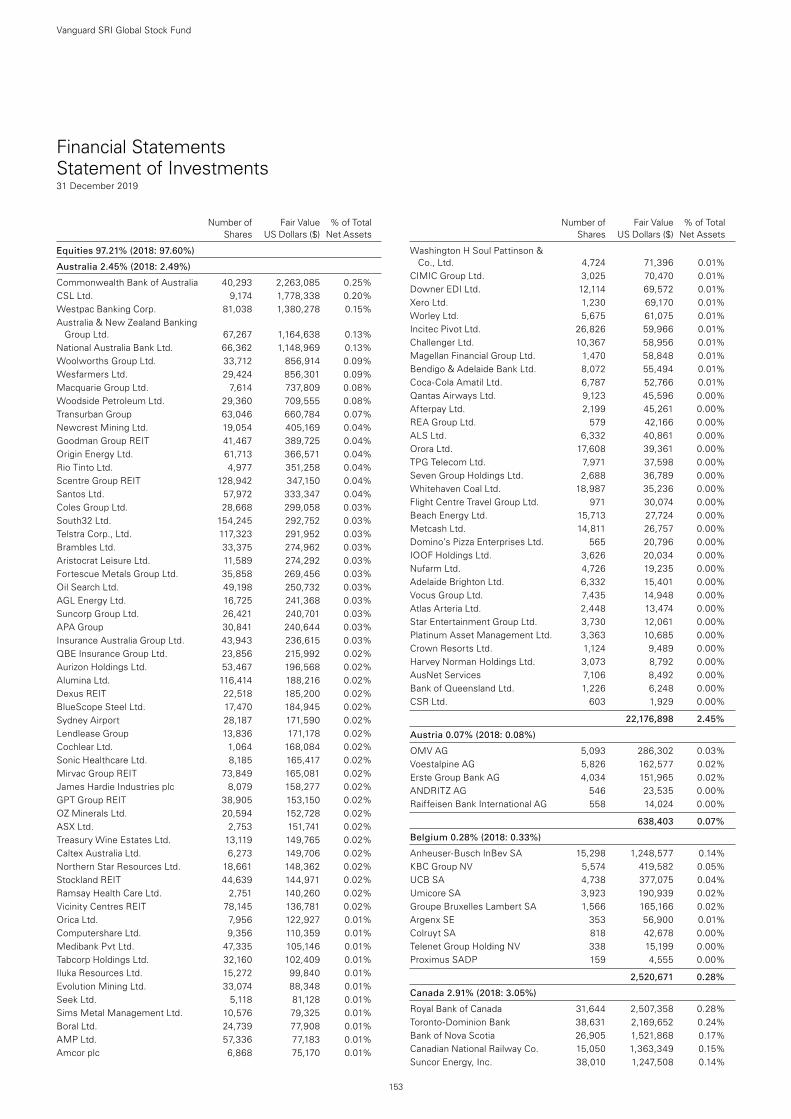
153
Vanguard SRI Global Stock Fund
Number of Fair Value % of Total Shares US Dollars ($) Net Assets
Number of Fair Value % of Total Shares US Dollars ($) Net Assets
Equities 97.21% (2018: 97.60%)
Australia 2.45% (2018: 2.49%)
Commonwealth Bank of Australia 40,293 2,263,085 0.25%CSL Ltd. 9,174 1,778,338 0.20%Westpac Banking Corp. 81,038 1,380,278 0.15%Australia & New Zealand Banking
Group Ltd. 67,267 1,164,638 0.13%National Australia Bank Ltd. 66,362 1,148,969 0.13%Woolworths Group Ltd. 33,712 856,914 0.09%Wesfarmers Ltd. 29,424 856,301 0.09%Macquarie Group Ltd. 7,614 737,809 0.08%Woodside Petroleum Ltd. 29,360 709,555 0.08%Transurban Group 63,046 660,784 0.07%Newcrest Mining Ltd. 19,054 405,169 0.04%Goodman Group REIT 41,467 389,725 0.04%Origin Energy Ltd. 61,713 366,571 0.04%Rio Tinto Ltd. 4,977 351,258 0.04%Scentre Group REIT 128,942 347,150 0.04%Santos Ltd. 57,972 333,347 0.04%Coles Group Ltd. 28,668 299,058 0.03%South32 Ltd. 154,245 292,752 0.03%Telstra Corp., Ltd. 117,323 291,952 0.03%Brambles Ltd. 33,375 274,962 0.03%Aristocrat Leisure Ltd. 11,589 274,292 0.03%Fortescue Metals Group Ltd. 35,858 269,456 0.03%Oil Search Ltd. 49,198 250,732 0.03%AGL Energy Ltd. 16,725 241,368 0.03%Suncorp Group Ltd. 26,421 240,701 0.03%APA Group 30,841 240,644 0.03%Insurance Australia Group Ltd. 43,943 236,615 0.03%QBE Insurance Group Ltd. 23,856 215,992 0.02%Aurizon Holdings Ltd. 53,467 196,568 0.02%Alumina Ltd. 116,414 188,216 0.02%Dexus REIT 22,518 185,200 0.02%BlueScope Steel Ltd. 17,470 184,945 0.02%Sydney Airport 28,187 171,590 0.02%Lendlease Group 13,836 171,178 0.02%Cochlear Ltd. 1,064 168,084 0.02%Sonic Healthcare Ltd. 8,185 165,417 0.02%Mirvac Group REIT 73,849 165,081 0.02%James Hardie Industries plc 8,079 158,277 0.02%GPT Group REIT 38,905 153,150 0.02%OZ Minerals Ltd. 20,594 152,728 0.02%ASX Ltd. 2,753 151,741 0.02%Treasury Wine Estates Ltd. 13,119 149,765 0.02%Caltex Australia Ltd. 6,273 149,706 0.02%Northern Star Resources Ltd. 18,661 148,362 0.02%Stockland REIT 44,639 144,971 0.02%Ramsay Health Care Ltd. 2,751 140,260 0.02%Vicinity Centres REIT 78,145 136,781 0.02%Orica Ltd. 7,956 122,927 0.01%Computershare Ltd. 9,356 110,359 0.01%Medibank Pvt Ltd. 47,335 105,146 0.01%Tabcorp Holdings Ltd. 32,160 102,409 0.01%Iluka Resources Ltd. 15,272 99,840 0.01%Evolution Mining Ltd. 33,074 88,348 0.01%Seek Ltd. 5,118 81,128 0.01%Sims Metal Management Ltd. 10,576 79,325 0.01%Boral Ltd. 24,739 77,908 0.01%AMP Ltd. 57,336 77,183 0.01%Amcor plc 6,868 75,170 0.01%
Washington H Soul Pattinson & Co., Ltd. 4,724 71,396 0.01%
CIMIC Group Ltd. 3,025 70,470 0.01%Downer EDI Ltd. 12,114 69,572 0.01%Xero Ltd. 1,230 69,170 0.01%Worley Ltd. 5,675 61,075 0.01%Incitec Pivot Ltd. 26,826 59,966 0.01%Challenger Ltd. 10,367 58,956 0.01%Magellan Financial Group Ltd. 1,470 58,848 0.01%Bendigo & Adelaide Bank Ltd. 8,072 55,494 0.01%Coca-Cola Amatil Ltd. 6,787 52,766 0.01%Qantas Airways Ltd. 9,123 45,596 0.00%Afterpay Ltd. 2,199 45,261 0.00%REA Group Ltd. 579 42,166 0.00%ALS Ltd. 6,332 40,861 0.00%Orora Ltd. 17,608 39,361 0.00%TPG Telecom Ltd. 7,971 37,598 0.00%Seven Group Holdings Ltd. 2,688 36,789 0.00%Whitehaven Coal Ltd. 18,987 35,236 0.00%Flight Centre Travel Group Ltd. 971 30,074 0.00%Beach Energy Ltd. 15,713 27,724 0.00%Metcash Ltd. 14,811 26,757 0.00%Domino’s Pizza Enterprises Ltd. 565 20,796 0.00%IOOF Holdings Ltd. 3,626 20,034 0.00%Nufarm Ltd. 4,726 19,235 0.00%Adelaide Brighton Ltd. 6,332 15,401 0.00%Vocus Group Ltd. 7,435 14,948 0.00%Atlas Arteria Ltd. 2,448 13,474 0.00%Star Entertainment Group Ltd. 3,730 12,061 0.00%Platinum Asset Management Ltd. 3,363 10,685 0.00%Crown Resorts Ltd. 1,124 9,489 0.00%Harvey Norman Holdings Ltd. 3,073 8,792 0.00%AusNet Services 7,106 8,492 0.00%Bank of Queensland Ltd. 1,226 6,248 0.00%CSR Ltd. 603 1,929 0.00%
22,176,898 2.45%
Austria 0.07% (2018: 0.08%)
OMV AG 5,093 286,302 0.03%Voestalpine AG 5,826 162,577 0.02%Erste Group Bank AG 4,034 151,965 0.02%ANDRITZ AG 546 23,535 0.00%Raiffeisen Bank International AG 558 14,024 0.00%
638,403 0.07%
Belgium 0.28% (2018: 0.33%)
Anheuser-Busch InBev SA 15,298 1,248,577 0.14%KBC Group NV 5,574 419,582 0.05%UCB SA 4,738 377,075 0.04%Umicore SA 3,923 190,939 0.02%Groupe Bruxelles Lambert SA 1,566 165,166 0.02%Argenx SE 353 56,900 0.01%Colruyt SA 818 42,678 0.00%Telenet Group Holding NV 338 15,199 0.00%Proximus SADP 159 4,555 0.00%
2,520,671 0.28%
Canada 2.91% (2018: 3.05%)
Royal Bank of Canada 31,644 2,507,358 0.28%Toronto-Dominion Bank 38,631 2,169,652 0.24%Bank of Nova Scotia 26,905 1,521,868 0.17%Canadian National Railway Co. 15,050 1,363,349 0.15%Suncor Energy, Inc. 38,010 1,247,508 0.14%
Financial Statements Statement of Investments31 December 2019
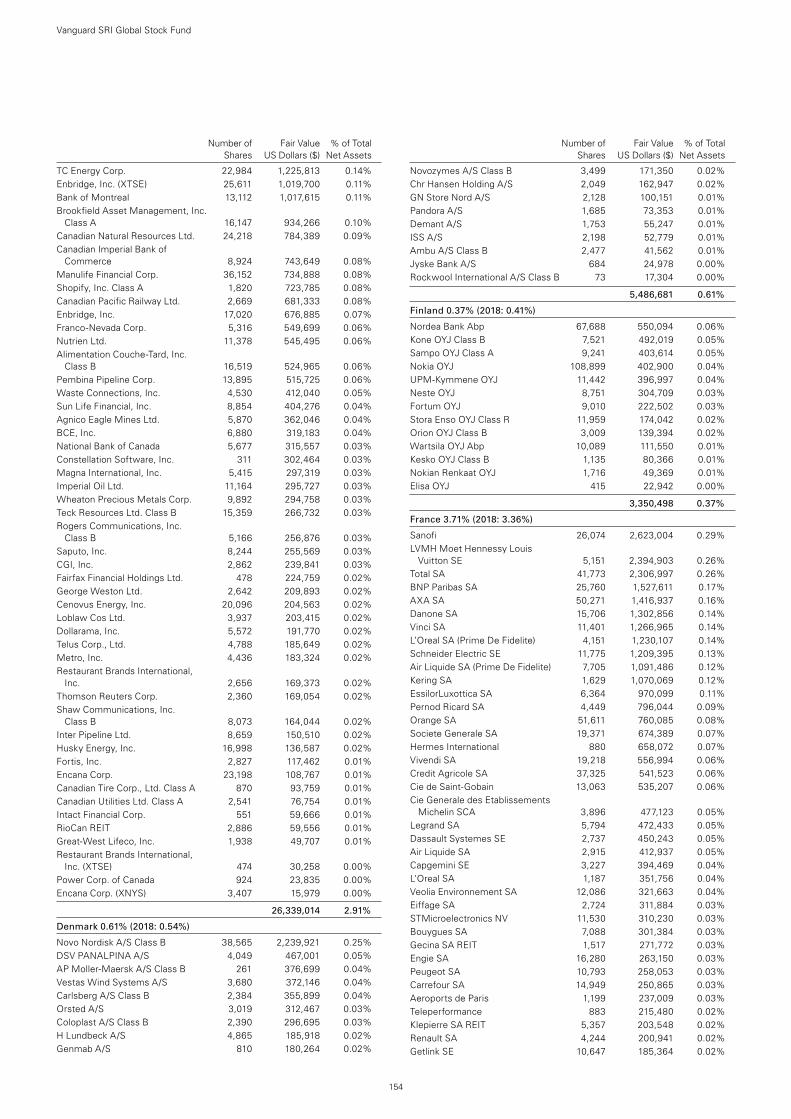
154
Number of Fair Value % of Total Shares US Dollars ($) Net Assets
TC Energy Corp. 22,984 1,225,813 0.14%Enbridge, Inc. (XTSE) 25,611 1,019,700 0.11%Bank of Montreal 13,112 1,017,615 0.11%Brookfield Asset Management, Inc.
Class A 16,147 934,266 0.10%Canadian Natural Resources Ltd. 24,218 784,389 0.09%Canadian Imperial Bank of
Commerce 8,924 743,649 0.08%Manulife Financial Corp. 36,152 734,888 0.08%Shopify, Inc. Class A 1,820 723,785 0.08%Canadian Pacific Railway Ltd. 2,669 681,333 0.08%Enbridge, Inc. 17,020 676,885 0.07%Franco-Nevada Corp. 5,316 549,699 0.06%Nutrien Ltd. 11,378 545,495 0.06%Alimentation Couche-Tard, Inc.
Class B 16,519 524,965 0.06%Pembina Pipeline Corp. 13,895 515,725 0.06%Waste Connections, Inc. 4,530 412,040 0.05%Sun Life Financial, Inc. 8,854 404,276 0.04%Agnico Eagle Mines Ltd. 5,870 362,046 0.04%BCE, Inc. 6,880 319,183 0.04%National Bank of Canada 5,677 315,557 0.03%Constellation Software, Inc. 311 302,464 0.03%Magna International, Inc. 5,415 297,319 0.03%Imperial Oil Ltd. 11,164 295,727 0.03%Wheaton Precious Metals Corp. 9,892 294,758 0.03%Teck Resources Ltd. Class B 15,359 266,732 0.03%Rogers Communications, Inc.
Class B 5,166 256,876 0.03%Saputo, Inc. 8,244 255,569 0.03%CGI, Inc. 2,862 239,841 0.03%Fairfax Financial Holdings Ltd. 478 224,759 0.02%George Weston Ltd. 2,642 209,893 0.02%Cenovus Energy, Inc. 20,096 204,563 0.02%Loblaw Cos Ltd. 3,937 203,415 0.02%Dollarama, Inc. 5,572 191,770 0.02%Telus Corp., Ltd. 4,788 185,649 0.02%Metro, Inc. 4,436 183,324 0.02%Restaurant Brands International,
Inc. 2,656 169,373 0.02%Thomson Reuters Corp. 2,360 169,054 0.02%Shaw Communications, Inc.
Class B 8,073 164,044 0.02%Inter Pipeline Ltd. 8,659 150,510 0.02%Husky Energy, Inc. 16,998 136,587 0.02%Fortis, Inc. 2,827 117,462 0.01%Encana Corp. 23,198 108,767 0.01%Canadian Tire Corp., Ltd. Class A 870 93,759 0.01%Canadian Utilities Ltd. Class A 2,541 76,754 0.01%Intact Financial Corp. 551 59,666 0.01%RioCan REIT 2,886 59,556 0.01%Great-West Lifeco, Inc. 1,938 49,707 0.01%Restaurant Brands International,
Inc. (XTSE) 474 30,258 0.00%Power Corp. of Canada 924 23,835 0.00%Encana Corp. (XNYS) 3,407 15,979 0.00%
26,339,014 2.91%
Denmark 0.61% (2018: 0.54%)
Novo Nordisk A/S Class B 38,565 2,239,921 0.25%DSV PANALPINA A/S 4,049 467,001 0.05%AP Moller-Maersk A/S Class B 261 376,699 0.04%Vestas Wind Systems A/S 3,680 372,146 0.04%Carlsberg A/S Class B 2,384 355,899 0.04%Orsted A/S 3,019 312,467 0.03%Coloplast A/S Class B 2,390 296,695 0.03%H Lundbeck A/S 4,865 185,918 0.02%Genmab A/S 810 180,264 0.02%
Novozymes A/S Class B 3,499 171,350 0.02%Chr Hansen Holding A/S 2,049 162,947 0.02%GN Store Nord A/S 2,128 100,151 0.01%Pandora A/S 1,685 73,353 0.01%Demant A/S 1,753 55,247 0.01%ISS A/S 2,198 52,779 0.01%Ambu A/S Class B 2,477 41,562 0.01%Jyske Bank A/S 684 24,978 0.00%Rockwool International A/S Class B 73 17,304 0.00%
5,486,681 0.61%
Finland 0.37% (2018: 0.41%)
Nordea Bank Abp 67,688 550,094 0.06%Kone OYJ Class B 7,521 492,019 0.05%Sampo OYJ Class A 9,241 403,614 0.05%Nokia OYJ 108,899 402,900 0.04%UPM-Kymmene OYJ 11,442 396,997 0.04%Neste OYJ 8,751 304,709 0.03%Fortum OYJ 9,010 222,502 0.03%Stora Enso OYJ Class R 11,959 174,042 0.02%Orion OYJ Class B 3,009 139,394 0.02%Wartsila OYJ Abp 10,089 111,550 0.01%Kesko OYJ Class B 1,135 80,366 0.01%Nokian Renkaat OYJ 1,716 49,369 0.01%Elisa OYJ 415 22,942 0.00%
3,350,498 0.37%
France 3.71% (2018: 3.36%)
Sanofi 26,074 2,623,004 0.29%LVMH Moet Hennessy Louis
Vuitton SE 5,151 2,394,903 0.26%Total SA 41,773 2,306,997 0.26%BNP Paribas SA 25,760 1,527,611 0.17%AXA SA 50,271 1,416,937 0.16%Danone SA 15,706 1,302,856 0.14%Vinci SA 11,401 1,266,965 0.14%L’Oreal SA (Prime De Fidelite) 4,151 1,230,107 0.14%Schneider Electric SE 11,775 1,209,395 0.13%Air Liquide SA (Prime De Fidelite) 7,705 1,091,486 0.12%Kering SA 1,629 1,070,069 0.12%EssilorLuxottica SA 6,364 970,099 0.11%Pernod Ricard SA 4,449 796,044 0.09%Orange SA 51,611 760,085 0.08%Societe Generale SA 19,371 674,389 0.07%Hermes International 880 658,072 0.07%Vivendi SA 19,218 556,994 0.06%Credit Agricole SA 37,325 541,523 0.06%Cie de Saint-Gobain 13,063 535,207 0.06%Cie Generale des Etablissements
Michelin SCA 3,896 477,123 0.05%Legrand SA 5,794 472,433 0.05%Dassault Systemes SE 2,737 450,243 0.05%Air Liquide SA 2,915 412,937 0.05%Capgemini SE 3,227 394,469 0.04%L’Oreal SA 1,187 351,756 0.04%Veolia Environnement SA 12,086 321,663 0.04%Eiffage SA 2,724 311,884 0.03%STMicroelectronics NV 11,530 310,230 0.03%Bouygues SA 7,088 301,384 0.03%Gecina SA REIT 1,517 271,772 0.03%Engie SA 16,280 263,150 0.03%Peugeot SA 10,793 258,053 0.03%Carrefour SA 14,949 250,865 0.03%Aeroports de Paris 1,199 237,009 0.03%Teleperformance 883 215,480 0.02%Klepierre SA REIT 5,357 203,548 0.02%Renault SA 4,244 200,941 0.02%Getlink SE 10,647 185,364 0.02%
Number of Fair Value % of Total Shares US Dollars ($) Net Assets
Vanguard SRI Global Stock Fund
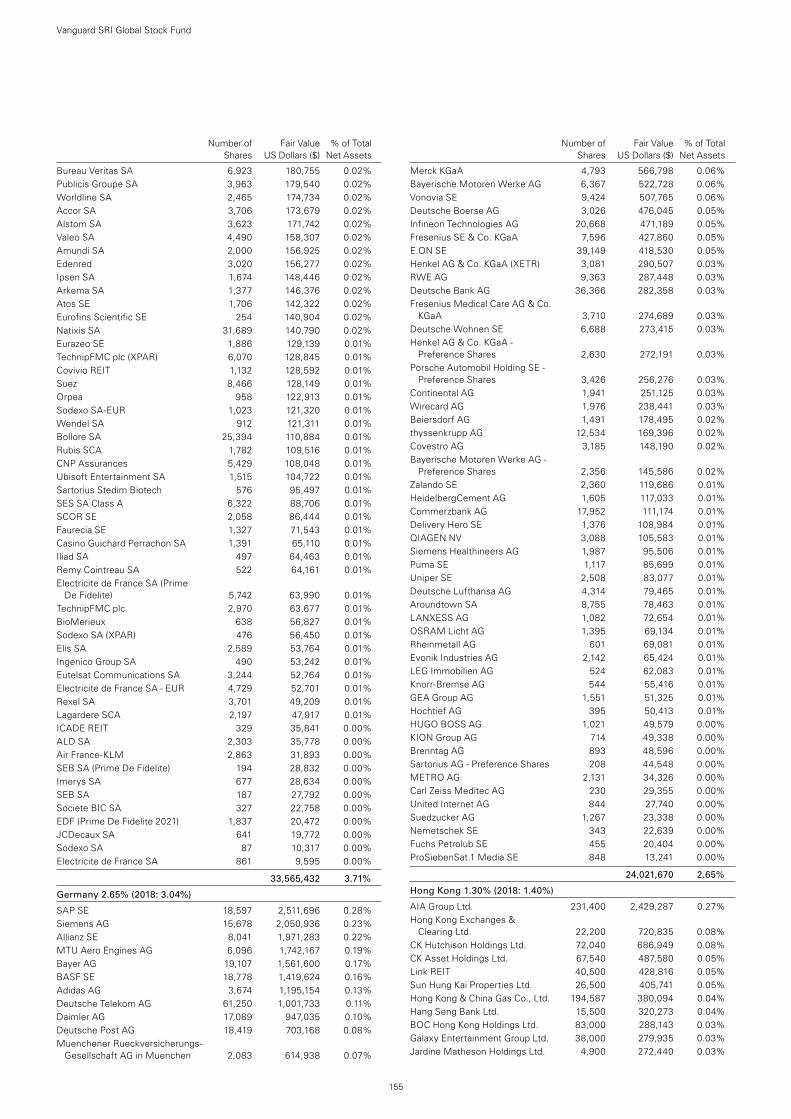
155
Number of Fair Value % of Total Shares US Dollars ($) Net Assets
Bureau Veritas SA 6,923 180,755 0.02%Publicis Groupe SA 3,963 179,540 0.02%Worldline SA 2,465 174,734 0.02%Accor SA 3,706 173,679 0.02%Alstom SA 3,623 171,742 0.02%Valeo SA 4,490 158,307 0.02%Amundi SA 2,000 156,925 0.02%Edenred 3,020 156,277 0.02%Ipsen SA 1,674 148,446 0.02%Arkema SA 1,377 146,376 0.02%Atos SE 1,706 142,322 0.02%Eurofins Scientific SE 254 140,904 0.02%Natixis SA 31,689 140,790 0.02%Eurazeo SE 1,886 129,139 0.01%TechnipFMC plc (XPAR) 6,070 128,845 0.01%Covivio REIT 1,132 128,592 0.01%Suez 8,466 128,149 0.01%Orpea 958 122,913 0.01%Sodexo SA-EUR 1,023 121,320 0.01%Wendel SA 912 121,311 0.01%Bollore SA 25,394 110,884 0.01%Rubis SCA 1,782 109,516 0.01%CNP Assurances 5,429 108,048 0.01%Ubisoft Entertainment SA 1,515 104,722 0.01%Sartorius Stedim Biotech 576 95,497 0.01%SES SA Class A 6,322 88,706 0.01%SCOR SE 2,058 86,444 0.01%Faurecia SE 1,327 71,543 0.01%Casino Guichard Perrachon SA 1,391 65,110 0.01%Iliad SA 497 64,463 0.01%Remy Cointreau SA 522 64,161 0.01%Electricite de France SA (Prime
De Fidelite) 5,742 63,990 0.01%TechnipFMC plc 2,970 63,677 0.01%BioMerieux 638 56,827 0.01%Sodexo SA (XPAR) 476 56,450 0.01%Elis SA 2,589 53,764 0.01%Ingenico Group SA 490 53,242 0.01%Eutelsat Communications SA 3,244 52,764 0.01%Electricite de France SA - EUR 4,729 52,701 0.01%Rexel SA 3,701 49,209 0.01%Lagardere SCA 2,197 47,917 0.01%ICADE REIT 329 35,841 0.00%ALD SA 2,303 35,778 0.00%Air France-KLM 2,863 31,893 0.00%SEB SA (Prime De Fidelite) 194 28,832 0.00%Imerys SA 677 28,634 0.00%SEB SA 187 27,792 0.00%Societe BIC SA 327 22,758 0.00%EDF (Prime De Fidelite 2021) 1,837 20,472 0.00%JCDecaux SA 641 19,772 0.00%Sodexo SA 87 10,317 0.00%Electricite de France SA 861 9,595 0.00%
33,565,432 3.71%
Germany 2.65% (2018: 3.04%)
SAP SE 18,597 2,511,696 0.28%Siemens AG 15,678 2,050,936 0.23%Allianz SE 8,041 1,971,283 0.22%MTU Aero Engines AG 6,096 1,742,167 0.19%Bayer AG 19,107 1,561,600 0.17%BASF SE 18,778 1,419,624 0.16%Adidas AG 3,674 1,195,154 0.13%Deutsche Telekom AG 61,250 1,001,733 0.11%Daimler AG 17,089 947,035 0.10%Deutsche Post AG 18,419 703,168 0.08%Muenchener Rueckversicherungs-
Gesellschaft AG in Muenchen 2,083 614,938 0.07%
Merck KGaA 4,793 566,798 0.06%Bayerische Motoren Werke AG 6,367 522,728 0.06%Vonovia SE 9,424 507,765 0.06%Deutsche Boerse AG 3,026 476,045 0.05%Infineon Technologies AG 20,668 471,189 0.05%Fresenius SE & Co. KGaA 7,596 427,860 0.05%E.ON SE 39,149 418,530 0.05%Henkel AG & Co. KGaA (XETR) 3,081 290,507 0.03%RWE AG 9,363 287,448 0.03%Deutsche Bank AG 36,366 282,358 0.03%Fresenius Medical Care AG & Co.
KGaA 3,710 274,689 0.03%Deutsche Wohnen SE 6,688 273,415 0.03%Henkel AG & Co. KGaA -
Preference Shares 2,630 272,191 0.03%Porsche Automobil Holding SE -
Preference Shares 3,426 256,276 0.03%Continental AG 1,941 251,125 0.03%Wirecard AG 1,976 238,441 0.03%Beiersdorf AG 1,491 178,495 0.02%thyssenkrupp AG 12,534 169,396 0.02%Covestro AG 3,185 148,190 0.02%Bayerische Motoren Werke AG -
Preference Shares 2,356 145,586 0.02%Zalando SE 2,360 119,686 0.01%HeidelbergCement AG 1,605 117,033 0.01%Commerzbank AG 17,952 111,174 0.01%Delivery Hero SE 1,376 108,984 0.01%QIAGEN NV 3,088 105,583 0.01%Siemens Healthineers AG 1,987 95,506 0.01%Puma SE 1,117 85,699 0.01%Uniper SE 2,508 83,077 0.01%Deutsche Lufthansa AG 4,314 79,465 0.01%Aroundtown SA 8,755 78,463 0.01%LANXESS AG 1,082 72,654 0.01%OSRAM Licht AG 1,395 69,134 0.01%Rheinmetall AG 601 69,081 0.01%Evonik Industries AG 2,142 65,424 0.01%LEG Immobilien AG 524 62,083 0.01%Knorr-Bremse AG 544 55,416 0.01%GEA Group AG 1,551 51,325 0.01%Hochtief AG 395 50,413 0.01%HUGO BOSS AG 1,021 49,579 0.00%KION Group AG 714 49,338 0.00%Brenntag AG 893 48,596 0.00%Sartorius AG - Preference Shares 208 44,548 0.00%METRO AG 2,131 34,326 0.00%Carl Zeiss Meditec AG 230 29,355 0.00%United Internet AG 844 27,740 0.00%Suedzucker AG 1,267 23,338 0.00%Nemetschek SE 343 22,639 0.00%Fuchs Petrolub SE 455 20,404 0.00%ProSiebenSat.1 Media SE 848 13,241 0.00%
24,021,670 2.65%
Hong Kong 1.30% (2018: 1.40%)
AIA Group Ltd. 231,400 2,429,287 0.27%Hong Kong Exchanges &
Clearing Ltd. 22,200 720,835 0.08%CK Hutchison Holdings Ltd. 72,040 686,949 0.08%CK Asset Holdings Ltd. 67,540 487,580 0.05%Link REIT 40,500 428,816 0.05%Sun Hung Kai Properties Ltd. 26,500 405,741 0.05%Hong Kong & China Gas Co., Ltd. 194,587 380,094 0.04%Hang Seng Bank Ltd. 15,500 320,273 0.04%BOC Hong Kong Holdings Ltd. 83,000 288,143 0.03%Galaxy Entertainment Group Ltd. 38,000 279,935 0.03%Jardine Matheson Holdings Ltd. 4,900 272,440 0.03%
Number of Fair Value % of Total Shares US Dollars ($) Net Assets
Vanguard SRI Global Stock Fund
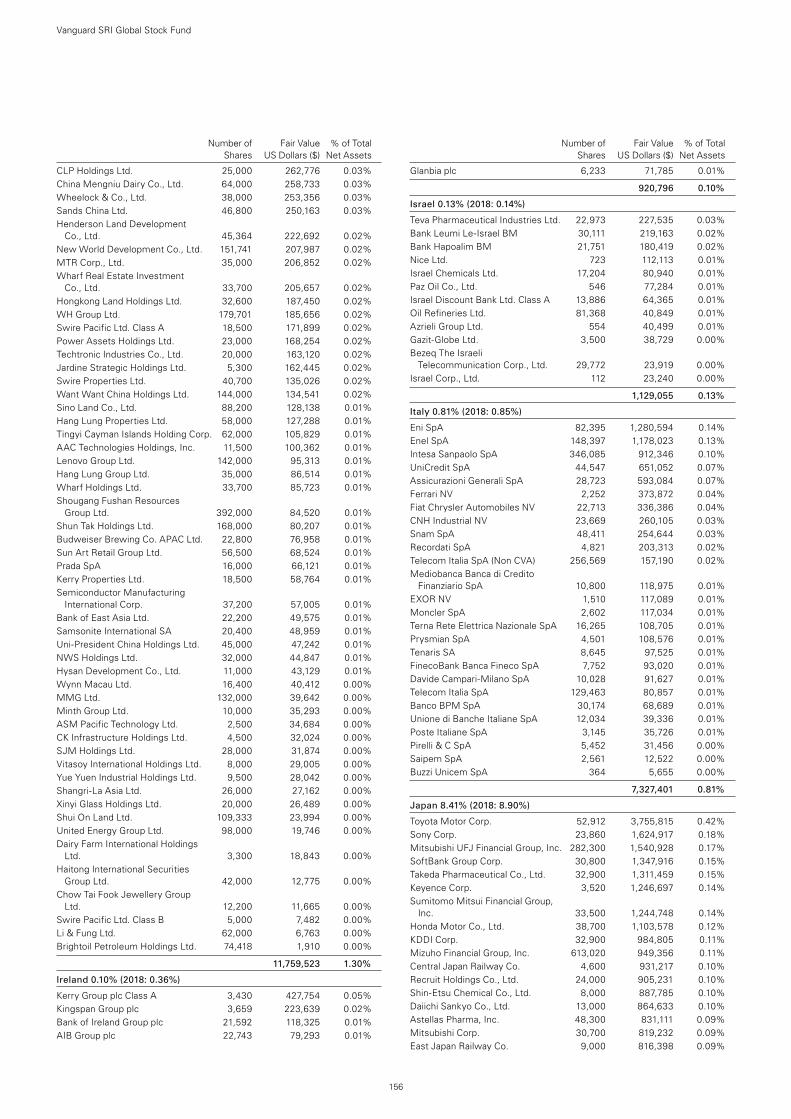
156
Number of Fair Value % of Total Shares US Dollars ($) Net Assets
CLP Holdings Ltd. 25,000 262,776 0.03%China Mengniu Dairy Co., Ltd. 64,000 258,733 0.03%Wheelock & Co., Ltd. 38,000 253,356 0.03%Sands China Ltd. 46,800 250,163 0.03%Henderson Land Development
Co., Ltd. 45,364 222,692 0.02%New World Development Co., Ltd. 151,741 207,987 0.02%MTR Corp., Ltd. 35,000 206,852 0.02%Wharf Real Estate Investment
Co., Ltd. 33,700 205,657 0.02%Hongkong Land Holdings Ltd. 32,600 187,450 0.02%WH Group Ltd. 179,701 185,656 0.02%Swire Pacific Ltd. Class A 18,500 171,899 0.02%Power Assets Holdings Ltd. 23,000 168,254 0.02%Techtronic Industries Co., Ltd. 20,000 163,120 0.02%Jardine Strategic Holdings Ltd. 5,300 162,445 0.02%Swire Properties Ltd. 40,700 135,026 0.02%Want Want China Holdings Ltd. 144,000 134,541 0.02%Sino Land Co., Ltd. 88,200 128,138 0.01%Hang Lung Properties Ltd. 58,000 127,288 0.01%Tingyi Cayman Islands Holding Corp. 62,000 105,829 0.01%AAC Technologies Holdings, Inc. 11,500 100,362 0.01%Lenovo Group Ltd. 142,000 95,313 0.01%Hang Lung Group Ltd. 35,000 86,514 0.01%Wharf Holdings Ltd. 33,700 85,723 0.01%Shougang Fushan Resources
Group Ltd. 392,000 84,520 0.01%Shun Tak Holdings Ltd. 168,000 80,207 0.01%Budweiser Brewing Co. APAC Ltd. 22,800 76,958 0.01%Sun Art Retail Group Ltd. 56,500 68,524 0.01%Prada SpA 16,000 66,121 0.01%Kerry Properties Ltd. 18,500 58,764 0.01%Semiconductor Manufacturing
International Corp. 37,200 57,005 0.01%Bank of East Asia Ltd. 22,200 49,575 0.01%Samsonite International SA 20,400 48,959 0.01%Uni-President China Holdings Ltd. 45,000 47,242 0.01%NWS Holdings Ltd. 32,000 44,847 0.01%Hysan Development Co., Ltd. 11,000 43,129 0.01%Wynn Macau Ltd. 16,400 40,412 0.00%MMG Ltd. 132,000 39,642 0.00%Minth Group Ltd. 10,000 35,293 0.00%ASM Pacific Technology Ltd. 2,500 34,684 0.00%CK Infrastructure Holdings Ltd. 4,500 32,024 0.00%SJM Holdings Ltd. 28,000 31,874 0.00%Vitasoy International Holdings Ltd. 8,000 29,005 0.00%Yue Yuen Industrial Holdings Ltd. 9,500 28,042 0.00%Shangri-La Asia Ltd. 26,000 27,162 0.00%Xinyi Glass Holdings Ltd. 20,000 26,489 0.00%Shui On Land Ltd. 109,333 23,994 0.00%United Energy Group Ltd. 98,000 19,746 0.00%Dairy Farm International Holdings
Ltd. 3,300 18,843 0.00%Haitong International Securities
Group Ltd. 42,000 12,775 0.00%Chow Tai Fook Jewellery Group
Ltd. 12,200 11,665 0.00%Swire Pacific Ltd. Class B 5,000 7,482 0.00%Li & Fung Ltd. 62,000 6,763 0.00%Brightoil Petroleum Holdings Ltd. 74,418 1,910 0.00%
11,759,523 1.30%
Ireland 0.10% (2018: 0.36%)
Kerry Group plc Class A 3,430 427,754 0.05%Kingspan Group plc 3,659 223,639 0.02%Bank of Ireland Group plc 21,592 118,325 0.01%AIB Group plc 22,743 79,293 0.01%
Glanbia plc 6,233 71,785 0.01%
920,796 0.10%
Israel 0.13% (2018: 0.14%)
Teva Pharmaceutical Industries Ltd. 22,973 227,535 0.03%Bank Leumi Le-Israel BM 30,111 219,163 0.02%Bank Hapoalim BM 21,751 180,419 0.02%Nice Ltd. 723 112,113 0.01%Israel Chemicals Ltd. 17,204 80,940 0.01%Paz Oil Co., Ltd. 546 77,284 0.01%Israel Discount Bank Ltd. Class A 13,886 64,365 0.01%Oil Refineries Ltd. 81,368 40,849 0.01%Azrieli Group Ltd. 554 40,499 0.01%Gazit-Globe Ltd. 3,500 38,729 0.00%Bezeq The Israeli
Telecommunication Corp., Ltd. 29,772 23,919 0.00%Israel Corp., Ltd. 112 23,240 0.00%
1,129,055 0.13%
Italy 0.81% (2018: 0.85%)
Eni SpA 82,395 1,280,594 0.14%Enel SpA 148,397 1,178,023 0.13%Intesa Sanpaolo SpA 346,085 912,346 0.10%UniCredit SpA 44,547 651,052 0.07%Assicurazioni Generali SpA 28,723 593,084 0.07%Ferrari NV 2,252 373,872 0.04%Fiat Chrysler Automobiles NV 22,713 336,386 0.04%CNH Industrial NV 23,669 260,105 0.03%Snam SpA 48,411 254,644 0.03%Recordati SpA 4,821 203,313 0.02%Telecom Italia SpA (Non CVA) 256,569 157,190 0.02%Mediobanca Banca di Credito
Finanziario SpA 10,800 118,975 0.01%EXOR NV 1,510 117,089 0.01%Moncler SpA 2,602 117,034 0.01%Terna Rete Elettrica Nazionale SpA 16,265 108,705 0.01%Prysmian SpA 4,501 108,576 0.01%Tenaris SA 8,645 97,525 0.01%FinecoBank Banca Fineco SpA 7,752 93,020 0.01%Davide Campari-Milano SpA 10,028 91,627 0.01%Telecom Italia SpA 129,463 80,857 0.01%Banco BPM SpA 30,174 68,689 0.01%Unione di Banche Italiane SpA 12,034 39,336 0.01%Poste Italiane SpA 3,145 35,726 0.01%Pirelli & C SpA 5,452 31,456 0.00%Saipem SpA 2,561 12,522 0.00%Buzzi Unicem SpA 364 5,655 0.00%
7,327,401 0.81%
Japan 8.41% (2018: 8.90%)
Toyota Motor Corp. 52,912 3,755,815 0.42%Sony Corp. 23,860 1,624,917 0.18%Mitsubishi UFJ Financial Group, Inc. 282,300 1,540,928 0.17%SoftBank Group Corp. 30,800 1,347,916 0.15%Takeda Pharmaceutical Co., Ltd. 32,900 1,311,459 0.15%Keyence Corp. 3,520 1,246,697 0.14%Sumitomo Mitsui Financial Group,
Inc. 33,500 1,244,748 0.14%Honda Motor Co., Ltd. 38,700 1,103,578 0.12%KDDI Corp. 32,900 984,805 0.11%Mizuho Financial Group, Inc. 613,020 949,356 0.11%Central Japan Railway Co. 4,600 931,217 0.10%Recruit Holdings Co., Ltd. 24,000 905,231 0.10%Shin-Etsu Chemical Co., Ltd. 8,000 887,785 0.10%Daiichi Sankyo Co., Ltd. 13,000 864,633 0.10%Astellas Pharma, Inc. 48,300 831,111 0.09%Mitsubishi Corp. 30,700 819,232 0.09%East Japan Railway Co. 9,000 816,398 0.09%
Number of Fair Value % of Total Shares US Dollars ($) Net Assets
Vanguard SRI Global Stock Fund
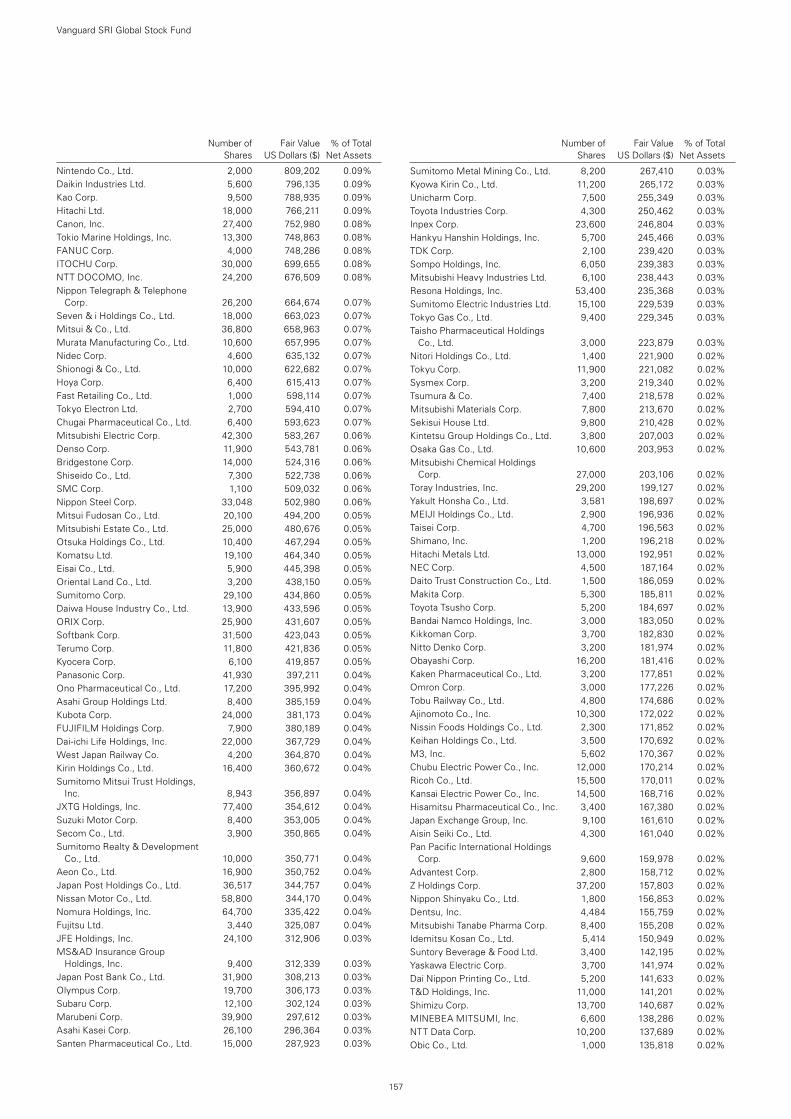
157
Number of Fair Value % of Total Shares US Dollars ($) Net Assets
Nintendo Co., Ltd. 2,000 809,202 0.09%Daikin Industries Ltd. 5,600 796,135 0.09%Kao Corp. 9,500 788,935 0.09%Hitachi Ltd. 18,000 766,211 0.09%Canon, Inc. 27,400 752,980 0.08%Tokio Marine Holdings, Inc. 13,300 748,863 0.08%FANUC Corp. 4,000 748,286 0.08%ITOCHU Corp. 30,000 699,655 0.08%NTT DOCOMO, Inc. 24,200 676,509 0.08%Nippon Telegraph & Telephone
Corp. 26,200 664,674 0.07%Seven & i Holdings Co., Ltd. 18,000 663,023 0.07%Mitsui & Co., Ltd. 36,800 658,963 0.07%Murata Manufacturing Co., Ltd. 10,600 657,995 0.07%Nidec Corp. 4,600 635,132 0.07%Shionogi & Co., Ltd. 10,000 622,682 0.07%Hoya Corp. 6,400 615,413 0.07%Fast Retailing Co., Ltd. 1,000 598,114 0.07%Tokyo Electron Ltd. 2,700 594,410 0.07%Chugai Pharmaceutical Co., Ltd. 6,400 593,623 0.07%Mitsubishi Electric Corp. 42,300 583,267 0.06%Denso Corp. 11,900 543,781 0.06%Bridgestone Corp. 14,000 524,316 0.06%Shiseido Co., Ltd. 7,300 522,738 0.06%SMC Corp. 1,100 509,032 0.06%Nippon Steel Corp. 33,048 502,980 0.06%Mitsui Fudosan Co., Ltd. 20,100 494,200 0.05%Mitsubishi Estate Co., Ltd. 25,000 480,676 0.05%Otsuka Holdings Co., Ltd. 10,400 467,294 0.05%Komatsu Ltd. 19,100 464,340 0.05%Eisai Co., Ltd. 5,900 445,398 0.05%Oriental Land Co., Ltd. 3,200 438,150 0.05%Sumitomo Corp. 29,100 434,860 0.05%Daiwa House Industry Co., Ltd. 13,900 433,596 0.05%ORIX Corp. 25,900 431,607 0.05%Softbank Corp. 31,500 423,043 0.05%Terumo Corp. 11,800 421,836 0.05%Kyocera Corp. 6,100 419,857 0.05%Panasonic Corp. 41,930 397,211 0.04%Ono Pharmaceutical Co., Ltd. 17,200 395,992 0.04%Asahi Group Holdings Ltd. 8,400 385,159 0.04%Kubota Corp. 24,000 381,173 0.04%FUJIFILM Holdings Corp. 7,900 380,189 0.04%Dai-ichi Life Holdings, Inc. 22,000 367,729 0.04%West Japan Railway Co. 4,200 364,870 0.04%Kirin Holdings Co., Ltd. 16,400 360,672 0.04%Sumitomo Mitsui Trust Holdings,
Inc. 8,943 356,897 0.04%JXTG Holdings, Inc. 77,400 354,612 0.04%Suzuki Motor Corp. 8,400 353,005 0.04%Secom Co., Ltd. 3,900 350,865 0.04%Sumitomo Realty & Development
Co., Ltd. 10,000 350,771 0.04%Aeon Co., Ltd. 16,900 350,752 0.04%Japan Post Holdings Co., Ltd. 36,517 344,757 0.04%Nissan Motor Co., Ltd. 58,800 344,170 0.04%Nomura Holdings, Inc. 64,700 335,422 0.04%Fujitsu Ltd. 3,440 325,087 0.04%JFE Holdings, Inc. 24,100 312,906 0.03%MS&AD Insurance Group
Holdings, Inc. 9,400 312,339 0.03%Japan Post Bank Co., Ltd. 31,900 308,213 0.03%Olympus Corp. 19,700 306,173 0.03%Subaru Corp. 12,100 302,124 0.03%Marubeni Corp. 39,900 297,612 0.03%Asahi Kasei Corp. 26,100 296,364 0.03%Santen Pharmaceutical Co., Ltd. 15,000 287,923 0.03%
Sumitomo Metal Mining Co., Ltd. 8,200 267,410 0.03%Kyowa Kirin Co., Ltd. 11,200 265,172 0.03%Unicharm Corp. 7,500 255,349 0.03%Toyota Industries Corp. 4,300 250,462 0.03%Inpex Corp. 23,600 246,804 0.03%Hankyu Hanshin Holdings, Inc. 5,700 245,466 0.03%TDK Corp. 2,100 239,420 0.03%Sompo Holdings, Inc. 6,050 239,383 0.03%Mitsubishi Heavy Industries Ltd. 6,100 238,443 0.03%Resona Holdings, Inc. 53,400 235,368 0.03%Sumitomo Electric Industries Ltd. 15,100 229,539 0.03%Tokyo Gas Co., Ltd. 9,400 229,345 0.03%Taisho Pharmaceutical Holdings
Co., Ltd. 3,000 223,879 0.03%Nitori Holdings Co., Ltd. 1,400 221,900 0.02%Tokyu Corp. 11,900 221,082 0.02%Sysmex Corp. 3,200 219,340 0.02%Tsumura & Co. 7,400 218,578 0.02%Mitsubishi Materials Corp. 7,800 213,670 0.02%Sekisui House Ltd. 9,800 210,428 0.02%Kintetsu Group Holdings Co., Ltd. 3,800 207,003 0.02%Osaka Gas Co., Ltd. 10,600 203,953 0.02%Mitsubishi Chemical Holdings
Corp. 27,000 203,106 0.02%Toray Industries, Inc. 29,200 199,127 0.02%Yakult Honsha Co., Ltd. 3,581 198,697 0.02%MEIJI Holdings Co., Ltd. 2,900 196,936 0.02%Taisei Corp. 4,700 196,563 0.02%Shimano, Inc. 1,200 196,218 0.02%Hitachi Metals Ltd. 13,000 192,951 0.02%NEC Corp. 4,500 187,164 0.02%Daito Trust Construction Co., Ltd. 1,500 186,059 0.02%Makita Corp. 5,300 185,811 0.02%Toyota Tsusho Corp. 5,200 184,697 0.02%Bandai Namco Holdings, Inc. 3,000 183,050 0.02%Kikkoman Corp. 3,700 182,830 0.02%Nitto Denko Corp. 3,200 181,974 0.02%Obayashi Corp. 16,200 181,416 0.02%Kaken Pharmaceutical Co., Ltd. 3,200 177,851 0.02%Omron Corp. 3,000 177,226 0.02%Tobu Railway Co., Ltd. 4,800 174,686 0.02%Ajinomoto Co., Inc. 10,300 172,022 0.02%Nissin Foods Holdings Co., Ltd. 2,300 171,852 0.02%Keihan Holdings Co., Ltd. 3,500 170,692 0.02%M3, Inc. 5,602 170,367 0.02%Chubu Electric Power Co., Inc. 12,000 170,214 0.02%Ricoh Co., Ltd. 15,500 170,011 0.02%Kansai Electric Power Co., Inc. 14,500 168,716 0.02%Hisamitsu Pharmaceutical Co., Inc. 3,400 167,380 0.02%Japan Exchange Group, Inc. 9,100 161,610 0.02%Aisin Seiki Co., Ltd. 4,300 161,040 0.02%Pan Pacific International Holdings
Corp. 9,600 159,978 0.02%Advantest Corp. 2,800 158,712 0.02%Z Holdings Corp. 37,200 157,803 0.02%Nippon Shinyaku Co., Ltd. 1,800 156,853 0.02%Dentsu, Inc. 4,484 155,759 0.02%Mitsubishi Tanabe Pharma Corp. 8,400 155,208 0.02%Idemitsu Kosan Co., Ltd. 5,414 150,949 0.02%Suntory Beverage & Food Ltd. 3,400 142,195 0.02%Yaskawa Electric Corp. 3,700 141,974 0.02%Dai Nippon Printing Co., Ltd. 5,200 141,633 0.02%T&D Holdings, Inc. 11,000 141,201 0.02%Shimizu Corp. 13,700 140,687 0.02%MINEBEA MITSUMI, Inc. 6,600 138,286 0.02%NTT Data Corp. 10,200 137,689 0.02%Obic Co., Ltd. 1,000 135,818 0.02%
Number of Fair Value % of Total Shares US Dollars ($) Net Assets
Vanguard SRI Global Stock Fund
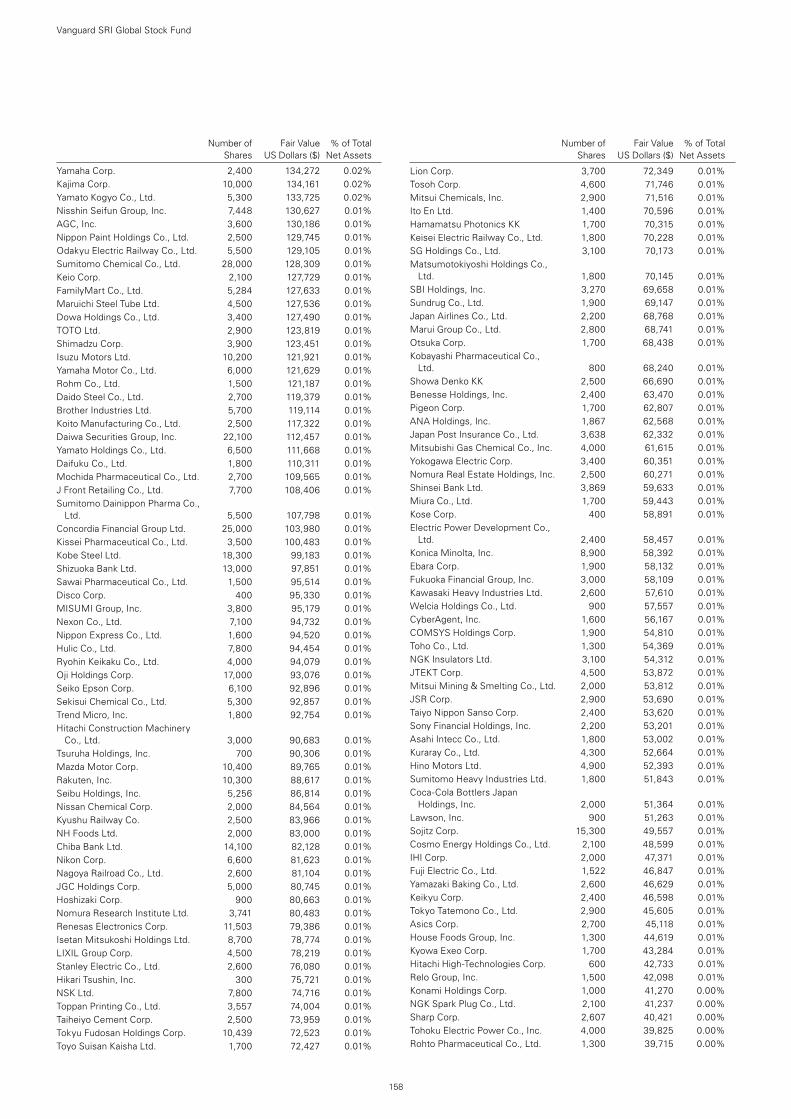
158
Number of Fair Value % of Total Shares US Dollars ($) Net Assets
Yamaha Corp. 2,400 134,272 0.02%Kajima Corp. 10,000 134,161 0.02%Yamato Kogyo Co., Ltd. 5,300 133,725 0.02%Nisshin Seifun Group, Inc. 7,448 130,627 0.01%AGC, Inc. 3,600 130,186 0.01%Nippon Paint Holdings Co., Ltd. 2,500 129,745 0.01%Odakyu Electric Railway Co., Ltd. 5,500 129,105 0.01%Sumitomo Chemical Co., Ltd. 28,000 128,309 0.01%Keio Corp. 2,100 127,729 0.01%FamilyMart Co., Ltd. 5,284 127,633 0.01%Maruichi Steel Tube Ltd. 4,500 127,536 0.01%Dowa Holdings Co., Ltd. 3,400 127,490 0.01%TOTO Ltd. 2,900 123,819 0.01%Shimadzu Corp. 3,900 123,451 0.01%Isuzu Motors Ltd. 10,200 121,921 0.01%Yamaha Motor Co., Ltd. 6,000 121,629 0.01%Rohm Co., Ltd. 1,500 121,187 0.01%Daido Steel Co., Ltd. 2,700 119,379 0.01%Brother Industries Ltd. 5,700 119,114 0.01%Koito Manufacturing Co., Ltd. 2,500 117,322 0.01%Daiwa Securities Group, Inc. 22,100 112,457 0.01%Yamato Holdings Co., Ltd. 6,500 111,668 0.01%Daifuku Co., Ltd. 1,800 110,311 0.01%Mochida Pharmaceutical Co., Ltd. 2,700 109,565 0.01%J Front Retailing Co., Ltd. 7,700 108,406 0.01%Sumitomo Dainippon Pharma Co.,
Ltd. 5,500 107,798 0.01%Concordia Financial Group Ltd. 25,000 103,980 0.01%Kissei Pharmaceutical Co., Ltd. 3,500 100,483 0.01%Kobe Steel Ltd. 18,300 99,183 0.01%Shizuoka Bank Ltd. 13,000 97,851 0.01%Sawai Pharmaceutical Co., Ltd. 1,500 95,514 0.01%Disco Corp. 400 95,330 0.01%MISUMI Group, Inc. 3,800 95,179 0.01%Nexon Co., Ltd. 7,100 94,732 0.01%Nippon Express Co., Ltd. 1,600 94,520 0.01%Hulic Co., Ltd. 7,800 94,454 0.01%Ryohin Keikaku Co., Ltd. 4,000 94,079 0.01%Oji Holdings Corp. 17,000 93,076 0.01%Seiko Epson Corp. 6,100 92,896 0.01%Sekisui Chemical Co., Ltd. 5,300 92,857 0.01%Trend Micro, Inc. 1,800 92,754 0.01%Hitachi Construction Machinery
Co., Ltd. 3,000 90,683 0.01%Tsuruha Holdings, Inc. 700 90,306 0.01%Mazda Motor Corp. 10,400 89,765 0.01%Rakuten, Inc. 10,300 88,617 0.01%Seibu Holdings, Inc. 5,256 86,814 0.01%Nissan Chemical Corp. 2,000 84,564 0.01%Kyushu Railway Co. 2,500 83,966 0.01%NH Foods Ltd. 2,000 83,000 0.01%Chiba Bank Ltd. 14,100 82,128 0.01%Nikon Corp. 6,600 81,623 0.01%Nagoya Railroad Co., Ltd. 2,600 81,104 0.01%JGC Holdings Corp. 5,000 80,745 0.01%Hoshizaki Corp. 900 80,663 0.01%Nomura Research Institute Ltd. 3,741 80,483 0.01%Renesas Electronics Corp. 11,503 79,386 0.01%Isetan Mitsukoshi Holdings Ltd. 8,700 78,774 0.01%LIXIL Group Corp. 4,500 78,219 0.01%Stanley Electric Co., Ltd. 2,600 76,080 0.01%Hikari Tsushin, Inc. 300 75,721 0.01%NSK Ltd. 7,800 74,716 0.01%Toppan Printing Co., Ltd. 3,557 74,004 0.01%Taiheiyo Cement Corp. 2,500 73,959 0.01%Tokyu Fudosan Holdings Corp. 10,439 72,523 0.01%Toyo Suisan Kaisha Ltd. 1,700 72,427 0.01%
Lion Corp. 3,700 72,349 0.01%Tosoh Corp. 4,600 71,746 0.01%Mitsui Chemicals, Inc. 2,900 71,516 0.01%Ito En Ltd. 1,400 70,596 0.01%Hamamatsu Photonics KK 1,700 70,315 0.01%Keisei Electric Railway Co., Ltd. 1,800 70,228 0.01%SG Holdings Co., Ltd. 3,100 70,173 0.01%Matsumotokiyoshi Holdings Co.,
Ltd. 1,800 70,145 0.01%SBI Holdings, Inc. 3,270 69,658 0.01%Sundrug Co., Ltd. 1,900 69,147 0.01%Japan Airlines Co., Ltd. 2,200 68,768 0.01%Marui Group Co., Ltd. 2,800 68,741 0.01%Otsuka Corp. 1,700 68,438 0.01%Kobayashi Pharmaceutical Co.,
Ltd. 800 68,240 0.01%Showa Denko KK 2,500 66,690 0.01%Benesse Holdings, Inc. 2,400 63,470 0.01%Pigeon Corp. 1,700 62,807 0.01%ANA Holdings, Inc. 1,867 62,568 0.01%Japan Post Insurance Co., Ltd. 3,638 62,332 0.01%Mitsubishi Gas Chemical Co., Inc. 4,000 61,615 0.01%Yokogawa Electric Corp. 3,400 60,351 0.01%Nomura Real Estate Holdings, Inc. 2,500 60,271 0.01%Shinsei Bank Ltd. 3,869 59,633 0.01%Miura Co., Ltd. 1,700 59,443 0.01%Kose Corp. 400 58,891 0.01%Electric Power Development Co.,
Ltd. 2,400 58,457 0.01%Konica Minolta, Inc. 8,900 58,392 0.01%Ebara Corp. 1,900 58,132 0.01%Fukuoka Financial Group, Inc. 3,000 58,109 0.01%Kawasaki Heavy Industries Ltd. 2,600 57,610 0.01%Welcia Holdings Co., Ltd. 900 57,557 0.01%CyberAgent, Inc. 1,600 56,167 0.01%COMSYS Holdings Corp. 1,900 54,810 0.01%Toho Co., Ltd. 1,300 54,369 0.01%NGK Insulators Ltd. 3,100 54,312 0.01%JTEKT Corp. 4,500 53,872 0.01%Mitsui Mining & Smelting Co., Ltd. 2,000 53,812 0.01%JSR Corp. 2,900 53,690 0.01%Taiyo Nippon Sanso Corp. 2,400 53,620 0.01%Sony Financial Holdings, Inc. 2,200 53,201 0.01%Asahi Intecc Co., Ltd. 1,800 53,002 0.01%Kuraray Co., Ltd. 4,300 52,664 0.01%Hino Motors Ltd. 4,900 52,393 0.01%Sumitomo Heavy Industries Ltd. 1,800 51,843 0.01%Coca-Cola Bottlers Japan
Holdings, Inc. 2,000 51,364 0.01%Lawson, Inc. 900 51,263 0.01%Sojitz Corp. 15,300 49,557 0.01%Cosmo Energy Holdings Co., Ltd. 2,100 48,599 0.01%IHI Corp. 2,000 47,371 0.01%Fuji Electric Co., Ltd. 1,522 46,847 0.01%Yamazaki Baking Co., Ltd. 2,600 46,629 0.01%Keikyu Corp. 2,400 46,598 0.01%Tokyo Tatemono Co., Ltd. 2,900 45,605 0.01%Asics Corp. 2,700 45,118 0.01%House Foods Group, Inc. 1,300 44,619 0.01%Kyowa Exeo Corp. 1,700 43,284 0.01%Hitachi High-Technologies Corp. 600 42,733 0.01%Relo Group, Inc. 1,500 42,098 0.01%Konami Holdings Corp. 1,000 41,270 0.00%NGK Spark Plug Co., Ltd. 2,100 41,237 0.00%Sharp Corp. 2,607 40,421 0.00%Tohoku Electric Power Co., Inc. 4,000 39,825 0.00%Rohto Pharmaceutical Co., Ltd. 1,300 39,715 0.00%
Number of Fair Value % of Total Shares US Dollars ($) Net Assets
Vanguard SRI Global Stock Fund
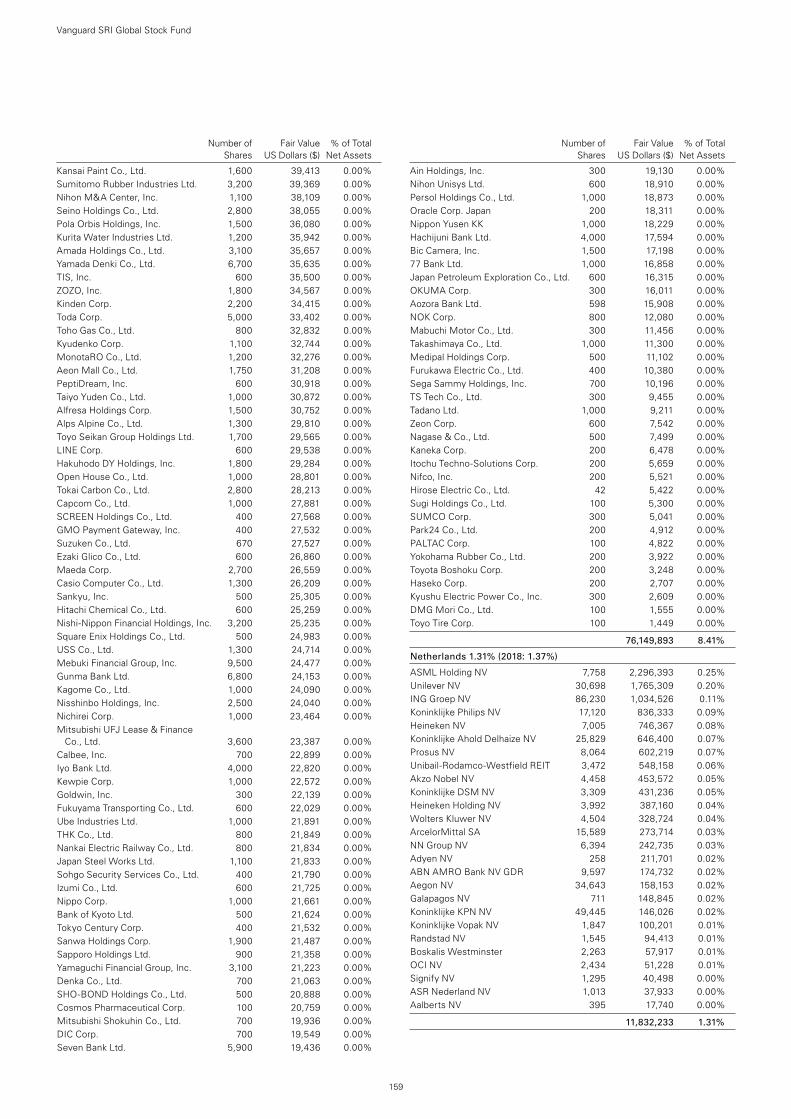
159
Number of Fair Value % of Total Shares US Dollars ($) Net Assets
Kansai Paint Co., Ltd. 1,600 39,413 0.00%Sumitomo Rubber Industries Ltd. 3,200 39,369 0.00%Nihon M&A Center, Inc. 1,100 38,109 0.00%Seino Holdings Co., Ltd. 2,800 38,055 0.00%Pola Orbis Holdings, Inc. 1,500 36,080 0.00%Kurita Water Industries Ltd. 1,200 35,942 0.00%Amada Holdings Co., Ltd. 3,100 35,657 0.00%Yamada Denki Co., Ltd. 6,700 35,635 0.00%TIS, Inc. 600 35,500 0.00%ZOZO, Inc. 1,800 34,567 0.00%Kinden Corp. 2,200 34,415 0.00%Toda Corp. 5,000 33,402 0.00%Toho Gas Co., Ltd. 800 32,832 0.00%Kyudenko Corp. 1,100 32,744 0.00%MonotaRO Co., Ltd. 1,200 32,276 0.00%Aeon Mall Co., Ltd. 1,750 31,208 0.00%PeptiDream, Inc. 600 30,918 0.00%Taiyo Yuden Co., Ltd. 1,000 30,872 0.00%Alfresa Holdings Corp. 1,500 30,752 0.00%Alps Alpine Co., Ltd. 1,300 29,810 0.00%Toyo Seikan Group Holdings Ltd. 1,700 29,565 0.00%LINE Corp. 600 29,538 0.00%Hakuhodo DY Holdings, Inc. 1,800 29,284 0.00%Open House Co., Ltd. 1,000 28,801 0.00%Tokai Carbon Co., Ltd. 2,800 28,213 0.00%Capcom Co., Ltd. 1,000 27,881 0.00%SCREEN Holdings Co., Ltd. 400 27,568 0.00%GMO Payment Gateway, Inc. 400 27,532 0.00%Suzuken Co., Ltd. 670 27,527 0.00%Ezaki Glico Co., Ltd. 600 26,860 0.00%Maeda Corp. 2,700 26,559 0.00%Casio Computer Co., Ltd. 1,300 26,209 0.00%Sankyu, Inc. 500 25,305 0.00%Hitachi Chemical Co., Ltd. 600 25,259 0.00%Nishi-Nippon Financial Holdings, Inc. 3,200 25,235 0.00%Square Enix Holdings Co., Ltd. 500 24,983 0.00%USS Co., Ltd. 1,300 24,714 0.00%Mebuki Financial Group, Inc. 9,500 24,477 0.00%Gunma Bank Ltd. 6,800 24,153 0.00%Kagome Co., Ltd. 1,000 24,090 0.00%Nisshinbo Holdings, Inc. 2,500 24,040 0.00%Nichirei Corp. 1,000 23,464 0.00%Mitsubishi UFJ Lease & Finance
Co., Ltd. 3,600 23,387 0.00%Calbee, Inc. 700 22,899 0.00%Iyo Bank Ltd. 4,000 22,820 0.00%Kewpie Corp. 1,000 22,572 0.00%Goldwin, Inc. 300 22,139 0.00%Fukuyama Transporting Co., Ltd. 600 22,029 0.00%Ube Industries Ltd. 1,000 21,891 0.00%THK Co., Ltd. 800 21,849 0.00%Nankai Electric Railway Co., Ltd. 800 21,834 0.00%Japan Steel Works Ltd. 1,100 21,833 0.00%Sohgo Security Services Co., Ltd. 400 21,790 0.00%Izumi Co., Ltd. 600 21,725 0.00%Nippo Corp. 1,000 21,661 0.00%Bank of Kyoto Ltd. 500 21,624 0.00%Tokyo Century Corp. 400 21,532 0.00%Sanwa Holdings Corp. 1,900 21,487 0.00%Sapporo Holdings Ltd. 900 21,358 0.00%Yamaguchi Financial Group, Inc. 3,100 21,223 0.00%Denka Co., Ltd. 700 21,063 0.00%SHO-BOND Holdings Co., Ltd. 500 20,888 0.00%Cosmos Pharmaceutical Corp. 100 20,759 0.00%Mitsubishi Shokuhin Co., Ltd. 700 19,936 0.00%DIC Corp. 700 19,549 0.00%Seven Bank Ltd. 5,900 19,436 0.00%
Ain Holdings, Inc. 300 19,130 0.00%Nihon Unisys Ltd. 600 18,910 0.00%Persol Holdings Co., Ltd. 1,000 18,873 0.00%Oracle Corp. Japan 200 18,311 0.00%Nippon Yusen KK 1,000 18,229 0.00%Hachijuni Bank Ltd. 4,000 17,594 0.00%Bic Camera, Inc. 1,500 17,198 0.00%77 Bank Ltd. 1,000 16,858 0.00%Japan Petroleum Exploration Co., Ltd. 600 16,315 0.00%OKUMA Corp. 300 16,011 0.00%Aozora Bank Ltd. 598 15,908 0.00%NOK Corp. 800 12,080 0.00%Mabuchi Motor Co., Ltd. 300 11,456 0.00%Takashimaya Co., Ltd. 1,000 11,300 0.00%Medipal Holdings Corp. 500 11,102 0.00%Furukawa Electric Co., Ltd. 400 10,380 0.00%Sega Sammy Holdings, Inc. 700 10,196 0.00%TS Tech Co., Ltd. 300 9,455 0.00%Tadano Ltd. 1,000 9,211 0.00%Zeon Corp. 600 7,542 0.00%Nagase & Co., Ltd. 500 7,499 0.00%Kaneka Corp. 200 6,478 0.00%Itochu Techno-Solutions Corp. 200 5,659 0.00%Nifco, Inc. 200 5,521 0.00%Hirose Electric Co., Ltd. 42 5,422 0.00%Sugi Holdings Co., Ltd. 100 5,300 0.00%SUMCO Corp. 300 5,041 0.00%Park24 Co., Ltd. 200 4,912 0.00%PALTAC Corp. 100 4,822 0.00%Yokohama Rubber Co., Ltd. 200 3,922 0.00%Toyota Boshoku Corp. 200 3,248 0.00%Haseko Corp. 200 2,707 0.00%Kyushu Electric Power Co., Inc. 300 2,609 0.00%DMG Mori Co., Ltd. 100 1,555 0.00%Toyo Tire Corp. 100 1,449 0.00%
76,149,893 8.41%
Netherlands 1.31% (2018: 1.37%)
ASML Holding NV 7,758 2,296,393 0.25%Unilever NV 30,698 1,765,309 0.20%ING Groep NV 86,230 1,034,526 0.11%Koninklijke Philips NV 17,120 836,333 0.09%Heineken NV 7,005 746,367 0.08%Koninklijke Ahold Delhaize NV 25,829 646,400 0.07%Prosus NV 8,064 602,219 0.07%Unibail-Rodamco-Westfield REIT 3,472 548,158 0.06%Akzo Nobel NV 4,458 453,572 0.05%Koninklijke DSM NV 3,309 431,236 0.05%Heineken Holding NV 3,992 387,160 0.04%Wolters Kluwer NV 4,504 328,724 0.04%ArcelorMittal SA 15,589 273,714 0.03%NN Group NV 6,394 242,735 0.03%Adyen NV 258 211,701 0.02%ABN AMRO Bank NV GDR 9,597 174,732 0.02%Aegon NV 34,643 158,153 0.02%Galapagos NV 711 148,845 0.02%Koninklijke KPN NV 49,445 146,026 0.02%Koninklijke Vopak NV 1,847 100,201 0.01%Randstad NV 1,545 94,413 0.01%Boskalis Westminster 2,263 57,917 0.01%OCI NV 2,434 51,228 0.01%Signify NV 1,295 40,498 0.00%ASR Nederland NV 1,013 37,933 0.00%Aalberts NV 395 17,740 0.00%
11,832,233 1.31%
Number of Fair Value % of Total Shares US Dollars ($) Net Assets
Vanguard SRI Global Stock Fund
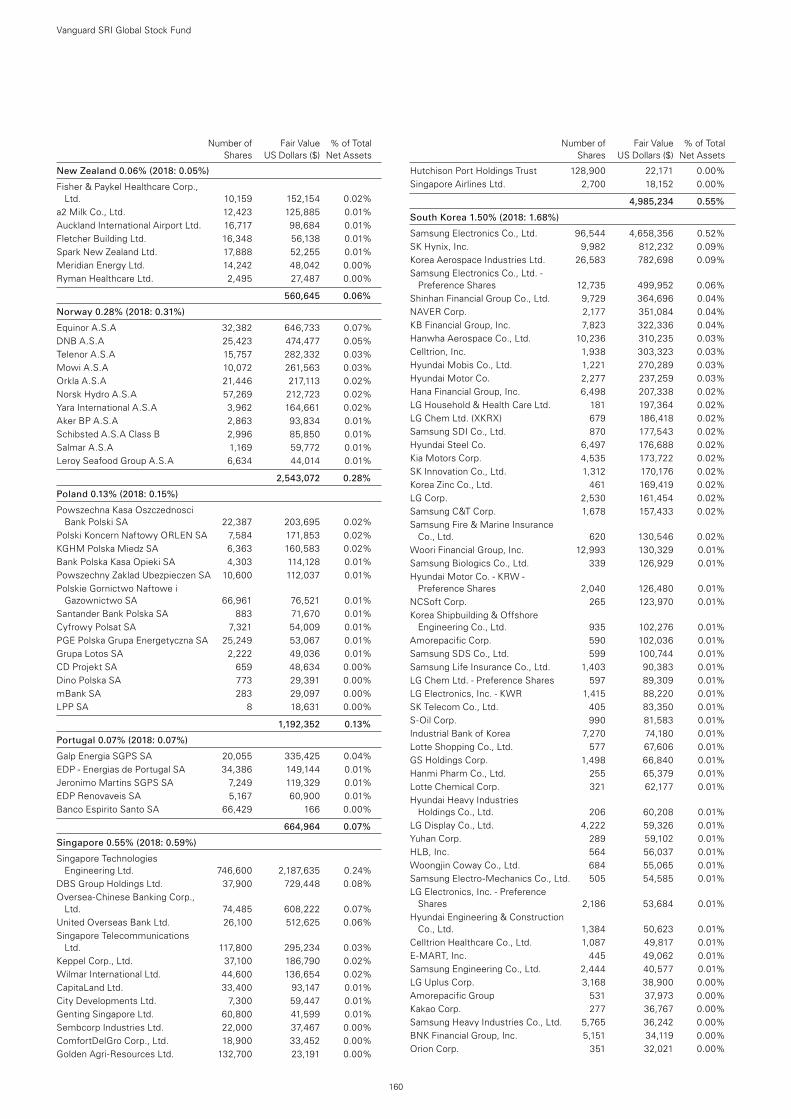
160
Number of Fair Value % of Total Shares US Dollars ($) Net Assets
New Zealand 0.06% (2018: 0.05%)
Fisher & Paykel Healthcare Corp., Ltd. 10,159 152,154 0.02%
a2 Milk Co., Ltd. 12,423 125,885 0.01%Auckland International Airport Ltd. 16,717 98,684 0.01%Fletcher Building Ltd. 16,348 56,138 0.01%Spark New Zealand Ltd. 17,888 52,255 0.01%Meridian Energy Ltd. 14,242 48,042 0.00%Ryman Healthcare Ltd. 2,495 27,487 0.00%
560,645 0.06%
Norway 0.28% (2018: 0.31%)
Equinor A.S.A 32,382 646,733 0.07%DNB A.S.A 25,423 474,477 0.05%Telenor A.S.A 15,757 282,332 0.03%Mowi A.S.A 10,072 261,563 0.03%Orkla A.S.A 21,446 217,113 0.02%Norsk Hydro A.S.A 57,269 212,723 0.02%Yara International A.S.A 3,962 164,661 0.02%Aker BP A.S.A 2,863 93,834 0.01%Schibsted A.S.A Class B 2,996 85,850 0.01%Salmar A.S.A 1,169 59,772 0.01%Leroy Seafood Group A.S.A 6,634 44,014 0.01%
2,543,072 0.28%
Poland 0.13% (2018: 0.15%)
Powszechna Kasa Oszczednosci Bank Polski SA 22,387 203,695 0.02%
Polski Koncern Naftowy ORLEN SA 7,584 171,853 0.02%KGHM Polska Miedz SA 6,363 160,583 0.02%Bank Polska Kasa Opieki SA 4,303 114,128 0.01%Powszechny Zaklad Ubezpieczen SA 10,600 112,037 0.01%Polskie Gornictwo Naftowe i
Gazownictwo SA 66,961 76,521 0.01%Santander Bank Polska SA 883 71,670 0.01%Cyfrowy Polsat SA 7,321 54,009 0.01%PGE Polska Grupa Energetyczna SA 25,249 53,067 0.01%Grupa Lotos SA 2,222 49,036 0.01%CD Projekt SA 659 48,634 0.00%Dino Polska SA 773 29,391 0.00%mBank SA 283 29,097 0.00%LPP SA 8 18,631 0.00%
1,192,352 0.13%
Portugal 0.07% (2018: 0.07%)
Galp Energia SGPS SA 20,055 335,425 0.04%EDP - Energias de Portugal SA 34,386 149,144 0.01%Jeronimo Martins SGPS SA 7,249 119,329 0.01%EDP Renovaveis SA 5,167 60,900 0.01%Banco Espirito Santo SA 66,429 166 0.00%
664,964 0.07%
Singapore 0.55% (2018: 0.59%)
Singapore Technologies Engineering Ltd. 746,600 2,187,635 0.24%
DBS Group Holdings Ltd. 37,900 729,448 0.08%Oversea-Chinese Banking Corp.,
Ltd. 74,485 608,222 0.07%United Overseas Bank Ltd. 26,100 512,625 0.06%Singapore Telecommunications
Ltd. 117,800 295,234 0.03%Keppel Corp., Ltd. 37,100 186,790 0.02%Wilmar International Ltd. 44,600 136,654 0.02%CapitaLand Ltd. 33,400 93,147 0.01%City Developments Ltd. 7,300 59,447 0.01%Genting Singapore Ltd. 60,800 41,599 0.01%Sembcorp Industries Ltd. 22,000 37,467 0.00%ComfortDelGro Corp., Ltd. 18,900 33,452 0.00%Golden Agri-Resources Ltd. 132,700 23,191 0.00%
Hutchison Port Holdings Trust 128,900 22,171 0.00%Singapore Airlines Ltd. 2,700 18,152 0.00%
4,985,234 0.55%
South Korea 1.50% (2018: 1.68%)
Samsung Electronics Co., Ltd. 96,544 4,658,356 0.52%SK Hynix, Inc. 9,982 812,232 0.09%Korea Aerospace Industries Ltd. 26,583 782,698 0.09%Samsung Electronics Co., Ltd. -
Preference Shares 12,735 499,952 0.06%Shinhan Financial Group Co., Ltd. 9,729 364,696 0.04%NAVER Corp. 2,177 351,084 0.04%KB Financial Group, Inc. 7,823 322,336 0.04%Hanwha Aerospace Co., Ltd. 10,236 310,235 0.03%Celltrion, Inc. 1,938 303,323 0.03%Hyundai Mobis Co., Ltd. 1,221 270,289 0.03%Hyundai Motor Co. 2,277 237,259 0.03%Hana Financial Group, Inc. 6,498 207,338 0.02%LG Household & Health Care Ltd. 181 197,364 0.02%LG Chem Ltd. (XKRX) 679 186,418 0.02%Samsung SDI Co., Ltd. 870 177,543 0.02%Hyundai Steel Co. 6,497 176,688 0.02%Kia Motors Corp. 4,535 173,722 0.02%SK Innovation Co., Ltd. 1,312 170,176 0.02%Korea Zinc Co., Ltd. 461 169,419 0.02%LG Corp. 2,530 161,454 0.02%Samsung C&T Corp. 1,678 157,433 0.02%Samsung Fire & Marine Insurance
Co., Ltd. 620 130,546 0.02%Woori Financial Group, Inc. 12,993 130,329 0.01%Samsung Biologics Co., Ltd. 339 126,929 0.01%Hyundai Motor Co. - KRW -
Preference Shares 2,040 126,480 0.01%NCSoft Corp. 265 123,970 0.01%Korea Shipbuilding & Offshore
Engineering Co., Ltd. 935 102,276 0.01%Amorepacific Corp. 590 102,036 0.01%Samsung SDS Co., Ltd. 599 100,744 0.01%Samsung Life Insurance Co., Ltd. 1,403 90,383 0.01%LG Chem Ltd. - Preference Shares 597 89,309 0.01%LG Electronics, Inc. - KWR 1,415 88,220 0.01%SK Telecom Co., Ltd. 405 83,350 0.01%S-Oil Corp. 990 81,583 0.01%Industrial Bank of Korea 7,270 74,180 0.01%Lotte Shopping Co., Ltd. 577 67,606 0.01%GS Holdings Corp. 1,498 66,840 0.01%Hanmi Pharm Co., Ltd. 255 65,379 0.01%Lotte Chemical Corp. 321 62,177 0.01%Hyundai Heavy Industries
Holdings Co., Ltd. 206 60,208 0.01%LG Display Co., Ltd. 4,222 59,326 0.01%Yuhan Corp. 289 59,102 0.01%HLB, Inc. 564 56,037 0.01%Woongjin Coway Co., Ltd. 684 55,065 0.01%Samsung Electro-Mechanics Co., Ltd. 505 54,585 0.01%LG Electronics, Inc. - Preference
Shares 2,186 53,684 0.01%Hyundai Engineering & Construction
Co., Ltd. 1,384 50,623 0.01%Celltrion Healthcare Co., Ltd. 1,087 49,817 0.01%E-MART, Inc. 445 49,062 0.01%Samsung Engineering Co., Ltd. 2,444 40,577 0.01%LG Uplus Corp. 3,168 38,900 0.00%Amorepacific Group 531 37,973 0.00%Kakao Corp. 277 36,767 0.00%Samsung Heavy Industries Co., Ltd. 5,765 36,242 0.00%BNK Financial Group, Inc. 5,151 34,119 0.00%Orion Corp. 351 32,021 0.00%
Number of Fair Value % of Total Shares US Dollars ($) Net Assets
Vanguard SRI Global Stock Fund
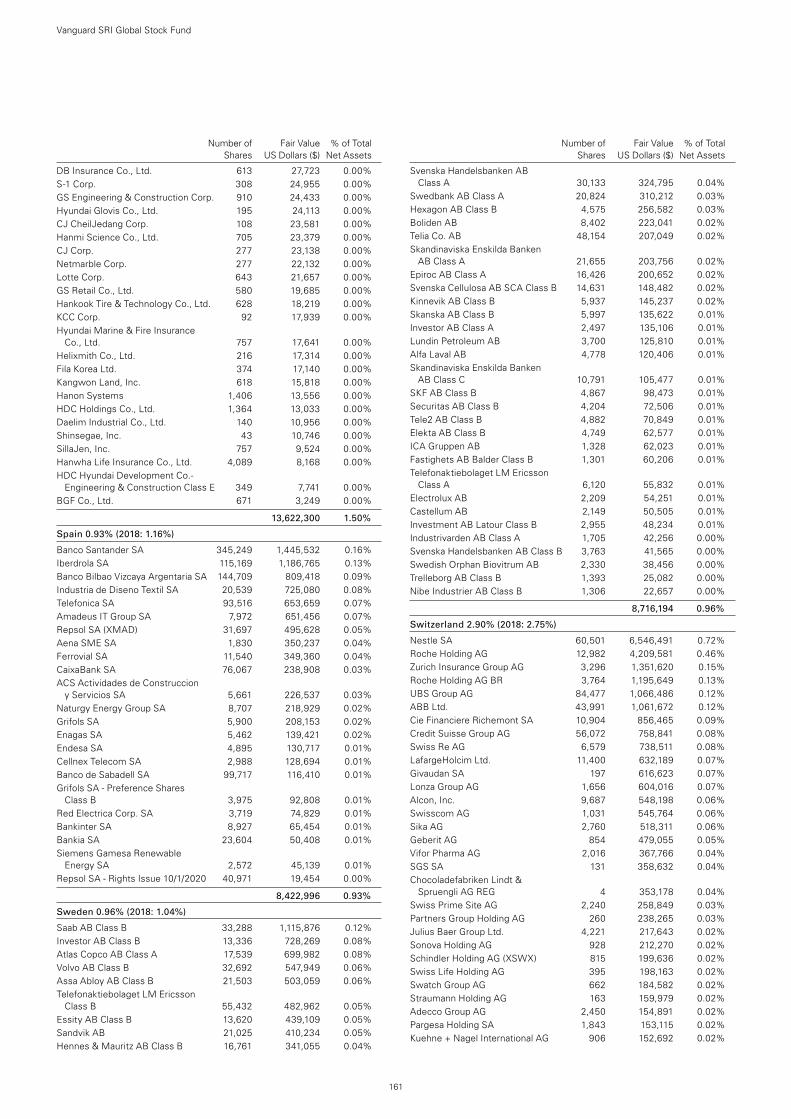
161
Number of Fair Value % of Total Shares US Dollars ($) Net Assets
DB Insurance Co., Ltd. 613 27,723 0.00%S-1 Corp. 308 24,955 0.00%GS Engineering & Construction Corp. 910 24,433 0.00%Hyundai Glovis Co., Ltd. 195 24,113 0.00%CJ CheilJedang Corp. 108 23,581 0.00%Hanmi Science Co., Ltd. 705 23,379 0.00%CJ Corp. 277 23,138 0.00%Netmarble Corp. 277 22,132 0.00%Lotte Corp. 643 21,657 0.00%GS Retail Co., Ltd. 580 19,685 0.00%Hankook Tire & Technology Co., Ltd. 628 18,219 0.00%KCC Corp. 92 17,939 0.00%Hyundai Marine & Fire Insurance
Co., Ltd. 757 17,641 0.00%Helixmith Co., Ltd. 216 17,314 0.00%Fila Korea Ltd. 374 17,140 0.00%Kangwon Land, Inc. 618 15,818 0.00%Hanon Systems 1,406 13,556 0.00%HDC Holdings Co., Ltd. 1,364 13,033 0.00%Daelim Industrial Co., Ltd. 140 10,956 0.00%Shinsegae, Inc. 43 10,746 0.00%SillaJen, Inc. 757 9,524 0.00%Hanwha Life Insurance Co., Ltd. 4,089 8,168 0.00%HDC Hyundai Development Co.-
Engineering & Construction Class E 349 7,741 0.00%BGF Co., Ltd. 671 3,249 0.00%
13,622,300 1.50%
Spain 0.93% (2018: 1.16%)
Banco Santander SA 345,249 1,445,532 0.16%Iberdrola SA 115,169 1,186,765 0.13%Banco Bilbao Vizcaya Argentaria SA 144,709 809,418 0.09%Industria de Diseno Textil SA 20,539 725,080 0.08%Telefonica SA 93,516 653,659 0.07%Amadeus IT Group SA 7,972 651,456 0.07%Repsol SA (XMAD) 31,697 495,628 0.05%Aena SME SA 1,830 350,237 0.04%Ferrovial SA 11,540 349,360 0.04%CaixaBank SA 76,067 238,908 0.03%ACS Actividades de Construccion
y Servicios SA 5,661 226,537 0.03%Naturgy Energy Group SA 8,707 218,929 0.02%Grifols SA 5,900 208,153 0.02%Enagas SA 5,462 139,421 0.02%Endesa SA 4,895 130,717 0.01%Cellnex Telecom SA 2,988 128,694 0.01%Banco de Sabadell SA 99,717 116,410 0.01%Grifols SA - Preference Shares
Class B 3,975 92,808 0.01%Red Electrica Corp. SA 3,719 74,829 0.01%Bankinter SA 8,927 65,454 0.01%Bankia SA 23,604 50,408 0.01%Siemens Gamesa Renewable
Energy SA 2,572 45,139 0.01%Repsol SA - Rights Issue 10/1/2020 40,971 19,454 0.00%
8,422,996 0.93%
Sweden 0.96% (2018: 1.04%)
Saab AB Class B 33,288 1,115,876 0.12%Investor AB Class B 13,336 728,269 0.08%Atlas Copco AB Class A 17,539 699,982 0.08%Volvo AB Class B 32,692 547,949 0.06%Assa Abloy AB Class B 21,503 503,059 0.06%Telefonaktiebolaget LM Ericsson
Class B 55,432 482,962 0.05%Essity AB Class B 13,620 439,109 0.05%Sandvik AB 21,025 410,234 0.05%Hennes & Mauritz AB Class B 16,761 341,055 0.04%
Svenska Handelsbanken AB Class A 30,133 324,795 0.04%
Swedbank AB Class A 20,824 310,212 0.03%Hexagon AB Class B 4,575 256,582 0.03%Boliden AB 8,402 223,041 0.02%Telia Co. AB 48,154 207,049 0.02%Skandinaviska Enskilda Banken
AB Class A 21,655 203,756 0.02%Epiroc AB Class A 16,426 200,652 0.02%Svenska Cellulosa AB SCA Class B 14,631 148,482 0.02%Kinnevik AB Class B 5,937 145,237 0.02%Skanska AB Class B 5,997 135,622 0.01%Investor AB Class A 2,497 135,106 0.01%Lundin Petroleum AB 3,700 125,810 0.01%Alfa Laval AB 4,778 120,406 0.01%Skandinaviska Enskilda Banken
AB Class C 10,791 105,477 0.01%SKF AB Class B 4,867 98,473 0.01%Securitas AB Class B 4,204 72,506 0.01%Tele2 AB Class B 4,882 70,849 0.01%Elekta AB Class B 4,749 62,577 0.01%ICA Gruppen AB 1,328 62,023 0.01%Fastighets AB Balder Class B 1,301 60,206 0.01%Telefonaktiebolaget LM Ericsson
Class A 6,120 55,832 0.01%Electrolux AB 2,209 54,251 0.01%Castellum AB 2,149 50,505 0.01%Investment AB Latour Class B 2,955 48,234 0.01%Industrivarden AB Class A 1,705 42,256 0.00%Svenska Handelsbanken AB Class B 3,763 41,565 0.00%Swedish Orphan Biovitrum AB 2,330 38,456 0.00%Trelleborg AB Class B 1,393 25,082 0.00%Nibe Industrier AB Class B 1,306 22,657 0.00%
8,716,194 0.96%
Switzerland 2.90% (2018: 2.75%)
Nestle SA 60,501 6,546,491 0.72%Roche Holding AG 12,982 4,209,581 0.46%Zurich Insurance Group AG 3,296 1,351,620 0.15%Roche Holding AG BR 3,764 1,195,649 0.13%UBS Group AG 84,477 1,066,486 0.12%ABB Ltd. 43,991 1,061,672 0.12%Cie Financiere Richemont SA 10,904 856,465 0.09%Credit Suisse Group AG 56,072 758,841 0.08%Swiss Re AG 6,579 738,511 0.08%LafargeHolcim Ltd. 11,400 632,189 0.07%Givaudan SA 197 616,623 0.07%Lonza Group AG 1,656 604,016 0.07%Alcon, Inc. 9,687 548,198 0.06%Swisscom AG 1,031 545,764 0.06%Sika AG 2,760 518,311 0.06%Geberit AG 854 479,055 0.05%Vifor Pharma AG 2,016 367,766 0.04%SGS SA 131 358,632 0.04%Chocoladefabriken Lindt &
Spruengli AG REG 4 353,178 0.04%Swiss Prime Site AG 2,240 258,849 0.03%Partners Group Holding AG 260 238,265 0.03%Julius Baer Group Ltd. 4,221 217,643 0.02%Sonova Holding AG 928 212,270 0.02%Schindler Holding AG (XSWX) 815 199,636 0.02%Swiss Life Holding AG 395 198,163 0.02%Swatch Group AG 662 184,582 0.02%Straumann Holding AG 163 159,979 0.02%Adecco Group AG 2,450 154,891 0.02%Pargesa Holding SA 1,843 153,115 0.02%Kuehne + Nagel International AG 906 152,692 0.02%
Number of Fair Value % of Total Shares US Dollars ($) Net Assets
Vanguard SRI Global Stock Fund
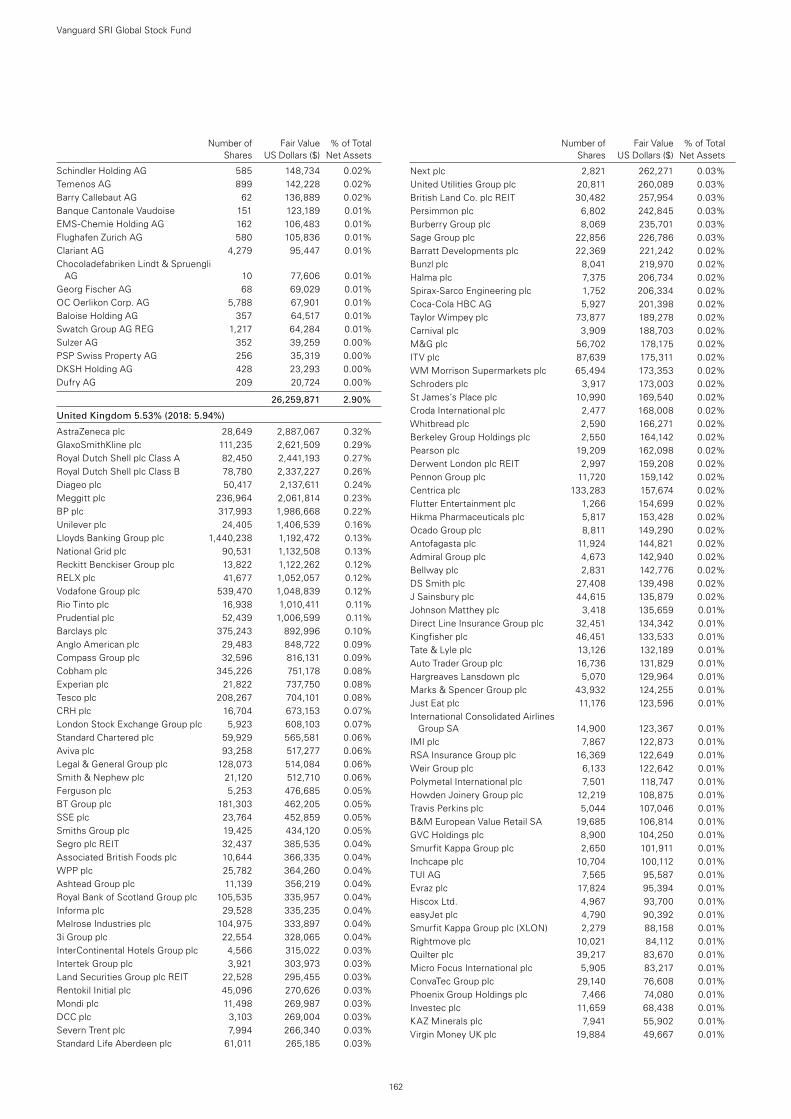
162
Number of Fair Value % of Total Shares US Dollars ($) Net Assets
Schindler Holding AG 585 148,734 0.02%Temenos AG 899 142,228 0.02%Barry Callebaut AG 62 136,889 0.02%Banque Cantonale Vaudoise 151 123,189 0.01%EMS-Chemie Holding AG 162 106,483 0.01%Flughafen Zurich AG 580 105,836 0.01%Clariant AG 4,279 95,447 0.01%Chocoladefabriken Lindt & Spruengli
AG 10 77,606 0.01%Georg Fischer AG 68 69,029 0.01%OC Oerlikon Corp. AG 5,788 67,901 0.01%Baloise Holding AG 357 64,517 0.01%Swatch Group AG REG 1,217 64,284 0.01%Sulzer AG 352 39,259 0.00%PSP Swiss Property AG 256 35,319 0.00%DKSH Holding AG 428 23,293 0.00%Dufry AG 209 20,724 0.00%
26,259,871 2.90%
United Kingdom 5.53% (2018: 5.94%)
AstraZeneca plc 28,649 2,887,067 0.32%GlaxoSmithKline plc 111,235 2,621,509 0.29%Royal Dutch Shell plc Class A 82,450 2,441,193 0.27%Royal Dutch Shell plc Class B 78,780 2,337,227 0.26%Diageo plc 50,417 2,137,611 0.24%Meggitt plc 236,964 2,061,814 0.23%BP plc 317,993 1,986,668 0.22%Unilever plc 24,405 1,406,539 0.16%Lloyds Banking Group plc 1,440,238 1,192,472 0.13%National Grid plc 90,531 1,132,508 0.13%Reckitt Benckiser Group plc 13,822 1,122,262 0.12%RELX plc 41,677 1,052,057 0.12%Vodafone Group plc 539,470 1,048,839 0.12%Rio Tinto plc 16,938 1,010,411 0.11%Prudential plc 52,439 1,006,599 0.11%Barclays plc 375,243 892,996 0.10%Anglo American plc 29,483 848,722 0.09%Compass Group plc 32,596 816,131 0.09%Cobham plc 345,226 751,178 0.08%Experian plc 21,822 737,750 0.08%Tesco plc 208,267 704,101 0.08%CRH plc 16,704 673,153 0.07%London Stock Exchange Group plc 5,923 608,103 0.07%Standard Chartered plc 59,929 565,581 0.06%Aviva plc 93,258 517,277 0.06%Legal & General Group plc 128,073 514,084 0.06%Smith & Nephew plc 21,120 512,710 0.06%Ferguson plc 5,253 476,685 0.05%BT Group plc 181,303 462,205 0.05%SSE plc 23,764 452,859 0.05%Smiths Group plc 19,425 434,120 0.05%Segro plc REIT 32,437 385,535 0.04%Associated British Foods plc 10,644 366,335 0.04%WPP plc 25,782 364,260 0.04%Ashtead Group plc 11,139 356,219 0.04%Royal Bank of Scotland Group plc 105,535 335,957 0.04%Informa plc 29,528 335,235 0.04%Melrose Industries plc 104,975 333,897 0.04%3i Group plc 22,554 328,065 0.04%InterContinental Hotels Group plc 4,566 315,022 0.03%Intertek Group plc 3,921 303,973 0.03%Land Securities Group plc REIT 22,528 295,455 0.03%Rentokil Initial plc 45,096 270,626 0.03%Mondi plc 11,498 269,987 0.03%DCC plc 3,103 269,004 0.03%Severn Trent plc 7,994 266,340 0.03%Standard Life Aberdeen plc 61,011 265,185 0.03%
Next plc 2,821 262,271 0.03%United Utilities Group plc 20,811 260,089 0.03%British Land Co. plc REIT 30,482 257,954 0.03%Persimmon plc 6,802 242,845 0.03%Burberry Group plc 8,069 235,701 0.03%Sage Group plc 22,856 226,786 0.03%Barratt Developments plc 22,369 221,242 0.02%Bunzl plc 8,041 219,970 0.02%Halma plc 7,375 206,734 0.02%Spirax-Sarco Engineering plc 1,752 206,334 0.02%Coca-Cola HBC AG 5,927 201,398 0.02%Taylor Wimpey plc 73,877 189,278 0.02%Carnival plc 3,909 188,703 0.02%M&G plc 56,702 178,175 0.02%ITV plc 87,639 175,311 0.02%WM Morrison Supermarkets plc 65,494 173,353 0.02%Schroders plc 3,917 173,003 0.02%St James’s Place plc 10,990 169,540 0.02%Croda International plc 2,477 168,008 0.02%Whitbread plc 2,590 166,271 0.02%Berkeley Group Holdings plc 2,550 164,142 0.02%Pearson plc 19,209 162,098 0.02%Derwent London plc REIT 2,997 159,208 0.02%Pennon Group plc 11,720 159,142 0.02%Centrica plc 133,283 157,674 0.02%Flutter Entertainment plc 1,266 154,699 0.02%Hikma Pharmaceuticals plc 5,817 153,428 0.02%Ocado Group plc 8,811 149,290 0.02%Antofagasta plc 11,924 144,821 0.02%Admiral Group plc 4,673 142,940 0.02%Bellway plc 2,831 142,776 0.02%DS Smith plc 27,408 139,498 0.02%J Sainsbury plc 44,615 135,879 0.02%Johnson Matthey plc 3,418 135,659 0.01%Direct Line Insurance Group plc 32,451 134,342 0.01%Kingfisher plc 46,451 133,533 0.01%Tate & Lyle plc 13,126 132,189 0.01%Auto Trader Group plc 16,736 131,829 0.01%Hargreaves Lansdown plc 5,070 129,964 0.01%Marks & Spencer Group plc 43,932 124,255 0.01%Just Eat plc 11,176 123,596 0.01%International Consolidated Airlines
Group SA 14,900 123,367 0.01%IMI plc 7,867 122,873 0.01%RSA Insurance Group plc 16,369 122,649 0.01%Weir Group plc 6,133 122,642 0.01%Polymetal International plc 7,501 118,747 0.01%Howden Joinery Group plc 12,219 108,875 0.01%Travis Perkins plc 5,044 107,046 0.01%B&M European Value Retail SA 19,685 106,814 0.01%GVC Holdings plc 8,900 104,250 0.01%Smurfit Kappa Group plc 2,650 101,911 0.01%Inchcape plc 10,704 100,112 0.01%TUI AG 7,565 95,587 0.01%Evraz plc 17,824 95,394 0.01%Hiscox Ltd. 4,967 93,700 0.01%easyJet plc 4,790 90,392 0.01%Smurfit Kappa Group plc (XLON) 2,279 88,158 0.01%Rightmove plc 10,021 84,112 0.01%Quilter plc 39,217 83,670 0.01%Micro Focus International plc 5,905 83,217 0.01%ConvaTec Group plc 29,140 76,608 0.01%Phoenix Group Holdings plc 7,466 74,080 0.01%Investec plc 11,659 68,438 0.01%KAZ Minerals plc 7,941 55,902 0.01%Virgin Money UK plc 19,884 49,667 0.01%
Number of Fair Value % of Total Shares US Dollars ($) Net Assets
Vanguard SRI Global Stock Fund
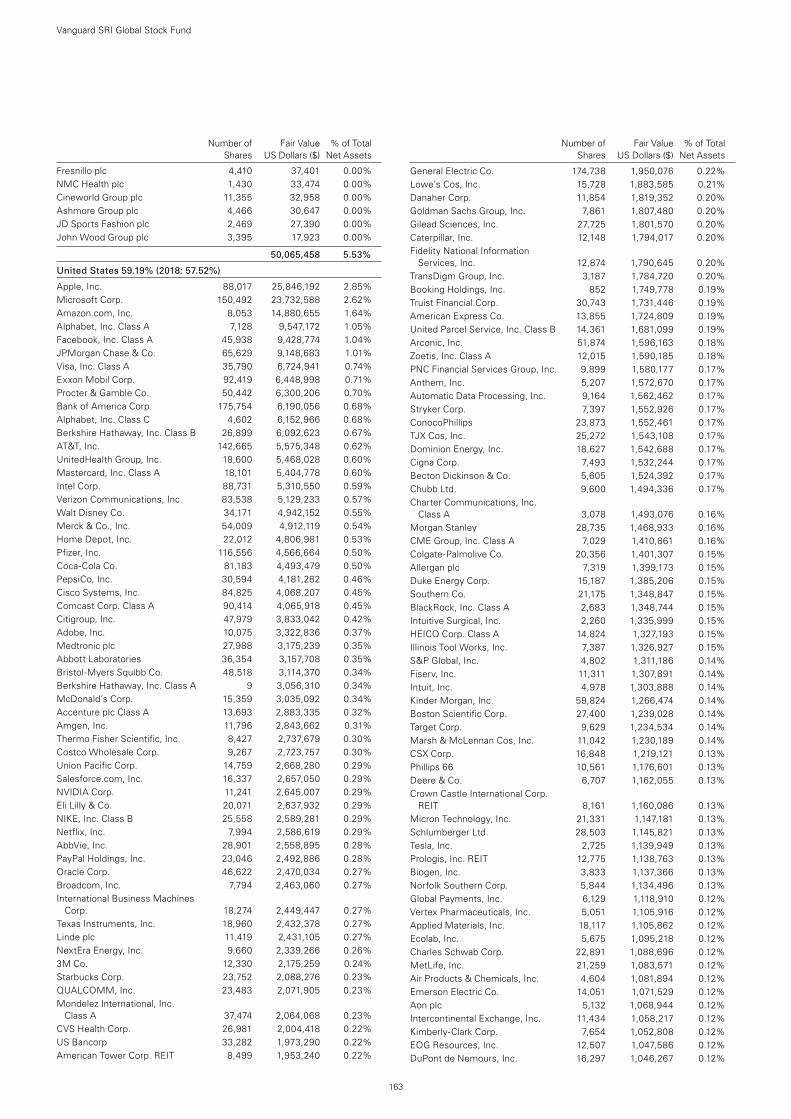
163
Number of Fair Value % of Total Shares US Dollars ($) Net Assets
Fresnillo plc 4,410 37,401 0.00%NMC Health plc 1,430 33,474 0.00%Cineworld Group plc 11,355 32,958 0.00%Ashmore Group plc 4,466 30,647 0.00%JD Sports Fashion plc 2,469 27,390 0.00%John Wood Group plc 3,395 17,923 0.00%
50,065,458 5.53%
United States 59.19% (2018: 57.52%)
Apple, Inc. 88,017 25,846,192 2.85%Microsoft Corp. 150,492 23,732,588 2.62%Amazon.com, Inc. 8,053 14,880,655 1.64%Alphabet, Inc. Class A 7,128 9,547,172 1.05%Facebook, Inc. Class A 45,938 9,428,774 1.04%JPMorgan Chase & Co. 65,629 9,148,683 1.01%Visa, Inc. Class A 35,790 6,724,941 0.74%Exxon Mobil Corp. 92,419 6,448,998 0.71%Procter & Gamble Co. 50,442 6,300,206 0.70%Bank of America Corp. 175,754 6,190,056 0.68%Alphabet, Inc. Class C 4,602 6,152,966 0.68%Berkshire Hathaway, Inc. Class B 26,899 6,092,623 0.67%AT&T, Inc. 142,665 5,575,348 0.62%UnitedHealth Group, Inc. 18,600 5,468,028 0.60%Mastercard, Inc. Class A 18,101 5,404,778 0.60%Intel Corp. 88,731 5,310,550 0.59%Verizon Communications, Inc. 83,538 5,129,233 0.57%Walt Disney Co. 34,171 4,942,152 0.55%Merck & Co., Inc. 54,009 4,912,119 0.54%Home Depot, Inc. 22,012 4,806,981 0.53%Pfizer, Inc. 116,556 4,566,664 0.50%Coca-Cola Co. 81,183 4,493,479 0.50%PepsiCo, Inc. 30,594 4,181,282 0.46%Cisco Systems, Inc. 84,825 4,068,207 0.45%Comcast Corp. Class A 90,414 4,065,918 0.45%Citigroup, Inc. 47,979 3,833,042 0.42%Adobe, Inc. 10,075 3,322,836 0.37%Medtronic plc 27,988 3,175,239 0.35%Abbott Laboratories 36,354 3,157,708 0.35%Bristol-Myers Squibb Co. 48,518 3,114,370 0.34%Berkshire Hathaway, Inc. Class A 9 3,056,310 0.34%McDonald’s Corp. 15,359 3,035,092 0.34%Accenture plc Class A 13,693 2,883,335 0.32%Amgen, Inc. 11,796 2,843,662 0.31%Thermo Fisher Scientific, Inc. 8,427 2,737,679 0.30%Costco Wholesale Corp. 9,267 2,723,757 0.30%Union Pacific Corp. 14,759 2,668,280 0.29%Salesforce.com, Inc. 16,337 2,657,050 0.29%NVIDIA Corp. 11,241 2,645,007 0.29%Eli Lilly & Co. 20,071 2,637,932 0.29%NIKE, Inc. Class B 25,558 2,589,281 0.29%Netflix, Inc. 7,994 2,586,619 0.29%AbbVie, Inc. 28,901 2,558,895 0.28%PayPal Holdings, Inc. 23,046 2,492,886 0.28%Oracle Corp. 46,622 2,470,034 0.27%Broadcom, Inc. 7,794 2,463,060 0.27%International Business Machines
Corp. 18,274 2,449,447 0.27%Texas Instruments, Inc. 18,960 2,432,378 0.27%Linde plc 11,419 2,431,105 0.27%NextEra Energy, Inc. 9,660 2,339,266 0.26%3M Co. 12,330 2,175,259 0.24%Starbucks Corp. 23,752 2,088,276 0.23%QUALCOMM, Inc. 23,483 2,071,905 0.23%Mondelez International, Inc.
Class A 37,474 2,064,068 0.23%CVS Health Corp. 26,981 2,004,418 0.22%US Bancorp 33,282 1,973,290 0.22%American Tower Corp. REIT 8,499 1,953,240 0.22%
General Electric Co. 174,738 1,950,076 0.22%Lowe’s Cos, Inc. 15,728 1,883,585 0.21%Danaher Corp. 11,854 1,819,352 0.20%Goldman Sachs Group, Inc. 7,861 1,807,480 0.20%Gilead Sciences, Inc. 27,725 1,801,570 0.20%Caterpillar, Inc. 12,148 1,794,017 0.20%Fidelity National Information
Services, Inc. 12,874 1,790,645 0.20%TransDigm Group, Inc. 3,187 1,784,720 0.20%Booking Holdings, Inc. 852 1,749,778 0.19%Truist Financial Corp. 30,743 1,731,446 0.19%American Express Co. 13,855 1,724,809 0.19%United Parcel Service, Inc. Class B 14,361 1,681,099 0.19%Arconic, Inc. 51,874 1,596,163 0.18%Zoetis, Inc. Class A 12,015 1,590,185 0.18%PNC Financial Services Group, Inc. 9,899 1,580,177 0.17%Anthem, Inc. 5,207 1,572,670 0.17%Automatic Data Processing, Inc. 9,164 1,562,462 0.17%Stryker Corp. 7,397 1,552,926 0.17%ConocoPhillips 23,873 1,552,461 0.17%TJX Cos, Inc. 25,272 1,543,108 0.17%Dominion Energy, Inc. 18,627 1,542,688 0.17%Cigna Corp. 7,493 1,532,244 0.17%Becton Dickinson & Co. 5,605 1,524,392 0.17%Chubb Ltd. 9,600 1,494,336 0.17%Charter Communications, Inc.
Class A 3,078 1,493,076 0.16%Morgan Stanley 28,735 1,468,933 0.16%CME Group, Inc. Class A 7,029 1,410,861 0.16%Colgate-Palmolive Co. 20,356 1,401,307 0.15%Allergan plc 7,319 1,399,173 0.15%Duke Energy Corp. 15,187 1,385,206 0.15%Southern Co. 21,175 1,348,847 0.15%BlackRock, Inc. Class A 2,683 1,348,744 0.15%Intuitive Surgical, Inc. 2,260 1,335,999 0.15%HEICO Corp. Class A 14,824 1,327,193 0.15%Illinois Tool Works, Inc. 7,387 1,326,927 0.15%S&P Global, Inc. 4,802 1,311,186 0.14%Fiserv, Inc. 11,311 1,307,891 0.14%Intuit, Inc. 4,978 1,303,888 0.14%Kinder Morgan, Inc. 59,824 1,266,474 0.14%Boston Scientific Corp. 27,400 1,239,028 0.14%Target Corp. 9,629 1,234,534 0.14%Marsh & McLennan Cos, Inc. 11,042 1,230,189 0.14%CSX Corp. 16,848 1,219,121 0.13%Phillips 66 10,561 1,176,601 0.13%Deere & Co. 6,707 1,162,055 0.13%Crown Castle International Corp.
REIT 8,161 1,160,086 0.13%Micron Technology, Inc. 21,331 1,147,181 0.13%Schlumberger Ltd. 28,503 1,145,821 0.13%Tesla, Inc. 2,725 1,139,949 0.13%Prologis, Inc. REIT 12,775 1,138,763 0.13%Biogen, Inc. 3,833 1,137,366 0.13%Norfolk Southern Corp. 5,844 1,134,496 0.13%Global Payments, Inc. 6,129 1,118,910 0.12%Vertex Pharmaceuticals, Inc. 5,051 1,105,916 0.12%Applied Materials, Inc. 18,117 1,105,862 0.12%Ecolab, Inc. 5,675 1,095,218 0.12%Charles Schwab Corp. 22,891 1,088,696 0.12%MetLife, Inc. 21,259 1,083,571 0.12%Air Products & Chemicals, Inc. 4,604 1,081,894 0.12%Emerson Electric Co. 14,051 1,071,529 0.12%Aon plc 5,132 1,068,944 0.12%Intercontinental Exchange, Inc. 11,434 1,058,217 0.12%Kimberly-Clark Corp. 7,654 1,052,808 0.12%EOG Resources, Inc. 12,507 1,047,586 0.12%DuPont de Nemours, Inc. 16,297 1,046,267 0.12%
Number of Fair Value % of Total Shares US Dollars ($) Net Assets
Vanguard SRI Global Stock Fund
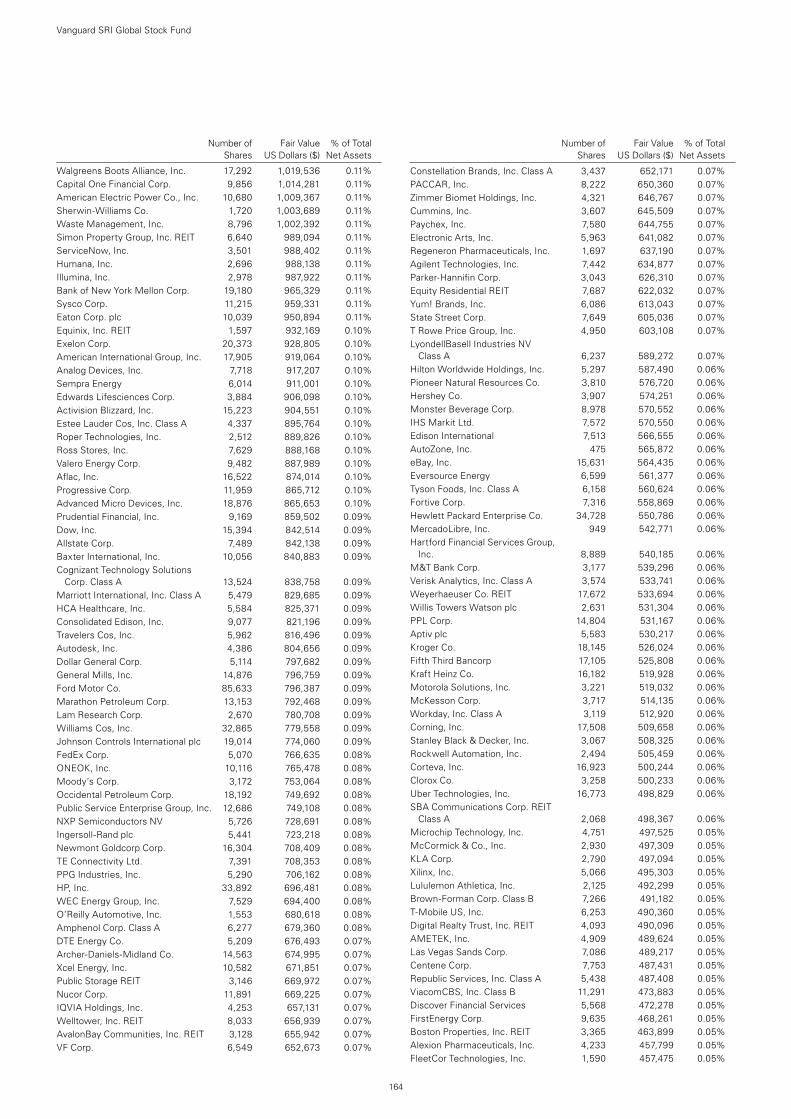
164
Number of Fair Value % of Total Shares US Dollars ($) Net Assets
Walgreens Boots Alliance, Inc. 17,292 1,019,536 0.11%Capital One Financial Corp. 9,856 1,014,281 0.11%American Electric Power Co., Inc. 10,680 1,009,367 0.11%Sherwin-Williams Co. 1,720 1,003,689 0.11%Waste Management, Inc. 8,796 1,002,392 0.11%Simon Property Group, Inc. REIT 6,640 989,094 0.11%ServiceNow, Inc. 3,501 988,402 0.11%Humana, Inc. 2,696 988,138 0.11%Illumina, Inc. 2,978 987,922 0.11%Bank of New York Mellon Corp. 19,180 965,329 0.11%Sysco Corp. 11,215 959,331 0.11%Eaton Corp. plc 10,039 950,894 0.11%Equinix, Inc. REIT 1,597 932,169 0.10%Exelon Corp. 20,373 928,805 0.10%American International Group, Inc. 17,905 919,064 0.10%Analog Devices, Inc. 7,718 917,207 0.10%Sempra Energy 6,014 911,001 0.10%Edwards Lifesciences Corp. 3,884 906,098 0.10%Activision Blizzard, Inc. 15,223 904,551 0.10%Estee Lauder Cos, Inc. Class A 4,337 895,764 0.10%Roper Technologies, Inc. 2,512 889,826 0.10%Ross Stores, Inc. 7,629 888,168 0.10%Valero Energy Corp. 9,482 887,989 0.10%Aflac, Inc. 16,522 874,014 0.10%Progressive Corp. 11,959 865,712 0.10%Advanced Micro Devices, Inc. 18,876 865,653 0.10%Prudential Financial, Inc. 9,169 859,502 0.09%Dow, Inc. 15,394 842,514 0.09%Allstate Corp. 7,489 842,138 0.09%Baxter International, Inc. 10,056 840,883 0.09%Cognizant Technology Solutions
Corp. Class A 13,524 838,758 0.09%Marriott International, Inc. Class A 5,479 829,685 0.09%HCA Healthcare, Inc. 5,584 825,371 0.09%Consolidated Edison, Inc. 9,077 821,196 0.09%Travelers Cos, Inc. 5,962 816,496 0.09%Autodesk, Inc. 4,386 804,656 0.09%Dollar General Corp. 5,114 797,682 0.09%General Mills, Inc. 14,876 796,759 0.09%Ford Motor Co. 85,633 796,387 0.09%Marathon Petroleum Corp. 13,153 792,468 0.09%Lam Research Corp. 2,670 780,708 0.09%Williams Cos, Inc. 32,865 779,558 0.09%Johnson Controls International plc 19,014 774,060 0.09%FedEx Corp. 5,070 766,635 0.08%ONEOK, Inc. 10,116 765,478 0.08%Moody’s Corp. 3,172 753,064 0.08%Occidental Petroleum Corp. 18,192 749,692 0.08%Public Service Enterprise Group, Inc. 12,686 749,108 0.08%NXP Semiconductors NV 5,726 728,691 0.08%Ingersoll-Rand plc 5,441 723,218 0.08%Newmont Goldcorp Corp. 16,304 708,409 0.08%TE Connectivity Ltd. 7,391 708,353 0.08%PPG Industries, Inc. 5,290 706,162 0.08%HP, Inc. 33,892 696,481 0.08%WEC Energy Group, Inc. 7,529 694,400 0.08%O’Reilly Automotive, Inc. 1,553 680,618 0.08%Amphenol Corp. Class A 6,277 679,360 0.08%DTE Energy Co. 5,209 676,493 0.07%Archer-Daniels-Midland Co. 14,563 674,995 0.07%Xcel Energy, Inc. 10,582 671,851 0.07%Public Storage REIT 3,146 669,972 0.07%Nucor Corp. 11,891 669,225 0.07%IQVIA Holdings, Inc. 4,253 657,131 0.07%Welltower, Inc. REIT 8,033 656,939 0.07%AvalonBay Communities, Inc. REIT 3,128 655,942 0.07%VF Corp. 6,549 652,673 0.07%
Constellation Brands, Inc. Class A 3,437 652,171 0.07%PACCAR, Inc. 8,222 650,360 0.07%Zimmer Biomet Holdings, Inc. 4,321 646,767 0.07%Cummins, Inc. 3,607 645,509 0.07%Paychex, Inc. 7,580 644,755 0.07%Electronic Arts, Inc. 5,963 641,082 0.07%Regeneron Pharmaceuticals, Inc. 1,697 637,190 0.07%Agilent Technologies, Inc. 7,442 634,877 0.07%Parker-Hannifin Corp. 3,043 626,310 0.07%Equity Residential REIT 7,687 622,032 0.07%Yum! Brands, Inc. 6,086 613,043 0.07%State Street Corp. 7,649 605,036 0.07%T Rowe Price Group, Inc. 4,950 603,108 0.07%LyondellBasell Industries NV
Class A 6,237 589,272 0.07%Hilton Worldwide Holdings, Inc. 5,297 587,490 0.06%Pioneer Natural Resources Co. 3,810 576,720 0.06%Hershey Co. 3,907 574,251 0.06%Monster Beverage Corp. 8,978 570,552 0.06%IHS Markit Ltd. 7,572 570,550 0.06%Edison International 7,513 566,555 0.06%AutoZone, Inc. 475 565,872 0.06%eBay, Inc. 15,631 564,435 0.06%Eversource Energy 6,599 561,377 0.06%Tyson Foods, Inc. Class A 6,158 560,624 0.06%Fortive Corp. 7,316 558,869 0.06%Hewlett Packard Enterprise Co. 34,728 550,786 0.06%MercadoLibre, Inc. 949 542,771 0.06%Hartford Financial Services Group,
Inc. 8,889 540,185 0.06%M&T Bank Corp. 3,177 539,296 0.06%Verisk Analytics, Inc. Class A 3,574 533,741 0.06%Weyerhaeuser Co. REIT 17,672 533,694 0.06%Willis Towers Watson plc 2,631 531,304 0.06%PPL Corp. 14,804 531,167 0.06%Aptiv plc 5,583 530,217 0.06%Kroger Co. 18,145 526,024 0.06%Fifth Third Bancorp 17,105 525,808 0.06%Kraft Heinz Co. 16,182 519,928 0.06%Motorola Solutions, Inc. 3,221 519,032 0.06%McKesson Corp. 3,717 514,135 0.06%Workday, Inc. Class A 3,119 512,920 0.06%Corning, Inc. 17,508 509,658 0.06%Stanley Black & Decker, Inc. 3,067 508,325 0.06%Rockwell Automation, Inc. 2,494 505,459 0.06%Corteva, Inc. 16,923 500,244 0.06%Clorox Co. 3,258 500,233 0.06%Uber Technologies, Inc. 16,773 498,829 0.06%SBA Communications Corp. REIT
Class A 2,068 498,367 0.06%Microchip Technology, Inc. 4,751 497,525 0.05%McCormick & Co., Inc. 2,930 497,309 0.05%KLA Corp. 2,790 497,094 0.05%Xilinx, Inc. 5,066 495,303 0.05%Lululemon Athletica, Inc. 2,125 492,299 0.05%Brown-Forman Corp. Class B 7,266 491,182 0.05%T-Mobile US, Inc. 6,253 490,360 0.05%Digital Realty Trust, Inc. REIT 4,093 490,096 0.05%AMETEK, Inc. 4,909 489,624 0.05%Las Vegas Sands Corp. 7,086 489,217 0.05%Centene Corp. 7,753 487,431 0.05%Republic Services, Inc. Class A 5,438 487,408 0.05%ViacomCBS, Inc. Class B 11,291 473,883 0.05%Discover Financial Services 5,568 472,278 0.05%FirstEnergy Corp. 9,635 468,261 0.05%Boston Properties, Inc. REIT 3,365 463,899 0.05%Alexion Pharmaceuticals, Inc. 4,233 457,799 0.05%FleetCor Technologies, Inc. 1,590 457,475 0.05%
Number of Fair Value % of Total Shares US Dollars ($) Net Assets
Vanguard SRI Global Stock Fund
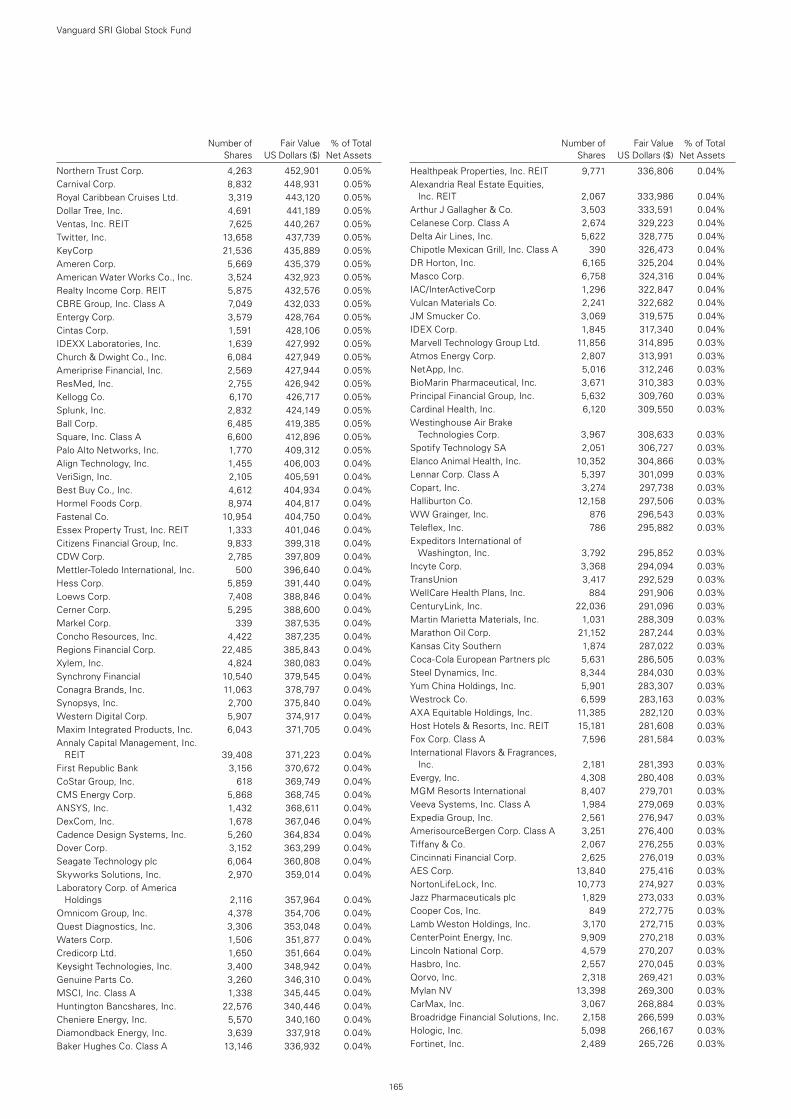
165
Number of Fair Value % of Total Shares US Dollars ($) Net Assets
Northern Trust Corp. 4,263 452,901 0.05%Carnival Corp. 8,832 448,931 0.05%Royal Caribbean Cruises Ltd. 3,319 443,120 0.05%Dollar Tree, Inc. 4,691 441,189 0.05%Ventas, Inc. REIT 7,625 440,267 0.05%Twitter, Inc. 13,658 437,739 0.05%KeyCorp 21,536 435,889 0.05%Ameren Corp. 5,669 435,379 0.05%American Water Works Co., Inc. 3,524 432,923 0.05%Realty Income Corp. REIT 5,875 432,576 0.05%CBRE Group, Inc. Class A 7,049 432,033 0.05%Entergy Corp. 3,579 428,764 0.05%Cintas Corp. 1,591 428,106 0.05%IDEXX Laboratories, Inc. 1,639 427,992 0.05%Church & Dwight Co., Inc. 6,084 427,949 0.05%Ameriprise Financial, Inc. 2,569 427,944 0.05%ResMed, Inc. 2,755 426,942 0.05%Kellogg Co. 6,170 426,717 0.05%Splunk, Inc. 2,832 424,149 0.05%Ball Corp. 6,485 419,385 0.05%Square, Inc. Class A 6,600 412,896 0.05%Palo Alto Networks, Inc. 1,770 409,312 0.05%Align Technology, Inc. 1,455 406,003 0.04%VeriSign, Inc. 2,105 405,591 0.04%Best Buy Co., Inc. 4,612 404,934 0.04%Hormel Foods Corp. 8,974 404,817 0.04%Fastenal Co. 10,954 404,750 0.04%Essex Property Trust, Inc. REIT 1,333 401,046 0.04%Citizens Financial Group, Inc. 9,833 399,318 0.04%CDW Corp. 2,785 397,809 0.04%Mettler-Toledo International, Inc. 500 396,640 0.04%Hess Corp. 5,859 391,440 0.04%Loews Corp. 7,408 388,846 0.04%Cerner Corp. 5,295 388,600 0.04%Markel Corp. 339 387,535 0.04%Concho Resources, Inc. 4,422 387,235 0.04%Regions Financial Corp. 22,485 385,843 0.04%Xylem, Inc. 4,824 380,083 0.04%Synchrony Financial 10,540 379,545 0.04%Conagra Brands, Inc. 11,063 378,797 0.04%Synopsys, Inc. 2,700 375,840 0.04%Western Digital Corp. 5,907 374,917 0.04%Maxim Integrated Products, Inc. 6,043 371,705 0.04%Annaly Capital Management, Inc.
REIT 39,408 371,223 0.04%First Republic Bank 3,156 370,672 0.04%CoStar Group, Inc. 618 369,749 0.04%CMS Energy Corp. 5,868 368,745 0.04%ANSYS, Inc. 1,432 368,611 0.04%DexCom, Inc. 1,678 367,046 0.04%Cadence Design Systems, Inc. 5,260 364,834 0.04%Dover Corp. 3,152 363,299 0.04%Seagate Technology plc 6,064 360,808 0.04%Skyworks Solutions, Inc. 2,970 359,014 0.04%Laboratory Corp. of America
Holdings 2,116 357,964 0.04%Omnicom Group, Inc. 4,378 354,706 0.04%Quest Diagnostics, Inc. 3,306 353,048 0.04%Waters Corp. 1,506 351,877 0.04%Credicorp Ltd. 1,650 351,664 0.04%Keysight Technologies, Inc. 3,400 348,942 0.04%Genuine Parts Co. 3,260 346,310 0.04%MSCI, Inc. Class A 1,338 345,445 0.04%Huntington Bancshares, Inc. 22,576 340,446 0.04%Cheniere Energy, Inc. 5,570 340,160 0.04%Diamondback Energy, Inc. 3,639 337,918 0.04%Baker Hughes Co. Class A 13,146 336,932 0.04%
Healthpeak Properties, Inc. REIT 9,771 336,806 0.04%Alexandria Real Estate Equities,
Inc. REIT 2,067 333,986 0.04%Arthur J Gallagher & Co. 3,503 333,591 0.04%Celanese Corp. Class A 2,674 329,223 0.04%Delta Air Lines, Inc. 5,622 328,775 0.04%Chipotle Mexican Grill, Inc. Class A 390 326,473 0.04%DR Horton, Inc. 6,165 325,204 0.04%Masco Corp. 6,758 324,316 0.04%IAC/InterActiveCorp 1,296 322,847 0.04%Vulcan Materials Co. 2,241 322,682 0.04%JM Smucker Co. 3,069 319,575 0.04%IDEX Corp. 1,845 317,340 0.04%Marvell Technology Group Ltd. 11,856 314,895 0.03%Atmos Energy Corp. 2,807 313,991 0.03%NetApp, Inc. 5,016 312,246 0.03%BioMarin Pharmaceutical, Inc. 3,671 310,383 0.03%Principal Financial Group, Inc. 5,632 309,760 0.03%Cardinal Health, Inc. 6,120 309,550 0.03%Westinghouse Air Brake
Technologies Corp. 3,967 308,633 0.03%Spotify Technology SA 2,051 306,727 0.03%Elanco Animal Health, Inc. 10,352 304,866 0.03%Lennar Corp. Class A 5,397 301,099 0.03%Copart, Inc. 3,274 297,738 0.03%Halliburton Co. 12,158 297,506 0.03%WW Grainger, Inc. 876 296,543 0.03%Teleflex, Inc. 786 295,882 0.03%Expeditors International of
Washington, Inc. 3,792 295,852 0.03%Incyte Corp. 3,368 294,094 0.03%TransUnion 3,417 292,529 0.03%WellCare Health Plans, Inc. 884 291,906 0.03%CenturyLink, Inc. 22,036 291,096 0.03%Martin Marietta Materials, Inc. 1,031 288,309 0.03%Marathon Oil Corp. 21,152 287,244 0.03%Kansas City Southern 1,874 287,022 0.03%Coca-Cola European Partners plc 5,631 286,505 0.03%Steel Dynamics, Inc. 8,344 284,030 0.03%Yum China Holdings, Inc. 5,901 283,307 0.03%Westrock Co. 6,599 283,163 0.03%AXA Equitable Holdings, Inc. 11,385 282,120 0.03%Host Hotels & Resorts, Inc. REIT 15,181 281,608 0.03%Fox Corp. Class A 7,596 281,584 0.03%International Flavors & Fragrances,
Inc. 2,181 281,393 0.03%Evergy, Inc. 4,308 280,408 0.03%MGM Resorts International 8,407 279,701 0.03%Veeva Systems, Inc. Class A 1,984 279,069 0.03%Expedia Group, Inc. 2,561 276,947 0.03%AmerisourceBergen Corp. Class A 3,251 276,400 0.03%Tiffany & Co. 2,067 276,255 0.03%Cincinnati Financial Corp. 2,625 276,019 0.03%AES Corp. 13,840 275,416 0.03%NortonLifeLock, Inc. 10,773 274,927 0.03%Jazz Pharmaceuticals plc 1,829 273,033 0.03%Cooper Cos, Inc. 849 272,775 0.03%Lamb Weston Holdings, Inc. 3,170 272,715 0.03%CenterPoint Energy, Inc. 9,909 270,218 0.03%Lincoln National Corp. 4,579 270,207 0.03%Hasbro, Inc. 2,557 270,045 0.03%Qorvo, Inc. 2,318 269,421 0.03%Mylan NV 13,398 269,300 0.03%CarMax, Inc. 3,067 268,884 0.03%Broadridge Financial Solutions, Inc. 2,158 266,599 0.03%Hologic, Inc. 5,098 266,167 0.03%Fortinet, Inc. 2,489 265,726 0.03%
Number of Fair Value % of Total Shares US Dollars ($) Net Assets
Vanguard SRI Global Stock Fund
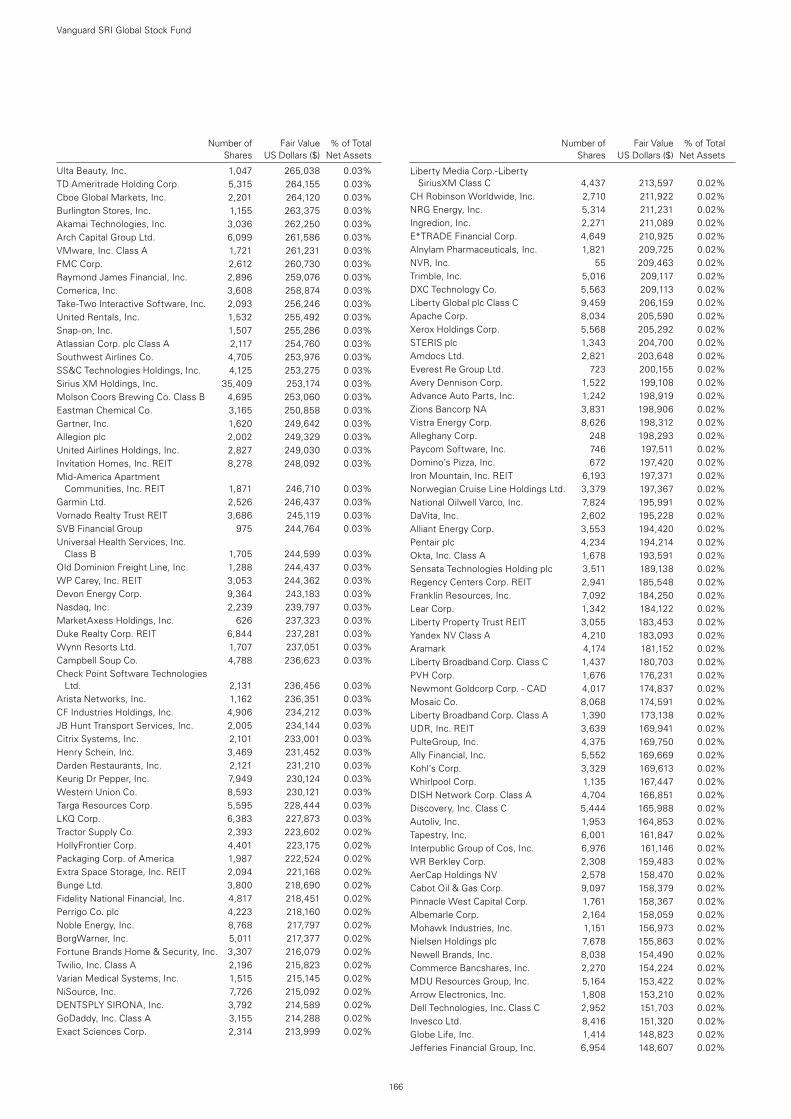
166
Number of Fair Value % of Total Shares US Dollars ($) Net Assets
Ulta Beauty, Inc. 1,047 265,038 0.03%TD Ameritrade Holding Corp. 5,315 264,155 0.03%Cboe Global Markets, Inc. 2,201 264,120 0.03%Burlington Stores, Inc. 1,155 263,375 0.03%Akamai Technologies, Inc. 3,036 262,250 0.03%Arch Capital Group Ltd. 6,099 261,586 0.03%VMware, Inc. Class A 1,721 261,231 0.03%FMC Corp. 2,612 260,730 0.03%Raymond James Financial, Inc. 2,896 259,076 0.03%Comerica, Inc. 3,608 258,874 0.03%Take-Two Interactive Software, Inc. 2,093 256,246 0.03%United Rentals, Inc. 1,532 255,492 0.03%Snap-on, Inc. 1,507 255,286 0.03%Atlassian Corp. plc Class A 2,117 254,760 0.03%Southwest Airlines Co. 4,705 253,976 0.03%SS&C Technologies Holdings, Inc. 4,125 253,275 0.03%Sirius XM Holdings, Inc. 35,409 253,174 0.03%Molson Coors Brewing Co. Class B 4,695 253,060 0.03%Eastman Chemical Co. 3,165 250,858 0.03%Gartner, Inc. 1,620 249,642 0.03%Allegion plc 2,002 249,329 0.03%United Airlines Holdings, Inc. 2,827 249,030 0.03%Invitation Homes, Inc. REIT 8,278 248,092 0.03%Mid-America Apartment
Communities, Inc. REIT 1,871 246,710 0.03%Garmin Ltd. 2,526 246,437 0.03%Vornado Realty Trust REIT 3,686 245,119 0.03%SVB Financial Group 975 244,764 0.03%Universal Health Services, Inc.
Class B 1,705 244,599 0.03%Old Dominion Freight Line, Inc. 1,288 244,437 0.03%WP Carey, Inc. REIT 3,053 244,362 0.03%Devon Energy Corp. 9,364 243,183 0.03%Nasdaq, Inc. 2,239 239,797 0.03%MarketAxess Holdings, Inc. 626 237,323 0.03%Duke Realty Corp. REIT 6,844 237,281 0.03%Wynn Resorts Ltd. 1,707 237,051 0.03%Campbell Soup Co. 4,788 236,623 0.03%Check Point Software Technologies
Ltd. 2,131 236,456 0.03%Arista Networks, Inc. 1,162 236,351 0.03%CF Industries Holdings, Inc. 4,906 234,212 0.03%JB Hunt Transport Services, Inc. 2,005 234,144 0.03%Citrix Systems, Inc. 2,101 233,001 0.03%Henry Schein, Inc. 3,469 231,452 0.03%Darden Restaurants, Inc. 2,121 231,210 0.03%Keurig Dr Pepper, Inc. 7,949 230,124 0.03%Western Union Co. 8,593 230,121 0.03%Targa Resources Corp. 5,595 228,444 0.03%LKQ Corp. 6,383 227,873 0.03%Tractor Supply Co. 2,393 223,602 0.02%HollyFrontier Corp. 4,401 223,175 0.02%Packaging Corp. of America 1,987 222,524 0.02%Extra Space Storage, Inc. REIT 2,094 221,168 0.02%Bunge Ltd. 3,800 218,690 0.02%Fidelity National Financial, Inc. 4,817 218,451 0.02%Perrigo Co. plc 4,223 218,160 0.02%Noble Energy, Inc. 8,768 217,797 0.02%BorgWarner, Inc. 5,011 217,377 0.02%Fortune Brands Home & Security, Inc. 3,307 216,079 0.02%Twilio, Inc. Class A 2,196 215,823 0.02%Varian Medical Systems, Inc. 1,515 215,145 0.02%NiSource, Inc. 7,726 215,092 0.02%DENTSPLY SIRONA, Inc. 3,792 214,589 0.02%GoDaddy, Inc. Class A 3,155 214,288 0.02%Exact Sciences Corp. 2,314 213,999 0.02%
Liberty Media Corp.-Liberty SiriusXM Class C 4,437 213,597 0.02%
CH Robinson Worldwide, Inc. 2,710 211,922 0.02%NRG Energy, Inc. 5,314 211,231 0.02%Ingredion, Inc. 2,271 211,089 0.02%E*TRADE Financial Corp. 4,649 210,925 0.02%Alnylam Pharmaceuticals, Inc. 1,821 209,725 0.02%NVR, Inc. 55 209,463 0.02%Trimble, Inc. 5,016 209,117 0.02%DXC Technology Co. 5,563 209,113 0.02%Liberty Global plc Class C 9,459 206,159 0.02%Apache Corp. 8,034 205,590 0.02%Xerox Holdings Corp. 5,568 205,292 0.02%STERIS plc 1,343 204,700 0.02%Amdocs Ltd. 2,821 203,648 0.02%Everest Re Group Ltd. 723 200,155 0.02%Avery Dennison Corp. 1,522 199,108 0.02%Advance Auto Parts, Inc. 1,242 198,919 0.02%Zions Bancorp NA 3,831 198,906 0.02%Vistra Energy Corp. 8,626 198,312 0.02%Alleghany Corp. 248 198,293 0.02%Paycom Software, Inc. 746 197,511 0.02%Domino’s Pizza, Inc. 672 197,420 0.02%Iron Mountain, Inc. REIT 6,193 197,371 0.02%Norwegian Cruise Line Holdings Ltd. 3,379 197,367 0.02%National Oilwell Varco, Inc. 7,824 195,991 0.02%DaVita, Inc. 2,602 195,228 0.02%Alliant Energy Corp. 3,553 194,420 0.02%Pentair plc 4,234 194,214 0.02%Okta, Inc. Class A 1,678 193,591 0.02%Sensata Technologies Holding plc 3,511 189,138 0.02%Regency Centers Corp. REIT 2,941 185,548 0.02%Franklin Resources, Inc. 7,092 184,250 0.02%Lear Corp. 1,342 184,122 0.02%Liberty Property Trust REIT 3,055 183,453 0.02%Yandex NV Class A 4,210 183,093 0.02%Aramark 4,174 181,152 0.02%Liberty Broadband Corp. Class C 1,437 180,703 0.02%PVH Corp. 1,676 176,231 0.02%Newmont Goldcorp Corp. - CAD 4,017 174,837 0.02%Mosaic Co. 8,068 174,591 0.02%Liberty Broadband Corp. Class A 1,390 173,138 0.02%UDR, Inc. REIT 3,639 169,941 0.02%PulteGroup, Inc. 4,375 169,750 0.02%Ally Financial, Inc. 5,552 169,669 0.02%Kohl’s Corp. 3,329 169,613 0.02%Whirlpool Corp. 1,135 167,447 0.02%DISH Network Corp. Class A 4,704 166,851 0.02%Discovery, Inc. Class C 5,444 165,988 0.02%Autoliv, Inc. 1,953 164,853 0.02%Tapestry, Inc. 6,001 161,847 0.02%Interpublic Group of Cos, Inc. 6,976 161,146 0.02%WR Berkley Corp. 2,308 159,483 0.02%AerCap Holdings NV 2,578 158,470 0.02%Cabot Oil & Gas Corp. 9,097 158,379 0.02%Pinnacle West Capital Corp. 1,761 158,367 0.02%Albemarle Corp. 2,164 158,059 0.02%Mohawk Industries, Inc. 1,151 156,973 0.02%Nielsen Holdings plc 7,678 155,863 0.02%Newell Brands, Inc. 8,038 154,490 0.02%Commerce Bancshares, Inc. 2,270 154,224 0.02%MDU Resources Group, Inc. 5,164 153,422 0.02%Arrow Electronics, Inc. 1,808 153,210 0.02%Dell Technologies, Inc. Class C 2,952 151,703 0.02%Invesco Ltd. 8,416 151,320 0.02%Globe Life, Inc. 1,414 148,823 0.02%Jefferies Financial Group, Inc. 6,954 148,607 0.02%
Number of Fair Value % of Total Shares US Dollars ($) Net Assets
Vanguard SRI Global Stock Fund
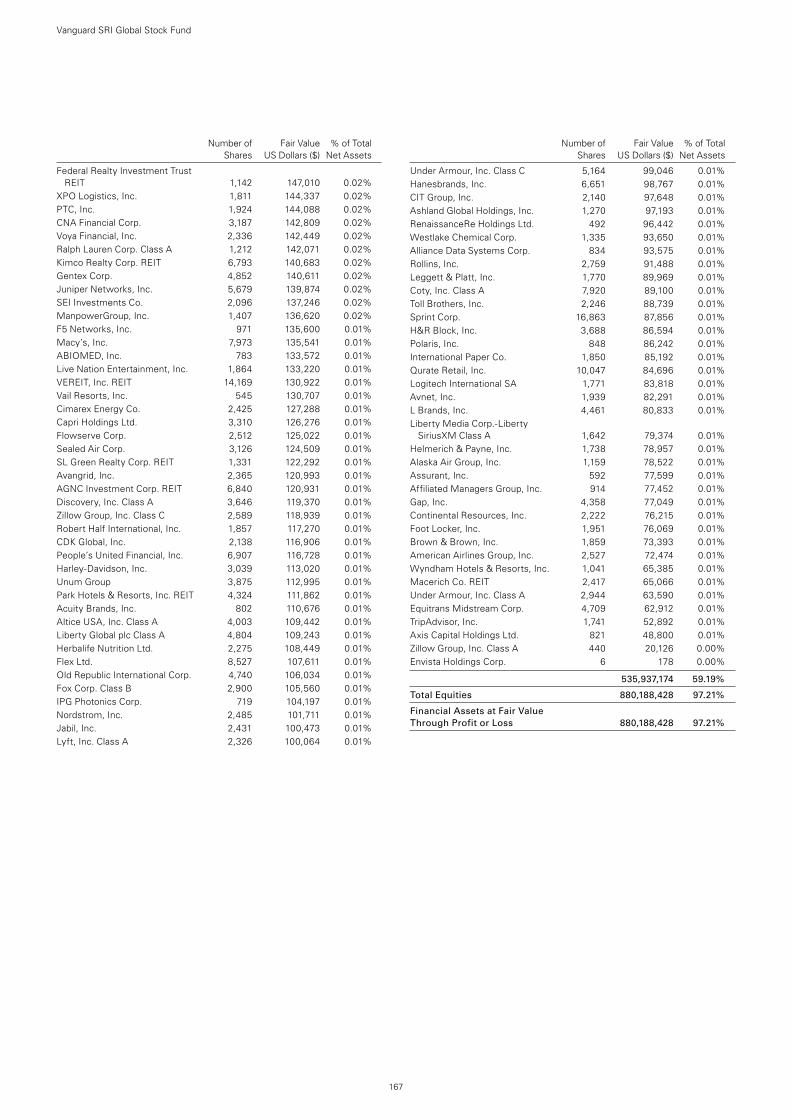
Number of Fair Value % of Total Shares US Dollars ($) Net Assets
Federal Realty Investment Trust REIT 1,142 147,010 0.02%
XPO Logistics, Inc. 1,811 144,337 0.02%PTC, Inc. 1,924 144,088 0.02%CNA Financial Corp. 3,187 142,809 0.02%Voya Financial, Inc. 2,336 142,449 0.02%Ralph Lauren Corp. Class A 1,212 142,071 0.02%Kimco Realty Corp. REIT 6,793 140,683 0.02%Gentex Corp. 4,852 140,611 0.02%Juniper Networks, Inc. 5,679 139,874 0.02%SEI Investments Co. 2,096 137,246 0.02%ManpowerGroup, Inc. 1,407 136,620 0.02%F5 Networks, Inc. 971 135,600 0.01%Macy’s, Inc. 7,973 135,541 0.01%ABIOMED, Inc. 783 133,572 0.01%Live Nation Entertainment, Inc. 1,864 133,220 0.01%VEREIT, Inc. REIT 14,169 130,922 0.01%Vail Resorts, Inc. 545 130,707 0.01%Cimarex Energy Co. 2,425 127,288 0.01%Capri Holdings Ltd. 3,310 126,276 0.01%Flowserve Corp. 2,512 125,022 0.01%Sealed Air Corp. 3,126 124,509 0.01%SL Green Realty Corp. REIT 1,331 122,292 0.01%Avangrid, Inc. 2,365 120,993 0.01%AGNC Investment Corp. REIT 6,840 120,931 0.01%Discovery, Inc. Class A 3,646 119,370 0.01%Zillow Group, Inc. Class C 2,589 118,939 0.01%Robert Half International, Inc. 1,857 117,270 0.01%CDK Global, Inc. 2,138 116,906 0.01%People’s United Financial, Inc. 6,907 116,728 0.01%Harley-Davidson, Inc. 3,039 113,020 0.01%Unum Group 3,875 112,995 0.01%Park Hotels & Resorts, Inc. REIT 4,324 111,862 0.01%Acuity Brands, Inc. 802 110,676 0.01%Altice USA, Inc. Class A 4,003 109,442 0.01%Liberty Global plc Class A 4,804 109,243 0.01%Herbalife Nutrition Ltd. 2,275 108,449 0.01%Flex Ltd. 8,527 107,611 0.01%Old Republic International Corp. 4,740 106,034 0.01%Fox Corp. Class B 2,900 105,560 0.01%IPG Photonics Corp. 719 104,197 0.01%Nordstrom, Inc. 2,485 101,711 0.01%Jabil, Inc. 2,431 100,473 0.01%Lyft, Inc. Class A 2,326 100,064 0.01%
Under Armour, Inc. Class C 5,164 99,046 0.01%Hanesbrands, Inc. 6,651 98,767 0.01%CIT Group, Inc. 2,140 97,648 0.01%Ashland Global Holdings, Inc. 1,270 97,193 0.01%RenaissanceRe Holdings Ltd. 492 96,442 0.01%Westlake Chemical Corp. 1,335 93,650 0.01%Alliance Data Systems Corp. 834 93,575 0.01%Rollins, Inc. 2,759 91,488 0.01%Leggett & Platt, Inc. 1,770 89,969 0.01%Coty, Inc. Class A 7,920 89,100 0.01%Toll Brothers, Inc. 2,246 88,739 0.01%Sprint Corp. 16,863 87,856 0.01%H&R Block, Inc. 3,688 86,594 0.01%Polaris, Inc. 848 86,242 0.01%International Paper Co. 1,850 85,192 0.01%Qurate Retail, Inc. 10,047 84,696 0.01%Logitech International SA 1,771 83,818 0.01%Avnet, Inc. 1,939 82,291 0.01%L Brands, Inc. 4,461 80,833 0.01%Liberty Media Corp.-Liberty
SiriusXM Class A 1,642 79,374 0.01%Helmerich & Payne, Inc. 1,738 78,957 0.01%Alaska Air Group, Inc. 1,159 78,522 0.01%Assurant, Inc. 592 77,599 0.01%Affiliated Managers Group, Inc. 914 77,452 0.01%Gap, Inc. 4,358 77,049 0.01%Continental Resources, Inc. 2,222 76,215 0.01%Foot Locker, Inc. 1,951 76,069 0.01%Brown & Brown, Inc. 1,859 73,393 0.01%American Airlines Group, Inc. 2,527 72,474 0.01%Wyndham Hotels & Resorts, Inc. 1,041 65,385 0.01%Macerich Co. REIT 2,417 65,066 0.01%Under Armour, Inc. Class A 2,944 63,590 0.01%Equitrans Midstream Corp. 4,709 62,912 0.01%TripAdvisor, Inc. 1,741 52,892 0.01%Axis Capital Holdings Ltd. 821 48,800 0.01%Zillow Group, Inc. Class A 440 20,126 0.00%Envista Holdings Corp. 6 178 0.00%
535,937,174 59.19%
Total Equities 880,188,428 97.21%
Financial Assets at Fair Value Through Profit or Loss 880,188,428 97.21%
Number of Fair Value % of Total Shares US Dollars ($) Net Assets
167
Vanguard SRI Global Stock Fund
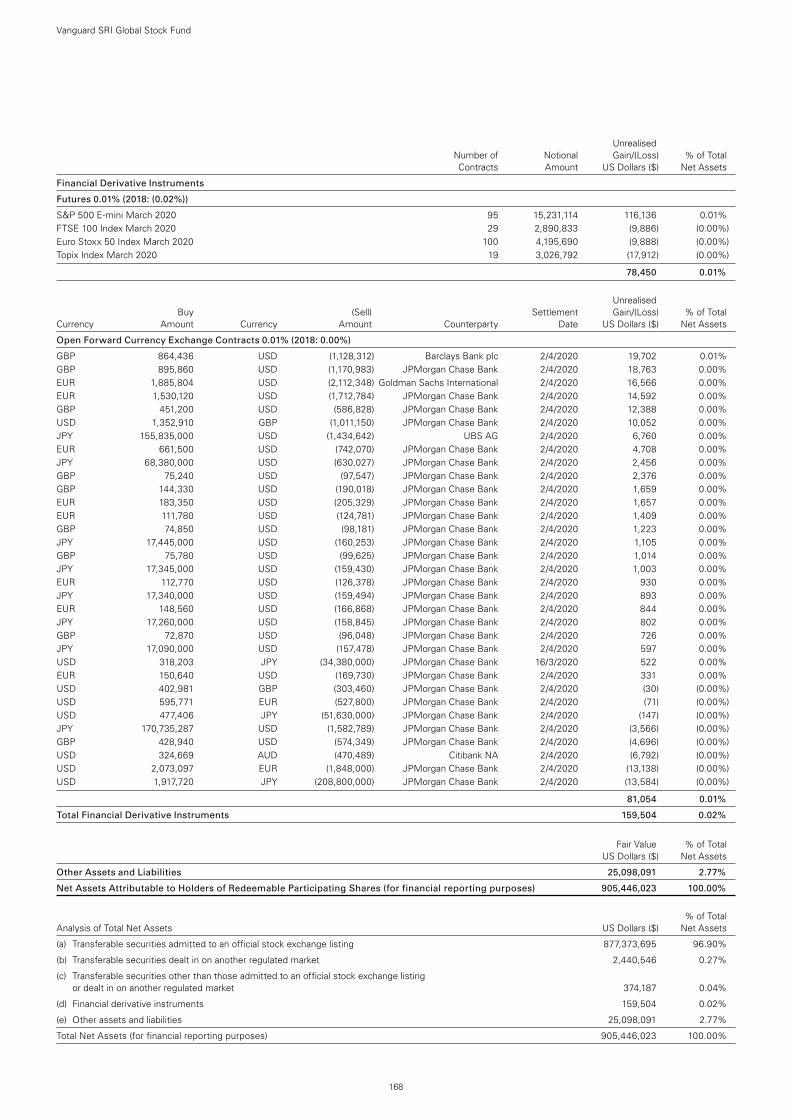
168
Unrealised Number of Notional Gain/(Loss) % of Total Contracts Amount US Dollars ($) Net Assets
Financial Derivative Instruments
Futures 0.01% (2018: (0.02%))
S&P 500 E-mini March 2020 95 15,231,114 116,136 0.01%FTSE 100 Index March 2020 29 2,890,833 (9,886) (0.00%)Euro Stoxx 50 Index March 2020 100 4,195,690 (9,888) (0.00%)Topix Index March 2020 19 3,026,792 (17,912) (0.00%)
78,450 0.01%
Unrealised Buy (Sell) Settlement Gain/(Loss) % of Total Currency Amount Currency Amount Counterparty Date US Dollars ($) Net Assets
Open Forward Currency Exchange Contracts 0.01% (2018: 0.00%)
GBP 864,436 USD (1,128,312) Barclays Bank plc 2/4/2020 19,702 0.01%GBP 895,860 USD (1,170,983) JPMorgan Chase Bank 2/4/2020 18,763 0.00%EUR 1,885,804 USD (2,112,348) Goldman Sachs International 2/4/2020 16,566 0.00%EUR 1,530,120 USD (1,712,784) JPMorgan Chase Bank 2/4/2020 14,592 0.00%GBP 451,200 USD (586,828) JPMorgan Chase Bank 2/4/2020 12,388 0.00%USD 1,352,910 GBP (1,011,150) JPMorgan Chase Bank 2/4/2020 10,052 0.00%JPY 155,835,000 USD (1,434,642) UBS AG 2/4/2020 6,760 0.00%EUR 661,500 USD (742,070) JPMorgan Chase Bank 2/4/2020 4,708 0.00%JPY 68,380,000 USD (630,027) JPMorgan Chase Bank 2/4/2020 2,456 0.00%GBP 75,240 USD (97,547) JPMorgan Chase Bank 2/4/2020 2,376 0.00%GBP 144,330 USD (190,018) JPMorgan Chase Bank 2/4/2020 1,659 0.00%EUR 183,350 USD (205,329) JPMorgan Chase Bank 2/4/2020 1,657 0.00%EUR 111,780 USD (124,781) JPMorgan Chase Bank 2/4/2020 1,409 0.00%GBP 74,850 USD (98,181) JPMorgan Chase Bank 2/4/2020 1,223 0.00%JPY 17,445,000 USD (160,253) JPMorgan Chase Bank 2/4/2020 1,105 0.00%GBP 75,780 USD (99,625) JPMorgan Chase Bank 2/4/2020 1,014 0.00%JPY 17,345,000 USD (159,430) JPMorgan Chase Bank 2/4/2020 1,003 0.00%EUR 112,770 USD (126,378) JPMorgan Chase Bank 2/4/2020 930 0.00%JPY 17,340,000 USD (159,494) JPMorgan Chase Bank 2/4/2020 893 0.00%EUR 148,560 USD (166,868) JPMorgan Chase Bank 2/4/2020 844 0.00%JPY 17,260,000 USD (158,845) JPMorgan Chase Bank 2/4/2020 802 0.00%GBP 72,870 USD (96,048) JPMorgan Chase Bank 2/4/2020 726 0.00%JPY 17,090,000 USD (157,478) JPMorgan Chase Bank 2/4/2020 597 0.00%USD 318,203 JPY (34,380,000) JPMorgan Chase Bank 16/3/2020 522 0.00%EUR 150,640 USD (169,730) JPMorgan Chase Bank 2/4/2020 331 0.00%USD 402,981 GBP (303,460) JPMorgan Chase Bank 2/4/2020 (30) (0.00%)USD 595,771 EUR (527,800) JPMorgan Chase Bank 2/4/2020 (71) (0.00%)USD 477,406 JPY (51,630,000) JPMorgan Chase Bank 2/4/2020 (147) (0.00%)JPY 170,735,287 USD (1,582,789) JPMorgan Chase Bank 2/4/2020 (3,566) (0.00%)GBP 428,940 USD (574,349) JPMorgan Chase Bank 2/4/2020 (4,696) (0.00%)USD 324,669 AUD (470,489) Citibank NA 2/4/2020 (6,792) (0.00%)USD 2,073,097 EUR (1,848,000) JPMorgan Chase Bank 2/4/2020 (13,138) (0.00%)USD 1,917,720 JPY (208,800,000) JPMorgan Chase Bank 2/4/2020 (13,584) (0.00%)
81,054 0.01%
Total Financial Derivative Instruments 159,504 0.02%
Fair Value % of Total US Dollars ($) Net Assets
Other Assets and Liabilities 25,098,091 2.77%
Net Assets Attributable to Holders of Redeemable Participating Shares (for financial reporting purposes) 905,446,023 100.00%
% of Total Analysis of Total Net Assets US Dollars ($) Net Assets
(a) Transferable securities admitted to an official stock exchange listing 877,373,695 96.90%
(b) Transferable securities dealt in on another regulated market 2,440,546 0.27%
(c) Transferable securities other than those admitted to an official stock exchange listing or dealt in on another regulated market 374,187 0.04%
(d) Financial derivative instruments 159,504 0.02%
(e) Other assets and liabilities 25,098,091 2.77%
Total Net Assets (for financial reporting purposes) 905,446,023 100.00%
Vanguard SRI Global Stock Fund

The accompanying notes form an integral part of the financial statements.
169
Vanguard SRI Global Stock Fund
Statement of Assets and Liabilities
US Dollars ($) US Dollars ($) As at As at 31 December 2019 31 December 2018
Current Assets Financial Assets at Fair Value Through Profit or Loss 880,188,428 673,711,542Financial Derivative Instruments 239,214 52,172Cash 26,656,318 14,800,242Receivables:
Interest and Dividends 1,250,740 1,137,901Capital Shares Issued 1,223,426 497,711Investments Sold 802 730,225Futures Margin Cash 1,217,702 1,082,625
Total Current Assets 910,776,630 692,012,418
Current Liabilities Financial Derivative Instruments 79,710 187,995Bank Overdraft — 85,127Unrealised Depreciation on Spot Currency Contracts 5,523 430Payables and Other Liabilities:
Investments Purchased — 626,167Income Distribution Payable 526,972 389,631Capital Shares Redeemed 4,553,209 209,174Management Fees Payable 165,193 203,680
Total Current Liabilities 5,330,607 1,702,204
Net Assets Attributable to Holders of Redeemable Participating Shares (for financial reporting purposes) (“Net Assets”) 905,446,023 690,310,214
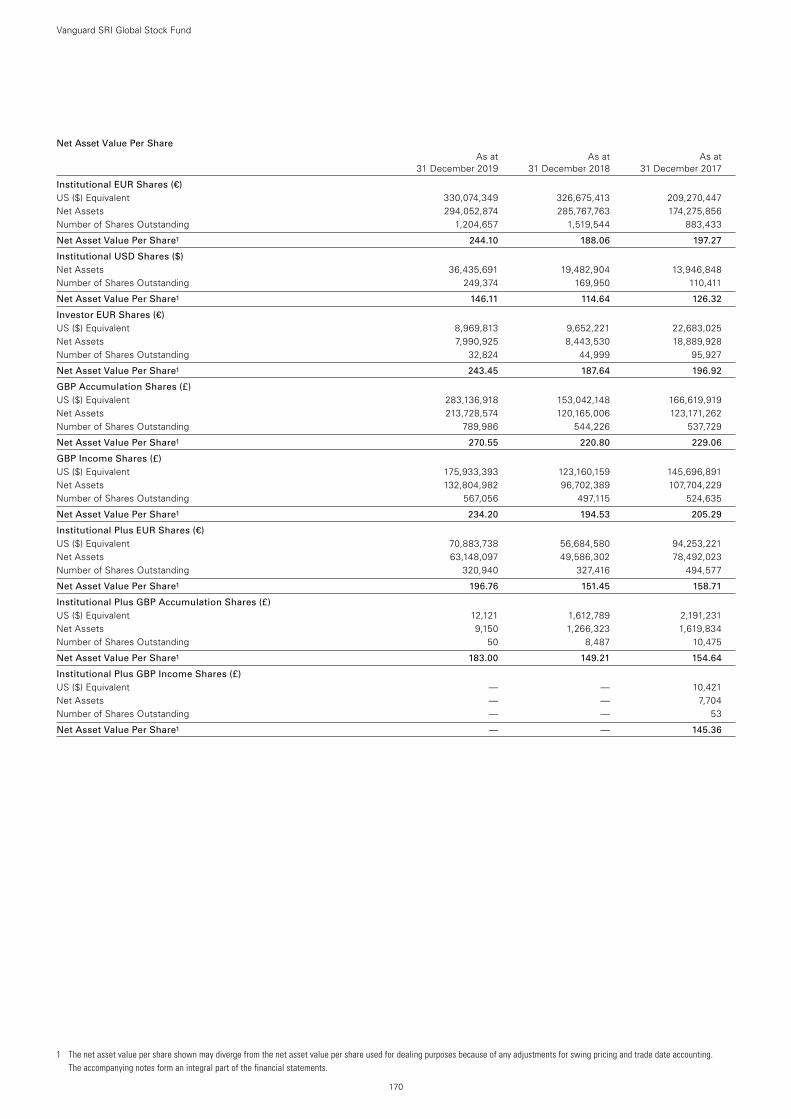
1 The net asset value per share shown may diverge from the net asset value per share used for dealing purposes because of any adjustments for swing pricing and trade date accounting. The accompanying notes form an integral part of the financial statements.
170
Net Asset Value Per Share As at As at As at 31 December 2019 31 December 2018 31 December 2017
Institutional EUR Shares (€) US ($) Equivalent 330,074,349 326,675,413 209,270,447Net Assets 294,052,874 285,767,763 174,275,856Number of Shares Outstanding 1,204,657 1,519,544 883,433
Net Asset Value Per Share1 244.10 188.06 197.27
Institutional USD Shares ($) Net Assets 36,435,691 19,482,904 13,946,848Number of Shares Outstanding 249,374 169,950 110,411
Net Asset Value Per Share1 146.11 114.64 126.32
Investor EUR Shares (€) US ($) Equivalent 8,969,813 9,652,221 22,683,025Net Assets 7,990,925 8,443,530 18,889,928Number of Shares Outstanding 32,824 44,999 95,927
Net Asset Value Per Share1 243.45 187.64 196.92
GBP Accumulation Shares (£) US ($) Equivalent 283,136,918 153,042,148 166,619,919Net Assets 213,728,574 120,165,006 123,171,262Number of Shares Outstanding 789,986 544,226 537,729
Net Asset Value Per Share1 270.55 220.80 229.06
GBP Income Shares (£) US ($) Equivalent 175,933,393 123,160,159 145,696,891Net Assets 132,804,982 96,702,389 107,704,229Number of Shares Outstanding 567,056 497,115 524,635
Net Asset Value Per Share1 234.20 194.53 205.29
Institutional Plus EUR Shares (€) US ($) Equivalent 70,883,738 56,684,580 94,253,221Net Assets 63,148,097 49,586,302 78,492,023Number of Shares Outstanding 320,940 327,416 494,577
Net Asset Value Per Share1 196.76 151.45 158.71
Institutional Plus GBP Accumulation Shares (£) US ($) Equivalent 12,121 1,612,789 2,191,231Net Assets 9,150 1,266,323 1,619,834Number of Shares Outstanding 50 8,487 10,475
Net Asset Value Per Share1 183.00 149.21 154.64
Institutional Plus GBP Income Shares (£) US ($) Equivalent — — 10,421Net Assets — — 7,704Number of Shares Outstanding — — 53
Net Asset Value Per Share1 — — 145.36
Vanguard SRI Global Stock Fund
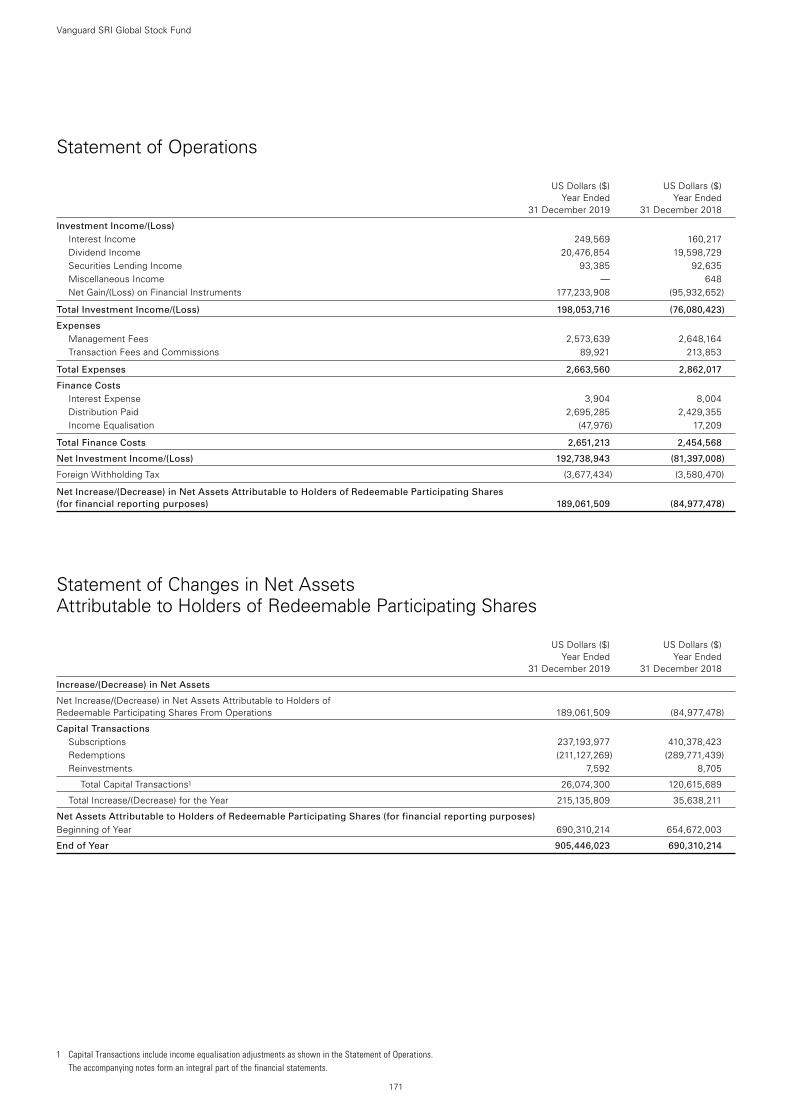
171
Vanguard SRI Global Stock Fund
Statement of Operations
US Dollars ($) US Dollars ($) Year Ended Year Ended 31 December 2019 31 December 2018
Investment Income/(Loss) Interest Income 249,569 160,217Dividend Income 20,476,854 19,598,729Securities Lending Income 93,385 92,635Miscellaneous Income — 648Net Gain/(Loss) on Financial Instruments 177,233,908 (95,932,652)
Total Investment Income/(Loss) 198,053,716 (76,080,423)
Expenses Management Fees 2,573,639 2,648,164Transaction Fees and Commissions 89,921 213,853
Total Expenses 2,663,560 2,862,017
Finance Costs Interest Expense 3,904 8,004Distribution Paid 2,695,285 2,429,355Income Equalisation (47,976) 17,209
Total Finance Costs 2,651,213 2,454,568
Net Investment Income/(Loss) 192,738,943 (81,397,008)
Foreign Withholding Tax (3,677,434) (3,580,470)
Net Increase/(Decrease) in Net Assets Attributable to Holders of Redeemable Participating Shares (for financial reporting purposes) 189,061,509 (84,977,478)
Statement of Changes in Net Assets Attributable to Holders of Redeemable Participating Shares
US Dollars ($) US Dollars ($) Year Ended Year Ended 31 December 2019 31 December 2018
Increase/(Decrease) in Net Assets
Net Increase/(Decrease) in Net Assets Attributable to Holders of Redeemable Participating Shares From Operations 189,061,509 (84,977,478)
Capital Transactions Subscriptions 237,193,977 410,378,423Redemptions (211,127,269) (289,771,439)Reinvestments 7,592 8,705
Total Capital Transactions1 26,074,300 120,615,689
Total Increase/(Decrease) for the Year 215,135,809 35,638,211
Net Assets Attributable to Holders of Redeemable Participating Shares (for financial reporting purposes) Beginning of Year 690,310,214 654,672,003
End of Year 905,446,023 690,310,214
1 Capital Transactions include income equalisation adjustments as shown in the Statement of Operations. The accompanying notes form an integral part of the financial statements.
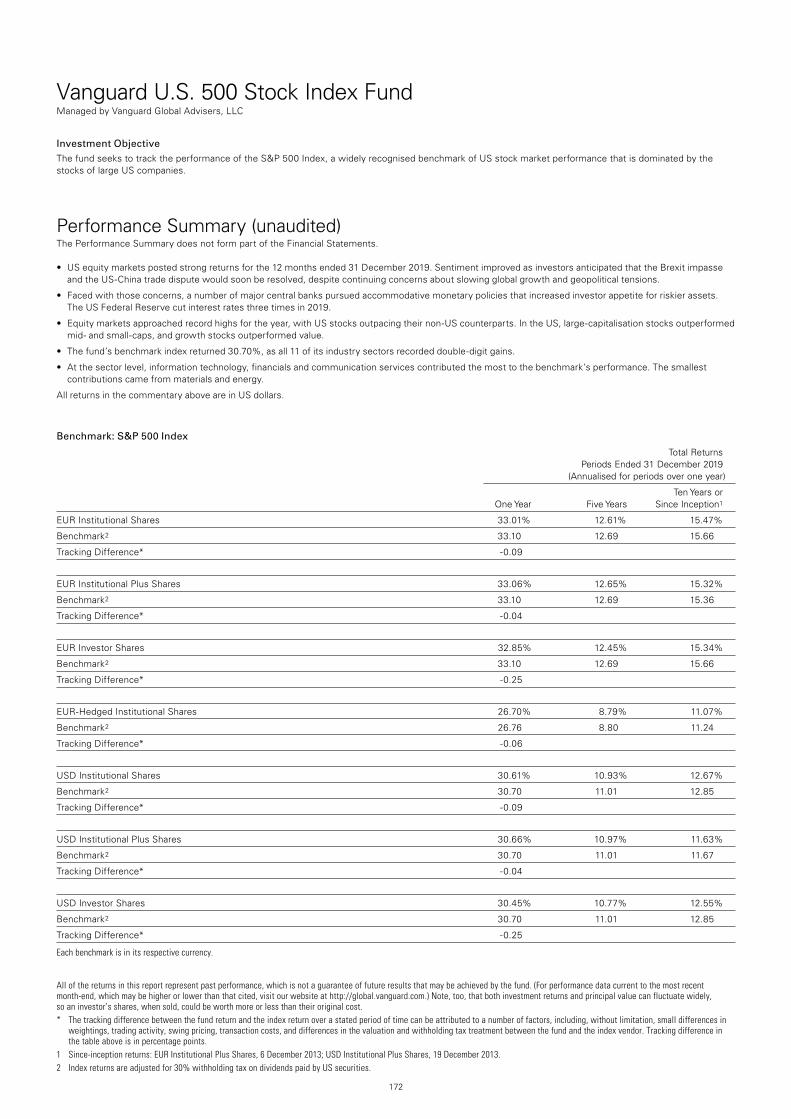
172
Vanguard U.S. 500 Stock Index FundManaged by Vanguard Global Advisers, LLC
All of the returns in this report represent past performance, which is not a guarantee of future results that may be achieved by the fund. (For performance data current to the most recent month-end, which may be higher or lower than that cited, visit our website at http://global.vanguard.com.) Note, too, that both investment returns and principal value can fluctuate widely, so an investor’s shares, when sold, could be worth more or less than their original cost.* The tracking difference between the fund return and the index return over a stated period of time can be attributed to a number of factors, including, without limitation, small differences in
weightings, trading activity, swing pricing, transaction costs, and differences in the valuation and withholding tax treatment between the fund and the index vendor. Tracking difference in the table above is in percentage points.
1 Since-inception returns: EUR Institutional Plus Shares, 6 December 2013; USD Institutional Plus Shares, 19 December 2013. 2 Index returns are adjusted for 30% withholding tax on dividends paid by US securities.
Investment ObjectiveThe fund seeks to track the performance of the S&P 500 Index, a widely recognised benchmark of US stock market performance that is dominated by the stocks of large US companies.
Performance Summary (unaudited)The Performance Summary does not form part of the Financial Statements.
• USequitymarketspostedstrongreturnsforthe12monthsended31December2019.SentimentimprovedasinvestorsanticipatedthattheBrexitimpasseand the US-China trade dispute would soon be resolved, despite continuing concerns about slowing global growth and geopolitical tensions.
• Facedwiththoseconcerns,anumberofmajorcentralbankspursuedaccommodativemonetarypoliciesthatincreasedinvestorappetiteforriskierassets.The US Federal Reserve cut interest rates three times in 2019.
• Equitymarketsapproachedrecordhighsfortheyear,withUSstocksoutpacingtheirnon-UScounterparts.IntheUS,large-capitalisationstocksoutperformedmid- and small-caps, and growth stocks outperformed value.
• Thefund’sbenchmarkindexreturned30.70%,asall11ofitsindustrysectorsrecordeddouble-digitgains.
• Atthesectorlevel,informationtechnology,financialsandcommunicationservicescontributedthemosttothebenchmark’sperformance.Thesmallestcontributions came from materials and energy.
All returns in the commentary above are in US dollars.
Benchmark: S&P 500 Index
Total Returns Periods Ended 31 December 2019 (Annualised for periods over one year)
Ten Years or One Year Five Years Since Inception1
EUR Institutional Shares 33.01% 12.61% 15.47%
Benchmark2 33.10 12.69 15.66
Tracking Difference* -0.09
EUR Institutional Plus Shares 33.06% 12.65% 15.32%
Benchmark2 33.10 12.69 15.36
Tracking Difference* -0.04
EUR Investor Shares 32.85% 12.45% 15.34%
Benchmark2 33.10 12.69 15.66
Tracking Difference* -0.25
EUR-Hedged Institutional Shares 26.70% 8.79% 11.07%
Benchmark2 26.76 8.80 11.24
Tracking Difference* -0.06
USD Institutional Shares 30.61% 10.93% 12.67%
Benchmark2 30.70 11.01 12.85
Tracking Difference* -0.09
USD Institutional Plus Shares 30.66% 10.97% 11.63%
Benchmark2 30.70 11.01 11.67
Tracking Difference* -0.04
USD Investor Shares 30.45% 10.77% 12.55%
Benchmark2 30.70 11.01 12.85
Tracking Difference* -0.25
Each benchmark is in its respective currency.
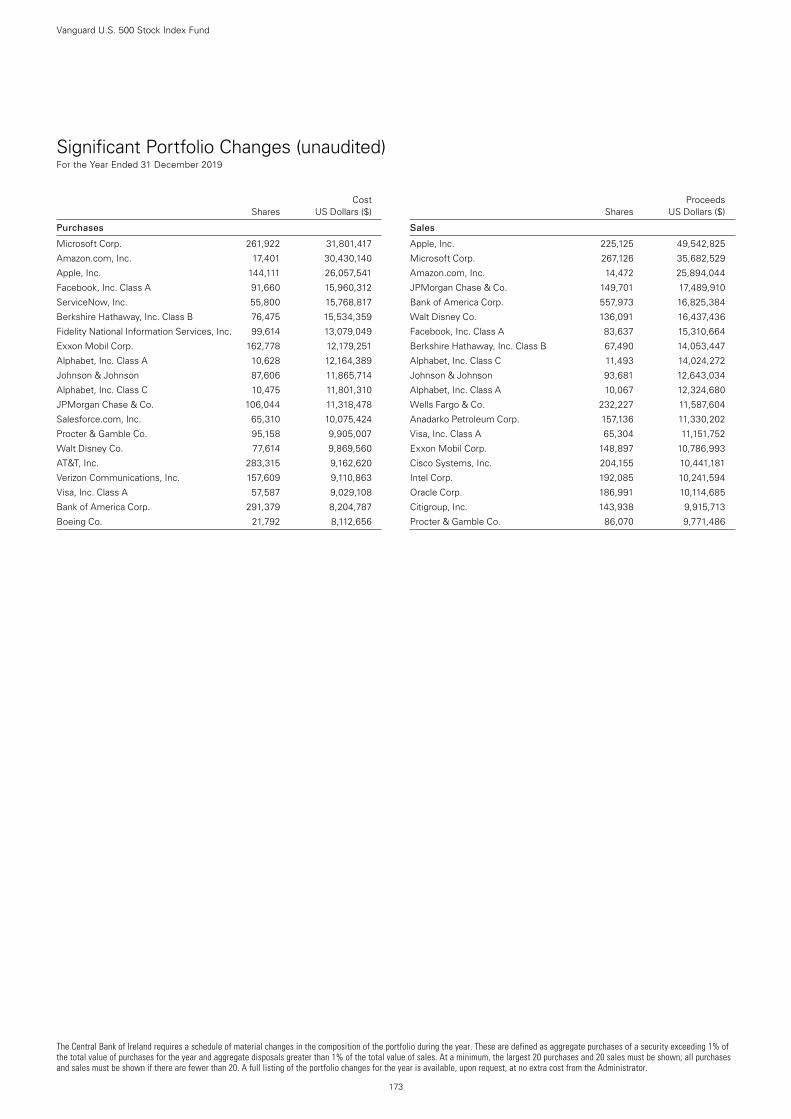
The Central Bank of Ireland requires a schedule of material changes in the composition of the portfolio during the year. These are defined as aggregate purchases of a security exceeding 1% of the total value of purchases for the year and aggregate disposals greater than 1% of the total value of sales. At a minimum, the largest 20 purchases and 20 sales must be shown; all purchases and sales must be shown if there are fewer than 20. A full listing of the portfolio changes for the year is available, upon request, at no extra cost from the Administrator.
173
Vanguard U.S. 500 Stock Index Fund
Significant Portfolio Changes (unaudited) For the Year Ended 31 December 2019
Cost Shares US Dollars ($)
Purchases
Microsoft Corp. 261,922 31,801,417
Amazon.com, Inc. 17,401 30,430,140
Apple, Inc. 144,111 26,057,541
Facebook, Inc. Class A 91,660 15,960,312
ServiceNow, Inc. 55,800 15,768,817
Berkshire Hathaway, Inc. Class B 76,475 15,534,359
Fidelity National Information Services, Inc. 99,614 13,079,049
Exxon Mobil Corp. 162,778 12,179,251
Alphabet, Inc. Class A 10,628 12,164,389
Johnson & Johnson 87,606 11,865,714
Alphabet, Inc. Class C 10,475 11,801,310
JPMorgan Chase & Co. 106,044 11,318,478
Salesforce.com, Inc. 65,310 10,075,424
Procter & Gamble Co. 95,158 9,905,007
Walt Disney Co. 77,614 9,869,560
AT&T, Inc. 283,315 9,162,620
Verizon Communications, Inc. 157,609 9,110,863
Visa, Inc. Class A 57,587 9,029,108
Bank of America Corp. 291,379 8,204,787
Boeing Co. 21,792 8,112,656
Proceeds Shares US Dollars ($)
Sales
Apple, Inc. 225,125 49,542,825
Microsoft Corp. 267,126 35,682,529
Amazon.com, Inc. 14,472 25,894,044
JPMorgan Chase & Co. 149,701 17,489,910
Bank of America Corp. 557,973 16,825,384
Walt Disney Co. 136,091 16,437,436
Facebook, Inc. Class A 83,637 15,310,664
Berkshire Hathaway, Inc. Class B 67,490 14,053,447
Alphabet, Inc. Class C 11,493 14,024,272
Johnson & Johnson 93,681 12,643,034
Alphabet, Inc. Class A 10,067 12,324,680
Wells Fargo & Co. 232,227 11,587,604
Anadarko Petroleum Corp. 157,136 11,330,202
Visa, Inc. Class A 65,304 11,151,752
Exxon Mobil Corp. 148,897 10,786,993
Cisco Systems, Inc. 204,155 10,441,181
Intel Corp. 192,085 10,241,594
Oracle Corp. 186,991 10,114,685
Citigroup, Inc. 143,938 9,915,713
Procter & Gamble Co. 86,070 9,771,486
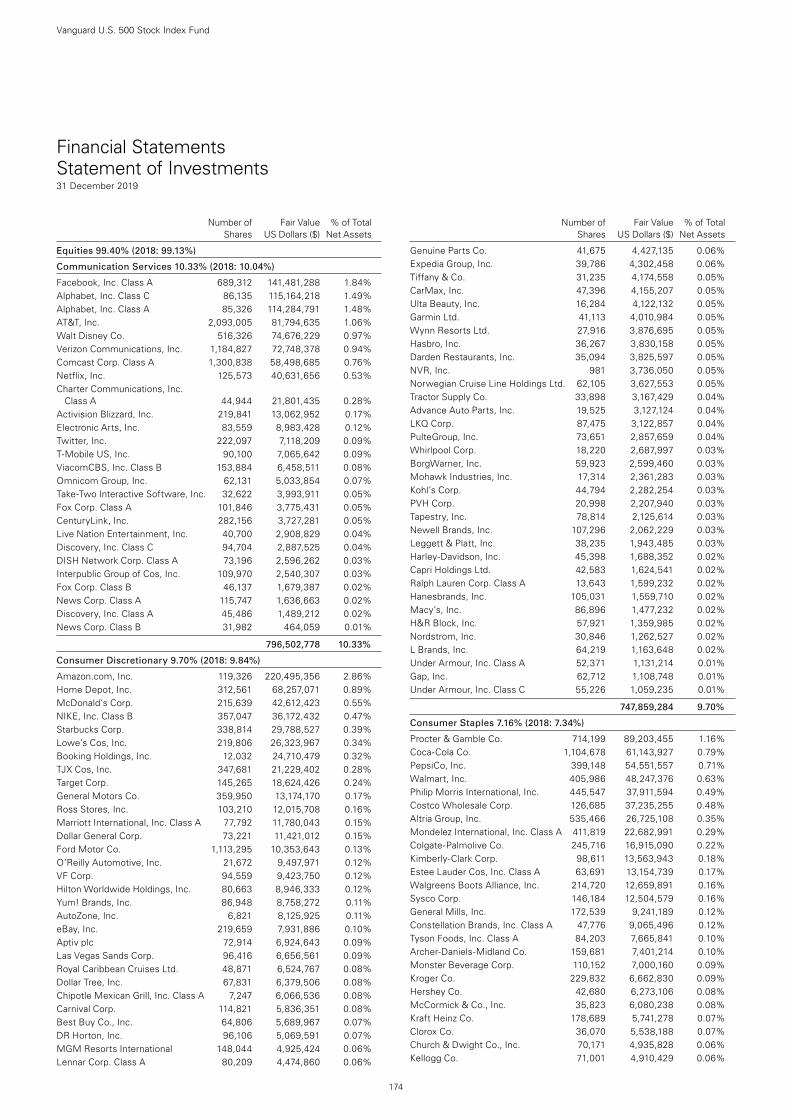
174
Vanguard U.S. 500 Stock Index Fund
Number of Fair Value % of Total Shares US Dollars ($) Net Assets
Number of Fair Value % of Total Shares US Dollars ($) Net Assets
Equities 99.40% (2018: 99.13%)
Communication Services 10.33% (2018: 10.04%)
Facebook, Inc. Class A 689,312 141,481,288 1.84%Alphabet, Inc. Class C 86,135 115,164,218 1.49%Alphabet, Inc. Class A 85,326 114,284,791 1.48%AT&T, Inc. 2,093,005 81,794,635 1.06%Walt Disney Co. 516,326 74,676,229 0.97%Verizon Communications, Inc. 1,184,827 72,748,378 0.94%Comcast Corp. Class A 1,300,838 58,498,685 0.76%Netflix, Inc. 125,573 40,631,656 0.53%Charter Communications, Inc.
Class A 44,944 21,801,435 0.28%Activision Blizzard, Inc. 219,841 13,062,952 0.17%Electronic Arts, Inc. 83,559 8,983,428 0.12%Twitter, Inc. 222,097 7,118,209 0.09%T-Mobile US, Inc. 90,100 7,065,642 0.09%ViacomCBS, Inc. Class B 153,884 6,458,511 0.08%Omnicom Group, Inc. 62,131 5,033,854 0.07%Take-Two Interactive Software, Inc. 32,622 3,993,911 0.05%Fox Corp. Class A 101,846 3,775,431 0.05%CenturyLink, Inc. 282,156 3,727,281 0.05%Live Nation Entertainment, Inc. 40,700 2,908,829 0.04%Discovery, Inc. Class C 94,704 2,887,525 0.04%DISH Network Corp. Class A 73,196 2,596,262 0.03%Interpublic Group of Cos, Inc. 109,970 2,540,307 0.03%Fox Corp. Class B 46,137 1,679,387 0.02%News Corp. Class A 115,747 1,636,663 0.02%Discovery, Inc. Class A 45,486 1,489,212 0.02%News Corp. Class B 31,982 464,059 0.01%
796,502,778 10.33%
Consumer Discretionary 9.70% (2018: 9.84%)
Amazon.com, Inc. 119,326 220,495,356 2.86%Home Depot, Inc. 312,561 68,257,071 0.89%McDonald’s Corp. 215,639 42,612,423 0.55%NIKE, Inc. Class B 357,047 36,172,432 0.47%Starbucks Corp. 338,814 29,788,527 0.39%Lowe’s Cos, Inc. 219,806 26,323,967 0.34%Booking Holdings, Inc. 12,032 24,710,479 0.32%TJX Cos, Inc. 347,681 21,229,402 0.28%Target Corp. 145,265 18,624,426 0.24%General Motors Co. 359,950 13,174,170 0.17%Ross Stores, Inc. 103,210 12,015,708 0.16%Marriott International, Inc. Class A 77,792 11,780,043 0.15%Dollar General Corp. 73,221 11,421,012 0.15%Ford Motor Co. 1,113,295 10,353,643 0.13%O’Reilly Automotive, Inc. 21,672 9,497,971 0.12%VF Corp. 94,559 9,423,750 0.12%Hilton Worldwide Holdings, Inc. 80,663 8,946,333 0.12%Yum! Brands, Inc. 86,948 8,758,272 0.11%AutoZone, Inc. 6,821 8,125,925 0.11%eBay, Inc. 219,659 7,931,886 0.10%Aptiv plc 72,914 6,924,643 0.09%Las Vegas Sands Corp. 96,416 6,656,561 0.09%Royal Caribbean Cruises Ltd. 48,871 6,524,767 0.08%Dollar Tree, Inc. 67,831 6,379,506 0.08%Chipotle Mexican Grill, Inc. Class A 7,247 6,066,536 0.08%Carnival Corp. 114,821 5,836,351 0.08%Best Buy Co., Inc. 64,806 5,689,967 0.07%DR Horton, Inc. 96,106 5,069,591 0.07%MGM Resorts International 148,044 4,925,424 0.06%Lennar Corp. Class A 80,209 4,474,860 0.06%
Genuine Parts Co. 41,675 4,427,135 0.06%Expedia Group, Inc. 39,786 4,302,458 0.06%Tiffany & Co. 31,235 4,174,558 0.05%CarMax, Inc. 47,396 4,155,207 0.05%Ulta Beauty, Inc. 16,284 4,122,132 0.05%Garmin Ltd. 41,113 4,010,984 0.05%Wynn Resorts Ltd. 27,916 3,876,695 0.05%Hasbro, Inc. 36,267 3,830,158 0.05%Darden Restaurants, Inc. 35,094 3,825,597 0.05%NVR, Inc. 981 3,736,050 0.05%Norwegian Cruise Line Holdings Ltd. 62,105 3,627,553 0.05%Tractor Supply Co. 33,898 3,167,429 0.04%Advance Auto Parts, Inc. 19,525 3,127,124 0.04%LKQ Corp. 87,475 3,122,857 0.04%PulteGroup, Inc. 73,651 2,857,659 0.04%Whirlpool Corp. 18,220 2,687,997 0.03%BorgWarner, Inc. 59,923 2,599,460 0.03%Mohawk Industries, Inc. 17,314 2,361,283 0.03%Kohl’s Corp. 44,794 2,282,254 0.03%PVH Corp. 20,998 2,207,940 0.03%Tapestry, Inc. 78,814 2,125,614 0.03%Newell Brands, Inc. 107,296 2,062,229 0.03%Leggett & Platt, Inc. 38,235 1,943,485 0.03%Harley-Davidson, Inc. 45,398 1,688,352 0.02%Capri Holdings Ltd. 42,583 1,624,541 0.02%Ralph Lauren Corp. Class A 13,643 1,599,232 0.02%Hanesbrands, Inc. 105,031 1,559,710 0.02%Macy’s, Inc. 86,896 1,477,232 0.02%H&R Block, Inc. 57,921 1,359,985 0.02%Nordstrom, Inc. 30,846 1,262,527 0.02%L Brands, Inc. 64,219 1,163,648 0.02%Under Armour, Inc. Class A 52,371 1,131,214 0.01%Gap, Inc. 62,712 1,108,748 0.01%Under Armour, Inc. Class C 55,226 1,059,235 0.01%
747,859,284 9.70%
Consumer Staples 7.16% (2018: 7.34%)
Procter & Gamble Co. 714,199 89,203,455 1.16%Coca-Cola Co. 1,104,678 61,143,927 0.79%PepsiCo, Inc. 399,148 54,551,557 0.71%Walmart, Inc. 405,986 48,247,376 0.63%Philip Morris International, Inc. 445,547 37,911,594 0.49%Costco Wholesale Corp. 126,685 37,235,255 0.48%Altria Group, Inc. 535,466 26,725,108 0.35%Mondelez International, Inc. Class A 411,819 22,682,991 0.29%Colgate-Palmolive Co. 245,716 16,915,090 0.22%Kimberly-Clark Corp. 98,611 13,563,943 0.18%Estee Lauder Cos, Inc. Class A 63,691 13,154,739 0.17%Walgreens Boots Alliance, Inc. 214,720 12,659,891 0.16%Sysco Corp. 146,184 12,504,579 0.16%General Mills, Inc. 172,539 9,241,189 0.12%Constellation Brands, Inc. Class A 47,776 9,065,496 0.12%Tyson Foods, Inc. Class A 84,203 7,665,841 0.10%Archer-Daniels-Midland Co. 159,681 7,401,214 0.10%Monster Beverage Corp. 110,152 7,000,160 0.09%Kroger Co. 229,832 6,662,830 0.09%Hershey Co. 42,680 6,273,106 0.08%McCormick & Co., Inc. 35,823 6,080,238 0.08%Kraft Heinz Co. 178,689 5,741,278 0.07%Clorox Co. 36,070 5,538,188 0.07%Church & Dwight Co., Inc. 70,171 4,935,828 0.06%Kellogg Co. 71,001 4,910,429 0.06%
Financial Statements Statement of Investments31 December 2019
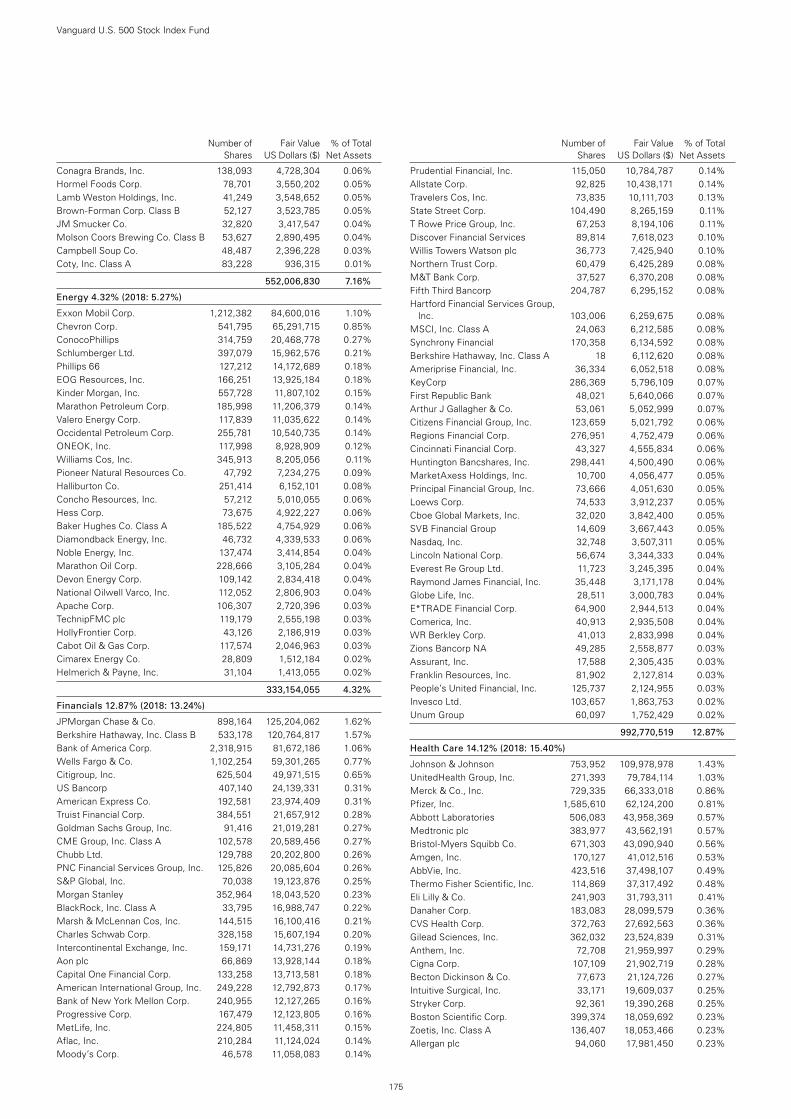
175
Number of Fair Value % of Total Shares US Dollars ($) Net Assets
Conagra Brands, Inc. 138,093 4,728,304 0.06%Hormel Foods Corp. 78,701 3,550,202 0.05%Lamb Weston Holdings, Inc. 41,249 3,548,652 0.05%Brown-Forman Corp. Class B 52,127 3,523,785 0.05%JM Smucker Co. 32,820 3,417,547 0.04%Molson Coors Brewing Co. Class B 53,627 2,890,495 0.04%Campbell Soup Co. 48,487 2,396,228 0.03%Coty, Inc. Class A 83,228 936,315 0.01%
552,006,830 7.16%
Energy 4.32% (2018: 5.27%)
Exxon Mobil Corp. 1,212,382 84,600,016 1.10%Chevron Corp. 541,795 65,291,715 0.85%ConocoPhillips 314,759 20,468,778 0.27%Schlumberger Ltd. 397,079 15,962,576 0.21%Phillips 66 127,212 14,172,689 0.18%EOG Resources, Inc. 166,251 13,925,184 0.18%Kinder Morgan, Inc. 557,728 11,807,102 0.15%Marathon Petroleum Corp. 185,998 11,206,379 0.14%Valero Energy Corp. 117,839 11,035,622 0.14%Occidental Petroleum Corp. 255,781 10,540,735 0.14%ONEOK, Inc. 117,998 8,928,909 0.12%Williams Cos, Inc. 345,913 8,205,056 0.11%Pioneer Natural Resources Co. 47,792 7,234,275 0.09%Halliburton Co. 251,414 6,152,101 0.08%Concho Resources, Inc. 57,212 5,010,055 0.06%Hess Corp. 73,675 4,922,227 0.06%Baker Hughes Co. Class A 185,522 4,754,929 0.06%Diamondback Energy, Inc. 46,732 4,339,533 0.06%Noble Energy, Inc. 137,474 3,414,854 0.04%Marathon Oil Corp. 228,666 3,105,284 0.04%Devon Energy Corp. 109,142 2,834,418 0.04%National Oilwell Varco, Inc. 112,052 2,806,903 0.04%Apache Corp. 106,307 2,720,396 0.03%TechnipFMC plc 119,179 2,555,198 0.03%HollyFrontier Corp. 43,126 2,186,919 0.03%Cabot Oil & Gas Corp. 117,574 2,046,963 0.03%Cimarex Energy Co. 28,809 1,512,184 0.02%Helmerich & Payne, Inc. 31,104 1,413,055 0.02%
333,154,055 4.32%
Financials 12.87% (2018: 13.24%)
JPMorgan Chase & Co. 898,164 125,204,062 1.62%Berkshire Hathaway, Inc. Class B 533,178 120,764,817 1.57%Bank of America Corp. 2,318,915 81,672,186 1.06%Wells Fargo & Co. 1,102,254 59,301,265 0.77%Citigroup, Inc. 625,504 49,971,515 0.65%US Bancorp 407,140 24,139,331 0.31%American Express Co. 192,581 23,974,409 0.31%Truist Financial Corp. 384,551 21,657,912 0.28%Goldman Sachs Group, Inc. 91,416 21,019,281 0.27%CME Group, Inc. Class A 102,578 20,589,456 0.27%Chubb Ltd. 129,788 20,202,800 0.26%PNC Financial Services Group, Inc. 125,826 20,085,604 0.26%S&P Global, Inc. 70,038 19,123,876 0.25%Morgan Stanley 352,964 18,043,520 0.23%BlackRock, Inc. Class A 33,795 16,988,747 0.22%Marsh & McLennan Cos, Inc. 144,515 16,100,416 0.21%Charles Schwab Corp. 328,158 15,607,194 0.20%Intercontinental Exchange, Inc. 159,171 14,731,276 0.19%Aon plc 66,869 13,928,144 0.18%Capital One Financial Corp. 133,258 13,713,581 0.18%American International Group, Inc. 249,228 12,792,873 0.17%Bank of New York Mellon Corp. 240,955 12,127,265 0.16%Progressive Corp. 167,479 12,123,805 0.16%MetLife, Inc. 224,805 11,458,311 0.15%Aflac, Inc. 210,284 11,124,024 0.14%Moody’s Corp. 46,578 11,058,083 0.14%
Prudential Financial, Inc. 115,050 10,784,787 0.14%Allstate Corp. 92,825 10,438,171 0.14%Travelers Cos, Inc. 73,835 10,111,703 0.13%State Street Corp. 104,490 8,265,159 0.11%T Rowe Price Group, Inc. 67,253 8,194,106 0.11%Discover Financial Services 89,814 7,618,023 0.10%Willis Towers Watson plc 36,773 7,425,940 0.10%Northern Trust Corp. 60,479 6,425,289 0.08%M&T Bank Corp. 37,527 6,370,208 0.08%Fifth Third Bancorp 204,787 6,295,152 0.08%Hartford Financial Services Group,
Inc. 103,006 6,259,675 0.08%MSCI, Inc. Class A 24,063 6,212,585 0.08%Synchrony Financial 170,358 6,134,592 0.08%Berkshire Hathaway, Inc. Class A 18 6,112,620 0.08%Ameriprise Financial, Inc. 36,334 6,052,518 0.08%KeyCorp 286,369 5,796,109 0.07%First Republic Bank 48,021 5,640,066 0.07%Arthur J Gallagher & Co. 53,061 5,052,999 0.07%Citizens Financial Group, Inc. 123,659 5,021,792 0.06%Regions Financial Corp. 276,951 4,752,479 0.06%Cincinnati Financial Corp. 43,327 4,555,834 0.06%Huntington Bancshares, Inc. 298,441 4,500,490 0.06%MarketAxess Holdings, Inc. 10,700 4,056,477 0.05%Principal Financial Group, Inc. 73,666 4,051,630 0.05%Loews Corp. 74,533 3,912,237 0.05%Cboe Global Markets, Inc. 32,020 3,842,400 0.05%SVB Financial Group 14,609 3,667,443 0.05%Nasdaq, Inc. 32,748 3,507,311 0.05%Lincoln National Corp. 56,674 3,344,333 0.04%Everest Re Group Ltd. 11,723 3,245,395 0.04%Raymond James Financial, Inc. 35,448 3,171,178 0.04%Globe Life, Inc. 28,511 3,000,783 0.04%E*TRADE Financial Corp. 64,900 2,944,513 0.04%Comerica, Inc. 40,913 2,935,508 0.04%WR Berkley Corp. 41,013 2,833,998 0.04%Zions Bancorp NA 49,285 2,558,877 0.03%Assurant, Inc. 17,588 2,305,435 0.03%Franklin Resources, Inc. 81,902 2,127,814 0.03%People’s United Financial, Inc. 125,737 2,124,955 0.03%Invesco Ltd. 103,657 1,863,753 0.02%Unum Group 60,097 1,752,429 0.02%
992,770,519 12.87%
Health Care 14.12% (2018: 15.40%)
Johnson & Johnson 753,952 109,978,978 1.43%UnitedHealth Group, Inc. 271,393 79,784,114 1.03%Merck & Co., Inc. 729,335 66,333,018 0.86%Pfizer, Inc. 1,585,610 62,124,200 0.81%Abbott Laboratories 506,083 43,958,369 0.57%Medtronic plc 383,977 43,562,191 0.57%Bristol-Myers Squibb Co. 671,303 43,090,940 0.56%Amgen, Inc. 170,127 41,012,516 0.53%AbbVie, Inc. 423,516 37,498,107 0.49%Thermo Fisher Scientific, Inc. 114,869 37,317,492 0.48%Eli Lilly & Co. 241,903 31,793,311 0.41%Danaher Corp. 183,083 28,099,579 0.36%CVS Health Corp. 372,763 27,692,563 0.36%Gilead Sciences, Inc. 362,032 23,524,839 0.31%Anthem, Inc. 72,708 21,959,997 0.29%Cigna Corp. 107,109 21,902,719 0.28%Becton Dickinson & Co. 77,673 21,124,726 0.27%Intuitive Surgical, Inc. 33,171 19,609,037 0.25%Stryker Corp. 92,361 19,390,268 0.25%Boston Scientific Corp. 399,374 18,059,692 0.23%Zoetis, Inc. Class A 136,407 18,053,466 0.23%Allergan plc 94,060 17,981,450 0.23%
Number of Fair Value % of Total Shares US Dollars ($) Net Assets
Vanguard U.S. 500 Stock Index Fund
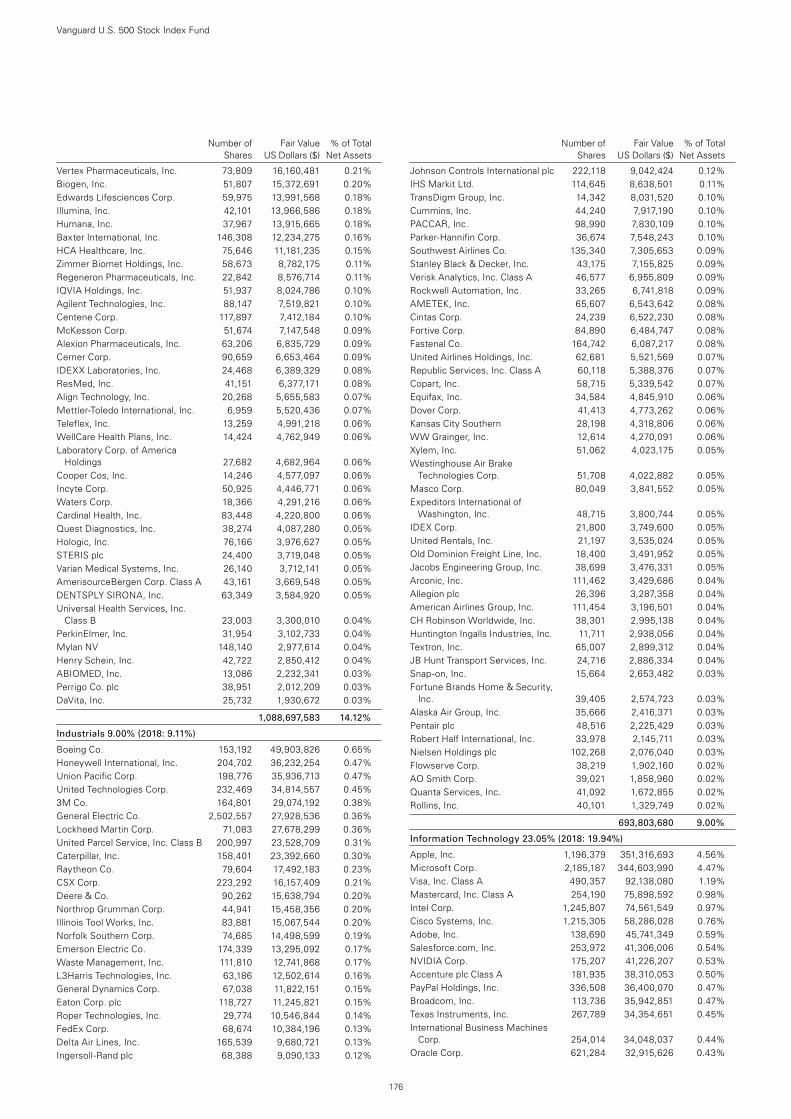
176
Number of Fair Value % of Total Shares US Dollars ($) Net Assets
Vertex Pharmaceuticals, Inc. 73,809 16,160,481 0.21%Biogen, Inc. 51,807 15,372,691 0.20%Edwards Lifesciences Corp. 59,975 13,991,568 0.18%Illumina, Inc. 42,101 13,966,586 0.18%Humana, Inc. 37,967 13,915,665 0.18%Baxter International, Inc. 146,308 12,234,275 0.16%HCA Healthcare, Inc. 75,646 11,181,235 0.15%Zimmer Biomet Holdings, Inc. 58,673 8,782,175 0.11%Regeneron Pharmaceuticals, Inc. 22,842 8,576,714 0.11%IQVIA Holdings, Inc. 51,937 8,024,786 0.10%Agilent Technologies, Inc. 88,147 7,519,821 0.10%Centene Corp. 117,897 7,412,184 0.10%McKesson Corp. 51,674 7,147,548 0.09%Alexion Pharmaceuticals, Inc. 63,206 6,835,729 0.09%Cerner Corp. 90,659 6,653,464 0.09%IDEXX Laboratories, Inc. 24,468 6,389,329 0.08%ResMed, Inc. 41,151 6,377,171 0.08%Align Technology, Inc. 20,268 5,655,583 0.07%Mettler-Toledo International, Inc. 6,959 5,520,436 0.07%Teleflex, Inc. 13,259 4,991,218 0.06%WellCare Health Plans, Inc. 14,424 4,762,949 0.06%Laboratory Corp. of America
Holdings 27,682 4,682,964 0.06%Cooper Cos, Inc. 14,246 4,577,097 0.06%Incyte Corp. 50,925 4,446,771 0.06%Waters Corp. 18,366 4,291,216 0.06%Cardinal Health, Inc. 83,448 4,220,800 0.06%Quest Diagnostics, Inc. 38,274 4,087,280 0.05%Hologic, Inc. 76,166 3,976,627 0.05%STERIS plc 24,400 3,719,048 0.05%Varian Medical Systems, Inc. 26,140 3,712,141 0.05%AmerisourceBergen Corp. Class A 43,161 3,669,548 0.05%DENTSPLY SIRONA, Inc. 63,349 3,584,920 0.05%Universal Health Services, Inc.
Class B 23,003 3,300,010 0.04%PerkinElmer, Inc. 31,954 3,102,733 0.04%Mylan NV 148,140 2,977,614 0.04%Henry Schein, Inc. 42,722 2,850,412 0.04%ABIOMED, Inc. 13,086 2,232,341 0.03%Perrigo Co. plc 38,951 2,012,209 0.03%DaVita, Inc. 25,732 1,930,672 0.03%
1,088,697,583 14.12%
Industrials 9.00% (2018: 9.11%)
Boeing Co. 153,192 49,903,826 0.65%Honeywell International, Inc. 204,702 36,232,254 0.47%Union Pacific Corp. 198,776 35,936,713 0.47%United Technologies Corp. 232,469 34,814,557 0.45%3M Co. 164,801 29,074,192 0.38%General Electric Co. 2,502,557 27,928,536 0.36%Lockheed Martin Corp. 71,083 27,678,299 0.36%United Parcel Service, Inc. Class B 200,997 23,528,709 0.31%Caterpillar, Inc. 158,401 23,392,660 0.30%Raytheon Co. 79,604 17,492,183 0.23%CSX Corp. 223,292 16,157,409 0.21%Deere & Co. 90,262 15,638,794 0.20%Northrop Grumman Corp. 44,941 15,458,356 0.20%Illinois Tool Works, Inc. 83,881 15,067,544 0.20%Norfolk Southern Corp. 74,685 14,498,599 0.19%Emerson Electric Co. 174,339 13,295,092 0.17%Waste Management, Inc. 111,810 12,741,868 0.17%L3Harris Technologies, Inc. 63,186 12,502,614 0.16%General Dynamics Corp. 67,038 11,822,151 0.15%Eaton Corp. plc 118,727 11,245,821 0.15%Roper Technologies, Inc. 29,774 10,546,844 0.14%FedEx Corp. 68,674 10,384,196 0.13%Delta Air Lines, Inc. 165,539 9,680,721 0.13%Ingersoll-Rand plc 68,388 9,090,133 0.12%
Johnson Controls International plc 222,118 9,042,424 0.12%IHS Markit Ltd. 114,645 8,638,501 0.11%TransDigm Group, Inc. 14,342 8,031,520 0.10%Cummins, Inc. 44,240 7,917,190 0.10%PACCAR, Inc. 98,990 7,830,109 0.10%Parker-Hannifin Corp. 36,674 7,548,243 0.10%Southwest Airlines Co. 135,340 7,305,653 0.09%Stanley Black & Decker, Inc. 43,175 7,155,825 0.09%Verisk Analytics, Inc. Class A 46,577 6,955,809 0.09%Rockwell Automation, Inc. 33,265 6,741,818 0.09%AMETEK, Inc. 65,607 6,543,642 0.08%Cintas Corp. 24,239 6,522,230 0.08%Fortive Corp. 84,890 6,484,747 0.08%Fastenal Co. 164,742 6,087,217 0.08%United Airlines Holdings, Inc. 62,681 5,521,569 0.07%Republic Services, Inc. Class A 60,118 5,388,376 0.07%Copart, Inc. 58,715 5,339,542 0.07%Equifax, Inc. 34,584 4,845,910 0.06%Dover Corp. 41,413 4,773,262 0.06%Kansas City Southern 28,198 4,318,806 0.06%WW Grainger, Inc. 12,614 4,270,091 0.06%Xylem, Inc. 51,062 4,023,175 0.05%Westinghouse Air Brake
Technologies Corp. 51,708 4,022,882 0.05%Masco Corp. 80,049 3,841,552 0.05%Expeditors International of
Washington, Inc. 48,715 3,800,744 0.05%IDEX Corp. 21,800 3,749,600 0.05%United Rentals, Inc. 21,197 3,535,024 0.05%Old Dominion Freight Line, Inc. 18,400 3,491,952 0.05%Jacobs Engineering Group, Inc. 38,699 3,476,331 0.05%Arconic, Inc. 111,462 3,429,686 0.04%Allegion plc 26,396 3,287,358 0.04%American Airlines Group, Inc. 111,454 3,196,501 0.04%CH Robinson Worldwide, Inc. 38,301 2,995,138 0.04%Huntington Ingalls Industries, Inc. 11,711 2,938,056 0.04%Textron, Inc. 65,007 2,899,312 0.04%JB Hunt Transport Services, Inc. 24,716 2,886,334 0.04%Snap-on, Inc. 15,664 2,653,482 0.03%Fortune Brands Home & Security,
Inc. 39,405 2,574,723 0.03%Alaska Air Group, Inc. 35,666 2,416,371 0.03%Pentair plc 48,516 2,225,429 0.03%Robert Half International, Inc. 33,978 2,145,711 0.03%Nielsen Holdings plc 102,268 2,076,040 0.03%Flowserve Corp. 38,219 1,902,160 0.02%AO Smith Corp. 39,021 1,858,960 0.02%Quanta Services, Inc. 41,092 1,672,855 0.02%Rollins, Inc. 40,101 1,329,749 0.02%
693,803,680 9.00%
Information Technology 23.05% (2018: 19.94%)
Apple, Inc. 1,196,379 351,316,693 4.56%Microsoft Corp. 2,185,187 344,603,990 4.47%Visa, Inc. Class A 490,357 92,138,080 1.19%Mastercard, Inc. Class A 254,190 75,898,592 0.98%Intel Corp. 1,245,807 74,561,549 0.97%Cisco Systems, Inc. 1,215,305 58,286,028 0.76%Adobe, Inc. 138,690 45,741,349 0.59%Salesforce.com, Inc. 253,972 41,306,006 0.54%NVIDIA Corp. 175,207 41,226,207 0.53%Accenture plc Class A 181,935 38,310,053 0.50%PayPal Holdings, Inc. 336,508 36,400,070 0.47%Broadcom, Inc. 113,736 35,942,851 0.47%Texas Instruments, Inc. 267,789 34,354,651 0.45%International Business Machines
Corp. 254,014 34,048,037 0.44%Oracle Corp. 621,284 32,915,626 0.43%
Number of Fair Value % of Total Shares US Dollars ($) Net Assets
Vanguard U.S. 500 Stock Index Fund
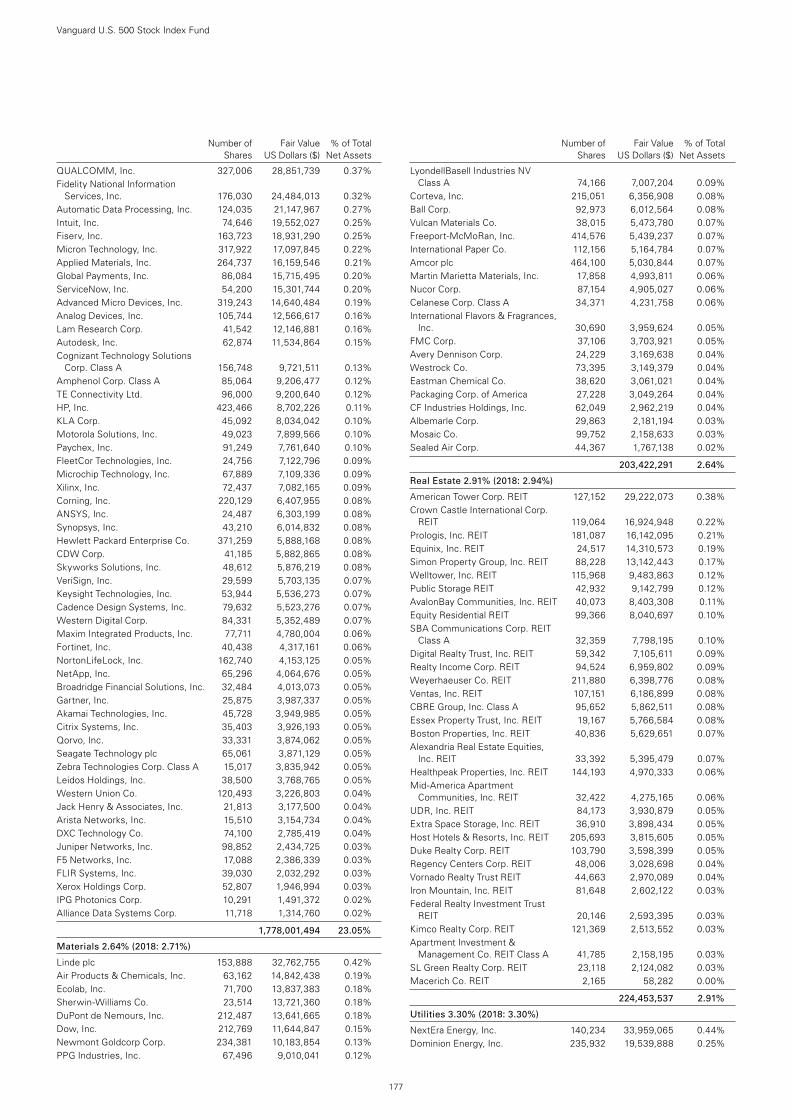
177
Number of Fair Value % of Total Shares US Dollars ($) Net Assets
QUALCOMM, Inc. 327,006 28,851,739 0.37%Fidelity National Information
Services, Inc. 176,030 24,484,013 0.32%Automatic Data Processing, Inc. 124,035 21,147,967 0.27%Intuit, Inc. 74,646 19,552,027 0.25%Fiserv, Inc. 163,723 18,931,290 0.25%Micron Technology, Inc. 317,922 17,097,845 0.22%Applied Materials, Inc. 264,737 16,159,546 0.21%Global Payments, Inc. 86,084 15,715,495 0.20%ServiceNow, Inc. 54,200 15,301,744 0.20%Advanced Micro Devices, Inc. 319,243 14,640,484 0.19%Analog Devices, Inc. 105,744 12,566,617 0.16%Lam Research Corp. 41,542 12,146,881 0.16%Autodesk, Inc. 62,874 11,534,864 0.15%Cognizant Technology Solutions
Corp. Class A 156,748 9,721,511 0.13%Amphenol Corp. Class A 85,064 9,206,477 0.12%TE Connectivity Ltd. 96,000 9,200,640 0.12%HP, Inc. 423,466 8,702,226 0.11%KLA Corp. 45,092 8,034,042 0.10%Motorola Solutions, Inc. 49,023 7,899,566 0.10%Paychex, Inc. 91,249 7,761,640 0.10%FleetCor Technologies, Inc. 24,756 7,122,796 0.09%Microchip Technology, Inc. 67,889 7,109,336 0.09%Xilinx, Inc. 72,437 7,082,165 0.09%Corning, Inc. 220,129 6,407,955 0.08%ANSYS, Inc. 24,487 6,303,199 0.08%Synopsys, Inc. 43,210 6,014,832 0.08%Hewlett Packard Enterprise Co. 371,259 5,888,168 0.08%CDW Corp. 41,185 5,882,865 0.08%Skyworks Solutions, Inc. 48,612 5,876,219 0.08%VeriSign, Inc. 29,599 5,703,135 0.07%Keysight Technologies, Inc. 53,944 5,536,273 0.07%Cadence Design Systems, Inc. 79,632 5,523,276 0.07%Western Digital Corp. 84,331 5,352,489 0.07%Maxim Integrated Products, Inc. 77,711 4,780,004 0.06%Fortinet, Inc. 40,438 4,317,161 0.06%NortonLifeLock, Inc. 162,740 4,153,125 0.05%NetApp, Inc. 65,296 4,064,676 0.05%Broadridge Financial Solutions, Inc. 32,484 4,013,073 0.05%Gartner, Inc. 25,875 3,987,337 0.05%Akamai Technologies, Inc. 45,728 3,949,985 0.05%Citrix Systems, Inc. 35,403 3,926,193 0.05%Qorvo, Inc. 33,331 3,874,062 0.05%Seagate Technology plc 65,061 3,871,129 0.05%Zebra Technologies Corp. Class A 15,017 3,835,942 0.05%Leidos Holdings, Inc. 38,500 3,768,765 0.05%Western Union Co. 120,493 3,226,803 0.04%Jack Henry & Associates, Inc. 21,813 3,177,500 0.04%Arista Networks, Inc. 15,510 3,154,734 0.04%DXC Technology Co. 74,100 2,785,419 0.04%Juniper Networks, Inc. 98,852 2,434,725 0.03%F5 Networks, Inc. 17,088 2,386,339 0.03%FLIR Systems, Inc. 39,030 2,032,292 0.03%Xerox Holdings Corp. 52,807 1,946,994 0.03%IPG Photonics Corp. 10,291 1,491,372 0.02%Alliance Data Systems Corp. 11,718 1,314,760 0.02%
1,778,001,494 23.05%
Materials 2.64% (2018: 2.71%)
Linde plc 153,888 32,762,755 0.42%Air Products & Chemicals, Inc. 63,162 14,842,438 0.19%Ecolab, Inc. 71,700 13,837,383 0.18%Sherwin-Williams Co. 23,514 13,721,360 0.18%DuPont de Nemours, Inc. 212,487 13,641,665 0.18%Dow, Inc. 212,769 11,644,847 0.15%Newmont Goldcorp Corp. 234,381 10,183,854 0.13%PPG Industries, Inc. 67,496 9,010,041 0.12%
LyondellBasell Industries NV Class A 74,166 7,007,204 0.09%
Corteva, Inc. 215,051 6,356,908 0.08%Ball Corp. 92,973 6,012,564 0.08%Vulcan Materials Co. 38,015 5,473,780 0.07%Freeport-McMoRan, Inc. 414,576 5,439,237 0.07%International Paper Co. 112,156 5,164,784 0.07%Amcor plc 464,100 5,030,844 0.07%Martin Marietta Materials, Inc. 17,858 4,993,811 0.06%Nucor Corp. 87,154 4,905,027 0.06%Celanese Corp. Class A 34,371 4,231,758 0.06%International Flavors & Fragrances,
Inc. 30,690 3,959,624 0.05%FMC Corp. 37,106 3,703,921 0.05%Avery Dennison Corp. 24,229 3,169,638 0.04%Westrock Co. 73,395 3,149,379 0.04%Eastman Chemical Co. 38,620 3,061,021 0.04%Packaging Corp. of America 27,228 3,049,264 0.04%CF Industries Holdings, Inc. 62,049 2,962,219 0.04%Albemarle Corp. 29,863 2,181,194 0.03%Mosaic Co. 99,752 2,158,633 0.03%Sealed Air Corp. 44,367 1,767,138 0.02%
203,422,291 2.64%
Real Estate 2.91% (2018: 2.94%)
American Tower Corp. REIT 127,152 29,222,073 0.38%Crown Castle International Corp.
REIT 119,064 16,924,948 0.22%Prologis, Inc. REIT 181,087 16,142,095 0.21%Equinix, Inc. REIT 24,517 14,310,573 0.19%Simon Property Group, Inc. REIT 88,228 13,142,443 0.17%Welltower, Inc. REIT 115,968 9,483,863 0.12%Public Storage REIT 42,932 9,142,799 0.12%AvalonBay Communities, Inc. REIT 40,073 8,403,308 0.11%Equity Residential REIT 99,366 8,040,697 0.10%SBA Communications Corp. REIT
Class A 32,359 7,798,195 0.10%Digital Realty Trust, Inc. REIT 59,342 7,105,611 0.09%Realty Income Corp. REIT 94,524 6,959,802 0.09%Weyerhaeuser Co. REIT 211,880 6,398,776 0.08%Ventas, Inc. REIT 107,151 6,186,899 0.08%CBRE Group, Inc. Class A 95,652 5,862,511 0.08%Essex Property Trust, Inc. REIT 19,167 5,766,584 0.08%Boston Properties, Inc. REIT 40,836 5,629,651 0.07%Alexandria Real Estate Equities,
Inc. REIT 33,392 5,395,479 0.07%Healthpeak Properties, Inc. REIT 144,193 4,970,333 0.06%Mid-America Apartment
Communities, Inc. REIT 32,422 4,275,165 0.06%UDR, Inc. REIT 84,173 3,930,879 0.05%Extra Space Storage, Inc. REIT 36,910 3,898,434 0.05%Host Hotels & Resorts, Inc. REIT 205,693 3,815,605 0.05%Duke Realty Corp. REIT 103,790 3,598,399 0.05%Regency Centers Corp. REIT 48,006 3,028,698 0.04%Vornado Realty Trust REIT 44,663 2,970,089 0.04%Iron Mountain, Inc. REIT 81,648 2,602,122 0.03%Federal Realty Investment Trust
REIT 20,146 2,593,395 0.03%Kimco Realty Corp. REIT 121,369 2,513,552 0.03%Apartment Investment &
Management Co. REIT Class A 41,785 2,158,195 0.03%SL Green Realty Corp. REIT 23,118 2,124,082 0.03%Macerich Co. REIT 2,165 58,282 0.00%
224,453,537 2.91%
Utilities 3.30% (2018: 3.30%)
NextEra Energy, Inc. 140,234 33,959,065 0.44%Dominion Energy, Inc. 235,932 19,539,888 0.25%
Number of Fair Value % of Total Shares US Dollars ($) Net Assets
Vanguard U.S. 500 Stock Index Fund
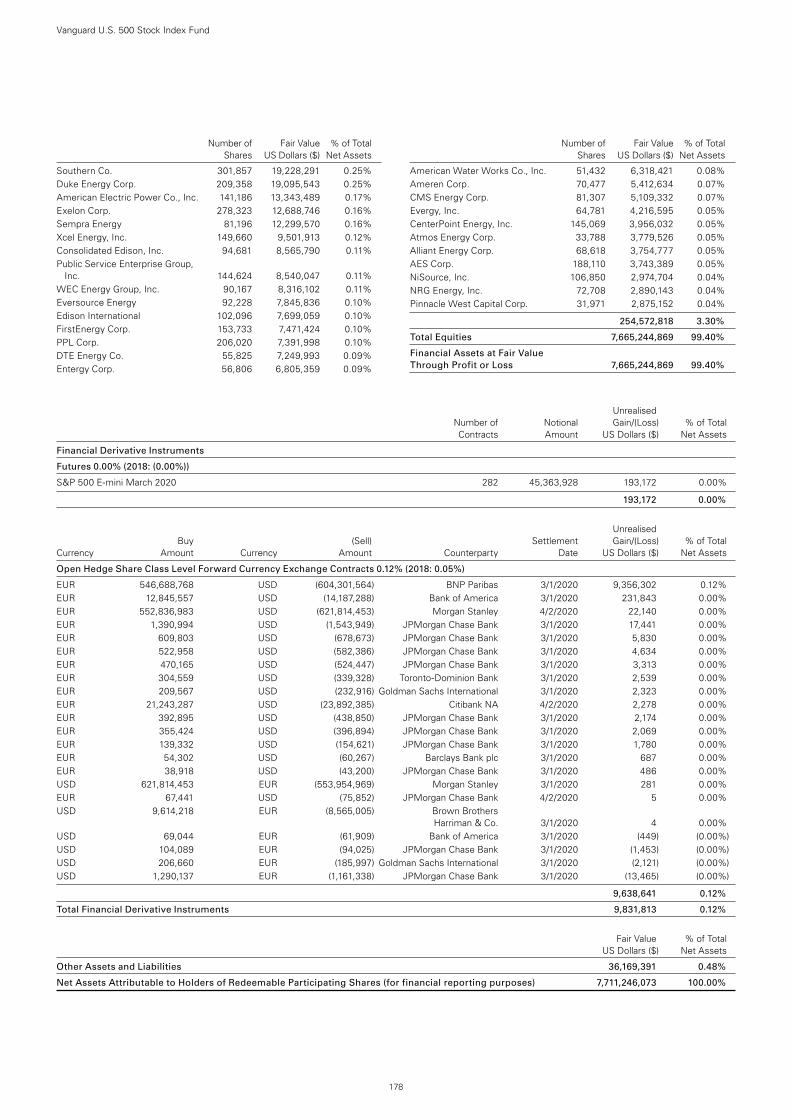
178
Number of Fair Value % of Total Shares US Dollars ($) Net Assets
Southern Co. 301,857 19,228,291 0.25%Duke Energy Corp. 209,358 19,095,543 0.25%American Electric Power Co., Inc. 141,186 13,343,489 0.17%Exelon Corp. 278,323 12,688,746 0.16%Sempra Energy 81,196 12,299,570 0.16%Xcel Energy, Inc. 149,660 9,501,913 0.12%Consolidated Edison, Inc. 94,681 8,565,790 0.11%Public Service Enterprise Group,
Inc. 144,624 8,540,047 0.11%WEC Energy Group, Inc. 90,167 8,316,102 0.11%Eversource Energy 92,228 7,845,836 0.10%Edison International 102,096 7,699,059 0.10%FirstEnergy Corp. 153,733 7,471,424 0.10%PPL Corp. 206,020 7,391,998 0.10%DTE Energy Co. 55,825 7,249,993 0.09%Entergy Corp. 56,806 6,805,359 0.09%
American Water Works Co., Inc. 51,432 6,318,421 0.08%Ameren Corp. 70,477 5,412,634 0.07%CMS Energy Corp. 81,307 5,109,332 0.07%Evergy, Inc. 64,781 4,216,595 0.05%CenterPoint Energy, Inc. 145,069 3,956,032 0.05%Atmos Energy Corp. 33,788 3,779,526 0.05%Alliant Energy Corp. 68,618 3,754,777 0.05%AES Corp. 188,110 3,743,389 0.05%NiSource, Inc. 106,850 2,974,704 0.04%NRG Energy, Inc. 72,708 2,890,143 0.04%Pinnacle West Capital Corp. 31,971 2,875,152 0.04%
254,572,818 3.30%
Total Equities 7,665,244,869 99.40%
Financial Assets at Fair Value Through Profit or Loss 7,665,244,869 99.40%
Number of Fair Value % of Total Shares US Dollars ($) Net Assets
Vanguard U.S. 500 Stock Index Fund
Unrealised Number of Notional Gain/(Loss) % of Total Contracts Amount US Dollars ($) Net Assets
Financial Derivative Instruments
Futures 0.00% (2018: (0.00%))
S&P 500 E-mini March 2020 282 45,363,928 193,172 0.00%
193,172 0.00%
Unrealised Buy (Sell) Settlement Gain/(Loss) % of Total Currency Amount Currency Amount Counterparty Date US Dollars ($) Net Assets
Open Hedge Share Class Level Forward Currency Exchange Contracts 0.12% (2018: 0.05%)
EUR 546,688,768 USD (604,301,564) BNP Paribas 3/1/2020 9,356,302 0.12%EUR 12,845,557 USD (14,187,288) Bank of America 3/1/2020 231,843 0.00%EUR 552,836,983 USD (621,814,453) Morgan Stanley 4/2/2020 22,140 0.00%EUR 1,390,994 USD (1,543,949) JPMorgan Chase Bank 3/1/2020 17,441 0.00%EUR 609,803 USD (678,673) JPMorgan Chase Bank 3/1/2020 5,830 0.00%EUR 522,958 USD (582,386) JPMorgan Chase Bank 3/1/2020 4,634 0.00%EUR 470,165 USD (524,447) JPMorgan Chase Bank 3/1/2020 3,313 0.00%EUR 304,559 USD (339,328) Toronto-Dominion Bank 3/1/2020 2,539 0.00%EUR 209,567 USD (232,916) Goldman Sachs International 3/1/2020 2,323 0.00%EUR 21,243,287 USD (23,892,385) Citibank NA 4/2/2020 2,278 0.00%EUR 392,895 USD (438,850) JPMorgan Chase Bank 3/1/2020 2,174 0.00%EUR 355,424 USD (396,894) JPMorgan Chase Bank 3/1/2020 2,069 0.00%EUR 139,332 USD (154,621) JPMorgan Chase Bank 3/1/2020 1,780 0.00%EUR 54,302 USD (60,267) Barclays Bank plc 3/1/2020 687 0.00%EUR 38,918 USD (43,200) JPMorgan Chase Bank 3/1/2020 486 0.00%USD 621,814,453 EUR (553,954,969) Morgan Stanley 3/1/2020 281 0.00%EUR 67,441 USD (75,852) JPMorgan Chase Bank 4/2/2020 5 0.00%USD 9,614,218 EUR (8,565,005) Brown Brothers
Harriman & Co. 3/1/2020 4 0.00%USD 69,044 EUR (61,909) Bank of America 3/1/2020 (449) (0.00%)USD 104,089 EUR (94,025) JPMorgan Chase Bank 3/1/2020 (1,453) (0.00%)USD 206,660 EUR (185,997) Goldman Sachs International 3/1/2020 (2,121) (0.00%)USD 1,290,137 EUR (1,161,338) JPMorgan Chase Bank 3/1/2020 (13,465) (0.00%)
9,638,641 0.12%
Total Financial Derivative Instruments 9,831,813 0.12%
Fair Value % of Total US Dollars ($) Net Assets
Other Assets and Liabilities 36,169,391 0.48%
Net Assets Attributable to Holders of Redeemable Participating Shares (for financial reporting purposes) 7,711,246,073 100.00%

179
Vanguard U.S. 500 Stock Index Fund
% of Total Analysis of Total Net Assets US Dollars ($) Net Assets
(a) Transferable securities admitted to an official stock exchange listing 7,661,402,469 99.35%
(b) Transferable securities dealt in on another regulated market 3,842,400 0.05%
(c) Transferable securities other than those admitted to an official stock exchange listing or dealt in on another regulated market — 0.00%
(d) Financial derivative instruments 9,831,813 0.12%
(e) Other assets and liabilities 36,169,391 0.48%
Total Net Assets (for financial reporting purposes) 7,711,246,073 100.00%

The accompanying notes form an integral part of the financial statements.
180
Vanguard U.S. 500 Stock Index Fund
Statement of Assets and Liabilities
US Dollars ($) US Dollars ($) As at As at 31 December 2019 31 December 2018
Current Assets Financial Assets at Fair Value Through Profit or Loss 7,665,244,869 5,962,024,149Financial Derivative Instruments 9,849,301 2,750,792Cash 24,611,997 37,821,667Unrealised Appreciation on Spot Currency Contracts — 727Receivables:
Interest and Dividends 5,818,975 5,336,830Capital Shares Issued 8,387,681 12,592,646Investments Sold 45,156 2,468,004Futures Margin Cash 1,233,119 2,918,333
Total Current Assets 7,715,191,098 6,025,913,148
Current Liabilities Financial Derivative Instruments 17,488 169,241Unrealised Depreciation on Spot Currency Contracts 4,313 —Payables and Other Liabilities:
Investments Purchased 130,015 3,340,420Capital Shares Redeemed 3,172,124 7,658,333Management Fees Payable 621,085 570,205
Total Current Liabilities 3,945,025 11,738,199
Net Assets Attributable to Holders of Redeemable Participating Shares (for financial reporting purposes) (“Net Assets”) 7,711,246,073 6,014,174,949
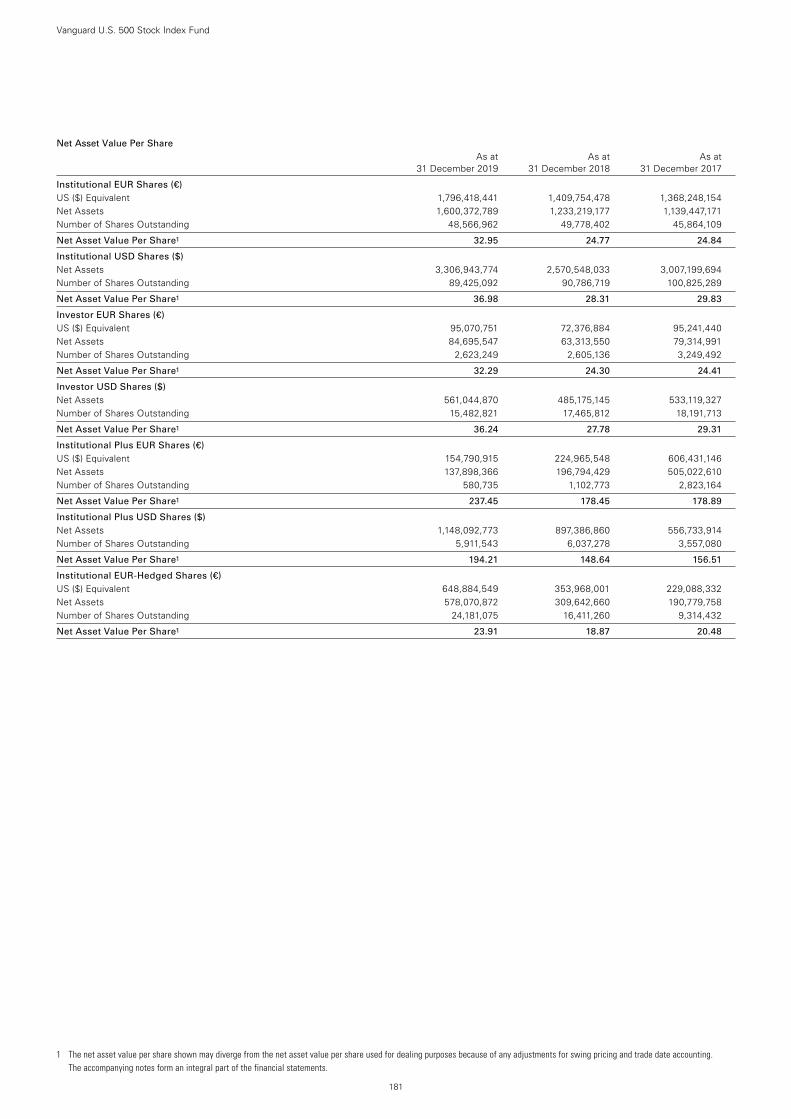
1 The net asset value per share shown may diverge from the net asset value per share used for dealing purposes because of any adjustments for swing pricing and trade date accounting. The accompanying notes form an integral part of the financial statements.
181
Net Asset Value Per Share As at As at As at 31 December 2019 31 December 2018 31 December 2017
Institutional EUR Shares (€) US ($) Equivalent 1,796,418,441 1,409,754,478 1,368,248,154Net Assets 1,600,372,789 1,233,219,177 1,139,447,171Number of Shares Outstanding 48,566,962 49,778,402 45,864,109
Net Asset Value Per Share1 32.95 24.77 24.84
Institutional USD Shares ($) Net Assets 3,306,943,774 2,570,548,033 3,007,199,694Number of Shares Outstanding 89,425,092 90,786,719 100,825,289
Net Asset Value Per Share1 36.98 28.31 29.83
Investor EUR Shares (€) US ($) Equivalent 95,070,751 72,376,884 95,241,440Net Assets 84,695,547 63,313,550 79,314,991Number of Shares Outstanding 2,623,249 2,605,136 3,249,492
Net Asset Value Per Share1 32.29 24.30 24.41
Investor USD Shares ($) Net Assets 561,044,870 485,175,145 533,119,327Number of Shares Outstanding 15,482,821 17,465,812 18,191,713
Net Asset Value Per Share1 36.24 27.78 29.31
Institutional Plus EUR Shares (€) US ($) Equivalent 154,790,915 224,965,548 606,431,146Net Assets 137,898,366 196,794,429 505,022,610Number of Shares Outstanding 580,735 1,102,773 2,823,164
Net Asset Value Per Share1 237.45 178.45 178.89
Institutional Plus USD Shares ($) Net Assets 1,148,092,773 897,386,860 556,733,914Number of Shares Outstanding 5,911,543 6,037,278 3,557,080
Net Asset Value Per Share1 194.21 148.64 156.51
Institutional EUR-Hedged Shares (€) US ($) Equivalent 648,884,549 353,968,001 229,088,332Net Assets 578,070,872 309,642,660 190,779,758Number of Shares Outstanding 24,181,075 16,411,260 9,314,432
Net Asset Value Per Share1 23.91 18.87 20.48
Vanguard U.S. 500 Stock Index Fund
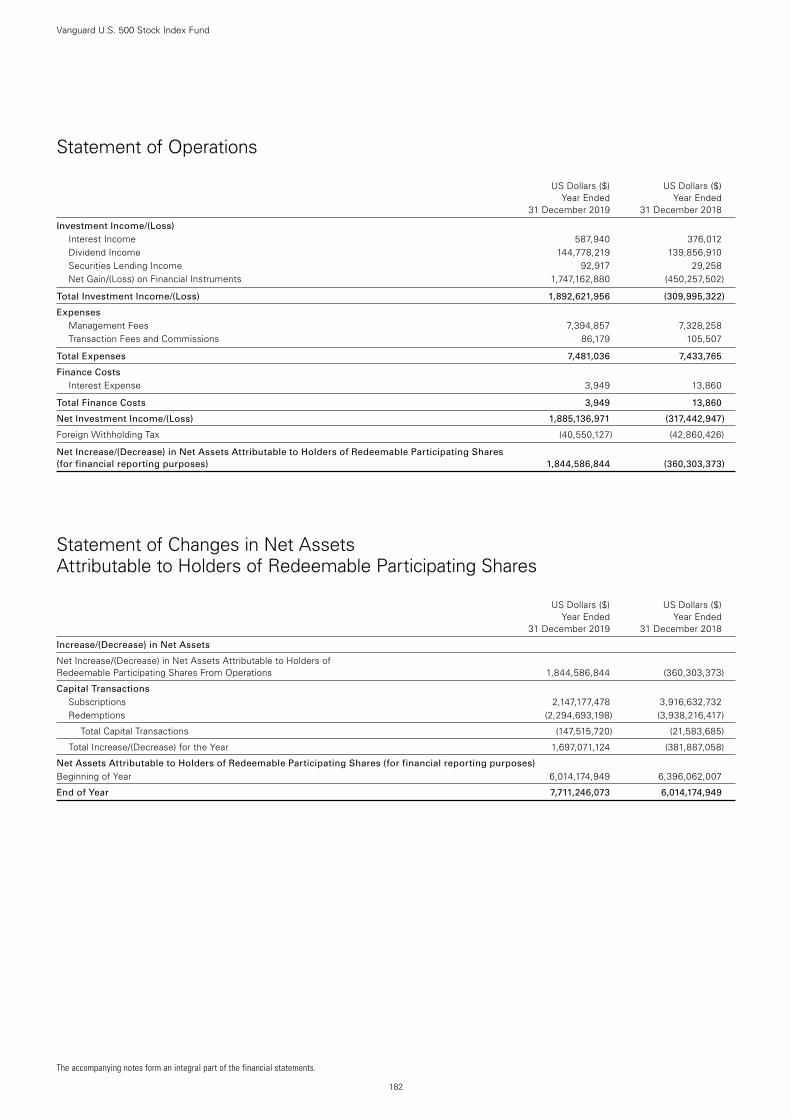
182
Vanguard U.S. 500 Stock Index Fund
Statement of Operations
US Dollars ($) US Dollars ($) Year Ended Year Ended 31 December 2019 31 December 2018
Investment Income/(Loss) Interest Income 587,940 376,012Dividend Income 144,778,219 139,856,910Securities Lending Income 92,917 29,258Net Gain/(Loss) on Financial Instruments 1,747,162,880 (450,257,502)
Total Investment Income/(Loss) 1,892,621,956 (309,995,322)
Expenses Management Fees 7,394,857 7,328,258Transaction Fees and Commissions 86,179 105,507
Total Expenses 7,481,036 7,433,765
Finance Costs Interest Expense 3,949 13,860
Total Finance Costs 3,949 13,860
Net Investment Income/(Loss) 1,885,136,971 (317,442,947)
Foreign Withholding Tax (40,550,127) (42,860,426)
Net Increase/(Decrease) in Net Assets Attributable to Holders of Redeemable Participating Shares (for financial reporting purposes) 1,844,586,844 (360,303,373)
Statement of Changes in Net Assets Attributable to Holders of Redeemable Participating Shares
US Dollars ($) US Dollars ($) Year Ended Year Ended 31 December 2019 31 December 2018
Increase/(Decrease) in Net Assets
Net Increase/(Decrease) in Net Assets Attributable to Holders of Redeemable Participating Shares From Operations 1,844,586,844 (360,303,373)
Capital Transactions Subscriptions 2,147,177,478 3,916,632,732Redemptions (2,294,693,198) (3,938,216,417)
Total Capital Transactions (147,515,720) (21,583,685)
Total Increase/(Decrease) for the Year 1,697,071,124 (381,887,058)
Net Assets Attributable to Holders of Redeemable Participating Shares (for financial reporting purposes) Beginning of Year 6,014,174,949 6,396,062,007
End of Year 7,711,246,073 6,014,174,949
The accompanying notes form an integral part of the financial statements.
183
Vanguard U.S. Fundamental Value FundSub-managed by Pzena Investment Management, LLC.
All of the returns in this report represent past performance, which is not a guarantee of future results that may be achieved by the fund. (For performance data current to the most recent month-end, which may be higher or lower than that cited, visit our website at http://global.vanguard.com.) Note, too, that both investment returns and principal value can fluctuate widely, so an investor’s shares, when sold, could be worth more or less than their original cost.
Investment ObjectiveThe fund seeks to provide long-term capital growth by investing mainly in large companies whose stocks are considered undervalued.
Performance Summary (unaudited)The Performance Summary does not form part of the Financial Statements. The fund is actively managed and seeks to invest as described in the prospectus. The following performance information shows how the fund’s returns compare with those of the Russell 1000 Value Index, a market index that has investment characteristics similar to those of the fund.
• USequitymarketspostedstrongreturnsforthe12monthsended31December2019.Despitecontinuingconcernsaboutslowingglobalgrowthandgeopolitical tensions, sentiment improved as investors anticipated resolutions of the Brexit impasse and the US-China trade dispute.
• Tocounterthoseconcerns,anumberofmajorcentralbankspursuedaccommodativemonetarypoliciesthatincreasedinvestorappetiteforriskierassets. The US Federal Reserve cut interest rates three times in 2019.
• Equitymarketsapproachedrecordhighsfortheyear,withUSstocksoutpacingtheirnon-UScounterparts.IntheUS,large-capitalisationstocksoutperformedmid- and small-caps, and growth stocks outperformed value.
• Inthisenvironment,thefund’sbenchmarkindexreturned25.56%.
• Securityselectionininformationtechnologydetractedmostfromthefund’srelativeperformance.Incontrast,selectioninfinancialsandindustrialsprovidedthe biggest boost for the fund. Selection in utilities also added value.
All returns in the commentary above are in US dollars.
Benchmark: Russell 1000 Value Index
Total Returns Periods Ended 31 December 2019 (Annualised for periods over one year)
Ten Years or One Year Five Years Since Inception
GBP Investor Shares 19.68% 9.68% 12.38%
Benchmark 20.71 11.04 13.20
USD Investor Shares 24.48% 6.16% 10.18%
Benchmark 25.56 7.48 10.98
Each benchmark is in its respective currency.
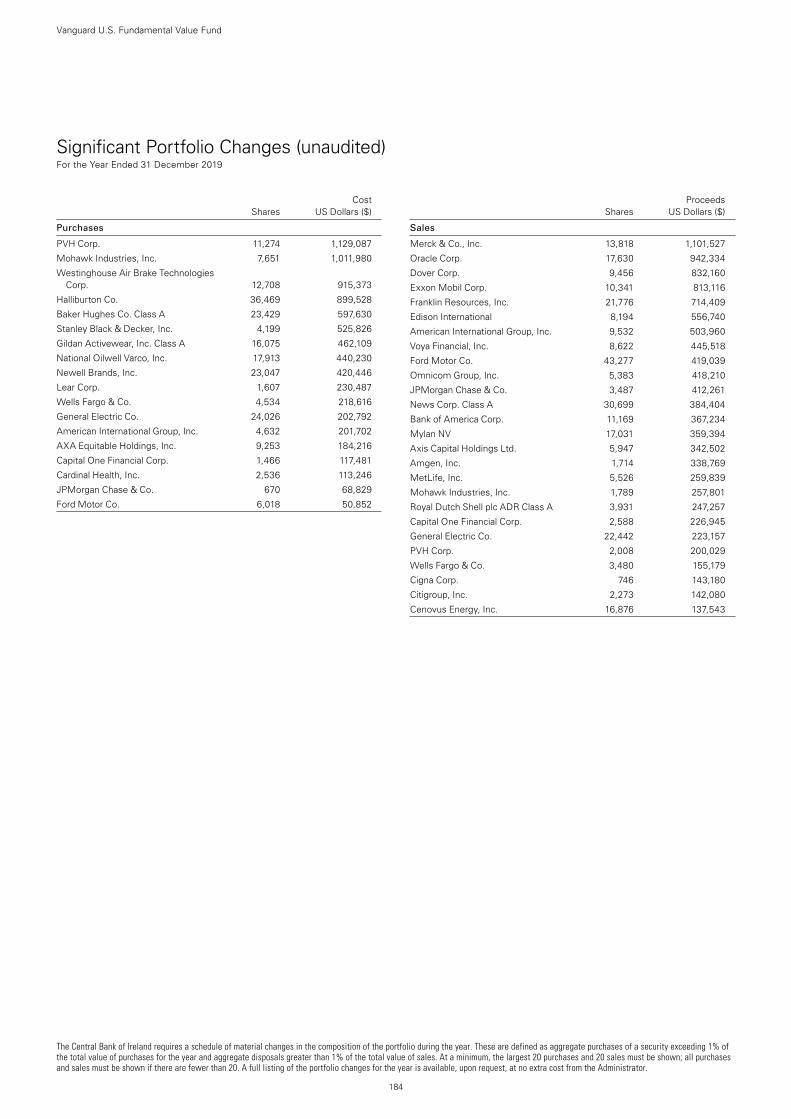
The Central Bank of Ireland requires a schedule of material changes in the composition of the portfolio during the year. These are defined as aggregate purchases of a security exceeding 1% of the total value of purchases for the year and aggregate disposals greater than 1% of the total value of sales. At a minimum, the largest 20 purchases and 20 sales must be shown; all purchases and sales must be shown if there are fewer than 20. A full listing of the portfolio changes for the year is available, upon request, at no extra cost from the Administrator.
184
Vanguard U.S. Fundamental Value Fund
Significant Portfolio Changes (unaudited) For the Year Ended 31 December 2019
Cost Shares US Dollars ($)
Purchases
PVH Corp. 11,274 1,129,087
Mohawk Industries, Inc. 7,651 1,011,980
Westinghouse Air Brake Technologies Corp. 12,708 915,373
Halliburton Co. 36,469 899,528
Baker Hughes Co. Class A 23,429 597,630
Stanley Black & Decker, Inc. 4,199 525,826
Gildan Activewear, Inc. Class A 16,075 462,109
National Oilwell Varco, Inc. 17,913 440,230
Newell Brands, Inc. 23,047 420,446
Lear Corp. 1,607 230,487
Wells Fargo & Co. 4,534 218,616
General Electric Co. 24,026 202,792
American International Group, Inc. 4,632 201,702
AXA Equitable Holdings, Inc. 9,253 184,216
Capital One Financial Corp. 1,466 117,481
Cardinal Health, Inc. 2,536 113,246
JPMorgan Chase & Co. 670 68,829
Ford Motor Co. 6,018 50,852
Proceeds Shares US Dollars ($)
Sales
Merck & Co., Inc. 13,818 1,101,527
Oracle Corp. 17,630 942,334
Dover Corp. 9,456 832,160
Exxon Mobil Corp. 10,341 813,116
Franklin Resources, Inc. 21,776 714,409
Edison International 8,194 556,740
American International Group, Inc. 9,532 503,960
Voya Financial, Inc. 8,622 445,518
Ford Motor Co. 43,277 419,039
Omnicom Group, Inc. 5,383 418,210
JPMorgan Chase & Co. 3,487 412,261
News Corp. Class A 30,699 384,404
Bank of America Corp. 11,169 367,234
Mylan NV 17,031 359,394
Axis Capital Holdings Ltd. 5,947 342,502
Amgen, Inc. 1,714 338,769
MetLife, Inc. 5,526 259,839
Mohawk Industries, Inc. 1,789 257,801
Royal Dutch Shell plc ADR Class A 3,931 247,257
Capital One Financial Corp. 2,588 226,945
General Electric Co. 22,442 223,157
PVH Corp. 2,008 200,029
Wells Fargo & Co. 3,480 155,179
Cigna Corp. 746 143,180
Citigroup, Inc. 2,273 142,080
Cenovus Energy, Inc. 16,876 137,543
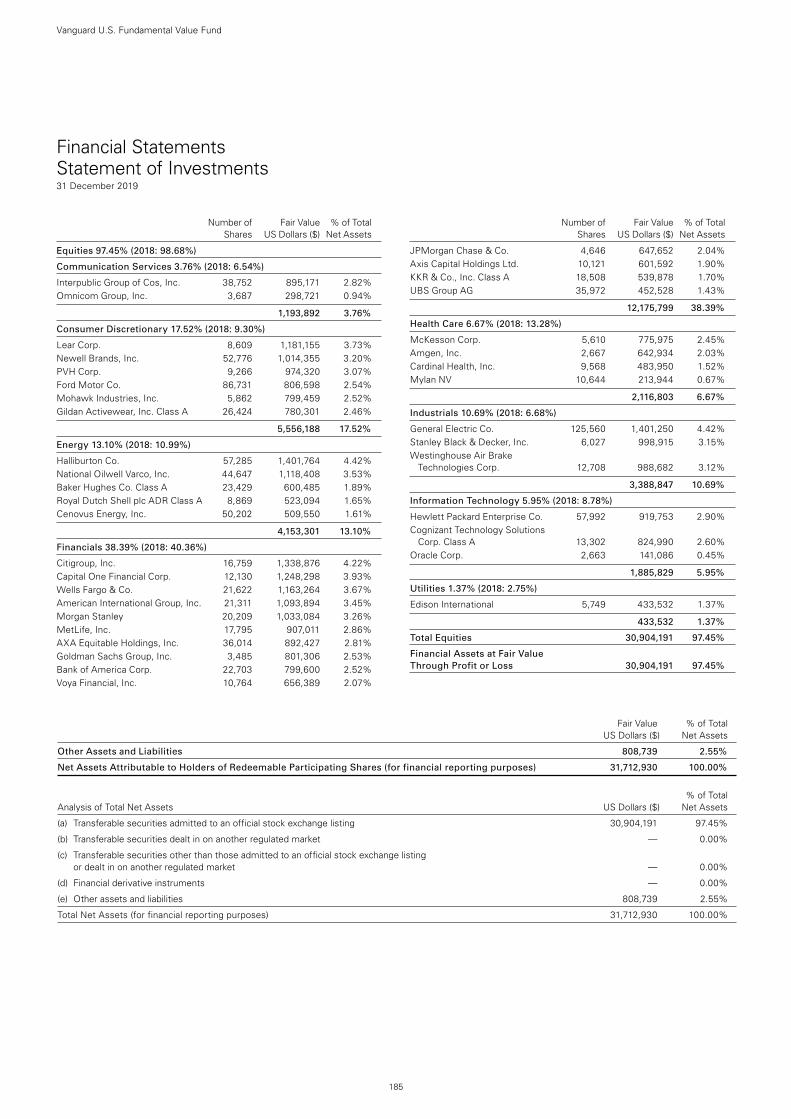
185
Vanguard U.S. Fundamental Value Fund
Number of Fair Value % of Total Shares US Dollars ($) Net Assets
Number of Fair Value % of Total Shares US Dollars ($) Net Assets
Equities 97.45% (2018: 98.68%)
Communication Services 3.76% (2018: 6.54%)
Interpublic Group of Cos, Inc. 38,752 895,171 2.82%Omnicom Group, Inc. 3,687 298,721 0.94%
1,193,892 3.76%
Consumer Discretionary 17.52% (2018: 9.30%)
Lear Corp. 8,609 1,181,155 3.73%Newell Brands, Inc. 52,776 1,014,355 3.20%PVH Corp. 9,266 974,320 3.07%Ford Motor Co. 86,731 806,598 2.54%Mohawk Industries, Inc. 5,862 799,459 2.52%Gildan Activewear, Inc. Class A 26,424 780,301 2.46%
5,556,188 17.52%
Energy 13.10% (2018: 10.99%)
Halliburton Co. 57,285 1,401,764 4.42%National Oilwell Varco, Inc. 44,647 1,118,408 3.53%Baker Hughes Co. Class A 23,429 600,485 1.89%Royal Dutch Shell plc ADR Class A 8,869 523,094 1.65%Cenovus Energy, Inc. 50,202 509,550 1.61%
4,153,301 13.10%
Financials 38.39% (2018: 40.36%)
Citigroup, Inc. 16,759 1,338,876 4.22%Capital One Financial Corp. 12,130 1,248,298 3.93%Wells Fargo & Co. 21,622 1,163,264 3.67%American International Group, Inc. 21,311 1,093,894 3.45%Morgan Stanley 20,209 1,033,084 3.26%MetLife, Inc. 17,795 907,011 2.86%AXA Equitable Holdings, Inc. 36,014 892,427 2.81%Goldman Sachs Group, Inc. 3,485 801,306 2.53%Bank of America Corp. 22,703 799,600 2.52%Voya Financial, Inc. 10,764 656,389 2.07%
JPMorgan Chase & Co. 4,646 647,652 2.04%Axis Capital Holdings Ltd. 10,121 601,592 1.90%KKR & Co., Inc. Class A 18,508 539,878 1.70%UBS Group AG 35,972 452,528 1.43%
12,175,799 38.39%
Health Care 6.67% (2018: 13.28%)
McKesson Corp. 5,610 775,975 2.45%Amgen, Inc. 2,667 642,934 2.03%Cardinal Health, Inc. 9,568 483,950 1.52%Mylan NV 10,644 213,944 0.67%
2,116,803 6.67%
Industrials 10.69% (2018: 6.68%)
General Electric Co. 125,560 1,401,250 4.42%Stanley Black & Decker, Inc. 6,027 998,915 3.15%Westinghouse Air Brake
Technologies Corp. 12,708 988,682 3.12%
3,388,847 10.69%
Information Technology 5.95% (2018: 8.78%)
Hewlett Packard Enterprise Co. 57,992 919,753 2.90%Cognizant Technology Solutions
Corp. Class A 13,302 824,990 2.60%Oracle Corp. 2,663 141,086 0.45%
1,885,829 5.95%
Utilities 1.37% (2018: 2.75%)
Edison International 5,749 433,532 1.37%
433,532 1.37%
Total Equities 30,904,191 97.45%
Financial Assets at Fair Value Through Profit or Loss 30,904,191 97.45%
Financial Statements Statement of Investments31 December 2019
Fair Value % of Total US Dollars ($) Net Assets
Other Assets and Liabilities 808,739 2.55%
Net Assets Attributable to Holders of Redeemable Participating Shares (for financial reporting purposes) 31,712,930 100.00%
% of Total Analysis of Total Net Assets US Dollars ($) Net Assets
(a) Transferable securities admitted to an official stock exchange listing 30,904,191 97.45%
(b) Transferable securities dealt in on another regulated market — 0.00%
(c) Transferable securities other than those admitted to an official stock exchange listing or dealt in on another regulated market — 0.00%
(d) Financial derivative instruments — 0.00%
(e) Other assets and liabilities 808,739 2.55%
Total Net Assets (for financial reporting purposes) 31,712,930 100.00%
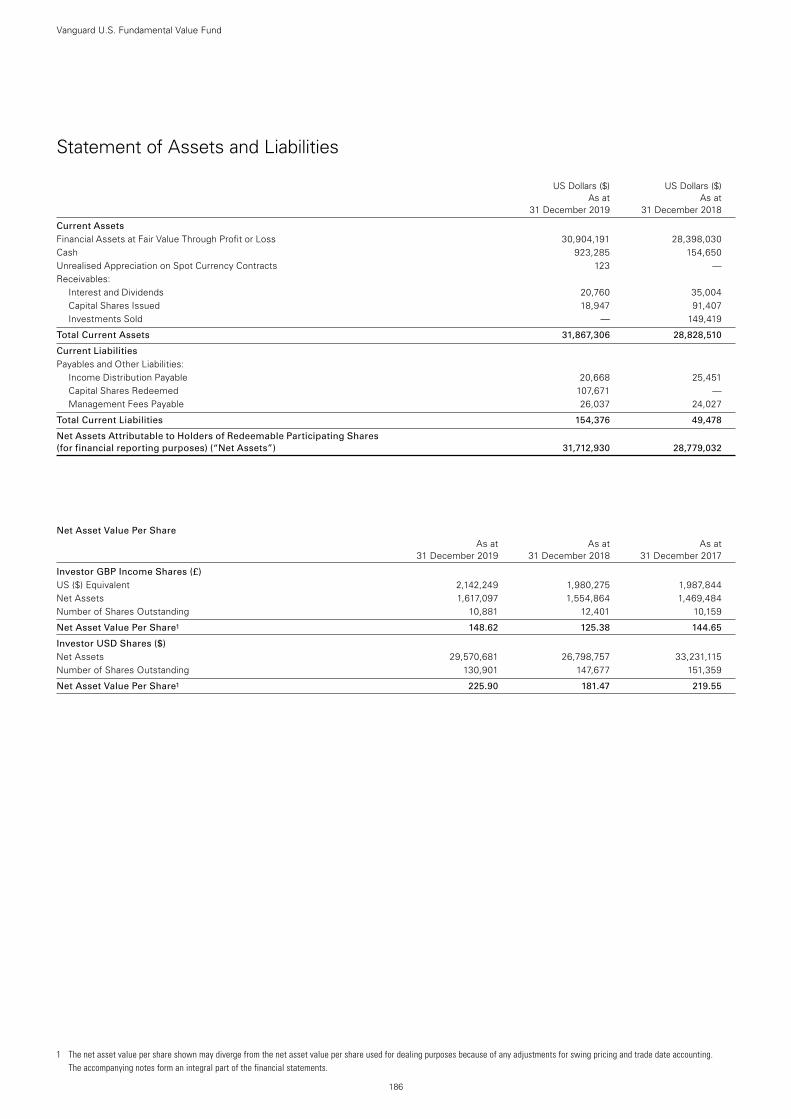
1 The net asset value per share shown may diverge from the net asset value per share used for dealing purposes because of any adjustments for swing pricing and trade date accounting. The accompanying notes form an integral part of the financial statements.
186
Vanguard U.S. Fundamental Value Fund
Statement of Assets and Liabilities
US Dollars ($) US Dollars ($) As at As at 31 December 2019 31 December 2018
Current Assets Financial Assets at Fair Value Through Profit or Loss 30,904,191 28,398,030Cash 923,285 154,650Unrealised Appreciation on Spot Currency Contracts 123 —Receivables:
Interest and Dividends 20,760 35,004Capital Shares Issued 18,947 91,407Investments Sold — 149,419
Total Current Assets 31,867,306 28,828,510
Current Liabilities Payables and Other Liabilities:
Income Distribution Payable 20,668 25,451Capital Shares Redeemed 107,671 —Management Fees Payable 26,037 24,027
Total Current Liabilities 154,376 49,478
Net Assets Attributable to Holders of Redeemable Participating Shares (for financial reporting purposes) (“Net Assets”) 31,712,930 28,779,032
Net Asset Value Per Share As at As at As at 31 December 2019 31 December 2018 31 December 2017
Investor GBP Income Shares (£) US ($) Equivalent 2,142,249 1,980,275 1,987,844Net Assets 1,617,097 1,554,864 1,469,484Number of Shares Outstanding 10,881 12,401 10,159
Net Asset Value Per Share1 148.62 125.38 144.65
Investor USD Shares ($) Net Assets 29,570,681 26,798,757 33,231,115Number of Shares Outstanding 130,901 147,677 151,359
Net Asset Value Per Share1 225.90 181.47 219.55
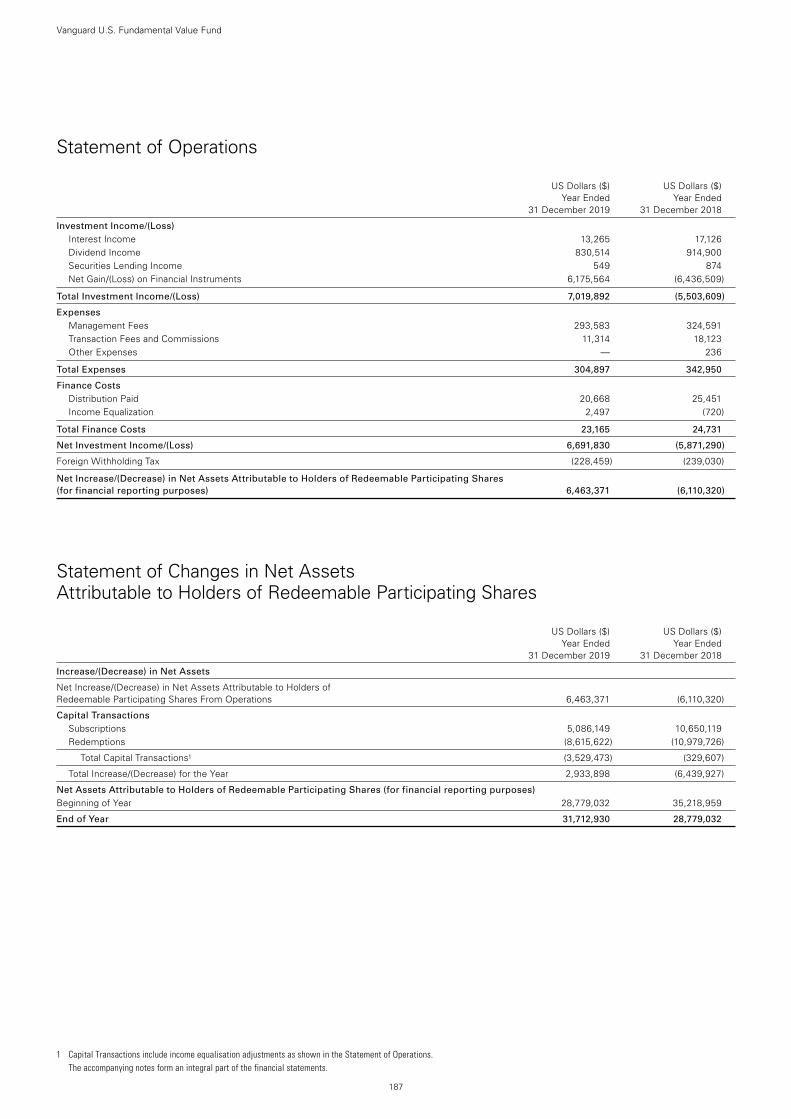
187
Vanguard U.S. Fundamental Value Fund
Statement of Operations
US Dollars ($) US Dollars ($) Year Ended Year Ended 31 December 2019 31 December 2018
Investment Income/(Loss) Interest Income 13,265 17,126Dividend Income 830,514 914,900Securities Lending Income 549 874Net Gain/(Loss) on Financial Instruments 6,175,564 (6,436,509)
Total Investment Income/(Loss) 7,019,892 (5,503,609)
Expenses Management Fees 293,583 324,591Transaction Fees and Commissions 11,314 18,123Other Expenses — 236
Total Expenses 304,897 342,950
Finance Costs Distribution Paid 20,668 25,451Income Equalization 2,497 (720)
Total Finance Costs 23,165 24,731
Net Investment Income/(Loss) 6,691,830 (5,871,290)
Foreign Withholding Tax (228,459) (239,030)
Net Increase/(Decrease) in Net Assets Attributable to Holders of Redeemable Participating Shares (for financial reporting purposes) 6,463,371 (6,110,320)
Statement of Changes in Net Assets Attributable to Holders of Redeemable Participating Shares
US Dollars ($) US Dollars ($) Year Ended Year Ended 31 December 2019 31 December 2018
Increase/(Decrease) in Net Assets
Net Increase/(Decrease) in Net Assets Attributable to Holders of Redeemable Participating Shares From Operations 6,463,371 (6,110,320)
Capital Transactions Subscriptions 5,086,149 10,650,119Redemptions (8,615,622) (10,979,726)
Total Capital Transactions1 (3,529,473) (329,607)
Total Increase/(Decrease) for the Year 2,933,898 (6,439,927)
Net Assets Attributable to Holders of Redeemable Participating Shares (for financial reporting purposes) Beginning of Year 28,779,032 35,218,959
End of Year 31,712,930 28,779,032
1 Capital Transactions include income equalisation adjustments as shown in the Statement of Operations. The accompanying notes form an integral part of the financial statements.
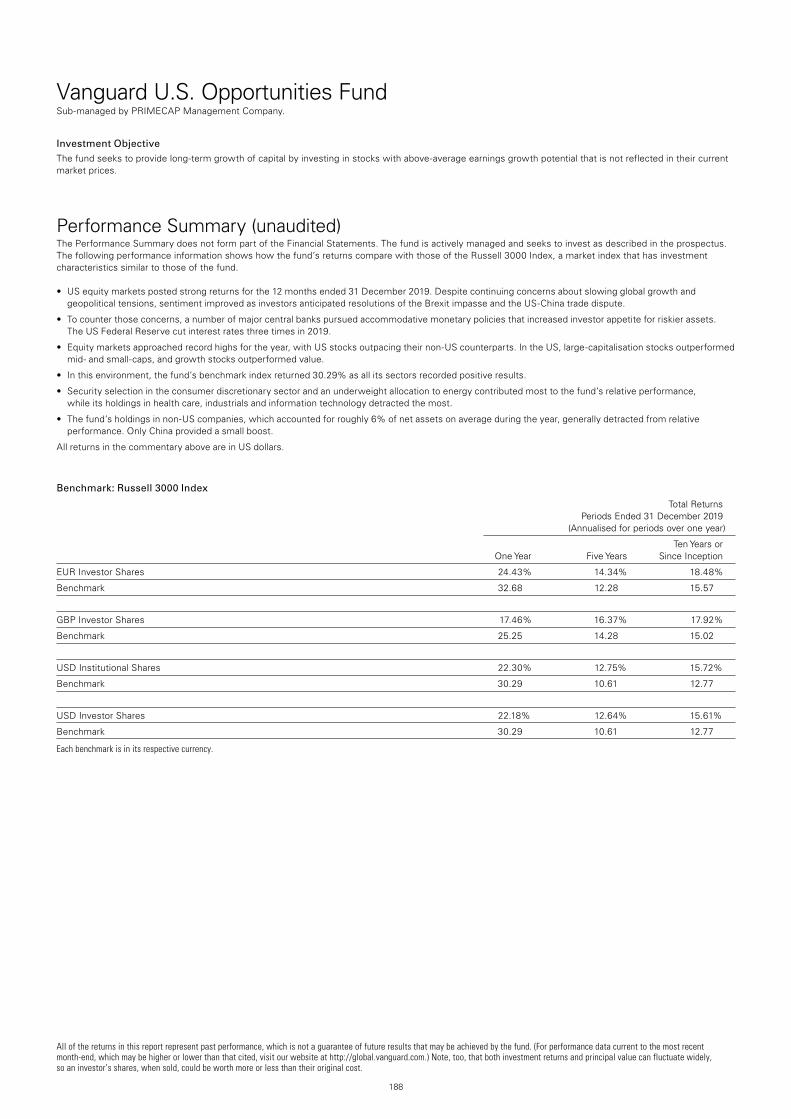
188
Vanguard U.S. Opportunities FundSub-managed by PRIMECAP Management Company.
All of the returns in this report represent past performance, which is not a guarantee of future results that may be achieved by the fund. (For performance data current to the most recent month-end, which may be higher or lower than that cited, visit our website at http://global.vanguard.com.) Note, too, that both investment returns and principal value can fluctuate widely, so an investor’s shares, when sold, could be worth more or less than their original cost.
Investment ObjectiveThe fund seeks to provide long-term growth of capital by investing in stocks with above-average earnings growth potential that is not reflected in their current market prices.
Performance Summary (unaudited)The Performance Summary does not form part of the Financial Statements. The fund is actively managed and seeks to invest as described in the prospectus. The following performance information shows how the fund’s returns compare with those of the Russell 3000 Index, a market index that has investment characteristics similar to those of the fund.
• USequitymarketspostedstrongreturnsforthe12monthsended31December2019.Despitecontinuingconcernsaboutslowingglobalgrowthandgeopolitical tensions, sentiment improved as investors anticipated resolutions of the Brexit impasse and the US-China trade dispute.
• Tocounterthoseconcerns,anumberofmajorcentralbankspursuedaccommodativemonetarypoliciesthatincreasedinvestorappetiteforriskierassets. The US Federal Reserve cut interest rates three times in 2019.
• Equitymarketsapproachedrecordhighsfortheyear,withUSstocksoutpacingtheirnon-UScounterparts.IntheUS,large-capitalisationstocksoutperformedmid- and small-caps, and growth stocks outperformed value.
• Inthisenvironment,thefund’sbenchmarkindexreturned30.29%asallitssectorsrecordedpositiveresults.
• Securityselectionintheconsumerdiscretionarysectorandanunderweightallocationtoenergycontributedmosttothefund’srelativeperformance, while its holdings in health care, industrials and information technology detracted the most.
• Thefund’sholdingsinnon-UScompanies,whichaccountedforroughly6%ofnetassetsonaverageduringtheyear,generallydetractedfromrelativeperformance. Only China provided a small boost.
All returns in the commentary above are in US dollars.
Benchmark: Russell 3000 Index
Total Returns Periods Ended 31 December 2019 (Annualised for periods over one year)
Ten Years or One Year Five Years Since Inception
EUR Investor Shares 24.43% 14.34% 18.48%
Benchmark 32.68 12.28 15.57
GBP Investor Shares 17.46% 16.37% 17.92%
Benchmark 25.25 14.28 15.02
USD Institutional Shares 22.30% 12.75% 15.72%
Benchmark 30.29 10.61 12.77
USD Investor Shares 22.18% 12.64% 15.61%
Benchmark 30.29 10.61 12.77
Each benchmark is in its respective currency.
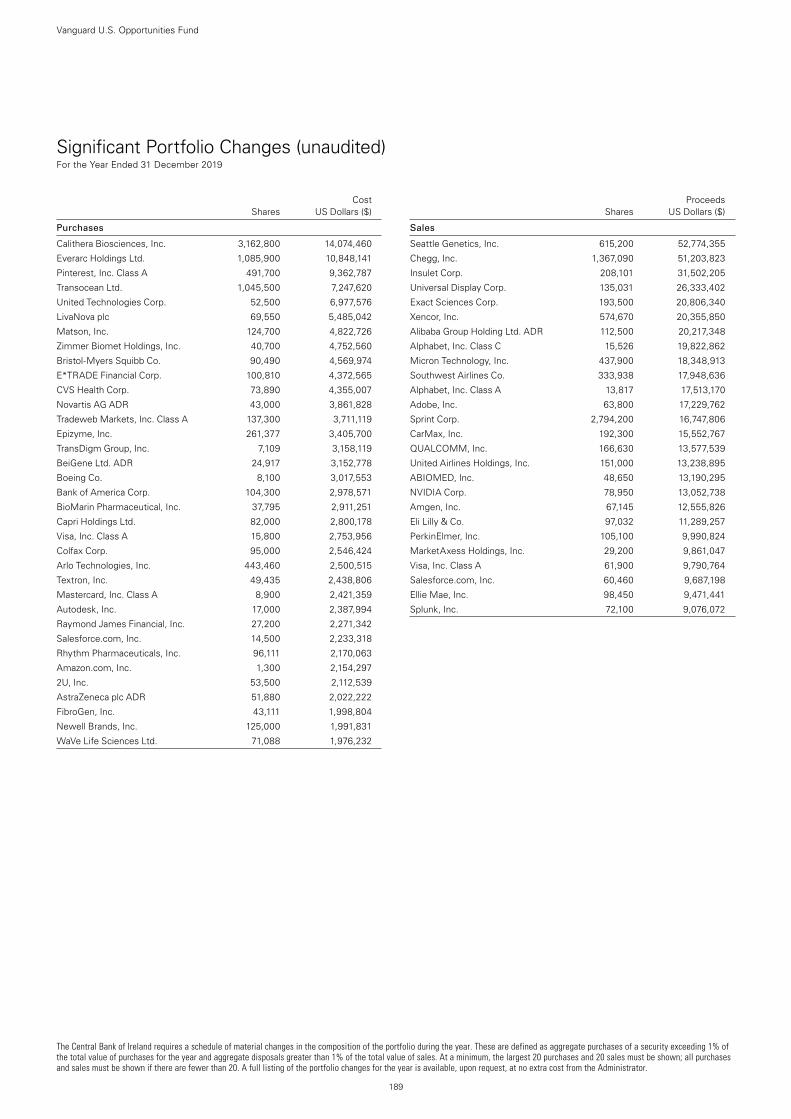
The Central Bank of Ireland requires a schedule of material changes in the composition of the portfolio during the year. These are defined as aggregate purchases of a security exceeding 1% of the total value of purchases for the year and aggregate disposals greater than 1% of the total value of sales. At a minimum, the largest 20 purchases and 20 sales must be shown; all purchases and sales must be shown if there are fewer than 20. A full listing of the portfolio changes for the year is available, upon request, at no extra cost from the Administrator.
189
Vanguard U.S. Opportunities Fund
Significant Portfolio Changes (unaudited) For the Year Ended 31 December 2019
Cost Shares US Dollars ($)
Purchases
Calithera Biosciences, Inc. 3,162,800 14,074,460
Everarc Holdings Ltd. 1,085,900 10,848,141
Pinterest, Inc. Class A 491,700 9,362,787
Transocean Ltd. 1,045,500 7,247,620
United Technologies Corp. 52,500 6,977,576
LivaNova plc 69,550 5,485,042
Matson, Inc. 124,700 4,822,726
Zimmer Biomet Holdings, Inc. 40,700 4,752,560
Bristol-Myers Squibb Co. 90,490 4,569,974
E*TRADE Financial Corp. 100,810 4,372,565
CVS Health Corp. 73,890 4,355,007
Novartis AG ADR 43,000 3,861,828
Tradeweb Markets, Inc. Class A 137,300 3,711,119
Epizyme, Inc. 261,377 3,405,700
TransDigm Group, Inc. 7,109 3,158,119
BeiGene Ltd. ADR 24,917 3,152,778
Boeing Co. 8,100 3,017,553
Bank of America Corp. 104,300 2,978,571
BioMarin Pharmaceutical, Inc. 37,795 2,911,251
Capri Holdings Ltd. 82,000 2,800,178
Visa, Inc. Class A 15,800 2,753,956
Colfax Corp. 95,000 2,546,424
Arlo Technologies, Inc. 443,460 2,500,515
Textron, Inc. 49,435 2,438,806
Mastercard, Inc. Class A 8,900 2,421,359
Autodesk, Inc. 17,000 2,387,994
Raymond James Financial, Inc. 27,200 2,271,342
Salesforce.com, Inc. 14,500 2,233,318
Rhythm Pharmaceuticals, Inc. 96,111 2,170,063
Amazon.com, Inc. 1,300 2,154,297
2U, Inc. 53,500 2,112,539
AstraZeneca plc ADR 51,880 2,022,222
FibroGen, Inc. 43,111 1,998,804
Newell Brands, Inc. 125,000 1,991,831
WaVe Life Sciences Ltd. 71,088 1,976,232
Proceeds Shares US Dollars ($)
Sales
Seattle Genetics, Inc. 615,200 52,774,355
Chegg, Inc. 1,367,090 51,203,823
Insulet Corp. 208,101 31,502,205
Universal Display Corp. 135,031 26,333,402
Exact Sciences Corp. 193,500 20,806,340
Xencor, Inc. 574,670 20,355,850
Alibaba Group Holding Ltd. ADR 112,500 20,217,348
Alphabet, Inc. Class C 15,526 19,822,862
Micron Technology, Inc. 437,900 18,348,913
Southwest Airlines Co. 333,938 17,948,636
Alphabet, Inc. Class A 13,817 17,513,170
Adobe, Inc. 63,800 17,229,762
Sprint Corp. 2,794,200 16,747,806
CarMax, Inc. 192,300 15,552,767
QUALCOMM, Inc. 166,630 13,577,539
United Airlines Holdings, Inc. 151,000 13,238,895
ABIOMED, Inc. 48,650 13,190,295
NVIDIA Corp. 78,950 13,052,738
Amgen, Inc. 67,145 12,555,826
Eli Lilly & Co. 97,032 11,289,257
PerkinElmer, Inc. 105,100 9,990,824
MarketAxess Holdings, Inc. 29,200 9,861,047
Visa, Inc. Class A 61,900 9,790,764
Salesforce.com, Inc. 60,460 9,687,198
Ellie Mae, Inc. 98,450 9,471,441
Splunk, Inc. 72,100 9,076,072
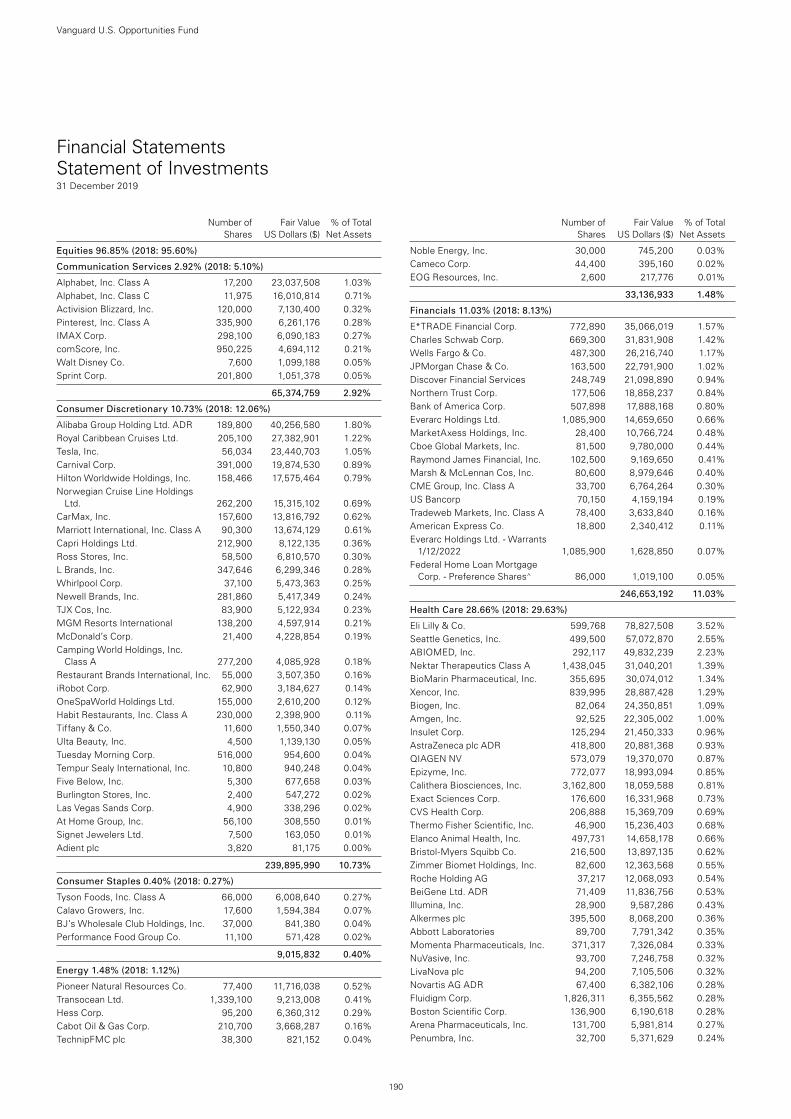
190
Vanguard U.S. Opportunities Fund
Number of Fair Value % of Total Shares US Dollars ($) Net Assets
Number of Fair Value % of Total Shares US Dollars ($) Net Assets
Equities 96.85% (2018: 95.60%)
Communication Services 2.92% (2018: 5.10%)
Alphabet, Inc. Class A 17,200 23,037,508 1.03%Alphabet, Inc. Class C 11,975 16,010,814 0.71%Activision Blizzard, Inc. 120,000 7,130,400 0.32%Pinterest, Inc. Class A 335,900 6,261,176 0.28%IMAX Corp. 298,100 6,090,183 0.27%comScore, Inc. 950,225 4,694,112 0.21%Walt Disney Co. 7,600 1,099,188 0.05%Sprint Corp. 201,800 1,051,378 0.05%
65,374,759 2.92%
Consumer Discretionary 10.73% (2018: 12.06%)
Alibaba Group Holding Ltd. ADR 189,800 40,256,580 1.80%Royal Caribbean Cruises Ltd. 205,100 27,382,901 1.22%Tesla, Inc. 56,034 23,440,703 1.05%Carnival Corp. 391,000 19,874,530 0.89%Hilton Worldwide Holdings, Inc. 158,466 17,575,464 0.79%Norwegian Cruise Line Holdings
Ltd. 262,200 15,315,102 0.69%CarMax, Inc. 157,600 13,816,792 0.62%Marriott International, Inc. Class A 90,300 13,674,129 0.61%Capri Holdings Ltd. 212,900 8,122,135 0.36%Ross Stores, Inc. 58,500 6,810,570 0.30%L Brands, Inc. 347,646 6,299,346 0.28%Whirlpool Corp. 37,100 5,473,363 0.25%Newell Brands, Inc. 281,860 5,417,349 0.24%TJX Cos, Inc. 83,900 5,122,934 0.23%MGM Resorts International 138,200 4,597,914 0.21%McDonald’s Corp. 21,400 4,228,854 0.19%Camping World Holdings, Inc.
Class A 277,200 4,085,928 0.18%Restaurant Brands International, Inc. 55,000 3,507,350 0.16%iRobot Corp. 62,900 3,184,627 0.14%OneSpaWorld Holdings Ltd. 155,000 2,610,200 0.12%Habit Restaurants, Inc. Class A 230,000 2,398,900 0.11%Tiffany & Co. 11,600 1,550,340 0.07%Ulta Beauty, Inc. 4,500 1,139,130 0.05%Tuesday Morning Corp. 516,000 954,600 0.04%Tempur Sealy International, Inc. 10,800 940,248 0.04%Five Below, Inc. 5,300 677,658 0.03%Burlington Stores, Inc. 2,400 547,272 0.02%Las Vegas Sands Corp. 4,900 338,296 0.02%At Home Group, Inc. 56,100 308,550 0.01%Signet Jewelers Ltd. 7,500 163,050 0.01%Adient plc 3,820 81,175 0.00%
239,895,990 10.73%
Consumer Staples 0.40% (2018: 0.27%)
Tyson Foods, Inc. Class A 66,000 6,008,640 0.27%Calavo Growers, Inc. 17,600 1,594,384 0.07%BJ’s Wholesale Club Holdings, Inc. 37,000 841,380 0.04%Performance Food Group Co. 11,100 571,428 0.02%
9,015,832 0.40%
Energy 1.48% (2018: 1.12%)
Pioneer Natural Resources Co. 77,400 11,716,038 0.52%Transocean Ltd. 1,339,100 9,213,008 0.41%Hess Corp. 95,200 6,360,312 0.29%Cabot Oil & Gas Corp. 210,700 3,668,287 0.16%TechnipFMC plc 38,300 821,152 0.04%
Noble Energy, Inc. 30,000 745,200 0.03%Cameco Corp. 44,400 395,160 0.02%EOG Resources, Inc. 2,600 217,776 0.01%
33,136,933 1.48%
Financials 11.03% (2018: 8.13%)
E*TRADE Financial Corp. 772,890 35,066,019 1.57%Charles Schwab Corp. 669,300 31,831,908 1.42%Wells Fargo & Co. 487,300 26,216,740 1.17%JPMorgan Chase & Co. 163,500 22,791,900 1.02%Discover Financial Services 248,749 21,098,890 0.94%Northern Trust Corp. 177,506 18,858,237 0.84%Bank of America Corp. 507,898 17,888,168 0.80%Everarc Holdings Ltd. 1,085,900 14,659,650 0.66%MarketAxess Holdings, Inc. 28,400 10,766,724 0.48%Cboe Global Markets, Inc. 81,500 9,780,000 0.44%Raymond James Financial, Inc. 102,500 9,169,650 0.41%Marsh & McLennan Cos, Inc. 80,600 8,979,646 0.40%CME Group, Inc. Class A 33,700 6,764,264 0.30%US Bancorp 70,150 4,159,194 0.19%Tradeweb Markets, Inc. Class A 78,400 3,633,840 0.16%American Express Co. 18,800 2,340,412 0.11%Everarc Holdings Ltd. - Warrants
1/12/2022 1,085,900 1,628,850 0.07%Federal Home Loan Mortgage
Corp. - Preference Shares^ 86,000 1,019,100 0.05%
246,653,192 11.03%
Health Care 28.66% (2018: 29.63%)
Eli Lilly & Co. 599,768 78,827,508 3.52%Seattle Genetics, Inc. 499,500 57,072,870 2.55%ABIOMED, Inc. 292,117 49,832,239 2.23%Nektar Therapeutics Class A 1,438,045 31,040,201 1.39%BioMarin Pharmaceutical, Inc. 355,695 30,074,012 1.34%Xencor, Inc. 839,995 28,887,428 1.29%Biogen, Inc. 82,064 24,350,851 1.09%Amgen, Inc. 92,525 22,305,002 1.00%Insulet Corp. 125,294 21,450,333 0.96%AstraZeneca plc ADR 418,800 20,881,368 0.93%QIAGEN NV 573,079 19,370,070 0.87%Epizyme, Inc. 772,077 18,993,094 0.85%Calithera Biosciences, Inc. 3,162,800 18,059,588 0.81%Exact Sciences Corp. 176,600 16,331,968 0.73%CVS Health Corp. 206,888 15,369,709 0.69%Thermo Fisher Scientific, Inc. 46,900 15,236,403 0.68%Elanco Animal Health, Inc. 497,731 14,658,178 0.66%Bristol-Myers Squibb Co. 216,500 13,897,135 0.62%Zimmer Biomet Holdings, Inc. 82,600 12,363,568 0.55%Roche Holding AG 37,217 12,068,093 0.54%BeiGene Ltd. ADR 71,409 11,836,756 0.53%Illumina, Inc. 28,900 9,587,286 0.43%Alkermes plc 395,500 8,068,200 0.36%Abbott Laboratories 89,700 7,791,342 0.35%Momenta Pharmaceuticals, Inc. 371,317 7,326,084 0.33%NuVasive, Inc. 93,700 7,246,758 0.32%LivaNova plc 94,200 7,105,506 0.32%Novartis AG ADR 67,400 6,382,106 0.28%Fluidigm Corp. 1,826,311 6,355,562 0.28%Boston Scientific Corp. 136,900 6,190,618 0.28%Arena Pharmaceuticals, Inc. 131,700 5,981,814 0.27%Penumbra, Inc. 32,700 5,371,629 0.24%
Financial Statements Statement of Investments31 December 2019
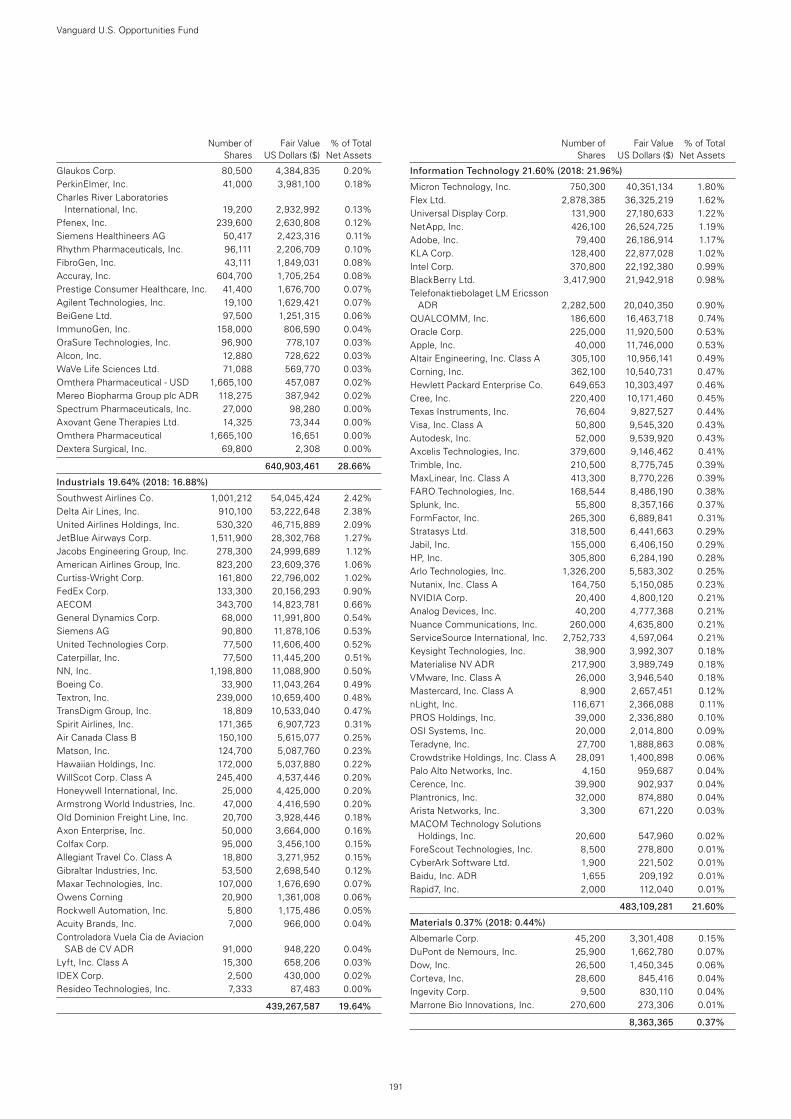
191
Number of Fair Value % of Total Shares US Dollars ($) Net Assets
Glaukos Corp. 80,500 4,384,835 0.20%PerkinElmer, Inc. 41,000 3,981,100 0.18%Charles River Laboratories
International, Inc. 19,200 2,932,992 0.13%Pfenex, Inc. 239,600 2,630,808 0.12%Siemens Healthineers AG 50,417 2,423,316 0.11%Rhythm Pharmaceuticals, Inc. 96,111 2,206,709 0.10%FibroGen, Inc. 43,111 1,849,031 0.08%Accuray, Inc. 604,700 1,705,254 0.08%Prestige Consumer Healthcare, Inc. 41,400 1,676,700 0.07%Agilent Technologies, Inc. 19,100 1,629,421 0.07%BeiGene Ltd. 97,500 1,251,315 0.06%ImmunoGen, Inc. 158,000 806,590 0.04%OraSure Technologies, Inc. 96,900 778,107 0.03%Alcon, Inc. 12,880 728,622 0.03%WaVe Life Sciences Ltd. 71,088 569,770 0.03%Omthera Pharmaceutical - USD 1,665,100 457,087 0.02%Mereo Biopharma Group plc ADR 118,275 387,942 0.02%Spectrum Pharmaceuticals, Inc. 27,000 98,280 0.00%Axovant Gene Therapies Ltd. 14,325 73,344 0.00%Omthera Pharmaceutical 1,665,100 16,651 0.00%Dextera Surgical, Inc. 69,800 2,308 0.00%
640,903,461 28.66%
Industrials 19.64% (2018: 16.88%)
Southwest Airlines Co. 1,001,212 54,045,424 2.42%Delta Air Lines, Inc. 910,100 53,222,648 2.38%United Airlines Holdings, Inc. 530,320 46,715,889 2.09%JetBlue Airways Corp. 1,511,900 28,302,768 1.27%Jacobs Engineering Group, Inc. 278,300 24,999,689 1.12%American Airlines Group, Inc. 823,200 23,609,376 1.06%Curtiss-Wright Corp. 161,800 22,796,002 1.02%FedEx Corp. 133,300 20,156,293 0.90%AECOM 343,700 14,823,781 0.66%General Dynamics Corp. 68,000 11,991,800 0.54%Siemens AG 90,800 11,878,106 0.53%United Technologies Corp. 77,500 11,606,400 0.52%Caterpillar, Inc. 77,500 11,445,200 0.51%NN, Inc. 1,198,800 11,088,900 0.50%Boeing Co. 33,900 11,043,264 0.49%Textron, Inc. 239,000 10,659,400 0.48%TransDigm Group, Inc. 18,809 10,533,040 0.47%Spirit Airlines, Inc. 171,365 6,907,723 0.31%Air Canada Class B 150,100 5,615,077 0.25%Matson, Inc. 124,700 5,087,760 0.23%Hawaiian Holdings, Inc. 172,000 5,037,880 0.22%WillScot Corp. Class A 245,400 4,537,446 0.20%Honeywell International, Inc. 25,000 4,425,000 0.20%Armstrong World Industries, Inc. 47,000 4,416,590 0.20%Old Dominion Freight Line, Inc. 20,700 3,928,446 0.18%Axon Enterprise, Inc. 50,000 3,664,000 0.16%Colfax Corp. 95,000 3,456,100 0.15%Allegiant Travel Co. Class A 18,800 3,271,952 0.15%Gibraltar Industries, Inc. 53,500 2,698,540 0.12%Maxar Technologies, Inc. 107,000 1,676,690 0.07%Owens Corning 20,900 1,361,008 0.06%Rockwell Automation, Inc. 5,800 1,175,486 0.05%Acuity Brands, Inc. 7,000 966,000 0.04%Controladora Vuela Cia de Aviacion
SAB de CV ADR 91,000 948,220 0.04%Lyft, Inc. Class A 15,300 658,206 0.03%IDEX Corp. 2,500 430,000 0.02%Resideo Technologies, Inc. 7,333 87,483 0.00%
439,267,587 19.64%
Information Technology 21.60% (2018: 21.96%)
Micron Technology, Inc. 750,300 40,351,134 1.80%Flex Ltd. 2,878,385 36,325,219 1.62%Universal Display Corp. 131,900 27,180,633 1.22%NetApp, Inc. 426,100 26,524,725 1.19%Adobe, Inc. 79,400 26,186,914 1.17%KLA Corp. 128,400 22,877,028 1.02%Intel Corp. 370,800 22,192,380 0.99%BlackBerry Ltd. 3,417,900 21,942,918 0.98%Telefonaktiebolaget LM Ericsson
ADR 2,282,500 20,040,350 0.90%QUALCOMM, Inc. 186,600 16,463,718 0.74%Oracle Corp. 225,000 11,920,500 0.53%Apple, Inc. 40,000 11,746,000 0.53%Altair Engineering, Inc. Class A 305,100 10,956,141 0.49%Corning, Inc. 362,100 10,540,731 0.47%Hewlett Packard Enterprise Co. 649,653 10,303,497 0.46%Cree, Inc. 220,400 10,171,460 0.45%Texas Instruments, Inc. 76,604 9,827,527 0.44%Visa, Inc. Class A 50,800 9,545,320 0.43%Autodesk, Inc. 52,000 9,539,920 0.43%Axcelis Technologies, Inc. 379,600 9,146,462 0.41%Trimble, Inc. 210,500 8,775,745 0.39%MaxLinear, Inc. Class A 413,300 8,770,226 0.39%FARO Technologies, Inc. 168,544 8,486,190 0.38%Splunk, Inc. 55,800 8,357,166 0.37%FormFactor, Inc. 265,300 6,889,841 0.31%Stratasys Ltd. 318,500 6,441,663 0.29%Jabil, Inc. 155,000 6,406,150 0.29%HP, Inc. 305,800 6,284,190 0.28%Arlo Technologies, Inc. 1,326,200 5,583,302 0.25%Nutanix, Inc. Class A 164,750 5,150,085 0.23%NVIDIA Corp. 20,400 4,800,120 0.21%Analog Devices, Inc. 40,200 4,777,368 0.21%Nuance Communications, Inc. 260,000 4,635,800 0.21%ServiceSource International, Inc. 2,752,733 4,597,064 0.21%Keysight Technologies, Inc. 38,900 3,992,307 0.18%Materialise NV ADR 217,900 3,989,749 0.18%VMware, Inc. Class A 26,000 3,946,540 0.18%Mastercard, Inc. Class A 8,900 2,657,451 0.12%nLight, Inc. 116,671 2,366,088 0.11%PROS Holdings, Inc. 39,000 2,336,880 0.10%OSI Systems, Inc. 20,000 2,014,800 0.09%Teradyne, Inc. 27,700 1,888,863 0.08%Crowdstrike Holdings, Inc. Class A 28,091 1,400,898 0.06%Palo Alto Networks, Inc. 4,150 959,687 0.04%Cerence, Inc. 39,900 902,937 0.04%Plantronics, Inc. 32,000 874,880 0.04%Arista Networks, Inc. 3,300 671,220 0.03%MACOM Technology Solutions
Holdings, Inc. 20,600 547,960 0.02%ForeScout Technologies, Inc. 8,500 278,800 0.01%CyberArk Software Ltd. 1,900 221,502 0.01%Baidu, Inc. ADR 1,655 209,192 0.01%Rapid7, Inc. 2,000 112,040 0.01%
483,109,281 21.60%
Materials 0.37% (2018: 0.44%)
Albemarle Corp. 45,200 3,301,408 0.15%DuPont de Nemours, Inc. 25,900 1,662,780 0.07%Dow, Inc. 26,500 1,450,345 0.06%Corteva, Inc. 28,600 845,416 0.04%Ingevity Corp. 9,500 830,110 0.04%Marrone Bio Innovations, Inc. 270,600 273,306 0.01%
8,363,365 0.37%
Number of Fair Value % of Total Shares US Dollars ($) Net Assets
Vanguard U.S. Opportunities Fund
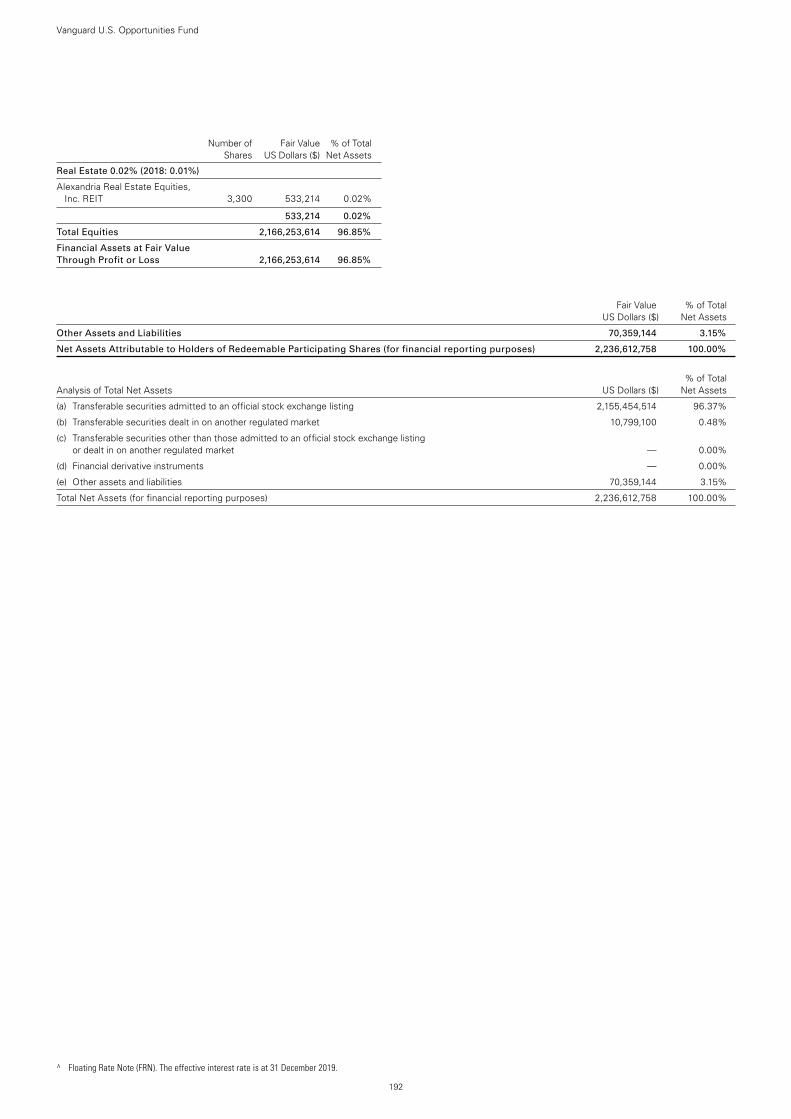
^ Floating Rate Note (FRN). The effective interest rate is at 31 December 2019.
Number of Fair Value % of Total Shares US Dollars ($) Net Assets
Real Estate 0.02% (2018: 0.01%)
Alexandria Real Estate Equities, Inc. REIT 3,300 533,214 0.02%
533,214 0.02%
Total Equities 2,166,253,614 96.85%
Financial Assets at Fair Value Through Profit or Loss 2,166,253,614 96.85%
Fair Value % of Total US Dollars ($) Net Assets
Other Assets and Liabilities 70,359,144 3.15%
Net Assets Attributable to Holders of Redeemable Participating Shares (for financial reporting purposes) 2,236,612,758 100.00%
% of Total Analysis of Total Net Assets US Dollars ($) Net Assets
(a) Transferable securities admitted to an official stock exchange listing 2,155,454,514 96.37%
(b) Transferable securities dealt in on another regulated market 10,799,100 0.48%
(c) Transferable securities other than those admitted to an official stock exchange listing or dealt in on another regulated market — 0.00%
(d) Financial derivative instruments — 0.00%
(e) Other assets and liabilities 70,359,144 3.15%
Total Net Assets (for financial reporting purposes) 2,236,612,758 100.00%
Vanguard U.S. Opportunities Fund
192
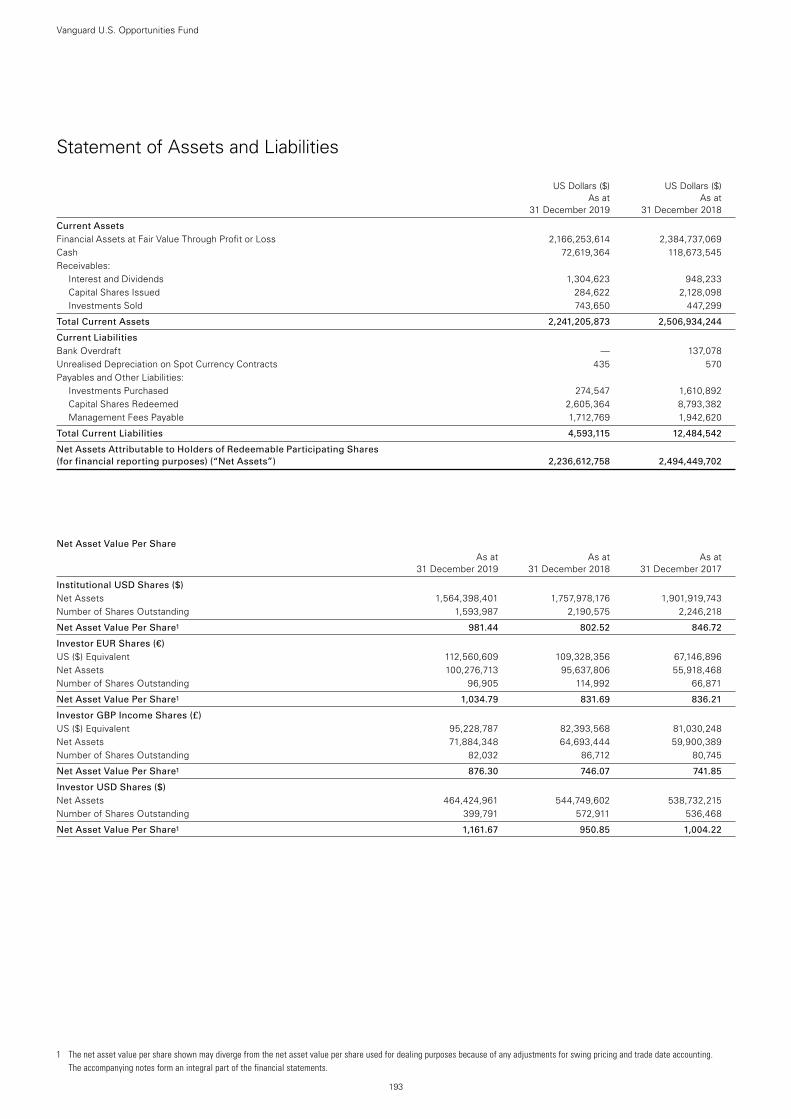
1 The net asset value per share shown may diverge from the net asset value per share used for dealing purposes because of any adjustments for swing pricing and trade date accounting. The accompanying notes form an integral part of the financial statements.
193
Vanguard U.S. Opportunities Fund
Statement of Assets and Liabilities
US Dollars ($) US Dollars ($) As at As at 31 December 2019 31 December 2018
Current Assets Financial Assets at Fair Value Through Profit or Loss 2,166,253,614 2,384,737,069Cash 72,619,364 118,673,545Receivables:
Interest and Dividends 1,304,623 948,233Capital Shares Issued 284,622 2,128,098Investments Sold 743,650 447,299
Total Current Assets 2,241,205,873 2,506,934,244
Current Liabilities Bank Overdraft — 137,078Unrealised Depreciation on Spot Currency Contracts 435 570Payables and Other Liabilities:
Investments Purchased 274,547 1,610,892Capital Shares Redeemed 2,605,364 8,793,382Management Fees Payable 1,712,769 1,942,620
Total Current Liabilities 4,593,115 12,484,542
Net Assets Attributable to Holders of Redeemable Participating Shares (for financial reporting purposes) (“Net Assets”) 2,236,612,758 2,494,449,702
Net Asset Value Per Share As at As at As at 31 December 2019 31 December 2018 31 December 2017
Institutional USD Shares ($) Net Assets 1,564,398,401 1,757,978,176 1,901,919,743Number of Shares Outstanding 1,593,987 2,190,575 2,246,218
Net Asset Value Per Share1 981.44 802.52 846.72
Investor EUR Shares (€) US ($) Equivalent 112,560,609 109,328,356 67,146,896Net Assets 100,276,713 95,637,806 55,918,468Number of Shares Outstanding 96,905 114,992 66,871
Net Asset Value Per Share1 1,034.79 831.69 836.21
Investor GBP Income Shares (£) US ($) Equivalent 95,228,787 82,393,568 81,030,248Net Assets 71,884,348 64,693,444 59,900,389Number of Shares Outstanding 82,032 86,712 80,745
Net Asset Value Per Share1 876.30 746.07 741.85
Investor USD Shares ($) Net Assets 464,424,961 544,749,602 538,732,215Number of Shares Outstanding 399,791 572,911 536,468
Net Asset Value Per Share1 1,161.67 950.85 1,004.22
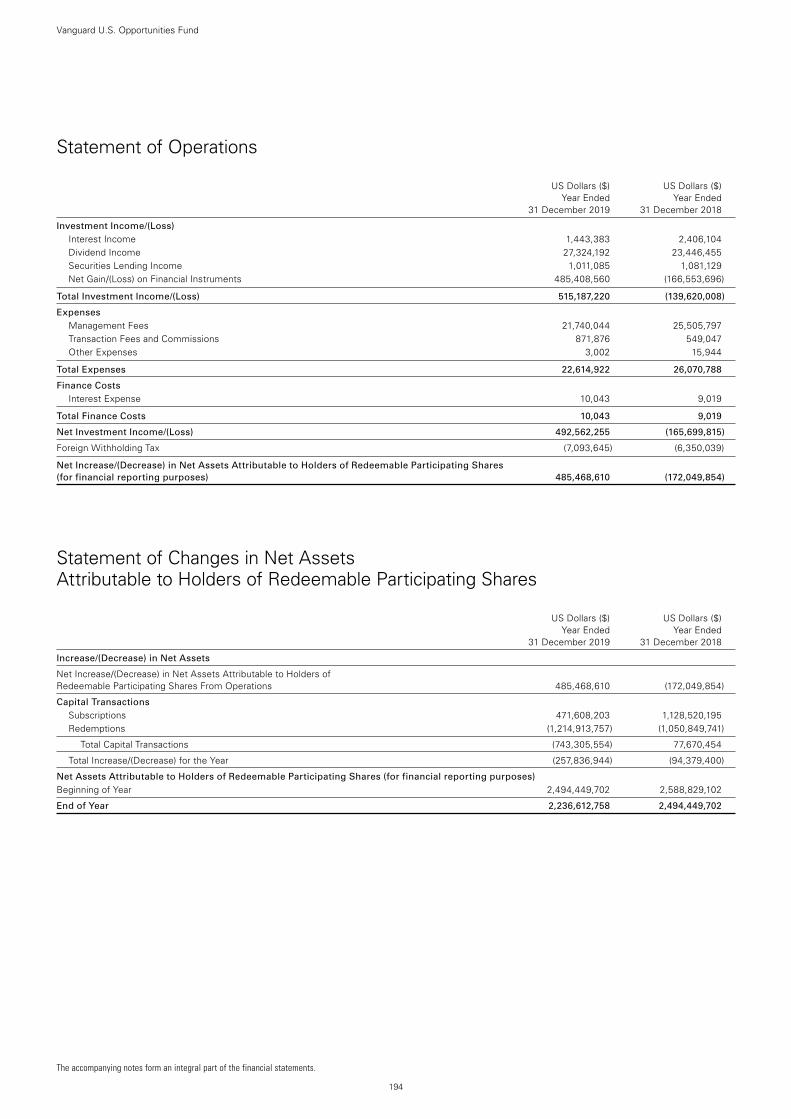
194
Vanguard U.S. Opportunities Fund
Statement of Operations
US Dollars ($) US Dollars ($) Year Ended Year Ended 31 December 2019 31 December 2018
Investment Income/(Loss) Interest Income 1,443,383 2,406,104Dividend Income 27,324,192 23,446,455Securities Lending Income 1,011,085 1,081,129Net Gain/(Loss) on Financial Instruments 485,408,560 (166,553,696)
Total Investment Income/(Loss) 515,187,220 (139,620,008)
Expenses Management Fees 21,740,044 25,505,797Transaction Fees and Commissions 871,876 549,047Other Expenses 3,002 15,944
Total Expenses 22,614,922 26,070,788
Finance Costs Interest Expense 10,043 9,019
Total Finance Costs 10,043 9,019
Net Investment Income/(Loss) 492,562,255 (165,699,815)
Foreign Withholding Tax (7,093,645) (6,350,039)
Net Increase/(Decrease) in Net Assets Attributable to Holders of Redeemable Participating Shares (for financial reporting purposes) 485,468,610 (172,049,854)
Statement of Changes in Net Assets Attributable to Holders of Redeemable Participating Shares
US Dollars ($) US Dollars ($) Year Ended Year Ended 31 December 2019 31 December 2018
Increase/(Decrease) in Net Assets
Net Increase/(Decrease) in Net Assets Attributable to Holders of Redeemable Participating Shares From Operations 485,468,610 (172,049,854)
Capital Transactions Subscriptions 471,608,203 1,128,520,195Redemptions (1,214,913,757) (1,050,849,741)
Total Capital Transactions (743,305,554) 77,670,454
Total Increase/(Decrease) for the Year (257,836,944) (94,379,400)
Net Assets Attributable to Holders of Redeemable Participating Shares (for financial reporting purposes) Beginning of Year 2,494,449,702 2,588,829,102
End of Year 2,236,612,758 2,494,449,702
The accompanying notes form an integral part of the financial statements.
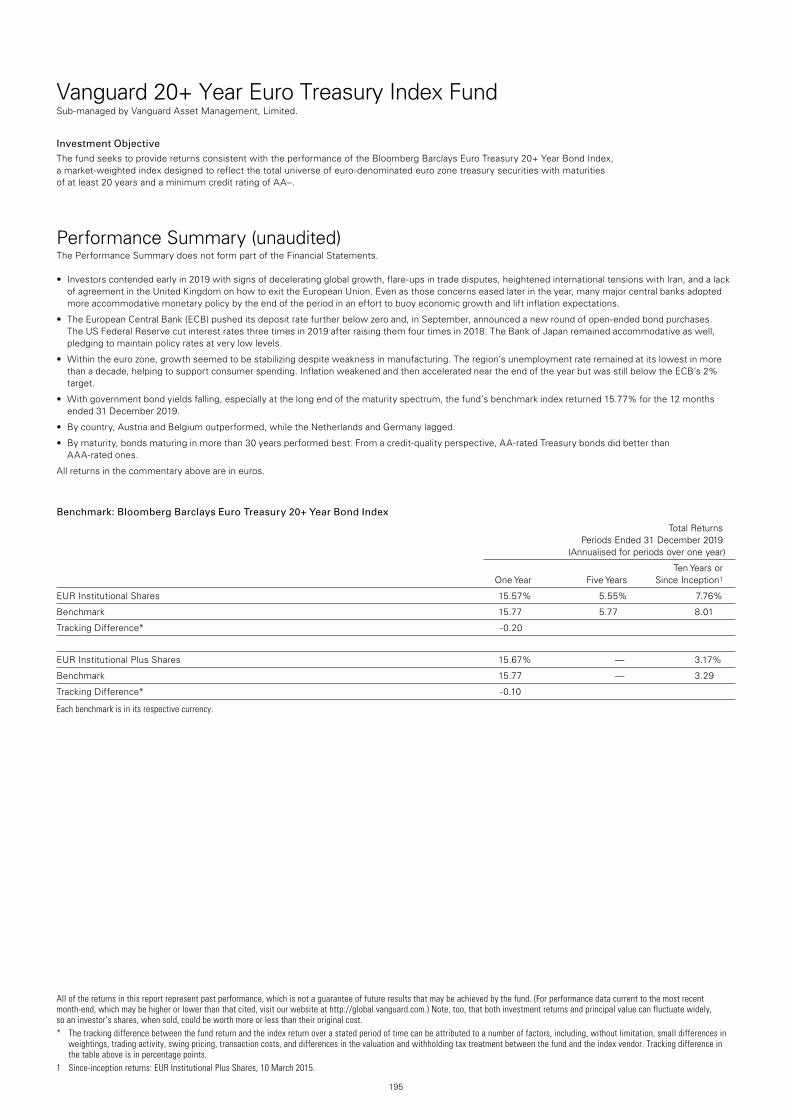
195
Vanguard 20+ Year Euro Treasury Index FundSub-managed by Vanguard Asset Management, Limited.
All of the returns in this report represent past performance, which is not a guarantee of future results that may be achieved by the fund. (For performance data current to the most recent month-end, which may be higher or lower than that cited, visit our website at http://global.vanguard.com.) Note, too, that both investment returns and principal value can fluctuate widely, so an investor’s shares, when sold, could be worth more or less than their original cost.* The tracking difference between the fund return and the index return over a stated period of time can be attributed to a number of factors, including, without limitation, small differences in
weightings, trading activity, swing pricing, transaction costs, and differences in the valuation and withholding tax treatment between the fund and the index vendor. Tracking difference in the table above is in percentage points.
1 Since-inception returns: EUR Institutional Plus Shares, 10 March 2015.
Investment ObjectiveThe fund seeks to provide returns consistent with the performance of the Bloomberg Barclays Euro Treasury 20+ Year Bond Index, a market-weighted index designed to reflect the total universe of euro-denominated euro zone treasury securities with maturities of at least 20 years and a minimum credit rating of AA–.
Performance Summary (unaudited)The Performance Summary does not form part of the Financial Statements.
• Investorscontendedearlyin2019withsignsofdeceleratingglobalgrowth,flare-upsintradedisputes,heightenedinternationaltensionswithIran,andalackof agreement in the United Kingdom on how to exit the European Union. Even as those concerns eased later in the year, many major central banks adopted more accommodative monetary policy by the end of the period in an effort to buoy economic growth and lift inflation expectations.
• TheEuropeanCentralBank(ECB)pusheditsdepositratefurtherbelowzeroand,inSeptember,announcedanewroundofopen-endedbondpurchases. The US Federal Reserve cut interest rates three times in 2019 after raising them four times in 2018. The Bank of Japan remained accommodative as well, pledging to maintain policy rates at very low levels.
• Withintheeurozone,growthseemedtobestabilizingdespiteweaknessinmanufacturing.Theregion’sunemploymentrateremainedatitslowestinmorethan a decade, helping to support consumer spending. Inflation weakened and then accelerated near the end of the year but was still below the ECB’s 2% target.
• Withgovernmentbondyieldsfalling,especiallyatthelongendofthematurityspectrum,thefund’sbenchmarkindexreturned15.77%forthe12monthsended 31 December 2019.
• Bycountry,AustriaandBelgiumoutperformed,whiletheNetherlandsandGermanylagged.
• Bymaturity,bondsmaturinginmorethan30yearsperformedbest.Fromacredit-qualityperspective,AA-ratedTreasurybondsdidbetterthan AAA-rated ones.
All returns in the commentary above are in euros.
Benchmark: Bloomberg Barclays Euro Treasury 20+ Year Bond Index
Total Returns Periods Ended 31 December 2019 (Annualised for periods over one year)
Ten Years or One Year Five Years Since Inception1
EUR Institutional Shares 15.57% 5.55% 7.76%
Benchmark 15.77 5.77 8.01
Tracking Difference* -0.20
EUR Institutional Plus Shares 15.67% — 3.17%
Benchmark 15.77 — 3.29
Tracking Difference* -0.10
Each benchmark is in its respective currency.
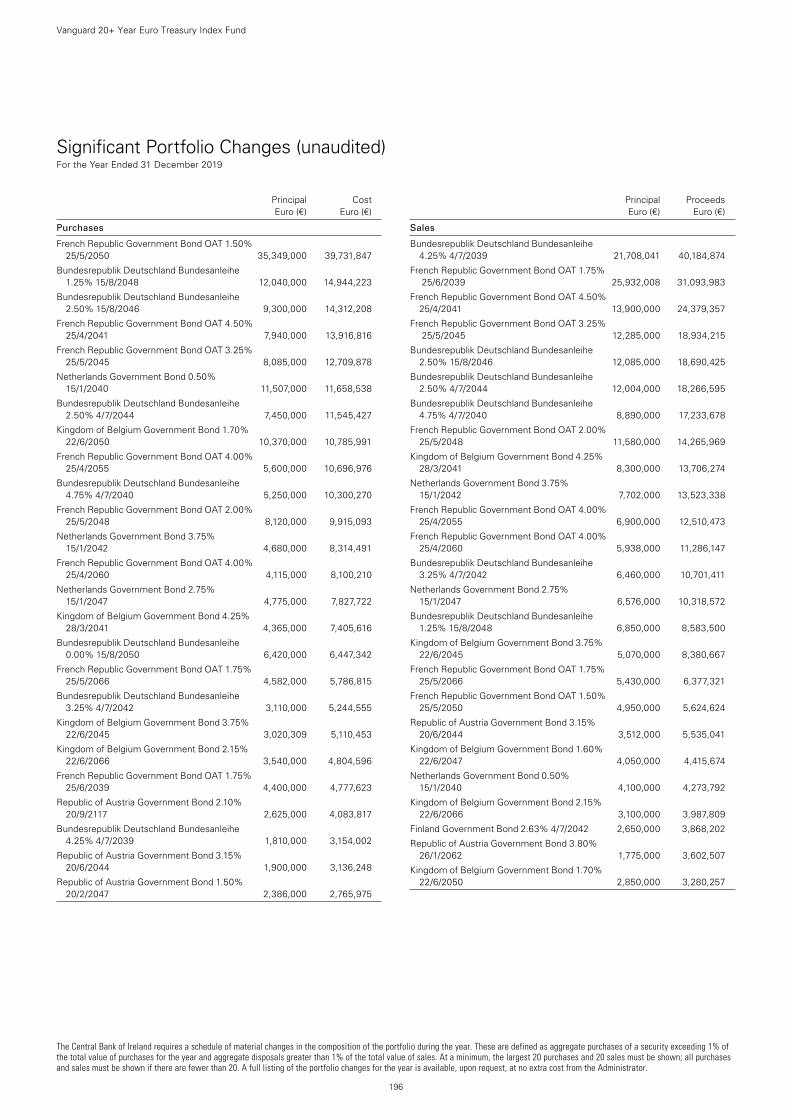
The Central Bank of Ireland requires a schedule of material changes in the composition of the portfolio during the year. These are defined as aggregate purchases of a security exceeding 1% of the total value of purchases for the year and aggregate disposals greater than 1% of the total value of sales. At a minimum, the largest 20 purchases and 20 sales must be shown; all purchases and sales must be shown if there are fewer than 20. A full listing of the portfolio changes for the year is available, upon request, at no extra cost from the Administrator.
196
Vanguard 20+ Year Euro Treasury Index Fund
Significant Portfolio Changes (unaudited) For the Year Ended 31 December 2019
Principal Cost Euro (€) Euro (€)
Purchases
French Republic Government Bond OAT 1.50% 25/5/2050 35,349,000 39,731,847
Bundesrepublik Deutschland Bundesanleihe 1.25% 15/8/2048 12,040,000 14,944,223
Bundesrepublik Deutschland Bundesanleihe 2.50% 15/8/2046 9,300,000 14,312,208
French Republic Government Bond OAT 4.50% 25/4/2041 7,940,000 13,916,816
French Republic Government Bond OAT 3.25% 25/5/2045 8,085,000 12,709,878
Netherlands Government Bond 0.50% 15/1/2040 11,507,000 11,658,538
Bundesrepublik Deutschland Bundesanleihe 2.50% 4/7/2044 7,450,000 11,545,427
Kingdom of Belgium Government Bond 1.70% 22/6/2050 10,370,000 10,785,991
French Republic Government Bond OAT 4.00% 25/4/2055 5,600,000 10,696,976
Bundesrepublik Deutschland Bundesanleihe 4.75% 4/7/2040 5,250,000 10,300,270
French Republic Government Bond OAT 2.00% 25/5/2048 8,120,000 9,915,093
Netherlands Government Bond 3.75% 15/1/2042 4,680,000 8,314,491
French Republic Government Bond OAT 4.00% 25/4/2060 4,115,000 8,100,210
Netherlands Government Bond 2.75% 15/1/2047 4,775,000 7,827,722
Kingdom of Belgium Government Bond 4.25% 28/3/2041 4,365,000 7,405,616
Bundesrepublik Deutschland Bundesanleihe 0.00% 15/8/2050 6,420,000 6,447,342
French Republic Government Bond OAT 1.75% 25/5/2066 4,582,000 5,786,815
Bundesrepublik Deutschland Bundesanleihe 3.25% 4/7/2042 3,110,000 5,244,555
Kingdom of Belgium Government Bond 3.75% 22/6/2045 3,020,309 5,110,453
Kingdom of Belgium Government Bond 2.15% 22/6/2066 3,540,000 4,804,596
French Republic Government Bond OAT 1.75% 25/6/2039 4,400,000 4,777,623
Republic of Austria Government Bond 2.10% 20/9/2117 2,625,000 4,083,817
Bundesrepublik Deutschland Bundesanleihe 4.25% 4/7/2039 1,810,000 3,154,002
Republic of Austria Government Bond 3.15% 20/6/2044 1,900,000 3,136,248
Republic of Austria Government Bond 1.50% 20/2/2047 2,386,000 2,765,975
Principal Proceeds Euro (€) Euro (€)
Sales
Bundesrepublik Deutschland Bundesanleihe 4.25% 4/7/2039 21,708,041 40,184,874
French Republic Government Bond OAT 1.75% 25/6/2039 25,932,008 31,093,983
French Republic Government Bond OAT 4.50% 25/4/2041 13,900,000 24,379,357
French Republic Government Bond OAT 3.25% 25/5/2045 12,285,000 18,934,215
Bundesrepublik Deutschland Bundesanleihe 2.50% 15/8/2046 12,085,000 18,690,425
Bundesrepublik Deutschland Bundesanleihe 2.50% 4/7/2044 12,004,000 18,266,595
Bundesrepublik Deutschland Bundesanleihe 4.75% 4/7/2040 8,890,000 17,233,678
French Republic Government Bond OAT 2.00% 25/5/2048 11,580,000 14,265,969
Kingdom of Belgium Government Bond 4.25% 28/3/2041 8,300,000 13,706,274
Netherlands Government Bond 3.75% 15/1/2042 7,702,000 13,523,338
French Republic Government Bond OAT 4.00% 25/4/2055 6,900,000 12,510,473
French Republic Government Bond OAT 4.00% 25/4/2060 5,938,000 11,286,147
Bundesrepublik Deutschland Bundesanleihe 3.25% 4/7/2042 6,460,000 10,701,411
Netherlands Government Bond 2.75% 15/1/2047 6,576,000 10,318,572
Bundesrepublik Deutschland Bundesanleihe 1.25% 15/8/2048 6,850,000 8,583,500
Kingdom of Belgium Government Bond 3.75% 22/6/2045 5,070,000 8,380,667
French Republic Government Bond OAT 1.75% 25/5/2066 5,430,000 6,377,321
French Republic Government Bond OAT 1.50% 25/5/2050 4,950,000 5,624,624
Republic of Austria Government Bond 3.15% 20/6/2044 3,512,000 5,535,041
Kingdom of Belgium Government Bond 1.60% 22/6/2047 4,050,000 4,415,674
Netherlands Government Bond 0.50% 15/1/2040 4,100,000 4,273,792
Kingdom of Belgium Government Bond 2.15% 22/6/2066 3,100,000 3,987,809
Finland Government Bond 2.63% 4/7/2042 2,650,000 3,868,202
Republic of Austria Government Bond 3.80% 26/1/2062 1,775,000 3,602,507
Kingdom of Belgium Government Bond 1.70% 22/6/2050 2,850,000 3,280,257

Financial Statements Statement of Investments31 December 2019
Principal Maturity Fair Value % of Total Euro (€) Coupon Date Euro (€) Net Assets
Bonds 98.87% (2018: 98.66%)
Austria 6.51% (2018: 5.88%)
Republic of Austria Government Bond 8,443,000 3.15% 20/6/2044 13,502,299 1.80%Republic of Austria Government Bond 7,209,000 2.10% 20/9/2117 11,388,230 1.52%Republic of Austria Government Bond 8,657,000 1.50% 20/2/2047 10,527,691 1.40%Republic of Austria Government Bond 4,650,000 3.80% 26/1/2062 9,645,402 1.28%Republic of Austria Government Bond 3,088,000 1.50% 2/11/2086 3,826,415 0.51%
48,890,037 6.51%
Belgium 13.25% (2018: 11.95%)
Kingdom of Belgium Government Bond 21,471,295 4.25% 28/3/2041 36,497,551 4.86%Kingdom of Belgium Government Bond 12,044,828 3.75% 22/6/2045 20,276,264 2.70%Kingdom of Belgium Government Bond 13,660,000 1.60% 22/6/2047 16,183,548 2.15%Kingdom of Belgium Government Bond 6,605,000 2.15% 22/6/2066 9,085,746 1.21%Kingdom of Belgium Government Bond 7,520,000 1.70% 22/6/2050 9,051,800 1.21%Kingdom of Belgium Government Bond 6,142,560 2.25% 22/6/2057 8,443,686 1.12%
99,538,595 13.25%
Finland 1.80% (2018: 1.71%)
Finland Government Bond 5,597,000 2.63% 4/7/2042 8,226,694 1.10%Finland Government Bond 4,329,000 1.38% 15/4/2047 5,231,545 0.70%
13,458,239 1.80%
France 39.77% (2018: 37.80%)
French Republic Government Bond OAT 44,957,943 4.50% 25/4/2041 79,452,014 10.58%French Republic Government Bond OAT 32,314,691 3.25% 25/5/2045 50,646,544 6.74%French Republic Government Bond OAT 32,849,000 2.00% 25/5/2048 42,189,941 5.62%French Republic Government Bond OAT 20,607,762 4.00% 25/4/2055 39,236,973 5.22%French Republic Government Bond OAT 30,399,000 1.50% 25/5/2050 35,046,825 4.67%French Republic Government Bond OAT 17,052,884 4.00% 25/4/2060 33,897,450 4.51%French Republic Government Bond OAT 14,662,000 1.75% 25/5/2066 18,283,614 2.43%
298,753,361 39.77%
Germany 27.81% (2018: 32.10%)
Bundesrepublik Deutschland Bundesanleihe 34,635,890 2.50% 15/8/2046 54,281,367 7.23%Bundesrepublik Deutschland Bundesanleihe 34,063,075 2.50% 4/7/2044 52,264,121 6.96%Bundesrepublik Deutschland Bundesanleihe 19,840,133 4.75% 4/7/2040 38,339,430 5.10%Bundesrepublik Deutschland Bundesanleihe 18,610,322 3.25% 4/7/2042 31,118,319 4.14%Bundesrepublik Deutschland Bundesanleihe 21,612,000 1.25% 15/8/2048 27,129,111 3.61%Bundesrepublik Deutschland Bundesanleihe 6,420,000 0.00% 15/8/2050 5,774,148 0.77%
208,906,496 27.81%
Netherlands 9.73% (2018: 9.22%)
Netherlands Government Bond 19,999,646 3.75% 15/1/2042 34,887,063 4.64%Netherlands Government Bond 18,822,287 2.75% 15/1/2047 30,516,224 4.06%Netherlands Government Bond 7,407,000 0.50% 15/1/2040 7,698,000 1.03%
73,101,287 9.73%
Total Bonds 742,648,015 98.87%
Financial Assets at Fair Value Through Profit or Loss 742,648,015 98.87%
Other Assets and Liabilities 8,523,982 1.13%
Net Assets Attributable to Holders of Redeemable Participating Shares (for financial reporting purposes) 751,171,997 100.00%
Vanguard 20+ Year Euro Treasury Index Fund
197
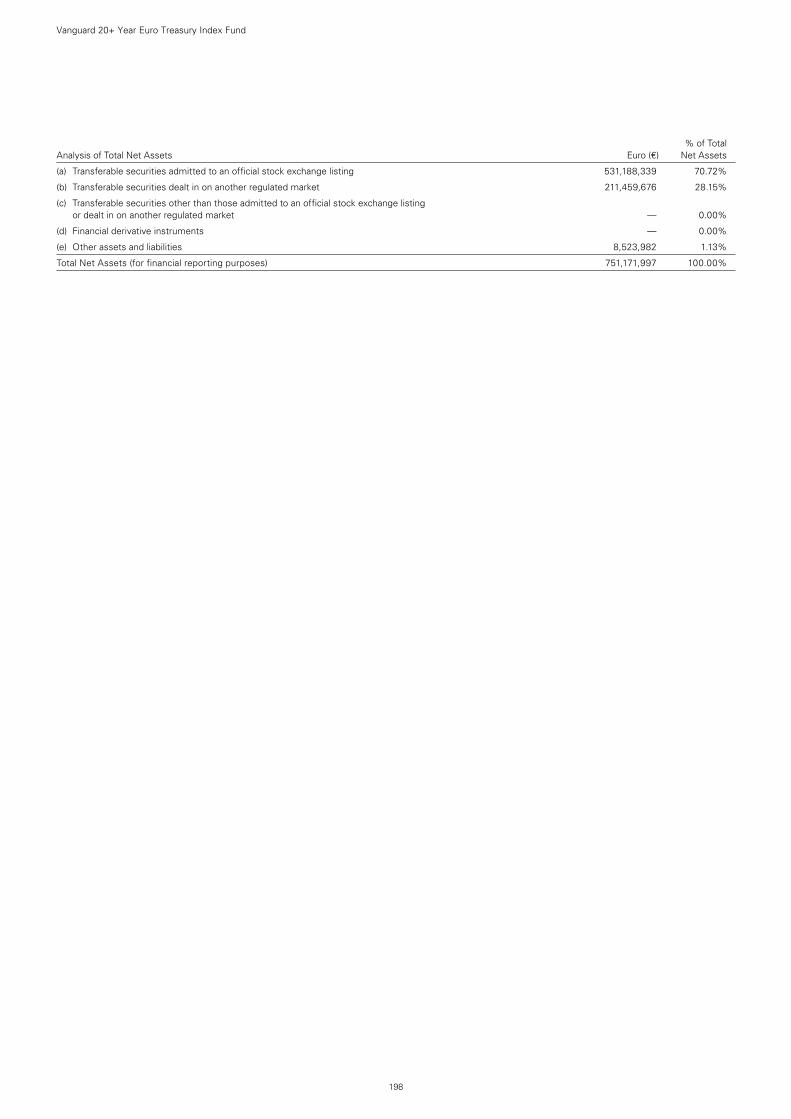
% of Total Analysis of Total Net Assets Euro (€) Net Assets
(a) Transferable securities admitted to an official stock exchange listing 531,188,339 70.72%
(b) Transferable securities dealt in on another regulated market 211,459,676 28.15%
(c) Transferable securities other than those admitted to an official stock exchange listing or dealt in on another regulated market — 0.00%
(d) Financial derivative instruments — 0.00%
(e) Other assets and liabilities 8,523,982 1.13%
Total Net Assets (for financial reporting purposes) 751,171,997 100.00%
Vanguard 20+ Year Euro Treasury Index Fund
198
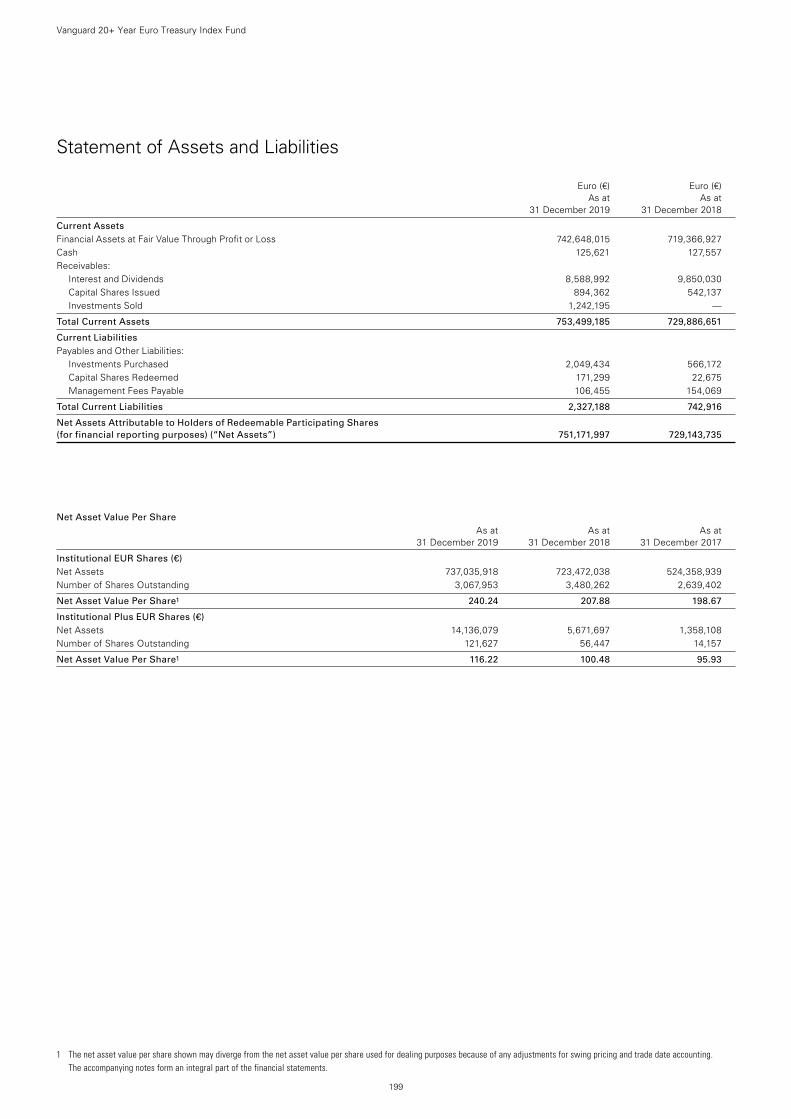
1 The net asset value per share shown may diverge from the net asset value per share used for dealing purposes because of any adjustments for swing pricing and trade date accounting. The accompanying notes form an integral part of the financial statements.
199
Vanguard 20+ Year Euro Treasury Index Fund
Statement of Assets and Liabilities
Euro (€) Euro (€) As at As at 31 December 2019 31 December 2018
Current Assets Financial Assets at Fair Value Through Profit or Loss 742,648,015 719,366,927Cash 125,621 127,557Receivables:
Interest and Dividends 8,588,992 9,850,030Capital Shares Issued 894,362 542,137Investments Sold 1,242,195 —
Total Current Assets 753,499,185 729,886,651
Current Liabilities Payables and Other Liabilities:
Investments Purchased 2,049,434 566,172Capital Shares Redeemed 171,299 22,675Management Fees Payable 106,455 154,069
Total Current Liabilities 2,327,188 742,916
Net Assets Attributable to Holders of Redeemable Participating Shares (for financial reporting purposes) (“Net Assets”) 751,171,997 729,143,735
Net Asset Value Per Share As at As at As at 31 December 2019 31 December 2018 31 December 2017
Institutional EUR Shares (€) Net Assets 737,035,918 723,472,038 524,358,939Number of Shares Outstanding 3,067,953 3,480,262 2,639,402
Net Asset Value Per Share1 240.24 207.88 198.67
Institutional Plus EUR Shares (€) Net Assets 14,136,079 5,671,697 1,358,108Number of Shares Outstanding 121,627 56,447 14,157
Net Asset Value Per Share1 116.22 100.48 95.93
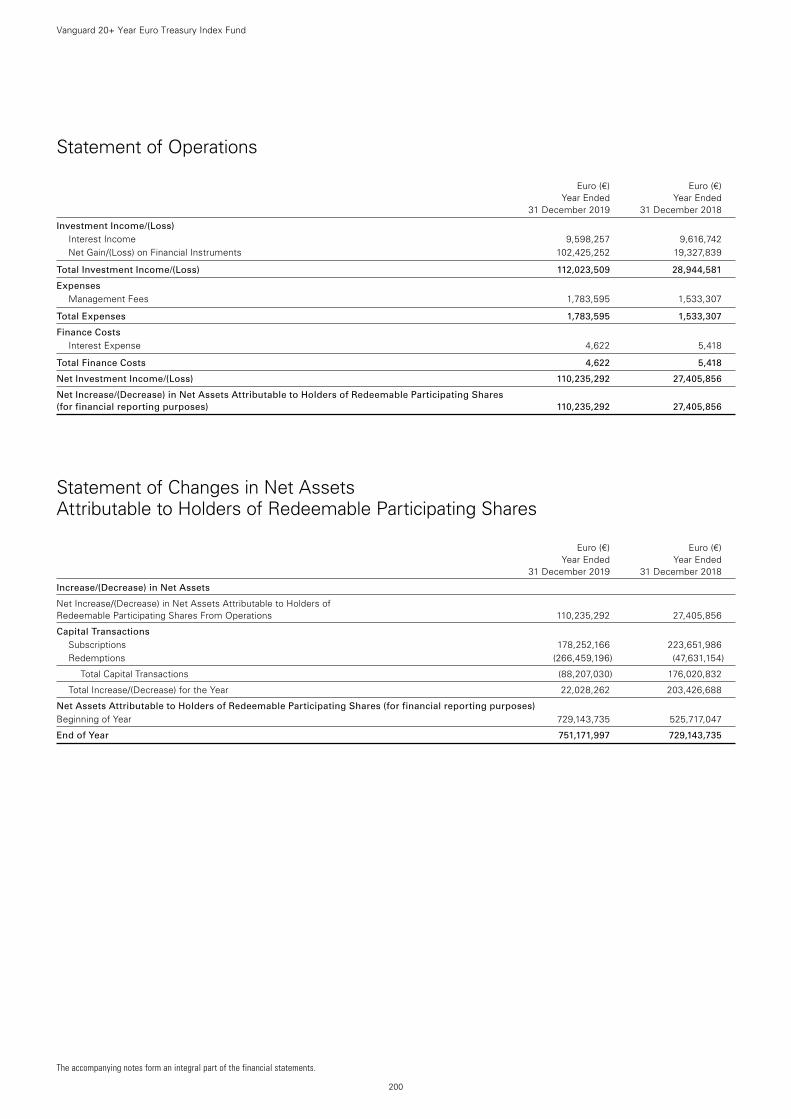
200
Vanguard 20+ Year Euro Treasury Index Fund
Statement of Operations
Euro (€) Euro (€) Year Ended Year Ended 31 December 2019 31 December 2018
Investment Income/(Loss) Interest Income 9,598,257 9,616,742Net Gain/(Loss) on Financial Instruments 102,425,252 19,327,839
Total Investment Income/(Loss) 112,023,509 28,944,581
Expenses Management Fees 1,783,595 1,533,307
Total Expenses 1,783,595 1,533,307
Finance Costs Interest Expense 4,622 5,418
Total Finance Costs 4,622 5,418
Net Investment Income/(Loss) 110,235,292 27,405,856
Net Increase/(Decrease) in Net Assets Attributable to Holders of Redeemable Participating Shares (for financial reporting purposes) 110,235,292 27,405,856
Statement of Changes in Net Assets Attributable to Holders of Redeemable Participating Shares
Euro (€) Euro (€) Year Ended Year Ended 31 December 2019 31 December 2018
Increase/(Decrease) in Net Assets
Net Increase/(Decrease) in Net Assets Attributable to Holders of Redeemable Participating Shares From Operations 110,235,292 27,405,856
Capital Transactions Subscriptions 178,252,166 223,651,986Redemptions (266,459,196) (47,631,154)
Total Capital Transactions (88,207,030) 176,020,832
Total Increase/(Decrease) for the Year 22,028,262 203,426,688
Net Assets Attributable to Holders of Redeemable Participating Shares (for financial reporting purposes) Beginning of Year 729,143,735 525,717,047
End of Year 751,171,997 729,143,735
The accompanying notes form an integral part of the financial statements.
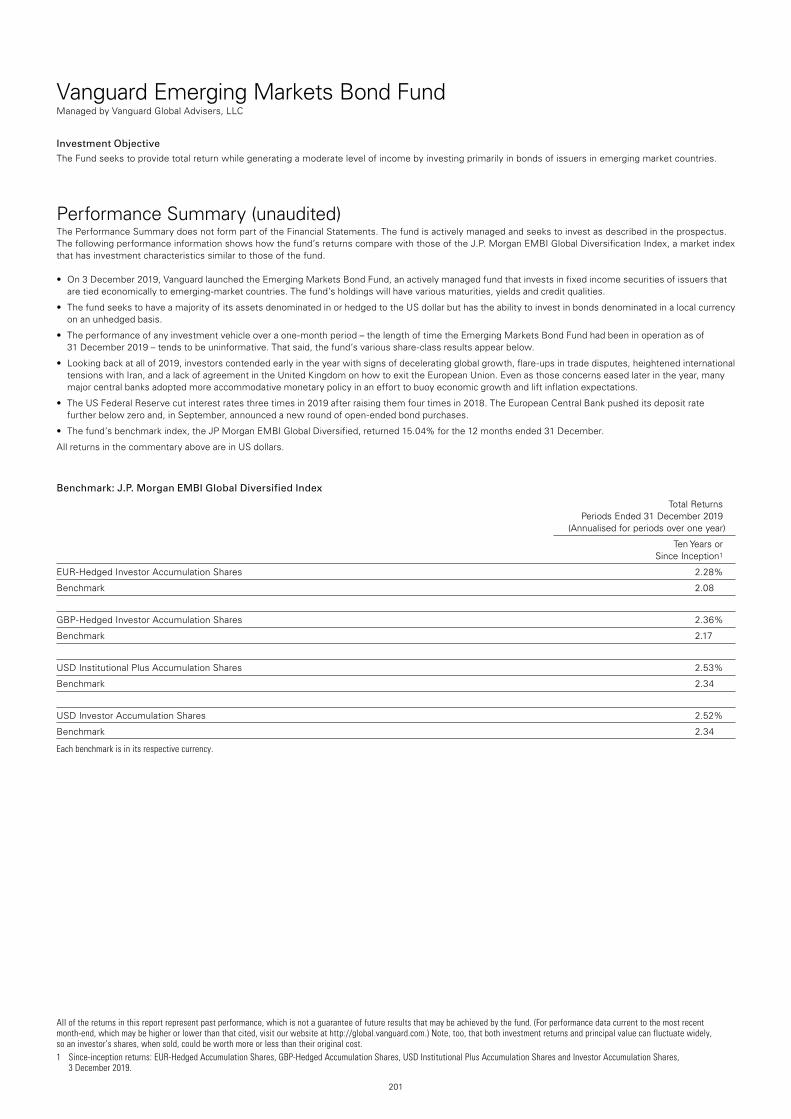
201
Vanguard Emerging Markets Bond FundManaged by Vanguard Global Advisers, LLC
All of the returns in this report represent past performance, which is not a guarantee of future results that may be achieved by the fund. (For performance data current to the most recent month-end, which may be higher or lower than that cited, visit our website at http://global.vanguard.com.) Note, too, that both investment returns and principal value can fluctuate widely, so an investor’s shares, when sold, could be worth more or less than their original cost.1 Since-inception returns: EUR-Hedged Accumulation Shares, GBP-Hedged Accumulation Shares, USD Institutional Plus Accumulation Shares and Investor Accumulation Shares,
3 December 2019.
Investment ObjectiveThe Fund seeks to provide total return while generating a moderate level of income by investing primarily in bonds of issuers in emerging market countries.
Performance Summary (unaudited)The Performance Summary does not form part of the Financial Statements. The fund is actively managed and seeks to invest as described in the prospectus. The following performance information shows how the fund’s returns compare with those of the J.P. Morgan EMBI Global Diversification Index, a market index that has investment characteristics similar to those of the fund.
• On3December2019,VanguardlaunchedtheEmergingMarketsBondFund,anactivelymanagedfundthatinvestsinfixedincomesecuritiesofissuersthatare tied economically to emerging-market countries. The fund’s holdings will have various maturities, yields and credit qualities.
• ThefundseekstohaveamajorityofitsassetsdenominatedinorhedgedtotheUSdollarbuthastheabilitytoinvestinbondsdenominatedinalocalcurrencyon an unhedged basis.
• Theperformanceofanyinvestmentvehicleoveraone-monthperiod–thelengthoftimetheEmergingMarketsBondFundhadbeeninoperationasof 31 December 2019 – tends to be uninformative. That said, the fund’s various share-class results appear below.
• Lookingbackatallof2019,investorscontendedearlyintheyearwithsignsofdeceleratingglobalgrowth,flare-upsintradedisputes,heightenedinternationaltensions with Iran, and a lack of agreement in the United Kingdom on how to exit the European Union. Even as those concerns eased later in the year, many major central banks adopted more accommodative monetary policy in an effort to buoy economic growth and lift inflation expectations.
• TheUSFederalReservecutinterestratesthreetimesin2019afterraisingthemfourtimesin2018.TheEuropeanCentralBankpusheditsdepositratefurther below zero and, in September, announced a new round of open-ended bond purchases.
• Thefund’sbenchmarkindex,theJPMorganEMBIGlobalDiversified,returned15.04%forthe12monthsended31December.
All returns in the commentary above are in US dollars.
Benchmark: J.P. Morgan EMBI Global Diversified Index
Total Returns Periods Ended 31 December 2019 (Annualised for periods over one year)
Ten Years or Since Inception1
EUR-Hedged Investor Accumulation Shares 2.28%
Benchmark 2.08
GBP-Hedged Investor Accumulation Shares 2.36%
Benchmark 2.17
USD Institutional Plus Accumulation Shares 2.53%
Benchmark 2.34
USD Investor Accumulation Shares 2.52%
Benchmark 2.34
Each benchmark is in its respective currency.
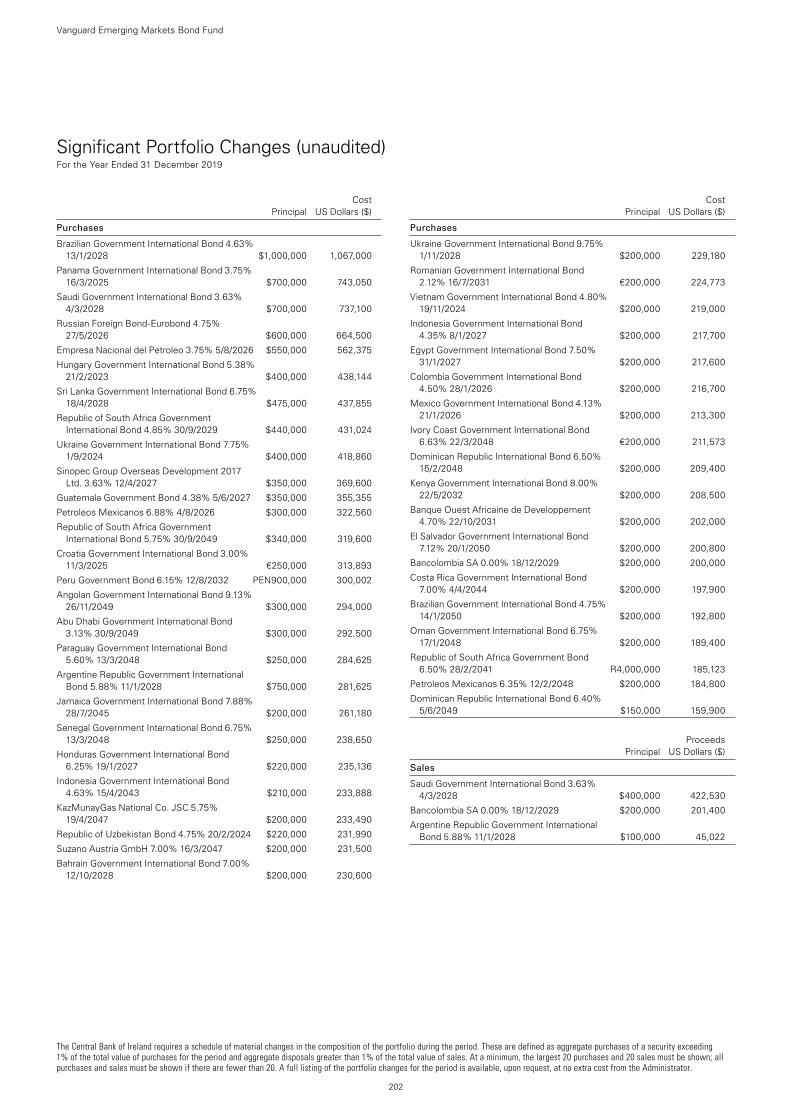
The Central Bank of Ireland requires a schedule of material changes in the composition of the portfolio during the period. These are defined as aggregate purchases of a security exceeding 1% of the total value of purchases for the period and aggregate disposals greater than 1% of the total value of sales. At a minimum, the largest 20 purchases and 20 sales must be shown; all purchases and sales must be shown if there are fewer than 20. A full listing of the portfolio changes for the period is available, upon request, at no extra cost from the Administrator.
202
Vanguard Emerging Markets Bond Fund
Significant Portfolio Changes (unaudited) For the Year Ended 31 December 2019
Cost Principal US Dollars ($)
Purchases
Brazilian Government International Bond 4.63% 13/1/2028 $1,000,000 1,067,000
Panama Government International Bond 3.75% 16/3/2025 $700,000 743,050
Saudi Government International Bond 3.63% 4/3/2028 $700,000 737,100
Russian Foreign Bond-Eurobond 4.75% 27/5/2026 $600,000 664,500
Empresa Nacional del Petroleo 3.75% 5/8/2026 $550,000 562,375
Hungary Government International Bond 5.38% 21/2/2023 $400,000 438,144
Sri Lanka Government International Bond 6.75% 18/4/2028 $475,000 437,855
Republic of South Africa Government International Bond 4.85% 30/9/2029 $440,000 431,024
Ukraine Government International Bond 7.75% 1/9/2024 $400,000 418,860
Sinopec Group Overseas Development 2017 Ltd. 3.63% 12/4/2027 $350,000 369,600
Guatemala Government Bond 4.38% 5/6/2027 $350,000 355,355
Petroleos Mexicanos 6.88% 4/8/2026 $300,000 322,560
Republic of South Africa Government International Bond 5.75% 30/9/2049 $340,000 319,600
Croatia Government International Bond 3.00% 11/3/2025 €250,000 313,893
Peru Government Bond 6.15% 12/8/2032 PEN900,000 300,002
Angolan Government International Bond 9.13% 26/11/2049 $300,000 294,000
Abu Dhabi Government International Bond 3.13% 30/9/2049 $300,000 292,500
Paraguay Government International Bond 5.60% 13/3/2048 $250,000 284,625
Argentine Republic Government International Bond 5.88% 11/1/2028 $750,000 281,625
Jamaica Government International Bond 7.88% 28/7/2045 $200,000 261,180
Senegal Government International Bond 6.75% 13/3/2048 $250,000 238,650
Honduras Government International Bond 6.25% 19/1/2027 $220,000 235,136
Indonesia Government International Bond 4.63% 15/4/2043 $210,000 233,888
KazMunayGas National Co. JSC 5.75% 19/4/2047 $200,000 233,490
Republic of Uzbekistan Bond 4.75% 20/2/2024 $220,000 231,990
Suzano Austria GmbH 7.00% 16/3/2047 $200,000 231,500
Bahrain Government International Bond 7.00% 12/10/2028 $200,000 230,600
Cost Principal US Dollars ($)
Purchases
Ukraine Government International Bond 9.75% 1/11/2028 $200,000 229,180
Romanian Government International Bond 2.12% 16/7/2031 €200,000 224,773
Vietnam Government International Bond 4.80% 19/11/2024 $200,000 219,000
Indonesia Government International Bond 4.35% 8/1/2027 $200,000 217,700
Egypt Government International Bond 7.50% 31/1/2027 $200,000 217,600
Colombia Government International Bond 4.50% 28/1/2026 $200,000 216,700
Mexico Government International Bond 4.13% 21/1/2026 $200,000 213,300
Ivory Coast Government International Bond 6.63% 22/3/2048 €200,000 211,573
Dominican Republic International Bond 6.50% 15/2/2048 $200,000 209,400
Kenya Government International Bond 8.00% 22/5/2032 $200,000 208,500
Banque Ouest Africaine de Developpement 4.70% 22/10/2031 $200,000 202,000
El Salvador Government International Bond 7.12% 20/1/2050 $200,000 200,800
Bancolombia SA 0.00% 18/12/2029 $200,000 200,000
Costa Rica Government International Bond 7.00% 4/4/2044 $200,000 197,900
Brazilian Government International Bond 4.75% 14/1/2050 $200,000 192,800
Oman Government International Bond 6.75% 17/1/2048 $200,000 189,400
Republic of South Africa Government Bond 6.50% 28/2/2041 R4,000,000 185,123
Petroleos Mexicanos 6.35% 12/2/2048 $200,000 184,800
Dominican Republic International Bond 6.40% 5/6/2049 $150,000 159,900
Proceeds Principal US Dollars ($)
Sales
Saudi Government International Bond 3.63% 4/3/2028 $400,000 422,530
Bancolombia SA 0.00% 18/12/2029 $200,000 201,400
Argentine Republic Government International Bond 5.88% 11/1/2028 $100,000 45,022
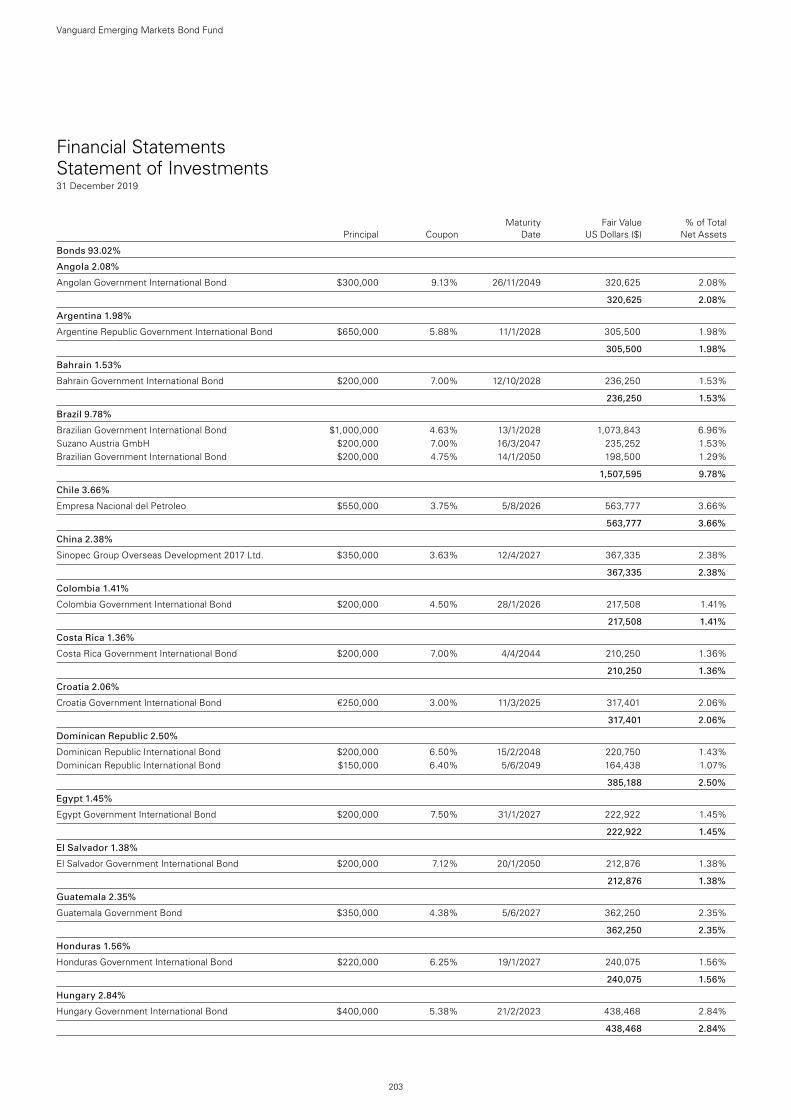
Financial Statements Statement of Investments31 December 2019
Maturity Fair Value % of Total Principal Coupon Date US Dollars ($) Net Assets
Bonds 93.02%
Angola 2.08%
Angolan Government International Bond $300,000 9.13% 26/11/2049 320,625 2.08%
320,625 2.08%
Argentina 1.98%
Argentine Republic Government International Bond $650,000 5.88% 11/1/2028 305,500 1.98%
305,500 1.98%
Bahrain 1.53%
Bahrain Government International Bond $200,000 7.00% 12/10/2028 236,250 1.53%
236,250 1.53%
Brazil 9.78%
Brazilian Government International Bond $1,000,000 4.63% 13/1/2028 1,073,843 6.96%Suzano Austria GmbH $200,000 7.00% 16/3/2047 235,252 1.53%Brazilian Government International Bond $200,000 4.75% 14/1/2050 198,500 1.29%
1,507,595 9.78%
Chile 3.66%
Empresa Nacional del Petroleo $550,000 3.75% 5/8/2026 563,777 3.66%
563,777 3.66%
China 2.38%
Sinopec Group Overseas Development 2017 Ltd. $350,000 3.63% 12/4/2027 367,335 2.38%
367,335 2.38%
Colombia 1.41%
Colombia Government International Bond $200,000 4.50% 28/1/2026 217,508 1.41%
217,508 1.41%
Costa Rica 1.36%
Costa Rica Government International Bond $200,000 7.00% 4/4/2044 210,250 1.36%
210,250 1.36%
Croatia 2.06%
Croatia Government International Bond €250,000 3.00% 11/3/2025 317,401 2.06%
317,401 2.06%
Dominican Republic 2.50%
Dominican Republic International Bond $200,000 6.50% 15/2/2048 220,750 1.43%Dominican Republic International Bond $150,000 6.40% 5/6/2049 164,438 1.07%
385,188 2.50%
Egypt 1.45%
Egypt Government International Bond $200,000 7.50% 31/1/2027 222,922 1.45%
222,922 1.45%
El Salvador 1.38%
El Salvador Government International Bond $200,000 7.12% 20/1/2050 212,876 1.38%
212,876 1.38%
Guatemala 2.35%
Guatemala Government Bond $350,000 4.38% 5/6/2027 362,250 2.35%
362,250 2.35%
Honduras 1.56%
Honduras Government International Bond $220,000 6.25% 19/1/2027 240,075 1.56%
240,075 1.56%
Hungary 2.84%
Hungary Government International Bond $400,000 5.38% 21/2/2023 438,468 2.84%
438,468 2.84%
Vanguard Emerging Markets Bond Fund
203
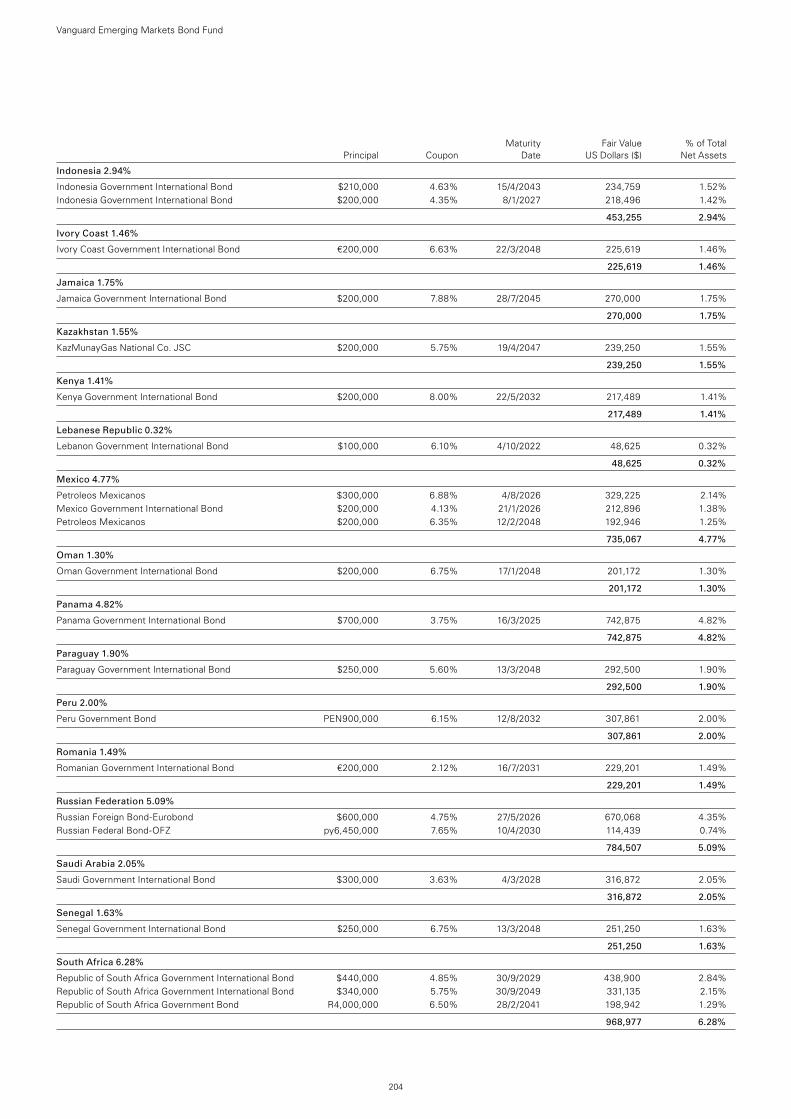
Maturity Fair Value % of Total Principal Coupon Date US Dollars ($) Net Assets
Indonesia 2.94%
Indonesia Government International Bond $210,000 4.63% 15/4/2043 234,759 1.52%Indonesia Government International Bond $200,000 4.35% 8/1/2027 218,496 1.42%
453,255 2.94%
Ivory Coast 1.46%
Ivory Coast Government International Bond €200,000 6.63% 22/3/2048 225,619 1.46%
225,619 1.46%
Jamaica 1.75%
Jamaica Government International Bond $200,000 7.88% 28/7/2045 270,000 1.75%
270,000 1.75%
Kazakhstan 1.55%
KazMunayGas National Co. JSC $200,000 5.75% 19/4/2047 239,250 1.55%
239,250 1.55%
Kenya 1.41%
Kenya Government International Bond $200,000 8.00% 22/5/2032 217,489 1.41%
217,489 1.41%
Lebanese Republic 0.32%
Lebanon Government International Bond $100,000 6.10% 4/10/2022 48,625 0.32%
48,625 0.32%
Mexico 4.77%
Petroleos Mexicanos $300,000 6.88% 4/8/2026 329,225 2.14%Mexico Government International Bond $200,000 4.13% 21/1/2026 212,896 1.38%Petroleos Mexicanos $200,000 6.35% 12/2/2048 192,946 1.25%
735,067 4.77%
Oman 1.30%
Oman Government International Bond $200,000 6.75% 17/1/2048 201,172 1.30%
201,172 1.30%
Panama 4.82%
Panama Government International Bond $700,000 3.75% 16/3/2025 742,875 4.82%
742,875 4.82%
Paraguay 1.90%
Paraguay Government International Bond $250,000 5.60% 13/3/2048 292,500 1.90%
292,500 1.90%
Peru 2.00%
Peru Government Bond PEN900,000 6.15% 12/8/2032 307,861 2.00%
307,861 2.00%
Romania 1.49%
Romanian Government International Bond €200,000 2.12% 16/7/2031 229,201 1.49%
229,201 1.49%
Russian Federation 5.09%
Russian Foreign Bond-Eurobond $600,000 4.75% 27/5/2026 670,068 4.35%Russian Federal Bond-OFZ py6,450,000 7.65% 10/4/2030 114,439 0.74%
784,507 5.09%
Saudi Arabia 2.05%
Saudi Government International Bond $300,000 3.63% 4/3/2028 316,872 2.05%
316,872 2.05%
Senegal 1.63%
Senegal Government International Bond $250,000 6.75% 13/3/2048 251,250 1.63%
251,250 1.63%
South Africa 6.28%
Republic of South Africa Government International Bond $440,000 4.85% 30/9/2029 438,900 2.84%Republic of South Africa Government International Bond $340,000 5.75% 30/9/2049 331,135 2.15%Republic of South Africa Government Bond R4,000,000 6.50% 28/2/2041 198,942 1.29%
968,977 6.28%
Vanguard Emerging Markets Bond Fund
204
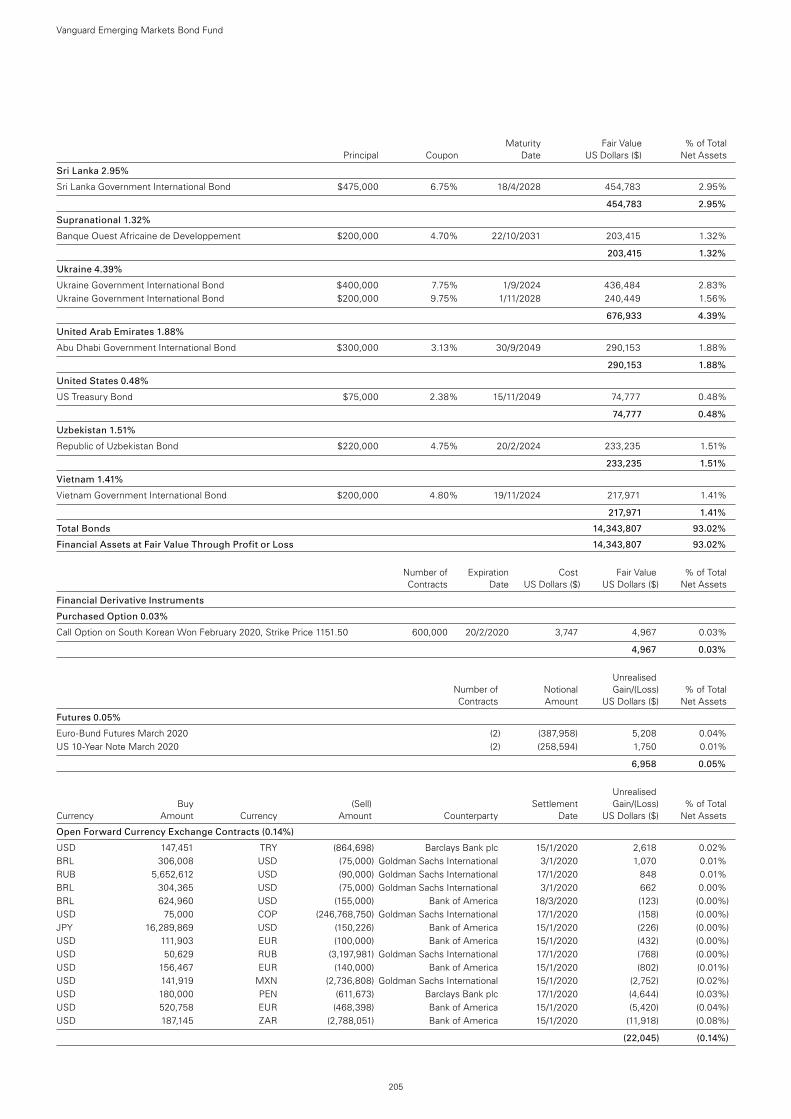
Maturity Fair Value % of Total Principal Coupon Date US Dollars ($) Net Assets
Sri Lanka 2.95%
Sri Lanka Government International Bond $475,000 6.75% 18/4/2028 454,783 2.95%
454,783 2.95%
Supranational 1.32%
Banque Ouest Africaine de Developpement $200,000 4.70% 22/10/2031 203,415 1.32%
203,415 1.32%
Ukraine 4.39%
Ukraine Government International Bond $400,000 7.75% 1/9/2024 436,484 2.83%Ukraine Government International Bond $200,000 9.75% 1/11/2028 240,449 1.56%
676,933 4.39%
United Arab Emirates 1.88%
Abu Dhabi Government International Bond $300,000 3.13% 30/9/2049 290,153 1.88%
290,153 1.88%
United States 0.48%
US Treasury Bond $75,000 2.38% 15/11/2049 74,777 0.48%
74,777 0.48%
Uzbekistan 1.51%
Republic of Uzbekistan Bond $220,000 4.75% 20/2/2024 233,235 1.51%
233,235 1.51%
Vietnam 1.41%
Vietnam Government International Bond $200,000 4.80% 19/11/2024 217,971 1.41%
217,971 1.41%
Total Bonds 14,343,807 93.02%
Financial Assets at Fair Value Through Profit or Loss 14,343,807 93.02%
Number of Expiration Cost Fair Value % of Total Contracts Date US Dollars ($) US Dollars ($) Net Assets
Financial Derivative Instruments
Purchased Option 0.03%
Call Option on South Korean Won February 2020, Strike Price 1151.50 600,000 20/2/2020 3,747 4,967 0.03%
4,967 0.03%
Unrealised Number of Notional Gain/(Loss) % of Total Contracts Amount US Dollars ($) Net Assets
Futures 0.05%
Euro-Bund Futures March 2020 (2) (387,958) 5,208 0.04%US 10-Year Note March 2020 (2) (258,594) 1,750 0.01%
6,958 0.05%
Unrealised Buy (Sell) Settlement Gain/(Loss) % of Total Currency Amount Currency Amount Counterparty Date US Dollars ($) Net Assets
Open Forward Currency Exchange Contracts (0.14%)
USD 147,451 TRY (864,698) Barclays Bank plc 15/1/2020 2,618 0.02%BRL 306,008 USD (75,000) Goldman Sachs International 3/1/2020 1,070 0.01%RUB 5,652,612 USD (90,000) Goldman Sachs International 17/1/2020 848 0.01%BRL 304,365 USD (75,000) Goldman Sachs International 3/1/2020 662 0.00%BRL 624,960 USD (155,000) Bank of America 18/3/2020 (123) (0.00%)USD 75,000 COP (246,768,750) Goldman Sachs International 17/1/2020 (158) (0.00%)JPY 16,289,869 USD (150,226) Bank of America 15/1/2020 (226) (0.00%)USD 111,903 EUR (100,000) Bank of America 15/1/2020 (432) (0.00%)USD 50,629 RUB (3,197,981) Goldman Sachs International 17/1/2020 (768) (0.00%)USD 156,467 EUR (140,000) Bank of America 15/1/2020 (802) (0.01%)USD 141,919 MXN (2,736,808) Goldman Sachs International 15/1/2020 (2,752) (0.02%)USD 180,000 PEN (611,673) Barclays Bank plc 17/1/2020 (4,644) (0.03%)USD 520,758 EUR (468,398) Bank of America 15/1/2020 (5,420) (0.04%)USD 187,145 ZAR (2,788,051) Bank of America 15/1/2020 (11,918) (0.08%)
(22,045) (0.14%)
Vanguard Emerging Markets Bond Fund
205
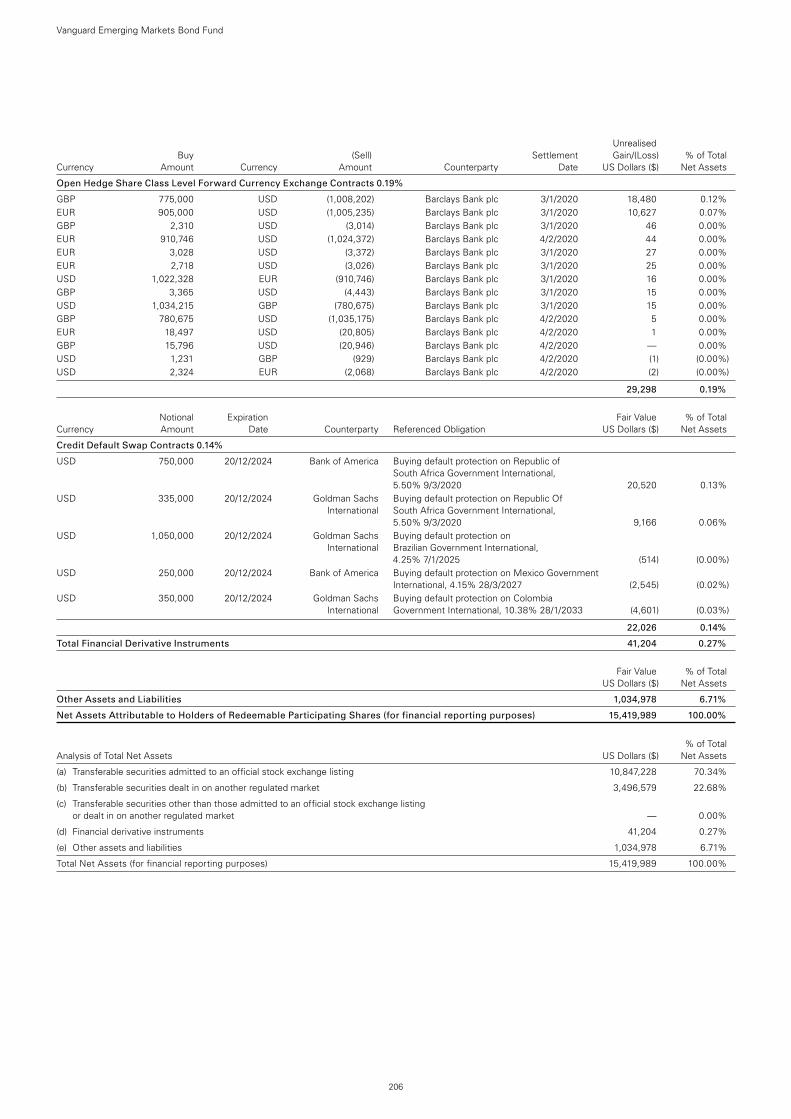
Unrealised Buy (Sell) Settlement Gain/(Loss) % of Total Currency Amount Currency Amount Counterparty Date US Dollars ($) Net Assets
Open Hedge Share Class Level Forward Currency Exchange Contracts 0.19%
GBP 775,000 USD (1,008,202) Barclays Bank plc 3/1/2020 18,480 0.12%EUR 905,000 USD (1,005,235) Barclays Bank plc 3/1/2020 10,627 0.07%GBP 2,310 USD (3,014) Barclays Bank plc 3/1/2020 46 0.00%EUR 910,746 USD (1,024,372) Barclays Bank plc 4/2/2020 44 0.00%EUR 3,028 USD (3,372) Barclays Bank plc 3/1/2020 27 0.00%EUR 2,718 USD (3,026) Barclays Bank plc 3/1/2020 25 0.00%USD 1,022,328 EUR (910,746) Barclays Bank plc 3/1/2020 16 0.00%GBP 3,365 USD (4,443) Barclays Bank plc 3/1/2020 15 0.00%USD 1,034,215 GBP (780,675) Barclays Bank plc 3/1/2020 15 0.00%GBP 780,675 USD (1,035,175) Barclays Bank plc 4/2/2020 5 0.00%EUR 18,497 USD (20,805) Barclays Bank plc 4/2/2020 1 0.00%GBP 15,796 USD (20,946) Barclays Bank plc 4/2/2020 — 0.00%USD 1,231 GBP (929) Barclays Bank plc 4/2/2020 (1) (0.00%)USD 2,324 EUR (2,068) Barclays Bank plc 4/2/2020 (2) (0.00%)
29,298 0.19%
Notional Expiration Fair Value % of Total Currency Amount Date Counterparty Referenced Obligation US Dollars ($) Net Assets
Credit Default Swap Contracts 0.14%
USD 750,000 20/12/2024 Bank of America Buying default protection on Republic of South Africa Government International, 5.50% 9/3/2020 20,520 0.13%
USD 335,000 20/12/2024 Goldman Sachs Buying default protection on Republic Of International South Africa Government International, 5.50% 9/3/2020 9,166 0.06%
USD 1,050,000 20/12/2024 Goldman Sachs Buying default protection on International Brazilian Government International, 4.25% 7/1/2025 (514) (0.00%)
USD 250,000 20/12/2024 Bank of America Buying default protection on Mexico Government International, 4.15% 28/3/2027 (2,545) (0.02%)
USD 350,000 20/12/2024 Goldman Sachs Buying default protection on Colombia International Government International, 10.38% 28/1/2033 (4,601) (0.03%)
22,026 0.14%
Total Financial Derivative Instruments 41,204 0.27%
Fair Value % of Total US Dollars ($) Net Assets
Other Assets and Liabilities 1,034,978 6.71%
Net Assets Attributable to Holders of Redeemable Participating Shares (for financial reporting purposes) 15,419,989 100.00%
% of Total Analysis of Total Net Assets US Dollars ($) Net Assets
(a) Transferable securities admitted to an official stock exchange listing 10,847,228 70.34%
(b) Transferable securities dealt in on another regulated market 3,496,579 22.68%
(c) Transferable securities other than those admitted to an official stock exchange listing or dealt in on another regulated market — 0.00%
(d) Financial derivative instruments 41,204 0.27%
(e) Other assets and liabilities 1,034,978 6.71%
Total Net Assets (for financial reporting purposes) 15,419,989 100.00%
Vanguard Emerging Markets Bond Fund
206
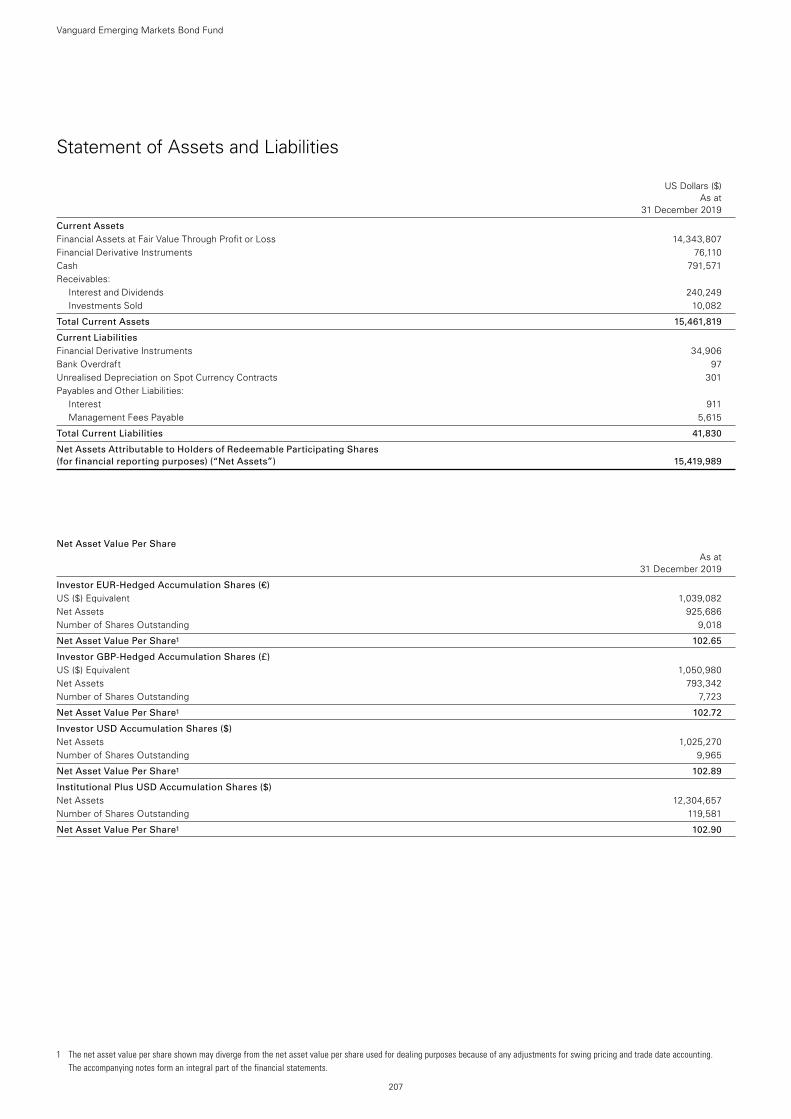
1 The net asset value per share shown may diverge from the net asset value per share used for dealing purposes because of any adjustments for swing pricing and trade date accounting. The accompanying notes form an integral part of the financial statements.
207
Vanguard Emerging Markets Bond Fund
Statement of Assets and Liabilities
US Dollars ($) As at 31 December 2019
Current Assets Financial Assets at Fair Value Through Profit or Loss 14,343,807Financial Derivative Instruments 76,110Cash 791,571Receivables:
Interest and Dividends 240,249Investments Sold 10,082
Total Current Assets 15,461,819
Current Liabilities Financial Derivative Instruments 34,906Bank Overdraft 97Unrealised Depreciation on Spot Currency Contracts 301Payables and Other Liabilities:
Interest 911Management Fees Payable 5,615
Total Current Liabilities 41,830
Net Assets Attributable to Holders of Redeemable Participating Shares (for financial reporting purposes) (“Net Assets”) 15,419,989
Net Asset Value Per Share As at 31 December 2019
Investor EUR-Hedged Accumulation Shares (€) US ($) Equivalent 1,039,082 Net Assets 925,686Number of Shares Outstanding 9,018
Net Asset Value Per Share1 102.65
Investor GBP-Hedged Accumulation Shares (£) US ($) Equivalent 1,050,980 Net Assets 793,342Number of Shares Outstanding 7,723
Net Asset Value Per Share1 102.72
Investor USD Accumulation Shares ($) Net Assets 1,025,270Number of Shares Outstanding 9,965
Net Asset Value Per Share1 102.89
Institutional Plus USD Accumulation Shares ($) Net Assets 12,304,657Number of Shares Outstanding 119,581
Net Asset Value Per Share1 102.90
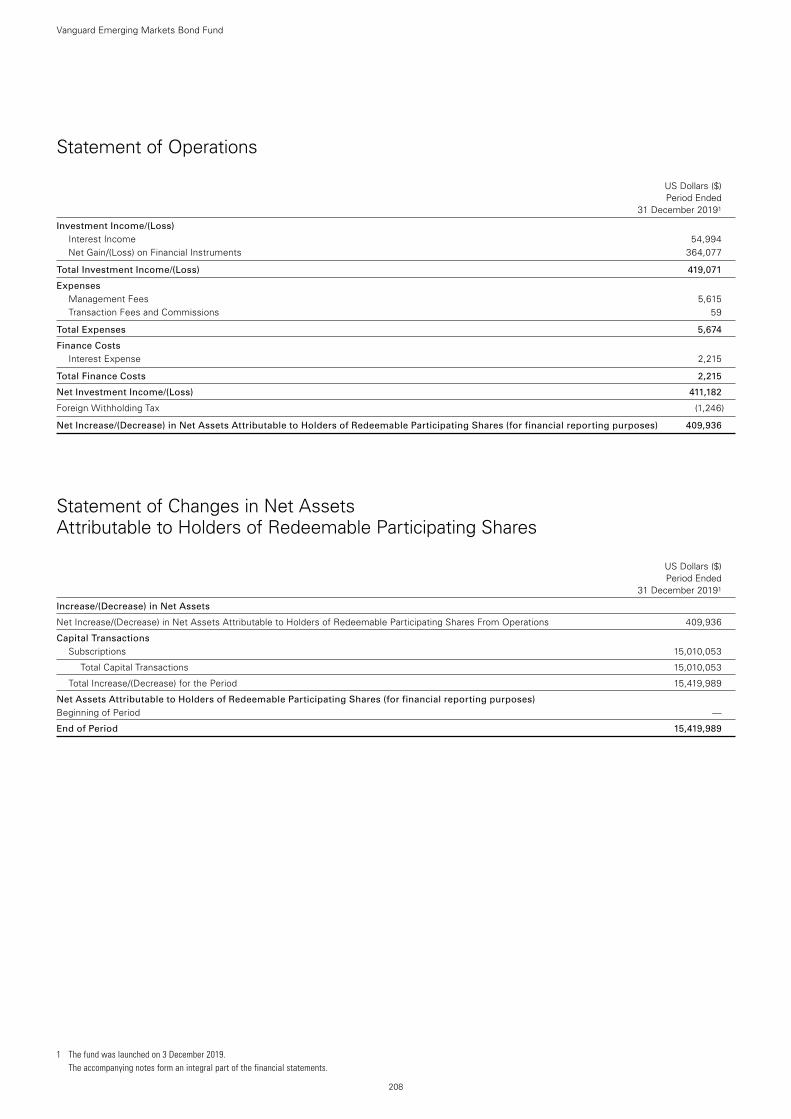
208
Vanguard Emerging Markets Bond Fund
Statement of Operations
US Dollars ($) Period Ended 31 December 20191
Investment Income/(Loss) Interest Income 54,994Net Gain/(Loss) on Financial Instruments 364,077
Total Investment Income/(Loss) 419,071
Expenses Management Fees 5,615Transaction Fees and Commissions 59
Total Expenses 5,674
Finance Costs Interest Expense 2,215
Total Finance Costs 2,215
Net Investment Income/(Loss) 411,182
Foreign Withholding Tax (1,246)
Net Increase/(Decrease) in Net Assets Attributable to Holders of Redeemable Participating Shares (for financial reporting purposes) 409,936
Statement of Changes in Net Assets Attributable to Holders of Redeemable Participating Shares
US Dollars ($) Period Ended 31 December 20191
Increase/(Decrease) in Net Assets
Net Increase/(Decrease) in Net Assets Attributable to Holders of Redeemable Participating Shares From Operations 409,936
Capital Transactions Subscriptions 15,010,053
Total Capital Transactions 15,010,053
Total Increase/(Decrease) for the Period 15,419,989
Net Assets Attributable to Holders of Redeemable Participating Shares (for financial reporting purposes) Beginning of Period —
End of Period 15,419,989
1 The fund was launched on 3 December 2019. The accompanying notes form an integral part of the financial statements.
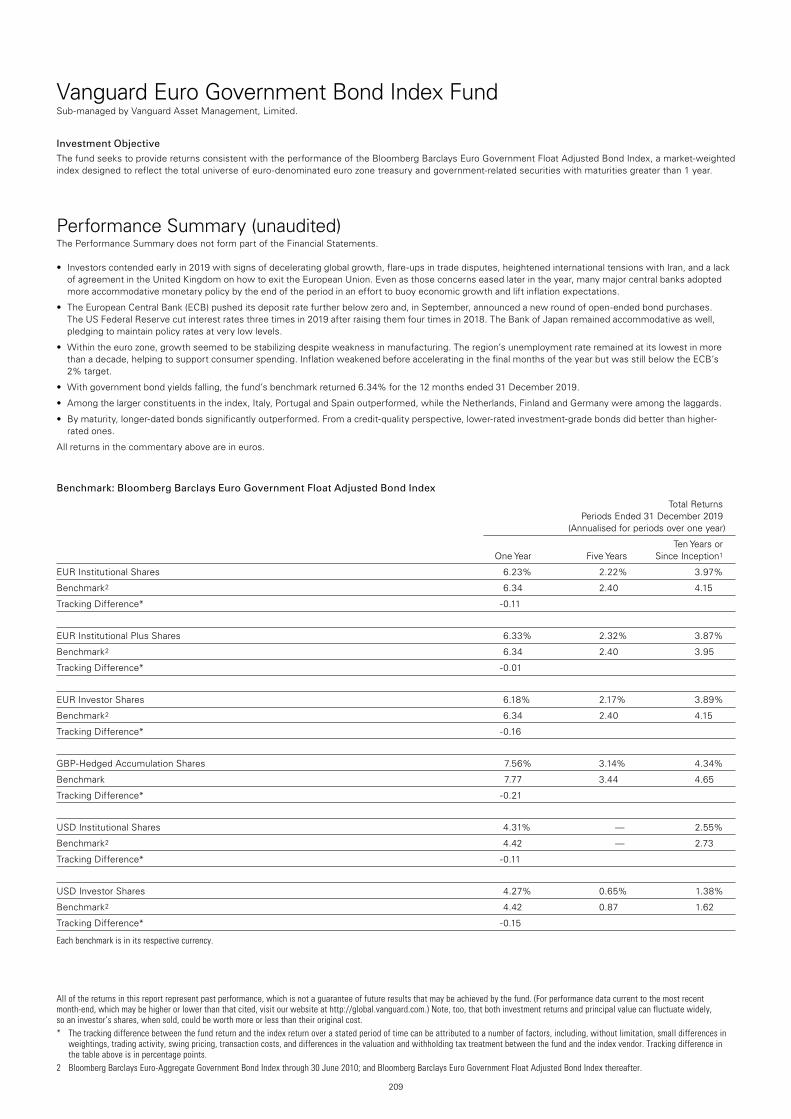
209
Vanguard Euro Government Bond Index FundSub-managed by Vanguard Asset Management, Limited.
All of the returns in this report represent past performance, which is not a guarantee of future results that may be achieved by the fund. (For performance data current to the most recent month-end, which may be higher or lower than that cited, visit our website at http://global.vanguard.com.) Note, too, that both investment returns and principal value can fluctuate widely, so an investor’s shares, when sold, could be worth more or less than their original cost.* The tracking difference between the fund return and the index return over a stated period of time can be attributed to a number of factors, including, without limitation, small differences in
weightings, trading activity, swing pricing, transaction costs, and differences in the valuation and withholding tax treatment between the fund and the index vendor. Tracking difference in the table above is in percentage points.
2 Bloomberg Barclays Euro-Aggregate Government Bond Index through 30 June 2010; and Bloomberg Barclays Euro Government Float Adjusted Bond Index thereafter.
Investment ObjectiveThe fund seeks to provide returns consistent with the performance of the Bloomberg Barclays Euro Government Float Adjusted Bond Index, a market-weighted index designed to reflect the total universe of euro-denominated euro zone treasury and government-related securities with maturities greater than 1 year.
Performance Summary (unaudited)The Performance Summary does not form part of the Financial Statements.
• Investorscontendedearlyin2019withsignsofdeceleratingglobalgrowth,flare-upsintradedisputes,heightenedinternationaltensionswithIran,andalackof agreement in the United Kingdom on how to exit the European Union. Even as those concerns eased later in the year, many major central banks adopted more accommodative monetary policy by the end of the period in an effort to buoy economic growth and lift inflation expectations.
• TheEuropeanCentralBank(ECB)pusheditsdepositratefurtherbelowzeroand,inSeptember,announcedanewroundofopen-endedbondpurchases. The US Federal Reserve cut interest rates three times in 2019 after raising them four times in 2018. The Bank of Japan remained accommodative as well, pledging to maintain policy rates at very low levels.
• Withintheeurozone,growthseemedtobestabilizingdespiteweaknessinmanufacturing.Theregion’sunemploymentrateremainedatitslowestinmorethan a decade, helping to support consumer spending. Inflation weakened before accelerating in the final months of the year but was still below the ECB’s 2% target.
• Withgovernmentbondyieldsfalling,thefund’sbenchmarkreturned6.34%forthe12monthsended31December2019.
• Amongthelargerconstituentsintheindex,Italy,PortugalandSpainoutperformed,whiletheNetherlands,FinlandandGermanywereamongthelaggards.
• Bymaturity,longer-datedbondssignificantlyoutperformed.Fromacredit-qualityperspective,lower-ratedinvestment-gradebondsdidbetterthanhigher-rated ones.
All returns in the commentary above are in euros.
Benchmark: Bloomberg Barclays Euro Government Float Adjusted Bond Index
Total Returns Periods Ended 31 December 2019 (Annualised for periods over one year)
Ten Years or One Year Five Years Since Inception1
EUR Institutional Shares 6.23% 2.22% 3.97%
Benchmark2 6.34 2.40 4.15
Tracking Difference* -0.11
EUR Institutional Plus Shares 6.33% 2.32% 3.87%
Benchmark2 6.34 2.40 3.95
Tracking Difference* -0.01
EUR Investor Shares 6.18% 2.17% 3.89%
Benchmark2 6.34 2.40 4.15
Tracking Difference* -0.16
GBP-Hedged Accumulation Shares 7.56% 3.14% 4.34%
Benchmark 7.77 3.44 4.65
Tracking Difference* -0.21
USD Institutional Shares 4.31% — 2.55%
Benchmark2 4.42 — 2.73
Tracking Difference* -0.11
USD Investor Shares 4.27% 0.65% 1.38%
Benchmark2 4.42 0.87 1.62
Tracking Difference* -0.15
Each benchmark is in its respective currency.
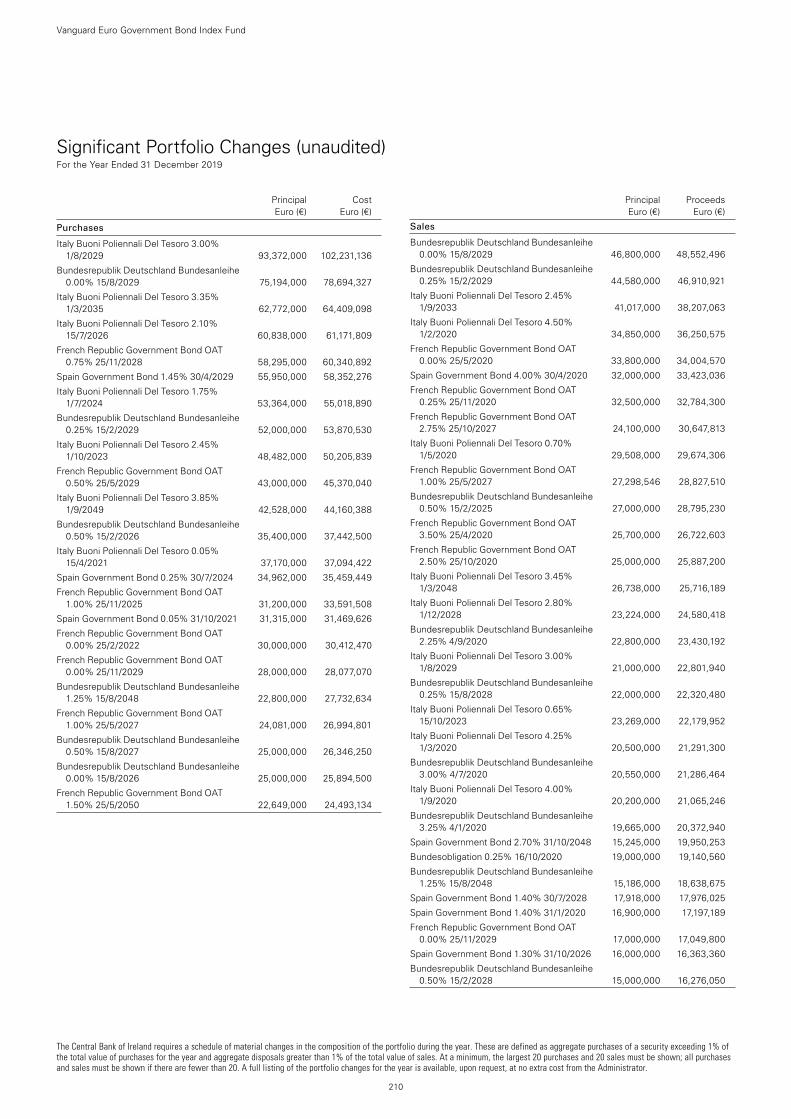
The Central Bank of Ireland requires a schedule of material changes in the composition of the portfolio during the year. These are defined as aggregate purchases of a security exceeding 1% of the total value of purchases for the year and aggregate disposals greater than 1% of the total value of sales. At a minimum, the largest 20 purchases and 20 sales must be shown; all purchases and sales must be shown if there are fewer than 20. A full listing of the portfolio changes for the year is available, upon request, at no extra cost from the Administrator.
210
Vanguard Euro Government Bond Index Fund
Significant Portfolio Changes (unaudited) For the Year Ended 31 December 2019
Principal Cost Euro (€) Euro (€)
Purchases
Italy Buoni Poliennali Del Tesoro 3.00% 1/8/2029 93,372,000 102,231,136
Bundesrepublik Deutschland Bundesanleihe 0.00% 15/8/2029 75,194,000 78,694,327
Italy Buoni Poliennali Del Tesoro 3.35% 1/3/2035 62,772,000 64,409,098
Italy Buoni Poliennali Del Tesoro 2.10% 15/7/2026 60,838,000 61,171,809
French Republic Government Bond OAT 0.75% 25/11/2028 58,295,000 60,340,892
Spain Government Bond 1.45% 30/4/2029 55,950,000 58,352,276
Italy Buoni Poliennali Del Tesoro 1.75% 1/7/2024 53,364,000 55,018,890
Bundesrepublik Deutschland Bundesanleihe 0.25% 15/2/2029 52,000,000 53,870,530
Italy Buoni Poliennali Del Tesoro 2.45% 1/10/2023 48,482,000 50,205,839
French Republic Government Bond OAT 0.50% 25/5/2029 43,000,000 45,370,040
Italy Buoni Poliennali Del Tesoro 3.85% 1/9/2049 42,528,000 44,160,388
Bundesrepublik Deutschland Bundesanleihe 0.50% 15/2/2026 35,400,000 37,442,500
Italy Buoni Poliennali Del Tesoro 0.05% 15/4/2021 37,170,000 37,094,422
Spain Government Bond 0.25% 30/7/2024 34,962,000 35,459,449
French Republic Government Bond OAT 1.00% 25/11/2025 31,200,000 33,591,508
Spain Government Bond 0.05% 31/10/2021 31,315,000 31,469,626
French Republic Government Bond OAT 0.00% 25/2/2022 30,000,000 30,412,470
French Republic Government Bond OAT 0.00% 25/11/2029 28,000,000 28,077,070
Bundesrepublik Deutschland Bundesanleihe 1.25% 15/8/2048 22,800,000 27,732,634
French Republic Government Bond OAT 1.00% 25/5/2027 24,081,000 26,994,801
Bundesrepublik Deutschland Bundesanleihe 0.50% 15/8/2027 25,000,000 26,346,250
Bundesrepublik Deutschland Bundesanleihe 0.00% 15/8/2026 25,000,000 25,894,500
French Republic Government Bond OAT 1.50% 25/5/2050 22,649,000 24,493,134
Principal Proceeds Euro (€) Euro (€)
Sales
Bundesrepublik Deutschland Bundesanleihe 0.00% 15/8/2029 46,800,000 48,552,496
Bundesrepublik Deutschland Bundesanleihe 0.25% 15/2/2029 44,580,000 46,910,921
Italy Buoni Poliennali Del Tesoro 2.45% 1/9/2033 41,017,000 38,207,063
Italy Buoni Poliennali Del Tesoro 4.50% 1/2/2020 34,850,000 36,250,575
French Republic Government Bond OAT 0.00% 25/5/2020 33,800,000 34,004,570
Spain Government Bond 4.00% 30/4/2020 32,000,000 33,423,036
French Republic Government Bond OAT 0.25% 25/11/2020 32,500,000 32,784,300
French Republic Government Bond OAT 2.75% 25/10/2027 24,100,000 30,647,813
Italy Buoni Poliennali Del Tesoro 0.70% 1/5/2020 29,508,000 29,674,306
French Republic Government Bond OAT 1.00% 25/5/2027 27,298,546 28,827,510
Bundesrepublik Deutschland Bundesanleihe 0.50% 15/2/2025 27,000,000 28,795,230
French Republic Government Bond OAT 3.50% 25/4/2020 25,700,000 26,722,603
French Republic Government Bond OAT 2.50% 25/10/2020 25,000,000 25,887,200
Italy Buoni Poliennali Del Tesoro 3.45% 1/3/2048 26,738,000 25,716,189
Italy Buoni Poliennali Del Tesoro 2.80% 1/12/2028 23,224,000 24,580,418
Bundesrepublik Deutschland Bundesanleihe 2.25% 4/9/2020 22,800,000 23,430,192
Italy Buoni Poliennali Del Tesoro 3.00% 1/8/2029 21,000,000 22,801,940
Bundesrepublik Deutschland Bundesanleihe 0.25% 15/8/2028 22,000,000 22,320,480
Italy Buoni Poliennali Del Tesoro 0.65% 15/10/2023 23,269,000 22,179,952
Italy Buoni Poliennali Del Tesoro 4.25% 1/3/2020 20,500,000 21,291,300
Bundesrepublik Deutschland Bundesanleihe 3.00% 4/7/2020 20,550,000 21,286,464
Italy Buoni Poliennali Del Tesoro 4.00% 1/9/2020 20,200,000 21,065,246
Bundesrepublik Deutschland Bundesanleihe 3.25% 4/1/2020 19,665,000 20,372,940
Spain Government Bond 2.70% 31/10/2048 15,245,000 19,950,253
Bundesobligation 0.25% 16/10/2020 19,000,000 19,140,560
Bundesrepublik Deutschland Bundesanleihe 1.25% 15/8/2048 15,186,000 18,638,675
Spain Government Bond 1.40% 30/7/2028 17,918,000 17,976,025
Spain Government Bond 1.40% 31/1/2020 16,900,000 17,197,189
French Republic Government Bond OAT 0.00% 25/11/2029 17,000,000 17,049,800
Spain Government Bond 1.30% 31/10/2026 16,000,000 16,363,360
Bundesrepublik Deutschland Bundesanleihe 0.50% 15/2/2028 15,000,000 16,276,050
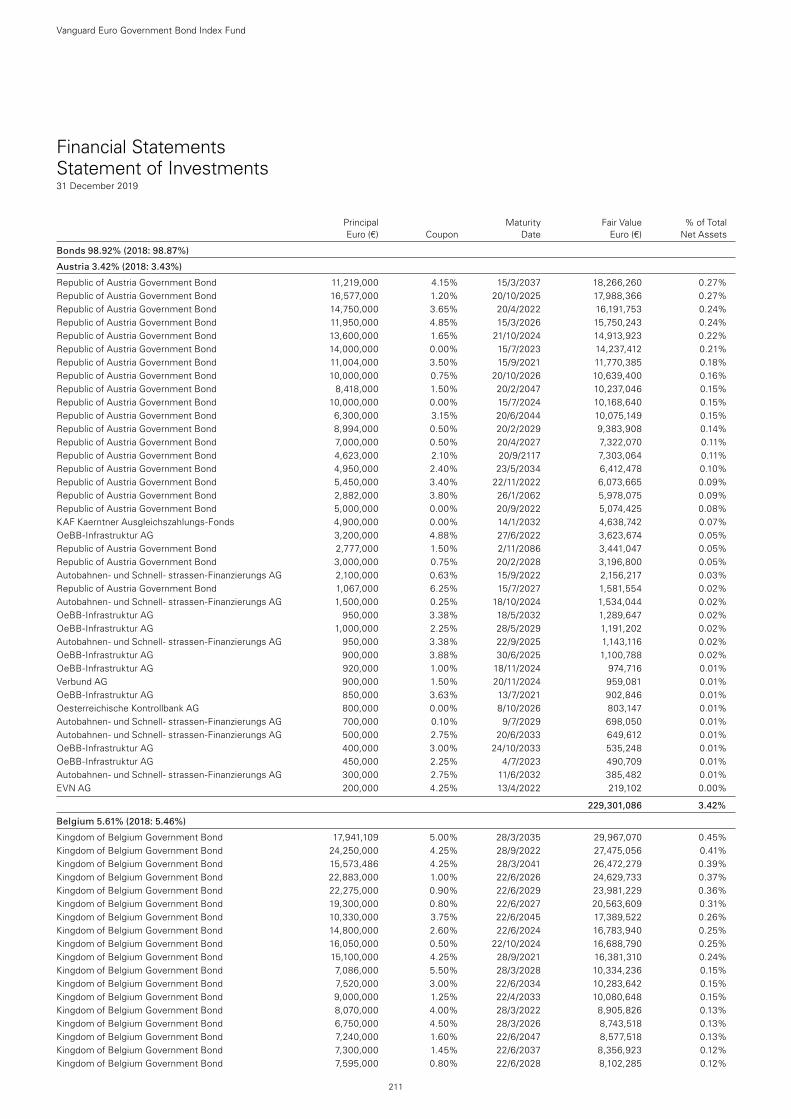
Financial Statements Statement of Investments31 December 2019
Principal Maturity Fair Value % of Total Euro (€) Coupon Date Euro (€) Net Assets
Bonds 98.92% (2018: 98.87%)
Austria 3.42% (2018: 3.43%)
Republic of Austria Government Bond 11,219,000 4.15% 15/3/2037 18,266,260 0.27%Republic of Austria Government Bond 16,577,000 1.20% 20/10/2025 17,988,366 0.27%Republic of Austria Government Bond 14,750,000 3.65% 20/4/2022 16,191,753 0.24%Republic of Austria Government Bond 11,950,000 4.85% 15/3/2026 15,750,243 0.24%Republic of Austria Government Bond 13,600,000 1.65% 21/10/2024 14,913,923 0.22%Republic of Austria Government Bond 14,000,000 0.00% 15/7/2023 14,237,412 0.21%Republic of Austria Government Bond 11,004,000 3.50% 15/9/2021 11,770,385 0.18%Republic of Austria Government Bond 10,000,000 0.75% 20/10/2026 10,639,400 0.16%Republic of Austria Government Bond 8,418,000 1.50% 20/2/2047 10,237,046 0.15%Republic of Austria Government Bond 10,000,000 0.00% 15/7/2024 10,168,640 0.15%Republic of Austria Government Bond 6,300,000 3.15% 20/6/2044 10,075,149 0.15%Republic of Austria Government Bond 8,994,000 0.50% 20/2/2029 9,383,908 0.14%Republic of Austria Government Bond 7,000,000 0.50% 20/4/2027 7,322,070 0.11%Republic of Austria Government Bond 4,623,000 2.10% 20/9/2117 7,303,064 0.11%Republic of Austria Government Bond 4,950,000 2.40% 23/5/2034 6,412,478 0.10%Republic of Austria Government Bond 5,450,000 3.40% 22/11/2022 6,073,665 0.09%Republic of Austria Government Bond 2,882,000 3.80% 26/1/2062 5,978,075 0.09%Republic of Austria Government Bond 5,000,000 0.00% 20/9/2022 5,074,425 0.08%KAF Kaerntner Ausgleichszahlungs-Fonds 4,900,000 0.00% 14/1/2032 4,638,742 0.07%OeBB-Infrastruktur AG 3,200,000 4.88% 27/6/2022 3,623,674 0.05%Republic of Austria Government Bond 2,777,000 1.50% 2/11/2086 3,441,047 0.05%Republic of Austria Government Bond 3,000,000 0.75% 20/2/2028 3,196,800 0.05%Autobahnen- und Schnell- strassen-Finanzierungs AG 2,100,000 0.63% 15/9/2022 2,156,217 0.03%Republic of Austria Government Bond 1,067,000 6.25% 15/7/2027 1,581,554 0.02%Autobahnen- und Schnell- strassen-Finanzierungs AG 1,500,000 0.25% 18/10/2024 1,534,044 0.02%OeBB-Infrastruktur AG 950,000 3.38% 18/5/2032 1,289,647 0.02%OeBB-Infrastruktur AG 1,000,000 2.25% 28/5/2029 1,191,202 0.02%Autobahnen- und Schnell- strassen-Finanzierungs AG 950,000 3.38% 22/9/2025 1,143,116 0.02%OeBB-Infrastruktur AG 900,000 3.88% 30/6/2025 1,100,788 0.02%OeBB-Infrastruktur AG 920,000 1.00% 18/11/2024 974,716 0.01%Verbund AG 900,000 1.50% 20/11/2024 959,081 0.01%OeBB-Infrastruktur AG 850,000 3.63% 13/7/2021 902,846 0.01%Oesterreichische Kontrollbank AG 800,000 0.00% 8/10/2026 803,147 0.01%Autobahnen- und Schnell- strassen-Finanzierungs AG 700,000 0.10% 9/7/2029 698,050 0.01%Autobahnen- und Schnell- strassen-Finanzierungs AG 500,000 2.75% 20/6/2033 649,612 0.01%OeBB-Infrastruktur AG 400,000 3.00% 24/10/2033 535,248 0.01%OeBB-Infrastruktur AG 450,000 2.25% 4/7/2023 490,709 0.01%Autobahnen- und Schnell- strassen-Finanzierungs AG 300,000 2.75% 11/6/2032 385,482 0.01%EVN AG 200,000 4.25% 13/4/2022 219,102 0.00%
229,301,086 3.42%
Belgium 5.61% (2018: 5.46%)
Kingdom of Belgium Government Bond 17,941,109 5.00% 28/3/2035 29,967,070 0.45%Kingdom of Belgium Government Bond 24,250,000 4.25% 28/9/2022 27,475,056 0.41%Kingdom of Belgium Government Bond 15,573,486 4.25% 28/3/2041 26,472,279 0.39%Kingdom of Belgium Government Bond 22,883,000 1.00% 22/6/2026 24,629,733 0.37%Kingdom of Belgium Government Bond 22,275,000 0.90% 22/6/2029 23,981,229 0.36%Kingdom of Belgium Government Bond 19,300,000 0.80% 22/6/2027 20,563,609 0.31%Kingdom of Belgium Government Bond 10,330,000 3.75% 22/6/2045 17,389,522 0.26%Kingdom of Belgium Government Bond 14,800,000 2.60% 22/6/2024 16,783,940 0.25%Kingdom of Belgium Government Bond 16,050,000 0.50% 22/10/2024 16,688,790 0.25%Kingdom of Belgium Government Bond 15,100,000 4.25% 28/9/2021 16,381,310 0.24%Kingdom of Belgium Government Bond 7,086,000 5.50% 28/3/2028 10,334,236 0.15%Kingdom of Belgium Government Bond 7,520,000 3.00% 22/6/2034 10,283,642 0.15%Kingdom of Belgium Government Bond 9,000,000 1.25% 22/4/2033 10,080,648 0.15%Kingdom of Belgium Government Bond 8,070,000 4.00% 28/3/2022 8,905,826 0.13%Kingdom of Belgium Government Bond 6,750,000 4.50% 28/3/2026 8,743,518 0.13%Kingdom of Belgium Government Bond 7,240,000 1.60% 22/6/2047 8,577,518 0.13%Kingdom of Belgium Government Bond 7,300,000 1.45% 22/6/2037 8,356,923 0.12%Kingdom of Belgium Government Bond 7,595,000 0.80% 22/6/2028 8,102,285 0.12%
Vanguard Euro Government Bond Index Fund
211
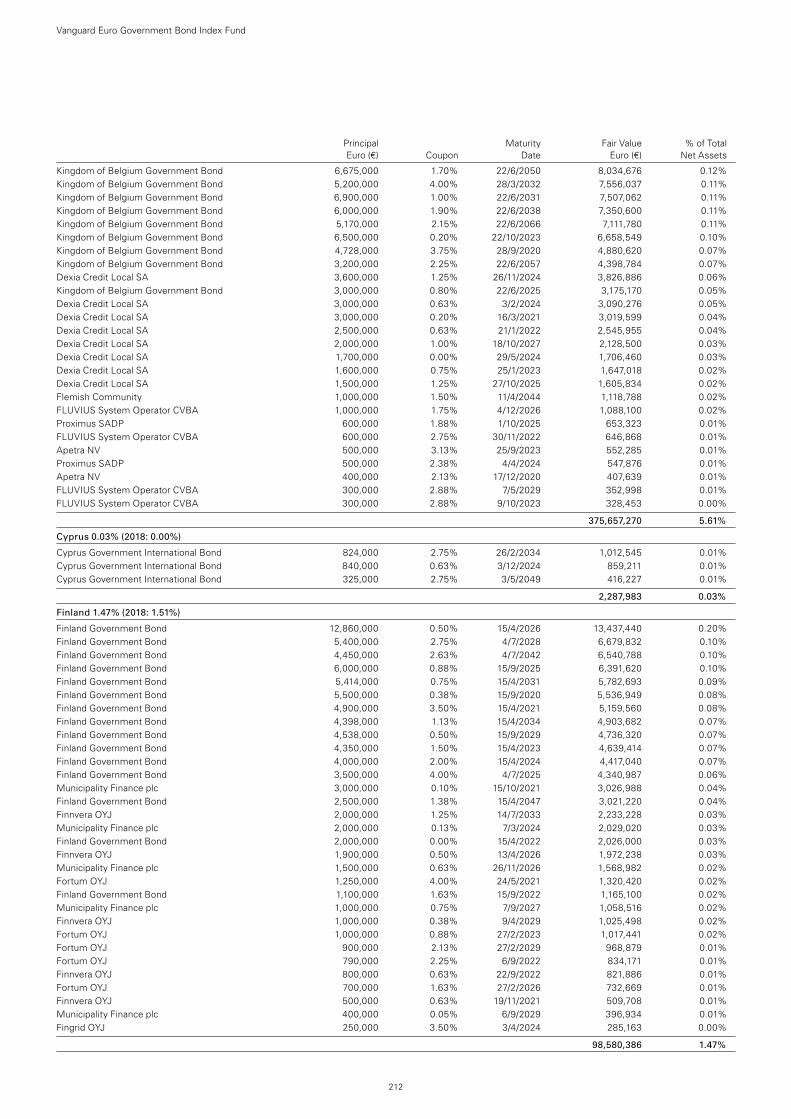
Principal Maturity Fair Value % of Total Euro (€) Coupon Date Euro (€) Net Assets
Kingdom of Belgium Government Bond 6,675,000 1.70% 22/6/2050 8,034,676 0.12%Kingdom of Belgium Government Bond 5,200,000 4.00% 28/3/2032 7,556,037 0.11%Kingdom of Belgium Government Bond 6,900,000 1.00% 22/6/2031 7,507,062 0.11%Kingdom of Belgium Government Bond 6,000,000 1.90% 22/6/2038 7,350,600 0.11%Kingdom of Belgium Government Bond 5,170,000 2.15% 22/6/2066 7,111,780 0.11%Kingdom of Belgium Government Bond 6,500,000 0.20% 22/10/2023 6,658,549 0.10%Kingdom of Belgium Government Bond 4,728,000 3.75% 28/9/2020 4,880,620 0.07%Kingdom of Belgium Government Bond 3,200,000 2.25% 22/6/2057 4,398,784 0.07%Dexia Credit Local SA 3,600,000 1.25% 26/11/2024 3,826,886 0.06%Kingdom of Belgium Government Bond 3,000,000 0.80% 22/6/2025 3,175,170 0.05%Dexia Credit Local SA 3,000,000 0.63% 3/2/2024 3,090,276 0.05%Dexia Credit Local SA 3,000,000 0.20% 16/3/2021 3,019,599 0.04%Dexia Credit Local SA 2,500,000 0.63% 21/1/2022 2,545,955 0.04%Dexia Credit Local SA 2,000,000 1.00% 18/10/2027 2,128,500 0.03%Dexia Credit Local SA 1,700,000 0.00% 29/5/2024 1,706,460 0.03%Dexia Credit Local SA 1,600,000 0.75% 25/1/2023 1,647,018 0.02%Dexia Credit Local SA 1,500,000 1.25% 27/10/2025 1,605,834 0.02%Flemish Community 1,000,000 1.50% 11/4/2044 1,118,788 0.02%FLUVIUS System Operator CVBA 1,000,000 1.75% 4/12/2026 1,088,100 0.02%Proximus SADP 600,000 1.88% 1/10/2025 653,323 0.01%FLUVIUS System Operator CVBA 600,000 2.75% 30/11/2022 646,868 0.01%Apetra NV 500,000 3.13% 25/9/2023 552,285 0.01%Proximus SADP 500,000 2.38% 4/4/2024 547,876 0.01%Apetra NV 400,000 2.13% 17/12/2020 407,639 0.01%FLUVIUS System Operator CVBA 300,000 2.88% 7/5/2029 352,998 0.01%FLUVIUS System Operator CVBA 300,000 2.88% 9/10/2023 328,453 0.00%
375,657,270 5.61%
Cyprus 0.03% (2018: 0.00%)
Cyprus Government International Bond 824,000 2.75% 26/2/2034 1,012,545 0.01%Cyprus Government International Bond 840,000 0.63% 3/12/2024 859,211 0.01%Cyprus Government International Bond 325,000 2.75% 3/5/2049 416,227 0.01%
2,287,983 0.03%
Finland 1.47% (2018: 1.51%)
Finland Government Bond 12,860,000 0.50% 15/4/2026 13,437,440 0.20%Finland Government Bond 5,400,000 2.75% 4/7/2028 6,679,832 0.10%Finland Government Bond 4,450,000 2.63% 4/7/2042 6,540,788 0.10%Finland Government Bond 6,000,000 0.88% 15/9/2025 6,391,620 0.10%Finland Government Bond 5,414,000 0.75% 15/4/2031 5,782,693 0.09%Finland Government Bond 5,500,000 0.38% 15/9/2020 5,536,949 0.08%Finland Government Bond 4,900,000 3.50% 15/4/2021 5,159,560 0.08%Finland Government Bond 4,398,000 1.13% 15/4/2034 4,903,682 0.07%Finland Government Bond 4,538,000 0.50% 15/9/2029 4,736,320 0.07%Finland Government Bond 4,350,000 1.50% 15/4/2023 4,639,414 0.07%Finland Government Bond 4,000,000 2.00% 15/4/2024 4,417,040 0.07%Finland Government Bond 3,500,000 4.00% 4/7/2025 4,340,987 0.06%Municipality Finance plc 3,000,000 0.10% 15/10/2021 3,026,988 0.04%Finland Government Bond 2,500,000 1.38% 15/4/2047 3,021,220 0.04%Finnvera OYJ 2,000,000 1.25% 14/7/2033 2,233,228 0.03%Municipality Finance plc 2,000,000 0.13% 7/3/2024 2,029,020 0.03%Finland Government Bond 2,000,000 0.00% 15/4/2022 2,026,000 0.03%Finnvera OYJ 1,900,000 0.50% 13/4/2026 1,972,238 0.03%Municipality Finance plc 1,500,000 0.63% 26/11/2026 1,568,982 0.02%Fortum OYJ 1,250,000 4.00% 24/5/2021 1,320,420 0.02%Finland Government Bond 1,100,000 1.63% 15/9/2022 1,165,100 0.02%Municipality Finance plc 1,000,000 0.75% 7/9/2027 1,058,516 0.02%Finnvera OYJ 1,000,000 0.38% 9/4/2029 1,025,498 0.02%Fortum OYJ 1,000,000 0.88% 27/2/2023 1,017,441 0.02%Fortum OYJ 900,000 2.13% 27/2/2029 968,879 0.01%Fortum OYJ 790,000 2.25% 6/9/2022 834,171 0.01%Finnvera OYJ 800,000 0.63% 22/9/2022 821,886 0.01%Fortum OYJ 700,000 1.63% 27/2/2026 732,669 0.01%Finnvera OYJ 500,000 0.63% 19/11/2021 509,708 0.01%Municipality Finance plc 400,000 0.05% 6/9/2029 396,934 0.01%Fingrid OYJ 250,000 3.50% 3/4/2024 285,163 0.00%
98,580,386 1.47%
Vanguard Euro Government Bond Index Fund
212
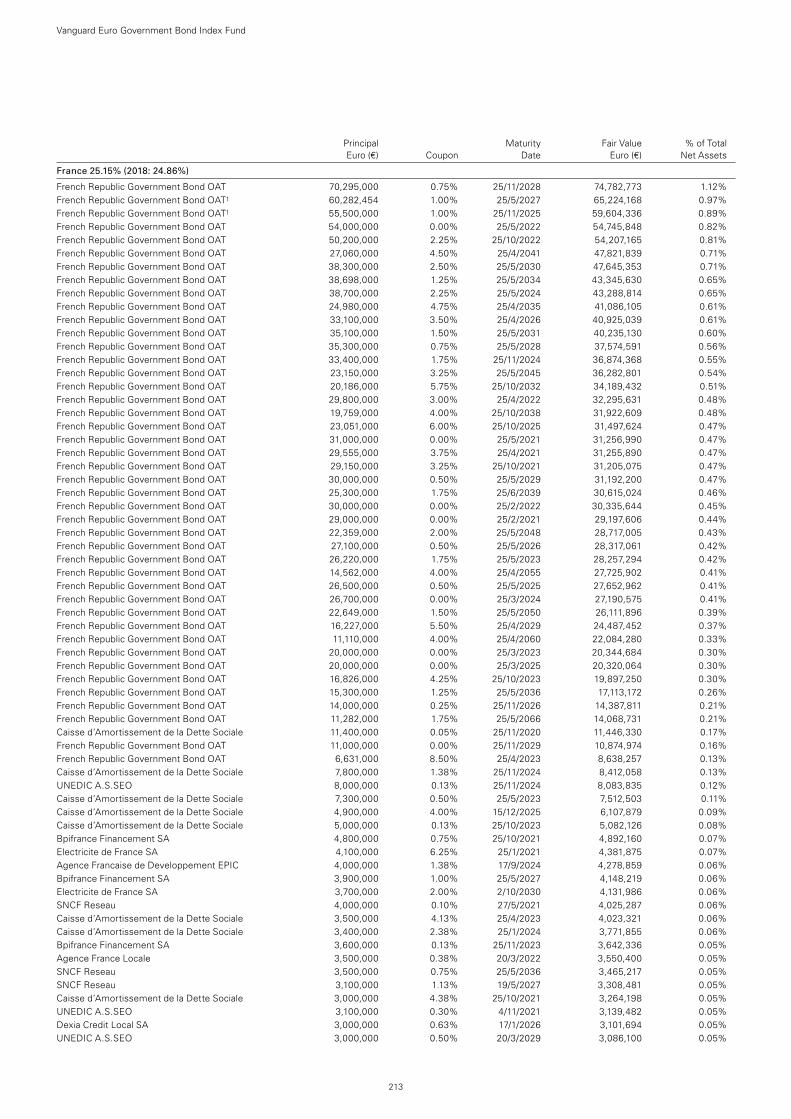
Principal Maturity Fair Value % of Total Euro (€) Coupon Date Euro (€) Net Assets
France 25.15% (2018: 24.86%)
French Republic Government Bond OAT 70,295,000 0.75% 25/11/2028 74,782,773 1.12%French Republic Government Bond OAT1 60,282,454 1.00% 25/5/2027 65,224,168 0.97%French Republic Government Bond OAT1 55,500,000 1.00% 25/11/2025 59,604,336 0.89%French Republic Government Bond OAT 54,000,000 0.00% 25/5/2022 54,745,848 0.82%French Republic Government Bond OAT 50,200,000 2.25% 25/10/2022 54,207,165 0.81%French Republic Government Bond OAT 27,060,000 4.50% 25/4/2041 47,821,839 0.71%French Republic Government Bond OAT 38,300,000 2.50% 25/5/2030 47,645,353 0.71%French Republic Government Bond OAT 38,698,000 1.25% 25/5/2034 43,345,630 0.65%French Republic Government Bond OAT 38,700,000 2.25% 25/5/2024 43,288,814 0.65%French Republic Government Bond OAT 24,980,000 4.75% 25/4/2035 41,086,105 0.61%French Republic Government Bond OAT 33,100,000 3.50% 25/4/2026 40,925,039 0.61%French Republic Government Bond OAT 35,100,000 1.50% 25/5/2031 40,235,130 0.60%French Republic Government Bond OAT 35,300,000 0.75% 25/5/2028 37,574,591 0.56%French Republic Government Bond OAT 33,400,000 1.75% 25/11/2024 36,874,368 0.55%French Republic Government Bond OAT 23,150,000 3.25% 25/5/2045 36,282,801 0.54%French Republic Government Bond OAT 20,186,000 5.75% 25/10/2032 34,189,432 0.51%French Republic Government Bond OAT 29,800,000 3.00% 25/4/2022 32,295,631 0.48%French Republic Government Bond OAT 19,759,000 4.00% 25/10/2038 31,922,609 0.48%French Republic Government Bond OAT 23,051,000 6.00% 25/10/2025 31,497,624 0.47%French Republic Government Bond OAT 31,000,000 0.00% 25/5/2021 31,256,990 0.47%French Republic Government Bond OAT 29,555,000 3.75% 25/4/2021 31,255,890 0.47%French Republic Government Bond OAT 29,150,000 3.25% 25/10/2021 31,205,075 0.47%French Republic Government Bond OAT 30,000,000 0.50% 25/5/2029 31,192,200 0.47%French Republic Government Bond OAT 25,300,000 1.75% 25/6/2039 30,615,024 0.46%French Republic Government Bond OAT 30,000,000 0.00% 25/2/2022 30,335,644 0.45%French Republic Government Bond OAT 29,000,000 0.00% 25/2/2021 29,197,606 0.44%French Republic Government Bond OAT 22,359,000 2.00% 25/5/2048 28,717,005 0.43%French Republic Government Bond OAT 27,100,000 0.50% 25/5/2026 28,317,061 0.42%French Republic Government Bond OAT 26,220,000 1.75% 25/5/2023 28,257,294 0.42%French Republic Government Bond OAT 14,562,000 4.00% 25/4/2055 27,725,902 0.41%French Republic Government Bond OAT 26,500,000 0.50% 25/5/2025 27,652,962 0.41%French Republic Government Bond OAT 26,700,000 0.00% 25/3/2024 27,190,575 0.41%French Republic Government Bond OAT 22,649,000 1.50% 25/5/2050 26,111,896 0.39%French Republic Government Bond OAT 16,227,000 5.50% 25/4/2029 24,487,452 0.37%French Republic Government Bond OAT 11,110,000 4.00% 25/4/2060 22,084,280 0.33%French Republic Government Bond OAT 20,000,000 0.00% 25/3/2023 20,344,684 0.30%French Republic Government Bond OAT 20,000,000 0.00% 25/3/2025 20,320,064 0.30%French Republic Government Bond OAT 16,826,000 4.25% 25/10/2023 19,897,250 0.30%French Republic Government Bond OAT 15,300,000 1.25% 25/5/2036 17,113,172 0.26%French Republic Government Bond OAT 14,000,000 0.25% 25/11/2026 14,387,811 0.21%French Republic Government Bond OAT 11,282,000 1.75% 25/5/2066 14,068,731 0.21%Caisse d’Amortissement de la Dette Sociale 11,400,000 0.05% 25/11/2020 11,446,330 0.17%French Republic Government Bond OAT 11,000,000 0.00% 25/11/2029 10,874,974 0.16%French Republic Government Bond OAT 6,631,000 8.50% 25/4/2023 8,638,257 0.13%Caisse d’Amortissement de la Dette Sociale 7,800,000 1.38% 25/11/2024 8,412,058 0.13%UNEDIC A.S.SEO 8,000,000 0.13% 25/11/2024 8,083,835 0.12%Caisse d’Amortissement de la Dette Sociale 7,300,000 0.50% 25/5/2023 7,512,503 0.11%Caisse d’Amortissement de la Dette Sociale 4,900,000 4.00% 15/12/2025 6,107,879 0.09%Caisse d’Amortissement de la Dette Sociale 5,000,000 0.13% 25/10/2023 5,082,126 0.08%Bpifrance Financement SA 4,800,000 0.75% 25/10/2021 4,892,160 0.07%Electricite de France SA 4,100,000 6.25% 25/1/2021 4,381,875 0.07%Agence Francaise de Developpement EPIC 4,000,000 1.38% 17/9/2024 4,278,859 0.06%Bpifrance Financement SA 3,900,000 1.00% 25/5/2027 4,148,219 0.06%Electricite de France SA 3,700,000 2.00% 2/10/2030 4,131,986 0.06%SNCF Reseau 4,000,000 0.10% 27/5/2021 4,025,287 0.06%Caisse d’Amortissement de la Dette Sociale 3,500,000 4.13% 25/4/2023 4,023,321 0.06%Caisse d’Amortissement de la Dette Sociale 3,400,000 2.38% 25/1/2024 3,771,855 0.06%Bpifrance Financement SA 3,600,000 0.13% 25/11/2023 3,642,336 0.05%Agence France Locale 3,500,000 0.38% 20/3/2022 3,550,400 0.05%SNCF Reseau 3,500,000 0.75% 25/5/2036 3,465,217 0.05%SNCF Reseau 3,100,000 1.13% 19/5/2027 3,308,481 0.05%Caisse d’Amortissement de la Dette Sociale 3,000,000 4.38% 25/10/2021 3,264,198 0.05%UNEDIC A.S.SEO 3,100,000 0.30% 4/11/2021 3,139,482 0.05%Dexia Credit Local SA 3,000,000 0.63% 17/1/2026 3,101,694 0.05%UNEDIC A.S.SEO 3,000,000 0.50% 20/3/2029 3,086,100 0.05%
Vanguard Euro Government Bond Index Fund
213
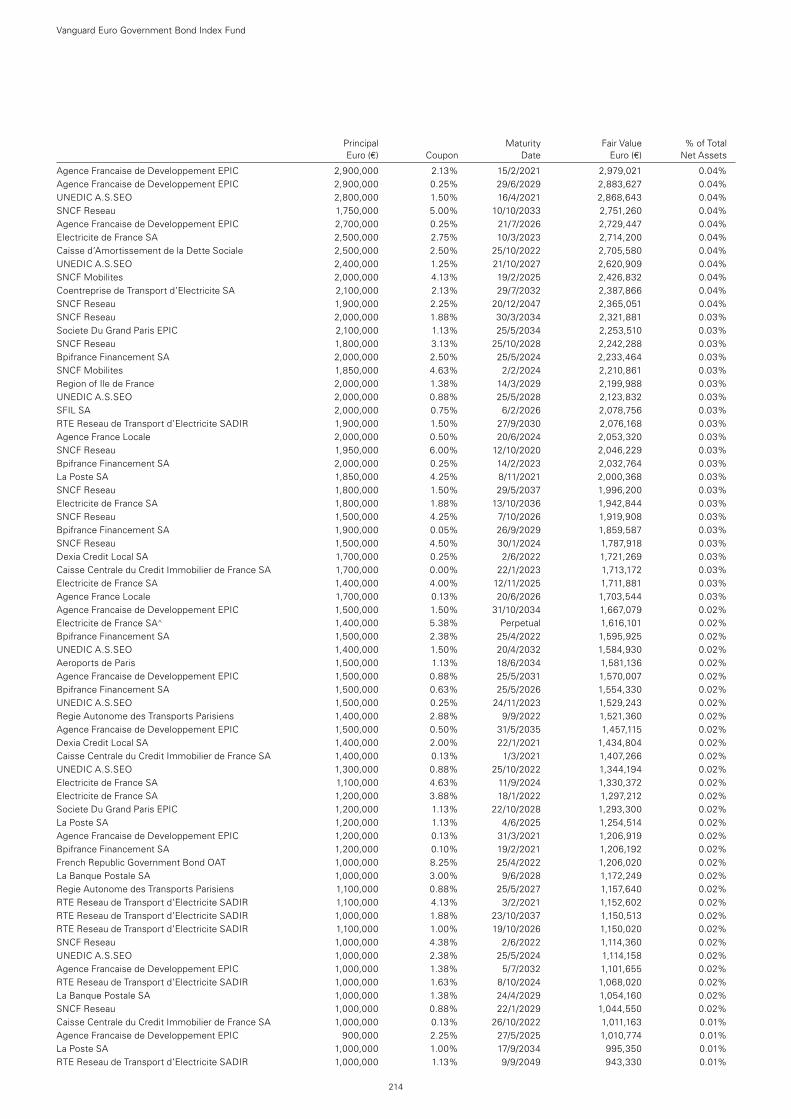
Principal Maturity Fair Value % of Total Euro (€) Coupon Date Euro (€) Net Assets
Agence Francaise de Developpement EPIC 2,900,000 2.13% 15/2/2021 2,979,021 0.04%Agence Francaise de Developpement EPIC 2,900,000 0.25% 29/6/2029 2,883,627 0.04%UNEDIC A.S.SEO 2,800,000 1.50% 16/4/2021 2,868,643 0.04%SNCF Reseau 1,750,000 5.00% 10/10/2033 2,751,260 0.04%Agence Francaise de Developpement EPIC 2,700,000 0.25% 21/7/2026 2,729,447 0.04%Electricite de France SA 2,500,000 2.75% 10/3/2023 2,714,200 0.04%Caisse d’Amortissement de la Dette Sociale 2,500,000 2.50% 25/10/2022 2,705,580 0.04%UNEDIC A.S.SEO 2,400,000 1.25% 21/10/2027 2,620,909 0.04%SNCF Mobilites 2,000,000 4.13% 19/2/2025 2,426,832 0.04%Coentreprise de Transport d’Electricite SA 2,100,000 2.13% 29/7/2032 2,387,866 0.04%SNCF Reseau 1,900,000 2.25% 20/12/2047 2,365,051 0.04%SNCF Reseau 2,000,000 1.88% 30/3/2034 2,321,881 0.03%Societe Du Grand Paris EPIC 2,100,000 1.13% 25/5/2034 2,253,510 0.03%SNCF Reseau 1,800,000 3.13% 25/10/2028 2,242,288 0.03%Bpifrance Financement SA 2,000,000 2.50% 25/5/2024 2,233,464 0.03%SNCF Mobilites 1,850,000 4.63% 2/2/2024 2,210,861 0.03%Region of Ile de France 2,000,000 1.38% 14/3/2029 2,199,988 0.03%UNEDIC A.S.SEO 2,000,000 0.88% 25/5/2028 2,123,832 0.03%SFIL SA 2,000,000 0.75% 6/2/2026 2,078,756 0.03%RTE Reseau de Transport d’Electricite SADIR 1,900,000 1.50% 27/9/2030 2,076,168 0.03%Agence France Locale 2,000,000 0.50% 20/6/2024 2,053,320 0.03%SNCF Reseau 1,950,000 6.00% 12/10/2020 2,046,229 0.03%Bpifrance Financement SA 2,000,000 0.25% 14/2/2023 2,032,764 0.03%La Poste SA 1,850,000 4.25% 8/11/2021 2,000,368 0.03%SNCF Reseau 1,800,000 1.50% 29/5/2037 1,996,200 0.03%Electricite de France SA 1,800,000 1.88% 13/10/2036 1,942,844 0.03%SNCF Reseau 1,500,000 4.25% 7/10/2026 1,919,908 0.03%Bpifrance Financement SA 1,900,000 0.05% 26/9/2029 1,859,587 0.03%SNCF Reseau 1,500,000 4.50% 30/1/2024 1,787,918 0.03%Dexia Credit Local SA 1,700,000 0.25% 2/6/2022 1,721,269 0.03%Caisse Centrale du Credit Immobilier de France SA 1,700,000 0.00% 22/1/2023 1,713,172 0.03%Electricite de France SA 1,400,000 4.00% 12/11/2025 1,711,881 0.03%Agence France Locale 1,700,000 0.13% 20/6/2026 1,703,544 0.03%Agence Francaise de Developpement EPIC 1,500,000 1.50% 31/10/2034 1,667,079 0.02%Electricite de France SA^ 1,400,000 5.38% Perpetual 1,616,101 0.02%Bpifrance Financement SA 1,500,000 2.38% 25/4/2022 1,595,925 0.02%UNEDIC A.S.SEO 1,400,000 1.50% 20/4/2032 1,584,930 0.02%Aeroports de Paris 1,500,000 1.13% 18/6/2034 1,581,136 0.02%Agence Francaise de Developpement EPIC 1,500,000 0.88% 25/5/2031 1,570,007 0.02%Bpifrance Financement SA 1,500,000 0.63% 25/5/2026 1,554,330 0.02%UNEDIC A.S.SEO 1,500,000 0.25% 24/11/2023 1,529,243 0.02%Regie Autonome des Transports Parisiens 1,400,000 2.88% 9/9/2022 1,521,360 0.02%Agence Francaise de Developpement EPIC 1,500,000 0.50% 31/5/2035 1,457,115 0.02%Dexia Credit Local SA 1,400,000 2.00% 22/1/2021 1,434,804 0.02%Caisse Centrale du Credit Immobilier de France SA 1,400,000 0.13% 1/3/2021 1,407,266 0.02%UNEDIC A.S.SEO 1,300,000 0.88% 25/10/2022 1,344,194 0.02%Electricite de France SA 1,100,000 4.63% 11/9/2024 1,330,372 0.02%Electricite de France SA 1,200,000 3.88% 18/1/2022 1,297,212 0.02%Societe Du Grand Paris EPIC 1,200,000 1.13% 22/10/2028 1,293,300 0.02%La Poste SA 1,200,000 1.13% 4/6/2025 1,254,514 0.02%Agence Francaise de Developpement EPIC 1,200,000 0.13% 31/3/2021 1,206,919 0.02%Bpifrance Financement SA 1,200,000 0.10% 19/2/2021 1,206,192 0.02%French Republic Government Bond OAT 1,000,000 8.25% 25/4/2022 1,206,020 0.02%La Banque Postale SA 1,000,000 3.00% 9/6/2028 1,172,249 0.02%Regie Autonome des Transports Parisiens 1,100,000 0.88% 25/5/2027 1,157,640 0.02%RTE Reseau de Transport d’Electricite SADIR 1,100,000 4.13% 3/2/2021 1,152,602 0.02%RTE Reseau de Transport d’Electricite SADIR 1,000,000 1.88% 23/10/2037 1,150,513 0.02%RTE Reseau de Transport d’Electricite SADIR 1,100,000 1.00% 19/10/2026 1,150,020 0.02%SNCF Reseau 1,000,000 4.38% 2/6/2022 1,114,360 0.02%UNEDIC A.S.SEO 1,000,000 2.38% 25/5/2024 1,114,158 0.02%Agence Francaise de Developpement EPIC 1,000,000 1.38% 5/7/2032 1,101,655 0.02%RTE Reseau de Transport d’Electricite SADIR 1,000,000 1.63% 8/10/2024 1,068,020 0.02%La Banque Postale SA 1,000,000 1.38% 24/4/2029 1,054,160 0.02%SNCF Reseau 1,000,000 0.88% 22/1/2029 1,044,550 0.02%Caisse Centrale du Credit Immobilier de France SA 1,000,000 0.13% 26/10/2022 1,011,163 0.01%Agence Francaise de Developpement EPIC 900,000 2.25% 27/5/2025 1,010,774 0.01%La Poste SA 1,000,000 1.00% 17/9/2034 995,350 0.01%RTE Reseau de Transport d’Electricite SADIR 1,000,000 1.13% 9/9/2049 943,330 0.01%
Vanguard Euro Government Bond Index Fund
214
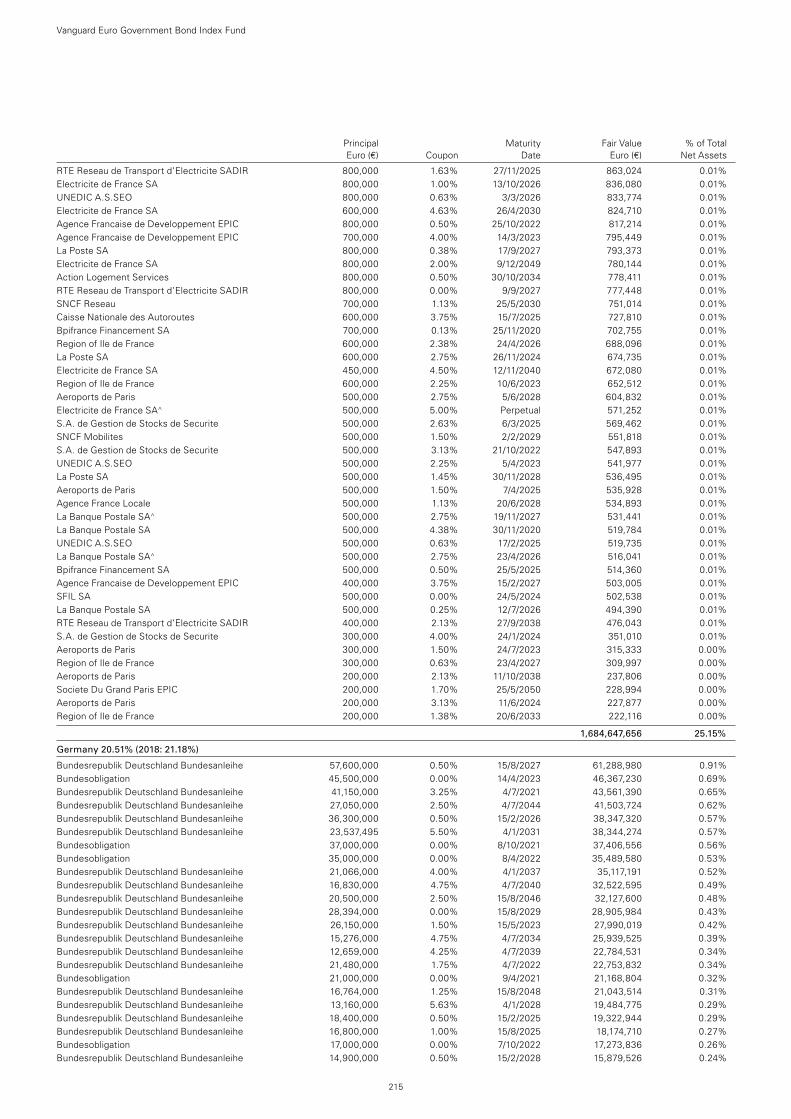
Principal Maturity Fair Value % of Total Euro (€) Coupon Date Euro (€) Net Assets
RTE Reseau de Transport d’Electricite SADIR 800,000 1.63% 27/11/2025 863,024 0.01%Electricite de France SA 800,000 1.00% 13/10/2026 836,080 0.01%UNEDIC A.S.SEO 800,000 0.63% 3/3/2026 833,774 0.01%Electricite de France SA 600,000 4.63% 26/4/2030 824,710 0.01%Agence Francaise de Developpement EPIC 800,000 0.50% 25/10/2022 817,214 0.01%Agence Francaise de Developpement EPIC 700,000 4.00% 14/3/2023 795,449 0.01%La Poste SA 800,000 0.38% 17/9/2027 793,373 0.01%Electricite de France SA 800,000 2.00% 9/12/2049 780,144 0.01%Action Logement Services 800,000 0.50% 30/10/2034 778,411 0.01%RTE Reseau de Transport d’Electricite SADIR 800,000 0.00% 9/9/2027 777,448 0.01%SNCF Reseau 700,000 1.13% 25/5/2030 751,014 0.01%Caisse Nationale des Autoroutes 600,000 3.75% 15/7/2025 727,810 0.01%Bpifrance Financement SA 700,000 0.13% 25/11/2020 702,755 0.01%Region of Ile de France 600,000 2.38% 24/4/2026 688,096 0.01%La Poste SA 600,000 2.75% 26/11/2024 674,735 0.01%Electricite de France SA 450,000 4.50% 12/11/2040 672,080 0.01%Region of Ile de France 600,000 2.25% 10/6/2023 652,512 0.01%Aeroports de Paris 500,000 2.75% 5/6/2028 604,832 0.01%Electricite de France SA^ 500,000 5.00% Perpetual 571,252 0.01%S.A. de Gestion de Stocks de Securite 500,000 2.63% 6/3/2025 569,462 0.01%SNCF Mobilites 500,000 1.50% 2/2/2029 551,818 0.01%S.A. de Gestion de Stocks de Securite 500,000 3.13% 21/10/2022 547,893 0.01%UNEDIC A.S.SEO 500,000 2.25% 5/4/2023 541,977 0.01%La Poste SA 500,000 1.45% 30/11/2028 536,495 0.01%Aeroports de Paris 500,000 1.50% 7/4/2025 535,928 0.01%Agence France Locale 500,000 1.13% 20/6/2028 534,893 0.01%La Banque Postale SA^ 500,000 2.75% 19/11/2027 531,441 0.01%La Banque Postale SA 500,000 4.38% 30/11/2020 519,784 0.01%UNEDIC A.S.SEO 500,000 0.63% 17/2/2025 519,735 0.01%La Banque Postale SA^ 500,000 2.75% 23/4/2026 516,041 0.01%Bpifrance Financement SA 500,000 0.50% 25/5/2025 514,360 0.01%Agence Francaise de Developpement EPIC 400,000 3.75% 15/2/2027 503,005 0.01%SFIL SA 500,000 0.00% 24/5/2024 502,538 0.01%La Banque Postale SA 500,000 0.25% 12/7/2026 494,390 0.01%RTE Reseau de Transport d’Electricite SADIR 400,000 2.13% 27/9/2038 476,043 0.01%S.A. de Gestion de Stocks de Securite 300,000 4.00% 24/1/2024 351,010 0.01%Aeroports de Paris 300,000 1.50% 24/7/2023 315,333 0.00%Region of Ile de France 300,000 0.63% 23/4/2027 309,997 0.00%Aeroports de Paris 200,000 2.13% 11/10/2038 237,806 0.00%Societe Du Grand Paris EPIC 200,000 1.70% 25/5/2050 228,994 0.00%Aeroports de Paris 200,000 3.13% 11/6/2024 227,877 0.00%Region of Ile de France 200,000 1.38% 20/6/2033 222,116 0.00%
1,684,647,656 25.15%
Germany 20.51% (2018: 21.18%)
Bundesrepublik Deutschland Bundesanleihe 57,600,000 0.50% 15/8/2027 61,288,980 0.91%Bundesobligation 45,500,000 0.00% 14/4/2023 46,367,230 0.69%Bundesrepublik Deutschland Bundesanleihe 41,150,000 3.25% 4/7/2021 43,561,390 0.65%Bundesrepublik Deutschland Bundesanleihe 27,050,000 2.50% 4/7/2044 41,503,724 0.62%Bundesrepublik Deutschland Bundesanleihe 36,300,000 0.50% 15/2/2026 38,347,320 0.57%Bundesrepublik Deutschland Bundesanleihe 23,537,495 5.50% 4/1/2031 38,344,274 0.57%Bundesobligation 37,000,000 0.00% 8/10/2021 37,406,556 0.56%Bundesobligation 35,000,000 0.00% 8/4/2022 35,489,580 0.53%Bundesrepublik Deutschland Bundesanleihe 21,066,000 4.00% 4/1/2037 35,117,191 0.52%Bundesrepublik Deutschland Bundesanleihe 16,830,000 4.75% 4/7/2040 32,522,595 0.49%Bundesrepublik Deutschland Bundesanleihe 20,500,000 2.50% 15/8/2046 32,127,600 0.48%Bundesrepublik Deutschland Bundesanleihe 28,394,000 0.00% 15/8/2029 28,905,984 0.43%Bundesrepublik Deutschland Bundesanleihe 26,150,000 1.50% 15/5/2023 27,990,019 0.42%Bundesrepublik Deutschland Bundesanleihe 15,276,000 4.75% 4/7/2034 25,939,525 0.39%Bundesrepublik Deutschland Bundesanleihe 12,659,000 4.25% 4/7/2039 22,784,531 0.34%Bundesrepublik Deutschland Bundesanleihe 21,480,000 1.75% 4/7/2022 22,753,832 0.34%Bundesobligation 21,000,000 0.00% 9/4/2021 21,168,804 0.32%Bundesrepublik Deutschland Bundesanleihe 16,764,000 1.25% 15/8/2048 21,043,514 0.31%Bundesrepublik Deutschland Bundesanleihe 13,160,000 5.63% 4/1/2028 19,484,775 0.29%Bundesrepublik Deutschland Bundesanleihe 18,400,000 0.50% 15/2/2025 19,322,944 0.29%Bundesrepublik Deutschland Bundesanleihe 16,800,000 1.00% 15/8/2025 18,174,710 0.27%Bundesobligation 17,000,000 0.00% 7/10/2022 17,273,836 0.26%Bundesrepublik Deutschland Bundesanleihe 14,900,000 0.50% 15/2/2028 15,879,526 0.24%
Vanguard Euro Government Bond Index Fund
215
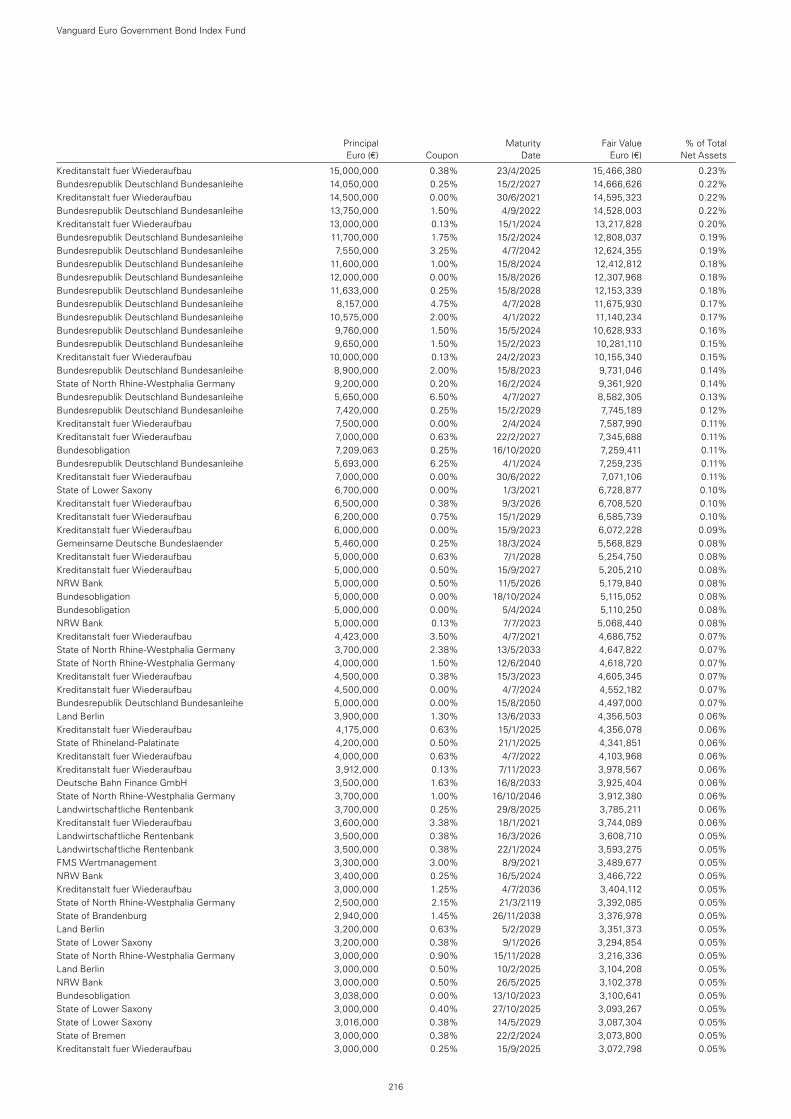
Principal Maturity Fair Value % of Total Euro (€) Coupon Date Euro (€) Net Assets
Kreditanstalt fuer Wiederaufbau 15,000,000 0.38% 23/4/2025 15,466,380 0.23%Bundesrepublik Deutschland Bundesanleihe 14,050,000 0.25% 15/2/2027 14,666,626 0.22%Kreditanstalt fuer Wiederaufbau 14,500,000 0.00% 30/6/2021 14,595,323 0.22%Bundesrepublik Deutschland Bundesanleihe 13,750,000 1.50% 4/9/2022 14,528,003 0.22%Kreditanstalt fuer Wiederaufbau 13,000,000 0.13% 15/1/2024 13,217,828 0.20%Bundesrepublik Deutschland Bundesanleihe 11,700,000 1.75% 15/2/2024 12,808,037 0.19%Bundesrepublik Deutschland Bundesanleihe 7,550,000 3.25% 4/7/2042 12,624,355 0.19%Bundesrepublik Deutschland Bundesanleihe 11,600,000 1.00% 15/8/2024 12,412,812 0.18%Bundesrepublik Deutschland Bundesanleihe 12,000,000 0.00% 15/8/2026 12,307,968 0.18%Bundesrepublik Deutschland Bundesanleihe 11,633,000 0.25% 15/8/2028 12,153,339 0.18%Bundesrepublik Deutschland Bundesanleihe 8,157,000 4.75% 4/7/2028 11,675,930 0.17%Bundesrepublik Deutschland Bundesanleihe 10,575,000 2.00% 4/1/2022 11,140,234 0.17%Bundesrepublik Deutschland Bundesanleihe 9,760,000 1.50% 15/5/2024 10,628,933 0.16%Bundesrepublik Deutschland Bundesanleihe 9,650,000 1.50% 15/2/2023 10,281,110 0.15%Kreditanstalt fuer Wiederaufbau 10,000,000 0.13% 24/2/2023 10,155,340 0.15%Bundesrepublik Deutschland Bundesanleihe 8,900,000 2.00% 15/8/2023 9,731,046 0.14%State of North Rhine-Westphalia Germany 9,200,000 0.20% 16/2/2024 9,361,920 0.14%Bundesrepublik Deutschland Bundesanleihe 5,650,000 6.50% 4/7/2027 8,582,305 0.13%Bundesrepublik Deutschland Bundesanleihe 7,420,000 0.25% 15/2/2029 7,745,189 0.12%Kreditanstalt fuer Wiederaufbau 7,500,000 0.00% 2/4/2024 7,587,990 0.11%Kreditanstalt fuer Wiederaufbau 7,000,000 0.63% 22/2/2027 7,345,688 0.11%Bundesobligation 7,209,063 0.25% 16/10/2020 7,259,411 0.11%Bundesrepublik Deutschland Bundesanleihe 5,693,000 6.25% 4/1/2024 7,259,235 0.11%Kreditanstalt fuer Wiederaufbau 7,000,000 0.00% 30/6/2022 7,071,106 0.11%State of Lower Saxony 6,700,000 0.00% 1/3/2021 6,728,877 0.10%Kreditanstalt fuer Wiederaufbau 6,500,000 0.38% 9/3/2026 6,708,520 0.10%Kreditanstalt fuer Wiederaufbau 6,200,000 0.75% 15/1/2029 6,585,739 0.10%Kreditanstalt fuer Wiederaufbau 6,000,000 0.00% 15/9/2023 6,072,228 0.09%Gemeinsame Deutsche Bundeslaender 5,460,000 0.25% 18/3/2024 5,568,829 0.08%Kreditanstalt fuer Wiederaufbau 5,000,000 0.63% 7/1/2028 5,254,750 0.08%Kreditanstalt fuer Wiederaufbau 5,000,000 0.50% 15/9/2027 5,205,210 0.08%NRW Bank 5,000,000 0.50% 11/5/2026 5,179,840 0.08%Bundesobligation 5,000,000 0.00% 18/10/2024 5,115,052 0.08%Bundesobligation 5,000,000 0.00% 5/4/2024 5,110,250 0.08%NRW Bank 5,000,000 0.13% 7/7/2023 5,068,440 0.08%Kreditanstalt fuer Wiederaufbau 4,423,000 3.50% 4/7/2021 4,686,752 0.07%State of North Rhine-Westphalia Germany 3,700,000 2.38% 13/5/2033 4,647,822 0.07%State of North Rhine-Westphalia Germany 4,000,000 1.50% 12/6/2040 4,618,720 0.07%Kreditanstalt fuer Wiederaufbau 4,500,000 0.38% 15/3/2023 4,605,345 0.07%Kreditanstalt fuer Wiederaufbau 4,500,000 0.00% 4/7/2024 4,552,182 0.07%Bundesrepublik Deutschland Bundesanleihe 5,000,000 0.00% 15/8/2050 4,497,000 0.07%Land Berlin 3,900,000 1.30% 13/6/2033 4,356,503 0.06%Kreditanstalt fuer Wiederaufbau 4,175,000 0.63% 15/1/2025 4,356,078 0.06%State of Rhineland-Palatinate 4,200,000 0.50% 21/1/2025 4,341,851 0.06%Kreditanstalt fuer Wiederaufbau 4,000,000 0.63% 4/7/2022 4,103,968 0.06%Kreditanstalt fuer Wiederaufbau 3,912,000 0.13% 7/11/2023 3,978,567 0.06%Deutsche Bahn Finance GmbH 3,500,000 1.63% 16/8/2033 3,925,404 0.06%State of North Rhine-Westphalia Germany 3,700,000 1.00% 16/10/2046 3,912,380 0.06%Landwirtschaftliche Rentenbank 3,700,000 0.25% 29/8/2025 3,785,211 0.06%Kreditanstalt fuer Wiederaufbau 3,600,000 3.38% 18/1/2021 3,744,089 0.06%Landwirtschaftliche Rentenbank 3,500,000 0.38% 16/3/2026 3,608,710 0.05%Landwirtschaftliche Rentenbank 3,500,000 0.38% 22/1/2024 3,593,275 0.05%FMS Wertmanagement 3,300,000 3.00% 8/9/2021 3,489,677 0.05%NRW Bank 3,400,000 0.25% 16/5/2024 3,466,722 0.05%Kreditanstalt fuer Wiederaufbau 3,000,000 1.25% 4/7/2036 3,404,112 0.05%State of North Rhine-Westphalia Germany 2,500,000 2.15% 21/3/2119 3,392,085 0.05%State of Brandenburg 2,940,000 1.45% 26/11/2038 3,376,978 0.05%Land Berlin 3,200,000 0.63% 5/2/2029 3,351,373 0.05%State of Lower Saxony 3,200,000 0.38% 9/1/2026 3,294,854 0.05%State of North Rhine-Westphalia Germany 3,000,000 0.90% 15/11/2028 3,216,336 0.05%Land Berlin 3,000,000 0.50% 10/2/2025 3,104,208 0.05%NRW Bank 3,000,000 0.50% 26/5/2025 3,102,378 0.05%Bundesobligation 3,038,000 0.00% 13/10/2023 3,100,641 0.05%State of Lower Saxony 3,000,000 0.40% 27/10/2025 3,093,267 0.05%State of Lower Saxony 3,016,000 0.38% 14/5/2029 3,087,304 0.05%State of Bremen 3,000,000 0.38% 22/2/2024 3,073,800 0.05%Kreditanstalt fuer Wiederaufbau 3,000,000 0.25% 15/9/2025 3,072,798 0.05%
Vanguard Euro Government Bond Index Fund
216
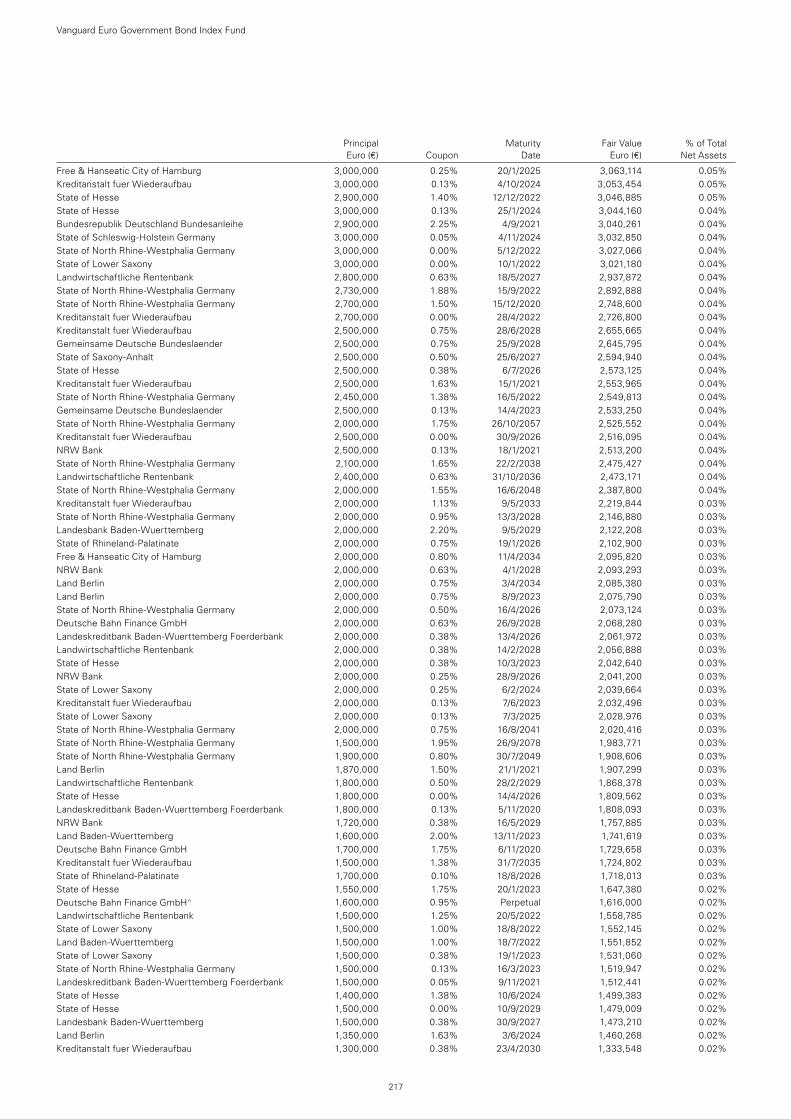
Principal Maturity Fair Value % of Total Euro (€) Coupon Date Euro (€) Net Assets
Free & Hanseatic City of Hamburg 3,000,000 0.25% 20/1/2025 3,063,114 0.05%Kreditanstalt fuer Wiederaufbau 3,000,000 0.13% 4/10/2024 3,053,454 0.05%State of Hesse 2,900,000 1.40% 12/12/2022 3,046,885 0.05%State of Hesse 3,000,000 0.13% 25/1/2024 3,044,160 0.04%Bundesrepublik Deutschland Bundesanleihe 2,900,000 2.25% 4/9/2021 3,040,261 0.04%State of Schleswig-Holstein Germany 3,000,000 0.05% 4/11/2024 3,032,850 0.04%State of North Rhine-Westphalia Germany 3,000,000 0.00% 5/12/2022 3,027,066 0.04%State of Lower Saxony 3,000,000 0.00% 10/1/2022 3,021,180 0.04%Landwirtschaftliche Rentenbank 2,800,000 0.63% 18/5/2027 2,937,872 0.04%State of North Rhine-Westphalia Germany 2,730,000 1.88% 15/9/2022 2,892,888 0.04%State of North Rhine-Westphalia Germany 2,700,000 1.50% 15/12/2020 2,748,600 0.04%Kreditanstalt fuer Wiederaufbau 2,700,000 0.00% 28/4/2022 2,726,800 0.04%Kreditanstalt fuer Wiederaufbau 2,500,000 0.75% 28/6/2028 2,655,665 0.04%Gemeinsame Deutsche Bundeslaender 2,500,000 0.75% 25/9/2028 2,645,795 0.04%State of Saxony-Anhalt 2,500,000 0.50% 25/6/2027 2,594,940 0.04%State of Hesse 2,500,000 0.38% 6/7/2026 2,573,125 0.04%Kreditanstalt fuer Wiederaufbau 2,500,000 1.63% 15/1/2021 2,553,965 0.04%State of North Rhine-Westphalia Germany 2,450,000 1.38% 16/5/2022 2,549,813 0.04%Gemeinsame Deutsche Bundeslaender 2,500,000 0.13% 14/4/2023 2,533,250 0.04%State of North Rhine-Westphalia Germany 2,000,000 1.75% 26/10/2057 2,525,552 0.04%Kreditanstalt fuer Wiederaufbau 2,500,000 0.00% 30/9/2026 2,516,095 0.04%NRW Bank 2,500,000 0.13% 18/1/2021 2,513,200 0.04%State of North Rhine-Westphalia Germany 2,100,000 1.65% 22/2/2038 2,475,427 0.04%Landwirtschaftliche Rentenbank 2,400,000 0.63% 31/10/2036 2,473,171 0.04%State of North Rhine-Westphalia Germany 2,000,000 1.55% 16/6/2048 2,387,800 0.04%Kreditanstalt fuer Wiederaufbau 2,000,000 1.13% 9/5/2033 2,219,844 0.03%State of North Rhine-Westphalia Germany 2,000,000 0.95% 13/3/2028 2,146,880 0.03%Landesbank Baden-Wuerttemberg 2,000,000 2.20% 9/5/2029 2,122,208 0.03%State of Rhineland-Palatinate 2,000,000 0.75% 19/1/2026 2,102,900 0.03%Free & Hanseatic City of Hamburg 2,000,000 0.80% 11/4/2034 2,095,820 0.03%NRW Bank 2,000,000 0.63% 4/1/2028 2,093,293 0.03%Land Berlin 2,000,000 0.75% 3/4/2034 2,085,380 0.03%Land Berlin 2,000,000 0.75% 8/9/2023 2,075,790 0.03%State of North Rhine-Westphalia Germany 2,000,000 0.50% 16/4/2026 2,073,124 0.03%Deutsche Bahn Finance GmbH 2,000,000 0.63% 26/9/2028 2,068,280 0.03%Landeskreditbank Baden-Wuerttemberg Foerderbank 2,000,000 0.38% 13/4/2026 2,061,972 0.03%Landwirtschaftliche Rentenbank 2,000,000 0.38% 14/2/2028 2,056,888 0.03%State of Hesse 2,000,000 0.38% 10/3/2023 2,042,640 0.03%NRW Bank 2,000,000 0.25% 28/9/2026 2,041,200 0.03%State of Lower Saxony 2,000,000 0.25% 6/2/2024 2,039,664 0.03%Kreditanstalt fuer Wiederaufbau 2,000,000 0.13% 7/6/2023 2,032,496 0.03%State of Lower Saxony 2,000,000 0.13% 7/3/2025 2,028,976 0.03%State of North Rhine-Westphalia Germany 2,000,000 0.75% 16/8/2041 2,020,416 0.03%State of North Rhine-Westphalia Germany 1,500,000 1.95% 26/9/2078 1,983,771 0.03%State of North Rhine-Westphalia Germany 1,900,000 0.80% 30/7/2049 1,908,606 0.03%Land Berlin 1,870,000 1.50% 21/1/2021 1,907,299 0.03%Landwirtschaftliche Rentenbank 1,800,000 0.50% 28/2/2029 1,868,378 0.03%State of Hesse 1,800,000 0.00% 14/4/2026 1,809,562 0.03%Landeskreditbank Baden-Wuerttemberg Foerderbank 1,800,000 0.13% 5/11/2020 1,808,093 0.03%NRW Bank 1,720,000 0.38% 16/5/2029 1,757,885 0.03%Land Baden-Wuerttemberg 1,600,000 2.00% 13/11/2023 1,741,619 0.03%Deutsche Bahn Finance GmbH 1,700,000 1.75% 6/11/2020 1,729,658 0.03%Kreditanstalt fuer Wiederaufbau 1,500,000 1.38% 31/7/2035 1,724,802 0.03%State of Rhineland-Palatinate 1,700,000 0.10% 18/8/2026 1,718,013 0.03%State of Hesse 1,550,000 1.75% 20/1/2023 1,647,380 0.02%Deutsche Bahn Finance GmbH^ 1,600,000 0.95% Perpetual 1,616,000 0.02%Landwirtschaftliche Rentenbank 1,500,000 1.25% 20/5/2022 1,558,785 0.02%State of Lower Saxony 1,500,000 1.00% 18/8/2022 1,552,145 0.02%Land Baden-Wuerttemberg 1,500,000 1.00% 18/7/2022 1,551,852 0.02%State of Lower Saxony 1,500,000 0.38% 19/1/2023 1,531,060 0.02%State of North Rhine-Westphalia Germany 1,500,000 0.13% 16/3/2023 1,519,947 0.02%Landeskreditbank Baden-Wuerttemberg Foerderbank 1,500,000 0.05% 9/11/2021 1,512,441 0.02%State of Hesse 1,400,000 1.38% 10/6/2024 1,499,383 0.02%State of Hesse 1,500,000 0.00% 10/9/2029 1,479,009 0.02%Landesbank Baden-Wuerttemberg 1,500,000 0.38% 30/9/2027 1,473,210 0.02%Land Berlin 1,350,000 1.63% 3/6/2024 1,460,268 0.02%Kreditanstalt fuer Wiederaufbau 1,300,000 0.38% 23/4/2030 1,333,548 0.02%
Vanguard Euro Government Bond Index Fund
217
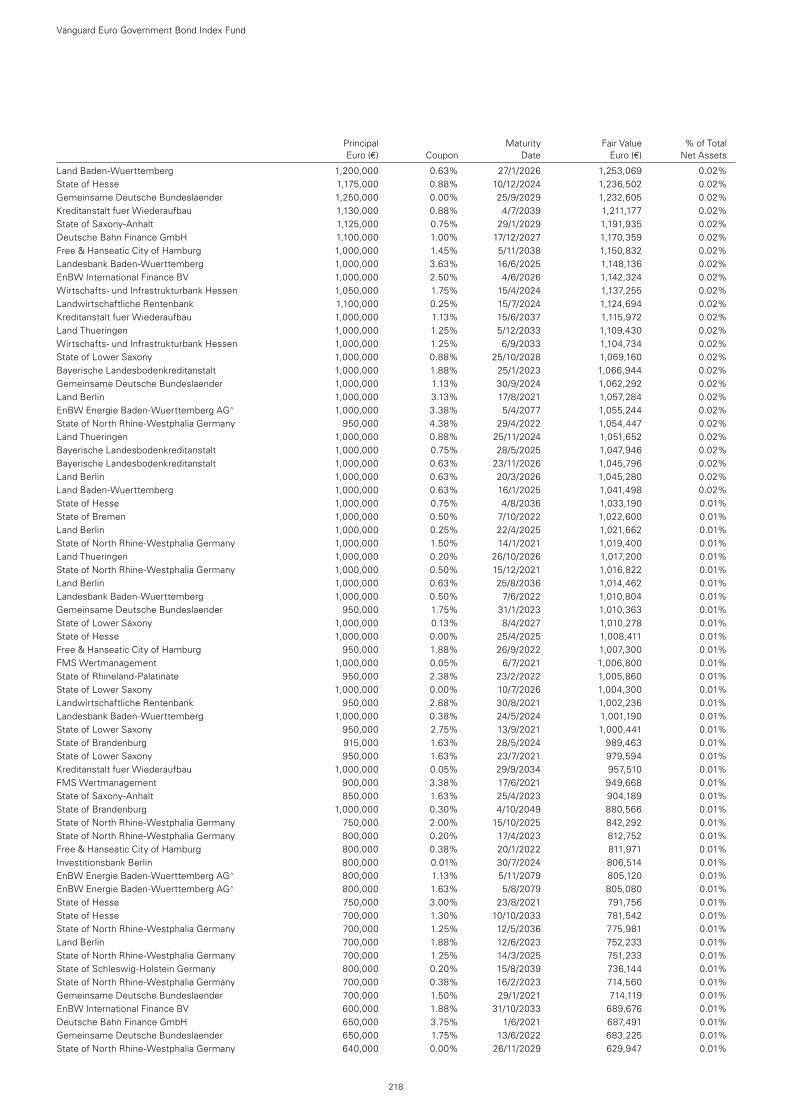
Principal Maturity Fair Value % of Total Euro (€) Coupon Date Euro (€) Net Assets
Land Baden-Wuerttemberg 1,200,000 0.63% 27/1/2026 1,253,069 0.02%State of Hesse 1,175,000 0.88% 10/12/2024 1,236,502 0.02%Gemeinsame Deutsche Bundeslaender 1,250,000 0.00% 25/9/2029 1,232,605 0.02%Kreditanstalt fuer Wiederaufbau 1,130,000 0.88% 4/7/2039 1,211,177 0.02%State of Saxony-Anhalt 1,125,000 0.75% 29/1/2029 1,191,935 0.02%Deutsche Bahn Finance GmbH 1,100,000 1.00% 17/12/2027 1,170,359 0.02%Free & Hanseatic City of Hamburg 1,000,000 1.45% 5/11/2038 1,150,832 0.02%Landesbank Baden-Wuerttemberg 1,000,000 3.63% 16/6/2025 1,148,136 0.02%EnBW International Finance BV 1,000,000 2.50% 4/6/2026 1,142,324 0.02%Wirtschafts- und Infrastrukturbank Hessen 1,050,000 1.75% 15/4/2024 1,137,255 0.02%Landwirtschaftliche Rentenbank 1,100,000 0.25% 15/7/2024 1,124,694 0.02%Kreditanstalt fuer Wiederaufbau 1,000,000 1.13% 15/6/2037 1,115,972 0.02%Land Thueringen 1,000,000 1.25% 5/12/2033 1,109,430 0.02%Wirtschafts- und Infrastrukturbank Hessen 1,000,000 1.25% 6/9/2033 1,104,734 0.02%State of Lower Saxony 1,000,000 0.88% 25/10/2028 1,069,160 0.02%Bayerische Landesbodenkreditanstalt 1,000,000 1.88% 25/1/2023 1,066,944 0.02%Gemeinsame Deutsche Bundeslaender 1,000,000 1.13% 30/9/2024 1,062,292 0.02%Land Berlin 1,000,000 3.13% 17/8/2021 1,057,284 0.02%EnBW Energie Baden-Wuerttemberg AG^ 1,000,000 3.38% 5/4/2077 1,055,244 0.02%State of North Rhine-Westphalia Germany 950,000 4.38% 29/4/2022 1,054,447 0.02%Land Thueringen 1,000,000 0.88% 25/11/2024 1,051,652 0.02%Bayerische Landesbodenkreditanstalt 1,000,000 0.75% 28/5/2025 1,047,946 0.02%Bayerische Landesbodenkreditanstalt 1,000,000 0.63% 23/11/2026 1,045,796 0.02%Land Berlin 1,000,000 0.63% 20/3/2026 1,045,280 0.02%Land Baden-Wuerttemberg 1,000,000 0.63% 16/1/2025 1,041,498 0.02%State of Hesse 1,000,000 0.75% 4/8/2036 1,033,190 0.01%State of Bremen 1,000,000 0.50% 7/10/2022 1,022,600 0.01%Land Berlin 1,000,000 0.25% 22/4/2025 1,021,662 0.01%State of North Rhine-Westphalia Germany 1,000,000 1.50% 14/1/2021 1,019,400 0.01%Land Thueringen 1,000,000 0.20% 26/10/2026 1,017,200 0.01%State of North Rhine-Westphalia Germany 1,000,000 0.50% 15/12/2021 1,016,822 0.01%Land Berlin 1,000,000 0.63% 25/8/2036 1,014,462 0.01%Landesbank Baden-Wuerttemberg 1,000,000 0.50% 7/6/2022 1,010,804 0.01%Gemeinsame Deutsche Bundeslaender 950,000 1.75% 31/1/2023 1,010,363 0.01%State of Lower Saxony 1,000,000 0.13% 8/4/2027 1,010,278 0.01%State of Hesse 1,000,000 0.00% 25/4/2025 1,008,411 0.01%Free & Hanseatic City of Hamburg 950,000 1.88% 26/9/2022 1,007,300 0.01%FMS Wertmanagement 1,000,000 0.05% 6/7/2021 1,006,800 0.01%State of Rhineland-Palatinate 950,000 2.38% 23/2/2022 1,005,860 0.01%State of Lower Saxony 1,000,000 0.00% 10/7/2026 1,004,300 0.01%Landwirtschaftliche Rentenbank 950,000 2.88% 30/8/2021 1,002,236 0.01%Landesbank Baden-Wuerttemberg 1,000,000 0.38% 24/5/2024 1,001,190 0.01%State of Lower Saxony 950,000 2.75% 13/9/2021 1,000,441 0.01%State of Brandenburg 915,000 1.63% 28/5/2024 989,463 0.01%State of Lower Saxony 950,000 1.63% 23/7/2021 979,594 0.01%Kreditanstalt fuer Wiederaufbau 1,000,000 0.05% 29/9/2034 957,510 0.01%FMS Wertmanagement 900,000 3.38% 17/6/2021 949,668 0.01%State of Saxony-Anhalt 850,000 1.63% 25/4/2023 904,189 0.01%State of Brandenburg 1,000,000 0.30% 4/10/2049 880,566 0.01%State of North Rhine-Westphalia Germany 750,000 2.00% 15/10/2025 842,292 0.01%State of North Rhine-Westphalia Germany 800,000 0.20% 17/4/2023 812,752 0.01%Free & Hanseatic City of Hamburg 800,000 0.38% 20/1/2022 811,971 0.01%Investitionsbank Berlin 800,000 0.01% 30/7/2024 806,514 0.01%EnBW Energie Baden-Wuerttemberg AG^ 800,000 1.13% 5/11/2079 805,120 0.01%EnBW Energie Baden-Wuerttemberg AG^ 800,000 1.63% 5/8/2079 805,080 0.01%State of Hesse 750,000 3.00% 23/8/2021 791,756 0.01%State of Hesse 700,000 1.30% 10/10/2033 781,542 0.01%State of North Rhine-Westphalia Germany 700,000 1.25% 12/5/2036 775,981 0.01%Land Berlin 700,000 1.88% 12/6/2023 752,233 0.01%State of North Rhine-Westphalia Germany 700,000 1.25% 14/3/2025 751,233 0.01%State of Schleswig-Holstein Germany 800,000 0.20% 15/8/2039 736,144 0.01%State of North Rhine-Westphalia Germany 700,000 0.38% 16/2/2023 714,560 0.01%Gemeinsame Deutsche Bundeslaender 700,000 1.50% 29/1/2021 714,119 0.01%EnBW International Finance BV 600,000 1.88% 31/10/2033 689,676 0.01%Deutsche Bahn Finance GmbH 650,000 3.75% 1/6/2021 687,491 0.01%Gemeinsame Deutsche Bundeslaender 650,000 1.75% 13/6/2022 683,225 0.01%State of North Rhine-Westphalia Germany 640,000 0.00% 26/11/2029 629,947 0.01%
Vanguard Euro Government Bond Index Fund
218
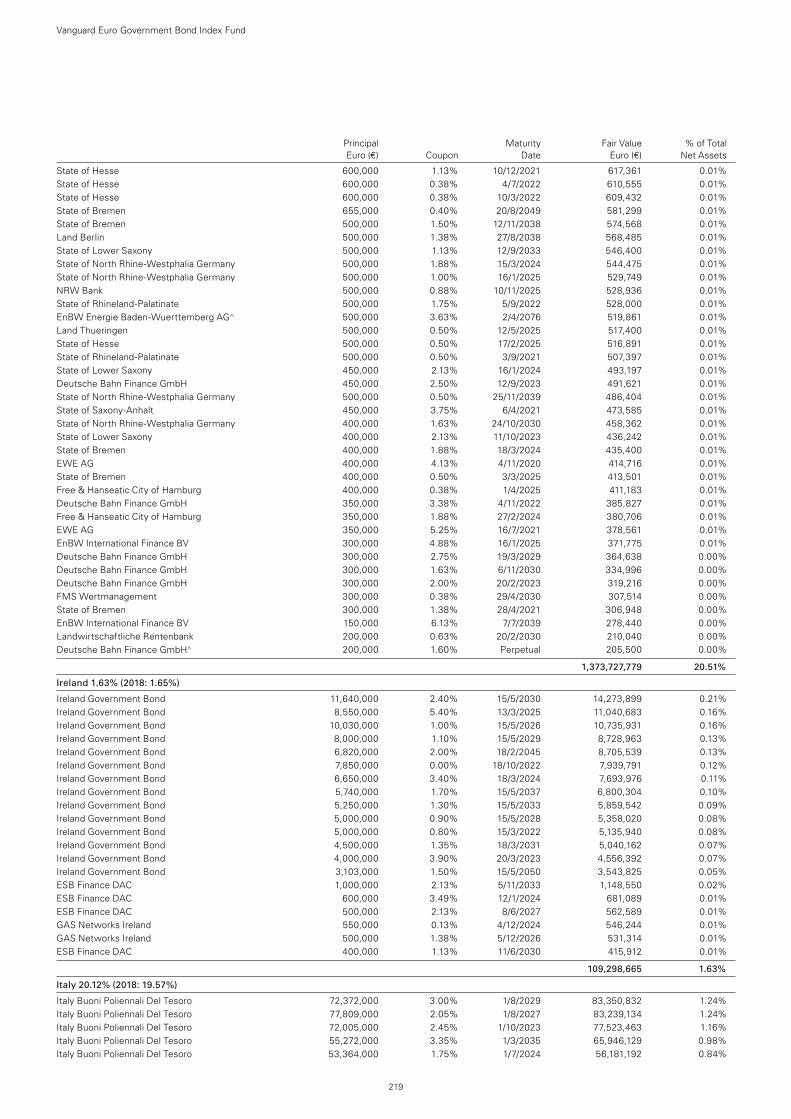
Principal Maturity Fair Value % of Total Euro (€) Coupon Date Euro (€) Net Assets
State of Hesse 600,000 1.13% 10/12/2021 617,361 0.01%State of Hesse 600,000 0.38% 4/7/2022 610,555 0.01%State of Hesse 600,000 0.38% 10/3/2022 609,432 0.01%State of Bremen 655,000 0.40% 20/8/2049 581,299 0.01%State of Bremen 500,000 1.50% 12/11/2038 574,568 0.01%Land Berlin 500,000 1.38% 27/8/2038 568,485 0.01%State of Lower Saxony 500,000 1.13% 12/9/2033 546,400 0.01%State of North Rhine-Westphalia Germany 500,000 1.88% 15/3/2024 544,475 0.01%State of North Rhine-Westphalia Germany 500,000 1.00% 16/1/2025 529,749 0.01%NRW Bank 500,000 0.88% 10/11/2025 528,936 0.01%State of Rhineland-Palatinate 500,000 1.75% 5/9/2022 528,000 0.01%EnBW Energie Baden-Wuerttemberg AG^ 500,000 3.63% 2/4/2076 519,861 0.01%Land Thueringen 500,000 0.50% 12/5/2025 517,400 0.01%State of Hesse 500,000 0.50% 17/2/2025 516,891 0.01%State of Rhineland-Palatinate 500,000 0.50% 3/9/2021 507,397 0.01%State of Lower Saxony 450,000 2.13% 16/1/2024 493,197 0.01%Deutsche Bahn Finance GmbH 450,000 2.50% 12/9/2023 491,621 0.01%State of North Rhine-Westphalia Germany 500,000 0.50% 25/11/2039 486,404 0.01%State of Saxony-Anhalt 450,000 3.75% 6/4/2021 473,585 0.01%State of North Rhine-Westphalia Germany 400,000 1.63% 24/10/2030 458,362 0.01%State of Lower Saxony 400,000 2.13% 11/10/2023 436,242 0.01%State of Bremen 400,000 1.88% 18/3/2024 435,400 0.01%EWE AG 400,000 4.13% 4/11/2020 414,716 0.01%State of Bremen 400,000 0.50% 3/3/2025 413,501 0.01%Free & Hanseatic City of Hamburg 400,000 0.38% 1/4/2025 411,183 0.01%Deutsche Bahn Finance GmbH 350,000 3.38% 4/11/2022 385,827 0.01%Free & Hanseatic City of Hamburg 350,000 1.88% 27/2/2024 380,706 0.01%EWE AG 350,000 5.25% 16/7/2021 378,561 0.01%EnBW International Finance BV 300,000 4.88% 16/1/2025 371,775 0.01%Deutsche Bahn Finance GmbH 300,000 2.75% 19/3/2029 364,638 0.00%Deutsche Bahn Finance GmbH 300,000 1.63% 6/11/2030 334,996 0.00%Deutsche Bahn Finance GmbH 300,000 2.00% 20/2/2023 319,216 0.00%FMS Wertmanagement 300,000 0.38% 29/4/2030 307,514 0.00%State of Bremen 300,000 1.38% 28/4/2021 306,948 0.00%EnBW International Finance BV 150,000 6.13% 7/7/2039 278,440 0.00%Landwirtschaftliche Rentenbank 200,000 0.63% 20/2/2030 210,040 0.00%Deutsche Bahn Finance GmbH^ 200,000 1.60% Perpetual 205,500 0.00%
1,373,727,779 20.51%
Ireland 1.63% (2018: 1.65%)
Ireland Government Bond 11,640,000 2.40% 15/5/2030 14,273,899 0.21%Ireland Government Bond 8,550,000 5.40% 13/3/2025 11,040,683 0.16%Ireland Government Bond 10,030,000 1.00% 15/5/2026 10,735,931 0.16%Ireland Government Bond 8,000,000 1.10% 15/5/2029 8,728,963 0.13%Ireland Government Bond 6,820,000 2.00% 18/2/2045 8,705,539 0.13%Ireland Government Bond 7,850,000 0.00% 18/10/2022 7,939,791 0.12%Ireland Government Bond 6,650,000 3.40% 18/3/2024 7,693,976 0.11%Ireland Government Bond 5,740,000 1.70% 15/5/2037 6,800,304 0.10%Ireland Government Bond 5,250,000 1.30% 15/5/2033 5,859,542 0.09%Ireland Government Bond 5,000,000 0.90% 15/5/2028 5,358,020 0.08%Ireland Government Bond 5,000,000 0.80% 15/3/2022 5,135,940 0.08%Ireland Government Bond 4,500,000 1.35% 18/3/2031 5,040,162 0.07%Ireland Government Bond 4,000,000 3.90% 20/3/2023 4,556,392 0.07%Ireland Government Bond 3,103,000 1.50% 15/5/2050 3,543,825 0.05%ESB Finance DAC 1,000,000 2.13% 5/11/2033 1,148,550 0.02%ESB Finance DAC 600,000 3.49% 12/1/2024 681,089 0.01%ESB Finance DAC 500,000 2.13% 8/6/2027 562,589 0.01%GAS Networks Ireland 550,000 0.13% 4/12/2024 546,244 0.01%GAS Networks Ireland 500,000 1.38% 5/12/2026 531,314 0.01%ESB Finance DAC 400,000 1.13% 11/6/2030 415,912 0.01%
109,298,665 1.63%
Italy 20.12% (2018: 19.57%)
Italy Buoni Poliennali Del Tesoro 72,372,000 3.00% 1/8/2029 83,350,832 1.24%Italy Buoni Poliennali Del Tesoro 77,809,000 2.05% 1/8/2027 83,239,134 1.24%Italy Buoni Poliennali Del Tesoro 72,005,000 2.45% 1/10/2023 77,523,463 1.16%Italy Buoni Poliennali Del Tesoro 55,272,000 3.35% 1/3/2035 65,946,129 0.98%Italy Buoni Poliennali Del Tesoro 53,364,000 1.75% 1/7/2024 56,181,192 0.84%
Vanguard Euro Government Bond Index Fund
219
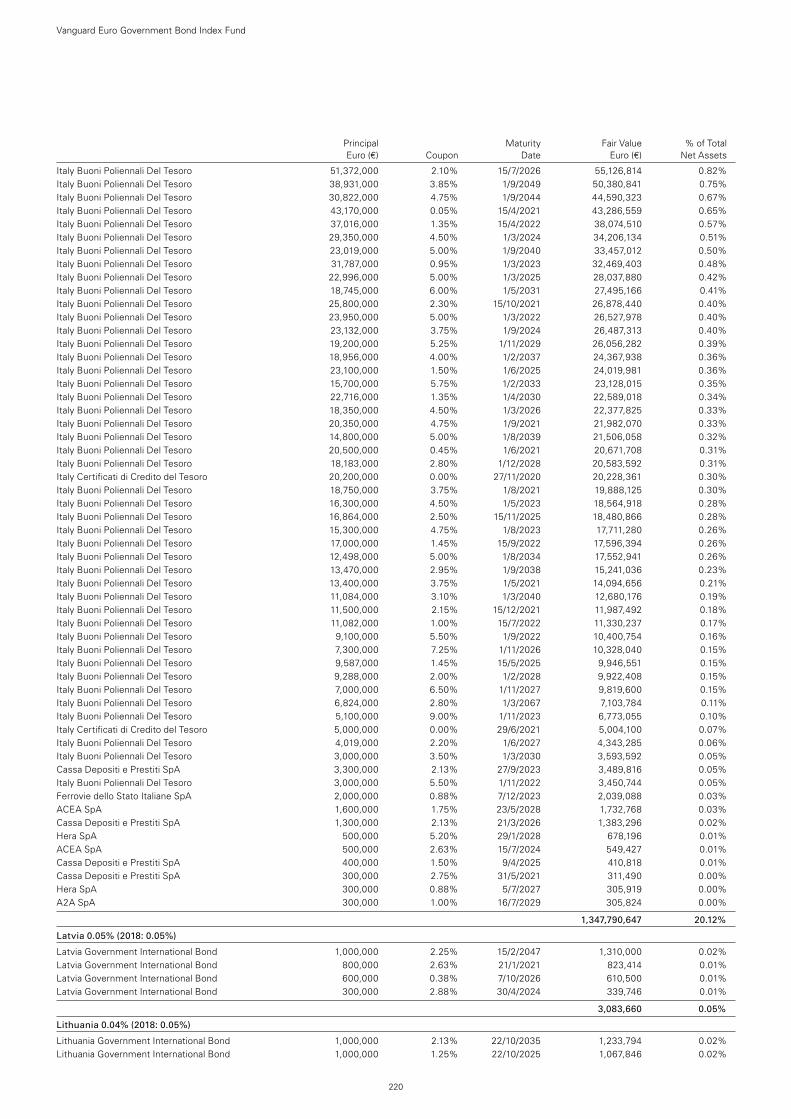
Principal Maturity Fair Value % of Total Euro (€) Coupon Date Euro (€) Net Assets
Italy Buoni Poliennali Del Tesoro 51,372,000 2.10% 15/7/2026 55,126,814 0.82%Italy Buoni Poliennali Del Tesoro 38,931,000 3.85% 1/9/2049 50,380,841 0.75%Italy Buoni Poliennali Del Tesoro 30,822,000 4.75% 1/9/2044 44,590,323 0.67%Italy Buoni Poliennali Del Tesoro 43,170,000 0.05% 15/4/2021 43,286,559 0.65%Italy Buoni Poliennali Del Tesoro 37,016,000 1.35% 15/4/2022 38,074,510 0.57%Italy Buoni Poliennali Del Tesoro 29,350,000 4.50% 1/3/2024 34,206,134 0.51%Italy Buoni Poliennali Del Tesoro 23,019,000 5.00% 1/9/2040 33,457,012 0.50%Italy Buoni Poliennali Del Tesoro 31,787,000 0.95% 1/3/2023 32,469,403 0.48%Italy Buoni Poliennali Del Tesoro 22,996,000 5.00% 1/3/2025 28,037,880 0.42%Italy Buoni Poliennali Del Tesoro 18,745,000 6.00% 1/5/2031 27,495,166 0.41%Italy Buoni Poliennali Del Tesoro 25,800,000 2.30% 15/10/2021 26,878,440 0.40%Italy Buoni Poliennali Del Tesoro 23,950,000 5.00% 1/3/2022 26,527,978 0.40%Italy Buoni Poliennali Del Tesoro 23,132,000 3.75% 1/9/2024 26,487,313 0.40%Italy Buoni Poliennali Del Tesoro 19,200,000 5.25% 1/11/2029 26,056,282 0.39%Italy Buoni Poliennali Del Tesoro 18,956,000 4.00% 1/2/2037 24,367,938 0.36%Italy Buoni Poliennali Del Tesoro 23,100,000 1.50% 1/6/2025 24,019,981 0.36%Italy Buoni Poliennali Del Tesoro 15,700,000 5.75% 1/2/2033 23,128,015 0.35%Italy Buoni Poliennali Del Tesoro 22,716,000 1.35% 1/4/2030 22,589,018 0.34%Italy Buoni Poliennali Del Tesoro 18,350,000 4.50% 1/3/2026 22,377,825 0.33%Italy Buoni Poliennali Del Tesoro 20,350,000 4.75% 1/9/2021 21,982,070 0.33%Italy Buoni Poliennali Del Tesoro 14,800,000 5.00% 1/8/2039 21,506,058 0.32%Italy Buoni Poliennali Del Tesoro 20,500,000 0.45% 1/6/2021 20,671,708 0.31%Italy Buoni Poliennali Del Tesoro 18,183,000 2.80% 1/12/2028 20,583,592 0.31%Italy Certificati di Credito del Tesoro 20,200,000 0.00% 27/11/2020 20,228,361 0.30%Italy Buoni Poliennali Del Tesoro 18,750,000 3.75% 1/8/2021 19,888,125 0.30%Italy Buoni Poliennali Del Tesoro 16,300,000 4.50% 1/5/2023 18,564,918 0.28%Italy Buoni Poliennali Del Tesoro 16,864,000 2.50% 15/11/2025 18,480,866 0.28%Italy Buoni Poliennali Del Tesoro 15,300,000 4.75% 1/8/2023 17,711,280 0.26%Italy Buoni Poliennali Del Tesoro 17,000,000 1.45% 15/9/2022 17,596,394 0.26%Italy Buoni Poliennali Del Tesoro 12,498,000 5.00% 1/8/2034 17,552,941 0.26%Italy Buoni Poliennali Del Tesoro 13,470,000 2.95% 1/9/2038 15,241,036 0.23%Italy Buoni Poliennali Del Tesoro 13,400,000 3.75% 1/5/2021 14,094,656 0.21%Italy Buoni Poliennali Del Tesoro 11,084,000 3.10% 1/3/2040 12,680,176 0.19%Italy Buoni Poliennali Del Tesoro 11,500,000 2.15% 15/12/2021 11,987,492 0.18%Italy Buoni Poliennali Del Tesoro 11,082,000 1.00% 15/7/2022 11,330,237 0.17%Italy Buoni Poliennali Del Tesoro 9,100,000 5.50% 1/9/2022 10,400,754 0.16%Italy Buoni Poliennali Del Tesoro 7,300,000 7.25% 1/11/2026 10,328,040 0.15%Italy Buoni Poliennali Del Tesoro 9,587,000 1.45% 15/5/2025 9,946,551 0.15%Italy Buoni Poliennali Del Tesoro 9,288,000 2.00% 1/2/2028 9,922,408 0.15%Italy Buoni Poliennali Del Tesoro 7,000,000 6.50% 1/11/2027 9,819,600 0.15%Italy Buoni Poliennali Del Tesoro 6,824,000 2.80% 1/3/2067 7,103,784 0.11%Italy Buoni Poliennali Del Tesoro 5,100,000 9.00% 1/11/2023 6,773,055 0.10%Italy Certificati di Credito del Tesoro 5,000,000 0.00% 29/6/2021 5,004,100 0.07%Italy Buoni Poliennali Del Tesoro 4,019,000 2.20% 1/6/2027 4,343,285 0.06%Italy Buoni Poliennali Del Tesoro 3,000,000 3.50% 1/3/2030 3,593,592 0.05%Cassa Depositi e Prestiti SpA 3,300,000 2.13% 27/9/2023 3,489,816 0.05%Italy Buoni Poliennali Del Tesoro 3,000,000 5.50% 1/11/2022 3,450,744 0.05%Ferrovie dello Stato Italiane SpA 2,000,000 0.88% 7/12/2023 2,039,088 0.03%ACEA SpA 1,600,000 1.75% 23/5/2028 1,732,768 0.03%Cassa Depositi e Prestiti SpA 1,300,000 2.13% 21/3/2026 1,383,296 0.02%Hera SpA 500,000 5.20% 29/1/2028 678,196 0.01%ACEA SpA 500,000 2.63% 15/7/2024 549,427 0.01%Cassa Depositi e Prestiti SpA 400,000 1.50% 9/4/2025 410,818 0.01%Cassa Depositi e Prestiti SpA 300,000 2.75% 31/5/2021 311,490 0.00%Hera SpA 300,000 0.88% 5/7/2027 305,919 0.00%A2A SpA 300,000 1.00% 16/7/2029 305,824 0.00%
1,347,790,647 20.12%
Latvia 0.05% (2018: 0.05%)
Latvia Government International Bond 1,000,000 2.25% 15/2/2047 1,310,000 0.02%Latvia Government International Bond 800,000 2.63% 21/1/2021 823,414 0.01%Latvia Government International Bond 600,000 0.38% 7/10/2026 610,500 0.01%Latvia Government International Bond 300,000 2.88% 30/4/2024 339,746 0.01%
3,083,660 0.05%
Lithuania 0.04% (2018: 0.05%)
Lithuania Government International Bond 1,000,000 2.13% 22/10/2035 1,233,794 0.02%Lithuania Government International Bond 1,000,000 1.25% 22/10/2025 1,067,846 0.02%
Vanguard Euro Government Bond Index Fund
220
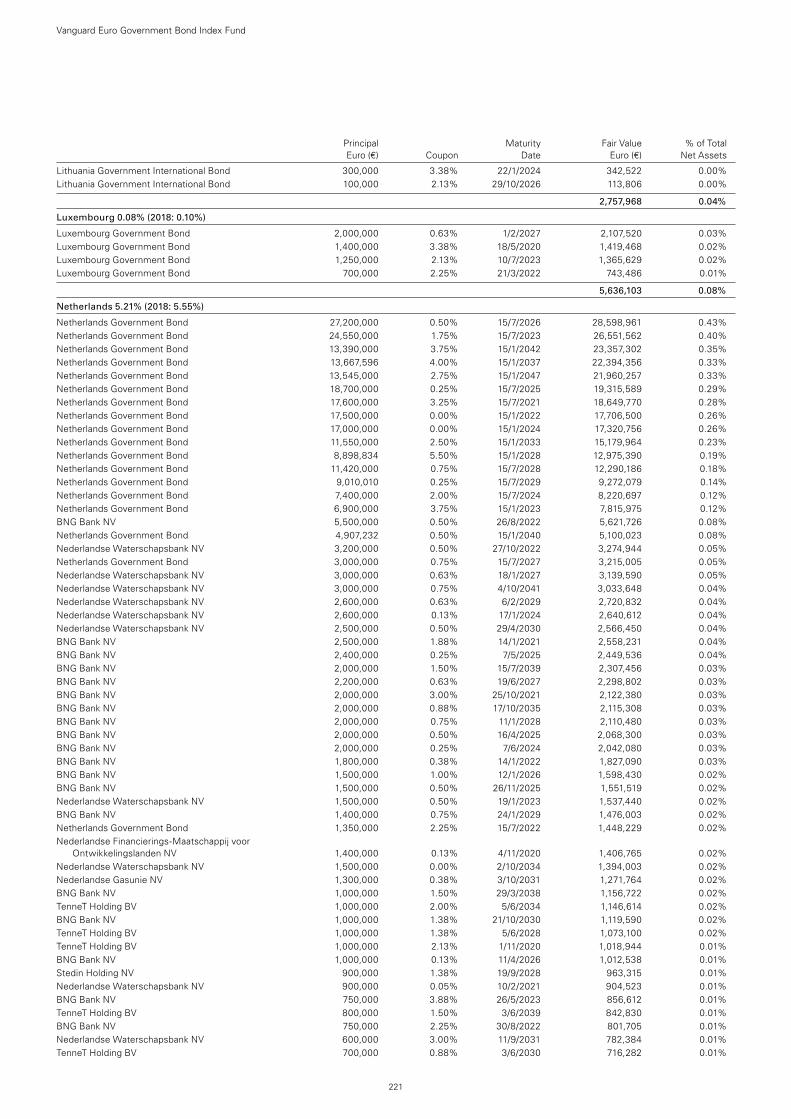
Principal Maturity Fair Value % of Total Euro (€) Coupon Date Euro (€) Net Assets
Lithuania Government International Bond 300,000 3.38% 22/1/2024 342,522 0.00%Lithuania Government International Bond 100,000 2.13% 29/10/2026 113,806 0.00%
2,757,968 0.04%
Luxembourg 0.08% (2018: 0.10%)
Luxembourg Government Bond 2,000,000 0.63% 1/2/2027 2,107,520 0.03%Luxembourg Government Bond 1,400,000 3.38% 18/5/2020 1,419,468 0.02%Luxembourg Government Bond 1,250,000 2.13% 10/7/2023 1,365,629 0.02%Luxembourg Government Bond 700,000 2.25% 21/3/2022 743,486 0.01%
5,636,103 0.08%
Netherlands 5.21% (2018: 5.55%)
Netherlands Government Bond 27,200,000 0.50% 15/7/2026 28,598,961 0.43%Netherlands Government Bond 24,550,000 1.75% 15/7/2023 26,551,562 0.40%Netherlands Government Bond 13,390,000 3.75% 15/1/2042 23,357,302 0.35%Netherlands Government Bond 13,667,596 4.00% 15/1/2037 22,394,356 0.33%Netherlands Government Bond 13,545,000 2.75% 15/1/2047 21,960,257 0.33%Netherlands Government Bond 18,700,000 0.25% 15/7/2025 19,315,589 0.29%Netherlands Government Bond 17,600,000 3.25% 15/7/2021 18,649,770 0.28%Netherlands Government Bond 17,500,000 0.00% 15/1/2022 17,706,500 0.26%Netherlands Government Bond 17,000,000 0.00% 15/1/2024 17,320,756 0.26%Netherlands Government Bond 11,550,000 2.50% 15/1/2033 15,179,964 0.23%Netherlands Government Bond 8,898,834 5.50% 15/1/2028 12,975,390 0.19%Netherlands Government Bond 11,420,000 0.75% 15/7/2028 12,290,186 0.18%Netherlands Government Bond 9,010,010 0.25% 15/7/2029 9,272,079 0.14%Netherlands Government Bond 7,400,000 2.00% 15/7/2024 8,220,697 0.12%Netherlands Government Bond 6,900,000 3.75% 15/1/2023 7,815,975 0.12%BNG Bank NV 5,500,000 0.50% 26/8/2022 5,621,726 0.08%Netherlands Government Bond 4,907,232 0.50% 15/1/2040 5,100,023 0.08%Nederlandse Waterschapsbank NV 3,200,000 0.50% 27/10/2022 3,274,944 0.05%Netherlands Government Bond 3,000,000 0.75% 15/7/2027 3,215,005 0.05%Nederlandse Waterschapsbank NV 3,000,000 0.63% 18/1/2027 3,139,590 0.05%Nederlandse Waterschapsbank NV 3,000,000 0.75% 4/10/2041 3,033,648 0.04%Nederlandse Waterschapsbank NV 2,600,000 0.63% 6/2/2029 2,720,832 0.04%Nederlandse Waterschapsbank NV 2,600,000 0.13% 17/1/2024 2,640,612 0.04%Nederlandse Waterschapsbank NV 2,500,000 0.50% 29/4/2030 2,566,450 0.04%BNG Bank NV 2,500,000 1.88% 14/1/2021 2,558,231 0.04%BNG Bank NV 2,400,000 0.25% 7/5/2025 2,449,536 0.04%BNG Bank NV 2,000,000 1.50% 15/7/2039 2,307,456 0.03%BNG Bank NV 2,200,000 0.63% 19/6/2027 2,298,802 0.03%BNG Bank NV 2,000,000 3.00% 25/10/2021 2,122,380 0.03%BNG Bank NV 2,000,000 0.88% 17/10/2035 2,115,308 0.03%BNG Bank NV 2,000,000 0.75% 11/1/2028 2,110,480 0.03%BNG Bank NV 2,000,000 0.50% 16/4/2025 2,068,300 0.03%BNG Bank NV 2,000,000 0.25% 7/6/2024 2,042,080 0.03%BNG Bank NV 1,800,000 0.38% 14/1/2022 1,827,090 0.03%BNG Bank NV 1,500,000 1.00% 12/1/2026 1,598,430 0.02%BNG Bank NV 1,500,000 0.50% 26/11/2025 1,551,519 0.02%Nederlandse Waterschapsbank NV 1,500,000 0.50% 19/1/2023 1,537,440 0.02%BNG Bank NV 1,400,000 0.75% 24/1/2029 1,476,003 0.02%Netherlands Government Bond 1,350,000 2.25% 15/7/2022 1,448,229 0.02%Nederlandse Financierings-Maatschappij voor
Ontwikkelingslanden NV 1,400,000 0.13% 4/11/2020 1,406,765 0.02%Nederlandse Waterschapsbank NV 1,500,000 0.00% 2/10/2034 1,394,003 0.02%Nederlandse Gasunie NV 1,300,000 0.38% 3/10/2031 1,271,764 0.02%BNG Bank NV 1,000,000 1.50% 29/3/2038 1,156,722 0.02%TenneT Holding BV 1,000,000 2.00% 5/6/2034 1,146,614 0.02%BNG Bank NV 1,000,000 1.38% 21/10/2030 1,119,590 0.02%TenneT Holding BV 1,000,000 1.38% 5/6/2028 1,073,100 0.02%TenneT Holding BV 1,000,000 2.13% 1/11/2020 1,018,944 0.01%BNG Bank NV 1,000,000 0.13% 11/4/2026 1,012,538 0.01%Stedin Holding NV 900,000 1.38% 19/9/2028 963,315 0.01%Nederlandse Waterschapsbank NV 900,000 0.05% 10/2/2021 904,523 0.01%BNG Bank NV 750,000 3.88% 26/5/2023 856,612 0.01%TenneT Holding BV 800,000 1.50% 3/6/2039 842,830 0.01%BNG Bank NV 750,000 2.25% 30/8/2022 801,705 0.01%Nederlandse Waterschapsbank NV 600,000 3.00% 11/9/2031 782,384 0.01%TenneT Holding BV 700,000 0.88% 3/6/2030 716,282 0.01%
Vanguard Euro Government Bond Index Fund
221
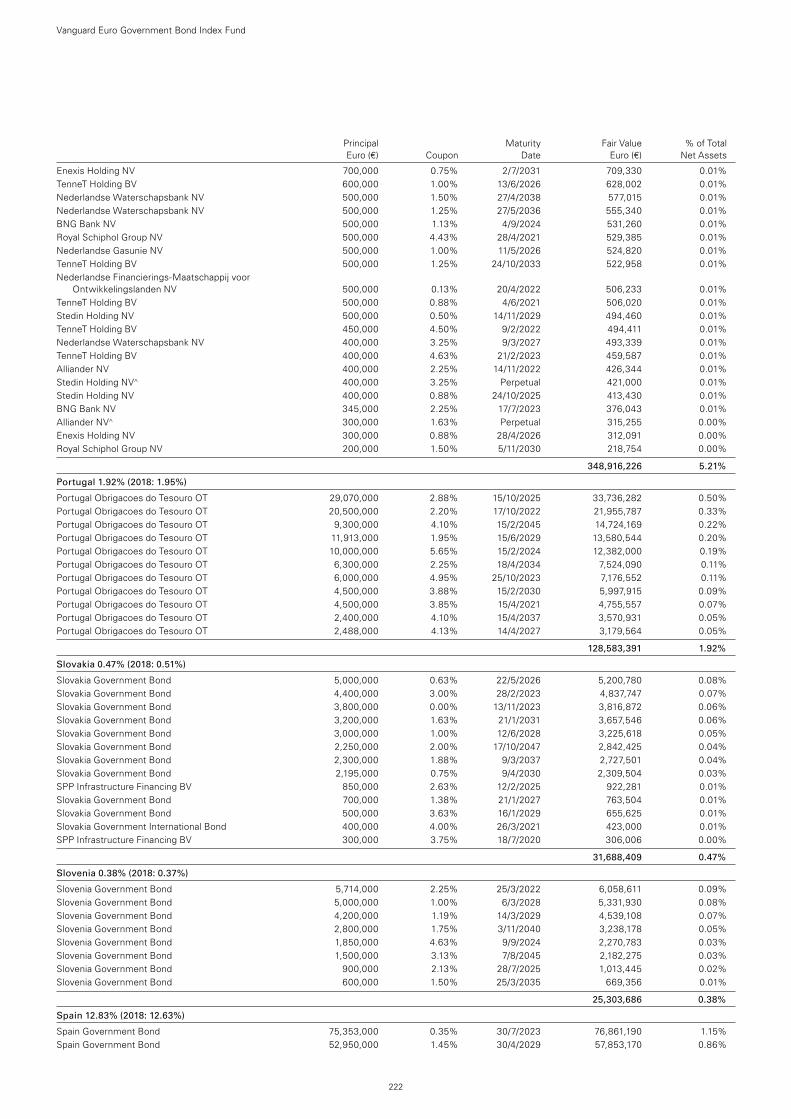
Enexis Holding NV 700,000 0.75% 2/7/2031 709,330 0.01%TenneT Holding BV 600,000 1.00% 13/6/2026 628,002 0.01%Nederlandse Waterschapsbank NV 500,000 1.50% 27/4/2038 577,015 0.01%Nederlandse Waterschapsbank NV 500,000 1.25% 27/5/2036 555,340 0.01%BNG Bank NV 500,000 1.13% 4/9/2024 531,260 0.01%Royal Schiphol Group NV 500,000 4.43% 28/4/2021 529,385 0.01%Nederlandse Gasunie NV 500,000 1.00% 11/5/2026 524,820 0.01%TenneT Holding BV 500,000 1.25% 24/10/2033 522,958 0.01%Nederlandse Financierings-Maatschappij voor
Ontwikkelingslanden NV 500,000 0.13% 20/4/2022 506,233 0.01%TenneT Holding BV 500,000 0.88% 4/6/2021 506,020 0.01%Stedin Holding NV 500,000 0.50% 14/11/2029 494,460 0.01%TenneT Holding BV 450,000 4.50% 9/2/2022 494,411 0.01%Nederlandse Waterschapsbank NV 400,000 3.25% 9/3/2027 493,339 0.01%TenneT Holding BV 400,000 4.63% 21/2/2023 459,587 0.01%Alliander NV 400,000 2.25% 14/11/2022 426,344 0.01%Stedin Holding NV^ 400,000 3.25% Perpetual 421,000 0.01%Stedin Holding NV 400,000 0.88% 24/10/2025 413,430 0.01%BNG Bank NV 345,000 2.25% 17/7/2023 376,043 0.01%Alliander NV^ 300,000 1.63% Perpetual 315,255 0.00%Enexis Holding NV 300,000 0.88% 28/4/2026 312,091 0.00%Royal Schiphol Group NV 200,000 1.50% 5/11/2030 218,754 0.00%
348,916,226 5.21%
Portugal 1.92% (2018: 1.95%)
Portugal Obrigacoes do Tesouro OT 29,070,000 2.88% 15/10/2025 33,736,282 0.50%Portugal Obrigacoes do Tesouro OT 20,500,000 2.20% 17/10/2022 21,955,787 0.33%Portugal Obrigacoes do Tesouro OT 9,300,000 4.10% 15/2/2045 14,724,169 0.22%Portugal Obrigacoes do Tesouro OT 11,913,000 1.95% 15/6/2029 13,580,544 0.20%Portugal Obrigacoes do Tesouro OT 10,000,000 5.65% 15/2/2024 12,382,000 0.19%Portugal Obrigacoes do Tesouro OT 6,300,000 2.25% 18/4/2034 7,524,090 0.11%Portugal Obrigacoes do Tesouro OT 6,000,000 4.95% 25/10/2023 7,176,552 0.11%Portugal Obrigacoes do Tesouro OT 4,500,000 3.88% 15/2/2030 5,997,915 0.09%Portugal Obrigacoes do Tesouro OT 4,500,000 3.85% 15/4/2021 4,755,557 0.07%Portugal Obrigacoes do Tesouro OT 2,400,000 4.10% 15/4/2037 3,570,931 0.05%Portugal Obrigacoes do Tesouro OT 2,488,000 4.13% 14/4/2027 3,179,564 0.05%
128,583,391 1.92%
Slovakia 0.47% (2018: 0.51%)
Slovakia Government Bond 5,000,000 0.63% 22/5/2026 5,200,780 0.08%Slovakia Government Bond 4,400,000 3.00% 28/2/2023 4,837,747 0.07%Slovakia Government Bond 3,800,000 0.00% 13/11/2023 3,816,872 0.06%Slovakia Government Bond 3,200,000 1.63% 21/1/2031 3,657,546 0.06%Slovakia Government Bond 3,000,000 1.00% 12/6/2028 3,225,618 0.05%Slovakia Government Bond 2,250,000 2.00% 17/10/2047 2,842,425 0.04%Slovakia Government Bond 2,300,000 1.88% 9/3/2037 2,727,501 0.04%Slovakia Government Bond 2,195,000 0.75% 9/4/2030 2,309,504 0.03%SPP Infrastructure Financing BV 850,000 2.63% 12/2/2025 922,281 0.01%Slovakia Government Bond 700,000 1.38% 21/1/2027 763,504 0.01%Slovakia Government Bond 500,000 3.63% 16/1/2029 655,625 0.01%Slovakia Government International Bond 400,000 4.00% 26/3/2021 423,000 0.01%SPP Infrastructure Financing BV 300,000 3.75% 18/7/2020 306,006 0.00%
31,688,409 0.47%
Slovenia 0.38% (2018: 0.37%)
Slovenia Government Bond 5,714,000 2.25% 25/3/2022 6,058,611 0.09%Slovenia Government Bond 5,000,000 1.00% 6/3/2028 5,331,930 0.08%Slovenia Government Bond 4,200,000 1.19% 14/3/2029 4,539,108 0.07%Slovenia Government Bond 2,800,000 1.75% 3/11/2040 3,238,178 0.05%Slovenia Government Bond 1,850,000 4.63% 9/9/2024 2,270,783 0.03%Slovenia Government Bond 1,500,000 3.13% 7/8/2045 2,182,275 0.03%Slovenia Government Bond 900,000 2.13% 28/7/2025 1,013,445 0.02%Slovenia Government Bond 600,000 1.50% 25/3/2035 669,356 0.01%
25,303,686 0.38%
Spain 12.83% (2018: 12.63%)
Spain Government Bond 75,353,000 0.35% 30/7/2023 76,861,190 1.15%Spain Government Bond 52,950,000 1.45% 30/4/2029 57,853,170 0.86%
Vanguard Euro Government Bond Index Fund
222
Principal Maturity Fair Value % of Total Euro (€) Coupon Date Euro (€) Net Assets
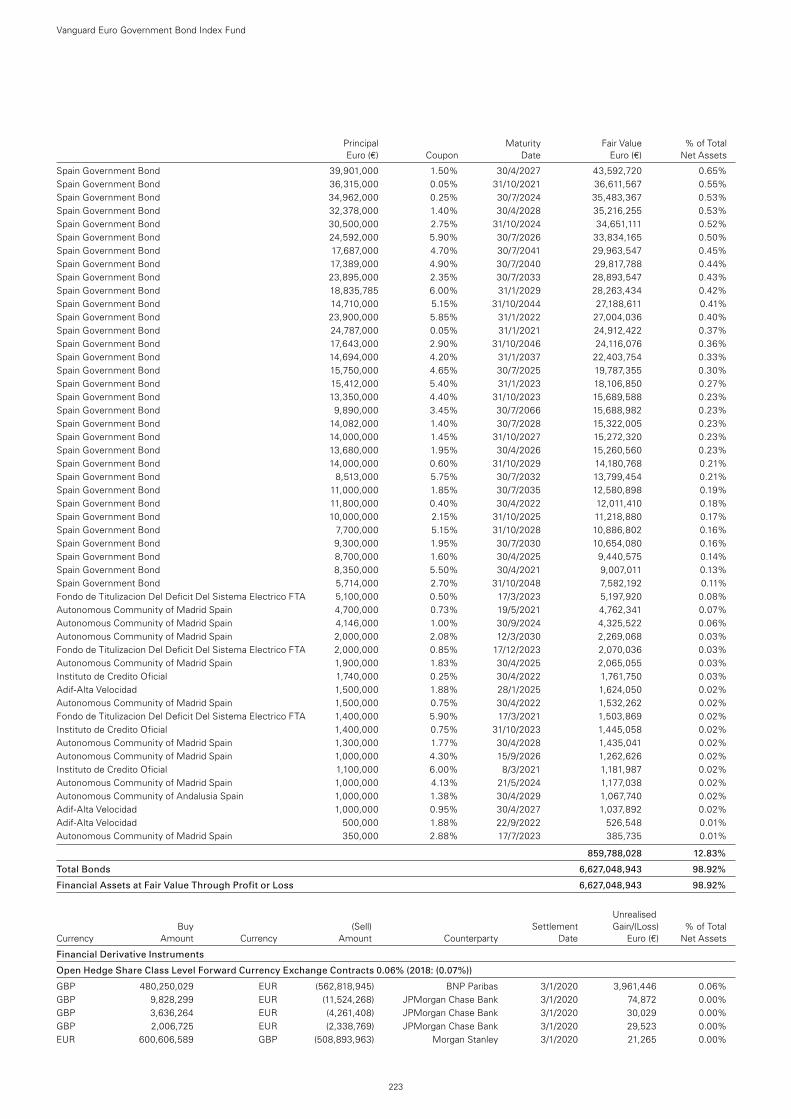
Principal Maturity Fair Value % of Total Euro (€) Coupon Date Euro (€) Net Assets
Vanguard Euro Government Bond Index Fund
223
Spain Government Bond 39,901,000 1.50% 30/4/2027 43,592,720 0.65%Spain Government Bond 36,315,000 0.05% 31/10/2021 36,611,567 0.55%Spain Government Bond 34,962,000 0.25% 30/7/2024 35,483,367 0.53%Spain Government Bond 32,378,000 1.40% 30/4/2028 35,216,255 0.53%Spain Government Bond 30,500,000 2.75% 31/10/2024 34,651,111 0.52%Spain Government Bond 24,592,000 5.90% 30/7/2026 33,834,165 0.50%Spain Government Bond 17,687,000 4.70% 30/7/2041 29,963,547 0.45%Spain Government Bond 17,389,000 4.90% 30/7/2040 29,817,788 0.44%Spain Government Bond 23,895,000 2.35% 30/7/2033 28,893,547 0.43%Spain Government Bond 18,835,785 6.00% 31/1/2029 28,263,434 0.42%Spain Government Bond 14,710,000 5.15% 31/10/2044 27,188,611 0.41%Spain Government Bond 23,900,000 5.85% 31/1/2022 27,004,036 0.40%Spain Government Bond 24,787,000 0.05% 31/1/2021 24,912,422 0.37%Spain Government Bond 17,643,000 2.90% 31/10/2046 24,116,076 0.36%Spain Government Bond 14,694,000 4.20% 31/1/2037 22,403,754 0.33%Spain Government Bond 15,750,000 4.65% 30/7/2025 19,787,355 0.30%Spain Government Bond 15,412,000 5.40% 31/1/2023 18,106,850 0.27%Spain Government Bond 13,350,000 4.40% 31/10/2023 15,689,588 0.23%Spain Government Bond 9,890,000 3.45% 30/7/2066 15,688,982 0.23%Spain Government Bond 14,082,000 1.40% 30/7/2028 15,322,005 0.23%Spain Government Bond 14,000,000 1.45% 31/10/2027 15,272,320 0.23%Spain Government Bond 13,680,000 1.95% 30/4/2026 15,260,560 0.23%Spain Government Bond 14,000,000 0.60% 31/10/2029 14,180,768 0.21%Spain Government Bond 8,513,000 5.75% 30/7/2032 13,799,454 0.21%Spain Government Bond 11,000,000 1.85% 30/7/2035 12,580,898 0.19%Spain Government Bond 11,800,000 0.40% 30/4/2022 12,011,410 0.18%Spain Government Bond 10,000,000 2.15% 31/10/2025 11,218,880 0.17%Spain Government Bond 7,700,000 5.15% 31/10/2028 10,886,802 0.16%Spain Government Bond 9,300,000 1.95% 30/7/2030 10,654,080 0.16%Spain Government Bond 8,700,000 1.60% 30/4/2025 9,440,575 0.14%Spain Government Bond 8,350,000 5.50% 30/4/2021 9,007,011 0.13%Spain Government Bond 5,714,000 2.70% 31/10/2048 7,582,192 0.11%Fondo de Titulizacion Del Deficit Del Sistema Electrico FTA 5,100,000 0.50% 17/3/2023 5,197,920 0.08%Autonomous Community of Madrid Spain 4,700,000 0.73% 19/5/2021 4,762,341 0.07%Autonomous Community of Madrid Spain 4,146,000 1.00% 30/9/2024 4,325,522 0.06%Autonomous Community of Madrid Spain 2,000,000 2.08% 12/3/2030 2,269,068 0.03%Fondo de Titulizacion Del Deficit Del Sistema Electrico FTA 2,000,000 0.85% 17/12/2023 2,070,036 0.03%Autonomous Community of Madrid Spain 1,900,000 1.83% 30/4/2025 2,065,055 0.03%Instituto de Credito Oficial 1,740,000 0.25% 30/4/2022 1,761,750 0.03%Adif-Alta Velocidad 1,500,000 1.88% 28/1/2025 1,624,050 0.02%Autonomous Community of Madrid Spain 1,500,000 0.75% 30/4/2022 1,532,262 0.02%Fondo de Titulizacion Del Deficit Del Sistema Electrico FTA 1,400,000 5.90% 17/3/2021 1,503,869 0.02%Instituto de Credito Oficial 1,400,000 0.75% 31/10/2023 1,445,058 0.02%Autonomous Community of Madrid Spain 1,300,000 1.77% 30/4/2028 1,435,041 0.02%Autonomous Community of Madrid Spain 1,000,000 4.30% 15/9/2026 1,262,626 0.02%Instituto de Credito Oficial 1,100,000 6.00% 8/3/2021 1,181,987 0.02%Autonomous Community of Madrid Spain 1,000,000 4.13% 21/5/2024 1,177,038 0.02%Autonomous Community of Andalusia Spain 1,000,000 1.38% 30/4/2029 1,067,740 0.02%Adif-Alta Velocidad 1,000,000 0.95% 30/4/2027 1,037,892 0.02%Adif-Alta Velocidad 500,000 1.88% 22/9/2022 526,548 0.01%Autonomous Community of Madrid Spain 350,000 2.88% 17/7/2023 385,735 0.01%
859,788,028 12.83%
Total Bonds 6,627,048,943 98.92%
Financial Assets at Fair Value Through Profit or Loss 6,627,048,943 98.92%
Unrealised Buy (Sell) Settlement Gain/(Loss) % of Total Currency Amount Currency Amount Counterparty Date Euro (€) Net Assets
Financial Derivative Instruments
Open Hedge Share Class Level Forward Currency Exchange Contracts 0.06% (2018: (0.07%))
GBP 480,250,029 EUR (562,818,945) BNP Paribas 3/1/2020 3,961,446 0.06%GBP 9,828,299 EUR (11,524,268) JPMorgan Chase Bank 3/1/2020 74,872 0.00%GBP 3,636,264 EUR (4,261,408) JPMorgan Chase Bank 3/1/2020 30,029 0.00%GBP 2,006,725 EUR (2,338,769) JPMorgan Chase Bank 3/1/2020 29,523 0.00%EUR 600,606,589 GBP (508,893,963) Morgan Stanley 3/1/2020 21,265 0.00%
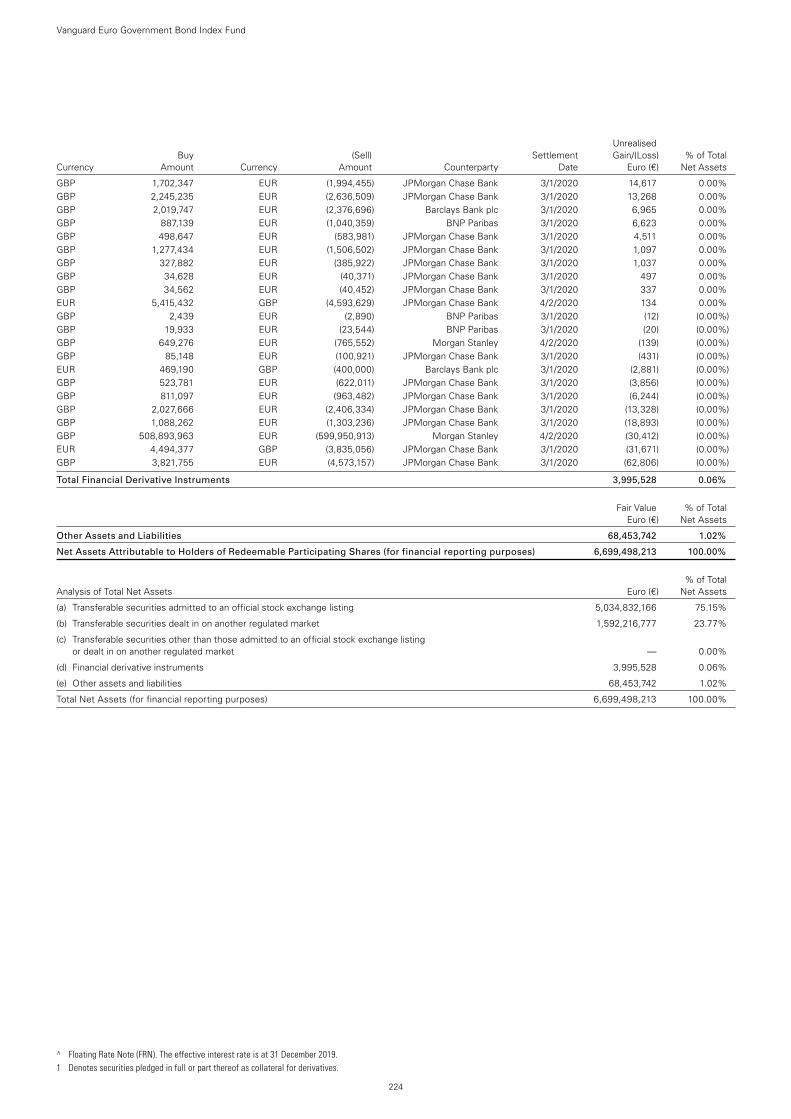
^ Floating Rate Note (FRN). The effective interest rate is at 31 December 2019. 1 Denotes securities pledged in full or part thereof as collateral for derivatives.
Vanguard Euro Government Bond Index Fund
224
Unrealised Buy (Sell) Settlement Gain/(Loss) % of Total Currency Amount Currency Amount Counterparty Date Euro (€) Net Assets
GBP 1,702,347 EUR (1,994,455) JPMorgan Chase Bank 3/1/2020 14,617 0.00%GBP 2,245,235 EUR (2,636,509) JPMorgan Chase Bank 3/1/2020 13,268 0.00%GBP 2,019,747 EUR (2,376,696) Barclays Bank plc 3/1/2020 6,965 0.00%GBP 887,139 EUR (1,040,359) BNP Paribas 3/1/2020 6,623 0.00%GBP 498,647 EUR (583,981) JPMorgan Chase Bank 3/1/2020 4,511 0.00%GBP 1,277,434 EUR (1,506,502) JPMorgan Chase Bank 3/1/2020 1,097 0.00%GBP 327,882 EUR (385,922) JPMorgan Chase Bank 3/1/2020 1,037 0.00%GBP 34,628 EUR (40,371) JPMorgan Chase Bank 3/1/2020 497 0.00%GBP 34,562 EUR (40,452) JPMorgan Chase Bank 3/1/2020 337 0.00%EUR 5,415,432 GBP (4,593,629) JPMorgan Chase Bank 4/2/2020 134 0.00%GBP 2,439 EUR (2,890) BNP Paribas 3/1/2020 (12) (0.00%)GBP 19,933 EUR (23,544) BNP Paribas 3/1/2020 (20) (0.00%)GBP 649,276 EUR (765,552) Morgan Stanley 4/2/2020 (139) (0.00%)GBP 85,148 EUR (100,921) JPMorgan Chase Bank 3/1/2020 (431) (0.00%)EUR 469,190 GBP (400,000) Barclays Bank plc 3/1/2020 (2,881) (0.00%)GBP 523,781 EUR (622,011) JPMorgan Chase Bank 3/1/2020 (3,856) (0.00%)GBP 811,097 EUR (963,482) JPMorgan Chase Bank 3/1/2020 (6,244) (0.00%)GBP 2,027,666 EUR (2,406,334) JPMorgan Chase Bank 3/1/2020 (13,328) (0.00%)GBP 1,088,262 EUR (1,303,236) JPMorgan Chase Bank 3/1/2020 (18,893) (0.00%)GBP 508,893,963 EUR (599,950,913) Morgan Stanley 4/2/2020 (30,412) (0.00%)EUR 4,494,377 GBP (3,835,056) JPMorgan Chase Bank 3/1/2020 (31,671) (0.00%)GBP 3,821,755 EUR (4,573,157) JPMorgan Chase Bank 3/1/2020 (62,806) (0.00%)
Total Financial Derivative Instruments 3,995,528 0.06%
Fair Value % of Total Euro (€) Net Assets
Other Assets and Liabilities 68,453,742 1.02%
Net Assets Attributable to Holders of Redeemable Participating Shares (for financial reporting purposes) 6,699,498,213 100.00%
% of Total Analysis of Total Net Assets Euro (€) Net Assets
(a) Transferable securities admitted to an official stock exchange listing 5,034,832,166 75.15%
(b) Transferable securities dealt in on another regulated market 1,592,216,777 23.77%
(c) Transferable securities other than those admitted to an official stock exchange listing or dealt in on another regulated market — 0.00%
(d) Financial derivative instruments 3,995,528 0.06%
(e) Other assets and liabilities 68,453,742 1.02%
Total Net Assets (for financial reporting purposes) 6,699,498,213 100.00%
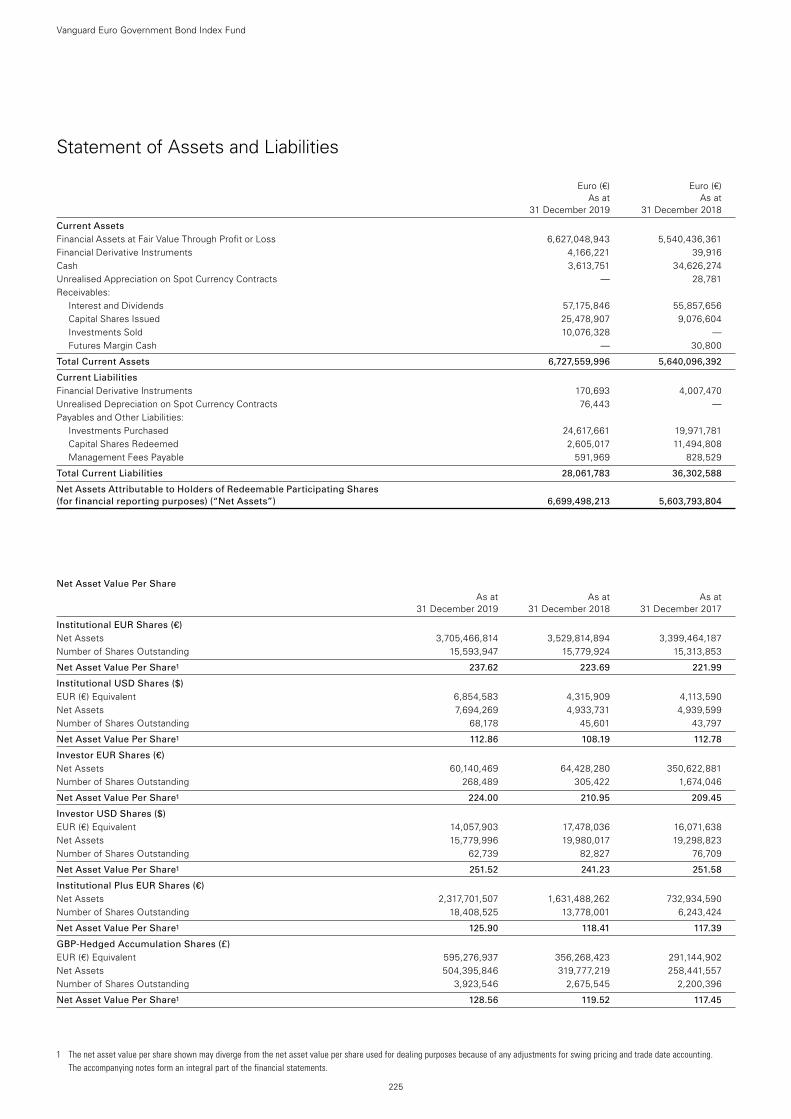
1 The net asset value per share shown may diverge from the net asset value per share used for dealing purposes because of any adjustments for swing pricing and trade date accounting. The accompanying notes form an integral part of the financial statements.
225
Vanguard Euro Government Bond Index Fund
Statement of Assets and Liabilities
Euro (€) Euro (€) As at As at 31 December 2019 31 December 2018
Current Assets Financial Assets at Fair Value Through Profit or Loss 6,627,048,943 5,540,436,361Financial Derivative Instruments 4,166,221 39,916Cash 3,613,751 34,626,274Unrealised Appreciation on Spot Currency Contracts — 28,781Receivables:
Interest and Dividends 57,175,846 55,857,656Capital Shares Issued 25,478,907 9,076,604Investments Sold 10,076,328 —Futures Margin Cash — 30,800
Total Current Assets 6,727,559,996 5,640,096,392
Current Liabilities Financial Derivative Instruments 170,693 4,007,470Unrealised Depreciation on Spot Currency Contracts 76,443 —Payables and Other Liabilities:
Investments Purchased 24,617,661 19,971,781Capital Shares Redeemed 2,605,017 11,494,808Management Fees Payable 591,969 828,529
Total Current Liabilities 28,061,783 36,302,588
Net Assets Attributable to Holders of Redeemable Participating Shares (for financial reporting purposes) (“Net Assets”) 6,699,498,213 5,603,793,804
Net Asset Value Per Share As at As at As at 31 December 2019 31 December 2018 31 December 2017
Institutional EUR Shares (€) Net Assets 3,705,466,814 3,529,814,894 3,399,464,187Number of Shares Outstanding 15,593,947 15,779,924 15,313,853
Net Asset Value Per Share1 237.62 223.69 221.99
Institutional USD Shares ($) EUR (€) Equivalent 6,854,583 4,315,909 4,113,590Net Assets 7,694,269 4,933,731 4,939,599Number of Shares Outstanding 68,178 45,601 43,797
Net Asset Value Per Share1 112.86 108.19 112.78
Investor EUR Shares (€) Net Assets 60,140,469 64,428,280 350,622,881Number of Shares Outstanding 268,489 305,422 1,674,046
Net Asset Value Per Share1 224.00 210.95 209.45
Investor USD Shares ($) EUR (€) Equivalent 14,057,903 17,478,036 16,071,638Net Assets 15,779,996 19,980,017 19,298,823Number of Shares Outstanding 62,739 82,827 76,709
Net Asset Value Per Share1 251.52 241.23 251.58
Institutional Plus EUR Shares (€) Net Assets 2,317,701,507 1,631,488,262 732,934,590Number of Shares Outstanding 18,408,525 13,778,001 6,243,424
Net Asset Value Per Share1 125.90 118.41 117.39
GBP-Hedged Accumulation Shares (£) EUR (€) Equivalent 595,276,937 356,268,423 291,144,902Net Assets 504,395,846 319,777,219 258,441,557Number of Shares Outstanding 3,923,546 2,675,545 2,200,396
Net Asset Value Per Share1 128.56 119.52 117.45
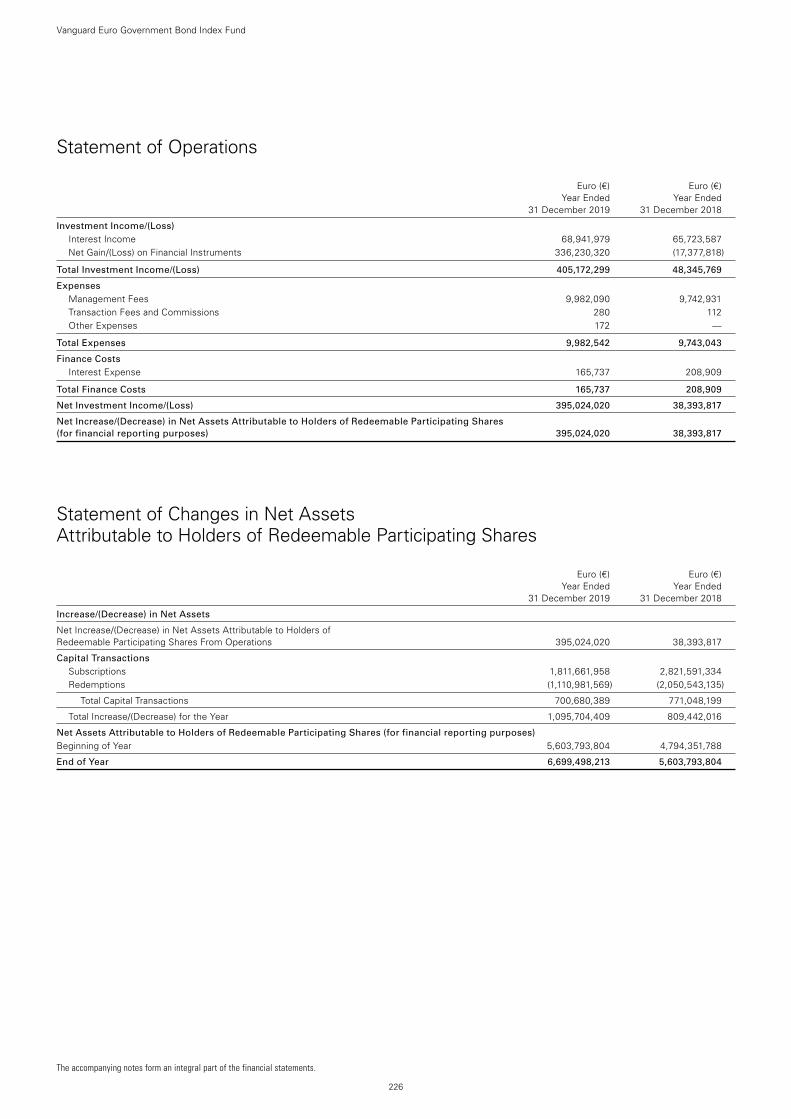
226
Vanguard Euro Government Bond Index Fund
Statement of Operations
Euro (€) Euro (€) Year Ended Year Ended 31 December 2019 31 December 2018
Investment Income/(Loss) Interest Income 68,941,979 65,723,587Net Gain/(Loss) on Financial Instruments 336,230,320 (17,377,818)
Total Investment Income/(Loss) 405,172,299 48,345,769
Expenses Management Fees 9,982,090 9,742,931Transaction Fees and Commissions 280 112Other Expenses 172 —
Total Expenses 9,982,542 9,743,043
Finance Costs Interest Expense 165,737 208,909
Total Finance Costs 165,737 208,909
Net Investment Income/(Loss) 395,024,020 38,393,817
Net Increase/(Decrease) in Net Assets Attributable to Holders of Redeemable Participating Shares (for financial reporting purposes) 395,024,020 38,393,817
Statement of Changes in Net Assets Attributable to Holders of Redeemable Participating Shares
Euro (€) Euro (€) Year Ended Year Ended 31 December 2019 31 December 2018
Increase/(Decrease) in Net Assets
Net Increase/(Decrease) in Net Assets Attributable to Holders of Redeemable Participating Shares From Operations 395,024,020 38,393,817
Capital Transactions Subscriptions 1,811,661,958 2,821,591,334Redemptions (1,110,981,569) (2,050,543,135)
Total Capital Transactions 700,680,389 771,048,199
Total Increase/(Decrease) for the Year 1,095,704,409 809,442,016
Net Assets Attributable to Holders of Redeemable Participating Shares (for financial reporting purposes) Beginning of Year 5,603,793,804 4,794,351,788
End of Year 6,699,498,213 5,603,793,804
The accompanying notes form an integral part of the financial statements.
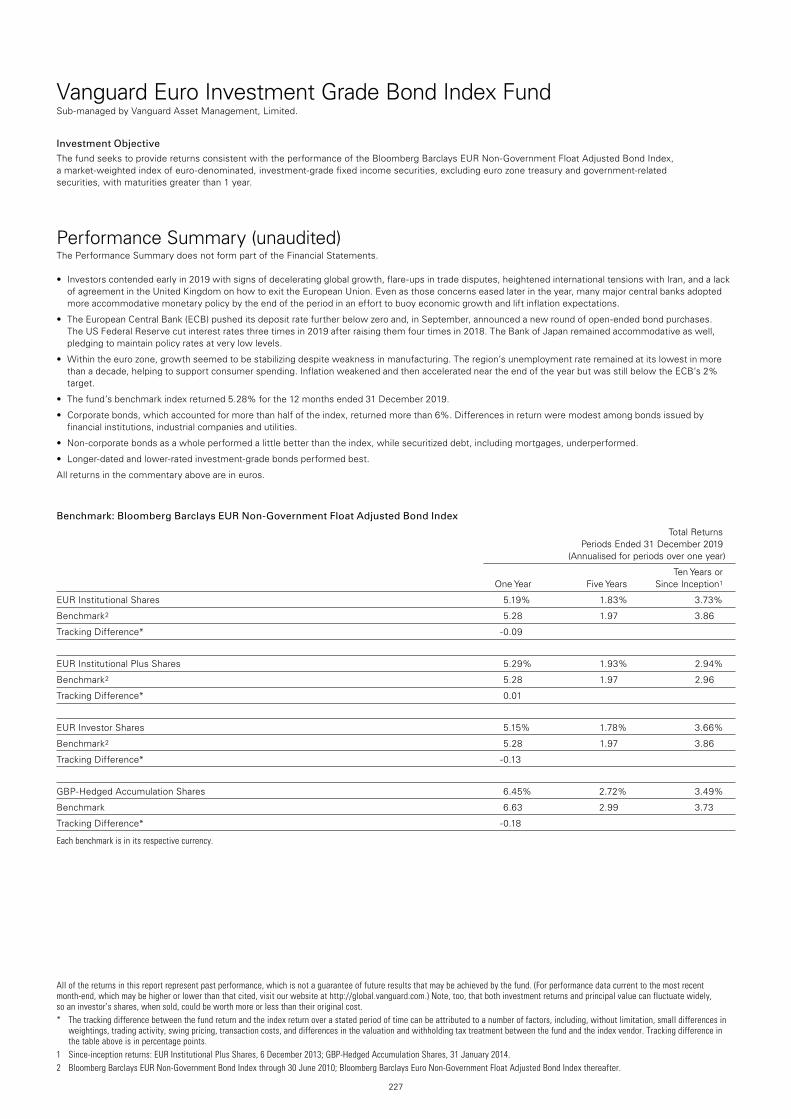
227
Vanguard Euro Investment Grade Bond Index FundSub-managed by Vanguard Asset Management, Limited.
All of the returns in this report represent past performance, which is not a guarantee of future results that may be achieved by the fund. (For performance data current to the most recent month-end, which may be higher or lower than that cited, visit our website at http://global.vanguard.com.) Note, too, that both investment returns and principal value can fluctuate widely, so an investor’s shares, when sold, could be worth more or less than their original cost.* The tracking difference between the fund return and the index return over a stated period of time can be attributed to a number of factors, including, without limitation, small differences in
weightings, trading activity, swing pricing, transaction costs, and differences in the valuation and withholding tax treatment between the fund and the index vendor. Tracking difference in the table above is in percentage points.
1 Since-inception returns: EUR Institutional Plus Shares, 6 December 2013; GBP-Hedged Accumulation Shares, 31 January 2014. 2 Bloomberg Barclays EUR Non-Government Bond Index through 30 June 2010; Bloomberg Barclays Euro Non-Government Float Adjusted Bond Index thereafter.
Investment ObjectiveThe fund seeks to provide returns consistent with the performance of the Bloomberg Barclays EUR Non-Government Float Adjusted Bond Index, a market-weighted index of euro-denominated, investment-grade fixed income securities, excluding euro zone treasury and government-related securities, with maturities greater than 1 year.
Performance Summary (unaudited)The Performance Summary does not form part of the Financial Statements.
• Investorscontendedearlyin2019withsignsofdeceleratingglobalgrowth,flare-upsintradedisputes,heightenedinternationaltensionswithIran,andalackof agreement in the United Kingdom on how to exit the European Union. Even as those concerns eased later in the year, many major central banks adopted more accommodative monetary policy by the end of the period in an effort to buoy economic growth and lift inflation expectations.
• TheEuropeanCentralBank(ECB)pusheditsdepositratefurtherbelowzeroand,inSeptember,announcedanewroundofopen-endedbondpurchases. The US Federal Reserve cut interest rates three times in 2019 after raising them four times in 2018. The Bank of Japan remained accommodative as well, pledging to maintain policy rates at very low levels.
• Withintheeurozone,growthseemedtobestabilizingdespiteweaknessinmanufacturing.Theregion’sunemploymentrateremainedatitslowestinmorethan a decade, helping to support consumer spending. Inflation weakened and then accelerated near the end of the year but was still below the ECB’s 2% target.
• Thefund’sbenchmarkindexreturned5.28%forthe12monthsended31December2019.
• Corporatebonds,whichaccountedformorethanhalfoftheindex,returnedmorethan6%.Differencesinreturnweremodestamongbondsissuedbyfinancial institutions, industrial companies and utilities.
• Non-corporatebondsasawholeperformedalittlebetterthantheindex,whilesecuritizeddebt,includingmortgages,underperformed.
• Longer-datedandlower-ratedinvestment-gradebondsperformedbest.
All returns in the commentary above are in euros.
Benchmark: Bloomberg Barclays EUR Non-Government Float Adjusted Bond Index
Total Returns Periods Ended 31 December 2019 (Annualised for periods over one year)
Ten Years or One Year Five Years Since Inception1
EUR Institutional Shares 5.19% 1.83% 3.73%
Benchmark2 5.28 1.97 3.86
Tracking Difference* -0.09
EUR Institutional Plus Shares 5.29% 1.93% 2.94%
Benchmark2 5.28 1.97 2.96
Tracking Difference* 0.01
EUR Investor Shares 5.15% 1.78% 3.66%
Benchmark2 5.28 1.97 3.86
Tracking Difference* -0.13
GBP-Hedged Accumulation Shares 6.45% 2.72% 3.49%
Benchmark 6.63 2.99 3.73
Tracking Difference* -0.18
Each benchmark is in its respective currency.
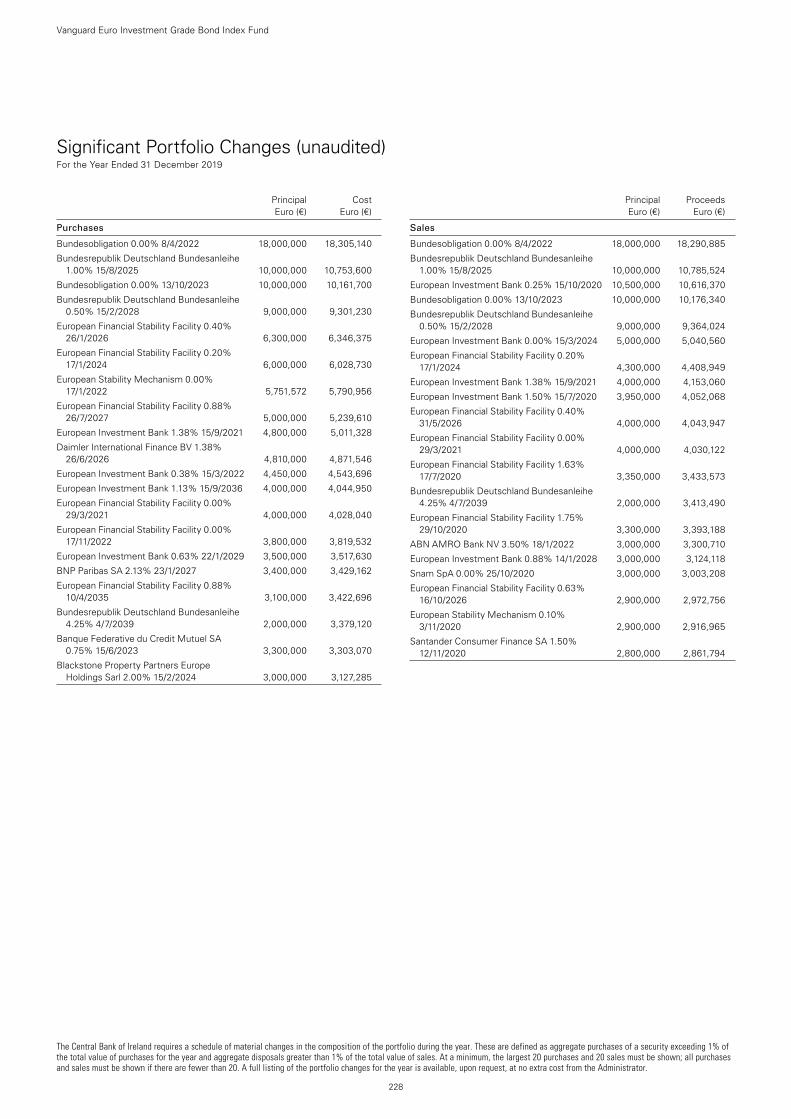
The Central Bank of Ireland requires a schedule of material changes in the composition of the portfolio during the year. These are defined as aggregate purchases of a security exceeding 1% of the total value of purchases for the year and aggregate disposals greater than 1% of the total value of sales. At a minimum, the largest 20 purchases and 20 sales must be shown; all purchases and sales must be shown if there are fewer than 20. A full listing of the portfolio changes for the year is available, upon request, at no extra cost from the Administrator.
228
Vanguard Euro Investment Grade Bond Index Fund
Significant Portfolio Changes (unaudited) For the Year Ended 31 December 2019
Principal Cost Euro (€) Euro (€)
Purchases
Bundesobligation 0.00% 8/4/2022 18,000,000 18,305,140
Bundesrepublik Deutschland Bundesanleihe 1.00% 15/8/2025 10,000,000 10,753,600
Bundesobligation 0.00% 13/10/2023 10,000,000 10,161,700
Bundesrepublik Deutschland Bundesanleihe 0.50% 15/2/2028 9,000,000 9,301,230
European Financial Stability Facility 0.40% 26/1/2026 6,300,000 6,346,375
European Financial Stability Facility 0.20% 17/1/2024 6,000,000 6,028,730
European Stability Mechanism 0.00% 17/1/2022 5,751,572 5,790,956
European Financial Stability Facility 0.88% 26/7/2027 5,000,000 5,239,610
European Investment Bank 1.38% 15/9/2021 4,800,000 5,011,328
Daimler International Finance BV 1.38% 26/6/2026 4,810,000 4,871,546
European Investment Bank 0.38% 15/3/2022 4,450,000 4,543,696
European Investment Bank 1.13% 15/9/2036 4,000,000 4,044,950
European Financial Stability Facility 0.00% 29/3/2021 4,000,000 4,028,040
European Financial Stability Facility 0.00% 17/11/2022 3,800,000 3,819,532
European Investment Bank 0.63% 22/1/2029 3,500,000 3,517,630
BNP Paribas SA 2.13% 23/1/2027 3,400,000 3,429,162
European Financial Stability Facility 0.88% 10/4/2035 3,100,000 3,422,696
Bundesrepublik Deutschland Bundesanleihe 4.25% 4/7/2039 2,000,000 3,379,120
Banque Federative du Credit Mutuel SA 0.75% 15/6/2023 3,300,000 3,303,070
Blackstone Property Partners Europe Holdings Sarl 2.00% 15/2/2024 3,000,000 3,127,285
Principal Proceeds Euro (€) Euro (€)
Sales
Bundesobligation 0.00% 8/4/2022 18,000,000 18,290,885
Bundesrepublik Deutschland Bundesanleihe 1.00% 15/8/2025 10,000,000 10,785,524
European Investment Bank 0.25% 15/10/2020 10,500,000 10,616,370
Bundesobligation 0.00% 13/10/2023 10,000,000 10,176,340
Bundesrepublik Deutschland Bundesanleihe 0.50% 15/2/2028 9,000,000 9,364,024
European Investment Bank 0.00% 15/3/2024 5,000,000 5,040,560
European Financial Stability Facility 0.20% 17/1/2024 4,300,000 4,408,949
European Investment Bank 1.38% 15/9/2021 4,000,000 4,153,060
European Investment Bank 1.50% 15/7/2020 3,950,000 4,052,068
European Financial Stability Facility 0.40% 31/5/2026 4,000,000 4,043,947
European Financial Stability Facility 0.00% 29/3/2021 4,000,000 4,030,122
European Financial Stability Facility 1.63% 17/7/2020 3,350,000 3,433,573
Bundesrepublik Deutschland Bundesanleihe 4.25% 4/7/2039 2,000,000 3,413,490
European Financial Stability Facility 1.75% 29/10/2020 3,300,000 3,393,188
ABN AMRO Bank NV 3.50% 18/1/2022 3,000,000 3,300,710
European Investment Bank 0.88% 14/1/2028 3,000,000 3,124,118
Snam SpA 0.00% 25/10/2020 3,000,000 3,003,208
European Financial Stability Facility 0.63% 16/10/2026 2,900,000 2,972,756
European Stability Mechanism 0.10% 3/11/2020 2,900,000 2,916,965
Santander Consumer Finance SA 1.50% 12/11/2020 2,800,000 2,861,794
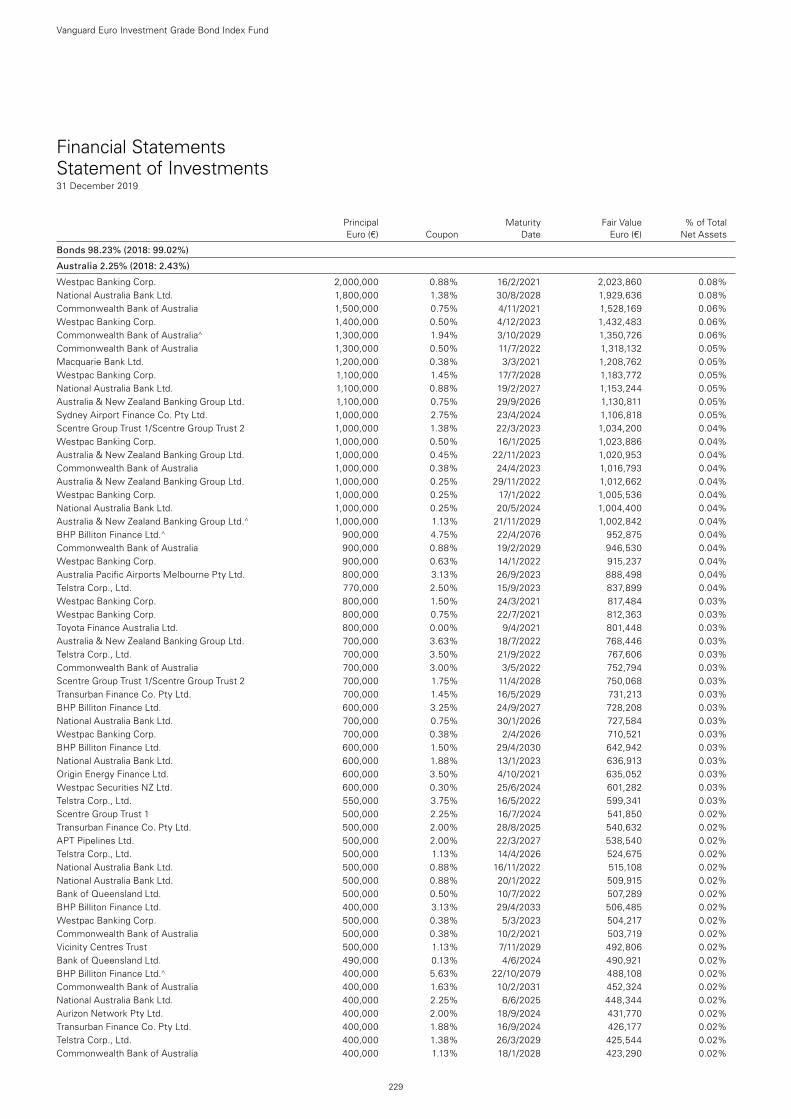
Financial Statements Statement of Investments31 December 2019
Principal Maturity Fair Value % of Total Euro (€) Coupon Date Euro (€) Net Assets
Bonds 98.23% (2018: 99.02%)
Australia 2.25% (2018: 2.43%)
Westpac Banking Corp. 2,000,000 0.88% 16/2/2021 2,023,860 0.08%National Australia Bank Ltd. 1,800,000 1.38% 30/8/2028 1,929,636 0.08%Commonwealth Bank of Australia 1,500,000 0.75% 4/11/2021 1,528,169 0.06%Westpac Banking Corp. 1,400,000 0.50% 4/12/2023 1,432,483 0.06%Commonwealth Bank of Australia^ 1,300,000 1.94% 3/10/2029 1,350,726 0.06%Commonwealth Bank of Australia 1,300,000 0.50% 11/7/2022 1,318,132 0.05%Macquarie Bank Ltd. 1,200,000 0.38% 3/3/2021 1,208,762 0.05%Westpac Banking Corp. 1,100,000 1.45% 17/7/2028 1,183,772 0.05%National Australia Bank Ltd. 1,100,000 0.88% 19/2/2027 1,153,244 0.05%Australia & New Zealand Banking Group Ltd. 1,100,000 0.75% 29/9/2026 1,130,811 0.05%Sydney Airport Finance Co. Pty Ltd. 1,000,000 2.75% 23/4/2024 1,106,818 0.05%Scentre Group Trust 1/Scentre Group Trust 2 1,000,000 1.38% 22/3/2023 1,034,200 0.04%Westpac Banking Corp. 1,000,000 0.50% 16/1/2025 1,023,886 0.04%Australia & New Zealand Banking Group Ltd. 1,000,000 0.45% 22/11/2023 1,020,953 0.04%Commonwealth Bank of Australia 1,000,000 0.38% 24/4/2023 1,016,793 0.04%Australia & New Zealand Banking Group Ltd. 1,000,000 0.25% 29/11/2022 1,012,662 0.04%Westpac Banking Corp. 1,000,000 0.25% 17/1/2022 1,005,536 0.04%National Australia Bank Ltd. 1,000,000 0.25% 20/5/2024 1,004,400 0.04%Australia & New Zealand Banking Group Ltd.^ 1,000,000 1.13% 21/11/2029 1,002,842 0.04%BHP Billiton Finance Ltd.^ 900,000 4.75% 22/4/2076 952,875 0.04%Commonwealth Bank of Australia 900,000 0.88% 19/2/2029 946,530 0.04%Westpac Banking Corp. 900,000 0.63% 14/1/2022 915,237 0.04%Australia Pacific Airports Melbourne Pty Ltd. 800,000 3.13% 26/9/2023 888,498 0.04%Telstra Corp., Ltd. 770,000 2.50% 15/9/2023 837,899 0.04%Westpac Banking Corp. 800,000 1.50% 24/3/2021 817,484 0.03%Westpac Banking Corp. 800,000 0.75% 22/7/2021 812,363 0.03%Toyota Finance Australia Ltd. 800,000 0.00% 9/4/2021 801,448 0.03%Australia & New Zealand Banking Group Ltd. 700,000 3.63% 18/7/2022 768,446 0.03%Telstra Corp., Ltd. 700,000 3.50% 21/9/2022 767,606 0.03%Commonwealth Bank of Australia 700,000 3.00% 3/5/2022 752,794 0.03%Scentre Group Trust 1/Scentre Group Trust 2 700,000 1.75% 11/4/2028 750,068 0.03%Transurban Finance Co. Pty Ltd. 700,000 1.45% 16/5/2029 731,213 0.03%BHP Billiton Finance Ltd. 600,000 3.25% 24/9/2027 728,208 0.03%National Australia Bank Ltd. 700,000 0.75% 30/1/2026 727,584 0.03%Westpac Banking Corp. 700,000 0.38% 2/4/2026 710,521 0.03%BHP Billiton Finance Ltd. 600,000 1.50% 29/4/2030 642,942 0.03%National Australia Bank Ltd. 600,000 1.88% 13/1/2023 636,913 0.03%Origin Energy Finance Ltd. 600,000 3.50% 4/10/2021 635,052 0.03%Westpac Securities NZ Ltd. 600,000 0.30% 25/6/2024 601,282 0.03%Telstra Corp., Ltd. 550,000 3.75% 16/5/2022 599,341 0.03%Scentre Group Trust 1 500,000 2.25% 16/7/2024 541,850 0.02%Transurban Finance Co. Pty Ltd. 500,000 2.00% 28/8/2025 540,632 0.02%APT Pipelines Ltd. 500,000 2.00% 22/3/2027 538,540 0.02%Telstra Corp., Ltd. 500,000 1.13% 14/4/2026 524,675 0.02%National Australia Bank Ltd. 500,000 0.88% 16/11/2022 515,108 0.02%National Australia Bank Ltd. 500,000 0.88% 20/1/2022 509,915 0.02%Bank of Queensland Ltd. 500,000 0.50% 10/7/2022 507,289 0.02%BHP Billiton Finance Ltd. 400,000 3.13% 29/4/2033 506,485 0.02%Westpac Banking Corp. 500,000 0.38% 5/3/2023 504,217 0.02%Commonwealth Bank of Australia 500,000 0.38% 10/2/2021 503,719 0.02%Vicinity Centres Trust 500,000 1.13% 7/11/2029 492,806 0.02%Bank of Queensland Ltd. 490,000 0.13% 4/6/2024 490,921 0.02%BHP Billiton Finance Ltd.^ 400,000 5.63% 22/10/2079 488,108 0.02%Commonwealth Bank of Australia 400,000 1.63% 10/2/2031 452,324 0.02%National Australia Bank Ltd. 400,000 2.25% 6/6/2025 448,344 0.02%Aurizon Network Pty Ltd. 400,000 2.00% 18/9/2024 431,770 0.02%Transurban Finance Co. Pty Ltd. 400,000 1.88% 16/9/2024 426,177 0.02%Telstra Corp., Ltd. 400,000 1.38% 26/3/2029 425,544 0.02%Commonwealth Bank of Australia 400,000 1.13% 18/1/2028 423,290 0.02%
Vanguard Euro Investment Grade Bond Index Fund
229
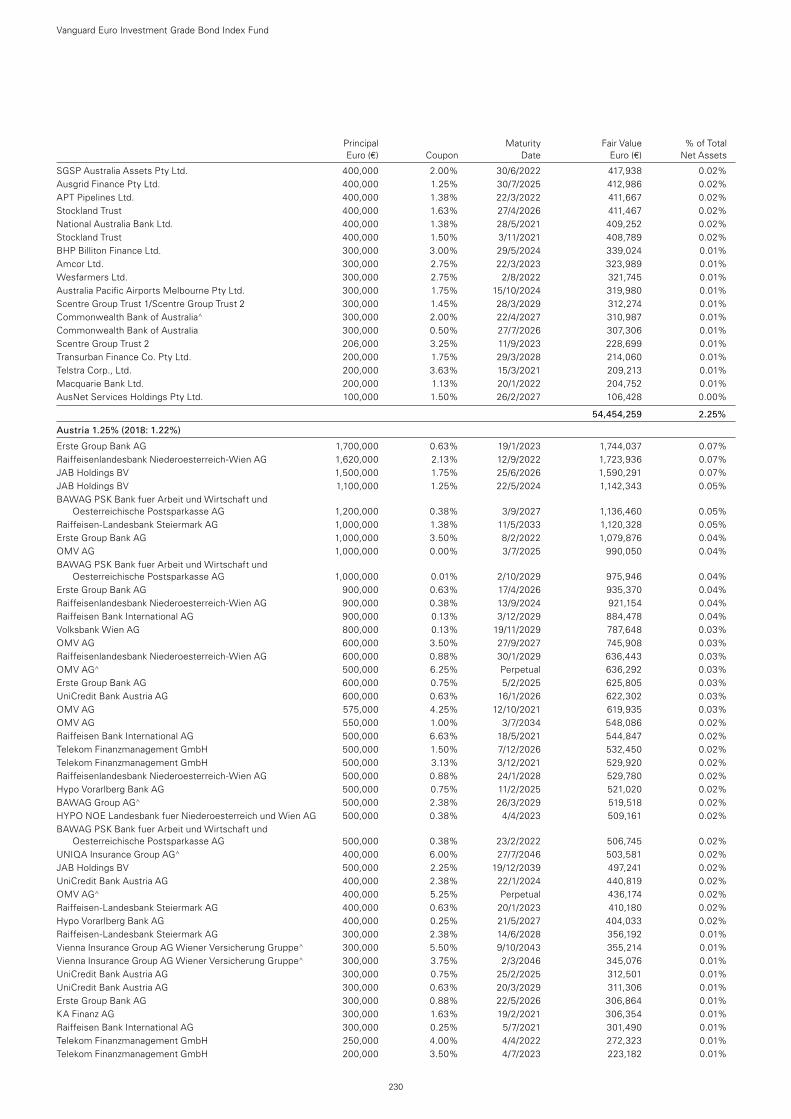
Principal Maturity Fair Value % of Total Euro (€) Coupon Date Euro (€) Net Assets
SGSP Australia Assets Pty Ltd. 400,000 2.00% 30/6/2022 417,938 0.02%Ausgrid Finance Pty Ltd. 400,000 1.25% 30/7/2025 412,986 0.02%APT Pipelines Ltd. 400,000 1.38% 22/3/2022 411,667 0.02%Stockland Trust 400,000 1.63% 27/4/2026 411,467 0.02%National Australia Bank Ltd. 400,000 1.38% 28/5/2021 409,252 0.02%Stockland Trust 400,000 1.50% 3/11/2021 408,789 0.02%BHP Billiton Finance Ltd. 300,000 3.00% 29/5/2024 339,024 0.01%Amcor Ltd. 300,000 2.75% 22/3/2023 323,989 0.01%Wesfarmers Ltd. 300,000 2.75% 2/8/2022 321,745 0.01%Australia Pacific Airports Melbourne Pty Ltd. 300,000 1.75% 15/10/2024 319,980 0.01%Scentre Group Trust 1/Scentre Group Trust 2 300,000 1.45% 28/3/2029 312,274 0.01%Commonwealth Bank of Australia^ 300,000 2.00% 22/4/2027 310,987 0.01%Commonwealth Bank of Australia 300,000 0.50% 27/7/2026 307,306 0.01%Scentre Group Trust 2 206,000 3.25% 11/9/2023 228,699 0.01%Transurban Finance Co. Pty Ltd. 200,000 1.75% 29/3/2028 214,060 0.01%Telstra Corp., Ltd. 200,000 3.63% 15/3/2021 209,213 0.01%Macquarie Bank Ltd. 200,000 1.13% 20/1/2022 204,752 0.01%AusNet Services Holdings Pty Ltd. 100,000 1.50% 26/2/2027 106,428 0.00%
54,454,259 2.25%
Austria 1.25% (2018: 1.22%)
Erste Group Bank AG 1,700,000 0.63% 19/1/2023 1,744,037 0.07%Raiffeisenlandesbank Niederoesterreich-Wien AG 1,620,000 2.13% 12/9/2022 1,723,936 0.07%JAB Holdings BV 1,500,000 1.75% 25/6/2026 1,590,291 0.07%JAB Holdings BV 1,100,000 1.25% 22/5/2024 1,142,343 0.05%BAWAG PSK Bank fuer Arbeit und Wirtschaft und
Oesterreichische Postsparkasse AG 1,200,000 0.38% 3/9/2027 1,136,460 0.05%Raiffeisen-Landesbank Steiermark AG 1,000,000 1.38% 11/5/2033 1,120,328 0.05%Erste Group Bank AG 1,000,000 3.50% 8/2/2022 1,079,876 0.04%OMV AG 1,000,000 0.00% 3/7/2025 990,050 0.04%BAWAG PSK Bank fuer Arbeit und Wirtschaft und
Oesterreichische Postsparkasse AG 1,000,000 0.01% 2/10/2029 975,946 0.04%Erste Group Bank AG 900,000 0.63% 17/4/2026 935,370 0.04%Raiffeisenlandesbank Niederoesterreich-Wien AG 900,000 0.38% 13/9/2024 921,154 0.04%Raiffeisen Bank International AG 900,000 0.13% 3/12/2029 884,478 0.04%Volksbank Wien AG 800,000 0.13% 19/11/2029 787,648 0.03%OMV AG 600,000 3.50% 27/9/2027 745,908 0.03%Raiffeisenlandesbank Niederoesterreich-Wien AG 600,000 0.88% 30/1/2029 636,443 0.03%OMV AG^ 500,000 6.25% Perpetual 636,292 0.03%Erste Group Bank AG 600,000 0.75% 5/2/2025 625,805 0.03%UniCredit Bank Austria AG 600,000 0.63% 16/1/2026 622,302 0.03%OMV AG 575,000 4.25% 12/10/2021 619,935 0.03%OMV AG 550,000 1.00% 3/7/2034 548,086 0.02%Raiffeisen Bank International AG 500,000 6.63% 18/5/2021 544,847 0.02%Telekom Finanzmanagement GmbH 500,000 1.50% 7/12/2026 532,450 0.02%Telekom Finanzmanagement GmbH 500,000 3.13% 3/12/2021 529,920 0.02%Raiffeisenlandesbank Niederoesterreich-Wien AG 500,000 0.88% 24/1/2028 529,780 0.02%Hypo Vorarlberg Bank AG 500,000 0.75% 11/2/2025 521,020 0.02%BAWAG Group AG^ 500,000 2.38% 26/3/2029 519,518 0.02%HYPO NOE Landesbank fuer Niederoesterreich und Wien AG 500,000 0.38% 4/4/2023 509,161 0.02%BAWAG PSK Bank fuer Arbeit und Wirtschaft und
Oesterreichische Postsparkasse AG 500,000 0.38% 23/2/2022 506,745 0.02%UNIQA Insurance Group AG^ 400,000 6.00% 27/7/2046 503,581 0.02%JAB Holdings BV 500,000 2.25% 19/12/2039 497,241 0.02%UniCredit Bank Austria AG 400,000 2.38% 22/1/2024 440,819 0.02%OMV AG^ 400,000 5.25% Perpetual 436,174 0.02%Raiffeisen-Landesbank Steiermark AG 400,000 0.63% 20/1/2023 410,180 0.02%Hypo Vorarlberg Bank AG 400,000 0.25% 21/5/2027 404,033 0.02%Raiffeisen-Landesbank Steiermark AG 300,000 2.38% 14/6/2028 356,192 0.01%Vienna Insurance Group AG Wiener Versicherung Gruppe^ 300,000 5.50% 9/10/2043 355,214 0.01%Vienna Insurance Group AG Wiener Versicherung Gruppe^ 300,000 3.75% 2/3/2046 345,076 0.01%UniCredit Bank Austria AG 300,000 0.75% 25/2/2025 312,501 0.01%UniCredit Bank Austria AG 300,000 0.63% 20/3/2029 311,306 0.01%Erste Group Bank AG 300,000 0.88% 22/5/2026 306,864 0.01%KA Finanz AG 300,000 1.63% 19/2/2021 306,354 0.01%Raiffeisen Bank International AG 300,000 0.25% 5/7/2021 301,490 0.01%Telekom Finanzmanagement GmbH 250,000 4.00% 4/4/2022 272,323 0.01%Telekom Finanzmanagement GmbH 200,000 3.50% 4/7/2023 223,182 0.01%
Vanguard Euro Investment Grade Bond Index Fund
230
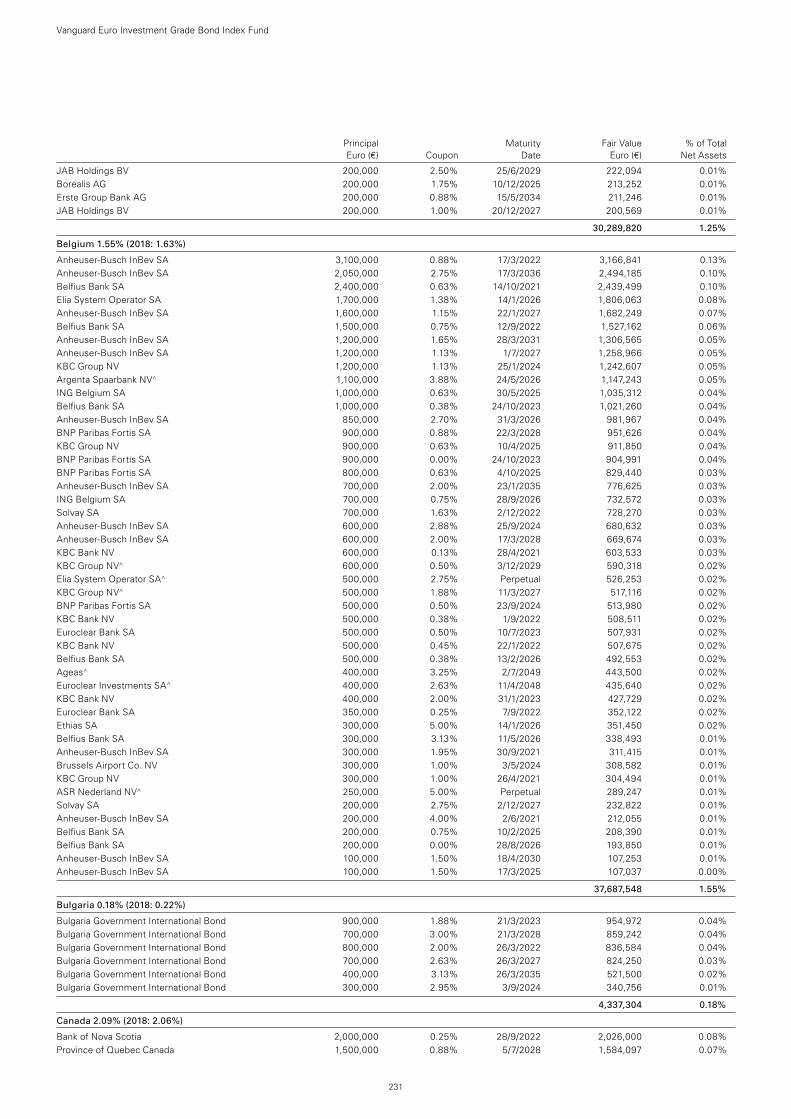
Principal Maturity Fair Value % of Total Euro (€) Coupon Date Euro (€) Net Assets
JAB Holdings BV 200,000 2.50% 25/6/2029 222,094 0.01%Borealis AG 200,000 1.75% 10/12/2025 213,252 0.01%Erste Group Bank AG 200,000 0.88% 15/5/2034 211,246 0.01%JAB Holdings BV 200,000 1.00% 20/12/2027 200,569 0.01%
30,289,820 1.25%
Belgium 1.55% (2018: 1.63%)
Anheuser-Busch InBev SA 3,100,000 0.88% 17/3/2022 3,166,841 0.13%Anheuser-Busch InBev SA 2,050,000 2.75% 17/3/2036 2,494,185 0.10%Belfius Bank SA 2,400,000 0.63% 14/10/2021 2,439,499 0.10%Elia System Operator SA 1,700,000 1.38% 14/1/2026 1,806,063 0.08%Anheuser-Busch InBev SA 1,600,000 1.15% 22/1/2027 1,682,249 0.07%Belfius Bank SA 1,500,000 0.75% 12/9/2022 1,527,162 0.06%Anheuser-Busch InBev SA 1,200,000 1.65% 28/3/2031 1,306,565 0.05%Anheuser-Busch InBev SA 1,200,000 1.13% 1/7/2027 1,258,966 0.05%KBC Group NV 1,200,000 1.13% 25/1/2024 1,242,607 0.05%Argenta Spaarbank NV^ 1,100,000 3.88% 24/5/2026 1,147,243 0.05%ING Belgium SA 1,000,000 0.63% 30/5/2025 1,035,312 0.04%Belfius Bank SA 1,000,000 0.38% 24/10/2023 1,021,260 0.04%Anheuser-Busch InBev SA 850,000 2.70% 31/3/2026 981,967 0.04%BNP Paribas Fortis SA 900,000 0.88% 22/3/2028 951,626 0.04%KBC Group NV 900,000 0.63% 10/4/2025 911,850 0.04%BNP Paribas Fortis SA 900,000 0.00% 24/10/2023 904,991 0.04%BNP Paribas Fortis SA 800,000 0.63% 4/10/2025 829,440 0.03%Anheuser-Busch InBev SA 700,000 2.00% 23/1/2035 776,625 0.03%ING Belgium SA 700,000 0.75% 28/9/2026 732,572 0.03%Solvay SA 700,000 1.63% 2/12/2022 728,270 0.03%Anheuser-Busch InBev SA 600,000 2.88% 25/9/2024 680,632 0.03%Anheuser-Busch InBev SA 600,000 2.00% 17/3/2028 669,674 0.03%KBC Bank NV 600,000 0.13% 28/4/2021 603,533 0.03%KBC Group NV^ 600,000 0.50% 3/12/2029 590,318 0.02%Elia System Operator SA^ 500,000 2.75% Perpetual 526,253 0.02%KBC Group NV^ 500,000 1.88% 11/3/2027 517,116 0.02%BNP Paribas Fortis SA 500,000 0.50% 23/9/2024 513,980 0.02%KBC Bank NV 500,000 0.38% 1/9/2022 508,511 0.02%Euroclear Bank SA 500,000 0.50% 10/7/2023 507,931 0.02%KBC Bank NV 500,000 0.45% 22/1/2022 507,675 0.02%Belfius Bank SA 500,000 0.38% 13/2/2026 492,553 0.02%Ageas^ 400,000 3.25% 2/7/2049 443,500 0.02%Euroclear Investments SA^ 400,000 2.63% 11/4/2048 435,640 0.02%KBC Bank NV 400,000 2.00% 31/1/2023 427,729 0.02%Euroclear Bank SA 350,000 0.25% 7/9/2022 352,122 0.02%Ethias SA 300,000 5.00% 14/1/2026 351,450 0.02%Belfius Bank SA 300,000 3.13% 11/5/2026 338,493 0.01%Anheuser-Busch InBev SA 300,000 1.95% 30/9/2021 311,415 0.01%Brussels Airport Co. NV 300,000 1.00% 3/5/2024 308,582 0.01%KBC Group NV 300,000 1.00% 26/4/2021 304,494 0.01%ASR Nederland NV^ 250,000 5.00% Perpetual 289,247 0.01%Solvay SA 200,000 2.75% 2/12/2027 232,822 0.01%Anheuser-Busch InBev SA 200,000 4.00% 2/6/2021 212,055 0.01%Belfius Bank SA 200,000 0.75% 10/2/2025 208,390 0.01%Belfius Bank SA 200,000 0.00% 28/8/2026 193,850 0.01%Anheuser-Busch InBev SA 100,000 1.50% 18/4/2030 107,253 0.01%Anheuser-Busch InBev SA 100,000 1.50% 17/3/2025 107,037 0.00%
37,687,548 1.55%
Bulgaria 0.18% (2018: 0.22%)
Bulgaria Government International Bond 900,000 1.88% 21/3/2023 954,972 0.04%Bulgaria Government International Bond 700,000 3.00% 21/3/2028 859,242 0.04%Bulgaria Government International Bond 800,000 2.00% 26/3/2022 836,584 0.04%Bulgaria Government International Bond 700,000 2.63% 26/3/2027 824,250 0.03%Bulgaria Government International Bond 400,000 3.13% 26/3/2035 521,500 0.02%Bulgaria Government International Bond 300,000 2.95% 3/9/2024 340,756 0.01%
4,337,304 0.18%
Canada 2.09% (2018: 2.06%)
Bank of Nova Scotia 2,000,000 0.25% 28/9/2022 2,026,000 0.08%Province of Quebec Canada 1,500,000 0.88% 5/7/2028 1,584,097 0.07%
Vanguard Euro Investment Grade Bond Index Fund
231
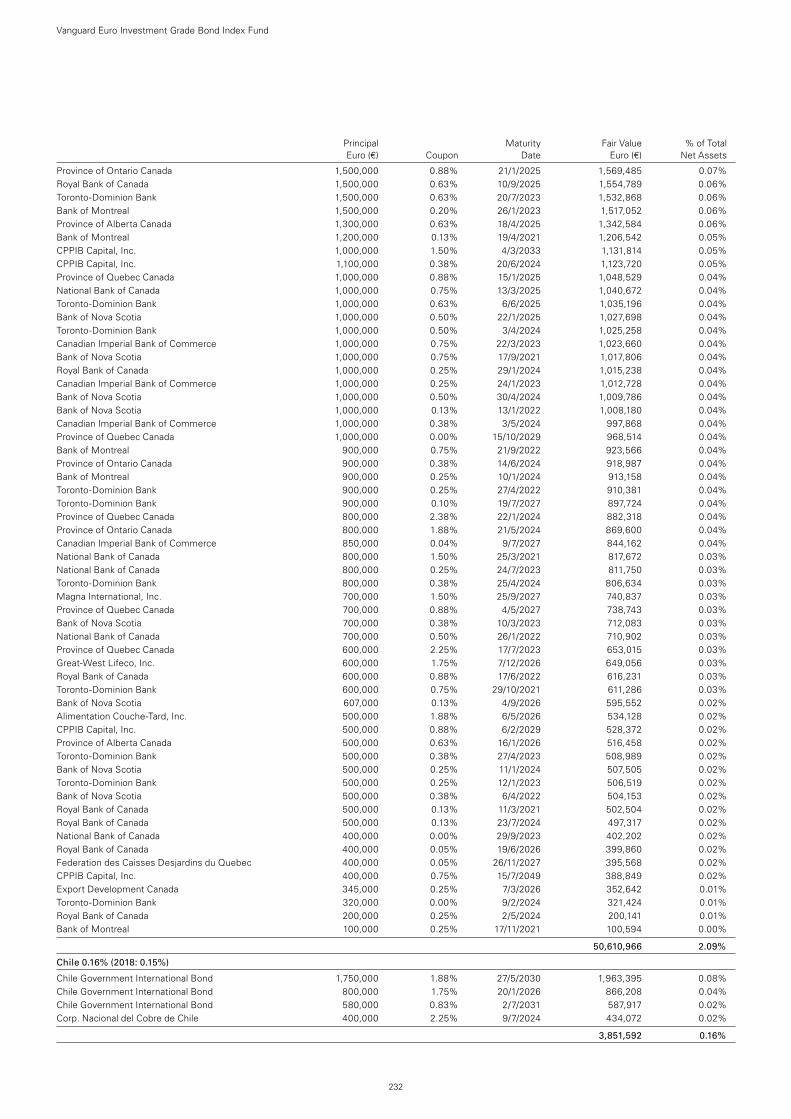
Principal Maturity Fair Value % of Total Euro (€) Coupon Date Euro (€) Net Assets
Province of Ontario Canada 1,500,000 0.88% 21/1/2025 1,569,485 0.07%Royal Bank of Canada 1,500,000 0.63% 10/9/2025 1,554,789 0.06%Toronto-Dominion Bank 1,500,000 0.63% 20/7/2023 1,532,868 0.06%Bank of Montreal 1,500,000 0.20% 26/1/2023 1,517,052 0.06%Province of Alberta Canada 1,300,000 0.63% 18/4/2025 1,342,584 0.06%Bank of Montreal 1,200,000 0.13% 19/4/2021 1,206,542 0.05%CPPIB Capital, Inc. 1,000,000 1.50% 4/3/2033 1,131,814 0.05%CPPIB Capital, Inc. 1,100,000 0.38% 20/6/2024 1,123,720 0.05%Province of Quebec Canada 1,000,000 0.88% 15/1/2025 1,048,529 0.04%National Bank of Canada 1,000,000 0.75% 13/3/2025 1,040,672 0.04%Toronto-Dominion Bank 1,000,000 0.63% 6/6/2025 1,035,196 0.04%Bank of Nova Scotia 1,000,000 0.50% 22/1/2025 1,027,698 0.04%Toronto-Dominion Bank 1,000,000 0.50% 3/4/2024 1,025,258 0.04%Canadian Imperial Bank of Commerce 1,000,000 0.75% 22/3/2023 1,023,660 0.04%Bank of Nova Scotia 1,000,000 0.75% 17/9/2021 1,017,806 0.04%Royal Bank of Canada 1,000,000 0.25% 29/1/2024 1,015,238 0.04%Canadian Imperial Bank of Commerce 1,000,000 0.25% 24/1/2023 1,012,728 0.04%Bank of Nova Scotia 1,000,000 0.50% 30/4/2024 1,009,786 0.04%Bank of Nova Scotia 1,000,000 0.13% 13/1/2022 1,008,180 0.04%Canadian Imperial Bank of Commerce 1,000,000 0.38% 3/5/2024 997,868 0.04%Province of Quebec Canada 1,000,000 0.00% 15/10/2029 968,514 0.04%Bank of Montreal 900,000 0.75% 21/9/2022 923,566 0.04%Province of Ontario Canada 900,000 0.38% 14/6/2024 918,987 0.04%Bank of Montreal 900,000 0.25% 10/1/2024 913,158 0.04%Toronto-Dominion Bank 900,000 0.25% 27/4/2022 910,381 0.04%Toronto-Dominion Bank 900,000 0.10% 19/7/2027 897,724 0.04%Province of Quebec Canada 800,000 2.38% 22/1/2024 882,318 0.04%Province of Ontario Canada 800,000 1.88% 21/5/2024 869,600 0.04%Canadian Imperial Bank of Commerce 850,000 0.04% 9/7/2027 844,162 0.04%National Bank of Canada 800,000 1.50% 25/3/2021 817,672 0.03%National Bank of Canada 800,000 0.25% 24/7/2023 811,750 0.03%Toronto-Dominion Bank 800,000 0.38% 25/4/2024 806,634 0.03%Magna International, Inc. 700,000 1.50% 25/9/2027 740,837 0.03%Province of Quebec Canada 700,000 0.88% 4/5/2027 738,743 0.03%Bank of Nova Scotia 700,000 0.38% 10/3/2023 712,083 0.03%National Bank of Canada 700,000 0.50% 26/1/2022 710,902 0.03%Province of Quebec Canada 600,000 2.25% 17/7/2023 653,015 0.03%Great-West Lifeco, Inc. 600,000 1.75% 7/12/2026 649,056 0.03%Royal Bank of Canada 600,000 0.88% 17/6/2022 616,231 0.03%Toronto-Dominion Bank 600,000 0.75% 29/10/2021 611,286 0.03%Bank of Nova Scotia 607,000 0.13% 4/9/2026 595,552 0.02%Alimentation Couche-Tard, Inc. 500,000 1.88% 6/5/2026 534,128 0.02%CPPIB Capital, Inc. 500,000 0.88% 6/2/2029 528,372 0.02%Province of Alberta Canada 500,000 0.63% 16/1/2026 516,458 0.02%Toronto-Dominion Bank 500,000 0.38% 27/4/2023 508,989 0.02%Bank of Nova Scotia 500,000 0.25% 11/1/2024 507,505 0.02%Toronto-Dominion Bank 500,000 0.25% 12/1/2023 506,519 0.02%Bank of Nova Scotia 500,000 0.38% 6/4/2022 504,153 0.02%Royal Bank of Canada 500,000 0.13% 11/3/2021 502,504 0.02%Royal Bank of Canada 500,000 0.13% 23/7/2024 497,317 0.02%National Bank of Canada 400,000 0.00% 29/9/2023 402,202 0.02%Royal Bank of Canada 400,000 0.05% 19/6/2026 399,860 0.02%Federation des Caisses Desjardins du Quebec 400,000 0.05% 26/11/2027 395,568 0.02%CPPIB Capital, Inc. 400,000 0.75% 15/7/2049 388,849 0.02%Export Development Canada 345,000 0.25% 7/3/2026 352,642 0.01%Toronto-Dominion Bank 320,000 0.00% 9/2/2024 321,424 0.01%Royal Bank of Canada 200,000 0.25% 2/5/2024 200,141 0.01%Bank of Montreal 100,000 0.25% 17/11/2021 100,594 0.00%
50,610,966 2.09%
Chile 0.16% (2018: 0.15%)
Chile Government International Bond 1,750,000 1.88% 27/5/2030 1,963,395 0.08%Chile Government International Bond 800,000 1.75% 20/1/2026 866,208 0.04%Chile Government International Bond 580,000 0.83% 2/7/2031 587,917 0.02%Corp. Nacional del Cobre de Chile 400,000 2.25% 9/7/2024 434,072 0.02%
3,851,592 0.16%
Vanguard Euro Investment Grade Bond Index Fund
232
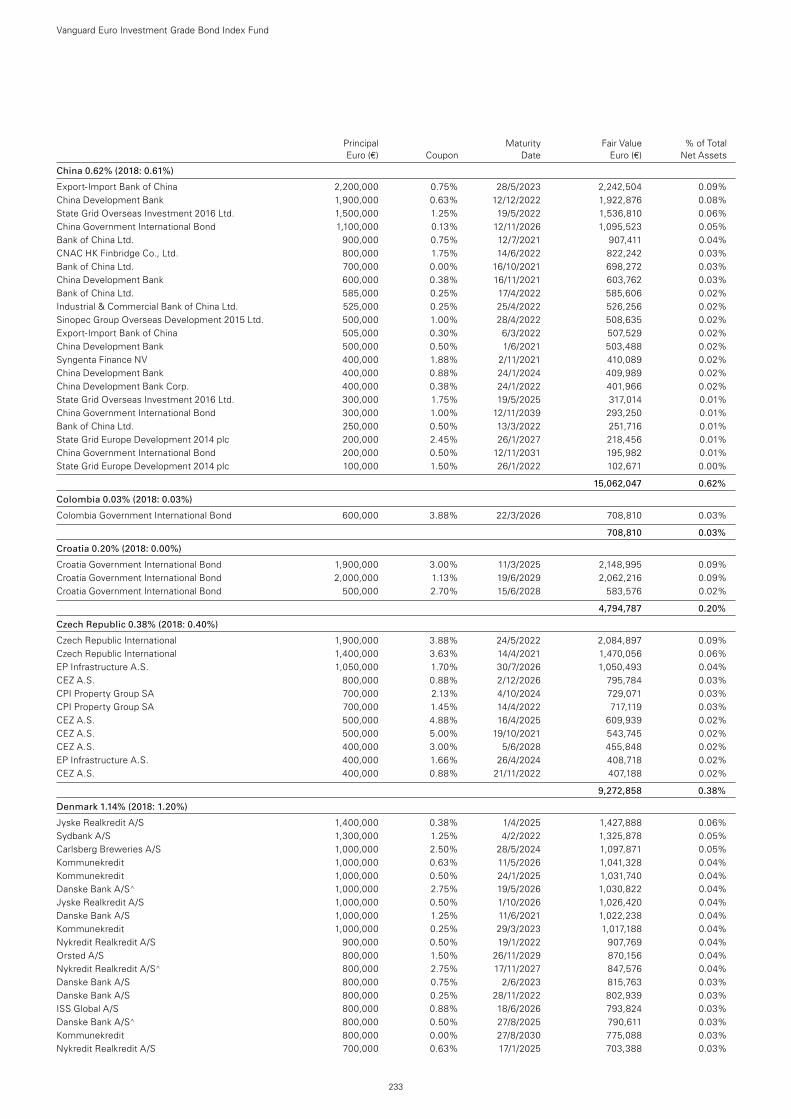
Principal Maturity Fair Value % of Total Euro (€) Coupon Date Euro (€) Net Assets
China 0.62% (2018: 0.61%)
Export-Import Bank of China 2,200,000 0.75% 28/5/2023 2,242,504 0.09%China Development Bank 1,900,000 0.63% 12/12/2022 1,922,876 0.08%State Grid Overseas Investment 2016 Ltd. 1,500,000 1.25% 19/5/2022 1,536,810 0.06%China Government International Bond 1,100,000 0.13% 12/11/2026 1,095,523 0.05%Bank of China Ltd. 900,000 0.75% 12/7/2021 907,411 0.04%CNAC HK Finbridge Co., Ltd. 800,000 1.75% 14/6/2022 822,242 0.03%Bank of China Ltd. 700,000 0.00% 16/10/2021 698,272 0.03%China Development Bank 600,000 0.38% 16/11/2021 603,762 0.03%Bank of China Ltd. 585,000 0.25% 17/4/2022 585,606 0.02%Industrial & Commercial Bank of China Ltd. 525,000 0.25% 25/4/2022 526,256 0.02%Sinopec Group Overseas Development 2015 Ltd. 500,000 1.00% 28/4/2022 508,635 0.02%Export-Import Bank of China 505,000 0.30% 6/3/2022 507,529 0.02%China Development Bank 500,000 0.50% 1/6/2021 503,488 0.02%Syngenta Finance NV 400,000 1.88% 2/11/2021 410,089 0.02%China Development Bank 400,000 0.88% 24/1/2024 409,989 0.02%China Development Bank Corp. 400,000 0.38% 24/1/2022 401,966 0.02%State Grid Overseas Investment 2016 Ltd. 300,000 1.75% 19/5/2025 317,014 0.01%China Government International Bond 300,000 1.00% 12/11/2039 293,250 0.01%Bank of China Ltd. 250,000 0.50% 13/3/2022 251,716 0.01%State Grid Europe Development 2014 plc 200,000 2.45% 26/1/2027 218,456 0.01%China Government International Bond 200,000 0.50% 12/11/2031 195,982 0.01%State Grid Europe Development 2014 plc 100,000 1.50% 26/1/2022 102,671 0.00%
15,062,047 0.62%
Colombia 0.03% (2018: 0.03%)
Colombia Government International Bond 600,000 3.88% 22/3/2026 708,810 0.03%
708,810 0.03%
Croatia 0.20% (2018: 0.00%)
Croatia Government International Bond 1,900,000 3.00% 11/3/2025 2,148,995 0.09%Croatia Government International Bond 2,000,000 1.13% 19/6/2029 2,062,216 0.09%Croatia Government International Bond 500,000 2.70% 15/6/2028 583,576 0.02%
4,794,787 0.20%
Czech Republic 0.38% (2018: 0.40%)
Czech Republic International 1,900,000 3.88% 24/5/2022 2,084,897 0.09%Czech Republic International 1,400,000 3.63% 14/4/2021 1,470,056 0.06%EP Infrastructure A.S. 1,050,000 1.70% 30/7/2026 1,050,493 0.04%CEZ A.S. 800,000 0.88% 2/12/2026 795,784 0.03%CPI Property Group SA 700,000 2.13% 4/10/2024 729,071 0.03%CPI Property Group SA 700,000 1.45% 14/4/2022 717,119 0.03%CEZ A.S. 500,000 4.88% 16/4/2025 609,939 0.02%CEZ A.S. 500,000 5.00% 19/10/2021 543,745 0.02%CEZ A.S. 400,000 3.00% 5/6/2028 455,848 0.02%EP Infrastructure A.S. 400,000 1.66% 26/4/2024 408,718 0.02%CEZ A.S. 400,000 0.88% 21/11/2022 407,188 0.02%
9,272,858 0.38%
Denmark 1.14% (2018: 1.20%)
Jyske Realkredit A/S 1,400,000 0.38% 1/4/2025 1,427,888 0.06%Sydbank A/S 1,300,000 1.25% 4/2/2022 1,325,878 0.05%Carlsberg Breweries A/S 1,000,000 2.50% 28/5/2024 1,097,871 0.05%Kommunekredit 1,000,000 0.63% 11/5/2026 1,041,328 0.04%Kommunekredit 1,000,000 0.50% 24/1/2025 1,031,740 0.04%Danske Bank A/S^ 1,000,000 2.75% 19/5/2026 1,030,822 0.04%Jyske Realkredit A/S 1,000,000 0.50% 1/10/2026 1,026,420 0.04%Danske Bank A/S 1,000,000 1.25% 11/6/2021 1,022,238 0.04%Kommunekredit 1,000,000 0.25% 29/3/2023 1,017,188 0.04%Nykredit Realkredit A/S 900,000 0.50% 19/1/2022 907,769 0.04%Orsted A/S 800,000 1.50% 26/11/2029 870,156 0.04%Nykredit Realkredit A/S^ 800,000 2.75% 17/11/2027 847,576 0.04%Danske Bank A/S 800,000 0.75% 2/6/2023 815,763 0.03%Danske Bank A/S 800,000 0.25% 28/11/2022 802,939 0.03%ISS Global A/S 800,000 0.88% 18/6/2026 793,824 0.03%Danske Bank A/S^ 800,000 0.50% 27/8/2025 790,611 0.03%Kommunekredit 800,000 0.00% 27/8/2030 775,088 0.03%Nykredit Realkredit A/S 700,000 0.63% 17/1/2025 703,388 0.03%
Vanguard Euro Investment Grade Bond Index Fund
233
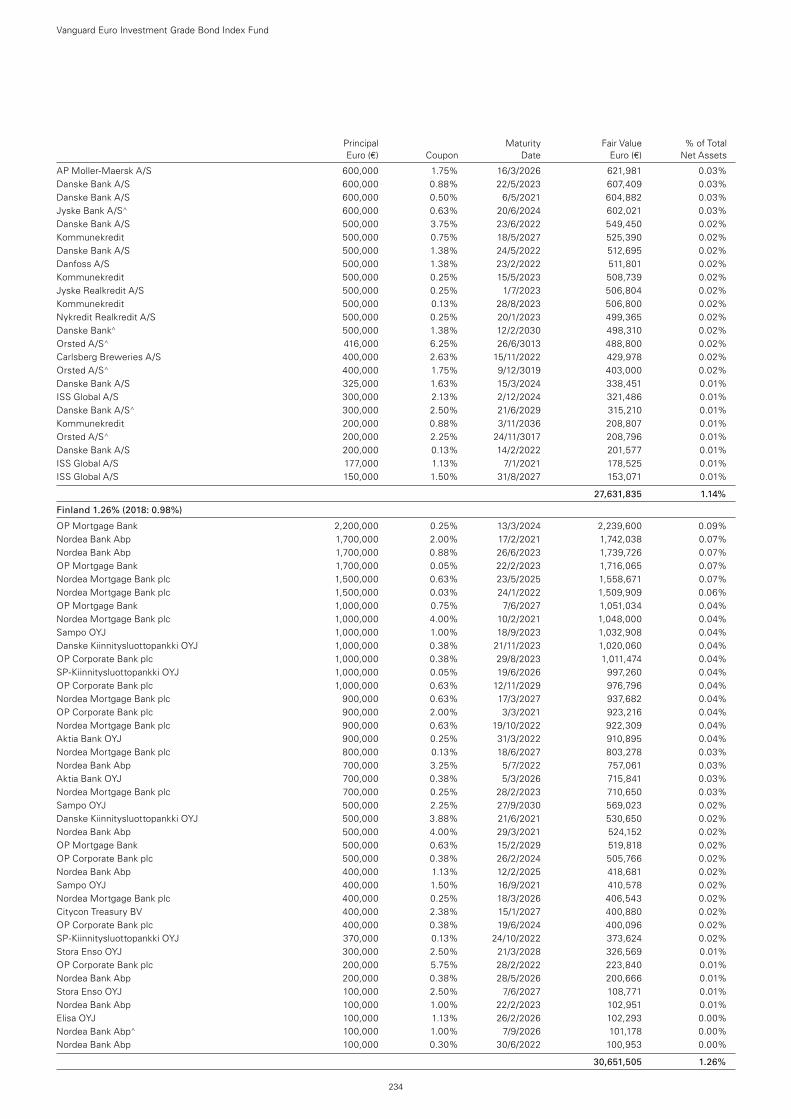
Principal Maturity Fair Value % of Total Euro (€) Coupon Date Euro (€) Net Assets
AP Moller-Maersk A/S 600,000 1.75% 16/3/2026 621,981 0.03%Danske Bank A/S 600,000 0.88% 22/5/2023 607,409 0.03%Danske Bank A/S 600,000 0.50% 6/5/2021 604,882 0.03%Jyske Bank A/S^ 600,000 0.63% 20/6/2024 602,021 0.03%Danske Bank A/S 500,000 3.75% 23/6/2022 549,450 0.02%Kommunekredit 500,000 0.75% 18/5/2027 525,390 0.02%Danske Bank A/S 500,000 1.38% 24/5/2022 512,695 0.02%Danfoss A/S 500,000 1.38% 23/2/2022 511,801 0.02%Kommunekredit 500,000 0.25% 15/5/2023 508,739 0.02%Jyske Realkredit A/S 500,000 0.25% 1/7/2023 506,804 0.02%Kommunekredit 500,000 0.13% 28/8/2023 506,800 0.02%Nykredit Realkredit A/S 500,000 0.25% 20/1/2023 499,365 0.02%Danske Bank^ 500,000 1.38% 12/2/2030 498,310 0.02%Orsted A/S^ 416,000 6.25% 26/6/3013 488,800 0.02%Carlsberg Breweries A/S 400,000 2.63% 15/11/2022 429,978 0.02%Orsted A/S^ 400,000 1.75% 9/12/3019 403,000 0.02%Danske Bank A/S 325,000 1.63% 15/3/2024 338,451 0.01%ISS Global A/S 300,000 2.13% 2/12/2024 321,486 0.01%Danske Bank A/S^ 300,000 2.50% 21/6/2029 315,210 0.01%Kommunekredit 200,000 0.88% 3/11/2036 208,807 0.01%Orsted A/S^ 200,000 2.25% 24/11/3017 208,796 0.01%Danske Bank A/S 200,000 0.13% 14/2/2022 201,577 0.01%ISS Global A/S 177,000 1.13% 7/1/2021 178,525 0.01%ISS Global A/S 150,000 1.50% 31/8/2027 153,071 0.01%
27,631,835 1.14%
Finland 1.26% (2018: 0.98%)
OP Mortgage Bank 2,200,000 0.25% 13/3/2024 2,239,600 0.09%Nordea Bank Abp 1,700,000 2.00% 17/2/2021 1,742,038 0.07%Nordea Bank Abp 1,700,000 0.88% 26/6/2023 1,739,726 0.07%OP Mortgage Bank 1,700,000 0.05% 22/2/2023 1,716,065 0.07%Nordea Mortgage Bank plc 1,500,000 0.63% 23/5/2025 1,558,671 0.07%Nordea Mortgage Bank plc 1,500,000 0.03% 24/1/2022 1,509,909 0.06%OP Mortgage Bank 1,000,000 0.75% 7/6/2027 1,051,034 0.04%Nordea Mortgage Bank plc 1,000,000 4.00% 10/2/2021 1,048,000 0.04%Sampo OYJ 1,000,000 1.00% 18/9/2023 1,032,908 0.04%Danske Kiinnitysluottopankki OYJ 1,000,000 0.38% 21/11/2023 1,020,060 0.04%OP Corporate Bank plc 1,000,000 0.38% 29/8/2023 1,011,474 0.04%SP-Kiinnitysluottopankki OYJ 1,000,000 0.05% 19/6/2026 997,260 0.04%OP Corporate Bank plc 1,000,000 0.63% 12/11/2029 976,796 0.04%Nordea Mortgage Bank plc 900,000 0.63% 17/3/2027 937,682 0.04%OP Corporate Bank plc 900,000 2.00% 3/3/2021 923,216 0.04%Nordea Mortgage Bank plc 900,000 0.63% 19/10/2022 922,309 0.04%Aktia Bank OYJ 900,000 0.25% 31/3/2022 910,895 0.04%Nordea Mortgage Bank plc 800,000 0.13% 18/6/2027 803,278 0.03%Nordea Bank Abp 700,000 3.25% 5/7/2022 757,061 0.03%Aktia Bank OYJ 700,000 0.38% 5/3/2026 715,841 0.03%Nordea Mortgage Bank plc 700,000 0.25% 28/2/2023 710,650 0.03%Sampo OYJ 500,000 2.25% 27/9/2030 569,023 0.02%Danske Kiinnitysluottopankki OYJ 500,000 3.88% 21/6/2021 530,650 0.02%Nordea Bank Abp 500,000 4.00% 29/3/2021 524,152 0.02%OP Mortgage Bank 500,000 0.63% 15/2/2029 519,818 0.02%OP Corporate Bank plc 500,000 0.38% 26/2/2024 505,766 0.02%Nordea Bank Abp 400,000 1.13% 12/2/2025 418,681 0.02%Sampo OYJ 400,000 1.50% 16/9/2021 410,578 0.02%Nordea Mortgage Bank plc 400,000 0.25% 18/3/2026 406,543 0.02%Citycon Treasury BV 400,000 2.38% 15/1/2027 400,880 0.02%OP Corporate Bank plc 400,000 0.38% 19/6/2024 400,096 0.02%SP-Kiinnitysluottopankki OYJ 370,000 0.13% 24/10/2022 373,624 0.02%Stora Enso OYJ 300,000 2.50% 21/3/2028 326,569 0.01%OP Corporate Bank plc 200,000 5.75% 28/2/2022 223,840 0.01%Nordea Bank Abp 200,000 0.38% 28/5/2026 200,666 0.01%Stora Enso OYJ 100,000 2.50% 7/6/2027 108,771 0.01%Nordea Bank Abp 100,000 1.00% 22/2/2023 102,951 0.01%Elisa OYJ 100,000 1.13% 26/2/2026 102,293 0.00%Nordea Bank Abp^ 100,000 1.00% 7/9/2026 101,178 0.00%Nordea Bank Abp 100,000 0.30% 30/6/2022 100,953 0.00%
30,651,505 1.26%
Vanguard Euro Investment Grade Bond Index Fund
234
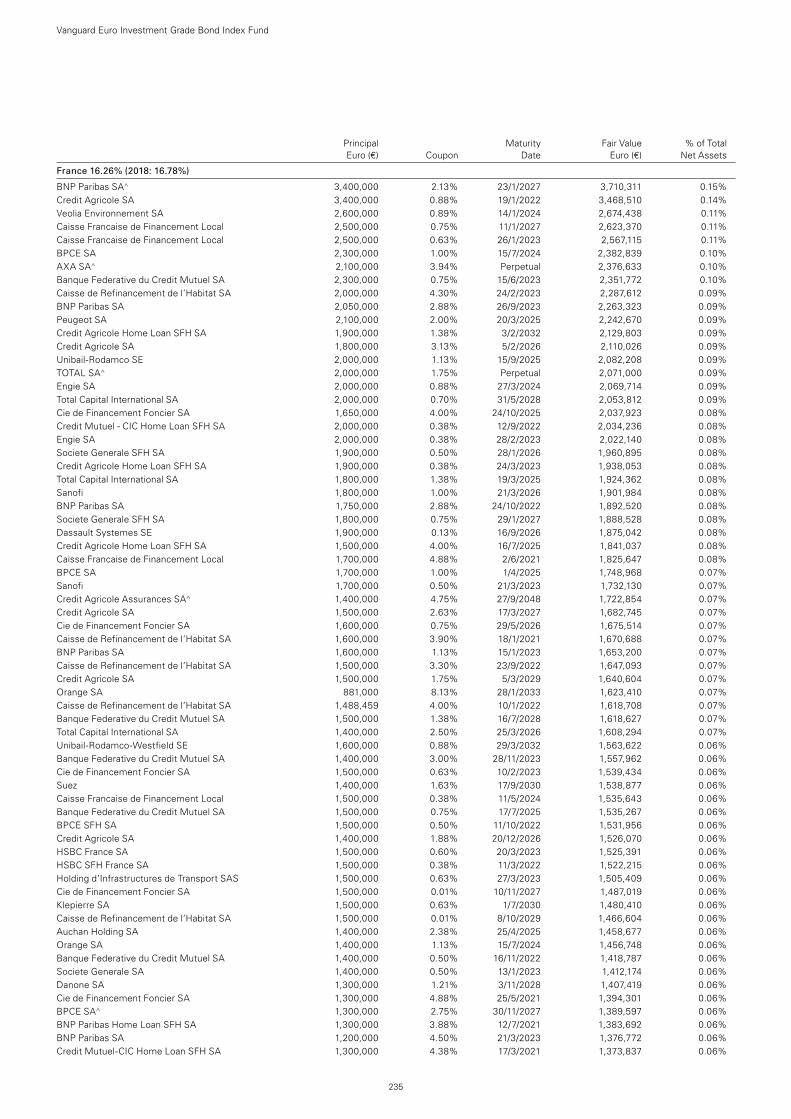
Principal Maturity Fair Value % of Total Euro (€) Coupon Date Euro (€) Net Assets
France 16.26% (2018: 16.78%)
BNP Paribas SA^ 3,400,000 2.13% 23/1/2027 3,710,311 0.15%Credit Agricole SA 3,400,000 0.88% 19/1/2022 3,468,510 0.14%Veolia Environnement SA 2,600,000 0.89% 14/1/2024 2,674,438 0.11%Caisse Francaise de Financement Local 2,500,000 0.75% 11/1/2027 2,623,370 0.11%Caisse Francaise de Financement Local 2,500,000 0.63% 26/1/2023 2,567,115 0.11%BPCE SA 2,300,000 1.00% 15/7/2024 2,382,839 0.10%AXA SA^ 2,100,000 3.94% Perpetual 2,376,633 0.10%Banque Federative du Credit Mutuel SA 2,300,000 0.75% 15/6/2023 2,351,772 0.10%Caisse de Refinancement de l’Habitat SA 2,000,000 4.30% 24/2/2023 2,287,612 0.09%BNP Paribas SA 2,050,000 2.88% 26/9/2023 2,263,323 0.09%Peugeot SA 2,100,000 2.00% 20/3/2025 2,242,670 0.09%Credit Agricole Home Loan SFH SA 1,900,000 1.38% 3/2/2032 2,129,803 0.09%Credit Agricole SA 1,800,000 3.13% 5/2/2026 2,110,026 0.09%Unibail-Rodamco SE 2,000,000 1.13% 15/9/2025 2,082,208 0.09%TOTAL SA^ 2,000,000 1.75% Perpetual 2,071,000 0.09%Engie SA 2,000,000 0.88% 27/3/2024 2,069,714 0.09%Total Capital International SA 2,000,000 0.70% 31/5/2028 2,053,812 0.09%Cie de Financement Foncier SA 1,650,000 4.00% 24/10/2025 2,037,923 0.08%Credit Mutuel - CIC Home Loan SFH SA 2,000,000 0.38% 12/9/2022 2,034,236 0.08%Engie SA 2,000,000 0.38% 28/2/2023 2,022,140 0.08%Societe Generale SFH SA 1,900,000 0.50% 28/1/2026 1,960,895 0.08%Credit Agricole Home Loan SFH SA 1,900,000 0.38% 24/3/2023 1,938,053 0.08%Total Capital International SA 1,800,000 1.38% 19/3/2025 1,924,362 0.08%Sanofi 1,800,000 1.00% 21/3/2026 1,901,984 0.08%BNP Paribas SA 1,750,000 2.88% 24/10/2022 1,892,520 0.08%Societe Generale SFH SA 1,800,000 0.75% 29/1/2027 1,888,528 0.08%Dassault Systemes SE 1,900,000 0.13% 16/9/2026 1,875,042 0.08%Credit Agricole Home Loan SFH SA 1,500,000 4.00% 16/7/2025 1,841,037 0.08%Caisse Francaise de Financement Local 1,700,000 4.88% 2/6/2021 1,825,647 0.08%BPCE SA 1,700,000 1.00% 1/4/2025 1,748,968 0.07%Sanofi 1,700,000 0.50% 21/3/2023 1,732,130 0.07%Credit Agricole Assurances SA^ 1,400,000 4.75% 27/9/2048 1,722,854 0.07%Credit Agricole SA 1,500,000 2.63% 17/3/2027 1,682,745 0.07%Cie de Financement Foncier SA 1,600,000 0.75% 29/5/2026 1,675,514 0.07%Caisse de Refinancement de l’Habitat SA 1,600,000 3.90% 18/1/2021 1,670,688 0.07%BNP Paribas SA 1,600,000 1.13% 15/1/2023 1,653,200 0.07%Caisse de Refinancement de l’Habitat SA 1,500,000 3.30% 23/9/2022 1,647,093 0.07%Credit Agricole SA 1,500,000 1.75% 5/3/2029 1,640,604 0.07%Orange SA 881,000 8.13% 28/1/2033 1,623,410 0.07%Caisse de Refinancement de l’Habitat SA 1,488,459 4.00% 10/1/2022 1,618,708 0.07%Banque Federative du Credit Mutuel SA 1,500,000 1.38% 16/7/2028 1,618,627 0.07%Total Capital International SA 1,400,000 2.50% 25/3/2026 1,608,294 0.07%Unibail-Rodamco-Westfield SE 1,600,000 0.88% 29/3/2032 1,563,622 0.06%Banque Federative du Credit Mutuel SA 1,400,000 3.00% 28/11/2023 1,557,962 0.06%Cie de Financement Foncier SA 1,500,000 0.63% 10/2/2023 1,539,434 0.06%Suez 1,400,000 1.63% 17/9/2030 1,538,877 0.06%Caisse Francaise de Financement Local 1,500,000 0.38% 11/5/2024 1,535,643 0.06%Banque Federative du Credit Mutuel SA 1,500,000 0.75% 17/7/2025 1,535,267 0.06%BPCE SFH SA 1,500,000 0.50% 11/10/2022 1,531,956 0.06%Credit Agricole SA 1,400,000 1.88% 20/12/2026 1,526,070 0.06%HSBC France SA 1,500,000 0.60% 20/3/2023 1,525,391 0.06%HSBC SFH France SA 1,500,000 0.38% 11/3/2022 1,522,215 0.06%Holding d’Infrastructures de Transport SAS 1,500,000 0.63% 27/3/2023 1,505,409 0.06%Cie de Financement Foncier SA 1,500,000 0.01% 10/11/2027 1,487,019 0.06%Klepierre SA 1,500,000 0.63% 1/7/2030 1,480,410 0.06%Caisse de Refinancement de l’Habitat SA 1,500,000 0.01% 8/10/2029 1,466,604 0.06%Auchan Holding SA 1,400,000 2.38% 25/4/2025 1,458,677 0.06%Orange SA 1,400,000 1.13% 15/7/2024 1,456,748 0.06%Banque Federative du Credit Mutuel SA 1,400,000 0.50% 16/11/2022 1,418,787 0.06%Societe Generale SA 1,400,000 0.50% 13/1/2023 1,412,174 0.06%Danone SA 1,300,000 1.21% 3/11/2028 1,407,419 0.06%Cie de Financement Foncier SA 1,300,000 4.88% 25/5/2021 1,394,301 0.06%BPCE SA^ 1,300,000 2.75% 30/11/2027 1,389,597 0.06%BNP Paribas Home Loan SFH SA 1,300,000 3.88% 12/7/2021 1,383,692 0.06%BNP Paribas SA 1,200,000 4.50% 21/3/2023 1,376,772 0.06%Credit Mutuel-CIC Home Loan SFH SA 1,300,000 4.38% 17/3/2021 1,373,837 0.06%
Vanguard Euro Investment Grade Bond Index Fund
235
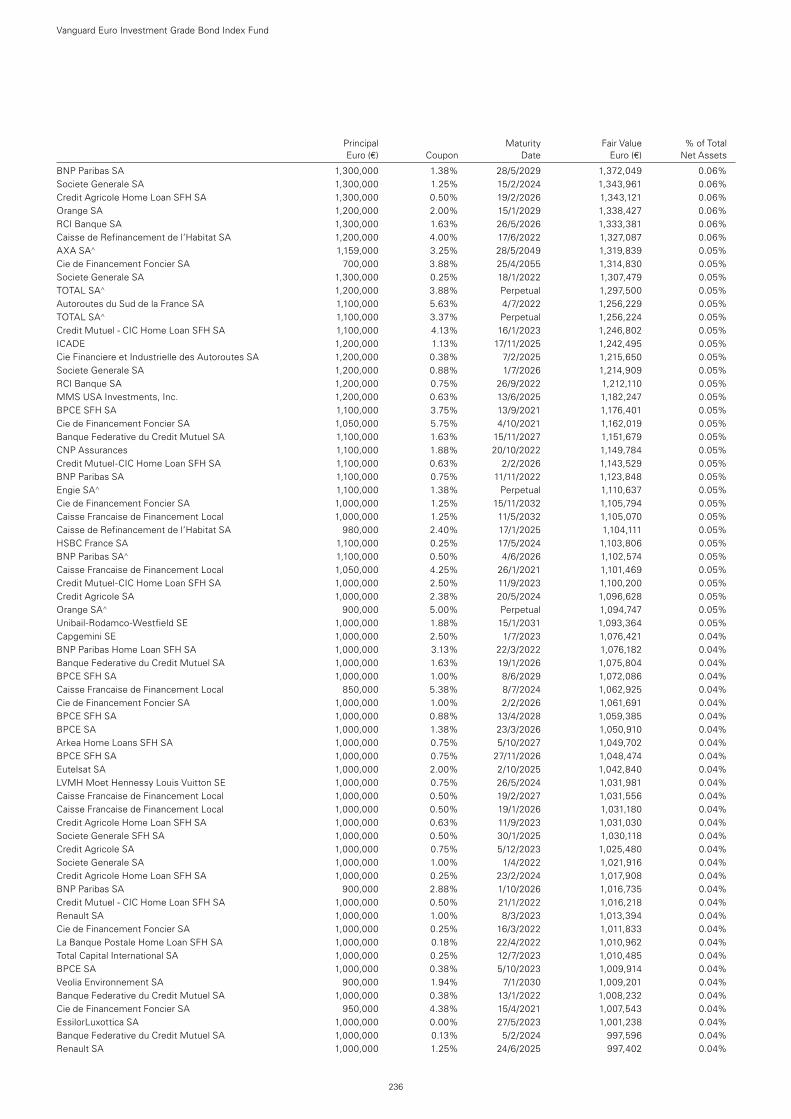
Principal Maturity Fair Value % of Total Euro (€) Coupon Date Euro (€) Net Assets
BNP Paribas SA 1,300,000 1.38% 28/5/2029 1,372,049 0.06%Societe Generale SA 1,300,000 1.25% 15/2/2024 1,343,961 0.06%Credit Agricole Home Loan SFH SA 1,300,000 0.50% 19/2/2026 1,343,121 0.06%Orange SA 1,200,000 2.00% 15/1/2029 1,338,427 0.06%RCI Banque SA 1,300,000 1.63% 26/5/2026 1,333,381 0.06%Caisse de Refinancement de l’Habitat SA 1,200,000 4.00% 17/6/2022 1,327,087 0.06%AXA SA^ 1,159,000 3.25% 28/5/2049 1,319,839 0.05%Cie de Financement Foncier SA 700,000 3.88% 25/4/2055 1,314,830 0.05%Societe Generale SA 1,300,000 0.25% 18/1/2022 1,307,479 0.05%TOTAL SA^ 1,200,000 3.88% Perpetual 1,297,500 0.05%Autoroutes du Sud de la France SA 1,100,000 5.63% 4/7/2022 1,256,229 0.05%TOTAL SA^ 1,100,000 3.37% Perpetual 1,256,224 0.05%Credit Mutuel - CIC Home Loan SFH SA 1,100,000 4.13% 16/1/2023 1,246,802 0.05%ICADE 1,200,000 1.13% 17/11/2025 1,242,495 0.05%Cie Financiere et Industrielle des Autoroutes SA 1,200,000 0.38% 7/2/2025 1,215,650 0.05%Societe Generale SA 1,200,000 0.88% 1/7/2026 1,214,909 0.05%RCI Banque SA 1,200,000 0.75% 26/9/2022 1,212,110 0.05%MMS USA Investments, Inc. 1,200,000 0.63% 13/6/2025 1,182,247 0.05%BPCE SFH SA 1,100,000 3.75% 13/9/2021 1,176,401 0.05%Cie de Financement Foncier SA 1,050,000 5.75% 4/10/2021 1,162,019 0.05%Banque Federative du Credit Mutuel SA 1,100,000 1.63% 15/11/2027 1,151,679 0.05%CNP Assurances 1,100,000 1.88% 20/10/2022 1,149,784 0.05%Credit Mutuel-CIC Home Loan SFH SA 1,100,000 0.63% 2/2/2026 1,143,529 0.05%BNP Paribas SA 1,100,000 0.75% 11/11/2022 1,123,848 0.05%Engie SA^ 1,100,000 1.38% Perpetual 1,110,637 0.05%Cie de Financement Foncier SA 1,000,000 1.25% 15/11/2032 1,105,794 0.05%Caisse Francaise de Financement Local 1,000,000 1.25% 11/5/2032 1,105,070 0.05%Caisse de Refinancement de l’Habitat SA 980,000 2.40% 17/1/2025 1,104,111 0.05%HSBC France SA 1,100,000 0.25% 17/5/2024 1,103,806 0.05%BNP Paribas SA^ 1,100,000 0.50% 4/6/2026 1,102,574 0.05%Caisse Francaise de Financement Local 1,050,000 4.25% 26/1/2021 1,101,469 0.05%Credit Mutuel-CIC Home Loan SFH SA 1,000,000 2.50% 11/9/2023 1,100,200 0.05%Credit Agricole SA 1,000,000 2.38% 20/5/2024 1,096,628 0.05%Orange SA^ 900,000 5.00% Perpetual 1,094,747 0.05%Unibail-Rodamco-Westfield SE 1,000,000 1.88% 15/1/2031 1,093,364 0.05%Capgemini SE 1,000,000 2.50% 1/7/2023 1,076,421 0.04%BNP Paribas Home Loan SFH SA 1,000,000 3.13% 22/3/2022 1,076,182 0.04%Banque Federative du Credit Mutuel SA 1,000,000 1.63% 19/1/2026 1,075,804 0.04%BPCE SFH SA 1,000,000 1.00% 8/6/2029 1,072,086 0.04%Caisse Francaise de Financement Local 850,000 5.38% 8/7/2024 1,062,925 0.04%Cie de Financement Foncier SA 1,000,000 1.00% 2/2/2026 1,061,691 0.04%BPCE SFH SA 1,000,000 0.88% 13/4/2028 1,059,385 0.04%BPCE SA 1,000,000 1.38% 23/3/2026 1,050,910 0.04%Arkea Home Loans SFH SA 1,000,000 0.75% 5/10/2027 1,049,702 0.04%BPCE SFH SA 1,000,000 0.75% 27/11/2026 1,048,474 0.04%Eutelsat SA 1,000,000 2.00% 2/10/2025 1,042,840 0.04%LVMH Moet Hennessy Louis Vuitton SE 1,000,000 0.75% 26/5/2024 1,031,981 0.04%Caisse Francaise de Financement Local 1,000,000 0.50% 19/2/2027 1,031,556 0.04%Caisse Francaise de Financement Local 1,000,000 0.50% 19/1/2026 1,031,180 0.04%Credit Agricole Home Loan SFH SA 1,000,000 0.63% 11/9/2023 1,031,030 0.04%Societe Generale SFH SA 1,000,000 0.50% 30/1/2025 1,030,118 0.04%Credit Agricole SA 1,000,000 0.75% 5/12/2023 1,025,480 0.04%Societe Generale SA 1,000,000 1.00% 1/4/2022 1,021,916 0.04%Credit Agricole Home Loan SFH SA 1,000,000 0.25% 23/2/2024 1,017,908 0.04%BNP Paribas SA 900,000 2.88% 1/10/2026 1,016,735 0.04%Credit Mutuel - CIC Home Loan SFH SA 1,000,000 0.50% 21/1/2022 1,016,218 0.04%Renault SA 1,000,000 1.00% 8/3/2023 1,013,394 0.04%Cie de Financement Foncier SA 1,000,000 0.25% 16/3/2022 1,011,833 0.04%La Banque Postale Home Loan SFH SA 1,000,000 0.18% 22/4/2022 1,010,962 0.04%Total Capital International SA 1,000,000 0.25% 12/7/2023 1,010,485 0.04%BPCE SA 1,000,000 0.38% 5/10/2023 1,009,914 0.04%Veolia Environnement SA 900,000 1.94% 7/1/2030 1,009,201 0.04%Banque Federative du Credit Mutuel SA 1,000,000 0.38% 13/1/2022 1,008,232 0.04%Cie de Financement Foncier SA 950,000 4.38% 15/4/2021 1,007,543 0.04%EssilorLuxottica SA 1,000,000 0.00% 27/5/2023 1,001,238 0.04%Banque Federative du Credit Mutuel SA 1,000,000 0.13% 5/2/2024 997,596 0.04%Renault SA 1,000,000 1.25% 24/6/2025 997,402 0.04%
Vanguard Euro Investment Grade Bond Index Fund
236
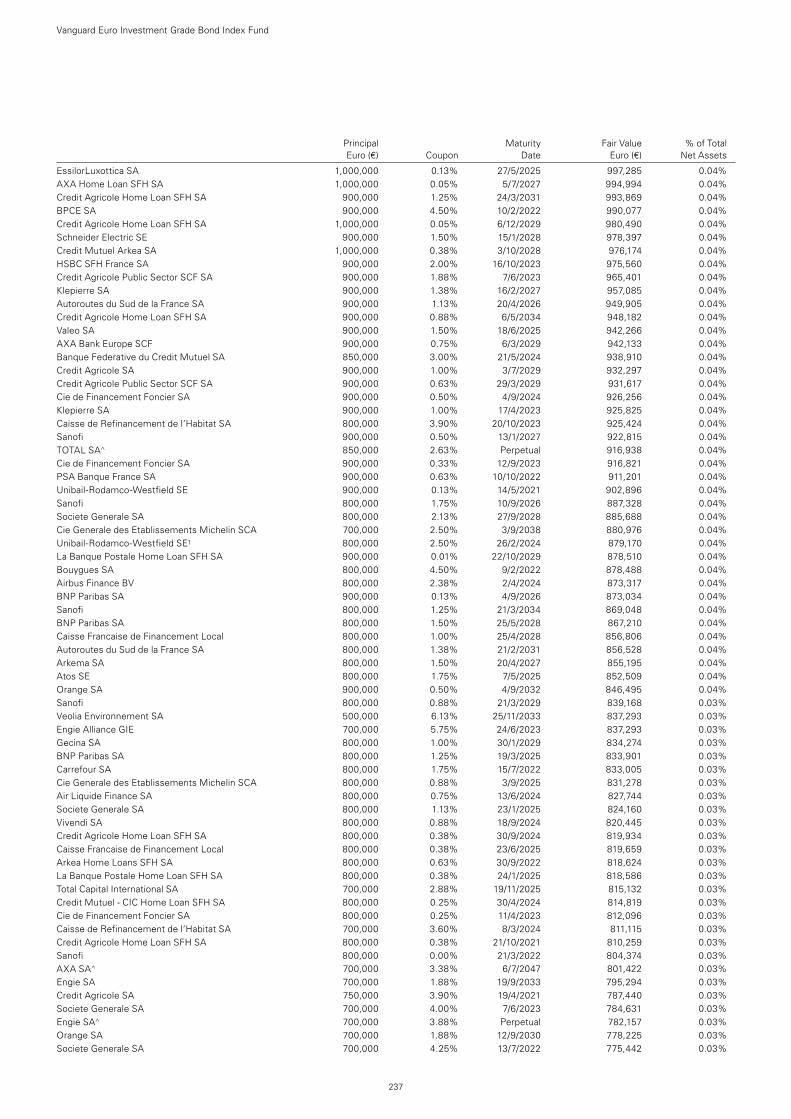
Principal Maturity Fair Value % of Total Euro (€) Coupon Date Euro (€) Net Assets
EssilorLuxottica SA 1,000,000 0.13% 27/5/2025 997,285 0.04%AXA Home Loan SFH SA 1,000,000 0.05% 5/7/2027 994,994 0.04%Credit Agricole Home Loan SFH SA 900,000 1.25% 24/3/2031 993,869 0.04%BPCE SA 900,000 4.50% 10/2/2022 990,077 0.04%Credit Agricole Home Loan SFH SA 1,000,000 0.05% 6/12/2029 980,490 0.04%Schneider Electric SE 900,000 1.50% 15/1/2028 978,397 0.04%Credit Mutuel Arkea SA 1,000,000 0.38% 3/10/2028 976,174 0.04%HSBC SFH France SA 900,000 2.00% 16/10/2023 975,560 0.04%Credit Agricole Public Sector SCF SA 900,000 1.88% 7/6/2023 965,401 0.04%Klepierre SA 900,000 1.38% 16/2/2027 957,085 0.04%Autoroutes du Sud de la France SA 900,000 1.13% 20/4/2026 949,905 0.04%Credit Agricole Home Loan SFH SA 900,000 0.88% 6/5/2034 948,182 0.04%Valeo SA 900,000 1.50% 18/6/2025 942,266 0.04%AXA Bank Europe SCF 900,000 0.75% 6/3/2029 942,133 0.04%Banque Federative du Credit Mutuel SA 850,000 3.00% 21/5/2024 938,910 0.04%Credit Agricole SA 900,000 1.00% 3/7/2029 932,297 0.04%Credit Agricole Public Sector SCF SA 900,000 0.63% 29/3/2029 931,617 0.04%Cie de Financement Foncier SA 900,000 0.50% 4/9/2024 926,256 0.04%Klepierre SA 900,000 1.00% 17/4/2023 925,825 0.04%Caisse de Refinancement de l’Habitat SA 800,000 3.90% 20/10/2023 925,424 0.04%Sanofi 900,000 0.50% 13/1/2027 922,815 0.04%TOTAL SA^ 850,000 2.63% Perpetual 916,938 0.04%Cie de Financement Foncier SA 900,000 0.33% 12/9/2023 916,821 0.04%PSA Banque France SA 900,000 0.63% 10/10/2022 911,201 0.04%Unibail-Rodamco-Westfield SE 900,000 0.13% 14/5/2021 902,896 0.04%Sanofi 800,000 1.75% 10/9/2026 887,328 0.04%Societe Generale SA 800,000 2.13% 27/9/2028 885,688 0.04%Cie Generale des Etablissements Michelin SCA 700,000 2.50% 3/9/2038 880,976 0.04%Unibail-Rodamco-Westfield SE1 800,000 2.50% 26/2/2024 879,170 0.04%La Banque Postale Home Loan SFH SA 900,000 0.01% 22/10/2029 878,510 0.04%Bouygues SA 800,000 4.50% 9/2/2022 878,488 0.04%Airbus Finance BV 800,000 2.38% 2/4/2024 873,317 0.04%BNP Paribas SA 900,000 0.13% 4/9/2026 873,034 0.04%Sanofi 800,000 1.25% 21/3/2034 869,048 0.04%BNP Paribas SA 800,000 1.50% 25/5/2028 867,210 0.04%Caisse Francaise de Financement Local 800,000 1.00% 25/4/2028 856,806 0.04%Autoroutes du Sud de la France SA 800,000 1.38% 21/2/2031 856,528 0.04%Arkema SA 800,000 1.50% 20/4/2027 855,195 0.04%Atos SE 800,000 1.75% 7/5/2025 852,509 0.04%Orange SA 900,000 0.50% 4/9/2032 846,495 0.04%Sanofi 800,000 0.88% 21/3/2029 839,168 0.03%Veolia Environnement SA 500,000 6.13% 25/11/2033 837,293 0.03%Engie Alliance GIE 700,000 5.75% 24/6/2023 837,293 0.03%Gecina SA 800,000 1.00% 30/1/2029 834,274 0.03%BNP Paribas SA 800,000 1.25% 19/3/2025 833,901 0.03%Carrefour SA 800,000 1.75% 15/7/2022 833,005 0.03%Cie Generale des Etablissements Michelin SCA 800,000 0.88% 3/9/2025 831,278 0.03%Air Liquide Finance SA 800,000 0.75% 13/6/2024 827,744 0.03%Societe Generale SA 800,000 1.13% 23/1/2025 824,160 0.03%Vivendi SA 800,000 0.88% 18/9/2024 820,445 0.03%Credit Agricole Home Loan SFH SA 800,000 0.38% 30/9/2024 819,934 0.03%Caisse Francaise de Financement Local 800,000 0.38% 23/6/2025 819,659 0.03%Arkea Home Loans SFH SA 800,000 0.63% 30/9/2022 818,624 0.03%La Banque Postale Home Loan SFH SA 800,000 0.38% 24/1/2025 818,586 0.03%Total Capital International SA 700,000 2.88% 19/11/2025 815,132 0.03%Credit Mutuel - CIC Home Loan SFH SA 800,000 0.25% 30/4/2024 814,819 0.03%Cie de Financement Foncier SA 800,000 0.25% 11/4/2023 812,096 0.03%Caisse de Refinancement de l’Habitat SA 700,000 3.60% 8/3/2024 811,115 0.03%Credit Agricole Home Loan SFH SA 800,000 0.38% 21/10/2021 810,259 0.03%Sanofi 800,000 0.00% 21/3/2022 804,374 0.03%AXA SA^ 700,000 3.38% 6/7/2047 801,422 0.03%Engie SA 700,000 1.88% 19/9/2033 795,294 0.03%Credit Agricole SA 750,000 3.90% 19/4/2021 787,440 0.03%Societe Generale SA 700,000 4.00% 7/6/2023 784,631 0.03%Engie SA^ 700,000 3.88% Perpetual 782,157 0.03%Orange SA 700,000 1.88% 12/9/2030 778,225 0.03%Societe Generale SA 700,000 4.25% 13/7/2022 775,442 0.03%
Vanguard Euro Investment Grade Bond Index Fund
237
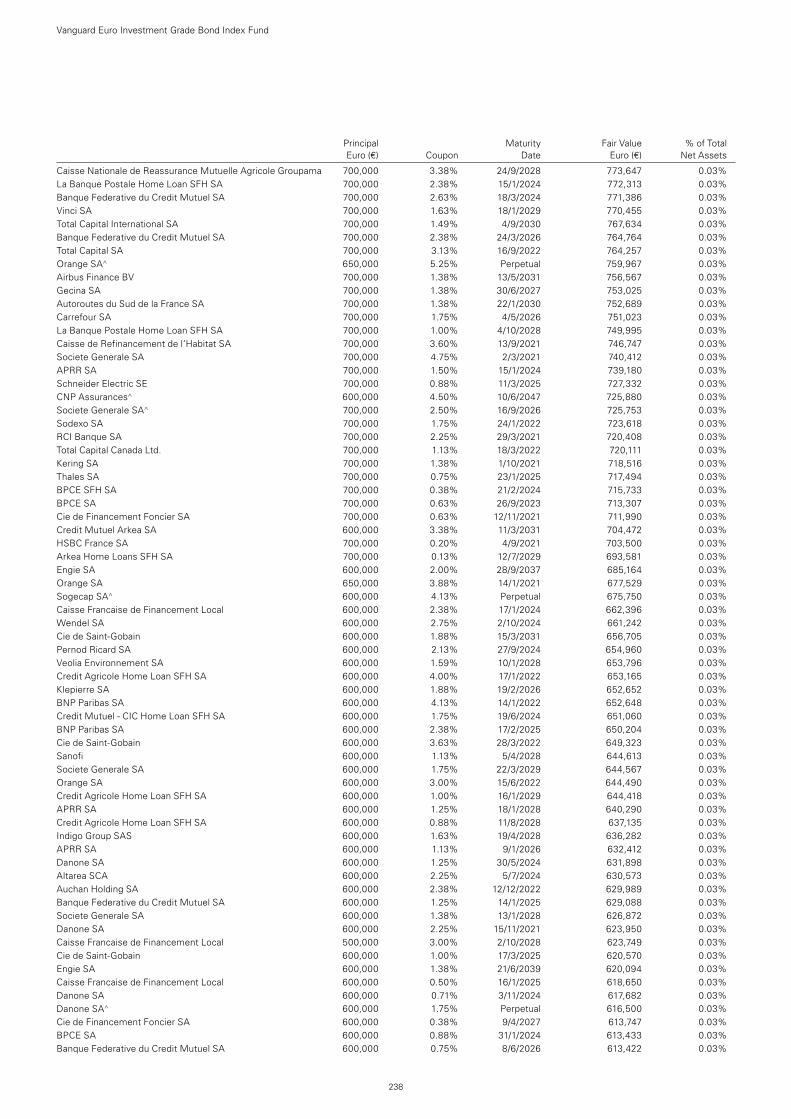
Principal Maturity Fair Value % of Total Euro (€) Coupon Date Euro (€) Net Assets
Caisse Nationale de Reassurance Mutuelle Agricole Groupama 700,000 3.38% 24/9/2028 773,647 0.03%La Banque Postale Home Loan SFH SA 700,000 2.38% 15/1/2024 772,313 0.03%Banque Federative du Credit Mutuel SA 700,000 2.63% 18/3/2024 771,386 0.03%Vinci SA 700,000 1.63% 18/1/2029 770,455 0.03%Total Capital International SA 700,000 1.49% 4/9/2030 767,634 0.03%Banque Federative du Credit Mutuel SA 700,000 2.38% 24/3/2026 764,764 0.03%Total Capital SA 700,000 3.13% 16/9/2022 764,257 0.03%Orange SA^ 650,000 5.25% Perpetual 759,967 0.03%Airbus Finance BV 700,000 1.38% 13/5/2031 756,567 0.03%Gecina SA 700,000 1.38% 30/6/2027 753,025 0.03%Autoroutes du Sud de la France SA 700,000 1.38% 22/1/2030 752,689 0.03%Carrefour SA 700,000 1.75% 4/5/2026 751,023 0.03%La Banque Postale Home Loan SFH SA 700,000 1.00% 4/10/2028 749,995 0.03%Caisse de Refinancement de l’Habitat SA 700,000 3.60% 13/9/2021 746,747 0.03%Societe Generale SA 700,000 4.75% 2/3/2021 740,412 0.03%APRR SA 700,000 1.50% 15/1/2024 739,180 0.03%Schneider Electric SE 700,000 0.88% 11/3/2025 727,332 0.03%CNP Assurances^ 600,000 4.50% 10/6/2047 725,880 0.03%Societe Generale SA^ 700,000 2.50% 16/9/2026 725,753 0.03%Sodexo SA 700,000 1.75% 24/1/2022 723,618 0.03%RCI Banque SA 700,000 2.25% 29/3/2021 720,408 0.03%Total Capital Canada Ltd. 700,000 1.13% 18/3/2022 720,111 0.03%Kering SA 700,000 1.38% 1/10/2021 718,516 0.03%Thales SA 700,000 0.75% 23/1/2025 717,494 0.03%BPCE SFH SA 700,000 0.38% 21/2/2024 715,733 0.03%BPCE SA 700,000 0.63% 26/9/2023 713,307 0.03%Cie de Financement Foncier SA 700,000 0.63% 12/11/2021 711,990 0.03%Credit Mutuel Arkea SA 600,000 3.38% 11/3/2031 704,472 0.03%HSBC France SA 700,000 0.20% 4/9/2021 703,500 0.03%Arkea Home Loans SFH SA 700,000 0.13% 12/7/2029 693,581 0.03%Engie SA 600,000 2.00% 28/9/2037 685,164 0.03%Orange SA 650,000 3.88% 14/1/2021 677,529 0.03%Sogecap SA^ 600,000 4.13% Perpetual 675,750 0.03%Caisse Francaise de Financement Local 600,000 2.38% 17/1/2024 662,396 0.03%Wendel SA 600,000 2.75% 2/10/2024 661,242 0.03%Cie de Saint-Gobain 600,000 1.88% 15/3/2031 656,705 0.03%Pernod Ricard SA 600,000 2.13% 27/9/2024 654,960 0.03%Veolia Environnement SA 600,000 1.59% 10/1/2028 653,796 0.03%Credit Agricole Home Loan SFH SA 600,000 4.00% 17/1/2022 653,165 0.03%Klepierre SA 600,000 1.88% 19/2/2026 652,652 0.03%BNP Paribas SA 600,000 4.13% 14/1/2022 652,648 0.03%Credit Mutuel - CIC Home Loan SFH SA 600,000 1.75% 19/6/2024 651,060 0.03%BNP Paribas SA 600,000 2.38% 17/2/2025 650,204 0.03%Cie de Saint-Gobain 600,000 3.63% 28/3/2022 649,323 0.03%Sanofi 600,000 1.13% 5/4/2028 644,613 0.03%Societe Generale SA 600,000 1.75% 22/3/2029 644,567 0.03%Orange SA 600,000 3.00% 15/6/2022 644,490 0.03%Credit Agricole Home Loan SFH SA 600,000 1.00% 16/1/2029 644,418 0.03%APRR SA 600,000 1.25% 18/1/2028 640,290 0.03%Credit Agricole Home Loan SFH SA 600,000 0.88% 11/8/2028 637,135 0.03%Indigo Group SAS 600,000 1.63% 19/4/2028 636,282 0.03%APRR SA 600,000 1.13% 9/1/2026 632,412 0.03%Danone SA 600,000 1.25% 30/5/2024 631,898 0.03%Altarea SCA 600,000 2.25% 5/7/2024 630,573 0.03%Auchan Holding SA 600,000 2.38% 12/12/2022 629,989 0.03%Banque Federative du Credit Mutuel SA 600,000 1.25% 14/1/2025 629,088 0.03%Societe Generale SA 600,000 1.38% 13/1/2028 626,872 0.03%Danone SA 600,000 2.25% 15/11/2021 623,950 0.03%Caisse Francaise de Financement Local 500,000 3.00% 2/10/2028 623,749 0.03%Cie de Saint-Gobain 600,000 1.00% 17/3/2025 620,570 0.03%Engie SA 600,000 1.38% 21/6/2039 620,094 0.03%Caisse Francaise de Financement Local 600,000 0.50% 16/1/2025 618,650 0.03%Danone SA 600,000 0.71% 3/11/2024 617,682 0.03%Danone SA^ 600,000 1.75% Perpetual 616,500 0.03%Cie de Financement Foncier SA 600,000 0.38% 9/4/2027 613,747 0.03%BPCE SA 600,000 0.88% 31/1/2024 613,433 0.03%Banque Federative du Credit Mutuel SA 600,000 0.75% 8/6/2026 613,422 0.03%
Vanguard Euro Investment Grade Bond Index Fund
238
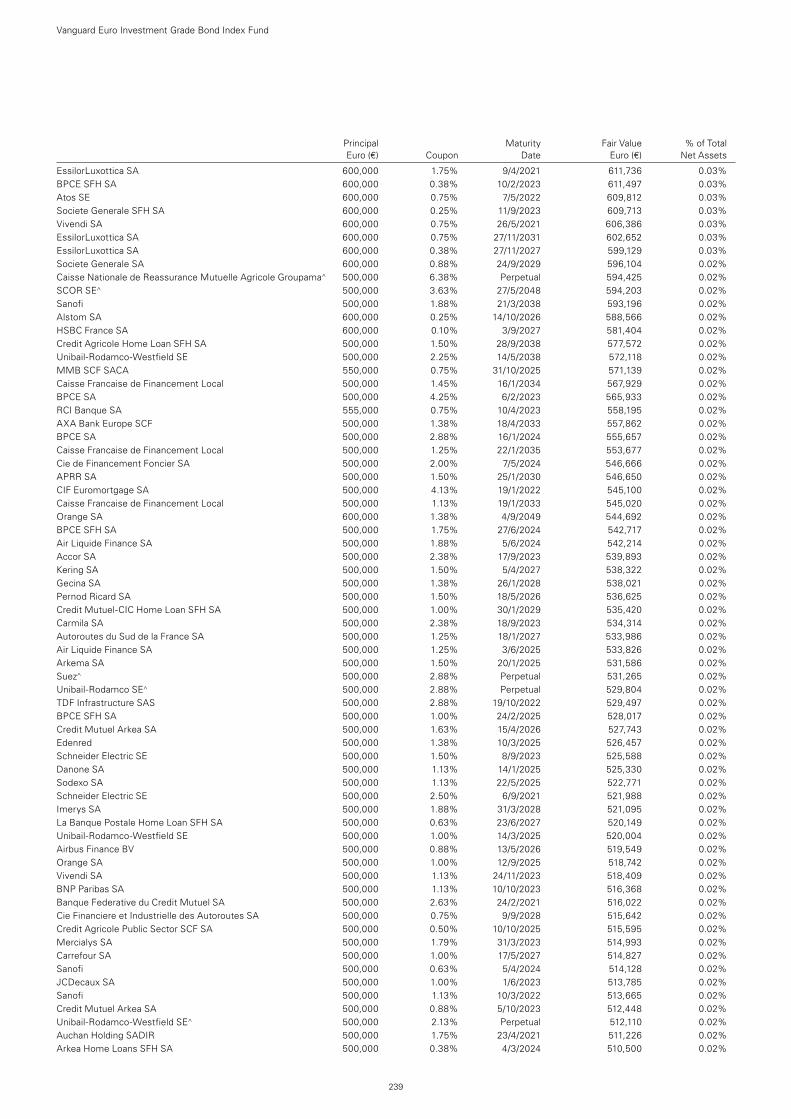
Principal Maturity Fair Value % of Total Euro (€) Coupon Date Euro (€) Net Assets
EssilorLuxottica SA 600,000 1.75% 9/4/2021 611,736 0.03%BPCE SFH SA 600,000 0.38% 10/2/2023 611,497 0.03%Atos SE 600,000 0.75% 7/5/2022 609,812 0.03%Societe Generale SFH SA 600,000 0.25% 11/9/2023 609,713 0.03%Vivendi SA 600,000 0.75% 26/5/2021 606,386 0.03%EssilorLuxottica SA 600,000 0.75% 27/11/2031 602,652 0.03%EssilorLuxottica SA 600,000 0.38% 27/11/2027 599,129 0.03%Societe Generale SA 600,000 0.88% 24/9/2029 596,104 0.02%Caisse Nationale de Reassurance Mutuelle Agricole Groupama^ 500,000 6.38% Perpetual 594,425 0.02%SCOR SE^ 500,000 3.63% 27/5/2048 594,203 0.02%Sanofi 500,000 1.88% 21/3/2038 593,196 0.02%Alstom SA 600,000 0.25% 14/10/2026 588,566 0.02%HSBC France SA 600,000 0.10% 3/9/2027 581,404 0.02%Credit Agricole Home Loan SFH SA 500,000 1.50% 28/9/2038 577,572 0.02%Unibail-Rodamco-Westfield SE 500,000 2.25% 14/5/2038 572,118 0.02%MMB SCF SACA 550,000 0.75% 31/10/2025 571,139 0.02%Caisse Francaise de Financement Local 500,000 1.45% 16/1/2034 567,929 0.02%BPCE SA 500,000 4.25% 6/2/2023 565,933 0.02%RCI Banque SA 555,000 0.75% 10/4/2023 558,195 0.02%AXA Bank Europe SCF 500,000 1.38% 18/4/2033 557,862 0.02%BPCE SA 500,000 2.88% 16/1/2024 555,657 0.02%Caisse Francaise de Financement Local 500,000 1.25% 22/1/2035 553,677 0.02%Cie de Financement Foncier SA 500,000 2.00% 7/5/2024 546,666 0.02%APRR SA 500,000 1.50% 25/1/2030 546,650 0.02%CIF Euromortgage SA 500,000 4.13% 19/1/2022 545,100 0.02%Caisse Francaise de Financement Local 500,000 1.13% 19/1/2033 545,020 0.02%Orange SA 600,000 1.38% 4/9/2049 544,692 0.02%BPCE SFH SA 500,000 1.75% 27/6/2024 542,717 0.02%Air Liquide Finance SA 500,000 1.88% 5/6/2024 542,214 0.02%Accor SA 500,000 2.38% 17/9/2023 539,893 0.02%Kering SA 500,000 1.50% 5/4/2027 538,322 0.02%Gecina SA 500,000 1.38% 26/1/2028 538,021 0.02%Pernod Ricard SA 500,000 1.50% 18/5/2026 536,625 0.02%Credit Mutuel-CIC Home Loan SFH SA 500,000 1.00% 30/1/2029 535,420 0.02%Carmila SA 500,000 2.38% 18/9/2023 534,314 0.02%Autoroutes du Sud de la France SA 500,000 1.25% 18/1/2027 533,986 0.02%Air Liquide Finance SA 500,000 1.25% 3/6/2025 533,826 0.02%Arkema SA 500,000 1.50% 20/1/2025 531,586 0.02%Suez^ 500,000 2.88% Perpetual 531,265 0.02%Unibail-Rodamco SE^ 500,000 2.88% Perpetual 529,804 0.02%TDF Infrastructure SAS 500,000 2.88% 19/10/2022 529,497 0.02%BPCE SFH SA 500,000 1.00% 24/2/2025 528,017 0.02%Credit Mutuel Arkea SA 500,000 1.63% 15/4/2026 527,743 0.02%Edenred 500,000 1.38% 10/3/2025 526,457 0.02%Schneider Electric SE 500,000 1.50% 8/9/2023 525,588 0.02%Danone SA 500,000 1.13% 14/1/2025 525,330 0.02%Sodexo SA 500,000 1.13% 22/5/2025 522,771 0.02%Schneider Electric SE 500,000 2.50% 6/9/2021 521,988 0.02%Imerys SA 500,000 1.88% 31/3/2028 521,095 0.02%La Banque Postale Home Loan SFH SA 500,000 0.63% 23/6/2027 520,149 0.02%Unibail-Rodamco-Westfield SE 500,000 1.00% 14/3/2025 520,004 0.02%Airbus Finance BV 500,000 0.88% 13/5/2026 519,549 0.02%Orange SA 500,000 1.00% 12/9/2025 518,742 0.02%Vivendi SA 500,000 1.13% 24/11/2023 518,409 0.02%BNP Paribas SA 500,000 1.13% 10/10/2023 516,368 0.02%Banque Federative du Credit Mutuel SA 500,000 2.63% 24/2/2021 516,022 0.02%Cie Financiere et Industrielle des Autoroutes SA 500,000 0.75% 9/9/2028 515,642 0.02%Credit Agricole Public Sector SCF SA 500,000 0.50% 10/10/2025 515,595 0.02%Mercialys SA 500,000 1.79% 31/3/2023 514,993 0.02%Carrefour SA 500,000 1.00% 17/5/2027 514,827 0.02%Sanofi 500,000 0.63% 5/4/2024 514,128 0.02%JCDecaux SA 500,000 1.00% 1/6/2023 513,785 0.02%Sanofi 500,000 1.13% 10/3/2022 513,665 0.02%Credit Mutuel Arkea SA 500,000 0.88% 5/10/2023 512,448 0.02%Unibail-Rodamco-Westfield SE^ 500,000 2.13% Perpetual 512,110 0.02%Auchan Holding SADIR 500,000 1.75% 23/4/2021 511,226 0.02%Arkea Home Loans SFH SA 500,000 0.38% 4/3/2024 510,500 0.02%
Vanguard Euro Investment Grade Bond Index Fund
239
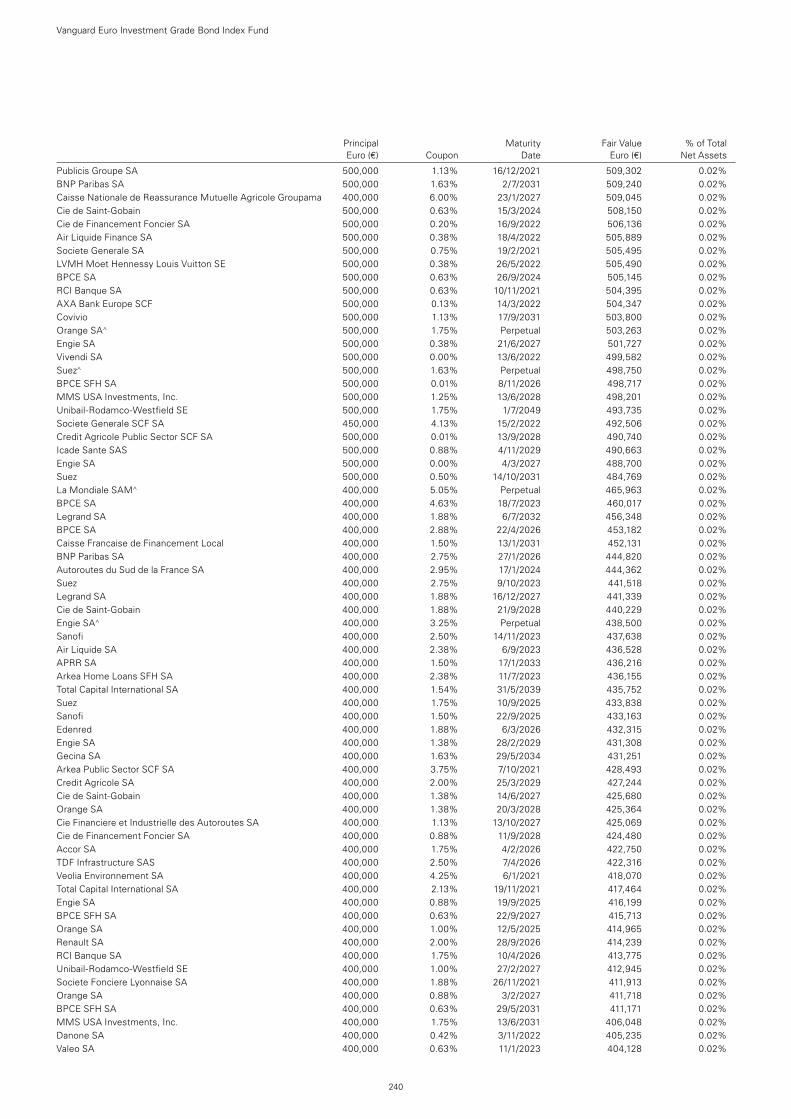
Principal Maturity Fair Value % of Total Euro (€) Coupon Date Euro (€) Net Assets
Publicis Groupe SA 500,000 1.13% 16/12/2021 509,302 0.02%BNP Paribas SA 500,000 1.63% 2/7/2031 509,240 0.02%Caisse Nationale de Reassurance Mutuelle Agricole Groupama 400,000 6.00% 23/1/2027 509,045 0.02%Cie de Saint-Gobain 500,000 0.63% 15/3/2024 508,150 0.02%Cie de Financement Foncier SA 500,000 0.20% 16/9/2022 506,136 0.02%Air Liquide Finance SA 500,000 0.38% 18/4/2022 505,889 0.02%Societe Generale SA 500,000 0.75% 19/2/2021 505,495 0.02%LVMH Moet Hennessy Louis Vuitton SE 500,000 0.38% 26/5/2022 505,490 0.02%BPCE SA 500,000 0.63% 26/9/2024 505,145 0.02%RCI Banque SA 500,000 0.63% 10/11/2021 504,395 0.02%AXA Bank Europe SCF 500,000 0.13% 14/3/2022 504,347 0.02%Covivio 500,000 1.13% 17/9/2031 503,800 0.02%Orange SA^ 500,000 1.75% Perpetual 503,263 0.02%Engie SA 500,000 0.38% 21/6/2027 501,727 0.02%Vivendi SA 500,000 0.00% 13/6/2022 499,582 0.02%Suez^ 500,000 1.63% Perpetual 498,750 0.02%BPCE SFH SA 500,000 0.01% 8/11/2026 498,717 0.02%MMS USA Investments, Inc. 500,000 1.25% 13/6/2028 498,201 0.02%Unibail-Rodamco-Westfield SE 500,000 1.75% 1/7/2049 493,735 0.02%Societe Generale SCF SA 450,000 4.13% 15/2/2022 492,506 0.02%Credit Agricole Public Sector SCF SA 500,000 0.01% 13/9/2028 490,740 0.02%Icade Sante SAS 500,000 0.88% 4/11/2029 490,663 0.02%Engie SA 500,000 0.00% 4/3/2027 488,700 0.02%Suez 500,000 0.50% 14/10/2031 484,769 0.02%La Mondiale SAM^ 400,000 5.05% Perpetual 465,963 0.02%BPCE SA 400,000 4.63% 18/7/2023 460,017 0.02%Legrand SA 400,000 1.88% 6/7/2032 456,348 0.02%BPCE SA 400,000 2.88% 22/4/2026 453,182 0.02%Caisse Francaise de Financement Local 400,000 1.50% 13/1/2031 452,131 0.02%BNP Paribas SA 400,000 2.75% 27/1/2026 444,820 0.02%Autoroutes du Sud de la France SA 400,000 2.95% 17/1/2024 444,362 0.02%Suez 400,000 2.75% 9/10/2023 441,518 0.02%Legrand SA 400,000 1.88% 16/12/2027 441,339 0.02%Cie de Saint-Gobain 400,000 1.88% 21/9/2028 440,229 0.02%Engie SA^ 400,000 3.25% Perpetual 438,500 0.02%Sanofi 400,000 2.50% 14/11/2023 437,638 0.02%Air Liquide SA 400,000 2.38% 6/9/2023 436,528 0.02%APRR SA 400,000 1.50% 17/1/2033 436,216 0.02%Arkea Home Loans SFH SA 400,000 2.38% 11/7/2023 436,155 0.02%Total Capital International SA 400,000 1.54% 31/5/2039 435,752 0.02%Suez 400,000 1.75% 10/9/2025 433,838 0.02%Sanofi 400,000 1.50% 22/9/2025 433,163 0.02%Edenred 400,000 1.88% 6/3/2026 432,315 0.02%Engie SA 400,000 1.38% 28/2/2029 431,308 0.02%Gecina SA 400,000 1.63% 29/5/2034 431,251 0.02%Arkea Public Sector SCF SA 400,000 3.75% 7/10/2021 428,493 0.02%Credit Agricole SA 400,000 2.00% 25/3/2029 427,244 0.02%Cie de Saint-Gobain 400,000 1.38% 14/6/2027 425,680 0.02%Orange SA 400,000 1.38% 20/3/2028 425,364 0.02%Cie Financiere et Industrielle des Autoroutes SA 400,000 1.13% 13/10/2027 425,069 0.02%Cie de Financement Foncier SA 400,000 0.88% 11/9/2028 424,480 0.02%Accor SA 400,000 1.75% 4/2/2026 422,750 0.02%TDF Infrastructure SAS 400,000 2.50% 7/4/2026 422,316 0.02%Veolia Environnement SA 400,000 4.25% 6/1/2021 418,070 0.02%Total Capital International SA 400,000 2.13% 19/11/2021 417,464 0.02%Engie SA 400,000 0.88% 19/9/2025 416,199 0.02%BPCE SFH SA 400,000 0.63% 22/9/2027 415,713 0.02%Orange SA 400,000 1.00% 12/5/2025 414,965 0.02%Renault SA 400,000 2.00% 28/9/2026 414,239 0.02%RCI Banque SA 400,000 1.75% 10/4/2026 413,775 0.02%Unibail-Rodamco-Westfield SE 400,000 1.00% 27/2/2027 412,945 0.02%Societe Fonciere Lyonnaise SA 400,000 1.88% 26/11/2021 411,913 0.02%Orange SA 400,000 0.88% 3/2/2027 411,718 0.02%BPCE SFH SA 400,000 0.63% 29/5/2031 411,171 0.02%MMS USA Investments, Inc. 400,000 1.75% 13/6/2031 406,048 0.02%Danone SA 400,000 0.42% 3/11/2022 405,235 0.02%Valeo SA 400,000 0.63% 11/1/2023 404,128 0.02%
Vanguard Euro Investment Grade Bond Index Fund
240
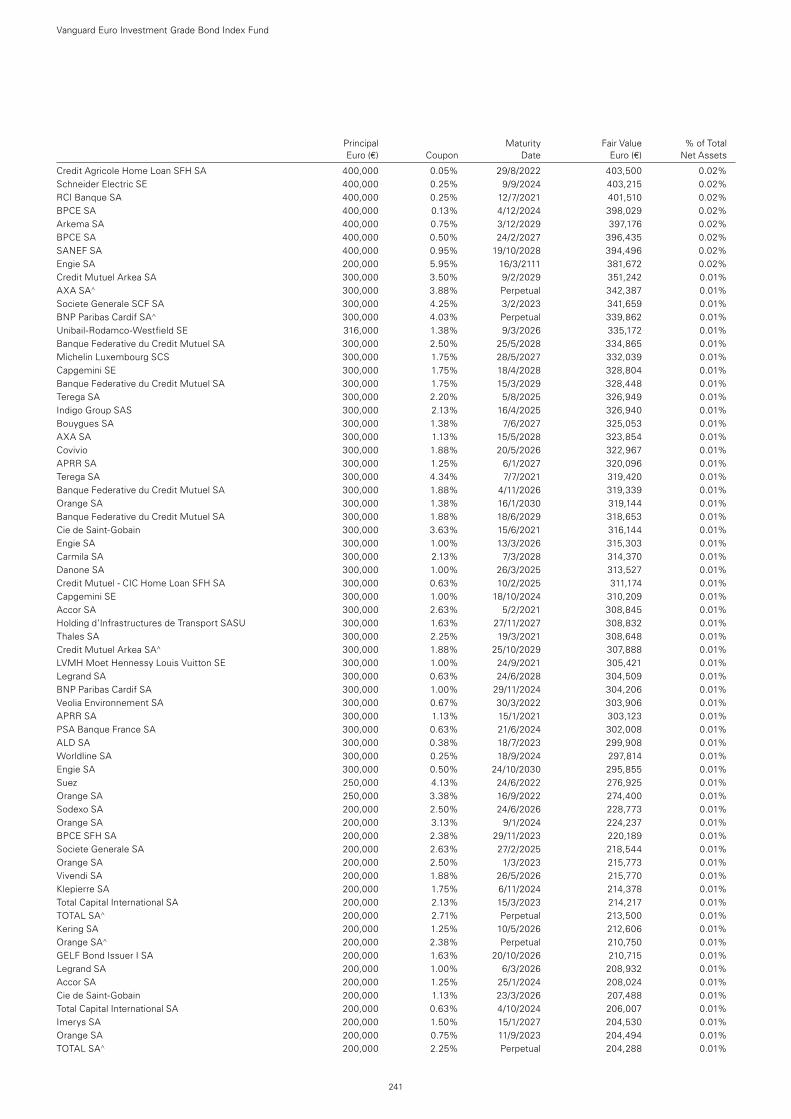
Principal Maturity Fair Value % of Total Euro (€) Coupon Date Euro (€) Net Assets
Credit Agricole Home Loan SFH SA 400,000 0.05% 29/8/2022 403,500 0.02%Schneider Electric SE 400,000 0.25% 9/9/2024 403,215 0.02%RCI Banque SA 400,000 0.25% 12/7/2021 401,510 0.02%BPCE SA 400,000 0.13% 4/12/2024 398,029 0.02%Arkema SA 400,000 0.75% 3/12/2029 397,176 0.02%BPCE SA 400,000 0.50% 24/2/2027 396,435 0.02%SANEF SA 400,000 0.95% 19/10/2028 394,496 0.02%Engie SA 200,000 5.95% 16/3/2111 381,672 0.02%Credit Mutuel Arkea SA 300,000 3.50% 9/2/2029 351,242 0.01%AXA SA^ 300,000 3.88% Perpetual 342,387 0.01%Societe Generale SCF SA 300,000 4.25% 3/2/2023 341,659 0.01%BNP Paribas Cardif SA^ 300,000 4.03% Perpetual 339,862 0.01%Unibail-Rodamco-Westfield SE 316,000 1.38% 9/3/2026 335,172 0.01%Banque Federative du Credit Mutuel SA 300,000 2.50% 25/5/2028 334,865 0.01%Michelin Luxembourg SCS 300,000 1.75% 28/5/2027 332,039 0.01%Capgemini SE 300,000 1.75% 18/4/2028 328,804 0.01%Banque Federative du Credit Mutuel SA 300,000 1.75% 15/3/2029 328,448 0.01%Terega SA 300,000 2.20% 5/8/2025 326,949 0.01%Indigo Group SAS 300,000 2.13% 16/4/2025 326,940 0.01%Bouygues SA 300,000 1.38% 7/6/2027 325,053 0.01%AXA SA 300,000 1.13% 15/5/2028 323,854 0.01%Covivio 300,000 1.88% 20/5/2026 322,967 0.01%APRR SA 300,000 1.25% 6/1/2027 320,096 0.01%Terega SA 300,000 4.34% 7/7/2021 319,420 0.01%Banque Federative du Credit Mutuel SA 300,000 1.88% 4/11/2026 319,339 0.01%Orange SA 300,000 1.38% 16/1/2030 319,144 0.01%Banque Federative du Credit Mutuel SA 300,000 1.88% 18/6/2029 318,653 0.01%Cie de Saint-Gobain 300,000 3.63% 15/6/2021 316,144 0.01%Engie SA 300,000 1.00% 13/3/2026 315,303 0.01%Carmila SA 300,000 2.13% 7/3/2028 314,370 0.01%Danone SA 300,000 1.00% 26/3/2025 313,527 0.01%Credit Mutuel - CIC Home Loan SFH SA 300,000 0.63% 10/2/2025 311,174 0.01%Capgemini SE 300,000 1.00% 18/10/2024 310,209 0.01%Accor SA 300,000 2.63% 5/2/2021 308,845 0.01%Holding d’Infrastructures de Transport SASU 300,000 1.63% 27/11/2027 308,832 0.01%Thales SA 300,000 2.25% 19/3/2021 308,648 0.01%Credit Mutuel Arkea SA^ 300,000 1.88% 25/10/2029 307,888 0.01%LVMH Moet Hennessy Louis Vuitton SE 300,000 1.00% 24/9/2021 305,421 0.01%Legrand SA 300,000 0.63% 24/6/2028 304,509 0.01%BNP Paribas Cardif SA 300,000 1.00% 29/11/2024 304,206 0.01%Veolia Environnement SA 300,000 0.67% 30/3/2022 303,906 0.01%APRR SA 300,000 1.13% 15/1/2021 303,123 0.01%PSA Banque France SA 300,000 0.63% 21/6/2024 302,008 0.01%ALD SA 300,000 0.38% 18/7/2023 299,908 0.01%Worldline SA 300,000 0.25% 18/9/2024 297,814 0.01%Engie SA 300,000 0.50% 24/10/2030 295,855 0.01%Suez 250,000 4.13% 24/6/2022 276,925 0.01%Orange SA 250,000 3.38% 16/9/2022 274,400 0.01%Sodexo SA 200,000 2.50% 24/6/2026 228,773 0.01%Orange SA 200,000 3.13% 9/1/2024 224,237 0.01%BPCE SFH SA 200,000 2.38% 29/11/2023 220,189 0.01%Societe Generale SA 200,000 2.63% 27/2/2025 218,544 0.01%Orange SA 200,000 2.50% 1/3/2023 215,773 0.01%Vivendi SA 200,000 1.88% 26/5/2026 215,770 0.01%Klepierre SA 200,000 1.75% 6/11/2024 214,378 0.01%Total Capital International SA 200,000 2.13% 15/3/2023 214,217 0.01%TOTAL SA^ 200,000 2.71% Perpetual 213,500 0.01%Kering SA 200,000 1.25% 10/5/2026 212,606 0.01%Orange SA^ 200,000 2.38% Perpetual 210,750 0.01%GELF Bond Issuer I SA 200,000 1.63% 20/10/2026 210,715 0.01%Legrand SA 200,000 1.00% 6/3/2026 208,932 0.01%Accor SA 200,000 1.25% 25/1/2024 208,024 0.01%Cie de Saint-Gobain 200,000 1.13% 23/3/2026 207,488 0.01%Total Capital International SA 200,000 0.63% 4/10/2024 206,007 0.01%Imerys SA 200,000 1.50% 15/1/2027 204,530 0.01%Orange SA 200,000 0.75% 11/9/2023 204,494 0.01%TOTAL SA^ 200,000 2.25% Perpetual 204,288 0.01%
Vanguard Euro Investment Grade Bond Index Fund
241
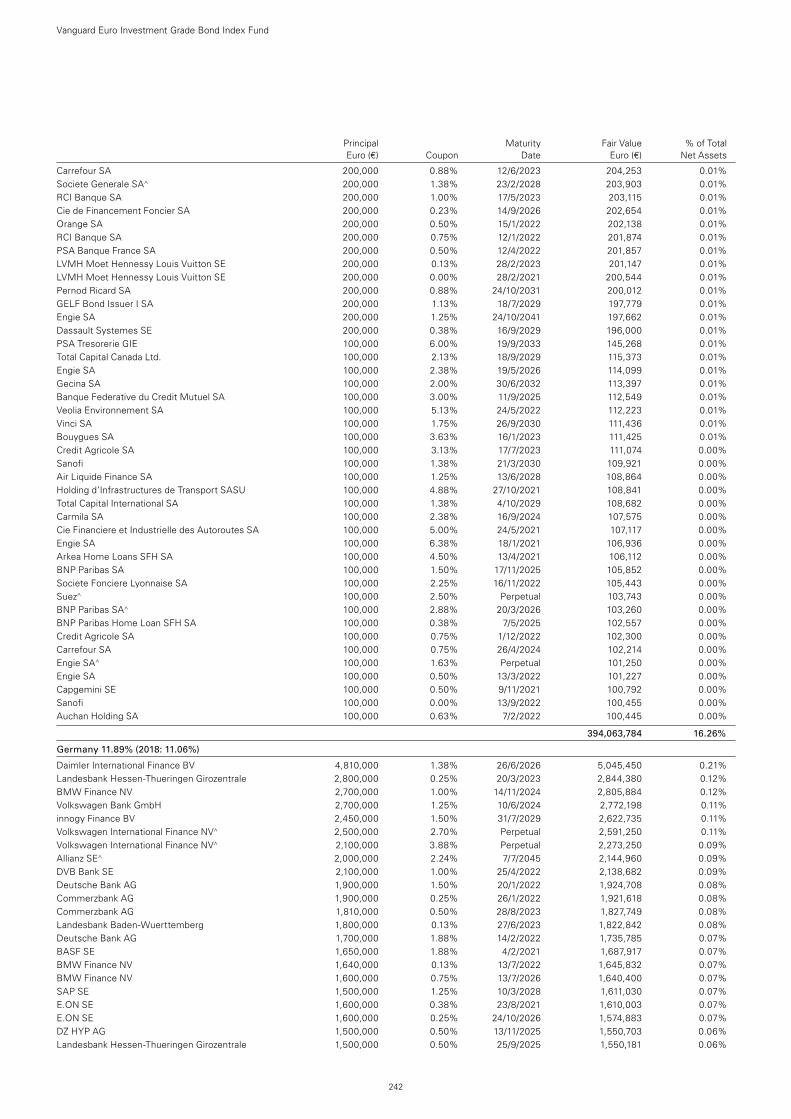
Principal Maturity Fair Value % of Total Euro (€) Coupon Date Euro (€) Net Assets
Carrefour SA 200,000 0.88% 12/6/2023 204,253 0.01%Societe Generale SA^ 200,000 1.38% 23/2/2028 203,903 0.01%RCI Banque SA 200,000 1.00% 17/5/2023 203,115 0.01%Cie de Financement Foncier SA 200,000 0.23% 14/9/2026 202,654 0.01%Orange SA 200,000 0.50% 15/1/2022 202,138 0.01%RCI Banque SA 200,000 0.75% 12/1/2022 201,874 0.01%PSA Banque France SA 200,000 0.50% 12/4/2022 201,857 0.01%LVMH Moet Hennessy Louis Vuitton SE 200,000 0.13% 28/2/2023 201,147 0.01%LVMH Moet Hennessy Louis Vuitton SE 200,000 0.00% 28/2/2021 200,544 0.01%Pernod Ricard SA 200,000 0.88% 24/10/2031 200,012 0.01%GELF Bond Issuer I SA 200,000 1.13% 18/7/2029 197,779 0.01%Engie SA 200,000 1.25% 24/10/2041 197,662 0.01%Dassault Systemes SE 200,000 0.38% 16/9/2029 196,000 0.01%PSA Tresorerie GIE 100,000 6.00% 19/9/2033 145,268 0.01%Total Capital Canada Ltd. 100,000 2.13% 18/9/2029 115,373 0.01%Engie SA 100,000 2.38% 19/5/2026 114,099 0.01%Gecina SA 100,000 2.00% 30/6/2032 113,397 0.01%Banque Federative du Credit Mutuel SA 100,000 3.00% 11/9/2025 112,549 0.01%Veolia Environnement SA 100,000 5.13% 24/5/2022 112,223 0.01%Vinci SA 100,000 1.75% 26/9/2030 111,436 0.01%Bouygues SA 100,000 3.63% 16/1/2023 111,425 0.01%Credit Agricole SA 100,000 3.13% 17/7/2023 111,074 0.00%Sanofi 100,000 1.38% 21/3/2030 109,921 0.00%Air Liquide Finance SA 100,000 1.25% 13/6/2028 108,864 0.00%Holding d’Infrastructures de Transport SASU 100,000 4.88% 27/10/2021 108,841 0.00%Total Capital International SA 100,000 1.38% 4/10/2029 108,682 0.00%Carmila SA 100,000 2.38% 16/9/2024 107,575 0.00%Cie Financiere et Industrielle des Autoroutes SA 100,000 5.00% 24/5/2021 107,117 0.00%Engie SA 100,000 6.38% 18/1/2021 106,936 0.00%Arkea Home Loans SFH SA 100,000 4.50% 13/4/2021 106,112 0.00%BNP Paribas SA 100,000 1.50% 17/11/2025 105,852 0.00%Societe Fonciere Lyonnaise SA 100,000 2.25% 16/11/2022 105,443 0.00%Suez^ 100,000 2.50% Perpetual 103,743 0.00%BNP Paribas SA^ 100,000 2.88% 20/3/2026 103,260 0.00%BNP Paribas Home Loan SFH SA 100,000 0.38% 7/5/2025 102,557 0.00%Credit Agricole SA 100,000 0.75% 1/12/2022 102,300 0.00%Carrefour SA 100,000 0.75% 26/4/2024 102,214 0.00%Engie SA^ 100,000 1.63% Perpetual 101,250 0.00%Engie SA 100,000 0.50% 13/3/2022 101,227 0.00%Capgemini SE 100,000 0.50% 9/11/2021 100,792 0.00%Sanofi 100,000 0.00% 13/9/2022 100,455 0.00%Auchan Holding SA 100,000 0.63% 7/2/2022 100,445 0.00%
394,063,784 16.26%
Germany 11.89% (2018: 11.06%)
Daimler International Finance BV 4,810,000 1.38% 26/6/2026 5,045,450 0.21%Landesbank Hessen-Thueringen Girozentrale 2,800,000 0.25% 20/3/2023 2,844,380 0.12%BMW Finance NV 2,700,000 1.00% 14/11/2024 2,805,884 0.12%Volkswagen Bank GmbH 2,700,000 1.25% 10/6/2024 2,772,198 0.11%innogy Finance BV 2,450,000 1.50% 31/7/2029 2,622,735 0.11%Volkswagen International Finance NV^ 2,500,000 2.70% Perpetual 2,591,250 0.11%Volkswagen International Finance NV^ 2,100,000 3.88% Perpetual 2,273,250 0.09%Allianz SE^ 2,000,000 2.24% 7/7/2045 2,144,960 0.09%DVB Bank SE 2,100,000 1.00% 25/4/2022 2,138,682 0.09%Deutsche Bank AG 1,900,000 1.50% 20/1/2022 1,924,708 0.08%Commerzbank AG 1,900,000 0.25% 26/1/2022 1,921,618 0.08%Commerzbank AG 1,810,000 0.50% 28/8/2023 1,827,749 0.08%Landesbank Baden-Wuerttemberg 1,800,000 0.13% 27/6/2023 1,822,842 0.08%Deutsche Bank AG 1,700,000 1.88% 14/2/2022 1,735,785 0.07%BASF SE 1,650,000 1.88% 4/2/2021 1,687,917 0.07%BMW Finance NV 1,640,000 0.13% 13/7/2022 1,645,832 0.07%BMW Finance NV 1,600,000 0.75% 13/7/2026 1,640,400 0.07%SAP SE 1,500,000 1.25% 10/3/2028 1,611,030 0.07%E.ON SE 1,600,000 0.38% 23/8/2021 1,610,003 0.07%E.ON SE 1,600,000 0.25% 24/10/2026 1,574,883 0.07%DZ HYP AG 1,500,000 0.50% 13/11/2025 1,550,703 0.06%Landesbank Hessen-Thueringen Girozentrale 1,500,000 0.50% 25/9/2025 1,550,181 0.06%
Vanguard Euro Investment Grade Bond Index Fund
242
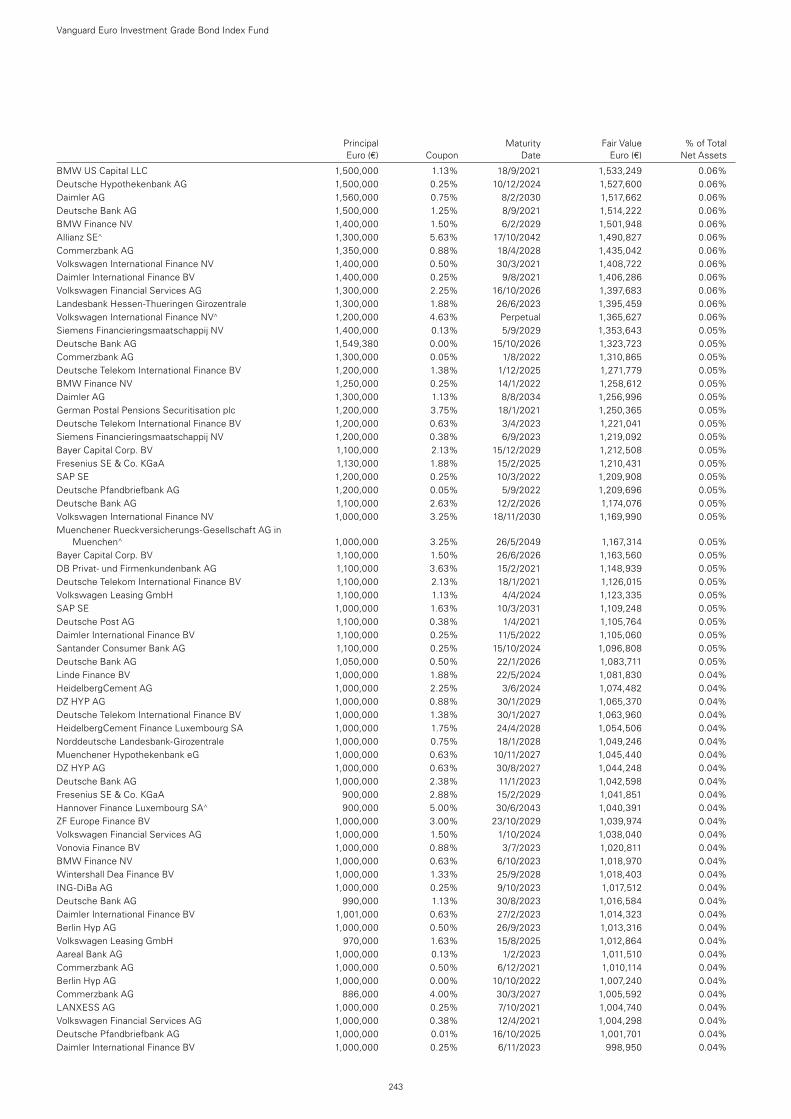
Principal Maturity Fair Value % of Total Euro (€) Coupon Date Euro (€) Net Assets
BMW US Capital LLC 1,500,000 1.13% 18/9/2021 1,533,249 0.06%Deutsche Hypothekenbank AG 1,500,000 0.25% 10/12/2024 1,527,600 0.06%Daimler AG 1,560,000 0.75% 8/2/2030 1,517,662 0.06%Deutsche Bank AG 1,500,000 1.25% 8/9/2021 1,514,222 0.06%BMW Finance NV 1,400,000 1.50% 6/2/2029 1,501,948 0.06%Allianz SE^ 1,300,000 5.63% 17/10/2042 1,490,827 0.06%Commerzbank AG 1,350,000 0.88% 18/4/2028 1,435,042 0.06%Volkswagen International Finance NV 1,400,000 0.50% 30/3/2021 1,408,722 0.06%Daimler International Finance BV 1,400,000 0.25% 9/8/2021 1,406,286 0.06%Volkswagen Financial Services AG 1,300,000 2.25% 16/10/2026 1,397,683 0.06%Landesbank Hessen-Thueringen Girozentrale 1,300,000 1.88% 26/6/2023 1,395,459 0.06%Volkswagen International Finance NV^ 1,200,000 4.63% Perpetual 1,365,627 0.06%Siemens Financieringsmaatschappij NV 1,400,000 0.13% 5/9/2029 1,353,643 0.05%Deutsche Bank AG 1,549,380 0.00% 15/10/2026 1,323,723 0.05%Commerzbank AG 1,300,000 0.05% 1/8/2022 1,310,865 0.05%Deutsche Telekom International Finance BV 1,200,000 1.38% 1/12/2025 1,271,779 0.05%BMW Finance NV 1,250,000 0.25% 14/1/2022 1,258,612 0.05%Daimler AG 1,300,000 1.13% 8/8/2034 1,256,996 0.05%German Postal Pensions Securitisation plc 1,200,000 3.75% 18/1/2021 1,250,365 0.05%Deutsche Telekom International Finance BV 1,200,000 0.63% 3/4/2023 1,221,041 0.05%Siemens Financieringsmaatschappij NV 1,200,000 0.38% 6/9/2023 1,219,092 0.05%Bayer Capital Corp. BV 1,100,000 2.13% 15/12/2029 1,212,508 0.05%Fresenius SE & Co. KGaA 1,130,000 1.88% 15/2/2025 1,210,431 0.05%SAP SE 1,200,000 0.25% 10/3/2022 1,209,908 0.05%Deutsche Pfandbriefbank AG 1,200,000 0.05% 5/9/2022 1,209,696 0.05%Deutsche Bank AG 1,100,000 2.63% 12/2/2026 1,174,076 0.05%Volkswagen International Finance NV 1,000,000 3.25% 18/11/2030 1,169,990 0.05%Muenchener Rueckversicherungs-Gesellschaft AG in
Muenchen^ 1,000,000 3.25% 26/5/2049 1,167,314 0.05%Bayer Capital Corp. BV 1,100,000 1.50% 26/6/2026 1,163,560 0.05%DB Privat- und Firmenkundenbank AG 1,100,000 3.63% 15/2/2021 1,148,939 0.05%Deutsche Telekom International Finance BV 1,100,000 2.13% 18/1/2021 1,126,015 0.05%Volkswagen Leasing GmbH 1,100,000 1.13% 4/4/2024 1,123,335 0.05%SAP SE 1,000,000 1.63% 10/3/2031 1,109,248 0.05%Deutsche Post AG 1,100,000 0.38% 1/4/2021 1,105,764 0.05%Daimler International Finance BV 1,100,000 0.25% 11/5/2022 1,105,060 0.05%Santander Consumer Bank AG 1,100,000 0.25% 15/10/2024 1,096,808 0.05%Deutsche Bank AG 1,050,000 0.50% 22/1/2026 1,083,711 0.05%Linde Finance BV 1,000,000 1.88% 22/5/2024 1,081,830 0.04%HeidelbergCement AG 1,000,000 2.25% 3/6/2024 1,074,482 0.04%DZ HYP AG 1,000,000 0.88% 30/1/2029 1,065,370 0.04%Deutsche Telekom International Finance BV 1,000,000 1.38% 30/1/2027 1,063,960 0.04%HeidelbergCement Finance Luxembourg SA 1,000,000 1.75% 24/4/2028 1,054,506 0.04%Norddeutsche Landesbank-Girozentrale 1,000,000 0.75% 18/1/2028 1,049,246 0.04%Muenchener Hypothekenbank eG 1,000,000 0.63% 10/11/2027 1,045,440 0.04%DZ HYP AG 1,000,000 0.63% 30/8/2027 1,044,248 0.04%Deutsche Bank AG 1,000,000 2.38% 11/1/2023 1,042,598 0.04%Fresenius SE & Co. KGaA 900,000 2.88% 15/2/2029 1,041,851 0.04%Hannover Finance Luxembourg SA^ 900,000 5.00% 30/6/2043 1,040,391 0.04%ZF Europe Finance BV 1,000,000 3.00% 23/10/2029 1,039,974 0.04%Volkswagen Financial Services AG 1,000,000 1.50% 1/10/2024 1,038,040 0.04%Vonovia Finance BV 1,000,000 0.88% 3/7/2023 1,020,811 0.04%BMW Finance NV 1,000,000 0.63% 6/10/2023 1,018,970 0.04%Wintershall Dea Finance BV 1,000,000 1.33% 25/9/2028 1,018,403 0.04%ING-DiBa AG 1,000,000 0.25% 9/10/2023 1,017,512 0.04%Deutsche Bank AG 990,000 1.13% 30/8/2023 1,016,584 0.04%Daimler International Finance BV 1,001,000 0.63% 27/2/2023 1,014,323 0.04%Berlin Hyp AG 1,000,000 0.50% 26/9/2023 1,013,316 0.04%Volkswagen Leasing GmbH 970,000 1.63% 15/8/2025 1,012,864 0.04%Aareal Bank AG 1,000,000 0.13% 1/2/2023 1,011,510 0.04%Commerzbank AG 1,000,000 0.50% 6/12/2021 1,010,114 0.04%Berlin Hyp AG 1,000,000 0.00% 10/10/2022 1,007,240 0.04%Commerzbank AG 886,000 4.00% 30/3/2027 1,005,592 0.04%LANXESS AG 1,000,000 0.25% 7/10/2021 1,004,740 0.04%Volkswagen Financial Services AG 1,000,000 0.38% 12/4/2021 1,004,298 0.04%Deutsche Pfandbriefbank AG 1,000,000 0.01% 16/10/2025 1,001,701 0.04%Daimler International Finance BV 1,000,000 0.25% 6/11/2023 998,950 0.04%
Vanguard Euro Investment Grade Bond Index Fund
243
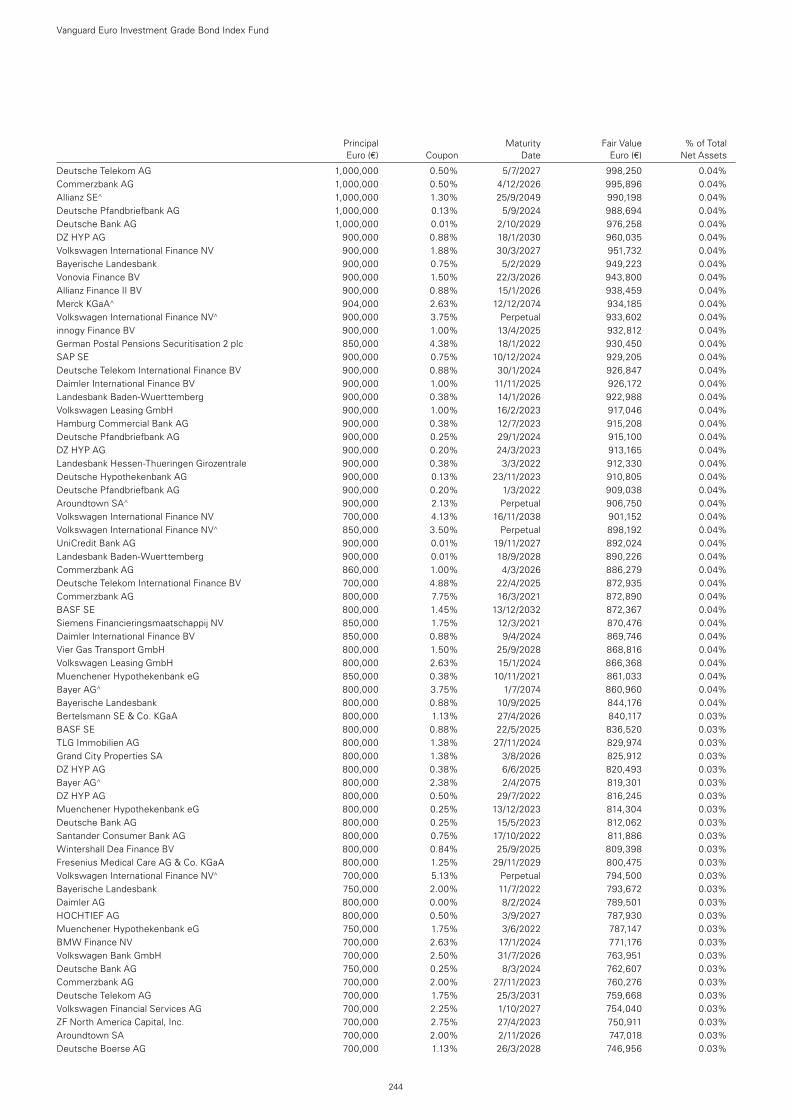
Principal Maturity Fair Value % of Total Euro (€) Coupon Date Euro (€) Net Assets
Deutsche Telekom AG 1,000,000 0.50% 5/7/2027 998,250 0.04%Commerzbank AG 1,000,000 0.50% 4/12/2026 995,896 0.04%Allianz SE^ 1,000,000 1.30% 25/9/2049 990,198 0.04%Deutsche Pfandbriefbank AG 1,000,000 0.13% 5/9/2024 988,694 0.04%Deutsche Bank AG 1,000,000 0.01% 2/10/2029 976,258 0.04%DZ HYP AG 900,000 0.88% 18/1/2030 960,035 0.04%Volkswagen International Finance NV 900,000 1.88% 30/3/2027 951,732 0.04%Bayerische Landesbank 900,000 0.75% 5/2/2029 949,223 0.04%Vonovia Finance BV 900,000 1.50% 22/3/2026 943,800 0.04%Allianz Finance II BV 900,000 0.88% 15/1/2026 938,459 0.04%Merck KGaA^ 904,000 2.63% 12/12/2074 934,185 0.04%Volkswagen International Finance NV^ 900,000 3.75% Perpetual 933,602 0.04%innogy Finance BV 900,000 1.00% 13/4/2025 932,812 0.04%German Postal Pensions Securitisation 2 plc 850,000 4.38% 18/1/2022 930,450 0.04%SAP SE 900,000 0.75% 10/12/2024 929,205 0.04%Deutsche Telekom International Finance BV 900,000 0.88% 30/1/2024 926,847 0.04%Daimler International Finance BV 900,000 1.00% 11/11/2025 926,172 0.04%Landesbank Baden-Wuerttemberg 900,000 0.38% 14/1/2026 922,988 0.04%Volkswagen Leasing GmbH 900,000 1.00% 16/2/2023 917,046 0.04%Hamburg Commercial Bank AG 900,000 0.38% 12/7/2023 915,208 0.04%Deutsche Pfandbriefbank AG 900,000 0.25% 29/1/2024 915,100 0.04%DZ HYP AG 900,000 0.20% 24/3/2023 913,165 0.04%Landesbank Hessen-Thueringen Girozentrale 900,000 0.38% 3/3/2022 912,330 0.04%Deutsche Hypothekenbank AG 900,000 0.13% 23/11/2023 910,805 0.04%Deutsche Pfandbriefbank AG 900,000 0.20% 1/3/2022 909,038 0.04%Aroundtown SA^ 900,000 2.13% Perpetual 906,750 0.04%Volkswagen International Finance NV 700,000 4.13% 16/11/2038 901,152 0.04%Volkswagen International Finance NV^ 850,000 3.50% Perpetual 898,192 0.04%UniCredit Bank AG 900,000 0.01% 19/11/2027 892,024 0.04%Landesbank Baden-Wuerttemberg 900,000 0.01% 18/9/2028 890,226 0.04%Commerzbank AG 860,000 1.00% 4/3/2026 886,279 0.04%Deutsche Telekom International Finance BV 700,000 4.88% 22/4/2025 872,935 0.04%Commerzbank AG 800,000 7.75% 16/3/2021 872,890 0.04%BASF SE 800,000 1.45% 13/12/2032 872,367 0.04%Siemens Financieringsmaatschappij NV 850,000 1.75% 12/3/2021 870,476 0.04%Daimler International Finance BV 850,000 0.88% 9/4/2024 869,746 0.04%Vier Gas Transport GmbH 800,000 1.50% 25/9/2028 868,816 0.04%Volkswagen Leasing GmbH 800,000 2.63% 15/1/2024 866,368 0.04%Muenchener Hypothekenbank eG 850,000 0.38% 10/11/2021 861,033 0.04%Bayer AG^ 800,000 3.75% 1/7/2074 860,960 0.04%Bayerische Landesbank 800,000 0.88% 10/9/2025 844,176 0.04%Bertelsmann SE & Co. KGaA 800,000 1.13% 27/4/2026 840,117 0.03%BASF SE 800,000 0.88% 22/5/2025 836,520 0.03%TLG Immobilien AG 800,000 1.38% 27/11/2024 829,974 0.03%Grand City Properties SA 800,000 1.38% 3/8/2026 825,912 0.03%DZ HYP AG 800,000 0.38% 6/6/2025 820,493 0.03%Bayer AG^ 800,000 2.38% 2/4/2075 819,301 0.03%DZ HYP AG 800,000 0.50% 29/7/2022 816,245 0.03%Muenchener Hypothekenbank eG 800,000 0.25% 13/12/2023 814,304 0.03%Deutsche Bank AG 800,000 0.25% 15/5/2023 812,062 0.03%Santander Consumer Bank AG 800,000 0.75% 17/10/2022 811,886 0.03%Wintershall Dea Finance BV 800,000 0.84% 25/9/2025 809,398 0.03%Fresenius Medical Care AG & Co. KGaA 800,000 1.25% 29/11/2029 800,475 0.03%Volkswagen International Finance NV^ 700,000 5.13% Perpetual 794,500 0.03%Bayerische Landesbank 750,000 2.00% 11/7/2022 793,672 0.03%Daimler AG 800,000 0.00% 8/2/2024 789,501 0.03%HOCHTIEF AG 800,000 0.50% 3/9/2027 787,930 0.03%Muenchener Hypothekenbank eG 750,000 1.75% 3/6/2022 787,147 0.03%BMW Finance NV 700,000 2.63% 17/1/2024 771,176 0.03%Volkswagen Bank GmbH 700,000 2.50% 31/7/2026 763,951 0.03%Deutsche Bank AG 750,000 0.25% 8/3/2024 762,607 0.03%Commerzbank AG 700,000 2.00% 27/11/2023 760,276 0.03%Deutsche Telekom AG 700,000 1.75% 25/3/2031 759,668 0.03%Volkswagen Financial Services AG 700,000 2.25% 1/10/2027 754,040 0.03%ZF North America Capital, Inc. 700,000 2.75% 27/4/2023 750,911 0.03%Aroundtown SA 700,000 2.00% 2/11/2026 747,018 0.03%Deutsche Boerse AG 700,000 1.13% 26/3/2028 746,956 0.03%
Vanguard Euro Investment Grade Bond Index Fund
244
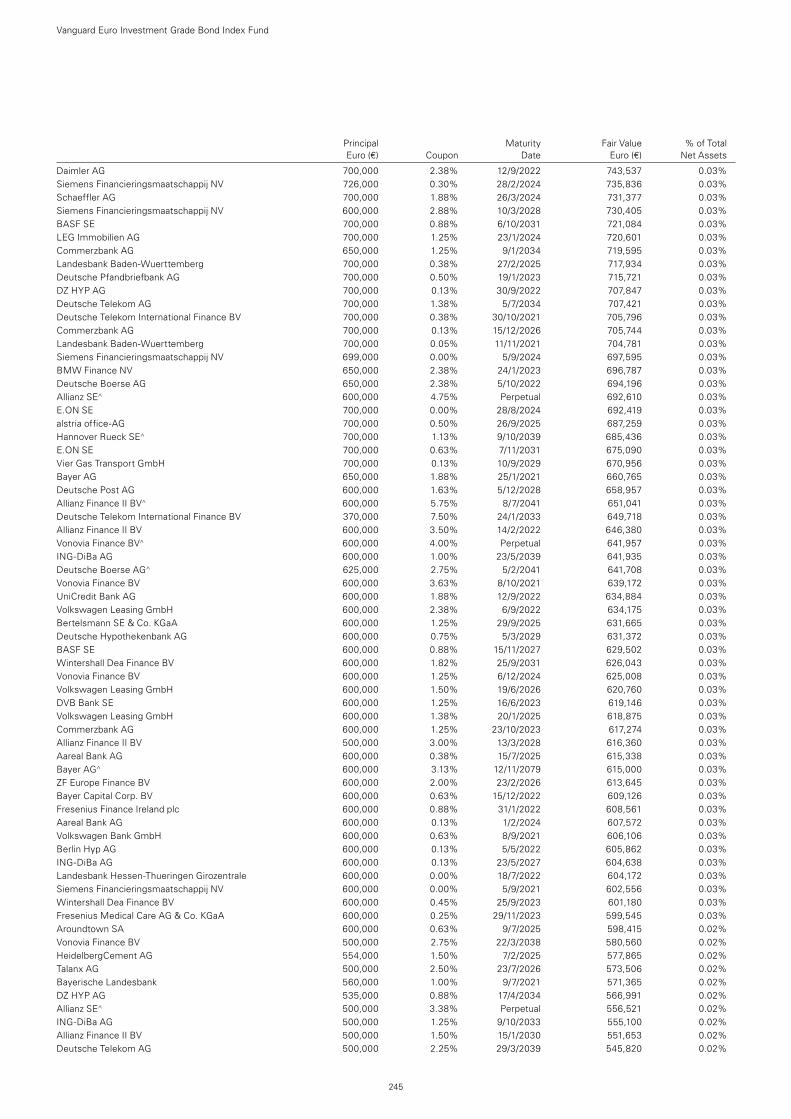
Principal Maturity Fair Value % of Total Euro (€) Coupon Date Euro (€) Net Assets
Daimler AG 700,000 2.38% 12/9/2022 743,537 0.03%Siemens Financieringsmaatschappij NV 726,000 0.30% 28/2/2024 735,836 0.03%Schaeffler AG 700,000 1.88% 26/3/2024 731,377 0.03%Siemens Financieringsmaatschappij NV 600,000 2.88% 10/3/2028 730,405 0.03%BASF SE 700,000 0.88% 6/10/2031 721,084 0.03%LEG Immobilien AG 700,000 1.25% 23/1/2024 720,601 0.03%Commerzbank AG 650,000 1.25% 9/1/2034 719,595 0.03%Landesbank Baden-Wuerttemberg 700,000 0.38% 27/2/2025 717,934 0.03%Deutsche Pfandbriefbank AG 700,000 0.50% 19/1/2023 715,721 0.03%DZ HYP AG 700,000 0.13% 30/9/2022 707,847 0.03%Deutsche Telekom AG 700,000 1.38% 5/7/2034 707,421 0.03%Deutsche Telekom International Finance BV 700,000 0.38% 30/10/2021 705,796 0.03%Commerzbank AG 700,000 0.13% 15/12/2026 705,744 0.03%Landesbank Baden-Wuerttemberg 700,000 0.05% 11/11/2021 704,781 0.03%Siemens Financieringsmaatschappij NV 699,000 0.00% 5/9/2024 697,595 0.03%BMW Finance NV 650,000 2.38% 24/1/2023 696,787 0.03%Deutsche Boerse AG 650,000 2.38% 5/10/2022 694,196 0.03%Allianz SE^ 600,000 4.75% Perpetual 692,610 0.03%E.ON SE 700,000 0.00% 28/8/2024 692,419 0.03%alstria office-AG 700,000 0.50% 26/9/2025 687,259 0.03%Hannover Rueck SE^ 700,000 1.13% 9/10/2039 685,436 0.03%E.ON SE 700,000 0.63% 7/11/2031 675,090 0.03%Vier Gas Transport GmbH 700,000 0.13% 10/9/2029 670,956 0.03%Bayer AG 650,000 1.88% 25/1/2021 660,765 0.03%Deutsche Post AG 600,000 1.63% 5/12/2028 658,957 0.03%Allianz Finance II BV^ 600,000 5.75% 8/7/2041 651,041 0.03%Deutsche Telekom International Finance BV 370,000 7.50% 24/1/2033 649,718 0.03%Allianz Finance II BV 600,000 3.50% 14/2/2022 646,380 0.03%Vonovia Finance BV^ 600,000 4.00% Perpetual 641,957 0.03%ING-DiBa AG 600,000 1.00% 23/5/2039 641,935 0.03%Deutsche Boerse AG^ 625,000 2.75% 5/2/2041 641,708 0.03%Vonovia Finance BV 600,000 3.63% 8/10/2021 639,172 0.03%UniCredit Bank AG 600,000 1.88% 12/9/2022 634,884 0.03%Volkswagen Leasing GmbH 600,000 2.38% 6/9/2022 634,175 0.03%Bertelsmann SE & Co. KGaA 600,000 1.25% 29/9/2025 631,665 0.03%Deutsche Hypothekenbank AG 600,000 0.75% 5/3/2029 631,372 0.03%BASF SE 600,000 0.88% 15/11/2027 629,502 0.03%Wintershall Dea Finance BV 600,000 1.82% 25/9/2031 626,043 0.03%Vonovia Finance BV 600,000 1.25% 6/12/2024 625,008 0.03%Volkswagen Leasing GmbH 600,000 1.50% 19/6/2026 620,760 0.03%DVB Bank SE 600,000 1.25% 16/6/2023 619,146 0.03%Volkswagen Leasing GmbH 600,000 1.38% 20/1/2025 618,875 0.03%Commerzbank AG 600,000 1.25% 23/10/2023 617,274 0.03%Allianz Finance II BV 500,000 3.00% 13/3/2028 616,360 0.03%Aareal Bank AG 600,000 0.38% 15/7/2025 615,338 0.03%Bayer AG^ 600,000 3.13% 12/11/2079 615,000 0.03%ZF Europe Finance BV 600,000 2.00% 23/2/2026 613,645 0.03%Bayer Capital Corp. BV 600,000 0.63% 15/12/2022 609,126 0.03%Fresenius Finance Ireland plc 600,000 0.88% 31/1/2022 608,561 0.03%Aareal Bank AG 600,000 0.13% 1/2/2024 607,572 0.03%Volkswagen Bank GmbH 600,000 0.63% 8/9/2021 606,106 0.03%Berlin Hyp AG 600,000 0.13% 5/5/2022 605,862 0.03%ING-DiBa AG 600,000 0.13% 23/5/2027 604,638 0.03%Landesbank Hessen-Thueringen Girozentrale 600,000 0.00% 18/7/2022 604,172 0.03%Siemens Financieringsmaatschappij NV 600,000 0.00% 5/9/2021 602,556 0.03%Wintershall Dea Finance BV 600,000 0.45% 25/9/2023 601,180 0.03%Fresenius Medical Care AG & Co. KGaA 600,000 0.25% 29/11/2023 599,545 0.03%Aroundtown SA 600,000 0.63% 9/7/2025 598,415 0.02%Vonovia Finance BV 500,000 2.75% 22/3/2038 580,560 0.02%HeidelbergCement AG 554,000 1.50% 7/2/2025 577,865 0.02%Talanx AG 500,000 2.50% 23/7/2026 573,506 0.02%Bayerische Landesbank 560,000 1.00% 9/7/2021 571,365 0.02%DZ HYP AG 535,000 0.88% 17/4/2034 566,991 0.02%Allianz SE^ 500,000 3.38% Perpetual 556,521 0.02%ING-DiBa AG 500,000 1.25% 9/10/2033 555,100 0.02%Allianz Finance II BV 500,000 1.50% 15/1/2030 551,653 0.02%Deutsche Telekom AG 500,000 2.25% 29/3/2039 545,820 0.02%
Vanguard Euro Investment Grade Bond Index Fund
245
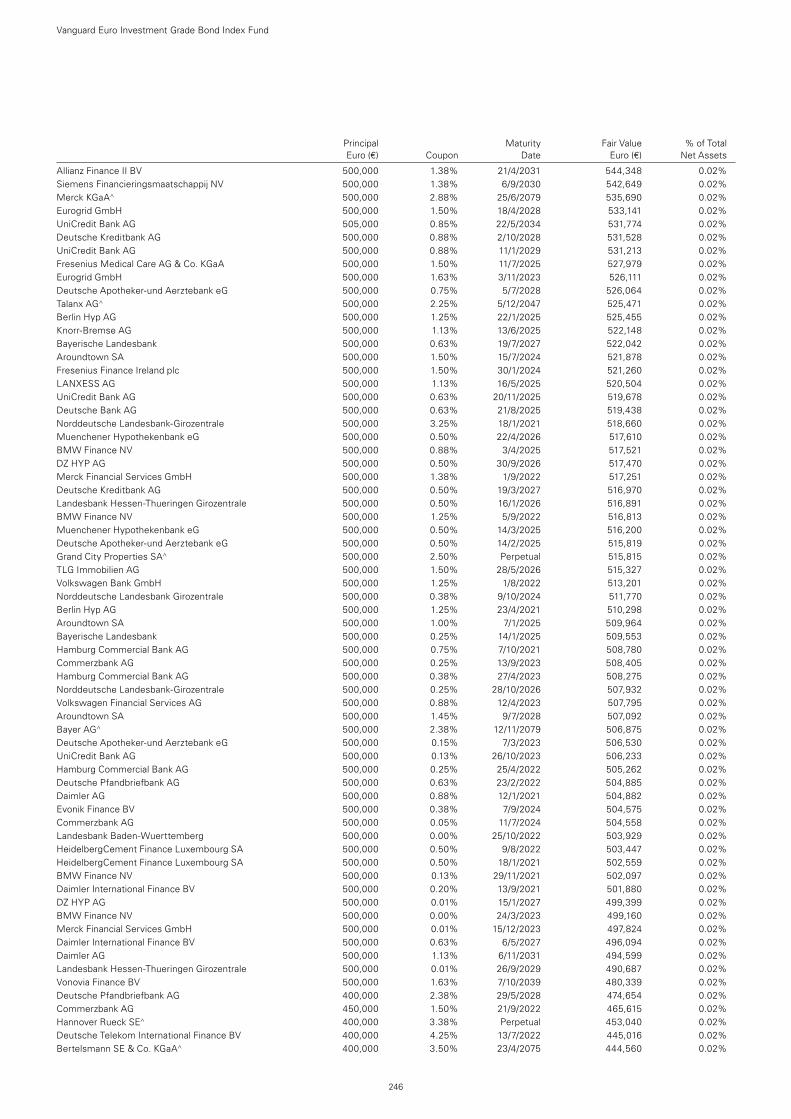
Principal Maturity Fair Value % of Total Euro (€) Coupon Date Euro (€) Net Assets
Allianz Finance II BV 500,000 1.38% 21/4/2031 544,348 0.02%Siemens Financieringsmaatschappij NV 500,000 1.38% 6/9/2030 542,649 0.02%Merck KGaA^ 500,000 2.88% 25/6/2079 535,690 0.02%Eurogrid GmbH 500,000 1.50% 18/4/2028 533,141 0.02%UniCredit Bank AG 505,000 0.85% 22/5/2034 531,774 0.02%Deutsche Kreditbank AG 500,000 0.88% 2/10/2028 531,528 0.02%UniCredit Bank AG 500,000 0.88% 11/1/2029 531,213 0.02%Fresenius Medical Care AG & Co. KGaA 500,000 1.50% 11/7/2025 527,979 0.02%Eurogrid GmbH 500,000 1.63% 3/11/2023 526,111 0.02%Deutsche Apotheker-und Aerztebank eG 500,000 0.75% 5/7/2028 526,064 0.02%Talanx AG^ 500,000 2.25% 5/12/2047 525,471 0.02%Berlin Hyp AG 500,000 1.25% 22/1/2025 525,455 0.02%Knorr-Bremse AG 500,000 1.13% 13/6/2025 522,148 0.02%Bayerische Landesbank 500,000 0.63% 19/7/2027 522,042 0.02%Aroundtown SA 500,000 1.50% 15/7/2024 521,878 0.02%Fresenius Finance Ireland plc 500,000 1.50% 30/1/2024 521,260 0.02%LANXESS AG 500,000 1.13% 16/5/2025 520,504 0.02%UniCredit Bank AG 500,000 0.63% 20/11/2025 519,678 0.02%Deutsche Bank AG 500,000 0.63% 21/8/2025 519,438 0.02%Norddeutsche Landesbank-Girozentrale 500,000 3.25% 18/1/2021 518,660 0.02%Muenchener Hypothekenbank eG 500,000 0.50% 22/4/2026 517,610 0.02%BMW Finance NV 500,000 0.88% 3/4/2025 517,521 0.02%DZ HYP AG 500,000 0.50% 30/9/2026 517,470 0.02%Merck Financial Services GmbH 500,000 1.38% 1/9/2022 517,251 0.02%Deutsche Kreditbank AG 500,000 0.50% 19/3/2027 516,970 0.02%Landesbank Hessen-Thueringen Girozentrale 500,000 0.50% 16/1/2026 516,891 0.02%BMW Finance NV 500,000 1.25% 5/9/2022 516,813 0.02%Muenchener Hypothekenbank eG 500,000 0.50% 14/3/2025 516,200 0.02%Deutsche Apotheker-und Aerztebank eG 500,000 0.50% 14/2/2025 515,819 0.02%Grand City Properties SA^ 500,000 2.50% Perpetual 515,815 0.02%TLG Immobilien AG 500,000 1.50% 28/5/2026 515,327 0.02%Volkswagen Bank GmbH 500,000 1.25% 1/8/2022 513,201 0.02%Norddeutsche Landesbank Girozentrale 500,000 0.38% 9/10/2024 511,770 0.02%Berlin Hyp AG 500,000 1.25% 23/4/2021 510,298 0.02%Aroundtown SA 500,000 1.00% 7/1/2025 509,964 0.02%Bayerische Landesbank 500,000 0.25% 14/1/2025 509,553 0.02%Hamburg Commercial Bank AG 500,000 0.75% 7/10/2021 508,780 0.02%Commerzbank AG 500,000 0.25% 13/9/2023 508,405 0.02%Hamburg Commercial Bank AG 500,000 0.38% 27/4/2023 508,275 0.02%Norddeutsche Landesbank-Girozentrale 500,000 0.25% 28/10/2026 507,932 0.02%Volkswagen Financial Services AG 500,000 0.88% 12/4/2023 507,795 0.02%Aroundtown SA 500,000 1.45% 9/7/2028 507,092 0.02%Bayer AG^ 500,000 2.38% 12/11/2079 506,875 0.02%Deutsche Apotheker-und Aerztebank eG 500,000 0.15% 7/3/2023 506,530 0.02%UniCredit Bank AG 500,000 0.13% 26/10/2023 506,233 0.02%Hamburg Commercial Bank AG 500,000 0.25% 25/4/2022 505,262 0.02%Deutsche Pfandbriefbank AG 500,000 0.63% 23/2/2022 504,885 0.02%Daimler AG 500,000 0.88% 12/1/2021 504,882 0.02%Evonik Finance BV 500,000 0.38% 7/9/2024 504,575 0.02%Commerzbank AG 500,000 0.05% 11/7/2024 504,558 0.02%Landesbank Baden-Wuerttemberg 500,000 0.00% 25/10/2022 503,929 0.02%HeidelbergCement Finance Luxembourg SA 500,000 0.50% 9/8/2022 503,447 0.02%HeidelbergCement Finance Luxembourg SA 500,000 0.50% 18/1/2021 502,559 0.02%BMW Finance NV 500,000 0.13% 29/11/2021 502,097 0.02%Daimler International Finance BV 500,000 0.20% 13/9/2021 501,880 0.02%DZ HYP AG 500,000 0.01% 15/1/2027 499,399 0.02%BMW Finance NV 500,000 0.00% 24/3/2023 499,160 0.02%Merck Financial Services GmbH 500,000 0.01% 15/12/2023 497,824 0.02%Daimler International Finance BV 500,000 0.63% 6/5/2027 496,094 0.02%Daimler AG 500,000 1.13% 6/11/2031 494,599 0.02%Landesbank Hessen-Thueringen Girozentrale 500,000 0.01% 26/9/2029 490,687 0.02%Vonovia Finance BV 500,000 1.63% 7/10/2039 480,339 0.02%Deutsche Pfandbriefbank AG 400,000 2.38% 29/5/2028 474,654 0.02%Commerzbank AG 450,000 1.50% 21/9/2022 465,615 0.02%Hannover Rueck SE^ 400,000 3.38% Perpetual 453,040 0.02%Deutsche Telekom International Finance BV 400,000 4.25% 13/7/2022 445,016 0.02%Bertelsmann SE & Co. KGaA^ 400,000 3.50% 23/4/2075 444,560 0.02%
Vanguard Euro Investment Grade Bond Index Fund
246
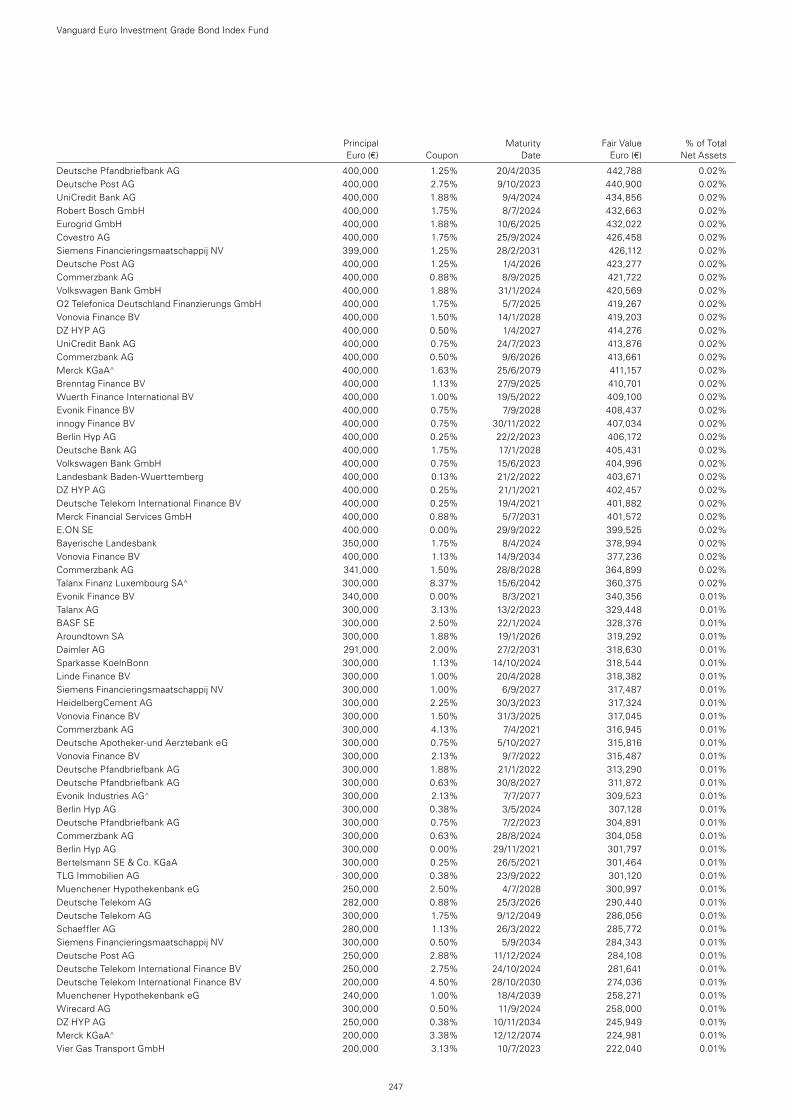
Principal Maturity Fair Value % of Total Euro (€) Coupon Date Euro (€) Net Assets
Deutsche Pfandbriefbank AG 400,000 1.25% 20/4/2035 442,788 0.02%Deutsche Post AG 400,000 2.75% 9/10/2023 440,900 0.02%UniCredit Bank AG 400,000 1.88% 9/4/2024 434,856 0.02%Robert Bosch GmbH 400,000 1.75% 8/7/2024 432,663 0.02%Eurogrid GmbH 400,000 1.88% 10/6/2025 432,022 0.02%Covestro AG 400,000 1.75% 25/9/2024 426,458 0.02%Siemens Financieringsmaatschappij NV 399,000 1.25% 28/2/2031 426,112 0.02%Deutsche Post AG 400,000 1.25% 1/4/2026 423,277 0.02%Commerzbank AG 400,000 0.88% 8/9/2025 421,722 0.02%Volkswagen Bank GmbH 400,000 1.88% 31/1/2024 420,569 0.02%O2 Telefonica Deutschland Finanzierungs GmbH 400,000 1.75% 5/7/2025 419,267 0.02%Vonovia Finance BV 400,000 1.50% 14/1/2028 419,203 0.02%DZ HYP AG 400,000 0.50% 1/4/2027 414,276 0.02%UniCredit Bank AG 400,000 0.75% 24/7/2023 413,876 0.02%Commerzbank AG 400,000 0.50% 9/6/2026 413,661 0.02%Merck KGaA^ 400,000 1.63% 25/6/2079 411,157 0.02%Brenntag Finance BV 400,000 1.13% 27/9/2025 410,701 0.02%Wuerth Finance International BV 400,000 1.00% 19/5/2022 409,100 0.02%Evonik Finance BV 400,000 0.75% 7/9/2028 408,437 0.02%innogy Finance BV 400,000 0.75% 30/11/2022 407,034 0.02%Berlin Hyp AG 400,000 0.25% 22/2/2023 406,172 0.02%Deutsche Bank AG 400,000 1.75% 17/1/2028 405,431 0.02%Volkswagen Bank GmbH 400,000 0.75% 15/6/2023 404,996 0.02%Landesbank Baden-Wuerttemberg 400,000 0.13% 21/2/2022 403,671 0.02%DZ HYP AG 400,000 0.25% 21/1/2021 402,457 0.02%Deutsche Telekom International Finance BV 400,000 0.25% 19/4/2021 401,882 0.02%Merck Financial Services GmbH 400,000 0.88% 5/7/2031 401,572 0.02%E.ON SE 400,000 0.00% 29/9/2022 399,525 0.02%Bayerische Landesbank 350,000 1.75% 8/4/2024 378,994 0.02%Vonovia Finance BV 400,000 1.13% 14/9/2034 377,236 0.02%Commerzbank AG 341,000 1.50% 28/8/2028 364,899 0.02%Talanx Finanz Luxembourg SA^ 300,000 8.37% 15/6/2042 360,375 0.02%Evonik Finance BV 340,000 0.00% 8/3/2021 340,356 0.01%Talanx AG 300,000 3.13% 13/2/2023 329,448 0.01%BASF SE 300,000 2.50% 22/1/2024 328,376 0.01%Aroundtown SA 300,000 1.88% 19/1/2026 319,292 0.01%Daimler AG 291,000 2.00% 27/2/2031 318,630 0.01%Sparkasse KoelnBonn 300,000 1.13% 14/10/2024 318,544 0.01%Linde Finance BV 300,000 1.00% 20/4/2028 318,382 0.01%Siemens Financieringsmaatschappij NV 300,000 1.00% 6/9/2027 317,487 0.01%HeidelbergCement AG 300,000 2.25% 30/3/2023 317,324 0.01%Vonovia Finance BV 300,000 1.50% 31/3/2025 317,045 0.01%Commerzbank AG 300,000 4.13% 7/4/2021 316,945 0.01%Deutsche Apotheker-und Aerztebank eG 300,000 0.75% 5/10/2027 315,816 0.01%Vonovia Finance BV 300,000 2.13% 9/7/2022 315,487 0.01%Deutsche Pfandbriefbank AG 300,000 1.88% 21/1/2022 313,290 0.01%Deutsche Pfandbriefbank AG 300,000 0.63% 30/8/2027 311,872 0.01%Evonik Industries AG^ 300,000 2.13% 7/7/2077 309,523 0.01%Berlin Hyp AG 300,000 0.38% 3/5/2024 307,128 0.01%Deutsche Pfandbriefbank AG 300,000 0.75% 7/2/2023 304,891 0.01%Commerzbank AG 300,000 0.63% 28/8/2024 304,058 0.01%Berlin Hyp AG 300,000 0.00% 29/11/2021 301,797 0.01%Bertelsmann SE & Co. KGaA 300,000 0.25% 26/5/2021 301,464 0.01%TLG Immobilien AG 300,000 0.38% 23/9/2022 301,120 0.01%Muenchener Hypothekenbank eG 250,000 2.50% 4/7/2028 300,997 0.01%Deutsche Telekom AG 282,000 0.88% 25/3/2026 290,440 0.01%Deutsche Telekom AG 300,000 1.75% 9/12/2049 286,056 0.01%Schaeffler AG 280,000 1.13% 26/3/2022 285,772 0.01%Siemens Financieringsmaatschappij NV 300,000 0.50% 5/9/2034 284,343 0.01%Deutsche Post AG 250,000 2.88% 11/12/2024 284,108 0.01%Deutsche Telekom International Finance BV 250,000 2.75% 24/10/2024 281,641 0.01%Deutsche Telekom International Finance BV 200,000 4.50% 28/10/2030 274,036 0.01%Muenchener Hypothekenbank eG 240,000 1.00% 18/4/2039 258,271 0.01%Wirecard AG 300,000 0.50% 11/9/2024 258,000 0.01%DZ HYP AG 250,000 0.38% 10/11/2034 245,949 0.01%Merck KGaA^ 200,000 3.38% 12/12/2074 224,981 0.01%Vier Gas Transport GmbH 200,000 3.13% 10/7/2023 222,040 0.01%
Vanguard Euro Investment Grade Bond Index Fund
247
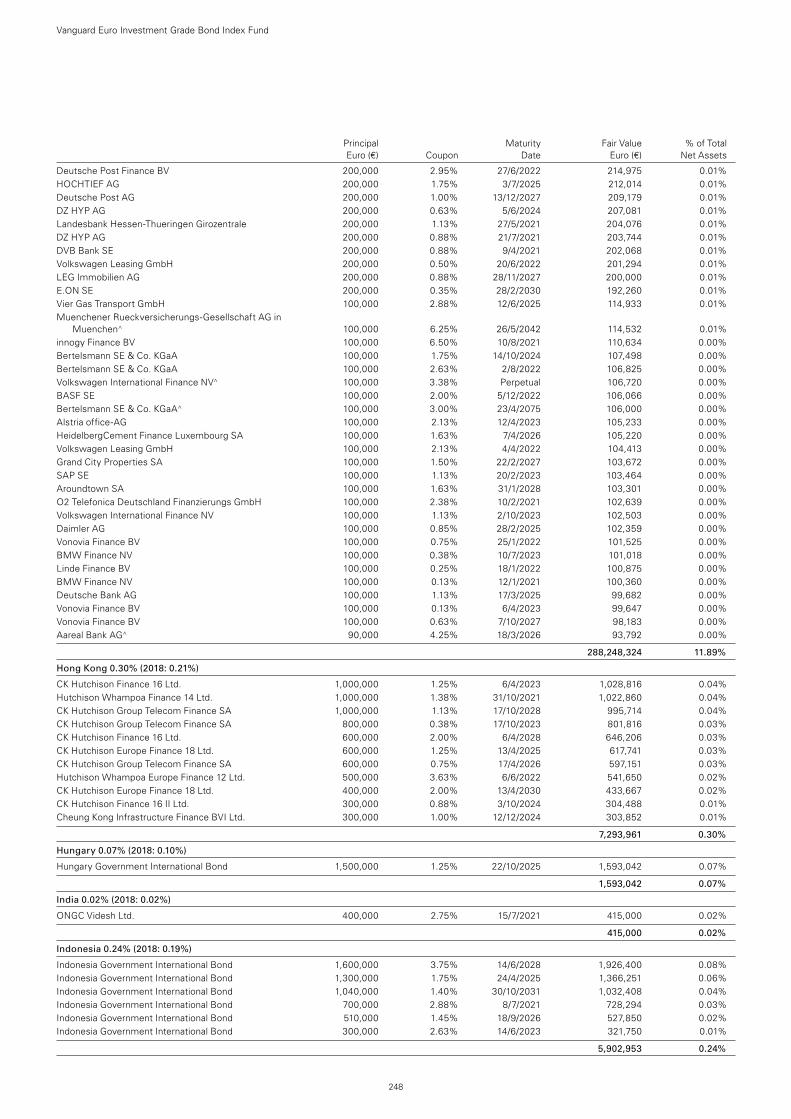
Principal Maturity Fair Value % of Total Euro (€) Coupon Date Euro (€) Net Assets
Deutsche Post Finance BV 200,000 2.95% 27/6/2022 214,975 0.01%HOCHTIEF AG 200,000 1.75% 3/7/2025 212,014 0.01%Deutsche Post AG 200,000 1.00% 13/12/2027 209,179 0.01%DZ HYP AG 200,000 0.63% 5/6/2024 207,081 0.01%Landesbank Hessen-Thueringen Girozentrale 200,000 1.13% 27/5/2021 204,076 0.01%DZ HYP AG 200,000 0.88% 21/7/2021 203,744 0.01%DVB Bank SE 200,000 0.88% 9/4/2021 202,068 0.01%Volkswagen Leasing GmbH 200,000 0.50% 20/6/2022 201,294 0.01%LEG Immobilien AG 200,000 0.88% 28/11/2027 200,000 0.01%E.ON SE 200,000 0.35% 28/2/2030 192,260 0.01%Vier Gas Transport GmbH 100,000 2.88% 12/6/2025 114,933 0.01%Muenchener Rueckversicherungs-Gesellschaft AG in
Muenchen^ 100,000 6.25% 26/5/2042 114,532 0.01%innogy Finance BV 100,000 6.50% 10/8/2021 110,634 0.00%Bertelsmann SE & Co. KGaA 100,000 1.75% 14/10/2024 107,498 0.00%Bertelsmann SE & Co. KGaA 100,000 2.63% 2/8/2022 106,825 0.00%Volkswagen International Finance NV^ 100,000 3.38% Perpetual 106,720 0.00%BASF SE 100,000 2.00% 5/12/2022 106,066 0.00%Bertelsmann SE & Co. KGaA^ 100,000 3.00% 23/4/2075 106,000 0.00%Alstria office-AG 100,000 2.13% 12/4/2023 105,233 0.00%HeidelbergCement Finance Luxembourg SA 100,000 1.63% 7/4/2026 105,220 0.00%Volkswagen Leasing GmbH 100,000 2.13% 4/4/2022 104,413 0.00%Grand City Properties SA 100,000 1.50% 22/2/2027 103,672 0.00%SAP SE 100,000 1.13% 20/2/2023 103,464 0.00%Aroundtown SA 100,000 1.63% 31/1/2028 103,301 0.00%O2 Telefonica Deutschland Finanzierungs GmbH 100,000 2.38% 10/2/2021 102,639 0.00%Volkswagen International Finance NV 100,000 1.13% 2/10/2023 102,503 0.00%Daimler AG 100,000 0.85% 28/2/2025 102,359 0.00%Vonovia Finance BV 100,000 0.75% 25/1/2022 101,525 0.00%BMW Finance NV 100,000 0.38% 10/7/2023 101,018 0.00%Linde Finance BV 100,000 0.25% 18/1/2022 100,875 0.00%BMW Finance NV 100,000 0.13% 12/1/2021 100,360 0.00%Deutsche Bank AG 100,000 1.13% 17/3/2025 99,682 0.00%Vonovia Finance BV 100,000 0.13% 6/4/2023 99,647 0.00%Vonovia Finance BV 100,000 0.63% 7/10/2027 98,183 0.00%Aareal Bank AG^ 90,000 4.25% 18/3/2026 93,792 0.00%
288,248,324 11.89%
Hong Kong 0.30% (2018: 0.21%)
CK Hutchison Finance 16 Ltd. 1,000,000 1.25% 6/4/2023 1,028,816 0.04%Hutchison Whampoa Finance 14 Ltd. 1,000,000 1.38% 31/10/2021 1,022,860 0.04%CK Hutchison Group Telecom Finance SA 1,000,000 1.13% 17/10/2028 995,714 0.04%CK Hutchison Group Telecom Finance SA 800,000 0.38% 17/10/2023 801,816 0.03%CK Hutchison Finance 16 Ltd. 600,000 2.00% 6/4/2028 646,206 0.03%CK Hutchison Europe Finance 18 Ltd. 600,000 1.25% 13/4/2025 617,741 0.03%CK Hutchison Group Telecom Finance SA 600,000 0.75% 17/4/2026 597,151 0.03%Hutchison Whampoa Europe Finance 12 Ltd. 500,000 3.63% 6/6/2022 541,650 0.02%CK Hutchison Europe Finance 18 Ltd. 400,000 2.00% 13/4/2030 433,667 0.02%CK Hutchison Finance 16 II Ltd. 300,000 0.88% 3/10/2024 304,488 0.01%Cheung Kong Infrastructure Finance BVI Ltd. 300,000 1.00% 12/12/2024 303,852 0.01%
7,293,961 0.30%
Hungary 0.07% (2018: 0.10%)
Hungary Government International Bond 1,500,000 1.25% 22/10/2025 1,593,042 0.07%
1,593,042 0.07%
India 0.02% (2018: 0.02%)
ONGC Videsh Ltd. 400,000 2.75% 15/7/2021 415,000 0.02%
415,000 0.02%
Indonesia 0.24% (2018: 0.19%)
Indonesia Government International Bond 1,600,000 3.75% 14/6/2028 1,926,400 0.08%Indonesia Government International Bond 1,300,000 1.75% 24/4/2025 1,366,251 0.06%Indonesia Government International Bond 1,040,000 1.40% 30/10/2031 1,032,408 0.04%Indonesia Government International Bond 700,000 2.88% 8/7/2021 728,294 0.03%Indonesia Government International Bond 510,000 1.45% 18/9/2026 527,850 0.02%Indonesia Government International Bond 300,000 2.63% 14/6/2023 321,750 0.01%
5,902,953 0.24%
Vanguard Euro Investment Grade Bond Index Fund
248
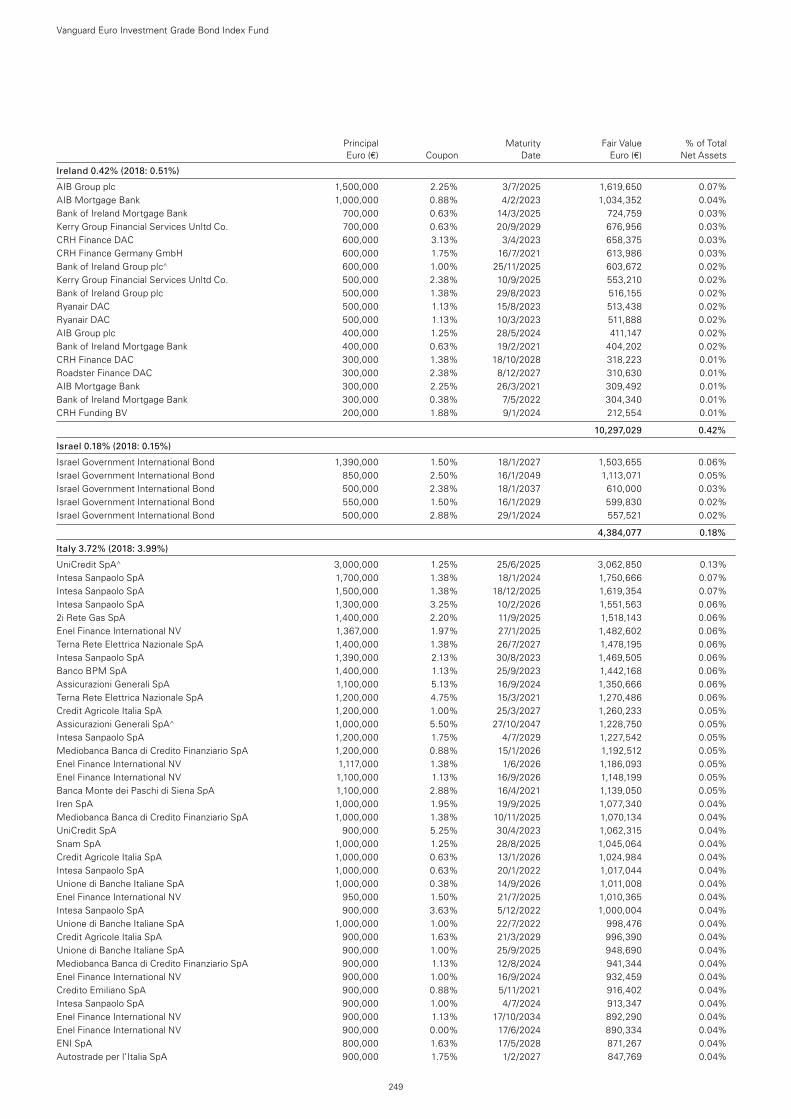
Principal Maturity Fair Value % of Total Euro (€) Coupon Date Euro (€) Net Assets
Ireland 0.42% (2018: 0.51%)
AIB Group plc 1,500,000 2.25% 3/7/2025 1,619,650 0.07%AIB Mortgage Bank 1,000,000 0.88% 4/2/2023 1,034,352 0.04%Bank of Ireland Mortgage Bank 700,000 0.63% 14/3/2025 724,759 0.03%Kerry Group Financial Services Unltd Co. 700,000 0.63% 20/9/2029 676,956 0.03%CRH Finance DAC 600,000 3.13% 3/4/2023 658,375 0.03%CRH Finance Germany GmbH 600,000 1.75% 16/7/2021 613,986 0.03%Bank of Ireland Group plc^ 600,000 1.00% 25/11/2025 603,672 0.02%Kerry Group Financial Services Unltd Co. 500,000 2.38% 10/9/2025 553,210 0.02%Bank of Ireland Group plc 500,000 1.38% 29/8/2023 516,155 0.02%Ryanair DAC 500,000 1.13% 15/8/2023 513,438 0.02%Ryanair DAC 500,000 1.13% 10/3/2023 511,888 0.02%AIB Group plc 400,000 1.25% 28/5/2024 411,147 0.02%Bank of Ireland Mortgage Bank 400,000 0.63% 19/2/2021 404,202 0.02%CRH Finance DAC 300,000 1.38% 18/10/2028 318,223 0.01%Roadster Finance DAC 300,000 2.38% 8/12/2027 310,630 0.01%AIB Mortgage Bank 300,000 2.25% 26/3/2021 309,492 0.01%Bank of Ireland Mortgage Bank 300,000 0.38% 7/5/2022 304,340 0.01%CRH Funding BV 200,000 1.88% 9/1/2024 212,554 0.01%
10,297,029 0.42%
Israel 0.18% (2018: 0.15%)
Israel Government International Bond 1,390,000 1.50% 18/1/2027 1,503,655 0.06%Israel Government International Bond 850,000 2.50% 16/1/2049 1,113,071 0.05%Israel Government International Bond 500,000 2.38% 18/1/2037 610,000 0.03%Israel Government International Bond 550,000 1.50% 16/1/2029 599,830 0.02%Israel Government International Bond 500,000 2.88% 29/1/2024 557,521 0.02%
4,384,077 0.18%
Italy 3.72% (2018: 3.99%)
UniCredit SpA^ 3,000,000 1.25% 25/6/2025 3,062,850 0.13%Intesa Sanpaolo SpA 1,700,000 1.38% 18/1/2024 1,750,666 0.07%Intesa Sanpaolo SpA 1,500,000 1.38% 18/12/2025 1,619,354 0.07%Intesa Sanpaolo SpA 1,300,000 3.25% 10/2/2026 1,551,563 0.06%2i Rete Gas SpA 1,400,000 2.20% 11/9/2025 1,518,143 0.06%Enel Finance International NV 1,367,000 1.97% 27/1/2025 1,482,602 0.06%Terna Rete Elettrica Nazionale SpA 1,400,000 1.38% 26/7/2027 1,478,195 0.06%Intesa Sanpaolo SpA 1,390,000 2.13% 30/8/2023 1,469,505 0.06%Banco BPM SpA 1,400,000 1.13% 25/9/2023 1,442,168 0.06%Assicurazioni Generali SpA 1,100,000 5.13% 16/9/2024 1,350,666 0.06%Terna Rete Elettrica Nazionale SpA 1,200,000 4.75% 15/3/2021 1,270,486 0.06%Credit Agricole Italia SpA 1,200,000 1.00% 25/3/2027 1,260,233 0.05%Assicurazioni Generali SpA^ 1,000,000 5.50% 27/10/2047 1,228,750 0.05%Intesa Sanpaolo SpA 1,200,000 1.75% 4/7/2029 1,227,542 0.05%Mediobanca Banca di Credito Finanziario SpA 1,200,000 0.88% 15/1/2026 1,192,512 0.05%Enel Finance International NV 1,117,000 1.38% 1/6/2026 1,186,093 0.05%Enel Finance International NV 1,100,000 1.13% 16/9/2026 1,148,199 0.05%Banca Monte dei Paschi di Siena SpA 1,100,000 2.88% 16/4/2021 1,139,050 0.05%Iren SpA 1,000,000 1.95% 19/9/2025 1,077,340 0.04%Mediobanca Banca di Credito Finanziario SpA 1,000,000 1.38% 10/11/2025 1,070,134 0.04%UniCredit SpA 900,000 5.25% 30/4/2023 1,062,315 0.04%Snam SpA 1,000,000 1.25% 28/8/2025 1,045,064 0.04%Credit Agricole Italia SpA 1,000,000 0.63% 13/1/2026 1,024,984 0.04%Intesa Sanpaolo SpA 1,000,000 0.63% 20/1/2022 1,017,044 0.04%Unione di Banche Italiane SpA 1,000,000 0.38% 14/9/2026 1,011,008 0.04%Enel Finance International NV 950,000 1.50% 21/7/2025 1,010,365 0.04%Intesa Sanpaolo SpA 900,000 3.63% 5/12/2022 1,000,004 0.04%Unione di Banche Italiane SpA 1,000,000 1.00% 22/7/2022 998,476 0.04%Credit Agricole Italia SpA 900,000 1.63% 21/3/2029 996,390 0.04%Unione di Banche Italiane SpA 900,000 1.00% 25/9/2025 948,690 0.04%Mediobanca Banca di Credito Finanziario SpA 900,000 1.13% 12/8/2024 941,344 0.04%Enel Finance International NV 900,000 1.00% 16/9/2024 932,459 0.04%Credito Emiliano SpA 900,000 0.88% 5/11/2021 916,402 0.04%Intesa Sanpaolo SpA 900,000 1.00% 4/7/2024 913,347 0.04%Enel Finance International NV 900,000 1.13% 17/10/2034 892,290 0.04%Enel Finance International NV 900,000 0.00% 17/6/2024 890,334 0.04%ENI SpA 800,000 1.63% 17/5/2028 871,267 0.04%Autostrade per l’Italia SpA 900,000 1.75% 1/2/2027 847,769 0.04%
Vanguard Euro Investment Grade Bond Index Fund
249
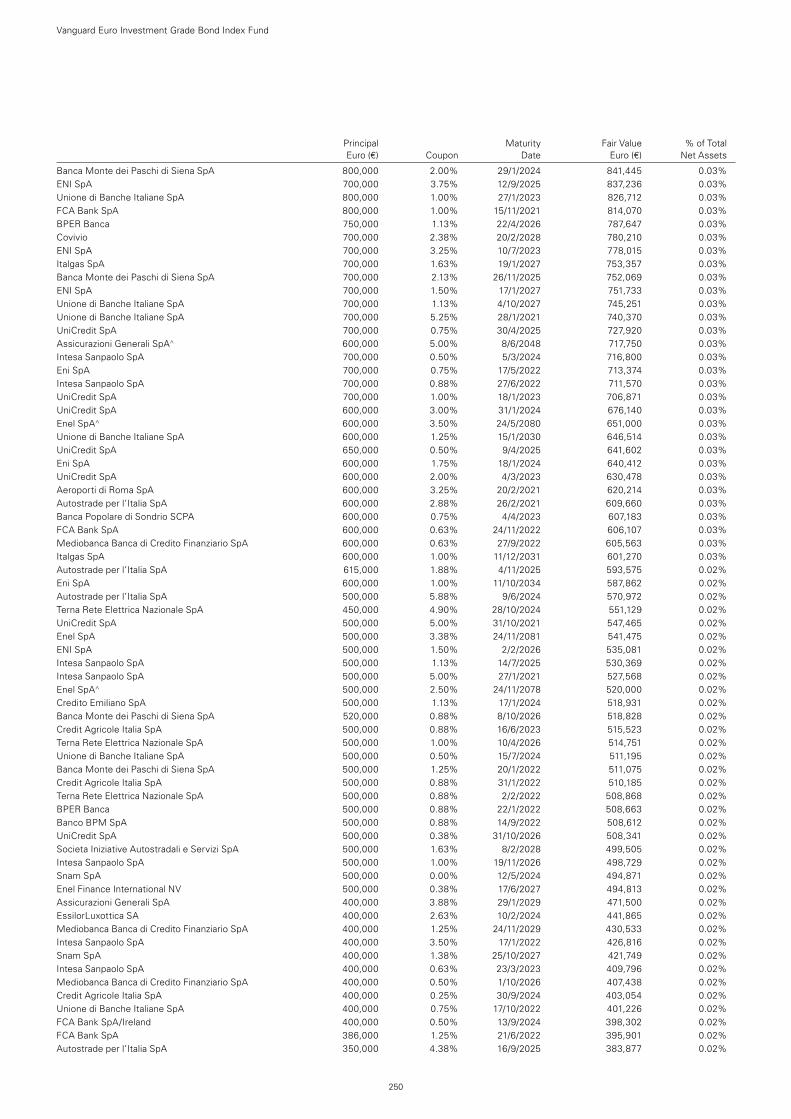
Principal Maturity Fair Value % of Total Euro (€) Coupon Date Euro (€) Net Assets
Banca Monte dei Paschi di Siena SpA 800,000 2.00% 29/1/2024 841,445 0.03%ENI SpA 700,000 3.75% 12/9/2025 837,236 0.03%Unione di Banche Italiane SpA 800,000 1.00% 27/1/2023 826,712 0.03%FCA Bank SpA 800,000 1.00% 15/11/2021 814,070 0.03%BPER Banca 750,000 1.13% 22/4/2026 787,647 0.03%Covivio 700,000 2.38% 20/2/2028 780,210 0.03%ENI SpA 700,000 3.25% 10/7/2023 778,015 0.03%Italgas SpA 700,000 1.63% 19/1/2027 753,357 0.03%Banca Monte dei Paschi di Siena SpA 700,000 2.13% 26/11/2025 752,069 0.03%ENI SpA 700,000 1.50% 17/1/2027 751,733 0.03%Unione di Banche Italiane SpA 700,000 1.13% 4/10/2027 745,251 0.03%Unione di Banche Italiane SpA 700,000 5.25% 28/1/2021 740,370 0.03%UniCredit SpA 700,000 0.75% 30/4/2025 727,920 0.03%Assicurazioni Generali SpA^ 600,000 5.00% 8/6/2048 717,750 0.03%Intesa Sanpaolo SpA 700,000 0.50% 5/3/2024 716,800 0.03%Eni SpA 700,000 0.75% 17/5/2022 713,374 0.03%Intesa Sanpaolo SpA 700,000 0.88% 27/6/2022 711,570 0.03%UniCredit SpA 700,000 1.00% 18/1/2023 706,871 0.03%UniCredit SpA 600,000 3.00% 31/1/2024 676,140 0.03%Enel SpA^ 600,000 3.50% 24/5/2080 651,000 0.03%Unione di Banche Italiane SpA 600,000 1.25% 15/1/2030 646,514 0.03%UniCredit SpA 650,000 0.50% 9/4/2025 641,602 0.03%Eni SpA 600,000 1.75% 18/1/2024 640,412 0.03%UniCredit SpA 600,000 2.00% 4/3/2023 630,478 0.03%Aeroporti di Roma SpA 600,000 3.25% 20/2/2021 620,214 0.03%Autostrade per l’Italia SpA 600,000 2.88% 26/2/2021 609,660 0.03%Banca Popolare di Sondrio SCPA 600,000 0.75% 4/4/2023 607,183 0.03%FCA Bank SpA 600,000 0.63% 24/11/2022 606,107 0.03%Mediobanca Banca di Credito Finanziario SpA 600,000 0.63% 27/9/2022 605,563 0.03%Italgas SpA 600,000 1.00% 11/12/2031 601,270 0.03%Autostrade per l’Italia SpA 615,000 1.88% 4/11/2025 593,575 0.02%Eni SpA 600,000 1.00% 11/10/2034 587,862 0.02%Autostrade per l’Italia SpA 500,000 5.88% 9/6/2024 570,972 0.02%Terna Rete Elettrica Nazionale SpA 450,000 4.90% 28/10/2024 551,129 0.02%UniCredit SpA 500,000 5.00% 31/10/2021 547,465 0.02%Enel SpA 500,000 3.38% 24/11/2081 541,475 0.02%ENI SpA 500,000 1.50% 2/2/2026 535,081 0.02%Intesa Sanpaolo SpA 500,000 1.13% 14/7/2025 530,369 0.02%Intesa Sanpaolo SpA 500,000 5.00% 27/1/2021 527,568 0.02%Enel SpA^ 500,000 2.50% 24/11/2078 520,000 0.02%Credito Emiliano SpA 500,000 1.13% 17/1/2024 518,931 0.02%Banca Monte dei Paschi di Siena SpA 520,000 0.88% 8/10/2026 518,828 0.02%Credit Agricole Italia SpA 500,000 0.88% 16/6/2023 515,523 0.02%Terna Rete Elettrica Nazionale SpA 500,000 1.00% 10/4/2026 514,751 0.02%Unione di Banche Italiane SpA 500,000 0.50% 15/7/2024 511,195 0.02%Banca Monte dei Paschi di Siena SpA 500,000 1.25% 20/1/2022 511,075 0.02%Credit Agricole Italia SpA 500,000 0.88% 31/1/2022 510,185 0.02%Terna Rete Elettrica Nazionale SpA 500,000 0.88% 2/2/2022 508,868 0.02%BPER Banca 500,000 0.88% 22/1/2022 508,663 0.02%Banco BPM SpA 500,000 0.88% 14/9/2022 508,612 0.02%UniCredit SpA 500,000 0.38% 31/10/2026 508,341 0.02%Societa Iniziative Autostradali e Servizi SpA 500,000 1.63% 8/2/2028 499,505 0.02%Intesa Sanpaolo SpA 500,000 1.00% 19/11/2026 498,729 0.02%Snam SpA 500,000 0.00% 12/5/2024 494,871 0.02%Enel Finance International NV 500,000 0.38% 17/6/2027 494,813 0.02%Assicurazioni Generali SpA 400,000 3.88% 29/1/2029 471,500 0.02%EssilorLuxottica SA 400,000 2.63% 10/2/2024 441,865 0.02%Mediobanca Banca di Credito Finanziario SpA 400,000 1.25% 24/11/2029 430,533 0.02%Intesa Sanpaolo SpA 400,000 3.50% 17/1/2022 426,816 0.02%Snam SpA 400,000 1.38% 25/10/2027 421,749 0.02%Intesa Sanpaolo SpA 400,000 0.63% 23/3/2023 409,796 0.02%Mediobanca Banca di Credito Finanziario SpA 400,000 0.50% 1/10/2026 407,438 0.02%Credit Agricole Italia SpA 400,000 0.25% 30/9/2024 403,054 0.02%Unione di Banche Italiane SpA 400,000 0.75% 17/10/2022 401,226 0.02%FCA Bank SpA/Ireland 400,000 0.50% 13/9/2024 398,302 0.02%FCA Bank SpA 386,000 1.25% 21/6/2022 395,901 0.02%Autostrade per l’Italia SpA 350,000 4.38% 16/9/2025 383,877 0.02%
Vanguard Euro Investment Grade Bond Index Fund
250
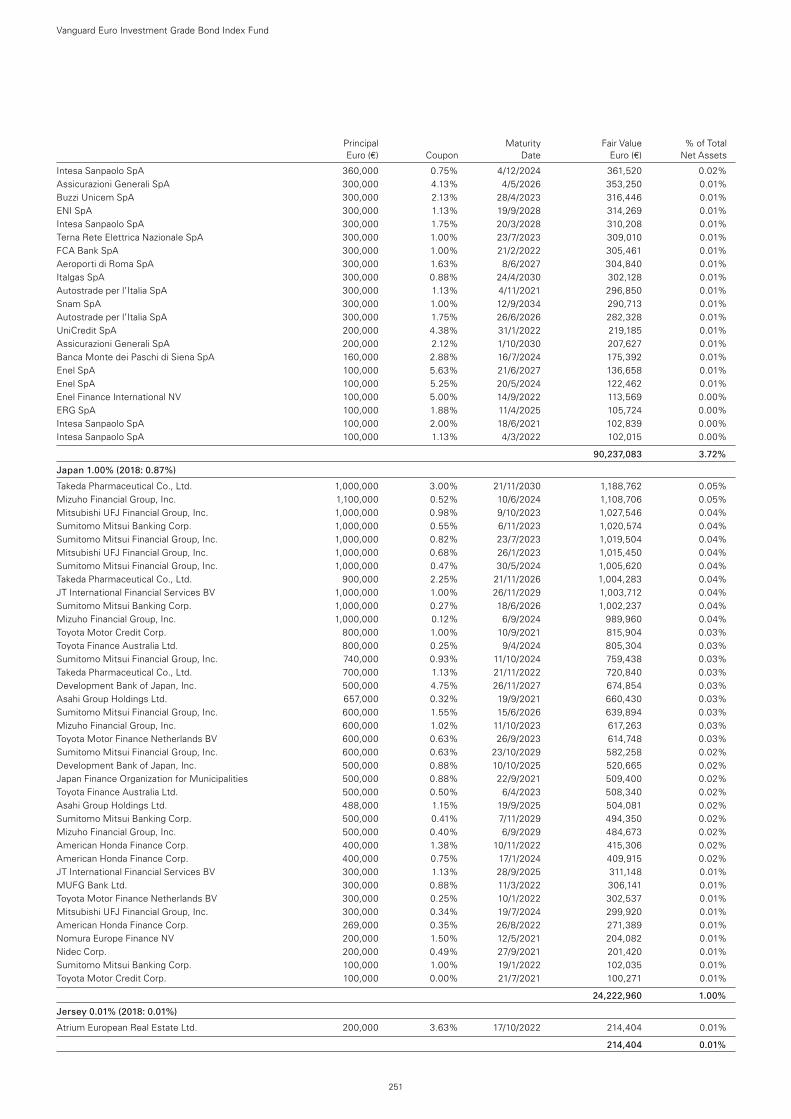
Principal Maturity Fair Value % of Total Euro (€) Coupon Date Euro (€) Net Assets
Intesa Sanpaolo SpA 360,000 0.75% 4/12/2024 361,520 0.02%Assicurazioni Generali SpA 300,000 4.13% 4/5/2026 353,250 0.01%Buzzi Unicem SpA 300,000 2.13% 28/4/2023 316,446 0.01%ENI SpA 300,000 1.13% 19/9/2028 314,269 0.01%Intesa Sanpaolo SpA 300,000 1.75% 20/3/2028 310,208 0.01%Terna Rete Elettrica Nazionale SpA 300,000 1.00% 23/7/2023 309,010 0.01%FCA Bank SpA 300,000 1.00% 21/2/2022 305,461 0.01%Aeroporti di Roma SpA 300,000 1.63% 8/6/2027 304,840 0.01%Italgas SpA 300,000 0.88% 24/4/2030 302,128 0.01%Autostrade per l’Italia SpA 300,000 1.13% 4/11/2021 296,850 0.01%Snam SpA 300,000 1.00% 12/9/2034 290,713 0.01%Autostrade per l’Italia SpA 300,000 1.75% 26/6/2026 282,328 0.01%UniCredit SpA 200,000 4.38% 31/1/2022 219,185 0.01%Assicurazioni Generali SpA 200,000 2.12% 1/10/2030 207,627 0.01%Banca Monte dei Paschi di Siena SpA 160,000 2.88% 16/7/2024 175,392 0.01%Enel SpA 100,000 5.63% 21/6/2027 136,658 0.01%Enel SpA 100,000 5.25% 20/5/2024 122,462 0.01%Enel Finance International NV 100,000 5.00% 14/9/2022 113,569 0.00%ERG SpA 100,000 1.88% 11/4/2025 105,724 0.00%Intesa Sanpaolo SpA 100,000 2.00% 18/6/2021 102,839 0.00%Intesa Sanpaolo SpA 100,000 1.13% 4/3/2022 102,015 0.00%
90,237,083 3.72%
Japan 1.00% (2018: 0.87%)
Takeda Pharmaceutical Co., Ltd. 1,000,000 3.00% 21/11/2030 1,188,762 0.05%Mizuho Financial Group, Inc. 1,100,000 0.52% 10/6/2024 1,108,706 0.05%Mitsubishi UFJ Financial Group, Inc. 1,000,000 0.98% 9/10/2023 1,027,546 0.04%Sumitomo Mitsui Banking Corp. 1,000,000 0.55% 6/11/2023 1,020,574 0.04%Sumitomo Mitsui Financial Group, Inc. 1,000,000 0.82% 23/7/2023 1,019,504 0.04%Mitsubishi UFJ Financial Group, Inc. 1,000,000 0.68% 26/1/2023 1,015,450 0.04%Sumitomo Mitsui Financial Group, Inc. 1,000,000 0.47% 30/5/2024 1,005,620 0.04%Takeda Pharmaceutical Co., Ltd. 900,000 2.25% 21/11/2026 1,004,283 0.04%JT International Financial Services BV 1,000,000 1.00% 26/11/2029 1,003,712 0.04%Sumitomo Mitsui Banking Corp. 1,000,000 0.27% 18/6/2026 1,002,237 0.04%Mizuho Financial Group, Inc. 1,000,000 0.12% 6/9/2024 989,960 0.04%Toyota Motor Credit Corp. 800,000 1.00% 10/9/2021 815,904 0.03%Toyota Finance Australia Ltd. 800,000 0.25% 9/4/2024 805,304 0.03%Sumitomo Mitsui Financial Group, Inc. 740,000 0.93% 11/10/2024 759,438 0.03%Takeda Pharmaceutical Co., Ltd. 700,000 1.13% 21/11/2022 720,840 0.03%Development Bank of Japan, Inc. 500,000 4.75% 26/11/2027 674,854 0.03%Asahi Group Holdings Ltd. 657,000 0.32% 19/9/2021 660,430 0.03%Sumitomo Mitsui Financial Group, Inc. 600,000 1.55% 15/6/2026 639,894 0.03%Mizuho Financial Group, Inc. 600,000 1.02% 11/10/2023 617,263 0.03%Toyota Motor Finance Netherlands BV 600,000 0.63% 26/9/2023 614,748 0.03%Sumitomo Mitsui Financial Group, Inc. 600,000 0.63% 23/10/2029 582,258 0.02%Development Bank of Japan, Inc. 500,000 0.88% 10/10/2025 520,665 0.02%Japan Finance Organization for Municipalities 500,000 0.88% 22/9/2021 509,400 0.02%Toyota Finance Australia Ltd. 500,000 0.50% 6/4/2023 508,340 0.02%Asahi Group Holdings Ltd. 488,000 1.15% 19/9/2025 504,081 0.02%Sumitomo Mitsui Banking Corp. 500,000 0.41% 7/11/2029 494,350 0.02%Mizuho Financial Group, Inc. 500,000 0.40% 6/9/2029 484,673 0.02%American Honda Finance Corp. 400,000 1.38% 10/11/2022 415,306 0.02%American Honda Finance Corp. 400,000 0.75% 17/1/2024 409,915 0.02%JT International Financial Services BV 300,000 1.13% 28/9/2025 311,148 0.01%MUFG Bank Ltd. 300,000 0.88% 11/3/2022 306,141 0.01%Toyota Motor Finance Netherlands BV 300,000 0.25% 10/1/2022 302,537 0.01%Mitsubishi UFJ Financial Group, Inc. 300,000 0.34% 19/7/2024 299,920 0.01%American Honda Finance Corp. 269,000 0.35% 26/8/2022 271,389 0.01%Nomura Europe Finance NV 200,000 1.50% 12/5/2021 204,082 0.01%Nidec Corp. 200,000 0.49% 27/9/2021 201,420 0.01%Sumitomo Mitsui Banking Corp. 100,000 1.00% 19/1/2022 102,035 0.01%Toyota Motor Credit Corp. 100,000 0.00% 21/7/2021 100,271 0.01%
24,222,960 1.00%
Jersey 0.01% (2018: 0.01%)
Atrium European Real Estate Ltd. 200,000 3.63% 17/10/2022 214,404 0.01%
214,404 0.01%
Vanguard Euro Investment Grade Bond Index Fund
251
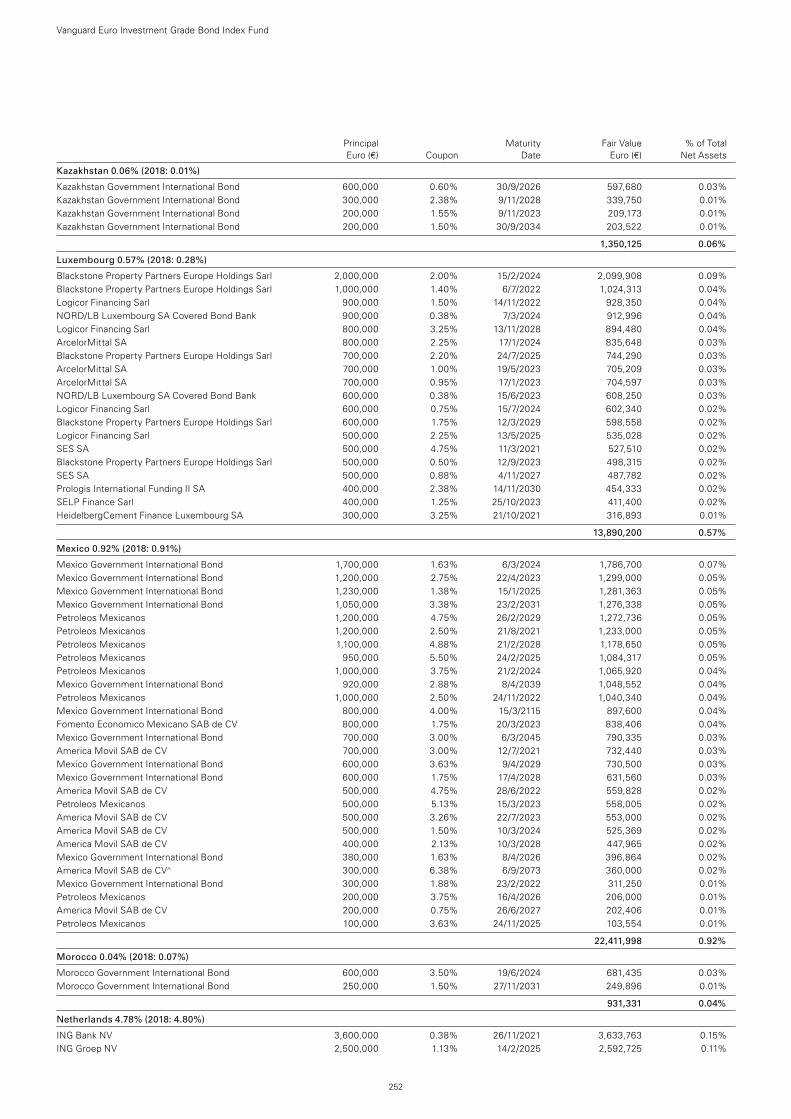
Principal Maturity Fair Value % of Total Euro (€) Coupon Date Euro (€) Net Assets
Kazakhstan 0.06% (2018: 0.01%)
Kazakhstan Government International Bond 600,000 0.60% 30/9/2026 597,680 0.03%Kazakhstan Government International Bond 300,000 2.38% 9/11/2028 339,750 0.01%Kazakhstan Government International Bond 200,000 1.55% 9/11/2023 209,173 0.01%Kazakhstan Government International Bond 200,000 1.50% 30/9/2034 203,522 0.01%
1,350,125 0.06%
Luxembourg 0.57% (2018: 0.28%)
Blackstone Property Partners Europe Holdings Sarl 2,000,000 2.00% 15/2/2024 2,099,908 0.09%Blackstone Property Partners Europe Holdings Sarl 1,000,000 1.40% 6/7/2022 1,024,313 0.04%Logicor Financing Sarl 900,000 1.50% 14/11/2022 928,350 0.04%NORD/LB Luxembourg SA Covered Bond Bank 900,000 0.38% 7/3/2024 912,996 0.04%Logicor Financing Sarl 800,000 3.25% 13/11/2028 894,480 0.04%ArcelorMittal SA 800,000 2.25% 17/1/2024 835,648 0.03%Blackstone Property Partners Europe Holdings Sarl 700,000 2.20% 24/7/2025 744,290 0.03%ArcelorMittal SA 700,000 1.00% 19/5/2023 705,209 0.03%ArcelorMittal SA 700,000 0.95% 17/1/2023 704,597 0.03%NORD/LB Luxembourg SA Covered Bond Bank 600,000 0.38% 15/6/2023 608,250 0.03%Logicor Financing Sarl 600,000 0.75% 15/7/2024 602,340 0.02%Blackstone Property Partners Europe Holdings Sarl 600,000 1.75% 12/3/2029 598,558 0.02%Logicor Financing Sarl 500,000 2.25% 13/5/2025 535,028 0.02%SES SA 500,000 4.75% 11/3/2021 527,510 0.02%Blackstone Property Partners Europe Holdings Sarl 500,000 0.50% 12/9/2023 498,315 0.02%SES SA 500,000 0.88% 4/11/2027 487,782 0.02%Prologis International Funding II SA 400,000 2.38% 14/11/2030 454,333 0.02%SELP Finance Sarl 400,000 1.25% 25/10/2023 411,400 0.02%HeidelbergCement Finance Luxembourg SA 300,000 3.25% 21/10/2021 316,893 0.01%
13,890,200 0.57%
Mexico 0.92% (2018: 0.91%)
Mexico Government International Bond 1,700,000 1.63% 6/3/2024 1,786,700 0.07%Mexico Government International Bond 1,200,000 2.75% 22/4/2023 1,299,000 0.05%Mexico Government International Bond 1,230,000 1.38% 15/1/2025 1,281,363 0.05%Mexico Government International Bond 1,050,000 3.38% 23/2/2031 1,276,338 0.05%Petroleos Mexicanos 1,200,000 4.75% 26/2/2029 1,272,736 0.05%Petroleos Mexicanos 1,200,000 2.50% 21/8/2021 1,233,000 0.05%Petroleos Mexicanos 1,100,000 4.88% 21/2/2028 1,178,650 0.05%Petroleos Mexicanos 950,000 5.50% 24/2/2025 1,084,317 0.05%Petroleos Mexicanos 1,000,000 3.75% 21/2/2024 1,065,920 0.04%Mexico Government International Bond 920,000 2.88% 8/4/2039 1,048,552 0.04%Petroleos Mexicanos 1,000,000 2.50% 24/11/2022 1,040,340 0.04%Mexico Government International Bond 800,000 4.00% 15/3/2115 897,600 0.04%Fomento Economico Mexicano SAB de CV 800,000 1.75% 20/3/2023 838,406 0.04%Mexico Government International Bond 700,000 3.00% 6/3/2045 790,335 0.03%America Movil SAB de CV 700,000 3.00% 12/7/2021 732,440 0.03%Mexico Government International Bond 600,000 3.63% 9/4/2029 730,500 0.03%Mexico Government International Bond 600,000 1.75% 17/4/2028 631,560 0.03%America Movil SAB de CV 500,000 4.75% 28/6/2022 559,828 0.02%Petroleos Mexicanos 500,000 5.13% 15/3/2023 558,005 0.02%America Movil SAB de CV 500,000 3.26% 22/7/2023 553,000 0.02%America Movil SAB de CV 500,000 1.50% 10/3/2024 525,369 0.02%America Movil SAB de CV 400,000 2.13% 10/3/2028 447,965 0.02%Mexico Government International Bond 380,000 1.63% 8/4/2026 396,864 0.02%America Movil SAB de CV^ 300,000 6.38% 6/9/2073 360,000 0.02%Mexico Government International Bond 300,000 1.88% 23/2/2022 311,250 0.01%Petroleos Mexicanos 200,000 3.75% 16/4/2026 206,000 0.01%America Movil SAB de CV 200,000 0.75% 26/6/2027 202,406 0.01%Petroleos Mexicanos 100,000 3.63% 24/11/2025 103,554 0.01%
22,411,998 0.92%
Morocco 0.04% (2018: 0.07%)
Morocco Government International Bond 600,000 3.50% 19/6/2024 681,435 0.03%Morocco Government International Bond 250,000 1.50% 27/11/2031 249,896 0.01%
931,331 0.04%
Netherlands 4.78% (2018: 4.80%)
ING Bank NV 3,600,000 0.38% 26/11/2021 3,633,763 0.15%ING Groep NV 2,500,000 1.13% 14/2/2025 2,592,725 0.11%
Vanguard Euro Investment Grade Bond Index Fund
252
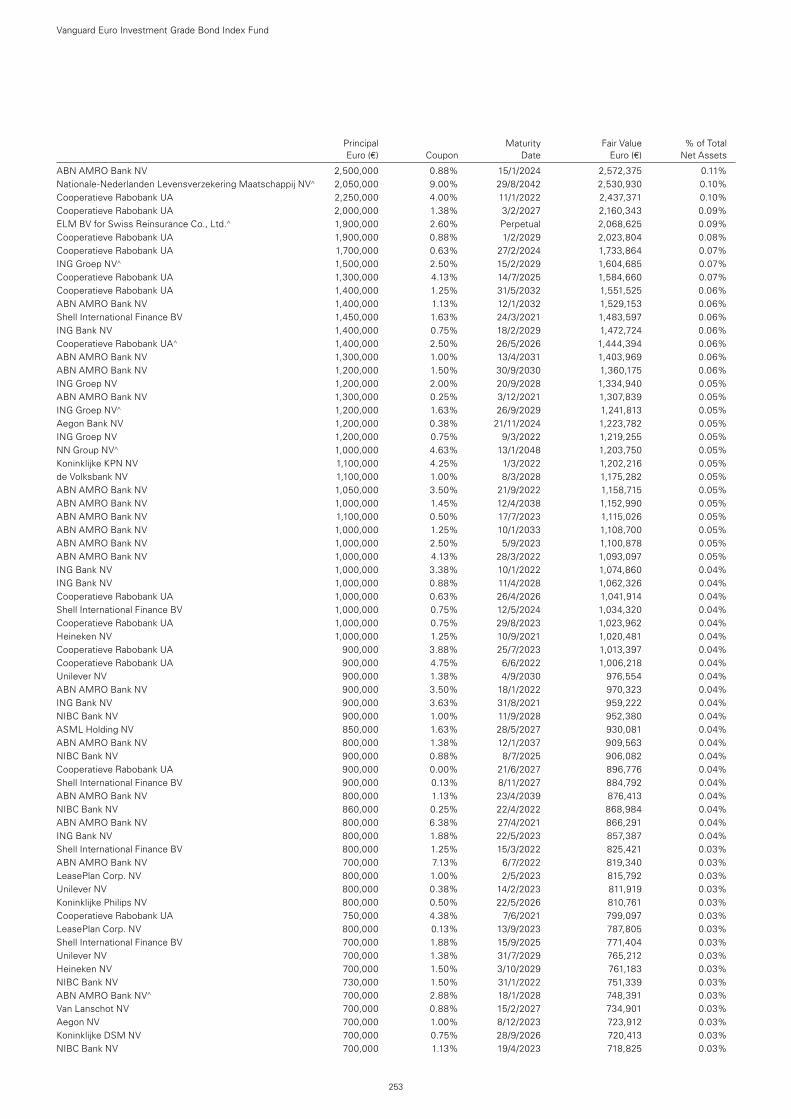
Principal Maturity Fair Value % of Total Euro (€) Coupon Date Euro (€) Net Assets
ABN AMRO Bank NV 2,500,000 0.88% 15/1/2024 2,572,375 0.11%Nationale-Nederlanden Levensverzekering Maatschappij NV^ 2,050,000 9.00% 29/8/2042 2,530,930 0.10%Cooperatieve Rabobank UA 2,250,000 4.00% 11/1/2022 2,437,371 0.10%Cooperatieve Rabobank UA 2,000,000 1.38% 3/2/2027 2,160,343 0.09%ELM BV for Swiss Reinsurance Co., Ltd.^ 1,900,000 2.60% Perpetual 2,068,625 0.09%Cooperatieve Rabobank UA 1,900,000 0.88% 1/2/2029 2,023,804 0.08%Cooperatieve Rabobank UA 1,700,000 0.63% 27/2/2024 1,733,864 0.07%ING Groep NV^ 1,500,000 2.50% 15/2/2029 1,604,685 0.07%Cooperatieve Rabobank UA 1,300,000 4.13% 14/7/2025 1,584,660 0.07%Cooperatieve Rabobank UA 1,400,000 1.25% 31/5/2032 1,551,525 0.06%ABN AMRO Bank NV 1,400,000 1.13% 12/1/2032 1,529,153 0.06%Shell International Finance BV 1,450,000 1.63% 24/3/2021 1,483,597 0.06%ING Bank NV 1,400,000 0.75% 18/2/2029 1,472,724 0.06%Cooperatieve Rabobank UA^ 1,400,000 2.50% 26/5/2026 1,444,394 0.06%ABN AMRO Bank NV 1,300,000 1.00% 13/4/2031 1,403,969 0.06%ABN AMRO Bank NV 1,200,000 1.50% 30/9/2030 1,360,175 0.06%ING Groep NV 1,200,000 2.00% 20/9/2028 1,334,940 0.05%ABN AMRO Bank NV 1,300,000 0.25% 3/12/2021 1,307,839 0.05%ING Groep NV^ 1,200,000 1.63% 26/9/2029 1,241,813 0.05%Aegon Bank NV 1,200,000 0.38% 21/11/2024 1,223,782 0.05%ING Groep NV 1,200,000 0.75% 9/3/2022 1,219,255 0.05%NN Group NV^ 1,000,000 4.63% 13/1/2048 1,203,750 0.05%Koninklijke KPN NV 1,100,000 4.25% 1/3/2022 1,202,216 0.05%de Volksbank NV 1,100,000 1.00% 8/3/2028 1,175,282 0.05%ABN AMRO Bank NV 1,050,000 3.50% 21/9/2022 1,158,715 0.05%ABN AMRO Bank NV 1,000,000 1.45% 12/4/2038 1,152,990 0.05%ABN AMRO Bank NV 1,100,000 0.50% 17/7/2023 1,115,026 0.05%ABN AMRO Bank NV 1,000,000 1.25% 10/1/2033 1,108,700 0.05%ABN AMRO Bank NV 1,000,000 2.50% 5/9/2023 1,100,878 0.05%ABN AMRO Bank NV 1,000,000 4.13% 28/3/2022 1,093,097 0.05%ING Bank NV 1,000,000 3.38% 10/1/2022 1,074,860 0.04%ING Bank NV 1,000,000 0.88% 11/4/2028 1,062,326 0.04%Cooperatieve Rabobank UA 1,000,000 0.63% 26/4/2026 1,041,914 0.04%Shell International Finance BV 1,000,000 0.75% 12/5/2024 1,034,320 0.04%Cooperatieve Rabobank UA 1,000,000 0.75% 29/8/2023 1,023,962 0.04%Heineken NV 1,000,000 1.25% 10/9/2021 1,020,481 0.04%Cooperatieve Rabobank UA 900,000 3.88% 25/7/2023 1,013,397 0.04%Cooperatieve Rabobank UA 900,000 4.75% 6/6/2022 1,006,218 0.04%Unilever NV 900,000 1.38% 4/9/2030 976,554 0.04%ABN AMRO Bank NV 900,000 3.50% 18/1/2022 970,323 0.04%ING Bank NV 900,000 3.63% 31/8/2021 959,222 0.04%NIBC Bank NV 900,000 1.00% 11/9/2028 952,380 0.04%ASML Holding NV 850,000 1.63% 28/5/2027 930,081 0.04%ABN AMRO Bank NV 800,000 1.38% 12/1/2037 909,563 0.04%NIBC Bank NV 900,000 0.88% 8/7/2025 906,082 0.04%Cooperatieve Rabobank UA 900,000 0.00% 21/6/2027 896,776 0.04%Shell International Finance BV 900,000 0.13% 8/11/2027 884,792 0.04%ABN AMRO Bank NV 800,000 1.13% 23/4/2039 876,413 0.04%NIBC Bank NV 860,000 0.25% 22/4/2022 868,984 0.04%ABN AMRO Bank NV 800,000 6.38% 27/4/2021 866,291 0.04%ING Bank NV 800,000 1.88% 22/5/2023 857,387 0.04%Shell International Finance BV 800,000 1.25% 15/3/2022 825,421 0.03%ABN AMRO Bank NV 700,000 7.13% 6/7/2022 819,340 0.03%LeasePlan Corp. NV 800,000 1.00% 2/5/2023 815,792 0.03%Unilever NV 800,000 0.38% 14/2/2023 811,919 0.03%Koninklijke Philips NV 800,000 0.50% 22/5/2026 810,761 0.03%Cooperatieve Rabobank UA 750,000 4.38% 7/6/2021 799,097 0.03%LeasePlan Corp. NV 800,000 0.13% 13/9/2023 787,805 0.03%Shell International Finance BV 700,000 1.88% 15/9/2025 771,404 0.03%Unilever NV 700,000 1.38% 31/7/2029 765,212 0.03%Heineken NV 700,000 1.50% 3/10/2029 761,183 0.03%NIBC Bank NV 730,000 1.50% 31/1/2022 751,339 0.03%ABN AMRO Bank NV^ 700,000 2.88% 18/1/2028 748,391 0.03%Van Lanschot NV 700,000 0.88% 15/2/2027 734,901 0.03%Aegon NV 700,000 1.00% 8/12/2023 723,912 0.03%Koninklijke DSM NV 700,000 0.75% 28/9/2026 720,413 0.03%NIBC Bank NV 700,000 1.13% 19/4/2023 718,825 0.03%
Vanguard Euro Investment Grade Bond Index Fund
253
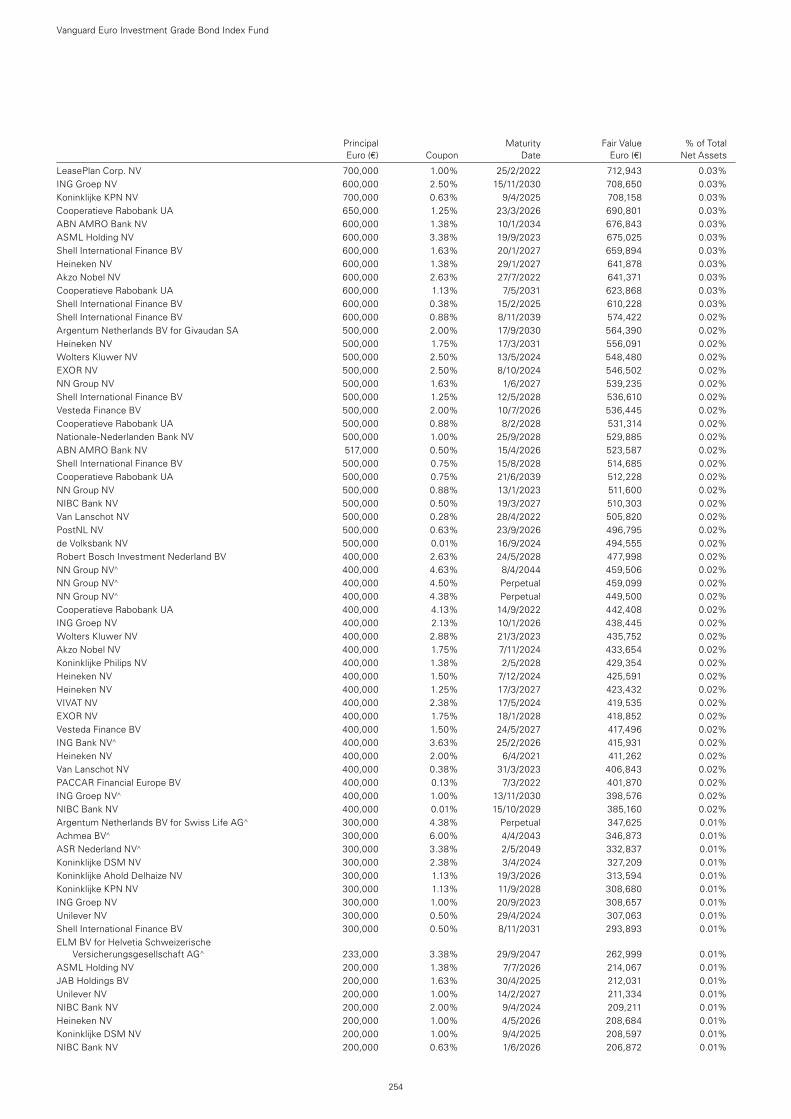
Principal Maturity Fair Value % of Total Euro (€) Coupon Date Euro (€) Net Assets
LeasePlan Corp. NV 700,000 1.00% 25/2/2022 712,943 0.03%ING Groep NV 600,000 2.50% 15/11/2030 708,650 0.03%Koninklijke KPN NV 700,000 0.63% 9/4/2025 708,158 0.03%Cooperatieve Rabobank UA 650,000 1.25% 23/3/2026 690,801 0.03%ABN AMRO Bank NV 600,000 1.38% 10/1/2034 676,843 0.03%ASML Holding NV 600,000 3.38% 19/9/2023 675,025 0.03%Shell International Finance BV 600,000 1.63% 20/1/2027 659,894 0.03%Heineken NV 600,000 1.38% 29/1/2027 641,878 0.03%Akzo Nobel NV 600,000 2.63% 27/7/2022 641,371 0.03%Cooperatieve Rabobank UA 600,000 1.13% 7/5/2031 623,868 0.03%Shell International Finance BV 600,000 0.38% 15/2/2025 610,228 0.03%Shell International Finance BV 600,000 0.88% 8/11/2039 574,422 0.02%Argentum Netherlands BV for Givaudan SA 500,000 2.00% 17/9/2030 564,390 0.02%Heineken NV 500,000 1.75% 17/3/2031 556,091 0.02%Wolters Kluwer NV 500,000 2.50% 13/5/2024 548,480 0.02%EXOR NV 500,000 2.50% 8/10/2024 546,502 0.02%NN Group NV 500,000 1.63% 1/6/2027 539,235 0.02%Shell International Finance BV 500,000 1.25% 12/5/2028 536,610 0.02%Vesteda Finance BV 500,000 2.00% 10/7/2026 536,445 0.02%Cooperatieve Rabobank UA 500,000 0.88% 8/2/2028 531,314 0.02%Nationale-Nederlanden Bank NV 500,000 1.00% 25/9/2028 529,885 0.02%ABN AMRO Bank NV 517,000 0.50% 15/4/2026 523,587 0.02%Shell International Finance BV 500,000 0.75% 15/8/2028 514,685 0.02%Cooperatieve Rabobank UA 500,000 0.75% 21/6/2039 512,228 0.02%NN Group NV 500,000 0.88% 13/1/2023 511,600 0.02%NIBC Bank NV 500,000 0.50% 19/3/2027 510,303 0.02%Van Lanschot NV 500,000 0.28% 28/4/2022 505,820 0.02%PostNL NV 500,000 0.63% 23/9/2026 496,795 0.02%de Volksbank NV 500,000 0.01% 16/9/2024 494,555 0.02%Robert Bosch Investment Nederland BV 400,000 2.63% 24/5/2028 477,998 0.02%NN Group NV^ 400,000 4.63% 8/4/2044 459,506 0.02%NN Group NV^ 400,000 4.50% Perpetual 459,099 0.02%NN Group NV^ 400,000 4.38% Perpetual 449,500 0.02%Cooperatieve Rabobank UA 400,000 4.13% 14/9/2022 442,408 0.02%ING Groep NV 400,000 2.13% 10/1/2026 438,445 0.02%Wolters Kluwer NV 400,000 2.88% 21/3/2023 435,752 0.02%Akzo Nobel NV 400,000 1.75% 7/11/2024 433,654 0.02%Koninklijke Philips NV 400,000 1.38% 2/5/2028 429,354 0.02%Heineken NV 400,000 1.50% 7/12/2024 425,591 0.02%Heineken NV 400,000 1.25% 17/3/2027 423,432 0.02%VIVAT NV 400,000 2.38% 17/5/2024 419,535 0.02%EXOR NV 400,000 1.75% 18/1/2028 418,852 0.02%Vesteda Finance BV 400,000 1.50% 24/5/2027 417,496 0.02%ING Bank NV^ 400,000 3.63% 25/2/2026 415,931 0.02%Heineken NV 400,000 2.00% 6/4/2021 411,262 0.02%Van Lanschot NV 400,000 0.38% 31/3/2023 406,843 0.02%PACCAR Financial Europe BV 400,000 0.13% 7/3/2022 401,870 0.02%ING Groep NV^ 400,000 1.00% 13/11/2030 398,576 0.02%NIBC Bank NV 400,000 0.01% 15/10/2029 385,160 0.02%Argentum Netherlands BV for Swiss Life AG^ 300,000 4.38% Perpetual 347,625 0.01%Achmea BV^ 300,000 6.00% 4/4/2043 346,873 0.01%ASR Nederland NV^ 300,000 3.38% 2/5/2049 332,837 0.01%Koninklijke DSM NV 300,000 2.38% 3/4/2024 327,209 0.01%Koninklijke Ahold Delhaize NV 300,000 1.13% 19/3/2026 313,594 0.01%Koninklijke KPN NV 300,000 1.13% 11/9/2028 308,680 0.01%ING Groep NV 300,000 1.00% 20/9/2023 308,657 0.01%Unilever NV 300,000 0.50% 29/4/2024 307,063 0.01%Shell International Finance BV 300,000 0.50% 8/11/2031 293,893 0.01%ELM BV for Helvetia Schweizerische
Versicherungsgesellschaft AG^ 233,000 3.38% 29/9/2047 262,999 0.01%ASML Holding NV 200,000 1.38% 7/7/2026 214,067 0.01%JAB Holdings BV 200,000 1.63% 30/4/2025 212,031 0.01%Unilever NV 200,000 1.00% 14/2/2027 211,334 0.01%NIBC Bank NV 200,000 2.00% 9/4/2024 209,211 0.01%Heineken NV 200,000 1.00% 4/5/2026 208,684 0.01%Koninklijke DSM NV 200,000 1.00% 9/4/2025 208,597 0.01%NIBC Bank NV 200,000 0.63% 1/6/2026 206,872 0.01%
Vanguard Euro Investment Grade Bond Index Fund
254
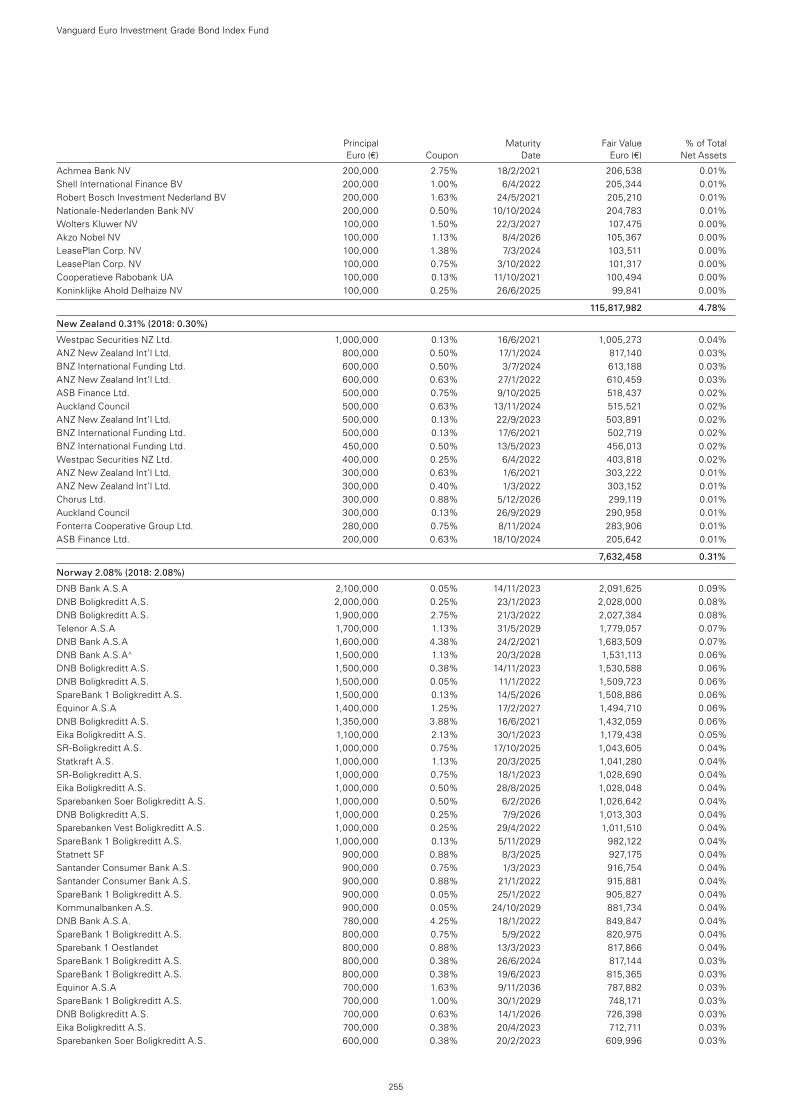
Principal Maturity Fair Value % of Total Euro (€) Coupon Date Euro (€) Net Assets
Achmea Bank NV 200,000 2.75% 18/2/2021 206,538 0.01%Shell International Finance BV 200,000 1.00% 6/4/2022 205,344 0.01%Robert Bosch Investment Nederland BV 200,000 1.63% 24/5/2021 205,210 0.01%Nationale-Nederlanden Bank NV 200,000 0.50% 10/10/2024 204,783 0.01%Wolters Kluwer NV 100,000 1.50% 22/3/2027 107,475 0.00%Akzo Nobel NV 100,000 1.13% 8/4/2026 105,367 0.00%LeasePlan Corp. NV 100,000 1.38% 7/3/2024 103,511 0.00%LeasePlan Corp. NV 100,000 0.75% 3/10/2022 101,317 0.00%Cooperatieve Rabobank UA 100,000 0.13% 11/10/2021 100,494 0.00%Koninklijke Ahold Delhaize NV 100,000 0.25% 26/6/2025 99,841 0.00%
115,817,982 4.78%
New Zealand 0.31% (2018: 0.30%)
Westpac Securities NZ Ltd. 1,000,000 0.13% 16/6/2021 1,005,273 0.04%ANZ New Zealand Int’l Ltd. 800,000 0.50% 17/1/2024 817,140 0.03%BNZ International Funding Ltd. 600,000 0.50% 3/7/2024 613,188 0.03%ANZ New Zealand Int’l Ltd. 600,000 0.63% 27/1/2022 610,459 0.03%ASB Finance Ltd. 500,000 0.75% 9/10/2025 518,437 0.02%Auckland Council 500,000 0.63% 13/11/2024 515,521 0.02%ANZ New Zealand Int’l Ltd. 500,000 0.13% 22/9/2023 503,891 0.02%BNZ International Funding Ltd. 500,000 0.13% 17/6/2021 502,719 0.02%BNZ International Funding Ltd. 450,000 0.50% 13/5/2023 456,013 0.02%Westpac Securities NZ Ltd. 400,000 0.25% 6/4/2022 403,818 0.02%ANZ New Zealand Int’l Ltd. 300,000 0.63% 1/6/2021 303,222 0.01%ANZ New Zealand Int’l Ltd. 300,000 0.40% 1/3/2022 303,152 0.01%Chorus Ltd. 300,000 0.88% 5/12/2026 299,119 0.01%Auckland Council 300,000 0.13% 26/9/2029 290,958 0.01%Fonterra Cooperative Group Ltd. 280,000 0.75% 8/11/2024 283,906 0.01%ASB Finance Ltd. 200,000 0.63% 18/10/2024 205,642 0.01%
7,632,458 0.31%
Norway 2.08% (2018: 2.08%)
DNB Bank A.S.A 2,100,000 0.05% 14/11/2023 2,091,625 0.09%DNB Boligkreditt A.S. 2,000,000 0.25% 23/1/2023 2,028,000 0.08%DNB Boligkreditt A.S. 1,900,000 2.75% 21/3/2022 2,027,384 0.08%Telenor A.S.A 1,700,000 1.13% 31/5/2029 1,779,057 0.07%DNB Bank A.S.A 1,600,000 4.38% 24/2/2021 1,683,509 0.07%DNB Bank A.S.A^ 1,500,000 1.13% 20/3/2028 1,531,113 0.06%DNB Boligkreditt A.S. 1,500,000 0.38% 14/11/2023 1,530,588 0.06%DNB Boligkreditt A.S. 1,500,000 0.05% 11/1/2022 1,509,723 0.06%SpareBank 1 Boligkreditt A.S. 1,500,000 0.13% 14/5/2026 1,508,886 0.06%Equinor A.S.A 1,400,000 1.25% 17/2/2027 1,494,710 0.06%DNB Boligkreditt A.S. 1,350,000 3.88% 16/6/2021 1,432,059 0.06%Eika Boligkreditt A.S. 1,100,000 2.13% 30/1/2023 1,179,438 0.05%SR-Boligkreditt A.S. 1,000,000 0.75% 17/10/2025 1,043,605 0.04%Statkraft A.S. 1,000,000 1.13% 20/3/2025 1,041,280 0.04%SR-Boligkreditt A.S. 1,000,000 0.75% 18/1/2023 1,028,690 0.04%Eika Boligkreditt A.S. 1,000,000 0.50% 28/8/2025 1,028,048 0.04%Sparebanken Soer Boligkreditt A.S. 1,000,000 0.50% 6/2/2026 1,026,642 0.04%DNB Boligkreditt A.S. 1,000,000 0.25% 7/9/2026 1,013,303 0.04%Sparebanken Vest Boligkreditt A.S. 1,000,000 0.25% 29/4/2022 1,011,510 0.04%SpareBank 1 Boligkreditt A.S. 1,000,000 0.13% 5/11/2029 982,122 0.04%Statnett SF 900,000 0.88% 8/3/2025 927,175 0.04%Santander Consumer Bank A.S. 900,000 0.75% 1/3/2023 916,754 0.04%Santander Consumer Bank A.S. 900,000 0.88% 21/1/2022 915,881 0.04%SpareBank 1 Boligkreditt A.S. 900,000 0.05% 25/1/2022 905,827 0.04%Kommunalbanken A.S. 900,000 0.05% 24/10/2029 881,734 0.04%DNB Bank A.S.A. 780,000 4.25% 18/1/2022 849,847 0.04%SpareBank 1 Boligkreditt A.S. 800,000 0.75% 5/9/2022 820,975 0.04%Sparebank 1 Oestlandet 800,000 0.88% 13/3/2023 817,866 0.04%SpareBank 1 Boligkreditt A.S. 800,000 0.38% 26/6/2024 817,144 0.03%SpareBank 1 Boligkreditt A.S. 800,000 0.38% 19/6/2023 815,365 0.03%Equinor A.S.A 700,000 1.63% 9/11/2036 787,882 0.03%SpareBank 1 Boligkreditt A.S. 700,000 1.00% 30/1/2029 748,171 0.03%DNB Boligkreditt A.S. 700,000 0.63% 14/1/2026 726,398 0.03%Eika Boligkreditt A.S. 700,000 0.38% 20/4/2023 712,711 0.03%Sparebanken Soer Boligkreditt A.S. 600,000 0.38% 20/2/2023 609,996 0.03%
Vanguard Euro Investment Grade Bond Index Fund
255
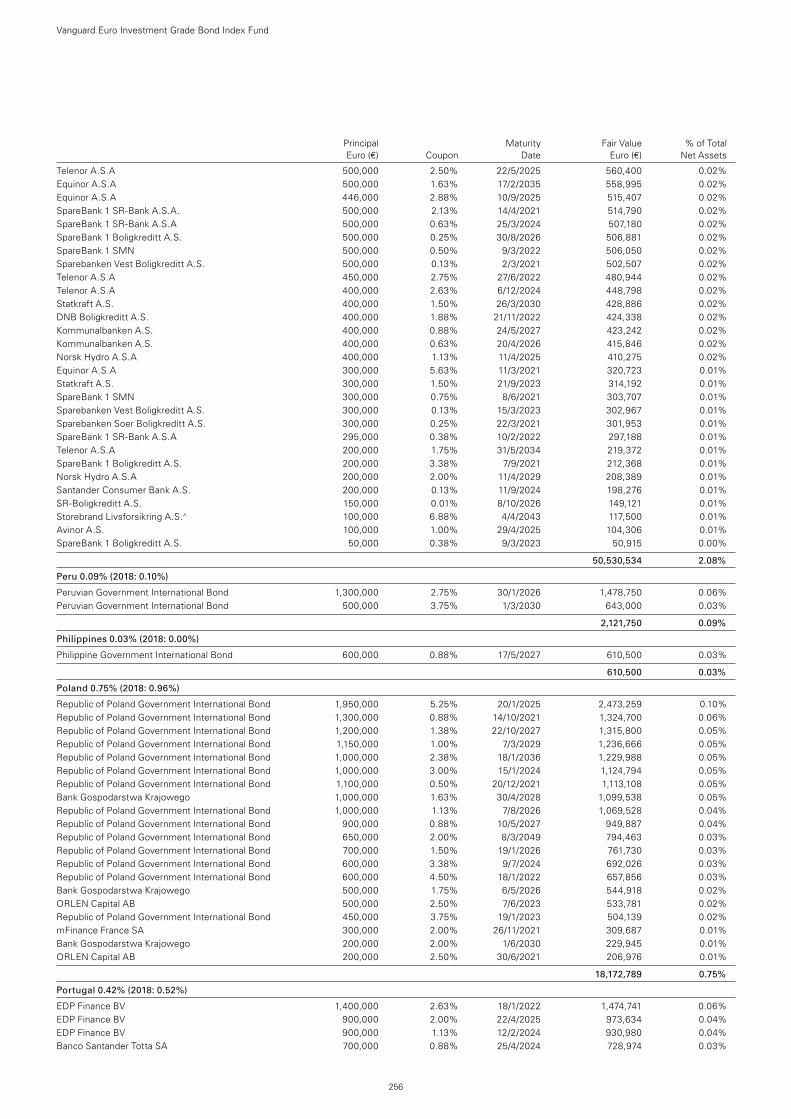
Principal Maturity Fair Value % of Total Euro (€) Coupon Date Euro (€) Net Assets
Telenor A.S.A 500,000 2.50% 22/5/2025 560,400 0.02%Equinor A.S.A 500,000 1.63% 17/2/2035 558,995 0.02%Equinor A.S.A 446,000 2.88% 10/9/2025 515,407 0.02%SpareBank 1 SR-Bank A.S.A. 500,000 2.13% 14/4/2021 514,790 0.02%SpareBank 1 SR-Bank A.S.A 500,000 0.63% 25/3/2024 507,180 0.02%SpareBank 1 Boligkreditt A.S. 500,000 0.25% 30/8/2026 506,881 0.02%SpareBank 1 SMN 500,000 0.50% 9/3/2022 506,050 0.02%Sparebanken Vest Boligkreditt A.S. 500,000 0.13% 2/3/2021 502,507 0.02%Telenor A.S.A 450,000 2.75% 27/6/2022 480,944 0.02%Telenor A.S.A 400,000 2.63% 6/12/2024 448,798 0.02%Statkraft A.S. 400,000 1.50% 26/3/2030 428,886 0.02%DNB Boligkreditt A.S. 400,000 1.88% 21/11/2022 424,338 0.02%Kommunalbanken A.S. 400,000 0.88% 24/5/2027 423,242 0.02%Kommunalbanken A.S. 400,000 0.63% 20/4/2026 415,846 0.02%Norsk Hydro A.S.A 400,000 1.13% 11/4/2025 410,275 0.02%Equinor A.S.A 300,000 5.63% 11/3/2021 320,723 0.01%Statkraft A.S. 300,000 1.50% 21/9/2023 314,192 0.01%SpareBank 1 SMN 300,000 0.75% 8/6/2021 303,707 0.01%Sparebanken Vest Boligkreditt A.S. 300,000 0.13% 15/3/2023 302,967 0.01%Sparebanken Soer Boligkreditt A.S. 300,000 0.25% 22/3/2021 301,953 0.01%SpareBank 1 SR-Bank A.S.A 295,000 0.38% 10/2/2022 297,188 0.01%Telenor A.S.A 200,000 1.75% 31/5/2034 219,372 0.01%SpareBank 1 Boligkreditt A.S. 200,000 3.38% 7/9/2021 212,368 0.01%Norsk Hydro A.S.A 200,000 2.00% 11/4/2029 208,389 0.01%Santander Consumer Bank A.S. 200,000 0.13% 11/9/2024 198,276 0.01%SR-Boligkreditt A.S. 150,000 0.01% 8/10/2026 149,121 0.01%Storebrand Livsforsikring A.S.^ 100,000 6.88% 4/4/2043 117,500 0.01%Avinor A.S. 100,000 1.00% 29/4/2025 104,306 0.01%SpareBank 1 Boligkreditt A.S. 50,000 0.38% 9/3/2023 50,915 0.00%
50,530,534 2.08%
Peru 0.09% (2018: 0.10%)
Peruvian Government International Bond 1,300,000 2.75% 30/1/2026 1,478,750 0.06%Peruvian Government International Bond 500,000 3.75% 1/3/2030 643,000 0.03%
2,121,750 0.09%
Philippines 0.03% (2018: 0.00%)
Philippine Government International Bond 600,000 0.88% 17/5/2027 610,500 0.03%
610,500 0.03%
Poland 0.75% (2018: 0.96%)
Republic of Poland Government International Bond 1,950,000 5.25% 20/1/2025 2,473,259 0.10%Republic of Poland Government International Bond 1,300,000 0.88% 14/10/2021 1,324,700 0.06%Republic of Poland Government International Bond 1,200,000 1.38% 22/10/2027 1,315,800 0.05%Republic of Poland Government International Bond 1,150,000 1.00% 7/3/2029 1,236,666 0.05%Republic of Poland Government International Bond 1,000,000 2.38% 18/1/2036 1,229,988 0.05%Republic of Poland Government International Bond 1,000,000 3.00% 15/1/2024 1,124,794 0.05%Republic of Poland Government International Bond 1,100,000 0.50% 20/12/2021 1,113,108 0.05%Bank Gospodarstwa Krajowego 1,000,000 1.63% 30/4/2028 1,099,538 0.05%Republic of Poland Government International Bond 1,000,000 1.13% 7/8/2026 1,069,528 0.04%Republic of Poland Government International Bond 900,000 0.88% 10/5/2027 949,887 0.04%Republic of Poland Government International Bond 650,000 2.00% 8/3/2049 794,463 0.03%Republic of Poland Government International Bond 700,000 1.50% 19/1/2026 761,730 0.03%Republic of Poland Government International Bond 600,000 3.38% 9/7/2024 692,026 0.03%Republic of Poland Government International Bond 600,000 4.50% 18/1/2022 657,856 0.03%Bank Gospodarstwa Krajowego 500,000 1.75% 6/5/2026 544,918 0.02%ORLEN Capital AB 500,000 2.50% 7/6/2023 533,781 0.02%Republic of Poland Government International Bond 450,000 3.75% 19/1/2023 504,139 0.02%mFinance France SA 300,000 2.00% 26/11/2021 309,687 0.01%Bank Gospodarstwa Krajowego 200,000 2.00% 1/6/2030 229,945 0.01%ORLEN Capital AB 200,000 2.50% 30/6/2021 206,976 0.01%
18,172,789 0.75%
Portugal 0.42% (2018: 0.52%)
EDP Finance BV 1,400,000 2.63% 18/1/2022 1,474,741 0.06%EDP Finance BV 900,000 2.00% 22/4/2025 973,634 0.04%EDP Finance BV 900,000 1.13% 12/2/2024 930,980 0.04%Banco Santander Totta SA 700,000 0.88% 25/4/2024 728,974 0.03%
Vanguard Euro Investment Grade Bond Index Fund
256
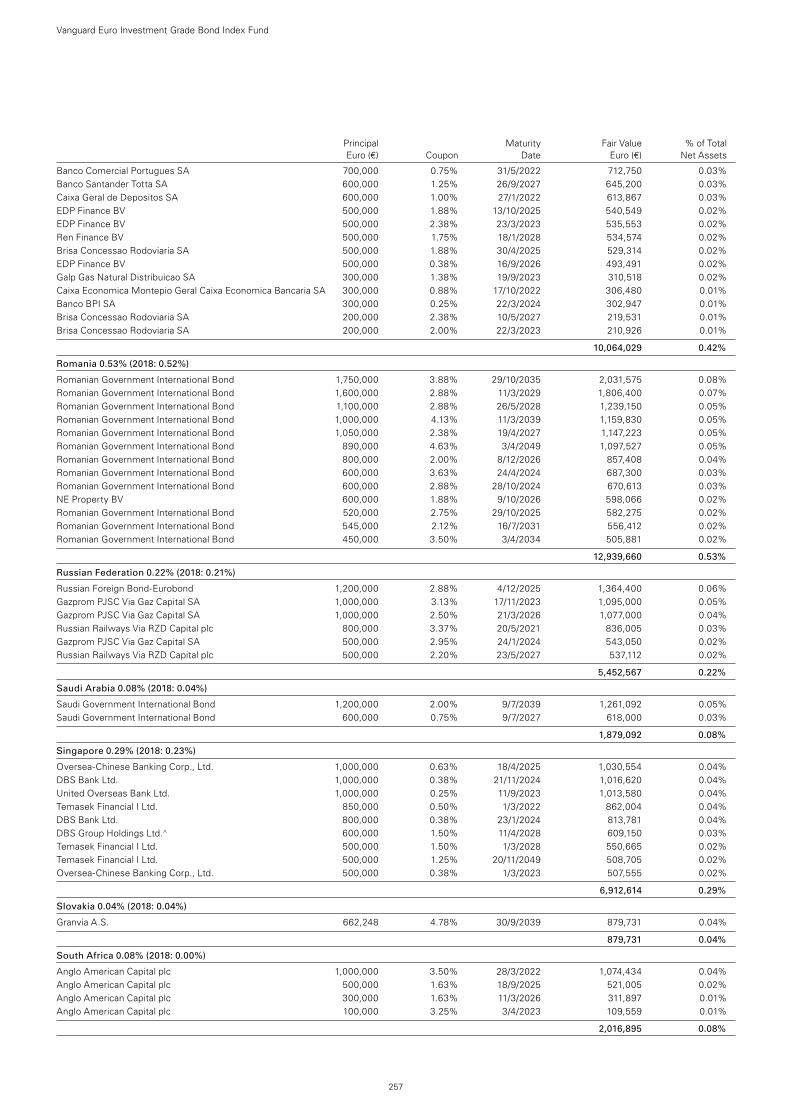
Principal Maturity Fair Value % of Total Euro (€) Coupon Date Euro (€) Net Assets
Banco Comercial Portugues SA 700,000 0.75% 31/5/2022 712,750 0.03%Banco Santander Totta SA 600,000 1.25% 26/9/2027 645,200 0.03%Caixa Geral de Depositos SA 600,000 1.00% 27/1/2022 613,867 0.03%EDP Finance BV 500,000 1.88% 13/10/2025 540,549 0.02%EDP Finance BV 500,000 2.38% 23/3/2023 535,553 0.02%Ren Finance BV 500,000 1.75% 18/1/2028 534,574 0.02%Brisa Concessao Rodoviaria SA 500,000 1.88% 30/4/2025 529,314 0.02%EDP Finance BV 500,000 0.38% 16/9/2026 493,491 0.02%Galp Gas Natural Distribuicao SA 300,000 1.38% 19/9/2023 310,518 0.02%Caixa Economica Montepio Geral Caixa Economica Bancaria SA 300,000 0.88% 17/10/2022 306,480 0.01%Banco BPI SA 300,000 0.25% 22/3/2024 302,947 0.01%Brisa Concessao Rodoviaria SA 200,000 2.38% 10/5/2027 219,531 0.01%Brisa Concessao Rodoviaria SA 200,000 2.00% 22/3/2023 210,926 0.01%
10,064,029 0.42%
Romania 0.53% (2018: 0.52%)
Romanian Government International Bond 1,750,000 3.88% 29/10/2035 2,031,575 0.08%Romanian Government International Bond 1,600,000 2.88% 11/3/2029 1,806,400 0.07%Romanian Government International Bond 1,100,000 2.88% 26/5/2028 1,239,150 0.05%Romanian Government International Bond 1,000,000 4.13% 11/3/2039 1,159,830 0.05%Romanian Government International Bond 1,050,000 2.38% 19/4/2027 1,147,223 0.05%Romanian Government International Bond 890,000 4.63% 3/4/2049 1,097,527 0.05%Romanian Government International Bond 800,000 2.00% 8/12/2026 857,408 0.04%Romanian Government International Bond 600,000 3.63% 24/4/2024 687,300 0.03%Romanian Government International Bond 600,000 2.88% 28/10/2024 670,613 0.03%NE Property BV 600,000 1.88% 9/10/2026 598,066 0.02%Romanian Government International Bond 520,000 2.75% 29/10/2025 582,275 0.02%Romanian Government International Bond 545,000 2.12% 16/7/2031 556,412 0.02%Romanian Government International Bond 450,000 3.50% 3/4/2034 505,881 0.02%
12,939,660 0.53%
Russian Federation 0.22% (2018: 0.21%)
Russian Foreign Bond-Eurobond 1,200,000 2.88% 4/12/2025 1,364,400 0.06%Gazprom PJSC Via Gaz Capital SA 1,000,000 3.13% 17/11/2023 1,095,000 0.05%Gazprom PJSC Via Gaz Capital SA 1,000,000 2.50% 21/3/2026 1,077,000 0.04%Russian Railways Via RZD Capital plc 800,000 3.37% 20/5/2021 836,005 0.03%Gazprom PJSC Via Gaz Capital SA 500,000 2.95% 24/1/2024 543,050 0.02%Russian Railways Via RZD Capital plc 500,000 2.20% 23/5/2027 537,112 0.02%
5,452,567 0.22%
Saudi Arabia 0.08% (2018: 0.04%)
Saudi Government International Bond 1,200,000 2.00% 9/7/2039 1,261,092 0.05%Saudi Government International Bond 600,000 0.75% 9/7/2027 618,000 0.03%
1,879,092 0.08%
Singapore 0.29% (2018: 0.23%)
Oversea-Chinese Banking Corp., Ltd. 1,000,000 0.63% 18/4/2025 1,030,554 0.04%DBS Bank Ltd. 1,000,000 0.38% 21/11/2024 1,016,620 0.04%United Overseas Bank Ltd. 1,000,000 0.25% 11/9/2023 1,013,580 0.04%Temasek Financial I Ltd. 850,000 0.50% 1/3/2022 862,004 0.04%DBS Bank Ltd. 800,000 0.38% 23/1/2024 813,781 0.04%DBS Group Holdings Ltd.^ 600,000 1.50% 11/4/2028 609,150 0.03%Temasek Financial I Ltd. 500,000 1.50% 1/3/2028 550,665 0.02%Temasek Financial I Ltd. 500,000 1.25% 20/11/2049 508,705 0.02%Oversea-Chinese Banking Corp., Ltd. 500,000 0.38% 1/3/2023 507,555 0.02%
6,912,614 0.29%
Slovakia 0.04% (2018: 0.04%)
Granvia A.S. 662,248 4.78% 30/9/2039 879,731 0.04%
879,731 0.04%
South Africa 0.08% (2018: 0.00%)
Anglo American Capital plc 1,000,000 3.50% 28/3/2022 1,074,434 0.04%Anglo American Capital plc 500,000 1.63% 18/9/2025 521,005 0.02%Anglo American Capital plc 300,000 1.63% 11/3/2026 311,897 0.01%Anglo American Capital plc 100,000 3.25% 3/4/2023 109,559 0.01%
2,016,895 0.08%
Vanguard Euro Investment Grade Bond Index Fund
257
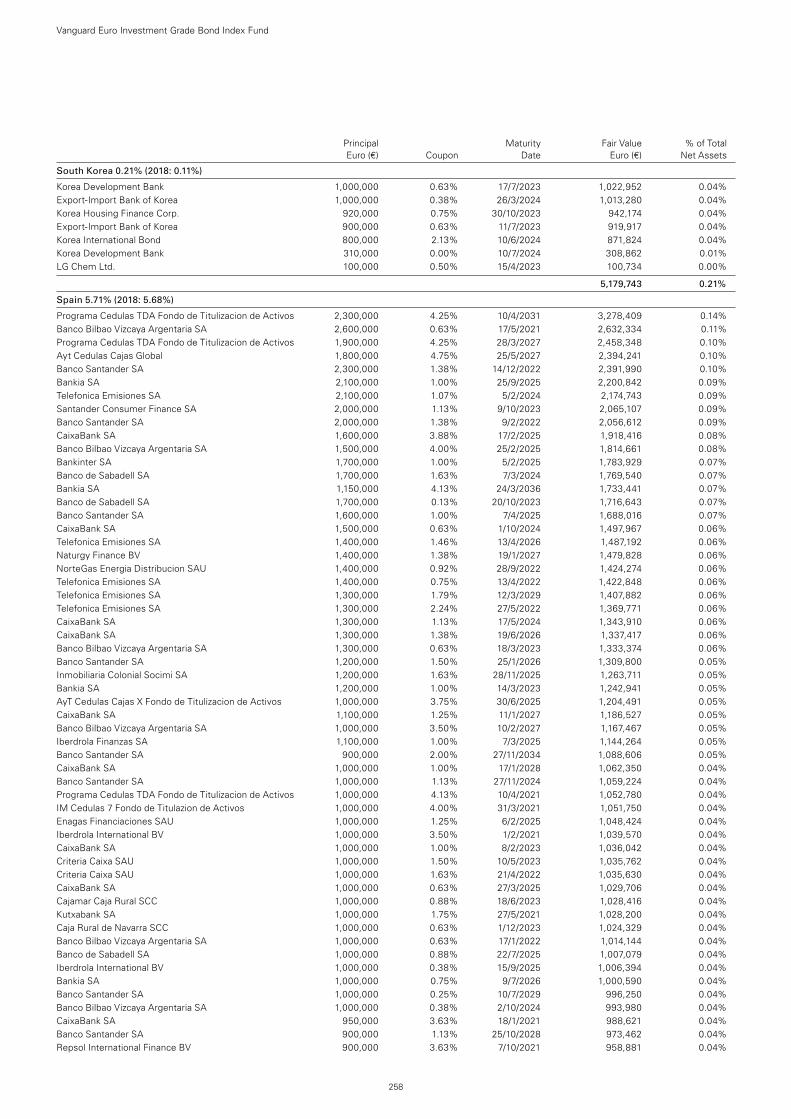
Principal Maturity Fair Value % of Total Euro (€) Coupon Date Euro (€) Net Assets
South Korea 0.21% (2018: 0.11%)
Korea Development Bank 1,000,000 0.63% 17/7/2023 1,022,952 0.04%Export-Import Bank of Korea 1,000,000 0.38% 26/3/2024 1,013,280 0.04%Korea Housing Finance Corp. 920,000 0.75% 30/10/2023 942,174 0.04%Export-Import Bank of Korea 900,000 0.63% 11/7/2023 919,917 0.04%Korea International Bond 800,000 2.13% 10/6/2024 871,824 0.04%Korea Development Bank 310,000 0.00% 10/7/2024 308,862 0.01%LG Chem Ltd. 100,000 0.50% 15/4/2023 100,734 0.00%
5,179,743 0.21%
Spain 5.71% (2018: 5.68%)
Programa Cedulas TDA Fondo de Titulizacion de Activos 2,300,000 4.25% 10/4/2031 3,278,409 0.14%Banco Bilbao Vizcaya Argentaria SA 2,600,000 0.63% 17/5/2021 2,632,334 0.11%Programa Cedulas TDA Fondo de Titulizacion de Activos 1,900,000 4.25% 28/3/2027 2,458,348 0.10%Ayt Cedulas Cajas Global 1,800,000 4.75% 25/5/2027 2,394,241 0.10%Banco Santander SA 2,300,000 1.38% 14/12/2022 2,391,990 0.10%Bankia SA 2,100,000 1.00% 25/9/2025 2,200,842 0.09%Telefonica Emisiones SA 2,100,000 1.07% 5/2/2024 2,174,743 0.09%Santander Consumer Finance SA 2,000,000 1.13% 9/10/2023 2,065,107 0.09%Banco Santander SA 2,000,000 1.38% 9/2/2022 2,056,612 0.09%CaixaBank SA 1,600,000 3.88% 17/2/2025 1,918,416 0.08%Banco Bilbao Vizcaya Argentaria SA 1,500,000 4.00% 25/2/2025 1,814,661 0.08%Bankinter SA 1,700,000 1.00% 5/2/2025 1,783,929 0.07%Banco de Sabadell SA 1,700,000 1.63% 7/3/2024 1,769,540 0.07%Bankia SA 1,150,000 4.13% 24/3/2036 1,733,441 0.07%Banco de Sabadell SA 1,700,000 0.13% 20/10/2023 1,716,643 0.07%Banco Santander SA 1,600,000 1.00% 7/4/2025 1,688,016 0.07%CaixaBank SA 1,500,000 0.63% 1/10/2024 1,497,967 0.06%Telefonica Emisiones SA 1,400,000 1.46% 13/4/2026 1,487,192 0.06%Naturgy Finance BV 1,400,000 1.38% 19/1/2027 1,479,828 0.06%NorteGas Energia Distribucion SAU 1,400,000 0.92% 28/9/2022 1,424,274 0.06%Telefonica Emisiones SA 1,400,000 0.75% 13/4/2022 1,422,848 0.06%Telefonica Emisiones SA 1,300,000 1.79% 12/3/2029 1,407,882 0.06%Telefonica Emisiones SA 1,300,000 2.24% 27/5/2022 1,369,771 0.06%CaixaBank SA 1,300,000 1.13% 17/5/2024 1,343,910 0.06%CaixaBank SA 1,300,000 1.38% 19/6/2026 1,337,417 0.06%Banco Bilbao Vizcaya Argentaria SA 1,300,000 0.63% 18/3/2023 1,333,374 0.06%Banco Santander SA 1,200,000 1.50% 25/1/2026 1,309,800 0.05%Inmobiliaria Colonial Socimi SA 1,200,000 1.63% 28/11/2025 1,263,711 0.05%Bankia SA 1,200,000 1.00% 14/3/2023 1,242,941 0.05%AyT Cedulas Cajas X Fondo de Titulizacion de Activos 1,000,000 3.75% 30/6/2025 1,204,491 0.05%CaixaBank SA 1,100,000 1.25% 11/1/2027 1,186,527 0.05%Banco Bilbao Vizcaya Argentaria SA 1,000,000 3.50% 10/2/2027 1,167,467 0.05%Iberdrola Finanzas SA 1,100,000 1.00% 7/3/2025 1,144,264 0.05%Banco Santander SA 900,000 2.00% 27/11/2034 1,088,606 0.05%CaixaBank SA 1,000,000 1.00% 17/1/2028 1,062,350 0.04%Banco Santander SA 1,000,000 1.13% 27/11/2024 1,059,224 0.04%Programa Cedulas TDA Fondo de Titulizacion de Activos 1,000,000 4.13% 10/4/2021 1,052,780 0.04%IM Cedulas 7 Fondo de Titulazion de Activos 1,000,000 4.00% 31/3/2021 1,051,750 0.04%Enagas Financiaciones SAU 1,000,000 1.25% 6/2/2025 1,048,424 0.04%Iberdrola International BV 1,000,000 3.50% 1/2/2021 1,039,570 0.04%CaixaBank SA 1,000,000 1.00% 8/2/2023 1,036,042 0.04%Criteria Caixa SAU 1,000,000 1.50% 10/5/2023 1,035,762 0.04%Criteria Caixa SAU 1,000,000 1.63% 21/4/2022 1,035,630 0.04%CaixaBank SA 1,000,000 0.63% 27/3/2025 1,029,706 0.04%Cajamar Caja Rural SCC 1,000,000 0.88% 18/6/2023 1,028,416 0.04%Kutxabank SA 1,000,000 1.75% 27/5/2021 1,028,200 0.04%Caja Rural de Navarra SCC 1,000,000 0.63% 1/12/2023 1,024,329 0.04%Banco Bilbao Vizcaya Argentaria SA 1,000,000 0.63% 17/1/2022 1,014,144 0.04%Banco de Sabadell SA 1,000,000 0.88% 22/7/2025 1,007,079 0.04%Iberdrola International BV 1,000,000 0.38% 15/9/2025 1,006,394 0.04%Bankia SA 1,000,000 0.75% 9/7/2026 1,000,590 0.04%Banco Santander SA 1,000,000 0.25% 10/7/2029 996,250 0.04%Banco Bilbao Vizcaya Argentaria SA 1,000,000 0.38% 2/10/2024 993,980 0.04%CaixaBank SA 950,000 3.63% 18/1/2021 988,621 0.04%Banco Santander SA 900,000 1.13% 25/10/2028 973,462 0.04%Repsol International Finance BV 900,000 3.63% 7/10/2021 958,881 0.04%
Vanguard Euro Investment Grade Bond Index Fund
258
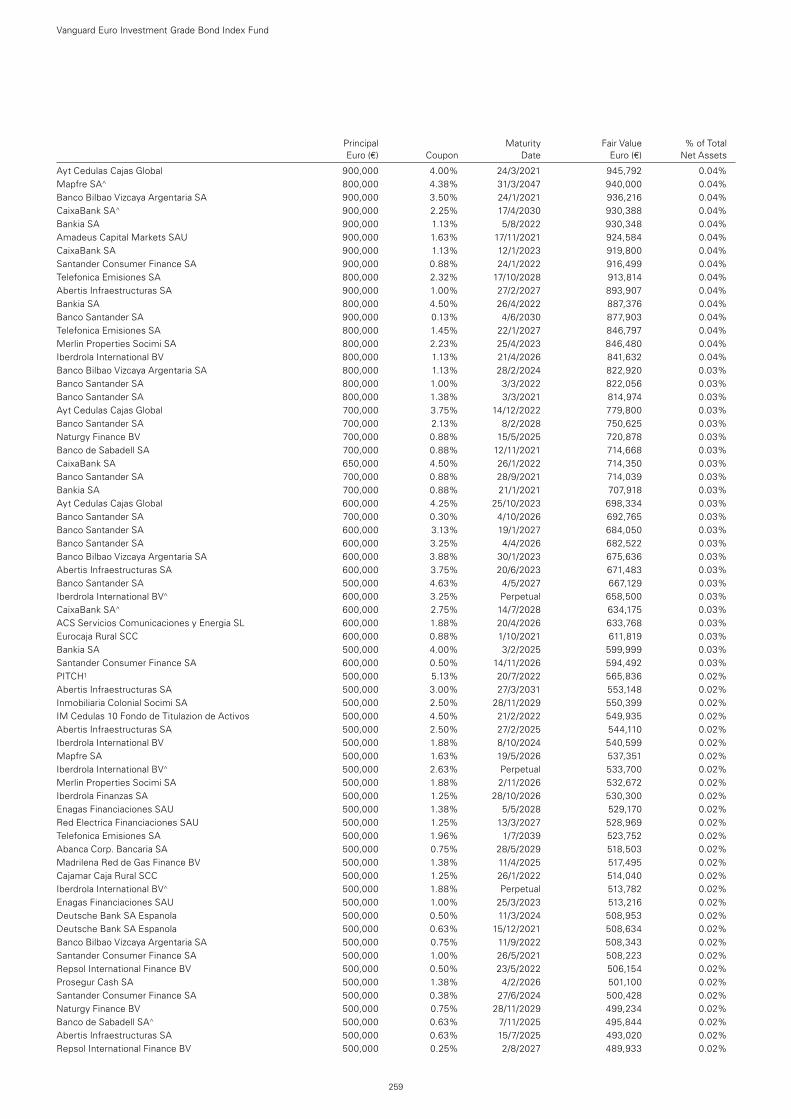
Principal Maturity Fair Value % of Total Euro (€) Coupon Date Euro (€) Net Assets
Ayt Cedulas Cajas Global 900,000 4.00% 24/3/2021 945,792 0.04%Mapfre SA^ 800,000 4.38% 31/3/2047 940,000 0.04%Banco Bilbao Vizcaya Argentaria SA 900,000 3.50% 24/1/2021 936,216 0.04%CaixaBank SA^ 900,000 2.25% 17/4/2030 930,388 0.04%Bankia SA 900,000 1.13% 5/8/2022 930,348 0.04%Amadeus Capital Markets SAU 900,000 1.63% 17/11/2021 924,584 0.04%CaixaBank SA 900,000 1.13% 12/1/2023 919,800 0.04%Santander Consumer Finance SA 900,000 0.88% 24/1/2022 916,499 0.04%Telefonica Emisiones SA 800,000 2.32% 17/10/2028 913,814 0.04%Abertis Infraestructuras SA 900,000 1.00% 27/2/2027 893,907 0.04%Bankia SA 800,000 4.50% 26/4/2022 887,376 0.04%Banco Santander SA 900,000 0.13% 4/6/2030 877,903 0.04%Telefonica Emisiones SA 800,000 1.45% 22/1/2027 846,797 0.04%Merlin Properties Socimi SA 800,000 2.23% 25/4/2023 846,480 0.04%Iberdrola International BV 800,000 1.13% 21/4/2026 841,632 0.04%Banco Bilbao Vizcaya Argentaria SA 800,000 1.13% 28/2/2024 822,920 0.03%Banco Santander SA 800,000 1.00% 3/3/2022 822,056 0.03%Banco Santander SA 800,000 1.38% 3/3/2021 814,974 0.03%Ayt Cedulas Cajas Global 700,000 3.75% 14/12/2022 779,800 0.03%Banco Santander SA 700,000 2.13% 8/2/2028 750,625 0.03%Naturgy Finance BV 700,000 0.88% 15/5/2025 720,878 0.03%Banco de Sabadell SA 700,000 0.88% 12/11/2021 714,668 0.03%CaixaBank SA 650,000 4.50% 26/1/2022 714,350 0.03%Banco Santander SA 700,000 0.88% 28/9/2021 714,039 0.03%Bankia SA 700,000 0.88% 21/1/2021 707,918 0.03%Ayt Cedulas Cajas Global 600,000 4.25% 25/10/2023 698,334 0.03%Banco Santander SA 700,000 0.30% 4/10/2026 692,765 0.03%Banco Santander SA 600,000 3.13% 19/1/2027 684,050 0.03%Banco Santander SA 600,000 3.25% 4/4/2026 682,522 0.03%Banco Bilbao Vizcaya Argentaria SA 600,000 3.88% 30/1/2023 675,636 0.03%Abertis Infraestructuras SA 600,000 3.75% 20/6/2023 671,483 0.03%Banco Santander SA 500,000 4.63% 4/5/2027 667,129 0.03%Iberdrola International BV^ 600,000 3.25% Perpetual 658,500 0.03%CaixaBank SA^ 600,000 2.75% 14/7/2028 634,175 0.03%ACS Servicios Comunicaciones y Energia SL 600,000 1.88% 20/4/2026 633,768 0.03%Eurocaja Rural SCC 600,000 0.88% 1/10/2021 611,819 0.03%Bankia SA 500,000 4.00% 3/2/2025 599,999 0.03%Santander Consumer Finance SA 600,000 0.50% 14/11/2026 594,492 0.03%PITCH1 500,000 5.13% 20/7/2022 565,836 0.02%Abertis Infraestructuras SA 500,000 3.00% 27/3/2031 553,148 0.02%Inmobiliaria Colonial Socimi SA 500,000 2.50% 28/11/2029 550,399 0.02%IM Cedulas 10 Fondo de Titulazion de Activos 500,000 4.50% 21/2/2022 549,935 0.02%Abertis Infraestructuras SA 500,000 2.50% 27/2/2025 544,110 0.02%Iberdrola International BV 500,000 1.88% 8/10/2024 540,599 0.02%Mapfre SA 500,000 1.63% 19/5/2026 537,351 0.02%Iberdrola International BV^ 500,000 2.63% Perpetual 533,700 0.02%Merlin Properties Socimi SA 500,000 1.88% 2/11/2026 532,672 0.02%Iberdrola Finanzas SA 500,000 1.25% 28/10/2026 530,300 0.02%Enagas Financiaciones SAU 500,000 1.38% 5/5/2028 529,170 0.02%Red Electrica Financiaciones SAU 500,000 1.25% 13/3/2027 528,969 0.02%Telefonica Emisiones SA 500,000 1.96% 1/7/2039 523,752 0.02%Abanca Corp. Bancaria SA 500,000 0.75% 28/5/2029 518,503 0.02%Madrilena Red de Gas Finance BV 500,000 1.38% 11/4/2025 517,495 0.02%Cajamar Caja Rural SCC 500,000 1.25% 26/1/2022 514,040 0.02%Iberdrola International BV^ 500,000 1.88% Perpetual 513,782 0.02%Enagas Financiaciones SAU 500,000 1.00% 25/3/2023 513,216 0.02%Deutsche Bank SA Espanola 500,000 0.50% 11/3/2024 508,953 0.02%Deutsche Bank SA Espanola 500,000 0.63% 15/12/2021 508,634 0.02%Banco Bilbao Vizcaya Argentaria SA 500,000 0.75% 11/9/2022 508,343 0.02%Santander Consumer Finance SA 500,000 1.00% 26/5/2021 508,223 0.02%Repsol International Finance BV 500,000 0.50% 23/5/2022 506,154 0.02%Prosegur Cash SA 500,000 1.38% 4/2/2026 501,100 0.02%Santander Consumer Finance SA 500,000 0.38% 27/6/2024 500,428 0.02%Naturgy Finance BV 500,000 0.75% 28/11/2029 499,234 0.02%Banco de Sabadell SA^ 500,000 0.63% 7/11/2025 495,844 0.02%Abertis Infraestructuras SA 500,000 0.63% 15/7/2025 493,020 0.02%Repsol International Finance BV 500,000 0.25% 2/8/2027 489,933 0.02%
Vanguard Euro Investment Grade Bond Index Fund
259
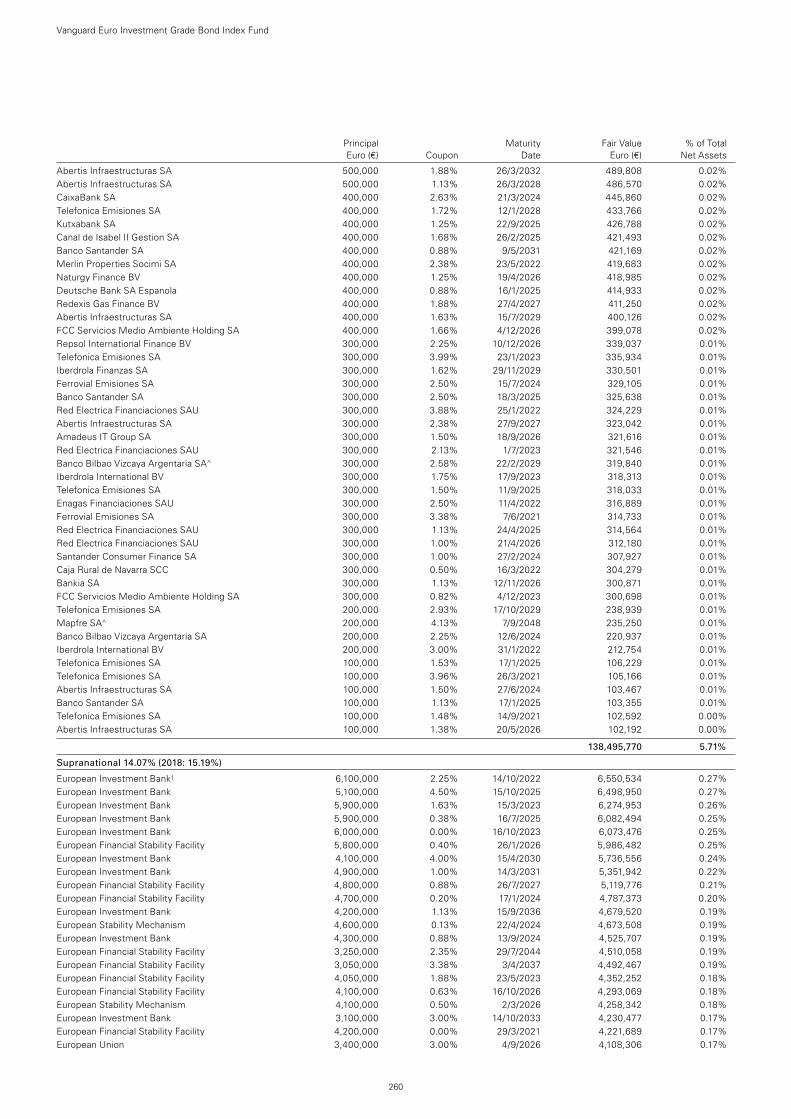
Principal Maturity Fair Value % of Total Euro (€) Coupon Date Euro (€) Net Assets
Abertis Infraestructuras SA 500,000 1.88% 26/3/2032 489,808 0.02%Abertis Infraestructuras SA 500,000 1.13% 26/3/2028 486,570 0.02%CaixaBank SA 400,000 2.63% 21/3/2024 445,860 0.02%Telefonica Emisiones SA 400,000 1.72% 12/1/2028 433,766 0.02%Kutxabank SA 400,000 1.25% 22/9/2025 426,788 0.02%Canal de Isabel II Gestion SA 400,000 1.68% 26/2/2025 421,493 0.02%Banco Santander SA 400,000 0.88% 9/5/2031 421,169 0.02%Merlin Properties Socimi SA 400,000 2.38% 23/5/2022 419,683 0.02%Naturgy Finance BV 400,000 1.25% 19/4/2026 418,985 0.02%Deutsche Bank SA Espanola 400,000 0.88% 16/1/2025 414,933 0.02%Redexis Gas Finance BV 400,000 1.88% 27/4/2027 411,250 0.02%Abertis Infraestructuras SA 400,000 1.63% 15/7/2029 400,126 0.02%FCC Servicios Medio Ambiente Holding SA 400,000 1.66% 4/12/2026 399,078 0.02%Repsol International Finance BV 300,000 2.25% 10/12/2026 339,037 0.01%Telefonica Emisiones SA 300,000 3.99% 23/1/2023 335,934 0.01%Iberdrola Finanzas SA 300,000 1.62% 29/11/2029 330,501 0.01%Ferrovial Emisiones SA 300,000 2.50% 15/7/2024 329,105 0.01%Banco Santander SA 300,000 2.50% 18/3/2025 325,638 0.01%Red Electrica Financiaciones SAU 300,000 3.88% 25/1/2022 324,229 0.01%Abertis Infraestructuras SA 300,000 2.38% 27/9/2027 323,042 0.01%Amadeus IT Group SA 300,000 1.50% 18/9/2026 321,616 0.01%Red Electrica Financiaciones SAU 300,000 2.13% 1/7/2023 321,546 0.01%Banco Bilbao Vizcaya Argentaria SA^ 300,000 2.58% 22/2/2029 319,840 0.01%Iberdrola International BV 300,000 1.75% 17/9/2023 318,313 0.01%Telefonica Emisiones SA 300,000 1.50% 11/9/2025 318,033 0.01%Enagas Financiaciones SAU 300,000 2.50% 11/4/2022 316,889 0.01%Ferrovial Emisiones SA 300,000 3.38% 7/6/2021 314,733 0.01%Red Electrica Financiaciones SAU 300,000 1.13% 24/4/2025 314,564 0.01%Red Electrica Financiaciones SAU 300,000 1.00% 21/4/2026 312,180 0.01%Santander Consumer Finance SA 300,000 1.00% 27/2/2024 307,927 0.01%Caja Rural de Navarra SCC 300,000 0.50% 16/3/2022 304,279 0.01%Bankia SA 300,000 1.13% 12/11/2026 300,871 0.01%FCC Servicios Medio Ambiente Holding SA 300,000 0.82% 4/12/2023 300,698 0.01%Telefonica Emisiones SA 200,000 2.93% 17/10/2029 238,939 0.01%Mapfre SA^ 200,000 4.13% 7/9/2048 235,250 0.01%Banco Bilbao Vizcaya Argentaria SA 200,000 2.25% 12/6/2024 220,937 0.01%Iberdrola International BV 200,000 3.00% 31/1/2022 212,754 0.01%Telefonica Emisiones SA 100,000 1.53% 17/1/2025 106,229 0.01%Telefonica Emisiones SA 100,000 3.96% 26/3/2021 105,166 0.01%Abertis Infraestructuras SA 100,000 1.50% 27/6/2024 103,467 0.01%Banco Santander SA 100,000 1.13% 17/1/2025 103,355 0.01%Telefonica Emisiones SA 100,000 1.48% 14/9/2021 102,592 0.00%Abertis Infraestructuras SA 100,000 1.38% 20/5/2026 102,192 0.00%
138,495,770 5.71%
Supranational 14.07% (2018: 15.19%)
European Investment Bank1 6,100,000 2.25% 14/10/2022 6,550,534 0.27%European Investment Bank 5,100,000 4.50% 15/10/2025 6,498,950 0.27%European Investment Bank 5,900,000 1.63% 15/3/2023 6,274,953 0.26%European Investment Bank 5,900,000 0.38% 16/7/2025 6,082,494 0.25%European Investment Bank 6,000,000 0.00% 16/10/2023 6,073,476 0.25%European Financial Stability Facility 5,800,000 0.40% 26/1/2026 5,986,482 0.25%European Investment Bank 4,100,000 4.00% 15/4/2030 5,736,556 0.24%European Investment Bank 4,900,000 1.00% 14/3/2031 5,351,942 0.22%European Financial Stability Facility 4,800,000 0.88% 26/7/2027 5,119,776 0.21%European Financial Stability Facility 4,700,000 0.20% 17/1/2024 4,787,373 0.20%European Investment Bank 4,200,000 1.13% 15/9/2036 4,679,520 0.19%European Stability Mechanism 4,600,000 0.13% 22/4/2024 4,673,508 0.19%European Investment Bank 4,300,000 0.88% 13/9/2024 4,525,707 0.19%European Financial Stability Facility 3,250,000 2.35% 29/7/2044 4,510,058 0.19%European Financial Stability Facility 3,050,000 3.38% 3/4/2037 4,492,467 0.19%European Financial Stability Facility 4,050,000 1.88% 23/5/2023 4,352,252 0.18%European Financial Stability Facility 4,100,000 0.63% 16/10/2026 4,293,069 0.18%European Stability Mechanism 4,100,000 0.50% 2/3/2026 4,258,342 0.18%European Investment Bank 3,100,000 3.00% 14/10/2033 4,230,477 0.17%European Financial Stability Facility 4,200,000 0.00% 29/3/2021 4,221,689 0.17%European Union 3,400,000 3.00% 4/9/2026 4,108,306 0.17%
Vanguard Euro Investment Grade Bond Index Fund
260
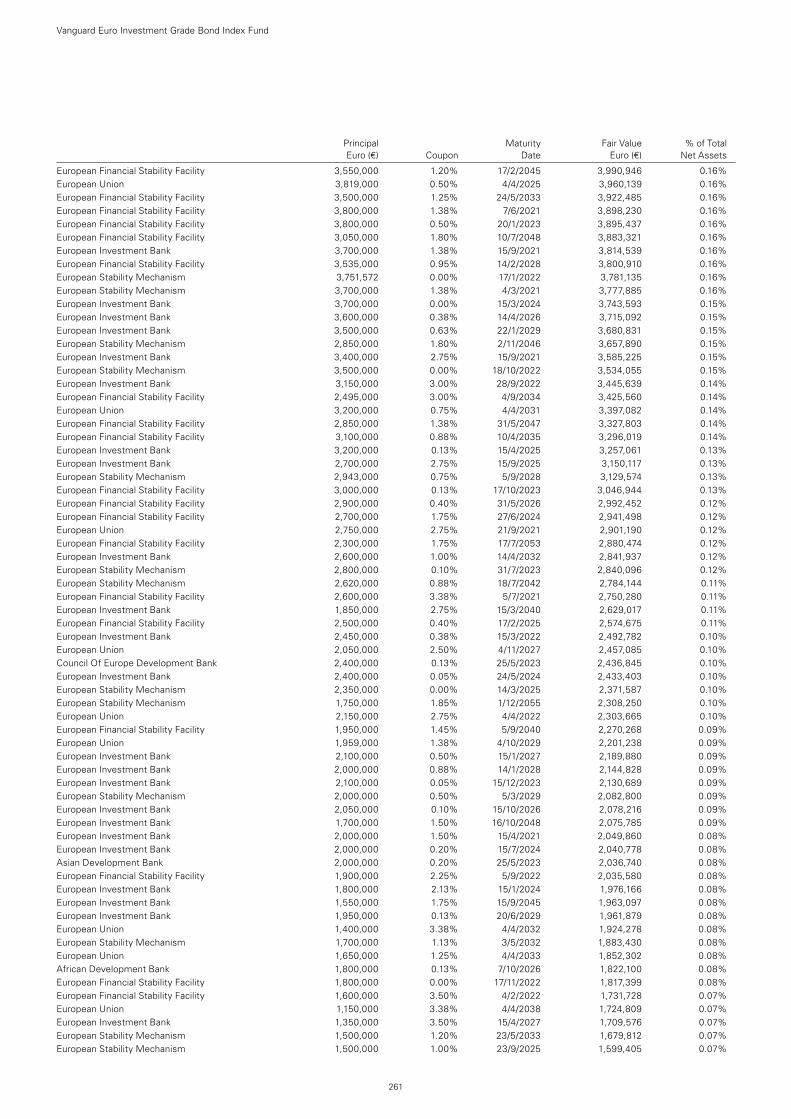
Principal Maturity Fair Value % of Total Euro (€) Coupon Date Euro (€) Net Assets
European Financial Stability Facility 3,550,000 1.20% 17/2/2045 3,990,946 0.16%European Union 3,819,000 0.50% 4/4/2025 3,960,139 0.16%European Financial Stability Facility 3,500,000 1.25% 24/5/2033 3,922,485 0.16%European Financial Stability Facility 3,800,000 1.38% 7/6/2021 3,898,230 0.16%European Financial Stability Facility 3,800,000 0.50% 20/1/2023 3,895,437 0.16%European Financial Stability Facility 3,050,000 1.80% 10/7/2048 3,883,321 0.16%European Investment Bank 3,700,000 1.38% 15/9/2021 3,814,539 0.16%European Financial Stability Facility 3,535,000 0.95% 14/2/2028 3,800,910 0.16%European Stability Mechanism 3,751,572 0.00% 17/1/2022 3,781,135 0.16%European Stability Mechanism 3,700,000 1.38% 4/3/2021 3,777,885 0.16%European Investment Bank 3,700,000 0.00% 15/3/2024 3,743,593 0.15%European Investment Bank 3,600,000 0.38% 14/4/2026 3,715,092 0.15%European Investment Bank 3,500,000 0.63% 22/1/2029 3,680,831 0.15%European Stability Mechanism 2,850,000 1.80% 2/11/2046 3,657,890 0.15%European Investment Bank 3,400,000 2.75% 15/9/2021 3,585,225 0.15%European Stability Mechanism 3,500,000 0.00% 18/10/2022 3,534,055 0.15%European Investment Bank 3,150,000 3.00% 28/9/2022 3,445,639 0.14%European Financial Stability Facility 2,495,000 3.00% 4/9/2034 3,425,560 0.14%European Union 3,200,000 0.75% 4/4/2031 3,397,082 0.14%European Financial Stability Facility 2,850,000 1.38% 31/5/2047 3,327,803 0.14%European Financial Stability Facility 3,100,000 0.88% 10/4/2035 3,296,019 0.14%European Investment Bank 3,200,000 0.13% 15/4/2025 3,257,061 0.13%European Investment Bank 2,700,000 2.75% 15/9/2025 3,150,117 0.13%European Stability Mechanism 2,943,000 0.75% 5/9/2028 3,129,574 0.13%European Financial Stability Facility 3,000,000 0.13% 17/10/2023 3,046,944 0.13%European Financial Stability Facility 2,900,000 0.40% 31/5/2026 2,992,452 0.12%European Financial Stability Facility 2,700,000 1.75% 27/6/2024 2,941,498 0.12%European Union 2,750,000 2.75% 21/9/2021 2,901,190 0.12%European Financial Stability Facility 2,300,000 1.75% 17/7/2053 2,880,474 0.12%European Investment Bank 2,600,000 1.00% 14/4/2032 2,841,937 0.12%European Stability Mechanism 2,800,000 0.10% 31/7/2023 2,840,096 0.12%European Stability Mechanism 2,620,000 0.88% 18/7/2042 2,784,144 0.11%European Financial Stability Facility 2,600,000 3.38% 5/7/2021 2,750,280 0.11%European Investment Bank 1,850,000 2.75% 15/3/2040 2,629,017 0.11%European Financial Stability Facility 2,500,000 0.40% 17/2/2025 2,574,675 0.11%European Investment Bank 2,450,000 0.38% 15/3/2022 2,492,782 0.10%European Union 2,050,000 2.50% 4/11/2027 2,457,085 0.10%Council Of Europe Development Bank 2,400,000 0.13% 25/5/2023 2,436,845 0.10%European Investment Bank 2,400,000 0.05% 24/5/2024 2,433,403 0.10%European Stability Mechanism 2,350,000 0.00% 14/3/2025 2,371,587 0.10%European Stability Mechanism 1,750,000 1.85% 1/12/2055 2,308,250 0.10%European Union 2,150,000 2.75% 4/4/2022 2,303,665 0.10%European Financial Stability Facility 1,950,000 1.45% 5/9/2040 2,270,268 0.09%European Union 1,959,000 1.38% 4/10/2029 2,201,238 0.09%European Investment Bank 2,100,000 0.50% 15/1/2027 2,189,880 0.09%European Investment Bank 2,000,000 0.88% 14/1/2028 2,144,828 0.09%European Investment Bank 2,100,000 0.05% 15/12/2023 2,130,689 0.09%European Stability Mechanism 2,000,000 0.50% 5/3/2029 2,082,800 0.09%European Investment Bank 2,050,000 0.10% 15/10/2026 2,078,216 0.09%European Investment Bank 1,700,000 1.50% 16/10/2048 2,075,785 0.09%European Investment Bank 2,000,000 1.50% 15/4/2021 2,049,860 0.08%European Investment Bank 2,000,000 0.20% 15/7/2024 2,040,778 0.08%Asian Development Bank 2,000,000 0.20% 25/5/2023 2,036,740 0.08%European Financial Stability Facility 1,900,000 2.25% 5/9/2022 2,035,580 0.08%European Investment Bank 1,800,000 2.13% 15/1/2024 1,976,166 0.08%European Investment Bank 1,550,000 1.75% 15/9/2045 1,963,097 0.08%European Investment Bank 1,950,000 0.13% 20/6/2029 1,961,879 0.08%European Union 1,400,000 3.38% 4/4/2032 1,924,278 0.08%European Stability Mechanism 1,700,000 1.13% 3/5/2032 1,883,430 0.08%European Union 1,650,000 1.25% 4/4/2033 1,852,302 0.08%African Development Bank 1,800,000 0.13% 7/10/2026 1,822,100 0.08%European Financial Stability Facility 1,800,000 0.00% 17/11/2022 1,817,399 0.08%European Financial Stability Facility 1,600,000 3.50% 4/2/2022 1,731,728 0.07%European Union 1,150,000 3.38% 4/4/2038 1,724,809 0.07%European Investment Bank 1,350,000 3.50% 15/4/2027 1,709,576 0.07%European Stability Mechanism 1,500,000 1.20% 23/5/2033 1,679,812 0.07%European Stability Mechanism 1,500,000 1.00% 23/9/2025 1,599,405 0.07%
Vanguard Euro Investment Grade Bond Index Fund
261
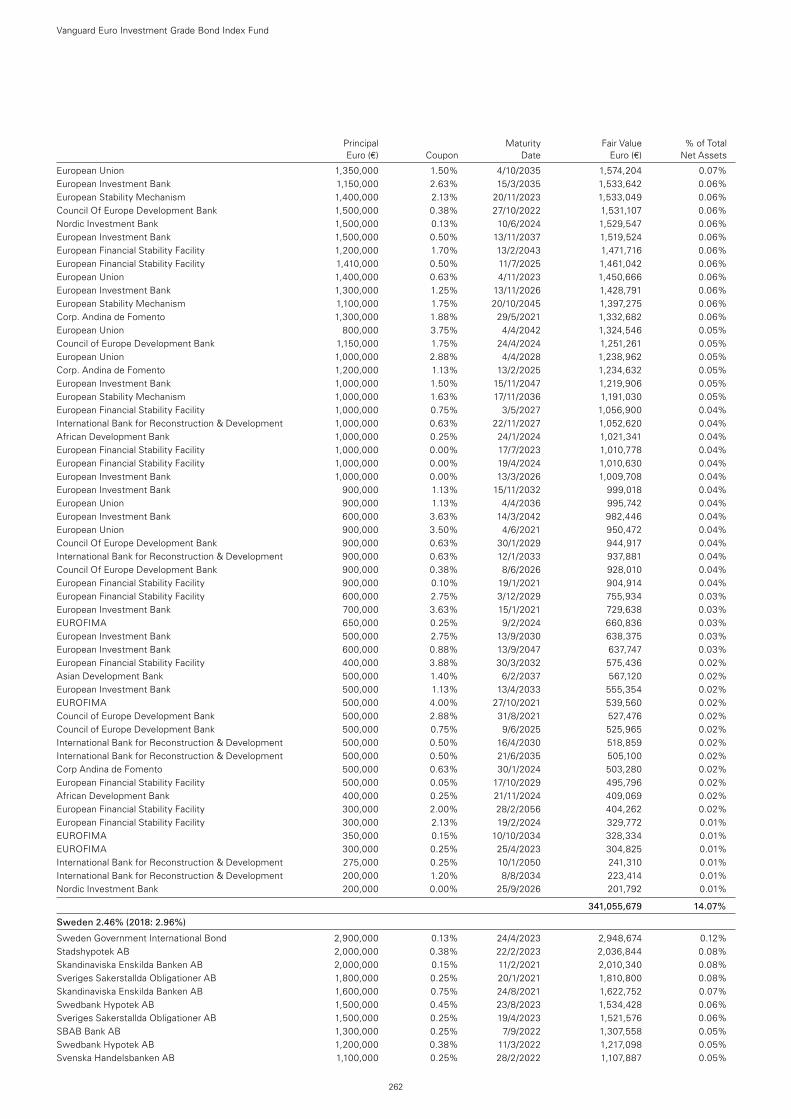
European Union 1,350,000 1.50% 4/10/2035 1,574,204 0.07%European Investment Bank 1,150,000 2.63% 15/3/2035 1,533,642 0.06%European Stability Mechanism 1,400,000 2.13% 20/11/2023 1,533,049 0.06%Council Of Europe Development Bank 1,500,000 0.38% 27/10/2022 1,531,107 0.06%Nordic Investment Bank 1,500,000 0.13% 10/6/2024 1,529,547 0.06%European Investment Bank 1,500,000 0.50% 13/11/2037 1,519,524 0.06%European Financial Stability Facility 1,200,000 1.70% 13/2/2043 1,471,716 0.06%European Financial Stability Facility 1,410,000 0.50% 11/7/2025 1,461,042 0.06%European Union 1,400,000 0.63% 4/11/2023 1,450,666 0.06%European Investment Bank 1,300,000 1.25% 13/11/2026 1,428,791 0.06%European Stability Mechanism 1,100,000 1.75% 20/10/2045 1,397,275 0.06%Corp. Andina de Fomento 1,300,000 1.88% 29/5/2021 1,332,682 0.06%European Union 800,000 3.75% 4/4/2042 1,324,546 0.05%Council of Europe Development Bank 1,150,000 1.75% 24/4/2024 1,251,261 0.05%European Union 1,000,000 2.88% 4/4/2028 1,238,962 0.05%Corp. Andina de Fomento 1,200,000 1.13% 13/2/2025 1,234,632 0.05%European Investment Bank 1,000,000 1.50% 15/11/2047 1,219,906 0.05%European Stability Mechanism 1,000,000 1.63% 17/11/2036 1,191,030 0.05%European Financial Stability Facility 1,000,000 0.75% 3/5/2027 1,056,900 0.04%International Bank for Reconstruction & Development 1,000,000 0.63% 22/11/2027 1,052,620 0.04%African Development Bank 1,000,000 0.25% 24/1/2024 1,021,341 0.04%European Financial Stability Facility 1,000,000 0.00% 17/7/2023 1,010,778 0.04%European Financial Stability Facility 1,000,000 0.00% 19/4/2024 1,010,630 0.04%European Investment Bank 1,000,000 0.00% 13/3/2026 1,009,708 0.04%European Investment Bank 900,000 1.13% 15/11/2032 999,018 0.04%European Union 900,000 1.13% 4/4/2036 995,742 0.04%European Investment Bank 600,000 3.63% 14/3/2042 982,446 0.04%European Union 900,000 3.50% 4/6/2021 950,472 0.04%Council Of Europe Development Bank 900,000 0.63% 30/1/2029 944,917 0.04%International Bank for Reconstruction & Development 900,000 0.63% 12/1/2033 937,881 0.04%Council Of Europe Development Bank 900,000 0.38% 8/6/2026 928,010 0.04%European Financial Stability Facility 900,000 0.10% 19/1/2021 904,914 0.04%European Financial Stability Facility 600,000 2.75% 3/12/2029 755,934 0.03%European Investment Bank 700,000 3.63% 15/1/2021 729,638 0.03%EUROFIMA 650,000 0.25% 9/2/2024 660,836 0.03%European Investment Bank 500,000 2.75% 13/9/2030 638,375 0.03%European Investment Bank 600,000 0.88% 13/9/2047 637,747 0.03%European Financial Stability Facility 400,000 3.88% 30/3/2032 575,436 0.02%Asian Development Bank 500,000 1.40% 6/2/2037 567,120 0.02%European Investment Bank 500,000 1.13% 13/4/2033 555,354 0.02%EUROFIMA 500,000 4.00% 27/10/2021 539,560 0.02%Council of Europe Development Bank 500,000 2.88% 31/8/2021 527,476 0.02%Council of Europe Development Bank 500,000 0.75% 9/6/2025 525,965 0.02%International Bank for Reconstruction & Development 500,000 0.50% 16/4/2030 518,859 0.02%International Bank for Reconstruction & Development 500,000 0.50% 21/6/2035 505,100 0.02%Corp Andina de Fomento 500,000 0.63% 30/1/2024 503,280 0.02%European Financial Stability Facility 500,000 0.05% 17/10/2029 495,796 0.02%African Development Bank 400,000 0.25% 21/11/2024 409,069 0.02%European Financial Stability Facility 300,000 2.00% 28/2/2056 404,262 0.02%European Financial Stability Facility 300,000 2.13% 19/2/2024 329,772 0.01%EUROFIMA 350,000 0.15% 10/10/2034 328,334 0.01%EUROFIMA 300,000 0.25% 25/4/2023 304,825 0.01%International Bank for Reconstruction & Development 275,000 0.25% 10/1/2050 241,310 0.01%International Bank for Reconstruction & Development 200,000 1.20% 8/8/2034 223,414 0.01%Nordic Investment Bank 200,000 0.00% 25/9/2026 201,792 0.01%
341,055,679 14.07%
Sweden 2.46% (2018: 2.96%)
Sweden Government International Bond 2,900,000 0.13% 24/4/2023 2,948,674 0.12%Stadshypotek AB 2,000,000 0.38% 22/2/2023 2,036,844 0.08%Skandinaviska Enskilda Banken AB 2,000,000 0.15% 11/2/2021 2,010,340 0.08%Sveriges Sakerstallda Obligationer AB 1,800,000 0.25% 20/1/2021 1,810,800 0.08%Skandinaviska Enskilda Banken AB 1,600,000 0.75% 24/8/2021 1,622,752 0.07%Swedbank Hypotek AB 1,500,000 0.45% 23/8/2023 1,534,428 0.06%Sveriges Sakerstallda Obligationer AB 1,500,000 0.25% 19/4/2023 1,521,576 0.06%SBAB Bank AB 1,300,000 0.25% 7/9/2022 1,307,558 0.05%Swedbank Hypotek AB 1,200,000 0.38% 11/3/2022 1,217,098 0.05%Svenska Handelsbanken AB 1,100,000 0.25% 28/2/2022 1,107,887 0.05%
Vanguard Euro Investment Grade Bond Index Fund
262
Principal Maturity Fair Value % of Total Euro (€) Coupon Date Euro (€) Net Assets
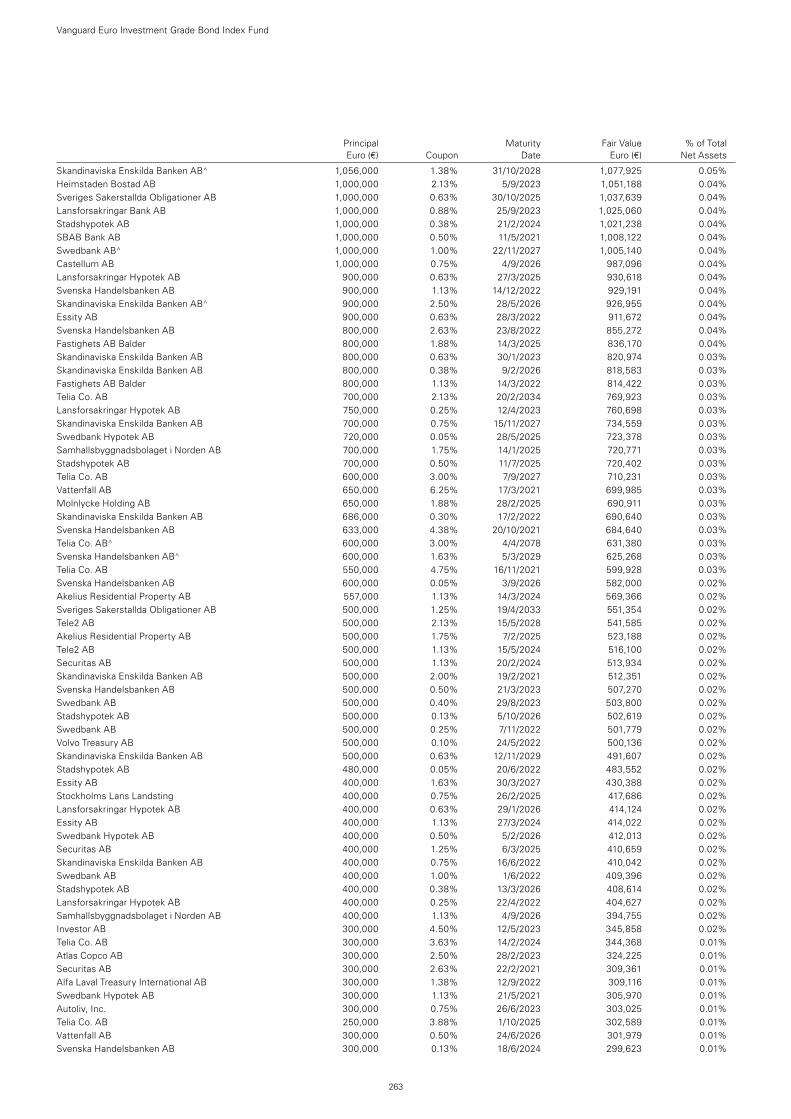
Principal Maturity Fair Value % of Total Euro (€) Coupon Date Euro (€) Net Assets
Vanguard Euro Investment Grade Bond Index Fund
263
Skandinaviska Enskilda Banken AB^ 1,056,000 1.38% 31/10/2028 1,077,925 0.05%Heimstaden Bostad AB 1,000,000 2.13% 5/9/2023 1,051,188 0.04%Sveriges Sakerstallda Obligationer AB 1,000,000 0.63% 30/10/2025 1,037,639 0.04%Lansforsakringar Bank AB 1,000,000 0.88% 25/9/2023 1,025,060 0.04%Stadshypotek AB 1,000,000 0.38% 21/2/2024 1,021,238 0.04%SBAB Bank AB 1,000,000 0.50% 11/5/2021 1,008,122 0.04%Swedbank AB^ 1,000,000 1.00% 22/11/2027 1,005,140 0.04%Castellum AB 1,000,000 0.75% 4/9/2026 987,096 0.04%Lansforsakringar Hypotek AB 900,000 0.63% 27/3/2025 930,618 0.04%Svenska Handelsbanken AB 900,000 1.13% 14/12/2022 929,191 0.04%Skandinaviska Enskilda Banken AB^ 900,000 2.50% 28/5/2026 926,955 0.04%Essity AB 900,000 0.63% 28/3/2022 911,672 0.04%Svenska Handelsbanken AB 800,000 2.63% 23/8/2022 855,272 0.04%Fastighets AB Balder 800,000 1.88% 14/3/2025 836,170 0.04%Skandinaviska Enskilda Banken AB 800,000 0.63% 30/1/2023 820,974 0.03%Skandinaviska Enskilda Banken AB 800,000 0.38% 9/2/2026 818,583 0.03%Fastighets AB Balder 800,000 1.13% 14/3/2022 814,422 0.03%Telia Co. AB 700,000 2.13% 20/2/2034 769,923 0.03%Lansforsakringar Hypotek AB 750,000 0.25% 12/4/2023 760,698 0.03%Skandinaviska Enskilda Banken AB 700,000 0.75% 15/11/2027 734,559 0.03%Swedbank Hypotek AB 720,000 0.05% 28/5/2025 723,378 0.03%Samhallsbyggnadsbolaget i Norden AB 700,000 1.75% 14/1/2025 720,771 0.03%Stadshypotek AB 700,000 0.50% 11/7/2025 720,402 0.03%Telia Co. AB 600,000 3.00% 7/9/2027 710,231 0.03%Vattenfall AB 650,000 6.25% 17/3/2021 699,985 0.03%Molnlycke Holding AB 650,000 1.88% 28/2/2025 690,911 0.03%Skandinaviska Enskilda Banken AB 686,000 0.30% 17/2/2022 690,640 0.03%Svenska Handelsbanken AB 633,000 4.38% 20/10/2021 684,640 0.03%Telia Co. AB^ 600,000 3.00% 4/4/2078 631,380 0.03%Svenska Handelsbanken AB^ 600,000 1.63% 5/3/2029 625,268 0.03%Telia Co. AB 550,000 4.75% 16/11/2021 599,928 0.03%Svenska Handelsbanken AB 600,000 0.05% 3/9/2026 582,000 0.02%Akelius Residential Property AB 557,000 1.13% 14/3/2024 569,366 0.02%Sveriges Sakerstallda Obligationer AB 500,000 1.25% 19/4/2033 551,354 0.02%Tele2 AB 500,000 2.13% 15/5/2028 541,585 0.02%Akelius Residential Property AB 500,000 1.75% 7/2/2025 523,188 0.02%Tele2 AB 500,000 1.13% 15/5/2024 516,100 0.02%Securitas AB 500,000 1.13% 20/2/2024 513,934 0.02%Skandinaviska Enskilda Banken AB 500,000 2.00% 19/2/2021 512,351 0.02%Svenska Handelsbanken AB 500,000 0.50% 21/3/2023 507,270 0.02%Swedbank AB 500,000 0.40% 29/8/2023 503,800 0.02%Stadshypotek AB 500,000 0.13% 5/10/2026 502,619 0.02%Swedbank AB 500,000 0.25% 7/11/2022 501,779 0.02%Volvo Treasury AB 500,000 0.10% 24/5/2022 500,136 0.02%Skandinaviska Enskilda Banken AB 500,000 0.63% 12/11/2029 491,607 0.02%Stadshypotek AB 480,000 0.05% 20/6/2022 483,552 0.02%Essity AB 400,000 1.63% 30/3/2027 430,388 0.02%Stockholms Lans Landsting 400,000 0.75% 26/2/2025 417,686 0.02%Lansforsakringar Hypotek AB 400,000 0.63% 29/1/2026 414,124 0.02%Essity AB 400,000 1.13% 27/3/2024 414,022 0.02%Swedbank Hypotek AB 400,000 0.50% 5/2/2026 412,013 0.02%Securitas AB 400,000 1.25% 6/3/2025 410,659 0.02%Skandinaviska Enskilda Banken AB 400,000 0.75% 16/6/2022 410,042 0.02%Swedbank AB 400,000 1.00% 1/6/2022 409,396 0.02%Stadshypotek AB 400,000 0.38% 13/3/2026 408,614 0.02%Lansforsakringar Hypotek AB 400,000 0.25% 22/4/2022 404,627 0.02%Samhallsbyggnadsbolaget i Norden AB 400,000 1.13% 4/9/2026 394,755 0.02%Investor AB 300,000 4.50% 12/5/2023 345,858 0.02%Telia Co. AB 300,000 3.63% 14/2/2024 344,368 0.01%Atlas Copco AB 300,000 2.50% 28/2/2023 324,225 0.01%Securitas AB 300,000 2.63% 22/2/2021 309,361 0.01%Alfa Laval Treasury International AB 300,000 1.38% 12/9/2022 309,116 0.01%Swedbank Hypotek AB 300,000 1.13% 21/5/2021 305,970 0.01%Autoliv, Inc. 300,000 0.75% 26/6/2023 303,025 0.01%Telia Co. AB 250,000 3.88% 1/10/2025 302,589 0.01%Vattenfall AB 300,000 0.50% 24/6/2026 301,979 0.01%Svenska Handelsbanken AB 300,000 0.13% 18/6/2024 299,623 0.01%
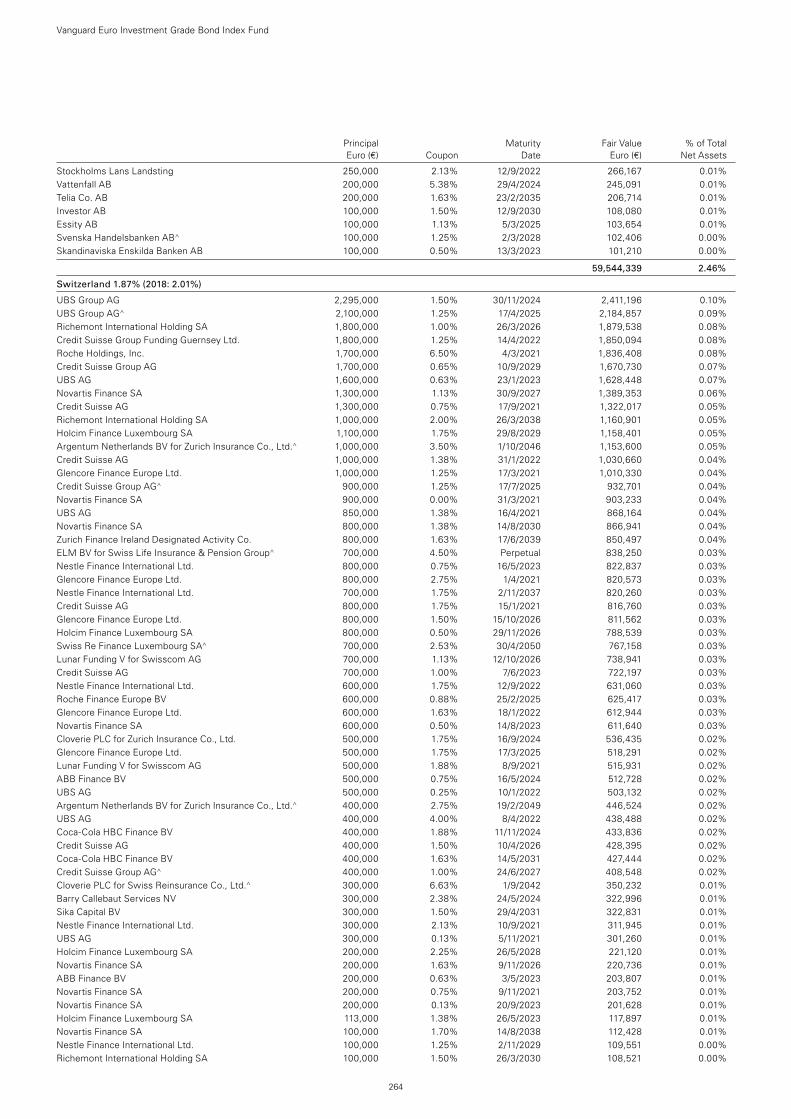
Principal Maturity Fair Value % of Total Euro (€) Coupon Date Euro (€) Net Assets
Vanguard Euro Investment Grade Bond Index Fund
264
Stockholms Lans Landsting 250,000 2.13% 12/9/2022 266,167 0.01%Vattenfall AB 200,000 5.38% 29/4/2024 245,091 0.01%Telia Co. AB 200,000 1.63% 23/2/2035 206,714 0.01%Investor AB 100,000 1.50% 12/9/2030 108,080 0.01%Essity AB 100,000 1.13% 5/3/2025 103,654 0.01%Svenska Handelsbanken AB^ 100,000 1.25% 2/3/2028 102,406 0.00%Skandinaviska Enskilda Banken AB 100,000 0.50% 13/3/2023 101,210 0.00%
59,544,339 2.46%
Switzerland 1.87% (2018: 2.01%)
UBS Group AG 2,295,000 1.50% 30/11/2024 2,411,196 0.10%UBS Group AG^ 2,100,000 1.25% 17/4/2025 2,184,857 0.09%Richemont International Holding SA 1,800,000 1.00% 26/3/2026 1,879,538 0.08%Credit Suisse Group Funding Guernsey Ltd. 1,800,000 1.25% 14/4/2022 1,850,094 0.08%Roche Holdings, Inc. 1,700,000 6.50% 4/3/2021 1,836,408 0.08%Credit Suisse Group AG 1,700,000 0.65% 10/9/2029 1,670,730 0.07%UBS AG 1,600,000 0.63% 23/1/2023 1,628,448 0.07%Novartis Finance SA 1,300,000 1.13% 30/9/2027 1,389,353 0.06%Credit Suisse AG 1,300,000 0.75% 17/9/2021 1,322,017 0.05%Richemont International Holding SA 1,000,000 2.00% 26/3/2038 1,160,901 0.05%Holcim Finance Luxembourg SA 1,100,000 1.75% 29/8/2029 1,158,401 0.05%Argentum Netherlands BV for Zurich Insurance Co., Ltd.^ 1,000,000 3.50% 1/10/2046 1,153,600 0.05%Credit Suisse AG 1,000,000 1.38% 31/1/2022 1,030,660 0.04%Glencore Finance Europe Ltd. 1,000,000 1.25% 17/3/2021 1,010,330 0.04%Credit Suisse Group AG^ 900,000 1.25% 17/7/2025 932,701 0.04%Novartis Finance SA 900,000 0.00% 31/3/2021 903,233 0.04%UBS AG 850,000 1.38% 16/4/2021 868,164 0.04%Novartis Finance SA 800,000 1.38% 14/8/2030 866,941 0.04%Zurich Finance Ireland Designated Activity Co. 800,000 1.63% 17/6/2039 850,497 0.04%ELM BV for Swiss Life Insurance & Pension Group^ 700,000 4.50% Perpetual 838,250 0.03%Nestle Finance International Ltd. 800,000 0.75% 16/5/2023 822,837 0.03%Glencore Finance Europe Ltd. 800,000 2.75% 1/4/2021 820,573 0.03%Nestle Finance International Ltd. 700,000 1.75% 2/11/2037 820,260 0.03%Credit Suisse AG 800,000 1.75% 15/1/2021 816,760 0.03%Glencore Finance Europe Ltd. 800,000 1.50% 15/10/2026 811,562 0.03%Holcim Finance Luxembourg SA 800,000 0.50% 29/11/2026 788,539 0.03%Swiss Re Finance Luxembourg SA^ 700,000 2.53% 30/4/2050 767,158 0.03%Lunar Funding V for Swisscom AG 700,000 1.13% 12/10/2026 738,941 0.03%Credit Suisse AG 700,000 1.00% 7/6/2023 722,197 0.03%Nestle Finance International Ltd. 600,000 1.75% 12/9/2022 631,060 0.03%Roche Finance Europe BV 600,000 0.88% 25/2/2025 625,417 0.03%Glencore Finance Europe Ltd. 600,000 1.63% 18/1/2022 612,944 0.03%Novartis Finance SA 600,000 0.50% 14/8/2023 611,640 0.03%Cloverie PLC for Zurich Insurance Co., Ltd. 500,000 1.75% 16/9/2024 536,435 0.02%Glencore Finance Europe Ltd. 500,000 1.75% 17/3/2025 518,291 0.02%Lunar Funding V for Swisscom AG 500,000 1.88% 8/9/2021 515,931 0.02%ABB Finance BV 500,000 0.75% 16/5/2024 512,728 0.02%UBS AG 500,000 0.25% 10/1/2022 503,132 0.02%Argentum Netherlands BV for Zurich Insurance Co., Ltd.^ 400,000 2.75% 19/2/2049 446,524 0.02%UBS AG 400,000 4.00% 8/4/2022 438,488 0.02%Coca-Cola HBC Finance BV 400,000 1.88% 11/11/2024 433,836 0.02%Credit Suisse AG 400,000 1.50% 10/4/2026 428,395 0.02%Coca-Cola HBC Finance BV 400,000 1.63% 14/5/2031 427,444 0.02%Credit Suisse Group AG^ 400,000 1.00% 24/6/2027 408,548 0.02%Cloverie PLC for Swiss Reinsurance Co., Ltd.^ 300,000 6.63% 1/9/2042 350,232 0.01%Barry Callebaut Services NV 300,000 2.38% 24/5/2024 322,996 0.01%Sika Capital BV 300,000 1.50% 29/4/2031 322,831 0.01%Nestle Finance International Ltd. 300,000 2.13% 10/9/2021 311,945 0.01%UBS AG 300,000 0.13% 5/11/2021 301,260 0.01%Holcim Finance Luxembourg SA 200,000 2.25% 26/5/2028 221,120 0.01%Novartis Finance SA 200,000 1.63% 9/11/2026 220,736 0.01%ABB Finance BV 200,000 0.63% 3/5/2023 203,807 0.01%Novartis Finance SA 200,000 0.75% 9/11/2021 203,752 0.01%Novartis Finance SA 200,000 0.13% 20/9/2023 201,628 0.01%Holcim Finance Luxembourg SA 113,000 1.38% 26/5/2023 117,897 0.01%Novartis Finance SA 100,000 1.70% 14/8/2038 112,428 0.01%Nestle Finance International Ltd. 100,000 1.25% 2/11/2029 109,551 0.00%Richemont International Holding SA 100,000 1.50% 26/3/2030 108,521 0.00%
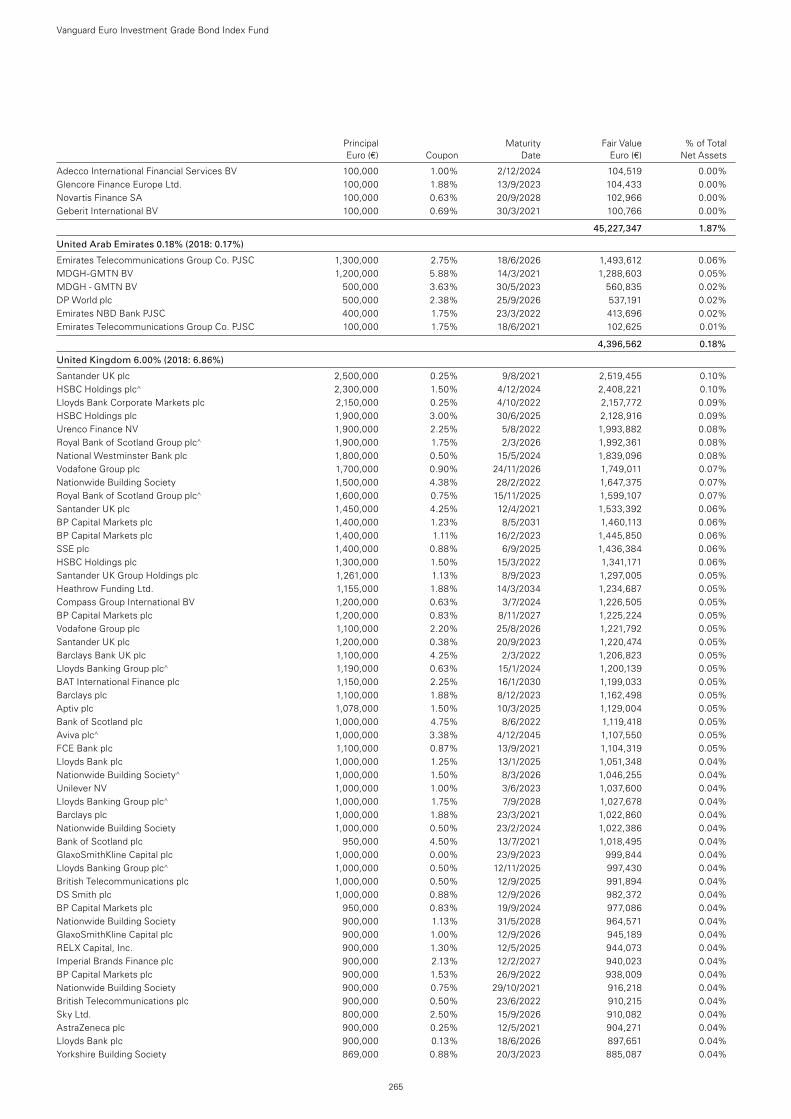
Principal Maturity Fair Value % of Total Euro (€) Coupon Date Euro (€) Net Assets
Vanguard Euro Investment Grade Bond Index Fund
Adecco International Financial Services BV 100,000 1.00% 2/12/2024 104,519 0.00%Glencore Finance Europe Ltd. 100,000 1.88% 13/9/2023 104,433 0.00%Novartis Finance SA 100,000 0.63% 20/9/2028 102,966 0.00%Geberit International BV 100,000 0.69% 30/3/2021 100,766 0.00%
45,227,347 1.87%
United Arab Emirates 0.18% (2018: 0.17%)
Emirates Telecommunications Group Co. PJSC 1,300,000 2.75% 18/6/2026 1,493,612 0.06%MDGH-GMTN BV 1,200,000 5.88% 14/3/2021 1,288,603 0.05%MDGH - GMTN BV 500,000 3.63% 30/5/2023 560,835 0.02%DP World plc 500,000 2.38% 25/9/2026 537,191 0.02%Emirates NBD Bank PJSC 400,000 1.75% 23/3/2022 413,696 0.02%Emirates Telecommunications Group Co. PJSC 100,000 1.75% 18/6/2021 102,625 0.01%
4,396,562 0.18%
United Kingdom 6.00% (2018: 6.86%)
Santander UK plc 2,500,000 0.25% 9/8/2021 2,519,455 0.10%HSBC Holdings plc^ 2,300,000 1.50% 4/12/2024 2,408,221 0.10%Lloyds Bank Corporate Markets plc 2,150,000 0.25% 4/10/2022 2,157,772 0.09%HSBC Holdings plc 1,900,000 3.00% 30/6/2025 2,128,916 0.09%Urenco Finance NV 1,900,000 2.25% 5/8/2022 1,993,882 0.08%Royal Bank of Scotland Group plc^ 1,900,000 1.75% 2/3/2026 1,992,361 0.08%National Westminster Bank plc 1,800,000 0.50% 15/5/2024 1,839,096 0.08%Vodafone Group plc 1,700,000 0.90% 24/11/2026 1,749,011 0.07%Nationwide Building Society 1,500,000 4.38% 28/2/2022 1,647,375 0.07%Royal Bank of Scotland Group plc^ 1,600,000 0.75% 15/11/2025 1,599,107 0.07%Santander UK plc 1,450,000 4.25% 12/4/2021 1,533,392 0.06%BP Capital Markets plc 1,400,000 1.23% 8/5/2031 1,460,113 0.06%BP Capital Markets plc 1,400,000 1.11% 16/2/2023 1,445,850 0.06%SSE plc 1,400,000 0.88% 6/9/2025 1,436,384 0.06%HSBC Holdings plc 1,300,000 1.50% 15/3/2022 1,341,171 0.06%Santander UK Group Holdings plc 1,261,000 1.13% 8/9/2023 1,297,005 0.05%Heathrow Funding Ltd. 1,155,000 1.88% 14/3/2034 1,234,687 0.05%Compass Group International BV 1,200,000 0.63% 3/7/2024 1,226,505 0.05%BP Capital Markets plc 1,200,000 0.83% 8/11/2027 1,225,224 0.05%Vodafone Group plc 1,100,000 2.20% 25/8/2026 1,221,792 0.05%Santander UK plc 1,200,000 0.38% 20/9/2023 1,220,474 0.05%Barclays Bank UK plc 1,100,000 4.25% 2/3/2022 1,206,823 0.05%Lloyds Banking Group plc^ 1,190,000 0.63% 15/1/2024 1,200,139 0.05%BAT International Finance plc 1,150,000 2.25% 16/1/2030 1,199,033 0.05%Barclays plc 1,100,000 1.88% 8/12/2023 1,162,498 0.05%Aptiv plc 1,078,000 1.50% 10/3/2025 1,129,004 0.05%Bank of Scotland plc 1,000,000 4.75% 8/6/2022 1,119,418 0.05%Aviva plc^ 1,000,000 3.38% 4/12/2045 1,107,550 0.05%FCE Bank plc 1,100,000 0.87% 13/9/2021 1,104,319 0.05%Lloyds Bank plc 1,000,000 1.25% 13/1/2025 1,051,348 0.04%Nationwide Building Society^ 1,000,000 1.50% 8/3/2026 1,046,255 0.04%Unilever NV 1,000,000 1.00% 3/6/2023 1,037,600 0.04%Lloyds Banking Group plc^ 1,000,000 1.75% 7/9/2028 1,027,678 0.04%Barclays plc 1,000,000 1.88% 23/3/2021 1,022,860 0.04%Nationwide Building Society 1,000,000 0.50% 23/2/2024 1,022,386 0.04%Bank of Scotland plc 950,000 4.50% 13/7/2021 1,018,495 0.04%GlaxoSmithKline Capital plc 1,000,000 0.00% 23/9/2023 999,844 0.04%Lloyds Banking Group plc^ 1,000,000 0.50% 12/11/2025 997,430 0.04%British Telecommunications plc 1,000,000 0.50% 12/9/2025 991,894 0.04%DS Smith plc 1,000,000 0.88% 12/9/2026 982,372 0.04%BP Capital Markets plc 950,000 0.83% 19/9/2024 977,086 0.04%Nationwide Building Society 900,000 1.13% 31/5/2028 964,571 0.04%GlaxoSmithKline Capital plc 900,000 1.00% 12/9/2026 945,189 0.04%RELX Capital, Inc. 900,000 1.30% 12/5/2025 944,073 0.04%Imperial Brands Finance plc 900,000 2.13% 12/2/2027 940,023 0.04%BP Capital Markets plc 900,000 1.53% 26/9/2022 938,009 0.04%Nationwide Building Society 900,000 0.75% 29/10/2021 916,218 0.04%British Telecommunications plc 900,000 0.50% 23/6/2022 910,215 0.04%Sky Ltd. 800,000 2.50% 15/9/2026 910,082 0.04%AstraZeneca plc 900,000 0.25% 12/5/2021 904,271 0.04%Lloyds Bank plc 900,000 0.13% 18/6/2026 897,651 0.04%Yorkshire Building Society 869,000 0.88% 20/3/2023 885,087 0.04%
265
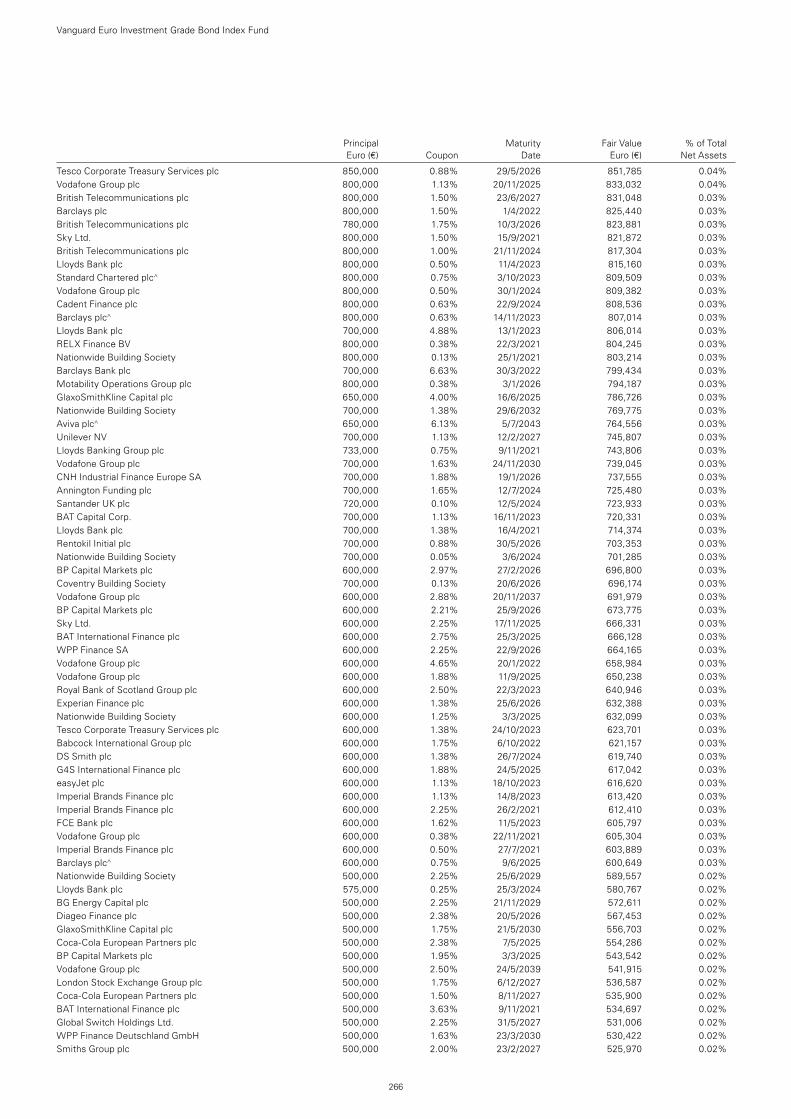
Principal Maturity Fair Value % of Total Euro (€) Coupon Date Euro (€) Net Assets
Vanguard Euro Investment Grade Bond Index Fund
Tesco Corporate Treasury Services plc 850,000 0.88% 29/5/2026 851,785 0.04%Vodafone Group plc 800,000 1.13% 20/11/2025 833,032 0.04%British Telecommunications plc 800,000 1.50% 23/6/2027 831,048 0.03%Barclays plc 800,000 1.50% 1/4/2022 825,440 0.03%British Telecommunications plc 780,000 1.75% 10/3/2026 823,881 0.03%Sky Ltd. 800,000 1.50% 15/9/2021 821,872 0.03%British Telecommunications plc 800,000 1.00% 21/11/2024 817,304 0.03%Lloyds Bank plc 800,000 0.50% 11/4/2023 815,160 0.03%Standard Chartered plc^ 800,000 0.75% 3/10/2023 809,509 0.03%Vodafone Group plc 800,000 0.50% 30/1/2024 809,382 0.03%Cadent Finance plc 800,000 0.63% 22/9/2024 808,536 0.03%Barclays plc^ 800,000 0.63% 14/11/2023 807,014 0.03%Lloyds Bank plc 700,000 4.88% 13/1/2023 806,014 0.03%RELX Finance BV 800,000 0.38% 22/3/2021 804,245 0.03%Nationwide Building Society 800,000 0.13% 25/1/2021 803,214 0.03%Barclays Bank plc 700,000 6.63% 30/3/2022 799,434 0.03%Motability Operations Group plc 800,000 0.38% 3/1/2026 794,187 0.03%GlaxoSmithKline Capital plc 650,000 4.00% 16/6/2025 786,726 0.03%Nationwide Building Society 700,000 1.38% 29/6/2032 769,775 0.03%Aviva plc^ 650,000 6.13% 5/7/2043 764,556 0.03%Unilever NV 700,000 1.13% 12/2/2027 745,807 0.03%Lloyds Banking Group plc 733,000 0.75% 9/11/2021 743,806 0.03%Vodafone Group plc 700,000 1.63% 24/11/2030 739,045 0.03%CNH Industrial Finance Europe SA 700,000 1.88% 19/1/2026 737,555 0.03%Annington Funding plc 700,000 1.65% 12/7/2024 725,480 0.03%Santander UK plc 720,000 0.10% 12/5/2024 723,933 0.03%BAT Capital Corp. 700,000 1.13% 16/11/2023 720,331 0.03%Lloyds Bank plc 700,000 1.38% 16/4/2021 714,374 0.03%Rentokil Initial plc 700,000 0.88% 30/5/2026 703,353 0.03%Nationwide Building Society 700,000 0.05% 3/6/2024 701,285 0.03%BP Capital Markets plc 600,000 2.97% 27/2/2026 696,800 0.03%Coventry Building Society 700,000 0.13% 20/6/2026 696,174 0.03%Vodafone Group plc 600,000 2.88% 20/11/2037 691,979 0.03%BP Capital Markets plc 600,000 2.21% 25/9/2026 673,775 0.03%Sky Ltd. 600,000 2.25% 17/11/2025 666,331 0.03%BAT International Finance plc 600,000 2.75% 25/3/2025 666,128 0.03%WPP Finance SA 600,000 2.25% 22/9/2026 664,165 0.03%Vodafone Group plc 600,000 4.65% 20/1/2022 658,984 0.03%Vodafone Group plc 600,000 1.88% 11/9/2025 650,238 0.03%Royal Bank of Scotland Group plc 600,000 2.50% 22/3/2023 640,946 0.03%Experian Finance plc 600,000 1.38% 25/6/2026 632,388 0.03%Nationwide Building Society 600,000 1.25% 3/3/2025 632,099 0.03%Tesco Corporate Treasury Services plc 600,000 1.38% 24/10/2023 623,701 0.03%Babcock International Group plc 600,000 1.75% 6/10/2022 621,157 0.03%DS Smith plc 600,000 1.38% 26/7/2024 619,740 0.03%G4S International Finance plc 600,000 1.88% 24/5/2025 617,042 0.03%easyJet plc 600,000 1.13% 18/10/2023 616,620 0.03%Imperial Brands Finance plc 600,000 1.13% 14/8/2023 613,420 0.03%Imperial Brands Finance plc 600,000 2.25% 26/2/2021 612,410 0.03%FCE Bank plc 600,000 1.62% 11/5/2023 605,797 0.03%Vodafone Group plc 600,000 0.38% 22/11/2021 605,304 0.03%Imperial Brands Finance plc 600,000 0.50% 27/7/2021 603,889 0.03%Barclays plc^ 600,000 0.75% 9/6/2025 600,649 0.03%Nationwide Building Society 500,000 2.25% 25/6/2029 589,557 0.02%Lloyds Bank plc 575,000 0.25% 25/3/2024 580,767 0.02%BG Energy Capital plc 500,000 2.25% 21/11/2029 572,611 0.02%Diageo Finance plc 500,000 2.38% 20/5/2026 567,453 0.02%GlaxoSmithKline Capital plc 500,000 1.75% 21/5/2030 556,703 0.02%Coca-Cola European Partners plc 500,000 2.38% 7/5/2025 554,286 0.02%BP Capital Markets plc 500,000 1.95% 3/3/2025 543,542 0.02%Vodafone Group plc 500,000 2.50% 24/5/2039 541,915 0.02%London Stock Exchange Group plc 500,000 1.75% 6/12/2027 536,587 0.02%Coca-Cola European Partners plc 500,000 1.50% 8/11/2027 535,900 0.02%BAT International Finance plc 500,000 3.63% 9/11/2021 534,697 0.02%Global Switch Holdings Ltd. 500,000 2.25% 31/5/2027 531,006 0.02%WPP Finance Deutschland GmbH 500,000 1.63% 23/3/2030 530,422 0.02%Smiths Group plc 500,000 2.00% 23/2/2027 525,970 0.02%
266
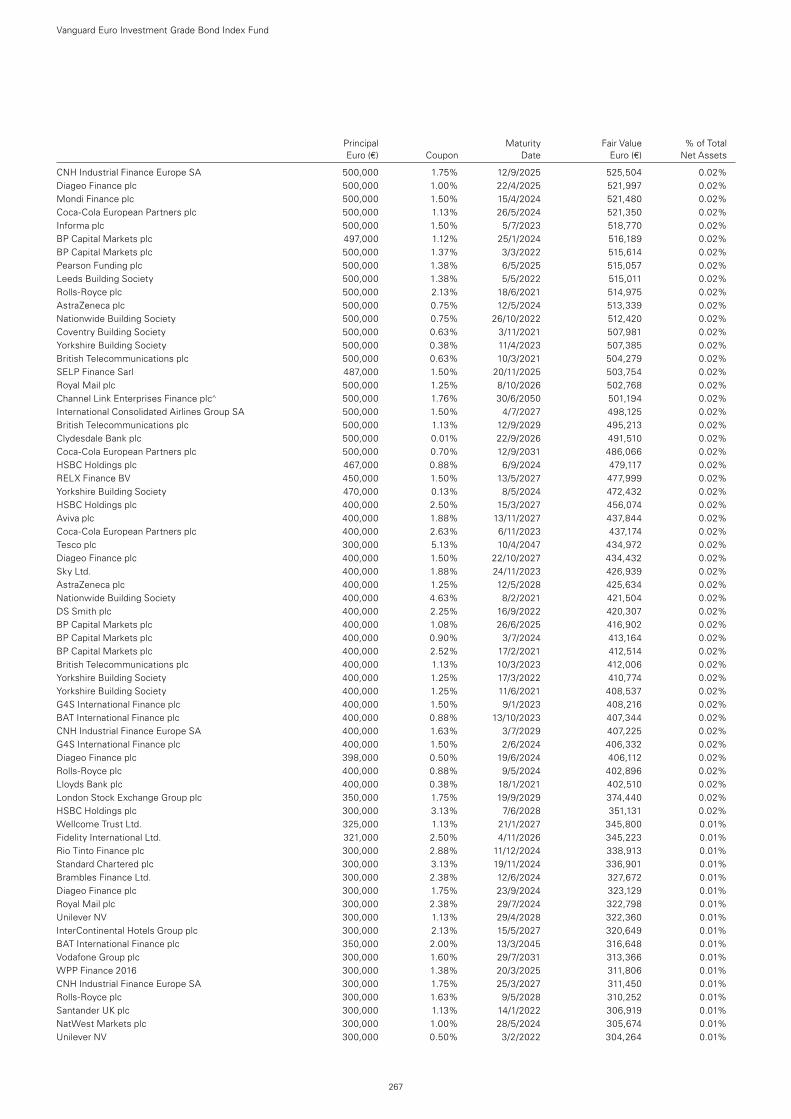
Vanguard Euro Investment Grade Bond Index Fund
CNH Industrial Finance Europe SA 500,000 1.75% 12/9/2025 525,504 0.02%Diageo Finance plc 500,000 1.00% 22/4/2025 521,997 0.02%Mondi Finance plc 500,000 1.50% 15/4/2024 521,480 0.02%Coca-Cola European Partners plc 500,000 1.13% 26/5/2024 521,350 0.02%Informa plc 500,000 1.50% 5/7/2023 518,770 0.02%BP Capital Markets plc 497,000 1.12% 25/1/2024 516,189 0.02%BP Capital Markets plc 500,000 1.37% 3/3/2022 515,614 0.02%Pearson Funding plc 500,000 1.38% 6/5/2025 515,057 0.02%Leeds Building Society 500,000 1.38% 5/5/2022 515,011 0.02%Rolls-Royce plc 500,000 2.13% 18/6/2021 514,975 0.02%AstraZeneca plc 500,000 0.75% 12/5/2024 513,339 0.02%Nationwide Building Society 500,000 0.75% 26/10/2022 512,420 0.02%Coventry Building Society 500,000 0.63% 3/11/2021 507,981 0.02%Yorkshire Building Society 500,000 0.38% 11/4/2023 507,385 0.02%British Telecommunications plc 500,000 0.63% 10/3/2021 504,279 0.02%SELP Finance Sarl 487,000 1.50% 20/11/2025 503,754 0.02%Royal Mail plc 500,000 1.25% 8/10/2026 502,768 0.02%Channel Link Enterprises Finance plc^ 500,000 1.76% 30/6/2050 501,194 0.02%International Consolidated Airlines Group SA 500,000 1.50% 4/7/2027 498,125 0.02%British Telecommunications plc 500,000 1.13% 12/9/2029 495,213 0.02%Clydesdale Bank plc 500,000 0.01% 22/9/2026 491,510 0.02%Coca-Cola European Partners plc 500,000 0.70% 12/9/2031 486,066 0.02%HSBC Holdings plc 467,000 0.88% 6/9/2024 479,117 0.02%RELX Finance BV 450,000 1.50% 13/5/2027 477,999 0.02%Yorkshire Building Society 470,000 0.13% 8/5/2024 472,432 0.02%HSBC Holdings plc 400,000 2.50% 15/3/2027 456,074 0.02%Aviva plc 400,000 1.88% 13/11/2027 437,844 0.02%Coca-Cola European Partners plc 400,000 2.63% 6/11/2023 437,174 0.02%Tesco plc 300,000 5.13% 10/4/2047 434,972 0.02%Diageo Finance plc 400,000 1.50% 22/10/2027 434,432 0.02%Sky Ltd. 400,000 1.88% 24/11/2023 426,939 0.02%AstraZeneca plc 400,000 1.25% 12/5/2028 425,634 0.02%Nationwide Building Society 400,000 4.63% 8/2/2021 421,504 0.02%DS Smith plc 400,000 2.25% 16/9/2022 420,307 0.02%BP Capital Markets plc 400,000 1.08% 26/6/2025 416,902 0.02%BP Capital Markets plc 400,000 0.90% 3/7/2024 413,164 0.02%BP Capital Markets plc 400,000 2.52% 17/2/2021 412,514 0.02%British Telecommunications plc 400,000 1.13% 10/3/2023 412,006 0.02%Yorkshire Building Society 400,000 1.25% 17/3/2022 410,774 0.02%Yorkshire Building Society 400,000 1.25% 11/6/2021 408,537 0.02%G4S International Finance plc 400,000 1.50% 9/1/2023 408,216 0.02%BAT International Finance plc 400,000 0.88% 13/10/2023 407,344 0.02%CNH Industrial Finance Europe SA 400,000 1.63% 3/7/2029 407,225 0.02%G4S International Finance plc 400,000 1.50% 2/6/2024 406,332 0.02%Diageo Finance plc 398,000 0.50% 19/6/2024 406,112 0.02%Rolls-Royce plc 400,000 0.88% 9/5/2024 402,896 0.02%Lloyds Bank plc 400,000 0.38% 18/1/2021 402,510 0.02%London Stock Exchange Group plc 350,000 1.75% 19/9/2029 374,440 0.02%HSBC Holdings plc 300,000 3.13% 7/6/2028 351,131 0.02%Wellcome Trust Ltd. 325,000 1.13% 21/1/2027 345,800 0.01%Fidelity International Ltd. 321,000 2.50% 4/11/2026 345,223 0.01%Rio Tinto Finance plc 300,000 2.88% 11/12/2024 338,913 0.01%Standard Chartered plc 300,000 3.13% 19/11/2024 336,901 0.01%Brambles Finance Ltd. 300,000 2.38% 12/6/2024 327,672 0.01%Diageo Finance plc 300,000 1.75% 23/9/2024 323,129 0.01%Royal Mail plc 300,000 2.38% 29/7/2024 322,798 0.01%Unilever NV 300,000 1.13% 29/4/2028 322,360 0.01%InterContinental Hotels Group plc 300,000 2.13% 15/5/2027 320,649 0.01%BAT International Finance plc 350,000 2.00% 13/3/2045 316,648 0.01%Vodafone Group plc 300,000 1.60% 29/7/2031 313,366 0.01%WPP Finance 2016 300,000 1.38% 20/3/2025 311,806 0.01%CNH Industrial Finance Europe SA 300,000 1.75% 25/3/2027 311,450 0.01%Rolls-Royce plc 300,000 1.63% 9/5/2028 310,252 0.01%Santander UK plc 300,000 1.13% 14/1/2022 306,919 0.01%NatWest Markets plc 300,000 1.00% 28/5/2024 305,674 0.01%Unilever NV 300,000 0.50% 3/2/2022 304,264 0.01%
267
Principal Maturity Fair Value % of Total Euro (€) Coupon Date Euro (€) Net Assets
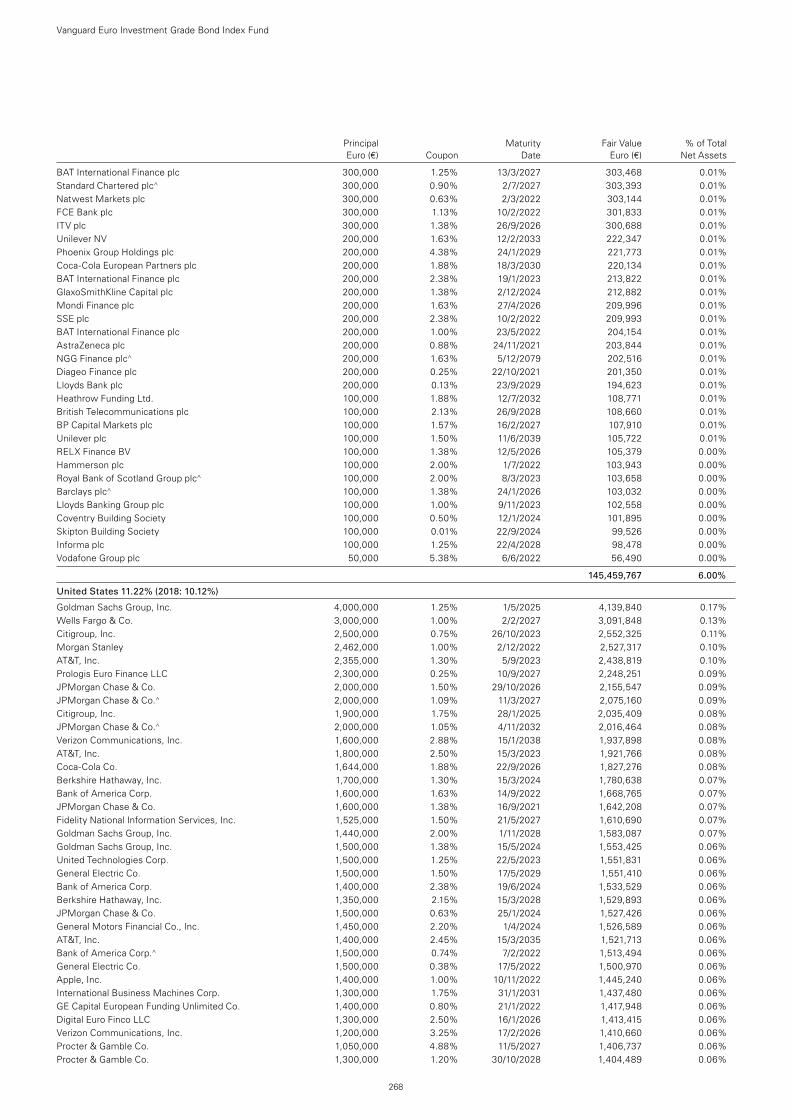
Principal Maturity Fair Value % of Total Euro (€) Coupon Date Euro (€) Net Assets
Vanguard Euro Investment Grade Bond Index Fund
BAT International Finance plc 300,000 1.25% 13/3/2027 303,468 0.01%Standard Chartered plc^ 300,000 0.90% 2/7/2027 303,393 0.01%Natwest Markets plc 300,000 0.63% 2/3/2022 303,144 0.01%FCE Bank plc 300,000 1.13% 10/2/2022 301,833 0.01%ITV plc 300,000 1.38% 26/9/2026 300,688 0.01%Unilever NV 200,000 1.63% 12/2/2033 222,347 0.01%Phoenix Group Holdings plc 200,000 4.38% 24/1/2029 221,773 0.01%Coca-Cola European Partners plc 200,000 1.88% 18/3/2030 220,134 0.01%BAT International Finance plc 200,000 2.38% 19/1/2023 213,822 0.01%GlaxoSmithKline Capital plc 200,000 1.38% 2/12/2024 212,882 0.01%Mondi Finance plc 200,000 1.63% 27/4/2026 209,996 0.01%SSE plc 200,000 2.38% 10/2/2022 209,993 0.01%BAT International Finance plc 200,000 1.00% 23/5/2022 204,154 0.01%AstraZeneca plc 200,000 0.88% 24/11/2021 203,844 0.01%NGG Finance plc^ 200,000 1.63% 5/12/2079 202,516 0.01%Diageo Finance plc 200,000 0.25% 22/10/2021 201,350 0.01%Lloyds Bank plc 200,000 0.13% 23/9/2029 194,623 0.01%Heathrow Funding Ltd. 100,000 1.88% 12/7/2032 108,771 0.01%British Telecommunications plc 100,000 2.13% 26/9/2028 108,660 0.01%BP Capital Markets plc 100,000 1.57% 16/2/2027 107,910 0.01%Unilever plc 100,000 1.50% 11/6/2039 105,722 0.01%RELX Finance BV 100,000 1.38% 12/5/2026 105,379 0.00%Hammerson plc 100,000 2.00% 1/7/2022 103,943 0.00%Royal Bank of Scotland Group plc^ 100,000 2.00% 8/3/2023 103,658 0.00%Barclays plc^ 100,000 1.38% 24/1/2026 103,032 0.00%Lloyds Banking Group plc 100,000 1.00% 9/11/2023 102,558 0.00%Coventry Building Society 100,000 0.50% 12/1/2024 101,895 0.00%Skipton Building Society 100,000 0.01% 22/9/2024 99,526 0.00%Informa plc 100,000 1.25% 22/4/2028 98,478 0.00%Vodafone Group plc 50,000 5.38% 6/6/2022 56,490 0.00%
145,459,767 6.00%
United States 11.22% (2018: 10.12%)
Goldman Sachs Group, Inc. 4,000,000 1.25% 1/5/2025 4,139,840 0.17%Wells Fargo & Co. 3,000,000 1.00% 2/2/2027 3,091,848 0.13%Citigroup, Inc. 2,500,000 0.75% 26/10/2023 2,552,325 0.11%Morgan Stanley 2,462,000 1.00% 2/12/2022 2,527,317 0.10%AT&T, Inc. 2,355,000 1.30% 5/9/2023 2,438,819 0.10%Prologis Euro Finance LLC 2,300,000 0.25% 10/9/2027 2,248,251 0.09%JPMorgan Chase & Co. 2,000,000 1.50% 29/10/2026 2,155,547 0.09%JPMorgan Chase & Co.^ 2,000,000 1.09% 11/3/2027 2,075,160 0.09%Citigroup, Inc. 1,900,000 1.75% 28/1/2025 2,035,409 0.08%JPMorgan Chase & Co.^ 2,000,000 1.05% 4/11/2032 2,016,464 0.08%Verizon Communications, Inc. 1,600,000 2.88% 15/1/2038 1,937,898 0.08%AT&T, Inc. 1,800,000 2.50% 15/3/2023 1,921,766 0.08%Coca-Cola Co. 1,644,000 1.88% 22/9/2026 1,827,276 0.08%Berkshire Hathaway, Inc. 1,700,000 1.30% 15/3/2024 1,780,638 0.07%Bank of America Corp. 1,600,000 1.63% 14/9/2022 1,668,765 0.07%JPMorgan Chase & Co. 1,600,000 1.38% 16/9/2021 1,642,208 0.07%Fidelity National Information Services, Inc. 1,525,000 1.50% 21/5/2027 1,610,690 0.07%Goldman Sachs Group, Inc. 1,440,000 2.00% 1/11/2028 1,583,087 0.07%Goldman Sachs Group, Inc. 1,500,000 1.38% 15/5/2024 1,553,425 0.06%United Technologies Corp. 1,500,000 1.25% 22/5/2023 1,551,831 0.06%General Electric Co. 1,500,000 1.50% 17/5/2029 1,551,410 0.06%Bank of America Corp. 1,400,000 2.38% 19/6/2024 1,533,529 0.06%Berkshire Hathaway, Inc. 1,350,000 2.15% 15/3/2028 1,529,893 0.06%JPMorgan Chase & Co. 1,500,000 0.63% 25/1/2024 1,527,426 0.06%General Motors Financial Co., Inc. 1,450,000 2.20% 1/4/2024 1,526,589 0.06%AT&T, Inc. 1,400,000 2.45% 15/3/2035 1,521,713 0.06%Bank of America Corp.^ 1,500,000 0.74% 7/2/2022 1,513,494 0.06%General Electric Co. 1,500,000 0.38% 17/5/2022 1,500,970 0.06%Apple, Inc. 1,400,000 1.00% 10/11/2022 1,445,240 0.06%International Business Machines Corp. 1,300,000 1.75% 31/1/2031 1,437,480 0.06%GE Capital European Funding Unlimited Co. 1,400,000 0.80% 21/1/2022 1,417,948 0.06%Digital Euro Finco LLC 1,300,000 2.50% 16/1/2026 1,413,415 0.06%Verizon Communications, Inc. 1,200,000 3.25% 17/2/2026 1,410,660 0.06%Procter & Gamble Co. 1,050,000 4.88% 11/5/2027 1,406,737 0.06%Procter & Gamble Co. 1,300,000 1.20% 30/10/2028 1,404,489 0.06%
268
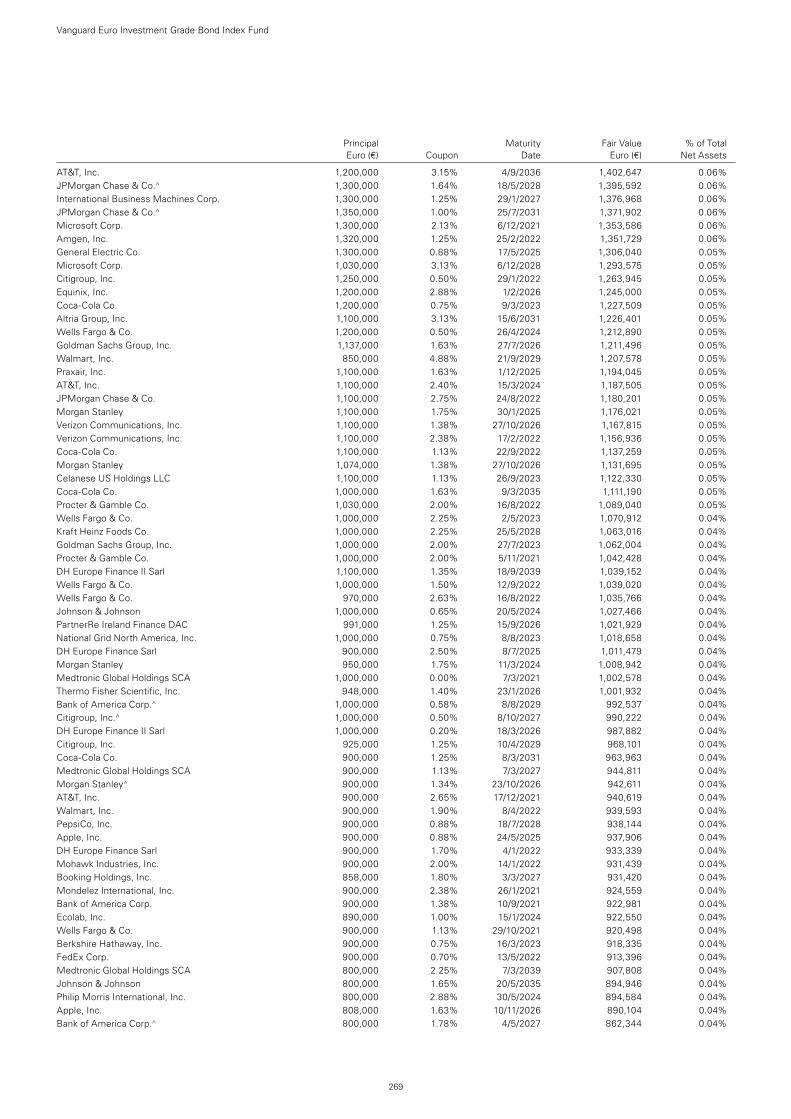
Principal Maturity Fair Value % of Total Euro (€) Coupon Date Euro (€) Net Assets
Vanguard Euro Investment Grade Bond Index Fund
AT&T, Inc. 1,200,000 3.15% 4/9/2036 1,402,647 0.06%JPMorgan Chase & Co.^ 1,300,000 1.64% 18/5/2028 1,395,592 0.06%International Business Machines Corp. 1,300,000 1.25% 29/1/2027 1,376,968 0.06%JPMorgan Chase & Co.^ 1,350,000 1.00% 25/7/2031 1,371,902 0.06%Microsoft Corp. 1,300,000 2.13% 6/12/2021 1,353,586 0.06%Amgen, Inc. 1,320,000 1.25% 25/2/2022 1,351,729 0.06%General Electric Co. 1,300,000 0.88% 17/5/2025 1,306,040 0.05%Microsoft Corp. 1,030,000 3.13% 6/12/2028 1,293,575 0.05%Citigroup, Inc. 1,250,000 0.50% 29/1/2022 1,263,945 0.05%Equinix, Inc. 1,200,000 2.88% 1/2/2026 1,245,000 0.05%Coca-Cola Co. 1,200,000 0.75% 9/3/2023 1,227,509 0.05%Altria Group, Inc. 1,100,000 3.13% 15/6/2031 1,226,401 0.05%Wells Fargo & Co. 1,200,000 0.50% 26/4/2024 1,212,890 0.05%Goldman Sachs Group, Inc. 1,137,000 1.63% 27/7/2026 1,211,496 0.05%Walmart, Inc. 850,000 4.88% 21/9/2029 1,207,578 0.05%Praxair, Inc. 1,100,000 1.63% 1/12/2025 1,194,045 0.05%AT&T, Inc. 1,100,000 2.40% 15/3/2024 1,187,505 0.05%JPMorgan Chase & Co. 1,100,000 2.75% 24/8/2022 1,180,201 0.05%Morgan Stanley 1,100,000 1.75% 30/1/2025 1,176,021 0.05%Verizon Communications, Inc. 1,100,000 1.38% 27/10/2026 1,167,815 0.05%Verizon Communications, Inc. 1,100,000 2.38% 17/2/2022 1,156,936 0.05%Coca-Cola Co. 1,100,000 1.13% 22/9/2022 1,137,259 0.05%Morgan Stanley 1,074,000 1.38% 27/10/2026 1,131,695 0.05%Celanese US Holdings LLC 1,100,000 1.13% 26/9/2023 1,122,330 0.05%Coca-Cola Co. 1,000,000 1.63% 9/3/2035 1,111,190 0.05%Procter & Gamble Co. 1,030,000 2.00% 16/8/2022 1,089,040 0.05%Wells Fargo & Co. 1,000,000 2.25% 2/5/2023 1,070,912 0.04%Kraft Heinz Foods Co. 1,000,000 2.25% 25/5/2028 1,063,016 0.04%Goldman Sachs Group, Inc. 1,000,000 2.00% 27/7/2023 1,062,004 0.04%Procter & Gamble Co. 1,000,000 2.00% 5/11/2021 1,042,428 0.04%DH Europe Finance II Sarl 1,100,000 1.35% 18/9/2039 1,039,152 0.04%Wells Fargo & Co. 1,000,000 1.50% 12/9/2022 1,039,020 0.04%Wells Fargo & Co. 970,000 2.63% 16/8/2022 1,035,766 0.04%Johnson & Johnson 1,000,000 0.65% 20/5/2024 1,027,466 0.04%PartnerRe Ireland Finance DAC 991,000 1.25% 15/9/2026 1,021,929 0.04%National Grid North America, Inc. 1,000,000 0.75% 8/8/2023 1,018,658 0.04%DH Europe Finance Sarl 900,000 2.50% 8/7/2025 1,011,479 0.04%Morgan Stanley 950,000 1.75% 11/3/2024 1,008,942 0.04%Medtronic Global Holdings SCA 1,000,000 0.00% 7/3/2021 1,002,578 0.04%Thermo Fisher Scientific, Inc. 948,000 1.40% 23/1/2026 1,001,932 0.04%Bank of America Corp.^ 1,000,000 0.58% 8/8/2029 992,537 0.04%Citigroup, Inc.^ 1,000,000 0.50% 8/10/2027 990,222 0.04%DH Europe Finance II Sarl 1,000,000 0.20% 18/3/2026 987,882 0.04%Citigroup, Inc. 925,000 1.25% 10/4/2029 968,101 0.04%Coca-Cola Co. 900,000 1.25% 8/3/2031 963,963 0.04%Medtronic Global Holdings SCA 900,000 1.13% 7/3/2027 944,811 0.04%Morgan Stanley^ 900,000 1.34% 23/10/2026 942,611 0.04%AT&T, Inc. 900,000 2.65% 17/12/2021 940,619 0.04%Walmart, Inc. 900,000 1.90% 8/4/2022 939,593 0.04%PepsiCo, Inc. 900,000 0.88% 18/7/2028 938,144 0.04%Apple, Inc. 900,000 0.88% 24/5/2025 937,906 0.04%DH Europe Finance Sarl 900,000 1.70% 4/1/2022 933,339 0.04%Mohawk Industries, Inc. 900,000 2.00% 14/1/2022 931,439 0.04%Booking Holdings, Inc. 858,000 1.80% 3/3/2027 931,420 0.04%Mondelez International, Inc. 900,000 2.38% 26/1/2021 924,559 0.04%Bank of America Corp. 900,000 1.38% 10/9/2021 922,981 0.04%Ecolab, Inc. 890,000 1.00% 15/1/2024 922,550 0.04%Wells Fargo & Co. 900,000 1.13% 29/10/2021 920,498 0.04%Berkshire Hathaway, Inc. 900,000 0.75% 16/3/2023 918,335 0.04%FedEx Corp. 900,000 0.70% 13/5/2022 913,396 0.04%Medtronic Global Holdings SCA 800,000 2.25% 7/3/2039 907,808 0.04%Johnson & Johnson 800,000 1.65% 20/5/2035 894,946 0.04%Philip Morris International, Inc. 800,000 2.88% 30/5/2024 894,584 0.04%Apple, Inc. 808,000 1.63% 10/11/2026 890,104 0.04%Bank of America Corp.^ 800,000 1.78% 4/5/2027 862,344 0.04%
269
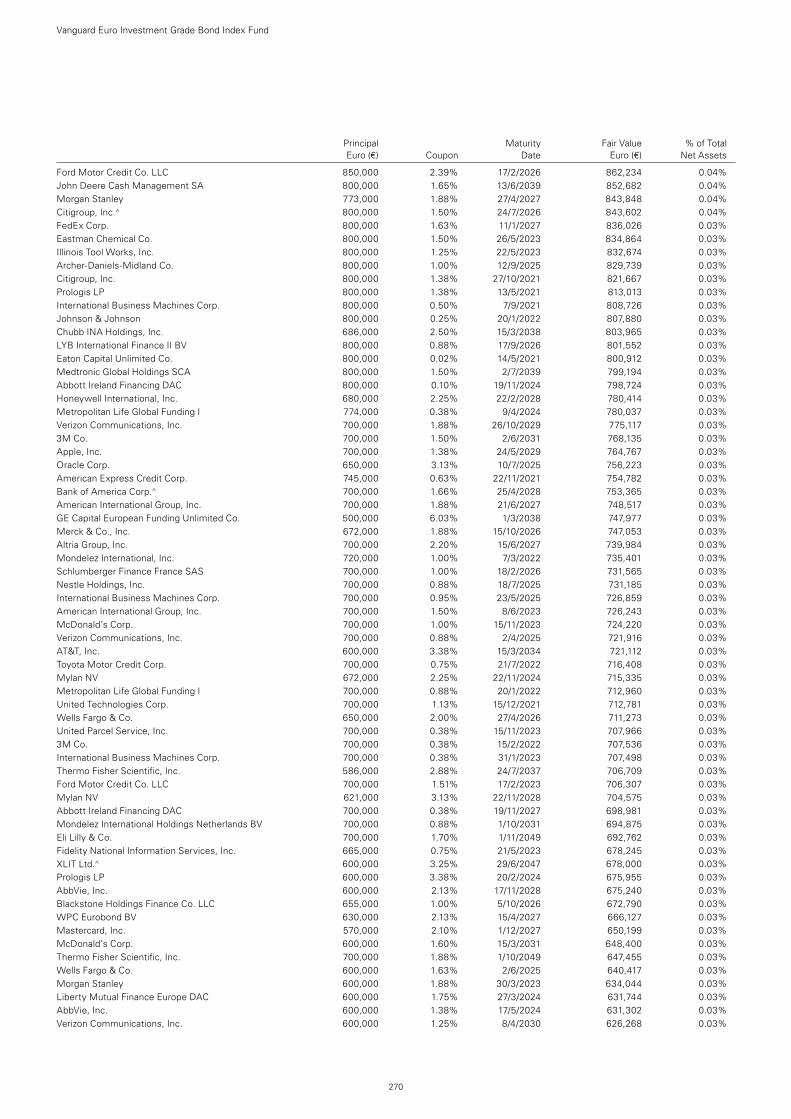
Principal Maturity Fair Value % of Total Euro (€) Coupon Date Euro (€) Net Assets
Vanguard Euro Investment Grade Bond Index Fund
Ford Motor Credit Co. LLC 850,000 2.39% 17/2/2026 862,234 0.04%John Deere Cash Management SA 800,000 1.65% 13/6/2039 852,682 0.04%Morgan Stanley 773,000 1.88% 27/4/2027 843,848 0.04%Citigroup, Inc.^ 800,000 1.50% 24/7/2026 843,602 0.04%FedEx Corp. 800,000 1.63% 11/1/2027 836,026 0.03%Eastman Chemical Co. 800,000 1.50% 26/5/2023 834,864 0.03%Illinois Tool Works, Inc. 800,000 1.25% 22/5/2023 832,674 0.03%Archer-Daniels-Midland Co. 800,000 1.00% 12/9/2025 829,739 0.03%Citigroup, Inc. 800,000 1.38% 27/10/2021 821,667 0.03%Prologis LP 800,000 1.38% 13/5/2021 813,013 0.03%International Business Machines Corp. 800,000 0.50% 7/9/2021 808,726 0.03%Johnson & Johnson 800,000 0.25% 20/1/2022 807,880 0.03%Chubb INA Holdings, Inc. 686,000 2.50% 15/3/2038 803,965 0.03%LYB International Finance II BV 800,000 0.88% 17/9/2026 801,552 0.03%Eaton Capital Unlimited Co. 800,000 0.02% 14/5/2021 800,912 0.03%Medtronic Global Holdings SCA 800,000 1.50% 2/7/2039 799,194 0.03%Abbott Ireland Financing DAC 800,000 0.10% 19/11/2024 798,724 0.03%Honeywell International, Inc. 680,000 2.25% 22/2/2028 780,414 0.03%Metropolitan Life Global Funding I 774,000 0.38% 9/4/2024 780,037 0.03%Verizon Communications, Inc. 700,000 1.88% 26/10/2029 775,117 0.03%3M Co. 700,000 1.50% 2/6/2031 768,135 0.03%Apple, Inc. 700,000 1.38% 24/5/2029 764,767 0.03%Oracle Corp. 650,000 3.13% 10/7/2025 756,223 0.03%American Express Credit Corp. 745,000 0.63% 22/11/2021 754,782 0.03%Bank of America Corp.^ 700,000 1.66% 25/4/2028 753,365 0.03%American International Group, Inc. 700,000 1.88% 21/6/2027 748,517 0.03%GE Capital European Funding Unlimited Co. 500,000 6.03% 1/3/2038 747,977 0.03%Merck & Co., Inc. 672,000 1.88% 15/10/2026 747,053 0.03%Altria Group, Inc. 700,000 2.20% 15/6/2027 739,984 0.03%Mondelez International, Inc. 720,000 1.00% 7/3/2022 735,401 0.03%Schlumberger Finance France SAS 700,000 1.00% 18/2/2026 731,565 0.03%Nestle Holdings, Inc. 700,000 0.88% 18/7/2025 731,185 0.03%International Business Machines Corp. 700,000 0.95% 23/5/2025 726,859 0.03%American International Group, Inc. 700,000 1.50% 8/6/2023 726,243 0.03%McDonald’s Corp. 700,000 1.00% 15/11/2023 724,220 0.03%Verizon Communications, Inc. 700,000 0.88% 2/4/2025 721,916 0.03%AT&T, Inc. 600,000 3.38% 15/3/2034 721,112 0.03%Toyota Motor Credit Corp. 700,000 0.75% 21/7/2022 716,408 0.03%Mylan NV 672,000 2.25% 22/11/2024 715,335 0.03%Metropolitan Life Global Funding I 700,000 0.88% 20/1/2022 712,960 0.03%United Technologies Corp. 700,000 1.13% 15/12/2021 712,781 0.03%Wells Fargo & Co. 650,000 2.00% 27/4/2026 711,273 0.03%United Parcel Service, Inc. 700,000 0.38% 15/11/2023 707,966 0.03%3M Co. 700,000 0.38% 15/2/2022 707,536 0.03%International Business Machines Corp. 700,000 0.38% 31/1/2023 707,498 0.03%Thermo Fisher Scientific, Inc. 586,000 2.88% 24/7/2037 706,709 0.03%Ford Motor Credit Co. LLC 700,000 1.51% 17/2/2023 706,307 0.03%Mylan NV 621,000 3.13% 22/11/2028 704,575 0.03%Abbott Ireland Financing DAC 700,000 0.38% 19/11/2027 698,981 0.03%Mondelez International Holdings Netherlands BV 700,000 0.88% 1/10/2031 694,875 0.03%Eli Lilly & Co. 700,000 1.70% 1/11/2049 692,762 0.03%Fidelity National Information Services, Inc. 665,000 0.75% 21/5/2023 678,245 0.03%XLIT Ltd.^ 600,000 3.25% 29/6/2047 678,000 0.03%Prologis LP 600,000 3.38% 20/2/2024 675,955 0.03%AbbVie, Inc. 600,000 2.13% 17/11/2028 675,240 0.03%Blackstone Holdings Finance Co. LLC 655,000 1.00% 5/10/2026 672,790 0.03%WPC Eurobond BV 630,000 2.13% 15/4/2027 666,127 0.03%Mastercard, Inc. 570,000 2.10% 1/12/2027 650,199 0.03%McDonald’s Corp. 600,000 1.60% 15/3/2031 648,400 0.03%Thermo Fisher Scientific, Inc. 700,000 1.88% 1/10/2049 647,455 0.03%Wells Fargo & Co. 600,000 1.63% 2/6/2025 640,417 0.03%Morgan Stanley 600,000 1.88% 30/3/2023 634,044 0.03%Liberty Mutual Finance Europe DAC 600,000 1.75% 27/3/2024 631,744 0.03%AbbVie, Inc. 600,000 1.38% 17/5/2024 631,302 0.03%Verizon Communications, Inc. 600,000 1.25% 8/4/2030 626,268 0.03%
270
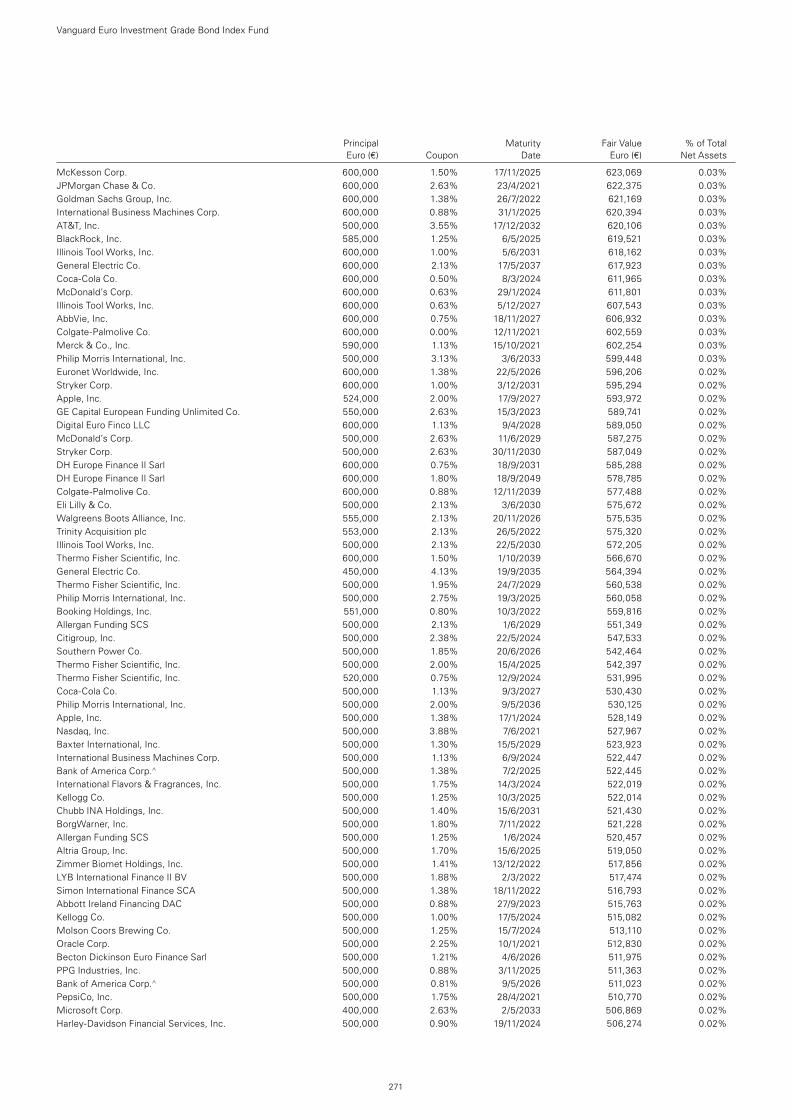
Vanguard Euro Investment Grade Bond Index Fund
McKesson Corp. 600,000 1.50% 17/11/2025 623,069 0.03%JPMorgan Chase & Co. 600,000 2.63% 23/4/2021 622,375 0.03%Goldman Sachs Group, Inc. 600,000 1.38% 26/7/2022 621,169 0.03%International Business Machines Corp. 600,000 0.88% 31/1/2025 620,394 0.03%AT&T, Inc. 500,000 3.55% 17/12/2032 620,106 0.03%BlackRock, Inc. 585,000 1.25% 6/5/2025 619,521 0.03%Illinois Tool Works, Inc. 600,000 1.00% 5/6/2031 618,162 0.03%General Electric Co. 600,000 2.13% 17/5/2037 617,923 0.03%Coca-Cola Co. 600,000 0.50% 8/3/2024 611,965 0.03%McDonald’s Corp. 600,000 0.63% 29/1/2024 611,801 0.03%Illinois Tool Works, Inc. 600,000 0.63% 5/12/2027 607,543 0.03%AbbVie, Inc. 600,000 0.75% 18/11/2027 606,932 0.03%Colgate-Palmolive Co. 600,000 0.00% 12/11/2021 602,559 0.03%Merck & Co., Inc. 590,000 1.13% 15/10/2021 602,254 0.03%Philip Morris International, Inc. 500,000 3.13% 3/6/2033 599,448 0.03%Euronet Worldwide, Inc. 600,000 1.38% 22/5/2026 596,206 0.02%Stryker Corp. 600,000 1.00% 3/12/2031 595,294 0.02%Apple, Inc. 524,000 2.00% 17/9/2027 593,972 0.02%GE Capital European Funding Unlimited Co. 550,000 2.63% 15/3/2023 589,741 0.02%Digital Euro Finco LLC 600,000 1.13% 9/4/2028 589,050 0.02%McDonald’s Corp. 500,000 2.63% 11/6/2029 587,275 0.02%Stryker Corp. 500,000 2.63% 30/11/2030 587,049 0.02%DH Europe Finance II Sarl 600,000 0.75% 18/9/2031 585,288 0.02%DH Europe Finance II Sarl 600,000 1.80% 18/9/2049 578,785 0.02%Colgate-Palmolive Co. 600,000 0.88% 12/11/2039 577,488 0.02%Eli Lilly & Co. 500,000 2.13% 3/6/2030 575,672 0.02%Walgreens Boots Alliance, Inc. 555,000 2.13% 20/11/2026 575,535 0.02%Trinity Acquisition plc 553,000 2.13% 26/5/2022 575,320 0.02%Illinois Tool Works, Inc. 500,000 2.13% 22/5/2030 572,205 0.02%Thermo Fisher Scientific, Inc. 600,000 1.50% 1/10/2039 566,670 0.02%General Electric Co. 450,000 4.13% 19/9/2035 564,394 0.02%Thermo Fisher Scientific, Inc. 500,000 1.95% 24/7/2029 560,538 0.02%Philip Morris International, Inc. 500,000 2.75% 19/3/2025 560,058 0.02%Booking Holdings, Inc. 551,000 0.80% 10/3/2022 559,816 0.02%Allergan Funding SCS 500,000 2.13% 1/6/2029 551,349 0.02%Citigroup, Inc. 500,000 2.38% 22/5/2024 547,533 0.02%Southern Power Co. 500,000 1.85% 20/6/2026 542,464 0.02%Thermo Fisher Scientific, Inc. 500,000 2.00% 15/4/2025 542,397 0.02%Thermo Fisher Scientific, Inc. 520,000 0.75% 12/9/2024 531,995 0.02%Coca-Cola Co. 500,000 1.13% 9/3/2027 530,430 0.02%Philip Morris International, Inc. 500,000 2.00% 9/5/2036 530,125 0.02%Apple, Inc. 500,000 1.38% 17/1/2024 528,149 0.02%Nasdaq, Inc. 500,000 3.88% 7/6/2021 527,967 0.02%Baxter International, Inc. 500,000 1.30% 15/5/2029 523,923 0.02%International Business Machines Corp. 500,000 1.13% 6/9/2024 522,447 0.02%Bank of America Corp.^ 500,000 1.38% 7/2/2025 522,445 0.02%International Flavors & Fragrances, Inc. 500,000 1.75% 14/3/2024 522,019 0.02%Kellogg Co. 500,000 1.25% 10/3/2025 522,014 0.02%Chubb INA Holdings, Inc. 500,000 1.40% 15/6/2031 521,430 0.02%BorgWarner, Inc. 500,000 1.80% 7/11/2022 521,228 0.02%Allergan Funding SCS 500,000 1.25% 1/6/2024 520,457 0.02%Altria Group, Inc. 500,000 1.70% 15/6/2025 519,050 0.02%Zimmer Biomet Holdings, Inc. 500,000 1.41% 13/12/2022 517,856 0.02%LYB International Finance II BV 500,000 1.88% 2/3/2022 517,474 0.02%Simon International Finance SCA 500,000 1.38% 18/11/2022 516,793 0.02%Abbott Ireland Financing DAC 500,000 0.88% 27/9/2023 515,763 0.02%Kellogg Co. 500,000 1.00% 17/5/2024 515,082 0.02%Molson Coors Brewing Co. 500,000 1.25% 15/7/2024 513,110 0.02%Oracle Corp. 500,000 2.25% 10/1/2021 512,830 0.02%Becton Dickinson Euro Finance Sarl 500,000 1.21% 4/6/2026 511,975 0.02%PPG Industries, Inc. 500,000 0.88% 3/11/2025 511,363 0.02%Bank of America Corp.^ 500,000 0.81% 9/5/2026 511,023 0.02%PepsiCo, Inc. 500,000 1.75% 28/4/2021 510,770 0.02%Microsoft Corp. 400,000 2.63% 2/5/2033 506,869 0.02%Harley-Davidson Financial Services, Inc. 500,000 0.90% 19/11/2024 506,274 0.02%
271
Principal Maturity Fair Value % of Total Euro (€) Coupon Date Euro (€) Net Assets
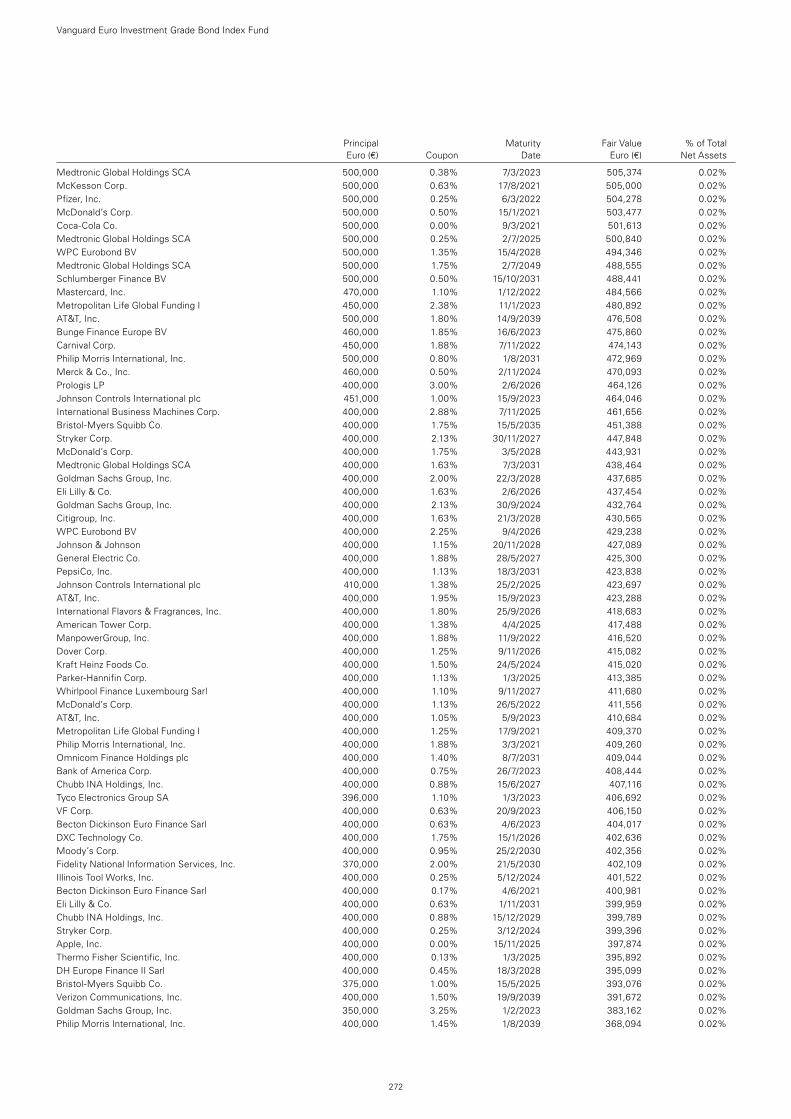
Principal Maturity Fair Value % of Total Euro (€) Coupon Date Euro (€) Net Assets
Vanguard Euro Investment Grade Bond Index Fund
Medtronic Global Holdings SCA 500,000 0.38% 7/3/2023 505,374 0.02%McKesson Corp. 500,000 0.63% 17/8/2021 505,000 0.02%Pfizer, Inc. 500,000 0.25% 6/3/2022 504,278 0.02%McDonald’s Corp. 500,000 0.50% 15/1/2021 503,477 0.02%Coca-Cola Co. 500,000 0.00% 9/3/2021 501,613 0.02%Medtronic Global Holdings SCA 500,000 0.25% 2/7/2025 500,840 0.02%WPC Eurobond BV 500,000 1.35% 15/4/2028 494,346 0.02%Medtronic Global Holdings SCA 500,000 1.75% 2/7/2049 488,555 0.02%Schlumberger Finance BV 500,000 0.50% 15/10/2031 488,441 0.02%Mastercard, Inc. 470,000 1.10% 1/12/2022 484,566 0.02%Metropolitan Life Global Funding I 450,000 2.38% 11/1/2023 480,892 0.02%AT&T, Inc. 500,000 1.80% 14/9/2039 476,508 0.02%Bunge Finance Europe BV 460,000 1.85% 16/6/2023 475,860 0.02%Carnival Corp. 450,000 1.88% 7/11/2022 474,143 0.02%Philip Morris International, Inc. 500,000 0.80% 1/8/2031 472,969 0.02%Merck & Co., Inc. 460,000 0.50% 2/11/2024 470,093 0.02%Prologis LP 400,000 3.00% 2/6/2026 464,126 0.02%Johnson Controls International plc 451,000 1.00% 15/9/2023 464,046 0.02%International Business Machines Corp. 400,000 2.88% 7/11/2025 461,656 0.02%Bristol-Myers Squibb Co. 400,000 1.75% 15/5/2035 451,388 0.02%Stryker Corp. 400,000 2.13% 30/11/2027 447,848 0.02%McDonald’s Corp. 400,000 1.75% 3/5/2028 443,931 0.02%Medtronic Global Holdings SCA 400,000 1.63% 7/3/2031 438,464 0.02%Goldman Sachs Group, Inc. 400,000 2.00% 22/3/2028 437,685 0.02%Eli Lilly & Co. 400,000 1.63% 2/6/2026 437,454 0.02%Goldman Sachs Group, Inc. 400,000 2.13% 30/9/2024 432,764 0.02%Citigroup, Inc. 400,000 1.63% 21/3/2028 430,565 0.02%WPC Eurobond BV 400,000 2.25% 9/4/2026 429,238 0.02%Johnson & Johnson 400,000 1.15% 20/11/2028 427,089 0.02%General Electric Co. 400,000 1.88% 28/5/2027 425,300 0.02%PepsiCo, Inc. 400,000 1.13% 18/3/2031 423,838 0.02%Johnson Controls International plc 410,000 1.38% 25/2/2025 423,697 0.02%AT&T, Inc. 400,000 1.95% 15/9/2023 423,288 0.02%International Flavors & Fragrances, Inc. 400,000 1.80% 25/9/2026 418,683 0.02%American Tower Corp. 400,000 1.38% 4/4/2025 417,488 0.02%ManpowerGroup, Inc. 400,000 1.88% 11/9/2022 416,520 0.02%Dover Corp. 400,000 1.25% 9/11/2026 415,082 0.02%Kraft Heinz Foods Co. 400,000 1.50% 24/5/2024 415,020 0.02%Parker-Hannifin Corp. 400,000 1.13% 1/3/2025 413,385 0.02%Whirlpool Finance Luxembourg Sarl 400,000 1.10% 9/11/2027 411,680 0.02%McDonald’s Corp. 400,000 1.13% 26/5/2022 411,556 0.02%AT&T, Inc. 400,000 1.05% 5/9/2023 410,684 0.02%Metropolitan Life Global Funding I 400,000 1.25% 17/9/2021 409,370 0.02%Philip Morris International, Inc. 400,000 1.88% 3/3/2021 409,260 0.02%Omnicom Finance Holdings plc 400,000 1.40% 8/7/2031 409,044 0.02%Bank of America Corp. 400,000 0.75% 26/7/2023 408,444 0.02%Chubb INA Holdings, Inc. 400,000 0.88% 15/6/2027 407,116 0.02%Tyco Electronics Group SA 396,000 1.10% 1/3/2023 406,692 0.02%VF Corp. 400,000 0.63% 20/9/2023 406,150 0.02%Becton Dickinson Euro Finance Sarl 400,000 0.63% 4/6/2023 404,017 0.02%DXC Technology Co. 400,000 1.75% 15/1/2026 402,636 0.02%Moody’s Corp. 400,000 0.95% 25/2/2030 402,356 0.02%Fidelity National Information Services, Inc. 370,000 2.00% 21/5/2030 402,109 0.02%Illinois Tool Works, Inc. 400,000 0.25% 5/12/2024 401,522 0.02%Becton Dickinson Euro Finance Sarl 400,000 0.17% 4/6/2021 400,981 0.02%Eli Lilly & Co. 400,000 0.63% 1/11/2031 399,959 0.02%Chubb INA Holdings, Inc. 400,000 0.88% 15/12/2029 399,789 0.02%Stryker Corp. 400,000 0.25% 3/12/2024 399,396 0.02%Apple, Inc. 400,000 0.00% 15/11/2025 397,874 0.02%Thermo Fisher Scientific, Inc. 400,000 0.13% 1/3/2025 395,892 0.02%DH Europe Finance II Sarl 400,000 0.45% 18/3/2028 395,099 0.02%Bristol-Myers Squibb Co. 375,000 1.00% 15/5/2025 393,076 0.02%Verizon Communications, Inc. 400,000 1.50% 19/9/2039 391,672 0.02%Goldman Sachs Group, Inc. 350,000 3.25% 1/2/2023 383,162 0.02%Philip Morris International, Inc. 400,000 1.45% 1/8/2039 368,094 0.02%
272
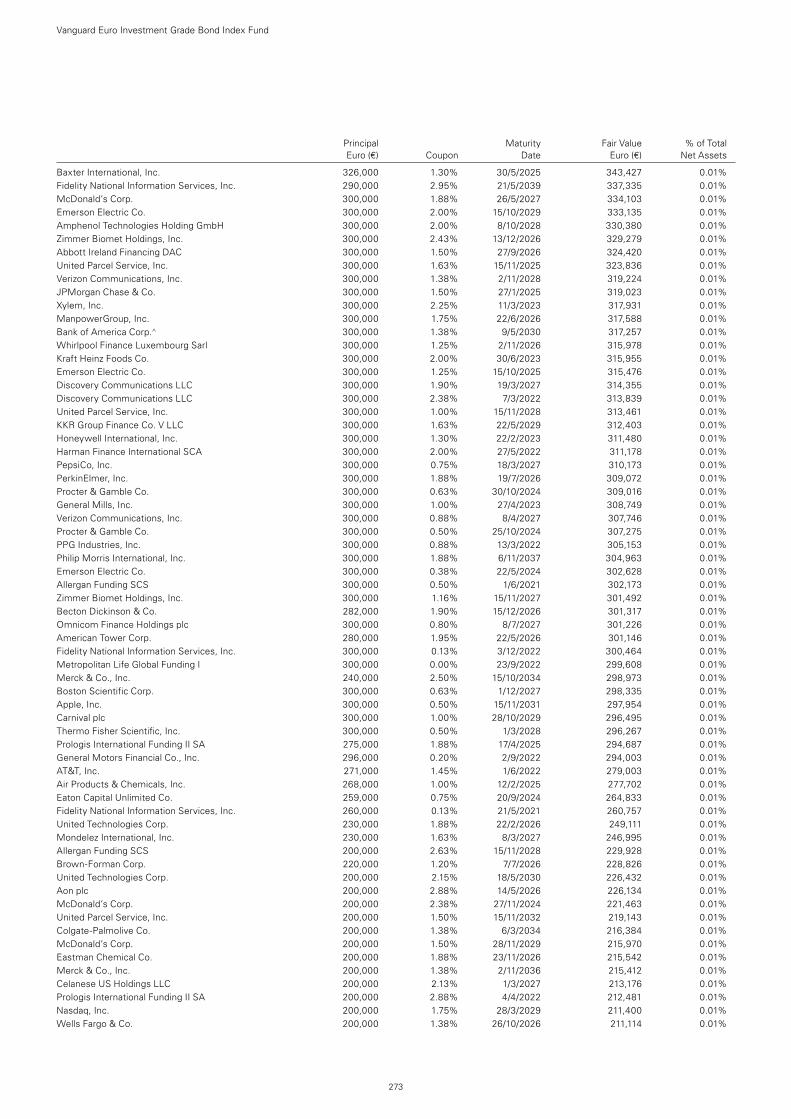
Principal Maturity Fair Value % of Total Euro (€) Coupon Date Euro (€) Net Assets
Vanguard Euro Investment Grade Bond Index Fund
Baxter International, Inc. 326,000 1.30% 30/5/2025 343,427 0.01%Fidelity National Information Services, Inc. 290,000 2.95% 21/5/2039 337,335 0.01%McDonald’s Corp. 300,000 1.88% 26/5/2027 334,103 0.01%Emerson Electric Co. 300,000 2.00% 15/10/2029 333,135 0.01%Amphenol Technologies Holding GmbH 300,000 2.00% 8/10/2028 330,380 0.01%Zimmer Biomet Holdings, Inc. 300,000 2.43% 13/12/2026 329,279 0.01%Abbott Ireland Financing DAC 300,000 1.50% 27/9/2026 324,420 0.01%United Parcel Service, Inc. 300,000 1.63% 15/11/2025 323,836 0.01%Verizon Communications, Inc. 300,000 1.38% 2/11/2028 319,224 0.01%JPMorgan Chase & Co. 300,000 1.50% 27/1/2025 319,023 0.01%Xylem, Inc. 300,000 2.25% 11/3/2023 317,931 0.01%ManpowerGroup, Inc. 300,000 1.75% 22/6/2026 317,588 0.01%Bank of America Corp.^ 300,000 1.38% 9/5/2030 317,257 0.01%Whirlpool Finance Luxembourg Sarl 300,000 1.25% 2/11/2026 315,978 0.01%Kraft Heinz Foods Co. 300,000 2.00% 30/6/2023 315,955 0.01%Emerson Electric Co. 300,000 1.25% 15/10/2025 315,476 0.01%Discovery Communications LLC 300,000 1.90% 19/3/2027 314,355 0.01%Discovery Communications LLC 300,000 2.38% 7/3/2022 313,839 0.01%United Parcel Service, Inc. 300,000 1.00% 15/11/2028 313,461 0.01%KKR Group Finance Co. V LLC 300,000 1.63% 22/5/2029 312,403 0.01%Honeywell International, Inc. 300,000 1.30% 22/2/2023 311,480 0.01%Harman Finance International SCA 300,000 2.00% 27/5/2022 311,178 0.01%PepsiCo, Inc. 300,000 0.75% 18/3/2027 310,173 0.01%PerkinElmer, Inc. 300,000 1.88% 19/7/2026 309,072 0.01%Procter & Gamble Co. 300,000 0.63% 30/10/2024 309,016 0.01%General Mills, Inc. 300,000 1.00% 27/4/2023 308,749 0.01%Verizon Communications, Inc. 300,000 0.88% 8/4/2027 307,746 0.01%Procter & Gamble Co. 300,000 0.50% 25/10/2024 307,275 0.01%PPG Industries, Inc. 300,000 0.88% 13/3/2022 305,153 0.01%Philip Morris International, Inc. 300,000 1.88% 6/11/2037 304,963 0.01%Emerson Electric Co. 300,000 0.38% 22/5/2024 302,628 0.01%Allergan Funding SCS 300,000 0.50% 1/6/2021 302,173 0.01%Zimmer Biomet Holdings, Inc. 300,000 1.16% 15/11/2027 301,492 0.01%Becton Dickinson & Co. 282,000 1.90% 15/12/2026 301,317 0.01%Omnicom Finance Holdings plc 300,000 0.80% 8/7/2027 301,226 0.01%American Tower Corp. 280,000 1.95% 22/5/2026 301,146 0.01%Fidelity National Information Services, Inc. 300,000 0.13% 3/12/2022 300,464 0.01%Metropolitan Life Global Funding I 300,000 0.00% 23/9/2022 299,608 0.01%Merck & Co., Inc. 240,000 2.50% 15/10/2034 298,973 0.01%Boston Scientific Corp. 300,000 0.63% 1/12/2027 298,335 0.01%Apple, Inc. 300,000 0.50% 15/11/2031 297,954 0.01%Carnival plc 300,000 1.00% 28/10/2029 296,495 0.01%Thermo Fisher Scientific, Inc. 300,000 0.50% 1/3/2028 296,267 0.01%Prologis International Funding II SA 275,000 1.88% 17/4/2025 294,687 0.01%General Motors Financial Co., Inc. 296,000 0.20% 2/9/2022 294,003 0.01%AT&T, Inc. 271,000 1.45% 1/6/2022 279,003 0.01%Air Products & Chemicals, Inc. 268,000 1.00% 12/2/2025 277,702 0.01%Eaton Capital Unlimited Co. 259,000 0.75% 20/9/2024 264,833 0.01%Fidelity National Information Services, Inc. 260,000 0.13% 21/5/2021 260,757 0.01%United Technologies Corp. 230,000 1.88% 22/2/2026 249,111 0.01%Mondelez International, Inc. 230,000 1.63% 8/3/2027 246,995 0.01%Allergan Funding SCS 200,000 2.63% 15/11/2028 229,928 0.01%Brown-Forman Corp. 220,000 1.20% 7/7/2026 228,826 0.01%United Technologies Corp. 200,000 2.15% 18/5/2030 226,432 0.01%Aon plc 200,000 2.88% 14/5/2026 226,134 0.01%McDonald’s Corp. 200,000 2.38% 27/11/2024 221,463 0.01%United Parcel Service, Inc. 200,000 1.50% 15/11/2032 219,143 0.01%Colgate-Palmolive Co. 200,000 1.38% 6/3/2034 216,384 0.01%McDonald’s Corp. 200,000 1.50% 28/11/2029 215,970 0.01%Eastman Chemical Co. 200,000 1.88% 23/11/2026 215,542 0.01%Merck & Co., Inc. 200,000 1.38% 2/11/2036 215,412 0.01%Celanese US Holdings LLC 200,000 2.13% 1/3/2027 213,176 0.01%Prologis International Funding II SA 200,000 2.88% 4/4/2022 212,481 0.01%Nasdaq, Inc. 200,000 1.75% 28/3/2029 211,400 0.01%Wells Fargo & Co. 200,000 1.38% 26/10/2026 211,114 0.01%
273
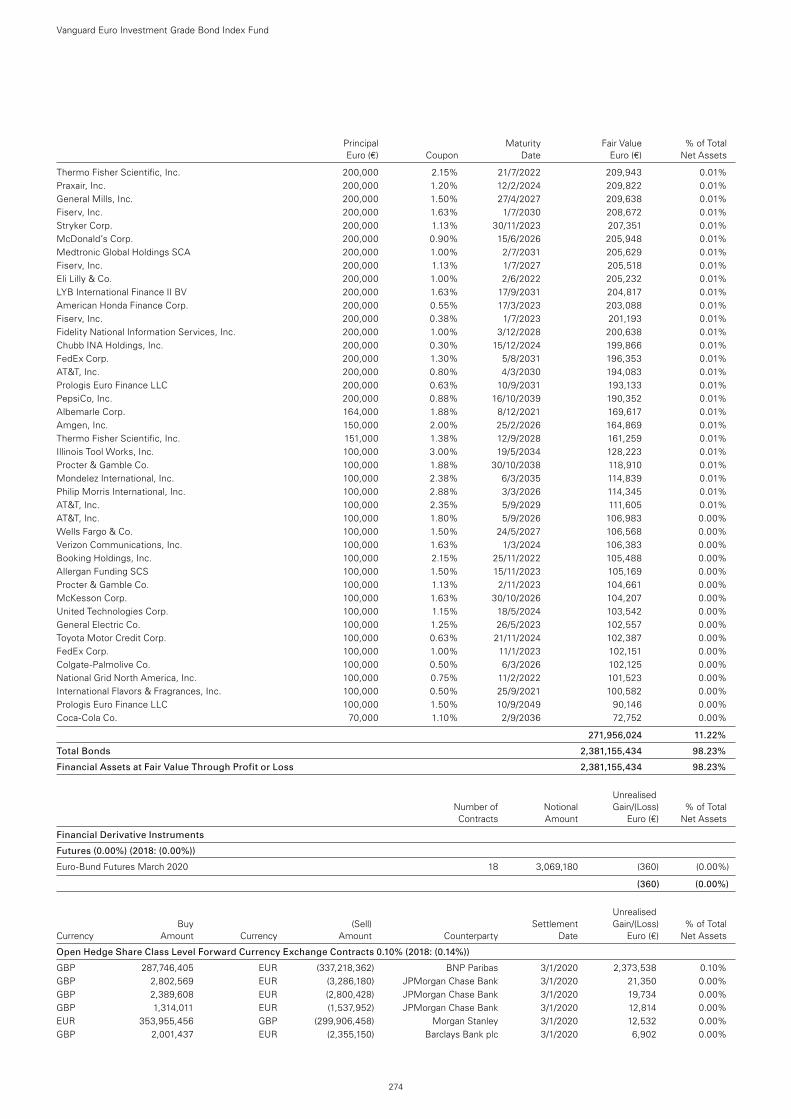
Principal Maturity Fair Value % of Total Euro (€) Coupon Date Euro (€) Net Assets
Vanguard Euro Investment Grade Bond Index Fund
Thermo Fisher Scientific, Inc. 200,000 2.15% 21/7/2022 209,943 0.01%Praxair, Inc. 200,000 1.20% 12/2/2024 209,822 0.01%General Mills, Inc. 200,000 1.50% 27/4/2027 209,638 0.01%Fiserv, Inc. 200,000 1.63% 1/7/2030 208,672 0.01%Stryker Corp. 200,000 1.13% 30/11/2023 207,351 0.01%McDonald’s Corp. 200,000 0.90% 15/6/2026 205,948 0.01%Medtronic Global Holdings SCA 200,000 1.00% 2/7/2031 205,629 0.01%Fiserv, Inc. 200,000 1.13% 1/7/2027 205,518 0.01%Eli Lilly & Co. 200,000 1.00% 2/6/2022 205,232 0.01%LYB International Finance II BV 200,000 1.63% 17/9/2031 204,817 0.01%American Honda Finance Corp. 200,000 0.55% 17/3/2023 203,088 0.01%Fiserv, Inc. 200,000 0.38% 1/7/2023 201,193 0.01%Fidelity National Information Services, Inc. 200,000 1.00% 3/12/2028 200,638 0.01%Chubb INA Holdings, Inc. 200,000 0.30% 15/12/2024 199,866 0.01%FedEx Corp. 200,000 1.30% 5/8/2031 196,353 0.01%AT&T, Inc. 200,000 0.80% 4/3/2030 194,083 0.01%Prologis Euro Finance LLC 200,000 0.63% 10/9/2031 193,133 0.01%PepsiCo, Inc. 200,000 0.88% 16/10/2039 190,352 0.01%Albemarle Corp. 164,000 1.88% 8/12/2021 169,617 0.01%Amgen, Inc. 150,000 2.00% 25/2/2026 164,869 0.01%Thermo Fisher Scientific, Inc. 151,000 1.38% 12/9/2028 161,259 0.01%Illinois Tool Works, Inc. 100,000 3.00% 19/5/2034 128,223 0.01%Procter & Gamble Co. 100,000 1.88% 30/10/2038 118,910 0.01%Mondelez International, Inc. 100,000 2.38% 6/3/2035 114,839 0.01%Philip Morris International, Inc. 100,000 2.88% 3/3/2026 114,345 0.01%AT&T, Inc. 100,000 2.35% 5/9/2029 111,605 0.01%AT&T, Inc. 100,000 1.80% 5/9/2026 106,983 0.00%Wells Fargo & Co. 100,000 1.50% 24/5/2027 106,568 0.00%Verizon Communications, Inc. 100,000 1.63% 1/3/2024 106,383 0.00%Booking Holdings, Inc. 100,000 2.15% 25/11/2022 105,488 0.00%Allergan Funding SCS 100,000 1.50% 15/11/2023 105,169 0.00%Procter & Gamble Co. 100,000 1.13% 2/11/2023 104,661 0.00%McKesson Corp. 100,000 1.63% 30/10/2026 104,207 0.00%United Technologies Corp. 100,000 1.15% 18/5/2024 103,542 0.00%General Electric Co. 100,000 1.25% 26/5/2023 102,557 0.00%Toyota Motor Credit Corp. 100,000 0.63% 21/11/2024 102,387 0.00%FedEx Corp. 100,000 1.00% 11/1/2023 102,151 0.00%Colgate-Palmolive Co. 100,000 0.50% 6/3/2026 102,125 0.00%National Grid North America, Inc. 100,000 0.75% 11/2/2022 101,523 0.00%International Flavors & Fragrances, Inc. 100,000 0.50% 25/9/2021 100,582 0.00%Prologis Euro Finance LLC 100,000 1.50% 10/9/2049 90,146 0.00%Coca-Cola Co. 70,000 1.10% 2/9/2036 72,752 0.00%
271,956,024 11.22%
Total Bonds 2,381,155,434 98.23%
Financial Assets at Fair Value Through Profit or Loss 2,381,155,434 98.23%
Unrealised Number of Notional Gain/(Loss) % of Total Contracts Amount Euro (€) Net Assets
Financial Derivative Instruments
Futures (0.00%) (2018: (0.00%))
Euro-Bund Futures March 2020 18 3,069,180 (360) (0.00%)
(360) (0.00%)
Unrealised Buy (Sell) Settlement Gain/(Loss) % of Total Currency Amount Currency Amount Counterparty Date Euro (€) Net Assets
Open Hedge Share Class Level Forward Currency Exchange Contracts 0.10% (2018: (0.14%))
GBP 287,746,405 EUR (337,218,362) BNP Paribas 3/1/2020 2,373,538 0.10%GBP 2,802,569 EUR (3,286,180) JPMorgan Chase Bank 3/1/2020 21,350 0.00%GBP 2,389,608 EUR (2,800,428) JPMorgan Chase Bank 3/1/2020 19,734 0.00%GBP 1,314,011 EUR (1,537,952) JPMorgan Chase Bank 3/1/2020 12,814 0.00%EUR 353,955,456 GBP (299,906,458) Morgan Stanley 3/1/2020 12,532 0.00%GBP 2,001,437 EUR (2,355,150) Barclays Bank plc 3/1/2020 6,902 0.00%
274
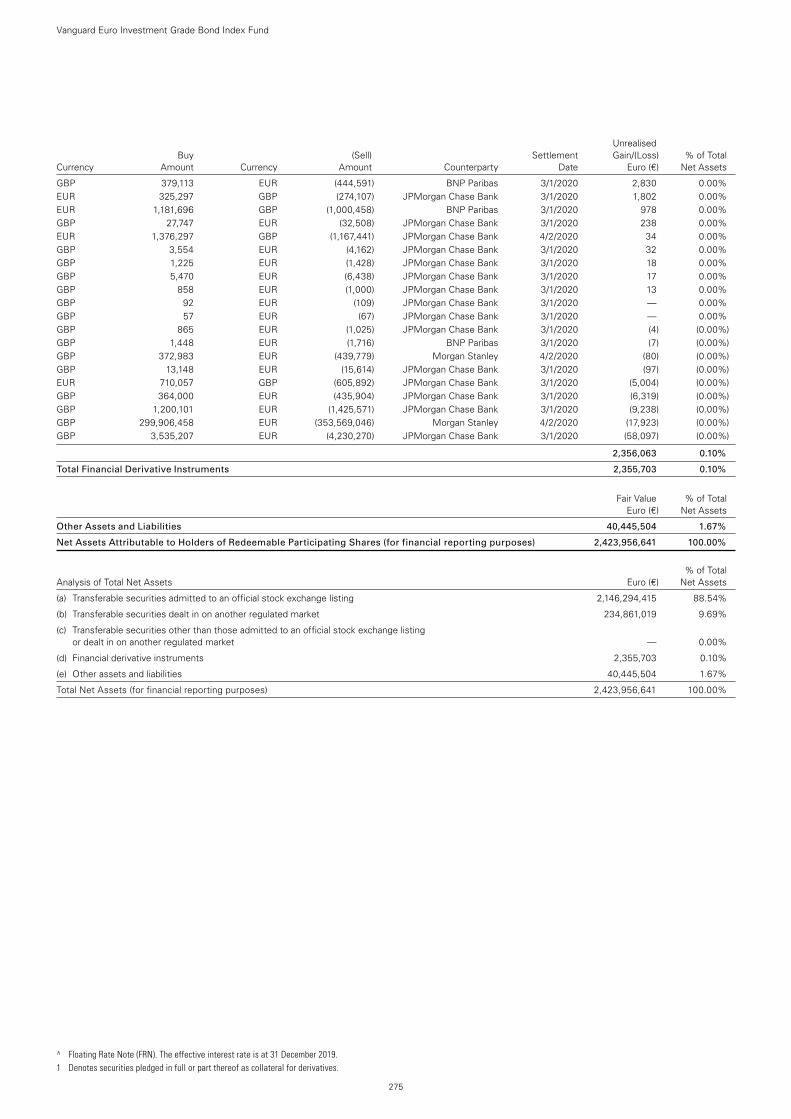
^ Floating Rate Note (FRN). The effective interest rate is at 31 December 2019. 1 Denotes securities pledged in full or part thereof as collateral for derivatives.
Vanguard Euro Investment Grade Bond Index Fund
Unrealised Buy (Sell) Settlement Gain/(Loss) % of Total Currency Amount Currency Amount Counterparty Date Euro (€) Net Assets
GBP 379,113 EUR (444,591) BNP Paribas 3/1/2020 2,830 0.00%EUR 325,297 GBP (274,107) JPMorgan Chase Bank 3/1/2020 1,802 0.00%EUR 1,181,696 GBP (1,000,458) BNP Paribas 3/1/2020 978 0.00%GBP 27,747 EUR (32,508) JPMorgan Chase Bank 3/1/2020 238 0.00%EUR 1,376,297 GBP (1,167,441) JPMorgan Chase Bank 4/2/2020 34 0.00%GBP 3,554 EUR (4,162) JPMorgan Chase Bank 3/1/2020 32 0.00%GBP 1,225 EUR (1,428) JPMorgan Chase Bank 3/1/2020 18 0.00%GBP 5,470 EUR (6,438) JPMorgan Chase Bank 3/1/2020 17 0.00%GBP 858 EUR (1,000) JPMorgan Chase Bank 3/1/2020 13 0.00%GBP 92 EUR (109) JPMorgan Chase Bank 3/1/2020 — 0.00%GBP 57 EUR (67) JPMorgan Chase Bank 3/1/2020 — 0.00%GBP 865 EUR (1,025) JPMorgan Chase Bank 3/1/2020 (4) (0.00%)GBP 1,448 EUR (1,716) BNP Paribas 3/1/2020 (7) (0.00%)GBP 372,983 EUR (439,779) Morgan Stanley 4/2/2020 (80) (0.00%)GBP 13,148 EUR (15,614) JPMorgan Chase Bank 3/1/2020 (97) (0.00%)EUR 710,057 GBP (605,892) JPMorgan Chase Bank 3/1/2020 (5,004) (0.00%)GBP 364,000 EUR (435,904) JPMorgan Chase Bank 3/1/2020 (6,319) (0.00%)GBP 1,200,101 EUR (1,425,571) JPMorgan Chase Bank 3/1/2020 (9,238) (0.00%)GBP 299,906,458 EUR (353,569,046) Morgan Stanley 4/2/2020 (17,923) (0.00%)GBP 3,535,207 EUR (4,230,270) JPMorgan Chase Bank 3/1/2020 (58,097) (0.00%)
2,356,063 0.10%
Total Financial Derivative Instruments 2,355,703 0.10%
Fair Value % of Total Euro (€) Net Assets
Other Assets and Liabilities 40,445,504 1.67%
Net Assets Attributable to Holders of Redeemable Participating Shares (for financial reporting purposes) 2,423,956,641 100.00%
% of Total Analysis of Total Net Assets Euro (€) Net Assets
(a) Transferable securities admitted to an official stock exchange listing 2,146,294,415 88.54%
(b) Transferable securities dealt in on another regulated market 234,861,019 9.69%
(c) Transferable securities other than those admitted to an official stock exchange listing or dealt in on another regulated market — 0.00%
(d) Financial derivative instruments 2,355,703 0.10%
(e) Other assets and liabilities 40,445,504 1.67%
Total Net Assets (for financial reporting purposes) 2,423,956,641 100.00%
275

1 The net asset value per share shown may diverge from the net asset value per share used for dealing purposes because of any adjustments for swing pricing and trade date accounting. The accompanying notes form an integral part of the financial statements.
276
Vanguard Euro Investment Grade Bond Index Fund
Statement of Assets and Liabilities
Euro (€) Euro (€) As at As at 31 December 2019 31 December 2018
Current Assets Financial Assets at Fair Value Through Profit or Loss 2,381,155,434 2,010,697,767Financial Derivative Instruments 2,452,832 46,619Cash 14,791,574 4,868,309Receivables:
Interest and Dividends 19,346,384 19,253,269Capital Shares Issued 7,080,000 873,352Investments Sold 22,209 —Futures Margin Cash 20,770 9,463
Total Current Assets 2,424,869,203 2,035,748,779
Current Liabilities Financial Derivative Instruments 97,129 2,967,481Unrealised Depreciation on Spot Currency Contracts 34,495 851Payables and Other Liabilities:
Investments Purchased 94 —Capital Shares Redeemed 541,354 1,805,251Management Fees Payable 239,490 435,375Other Payables — 2,268
Total Current Liabilities 912,562 5,211,226
Net Assets Attributable to Holders of Redeemable Participating Shares (for financial reporting purposes) (“Net Assets”) 2,423,956,641 2,030,537,553
Net Asset Value Per Share As at As at As at 31 December 2019 31 December 2018 31 December 2017
Institutional EUR Shares (€) Net Assets 1,559,392,128 1,596,757,229 1,751,905,570Number of Shares Outstanding 6,918,363 7,452,190 8,111,563
Net Asset Value Per Share1 225.40 214.27 215.98
Investor EUR Shares (€) Net Assets 59,329,586 51,690,293 52,986,434Number of Shares Outstanding 281,649 258,028 262,273
Net Asset Value Per Share1 210.65 200.33 202.03
Institutional Plus EUR Shares (€) Net Assets 452,633,868 115,923,366 103,447,267Number of Shares Outstanding 3,797,269 1,023,945 907,419
Net Asset Value Per Share1 119.20 113.21 114.00
GBP-Hedged Accumulation Shares (£) EUR (€) Equivalent 352,601,059 266,166,665 166,381,563Net Assets 298,769,360 238,904,237 147,692,471Number of Shares Outstanding 2,439,608 2,076,530 1,286,171
Net Asset Value Per Share1 122.47 115.05 114.83
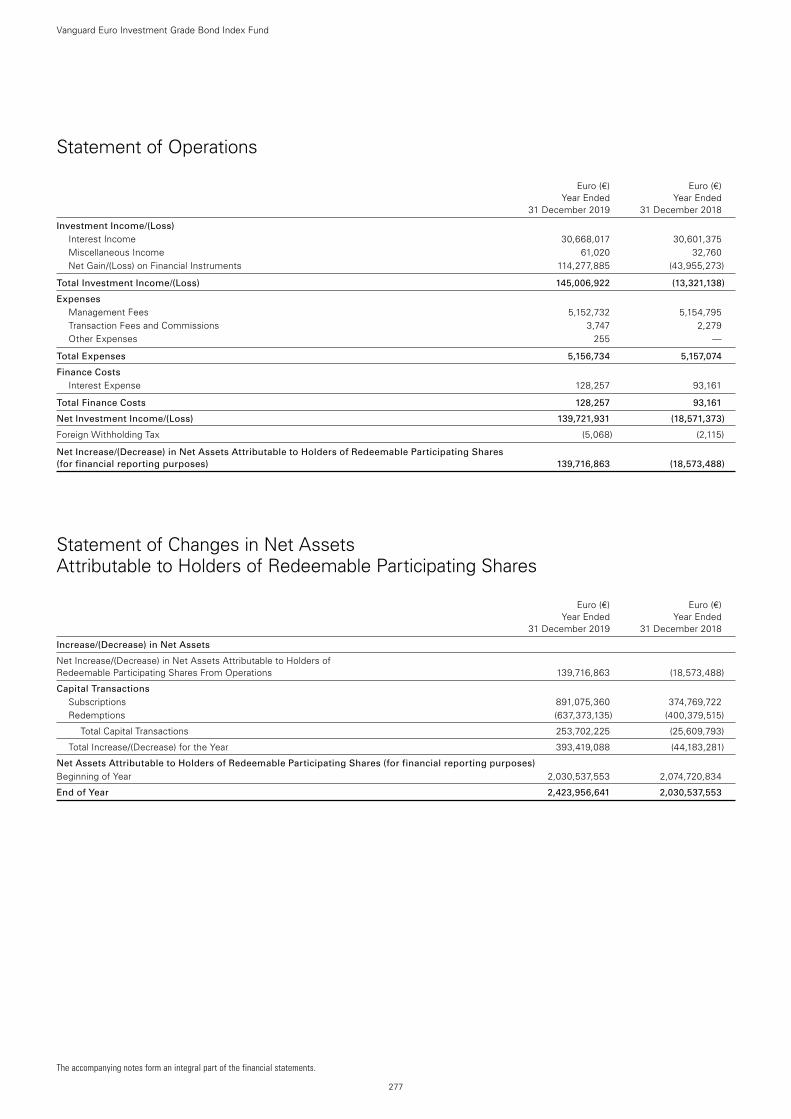
277
Vanguard Euro Investment Grade Bond Index Fund
Statement of Operations
Euro (€) Euro (€) Year Ended Year Ended 31 December 2019 31 December 2018
Investment Income/(Loss) Interest Income 30,668,017 30,601,375Miscellaneous Income 61,020 32,760Net Gain/(Loss) on Financial Instruments 114,277,885 (43,955,273)
Total Investment Income/(Loss) 145,006,922 (13,321,138)
Expenses Management Fees 5,152,732 5,154,795Transaction Fees and Commissions 3,747 2,279Other Expenses 255 —
Total Expenses 5,156,734 5,157,074
Finance Costs Interest Expense 128,257 93,161
Total Finance Costs 128,257 93,161
Net Investment Income/(Loss) 139,721,931 (18,571,373)
Foreign Withholding Tax (5,068) (2,115)
Net Increase/(Decrease) in Net Assets Attributable to Holders of Redeemable Participating Shares (for financial reporting purposes) 139,716,863 (18,573,488)
Statement of Changes in Net Assets Attributable to Holders of Redeemable Participating Shares
Euro (€) Euro (€) Year Ended Year Ended 31 December 2019 31 December 2018
Increase/(Decrease) in Net Assets
Net Increase/(Decrease) in Net Assets Attributable to Holders of Redeemable Participating Shares From Operations 139,716,863 (18,573,488)
Capital Transactions Subscriptions 891,075,360 374,769,722Redemptions (637,373,135) (400,379,515)
Total Capital Transactions 253,702,225 (25,609,793)
Total Increase/(Decrease) for the Year 393,419,088 (44,183,281)
Net Assets Attributable to Holders of Redeemable Participating Shares (for financial reporting purposes) Beginning of Year 2,030,537,553 2,074,720,834
End of Year 2,423,956,641 2,030,537,553
The accompanying notes form an integral part of the financial statements.
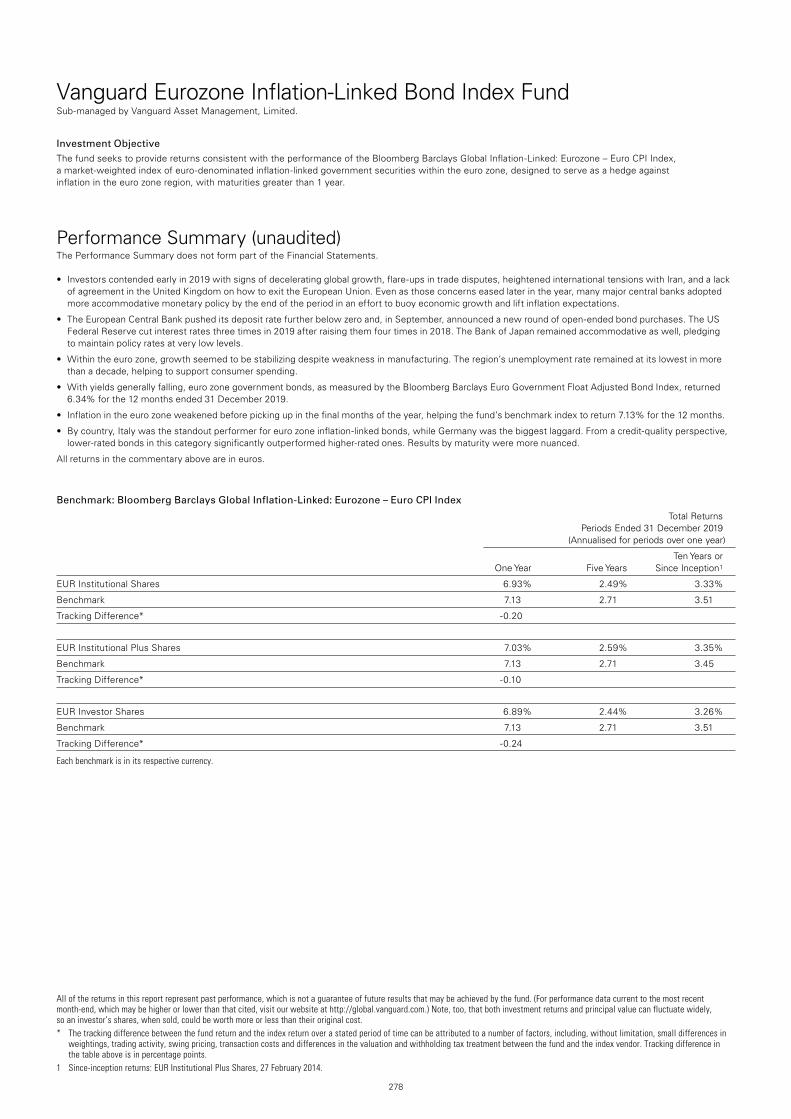
278
Vanguard Eurozone Inflation-Linked Bond Index FundSub-managed by Vanguard Asset Management, Limited.
All of the returns in this report represent past performance, which is not a guarantee of future results that may be achieved by the fund. (For performance data current to the most recent month-end, which may be higher or lower than that cited, visit our website at http://global.vanguard.com.) Note, too, that both investment returns and principal value can fluctuate widely, so an investor’s shares, when sold, could be worth more or less than their original cost.* The tracking difference between the fund return and the index return over a stated period of time can be attributed to a number of factors, including, without limitation, small differences in
weightings, trading activity, swing pricing, transaction costs and differences in the valuation and withholding tax treatment between the fund and the index vendor. Tracking difference in the table above is in percentage points.
1 Since-inception returns: EUR Institutional Plus Shares, 27 February 2014.
Investment ObjectiveThe fund seeks to provide returns consistent with the performance of the Bloomberg Barclays Global Inflation-Linked: Eurozone – Euro CPI Index, a market-weighted index of euro-denominated inflation-linked government securities within the euro zone, designed to serve as a hedge against inflation in the euro zone region, with maturities greater than 1 year.
Performance Summary (unaudited)The Performance Summary does not form part of the Financial Statements.
• Investorscontendedearlyin2019withsignsofdeceleratingglobalgrowth,flare-upsintradedisputes,heightenedinternationaltensionswithIran,andalackof agreement in the United Kingdom on how to exit the European Union. Even as those concerns eased later in the year, many major central banks adopted more accommodative monetary policy by the end of the period in an effort to buoy economic growth and lift inflation expectations.
• TheEuropeanCentralBankpusheditsdepositratefurtherbelowzeroand,inSeptember,announcedanewroundofopen-endedbondpurchases.TheUSFederal Reserve cut interest rates three times in 2019 after raising them four times in 2018. The Bank of Japan remained accommodative as well, pledging to maintain policy rates at very low levels.
• Withintheeurozone,growthseemedtobestabilizingdespiteweaknessinmanufacturing.Theregion’sunemploymentrateremainedatitslowestinmorethan a decade, helping to support consumer spending.
• Withyieldsgenerallyfalling,eurozonegovernmentbonds,asmeasuredbytheBloombergBarclaysEuroGovernmentFloatAdjustedBondIndex,returned6.34% for the 12 months ended 31 December 2019.
• Inflationintheeurozoneweakenedbeforepickingupinthefinalmonthsoftheyear,helpingthefund’sbenchmarkindextoreturn7.13%forthe12months.
• Bycountry,Italywasthestandoutperformerforeurozoneinflation-linkedbonds,whileGermanywasthebiggestlaggard.Fromacredit-qualityperspective,lower-rated bonds in this category significantly outperformed higher-rated ones. Results by maturity were more nuanced.
All returns in the commentary above are in euros.
Benchmark: Bloomberg Barclays Global Inflation-Linked: Eurozone – Euro CPI Index
Total Returns Periods Ended 31 December 2019 (Annualised for periods over one year)
Ten Years or One Year Five Years Since Inception1
EUR Institutional Shares 6.93% 2.49% 3.33%
Benchmark 7.13 2.71 3.51
Tracking Difference* -0.20
EUR Institutional Plus Shares 7.03% 2.59% 3.35%
Benchmark 7.13 2.71 3.45
Tracking Difference* -0.10
EUR Investor Shares 6.89% 2.44% 3.26%
Benchmark 7.13 2.71 3.51
Tracking Difference* -0.24
Each benchmark is in its respective currency.
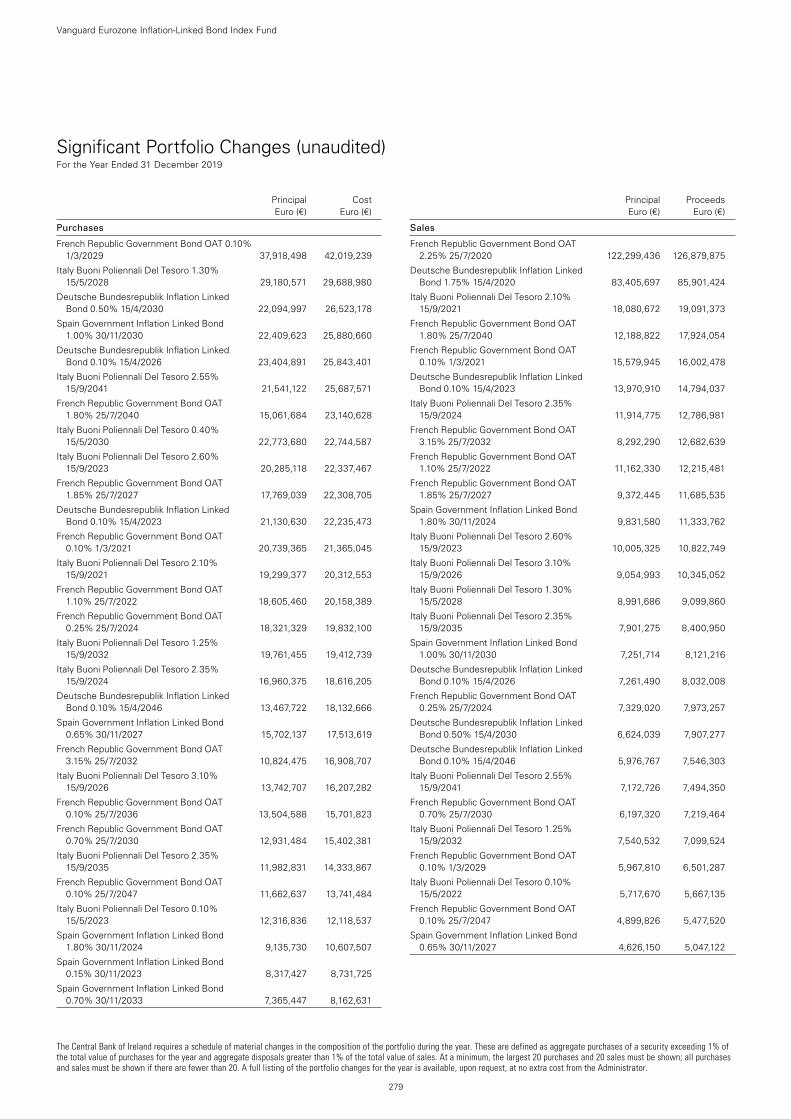
The Central Bank of Ireland requires a schedule of material changes in the composition of the portfolio during the year. These are defined as aggregate purchases of a security exceeding 1% of the total value of purchases for the year and aggregate disposals greater than 1% of the total value of sales. At a minimum, the largest 20 purchases and 20 sales must be shown; all purchases and sales must be shown if there are fewer than 20. A full listing of the portfolio changes for the year is available, upon request, at no extra cost from the Administrator.
279
Vanguard Eurozone Inflation-Linked Bond Index Fund
Significant Portfolio Changes (unaudited) For the Year Ended 31 December 2019
Principal Cost Euro (€) Euro (€)
Purchases
French Republic Government Bond OAT 0.10% 1/3/2029 37,918,498 42,019,239
Italy Buoni Poliennali Del Tesoro 1.30% 15/5/2028 29,180,571 29,688,980
Deutsche Bundesrepublik Inflation Linked Bond 0.50% 15/4/2030 22,094,997 26,523,178
Spain Government Inflation Linked Bond 1.00% 30/11/2030 22,409,623 25,880,660
Deutsche Bundesrepublik Inflation Linked Bond 0.10% 15/4/2026 23,404,891 25,843,401
Italy Buoni Poliennali Del Tesoro 2.55% 15/9/2041 21,541,122 25,687,571
French Republic Government Bond OAT 1.80% 25/7/2040 15,061,684 23,140,628
Italy Buoni Poliennali Del Tesoro 0.40% 15/5/2030 22,773,680 22,744,587
Italy Buoni Poliennali Del Tesoro 2.60% 15/9/2023 20,285,118 22,337,467
French Republic Government Bond OAT 1.85% 25/7/2027 17,769,039 22,308,705
Deutsche Bundesrepublik Inflation Linked Bond 0.10% 15/4/2023 21,130,630 22,235,473
French Republic Government Bond OAT 0.10% 1/3/2021 20,739,365 21,365,045
Italy Buoni Poliennali Del Tesoro 2.10% 15/9/2021 19,299,377 20,312,553
French Republic Government Bond OAT 1.10% 25/7/2022 18,605,460 20,158,389
French Republic Government Bond OAT 0.25% 25/7/2024 18,321,329 19,832,100
Italy Buoni Poliennali Del Tesoro 1.25% 15/9/2032 19,761,455 19,412,739
Italy Buoni Poliennali Del Tesoro 2.35% 15/9/2024 16,960,375 18,616,205
Deutsche Bundesrepublik Inflation Linked Bond 0.10% 15/4/2046 13,467,722 18,132,666
Spain Government Inflation Linked Bond 0.65% 30/11/2027 15,702,137 17,513,619
French Republic Government Bond OAT 3.15% 25/7/2032 10,824,475 16,908,707
Italy Buoni Poliennali Del Tesoro 3.10% 15/9/2026 13,742,707 16,207,282
French Republic Government Bond OAT 0.10% 25/7/2036 13,504,588 15,701,823
French Republic Government Bond OAT 0.70% 25/7/2030 12,931,484 15,402,381
Italy Buoni Poliennali Del Tesoro 2.35% 15/9/2035 11,982,831 14,333,867
French Republic Government Bond OAT 0.10% 25/7/2047 11,662,637 13,741,484
Italy Buoni Poliennali Del Tesoro 0.10% 15/5/2023 12,316,836 12,118,537
Spain Government Inflation Linked Bond 1.80% 30/11/2024 9,135,730 10,607,507
Spain Government Inflation Linked Bond 0.15% 30/11/2023 8,317,427 8,731,725
Spain Government Inflation Linked Bond 0.70% 30/11/2033 7,365,447 8,162,631
Principal Proceeds Euro (€) Euro (€)
Sales
French Republic Government Bond OAT 2.25% 25/7/2020 122,299,436 126,879,875
Deutsche Bundesrepublik Inflation Linked Bond 1.75% 15/4/2020 83,405,697 85,901,424
Italy Buoni Poliennali Del Tesoro 2.10% 15/9/2021 18,080,672 19,091,373
French Republic Government Bond OAT 1.80% 25/7/2040 12,188,822 17,924,054
French Republic Government Bond OAT 0.10% 1/3/2021 15,579,945 16,002,478
Deutsche Bundesrepublik Inflation Linked Bond 0.10% 15/4/2023 13,970,910 14,794,037
Italy Buoni Poliennali Del Tesoro 2.35% 15/9/2024 11,914,775 12,786,981
French Republic Government Bond OAT 3.15% 25/7/2032 8,292,290 12,682,639
French Republic Government Bond OAT 1.10% 25/7/2022 11,162,330 12,215,481
French Republic Government Bond OAT 1.85% 25/7/2027 9,372,445 11,685,535
Spain Government Inflation Linked Bond 1.80% 30/11/2024 9,831,580 11,333,762
Italy Buoni Poliennali Del Tesoro 2.60% 15/9/2023 10,005,325 10,822,749
Italy Buoni Poliennali Del Tesoro 3.10% 15/9/2026 9,054,993 10,345,052
Italy Buoni Poliennali Del Tesoro 1.30% 15/5/2028 8,991,686 9,099,860
Italy Buoni Poliennali Del Tesoro 2.35% 15/9/2035 7,901,275 8,400,950
Spain Government Inflation Linked Bond 1.00% 30/11/2030 7,251,714 8,121,216
Deutsche Bundesrepublik Inflation Linked Bond 0.10% 15/4/2026 7,261,490 8,032,008
French Republic Government Bond OAT 0.25% 25/7/2024 7,329,020 7,973,257
Deutsche Bundesrepublik Inflation Linked Bond 0.50% 15/4/2030 6,624,039 7,907,277
Deutsche Bundesrepublik Inflation Linked Bond 0.10% 15/4/2046 5,976,767 7,546,303
Italy Buoni Poliennali Del Tesoro 2.55% 15/9/2041 7,172,726 7,494,350
French Republic Government Bond OAT 0.70% 25/7/2030 6,197,320 7,219,464
Italy Buoni Poliennali Del Tesoro 1.25% 15/9/2032 7,540,532 7,099,524
French Republic Government Bond OAT 0.10% 1/3/2029 5,967,810 6,501,287
Italy Buoni Poliennali Del Tesoro 0.10% 15/5/2022 5,717,670 5,667,135
French Republic Government Bond OAT 0.10% 25/7/2047 4,899,826 5,477,520
Spain Government Inflation Linked Bond 0.65% 30/11/2027 4,626,150 5,047,122
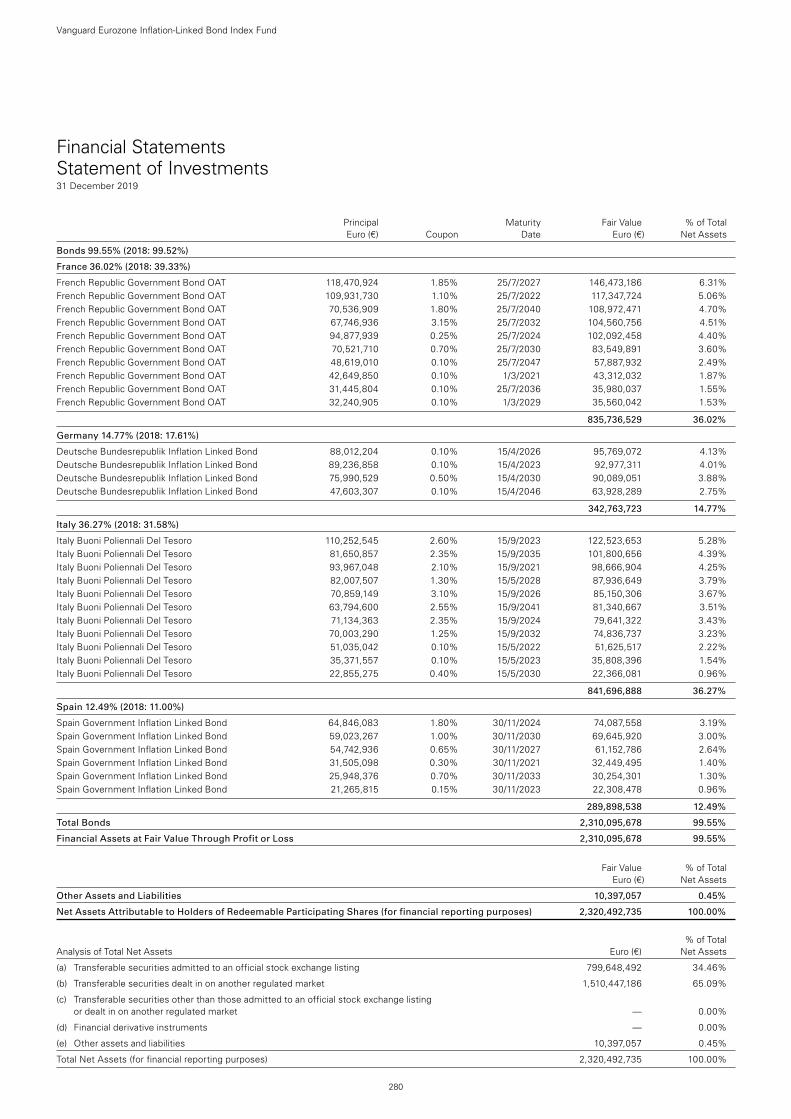
Financial Statements Statement of Investments31 December 2019
Principal Maturity Fair Value % of Total Euro (€) Coupon Date Euro (€) Net Assets
Bonds 99.55% (2018: 99.52%)
France 36.02% (2018: 39.33%)
French Republic Government Bond OAT 118,470,924 1.85% 25/7/2027 146,473,186 6.31%French Republic Government Bond OAT 109,931,730 1.10% 25/7/2022 117,347,724 5.06%French Republic Government Bond OAT 70,536,909 1.80% 25/7/2040 108,972,471 4.70%French Republic Government Bond OAT 67,746,936 3.15% 25/7/2032 104,560,756 4.51%French Republic Government Bond OAT 94,877,939 0.25% 25/7/2024 102,092,458 4.40%French Republic Government Bond OAT 70,521,710 0.70% 25/7/2030 83,549,891 3.60%French Republic Government Bond OAT 48,619,010 0.10% 25/7/2047 57,887,932 2.49%French Republic Government Bond OAT 42,649,850 0.10% 1/3/2021 43,312,032 1.87%French Republic Government Bond OAT 31,445,804 0.10% 25/7/2036 35,980,037 1.55%French Republic Government Bond OAT 32,240,905 0.10% 1/3/2029 35,560,042 1.53%
835,736,529 36.02%
Germany 14.77% (2018: 17.61%)
Deutsche Bundesrepublik Inflation Linked Bond 88,012,204 0.10% 15/4/2026 95,769,072 4.13%Deutsche Bundesrepublik Inflation Linked Bond 89,236,858 0.10% 15/4/2023 92,977,311 4.01%Deutsche Bundesrepublik Inflation Linked Bond 75,990,529 0.50% 15/4/2030 90,089,051 3.88%Deutsche Bundesrepublik Inflation Linked Bond 47,603,307 0.10% 15/4/2046 63,928,289 2.75%
342,763,723 14.77%
Italy 36.27% (2018: 31.58%)
Italy Buoni Poliennali Del Tesoro 110,252,545 2.60% 15/9/2023 122,523,653 5.28%Italy Buoni Poliennali Del Tesoro 81,650,857 2.35% 15/9/2035 101,800,656 4.39%Italy Buoni Poliennali Del Tesoro 93,967,048 2.10% 15/9/2021 98,666,904 4.25%Italy Buoni Poliennali Del Tesoro 82,007,507 1.30% 15/5/2028 87,936,649 3.79%Italy Buoni Poliennali Del Tesoro 70,859,149 3.10% 15/9/2026 85,150,306 3.67%Italy Buoni Poliennali Del Tesoro 63,794,600 2.55% 15/9/2041 81,340,667 3.51%Italy Buoni Poliennali Del Tesoro 71,134,363 2.35% 15/9/2024 79,641,322 3.43%Italy Buoni Poliennali Del Tesoro 70,003,290 1.25% 15/9/2032 74,836,737 3.23%Italy Buoni Poliennali Del Tesoro 51,035,042 0.10% 15/5/2022 51,625,517 2.22%Italy Buoni Poliennali Del Tesoro 35,371,557 0.10% 15/5/2023 35,808,396 1.54%Italy Buoni Poliennali Del Tesoro 22,855,275 0.40% 15/5/2030 22,366,081 0.96%
841,696,888 36.27%
Spain 12.49% (2018: 11.00%)
Spain Government Inflation Linked Bond 64,846,083 1.80% 30/11/2024 74,087,558 3.19%Spain Government Inflation Linked Bond 59,023,267 1.00% 30/11/2030 69,645,920 3.00%Spain Government Inflation Linked Bond 54,742,936 0.65% 30/11/2027 61,152,786 2.64%Spain Government Inflation Linked Bond 31,505,098 0.30% 30/11/2021 32,449,495 1.40%Spain Government Inflation Linked Bond 25,948,376 0.70% 30/11/2033 30,254,301 1.30%Spain Government Inflation Linked Bond 21,265,815 0.15% 30/11/2023 22,308,478 0.96%
289,898,538 12.49%
Total Bonds 2,310,095,678 99.55%
Financial Assets at Fair Value Through Profit or Loss 2,310,095,678 99.55%
Fair Value % of Total Euro (€) Net Assets
Other Assets and Liabilities 10,397,057 0.45%
Net Assets Attributable to Holders of Redeemable Participating Shares (for financial reporting purposes) 2,320,492,735 100.00%
% of Total Analysis of Total Net Assets Euro (€) Net Assets
(a) Transferable securities admitted to an official stock exchange listing 799,648,492 34.46%
(b) Transferable securities dealt in on another regulated market 1,510,447,186 65.09%
(c) Transferable securities other than those admitted to an official stock exchange listing or dealt in on another regulated market — 0.00%
(d) Financial derivative instruments — 0.00%
(e) Other assets and liabilities 10,397,057 0.45%
Total Net Assets (for financial reporting purposes) 2,320,492,735 100.00%
Vanguard Eurozone Inflation-Linked Bond Index Fund
280
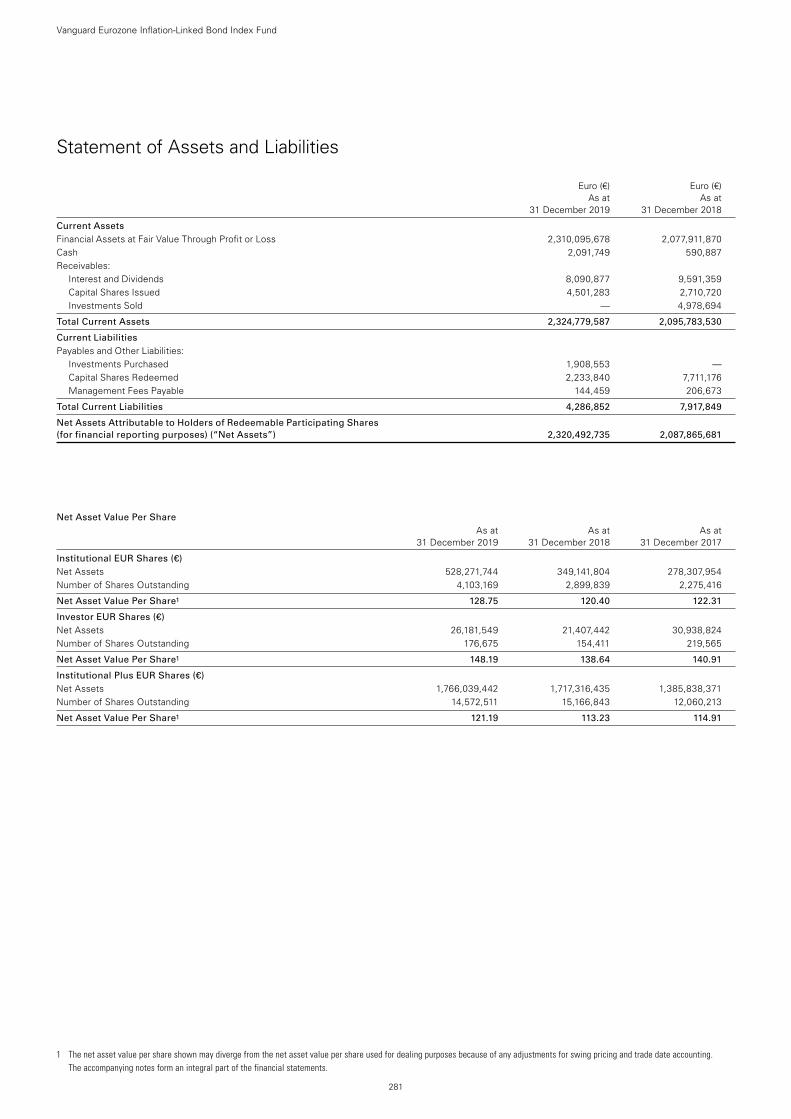
1 The net asset value per share shown may diverge from the net asset value per share used for dealing purposes because of any adjustments for swing pricing and trade date accounting. The accompanying notes form an integral part of the financial statements.
281
Vanguard Eurozone Inflation-Linked Bond Index Fund
Statement of Assets and Liabilities
Euro (€) Euro (€) As at As at 31 December 2019 31 December 2018
Current Assets Financial Assets at Fair Value Through Profit or Loss 2,310,095,678 2,077,911,870Cash 2,091,749 590,887Receivables:
Interest and Dividends 8,090,877 9,591,359Capital Shares Issued 4,501,283 2,710,720Investments Sold — 4,978,694
Total Current Assets 2,324,779,587 2,095,783,530
Current Liabilities Payables and Other Liabilities:
Investments Purchased 1,908,553 —Capital Shares Redeemed 2,233,840 7,711,176Management Fees Payable 144,459 206,673
Total Current Liabilities 4,286,852 7,917,849
Net Assets Attributable to Holders of Redeemable Participating Shares (for financial reporting purposes) (“Net Assets”) 2,320,492,735 2,087,865,681
Net Asset Value Per Share As at As at As at 31 December 2019 31 December 2018 31 December 2017
Institutional EUR Shares (€) Net Assets 528,271,744 349,141,804 278,307,954Number of Shares Outstanding 4,103,169 2,899,839 2,275,416
Net Asset Value Per Share1 128.75 120.40 122.31
Investor EUR Shares (€) Net Assets 26,181,549 21,407,442 30,938,824Number of Shares Outstanding 176,675 154,411 219,565
Net Asset Value Per Share1 148.19 138.64 140.91
Institutional Plus EUR Shares (€) Net Assets 1,766,039,442 1,717,316,435 1,385,838,371Number of Shares Outstanding 14,572,511 15,166,843 12,060,213
Net Asset Value Per Share1 121.19 113.23 114.91
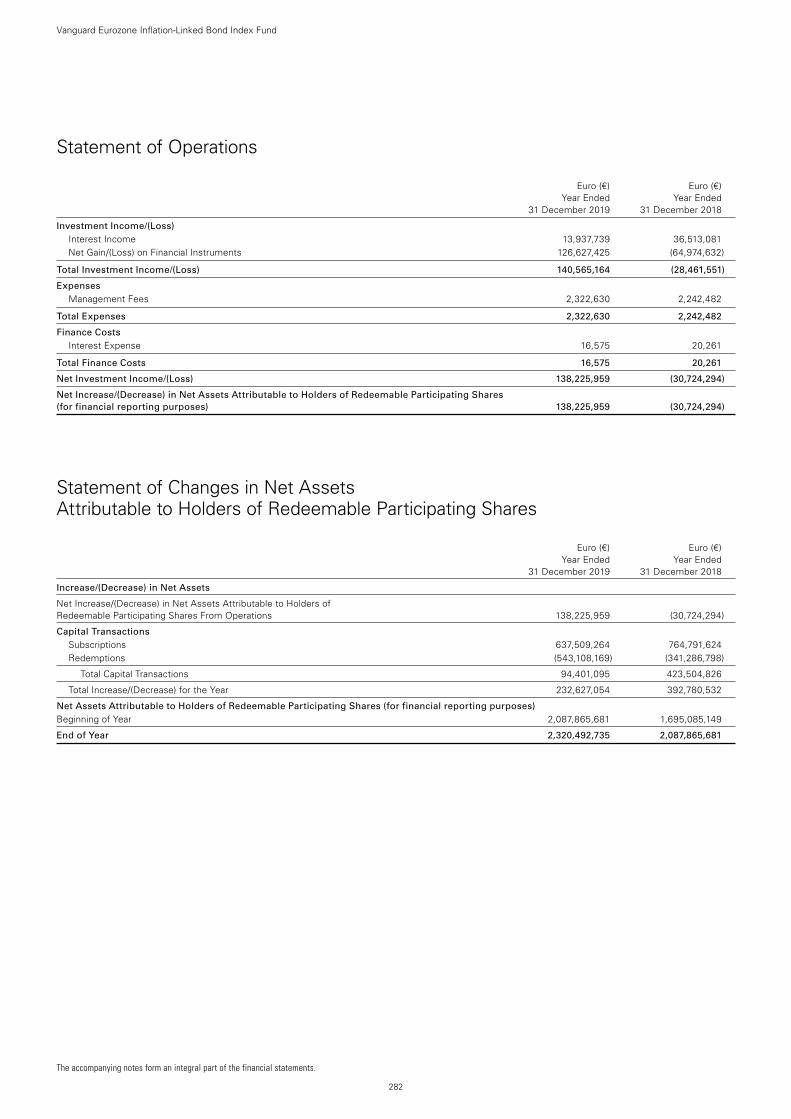
282
Vanguard Eurozone Inflation-Linked Bond Index Fund
Statement of Operations
Euro (€) Euro (€) Year Ended Year Ended 31 December 2019 31 December 2018
Investment Income/(Loss) Interest Income 13,937,739 36,513,081Net Gain/(Loss) on Financial Instruments 126,627,425 (64,974,632)
Total Investment Income/(Loss) 140,565,164 (28,461,551)
Expenses Management Fees 2,322,630 2,242,482
Total Expenses 2,322,630 2,242,482
Finance Costs Interest Expense 16,575 20,261
Total Finance Costs 16,575 20,261
Net Investment Income/(Loss) 138,225,959 (30,724,294)
Net Increase/(Decrease) in Net Assets Attributable to Holders of Redeemable Participating Shares (for financial reporting purposes) 138,225,959 (30,724,294)
Statement of Changes in Net Assets Attributable to Holders of Redeemable Participating Shares
Euro (€) Euro (€) Year Ended Year Ended 31 December 2019 31 December 2018
Increase/(Decrease) in Net Assets
Net Increase/(Decrease) in Net Assets Attributable to Holders of Redeemable Participating Shares From Operations 138,225,959 (30,724,294)
Capital Transactions Subscriptions 637,509,264 764,791,624Redemptions (543,108,169) (341,286,798)
Total Capital Transactions 94,401,095 423,504,826
Total Increase/(Decrease) for the Year 232,627,054 392,780,532
Net Assets Attributable to Holders of Redeemable Participating Shares (for financial reporting purposes) Beginning of Year 2,087,865,681 1,695,085,149
End of Year 2,320,492,735 2,087,865,681
The accompanying notes form an integral part of the financial statements.
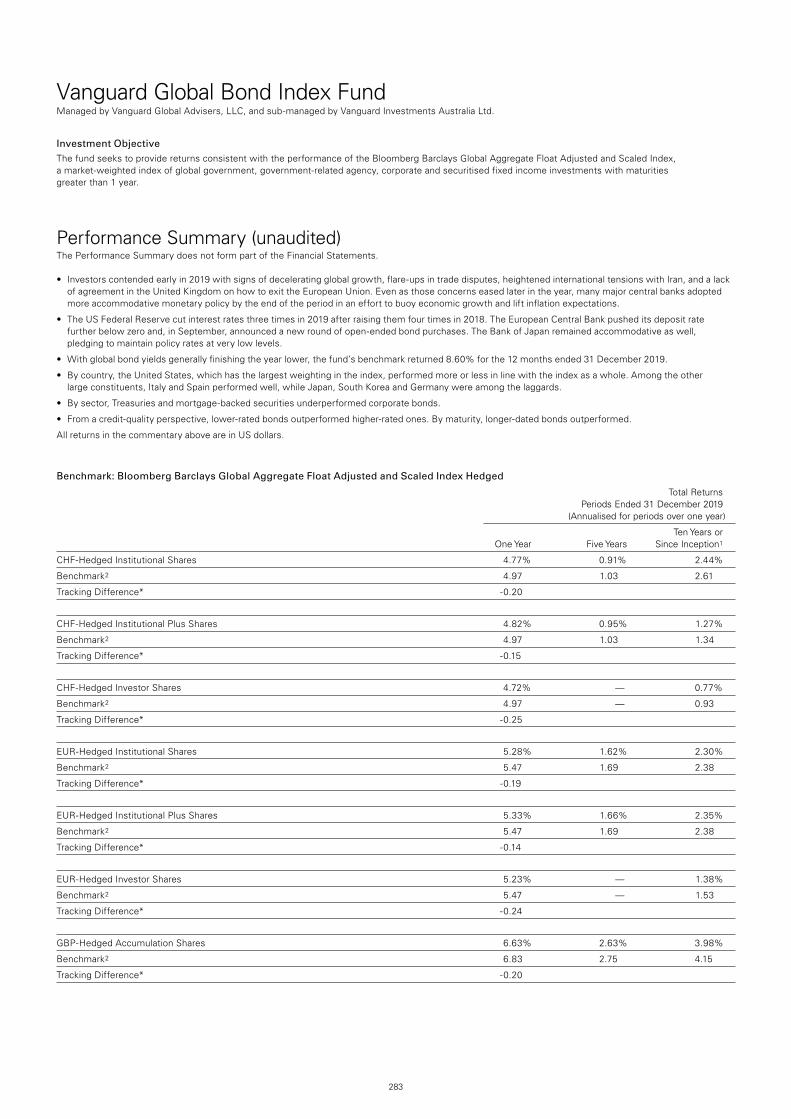
283
Vanguard Global Bond Index FundManaged by Vanguard Global Advisers, LLC, and sub-managed by Vanguard Investments Australia Ltd.
Investment ObjectiveThe fund seeks to provide returns consistent with the performance of the Bloomberg Barclays Global Aggregate Float Adjusted and Scaled Index, a market-weighted index of global government, government-related agency, corporate and securitised fixed income investments with maturities greater than 1 year.
Performance Summary (unaudited)The Performance Summary does not form part of the Financial Statements.
• Investorscontendedearlyin2019withsignsofdeceleratingglobalgrowth,flare-upsintradedisputes,heightenedinternationaltensionswithIran,andalackof agreement in the United Kingdom on how to exit the European Union. Even as those concerns eased later in the year, many major central banks adopted more accommodative monetary policy by the end of the period in an effort to buoy economic growth and lift inflation expectations.
• TheUSFederalReservecutinterestratesthreetimesin2019afterraisingthemfourtimesin2018.TheEuropeanCentralBankpusheditsdepositratefurther below zero and, in September, announced a new round of open-ended bond purchases. The Bank of Japan remained accommodative as well, pledging to maintain policy rates at very low levels.
• Withglobalbondyieldsgenerallyfinishingtheyearlower,thefund’sbenchmarkreturned8.60%forthe12monthsended31December2019.
• Bycountry,theUnitedStates,whichhasthelargestweightingintheindex,performedmoreorlessinlinewiththeindexasawhole.Amongtheother large constituents, Italy and Spain performed well, while Japan, South Korea and Germany were among the laggards.
• Bysector,Treasuriesandmortgage-backedsecuritiesunderperformedcorporatebonds.
• Fromacredit-qualityperspective,lower-ratedbondsoutperformedhigher-ratedones.Bymaturity,longer-datedbondsoutperformed.
All returns in the commentary above are in US dollars.
Benchmark: Bloomberg Barclays Global Aggregate Float Adjusted and Scaled Index Hedged
Total Returns Periods Ended 31 December 2019 (Annualised for periods over one year)
Ten Years or One Year Five Years Since Inception1
CHF-Hedged Institutional Shares 4.77% 0.91% 2.44%
Benchmark2 4.97 1.03 2.61
Tracking Difference* -0.20
CHF-Hedged Institutional Plus Shares 4.82% 0.95% 1.27%
Benchmark2 4.97 1.03 1.34
Tracking Difference* -0.15
CHF-Hedged Investor Shares 4.72% — 0.77%
Benchmark2 4.97 — 0.93
Tracking Difference* -0.25
EUR-Hedged Institutional Shares 5.28% 1.62% 2.30%
Benchmark2 5.47 1.69 2.38
Tracking Difference* -0.19
EUR-Hedged Institutional Plus Shares 5.33% 1.66% 2.35%
Benchmark2 5.47 1.69 2.38
Tracking Difference* -0.14
EUR-Hedged Investor Shares 5.23% — 1.38%
Benchmark2 5.47 — 1.53
Tracking Difference* -0.24
GBP-Hedged Accumulation Shares 6.63% 2.63% 3.98%
Benchmark2 6.83 2.75 4.15
Tracking Difference* -0.20
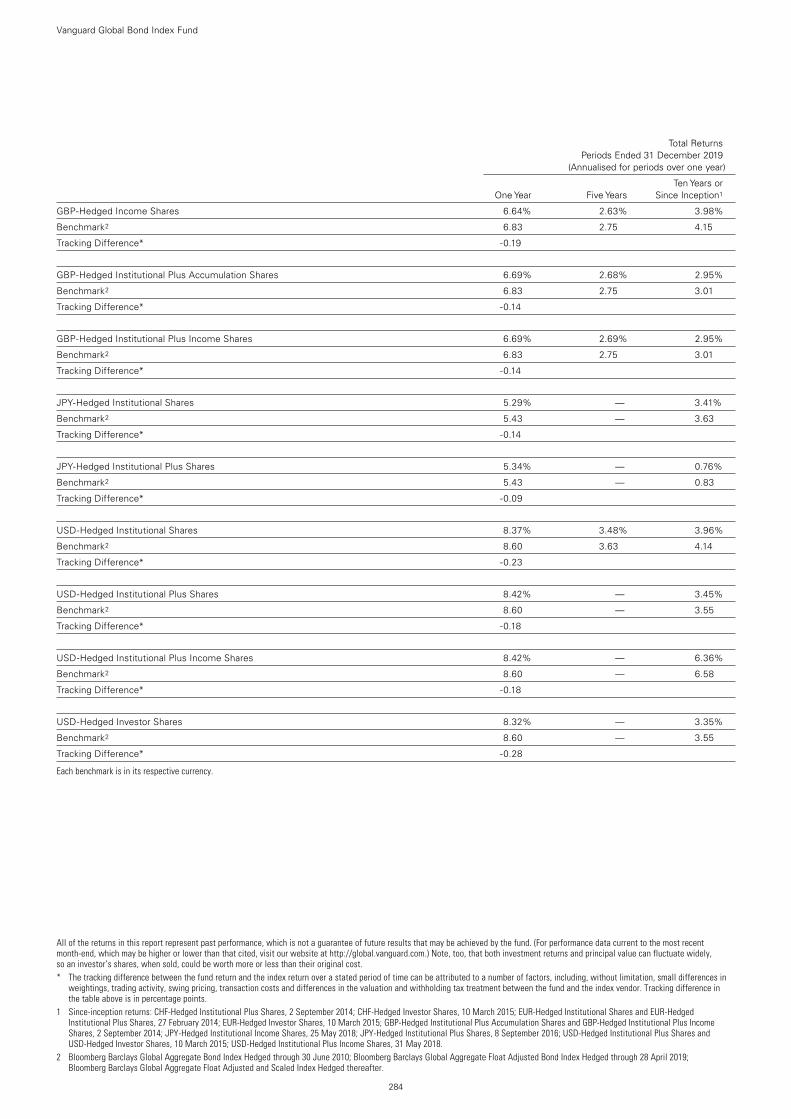
Vanguard Global Bond Index Fund
284
All of the returns in this report represent past performance, which is not a guarantee of future results that may be achieved by the fund. (For performance data current to the most recent month-end, which may be higher or lower than that cited, visit our website at http://global.vanguard.com.) Note, too, that both investment returns and principal value can fluctuate widely, so an investor’s shares, when sold, could be worth more or less than their original cost.* The tracking difference between the fund return and the index return over a stated period of time can be attributed to a number of factors, including, without limitation, small differences in
weightings, trading activity, swing pricing, transaction costs and differences in the valuation and withholding tax treatment between the fund and the index vendor. Tracking difference in the table above is in percentage points.
1 Since-inception returns: CHF-Hedged Institutional Plus Shares, 2 September 2014; CHF-Hedged Investor Shares, 10 March 2015; EUR-Hedged Institutional Shares and EUR-Hedged Institutional Plus Shares, 27 February 2014; EUR-Hedged Investor Shares, 10 March 2015; GBP-Hedged Institutional Plus Accumulation Shares and GBP-Hedged Institutional Plus Income Shares, 2 September 2014; JPY-Hedged Institutional Income Shares, 25 May 2018; JPY-Hedged Institutional Plus Shares, 8 September 2016; USD-Hedged Institutional Plus Shares and USD-Hedged Investor Shares, 10 March 2015; USD-Hedged Institutional Plus Income Shares, 31 May 2018.
2 Bloomberg Barclays Global Aggregate Bond Index Hedged through 30 June 2010; Bloomberg Barclays Global Aggregate Float Adjusted Bond Index Hedged through 28 April 2019; Bloomberg Barclays Global Aggregate Float Adjusted and Scaled Index Hedged thereafter.
Total Returns Periods Ended 31 December 2019 (Annualised for periods over one year)
Ten Years or One Year Five Years Since Inception1
GBP-Hedged Income Shares 6.64% 2.63% 3.98%
Benchmark2 6.83 2.75 4.15
Tracking Difference* -0.19
GBP-Hedged Institutional Plus Accumulation Shares 6.69% 2.68% 2.95%
Benchmark2 6.83 2.75 3.01
Tracking Difference* -0.14
GBP-Hedged Institutional Plus Income Shares 6.69% 2.69% 2.95%
Benchmark2 6.83 2.75 3.01
Tracking Difference* -0.14
JPY-Hedged Institutional Shares 5.29% — 3.41%
Benchmark2 5.43 — 3.63
Tracking Difference* -0.14
JPY-Hedged Institutional Plus Shares 5.34% — 0.76%
Benchmark2 5.43 — 0.83
Tracking Difference* -0.09
USD-Hedged Institutional Shares 8.37% 3.48% 3.96%
Benchmark2 8.60 3.63 4.14
Tracking Difference* -0.23
USD-Hedged Institutional Plus Shares 8.42% — 3.45%
Benchmark2 8.60 — 3.55
Tracking Difference* -0.18
USD-Hedged Institutional Plus Income Shares 8.42% — 6.36%
Benchmark2 8.60 — 6.58
Tracking Difference* -0.18
USD-Hedged Investor Shares 8.32% — 3.35%
Benchmark2 8.60 — 3.55
Tracking Difference* -0.28
Each benchmark is in its respective currency.
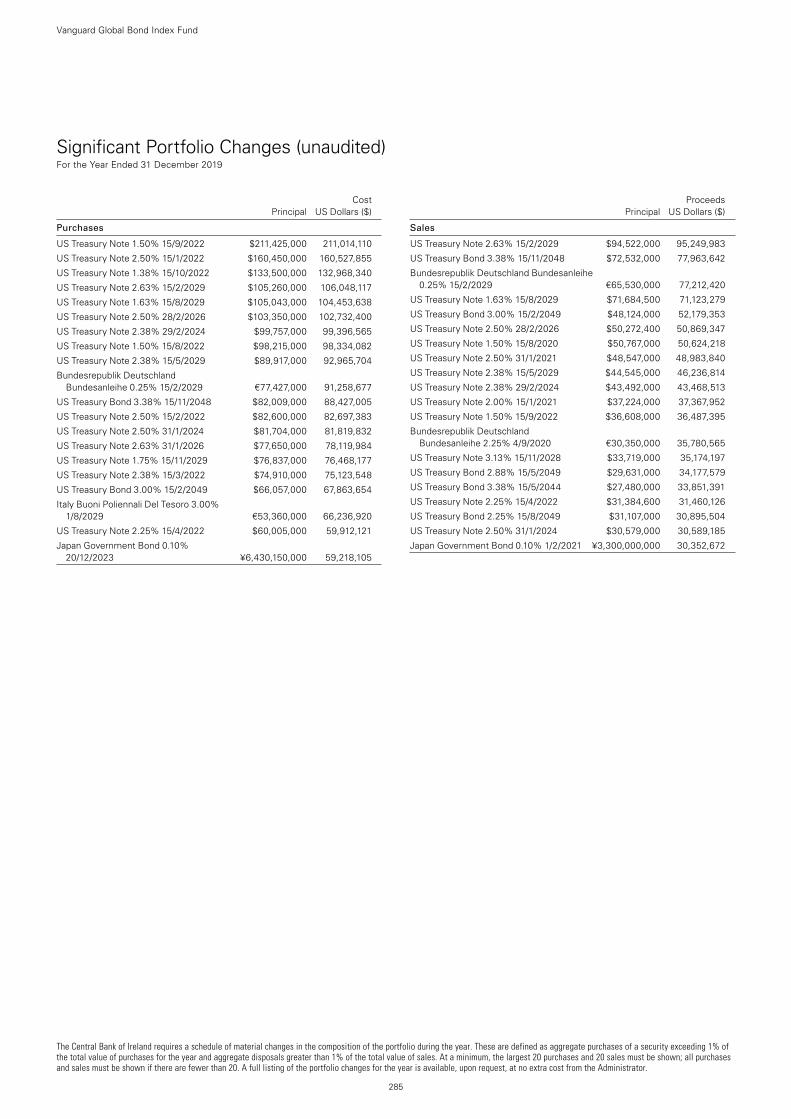
The Central Bank of Ireland requires a schedule of material changes in the composition of the portfolio during the year. These are defined as aggregate purchases of a security exceeding 1% of the total value of purchases for the year and aggregate disposals greater than 1% of the total value of sales. At a minimum, the largest 20 purchases and 20 sales must be shown; all purchases and sales must be shown if there are fewer than 20. A full listing of the portfolio changes for the year is available, upon request, at no extra cost from the Administrator.
285
Vanguard Global Bond Index Fund
Significant Portfolio Changes (unaudited) For the Year Ended 31 December 2019
Cost Principal US Dollars ($)
Purchases
US Treasury Note 1.50% 15/9/2022 $211,425,000 211,014,110
US Treasury Note 2.50% 15/1/2022 $160,450,000 160,527,855
US Treasury Note 1.38% 15/10/2022 $133,500,000 132,968,340
US Treasury Note 2.63% 15/2/2029 $105,260,000 106,048,117
US Treasury Note 1.63% 15/8/2029 $105,043,000 104,453,638
US Treasury Note 2.50% 28/2/2026 $103,350,000 102,732,400
US Treasury Note 2.38% 29/2/2024 $99,757,000 99,396,565
US Treasury Note 1.50% 15/8/2022 $98,215,000 98,334,082
US Treasury Note 2.38% 15/5/2029 $89,917,000 92,965,704
Bundesrepublik Deutschland Bundesanleihe 0.25% 15/2/2029 €77,427,000 91,258,677
US Treasury Bond 3.38% 15/11/2048 $82,009,000 88,427,005
US Treasury Note 2.50% 15/2/2022 $82,600,000 82,697,383
US Treasury Note 2.50% 31/1/2024 $81,704,000 81,819,832
US Treasury Note 2.63% 31/1/2026 $77,650,000 78,119,984
US Treasury Note 1.75% 15/11/2029 $76,837,000 76,468,177
US Treasury Note 2.38% 15/3/2022 $74,910,000 75,123,548
US Treasury Bond 3.00% 15/2/2049 $66,057,000 67,863,654
Italy Buoni Poliennali Del Tesoro 3.00% 1/8/2029 €53,360,000 66,236,920
US Treasury Note 2.25% 15/4/2022 $60,005,000 59,912,121
Japan Government Bond 0.10% 20/12/2023 ¥6,430,150,000 59,218,105
Proceeds Principal US Dollars ($)
Sales
US Treasury Note 2.63% 15/2/2029 $94,522,000 95,249,983
US Treasury Bond 3.38% 15/11/2048 $72,532,000 77,963,642
Bundesrepublik Deutschland Bundesanleihe 0.25% 15/2/2029 €65,530,000 77,212,420
US Treasury Note 1.63% 15/8/2029 $71,684,500 71,123,279
US Treasury Bond 3.00% 15/2/2049 $48,124,000 52,179,353
US Treasury Note 2.50% 28/2/2026 $50,272,400 50,869,347
US Treasury Note 1.50% 15/8/2020 $50,767,000 50,624,218
US Treasury Note 2.50% 31/1/2021 $48,547,000 48,983,840
US Treasury Note 2.38% 15/5/2029 $44,545,000 46,236,814
US Treasury Note 2.38% 29/2/2024 $43,492,000 43,468,513
US Treasury Note 2.00% 15/1/2021 $37,224,000 37,367,952
US Treasury Note 1.50% 15/9/2022 $36,608,000 36,487,395
Bundesrepublik Deutschland Bundesanleihe 2.25% 4/9/2020 €30,350,000 35,780,565
US Treasury Note 3.13% 15/11/2028 $33,719,000 35,174,197
US Treasury Bond 2.88% 15/5/2049 $29,631,000 34,177,579
US Treasury Bond 3.38% 15/5/2044 $27,480,000 33,851,391
US Treasury Note 2.25% 15/4/2022 $31,384,600 31,460,126
US Treasury Bond 2.25% 15/8/2049 $31,107,000 30,895,504
US Treasury Note 2.50% 31/1/2024 $30,579,000 30,589,185
Japan Government Bond 0.10% 1/2/2021 ¥3,300,000,000 30,352,672
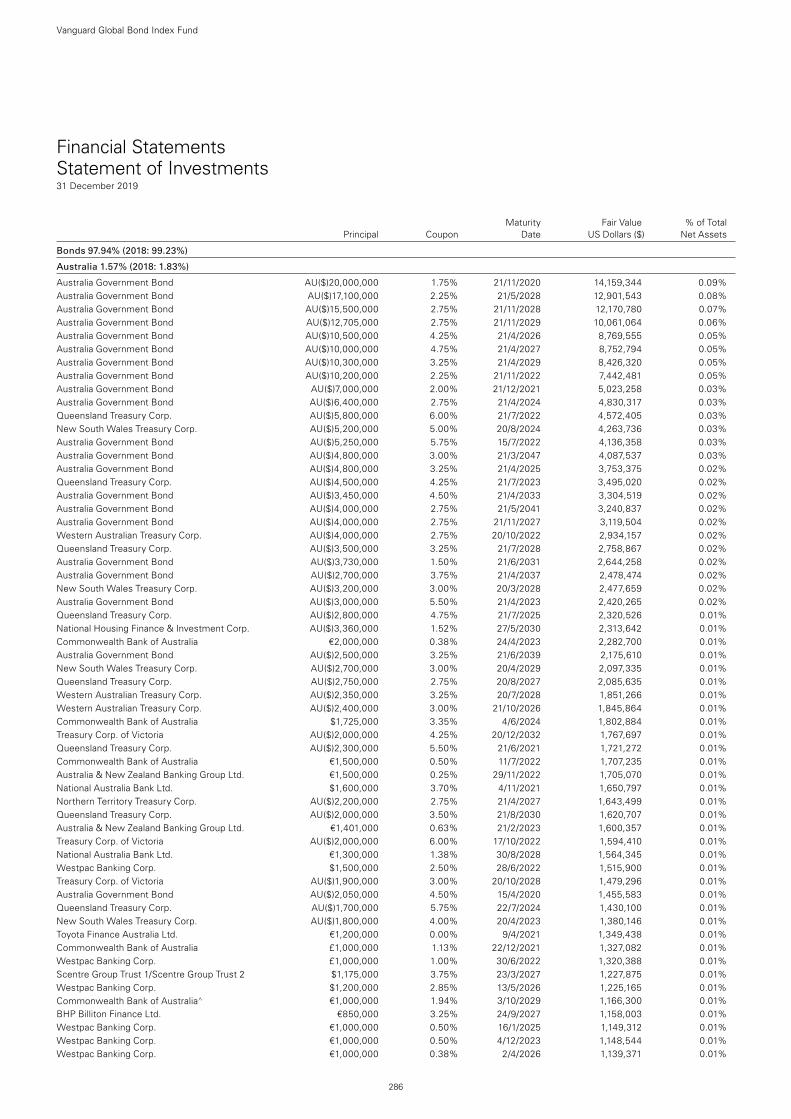
Financial Statements Statement of Investments31 December 2019
Maturity Fair Value % of Total Principal Coupon Date US Dollars ($) Net Assets
Bonds 97.94% (2018: 99.23%)
Australia 1.57% (2018: 1.83%)
Australia Government Bond AU($)20,000,000 1.75% 21/11/2020 14,159,344 0.09%Australia Government Bond AU($)17,100,000 2.25% 21/5/2028 12,901,543 0.08%Australia Government Bond AU($)15,500,000 2.75% 21/11/2028 12,170,780 0.07%Australia Government Bond AU($)12,705,000 2.75% 21/11/2029 10,061,064 0.06%Australia Government Bond AU($)10,500,000 4.25% 21/4/2026 8,769,555 0.05%Australia Government Bond AU($)10,000,000 4.75% 21/4/2027 8,752,794 0.05%Australia Government Bond AU($)10,300,000 3.25% 21/4/2029 8,426,320 0.05%Australia Government Bond AU($)10,200,000 2.25% 21/11/2022 7,442,481 0.05%Australia Government Bond AU($)7,000,000 2.00% 21/12/2021 5,023,258 0.03%Australia Government Bond AU($)6,400,000 2.75% 21/4/2024 4,830,317 0.03%Queensland Treasury Corp. AU($)5,800,000 6.00% 21/7/2022 4,572,405 0.03%New South Wales Treasury Corp. AU($)5,200,000 5.00% 20/8/2024 4,263,736 0.03%Australia Government Bond AU($)5,250,000 5.75% 15/7/2022 4,136,358 0.03%Australia Government Bond AU($)4,800,000 3.00% 21/3/2047 4,087,537 0.03%Australia Government Bond AU($)4,800,000 3.25% 21/4/2025 3,753,375 0.02%Queensland Treasury Corp. AU($)4,500,000 4.25% 21/7/2023 3,495,020 0.02%Australia Government Bond AU($)3,450,000 4.50% 21/4/2033 3,304,519 0.02%Australia Government Bond AU($)4,000,000 2.75% 21/5/2041 3,240,837 0.02%Australia Government Bond AU($)4,000,000 2.75% 21/11/2027 3,119,504 0.02%Western Australian Treasury Corp. AU($)4,000,000 2.75% 20/10/2022 2,934,157 0.02%Queensland Treasury Corp. AU($)3,500,000 3.25% 21/7/2028 2,758,867 0.02%Australia Government Bond AU($)3,730,000 1.50% 21/6/2031 2,644,258 0.02%Australia Government Bond AU($)2,700,000 3.75% 21/4/2037 2,478,474 0.02%New South Wales Treasury Corp. AU($)3,200,000 3.00% 20/3/2028 2,477,659 0.02%Australia Government Bond AU($)3,000,000 5.50% 21/4/2023 2,420,265 0.02%Queensland Treasury Corp. AU($)2,800,000 4.75% 21/7/2025 2,320,526 0.01%National Housing Finance & Investment Corp. AU($)3,360,000 1.52% 27/5/2030 2,313,642 0.01%Commonwealth Bank of Australia €2,000,000 0.38% 24/4/2023 2,282,700 0.01%Australia Government Bond AU($)2,500,000 3.25% 21/6/2039 2,175,610 0.01%New South Wales Treasury Corp. AU($)2,700,000 3.00% 20/4/2029 2,097,335 0.01%Queensland Treasury Corp. AU($)2,750,000 2.75% 20/8/2027 2,085,635 0.01%Western Australian Treasury Corp. AU($)2,350,000 3.25% 20/7/2028 1,851,266 0.01%Western Australian Treasury Corp. AU($)2,400,000 3.00% 21/10/2026 1,845,864 0.01%Commonwealth Bank of Australia $1,725,000 3.35% 4/6/2024 1,802,884 0.01%Treasury Corp. of Victoria AU($)2,000,000 4.25% 20/12/2032 1,767,697 0.01%Queensland Treasury Corp. AU($)2,300,000 5.50% 21/6/2021 1,721,272 0.01%Commonwealth Bank of Australia €1,500,000 0.50% 11/7/2022 1,707,235 0.01%Australia & New Zealand Banking Group Ltd. €1,500,000 0.25% 29/11/2022 1,705,070 0.01%National Australia Bank Ltd. $1,600,000 3.70% 4/11/2021 1,650,797 0.01%Northern Territory Treasury Corp. AU($)2,200,000 2.75% 21/4/2027 1,643,499 0.01%Queensland Treasury Corp. AU($)2,000,000 3.50% 21/8/2030 1,620,707 0.01%Australia & New Zealand Banking Group Ltd. €1,401,000 0.63% 21/2/2023 1,600,357 0.01%Treasury Corp. of Victoria AU($)2,000,000 6.00% 17/10/2022 1,594,410 0.01%National Australia Bank Ltd. €1,300,000 1.38% 30/8/2028 1,564,345 0.01%Westpac Banking Corp. $1,500,000 2.50% 28/6/2022 1,515,900 0.01%Treasury Corp. of Victoria AU($)1,900,000 3.00% 20/10/2028 1,479,296 0.01%Australia Government Bond AU($)2,050,000 4.50% 15/4/2020 1,455,583 0.01%Queensland Treasury Corp. AU($)1,700,000 5.75% 22/7/2024 1,430,100 0.01%New South Wales Treasury Corp. AU($)1,800,000 4.00% 20/4/2023 1,380,146 0.01%Toyota Finance Australia Ltd. €1,200,000 0.00% 9/4/2021 1,349,438 0.01%Commonwealth Bank of Australia £1,000,000 1.13% 22/12/2021 1,327,082 0.01%Westpac Banking Corp. £1,000,000 1.00% 30/6/2022 1,320,388 0.01%Scentre Group Trust 1/Scentre Group Trust 2 $1,175,000 3.75% 23/3/2027 1,227,875 0.01%Westpac Banking Corp. $1,200,000 2.85% 13/5/2026 1,225,165 0.01%Commonwealth Bank of Australia^ €1,000,000 1.94% 3/10/2029 1,166,300 0.01%BHP Billiton Finance Ltd. €850,000 3.25% 24/9/2027 1,158,003 0.01%Westpac Banking Corp. €1,000,000 0.50% 16/1/2025 1,149,312 0.01%Westpac Banking Corp. €1,000,000 0.50% 4/12/2023 1,148,544 0.01%Westpac Banking Corp. €1,000,000 0.38% 2/4/2026 1,139,371 0.01%
Vanguard Global Bond Index Fund
286
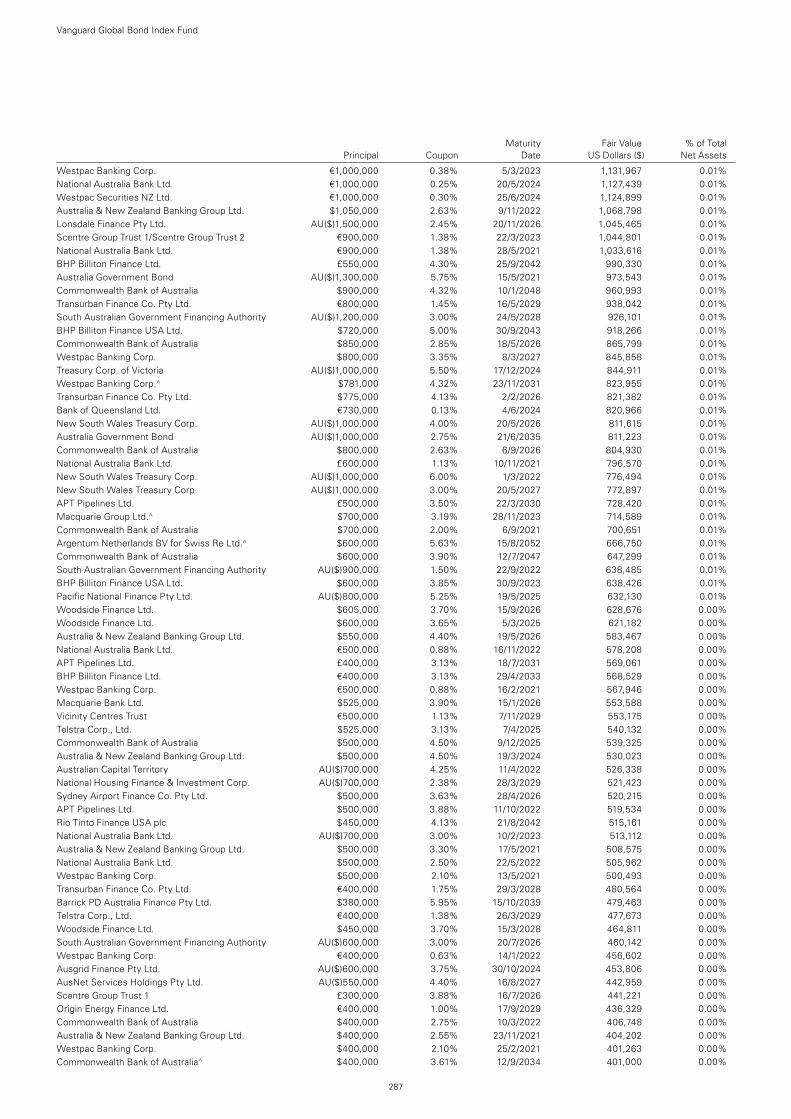
Maturity Fair Value % of Total Principal Coupon Date US Dollars ($) Net Assets
Westpac Banking Corp. €1,000,000 0.38% 5/3/2023 1,131,967 0.01%National Australia Bank Ltd. €1,000,000 0.25% 20/5/2024 1,127,439 0.01%Westpac Securities NZ Ltd. €1,000,000 0.30% 25/6/2024 1,124,899 0.01%Australia & New Zealand Banking Group Ltd. $1,050,000 2.63% 9/11/2022 1,068,798 0.01%Lonsdale Finance Pty Ltd. AU($)1,500,000 2.45% 20/11/2026 1,045,465 0.01%Scentre Group Trust 1/Scentre Group Trust 2 €900,000 1.38% 22/3/2023 1,044,801 0.01%National Australia Bank Ltd. €900,000 1.38% 28/5/2021 1,033,616 0.01%BHP Billiton Finance Ltd. £550,000 4.30% 25/9/2042 990,330 0.01%Australia Government Bond AU($)1,300,000 5.75% 15/5/2021 973,543 0.01%Commonwealth Bank of Australia $900,000 4.32% 10/1/2048 960,993 0.01%Transurban Finance Co. Pty Ltd. €800,000 1.45% 16/5/2029 938,042 0.01%South Australian Government Financing Authority AU($)1,200,000 3.00% 24/5/2028 926,101 0.01%BHP Billiton Finance USA Ltd. $720,000 5.00% 30/9/2043 918,266 0.01%Commonwealth Bank of Australia $850,000 2.85% 18/5/2026 865,799 0.01%Westpac Banking Corp. $800,000 3.35% 8/3/2027 845,858 0.01%Treasury Corp. of Victoria AU($)1,000,000 5.50% 17/12/2024 844,911 0.01%Westpac Banking Corp.^ $781,000 4.32% 23/11/2031 823,955 0.01%Transurban Finance Co. Pty Ltd. $775,000 4.13% 2/2/2026 821,382 0.01%Bank of Queensland Ltd. €730,000 0.13% 4/6/2024 820,966 0.01%New South Wales Treasury Corp. AU($)1,000,000 4.00% 20/5/2026 811,615 0.01%Australia Government Bond AU($)1,000,000 2.75% 21/6/2035 811,223 0.01%Commonwealth Bank of Australia $800,000 2.63% 6/9/2026 804,930 0.01%National Australia Bank Ltd. £600,000 1.13% 10/11/2021 796,570 0.01%New South Wales Treasury Corp. AU($)1,000,000 6.00% 1/3/2022 776,494 0.01%New South Wales Treasury Corp. AU($)1,000,000 3.00% 20/5/2027 772,897 0.01%APT Pipelines Ltd. £500,000 3.50% 22/3/2030 728,420 0.01%Macquarie Group Ltd.^ $700,000 3.19% 28/11/2023 714,589 0.01%Commonwealth Bank of Australia $700,000 2.00% 6/9/2021 700,651 0.01%Argentum Netherlands BV for Swiss Re Ltd.^ $600,000 5.63% 15/8/2052 666,750 0.01%Commonwealth Bank of Australia $600,000 3.90% 12/7/2047 647,299 0.01%South Australian Government Financing Authority AU($)900,000 1.50% 22/9/2022 638,485 0.01%BHP Billiton Finance USA Ltd. $600,000 3.85% 30/9/2023 638,426 0.01%Pacific National Finance Pty Ltd. AU($)800,000 5.25% 19/5/2025 632,130 0.01%Woodside Finance Ltd. $605,000 3.70% 15/9/2026 628,676 0.00%Woodside Finance Ltd. $600,000 3.65% 5/3/2025 621,182 0.00%Australia & New Zealand Banking Group Ltd. $550,000 4.40% 19/5/2026 583,467 0.00%National Australia Bank Ltd. €500,000 0.88% 16/11/2022 578,208 0.00%APT Pipelines Ltd. £400,000 3.13% 18/7/2031 569,061 0.00%BHP Billiton Finance Ltd. €400,000 3.13% 29/4/2033 568,529 0.00%Westpac Banking Corp. €500,000 0.88% 16/2/2021 567,946 0.00%Macquarie Bank Ltd. $525,000 3.90% 15/1/2026 553,588 0.00%Vicinity Centres Trust €500,000 1.13% 7/11/2029 553,175 0.00%Telstra Corp., Ltd. $525,000 3.13% 7/4/2025 540,132 0.00%Commonwealth Bank of Australia $500,000 4.50% 9/12/2025 539,325 0.00%Australia & New Zealand Banking Group Ltd. $500,000 4.50% 19/3/2024 530,023 0.00%Australian Capital Territory AU($)700,000 4.25% 11/4/2022 526,338 0.00%National Housing Finance & Investment Corp. AU($)700,000 2.38% 28/3/2029 521,423 0.00%Sydney Airport Finance Co. Pty Ltd. $500,000 3.63% 28/4/2026 520,215 0.00%APT Pipelines Ltd. $500,000 3.88% 11/10/2022 519,534 0.00%Rio Tinto Finance USA plc $450,000 4.13% 21/8/2042 515,161 0.00%National Australia Bank Ltd. AU($)700,000 3.00% 10/2/2023 513,112 0.00%Australia & New Zealand Banking Group Ltd. $500,000 3.30% 17/5/2021 508,575 0.00%National Australia Bank Ltd. $500,000 2.50% 22/5/2022 505,962 0.00%Westpac Banking Corp. $500,000 2.10% 13/5/2021 500,493 0.00%Transurban Finance Co. Pty Ltd. €400,000 1.75% 29/3/2028 480,564 0.00%Barrick PD Australia Finance Pty Ltd. $380,000 5.95% 15/10/2039 479,463 0.00%Telstra Corp., Ltd. €400,000 1.38% 26/3/2029 477,673 0.00%Woodside Finance Ltd. $450,000 3.70% 15/3/2028 464,811 0.00%South Australian Government Financing Authority AU($)600,000 3.00% 20/7/2026 460,142 0.00%Westpac Banking Corp. €400,000 0.63% 14/1/2022 456,602 0.00%Ausgrid Finance Pty Ltd. AU($)600,000 3.75% 30/10/2024 453,806 0.00%AusNet Services Holdings Pty Ltd. AU($)550,000 4.40% 16/8/2027 442,959 0.00%Scentre Group Trust 1 £300,000 3.88% 16/7/2026 441,221 0.00%Origin Energy Finance Ltd. €400,000 1.00% 17/9/2029 436,329 0.00%Commonwealth Bank of Australia $400,000 2.75% 10/3/2022 406,748 0.00%Australia & New Zealand Banking Group Ltd. $400,000 2.55% 23/11/2021 404,202 0.00%Westpac Banking Corp. $400,000 2.10% 25/2/2021 401,263 0.00%Commonwealth Bank of Australia^ $400,000 3.61% 12/9/2034 401,000 0.00%
Vanguard Global Bond Index Fund
287
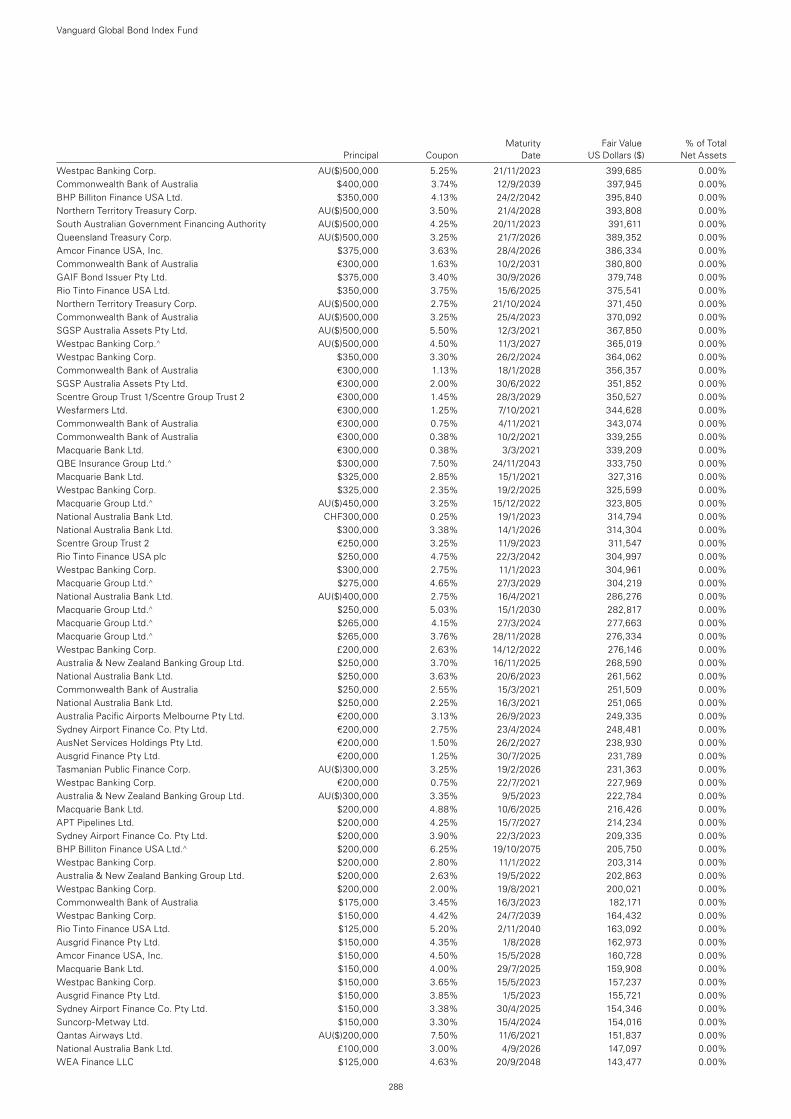
Maturity Fair Value % of Total Principal Coupon Date US Dollars ($) Net Assets
Westpac Banking Corp. AU($)500,000 5.25% 21/11/2023 399,685 0.00%Commonwealth Bank of Australia $400,000 3.74% 12/9/2039 397,945 0.00%BHP Billiton Finance USA Ltd. $350,000 4.13% 24/2/2042 395,840 0.00%Northern Territory Treasury Corp. AU($)500,000 3.50% 21/4/2028 393,808 0.00%South Australian Government Financing Authority AU($)500,000 4.25% 20/11/2023 391,611 0.00%Queensland Treasury Corp. AU($)500,000 3.25% 21/7/2026 389,352 0.00%Amcor Finance USA, Inc. $375,000 3.63% 28/4/2026 386,334 0.00%Commonwealth Bank of Australia €300,000 1.63% 10/2/2031 380,800 0.00%GAIF Bond Issuer Pty Ltd. $375,000 3.40% 30/9/2026 379,748 0.00%Rio Tinto Finance USA Ltd. $350,000 3.75% 15/6/2025 375,541 0.00%Northern Territory Treasury Corp. AU($)500,000 2.75% 21/10/2024 371,450 0.00%Commonwealth Bank of Australia AU($)500,000 3.25% 25/4/2023 370,092 0.00%SGSP Australia Assets Pty Ltd. AU($)500,000 5.50% 12/3/2021 367,850 0.00%Westpac Banking Corp.^ AU($)500,000 4.50% 11/3/2027 365,019 0.00%Westpac Banking Corp. $350,000 3.30% 26/2/2024 364,062 0.00%Commonwealth Bank of Australia €300,000 1.13% 18/1/2028 356,357 0.00%SGSP Australia Assets Pty Ltd. €300,000 2.00% 30/6/2022 351,852 0.00%Scentre Group Trust 1/Scentre Group Trust 2 €300,000 1.45% 28/3/2029 350,527 0.00%Wesfarmers Ltd. €300,000 1.25% 7/10/2021 344,628 0.00%Commonwealth Bank of Australia €300,000 0.75% 4/11/2021 343,074 0.00%Commonwealth Bank of Australia €300,000 0.38% 10/2/2021 339,255 0.00%Macquarie Bank Ltd. €300,000 0.38% 3/3/2021 339,209 0.00%QBE Insurance Group Ltd.^ $300,000 7.50% 24/11/2043 333,750 0.00%Macquarie Bank Ltd. $325,000 2.85% 15/1/2021 327,316 0.00%Westpac Banking Corp. $325,000 2.35% 19/2/2025 325,599 0.00%Macquarie Group Ltd.^ AU($)450,000 3.25% 15/12/2022 323,805 0.00%National Australia Bank Ltd. CHF300,000 0.25% 19/1/2023 314,794 0.00%National Australia Bank Ltd. $300,000 3.38% 14/1/2026 314,304 0.00%Scentre Group Trust 2 €250,000 3.25% 11/9/2023 311,547 0.00%Rio Tinto Finance USA plc $250,000 4.75% 22/3/2042 304,997 0.00%Westpac Banking Corp. $300,000 2.75% 11/1/2023 304,961 0.00%Macquarie Group Ltd.^ $275,000 4.65% 27/3/2029 304,219 0.00%National Australia Bank Ltd. AU($)400,000 2.75% 16/4/2021 286,276 0.00%Macquarie Group Ltd.^ $250,000 5.03% 15/1/2030 282,817 0.00%Macquarie Group Ltd.^ $265,000 4.15% 27/3/2024 277,663 0.00%Macquarie Group Ltd.^ $265,000 3.76% 28/11/2028 276,334 0.00%Westpac Banking Corp. £200,000 2.63% 14/12/2022 276,146 0.00%Australia & New Zealand Banking Group Ltd. $250,000 3.70% 16/11/2025 268,590 0.00%National Australia Bank Ltd. $250,000 3.63% 20/6/2023 261,562 0.00%Commonwealth Bank of Australia $250,000 2.55% 15/3/2021 251,509 0.00%National Australia Bank Ltd. $250,000 2.25% 16/3/2021 251,065 0.00%Australia Pacific Airports Melbourne Pty Ltd. €200,000 3.13% 26/9/2023 249,335 0.00%Sydney Airport Finance Co. Pty Ltd. €200,000 2.75% 23/4/2024 248,481 0.00%AusNet Services Holdings Pty Ltd. €200,000 1.50% 26/2/2027 238,930 0.00%Ausgrid Finance Pty Ltd. €200,000 1.25% 30/7/2025 231,789 0.00%Tasmanian Public Finance Corp. AU($)300,000 3.25% 19/2/2026 231,363 0.00%Westpac Banking Corp. €200,000 0.75% 22/7/2021 227,969 0.00%Australia & New Zealand Banking Group Ltd. AU($)300,000 3.35% 9/5/2023 222,784 0.00%Macquarie Bank Ltd. $200,000 4.88% 10/6/2025 216,426 0.00%APT Pipelines Ltd. $200,000 4.25% 15/7/2027 214,234 0.00%Sydney Airport Finance Co. Pty Ltd. $200,000 3.90% 22/3/2023 209,335 0.00%BHP Billiton Finance USA Ltd.^ $200,000 6.25% 19/10/2075 205,750 0.00%Westpac Banking Corp. $200,000 2.80% 11/1/2022 203,314 0.00%Australia & New Zealand Banking Group Ltd. $200,000 2.63% 19/5/2022 202,863 0.00%Westpac Banking Corp. $200,000 2.00% 19/8/2021 200,021 0.00%Commonwealth Bank of Australia $175,000 3.45% 16/3/2023 182,171 0.00%Westpac Banking Corp. $150,000 4.42% 24/7/2039 164,432 0.00%Rio Tinto Finance USA Ltd. $125,000 5.20% 2/11/2040 163,092 0.00%Ausgrid Finance Pty Ltd. $150,000 4.35% 1/8/2028 162,973 0.00%Amcor Finance USA, Inc. $150,000 4.50% 15/5/2028 160,728 0.00%Macquarie Bank Ltd. $150,000 4.00% 29/7/2025 159,908 0.00%Westpac Banking Corp. $150,000 3.65% 15/5/2023 157,237 0.00%Ausgrid Finance Pty Ltd. $150,000 3.85% 1/5/2023 155,721 0.00%Sydney Airport Finance Co. Pty Ltd. $150,000 3.38% 30/4/2025 154,346 0.00%Suncorp-Metway Ltd. $150,000 3.30% 15/4/2024 154,016 0.00%Qantas Airways Ltd. AU($)200,000 7.50% 11/6/2021 151,837 0.00%National Australia Bank Ltd. £100,000 3.00% 4/9/2026 147,097 0.00%WEA Finance LLC $125,000 4.63% 20/9/2048 143,477 0.00%
Vanguard Global Bond Index Fund
288
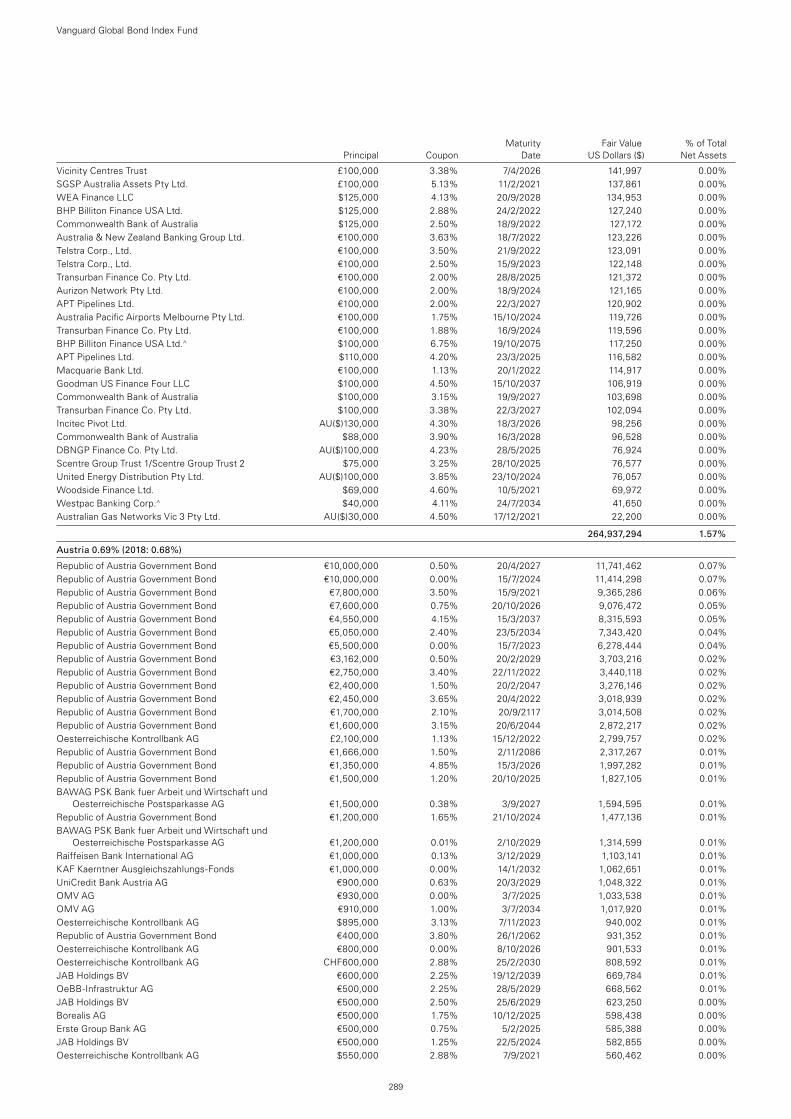
Maturity Fair Value % of Total Principal Coupon Date US Dollars ($) Net Assets
Vicinity Centres Trust £100,000 3.38% 7/4/2026 141,997 0.00%SGSP Australia Assets Pty Ltd. £100,000 5.13% 11/2/2021 137,861 0.00%WEA Finance LLC $125,000 4.13% 20/9/2028 134,953 0.00%BHP Billiton Finance USA Ltd. $125,000 2.88% 24/2/2022 127,240 0.00%Commonwealth Bank of Australia $125,000 2.50% 18/9/2022 127,172 0.00%Australia & New Zealand Banking Group Ltd. €100,000 3.63% 18/7/2022 123,226 0.00%Telstra Corp., Ltd. €100,000 3.50% 21/9/2022 123,091 0.00%Telstra Corp., Ltd. €100,000 2.50% 15/9/2023 122,148 0.00%Transurban Finance Co. Pty Ltd. €100,000 2.00% 28/8/2025 121,372 0.00%Aurizon Network Pty Ltd. €100,000 2.00% 18/9/2024 121,165 0.00%APT Pipelines Ltd. €100,000 2.00% 22/3/2027 120,902 0.00%Australia Pacific Airports Melbourne Pty Ltd. €100,000 1.75% 15/10/2024 119,726 0.00%Transurban Finance Co. Pty Ltd. €100,000 1.88% 16/9/2024 119,596 0.00%BHP Billiton Finance USA Ltd.^ $100,000 6.75% 19/10/2075 117,250 0.00%APT Pipelines Ltd. $110,000 4.20% 23/3/2025 116,582 0.00%Macquarie Bank Ltd. €100,000 1.13% 20/1/2022 114,917 0.00%Goodman US Finance Four LLC $100,000 4.50% 15/10/2037 106,919 0.00%Commonwealth Bank of Australia $100,000 3.15% 19/9/2027 103,698 0.00%Transurban Finance Co. Pty Ltd. $100,000 3.38% 22/3/2027 102,094 0.00%Incitec Pivot Ltd. AU($)130,000 4.30% 18/3/2026 98,256 0.00%Commonwealth Bank of Australia $88,000 3.90% 16/3/2028 96,528 0.00%DBNGP Finance Co. Pty Ltd. AU($)100,000 4.23% 28/5/2025 76,924 0.00%Scentre Group Trust 1/Scentre Group Trust 2 $75,000 3.25% 28/10/2025 76,577 0.00%United Energy Distribution Pty Ltd. AU($)100,000 3.85% 23/10/2024 76,057 0.00%Woodside Finance Ltd. $69,000 4.60% 10/5/2021 69,972 0.00%Westpac Banking Corp.^ $40,000 4.11% 24/7/2034 41,650 0.00%Australian Gas Networks Vic 3 Pty Ltd. AU($)30,000 4.50% 17/12/2021 22,200 0.00%
264,937,294 1.57%
Austria 0.69% (2018: 0.68%)
Republic of Austria Government Bond €10,000,000 0.50% 20/4/2027 11,741,462 0.07%Republic of Austria Government Bond €10,000,000 0.00% 15/7/2024 11,414,298 0.07%Republic of Austria Government Bond €7,800,000 3.50% 15/9/2021 9,365,286 0.06%Republic of Austria Government Bond €7,600,000 0.75% 20/10/2026 9,076,472 0.05%Republic of Austria Government Bond €4,550,000 4.15% 15/3/2037 8,315,593 0.05%Republic of Austria Government Bond €5,050,000 2.40% 23/5/2034 7,343,420 0.04%Republic of Austria Government Bond €5,500,000 0.00% 15/7/2023 6,278,444 0.04%Republic of Austria Government Bond €3,162,000 0.50% 20/2/2029 3,703,216 0.02%Republic of Austria Government Bond €2,750,000 3.40% 22/11/2022 3,440,118 0.02%Republic of Austria Government Bond €2,400,000 1.50% 20/2/2047 3,276,146 0.02%Republic of Austria Government Bond €2,450,000 3.65% 20/4/2022 3,018,939 0.02%Republic of Austria Government Bond €1,700,000 2.10% 20/9/2117 3,014,508 0.02%Republic of Austria Government Bond €1,600,000 3.15% 20/6/2044 2,872,217 0.02%Oesterreichische Kontrollbank AG £2,100,000 1.13% 15/12/2022 2,799,757 0.02%Republic of Austria Government Bond €1,666,000 1.50% 2/11/2086 2,317,267 0.01%Republic of Austria Government Bond €1,350,000 4.85% 15/3/2026 1,997,282 0.01%Republic of Austria Government Bond €1,500,000 1.20% 20/10/2025 1,827,105 0.01%BAWAG PSK Bank fuer Arbeit und Wirtschaft und
Oesterreichische Postsparkasse AG €1,500,000 0.38% 3/9/2027 1,594,595 0.01%Republic of Austria Government Bond €1,200,000 1.65% 21/10/2024 1,477,136 0.01%BAWAG PSK Bank fuer Arbeit und Wirtschaft und
Oesterreichische Postsparkasse AG €1,200,000 0.01% 2/10/2029 1,314,599 0.01%Raiffeisen Bank International AG €1,000,000 0.13% 3/12/2029 1,103,141 0.01%KAF Kaerntner Ausgleichszahlungs-Fonds €1,000,000 0.00% 14/1/2032 1,062,651 0.01%UniCredit Bank Austria AG €900,000 0.63% 20/3/2029 1,048,322 0.01%OMV AG €930,000 0.00% 3/7/2025 1,033,538 0.01%OMV AG €910,000 1.00% 3/7/2034 1,017,920 0.01%Oesterreichische Kontrollbank AG $895,000 3.13% 7/11/2023 940,002 0.01%Republic of Austria Government Bond €400,000 3.80% 26/1/2062 931,352 0.01%Oesterreichische Kontrollbank AG €800,000 0.00% 8/10/2026 901,533 0.01%Oesterreichische Kontrollbank AG CHF600,000 2.88% 25/2/2030 808,592 0.01%JAB Holdings BV €600,000 2.25% 19/12/2039 669,784 0.01%OeBB-Infrastruktur AG €500,000 2.25% 28/5/2029 668,562 0.01%JAB Holdings BV €500,000 2.50% 25/6/2029 623,250 0.00%Borealis AG €500,000 1.75% 10/12/2025 598,438 0.00%Erste Group Bank AG €500,000 0.75% 5/2/2025 585,388 0.00%JAB Holdings BV €500,000 1.25% 22/5/2024 582,855 0.00%Oesterreichische Kontrollbank AG $550,000 2.88% 7/9/2021 560,462 0.00%
Vanguard Global Bond Index Fund
289
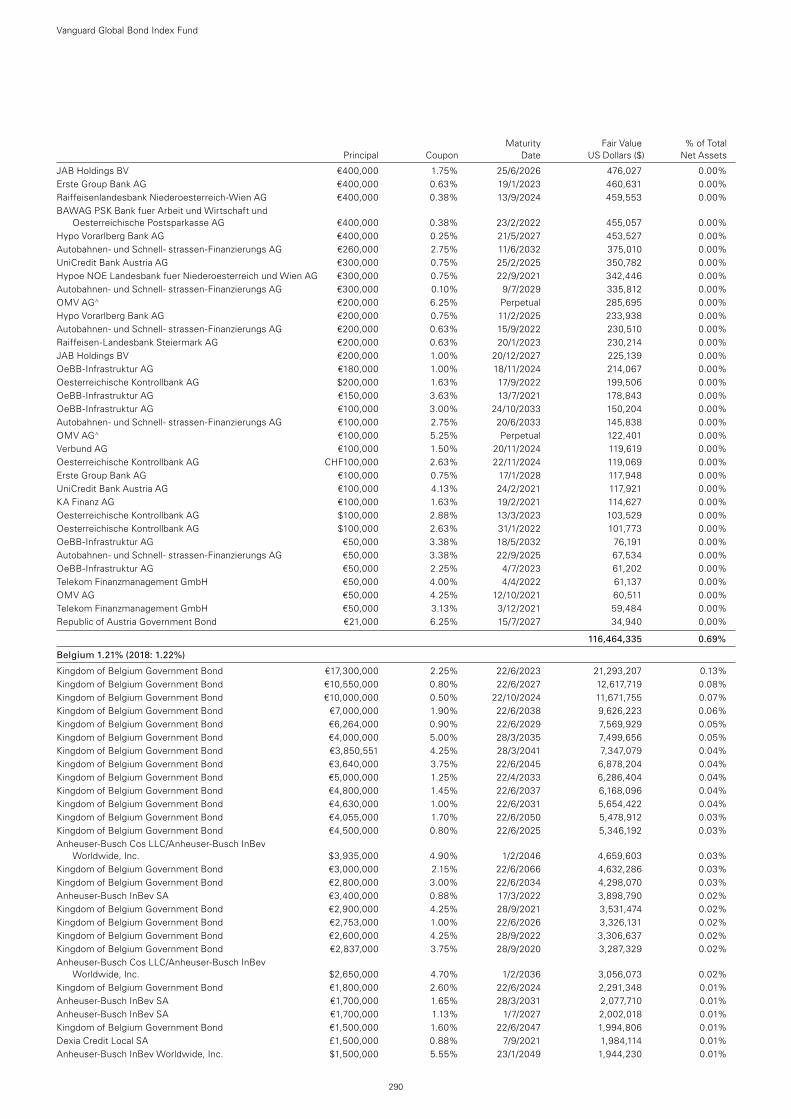
Maturity Fair Value % of Total Principal Coupon Date US Dollars ($) Net Assets
JAB Holdings BV €400,000 1.75% 25/6/2026 476,027 0.00%Erste Group Bank AG €400,000 0.63% 19/1/2023 460,631 0.00%Raiffeisenlandesbank Niederoesterreich-Wien AG €400,000 0.38% 13/9/2024 459,553 0.00%BAWAG PSK Bank fuer Arbeit und Wirtschaft und
Oesterreichische Postsparkasse AG €400,000 0.38% 23/2/2022 455,057 0.00%Hypo Vorarlberg Bank AG €400,000 0.25% 21/5/2027 453,527 0.00%Autobahnen- und Schnell- strassen-Finanzierungs AG €260,000 2.75% 11/6/2032 375,010 0.00%UniCredit Bank Austria AG €300,000 0.75% 25/2/2025 350,782 0.00%Hypoe NOE Landesbank fuer Niederoesterreich und Wien AG €300,000 0.75% 22/9/2021 342,446 0.00%Autobahnen- und Schnell- strassen-Finanzierungs AG €300,000 0.10% 9/7/2029 335,812 0.00%OMV AG^ €200,000 6.25% Perpetual 285,695 0.00%Hypo Vorarlberg Bank AG €200,000 0.75% 11/2/2025 233,938 0.00%Autobahnen- und Schnell- strassen-Finanzierungs AG €200,000 0.63% 15/9/2022 230,510 0.00%Raiffeisen-Landesbank Steiermark AG €200,000 0.63% 20/1/2023 230,214 0.00%JAB Holdings BV €200,000 1.00% 20/12/2027 225,139 0.00%OeBB-Infrastruktur AG €180,000 1.00% 18/11/2024 214,067 0.00%Oesterreichische Kontrollbank AG $200,000 1.63% 17/9/2022 199,506 0.00%OeBB-Infrastruktur AG €150,000 3.63% 13/7/2021 178,843 0.00%OeBB-Infrastruktur AG €100,000 3.00% 24/10/2033 150,204 0.00%Autobahnen- und Schnell- strassen-Finanzierungs AG €100,000 2.75% 20/6/2033 145,838 0.00%OMV AG^ €100,000 5.25% Perpetual 122,401 0.00%Verbund AG €100,000 1.50% 20/11/2024 119,619 0.00%Oesterreichische Kontrollbank AG CHF100,000 2.63% 22/11/2024 119,069 0.00%Erste Group Bank AG €100,000 0.75% 17/1/2028 117,948 0.00%UniCredit Bank Austria AG €100,000 4.13% 24/2/2021 117,921 0.00%KA Finanz AG €100,000 1.63% 19/2/2021 114,627 0.00%Oesterreichische Kontrollbank AG $100,000 2.88% 13/3/2023 103,529 0.00%Oesterreichische Kontrollbank AG $100,000 2.63% 31/1/2022 101,773 0.00%OeBB-Infrastruktur AG €50,000 3.38% 18/5/2032 76,191 0.00%Autobahnen- und Schnell- strassen-Finanzierungs AG €50,000 3.38% 22/9/2025 67,534 0.00%OeBB-Infrastruktur AG €50,000 2.25% 4/7/2023 61,202 0.00%Telekom Finanzmanagement GmbH €50,000 4.00% 4/4/2022 61,137 0.00%OMV AG €50,000 4.25% 12/10/2021 60,511 0.00%Telekom Finanzmanagement GmbH €50,000 3.13% 3/12/2021 59,484 0.00%Republic of Austria Government Bond €21,000 6.25% 15/7/2027 34,940 0.00%
116,464,335 0.69%
Belgium 1.21% (2018: 1.22%)
Kingdom of Belgium Government Bond €17,300,000 2.25% 22/6/2023 21,293,207 0.13%Kingdom of Belgium Government Bond €10,550,000 0.80% 22/6/2027 12,617,719 0.08%Kingdom of Belgium Government Bond €10,000,000 0.50% 22/10/2024 11,671,755 0.07%Kingdom of Belgium Government Bond €7,000,000 1.90% 22/6/2038 9,626,223 0.06%Kingdom of Belgium Government Bond €6,264,000 0.90% 22/6/2029 7,569,929 0.05%Kingdom of Belgium Government Bond €4,000,000 5.00% 28/3/2035 7,499,656 0.05%Kingdom of Belgium Government Bond €3,850,551 4.25% 28/3/2041 7,347,079 0.04%Kingdom of Belgium Government Bond €3,640,000 3.75% 22/6/2045 6,878,204 0.04%Kingdom of Belgium Government Bond €5,000,000 1.25% 22/4/2033 6,286,404 0.04%Kingdom of Belgium Government Bond €4,800,000 1.45% 22/6/2037 6,168,096 0.04%Kingdom of Belgium Government Bond €4,630,000 1.00% 22/6/2031 5,654,422 0.04%Kingdom of Belgium Government Bond €4,055,000 1.70% 22/6/2050 5,478,912 0.03%Kingdom of Belgium Government Bond €4,500,000 0.80% 22/6/2025 5,346,192 0.03%Anheuser-Busch Cos LLC/Anheuser-Busch InBev
Worldwide, Inc. $3,935,000 4.90% 1/2/2046 4,659,603 0.03%Kingdom of Belgium Government Bond €3,000,000 2.15% 22/6/2066 4,632,286 0.03%Kingdom of Belgium Government Bond €2,800,000 3.00% 22/6/2034 4,298,070 0.03%Anheuser-Busch InBev SA €3,400,000 0.88% 17/3/2022 3,898,790 0.02%Kingdom of Belgium Government Bond €2,900,000 4.25% 28/9/2021 3,531,474 0.02%Kingdom of Belgium Government Bond €2,753,000 1.00% 22/6/2026 3,326,131 0.02%Kingdom of Belgium Government Bond €2,600,000 4.25% 28/9/2022 3,306,637 0.02%Kingdom of Belgium Government Bond €2,837,000 3.75% 28/9/2020 3,287,329 0.02%Anheuser-Busch Cos LLC/Anheuser-Busch InBev
Worldwide, Inc. $2,650,000 4.70% 1/2/2036 3,056,073 0.02%Kingdom of Belgium Government Bond €1,800,000 2.60% 22/6/2024 2,291,348 0.01%Anheuser-Busch InBev SA €1,700,000 1.65% 28/3/2031 2,077,710 0.01%Anheuser-Busch InBev SA €1,700,000 1.13% 1/7/2027 2,002,018 0.01%Kingdom of Belgium Government Bond €1,500,000 1.60% 22/6/2047 1,994,806 0.01%Dexia Credit Local SA £1,500,000 0.88% 7/9/2021 1,984,114 0.01%Anheuser-Busch InBev Worldwide, Inc. $1,500,000 5.55% 23/1/2049 1,944,230 0.01%
Vanguard Global Bond Index Fund
290
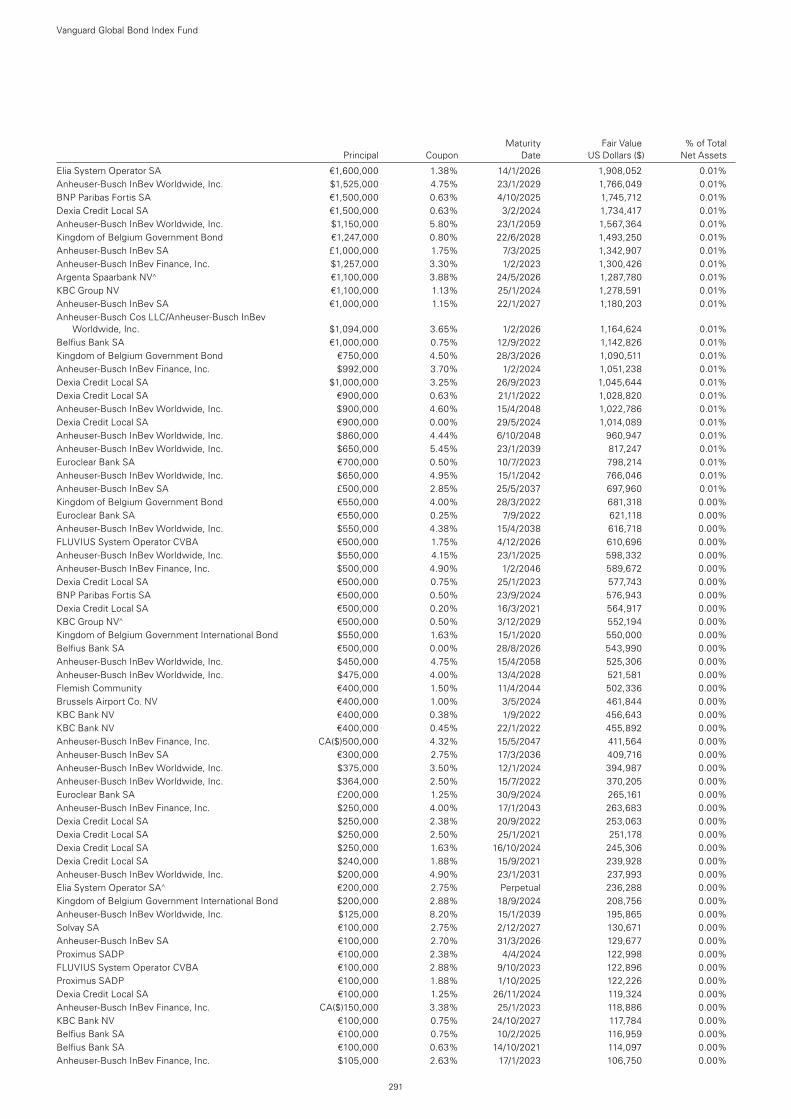
Maturity Fair Value % of Total Principal Coupon Date US Dollars ($) Net Assets
Elia System Operator SA €1,600,000 1.38% 14/1/2026 1,908,052 0.01%Anheuser-Busch InBev Worldwide, Inc. $1,525,000 4.75% 23/1/2029 1,766,049 0.01%BNP Paribas Fortis SA €1,500,000 0.63% 4/10/2025 1,745,712 0.01%Dexia Credit Local SA €1,500,000 0.63% 3/2/2024 1,734,417 0.01%Anheuser-Busch InBev Worldwide, Inc. $1,150,000 5.80% 23/1/2059 1,567,364 0.01%Kingdom of Belgium Government Bond €1,247,000 0.80% 22/6/2028 1,493,250 0.01%Anheuser-Busch InBev SA £1,000,000 1.75% 7/3/2025 1,342,907 0.01%Anheuser-Busch InBev Finance, Inc. $1,257,000 3.30% 1/2/2023 1,300,426 0.01%Argenta Spaarbank NV^ €1,100,000 3.88% 24/5/2026 1,287,780 0.01%KBC Group NV €1,100,000 1.13% 25/1/2024 1,278,591 0.01%Anheuser-Busch InBev SA €1,000,000 1.15% 22/1/2027 1,180,203 0.01%Anheuser-Busch Cos LLC/Anheuser-Busch InBev
Worldwide, Inc. $1,094,000 3.65% 1/2/2026 1,164,624 0.01%Belfius Bank SA €1,000,000 0.75% 12/9/2022 1,142,826 0.01%Kingdom of Belgium Government Bond €750,000 4.50% 28/3/2026 1,090,511 0.01%Anheuser-Busch InBev Finance, Inc. $992,000 3.70% 1/2/2024 1,051,238 0.01%Dexia Credit Local SA $1,000,000 3.25% 26/9/2023 1,045,644 0.01%Dexia Credit Local SA €900,000 0.63% 21/1/2022 1,028,820 0.01%Anheuser-Busch InBev Worldwide, Inc. $900,000 4.60% 15/4/2048 1,022,786 0.01%Dexia Credit Local SA €900,000 0.00% 29/5/2024 1,014,089 0.01%Anheuser-Busch InBev Worldwide, Inc. $860,000 4.44% 6/10/2048 960,947 0.01%Anheuser-Busch InBev Worldwide, Inc. $650,000 5.45% 23/1/2039 817,247 0.01%Euroclear Bank SA €700,000 0.50% 10/7/2023 798,214 0.01%Anheuser-Busch InBev Worldwide, Inc. $650,000 4.95% 15/1/2042 766,046 0.01%Anheuser-Busch InBev SA £500,000 2.85% 25/5/2037 697,960 0.01%Kingdom of Belgium Government Bond €550,000 4.00% 28/3/2022 681,318 0.00%Euroclear Bank SA €550,000 0.25% 7/9/2022 621,118 0.00%Anheuser-Busch InBev Worldwide, Inc. $550,000 4.38% 15/4/2038 616,718 0.00%FLUVIUS System Operator CVBA €500,000 1.75% 4/12/2026 610,696 0.00%Anheuser-Busch InBev Worldwide, Inc. $550,000 4.15% 23/1/2025 598,332 0.00%Anheuser-Busch InBev Finance, Inc. $500,000 4.90% 1/2/2046 589,672 0.00%Dexia Credit Local SA €500,000 0.75% 25/1/2023 577,743 0.00%BNP Paribas Fortis SA €500,000 0.50% 23/9/2024 576,943 0.00%Dexia Credit Local SA €500,000 0.20% 16/3/2021 564,917 0.00%KBC Group NV^ €500,000 0.50% 3/12/2029 552,194 0.00%Kingdom of Belgium Government International Bond $550,000 1.63% 15/1/2020 550,000 0.00%Belfius Bank SA €500,000 0.00% 28/8/2026 543,990 0.00%Anheuser-Busch InBev Worldwide, Inc. $450,000 4.75% 15/4/2058 525,306 0.00%Anheuser-Busch InBev Worldwide, Inc. $475,000 4.00% 13/4/2028 521,581 0.00%Flemish Community €400,000 1.50% 11/4/2044 502,336 0.00%Brussels Airport Co. NV €400,000 1.00% 3/5/2024 461,844 0.00%KBC Bank NV €400,000 0.38% 1/9/2022 456,643 0.00%KBC Bank NV €400,000 0.45% 22/1/2022 455,892 0.00%Anheuser-Busch InBev Finance, Inc. CA($)500,000 4.32% 15/5/2047 411,564 0.00%Anheuser-Busch InBev SA €300,000 2.75% 17/3/2036 409,716 0.00%Anheuser-Busch InBev Worldwide, Inc. $375,000 3.50% 12/1/2024 394,987 0.00%Anheuser-Busch InBev Worldwide, Inc. $364,000 2.50% 15/7/2022 370,205 0.00%Euroclear Bank SA £200,000 1.25% 30/9/2024 265,161 0.00%Anheuser-Busch InBev Finance, Inc. $250,000 4.00% 17/1/2043 263,683 0.00%Dexia Credit Local SA $250,000 2.38% 20/9/2022 253,063 0.00%Dexia Credit Local SA $250,000 2.50% 25/1/2021 251,178 0.00%Dexia Credit Local SA $250,000 1.63% 16/10/2024 245,306 0.00%Dexia Credit Local SA $240,000 1.88% 15/9/2021 239,928 0.00%Anheuser-Busch InBev Worldwide, Inc. $200,000 4.90% 23/1/2031 237,993 0.00%Elia System Operator SA^ €200,000 2.75% Perpetual 236,288 0.00%Kingdom of Belgium Government International Bond $200,000 2.88% 18/9/2024 208,756 0.00%Anheuser-Busch InBev Worldwide, Inc. $125,000 8.20% 15/1/2039 195,865 0.00%Solvay SA €100,000 2.75% 2/12/2027 130,671 0.00%Anheuser-Busch InBev SA €100,000 2.70% 31/3/2026 129,677 0.00%Proximus SADP €100,000 2.38% 4/4/2024 122,998 0.00%FLUVIUS System Operator CVBA €100,000 2.88% 9/10/2023 122,896 0.00%Proximus SADP €100,000 1.88% 1/10/2025 122,226 0.00%Dexia Credit Local SA €100,000 1.25% 26/11/2024 119,324 0.00%Anheuser-Busch InBev Finance, Inc. CA($)150,000 3.38% 25/1/2023 118,886 0.00%KBC Bank NV €100,000 0.75% 24/10/2027 117,784 0.00%Belfius Bank SA €100,000 0.75% 10/2/2025 116,959 0.00%Belfius Bank SA €100,000 0.63% 14/10/2021 114,097 0.00%Anheuser-Busch InBev Finance, Inc. $105,000 2.63% 17/1/2023 106,750 0.00%
Vanguard Global Bond Index Fund
291
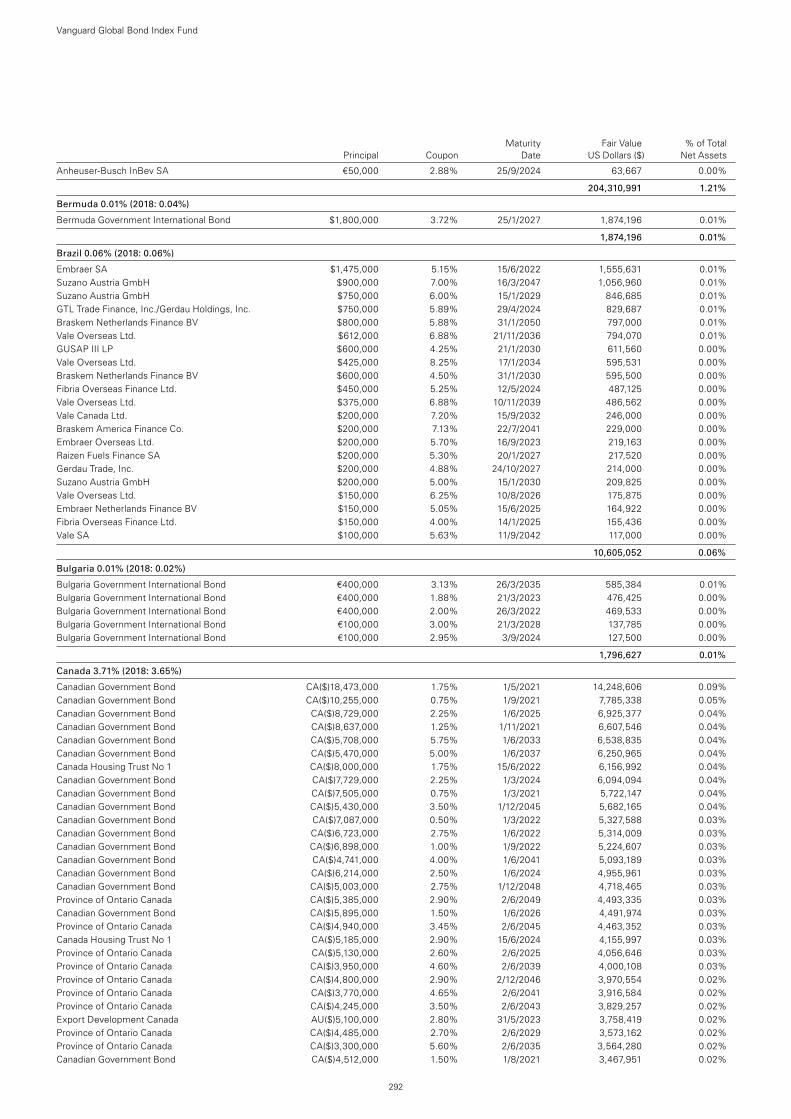
Maturity Fair Value % of Total Principal Coupon Date US Dollars ($) Net Assets
Anheuser-Busch InBev SA €50,000 2.88% 25/9/2024 63,667 0.00%
204,310,991 1.21%
Bermuda 0.01% (2018: 0.04%)
Bermuda Government International Bond $1,800,000 3.72% 25/1/2027 1,874,196 0.01%
1,874,196 0.01%
Brazil 0.06% (2018: 0.06%)
Embraer SA $1,475,000 5.15% 15/6/2022 1,555,631 0.01%Suzano Austria GmbH $900,000 7.00% 16/3/2047 1,056,960 0.01%Suzano Austria GmbH $750,000 6.00% 15/1/2029 846,685 0.01%GTL Trade Finance, Inc./Gerdau Holdings, Inc. $750,000 5.89% 29/4/2024 829,687 0.01%Braskem Netherlands Finance BV $800,000 5.88% 31/1/2050 797,000 0.01%Vale Overseas Ltd. $612,000 6.88% 21/11/2036 794,070 0.01%GUSAP III LP $600,000 4.25% 21/1/2030 611,560 0.00%Vale Overseas Ltd. $425,000 8.25% 17/1/2034 595,531 0.00%Braskem Netherlands Finance BV $600,000 4.50% 31/1/2030 595,500 0.00%Fibria Overseas Finance Ltd. $450,000 5.25% 12/5/2024 487,125 0.00%Vale Overseas Ltd. $375,000 6.88% 10/11/2039 486,562 0.00%Vale Canada Ltd. $200,000 7.20% 15/9/2032 246,000 0.00%Braskem America Finance Co. $200,000 7.13% 22/7/2041 229,000 0.00%Embraer Overseas Ltd. $200,000 5.70% 16/9/2023 219,163 0.00%Raizen Fuels Finance SA $200,000 5.30% 20/1/2027 217,520 0.00%Gerdau Trade, Inc. $200,000 4.88% 24/10/2027 214,000 0.00%Suzano Austria GmbH $200,000 5.00% 15/1/2030 209,825 0.00%Vale Overseas Ltd. $150,000 6.25% 10/8/2026 175,875 0.00%Embraer Netherlands Finance BV $150,000 5.05% 15/6/2025 164,922 0.00%Fibria Overseas Finance Ltd. $150,000 4.00% 14/1/2025 155,436 0.00%Vale SA $100,000 5.63% 11/9/2042 117,000 0.00%
10,605,052 0.06%
Bulgaria 0.01% (2018: 0.02%)
Bulgaria Government International Bond €400,000 3.13% 26/3/2035 585,384 0.01%Bulgaria Government International Bond €400,000 1.88% 21/3/2023 476,425 0.00%Bulgaria Government International Bond €400,000 2.00% 26/3/2022 469,533 0.00%Bulgaria Government International Bond €100,000 3.00% 21/3/2028 137,785 0.00%Bulgaria Government International Bond €100,000 2.95% 3/9/2024 127,500 0.00%
1,796,627 0.01%
Canada 3.71% (2018: 3.65%)
Canadian Government Bond CA($)18,473,000 1.75% 1/5/2021 14,248,606 0.09%Canadian Government Bond CA($)10,255,000 0.75% 1/9/2021 7,785,338 0.05%Canadian Government Bond CA($)8,729,000 2.25% 1/6/2025 6,925,377 0.04%Canadian Government Bond CA($)8,637,000 1.25% 1/11/2021 6,607,546 0.04%Canadian Government Bond CA($)5,708,000 5.75% 1/6/2033 6,538,835 0.04%Canadian Government Bond CA($)5,470,000 5.00% 1/6/2037 6,250,965 0.04%Canada Housing Trust No 1 CA($)8,000,000 1.75% 15/6/2022 6,156,992 0.04%Canadian Government Bond CA($)7,729,000 2.25% 1/3/2024 6,094,094 0.04%Canadian Government Bond CA($)7,505,000 0.75% 1/3/2021 5,722,147 0.04%Canadian Government Bond CA($)5,430,000 3.50% 1/12/2045 5,682,165 0.04%Canadian Government Bond CA($)7,087,000 0.50% 1/3/2022 5,327,588 0.03%Canadian Government Bond CA($)6,723,000 2.75% 1/6/2022 5,314,009 0.03%Canadian Government Bond CA($)6,898,000 1.00% 1/9/2022 5,224,607 0.03%Canadian Government Bond CA($)4,741,000 4.00% 1/6/2041 5,093,189 0.03%Canadian Government Bond CA($)6,214,000 2.50% 1/6/2024 4,955,961 0.03%Canadian Government Bond CA($)5,003,000 2.75% 1/12/2048 4,718,465 0.03%Province of Ontario Canada CA($)5,385,000 2.90% 2/6/2049 4,493,335 0.03%Canadian Government Bond CA($)5,895,000 1.50% 1/6/2026 4,491,974 0.03%Province of Ontario Canada CA($)4,940,000 3.45% 2/6/2045 4,463,352 0.03%Canada Housing Trust No 1 CA($)5,185,000 2.90% 15/6/2024 4,155,997 0.03%Province of Ontario Canada CA($)5,130,000 2.60% 2/6/2025 4,056,646 0.03%Province of Ontario Canada CA($)3,950,000 4.60% 2/6/2039 4,000,108 0.03%Province of Ontario Canada CA($)4,800,000 2.90% 2/12/2046 3,970,554 0.02%Province of Ontario Canada CA($)3,770,000 4.65% 2/6/2041 3,916,584 0.02%Province of Ontario Canada CA($)4,245,000 3.50% 2/6/2043 3,829,257 0.02%Export Development Canada AU($)5,100,000 2.80% 31/5/2023 3,758,419 0.02%Province of Ontario Canada CA($)4,485,000 2.70% 2/6/2029 3,573,162 0.02%Province of Ontario Canada CA($)3,300,000 5.60% 2/6/2035 3,564,280 0.02%Canadian Government Bond CA($)4,512,000 1.50% 1/8/2021 3,467,951 0.02%
Vanguard Global Bond Index Fund
292
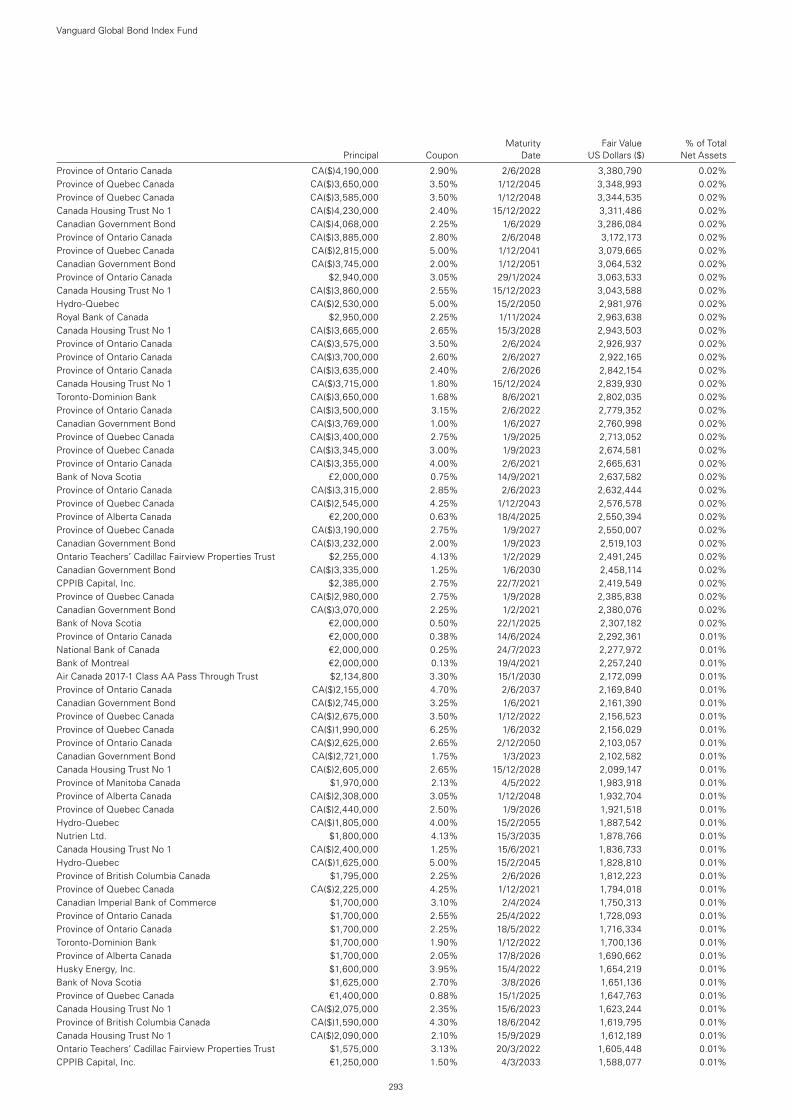
Maturity Fair Value % of Total Principal Coupon Date US Dollars ($) Net Assets
Province of Ontario Canada CA($)4,190,000 2.90% 2/6/2028 3,380,790 0.02%Province of Quebec Canada CA($)3,650,000 3.50% 1/12/2045 3,348,993 0.02%Province of Quebec Canada CA($)3,585,000 3.50% 1/12/2048 3,344,535 0.02%Canada Housing Trust No 1 CA($)4,230,000 2.40% 15/12/2022 3,311,486 0.02%Canadian Government Bond CA($)4,068,000 2.25% 1/6/2029 3,286,084 0.02%Province of Ontario Canada CA($)3,885,000 2.80% 2/6/2048 3,172,173 0.02%Province of Quebec Canada CA($)2,815,000 5.00% 1/12/2041 3,079,665 0.02%Canadian Government Bond CA($)3,745,000 2.00% 1/12/2051 3,064,532 0.02%Province of Ontario Canada $2,940,000 3.05% 29/1/2024 3,063,533 0.02%Canada Housing Trust No 1 CA($)3,860,000 2.55% 15/12/2023 3,043,588 0.02%Hydro-Quebec CA($)2,530,000 5.00% 15/2/2050 2,981,976 0.02%Royal Bank of Canada $2,950,000 2.25% 1/11/2024 2,963,638 0.02%Canada Housing Trust No 1 CA($)3,665,000 2.65% 15/3/2028 2,943,503 0.02%Province of Ontario Canada CA($)3,575,000 3.50% 2/6/2024 2,926,937 0.02%Province of Ontario Canada CA($)3,700,000 2.60% 2/6/2027 2,922,165 0.02%Province of Ontario Canada CA($)3,635,000 2.40% 2/6/2026 2,842,154 0.02%Canada Housing Trust No 1 CA($)3,715,000 1.80% 15/12/2024 2,839,930 0.02%Toronto-Dominion Bank CA($)3,650,000 1.68% 8/6/2021 2,802,035 0.02%Province of Ontario Canada CA($)3,500,000 3.15% 2/6/2022 2,779,352 0.02%Canadian Government Bond CA($)3,769,000 1.00% 1/6/2027 2,760,998 0.02%Province of Quebec Canada CA($)3,400,000 2.75% 1/9/2025 2,713,052 0.02%Province of Quebec Canada CA($)3,345,000 3.00% 1/9/2023 2,674,581 0.02%Province of Ontario Canada CA($)3,355,000 4.00% 2/6/2021 2,665,631 0.02%Bank of Nova Scotia £2,000,000 0.75% 14/9/2021 2,637,582 0.02%Province of Ontario Canada CA($)3,315,000 2.85% 2/6/2023 2,632,444 0.02%Province of Quebec Canada CA($)2,545,000 4.25% 1/12/2043 2,576,578 0.02%Province of Alberta Canada €2,200,000 0.63% 18/4/2025 2,550,394 0.02%Province of Quebec Canada CA($)3,190,000 2.75% 1/9/2027 2,550,007 0.02%Canadian Government Bond CA($)3,232,000 2.00% 1/9/2023 2,519,103 0.02%Ontario Teachers’ Cadillac Fairview Properties Trust $2,255,000 4.13% 1/2/2029 2,491,245 0.02%Canadian Government Bond CA($)3,335,000 1.25% 1/6/2030 2,458,114 0.02%CPPIB Capital, Inc. $2,385,000 2.75% 22/7/2021 2,419,549 0.02%Province of Quebec Canada CA($)2,980,000 2.75% 1/9/2028 2,385,838 0.02%Canadian Government Bond CA($)3,070,000 2.25% 1/2/2021 2,380,076 0.02%Bank of Nova Scotia €2,000,000 0.50% 22/1/2025 2,307,182 0.02%Province of Ontario Canada €2,000,000 0.38% 14/6/2024 2,292,361 0.01%National Bank of Canada €2,000,000 0.25% 24/7/2023 2,277,972 0.01%Bank of Montreal €2,000,000 0.13% 19/4/2021 2,257,240 0.01%Air Canada 2017-1 Class AA Pass Through Trust $2,134,800 3.30% 15/1/2030 2,172,099 0.01%Province of Ontario Canada CA($)2,155,000 4.70% 2/6/2037 2,169,840 0.01%Canadian Government Bond CA($)2,745,000 3.25% 1/6/2021 2,161,390 0.01%Province of Quebec Canada CA($)2,675,000 3.50% 1/12/2022 2,156,523 0.01%Province of Quebec Canada CA($)1,990,000 6.25% 1/6/2032 2,156,029 0.01%Province of Ontario Canada CA($)2,625,000 2.65% 2/12/2050 2,103,057 0.01%Canadian Government Bond CA($)2,721,000 1.75% 1/3/2023 2,102,582 0.01%Canada Housing Trust No 1 CA($)2,605,000 2.65% 15/12/2028 2,099,147 0.01%Province of Manitoba Canada $1,970,000 2.13% 4/5/2022 1,983,918 0.01%Province of Alberta Canada CA($)2,308,000 3.05% 1/12/2048 1,932,704 0.01%Province of Quebec Canada CA($)2,440,000 2.50% 1/9/2026 1,921,518 0.01%Hydro-Quebec CA($)1,805,000 4.00% 15/2/2055 1,887,542 0.01%Nutrien Ltd. $1,800,000 4.13% 15/3/2035 1,878,766 0.01%Canada Housing Trust No 1 CA($)2,400,000 1.25% 15/6/2021 1,836,733 0.01%Hydro-Quebec CA($)1,625,000 5.00% 15/2/2045 1,828,810 0.01%Province of British Columbia Canada $1,795,000 2.25% 2/6/2026 1,812,223 0.01%Province of Quebec Canada CA($)2,225,000 4.25% 1/12/2021 1,794,018 0.01%Canadian Imperial Bank of Commerce $1,700,000 3.10% 2/4/2024 1,750,313 0.01%Province of Ontario Canada $1,700,000 2.55% 25/4/2022 1,728,093 0.01%Province of Ontario Canada $1,700,000 2.25% 18/5/2022 1,716,334 0.01%Toronto-Dominion Bank $1,700,000 1.90% 1/12/2022 1,700,136 0.01%Province of Alberta Canada $1,700,000 2.05% 17/8/2026 1,690,662 0.01%Husky Energy, Inc. $1,600,000 3.95% 15/4/2022 1,654,219 0.01%Bank of Nova Scotia $1,625,000 2.70% 3/8/2026 1,651,136 0.01%Province of Quebec Canada €1,400,000 0.88% 15/1/2025 1,647,763 0.01%Canada Housing Trust No 1 CA($)2,075,000 2.35% 15/6/2023 1,623,244 0.01%Province of British Columbia Canada CA($)1,590,000 4.30% 18/6/2042 1,619,795 0.01%Canada Housing Trust No 1 CA($)2,090,000 2.10% 15/9/2029 1,612,189 0.01%Ontario Teachers’ Cadillac Fairview Properties Trust $1,575,000 3.13% 20/3/2022 1,605,448 0.01%CPPIB Capital, Inc. €1,250,000 1.50% 4/3/2033 1,588,077 0.01%
Vanguard Global Bond Index Fund
293
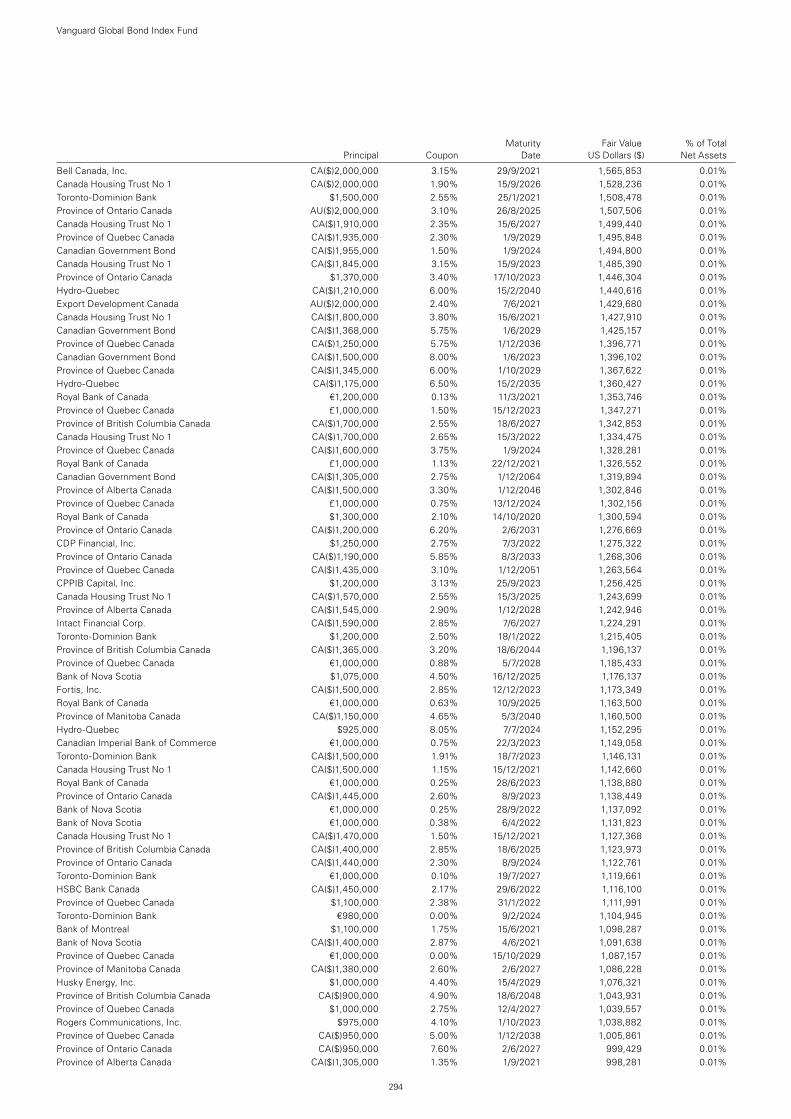
Maturity Fair Value % of Total Principal Coupon Date US Dollars ($) Net Assets
Bell Canada, Inc. CA($)2,000,000 3.15% 29/9/2021 1,565,853 0.01%Canada Housing Trust No 1 CA($)2,000,000 1.90% 15/9/2026 1,528,236 0.01%Toronto-Dominion Bank $1,500,000 2.55% 25/1/2021 1,508,478 0.01%Province of Ontario Canada AU($)2,000,000 3.10% 26/8/2025 1,507,506 0.01%Canada Housing Trust No 1 CA($)1,910,000 2.35% 15/6/2027 1,499,440 0.01%Province of Quebec Canada CA($)1,935,000 2.30% 1/9/2029 1,495,848 0.01%Canadian Government Bond CA($)1,955,000 1.50% 1/9/2024 1,494,800 0.01%Canada Housing Trust No 1 CA($)1,845,000 3.15% 15/9/2023 1,485,390 0.01%Province of Ontario Canada $1,370,000 3.40% 17/10/2023 1,446,304 0.01%Hydro-Quebec CA($)1,210,000 6.00% 15/2/2040 1,440,616 0.01%Export Development Canada AU($)2,000,000 2.40% 7/6/2021 1,429,680 0.01%Canada Housing Trust No 1 CA($)1,800,000 3.80% 15/6/2021 1,427,910 0.01%Canadian Government Bond CA($)1,368,000 5.75% 1/6/2029 1,425,157 0.01%Province of Quebec Canada CA($)1,250,000 5.75% 1/12/2036 1,396,771 0.01%Canadian Government Bond CA($)1,500,000 8.00% 1/6/2023 1,396,102 0.01%Province of Quebec Canada CA($)1,345,000 6.00% 1/10/2029 1,367,622 0.01%Hydro-Quebec CA($)1,175,000 6.50% 15/2/2035 1,360,427 0.01%Royal Bank of Canada €1,200,000 0.13% 11/3/2021 1,353,746 0.01%Province of Quebec Canada £1,000,000 1.50% 15/12/2023 1,347,271 0.01%Province of British Columbia Canada CA($)1,700,000 2.55% 18/6/2027 1,342,853 0.01%Canada Housing Trust No 1 CA($)1,700,000 2.65% 15/3/2022 1,334,475 0.01%Province of Quebec Canada CA($)1,600,000 3.75% 1/9/2024 1,328,281 0.01%Royal Bank of Canada £1,000,000 1.13% 22/12/2021 1,326,552 0.01%Canadian Government Bond CA($)1,305,000 2.75% 1/12/2064 1,319,894 0.01%Province of Alberta Canada CA($)1,500,000 3.30% 1/12/2046 1,302,846 0.01%Province of Quebec Canada £1,000,000 0.75% 13/12/2024 1,302,156 0.01%Royal Bank of Canada $1,300,000 2.10% 14/10/2020 1,300,594 0.01%Province of Ontario Canada CA($)1,200,000 6.20% 2/6/2031 1,276,669 0.01%CDP Financial, Inc. $1,250,000 2.75% 7/3/2022 1,275,322 0.01%Province of Ontario Canada CA($)1,190,000 5.85% 8/3/2033 1,268,306 0.01%Province of Quebec Canada CA($)1,435,000 3.10% 1/12/2051 1,263,564 0.01%CPPIB Capital, Inc. $1,200,000 3.13% 25/9/2023 1,256,425 0.01%Canada Housing Trust No 1 CA($)1,570,000 2.55% 15/3/2025 1,243,699 0.01%Province of Alberta Canada CA($)1,545,000 2.90% 1/12/2028 1,242,946 0.01%Intact Financial Corp. CA($)1,590,000 2.85% 7/6/2027 1,224,291 0.01%Toronto-Dominion Bank $1,200,000 2.50% 18/1/2022 1,215,405 0.01%Province of British Columbia Canada CA($)1,365,000 3.20% 18/6/2044 1,196,137 0.01%Province of Quebec Canada €1,000,000 0.88% 5/7/2028 1,185,433 0.01%Bank of Nova Scotia $1,075,000 4.50% 16/12/2025 1,176,137 0.01%Fortis, Inc. CA($)1,500,000 2.85% 12/12/2023 1,173,349 0.01%Royal Bank of Canada €1,000,000 0.63% 10/9/2025 1,163,500 0.01%Province of Manitoba Canada CA($)1,150,000 4.65% 5/3/2040 1,160,500 0.01%Hydro-Quebec $925,000 8.05% 7/7/2024 1,152,295 0.01%Canadian Imperial Bank of Commerce €1,000,000 0.75% 22/3/2023 1,149,058 0.01%Toronto-Dominion Bank CA($)1,500,000 1.91% 18/7/2023 1,146,131 0.01%Canada Housing Trust No 1 CA($)1,500,000 1.15% 15/12/2021 1,142,660 0.01%Royal Bank of Canada €1,000,000 0.25% 28/6/2023 1,138,880 0.01%Province of Ontario Canada CA($)1,445,000 2.60% 8/9/2023 1,138,449 0.01%Bank of Nova Scotia €1,000,000 0.25% 28/9/2022 1,137,092 0.01%Bank of Nova Scotia €1,000,000 0.38% 6/4/2022 1,131,823 0.01%Canada Housing Trust No 1 CA($)1,470,000 1.50% 15/12/2021 1,127,368 0.01%Province of British Columbia Canada CA($)1,400,000 2.85% 18/6/2025 1,123,973 0.01%Province of Ontario Canada CA($)1,440,000 2.30% 8/9/2024 1,122,761 0.01%Toronto-Dominion Bank €1,000,000 0.10% 19/7/2027 1,119,661 0.01%HSBC Bank Canada CA($)1,450,000 2.17% 29/6/2022 1,116,100 0.01%Province of Quebec Canada $1,100,000 2.38% 31/1/2022 1,111,991 0.01%Toronto-Dominion Bank €980,000 0.00% 9/2/2024 1,104,945 0.01%Bank of Montreal $1,100,000 1.75% 15/6/2021 1,098,287 0.01%Bank of Nova Scotia CA($)1,400,000 2.87% 4/6/2021 1,091,638 0.01%Province of Quebec Canada €1,000,000 0.00% 15/10/2029 1,087,157 0.01%Province of Manitoba Canada CA($)1,380,000 2.60% 2/6/2027 1,086,228 0.01%Husky Energy, Inc. $1,000,000 4.40% 15/4/2029 1,076,321 0.01%Province of British Columbia Canada CA($)900,000 4.90% 18/6/2048 1,043,931 0.01%Province of Quebec Canada $1,000,000 2.75% 12/4/2027 1,039,557 0.01%Rogers Communications, Inc. $975,000 4.10% 1/10/2023 1,038,882 0.01%Province of Quebec Canada CA($)950,000 5.00% 1/12/2038 1,005,861 0.01%Province of Ontario Canada CA($)950,000 7.60% 2/6/2027 999,429 0.01%Province of Alberta Canada CA($)1,305,000 1.35% 1/9/2021 998,281 0.01%
Vanguard Global Bond Index Fund
294
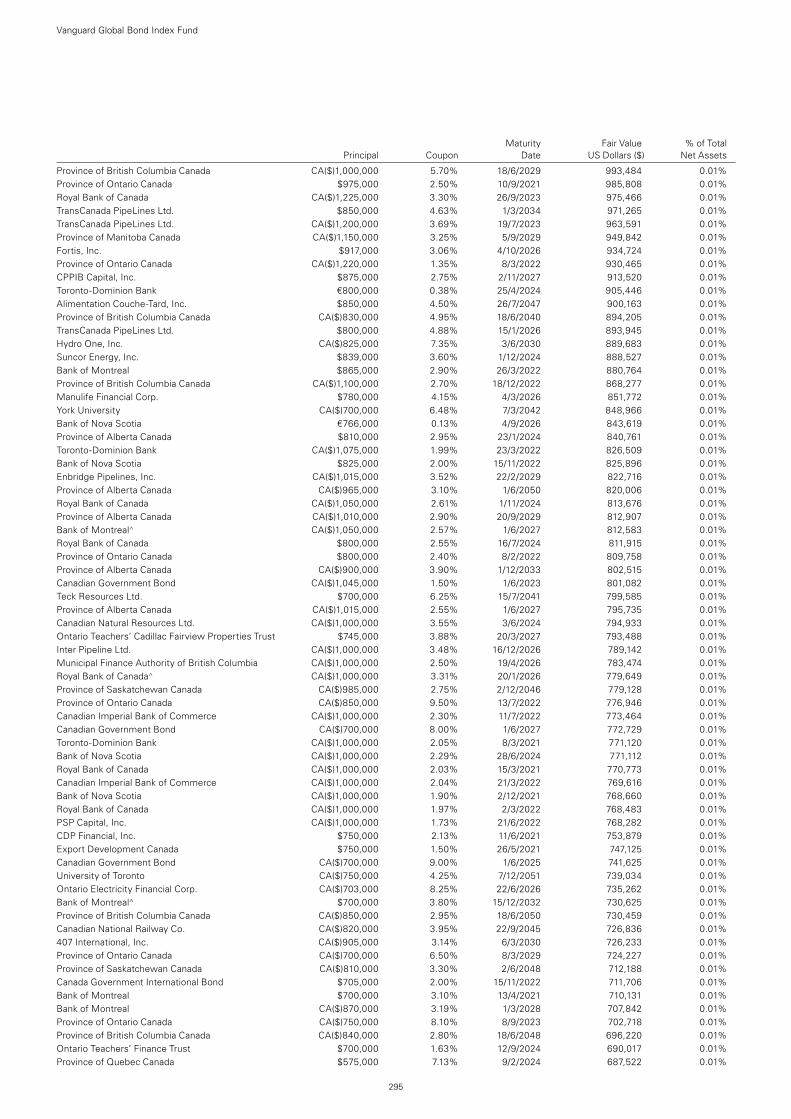
Maturity Fair Value % of Total Principal Coupon Date US Dollars ($) Net Assets
Province of British Columbia Canada CA($)1,000,000 5.70% 18/6/2029 993,484 0.01%Province of Ontario Canada $975,000 2.50% 10/9/2021 985,808 0.01%Royal Bank of Canada CA($)1,225,000 3.30% 26/9/2023 975,466 0.01%TransCanada PipeLines Ltd. $850,000 4.63% 1/3/2034 971,265 0.01%TransCanada PipeLines Ltd. CA($)1,200,000 3.69% 19/7/2023 963,591 0.01%Province of Manitoba Canada CA($)1,150,000 3.25% 5/9/2029 949,842 0.01%Fortis, Inc. $917,000 3.06% 4/10/2026 934,724 0.01%Province of Ontario Canada CA($)1,220,000 1.35% 8/3/2022 930,465 0.01%CPPIB Capital, Inc. $875,000 2.75% 2/11/2027 913,520 0.01%Toronto-Dominion Bank €800,000 0.38% 25/4/2024 905,446 0.01%Alimentation Couche-Tard, Inc. $850,000 4.50% 26/7/2047 900,163 0.01%Province of British Columbia Canada CA($)830,000 4.95% 18/6/2040 894,205 0.01%TransCanada PipeLines Ltd. $800,000 4.88% 15/1/2026 893,945 0.01%Hydro One, Inc. CA($)825,000 7.35% 3/6/2030 889,683 0.01%Suncor Energy, Inc. $839,000 3.60% 1/12/2024 888,527 0.01%Bank of Montreal $865,000 2.90% 26/3/2022 880,764 0.01%Province of British Columbia Canada CA($)1,100,000 2.70% 18/12/2022 868,277 0.01%Manulife Financial Corp. $780,000 4.15% 4/3/2026 851,772 0.01%York University CA($)700,000 6.48% 7/3/2042 848,966 0.01%Bank of Nova Scotia €766,000 0.13% 4/9/2026 843,619 0.01%Province of Alberta Canada $810,000 2.95% 23/1/2024 840,761 0.01%Toronto-Dominion Bank CA($)1,075,000 1.99% 23/3/2022 826,509 0.01%Bank of Nova Scotia $825,000 2.00% 15/11/2022 825,896 0.01%Enbridge Pipelines, Inc. CA($)1,015,000 3.52% 22/2/2029 822,716 0.01%Province of Alberta Canada CA($)965,000 3.10% 1/6/2050 820,006 0.01%Royal Bank of Canada CA($)1,050,000 2.61% 1/11/2024 813,676 0.01%Province of Alberta Canada CA($)1,010,000 2.90% 20/9/2029 812,907 0.01%Bank of Montreal^ CA($)1,050,000 2.57% 1/6/2027 812,583 0.01%Royal Bank of Canada $800,000 2.55% 16/7/2024 811,915 0.01%Province of Ontario Canada $800,000 2.40% 8/2/2022 809,758 0.01%Province of Alberta Canada CA($)900,000 3.90% 1/12/2033 802,515 0.01%Canadian Government Bond CA($)1,045,000 1.50% 1/6/2023 801,082 0.01%Teck Resources Ltd. $700,000 6.25% 15/7/2041 799,585 0.01%Province of Alberta Canada CA($)1,015,000 2.55% 1/6/2027 795,735 0.01%Canadian Natural Resources Ltd. CA($)1,000,000 3.55% 3/6/2024 794,933 0.01%Ontario Teachers’ Cadillac Fairview Properties Trust $745,000 3.88% 20/3/2027 793,488 0.01%Inter Pipeline Ltd. CA($)1,000,000 3.48% 16/12/2026 789,142 0.01%Municipal Finance Authority of British Columbia CA($)1,000,000 2.50% 19/4/2026 783,474 0.01%Royal Bank of Canada^ CA($)1,000,000 3.31% 20/1/2026 779,649 0.01%Province of Saskatchewan Canada CA($)985,000 2.75% 2/12/2046 779,128 0.01%Province of Ontario Canada CA($)850,000 9.50% 13/7/2022 776,946 0.01%Canadian Imperial Bank of Commerce CA($)1,000,000 2.30% 11/7/2022 773,464 0.01%Canadian Government Bond CA($)700,000 8.00% 1/6/2027 772,729 0.01%Toronto-Dominion Bank CA($)1,000,000 2.05% 8/3/2021 771,120 0.01%Bank of Nova Scotia CA($)1,000,000 2.29% 28/6/2024 771,112 0.01%Royal Bank of Canada CA($)1,000,000 2.03% 15/3/2021 770,773 0.01%Canadian Imperial Bank of Commerce CA($)1,000,000 2.04% 21/3/2022 769,616 0.01%Bank of Nova Scotia CA($)1,000,000 1.90% 2/12/2021 768,660 0.01%Royal Bank of Canada CA($)1,000,000 1.97% 2/3/2022 768,483 0.01%PSP Capital, Inc. CA($)1,000,000 1.73% 21/6/2022 768,282 0.01%CDP Financial, Inc. $750,000 2.13% 11/6/2021 753,879 0.01%Export Development Canada $750,000 1.50% 26/5/2021 747,125 0.01%Canadian Government Bond CA($)700,000 9.00% 1/6/2025 741,625 0.01%University of Toronto CA($)750,000 4.25% 7/12/2051 739,034 0.01%Ontario Electricity Financial Corp. CA($)703,000 8.25% 22/6/2026 735,262 0.01%Bank of Montreal^ $700,000 3.80% 15/12/2032 730,625 0.01%Province of British Columbia Canada CA($)850,000 2.95% 18/6/2050 730,459 0.01%Canadian National Railway Co. CA($)820,000 3.95% 22/9/2045 726,836 0.01%407 International, Inc. CA($)905,000 3.14% 6/3/2030 726,233 0.01%Province of Ontario Canada CA($)700,000 6.50% 8/3/2029 724,227 0.01%Province of Saskatchewan Canada CA($)810,000 3.30% 2/6/2048 712,188 0.01%Canada Government International Bond $705,000 2.00% 15/11/2022 711,706 0.01%Bank of Montreal $700,000 3.10% 13/4/2021 710,131 0.01%Bank of Montreal CA($)870,000 3.19% 1/3/2028 707,842 0.01%Province of Ontario Canada CA($)750,000 8.10% 8/9/2023 702,718 0.01%Province of British Columbia Canada CA($)840,000 2.80% 18/6/2048 696,220 0.01%Ontario Teachers’ Finance Trust $700,000 1.63% 12/9/2024 690,017 0.01%Province of Quebec Canada $575,000 7.13% 9/2/2024 687,522 0.01%
Vanguard Global Bond Index Fund
295
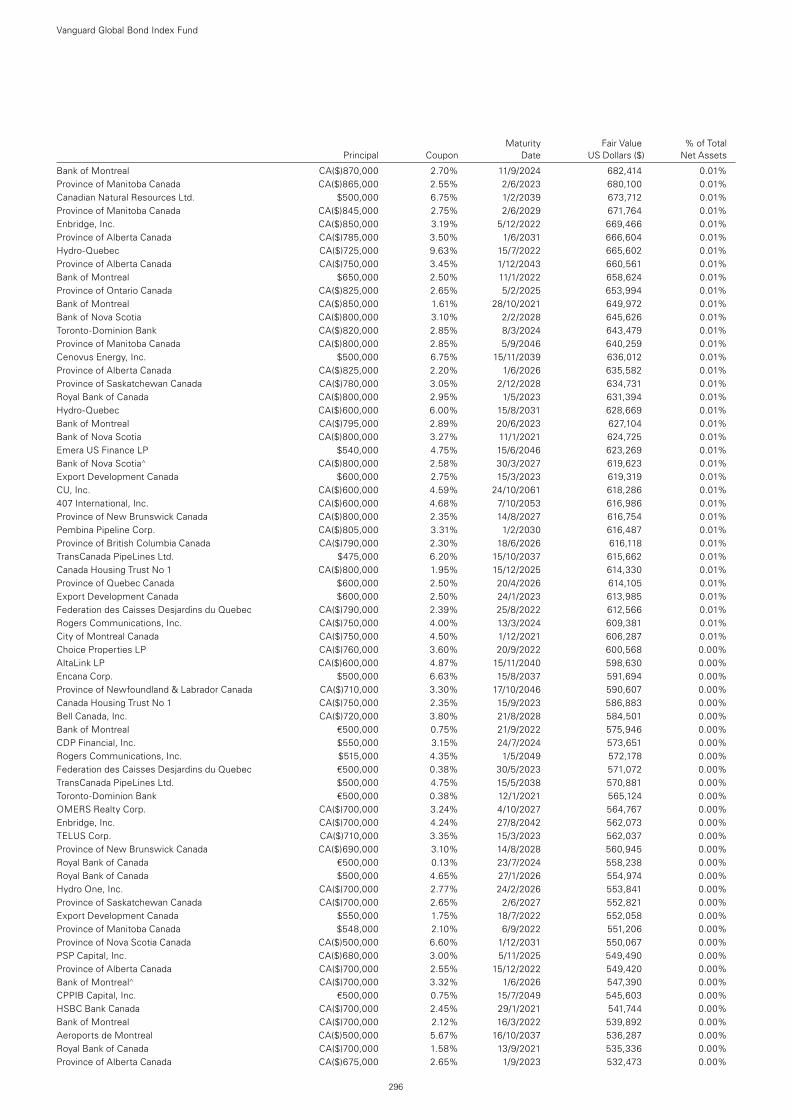
Maturity Fair Value % of Total Principal Coupon Date US Dollars ($) Net Assets
Bank of Montreal CA($)870,000 2.70% 11/9/2024 682,414 0.01%Province of Manitoba Canada CA($)865,000 2.55% 2/6/2023 680,100 0.01%Canadian Natural Resources Ltd. $500,000 6.75% 1/2/2039 673,712 0.01%Province of Manitoba Canada CA($)845,000 2.75% 2/6/2029 671,764 0.01%Enbridge, Inc. CA($)850,000 3.19% 5/12/2022 669,466 0.01%Province of Alberta Canada CA($)785,000 3.50% 1/6/2031 666,604 0.01%Hydro-Quebec CA($)725,000 9.63% 15/7/2022 665,602 0.01%Province of Alberta Canada CA($)750,000 3.45% 1/12/2043 660,561 0.01%Bank of Montreal $650,000 2.50% 11/1/2022 658,624 0.01%Province of Ontario Canada CA($)825,000 2.65% 5/2/2025 653,994 0.01%Bank of Montreal CA($)850,000 1.61% 28/10/2021 649,972 0.01%Bank of Nova Scotia CA($)800,000 3.10% 2/2/2028 645,626 0.01%Toronto-Dominion Bank CA($)820,000 2.85% 8/3/2024 643,479 0.01%Province of Manitoba Canada CA($)800,000 2.85% 5/9/2046 640,259 0.01%Cenovus Energy, Inc. $500,000 6.75% 15/11/2039 636,012 0.01%Province of Alberta Canada CA($)825,000 2.20% 1/6/2026 635,582 0.01%Province of Saskatchewan Canada CA($)780,000 3.05% 2/12/2028 634,731 0.01%Royal Bank of Canada CA($)800,000 2.95% 1/5/2023 631,394 0.01%Hydro-Quebec CA($)600,000 6.00% 15/8/2031 628,669 0.01%Bank of Montreal CA($)795,000 2.89% 20/6/2023 627,104 0.01%Bank of Nova Scotia CA($)800,000 3.27% 11/1/2021 624,725 0.01%Emera US Finance LP $540,000 4.75% 15/6/2046 623,269 0.01%Bank of Nova Scotia^ CA($)800,000 2.58% 30/3/2027 619,623 0.01%Export Development Canada $600,000 2.75% 15/3/2023 619,319 0.01%CU, Inc. CA($)600,000 4.59% 24/10/2061 618,286 0.01%407 International, Inc. CA($)600,000 4.68% 7/10/2053 616,986 0.01%Province of New Brunswick Canada CA($)800,000 2.35% 14/8/2027 616,754 0.01%Pembina Pipeline Corp. CA($)805,000 3.31% 1/2/2030 616,487 0.01%Province of British Columbia Canada CA($)790,000 2.30% 18/6/2026 616,118 0.01%TransCanada PipeLines Ltd. $475,000 6.20% 15/10/2037 615,662 0.01%Canada Housing Trust No 1 CA($)800,000 1.95% 15/12/2025 614,330 0.01%Province of Quebec Canada $600,000 2.50% 20/4/2026 614,105 0.01%Export Development Canada $600,000 2.50% 24/1/2023 613,985 0.01%Federation des Caisses Desjardins du Quebec CA($)790,000 2.39% 25/8/2022 612,566 0.01%Rogers Communications, Inc. CA($)750,000 4.00% 13/3/2024 609,381 0.01%City of Montreal Canada CA($)750,000 4.50% 1/12/2021 606,287 0.01%Choice Properties LP CA($)760,000 3.60% 20/9/2022 600,568 0.00%AltaLink LP CA($)600,000 4.87% 15/11/2040 598,630 0.00%Encana Corp. $500,000 6.63% 15/8/2037 591,694 0.00%Province of Newfoundland & Labrador Canada CA($)710,000 3.30% 17/10/2046 590,607 0.00%Canada Housing Trust No 1 CA($)750,000 2.35% 15/9/2023 586,883 0.00%Bell Canada, Inc. CA($)720,000 3.80% 21/8/2028 584,501 0.00%Bank of Montreal €500,000 0.75% 21/9/2022 575,946 0.00%CDP Financial, Inc. $550,000 3.15% 24/7/2024 573,651 0.00%Rogers Communications, Inc. $515,000 4.35% 1/5/2049 572,178 0.00%Federation des Caisses Desjardins du Quebec €500,000 0.38% 30/5/2023 571,072 0.00%TransCanada PipeLines Ltd. $500,000 4.75% 15/5/2038 570,881 0.00%Toronto-Dominion Bank €500,000 0.38% 12/1/2021 565,124 0.00%OMERS Realty Corp. CA($)700,000 3.24% 4/10/2027 564,767 0.00%Enbridge, Inc. CA($)700,000 4.24% 27/8/2042 562,073 0.00%TELUS Corp. CA($)710,000 3.35% 15/3/2023 562,037 0.00%Province of New Brunswick Canada CA($)690,000 3.10% 14/8/2028 560,945 0.00%Royal Bank of Canada €500,000 0.13% 23/7/2024 558,238 0.00%Royal Bank of Canada $500,000 4.65% 27/1/2026 554,974 0.00%Hydro One, Inc. CA($)700,000 2.77% 24/2/2026 553,841 0.00%Province of Saskatchewan Canada CA($)700,000 2.65% 2/6/2027 552,821 0.00%Export Development Canada $550,000 1.75% 18/7/2022 552,058 0.00%Province of Manitoba Canada $548,000 2.10% 6/9/2022 551,206 0.00%Province of Nova Scotia Canada CA($)500,000 6.60% 1/12/2031 550,067 0.00%PSP Capital, Inc. CA($)680,000 3.00% 5/11/2025 549,490 0.00%Province of Alberta Canada CA($)700,000 2.55% 15/12/2022 549,420 0.00%Bank of Montreal^ CA($)700,000 3.32% 1/6/2026 547,390 0.00%CPPIB Capital, Inc. €500,000 0.75% 15/7/2049 545,603 0.00%HSBC Bank Canada CA($)700,000 2.45% 29/1/2021 541,744 0.00%Bank of Montreal CA($)700,000 2.12% 16/3/2022 539,892 0.00%Aeroports de Montreal CA($)500,000 5.67% 16/10/2037 536,287 0.00%Royal Bank of Canada CA($)700,000 1.58% 13/9/2021 535,336 0.00%Province of Alberta Canada CA($)675,000 2.65% 1/9/2023 532,473 0.00%
Vanguard Global Bond Index Fund
296
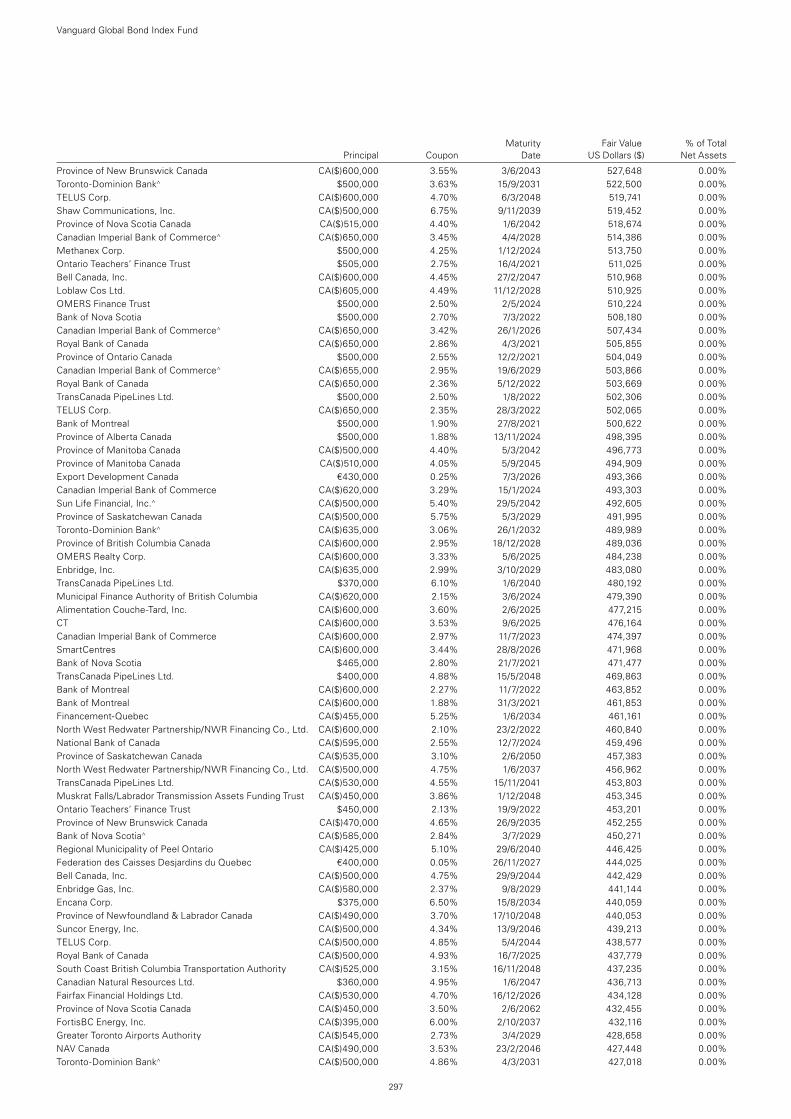
Maturity Fair Value % of Total Principal Coupon Date US Dollars ($) Net Assets
Province of New Brunswick Canada CA($)600,000 3.55% 3/6/2043 527,648 0.00%Toronto-Dominion Bank^ $500,000 3.63% 15/9/2031 522,500 0.00%TELUS Corp. CA($)600,000 4.70% 6/3/2048 519,741 0.00%Shaw Communications, Inc. CA($)500,000 6.75% 9/11/2039 519,452 0.00%Province of Nova Scotia Canada CA($)515,000 4.40% 1/6/2042 518,674 0.00%Canadian Imperial Bank of Commerce^ CA($)650,000 3.45% 4/4/2028 514,386 0.00%Methanex Corp. $500,000 4.25% 1/12/2024 513,750 0.00%Ontario Teachers’ Finance Trust $505,000 2.75% 16/4/2021 511,025 0.00%Bell Canada, Inc. CA($)600,000 4.45% 27/2/2047 510,968 0.00%Loblaw Cos Ltd. CA($)605,000 4.49% 11/12/2028 510,925 0.00%OMERS Finance Trust $500,000 2.50% 2/5/2024 510,224 0.00%Bank of Nova Scotia $500,000 2.70% 7/3/2022 508,180 0.00%Canadian Imperial Bank of Commerce^ CA($)650,000 3.42% 26/1/2026 507,434 0.00%Royal Bank of Canada CA($)650,000 2.86% 4/3/2021 505,855 0.00%Province of Ontario Canada $500,000 2.55% 12/2/2021 504,049 0.00%Canadian Imperial Bank of Commerce^ CA($)655,000 2.95% 19/6/2029 503,866 0.00%Royal Bank of Canada CA($)650,000 2.36% 5/12/2022 503,669 0.00%TransCanada PipeLines Ltd. $500,000 2.50% 1/8/2022 502,306 0.00%TELUS Corp. CA($)650,000 2.35% 28/3/2022 502,065 0.00%Bank of Montreal $500,000 1.90% 27/8/2021 500,622 0.00%Province of Alberta Canada $500,000 1.88% 13/11/2024 498,395 0.00%Province of Manitoba Canada CA($)500,000 4.40% 5/3/2042 496,773 0.00%Province of Manitoba Canada CA($)510,000 4.05% 5/9/2045 494,909 0.00%Export Development Canada €430,000 0.25% 7/3/2026 493,366 0.00%Canadian Imperial Bank of Commerce CA($)620,000 3.29% 15/1/2024 493,303 0.00%Sun Life Financial, Inc.^ CA($)500,000 5.40% 29/5/2042 492,605 0.00%Province of Saskatchewan Canada CA($)500,000 5.75% 5/3/2029 491,995 0.00%Toronto-Dominion Bank^ CA($)635,000 3.06% 26/1/2032 489,989 0.00%Province of British Columbia Canada CA($)600,000 2.95% 18/12/2028 489,036 0.00%OMERS Realty Corp. CA($)600,000 3.33% 5/6/2025 484,238 0.00%Enbridge, Inc. CA($)635,000 2.99% 3/10/2029 483,080 0.00%TransCanada PipeLines Ltd. $370,000 6.10% 1/6/2040 480,192 0.00%Municipal Finance Authority of British Columbia CA($)620,000 2.15% 3/6/2024 479,390 0.00%Alimentation Couche-Tard, Inc. CA($)600,000 3.60% 2/6/2025 477,215 0.00%CT CA($)600,000 3.53% 9/6/2025 476,164 0.00%Canadian Imperial Bank of Commerce CA($)600,000 2.97% 11/7/2023 474,397 0.00%SmartCentres CA($)600,000 3.44% 28/8/2026 471,968 0.00%Bank of Nova Scotia $465,000 2.80% 21/7/2021 471,477 0.00%TransCanada PipeLines Ltd. $400,000 4.88% 15/5/2048 469,863 0.00%Bank of Montreal CA($)600,000 2.27% 11/7/2022 463,852 0.00%Bank of Montreal CA($)600,000 1.88% 31/3/2021 461,853 0.00%Financement-Quebec CA($)455,000 5.25% 1/6/2034 461,161 0.00%North West Redwater Partnership/NWR Financing Co., Ltd. CA($)600,000 2.10% 23/2/2022 460,840 0.00%National Bank of Canada CA($)595,000 2.55% 12/7/2024 459,496 0.00%Province of Saskatchewan Canada CA($)535,000 3.10% 2/6/2050 457,383 0.00%North West Redwater Partnership/NWR Financing Co., Ltd. CA($)500,000 4.75% 1/6/2037 456,962 0.00%TransCanada PipeLines Ltd. CA($)530,000 4.55% 15/11/2041 453,803 0.00%Muskrat Falls/Labrador Transmission Assets Funding Trust CA($)450,000 3.86% 1/12/2048 453,345 0.00%Ontario Teachers’ Finance Trust $450,000 2.13% 19/9/2022 453,201 0.00%Province of New Brunswick Canada CA($)470,000 4.65% 26/9/2035 452,255 0.00%Bank of Nova Scotia^ CA($)585,000 2.84% 3/7/2029 450,271 0.00%Regional Municipality of Peel Ontario CA($)425,000 5.10% 29/6/2040 446,425 0.00%Federation des Caisses Desjardins du Quebec €400,000 0.05% 26/11/2027 444,025 0.00%Bell Canada, Inc. CA($)500,000 4.75% 29/9/2044 442,429 0.00%Enbridge Gas, Inc. CA($)580,000 2.37% 9/8/2029 441,144 0.00%Encana Corp. $375,000 6.50% 15/8/2034 440,059 0.00%Province of Newfoundland & Labrador Canada CA($)490,000 3.70% 17/10/2048 440,053 0.00%Suncor Energy, Inc. CA($)500,000 4.34% 13/9/2046 439,213 0.00%TELUS Corp. CA($)500,000 4.85% 5/4/2044 438,577 0.00%Royal Bank of Canada CA($)500,000 4.93% 16/7/2025 437,779 0.00%South Coast British Columbia Transportation Authority CA($)525,000 3.15% 16/11/2048 437,235 0.00%Canadian Natural Resources Ltd. $360,000 4.95% 1/6/2047 436,713 0.00%Fairfax Financial Holdings Ltd. CA($)530,000 4.70% 16/12/2026 434,128 0.00%Province of Nova Scotia Canada CA($)450,000 3.50% 2/6/2062 432,455 0.00%FortisBC Energy, Inc. CA($)395,000 6.00% 2/10/2037 432,116 0.00%Greater Toronto Airports Authority CA($)545,000 2.73% 3/4/2029 428,658 0.00%NAV Canada CA($)490,000 3.53% 23/2/2046 427,448 0.00%Toronto-Dominion Bank^ CA($)500,000 4.86% 4/3/2031 427,018 0.00%
Vanguard Global Bond Index Fund
297
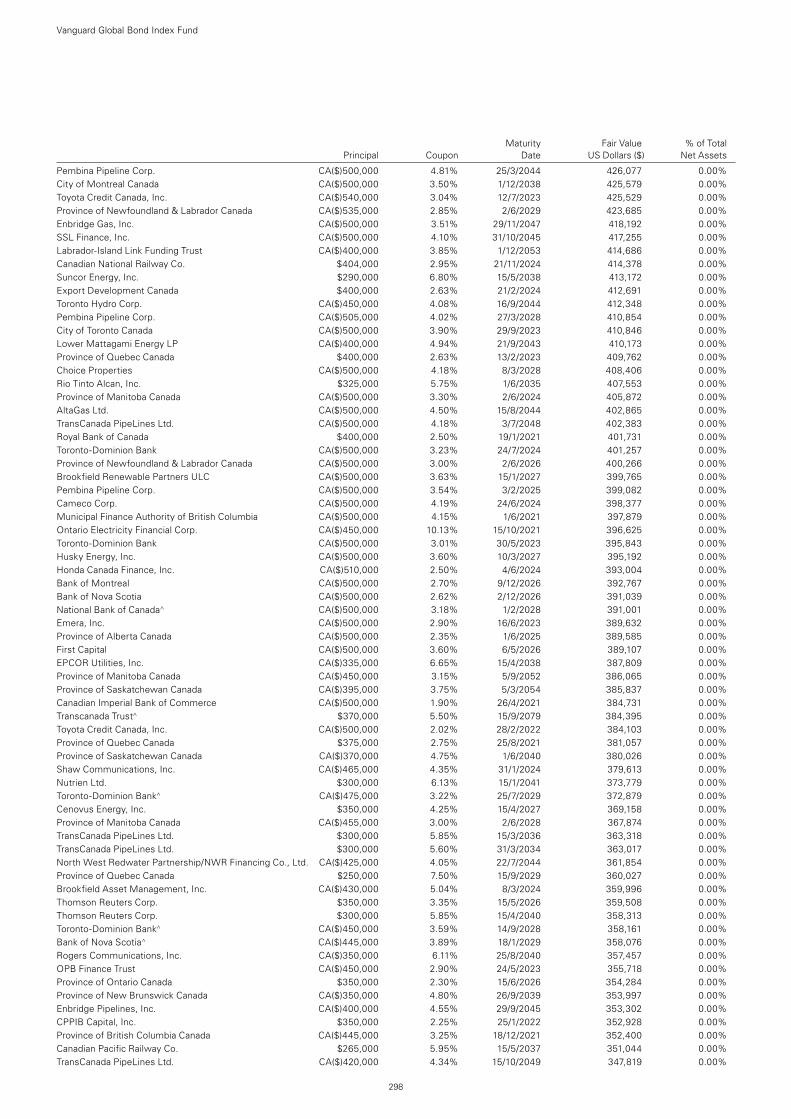
Maturity Fair Value % of Total Principal Coupon Date US Dollars ($) Net Assets
Pembina Pipeline Corp. CA($)500,000 4.81% 25/3/2044 426,077 0.00%City of Montreal Canada CA($)500,000 3.50% 1/12/2038 425,579 0.00%Toyota Credit Canada, Inc. CA($)540,000 3.04% 12/7/2023 425,529 0.00%Province of Newfoundland & Labrador Canada CA($)535,000 2.85% 2/6/2029 423,685 0.00%Enbridge Gas, Inc. CA($)500,000 3.51% 29/11/2047 418,192 0.00%SSL Finance, Inc. CA($)500,000 4.10% 31/10/2045 417,255 0.00%Labrador-Island Link Funding Trust CA($)400,000 3.85% 1/12/2053 414,686 0.00%Canadian National Railway Co. $404,000 2.95% 21/11/2024 414,378 0.00%Suncor Energy, Inc. $290,000 6.80% 15/5/2038 413,172 0.00%Export Development Canada $400,000 2.63% 21/2/2024 412,691 0.00%Toronto Hydro Corp. CA($)450,000 4.08% 16/9/2044 412,348 0.00%Pembina Pipeline Corp. CA($)505,000 4.02% 27/3/2028 410,854 0.00%City of Toronto Canada CA($)500,000 3.90% 29/9/2023 410,846 0.00%Lower Mattagami Energy LP CA($)400,000 4.94% 21/9/2043 410,173 0.00%Province of Quebec Canada $400,000 2.63% 13/2/2023 409,762 0.00%Choice Properties CA($)500,000 4.18% 8/3/2028 408,406 0.00%Rio Tinto Alcan, Inc. $325,000 5.75% 1/6/2035 407,553 0.00%Province of Manitoba Canada CA($)500,000 3.30% 2/6/2024 405,872 0.00%AltaGas Ltd. CA($)500,000 4.50% 15/8/2044 402,865 0.00%TransCanada PipeLines Ltd. CA($)500,000 4.18% 3/7/2048 402,383 0.00%Royal Bank of Canada $400,000 2.50% 19/1/2021 401,731 0.00%Toronto-Dominion Bank CA($)500,000 3.23% 24/7/2024 401,257 0.00%Province of Newfoundland & Labrador Canada CA($)500,000 3.00% 2/6/2026 400,266 0.00%Brookfield Renewable Partners ULC CA($)500,000 3.63% 15/1/2027 399,765 0.00%Pembina Pipeline Corp. CA($)500,000 3.54% 3/2/2025 399,082 0.00%Cameco Corp. CA($)500,000 4.19% 24/6/2024 398,377 0.00%Municipal Finance Authority of British Columbia CA($)500,000 4.15% 1/6/2021 397,879 0.00%Ontario Electricity Financial Corp. CA($)450,000 10.13% 15/10/2021 396,625 0.00%Toronto-Dominion Bank CA($)500,000 3.01% 30/5/2023 395,843 0.00%Husky Energy, Inc. CA($)500,000 3.60% 10/3/2027 395,192 0.00%Honda Canada Finance, Inc. CA($)510,000 2.50% 4/6/2024 393,004 0.00%Bank of Montreal CA($)500,000 2.70% 9/12/2026 392,767 0.00%Bank of Nova Scotia CA($)500,000 2.62% 2/12/2026 391,039 0.00%National Bank of Canada^ CA($)500,000 3.18% 1/2/2028 391,001 0.00%Emera, Inc. CA($)500,000 2.90% 16/6/2023 389,632 0.00%Province of Alberta Canada CA($)500,000 2.35% 1/6/2025 389,585 0.00%First Capital CA($)500,000 3.60% 6/5/2026 389,107 0.00%EPCOR Utilities, Inc. CA($)335,000 6.65% 15/4/2038 387,809 0.00%Province of Manitoba Canada CA($)450,000 3.15% 5/9/2052 386,065 0.00%Province of Saskatchewan Canada CA($)395,000 3.75% 5/3/2054 385,837 0.00%Canadian Imperial Bank of Commerce CA($)500,000 1.90% 26/4/2021 384,731 0.00%Transcanada Trust^ $370,000 5.50% 15/9/2079 384,395 0.00%Toyota Credit Canada, Inc. CA($)500,000 2.02% 28/2/2022 384,103 0.00%Province of Quebec Canada $375,000 2.75% 25/8/2021 381,057 0.00%Province of Saskatchewan Canada CA($)370,000 4.75% 1/6/2040 380,026 0.00%Shaw Communications, Inc. CA($)465,000 4.35% 31/1/2024 379,613 0.00%Nutrien Ltd. $300,000 6.13% 15/1/2041 373,779 0.00%Toronto-Dominion Bank^ CA($)475,000 3.22% 25/7/2029 372,879 0.00%Cenovus Energy, Inc. $350,000 4.25% 15/4/2027 369,158 0.00%Province of Manitoba Canada CA($)455,000 3.00% 2/6/2028 367,874 0.00%TransCanada PipeLines Ltd. $300,000 5.85% 15/3/2036 363,318 0.00%TransCanada PipeLines Ltd. $300,000 5.60% 31/3/2034 363,017 0.00%North West Redwater Partnership/NWR Financing Co., Ltd. CA($)425,000 4.05% 22/7/2044 361,854 0.00%Province of Quebec Canada $250,000 7.50% 15/9/2029 360,027 0.00%Brookfield Asset Management, Inc. CA($)430,000 5.04% 8/3/2024 359,996 0.00%Thomson Reuters Corp. $350,000 3.35% 15/5/2026 359,508 0.00%Thomson Reuters Corp. $300,000 5.85% 15/4/2040 358,313 0.00%Toronto-Dominion Bank^ CA($)450,000 3.59% 14/9/2028 358,161 0.00%Bank of Nova Scotia^ CA($)445,000 3.89% 18/1/2029 358,076 0.00%Rogers Communications, Inc. CA($)350,000 6.11% 25/8/2040 357,457 0.00%OPB Finance Trust CA($)450,000 2.90% 24/5/2023 355,718 0.00%Province of Ontario Canada $350,000 2.30% 15/6/2026 354,284 0.00%Province of New Brunswick Canada CA($)350,000 4.80% 26/9/2039 353,997 0.00%Enbridge Pipelines, Inc. CA($)400,000 4.55% 29/9/2045 353,302 0.00%CPPIB Capital, Inc. $350,000 2.25% 25/1/2022 352,928 0.00%Province of British Columbia Canada CA($)445,000 3.25% 18/12/2021 352,400 0.00%Canadian Pacific Railway Co. $265,000 5.95% 15/5/2037 351,044 0.00%TransCanada PipeLines Ltd. CA($)420,000 4.34% 15/10/2049 347,819 0.00%
Vanguard Global Bond Index Fund
298
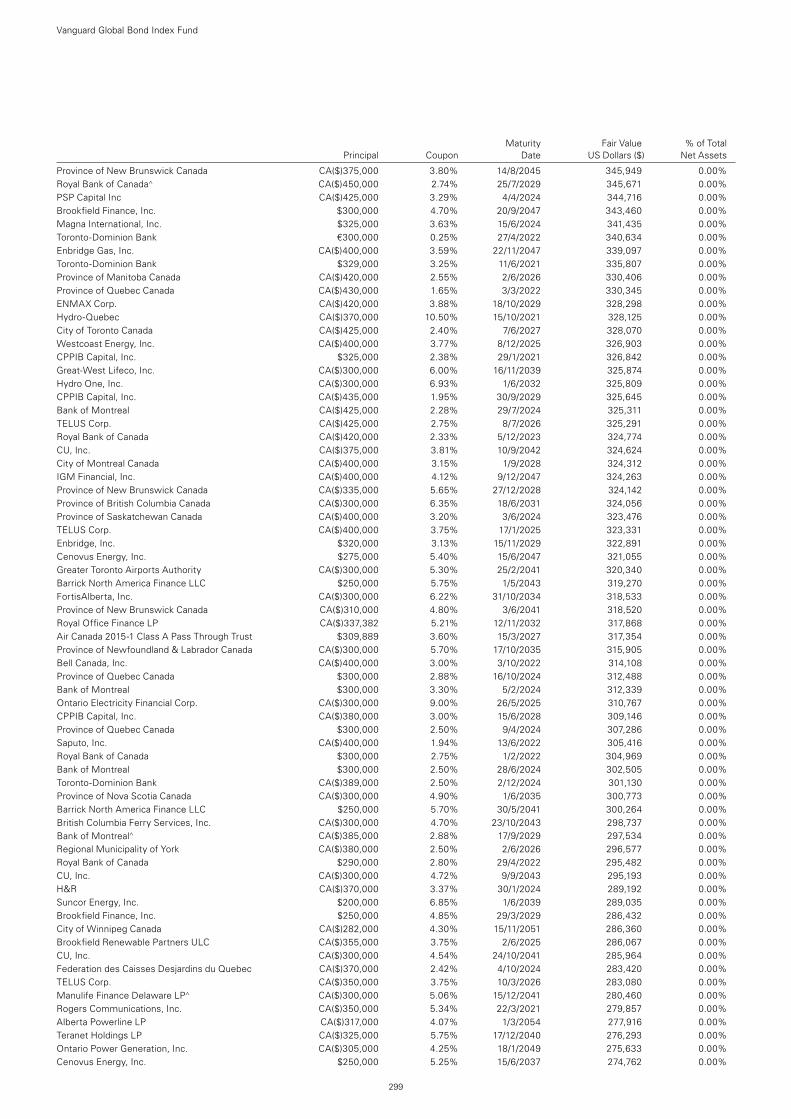
Maturity Fair Value % of Total Principal Coupon Date US Dollars ($) Net Assets
Province of New Brunswick Canada CA($)375,000 3.80% 14/8/2045 345,949 0.00%Royal Bank of Canada^ CA($)450,000 2.74% 25/7/2029 345,671 0.00%PSP Capital Inc CA($)425,000 3.29% 4/4/2024 344,716 0.00%Brookfield Finance, Inc. $300,000 4.70% 20/9/2047 343,460 0.00%Magna International, Inc. $325,000 3.63% 15/6/2024 341,435 0.00%Toronto-Dominion Bank €300,000 0.25% 27/4/2022 340,634 0.00%Enbridge Gas, Inc. CA($)400,000 3.59% 22/11/2047 339,097 0.00%Toronto-Dominion Bank $329,000 3.25% 11/6/2021 335,807 0.00%Province of Manitoba Canada CA($)420,000 2.55% 2/6/2026 330,406 0.00%Province of Quebec Canada CA($)430,000 1.65% 3/3/2022 330,345 0.00%ENMAX Corp. CA($)420,000 3.88% 18/10/2029 328,298 0.00%Hydro-Quebec CA($)370,000 10.50% 15/10/2021 328,125 0.00%City of Toronto Canada CA($)425,000 2.40% 7/6/2027 328,070 0.00%Westcoast Energy, Inc. CA($)400,000 3.77% 8/12/2025 326,903 0.00%CPPIB Capital, Inc. $325,000 2.38% 29/1/2021 326,842 0.00%Great-West Lifeco, Inc. CA($)300,000 6.00% 16/11/2039 325,874 0.00%Hydro One, Inc. CA($)300,000 6.93% 1/6/2032 325,809 0.00%CPPIB Capital, Inc. CA($)435,000 1.95% 30/9/2029 325,645 0.00%Bank of Montreal CA($)425,000 2.28% 29/7/2024 325,311 0.00%TELUS Corp. CA($)425,000 2.75% 8/7/2026 325,291 0.00%Royal Bank of Canada CA($)420,000 2.33% 5/12/2023 324,774 0.00%CU, Inc. CA($)375,000 3.81% 10/9/2042 324,624 0.00%City of Montreal Canada CA($)400,000 3.15% 1/9/2028 324,312 0.00%IGM Financial, Inc. CA($)400,000 4.12% 9/12/2047 324,263 0.00%Province of New Brunswick Canada CA($)335,000 5.65% 27/12/2028 324,142 0.00%Province of British Columbia Canada CA($)300,000 6.35% 18/6/2031 324,056 0.00%Province of Saskatchewan Canada CA($)400,000 3.20% 3/6/2024 323,476 0.00%TELUS Corp. CA($)400,000 3.75% 17/1/2025 323,331 0.00%Enbridge, Inc. $320,000 3.13% 15/11/2029 322,891 0.00%Cenovus Energy, Inc. $275,000 5.40% 15/6/2047 321,055 0.00%Greater Toronto Airports Authority CA($)300,000 5.30% 25/2/2041 320,340 0.00%Barrick North America Finance LLC $250,000 5.75% 1/5/2043 319,270 0.00%FortisAlberta, Inc. CA($)300,000 6.22% 31/10/2034 318,533 0.00%Province of New Brunswick Canada CA($)310,000 4.80% 3/6/2041 318,520 0.00%Royal Office Finance LP CA($)337,382 5.21% 12/11/2032 317,868 0.00%Air Canada 2015-1 Class A Pass Through Trust $309,889 3.60% 15/3/2027 317,354 0.00%Province of Newfoundland & Labrador Canada CA($)300,000 5.70% 17/10/2035 315,905 0.00%Bell Canada, Inc. CA($)400,000 3.00% 3/10/2022 314,108 0.00%Province of Quebec Canada $300,000 2.88% 16/10/2024 312,488 0.00%Bank of Montreal $300,000 3.30% 5/2/2024 312,339 0.00%Ontario Electricity Financial Corp. CA($)300,000 9.00% 26/5/2025 310,767 0.00%CPPIB Capital, Inc. CA($)380,000 3.00% 15/6/2028 309,146 0.00%Province of Quebec Canada $300,000 2.50% 9/4/2024 307,286 0.00%Saputo, Inc. CA($)400,000 1.94% 13/6/2022 305,416 0.00%Royal Bank of Canada $300,000 2.75% 1/2/2022 304,969 0.00%Bank of Montreal $300,000 2.50% 28/6/2024 302,505 0.00%Toronto-Dominion Bank CA($)389,000 2.50% 2/12/2024 301,130 0.00%Province of Nova Scotia Canada CA($)300,000 4.90% 1/6/2035 300,773 0.00%Barrick North America Finance LLC $250,000 5.70% 30/5/2041 300,264 0.00%British Columbia Ferry Services, Inc. CA($)300,000 4.70% 23/10/2043 298,737 0.00%Bank of Montreal^ CA($)385,000 2.88% 17/9/2029 297,534 0.00%Regional Municipality of York CA($)380,000 2.50% 2/6/2026 296,577 0.00%Royal Bank of Canada $290,000 2.80% 29/4/2022 295,482 0.00%CU, Inc. CA($)300,000 4.72% 9/9/2043 295,193 0.00%H&R CA($)370,000 3.37% 30/1/2024 289,192 0.00%Suncor Energy, Inc. $200,000 6.85% 1/6/2039 289,035 0.00%Brookfield Finance, Inc. $250,000 4.85% 29/3/2029 286,432 0.00%City of Winnipeg Canada CA($)282,000 4.30% 15/11/2051 286,360 0.00%Brookfield Renewable Partners ULC CA($)355,000 3.75% 2/6/2025 286,067 0.00%CU, Inc. CA($)300,000 4.54% 24/10/2041 285,964 0.00%Federation des Caisses Desjardins du Quebec CA($)370,000 2.42% 4/10/2024 283,420 0.00%TELUS Corp. CA($)350,000 3.75% 10/3/2026 283,080 0.00%Manulife Finance Delaware LP^ CA($)300,000 5.06% 15/12/2041 280,460 0.00%Rogers Communications, Inc. CA($)350,000 5.34% 22/3/2021 279,857 0.00%Alberta Powerline LP CA($)317,000 4.07% 1/3/2054 277,916 0.00%Teranet Holdings LP CA($)325,000 5.75% 17/12/2040 276,293 0.00%Ontario Power Generation, Inc. CA($)305,000 4.25% 18/1/2049 275,633 0.00%Cenovus Energy, Inc. $250,000 5.25% 15/6/2037 274,762 0.00%
Vanguard Global Bond Index Fund
299
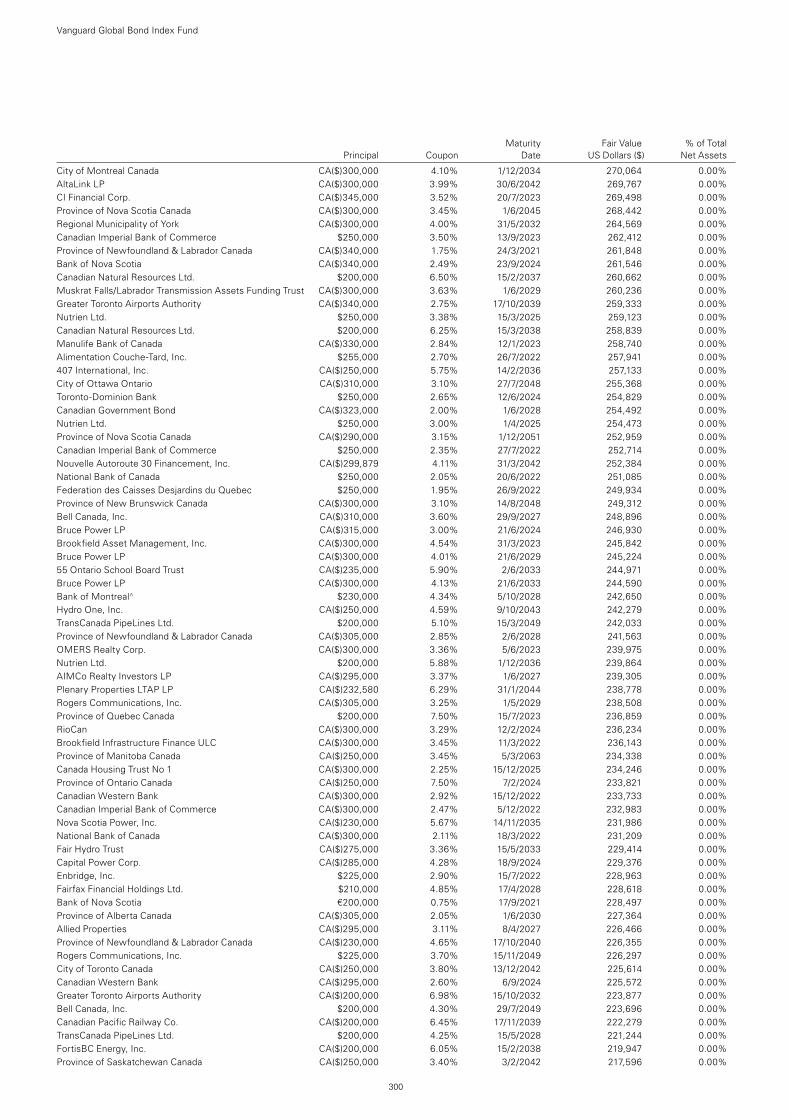
Maturity Fair Value % of Total Principal Coupon Date US Dollars ($) Net Assets
City of Montreal Canada CA($)300,000 4.10% 1/12/2034 270,064 0.00%AltaLink LP CA($)300,000 3.99% 30/6/2042 269,767 0.00%CI Financial Corp. CA($)345,000 3.52% 20/7/2023 269,498 0.00%Province of Nova Scotia Canada CA($)300,000 3.45% 1/6/2045 268,442 0.00%Regional Municipality of York CA($)300,000 4.00% 31/5/2032 264,569 0.00%Canadian Imperial Bank of Commerce $250,000 3.50% 13/9/2023 262,412 0.00%Province of Newfoundland & Labrador Canada CA($)340,000 1.75% 24/3/2021 261,848 0.00%Bank of Nova Scotia CA($)340,000 2.49% 23/9/2024 261,546 0.00%Canadian Natural Resources Ltd. $200,000 6.50% 15/2/2037 260,662 0.00%Muskrat Falls/Labrador Transmission Assets Funding Trust CA($)300,000 3.63% 1/6/2029 260,236 0.00%Greater Toronto Airports Authority CA($)340,000 2.75% 17/10/2039 259,333 0.00%Nutrien Ltd. $250,000 3.38% 15/3/2025 259,123 0.00%Canadian Natural Resources Ltd. $200,000 6.25% 15/3/2038 258,839 0.00%Manulife Bank of Canada CA($)330,000 2.84% 12/1/2023 258,740 0.00%Alimentation Couche-Tard, Inc. $255,000 2.70% 26/7/2022 257,941 0.00%407 International, Inc. CA($)250,000 5.75% 14/2/2036 257,133 0.00%City of Ottawa Ontario CA($)310,000 3.10% 27/7/2048 255,368 0.00%Toronto-Dominion Bank $250,000 2.65% 12/6/2024 254,829 0.00%Canadian Government Bond CA($)323,000 2.00% 1/6/2028 254,492 0.00%Nutrien Ltd. $250,000 3.00% 1/4/2025 254,473 0.00%Province of Nova Scotia Canada CA($)290,000 3.15% 1/12/2051 252,959 0.00%Canadian Imperial Bank of Commerce $250,000 2.35% 27/7/2022 252,714 0.00%Nouvelle Autoroute 30 Financement, Inc. CA($)299,879 4.11% 31/3/2042 252,384 0.00%National Bank of Canada $250,000 2.05% 20/6/2022 251,085 0.00%Federation des Caisses Desjardins du Quebec $250,000 1.95% 26/9/2022 249,934 0.00%Province of New Brunswick Canada CA($)300,000 3.10% 14/8/2048 249,312 0.00%Bell Canada, Inc. CA($)310,000 3.60% 29/9/2027 248,896 0.00%Bruce Power LP CA($)315,000 3.00% 21/6/2024 246,930 0.00%Brookfield Asset Management, Inc. CA($)300,000 4.54% 31/3/2023 245,842 0.00%Bruce Power LP CA($)300,000 4.01% 21/6/2029 245,224 0.00%55 Ontario School Board Trust CA($)235,000 5.90% 2/6/2033 244,971 0.00%Bruce Power LP CA($)300,000 4.13% 21/6/2033 244,590 0.00%Bank of Montreal^ $230,000 4.34% 5/10/2028 242,650 0.00%Hydro One, Inc. CA($)250,000 4.59% 9/10/2043 242,279 0.00%TransCanada PipeLines Ltd. $200,000 5.10% 15/3/2049 242,033 0.00%Province of Newfoundland & Labrador Canada CA($)305,000 2.85% 2/6/2028 241,563 0.00%OMERS Realty Corp. CA($)300,000 3.36% 5/6/2023 239,975 0.00%Nutrien Ltd. $200,000 5.88% 1/12/2036 239,864 0.00%AIMCo Realty Investors LP CA($)295,000 3.37% 1/6/2027 239,305 0.00%Plenary Properties LTAP LP CA($)232,580 6.29% 31/1/2044 238,778 0.00%Rogers Communications, Inc. CA($)305,000 3.25% 1/5/2029 238,508 0.00%Province of Quebec Canada $200,000 7.50% 15/7/2023 236,859 0.00%RioCan CA($)300,000 3.29% 12/2/2024 236,234 0.00%Brookfield Infrastructure Finance ULC CA($)300,000 3.45% 11/3/2022 236,143 0.00%Province of Manitoba Canada CA($)250,000 3.45% 5/3/2063 234,338 0.00%Canada Housing Trust No 1 CA($)300,000 2.25% 15/12/2025 234,246 0.00%Province of Ontario Canada CA($)250,000 7.50% 7/2/2024 233,821 0.00%Canadian Western Bank CA($)300,000 2.92% 15/12/2022 233,733 0.00%Canadian Imperial Bank of Commerce CA($)300,000 2.47% 5/12/2022 232,983 0.00%Nova Scotia Power, Inc. CA($)230,000 5.67% 14/11/2035 231,986 0.00%National Bank of Canada CA($)300,000 2.11% 18/3/2022 231,209 0.00%Fair Hydro Trust CA($)275,000 3.36% 15/5/2033 229,414 0.00%Capital Power Corp. CA($)285,000 4.28% 18/9/2024 229,376 0.00%Enbridge, Inc. $225,000 2.90% 15/7/2022 228,963 0.00%Fairfax Financial Holdings Ltd. $210,000 4.85% 17/4/2028 228,618 0.00%Bank of Nova Scotia €200,000 0.75% 17/9/2021 228,497 0.00%Province of Alberta Canada CA($)305,000 2.05% 1/6/2030 227,364 0.00%Allied Properties CA($)295,000 3.11% 8/4/2027 226,466 0.00%Province of Newfoundland & Labrador Canada CA($)230,000 4.65% 17/10/2040 226,355 0.00%Rogers Communications, Inc. $225,000 3.70% 15/11/2049 226,297 0.00%City of Toronto Canada CA($)250,000 3.80% 13/12/2042 225,614 0.00%Canadian Western Bank CA($)295,000 2.60% 6/9/2024 225,572 0.00%Greater Toronto Airports Authority CA($)200,000 6.98% 15/10/2032 223,877 0.00%Bell Canada, Inc. $200,000 4.30% 29/7/2049 223,696 0.00%Canadian Pacific Railway Co. CA($)200,000 6.45% 17/11/2039 222,279 0.00%TransCanada PipeLines Ltd. $200,000 4.25% 15/5/2028 221,244 0.00%FortisBC Energy, Inc. CA($)200,000 6.05% 15/2/2038 219,947 0.00%Province of Saskatchewan Canada CA($)250,000 3.40% 3/2/2042 217,596 0.00%
Vanguard Global Bond Index Fund
300
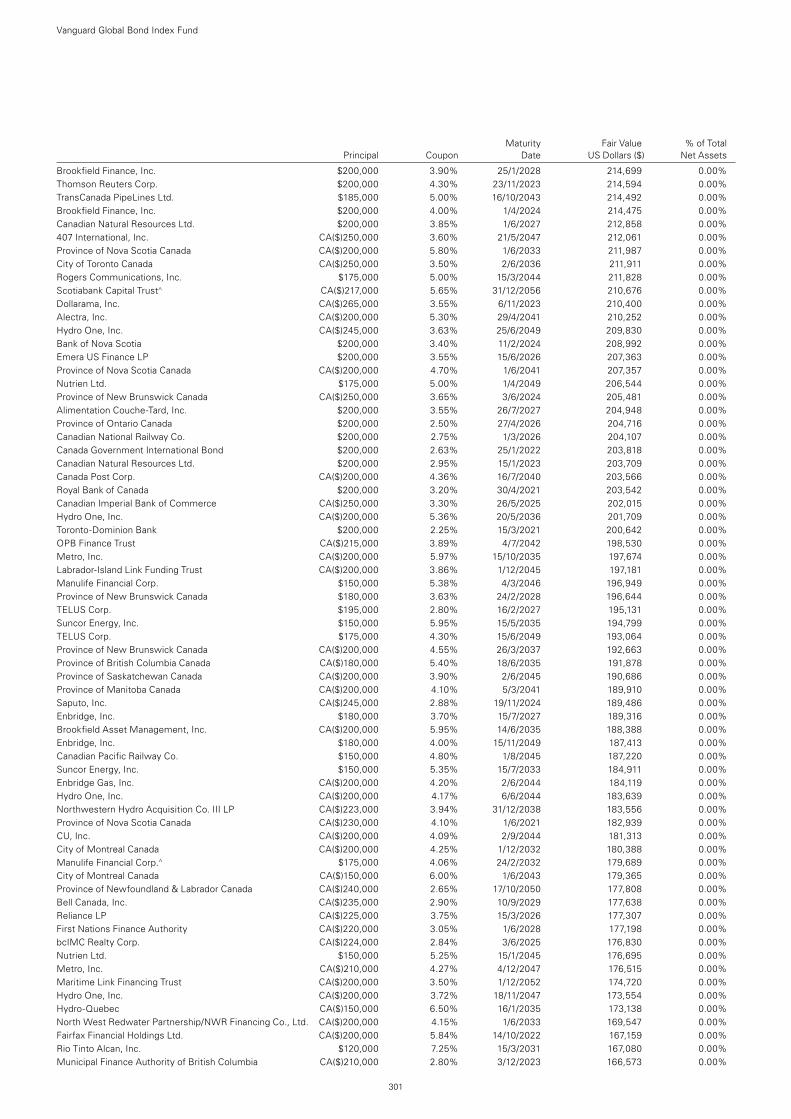
Maturity Fair Value % of Total Principal Coupon Date US Dollars ($) Net Assets
Brookfield Finance, Inc. $200,000 3.90% 25/1/2028 214,699 0.00%Thomson Reuters Corp. $200,000 4.30% 23/11/2023 214,594 0.00%TransCanada PipeLines Ltd. $185,000 5.00% 16/10/2043 214,492 0.00%Brookfield Finance, Inc. $200,000 4.00% 1/4/2024 214,475 0.00%Canadian Natural Resources Ltd. $200,000 3.85% 1/6/2027 212,858 0.00%407 International, Inc. CA($)250,000 3.60% 21/5/2047 212,061 0.00%Province of Nova Scotia Canada CA($)200,000 5.80% 1/6/2033 211,987 0.00%City of Toronto Canada CA($)250,000 3.50% 2/6/2036 211,911 0.00%Rogers Communications, Inc. $175,000 5.00% 15/3/2044 211,828 0.00%Scotiabank Capital Trust^ CA($)217,000 5.65% 31/12/2056 210,676 0.00%Dollarama, Inc. CA($)265,000 3.55% 6/11/2023 210,400 0.00%Alectra, Inc. CA($)200,000 5.30% 29/4/2041 210,252 0.00%Hydro One, Inc. CA($)245,000 3.63% 25/6/2049 209,830 0.00%Bank of Nova Scotia $200,000 3.40% 11/2/2024 208,992 0.00%Emera US Finance LP $200,000 3.55% 15/6/2026 207,363 0.00%Province of Nova Scotia Canada CA($)200,000 4.70% 1/6/2041 207,357 0.00%Nutrien Ltd. $175,000 5.00% 1/4/2049 206,544 0.00%Province of New Brunswick Canada CA($)250,000 3.65% 3/6/2024 205,481 0.00%Alimentation Couche-Tard, Inc. $200,000 3.55% 26/7/2027 204,948 0.00%Province of Ontario Canada $200,000 2.50% 27/4/2026 204,716 0.00%Canadian National Railway Co. $200,000 2.75% 1/3/2026 204,107 0.00%Canada Government International Bond $200,000 2.63% 25/1/2022 203,818 0.00%Canadian Natural Resources Ltd. $200,000 2.95% 15/1/2023 203,709 0.00%Canada Post Corp. CA($)200,000 4.36% 16/7/2040 203,566 0.00%Royal Bank of Canada $200,000 3.20% 30/4/2021 203,542 0.00%Canadian Imperial Bank of Commerce CA($)250,000 3.30% 26/5/2025 202,015 0.00%Hydro One, Inc. CA($)200,000 5.36% 20/5/2036 201,709 0.00%Toronto-Dominion Bank $200,000 2.25% 15/3/2021 200,642 0.00%OPB Finance Trust CA($)215,000 3.89% 4/7/2042 198,530 0.00%Metro, Inc. CA($)200,000 5.97% 15/10/2035 197,674 0.00%Labrador-Island Link Funding Trust CA($)200,000 3.86% 1/12/2045 197,181 0.00%Manulife Financial Corp. $150,000 5.38% 4/3/2046 196,949 0.00%Province of New Brunswick Canada $180,000 3.63% 24/2/2028 196,644 0.00%TELUS Corp. $195,000 2.80% 16/2/2027 195,131 0.00%Suncor Energy, Inc. $150,000 5.95% 15/5/2035 194,799 0.00%TELUS Corp. $175,000 4.30% 15/6/2049 193,064 0.00%Province of New Brunswick Canada CA($)200,000 4.55% 26/3/2037 192,663 0.00%Province of British Columbia Canada CA($)180,000 5.40% 18/6/2035 191,878 0.00%Province of Saskatchewan Canada CA($)200,000 3.90% 2/6/2045 190,686 0.00%Province of Manitoba Canada CA($)200,000 4.10% 5/3/2041 189,910 0.00%Saputo, Inc. CA($)245,000 2.88% 19/11/2024 189,486 0.00%Enbridge, Inc. $180,000 3.70% 15/7/2027 189,316 0.00%Brookfield Asset Management, Inc. CA($)200,000 5.95% 14/6/2035 188,388 0.00%Enbridge, Inc. $180,000 4.00% 15/11/2049 187,413 0.00%Canadian Pacific Railway Co. $150,000 4.80% 1/8/2045 187,220 0.00%Suncor Energy, Inc. $150,000 5.35% 15/7/2033 184,911 0.00%Enbridge Gas, Inc. CA($)200,000 4.20% 2/6/2044 184,119 0.00%Hydro One, Inc. CA($)200,000 4.17% 6/6/2044 183,639 0.00%Northwestern Hydro Acquisition Co. III LP CA($)223,000 3.94% 31/12/2038 183,556 0.00%Province of Nova Scotia Canada CA($)230,000 4.10% 1/6/2021 182,939 0.00%CU, Inc. CA($)200,000 4.09% 2/9/2044 181,313 0.00%City of Montreal Canada CA($)200,000 4.25% 1/12/2032 180,388 0.00%Manulife Financial Corp.^ $175,000 4.06% 24/2/2032 179,689 0.00%City of Montreal Canada CA($)150,000 6.00% 1/6/2043 179,365 0.00%Province of Newfoundland & Labrador Canada CA($)240,000 2.65% 17/10/2050 177,808 0.00%Bell Canada, Inc. CA($)235,000 2.90% 10/9/2029 177,638 0.00%Reliance LP CA($)225,000 3.75% 15/3/2026 177,307 0.00%First Nations Finance Authority CA($)220,000 3.05% 1/6/2028 177,198 0.00%bcIMC Realty Corp. CA($)224,000 2.84% 3/6/2025 176,830 0.00%Nutrien Ltd. $150,000 5.25% 15/1/2045 176,695 0.00%Metro, Inc. CA($)210,000 4.27% 4/12/2047 176,515 0.00%Maritime Link Financing Trust CA($)200,000 3.50% 1/12/2052 174,720 0.00%Hydro One, Inc. CA($)200,000 3.72% 18/11/2047 173,554 0.00%Hydro-Quebec CA($)150,000 6.50% 16/1/2035 173,138 0.00%North West Redwater Partnership/NWR Financing Co., Ltd. CA($)200,000 4.15% 1/6/2033 169,547 0.00%Fairfax Financial Holdings Ltd. CA($)200,000 5.84% 14/10/2022 167,159 0.00%Rio Tinto Alcan, Inc. $120,000 7.25% 15/3/2031 167,080 0.00%Municipal Finance Authority of British Columbia CA($)210,000 2.80% 3/12/2023 166,573 0.00%
Vanguard Global Bond Index Fund
301
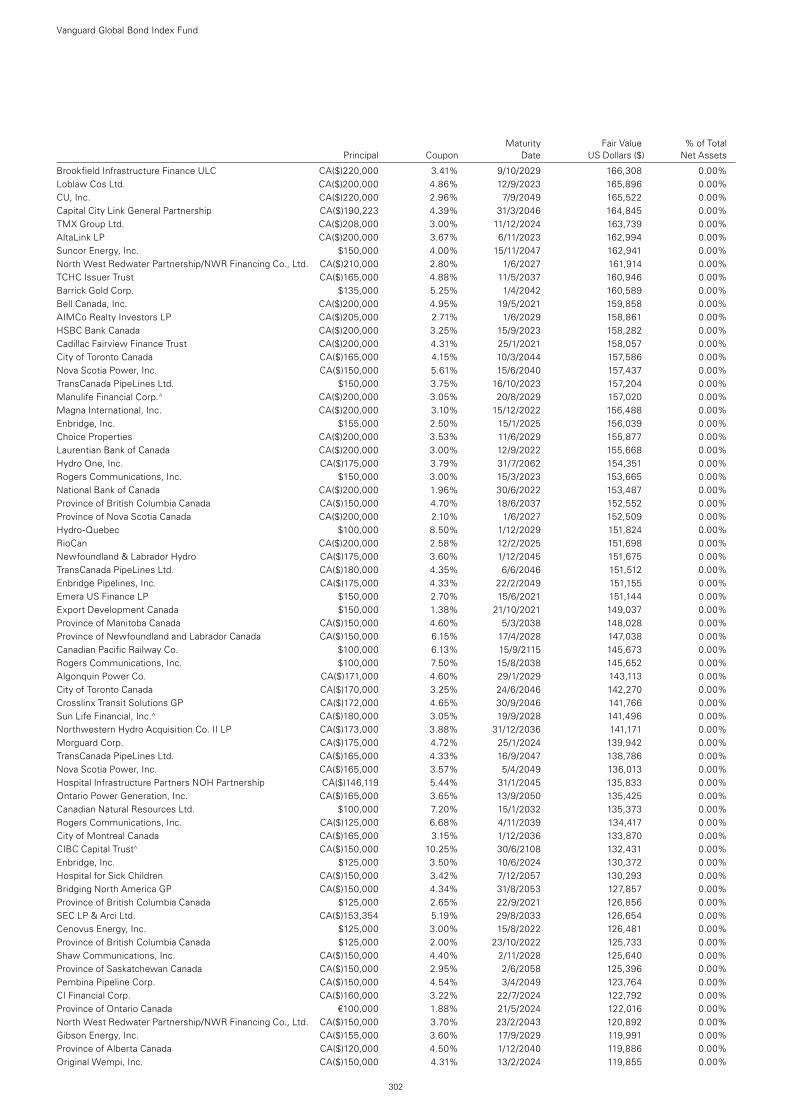
Maturity Fair Value % of Total Principal Coupon Date US Dollars ($) Net Assets
Brookfield Infrastructure Finance ULC CA($)220,000 3.41% 9/10/2029 166,308 0.00%Loblaw Cos Ltd. CA($)200,000 4.86% 12/9/2023 165,896 0.00%CU, Inc. CA($)220,000 2.96% 7/9/2049 165,522 0.00%Capital City Link General Partnership CA($)190,223 4.39% 31/3/2046 164,845 0.00%TMX Group Ltd. CA($)208,000 3.00% 11/12/2024 163,739 0.00%AltaLink LP CA($)200,000 3.67% 6/11/2023 162,994 0.00%Suncor Energy, Inc. $150,000 4.00% 15/11/2047 162,941 0.00%North West Redwater Partnership/NWR Financing Co., Ltd. CA($)210,000 2.80% 1/6/2027 161,914 0.00%TCHC Issuer Trust CA($)165,000 4.88% 11/5/2037 160,946 0.00%Barrick Gold Corp. $135,000 5.25% 1/4/2042 160,589 0.00%Bell Canada, Inc. CA($)200,000 4.95% 19/5/2021 159,858 0.00%AIMCo Realty Investors LP CA($)205,000 2.71% 1/6/2029 158,861 0.00%HSBC Bank Canada CA($)200,000 3.25% 15/9/2023 158,282 0.00%Cadillac Fairview Finance Trust CA($)200,000 4.31% 25/1/2021 158,057 0.00%City of Toronto Canada CA($)165,000 4.15% 10/3/2044 157,586 0.00%Nova Scotia Power, Inc. CA($)150,000 5.61% 15/6/2040 157,437 0.00%TransCanada PipeLines Ltd. $150,000 3.75% 16/10/2023 157,204 0.00%Manulife Financial Corp.^ CA($)200,000 3.05% 20/8/2029 157,020 0.00%Magna International, Inc. CA($)200,000 3.10% 15/12/2022 156,488 0.00%Enbridge, Inc. $155,000 2.50% 15/1/2025 156,039 0.00%Choice Properties CA($)200,000 3.53% 11/6/2029 155,877 0.00%Laurentian Bank of Canada CA($)200,000 3.00% 12/9/2022 155,668 0.00%Hydro One, Inc. CA($)175,000 3.79% 31/7/2062 154,351 0.00%Rogers Communications, Inc. $150,000 3.00% 15/3/2023 153,665 0.00%National Bank of Canada CA($)200,000 1.96% 30/6/2022 153,487 0.00%Province of British Columbia Canada CA($)150,000 4.70% 18/6/2037 152,552 0.00%Province of Nova Scotia Canada CA($)200,000 2.10% 1/6/2027 152,509 0.00%Hydro-Quebec $100,000 8.50% 1/12/2029 151,824 0.00%RioCan CA($)200,000 2.58% 12/2/2025 151,698 0.00%Newfoundland & Labrador Hydro CA($)175,000 3.60% 1/12/2045 151,675 0.00%TransCanada PipeLines Ltd. CA($)180,000 4.35% 6/6/2046 151,512 0.00%Enbridge Pipelines, Inc. CA($)175,000 4.33% 22/2/2049 151,155 0.00%Emera US Finance LP $150,000 2.70% 15/6/2021 151,144 0.00%Export Development Canada $150,000 1.38% 21/10/2021 149,037 0.00%Province of Manitoba Canada CA($)150,000 4.60% 5/3/2038 148,028 0.00%Province of Newfoundland and Labrador Canada CA($)150,000 6.15% 17/4/2028 147,038 0.00%Canadian Pacific Railway Co. $100,000 6.13% 15/9/2115 145,673 0.00%Rogers Communications, Inc. $100,000 7.50% 15/8/2038 145,652 0.00%Algonquin Power Co. CA($)171,000 4.60% 29/1/2029 143,113 0.00%City of Toronto Canada CA($)170,000 3.25% 24/6/2046 142,270 0.00%Crosslinx Transit Solutions GP CA($)172,000 4.65% 30/9/2046 141,766 0.00%Sun Life Financial, Inc.^ CA($)180,000 3.05% 19/9/2028 141,496 0.00%Northwestern Hydro Acquisition Co. II LP CA($)173,000 3.88% 31/12/2036 141,171 0.00%Morguard Corp. CA($)175,000 4.72% 25/1/2024 139,942 0.00%TransCanada PipeLines Ltd. CA($)165,000 4.33% 16/9/2047 138,786 0.00%Nova Scotia Power, Inc. CA($)165,000 3.57% 5/4/2049 136,013 0.00%Hospital Infrastructure Partners NOH Partnership CA($)146,119 5.44% 31/1/2045 135,833 0.00%Ontario Power Generation, Inc. CA($)165,000 3.65% 13/9/2050 135,425 0.00%Canadian Natural Resources Ltd. $100,000 7.20% 15/1/2032 135,373 0.00%Rogers Communications, Inc. CA($)125,000 6.68% 4/11/2039 134,417 0.00%City of Montreal Canada CA($)165,000 3.15% 1/12/2036 133,870 0.00%CIBC Capital Trust^ CA($)150,000 10.25% 30/6/2108 132,431 0.00%Enbridge, Inc. $125,000 3.50% 10/6/2024 130,372 0.00%Hospital for Sick Children CA($)150,000 3.42% 7/12/2057 130,293 0.00%Bridging North America GP CA($)150,000 4.34% 31/8/2053 127,857 0.00%Province of British Columbia Canada $125,000 2.65% 22/9/2021 126,856 0.00%SEC LP & Arci Ltd. CA($)153,354 5.19% 29/8/2033 126,654 0.00%Cenovus Energy, Inc. $125,000 3.00% 15/8/2022 126,481 0.00%Province of British Columbia Canada $125,000 2.00% 23/10/2022 125,733 0.00%Shaw Communications, Inc. CA($)150,000 4.40% 2/11/2028 125,640 0.00%Province of Saskatchewan Canada CA($)150,000 2.95% 2/6/2058 125,396 0.00%Pembina Pipeline Corp. CA($)150,000 4.54% 3/4/2049 123,764 0.00%CI Financial Corp. CA($)160,000 3.22% 22/7/2024 122,792 0.00%Province of Ontario Canada €100,000 1.88% 21/5/2024 122,016 0.00%North West Redwater Partnership/NWR Financing Co., Ltd. CA($)150,000 3.70% 23/2/2043 120,892 0.00%Gibson Energy, Inc. CA($)155,000 3.60% 17/9/2029 119,991 0.00%Province of Alberta Canada CA($)120,000 4.50% 1/12/2040 119,886 0.00%Original Wempi, Inc. CA($)150,000 4.31% 13/2/2024 119,855 0.00%
Vanguard Global Bond Index Fund
302
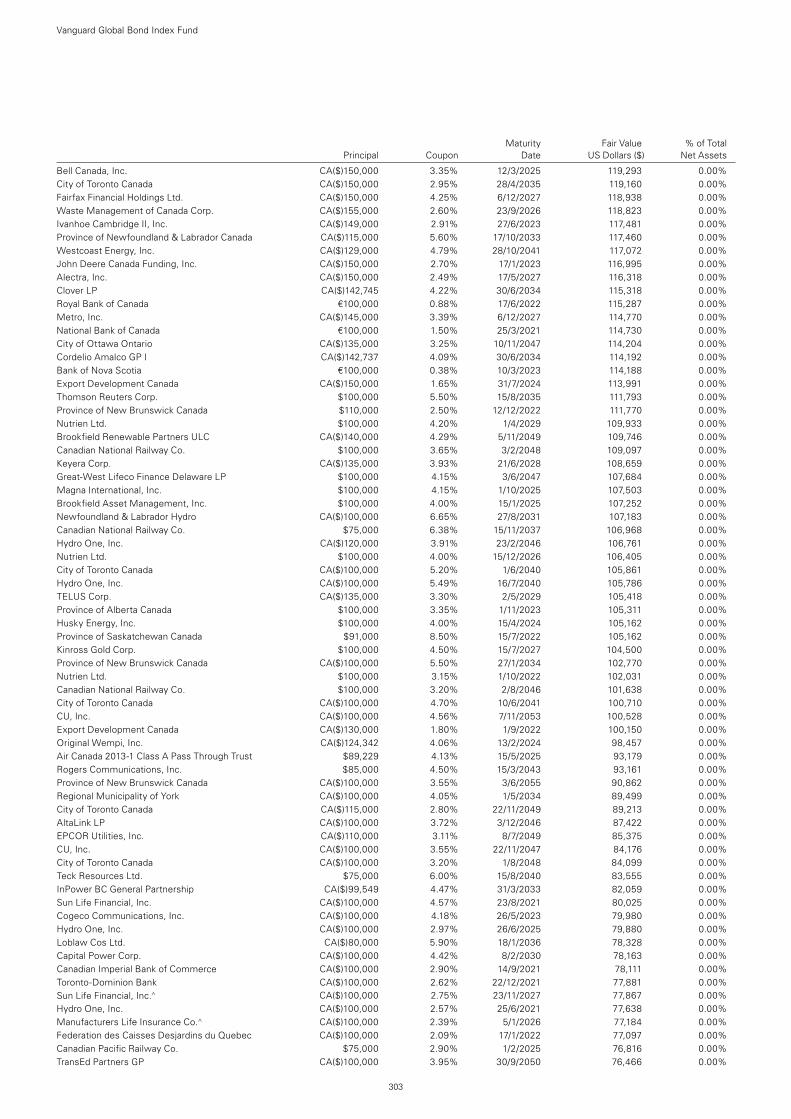
Maturity Fair Value % of Total Principal Coupon Date US Dollars ($) Net Assets
Bell Canada, Inc. CA($)150,000 3.35% 12/3/2025 119,293 0.00%City of Toronto Canada CA($)150,000 2.95% 28/4/2035 119,160 0.00%Fairfax Financial Holdings Ltd. CA($)150,000 4.25% 6/12/2027 118,938 0.00%Waste Management of Canada Corp. CA($)155,000 2.60% 23/9/2026 118,823 0.00%Ivanhoe Cambridge II, Inc. CA($)149,000 2.91% 27/6/2023 117,481 0.00%Province of Newfoundland & Labrador Canada CA($)115,000 5.60% 17/10/2033 117,460 0.00%Westcoast Energy, Inc. CA($)129,000 4.79% 28/10/2041 117,072 0.00%John Deere Canada Funding, Inc. CA($)150,000 2.70% 17/1/2023 116,995 0.00%Alectra, Inc. CA($)150,000 2.49% 17/5/2027 116,318 0.00%Clover LP CA($)142,745 4.22% 30/6/2034 115,318 0.00%Royal Bank of Canada €100,000 0.88% 17/6/2022 115,287 0.00%Metro, Inc. CA($)145,000 3.39% 6/12/2027 114,770 0.00%National Bank of Canada €100,000 1.50% 25/3/2021 114,730 0.00%City of Ottawa Ontario CA($)135,000 3.25% 10/11/2047 114,204 0.00%Cordelio Amalco GP I CA($)142,737 4.09% 30/6/2034 114,192 0.00%Bank of Nova Scotia €100,000 0.38% 10/3/2023 114,188 0.00%Export Development Canada CA($)150,000 1.65% 31/7/2024 113,991 0.00%Thomson Reuters Corp. $100,000 5.50% 15/8/2035 111,793 0.00%Province of New Brunswick Canada $110,000 2.50% 12/12/2022 111,770 0.00%Nutrien Ltd. $100,000 4.20% 1/4/2029 109,933 0.00%Brookfield Renewable Partners ULC CA($)140,000 4.29% 5/11/2049 109,746 0.00%Canadian National Railway Co. $100,000 3.65% 3/2/2048 109,097 0.00%Keyera Corp. CA($)135,000 3.93% 21/6/2028 108,659 0.00%Great-West Lifeco Finance Delaware LP $100,000 4.15% 3/6/2047 107,684 0.00%Magna International, Inc. $100,000 4.15% 1/10/2025 107,503 0.00%Brookfield Asset Management, Inc. $100,000 4.00% 15/1/2025 107,252 0.00%Newfoundland & Labrador Hydro CA($)100,000 6.65% 27/8/2031 107,183 0.00%Canadian National Railway Co. $75,000 6.38% 15/11/2037 106,968 0.00%Hydro One, Inc. CA($)120,000 3.91% 23/2/2046 106,761 0.00%Nutrien Ltd. $100,000 4.00% 15/12/2026 106,405 0.00%City of Toronto Canada CA($)100,000 5.20% 1/6/2040 105,861 0.00%Hydro One, Inc. CA($)100,000 5.49% 16/7/2040 105,786 0.00%TELUS Corp. CA($)135,000 3.30% 2/5/2029 105,418 0.00%Province of Alberta Canada $100,000 3.35% 1/11/2023 105,311 0.00%Husky Energy, Inc. $100,000 4.00% 15/4/2024 105,162 0.00%Province of Saskatchewan Canada $91,000 8.50% 15/7/2022 105,162 0.00%Kinross Gold Corp. $100,000 4.50% 15/7/2027 104,500 0.00%Province of New Brunswick Canada CA($)100,000 5.50% 27/1/2034 102,770 0.00%Nutrien Ltd. $100,000 3.15% 1/10/2022 102,031 0.00%Canadian National Railway Co. $100,000 3.20% 2/8/2046 101,638 0.00%City of Toronto Canada CA($)100,000 4.70% 10/6/2041 100,710 0.00%CU, Inc. CA($)100,000 4.56% 7/11/2053 100,528 0.00%Export Development Canada CA($)130,000 1.80% 1/9/2022 100,150 0.00%Original Wempi, Inc. CA($)124,342 4.06% 13/2/2024 98,457 0.00%Air Canada 2013-1 Class A Pass Through Trust $89,229 4.13% 15/5/2025 93,179 0.00%Rogers Communications, Inc. $85,000 4.50% 15/3/2043 93,161 0.00%Province of New Brunswick Canada CA($)100,000 3.55% 3/6/2055 90,862 0.00%Regional Municipality of York CA($)100,000 4.05% 1/5/2034 89,499 0.00%City of Toronto Canada CA($)115,000 2.80% 22/11/2049 89,213 0.00%AltaLink LP CA($)100,000 3.72% 3/12/2046 87,422 0.00%EPCOR Utilities, Inc. CA($)110,000 3.11% 8/7/2049 85,375 0.00%CU, Inc. CA($)100,000 3.55% 22/11/2047 84,176 0.00%City of Toronto Canada CA($)100,000 3.20% 1/8/2048 84,099 0.00%Teck Resources Ltd. $75,000 6.00% 15/8/2040 83,555 0.00%InPower BC General Partnership CA($)99,549 4.47% 31/3/2033 82,059 0.00%Sun Life Financial, Inc. CA($)100,000 4.57% 23/8/2021 80,025 0.00%Cogeco Communications, Inc. CA($)100,000 4.18% 26/5/2023 79,980 0.00%Hydro One, Inc. CA($)100,000 2.97% 26/6/2025 79,880 0.00%Loblaw Cos Ltd. CA($)80,000 5.90% 18/1/2036 78,328 0.00%Capital Power Corp. CA($)100,000 4.42% 8/2/2030 78,163 0.00%Canadian Imperial Bank of Commerce CA($)100,000 2.90% 14/9/2021 78,111 0.00%Toronto-Dominion Bank CA($)100,000 2.62% 22/12/2021 77,881 0.00%Sun Life Financial, Inc.^ CA($)100,000 2.75% 23/11/2027 77,867 0.00%Hydro One, Inc. CA($)100,000 2.57% 25/6/2021 77,638 0.00%Manufacturers Life Insurance Co.^ CA($)100,000 2.39% 5/1/2026 77,184 0.00%Federation des Caisses Desjardins du Quebec CA($)100,000 2.09% 17/1/2022 77,097 0.00%Canadian Pacific Railway Co. $75,000 2.90% 1/2/2025 76,816 0.00%TransEd Partners GP CA($)100,000 3.95% 30/9/2050 76,466 0.00%
Vanguard Global Bond Index Fund
303
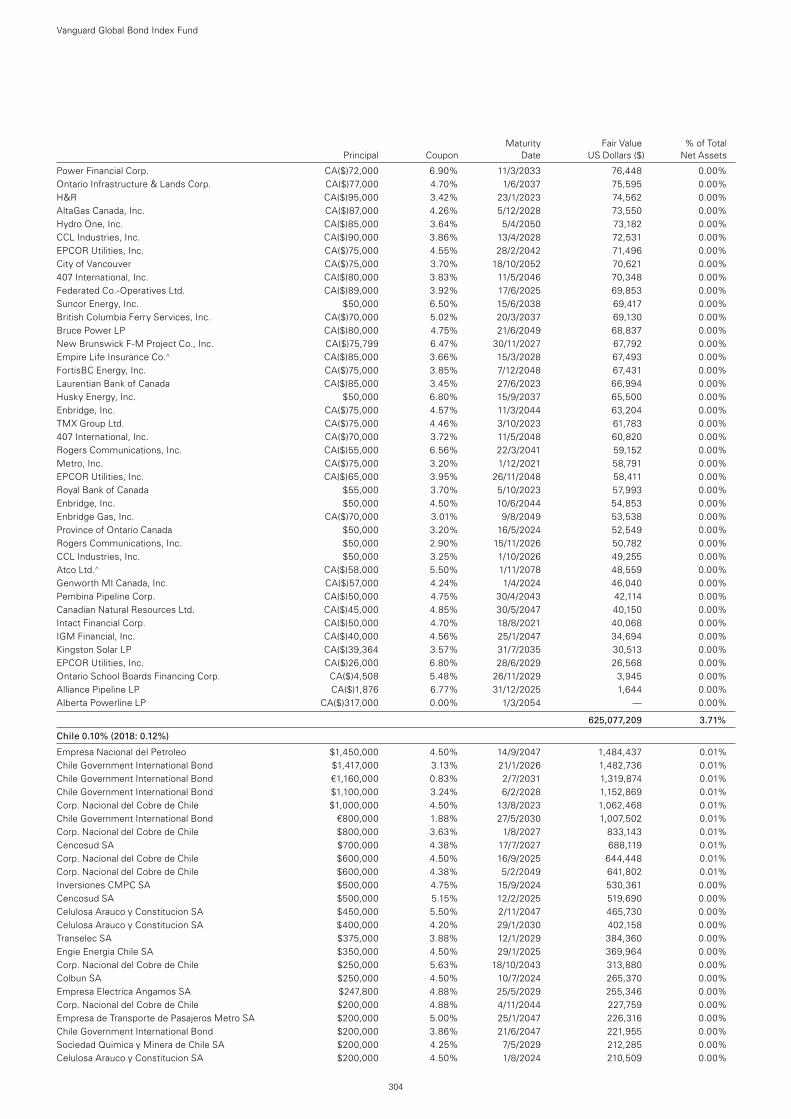
Maturity Fair Value % of Total Principal Coupon Date US Dollars ($) Net Assets
Power Financial Corp. CA($)72,000 6.90% 11/3/2033 76,448 0.00%Ontario Infrastructure & Lands Corp. CA($)77,000 4.70% 1/6/2037 75,595 0.00%H&R CA($)95,000 3.42% 23/1/2023 74,562 0.00%AltaGas Canada, Inc. CA($)87,000 4.26% 5/12/2028 73,550 0.00%Hydro One, Inc. CA($)85,000 3.64% 5/4/2050 73,182 0.00%CCL Industries, Inc. CA($)90,000 3.86% 13/4/2028 72,531 0.00%EPCOR Utilities, Inc. CA($)75,000 4.55% 28/2/2042 71,496 0.00%City of Vancouver CA($)75,000 3.70% 18/10/2052 70,621 0.00%407 International, Inc. CA($)80,000 3.83% 11/5/2046 70,348 0.00%Federated Co.-Operatives Ltd. CA($)89,000 3.92% 17/6/2025 69,853 0.00%Suncor Energy, Inc. $50,000 6.50% 15/6/2038 69,417 0.00%British Columbia Ferry Services, Inc. CA($)70,000 5.02% 20/3/2037 69,130 0.00%Bruce Power LP CA($)80,000 4.75% 21/6/2049 68,837 0.00%New Brunswick F-M Project Co., Inc. CA($)75,799 6.47% 30/11/2027 67,792 0.00%Empire Life Insurance Co.^ CA($)85,000 3.66% 15/3/2028 67,493 0.00%FortisBC Energy, Inc. CA($)75,000 3.85% 7/12/2048 67,431 0.00%Laurentian Bank of Canada CA($)85,000 3.45% 27/6/2023 66,994 0.00%Husky Energy, Inc. $50,000 6.80% 15/9/2037 65,500 0.00%Enbridge, Inc. CA($)75,000 4.57% 11/3/2044 63,204 0.00%TMX Group Ltd. CA($)75,000 4.46% 3/10/2023 61,783 0.00%407 International, Inc. CA($)70,000 3.72% 11/5/2048 60,820 0.00%Rogers Communications, Inc. CA($)55,000 6.56% 22/3/2041 59,152 0.00%Metro, Inc. CA($)75,000 3.20% 1/12/2021 58,791 0.00%EPCOR Utilities, Inc. CA($)65,000 3.95% 26/11/2048 58,411 0.00%Royal Bank of Canada $55,000 3.70% 5/10/2023 57,993 0.00%Enbridge, Inc. $50,000 4.50% 10/6/2044 54,853 0.00%Enbridge Gas, Inc. CA($)70,000 3.01% 9/8/2049 53,538 0.00%Province of Ontario Canada $50,000 3.20% 16/5/2024 52,549 0.00%Rogers Communications, Inc. $50,000 2.90% 15/11/2026 50,782 0.00%CCL Industries, Inc. $50,000 3.25% 1/10/2026 49,255 0.00%Atco Ltd.^ CA($)58,000 5.50% 1/11/2078 48,559 0.00%Genworth MI Canada, Inc. CA($)57,000 4.24% 1/4/2024 46,040 0.00%Pembina Pipeline Corp. CA($)50,000 4.75% 30/4/2043 42,114 0.00%Canadian Natural Resources Ltd. CA($)45,000 4.85% 30/5/2047 40,150 0.00%Intact Financial Corp. CA($)50,000 4.70% 18/8/2021 40,068 0.00%IGM Financial, Inc. CA($)40,000 4.56% 25/1/2047 34,694 0.00%Kingston Solar LP CA($)39,364 3.57% 31/7/2035 30,513 0.00%EPCOR Utilities, Inc. CA($)26,000 6.80% 28/6/2029 26,568 0.00%Ontario School Boards Financing Corp. CA($)4,508 5.48% 26/11/2029 3,945 0.00%Alliance Pipeline LP CA($)1,876 6.77% 31/12/2025 1,644 0.00%Alberta Powerline LP CA($)317,000 0.00% 1/3/2054 — 0.00%
625,077,209 3.71%
Chile 0.10% (2018: 0.12%)
Empresa Nacional del Petroleo $1,450,000 4.50% 14/9/2047 1,484,437 0.01%Chile Government International Bond $1,417,000 3.13% 21/1/2026 1,482,736 0.01%Chile Government International Bond €1,160,000 0.83% 2/7/2031 1,319,874 0.01%Chile Government International Bond $1,100,000 3.24% 6/2/2028 1,152,869 0.01%Corp. Nacional del Cobre de Chile $1,000,000 4.50% 13/8/2023 1,062,468 0.01%Chile Government International Bond €800,000 1.88% 27/5/2030 1,007,502 0.01%Corp. Nacional del Cobre de Chile $800,000 3.63% 1/8/2027 833,143 0.01%Cencosud SA $700,000 4.38% 17/7/2027 688,119 0.01%Corp. Nacional del Cobre de Chile $600,000 4.50% 16/9/2025 644,448 0.01%Corp. Nacional del Cobre de Chile $600,000 4.38% 5/2/2049 641,802 0.01%Inversiones CMPC SA $500,000 4.75% 15/9/2024 530,361 0.00%Cencosud SA $500,000 5.15% 12/2/2025 519,690 0.00%Celulosa Arauco y Constitucion SA $450,000 5.50% 2/11/2047 465,730 0.00%Celulosa Arauco y Constitucion SA $400,000 4.20% 29/1/2030 402,158 0.00%Transelec SA $375,000 3.88% 12/1/2029 384,360 0.00%Engie Energia Chile SA $350,000 4.50% 29/1/2025 369,964 0.00%Corp. Nacional del Cobre de Chile $250,000 5.63% 18/10/2043 313,880 0.00%Colbun SA $250,000 4.50% 10/7/2024 265,370 0.00%Empresa Electrica Angamos SA $247,800 4.88% 25/5/2029 255,346 0.00%Corp. Nacional del Cobre de Chile $200,000 4.88% 4/11/2044 227,759 0.00%Empresa de Transporte de Pasajeros Metro SA $200,000 5.00% 25/1/2047 226,316 0.00%Chile Government International Bond $200,000 3.86% 21/6/2047 221,955 0.00%Sociedad Quimica y Minera de Chile SA $200,000 4.25% 7/5/2029 212,285 0.00%Celulosa Arauco y Constitucion SA $200,000 4.50% 1/8/2024 210,509 0.00%
Vanguard Global Bond Index Fund
304
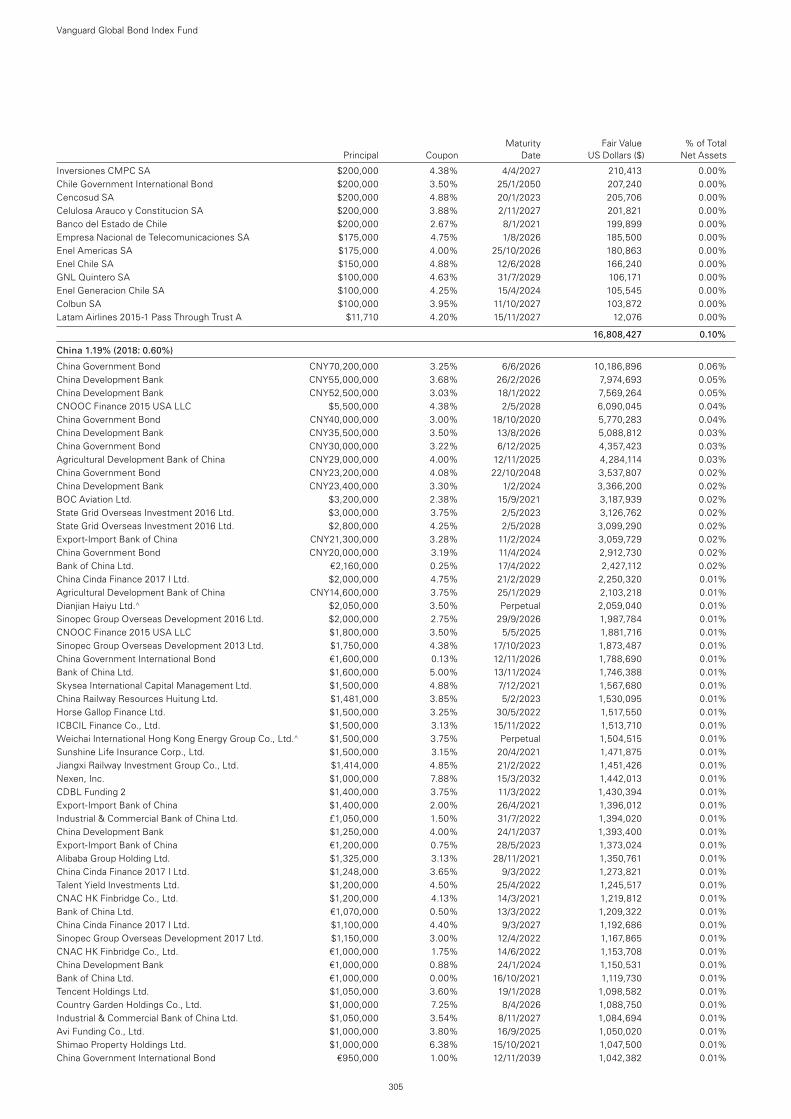
Maturity Fair Value % of Total Principal Coupon Date US Dollars ($) Net Assets
Inversiones CMPC SA $200,000 4.38% 4/4/2027 210,413 0.00%Chile Government International Bond $200,000 3.50% 25/1/2050 207,240 0.00%Cencosud SA $200,000 4.88% 20/1/2023 205,706 0.00%Celulosa Arauco y Constitucion SA $200,000 3.88% 2/11/2027 201,821 0.00%Banco del Estado de Chile $200,000 2.67% 8/1/2021 199,899 0.00%Empresa Nacional de Telecomunicaciones SA $175,000 4.75% 1/8/2026 185,500 0.00%Enel Americas SA $175,000 4.00% 25/10/2026 180,863 0.00%Enel Chile SA $150,000 4.88% 12/6/2028 166,240 0.00%GNL Quintero SA $100,000 4.63% 31/7/2029 106,171 0.00%Enel Generacion Chile SA $100,000 4.25% 15/4/2024 105,545 0.00%Colbun SA $100,000 3.95% 11/10/2027 103,872 0.00%Latam Airlines 2015-1 Pass Through Trust A $11,710 4.20% 15/11/2027 12,076 0.00%
16,808,427 0.10%
China 1.19% (2018: 0.60%)
China Government Bond CNY70,200,000 3.25% 6/6/2026 10,186,896 0.06%China Development Bank CNY55,000,000 3.68% 26/2/2026 7,974,693 0.05%China Development Bank CNY52,500,000 3.03% 18/1/2022 7,569,264 0.05%CNOOC Finance 2015 USA LLC $5,500,000 4.38% 2/5/2028 6,090,045 0.04%China Government Bond CNY40,000,000 3.00% 18/10/2020 5,770,283 0.04%China Development Bank CNY35,500,000 3.50% 13/8/2026 5,088,812 0.03%China Government Bond CNY30,000,000 3.22% 6/12/2025 4,357,423 0.03%Agricultural Development Bank of China CNY29,000,000 4.00% 12/11/2025 4,284,114 0.03%China Government Bond CNY23,200,000 4.08% 22/10/2048 3,537,807 0.02%China Development Bank CNY23,400,000 3.30% 1/2/2024 3,366,200 0.02%BOC Aviation Ltd. $3,200,000 2.38% 15/9/2021 3,187,939 0.02%State Grid Overseas Investment 2016 Ltd. $3,000,000 3.75% 2/5/2023 3,126,762 0.02%State Grid Overseas Investment 2016 Ltd. $2,800,000 4.25% 2/5/2028 3,099,290 0.02%Export-Import Bank of China CNY21,300,000 3.28% 11/2/2024 3,059,729 0.02%China Government Bond CNY20,000,000 3.19% 11/4/2024 2,912,730 0.02%Bank of China Ltd. €2,160,000 0.25% 17/4/2022 2,427,112 0.02%China Cinda Finance 2017 I Ltd. $2,000,000 4.75% 21/2/2029 2,250,320 0.01%Agricultural Development Bank of China CNY14,600,000 3.75% 25/1/2029 2,103,218 0.01%Dianjian Haiyu Ltd.^ $2,050,000 3.50% Perpetual 2,059,040 0.01%Sinopec Group Overseas Development 2016 Ltd. $2,000,000 2.75% 29/9/2026 1,987,784 0.01%CNOOC Finance 2015 USA LLC $1,800,000 3.50% 5/5/2025 1,881,716 0.01%Sinopec Group Overseas Development 2013 Ltd. $1,750,000 4.38% 17/10/2023 1,873,487 0.01%China Government International Bond €1,600,000 0.13% 12/11/2026 1,788,690 0.01%Bank of China Ltd. $1,600,000 5.00% 13/11/2024 1,746,388 0.01%Skysea International Capital Management Ltd. $1,500,000 4.88% 7/12/2021 1,567,680 0.01%China Railway Resources Huitung Ltd. $1,481,000 3.85% 5/2/2023 1,530,095 0.01%Horse Gallop Finance Ltd. $1,500,000 3.25% 30/5/2022 1,517,550 0.01%ICBCIL Finance Co., Ltd. $1,500,000 3.13% 15/11/2022 1,513,710 0.01%Weichai International Hong Kong Energy Group Co., Ltd.^ $1,500,000 3.75% Perpetual 1,504,515 0.01%Sunshine Life Insurance Corp., Ltd. $1,500,000 3.15% 20/4/2021 1,471,875 0.01%Jiangxi Railway Investment Group Co., Ltd. $1,414,000 4.85% 21/2/2022 1,451,426 0.01%Nexen, Inc. $1,000,000 7.88% 15/3/2032 1,442,013 0.01%CDBL Funding 2 $1,400,000 3.75% 11/3/2022 1,430,394 0.01%Export-Import Bank of China $1,400,000 2.00% 26/4/2021 1,396,012 0.01%Industrial & Commercial Bank of China Ltd. £1,050,000 1.50% 31/7/2022 1,394,020 0.01%China Development Bank $1,250,000 4.00% 24/1/2037 1,393,400 0.01%Export-Import Bank of China €1,200,000 0.75% 28/5/2023 1,373,024 0.01%Alibaba Group Holding Ltd. $1,325,000 3.13% 28/11/2021 1,350,761 0.01%China Cinda Finance 2017 I Ltd. $1,248,000 3.65% 9/3/2022 1,273,821 0.01%Talent Yield Investments Ltd. $1,200,000 4.50% 25/4/2022 1,245,517 0.01%CNAC HK Finbridge Co., Ltd. $1,200,000 4.13% 14/3/2021 1,219,812 0.01%Bank of China Ltd. €1,070,000 0.50% 13/3/2022 1,209,322 0.01%China Cinda Finance 2017 I Ltd. $1,100,000 4.40% 9/3/2027 1,192,686 0.01%Sinopec Group Overseas Development 2017 Ltd. $1,150,000 3.00% 12/4/2022 1,167,865 0.01%CNAC HK Finbridge Co., Ltd. €1,000,000 1.75% 14/6/2022 1,153,708 0.01%China Development Bank €1,000,000 0.88% 24/1/2024 1,150,531 0.01%Bank of China Ltd. €1,000,000 0.00% 16/10/2021 1,119,730 0.01%Tencent Holdings Ltd. $1,050,000 3.60% 19/1/2028 1,098,582 0.01%Country Garden Holdings Co., Ltd. $1,000,000 7.25% 8/4/2026 1,088,750 0.01%Industrial & Commercial Bank of China Ltd. $1,050,000 3.54% 8/11/2027 1,084,694 0.01%Avi Funding Co., Ltd. $1,000,000 3.80% 16/9/2025 1,050,020 0.01%Shimao Property Holdings Ltd. $1,000,000 6.38% 15/10/2021 1,047,500 0.01%China Government International Bond €950,000 1.00% 12/11/2039 1,042,382 0.01%
Vanguard Global Bond Index Fund
305
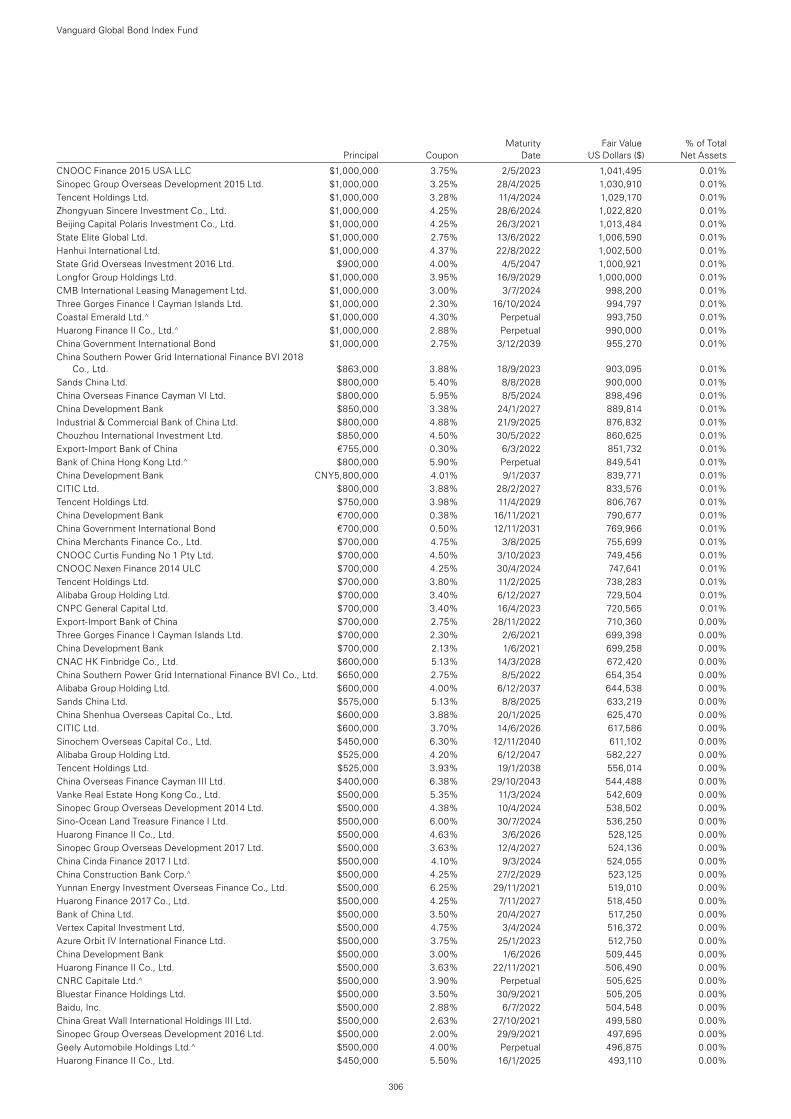
Maturity Fair Value % of Total Principal Coupon Date US Dollars ($) Net Assets
CNOOC Finance 2015 USA LLC $1,000,000 3.75% 2/5/2023 1,041,495 0.01%Sinopec Group Overseas Development 2015 Ltd. $1,000,000 3.25% 28/4/2025 1,030,910 0.01%Tencent Holdings Ltd. $1,000,000 3.28% 11/4/2024 1,029,170 0.01%Zhongyuan Sincere Investment Co., Ltd. $1,000,000 4.25% 28/6/2024 1,022,820 0.01%Beijing Capital Polaris Investment Co., Ltd. $1,000,000 4.25% 26/3/2021 1,013,484 0.01%State Elite Global Ltd. $1,000,000 2.75% 13/6/2022 1,006,590 0.01%Hanhui International Ltd. $1,000,000 4.37% 22/8/2022 1,002,500 0.01%State Grid Overseas Investment 2016 Ltd. $900,000 4.00% 4/5/2047 1,000,921 0.01%Longfor Group Holdings Ltd. $1,000,000 3.95% 16/9/2029 1,000,000 0.01%CMB International Leasing Management Ltd. $1,000,000 3.00% 3/7/2024 998,200 0.01%Three Gorges Finance I Cayman Islands Ltd. $1,000,000 2.30% 16/10/2024 994,797 0.01%Coastal Emerald Ltd.^ $1,000,000 4.30% Perpetual 993,750 0.01%Huarong Finance II Co., Ltd.^ $1,000,000 2.88% Perpetual 990,000 0.01%China Government International Bond $1,000,000 2.75% 3/12/2039 955,270 0.01%China Southern Power Grid International Finance BVI 2018
Co., Ltd. $863,000 3.88% 18/9/2023 903,095 0.01%Sands China Ltd. $800,000 5.40% 8/8/2028 900,000 0.01%China Overseas Finance Cayman VI Ltd. $800,000 5.95% 8/5/2024 898,496 0.01%China Development Bank $850,000 3.38% 24/1/2027 889,814 0.01%Industrial & Commercial Bank of China Ltd. $800,000 4.88% 21/9/2025 876,832 0.01%Chouzhou International Investment Ltd. $850,000 4.50% 30/5/2022 860,625 0.01%Export-Import Bank of China €755,000 0.30% 6/3/2022 851,732 0.01%Bank of China Hong Kong Ltd.^ $800,000 5.90% Perpetual 849,541 0.01%China Development Bank CNY5,800,000 4.01% 9/1/2037 839,771 0.01%CITIC Ltd. $800,000 3.88% 28/2/2027 833,576 0.01%Tencent Holdings Ltd. $750,000 3.98% 11/4/2029 806,767 0.01%China Development Bank €700,000 0.38% 16/11/2021 790,677 0.01%China Government International Bond €700,000 0.50% 12/11/2031 769,966 0.01%China Merchants Finance Co., Ltd. $700,000 4.75% 3/8/2025 755,699 0.01%CNOOC Curtis Funding No 1 Pty Ltd. $700,000 4.50% 3/10/2023 749,456 0.01%CNOOC Nexen Finance 2014 ULC $700,000 4.25% 30/4/2024 747,641 0.01%Tencent Holdings Ltd. $700,000 3.80% 11/2/2025 738,283 0.01%Alibaba Group Holding Ltd. $700,000 3.40% 6/12/2027 729,504 0.01%CNPC General Capital Ltd. $700,000 3.40% 16/4/2023 720,565 0.01%Export-Import Bank of China $700,000 2.75% 28/11/2022 710,360 0.00%Three Gorges Finance I Cayman Islands Ltd. $700,000 2.30% 2/6/2021 699,398 0.00%China Development Bank $700,000 2.13% 1/6/2021 699,258 0.00%CNAC HK Finbridge Co., Ltd. $600,000 5.13% 14/3/2028 672,420 0.00%China Southern Power Grid International Finance BVI Co., Ltd. $650,000 2.75% 8/5/2022 654,354 0.00%Alibaba Group Holding Ltd. $600,000 4.00% 6/12/2037 644,538 0.00%Sands China Ltd. $575,000 5.13% 8/8/2025 633,219 0.00%China Shenhua Overseas Capital Co., Ltd. $600,000 3.88% 20/1/2025 625,470 0.00%CITIC Ltd. $600,000 3.70% 14/6/2026 617,586 0.00%Sinochem Overseas Capital Co., Ltd. $450,000 6.30% 12/11/2040 611,102 0.00%Alibaba Group Holding Ltd. $525,000 4.20% 6/12/2047 582,227 0.00%Tencent Holdings Ltd. $525,000 3.93% 19/1/2038 556,014 0.00%China Overseas Finance Cayman III Ltd. $400,000 6.38% 29/10/2043 544,488 0.00%Vanke Real Estate Hong Kong Co., Ltd. $500,000 5.35% 11/3/2024 542,609 0.00%Sinopec Group Overseas Development 2014 Ltd. $500,000 4.38% 10/4/2024 538,502 0.00%Sino-Ocean Land Treasure Finance I Ltd. $500,000 6.00% 30/7/2024 536,250 0.00%Huarong Finance II Co., Ltd. $500,000 4.63% 3/6/2026 528,125 0.00%Sinopec Group Overseas Development 2017 Ltd. $500,000 3.63% 12/4/2027 524,136 0.00%China Cinda Finance 2017 I Ltd. $500,000 4.10% 9/3/2024 524,055 0.00%China Construction Bank Corp.^ $500,000 4.25% 27/2/2029 523,125 0.00%Yunnan Energy Investment Overseas Finance Co., Ltd. $500,000 6.25% 29/11/2021 519,010 0.00%Huarong Finance 2017 Co., Ltd. $500,000 4.25% 7/11/2027 518,450 0.00%Bank of China Ltd. $500,000 3.50% 20/4/2027 517,250 0.00%Vertex Capital Investment Ltd. $500,000 4.75% 3/4/2024 516,372 0.00%Azure Orbit IV International Finance Ltd. $500,000 3.75% 25/1/2023 512,750 0.00%China Development Bank $500,000 3.00% 1/6/2026 509,445 0.00%Huarong Finance II Co., Ltd. $500,000 3.63% 22/11/2021 506,490 0.00%CNRC Capitale Ltd.^ $500,000 3.90% Perpetual 505,625 0.00%Bluestar Finance Holdings Ltd. $500,000 3.50% 30/9/2021 505,205 0.00%Baidu, Inc. $500,000 2.88% 6/7/2022 504,548 0.00%China Great Wall International Holdings III Ltd. $500,000 2.63% 27/10/2021 499,580 0.00%Sinopec Group Overseas Development 2016 Ltd. $500,000 2.00% 29/9/2021 497,695 0.00%Geely Automobile Holdings Ltd.^ $500,000 4.00% Perpetual 496,875 0.00%Huarong Finance II Co., Ltd. $450,000 5.50% 16/1/2025 493,110 0.00%
Vanguard Global Bond Index Fund
306
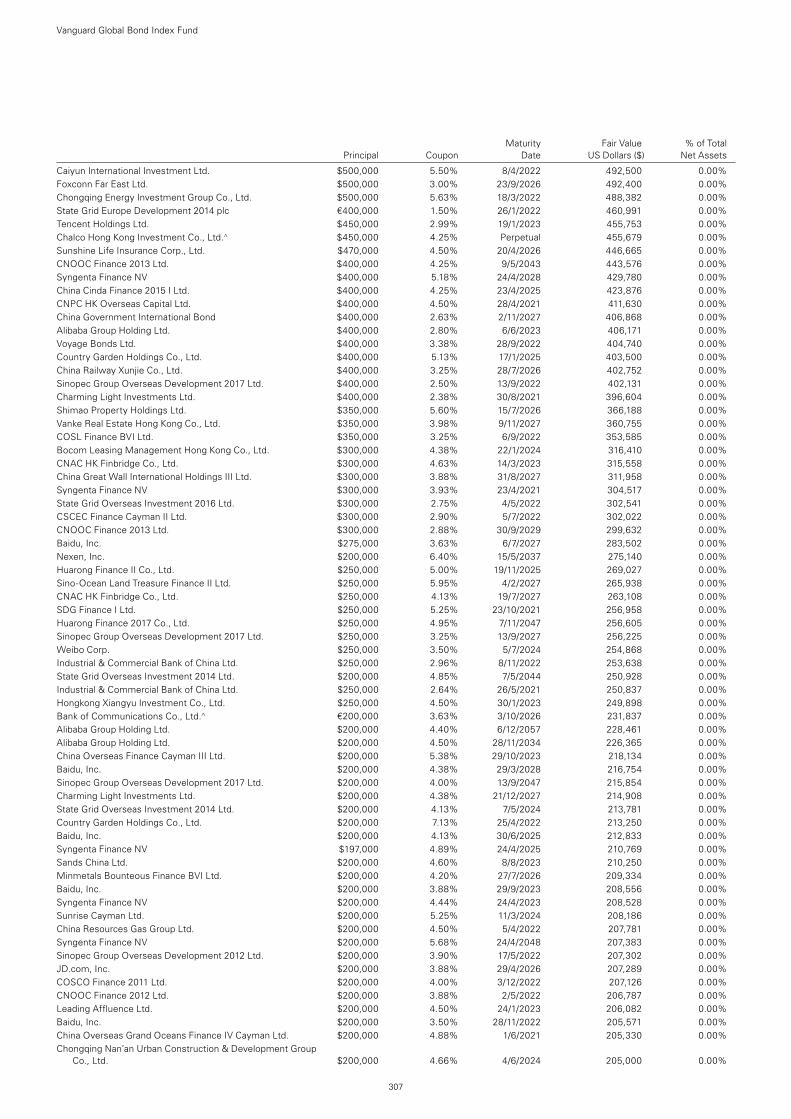
Maturity Fair Value % of Total Principal Coupon Date US Dollars ($) Net Assets
Caiyun International Investment Ltd. $500,000 5.50% 8/4/2022 492,500 0.00%Foxconn Far East Ltd. $500,000 3.00% 23/9/2026 492,400 0.00%Chongqing Energy Investment Group Co., Ltd. $500,000 5.63% 18/3/2022 488,382 0.00%State Grid Europe Development 2014 plc €400,000 1.50% 26/1/2022 460,991 0.00%Tencent Holdings Ltd. $450,000 2.99% 19/1/2023 455,753 0.00%Chalco Hong Kong Investment Co., Ltd.^ $450,000 4.25% Perpetual 455,679 0.00%Sunshine Life Insurance Corp., Ltd. $470,000 4.50% 20/4/2026 446,665 0.00%CNOOC Finance 2013 Ltd. $400,000 4.25% 9/5/2043 443,576 0.00%Syngenta Finance NV $400,000 5.18% 24/4/2028 429,780 0.00%China Cinda Finance 2015 I Ltd. $400,000 4.25% 23/4/2025 423,876 0.00%CNPC HK Overseas Capital Ltd. $400,000 4.50% 28/4/2021 411,630 0.00%China Government International Bond $400,000 2.63% 2/11/2027 406,868 0.00%Alibaba Group Holding Ltd. $400,000 2.80% 6/6/2023 406,171 0.00%Voyage Bonds Ltd. $400,000 3.38% 28/9/2022 404,740 0.00%Country Garden Holdings Co., Ltd. $400,000 5.13% 17/1/2025 403,500 0.00%China Railway Xunjie Co., Ltd. $400,000 3.25% 28/7/2026 402,752 0.00%Sinopec Group Overseas Development 2017 Ltd. $400,000 2.50% 13/9/2022 402,131 0.00%Charming Light Investments Ltd. $400,000 2.38% 30/8/2021 396,604 0.00%Shimao Property Holdings Ltd. $350,000 5.60% 15/7/2026 366,188 0.00%Vanke Real Estate Hong Kong Co., Ltd. $350,000 3.98% 9/11/2027 360,755 0.00%COSL Finance BVI Ltd. $350,000 3.25% 6/9/2022 353,585 0.00%Bocom Leasing Management Hong Kong Co., Ltd. $300,000 4.38% 22/1/2024 316,410 0.00%CNAC HK Finbridge Co., Ltd. $300,000 4.63% 14/3/2023 315,558 0.00%China Great Wall International Holdings III Ltd. $300,000 3.88% 31/8/2027 311,958 0.00%Syngenta Finance NV $300,000 3.93% 23/4/2021 304,517 0.00%State Grid Overseas Investment 2016 Ltd. $300,000 2.75% 4/5/2022 302,541 0.00%CSCEC Finance Cayman II Ltd. $300,000 2.90% 5/7/2022 302,022 0.00%CNOOC Finance 2013 Ltd. $300,000 2.88% 30/9/2029 299,632 0.00%Baidu, Inc. $275,000 3.63% 6/7/2027 283,502 0.00%Nexen, Inc. $200,000 6.40% 15/5/2037 275,140 0.00%Huarong Finance II Co., Ltd. $250,000 5.00% 19/11/2025 269,027 0.00%Sino-Ocean Land Treasure Finance II Ltd. $250,000 5.95% 4/2/2027 265,938 0.00%CNAC HK Finbridge Co., Ltd. $250,000 4.13% 19/7/2027 263,108 0.00%SDG Finance I Ltd. $250,000 5.25% 23/10/2021 256,958 0.00%Huarong Finance 2017 Co., Ltd. $250,000 4.95% 7/11/2047 256,605 0.00%Sinopec Group Overseas Development 2017 Ltd. $250,000 3.25% 13/9/2027 256,225 0.00%Weibo Corp. $250,000 3.50% 5/7/2024 254,868 0.00%Industrial & Commercial Bank of China Ltd. $250,000 2.96% 8/11/2022 253,638 0.00%State Grid Overseas Investment 2014 Ltd. $200,000 4.85% 7/5/2044 250,928 0.00%Industrial & Commercial Bank of China Ltd. $250,000 2.64% 26/5/2021 250,837 0.00%Hongkong Xiangyu Investment Co., Ltd. $250,000 4.50% 30/1/2023 249,898 0.00%Bank of Communications Co., Ltd.^ €200,000 3.63% 3/10/2026 231,837 0.00%Alibaba Group Holding Ltd. $200,000 4.40% 6/12/2057 228,461 0.00%Alibaba Group Holding Ltd. $200,000 4.50% 28/11/2034 226,365 0.00%China Overseas Finance Cayman III Ltd. $200,000 5.38% 29/10/2023 218,134 0.00%Baidu, Inc. $200,000 4.38% 29/3/2028 216,754 0.00%Sinopec Group Overseas Development 2017 Ltd. $200,000 4.00% 13/9/2047 215,854 0.00%Charming Light Investments Ltd. $200,000 4.38% 21/12/2027 214,908 0.00%State Grid Overseas Investment 2014 Ltd. $200,000 4.13% 7/5/2024 213,781 0.00%Country Garden Holdings Co., Ltd. $200,000 7.13% 25/4/2022 213,250 0.00%Baidu, Inc. $200,000 4.13% 30/6/2025 212,833 0.00%Syngenta Finance NV $197,000 4.89% 24/4/2025 210,769 0.00%Sands China Ltd. $200,000 4.60% 8/8/2023 210,250 0.00%Minmetals Bounteous Finance BVI Ltd. $200,000 4.20% 27/7/2026 209,334 0.00%Baidu, Inc. $200,000 3.88% 29/9/2023 208,556 0.00%Syngenta Finance NV $200,000 4.44% 24/4/2023 208,528 0.00%Sunrise Cayman Ltd. $200,000 5.25% 11/3/2024 208,186 0.00%China Resources Gas Group Ltd. $200,000 4.50% 5/4/2022 207,781 0.00%Syngenta Finance NV $200,000 5.68% 24/4/2048 207,383 0.00%Sinopec Group Overseas Development 2012 Ltd. $200,000 3.90% 17/5/2022 207,302 0.00%JD.com, Inc. $200,000 3.88% 29/4/2026 207,289 0.00%COSCO Finance 2011 Ltd. $200,000 4.00% 3/12/2022 207,126 0.00%CNOOC Finance 2012 Ltd. $200,000 3.88% 2/5/2022 206,787 0.00%Leading Affluence Ltd. $200,000 4.50% 24/1/2023 206,082 0.00%Baidu, Inc. $200,000 3.50% 28/11/2022 205,571 0.00%China Overseas Grand Oceans Finance IV Cayman Ltd. $200,000 4.88% 1/6/2021 205,330 0.00%Chongqing Nan’an Urban Construction & Development Group
Co., Ltd. $200,000 4.66% 4/6/2024 205,000 0.00%
Vanguard Global Bond Index Fund
307
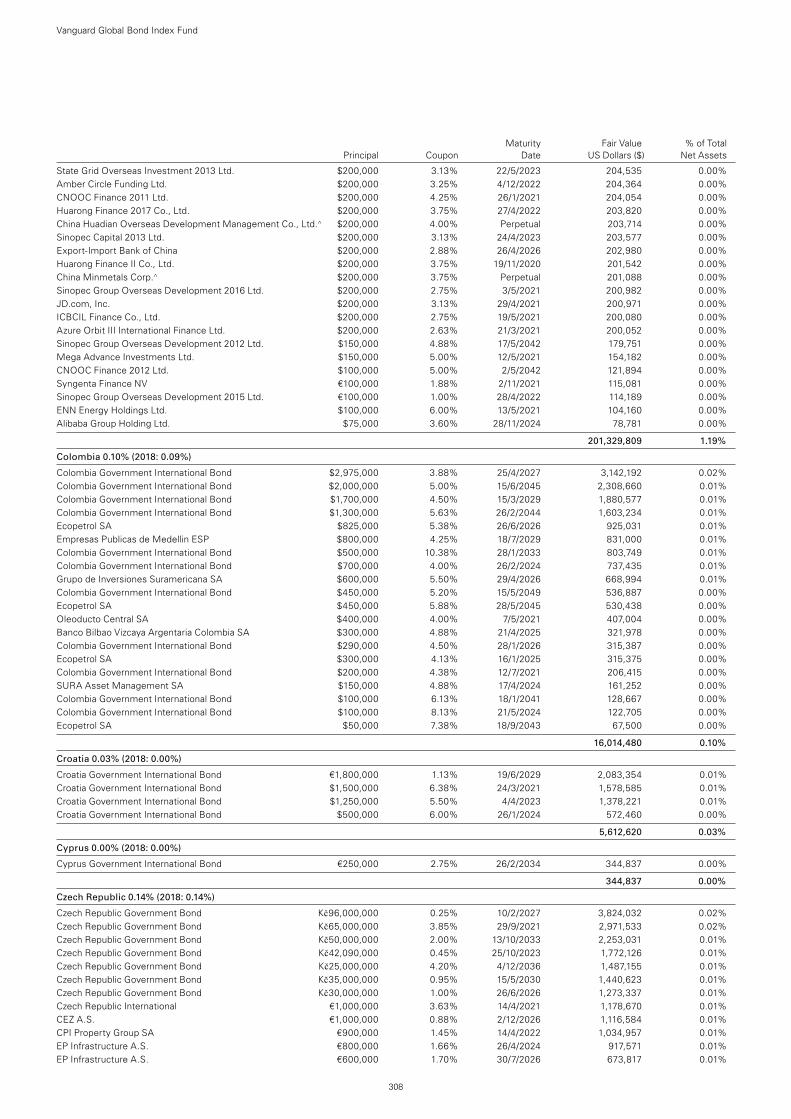
Maturity Fair Value % of Total Principal Coupon Date US Dollars ($) Net Assets
State Grid Overseas Investment 2013 Ltd. $200,000 3.13% 22/5/2023 204,535 0.00%Amber Circle Funding Ltd. $200,000 3.25% 4/12/2022 204,364 0.00%CNOOC Finance 2011 Ltd. $200,000 4.25% 26/1/2021 204,054 0.00%Huarong Finance 2017 Co., Ltd. $200,000 3.75% 27/4/2022 203,820 0.00%China Huadian Overseas Development Management Co., Ltd.^ $200,000 4.00% Perpetual 203,714 0.00%Sinopec Capital 2013 Ltd. $200,000 3.13% 24/4/2023 203,577 0.00%Export-Import Bank of China $200,000 2.88% 26/4/2026 202,980 0.00%Huarong Finance II Co., Ltd. $200,000 3.75% 19/11/2020 201,542 0.00%China Minmetals Corp.^ $200,000 3.75% Perpetual 201,088 0.00%Sinopec Group Overseas Development 2016 Ltd. $200,000 2.75% 3/5/2021 200,982 0.00%JD.com, Inc. $200,000 3.13% 29/4/2021 200,971 0.00%ICBCIL Finance Co., Ltd. $200,000 2.75% 19/5/2021 200,080 0.00%Azure Orbit III International Finance Ltd. $200,000 2.63% 21/3/2021 200,052 0.00%Sinopec Group Overseas Development 2012 Ltd. $150,000 4.88% 17/5/2042 179,751 0.00%Mega Advance Investments Ltd. $150,000 5.00% 12/5/2021 154,182 0.00%CNOOC Finance 2012 Ltd. $100,000 5.00% 2/5/2042 121,894 0.00%Syngenta Finance NV €100,000 1.88% 2/11/2021 115,081 0.00%Sinopec Group Overseas Development 2015 Ltd. €100,000 1.00% 28/4/2022 114,189 0.00%ENN Energy Holdings Ltd. $100,000 6.00% 13/5/2021 104,160 0.00%Alibaba Group Holding Ltd. $75,000 3.60% 28/11/2024 78,781 0.00%
201,329,809 1.19%
Colombia 0.10% (2018: 0.09%)
Colombia Government International Bond $2,975,000 3.88% 25/4/2027 3,142,192 0.02%Colombia Government International Bond $2,000,000 5.00% 15/6/2045 2,308,660 0.01%Colombia Government International Bond $1,700,000 4.50% 15/3/2029 1,880,577 0.01%Colombia Government International Bond $1,300,000 5.63% 26/2/2044 1,603,234 0.01%Ecopetrol SA $825,000 5.38% 26/6/2026 925,031 0.01%Empresas Publicas de Medellin ESP $800,000 4.25% 18/7/2029 831,000 0.01%Colombia Government International Bond $500,000 10.38% 28/1/2033 803,749 0.01%Colombia Government International Bond $700,000 4.00% 26/2/2024 737,435 0.01%Grupo de Inversiones Suramericana SA $600,000 5.50% 29/4/2026 668,994 0.01%Colombia Government International Bond $450,000 5.20% 15/5/2049 536,887 0.00%Ecopetrol SA $450,000 5.88% 28/5/2045 530,438 0.00%Oleoducto Central SA $400,000 4.00% 7/5/2021 407,004 0.00%Banco Bilbao Vizcaya Argentaria Colombia SA $300,000 4.88% 21/4/2025 321,978 0.00%Colombia Government International Bond $290,000 4.50% 28/1/2026 315,387 0.00%Ecopetrol SA $300,000 4.13% 16/1/2025 315,375 0.00%Colombia Government International Bond $200,000 4.38% 12/7/2021 206,415 0.00%SURA Asset Management SA $150,000 4.88% 17/4/2024 161,252 0.00%Colombia Government International Bond $100,000 6.13% 18/1/2041 128,667 0.00%Colombia Government International Bond $100,000 8.13% 21/5/2024 122,705 0.00%Ecopetrol SA $50,000 7.38% 18/9/2043 67,500 0.00%
16,014,480 0.10%
Croatia 0.03% (2018: 0.00%)
Croatia Government International Bond €1,800,000 1.13% 19/6/2029 2,083,354 0.01%Croatia Government International Bond $1,500,000 6.38% 24/3/2021 1,578,585 0.01%Croatia Government International Bond $1,250,000 5.50% 4/4/2023 1,378,221 0.01%Croatia Government International Bond $500,000 6.00% 26/1/2024 572,460 0.00%
5,612,620 0.03%
Cyprus 0.00% (2018: 0.00%)
Cyprus Government International Bond €250,000 2.75% 26/2/2034 344,837 0.00%
344,837 0.00%
Czech Republic 0.14% (2018: 0.14%)
Czech Republic Government Bond Kč96,000,000 0.25% 10/2/2027 3,824,032 0.02%Czech Republic Government Bond Kč65,000,000 3.85% 29/9/2021 2,971,533 0.02%Czech Republic Government Bond Kč50,000,000 2.00% 13/10/2033 2,253,031 0.01%Czech Republic Government Bond Kč42,090,000 0.45% 25/10/2023 1,772,126 0.01%Czech Republic Government Bond Kč25,000,000 4.20% 4/12/2036 1,487,155 0.01%Czech Republic Government Bond Kč35,000,000 0.95% 15/5/2030 1,440,623 0.01%Czech Republic Government Bond Kč30,000,000 1.00% 26/6/2026 1,273,337 0.01%Czech Republic International €1,000,000 3.63% 14/4/2021 1,178,670 0.01%CEZ A.S. €1,000,000 0.88% 2/12/2026 1,116,584 0.01%CPI Property Group SA €900,000 1.45% 14/4/2022 1,034,957 0.01%EP Infrastructure A.S. €800,000 1.66% 26/4/2024 917,571 0.01%EP Infrastructure A.S. €600,000 1.70% 30/7/2026 673,817 0.01%
Vanguard Global Bond Index Fund
308
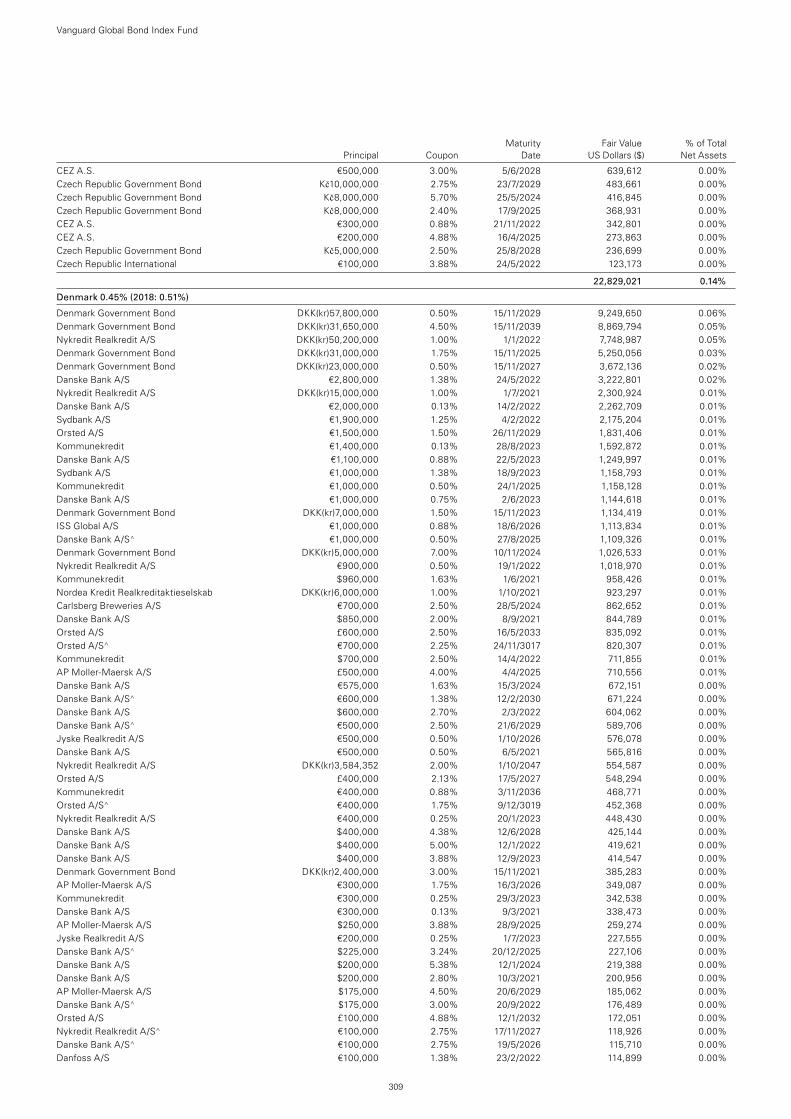
Maturity Fair Value % of Total Principal Coupon Date US Dollars ($) Net Assets
CEZ A.S. €500,000 3.00% 5/6/2028 639,612 0.00%Czech Republic Government Bond Kč10,000,000 2.75% 23/7/2029 483,661 0.00%Czech Republic Government Bond Kč8,000,000 5.70% 25/5/2024 416,845 0.00%Czech Republic Government Bond Kč8,000,000 2.40% 17/9/2025 368,931 0.00%CEZ A.S. €300,000 0.88% 21/11/2022 342,801 0.00%CEZ A.S. €200,000 4.88% 16/4/2025 273,863 0.00%Czech Republic Government Bond Kč5,000,000 2.50% 25/8/2028 236,699 0.00%Czech Republic International €100,000 3.88% 24/5/2022 123,173 0.00%
22,829,021 0.14%
Denmark 0.45% (2018: 0.51%)
Denmark Government Bond DKK(kr)57,800,000 0.50% 15/11/2029 9,249,650 0.06%Denmark Government Bond DKK(kr)31,650,000 4.50% 15/11/2039 8,869,794 0.05%Nykredit Realkredit A/S DKK(kr)50,200,000 1.00% 1/1/2022 7,748,987 0.05%Denmark Government Bond DKK(kr)31,000,000 1.75% 15/11/2025 5,250,056 0.03%Denmark Government Bond DKK(kr)23,000,000 0.50% 15/11/2027 3,672,136 0.02%Danske Bank A/S €2,800,000 1.38% 24/5/2022 3,222,801 0.02%Nykredit Realkredit A/S DKK(kr)15,000,000 1.00% 1/7/2021 2,300,924 0.01%Danske Bank A/S €2,000,000 0.13% 14/2/2022 2,262,709 0.01%Sydbank A/S €1,900,000 1.25% 4/2/2022 2,175,204 0.01%Orsted A/S €1,500,000 1.50% 26/11/2029 1,831,406 0.01%Kommunekredit €1,400,000 0.13% 28/8/2023 1,592,872 0.01%Danske Bank A/S €1,100,000 0.88% 22/5/2023 1,249,997 0.01%Sydbank A/S €1,000,000 1.38% 18/9/2023 1,158,793 0.01%Kommunekredit €1,000,000 0.50% 24/1/2025 1,158,128 0.01%Danske Bank A/S €1,000,000 0.75% 2/6/2023 1,144,618 0.01%Denmark Government Bond DKK(kr)7,000,000 1.50% 15/11/2023 1,134,419 0.01%ISS Global A/S €1,000,000 0.88% 18/6/2026 1,113,834 0.01%Danske Bank A/S^ €1,000,000 0.50% 27/8/2025 1,109,326 0.01%Denmark Government Bond DKK(kr)5,000,000 7.00% 10/11/2024 1,026,533 0.01%Nykredit Realkredit A/S €900,000 0.50% 19/1/2022 1,018,970 0.01%Kommunekredit $960,000 1.63% 1/6/2021 958,426 0.01%Nordea Kredit Realkreditaktieselskab DKK(kr)6,000,000 1.00% 1/10/2021 923,297 0.01%Carlsberg Breweries A/S €700,000 2.50% 28/5/2024 862,652 0.01%Danske Bank A/S $850,000 2.00% 8/9/2021 844,789 0.01%Orsted A/S £600,000 2.50% 16/5/2033 835,092 0.01%Orsted A/S^ €700,000 2.25% 24/11/3017 820,307 0.01%Kommunekredit $700,000 2.50% 14/4/2022 711,855 0.01%AP Moller-Maersk A/S £500,000 4.00% 4/4/2025 710,556 0.01%Danske Bank A/S €575,000 1.63% 15/3/2024 672,151 0.00%Danske Bank A/S^ €600,000 1.38% 12/2/2030 671,224 0.00%Danske Bank A/S $600,000 2.70% 2/3/2022 604,062 0.00%Danske Bank A/S^ €500,000 2.50% 21/6/2029 589,706 0.00%Jyske Realkredit A/S €500,000 0.50% 1/10/2026 576,078 0.00%Danske Bank A/S €500,000 0.50% 6/5/2021 565,816 0.00%Nykredit Realkredit A/S DKK(kr)3,584,352 2.00% 1/10/2047 554,587 0.00%Orsted A/S £400,000 2.13% 17/5/2027 548,294 0.00%Kommunekredit €400,000 0.88% 3/11/2036 468,771 0.00%Orsted A/S^ €400,000 1.75% 9/12/3019 452,368 0.00%Nykredit Realkredit A/S €400,000 0.25% 20/1/2023 448,430 0.00%Danske Bank A/S $400,000 4.38% 12/6/2028 425,144 0.00%Danske Bank A/S $400,000 5.00% 12/1/2022 419,621 0.00%Danske Bank A/S $400,000 3.88% 12/9/2023 414,547 0.00%Denmark Government Bond DKK(kr)2,400,000 3.00% 15/11/2021 385,283 0.00%AP Moller-Maersk A/S €300,000 1.75% 16/3/2026 349,087 0.00%Kommunekredit €300,000 0.25% 29/3/2023 342,538 0.00%Danske Bank A/S €300,000 0.13% 9/3/2021 338,473 0.00%AP Moller-Maersk A/S $250,000 3.88% 28/9/2025 259,274 0.00%Jyske Realkredit A/S €200,000 0.25% 1/7/2023 227,555 0.00%Danske Bank A/S^ $225,000 3.24% 20/12/2025 227,106 0.00%Danske Bank A/S $200,000 5.38% 12/1/2024 219,388 0.00%Danske Bank A/S $200,000 2.80% 10/3/2021 200,956 0.00%AP Moller-Maersk A/S $175,000 4.50% 20/6/2029 185,062 0.00%Danske Bank A/S^ $175,000 3.00% 20/9/2022 176,489 0.00%Orsted A/S £100,000 4.88% 12/1/2032 172,051 0.00%Nykredit Realkredit A/S^ €100,000 2.75% 17/11/2027 118,926 0.00%Danske Bank A/S^ €100,000 2.75% 19/5/2026 115,710 0.00%Danfoss A/S €100,000 1.38% 23/2/2022 114,899 0.00%
Vanguard Global Bond Index Fund
309
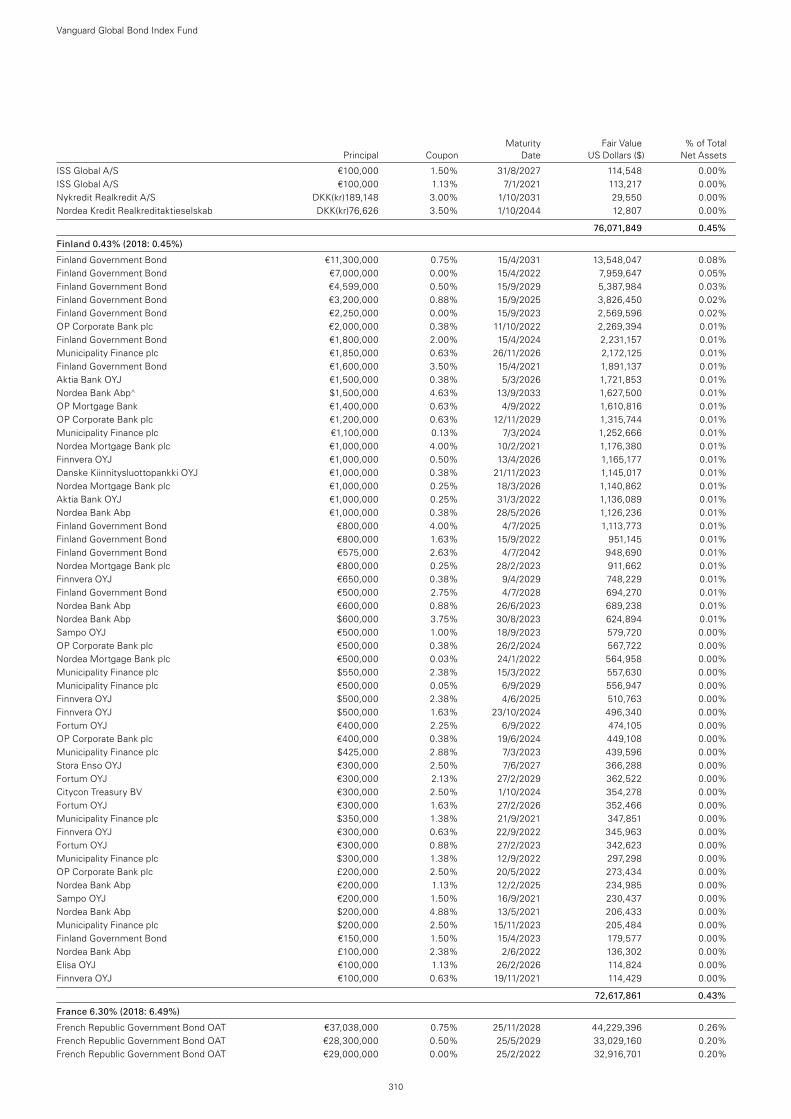
Maturity Fair Value % of Total Principal Coupon Date US Dollars ($) Net Assets
ISS Global A/S €100,000 1.50% 31/8/2027 114,548 0.00%ISS Global A/S €100,000 1.13% 7/1/2021 113,217 0.00%Nykredit Realkredit A/S DKK(kr)189,148 3.00% 1/10/2031 29,550 0.00%Nordea Kredit Realkreditaktieselskab DKK(kr)76,626 3.50% 1/10/2044 12,807 0.00%
76,071,849 0.45%
Finland 0.43% (2018: 0.45%)
Finland Government Bond €11,300,000 0.75% 15/4/2031 13,548,047 0.08%Finland Government Bond €7,000,000 0.00% 15/4/2022 7,959,647 0.05%Finland Government Bond €4,599,000 0.50% 15/9/2029 5,387,984 0.03%Finland Government Bond €3,200,000 0.88% 15/9/2025 3,826,450 0.02%Finland Government Bond €2,250,000 0.00% 15/9/2023 2,569,596 0.02%OP Corporate Bank plc €2,000,000 0.38% 11/10/2022 2,269,394 0.01%Finland Government Bond €1,800,000 2.00% 15/4/2024 2,231,157 0.01%Municipality Finance plc €1,850,000 0.63% 26/11/2026 2,172,125 0.01%Finland Government Bond €1,600,000 3.50% 15/4/2021 1,891,137 0.01%Aktia Bank OYJ €1,500,000 0.38% 5/3/2026 1,721,853 0.01%Nordea Bank Abp^ $1,500,000 4.63% 13/9/2033 1,627,500 0.01%OP Mortgage Bank €1,400,000 0.63% 4/9/2022 1,610,816 0.01%OP Corporate Bank plc €1,200,000 0.63% 12/11/2029 1,315,744 0.01%Municipality Finance plc €1,100,000 0.13% 7/3/2024 1,252,666 0.01%Nordea Mortgage Bank plc €1,000,000 4.00% 10/2/2021 1,176,380 0.01%Finnvera OYJ €1,000,000 0.50% 13/4/2026 1,165,177 0.01%Danske Kiinnitysluottopankki OYJ €1,000,000 0.38% 21/11/2023 1,145,017 0.01%Nordea Mortgage Bank plc €1,000,000 0.25% 18/3/2026 1,140,862 0.01%Aktia Bank OYJ €1,000,000 0.25% 31/3/2022 1,136,089 0.01%Nordea Bank Abp €1,000,000 0.38% 28/5/2026 1,126,236 0.01%Finland Government Bond €800,000 4.00% 4/7/2025 1,113,773 0.01%Finland Government Bond €800,000 1.63% 15/9/2022 951,145 0.01%Finland Government Bond €575,000 2.63% 4/7/2042 948,690 0.01%Nordea Mortgage Bank plc €800,000 0.25% 28/2/2023 911,662 0.01%Finnvera OYJ €650,000 0.38% 9/4/2029 748,229 0.01%Finland Government Bond €500,000 2.75% 4/7/2028 694,270 0.01%Nordea Bank Abp €600,000 0.88% 26/6/2023 689,238 0.01%Nordea Bank Abp $600,000 3.75% 30/8/2023 624,894 0.01%Sampo OYJ €500,000 1.00% 18/9/2023 579,720 0.00%OP Corporate Bank plc €500,000 0.38% 26/2/2024 567,722 0.00%Nordea Mortgage Bank plc €500,000 0.03% 24/1/2022 564,958 0.00%Municipality Finance plc $550,000 2.38% 15/3/2022 557,630 0.00%Municipality Finance plc €500,000 0.05% 6/9/2029 556,947 0.00%Finnvera OYJ $500,000 2.38% 4/6/2025 510,763 0.00%Finnvera OYJ $500,000 1.63% 23/10/2024 496,340 0.00%Fortum OYJ €400,000 2.25% 6/9/2022 474,105 0.00%OP Corporate Bank plc €400,000 0.38% 19/6/2024 449,108 0.00%Municipality Finance plc $425,000 2.88% 7/3/2023 439,596 0.00%Stora Enso OYJ €300,000 2.50% 7/6/2027 366,288 0.00%Fortum OYJ €300,000 2.13% 27/2/2029 362,522 0.00%Citycon Treasury BV €300,000 2.50% 1/10/2024 354,278 0.00%Fortum OYJ €300,000 1.63% 27/2/2026 352,466 0.00%Municipality Finance plc $350,000 1.38% 21/9/2021 347,851 0.00%Finnvera OYJ €300,000 0.63% 22/9/2022 345,963 0.00%Fortum OYJ €300,000 0.88% 27/2/2023 342,623 0.00%Municipality Finance plc $300,000 1.38% 12/9/2022 297,298 0.00%OP Corporate Bank plc £200,000 2.50% 20/5/2022 273,434 0.00%Nordea Bank Abp €200,000 1.13% 12/2/2025 234,985 0.00%Sampo OYJ €200,000 1.50% 16/9/2021 230,437 0.00%Nordea Bank Abp $200,000 4.88% 13/5/2021 206,433 0.00%Municipality Finance plc $200,000 2.50% 15/11/2023 205,484 0.00%Finland Government Bond €150,000 1.50% 15/4/2023 179,577 0.00%Nordea Bank Abp £100,000 2.38% 2/6/2022 136,302 0.00%Elisa OYJ €100,000 1.13% 26/2/2026 114,824 0.00%Finnvera OYJ €100,000 0.63% 19/11/2021 114,429 0.00%
72,617,861 0.43%
France 6.30% (2018: 6.49%)
French Republic Government Bond OAT €37,038,000 0.75% 25/11/2028 44,229,396 0.26%French Republic Government Bond OAT €28,300,000 0.50% 25/5/2029 33,029,160 0.20%French Republic Government Bond OAT €29,000,000 0.00% 25/2/2022 32,916,701 0.20%
Vanguard Global Bond Index Fund
310
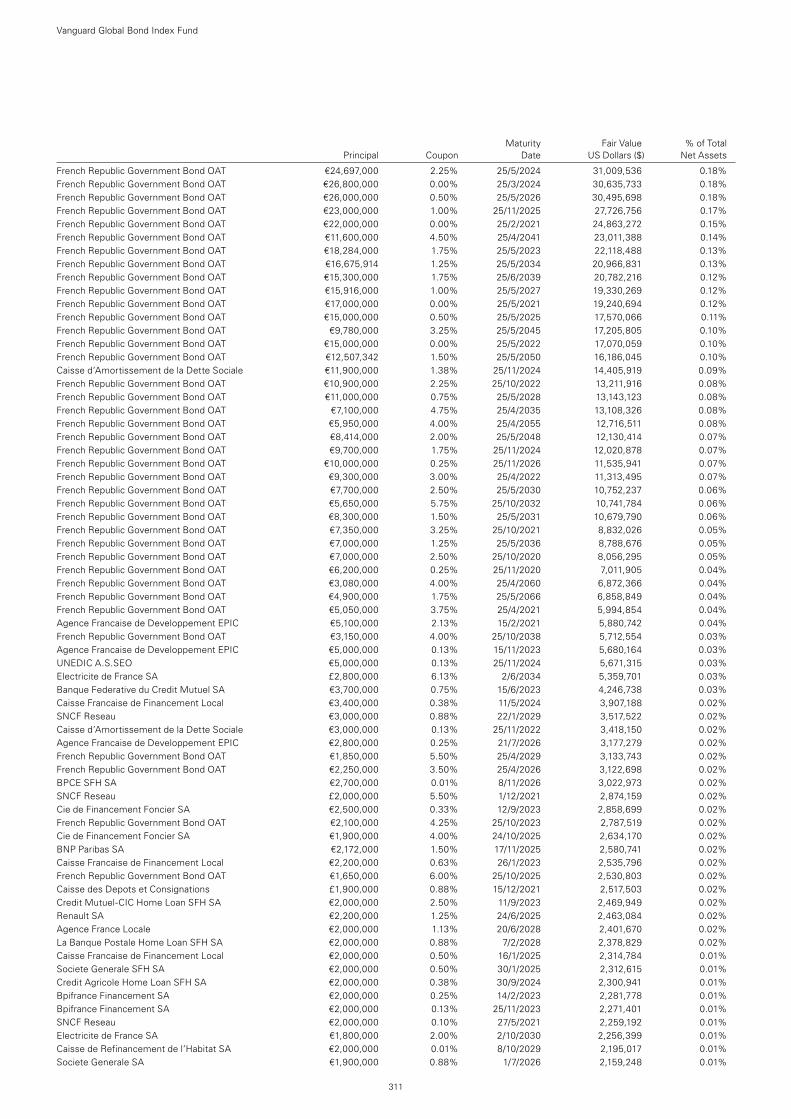
Maturity Fair Value % of Total Principal Coupon Date US Dollars ($) Net Assets
French Republic Government Bond OAT €24,697,000 2.25% 25/5/2024 31,009,536 0.18%French Republic Government Bond OAT €26,800,000 0.00% 25/3/2024 30,635,733 0.18%French Republic Government Bond OAT €26,000,000 0.50% 25/5/2026 30,495,698 0.18%French Republic Government Bond OAT €23,000,000 1.00% 25/11/2025 27,726,756 0.17%French Republic Government Bond OAT €22,000,000 0.00% 25/2/2021 24,863,272 0.15%French Republic Government Bond OAT €11,600,000 4.50% 25/4/2041 23,011,388 0.14%French Republic Government Bond OAT €18,284,000 1.75% 25/5/2023 22,118,488 0.13%French Republic Government Bond OAT €16,675,914 1.25% 25/5/2034 20,966,831 0.13%French Republic Government Bond OAT €15,300,000 1.75% 25/6/2039 20,782,216 0.12%French Republic Government Bond OAT €15,916,000 1.00% 25/5/2027 19,330,269 0.12%French Republic Government Bond OAT €17,000,000 0.00% 25/5/2021 19,240,694 0.12%French Republic Government Bond OAT €15,000,000 0.50% 25/5/2025 17,570,066 0.11%French Republic Government Bond OAT €9,780,000 3.25% 25/5/2045 17,205,805 0.10%French Republic Government Bond OAT €15,000,000 0.00% 25/5/2022 17,070,059 0.10%French Republic Government Bond OAT €12,507,342 1.50% 25/5/2050 16,186,045 0.10%Caisse d’Amortissement de la Dette Sociale €11,900,000 1.38% 25/11/2024 14,405,919 0.09%French Republic Government Bond OAT €10,900,000 2.25% 25/10/2022 13,211,916 0.08%French Republic Government Bond OAT €11,000,000 0.75% 25/5/2028 13,143,123 0.08%French Republic Government Bond OAT €7,100,000 4.75% 25/4/2035 13,108,326 0.08%French Republic Government Bond OAT €5,950,000 4.00% 25/4/2055 12,716,511 0.08%French Republic Government Bond OAT €8,414,000 2.00% 25/5/2048 12,130,414 0.07%French Republic Government Bond OAT €9,700,000 1.75% 25/11/2024 12,020,878 0.07%French Republic Government Bond OAT €10,000,000 0.25% 25/11/2026 11,535,941 0.07%French Republic Government Bond OAT €9,300,000 3.00% 25/4/2022 11,313,495 0.07%French Republic Government Bond OAT €7,700,000 2.50% 25/5/2030 10,752,237 0.06%French Republic Government Bond OAT €5,650,000 5.75% 25/10/2032 10,741,784 0.06%French Republic Government Bond OAT €8,300,000 1.50% 25/5/2031 10,679,790 0.06%French Republic Government Bond OAT €7,350,000 3.25% 25/10/2021 8,832,026 0.05%French Republic Government Bond OAT €7,000,000 1.25% 25/5/2036 8,788,676 0.05%French Republic Government Bond OAT €7,000,000 2.50% 25/10/2020 8,056,295 0.05%French Republic Government Bond OAT €6,200,000 0.25% 25/11/2020 7,011,905 0.04%French Republic Government Bond OAT €3,080,000 4.00% 25/4/2060 6,872,366 0.04%French Republic Government Bond OAT €4,900,000 1.75% 25/5/2066 6,858,849 0.04%French Republic Government Bond OAT €5,050,000 3.75% 25/4/2021 5,994,854 0.04%Agence Francaise de Developpement EPIC €5,100,000 2.13% 15/2/2021 5,880,742 0.04%French Republic Government Bond OAT €3,150,000 4.00% 25/10/2038 5,712,554 0.03%Agence Francaise de Developpement EPIC €5,000,000 0.13% 15/11/2023 5,680,164 0.03%UNEDIC A.S.SEO €5,000,000 0.13% 25/11/2024 5,671,315 0.03%Electricite de France SA £2,800,000 6.13% 2/6/2034 5,359,701 0.03%Banque Federative du Credit Mutuel SA €3,700,000 0.75% 15/6/2023 4,246,738 0.03%Caisse Francaise de Financement Local €3,400,000 0.38% 11/5/2024 3,907,188 0.02%SNCF Reseau €3,000,000 0.88% 22/1/2029 3,517,522 0.02%Caisse d’Amortissement de la Dette Sociale €3,000,000 0.13% 25/11/2022 3,418,150 0.02%Agence Francaise de Developpement EPIC €2,800,000 0.25% 21/7/2026 3,177,279 0.02%French Republic Government Bond OAT €1,850,000 5.50% 25/4/2029 3,133,743 0.02%French Republic Government Bond OAT €2,250,000 3.50% 25/4/2026 3,122,698 0.02%BPCE SFH SA €2,700,000 0.01% 8/11/2026 3,022,973 0.02%SNCF Reseau £2,000,000 5.50% 1/12/2021 2,874,159 0.02%Cie de Financement Foncier SA €2,500,000 0.33% 12/9/2023 2,858,699 0.02%French Republic Government Bond OAT €2,100,000 4.25% 25/10/2023 2,787,519 0.02%Cie de Financement Foncier SA €1,900,000 4.00% 24/10/2025 2,634,170 0.02%BNP Paribas SA €2,172,000 1.50% 17/11/2025 2,580,741 0.02%Caisse Francaise de Financement Local €2,200,000 0.63% 26/1/2023 2,535,796 0.02%French Republic Government Bond OAT €1,650,000 6.00% 25/10/2025 2,530,803 0.02%Caisse des Depots et Consignations £1,900,000 0.88% 15/12/2021 2,517,503 0.02%Credit Mutuel-CIC Home Loan SFH SA €2,000,000 2.50% 11/9/2023 2,469,949 0.02%Renault SA €2,200,000 1.25% 24/6/2025 2,463,084 0.02%Agence France Locale €2,000,000 1.13% 20/6/2028 2,401,670 0.02%La Banque Postale Home Loan SFH SA €2,000,000 0.88% 7/2/2028 2,378,829 0.02%Caisse Francaise de Financement Local €2,000,000 0.50% 16/1/2025 2,314,784 0.01%Societe Generale SFH SA €2,000,000 0.50% 30/1/2025 2,312,615 0.01%Credit Agricole Home Loan SFH SA €2,000,000 0.38% 30/9/2024 2,300,941 0.01%Bpifrance Financement SA €2,000,000 0.25% 14/2/2023 2,281,778 0.01%Bpifrance Financement SA €2,000,000 0.13% 25/11/2023 2,271,401 0.01%SNCF Reseau €2,000,000 0.10% 27/5/2021 2,259,192 0.01%Electricite de France SA €1,800,000 2.00% 2/10/2030 2,256,399 0.01%Caisse de Refinancement de l’Habitat SA €2,000,000 0.01% 8/10/2029 2,195,017 0.01%Societe Generale SA €1,900,000 0.88% 1/7/2026 2,159,248 0.01%
Vanguard Global Bond Index Fund
311
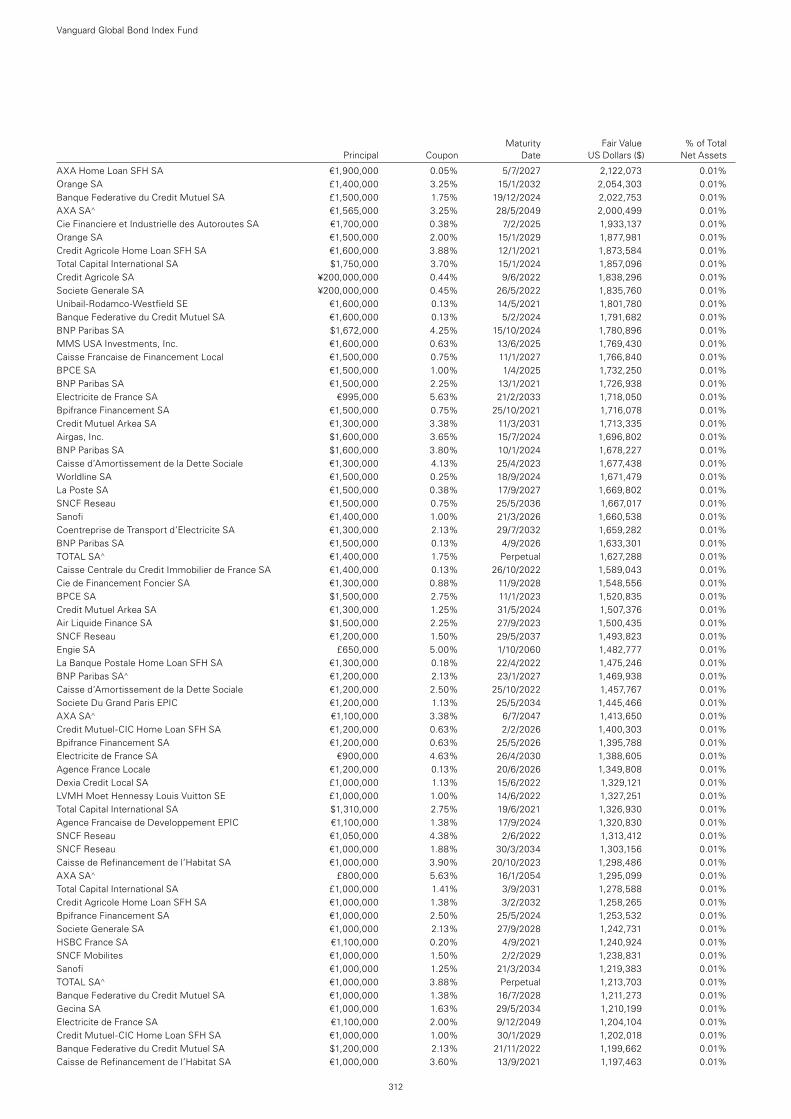
Maturity Fair Value % of Total Principal Coupon Date US Dollars ($) Net Assets
AXA Home Loan SFH SA €1,900,000 0.05% 5/7/2027 2,122,073 0.01%Orange SA £1,400,000 3.25% 15/1/2032 2,054,303 0.01%Banque Federative du Credit Mutuel SA £1,500,000 1.75% 19/12/2024 2,022,753 0.01%AXA SA^ €1,565,000 3.25% 28/5/2049 2,000,499 0.01%Cie Financiere et Industrielle des Autoroutes SA €1,700,000 0.38% 7/2/2025 1,933,137 0.01%Orange SA €1,500,000 2.00% 15/1/2029 1,877,981 0.01%Credit Agricole Home Loan SFH SA €1,600,000 3.88% 12/1/2021 1,873,584 0.01%Total Capital International SA $1,750,000 3.70% 15/1/2024 1,857,096 0.01%Credit Agricole SA ¥200,000,000 0.44% 9/6/2022 1,838,296 0.01%Societe Generale SA ¥200,000,000 0.45% 26/5/2022 1,835,760 0.01%Unibail-Rodamco-Westfield SE €1,600,000 0.13% 14/5/2021 1,801,780 0.01%Banque Federative du Credit Mutuel SA €1,600,000 0.13% 5/2/2024 1,791,682 0.01%BNP Paribas SA $1,672,000 4.25% 15/10/2024 1,780,896 0.01%MMS USA Investments, Inc. €1,600,000 0.63% 13/6/2025 1,769,430 0.01%Caisse Francaise de Financement Local €1,500,000 0.75% 11/1/2027 1,766,840 0.01%BPCE SA €1,500,000 1.00% 1/4/2025 1,732,250 0.01%BNP Paribas SA €1,500,000 2.25% 13/1/2021 1,726,938 0.01%Electricite de France SA €995,000 5.63% 21/2/2033 1,718,050 0.01%Bpifrance Financement SA €1,500,000 0.75% 25/10/2021 1,716,078 0.01%Credit Mutuel Arkea SA €1,300,000 3.38% 11/3/2031 1,713,335 0.01%Airgas, Inc. $1,600,000 3.65% 15/7/2024 1,696,802 0.01%BNP Paribas SA $1,600,000 3.80% 10/1/2024 1,678,227 0.01%Caisse d’Amortissement de la Dette Sociale €1,300,000 4.13% 25/4/2023 1,677,438 0.01%Worldline SA €1,500,000 0.25% 18/9/2024 1,671,479 0.01%La Poste SA €1,500,000 0.38% 17/9/2027 1,669,802 0.01%SNCF Reseau €1,500,000 0.75% 25/5/2036 1,667,017 0.01%Sanofi €1,400,000 1.00% 21/3/2026 1,660,538 0.01%Coentreprise de Transport d’Electricite SA €1,300,000 2.13% 29/7/2032 1,659,282 0.01%BNP Paribas SA €1,500,000 0.13% 4/9/2026 1,633,301 0.01%TOTAL SA^ €1,400,000 1.75% Perpetual 1,627,288 0.01%Caisse Centrale du Credit Immobilier de France SA €1,400,000 0.13% 26/10/2022 1,589,043 0.01%Cie de Financement Foncier SA €1,300,000 0.88% 11/9/2028 1,548,556 0.01%BPCE SA $1,500,000 2.75% 11/1/2023 1,520,835 0.01%Credit Mutuel Arkea SA €1,300,000 1.25% 31/5/2024 1,507,376 0.01%Air Liquide Finance SA $1,500,000 2.25% 27/9/2023 1,500,435 0.01%SNCF Reseau €1,200,000 1.50% 29/5/2037 1,493,823 0.01%Engie SA £650,000 5.00% 1/10/2060 1,482,777 0.01%La Banque Postale Home Loan SFH SA €1,300,000 0.18% 22/4/2022 1,475,246 0.01%BNP Paribas SA^ €1,200,000 2.13% 23/1/2027 1,469,938 0.01%Caisse d’Amortissement de la Dette Sociale €1,200,000 2.50% 25/10/2022 1,457,767 0.01%Societe Du Grand Paris EPIC €1,200,000 1.13% 25/5/2034 1,445,466 0.01%AXA SA^ €1,100,000 3.38% 6/7/2047 1,413,650 0.01%Credit Mutuel-CIC Home Loan SFH SA €1,200,000 0.63% 2/2/2026 1,400,303 0.01%Bpifrance Financement SA €1,200,000 0.63% 25/5/2026 1,395,788 0.01%Electricite de France SA €900,000 4.63% 26/4/2030 1,388,605 0.01%Agence France Locale €1,200,000 0.13% 20/6/2026 1,349,808 0.01%Dexia Credit Local SA £1,000,000 1.13% 15/6/2022 1,329,121 0.01%LVMH Moet Hennessy Louis Vuitton SE £1,000,000 1.00% 14/6/2022 1,327,251 0.01%Total Capital International SA $1,310,000 2.75% 19/6/2021 1,326,930 0.01%Agence Francaise de Developpement EPIC €1,100,000 1.38% 17/9/2024 1,320,830 0.01%SNCF Reseau €1,050,000 4.38% 2/6/2022 1,313,412 0.01%SNCF Reseau €1,000,000 1.88% 30/3/2034 1,303,156 0.01%Caisse de Refinancement de l’Habitat SA €1,000,000 3.90% 20/10/2023 1,298,486 0.01%AXA SA^ £800,000 5.63% 16/1/2054 1,295,099 0.01%Total Capital International SA £1,000,000 1.41% 3/9/2031 1,278,588 0.01%Credit Agricole Home Loan SFH SA €1,000,000 1.38% 3/2/2032 1,258,265 0.01%Bpifrance Financement SA €1,000,000 2.50% 25/5/2024 1,253,532 0.01%Societe Generale SA €1,000,000 2.13% 27/9/2028 1,242,731 0.01%HSBC France SA €1,100,000 0.20% 4/9/2021 1,240,924 0.01%SNCF Mobilites €1,000,000 1.50% 2/2/2029 1,238,831 0.01%Sanofi €1,000,000 1.25% 21/3/2034 1,219,383 0.01%TOTAL SA^ €1,000,000 3.88% Perpetual 1,213,703 0.01%Banque Federative du Credit Mutuel SA €1,000,000 1.38% 16/7/2028 1,211,273 0.01%Gecina SA €1,000,000 1.63% 29/5/2034 1,210,199 0.01%Electricite de France SA €1,100,000 2.00% 9/12/2049 1,204,104 0.01%Credit Mutuel-CIC Home Loan SFH SA €1,000,000 1.00% 30/1/2029 1,202,018 0.01%Banque Federative du Credit Mutuel SA $1,200,000 2.13% 21/11/2022 1,199,662 0.01%Caisse de Refinancement de l’Habitat SA €1,000,000 3.60% 13/9/2021 1,197,463 0.01%
Vanguard Global Bond Index Fund
312
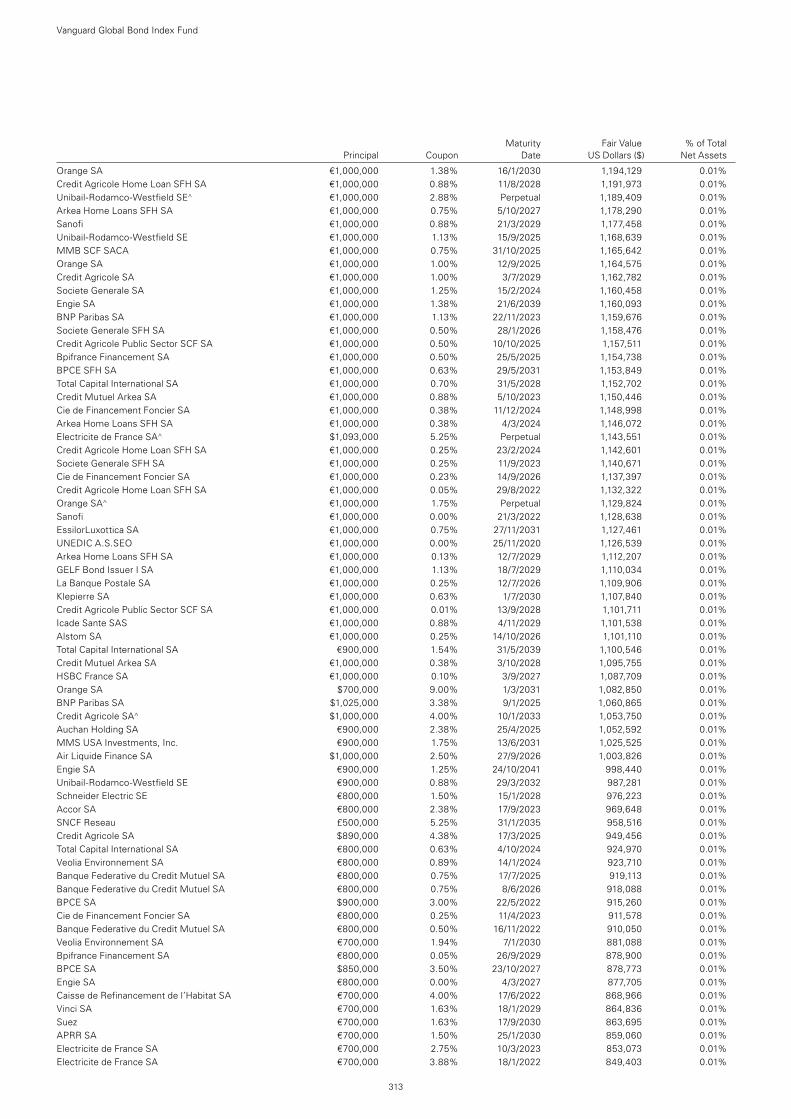
Maturity Fair Value % of Total Principal Coupon Date US Dollars ($) Net Assets
Orange SA €1,000,000 1.38% 16/1/2030 1,194,129 0.01%Credit Agricole Home Loan SFH SA €1,000,000 0.88% 11/8/2028 1,191,973 0.01%Unibail-Rodamco-Westfield SE^ €1,000,000 2.88% Perpetual 1,189,409 0.01%Arkea Home Loans SFH SA €1,000,000 0.75% 5/10/2027 1,178,290 0.01%Sanofi €1,000,000 0.88% 21/3/2029 1,177,458 0.01%Unibail-Rodamco-Westfield SE €1,000,000 1.13% 15/9/2025 1,168,639 0.01%MMB SCF SACA €1,000,000 0.75% 31/10/2025 1,165,642 0.01%Orange SA €1,000,000 1.00% 12/9/2025 1,164,575 0.01%Credit Agricole SA €1,000,000 1.00% 3/7/2029 1,162,782 0.01%Societe Generale SA €1,000,000 1.25% 15/2/2024 1,160,458 0.01%Engie SA €1,000,000 1.38% 21/6/2039 1,160,093 0.01%BNP Paribas SA €1,000,000 1.13% 22/11/2023 1,159,676 0.01%Societe Generale SFH SA €1,000,000 0.50% 28/1/2026 1,158,476 0.01%Credit Agricole Public Sector SCF SA €1,000,000 0.50% 10/10/2025 1,157,511 0.01%Bpifrance Financement SA €1,000,000 0.50% 25/5/2025 1,154,738 0.01%BPCE SFH SA €1,000,000 0.63% 29/5/2031 1,153,849 0.01%Total Capital International SA €1,000,000 0.70% 31/5/2028 1,152,702 0.01%Credit Mutuel Arkea SA €1,000,000 0.88% 5/10/2023 1,150,446 0.01%Cie de Financement Foncier SA €1,000,000 0.38% 11/12/2024 1,148,998 0.01%Arkea Home Loans SFH SA €1,000,000 0.38% 4/3/2024 1,146,072 0.01%Electricite de France SA^ $1,093,000 5.25% Perpetual 1,143,551 0.01%Credit Agricole Home Loan SFH SA €1,000,000 0.25% 23/2/2024 1,142,601 0.01%Societe Generale SFH SA €1,000,000 0.25% 11/9/2023 1,140,671 0.01%Cie de Financement Foncier SA €1,000,000 0.23% 14/9/2026 1,137,397 0.01%Credit Agricole Home Loan SFH SA €1,000,000 0.05% 29/8/2022 1,132,322 0.01%Orange SA^ €1,000,000 1.75% Perpetual 1,129,824 0.01%Sanofi €1,000,000 0.00% 21/3/2022 1,128,638 0.01%EssilorLuxottica SA €1,000,000 0.75% 27/11/2031 1,127,461 0.01%UNEDIC A.S.SEO €1,000,000 0.00% 25/11/2020 1,126,539 0.01%Arkea Home Loans SFH SA €1,000,000 0.13% 12/7/2029 1,112,207 0.01%GELF Bond Issuer I SA €1,000,000 1.13% 18/7/2029 1,110,034 0.01%La Banque Postale SA €1,000,000 0.25% 12/7/2026 1,109,906 0.01%Klepierre SA €1,000,000 0.63% 1/7/2030 1,107,840 0.01%Credit Agricole Public Sector SCF SA €1,000,000 0.01% 13/9/2028 1,101,711 0.01%Icade Sante SAS €1,000,000 0.88% 4/11/2029 1,101,538 0.01%Alstom SA €1,000,000 0.25% 14/10/2026 1,101,110 0.01%Total Capital International SA €900,000 1.54% 31/5/2039 1,100,546 0.01%Credit Mutuel Arkea SA €1,000,000 0.38% 3/10/2028 1,095,755 0.01%HSBC France SA €1,000,000 0.10% 3/9/2027 1,087,709 0.01%Orange SA $700,000 9.00% 1/3/2031 1,082,850 0.01%BNP Paribas SA $1,025,000 3.38% 9/1/2025 1,060,865 0.01%Credit Agricole SA^ $1,000,000 4.00% 10/1/2033 1,053,750 0.01%Auchan Holding SA €900,000 2.38% 25/4/2025 1,052,592 0.01%MMS USA Investments, Inc. €900,000 1.75% 13/6/2031 1,025,525 0.01%Air Liquide Finance SA $1,000,000 2.50% 27/9/2026 1,003,826 0.01%Engie SA €900,000 1.25% 24/10/2041 998,440 0.01%Unibail-Rodamco-Westfield SE €900,000 0.88% 29/3/2032 987,281 0.01%Schneider Electric SE €800,000 1.50% 15/1/2028 976,223 0.01%Accor SA €800,000 2.38% 17/9/2023 969,648 0.01%SNCF Reseau £500,000 5.25% 31/1/2035 958,516 0.01%Credit Agricole SA $890,000 4.38% 17/3/2025 949,456 0.01%Total Capital International SA €800,000 0.63% 4/10/2024 924,970 0.01%Veolia Environnement SA €800,000 0.89% 14/1/2024 923,710 0.01%Banque Federative du Credit Mutuel SA €800,000 0.75% 17/7/2025 919,113 0.01%Banque Federative du Credit Mutuel SA €800,000 0.75% 8/6/2026 918,088 0.01%BPCE SA $900,000 3.00% 22/5/2022 915,260 0.01%Cie de Financement Foncier SA €800,000 0.25% 11/4/2023 911,578 0.01%Banque Federative du Credit Mutuel SA €800,000 0.50% 16/11/2022 910,050 0.01%Veolia Environnement SA €700,000 1.94% 7/1/2030 881,088 0.01%Bpifrance Financement SA €800,000 0.05% 26/9/2029 878,900 0.01%BPCE SA $850,000 3.50% 23/10/2027 878,773 0.01%Engie SA €800,000 0.00% 4/3/2027 877,705 0.01%Caisse de Refinancement de l’Habitat SA €700,000 4.00% 17/6/2022 868,966 0.01%Vinci SA €700,000 1.63% 18/1/2029 864,836 0.01%Suez €700,000 1.63% 17/9/2030 863,695 0.01%APRR SA €700,000 1.50% 25/1/2030 859,060 0.01%Electricite de France SA €700,000 2.75% 10/3/2023 853,073 0.01%Electricite de France SA €700,000 3.88% 18/1/2022 849,403 0.01%
Vanguard Global Bond Index Fund
313
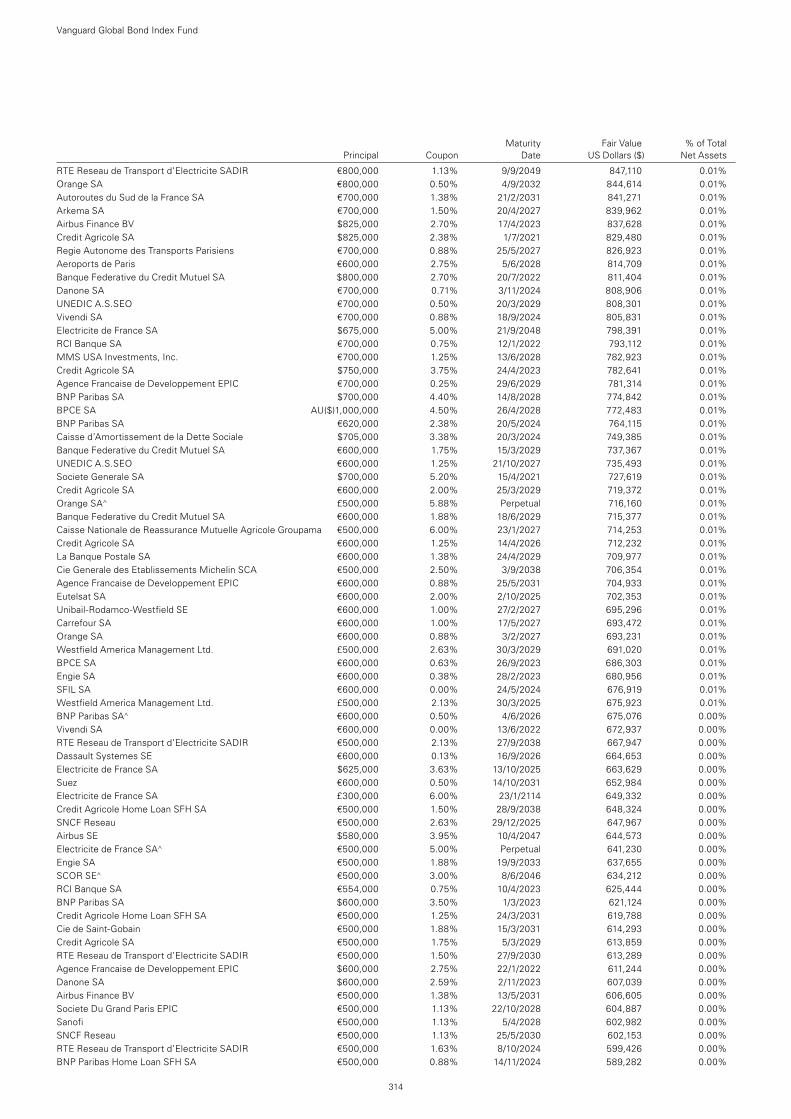
Maturity Fair Value % of Total Principal Coupon Date US Dollars ($) Net Assets
RTE Reseau de Transport d’Electricite SADIR €800,000 1.13% 9/9/2049 847,110 0.01%Orange SA €800,000 0.50% 4/9/2032 844,614 0.01%Autoroutes du Sud de la France SA €700,000 1.38% 21/2/2031 841,271 0.01%Arkema SA €700,000 1.50% 20/4/2027 839,962 0.01%Airbus Finance BV $825,000 2.70% 17/4/2023 837,628 0.01%Credit Agricole SA $825,000 2.38% 1/7/2021 829,480 0.01%Regie Autonome des Transports Parisiens €700,000 0.88% 25/5/2027 826,923 0.01%Aeroports de Paris €600,000 2.75% 5/6/2028 814,709 0.01%Banque Federative du Credit Mutuel SA $800,000 2.70% 20/7/2022 811,404 0.01%Danone SA €700,000 0.71% 3/11/2024 808,906 0.01%UNEDIC A.S.SEO €700,000 0.50% 20/3/2029 808,301 0.01%Vivendi SA €700,000 0.88% 18/9/2024 805,831 0.01%Electricite de France SA $675,000 5.00% 21/9/2048 798,391 0.01%RCI Banque SA €700,000 0.75% 12/1/2022 793,112 0.01%MMS USA Investments, Inc. €700,000 1.25% 13/6/2028 782,923 0.01%Credit Agricole SA $750,000 3.75% 24/4/2023 782,641 0.01%Agence Francaise de Developpement EPIC €700,000 0.25% 29/6/2029 781,314 0.01%BNP Paribas SA $700,000 4.40% 14/8/2028 774,842 0.01%BPCE SA AU($)1,000,000 4.50% 26/4/2028 772,483 0.01%BNP Paribas SA €620,000 2.38% 20/5/2024 764,115 0.01%Caisse d’Amortissement de la Dette Sociale $705,000 3.38% 20/3/2024 749,385 0.01%Banque Federative du Credit Mutuel SA €600,000 1.75% 15/3/2029 737,367 0.01%UNEDIC A.S.SEO €600,000 1.25% 21/10/2027 735,493 0.01%Societe Generale SA $700,000 5.20% 15/4/2021 727,619 0.01%Credit Agricole SA €600,000 2.00% 25/3/2029 719,372 0.01%Orange SA^ £500,000 5.88% Perpetual 716,160 0.01%Banque Federative du Credit Mutuel SA €600,000 1.88% 18/6/2029 715,377 0.01%Caisse Nationale de Reassurance Mutuelle Agricole Groupama €500,000 6.00% 23/1/2027 714,253 0.01%Credit Agricole SA €600,000 1.25% 14/4/2026 712,232 0.01%La Banque Postale SA €600,000 1.38% 24/4/2029 709,977 0.01%Cie Generale des Etablissements Michelin SCA €500,000 2.50% 3/9/2038 706,354 0.01%Agence Francaise de Developpement EPIC €600,000 0.88% 25/5/2031 704,933 0.01%Eutelsat SA €600,000 2.00% 2/10/2025 702,353 0.01%Unibail-Rodamco-Westfield SE €600,000 1.00% 27/2/2027 695,296 0.01%Carrefour SA €600,000 1.00% 17/5/2027 693,472 0.01%Orange SA €600,000 0.88% 3/2/2027 693,231 0.01%Westfield America Management Ltd. £500,000 2.63% 30/3/2029 691,020 0.01%BPCE SA €600,000 0.63% 26/9/2023 686,303 0.01%Engie SA €600,000 0.38% 28/2/2023 680,956 0.01%SFIL SA €600,000 0.00% 24/5/2024 676,919 0.01%Westfield America Management Ltd. £500,000 2.13% 30/3/2025 675,923 0.01%BNP Paribas SA^ €600,000 0.50% 4/6/2026 675,076 0.00%Vivendi SA €600,000 0.00% 13/6/2022 672,937 0.00%RTE Reseau de Transport d’Electricite SADIR €500,000 2.13% 27/9/2038 667,947 0.00%Dassault Systemes SE €600,000 0.13% 16/9/2026 664,653 0.00%Electricite de France SA $625,000 3.63% 13/10/2025 663,629 0.00%Suez €600,000 0.50% 14/10/2031 652,984 0.00%Electricite de France SA £300,000 6.00% 23/1/2114 649,332 0.00%Credit Agricole Home Loan SFH SA €500,000 1.50% 28/9/2038 648,324 0.00%SNCF Reseau €500,000 2.63% 29/12/2025 647,967 0.00%Airbus SE $580,000 3.95% 10/4/2047 644,573 0.00%Electricite de France SA^ €500,000 5.00% Perpetual 641,230 0.00%Engie SA €500,000 1.88% 19/9/2033 637,655 0.00%SCOR SE^ €500,000 3.00% 8/6/2046 634,212 0.00%RCI Banque SA €554,000 0.75% 10/4/2023 625,444 0.00%BNP Paribas SA $600,000 3.50% 1/3/2023 621,124 0.00%Credit Agricole Home Loan SFH SA €500,000 1.25% 24/3/2031 619,788 0.00%Cie de Saint-Gobain €500,000 1.88% 15/3/2031 614,293 0.00%Credit Agricole SA €500,000 1.75% 5/3/2029 613,859 0.00%RTE Reseau de Transport d’Electricite SADIR €500,000 1.50% 27/9/2030 613,289 0.00%Agence Francaise de Developpement EPIC $600,000 2.75% 22/1/2022 611,244 0.00%Danone SA $600,000 2.59% 2/11/2023 607,039 0.00%Airbus Finance BV €500,000 1.38% 13/5/2031 606,605 0.00%Societe Du Grand Paris EPIC €500,000 1.13% 22/10/2028 604,887 0.00%Sanofi €500,000 1.13% 5/4/2028 602,982 0.00%SNCF Reseau €500,000 1.13% 25/5/2030 602,153 0.00%RTE Reseau de Transport d’Electricite SADIR €500,000 1.63% 8/10/2024 599,426 0.00%BNP Paribas Home Loan SFH SA €500,000 0.88% 14/11/2024 589,282 0.00%
Vanguard Global Bond Index Fund
314
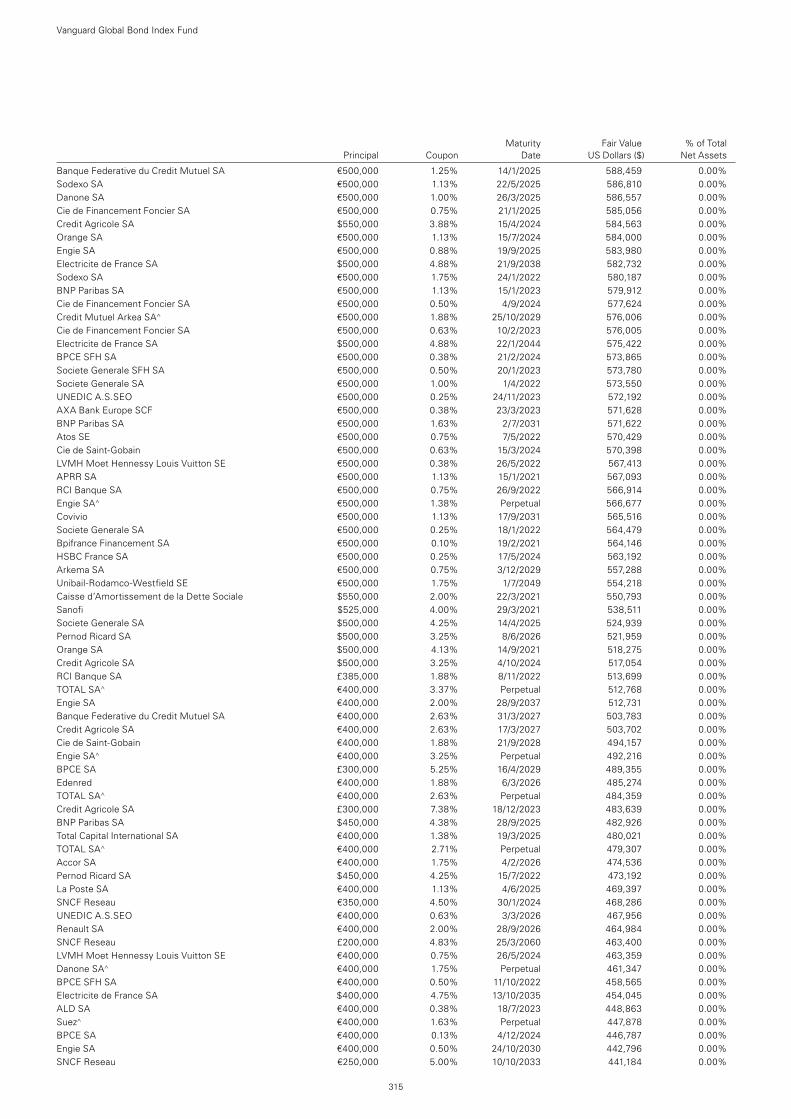
Maturity Fair Value % of Total Principal Coupon Date US Dollars ($) Net Assets
Banque Federative du Credit Mutuel SA €500,000 1.25% 14/1/2025 588,459 0.00%Sodexo SA €500,000 1.13% 22/5/2025 586,810 0.00%Danone SA €500,000 1.00% 26/3/2025 586,557 0.00%Cie de Financement Foncier SA €500,000 0.75% 21/1/2025 585,056 0.00%Credit Agricole SA $550,000 3.88% 15/4/2024 584,563 0.00%Orange SA €500,000 1.13% 15/7/2024 584,000 0.00%Engie SA €500,000 0.88% 19/9/2025 583,980 0.00%Electricite de France SA $500,000 4.88% 21/9/2038 582,732 0.00%Sodexo SA €500,000 1.75% 24/1/2022 580,187 0.00%BNP Paribas SA €500,000 1.13% 15/1/2023 579,912 0.00%Cie de Financement Foncier SA €500,000 0.50% 4/9/2024 577,624 0.00%Credit Mutuel Arkea SA^ €500,000 1.88% 25/10/2029 576,006 0.00%Cie de Financement Foncier SA €500,000 0.63% 10/2/2023 576,005 0.00%Electricite de France SA $500,000 4.88% 22/1/2044 575,422 0.00%BPCE SFH SA €500,000 0.38% 21/2/2024 573,865 0.00%Societe Generale SFH SA €500,000 0.50% 20/1/2023 573,780 0.00%Societe Generale SA €500,000 1.00% 1/4/2022 573,550 0.00%UNEDIC A.S.SEO €500,000 0.25% 24/11/2023 572,192 0.00%AXA Bank Europe SCF €500,000 0.38% 23/3/2023 571,628 0.00%BNP Paribas SA €500,000 1.63% 2/7/2031 571,622 0.00%Atos SE €500,000 0.75% 7/5/2022 570,429 0.00%Cie de Saint-Gobain €500,000 0.63% 15/3/2024 570,398 0.00%LVMH Moet Hennessy Louis Vuitton SE €500,000 0.38% 26/5/2022 567,413 0.00%APRR SA €500,000 1.13% 15/1/2021 567,093 0.00%RCI Banque SA €500,000 0.75% 26/9/2022 566,914 0.00%Engie SA^ €500,000 1.38% Perpetual 566,677 0.00%Covivio €500,000 1.13% 17/9/2031 565,516 0.00%Societe Generale SA €500,000 0.25% 18/1/2022 564,479 0.00%Bpifrance Financement SA €500,000 0.10% 19/2/2021 564,146 0.00%HSBC France SA €500,000 0.25% 17/5/2024 563,192 0.00%Arkema SA €500,000 0.75% 3/12/2029 557,288 0.00%Unibail-Rodamco-Westfield SE €500,000 1.75% 1/7/2049 554,218 0.00%Caisse d’Amortissement de la Dette Sociale $550,000 2.00% 22/3/2021 550,793 0.00%Sanofi $525,000 4.00% 29/3/2021 538,511 0.00%Societe Generale SA $500,000 4.25% 14/4/2025 524,939 0.00%Pernod Ricard SA $500,000 3.25% 8/6/2026 521,959 0.00%Orange SA $500,000 4.13% 14/9/2021 518,275 0.00%Credit Agricole SA $500,000 3.25% 4/10/2024 517,054 0.00%RCI Banque SA £385,000 1.88% 8/11/2022 513,699 0.00%TOTAL SA^ €400,000 3.37% Perpetual 512,768 0.00%Engie SA €400,000 2.00% 28/9/2037 512,731 0.00%Banque Federative du Credit Mutuel SA €400,000 2.63% 31/3/2027 503,783 0.00%Credit Agricole SA €400,000 2.63% 17/3/2027 503,702 0.00%Cie de Saint-Gobain €400,000 1.88% 21/9/2028 494,157 0.00%Engie SA^ €400,000 3.25% Perpetual 492,216 0.00%BPCE SA £300,000 5.25% 16/4/2029 489,355 0.00%Edenred €400,000 1.88% 6/3/2026 485,274 0.00%TOTAL SA^ €400,000 2.63% Perpetual 484,359 0.00%Credit Agricole SA £300,000 7.38% 18/12/2023 483,639 0.00%BNP Paribas SA $450,000 4.38% 28/9/2025 482,926 0.00%Total Capital International SA €400,000 1.38% 19/3/2025 480,021 0.00%TOTAL SA^ €400,000 2.71% Perpetual 479,307 0.00%Accor SA €400,000 1.75% 4/2/2026 474,536 0.00%Pernod Ricard SA $450,000 4.25% 15/7/2022 473,192 0.00%La Poste SA €400,000 1.13% 4/6/2025 469,397 0.00%SNCF Reseau €350,000 4.50% 30/1/2024 468,286 0.00%UNEDIC A.S.SEO €400,000 0.63% 3/3/2026 467,956 0.00%Renault SA €400,000 2.00% 28/9/2026 464,984 0.00%SNCF Reseau £200,000 4.83% 25/3/2060 463,400 0.00%LVMH Moet Hennessy Louis Vuitton SE €400,000 0.75% 26/5/2024 463,359 0.00%Danone SA^ €400,000 1.75% Perpetual 461,347 0.00%BPCE SFH SA €400,000 0.50% 11/10/2022 458,565 0.00%Electricite de France SA $400,000 4.75% 13/10/2035 454,045 0.00%ALD SA €400,000 0.38% 18/7/2023 448,863 0.00%Suez^ €400,000 1.63% Perpetual 447,878 0.00%BPCE SA €400,000 0.13% 4/12/2024 446,787 0.00%Engie SA €400,000 0.50% 24/10/2030 442,796 0.00%SNCF Reseau €250,000 5.00% 10/10/2033 441,184 0.00%
Vanguard Global Bond Index Fund
315

Maturity Fair Value % of Total Principal Coupon Date US Dollars ($) Net Assets
Dassault Systemes SE €400,000 0.38% 16/9/2029 440,020 0.00%Electricite de France SA^ £300,000 5.88% Perpetual 434,485 0.00%BNP Paribas SA^ $400,000 4.38% 1/3/2033 431,500 0.00%BNP Paribas SA $400,000 4.38% 12/5/2026 429,164 0.00%AXA SA $290,000 8.60% 15/12/2030 423,762 0.00%Credit Agricole Assurances SA^ €300,000 4.75% 27/9/2048 414,408 0.00%Credit Agricole Home Loan SFH SA €300,000 4.00% 16/7/2025 413,313 0.00%Veolia Environnement SA £200,000 6.13% 29/10/2037 409,911 0.00%Sodexo SA £300,000 1.75% 26/6/2028 408,709 0.00%Orange SA^ €300,000 5.25% Perpetual 393,721 0.00%Electricite de France SA $325,000 5.25% 13/10/2055 387,936 0.00%Total Capital International SA €300,000 2.50% 25/3/2026 386,852 0.00%BNP Paribas SA $350,000 4.63% 13/3/2027 381,998 0.00%Banque Federative du Credit Mutuel SA €300,000 2.63% 18/3/2024 371,092 0.00%APRR SA €300,000 1.63% 13/1/2032 370,942 0.00%APRR SA €300,000 1.50% 17/1/2033 367,239 0.00%Credit Agricole Home Loan SFH SA €300,000 4.00% 17/1/2022 366,589 0.00%Engie SA €300,000 1.38% 28/2/2029 363,107 0.00%Capgemini SE €300,000 2.50% 1/7/2023 362,485 0.00%Total Capital International SA €300,000 2.13% 15/3/2023 360,688 0.00%Atos SE €300,000 1.75% 7/5/2025 358,853 0.00%Kering SA €300,000 1.25% 10/5/2026 357,976 0.00%Credit Mutuel-CIC Home Loan SFH SA €300,000 4.38% 17/3/2021 355,877 0.00%TDF Infrastructure SAS €300,000 2.50% 7/4/2026 355,537 0.00%Electricite de France SA $300,000 6.00% 22/1/2114 351,861 0.00%Caisse de Refinancement de l’Habitat SA €300,000 3.90% 18/1/2021 351,628 0.00%Cie de Saint-Gobain €300,000 1.00% 17/3/2025 348,295 0.00%Region of Ile de France €300,000 0.63% 23/4/2027 347,971 0.00%Auchan Holding SA €300,000 1.75% 23/4/2021 344,311 0.00%BPCE SFH SA €300,000 0.38% 10/2/2023 343,203 0.00%Caisse Francaise de Financement Local €300,000 0.50% 13/4/2022 343,023 0.00%Publicis Groupe SA €300,000 1.13% 16/12/2021 343,015 0.00%Cie de Financement Foncier SA €300,000 0.63% 12/11/2021 342,518 0.00%HSBC SFH France SA €300,000 0.38% 11/3/2022 341,737 0.00%BPCE SA €300,000 0.63% 26/9/2024 340,215 0.00%BNP Paribas Home Loan SFH SA €300,000 0.25% 2/9/2021 339,890 0.00%Agence Francaise de Developpement EPIC €300,000 0.13% 31/3/2021 338,692 0.00%Engie Alliance GIE €250,000 5.75% 24/6/2023 335,665 0.00%PSA Tresorerie GIE €200,000 6.00% 19/9/2033 326,127 0.00%Caisse d’Amortissement de la Dette Sociale $325,000 1.88% 12/2/2022 326,117 0.00%Vinci SA $300,000 3.75% 10/4/2029 325,980 0.00%Total Capital International SA $300,000 3.46% 19/2/2029 323,951 0.00%Sanofi $300,000 3.38% 19/6/2023 314,342 0.00%Pernod Ricard SA $300,000 5.75% 7/4/2021 313,934 0.00%Total Capital International SA $300,000 2.83% 10/1/2030 307,552 0.00%Caisse d’Amortissement de la Dette Sociale €250,000 4.38% 25/10/2021 305,339 0.00%Total Capital International SA $300,000 2.22% 12/7/2021 301,410 0.00%Danone SA $300,000 2.08% 2/11/2021 299,782 0.00%Orange SA^ £200,000 5.75% Perpetual 292,725 0.00%French Republic Government Bond OAT €200,000 8.50% 25/4/2023 292,458 0.00%Banque Federative du Credit Mutuel SA $275,000 3.75% 20/7/2023 288,472 0.00%Total Capital International SA $280,000 2.43% 10/1/2025 283,132 0.00%BPCE SA $250,000 4.63% 12/9/2028 280,764 0.00%SNCF Reseau €200,000 3.13% 25/10/2028 279,663 0.00%Sanofi $250,000 3.63% 19/6/2028 277,355 0.00%Banque Federative du Credit Mutuel SA £200,000 2.25% 18/12/2023 274,454 0.00%Electricite de France SA $190,000 6.95% 26/1/2039 274,409 0.00%Total Capital International SA £200,000 1.75% 7/7/2025 271,256 0.00%Aeroports de Paris €200,000 2.13% 11/10/2038 266,937 0.00%Total Capital International SA $250,000 3.46% 12/7/2049 262,853 0.00%BPCE SA $250,000 3.38% 2/12/2026 262,035 0.00%BPCE SA $250,000 3.25% 11/1/2028 259,567 0.00%Electricite de France SA^ €200,000 5.38% Perpetual 259,153 0.00%Societe Du Grand Paris EPIC €200,000 1.70% 25/5/2050 257,046 0.00%Orange SA $200,000 5.38% 13/1/2042 256,208 0.00%Credit Agricole SA $250,000 3.38% 10/1/2022 255,867 0.00%Societe Generale SCF SA €200,000 4.25% 3/2/2023 255,675 0.00%Caisse Francaise de Financement Local €200,000 1.50% 13/1/2031 253,759 0.00%
Vanguard Global Bond Index Fund
316
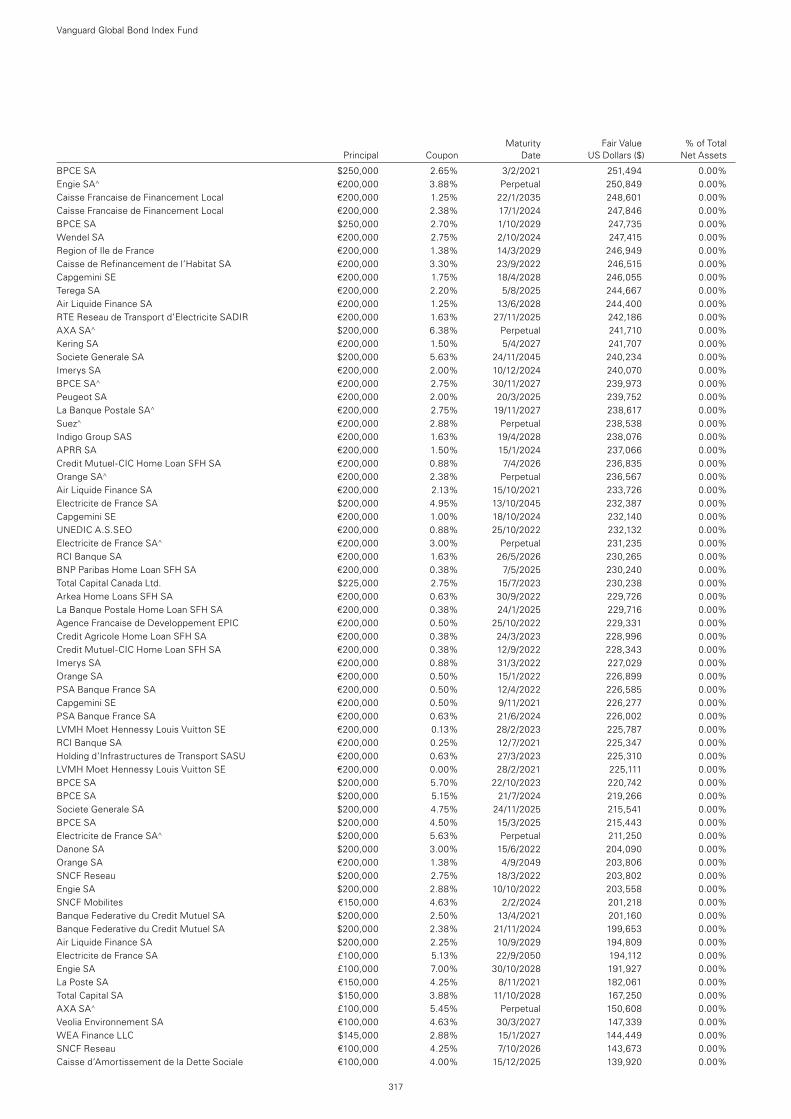
Maturity Fair Value % of Total Principal Coupon Date US Dollars ($) Net Assets
BPCE SA $250,000 2.65% 3/2/2021 251,494 0.00%Engie SA^ €200,000 3.88% Perpetual 250,849 0.00%Caisse Francaise de Financement Local €200,000 1.25% 22/1/2035 248,601 0.00%Caisse Francaise de Financement Local €200,000 2.38% 17/1/2024 247,846 0.00%BPCE SA $250,000 2.70% 1/10/2029 247,735 0.00%Wendel SA €200,000 2.75% 2/10/2024 247,415 0.00%Region of Ile de France €200,000 1.38% 14/3/2029 246,949 0.00%Caisse de Refinancement de l’Habitat SA €200,000 3.30% 23/9/2022 246,515 0.00%Capgemini SE €200,000 1.75% 18/4/2028 246,055 0.00%Terega SA €200,000 2.20% 5/8/2025 244,667 0.00%Air Liquide Finance SA €200,000 1.25% 13/6/2028 244,400 0.00%RTE Reseau de Transport d’Electricite SADIR €200,000 1.63% 27/11/2025 242,186 0.00%AXA SA^ $200,000 6.38% Perpetual 241,710 0.00%Kering SA €200,000 1.50% 5/4/2027 241,707 0.00%Societe Generale SA $200,000 5.63% 24/11/2045 240,234 0.00%Imerys SA €200,000 2.00% 10/12/2024 240,070 0.00%BPCE SA^ €200,000 2.75% 30/11/2027 239,973 0.00%Peugeot SA €200,000 2.00% 20/3/2025 239,752 0.00%La Banque Postale SA^ €200,000 2.75% 19/11/2027 238,617 0.00%Suez^ €200,000 2.88% Perpetual 238,538 0.00%Indigo Group SAS €200,000 1.63% 19/4/2028 238,076 0.00%APRR SA €200,000 1.50% 15/1/2024 237,066 0.00%Credit Mutuel-CIC Home Loan SFH SA €200,000 0.88% 7/4/2026 236,835 0.00%Orange SA^ €200,000 2.38% Perpetual 236,567 0.00%Air Liquide Finance SA €200,000 2.13% 15/10/2021 233,726 0.00%Electricite de France SA $200,000 4.95% 13/10/2045 232,387 0.00%Capgemini SE €200,000 1.00% 18/10/2024 232,140 0.00%UNEDIC A.S.SEO €200,000 0.88% 25/10/2022 232,132 0.00%Electricite de France SA^ €200,000 3.00% Perpetual 231,235 0.00%RCI Banque SA €200,000 1.63% 26/5/2026 230,265 0.00%BNP Paribas Home Loan SFH SA €200,000 0.38% 7/5/2025 230,240 0.00%Total Capital Canada Ltd. $225,000 2.75% 15/7/2023 230,238 0.00%Arkea Home Loans SFH SA €200,000 0.63% 30/9/2022 229,726 0.00%La Banque Postale Home Loan SFH SA €200,000 0.38% 24/1/2025 229,716 0.00%Agence Francaise de Developpement EPIC €200,000 0.50% 25/10/2022 229,331 0.00%Credit Agricole Home Loan SFH SA €200,000 0.38% 24/3/2023 228,996 0.00%Credit Mutuel-CIC Home Loan SFH SA €200,000 0.38% 12/9/2022 228,343 0.00%Imerys SA €200,000 0.88% 31/3/2022 227,029 0.00%Orange SA €200,000 0.50% 15/1/2022 226,899 0.00%PSA Banque France SA €200,000 0.50% 12/4/2022 226,585 0.00%Capgemini SE €200,000 0.50% 9/11/2021 226,277 0.00%PSA Banque France SA €200,000 0.63% 21/6/2024 226,002 0.00%LVMH Moet Hennessy Louis Vuitton SE €200,000 0.13% 28/2/2023 225,787 0.00%RCI Banque SA €200,000 0.25% 12/7/2021 225,347 0.00%Holding d’Infrastructures de Transport SASU €200,000 0.63% 27/3/2023 225,310 0.00%LVMH Moet Hennessy Louis Vuitton SE €200,000 0.00% 28/2/2021 225,111 0.00%BPCE SA $200,000 5.70% 22/10/2023 220,742 0.00%BPCE SA $200,000 5.15% 21/7/2024 219,266 0.00%Societe Generale SA $200,000 4.75% 24/11/2025 215,541 0.00%BPCE SA $200,000 4.50% 15/3/2025 215,443 0.00%Electricite de France SA^ $200,000 5.63% Perpetual 211,250 0.00%Danone SA $200,000 3.00% 15/6/2022 204,090 0.00%Orange SA €200,000 1.38% 4/9/2049 203,806 0.00%SNCF Reseau $200,000 2.75% 18/3/2022 203,802 0.00%Engie SA $200,000 2.88% 10/10/2022 203,558 0.00%SNCF Mobilites €150,000 4.63% 2/2/2024 201,218 0.00%Banque Federative du Credit Mutuel SA $200,000 2.50% 13/4/2021 201,160 0.00%Banque Federative du Credit Mutuel SA $200,000 2.38% 21/11/2024 199,653 0.00%Air Liquide Finance SA $200,000 2.25% 10/9/2029 194,809 0.00%Electricite de France SA £100,000 5.13% 22/9/2050 194,112 0.00%Engie SA £100,000 7.00% 30/10/2028 191,927 0.00%La Poste SA €150,000 4.25% 8/11/2021 182,061 0.00%Total Capital SA $150,000 3.88% 11/10/2028 167,250 0.00%AXA SA^ £100,000 5.45% Perpetual 150,608 0.00%Veolia Environnement SA €100,000 4.63% 30/3/2027 147,339 0.00%WEA Finance LLC $145,000 2.88% 15/1/2027 144,449 0.00%SNCF Reseau €100,000 4.25% 7/10/2026 143,673 0.00%Caisse d’Amortissement de la Dette Sociale €100,000 4.00% 15/12/2025 139,920 0.00%
Vanguard Global Bond Index Fund
317
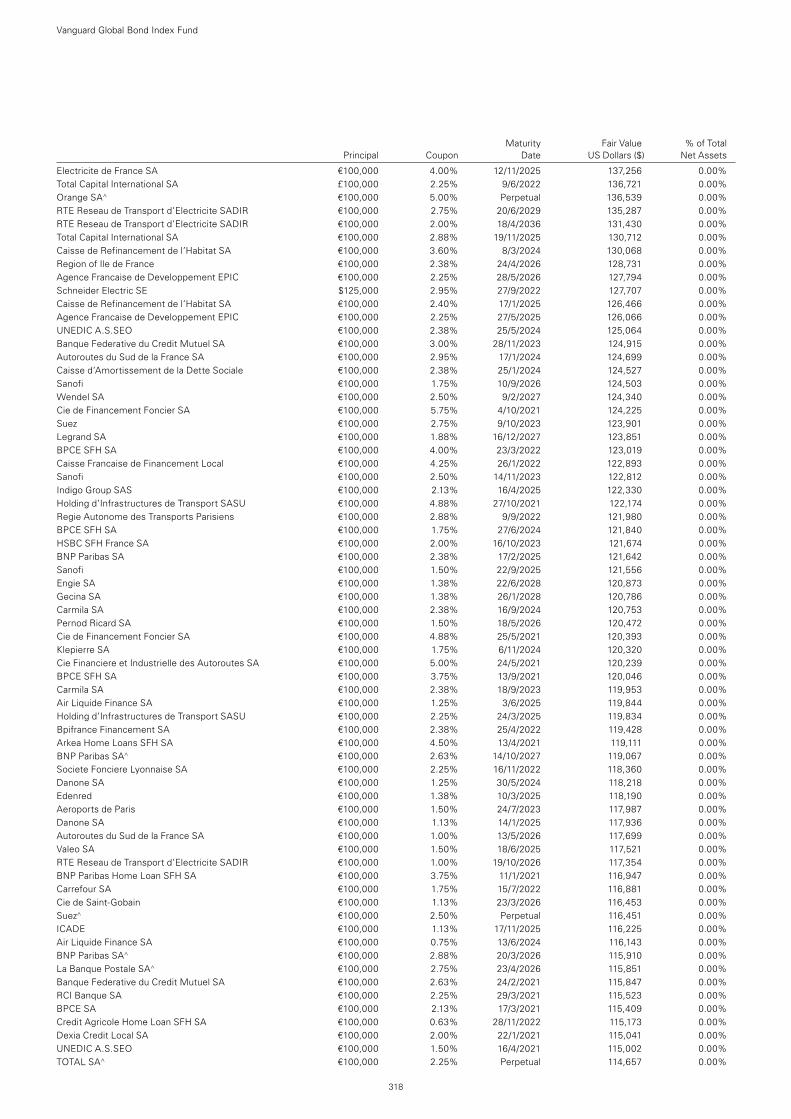
Maturity Fair Value % of Total Principal Coupon Date US Dollars ($) Net Assets
Electricite de France SA €100,000 4.00% 12/11/2025 137,256 0.00%Total Capital International SA £100,000 2.25% 9/6/2022 136,721 0.00%Orange SA^ €100,000 5.00% Perpetual 136,539 0.00%RTE Reseau de Transport d’Electricite SADIR €100,000 2.75% 20/6/2029 135,287 0.00%RTE Reseau de Transport d’Electricite SADIR €100,000 2.00% 18/4/2036 131,430 0.00%Total Capital International SA €100,000 2.88% 19/11/2025 130,712 0.00%Caisse de Refinancement de l’Habitat SA €100,000 3.60% 8/3/2024 130,068 0.00%Region of Ile de France €100,000 2.38% 24/4/2026 128,731 0.00%Agence Francaise de Developpement EPIC €100,000 2.25% 28/5/2026 127,794 0.00%Schneider Electric SE $125,000 2.95% 27/9/2022 127,707 0.00%Caisse de Refinancement de l’Habitat SA €100,000 2.40% 17/1/2025 126,466 0.00%Agence Francaise de Developpement EPIC €100,000 2.25% 27/5/2025 126,066 0.00%UNEDIC A.S.SEO €100,000 2.38% 25/5/2024 125,064 0.00%Banque Federative du Credit Mutuel SA €100,000 3.00% 28/11/2023 124,915 0.00%Autoroutes du Sud de la France SA €100,000 2.95% 17/1/2024 124,699 0.00%Caisse d’Amortissement de la Dette Sociale €100,000 2.38% 25/1/2024 124,527 0.00%Sanofi €100,000 1.75% 10/9/2026 124,503 0.00%Wendel SA €100,000 2.50% 9/2/2027 124,340 0.00%Cie de Financement Foncier SA €100,000 5.75% 4/10/2021 124,225 0.00%Suez €100,000 2.75% 9/10/2023 123,901 0.00%Legrand SA €100,000 1.88% 16/12/2027 123,851 0.00%BPCE SFH SA €100,000 4.00% 23/3/2022 123,019 0.00%Caisse Francaise de Financement Local €100,000 4.25% 26/1/2022 122,893 0.00%Sanofi €100,000 2.50% 14/11/2023 122,812 0.00%Indigo Group SAS €100,000 2.13% 16/4/2025 122,330 0.00%Holding d’Infrastructures de Transport SASU €100,000 4.88% 27/10/2021 122,174 0.00%Regie Autonome des Transports Parisiens €100,000 2.88% 9/9/2022 121,980 0.00%BPCE SFH SA €100,000 1.75% 27/6/2024 121,840 0.00%HSBC SFH France SA €100,000 2.00% 16/10/2023 121,674 0.00%BNP Paribas SA €100,000 2.38% 17/2/2025 121,642 0.00%Sanofi €100,000 1.50% 22/9/2025 121,556 0.00%Engie SA €100,000 1.38% 22/6/2028 120,873 0.00%Gecina SA €100,000 1.38% 26/1/2028 120,786 0.00%Carmila SA €100,000 2.38% 16/9/2024 120,753 0.00%Pernod Ricard SA €100,000 1.50% 18/5/2026 120,472 0.00%Cie de Financement Foncier SA €100,000 4.88% 25/5/2021 120,393 0.00%Klepierre SA €100,000 1.75% 6/11/2024 120,320 0.00%Cie Financiere et Industrielle des Autoroutes SA €100,000 5.00% 24/5/2021 120,239 0.00%BPCE SFH SA €100,000 3.75% 13/9/2021 120,046 0.00%Carmila SA €100,000 2.38% 18/9/2023 119,953 0.00%Air Liquide Finance SA €100,000 1.25% 3/6/2025 119,844 0.00%Holding d’Infrastructures de Transport SASU €100,000 2.25% 24/3/2025 119,834 0.00%Bpifrance Financement SA €100,000 2.38% 25/4/2022 119,428 0.00%Arkea Home Loans SFH SA €100,000 4.50% 13/4/2021 119,111 0.00%BNP Paribas SA^ €100,000 2.63% 14/10/2027 119,067 0.00%Societe Fonciere Lyonnaise SA €100,000 2.25% 16/11/2022 118,360 0.00%Danone SA €100,000 1.25% 30/5/2024 118,218 0.00%Edenred €100,000 1.38% 10/3/2025 118,190 0.00%Aeroports de Paris €100,000 1.50% 24/7/2023 117,987 0.00%Danone SA €100,000 1.13% 14/1/2025 117,936 0.00%Autoroutes du Sud de la France SA €100,000 1.00% 13/5/2026 117,699 0.00%Valeo SA €100,000 1.50% 18/6/2025 117,521 0.00%RTE Reseau de Transport d’Electricite SADIR €100,000 1.00% 19/10/2026 117,354 0.00%BNP Paribas Home Loan SFH SA €100,000 3.75% 11/1/2021 116,947 0.00%Carrefour SA €100,000 1.75% 15/7/2022 116,881 0.00%Cie de Saint-Gobain €100,000 1.13% 23/3/2026 116,453 0.00%Suez^ €100,000 2.50% Perpetual 116,451 0.00%ICADE €100,000 1.13% 17/11/2025 116,225 0.00%Air Liquide Finance SA €100,000 0.75% 13/6/2024 116,143 0.00%BNP Paribas SA^ €100,000 2.88% 20/3/2026 115,910 0.00%La Banque Postale SA^ €100,000 2.75% 23/4/2026 115,851 0.00%Banque Federative du Credit Mutuel SA €100,000 2.63% 24/2/2021 115,847 0.00%RCI Banque SA €100,000 2.25% 29/3/2021 115,523 0.00%BPCE SA €100,000 2.13% 17/3/2021 115,409 0.00%Credit Agricole Home Loan SFH SA €100,000 0.63% 28/11/2022 115,173 0.00%Dexia Credit Local SA €100,000 2.00% 22/1/2021 115,041 0.00%UNEDIC A.S.SEO €100,000 1.50% 16/4/2021 115,002 0.00%TOTAL SA^ €100,000 2.25% Perpetual 114,657 0.00%
Vanguard Global Bond Index Fund
318
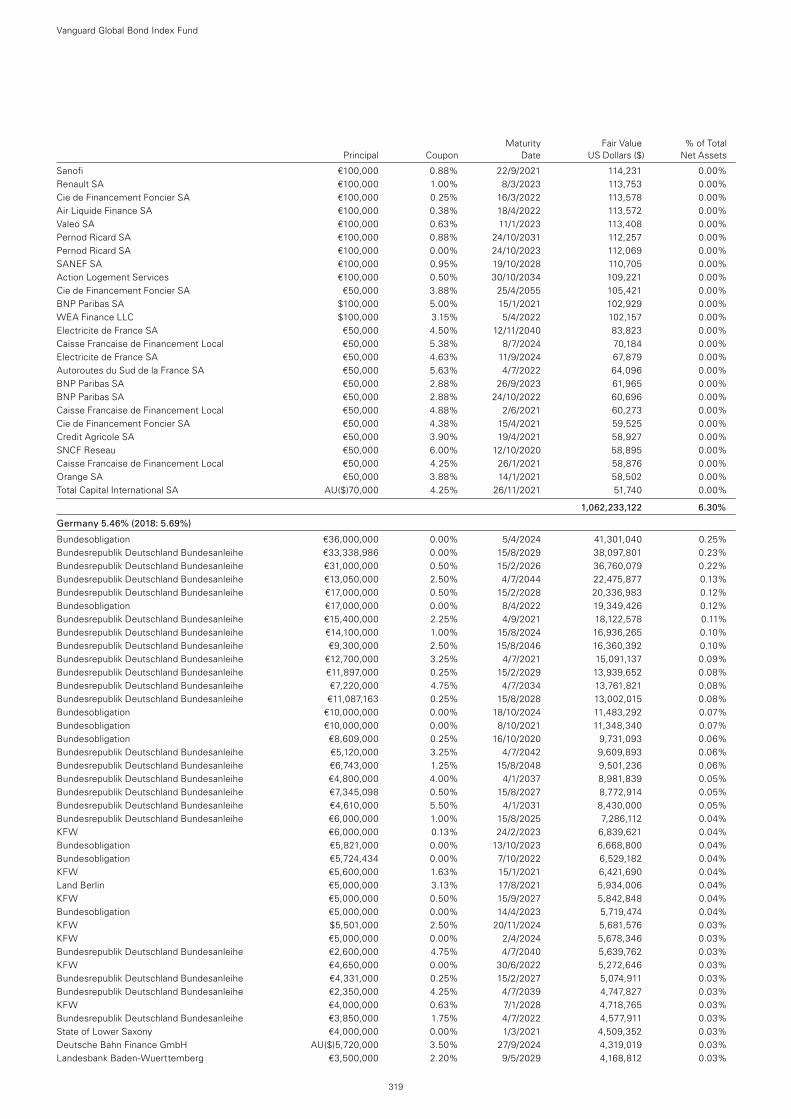
Maturity Fair Value % of Total Principal Coupon Date US Dollars ($) Net Assets
Sanofi €100,000 0.88% 22/9/2021 114,231 0.00%Renault SA €100,000 1.00% 8/3/2023 113,753 0.00%Cie de Financement Foncier SA €100,000 0.25% 16/3/2022 113,578 0.00%Air Liquide Finance SA €100,000 0.38% 18/4/2022 113,572 0.00%Valeo SA €100,000 0.63% 11/1/2023 113,408 0.00%Pernod Ricard SA €100,000 0.88% 24/10/2031 112,257 0.00%Pernod Ricard SA €100,000 0.00% 24/10/2023 112,069 0.00%SANEF SA €100,000 0.95% 19/10/2028 110,705 0.00%Action Logement Services €100,000 0.50% 30/10/2034 109,221 0.00%Cie de Financement Foncier SA €50,000 3.88% 25/4/2055 105,421 0.00%BNP Paribas SA $100,000 5.00% 15/1/2021 102,929 0.00%WEA Finance LLC $100,000 3.15% 5/4/2022 102,157 0.00%Electricite de France SA €50,000 4.50% 12/11/2040 83,823 0.00%Caisse Francaise de Financement Local €50,000 5.38% 8/7/2024 70,184 0.00%Electricite de France SA €50,000 4.63% 11/9/2024 67,879 0.00%Autoroutes du Sud de la France SA €50,000 5.63% 4/7/2022 64,096 0.00%BNP Paribas SA €50,000 2.88% 26/9/2023 61,965 0.00%BNP Paribas SA €50,000 2.88% 24/10/2022 60,696 0.00%Caisse Francaise de Financement Local €50,000 4.88% 2/6/2021 60,273 0.00%Cie de Financement Foncier SA €50,000 4.38% 15/4/2021 59,525 0.00%Credit Agricole SA €50,000 3.90% 19/4/2021 58,927 0.00%SNCF Reseau €50,000 6.00% 12/10/2020 58,895 0.00%Caisse Francaise de Financement Local €50,000 4.25% 26/1/2021 58,876 0.00%Orange SA €50,000 3.88% 14/1/2021 58,502 0.00%Total Capital International SA AU($)70,000 4.25% 26/11/2021 51,740 0.00%
1,062,233,122 6.30%
Germany 5.46% (2018: 5.69%)
Bundesobligation €36,000,000 0.00% 5/4/2024 41,301,040 0.25%Bundesrepublik Deutschland Bundesanleihe €33,338,986 0.00% 15/8/2029 38,097,801 0.23%Bundesrepublik Deutschland Bundesanleihe €31,000,000 0.50% 15/2/2026 36,760,079 0.22%Bundesrepublik Deutschland Bundesanleihe €13,050,000 2.50% 4/7/2044 22,475,877 0.13%Bundesrepublik Deutschland Bundesanleihe €17,000,000 0.50% 15/2/2028 20,336,983 0.12%Bundesobligation €17,000,000 0.00% 8/4/2022 19,349,426 0.12%Bundesrepublik Deutschland Bundesanleihe €15,400,000 2.25% 4/9/2021 18,122,578 0.11%Bundesrepublik Deutschland Bundesanleihe €14,100,000 1.00% 15/8/2024 16,936,265 0.10%Bundesrepublik Deutschland Bundesanleihe €9,300,000 2.50% 15/8/2046 16,360,392 0.10%Bundesrepublik Deutschland Bundesanleihe €12,700,000 3.25% 4/7/2021 15,091,137 0.09%Bundesrepublik Deutschland Bundesanleihe €11,897,000 0.25% 15/2/2029 13,939,652 0.08%Bundesrepublik Deutschland Bundesanleihe €7,220,000 4.75% 4/7/2034 13,761,821 0.08%Bundesrepublik Deutschland Bundesanleihe €11,087,163 0.25% 15/8/2028 13,002,015 0.08%Bundesobligation €10,000,000 0.00% 18/10/2024 11,483,292 0.07%Bundesobligation €10,000,000 0.00% 8/10/2021 11,348,340 0.07%Bundesobligation €8,609,000 0.25% 16/10/2020 9,731,093 0.06%Bundesrepublik Deutschland Bundesanleihe €5,120,000 3.25% 4/7/2042 9,609,893 0.06%Bundesrepublik Deutschland Bundesanleihe €6,743,000 1.25% 15/8/2048 9,501,236 0.06%Bundesrepublik Deutschland Bundesanleihe €4,800,000 4.00% 4/1/2037 8,981,839 0.05%Bundesrepublik Deutschland Bundesanleihe €7,345,098 0.50% 15/8/2027 8,772,914 0.05%Bundesrepublik Deutschland Bundesanleihe €4,610,000 5.50% 4/1/2031 8,430,000 0.05%Bundesrepublik Deutschland Bundesanleihe €6,000,000 1.00% 15/8/2025 7,286,112 0.04%KFW €6,000,000 0.13% 24/2/2023 6,839,621 0.04%Bundesobligation €5,821,000 0.00% 13/10/2023 6,668,800 0.04%Bundesobligation €5,724,434 0.00% 7/10/2022 6,529,182 0.04%KFW €5,600,000 1.63% 15/1/2021 6,421,690 0.04%Land Berlin €5,000,000 3.13% 17/8/2021 5,934,006 0.04%KFW €5,000,000 0.50% 15/9/2027 5,842,848 0.04%Bundesobligation €5,000,000 0.00% 14/4/2023 5,719,474 0.04%KFW $5,501,000 2.50% 20/11/2024 5,681,576 0.03%KFW €5,000,000 0.00% 2/4/2024 5,678,346 0.03%Bundesrepublik Deutschland Bundesanleihe €2,600,000 4.75% 4/7/2040 5,639,762 0.03%KFW €4,650,000 0.00% 30/6/2022 5,272,646 0.03%Bundesrepublik Deutschland Bundesanleihe €4,331,000 0.25% 15/2/2027 5,074,911 0.03%Bundesrepublik Deutschland Bundesanleihe €2,350,000 4.25% 4/7/2039 4,747,827 0.03%KFW €4,000,000 0.63% 7/1/2028 4,718,765 0.03%Bundesrepublik Deutschland Bundesanleihe €3,850,000 1.75% 4/7/2022 4,577,911 0.03%State of Lower Saxony €4,000,000 0.00% 1/3/2021 4,509,352 0.03%Deutsche Bahn Finance GmbH AU($)5,720,000 3.50% 27/9/2024 4,319,019 0.03%Landesbank Baden-Wuerttemberg €3,500,000 2.20% 9/5/2029 4,168,812 0.03%
Vanguard Global Bond Index Fund
319
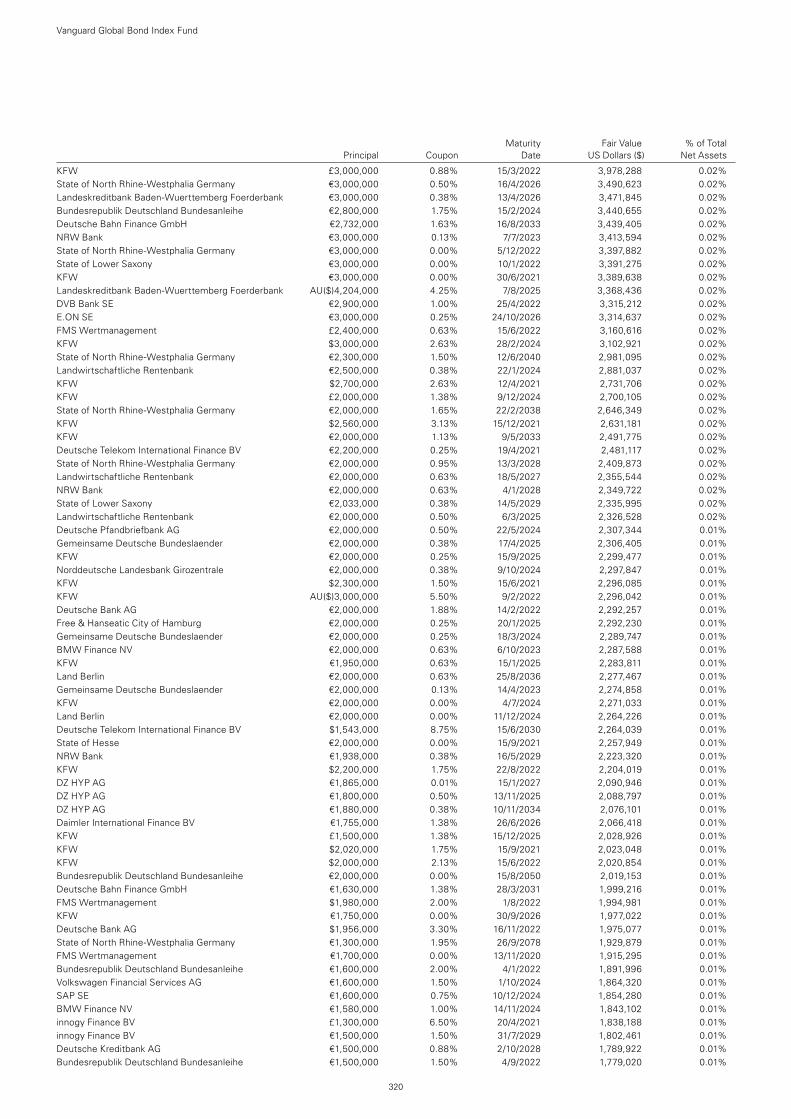
Maturity Fair Value % of Total Principal Coupon Date US Dollars ($) Net Assets
KFW £3,000,000 0.88% 15/3/2022 3,978,288 0.02%State of North Rhine-Westphalia Germany €3,000,000 0.50% 16/4/2026 3,490,623 0.02%Landeskreditbank Baden-Wuerttemberg Foerderbank €3,000,000 0.38% 13/4/2026 3,471,845 0.02%Bundesrepublik Deutschland Bundesanleihe €2,800,000 1.75% 15/2/2024 3,440,655 0.02%Deutsche Bahn Finance GmbH €2,732,000 1.63% 16/8/2033 3,439,405 0.02%NRW Bank €3,000,000 0.13% 7/7/2023 3,413,594 0.02%State of North Rhine-Westphalia Germany €3,000,000 0.00% 5/12/2022 3,397,882 0.02%State of Lower Saxony €3,000,000 0.00% 10/1/2022 3,391,275 0.02%KFW €3,000,000 0.00% 30/6/2021 3,389,638 0.02%Landeskreditbank Baden-Wuerttemberg Foerderbank AU($)4,204,000 4.25% 7/8/2025 3,368,436 0.02%DVB Bank SE €2,900,000 1.00% 25/4/2022 3,315,212 0.02%E.ON SE €3,000,000 0.25% 24/10/2026 3,314,637 0.02%FMS Wertmanagement £2,400,000 0.63% 15/6/2022 3,160,616 0.02%KFW $3,000,000 2.63% 28/2/2024 3,102,921 0.02%State of North Rhine-Westphalia Germany €2,300,000 1.50% 12/6/2040 2,981,095 0.02%Landwirtschaftliche Rentenbank €2,500,000 0.38% 22/1/2024 2,881,037 0.02%KFW $2,700,000 2.63% 12/4/2021 2,731,706 0.02%KFW £2,000,000 1.38% 9/12/2024 2,700,105 0.02%State of North Rhine-Westphalia Germany €2,000,000 1.65% 22/2/2038 2,646,349 0.02%KFW $2,560,000 3.13% 15/12/2021 2,631,181 0.02%KFW €2,000,000 1.13% 9/5/2033 2,491,775 0.02%Deutsche Telekom International Finance BV €2,200,000 0.25% 19/4/2021 2,481,117 0.02%State of North Rhine-Westphalia Germany €2,000,000 0.95% 13/3/2028 2,409,873 0.02%Landwirtschaftliche Rentenbank €2,000,000 0.63% 18/5/2027 2,355,544 0.02%NRW Bank €2,000,000 0.63% 4/1/2028 2,349,722 0.02%State of Lower Saxony €2,033,000 0.38% 14/5/2029 2,335,995 0.02%Landwirtschaftliche Rentenbank €2,000,000 0.50% 6/3/2025 2,326,528 0.02%Deutsche Pfandbriefbank AG €2,000,000 0.50% 22/5/2024 2,307,344 0.01%Gemeinsame Deutsche Bundeslaender €2,000,000 0.38% 17/4/2025 2,306,405 0.01%KFW €2,000,000 0.25% 15/9/2025 2,299,477 0.01%Norddeutsche Landesbank Girozentrale €2,000,000 0.38% 9/10/2024 2,297,847 0.01%KFW $2,300,000 1.50% 15/6/2021 2,296,085 0.01%KFW AU($)3,000,000 5.50% 9/2/2022 2,296,042 0.01%Deutsche Bank AG €2,000,000 1.88% 14/2/2022 2,292,257 0.01%Free & Hanseatic City of Hamburg €2,000,000 0.25% 20/1/2025 2,292,230 0.01%Gemeinsame Deutsche Bundeslaender €2,000,000 0.25% 18/3/2024 2,289,747 0.01%BMW Finance NV €2,000,000 0.63% 6/10/2023 2,287,588 0.01%KFW €1,950,000 0.63% 15/1/2025 2,283,811 0.01%Land Berlin €2,000,000 0.63% 25/8/2036 2,277,467 0.01%Gemeinsame Deutsche Bundeslaender €2,000,000 0.13% 14/4/2023 2,274,858 0.01%KFW €2,000,000 0.00% 4/7/2024 2,271,033 0.01%Land Berlin €2,000,000 0.00% 11/12/2024 2,264,226 0.01%Deutsche Telekom International Finance BV $1,543,000 8.75% 15/6/2030 2,264,039 0.01%State of Hesse €2,000,000 0.00% 15/9/2021 2,257,949 0.01%NRW Bank €1,938,000 0.38% 16/5/2029 2,223,320 0.01%KFW $2,200,000 1.75% 22/8/2022 2,204,019 0.01%DZ HYP AG €1,865,000 0.01% 15/1/2027 2,090,946 0.01%DZ HYP AG €1,800,000 0.50% 13/11/2025 2,088,797 0.01%DZ HYP AG €1,880,000 0.38% 10/11/2034 2,076,101 0.01%Daimler International Finance BV €1,755,000 1.38% 26/6/2026 2,066,418 0.01%KFW £1,500,000 1.38% 15/12/2025 2,028,926 0.01%KFW $2,020,000 1.75% 15/9/2021 2,023,048 0.01%KFW $2,000,000 2.13% 15/6/2022 2,020,854 0.01%Bundesrepublik Deutschland Bundesanleihe €2,000,000 0.00% 15/8/2050 2,019,153 0.01%Deutsche Bahn Finance GmbH €1,630,000 1.38% 28/3/2031 1,999,216 0.01%FMS Wertmanagement $1,980,000 2.00% 1/8/2022 1,994,981 0.01%KFW €1,750,000 0.00% 30/9/2026 1,977,022 0.01%Deutsche Bank AG $1,956,000 3.30% 16/11/2022 1,975,077 0.01%State of North Rhine-Westphalia Germany €1,300,000 1.95% 26/9/2078 1,929,879 0.01%FMS Wertmanagement €1,700,000 0.00% 13/11/2020 1,915,295 0.01%Bundesrepublik Deutschland Bundesanleihe €1,600,000 2.00% 4/1/2022 1,891,996 0.01%Volkswagen Financial Services AG €1,600,000 1.50% 1/10/2024 1,864,320 0.01%SAP SE €1,600,000 0.75% 10/12/2024 1,854,280 0.01%BMW Finance NV €1,580,000 1.00% 14/11/2024 1,843,102 0.01%innogy Finance BV £1,300,000 6.50% 20/4/2021 1,838,188 0.01%innogy Finance BV €1,500,000 1.50% 31/7/2029 1,802,461 0.01%Deutsche Kreditbank AG €1,500,000 0.88% 2/10/2028 1,789,922 0.01%Bundesrepublik Deutschland Bundesanleihe €1,500,000 1.50% 4/9/2022 1,779,020 0.01%
Vanguard Global Bond Index Fund
320
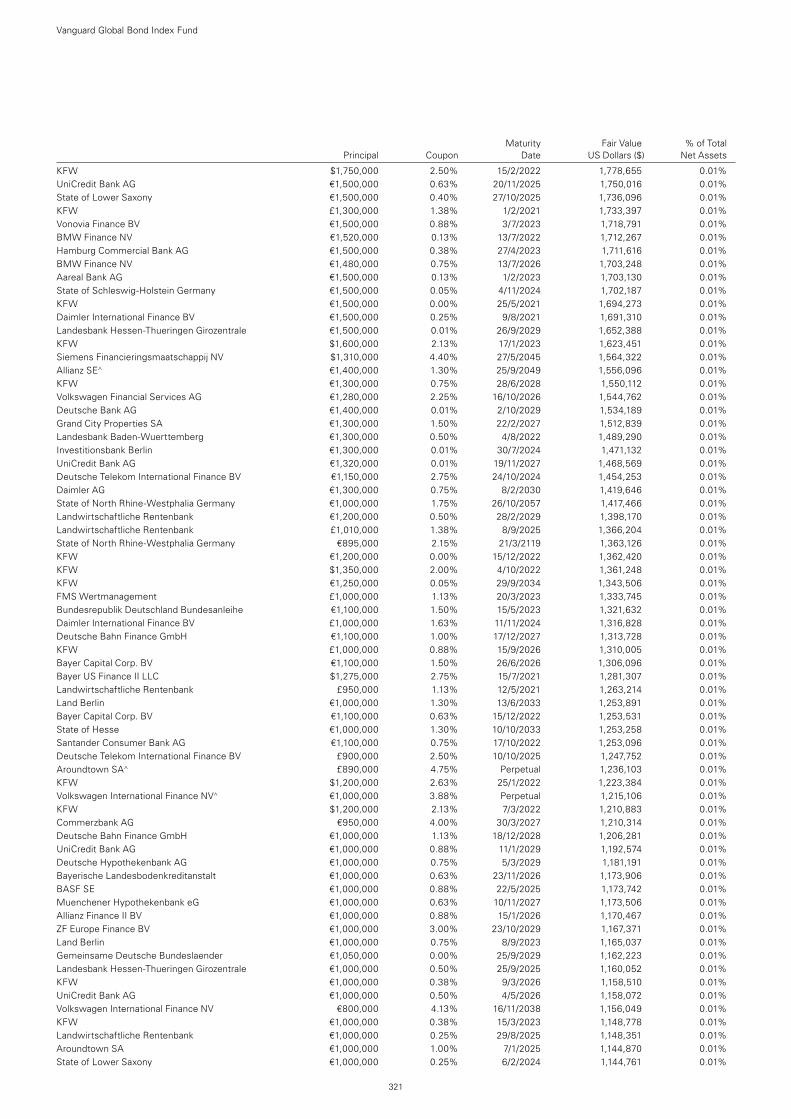
Maturity Fair Value % of Total Principal Coupon Date US Dollars ($) Net Assets
KFW $1,750,000 2.50% 15/2/2022 1,778,655 0.01%UniCredit Bank AG €1,500,000 0.63% 20/11/2025 1,750,016 0.01%State of Lower Saxony €1,500,000 0.40% 27/10/2025 1,736,096 0.01%KFW £1,300,000 1.38% 1/2/2021 1,733,397 0.01%Vonovia Finance BV €1,500,000 0.88% 3/7/2023 1,718,791 0.01%BMW Finance NV €1,520,000 0.13% 13/7/2022 1,712,267 0.01%Hamburg Commercial Bank AG €1,500,000 0.38% 27/4/2023 1,711,616 0.01%BMW Finance NV €1,480,000 0.75% 13/7/2026 1,703,248 0.01%Aareal Bank AG €1,500,000 0.13% 1/2/2023 1,703,130 0.01%State of Schleswig-Holstein Germany €1,500,000 0.05% 4/11/2024 1,702,187 0.01%KFW €1,500,000 0.00% 25/5/2021 1,694,273 0.01%Daimler International Finance BV €1,500,000 0.25% 9/8/2021 1,691,310 0.01%Landesbank Hessen-Thueringen Girozentrale €1,500,000 0.01% 26/9/2029 1,652,388 0.01%KFW $1,600,000 2.13% 17/1/2023 1,623,451 0.01%Siemens Financieringsmaatschappij NV $1,310,000 4.40% 27/5/2045 1,564,322 0.01%Allianz SE^ €1,400,000 1.30% 25/9/2049 1,556,096 0.01%KFW €1,300,000 0.75% 28/6/2028 1,550,112 0.01%Volkswagen Financial Services AG €1,280,000 2.25% 16/10/2026 1,544,762 0.01%Deutsche Bank AG €1,400,000 0.01% 2/10/2029 1,534,189 0.01%Grand City Properties SA €1,300,000 1.50% 22/2/2027 1,512,839 0.01%Landesbank Baden-Wuerttemberg €1,300,000 0.50% 4/8/2022 1,489,290 0.01%Investitionsbank Berlin €1,300,000 0.01% 30/7/2024 1,471,132 0.01%UniCredit Bank AG €1,320,000 0.01% 19/11/2027 1,468,569 0.01%Deutsche Telekom International Finance BV €1,150,000 2.75% 24/10/2024 1,454,253 0.01%Daimler AG €1,300,000 0.75% 8/2/2030 1,419,646 0.01%State of North Rhine-Westphalia Germany €1,000,000 1.75% 26/10/2057 1,417,466 0.01%Landwirtschaftliche Rentenbank €1,200,000 0.50% 28/2/2029 1,398,170 0.01%Landwirtschaftliche Rentenbank £1,010,000 1.38% 8/9/2025 1,366,204 0.01%State of North Rhine-Westphalia Germany €895,000 2.15% 21/3/2119 1,363,126 0.01%KFW €1,200,000 0.00% 15/12/2022 1,362,420 0.01%KFW $1,350,000 2.00% 4/10/2022 1,361,248 0.01%KFW €1,250,000 0.05% 29/9/2034 1,343,506 0.01%FMS Wertmanagement £1,000,000 1.13% 20/3/2023 1,333,745 0.01%Bundesrepublik Deutschland Bundesanleihe €1,100,000 1.50% 15/5/2023 1,321,632 0.01%Daimler International Finance BV £1,000,000 1.63% 11/11/2024 1,316,828 0.01%Deutsche Bahn Finance GmbH €1,100,000 1.00% 17/12/2027 1,313,728 0.01%KFW £1,000,000 0.88% 15/9/2026 1,310,005 0.01%Bayer Capital Corp. BV €1,100,000 1.50% 26/6/2026 1,306,096 0.01%Bayer US Finance II LLC $1,275,000 2.75% 15/7/2021 1,281,307 0.01%Landwirtschaftliche Rentenbank £950,000 1.13% 12/5/2021 1,263,214 0.01%Land Berlin €1,000,000 1.30% 13/6/2033 1,253,891 0.01%Bayer Capital Corp. BV €1,100,000 0.63% 15/12/2022 1,253,531 0.01%State of Hesse €1,000,000 1.30% 10/10/2033 1,253,258 0.01%Santander Consumer Bank AG €1,100,000 0.75% 17/10/2022 1,253,096 0.01%Deutsche Telekom International Finance BV £900,000 2.50% 10/10/2025 1,247,752 0.01%Aroundtown SA^ £890,000 4.75% Perpetual 1,236,103 0.01%KFW $1,200,000 2.63% 25/1/2022 1,223,384 0.01%Volkswagen International Finance NV^ €1,000,000 3.88% Perpetual 1,215,106 0.01%KFW $1,200,000 2.13% 7/3/2022 1,210,883 0.01%Commerzbank AG €950,000 4.00% 30/3/2027 1,210,314 0.01%Deutsche Bahn Finance GmbH €1,000,000 1.13% 18/12/2028 1,206,281 0.01%UniCredit Bank AG €1,000,000 0.88% 11/1/2029 1,192,574 0.01%Deutsche Hypothekenbank AG €1,000,000 0.75% 5/3/2029 1,181,191 0.01%Bayerische Landesbodenkreditanstalt €1,000,000 0.63% 23/11/2026 1,173,906 0.01%BASF SE €1,000,000 0.88% 22/5/2025 1,173,742 0.01%Muenchener Hypothekenbank eG €1,000,000 0.63% 10/11/2027 1,173,506 0.01%Allianz Finance II BV €1,000,000 0.88% 15/1/2026 1,170,467 0.01%ZF Europe Finance BV €1,000,000 3.00% 23/10/2029 1,167,371 0.01%Land Berlin €1,000,000 0.75% 8/9/2023 1,165,037 0.01%Gemeinsame Deutsche Bundeslaender €1,050,000 0.00% 25/9/2029 1,162,223 0.01%Landesbank Hessen-Thueringen Girozentrale €1,000,000 0.50% 25/9/2025 1,160,052 0.01%KFW €1,000,000 0.38% 9/3/2026 1,158,510 0.01%UniCredit Bank AG €1,000,000 0.50% 4/5/2026 1,158,072 0.01%Volkswagen International Finance NV €800,000 4.13% 16/11/2038 1,156,049 0.01%KFW €1,000,000 0.38% 15/3/2023 1,148,778 0.01%Landwirtschaftliche Rentenbank €1,000,000 0.25% 29/8/2025 1,148,351 0.01%Aroundtown SA €1,000,000 1.00% 7/1/2025 1,144,870 0.01%State of Lower Saxony €1,000,000 0.25% 6/2/2024 1,144,761 0.01%
Vanguard Global Bond Index Fund
321
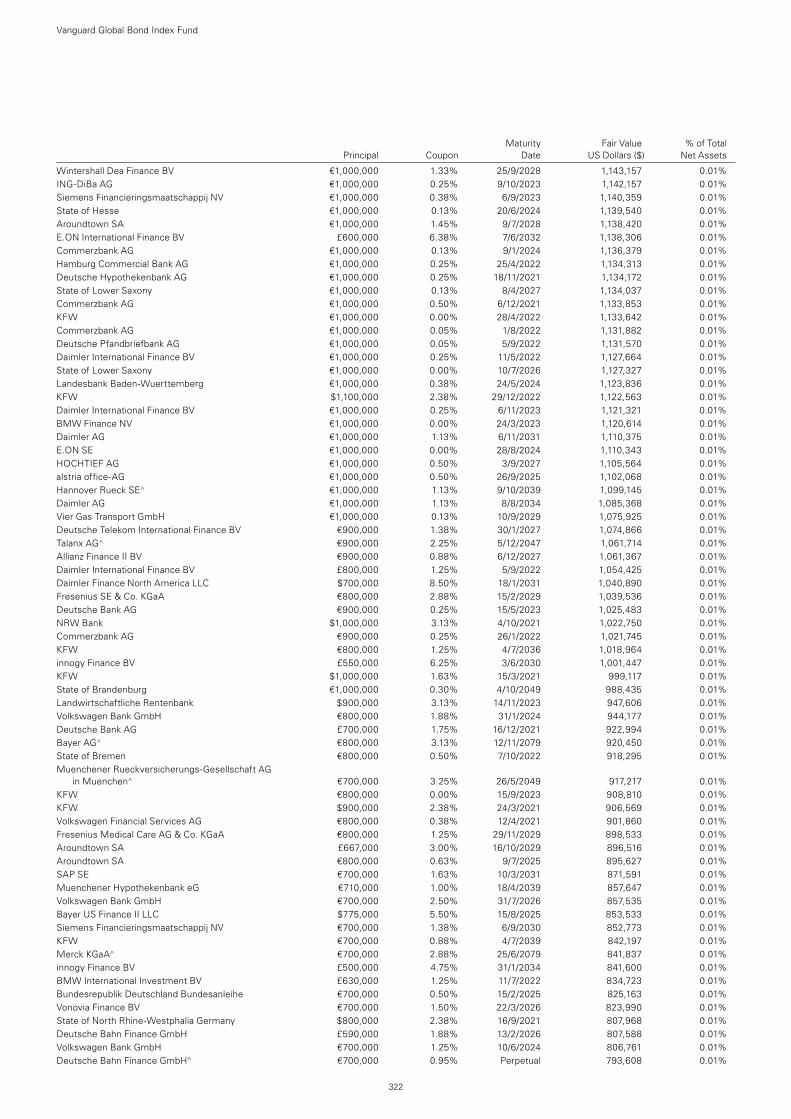
Maturity Fair Value % of Total Principal Coupon Date US Dollars ($) Net Assets
Wintershall Dea Finance BV €1,000,000 1.33% 25/9/2028 1,143,157 0.01%ING-DiBa AG €1,000,000 0.25% 9/10/2023 1,142,157 0.01%Siemens Financieringsmaatschappij NV €1,000,000 0.38% 6/9/2023 1,140,359 0.01%State of Hesse €1,000,000 0.13% 20/6/2024 1,139,540 0.01%Aroundtown SA €1,000,000 1.45% 9/7/2028 1,138,420 0.01%E.ON International Finance BV £600,000 6.38% 7/6/2032 1,138,306 0.01%Commerzbank AG €1,000,000 0.13% 9/1/2024 1,136,379 0.01%Hamburg Commercial Bank AG €1,000,000 0.25% 25/4/2022 1,134,313 0.01%Deutsche Hypothekenbank AG €1,000,000 0.25% 18/11/2021 1,134,172 0.01%State of Lower Saxony €1,000,000 0.13% 8/4/2027 1,134,037 0.01%Commerzbank AG €1,000,000 0.50% 6/12/2021 1,133,853 0.01%KFW €1,000,000 0.00% 28/4/2022 1,133,642 0.01%Commerzbank AG €1,000,000 0.05% 1/8/2022 1,131,882 0.01%Deutsche Pfandbriefbank AG €1,000,000 0.05% 5/9/2022 1,131,570 0.01%Daimler International Finance BV €1,000,000 0.25% 11/5/2022 1,127,664 0.01%State of Lower Saxony €1,000,000 0.00% 10/7/2026 1,127,327 0.01%Landesbank Baden-Wuerttemberg €1,000,000 0.38% 24/5/2024 1,123,836 0.01%KFW $1,100,000 2.38% 29/12/2022 1,122,563 0.01%Daimler International Finance BV €1,000,000 0.25% 6/11/2023 1,121,321 0.01%BMW Finance NV €1,000,000 0.00% 24/3/2023 1,120,614 0.01%Daimler AG €1,000,000 1.13% 6/11/2031 1,110,375 0.01%E.ON SE €1,000,000 0.00% 28/8/2024 1,110,343 0.01%HOCHTIEF AG €1,000,000 0.50% 3/9/2027 1,105,564 0.01%alstria office-AG €1,000,000 0.50% 26/9/2025 1,102,068 0.01%Hannover Rueck SE^ €1,000,000 1.13% 9/10/2039 1,099,145 0.01%Daimler AG €1,000,000 1.13% 8/8/2034 1,085,368 0.01%Vier Gas Transport GmbH €1,000,000 0.13% 10/9/2029 1,075,925 0.01%Deutsche Telekom International Finance BV €900,000 1.38% 30/1/2027 1,074,866 0.01%Talanx AG^ €900,000 2.25% 5/12/2047 1,061,714 0.01%Allianz Finance II BV €900,000 0.88% 6/12/2027 1,061,367 0.01%Daimler International Finance BV £800,000 1.25% 5/9/2022 1,054,425 0.01%Daimler Finance North America LLC $700,000 8.50% 18/1/2031 1,040,890 0.01%Fresenius SE & Co. KGaA €800,000 2.88% 15/2/2029 1,039,536 0.01%Deutsche Bank AG €900,000 0.25% 15/5/2023 1,025,483 0.01%NRW Bank $1,000,000 3.13% 4/10/2021 1,022,750 0.01%Commerzbank AG €900,000 0.25% 26/1/2022 1,021,745 0.01%KFW €800,000 1.25% 4/7/2036 1,018,964 0.01%innogy Finance BV £550,000 6.25% 3/6/2030 1,001,447 0.01%KFW $1,000,000 1.63% 15/3/2021 999,117 0.01%State of Brandenburg €1,000,000 0.30% 4/10/2049 988,435 0.01%Landwirtschaftliche Rentenbank $900,000 3.13% 14/11/2023 947,606 0.01%Volkswagen Bank GmbH €800,000 1.88% 31/1/2024 944,177 0.01%Deutsche Bank AG £700,000 1.75% 16/12/2021 922,994 0.01%Bayer AG^ €800,000 3.13% 12/11/2079 920,450 0.01%State of Bremen €800,000 0.50% 7/10/2022 918,295 0.01%Muenchener Rueckversicherungs-Gesellschaft AG
in Muenchen^ €700,000 3.25% 26/5/2049 917,217 0.01%KFW €800,000 0.00% 15/9/2023 908,810 0.01%KFW $900,000 2.38% 24/3/2021 906,569 0.01%Volkswagen Financial Services AG €800,000 0.38% 12/4/2021 901,860 0.01%Fresenius Medical Care AG & Co. KGaA €800,000 1.25% 29/11/2029 898,533 0.01%Aroundtown SA £667,000 3.00% 16/10/2029 896,516 0.01%Aroundtown SA €800,000 0.63% 9/7/2025 895,627 0.01%SAP SE €700,000 1.63% 10/3/2031 871,591 0.01%Muenchener Hypothekenbank eG €710,000 1.00% 18/4/2039 857,647 0.01%Volkswagen Bank GmbH €700,000 2.50% 31/7/2026 857,535 0.01%Bayer US Finance II LLC $775,000 5.50% 15/8/2025 853,533 0.01%Siemens Financieringsmaatschappij NV €700,000 1.38% 6/9/2030 852,773 0.01%KFW €700,000 0.88% 4/7/2039 842,197 0.01%Merck KGaA^ €700,000 2.88% 25/6/2079 841,837 0.01%innogy Finance BV £500,000 4.75% 31/1/2034 841,600 0.01%BMW International Investment BV £630,000 1.25% 11/7/2022 834,723 0.01%Bundesrepublik Deutschland Bundesanleihe €700,000 0.50% 15/2/2025 825,163 0.01%Vonovia Finance BV €700,000 1.50% 22/3/2026 823,990 0.01%State of North Rhine-Westphalia Germany $800,000 2.38% 16/9/2021 807,968 0.01%Deutsche Bahn Finance GmbH £590,000 1.88% 13/2/2026 807,588 0.01%Volkswagen Bank GmbH €700,000 1.25% 10/6/2024 806,761 0.01%Deutsche Bahn Finance GmbH^ €700,000 0.95% Perpetual 793,608 0.01%
Vanguard Global Bond Index Fund
322
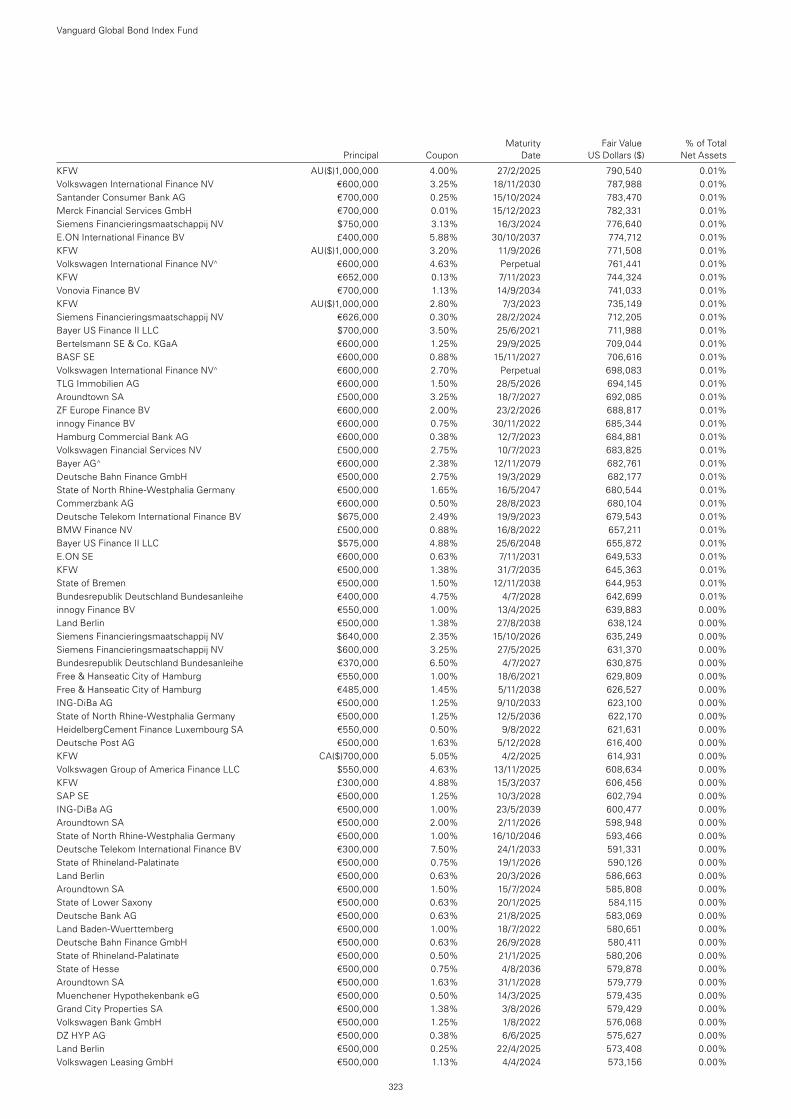
Maturity Fair Value % of Total Principal Coupon Date US Dollars ($) Net Assets
KFW AU($)1,000,000 4.00% 27/2/2025 790,540 0.01%Volkswagen International Finance NV €600,000 3.25% 18/11/2030 787,988 0.01%Santander Consumer Bank AG €700,000 0.25% 15/10/2024 783,470 0.01%Merck Financial Services GmbH €700,000 0.01% 15/12/2023 782,331 0.01%Siemens Financieringsmaatschappij NV $750,000 3.13% 16/3/2024 776,640 0.01%E.ON International Finance BV £400,000 5.88% 30/10/2037 774,712 0.01%KFW AU($)1,000,000 3.20% 11/9/2026 771,508 0.01%Volkswagen International Finance NV^ €600,000 4.63% Perpetual 761,441 0.01%KFW €652,000 0.13% 7/11/2023 744,324 0.01%Vonovia Finance BV €700,000 1.13% 14/9/2034 741,033 0.01%KFW AU($)1,000,000 2.80% 7/3/2023 735,149 0.01%Siemens Financieringsmaatschappij NV €626,000 0.30% 28/2/2024 712,205 0.01%Bayer US Finance II LLC $700,000 3.50% 25/6/2021 711,988 0.01%Bertelsmann SE & Co. KGaA €600,000 1.25% 29/9/2025 709,044 0.01%BASF SE €600,000 0.88% 15/11/2027 706,616 0.01%Volkswagen International Finance NV^ €600,000 2.70% Perpetual 698,083 0.01%TLG Immobilien AG €600,000 1.50% 28/5/2026 694,145 0.01%Aroundtown SA £500,000 3.25% 18/7/2027 692,085 0.01%ZF Europe Finance BV €600,000 2.00% 23/2/2026 688,817 0.01%innogy Finance BV €600,000 0.75% 30/11/2022 685,344 0.01%Hamburg Commercial Bank AG €600,000 0.38% 12/7/2023 684,881 0.01%Volkswagen Financial Services NV £500,000 2.75% 10/7/2023 683,825 0.01%Bayer AG^ €600,000 2.38% 12/11/2079 682,761 0.01%Deutsche Bahn Finance GmbH €500,000 2.75% 19/3/2029 682,177 0.01%State of North Rhine-Westphalia Germany €500,000 1.65% 16/5/2047 680,544 0.01%Commerzbank AG €600,000 0.50% 28/8/2023 680,104 0.01%Deutsche Telekom International Finance BV $675,000 2.49% 19/9/2023 679,543 0.01%BMW Finance NV £500,000 0.88% 16/8/2022 657,211 0.01%Bayer US Finance II LLC $575,000 4.88% 25/6/2048 655,872 0.01%E.ON SE €600,000 0.63% 7/11/2031 649,533 0.01%KFW €500,000 1.38% 31/7/2035 645,363 0.01%State of Bremen €500,000 1.50% 12/11/2038 644,953 0.01%Bundesrepublik Deutschland Bundesanleihe €400,000 4.75% 4/7/2028 642,699 0.01%innogy Finance BV €550,000 1.00% 13/4/2025 639,883 0.00%Land Berlin €500,000 1.38% 27/8/2038 638,124 0.00%Siemens Financieringsmaatschappij NV $640,000 2.35% 15/10/2026 635,249 0.00%Siemens Financieringsmaatschappij NV $600,000 3.25% 27/5/2025 631,370 0.00%Bundesrepublik Deutschland Bundesanleihe €370,000 6.50% 4/7/2027 630,875 0.00%Free & Hanseatic City of Hamburg €550,000 1.00% 18/6/2021 629,809 0.00%Free & Hanseatic City of Hamburg €485,000 1.45% 5/11/2038 626,527 0.00%ING-DiBa AG €500,000 1.25% 9/10/2033 623,100 0.00%State of North Rhine-Westphalia Germany €500,000 1.25% 12/5/2036 622,170 0.00%HeidelbergCement Finance Luxembourg SA €550,000 0.50% 9/8/2022 621,631 0.00%Deutsche Post AG €500,000 1.63% 5/12/2028 616,400 0.00%KFW CA($)700,000 5.05% 4/2/2025 614,931 0.00%Volkswagen Group of America Finance LLC $550,000 4.63% 13/11/2025 608,634 0.00%KFW £300,000 4.88% 15/3/2037 606,456 0.00%SAP SE €500,000 1.25% 10/3/2028 602,794 0.00%ING-DiBa AG €500,000 1.00% 23/5/2039 600,477 0.00%Aroundtown SA €500,000 2.00% 2/11/2026 598,948 0.00%State of North Rhine-Westphalia Germany €500,000 1.00% 16/10/2046 593,466 0.00%Deutsche Telekom International Finance BV €300,000 7.50% 24/1/2033 591,331 0.00%State of Rhineland-Palatinate €500,000 0.75% 19/1/2026 590,126 0.00%Land Berlin €500,000 0.63% 20/3/2026 586,663 0.00%Aroundtown SA €500,000 1.50% 15/7/2024 585,808 0.00%State of Lower Saxony €500,000 0.63% 20/1/2025 584,115 0.00%Deutsche Bank AG €500,000 0.63% 21/8/2025 583,069 0.00%Land Baden-Wuerttemberg €500,000 1.00% 18/7/2022 580,651 0.00%Deutsche Bahn Finance GmbH €500,000 0.63% 26/9/2028 580,411 0.00%State of Rhineland-Palatinate €500,000 0.50% 21/1/2025 580,206 0.00%State of Hesse €500,000 0.75% 4/8/2036 579,878 0.00%Aroundtown SA €500,000 1.63% 31/1/2028 579,779 0.00%Muenchener Hypothekenbank eG €500,000 0.50% 14/3/2025 579,435 0.00%Grand City Properties SA €500,000 1.38% 3/8/2026 579,429 0.00%Volkswagen Bank GmbH €500,000 1.25% 1/8/2022 576,068 0.00%DZ HYP AG €500,000 0.38% 6/6/2025 575,627 0.00%Land Berlin €500,000 0.25% 22/4/2025 573,408 0.00%Volkswagen Leasing GmbH €500,000 1.13% 4/4/2024 573,156 0.00%
Vanguard Global Bond Index Fund
323
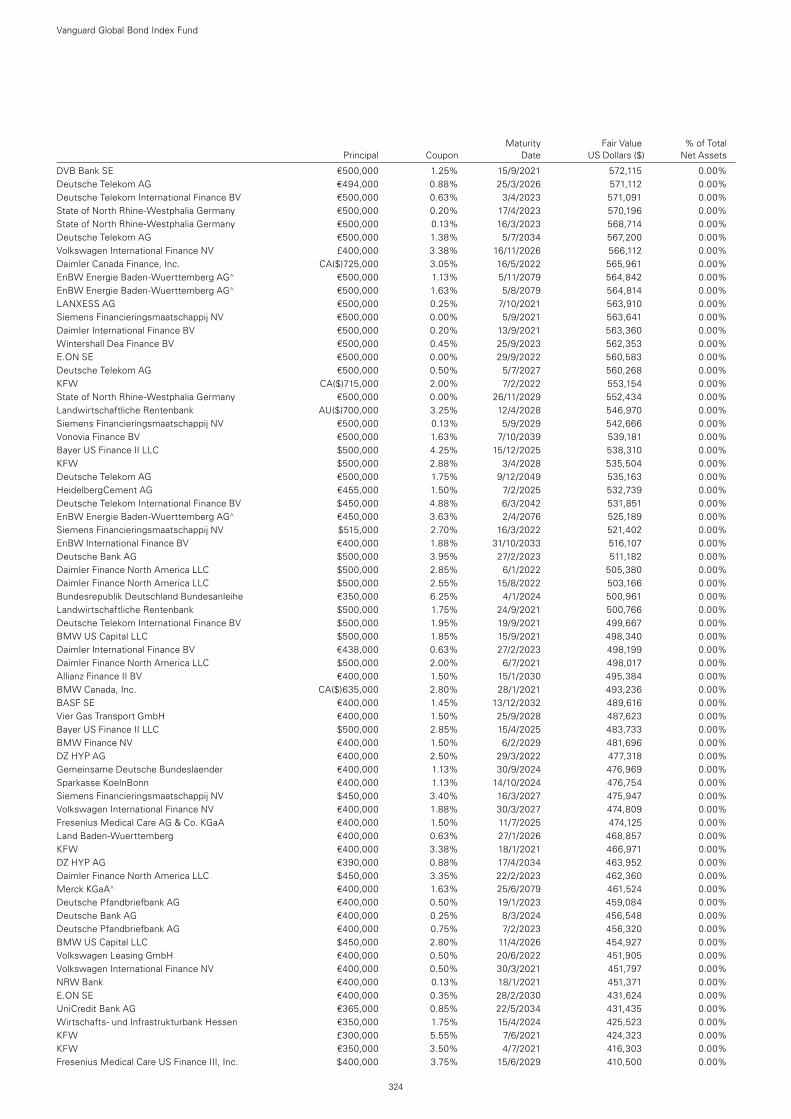
Maturity Fair Value % of Total Principal Coupon Date US Dollars ($) Net Assets
DVB Bank SE €500,000 1.25% 15/9/2021 572,115 0.00%Deutsche Telekom AG €494,000 0.88% 25/3/2026 571,112 0.00%Deutsche Telekom International Finance BV €500,000 0.63% 3/4/2023 571,091 0.00%State of North Rhine-Westphalia Germany €500,000 0.20% 17/4/2023 570,196 0.00%State of North Rhine-Westphalia Germany €500,000 0.13% 16/3/2023 568,714 0.00%Deutsche Telekom AG €500,000 1.38% 5/7/2034 567,200 0.00%Volkswagen International Finance NV £400,000 3.38% 16/11/2026 566,112 0.00%Daimler Canada Finance, Inc. CA($)725,000 3.05% 16/5/2022 565,961 0.00%EnBW Energie Baden-Wuerttemberg AG^ €500,000 1.13% 5/11/2079 564,842 0.00%EnBW Energie Baden-Wuerttemberg AG^ €500,000 1.63% 5/8/2079 564,814 0.00%LANXESS AG €500,000 0.25% 7/10/2021 563,910 0.00%Siemens Financieringsmaatschappij NV €500,000 0.00% 5/9/2021 563,641 0.00%Daimler International Finance BV €500,000 0.20% 13/9/2021 563,360 0.00%Wintershall Dea Finance BV €500,000 0.45% 25/9/2023 562,353 0.00%E.ON SE €500,000 0.00% 29/9/2022 560,583 0.00%Deutsche Telekom AG €500,000 0.50% 5/7/2027 560,268 0.00%KFW CA($)715,000 2.00% 7/2/2022 553,154 0.00%State of North Rhine-Westphalia Germany €500,000 0.00% 26/11/2029 552,434 0.00%Landwirtschaftliche Rentenbank AU($)700,000 3.25% 12/4/2028 546,970 0.00%Siemens Financieringsmaatschappij NV €500,000 0.13% 5/9/2029 542,666 0.00%Vonovia Finance BV €500,000 1.63% 7/10/2039 539,181 0.00%Bayer US Finance II LLC $500,000 4.25% 15/12/2025 538,310 0.00%KFW $500,000 2.88% 3/4/2028 535,504 0.00%Deutsche Telekom AG €500,000 1.75% 9/12/2049 535,163 0.00%HeidelbergCement AG €455,000 1.50% 7/2/2025 532,739 0.00%Deutsche Telekom International Finance BV $450,000 4.88% 6/3/2042 531,851 0.00%EnBW Energie Baden-Wuerttemberg AG^ €450,000 3.63% 2/4/2076 525,189 0.00%Siemens Financieringsmaatschappij NV $515,000 2.70% 16/3/2022 521,402 0.00%EnBW International Finance BV €400,000 1.88% 31/10/2033 516,107 0.00%Deutsche Bank AG $500,000 3.95% 27/2/2023 511,182 0.00%Daimler Finance North America LLC $500,000 2.85% 6/1/2022 505,380 0.00%Daimler Finance North America LLC $500,000 2.55% 15/8/2022 503,166 0.00%Bundesrepublik Deutschland Bundesanleihe €350,000 6.25% 4/1/2024 500,961 0.00%Landwirtschaftliche Rentenbank $500,000 1.75% 24/9/2021 500,766 0.00%Deutsche Telekom International Finance BV $500,000 1.95% 19/9/2021 499,667 0.00%BMW US Capital LLC $500,000 1.85% 15/9/2021 498,340 0.00%Daimler International Finance BV €438,000 0.63% 27/2/2023 498,199 0.00%Daimler Finance North America LLC $500,000 2.00% 6/7/2021 498,017 0.00%Allianz Finance II BV €400,000 1.50% 15/1/2030 495,384 0.00%BMW Canada, Inc. CA($)635,000 2.80% 28/1/2021 493,236 0.00%BASF SE €400,000 1.45% 13/12/2032 489,616 0.00%Vier Gas Transport GmbH €400,000 1.50% 25/9/2028 487,623 0.00%Bayer US Finance II LLC $500,000 2.85% 15/4/2025 483,733 0.00%BMW Finance NV €400,000 1.50% 6/2/2029 481,696 0.00%DZ HYP AG €400,000 2.50% 29/3/2022 477,318 0.00%Gemeinsame Deutsche Bundeslaender €400,000 1.13% 30/9/2024 476,969 0.00%Sparkasse KoelnBonn €400,000 1.13% 14/10/2024 476,754 0.00%Siemens Financieringsmaatschappij NV $450,000 3.40% 16/3/2027 475,947 0.00%Volkswagen International Finance NV €400,000 1.88% 30/3/2027 474,809 0.00%Fresenius Medical Care AG & Co. KGaA €400,000 1.50% 11/7/2025 474,125 0.00%Land Baden-Wuerttemberg €400,000 0.63% 27/1/2026 468,857 0.00%KFW €400,000 3.38% 18/1/2021 466,971 0.00%DZ HYP AG €390,000 0.88% 17/4/2034 463,952 0.00%Daimler Finance North America LLC $450,000 3.35% 22/2/2023 462,360 0.00%Merck KGaA^ €400,000 1.63% 25/6/2079 461,524 0.00%Deutsche Pfandbriefbank AG €400,000 0.50% 19/1/2023 459,084 0.00%Deutsche Bank AG €400,000 0.25% 8/3/2024 456,548 0.00%Deutsche Pfandbriefbank AG €400,000 0.75% 7/2/2023 456,320 0.00%BMW US Capital LLC $450,000 2.80% 11/4/2026 454,927 0.00%Volkswagen Leasing GmbH €400,000 0.50% 20/6/2022 451,905 0.00%Volkswagen International Finance NV €400,000 0.50% 30/3/2021 451,797 0.00%NRW Bank €400,000 0.13% 18/1/2021 451,371 0.00%E.ON SE €400,000 0.35% 28/2/2030 431,624 0.00%UniCredit Bank AG €365,000 0.85% 22/5/2034 431,435 0.00%Wirtschafts- und Infrastrukturbank Hessen €350,000 1.75% 15/4/2024 425,523 0.00%KFW £300,000 5.55% 7/6/2021 424,323 0.00%KFW €350,000 3.50% 4/7/2021 416,303 0.00%Fresenius Medical Care US Finance III, Inc. $400,000 3.75% 15/6/2029 410,500 0.00%
Vanguard Global Bond Index Fund
324
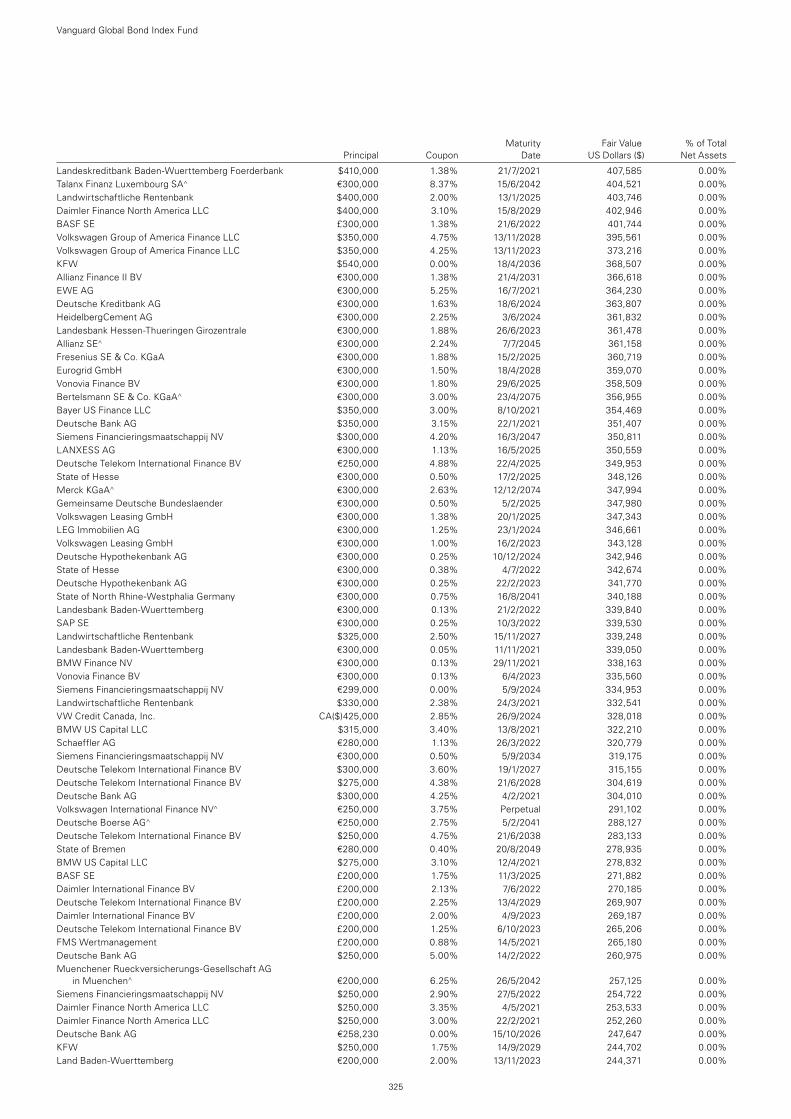
Maturity Fair Value % of Total Principal Coupon Date US Dollars ($) Net Assets
Landeskreditbank Baden-Wuerttemberg Foerderbank $410,000 1.38% 21/7/2021 407,585 0.00%Talanx Finanz Luxembourg SA^ €300,000 8.37% 15/6/2042 404,521 0.00%Landwirtschaftliche Rentenbank $400,000 2.00% 13/1/2025 403,746 0.00%Daimler Finance North America LLC $400,000 3.10% 15/8/2029 402,946 0.00%BASF SE £300,000 1.38% 21/6/2022 401,744 0.00%Volkswagen Group of America Finance LLC $350,000 4.75% 13/11/2028 395,561 0.00%Volkswagen Group of America Finance LLC $350,000 4.25% 13/11/2023 373,216 0.00%KFW $540,000 0.00% 18/4/2036 368,507 0.00%Allianz Finance II BV €300,000 1.38% 21/4/2031 366,618 0.00%EWE AG €300,000 5.25% 16/7/2021 364,230 0.00%Deutsche Kreditbank AG €300,000 1.63% 18/6/2024 363,807 0.00%HeidelbergCement AG €300,000 2.25% 3/6/2024 361,832 0.00%Landesbank Hessen-Thueringen Girozentrale €300,000 1.88% 26/6/2023 361,478 0.00%Allianz SE^ €300,000 2.24% 7/7/2045 361,158 0.00%Fresenius SE & Co. KGaA €300,000 1.88% 15/2/2025 360,719 0.00%Eurogrid GmbH €300,000 1.50% 18/4/2028 359,070 0.00%Vonovia Finance BV €300,000 1.80% 29/6/2025 358,509 0.00%Bertelsmann SE & Co. KGaA^ €300,000 3.00% 23/4/2075 356,955 0.00%Bayer US Finance LLC $350,000 3.00% 8/10/2021 354,469 0.00%Deutsche Bank AG $350,000 3.15% 22/1/2021 351,407 0.00%Siemens Financieringsmaatschappij NV $300,000 4.20% 16/3/2047 350,811 0.00%LANXESS AG €300,000 1.13% 16/5/2025 350,559 0.00%Deutsche Telekom International Finance BV €250,000 4.88% 22/4/2025 349,953 0.00%State of Hesse €300,000 0.50% 17/2/2025 348,126 0.00%Merck KGaA^ €300,000 2.63% 12/12/2074 347,994 0.00%Gemeinsame Deutsche Bundeslaender €300,000 0.50% 5/2/2025 347,980 0.00%Volkswagen Leasing GmbH €300,000 1.38% 20/1/2025 347,343 0.00%LEG Immobilien AG €300,000 1.25% 23/1/2024 346,661 0.00%Volkswagen Leasing GmbH €300,000 1.00% 16/2/2023 343,128 0.00%Deutsche Hypothekenbank AG €300,000 0.25% 10/12/2024 342,946 0.00%State of Hesse €300,000 0.38% 4/7/2022 342,674 0.00%Deutsche Hypothekenbank AG €300,000 0.25% 22/2/2023 341,770 0.00%State of North Rhine-Westphalia Germany €300,000 0.75% 16/8/2041 340,188 0.00%Landesbank Baden-Wuerttemberg €300,000 0.13% 21/2/2022 339,840 0.00%SAP SE €300,000 0.25% 10/3/2022 339,530 0.00%Landwirtschaftliche Rentenbank $325,000 2.50% 15/11/2027 339,248 0.00%Landesbank Baden-Wuerttemberg €300,000 0.05% 11/11/2021 339,050 0.00%BMW Finance NV €300,000 0.13% 29/11/2021 338,163 0.00%Vonovia Finance BV €300,000 0.13% 6/4/2023 335,560 0.00%Siemens Financieringsmaatschappij NV €299,000 0.00% 5/9/2024 334,953 0.00%Landwirtschaftliche Rentenbank $330,000 2.38% 24/3/2021 332,541 0.00%VW Credit Canada, Inc. CA($)425,000 2.85% 26/9/2024 328,018 0.00%BMW US Capital LLC $315,000 3.40% 13/8/2021 322,210 0.00%Schaeffler AG €280,000 1.13% 26/3/2022 320,779 0.00%Siemens Financieringsmaatschappij NV €300,000 0.50% 5/9/2034 319,175 0.00%Deutsche Telekom International Finance BV $300,000 3.60% 19/1/2027 315,155 0.00%Deutsche Telekom International Finance BV $275,000 4.38% 21/6/2028 304,619 0.00%Deutsche Bank AG $300,000 4.25% 4/2/2021 304,010 0.00%Volkswagen International Finance NV^ €250,000 3.75% Perpetual 291,102 0.00%Deutsche Boerse AG^ €250,000 2.75% 5/2/2041 288,127 0.00%Deutsche Telekom International Finance BV $250,000 4.75% 21/6/2038 283,133 0.00%State of Bremen €280,000 0.40% 20/8/2049 278,935 0.00%BMW US Capital LLC $275,000 3.10% 12/4/2021 278,832 0.00%BASF SE £200,000 1.75% 11/3/2025 271,882 0.00%Daimler International Finance BV £200,000 2.13% 7/6/2022 270,185 0.00%Deutsche Telekom International Finance BV £200,000 2.25% 13/4/2029 269,907 0.00%Daimler International Finance BV £200,000 2.00% 4/9/2023 269,187 0.00%Deutsche Telekom International Finance BV £200,000 1.25% 6/10/2023 265,206 0.00%FMS Wertmanagement £200,000 0.88% 14/5/2021 265,180 0.00%Deutsche Bank AG $250,000 5.00% 14/2/2022 260,975 0.00%Muenchener Rueckversicherungs-Gesellschaft AG
in Muenchen^ €200,000 6.25% 26/5/2042 257,125 0.00%Siemens Financieringsmaatschappij NV $250,000 2.90% 27/5/2022 254,722 0.00%Daimler Finance North America LLC $250,000 3.35% 4/5/2021 253,533 0.00%Daimler Finance North America LLC $250,000 3.00% 22/2/2021 252,260 0.00%Deutsche Bank AG €258,230 0.00% 15/10/2026 247,647 0.00%KFW $250,000 1.75% 14/9/2029 244,702 0.00%Land Baden-Wuerttemberg €200,000 2.00% 13/11/2023 244,371 0.00%
Vanguard Global Bond Index Fund
325
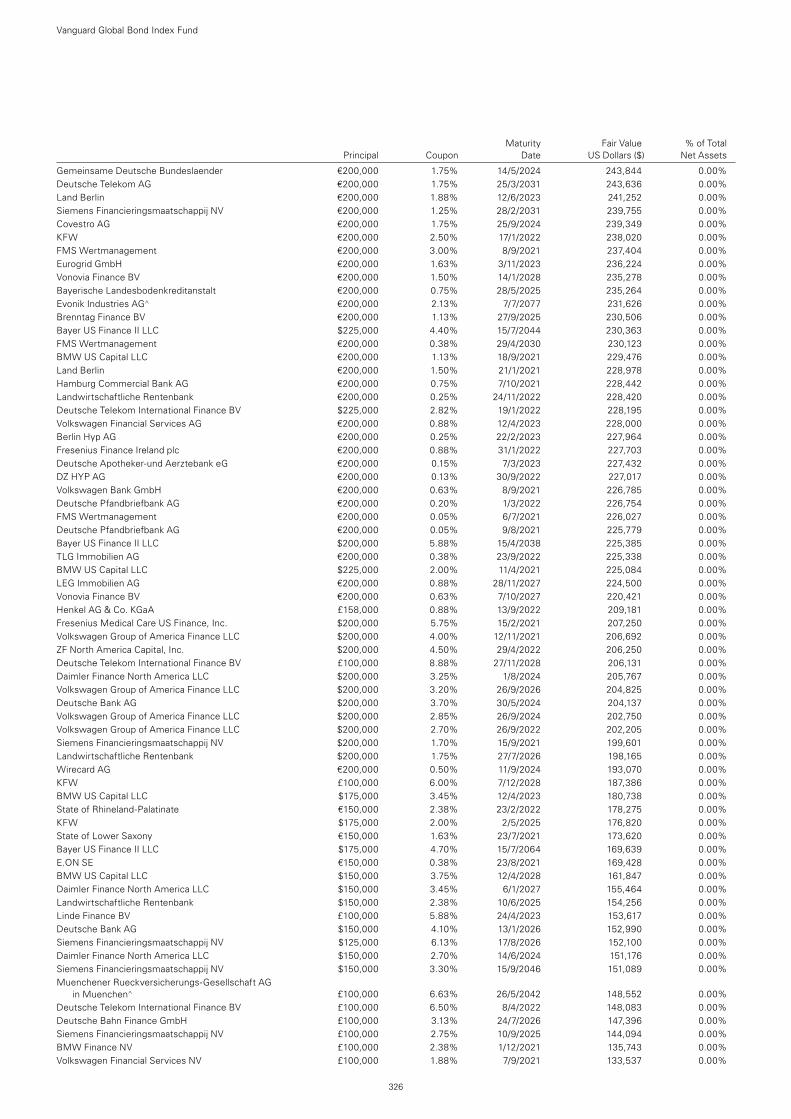
Maturity Fair Value % of Total Principal Coupon Date US Dollars ($) Net Assets
Gemeinsame Deutsche Bundeslaender €200,000 1.75% 14/5/2024 243,844 0.00%Deutsche Telekom AG €200,000 1.75% 25/3/2031 243,636 0.00%Land Berlin €200,000 1.88% 12/6/2023 241,252 0.00%Siemens Financieringsmaatschappij NV €200,000 1.25% 28/2/2031 239,755 0.00%Covestro AG €200,000 1.75% 25/9/2024 239,349 0.00%KFW €200,000 2.50% 17/1/2022 238,020 0.00%FMS Wertmanagement €200,000 3.00% 8/9/2021 237,404 0.00%Eurogrid GmbH €200,000 1.63% 3/11/2023 236,224 0.00%Vonovia Finance BV €200,000 1.50% 14/1/2028 235,278 0.00%Bayerische Landesbodenkreditanstalt €200,000 0.75% 28/5/2025 235,264 0.00%Evonik Industries AG^ €200,000 2.13% 7/7/2077 231,626 0.00%Brenntag Finance BV €200,000 1.13% 27/9/2025 230,506 0.00%Bayer US Finance II LLC $225,000 4.40% 15/7/2044 230,363 0.00%FMS Wertmanagement €200,000 0.38% 29/4/2030 230,123 0.00%BMW US Capital LLC €200,000 1.13% 18/9/2021 229,476 0.00%Land Berlin €200,000 1.50% 21/1/2021 228,978 0.00%Hamburg Commercial Bank AG €200,000 0.75% 7/10/2021 228,442 0.00%Landwirtschaftliche Rentenbank €200,000 0.25% 24/11/2022 228,420 0.00%Deutsche Telekom International Finance BV $225,000 2.82% 19/1/2022 228,195 0.00%Volkswagen Financial Services AG €200,000 0.88% 12/4/2023 228,000 0.00%Berlin Hyp AG €200,000 0.25% 22/2/2023 227,964 0.00%Fresenius Finance Ireland plc €200,000 0.88% 31/1/2022 227,703 0.00%Deutsche Apotheker-und Aerztebank eG €200,000 0.15% 7/3/2023 227,432 0.00%DZ HYP AG €200,000 0.13% 30/9/2022 227,017 0.00%Volkswagen Bank GmbH €200,000 0.63% 8/9/2021 226,785 0.00%Deutsche Pfandbriefbank AG €200,000 0.20% 1/3/2022 226,754 0.00%FMS Wertmanagement €200,000 0.05% 6/7/2021 226,027 0.00%Deutsche Pfandbriefbank AG €200,000 0.05% 9/8/2021 225,779 0.00%Bayer US Finance II LLC $200,000 5.88% 15/4/2038 225,385 0.00%TLG Immobilien AG €200,000 0.38% 23/9/2022 225,338 0.00%BMW US Capital LLC $225,000 2.00% 11/4/2021 225,084 0.00%LEG Immobilien AG €200,000 0.88% 28/11/2027 224,500 0.00%Vonovia Finance BV €200,000 0.63% 7/10/2027 220,421 0.00%Henkel AG & Co. KGaA £158,000 0.88% 13/9/2022 209,181 0.00%Fresenius Medical Care US Finance, Inc. $200,000 5.75% 15/2/2021 207,250 0.00%Volkswagen Group of America Finance LLC $200,000 4.00% 12/11/2021 206,692 0.00%ZF North America Capital, Inc. $200,000 4.50% 29/4/2022 206,250 0.00%Deutsche Telekom International Finance BV £100,000 8.88% 27/11/2028 206,131 0.00%Daimler Finance North America LLC $200,000 3.25% 1/8/2024 205,767 0.00%Volkswagen Group of America Finance LLC $200,000 3.20% 26/9/2026 204,825 0.00%Deutsche Bank AG $200,000 3.70% 30/5/2024 204,137 0.00%Volkswagen Group of America Finance LLC $200,000 2.85% 26/9/2024 202,750 0.00%Volkswagen Group of America Finance LLC $200,000 2.70% 26/9/2022 202,205 0.00%Siemens Financieringsmaatschappij NV $200,000 1.70% 15/9/2021 199,601 0.00%Landwirtschaftliche Rentenbank $200,000 1.75% 27/7/2026 198,165 0.00%Wirecard AG €200,000 0.50% 11/9/2024 193,070 0.00%KFW £100,000 6.00% 7/12/2028 187,386 0.00%BMW US Capital LLC $175,000 3.45% 12/4/2023 180,738 0.00%State of Rhineland-Palatinate €150,000 2.38% 23/2/2022 178,275 0.00%KFW $175,000 2.00% 2/5/2025 176,820 0.00%State of Lower Saxony €150,000 1.63% 23/7/2021 173,620 0.00%Bayer US Finance II LLC $175,000 4.70% 15/7/2064 169,639 0.00%E.ON SE €150,000 0.38% 23/8/2021 169,428 0.00%BMW US Capital LLC $150,000 3.75% 12/4/2028 161,847 0.00%Daimler Finance North America LLC $150,000 3.45% 6/1/2027 155,464 0.00%Landwirtschaftliche Rentenbank $150,000 2.38% 10/6/2025 154,256 0.00%Linde Finance BV £100,000 5.88% 24/4/2023 153,617 0.00%Deutsche Bank AG $150,000 4.10% 13/1/2026 152,990 0.00%Siemens Financieringsmaatschappij NV $125,000 6.13% 17/8/2026 152,100 0.00%Daimler Finance North America LLC $150,000 2.70% 14/6/2024 151,176 0.00%Siemens Financieringsmaatschappij NV $150,000 3.30% 15/9/2046 151,089 0.00%Muenchener Rueckversicherungs-Gesellschaft AG
in Muenchen^ £100,000 6.63% 26/5/2042 148,552 0.00%Deutsche Telekom International Finance BV £100,000 6.50% 8/4/2022 148,083 0.00%Deutsche Bahn Finance GmbH £100,000 3.13% 24/7/2026 147,396 0.00%Siemens Financieringsmaatschappij NV £100,000 2.75% 10/9/2025 144,094 0.00%BMW Finance NV £100,000 2.38% 1/12/2021 135,743 0.00%Volkswagen Financial Services NV £100,000 1.88% 7/9/2021 133,537 0.00%
Vanguard Global Bond Index Fund
326
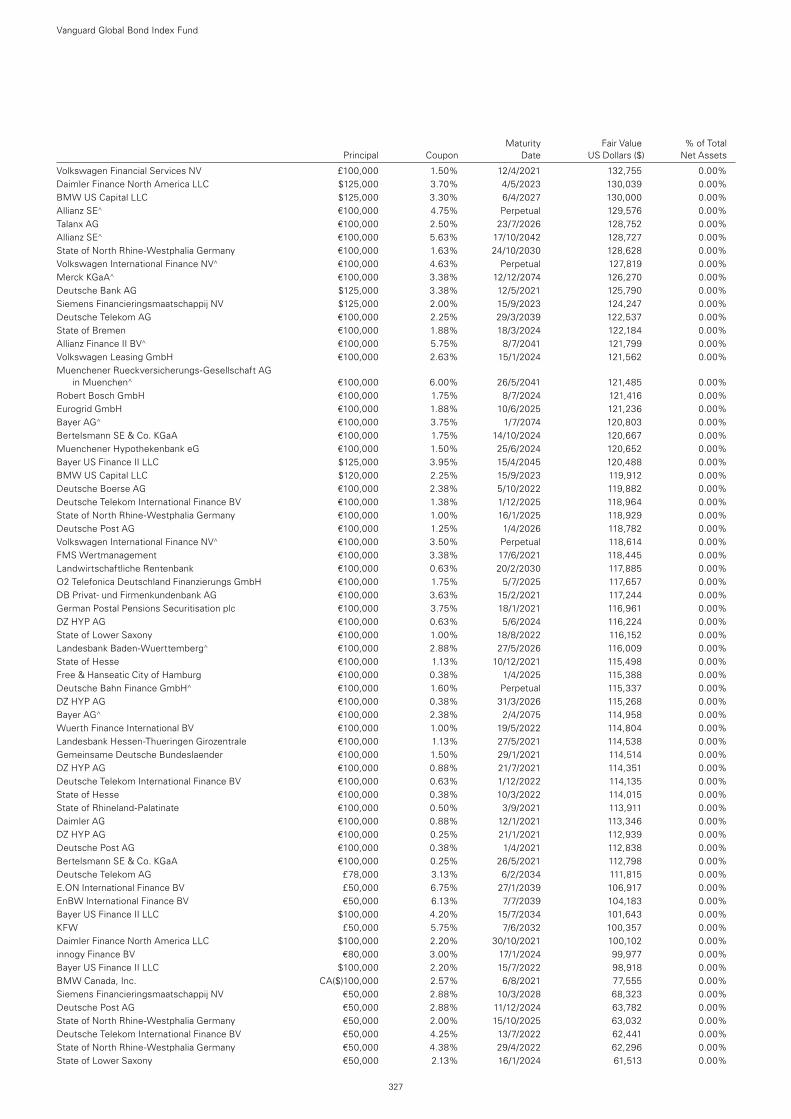
Maturity Fair Value % of Total Principal Coupon Date US Dollars ($) Net Assets
Volkswagen Financial Services NV £100,000 1.50% 12/4/2021 132,755 0.00%Daimler Finance North America LLC $125,000 3.70% 4/5/2023 130,039 0.00%BMW US Capital LLC $125,000 3.30% 6/4/2027 130,000 0.00%Allianz SE^ €100,000 4.75% Perpetual 129,576 0.00%Talanx AG €100,000 2.50% 23/7/2026 128,752 0.00%Allianz SE^ €100,000 5.63% 17/10/2042 128,727 0.00%State of North Rhine-Westphalia Germany €100,000 1.63% 24/10/2030 128,628 0.00%Volkswagen International Finance NV^ €100,000 4.63% Perpetual 127,819 0.00%Merck KGaA^ €100,000 3.38% 12/12/2074 126,270 0.00%Deutsche Bank AG $125,000 3.38% 12/5/2021 125,790 0.00%Siemens Financieringsmaatschappij NV $125,000 2.00% 15/9/2023 124,247 0.00%Deutsche Telekom AG €100,000 2.25% 29/3/2039 122,537 0.00%State of Bremen €100,000 1.88% 18/3/2024 122,184 0.00%Allianz Finance II BV^ €100,000 5.75% 8/7/2041 121,799 0.00%Volkswagen Leasing GmbH €100,000 2.63% 15/1/2024 121,562 0.00%Muenchener Rueckversicherungs-Gesellschaft AG
in Muenchen^ €100,000 6.00% 26/5/2041 121,485 0.00%Robert Bosch GmbH €100,000 1.75% 8/7/2024 121,416 0.00%Eurogrid GmbH €100,000 1.88% 10/6/2025 121,236 0.00%Bayer AG^ €100,000 3.75% 1/7/2074 120,803 0.00%Bertelsmann SE & Co. KGaA €100,000 1.75% 14/10/2024 120,667 0.00%Muenchener Hypothekenbank eG €100,000 1.50% 25/6/2024 120,652 0.00%Bayer US Finance II LLC $125,000 3.95% 15/4/2045 120,488 0.00%BMW US Capital LLC $120,000 2.25% 15/9/2023 119,912 0.00%Deutsche Boerse AG €100,000 2.38% 5/10/2022 119,882 0.00%Deutsche Telekom International Finance BV €100,000 1.38% 1/12/2025 118,964 0.00%State of North Rhine-Westphalia Germany €100,000 1.00% 16/1/2025 118,929 0.00%Deutsche Post AG €100,000 1.25% 1/4/2026 118,782 0.00%Volkswagen International Finance NV^ €100,000 3.50% Perpetual 118,614 0.00%FMS Wertmanagement €100,000 3.38% 17/6/2021 118,445 0.00%Landwirtschaftliche Rentenbank €100,000 0.63% 20/2/2030 117,885 0.00%O2 Telefonica Deutschland Finanzierungs GmbH €100,000 1.75% 5/7/2025 117,657 0.00%DB Privat- und Firmenkundenbank AG €100,000 3.63% 15/2/2021 117,244 0.00%German Postal Pensions Securitisation plc €100,000 3.75% 18/1/2021 116,961 0.00%DZ HYP AG €100,000 0.63% 5/6/2024 116,224 0.00%State of Lower Saxony €100,000 1.00% 18/8/2022 116,152 0.00%Landesbank Baden-Wuerttemberg^ €100,000 2.88% 27/5/2026 116,009 0.00%State of Hesse €100,000 1.13% 10/12/2021 115,498 0.00%Free & Hanseatic City of Hamburg €100,000 0.38% 1/4/2025 115,388 0.00%Deutsche Bahn Finance GmbH^ €100,000 1.60% Perpetual 115,337 0.00%DZ HYP AG €100,000 0.38% 31/3/2026 115,268 0.00%Bayer AG^ €100,000 2.38% 2/4/2075 114,958 0.00%Wuerth Finance International BV €100,000 1.00% 19/5/2022 114,804 0.00%Landesbank Hessen-Thueringen Girozentrale €100,000 1.13% 27/5/2021 114,538 0.00%Gemeinsame Deutsche Bundeslaender €100,000 1.50% 29/1/2021 114,514 0.00%DZ HYP AG €100,000 0.88% 21/7/2021 114,351 0.00%Deutsche Telekom International Finance BV €100,000 0.63% 1/12/2022 114,135 0.00%State of Hesse €100,000 0.38% 10/3/2022 114,015 0.00%State of Rhineland-Palatinate €100,000 0.50% 3/9/2021 113,911 0.00%Daimler AG €100,000 0.88% 12/1/2021 113,346 0.00%DZ HYP AG €100,000 0.25% 21/1/2021 112,939 0.00%Deutsche Post AG €100,000 0.38% 1/4/2021 112,838 0.00%Bertelsmann SE & Co. KGaA €100,000 0.25% 26/5/2021 112,798 0.00%Deutsche Telekom AG £78,000 3.13% 6/2/2034 111,815 0.00%E.ON International Finance BV £50,000 6.75% 27/1/2039 106,917 0.00%EnBW International Finance BV €50,000 6.13% 7/7/2039 104,183 0.00%Bayer US Finance II LLC $100,000 4.20% 15/7/2034 101,643 0.00%KFW £50,000 5.75% 7/6/2032 100,357 0.00%Daimler Finance North America LLC $100,000 2.20% 30/10/2021 100,102 0.00%innogy Finance BV €80,000 3.00% 17/1/2024 99,977 0.00%Bayer US Finance II LLC $100,000 2.20% 15/7/2022 98,918 0.00%BMW Canada, Inc. CA($)100,000 2.57% 6/8/2021 77,555 0.00%Siemens Financieringsmaatschappij NV €50,000 2.88% 10/3/2028 68,323 0.00%Deutsche Post AG €50,000 2.88% 11/12/2024 63,782 0.00%State of North Rhine-Westphalia Germany €50,000 2.00% 15/10/2025 63,032 0.00%Deutsche Telekom International Finance BV €50,000 4.25% 13/7/2022 62,441 0.00%State of North Rhine-Westphalia Germany €50,000 4.38% 29/4/2022 62,296 0.00%State of Lower Saxony €50,000 2.13% 16/1/2024 61,513 0.00%
Vanguard Global Bond Index Fund
327
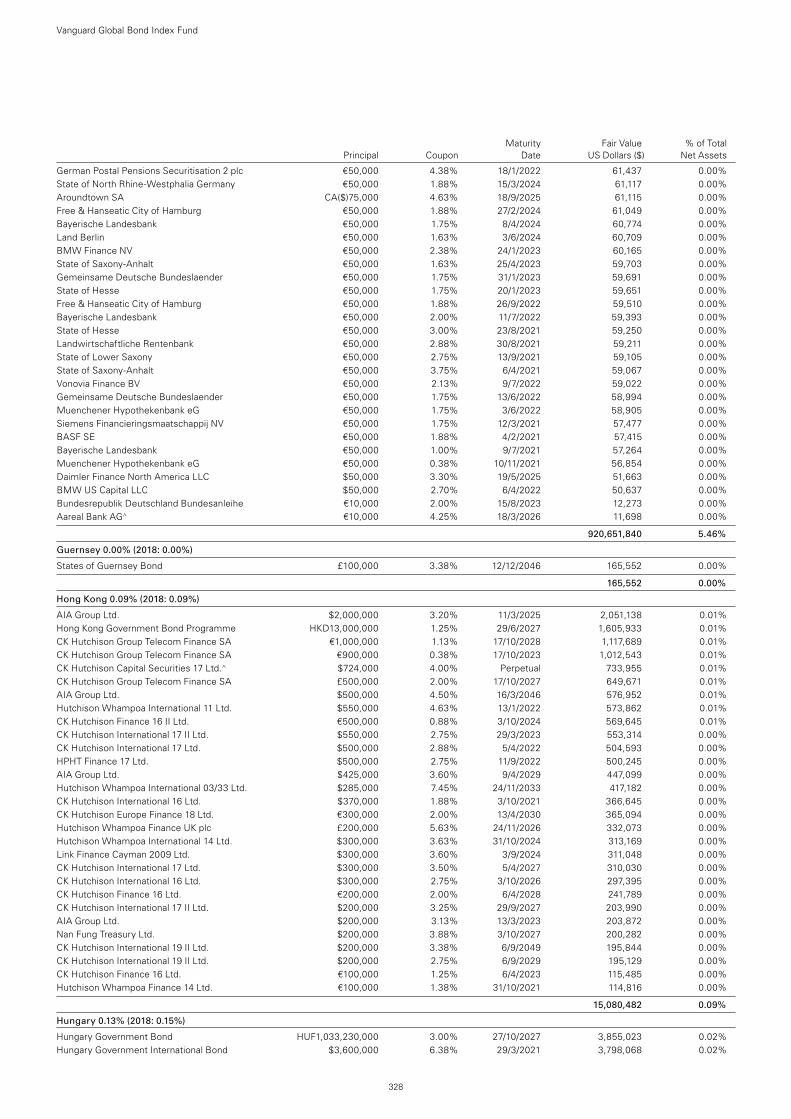
Maturity Fair Value % of Total Principal Coupon Date US Dollars ($) Net Assets
German Postal Pensions Securitisation 2 plc €50,000 4.38% 18/1/2022 61,437 0.00%State of North Rhine-Westphalia Germany €50,000 1.88% 15/3/2024 61,117 0.00%Aroundtown SA CA($)75,000 4.63% 18/9/2025 61,115 0.00%Free & Hanseatic City of Hamburg €50,000 1.88% 27/2/2024 61,049 0.00%Bayerische Landesbank €50,000 1.75% 8/4/2024 60,774 0.00%Land Berlin €50,000 1.63% 3/6/2024 60,709 0.00%BMW Finance NV €50,000 2.38% 24/1/2023 60,165 0.00%State of Saxony-Anhalt €50,000 1.63% 25/4/2023 59,703 0.00%Gemeinsame Deutsche Bundeslaender €50,000 1.75% 31/1/2023 59,691 0.00%State of Hesse €50,000 1.75% 20/1/2023 59,651 0.00%Free & Hanseatic City of Hamburg €50,000 1.88% 26/9/2022 59,510 0.00%Bayerische Landesbank €50,000 2.00% 11/7/2022 59,393 0.00%State of Hesse €50,000 3.00% 23/8/2021 59,250 0.00%Landwirtschaftliche Rentenbank €50,000 2.88% 30/8/2021 59,211 0.00%State of Lower Saxony €50,000 2.75% 13/9/2021 59,105 0.00%State of Saxony-Anhalt €50,000 3.75% 6/4/2021 59,067 0.00%Vonovia Finance BV €50,000 2.13% 9/7/2022 59,022 0.00%Gemeinsame Deutsche Bundeslaender €50,000 1.75% 13/6/2022 58,994 0.00%Muenchener Hypothekenbank eG €50,000 1.75% 3/6/2022 58,905 0.00%Siemens Financieringsmaatschappij NV €50,000 1.75% 12/3/2021 57,477 0.00%BASF SE €50,000 1.88% 4/2/2021 57,415 0.00%Bayerische Landesbank €50,000 1.00% 9/7/2021 57,264 0.00%Muenchener Hypothekenbank eG €50,000 0.38% 10/11/2021 56,854 0.00%Daimler Finance North America LLC $50,000 3.30% 19/5/2025 51,663 0.00%BMW US Capital LLC $50,000 2.70% 6/4/2022 50,637 0.00%Bundesrepublik Deutschland Bundesanleihe €10,000 2.00% 15/8/2023 12,273 0.00%Aareal Bank AG^ €10,000 4.25% 18/3/2026 11,698 0.00%
920,651,840 5.46%
Guernsey 0.00% (2018: 0.00%)
States of Guernsey Bond £100,000 3.38% 12/12/2046 165,552 0.00%
165,552 0.00%
Hong Kong 0.09% (2018: 0.09%)
AIA Group Ltd. $2,000,000 3.20% 11/3/2025 2,051,138 0.01%Hong Kong Government Bond Programme HKD13,000,000 1.25% 29/6/2027 1,605,933 0.01%CK Hutchison Group Telecom Finance SA €1,000,000 1.13% 17/10/2028 1,117,689 0.01%CK Hutchison Group Telecom Finance SA €900,000 0.38% 17/10/2023 1,012,543 0.01%CK Hutchison Capital Securities 17 Ltd.^ $724,000 4.00% Perpetual 733,955 0.01%CK Hutchison Group Telecom Finance SA £500,000 2.00% 17/10/2027 649,671 0.01%AIA Group Ltd. $500,000 4.50% 16/3/2046 576,952 0.01%Hutchison Whampoa International 11 Ltd. $550,000 4.63% 13/1/2022 573,862 0.01%CK Hutchison Finance 16 II Ltd. €500,000 0.88% 3/10/2024 569,645 0.01%CK Hutchison International 17 II Ltd. $550,000 2.75% 29/3/2023 553,314 0.00%CK Hutchison International 17 Ltd. $500,000 2.88% 5/4/2022 504,593 0.00%HPHT Finance 17 Ltd. $500,000 2.75% 11/9/2022 500,245 0.00%AIA Group Ltd. $425,000 3.60% 9/4/2029 447,099 0.00%Hutchison Whampoa International 03/33 Ltd. $285,000 7.45% 24/11/2033 417,182 0.00%CK Hutchison International 16 Ltd. $370,000 1.88% 3/10/2021 366,645 0.00%CK Hutchison Europe Finance 18 Ltd. €300,000 2.00% 13/4/2030 365,094 0.00%Hutchison Whampoa Finance UK plc £200,000 5.63% 24/11/2026 332,073 0.00%Hutchison Whampoa International 14 Ltd. $300,000 3.63% 31/10/2024 313,169 0.00%Link Finance Cayman 2009 Ltd. $300,000 3.60% 3/9/2024 311,048 0.00%CK Hutchison International 17 Ltd. $300,000 3.50% 5/4/2027 310,030 0.00%CK Hutchison International 16 Ltd. $300,000 2.75% 3/10/2026 297,395 0.00%CK Hutchison Finance 16 Ltd. €200,000 2.00% 6/4/2028 241,789 0.00%CK Hutchison International 17 II Ltd. $200,000 3.25% 29/9/2027 203,990 0.00%AIA Group Ltd. $200,000 3.13% 13/3/2023 203,872 0.00%Nan Fung Treasury Ltd. $200,000 3.88% 3/10/2027 200,282 0.00%CK Hutchison International 19 II Ltd. $200,000 3.38% 6/9/2049 195,844 0.00%CK Hutchison International 19 II Ltd. $200,000 2.75% 6/9/2029 195,129 0.00%CK Hutchison Finance 16 Ltd. €100,000 1.25% 6/4/2023 115,485 0.00%Hutchison Whampoa Finance 14 Ltd. €100,000 1.38% 31/10/2021 114,816 0.00%
15,080,482 0.09%
Hungary 0.13% (2018: 0.15%)
Hungary Government Bond HUF1,033,230,000 3.00% 27/10/2027 3,855,023 0.02%Hungary Government International Bond $3,600,000 6.38% 29/3/2021 3,798,068 0.02%
Vanguard Global Bond Index Fund
328
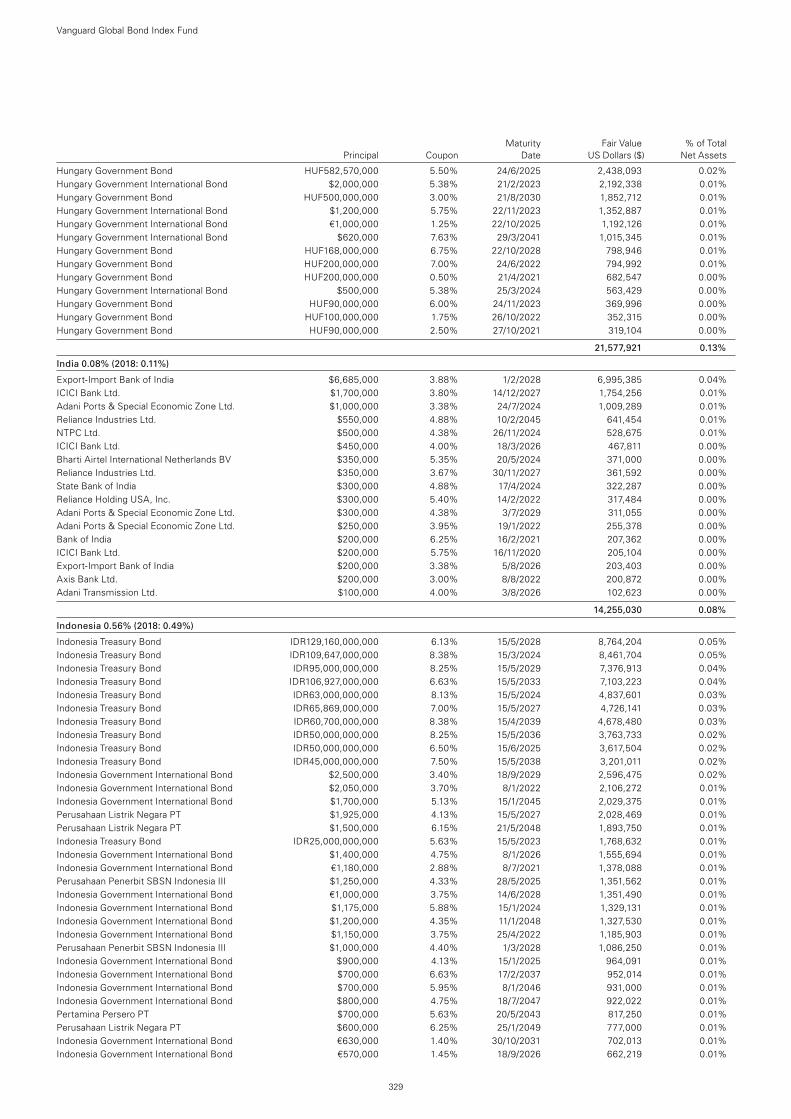
Maturity Fair Value % of Total Principal Coupon Date US Dollars ($) Net Assets
Hungary Government Bond HUF582,570,000 5.50% 24/6/2025 2,438,093 0.02%Hungary Government International Bond $2,000,000 5.38% 21/2/2023 2,192,338 0.01%Hungary Government Bond HUF500,000,000 3.00% 21/8/2030 1,852,712 0.01%Hungary Government International Bond $1,200,000 5.75% 22/11/2023 1,352,887 0.01%Hungary Government International Bond €1,000,000 1.25% 22/10/2025 1,192,126 0.01%Hungary Government International Bond $620,000 7.63% 29/3/2041 1,015,345 0.01%Hungary Government Bond HUF168,000,000 6.75% 22/10/2028 798,946 0.01%Hungary Government Bond HUF200,000,000 7.00% 24/6/2022 794,992 0.01%Hungary Government Bond HUF200,000,000 0.50% 21/4/2021 682,547 0.00%Hungary Government International Bond $500,000 5.38% 25/3/2024 563,429 0.00%Hungary Government Bond HUF90,000,000 6.00% 24/11/2023 369,996 0.00%Hungary Government Bond HUF100,000,000 1.75% 26/10/2022 352,315 0.00%Hungary Government Bond HUF90,000,000 2.50% 27/10/2021 319,104 0.00%
21,577,921 0.13%
India 0.08% (2018: 0.11%)
Export-Import Bank of India $6,685,000 3.88% 1/2/2028 6,995,385 0.04%ICICI Bank Ltd. $1,700,000 3.80% 14/12/2027 1,754,256 0.01%Adani Ports & Special Economic Zone Ltd. $1,000,000 3.38% 24/7/2024 1,009,289 0.01%Reliance Industries Ltd. $550,000 4.88% 10/2/2045 641,454 0.01%NTPC Ltd. $500,000 4.38% 26/11/2024 528,675 0.01%ICICI Bank Ltd. $450,000 4.00% 18/3/2026 467,811 0.00%Bharti Airtel International Netherlands BV $350,000 5.35% 20/5/2024 371,000 0.00%Reliance Industries Ltd. $350,000 3.67% 30/11/2027 361,592 0.00%State Bank of India $300,000 4.88% 17/4/2024 322,287 0.00%Reliance Holding USA, Inc. $300,000 5.40% 14/2/2022 317,484 0.00%Adani Ports & Special Economic Zone Ltd. $300,000 4.38% 3/7/2029 311,055 0.00%Adani Ports & Special Economic Zone Ltd. $250,000 3.95% 19/1/2022 255,378 0.00%Bank of India $200,000 6.25% 16/2/2021 207,362 0.00%ICICI Bank Ltd. $200,000 5.75% 16/11/2020 205,104 0.00%Export-Import Bank of India $200,000 3.38% 5/8/2026 203,403 0.00%Axis Bank Ltd. $200,000 3.00% 8/8/2022 200,872 0.00%Adani Transmission Ltd. $100,000 4.00% 3/8/2026 102,623 0.00%
14,255,030 0.08%
Indonesia 0.56% (2018: 0.49%)
Indonesia Treasury Bond IDR129,160,000,000 6.13% 15/5/2028 8,764,204 0.05%Indonesia Treasury Bond IDR109,647,000,000 8.38% 15/3/2024 8,461,704 0.05%Indonesia Treasury Bond IDR95,000,000,000 8.25% 15/5/2029 7,376,913 0.04%Indonesia Treasury Bond IDR106,927,000,000 6.63% 15/5/2033 7,103,223 0.04%Indonesia Treasury Bond IDR63,000,000,000 8.13% 15/5/2024 4,837,601 0.03%Indonesia Treasury Bond IDR65,869,000,000 7.00% 15/5/2027 4,726,141 0.03%Indonesia Treasury Bond IDR60,700,000,000 8.38% 15/4/2039 4,678,480 0.03%Indonesia Treasury Bond IDR50,000,000,000 8.25% 15/5/2036 3,763,733 0.02%Indonesia Treasury Bond IDR50,000,000,000 6.50% 15/6/2025 3,617,504 0.02%Indonesia Treasury Bond IDR45,000,000,000 7.50% 15/5/2038 3,201,011 0.02%Indonesia Government International Bond $2,500,000 3.40% 18/9/2029 2,596,475 0.02%Indonesia Government International Bond $2,050,000 3.70% 8/1/2022 2,106,272 0.01%Indonesia Government International Bond $1,700,000 5.13% 15/1/2045 2,029,375 0.01%Perusahaan Listrik Negara PT $1,925,000 4.13% 15/5/2027 2,028,469 0.01%Perusahaan Listrik Negara PT $1,500,000 6.15% 21/5/2048 1,893,750 0.01%Indonesia Treasury Bond IDR25,000,000,000 5.63% 15/5/2023 1,768,632 0.01%Indonesia Government International Bond $1,400,000 4.75% 8/1/2026 1,555,694 0.01%Indonesia Government International Bond €1,180,000 2.88% 8/7/2021 1,378,088 0.01%Perusahaan Penerbit SBSN Indonesia III $1,250,000 4.33% 28/5/2025 1,351,562 0.01%Indonesia Government International Bond €1,000,000 3.75% 14/6/2028 1,351,490 0.01%Indonesia Government International Bond $1,175,000 5.88% 15/1/2024 1,329,131 0.01%Indonesia Government International Bond $1,200,000 4.35% 11/1/2048 1,327,530 0.01%Indonesia Government International Bond $1,150,000 3.75% 25/4/2022 1,185,903 0.01%Perusahaan Penerbit SBSN Indonesia III $1,000,000 4.40% 1/3/2028 1,086,250 0.01%Indonesia Government International Bond $900,000 4.13% 15/1/2025 964,091 0.01%Indonesia Government International Bond $700,000 6.63% 17/2/2037 952,014 0.01%Indonesia Government International Bond $700,000 5.95% 8/1/2046 931,000 0.01%Indonesia Government International Bond $800,000 4.75% 18/7/2047 922,022 0.01%Pertamina Persero PT $700,000 5.63% 20/5/2043 817,250 0.01%Perusahaan Listrik Negara PT $600,000 6.25% 25/1/2049 777,000 0.01%Indonesia Government International Bond €630,000 1.40% 30/10/2031 702,013 0.01%Indonesia Government International Bond €570,000 1.45% 18/9/2026 662,219 0.01%
Vanguard Global Bond Index Fund
329
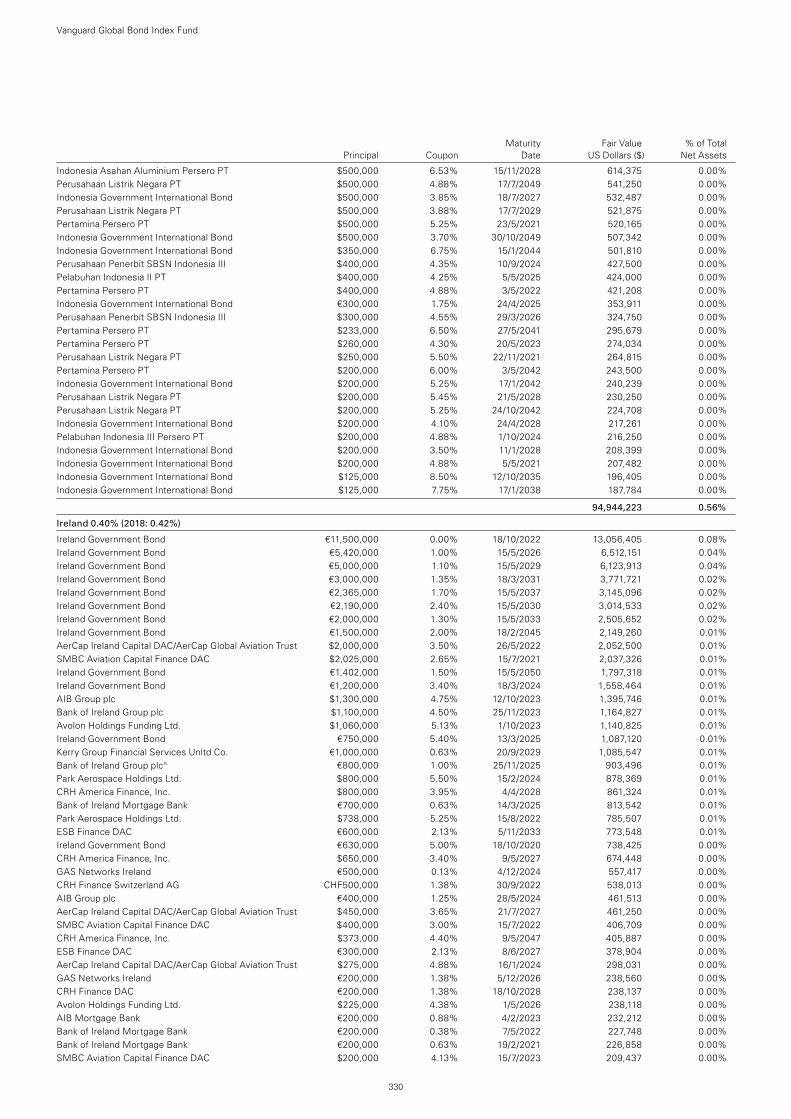
Maturity Fair Value % of Total Principal Coupon Date US Dollars ($) Net Assets
Indonesia Asahan Aluminium Persero PT $500,000 6.53% 15/11/2028 614,375 0.00%Perusahaan Listrik Negara PT $500,000 4.88% 17/7/2049 541,250 0.00%Indonesia Government International Bond $500,000 3.85% 18/7/2027 532,487 0.00%Perusahaan Listrik Negara PT $500,000 3.88% 17/7/2029 521,875 0.00%Pertamina Persero PT $500,000 5.25% 23/5/2021 520,165 0.00%Indonesia Government International Bond $500,000 3.70% 30/10/2049 507,342 0.00%Indonesia Government International Bond $350,000 6.75% 15/1/2044 501,810 0.00%Perusahaan Penerbit SBSN Indonesia III $400,000 4.35% 10/9/2024 427,500 0.00%Pelabuhan Indonesia II PT $400,000 4.25% 5/5/2025 424,000 0.00%Pertamina Persero PT $400,000 4.88% 3/5/2022 421,208 0.00%Indonesia Government International Bond €300,000 1.75% 24/4/2025 353,911 0.00%Perusahaan Penerbit SBSN Indonesia III $300,000 4.55% 29/3/2026 324,750 0.00%Pertamina Persero PT $233,000 6.50% 27/5/2041 295,679 0.00%Pertamina Persero PT $260,000 4.30% 20/5/2023 274,034 0.00%Perusahaan Listrik Negara PT $250,000 5.50% 22/11/2021 264,815 0.00%Pertamina Persero PT $200,000 6.00% 3/5/2042 243,500 0.00%Indonesia Government International Bond $200,000 5.25% 17/1/2042 240,239 0.00%Perusahaan Listrik Negara PT $200,000 5.45% 21/5/2028 230,250 0.00%Perusahaan Listrik Negara PT $200,000 5.25% 24/10/2042 224,708 0.00%Indonesia Government International Bond $200,000 4.10% 24/4/2028 217,261 0.00%Pelabuhan Indonesia III Persero PT $200,000 4.88% 1/10/2024 216,250 0.00%Indonesia Government International Bond $200,000 3.50% 11/1/2028 208,399 0.00%Indonesia Government International Bond $200,000 4.88% 5/5/2021 207,482 0.00%Indonesia Government International Bond $125,000 8.50% 12/10/2035 196,405 0.00%Indonesia Government International Bond $125,000 7.75% 17/1/2038 187,784 0.00%
94,944,223 0.56%
Ireland 0.40% (2018: 0.42%)
Ireland Government Bond €11,500,000 0.00% 18/10/2022 13,056,405 0.08%Ireland Government Bond €5,420,000 1.00% 15/5/2026 6,512,151 0.04%Ireland Government Bond €5,000,000 1.10% 15/5/2029 6,123,913 0.04%Ireland Government Bond €3,000,000 1.35% 18/3/2031 3,771,721 0.02%Ireland Government Bond €2,365,000 1.70% 15/5/2037 3,145,096 0.02%Ireland Government Bond €2,190,000 2.40% 15/5/2030 3,014,533 0.02%Ireland Government Bond €2,000,000 1.30% 15/5/2033 2,505,652 0.02%Ireland Government Bond €1,500,000 2.00% 18/2/2045 2,149,260 0.01%AerCap Ireland Capital DAC/AerCap Global Aviation Trust $2,000,000 3.50% 26/5/2022 2,052,500 0.01%SMBC Aviation Capital Finance DAC $2,025,000 2.65% 15/7/2021 2,037,326 0.01%Ireland Government Bond €1,402,000 1.50% 15/5/2050 1,797,318 0.01%Ireland Government Bond €1,200,000 3.40% 18/3/2024 1,558,464 0.01%AIB Group plc $1,300,000 4.75% 12/10/2023 1,395,746 0.01%Bank of Ireland Group plc $1,100,000 4.50% 25/11/2023 1,164,827 0.01%Avolon Holdings Funding Ltd. $1,060,000 5.13% 1/10/2023 1,140,825 0.01%Ireland Government Bond €750,000 5.40% 13/3/2025 1,087,120 0.01%Kerry Group Financial Services Unltd Co. €1,000,000 0.63% 20/9/2029 1,085,547 0.01%Bank of Ireland Group plc^ €800,000 1.00% 25/11/2025 903,496 0.01%Park Aerospace Holdings Ltd. $800,000 5.50% 15/2/2024 878,369 0.01%CRH America Finance, Inc. $800,000 3.95% 4/4/2028 861,324 0.01%Bank of Ireland Mortgage Bank €700,000 0.63% 14/3/2025 813,542 0.01%Park Aerospace Holdings Ltd. $738,000 5.25% 15/8/2022 785,507 0.01%ESB Finance DAC €600,000 2.13% 5/11/2033 773,548 0.01%Ireland Government Bond €630,000 5.00% 18/10/2020 738,425 0.00%CRH America Finance, Inc. $650,000 3.40% 9/5/2027 674,448 0.00%GAS Networks Ireland €500,000 0.13% 4/12/2024 557,417 0.00%CRH Finance Switzerland AG CHF500,000 1.38% 30/9/2022 538,013 0.00%AIB Group plc €400,000 1.25% 28/5/2024 461,513 0.00%AerCap Ireland Capital DAC/AerCap Global Aviation Trust $450,000 3.65% 21/7/2027 461,250 0.00%SMBC Aviation Capital Finance DAC $400,000 3.00% 15/7/2022 406,709 0.00%CRH America Finance, Inc. $373,000 4.40% 9/5/2047 405,887 0.00%ESB Finance DAC €300,000 2.13% 8/6/2027 378,904 0.00%AerCap Ireland Capital DAC/AerCap Global Aviation Trust $275,000 4.88% 16/1/2024 298,031 0.00%GAS Networks Ireland €200,000 1.38% 5/12/2026 238,560 0.00%CRH Finance DAC €200,000 1.38% 18/10/2028 238,137 0.00%Avolon Holdings Funding Ltd. $225,000 4.38% 1/5/2026 238,118 0.00%AIB Mortgage Bank €200,000 0.88% 4/2/2023 232,212 0.00%Bank of Ireland Mortgage Bank €200,000 0.38% 7/5/2022 227,748 0.00%Bank of Ireland Mortgage Bank €200,000 0.63% 19/2/2021 226,858 0.00%SMBC Aviation Capital Finance DAC $200,000 4.13% 15/7/2023 209,437 0.00%
Vanguard Global Bond Index Fund
330
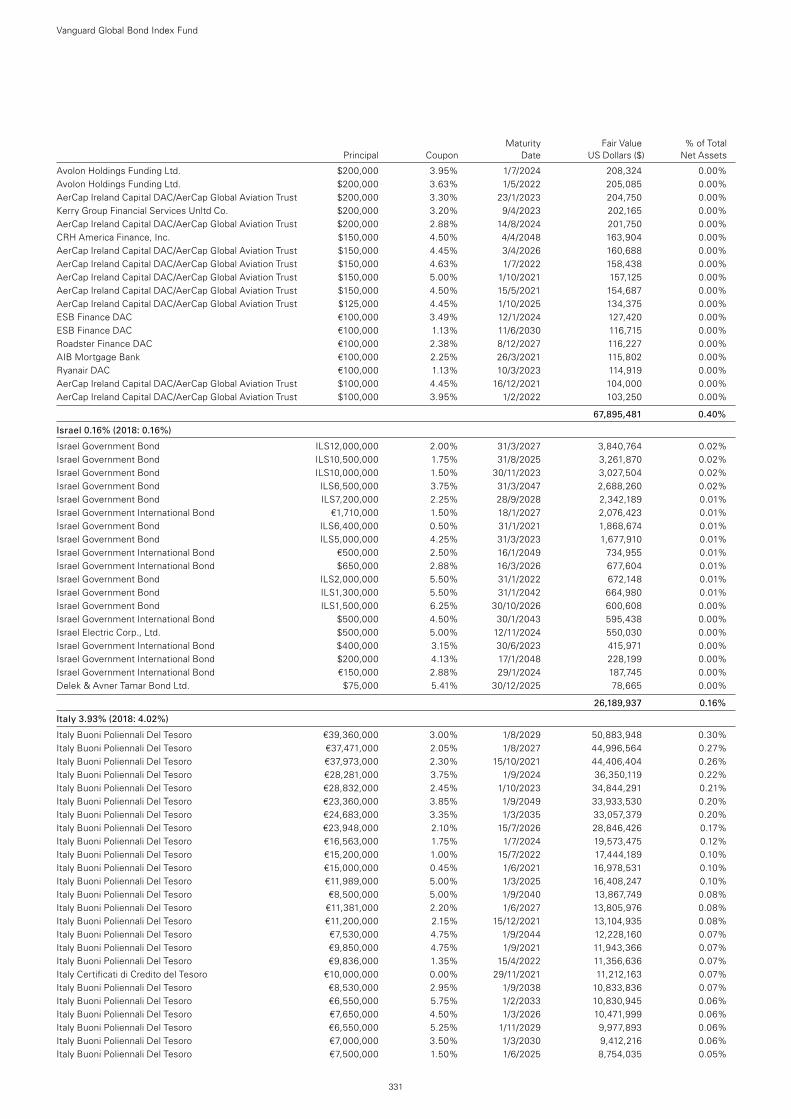
Maturity Fair Value % of Total Principal Coupon Date US Dollars ($) Net Assets
Avolon Holdings Funding Ltd. $200,000 3.95% 1/7/2024 208,324 0.00%Avolon Holdings Funding Ltd. $200,000 3.63% 1/5/2022 205,085 0.00%AerCap Ireland Capital DAC/AerCap Global Aviation Trust $200,000 3.30% 23/1/2023 204,750 0.00%Kerry Group Financial Services Unltd Co. $200,000 3.20% 9/4/2023 202,165 0.00%AerCap Ireland Capital DAC/AerCap Global Aviation Trust $200,000 2.88% 14/8/2024 201,750 0.00%CRH America Finance, Inc. $150,000 4.50% 4/4/2048 163,904 0.00%AerCap Ireland Capital DAC/AerCap Global Aviation Trust $150,000 4.45% 3/4/2026 160,688 0.00%AerCap Ireland Capital DAC/AerCap Global Aviation Trust $150,000 4.63% 1/7/2022 158,438 0.00%AerCap Ireland Capital DAC/AerCap Global Aviation Trust $150,000 5.00% 1/10/2021 157,125 0.00% AerCap Ireland Capital DAC/AerCap Global Aviation Trust $150,000 4.50% 15/5/2021 154,687 0.00%AerCap Ireland Capital DAC/AerCap Global Aviation Trust $125,000 4.45% 1/10/2025 134,375 0.00%ESB Finance DAC €100,000 3.49% 12/1/2024 127,420 0.00%ESB Finance DAC €100,000 1.13% 11/6/2030 116,715 0.00%Roadster Finance DAC €100,000 2.38% 8/12/2027 116,227 0.00%AIB Mortgage Bank €100,000 2.25% 26/3/2021 115,802 0.00%Ryanair DAC €100,000 1.13% 10/3/2023 114,919 0.00%AerCap Ireland Capital DAC/AerCap Global Aviation Trust $100,000 4.45% 16/12/2021 104,000 0.00%AerCap Ireland Capital DAC/AerCap Global Aviation Trust $100,000 3.95% 1/2/2022 103,250 0.00%
67,895,481 0.40%
Israel 0.16% (2018: 0.16%)
Israel Government Bond ILS12,000,000 2.00% 31/3/2027 3,840,764 0.02%Israel Government Bond ILS10,500,000 1.75% 31/8/2025 3,261,870 0.02%Israel Government Bond ILS10,000,000 1.50% 30/11/2023 3,027,504 0.02%Israel Government Bond ILS6,500,000 3.75% 31/3/2047 2,688,260 0.02%Israel Government Bond ILS7,200,000 2.25% 28/9/2028 2,342,189 0.01%Israel Government International Bond €1,710,000 1.50% 18/1/2027 2,076,423 0.01%Israel Government Bond ILS6,400,000 0.50% 31/1/2021 1,868,674 0.01%Israel Government Bond ILS5,000,000 4.25% 31/3/2023 1,677,910 0.01%Israel Government International Bond €500,000 2.50% 16/1/2049 734,955 0.01%Israel Government International Bond $650,000 2.88% 16/3/2026 677,604 0.01%Israel Government Bond ILS2,000,000 5.50% 31/1/2022 672,148 0.01%Israel Government Bond ILS1,300,000 5.50% 31/1/2042 664,980 0.01%Israel Government Bond ILS1,500,000 6.25% 30/10/2026 600,608 0.00%Israel Government International Bond $500,000 4.50% 30/1/2043 595,438 0.00%Israel Electric Corp., Ltd. $500,000 5.00% 12/11/2024 550,030 0.00%Israel Government International Bond $400,000 3.15% 30/6/2023 415,971 0.00%Israel Government International Bond $200,000 4.13% 17/1/2048 228,199 0.00%Israel Government International Bond €150,000 2.88% 29/1/2024 187,745 0.00%Delek & Avner Tamar Bond Ltd. $75,000 5.41% 30/12/2025 78,665 0.00%
26,189,937 0.16%
Italy 3.93% (2018: 4.02%)
Italy Buoni Poliennali Del Tesoro €39,360,000 3.00% 1/8/2029 50,883,948 0.30%Italy Buoni Poliennali Del Tesoro €37,471,000 2.05% 1/8/2027 44,996,564 0.27%Italy Buoni Poliennali Del Tesoro €37,973,000 2.30% 15/10/2021 44,406,404 0.26%Italy Buoni Poliennali Del Tesoro €28,281,000 3.75% 1/9/2024 36,350,119 0.22%Italy Buoni Poliennali Del Tesoro €28,832,000 2.45% 1/10/2023 34,844,291 0.21%Italy Buoni Poliennali Del Tesoro €23,360,000 3.85% 1/9/2049 33,933,530 0.20%Italy Buoni Poliennali Del Tesoro €24,683,000 3.35% 1/3/2035 33,057,379 0.20%Italy Buoni Poliennali Del Tesoro €23,948,000 2.10% 15/7/2026 28,846,426 0.17%Italy Buoni Poliennali Del Tesoro €16,563,000 1.75% 1/7/2024 19,573,475 0.12%Italy Buoni Poliennali Del Tesoro €15,200,000 1.00% 15/7/2022 17,444,189 0.10%Italy Buoni Poliennali Del Tesoro €15,000,000 0.45% 1/6/2021 16,978,531 0.10%Italy Buoni Poliennali Del Tesoro €11,989,000 5.00% 1/3/2025 16,408,247 0.10%Italy Buoni Poliennali Del Tesoro €8,500,000 5.00% 1/9/2040 13,867,749 0.08%Italy Buoni Poliennali Del Tesoro €11,381,000 2.20% 1/6/2027 13,805,976 0.08%Italy Buoni Poliennali Del Tesoro €11,200,000 2.15% 15/12/2021 13,104,935 0.08%Italy Buoni Poliennali Del Tesoro €7,530,000 4.75% 1/9/2044 12,228,160 0.07%Italy Buoni Poliennali Del Tesoro €9,850,000 4.75% 1/9/2021 11,943,366 0.07%Italy Buoni Poliennali Del Tesoro €9,836,000 1.35% 15/4/2022 11,356,636 0.07%Italy Certificati di Credito del Tesoro €10,000,000 0.00% 29/11/2021 11,212,163 0.07%Italy Buoni Poliennali Del Tesoro €8,530,000 2.95% 1/9/2038 10,833,836 0.07%Italy Buoni Poliennali Del Tesoro €6,550,000 5.75% 1/2/2033 10,830,945 0.06%Italy Buoni Poliennali Del Tesoro €7,650,000 4.50% 1/3/2026 10,471,999 0.06%Italy Buoni Poliennali Del Tesoro €6,550,000 5.25% 1/11/2029 9,977,893 0.06%Italy Buoni Poliennali Del Tesoro €7,000,000 3.50% 1/3/2030 9,412,216 0.06%Italy Buoni Poliennali Del Tesoro €7,500,000 1.50% 1/6/2025 8,754,035 0.05%
Vanguard Global Bond Index Fund
331
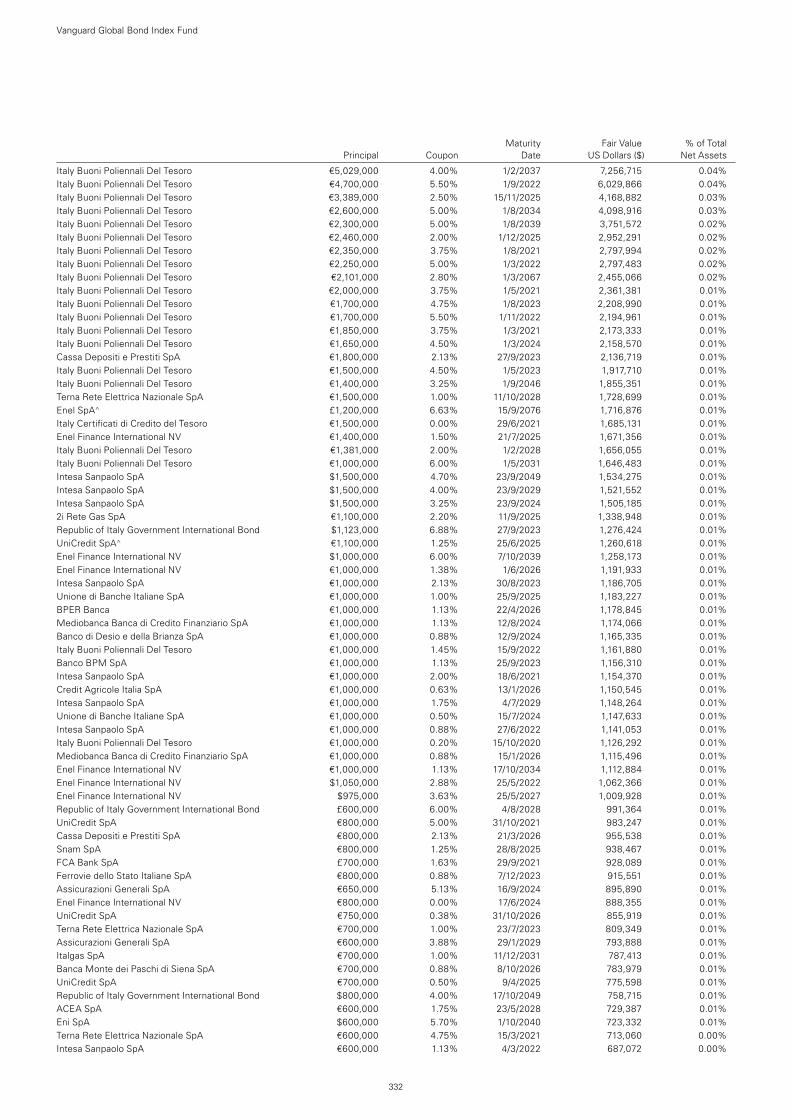
Maturity Fair Value % of Total Principal Coupon Date US Dollars ($) Net Assets
Italy Buoni Poliennali Del Tesoro €5,029,000 4.00% 1/2/2037 7,256,715 0.04%Italy Buoni Poliennali Del Tesoro €4,700,000 5.50% 1/9/2022 6,029,866 0.04%Italy Buoni Poliennali Del Tesoro €3,389,000 2.50% 15/11/2025 4,168,882 0.03%Italy Buoni Poliennali Del Tesoro €2,600,000 5.00% 1/8/2034 4,098,916 0.03%Italy Buoni Poliennali Del Tesoro €2,300,000 5.00% 1/8/2039 3,751,572 0.02%Italy Buoni Poliennali Del Tesoro €2,460,000 2.00% 1/12/2025 2,952,291 0.02%Italy Buoni Poliennali Del Tesoro €2,350,000 3.75% 1/8/2021 2,797,994 0.02%Italy Buoni Poliennali Del Tesoro €2,250,000 5.00% 1/3/2022 2,797,483 0.02%Italy Buoni Poliennali Del Tesoro €2,101,000 2.80% 1/3/2067 2,455,066 0.02%Italy Buoni Poliennali Del Tesoro €2,000,000 3.75% 1/5/2021 2,361,381 0.01%Italy Buoni Poliennali Del Tesoro €1,700,000 4.75% 1/8/2023 2,208,990 0.01%Italy Buoni Poliennali Del Tesoro €1,700,000 5.50% 1/11/2022 2,194,961 0.01%Italy Buoni Poliennali Del Tesoro €1,850,000 3.75% 1/3/2021 2,173,333 0.01%Italy Buoni Poliennali Del Tesoro €1,650,000 4.50% 1/3/2024 2,158,570 0.01%Cassa Depositi e Prestiti SpA €1,800,000 2.13% 27/9/2023 2,136,719 0.01%Italy Buoni Poliennali Del Tesoro €1,500,000 4.50% 1/5/2023 1,917,710 0.01%Italy Buoni Poliennali Del Tesoro €1,400,000 3.25% 1/9/2046 1,855,351 0.01%Terna Rete Elettrica Nazionale SpA €1,500,000 1.00% 11/10/2028 1,728,699 0.01%Enel SpA^ £1,200,000 6.63% 15/9/2076 1,716,876 0.01%Italy Certificati di Credito del Tesoro €1,500,000 0.00% 29/6/2021 1,685,131 0.01%Enel Finance International NV €1,400,000 1.50% 21/7/2025 1,671,356 0.01%Italy Buoni Poliennali Del Tesoro €1,381,000 2.00% 1/2/2028 1,656,055 0.01%Italy Buoni Poliennali Del Tesoro €1,000,000 6.00% 1/5/2031 1,646,483 0.01%Intesa Sanpaolo SpA $1,500,000 4.70% 23/9/2049 1,534,275 0.01%Intesa Sanpaolo SpA $1,500,000 4.00% 23/9/2029 1,521,552 0.01%Intesa Sanpaolo SpA $1,500,000 3.25% 23/9/2024 1,505,185 0.01%2i Rete Gas SpA €1,100,000 2.20% 11/9/2025 1,338,948 0.01%Republic of Italy Government International Bond $1,123,000 6.88% 27/9/2023 1,276,424 0.01%UniCredit SpA^ €1,100,000 1.25% 25/6/2025 1,260,618 0.01%Enel Finance International NV $1,000,000 6.00% 7/10/2039 1,258,173 0.01%Enel Finance International NV €1,000,000 1.38% 1/6/2026 1,191,933 0.01%Intesa Sanpaolo SpA €1,000,000 2.13% 30/8/2023 1,186,705 0.01%Unione di Banche Italiane SpA €1,000,000 1.00% 25/9/2025 1,183,227 0.01%BPER Banca €1,000,000 1.13% 22/4/2026 1,178,845 0.01%Mediobanca Banca di Credito Finanziario SpA €1,000,000 1.13% 12/8/2024 1,174,066 0.01%Banco di Desio e della Brianza SpA €1,000,000 0.88% 12/9/2024 1,165,335 0.01%Italy Buoni Poliennali Del Tesoro €1,000,000 1.45% 15/9/2022 1,161,880 0.01%Banco BPM SpA €1,000,000 1.13% 25/9/2023 1,156,310 0.01%Intesa Sanpaolo SpA €1,000,000 2.00% 18/6/2021 1,154,370 0.01%Credit Agricole Italia SpA €1,000,000 0.63% 13/1/2026 1,150,545 0.01%Intesa Sanpaolo SpA €1,000,000 1.75% 4/7/2029 1,148,264 0.01%Unione di Banche Italiane SpA €1,000,000 0.50% 15/7/2024 1,147,633 0.01%Intesa Sanpaolo SpA €1,000,000 0.88% 27/6/2022 1,141,053 0.01%Italy Buoni Poliennali Del Tesoro €1,000,000 0.20% 15/10/2020 1,126,292 0.01%Mediobanca Banca di Credito Finanziario SpA €1,000,000 0.88% 15/1/2026 1,115,496 0.01%Enel Finance International NV €1,000,000 1.13% 17/10/2034 1,112,884 0.01%Enel Finance International NV $1,050,000 2.88% 25/5/2022 1,062,366 0.01%Enel Finance International NV $975,000 3.63% 25/5/2027 1,009,928 0.01%Republic of Italy Government International Bond £600,000 6.00% 4/8/2028 991,364 0.01%UniCredit SpA €800,000 5.00% 31/10/2021 983,247 0.01%Cassa Depositi e Prestiti SpA €800,000 2.13% 21/3/2026 955,538 0.01%Snam SpA €800,000 1.25% 28/8/2025 938,467 0.01%FCA Bank SpA £700,000 1.63% 29/9/2021 928,089 0.01%Ferrovie dello Stato Italiane SpA €800,000 0.88% 7/12/2023 915,551 0.01%Assicurazioni Generali SpA €650,000 5.13% 16/9/2024 895,890 0.01%Enel Finance International NV €800,000 0.00% 17/6/2024 888,355 0.01%UniCredit SpA €750,000 0.38% 31/10/2026 855,919 0.01%Terna Rete Elettrica Nazionale SpA €700,000 1.00% 23/7/2023 809,349 0.01%Assicurazioni Generali SpA €600,000 3.88% 29/1/2029 793,888 0.01%Italgas SpA €700,000 1.00% 11/12/2031 787,413 0.01%Banca Monte dei Paschi di Siena SpA €700,000 0.88% 8/10/2026 783,979 0.01%UniCredit SpA €700,000 0.50% 9/4/2025 775,598 0.01%Republic of Italy Government International Bond $800,000 4.00% 17/10/2049 758,715 0.01%ACEA SpA €600,000 1.75% 23/5/2028 729,387 0.01%Eni SpA $600,000 5.70% 1/10/2040 723,332 0.01%Terna Rete Elettrica Nazionale SpA €600,000 4.75% 15/3/2021 713,060 0.00%Intesa Sanpaolo SpA €600,000 1.13% 4/3/2022 687,072 0.00%
Vanguard Global Bond Index Fund
332
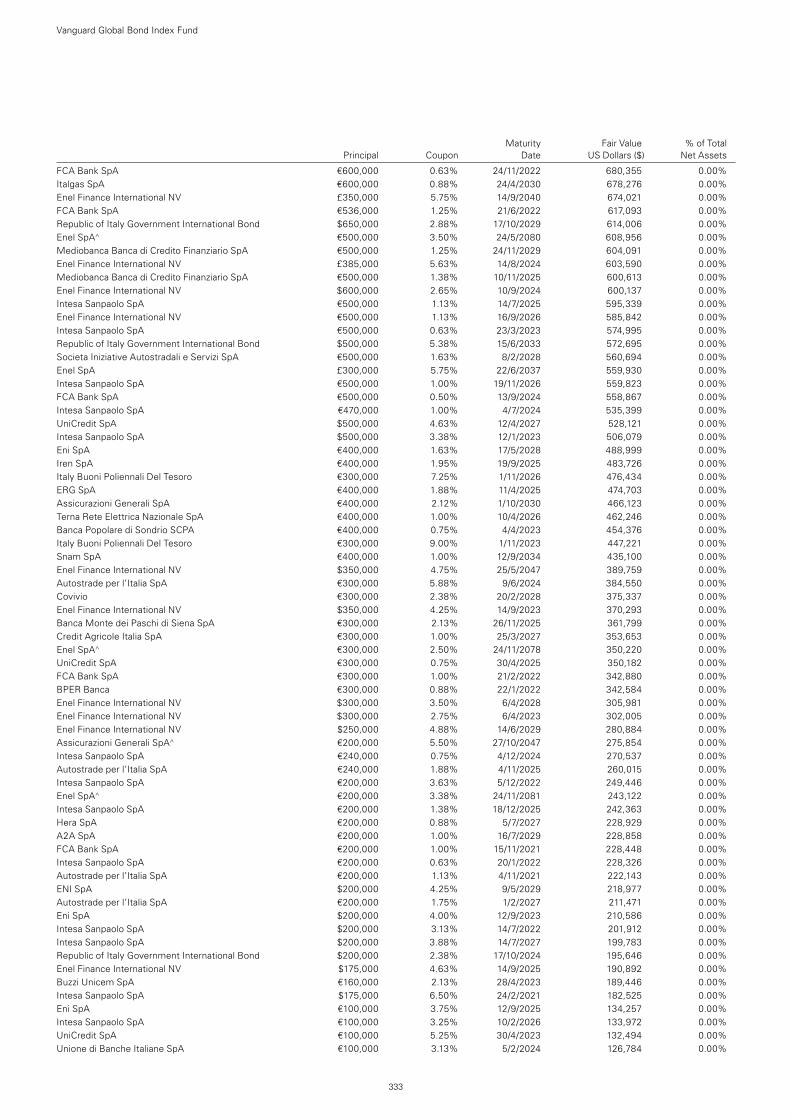
Maturity Fair Value % of Total Principal Coupon Date US Dollars ($) Net Assets
FCA Bank SpA €600,000 0.63% 24/11/2022 680,355 0.00%Italgas SpA €600,000 0.88% 24/4/2030 678,276 0.00%Enel Finance International NV £350,000 5.75% 14/9/2040 674,021 0.00%FCA Bank SpA €536,000 1.25% 21/6/2022 617,093 0.00%Republic of Italy Government International Bond $650,000 2.88% 17/10/2029 614,006 0.00%Enel SpA^ €500,000 3.50% 24/5/2080 608,956 0.00%Mediobanca Banca di Credito Finanziario SpA €500,000 1.25% 24/11/2029 604,091 0.00%Enel Finance International NV £385,000 5.63% 14/8/2024 603,590 0.00%Mediobanca Banca di Credito Finanziario SpA €500,000 1.38% 10/11/2025 600,613 0.00%Enel Finance International NV $600,000 2.65% 10/9/2024 600,137 0.00%Intesa Sanpaolo SpA €500,000 1.13% 14/7/2025 595,339 0.00%Enel Finance International NV €500,000 1.13% 16/9/2026 585,842 0.00%Intesa Sanpaolo SpA €500,000 0.63% 23/3/2023 574,995 0.00%Republic of Italy Government International Bond $500,000 5.38% 15/6/2033 572,695 0.00%Societa Iniziative Autostradali e Servizi SpA €500,000 1.63% 8/2/2028 560,694 0.00%Enel SpA £300,000 5.75% 22/6/2037 559,930 0.00%Intesa Sanpaolo SpA €500,000 1.00% 19/11/2026 559,823 0.00%FCA Bank SpA €500,000 0.50% 13/9/2024 558,867 0.00%Intesa Sanpaolo SpA €470,000 1.00% 4/7/2024 535,399 0.00%UniCredit SpA $500,000 4.63% 12/4/2027 528,121 0.00%Intesa Sanpaolo SpA $500,000 3.38% 12/1/2023 506,079 0.00%Eni SpA €400,000 1.63% 17/5/2028 488,999 0.00%Iren SpA €400,000 1.95% 19/9/2025 483,726 0.00%Italy Buoni Poliennali Del Tesoro €300,000 7.25% 1/11/2026 476,434 0.00%ERG SpA €400,000 1.88% 11/4/2025 474,703 0.00%Assicurazioni Generali SpA €400,000 2.12% 1/10/2030 466,123 0.00%Terna Rete Elettrica Nazionale SpA €400,000 1.00% 10/4/2026 462,246 0.00%Banca Popolare di Sondrio SCPA €400,000 0.75% 4/4/2023 454,376 0.00%Italy Buoni Poliennali Del Tesoro €300,000 9.00% 1/11/2023 447,221 0.00%Snam SpA €400,000 1.00% 12/9/2034 435,100 0.00%Enel Finance International NV $350,000 4.75% 25/5/2047 389,759 0.00%Autostrade per l’Italia SpA €300,000 5.88% 9/6/2024 384,550 0.00%Covivio €300,000 2.38% 20/2/2028 375,337 0.00%Enel Finance International NV $350,000 4.25% 14/9/2023 370,293 0.00%Banca Monte dei Paschi di Siena SpA €300,000 2.13% 26/11/2025 361,799 0.00%Credit Agricole Italia SpA €300,000 1.00% 25/3/2027 353,653 0.00%Enel SpA^ €300,000 2.50% 24/11/2078 350,220 0.00%UniCredit SpA €300,000 0.75% 30/4/2025 350,182 0.00%FCA Bank SpA €300,000 1.00% 21/2/2022 342,880 0.00%BPER Banca €300,000 0.88% 22/1/2022 342,584 0.00%Enel Finance International NV $300,000 3.50% 6/4/2028 305,981 0.00%Enel Finance International NV $300,000 2.75% 6/4/2023 302,005 0.00%Enel Finance International NV $250,000 4.88% 14/6/2029 280,884 0.00%Assicurazioni Generali SpA^ €200,000 5.50% 27/10/2047 275,854 0.00%Intesa Sanpaolo SpA €240,000 0.75% 4/12/2024 270,537 0.00%Autostrade per l’Italia SpA €240,000 1.88% 4/11/2025 260,015 0.00%Intesa Sanpaolo SpA €200,000 3.63% 5/12/2022 249,446 0.00%Enel SpA^ €200,000 3.38% 24/11/2081 243,122 0.00%Intesa Sanpaolo SpA €200,000 1.38% 18/12/2025 242,363 0.00%Hera SpA €200,000 0.88% 5/7/2027 228,929 0.00%A2A SpA €200,000 1.00% 16/7/2029 228,858 0.00%FCA Bank SpA €200,000 1.00% 15/11/2021 228,448 0.00%Intesa Sanpaolo SpA €200,000 0.63% 20/1/2022 228,326 0.00%Autostrade per l’Italia SpA €200,000 1.13% 4/11/2021 222,143 0.00%ENI SpA $200,000 4.25% 9/5/2029 218,977 0.00%Autostrade per l’Italia SpA €200,000 1.75% 1/2/2027 211,471 0.00%Eni SpA $200,000 4.00% 12/9/2023 210,586 0.00%Intesa Sanpaolo SpA $200,000 3.13% 14/7/2022 201,912 0.00%Intesa Sanpaolo SpA $200,000 3.88% 14/7/2027 199,783 0.00%Republic of Italy Government International Bond $200,000 2.38% 17/10/2024 195,646 0.00%Enel Finance International NV $175,000 4.63% 14/9/2025 190,892 0.00%Buzzi Unicem SpA €160,000 2.13% 28/4/2023 189,446 0.00%Intesa Sanpaolo SpA $175,000 6.50% 24/2/2021 182,525 0.00%Eni SpA €100,000 3.75% 12/9/2025 134,257 0.00%Intesa Sanpaolo SpA €100,000 3.25% 10/2/2026 133,972 0.00%UniCredit SpA €100,000 5.25% 30/4/2023 132,494 0.00%Unione di Banche Italiane SpA €100,000 3.13% 5/2/2024 126,784 0.00%
Vanguard Global Bond Index Fund
333
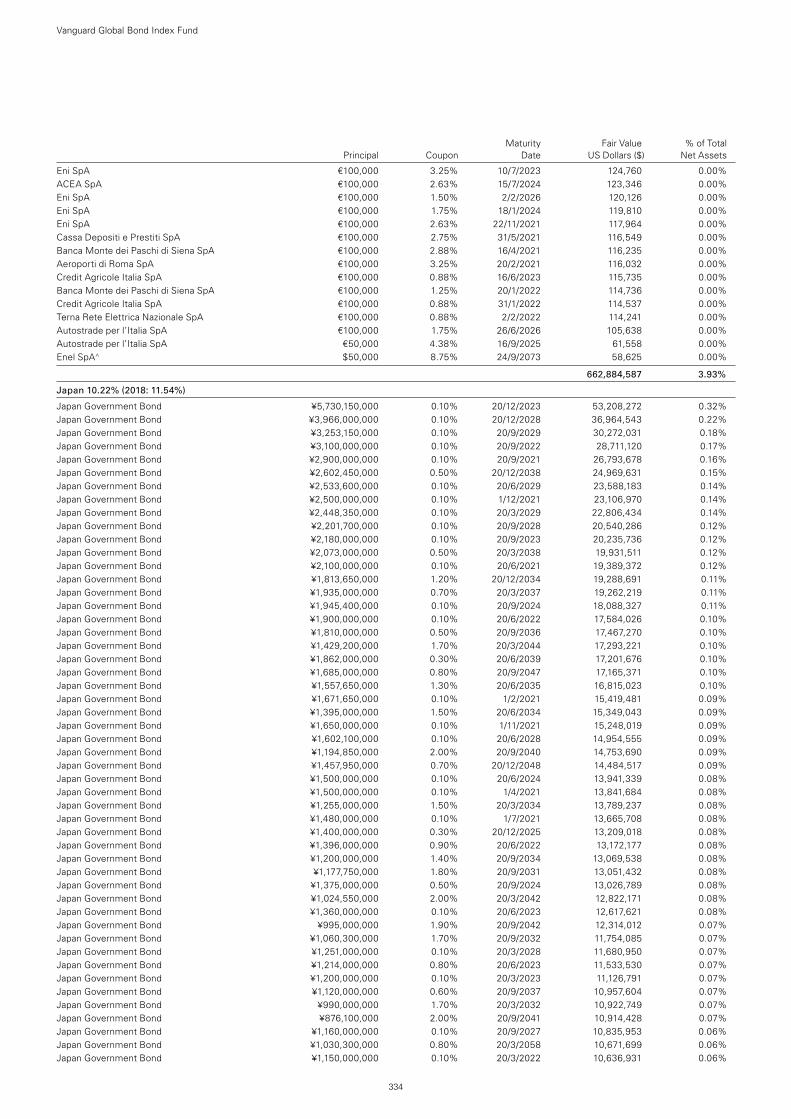
Maturity Fair Value % of Total Principal Coupon Date US Dollars ($) Net Assets
Eni SpA €100,000 3.25% 10/7/2023 124,760 0.00%ACEA SpA €100,000 2.63% 15/7/2024 123,346 0.00%Eni SpA €100,000 1.50% 2/2/2026 120,126 0.00%Eni SpA €100,000 1.75% 18/1/2024 119,810 0.00%Eni SpA €100,000 2.63% 22/11/2021 117,964 0.00%Cassa Depositi e Prestiti SpA €100,000 2.75% 31/5/2021 116,549 0.00%Banca Monte dei Paschi di Siena SpA €100,000 2.88% 16/4/2021 116,235 0.00%Aeroporti di Roma SpA €100,000 3.25% 20/2/2021 116,032 0.00%Credit Agricole Italia SpA €100,000 0.88% 16/6/2023 115,735 0.00%Banca Monte dei Paschi di Siena SpA €100,000 1.25% 20/1/2022 114,736 0.00%Credit Agricole Italia SpA €100,000 0.88% 31/1/2022 114,537 0.00%Terna Rete Elettrica Nazionale SpA €100,000 0.88% 2/2/2022 114,241 0.00%Autostrade per l’Italia SpA €100,000 1.75% 26/6/2026 105,638 0.00%Autostrade per l’Italia SpA €50,000 4.38% 16/9/2025 61,558 0.00%Enel SpA^ $50,000 8.75% 24/9/2073 58,625 0.00%
662,884,587 3.93%
Japan 10.22% (2018: 11.54%)
Japan Government Bond ¥5,730,150,000 0.10% 20/12/2023 53,208,272 0.32%Japan Government Bond ¥3,966,000,000 0.10% 20/12/2028 36,964,543 0.22%Japan Government Bond ¥3,253,150,000 0.10% 20/9/2029 30,272,031 0.18%Japan Government Bond ¥3,100,000,000 0.10% 20/9/2022 28,711,120 0.17%Japan Government Bond ¥2,900,000,000 0.10% 20/9/2021 26,793,678 0.16%Japan Government Bond ¥2,602,450,000 0.50% 20/12/2038 24,969,631 0.15%Japan Government Bond ¥2,533,600,000 0.10% 20/6/2029 23,588,183 0.14%Japan Government Bond ¥2,500,000,000 0.10% 1/12/2021 23,106,970 0.14%Japan Government Bond ¥2,448,350,000 0.10% 20/3/2029 22,806,434 0.14%Japan Government Bond ¥2,201,700,000 0.10% 20/9/2028 20,540,286 0.12%Japan Government Bond ¥2,180,000,000 0.10% 20/9/2023 20,235,736 0.12%Japan Government Bond ¥2,073,000,000 0.50% 20/3/2038 19,931,511 0.12%Japan Government Bond ¥2,100,000,000 0.10% 20/6/2021 19,389,372 0.12%Japan Government Bond ¥1,813,650,000 1.20% 20/12/2034 19,288,691 0.11%Japan Government Bond ¥1,935,000,000 0.70% 20/3/2037 19,262,219 0.11%Japan Government Bond ¥1,945,400,000 0.10% 20/9/2024 18,088,327 0.11%Japan Government Bond ¥1,900,000,000 0.10% 20/6/2022 17,584,026 0.10%Japan Government Bond ¥1,810,000,000 0.50% 20/9/2036 17,467,270 0.10%Japan Government Bond ¥1,429,200,000 1.70% 20/3/2044 17,293,221 0.10%Japan Government Bond ¥1,862,000,000 0.30% 20/6/2039 17,201,676 0.10%Japan Government Bond ¥1,685,000,000 0.80% 20/9/2047 17,165,371 0.10%Japan Government Bond ¥1,557,650,000 1.30% 20/6/2035 16,815,023 0.10%Japan Government Bond ¥1,671,650,000 0.10% 1/2/2021 15,419,481 0.09%Japan Government Bond ¥1,395,000,000 1.50% 20/6/2034 15,349,043 0.09%Japan Government Bond ¥1,650,000,000 0.10% 1/11/2021 15,248,019 0.09%Japan Government Bond ¥1,602,100,000 0.10% 20/6/2028 14,954,555 0.09%Japan Government Bond ¥1,194,850,000 2.00% 20/9/2040 14,753,690 0.09%Japan Government Bond ¥1,457,950,000 0.70% 20/12/2048 14,484,517 0.09%Japan Government Bond ¥1,500,000,000 0.10% 20/6/2024 13,941,339 0.08%Japan Government Bond ¥1,500,000,000 0.10% 1/4/2021 13,841,684 0.08%Japan Government Bond ¥1,255,000,000 1.50% 20/3/2034 13,789,237 0.08%Japan Government Bond ¥1,480,000,000 0.10% 1/7/2021 13,665,708 0.08%Japan Government Bond ¥1,400,000,000 0.30% 20/12/2025 13,209,018 0.08%Japan Government Bond ¥1,396,000,000 0.90% 20/6/2022 13,172,177 0.08%Japan Government Bond ¥1,200,000,000 1.40% 20/9/2034 13,069,538 0.08%Japan Government Bond ¥1,177,750,000 1.80% 20/9/2031 13,051,432 0.08%Japan Government Bond ¥1,375,000,000 0.50% 20/9/2024 13,026,789 0.08%Japan Government Bond ¥1,024,550,000 2.00% 20/3/2042 12,822,171 0.08%Japan Government Bond ¥1,360,000,000 0.10% 20/6/2023 12,617,621 0.08%Japan Government Bond ¥995,000,000 1.90% 20/9/2042 12,314,012 0.07%Japan Government Bond ¥1,060,300,000 1.70% 20/9/2032 11,754,085 0.07%Japan Government Bond ¥1,251,000,000 0.10% 20/3/2028 11,680,950 0.07%Japan Government Bond ¥1,214,000,000 0.80% 20/6/2023 11,533,530 0.07%Japan Government Bond ¥1,200,000,000 0.10% 20/3/2023 11,126,791 0.07%Japan Government Bond ¥1,120,000,000 0.60% 20/9/2037 10,957,604 0.07%Japan Government Bond ¥990,000,000 1.70% 20/3/2032 10,922,749 0.07%Japan Government Bond ¥876,100,000 2.00% 20/9/2041 10,914,428 0.07%Japan Government Bond ¥1,160,000,000 0.10% 20/9/2027 10,835,953 0.06%Japan Government Bond ¥1,030,300,000 0.80% 20/3/2058 10,671,699 0.06%Japan Government Bond ¥1,150,000,000 0.10% 20/3/2022 10,636,931 0.06%
Vanguard Global Bond Index Fund
334
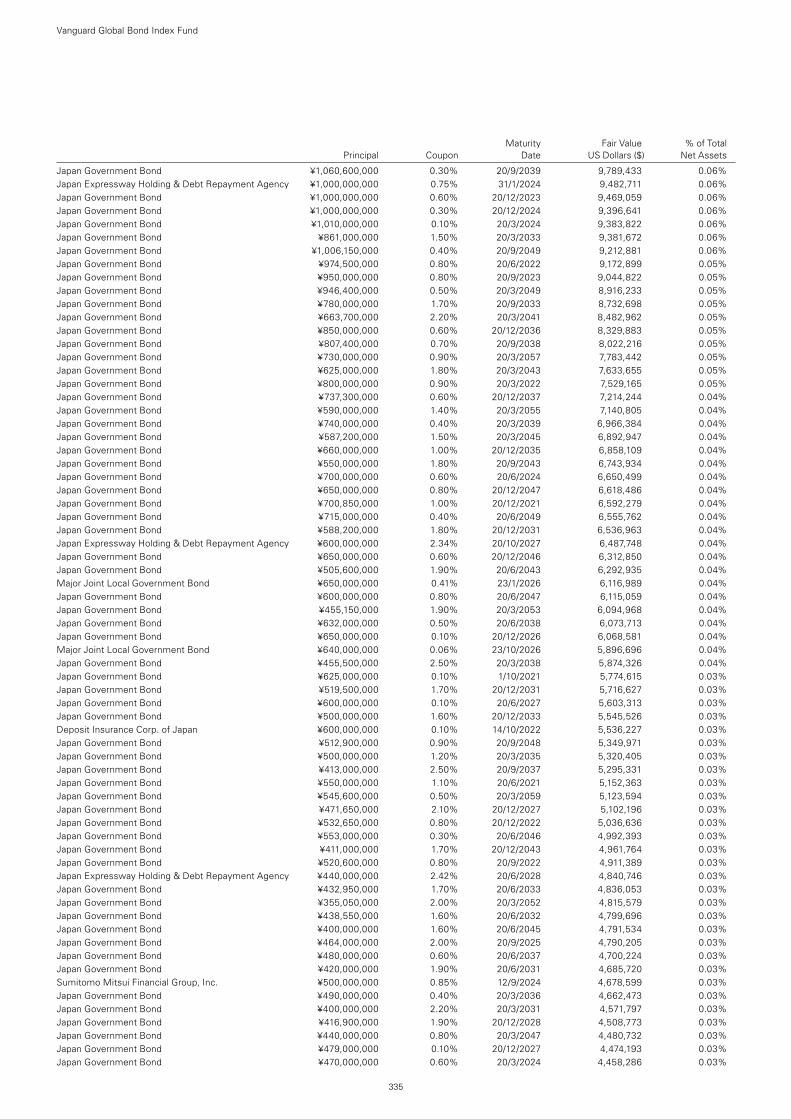
Maturity Fair Value % of Total Principal Coupon Date US Dollars ($) Net Assets
Japan Government Bond ¥1,060,600,000 0.30% 20/9/2039 9,789,433 0.06%Japan Expressway Holding & Debt Repayment Agency ¥1,000,000,000 0.75% 31/1/2024 9,482,711 0.06%Japan Government Bond ¥1,000,000,000 0.60% 20/12/2023 9,469,059 0.06%Japan Government Bond ¥1,000,000,000 0.30% 20/12/2024 9,396,641 0.06%Japan Government Bond ¥1,010,000,000 0.10% 20/3/2024 9,383,822 0.06%Japan Government Bond ¥861,000,000 1.50% 20/3/2033 9,381,672 0.06%Japan Government Bond ¥1,006,150,000 0.40% 20/9/2049 9,212,881 0.06%Japan Government Bond ¥974,500,000 0.80% 20/6/2022 9,172,899 0.05%Japan Government Bond ¥950,000,000 0.80% 20/9/2023 9,044,822 0.05%Japan Government Bond ¥946,400,000 0.50% 20/3/2049 8,916,233 0.05%Japan Government Bond ¥780,000,000 1.70% 20/9/2033 8,732,698 0.05%Japan Government Bond ¥663,700,000 2.20% 20/3/2041 8,482,962 0.05%Japan Government Bond ¥850,000,000 0.60% 20/12/2036 8,329,883 0.05%Japan Government Bond ¥807,400,000 0.70% 20/9/2038 8,022,216 0.05%Japan Government Bond ¥730,000,000 0.90% 20/3/2057 7,783,442 0.05%Japan Government Bond ¥625,000,000 1.80% 20/3/2043 7,633,655 0.05%Japan Government Bond ¥800,000,000 0.90% 20/3/2022 7,529,165 0.05%Japan Government Bond ¥737,300,000 0.60% 20/12/2037 7,214,244 0.04%Japan Government Bond ¥590,000,000 1.40% 20/3/2055 7,140,805 0.04%Japan Government Bond ¥740,000,000 0.40% 20/3/2039 6,966,384 0.04%Japan Government Bond ¥587,200,000 1.50% 20/3/2045 6,892,947 0.04%Japan Government Bond ¥660,000,000 1.00% 20/12/2035 6,858,109 0.04%Japan Government Bond ¥550,000,000 1.80% 20/9/2043 6,743,934 0.04%Japan Government Bond ¥700,000,000 0.60% 20/6/2024 6,650,499 0.04%Japan Government Bond ¥650,000,000 0.80% 20/12/2047 6,618,486 0.04%Japan Government Bond ¥700,850,000 1.00% 20/12/2021 6,592,279 0.04%Japan Government Bond ¥715,000,000 0.40% 20/6/2049 6,555,762 0.04%Japan Government Bond ¥588,200,000 1.80% 20/12/2031 6,536,963 0.04%Japan Expressway Holding & Debt Repayment Agency ¥600,000,000 2.34% 20/10/2027 6,487,748 0.04%Japan Government Bond ¥650,000,000 0.60% 20/12/2046 6,312,850 0.04%Japan Government Bond ¥505,600,000 1.90% 20/6/2043 6,292,935 0.04%Major Joint Local Government Bond ¥650,000,000 0.41% 23/1/2026 6,116,989 0.04%Japan Government Bond ¥600,000,000 0.80% 20/6/2047 6,115,059 0.04%Japan Government Bond ¥455,150,000 1.90% 20/3/2053 6,094,968 0.04%Japan Government Bond ¥632,000,000 0.50% 20/6/2038 6,073,713 0.04%Japan Government Bond ¥650,000,000 0.10% 20/12/2026 6,068,581 0.04%Major Joint Local Government Bond ¥640,000,000 0.06% 23/10/2026 5,896,696 0.04%Japan Government Bond ¥455,500,000 2.50% 20/3/2038 5,874,326 0.04%Japan Government Bond ¥625,000,000 0.10% 1/10/2021 5,774,615 0.03%Japan Government Bond ¥519,500,000 1.70% 20/12/2031 5,716,627 0.03%Japan Government Bond ¥600,000,000 0.10% 20/6/2027 5,603,313 0.03%Japan Government Bond ¥500,000,000 1.60% 20/12/2033 5,545,526 0.03%Deposit Insurance Corp. of Japan ¥600,000,000 0.10% 14/10/2022 5,536,227 0.03%Japan Government Bond ¥512,900,000 0.90% 20/9/2048 5,349,971 0.03%Japan Government Bond ¥500,000,000 1.20% 20/3/2035 5,320,405 0.03%Japan Government Bond ¥413,000,000 2.50% 20/9/2037 5,295,331 0.03%Japan Government Bond ¥550,000,000 1.10% 20/6/2021 5,152,363 0.03%Japan Government Bond ¥545,600,000 0.50% 20/3/2059 5,123,594 0.03%Japan Government Bond ¥471,650,000 2.10% 20/12/2027 5,102,196 0.03%Japan Government Bond ¥532,650,000 0.80% 20/12/2022 5,036,636 0.03%Japan Government Bond ¥553,000,000 0.30% 20/6/2046 4,992,393 0.03%Japan Government Bond ¥411,000,000 1.70% 20/12/2043 4,961,764 0.03%Japan Government Bond ¥520,600,000 0.80% 20/9/2022 4,911,389 0.03%Japan Expressway Holding & Debt Repayment Agency ¥440,000,000 2.42% 20/6/2028 4,840,746 0.03%Japan Government Bond ¥432,950,000 1.70% 20/6/2033 4,836,053 0.03%Japan Government Bond ¥355,050,000 2.00% 20/3/2052 4,815,579 0.03%Japan Government Bond ¥438,550,000 1.60% 20/6/2032 4,799,696 0.03%Japan Government Bond ¥400,000,000 1.60% 20/6/2045 4,791,534 0.03%Japan Government Bond ¥464,000,000 2.00% 20/9/2025 4,790,205 0.03%Japan Government Bond ¥480,000,000 0.60% 20/6/2037 4,700,224 0.03%Japan Government Bond ¥420,000,000 1.90% 20/6/2031 4,685,720 0.03%Sumitomo Mitsui Financial Group, Inc. ¥500,000,000 0.85% 12/9/2024 4,678,599 0.03%Japan Government Bond ¥490,000,000 0.40% 20/3/2036 4,662,473 0.03%Japan Government Bond ¥400,000,000 2.20% 20/3/2031 4,571,797 0.03%Japan Government Bond ¥416,900,000 1.90% 20/12/2028 4,508,773 0.03%Japan Government Bond ¥440,000,000 0.80% 20/3/2047 4,480,732 0.03%Japan Government Bond ¥479,000,000 0.10% 20/12/2027 4,474,193 0.03%Japan Government Bond ¥470,000,000 0.60% 20/3/2024 4,458,286 0.03%
Vanguard Global Bond Index Fund
335
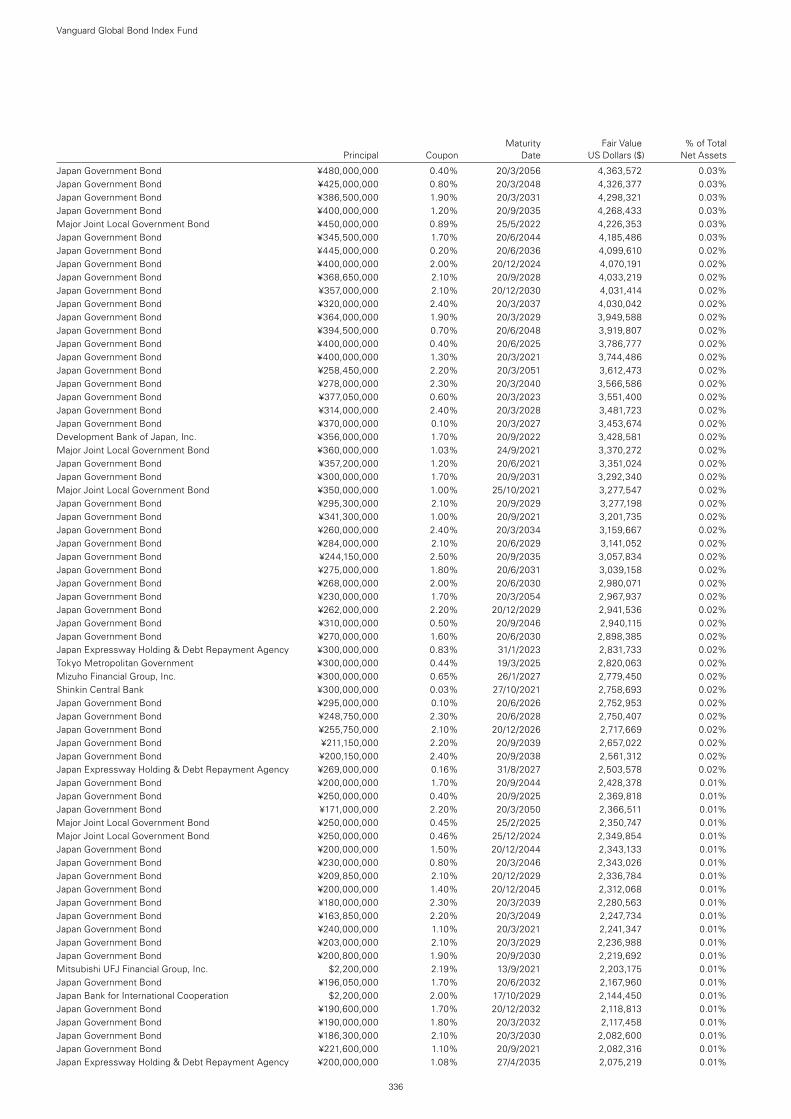
Maturity Fair Value % of Total Principal Coupon Date US Dollars ($) Net Assets
Japan Government Bond ¥480,000,000 0.40% 20/3/2056 4,363,572 0.03%Japan Government Bond ¥425,000,000 0.80% 20/3/2048 4,326,377 0.03%Japan Government Bond ¥386,500,000 1.90% 20/3/2031 4,298,321 0.03%Japan Government Bond ¥400,000,000 1.20% 20/9/2035 4,268,433 0.03%Major Joint Local Government Bond ¥450,000,000 0.89% 25/5/2022 4,226,353 0.03%Japan Government Bond ¥345,500,000 1.70% 20/6/2044 4,185,486 0.03%Japan Government Bond ¥445,000,000 0.20% 20/6/2036 4,099,610 0.02%Japan Government Bond ¥400,000,000 2.00% 20/12/2024 4,070,191 0.02%Japan Government Bond ¥368,650,000 2.10% 20/9/2028 4,033,219 0.02%Japan Government Bond ¥357,000,000 2.10% 20/12/2030 4,031,414 0.02%Japan Government Bond ¥320,000,000 2.40% 20/3/2037 4,030,042 0.02%Japan Government Bond ¥364,000,000 1.90% 20/3/2029 3,949,588 0.02%Japan Government Bond ¥394,500,000 0.70% 20/6/2048 3,919,807 0.02%Japan Government Bond ¥400,000,000 0.40% 20/6/2025 3,786,777 0.02%Japan Government Bond ¥400,000,000 1.30% 20/3/2021 3,744,486 0.02%Japan Government Bond ¥258,450,000 2.20% 20/3/2051 3,612,473 0.02%Japan Government Bond ¥278,000,000 2.30% 20/3/2040 3,566,586 0.02%Japan Government Bond ¥377,050,000 0.60% 20/3/2023 3,551,400 0.02%Japan Government Bond ¥314,000,000 2.40% 20/3/2028 3,481,723 0.02%Japan Government Bond ¥370,000,000 0.10% 20/3/2027 3,453,674 0.02%Development Bank of Japan, Inc. ¥356,000,000 1.70% 20/9/2022 3,428,581 0.02%Major Joint Local Government Bond ¥360,000,000 1.03% 24/9/2021 3,370,272 0.02%Japan Government Bond ¥357,200,000 1.20% 20/6/2021 3,351,024 0.02%Japan Government Bond ¥300,000,000 1.70% 20/9/2031 3,292,340 0.02%Major Joint Local Government Bond ¥350,000,000 1.00% 25/10/2021 3,277,547 0.02%Japan Government Bond ¥295,300,000 2.10% 20/9/2029 3,277,198 0.02%Japan Government Bond ¥341,300,000 1.00% 20/9/2021 3,201,735 0.02%Japan Government Bond ¥260,000,000 2.40% 20/3/2034 3,159,667 0.02%Japan Government Bond ¥284,000,000 2.10% 20/6/2029 3,141,052 0.02%Japan Government Bond ¥244,150,000 2.50% 20/9/2035 3,057,834 0.02%Japan Government Bond ¥275,000,000 1.80% 20/6/2031 3,039,158 0.02%Japan Government Bond ¥268,000,000 2.00% 20/6/2030 2,980,071 0.02%Japan Government Bond ¥230,000,000 1.70% 20/3/2054 2,967,937 0.02%Japan Government Bond ¥262,000,000 2.20% 20/12/2029 2,941,536 0.02%Japan Government Bond ¥310,000,000 0.50% 20/9/2046 2,940,115 0.02%Japan Government Bond ¥270,000,000 1.60% 20/6/2030 2,898,385 0.02%Japan Expressway Holding & Debt Repayment Agency ¥300,000,000 0.83% 31/1/2023 2,831,733 0.02%Tokyo Metropolitan Government ¥300,000,000 0.44% 19/3/2025 2,820,063 0.02%Mizuho Financial Group, Inc. ¥300,000,000 0.65% 26/1/2027 2,779,450 0.02%Shinkin Central Bank ¥300,000,000 0.03% 27/10/2021 2,758,693 0.02%Japan Government Bond ¥295,000,000 0.10% 20/6/2026 2,752,953 0.02%Japan Government Bond ¥248,750,000 2.30% 20/6/2028 2,750,407 0.02%Japan Government Bond ¥255,750,000 2.10% 20/12/2026 2,717,669 0.02%Japan Government Bond ¥211,150,000 2.20% 20/9/2039 2,657,022 0.02%Japan Government Bond ¥200,150,000 2.40% 20/9/2038 2,561,312 0.02%Japan Expressway Holding & Debt Repayment Agency ¥269,000,000 0.16% 31/8/2027 2,503,578 0.02%Japan Government Bond ¥200,000,000 1.70% 20/9/2044 2,428,378 0.01%Japan Government Bond ¥250,000,000 0.40% 20/9/2025 2,369,818 0.01%Japan Government Bond ¥171,000,000 2.20% 20/3/2050 2,366,511 0.01%Major Joint Local Government Bond ¥250,000,000 0.45% 25/2/2025 2,350,747 0.01%Major Joint Local Government Bond ¥250,000,000 0.46% 25/12/2024 2,349,854 0.01%Japan Government Bond ¥200,000,000 1.50% 20/12/2044 2,343,133 0.01%Japan Government Bond ¥230,000,000 0.80% 20/3/2046 2,343,026 0.01%Japan Government Bond ¥209,850,000 2.10% 20/12/2029 2,336,784 0.01%Japan Government Bond ¥200,000,000 1.40% 20/12/2045 2,312,068 0.01%Japan Government Bond ¥180,000,000 2.30% 20/3/2039 2,280,563 0.01%Japan Government Bond ¥163,850,000 2.20% 20/3/2049 2,247,734 0.01%Japan Government Bond ¥240,000,000 1.10% 20/3/2021 2,241,347 0.01%Japan Government Bond ¥203,000,000 2.10% 20/3/2029 2,236,988 0.01%Japan Government Bond ¥200,800,000 1.90% 20/9/2030 2,219,692 0.01%Mitsubishi UFJ Financial Group, Inc. $2,200,000 2.19% 13/9/2021 2,203,175 0.01%Japan Government Bond ¥196,050,000 1.70% 20/6/2032 2,167,960 0.01%Japan Bank for International Cooperation $2,200,000 2.00% 17/10/2029 2,144,450 0.01%Japan Government Bond ¥190,600,000 1.70% 20/12/2032 2,118,813 0.01%Japan Government Bond ¥190,000,000 1.80% 20/3/2032 2,117,458 0.01%Japan Government Bond ¥186,300,000 2.10% 20/3/2030 2,082,600 0.01%Japan Government Bond ¥221,600,000 1.10% 20/9/2021 2,082,316 0.01%Japan Expressway Holding & Debt Repayment Agency ¥200,000,000 1.08% 27/4/2035 2,075,219 0.01%
Vanguard Global Bond Index Fund
336

Maturity Fair Value % of Total Principal Coupon Date US Dollars ($) Net Assets
Japan Government Bond ¥219,400,000 0.70% 20/12/2022 2,068,608 0.01%Sumitomo Mitsui Financial Group, Inc. $2,000,000 3.04% 16/7/2029 2,036,448 0.01%Japan Government Bond ¥180,000,000 2.00% 20/12/2030 2,014,526 0.01%Japan Government Bond ¥170,000,000 1.40% 20/9/2045 1,961,707 0.01%Tokyo Metropolitan Government ¥180,000,000 1.29% 20/6/2035 1,912,088 0.01%Kyushu Electric Power Co., Inc. ¥200,000,000 1.02% 24/5/2024 1,906,993 0.01%Japan Expressway Holding & Debt Repayment Agency ¥200,000,000 0.91% 31/7/2023 1,900,542 0.01%Japan Finance Organization for Municipalities ¥200,000,000 0.92% 28/7/2023 1,899,027 0.01%Tokyo Metropolitan Government ¥200,000,000 0.76% 20/9/2023 1,891,010 0.01%Major Joint Local Government Bond ¥200,000,000 0.55% 25/9/2024 1,886,340 0.01%Japan Expressway Holding & Debt Repayment Agency ¥200,000,000 0.50% 29/11/2024 1,885,128 0.01%Japan Government Bond ¥200,000,000 1.10% 20/12/2021 1,884,849 0.01%Major Joint Local Government Bond ¥200,000,000 0.80% 25/10/2022 1,880,289 0.01%Japan Expressway Holding & Debt Repayment Agency ¥200,000,000 0.32% 30/1/2026 1,876,263 0.01%Japan Finance Organization for Municipalities ¥200,000,000 0.32% 19/1/2026 1,875,286 0.01%Major Joint Local Government Bond ¥200,000,000 0.25% 25/2/2027 1,866,943 0.01%Major Joint Local Government Bond ¥200,000,000 0.22% 25/10/2027 1,863,749 0.01%Major Joint Local Government Bond ¥200,000,000 0.18% 25/4/2028 1,858,484 0.01%Japan Expressway Holding & Debt Repayment Agency ¥200,000,000 0.14% 30/4/2027 1,858,471 0.01%Japan Finance Organization for Municipalities ¥200,000,000 0.14% 16/4/2027 1,856,988 0.01%Japan Finance Organization for Municipalities ¥200,000,000 0.13% 14/6/2027 1,856,462 0.01%Deposit Insurance Corp. of Japan ¥200,000,000 0.10% 19/10/2021 1,843,849 0.01%Norinchukin Bank ¥200,000,000 0.23% 27/1/2021 1,843,536 0.01%West Nippon Expressway Co., Ltd. ¥200,000,000 0.09% 20/9/2022 1,842,404 0.01%Shinkin Central Bank ¥200,000,000 0.04% 27/5/2021 1,839,705 0.01%Nissan Motor Co., Ltd. ¥200,000,000 0.15% 19/3/2021 1,837,779 0.01%Japan Expressway Holding & Debt Repayment Agency ¥200,000,000 0.30% 30/9/2049 1,751,066 0.01%Japan Government Bond ¥179,450,000 1.00% 20/3/2022 1,692,552 0.01%Japan Government Bond ¥150,000,000 1.80% 20/12/2032 1,685,190 0.01%Japan Government Bond ¥150,000,000 2.20% 20/6/2029 1,672,105 0.01%Shinkin Central Bank ¥180,000,000 0.06% 27/4/2021 1,656,266 0.01%Mitsubishi UFJ Financial Group, Inc. $1,630,000 2.95% 1/3/2021 1,646,021 0.01%Japan Government Bond ¥150,000,000 1.50% 20/6/2032 1,624,610 0.01%Mitsubishi UFJ Financial Group, Inc. $1,550,000 3.20% 18/7/2029 1,602,548 0.01%Japan Government Bond ¥144,000,000 1.60% 20/3/2033 1,586,352 0.01%Japan Finance Organization for Municipalities ¥170,000,000 0.31% 28/7/2023 1,581,673 0.01%Development Bank of Japan, Inc. $1,600,000 1.88% 28/8/2029 1,546,212 0.01%Japan Government Bond ¥137,000,000 2.10% 20/12/2028 1,504,220 0.01%Mitsubishi UFJ Financial Group, Inc. €1,300,000 0.98% 9/10/2023 1,499,446 0.01%Mizuho Financial Group, Inc. $1,400,000 3.48% 12/4/2026 1,462,006 0.01%Japan Government Bond ¥123,000,000 2.20% 20/3/2030 1,386,553 0.01%Tokyo Metropolitan Government ¥146,500,000 0.99% 20/12/2021 1,373,830 0.01%Toyota Finance Australia Ltd. €1,200,000 0.25% 9/4/2024 1,355,931 0.01%Japan Government Bond ¥123,450,000 1.60% 20/3/2032 1,348,266 0.01%Japan Government Bond ¥120,000,000 2.00% 20/3/2031 1,346,871 0.01%Japan Government Bond ¥137,900,000 1.40% 20/12/2022 1,326,581 0.01%Mitsubishi UFJ Financial Group, Inc. $1,300,000 2.80% 18/7/2024 1,323,741 0.01%Japan Government Bond ¥138,000,000 1.90% 22/3/2021 1,301,232 0.01%Japan Government Bond ¥118,000,000 1.80% 20/6/2030 1,289,406 0.01%Mizuho Financial Group, Inc. €1,100,000 1.02% 11/10/2023 1,270,276 0.01%Japan Government Bond ¥113,850,000 2.20% 20/3/2028 1,245,085 0.01%Japan Government Bond ¥101,000,000 2.40% 20/12/2034 1,239,491 0.01%Japan Government Bond ¥125,000,000 1.90% 20/9/2022 1,213,768 0.01%Sumitomo Life Insurance Co.^ $1,150,000 4.00% 14/9/2077 1,203,188 0.01%Japan Government Bond ¥125,000,000 2.20% 20/12/2021 1,203,071 0.01%Japan Government Bond ¥125,000,000 2.10% 20/12/2021 1,200,805 0.01%Japan Government Bond ¥109,000,000 2.00% 20/3/2027 1,156,177 0.01%Sumitomo Mitsui Banking Corp. €1,000,000 0.55% 6/11/2023 1,145,594 0.01%Mitsubishi UFJ Financial Group, Inc. $1,125,000 2.62% 18/7/2022 1,139,492 0.01%JT International Financial Services BV €1,000,000 1.00% 26/11/2029 1,126,667 0.01%Mitsubishi UFJ Financial Group, Inc. €1,000,000 0.34% 19/7/2024 1,122,201 0.01%Asahi Group Holdings Ltd. €986,000 0.32% 19/9/2021 1,112,562 0.01%Japan Government Bond ¥89,650,000 2.30% 20/12/2036 1,112,353 0.01%Mizuho Financial Group, Inc. €1,000,000 0.12% 6/9/2024 1,111,230 0.01%Japan Finance Organization for Municipalities $1,100,000 2.38% 13/2/2025 1,110,080 0.01%Sumitomo Mitsui Banking Corp. €1,000,000 0.41% 7/11/2029 1,109,816 0.01%Sumitomo Mitsui Financial Group, Inc. $1,100,000 2.44% 19/10/2021 1,107,367 0.01%Japan Government Bond ¥100,000,000 1.80% 20/9/2030 1,095,588 0.01%
Vanguard Global Bond Index Fund
337
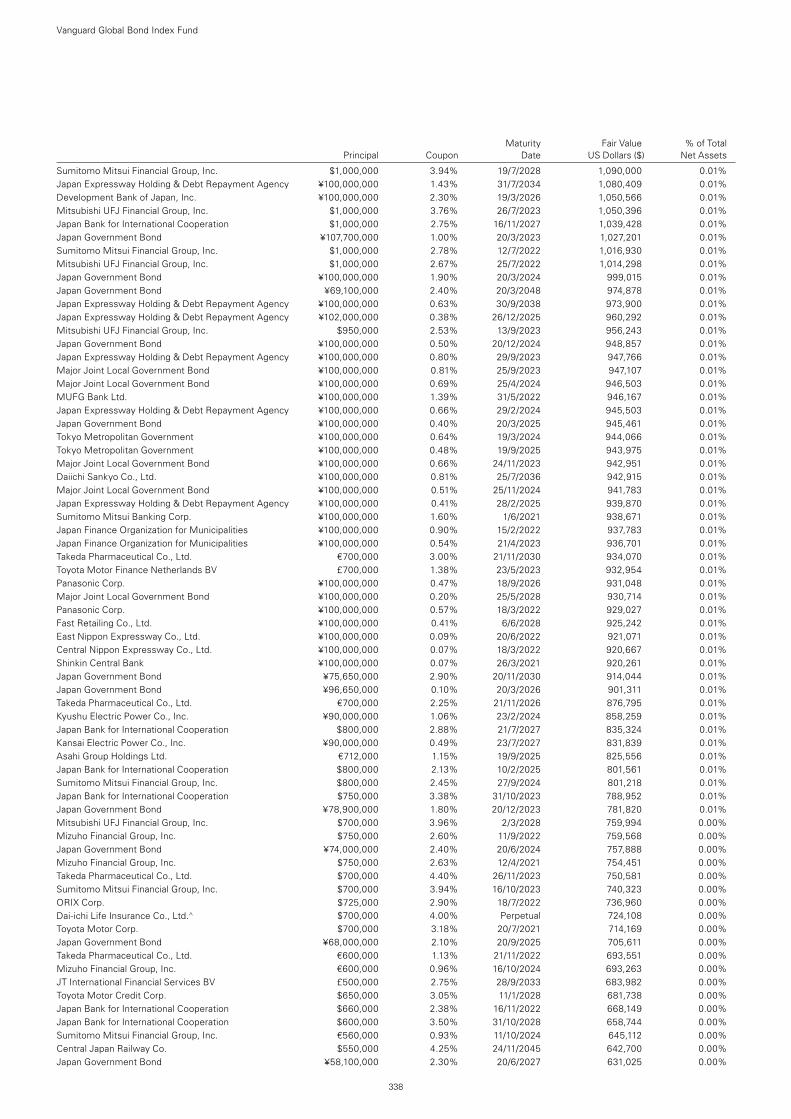
Maturity Fair Value % of Total Principal Coupon Date US Dollars ($) Net Assets
Sumitomo Mitsui Financial Group, Inc. $1,000,000 3.94% 19/7/2028 1,090,000 0.01%Japan Expressway Holding & Debt Repayment Agency ¥100,000,000 1.43% 31/7/2034 1,080,409 0.01%Development Bank of Japan, Inc. ¥100,000,000 2.30% 19/3/2026 1,050,566 0.01%Mitsubishi UFJ Financial Group, Inc. $1,000,000 3.76% 26/7/2023 1,050,396 0.01%Japan Bank for International Cooperation $1,000,000 2.75% 16/11/2027 1,039,428 0.01%Japan Government Bond ¥107,700,000 1.00% 20/3/2023 1,027,201 0.01%Sumitomo Mitsui Financial Group, Inc. $1,000,000 2.78% 12/7/2022 1,016,930 0.01%Mitsubishi UFJ Financial Group, Inc. $1,000,000 2.67% 25/7/2022 1,014,298 0.01%Japan Government Bond ¥100,000,000 1.90% 20/3/2024 999,015 0.01%Japan Government Bond ¥69,100,000 2.40% 20/3/2048 974,878 0.01%Japan Expressway Holding & Debt Repayment Agency ¥100,000,000 0.63% 30/9/2038 973,900 0.01%Japan Expressway Holding & Debt Repayment Agency ¥102,000,000 0.38% 26/12/2025 960,292 0.01%Mitsubishi UFJ Financial Group, Inc. $950,000 2.53% 13/9/2023 956,243 0.01%Japan Government Bond ¥100,000,000 0.50% 20/12/2024 948,857 0.01%Japan Expressway Holding & Debt Repayment Agency ¥100,000,000 0.80% 29/9/2023 947,766 0.01%Major Joint Local Government Bond ¥100,000,000 0.81% 25/9/2023 947,107 0.01%Major Joint Local Government Bond ¥100,000,000 0.69% 25/4/2024 946,503 0.01%MUFG Bank Ltd. ¥100,000,000 1.39% 31/5/2022 946,167 0.01%Japan Expressway Holding & Debt Repayment Agency ¥100,000,000 0.66% 29/2/2024 945,503 0.01%Japan Government Bond ¥100,000,000 0.40% 20/3/2025 945,461 0.01%Tokyo Metropolitan Government ¥100,000,000 0.64% 19/3/2024 944,066 0.01%Tokyo Metropolitan Government ¥100,000,000 0.48% 19/9/2025 943,975 0.01%Major Joint Local Government Bond ¥100,000,000 0.66% 24/11/2023 942,951 0.01%Daiichi Sankyo Co., Ltd. ¥100,000,000 0.81% 25/7/2036 942,915 0.01%Major Joint Local Government Bond ¥100,000,000 0.51% 25/11/2024 941,783 0.01%Japan Expressway Holding & Debt Repayment Agency ¥100,000,000 0.41% 28/2/2025 939,870 0.01%Sumitomo Mitsui Banking Corp. ¥100,000,000 1.60% 1/6/2021 938,671 0.01%Japan Finance Organization for Municipalities ¥100,000,000 0.90% 15/2/2022 937,783 0.01%Japan Finance Organization for Municipalities ¥100,000,000 0.54% 21/4/2023 936,701 0.01%Takeda Pharmaceutical Co., Ltd. €700,000 3.00% 21/11/2030 934,070 0.01%Toyota Motor Finance Netherlands BV £700,000 1.38% 23/5/2023 932,954 0.01%Panasonic Corp. ¥100,000,000 0.47% 18/9/2026 931,048 0.01%Major Joint Local Government Bond ¥100,000,000 0.20% 25/5/2028 930,714 0.01%Panasonic Corp. ¥100,000,000 0.57% 18/3/2022 929,027 0.01%Fast Retailing Co., Ltd. ¥100,000,000 0.41% 6/6/2028 925,242 0.01%East Nippon Expressway Co., Ltd. ¥100,000,000 0.09% 20/6/2022 921,071 0.01%Central Nippon Expressway Co., Ltd. ¥100,000,000 0.07% 18/3/2022 920,667 0.01%Shinkin Central Bank ¥100,000,000 0.07% 26/3/2021 920,261 0.01%Japan Government Bond ¥75,650,000 2.90% 20/11/2030 914,044 0.01%Japan Government Bond ¥96,650,000 0.10% 20/3/2026 901,311 0.01%Takeda Pharmaceutical Co., Ltd. €700,000 2.25% 21/11/2026 876,795 0.01%Kyushu Electric Power Co., Inc. ¥90,000,000 1.06% 23/2/2024 858,259 0.01%Japan Bank for International Cooperation $800,000 2.88% 21/7/2027 835,324 0.01%Kansai Electric Power Co., Inc. ¥90,000,000 0.49% 23/7/2027 831,839 0.01%Asahi Group Holdings Ltd. €712,000 1.15% 19/9/2025 825,556 0.01%Japan Bank for International Cooperation $800,000 2.13% 10/2/2025 801,561 0.01%Sumitomo Mitsui Financial Group, Inc. $800,000 2.45% 27/9/2024 801,218 0.01%Japan Bank for International Cooperation $750,000 3.38% 31/10/2023 788,952 0.01%Japan Government Bond ¥78,900,000 1.80% 20/12/2023 781,820 0.01%Mitsubishi UFJ Financial Group, Inc. $700,000 3.96% 2/3/2028 759,994 0.00%Mizuho Financial Group, Inc. $750,000 2.60% 11/9/2022 759,568 0.00%Japan Government Bond ¥74,000,000 2.40% 20/6/2024 757,888 0.00%Mizuho Financial Group, Inc. $750,000 2.63% 12/4/2021 754,451 0.00%Takeda Pharmaceutical Co., Ltd. $700,000 4.40% 26/11/2023 750,581 0.00%Sumitomo Mitsui Financial Group, Inc. $700,000 3.94% 16/10/2023 740,323 0.00%ORIX Corp. $725,000 2.90% 18/7/2022 736,960 0.00%Dai-ichi Life Insurance Co., Ltd.^ $700,000 4.00% Perpetual 724,108 0.00%Toyota Motor Corp. $700,000 3.18% 20/7/2021 714,169 0.00%Japan Government Bond ¥68,000,000 2.10% 20/9/2025 705,611 0.00%Takeda Pharmaceutical Co., Ltd. €600,000 1.13% 21/11/2022 693,551 0.00%Mizuho Financial Group, Inc. €600,000 0.96% 16/10/2024 693,263 0.00%JT International Financial Services BV £500,000 2.75% 28/9/2033 683,982 0.00%Toyota Motor Credit Corp. $650,000 3.05% 11/1/2028 681,738 0.00%Japan Bank for International Cooperation $660,000 2.38% 16/11/2022 668,149 0.00%Japan Bank for International Cooperation $600,000 3.50% 31/10/2028 658,744 0.00%Sumitomo Mitsui Financial Group, Inc. €560,000 0.93% 11/10/2024 645,112 0.00%Central Japan Railway Co. $550,000 4.25% 24/11/2045 642,700 0.00%Japan Government Bond ¥58,100,000 2.30% 20/6/2027 631,025 0.00%
Vanguard Global Bond Index Fund
338
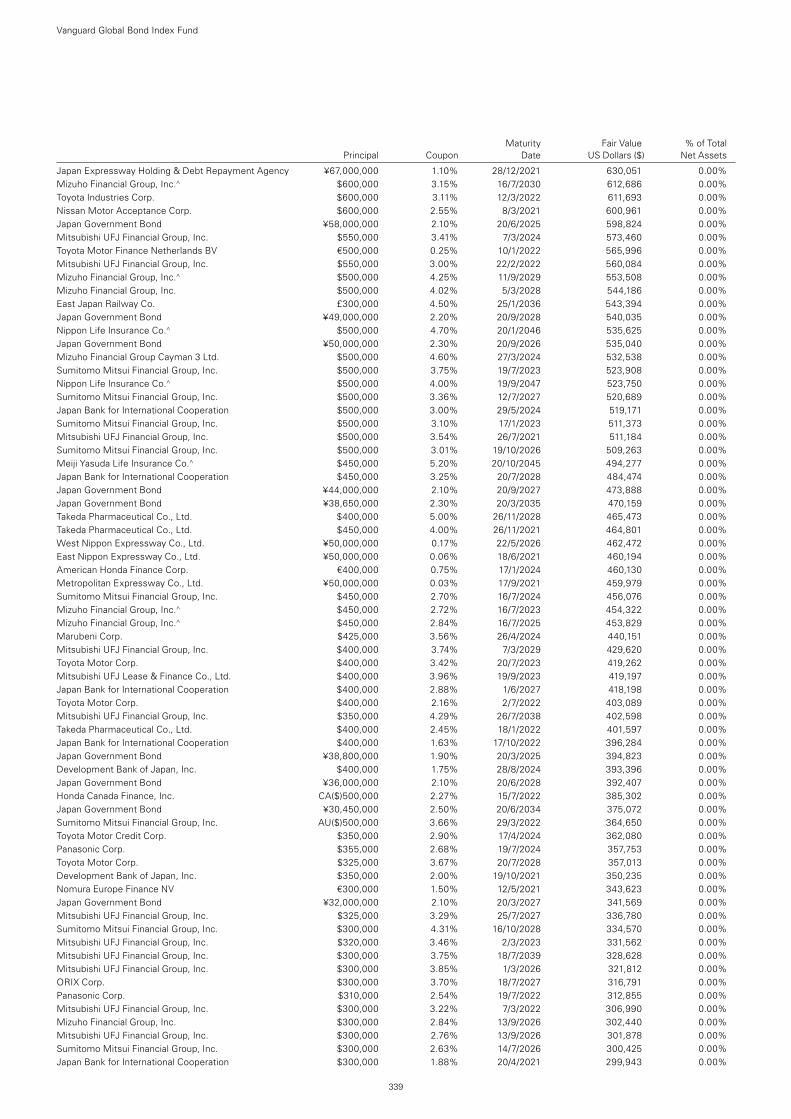
Maturity Fair Value % of Total Principal Coupon Date US Dollars ($) Net Assets
Japan Expressway Holding & Debt Repayment Agency ¥67,000,000 1.10% 28/12/2021 630,051 0.00%Mizuho Financial Group, Inc.^ $600,000 3.15% 16/7/2030 612,686 0.00%Toyota Industries Corp. $600,000 3.11% 12/3/2022 611,693 0.00%Nissan Motor Acceptance Corp. $600,000 2.55% 8/3/2021 600,961 0.00%Japan Government Bond ¥58,000,000 2.10% 20/6/2025 598,824 0.00%Mitsubishi UFJ Financial Group, Inc. $550,000 3.41% 7/3/2024 573,460 0.00%Toyota Motor Finance Netherlands BV €500,000 0.25% 10/1/2022 565,996 0.00%Mitsubishi UFJ Financial Group, Inc. $550,000 3.00% 22/2/2022 560,084 0.00%Mizuho Financial Group, Inc.^ $500,000 4.25% 11/9/2029 553,508 0.00%Mizuho Financial Group, Inc. $500,000 4.02% 5/3/2028 544,186 0.00%East Japan Railway Co. £300,000 4.50% 25/1/2036 543,394 0.00%Japan Government Bond ¥49,000,000 2.20% 20/9/2028 540,035 0.00%Nippon Life Insurance Co.^ $500,000 4.70% 20/1/2046 535,625 0.00%Japan Government Bond ¥50,000,000 2.30% 20/9/2026 535,040 0.00%Mizuho Financial Group Cayman 3 Ltd. $500,000 4.60% 27/3/2024 532,538 0.00%Sumitomo Mitsui Financial Group, Inc. $500,000 3.75% 19/7/2023 523,908 0.00%Nippon Life Insurance Co.^ $500,000 4.00% 19/9/2047 523,750 0.00%Sumitomo Mitsui Financial Group, Inc. $500,000 3.36% 12/7/2027 520,689 0.00%Japan Bank for International Cooperation $500,000 3.00% 29/5/2024 519,171 0.00%Sumitomo Mitsui Financial Group, Inc. $500,000 3.10% 17/1/2023 511,373 0.00%Mitsubishi UFJ Financial Group, Inc. $500,000 3.54% 26/7/2021 511,184 0.00%Sumitomo Mitsui Financial Group, Inc. $500,000 3.01% 19/10/2026 509,263 0.00%Meiji Yasuda Life Insurance Co.^ $450,000 5.20% 20/10/2045 494,277 0.00%Japan Bank for International Cooperation $450,000 3.25% 20/7/2028 484,474 0.00%Japan Government Bond ¥44,000,000 2.10% 20/9/2027 473,888 0.00%Japan Government Bond ¥38,650,000 2.30% 20/3/2035 470,159 0.00%Takeda Pharmaceutical Co., Ltd. $400,000 5.00% 26/11/2028 465,473 0.00%Takeda Pharmaceutical Co., Ltd. $450,000 4.00% 26/11/2021 464,801 0.00%West Nippon Expressway Co., Ltd. ¥50,000,000 0.17% 22/5/2026 462,472 0.00%East Nippon Expressway Co., Ltd. ¥50,000,000 0.06% 18/6/2021 460,194 0.00%American Honda Finance Corp. €400,000 0.75% 17/1/2024 460,130 0.00%Metropolitan Expressway Co., Ltd. ¥50,000,000 0.03% 17/9/2021 459,979 0.00%Sumitomo Mitsui Financial Group, Inc. $450,000 2.70% 16/7/2024 456,076 0.00%Mizuho Financial Group, Inc.^ $450,000 2.72% 16/7/2023 454,322 0.00%Mizuho Financial Group, Inc.^ $450,000 2.84% 16/7/2025 453,829 0.00%Marubeni Corp. $425,000 3.56% 26/4/2024 440,151 0.00%Mitsubishi UFJ Financial Group, Inc. $400,000 3.74% 7/3/2029 429,620 0.00%Toyota Motor Corp. $400,000 3.42% 20/7/2023 419,262 0.00%Mitsubishi UFJ Lease & Finance Co., Ltd. $400,000 3.96% 19/9/2023 419,197 0.00%Japan Bank for International Cooperation $400,000 2.88% 1/6/2027 418,198 0.00%Toyota Motor Corp. $400,000 2.16% 2/7/2022 403,089 0.00%Mitsubishi UFJ Financial Group, Inc. $350,000 4.29% 26/7/2038 402,598 0.00%Takeda Pharmaceutical Co., Ltd. $400,000 2.45% 18/1/2022 401,597 0.00%Japan Bank for International Cooperation $400,000 1.63% 17/10/2022 396,284 0.00%Japan Government Bond ¥38,800,000 1.90% 20/3/2025 394,823 0.00%Development Bank of Japan, Inc. $400,000 1.75% 28/8/2024 393,396 0.00%Japan Government Bond ¥36,000,000 2.10% 20/6/2028 392,407 0.00%Honda Canada Finance, Inc. CA($)500,000 2.27% 15/7/2022 385,302 0.00%Japan Government Bond ¥30,450,000 2.50% 20/6/2034 375,072 0.00%Sumitomo Mitsui Financial Group, Inc. AU($)500,000 3.66% 29/3/2022 364,650 0.00%Toyota Motor Credit Corp. $350,000 2.90% 17/4/2024 362,080 0.00%Panasonic Corp. $355,000 2.68% 19/7/2024 357,753 0.00%Toyota Motor Corp. $325,000 3.67% 20/7/2028 357,013 0.00%Development Bank of Japan, Inc. $350,000 2.00% 19/10/2021 350,235 0.00%Nomura Europe Finance NV €300,000 1.50% 12/5/2021 343,623 0.00%Japan Government Bond ¥32,000,000 2.10% 20/3/2027 341,569 0.00%Mitsubishi UFJ Financial Group, Inc. $325,000 3.29% 25/7/2027 336,780 0.00%Sumitomo Mitsui Financial Group, Inc. $300,000 4.31% 16/10/2028 334,570 0.00%Mitsubishi UFJ Financial Group, Inc. $320,000 3.46% 2/3/2023 331,562 0.00%Mitsubishi UFJ Financial Group, Inc. $300,000 3.75% 18/7/2039 328,628 0.00%Mitsubishi UFJ Financial Group, Inc. $300,000 3.85% 1/3/2026 321,812 0.00%ORIX Corp. $300,000 3.70% 18/7/2027 316,791 0.00%Panasonic Corp. $310,000 2.54% 19/7/2022 312,855 0.00%Mitsubishi UFJ Financial Group, Inc. $300,000 3.22% 7/3/2022 306,990 0.00%Mizuho Financial Group, Inc. $300,000 2.84% 13/9/2026 302,440 0.00%Mitsubishi UFJ Financial Group, Inc. $300,000 2.76% 13/9/2026 301,878 0.00%Sumitomo Mitsui Financial Group, Inc. $300,000 2.63% 14/7/2026 300,425 0.00%Japan Bank for International Cooperation $300,000 1.88% 20/4/2021 299,943 0.00%
Vanguard Global Bond Index Fund
339
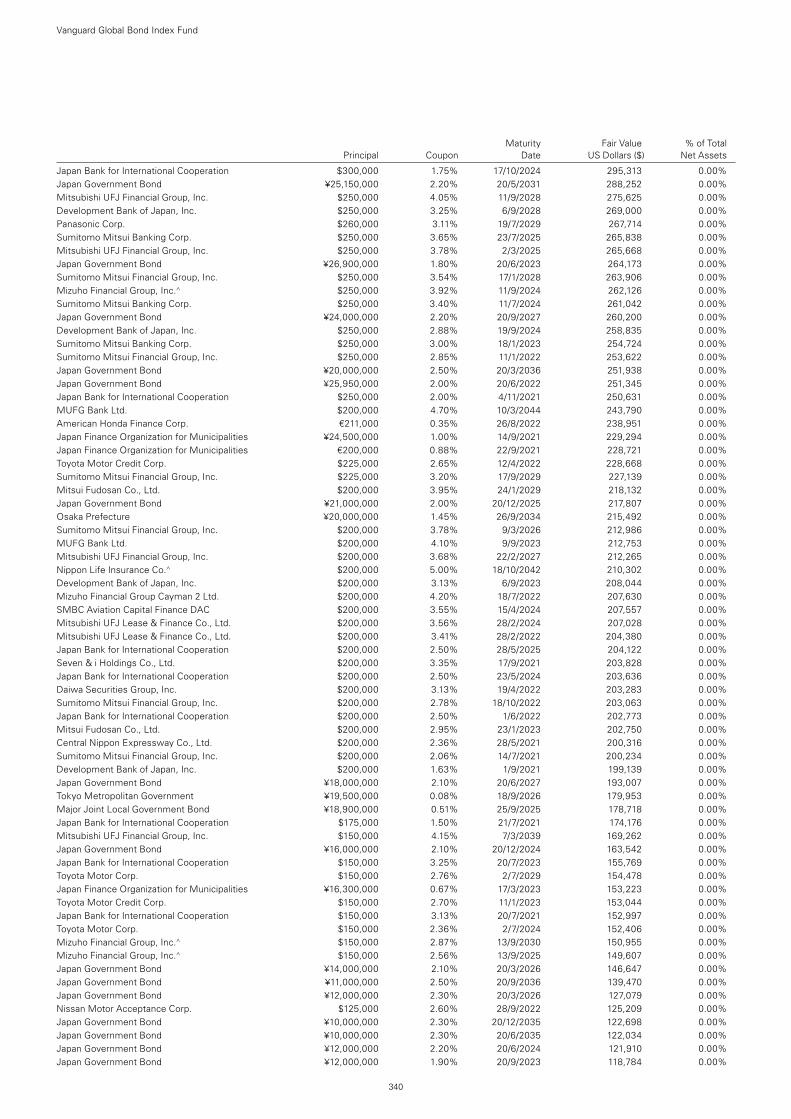
Maturity Fair Value % of Total Principal Coupon Date US Dollars ($) Net Assets
Japan Bank for International Cooperation $300,000 1.75% 17/10/2024 295,313 0.00%Japan Government Bond ¥25,150,000 2.20% 20/5/2031 288,252 0.00%Mitsubishi UFJ Financial Group, Inc. $250,000 4.05% 11/9/2028 275,625 0.00%Development Bank of Japan, Inc. $250,000 3.25% 6/9/2028 269,000 0.00%Panasonic Corp. $260,000 3.11% 19/7/2029 267,714 0.00%Sumitomo Mitsui Banking Corp. $250,000 3.65% 23/7/2025 265,838 0.00%Mitsubishi UFJ Financial Group, Inc. $250,000 3.78% 2/3/2025 265,668 0.00%Japan Government Bond ¥26,900,000 1.80% 20/6/2023 264,173 0.00%Sumitomo Mitsui Financial Group, Inc. $250,000 3.54% 17/1/2028 263,906 0.00%Mizuho Financial Group, Inc.^ $250,000 3.92% 11/9/2024 262,126 0.00%Sumitomo Mitsui Banking Corp. $250,000 3.40% 11/7/2024 261,042 0.00%Japan Government Bond ¥24,000,000 2.20% 20/9/2027 260,200 0.00%Development Bank of Japan, Inc. $250,000 2.88% 19/9/2024 258,835 0.00%Sumitomo Mitsui Banking Corp. $250,000 3.00% 18/1/2023 254,724 0.00%Sumitomo Mitsui Financial Group, Inc. $250,000 2.85% 11/1/2022 253,622 0.00%Japan Government Bond ¥20,000,000 2.50% 20/3/2036 251,938 0.00%Japan Government Bond ¥25,950,000 2.00% 20/6/2022 251,345 0.00%Japan Bank for International Cooperation $250,000 2.00% 4/11/2021 250,631 0.00%MUFG Bank Ltd. $200,000 4.70% 10/3/2044 243,790 0.00%American Honda Finance Corp. €211,000 0.35% 26/8/2022 238,951 0.00%Japan Finance Organization for Municipalities ¥24,500,000 1.00% 14/9/2021 229,294 0.00%Japan Finance Organization for Municipalities €200,000 0.88% 22/9/2021 228,721 0.00%Toyota Motor Credit Corp. $225,000 2.65% 12/4/2022 228,668 0.00%Sumitomo Mitsui Financial Group, Inc. $225,000 3.20% 17/9/2029 227,139 0.00%Mitsui Fudosan Co., Ltd. $200,000 3.95% 24/1/2029 218,132 0.00%Japan Government Bond ¥21,000,000 2.00% 20/12/2025 217,807 0.00%Osaka Prefecture ¥20,000,000 1.45% 26/9/2034 215,492 0.00%Sumitomo Mitsui Financial Group, Inc. $200,000 3.78% 9/3/2026 212,986 0.00%MUFG Bank Ltd. $200,000 4.10% 9/9/2023 212,753 0.00%Mitsubishi UFJ Financial Group, Inc. $200,000 3.68% 22/2/2027 212,265 0.00%Nippon Life Insurance Co.^ $200,000 5.00% 18/10/2042 210,302 0.00%Development Bank of Japan, Inc. $200,000 3.13% 6/9/2023 208,044 0.00%Mizuho Financial Group Cayman 2 Ltd. $200,000 4.20% 18/7/2022 207,630 0.00%SMBC Aviation Capital Finance DAC $200,000 3.55% 15/4/2024 207,557 0.00%Mitsubishi UFJ Lease & Finance Co., Ltd. $200,000 3.56% 28/2/2024 207,028 0.00%Mitsubishi UFJ Lease & Finance Co., Ltd. $200,000 3.41% 28/2/2022 204,380 0.00%Japan Bank for International Cooperation $200,000 2.50% 28/5/2025 204,122 0.00%Seven & i Holdings Co., Ltd. $200,000 3.35% 17/9/2021 203,828 0.00%Japan Bank for International Cooperation $200,000 2.50% 23/5/2024 203,636 0.00%Daiwa Securities Group, Inc. $200,000 3.13% 19/4/2022 203,283 0.00%Sumitomo Mitsui Financial Group, Inc. $200,000 2.78% 18/10/2022 203,063 0.00%Japan Bank for International Cooperation $200,000 2.50% 1/6/2022 202,773 0.00%Mitsui Fudosan Co., Ltd. $200,000 2.95% 23/1/2023 202,750 0.00%Central Nippon Expressway Co., Ltd. $200,000 2.36% 28/5/2021 200,316 0.00%Sumitomo Mitsui Financial Group, Inc. $200,000 2.06% 14/7/2021 200,234 0.00%Development Bank of Japan, Inc. $200,000 1.63% 1/9/2021 199,139 0.00%Japan Government Bond ¥18,000,000 2.10% 20/6/2027 193,007 0.00%Tokyo Metropolitan Government ¥19,500,000 0.08% 18/9/2026 179,953 0.00%Major Joint Local Government Bond ¥18,900,000 0.51% 25/9/2025 178,718 0.00%Japan Bank for International Cooperation $175,000 1.50% 21/7/2021 174,176 0.00%Mitsubishi UFJ Financial Group, Inc. $150,000 4.15% 7/3/2039 169,262 0.00%Japan Government Bond ¥16,000,000 2.10% 20/12/2024 163,542 0.00%Japan Bank for International Cooperation $150,000 3.25% 20/7/2023 155,769 0.00%Toyota Motor Corp. $150,000 2.76% 2/7/2029 154,478 0.00%Japan Finance Organization for Municipalities ¥16,300,000 0.67% 17/3/2023 153,223 0.00%Toyota Motor Credit Corp. $150,000 2.70% 11/1/2023 153,044 0.00%Japan Bank for International Cooperation $150,000 3.13% 20/7/2021 152,997 0.00%Toyota Motor Corp. $150,000 2.36% 2/7/2024 152,406 0.00%Mizuho Financial Group, Inc.^ $150,000 2.87% 13/9/2030 150,955 0.00%Mizuho Financial Group, Inc.^ $150,000 2.56% 13/9/2025 149,607 0.00%Japan Government Bond ¥14,000,000 2.10% 20/3/2026 146,647 0.00%Japan Government Bond ¥11,000,000 2.50% 20/9/2036 139,470 0.00%Japan Government Bond ¥12,000,000 2.30% 20/3/2026 127,079 0.00%Nissan Motor Acceptance Corp. $125,000 2.60% 28/9/2022 125,209 0.00%Japan Government Bond ¥10,000,000 2.30% 20/12/2035 122,698 0.00%Japan Government Bond ¥10,000,000 2.30% 20/6/2035 122,034 0.00%Japan Government Bond ¥12,000,000 2.20% 20/6/2024 121,910 0.00%Japan Government Bond ¥12,000,000 1.90% 20/9/2023 118,784 0.00%
Vanguard Global Bond Index Fund
340
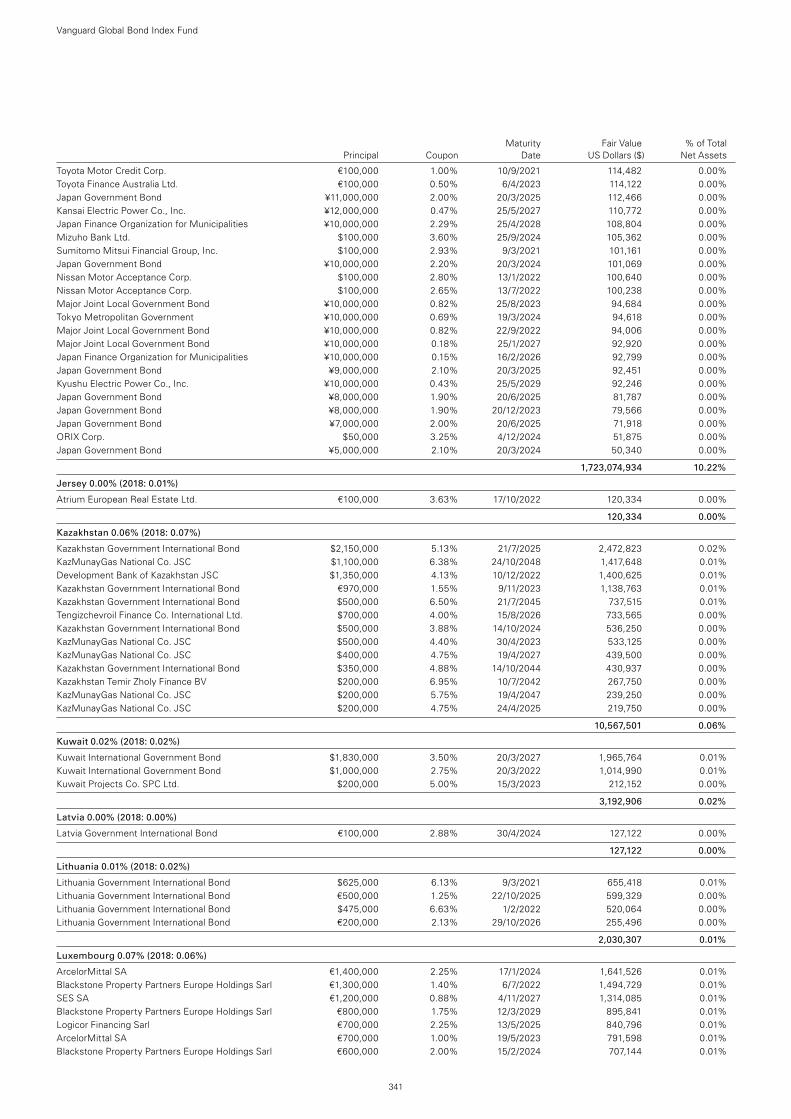
Maturity Fair Value % of Total Principal Coupon Date US Dollars ($) Net Assets
Toyota Motor Credit Corp. €100,000 1.00% 10/9/2021 114,482 0.00%Toyota Finance Australia Ltd. €100,000 0.50% 6/4/2023 114,122 0.00%Japan Government Bond ¥11,000,000 2.00% 20/3/2025 112,466 0.00%Kansai Electric Power Co., Inc. ¥12,000,000 0.47% 25/5/2027 110,772 0.00%Japan Finance Organization for Municipalities ¥10,000,000 2.29% 25/4/2028 108,804 0.00%Mizuho Bank Ltd. $100,000 3.60% 25/9/2024 105,362 0.00%Sumitomo Mitsui Financial Group, Inc. $100,000 2.93% 9/3/2021 101,161 0.00%Japan Government Bond ¥10,000,000 2.20% 20/3/2024 101,069 0.00%Nissan Motor Acceptance Corp. $100,000 2.80% 13/1/2022 100,640 0.00%Nissan Motor Acceptance Corp. $100,000 2.65% 13/7/2022 100,238 0.00%Major Joint Local Government Bond ¥10,000,000 0.82% 25/8/2023 94,684 0.00%Tokyo Metropolitan Government ¥10,000,000 0.69% 19/3/2024 94,618 0.00%Major Joint Local Government Bond ¥10,000,000 0.82% 22/9/2022 94,006 0.00%Major Joint Local Government Bond ¥10,000,000 0.18% 25/1/2027 92,920 0.00%Japan Finance Organization for Municipalities ¥10,000,000 0.15% 16/2/2026 92,799 0.00%Japan Government Bond ¥9,000,000 2.10% 20/3/2025 92,451 0.00%Kyushu Electric Power Co., Inc. ¥10,000,000 0.43% 25/5/2029 92,246 0.00%Japan Government Bond ¥8,000,000 1.90% 20/6/2025 81,787 0.00%Japan Government Bond ¥8,000,000 1.90% 20/12/2023 79,566 0.00%Japan Government Bond ¥7,000,000 2.00% 20/6/2025 71,918 0.00%ORIX Corp. $50,000 3.25% 4/12/2024 51,875 0.00%Japan Government Bond ¥5,000,000 2.10% 20/3/2024 50,340 0.00%
1,723,074,934 10.22%
Jersey 0.00% (2018: 0.01%)
Atrium European Real Estate Ltd. €100,000 3.63% 17/10/2022 120,334 0.00%
120,334 0.00%
Kazakhstan 0.06% (2018: 0.07%)
Kazakhstan Government International Bond $2,150,000 5.13% 21/7/2025 2,472,823 0.02%KazMunayGas National Co. JSC $1,100,000 6.38% 24/10/2048 1,417,648 0.01%Development Bank of Kazakhstan JSC $1,350,000 4.13% 10/12/2022 1,400,625 0.01%Kazakhstan Government International Bond €970,000 1.55% 9/11/2023 1,138,763 0.01%Kazakhstan Government International Bond $500,000 6.50% 21/7/2045 737,515 0.01%Tengizchevroil Finance Co. International Ltd. $700,000 4.00% 15/8/2026 733,565 0.00%Kazakhstan Government International Bond $500,000 3.88% 14/10/2024 536,250 0.00%KazMunayGas National Co. JSC $500,000 4.40% 30/4/2023 533,125 0.00%KazMunayGas National Co. JSC $400,000 4.75% 19/4/2027 439,500 0.00%Kazakhstan Government International Bond $350,000 4.88% 14/10/2044 430,937 0.00%Kazakhstan Temir Zholy Finance BV $200,000 6.95% 10/7/2042 267,750 0.00%KazMunayGas National Co. JSC $200,000 5.75% 19/4/2047 239,250 0.00%KazMunayGas National Co. JSC $200,000 4.75% 24/4/2025 219,750 0.00%
10,567,501 0.06%
Kuwait 0.02% (2018: 0.02%)
Kuwait International Government Bond $1,830,000 3.50% 20/3/2027 1,965,764 0.01%Kuwait International Government Bond $1,000,000 2.75% 20/3/2022 1,014,990 0.01%Kuwait Projects Co. SPC Ltd. $200,000 5.00% 15/3/2023 212,152 0.00%
3,192,906 0.02%
Latvia 0.00% (2018: 0.00%)
Latvia Government International Bond €100,000 2.88% 30/4/2024 127,122 0.00%
127,122 0.00%
Lithuania 0.01% (2018: 0.02%)
Lithuania Government International Bond $625,000 6.13% 9/3/2021 655,418 0.01%Lithuania Government International Bond €500,000 1.25% 22/10/2025 599,329 0.00%Lithuania Government International Bond $475,000 6.63% 1/2/2022 520,064 0.00%Lithuania Government International Bond €200,000 2.13% 29/10/2026 255,496 0.00%
2,030,307 0.01%
Luxembourg 0.07% (2018: 0.06%)
ArcelorMittal SA €1,400,000 2.25% 17/1/2024 1,641,526 0.01%Blackstone Property Partners Europe Holdings Sarl €1,300,000 1.40% 6/7/2022 1,494,729 0.01%SES SA €1,200,000 0.88% 4/11/2027 1,314,085 0.01%Blackstone Property Partners Europe Holdings Sarl €800,000 1.75% 12/3/2029 895,841 0.01%Logicor Financing Sarl €700,000 2.25% 13/5/2025 840,796 0.01%ArcelorMittal SA €700,000 1.00% 19/5/2023 791,598 0.01%Blackstone Property Partners Europe Holdings Sarl €600,000 2.00% 15/2/2024 707,144 0.01%
Vanguard Global Bond Index Fund
341
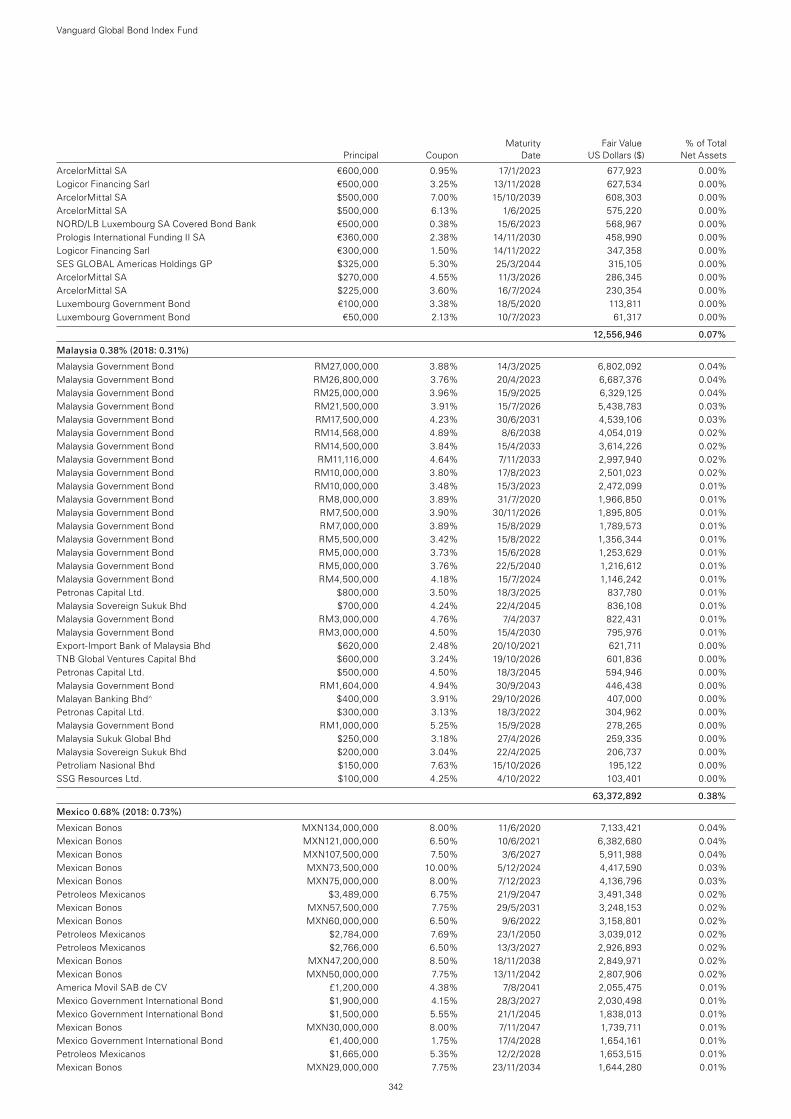
Maturity Fair Value % of Total Principal Coupon Date US Dollars ($) Net Assets
ArcelorMittal SA €600,000 0.95% 17/1/2023 677,923 0.00%Logicor Financing Sarl €500,000 3.25% 13/11/2028 627,534 0.00%ArcelorMittal SA $500,000 7.00% 15/10/2039 608,303 0.00%ArcelorMittal SA $500,000 6.13% 1/6/2025 575,220 0.00%NORD/LB Luxembourg SA Covered Bond Bank €500,000 0.38% 15/6/2023 568,967 0.00%Prologis International Funding II SA €360,000 2.38% 14/11/2030 458,990 0.00%Logicor Financing Sarl €300,000 1.50% 14/11/2022 347,358 0.00%SES GLOBAL Americas Holdings GP $325,000 5.30% 25/3/2044 315,105 0.00%ArcelorMittal SA $270,000 4.55% 11/3/2026 286,345 0.00%ArcelorMittal SA $225,000 3.60% 16/7/2024 230,354 0.00%Luxembourg Government Bond €100,000 3.38% 18/5/2020 113,811 0.00%Luxembourg Government Bond €50,000 2.13% 10/7/2023 61,317 0.00%
12,556,946 0.07%
Malaysia 0.38% (2018: 0.31%)
Malaysia Government Bond RM27,000,000 3.88% 14/3/2025 6,802,092 0.04%Malaysia Government Bond RM26,800,000 3.76% 20/4/2023 6,687,376 0.04%Malaysia Government Bond RM25,000,000 3.96% 15/9/2025 6,329,125 0.04%Malaysia Government Bond RM21,500,000 3.91% 15/7/2026 5,438,783 0.03%Malaysia Government Bond RM17,500,000 4.23% 30/6/2031 4,539,106 0.03%Malaysia Government Bond RM14,568,000 4.89% 8/6/2038 4,054,019 0.02%Malaysia Government Bond RM14,500,000 3.84% 15/4/2033 3,614,226 0.02%Malaysia Government Bond RM11,116,000 4.64% 7/11/2033 2,997,940 0.02%Malaysia Government Bond RM10,000,000 3.80% 17/8/2023 2,501,023 0.02%Malaysia Government Bond RM10,000,000 3.48% 15/3/2023 2,472,099 0.01%Malaysia Government Bond RM8,000,000 3.89% 31/7/2020 1,966,850 0.01%Malaysia Government Bond RM7,500,000 3.90% 30/11/2026 1,895,805 0.01%Malaysia Government Bond RM7,000,000 3.89% 15/8/2029 1,789,573 0.01%Malaysia Government Bond RM5,500,000 3.42% 15/8/2022 1,356,344 0.01%Malaysia Government Bond RM5,000,000 3.73% 15/6/2028 1,253,629 0.01%Malaysia Government Bond RM5,000,000 3.76% 22/5/2040 1,216,612 0.01%Malaysia Government Bond RM4,500,000 4.18% 15/7/2024 1,146,242 0.01%Petronas Capital Ltd. $800,000 3.50% 18/3/2025 837,780 0.01%Malaysia Sovereign Sukuk Bhd $700,000 4.24% 22/4/2045 836,108 0.01%Malaysia Government Bond RM3,000,000 4.76% 7/4/2037 822,431 0.01%Malaysia Government Bond RM3,000,000 4.50% 15/4/2030 795,976 0.01%Export-Import Bank of Malaysia Bhd $620,000 2.48% 20/10/2021 621,711 0.00%TNB Global Ventures Capital Bhd $600,000 3.24% 19/10/2026 601,836 0.00%Petronas Capital Ltd. $500,000 4.50% 18/3/2045 594,946 0.00%Malaysia Government Bond RM1,604,000 4.94% 30/9/2043 446,438 0.00%Malayan Banking Bhd^ $400,000 3.91% 29/10/2026 407,000 0.00%Petronas Capital Ltd. $300,000 3.13% 18/3/2022 304,962 0.00%Malaysia Government Bond RM1,000,000 5.25% 15/9/2028 278,265 0.00%Malaysia Sukuk Global Bhd $250,000 3.18% 27/4/2026 259,335 0.00%Malaysia Sovereign Sukuk Bhd $200,000 3.04% 22/4/2025 206,737 0.00%Petroliam Nasional Bhd $150,000 7.63% 15/10/2026 195,122 0.00%SSG Resources Ltd. $100,000 4.25% 4/10/2022 103,401 0.00%
63,372,892 0.38%
Mexico 0.68% (2018: 0.73%)
Mexican Bonos MXN134,000,000 8.00% 11/6/2020 7,133,421 0.04%Mexican Bonos MXN121,000,000 6.50% 10/6/2021 6,382,680 0.04%Mexican Bonos MXN107,500,000 7.50% 3/6/2027 5,911,988 0.04%Mexican Bonos MXN73,500,000 10.00% 5/12/2024 4,417,590 0.03%Mexican Bonos MXN75,000,000 8.00% 7/12/2023 4,136,796 0.03%Petroleos Mexicanos $3,489,000 6.75% 21/9/2047 3,491,348 0.02%Mexican Bonos MXN57,500,000 7.75% 29/5/2031 3,248,153 0.02%Mexican Bonos MXN60,000,000 6.50% 9/6/2022 3,158,801 0.02%Petroleos Mexicanos $2,784,000 7.69% 23/1/2050 3,039,012 0.02%Petroleos Mexicanos $2,766,000 6.50% 13/3/2027 2,926,893 0.02%Mexican Bonos MXN47,200,000 8.50% 18/11/2038 2,849,971 0.02%Mexican Bonos MXN50,000,000 7.75% 13/11/2042 2,807,906 0.02%America Movil SAB de CV £1,200,000 4.38% 7/8/2041 2,055,475 0.01%Mexico Government International Bond $1,900,000 4.15% 28/3/2027 2,030,498 0.01%Mexico Government International Bond $1,500,000 5.55% 21/1/2045 1,838,013 0.01%Mexican Bonos MXN30,000,000 8.00% 7/11/2047 1,739,711 0.01%Mexico Government International Bond €1,400,000 1.75% 17/4/2028 1,654,161 0.01%Petroleos Mexicanos $1,665,000 5.35% 12/2/2028 1,653,515 0.01%Mexican Bonos MXN29,000,000 7.75% 23/11/2034 1,644,280 0.01%
Vanguard Global Bond Index Fund
342
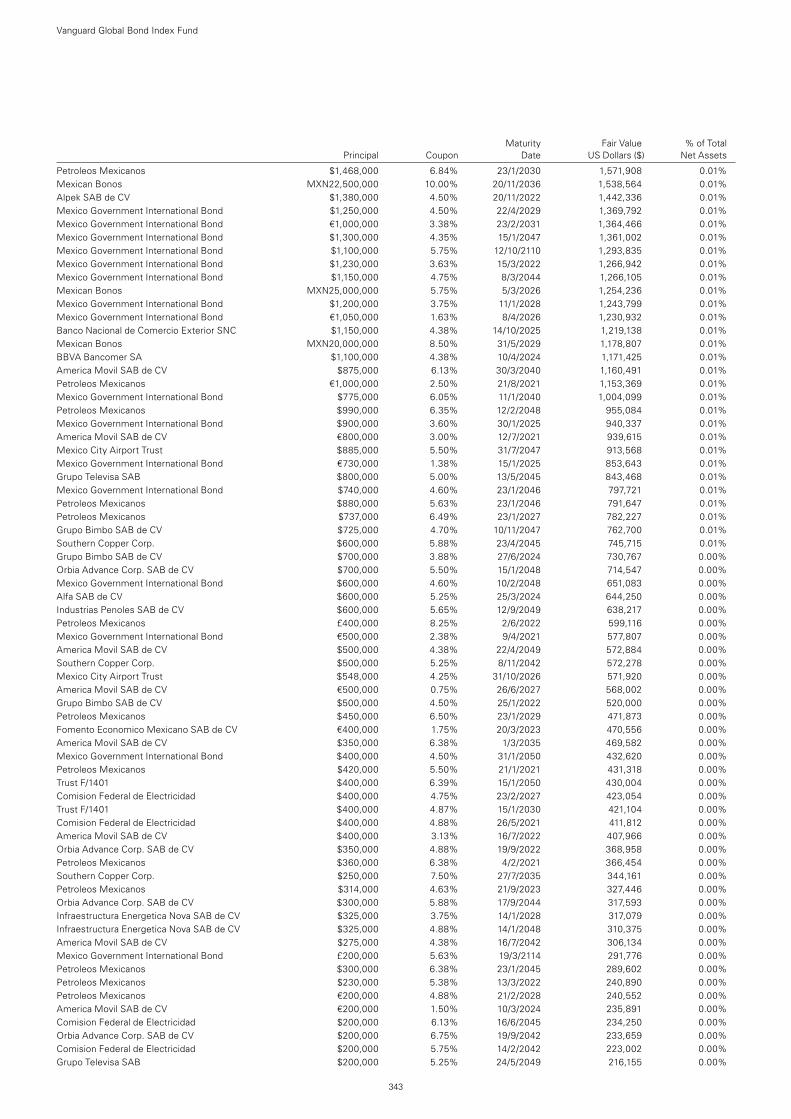
Maturity Fair Value % of Total Principal Coupon Date US Dollars ($) Net Assets
Petroleos Mexicanos $1,468,000 6.84% 23/1/2030 1,571,908 0.01%Mexican Bonos MXN22,500,000 10.00% 20/11/2036 1,538,564 0.01%Alpek SAB de CV $1,380,000 4.50% 20/11/2022 1,442,336 0.01%Mexico Government International Bond $1,250,000 4.50% 22/4/2029 1,369,792 0.01%Mexico Government International Bond €1,000,000 3.38% 23/2/2031 1,364,466 0.01%Mexico Government International Bond $1,300,000 4.35% 15/1/2047 1,361,002 0.01%Mexico Government International Bond $1,100,000 5.75% 12/10/2110 1,293,835 0.01%Mexico Government International Bond $1,230,000 3.63% 15/3/2022 1,266,942 0.01%Mexico Government International Bond $1,150,000 4.75% 8/3/2044 1,266,105 0.01%Mexican Bonos MXN25,000,000 5.75% 5/3/2026 1,254,236 0.01%Mexico Government International Bond $1,200,000 3.75% 11/1/2028 1,243,799 0.01%Mexico Government International Bond €1,050,000 1.63% 8/4/2026 1,230,932 0.01%Banco Nacional de Comercio Exterior SNC $1,150,000 4.38% 14/10/2025 1,219,138 0.01%Mexican Bonos MXN20,000,000 8.50% 31/5/2029 1,178,807 0.01%BBVA Bancomer SA $1,100,000 4.38% 10/4/2024 1,171,425 0.01%America Movil SAB de CV $875,000 6.13% 30/3/2040 1,160,491 0.01%Petroleos Mexicanos €1,000,000 2.50% 21/8/2021 1,153,369 0.01%Mexico Government International Bond $775,000 6.05% 11/1/2040 1,004,099 0.01%Petroleos Mexicanos $990,000 6.35% 12/2/2048 955,084 0.01%Mexico Government International Bond $900,000 3.60% 30/1/2025 940,337 0.01%America Movil SAB de CV €800,000 3.00% 12/7/2021 939,615 0.01%Mexico City Airport Trust $885,000 5.50% 31/7/2047 913,568 0.01%Mexico Government International Bond €730,000 1.38% 15/1/2025 853,643 0.01%Grupo Televisa SAB $800,000 5.00% 13/5/2045 843,468 0.01%Mexico Government International Bond $740,000 4.60% 23/1/2046 797,721 0.01%Petroleos Mexicanos $880,000 5.63% 23/1/2046 791,647 0.01%Petroleos Mexicanos $737,000 6.49% 23/1/2027 782,227 0.01%Grupo Bimbo SAB de CV $725,000 4.70% 10/11/2047 762,700 0.01%Southern Copper Corp. $600,000 5.88% 23/4/2045 745,715 0.01%Grupo Bimbo SAB de CV $700,000 3.88% 27/6/2024 730,767 0.00%Orbia Advance Corp. SAB de CV $700,000 5.50% 15/1/2048 714,547 0.00%Mexico Government International Bond $600,000 4.60% 10/2/2048 651,083 0.00%Alfa SAB de CV $600,000 5.25% 25/3/2024 644,250 0.00%Industrias Penoles SAB de CV $600,000 5.65% 12/9/2049 638,217 0.00%Petroleos Mexicanos £400,000 8.25% 2/6/2022 599,116 0.00%Mexico Government International Bond €500,000 2.38% 9/4/2021 577,807 0.00%America Movil SAB de CV $500,000 4.38% 22/4/2049 572,884 0.00%Southern Copper Corp. $500,000 5.25% 8/11/2042 572,278 0.00%Mexico City Airport Trust $548,000 4.25% 31/10/2026 571,920 0.00%America Movil SAB de CV €500,000 0.75% 26/6/2027 568,002 0.00%Grupo Bimbo SAB de CV $500,000 4.50% 25/1/2022 520,000 0.00%Petroleos Mexicanos $450,000 6.50% 23/1/2029 471,873 0.00%Fomento Economico Mexicano SAB de CV €400,000 1.75% 20/3/2023 470,556 0.00%America Movil SAB de CV $350,000 6.38% 1/3/2035 469,582 0.00%Mexico Government International Bond $400,000 4.50% 31/1/2050 432,620 0.00%Petroleos Mexicanos $420,000 5.50% 21/1/2021 431,318 0.00%Trust F/1401 $400,000 6.39% 15/1/2050 430,004 0.00%Comision Federal de Electricidad $400,000 4.75% 23/2/2027 423,054 0.00%Trust F/1401 $400,000 4.87% 15/1/2030 421,104 0.00%Comision Federal de Electricidad $400,000 4.88% 26/5/2021 411,812 0.00%America Movil SAB de CV $400,000 3.13% 16/7/2022 407,966 0.00%Orbia Advance Corp. SAB de CV $350,000 4.88% 19/9/2022 368,958 0.00%Petroleos Mexicanos $360,000 6.38% 4/2/2021 366,454 0.00%Southern Copper Corp. $250,000 7.50% 27/7/2035 344,161 0.00%Petroleos Mexicanos $314,000 4.63% 21/9/2023 327,446 0.00%Orbia Advance Corp. SAB de CV $300,000 5.88% 17/9/2044 317,593 0.00%Infraestructura Energetica Nova SAB de CV $325,000 3.75% 14/1/2028 317,079 0.00%Infraestructura Energetica Nova SAB de CV $325,000 4.88% 14/1/2048 310,375 0.00%America Movil SAB de CV $275,000 4.38% 16/7/2042 306,134 0.00%Mexico Government International Bond £200,000 5.63% 19/3/2114 291,776 0.00%Petroleos Mexicanos $300,000 6.38% 23/1/2045 289,602 0.00%Petroleos Mexicanos $230,000 5.38% 13/3/2022 240,890 0.00%Petroleos Mexicanos €200,000 4.88% 21/2/2028 240,552 0.00%America Movil SAB de CV €200,000 1.50% 10/3/2024 235,891 0.00%Comision Federal de Electricidad $200,000 6.13% 16/6/2045 234,250 0.00%Orbia Advance Corp. SAB de CV $200,000 6.75% 19/9/2042 233,659 0.00%Comision Federal de Electricidad $200,000 5.75% 14/2/2042 223,002 0.00%Grupo Televisa SAB $200,000 5.25% 24/5/2049 216,155 0.00%
Vanguard Global Bond Index Fund
343
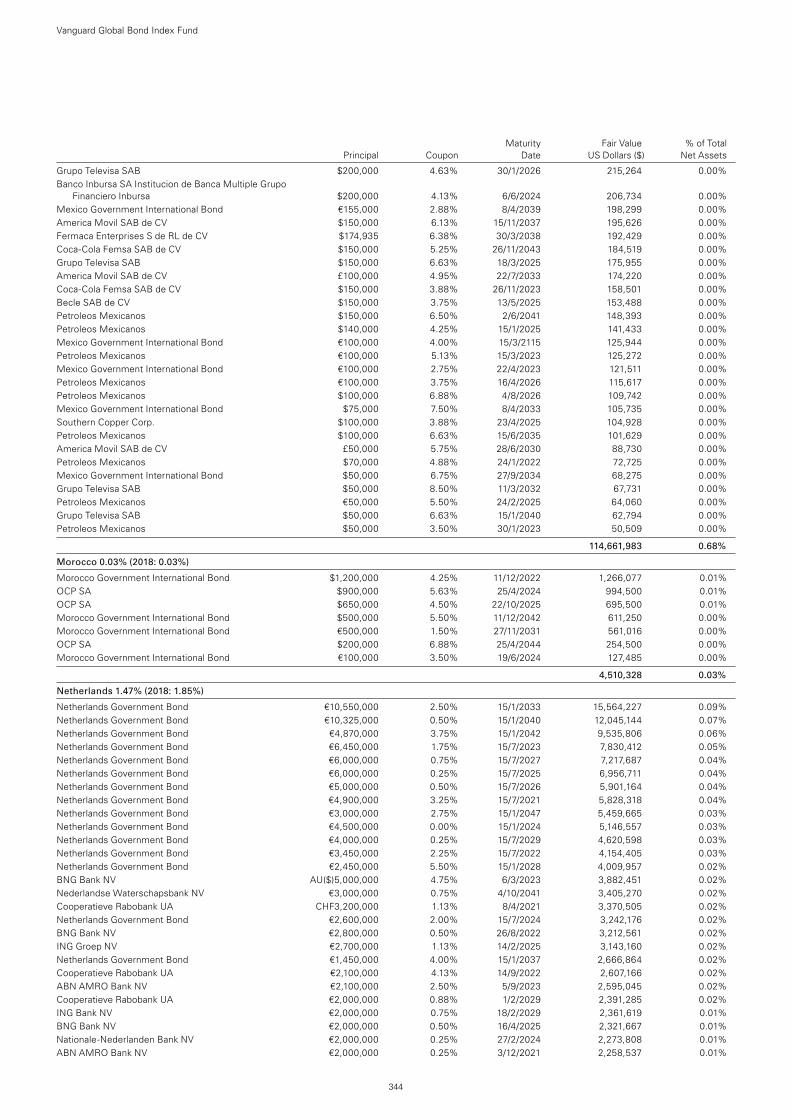
Maturity Fair Value % of Total Principal Coupon Date US Dollars ($) Net Assets
Grupo Televisa SAB $200,000 4.63% 30/1/2026 215,264 0.00%Banco Inbursa SA Institucion de Banca Multiple Grupo
Financiero Inbursa $200,000 4.13% 6/6/2024 206,734 0.00%Mexico Government International Bond €155,000 2.88% 8/4/2039 198,299 0.00%America Movil SAB de CV $150,000 6.13% 15/11/2037 195,626 0.00%Fermaca Enterprises S de RL de CV $174,935 6.38% 30/3/2038 192,429 0.00%Coca-Cola Femsa SAB de CV $150,000 5.25% 26/11/2043 184,519 0.00%Grupo Televisa SAB $150,000 6.63% 18/3/2025 175,955 0.00%America Movil SAB de CV £100,000 4.95% 22/7/2033 174,220 0.00%Coca-Cola Femsa SAB de CV $150,000 3.88% 26/11/2023 158,501 0.00%Becle SAB de CV $150,000 3.75% 13/5/2025 153,488 0.00%Petroleos Mexicanos $150,000 6.50% 2/6/2041 148,393 0.00%Petroleos Mexicanos $140,000 4.25% 15/1/2025 141,433 0.00%Mexico Government International Bond €100,000 4.00% 15/3/2115 125,944 0.00%Petroleos Mexicanos €100,000 5.13% 15/3/2023 125,272 0.00%Mexico Government International Bond €100,000 2.75% 22/4/2023 121,511 0.00%Petroleos Mexicanos €100,000 3.75% 16/4/2026 115,617 0.00%Petroleos Mexicanos $100,000 6.88% 4/8/2026 109,742 0.00%Mexico Government International Bond $75,000 7.50% 8/4/2033 105,735 0.00%Southern Copper Corp. $100,000 3.88% 23/4/2025 104,928 0.00%Petroleos Mexicanos $100,000 6.63% 15/6/2035 101,629 0.00%America Movil SAB de CV £50,000 5.75% 28/6/2030 88,730 0.00%Petroleos Mexicanos $70,000 4.88% 24/1/2022 72,725 0.00%Mexico Government International Bond $50,000 6.75% 27/9/2034 68,275 0.00%Grupo Televisa SAB $50,000 8.50% 11/3/2032 67,731 0.00%Petroleos Mexicanos €50,000 5.50% 24/2/2025 64,060 0.00%Grupo Televisa SAB $50,000 6.63% 15/1/2040 62,794 0.00%Petroleos Mexicanos $50,000 3.50% 30/1/2023 50,509 0.00%
114,661,983 0.68%
Morocco 0.03% (2018: 0.03%)
Morocco Government International Bond $1,200,000 4.25% 11/12/2022 1,266,077 0.01%OCP SA $900,000 5.63% 25/4/2024 994,500 0.01%OCP SA $650,000 4.50% 22/10/2025 695,500 0.01%Morocco Government International Bond $500,000 5.50% 11/12/2042 611,250 0.00%Morocco Government International Bond €500,000 1.50% 27/11/2031 561,016 0.00%OCP SA $200,000 6.88% 25/4/2044 254,500 0.00%Morocco Government International Bond €100,000 3.50% 19/6/2024 127,485 0.00%
4,510,328 0.03%
Netherlands 1.47% (2018: 1.85%)
Netherlands Government Bond €10,550,000 2.50% 15/1/2033 15,564,227 0.09%Netherlands Government Bond €10,325,000 0.50% 15/1/2040 12,045,144 0.07%Netherlands Government Bond €4,870,000 3.75% 15/1/2042 9,535,806 0.06%Netherlands Government Bond €6,450,000 1.75% 15/7/2023 7,830,412 0.05%Netherlands Government Bond €6,000,000 0.75% 15/7/2027 7,217,687 0.04%Netherlands Government Bond €6,000,000 0.25% 15/7/2025 6,956,711 0.04%Netherlands Government Bond €5,000,000 0.50% 15/7/2026 5,901,164 0.04%Netherlands Government Bond €4,900,000 3.25% 15/7/2021 5,828,318 0.04%Netherlands Government Bond €3,000,000 2.75% 15/1/2047 5,459,665 0.03%Netherlands Government Bond €4,500,000 0.00% 15/1/2024 5,146,557 0.03%Netherlands Government Bond €4,000,000 0.25% 15/7/2029 4,620,598 0.03%Netherlands Government Bond €3,450,000 2.25% 15/7/2022 4,154,405 0.03%Netherlands Government Bond €2,450,000 5.50% 15/1/2028 4,009,957 0.02%BNG Bank NV AU($)5,000,000 4.75% 6/3/2023 3,882,451 0.02%Nederlandse Waterschapsbank NV €3,000,000 0.75% 4/10/2041 3,405,270 0.02%Cooperatieve Rabobank UA CHF3,200,000 1.13% 8/4/2021 3,370,505 0.02%Netherlands Government Bond €2,600,000 2.00% 15/7/2024 3,242,176 0.02%BNG Bank NV €2,800,000 0.50% 26/8/2022 3,212,561 0.02%ING Groep NV €2,700,000 1.13% 14/2/2025 3,143,160 0.02%Netherlands Government Bond €1,450,000 4.00% 15/1/2037 2,666,864 0.02%Cooperatieve Rabobank UA €2,100,000 4.13% 14/9/2022 2,607,166 0.02%ABN AMRO Bank NV €2,100,000 2.50% 5/9/2023 2,595,045 0.02%Cooperatieve Rabobank UA €2,000,000 0.88% 1/2/2029 2,391,285 0.02%ING Bank NV €2,000,000 0.75% 18/2/2029 2,361,619 0.01%BNG Bank NV €2,000,000 0.50% 16/4/2025 2,321,667 0.01%Nationale-Nederlanden Bank NV €2,000,000 0.25% 27/2/2024 2,273,808 0.01%ABN AMRO Bank NV €2,000,000 0.25% 3/12/2021 2,258,537 0.01%
Vanguard Global Bond Index Fund
344
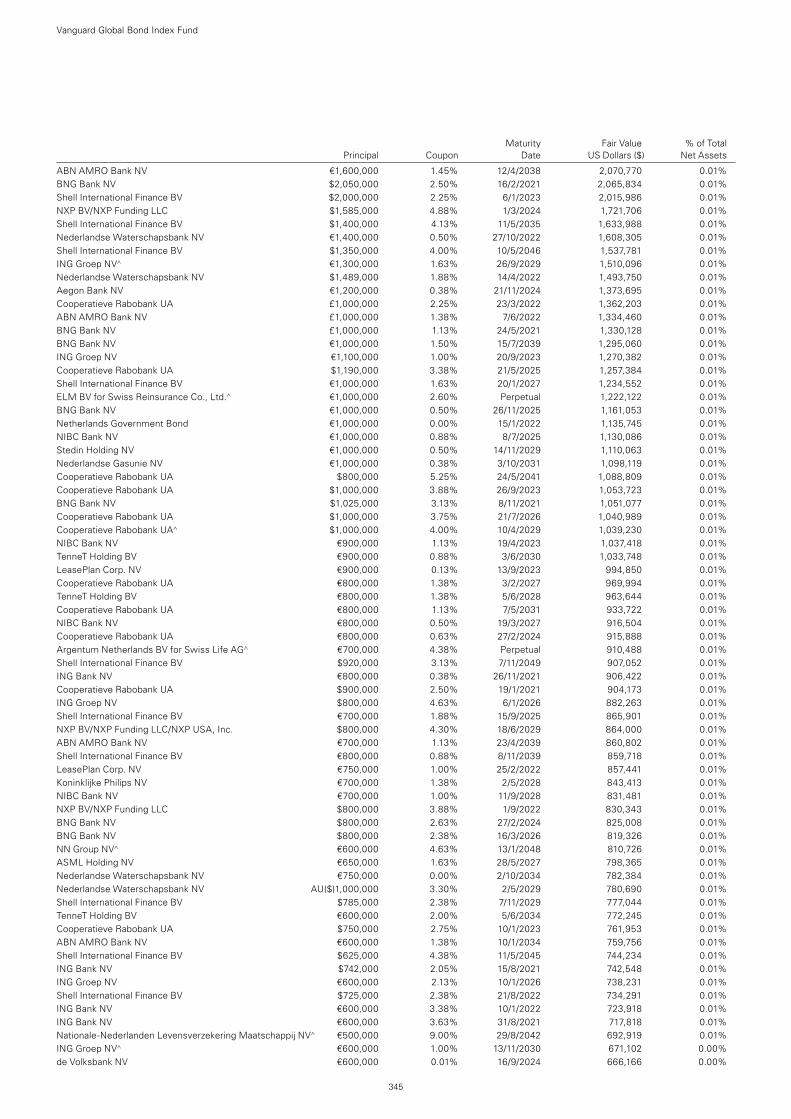
Maturity Fair Value % of Total Principal Coupon Date US Dollars ($) Net Assets
ABN AMRO Bank NV €1,600,000 1.45% 12/4/2038 2,070,770 0.01%BNG Bank NV $2,050,000 2.50% 16/2/2021 2,065,834 0.01%Shell International Finance BV $2,000,000 2.25% 6/1/2023 2,015,986 0.01%NXP BV/NXP Funding LLC $1,585,000 4.88% 1/3/2024 1,721,706 0.01%Shell International Finance BV $1,400,000 4.13% 11/5/2035 1,633,988 0.01%Nederlandse Waterschapsbank NV €1,400,000 0.50% 27/10/2022 1,608,305 0.01%Shell International Finance BV $1,350,000 4.00% 10/5/2046 1,537,781 0.01%ING Groep NV^ €1,300,000 1.63% 26/9/2029 1,510,096 0.01%Nederlandse Waterschapsbank NV $1,489,000 1.88% 14/4/2022 1,493,750 0.01%Aegon Bank NV €1,200,000 0.38% 21/11/2024 1,373,695 0.01%Cooperatieve Rabobank UA £1,000,000 2.25% 23/3/2022 1,362,203 0.01%ABN AMRO Bank NV £1,000,000 1.38% 7/6/2022 1,334,460 0.01%BNG Bank NV £1,000,000 1.13% 24/5/2021 1,330,128 0.01%BNG Bank NV €1,000,000 1.50% 15/7/2039 1,295,060 0.01%ING Groep NV €1,100,000 1.00% 20/9/2023 1,270,382 0.01%Cooperatieve Rabobank UA $1,190,000 3.38% 21/5/2025 1,257,384 0.01%Shell International Finance BV €1,000,000 1.63% 20/1/2027 1,234,552 0.01%ELM BV for Swiss Reinsurance Co., Ltd.^ €1,000,000 2.60% Perpetual 1,222,122 0.01%BNG Bank NV €1,000,000 0.50% 26/11/2025 1,161,053 0.01%Netherlands Government Bond €1,000,000 0.00% 15/1/2022 1,135,745 0.01%NIBC Bank NV €1,000,000 0.88% 8/7/2025 1,130,086 0.01%Stedin Holding NV €1,000,000 0.50% 14/11/2029 1,110,063 0.01%Nederlandse Gasunie NV €1,000,000 0.38% 3/10/2031 1,098,119 0.01%Cooperatieve Rabobank UA $800,000 5.25% 24/5/2041 1,088,809 0.01%Cooperatieve Rabobank UA $1,000,000 3.88% 26/9/2023 1,053,723 0.01%BNG Bank NV $1,025,000 3.13% 8/11/2021 1,051,077 0.01%Cooperatieve Rabobank UA $1,000,000 3.75% 21/7/2026 1,040,989 0.01%Cooperatieve Rabobank UA^ $1,000,000 4.00% 10/4/2029 1,039,230 0.01%NIBC Bank NV €900,000 1.13% 19/4/2023 1,037,418 0.01%TenneT Holding BV €900,000 0.88% 3/6/2030 1,033,748 0.01%LeasePlan Corp. NV €900,000 0.13% 13/9/2023 994,850 0.01%Cooperatieve Rabobank UA €800,000 1.38% 3/2/2027 969,994 0.01%TenneT Holding BV €800,000 1.38% 5/6/2028 963,644 0.01%Cooperatieve Rabobank UA €800,000 1.13% 7/5/2031 933,722 0.01%NIBC Bank NV €800,000 0.50% 19/3/2027 916,504 0.01%Cooperatieve Rabobank UA €800,000 0.63% 27/2/2024 915,888 0.01%Argentum Netherlands BV for Swiss Life AG^ €700,000 4.38% Perpetual 910,488 0.01%Shell International Finance BV $920,000 3.13% 7/11/2049 907,052 0.01%ING Bank NV €800,000 0.38% 26/11/2021 906,422 0.01%Cooperatieve Rabobank UA $900,000 2.50% 19/1/2021 904,173 0.01%ING Groep NV $800,000 4.63% 6/1/2026 882,263 0.01%Shell International Finance BV €700,000 1.88% 15/9/2025 865,901 0.01%NXP BV/NXP Funding LLC/NXP USA, Inc. $800,000 4.30% 18/6/2029 864,000 0.01%ABN AMRO Bank NV €700,000 1.13% 23/4/2039 860,802 0.01%Shell International Finance BV €800,000 0.88% 8/11/2039 859,718 0.01%LeasePlan Corp. NV €750,000 1.00% 25/2/2022 857,441 0.01%Koninklijke Philips NV €700,000 1.38% 2/5/2028 843,413 0.01%NIBC Bank NV €700,000 1.00% 11/9/2028 831,481 0.01%NXP BV/NXP Funding LLC $800,000 3.88% 1/9/2022 830,343 0.01%BNG Bank NV $800,000 2.63% 27/2/2024 825,008 0.01%BNG Bank NV $800,000 2.38% 16/3/2026 819,326 0.01%NN Group NV^ €600,000 4.63% 13/1/2048 810,726 0.01%ASML Holding NV €650,000 1.63% 28/5/2027 798,365 0.01%Nederlandse Waterschapsbank NV €750,000 0.00% 2/10/2034 782,384 0.01%Nederlandse Waterschapsbank NV AU($)1,000,000 3.30% 2/5/2029 780,690 0.01%Shell International Finance BV $785,000 2.38% 7/11/2029 777,044 0.01%TenneT Holding BV €600,000 2.00% 5/6/2034 772,245 0.01%Cooperatieve Rabobank UA $750,000 2.75% 10/1/2023 761,953 0.01%ABN AMRO Bank NV €600,000 1.38% 10/1/2034 759,756 0.01%Shell International Finance BV $625,000 4.38% 11/5/2045 744,234 0.01%ING Bank NV $742,000 2.05% 15/8/2021 742,548 0.01%ING Groep NV €600,000 2.13% 10/1/2026 738,231 0.01%Shell International Finance BV $725,000 2.38% 21/8/2022 734,291 0.01%ING Bank NV €600,000 3.38% 10/1/2022 723,918 0.01%ING Bank NV €600,000 3.63% 31/8/2021 717,818 0.01%Nationale-Nederlanden Levensverzekering Maatschappij NV^ €500,000 9.00% 29/8/2042 692,919 0.01%ING Groep NV^ €600,000 1.00% 13/11/2030 671,102 0.00%de Volksbank NV €600,000 0.01% 16/9/2024 666,166 0.00%
Vanguard Global Bond Index Fund
345
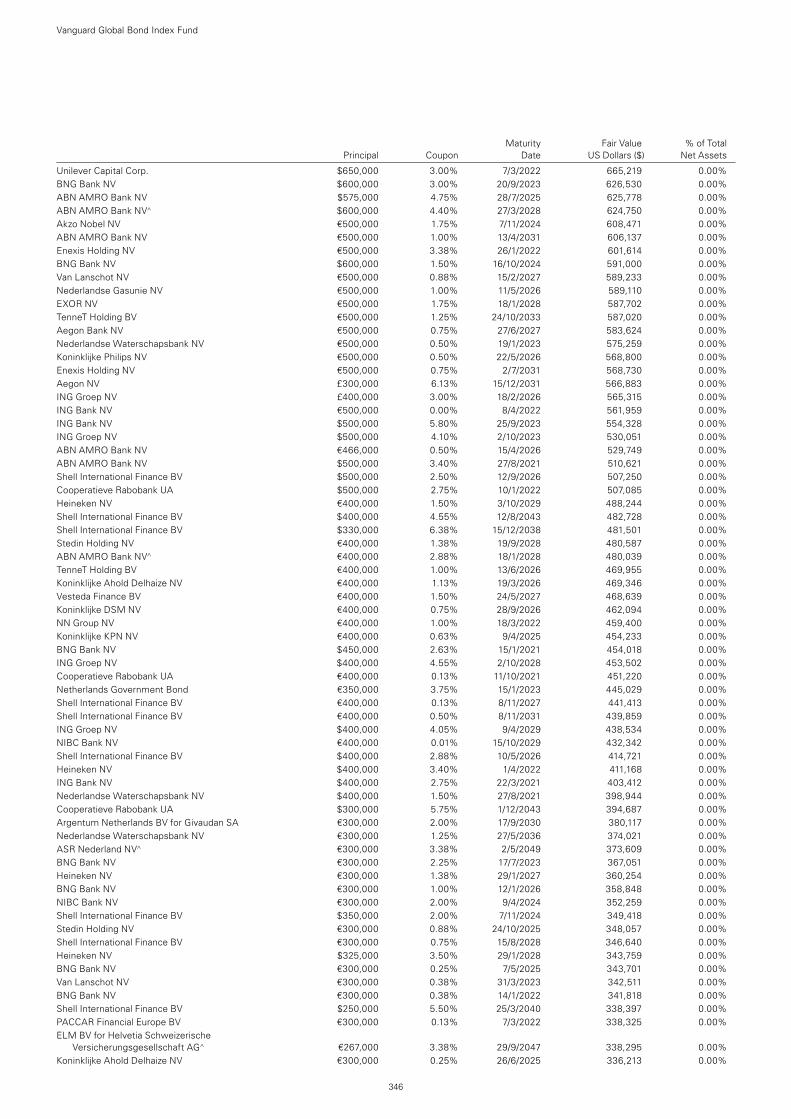
Maturity Fair Value % of Total Principal Coupon Date US Dollars ($) Net Assets
Unilever Capital Corp. $650,000 3.00% 7/3/2022 665,219 0.00%BNG Bank NV $600,000 3.00% 20/9/2023 626,530 0.00%ABN AMRO Bank NV $575,000 4.75% 28/7/2025 625,778 0.00%ABN AMRO Bank NV^ $600,000 4.40% 27/3/2028 624,750 0.00%Akzo Nobel NV €500,000 1.75% 7/11/2024 608,471 0.00%ABN AMRO Bank NV €500,000 1.00% 13/4/2031 606,137 0.00%Enexis Holding NV €500,000 3.38% 26/1/2022 601,614 0.00%BNG Bank NV $600,000 1.50% 16/10/2024 591,000 0.00%Van Lanschot NV €500,000 0.88% 15/2/2027 589,233 0.00%Nederlandse Gasunie NV €500,000 1.00% 11/5/2026 589,110 0.00%EXOR NV €500,000 1.75% 18/1/2028 587,702 0.00%TenneT Holding BV €500,000 1.25% 24/10/2033 587,020 0.00%Aegon Bank NV €500,000 0.75% 27/6/2027 583,624 0.00%Nederlandse Waterschapsbank NV €500,000 0.50% 19/1/2023 575,259 0.00%Koninklijke Philips NV €500,000 0.50% 22/5/2026 568,800 0.00%Enexis Holding NV €500,000 0.75% 2/7/2031 568,730 0.00%Aegon NV £300,000 6.13% 15/12/2031 566,883 0.00%ING Groep NV £400,000 3.00% 18/2/2026 565,315 0.00%ING Bank NV €500,000 0.00% 8/4/2022 561,959 0.00%ING Bank NV $500,000 5.80% 25/9/2023 554,328 0.00%ING Groep NV $500,000 4.10% 2/10/2023 530,051 0.00%ABN AMRO Bank NV €466,000 0.50% 15/4/2026 529,749 0.00%ABN AMRO Bank NV $500,000 3.40% 27/8/2021 510,621 0.00%Shell International Finance BV $500,000 2.50% 12/9/2026 507,250 0.00%Cooperatieve Rabobank UA $500,000 2.75% 10/1/2022 507,085 0.00%Heineken NV €400,000 1.50% 3/10/2029 488,244 0.00%Shell International Finance BV $400,000 4.55% 12/8/2043 482,728 0.00%Shell International Finance BV $330,000 6.38% 15/12/2038 481,501 0.00%Stedin Holding NV €400,000 1.38% 19/9/2028 480,587 0.00%ABN AMRO Bank NV^ €400,000 2.88% 18/1/2028 480,039 0.00%TenneT Holding BV €400,000 1.00% 13/6/2026 469,955 0.00%Koninklijke Ahold Delhaize NV €400,000 1.13% 19/3/2026 469,346 0.00%Vesteda Finance BV €400,000 1.50% 24/5/2027 468,639 0.00%Koninklijke DSM NV €400,000 0.75% 28/9/2026 462,094 0.00%NN Group NV €400,000 1.00% 18/3/2022 459,400 0.00%Koninklijke KPN NV €400,000 0.63% 9/4/2025 454,233 0.00%BNG Bank NV $450,000 2.63% 15/1/2021 454,018 0.00%ING Groep NV $400,000 4.55% 2/10/2028 453,502 0.00%Cooperatieve Rabobank UA €400,000 0.13% 11/10/2021 451,220 0.00%Netherlands Government Bond €350,000 3.75% 15/1/2023 445,029 0.00%Shell International Finance BV €400,000 0.13% 8/11/2027 441,413 0.00%Shell International Finance BV €400,000 0.50% 8/11/2031 439,859 0.00%ING Groep NV $400,000 4.05% 9/4/2029 438,534 0.00%NIBC Bank NV €400,000 0.01% 15/10/2029 432,342 0.00%Shell International Finance BV $400,000 2.88% 10/5/2026 414,721 0.00%Heineken NV $400,000 3.40% 1/4/2022 411,168 0.00%ING Bank NV $400,000 2.75% 22/3/2021 403,412 0.00%Nederlandse Waterschapsbank NV $400,000 1.50% 27/8/2021 398,944 0.00%Cooperatieve Rabobank UA $300,000 5.75% 1/12/2043 394,687 0.00%Argentum Netherlands BV for Givaudan SA €300,000 2.00% 17/9/2030 380,117 0.00%Nederlandse Waterschapsbank NV €300,000 1.25% 27/5/2036 374,021 0.00%ASR Nederland NV^ €300,000 3.38% 2/5/2049 373,609 0.00%BNG Bank NV €300,000 2.25% 17/7/2023 367,051 0.00%Heineken NV €300,000 1.38% 29/1/2027 360,254 0.00%BNG Bank NV €300,000 1.00% 12/1/2026 358,848 0.00%NIBC Bank NV €300,000 2.00% 9/4/2024 352,259 0.00%Shell International Finance BV $350,000 2.00% 7/11/2024 349,418 0.00%Stedin Holding NV €300,000 0.88% 24/10/2025 348,057 0.00%Shell International Finance BV €300,000 0.75% 15/8/2028 346,640 0.00%Heineken NV $325,000 3.50% 29/1/2028 343,759 0.00%BNG Bank NV €300,000 0.25% 7/5/2025 343,701 0.00%Van Lanschot NV €300,000 0.38% 31/3/2023 342,511 0.00%BNG Bank NV €300,000 0.38% 14/1/2022 341,818 0.00%Shell International Finance BV $250,000 5.50% 25/3/2040 338,397 0.00%PACCAR Financial Europe BV €300,000 0.13% 7/3/2022 338,325 0.00%ELM BV for Helvetia Schweizerische
Versicherungsgesellschaft AG^ €267,000 3.38% 29/9/2047 338,295 0.00%Koninklijke Ahold Delhaize NV €300,000 0.25% 26/6/2025 336,213 0.00%
Vanguard Global Bond Index Fund
346
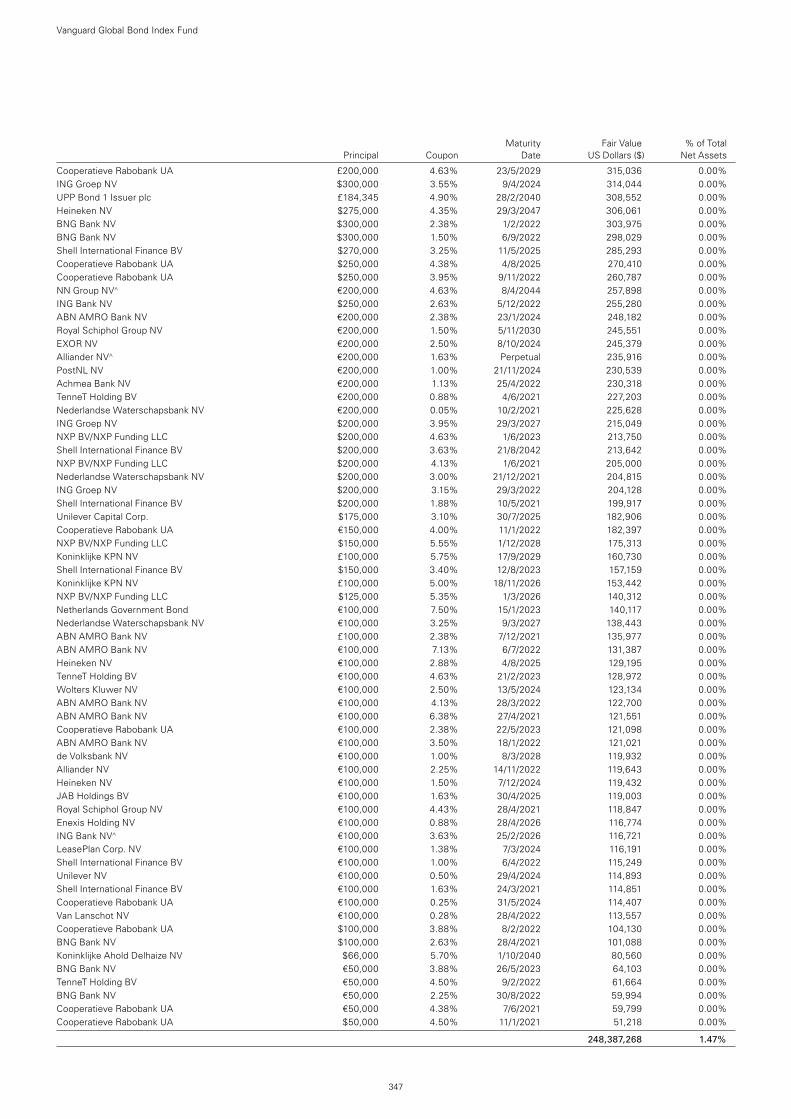
Maturity Fair Value % of Total Principal Coupon Date US Dollars ($) Net Assets
Cooperatieve Rabobank UA £200,000 4.63% 23/5/2029 315,036 0.00%ING Groep NV $300,000 3.55% 9/4/2024 314,044 0.00%UPP Bond 1 Issuer plc £184,345 4.90% 28/2/2040 308,552 0.00%Heineken NV $275,000 4.35% 29/3/2047 306,061 0.00%BNG Bank NV $300,000 2.38% 1/2/2022 303,975 0.00%BNG Bank NV $300,000 1.50% 6/9/2022 298,029 0.00%Shell International Finance BV $270,000 3.25% 11/5/2025 285,293 0.00%Cooperatieve Rabobank UA $250,000 4.38% 4/8/2025 270,410 0.00%Cooperatieve Rabobank UA $250,000 3.95% 9/11/2022 260,787 0.00%NN Group NV^ €200,000 4.63% 8/4/2044 257,898 0.00%ING Bank NV $250,000 2.63% 5/12/2022 255,280 0.00%ABN AMRO Bank NV €200,000 2.38% 23/1/2024 248,182 0.00%Royal Schiphol Group NV €200,000 1.50% 5/11/2030 245,551 0.00%EXOR NV €200,000 2.50% 8/10/2024 245,379 0.00%Alliander NV^ €200,000 1.63% Perpetual 235,916 0.00%PostNL NV €200,000 1.00% 21/11/2024 230,539 0.00%Achmea Bank NV €200,000 1.13% 25/4/2022 230,318 0.00%TenneT Holding BV €200,000 0.88% 4/6/2021 227,203 0.00%Nederlandse Waterschapsbank NV €200,000 0.05% 10/2/2021 225,628 0.00%ING Groep NV $200,000 3.95% 29/3/2027 215,049 0.00%NXP BV/NXP Funding LLC $200,000 4.63% 1/6/2023 213,750 0.00%Shell International Finance BV $200,000 3.63% 21/8/2042 213,642 0.00%NXP BV/NXP Funding LLC $200,000 4.13% 1/6/2021 205,000 0.00%Nederlandse Waterschapsbank NV $200,000 3.00% 21/12/2021 204,815 0.00%ING Groep NV $200,000 3.15% 29/3/2022 204,128 0.00%Shell International Finance BV $200,000 1.88% 10/5/2021 199,917 0.00%Unilever Capital Corp. $175,000 3.10% 30/7/2025 182,906 0.00%Cooperatieve Rabobank UA €150,000 4.00% 11/1/2022 182,397 0.00%NXP BV/NXP Funding LLC $150,000 5.55% 1/12/2028 175,313 0.00%Koninklijke KPN NV £100,000 5.75% 17/9/2029 160,730 0.00%Shell International Finance BV $150,000 3.40% 12/8/2023 157,159 0.00%Koninklijke KPN NV £100,000 5.00% 18/11/2026 153,442 0.00%NXP BV/NXP Funding LLC $125,000 5.35% 1/3/2026 140,312 0.00%Netherlands Government Bond €100,000 7.50% 15/1/2023 140,117 0.00%Nederlandse Waterschapsbank NV €100,000 3.25% 9/3/2027 138,443 0.00%ABN AMRO Bank NV £100,000 2.38% 7/12/2021 135,977 0.00%ABN AMRO Bank NV €100,000 7.13% 6/7/2022 131,387 0.00%Heineken NV €100,000 2.88% 4/8/2025 129,195 0.00%TenneT Holding BV €100,000 4.63% 21/2/2023 128,972 0.00%Wolters Kluwer NV €100,000 2.50% 13/5/2024 123,134 0.00%ABN AMRO Bank NV €100,000 4.13% 28/3/2022 122,700 0.00%ABN AMRO Bank NV €100,000 6.38% 27/4/2021 121,551 0.00%Cooperatieve Rabobank UA €100,000 2.38% 22/5/2023 121,098 0.00%ABN AMRO Bank NV €100,000 3.50% 18/1/2022 121,021 0.00%de Volksbank NV €100,000 1.00% 8/3/2028 119,932 0.00%Alliander NV €100,000 2.25% 14/11/2022 119,643 0.00%Heineken NV €100,000 1.50% 7/12/2024 119,432 0.00%JAB Holdings BV €100,000 1.63% 30/4/2025 119,003 0.00%Royal Schiphol Group NV €100,000 4.43% 28/4/2021 118,847 0.00%Enexis Holding NV €100,000 0.88% 28/4/2026 116,774 0.00%ING Bank NV^ €100,000 3.63% 25/2/2026 116,721 0.00%LeasePlan Corp. NV €100,000 1.38% 7/3/2024 116,191 0.00%Shell International Finance BV €100,000 1.00% 6/4/2022 115,249 0.00%Unilever NV €100,000 0.50% 29/4/2024 114,893 0.00%Shell International Finance BV €100,000 1.63% 24/3/2021 114,851 0.00%Cooperatieve Rabobank UA €100,000 0.25% 31/5/2024 114,407 0.00%Van Lanschot NV €100,000 0.28% 28/4/2022 113,557 0.00%Cooperatieve Rabobank UA $100,000 3.88% 8/2/2022 104,130 0.00%BNG Bank NV $100,000 2.63% 28/4/2021 101,088 0.00%Koninklijke Ahold Delhaize NV $66,000 5.70% 1/10/2040 80,560 0.00%BNG Bank NV €50,000 3.88% 26/5/2023 64,103 0.00%TenneT Holding BV €50,000 4.50% 9/2/2022 61,664 0.00%BNG Bank NV €50,000 2.25% 30/8/2022 59,994 0.00%Cooperatieve Rabobank UA €50,000 4.38% 7/6/2021 59,799 0.00%Cooperatieve Rabobank UA $50,000 4.50% 11/1/2021 51,218 0.00%
248,387,268 1.47%
Vanguard Global Bond Index Fund
347
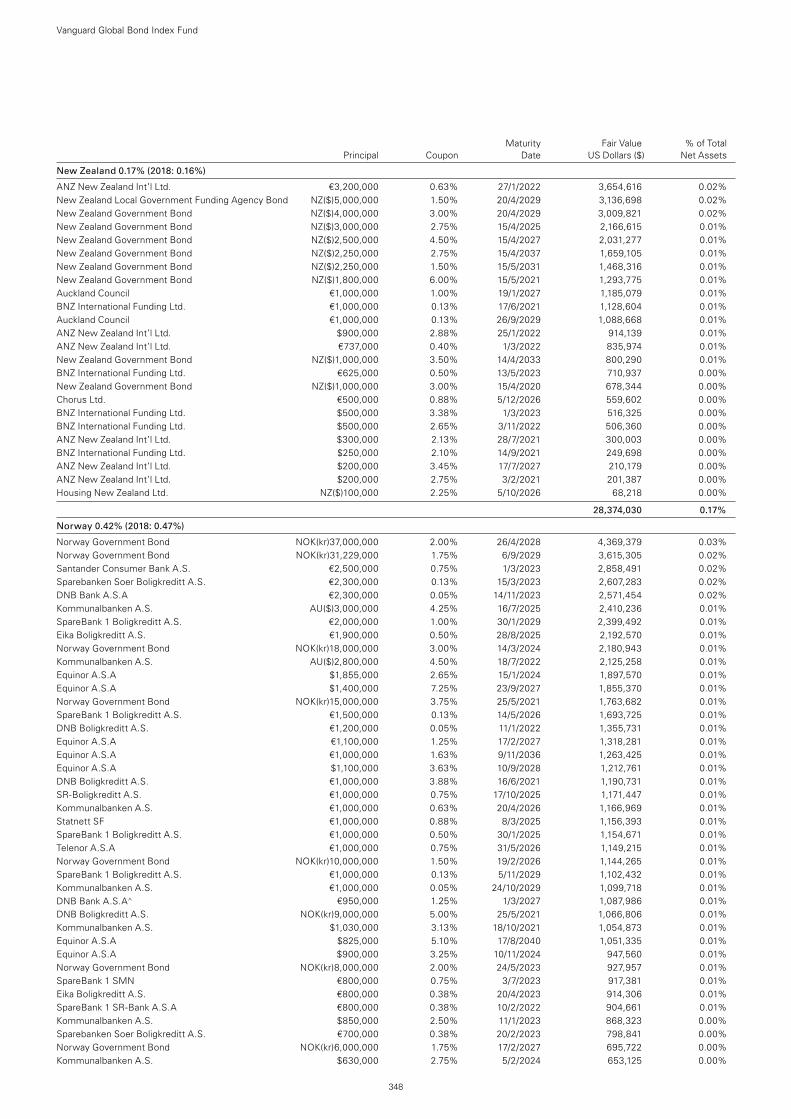
Maturity Fair Value % of Total Principal Coupon Date US Dollars ($) Net Assets
New Zealand 0.17% (2018: 0.16%)
ANZ New Zealand Int’l Ltd. €3,200,000 0.63% 27/1/2022 3,654,616 0.02%New Zealand Local Government Funding Agency Bond NZ($)5,000,000 1.50% 20/4/2029 3,136,698 0.02%New Zealand Government Bond NZ($)4,000,000 3.00% 20/4/2029 3,009,821 0.02%New Zealand Government Bond NZ($)3,000,000 2.75% 15/4/2025 2,166,615 0.01%New Zealand Government Bond NZ($)2,500,000 4.50% 15/4/2027 2,031,277 0.01%New Zealand Government Bond NZ($)2,250,000 2.75% 15/4/2037 1,659,105 0.01%New Zealand Government Bond NZ($)2,250,000 1.50% 15/5/2031 1,468,316 0.01%New Zealand Government Bond NZ($)1,800,000 6.00% 15/5/2021 1,293,775 0.01%Auckland Council €1,000,000 1.00% 19/1/2027 1,185,079 0.01%BNZ International Funding Ltd. €1,000,000 0.13% 17/6/2021 1,128,604 0.01%Auckland Council €1,000,000 0.13% 26/9/2029 1,088,668 0.01%ANZ New Zealand Int’l Ltd. $900,000 2.88% 25/1/2022 914,139 0.01%ANZ New Zealand Int’l Ltd. €737,000 0.40% 1/3/2022 835,974 0.01%New Zealand Government Bond NZ($)1,000,000 3.50% 14/4/2033 800,290 0.01%BNZ International Funding Ltd. €625,000 0.50% 13/5/2023 710,937 0.00%New Zealand Government Bond NZ($)1,000,000 3.00% 15/4/2020 678,344 0.00%Chorus Ltd. €500,000 0.88% 5/12/2026 559,602 0.00%BNZ International Funding Ltd. $500,000 3.38% 1/3/2023 516,325 0.00%BNZ International Funding Ltd. $500,000 2.65% 3/11/2022 506,360 0.00%ANZ New Zealand Int’l Ltd. $300,000 2.13% 28/7/2021 300,003 0.00%BNZ International Funding Ltd. $250,000 2.10% 14/9/2021 249,698 0.00%ANZ New Zealand Int’l Ltd. $200,000 3.45% 17/7/2027 210,179 0.00%ANZ New Zealand Int’l Ltd. $200,000 2.75% 3/2/2021 201,387 0.00%Housing New Zealand Ltd. NZ($)100,000 2.25% 5/10/2026 68,218 0.00%
28,374,030 0.17%
Norway 0.42% (2018: 0.47%)
Norway Government Bond NOK(kr)37,000,000 2.00% 26/4/2028 4,369,379 0.03%Norway Government Bond NOK(kr)31,229,000 1.75% 6/9/2029 3,615,305 0.02%Santander Consumer Bank A.S. €2,500,000 0.75% 1/3/2023 2,858,491 0.02%Sparebanken Soer Boligkreditt A.S. €2,300,000 0.13% 15/3/2023 2,607,283 0.02%DNB Bank A.S.A €2,300,000 0.05% 14/11/2023 2,571,454 0.02%Kommunalbanken A.S. AU($)3,000,000 4.25% 16/7/2025 2,410,236 0.01%SpareBank 1 Boligkreditt A.S. €2,000,000 1.00% 30/1/2029 2,399,492 0.01%Eika Boligkreditt A.S. €1,900,000 0.50% 28/8/2025 2,192,570 0.01%Norway Government Bond NOK(kr)18,000,000 3.00% 14/3/2024 2,180,943 0.01%Kommunalbanken A.S. AU($)2,800,000 4.50% 18/7/2022 2,125,258 0.01%Equinor A.S.A $1,855,000 2.65% 15/1/2024 1,897,570 0.01%Equinor A.S.A $1,400,000 7.25% 23/9/2027 1,855,370 0.01%Norway Government Bond NOK(kr)15,000,000 3.75% 25/5/2021 1,763,682 0.01%SpareBank 1 Boligkreditt A.S. €1,500,000 0.13% 14/5/2026 1,693,725 0.01%DNB Boligkreditt A.S. €1,200,000 0.05% 11/1/2022 1,355,731 0.01%Equinor A.S.A €1,100,000 1.25% 17/2/2027 1,318,281 0.01%Equinor A.S.A €1,000,000 1.63% 9/11/2036 1,263,425 0.01%Equinor A.S.A $1,100,000 3.63% 10/9/2028 1,212,761 0.01%DNB Boligkreditt A.S. €1,000,000 3.88% 16/6/2021 1,190,731 0.01%SR-Boligkreditt A.S. €1,000,000 0.75% 17/10/2025 1,171,447 0.01%Kommunalbanken A.S. €1,000,000 0.63% 20/4/2026 1,166,969 0.01%Statnett SF €1,000,000 0.88% 8/3/2025 1,156,393 0.01%SpareBank 1 Boligkreditt A.S. €1,000,000 0.50% 30/1/2025 1,154,671 0.01%Telenor A.S.A €1,000,000 0.75% 31/5/2026 1,149,215 0.01%Norway Government Bond NOK(kr)10,000,000 1.50% 19/2/2026 1,144,265 0.01%SpareBank 1 Boligkreditt A.S. €1,000,000 0.13% 5/11/2029 1,102,432 0.01%Kommunalbanken A.S. €1,000,000 0.05% 24/10/2029 1,099,718 0.01%DNB Bank A.S.A^ €950,000 1.25% 1/3/2027 1,087,986 0.01%DNB Boligkreditt A.S. NOK(kr)9,000,000 5.00% 25/5/2021 1,066,806 0.01%Kommunalbanken A.S. $1,030,000 3.13% 18/10/2021 1,054,873 0.01%Equinor A.S.A $825,000 5.10% 17/8/2040 1,051,335 0.01%Equinor A.S.A $900,000 3.25% 10/11/2024 947,560 0.01%Norway Government Bond NOK(kr)8,000,000 2.00% 24/5/2023 927,957 0.01%SpareBank 1 SMN €800,000 0.75% 3/7/2023 917,381 0.01%Eika Boligkreditt A.S. €800,000 0.38% 20/4/2023 914,306 0.01%SpareBank 1 SR-Bank A.S.A €800,000 0.38% 10/2/2022 904,661 0.01%Kommunalbanken A.S. $850,000 2.50% 11/1/2023 868,323 0.00%Sparebanken Soer Boligkreditt A.S. €700,000 0.38% 20/2/2023 798,841 0.00%Norway Government Bond NOK(kr)6,000,000 1.75% 17/2/2027 695,722 0.00%Kommunalbanken A.S. $630,000 2.75% 5/2/2024 653,125 0.00%
Vanguard Global Bond Index Fund
348
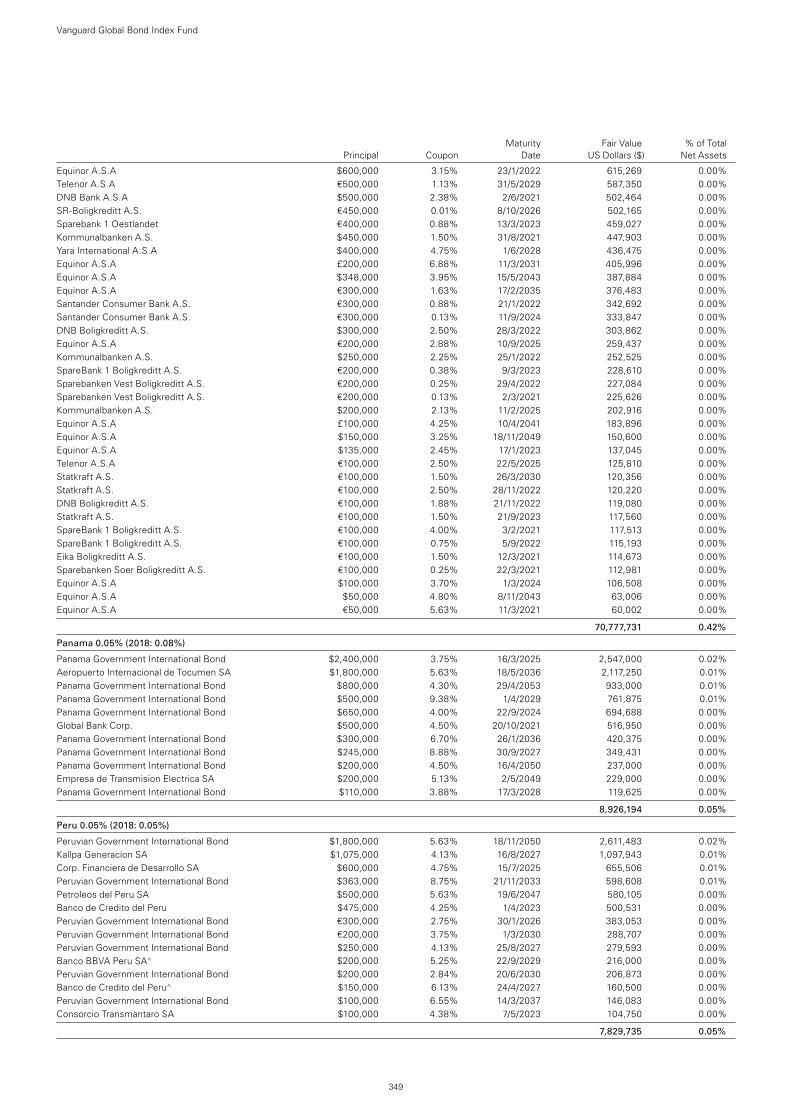
Maturity Fair Value % of Total Principal Coupon Date US Dollars ($) Net Assets
Equinor A.S.A $600,000 3.15% 23/1/2022 615,269 0.00%Telenor A.S.A €500,000 1.13% 31/5/2029 587,350 0.00%DNB Bank A.S.A $500,000 2.38% 2/6/2021 502,464 0.00%SR-Boligkreditt A.S. €450,000 0.01% 8/10/2026 502,165 0.00%Sparebank 1 Oestlandet €400,000 0.88% 13/3/2023 459,027 0.00%Kommunalbanken A.S. $450,000 1.50% 31/8/2021 447,903 0.00%Yara International A.S.A $400,000 4.75% 1/6/2028 436,475 0.00%Equinor A.S.A £200,000 6.88% 11/3/2031 405,996 0.00%Equinor A.S.A $348,000 3.95% 15/5/2043 387,884 0.00%Equinor A.S.A €300,000 1.63% 17/2/2035 376,483 0.00%Santander Consumer Bank A.S. €300,000 0.88% 21/1/2022 342,692 0.00%Santander Consumer Bank A.S. €300,000 0.13% 11/9/2024 333,847 0.00%DNB Boligkreditt A.S. $300,000 2.50% 28/3/2022 303,862 0.00%Equinor A.S.A €200,000 2.88% 10/9/2025 259,437 0.00%Kommunalbanken A.S. $250,000 2.25% 25/1/2022 252,525 0.00%SpareBank 1 Boligkreditt A.S. €200,000 0.38% 9/3/2023 228,610 0.00%Sparebanken Vest Boligkreditt A.S. €200,000 0.25% 29/4/2022 227,084 0.00%Sparebanken Vest Boligkreditt A.S. €200,000 0.13% 2/3/2021 225,626 0.00%Kommunalbanken A.S. $200,000 2.13% 11/2/2025 202,916 0.00%Equinor A.S.A £100,000 4.25% 10/4/2041 183,896 0.00%Equinor A.S.A $150,000 3.25% 18/11/2049 150,600 0.00%Equinor A.S.A $135,000 2.45% 17/1/2023 137,045 0.00%Telenor A.S.A €100,000 2.50% 22/5/2025 125,810 0.00%Statkraft A.S. €100,000 1.50% 26/3/2030 120,356 0.00%Statkraft A.S. €100,000 2.50% 28/11/2022 120,220 0.00%DNB Boligkreditt A.S. €100,000 1.88% 21/11/2022 119,080 0.00%Statkraft A.S. €100,000 1.50% 21/9/2023 117,560 0.00%SpareBank 1 Boligkreditt A.S. €100,000 4.00% 3/2/2021 117,513 0.00%SpareBank 1 Boligkreditt A.S. €100,000 0.75% 5/9/2022 115,193 0.00%Eika Boligkreditt A.S. €100,000 1.50% 12/3/2021 114,673 0.00%Sparebanken Soer Boligkreditt A.S. €100,000 0.25% 22/3/2021 112,981 0.00%Equinor A.S.A $100,000 3.70% 1/3/2024 106,508 0.00%Equinor A.S.A $50,000 4.80% 8/11/2043 63,006 0.00%Equinor A.S.A €50,000 5.63% 11/3/2021 60,002 0.00%
70,777,731 0.42%
Panama 0.05% (2018: 0.08%)
Panama Government International Bond $2,400,000 3.75% 16/3/2025 2,547,000 0.02%Aeropuerto Internacional de Tocumen SA $1,800,000 5.63% 18/5/2036 2,117,250 0.01%Panama Government International Bond $800,000 4.30% 29/4/2053 933,000 0.01%Panama Government International Bond $500,000 9.38% 1/4/2029 761,875 0.01%Panama Government International Bond $650,000 4.00% 22/9/2024 694,688 0.00%Global Bank Corp. $500,000 4.50% 20/10/2021 516,950 0.00%Panama Government International Bond $300,000 6.70% 26/1/2036 420,375 0.00%Panama Government International Bond $245,000 8.88% 30/9/2027 349,431 0.00%Panama Government International Bond $200,000 4.50% 16/4/2050 237,000 0.00%Empresa de Transmision Electrica SA $200,000 5.13% 2/5/2049 229,000 0.00%Panama Government International Bond $110,000 3.88% 17/3/2028 119,625 0.00%
8,926,194 0.05%
Peru 0.05% (2018: 0.05%)
Peruvian Government International Bond $1,800,000 5.63% 18/11/2050 2,611,483 0.02%Kallpa Generacion SA $1,075,000 4.13% 16/8/2027 1,097,943 0.01%Corp. Financiera de Desarrollo SA $600,000 4.75% 15/7/2025 655,506 0.01%Peruvian Government International Bond $363,000 8.75% 21/11/2033 598,608 0.01%Petroleos del Peru SA $500,000 5.63% 19/6/2047 580,105 0.00%Banco de Credito del Peru $475,000 4.25% 1/4/2023 500,531 0.00%Peruvian Government International Bond €300,000 2.75% 30/1/2026 383,053 0.00%Peruvian Government International Bond €200,000 3.75% 1/3/2030 288,707 0.00%Peruvian Government International Bond $250,000 4.13% 25/8/2027 279,593 0.00%Banco BBVA Peru SA^ $200,000 5.25% 22/9/2029 216,000 0.00%Peruvian Government International Bond $200,000 2.84% 20/6/2030 206,873 0.00%Banco de Credito del Peru^ $150,000 6.13% 24/4/2027 160,500 0.00%Peruvian Government International Bond $100,000 6.55% 14/3/2037 146,083 0.00%Consorcio Transmantaro SA $100,000 4.38% 7/5/2023 104,750 0.00%
7,829,735 0.05%
Vanguard Global Bond Index Fund
349
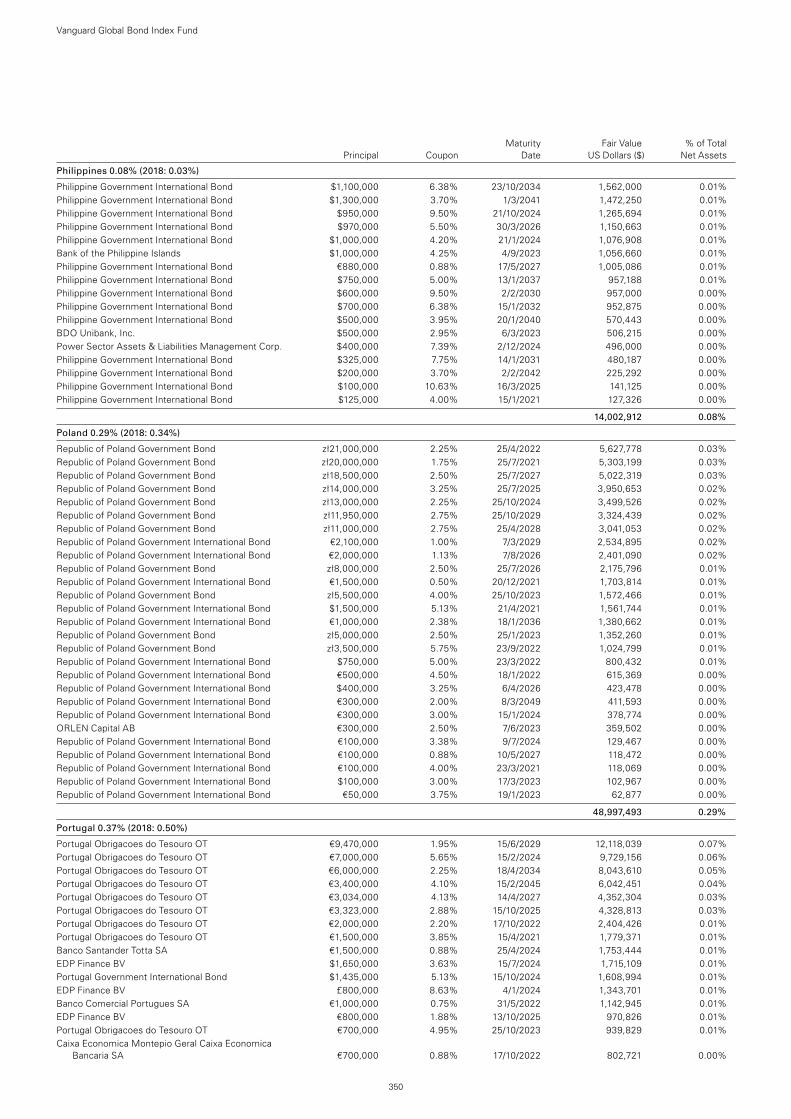
Maturity Fair Value % of Total Principal Coupon Date US Dollars ($) Net Assets
Philippines 0.08% (2018: 0.03%)
Philippine Government International Bond $1,100,000 6.38% 23/10/2034 1,562,000 0.01%Philippine Government International Bond $1,300,000 3.70% 1/3/2041 1,472,250 0.01%Philippine Government International Bond $950,000 9.50% 21/10/2024 1,265,694 0.01%Philippine Government International Bond $970,000 5.50% 30/3/2026 1,150,663 0.01%Philippine Government International Bond $1,000,000 4.20% 21/1/2024 1,076,908 0.01%Bank of the Philippine Islands $1,000,000 4.25% 4/9/2023 1,056,660 0.01%Philippine Government International Bond €880,000 0.88% 17/5/2027 1,005,086 0.01%Philippine Government International Bond $750,000 5.00% 13/1/2037 957,188 0.01%Philippine Government International Bond $600,000 9.50% 2/2/2030 957,000 0.00%Philippine Government International Bond $700,000 6.38% 15/1/2032 952,875 0.00%Philippine Government International Bond $500,000 3.95% 20/1/2040 570,443 0.00%BDO Unibank, Inc. $500,000 2.95% 6/3/2023 506,215 0.00%Power Sector Assets & Liabilities Management Corp. $400,000 7.39% 2/12/2024 496,000 0.00%Philippine Government International Bond $325,000 7.75% 14/1/2031 480,187 0.00%Philippine Government International Bond $200,000 3.70% 2/2/2042 225,292 0.00%Philippine Government International Bond $100,000 10.63% 16/3/2025 141,125 0.00%Philippine Government International Bond $125,000 4.00% 15/1/2021 127,326 0.00%
14,002,912 0.08%
Poland 0.29% (2018: 0.34%)
Republic of Poland Government Bond zł21,000,000 2.25% 25/4/2022 5,627,778 0.03%Republic of Poland Government Bond zł20,000,000 1.75% 25/7/2021 5,303,199 0.03%Republic of Poland Government Bond zł18,500,000 2.50% 25/7/2027 5,022,319 0.03%Republic of Poland Government Bond zł14,000,000 3.25% 25/7/2025 3,950,653 0.02%Republic of Poland Government Bond zł13,000,000 2.25% 25/10/2024 3,499,526 0.02%Republic of Poland Government Bond zł11,950,000 2.75% 25/10/2029 3,324,439 0.02%Republic of Poland Government Bond zł11,000,000 2.75% 25/4/2028 3,041,053 0.02%Republic of Poland Government International Bond €2,100,000 1.00% 7/3/2029 2,534,895 0.02%Republic of Poland Government International Bond €2,000,000 1.13% 7/8/2026 2,401,090 0.02%Republic of Poland Government Bond zł8,000,000 2.50% 25/7/2026 2,175,796 0.01%Republic of Poland Government International Bond €1,500,000 0.50% 20/12/2021 1,703,814 0.01%Republic of Poland Government Bond zł5,500,000 4.00% 25/10/2023 1,572,466 0.01%Republic of Poland Government International Bond $1,500,000 5.13% 21/4/2021 1,561,744 0.01%Republic of Poland Government International Bond €1,000,000 2.38% 18/1/2036 1,380,662 0.01%Republic of Poland Government Bond zł5,000,000 2.50% 25/1/2023 1,352,260 0.01%Republic of Poland Government Bond zł3,500,000 5.75% 23/9/2022 1,024,799 0.01%Republic of Poland Government International Bond $750,000 5.00% 23/3/2022 800,432 0.01%Republic of Poland Government International Bond €500,000 4.50% 18/1/2022 615,369 0.00%Republic of Poland Government International Bond $400,000 3.25% 6/4/2026 423,478 0.00%Republic of Poland Government International Bond €300,000 2.00% 8/3/2049 411,593 0.00%Republic of Poland Government International Bond €300,000 3.00% 15/1/2024 378,774 0.00%ORLEN Capital AB €300,000 2.50% 7/6/2023 359,502 0.00%Republic of Poland Government International Bond €100,000 3.38% 9/7/2024 129,467 0.00%Republic of Poland Government International Bond €100,000 0.88% 10/5/2027 118,472 0.00%Republic of Poland Government International Bond €100,000 4.00% 23/3/2021 118,069 0.00%Republic of Poland Government International Bond $100,000 3.00% 17/3/2023 102,967 0.00%Republic of Poland Government International Bond €50,000 3.75% 19/1/2023 62,877 0.00%
48,997,493 0.29%
Portugal 0.37% (2018: 0.50%)
Portugal Obrigacoes do Tesouro OT €9,470,000 1.95% 15/6/2029 12,118,039 0.07%Portugal Obrigacoes do Tesouro OT €7,000,000 5.65% 15/2/2024 9,729,156 0.06%Portugal Obrigacoes do Tesouro OT €6,000,000 2.25% 18/4/2034 8,043,610 0.05%Portugal Obrigacoes do Tesouro OT €3,400,000 4.10% 15/2/2045 6,042,451 0.04%Portugal Obrigacoes do Tesouro OT €3,034,000 4.13% 14/4/2027 4,352,304 0.03%Portugal Obrigacoes do Tesouro OT €3,323,000 2.88% 15/10/2025 4,328,813 0.03%Portugal Obrigacoes do Tesouro OT €2,000,000 2.20% 17/10/2022 2,404,426 0.01%Portugal Obrigacoes do Tesouro OT €1,500,000 3.85% 15/4/2021 1,779,371 0.01%Banco Santander Totta SA €1,500,000 0.88% 25/4/2024 1,753,444 0.01%EDP Finance BV $1,650,000 3.63% 15/7/2024 1,715,109 0.01%Portugal Government International Bond $1,435,000 5.13% 15/10/2024 1,608,994 0.01%EDP Finance BV £800,000 8.63% 4/1/2024 1,343,701 0.01%Banco Comercial Portugues SA €1,000,000 0.75% 31/5/2022 1,142,945 0.01%EDP Finance BV €800,000 1.88% 13/10/2025 970,826 0.01%Portugal Obrigacoes do Tesouro OT €700,000 4.95% 25/10/2023 939,829 0.01%Caixa Economica Montepio Geral Caixa Economica
Bancaria SA €700,000 0.88% 17/10/2022 802,721 0.00%
Vanguard Global Bond Index Fund
350
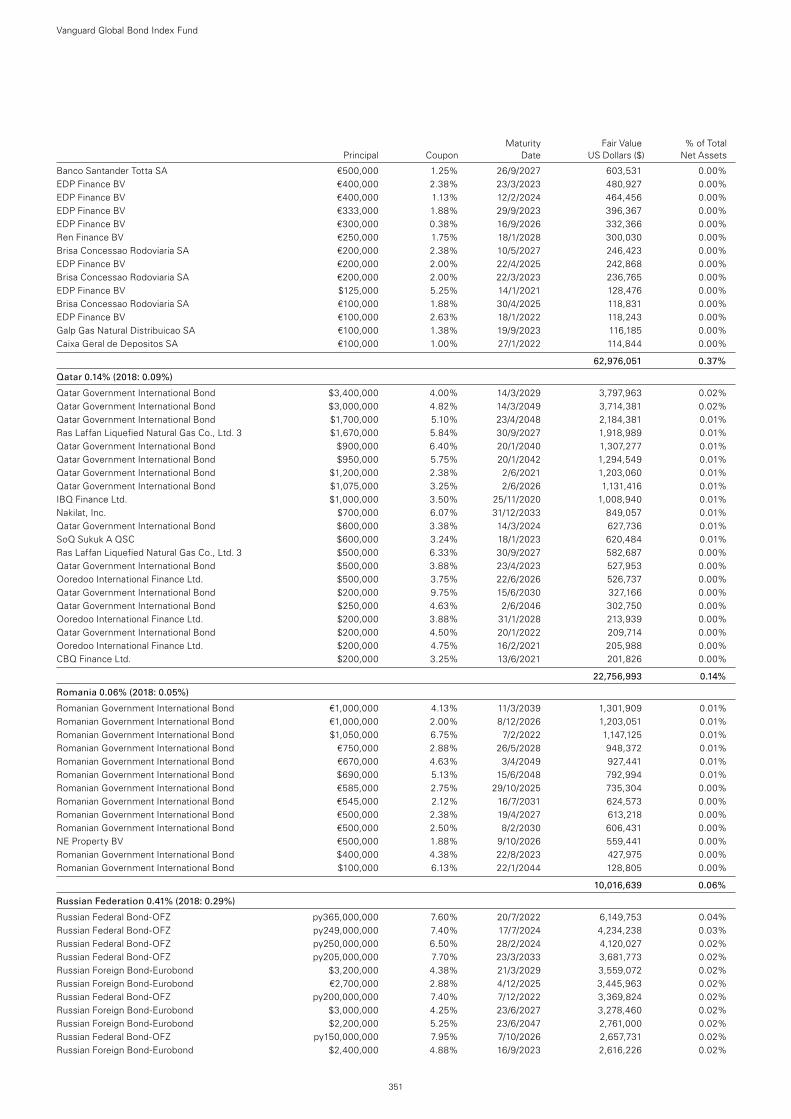
Maturity Fair Value % of Total Principal Coupon Date US Dollars ($) Net Assets
Banco Santander Totta SA €500,000 1.25% 26/9/2027 603,531 0.00%EDP Finance BV €400,000 2.38% 23/3/2023 480,927 0.00%EDP Finance BV €400,000 1.13% 12/2/2024 464,456 0.00%EDP Finance BV €333,000 1.88% 29/9/2023 396,367 0.00%EDP Finance BV €300,000 0.38% 16/9/2026 332,366 0.00%Ren Finance BV €250,000 1.75% 18/1/2028 300,030 0.00%Brisa Concessao Rodoviaria SA €200,000 2.38% 10/5/2027 246,423 0.00%EDP Finance BV €200,000 2.00% 22/4/2025 242,868 0.00%Brisa Concessao Rodoviaria SA €200,000 2.00% 22/3/2023 236,765 0.00%EDP Finance BV $125,000 5.25% 14/1/2021 128,476 0.00%Brisa Concessao Rodoviaria SA €100,000 1.88% 30/4/2025 118,831 0.00%EDP Finance BV €100,000 2.63% 18/1/2022 118,243 0.00%Galp Gas Natural Distribuicao SA €100,000 1.38% 19/9/2023 116,185 0.00%Caixa Geral de Depositos SA €100,000 1.00% 27/1/2022 114,844 0.00%
62,976,051 0.37%
Qatar 0.14% (2018: 0.09%)
Qatar Government International Bond $3,400,000 4.00% 14/3/2029 3,797,963 0.02%Qatar Government International Bond $3,000,000 4.82% 14/3/2049 3,714,381 0.02%Qatar Government International Bond $1,700,000 5.10% 23/4/2048 2,184,381 0.01%Ras Laffan Liquefied Natural Gas Co., Ltd. 3 $1,670,000 5.84% 30/9/2027 1,918,989 0.01%Qatar Government International Bond $900,000 6.40% 20/1/2040 1,307,277 0.01%Qatar Government International Bond $950,000 5.75% 20/1/2042 1,294,549 0.01%Qatar Government International Bond $1,200,000 2.38% 2/6/2021 1,203,060 0.01%Qatar Government International Bond $1,075,000 3.25% 2/6/2026 1,131,416 0.01%IBQ Finance Ltd. $1,000,000 3.50% 25/11/2020 1,008,940 0.01%Nakilat, Inc. $700,000 6.07% 31/12/2033 849,057 0.01%Qatar Government International Bond $600,000 3.38% 14/3/2024 627,736 0.01%SoQ Sukuk A QSC $600,000 3.24% 18/1/2023 620,484 0.01%Ras Laffan Liquefied Natural Gas Co., Ltd. 3 $500,000 6.33% 30/9/2027 582,687 0.00%Qatar Government International Bond $500,000 3.88% 23/4/2023 527,953 0.00%Ooredoo International Finance Ltd. $500,000 3.75% 22/6/2026 526,737 0.00%Qatar Government International Bond $200,000 9.75% 15/6/2030 327,166 0.00%Qatar Government International Bond $250,000 4.63% 2/6/2046 302,750 0.00%Ooredoo International Finance Ltd. $200,000 3.88% 31/1/2028 213,939 0.00%Qatar Government International Bond $200,000 4.50% 20/1/2022 209,714 0.00%Ooredoo International Finance Ltd. $200,000 4.75% 16/2/2021 205,988 0.00%CBQ Finance Ltd. $200,000 3.25% 13/6/2021 201,826 0.00%
22,756,993 0.14%
Romania 0.06% (2018: 0.05%)
Romanian Government International Bond €1,000,000 4.13% 11/3/2039 1,301,909 0.01%Romanian Government International Bond €1,000,000 2.00% 8/12/2026 1,203,051 0.01%Romanian Government International Bond $1,050,000 6.75% 7/2/2022 1,147,125 0.01%Romanian Government International Bond €750,000 2.88% 26/5/2028 948,372 0.01%Romanian Government International Bond €670,000 4.63% 3/4/2049 927,441 0.01%Romanian Government International Bond $690,000 5.13% 15/6/2048 792,994 0.01%Romanian Government International Bond €585,000 2.75% 29/10/2025 735,304 0.00%Romanian Government International Bond €545,000 2.12% 16/7/2031 624,573 0.00%Romanian Government International Bond €500,000 2.38% 19/4/2027 613,218 0.00%Romanian Government International Bond €500,000 2.50% 8/2/2030 606,431 0.00%NE Property BV €500,000 1.88% 9/10/2026 559,441 0.00%Romanian Government International Bond $400,000 4.38% 22/8/2023 427,975 0.00%Romanian Government International Bond $100,000 6.13% 22/1/2044 128,805 0.00%
10,016,639 0.06%
Russian Federation 0.41% (2018: 0.29%)
Russian Federal Bond-OFZ py365,000,000 7.60% 20/7/2022 6,149,753 0.04%Russian Federal Bond-OFZ py249,000,000 7.40% 17/7/2024 4,234,238 0.03%Russian Federal Bond-OFZ py250,000,000 6.50% 28/2/2024 4,120,027 0.02%Russian Federal Bond-OFZ py205,000,000 7.70% 23/3/2033 3,681,773 0.02%Russian Foreign Bond-Eurobond $3,200,000 4.38% 21/3/2029 3,559,072 0.02%Russian Foreign Bond-Eurobond €2,700,000 2.88% 4/12/2025 3,445,963 0.02%Russian Federal Bond-OFZ py200,000,000 7.40% 7/12/2022 3,369,824 0.02%Russian Foreign Bond-Eurobond $3,000,000 4.25% 23/6/2027 3,278,460 0.02%Russian Foreign Bond-Eurobond $2,200,000 5.25% 23/6/2047 2,761,000 0.02%Russian Federal Bond-OFZ py150,000,000 7.95% 7/10/2026 2,657,731 0.02%Russian Foreign Bond-Eurobond $2,400,000 4.88% 16/9/2023 2,616,226 0.02%
Vanguard Global Bond Index Fund
351
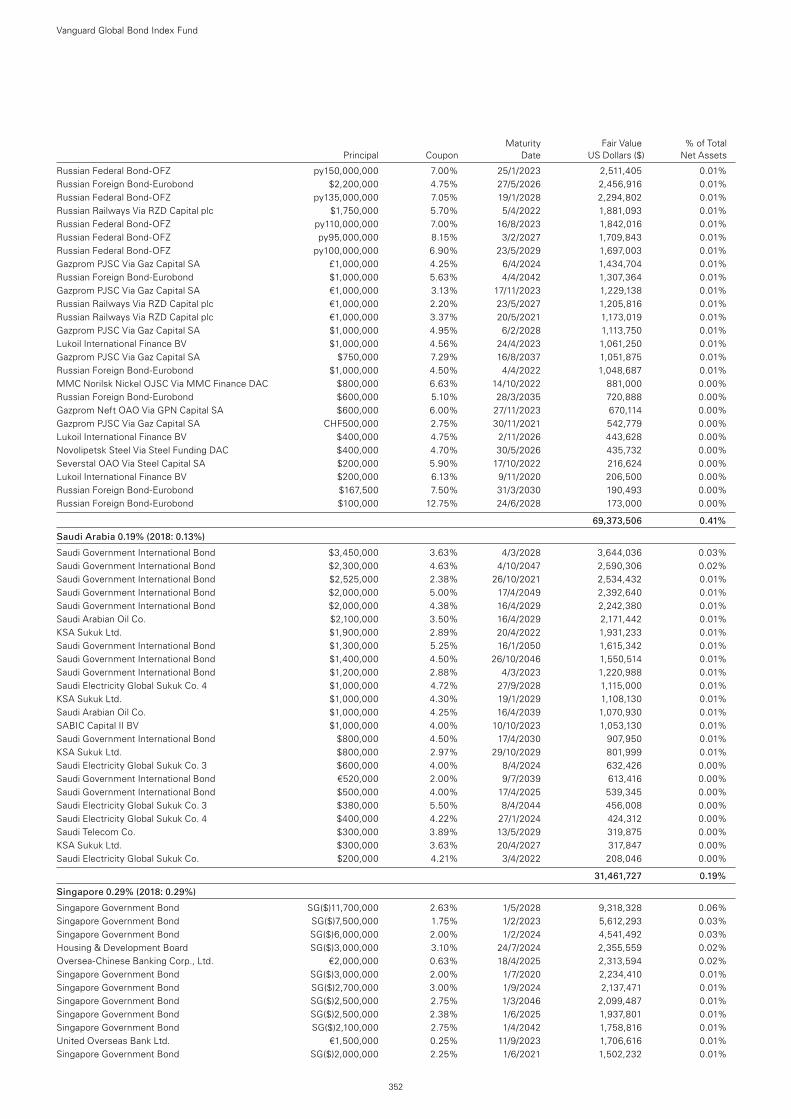
Maturity Fair Value % of Total Principal Coupon Date US Dollars ($) Net Assets
Russian Federal Bond-OFZ py150,000,000 7.00% 25/1/2023 2,511,405 0.01%Russian Foreign Bond-Eurobond $2,200,000 4.75% 27/5/2026 2,456,916 0.01%Russian Federal Bond-OFZ py135,000,000 7.05% 19/1/2028 2,294,802 0.01%Russian Railways Via RZD Capital plc $1,750,000 5.70% 5/4/2022 1,881,093 0.01%Russian Federal Bond-OFZ py110,000,000 7.00% 16/8/2023 1,842,016 0.01%Russian Federal Bond-OFZ py95,000,000 8.15% 3/2/2027 1,709,843 0.01%Russian Federal Bond-OFZ py100,000,000 6.90% 23/5/2029 1,697,003 0.01%Gazprom PJSC Via Gaz Capital SA £1,000,000 4.25% 6/4/2024 1,434,704 0.01%Russian Foreign Bond-Eurobond $1,000,000 5.63% 4/4/2042 1,307,364 0.01%Gazprom PJSC Via Gaz Capital SA €1,000,000 3.13% 17/11/2023 1,229,138 0.01%Russian Railways Via RZD Capital plc €1,000,000 2.20% 23/5/2027 1,205,816 0.01%Russian Railways Via RZD Capital plc €1,000,000 3.37% 20/5/2021 1,173,019 0.01%Gazprom PJSC Via Gaz Capital SA $1,000,000 4.95% 6/2/2028 1,113,750 0.01%Lukoil International Finance BV $1,000,000 4.56% 24/4/2023 1,061,250 0.01%Gazprom PJSC Via Gaz Capital SA $750,000 7.29% 16/8/2037 1,051,875 0.01%Russian Foreign Bond-Eurobond $1,000,000 4.50% 4/4/2022 1,048,687 0.01%MMC Norilsk Nickel OJSC Via MMC Finance DAC $800,000 6.63% 14/10/2022 881,000 0.00%Russian Foreign Bond-Eurobond $600,000 5.10% 28/3/2035 720,888 0.00%Gazprom Neft OAO Via GPN Capital SA $600,000 6.00% 27/11/2023 670,114 0.00%Gazprom PJSC Via Gaz Capital SA CHF500,000 2.75% 30/11/2021 542,779 0.00%Lukoil International Finance BV $400,000 4.75% 2/11/2026 443,628 0.00%Novolipetsk Steel Via Steel Funding DAC $400,000 4.70% 30/5/2026 435,732 0.00%Severstal OAO Via Steel Capital SA $200,000 5.90% 17/10/2022 216,624 0.00%Lukoil International Finance BV $200,000 6.13% 9/11/2020 206,500 0.00%Russian Foreign Bond-Eurobond $167,500 7.50% 31/3/2030 190,493 0.00%Russian Foreign Bond-Eurobond $100,000 12.75% 24/6/2028 173,000 0.00%
69,373,506 0.41%
Saudi Arabia 0.19% (2018: 0.13%)
Saudi Government International Bond $3,450,000 3.63% 4/3/2028 3,644,036 0.03%Saudi Government International Bond $2,300,000 4.63% 4/10/2047 2,590,306 0.02%Saudi Government International Bond $2,525,000 2.38% 26/10/2021 2,534,432 0.01%Saudi Government International Bond $2,000,000 5.00% 17/4/2049 2,392,640 0.01%Saudi Government International Bond $2,000,000 4.38% 16/4/2029 2,242,380 0.01%Saudi Arabian Oil Co. $2,100,000 3.50% 16/4/2029 2,171,442 0.01%KSA Sukuk Ltd. $1,900,000 2.89% 20/4/2022 1,931,233 0.01%Saudi Government International Bond $1,300,000 5.25% 16/1/2050 1,615,342 0.01%Saudi Government International Bond $1,400,000 4.50% 26/10/2046 1,550,514 0.01%Saudi Government International Bond $1,200,000 2.88% 4/3/2023 1,220,988 0.01%Saudi Electricity Global Sukuk Co. 4 $1,000,000 4.72% 27/9/2028 1,115,000 0.01%KSA Sukuk Ltd. $1,000,000 4.30% 19/1/2029 1,108,130 0.01%Saudi Arabian Oil Co. $1,000,000 4.25% 16/4/2039 1,070,930 0.01%SABIC Capital II BV $1,000,000 4.00% 10/10/2023 1,053,130 0.01%Saudi Government International Bond $800,000 4.50% 17/4/2030 907,950 0.01%KSA Sukuk Ltd. $800,000 2.97% 29/10/2029 801,999 0.01%Saudi Electricity Global Sukuk Co. 3 $600,000 4.00% 8/4/2024 632,426 0.00%Saudi Government International Bond €520,000 2.00% 9/7/2039 613,416 0.00%Saudi Government International Bond $500,000 4.00% 17/4/2025 539,345 0.00%Saudi Electricity Global Sukuk Co. 3 $380,000 5.50% 8/4/2044 456,008 0.00%Saudi Electricity Global Sukuk Co. 4 $400,000 4.22% 27/1/2024 424,312 0.00%Saudi Telecom Co. $300,000 3.89% 13/5/2029 319,875 0.00%KSA Sukuk Ltd. $300,000 3.63% 20/4/2027 317,847 0.00%Saudi Electricity Global Sukuk Co. $200,000 4.21% 3/4/2022 208,046 0.00%
31,461,727 0.19%
Singapore 0.29% (2018: 0.29%)
Singapore Government Bond SG($)11,700,000 2.63% 1/5/2028 9,318,328 0.06%Singapore Government Bond SG($)7,500,000 1.75% 1/2/2023 5,612,293 0.03%Singapore Government Bond SG($)6,000,000 2.00% 1/2/2024 4,541,492 0.03%Housing & Development Board SG($)3,000,000 3.10% 24/7/2024 2,355,559 0.02%Oversea-Chinese Banking Corp., Ltd. €2,000,000 0.63% 18/4/2025 2,313,594 0.02%Singapore Government Bond SG($)3,000,000 2.00% 1/7/2020 2,234,410 0.01%Singapore Government Bond SG($)2,700,000 3.00% 1/9/2024 2,137,471 0.01%Singapore Government Bond SG($)2,500,000 2.75% 1/3/2046 2,099,487 0.01%Singapore Government Bond SG($)2,500,000 2.38% 1/6/2025 1,937,801 0.01%Singapore Government Bond SG($)2,100,000 2.75% 1/4/2042 1,758,816 0.01%United Overseas Bank Ltd. €1,500,000 0.25% 11/9/2023 1,706,616 0.01%Singapore Government Bond SG($)2,000,000 2.25% 1/6/2021 1,502,232 0.01%
Vanguard Global Bond Index Fund
352
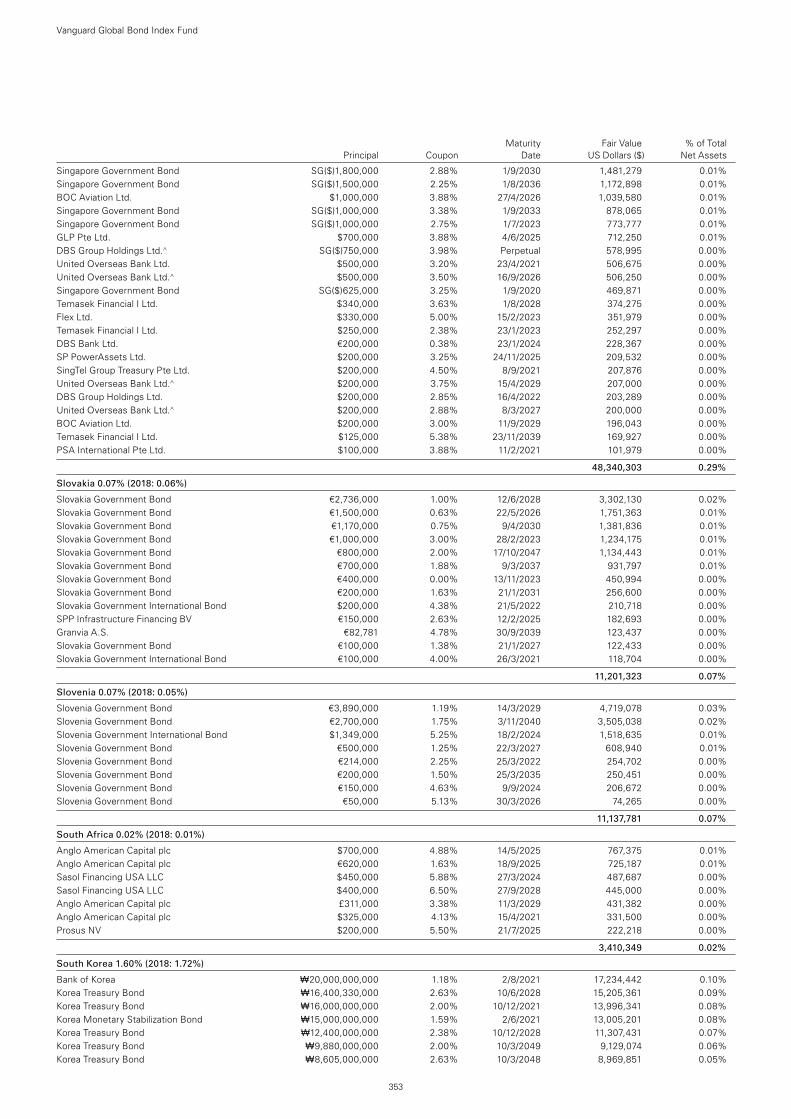
Maturity Fair Value % of Total Principal Coupon Date US Dollars ($) Net Assets
Singapore Government Bond SG($)1,800,000 2.88% 1/9/2030 1,481,279 0.01%Singapore Government Bond SG($)1,500,000 2.25% 1/8/2036 1,172,898 0.01%BOC Aviation Ltd. $1,000,000 3.88% 27/4/2026 1,039,580 0.01%Singapore Government Bond SG($)1,000,000 3.38% 1/9/2033 878,065 0.01%Singapore Government Bond SG($)1,000,000 2.75% 1/7/2023 773,777 0.01%GLP Pte Ltd. $700,000 3.88% 4/6/2025 712,250 0.01%DBS Group Holdings Ltd.^ SG($)750,000 3.98% Perpetual 578,995 0.00%United Overseas Bank Ltd. $500,000 3.20% 23/4/2021 506,675 0.00%United Overseas Bank Ltd.^ $500,000 3.50% 16/9/2026 506,250 0.00%Singapore Government Bond SG($)625,000 3.25% 1/9/2020 469,871 0.00%Temasek Financial I Ltd. $340,000 3.63% 1/8/2028 374,275 0.00%Flex Ltd. $330,000 5.00% 15/2/2023 351,979 0.00%Temasek Financial I Ltd. $250,000 2.38% 23/1/2023 252,297 0.00%DBS Bank Ltd. €200,000 0.38% 23/1/2024 228,367 0.00%SP PowerAssets Ltd. $200,000 3.25% 24/11/2025 209,532 0.00%SingTel Group Treasury Pte Ltd. $200,000 4.50% 8/9/2021 207,876 0.00%United Overseas Bank Ltd.^ $200,000 3.75% 15/4/2029 207,000 0.00%DBS Group Holdings Ltd. $200,000 2.85% 16/4/2022 203,289 0.00%United Overseas Bank Ltd.^ $200,000 2.88% 8/3/2027 200,000 0.00%BOC Aviation Ltd. $200,000 3.00% 11/9/2029 196,043 0.00%Temasek Financial I Ltd. $125,000 5.38% 23/11/2039 169,927 0.00%PSA International Pte Ltd. $100,000 3.88% 11/2/2021 101,979 0.00%
48,340,303 0.29%
Slovakia 0.07% (2018: 0.06%)
Slovakia Government Bond €2,736,000 1.00% 12/6/2028 3,302,130 0.02%Slovakia Government Bond €1,500,000 0.63% 22/5/2026 1,751,363 0.01%Slovakia Government Bond €1,170,000 0.75% 9/4/2030 1,381,836 0.01%Slovakia Government Bond €1,000,000 3.00% 28/2/2023 1,234,175 0.01%Slovakia Government Bond €800,000 2.00% 17/10/2047 1,134,443 0.01%Slovakia Government Bond €700,000 1.88% 9/3/2037 931,797 0.01%Slovakia Government Bond €400,000 0.00% 13/11/2023 450,994 0.00%Slovakia Government Bond €200,000 1.63% 21/1/2031 256,600 0.00%Slovakia Government International Bond $200,000 4.38% 21/5/2022 210,718 0.00%SPP Infrastructure Financing BV €150,000 2.63% 12/2/2025 182,693 0.00%Granvia A.S. €82,781 4.78% 30/9/2039 123,437 0.00%Slovakia Government Bond €100,000 1.38% 21/1/2027 122,433 0.00%Slovakia Government International Bond €100,000 4.00% 26/3/2021 118,704 0.00%
11,201,323 0.07%
Slovenia 0.07% (2018: 0.05%)
Slovenia Government Bond €3,890,000 1.19% 14/3/2029 4,719,078 0.03%Slovenia Government Bond €2,700,000 1.75% 3/11/2040 3,505,038 0.02%Slovenia Government International Bond $1,349,000 5.25% 18/2/2024 1,518,635 0.01%Slovenia Government Bond €500,000 1.25% 22/3/2027 608,940 0.01%Slovenia Government Bond €214,000 2.25% 25/3/2022 254,702 0.00%Slovenia Government Bond €200,000 1.50% 25/3/2035 250,451 0.00%Slovenia Government Bond €150,000 4.63% 9/9/2024 206,672 0.00%Slovenia Government Bond €50,000 5.13% 30/3/2026 74,265 0.00%
11,137,781 0.07%
South Africa 0.02% (2018: 0.01%)
Anglo American Capital plc $700,000 4.88% 14/5/2025 767,375 0.01%Anglo American Capital plc €620,000 1.63% 18/9/2025 725,187 0.01%Sasol Financing USA LLC $450,000 5.88% 27/3/2024 487,687 0.00%Sasol Financing USA LLC $400,000 6.50% 27/9/2028 445,000 0.00%Anglo American Capital plc £311,000 3.38% 11/3/2029 431,382 0.00%Anglo American Capital plc $325,000 4.13% 15/4/2021 331,500 0.00%Prosus NV $200,000 5.50% 21/7/2025 222,218 0.00%
3,410,349 0.02%
South Korea 1.60% (2018: 1.72%)
Bank of Korea ₩20,000,000,000 1.18% 2/8/2021 17,234,442 0.10%Korea Treasury Bond ₩16,400,330,000 2.63% 10/6/2028 15,205,361 0.09%Korea Treasury Bond ₩16,000,000,000 2.00% 10/12/2021 13,996,341 0.08%Korea Monetary Stabilization Bond ₩15,000,000,000 1.59% 2/6/2021 13,005,201 0.08%Korea Treasury Bond ₩12,400,000,000 2.38% 10/12/2028 11,307,431 0.07%Korea Treasury Bond ₩9,880,000,000 2.00% 10/3/2049 9,129,074 0.06%Korea Treasury Bond ₩8,605,000,000 2.63% 10/3/2048 8,969,851 0.05%
Vanguard Global Bond Index Fund
353
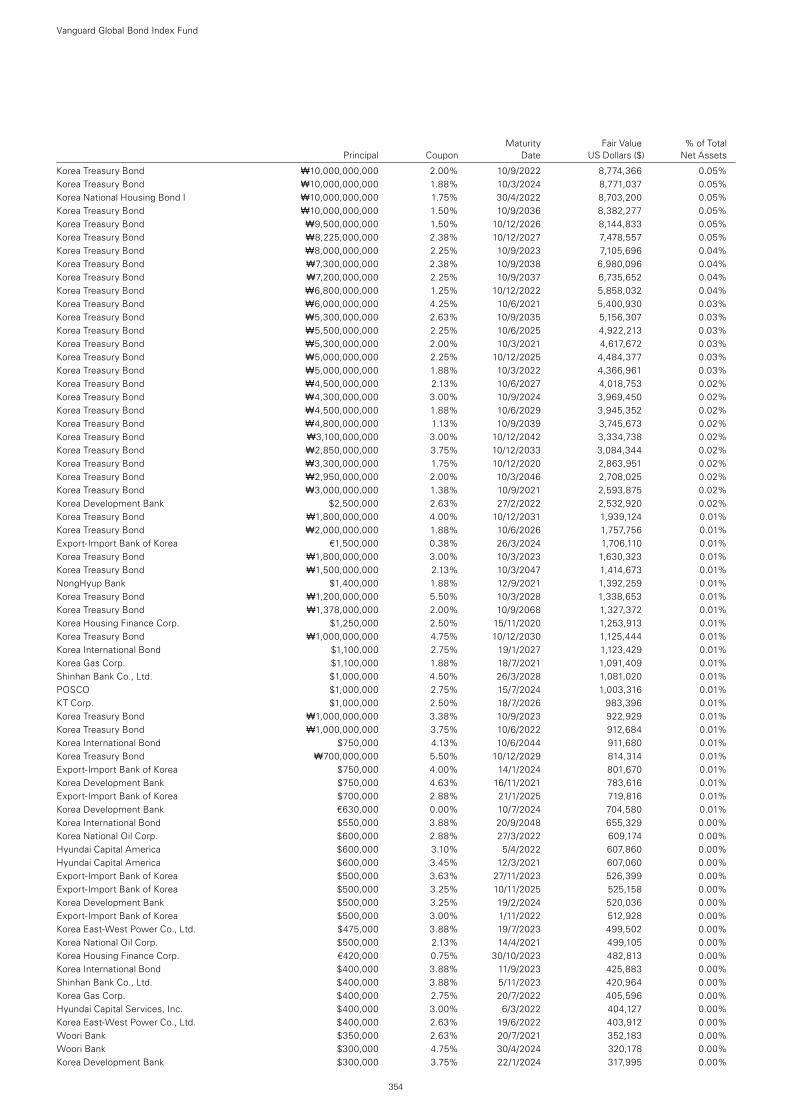
Maturity Fair Value % of Total Principal Coupon Date US Dollars ($) Net Assets
Korea Treasury Bond ₩10,000,000,000 2.00% 10/9/2022 8,774,366 0.05%Korea Treasury Bond ₩10,000,000,000 1.88% 10/3/2024 8,771,037 0.05%Korea National Housing Bond I ₩10,000,000,000 1.75% 30/4/2022 8,703,200 0.05%Korea Treasury Bond ₩10,000,000,000 1.50% 10/9/2036 8,382,277 0.05%Korea Treasury Bond ₩9,500,000,000 1.50% 10/12/2026 8,144,833 0.05%Korea Treasury Bond ₩8,225,000,000 2.38% 10/12/2027 7,478,557 0.05%Korea Treasury Bond ₩8,000,000,000 2.25% 10/9/2023 7,105,696 0.04%Korea Treasury Bond ₩7,300,000,000 2.38% 10/9/2038 6,980,096 0.04%Korea Treasury Bond ₩7,200,000,000 2.25% 10/9/2037 6,735,652 0.04%Korea Treasury Bond ₩6,800,000,000 1.25% 10/12/2022 5,858,032 0.04%Korea Treasury Bond ₩6,000,000,000 4.25% 10/6/2021 5,400,930 0.03%Korea Treasury Bond ₩5,300,000,000 2.63% 10/9/2035 5,156,307 0.03%Korea Treasury Bond ₩5,500,000,000 2.25% 10/6/2025 4,922,213 0.03%Korea Treasury Bond ₩5,300,000,000 2.00% 10/3/2021 4,617,672 0.03%Korea Treasury Bond ₩5,000,000,000 2.25% 10/12/2025 4,484,377 0.03%Korea Treasury Bond ₩5,000,000,000 1.88% 10/3/2022 4,366,961 0.03%Korea Treasury Bond ₩4,500,000,000 2.13% 10/6/2027 4,018,753 0.02%Korea Treasury Bond ₩4,300,000,000 3.00% 10/9/2024 3,969,450 0.02%Korea Treasury Bond ₩4,500,000,000 1.88% 10/6/2029 3,945,352 0.02%Korea Treasury Bond ₩4,800,000,000 1.13% 10/9/2039 3,745,673 0.02%Korea Treasury Bond ₩3,100,000,000 3.00% 10/12/2042 3,334,738 0.02%Korea Treasury Bond ₩2,850,000,000 3.75% 10/12/2033 3,084,344 0.02%Korea Treasury Bond ₩3,300,000,000 1.75% 10/12/2020 2,863,951 0.02%Korea Treasury Bond ₩2,950,000,000 2.00% 10/3/2046 2,708,025 0.02%Korea Treasury Bond ₩3,000,000,000 1.38% 10/9/2021 2,593,875 0.02%Korea Development Bank $2,500,000 2.63% 27/2/2022 2,532,920 0.02%Korea Treasury Bond ₩1,800,000,000 4.00% 10/12/2031 1,939,124 0.01%Korea Treasury Bond ₩2,000,000,000 1.88% 10/6/2026 1,757,756 0.01%Export-Import Bank of Korea €1,500,000 0.38% 26/3/2024 1,706,110 0.01%Korea Treasury Bond ₩1,800,000,000 3.00% 10/3/2023 1,630,323 0.01%Korea Treasury Bond ₩1,500,000,000 2.13% 10/3/2047 1,414,673 0.01%NongHyup Bank $1,400,000 1.88% 12/9/2021 1,392,259 0.01%Korea Treasury Bond ₩1,200,000,000 5.50% 10/3/2028 1,338,653 0.01%Korea Treasury Bond ₩1,378,000,000 2.00% 10/9/2068 1,327,372 0.01%Korea Housing Finance Corp. $1,250,000 2.50% 15/11/2020 1,253,913 0.01%Korea Treasury Bond ₩1,000,000,000 4.75% 10/12/2030 1,125,444 0.01%Korea International Bond $1,100,000 2.75% 19/1/2027 1,123,429 0.01%Korea Gas Corp. $1,100,000 1.88% 18/7/2021 1,091,409 0.01%Shinhan Bank Co., Ltd. $1,000,000 4.50% 26/3/2028 1,081,020 0.01%POSCO $1,000,000 2.75% 15/7/2024 1,003,316 0.01%KT Corp. $1,000,000 2.50% 18/7/2026 983,396 0.01%Korea Treasury Bond ₩1,000,000,000 3.38% 10/9/2023 922,929 0.01%Korea Treasury Bond ₩1,000,000,000 3.75% 10/6/2022 912,684 0.01%Korea International Bond $750,000 4.13% 10/6/2044 911,680 0.01%Korea Treasury Bond ₩700,000,000 5.50% 10/12/2029 814,314 0.01%Export-Import Bank of Korea $750,000 4.00% 14/1/2024 801,670 0.01%Korea Development Bank $750,000 4.63% 16/11/2021 783,616 0.01%Export-Import Bank of Korea $700,000 2.88% 21/1/2025 719,816 0.01%Korea Development Bank €630,000 0.00% 10/7/2024 704,580 0.01%Korea International Bond $550,000 3.88% 20/9/2048 655,329 0.00%Korea National Oil Corp. $600,000 2.88% 27/3/2022 609,174 0.00%Hyundai Capital America $600,000 3.10% 5/4/2022 607,860 0.00%Hyundai Capital America $600,000 3.45% 12/3/2021 607,060 0.00%Export-Import Bank of Korea $500,000 3.63% 27/11/2023 526,399 0.00%Export-Import Bank of Korea $500,000 3.25% 10/11/2025 525,158 0.00%Korea Development Bank $500,000 3.25% 19/2/2024 520,036 0.00%Export-Import Bank of Korea $500,000 3.00% 1/11/2022 512,928 0.00%Korea East-West Power Co., Ltd. $475,000 3.88% 19/7/2023 499,502 0.00%Korea National Oil Corp. $500,000 2.13% 14/4/2021 499,105 0.00%Korea Housing Finance Corp. €420,000 0.75% 30/10/2023 482,813 0.00%Korea International Bond $400,000 3.88% 11/9/2023 425,883 0.00%Shinhan Bank Co., Ltd. $400,000 3.88% 5/11/2023 420,964 0.00%Korea Gas Corp. $400,000 2.75% 20/7/2022 405,596 0.00%Hyundai Capital Services, Inc. $400,000 3.00% 6/3/2022 404,127 0.00%Korea East-West Power Co., Ltd. $400,000 2.63% 19/6/2022 403,912 0.00%Woori Bank $350,000 2.63% 20/7/2021 352,183 0.00%Woori Bank $300,000 4.75% 30/4/2024 320,178 0.00%Korea Development Bank $300,000 3.75% 22/1/2024 317,995 0.00%
Vanguard Global Bond Index Fund
354
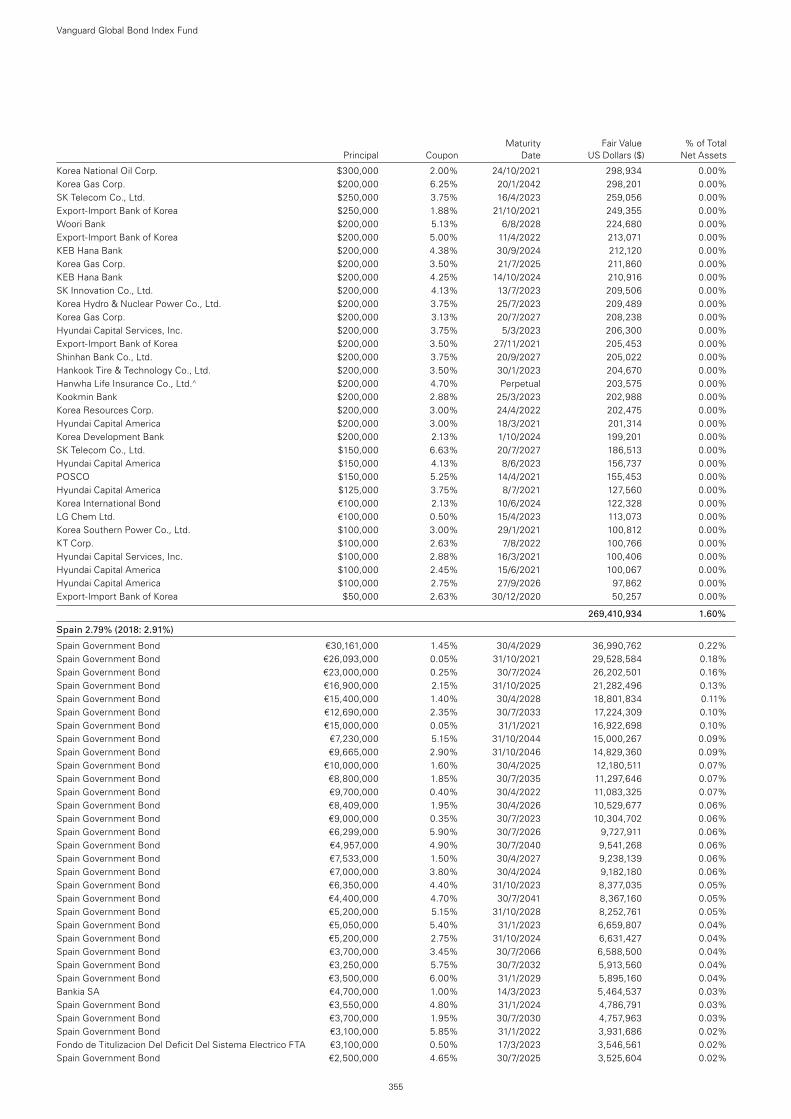
Maturity Fair Value % of Total Principal Coupon Date US Dollars ($) Net Assets
Korea National Oil Corp. $300,000 2.00% 24/10/2021 298,934 0.00%Korea Gas Corp. $200,000 6.25% 20/1/2042 298,201 0.00%SK Telecom Co., Ltd. $250,000 3.75% 16/4/2023 259,056 0.00%Export-Import Bank of Korea $250,000 1.88% 21/10/2021 249,355 0.00%Woori Bank $200,000 5.13% 6/8/2028 224,680 0.00%Export-Import Bank of Korea $200,000 5.00% 11/4/2022 213,071 0.00%KEB Hana Bank $200,000 4.38% 30/9/2024 212,120 0.00%Korea Gas Corp. $200,000 3.50% 21/7/2025 211,860 0.00%KEB Hana Bank $200,000 4.25% 14/10/2024 210,916 0.00%SK Innovation Co., Ltd. $200,000 4.13% 13/7/2023 209,506 0.00%Korea Hydro & Nuclear Power Co., Ltd. $200,000 3.75% 25/7/2023 209,489 0.00%Korea Gas Corp. $200,000 3.13% 20/7/2027 208,238 0.00%Hyundai Capital Services, Inc. $200,000 3.75% 5/3/2023 206,300 0.00%Export-Import Bank of Korea $200,000 3.50% 27/11/2021 205,453 0.00%Shinhan Bank Co., Ltd. $200,000 3.75% 20/9/2027 205,022 0.00%Hankook Tire & Technology Co., Ltd. $200,000 3.50% 30/1/2023 204,670 0.00%Hanwha Life Insurance Co., Ltd.^ $200,000 4.70% Perpetual 203,575 0.00%Kookmin Bank $200,000 2.88% 25/3/2023 202,988 0.00%Korea Resources Corp. $200,000 3.00% 24/4/2022 202,475 0.00%Hyundai Capital America $200,000 3.00% 18/3/2021 201,314 0.00%Korea Development Bank $200,000 2.13% 1/10/2024 199,201 0.00%SK Telecom Co., Ltd. $150,000 6.63% 20/7/2027 186,513 0.00%Hyundai Capital America $150,000 4.13% 8/6/2023 156,737 0.00%POSCO $150,000 5.25% 14/4/2021 155,453 0.00%Hyundai Capital America $125,000 3.75% 8/7/2021 127,560 0.00%Korea International Bond €100,000 2.13% 10/6/2024 122,328 0.00%LG Chem Ltd. €100,000 0.50% 15/4/2023 113,073 0.00%Korea Southern Power Co., Ltd. $100,000 3.00% 29/1/2021 100,812 0.00%KT Corp. $100,000 2.63% 7/8/2022 100,766 0.00%Hyundai Capital Services, Inc. $100,000 2.88% 16/3/2021 100,406 0.00%Hyundai Capital America $100,000 2.45% 15/6/2021 100,067 0.00%Hyundai Capital America $100,000 2.75% 27/9/2026 97,862 0.00%Export-Import Bank of Korea $50,000 2.63% 30/12/2020 50,257 0.00%
269,410,934 1.60%
Spain 2.79% (2018: 2.91%)
Spain Government Bond €30,161,000 1.45% 30/4/2029 36,990,762 0.22%Spain Government Bond €26,093,000 0.05% 31/10/2021 29,528,584 0.18%Spain Government Bond €23,000,000 0.25% 30/7/2024 26,202,501 0.16%Spain Government Bond €16,900,000 2.15% 31/10/2025 21,282,496 0.13%Spain Government Bond €15,400,000 1.40% 30/4/2028 18,801,834 0.11%Spain Government Bond €12,690,000 2.35% 30/7/2033 17,224,309 0.10%Spain Government Bond €15,000,000 0.05% 31/1/2021 16,922,698 0.10%Spain Government Bond €7,230,000 5.15% 31/10/2044 15,000,267 0.09%Spain Government Bond €9,665,000 2.90% 31/10/2046 14,829,360 0.09%Spain Government Bond €10,000,000 1.60% 30/4/2025 12,180,511 0.07%Spain Government Bond €8,800,000 1.85% 30/7/2035 11,297,646 0.07%Spain Government Bond €9,700,000 0.40% 30/4/2022 11,083,325 0.07%Spain Government Bond €8,409,000 1.95% 30/4/2026 10,529,677 0.06%Spain Government Bond €9,000,000 0.35% 30/7/2023 10,304,702 0.06%Spain Government Bond €6,299,000 5.90% 30/7/2026 9,727,911 0.06%Spain Government Bond €4,957,000 4.90% 30/7/2040 9,541,268 0.06%Spain Government Bond €7,533,000 1.50% 30/4/2027 9,238,139 0.06%Spain Government Bond €7,000,000 3.80% 30/4/2024 9,182,180 0.06%Spain Government Bond €6,350,000 4.40% 31/10/2023 8,377,035 0.05%Spain Government Bond €4,400,000 4.70% 30/7/2041 8,367,160 0.05%Spain Government Bond €5,200,000 5.15% 31/10/2028 8,252,761 0.05%Spain Government Bond €5,050,000 5.40% 31/1/2023 6,659,807 0.04%Spain Government Bond €5,200,000 2.75% 31/10/2024 6,631,427 0.04%Spain Government Bond €3,700,000 3.45% 30/7/2066 6,588,500 0.04%Spain Government Bond €3,250,000 5.75% 30/7/2032 5,913,560 0.04%Spain Government Bond €3,500,000 6.00% 31/1/2029 5,895,160 0.04%Bankia SA €4,700,000 1.00% 14/3/2023 5,464,537 0.03%Spain Government Bond €3,550,000 4.80% 31/1/2024 4,786,791 0.03%Spain Government Bond €3,700,000 1.95% 30/7/2030 4,757,963 0.03%Spain Government Bond €3,100,000 5.85% 31/1/2022 3,931,686 0.02%Fondo de Titulizacion Del Deficit Del Sistema Electrico FTA €3,100,000 0.50% 17/3/2023 3,546,561 0.02%Spain Government Bond €2,500,000 4.65% 30/7/2025 3,525,604 0.02%
Vanguard Global Bond Index Fund
355
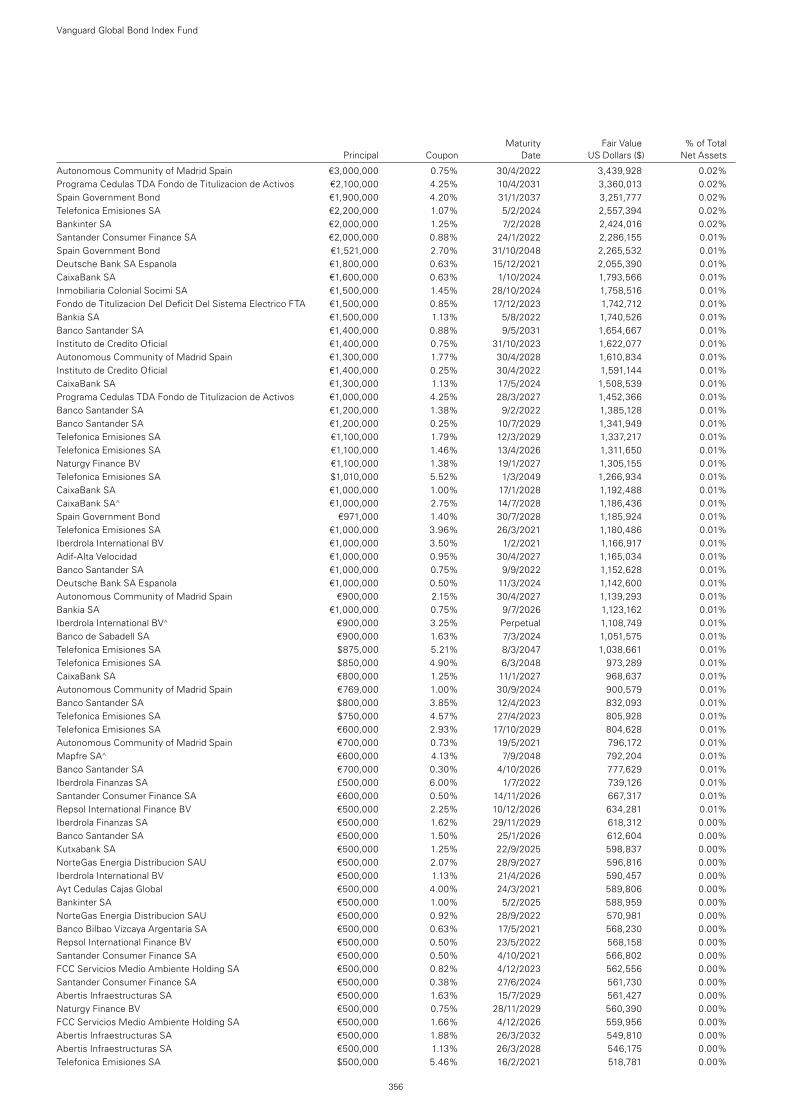
Maturity Fair Value % of Total Principal Coupon Date US Dollars ($) Net Assets
Autonomous Community of Madrid Spain €3,000,000 0.75% 30/4/2022 3,439,928 0.02%Programa Cedulas TDA Fondo de Titulizacion de Activos €2,100,000 4.25% 10/4/2031 3,360,013 0.02%Spain Government Bond €1,900,000 4.20% 31/1/2037 3,251,777 0.02%Telefonica Emisiones SA €2,200,000 1.07% 5/2/2024 2,557,394 0.02%Bankinter SA €2,000,000 1.25% 7/2/2028 2,424,016 0.02%Santander Consumer Finance SA €2,000,000 0.88% 24/1/2022 2,286,155 0.01%Spain Government Bond €1,521,000 2.70% 31/10/2048 2,265,532 0.01%Deutsche Bank SA Espanola €1,800,000 0.63% 15/12/2021 2,055,390 0.01%CaixaBank SA €1,600,000 0.63% 1/10/2024 1,793,566 0.01%Inmobiliaria Colonial Socimi SA €1,500,000 1.45% 28/10/2024 1,758,516 0.01%Fondo de Titulizacion Del Deficit Del Sistema Electrico FTA €1,500,000 0.85% 17/12/2023 1,742,712 0.01%Bankia SA €1,500,000 1.13% 5/8/2022 1,740,526 0.01%Banco Santander SA €1,400,000 0.88% 9/5/2031 1,654,667 0.01%Instituto de Credito Oficial €1,400,000 0.75% 31/10/2023 1,622,077 0.01%Autonomous Community of Madrid Spain €1,300,000 1.77% 30/4/2028 1,610,834 0.01%Instituto de Credito Oficial €1,400,000 0.25% 30/4/2022 1,591,144 0.01%CaixaBank SA €1,300,000 1.13% 17/5/2024 1,508,539 0.01%Programa Cedulas TDA Fondo de Titulizacion de Activos €1,000,000 4.25% 28/3/2027 1,452,366 0.01%Banco Santander SA €1,200,000 1.38% 9/2/2022 1,385,128 0.01%Banco Santander SA €1,200,000 0.25% 10/7/2029 1,341,949 0.01%Telefonica Emisiones SA €1,100,000 1.79% 12/3/2029 1,337,217 0.01%Telefonica Emisiones SA €1,100,000 1.46% 13/4/2026 1,311,650 0.01%Naturgy Finance BV €1,100,000 1.38% 19/1/2027 1,305,155 0.01%Telefonica Emisiones SA $1,010,000 5.52% 1/3/2049 1,266,934 0.01%CaixaBank SA €1,000,000 1.00% 17/1/2028 1,192,488 0.01%CaixaBank SA^ €1,000,000 2.75% 14/7/2028 1,186,436 0.01%Spain Government Bond €971,000 1.40% 30/7/2028 1,185,924 0.01%Telefonica Emisiones SA €1,000,000 3.96% 26/3/2021 1,180,486 0.01%Iberdrola International BV €1,000,000 3.50% 1/2/2021 1,166,917 0.01%Adif-Alta Velocidad €1,000,000 0.95% 30/4/2027 1,165,034 0.01%Banco Santander SA €1,000,000 0.75% 9/9/2022 1,152,628 0.01%Deutsche Bank SA Espanola €1,000,000 0.50% 11/3/2024 1,142,600 0.01%Autonomous Community of Madrid Spain €900,000 2.15% 30/4/2027 1,139,293 0.01%Bankia SA €1,000,000 0.75% 9/7/2026 1,123,162 0.01%Iberdrola International BV^ €900,000 3.25% Perpetual 1,108,749 0.01%Banco de Sabadell SA €900,000 1.63% 7/3/2024 1,051,575 0.01%Telefonica Emisiones SA $875,000 5.21% 8/3/2047 1,038,661 0.01%Telefonica Emisiones SA $850,000 4.90% 6/3/2048 973,289 0.01%CaixaBank SA €800,000 1.25% 11/1/2027 968,637 0.01%Autonomous Community of Madrid Spain €769,000 1.00% 30/9/2024 900,579 0.01%Banco Santander SA $800,000 3.85% 12/4/2023 832,093 0.01%Telefonica Emisiones SA $750,000 4.57% 27/4/2023 805,928 0.01%Telefonica Emisiones SA €600,000 2.93% 17/10/2029 804,628 0.01%Autonomous Community of Madrid Spain €700,000 0.73% 19/5/2021 796,172 0.01%Mapfre SA^ €600,000 4.13% 7/9/2048 792,204 0.01%Banco Santander SA €700,000 0.30% 4/10/2026 777,629 0.01%Iberdrola Finanzas SA £500,000 6.00% 1/7/2022 739,126 0.01%Santander Consumer Finance SA €600,000 0.50% 14/11/2026 667,317 0.01%Repsol International Finance BV €500,000 2.25% 10/12/2026 634,281 0.01%Iberdrola Finanzas SA €500,000 1.62% 29/11/2029 618,312 0.00%Banco Santander SA €500,000 1.50% 25/1/2026 612,604 0.00%Kutxabank SA €500,000 1.25% 22/9/2025 598,837 0.00%NorteGas Energia Distribucion SAU €500,000 2.07% 28/9/2027 596,816 0.00%Iberdrola International BV €500,000 1.13% 21/4/2026 590,457 0.00%Ayt Cedulas Cajas Global €500,000 4.00% 24/3/2021 589,806 0.00%Bankinter SA €500,000 1.00% 5/2/2025 588,959 0.00%NorteGas Energia Distribucion SAU €500,000 0.92% 28/9/2022 570,981 0.00%Banco Bilbao Vizcaya Argentaria SA €500,000 0.63% 17/5/2021 568,230 0.00%Repsol International Finance BV €500,000 0.50% 23/5/2022 568,158 0.00%Santander Consumer Finance SA €500,000 0.50% 4/10/2021 566,802 0.00%FCC Servicios Medio Ambiente Holding SA €500,000 0.82% 4/12/2023 562,556 0.00%Santander Consumer Finance SA €500,000 0.38% 27/6/2024 561,730 0.00%Abertis Infraestructuras SA €500,000 1.63% 15/7/2029 561,427 0.00%Naturgy Finance BV €500,000 0.75% 28/11/2029 560,390 0.00%FCC Servicios Medio Ambiente Holding SA €500,000 1.66% 4/12/2026 559,956 0.00%Abertis Infraestructuras SA €500,000 1.88% 26/3/2032 549,810 0.00%Abertis Infraestructuras SA €500,000 1.13% 26/3/2028 546,175 0.00%Telefonica Emisiones SA $500,000 5.46% 16/2/2021 518,781 0.00%
Vanguard Global Bond Index Fund
356
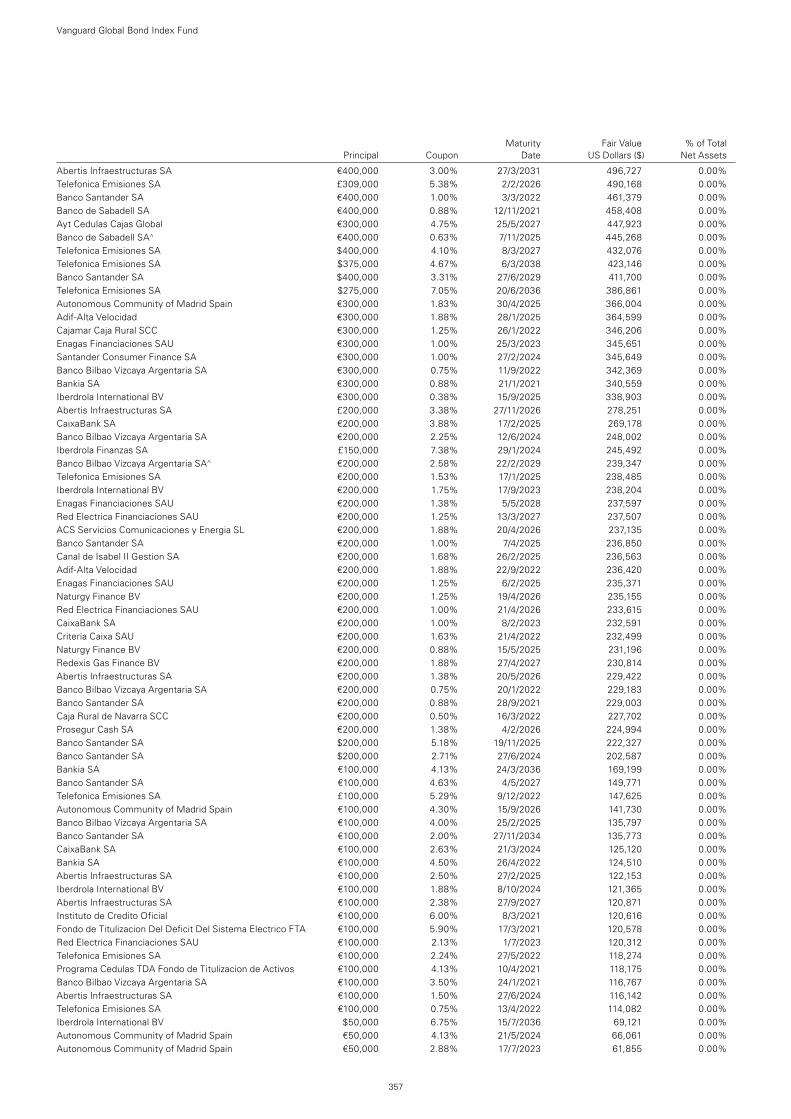
Maturity Fair Value % of Total Principal Coupon Date US Dollars ($) Net Assets
Abertis Infraestructuras SA €400,000 3.00% 27/3/2031 496,727 0.00%Telefonica Emisiones SA £309,000 5.38% 2/2/2026 490,168 0.00%Banco Santander SA €400,000 1.00% 3/3/2022 461,379 0.00%Banco de Sabadell SA €400,000 0.88% 12/11/2021 458,408 0.00%Ayt Cedulas Cajas Global €300,000 4.75% 25/5/2027 447,923 0.00%Banco de Sabadell SA^ €400,000 0.63% 7/11/2025 445,268 0.00%Telefonica Emisiones SA $400,000 4.10% 8/3/2027 432,076 0.00%Telefonica Emisiones SA $375,000 4.67% 6/3/2038 423,146 0.00%Banco Santander SA $400,000 3.31% 27/6/2029 411,700 0.00%Telefonica Emisiones SA $275,000 7.05% 20/6/2036 386,861 0.00%Autonomous Community of Madrid Spain €300,000 1.83% 30/4/2025 366,004 0.00%Adif-Alta Velocidad €300,000 1.88% 28/1/2025 364,599 0.00%Cajamar Caja Rural SCC €300,000 1.25% 26/1/2022 346,206 0.00%Enagas Financiaciones SAU €300,000 1.00% 25/3/2023 345,651 0.00%Santander Consumer Finance SA €300,000 1.00% 27/2/2024 345,649 0.00%Banco Bilbao Vizcaya Argentaria SA €300,000 0.75% 11/9/2022 342,369 0.00%Bankia SA €300,000 0.88% 21/1/2021 340,559 0.00%Iberdrola International BV €300,000 0.38% 15/9/2025 338,903 0.00%Abertis Infraestructuras SA £200,000 3.38% 27/11/2026 278,251 0.00%CaixaBank SA €200,000 3.88% 17/2/2025 269,178 0.00%Banco Bilbao Vizcaya Argentaria SA €200,000 2.25% 12/6/2024 248,002 0.00%Iberdrola Finanzas SA £150,000 7.38% 29/1/2024 245,492 0.00%Banco Bilbao Vizcaya Argentaria SA^ €200,000 2.58% 22/2/2029 239,347 0.00%Telefonica Emisiones SA €200,000 1.53% 17/1/2025 238,485 0.00%Iberdrola International BV €200,000 1.75% 17/9/2023 238,204 0.00%Enagas Financiaciones SAU €200,000 1.38% 5/5/2028 237,597 0.00%Red Electrica Financiaciones SAU €200,000 1.25% 13/3/2027 237,507 0.00%ACS Servicios Comunicaciones y Energia SL €200,000 1.88% 20/4/2026 237,135 0.00%Banco Santander SA €200,000 1.00% 7/4/2025 236,850 0.00%Canal de Isabel II Gestion SA €200,000 1.68% 26/2/2025 236,563 0.00%Adif-Alta Velocidad €200,000 1.88% 22/9/2022 236,420 0.00%Enagas Financiaciones SAU €200,000 1.25% 6/2/2025 235,371 0.00%Naturgy Finance BV €200,000 1.25% 19/4/2026 235,155 0.00%Red Electrica Financiaciones SAU €200,000 1.00% 21/4/2026 233,615 0.00%CaixaBank SA €200,000 1.00% 8/2/2023 232,591 0.00%Criteria Caixa SAU €200,000 1.63% 21/4/2022 232,499 0.00%Naturgy Finance BV €200,000 0.88% 15/5/2025 231,196 0.00%Redexis Gas Finance BV €200,000 1.88% 27/4/2027 230,814 0.00%Abertis Infraestructuras SA €200,000 1.38% 20/5/2026 229,422 0.00%Banco Bilbao Vizcaya Argentaria SA €200,000 0.75% 20/1/2022 229,183 0.00%Banco Santander SA €200,000 0.88% 28/9/2021 229,003 0.00%Caja Rural de Navarra SCC €200,000 0.50% 16/3/2022 227,702 0.00%Prosegur Cash SA €200,000 1.38% 4/2/2026 224,994 0.00%Banco Santander SA $200,000 5.18% 19/11/2025 222,327 0.00%Banco Santander SA $200,000 2.71% 27/6/2024 202,587 0.00%Bankia SA €100,000 4.13% 24/3/2036 169,199 0.00%Banco Santander SA €100,000 4.63% 4/5/2027 149,771 0.00%Telefonica Emisiones SA £100,000 5.29% 9/12/2022 147,625 0.00%Autonomous Community of Madrid Spain €100,000 4.30% 15/9/2026 141,730 0.00%Banco Bilbao Vizcaya Argentaria SA €100,000 4.00% 25/2/2025 135,797 0.00%Banco Santander SA €100,000 2.00% 27/11/2034 135,773 0.00%CaixaBank SA €100,000 2.63% 21/3/2024 125,120 0.00%Bankia SA €100,000 4.50% 26/4/2022 124,510 0.00%Abertis Infraestructuras SA €100,000 2.50% 27/2/2025 122,153 0.00%Iberdrola International BV €100,000 1.88% 8/10/2024 121,365 0.00%Abertis Infraestructuras SA €100,000 2.38% 27/9/2027 120,871 0.00%Instituto de Credito Oficial €100,000 6.00% 8/3/2021 120,616 0.00%Fondo de Titulizacion Del Deficit Del Sistema Electrico FTA €100,000 5.90% 17/3/2021 120,578 0.00%Red Electrica Financiaciones SAU €100,000 2.13% 1/7/2023 120,312 0.00%Telefonica Emisiones SA €100,000 2.24% 27/5/2022 118,274 0.00%Programa Cedulas TDA Fondo de Titulizacion de Activos €100,000 4.13% 10/4/2021 118,175 0.00%Banco Bilbao Vizcaya Argentaria SA €100,000 3.50% 24/1/2021 116,767 0.00%Abertis Infraestructuras SA €100,000 1.50% 27/6/2024 116,142 0.00%Telefonica Emisiones SA €100,000 0.75% 13/4/2022 114,082 0.00%Iberdrola International BV $50,000 6.75% 15/7/2036 69,121 0.00%Autonomous Community of Madrid Spain €50,000 4.13% 21/5/2024 66,061 0.00%Autonomous Community of Madrid Spain €50,000 2.88% 17/7/2023 61,855 0.00%
Vanguard Global Bond Index Fund
357
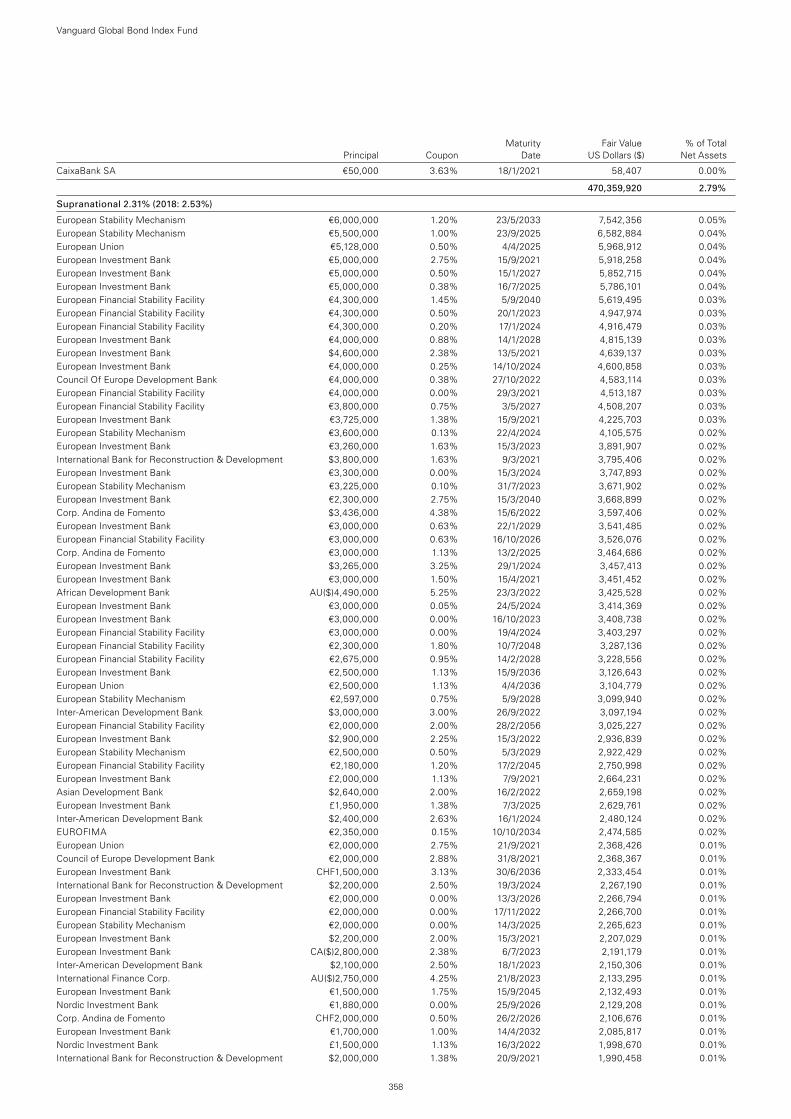
Maturity Fair Value % of Total Principal Coupon Date US Dollars ($) Net Assets
CaixaBank SA €50,000 3.63% 18/1/2021 58,407 0.00%
470,359,920 2.79%
Supranational 2.31% (2018: 2.53%)
European Stability Mechanism €6,000,000 1.20% 23/5/2033 7,542,356 0.05%European Stability Mechanism €5,500,000 1.00% 23/9/2025 6,582,884 0.04%European Union €5,128,000 0.50% 4/4/2025 5,968,912 0.04%European Investment Bank €5,000,000 2.75% 15/9/2021 5,918,258 0.04%European Investment Bank €5,000,000 0.50% 15/1/2027 5,852,715 0.04%European Investment Bank €5,000,000 0.38% 16/7/2025 5,786,101 0.04%European Financial Stability Facility €4,300,000 1.45% 5/9/2040 5,619,495 0.03%European Financial Stability Facility €4,300,000 0.50% 20/1/2023 4,947,974 0.03%European Financial Stability Facility €4,300,000 0.20% 17/1/2024 4,916,479 0.03%European Investment Bank €4,000,000 0.88% 14/1/2028 4,815,139 0.03%European Investment Bank $4,600,000 2.38% 13/5/2021 4,639,137 0.03%European Investment Bank €4,000,000 0.25% 14/10/2024 4,600,858 0.03%Council Of Europe Development Bank €4,000,000 0.38% 27/10/2022 4,583,114 0.03%European Financial Stability Facility €4,000,000 0.00% 29/3/2021 4,513,187 0.03%European Financial Stability Facility €3,800,000 0.75% 3/5/2027 4,508,207 0.03%European Investment Bank €3,725,000 1.38% 15/9/2021 4,225,703 0.03%European Stability Mechanism €3,600,000 0.13% 22/4/2024 4,105,575 0.02%European Investment Bank €3,260,000 1.63% 15/3/2023 3,891,907 0.02%International Bank for Reconstruction & Development $3,800,000 1.63% 9/3/2021 3,795,406 0.02%European Investment Bank €3,300,000 0.00% 15/3/2024 3,747,893 0.02%European Stability Mechanism €3,225,000 0.10% 31/7/2023 3,671,902 0.02%European Investment Bank €2,300,000 2.75% 15/3/2040 3,668,899 0.02%Corp. Andina de Fomento $3,436,000 4.38% 15/6/2022 3,597,406 0.02%European Investment Bank €3,000,000 0.63% 22/1/2029 3,541,485 0.02%European Financial Stability Facility €3,000,000 0.63% 16/10/2026 3,526,076 0.02%Corp. Andina de Fomento €3,000,000 1.13% 13/2/2025 3,464,686 0.02%European Investment Bank $3,265,000 3.25% 29/1/2024 3,457,413 0.02%European Investment Bank €3,000,000 1.50% 15/4/2021 3,451,452 0.02%African Development Bank AU($)4,490,000 5.25% 23/3/2022 3,425,528 0.02%European Investment Bank €3,000,000 0.05% 24/5/2024 3,414,369 0.02%European Investment Bank €3,000,000 0.00% 16/10/2023 3,408,738 0.02%European Financial Stability Facility €3,000,000 0.00% 19/4/2024 3,403,297 0.02%European Financial Stability Facility €2,300,000 1.80% 10/7/2048 3,287,136 0.02%European Financial Stability Facility €2,675,000 0.95% 14/2/2028 3,228,556 0.02%European Investment Bank €2,500,000 1.13% 15/9/2036 3,126,643 0.02%European Union €2,500,000 1.13% 4/4/2036 3,104,779 0.02%European Stability Mechanism €2,597,000 0.75% 5/9/2028 3,099,940 0.02%Inter-American Development Bank $3,000,000 3.00% 26/9/2022 3,097,194 0.02%European Financial Stability Facility €2,000,000 2.00% 28/2/2056 3,025,227 0.02%European Investment Bank $2,900,000 2.25% 15/3/2022 2,936,839 0.02%European Stability Mechanism €2,500,000 0.50% 5/3/2029 2,922,429 0.02%European Financial Stability Facility €2,180,000 1.20% 17/2/2045 2,750,998 0.02%European Investment Bank £2,000,000 1.13% 7/9/2021 2,664,231 0.02%Asian Development Bank $2,640,000 2.00% 16/2/2022 2,659,198 0.02%European Investment Bank £1,950,000 1.38% 7/3/2025 2,629,761 0.02%Inter-American Development Bank $2,400,000 2.63% 16/1/2024 2,480,124 0.02%EUROFIMA €2,350,000 0.15% 10/10/2034 2,474,585 0.02%European Union €2,000,000 2.75% 21/9/2021 2,368,426 0.01%Council of Europe Development Bank €2,000,000 2.88% 31/8/2021 2,368,367 0.01%European Investment Bank CHF1,500,000 3.13% 30/6/2036 2,333,454 0.01%International Bank for Reconstruction & Development $2,200,000 2.50% 19/3/2024 2,267,190 0.01%European Investment Bank €2,000,000 0.00% 13/3/2026 2,266,794 0.01%European Financial Stability Facility €2,000,000 0.00% 17/11/2022 2,266,700 0.01%European Stability Mechanism €2,000,000 0.00% 14/3/2025 2,265,623 0.01%European Investment Bank $2,200,000 2.00% 15/3/2021 2,207,029 0.01%European Investment Bank CA($)2,800,000 2.38% 6/7/2023 2,191,179 0.01%Inter-American Development Bank $2,100,000 2.50% 18/1/2023 2,150,306 0.01%International Finance Corp. AU($)2,750,000 4.25% 21/8/2023 2,133,295 0.01%European Investment Bank €1,500,000 1.75% 15/9/2045 2,132,493 0.01%Nordic Investment Bank €1,880,000 0.00% 25/9/2026 2,129,208 0.01%Corp. Andina de Fomento CHF2,000,000 0.50% 26/2/2026 2,106,676 0.01%European Investment Bank €1,700,000 1.00% 14/4/2032 2,085,817 0.01%Nordic Investment Bank £1,500,000 1.13% 16/3/2022 1,998,670 0.01%International Bank for Reconstruction & Development $2,000,000 1.38% 20/9/2021 1,990,458 0.01%
Vanguard Global Bond Index Fund
358
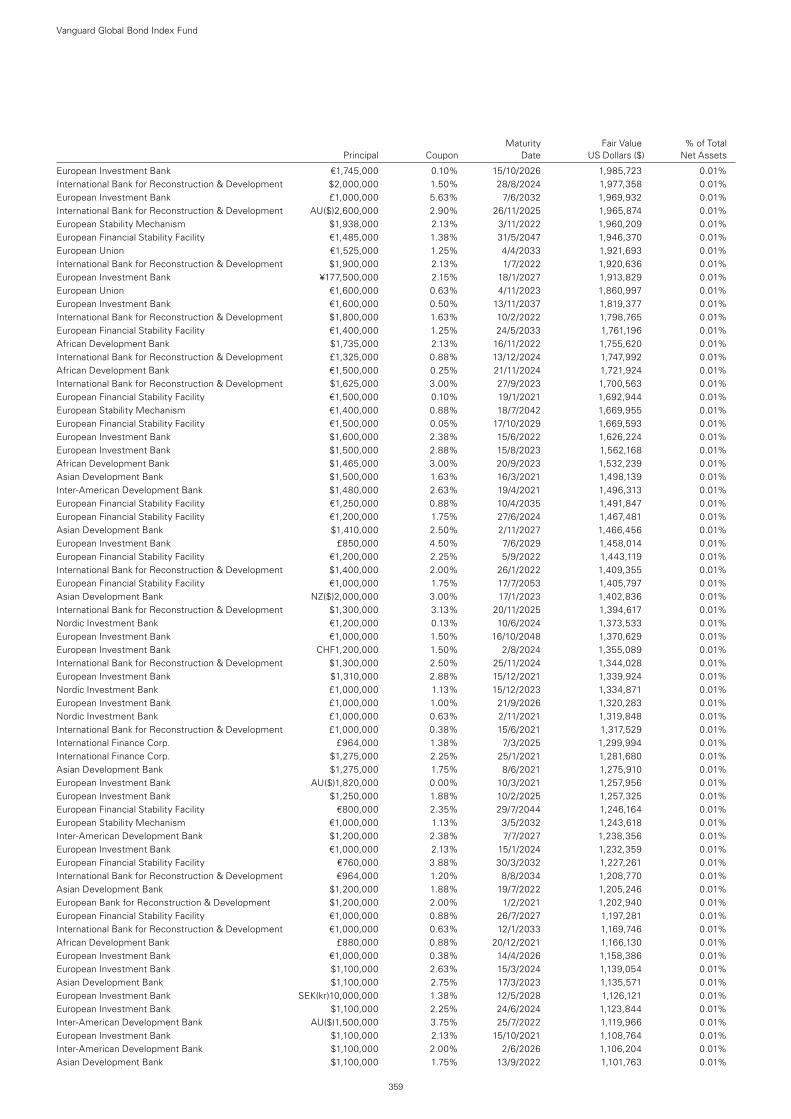
Maturity Fair Value % of Total Principal Coupon Date US Dollars ($) Net Assets
European Investment Bank €1,745,000 0.10% 15/10/2026 1,985,723 0.01%International Bank for Reconstruction & Development $2,000,000 1.50% 28/8/2024 1,977,358 0.01%European Investment Bank £1,000,000 5.63% 7/6/2032 1,969,932 0.01%International Bank for Reconstruction & Development AU($)2,600,000 2.90% 26/11/2025 1,965,874 0.01%European Stability Mechanism $1,938,000 2.13% 3/11/2022 1,960,209 0.01%European Financial Stability Facility €1,485,000 1.38% 31/5/2047 1,946,370 0.01%European Union €1,525,000 1.25% 4/4/2033 1,921,693 0.01%International Bank for Reconstruction & Development $1,900,000 2.13% 1/7/2022 1,920,636 0.01%European Investment Bank ¥177,500,000 2.15% 18/1/2027 1,913,829 0.01%European Union €1,600,000 0.63% 4/11/2023 1,860,997 0.01%European Investment Bank €1,600,000 0.50% 13/11/2037 1,819,377 0.01%International Bank for Reconstruction & Development $1,800,000 1.63% 10/2/2022 1,798,765 0.01%European Financial Stability Facility €1,400,000 1.25% 24/5/2033 1,761,196 0.01%African Development Bank $1,735,000 2.13% 16/11/2022 1,755,620 0.01%International Bank for Reconstruction & Development £1,325,000 0.88% 13/12/2024 1,747,992 0.01%African Development Bank €1,500,000 0.25% 21/11/2024 1,721,924 0.01%International Bank for Reconstruction & Development $1,625,000 3.00% 27/9/2023 1,700,563 0.01%European Financial Stability Facility €1,500,000 0.10% 19/1/2021 1,692,944 0.01%European Stability Mechanism €1,400,000 0.88% 18/7/2042 1,669,955 0.01%European Financial Stability Facility €1,500,000 0.05% 17/10/2029 1,669,593 0.01%European Investment Bank $1,600,000 2.38% 15/6/2022 1,626,224 0.01%European Investment Bank $1,500,000 2.88% 15/8/2023 1,562,168 0.01%African Development Bank $1,465,000 3.00% 20/9/2023 1,532,239 0.01%Asian Development Bank $1,500,000 1.63% 16/3/2021 1,498,139 0.01%Inter-American Development Bank $1,480,000 2.63% 19/4/2021 1,496,313 0.01%European Financial Stability Facility €1,250,000 0.88% 10/4/2035 1,491,847 0.01%European Financial Stability Facility €1,200,000 1.75% 27/6/2024 1,467,481 0.01%Asian Development Bank $1,410,000 2.50% 2/11/2027 1,466,456 0.01%European Investment Bank £850,000 4.50% 7/6/2029 1,458,014 0.01%European Financial Stability Facility €1,200,000 2.25% 5/9/2022 1,443,119 0.01%International Bank for Reconstruction & Development $1,400,000 2.00% 26/1/2022 1,409,355 0.01%European Financial Stability Facility €1,000,000 1.75% 17/7/2053 1,405,797 0.01%Asian Development Bank NZ($)2,000,000 3.00% 17/1/2023 1,402,836 0.01%International Bank for Reconstruction & Development $1,300,000 3.13% 20/11/2025 1,394,617 0.01%Nordic Investment Bank €1,200,000 0.13% 10/6/2024 1,373,533 0.01%European Investment Bank €1,000,000 1.50% 16/10/2048 1,370,629 0.01%European Investment Bank CHF1,200,000 1.50% 2/8/2024 1,355,089 0.01%International Bank for Reconstruction & Development $1,300,000 2.50% 25/11/2024 1,344,028 0.01%European Investment Bank $1,310,000 2.88% 15/12/2021 1,339,924 0.01%Nordic Investment Bank £1,000,000 1.13% 15/12/2023 1,334,871 0.01%European Investment Bank £1,000,000 1.00% 21/9/2026 1,320,283 0.01%Nordic Investment Bank £1,000,000 0.63% 2/11/2021 1,319,848 0.01%International Bank for Reconstruction & Development £1,000,000 0.38% 15/6/2021 1,317,529 0.01%International Finance Corp. £964,000 1.38% 7/3/2025 1,299,994 0.01%International Finance Corp. $1,275,000 2.25% 25/1/2021 1,281,680 0.01%Asian Development Bank $1,275,000 1.75% 8/6/2021 1,275,910 0.01%European Investment Bank AU($)1,820,000 0.00% 10/3/2021 1,257,956 0.01%European Investment Bank $1,250,000 1.88% 10/2/2025 1,257,325 0.01%European Financial Stability Facility €800,000 2.35% 29/7/2044 1,246,164 0.01%European Stability Mechanism €1,000,000 1.13% 3/5/2032 1,243,618 0.01%Inter-American Development Bank $1,200,000 2.38% 7/7/2027 1,238,356 0.01%European Investment Bank €1,000,000 2.13% 15/1/2024 1,232,359 0.01%European Financial Stability Facility €760,000 3.88% 30/3/2032 1,227,261 0.01%International Bank for Reconstruction & Development €964,000 1.20% 8/8/2034 1,208,770 0.01%Asian Development Bank $1,200,000 1.88% 19/7/2022 1,205,246 0.01%European Bank for Reconstruction & Development $1,200,000 2.00% 1/2/2021 1,202,940 0.01%European Financial Stability Facility €1,000,000 0.88% 26/7/2027 1,197,281 0.01%International Bank for Reconstruction & Development €1,000,000 0.63% 12/1/2033 1,169,746 0.01%African Development Bank £880,000 0.88% 20/12/2021 1,166,130 0.01%European Investment Bank €1,000,000 0.38% 14/4/2026 1,158,386 0.01%European Investment Bank $1,100,000 2.63% 15/3/2024 1,139,054 0.01%Asian Development Bank $1,100,000 2.75% 17/3/2023 1,135,571 0.01%European Investment Bank SEK(kr)10,000,000 1.38% 12/5/2028 1,126,121 0.01%European Investment Bank $1,100,000 2.25% 24/6/2024 1,123,844 0.01%Inter-American Development Bank AU($)1,500,000 3.75% 25/7/2022 1,119,966 0.01%European Investment Bank $1,100,000 2.13% 15/10/2021 1,108,764 0.01%Inter-American Development Bank $1,100,000 2.00% 2/6/2026 1,106,204 0.01%Asian Development Bank $1,100,000 1.75% 13/9/2022 1,101,763 0.01%
Vanguard Global Bond Index Fund
359
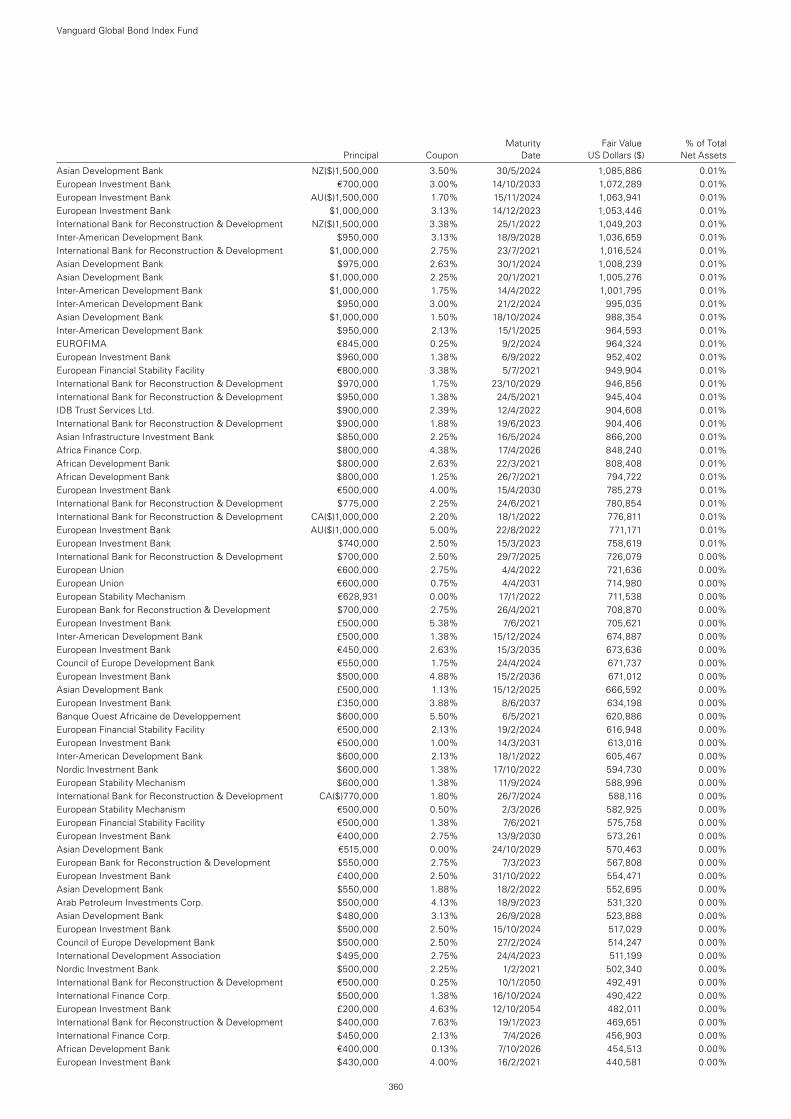
Maturity Fair Value % of Total Principal Coupon Date US Dollars ($) Net Assets
Asian Development Bank NZ($)1,500,000 3.50% 30/5/2024 1,085,886 0.01%European Investment Bank €700,000 3.00% 14/10/2033 1,072,289 0.01%European Investment Bank AU($)1,500,000 1.70% 15/11/2024 1,063,941 0.01%European Investment Bank $1,000,000 3.13% 14/12/2023 1,053,446 0.01%International Bank for Reconstruction & Development NZ($)1,500,000 3.38% 25/1/2022 1,049,203 0.01%Inter-American Development Bank $950,000 3.13% 18/9/2028 1,036,659 0.01%International Bank for Reconstruction & Development $1,000,000 2.75% 23/7/2021 1,016,524 0.01%Asian Development Bank $975,000 2.63% 30/1/2024 1,008,239 0.01%Asian Development Bank $1,000,000 2.25% 20/1/2021 1,005,276 0.01%Inter-American Development Bank $1,000,000 1.75% 14/4/2022 1,001,795 0.01%Inter-American Development Bank $950,000 3.00% 21/2/2024 995,035 0.01%Asian Development Bank $1,000,000 1.50% 18/10/2024 988,354 0.01%Inter-American Development Bank $950,000 2.13% 15/1/2025 964,593 0.01%EUROFIMA €845,000 0.25% 9/2/2024 964,324 0.01%European Investment Bank $960,000 1.38% 6/9/2022 952,402 0.01%European Financial Stability Facility €800,000 3.38% 5/7/2021 949,904 0.01%International Bank for Reconstruction & Development $970,000 1.75% 23/10/2029 946,856 0.01%International Bank for Reconstruction & Development $950,000 1.38% 24/5/2021 945,404 0.01%IDB Trust Services Ltd. $900,000 2.39% 12/4/2022 904,608 0.01%International Bank for Reconstruction & Development $900,000 1.88% 19/6/2023 904,406 0.01%Asian Infrastructure Investment Bank $850,000 2.25% 16/5/2024 866,200 0.01%Africa Finance Corp. $800,000 4.38% 17/4/2026 848,240 0.01%African Development Bank $800,000 2.63% 22/3/2021 808,408 0.01%African Development Bank $800,000 1.25% 26/7/2021 794,722 0.01%European Investment Bank €500,000 4.00% 15/4/2030 785,279 0.01%International Bank for Reconstruction & Development $775,000 2.25% 24/6/2021 780,854 0.01%International Bank for Reconstruction & Development CA($)1,000,000 2.20% 18/1/2022 776,811 0.01%European Investment Bank AU($)1,000,000 5.00% 22/8/2022 771,171 0.01%European Investment Bank $740,000 2.50% 15/3/2023 758,619 0.01%International Bank for Reconstruction & Development $700,000 2.50% 29/7/2025 726,079 0.00%European Union €600,000 2.75% 4/4/2022 721,636 0.00%European Union €600,000 0.75% 4/4/2031 714,980 0.00%European Stability Mechanism €628,931 0.00% 17/1/2022 711,538 0.00%European Bank for Reconstruction & Development $700,000 2.75% 26/4/2021 708,870 0.00%European Investment Bank £500,000 5.38% 7/6/2021 705,621 0.00%Inter-American Development Bank £500,000 1.38% 15/12/2024 674,887 0.00%European Investment Bank €450,000 2.63% 15/3/2035 673,636 0.00%Council of Europe Development Bank €550,000 1.75% 24/4/2024 671,737 0.00%European Investment Bank $500,000 4.88% 15/2/2036 671,012 0.00%Asian Development Bank £500,000 1.13% 15/12/2025 666,592 0.00%European Investment Bank £350,000 3.88% 8/6/2037 634,198 0.00%Banque Ouest Africaine de Developpement $600,000 5.50% 6/5/2021 620,886 0.00%European Financial Stability Facility €500,000 2.13% 19/2/2024 616,948 0.00%European Investment Bank €500,000 1.00% 14/3/2031 613,016 0.00%Inter-American Development Bank $600,000 2.13% 18/1/2022 605,467 0.00%Nordic Investment Bank $600,000 1.38% 17/10/2022 594,730 0.00%European Stability Mechanism $600,000 1.38% 11/9/2024 588,996 0.00%International Bank for Reconstruction & Development CA($)770,000 1.80% 26/7/2024 588,116 0.00%European Stability Mechanism €500,000 0.50% 2/3/2026 582,925 0.00%European Financial Stability Facility €500,000 1.38% 7/6/2021 575,758 0.00%European Investment Bank €400,000 2.75% 13/9/2030 573,261 0.00%Asian Development Bank €515,000 0.00% 24/10/2029 570,463 0.00%European Bank for Reconstruction & Development $550,000 2.75% 7/3/2023 567,808 0.00%European Investment Bank £400,000 2.50% 31/10/2022 554,471 0.00%Asian Development Bank $550,000 1.88% 18/2/2022 552,695 0.00%Arab Petroleum Investments Corp. $500,000 4.13% 18/9/2023 531,320 0.00%Asian Development Bank $480,000 3.13% 26/9/2028 523,888 0.00%European Investment Bank $500,000 2.50% 15/10/2024 517,029 0.00%Council of Europe Development Bank $500,000 2.50% 27/2/2024 514,247 0.00%International Development Association $495,000 2.75% 24/4/2023 511,199 0.00%Nordic Investment Bank $500,000 2.25% 1/2/2021 502,340 0.00%International Bank for Reconstruction & Development €500,000 0.25% 10/1/2050 492,491 0.00%International Finance Corp. $500,000 1.38% 16/10/2024 490,422 0.00%European Investment Bank £200,000 4.63% 12/10/2054 482,011 0.00%International Bank for Reconstruction & Development $400,000 7.63% 19/1/2023 469,651 0.00%International Finance Corp. $450,000 2.13% 7/4/2026 456,903 0.00%African Development Bank €400,000 0.13% 7/10/2026 454,513 0.00%European Investment Bank $430,000 4.00% 16/2/2021 440,581 0.00%
Vanguard Global Bond Index Fund
360
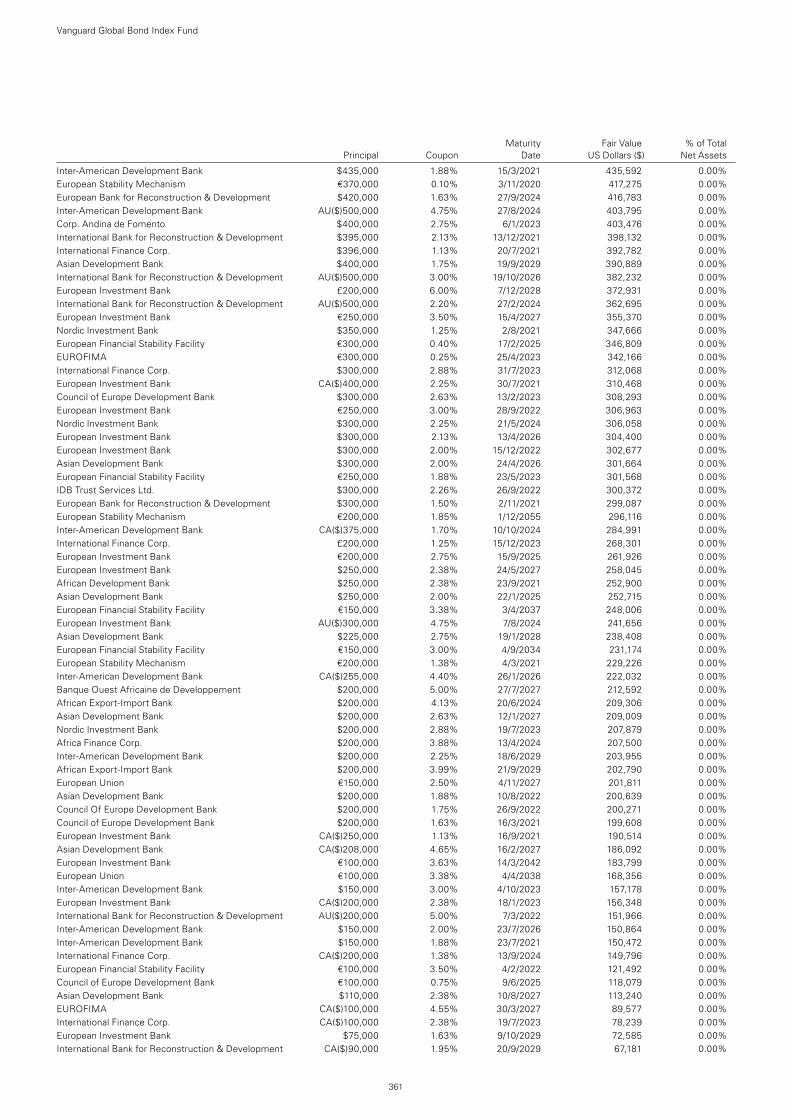
Maturity Fair Value % of Total Principal Coupon Date US Dollars ($) Net Assets
Inter-American Development Bank $435,000 1.88% 15/3/2021 435,592 0.00%European Stability Mechanism €370,000 0.10% 3/11/2020 417,275 0.00%European Bank for Reconstruction & Development $420,000 1.63% 27/9/2024 416,783 0.00%Inter-American Development Bank AU($)500,000 4.75% 27/8/2024 403,795 0.00%Corp. Andina de Fomento $400,000 2.75% 6/1/2023 403,476 0.00%International Bank for Reconstruction & Development $395,000 2.13% 13/12/2021 398,132 0.00%International Finance Corp. $396,000 1.13% 20/7/2021 392,782 0.00%Asian Development Bank $400,000 1.75% 19/9/2029 390,889 0.00%International Bank for Reconstruction & Development AU($)500,000 3.00% 19/10/2026 382,232 0.00%European Investment Bank £200,000 6.00% 7/12/2028 372,931 0.00%International Bank for Reconstruction & Development AU($)500,000 2.20% 27/2/2024 362,695 0.00%European Investment Bank €250,000 3.50% 15/4/2027 355,370 0.00%Nordic Investment Bank $350,000 1.25% 2/8/2021 347,666 0.00%European Financial Stability Facility €300,000 0.40% 17/2/2025 346,809 0.00%EUROFIMA €300,000 0.25% 25/4/2023 342,166 0.00%International Finance Corp. $300,000 2.88% 31/7/2023 312,068 0.00%European Investment Bank CA($)400,000 2.25% 30/7/2021 310,468 0.00%Council of Europe Development Bank $300,000 2.63% 13/2/2023 308,293 0.00%European Investment Bank €250,000 3.00% 28/9/2022 306,963 0.00%Nordic Investment Bank $300,000 2.25% 21/5/2024 306,058 0.00%European Investment Bank $300,000 2.13% 13/4/2026 304,400 0.00%European Investment Bank $300,000 2.00% 15/12/2022 302,677 0.00%Asian Development Bank $300,000 2.00% 24/4/2026 301,664 0.00%European Financial Stability Facility €250,000 1.88% 23/5/2023 301,568 0.00%IDB Trust Services Ltd. $300,000 2.26% 26/9/2022 300,372 0.00%European Bank for Reconstruction & Development $300,000 1.50% 2/11/2021 299,087 0.00%European Stability Mechanism €200,000 1.85% 1/12/2055 296,116 0.00%Inter-American Development Bank CA($)375,000 1.70% 10/10/2024 284,991 0.00%International Finance Corp. £200,000 1.25% 15/12/2023 268,301 0.00%European Investment Bank €200,000 2.75% 15/9/2025 261,926 0.00%European Investment Bank $250,000 2.38% 24/5/2027 258,045 0.00%African Development Bank $250,000 2.38% 23/9/2021 252,900 0.00%Asian Development Bank $250,000 2.00% 22/1/2025 252,715 0.00%European Financial Stability Facility €150,000 3.38% 3/4/2037 248,006 0.00%European Investment Bank AU($)300,000 4.75% 7/8/2024 241,656 0.00%Asian Development Bank $225,000 2.75% 19/1/2028 238,408 0.00%European Financial Stability Facility €150,000 3.00% 4/9/2034 231,174 0.00%European Stability Mechanism €200,000 1.38% 4/3/2021 229,226 0.00%Inter-American Development Bank CA($)255,000 4.40% 26/1/2026 222,032 0.00%Banque Ouest Africaine de Developpement $200,000 5.00% 27/7/2027 212,592 0.00%African Export-Import Bank $200,000 4.13% 20/6/2024 209,306 0.00%Asian Development Bank $200,000 2.63% 12/1/2027 209,009 0.00%Nordic Investment Bank $200,000 2.88% 19/7/2023 207,879 0.00%Africa Finance Corp. $200,000 3.88% 13/4/2024 207,500 0.00%Inter-American Development Bank $200,000 2.25% 18/6/2029 203,955 0.00%African Export-Import Bank $200,000 3.99% 21/9/2029 202,790 0.00%European Union €150,000 2.50% 4/11/2027 201,811 0.00%Asian Development Bank $200,000 1.88% 10/8/2022 200,639 0.00%Council Of Europe Development Bank $200,000 1.75% 26/9/2022 200,271 0.00%Council of Europe Development Bank $200,000 1.63% 16/3/2021 199,608 0.00%European Investment Bank CA($)250,000 1.13% 16/9/2021 190,514 0.00%Asian Development Bank CA($)208,000 4.65% 16/2/2027 186,092 0.00%European Investment Bank €100,000 3.63% 14/3/2042 183,799 0.00%European Union €100,000 3.38% 4/4/2038 168,356 0.00%Inter-American Development Bank $150,000 3.00% 4/10/2023 157,178 0.00%European Investment Bank CA($)200,000 2.38% 18/1/2023 156,348 0.00%International Bank for Reconstruction & Development AU($)200,000 5.00% 7/3/2022 151,966 0.00%Inter-American Development Bank $150,000 2.00% 23/7/2026 150,864 0.00%Inter-American Development Bank $150,000 1.88% 23/7/2021 150,472 0.00%International Finance Corp. CA($)200,000 1.38% 13/9/2024 149,796 0.00%European Financial Stability Facility €100,000 3.50% 4/2/2022 121,492 0.00%Council of Europe Development Bank €100,000 0.75% 9/6/2025 118,079 0.00%Asian Development Bank $110,000 2.38% 10/8/2027 113,240 0.00%EUROFIMA CA($)100,000 4.55% 30/3/2027 89,577 0.00%International Finance Corp. CA($)100,000 2.38% 19/7/2023 78,239 0.00%European Investment Bank $75,000 1.63% 9/10/2029 72,585 0.00%International Bank for Reconstruction & Development CA($)90,000 1.95% 20/9/2029 67,181 0.00%
Vanguard Global Bond Index Fund
361
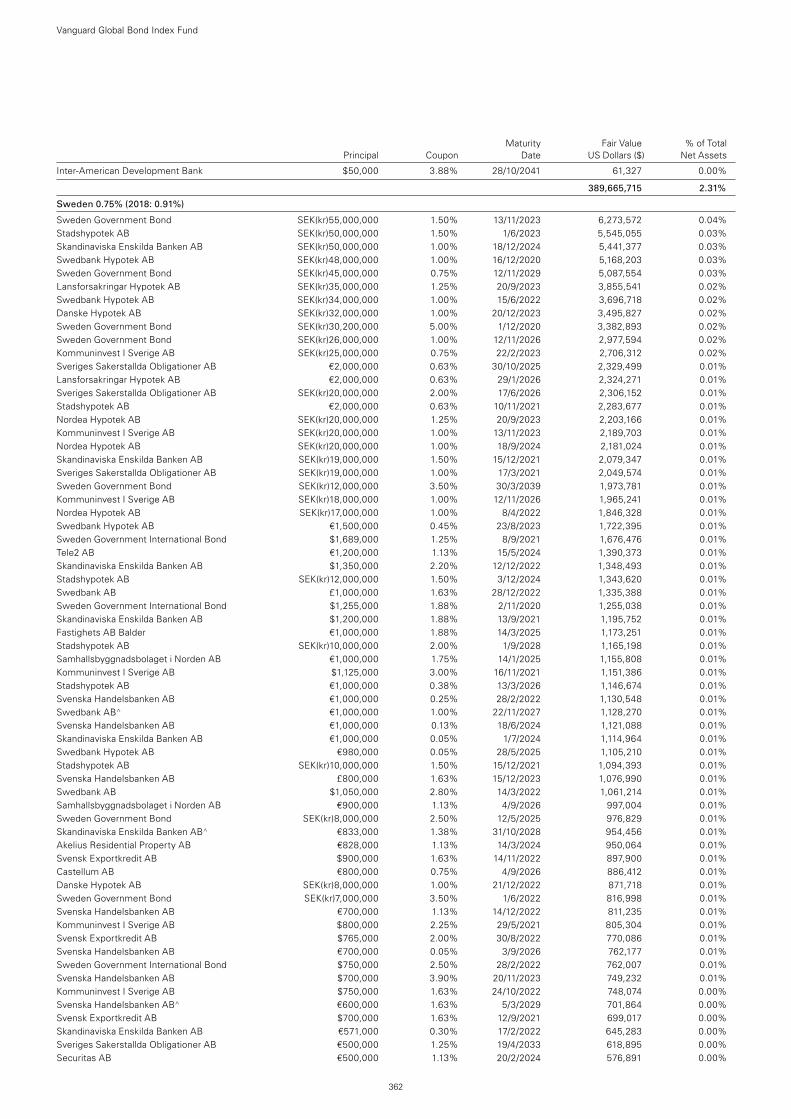
Maturity Fair Value % of Total Principal Coupon Date US Dollars ($) Net Assets
Inter-American Development Bank $50,000 3.88% 28/10/2041 61,327 0.00%
389,665,715 2.31%
Sweden 0.75% (2018: 0.91%)
Sweden Government Bond SEK(kr)55,000,000 1.50% 13/11/2023 6,273,572 0.04%Stadshypotek AB SEK(kr)50,000,000 1.50% 1/6/2023 5,545,055 0.03%Skandinaviska Enskilda Banken AB SEK(kr)50,000,000 1.00% 18/12/2024 5,441,377 0.03%Swedbank Hypotek AB SEK(kr)48,000,000 1.00% 16/12/2020 5,168,203 0.03%Sweden Government Bond SEK(kr)45,000,000 0.75% 12/11/2029 5,087,554 0.03%Lansforsakringar Hypotek AB SEK(kr)35,000,000 1.25% 20/9/2023 3,855,541 0.02%Swedbank Hypotek AB SEK(kr)34,000,000 1.00% 15/6/2022 3,696,718 0.02%Danske Hypotek AB SEK(kr)32,000,000 1.00% 20/12/2023 3,495,827 0.02%Sweden Government Bond SEK(kr)30,200,000 5.00% 1/12/2020 3,382,893 0.02%Sweden Government Bond SEK(kr)26,000,000 1.00% 12/11/2026 2,977,594 0.02%Kommuninvest I Sverige AB SEK(kr)25,000,000 0.75% 22/2/2023 2,706,312 0.02%Sveriges Sakerstallda Obligationer AB €2,000,000 0.63% 30/10/2025 2,329,499 0.01%Lansforsakringar Hypotek AB €2,000,000 0.63% 29/1/2026 2,324,271 0.01%Sveriges Sakerstallda Obligationer AB SEK(kr)20,000,000 2.00% 17/6/2026 2,306,152 0.01%Stadshypotek AB €2,000,000 0.63% 10/11/2021 2,283,677 0.01%Nordea Hypotek AB SEK(kr)20,000,000 1.25% 20/9/2023 2,203,166 0.01%Kommuninvest I Sverige AB SEK(kr)20,000,000 1.00% 13/11/2023 2,189,703 0.01%Nordea Hypotek AB SEK(kr)20,000,000 1.00% 18/9/2024 2,181,024 0.01%Skandinaviska Enskilda Banken AB SEK(kr)19,000,000 1.50% 15/12/2021 2,079,347 0.01%Sveriges Sakerstallda Obligationer AB SEK(kr)19,000,000 1.00% 17/3/2021 2,049,574 0.01%Sweden Government Bond SEK(kr)12,000,000 3.50% 30/3/2039 1,973,781 0.01%Kommuninvest I Sverige AB SEK(kr)18,000,000 1.00% 12/11/2026 1,965,241 0.01%Nordea Hypotek AB SEK(kr)17,000,000 1.00% 8/4/2022 1,846,328 0.01%Swedbank Hypotek AB €1,500,000 0.45% 23/8/2023 1,722,395 0.01%Sweden Government International Bond $1,689,000 1.25% 8/9/2021 1,676,476 0.01%Tele2 AB €1,200,000 1.13% 15/5/2024 1,390,373 0.01%Skandinaviska Enskilda Banken AB $1,350,000 2.20% 12/12/2022 1,348,493 0.01%Stadshypotek AB SEK(kr)12,000,000 1.50% 3/12/2024 1,343,620 0.01%Swedbank AB £1,000,000 1.63% 28/12/2022 1,335,388 0.01%Sweden Government International Bond $1,255,000 1.88% 2/11/2020 1,255,038 0.01%Skandinaviska Enskilda Banken AB $1,200,000 1.88% 13/9/2021 1,195,752 0.01%Fastighets AB Balder €1,000,000 1.88% 14/3/2025 1,173,251 0.01%Stadshypotek AB SEK(kr)10,000,000 2.00% 1/9/2028 1,165,198 0.01%Samhallsbyggnadsbolaget i Norden AB €1,000,000 1.75% 14/1/2025 1,155,808 0.01%Kommuninvest I Sverige AB $1,125,000 3.00% 16/11/2021 1,151,386 0.01%Stadshypotek AB €1,000,000 0.38% 13/3/2026 1,146,674 0.01%Svenska Handelsbanken AB €1,000,000 0.25% 28/2/2022 1,130,548 0.01%Swedbank AB^ €1,000,000 1.00% 22/11/2027 1,128,270 0.01%Svenska Handelsbanken AB €1,000,000 0.13% 18/6/2024 1,121,088 0.01%Skandinaviska Enskilda Banken AB €1,000,000 0.05% 1/7/2024 1,114,964 0.01%Swedbank Hypotek AB €980,000 0.05% 28/5/2025 1,105,210 0.01%Stadshypotek AB SEK(kr)10,000,000 1.50% 15/12/2021 1,094,393 0.01%Svenska Handelsbanken AB £800,000 1.63% 15/12/2023 1,076,990 0.01%Swedbank AB $1,050,000 2.80% 14/3/2022 1,061,214 0.01%Samhallsbyggnadsbolaget i Norden AB €900,000 1.13% 4/9/2026 997,004 0.01%Sweden Government Bond SEK(kr)8,000,000 2.50% 12/5/2025 976,829 0.01%Skandinaviska Enskilda Banken AB^ €833,000 1.38% 31/10/2028 954,456 0.01%Akelius Residential Property AB €828,000 1.13% 14/3/2024 950,064 0.01%Svensk Exportkredit AB $900,000 1.63% 14/11/2022 897,900 0.01%Castellum AB €800,000 0.75% 4/9/2026 886,412 0.01%Danske Hypotek AB SEK(kr)8,000,000 1.00% 21/12/2022 871,718 0.01%Sweden Government Bond SEK(kr)7,000,000 3.50% 1/6/2022 816,998 0.01%Svenska Handelsbanken AB €700,000 1.13% 14/12/2022 811,235 0.01%Kommuninvest I Sverige AB $800,000 2.25% 29/5/2021 805,304 0.01%Svensk Exportkredit AB $765,000 2.00% 30/8/2022 770,086 0.01%Svenska Handelsbanken AB €700,000 0.05% 3/9/2026 762,177 0.01%Sweden Government International Bond $750,000 2.50% 28/2/2022 762,007 0.01%Svenska Handelsbanken AB $700,000 3.90% 20/11/2023 749,232 0.01%Kommuninvest I Sverige AB $750,000 1.63% 24/10/2022 748,074 0.00%Svenska Handelsbanken AB^ €600,000 1.63% 5/3/2029 701,864 0.00%Svensk Exportkredit AB $700,000 1.63% 12/9/2021 699,017 0.00%Skandinaviska Enskilda Banken AB €571,000 0.30% 17/2/2022 645,283 0.00%Sveriges Sakerstallda Obligationer AB €500,000 1.25% 19/4/2033 618,895 0.00%Securitas AB €500,000 1.13% 20/2/2024 576,891 0.00%
Vanguard Global Bond Index Fund
362
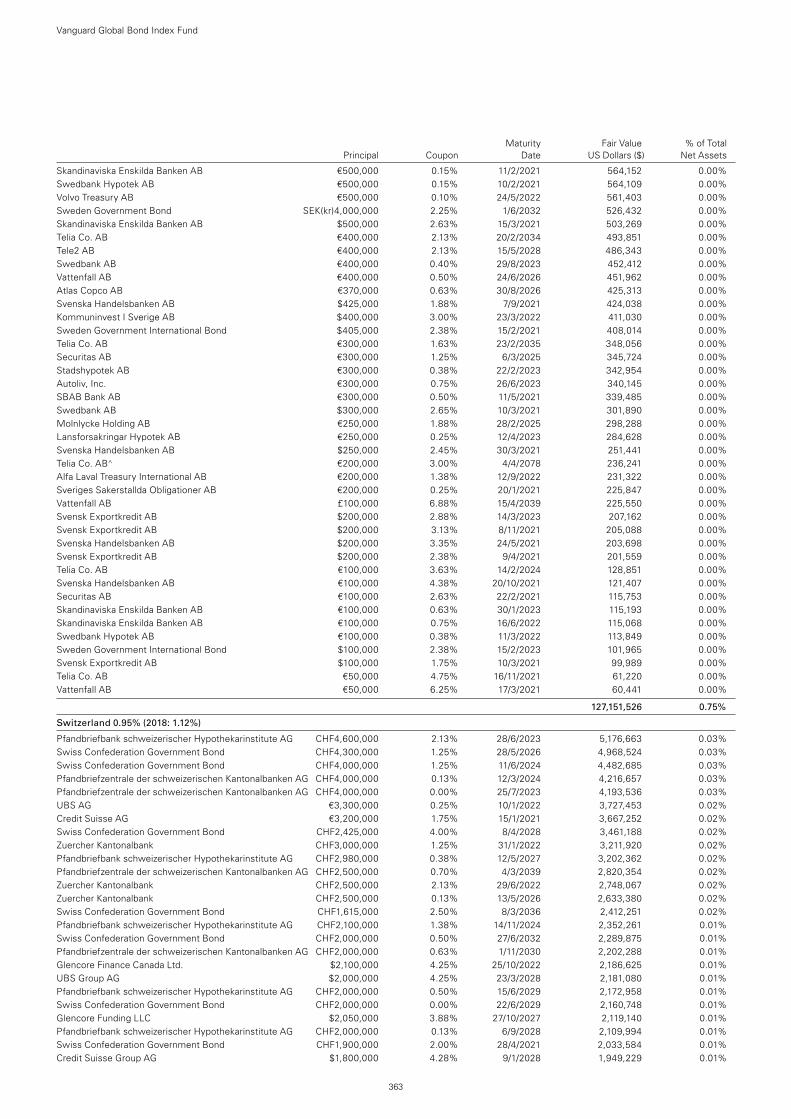
Maturity Fair Value % of Total Principal Coupon Date US Dollars ($) Net Assets
Skandinaviska Enskilda Banken AB €500,000 0.15% 11/2/2021 564,152 0.00%Swedbank Hypotek AB €500,000 0.15% 10/2/2021 564,109 0.00%Volvo Treasury AB €500,000 0.10% 24/5/2022 561,403 0.00%Sweden Government Bond SEK(kr)4,000,000 2.25% 1/6/2032 526,432 0.00%Skandinaviska Enskilda Banken AB $500,000 2.63% 15/3/2021 503,269 0.00%Telia Co. AB €400,000 2.13% 20/2/2034 493,851 0.00%Tele2 AB €400,000 2.13% 15/5/2028 486,343 0.00%Swedbank AB €400,000 0.40% 29/8/2023 452,412 0.00%Vattenfall AB €400,000 0.50% 24/6/2026 451,962 0.00%Atlas Copco AB €370,000 0.63% 30/8/2026 425,313 0.00%Svenska Handelsbanken AB $425,000 1.88% 7/9/2021 424,038 0.00%Kommuninvest I Sverige AB $400,000 3.00% 23/3/2022 411,030 0.00%Sweden Government International Bond $405,000 2.38% 15/2/2021 408,014 0.00%Telia Co. AB €300,000 1.63% 23/2/2035 348,056 0.00%Securitas AB €300,000 1.25% 6/3/2025 345,724 0.00%Stadshypotek AB €300,000 0.38% 22/2/2023 342,954 0.00%Autoliv, Inc. €300,000 0.75% 26/6/2023 340,145 0.00%SBAB Bank AB €300,000 0.50% 11/5/2021 339,485 0.00%Swedbank AB $300,000 2.65% 10/3/2021 301,890 0.00%Molnlycke Holding AB €250,000 1.88% 28/2/2025 298,288 0.00%Lansforsakringar Hypotek AB €250,000 0.25% 12/4/2023 284,628 0.00%Svenska Handelsbanken AB $250,000 2.45% 30/3/2021 251,441 0.00%Telia Co. AB^ €200,000 3.00% 4/4/2078 236,241 0.00%Alfa Laval Treasury International AB €200,000 1.38% 12/9/2022 231,322 0.00%Sveriges Sakerstallda Obligationer AB €200,000 0.25% 20/1/2021 225,847 0.00%Vattenfall AB £100,000 6.88% 15/4/2039 225,550 0.00%Svensk Exportkredit AB $200,000 2.88% 14/3/2023 207,162 0.00%Svensk Exportkredit AB $200,000 3.13% 8/11/2021 205,088 0.00%Svenska Handelsbanken AB $200,000 3.35% 24/5/2021 203,698 0.00%Svensk Exportkredit AB $200,000 2.38% 9/4/2021 201,559 0.00%Telia Co. AB €100,000 3.63% 14/2/2024 128,851 0.00%Svenska Handelsbanken AB €100,000 4.38% 20/10/2021 121,407 0.00%Securitas AB €100,000 2.63% 22/2/2021 115,753 0.00%Skandinaviska Enskilda Banken AB €100,000 0.63% 30/1/2023 115,193 0.00%Skandinaviska Enskilda Banken AB €100,000 0.75% 16/6/2022 115,068 0.00%Swedbank Hypotek AB €100,000 0.38% 11/3/2022 113,849 0.00%Sweden Government International Bond $100,000 2.38% 15/2/2023 101,965 0.00%Svensk Exportkredit AB $100,000 1.75% 10/3/2021 99,989 0.00%Telia Co. AB €50,000 4.75% 16/11/2021 61,220 0.00%Vattenfall AB €50,000 6.25% 17/3/2021 60,441 0.00%
127,151,526 0.75%
Switzerland 0.95% (2018: 1.12%)
Pfandbriefbank schweizerischer Hypothekarinstitute AG CHF4,600,000 2.13% 28/6/2023 5,176,663 0.03%Swiss Confederation Government Bond CHF4,300,000 1.25% 28/5/2026 4,968,524 0.03%Swiss Confederation Government Bond CHF4,000,000 1.25% 11/6/2024 4,482,685 0.03%Pfandbriefzentrale der schweizerischen Kantonalbanken AG CHF4,000,000 0.13% 12/3/2024 4,216,657 0.03%Pfandbriefzentrale der schweizerischen Kantonalbanken AG CHF4,000,000 0.00% 25/7/2023 4,193,536 0.03%UBS AG €3,300,000 0.25% 10/1/2022 3,727,453 0.02%Credit Suisse AG €3,200,000 1.75% 15/1/2021 3,667,252 0.02%Swiss Confederation Government Bond CHF2,425,000 4.00% 8/4/2028 3,461,188 0.02%Zuercher Kantonalbank CHF3,000,000 1.25% 31/1/2022 3,211,920 0.02%Pfandbriefbank schweizerischer Hypothekarinstitute AG CHF2,980,000 0.38% 12/5/2027 3,202,362 0.02%Pfandbriefzentrale der schweizerischen Kantonalbanken AG CHF2,500,000 0.70% 4/3/2039 2,820,354 0.02%Zuercher Kantonalbank CHF2,500,000 2.13% 29/6/2022 2,748,067 0.02%Zuercher Kantonalbank CHF2,500,000 0.13% 13/5/2026 2,633,380 0.02%Swiss Confederation Government Bond CHF1,615,000 2.50% 8/3/2036 2,412,251 0.02%Pfandbriefbank schweizerischer Hypothekarinstitute AG CHF2,100,000 1.38% 14/11/2024 2,352,261 0.01%Swiss Confederation Government Bond CHF2,000,000 0.50% 27/6/2032 2,289,875 0.01%Pfandbriefzentrale der schweizerischen Kantonalbanken AG CHF2,000,000 0.63% 1/11/2030 2,202,288 0.01%Glencore Finance Canada Ltd. $2,100,000 4.25% 25/10/2022 2,186,625 0.01%UBS Group AG $2,000,000 4.25% 23/3/2028 2,181,080 0.01%Pfandbriefbank schweizerischer Hypothekarinstitute AG CHF2,000,000 0.50% 15/6/2029 2,172,958 0.01%Swiss Confederation Government Bond CHF2,000,000 0.00% 22/6/2029 2,160,748 0.01%Glencore Funding LLC $2,050,000 3.88% 27/10/2027 2,119,140 0.01%Pfandbriefbank schweizerischer Hypothekarinstitute AG CHF2,000,000 0.13% 6/9/2028 2,109,994 0.01%Swiss Confederation Government Bond CHF1,900,000 2.00% 28/4/2021 2,033,584 0.01%Credit Suisse Group AG $1,800,000 4.28% 9/1/2028 1,949,229 0.01%
Vanguard Global Bond Index Fund
363
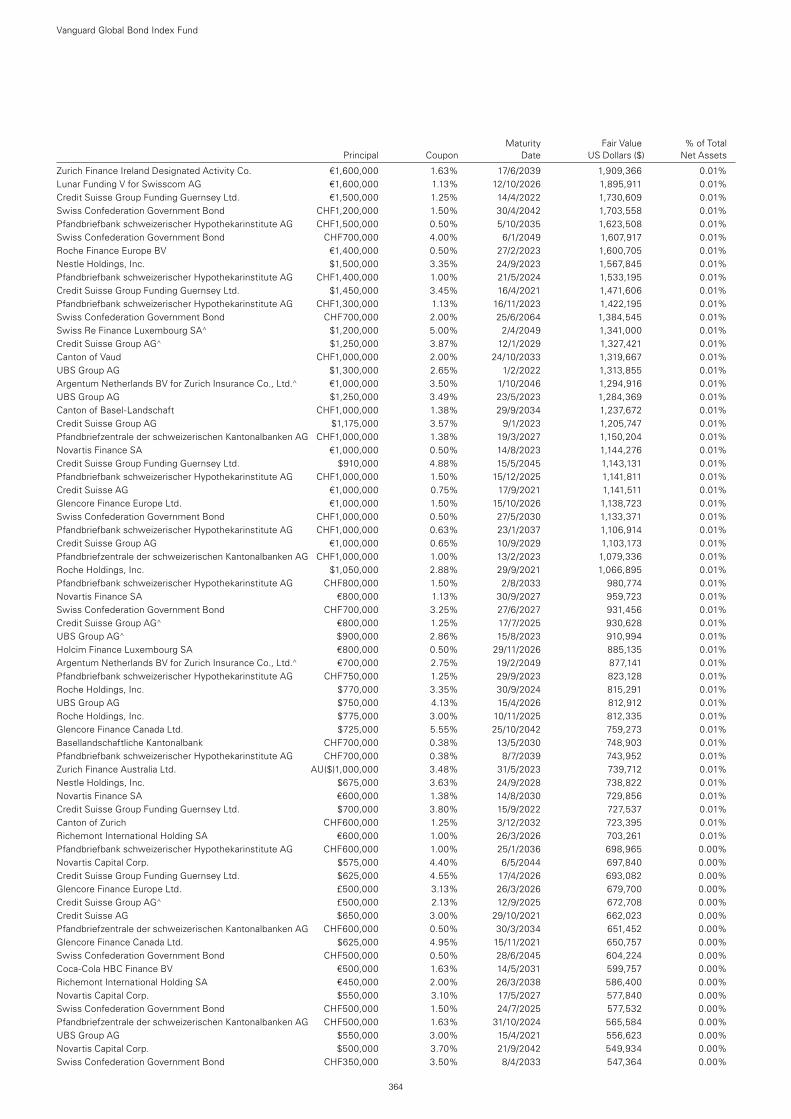
Maturity Fair Value % of Total Principal Coupon Date US Dollars ($) Net Assets
Zurich Finance Ireland Designated Activity Co. €1,600,000 1.63% 17/6/2039 1,909,366 0.01%Lunar Funding V for Swisscom AG €1,600,000 1.13% 12/10/2026 1,895,911 0.01%Credit Suisse Group Funding Guernsey Ltd. €1,500,000 1.25% 14/4/2022 1,730,609 0.01%Swiss Confederation Government Bond CHF1,200,000 1.50% 30/4/2042 1,703,558 0.01%Pfandbriefbank schweizerischer Hypothekarinstitute AG CHF1,500,000 0.50% 5/10/2035 1,623,508 0.01%Swiss Confederation Government Bond CHF700,000 4.00% 6/1/2049 1,607,917 0.01%Roche Finance Europe BV €1,400,000 0.50% 27/2/2023 1,600,705 0.01%Nestle Holdings, Inc. $1,500,000 3.35% 24/9/2023 1,567,845 0.01%Pfandbriefbank schweizerischer Hypothekarinstitute AG CHF1,400,000 1.00% 21/5/2024 1,533,195 0.01%Credit Suisse Group Funding Guernsey Ltd. $1,450,000 3.45% 16/4/2021 1,471,606 0.01%Pfandbriefbank schweizerischer Hypothekarinstitute AG CHF1,300,000 1.13% 16/11/2023 1,422,195 0.01%Swiss Confederation Government Bond CHF700,000 2.00% 25/6/2064 1,384,545 0.01%Swiss Re Finance Luxembourg SA^ $1,200,000 5.00% 2/4/2049 1,341,000 0.01%Credit Suisse Group AG^ $1,250,000 3.87% 12/1/2029 1,327,421 0.01%Canton of Vaud CHF1,000,000 2.00% 24/10/2033 1,319,667 0.01%UBS Group AG $1,300,000 2.65% 1/2/2022 1,313,855 0.01%Argentum Netherlands BV for Zurich Insurance Co., Ltd.^ €1,000,000 3.50% 1/10/2046 1,294,916 0.01%UBS Group AG $1,250,000 3.49% 23/5/2023 1,284,369 0.01%Canton of Basel-Landschaft CHF1,000,000 1.38% 29/9/2034 1,237,672 0.01%Credit Suisse Group AG $1,175,000 3.57% 9/1/2023 1,205,747 0.01%Pfandbriefzentrale der schweizerischen Kantonalbanken AG CHF1,000,000 1.38% 19/3/2027 1,150,204 0.01%Novartis Finance SA €1,000,000 0.50% 14/8/2023 1,144,276 0.01%Credit Suisse Group Funding Guernsey Ltd. $910,000 4.88% 15/5/2045 1,143,131 0.01%Pfandbriefbank schweizerischer Hypothekarinstitute AG CHF1,000,000 1.50% 15/12/2025 1,141,811 0.01%Credit Suisse AG €1,000,000 0.75% 17/9/2021 1,141,511 0.01%Glencore Finance Europe Ltd. €1,000,000 1.50% 15/10/2026 1,138,723 0.01%Swiss Confederation Government Bond CHF1,000,000 0.50% 27/5/2030 1,133,371 0.01%Pfandbriefbank schweizerischer Hypothekarinstitute AG CHF1,000,000 0.63% 23/1/2037 1,106,914 0.01%Credit Suisse Group AG €1,000,000 0.65% 10/9/2029 1,103,173 0.01%Pfandbriefzentrale der schweizerischen Kantonalbanken AG CHF1,000,000 1.00% 13/2/2023 1,079,336 0.01%Roche Holdings, Inc. $1,050,000 2.88% 29/9/2021 1,066,895 0.01%Pfandbriefbank schweizerischer Hypothekarinstitute AG CHF800,000 1.50% 2/8/2033 980,774 0.01%Novartis Finance SA €800,000 1.13% 30/9/2027 959,723 0.01%Swiss Confederation Government Bond CHF700,000 3.25% 27/6/2027 931,456 0.01%Credit Suisse Group AG^ €800,000 1.25% 17/7/2025 930,628 0.01%UBS Group AG^ $900,000 2.86% 15/8/2023 910,994 0.01%Holcim Finance Luxembourg SA €800,000 0.50% 29/11/2026 885,135 0.01%Argentum Netherlands BV for Zurich Insurance Co., Ltd.^ €700,000 2.75% 19/2/2049 877,141 0.01%Pfandbriefbank schweizerischer Hypothekarinstitute AG CHF750,000 1.25% 29/9/2023 823,128 0.01%Roche Holdings, Inc. $770,000 3.35% 30/9/2024 815,291 0.01%UBS Group AG $750,000 4.13% 15/4/2026 812,912 0.01%Roche Holdings, Inc. $775,000 3.00% 10/11/2025 812,335 0.01%Glencore Finance Canada Ltd. $725,000 5.55% 25/10/2042 759,273 0.01%Basellandschaftliche Kantonalbank CHF700,000 0.38% 13/5/2030 748,903 0.01%Pfandbriefbank schweizerischer Hypothekarinstitute AG CHF700,000 0.38% 8/7/2039 743,952 0.01%Zurich Finance Australia Ltd. AU($)1,000,000 3.48% 31/5/2023 739,712 0.01%Nestle Holdings, Inc. $675,000 3.63% 24/9/2028 738,822 0.01%Novartis Finance SA €600,000 1.38% 14/8/2030 729,856 0.01%Credit Suisse Group Funding Guernsey Ltd. $700,000 3.80% 15/9/2022 727,537 0.01%Canton of Zurich CHF600,000 1.25% 3/12/2032 723,395 0.01%Richemont International Holding SA €600,000 1.00% 26/3/2026 703,261 0.01%Pfandbriefbank schweizerischer Hypothekarinstitute AG CHF600,000 1.00% 25/1/2036 698,965 0.00%Novartis Capital Corp. $575,000 4.40% 6/5/2044 697,840 0.00%Credit Suisse Group Funding Guernsey Ltd. $625,000 4.55% 17/4/2026 693,082 0.00%Glencore Finance Europe Ltd. £500,000 3.13% 26/3/2026 679,700 0.00%Credit Suisse Group AG^ £500,000 2.13% 12/9/2025 672,708 0.00%Credit Suisse AG $650,000 3.00% 29/10/2021 662,023 0.00%Pfandbriefzentrale der schweizerischen Kantonalbanken AG CHF600,000 0.50% 30/3/2034 651,452 0.00%Glencore Finance Canada Ltd. $625,000 4.95% 15/11/2021 650,757 0.00%Swiss Confederation Government Bond CHF500,000 0.50% 28/6/2045 604,224 0.00%Coca-Cola HBC Finance BV €500,000 1.63% 14/5/2031 599,757 0.00%Richemont International Holding SA €450,000 2.00% 26/3/2038 586,400 0.00%Novartis Capital Corp. $550,000 3.10% 17/5/2027 577,840 0.00%Swiss Confederation Government Bond CHF500,000 1.50% 24/7/2025 577,532 0.00%Pfandbriefzentrale der schweizerischen Kantonalbanken AG CHF500,000 1.63% 31/10/2024 565,584 0.00%UBS Group AG $550,000 3.00% 15/4/2021 556,623 0.00%Novartis Capital Corp. $500,000 3.70% 21/9/2042 549,934 0.00%Swiss Confederation Government Bond CHF350,000 3.50% 8/4/2033 547,364 0.00%
Vanguard Global Bond Index Fund
364
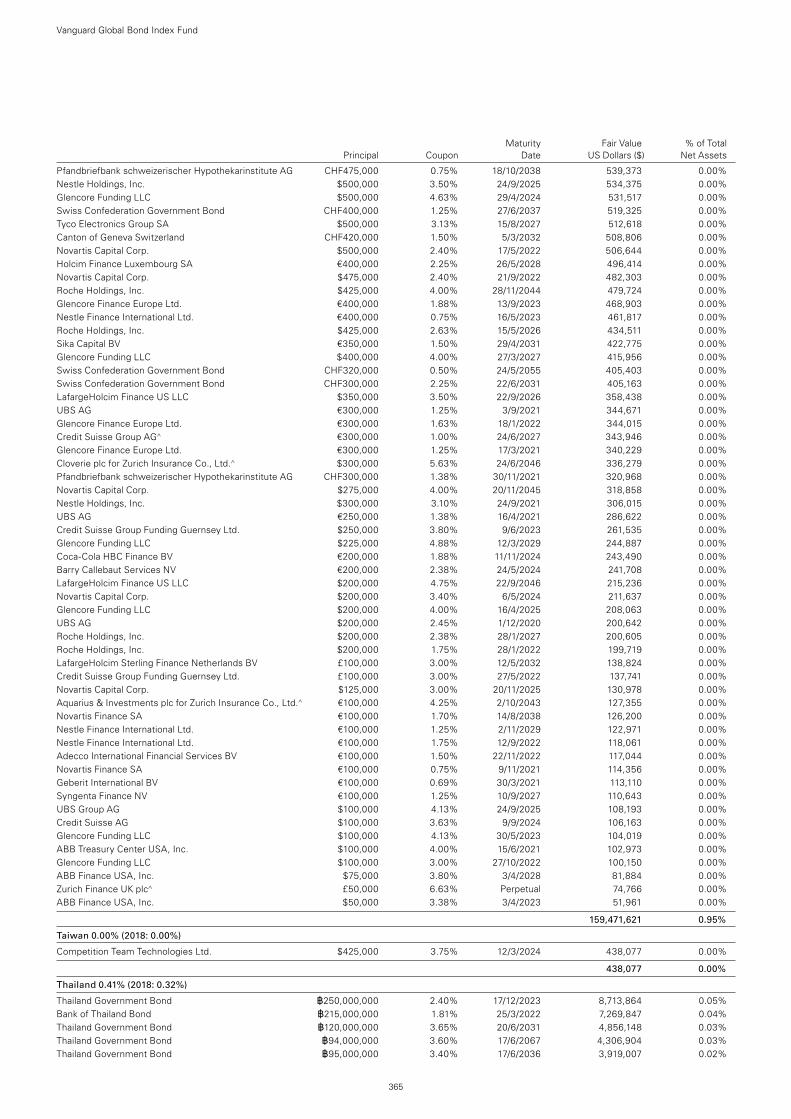
Maturity Fair Value % of Total Principal Coupon Date US Dollars ($) Net Assets
Pfandbriefbank schweizerischer Hypothekarinstitute AG CHF475,000 0.75% 18/10/2038 539,373 0.00%Nestle Holdings, Inc. $500,000 3.50% 24/9/2025 534,375 0.00%Glencore Funding LLC $500,000 4.63% 29/4/2024 531,517 0.00%Swiss Confederation Government Bond CHF400,000 1.25% 27/6/2037 519,325 0.00%Tyco Electronics Group SA $500,000 3.13% 15/8/2027 512,618 0.00%Canton of Geneva Switzerland CHF420,000 1.50% 5/3/2032 508,806 0.00%Novartis Capital Corp. $500,000 2.40% 17/5/2022 506,644 0.00%Holcim Finance Luxembourg SA €400,000 2.25% 26/5/2028 496,414 0.00%Novartis Capital Corp. $475,000 2.40% 21/9/2022 482,303 0.00%Roche Holdings, Inc. $425,000 4.00% 28/11/2044 479,724 0.00%Glencore Finance Europe Ltd. €400,000 1.88% 13/9/2023 468,903 0.00%Nestle Finance International Ltd. €400,000 0.75% 16/5/2023 461,817 0.00%Roche Holdings, Inc. $425,000 2.63% 15/5/2026 434,511 0.00%Sika Capital BV €350,000 1.50% 29/4/2031 422,775 0.00%Glencore Funding LLC $400,000 4.00% 27/3/2027 415,956 0.00%Swiss Confederation Government Bond CHF320,000 0.50% 24/5/2055 405,403 0.00%Swiss Confederation Government Bond CHF300,000 2.25% 22/6/2031 405,163 0.00%LafargeHolcim Finance US LLC $350,000 3.50% 22/9/2026 358,438 0.00%UBS AG €300,000 1.25% 3/9/2021 344,671 0.00%Glencore Finance Europe Ltd. €300,000 1.63% 18/1/2022 344,015 0.00%Credit Suisse Group AG^ €300,000 1.00% 24/6/2027 343,946 0.00%Glencore Finance Europe Ltd. €300,000 1.25% 17/3/2021 340,229 0.00%Cloverie plc for Zurich Insurance Co., Ltd.^ $300,000 5.63% 24/6/2046 336,279 0.00%Pfandbriefbank schweizerischer Hypothekarinstitute AG CHF300,000 1.38% 30/11/2021 320,968 0.00%Novartis Capital Corp. $275,000 4.00% 20/11/2045 318,858 0.00%Nestle Holdings, Inc. $300,000 3.10% 24/9/2021 306,015 0.00%UBS AG €250,000 1.38% 16/4/2021 286,622 0.00%Credit Suisse Group Funding Guernsey Ltd. $250,000 3.80% 9/6/2023 261,535 0.00%Glencore Funding LLC $225,000 4.88% 12/3/2029 244,887 0.00%Coca-Cola HBC Finance BV €200,000 1.88% 11/11/2024 243,490 0.00%Barry Callebaut Services NV €200,000 2.38% 24/5/2024 241,708 0.00%LafargeHolcim Finance US LLC $200,000 4.75% 22/9/2046 215,236 0.00%Novartis Capital Corp. $200,000 3.40% 6/5/2024 211,637 0.00%Glencore Funding LLC $200,000 4.00% 16/4/2025 208,063 0.00%UBS AG $200,000 2.45% 1/12/2020 200,642 0.00%Roche Holdings, Inc. $200,000 2.38% 28/1/2027 200,605 0.00%Roche Holdings, Inc. $200,000 1.75% 28/1/2022 199,719 0.00%LafargeHolcim Sterling Finance Netherlands BV £100,000 3.00% 12/5/2032 138,824 0.00%Credit Suisse Group Funding Guernsey Ltd. £100,000 3.00% 27/5/2022 137,741 0.00%Novartis Capital Corp. $125,000 3.00% 20/11/2025 130,978 0.00%Aquarius & Investments plc for Zurich Insurance Co., Ltd.^ €100,000 4.25% 2/10/2043 127,355 0.00%Novartis Finance SA €100,000 1.70% 14/8/2038 126,200 0.00%Nestle Finance International Ltd. €100,000 1.25% 2/11/2029 122,971 0.00%Nestle Finance International Ltd. €100,000 1.75% 12/9/2022 118,061 0.00%Adecco International Financial Services BV €100,000 1.50% 22/11/2022 117,044 0.00%Novartis Finance SA €100,000 0.75% 9/11/2021 114,356 0.00%Geberit International BV €100,000 0.69% 30/3/2021 113,110 0.00%Syngenta Finance NV €100,000 1.25% 10/9/2027 110,643 0.00%UBS Group AG $100,000 4.13% 24/9/2025 108,193 0.00%Credit Suisse AG $100,000 3.63% 9/9/2024 106,163 0.00%Glencore Funding LLC $100,000 4.13% 30/5/2023 104,019 0.00%ABB Treasury Center USA, Inc. $100,000 4.00% 15/6/2021 102,973 0.00%Glencore Funding LLC $100,000 3.00% 27/10/2022 100,150 0.00%ABB Finance USA, Inc. $75,000 3.80% 3/4/2028 81,884 0.00%Zurich Finance UK plc^ £50,000 6.63% Perpetual 74,766 0.00%ABB Finance USA, Inc. $50,000 3.38% 3/4/2023 51,961 0.00%
159,471,621 0.95%
Taiwan 0.00% (2018: 0.00%)
Competition Team Technologies Ltd. $425,000 3.75% 12/3/2024 438,077 0.00%
438,077 0.00%
Thailand 0.41% (2018: 0.32%)
Thailand Government Bond ฿250,000,000 2.40% 17/12/2023 8,713,864 0.05%Bank of Thailand Bond ฿215,000,000 1.81% 25/3/2022 7,269,847 0.04%Thailand Government Bond ฿120,000,000 3.65% 20/6/2031 4,856,148 0.03%Thailand Government Bond ฿94,000,000 3.60% 17/6/2067 4,306,904 0.03%Thailand Government Bond ฿95,000,000 3.40% 17/6/2036 3,919,007 0.02%
Vanguard Global Bond Index Fund
365
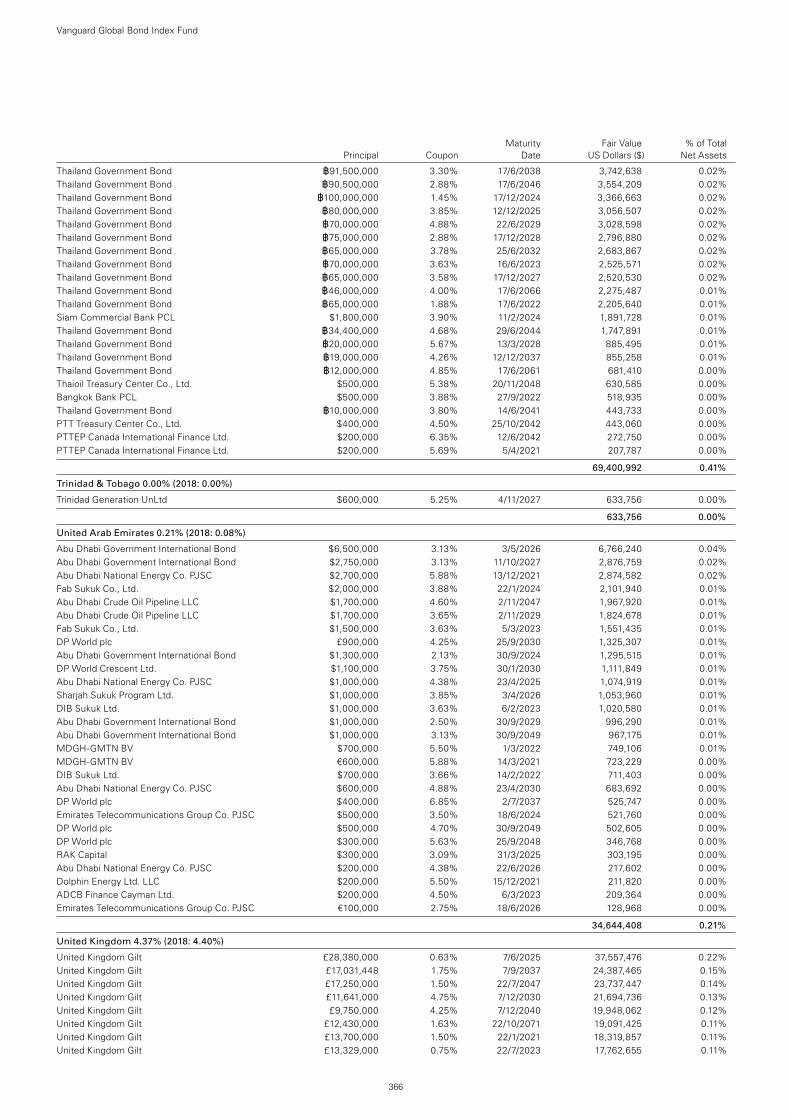
Maturity Fair Value % of Total Principal Coupon Date US Dollars ($) Net Assets
Thailand Government Bond ฿91,500,000 3.30% 17/6/2038 3,742,638 0.02%Thailand Government Bond ฿90,500,000 2.88% 17/6/2046 3,554,209 0.02%Thailand Government Bond ฿100,000,000 1.45% 17/12/2024 3,366,663 0.02%Thailand Government Bond ฿80,000,000 3.85% 12/12/2025 3,056,507 0.02%Thailand Government Bond ฿70,000,000 4.88% 22/6/2029 3,028,598 0.02%Thailand Government Bond ฿75,000,000 2.88% 17/12/2028 2,796,880 0.02%Thailand Government Bond ฿65,000,000 3.78% 25/6/2032 2,683,867 0.02%Thailand Government Bond ฿70,000,000 3.63% 16/6/2023 2,525,571 0.02%Thailand Government Bond ฿65,000,000 3.58% 17/12/2027 2,520,530 0.02%Thailand Government Bond ฿46,000,000 4.00% 17/6/2066 2,275,487 0.01%Thailand Government Bond ฿65,000,000 1.88% 17/6/2022 2,205,640 0.01%Siam Commercial Bank PCL $1,800,000 3.90% 11/2/2024 1,891,728 0.01%Thailand Government Bond ฿34,400,000 4.68% 29/6/2044 1,747,891 0.01%Thailand Government Bond ฿20,000,000 5.67% 13/3/2028 885,495 0.01%Thailand Government Bond ฿19,000,000 4.26% 12/12/2037 855,258 0.01%Thailand Government Bond ฿12,000,000 4.85% 17/6/2061 681,410 0.00%Thaioil Treasury Center Co., Ltd. $500,000 5.38% 20/11/2048 630,585 0.00%Bangkok Bank PCL $500,000 3.88% 27/9/2022 518,935 0.00%Thailand Government Bond ฿10,000,000 3.80% 14/6/2041 443,733 0.00%PTT Treasury Center Co., Ltd. $400,000 4.50% 25/10/2042 443,060 0.00%PTTEP Canada International Finance Ltd. $200,000 6.35% 12/6/2042 272,750 0.00%PTTEP Canada International Finance Ltd. $200,000 5.69% 5/4/2021 207,787 0.00%
69,400,992 0.41%
Trinidad & Tobago 0.00% (2018: 0.00%)
Trinidad Generation UnLtd $600,000 5.25% 4/11/2027 633,756 0.00%
633,756 0.00%
United Arab Emirates 0.21% (2018: 0.08%)
Abu Dhabi Government International Bond $6,500,000 3.13% 3/5/2026 6,766,240 0.04%Abu Dhabi Government International Bond $2,750,000 3.13% 11/10/2027 2,876,759 0.02%Abu Dhabi National Energy Co. PJSC $2,700,000 5.88% 13/12/2021 2,874,582 0.02%Fab Sukuk Co., Ltd. $2,000,000 3.88% 22/1/2024 2,101,940 0.01%Abu Dhabi Crude Oil Pipeline LLC $1,700,000 4.60% 2/11/2047 1,967,920 0.01%Abu Dhabi Crude Oil Pipeline LLC $1,700,000 3.65% 2/11/2029 1,824,678 0.01%Fab Sukuk Co., Ltd. $1,500,000 3.63% 5/3/2023 1,551,435 0.01%DP World plc £900,000 4.25% 25/9/2030 1,325,307 0.01%Abu Dhabi Government International Bond $1,300,000 2.13% 30/9/2024 1,295,515 0.01%DP World Crescent Ltd. $1,100,000 3.75% 30/1/2030 1,111,849 0.01%Abu Dhabi National Energy Co. PJSC $1,000,000 4.38% 23/4/2025 1,074,919 0.01%Sharjah Sukuk Program Ltd. $1,000,000 3.85% 3/4/2026 1,053,960 0.01%DIB Sukuk Ltd. $1,000,000 3.63% 6/2/2023 1,020,580 0.01%Abu Dhabi Government International Bond $1,000,000 2.50% 30/9/2029 996,290 0.01%Abu Dhabi Government International Bond $1,000,000 3.13% 30/9/2049 967,175 0.01%MDGH-GMTN BV $700,000 5.50% 1/3/2022 749,106 0.01%MDGH-GMTN BV €600,000 5.88% 14/3/2021 723,229 0.00%DIB Sukuk Ltd. $700,000 3.66% 14/2/2022 711,403 0.00%Abu Dhabi National Energy Co. PJSC $600,000 4.88% 23/4/2030 683,692 0.00%DP World plc $400,000 6.85% 2/7/2037 525,747 0.00%Emirates Telecommunications Group Co. PJSC $500,000 3.50% 18/6/2024 521,760 0.00%DP World plc $500,000 4.70% 30/9/2049 502,605 0.00%DP World plc $300,000 5.63% 25/9/2048 346,768 0.00%RAK Capital $300,000 3.09% 31/3/2025 303,195 0.00%Abu Dhabi National Energy Co. PJSC $200,000 4.38% 22/6/2026 217,602 0.00%Dolphin Energy Ltd. LLC $200,000 5.50% 15/12/2021 211,820 0.00%ADCB Finance Cayman Ltd. $200,000 4.50% 6/3/2023 209,364 0.00%Emirates Telecommunications Group Co. PJSC €100,000 2.75% 18/6/2026 128,968 0.00%
34,644,408 0.21%
United Kingdom 4.37% (2018: 4.40%)
United Kingdom Gilt £28,380,000 0.63% 7/6/2025 37,557,476 0.22%United Kingdom Gilt £17,031,448 1.75% 7/9/2037 24,387,465 0.15%United Kingdom Gilt £17,250,000 1.50% 22/7/2047 23,737,447 0.14%United Kingdom Gilt £11,641,000 4.75% 7/12/2030 21,694,736 0.13%United Kingdom Gilt £9,750,000 4.25% 7/12/2040 19,948,062 0.12%United Kingdom Gilt £12,430,000 1.63% 22/10/2071 19,091,425 0.11%United Kingdom Gilt £13,700,000 1.50% 22/1/2021 18,319,857 0.11%United Kingdom Gilt £13,329,000 0.75% 22/7/2023 17,762,655 0.11%
Vanguard Global Bond Index Fund
366
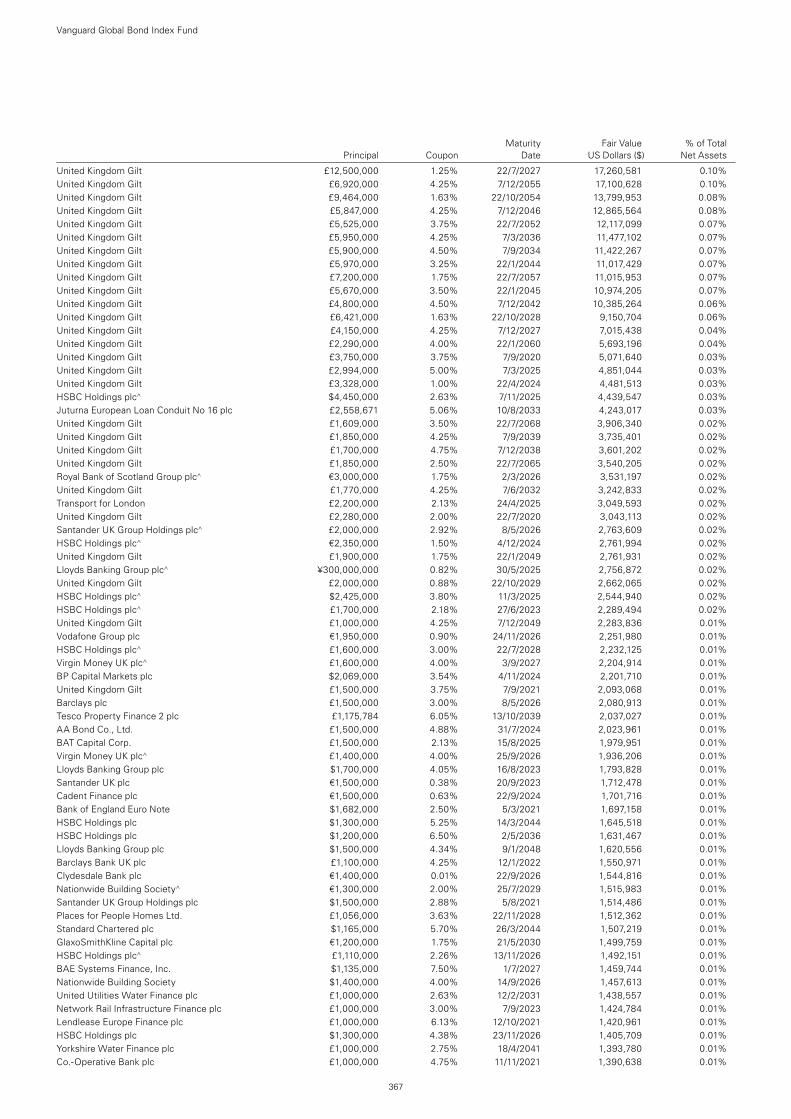
Maturity Fair Value % of Total Principal Coupon Date US Dollars ($) Net Assets
United Kingdom Gilt £12,500,000 1.25% 22/7/2027 17,260,581 0.10%United Kingdom Gilt £6,920,000 4.25% 7/12/2055 17,100,628 0.10%United Kingdom Gilt £9,464,000 1.63% 22/10/2054 13,799,953 0.08%United Kingdom Gilt £5,847,000 4.25% 7/12/2046 12,865,564 0.08%United Kingdom Gilt £5,525,000 3.75% 22/7/2052 12,117,099 0.07%United Kingdom Gilt £5,950,000 4.25% 7/3/2036 11,477,102 0.07%United Kingdom Gilt £5,900,000 4.50% 7/9/2034 11,422,267 0.07%United Kingdom Gilt £5,970,000 3.25% 22/1/2044 11,017,429 0.07%United Kingdom Gilt £7,200,000 1.75% 22/7/2057 11,015,953 0.07%United Kingdom Gilt £5,670,000 3.50% 22/1/2045 10,974,205 0.07%United Kingdom Gilt £4,800,000 4.50% 7/12/2042 10,385,264 0.06%United Kingdom Gilt £6,421,000 1.63% 22/10/2028 9,150,704 0.06%United Kingdom Gilt £4,150,000 4.25% 7/12/2027 7,015,438 0.04%United Kingdom Gilt £2,290,000 4.00% 22/1/2060 5,693,196 0.04%United Kingdom Gilt £3,750,000 3.75% 7/9/2020 5,071,640 0.03%United Kingdom Gilt £2,994,000 5.00% 7/3/2025 4,851,044 0.03%United Kingdom Gilt £3,328,000 1.00% 22/4/2024 4,481,513 0.03%HSBC Holdings plc^ $4,450,000 2.63% 7/11/2025 4,439,547 0.03%Juturna European Loan Conduit No 16 plc £2,558,671 5.06% 10/8/2033 4,243,017 0.03%United Kingdom Gilt £1,609,000 3.50% 22/7/2068 3,906,340 0.02%United Kingdom Gilt £1,850,000 4.25% 7/9/2039 3,735,401 0.02%United Kingdom Gilt £1,700,000 4.75% 7/12/2038 3,601,202 0.02%United Kingdom Gilt £1,850,000 2.50% 22/7/2065 3,540,205 0.02%Royal Bank of Scotland Group plc^ €3,000,000 1.75% 2/3/2026 3,531,197 0.02%United Kingdom Gilt £1,770,000 4.25% 7/6/2032 3,242,833 0.02%Transport for London £2,200,000 2.13% 24/4/2025 3,049,593 0.02%United Kingdom Gilt £2,280,000 2.00% 22/7/2020 3,043,113 0.02%Santander UK Group Holdings plc^ £2,000,000 2.92% 8/5/2026 2,763,609 0.02%HSBC Holdings plc^ €2,350,000 1.50% 4/12/2024 2,761,994 0.02%United Kingdom Gilt £1,900,000 1.75% 22/1/2049 2,761,931 0.02%Lloyds Banking Group plc^ ¥300,000,000 0.82% 30/5/2025 2,756,872 0.02%United Kingdom Gilt £2,000,000 0.88% 22/10/2029 2,662,065 0.02%HSBC Holdings plc^ $2,425,000 3.80% 11/3/2025 2,544,940 0.02%HSBC Holdings plc^ £1,700,000 2.18% 27/6/2023 2,289,494 0.02%United Kingdom Gilt £1,000,000 4.25% 7/12/2049 2,283,836 0.01%Vodafone Group plc €1,950,000 0.90% 24/11/2026 2,251,980 0.01%HSBC Holdings plc^ £1,600,000 3.00% 22/7/2028 2,232,125 0.01%Virgin Money UK plc^ £1,600,000 4.00% 3/9/2027 2,204,914 0.01%BP Capital Markets plc $2,069,000 3.54% 4/11/2024 2,201,710 0.01%United Kingdom Gilt £1,500,000 3.75% 7/9/2021 2,093,068 0.01%Barclays plc £1,500,000 3.00% 8/5/2026 2,080,913 0.01%Tesco Property Finance 2 plc £1,175,784 6.05% 13/10/2039 2,037,027 0.01%AA Bond Co., Ltd. £1,500,000 4.88% 31/7/2024 2,023,961 0.01%BAT Capital Corp. £1,500,000 2.13% 15/8/2025 1,979,951 0.01%Virgin Money UK plc^ £1,400,000 4.00% 25/9/2026 1,936,206 0.01%Lloyds Banking Group plc $1,700,000 4.05% 16/8/2023 1,793,828 0.01%Santander UK plc €1,500,000 0.38% 20/9/2023 1,712,478 0.01%Cadent Finance plc €1,500,000 0.63% 22/9/2024 1,701,716 0.01%Bank of England Euro Note $1,682,000 2.50% 5/3/2021 1,697,158 0.01%HSBC Holdings plc $1,300,000 5.25% 14/3/2044 1,645,518 0.01%HSBC Holdings plc $1,200,000 6.50% 2/5/2036 1,631,467 0.01%Lloyds Banking Group plc $1,500,000 4.34% 9/1/2048 1,620,556 0.01%Barclays Bank UK plc £1,100,000 4.25% 12/1/2022 1,550,971 0.01%Clydesdale Bank plc €1,400,000 0.01% 22/9/2026 1,544,816 0.01%Nationwide Building Society^ €1,300,000 2.00% 25/7/2029 1,515,983 0.01%Santander UK Group Holdings plc $1,500,000 2.88% 5/8/2021 1,514,486 0.01%Places for People Homes Ltd. £1,056,000 3.63% 22/11/2028 1,512,362 0.01%Standard Chartered plc $1,165,000 5.70% 26/3/2044 1,507,219 0.01%GlaxoSmithKline Capital plc €1,200,000 1.75% 21/5/2030 1,499,759 0.01%HSBC Holdings plc^ £1,110,000 2.26% 13/11/2026 1,492,151 0.01%BAE Systems Finance, Inc. $1,135,000 7.50% 1/7/2027 1,459,744 0.01%Nationwide Building Society $1,400,000 4.00% 14/9/2026 1,457,613 0.01%United Utilities Water Finance plc £1,000,000 2.63% 12/2/2031 1,438,557 0.01%Network Rail Infrastructure Finance plc £1,000,000 3.00% 7/9/2023 1,424,784 0.01%Lendlease Europe Finance plc £1,000,000 6.13% 12/10/2021 1,420,961 0.01%HSBC Holdings plc $1,300,000 4.38% 23/11/2026 1,405,709 0.01%Yorkshire Water Finance plc £1,000,000 2.75% 18/4/2041 1,393,780 0.01%Co.-Operative Bank plc £1,000,000 4.75% 11/11/2021 1,390,638 0.01%
Vanguard Global Bond Index Fund
367
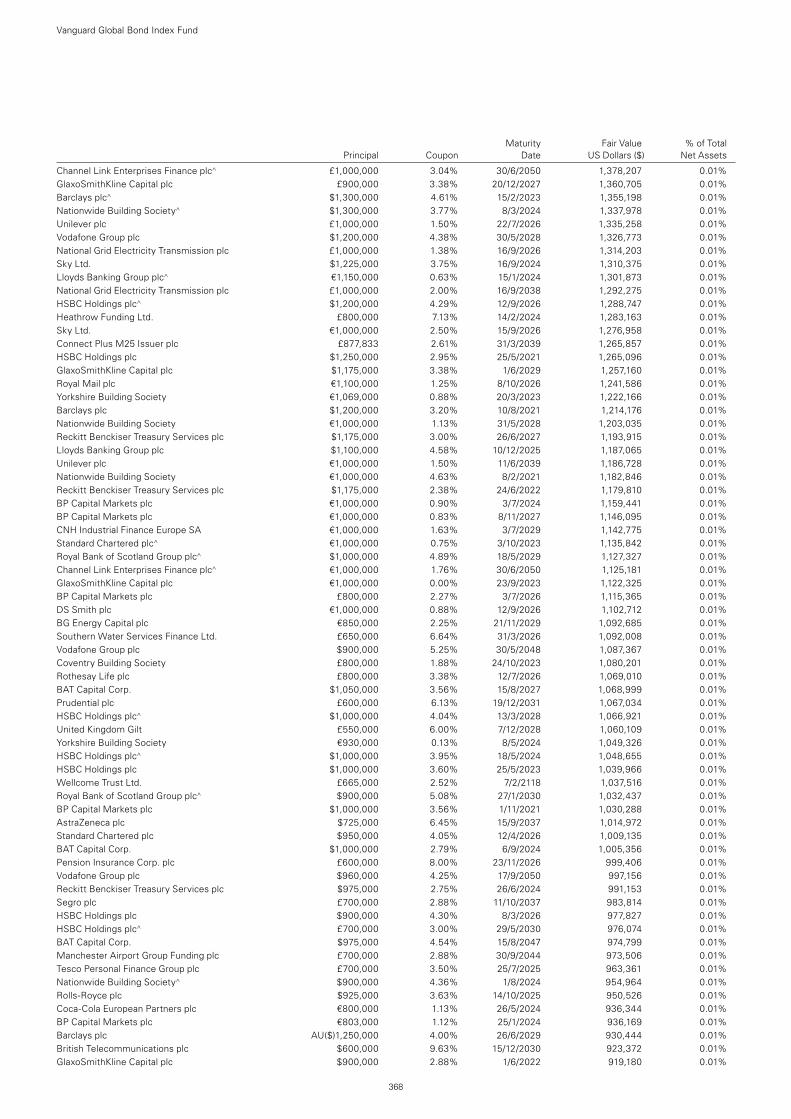
Maturity Fair Value % of Total Principal Coupon Date US Dollars ($) Net Assets
Channel Link Enterprises Finance plc^ £1,000,000 3.04% 30/6/2050 1,378,207 0.01%GlaxoSmithKline Capital plc £900,000 3.38% 20/12/2027 1,360,705 0.01%Barclays plc^ $1,300,000 4.61% 15/2/2023 1,355,198 0.01%Nationwide Building Society^ $1,300,000 3.77% 8/3/2024 1,337,978 0.01%Unilever plc £1,000,000 1.50% 22/7/2026 1,335,258 0.01%Vodafone Group plc $1,200,000 4.38% 30/5/2028 1,326,773 0.01%National Grid Electricity Transmission plc £1,000,000 1.38% 16/9/2026 1,314,203 0.01%Sky Ltd. $1,225,000 3.75% 16/9/2024 1,310,375 0.01%Lloyds Banking Group plc^ €1,150,000 0.63% 15/1/2024 1,301,873 0.01%National Grid Electricity Transmission plc £1,000,000 2.00% 16/9/2038 1,292,275 0.01%HSBC Holdings plc^ $1,200,000 4.29% 12/9/2026 1,288,747 0.01%Heathrow Funding Ltd. £800,000 7.13% 14/2/2024 1,283,163 0.01%Sky Ltd. €1,000,000 2.50% 15/9/2026 1,276,958 0.01%Connect Plus M25 Issuer plc £877,833 2.61% 31/3/2039 1,265,857 0.01%HSBC Holdings plc $1,250,000 2.95% 25/5/2021 1,265,096 0.01%GlaxoSmithKline Capital plc $1,175,000 3.38% 1/6/2029 1,257,160 0.01%Royal Mail plc €1,100,000 1.25% 8/10/2026 1,241,586 0.01%Yorkshire Building Society €1,069,000 0.88% 20/3/2023 1,222,166 0.01%Barclays plc $1,200,000 3.20% 10/8/2021 1,214,176 0.01%Nationwide Building Society €1,000,000 1.13% 31/5/2028 1,203,035 0.01%Reckitt Benckiser Treasury Services plc $1,175,000 3.00% 26/6/2027 1,193,915 0.01%Lloyds Banking Group plc $1,100,000 4.58% 10/12/2025 1,187,065 0.01%Unilever plc €1,000,000 1.50% 11/6/2039 1,186,728 0.01%Nationwide Building Society €1,000,000 4.63% 8/2/2021 1,182,846 0.01%Reckitt Benckiser Treasury Services plc $1,175,000 2.38% 24/6/2022 1,179,810 0.01%BP Capital Markets plc €1,000,000 0.90% 3/7/2024 1,159,441 0.01%BP Capital Markets plc €1,000,000 0.83% 8/11/2027 1,146,095 0.01%CNH Industrial Finance Europe SA €1,000,000 1.63% 3/7/2029 1,142,775 0.01%Standard Chartered plc^ €1,000,000 0.75% 3/10/2023 1,135,842 0.01%Royal Bank of Scotland Group plc^ $1,000,000 4.89% 18/5/2029 1,127,327 0.01%Channel Link Enterprises Finance plc^ €1,000,000 1.76% 30/6/2050 1,125,181 0.01%GlaxoSmithKline Capital plc €1,000,000 0.00% 23/9/2023 1,122,325 0.01%BP Capital Markets plc £800,000 2.27% 3/7/2026 1,115,365 0.01%DS Smith plc €1,000,000 0.88% 12/9/2026 1,102,712 0.01%BG Energy Capital plc €850,000 2.25% 21/11/2029 1,092,685 0.01%Southern Water Services Finance Ltd. £650,000 6.64% 31/3/2026 1,092,008 0.01%Vodafone Group plc $900,000 5.25% 30/5/2048 1,087,367 0.01%Coventry Building Society £800,000 1.88% 24/10/2023 1,080,201 0.01%Rothesay Life plc £800,000 3.38% 12/7/2026 1,069,010 0.01%BAT Capital Corp. $1,050,000 3.56% 15/8/2027 1,068,999 0.01%Prudential plc £600,000 6.13% 19/12/2031 1,067,034 0.01%HSBC Holdings plc^ $1,000,000 4.04% 13/3/2028 1,066,921 0.01%United Kingdom Gilt £550,000 6.00% 7/12/2028 1,060,109 0.01%Yorkshire Building Society €930,000 0.13% 8/5/2024 1,049,326 0.01%HSBC Holdings plc^ $1,000,000 3.95% 18/5/2024 1,048,655 0.01%HSBC Holdings plc $1,000,000 3.60% 25/5/2023 1,039,966 0.01%Wellcome Trust Ltd. £665,000 2.52% 7/2/2118 1,037,516 0.01%Royal Bank of Scotland Group plc^ $900,000 5.08% 27/1/2030 1,032,437 0.01%BP Capital Markets plc $1,000,000 3.56% 1/11/2021 1,030,288 0.01%AstraZeneca plc $725,000 6.45% 15/9/2037 1,014,972 0.01%Standard Chartered plc $950,000 4.05% 12/4/2026 1,009,135 0.01%BAT Capital Corp. $1,000,000 2.79% 6/9/2024 1,005,356 0.01%Pension Insurance Corp. plc £600,000 8.00% 23/11/2026 999,406 0.01%Vodafone Group plc $960,000 4.25% 17/9/2050 997,156 0.01%Reckitt Benckiser Treasury Services plc $975,000 2.75% 26/6/2024 991,153 0.01%Segro plc £700,000 2.88% 11/10/2037 983,814 0.01%HSBC Holdings plc $900,000 4.30% 8/3/2026 977,827 0.01%HSBC Holdings plc^ £700,000 3.00% 29/5/2030 976,074 0.01%BAT Capital Corp. $975,000 4.54% 15/8/2047 974,799 0.01%Manchester Airport Group Funding plc £700,000 2.88% 30/9/2044 973,506 0.01%Tesco Personal Finance Group plc £700,000 3.50% 25/7/2025 963,361 0.01%Nationwide Building Society^ $900,000 4.36% 1/8/2024 954,964 0.01%Rolls-Royce plc $925,000 3.63% 14/10/2025 950,526 0.01%Coca-Cola European Partners plc €800,000 1.13% 26/5/2024 936,344 0.01%BP Capital Markets plc €803,000 1.12% 25/1/2024 936,169 0.01%Barclays plc AU($)1,250,000 4.00% 26/6/2029 930,444 0.01%British Telecommunications plc $600,000 9.63% 15/12/2030 923,372 0.01%GlaxoSmithKline Capital plc $900,000 2.88% 1/6/2022 919,180 0.01%
Vanguard Global Bond Index Fund
368
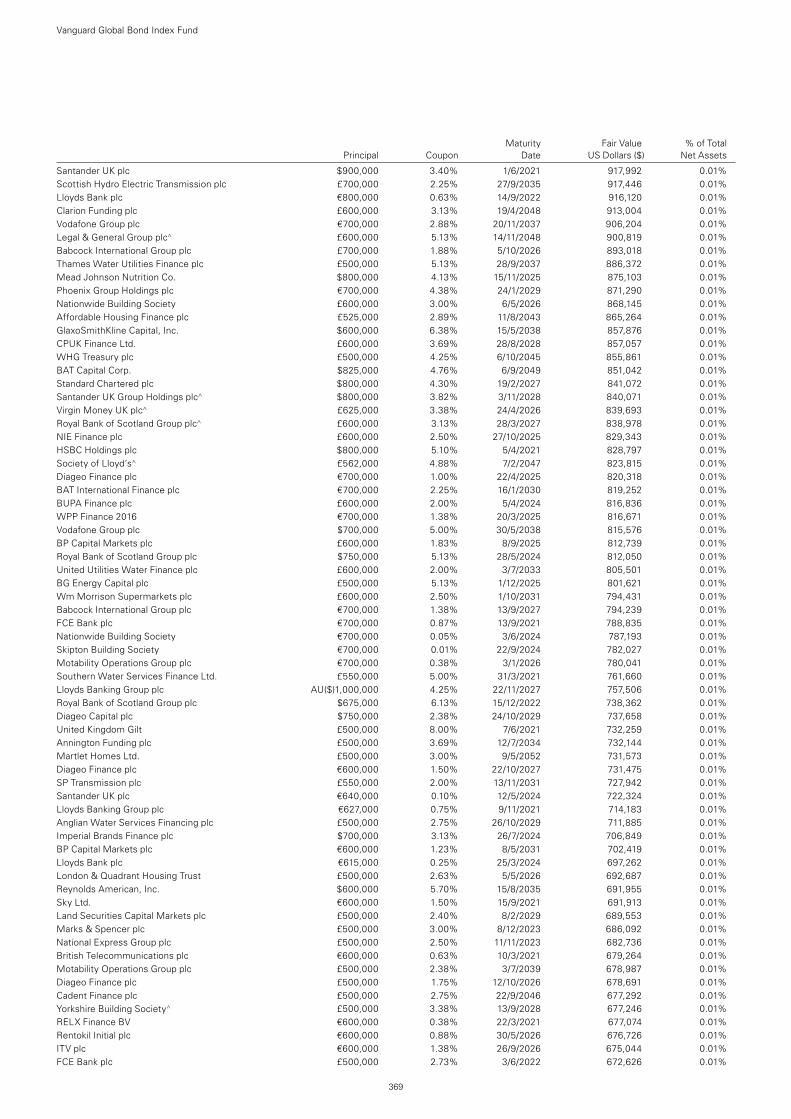
Maturity Fair Value % of Total Principal Coupon Date US Dollars ($) Net Assets
Santander UK plc $900,000 3.40% 1/6/2021 917,992 0.01%Scottish Hydro Electric Transmission plc £700,000 2.25% 27/9/2035 917,446 0.01%Lloyds Bank plc €800,000 0.63% 14/9/2022 916,120 0.01%Clarion Funding plc £600,000 3.13% 19/4/2048 913,004 0.01%Vodafone Group plc €700,000 2.88% 20/11/2037 906,204 0.01%Legal & General Group plc^ £600,000 5.13% 14/11/2048 900,819 0.01%Babcock International Group plc £700,000 1.88% 5/10/2026 893,018 0.01%Thames Water Utilities Finance plc £500,000 5.13% 28/9/2037 886,372 0.01%Mead Johnson Nutrition Co. $800,000 4.13% 15/11/2025 875,103 0.01%Phoenix Group Holdings plc €700,000 4.38% 24/1/2029 871,290 0.01%Nationwide Building Society £600,000 3.00% 6/5/2026 868,145 0.01%Affordable Housing Finance plc £525,000 2.89% 11/8/2043 865,264 0.01%GlaxoSmithKline Capital, Inc. $600,000 6.38% 15/5/2038 857,876 0.01%CPUK Finance Ltd. £600,000 3.69% 28/8/2028 857,057 0.01%WHG Treasury plc £500,000 4.25% 6/10/2045 855,861 0.01%BAT Capital Corp. $825,000 4.76% 6/9/2049 851,042 0.01%Standard Chartered plc $800,000 4.30% 19/2/2027 841,072 0.01%Santander UK Group Holdings plc^ $800,000 3.82% 3/11/2028 840,071 0.01%Virgin Money UK plc^ £625,000 3.38% 24/4/2026 839,693 0.01%Royal Bank of Scotland Group plc^ £600,000 3.13% 28/3/2027 838,978 0.01%NIE Finance plc £600,000 2.50% 27/10/2025 829,343 0.01%HSBC Holdings plc $800,000 5.10% 5/4/2021 828,797 0.01%Society of Lloyd’s^ £562,000 4.88% 7/2/2047 823,815 0.01%Diageo Finance plc €700,000 1.00% 22/4/2025 820,318 0.01%BAT International Finance plc €700,000 2.25% 16/1/2030 819,252 0.01%BUPA Finance plc £600,000 2.00% 5/4/2024 816,836 0.01%WPP Finance 2016 €700,000 1.38% 20/3/2025 816,671 0.01%Vodafone Group plc $700,000 5.00% 30/5/2038 815,576 0.01%BP Capital Markets plc £600,000 1.83% 8/9/2025 812,739 0.01%Royal Bank of Scotland Group plc $750,000 5.13% 28/5/2024 812,050 0.01%United Utilities Water Finance plc £600,000 2.00% 3/7/2033 805,501 0.01%BG Energy Capital plc £500,000 5.13% 1/12/2025 801,621 0.01%Wm Morrison Supermarkets plc £600,000 2.50% 1/10/2031 794,431 0.01%Babcock International Group plc €700,000 1.38% 13/9/2027 794,239 0.01%FCE Bank plc €700,000 0.87% 13/9/2021 788,835 0.01%Nationwide Building Society €700,000 0.05% 3/6/2024 787,193 0.01%Skipton Building Society €700,000 0.01% 22/9/2024 782,027 0.01%Motability Operations Group plc €700,000 0.38% 3/1/2026 780,041 0.01%Southern Water Services Finance Ltd. £550,000 5.00% 31/3/2021 761,660 0.01%Lloyds Banking Group plc AU($)1,000,000 4.25% 22/11/2027 757,506 0.01%Royal Bank of Scotland Group plc $675,000 6.13% 15/12/2022 738,362 0.01%Diageo Capital plc $750,000 2.38% 24/10/2029 737,658 0.01%United Kingdom Gilt £500,000 8.00% 7/6/2021 732,259 0.01%Annington Funding plc £500,000 3.69% 12/7/2034 732,144 0.01%Martlet Homes Ltd. £500,000 3.00% 9/5/2052 731,573 0.01%Diageo Finance plc €600,000 1.50% 22/10/2027 731,475 0.01%SP Transmission plc £550,000 2.00% 13/11/2031 727,942 0.01%Santander UK plc €640,000 0.10% 12/5/2024 722,324 0.01%Lloyds Banking Group plc €627,000 0.75% 9/11/2021 714,183 0.01%Anglian Water Services Financing plc £500,000 2.75% 26/10/2029 711,885 0.01%Imperial Brands Finance plc $700,000 3.13% 26/7/2024 706,849 0.01%BP Capital Markets plc €600,000 1.23% 8/5/2031 702,419 0.01%Lloyds Bank plc €615,000 0.25% 25/3/2024 697,262 0.01%London & Quadrant Housing Trust £500,000 2.63% 5/5/2026 692,687 0.01%Reynolds American, Inc. $600,000 5.70% 15/8/2035 691,955 0.01%Sky Ltd. €600,000 1.50% 15/9/2021 691,913 0.01%Land Securities Capital Markets plc £500,000 2.40% 8/2/2029 689,553 0.01%Marks & Spencer plc £500,000 3.00% 8/12/2023 686,092 0.01%National Express Group plc £500,000 2.50% 11/11/2023 682,736 0.01%British Telecommunications plc €600,000 0.63% 10/3/2021 679,264 0.01%Motability Operations Group plc £500,000 2.38% 3/7/2039 678,987 0.01%Diageo Finance plc £500,000 1.75% 12/10/2026 678,691 0.01%Cadent Finance plc £500,000 2.75% 22/9/2046 677,292 0.01%Yorkshire Building Society^ £500,000 3.38% 13/9/2028 677,246 0.01%RELX Finance BV €600,000 0.38% 22/3/2021 677,074 0.01%Rentokil Initial plc €600,000 0.88% 30/5/2026 676,726 0.01%ITV plc €600,000 1.38% 26/9/2026 675,044 0.01%FCE Bank plc £500,000 2.73% 3/6/2022 672,626 0.01%
Vanguard Global Bond Index Fund
369
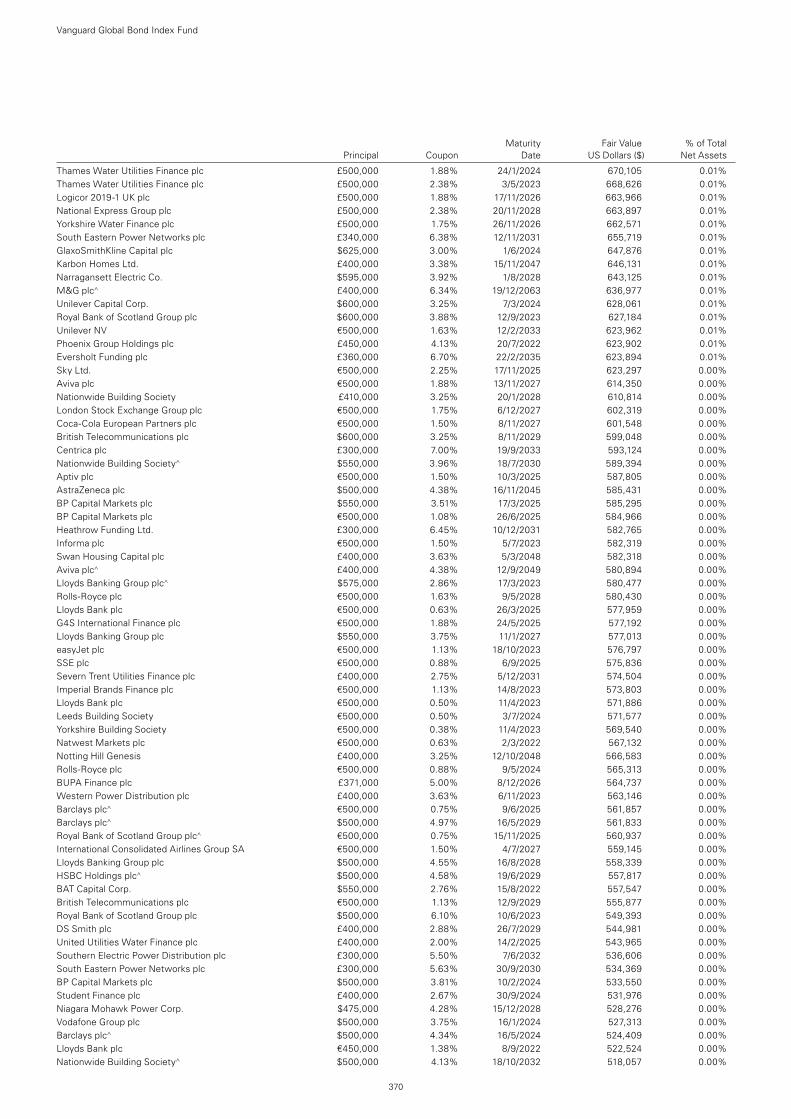
Maturity Fair Value % of Total Principal Coupon Date US Dollars ($) Net Assets
Thames Water Utilities Finance plc £500,000 1.88% 24/1/2024 670,105 0.01%Thames Water Utilities Finance plc £500,000 2.38% 3/5/2023 668,626 0.01%Logicor 2019-1 UK plc £500,000 1.88% 17/11/2026 663,966 0.01%National Express Group plc £500,000 2.38% 20/11/2028 663,897 0.01%Yorkshire Water Finance plc £500,000 1.75% 26/11/2026 662,571 0.01%South Eastern Power Networks plc £340,000 6.38% 12/11/2031 655,719 0.01%GlaxoSmithKline Capital plc $625,000 3.00% 1/6/2024 647,876 0.01%Karbon Homes Ltd. £400,000 3.38% 15/11/2047 646,131 0.01%Narragansett Electric Co. $595,000 3.92% 1/8/2028 643,125 0.01%M&G plc^ £400,000 6.34% 19/12/2063 636,977 0.01%Unilever Capital Corp. $600,000 3.25% 7/3/2024 628,061 0.01%Royal Bank of Scotland Group plc $600,000 3.88% 12/9/2023 627,184 0.01%Unilever NV €500,000 1.63% 12/2/2033 623,962 0.01%Phoenix Group Holdings plc £450,000 4.13% 20/7/2022 623,902 0.01%Eversholt Funding plc £360,000 6.70% 22/2/2035 623,894 0.01%Sky Ltd. €500,000 2.25% 17/11/2025 623,297 0.00%Aviva plc €500,000 1.88% 13/11/2027 614,350 0.00%Nationwide Building Society £410,000 3.25% 20/1/2028 610,814 0.00%London Stock Exchange Group plc €500,000 1.75% 6/12/2027 602,319 0.00%Coca-Cola European Partners plc €500,000 1.50% 8/11/2027 601,548 0.00%British Telecommunications plc $600,000 3.25% 8/11/2029 599,048 0.00%Centrica plc £300,000 7.00% 19/9/2033 593,124 0.00%Nationwide Building Society^ $550,000 3.96% 18/7/2030 589,394 0.00%Aptiv plc €500,000 1.50% 10/3/2025 587,805 0.00%AstraZeneca plc $500,000 4.38% 16/11/2045 585,431 0.00%BP Capital Markets plc $550,000 3.51% 17/3/2025 585,295 0.00%BP Capital Markets plc €500,000 1.08% 26/6/2025 584,966 0.00%Heathrow Funding Ltd. £300,000 6.45% 10/12/2031 582,765 0.00%Informa plc €500,000 1.50% 5/7/2023 582,319 0.00%Swan Housing Capital plc £400,000 3.63% 5/3/2048 582,318 0.00%Aviva plc^ £400,000 4.38% 12/9/2049 580,894 0.00%Lloyds Banking Group plc^ $575,000 2.86% 17/3/2023 580,477 0.00%Rolls-Royce plc €500,000 1.63% 9/5/2028 580,430 0.00%Lloyds Bank plc €500,000 0.63% 26/3/2025 577,959 0.00%G4S International Finance plc €500,000 1.88% 24/5/2025 577,192 0.00%Lloyds Banking Group plc $550,000 3.75% 11/1/2027 577,013 0.00%easyJet plc €500,000 1.13% 18/10/2023 576,797 0.00%SSE plc €500,000 0.88% 6/9/2025 575,836 0.00%Severn Trent Utilities Finance plc £400,000 2.75% 5/12/2031 574,504 0.00%Imperial Brands Finance plc €500,000 1.13% 14/8/2023 573,803 0.00%Lloyds Bank plc €500,000 0.50% 11/4/2023 571,886 0.00%Leeds Building Society €500,000 0.50% 3/7/2024 571,577 0.00%Yorkshire Building Society €500,000 0.38% 11/4/2023 569,540 0.00%Natwest Markets plc €500,000 0.63% 2/3/2022 567,132 0.00%Notting Hill Genesis £400,000 3.25% 12/10/2048 566,583 0.00%Rolls-Royce plc €500,000 0.88% 9/5/2024 565,313 0.00%BUPA Finance plc £371,000 5.00% 8/12/2026 564,737 0.00%Western Power Distribution plc £400,000 3.63% 6/11/2023 563,146 0.00%Barclays plc^ €500,000 0.75% 9/6/2025 561,857 0.00%Barclays plc^ $500,000 4.97% 16/5/2029 561,833 0.00%Royal Bank of Scotland Group plc^ €500,000 0.75% 15/11/2025 560,937 0.00%International Consolidated Airlines Group SA €500,000 1.50% 4/7/2027 559,145 0.00%Lloyds Banking Group plc $500,000 4.55% 16/8/2028 558,339 0.00%HSBC Holdings plc^ $500,000 4.58% 19/6/2029 557,817 0.00%BAT Capital Corp. $550,000 2.76% 15/8/2022 557,547 0.00%British Telecommunications plc €500,000 1.13% 12/9/2029 555,877 0.00%Royal Bank of Scotland Group plc $500,000 6.10% 10/6/2023 549,393 0.00%DS Smith plc £400,000 2.88% 26/7/2029 544,981 0.00%United Utilities Water Finance plc £400,000 2.00% 14/2/2025 543,965 0.00%Southern Electric Power Distribution plc £300,000 5.50% 7/6/2032 536,606 0.00%South Eastern Power Networks plc £300,000 5.63% 30/9/2030 534,369 0.00%BP Capital Markets plc $500,000 3.81% 10/2/2024 533,550 0.00%Student Finance plc £400,000 2.67% 30/9/2024 531,976 0.00%Niagara Mohawk Power Corp. $475,000 4.28% 15/12/2028 528,276 0.00%Vodafone Group plc $500,000 3.75% 16/1/2024 527,313 0.00%Barclays plc^ $500,000 4.34% 16/5/2024 524,409 0.00%Lloyds Bank plc €450,000 1.38% 8/9/2022 522,524 0.00%Nationwide Building Society^ $500,000 4.13% 18/10/2032 518,057 0.00%
Vanguard Global Bond Index Fund
370
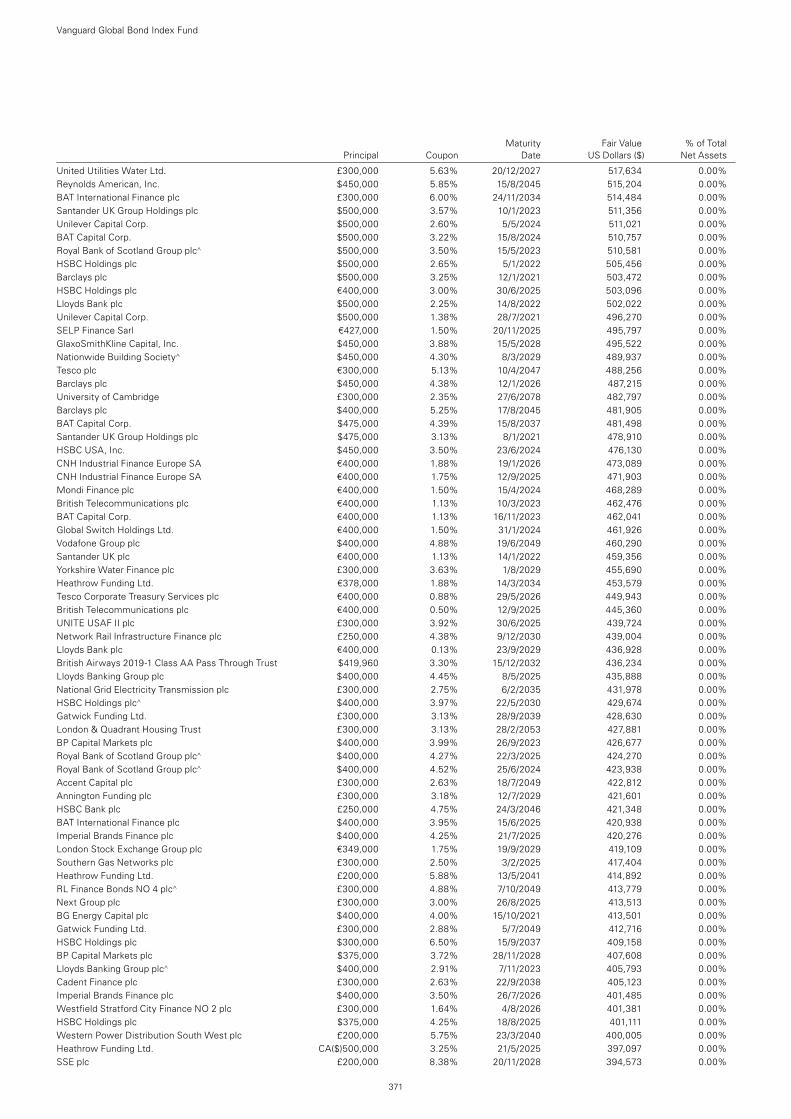
Maturity Fair Value % of Total Principal Coupon Date US Dollars ($) Net Assets
United Utilities Water Ltd. £300,000 5.63% 20/12/2027 517,634 0.00%Reynolds American, Inc. $450,000 5.85% 15/8/2045 515,204 0.00%BAT International Finance plc £300,000 6.00% 24/11/2034 514,484 0.00%Santander UK Group Holdings plc $500,000 3.57% 10/1/2023 511,356 0.00%Unilever Capital Corp. $500,000 2.60% 5/5/2024 511,021 0.00%BAT Capital Corp. $500,000 3.22% 15/8/2024 510,757 0.00%Royal Bank of Scotland Group plc^ $500,000 3.50% 15/5/2023 510,581 0.00%HSBC Holdings plc $500,000 2.65% 5/1/2022 505,456 0.00%Barclays plc $500,000 3.25% 12/1/2021 503,472 0.00%HSBC Holdings plc €400,000 3.00% 30/6/2025 503,096 0.00%Lloyds Bank plc $500,000 2.25% 14/8/2022 502,022 0.00%Unilever Capital Corp. $500,000 1.38% 28/7/2021 496,270 0.00%SELP Finance Sarl €427,000 1.50% 20/11/2025 495,797 0.00%GlaxoSmithKline Capital, Inc. $450,000 3.88% 15/5/2028 495,522 0.00%Nationwide Building Society^ $450,000 4.30% 8/3/2029 489,937 0.00%Tesco plc €300,000 5.13% 10/4/2047 488,256 0.00%Barclays plc $450,000 4.38% 12/1/2026 487,215 0.00%University of Cambridge £300,000 2.35% 27/6/2078 482,797 0.00%Barclays plc $400,000 5.25% 17/8/2045 481,905 0.00%BAT Capital Corp. $475,000 4.39% 15/8/2037 481,498 0.00%Santander UK Group Holdings plc $475,000 3.13% 8/1/2021 478,910 0.00%HSBC USA, Inc. $450,000 3.50% 23/6/2024 476,130 0.00%CNH Industrial Finance Europe SA €400,000 1.88% 19/1/2026 473,089 0.00%CNH Industrial Finance Europe SA €400,000 1.75% 12/9/2025 471,903 0.00%Mondi Finance plc €400,000 1.50% 15/4/2024 468,289 0.00%British Telecommunications plc €400,000 1.13% 10/3/2023 462,476 0.00%BAT Capital Corp. €400,000 1.13% 16/11/2023 462,041 0.00%Global Switch Holdings Ltd. €400,000 1.50% 31/1/2024 461,926 0.00%Vodafone Group plc $400,000 4.88% 19/6/2049 460,290 0.00%Santander UK plc €400,000 1.13% 14/1/2022 459,356 0.00%Yorkshire Water Finance plc £300,000 3.63% 1/8/2029 455,690 0.00%Heathrow Funding Ltd. €378,000 1.88% 14/3/2034 453,579 0.00%Tesco Corporate Treasury Services plc €400,000 0.88% 29/5/2026 449,943 0.00%British Telecommunications plc €400,000 0.50% 12/9/2025 445,360 0.00%UNITE USAF II plc £300,000 3.92% 30/6/2025 439,724 0.00%Network Rail Infrastructure Finance plc £250,000 4.38% 9/12/2030 439,004 0.00%Lloyds Bank plc €400,000 0.13% 23/9/2029 436,928 0.00%British Airways 2019-1 Class AA Pass Through Trust $419,960 3.30% 15/12/2032 436,234 0.00%Lloyds Banking Group plc $400,000 4.45% 8/5/2025 435,888 0.00%National Grid Electricity Transmission plc £300,000 2.75% 6/2/2035 431,978 0.00%HSBC Holdings plc^ $400,000 3.97% 22/5/2030 429,674 0.00%Gatwick Funding Ltd. £300,000 3.13% 28/9/2039 428,630 0.00%London & Quadrant Housing Trust £300,000 3.13% 28/2/2053 427,881 0.00%BP Capital Markets plc $400,000 3.99% 26/9/2023 426,677 0.00%Royal Bank of Scotland Group plc^ $400,000 4.27% 22/3/2025 424,270 0.00%Royal Bank of Scotland Group plc^ $400,000 4.52% 25/6/2024 423,938 0.00%Accent Capital plc £300,000 2.63% 18/7/2049 422,812 0.00%Annington Funding plc £300,000 3.18% 12/7/2029 421,601 0.00%HSBC Bank plc £250,000 4.75% 24/3/2046 421,348 0.00%BAT International Finance plc $400,000 3.95% 15/6/2025 420,938 0.00%Imperial Brands Finance plc $400,000 4.25% 21/7/2025 420,276 0.00%London Stock Exchange Group plc €349,000 1.75% 19/9/2029 419,109 0.00%Southern Gas Networks plc £300,000 2.50% 3/2/2025 417,404 0.00%Heathrow Funding Ltd. £200,000 5.88% 13/5/2041 414,892 0.00%RL Finance Bonds NO 4 plc^ £300,000 4.88% 7/10/2049 413,779 0.00%Next Group plc £300,000 3.00% 26/8/2025 413,513 0.00%BG Energy Capital plc $400,000 4.00% 15/10/2021 413,501 0.00%Gatwick Funding Ltd. £300,000 2.88% 5/7/2049 412,716 0.00%HSBC Holdings plc $300,000 6.50% 15/9/2037 409,158 0.00%BP Capital Markets plc $375,000 3.72% 28/11/2028 407,608 0.00%Lloyds Banking Group plc^ $400,000 2.91% 7/11/2023 405,793 0.00%Cadent Finance plc £300,000 2.63% 22/9/2038 405,123 0.00%Imperial Brands Finance plc $400,000 3.50% 26/7/2026 401,485 0.00%Westfield Stratford City Finance NO 2 plc £300,000 1.64% 4/8/2026 401,381 0.00%HSBC Holdings plc $375,000 4.25% 18/8/2025 401,111 0.00%Western Power Distribution South West plc £200,000 5.75% 23/3/2040 400,005 0.00%Heathrow Funding Ltd. CA($)500,000 3.25% 21/5/2025 397,097 0.00%SSE plc £200,000 8.38% 20/11/2028 394,573 0.00%
Vanguard Global Bond Index Fund
371
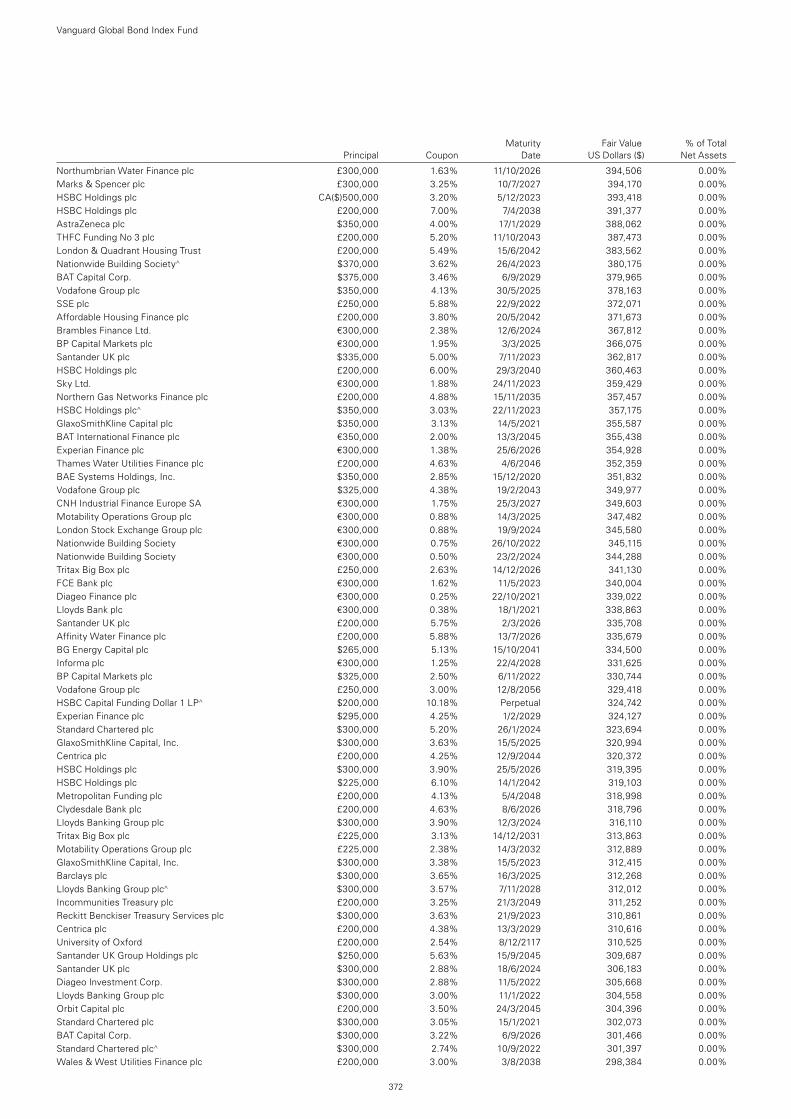
Maturity Fair Value % of Total Principal Coupon Date US Dollars ($) Net Assets
Northumbrian Water Finance plc £300,000 1.63% 11/10/2026 394,506 0.00%Marks & Spencer plc £300,000 3.25% 10/7/2027 394,170 0.00%HSBC Holdings plc CA($)500,000 3.20% 5/12/2023 393,418 0.00%HSBC Holdings plc £200,000 7.00% 7/4/2038 391,377 0.00%AstraZeneca plc $350,000 4.00% 17/1/2029 388,062 0.00%THFC Funding No 3 plc £200,000 5.20% 11/10/2043 387,473 0.00%London & Quadrant Housing Trust £200,000 5.49% 15/6/2042 383,562 0.00%Nationwide Building Society^ $370,000 3.62% 26/4/2023 380,175 0.00%BAT Capital Corp. $375,000 3.46% 6/9/2029 379,965 0.00%Vodafone Group plc $350,000 4.13% 30/5/2025 378,163 0.00%SSE plc £250,000 5.88% 22/9/2022 372,071 0.00%Affordable Housing Finance plc £200,000 3.80% 20/5/2042 371,673 0.00%Brambles Finance Ltd. €300,000 2.38% 12/6/2024 367,812 0.00%BP Capital Markets plc €300,000 1.95% 3/3/2025 366,075 0.00%Santander UK plc $335,000 5.00% 7/11/2023 362,817 0.00%HSBC Holdings plc £200,000 6.00% 29/3/2040 360,463 0.00%Sky Ltd. €300,000 1.88% 24/11/2023 359,429 0.00%Northern Gas Networks Finance plc £200,000 4.88% 15/11/2035 357,457 0.00%HSBC Holdings plc^ $350,000 3.03% 22/11/2023 357,175 0.00%GlaxoSmithKline Capital plc $350,000 3.13% 14/5/2021 355,587 0.00%BAT International Finance plc €350,000 2.00% 13/3/2045 355,438 0.00%Experian Finance plc €300,000 1.38% 25/6/2026 354,928 0.00%Thames Water Utilities Finance plc £200,000 4.63% 4/6/2046 352,359 0.00%BAE Systems Holdings, Inc. $350,000 2.85% 15/12/2020 351,832 0.00%Vodafone Group plc $325,000 4.38% 19/2/2043 349,977 0.00%CNH Industrial Finance Europe SA €300,000 1.75% 25/3/2027 349,603 0.00%Motability Operations Group plc €300,000 0.88% 14/3/2025 347,482 0.00%London Stock Exchange Group plc €300,000 0.88% 19/9/2024 345,580 0.00%Nationwide Building Society €300,000 0.75% 26/10/2022 345,115 0.00%Nationwide Building Society €300,000 0.50% 23/2/2024 344,288 0.00%Tritax Big Box plc £250,000 2.63% 14/12/2026 341,130 0.00%FCE Bank plc €300,000 1.62% 11/5/2023 340,004 0.00%Diageo Finance plc €300,000 0.25% 22/10/2021 339,022 0.00%Lloyds Bank plc €300,000 0.38% 18/1/2021 338,863 0.00%Santander UK plc £200,000 5.75% 2/3/2026 335,708 0.00%Affinity Water Finance plc £200,000 5.88% 13/7/2026 335,679 0.00%BG Energy Capital plc $265,000 5.13% 15/10/2041 334,500 0.00%Informa plc €300,000 1.25% 22/4/2028 331,625 0.00%BP Capital Markets plc $325,000 2.50% 6/11/2022 330,744 0.00%Vodafone Group plc £250,000 3.00% 12/8/2056 329,418 0.00%HSBC Capital Funding Dollar 1 LP^ $200,000 10.18% Perpetual 324,742 0.00%Experian Finance plc $295,000 4.25% 1/2/2029 324,127 0.00%Standard Chartered plc $300,000 5.20% 26/1/2024 323,694 0.00%GlaxoSmithKline Capital, Inc. $300,000 3.63% 15/5/2025 320,994 0.00%Centrica plc £200,000 4.25% 12/9/2044 320,372 0.00%HSBC Holdings plc $300,000 3.90% 25/5/2026 319,395 0.00%HSBC Holdings plc $225,000 6.10% 14/1/2042 319,103 0.00%Metropolitan Funding plc £200,000 4.13% 5/4/2048 318,998 0.00%Clydesdale Bank plc £200,000 4.63% 8/6/2026 318,796 0.00%Lloyds Banking Group plc $300,000 3.90% 12/3/2024 316,110 0.00%Tritax Big Box plc £225,000 3.13% 14/12/2031 313,863 0.00%Motability Operations Group plc £225,000 2.38% 14/3/2032 312,889 0.00%GlaxoSmithKline Capital, Inc. $300,000 3.38% 15/5/2023 312,415 0.00%Barclays plc $300,000 3.65% 16/3/2025 312,268 0.00%Lloyds Banking Group plc^ $300,000 3.57% 7/11/2028 312,012 0.00%Incommunities Treasury plc £200,000 3.25% 21/3/2049 311,252 0.00%Reckitt Benckiser Treasury Services plc $300,000 3.63% 21/9/2023 310,861 0.00%Centrica plc £200,000 4.38% 13/3/2029 310,616 0.00%University of Oxford £200,000 2.54% 8/12/2117 310,525 0.00%Santander UK Group Holdings plc $250,000 5.63% 15/9/2045 309,687 0.00%Santander UK plc $300,000 2.88% 18/6/2024 306,183 0.00%Diageo Investment Corp. $300,000 2.88% 11/5/2022 305,668 0.00%Lloyds Banking Group plc $300,000 3.00% 11/1/2022 304,558 0.00%Orbit Capital plc £200,000 3.50% 24/3/2045 304,396 0.00%Standard Chartered plc $300,000 3.05% 15/1/2021 302,073 0.00%BAT Capital Corp. $300,000 3.22% 6/9/2026 301,466 0.00%Standard Chartered plc^ $300,000 2.74% 10/9/2022 301,397 0.00%Wales & West Utilities Finance plc £200,000 3.00% 3/8/2038 298,384 0.00%
Vanguard Global Bond Index Fund
372
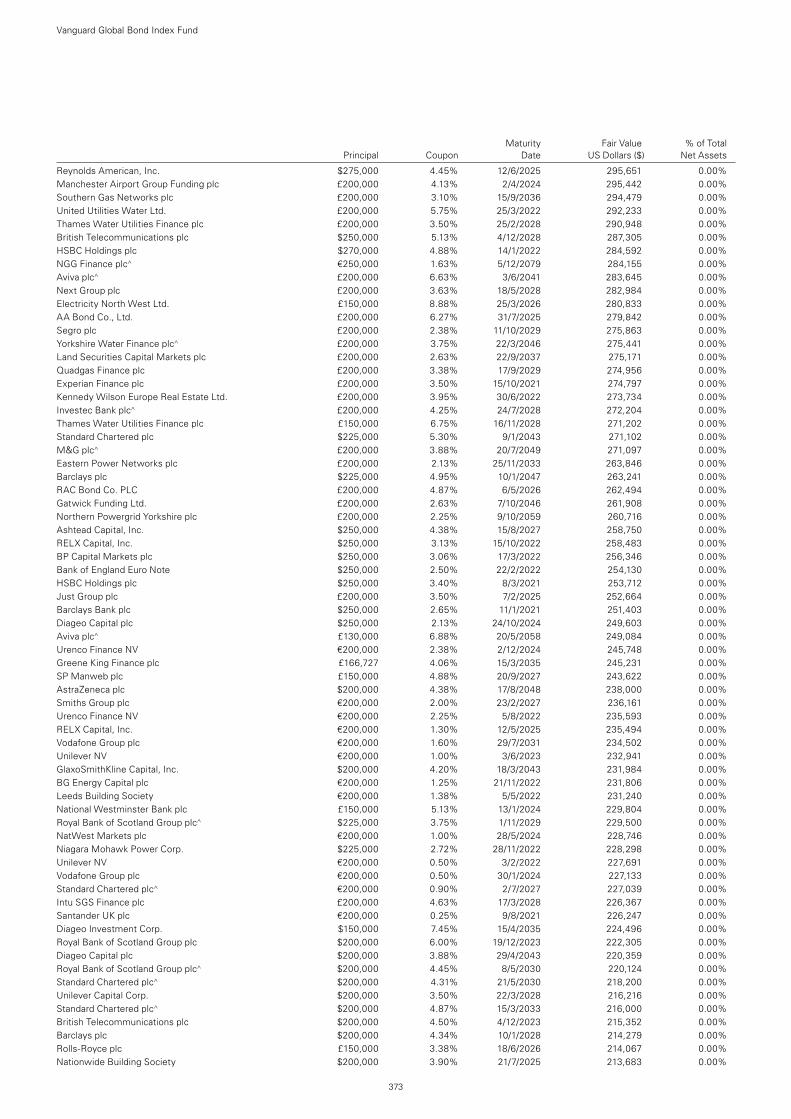
Maturity Fair Value % of Total Principal Coupon Date US Dollars ($) Net Assets
Reynolds American, Inc. $275,000 4.45% 12/6/2025 295,651 0.00%Manchester Airport Group Funding plc £200,000 4.13% 2/4/2024 295,442 0.00%Southern Gas Networks plc £200,000 3.10% 15/9/2036 294,479 0.00%United Utilities Water Ltd. £200,000 5.75% 25/3/2022 292,233 0.00%Thames Water Utilities Finance plc £200,000 3.50% 25/2/2028 290,948 0.00%British Telecommunications plc $250,000 5.13% 4/12/2028 287,305 0.00%HSBC Holdings plc $270,000 4.88% 14/1/2022 284,592 0.00%NGG Finance plc^ €250,000 1.63% 5/12/2079 284,155 0.00%Aviva plc^ £200,000 6.63% 3/6/2041 283,645 0.00%Next Group plc £200,000 3.63% 18/5/2028 282,984 0.00%Electricity North West Ltd. £150,000 8.88% 25/3/2026 280,833 0.00%AA Bond Co., Ltd. £200,000 6.27% 31/7/2025 279,842 0.00%Segro plc £200,000 2.38% 11/10/2029 275,863 0.00%Yorkshire Water Finance plc^ £200,000 3.75% 22/3/2046 275,441 0.00%Land Securities Capital Markets plc £200,000 2.63% 22/9/2037 275,171 0.00%Quadgas Finance plc £200,000 3.38% 17/9/2029 274,956 0.00%Experian Finance plc £200,000 3.50% 15/10/2021 274,797 0.00%Kennedy Wilson Europe Real Estate Ltd. £200,000 3.95% 30/6/2022 273,734 0.00%Investec Bank plc^ £200,000 4.25% 24/7/2028 272,204 0.00%Thames Water Utilities Finance plc £150,000 6.75% 16/11/2028 271,202 0.00%Standard Chartered plc $225,000 5.30% 9/1/2043 271,102 0.00%M&G plc^ £200,000 3.88% 20/7/2049 271,097 0.00%Eastern Power Networks plc £200,000 2.13% 25/11/2033 263,846 0.00%Barclays plc $225,000 4.95% 10/1/2047 263,241 0.00%RAC Bond Co. PLC £200,000 4.87% 6/5/2026 262,494 0.00%Gatwick Funding Ltd. £200,000 2.63% 7/10/2046 261,908 0.00%Northern Powergrid Yorkshire plc £200,000 2.25% 9/10/2059 260,716 0.00%Ashtead Capital, Inc. $250,000 4.38% 15/8/2027 258,750 0.00%RELX Capital, Inc. $250,000 3.13% 15/10/2022 258,483 0.00%BP Capital Markets plc $250,000 3.06% 17/3/2022 256,346 0.00%Bank of England Euro Note $250,000 2.50% 22/2/2022 254,130 0.00%HSBC Holdings plc $250,000 3.40% 8/3/2021 253,712 0.00%Just Group plc £200,000 3.50% 7/2/2025 252,664 0.00%Barclays Bank plc $250,000 2.65% 11/1/2021 251,403 0.00%Diageo Capital plc $250,000 2.13% 24/10/2024 249,603 0.00%Aviva plc^ £130,000 6.88% 20/5/2058 249,084 0.00%Urenco Finance NV €200,000 2.38% 2/12/2024 245,748 0.00%Greene King Finance plc £166,727 4.06% 15/3/2035 245,231 0.00%SP Manweb plc £150,000 4.88% 20/9/2027 243,622 0.00%AstraZeneca plc $200,000 4.38% 17/8/2048 238,000 0.00%Smiths Group plc €200,000 2.00% 23/2/2027 236,161 0.00%Urenco Finance NV €200,000 2.25% 5/8/2022 235,593 0.00%RELX Capital, Inc. €200,000 1.30% 12/5/2025 235,494 0.00%Vodafone Group plc €200,000 1.60% 29/7/2031 234,502 0.00%Unilever NV €200,000 1.00% 3/6/2023 232,941 0.00%GlaxoSmithKline Capital, Inc. $200,000 4.20% 18/3/2043 231,984 0.00%BG Energy Capital plc €200,000 1.25% 21/11/2022 231,806 0.00%Leeds Building Society €200,000 1.38% 5/5/2022 231,240 0.00%National Westminster Bank plc £150,000 5.13% 13/1/2024 229,804 0.00%Royal Bank of Scotland Group plc^ $225,000 3.75% 1/11/2029 229,500 0.00%NatWest Markets plc €200,000 1.00% 28/5/2024 228,746 0.00%Niagara Mohawk Power Corp. $225,000 2.72% 28/11/2022 228,298 0.00%Unilever NV €200,000 0.50% 3/2/2022 227,691 0.00%Vodafone Group plc €200,000 0.50% 30/1/2024 227,133 0.00%Standard Chartered plc^ €200,000 0.90% 2/7/2027 227,039 0.00%Intu SGS Finance plc £200,000 4.63% 17/3/2028 226,367 0.00%Santander UK plc €200,000 0.25% 9/8/2021 226,247 0.00%Diageo Investment Corp. $150,000 7.45% 15/4/2035 224,496 0.00%Royal Bank of Scotland Group plc $200,000 6.00% 19/12/2023 222,305 0.00%Diageo Capital plc $200,000 3.88% 29/4/2043 220,359 0.00%Royal Bank of Scotland Group plc^ $200,000 4.45% 8/5/2030 220,124 0.00%Standard Chartered plc^ $200,000 4.31% 21/5/2030 218,200 0.00%Unilever Capital Corp. $200,000 3.50% 22/3/2028 216,216 0.00%Standard Chartered plc^ $200,000 4.87% 15/3/2033 216,000 0.00%British Telecommunications plc $200,000 4.50% 4/12/2023 215,352 0.00%Barclays plc $200,000 4.34% 10/1/2028 214,279 0.00%Rolls-Royce plc £150,000 3.38% 18/6/2026 214,067 0.00%Nationwide Building Society $200,000 3.90% 21/7/2025 213,683 0.00%
Vanguard Global Bond Index Fund
373
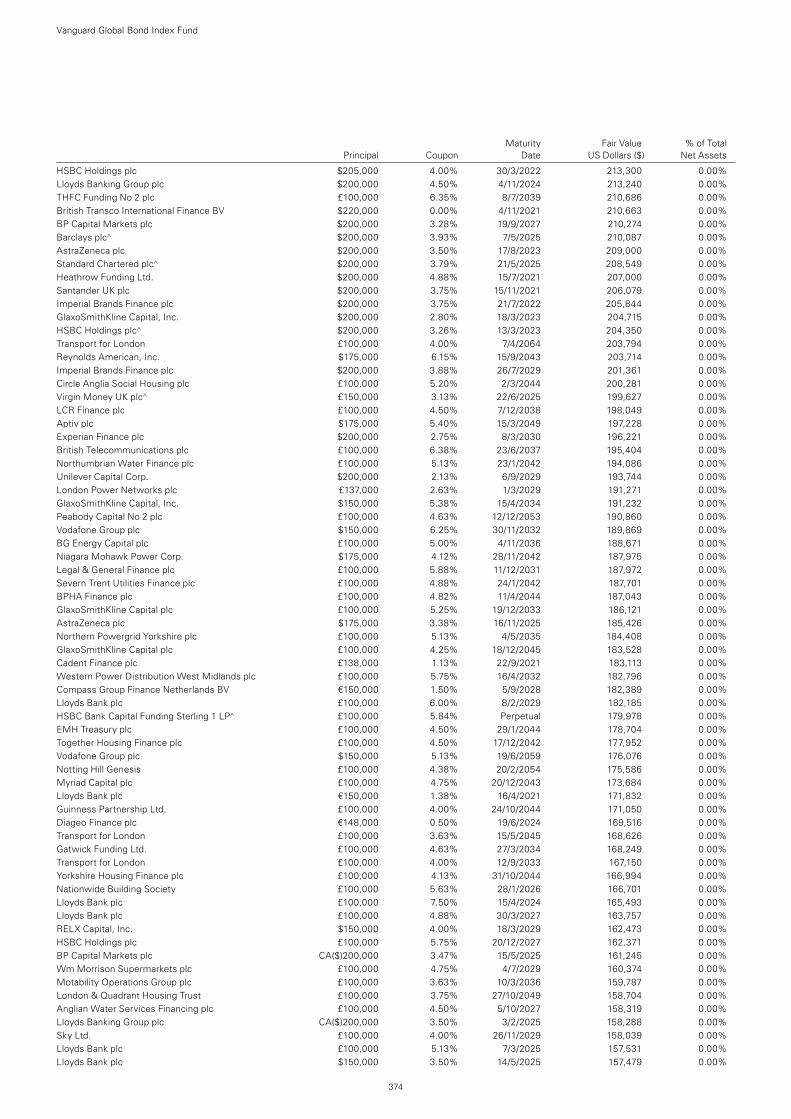
Maturity Fair Value % of Total Principal Coupon Date US Dollars ($) Net Assets
HSBC Holdings plc $205,000 4.00% 30/3/2022 213,300 0.00%Lloyds Banking Group plc $200,000 4.50% 4/11/2024 213,240 0.00%THFC Funding No 2 plc £100,000 6.35% 8/7/2039 210,686 0.00%British Transco International Finance BV $220,000 0.00% 4/11/2021 210,663 0.00%BP Capital Markets plc $200,000 3.28% 19/9/2027 210,274 0.00%Barclays plc^ $200,000 3.93% 7/5/2025 210,087 0.00%AstraZeneca plc $200,000 3.50% 17/8/2023 209,000 0.00%Standard Chartered plc^ $200,000 3.79% 21/5/2025 208,549 0.00%Heathrow Funding Ltd. $200,000 4.88% 15/7/2021 207,000 0.00%Santander UK plc $200,000 3.75% 15/11/2021 206,079 0.00%Imperial Brands Finance plc $200,000 3.75% 21/7/2022 205,844 0.00%GlaxoSmithKline Capital, Inc. $200,000 2.80% 18/3/2023 204,715 0.00%HSBC Holdings plc^ $200,000 3.26% 13/3/2023 204,350 0.00%Transport for London £100,000 4.00% 7/4/2064 203,794 0.00%Reynolds American, Inc. $175,000 6.15% 15/9/2043 203,714 0.00%Imperial Brands Finance plc $200,000 3.88% 26/7/2029 201,361 0.00%Circle Anglia Social Housing plc £100,000 5.20% 2/3/2044 200,281 0.00%Virgin Money UK plc^ £150,000 3.13% 22/6/2025 199,627 0.00%LCR Finance plc £100,000 4.50% 7/12/2038 198,049 0.00%Aptiv plc $175,000 5.40% 15/3/2049 197,228 0.00%Experian Finance plc $200,000 2.75% 8/3/2030 196,221 0.00%British Telecommunications plc £100,000 6.38% 23/6/2037 195,404 0.00%Northumbrian Water Finance plc £100,000 5.13% 23/1/2042 194,086 0.00%Unilever Capital Corp. $200,000 2.13% 6/9/2029 193,744 0.00%London Power Networks plc £137,000 2.63% 1/3/2029 191,271 0.00%GlaxoSmithKline Capital, Inc. $150,000 5.38% 15/4/2034 191,232 0.00%Peabody Capital No 2 plc £100,000 4.63% 12/12/2053 190,860 0.00%Vodafone Group plc $150,000 6.25% 30/11/2032 189,869 0.00%BG Energy Capital plc £100,000 5.00% 4/11/2036 188,671 0.00%Niagara Mohawk Power Corp. $175,000 4.12% 28/11/2042 187,975 0.00%Legal & General Finance plc £100,000 5.88% 11/12/2031 187,972 0.00%Severn Trent Utilities Finance plc £100,000 4.88% 24/1/2042 187,701 0.00%BPHA Finance plc £100,000 4.82% 11/4/2044 187,043 0.00%GlaxoSmithKline Capital plc £100,000 5.25% 19/12/2033 186,121 0.00%AstraZeneca plc $175,000 3.38% 16/11/2025 185,426 0.00%Northern Powergrid Yorkshire plc £100,000 5.13% 4/5/2035 184,408 0.00%GlaxoSmithKline Capital plc £100,000 4.25% 18/12/2045 183,528 0.00%Cadent Finance plc £138,000 1.13% 22/9/2021 183,113 0.00%Western Power Distribution West Midlands plc £100,000 5.75% 16/4/2032 182,796 0.00%Compass Group Finance Netherlands BV €150,000 1.50% 5/9/2028 182,389 0.00%Lloyds Bank plc £100,000 6.00% 8/2/2029 182,185 0.00%HSBC Bank Capital Funding Sterling 1 LP^ £100,000 5.84% Perpetual 179,978 0.00%EMH Treasury plc £100,000 4.50% 29/1/2044 178,704 0.00%Together Housing Finance plc £100,000 4.50% 17/12/2042 177,952 0.00%Vodafone Group plc $150,000 5.13% 19/6/2059 176,076 0.00%Notting Hill Genesis £100,000 4.38% 20/2/2054 175,586 0.00%Myriad Capital plc £100,000 4.75% 20/12/2043 173,684 0.00%Lloyds Bank plc €150,000 1.38% 16/4/2021 171,832 0.00%Guinness Partnership Ltd. £100,000 4.00% 24/10/2044 171,050 0.00%Diageo Finance plc €148,000 0.50% 19/6/2024 169,516 0.00%Transport for London £100,000 3.63% 15/5/2045 168,626 0.00%Gatwick Funding Ltd. £100,000 4.63% 27/3/2034 168,249 0.00%Transport for London £100,000 4.00% 12/9/2033 167,150 0.00%Yorkshire Housing Finance plc £100,000 4.13% 31/10/2044 166,994 0.00%Nationwide Building Society £100,000 5.63% 28/1/2026 166,701 0.00%Lloyds Bank plc £100,000 7.50% 15/4/2024 165,493 0.00%Lloyds Bank plc £100,000 4.88% 30/3/2027 163,757 0.00%RELX Capital, Inc. $150,000 4.00% 18/3/2029 162,473 0.00%HSBC Holdings plc £100,000 5.75% 20/12/2027 162,371 0.00%BP Capital Markets plc CA($)200,000 3.47% 15/5/2025 161,245 0.00%Wm Morrison Supermarkets plc £100,000 4.75% 4/7/2029 160,374 0.00%Motability Operations Group plc £100,000 3.63% 10/3/2036 159,787 0.00%London & Quadrant Housing Trust £100,000 3.75% 27/10/2049 158,704 0.00%Anglian Water Services Financing plc £100,000 4.50% 5/10/2027 158,319 0.00%Lloyds Banking Group plc CA($)200,000 3.50% 3/2/2025 158,288 0.00%Sky Ltd. £100,000 4.00% 26/11/2029 158,039 0.00%Lloyds Bank plc £100,000 5.13% 7/3/2025 157,531 0.00%Lloyds Bank plc $150,000 3.50% 14/5/2025 157,479 0.00%
Vanguard Global Bond Index Fund
374
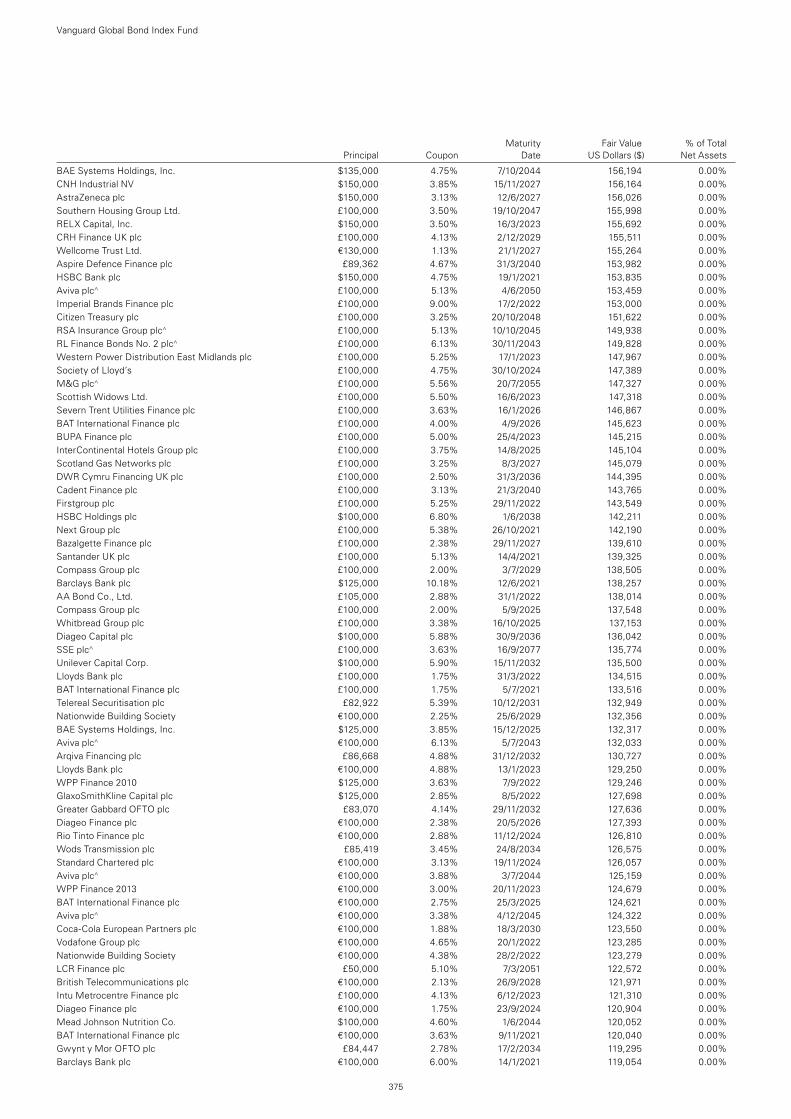
Maturity Fair Value % of Total Principal Coupon Date US Dollars ($) Net Assets
BAE Systems Holdings, Inc. $135,000 4.75% 7/10/2044 156,194 0.00%CNH Industrial NV $150,000 3.85% 15/11/2027 156,164 0.00%AstraZeneca plc $150,000 3.13% 12/6/2027 156,026 0.00%Southern Housing Group Ltd. £100,000 3.50% 19/10/2047 155,998 0.00%RELX Capital, Inc. $150,000 3.50% 16/3/2023 155,692 0.00%CRH Finance UK plc £100,000 4.13% 2/12/2029 155,511 0.00%Wellcome Trust Ltd. €130,000 1.13% 21/1/2027 155,264 0.00%Aspire Defence Finance plc £89,362 4.67% 31/3/2040 153,982 0.00%HSBC Bank plc $150,000 4.75% 19/1/2021 153,835 0.00%Aviva plc^ £100,000 5.13% 4/6/2050 153,459 0.00%Imperial Brands Finance plc £100,000 9.00% 17/2/2022 153,000 0.00%Citizen Treasury plc £100,000 3.25% 20/10/2048 151,622 0.00%RSA Insurance Group plc^ £100,000 5.13% 10/10/2045 149,938 0.00%RL Finance Bonds No. 2 plc^ £100,000 6.13% 30/11/2043 149,828 0.00%Western Power Distribution East Midlands plc £100,000 5.25% 17/1/2023 147,967 0.00%Society of Lloyd’s £100,000 4.75% 30/10/2024 147,389 0.00%M&G plc^ £100,000 5.56% 20/7/2055 147,327 0.00%Scottish Widows Ltd. £100,000 5.50% 16/6/2023 147,318 0.00%Severn Trent Utilities Finance plc £100,000 3.63% 16/1/2026 146,867 0.00%BAT International Finance plc £100,000 4.00% 4/9/2026 145,623 0.00%BUPA Finance plc £100,000 5.00% 25/4/2023 145,215 0.00%InterContinental Hotels Group plc £100,000 3.75% 14/8/2025 145,104 0.00%Scotland Gas Networks plc £100,000 3.25% 8/3/2027 145,079 0.00%DWR Cymru Financing UK plc £100,000 2.50% 31/3/2036 144,395 0.00%Cadent Finance plc £100,000 3.13% 21/3/2040 143,765 0.00%Firstgroup plc £100,000 5.25% 29/11/2022 143,549 0.00%HSBC Holdings plc $100,000 6.80% 1/6/2038 142,211 0.00%Next Group plc £100,000 5.38% 26/10/2021 142,190 0.00%Bazalgette Finance plc £100,000 2.38% 29/11/2027 139,610 0.00%Santander UK plc £100,000 5.13% 14/4/2021 139,325 0.00%Compass Group plc £100,000 2.00% 3/7/2029 138,505 0.00%Barclays Bank plc $125,000 10.18% 12/6/2021 138,257 0.00%AA Bond Co., Ltd. £105,000 2.88% 31/1/2022 138,014 0.00%Compass Group plc £100,000 2.00% 5/9/2025 137,548 0.00%Whitbread Group plc £100,000 3.38% 16/10/2025 137,153 0.00%Diageo Capital plc $100,000 5.88% 30/9/2036 136,042 0.00%SSE plc^ £100,000 3.63% 16/9/2077 135,774 0.00%Unilever Capital Corp. $100,000 5.90% 15/11/2032 135,500 0.00%Lloyds Bank plc £100,000 1.75% 31/3/2022 134,515 0.00%BAT International Finance plc £100,000 1.75% 5/7/2021 133,516 0.00%Telereal Securitisation plc £82,922 5.39% 10/12/2031 132,949 0.00%Nationwide Building Society €100,000 2.25% 25/6/2029 132,356 0.00%BAE Systems Holdings, Inc. $125,000 3.85% 15/12/2025 132,317 0.00%Aviva plc^ €100,000 6.13% 5/7/2043 132,033 0.00%Arqiva Financing plc £86,668 4.88% 31/12/2032 130,727 0.00%Lloyds Bank plc €100,000 4.88% 13/1/2023 129,250 0.00%WPP Finance 2010 $125,000 3.63% 7/9/2022 129,246 0.00%GlaxoSmithKline Capital plc $125,000 2.85% 8/5/2022 127,698 0.00%Greater Gabbard OFTO plc £83,070 4.14% 29/11/2032 127,636 0.00%Diageo Finance plc €100,000 2.38% 20/5/2026 127,393 0.00%Rio Tinto Finance plc €100,000 2.88% 11/12/2024 126,810 0.00%Wods Transmission plc £85,419 3.45% 24/8/2034 126,575 0.00%Standard Chartered plc €100,000 3.13% 19/11/2024 126,057 0.00%Aviva plc^ €100,000 3.88% 3/7/2044 125,159 0.00%WPP Finance 2013 €100,000 3.00% 20/11/2023 124,679 0.00%BAT International Finance plc €100,000 2.75% 25/3/2025 124,621 0.00%Aviva plc^ €100,000 3.38% 4/12/2045 124,322 0.00%Coca-Cola European Partners plc €100,000 1.88% 18/3/2030 123,550 0.00%Vodafone Group plc €100,000 4.65% 20/1/2022 123,285 0.00%Nationwide Building Society €100,000 4.38% 28/2/2022 123,279 0.00%LCR Finance plc £50,000 5.10% 7/3/2051 122,572 0.00%British Telecommunications plc €100,000 2.13% 26/9/2028 121,971 0.00%Intu Metrocentre Finance plc £100,000 4.13% 6/12/2023 121,310 0.00%Diageo Finance plc €100,000 1.75% 23/9/2024 120,904 0.00%Mead Johnson Nutrition Co. $100,000 4.60% 1/6/2044 120,052 0.00%BAT International Finance plc €100,000 3.63% 9/11/2021 120,040 0.00%Gwynt y Mor OFTO plc £84,447 2.78% 17/2/2034 119,295 0.00%Barclays Bank plc €100,000 6.00% 14/1/2021 119,054 0.00%
Vanguard Global Bond Index Fund
375
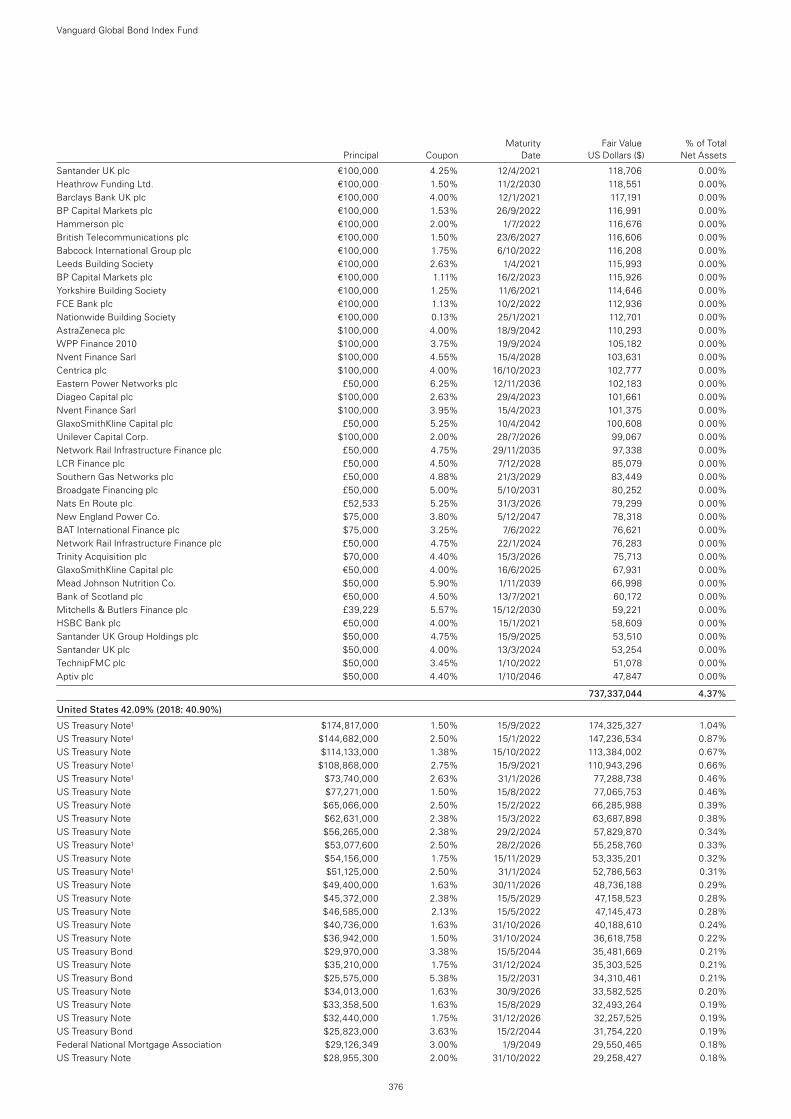
Maturity Fair Value % of Total Principal Coupon Date US Dollars ($) Net Assets
Santander UK plc €100,000 4.25% 12/4/2021 118,706 0.00%Heathrow Funding Ltd. €100,000 1.50% 11/2/2030 118,551 0.00%Barclays Bank UK plc €100,000 4.00% 12/1/2021 117,191 0.00%BP Capital Markets plc €100,000 1.53% 26/9/2022 116,991 0.00%Hammerson plc €100,000 2.00% 1/7/2022 116,676 0.00%British Telecommunications plc €100,000 1.50% 23/6/2027 116,606 0.00%Babcock International Group plc €100,000 1.75% 6/10/2022 116,208 0.00%Leeds Building Society €100,000 2.63% 1/4/2021 115,993 0.00%BP Capital Markets plc €100,000 1.11% 16/2/2023 115,926 0.00%Yorkshire Building Society €100,000 1.25% 11/6/2021 114,646 0.00%FCE Bank plc €100,000 1.13% 10/2/2022 112,936 0.00%Nationwide Building Society €100,000 0.13% 25/1/2021 112,701 0.00%AstraZeneca plc $100,000 4.00% 18/9/2042 110,293 0.00%WPP Finance 2010 $100,000 3.75% 19/9/2024 105,182 0.00%Nvent Finance Sarl $100,000 4.55% 15/4/2028 103,631 0.00%Centrica plc $100,000 4.00% 16/10/2023 102,777 0.00%Eastern Power Networks plc £50,000 6.25% 12/11/2036 102,183 0.00%Diageo Capital plc $100,000 2.63% 29/4/2023 101,661 0.00%Nvent Finance Sarl $100,000 3.95% 15/4/2023 101,375 0.00%GlaxoSmithKline Capital plc £50,000 5.25% 10/4/2042 100,608 0.00%Unilever Capital Corp. $100,000 2.00% 28/7/2026 99,067 0.00%Network Rail Infrastructure Finance plc £50,000 4.75% 29/11/2035 97,338 0.00%LCR Finance plc £50,000 4.50% 7/12/2028 85,079 0.00%Southern Gas Networks plc £50,000 4.88% 21/3/2029 83,449 0.00%Broadgate Financing plc £50,000 5.00% 5/10/2031 80,252 0.00%Nats En Route plc £52,533 5.25% 31/3/2026 79,299 0.00%New England Power Co. $75,000 3.80% 5/12/2047 78,318 0.00%BAT International Finance plc $75,000 3.25% 7/6/2022 76,621 0.00%Network Rail Infrastructure Finance plc £50,000 4.75% 22/1/2024 76,283 0.00%Trinity Acquisition plc $70,000 4.40% 15/3/2026 75,713 0.00%GlaxoSmithKline Capital plc €50,000 4.00% 16/6/2025 67,931 0.00%Mead Johnson Nutrition Co. $50,000 5.90% 1/11/2039 66,998 0.00%Bank of Scotland plc €50,000 4.50% 13/7/2021 60,172 0.00%Mitchells & Butlers Finance plc £39,229 5.57% 15/12/2030 59,221 0.00%HSBC Bank plc €50,000 4.00% 15/1/2021 58,609 0.00%Santander UK Group Holdings plc $50,000 4.75% 15/9/2025 53,510 0.00%Santander UK plc $50,000 4.00% 13/3/2024 53,254 0.00%TechnipFMC plc $50,000 3.45% 1/10/2022 51,078 0.00%Aptiv plc $50,000 4.40% 1/10/2046 47,847 0.00%
737,337,044 4.37%
United States 42.09% (2018: 40.90%)
US Treasury Note1 $174,817,000 1.50% 15/9/2022 174,325,327 1.04%US Treasury Note1 $144,682,000 2.50% 15/1/2022 147,236,534 0.87%US Treasury Note $114,133,000 1.38% 15/10/2022 113,384,002 0.67%US Treasury Note1 $108,868,000 2.75% 15/9/2021 110,943,296 0.66%US Treasury Note1 $73,740,000 2.63% 31/1/2026 77,288,738 0.46%US Treasury Note $77,271,000 1.50% 15/8/2022 77,065,753 0.46%US Treasury Note $65,066,000 2.50% 15/2/2022 66,285,988 0.39%US Treasury Note $62,631,000 2.38% 15/3/2022 63,687,898 0.38%US Treasury Note $56,265,000 2.38% 29/2/2024 57,829,870 0.34%US Treasury Note1 $53,077,600 2.50% 28/2/2026 55,258,760 0.33%US Treasury Note $54,156,000 1.75% 15/11/2029 53,335,201 0.32%US Treasury Note1 $51,125,000 2.50% 31/1/2024 52,786,563 0.31%US Treasury Note $49,400,000 1.63% 30/11/2026 48,736,188 0.29%US Treasury Note $45,372,000 2.38% 15/5/2029 47,158,523 0.28%US Treasury Note $46,585,000 2.13% 15/5/2022 47,145,473 0.28%US Treasury Note $40,736,000 1.63% 31/10/2026 40,188,610 0.24%US Treasury Note $36,942,000 1.50% 31/10/2024 36,618,758 0.22%US Treasury Bond $29,970,000 3.38% 15/5/2044 35,481,669 0.21%US Treasury Note $35,210,000 1.75% 31/12/2024 35,303,525 0.21%US Treasury Bond $25,575,000 5.38% 15/2/2031 34,310,461 0.21%US Treasury Note $34,013,000 1.63% 30/9/2026 33,582,525 0.20%US Treasury Note $33,358,500 1.63% 15/8/2029 32,493,264 0.19%US Treasury Note $32,440,000 1.75% 31/12/2026 32,257,525 0.19%US Treasury Bond $25,823,000 3.63% 15/2/2044 31,754,220 0.19%Federal National Mortgage Association $29,126,349 3.00% 1/9/2049 29,550,465 0.18%US Treasury Note $28,955,300 2.00% 31/10/2022 29,258,427 0.18%
Vanguard Global Bond Index Fund
376
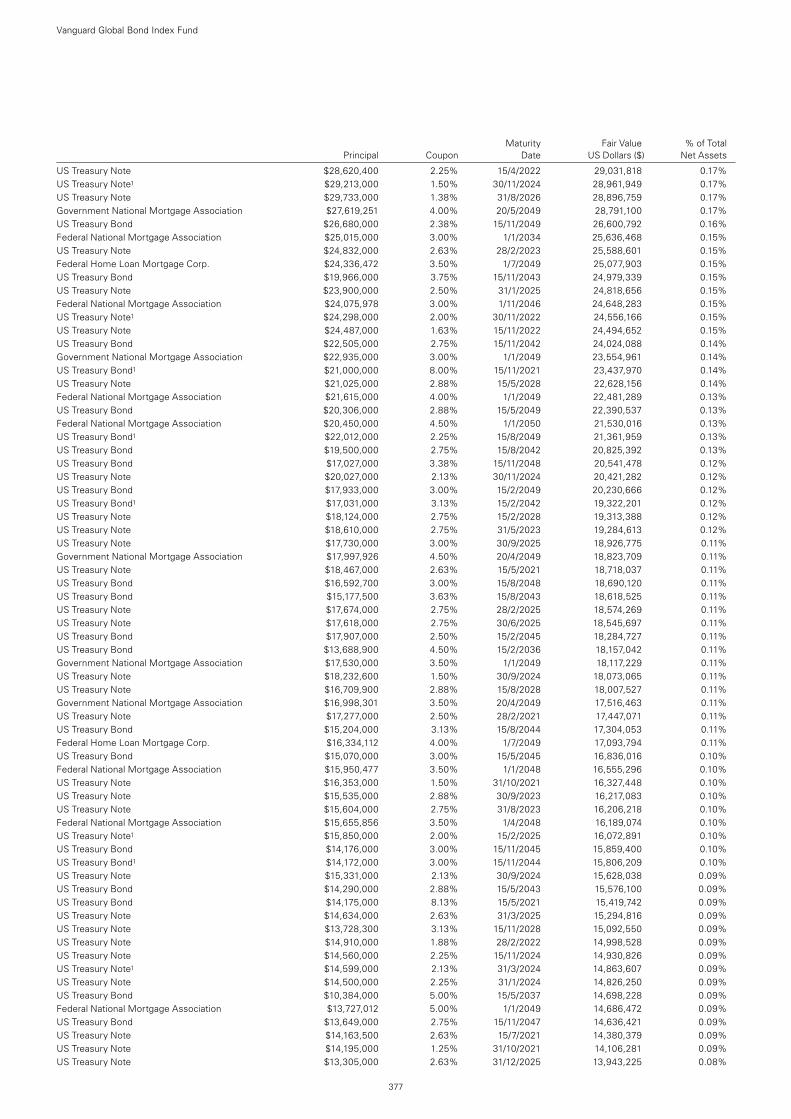
Maturity Fair Value % of Total Principal Coupon Date US Dollars ($) Net Assets
US Treasury Note $28,620,400 2.25% 15/4/2022 29,031,818 0.17%US Treasury Note1 $29,213,000 1.50% 30/11/2024 28,961,949 0.17%US Treasury Note $29,733,000 1.38% 31/8/2026 28,896,759 0.17%Government National Mortgage Association $27,619,251 4.00% 20/5/2049 28,791,100 0.17%US Treasury Bond $26,680,000 2.38% 15/11/2049 26,600,792 0.16%Federal National Mortgage Association $25,015,000 3.00% 1/1/2034 25,636,468 0.15%US Treasury Note $24,832,000 2.63% 28/2/2023 25,588,601 0.15%Federal Home Loan Mortgage Corp. $24,336,472 3.50% 1/7/2049 25,077,903 0.15%US Treasury Bond $19,966,000 3.75% 15/11/2043 24,979,339 0.15%US Treasury Note $23,900,000 2.50% 31/1/2025 24,818,656 0.15%Federal National Mortgage Association $24,075,978 3.00% 1/11/2046 24,648,283 0.15%US Treasury Note1 $24,298,000 2.00% 30/11/2022 24,556,166 0.15%US Treasury Note $24,487,000 1.63% 15/11/2022 24,494,652 0.15%US Treasury Bond $22,505,000 2.75% 15/11/2042 24,024,088 0.14%Government National Mortgage Association $22,935,000 3.00% 1/1/2049 23,554,961 0.14%US Treasury Bond1 $21,000,000 8.00% 15/11/2021 23,437,970 0.14%US Treasury Note $21,025,000 2.88% 15/5/2028 22,628,156 0.14%Federal National Mortgage Association $21,615,000 4.00% 1/1/2049 22,481,289 0.13%US Treasury Bond $20,306,000 2.88% 15/5/2049 22,390,537 0.13%Federal National Mortgage Association $20,450,000 4.50% 1/1/2050 21,530,016 0.13%US Treasury Bond1 $22,012,000 2.25% 15/8/2049 21,361,959 0.13%US Treasury Bond $19,500,000 2.75% 15/8/2042 20,825,392 0.13%US Treasury Bond $17,027,000 3.38% 15/11/2048 20,541,478 0.12%US Treasury Note $20,027,000 2.13% 30/11/2024 20,421,282 0.12%US Treasury Bond $17,933,000 3.00% 15/2/2049 20,230,666 0.12%US Treasury Bond1 $17,031,000 3.13% 15/2/2042 19,322,201 0.12%US Treasury Note $18,124,000 2.75% 15/2/2028 19,313,388 0.12%US Treasury Note $18,610,000 2.75% 31/5/2023 19,284,613 0.12%US Treasury Note $17,730,000 3.00% 30/9/2025 18,926,775 0.11%Government National Mortgage Association $17,997,926 4.50% 20/4/2049 18,823,709 0.11%US Treasury Note $18,467,000 2.63% 15/5/2021 18,718,037 0.11%US Treasury Bond $16,592,700 3.00% 15/8/2048 18,690,120 0.11%US Treasury Bond $15,177,500 3.63% 15/8/2043 18,618,525 0.11%US Treasury Note $17,674,000 2.75% 28/2/2025 18,574,269 0.11%US Treasury Note $17,618,000 2.75% 30/6/2025 18,545,697 0.11%US Treasury Bond $17,907,000 2.50% 15/2/2045 18,284,727 0.11%US Treasury Bond $13,688,900 4.50% 15/2/2036 18,157,042 0.11%Government National Mortgage Association $17,530,000 3.50% 1/1/2049 18,117,229 0.11%US Treasury Note $18,232,600 1.50% 30/9/2024 18,073,065 0.11%US Treasury Note $16,709,900 2.88% 15/8/2028 18,007,527 0.11%Government National Mortgage Association $16,998,301 3.50% 20/4/2049 17,516,463 0.11%US Treasury Note $17,277,000 2.50% 28/2/2021 17,447,071 0.11%US Treasury Bond $15,204,000 3.13% 15/8/2044 17,304,053 0.11%Federal Home Loan Mortgage Corp. $16,334,112 4.00% 1/7/2049 17,093,794 0.11%US Treasury Bond $15,070,000 3.00% 15/5/2045 16,836,016 0.10%Federal National Mortgage Association $15,950,477 3.50% 1/1/2048 16,555,296 0.10%US Treasury Note $16,353,000 1.50% 31/10/2021 16,327,448 0.10%US Treasury Note $15,535,000 2.88% 30/9/2023 16,217,083 0.10%US Treasury Note $15,604,000 2.75% 31/8/2023 16,206,218 0.10%Federal National Mortgage Association $15,655,856 3.50% 1/4/2048 16,189,074 0.10%US Treasury Note1 $15,850,000 2.00% 15/2/2025 16,072,891 0.10%US Treasury Bond $14,176,000 3.00% 15/11/2045 15,859,400 0.10%US Treasury Bond1 $14,172,000 3.00% 15/11/2044 15,806,209 0.10%US Treasury Note $15,331,000 2.13% 30/9/2024 15,628,038 0.09%US Treasury Bond $14,290,000 2.88% 15/5/2043 15,576,100 0.09%US Treasury Bond $14,175,000 8.13% 15/5/2021 15,419,742 0.09%US Treasury Note $14,634,000 2.63% 31/3/2025 15,294,816 0.09%US Treasury Note $13,728,300 3.13% 15/11/2028 15,092,550 0.09%US Treasury Note $14,910,000 1.88% 28/2/2022 14,998,528 0.09%US Treasury Note $14,560,000 2.25% 15/11/2024 14,930,826 0.09%US Treasury Note1 $14,599,000 2.13% 31/3/2024 14,863,607 0.09%US Treasury Note $14,500,000 2.25% 31/1/2024 14,826,250 0.09%US Treasury Bond $10,384,000 5.00% 15/5/2037 14,698,228 0.09%Federal National Mortgage Association $13,727,012 5.00% 1/1/2049 14,686,472 0.09%US Treasury Bond $13,649,000 2.75% 15/11/2047 14,636,421 0.09%US Treasury Note $14,163,500 2.63% 15/7/2021 14,380,379 0.09%US Treasury Note $14,195,000 1.25% 31/10/2021 14,106,281 0.09%US Treasury Note $13,305,000 2.63% 31/12/2025 13,943,225 0.08%
Vanguard Global Bond Index Fund
377
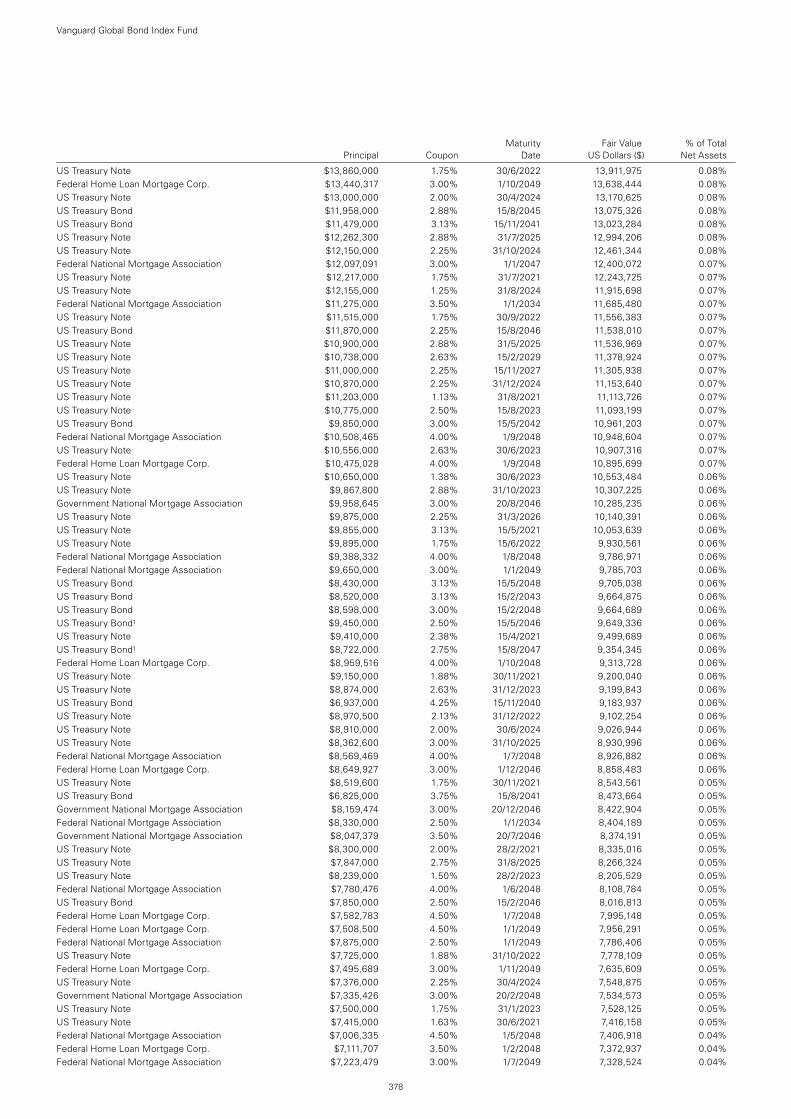
Maturity Fair Value % of Total Principal Coupon Date US Dollars ($) Net Assets
US Treasury Note $13,860,000 1.75% 30/6/2022 13,911,975 0.08%Federal Home Loan Mortgage Corp. $13,440,317 3.00% 1/10/2049 13,638,444 0.08%US Treasury Note $13,000,000 2.00% 30/4/2024 13,170,625 0.08%US Treasury Bond $11,958,000 2.88% 15/8/2045 13,075,326 0.08%US Treasury Bond $11,479,000 3.13% 15/11/2041 13,023,284 0.08%US Treasury Note $12,262,300 2.88% 31/7/2025 12,994,206 0.08%US Treasury Note $12,150,000 2.25% 31/10/2024 12,461,344 0.08%Federal National Mortgage Association $12,097,091 3.00% 1/1/2047 12,400,072 0.07%US Treasury Note $12,217,000 1.75% 31/7/2021 12,243,725 0.07%US Treasury Note $12,155,000 1.25% 31/8/2024 11,915,698 0.07%Federal National Mortgage Association $11,275,000 3.50% 1/1/2034 11,685,480 0.07%US Treasury Note $11,515,000 1.75% 30/9/2022 11,556,383 0.07%US Treasury Bond $11,870,000 2.25% 15/8/2046 11,538,010 0.07%US Treasury Note $10,900,000 2.88% 31/5/2025 11,536,969 0.07%US Treasury Note $10,738,000 2.63% 15/2/2029 11,378,924 0.07%US Treasury Note $11,000,000 2.25% 15/11/2027 11,305,938 0.07%US Treasury Note $10,870,000 2.25% 31/12/2024 11,153,640 0.07%US Treasury Note $11,203,000 1.13% 31/8/2021 11,113,726 0.07%US Treasury Note $10,775,000 2.50% 15/8/2023 11,093,199 0.07%US Treasury Bond $9,850,000 3.00% 15/5/2042 10,961,203 0.07%Federal National Mortgage Association $10,508,465 4.00% 1/9/2048 10,948,604 0.07%US Treasury Note $10,556,000 2.63% 30/6/2023 10,907,316 0.07%Federal Home Loan Mortgage Corp. $10,475,028 4.00% 1/9/2048 10,895,699 0.07%US Treasury Note $10,650,000 1.38% 30/6/2023 10,553,484 0.06%US Treasury Note $9,867,800 2.88% 31/10/2023 10,307,225 0.06%Government National Mortgage Association $9,958,645 3.00% 20/8/2046 10,285,235 0.06%US Treasury Note $9,875,000 2.25% 31/3/2026 10,140,391 0.06%US Treasury Note $9,855,000 3.13% 15/5/2021 10,053,639 0.06%US Treasury Note $9,895,000 1.75% 15/6/2022 9,930,561 0.06%Federal National Mortgage Association $9,388,332 4.00% 1/8/2048 9,786,971 0.06%Federal National Mortgage Association $9,650,000 3.00% 1/1/2049 9,785,703 0.06%US Treasury Bond $8,430,000 3.13% 15/5/2048 9,705,038 0.06%US Treasury Bond $8,520,000 3.13% 15/2/2043 9,664,875 0.06%US Treasury Bond $8,598,000 3.00% 15/2/2048 9,664,689 0.06%US Treasury Bond1 $9,450,000 2.50% 15/5/2046 9,649,336 0.06%US Treasury Note $9,410,000 2.38% 15/4/2021 9,499,689 0.06%US Treasury Bond1 $8,722,000 2.75% 15/8/2047 9,354,345 0.06%Federal Home Loan Mortgage Corp. $8,959,516 4.00% 1/10/2048 9,313,728 0.06%US Treasury Note $9,150,000 1.88% 30/11/2021 9,200,040 0.06%US Treasury Note $8,874,000 2.63% 31/12/2023 9,199,843 0.06%US Treasury Bond $6,937,000 4.25% 15/11/2040 9,183,937 0.06%US Treasury Note $8,970,500 2.13% 31/12/2022 9,102,254 0.06%US Treasury Note $8,910,000 2.00% 30/6/2024 9,026,944 0.06%US Treasury Note $8,362,600 3.00% 31/10/2025 8,930,996 0.06%Federal National Mortgage Association $8,569,469 4.00% 1/7/2048 8,926,882 0.06%Federal Home Loan Mortgage Corp. $8,649,927 3.00% 1/12/2046 8,858,483 0.06%US Treasury Note $8,519,600 1.75% 30/11/2021 8,543,561 0.05%US Treasury Bond $6,825,000 3.75% 15/8/2041 8,473,664 0.05%Government National Mortgage Association $8,159,474 3.00% 20/12/2046 8,422,904 0.05%Federal National Mortgage Association $8,330,000 2.50% 1/1/2034 8,404,189 0.05%Government National Mortgage Association $8,047,379 3.50% 20/7/2046 8,374,191 0.05%US Treasury Note $8,300,000 2.00% 28/2/2021 8,335,016 0.05%US Treasury Note $7,847,000 2.75% 31/8/2025 8,266,324 0.05%US Treasury Note $8,239,000 1.50% 28/2/2023 8,205,529 0.05%Federal National Mortgage Association $7,780,476 4.00% 1/6/2048 8,108,784 0.05%US Treasury Bond $7,850,000 2.50% 15/2/2046 8,016,813 0.05%Federal Home Loan Mortgage Corp. $7,582,783 4.50% 1/7/2048 7,995,148 0.05%Federal Home Loan Mortgage Corp. $7,508,500 4.50% 1/1/2049 7,956,291 0.05%Federal National Mortgage Association $7,875,000 2.50% 1/1/2049 7,786,406 0.05%US Treasury Note $7,725,000 1.88% 31/10/2022 7,778,109 0.05%Federal Home Loan Mortgage Corp. $7,495,689 3.00% 1/11/2049 7,635,609 0.05%US Treasury Note $7,376,000 2.25% 30/4/2024 7,548,875 0.05%Government National Mortgage Association $7,335,426 3.00% 20/2/2048 7,534,573 0.05%US Treasury Note $7,500,000 1.75% 31/1/2023 7,528,125 0.05%US Treasury Note $7,415,000 1.63% 30/6/2021 7,416,158 0.05%Federal National Mortgage Association $7,006,335 4.50% 1/5/2048 7,406,918 0.04%Federal Home Loan Mortgage Corp. $7,111,707 3.50% 1/2/2048 7,372,937 0.04%Federal National Mortgage Association $7,223,479 3.00% 1/7/2049 7,328,524 0.04%
Vanguard Global Bond Index Fund
378
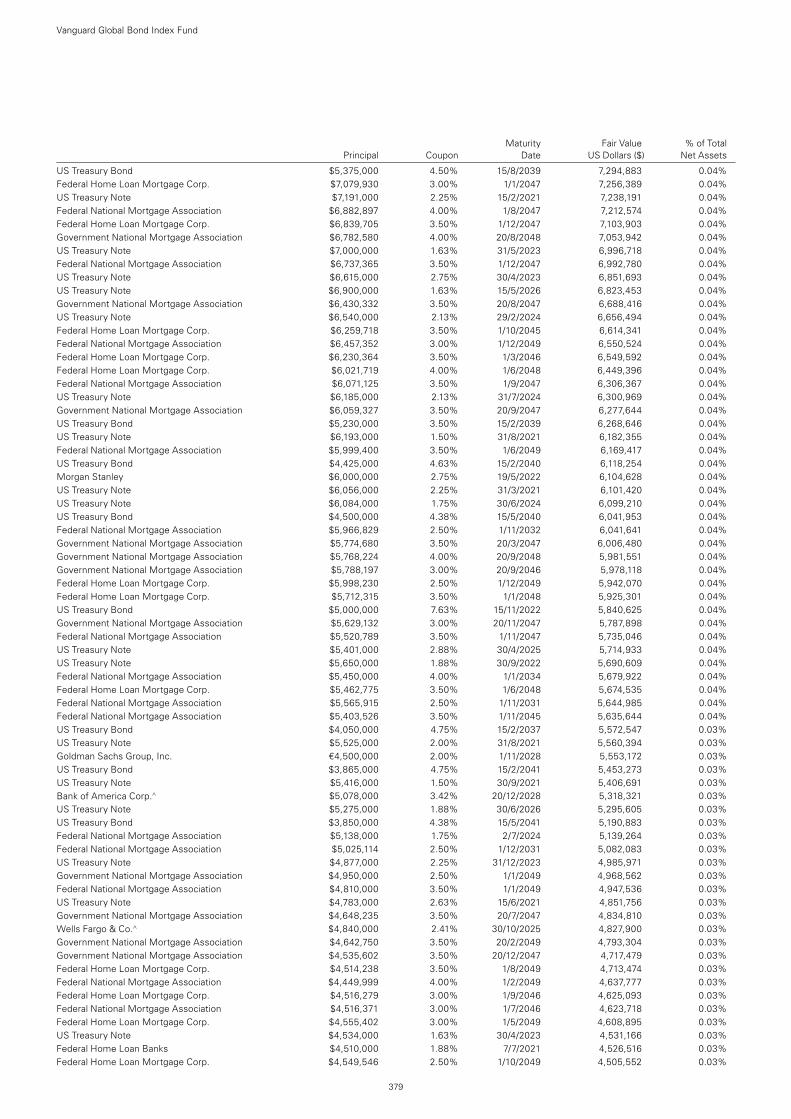
Maturity Fair Value % of Total Principal Coupon Date US Dollars ($) Net Assets
US Treasury Bond $5,375,000 4.50% 15/8/2039 7,294,883 0.04%Federal Home Loan Mortgage Corp. $7,079,930 3.00% 1/1/2047 7,256,389 0.04%US Treasury Note $7,191,000 2.25% 15/2/2021 7,238,191 0.04%Federal National Mortgage Association $6,882,897 4.00% 1/8/2047 7,212,574 0.04%Federal Home Loan Mortgage Corp. $6,839,705 3.50% 1/12/2047 7,103,903 0.04%Government National Mortgage Association $6,782,580 4.00% 20/8/2048 7,053,942 0.04%US Treasury Note $7,000,000 1.63% 31/5/2023 6,996,718 0.04%Federal National Mortgage Association $6,737,365 3.50% 1/12/2047 6,992,780 0.04%US Treasury Note $6,615,000 2.75% 30/4/2023 6,851,693 0.04%US Treasury Note $6,900,000 1.63% 15/5/2026 6,823,453 0.04%Government National Mortgage Association $6,430,332 3.50% 20/8/2047 6,688,416 0.04%US Treasury Note $6,540,000 2.13% 29/2/2024 6,656,494 0.04%Federal Home Loan Mortgage Corp. $6,259,718 3.50% 1/10/2045 6,614,341 0.04%Federal National Mortgage Association $6,457,352 3.00% 1/12/2049 6,550,524 0.04%Federal Home Loan Mortgage Corp. $6,230,364 3.50% 1/3/2046 6,549,592 0.04%Federal Home Loan Mortgage Corp. $6,021,719 4.00% 1/6/2048 6,449,396 0.04%Federal National Mortgage Association $6,071,125 3.50% 1/9/2047 6,306,367 0.04%US Treasury Note $6,185,000 2.13% 31/7/2024 6,300,969 0.04%Government National Mortgage Association $6,059,327 3.50% 20/9/2047 6,277,644 0.04%US Treasury Bond $5,230,000 3.50% 15/2/2039 6,268,646 0.04%US Treasury Note $6,193,000 1.50% 31/8/2021 6,182,355 0.04%Federal National Mortgage Association $5,999,400 3.50% 1/6/2049 6,169,417 0.04%US Treasury Bond $4,425,000 4.63% 15/2/2040 6,118,254 0.04%Morgan Stanley $6,000,000 2.75% 19/5/2022 6,104,628 0.04%US Treasury Note $6,056,000 2.25% 31/3/2021 6,101,420 0.04%US Treasury Note $6,084,000 1.75% 30/6/2024 6,099,210 0.04%US Treasury Bond $4,500,000 4.38% 15/5/2040 6,041,953 0.04%Federal National Mortgage Association $5,966,829 2.50% 1/11/2032 6,041,641 0.04%Government National Mortgage Association $5,774,680 3.50% 20/3/2047 6,006,480 0.04%Government National Mortgage Association $5,768,224 4.00% 20/9/2048 5,981,551 0.04%Government National Mortgage Association $5,788,197 3.00% 20/9/2046 5,978,118 0.04%Federal Home Loan Mortgage Corp. $5,998,230 2.50% 1/12/2049 5,942,070 0.04%Federal Home Loan Mortgage Corp. $5,712,315 3.50% 1/1/2048 5,925,301 0.04%US Treasury Bond $5,000,000 7.63% 15/11/2022 5,840,625 0.04%Government National Mortgage Association $5,629,132 3.00% 20/11/2047 5,787,898 0.04%Federal National Mortgage Association $5,520,789 3.50% 1/11/2047 5,735,046 0.04%US Treasury Note $5,401,000 2.88% 30/4/2025 5,714,933 0.04%US Treasury Note $5,650,000 1.88% 30/9/2022 5,690,609 0.04%Federal National Mortgage Association $5,450,000 4.00% 1/1/2034 5,679,922 0.04%Federal Home Loan Mortgage Corp. $5,462,775 3.50% 1/6/2048 5,674,535 0.04%Federal National Mortgage Association $5,565,915 2.50% 1/11/2031 5,644,985 0.04%Federal National Mortgage Association $5,403,526 3.50% 1/11/2045 5,635,644 0.04%US Treasury Bond $4,050,000 4.75% 15/2/2037 5,572,547 0.03%US Treasury Note $5,525,000 2.00% 31/8/2021 5,560,394 0.03%Goldman Sachs Group, Inc. €4,500,000 2.00% 1/11/2028 5,553,172 0.03%US Treasury Bond $3,865,000 4.75% 15/2/2041 5,453,273 0.03%US Treasury Note $5,416,000 1.50% 30/9/2021 5,406,691 0.03%Bank of America Corp.^ $5,078,000 3.42% 20/12/2028 5,318,321 0.03%US Treasury Note $5,275,000 1.88% 30/6/2026 5,295,605 0.03%US Treasury Bond $3,850,000 4.38% 15/5/2041 5,190,883 0.03%Federal National Mortgage Association $5,138,000 1.75% 2/7/2024 5,139,264 0.03%Federal National Mortgage Association $5,025,114 2.50% 1/12/2031 5,082,083 0.03%US Treasury Note $4,877,000 2.25% 31/12/2023 4,985,971 0.03%Government National Mortgage Association $4,950,000 2.50% 1/1/2049 4,968,562 0.03%Federal National Mortgage Association $4,810,000 3.50% 1/1/2049 4,947,536 0.03%US Treasury Note $4,783,000 2.63% 15/6/2021 4,851,756 0.03%Government National Mortgage Association $4,648,235 3.50% 20/7/2047 4,834,810 0.03%Wells Fargo & Co.^ $4,840,000 2.41% 30/10/2025 4,827,900 0.03%Government National Mortgage Association $4,642,750 3.50% 20/2/2049 4,793,304 0.03%Government National Mortgage Association $4,535,602 3.50% 20/12/2047 4,717,479 0.03%Federal Home Loan Mortgage Corp. $4,514,238 3.50% 1/8/2049 4,713,474 0.03%Federal National Mortgage Association $4,449,999 4.00% 1/2/2049 4,637,777 0.03%Federal Home Loan Mortgage Corp. $4,516,279 3.00% 1/9/2046 4,625,093 0.03%Federal National Mortgage Association $4,516,371 3.00% 1/7/2046 4,623,718 0.03%Federal Home Loan Mortgage Corp. $4,555,402 3.00% 1/5/2049 4,608,895 0.03%US Treasury Note $4,534,000 1.63% 30/4/2023 4,531,166 0.03%Federal Home Loan Banks $4,510,000 1.88% 7/7/2021 4,526,516 0.03%Federal Home Loan Mortgage Corp. $4,549,546 2.50% 1/10/2049 4,505,552 0.03%
Vanguard Global Bond Index Fund
379
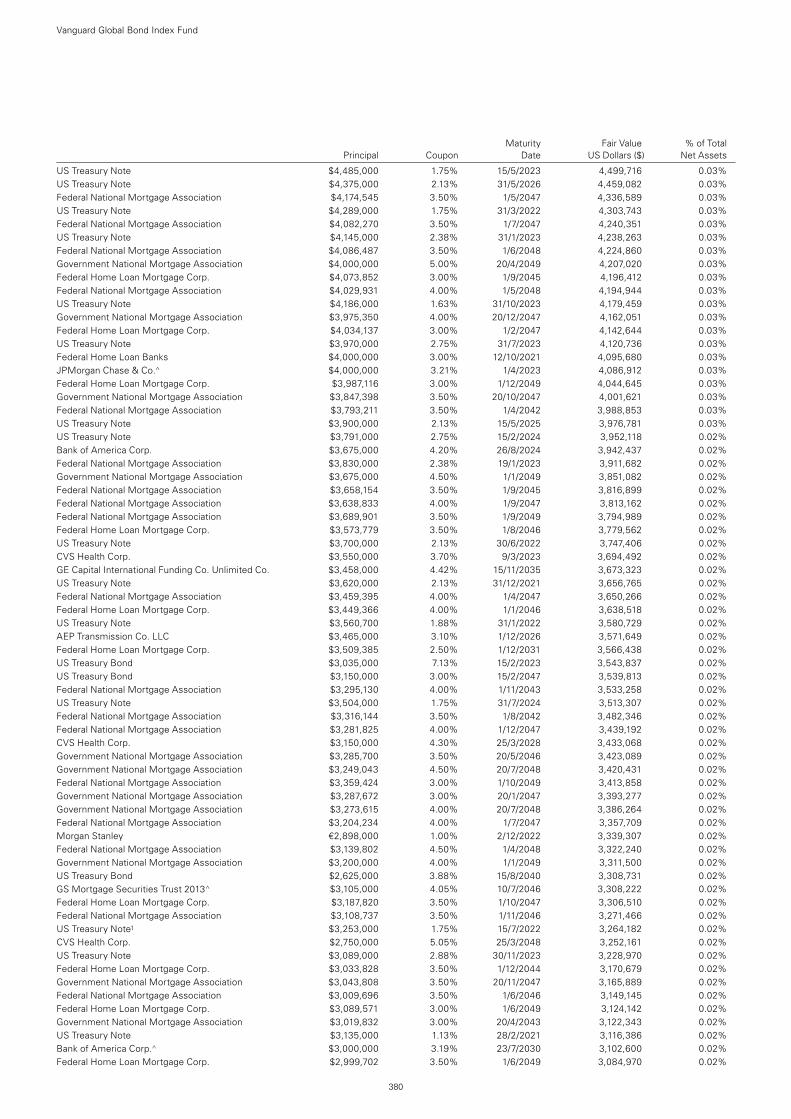
Maturity Fair Value % of Total Principal Coupon Date US Dollars ($) Net Assets
US Treasury Note $4,485,000 1.75% 15/5/2023 4,499,716 0.03%US Treasury Note $4,375,000 2.13% 31/5/2026 4,459,082 0.03%Federal National Mortgage Association $4,174,545 3.50% 1/5/2047 4,336,589 0.03%US Treasury Note $4,289,000 1.75% 31/3/2022 4,303,743 0.03%Federal National Mortgage Association $4,082,270 3.50% 1/7/2047 4,240,351 0.03%US Treasury Note $4,145,000 2.38% 31/1/2023 4,238,263 0.03%Federal National Mortgage Association $4,086,487 3.50% 1/6/2048 4,224,860 0.03%Government National Mortgage Association $4,000,000 5.00% 20/4/2049 4,207,020 0.03%Federal Home Loan Mortgage Corp. $4,073,852 3.00% 1/9/2045 4,196,412 0.03%Federal National Mortgage Association $4,029,931 4.00% 1/5/2048 4,194,944 0.03%US Treasury Note $4,186,000 1.63% 31/10/2023 4,179,459 0.03%Government National Mortgage Association $3,975,350 4.00% 20/12/2047 4,162,051 0.03%Federal Home Loan Mortgage Corp. $4,034,137 3.00% 1/2/2047 4,142,644 0.03%US Treasury Note $3,970,000 2.75% 31/7/2023 4,120,736 0.03%Federal Home Loan Banks $4,000,000 3.00% 12/10/2021 4,095,680 0.03%JPMorgan Chase & Co.^ $4,000,000 3.21% 1/4/2023 4,086,912 0.03%Federal Home Loan Mortgage Corp. $3,987,116 3.00% 1/12/2049 4,044,645 0.03%Government National Mortgage Association $3,847,398 3.50% 20/10/2047 4,001,621 0.03%Federal National Mortgage Association $3,793,211 3.50% 1/4/2042 3,988,853 0.03%US Treasury Note $3,900,000 2.13% 15/5/2025 3,976,781 0.03%US Treasury Note $3,791,000 2.75% 15/2/2024 3,952,118 0.02%Bank of America Corp. $3,675,000 4.20% 26/8/2024 3,942,437 0.02%Federal National Mortgage Association $3,830,000 2.38% 19/1/2023 3,911,682 0.02%Government National Mortgage Association $3,675,000 4.50% 1/1/2049 3,851,082 0.02%Federal National Mortgage Association $3,658,154 3.50% 1/9/2045 3,816,899 0.02%Federal National Mortgage Association $3,638,833 4.00% 1/9/2047 3,813,162 0.02%Federal National Mortgage Association $3,689,901 3.50% 1/9/2049 3,794,989 0.02%Federal Home Loan Mortgage Corp. $3,573,779 3.50% 1/8/2046 3,779,562 0.02%US Treasury Note $3,700,000 2.13% 30/6/2022 3,747,406 0.02%CVS Health Corp. $3,550,000 3.70% 9/3/2023 3,694,492 0.02%GE Capital International Funding Co. Unlimited Co. $3,458,000 4.42% 15/11/2035 3,673,323 0.02%US Treasury Note $3,620,000 2.13% 31/12/2021 3,656,765 0.02%Federal National Mortgage Association $3,459,395 4.00% 1/4/2047 3,650,266 0.02%Federal Home Loan Mortgage Corp. $3,449,366 4.00% 1/1/2046 3,638,518 0.02%US Treasury Note $3,560,700 1.88% 31/1/2022 3,580,729 0.02%AEP Transmission Co. LLC $3,465,000 3.10% 1/12/2026 3,571,649 0.02%Federal Home Loan Mortgage Corp. $3,509,385 2.50% 1/12/2031 3,566,438 0.02%US Treasury Bond $3,035,000 7.13% 15/2/2023 3,543,837 0.02%US Treasury Bond $3,150,000 3.00% 15/2/2047 3,539,813 0.02%Federal National Mortgage Association $3,295,130 4.00% 1/11/2043 3,533,258 0.02%US Treasury Note $3,504,000 1.75% 31/7/2024 3,513,307 0.02%Federal National Mortgage Association $3,316,144 3.50% 1/8/2042 3,482,346 0.02%Federal National Mortgage Association $3,281,825 4.00% 1/12/2047 3,439,192 0.02%CVS Health Corp. $3,150,000 4.30% 25/3/2028 3,433,068 0.02%Government National Mortgage Association $3,285,700 3.50% 20/5/2046 3,423,089 0.02%Government National Mortgage Association $3,249,043 4.50% 20/7/2048 3,420,431 0.02%Federal National Mortgage Association $3,359,424 3.00% 1/10/2049 3,413,858 0.02%Government National Mortgage Association $3,287,672 3.00% 20/1/2047 3,393,277 0.02%Government National Mortgage Association $3,273,615 4.00% 20/7/2048 3,386,264 0.02%Federal National Mortgage Association $3,204,234 4.00% 1/7/2047 3,357,709 0.02%Morgan Stanley €2,898,000 1.00% 2/12/2022 3,339,307 0.02%Federal National Mortgage Association $3,139,802 4.50% 1/4/2048 3,322,240 0.02%Government National Mortgage Association $3,200,000 4.00% 1/1/2049 3,311,500 0.02%US Treasury Bond $2,625,000 3.88% 15/8/2040 3,308,731 0.02%GS Mortgage Securities Trust 2013^ $3,105,000 4.05% 10/7/2046 3,308,222 0.02%Federal Home Loan Mortgage Corp. $3,187,820 3.50% 1/10/2047 3,306,510 0.02%Federal National Mortgage Association $3,108,737 3.50% 1/11/2046 3,271,466 0.02%US Treasury Note1 $3,253,000 1.75% 15/7/2022 3,264,182 0.02%CVS Health Corp. $2,750,000 5.05% 25/3/2048 3,252,161 0.02%US Treasury Note $3,089,000 2.88% 30/11/2023 3,228,970 0.02%Federal Home Loan Mortgage Corp. $3,033,828 3.50% 1/12/2044 3,170,679 0.02%Government National Mortgage Association $3,043,808 3.50% 20/11/2047 3,165,889 0.02%Federal National Mortgage Association $3,009,696 3.50% 1/6/2046 3,149,145 0.02%Federal Home Loan Mortgage Corp. $3,089,571 3.00% 1/6/2049 3,124,142 0.02%Government National Mortgage Association $3,019,832 3.00% 20/4/2043 3,122,343 0.02%US Treasury Note $3,135,000 1.13% 28/2/2021 3,116,386 0.02%Bank of America Corp.^ $3,000,000 3.19% 23/7/2030 3,102,600 0.02%Federal Home Loan Mortgage Corp. $2,999,702 3.50% 1/6/2049 3,084,970 0.02%
Vanguard Global Bond Index Fund
380
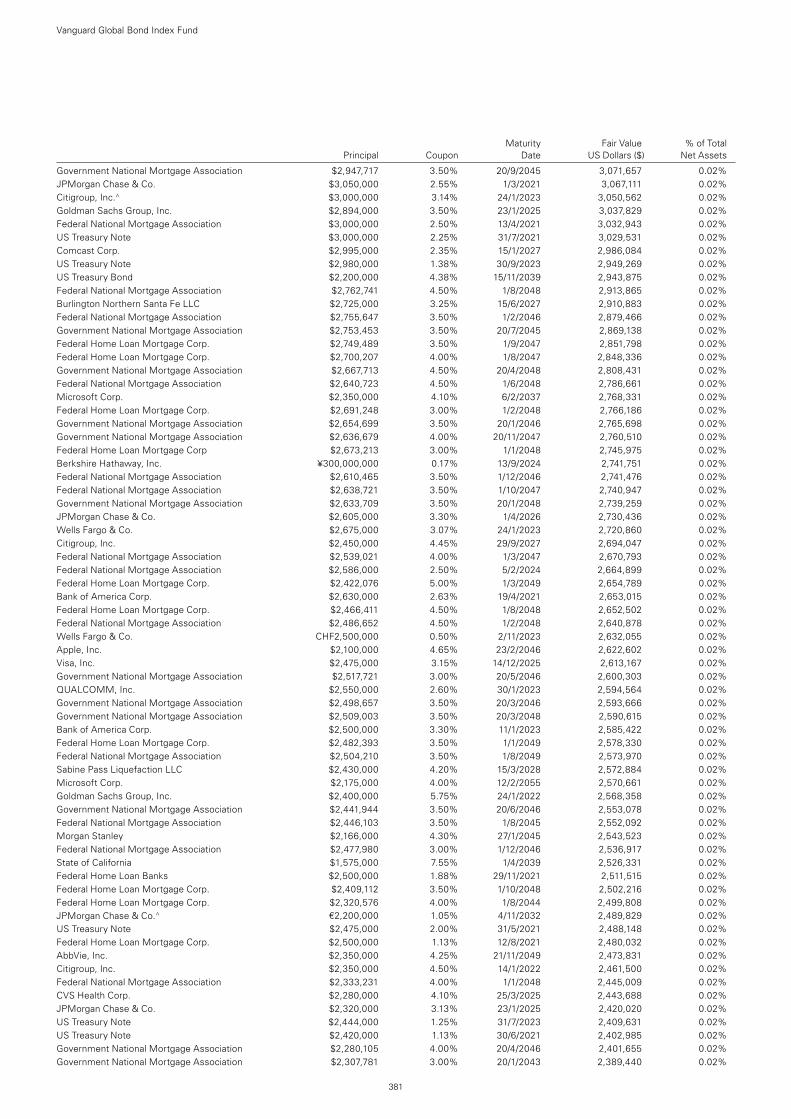
Maturity Fair Value % of Total Principal Coupon Date US Dollars ($) Net Assets
Government National Mortgage Association $2,947,717 3.50% 20/9/2045 3,071,657 0.02%JPMorgan Chase & Co. $3,050,000 2.55% 1/3/2021 3,067,111 0.02%Citigroup, Inc.^ $3,000,000 3.14% 24/1/2023 3,050,562 0.02%Goldman Sachs Group, Inc. $2,894,000 3.50% 23/1/2025 3,037,829 0.02%Federal National Mortgage Association $3,000,000 2.50% 13/4/2021 3,032,943 0.02%US Treasury Note $3,000,000 2.25% 31/7/2021 3,029,531 0.02%Comcast Corp. $2,995,000 2.35% 15/1/2027 2,986,084 0.02%US Treasury Note $2,980,000 1.38% 30/9/2023 2,949,269 0.02%US Treasury Bond $2,200,000 4.38% 15/11/2039 2,943,875 0.02%Federal National Mortgage Association $2,762,741 4.50% 1/8/2048 2,913,865 0.02%Burlington Northern Santa Fe LLC $2,725,000 3.25% 15/6/2027 2,910,883 0.02%Federal National Mortgage Association $2,755,647 3.50% 1/2/2046 2,879,466 0.02%Government National Mortgage Association $2,753,453 3.50% 20/7/2045 2,869,138 0.02%Federal Home Loan Mortgage Corp. $2,749,489 3.50% 1/9/2047 2,851,798 0.02%Federal Home Loan Mortgage Corp. $2,700,207 4.00% 1/8/2047 2,848,336 0.02%Government National Mortgage Association $2,667,713 4.50% 20/4/2048 2,808,431 0.02%Federal National Mortgage Association $2,640,723 4.50% 1/6/2048 2,786,661 0.02%Microsoft Corp. $2,350,000 4.10% 6/2/2037 2,768,331 0.02%Federal Home Loan Mortgage Corp. $2,691,248 3.00% 1/2/2048 2,766,186 0.02%Government National Mortgage Association $2,654,699 3.50% 20/1/2046 2,765,698 0.02%Government National Mortgage Association $2,636,679 4.00% 20/11/2047 2,760,510 0.02%Federal Home Loan Mortgage Corp $2,673,213 3.00% 1/1/2048 2,745,975 0.02%Berkshire Hathaway, Inc. ¥300,000,000 0.17% 13/9/2024 2,741,751 0.02%Federal National Mortgage Association $2,610,465 3.50% 1/12/2046 2,741,476 0.02%Federal National Mortgage Association $2,638,721 3.50% 1/10/2047 2,740,947 0.02%Government National Mortgage Association $2,633,709 3.50% 20/1/2048 2,739,259 0.02%JPMorgan Chase & Co. $2,605,000 3.30% 1/4/2026 2,730,436 0.02%Wells Fargo & Co. $2,675,000 3.07% 24/1/2023 2,720,860 0.02%Citigroup, Inc. $2,450,000 4.45% 29/9/2027 2,694,047 0.02%Federal National Mortgage Association $2,539,021 4.00% 1/3/2047 2,670,793 0.02%Federal National Mortgage Association $2,586,000 2.50% 5/2/2024 2,664,899 0.02%Federal Home Loan Mortgage Corp. $2,422,076 5.00% 1/3/2049 2,654,789 0.02%Bank of America Corp. $2,630,000 2.63% 19/4/2021 2,653,015 0.02%Federal Home Loan Mortgage Corp. $2,466,411 4.50% 1/8/2048 2,652,502 0.02%Federal National Mortgage Association $2,486,652 4.50% 1/2/2048 2,640,878 0.02%Wells Fargo & Co. CHF2,500,000 0.50% 2/11/2023 2,632,055 0.02%Apple, Inc. $2,100,000 4.65% 23/2/2046 2,622,602 0.02%Visa, Inc. $2,475,000 3.15% 14/12/2025 2,613,167 0.02%Government National Mortgage Association $2,517,721 3.00% 20/5/2046 2,600,303 0.02%QUALCOMM, Inc. $2,550,000 2.60% 30/1/2023 2,594,564 0.02%Government National Mortgage Association $2,498,657 3.50% 20/3/2046 2,593,666 0.02%Government National Mortgage Association $2,509,003 3.50% 20/3/2048 2,590,615 0.02%Bank of America Corp. $2,500,000 3.30% 11/1/2023 2,585,422 0.02%Federal Home Loan Mortgage Corp. $2,482,393 3.50% 1/1/2049 2,578,330 0.02%Federal National Mortgage Association $2,504,210 3.50% 1/8/2049 2,573,970 0.02%Sabine Pass Liquefaction LLC $2,430,000 4.20% 15/3/2028 2,572,884 0.02%Microsoft Corp. $2,175,000 4.00% 12/2/2055 2,570,661 0.02%Goldman Sachs Group, Inc. $2,400,000 5.75% 24/1/2022 2,568,358 0.02%Government National Mortgage Association $2,441,944 3.50% 20/6/2046 2,553,078 0.02%Federal National Mortgage Association $2,446,103 3.50% 1/8/2045 2,552,092 0.02%Morgan Stanley $2,166,000 4.30% 27/1/2045 2,543,523 0.02%Federal National Mortgage Association $2,477,980 3.00% 1/12/2046 2,536,917 0.02%State of California $1,575,000 7.55% 1/4/2039 2,526,331 0.02%Federal Home Loan Banks $2,500,000 1.88% 29/11/2021 2,511,515 0.02%Federal Home Loan Mortgage Corp. $2,409,112 3.50% 1/10/2048 2,502,216 0.02%Federal Home Loan Mortgage Corp. $2,320,576 4.00% 1/8/2044 2,499,808 0.02%JPMorgan Chase & Co.^ €2,200,000 1.05% 4/11/2032 2,489,829 0.02%US Treasury Note $2,475,000 2.00% 31/5/2021 2,488,148 0.02%Federal Home Loan Mortgage Corp. $2,500,000 1.13% 12/8/2021 2,480,032 0.02%AbbVie, Inc. $2,350,000 4.25% 21/11/2049 2,473,831 0.02%Citigroup, Inc. $2,350,000 4.50% 14/1/2022 2,461,500 0.02%Federal National Mortgage Association $2,333,231 4.00% 1/1/2048 2,445,009 0.02%CVS Health Corp. $2,280,000 4.10% 25/3/2025 2,443,688 0.02%JPMorgan Chase & Co. $2,320,000 3.13% 23/1/2025 2,420,020 0.02%US Treasury Note $2,444,000 1.25% 31/7/2023 2,409,631 0.02%US Treasury Note $2,420,000 1.13% 30/6/2021 2,402,985 0.02%Government National Mortgage Association $2,280,105 4.00% 20/4/2046 2,401,655 0.02%Government National Mortgage Association $2,307,781 3.00% 20/1/2043 2,389,440 0.02%
Vanguard Global Bond Index Fund
381
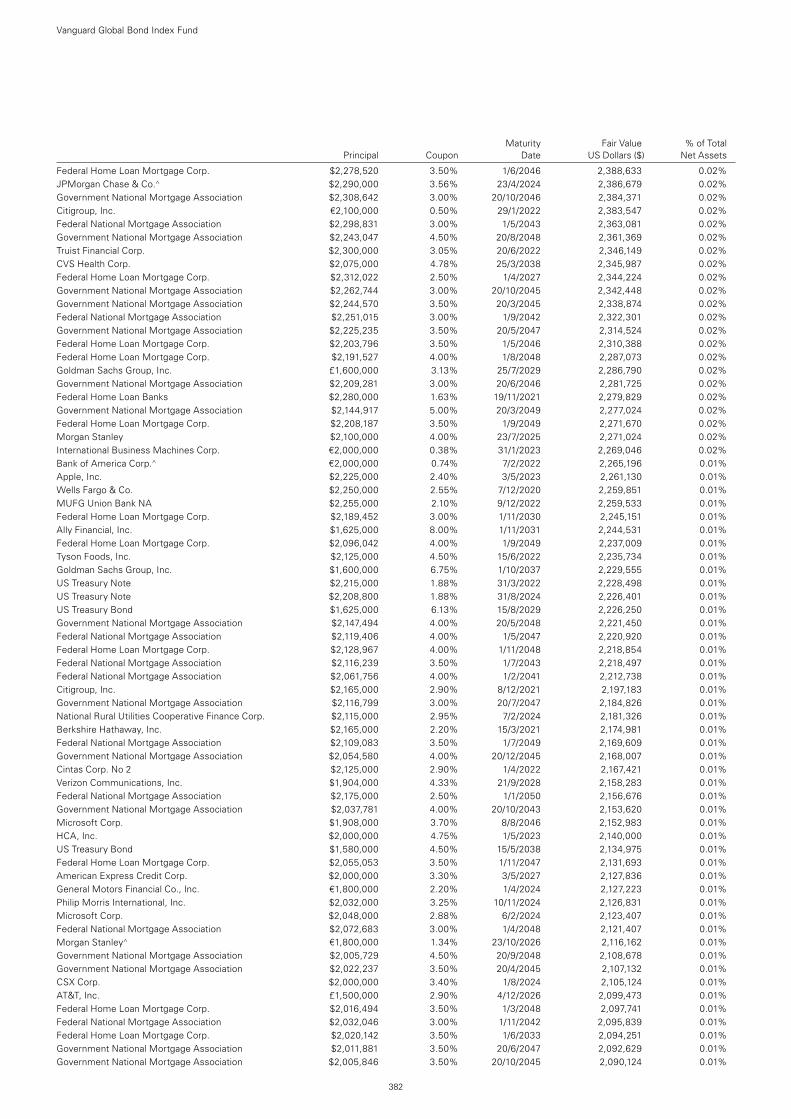
Maturity Fair Value % of Total Principal Coupon Date US Dollars ($) Net Assets
Federal Home Loan Mortgage Corp. $2,278,520 3.50% 1/6/2046 2,388,633 0.02%JPMorgan Chase & Co.^ $2,290,000 3.56% 23/4/2024 2,386,679 0.02%Government National Mortgage Association $2,308,642 3.00% 20/10/2046 2,384,371 0.02%Citigroup, Inc. €2,100,000 0.50% 29/1/2022 2,383,547 0.02%Federal National Mortgage Association $2,298,831 3.00% 1/5/2043 2,363,081 0.02%Government National Mortgage Association $2,243,047 4.50% 20/8/2048 2,361,369 0.02%Truist Financial Corp. $2,300,000 3.05% 20/6/2022 2,346,149 0.02%CVS Health Corp. $2,075,000 4.78% 25/3/2038 2,345,987 0.02%Federal Home Loan Mortgage Corp. $2,312,022 2.50% 1/4/2027 2,344,224 0.02%Government National Mortgage Association $2,262,744 3.00% 20/10/2045 2,342,448 0.02%Government National Mortgage Association $2,244,570 3.50% 20/3/2045 2,338,874 0.02%Federal National Mortgage Association $2,251,015 3.00% 1/9/2042 2,322,301 0.02%Government National Mortgage Association $2,225,235 3.50% 20/5/2047 2,314,524 0.02%Federal Home Loan Mortgage Corp. $2,203,796 3.50% 1/5/2046 2,310,388 0.02%Federal Home Loan Mortgage Corp. $2,191,527 4.00% 1/8/2048 2,287,073 0.02%Goldman Sachs Group, Inc. £1,600,000 3.13% 25/7/2029 2,286,790 0.02%Government National Mortgage Association $2,209,281 3.00% 20/6/2046 2,281,725 0.02%Federal Home Loan Banks $2,280,000 1.63% 19/11/2021 2,279,829 0.02%Government National Mortgage Association $2,144,917 5.00% 20/3/2049 2,277,024 0.02%Federal Home Loan Mortgage Corp. $2,208,187 3.50% 1/9/2049 2,271,670 0.02%Morgan Stanley $2,100,000 4.00% 23/7/2025 2,271,024 0.02%International Business Machines Corp. €2,000,000 0.38% 31/1/2023 2,269,046 0.02%Bank of America Corp.^ €2,000,000 0.74% 7/2/2022 2,265,196 0.01%Apple, Inc. $2,225,000 2.40% 3/5/2023 2,261,130 0.01%Wells Fargo & Co. $2,250,000 2.55% 7/12/2020 2,259,851 0.01%MUFG Union Bank NA $2,255,000 2.10% 9/12/2022 2,259,533 0.01%Federal Home Loan Mortgage Corp. $2,189,452 3.00% 1/11/2030 2,245,151 0.01%Ally Financial, Inc. $1,625,000 8.00% 1/11/2031 2,244,531 0.01%Federal Home Loan Mortgage Corp. $2,096,042 4.00% 1/9/2049 2,237,009 0.01%Tyson Foods, Inc. $2,125,000 4.50% 15/6/2022 2,235,734 0.01%Goldman Sachs Group, Inc. $1,600,000 6.75% 1/10/2037 2,229,555 0.01%US Treasury Note $2,215,000 1.88% 31/3/2022 2,228,498 0.01%US Treasury Note $2,208,800 1.88% 31/8/2024 2,226,401 0.01%US Treasury Bond $1,625,000 6.13% 15/8/2029 2,226,250 0.01%Government National Mortgage Association $2,147,494 4.00% 20/5/2048 2,221,450 0.01%Federal National Mortgage Association $2,119,406 4.00% 1/5/2047 2,220,920 0.01%Federal Home Loan Mortgage Corp. $2,128,967 4.00% 1/11/2048 2,218,854 0.01%Federal National Mortgage Association $2,116,239 3.50% 1/7/2043 2,218,497 0.01%Federal National Mortgage Association $2,061,756 4.00% 1/2/2041 2,212,738 0.01%Citigroup, Inc. $2,165,000 2.90% 8/12/2021 2,197,183 0.01%Government National Mortgage Association $2,116,799 3.00% 20/7/2047 2,184,826 0.01%National Rural Utilities Cooperative Finance Corp. $2,115,000 2.95% 7/2/2024 2,181,326 0.01%Berkshire Hathaway, Inc. $2,165,000 2.20% 15/3/2021 2,174,981 0.01%Federal National Mortgage Association $2,109,083 3.50% 1/7/2049 2,169,609 0.01%Government National Mortgage Association $2,054,580 4.00% 20/12/2045 2,168,007 0.01%Cintas Corp. No 2 $2,125,000 2.90% 1/4/2022 2,167,421 0.01%Verizon Communications, Inc. $1,904,000 4.33% 21/9/2028 2,158,283 0.01%Federal National Mortgage Association $2,175,000 2.50% 1/1/2050 2,156,676 0.01%Government National Mortgage Association $2,037,781 4.00% 20/10/2043 2,153,620 0.01%Microsoft Corp. $1,908,000 3.70% 8/8/2046 2,152,983 0.01%HCA, Inc. $2,000,000 4.75% 1/5/2023 2,140,000 0.01%US Treasury Bond $1,580,000 4.50% 15/5/2038 2,134,975 0.01%Federal Home Loan Mortgage Corp. $2,055,053 3.50% 1/11/2047 2,131,693 0.01%American Express Credit Corp. $2,000,000 3.30% 3/5/2027 2,127,836 0.01%General Motors Financial Co., Inc. €1,800,000 2.20% 1/4/2024 2,127,223 0.01%Philip Morris International, Inc. $2,032,000 3.25% 10/11/2024 2,126,831 0.01%Microsoft Corp. $2,048,000 2.88% 6/2/2024 2,123,407 0.01%Federal National Mortgage Association $2,072,683 3.00% 1/4/2048 2,121,407 0.01%Morgan Stanley^ €1,800,000 1.34% 23/10/2026 2,116,162 0.01%Government National Mortgage Association $2,005,729 4.50% 20/9/2048 2,108,678 0.01%Government National Mortgage Association $2,022,237 3.50% 20/4/2045 2,107,132 0.01%CSX Corp. $2,000,000 3.40% 1/8/2024 2,105,124 0.01%AT&T, Inc. £1,500,000 2.90% 4/12/2026 2,099,473 0.01%Federal Home Loan Mortgage Corp. $2,016,494 3.50% 1/3/2048 2,097,741 0.01%Federal National Mortgage Association $2,032,046 3.00% 1/11/2042 2,095,839 0.01%Federal Home Loan Mortgage Corp. $2,020,142 3.50% 1/6/2033 2,094,251 0.01%Government National Mortgage Association $2,011,881 3.50% 20/6/2047 2,092,629 0.01%Government National Mortgage Association $2,005,846 3.50% 20/10/2045 2,090,124 0.01%
Vanguard Global Bond Index Fund
382
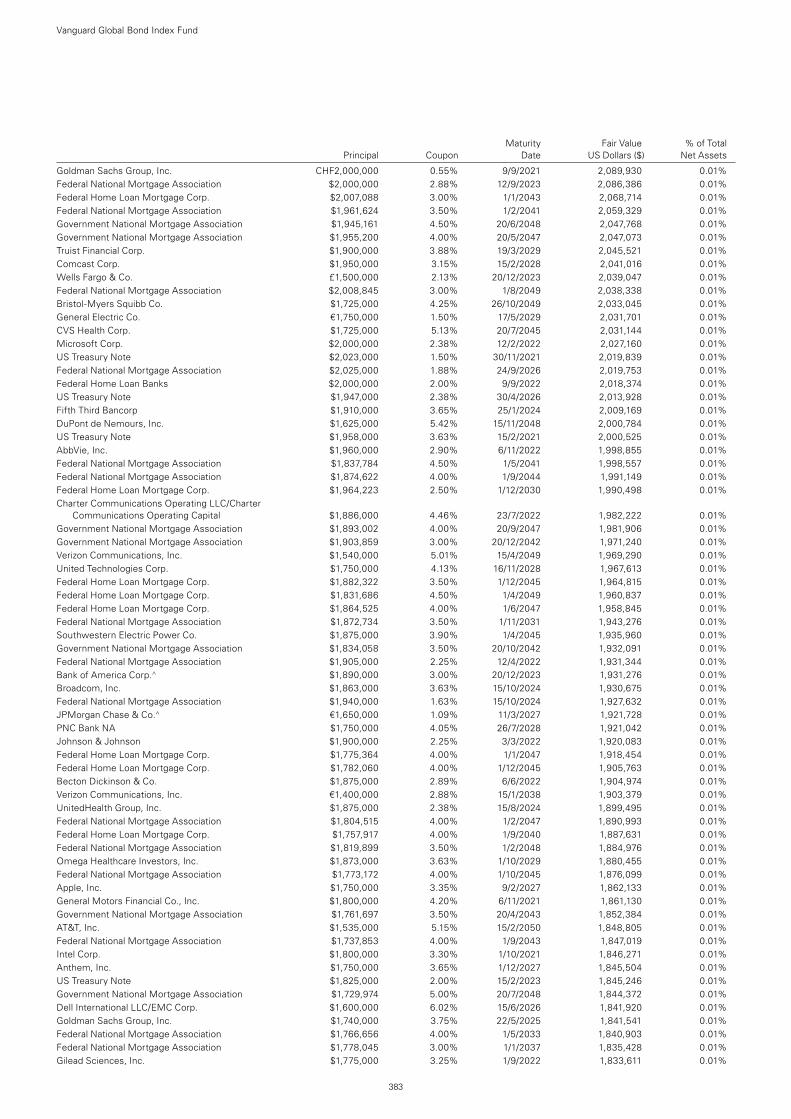
Maturity Fair Value % of Total Principal Coupon Date US Dollars ($) Net Assets
Goldman Sachs Group, Inc. CHF2,000,000 0.55% 9/9/2021 2,089,930 0.01%Federal National Mortgage Association $2,000,000 2.88% 12/9/2023 2,086,386 0.01%Federal Home Loan Mortgage Corp. $2,007,088 3.00% 1/1/2043 2,068,714 0.01%Federal National Mortgage Association $1,961,624 3.50% 1/2/2041 2,059,329 0.01%Government National Mortgage Association $1,945,161 4.50% 20/6/2048 2,047,768 0.01%Government National Mortgage Association $1,955,200 4.00% 20/5/2047 2,047,073 0.01%Truist Financial Corp. $1,900,000 3.88% 19/3/2029 2,045,521 0.01%Comcast Corp. $1,950,000 3.15% 15/2/2028 2,041,016 0.01%Wells Fargo & Co. £1,500,000 2.13% 20/12/2023 2,039,047 0.01%Federal National Mortgage Association $2,008,845 3.00% 1/8/2049 2,038,338 0.01%Bristol-Myers Squibb Co. $1,725,000 4.25% 26/10/2049 2,033,045 0.01%General Electric Co. €1,750,000 1.50% 17/5/2029 2,031,701 0.01%CVS Health Corp. $1,725,000 5.13% 20/7/2045 2,031,144 0.01%Microsoft Corp. $2,000,000 2.38% 12/2/2022 2,027,160 0.01%US Treasury Note $2,023,000 1.50% 30/11/2021 2,019,839 0.01%Federal National Mortgage Association $2,025,000 1.88% 24/9/2026 2,019,753 0.01%Federal Home Loan Banks $2,000,000 2.00% 9/9/2022 2,018,374 0.01%US Treasury Note $1,947,000 2.38% 30/4/2026 2,013,928 0.01%Fifth Third Bancorp $1,910,000 3.65% 25/1/2024 2,009,169 0.01%DuPont de Nemours, Inc. $1,625,000 5.42% 15/11/2048 2,000,784 0.01%US Treasury Note $1,958,000 3.63% 15/2/2021 2,000,525 0.01%AbbVie, Inc. $1,960,000 2.90% 6/11/2022 1,998,855 0.01%Federal National Mortgage Association $1,837,784 4.50% 1/5/2041 1,998,557 0.01%Federal National Mortgage Association $1,874,622 4.00% 1/9/2044 1,991,149 0.01%Federal Home Loan Mortgage Corp. $1,964,223 2.50% 1/12/2030 1,990,498 0.01%Charter Communications Operating LLC/Charter
Communications Operating Capital $1,886,000 4.46% 23/7/2022 1,982,222 0.01%Government National Mortgage Association $1,893,002 4.00% 20/9/2047 1,981,906 0.01%Government National Mortgage Association $1,903,859 3.00% 20/12/2042 1,971,240 0.01%Verizon Communications, Inc. $1,540,000 5.01% 15/4/2049 1,969,290 0.01%United Technologies Corp. $1,750,000 4.13% 16/11/2028 1,967,613 0.01%Federal Home Loan Mortgage Corp. $1,882,322 3.50% 1/12/2045 1,964,815 0.01%Federal Home Loan Mortgage Corp. $1,831,686 4.50% 1/4/2049 1,960,837 0.01%Federal Home Loan Mortgage Corp. $1,864,525 4.00% 1/6/2047 1,958,845 0.01%Federal National Mortgage Association $1,872,734 3.50% 1/11/2031 1,943,276 0.01%Southwestern Electric Power Co. $1,875,000 3.90% 1/4/2045 1,935,960 0.01%Government National Mortgage Association $1,834,058 3.50% 20/10/2042 1,932,091 0.01%Federal National Mortgage Association $1,905,000 2.25% 12/4/2022 1,931,344 0.01%Bank of America Corp.^ $1,890,000 3.00% 20/12/2023 1,931,276 0.01%Broadcom, Inc. $1,863,000 3.63% 15/10/2024 1,930,675 0.01%Federal National Mortgage Association $1,940,000 1.63% 15/10/2024 1,927,632 0.01%JPMorgan Chase & Co.^ €1,650,000 1.09% 11/3/2027 1,921,728 0.01%PNC Bank NA $1,750,000 4.05% 26/7/2028 1,921,042 0.01%Johnson & Johnson $1,900,000 2.25% 3/3/2022 1,920,083 0.01%Federal Home Loan Mortgage Corp. $1,775,364 4.00% 1/1/2047 1,918,454 0.01%Federal Home Loan Mortgage Corp. $1,782,060 4.00% 1/12/2045 1,905,763 0.01%Becton Dickinson & Co. $1,875,000 2.89% 6/6/2022 1,904,974 0.01%Verizon Communications, Inc. €1,400,000 2.88% 15/1/2038 1,903,379 0.01%UnitedHealth Group, Inc. $1,875,000 2.38% 15/8/2024 1,899,495 0.01%Federal National Mortgage Association $1,804,515 4.00% 1/2/2047 1,890,993 0.01%Federal Home Loan Mortgage Corp. $1,757,917 4.00% 1/9/2040 1,887,631 0.01%Federal National Mortgage Association $1,819,899 3.50% 1/2/2048 1,884,976 0.01%Omega Healthcare Investors, Inc. $1,873,000 3.63% 1/10/2029 1,880,455 0.01%Federal National Mortgage Association $1,773,172 4.00% 1/10/2045 1,876,099 0.01%Apple, Inc. $1,750,000 3.35% 9/2/2027 1,862,133 0.01%General Motors Financial Co., Inc. $1,800,000 4.20% 6/11/2021 1,861,130 0.01%Government National Mortgage Association $1,761,697 3.50% 20/4/2043 1,852,384 0.01%AT&T, Inc. $1,535,000 5.15% 15/2/2050 1,848,805 0.01%Federal National Mortgage Association $1,737,853 4.00% 1/9/2043 1,847,019 0.01%Intel Corp. $1,800,000 3.30% 1/10/2021 1,846,271 0.01%Anthem, Inc. $1,750,000 3.65% 1/12/2027 1,845,504 0.01%US Treasury Note $1,825,000 2.00% 15/2/2023 1,845,246 0.01%Government National Mortgage Association $1,729,974 5.00% 20/7/2048 1,844,372 0.01%Dell International LLC/EMC Corp. $1,600,000 6.02% 15/6/2026 1,841,920 0.01%Goldman Sachs Group, Inc. $1,740,000 3.75% 22/5/2025 1,841,541 0.01%Federal National Mortgage Association $1,766,656 4.00% 1/5/2033 1,840,903 0.01%Federal National Mortgage Association $1,778,045 3.00% 1/1/2037 1,835,428 0.01%Gilead Sciences, Inc. $1,775,000 3.25% 1/9/2022 1,833,611 0.01%
Vanguard Global Bond Index Fund
383
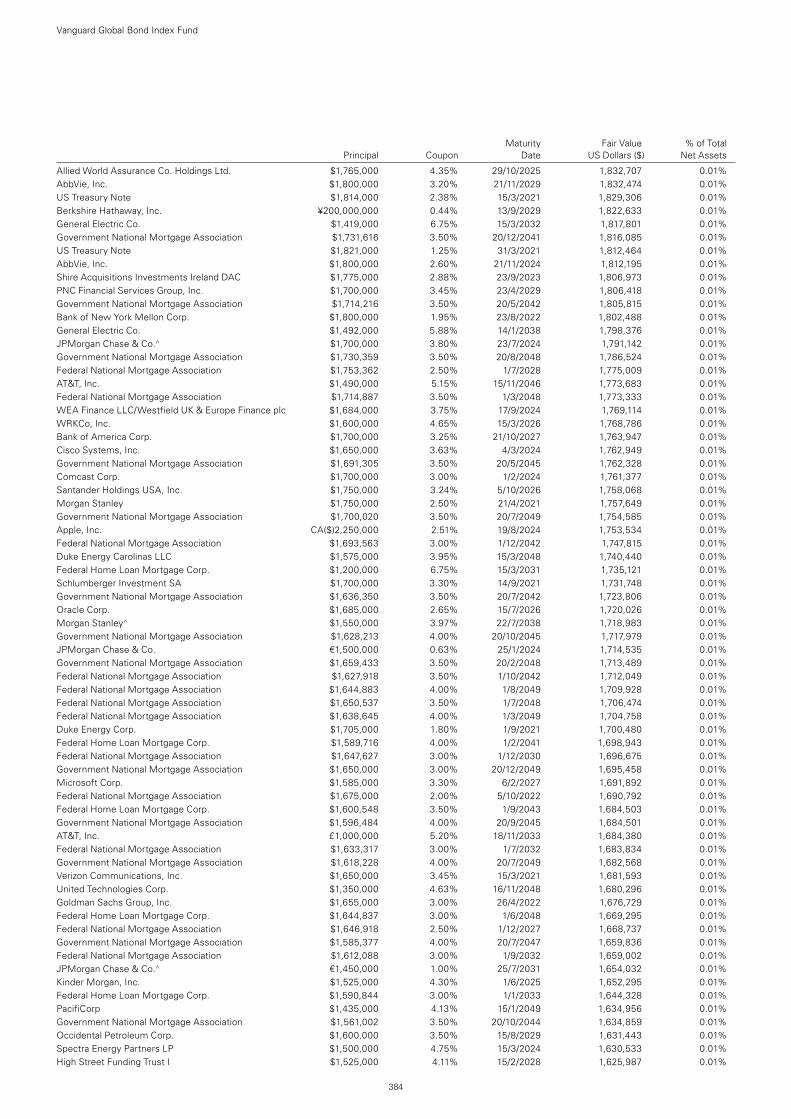
Maturity Fair Value % of Total Principal Coupon Date US Dollars ($) Net Assets
Allied World Assurance Co. Holdings Ltd. $1,765,000 4.35% 29/10/2025 1,832,707 0.01%AbbVie, Inc. $1,800,000 3.20% 21/11/2029 1,832,474 0.01%US Treasury Note $1,814,000 2.38% 15/3/2021 1,829,306 0.01%Berkshire Hathaway, Inc. ¥200,000,000 0.44% 13/9/2029 1,822,633 0.01%General Electric Co. $1,419,000 6.75% 15/3/2032 1,817,801 0.01%Government National Mortgage Association $1,731,616 3.50% 20/12/2041 1,816,085 0.01%US Treasury Note $1,821,000 1.25% 31/3/2021 1,812,464 0.01%AbbVie, Inc. $1,800,000 2.60% 21/11/2024 1,812,195 0.01%Shire Acquisitions Investments Ireland DAC $1,775,000 2.88% 23/9/2023 1,806,973 0.01%PNC Financial Services Group, Inc. $1,700,000 3.45% 23/4/2029 1,806,418 0.01%Government National Mortgage Association $1,714,216 3.50% 20/5/2042 1,805,815 0.01%Bank of New York Mellon Corp. $1,800,000 1.95% 23/8/2022 1,802,488 0.01%General Electric Co. $1,492,000 5.88% 14/1/2038 1,798,376 0.01%JPMorgan Chase & Co.^ $1,700,000 3.80% 23/7/2024 1,791,142 0.01%Government National Mortgage Association $1,730,359 3.50% 20/8/2048 1,786,524 0.01%Federal National Mortgage Association $1,753,362 2.50% 1/7/2028 1,775,009 0.01%AT&T, Inc. $1,490,000 5.15% 15/11/2046 1,773,683 0.01%Federal National Mortgage Association $1,714,887 3.50% 1/3/2048 1,773,333 0.01%WEA Finance LLC/Westfield UK & Europe Finance plc $1,684,000 3.75% 17/9/2024 1,769,114 0.01%WRKCo, Inc. $1,600,000 4.65% 15/3/2026 1,768,786 0.01%Bank of America Corp. $1,700,000 3.25% 21/10/2027 1,763,947 0.01%Cisco Systems, Inc. $1,650,000 3.63% 4/3/2024 1,762,949 0.01%Government National Mortgage Association $1,691,305 3.50% 20/5/2045 1,762,328 0.01%Comcast Corp. $1,700,000 3.00% 1/2/2024 1,761,377 0.01%Santander Holdings USA, Inc. $1,750,000 3.24% 5/10/2026 1,758,068 0.01%Morgan Stanley $1,750,000 2.50% 21/4/2021 1,757,649 0.01%Government National Mortgage Association $1,700,020 3.50% 20/7/2049 1,754,585 0.01%Apple, Inc. CA($)2,250,000 2.51% 19/8/2024 1,753,534 0.01%Federal National Mortgage Association $1,693,563 3.00% 1/12/2042 1,747,815 0.01%Duke Energy Carolinas LLC $1,575,000 3.95% 15/3/2048 1,740,440 0.01%Federal Home Loan Mortgage Corp. $1,200,000 6.75% 15/3/2031 1,735,121 0.01%Schlumberger Investment SA $1,700,000 3.30% 14/9/2021 1,731,748 0.01%Government National Mortgage Association $1,636,350 3.50% 20/7/2042 1,723,806 0.01%Oracle Corp. $1,685,000 2.65% 15/7/2026 1,720,026 0.01%Morgan Stanley^ $1,550,000 3.97% 22/7/2038 1,718,983 0.01%Government National Mortgage Association $1,628,213 4.00% 20/10/2045 1,717,979 0.01%JPMorgan Chase & Co. €1,500,000 0.63% 25/1/2024 1,714,535 0.01%Government National Mortgage Association $1,659,433 3.50% 20/2/2048 1,713,489 0.01%Federal National Mortgage Association $1,627,918 3.50% 1/10/2042 1,712,049 0.01%Federal National Mortgage Association $1,644,883 4.00% 1/8/2049 1,709,928 0.01%Federal National Mortgage Association $1,650,537 3.50% 1/7/2048 1,706,474 0.01%Federal National Mortgage Association $1,638,645 4.00% 1/3/2049 1,704,758 0.01%Duke Energy Corp. $1,705,000 1.80% 1/9/2021 1,700,480 0.01%Federal Home Loan Mortgage Corp. $1,589,716 4.00% 1/2/2041 1,698,943 0.01%Federal National Mortgage Association $1,647,627 3.00% 1/12/2030 1,696,675 0.01%Government National Mortgage Association $1,650,000 3.00% 20/12/2049 1,695,458 0.01%Microsoft Corp. $1,585,000 3.30% 6/2/2027 1,691,892 0.01%Federal National Mortgage Association $1,675,000 2.00% 5/10/2022 1,690,792 0.01%Federal Home Loan Mortgage Corp. $1,600,548 3.50% 1/9/2043 1,684,503 0.01%Government National Mortgage Association $1,596,484 4.00% 20/9/2045 1,684,501 0.01%AT&T, Inc. £1,000,000 5.20% 18/11/2033 1,684,380 0.01%Federal National Mortgage Association $1,633,317 3.00% 1/7/2032 1,683,834 0.01%Government National Mortgage Association $1,618,228 4.00% 20/7/2049 1,682,568 0.01%Verizon Communications, Inc. $1,650,000 3.45% 15/3/2021 1,681,593 0.01%United Technologies Corp. $1,350,000 4.63% 16/11/2048 1,680,296 0.01%Goldman Sachs Group, Inc. $1,655,000 3.00% 26/4/2022 1,676,729 0.01%Federal Home Loan Mortgage Corp. $1,644,837 3.00% 1/6/2048 1,669,295 0.01%Federal National Mortgage Association $1,646,918 2.50% 1/12/2027 1,668,737 0.01%Government National Mortgage Association $1,585,377 4.00% 20/7/2047 1,659,836 0.01%Federal National Mortgage Association $1,612,088 3.00% 1/9/2032 1,659,002 0.01%JPMorgan Chase & Co.^ €1,450,000 1.00% 25/7/2031 1,654,032 0.01%Kinder Morgan, Inc. $1,525,000 4.30% 1/6/2025 1,652,295 0.01%Federal Home Loan Mortgage Corp. $1,590,844 3.00% 1/1/2033 1,644,328 0.01%PacifiCorp $1,435,000 4.13% 15/1/2049 1,634,956 0.01%Government National Mortgage Association $1,561,002 3.50% 20/10/2044 1,634,859 0.01%Occidental Petroleum Corp. $1,600,000 3.50% 15/8/2029 1,631,443 0.01%Spectra Energy Partners LP $1,500,000 4.75% 15/3/2024 1,630,533 0.01%High Street Funding Trust I $1,525,000 4.11% 15/2/2028 1,625,987 0.01%
Vanguard Global Bond Index Fund
384
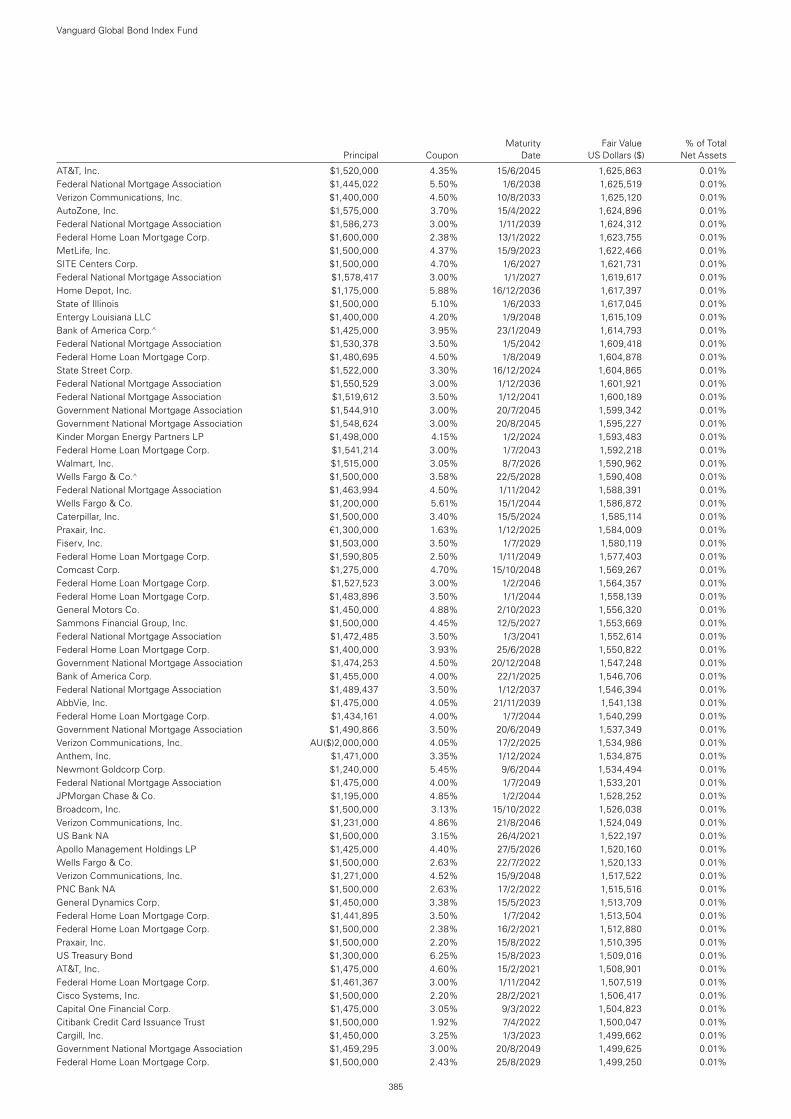
Maturity Fair Value % of Total Principal Coupon Date US Dollars ($) Net Assets
AT&T, Inc. $1,520,000 4.35% 15/6/2045 1,625,863 0.01%Federal National Mortgage Association $1,445,022 5.50% 1/6/2038 1,625,519 0.01%Verizon Communications, Inc. $1,400,000 4.50% 10/8/2033 1,625,120 0.01%AutoZone, Inc. $1,575,000 3.70% 15/4/2022 1,624,896 0.01%Federal National Mortgage Association $1,586,273 3.00% 1/11/2039 1,624,312 0.01%Federal Home Loan Mortgage Corp. $1,600,000 2.38% 13/1/2022 1,623,755 0.01%MetLife, Inc. $1,500,000 4.37% 15/9/2023 1,622,466 0.01%SITE Centers Corp. $1,500,000 4.70% 1/6/2027 1,621,731 0.01%Federal National Mortgage Association $1,578,417 3.00% 1/1/2027 1,619,617 0.01%Home Depot, Inc. $1,175,000 5.88% 16/12/2036 1,617,397 0.01%State of Illinois $1,500,000 5.10% 1/6/2033 1,617,045 0.01%Entergy Louisiana LLC $1,400,000 4.20% 1/9/2048 1,615,109 0.01%Bank of America Corp.^ $1,425,000 3.95% 23/1/2049 1,614,793 0.01%Federal National Mortgage Association $1,530,378 3.50% 1/5/2042 1,609,418 0.01%Federal Home Loan Mortgage Corp. $1,480,695 4.50% 1/8/2049 1,604,878 0.01%State Street Corp. $1,522,000 3.30% 16/12/2024 1,604,865 0.01%Federal National Mortgage Association $1,550,529 3.00% 1/12/2036 1,601,921 0.01%Federal National Mortgage Association $1,519,612 3.50% 1/12/2041 1,600,189 0.01%Government National Mortgage Association $1,544,910 3.00% 20/7/2045 1,599,342 0.01%Government National Mortgage Association $1,548,624 3.00% 20/8/2045 1,595,227 0.01%Kinder Morgan Energy Partners LP $1,498,000 4.15% 1/2/2024 1,593,483 0.01%Federal Home Loan Mortgage Corp. $1,541,214 3.00% 1/7/2043 1,592,218 0.01%Walmart, Inc. $1,515,000 3.05% 8/7/2026 1,590,962 0.01%Wells Fargo & Co.^ $1,500,000 3.58% 22/5/2028 1,590,408 0.01%Federal National Mortgage Association $1,463,994 4.50% 1/11/2042 1,588,391 0.01%Wells Fargo & Co. $1,200,000 5.61% 15/1/2044 1,586,872 0.01%Caterpillar, Inc. $1,500,000 3.40% 15/5/2024 1,585,114 0.01%Praxair, Inc. €1,300,000 1.63% 1/12/2025 1,584,009 0.01%Fiserv, Inc. $1,503,000 3.50% 1/7/2029 1,580,119 0.01%Federal Home Loan Mortgage Corp. $1,590,805 2.50% 1/11/2049 1,577,403 0.01%Comcast Corp. $1,275,000 4.70% 15/10/2048 1,569,267 0.01%Federal Home Loan Mortgage Corp. $1,527,523 3.00% 1/2/2046 1,564,357 0.01%Federal Home Loan Mortgage Corp. $1,483,896 3.50% 1/1/2044 1,558,139 0.01%General Motors Co. $1,450,000 4.88% 2/10/2023 1,556,320 0.01%Sammons Financial Group, Inc. $1,500,000 4.45% 12/5/2027 1,553,669 0.01%Federal National Mortgage Association $1,472,485 3.50% 1/3/2041 1,552,614 0.01%Federal Home Loan Mortgage Corp. $1,400,000 3.93% 25/6/2028 1,550,822 0.01%Government National Mortgage Association $1,474,253 4.50% 20/12/2048 1,547,248 0.01%Bank of America Corp. $1,455,000 4.00% 22/1/2025 1,546,706 0.01%Federal National Mortgage Association $1,489,437 3.50% 1/12/2037 1,546,394 0.01%AbbVie, Inc. $1,475,000 4.05% 21/11/2039 1,541,138 0.01%Federal Home Loan Mortgage Corp. $1,434,161 4.00% 1/7/2044 1,540,299 0.01%Government National Mortgage Association $1,490,866 3.50% 20/6/2049 1,537,349 0.01%Verizon Communications, Inc. AU($)2,000,000 4.05% 17/2/2025 1,534,986 0.01%Anthem, Inc. $1,471,000 3.35% 1/12/2024 1,534,875 0.01%Newmont Goldcorp Corp. $1,240,000 5.45% 9/6/2044 1,534,494 0.01%Federal National Mortgage Association $1,475,000 4.00% 1/7/2049 1,533,201 0.01%JPMorgan Chase & Co. $1,195,000 4.85% 1/2/2044 1,528,252 0.01%Broadcom, Inc. $1,500,000 3.13% 15/10/2022 1,526,038 0.01%Verizon Communications, Inc. $1,231,000 4.86% 21/8/2046 1,524,049 0.01%US Bank NA $1,500,000 3.15% 26/4/2021 1,522,197 0.01%Apollo Management Holdings LP $1,425,000 4.40% 27/5/2026 1,520,160 0.01%Wells Fargo & Co. $1,500,000 2.63% 22/7/2022 1,520,133 0.01%Verizon Communications, Inc. $1,271,000 4.52% 15/9/2048 1,517,522 0.01%PNC Bank NA $1,500,000 2.63% 17/2/2022 1,515,516 0.01%General Dynamics Corp. $1,450,000 3.38% 15/5/2023 1,513,709 0.01%Federal Home Loan Mortgage Corp. $1,441,895 3.50% 1/7/2042 1,513,504 0.01%Federal Home Loan Mortgage Corp. $1,500,000 2.38% 16/2/2021 1,512,880 0.01%Praxair, Inc. $1,500,000 2.20% 15/8/2022 1,510,395 0.01%US Treasury Bond $1,300,000 6.25% 15/8/2023 1,509,016 0.01%AT&T, Inc. $1,475,000 4.60% 15/2/2021 1,508,901 0.01%Federal Home Loan Mortgage Corp. $1,461,367 3.00% 1/11/2042 1,507,519 0.01%Cisco Systems, Inc. $1,500,000 2.20% 28/2/2021 1,506,417 0.01%Capital One Financial Corp. $1,475,000 3.05% 9/3/2022 1,504,823 0.01%Citibank Credit Card Issuance Trust $1,500,000 1.92% 7/4/2022 1,500,047 0.01%Cargill, Inc. $1,450,000 3.25% 1/3/2023 1,499,662 0.01%Government National Mortgage Association $1,459,295 3.00% 20/8/2049 1,499,625 0.01%Federal Home Loan Mortgage Corp. $1,500,000 2.43% 25/8/2029 1,499,250 0.01%
Vanguard Global Bond Index Fund
385
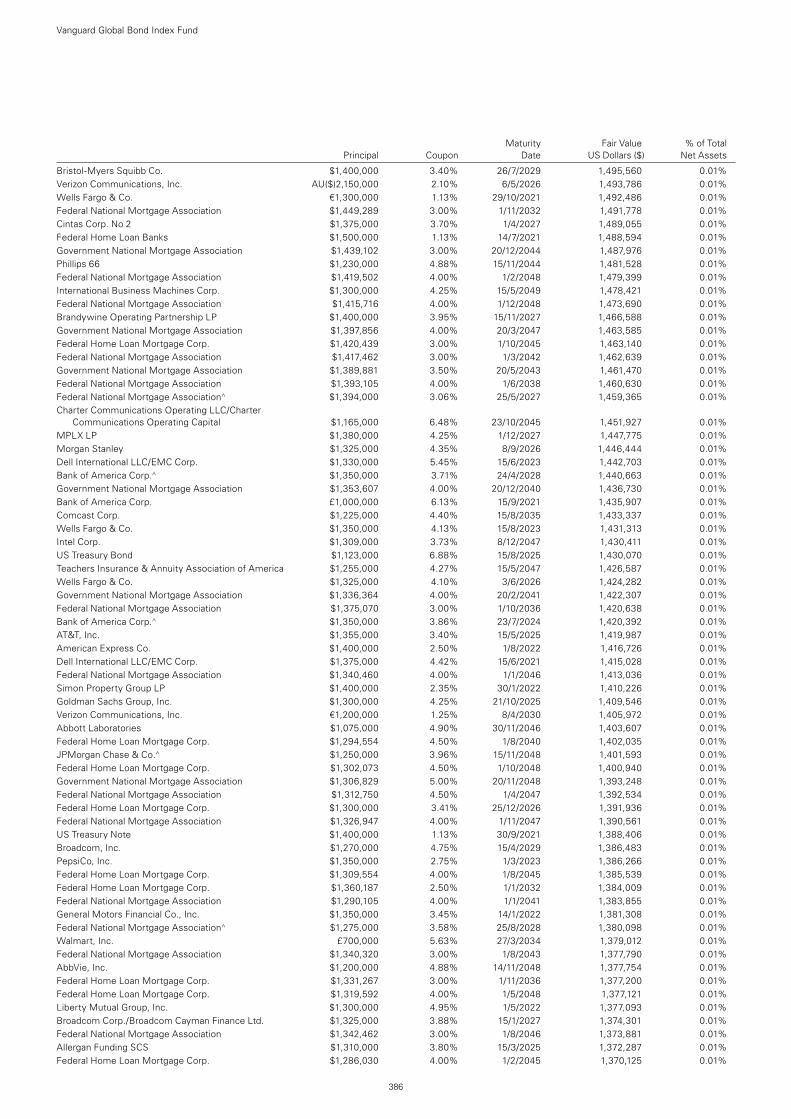
Maturity Fair Value % of Total Principal Coupon Date US Dollars ($) Net Assets
Bristol-Myers Squibb Co. $1,400,000 3.40% 26/7/2029 1,495,560 0.01%Verizon Communications, Inc. AU($)2,150,000 2.10% 6/5/2026 1,493,786 0.01%Wells Fargo & Co. €1,300,000 1.13% 29/10/2021 1,492,486 0.01%Federal National Mortgage Association $1,449,289 3.00% 1/11/2032 1,491,778 0.01%Cintas Corp. No 2 $1,375,000 3.70% 1/4/2027 1,489,055 0.01%Federal Home Loan Banks $1,500,000 1.13% 14/7/2021 1,488,594 0.01%Government National Mortgage Association $1,439,102 3.00% 20/12/2044 1,487,976 0.01%Phillips 66 $1,230,000 4.88% 15/11/2044 1,481,528 0.01%Federal National Mortgage Association $1,419,502 4.00% 1/2/2048 1,479,399 0.01%International Business Machines Corp. $1,300,000 4.25% 15/5/2049 1,478,421 0.01%Federal National Mortgage Association $1,415,716 4.00% 1/12/2048 1,473,690 0.01%Brandywine Operating Partnership LP $1,400,000 3.95% 15/11/2027 1,466,588 0.01%Government National Mortgage Association $1,397,856 4.00% 20/3/2047 1,463,585 0.01%Federal Home Loan Mortgage Corp. $1,420,439 3.00% 1/10/2045 1,463,140 0.01%Federal National Mortgage Association $1,417,462 3.00% 1/3/2042 1,462,639 0.01%Government National Mortgage Association $1,389,881 3.50% 20/5/2043 1,461,470 0.01%Federal National Mortgage Association $1,393,105 4.00% 1/6/2038 1,460,630 0.01%Federal National Mortgage Association^ $1,394,000 3.06% 25/5/2027 1,459,365 0.01%Charter Communications Operating LLC/Charter
Communications Operating Capital $1,165,000 6.48% 23/10/2045 1,451,927 0.01%MPLX LP $1,380,000 4.25% 1/12/2027 1,447,775 0.01%Morgan Stanley $1,325,000 4.35% 8/9/2026 1,446,444 0.01%Dell International LLC/EMC Corp. $1,330,000 5.45% 15/6/2023 1,442,703 0.01%Bank of America Corp.^ $1,350,000 3.71% 24/4/2028 1,440,663 0.01%Government National Mortgage Association $1,353,607 4.00% 20/12/2040 1,436,730 0.01%Bank of America Corp. £1,000,000 6.13% 15/9/2021 1,435,907 0.01%Comcast Corp. $1,225,000 4.40% 15/8/2035 1,433,337 0.01%Wells Fargo & Co. $1,350,000 4.13% 15/8/2023 1,431,313 0.01%Intel Corp. $1,309,000 3.73% 8/12/2047 1,430,411 0.01%US Treasury Bond $1,123,000 6.88% 15/8/2025 1,430,070 0.01%Teachers Insurance & Annuity Association of America $1,255,000 4.27% 15/5/2047 1,426,587 0.01%Wells Fargo & Co. $1,325,000 4.10% 3/6/2026 1,424,282 0.01%Government National Mortgage Association $1,336,364 4.00% 20/2/2041 1,422,307 0.01%Federal National Mortgage Association $1,375,070 3.00% 1/10/2036 1,420,638 0.01%Bank of America Corp.^ $1,350,000 3.86% 23/7/2024 1,420,392 0.01%AT&T, Inc. $1,355,000 3.40% 15/5/2025 1,419,987 0.01%American Express Co. $1,400,000 2.50% 1/8/2022 1,416,726 0.01%Dell International LLC/EMC Corp. $1,375,000 4.42% 15/6/2021 1,415,028 0.01%Federal National Mortgage Association $1,340,460 4.00% 1/1/2046 1,413,036 0.01%Simon Property Group LP $1,400,000 2.35% 30/1/2022 1,410,226 0.01%Goldman Sachs Group, Inc. $1,300,000 4.25% 21/10/2025 1,409,546 0.01%Verizon Communications, Inc. €1,200,000 1.25% 8/4/2030 1,405,972 0.01%Abbott Laboratories $1,075,000 4.90% 30/11/2046 1,403,607 0.01%Federal Home Loan Mortgage Corp. $1,294,554 4.50% 1/8/2040 1,402,035 0.01%JPMorgan Chase & Co.^ $1,250,000 3.96% 15/11/2048 1,401,593 0.01%Federal Home Loan Mortgage Corp. $1,302,073 4.50% 1/10/2048 1,400,940 0.01%Government National Mortgage Association $1,306,829 5.00% 20/11/2048 1,393,248 0.01%Federal National Mortgage Association $1,312,750 4.50% 1/4/2047 1,392,534 0.01%Federal Home Loan Mortgage Corp. $1,300,000 3.41% 25/12/2026 1,391,936 0.01%Federal National Mortgage Association $1,326,947 4.00% 1/11/2047 1,390,561 0.01%US Treasury Note $1,400,000 1.13% 30/9/2021 1,388,406 0.01%Broadcom, Inc. $1,270,000 4.75% 15/4/2029 1,386,483 0.01%PepsiCo, Inc. $1,350,000 2.75% 1/3/2023 1,386,266 0.01%Federal Home Loan Mortgage Corp. $1,309,554 4.00% 1/8/2045 1,385,539 0.01%Federal Home Loan Mortgage Corp. $1,360,187 2.50% 1/1/2032 1,384,009 0.01%Federal National Mortgage Association $1,290,105 4.00% 1/1/2041 1,383,855 0.01%General Motors Financial Co., Inc. $1,350,000 3.45% 14/1/2022 1,381,308 0.01%Federal National Mortgage Association^ $1,275,000 3.58% 25/8/2028 1,380,098 0.01%Walmart, Inc. £700,000 5.63% 27/3/2034 1,379,012 0.01%Federal National Mortgage Association $1,340,320 3.00% 1/8/2043 1,377,790 0.01%AbbVie, Inc. $1,200,000 4.88% 14/11/2048 1,377,754 0.01%Federal Home Loan Mortgage Corp. $1,331,267 3.00% 1/11/2036 1,377,200 0.01%Federal Home Loan Mortgage Corp. $1,319,592 4.00% 1/5/2048 1,377,121 0.01%Liberty Mutual Group, Inc. $1,300,000 4.95% 1/5/2022 1,377,093 0.01%Broadcom Corp./Broadcom Cayman Finance Ltd. $1,325,000 3.88% 15/1/2027 1,374,301 0.01%Federal National Mortgage Association $1,342,462 3.00% 1/8/2046 1,373,881 0.01%Allergan Funding SCS $1,310,000 3.80% 15/3/2025 1,372,287 0.01%Federal Home Loan Mortgage Corp. $1,286,030 4.00% 1/2/2045 1,370,125 0.01%
Vanguard Global Bond Index Fund
386
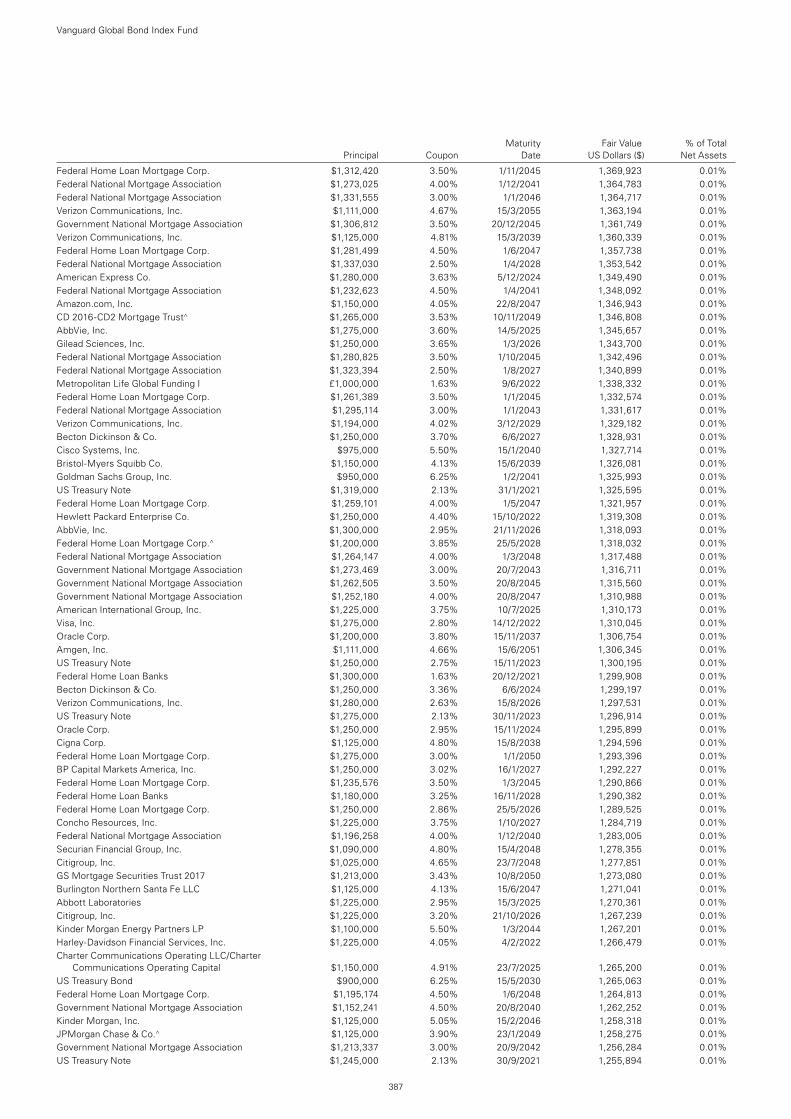
Maturity Fair Value % of Total Principal Coupon Date US Dollars ($) Net Assets
Federal Home Loan Mortgage Corp. $1,312,420 3.50% 1/11/2045 1,369,923 0.01%Federal National Mortgage Association $1,273,025 4.00% 1/12/2041 1,364,783 0.01%Federal National Mortgage Association $1,331,555 3.00% 1/1/2046 1,364,717 0.01%Verizon Communications, Inc. $1,111,000 4.67% 15/3/2055 1,363,194 0.01%Government National Mortgage Association $1,306,812 3.50% 20/12/2045 1,361,749 0.01%Verizon Communications, Inc. $1,125,000 4.81% 15/3/2039 1,360,339 0.01%Federal Home Loan Mortgage Corp. $1,281,499 4.50% 1/6/2047 1,357,738 0.01%Federal National Mortgage Association $1,337,030 2.50% 1/4/2028 1,353,542 0.01%American Express Co. $1,280,000 3.63% 5/12/2024 1,349,490 0.01%Federal National Mortgage Association $1,232,623 4.50% 1/4/2041 1,348,092 0.01%Amazon.com, Inc. $1,150,000 4.05% 22/8/2047 1,346,943 0.01%CD 2016-CD2 Mortgage Trust^ $1,265,000 3.53% 10/11/2049 1,346,808 0.01%AbbVie, Inc. $1,275,000 3.60% 14/5/2025 1,345,657 0.01%Gilead Sciences, Inc. $1,250,000 3.65% 1/3/2026 1,343,700 0.01%Federal National Mortgage Association $1,280,825 3.50% 1/10/2045 1,342,496 0.01%Federal National Mortgage Association $1,323,394 2.50% 1/8/2027 1,340,899 0.01%Metropolitan Life Global Funding I £1,000,000 1.63% 9/6/2022 1,338,332 0.01%Federal Home Loan Mortgage Corp. $1,261,389 3.50% 1/1/2045 1,332,574 0.01%Federal National Mortgage Association $1,295,114 3.00% 1/1/2043 1,331,617 0.01%Verizon Communications, Inc. $1,194,000 4.02% 3/12/2029 1,329,182 0.01%Becton Dickinson & Co. $1,250,000 3.70% 6/6/2027 1,328,931 0.01%Cisco Systems, Inc. $975,000 5.50% 15/1/2040 1,327,714 0.01%Bristol-Myers Squibb Co. $1,150,000 4.13% 15/6/2039 1,326,081 0.01%Goldman Sachs Group, Inc. $950,000 6.25% 1/2/2041 1,325,993 0.01%US Treasury Note $1,319,000 2.13% 31/1/2021 1,325,595 0.01%Federal Home Loan Mortgage Corp. $1,259,101 4.00% 1/5/2047 1,321,957 0.01%Hewlett Packard Enterprise Co. $1,250,000 4.40% 15/10/2022 1,319,308 0.01%AbbVie, Inc. $1,300,000 2.95% 21/11/2026 1,318,093 0.01%Federal Home Loan Mortgage Corp.^ $1,200,000 3.85% 25/5/2028 1,318,032 0.01%Federal National Mortgage Association $1,264,147 4.00% 1/3/2048 1,317,488 0.01%Government National Mortgage Association $1,273,469 3.00% 20/7/2043 1,316,711 0.01%Government National Mortgage Association $1,262,505 3.50% 20/8/2045 1,315,560 0.01%Government National Mortgage Association $1,252,180 4.00% 20/8/2047 1,310,988 0.01%American International Group, Inc. $1,225,000 3.75% 10/7/2025 1,310,173 0.01%Visa, Inc. $1,275,000 2.80% 14/12/2022 1,310,045 0.01%Oracle Corp. $1,200,000 3.80% 15/11/2037 1,306,754 0.01%Amgen, Inc. $1,111,000 4.66% 15/6/2051 1,306,345 0.01%US Treasury Note $1,250,000 2.75% 15/11/2023 1,300,195 0.01%Federal Home Loan Banks $1,300,000 1.63% 20/12/2021 1,299,908 0.01%Becton Dickinson & Co. $1,250,000 3.36% 6/6/2024 1,299,197 0.01%Verizon Communications, Inc. $1,280,000 2.63% 15/8/2026 1,297,531 0.01%US Treasury Note $1,275,000 2.13% 30/11/2023 1,296,914 0.01%Oracle Corp. $1,250,000 2.95% 15/11/2024 1,295,899 0.01%Cigna Corp. $1,125,000 4.80% 15/8/2038 1,294,596 0.01%Federal Home Loan Mortgage Corp. $1,275,000 3.00% 1/1/2050 1,293,396 0.01%BP Capital Markets America, Inc. $1,250,000 3.02% 16/1/2027 1,292,227 0.01%Federal Home Loan Mortgage Corp. $1,235,576 3.50% 1/3/2045 1,290,866 0.01%Federal Home Loan Banks $1,180,000 3.25% 16/11/2028 1,290,382 0.01%Federal Home Loan Mortgage Corp. $1,250,000 2.86% 25/5/2026 1,289,525 0.01%Concho Resources, Inc. $1,225,000 3.75% 1/10/2027 1,284,719 0.01%Federal National Mortgage Association $1,196,258 4.00% 1/12/2040 1,283,005 0.01%Securian Financial Group, Inc. $1,090,000 4.80% 15/4/2048 1,278,355 0.01%Citigroup, Inc. $1,025,000 4.65% 23/7/2048 1,277,851 0.01%GS Mortgage Securities Trust 2017 $1,213,000 3.43% 10/8/2050 1,273,080 0.01%Burlington Northern Santa Fe LLC $1,125,000 4.13% 15/6/2047 1,271,041 0.01%Abbott Laboratories $1,225,000 2.95% 15/3/2025 1,270,361 0.01%Citigroup, Inc. $1,225,000 3.20% 21/10/2026 1,267,239 0.01%Kinder Morgan Energy Partners LP $1,100,000 5.50% 1/3/2044 1,267,201 0.01%Harley-Davidson Financial Services, Inc. $1,225,000 4.05% 4/2/2022 1,266,479 0.01%Charter Communications Operating LLC/Charter
Communications Operating Capital $1,150,000 4.91% 23/7/2025 1,265,200 0.01%US Treasury Bond $900,000 6.25% 15/5/2030 1,265,063 0.01%Federal Home Loan Mortgage Corp. $1,195,174 4.50% 1/6/2048 1,264,813 0.01%Government National Mortgage Association $1,152,241 4.50% 20/8/2040 1,262,252 0.01%Kinder Morgan, Inc. $1,125,000 5.05% 15/2/2046 1,258,318 0.01%JPMorgan Chase & Co.^ $1,125,000 3.90% 23/1/2049 1,258,275 0.01%Government National Mortgage Association $1,213,337 3.00% 20/9/2042 1,256,284 0.01%US Treasury Note $1,245,000 2.13% 30/9/2021 1,255,894 0.01%
Vanguard Global Bond Index Fund
387
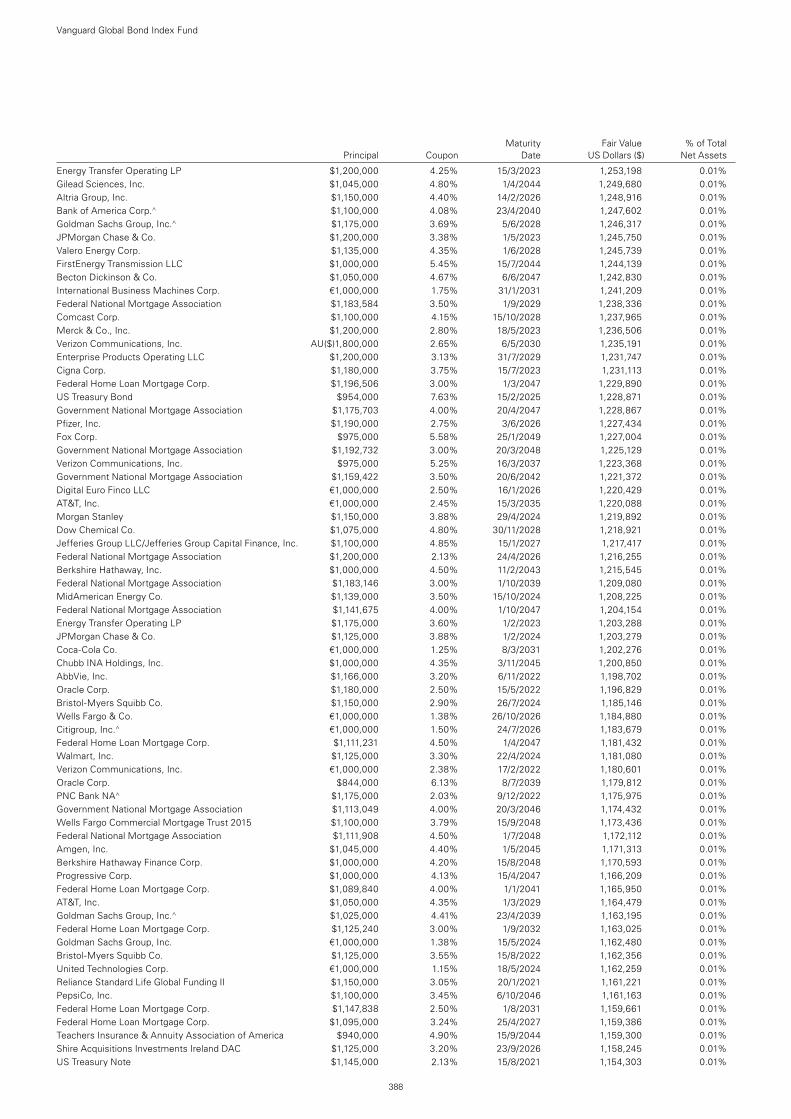
Maturity Fair Value % of Total Principal Coupon Date US Dollars ($) Net Assets
Energy Transfer Operating LP $1,200,000 4.25% 15/3/2023 1,253,198 0.01%Gilead Sciences, Inc. $1,045,000 4.80% 1/4/2044 1,249,680 0.01%Altria Group, Inc. $1,150,000 4.40% 14/2/2026 1,248,916 0.01%Bank of America Corp.^ $1,100,000 4.08% 23/4/2040 1,247,602 0.01%Goldman Sachs Group, Inc.^ $1,175,000 3.69% 5/6/2028 1,246,317 0.01%JPMorgan Chase & Co. $1,200,000 3.38% 1/5/2023 1,245,750 0.01%Valero Energy Corp. $1,135,000 4.35% 1/6/2028 1,245,739 0.01%FirstEnergy Transmission LLC $1,000,000 5.45% 15/7/2044 1,244,139 0.01%Becton Dickinson & Co. $1,050,000 4.67% 6/6/2047 1,242,830 0.01%International Business Machines Corp. €1,000,000 1.75% 31/1/2031 1,241,209 0.01%Federal National Mortgage Association $1,183,584 3.50% 1/9/2029 1,238,336 0.01%Comcast Corp. $1,100,000 4.15% 15/10/2028 1,237,965 0.01%Merck & Co., Inc. $1,200,000 2.80% 18/5/2023 1,236,506 0.01%Verizon Communications, Inc. AU($)1,800,000 2.65% 6/5/2030 1,235,191 0.01%Enterprise Products Operating LLC $1,200,000 3.13% 31/7/2029 1,231,747 0.01%Cigna Corp. $1,180,000 3.75% 15/7/2023 1,231,113 0.01%Federal Home Loan Mortgage Corp. $1,196,506 3.00% 1/3/2047 1,229,890 0.01%US Treasury Bond $954,000 7.63% 15/2/2025 1,228,871 0.01%Government National Mortgage Association $1,175,703 4.00% 20/4/2047 1,228,867 0.01%Pfizer, Inc. $1,190,000 2.75% 3/6/2026 1,227,434 0.01%Fox Corp. $975,000 5.58% 25/1/2049 1,227,004 0.01%Government National Mortgage Association $1,192,732 3.00% 20/3/2048 1,225,129 0.01%Verizon Communications, Inc. $975,000 5.25% 16/3/2037 1,223,368 0.01%Government National Mortgage Association $1,159,422 3.50% 20/6/2042 1,221,372 0.01%Digital Euro Finco LLC €1,000,000 2.50% 16/1/2026 1,220,429 0.01%AT&T, Inc. €1,000,000 2.45% 15/3/2035 1,220,088 0.01%Morgan Stanley $1,150,000 3.88% 29/4/2024 1,219,892 0.01%Dow Chemical Co. $1,075,000 4.80% 30/11/2028 1,218,921 0.01%Jefferies Group LLC/Jefferies Group Capital Finance, Inc. $1,100,000 4.85% 15/1/2027 1,217,417 0.01%Federal National Mortgage Association $1,200,000 2.13% 24/4/2026 1,216,255 0.01%Berkshire Hathaway, Inc. $1,000,000 4.50% 11/2/2043 1,215,545 0.01%Federal National Mortgage Association $1,183,146 3.00% 1/10/2039 1,209,080 0.01%MidAmerican Energy Co. $1,139,000 3.50% 15/10/2024 1,208,225 0.01%Federal National Mortgage Association $1,141,675 4.00% 1/10/2047 1,204,154 0.01%Energy Transfer Operating LP $1,175,000 3.60% 1/2/2023 1,203,288 0.01%JPMorgan Chase & Co. $1,125,000 3.88% 1/2/2024 1,203,279 0.01%Coca-Cola Co. €1,000,000 1.25% 8/3/2031 1,202,276 0.01%Chubb INA Holdings, Inc. $1,000,000 4.35% 3/11/2045 1,200,850 0.01%AbbVie, Inc. $1,166,000 3.20% 6/11/2022 1,198,702 0.01%Oracle Corp. $1,180,000 2.50% 15/5/2022 1,196,829 0.01%Bristol-Myers Squibb Co. $1,150,000 2.90% 26/7/2024 1,185,146 0.01%Wells Fargo & Co. €1,000,000 1.38% 26/10/2026 1,184,880 0.01%Citigroup, Inc.^ €1,000,000 1.50% 24/7/2026 1,183,679 0.01%Federal Home Loan Mortgage Corp. $1,111,231 4.50% 1/4/2047 1,181,432 0.01%Walmart, Inc. $1,125,000 3.30% 22/4/2024 1,181,080 0.01%Verizon Communications, Inc. €1,000,000 2.38% 17/2/2022 1,180,601 0.01%Oracle Corp. $844,000 6.13% 8/7/2039 1,179,812 0.01%PNC Bank NA^ $1,175,000 2.03% 9/12/2022 1,175,975 0.01%Government National Mortgage Association $1,113,049 4.00% 20/3/2046 1,174,432 0.01%Wells Fargo Commercial Mortgage Trust 2015 $1,100,000 3.79% 15/9/2048 1,173,436 0.01%Federal National Mortgage Association $1,111,908 4.50% 1/7/2048 1,172,112 0.01%Amgen, Inc. $1,045,000 4.40% 1/5/2045 1,171,313 0.01%Berkshire Hathaway Finance Corp. $1,000,000 4.20% 15/8/2048 1,170,593 0.01%Progressive Corp. $1,000,000 4.13% 15/4/2047 1,166,209 0.01%Federal Home Loan Mortgage Corp. $1,089,840 4.00% 1/1/2041 1,165,950 0.01%AT&T, Inc. $1,050,000 4.35% 1/3/2029 1,164,479 0.01%Goldman Sachs Group, Inc.^ $1,025,000 4.41% 23/4/2039 1,163,195 0.01%Federal Home Loan Mortgage Corp. $1,125,240 3.00% 1/9/2032 1,163,025 0.01%Goldman Sachs Group, Inc. €1,000,000 1.38% 15/5/2024 1,162,480 0.01%Bristol-Myers Squibb Co. $1,125,000 3.55% 15/8/2022 1,162,356 0.01%United Technologies Corp. €1,000,000 1.15% 18/5/2024 1,162,259 0.01%Reliance Standard Life Global Funding II $1,150,000 3.05% 20/1/2021 1,161,221 0.01%PepsiCo, Inc. $1,100,000 3.45% 6/10/2046 1,161,163 0.01%Federal Home Loan Mortgage Corp. $1,147,838 2.50% 1/8/2031 1,159,661 0.01%Federal Home Loan Mortgage Corp. $1,095,000 3.24% 25/4/2027 1,159,386 0.01%Teachers Insurance & Annuity Association of America $940,000 4.90% 15/9/2044 1,159,300 0.01%Shire Acquisitions Investments Ireland DAC $1,125,000 3.20% 23/9/2026 1,158,245 0.01%US Treasury Note $1,145,000 2.13% 15/8/2021 1,154,303 0.01%
Vanguard Global Bond Index Fund
388
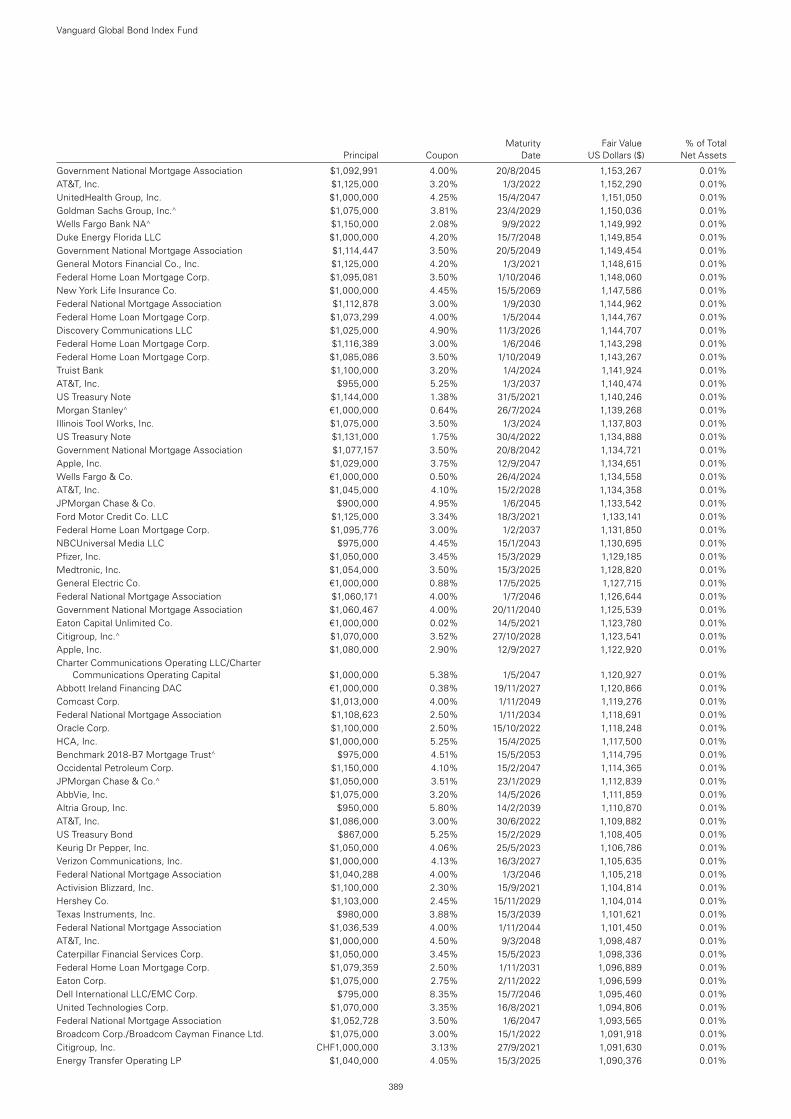
Maturity Fair Value % of Total Principal Coupon Date US Dollars ($) Net Assets
Government National Mortgage Association $1,092,991 4.00% 20/8/2045 1,153,267 0.01%AT&T, Inc. $1,125,000 3.20% 1/3/2022 1,152,290 0.01%UnitedHealth Group, Inc. $1,000,000 4.25% 15/4/2047 1,151,050 0.01%Goldman Sachs Group, Inc.^ $1,075,000 3.81% 23/4/2029 1,150,036 0.01%Wells Fargo Bank NA^ $1,150,000 2.08% 9/9/2022 1,149,992 0.01%Duke Energy Florida LLC $1,000,000 4.20% 15/7/2048 1,149,854 0.01%Government National Mortgage Association $1,114,447 3.50% 20/5/2049 1,149,454 0.01%General Motors Financial Co., Inc. $1,125,000 4.20% 1/3/2021 1,148,615 0.01%Federal Home Loan Mortgage Corp. $1,095,081 3.50% 1/10/2046 1,148,060 0.01%New York Life Insurance Co. $1,000,000 4.45% 15/5/2069 1,147,586 0.01%Federal National Mortgage Association $1,112,878 3.00% 1/9/2030 1,144,962 0.01%Federal Home Loan Mortgage Corp. $1,073,299 4.00% 1/5/2044 1,144,767 0.01%Discovery Communications LLC $1,025,000 4.90% 11/3/2026 1,144,707 0.01%Federal Home Loan Mortgage Corp. $1,116,389 3.00% 1/6/2046 1,143,298 0.01%Federal Home Loan Mortgage Corp. $1,085,086 3.50% 1/10/2049 1,143,267 0.01%Truist Bank $1,100,000 3.20% 1/4/2024 1,141,924 0.01%AT&T, Inc. $955,000 5.25% 1/3/2037 1,140,474 0.01%US Treasury Note $1,144,000 1.38% 31/5/2021 1,140,246 0.01%Morgan Stanley^ €1,000,000 0.64% 26/7/2024 1,139,268 0.01%Illinois Tool Works, Inc. $1,075,000 3.50% 1/3/2024 1,137,803 0.01%US Treasury Note $1,131,000 1.75% 30/4/2022 1,134,888 0.01%Government National Mortgage Association $1,077,157 3.50% 20/8/2042 1,134,721 0.01%Apple, Inc. $1,029,000 3.75% 12/9/2047 1,134,651 0.01%Wells Fargo & Co. €1,000,000 0.50% 26/4/2024 1,134,558 0.01%AT&T, Inc. $1,045,000 4.10% 15/2/2028 1,134,358 0.01%JPMorgan Chase & Co. $900,000 4.95% 1/6/2045 1,133,542 0.01%Ford Motor Credit Co. LLC $1,125,000 3.34% 18/3/2021 1,133,141 0.01%Federal Home Loan Mortgage Corp. $1,095,776 3.00% 1/2/2037 1,131,850 0.01%NBCUniversal Media LLC $975,000 4.45% 15/1/2043 1,130,695 0.01%Pfizer, Inc. $1,050,000 3.45% 15/3/2029 1,129,185 0.01%Medtronic, Inc. $1,054,000 3.50% 15/3/2025 1,128,820 0.01%General Electric Co. €1,000,000 0.88% 17/5/2025 1,127,715 0.01%Federal National Mortgage Association $1,060,171 4.00% 1/7/2046 1,126,644 0.01%Government National Mortgage Association $1,060,467 4.00% 20/11/2040 1,125,539 0.01%Eaton Capital Unlimited Co. €1,000,000 0.02% 14/5/2021 1,123,780 0.01%Citigroup, Inc.^ $1,070,000 3.52% 27/10/2028 1,123,541 0.01%Apple, Inc. $1,080,000 2.90% 12/9/2027 1,122,920 0.01%Charter Communications Operating LLC/Charter
Communications Operating Capital $1,000,000 5.38% 1/5/2047 1,120,927 0.01%Abbott Ireland Financing DAC €1,000,000 0.38% 19/11/2027 1,120,866 0.01%Comcast Corp. $1,013,000 4.00% 1/11/2049 1,119,276 0.01%Federal National Mortgage Association $1,108,623 2.50% 1/11/2034 1,118,691 0.01%Oracle Corp. $1,100,000 2.50% 15/10/2022 1,118,248 0.01%HCA, Inc. $1,000,000 5.25% 15/4/2025 1,117,500 0.01%Benchmark 2018-B7 Mortgage Trust^ $975,000 4.51% 15/5/2053 1,114,795 0.01%Occidental Petroleum Corp. $1,150,000 4.10% 15/2/2047 1,114,365 0.01%JPMorgan Chase & Co.^ $1,050,000 3.51% 23/1/2029 1,112,839 0.01%AbbVie, Inc. $1,075,000 3.20% 14/5/2026 1,111,859 0.01%Altria Group, Inc. $950,000 5.80% 14/2/2039 1,110,870 0.01%AT&T, Inc. $1,086,000 3.00% 30/6/2022 1,109,882 0.01%US Treasury Bond $867,000 5.25% 15/2/2029 1,108,405 0.01%Keurig Dr Pepper, Inc. $1,050,000 4.06% 25/5/2023 1,106,786 0.01%Verizon Communications, Inc. $1,000,000 4.13% 16/3/2027 1,105,635 0.01%Federal National Mortgage Association $1,040,288 4.00% 1/3/2046 1,105,218 0.01%Activision Blizzard, Inc. $1,100,000 2.30% 15/9/2021 1,104,814 0.01%Hershey Co. $1,103,000 2.45% 15/11/2029 1,104,014 0.01%Texas Instruments, Inc. $980,000 3.88% 15/3/2039 1,101,621 0.01%Federal National Mortgage Association $1,036,539 4.00% 1/11/2044 1,101,450 0.01%AT&T, Inc. $1,000,000 4.50% 9/3/2048 1,098,487 0.01%Caterpillar Financial Services Corp. $1,050,000 3.45% 15/5/2023 1,098,336 0.01%Federal Home Loan Mortgage Corp. $1,079,359 2.50% 1/11/2031 1,096,889 0.01%Eaton Corp. $1,075,000 2.75% 2/11/2022 1,096,599 0.01%Dell International LLC/EMC Corp. $795,000 8.35% 15/7/2046 1,095,460 0.01%United Technologies Corp. $1,070,000 3.35% 16/8/2021 1,094,806 0.01%Federal National Mortgage Association $1,052,728 3.50% 1/6/2047 1,093,565 0.01%Broadcom Corp./Broadcom Cayman Finance Ltd. $1,075,000 3.00% 15/1/2022 1,091,918 0.01%Citigroup, Inc. CHF1,000,000 3.13% 27/9/2021 1,091,630 0.01%Energy Transfer Operating LP $1,040,000 4.05% 15/3/2025 1,090,376 0.01%
Vanguard Global Bond Index Fund
389
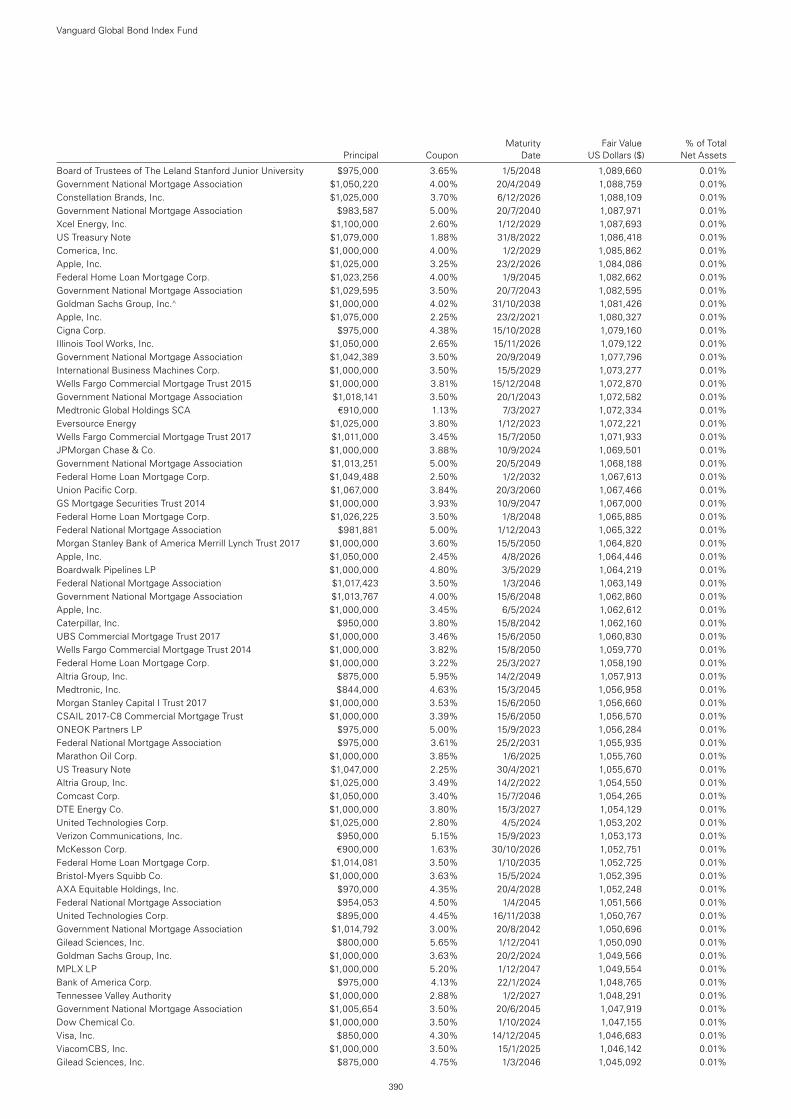
Maturity Fair Value % of Total Principal Coupon Date US Dollars ($) Net Assets
Board of Trustees of The Leland Stanford Junior University $975,000 3.65% 1/5/2048 1,089,660 0.01%Government National Mortgage Association $1,050,220 4.00% 20/4/2049 1,088,759 0.01%Constellation Brands, Inc. $1,025,000 3.70% 6/12/2026 1,088,109 0.01%Government National Mortgage Association $983,587 5.00% 20/7/2040 1,087,971 0.01%Xcel Energy, Inc. $1,100,000 2.60% 1/12/2029 1,087,693 0.01%US Treasury Note $1,079,000 1.88% 31/8/2022 1,086,418 0.01%Comerica, Inc. $1,000,000 4.00% 1/2/2029 1,085,862 0.01%Apple, Inc. $1,025,000 3.25% 23/2/2026 1,084,086 0.01%Federal Home Loan Mortgage Corp. $1,023,256 4.00% 1/9/2045 1,082,662 0.01%Government National Mortgage Association $1,029,595 3.50% 20/7/2043 1,082,595 0.01%Goldman Sachs Group, Inc.^ $1,000,000 4.02% 31/10/2038 1,081,426 0.01%Apple, Inc. $1,075,000 2.25% 23/2/2021 1,080,327 0.01%Cigna Corp. $975,000 4.38% 15/10/2028 1,079,160 0.01%Illinois Tool Works, Inc. $1,050,000 2.65% 15/11/2026 1,079,122 0.01%Government National Mortgage Association $1,042,389 3.50% 20/9/2049 1,077,796 0.01%International Business Machines Corp. $1,000,000 3.50% 15/5/2029 1,073,277 0.01%Wells Fargo Commercial Mortgage Trust 2015 $1,000,000 3.81% 15/12/2048 1,072,870 0.01%Government National Mortgage Association $1,018,141 3.50% 20/1/2043 1,072,582 0.01%Medtronic Global Holdings SCA €910,000 1.13% 7/3/2027 1,072,334 0.01%Eversource Energy $1,025,000 3.80% 1/12/2023 1,072,221 0.01%Wells Fargo Commercial Mortgage Trust 2017 $1,011,000 3.45% 15/7/2050 1,071,933 0.01%JPMorgan Chase & Co. $1,000,000 3.88% 10/9/2024 1,069,501 0.01%Government National Mortgage Association $1,013,251 5.00% 20/5/2049 1,068,188 0.01%Federal Home Loan Mortgage Corp. $1,049,488 2.50% 1/2/2032 1,067,613 0.01%Union Pacific Corp. $1,067,000 3.84% 20/3/2060 1,067,466 0.01%GS Mortgage Securities Trust 2014 $1,000,000 3.93% 10/9/2047 1,067,000 0.01%Federal Home Loan Mortgage Corp. $1,026,225 3.50% 1/8/2048 1,065,885 0.01%Federal National Mortgage Association $981,881 5.00% 1/12/2043 1,065,322 0.01%Morgan Stanley Bank of America Merrill Lynch Trust 2017 $1,000,000 3.60% 15/5/2050 1,064,820 0.01%Apple, Inc. $1,050,000 2.45% 4/8/2026 1,064,446 0.01%Boardwalk Pipelines LP $1,000,000 4.80% 3/5/2029 1,064,219 0.01%Federal National Mortgage Association $1,017,423 3.50% 1/3/2046 1,063,149 0.01%Government National Mortgage Association $1,013,767 4.00% 15/6/2048 1,062,860 0.01%Apple, Inc. $1,000,000 3.45% 6/5/2024 1,062,612 0.01%Caterpillar, Inc. $950,000 3.80% 15/8/2042 1,062,160 0.01%UBS Commercial Mortgage Trust 2017 $1,000,000 3.46% 15/6/2050 1,060,830 0.01%Wells Fargo Commercial Mortgage Trust 2014 $1,000,000 3.82% 15/8/2050 1,059,770 0.01%Federal Home Loan Mortgage Corp. $1,000,000 3.22% 25/3/2027 1,058,190 0.01%Altria Group, Inc. $875,000 5.95% 14/2/2049 1,057,913 0.01%Medtronic, Inc. $844,000 4.63% 15/3/2045 1,056,958 0.01%Morgan Stanley Capital I Trust 2017 $1,000,000 3.53% 15/6/2050 1,056,660 0.01%CSAIL 2017-C8 Commercial Mortgage Trust $1,000,000 3.39% 15/6/2050 1,056,570 0.01%ONEOK Partners LP $975,000 5.00% 15/9/2023 1,056,284 0.01%Federal National Mortgage Association $975,000 3.61% 25/2/2031 1,055,935 0.01%Marathon Oil Corp. $1,000,000 3.85% 1/6/2025 1,055,760 0.01%US Treasury Note $1,047,000 2.25% 30/4/2021 1,055,670 0.01%Altria Group, Inc. $1,025,000 3.49% 14/2/2022 1,054,550 0.01%Comcast Corp. $1,050,000 3.40% 15/7/2046 1,054,265 0.01%DTE Energy Co. $1,000,000 3.80% 15/3/2027 1,054,129 0.01%United Technologies Corp. $1,025,000 2.80% 4/5/2024 1,053,202 0.01%Verizon Communications, Inc. $950,000 5.15% 15/9/2023 1,053,173 0.01%McKesson Corp. €900,000 1.63% 30/10/2026 1,052,751 0.01%Federal Home Loan Mortgage Corp. $1,014,081 3.50% 1/10/2035 1,052,725 0.01%Bristol-Myers Squibb Co. $1,000,000 3.63% 15/5/2024 1,052,395 0.01%AXA Equitable Holdings, Inc. $970,000 4.35% 20/4/2028 1,052,248 0.01%Federal National Mortgage Association $954,053 4.50% 1/4/2045 1,051,566 0.01%United Technologies Corp. $895,000 4.45% 16/11/2038 1,050,767 0.01%Government National Mortgage Association $1,014,792 3.00% 20/8/2042 1,050,696 0.01%Gilead Sciences, Inc. $800,000 5.65% 1/12/2041 1,050,090 0.01%Goldman Sachs Group, Inc. $1,000,000 3.63% 20/2/2024 1,049,566 0.01%MPLX LP $1,000,000 5.20% 1/12/2047 1,049,554 0.01%Bank of America Corp. $975,000 4.13% 22/1/2024 1,048,765 0.01%Tennessee Valley Authority $1,000,000 2.88% 1/2/2027 1,048,291 0.01%Government National Mortgage Association $1,005,654 3.50% 20/6/2045 1,047,919 0.01%Dow Chemical Co. $1,000,000 3.50% 1/10/2024 1,047,155 0.01%Visa, Inc. $850,000 4.30% 14/12/2045 1,046,683 0.01%ViacomCBS, Inc. $1,000,000 3.50% 15/1/2025 1,046,142 0.01%Gilead Sciences, Inc. $875,000 4.75% 1/3/2046 1,045,092 0.01%
Vanguard Global Bond Index Fund
390
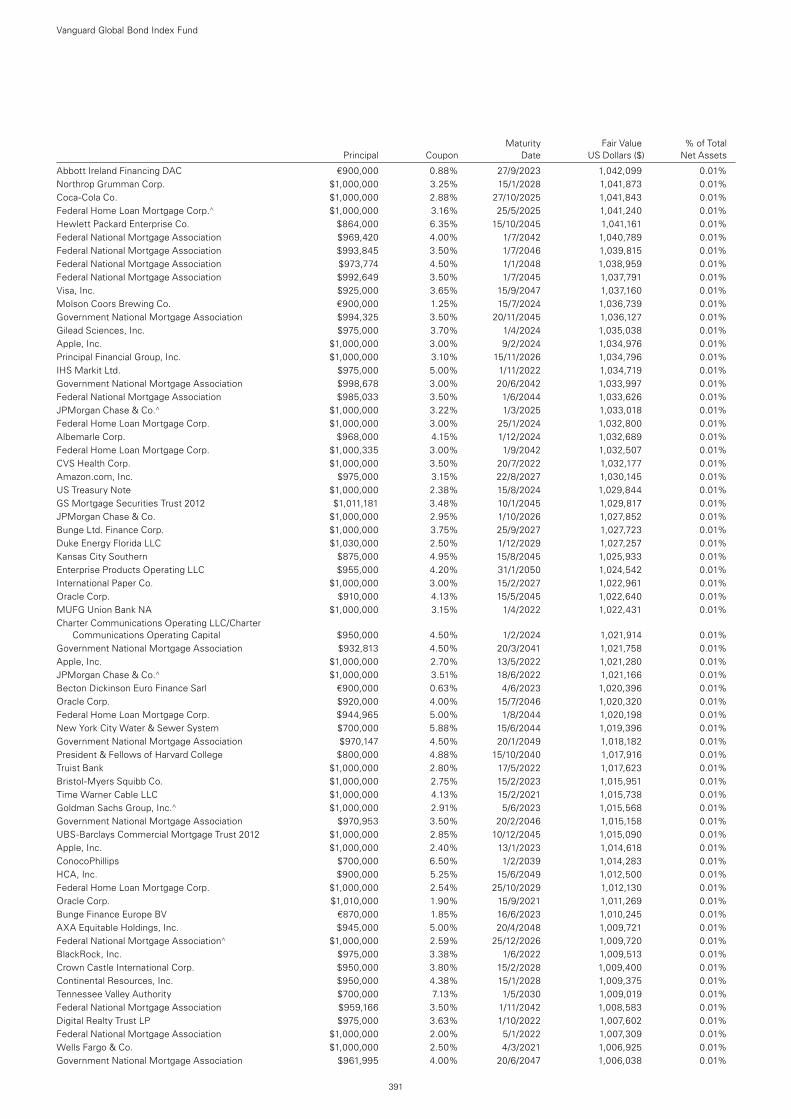
Maturity Fair Value % of Total Principal Coupon Date US Dollars ($) Net Assets
Abbott Ireland Financing DAC €900,000 0.88% 27/9/2023 1,042,099 0.01%Northrop Grumman Corp. $1,000,000 3.25% 15/1/2028 1,041,873 0.01%Coca-Cola Co. $1,000,000 2.88% 27/10/2025 1,041,843 0.01%Federal Home Loan Mortgage Corp.^ $1,000,000 3.16% 25/5/2025 1,041,240 0.01%Hewlett Packard Enterprise Co. $864,000 6.35% 15/10/2045 1,041,161 0.01%Federal National Mortgage Association $969,420 4.00% 1/7/2042 1,040,789 0.01%Federal National Mortgage Association $993,845 3.50% 1/7/2046 1,039,815 0.01%Federal National Mortgage Association $973,774 4.50% 1/1/2048 1,038,959 0.01%Federal National Mortgage Association $992,649 3.50% 1/7/2045 1,037,791 0.01%Visa, Inc. $925,000 3.65% 15/9/2047 1,037,160 0.01%Molson Coors Brewing Co. €900,000 1.25% 15/7/2024 1,036,739 0.01%Government National Mortgage Association $994,325 3.50% 20/11/2045 1,036,127 0.01%Gilead Sciences, Inc. $975,000 3.70% 1/4/2024 1,035,038 0.01%Apple, Inc. $1,000,000 3.00% 9/2/2024 1,034,976 0.01%Principal Financial Group, Inc. $1,000,000 3.10% 15/11/2026 1,034,796 0.01%IHS Markit Ltd. $975,000 5.00% 1/11/2022 1,034,719 0.01%Government National Mortgage Association $998,678 3.00% 20/6/2042 1,033,997 0.01%Federal National Mortgage Association $985,033 3.50% 1/6/2044 1,033,626 0.01%JPMorgan Chase & Co.^ $1,000,000 3.22% 1/3/2025 1,033,018 0.01%Federal Home Loan Mortgage Corp. $1,000,000 3.00% 25/1/2024 1,032,800 0.01%Albemarle Corp. $968,000 4.15% 1/12/2024 1,032,689 0.01%Federal Home Loan Mortgage Corp. $1,000,335 3.00% 1/9/2042 1,032,507 0.01%CVS Health Corp. $1,000,000 3.50% 20/7/2022 1,032,177 0.01%Amazon.com, Inc. $975,000 3.15% 22/8/2027 1,030,145 0.01%US Treasury Note $1,000,000 2.38% 15/8/2024 1,029,844 0.01%GS Mortgage Securities Trust 2012 $1,011,181 3.48% 10/1/2045 1,029,817 0.01%JPMorgan Chase & Co. $1,000,000 2.95% 1/10/2026 1,027,852 0.01%Bunge Ltd. Finance Corp. $1,000,000 3.75% 25/9/2027 1,027,723 0.01%Duke Energy Florida LLC $1,030,000 2.50% 1/12/2029 1,027,257 0.01%Kansas City Southern $875,000 4.95% 15/8/2045 1,025,933 0.01%Enterprise Products Operating LLC $955,000 4.20% 31/1/2050 1,024,542 0.01%International Paper Co. $1,000,000 3.00% 15/2/2027 1,022,961 0.01%Oracle Corp. $910,000 4.13% 15/5/2045 1,022,640 0.01%MUFG Union Bank NA $1,000,000 3.15% 1/4/2022 1,022,431 0.01%Charter Communications Operating LLC/Charter
Communications Operating Capital $950,000 4.50% 1/2/2024 1,021,914 0.01%Government National Mortgage Association $932,813 4.50% 20/3/2041 1,021,758 0.01%Apple, Inc. $1,000,000 2.70% 13/5/2022 1,021,280 0.01%JPMorgan Chase & Co.^ $1,000,000 3.51% 18/6/2022 1,021,166 0.01%Becton Dickinson Euro Finance Sarl €900,000 0.63% 4/6/2023 1,020,396 0.01%Oracle Corp. $920,000 4.00% 15/7/2046 1,020,320 0.01%Federal Home Loan Mortgage Corp. $944,965 5.00% 1/8/2044 1,020,198 0.01%New York City Water & Sewer System $700,000 5.88% 15/6/2044 1,019,396 0.01%Government National Mortgage Association $970,147 4.50% 20/1/2049 1,018,182 0.01%President & Fellows of Harvard College $800,000 4.88% 15/10/2040 1,017,916 0.01%Truist Bank $1,000,000 2.80% 17/5/2022 1,017,623 0.01%Bristol-Myers Squibb Co. $1,000,000 2.75% 15/2/2023 1,015,951 0.01%Time Warner Cable LLC $1,000,000 4.13% 15/2/2021 1,015,738 0.01%Goldman Sachs Group, Inc.^ $1,000,000 2.91% 5/6/2023 1,015,568 0.01%Government National Mortgage Association $970,953 3.50% 20/2/2046 1,015,158 0.01%UBS-Barclays Commercial Mortgage Trust 2012 $1,000,000 2.85% 10/12/2045 1,015,090 0.01%Apple, Inc. $1,000,000 2.40% 13/1/2023 1,014,618 0.01%ConocoPhillips $700,000 6.50% 1/2/2039 1,014,283 0.01%HCA, Inc. $900,000 5.25% 15/6/2049 1,012,500 0.01%Federal Home Loan Mortgage Corp. $1,000,000 2.54% 25/10/2029 1,012,130 0.01%Oracle Corp. $1,010,000 1.90% 15/9/2021 1,011,269 0.01%Bunge Finance Europe BV €870,000 1.85% 16/6/2023 1,010,245 0.01%AXA Equitable Holdings, Inc. $945,000 5.00% 20/4/2048 1,009,721 0.01%Federal National Mortgage Association^ $1,000,000 2.59% 25/12/2026 1,009,720 0.01%BlackRock, Inc. $975,000 3.38% 1/6/2022 1,009,513 0.01%Crown Castle International Corp. $950,000 3.80% 15/2/2028 1,009,400 0.01%Continental Resources, Inc. $950,000 4.38% 15/1/2028 1,009,375 0.01%Tennessee Valley Authority $700,000 7.13% 1/5/2030 1,009,019 0.01%Federal National Mortgage Association $959,166 3.50% 1/11/2042 1,008,583 0.01%Digital Realty Trust LP $975,000 3.63% 1/10/2022 1,007,602 0.01%Federal National Mortgage Association $1,000,000 2.00% 5/1/2022 1,007,309 0.01%Wells Fargo & Co. $1,000,000 2.50% 4/3/2021 1,006,925 0.01%Government National Mortgage Association $961,995 4.00% 20/6/2047 1,006,038 0.01%
Vanguard Global Bond Index Fund
391
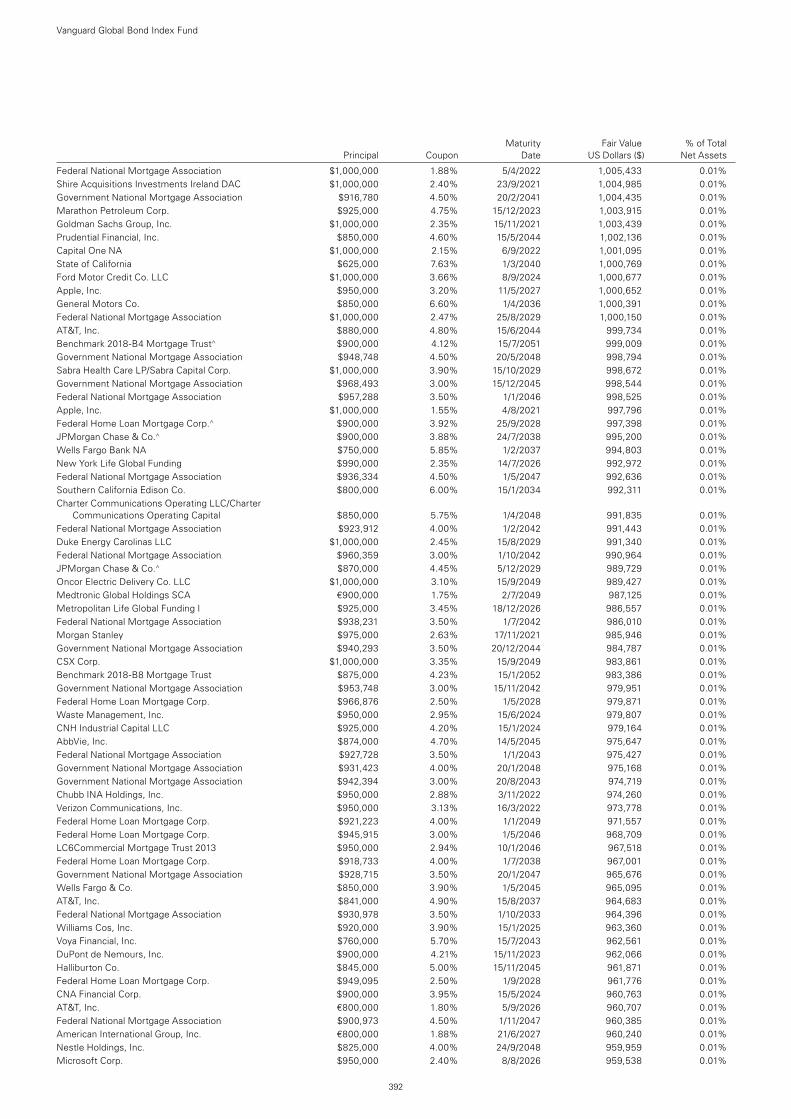
Maturity Fair Value % of Total Principal Coupon Date US Dollars ($) Net Assets
Federal National Mortgage Association $1,000,000 1.88% 5/4/2022 1,005,433 0.01%Shire Acquisitions Investments Ireland DAC $1,000,000 2.40% 23/9/2021 1,004,985 0.01%Government National Mortgage Association $916,780 4.50% 20/2/2041 1,004,435 0.01%Marathon Petroleum Corp. $925,000 4.75% 15/12/2023 1,003,915 0.01%Goldman Sachs Group, Inc. $1,000,000 2.35% 15/11/2021 1,003,439 0.01%Prudential Financial, Inc. $850,000 4.60% 15/5/2044 1,002,136 0.01%Capital One NA $1,000,000 2.15% 6/9/2022 1,001,095 0.01%State of California $625,000 7.63% 1/3/2040 1,000,769 0.01%Ford Motor Credit Co. LLC $1,000,000 3.66% 8/9/2024 1,000,677 0.01%Apple, Inc. $950,000 3.20% 11/5/2027 1,000,652 0.01%General Motors Co. $850,000 6.60% 1/4/2036 1,000,391 0.01%Federal National Mortgage Association $1,000,000 2.47% 25/8/2029 1,000,150 0.01%AT&T, Inc. $880,000 4.80% 15/6/2044 999,734 0.01%Benchmark 2018-B4 Mortgage Trust^ $900,000 4.12% 15/7/2051 999,009 0.01%Government National Mortgage Association $948,748 4.50% 20/5/2048 998,794 0.01%Sabra Health Care LP/Sabra Capital Corp. $1,000,000 3.90% 15/10/2029 998,672 0.01%Government National Mortgage Association $968,493 3.00% 15/12/2045 998,544 0.01%Federal National Mortgage Association $957,288 3.50% 1/1/2046 998,525 0.01%Apple, Inc. $1,000,000 1.55% 4/8/2021 997,796 0.01%Federal Home Loan Mortgage Corp.^ $900,000 3.92% 25/9/2028 997,398 0.01%JPMorgan Chase & Co.^ $900,000 3.88% 24/7/2038 995,200 0.01%Wells Fargo Bank NA $750,000 5.85% 1/2/2037 994,803 0.01%New York Life Global Funding $990,000 2.35% 14/7/2026 992,972 0.01%Federal National Mortgage Association $936,334 4.50% 1/5/2047 992,636 0.01%Southern California Edison Co. $800,000 6.00% 15/1/2034 992,311 0.01%Charter Communications Operating LLC/Charter
Communications Operating Capital $850,000 5.75% 1/4/2048 991,835 0.01%Federal National Mortgage Association $923,912 4.00% 1/2/2042 991,443 0.01%Duke Energy Carolinas LLC $1,000,000 2.45% 15/8/2029 991,340 0.01%Federal National Mortgage Association $960,359 3.00% 1/10/2042 990,964 0.01%JPMorgan Chase & Co.^ $870,000 4.45% 5/12/2029 989,729 0.01%Oncor Electric Delivery Co. LLC $1,000,000 3.10% 15/9/2049 989,427 0.01%Medtronic Global Holdings SCA €900,000 1.75% 2/7/2049 987,125 0.01%Metropolitan Life Global Funding I $925,000 3.45% 18/12/2026 986,557 0.01%Federal National Mortgage Association $938,231 3.50% 1/7/2042 986,010 0.01%Morgan Stanley $975,000 2.63% 17/11/2021 985,946 0.01%Government National Mortgage Association $940,293 3.50% 20/12/2044 984,787 0.01%CSX Corp. $1,000,000 3.35% 15/9/2049 983,861 0.01%Benchmark 2018-B8 Mortgage Trust $875,000 4.23% 15/1/2052 983,386 0.01%Government National Mortgage Association $953,748 3.00% 15/11/2042 979,951 0.01%Federal Home Loan Mortgage Corp. $966,876 2.50% 1/5/2028 979,871 0.01%Waste Management, Inc. $950,000 2.95% 15/6/2024 979,807 0.01%CNH Industrial Capital LLC $925,000 4.20% 15/1/2024 979,164 0.01%AbbVie, Inc. $874,000 4.70% 14/5/2045 975,647 0.01%Federal National Mortgage Association $927,728 3.50% 1/1/2043 975,427 0.01%Government National Mortgage Association $931,423 4.00% 20/1/2048 975,168 0.01%Government National Mortgage Association $942,394 3.00% 20/8/2043 974,719 0.01%Chubb INA Holdings, Inc. $950,000 2.88% 3/11/2022 974,260 0.01%Verizon Communications, Inc. $950,000 3.13% 16/3/2022 973,778 0.01%Federal Home Loan Mortgage Corp. $921,223 4.00% 1/1/2049 971,557 0.01%Federal Home Loan Mortgage Corp. $945,915 3.00% 1/5/2046 968,709 0.01%LC6Commercial Mortgage Trust 2013 $950,000 2.94% 10/1/2046 967,518 0.01%Federal Home Loan Mortgage Corp. $918,733 4.00% 1/7/2038 967,001 0.01%Government National Mortgage Association $928,715 3.50% 20/1/2047 965,676 0.01%Wells Fargo & Co. $850,000 3.90% 1/5/2045 965,095 0.01%AT&T, Inc. $841,000 4.90% 15/8/2037 964,683 0.01%Federal National Mortgage Association $930,978 3.50% 1/10/2033 964,396 0.01%Williams Cos, Inc. $920,000 3.90% 15/1/2025 963,360 0.01%Voya Financial, Inc. $760,000 5.70% 15/7/2043 962,561 0.01%DuPont de Nemours, Inc. $900,000 4.21% 15/11/2023 962,066 0.01%Halliburton Co. $845,000 5.00% 15/11/2045 961,871 0.01%Federal Home Loan Mortgage Corp. $949,095 2.50% 1/9/2028 961,776 0.01%CNA Financial Corp. $900,000 3.95% 15/5/2024 960,763 0.01%AT&T, Inc. €800,000 1.80% 5/9/2026 960,707 0.01%Federal National Mortgage Association $900,973 4.50% 1/11/2047 960,385 0.01%American International Group, Inc. €800,000 1.88% 21/6/2027 960,240 0.01%Nestle Holdings, Inc. $825,000 4.00% 24/9/2048 959,959 0.01%Microsoft Corp. $950,000 2.40% 8/8/2026 959,538 0.01%
Vanguard Global Bond Index Fund
392
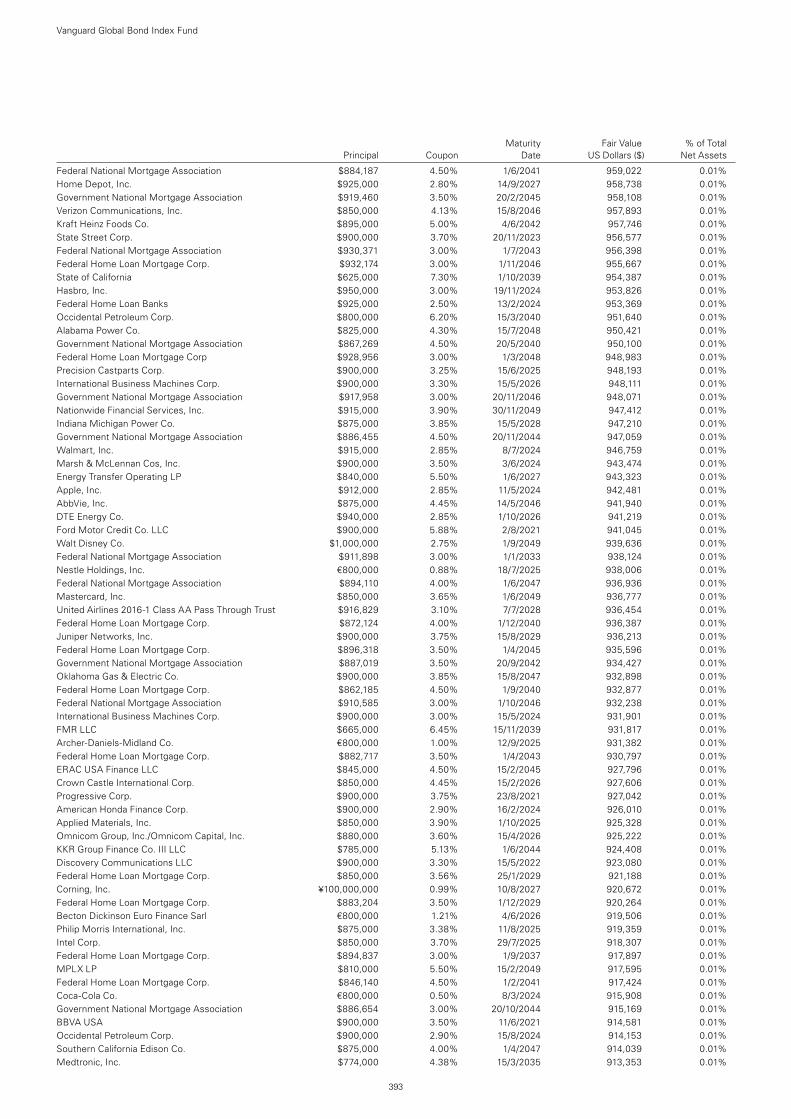
Maturity Fair Value % of Total Principal Coupon Date US Dollars ($) Net Assets
Federal National Mortgage Association $884,187 4.50% 1/6/2041 959,022 0.01%Home Depot, Inc. $925,000 2.80% 14/9/2027 958,738 0.01%Government National Mortgage Association $919,460 3.50% 20/2/2045 958,108 0.01%Verizon Communications, Inc. $850,000 4.13% 15/8/2046 957,893 0.01%Kraft Heinz Foods Co. $895,000 5.00% 4/6/2042 957,746 0.01%State Street Corp. $900,000 3.70% 20/11/2023 956,577 0.01%Federal National Mortgage Association $930,371 3.00% 1/7/2043 956,398 0.01%Federal Home Loan Mortgage Corp. $932,174 3.00% 1/11/2046 955,667 0.01%State of California $625,000 7.30% 1/10/2039 954,387 0.01%Hasbro, Inc. $950,000 3.00% 19/11/2024 953,826 0.01%Federal Home Loan Banks $925,000 2.50% 13/2/2024 953,369 0.01%Occidental Petroleum Corp. $800,000 6.20% 15/3/2040 951,640 0.01%Alabama Power Co. $825,000 4.30% 15/7/2048 950,421 0.01%Government National Mortgage Association $867,269 4.50% 20/5/2040 950,100 0.01%Federal Home Loan Mortgage Corp $928,956 3.00% 1/3/2048 948,983 0.01%Precision Castparts Corp. $900,000 3.25% 15/6/2025 948,193 0.01%International Business Machines Corp. $900,000 3.30% 15/5/2026 948,111 0.01%Government National Mortgage Association $917,958 3.00% 20/11/2046 948,071 0.01%Nationwide Financial Services, Inc. $915,000 3.90% 30/11/2049 947,412 0.01%Indiana Michigan Power Co. $875,000 3.85% 15/5/2028 947,210 0.01%Government National Mortgage Association $886,455 4.50% 20/11/2044 947,059 0.01%Walmart, Inc. $915,000 2.85% 8/7/2024 946,759 0.01%Marsh & McLennan Cos, Inc. $900,000 3.50% 3/6/2024 943,474 0.01%Energy Transfer Operating LP $840,000 5.50% 1/6/2027 943,323 0.01%Apple, Inc. $912,000 2.85% 11/5/2024 942,481 0.01%AbbVie, Inc. $875,000 4.45% 14/5/2046 941,940 0.01%DTE Energy Co. $940,000 2.85% 1/10/2026 941,219 0.01%Ford Motor Credit Co. LLC $900,000 5.88% 2/8/2021 941,045 0.01%Walt Disney Co. $1,000,000 2.75% 1/9/2049 939,636 0.01%Federal National Mortgage Association $911,898 3.00% 1/1/2033 938,124 0.01%Nestle Holdings, Inc. €800,000 0.88% 18/7/2025 938,006 0.01%Federal National Mortgage Association $894,110 4.00% 1/6/2047 936,936 0.01%Mastercard, Inc. $850,000 3.65% 1/6/2049 936,777 0.01%United Airlines 2016-1 Class AA Pass Through Trust $916,829 3.10% 7/7/2028 936,454 0.01%Federal Home Loan Mortgage Corp. $872,124 4.00% 1/12/2040 936,387 0.01%Juniper Networks, Inc. $900,000 3.75% 15/8/2029 936,213 0.01%Federal Home Loan Mortgage Corp. $896,318 3.50% 1/4/2045 935,596 0.01%Government National Mortgage Association $887,019 3.50% 20/9/2042 934,427 0.01%Oklahoma Gas & Electric Co. $900,000 3.85% 15/8/2047 932,898 0.01%Federal Home Loan Mortgage Corp. $862,185 4.50% 1/9/2040 932,877 0.01%Federal National Mortgage Association $910,585 3.00% 1/10/2046 932,238 0.01%International Business Machines Corp. $900,000 3.00% 15/5/2024 931,901 0.01%FMR LLC $665,000 6.45% 15/11/2039 931,817 0.01%Archer-Daniels-Midland Co. €800,000 1.00% 12/9/2025 931,382 0.01%Federal Home Loan Mortgage Corp. $882,717 3.50% 1/4/2043 930,797 0.01%ERAC USA Finance LLC $845,000 4.50% 15/2/2045 927,796 0.01%Crown Castle International Corp. $850,000 4.45% 15/2/2026 927,606 0.01%Progressive Corp. $900,000 3.75% 23/8/2021 927,042 0.01%American Honda Finance Corp. $900,000 2.90% 16/2/2024 926,010 0.01%Applied Materials, Inc. $850,000 3.90% 1/10/2025 925,328 0.01%Omnicom Group, Inc./Omnicom Capital, Inc. $880,000 3.60% 15/4/2026 925,222 0.01%KKR Group Finance Co. III LLC $785,000 5.13% 1/6/2044 924,408 0.01%Discovery Communications LLC $900,000 3.30% 15/5/2022 923,080 0.01%Federal Home Loan Mortgage Corp. $850,000 3.56% 25/1/2029 921,188 0.01%Corning, Inc. ¥100,000,000 0.99% 10/8/2027 920,672 0.01%Federal Home Loan Mortgage Corp. $883,204 3.50% 1/12/2029 920,264 0.01%Becton Dickinson Euro Finance Sarl €800,000 1.21% 4/6/2026 919,506 0.01%Philip Morris International, Inc. $875,000 3.38% 11/8/2025 919,359 0.01%Intel Corp. $850,000 3.70% 29/7/2025 918,307 0.01%Federal Home Loan Mortgage Corp. $894,837 3.00% 1/9/2037 917,897 0.01%MPLX LP $810,000 5.50% 15/2/2049 917,595 0.01%Federal Home Loan Mortgage Corp. $846,140 4.50% 1/2/2041 917,424 0.01%Coca-Cola Co. €800,000 0.50% 8/3/2024 915,908 0.01%Government National Mortgage Association $886,654 3.00% 20/10/2044 915,169 0.01%BBVA USA $900,000 3.50% 11/6/2021 914,581 0.01%Occidental Petroleum Corp. $900,000 2.90% 15/8/2024 914,153 0.01%Southern California Edison Co. $875,000 4.00% 1/4/2047 914,039 0.01%Medtronic, Inc. $774,000 4.38% 15/3/2035 913,353 0.01%
Vanguard Global Bond Index Fund
393
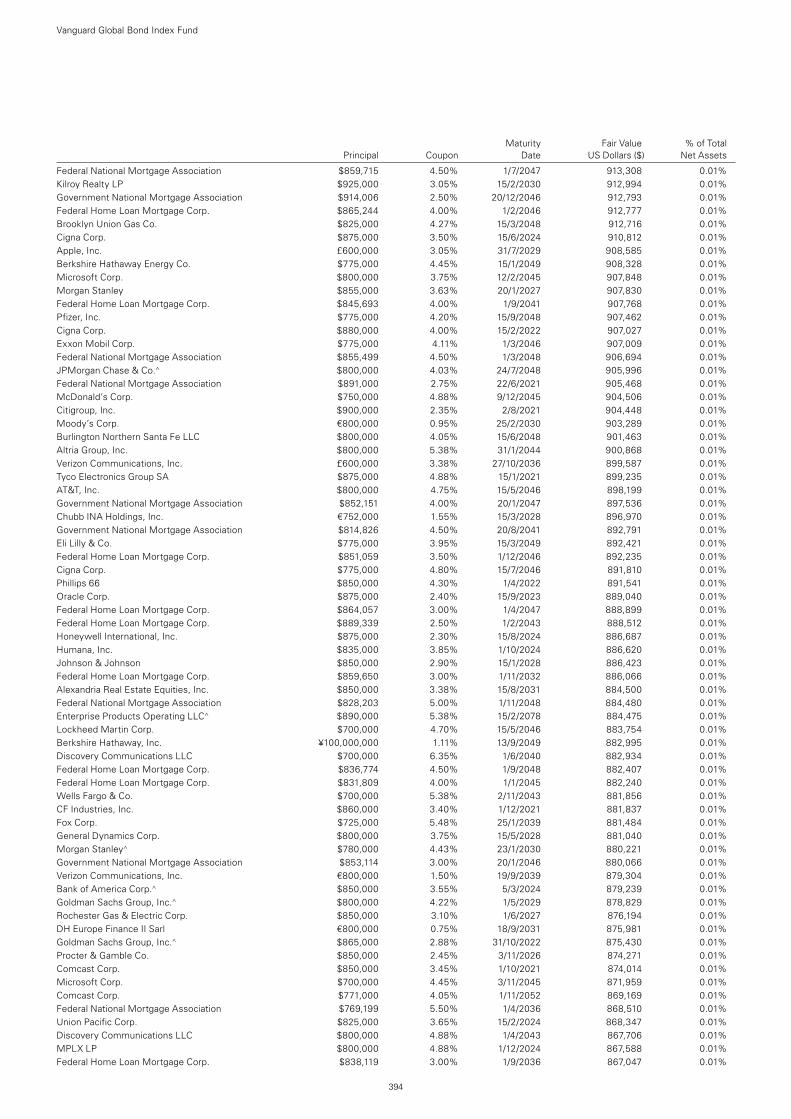
Maturity Fair Value % of Total Principal Coupon Date US Dollars ($) Net Assets
Federal National Mortgage Association $859,715 4.50% 1/7/2047 913,308 0.01%Kilroy Realty LP $925,000 3.05% 15/2/2030 912,994 0.01%Government National Mortgage Association $914,006 2.50% 20/12/2046 912,793 0.01%Federal Home Loan Mortgage Corp. $865,244 4.00% 1/2/2046 912,777 0.01%Brooklyn Union Gas Co. $825,000 4.27% 15/3/2048 912,716 0.01%Cigna Corp. $875,000 3.50% 15/6/2024 910,812 0.01%Apple, Inc. £600,000 3.05% 31/7/2029 908,585 0.01%Berkshire Hathaway Energy Co. $775,000 4.45% 15/1/2049 908,328 0.01%Microsoft Corp. $800,000 3.75% 12/2/2045 907,848 0.01%Morgan Stanley $855,000 3.63% 20/1/2027 907,830 0.01%Federal Home Loan Mortgage Corp. $845,693 4.00% 1/9/2041 907,768 0.01%Pfizer, Inc. $775,000 4.20% 15/9/2048 907,462 0.01%Cigna Corp. $880,000 4.00% 15/2/2022 907,027 0.01%Exxon Mobil Corp. $775,000 4.11% 1/3/2046 907,009 0.01%Federal National Mortgage Association $855,499 4.50% 1/3/2048 906,694 0.01%JPMorgan Chase & Co.^ $800,000 4.03% 24/7/2048 905,996 0.01%Federal National Mortgage Association $891,000 2.75% 22/6/2021 905,468 0.01%McDonald’s Corp. $750,000 4.88% 9/12/2045 904,506 0.01%Citigroup, Inc. $900,000 2.35% 2/8/2021 904,448 0.01%Moody’s Corp. €800,000 0.95% 25/2/2030 903,289 0.01%Burlington Northern Santa Fe LLC $800,000 4.05% 15/6/2048 901,463 0.01%Altria Group, Inc. $800,000 5.38% 31/1/2044 900,868 0.01%Verizon Communications, Inc. £600,000 3.38% 27/10/2036 899,587 0.01%Tyco Electronics Group SA $875,000 4.88% 15/1/2021 899,235 0.01%AT&T, Inc. $800,000 4.75% 15/5/2046 898,199 0.01%Government National Mortgage Association $852,151 4.00% 20/1/2047 897,536 0.01%Chubb INA Holdings, Inc. €752,000 1.55% 15/3/2028 896,970 0.01%Government National Mortgage Association $814,826 4.50% 20/8/2041 892,791 0.01%Eli Lilly & Co. $775,000 3.95% 15/3/2049 892,421 0.01%Federal Home Loan Mortgage Corp. $851,059 3.50% 1/12/2046 892,235 0.01%Cigna Corp. $775,000 4.80% 15/7/2046 891,810 0.01%Phillips 66 $850,000 4.30% 1/4/2022 891,541 0.01%Oracle Corp. $875,000 2.40% 15/9/2023 889,040 0.01%Federal Home Loan Mortgage Corp. $864,057 3.00% 1/4/2047 888,899 0.01%Federal Home Loan Mortgage Corp. $889,339 2.50% 1/2/2043 888,512 0.01%Honeywell International, Inc. $875,000 2.30% 15/8/2024 886,687 0.01%Humana, Inc. $835,000 3.85% 1/10/2024 886,620 0.01%Johnson & Johnson $850,000 2.90% 15/1/2028 886,423 0.01%Federal Home Loan Mortgage Corp. $859,650 3.00% 1/11/2032 886,066 0.01%Alexandria Real Estate Equities, Inc. $850,000 3.38% 15/8/2031 884,500 0.01%Federal National Mortgage Association $828,203 5.00% 1/11/2048 884,480 0.01%Enterprise Products Operating LLC^ $890,000 5.38% 15/2/2078 884,475 0.01%Lockheed Martin Corp. $700,000 4.70% 15/5/2046 883,754 0.01%Berkshire Hathaway, Inc. ¥100,000,000 1.11% 13/9/2049 882,995 0.01%Discovery Communications LLC $700,000 6.35% 1/6/2040 882,934 0.01%Federal Home Loan Mortgage Corp. $836,774 4.50% 1/9/2048 882,407 0.01%Federal Home Loan Mortgage Corp. $831,809 4.00% 1/1/2045 882,240 0.01%Wells Fargo & Co. $700,000 5.38% 2/11/2043 881,856 0.01%CF Industries, Inc. $860,000 3.40% 1/12/2021 881,837 0.01%Fox Corp. $725,000 5.48% 25/1/2039 881,484 0.01%General Dynamics Corp. $800,000 3.75% 15/5/2028 881,040 0.01%Morgan Stanley^ $780,000 4.43% 23/1/2030 880,221 0.01%Government National Mortgage Association $853,114 3.00% 20/1/2046 880,066 0.01%Verizon Communications, Inc. €800,000 1.50% 19/9/2039 879,304 0.01%Bank of America Corp.^ $850,000 3.55% 5/3/2024 879,239 0.01%Goldman Sachs Group, Inc.^ $800,000 4.22% 1/5/2029 878,829 0.01%Rochester Gas & Electric Corp. $850,000 3.10% 1/6/2027 876,194 0.01%DH Europe Finance II Sarl €800,000 0.75% 18/9/2031 875,981 0.01%Goldman Sachs Group, Inc.^ $865,000 2.88% 31/10/2022 875,430 0.01%Procter & Gamble Co. $850,000 2.45% 3/11/2026 874,271 0.01%Comcast Corp. $850,000 3.45% 1/10/2021 874,014 0.01%Microsoft Corp. $700,000 4.45% 3/11/2045 871,959 0.01%Comcast Corp. $771,000 4.05% 1/11/2052 869,169 0.01%Federal National Mortgage Association $769,199 5.50% 1/4/2036 868,510 0.01%Union Pacific Corp. $825,000 3.65% 15/2/2024 868,347 0.01%Discovery Communications LLC $800,000 4.88% 1/4/2043 867,706 0.01%MPLX LP $800,000 4.88% 1/12/2024 867,588 0.01%Federal Home Loan Mortgage Corp. $838,119 3.00% 1/9/2036 867,047 0.01%
Vanguard Global Bond Index Fund
394
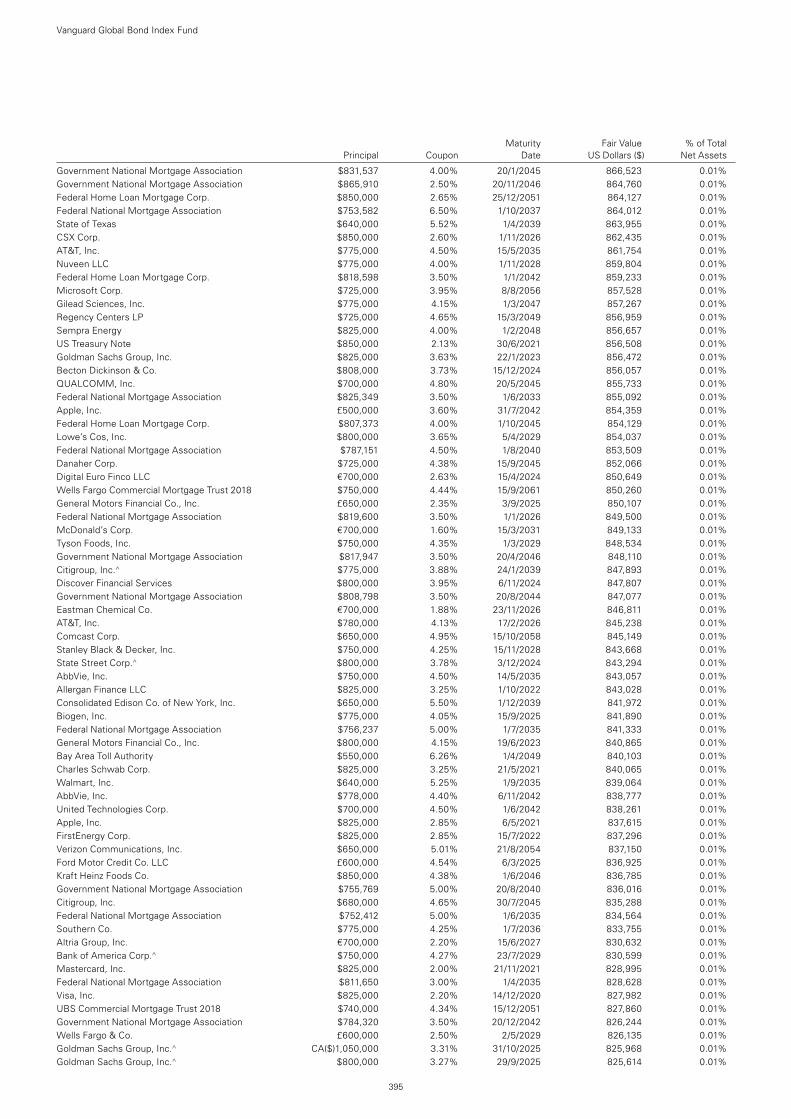
Maturity Fair Value % of Total Principal Coupon Date US Dollars ($) Net Assets
Government National Mortgage Association $831,537 4.00% 20/1/2045 866,523 0.01%Government National Mortgage Association $865,910 2.50% 20/11/2046 864,760 0.01%Federal Home Loan Mortgage Corp. $850,000 2.65% 25/12/2051 864,127 0.01%Federal National Mortgage Association $753,582 6.50% 1/10/2037 864,012 0.01%State of Texas $640,000 5.52% 1/4/2039 863,955 0.01%CSX Corp. $850,000 2.60% 1/11/2026 862,435 0.01%AT&T, Inc. $775,000 4.50% 15/5/2035 861,754 0.01%Nuveen LLC $775,000 4.00% 1/11/2028 859,804 0.01%Federal Home Loan Mortgage Corp. $818,598 3.50% 1/1/2042 859,233 0.01%Microsoft Corp. $725,000 3.95% 8/8/2056 857,528 0.01%Gilead Sciences, Inc. $775,000 4.15% 1/3/2047 857,267 0.01%Regency Centers LP $725,000 4.65% 15/3/2049 856,959 0.01%Sempra Energy $825,000 4.00% 1/2/2048 856,657 0.01%US Treasury Note $850,000 2.13% 30/6/2021 856,508 0.01%Goldman Sachs Group, Inc. $825,000 3.63% 22/1/2023 856,472 0.01%Becton Dickinson & Co. $808,000 3.73% 15/12/2024 856,057 0.01%QUALCOMM, Inc. $700,000 4.80% 20/5/2045 855,733 0.01%Federal National Mortgage Association $825,349 3.50% 1/6/2033 855,092 0.01%Apple, Inc. £500,000 3.60% 31/7/2042 854,359 0.01%Federal Home Loan Mortgage Corp. $807,373 4.00% 1/10/2045 854,129 0.01%Lowe’s Cos, Inc. $800,000 3.65% 5/4/2029 854,037 0.01%Federal National Mortgage Association $787,151 4.50% 1/8/2040 853,509 0.01%Danaher Corp. $725,000 4.38% 15/9/2045 852,066 0.01%Digital Euro Finco LLC €700,000 2.63% 15/4/2024 850,649 0.01%Wells Fargo Commercial Mortgage Trust 2018 $750,000 4.44% 15/9/2061 850,260 0.01%General Motors Financial Co., Inc. £650,000 2.35% 3/9/2025 850,107 0.01%Federal National Mortgage Association $819,600 3.50% 1/1/2026 849,500 0.01%McDonald’s Corp. €700,000 1.60% 15/3/2031 849,133 0.01%Tyson Foods, Inc. $750,000 4.35% 1/3/2029 848,534 0.01%Government National Mortgage Association $817,947 3.50% 20/4/2046 848,110 0.01%Citigroup, Inc.^ $775,000 3.88% 24/1/2039 847,893 0.01%Discover Financial Services $800,000 3.95% 6/11/2024 847,807 0.01%Government National Mortgage Association $808,798 3.50% 20/8/2044 847,077 0.01%Eastman Chemical Co. €700,000 1.88% 23/11/2026 846,811 0.01%AT&T, Inc. $780,000 4.13% 17/2/2026 845,238 0.01%Comcast Corp. $650,000 4.95% 15/10/2058 845,149 0.01%Stanley Black & Decker, Inc. $750,000 4.25% 15/11/2028 843,668 0.01%State Street Corp.^ $800,000 3.78% 3/12/2024 843,294 0.01%AbbVie, Inc. $750,000 4.50% 14/5/2035 843,057 0.01%Allergan Finance LLC $825,000 3.25% 1/10/2022 843,028 0.01%Consolidated Edison Co. of New York, Inc. $650,000 5.50% 1/12/2039 841,972 0.01%Biogen, Inc. $775,000 4.05% 15/9/2025 841,890 0.01%Federal National Mortgage Association $756,237 5.00% 1/7/2035 841,333 0.01%General Motors Financial Co., Inc. $800,000 4.15% 19/6/2023 840,865 0.01%Bay Area Toll Authority $550,000 6.26% 1/4/2049 840,103 0.01%Charles Schwab Corp. $825,000 3.25% 21/5/2021 840,065 0.01%Walmart, Inc. $640,000 5.25% 1/9/2035 839,064 0.01%AbbVie, Inc. $778,000 4.40% 6/11/2042 838,777 0.01%United Technologies Corp. $700,000 4.50% 1/6/2042 838,261 0.01%Apple, Inc. $825,000 2.85% 6/5/2021 837,615 0.01%FirstEnergy Corp. $825,000 2.85% 15/7/2022 837,296 0.01%Verizon Communications, Inc. $650,000 5.01% 21/8/2054 837,150 0.01%Ford Motor Credit Co. LLC £600,000 4.54% 6/3/2025 836,925 0.01%Kraft Heinz Foods Co. $850,000 4.38% 1/6/2046 836,785 0.01%Government National Mortgage Association $755,769 5.00% 20/8/2040 836,016 0.01%Citigroup, Inc. $680,000 4.65% 30/7/2045 835,288 0.01%Federal National Mortgage Association $752,412 5.00% 1/6/2035 834,564 0.01%Southern Co. $775,000 4.25% 1/7/2036 833,755 0.01%Altria Group, Inc. €700,000 2.20% 15/6/2027 830,632 0.01%Bank of America Corp.^ $750,000 4.27% 23/7/2029 830,599 0.01%Mastercard, Inc. $825,000 2.00% 21/11/2021 828,995 0.01%Federal National Mortgage Association $811,650 3.00% 1/4/2035 828,628 0.01%Visa, Inc. $825,000 2.20% 14/12/2020 827,982 0.01%UBS Commercial Mortgage Trust 2018 $740,000 4.34% 15/12/2051 827,860 0.01%Government National Mortgage Association $784,320 3.50% 20/12/2042 826,244 0.01%Wells Fargo & Co. £600,000 2.50% 2/5/2029 826,135 0.01%Goldman Sachs Group, Inc.^ CA($)1,050,000 3.31% 31/10/2025 825,968 0.01%Goldman Sachs Group, Inc.^ $800,000 3.27% 29/9/2025 825,614 0.01%
Vanguard Global Bond Index Fund
395
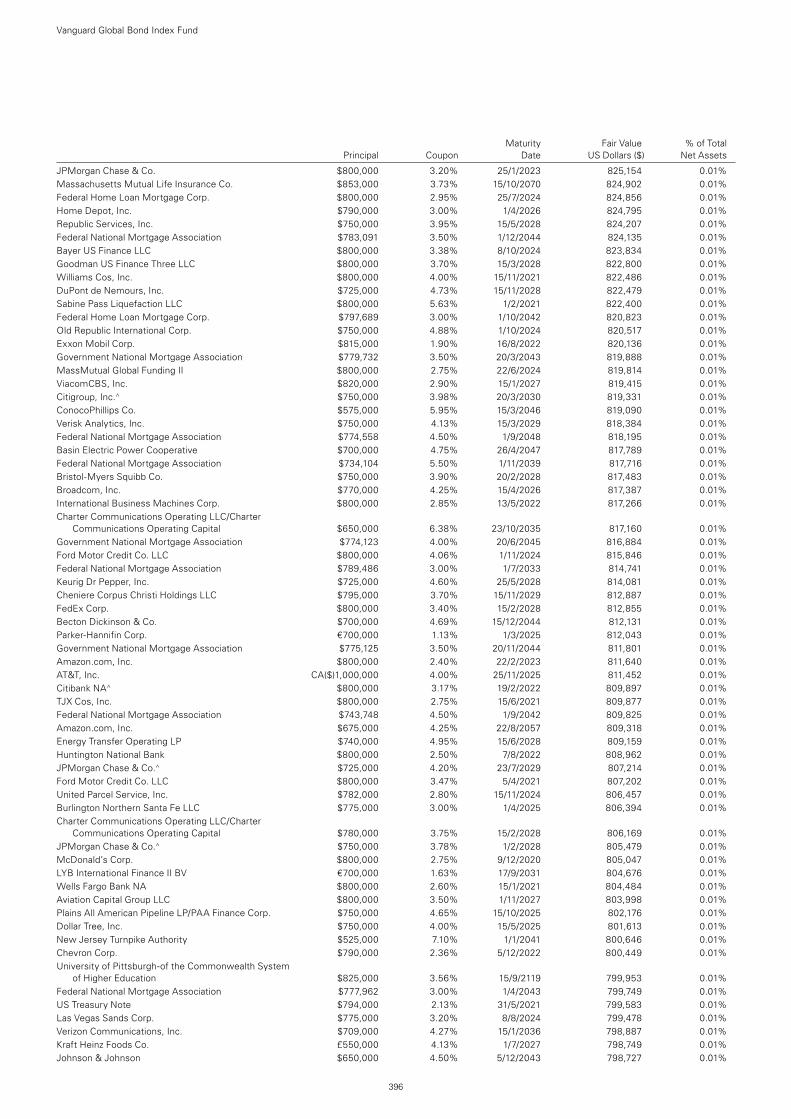
Maturity Fair Value % of Total Principal Coupon Date US Dollars ($) Net Assets
JPMorgan Chase & Co. $800,000 3.20% 25/1/2023 825,154 0.01%Massachusetts Mutual Life Insurance Co. $853,000 3.73% 15/10/2070 824,902 0.01%Federal Home Loan Mortgage Corp. $800,000 2.95% 25/7/2024 824,856 0.01%Home Depot, Inc. $790,000 3.00% 1/4/2026 824,795 0.01%Republic Services, Inc. $750,000 3.95% 15/5/2028 824,207 0.01%Federal National Mortgage Association $783,091 3.50% 1/12/2044 824,135 0.01%Bayer US Finance LLC $800,000 3.38% 8/10/2024 823,834 0.01%Goodman US Finance Three LLC $800,000 3.70% 15/3/2028 822,800 0.01%Williams Cos, Inc. $800,000 4.00% 15/11/2021 822,486 0.01%DuPont de Nemours, Inc. $725,000 4.73% 15/11/2028 822,479 0.01%Sabine Pass Liquefaction LLC $800,000 5.63% 1/2/2021 822,400 0.01%Federal Home Loan Mortgage Corp. $797,689 3.00% 1/10/2042 820,823 0.01%Old Republic International Corp. $750,000 4.88% 1/10/2024 820,517 0.01%Exxon Mobil Corp. $815,000 1.90% 16/8/2022 820,136 0.01%Government National Mortgage Association $779,732 3.50% 20/3/2043 819,888 0.01%MassMutual Global Funding II $800,000 2.75% 22/6/2024 819,814 0.01%ViacomCBS, Inc. $820,000 2.90% 15/1/2027 819,415 0.01%Citigroup, Inc.^ $750,000 3.98% 20/3/2030 819,331 0.01%ConocoPhillips Co. $575,000 5.95% 15/3/2046 819,090 0.01%Verisk Analytics, Inc. $750,000 4.13% 15/3/2029 818,384 0.01%Federal National Mortgage Association $774,558 4.50% 1/9/2048 818,195 0.01%Basin Electric Power Cooperative $700,000 4.75% 26/4/2047 817,789 0.01%Federal National Mortgage Association $734,104 5.50% 1/11/2039 817,716 0.01%Bristol-Myers Squibb Co. $750,000 3.90% 20/2/2028 817,483 0.01%Broadcom, Inc. $770,000 4.25% 15/4/2026 817,387 0.01%International Business Machines Corp. $800,000 2.85% 13/5/2022 817,266 0.01%Charter Communications Operating LLC/Charter
Communications Operating Capital $650,000 6.38% 23/10/2035 817,160 0.01%Government National Mortgage Association $774,123 4.00% 20/6/2045 816,884 0.01%Ford Motor Credit Co. LLC $800,000 4.06% 1/11/2024 815,846 0.01%Federal National Mortgage Association $789,486 3.00% 1/7/2033 814,741 0.01%Keurig Dr Pepper, Inc. $725,000 4.60% 25/5/2028 814,081 0.01%Cheniere Corpus Christi Holdings LLC $795,000 3.70% 15/11/2029 812,887 0.01%FedEx Corp. $800,000 3.40% 15/2/2028 812,855 0.01%Becton Dickinson & Co. $700,000 4.69% 15/12/2044 812,131 0.01%Parker-Hannifin Corp. €700,000 1.13% 1/3/2025 812,043 0.01%Government National Mortgage Association $775,125 3.50% 20/11/2044 811,801 0.01%Amazon.com, Inc. $800,000 2.40% 22/2/2023 811,640 0.01%AT&T, Inc. CA($)1,000,000 4.00% 25/11/2025 811,452 0.01%Citibank NA^ $800,000 3.17% 19/2/2022 809,897 0.01%TJX Cos, Inc. $800,000 2.75% 15/6/2021 809,877 0.01%Federal National Mortgage Association $743,748 4.50% 1/9/2042 809,825 0.01%Amazon.com, Inc. $675,000 4.25% 22/8/2057 809,318 0.01%Energy Transfer Operating LP $740,000 4.95% 15/6/2028 809,159 0.01%Huntington National Bank $800,000 2.50% 7/8/2022 808,962 0.01%JPMorgan Chase & Co.^ $725,000 4.20% 23/7/2029 807,214 0.01%Ford Motor Credit Co. LLC $800,000 3.47% 5/4/2021 807,202 0.01%United Parcel Service, Inc. $782,000 2.80% 15/11/2024 806,457 0.01%Burlington Northern Santa Fe LLC $775,000 3.00% 1/4/2025 806,394 0.01%Charter Communications Operating LLC/Charter
Communications Operating Capital $780,000 3.75% 15/2/2028 806,169 0.01%JPMorgan Chase & Co.^ $750,000 3.78% 1/2/2028 805,479 0.01%McDonald’s Corp. $800,000 2.75% 9/12/2020 805,047 0.01%LYB International Finance II BV €700,000 1.63% 17/9/2031 804,676 0.01%Wells Fargo Bank NA $800,000 2.60% 15/1/2021 804,484 0.01%Aviation Capital Group LLC $800,000 3.50% 1/11/2027 803,998 0.01%Plains All American Pipeline LP/PAA Finance Corp. $750,000 4.65% 15/10/2025 802,176 0.01%Dollar Tree, Inc. $750,000 4.00% 15/5/2025 801,613 0.01%New Jersey Turnpike Authority $525,000 7.10% 1/1/2041 800,646 0.01%Chevron Corp. $790,000 2.36% 5/12/2022 800,449 0.01%University of Pittsburgh-of the Commonwealth System
of Higher Education $825,000 3.56% 15/9/2119 799,953 0.01%Federal National Mortgage Association $777,962 3.00% 1/4/2043 799,749 0.01%US Treasury Note $794,000 2.13% 31/5/2021 799,583 0.01%Las Vegas Sands Corp. $775,000 3.20% 8/8/2024 799,478 0.01%Verizon Communications, Inc. $709,000 4.27% 15/1/2036 798,887 0.01%Kraft Heinz Foods Co. £550,000 4.13% 1/7/2027 798,749 0.01%Johnson & Johnson $650,000 4.50% 5/12/2043 798,727 0.01%
Vanguard Global Bond Index Fund
396
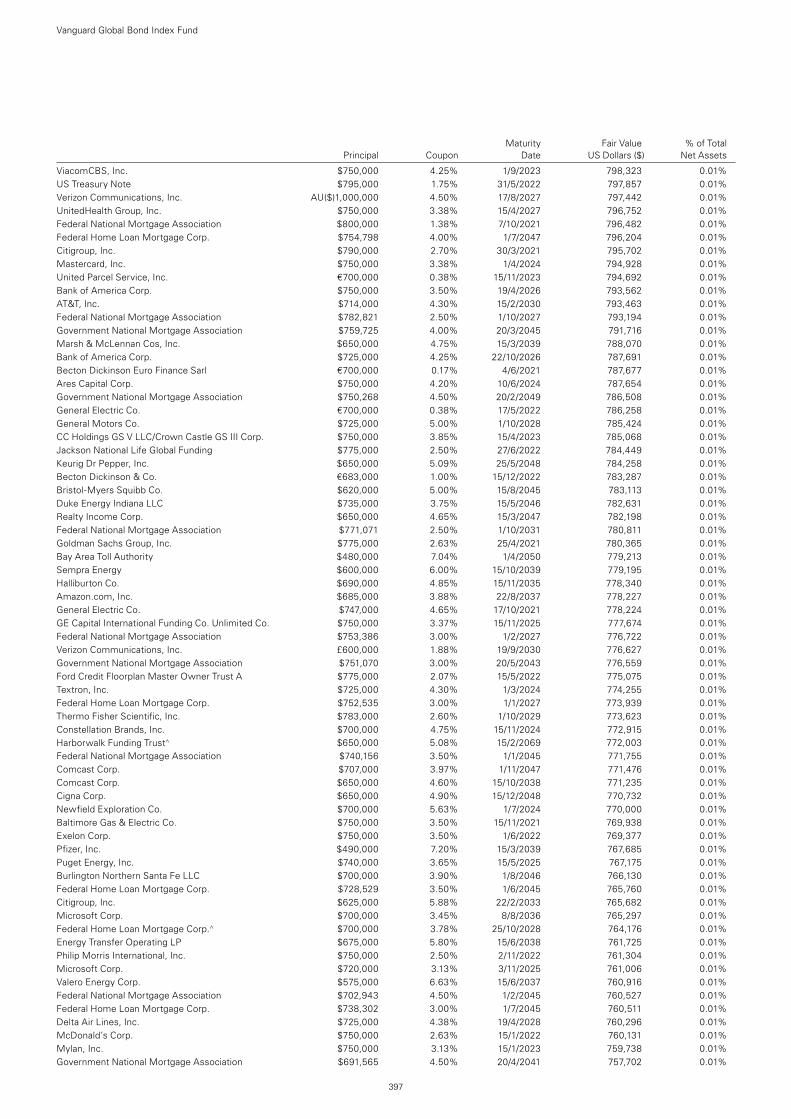
Maturity Fair Value % of Total Principal Coupon Date US Dollars ($) Net Assets
ViacomCBS, Inc. $750,000 4.25% 1/9/2023 798,323 0.01%US Treasury Note $795,000 1.75% 31/5/2022 797,857 0.01%Verizon Communications, Inc. AU($)1,000,000 4.50% 17/8/2027 797,442 0.01%UnitedHealth Group, Inc. $750,000 3.38% 15/4/2027 796,752 0.01%Federal National Mortgage Association $800,000 1.38% 7/10/2021 796,482 0.01%Federal Home Loan Mortgage Corp. $754,798 4.00% 1/7/2047 796,204 0.01%Citigroup, Inc. $790,000 2.70% 30/3/2021 795,702 0.01%Mastercard, Inc. $750,000 3.38% 1/4/2024 794,928 0.01%United Parcel Service, Inc. €700,000 0.38% 15/11/2023 794,692 0.01%Bank of America Corp. $750,000 3.50% 19/4/2026 793,562 0.01%AT&T, Inc. $714,000 4.30% 15/2/2030 793,463 0.01%Federal National Mortgage Association $782,821 2.50% 1/10/2027 793,194 0.01%Government National Mortgage Association $759,725 4.00% 20/3/2045 791,716 0.01%Marsh & McLennan Cos, Inc. $650,000 4.75% 15/3/2039 788,070 0.01%Bank of America Corp. $725,000 4.25% 22/10/2026 787,691 0.01%Becton Dickinson Euro Finance Sarl €700,000 0.17% 4/6/2021 787,677 0.01%Ares Capital Corp. $750,000 4.20% 10/6/2024 787,654 0.01%Government National Mortgage Association $750,268 4.50% 20/2/2049 786,508 0.01%General Electric Co. €700,000 0.38% 17/5/2022 786,258 0.01%General Motors Co. $725,000 5.00% 1/10/2028 785,424 0.01%CC Holdings GS V LLC/Crown Castle GS III Corp. $750,000 3.85% 15/4/2023 785,068 0.01%Jackson National Life Global Funding $775,000 2.50% 27/6/2022 784,449 0.01%Keurig Dr Pepper, Inc. $650,000 5.09% 25/5/2048 784,258 0.01%Becton Dickinson & Co. €683,000 1.00% 15/12/2022 783,287 0.01%Bristol-Myers Squibb Co. $620,000 5.00% 15/8/2045 783,113 0.01%Duke Energy Indiana LLC $735,000 3.75% 15/5/2046 782,631 0.01%Realty Income Corp. $650,000 4.65% 15/3/2047 782,198 0.01%Federal National Mortgage Association $771,071 2.50% 1/10/2031 780,811 0.01%Goldman Sachs Group, Inc. $775,000 2.63% 25/4/2021 780,365 0.01%Bay Area Toll Authority $480,000 7.04% 1/4/2050 779,213 0.01%Sempra Energy $600,000 6.00% 15/10/2039 779,195 0.01%Halliburton Co. $690,000 4.85% 15/11/2035 778,340 0.01%Amazon.com, Inc. $685,000 3.88% 22/8/2037 778,227 0.01%General Electric Co. $747,000 4.65% 17/10/2021 778,224 0.01%GE Capital International Funding Co. Unlimited Co. $750,000 3.37% 15/11/2025 777,674 0.01%Federal National Mortgage Association $753,386 3.00% 1/2/2027 776,722 0.01%Verizon Communications, Inc. £600,000 1.88% 19/9/2030 776,627 0.01%Government National Mortgage Association $751,070 3.00% 20/5/2043 776,559 0.01%Ford Credit Floorplan Master Owner Trust A $775,000 2.07% 15/5/2022 775,075 0.01%Textron, Inc. $725,000 4.30% 1/3/2024 774,255 0.01%Federal Home Loan Mortgage Corp. $752,535 3.00% 1/1/2027 773,939 0.01%Thermo Fisher Scientific, Inc. $783,000 2.60% 1/10/2029 773,623 0.01%Constellation Brands, Inc. $700,000 4.75% 15/11/2024 772,915 0.01%Harborwalk Funding Trust^ $650,000 5.08% 15/2/2069 772,003 0.01%Federal National Mortgage Association $740,156 3.50% 1/1/2045 771,755 0.01%Comcast Corp. $707,000 3.97% 1/11/2047 771,476 0.01%Comcast Corp. $650,000 4.60% 15/10/2038 771,235 0.01%Cigna Corp. $650,000 4.90% 15/12/2048 770,732 0.01%Newfield Exploration Co. $700,000 5.63% 1/7/2024 770,000 0.01%Baltimore Gas & Electric Co. $750,000 3.50% 15/11/2021 769,938 0.01%Exelon Corp. $750,000 3.50% 1/6/2022 769,377 0.01%Pfizer, Inc. $490,000 7.20% 15/3/2039 767,685 0.01%Puget Energy, Inc. $740,000 3.65% 15/5/2025 767,175 0.01%Burlington Northern Santa Fe LLC $700,000 3.90% 1/8/2046 766,130 0.01%Federal Home Loan Mortgage Corp. $728,529 3.50% 1/6/2045 765,760 0.01%Citigroup, Inc. $625,000 5.88% 22/2/2033 765,682 0.01%Microsoft Corp. $700,000 3.45% 8/8/2036 765,297 0.01%Federal Home Loan Mortgage Corp.^ $700,000 3.78% 25/10/2028 764,176 0.01%Energy Transfer Operating LP $675,000 5.80% 15/6/2038 761,725 0.01%Philip Morris International, Inc. $750,000 2.50% 2/11/2022 761,304 0.01%Microsoft Corp. $720,000 3.13% 3/11/2025 761,006 0.01%Valero Energy Corp. $575,000 6.63% 15/6/2037 760,916 0.01%Federal National Mortgage Association $702,943 4.50% 1/2/2045 760,527 0.01%Federal Home Loan Mortgage Corp. $738,302 3.00% 1/7/2045 760,511 0.01%Delta Air Lines, Inc. $725,000 4.38% 19/4/2028 760,296 0.01%McDonald’s Corp. $750,000 2.63% 15/1/2022 760,131 0.01%Mylan, Inc. $750,000 3.13% 15/1/2023 759,738 0.01%Government National Mortgage Association $691,565 4.50% 20/4/2041 757,702 0.01%
Vanguard Global Bond Index Fund
397
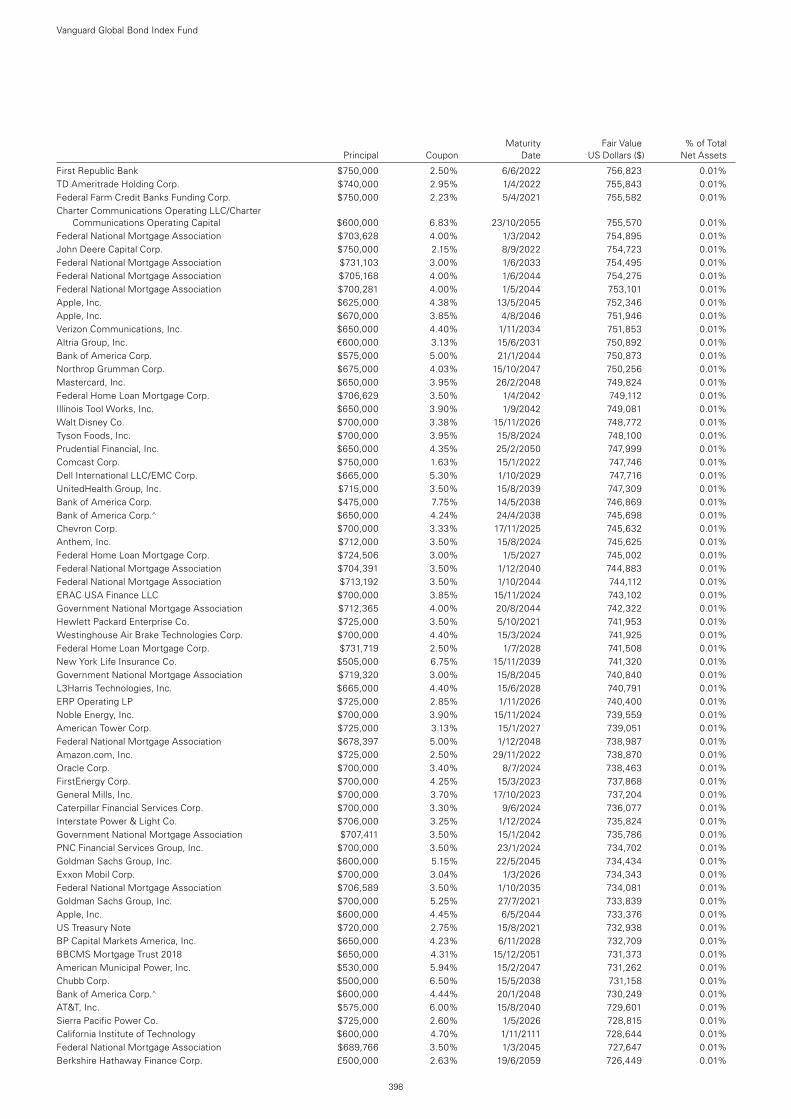
Maturity Fair Value % of Total Principal Coupon Date US Dollars ($) Net Assets
First Republic Bank $750,000 2.50% 6/6/2022 756,823 0.01%TD Ameritrade Holding Corp. $740,000 2.95% 1/4/2022 755,843 0.01%Federal Farm Credit Banks Funding Corp. $750,000 2.23% 5/4/2021 755,582 0.01%Charter Communications Operating LLC/Charter
Communications Operating Capital $600,000 6.83% 23/10/2055 755,570 0.01%Federal National Mortgage Association $703,628 4.00% 1/3/2042 754,895 0.01%John Deere Capital Corp. $750,000 2.15% 8/9/2022 754,723 0.01%Federal National Mortgage Association $731,103 3.00% 1/6/2033 754,495 0.01%Federal National Mortgage Association $705,168 4.00% 1/6/2044 754,275 0.01%Federal National Mortgage Association $700,281 4.00% 1/5/2044 753,101 0.01%Apple, Inc. $625,000 4.38% 13/5/2045 752,346 0.01%Apple, Inc. $670,000 3.85% 4/8/2046 751,946 0.01%Verizon Communications, Inc. $650,000 4.40% 1/11/2034 751,853 0.01%Altria Group, Inc. €600,000 3.13% 15/6/2031 750,892 0.01%Bank of America Corp. $575,000 5.00% 21/1/2044 750,873 0.01%Northrop Grumman Corp. $675,000 4.03% 15/10/2047 750,256 0.01%Mastercard, Inc. $650,000 3.95% 26/2/2048 749,824 0.01%Federal Home Loan Mortgage Corp. $706,629 3.50% 1/4/2042 749,112 0.01%Illinois Tool Works, Inc. $650,000 3.90% 1/9/2042 749,081 0.01%Walt Disney Co. $700,000 3.38% 15/11/2026 748,772 0.01%Tyson Foods, Inc. $700,000 3.95% 15/8/2024 748,100 0.01%Prudential Financial, Inc. $650,000 4.35% 25/2/2050 747,999 0.01%Comcast Corp. $750,000 1.63% 15/1/2022 747,746 0.01%Dell International LLC/EMC Corp. $665,000 5.30% 1/10/2029 747,716 0.01%UnitedHealth Group, Inc. $715,000 3.50% 15/8/2039 747,309 0.01%Bank of America Corp. $475,000 7.75% 14/5/2038 746,869 0.01%Bank of America Corp.^ $650,000 4.24% 24/4/2038 745,698 0.01%Chevron Corp. $700,000 3.33% 17/11/2025 745,632 0.01%Anthem, Inc. $712,000 3.50% 15/8/2024 745,625 0.01%Federal Home Loan Mortgage Corp. $724,506 3.00% 1/5/2027 745,002 0.01%Federal National Mortgage Association $704,391 3.50% 1/12/2040 744,883 0.01%Federal National Mortgage Association $713,192 3.50% 1/10/2044 744,112 0.01%ERAC USA Finance LLC $700,000 3.85% 15/11/2024 743,102 0.01%Government National Mortgage Association $712,365 4.00% 20/8/2044 742,322 0.01%Hewlett Packard Enterprise Co. $725,000 3.50% 5/10/2021 741,953 0.01%Westinghouse Air Brake Technologies Corp. $700,000 4.40% 15/3/2024 741,925 0.01%Federal Home Loan Mortgage Corp. $731,719 2.50% 1/7/2028 741,508 0.01%New York Life Insurance Co. $505,000 6.75% 15/11/2039 741,320 0.01%Government National Mortgage Association $719,320 3.00% 15/8/2045 740,840 0.01%L3Harris Technologies, Inc. $665,000 4.40% 15/6/2028 740,791 0.01%ERP Operating LP $725,000 2.85% 1/11/2026 740,400 0.01%Noble Energy, Inc. $700,000 3.90% 15/11/2024 739,559 0.01%American Tower Corp. $725,000 3.13% 15/1/2027 739,051 0.01%Federal National Mortgage Association $678,397 5.00% 1/12/2048 738,987 0.01%Amazon.com, Inc. $725,000 2.50% 29/11/2022 738,870 0.01%Oracle Corp. $700,000 3.40% 8/7/2024 738,463 0.01%FirstEnergy Corp. $700,000 4.25% 15/3/2023 737,868 0.01%General Mills, Inc. $700,000 3.70% 17/10/2023 737,204 0.01%Caterpillar Financial Services Corp. $700,000 3.30% 9/6/2024 736,077 0.01%Interstate Power & Light Co. $706,000 3.25% 1/12/2024 735,824 0.01%Government National Mortgage Association $707,411 3.50% 15/1/2042 735,786 0.01%PNC Financial Services Group, Inc. $700,000 3.50% 23/1/2024 734,702 0.01%Goldman Sachs Group, Inc. $600,000 5.15% 22/5/2045 734,434 0.01%Exxon Mobil Corp. $700,000 3.04% 1/3/2026 734,343 0.01%Federal National Mortgage Association $706,589 3.50% 1/10/2035 734,081 0.01%Goldman Sachs Group, Inc. $700,000 5.25% 27/7/2021 733,839 0.01%Apple, Inc. $600,000 4.45% 6/5/2044 733,376 0.01%US Treasury Note $720,000 2.75% 15/8/2021 732,938 0.01%BP Capital Markets America, Inc. $650,000 4.23% 6/11/2028 732,709 0.01%BBCMS Mortgage Trust 2018 $650,000 4.31% 15/12/2051 731,373 0.01%American Municipal Power, Inc. $530,000 5.94% 15/2/2047 731,262 0.01%Chubb Corp. $500,000 6.50% 15/5/2038 731,158 0.01%Bank of America Corp.^ $600,000 4.44% 20/1/2048 730,249 0.01%AT&T, Inc. $575,000 6.00% 15/8/2040 729,601 0.01%Sierra Pacific Power Co. $725,000 2.60% 1/5/2026 728,815 0.01%California Institute of Technology $600,000 4.70% 1/11/2111 728,644 0.01%Federal National Mortgage Association $689,766 3.50% 1/3/2045 727,647 0.01%Berkshire Hathaway Finance Corp. £500,000 2.63% 19/6/2059 726,449 0.01%
Vanguard Global Bond Index Fund
398
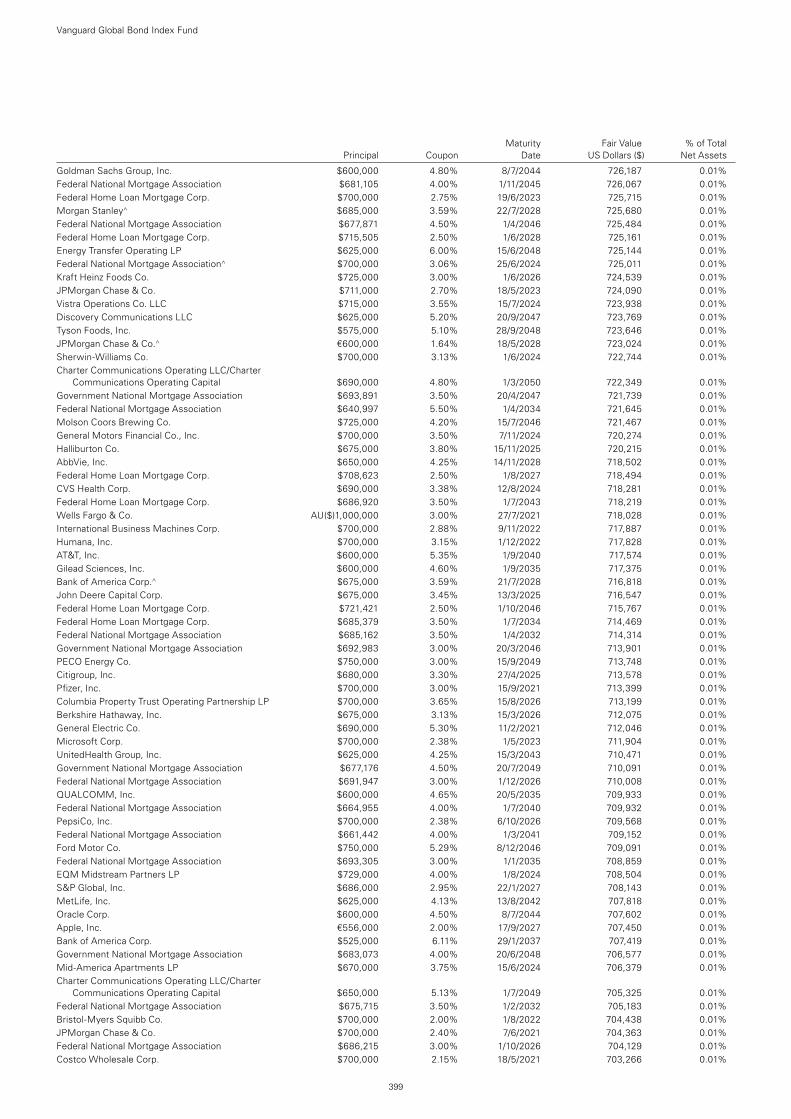
Maturity Fair Value % of Total Principal Coupon Date US Dollars ($) Net Assets
Vanguard Global Bond Index Fund
399
Goldman Sachs Group, Inc. $600,000 4.80% 8/7/2044 726,187 0.01%Federal National Mortgage Association $681,105 4.00% 1/11/2045 726,067 0.01%Federal Home Loan Mortgage Corp. $700,000 2.75% 19/6/2023 725,715 0.01%Morgan Stanley^ $685,000 3.59% 22/7/2028 725,680 0.01%Federal National Mortgage Association $677,871 4.50% 1/4/2046 725,484 0.01%Federal Home Loan Mortgage Corp. $715,505 2.50% 1/6/2028 725,161 0.01%Energy Transfer Operating LP $625,000 6.00% 15/6/2048 725,144 0.01%Federal National Mortgage Association^ $700,000 3.06% 25/6/2024 725,011 0.01%Kraft Heinz Foods Co. $725,000 3.00% 1/6/2026 724,539 0.01%JPMorgan Chase & Co. $711,000 2.70% 18/5/2023 724,090 0.01%Vistra Operations Co. LLC $715,000 3.55% 15/7/2024 723,938 0.01%Discovery Communications LLC $625,000 5.20% 20/9/2047 723,769 0.01%Tyson Foods, Inc. $575,000 5.10% 28/9/2048 723,646 0.01%JPMorgan Chase & Co.^ €600,000 1.64% 18/5/2028 723,024 0.01%Sherwin-Williams Co. $700,000 3.13% 1/6/2024 722,744 0.01%Charter Communications Operating LLC/Charter
Communications Operating Capital $690,000 4.80% 1/3/2050 722,349 0.01%Government National Mortgage Association $693,891 3.50% 20/4/2047 721,739 0.01%Federal National Mortgage Association $640,997 5.50% 1/4/2034 721,645 0.01%Molson Coors Brewing Co. $725,000 4.20% 15/7/2046 721,467 0.01%General Motors Financial Co., Inc. $700,000 3.50% 7/11/2024 720,274 0.01%Halliburton Co. $675,000 3.80% 15/11/2025 720,215 0.01%AbbVie, Inc. $650,000 4.25% 14/11/2028 718,502 0.01%Federal Home Loan Mortgage Corp. $708,623 2.50% 1/8/2027 718,494 0.01%CVS Health Corp. $690,000 3.38% 12/8/2024 718,281 0.01%Federal Home Loan Mortgage Corp. $686,920 3.50% 1/7/2043 718,219 0.01%Wells Fargo & Co. AU($)1,000,000 3.00% 27/7/2021 718,028 0.01%International Business Machines Corp. $700,000 2.88% 9/11/2022 717,887 0.01%Humana, Inc. $700,000 3.15% 1/12/2022 717,828 0.01%AT&T, Inc. $600,000 5.35% 1/9/2040 717,574 0.01%Gilead Sciences, Inc. $600,000 4.60% 1/9/2035 717,375 0.01%Bank of America Corp.^ $675,000 3.59% 21/7/2028 716,818 0.01%John Deere Capital Corp. $675,000 3.45% 13/3/2025 716,547 0.01%Federal Home Loan Mortgage Corp. $721,421 2.50% 1/10/2046 715,767 0.01%Federal Home Loan Mortgage Corp. $685,379 3.50% 1/7/2034 714,469 0.01%Federal National Mortgage Association $685,162 3.50% 1/4/2032 714,314 0.01%Government National Mortgage Association $692,983 3.00% 20/3/2046 713,901 0.01%PECO Energy Co. $750,000 3.00% 15/9/2049 713,748 0.01%Citigroup, Inc. $680,000 3.30% 27/4/2025 713,578 0.01%Pfizer, Inc. $700,000 3.00% 15/9/2021 713,399 0.01%Columbia Property Trust Operating Partnership LP $700,000 3.65% 15/8/2026 713,199 0.01%Berkshire Hathaway, Inc. $675,000 3.13% 15/3/2026 712,075 0.01%General Electric Co. $690,000 5.30% 11/2/2021 712,046 0.01%Microsoft Corp. $700,000 2.38% 1/5/2023 711,904 0.01%UnitedHealth Group, Inc. $625,000 4.25% 15/3/2043 710,471 0.01%Government National Mortgage Association $677,176 4.50% 20/7/2049 710,091 0.01%Federal National Mortgage Association $691,947 3.00% 1/12/2026 710,008 0.01%QUALCOMM, Inc. $600,000 4.65% 20/5/2035 709,933 0.01%Federal National Mortgage Association $664,955 4.00% 1/7/2040 709,932 0.01%PepsiCo, Inc. $700,000 2.38% 6/10/2026 709,568 0.01%Federal National Mortgage Association $661,442 4.00% 1/3/2041 709,152 0.01%Ford Motor Co. $750,000 5.29% 8/12/2046 709,091 0.01%Federal National Mortgage Association $693,305 3.00% 1/1/2035 708,859 0.01%EQM Midstream Partners LP $729,000 4.00% 1/8/2024 708,504 0.01%S&P Global, Inc. $686,000 2.95% 22/1/2027 708,143 0.01%MetLife, Inc. $625,000 4.13% 13/8/2042 707,818 0.01%Oracle Corp. $600,000 4.50% 8/7/2044 707,602 0.01%Apple, Inc. €556,000 2.00% 17/9/2027 707,450 0.01%Bank of America Corp. $525,000 6.11% 29/1/2037 707,419 0.01%Government National Mortgage Association $683,073 4.00% 20/6/2048 706,577 0.01%Mid-America Apartments LP $670,000 3.75% 15/6/2024 706,379 0.01%Charter Communications Operating LLC/Charter
Communications Operating Capital $650,000 5.13% 1/7/2049 705,325 0.01%Federal National Mortgage Association $675,715 3.50% 1/2/2032 705,183 0.01%Bristol-Myers Squibb Co. $700,000 2.00% 1/8/2022 704,438 0.01%JPMorgan Chase & Co. $700,000 2.40% 7/6/2021 704,363 0.01%Federal National Mortgage Association $686,215 3.00% 1/10/2026 704,129 0.01%Costco Wholesale Corp. $700,000 2.15% 18/5/2021 703,266 0.01%
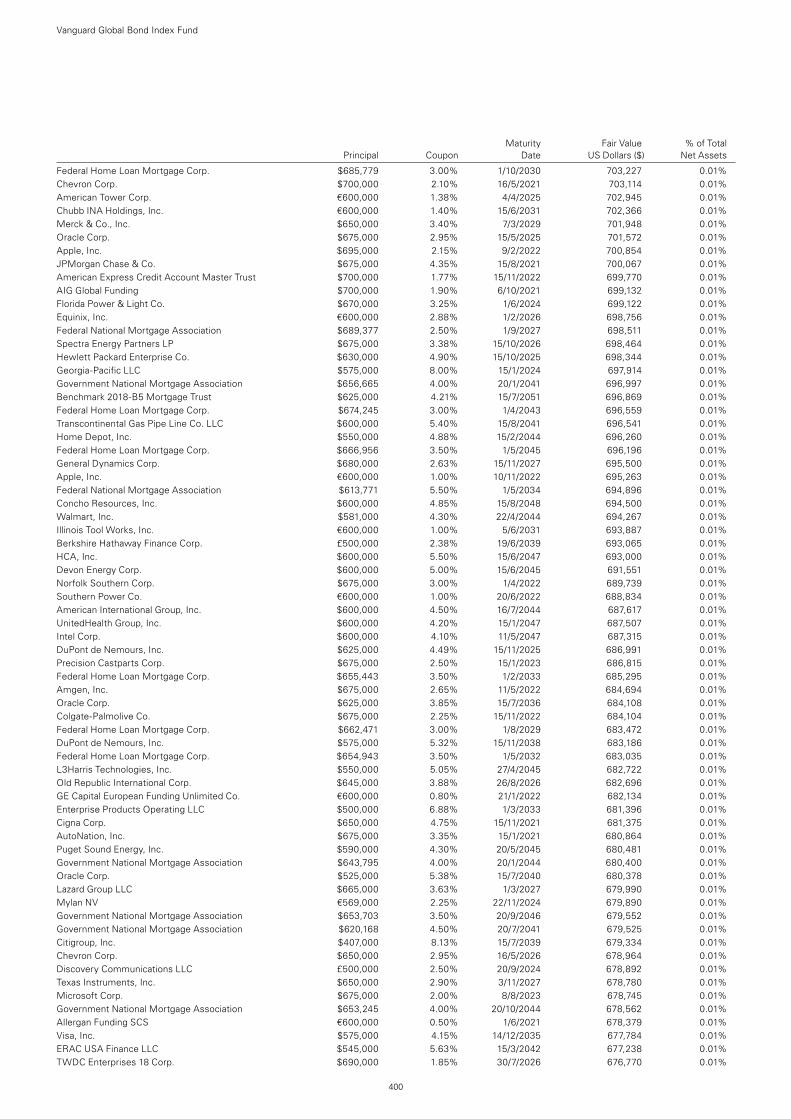
Maturity Fair Value % of Total Principal Coupon Date US Dollars ($) Net Assets
Vanguard Global Bond Index Fund
400
Federal Home Loan Mortgage Corp. $685,779 3.00% 1/10/2030 703,227 0.01%Chevron Corp. $700,000 2.10% 16/5/2021 703,114 0.01%American Tower Corp. €600,000 1.38% 4/4/2025 702,945 0.01%Chubb INA Holdings, Inc. €600,000 1.40% 15/6/2031 702,366 0.01%Merck & Co., Inc. $650,000 3.40% 7/3/2029 701,948 0.01%Oracle Corp. $675,000 2.95% 15/5/2025 701,572 0.01%Apple, Inc. $695,000 2.15% 9/2/2022 700,854 0.01%JPMorgan Chase & Co. $675,000 4.35% 15/8/2021 700,067 0.01%American Express Credit Account Master Trust $700,000 1.77% 15/11/2022 699,770 0.01%AIG Global Funding $700,000 1.90% 6/10/2021 699,132 0.01%Florida Power & Light Co. $670,000 3.25% 1/6/2024 699,122 0.01%Equinix, Inc. €600,000 2.88% 1/2/2026 698,756 0.01%Federal National Mortgage Association $689,377 2.50% 1/9/2027 698,511 0.01%Spectra Energy Partners LP $675,000 3.38% 15/10/2026 698,464 0.01%Hewlett Packard Enterprise Co. $630,000 4.90% 15/10/2025 698,344 0.01%Georgia-Pacific LLC $575,000 8.00% 15/1/2024 697,914 0.01%Government National Mortgage Association $656,665 4.00% 20/1/2041 696,997 0.01%Benchmark 2018-B5 Mortgage Trust $625,000 4.21% 15/7/2051 696,869 0.01%Federal Home Loan Mortgage Corp. $674,245 3.00% 1/4/2043 696,559 0.01%Transcontinental Gas Pipe Line Co. LLC $600,000 5.40% 15/8/2041 696,541 0.01%Home Depot, Inc. $550,000 4.88% 15/2/2044 696,260 0.01%Federal Home Loan Mortgage Corp. $666,956 3.50% 1/5/2045 696,196 0.01%General Dynamics Corp. $680,000 2.63% 15/11/2027 695,500 0.01%Apple, Inc. €600,000 1.00% 10/11/2022 695,263 0.01%Federal National Mortgage Association $613,771 5.50% 1/5/2034 694,896 0.01%Concho Resources, Inc. $600,000 4.85% 15/8/2048 694,500 0.01%Walmart, Inc. $581,000 4.30% 22/4/2044 694,267 0.01%Illinois Tool Works, Inc. €600,000 1.00% 5/6/2031 693,887 0.01%Berkshire Hathaway Finance Corp. £500,000 2.38% 19/6/2039 693,065 0.01%HCA, Inc. $600,000 5.50% 15/6/2047 693,000 0.01%Devon Energy Corp. $600,000 5.00% 15/6/2045 691,551 0.01%Norfolk Southern Corp. $675,000 3.00% 1/4/2022 689,739 0.01%Southern Power Co. €600,000 1.00% 20/6/2022 688,834 0.01%American International Group, Inc. $600,000 4.50% 16/7/2044 687,617 0.01%UnitedHealth Group, Inc. $600,000 4.20% 15/1/2047 687,507 0.01%Intel Corp. $600,000 4.10% 11/5/2047 687,315 0.01%DuPont de Nemours, Inc. $625,000 4.49% 15/11/2025 686,991 0.01%Precision Castparts Corp. $675,000 2.50% 15/1/2023 686,815 0.01%Federal Home Loan Mortgage Corp. $655,443 3.50% 1/2/2033 685,295 0.01%Amgen, Inc. $675,000 2.65% 11/5/2022 684,694 0.01%Oracle Corp. $625,000 3.85% 15/7/2036 684,108 0.01%Colgate-Palmolive Co. $675,000 2.25% 15/11/2022 684,104 0.01%Federal Home Loan Mortgage Corp. $662,471 3.00% 1/8/2029 683,472 0.01%DuPont de Nemours, Inc. $575,000 5.32% 15/11/2038 683,186 0.01%Federal Home Loan Mortgage Corp. $654,943 3.50% 1/5/2032 683,035 0.01%L3Harris Technologies, Inc. $550,000 5.05% 27/4/2045 682,722 0.01%Old Republic International Corp. $645,000 3.88% 26/8/2026 682,696 0.01%GE Capital European Funding Unlimited Co. €600,000 0.80% 21/1/2022 682,134 0.01%Enterprise Products Operating LLC $500,000 6.88% 1/3/2033 681,396 0.01%Cigna Corp. $650,000 4.75% 15/11/2021 681,375 0.01%AutoNation, Inc. $675,000 3.35% 15/1/2021 680,864 0.01%Puget Sound Energy, Inc. $590,000 4.30% 20/5/2045 680,481 0.01%Government National Mortgage Association $643,795 4.00% 20/1/2044 680,400 0.01%Oracle Corp. $525,000 5.38% 15/7/2040 680,378 0.01%Lazard Group LLC $665,000 3.63% 1/3/2027 679,990 0.01%Mylan NV €569,000 2.25% 22/11/2024 679,890 0.01%Government National Mortgage Association $653,703 3.50% 20/9/2046 679,552 0.01%Government National Mortgage Association $620,168 4.50% 20/7/2041 679,525 0.01%Citigroup, Inc. $407,000 8.13% 15/7/2039 679,334 0.01%Chevron Corp. $650,000 2.95% 16/5/2026 678,964 0.01%Discovery Communications LLC £500,000 2.50% 20/9/2024 678,892 0.01%Texas Instruments, Inc. $650,000 2.90% 3/11/2027 678,780 0.01%Microsoft Corp. $675,000 2.00% 8/8/2023 678,745 0.01%Government National Mortgage Association $653,245 4.00% 20/10/2044 678,562 0.01%Allergan Funding SCS €600,000 0.50% 1/6/2021 678,379 0.01%Visa, Inc. $575,000 4.15% 14/12/2035 677,784 0.01%ERAC USA Finance LLC $545,000 5.63% 15/3/2042 677,238 0.01%TWDC Enterprises 18 Corp. $690,000 1.85% 30/7/2026 676,770 0.01%
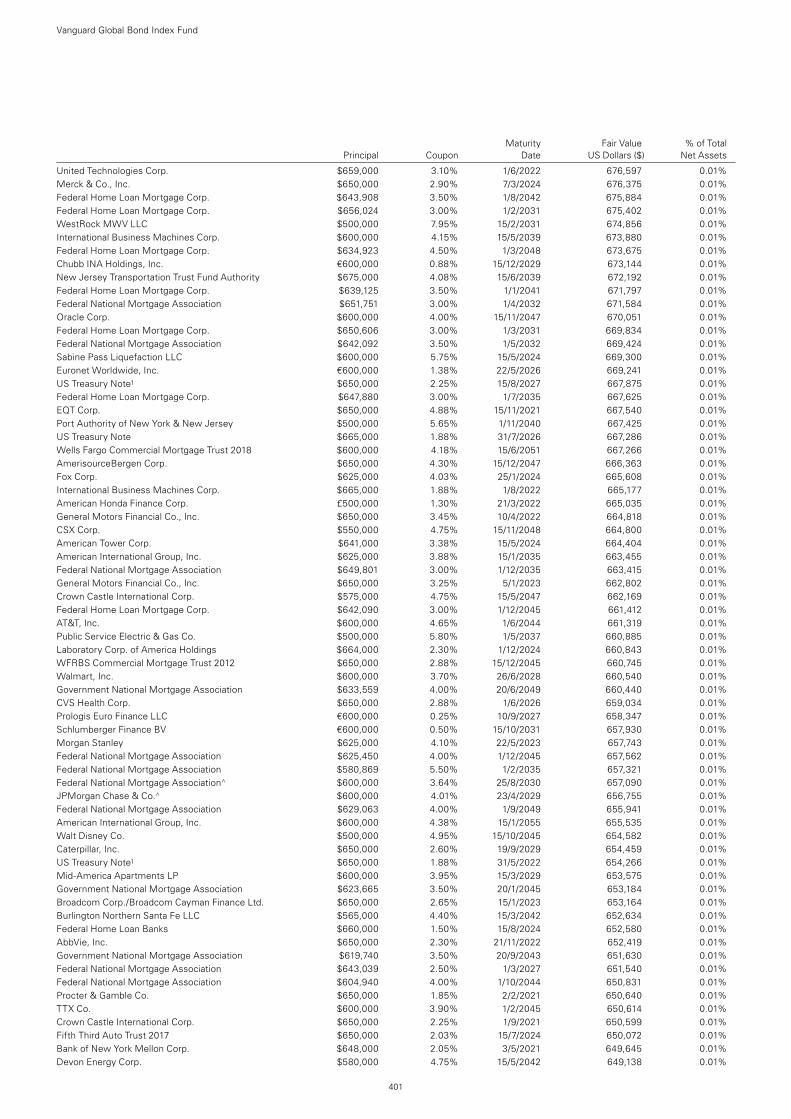
Maturity Fair Value % of Total Principal Coupon Date US Dollars ($) Net Assets
Vanguard Global Bond Index Fund
401
United Technologies Corp. $659,000 3.10% 1/6/2022 676,597 0.01%Merck & Co., Inc. $650,000 2.90% 7/3/2024 676,375 0.01%Federal Home Loan Mortgage Corp. $643,908 3.50% 1/8/2042 675,884 0.01%Federal Home Loan Mortgage Corp. $656,024 3.00% 1/2/2031 675,402 0.01%WestRock MWV LLC $500,000 7.95% 15/2/2031 674,856 0.01%International Business Machines Corp. $600,000 4.15% 15/5/2039 673,880 0.01%Federal Home Loan Mortgage Corp. $634,923 4.50% 1/3/2048 673,675 0.01%Chubb INA Holdings, Inc. €600,000 0.88% 15/12/2029 673,144 0.01%New Jersey Transportation Trust Fund Authority $675,000 4.08% 15/6/2039 672,192 0.01%Federal Home Loan Mortgage Corp. $639,125 3.50% 1/1/2041 671,797 0.01%Federal National Mortgage Association $651,751 3.00% 1/4/2032 671,584 0.01%Oracle Corp. $600,000 4.00% 15/11/2047 670,051 0.01%Federal Home Loan Mortgage Corp. $650,606 3.00% 1/3/2031 669,834 0.01%Federal National Mortgage Association $642,092 3.50% 1/5/2032 669,424 0.01%Sabine Pass Liquefaction LLC $600,000 5.75% 15/5/2024 669,300 0.01%Euronet Worldwide, Inc. €600,000 1.38% 22/5/2026 669,241 0.01%US Treasury Note1 $650,000 2.25% 15/8/2027 667,875 0.01%Federal Home Loan Mortgage Corp. $647,880 3.00% 1/7/2035 667,625 0.01%EQT Corp. $650,000 4.88% 15/11/2021 667,540 0.01%Port Authority of New York & New Jersey $500,000 5.65% 1/11/2040 667,425 0.01%US Treasury Note $665,000 1.88% 31/7/2026 667,286 0.01%Wells Fargo Commercial Mortgage Trust 2018 $600,000 4.18% 15/6/2051 667,266 0.01%AmerisourceBergen Corp. $650,000 4.30% 15/12/2047 666,363 0.01%Fox Corp. $625,000 4.03% 25/1/2024 665,608 0.01%International Business Machines Corp. $665,000 1.88% 1/8/2022 665,177 0.01%American Honda Finance Corp. £500,000 1.30% 21/3/2022 665,035 0.01%General Motors Financial Co., Inc. $650,000 3.45% 10/4/2022 664,818 0.01%CSX Corp. $550,000 4.75% 15/11/2048 664,800 0.01%American Tower Corp. $641,000 3.38% 15/5/2024 664,404 0.01%American International Group, Inc. $625,000 3.88% 15/1/2035 663,455 0.01%Federal National Mortgage Association $649,801 3.00% 1/12/2035 663,415 0.01%General Motors Financial Co., Inc. $650,000 3.25% 5/1/2023 662,802 0.01%Crown Castle International Corp. $575,000 4.75% 15/5/2047 662,169 0.01%Federal Home Loan Mortgage Corp. $642,090 3.00% 1/12/2045 661,412 0.01%AT&T, Inc. $600,000 4.65% 1/6/2044 661,319 0.01%Public Service Electric & Gas Co. $500,000 5.80% 1/5/2037 660,885 0.01%Laboratory Corp. of America Holdings $664,000 2.30% 1/12/2024 660,843 0.01%WFRBS Commercial Mortgage Trust 2012 $650,000 2.88% 15/12/2045 660,745 0.01%Walmart, Inc. $600,000 3.70% 26/6/2028 660,540 0.01%Government National Mortgage Association $633,559 4.00% 20/6/2049 660,440 0.01%CVS Health Corp. $650,000 2.88% 1/6/2026 659,034 0.01%Prologis Euro Finance LLC €600,000 0.25% 10/9/2027 658,347 0.01%Schlumberger Finance BV €600,000 0.50% 15/10/2031 657,930 0.01%Morgan Stanley $625,000 4.10% 22/5/2023 657,743 0.01%Federal National Mortgage Association $625,450 4.00% 1/12/2045 657,562 0.01%Federal National Mortgage Association $580,869 5.50% 1/2/2035 657,321 0.01%Federal National Mortgage Association^ $600,000 3.64% 25/8/2030 657,090 0.01%JPMorgan Chase & Co.^ $600,000 4.01% 23/4/2029 656,755 0.01%Federal National Mortgage Association $629,063 4.00% 1/9/2049 655,941 0.01%American International Group, Inc. $600,000 4.38% 15/1/2055 655,535 0.01%Walt Disney Co. $500,000 4.95% 15/10/2045 654,582 0.01%Caterpillar, Inc. $650,000 2.60% 19/9/2029 654,459 0.01%US Treasury Note1 $650,000 1.88% 31/5/2022 654,266 0.01%Mid-America Apartments LP $600,000 3.95% 15/3/2029 653,575 0.01%Government National Mortgage Association $623,665 3.50% 20/1/2045 653,184 0.01%Broadcom Corp./Broadcom Cayman Finance Ltd. $650,000 2.65% 15/1/2023 653,164 0.01%Burlington Northern Santa Fe LLC $565,000 4.40% 15/3/2042 652,634 0.01%Federal Home Loan Banks $660,000 1.50% 15/8/2024 652,580 0.01%AbbVie, Inc. $650,000 2.30% 21/11/2022 652,419 0.01%Government National Mortgage Association $619,740 3.50% 20/9/2043 651,630 0.01%Federal National Mortgage Association $643,039 2.50% 1/3/2027 651,540 0.01%Federal National Mortgage Association $604,940 4.00% 1/10/2044 650,831 0.01%Procter & Gamble Co. $650,000 1.85% 2/2/2021 650,640 0.01%TTX Co. $600,000 3.90% 1/2/2045 650,614 0.01%Crown Castle International Corp. $650,000 2.25% 1/9/2021 650,599 0.01%Fifth Third Auto Trust 2017 $650,000 2.03% 15/7/2024 650,072 0.01%Bank of New York Mellon Corp. $648,000 2.05% 3/5/2021 649,645 0.01%Devon Energy Corp. $580,000 4.75% 15/5/2042 649,138 0.01%
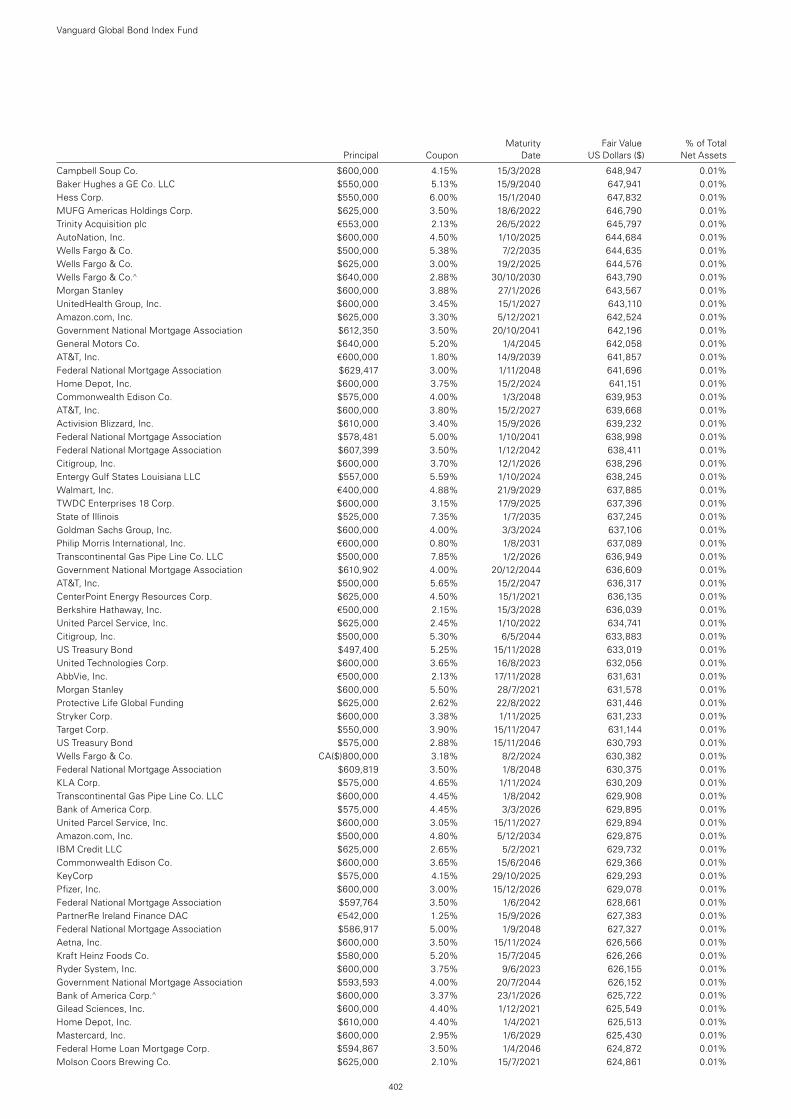
Maturity Fair Value % of Total Principal Coupon Date US Dollars ($) Net Assets
Vanguard Global Bond Index Fund
402
Campbell Soup Co. $600,000 4.15% 15/3/2028 648,947 0.01%Baker Hughes a GE Co. LLC $550,000 5.13% 15/9/2040 647,941 0.01%Hess Corp. $550,000 6.00% 15/1/2040 647,832 0.01%MUFG Americas Holdings Corp. $625,000 3.50% 18/6/2022 646,790 0.01%Trinity Acquisition plc €553,000 2.13% 26/5/2022 645,797 0.01%AutoNation, Inc. $600,000 4.50% 1/10/2025 644,684 0.01%Wells Fargo & Co. $500,000 5.38% 7/2/2035 644,635 0.01%Wells Fargo & Co. $625,000 3.00% 19/2/2025 644,576 0.01%Wells Fargo & Co.^ $640,000 2.88% 30/10/2030 643,790 0.01%Morgan Stanley $600,000 3.88% 27/1/2026 643,567 0.01%UnitedHealth Group, Inc. $600,000 3.45% 15/1/2027 643,110 0.01%Amazon.com, Inc. $625,000 3.30% 5/12/2021 642,524 0.01%Government National Mortgage Association $612,350 3.50% 20/10/2041 642,196 0.01%General Motors Co. $640,000 5.20% 1/4/2045 642,058 0.01%AT&T, Inc. €600,000 1.80% 14/9/2039 641,857 0.01%Federal National Mortgage Association $629,417 3.00% 1/11/2048 641,696 0.01%Home Depot, Inc. $600,000 3.75% 15/2/2024 641,151 0.01%Commonwealth Edison Co. $575,000 4.00% 1/3/2048 639,953 0.01%AT&T, Inc. $600,000 3.80% 15/2/2027 639,668 0.01%Activision Blizzard, Inc. $610,000 3.40% 15/9/2026 639,232 0.01%Federal National Mortgage Association $578,481 5.00% 1/10/2041 638,998 0.01%Federal National Mortgage Association $607,399 3.50% 1/12/2042 638,411 0.01%Citigroup, Inc. $600,000 3.70% 12/1/2026 638,296 0.01%Entergy Gulf States Louisiana LLC $557,000 5.59% 1/10/2024 638,245 0.01%Walmart, Inc. €400,000 4.88% 21/9/2029 637,885 0.01%TWDC Enterprises 18 Corp. $600,000 3.15% 17/9/2025 637,396 0.01%State of Illinois $525,000 7.35% 1/7/2035 637,245 0.01%Goldman Sachs Group, Inc. $600,000 4.00% 3/3/2024 637,106 0.01%Philip Morris International, Inc. €600,000 0.80% 1/8/2031 637,089 0.01%Transcontinental Gas Pipe Line Co. LLC $500,000 7.85% 1/2/2026 636,949 0.01%Government National Mortgage Association $610,902 4.00% 20/12/2044 636,609 0.01%AT&T, Inc. $500,000 5.65% 15/2/2047 636,317 0.01%CenterPoint Energy Resources Corp. $625,000 4.50% 15/1/2021 636,135 0.01%Berkshire Hathaway, Inc. €500,000 2.15% 15/3/2028 636,039 0.01%United Parcel Service, Inc. $625,000 2.45% 1/10/2022 634,741 0.01%Citigroup, Inc. $500,000 5.30% 6/5/2044 633,883 0.01%US Treasury Bond $497,400 5.25% 15/11/2028 633,019 0.01%United Technologies Corp. $600,000 3.65% 16/8/2023 632,056 0.01%AbbVie, Inc. €500,000 2.13% 17/11/2028 631,631 0.01%Morgan Stanley $600,000 5.50% 28/7/2021 631,578 0.01%Protective Life Global Funding $625,000 2.62% 22/8/2022 631,446 0.01%Stryker Corp. $600,000 3.38% 1/11/2025 631,233 0.01%Target Corp. $550,000 3.90% 15/11/2047 631,144 0.01%US Treasury Bond $575,000 2.88% 15/11/2046 630,793 0.01%Wells Fargo & Co. CA($)800,000 3.18% 8/2/2024 630,382 0.01%Federal National Mortgage Association $609,819 3.50% 1/8/2048 630,375 0.01%KLA Corp. $575,000 4.65% 1/11/2024 630,209 0.01%Transcontinental Gas Pipe Line Co. LLC $600,000 4.45% 1/8/2042 629,908 0.01%Bank of America Corp. $575,000 4.45% 3/3/2026 629,895 0.01%United Parcel Service, Inc. $600,000 3.05% 15/11/2027 629,894 0.01%Amazon.com, Inc. $500,000 4.80% 5/12/2034 629,875 0.01%IBM Credit LLC $625,000 2.65% 5/2/2021 629,732 0.01%Commonwealth Edison Co. $600,000 3.65% 15/6/2046 629,366 0.01%KeyCorp $575,000 4.15% 29/10/2025 629,293 0.01%Pfizer, Inc. $600,000 3.00% 15/12/2026 629,078 0.01%Federal National Mortgage Association $597,764 3.50% 1/6/2042 628,661 0.01%PartnerRe Ireland Finance DAC €542,000 1.25% 15/9/2026 627,383 0.01%Federal National Mortgage Association $586,917 5.00% 1/9/2048 627,327 0.01%Aetna, Inc. $600,000 3.50% 15/11/2024 626,566 0.01%Kraft Heinz Foods Co. $580,000 5.20% 15/7/2045 626,266 0.01%Ryder System, Inc. $600,000 3.75% 9/6/2023 626,155 0.01%Government National Mortgage Association $593,593 4.00% 20/7/2044 626,152 0.01%Bank of America Corp.^ $600,000 3.37% 23/1/2026 625,722 0.01%Gilead Sciences, Inc. $600,000 4.40% 1/12/2021 625,549 0.01%Home Depot, Inc. $610,000 4.40% 1/4/2021 625,513 0.01%Mastercard, Inc. $600,000 2.95% 1/6/2029 625,430 0.01%Federal Home Loan Mortgage Corp. $594,867 3.50% 1/4/2046 624,872 0.01%Molson Coors Brewing Co. $625,000 2.10% 15/7/2021 624,861 0.01%
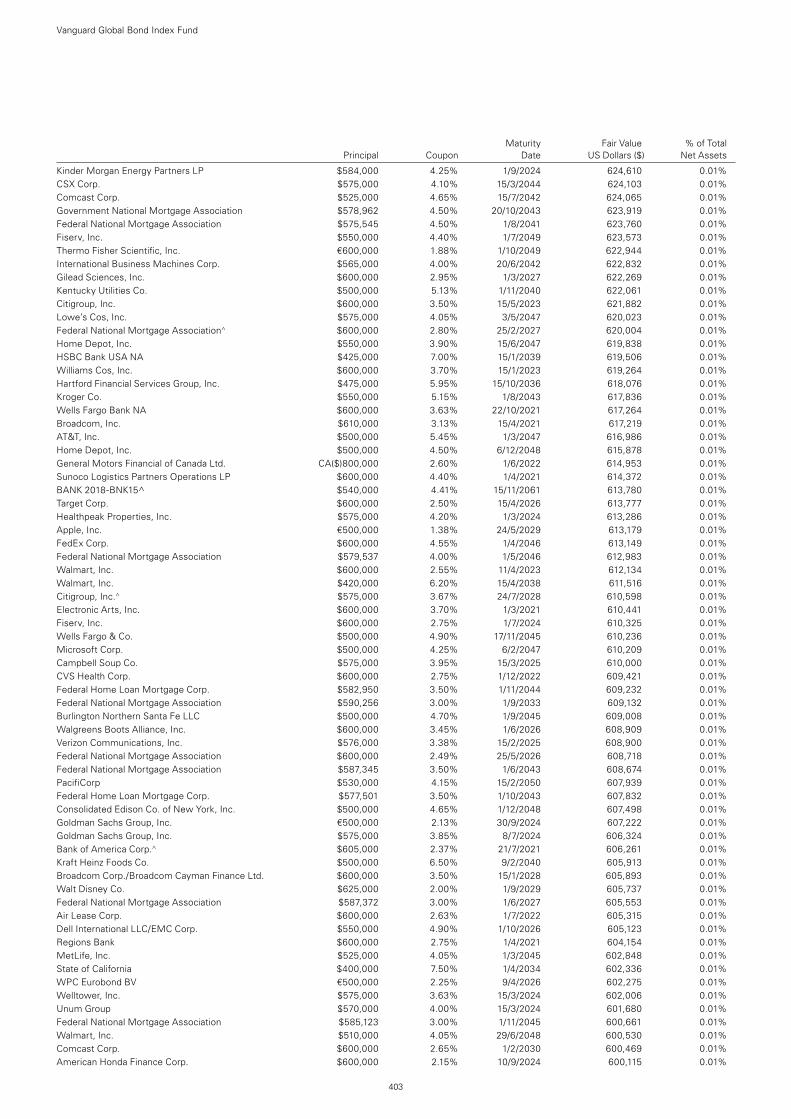
Maturity Fair Value % of Total Principal Coupon Date US Dollars ($) Net Assets
Vanguard Global Bond Index Fund
403
Kinder Morgan Energy Partners LP $584,000 4.25% 1/9/2024 624,610 0.01%CSX Corp. $575,000 4.10% 15/3/2044 624,103 0.01%Comcast Corp. $525,000 4.65% 15/7/2042 624,065 0.01%Government National Mortgage Association $578,962 4.50% 20/10/2043 623,919 0.01%Federal National Mortgage Association $575,545 4.50% 1/8/2041 623,760 0.01%Fiserv, Inc. $550,000 4.40% 1/7/2049 623,573 0.01%Thermo Fisher Scientific, Inc. €600,000 1.88% 1/10/2049 622,944 0.01%International Business Machines Corp. $565,000 4.00% 20/6/2042 622,832 0.01%Gilead Sciences, Inc. $600,000 2.95% 1/3/2027 622,269 0.01%Kentucky Utilities Co. $500,000 5.13% 1/11/2040 622,061 0.01%Citigroup, Inc. $600,000 3.50% 15/5/2023 621,882 0.01%Lowe’s Cos, Inc. $575,000 4.05% 3/5/2047 620,023 0.01%Federal National Mortgage Association^ $600,000 2.80% 25/2/2027 620,004 0.01%Home Depot, Inc. $550,000 3.90% 15/6/2047 619,838 0.01%HSBC Bank USA NA $425,000 7.00% 15/1/2039 619,506 0.01%Williams Cos, Inc. $600,000 3.70% 15/1/2023 619,264 0.01%Hartford Financial Services Group, Inc. $475,000 5.95% 15/10/2036 618,076 0.01%Kroger Co. $550,000 5.15% 1/8/2043 617,836 0.01%Wells Fargo Bank NA $600,000 3.63% 22/10/2021 617,264 0.01%Broadcom, Inc. $610,000 3.13% 15/4/2021 617,219 0.01%AT&T, Inc. $500,000 5.45% 1/3/2047 616,986 0.01%Home Depot, Inc. $500,000 4.50% 6/12/2048 615,878 0.01%General Motors Financial of Canada Ltd. CA($)800,000 2.60% 1/6/2022 614,953 0.01%Sunoco Logistics Partners Operations LP $600,000 4.40% 1/4/2021 614,372 0.01%BANK 2018-BNK15^ $540,000 4.41% 15/11/2061 613,780 0.01%Target Corp. $600,000 2.50% 15/4/2026 613,777 0.01%Healthpeak Properties, Inc. $575,000 4.20% 1/3/2024 613,286 0.01%Apple, Inc. €500,000 1.38% 24/5/2029 613,179 0.01%FedEx Corp. $600,000 4.55% 1/4/2046 613,149 0.01%Federal National Mortgage Association $579,537 4.00% 1/5/2046 612,983 0.01%Walmart, Inc. $600,000 2.55% 11/4/2023 612,134 0.01%Walmart, Inc. $420,000 6.20% 15/4/2038 611,516 0.01%Citigroup, Inc.^ $575,000 3.67% 24/7/2028 610,598 0.01%Electronic Arts, Inc. $600,000 3.70% 1/3/2021 610,441 0.01%Fiserv, Inc. $600,000 2.75% 1/7/2024 610,325 0.01%Wells Fargo & Co. $500,000 4.90% 17/11/2045 610,236 0.01%Microsoft Corp. $500,000 4.25% 6/2/2047 610,209 0.01%Campbell Soup Co. $575,000 3.95% 15/3/2025 610,000 0.01%CVS Health Corp. $600,000 2.75% 1/12/2022 609,421 0.01%Federal Home Loan Mortgage Corp. $582,950 3.50% 1/11/2044 609,232 0.01%Federal National Mortgage Association $590,256 3.00% 1/9/2033 609,132 0.01%Burlington Northern Santa Fe LLC $500,000 4.70% 1/9/2045 609,008 0.01%Walgreens Boots Alliance, Inc. $600,000 3.45% 1/6/2026 608,909 0.01%Verizon Communications, Inc. $576,000 3.38% 15/2/2025 608,900 0.01%Federal National Mortgage Association $600,000 2.49% 25/5/2026 608,718 0.01%Federal National Mortgage Association $587,345 3.50% 1/6/2043 608,674 0.01%PacifiCorp $530,000 4.15% 15/2/2050 607,939 0.01%Federal Home Loan Mortgage Corp. $577,501 3.50% 1/10/2043 607,832 0.01%Consolidated Edison Co. of New York, Inc. $500,000 4.65% 1/12/2048 607,498 0.01%Goldman Sachs Group, Inc. €500,000 2.13% 30/9/2024 607,222 0.01%Goldman Sachs Group, Inc. $575,000 3.85% 8/7/2024 606,324 0.01%Bank of America Corp.^ $605,000 2.37% 21/7/2021 606,261 0.01%Kraft Heinz Foods Co. $500,000 6.50% 9/2/2040 605,913 0.01%Broadcom Corp./Broadcom Cayman Finance Ltd. $600,000 3.50% 15/1/2028 605,893 0.01%Walt Disney Co. $625,000 2.00% 1/9/2029 605,737 0.01%Federal National Mortgage Association $587,372 3.00% 1/6/2027 605,553 0.01%Air Lease Corp. $600,000 2.63% 1/7/2022 605,315 0.01%Dell International LLC/EMC Corp. $550,000 4.90% 1/10/2026 605,123 0.01%Regions Bank $600,000 2.75% 1/4/2021 604,154 0.01%MetLife, Inc. $525,000 4.05% 1/3/2045 602,848 0.01%State of California $400,000 7.50% 1/4/2034 602,336 0.01%WPC Eurobond BV €500,000 2.25% 9/4/2026 602,275 0.01%Welltower, Inc. $575,000 3.63% 15/3/2024 602,006 0.01%Unum Group $570,000 4.00% 15/3/2024 601,680 0.01%Federal National Mortgage Association $585,123 3.00% 1/11/2045 600,661 0.01%Walmart, Inc. $510,000 4.05% 29/6/2048 600,530 0.01%Comcast Corp. $600,000 2.65% 1/2/2030 600,469 0.01%American Honda Finance Corp. $600,000 2.15% 10/9/2024 600,115 0.01%
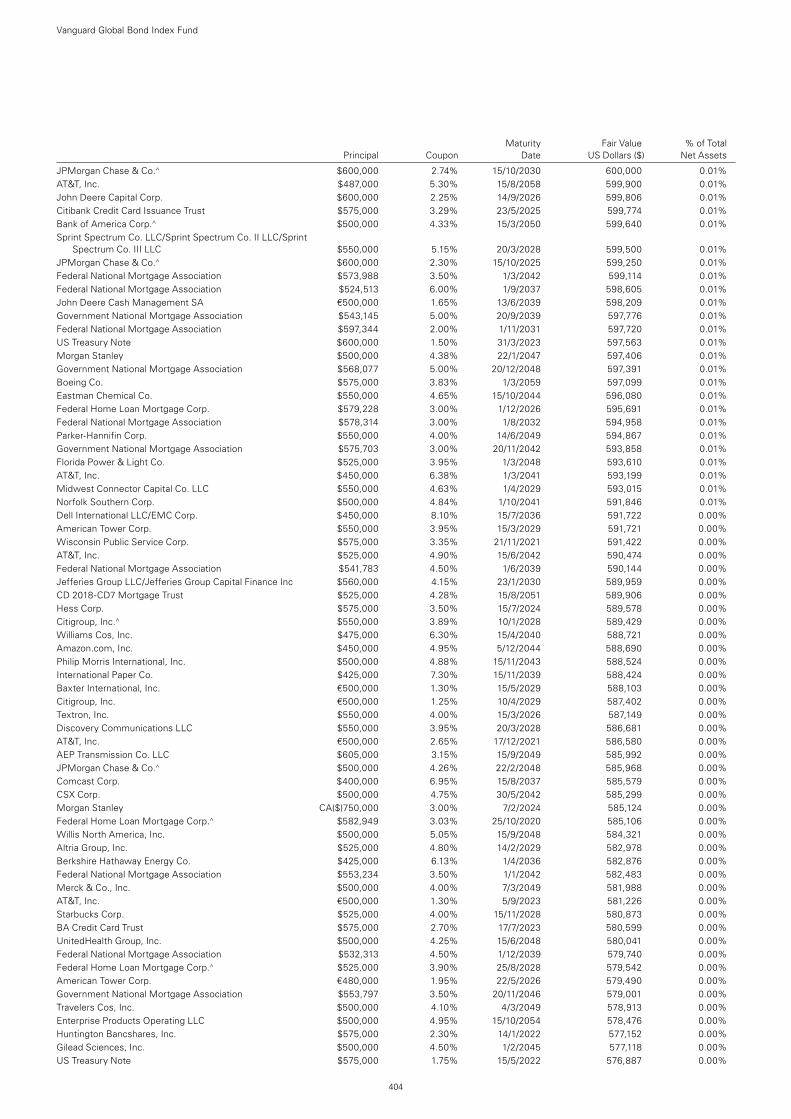
Maturity Fair Value % of Total Principal Coupon Date US Dollars ($) Net Assets
Vanguard Global Bond Index Fund
404
JPMorgan Chase & Co.^ $600,000 2.74% 15/10/2030 600,000 0.01%AT&T, Inc. $487,000 5.30% 15/8/2058 599,900 0.01%John Deere Capital Corp. $600,000 2.25% 14/9/2026 599,806 0.01%Citibank Credit Card Issuance Trust $575,000 3.29% 23/5/2025 599,774 0.01%Bank of America Corp.^ $500,000 4.33% 15/3/2050 599,640 0.01%Sprint Spectrum Co. LLC/Sprint Spectrum Co. II LLC/Sprint
Spectrum Co. III LLC $550,000 5.15% 20/3/2028 599,500 0.01%JPMorgan Chase & Co.^ $600,000 2.30% 15/10/2025 599,250 0.01%Federal National Mortgage Association $573,988 3.50% 1/3/2042 599,114 0.01%Federal National Mortgage Association $524,513 6.00% 1/9/2037 598,605 0.01%John Deere Cash Management SA €500,000 1.65% 13/6/2039 598,209 0.01%Government National Mortgage Association $543,145 5.00% 20/9/2039 597,776 0.01%Federal National Mortgage Association $597,344 2.00% 1/11/2031 597,720 0.01%US Treasury Note $600,000 1.50% 31/3/2023 597,563 0.01%Morgan Stanley $500,000 4.38% 22/1/2047 597,406 0.01%Government National Mortgage Association $568,077 5.00% 20/12/2048 597,391 0.01%Boeing Co. $575,000 3.83% 1/3/2059 597,099 0.01%Eastman Chemical Co. $550,000 4.65% 15/10/2044 596,080 0.01%Federal Home Loan Mortgage Corp. $579,228 3.00% 1/12/2026 595,691 0.01%Federal National Mortgage Association $578,314 3.00% 1/8/2032 594,958 0.01%Parker-Hannifin Corp. $550,000 4.00% 14/6/2049 594,867 0.01%Government National Mortgage Association $575,703 3.00% 20/11/2042 593,858 0.01%Florida Power & Light Co. $525,000 3.95% 1/3/2048 593,610 0.01%AT&T, Inc. $450,000 6.38% 1/3/2041 593,199 0.01%Midwest Connector Capital Co. LLC $550,000 4.63% 1/4/2029 593,015 0.01%Norfolk Southern Corp. $500,000 4.84% 1/10/2041 591,846 0.01%Dell International LLC/EMC Corp. $450,000 8.10% 15/7/2036 591,722 0.00%American Tower Corp. $550,000 3.95% 15/3/2029 591,721 0.00%Wisconsin Public Service Corp. $575,000 3.35% 21/11/2021 591,422 0.00%AT&T, Inc. $525,000 4.90% 15/6/2042 590,474 0.00%Federal National Mortgage Association $541,783 4.50% 1/6/2039 590,144 0.00%Jefferies Group LLC/Jefferies Group Capital Finance Inc $560,000 4.15% 23/1/2030 589,959 0.00%CD 2018-CD7 Mortgage Trust $525,000 4.28% 15/8/2051 589,906 0.00%Hess Corp. $575,000 3.50% 15/7/2024 589,578 0.00%Citigroup, Inc.^ $550,000 3.89% 10/1/2028 589,429 0.00%Williams Cos, Inc. $475,000 6.30% 15/4/2040 588,721 0.00%Amazon.com, Inc. $450,000 4.95% 5/12/2044 588,690 0.00%Philip Morris International, Inc. $500,000 4.88% 15/11/2043 588,524 0.00%International Paper Co. $425,000 7.30% 15/11/2039 588,424 0.00%Baxter International, Inc. €500,000 1.30% 15/5/2029 588,103 0.00%Citigroup, Inc. €500,000 1.25% 10/4/2029 587,402 0.00%Textron, Inc. $550,000 4.00% 15/3/2026 587,149 0.00%Discovery Communications LLC $550,000 3.95% 20/3/2028 586,681 0.00%AT&T, Inc. €500,000 2.65% 17/12/2021 586,580 0.00%AEP Transmission Co. LLC $605,000 3.15% 15/9/2049 585,992 0.00%JPMorgan Chase & Co.^ $500,000 4.26% 22/2/2048 585,968 0.00%Comcast Corp. $400,000 6.95% 15/8/2037 585,579 0.00%CSX Corp. $500,000 4.75% 30/5/2042 585,299 0.00%Morgan Stanley CA($)750,000 3.00% 7/2/2024 585,124 0.00%Federal Home Loan Mortgage Corp.^ $582,949 3.03% 25/10/2020 585,106 0.00%Willis North America, Inc. $500,000 5.05% 15/9/2048 584,321 0.00%Altria Group, Inc. $525,000 4.80% 14/2/2029 582,978 0.00%Berkshire Hathaway Energy Co. $425,000 6.13% 1/4/2036 582,876 0.00%Federal National Mortgage Association $553,234 3.50% 1/1/2042 582,483 0.00%Merck & Co., Inc. $500,000 4.00% 7/3/2049 581,988 0.00%AT&T, Inc. €500,000 1.30% 5/9/2023 581,226 0.00%Starbucks Corp. $525,000 4.00% 15/11/2028 580,873 0.00%BA Credit Card Trust $575,000 2.70% 17/7/2023 580,599 0.00%UnitedHealth Group, Inc. $500,000 4.25% 15/6/2048 580,041 0.00%Federal National Mortgage Association $532,313 4.50% 1/12/2039 579,740 0.00%Federal Home Loan Mortgage Corp.^ $525,000 3.90% 25/8/2028 579,542 0.00%American Tower Corp. €480,000 1.95% 22/5/2026 579,490 0.00%Government National Mortgage Association $553,797 3.50% 20/11/2046 579,001 0.00%Travelers Cos, Inc. $500,000 4.10% 4/3/2049 578,913 0.00%Enterprise Products Operating LLC $500,000 4.95% 15/10/2054 578,476 0.00%Huntington Bancshares, Inc. $575,000 2.30% 14/1/2022 577,152 0.00%Gilead Sciences, Inc. $500,000 4.50% 1/2/2045 577,118 0.00%US Treasury Note $575,000 1.75% 15/5/2022 576,887 0.00%
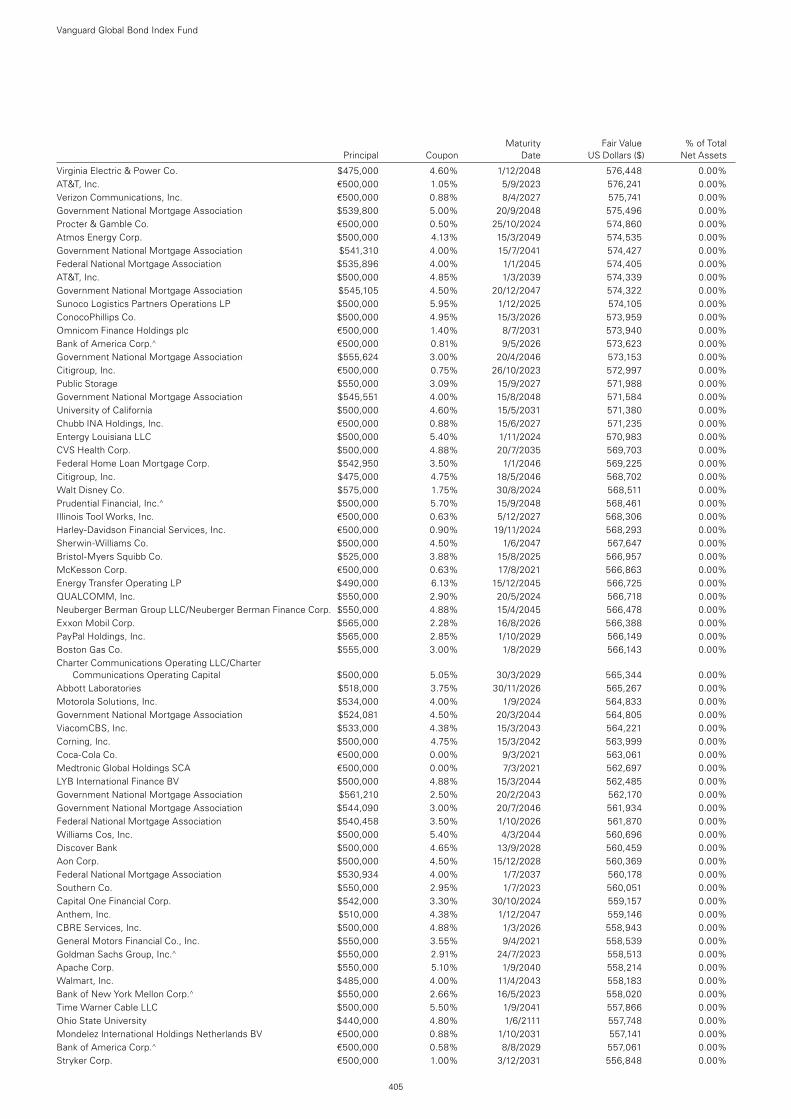
Maturity Fair Value % of Total Principal Coupon Date US Dollars ($) Net Assets
Vanguard Global Bond Index Fund
405
Virginia Electric & Power Co. $475,000 4.60% 1/12/2048 576,448 0.00%AT&T, Inc. €500,000 1.05% 5/9/2023 576,241 0.00%Verizon Communications, Inc. €500,000 0.88% 8/4/2027 575,741 0.00%Government National Mortgage Association $539,800 5.00% 20/9/2048 575,496 0.00%Procter & Gamble Co. €500,000 0.50% 25/10/2024 574,860 0.00%Atmos Energy Corp. $500,000 4.13% 15/3/2049 574,535 0.00%Government National Mortgage Association $541,310 4.00% 15/7/2041 574,427 0.00%Federal National Mortgage Association $535,896 4.00% 1/1/2045 574,405 0.00%AT&T, Inc. $500,000 4.85% 1/3/2039 574,339 0.00%Government National Mortgage Association $545,105 4.50% 20/12/2047 574,322 0.00%Sunoco Logistics Partners Operations LP $500,000 5.95% 1/12/2025 574,105 0.00%ConocoPhillips Co. $500,000 4.95% 15/3/2026 573,959 0.00%Omnicom Finance Holdings plc €500,000 1.40% 8/7/2031 573,940 0.00%Bank of America Corp.^ €500,000 0.81% 9/5/2026 573,623 0.00%Government National Mortgage Association $555,624 3.00% 20/4/2046 573,153 0.00%Citigroup, Inc. €500,000 0.75% 26/10/2023 572,997 0.00%Public Storage $550,000 3.09% 15/9/2027 571,988 0.00%Government National Mortgage Association $545,551 4.00% 15/8/2048 571,584 0.00%University of California $500,000 4.60% 15/5/2031 571,380 0.00%Chubb INA Holdings, Inc. €500,000 0.88% 15/6/2027 571,235 0.00%Entergy Louisiana LLC $500,000 5.40% 1/11/2024 570,983 0.00%CVS Health Corp. $500,000 4.88% 20/7/2035 569,703 0.00%Federal Home Loan Mortgage Corp. $542,950 3.50% 1/1/2046 569,225 0.00%Citigroup, Inc. $475,000 4.75% 18/5/2046 568,702 0.00%Walt Disney Co. $575,000 1.75% 30/8/2024 568,511 0.00%Prudential Financial, Inc.^ $500,000 5.70% 15/9/2048 568,461 0.00%Illinois Tool Works, Inc. €500,000 0.63% 5/12/2027 568,306 0.00%Harley-Davidson Financial Services, Inc. €500,000 0.90% 19/11/2024 568,293 0.00%Sherwin-Williams Co. $500,000 4.50% 1/6/2047 567,647 0.00%Bristol-Myers Squibb Co. $525,000 3.88% 15/8/2025 566,957 0.00%McKesson Corp. €500,000 0.63% 17/8/2021 566,863 0.00%Energy Transfer Operating LP $490,000 6.13% 15/12/2045 566,725 0.00%QUALCOMM, Inc. $550,000 2.90% 20/5/2024 566,718 0.00%Neuberger Berman Group LLC/Neuberger Berman Finance Corp. $550,000 4.88% 15/4/2045 566,478 0.00%Exxon Mobil Corp. $565,000 2.28% 16/8/2026 566,388 0.00%PayPal Holdings, Inc. $565,000 2.85% 1/10/2029 566,149 0.00%Boston Gas Co. $555,000 3.00% 1/8/2029 566,143 0.00%Charter Communications Operating LLC/Charter
Communications Operating Capital $500,000 5.05% 30/3/2029 565,344 0.00%Abbott Laboratories $518,000 3.75% 30/11/2026 565,267 0.00%Motorola Solutions, Inc. $534,000 4.00% 1/9/2024 564,833 0.00%Government National Mortgage Association $524,081 4.50% 20/3/2044 564,805 0.00%ViacomCBS, Inc. $533,000 4.38% 15/3/2043 564,221 0.00%Corning, Inc. $500,000 4.75% 15/3/2042 563,999 0.00%Coca-Cola Co. €500,000 0.00% 9/3/2021 563,061 0.00%Medtronic Global Holdings SCA €500,000 0.00% 7/3/2021 562,697 0.00%LYB International Finance BV $500,000 4.88% 15/3/2044 562,485 0.00%Government National Mortgage Association $561,210 2.50% 20/2/2043 562,170 0.00%Government National Mortgage Association $544,090 3.00% 20/7/2046 561,934 0.00%Federal National Mortgage Association $540,458 3.50% 1/10/2026 561,870 0.00%Williams Cos, Inc. $500,000 5.40% 4/3/2044 560,696 0.00%Discover Bank $500,000 4.65% 13/9/2028 560,459 0.00%Aon Corp. $500,000 4.50% 15/12/2028 560,369 0.00%Federal National Mortgage Association $530,934 4.00% 1/7/2037 560,178 0.00%Southern Co. $550,000 2.95% 1/7/2023 560,051 0.00%Capital One Financial Corp. $542,000 3.30% 30/10/2024 559,157 0.00%Anthem, Inc. $510,000 4.38% 1/12/2047 559,146 0.00%CBRE Services, Inc. $500,000 4.88% 1/3/2026 558,943 0.00%General Motors Financial Co., Inc. $550,000 3.55% 9/4/2021 558,539 0.00%Goldman Sachs Group, Inc.^ $550,000 2.91% 24/7/2023 558,513 0.00%Apache Corp. $550,000 5.10% 1/9/2040 558,214 0.00%Walmart, Inc. $485,000 4.00% 11/4/2043 558,183 0.00%Bank of New York Mellon Corp.^ $550,000 2.66% 16/5/2023 558,020 0.00%Time Warner Cable LLC $500,000 5.50% 1/9/2041 557,866 0.00%Ohio State University $440,000 4.80% 1/6/2111 557,748 0.00%Mondelez International Holdings Netherlands BV €500,000 0.88% 1/10/2031 557,141 0.00%Bank of America Corp.^ €500,000 0.58% 8/8/2029 557,061 0.00%Stryker Corp. €500,000 1.00% 3/12/2031 556,848 0.00%
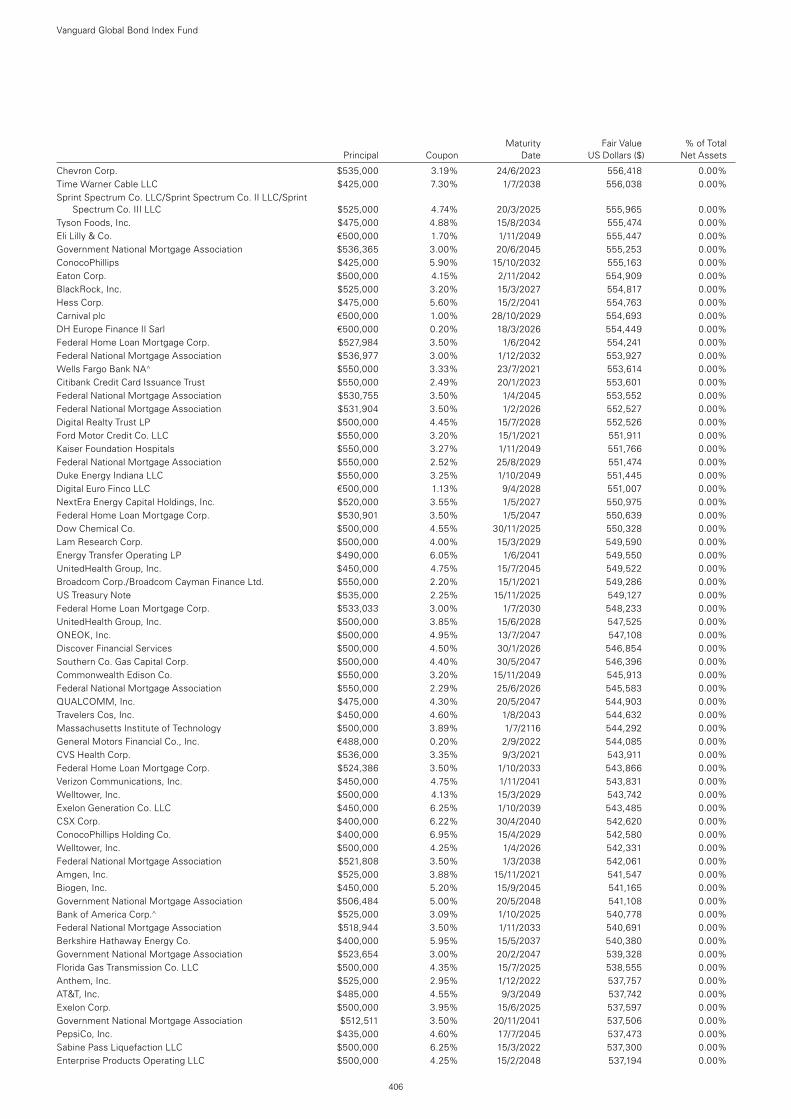
Maturity Fair Value % of Total Principal Coupon Date US Dollars ($) Net Assets
Chevron Corp. $535,000 3.19% 24/6/2023 556,418 0.00%Time Warner Cable LLC $425,000 7.30% 1/7/2038 556,038 0.00%Sprint Spectrum Co. LLC/Sprint Spectrum Co. II LLC/Sprint
Spectrum Co. III LLC $525,000 4.74% 20/3/2025 555,965 0.00%Tyson Foods, Inc. $475,000 4.88% 15/8/2034 555,474 0.00%Eli Lilly & Co. €500,000 1.70% 1/11/2049 555,447 0.00%Government National Mortgage Association $536,365 3.00% 20/6/2045 555,253 0.00%ConocoPhillips $425,000 5.90% 15/10/2032 555,163 0.00%Eaton Corp. $500,000 4.15% 2/11/2042 554,909 0.00%BlackRock, Inc. $525,000 3.20% 15/3/2027 554,817 0.00%Hess Corp. $475,000 5.60% 15/2/2041 554,763 0.00%Carnival plc €500,000 1.00% 28/10/2029 554,693 0.00%DH Europe Finance II Sarl €500,000 0.20% 18/3/2026 554,449 0.00%Federal Home Loan Mortgage Corp. $527,984 3.50% 1/6/2042 554,241 0.00%Federal National Mortgage Association $536,977 3.00% 1/12/2032 553,927 0.00%Wells Fargo Bank NA^ $550,000 3.33% 23/7/2021 553,614 0.00%Citibank Credit Card Issuance Trust $550,000 2.49% 20/1/2023 553,601 0.00%Federal National Mortgage Association $530,755 3.50% 1/4/2045 553,552 0.00%Federal National Mortgage Association $531,904 3.50% 1/2/2026 552,527 0.00%Digital Realty Trust LP $500,000 4.45% 15/7/2028 552,526 0.00%Ford Motor Credit Co. LLC $550,000 3.20% 15/1/2021 551,911 0.00%Kaiser Foundation Hospitals $550,000 3.27% 1/11/2049 551,766 0.00%Federal National Mortgage Association $550,000 2.52% 25/8/2029 551,474 0.00%Duke Energy Indiana LLC $550,000 3.25% 1/10/2049 551,445 0.00%Digital Euro Finco LLC €500,000 1.13% 9/4/2028 551,007 0.00%NextEra Energy Capital Holdings, Inc. $520,000 3.55% 1/5/2027 550,975 0.00%Federal Home Loan Mortgage Corp. $530,901 3.50% 1/5/2047 550,639 0.00%Dow Chemical Co. $500,000 4.55% 30/11/2025 550,328 0.00%Lam Research Corp. $500,000 4.00% 15/3/2029 549,590 0.00%Energy Transfer Operating LP $490,000 6.05% 1/6/2041 549,550 0.00%UnitedHealth Group, Inc. $450,000 4.75% 15/7/2045 549,522 0.00%Broadcom Corp./Broadcom Cayman Finance Ltd. $550,000 2.20% 15/1/2021 549,286 0.00%US Treasury Note $535,000 2.25% 15/11/2025 549,127 0.00%Federal Home Loan Mortgage Corp. $533,033 3.00% 1/7/2030 548,233 0.00%UnitedHealth Group, Inc. $500,000 3.85% 15/6/2028 547,525 0.00%ONEOK, Inc. $500,000 4.95% 13/7/2047 547,108 0.00%Discover Financial Services $500,000 4.50% 30/1/2026 546,854 0.00%Southern Co. Gas Capital Corp. $500,000 4.40% 30/5/2047 546,396 0.00%Commonwealth Edison Co. $550,000 3.20% 15/11/2049 545,913 0.00%Federal National Mortgage Association $550,000 2.29% 25/6/2026 545,583 0.00%QUALCOMM, Inc. $475,000 4.30% 20/5/2047 544,903 0.00%Travelers Cos, Inc. $450,000 4.60% 1/8/2043 544,632 0.00%Massachusetts Institute of Technology $500,000 3.89% 1/7/2116 544,292 0.00%General Motors Financial Co., Inc. €488,000 0.20% 2/9/2022 544,085 0.00%CVS Health Corp. $536,000 3.35% 9/3/2021 543,911 0.00%Federal Home Loan Mortgage Corp. $524,386 3.50% 1/10/2033 543,866 0.00%Verizon Communications, Inc. $450,000 4.75% 1/11/2041 543,831 0.00%Welltower, Inc. $500,000 4.13% 15/3/2029 543,742 0.00%Exelon Generation Co. LLC $450,000 6.25% 1/10/2039 543,485 0.00%CSX Corp. $400,000 6.22% 30/4/2040 542,620 0.00%ConocoPhillips Holding Co. $400,000 6.95% 15/4/2029 542,580 0.00%Welltower, Inc. $500,000 4.25% 1/4/2026 542,331 0.00%Federal National Mortgage Association $521,808 3.50% 1/3/2038 542,061 0.00%Amgen, Inc. $525,000 3.88% 15/11/2021 541,547 0.00%Biogen, Inc. $450,000 5.20% 15/9/2045 541,165 0.00%Government National Mortgage Association $506,484 5.00% 20/5/2048 541,108 0.00%Bank of America Corp.^ $525,000 3.09% 1/10/2025 540,778 0.00%Federal National Mortgage Association $518,944 3.50% 1/11/2033 540,691 0.00%Berkshire Hathaway Energy Co. $400,000 5.95% 15/5/2037 540,380 0.00%Government National Mortgage Association $523,654 3.00% 20/2/2047 539,328 0.00%Florida Gas Transmission Co. LLC $500,000 4.35% 15/7/2025 538,555 0.00%Anthem, Inc. $525,000 2.95% 1/12/2022 537,757 0.00%AT&T, Inc. $485,000 4.55% 9/3/2049 537,742 0.00%Exelon Corp. $500,000 3.95% 15/6/2025 537,597 0.00%Government National Mortgage Association $512,511 3.50% 20/11/2041 537,506 0.00%PepsiCo, Inc. $435,000 4.60% 17/7/2045 537,473 0.00%Sabine Pass Liquefaction LLC $500,000 6.25% 15/3/2022 537,300 0.00%Enterprise Products Operating LLC $500,000 4.25% 15/2/2048 537,194 0.00%
Vanguard Global Bond Index Fund
406
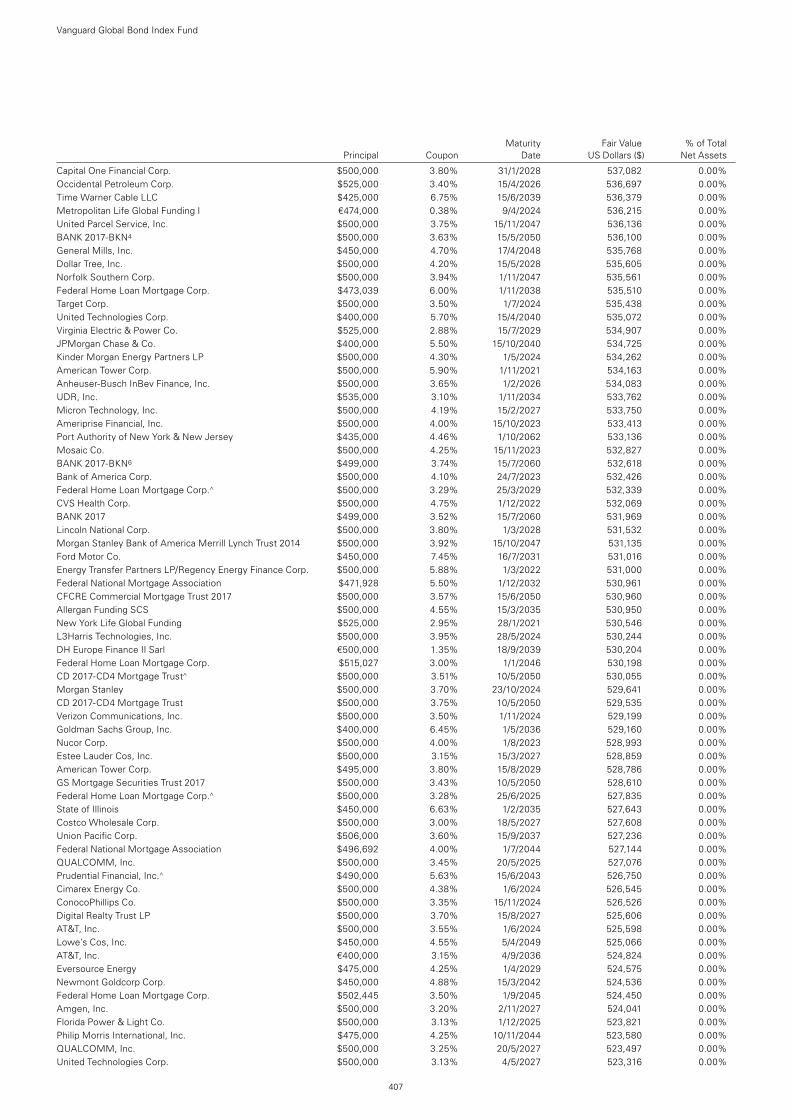
Maturity Fair Value % of Total Principal Coupon Date US Dollars ($) Net Assets
Vanguard Global Bond Index Fund
407
Capital One Financial Corp. $500,000 3.80% 31/1/2028 537,082 0.00%Occidental Petroleum Corp. $525,000 3.40% 15/4/2026 536,697 0.00%Time Warner Cable LLC $425,000 6.75% 15/6/2039 536,379 0.00%Metropolitan Life Global Funding I €474,000 0.38% 9/4/2024 536,215 0.00%United Parcel Service, Inc. $500,000 3.75% 15/11/2047 536,136 0.00%BANK 2017-BKN4 $500,000 3.63% 15/5/2050 536,100 0.00%General Mills, Inc. $450,000 4.70% 17/4/2048 535,768 0.00%Dollar Tree, Inc. $500,000 4.20% 15/5/2028 535,605 0.00%Norfolk Southern Corp. $500,000 3.94% 1/11/2047 535,561 0.00%Federal Home Loan Mortgage Corp. $473,039 6.00% 1/11/2038 535,510 0.00%Target Corp. $500,000 3.50% 1/7/2024 535,438 0.00%United Technologies Corp. $400,000 5.70% 15/4/2040 535,072 0.00%Virginia Electric & Power Co. $525,000 2.88% 15/7/2029 534,907 0.00%JPMorgan Chase & Co. $400,000 5.50% 15/10/2040 534,725 0.00%Kinder Morgan Energy Partners LP $500,000 4.30% 1/5/2024 534,262 0.00%American Tower Corp. $500,000 5.90% 1/11/2021 534,163 0.00%Anheuser-Busch InBev Finance, Inc. $500,000 3.65% 1/2/2026 534,083 0.00%UDR, Inc. $535,000 3.10% 1/11/2034 533,762 0.00%Micron Technology, Inc. $500,000 4.19% 15/2/2027 533,750 0.00%Ameriprise Financial, Inc. $500,000 4.00% 15/10/2023 533,413 0.00%Port Authority of New York & New Jersey $435,000 4.46% 1/10/2062 533,136 0.00%Mosaic Co. $500,000 4.25% 15/11/2023 532,827 0.00%BANK 2017-BKN6 $499,000 3.74% 15/7/2060 532,618 0.00%Bank of America Corp. $500,000 4.10% 24/7/2023 532,426 0.00%Federal Home Loan Mortgage Corp.^ $500,000 3.29% 25/3/2029 532,339 0.00%CVS Health Corp. $500,000 4.75% 1/12/2022 532,069 0.00%BANK 2017 $499,000 3.52% 15/7/2060 531,969 0.00%Lincoln National Corp. $500,000 3.80% 1/3/2028 531,532 0.00%Morgan Stanley Bank of America Merrill Lynch Trust 2014 $500,000 3.92% 15/10/2047 531,135 0.00%Ford Motor Co. $450,000 7.45% 16/7/2031 531,016 0.00%Energy Transfer Partners LP/Regency Energy Finance Corp. $500,000 5.88% 1/3/2022 531,000 0.00%Federal National Mortgage Association $471,928 5.50% 1/12/2032 530,961 0.00%CFCRE Commercial Mortgage Trust 2017 $500,000 3.57% 15/6/2050 530,960 0.00%Allergan Funding SCS $500,000 4.55% 15/3/2035 530,950 0.00%New York Life Global Funding $525,000 2.95% 28/1/2021 530,546 0.00%L3Harris Technologies, Inc. $500,000 3.95% 28/5/2024 530,244 0.00%DH Europe Finance II Sarl €500,000 1.35% 18/9/2039 530,204 0.00%Federal Home Loan Mortgage Corp. $515,027 3.00% 1/1/2046 530,198 0.00%CD 2017-CD4 Mortgage Trust^ $500,000 3.51% 10/5/2050 530,055 0.00%Morgan Stanley $500,000 3.70% 23/10/2024 529,641 0.00%CD 2017-CD4 Mortgage Trust $500,000 3.75% 10/5/2050 529,535 0.00%Verizon Communications, Inc. $500,000 3.50% 1/11/2024 529,199 0.00%Goldman Sachs Group, Inc. $400,000 6.45% 1/5/2036 529,160 0.00%Nucor Corp. $500,000 4.00% 1/8/2023 528,993 0.00%Estee Lauder Cos, Inc. $500,000 3.15% 15/3/2027 528,859 0.00%American Tower Corp. $495,000 3.80% 15/8/2029 528,786 0.00%GS Mortgage Securities Trust 2017 $500,000 3.43% 10/5/2050 528,610 0.00%Federal Home Loan Mortgage Corp.^ $500,000 3.28% 25/6/2025 527,835 0.00%State of Illinois $450,000 6.63% 1/2/2035 527,643 0.00%Costco Wholesale Corp. $500,000 3.00% 18/5/2027 527,608 0.00%Union Pacific Corp. $506,000 3.60% 15/9/2037 527,236 0.00%Federal National Mortgage Association $496,692 4.00% 1/7/2044 527,144 0.00%QUALCOMM, Inc. $500,000 3.45% 20/5/2025 527,076 0.00%Prudential Financial, Inc.^ $490,000 5.63% 15/6/2043 526,750 0.00%Cimarex Energy Co. $500,000 4.38% 1/6/2024 526,545 0.00%ConocoPhillips Co. $500,000 3.35% 15/11/2024 526,526 0.00%Digital Realty Trust LP $500,000 3.70% 15/8/2027 525,606 0.00%AT&T, Inc. $500,000 3.55% 1/6/2024 525,598 0.00%Lowe’s Cos, Inc. $450,000 4.55% 5/4/2049 525,066 0.00%AT&T, Inc. €400,000 3.15% 4/9/2036 524,824 0.00%Eversource Energy $475,000 4.25% 1/4/2029 524,575 0.00%Newmont Goldcorp Corp. $450,000 4.88% 15/3/2042 524,536 0.00%Federal Home Loan Mortgage Corp. $502,445 3.50% 1/9/2045 524,450 0.00%Amgen, Inc. $500,000 3.20% 2/11/2027 524,041 0.00%Florida Power & Light Co. $500,000 3.13% 1/12/2025 523,821 0.00%Philip Morris International, Inc. $475,000 4.25% 10/11/2044 523,580 0.00%QUALCOMM, Inc. $500,000 3.25% 20/5/2027 523,497 0.00%United Technologies Corp. $500,000 3.13% 4/5/2027 523,316 0.00%
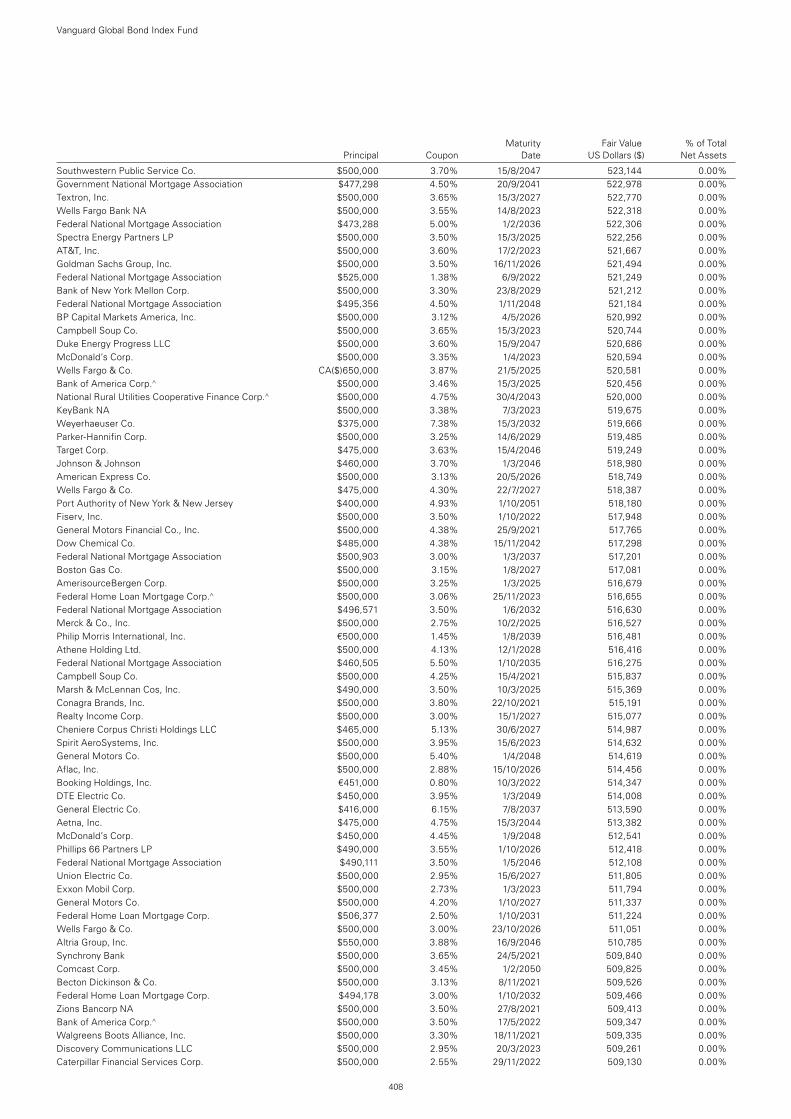
Maturity Fair Value % of Total Principal Coupon Date US Dollars ($) Net Assets
Vanguard Global Bond Index Fund
408
Southwestern Public Service Co. $500,000 3.70% 15/8/2047 523,144 0.00%Government National Mortgage Association $477,298 4.50% 20/9/2041 522,978 0.00%Textron, Inc. $500,000 3.65% 15/3/2027 522,770 0.00%Wells Fargo Bank NA $500,000 3.55% 14/8/2023 522,318 0.00%Federal National Mortgage Association $473,288 5.00% 1/2/2036 522,306 0.00%Spectra Energy Partners LP $500,000 3.50% 15/3/2025 522,256 0.00%AT&T, Inc. $500,000 3.60% 17/2/2023 521,667 0.00%Goldman Sachs Group, Inc. $500,000 3.50% 16/11/2026 521,494 0.00%Federal National Mortgage Association $525,000 1.38% 6/9/2022 521,249 0.00%Bank of New York Mellon Corp. $500,000 3.30% 23/8/2029 521,212 0.00%Federal National Mortgage Association $495,356 4.50% 1/11/2048 521,184 0.00%BP Capital Markets America, Inc. $500,000 3.12% 4/5/2026 520,992 0.00%Campbell Soup Co. $500,000 3.65% 15/3/2023 520,744 0.00%Duke Energy Progress LLC $500,000 3.60% 15/9/2047 520,686 0.00%McDonald’s Corp. $500,000 3.35% 1/4/2023 520,594 0.00%Wells Fargo & Co. CA($)650,000 3.87% 21/5/2025 520,581 0.00%Bank of America Corp.^ $500,000 3.46% 15/3/2025 520,456 0.00%National Rural Utilities Cooperative Finance Corp.^ $500,000 4.75% 30/4/2043 520,000 0.00%KeyBank NA $500,000 3.38% 7/3/2023 519,675 0.00%Weyerhaeuser Co. $375,000 7.38% 15/3/2032 519,666 0.00%Parker-Hannifin Corp. $500,000 3.25% 14/6/2029 519,485 0.00%Target Corp. $475,000 3.63% 15/4/2046 519,249 0.00%Johnson & Johnson $460,000 3.70% 1/3/2046 518,980 0.00%American Express Co. $500,000 3.13% 20/5/2026 518,749 0.00%Wells Fargo & Co. $475,000 4.30% 22/7/2027 518,387 0.00%Port Authority of New York & New Jersey $400,000 4.93% 1/10/2051 518,180 0.00%Fiserv, Inc. $500,000 3.50% 1/10/2022 517,948 0.00%General Motors Financial Co., Inc. $500,000 4.38% 25/9/2021 517,765 0.00%Dow Chemical Co. $485,000 4.38% 15/11/2042 517,298 0.00%Federal National Mortgage Association $500,903 3.00% 1/3/2037 517,201 0.00%Boston Gas Co. $500,000 3.15% 1/8/2027 517,081 0.00%AmerisourceBergen Corp. $500,000 3.25% 1/3/2025 516,679 0.00%Federal Home Loan Mortgage Corp.^ $500,000 3.06% 25/11/2023 516,655 0.00%Federal National Mortgage Association $496,571 3.50% 1/6/2032 516,630 0.00%Merck & Co., Inc. $500,000 2.75% 10/2/2025 516,527 0.00%Philip Morris International, Inc. €500,000 1.45% 1/8/2039 516,481 0.00%Athene Holding Ltd. $500,000 4.13% 12/1/2028 516,416 0.00%Federal National Mortgage Association $460,505 5.50% 1/10/2035 516,275 0.00%Campbell Soup Co. $500,000 4.25% 15/4/2021 515,837 0.00%Marsh & McLennan Cos, Inc. $490,000 3.50% 10/3/2025 515,369 0.00%Conagra Brands, Inc. $500,000 3.80% 22/10/2021 515,191 0.00%Realty Income Corp. $500,000 3.00% 15/1/2027 515,077 0.00%Cheniere Corpus Christi Holdings LLC $465,000 5.13% 30/6/2027 514,987 0.00%Spirit AeroSystems, Inc. $500,000 3.95% 15/6/2023 514,632 0.00%General Motors Co. $500,000 5.40% 1/4/2048 514,619 0.00%Aflac, Inc. $500,000 2.88% 15/10/2026 514,456 0.00%Booking Holdings, Inc. €451,000 0.80% 10/3/2022 514,347 0.00%DTE Electric Co. $450,000 3.95% 1/3/2049 514,008 0.00%General Electric Co. $416,000 6.15% 7/8/2037 513,590 0.00%Aetna, Inc. $475,000 4.75% 15/3/2044 513,382 0.00%McDonald’s Corp. $450,000 4.45% 1/9/2048 512,541 0.00%Phillips 66 Partners LP $490,000 3.55% 1/10/2026 512,418 0.00%Federal National Mortgage Association $490,111 3.50% 1/5/2046 512,108 0.00%Union Electric Co. $500,000 2.95% 15/6/2027 511,805 0.00%Exxon Mobil Corp. $500,000 2.73% 1/3/2023 511,794 0.00%General Motors Co. $500,000 4.20% 1/10/2027 511,337 0.00%Federal Home Loan Mortgage Corp. $506,377 2.50% 1/10/2031 511,224 0.00%Wells Fargo & Co. $500,000 3.00% 23/10/2026 511,051 0.00%Altria Group, Inc. $550,000 3.88% 16/9/2046 510,785 0.00%Synchrony Bank $500,000 3.65% 24/5/2021 509,840 0.00%Comcast Corp. $500,000 3.45% 1/2/2050 509,825 0.00%Becton Dickinson & Co. $500,000 3.13% 8/11/2021 509,526 0.00%Federal Home Loan Mortgage Corp. $494,178 3.00% 1/10/2032 509,466 0.00%Zions Bancorp NA $500,000 3.50% 27/8/2021 509,413 0.00%Bank of America Corp.^ $500,000 3.50% 17/5/2022 509,347 0.00%Walgreens Boots Alliance, Inc. $500,000 3.30% 18/11/2021 509,335 0.00%Discovery Communications LLC $500,000 2.95% 20/3/2023 509,261 0.00%Caterpillar Financial Services Corp. $500,000 2.55% 29/11/2022 509,130 0.00%
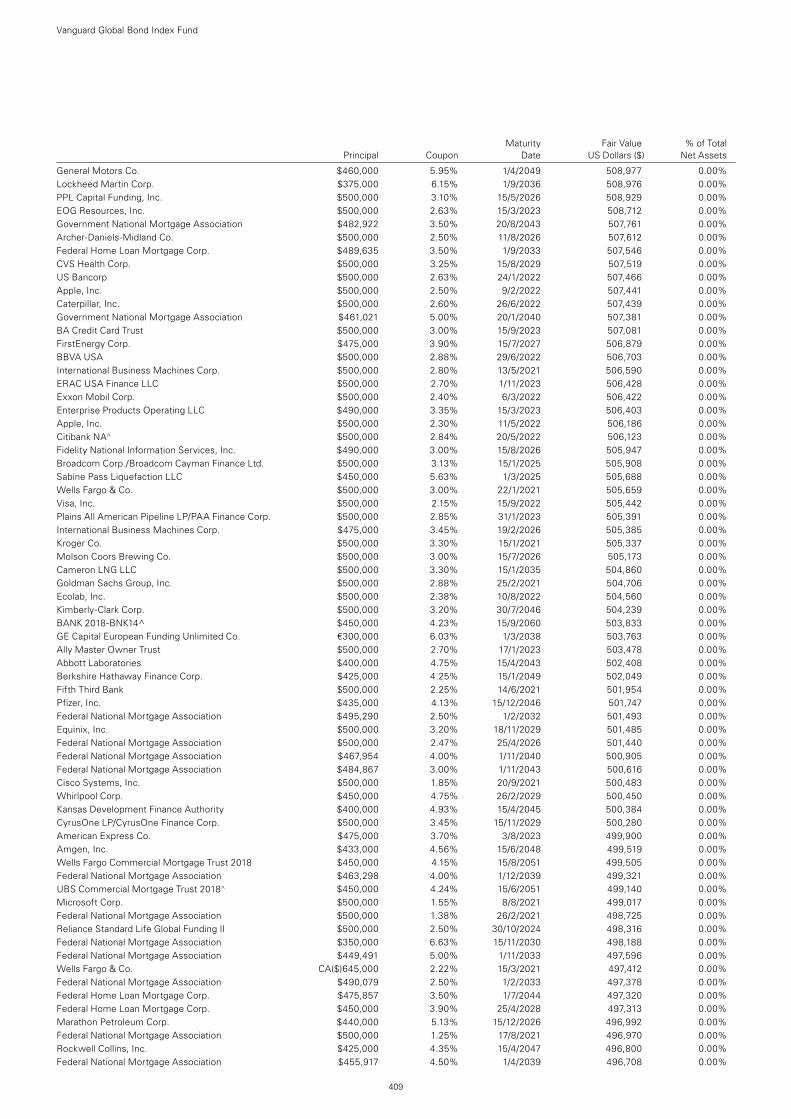
Maturity Fair Value % of Total Principal Coupon Date US Dollars ($) Net Assets
Vanguard Global Bond Index Fund
409
General Motors Co. $460,000 5.95% 1/4/2049 508,977 0.00%Lockheed Martin Corp. $375,000 6.15% 1/9/2036 508,976 0.00%PPL Capital Funding, Inc. $500,000 3.10% 15/5/2026 508,929 0.00%EOG Resources, Inc. $500,000 2.63% 15/3/2023 508,712 0.00%Government National Mortgage Association $482,922 3.50% 20/8/2043 507,761 0.00%Archer-Daniels-Midland Co. $500,000 2.50% 11/8/2026 507,612 0.00%Federal Home Loan Mortgage Corp. $489,635 3.50% 1/9/2033 507,546 0.00%CVS Health Corp. $500,000 3.25% 15/8/2029 507,519 0.00%US Bancorp $500,000 2.63% 24/1/2022 507,466 0.00%Apple, Inc. $500,000 2.50% 9/2/2022 507,441 0.00%Caterpillar, Inc. $500,000 2.60% 26/6/2022 507,439 0.00%Government National Mortgage Association $461,021 5.00% 20/1/2040 507,381 0.00%BA Credit Card Trust $500,000 3.00% 15/9/2023 507,081 0.00%FirstEnergy Corp. $475,000 3.90% 15/7/2027 506,879 0.00%BBVA USA $500,000 2.88% 29/6/2022 506,703 0.00%International Business Machines Corp. $500,000 2.80% 13/5/2021 506,590 0.00%ERAC USA Finance LLC $500,000 2.70% 1/11/2023 506,428 0.00%Exxon Mobil Corp. $500,000 2.40% 6/3/2022 506,422 0.00%Enterprise Products Operating LLC $490,000 3.35% 15/3/2023 506,403 0.00%Apple, Inc. $500,000 2.30% 11/5/2022 506,186 0.00%Citibank NA^ $500,000 2.84% 20/5/2022 506,123 0.00%Fidelity National Information Services, Inc. $490,000 3.00% 15/8/2026 505,947 0.00%Broadcom Corp./Broadcom Cayman Finance Ltd. $500,000 3.13% 15/1/2025 505,908 0.00%Sabine Pass Liquefaction LLC $450,000 5.63% 1/3/2025 505,688 0.00%Wells Fargo & Co. $500,000 3.00% 22/1/2021 505,659 0.00%Visa, Inc. $500,000 2.15% 15/9/2022 505,442 0.00%Plains All American Pipeline LP/PAA Finance Corp. $500,000 2.85% 31/1/2023 505,391 0.00%International Business Machines Corp. $475,000 3.45% 19/2/2026 505,385 0.00%Kroger Co. $500,000 3.30% 15/1/2021 505,337 0.00%Molson Coors Brewing Co. $500,000 3.00% 15/7/2026 505,173 0.00%Cameron LNG LLC $500,000 3.30% 15/1/2035 504,860 0.00%Goldman Sachs Group, Inc. $500,000 2.88% 25/2/2021 504,706 0.00%Ecolab, Inc. $500,000 2.38% 10/8/2022 504,560 0.00%Kimberly-Clark Corp. $500,000 3.20% 30/7/2046 504,239 0.00%BANK 2018-BNK14^ $450,000 4.23% 15/9/2060 503,833 0.00%GE Capital European Funding Unlimited Co. €300,000 6.03% 1/3/2038 503,763 0.00%Ally Master Owner Trust $500,000 2.70% 17/1/2023 503,478 0.00%Abbott Laboratories $400,000 4.75% 15/4/2043 502,408 0.00%Berkshire Hathaway Finance Corp. $425,000 4.25% 15/1/2049 502,049 0.00%Fifth Third Bank $500,000 2.25% 14/6/2021 501,954 0.00%Pfizer, Inc. $435,000 4.13% 15/12/2046 501,747 0.00%Federal National Mortgage Association $495,290 2.50% 1/2/2032 501,493 0.00%Equinix, Inc. $500,000 3.20% 18/11/2029 501,485 0.00%Federal National Mortgage Association $500,000 2.47% 25/4/2026 501,440 0.00%Federal National Mortgage Association $467,954 4.00% 1/11/2040 500,905 0.00%Federal National Mortgage Association $484,867 3.00% 1/11/2043 500,616 0.00%Cisco Systems, Inc. $500,000 1.85% 20/9/2021 500,483 0.00%Whirlpool Corp. $450,000 4.75% 26/2/2029 500,450 0.00%Kansas Development Finance Authority $400,000 4.93% 15/4/2045 500,384 0.00%CyrusOne LP/CyrusOne Finance Corp. $500,000 3.45% 15/11/2029 500,280 0.00%American Express Co. $475,000 3.70% 3/8/2023 499,900 0.00%Amgen, Inc. $433,000 4.56% 15/6/2048 499,519 0.00%Wells Fargo Commercial Mortgage Trust 2018 $450,000 4.15% 15/8/2051 499,505 0.00%Federal National Mortgage Association $463,298 4.00% 1/12/2039 499,321 0.00%UBS Commercial Mortgage Trust 2018^ $450,000 4.24% 15/6/2051 499,140 0.00%Microsoft Corp. $500,000 1.55% 8/8/2021 499,017 0.00%Federal National Mortgage Association $500,000 1.38% 26/2/2021 498,725 0.00%Reliance Standard Life Global Funding II $500,000 2.50% 30/10/2024 498,316 0.00%Federal National Mortgage Association $350,000 6.63% 15/11/2030 498,188 0.00%Federal National Mortgage Association $449,491 5.00% 1/11/2033 497,596 0.00%Wells Fargo & Co. CA($)645,000 2.22% 15/3/2021 497,412 0.00%Federal National Mortgage Association $490,079 2.50% 1/2/2033 497,378 0.00%Federal Home Loan Mortgage Corp. $475,857 3.50% 1/7/2044 497,320 0.00%Federal Home Loan Mortgage Corp. $450,000 3.90% 25/4/2028 497,313 0.00%Marathon Petroleum Corp. $440,000 5.13% 15/12/2026 496,992 0.00%Federal National Mortgage Association $500,000 1.25% 17/8/2021 496,970 0.00%Rockwell Collins, Inc. $425,000 4.35% 15/4/2047 496,800 0.00%Federal National Mortgage Association $455,917 4.50% 1/4/2039 496,708 0.00%
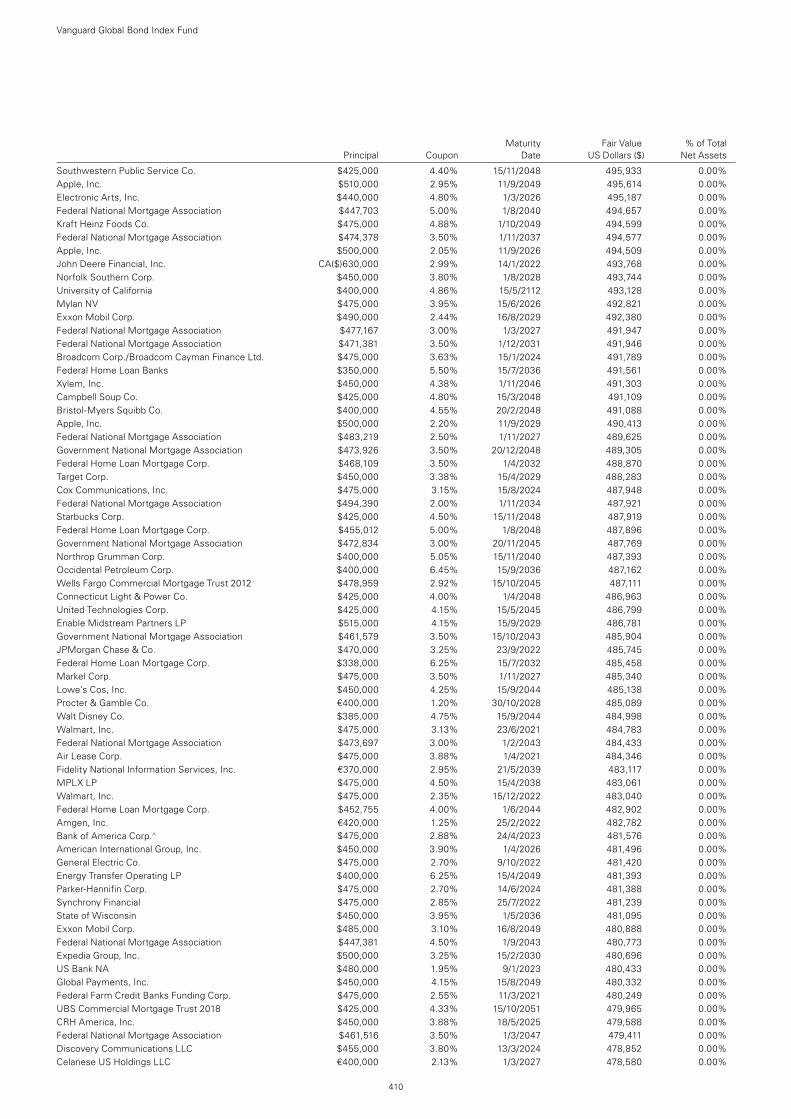
Maturity Fair Value % of Total Principal Coupon Date US Dollars ($) Net Assets
Vanguard Global Bond Index Fund
410
Southwestern Public Service Co. $425,000 4.40% 15/11/2048 495,933 0.00%Apple, Inc. $510,000 2.95% 11/9/2049 495,614 0.00%Electronic Arts, Inc. $440,000 4.80% 1/3/2026 495,187 0.00%Federal National Mortgage Association $447,703 5.00% 1/8/2040 494,657 0.00%Kraft Heinz Foods Co. $475,000 4.88% 1/10/2049 494,599 0.00%Federal National Mortgage Association $474,378 3.50% 1/11/2037 494,577 0.00%Apple, Inc. $500,000 2.05% 11/9/2026 494,509 0.00%John Deere Financial, Inc. CA($)630,000 2.99% 14/1/2022 493,768 0.00%Norfolk Southern Corp. $450,000 3.80% 1/8/2028 493,744 0.00%University of California $400,000 4.86% 15/5/2112 493,128 0.00%Mylan NV $475,000 3.95% 15/6/2026 492,821 0.00%Exxon Mobil Corp. $490,000 2.44% 16/8/2029 492,380 0.00%Federal National Mortgage Association $477,167 3.00% 1/3/2027 491,947 0.00%Federal National Mortgage Association $471,381 3.50% 1/12/2031 491,946 0.00%Broadcom Corp./Broadcom Cayman Finance Ltd. $475,000 3.63% 15/1/2024 491,789 0.00%Federal Home Loan Banks $350,000 5.50% 15/7/2036 491,561 0.00%Xylem, Inc. $450,000 4.38% 1/11/2046 491,303 0.00%Campbell Soup Co. $425,000 4.80% 15/3/2048 491,109 0.00%Bristol-Myers Squibb Co. $400,000 4.55% 20/2/2048 491,088 0.00%Apple, Inc. $500,000 2.20% 11/9/2029 490,413 0.00%Federal National Mortgage Association $483,219 2.50% 1/11/2027 489,625 0.00%Government National Mortgage Association $473,926 3.50% 20/12/2048 489,305 0.00%Federal Home Loan Mortgage Corp. $468,109 3.50% 1/4/2032 488,870 0.00%Target Corp. $450,000 3.38% 15/4/2029 488,283 0.00%Cox Communications, Inc. $475,000 3.15% 15/8/2024 487,948 0.00%Federal National Mortgage Association $494,390 2.00% 1/11/2034 487,921 0.00%Starbucks Corp. $425,000 4.50% 15/11/2048 487,919 0.00%Federal Home Loan Mortgage Corp. $455,012 5.00% 1/8/2048 487,896 0.00%Government National Mortgage Association $472,834 3.00% 20/11/2045 487,769 0.00%Northrop Grumman Corp. $400,000 5.05% 15/11/2040 487,393 0.00%Occidental Petroleum Corp. $400,000 6.45% 15/9/2036 487,162 0.00%Wells Fargo Commercial Mortgage Trust 2012 $478,959 2.92% 15/10/2045 487,111 0.00%Connecticut Light & Power Co. $425,000 4.00% 1/4/2048 486,963 0.00%United Technologies Corp. $425,000 4.15% 15/5/2045 486,799 0.00%Enable Midstream Partners LP $515,000 4.15% 15/9/2029 486,781 0.00%Government National Mortgage Association $461,579 3.50% 15/10/2043 485,904 0.00%JPMorgan Chase & Co. $470,000 3.25% 23/9/2022 485,745 0.00%Federal Home Loan Mortgage Corp. $338,000 6.25% 15/7/2032 485,458 0.00%Markel Corp. $475,000 3.50% 1/11/2027 485,340 0.00%Lowe’s Cos, Inc. $450,000 4.25% 15/9/2044 485,138 0.00%Procter & Gamble Co. €400,000 1.20% 30/10/2028 485,089 0.00%Walt Disney Co. $385,000 4.75% 15/9/2044 484,998 0.00%Walmart, Inc. $475,000 3.13% 23/6/2021 484,783 0.00%Federal National Mortgage Association $473,697 3.00% 1/2/2043 484,433 0.00%Air Lease Corp. $475,000 3.88% 1/4/2021 484,346 0.00%Fidelity National Information Services, Inc. €370,000 2.95% 21/5/2039 483,117 0.00%MPLX LP $475,000 4.50% 15/4/2038 483,061 0.00%Walmart, Inc. $475,000 2.35% 15/12/2022 483,040 0.00%Federal Home Loan Mortgage Corp. $452,755 4.00% 1/6/2044 482,902 0.00%Amgen, Inc. €420,000 1.25% 25/2/2022 482,782 0.00%Bank of America Corp.^ $475,000 2.88% 24/4/2023 481,576 0.00%American International Group, Inc. $450,000 3.90% 1/4/2026 481,496 0.00%General Electric Co. $475,000 2.70% 9/10/2022 481,420 0.00%Energy Transfer Operating LP $400,000 6.25% 15/4/2049 481,393 0.00%Parker-Hannifin Corp. $475,000 2.70% 14/6/2024 481,388 0.00%Synchrony Financial $475,000 2.85% 25/7/2022 481,239 0.00%State of Wisconsin $450,000 3.95% 1/5/2036 481,095 0.00%Exxon Mobil Corp. $485,000 3.10% 16/8/2049 480,888 0.00%Federal National Mortgage Association $447,381 4.50% 1/9/2043 480,773 0.00%Expedia Group, Inc. $500,000 3.25% 15/2/2030 480,696 0.00%US Bank NA $480,000 1.95% 9/1/2023 480,433 0.00%Global Payments, Inc. $450,000 4.15% 15/8/2049 480,332 0.00%Federal Farm Credit Banks Funding Corp. $475,000 2.55% 11/3/2021 480,249 0.00%UBS Commercial Mortgage Trust 2018 $425,000 4.33% 15/10/2051 479,965 0.00%CRH America, Inc. $450,000 3.88% 18/5/2025 479,588 0.00%Federal National Mortgage Association $461,516 3.50% 1/3/2047 479,411 0.00%Discovery Communications LLC $455,000 3.80% 13/3/2024 478,852 0.00%Celanese US Holdings LLC €400,000 2.13% 1/3/2027 478,580 0.00%
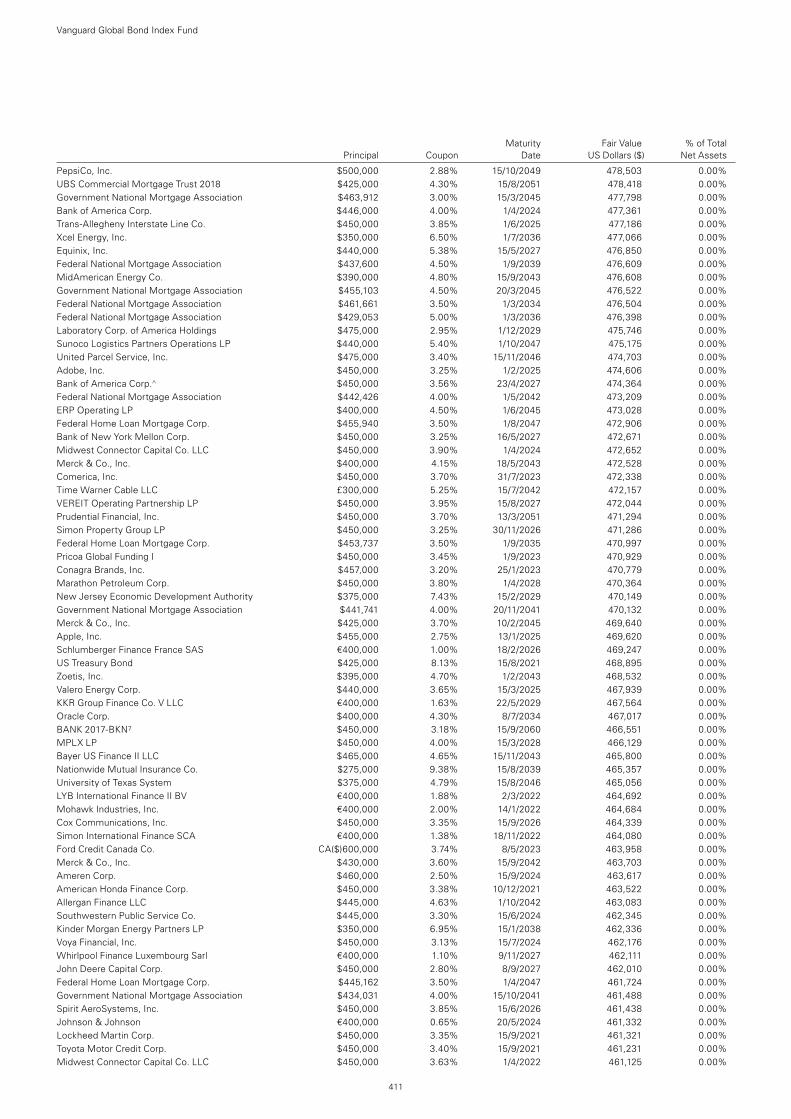
Maturity Fair Value % of Total Principal Coupon Date US Dollars ($) Net Assets
Vanguard Global Bond Index Fund
411
PepsiCo, Inc. $500,000 2.88% 15/10/2049 478,503 0.00%UBS Commercial Mortgage Trust 2018 $425,000 4.30% 15/8/2051 478,418 0.00%Government National Mortgage Association $463,912 3.00% 15/3/2045 477,798 0.00%Bank of America Corp. $446,000 4.00% 1/4/2024 477,361 0.00%Trans-Allegheny Interstate Line Co. $450,000 3.85% 1/6/2025 477,186 0.00%Xcel Energy, Inc. $350,000 6.50% 1/7/2036 477,066 0.00%Equinix, Inc. $440,000 5.38% 15/5/2027 476,850 0.00%Federal National Mortgage Association $437,600 4.50% 1/9/2039 476,609 0.00%MidAmerican Energy Co. $390,000 4.80% 15/9/2043 476,608 0.00%Government National Mortgage Association $455,103 4.50% 20/3/2045 476,522 0.00%Federal National Mortgage Association $461,661 3.50% 1/3/2034 476,504 0.00%Federal National Mortgage Association $429,053 5.00% 1/3/2036 476,398 0.00%Laboratory Corp. of America Holdings $475,000 2.95% 1/12/2029 475,746 0.00%Sunoco Logistics Partners Operations LP $440,000 5.40% 1/10/2047 475,175 0.00%United Parcel Service, Inc. $475,000 3.40% 15/11/2046 474,703 0.00%Adobe, Inc. $450,000 3.25% 1/2/2025 474,606 0.00%Bank of America Corp.^ $450,000 3.56% 23/4/2027 474,364 0.00%Federal National Mortgage Association $442,426 4.00% 1/5/2042 473,209 0.00%ERP Operating LP $400,000 4.50% 1/6/2045 473,028 0.00%Federal Home Loan Mortgage Corp. $455,940 3.50% 1/8/2047 472,906 0.00%Bank of New York Mellon Corp. $450,000 3.25% 16/5/2027 472,671 0.00%Midwest Connector Capital Co. LLC $450,000 3.90% 1/4/2024 472,652 0.00%Merck & Co., Inc. $400,000 4.15% 18/5/2043 472,528 0.00%Comerica, Inc. $450,000 3.70% 31/7/2023 472,338 0.00%Time Warner Cable LLC £300,000 5.25% 15/7/2042 472,157 0.00%VEREIT Operating Partnership LP $450,000 3.95% 15/8/2027 472,044 0.00%Prudential Financial, Inc. $450,000 3.70% 13/3/2051 471,294 0.00%Simon Property Group LP $450,000 3.25% 30/11/2026 471,286 0.00%Federal Home Loan Mortgage Corp. $453,737 3.50% 1/9/2035 470,997 0.00%Pricoa Global Funding I $450,000 3.45% 1/9/2023 470,929 0.00%Conagra Brands, Inc. $457,000 3.20% 25/1/2023 470,779 0.00%Marathon Petroleum Corp. $450,000 3.80% 1/4/2028 470,364 0.00%New Jersey Economic Development Authority $375,000 7.43% 15/2/2029 470,149 0.00%Government National Mortgage Association $441,741 4.00% 20/11/2041 470,132 0.00%Merck & Co., Inc. $425,000 3.70% 10/2/2045 469,640 0.00%Apple, Inc. $455,000 2.75% 13/1/2025 469,620 0.00%Schlumberger Finance France SAS €400,000 1.00% 18/2/2026 469,247 0.00%US Treasury Bond $425,000 8.13% 15/8/2021 468,895 0.00%Zoetis, Inc. $395,000 4.70% 1/2/2043 468,532 0.00%Valero Energy Corp. $440,000 3.65% 15/3/2025 467,939 0.00%KKR Group Finance Co. V LLC €400,000 1.63% 22/5/2029 467,564 0.00%Oracle Corp. $400,000 4.30% 8/7/2034 467,017 0.00%BANK 2017-BKN7 $450,000 3.18% 15/9/2060 466,551 0.00%MPLX LP $450,000 4.00% 15/3/2028 466,129 0.00%Bayer US Finance II LLC $465,000 4.65% 15/11/2043 465,800 0.00%Nationwide Mutual Insurance Co. $275,000 9.38% 15/8/2039 465,357 0.00%University of Texas System $375,000 4.79% 15/8/2046 465,056 0.00%LYB International Finance II BV €400,000 1.88% 2/3/2022 464,692 0.00%Mohawk Industries, Inc. €400,000 2.00% 14/1/2022 464,684 0.00%Cox Communications, Inc. $450,000 3.35% 15/9/2026 464,339 0.00%Simon International Finance SCA €400,000 1.38% 18/11/2022 464,080 0.00%Ford Credit Canada Co. CA($)600,000 3.74% 8/5/2023 463,958 0.00%Merck & Co., Inc. $430,000 3.60% 15/9/2042 463,703 0.00%Ameren Corp. $460,000 2.50% 15/9/2024 463,617 0.00%American Honda Finance Corp. $450,000 3.38% 10/12/2021 463,522 0.00%Allergan Finance LLC $445,000 4.63% 1/10/2042 463,083 0.00%Southwestern Public Service Co. $445,000 3.30% 15/6/2024 462,345 0.00%Kinder Morgan Energy Partners LP $350,000 6.95% 15/1/2038 462,336 0.00%Voya Financial, Inc. $450,000 3.13% 15/7/2024 462,176 0.00%Whirlpool Finance Luxembourg Sarl €400,000 1.10% 9/11/2027 462,111 0.00%John Deere Capital Corp. $450,000 2.80% 8/9/2027 462,010 0.00%Federal Home Loan Mortgage Corp. $445,162 3.50% 1/4/2047 461,724 0.00%Government National Mortgage Association $434,031 4.00% 15/10/2041 461,488 0.00%Spirit AeroSystems, Inc. $450,000 3.85% 15/6/2026 461,438 0.00%Johnson & Johnson €400,000 0.65% 20/5/2024 461,332 0.00%Lockheed Martin Corp. $450,000 3.35% 15/9/2021 461,321 0.00%Toyota Motor Credit Corp. $450,000 3.40% 15/9/2021 461,231 0.00%Midwest Connector Capital Co. LLC $450,000 3.63% 1/4/2022 461,125 0.00%
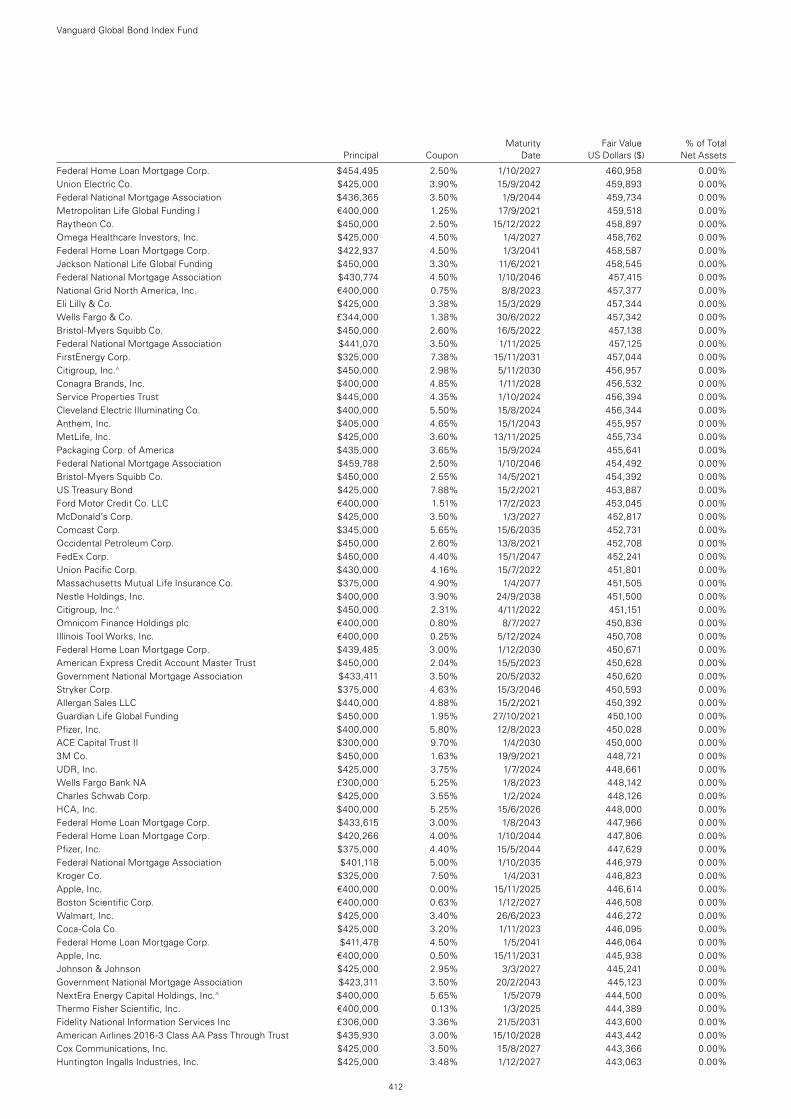
Maturity Fair Value % of Total Principal Coupon Date US Dollars ($) Net Assets
Vanguard Global Bond Index Fund
412
Federal Home Loan Mortgage Corp. $454,495 2.50% 1/10/2027 460,958 0.00%Union Electric Co. $425,000 3.90% 15/9/2042 459,893 0.00%Federal National Mortgage Association $436,365 3.50% 1/9/2044 459,734 0.00%Metropolitan Life Global Funding I €400,000 1.25% 17/9/2021 459,518 0.00%Raytheon Co. $450,000 2.50% 15/12/2022 458,897 0.00%Omega Healthcare Investors, Inc. $425,000 4.50% 1/4/2027 458,762 0.00%Federal Home Loan Mortgage Corp. $422,937 4.50% 1/3/2041 458,587 0.00%Jackson National Life Global Funding $450,000 3.30% 11/6/2021 458,545 0.00%Federal National Mortgage Association $430,774 4.50% 1/10/2046 457,415 0.00%National Grid North America, Inc. €400,000 0.75% 8/8/2023 457,377 0.00%Eli Lilly & Co. $425,000 3.38% 15/3/2029 457,344 0.00%Wells Fargo & Co. £344,000 1.38% 30/6/2022 457,342 0.00%Bristol-Myers Squibb Co. $450,000 2.60% 16/5/2022 457,138 0.00%Federal National Mortgage Association $441,070 3.50% 1/11/2025 457,125 0.00%FirstEnergy Corp. $325,000 7.38% 15/11/2031 457,044 0.00%Citigroup, Inc.^ $450,000 2.98% 5/11/2030 456,957 0.00%Conagra Brands, Inc. $400,000 4.85% 1/11/2028 456,532 0.00%Service Properties Trust $445,000 4.35% 1/10/2024 456,394 0.00%Cleveland Electric Illuminating Co. $400,000 5.50% 15/8/2024 456,344 0.00%Anthem, Inc. $405,000 4.65% 15/1/2043 455,957 0.00%MetLife, Inc. $425,000 3.60% 13/11/2025 455,734 0.00%Packaging Corp. of America $435,000 3.65% 15/9/2024 455,641 0.00%Federal National Mortgage Association $459,788 2.50% 1/10/2046 454,492 0.00%Bristol-Myers Squibb Co. $450,000 2.55% 14/5/2021 454,392 0.00%US Treasury Bond $425,000 7.88% 15/2/2021 453,887 0.00%Ford Motor Credit Co. LLC €400,000 1.51% 17/2/2023 453,045 0.00%McDonald’s Corp. $425,000 3.50% 1/3/2027 452,817 0.00%Comcast Corp. $345,000 5.65% 15/6/2035 452,731 0.00%Occidental Petroleum Corp. $450,000 2.60% 13/8/2021 452,708 0.00%FedEx Corp. $450,000 4.40% 15/1/2047 452,241 0.00%Union Pacific Corp. $430,000 4.16% 15/7/2022 451,801 0.00%Massachusetts Mutual Life Insurance Co. $375,000 4.90% 1/4/2077 451,505 0.00%Nestle Holdings, Inc. $400,000 3.90% 24/9/2038 451,500 0.00%Citigroup, Inc.^ $450,000 2.31% 4/11/2022 451,151 0.00%Omnicom Finance Holdings plc €400,000 0.80% 8/7/2027 450,836 0.00%Illinois Tool Works, Inc. €400,000 0.25% 5/12/2024 450,708 0.00%Federal Home Loan Mortgage Corp. $439,485 3.00% 1/12/2030 450,671 0.00%American Express Credit Account Master Trust $450,000 2.04% 15/5/2023 450,628 0.00%Government National Mortgage Association $433,411 3.50% 20/5/2032 450,620 0.00%Stryker Corp. $375,000 4.63% 15/3/2046 450,593 0.00%Allergan Sales LLC $440,000 4.88% 15/2/2021 450,392 0.00%Guardian Life Global Funding $450,000 1.95% 27/10/2021 450,100 0.00%Pfizer, Inc. $400,000 5.80% 12/8/2023 450,028 0.00%ACE Capital Trust II $300,000 9.70% 1/4/2030 450,000 0.00%3M Co. $450,000 1.63% 19/9/2021 448,721 0.00%UDR, Inc. $425,000 3.75% 1/7/2024 448,661 0.00%Wells Fargo Bank NA £300,000 5.25% 1/8/2023 448,142 0.00%Charles Schwab Corp. $425,000 3.55% 1/2/2024 448,126 0.00%HCA, Inc. $400,000 5.25% 15/6/2026 448,000 0.00%Federal Home Loan Mortgage Corp. $433,615 3.00% 1/8/2043 447,966 0.00%Federal Home Loan Mortgage Corp. $420,266 4.00% 1/10/2044 447,806 0.00%Pfizer, Inc. $375,000 4.40% 15/5/2044 447,629 0.00%Federal National Mortgage Association $401,118 5.00% 1/10/2035 446,979 0.00%Kroger Co. $325,000 7.50% 1/4/2031 446,823 0.00%Apple, Inc. €400,000 0.00% 15/11/2025 446,614 0.00%Boston Scientific Corp. €400,000 0.63% 1/12/2027 446,508 0.00%Walmart, Inc. $425,000 3.40% 26/6/2023 446,272 0.00%Coca-Cola Co. $425,000 3.20% 1/11/2023 446,095 0.00%Federal Home Loan Mortgage Corp. $411,478 4.50% 1/5/2041 446,064 0.00%Apple, Inc. €400,000 0.50% 15/11/2031 445,938 0.00%Johnson & Johnson $425,000 2.95% 3/3/2027 445,241 0.00%Government National Mortgage Association $423,311 3.50% 20/2/2043 445,123 0.00%NextEra Energy Capital Holdings, Inc.^ $400,000 5.65% 1/5/2079 444,500 0.00%Thermo Fisher Scientific, Inc. €400,000 0.13% 1/3/2025 444,389 0.00%Fidelity National Information Services Inc £306,000 3.36% 21/5/2031 443,600 0.00%American Airlines 2016-3 Class AA Pass Through Trust $435,930 3.00% 15/10/2028 443,442 0.00%Cox Communications, Inc. $425,000 3.50% 15/8/2027 443,366 0.00%Huntington Ingalls Industries, Inc. $425,000 3.48% 1/12/2027 443,063 0.00%
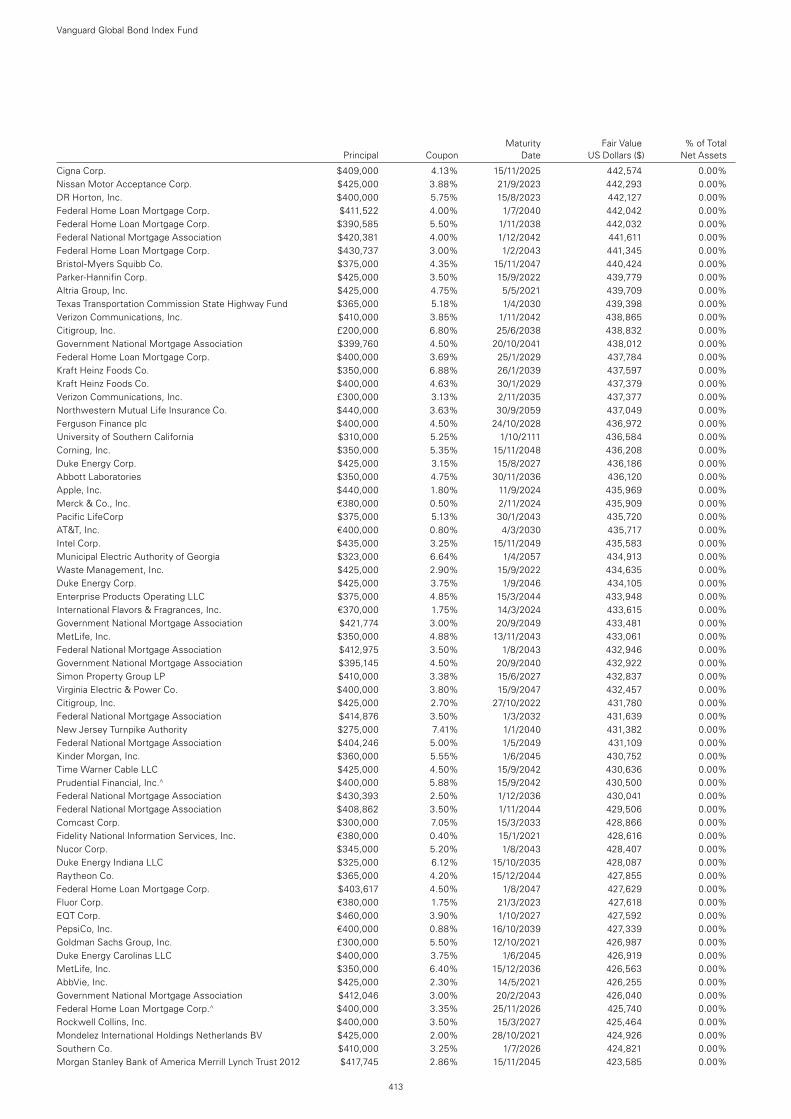
Maturity Fair Value % of Total Principal Coupon Date US Dollars ($) Net Assets
Vanguard Global Bond Index Fund
413
Cigna Corp. $409,000 4.13% 15/11/2025 442,574 0.00%Nissan Motor Acceptance Corp. $425,000 3.88% 21/9/2023 442,293 0.00%DR Horton, Inc. $400,000 5.75% 15/8/2023 442,127 0.00%Federal Home Loan Mortgage Corp. $411,522 4.00% 1/7/2040 442,042 0.00%Federal Home Loan Mortgage Corp. $390,585 5.50% 1/11/2038 442,032 0.00%Federal National Mortgage Association $420,381 4.00% 1/12/2042 441,611 0.00%Federal Home Loan Mortgage Corp. $430,737 3.00% 1/2/2043 441,345 0.00%Bristol-Myers Squibb Co. $375,000 4.35% 15/11/2047 440,424 0.00%Parker-Hannifin Corp. $425,000 3.50% 15/9/2022 439,779 0.00%Altria Group, Inc. $425,000 4.75% 5/5/2021 439,709 0.00%Texas Transportation Commission State Highway Fund $365,000 5.18% 1/4/2030 439,398 0.00%Verizon Communications, Inc. $410,000 3.85% 1/11/2042 438,865 0.00%Citigroup, Inc. £200,000 6.80% 25/6/2038 438,832 0.00%Government National Mortgage Association $399,760 4.50% 20/10/2041 438,012 0.00%Federal Home Loan Mortgage Corp. $400,000 3.69% 25/1/2029 437,784 0.00%Kraft Heinz Foods Co. $350,000 6.88% 26/1/2039 437,597 0.00%Kraft Heinz Foods Co. $400,000 4.63% 30/1/2029 437,379 0.00%Verizon Communications, Inc. £300,000 3.13% 2/11/2035 437,377 0.00%Northwestern Mutual Life Insurance Co. $440,000 3.63% 30/9/2059 437,049 0.00%Ferguson Finance plc $400,000 4.50% 24/10/2028 436,972 0.00%University of Southern California $310,000 5.25% 1/10/2111 436,584 0.00%Corning, Inc. $350,000 5.35% 15/11/2048 436,208 0.00%Duke Energy Corp. $425,000 3.15% 15/8/2027 436,186 0.00%Abbott Laboratories $350,000 4.75% 30/11/2036 436,120 0.00%Apple, Inc. $440,000 1.80% 11/9/2024 435,969 0.00%Merck & Co., Inc. €380,000 0.50% 2/11/2024 435,909 0.00%Pacific LifeCorp $375,000 5.13% 30/1/2043 435,720 0.00%AT&T, Inc. €400,000 0.80% 4/3/2030 435,717 0.00%Intel Corp. $435,000 3.25% 15/11/2049 435,583 0.00%Municipal Electric Authority of Georgia $323,000 6.64% 1/4/2057 434,913 0.00%Waste Management, Inc. $425,000 2.90% 15/9/2022 434,635 0.00%Duke Energy Corp. $425,000 3.75% 1/9/2046 434,105 0.00%Enterprise Products Operating LLC $375,000 4.85% 15/3/2044 433,948 0.00%International Flavors & Fragrances, Inc. €370,000 1.75% 14/3/2024 433,615 0.00%Government National Mortgage Association $421,774 3.00% 20/9/2049 433,481 0.00%MetLife, Inc. $350,000 4.88% 13/11/2043 433,061 0.00%Federal National Mortgage Association $412,975 3.50% 1/8/2043 432,946 0.00%Government National Mortgage Association $395,145 4.50% 20/9/2040 432,922 0.00%Simon Property Group LP $410,000 3.38% 15/6/2027 432,837 0.00%Virginia Electric & Power Co. $400,000 3.80% 15/9/2047 432,457 0.00%Citigroup, Inc. $425,000 2.70% 27/10/2022 431,780 0.00%Federal National Mortgage Association $414,876 3.50% 1/3/2032 431,639 0.00%New Jersey Turnpike Authority $275,000 7.41% 1/1/2040 431,382 0.00%Federal National Mortgage Association $404,246 5.00% 1/5/2049 431,109 0.00%Kinder Morgan, Inc. $360,000 5.55% 1/6/2045 430,752 0.00%Time Warner Cable LLC $425,000 4.50% 15/9/2042 430,636 0.00%Prudential Financial, Inc.^ $400,000 5.88% 15/9/2042 430,500 0.00%Federal National Mortgage Association $430,393 2.50% 1/12/2036 430,041 0.00%Federal National Mortgage Association $408,862 3.50% 1/11/2044 429,506 0.00%Comcast Corp. $300,000 7.05% 15/3/2033 428,866 0.00%Fidelity National Information Services, Inc. €380,000 0.40% 15/1/2021 428,616 0.00%Nucor Corp. $345,000 5.20% 1/8/2043 428,407 0.00%Duke Energy Indiana LLC $325,000 6.12% 15/10/2035 428,087 0.00%Raytheon Co. $365,000 4.20% 15/12/2044 427,855 0.00%Federal Home Loan Mortgage Corp. $403,617 4.50% 1/8/2047 427,629 0.00%Fluor Corp. €380,000 1.75% 21/3/2023 427,618 0.00%EQT Corp. $460,000 3.90% 1/10/2027 427,592 0.00%PepsiCo, Inc. €400,000 0.88% 16/10/2039 427,339 0.00%Goldman Sachs Group, Inc. £300,000 5.50% 12/10/2021 426,987 0.00%Duke Energy Carolinas LLC $400,000 3.75% 1/6/2045 426,919 0.00%MetLife, Inc. $350,000 6.40% 15/12/2036 426,563 0.00%AbbVie, Inc. $425,000 2.30% 14/5/2021 426,255 0.00%Government National Mortgage Association $412,046 3.00% 20/2/2043 426,040 0.00%Federal Home Loan Mortgage Corp.^ $400,000 3.35% 25/11/2026 425,740 0.00%Rockwell Collins, Inc. $400,000 3.50% 15/3/2027 425,464 0.00%Mondelez International Holdings Netherlands BV $425,000 2.00% 28/10/2021 424,926 0.00%Southern Co. $410,000 3.25% 1/7/2026 424,821 0.00%Morgan Stanley Bank of America Merrill Lynch Trust 2012 $417,745 2.86% 15/11/2045 423,585 0.00%
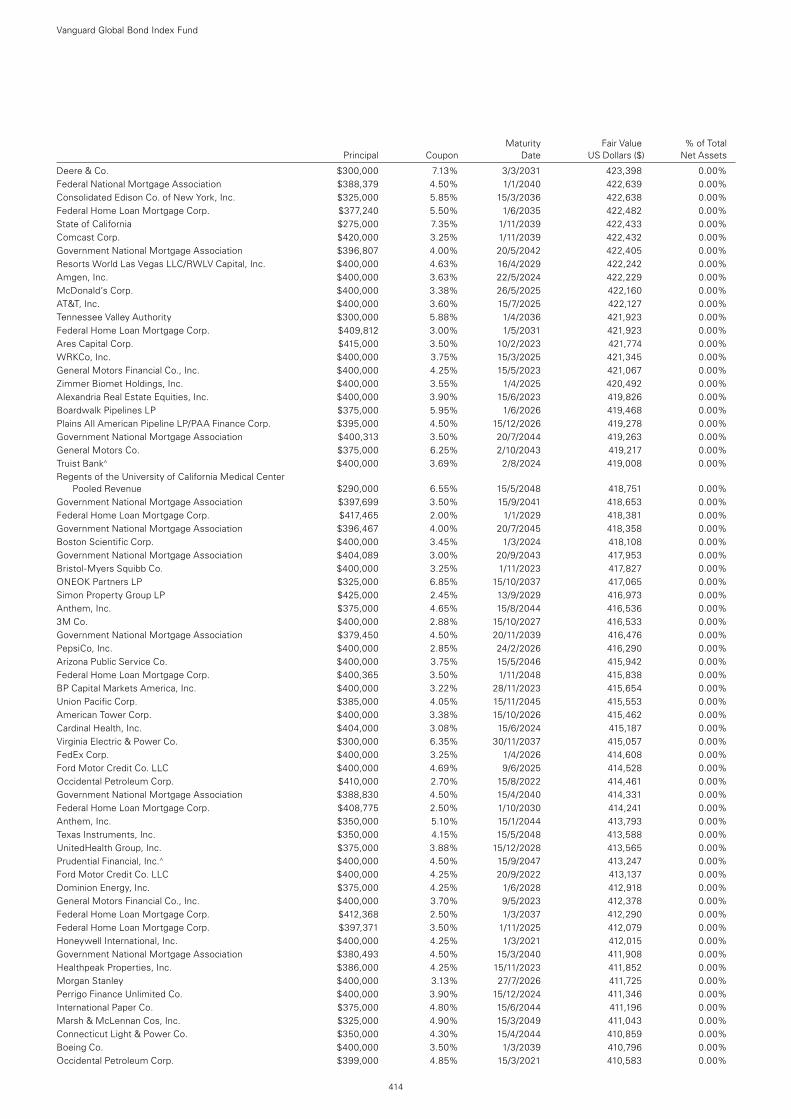
Maturity Fair Value % of Total Principal Coupon Date US Dollars ($) Net Assets
Vanguard Global Bond Index Fund
414
Deere & Co. $300,000 7.13% 3/3/2031 423,398 0.00%Federal National Mortgage Association $388,379 4.50% 1/1/2040 422,639 0.00%Consolidated Edison Co. of New York, Inc. $325,000 5.85% 15/3/2036 422,638 0.00%Federal Home Loan Mortgage Corp. $377,240 5.50% 1/6/2035 422,482 0.00%State of California $275,000 7.35% 1/11/2039 422,433 0.00%Comcast Corp. $420,000 3.25% 1/11/2039 422,432 0.00%Government National Mortgage Association $396,807 4.00% 20/5/2042 422,405 0.00%Resorts World Las Vegas LLC/RWLV Capital, Inc. $400,000 4.63% 16/4/2029 422,242 0.00%Amgen, Inc. $400,000 3.63% 22/5/2024 422,229 0.00%McDonald’s Corp. $400,000 3.38% 26/5/2025 422,160 0.00%AT&T, Inc. $400,000 3.60% 15/7/2025 422,127 0.00%Tennessee Valley Authority $300,000 5.88% 1/4/2036 421,923 0.00%Federal Home Loan Mortgage Corp. $409,812 3.00% 1/5/2031 421,923 0.00%Ares Capital Corp. $415,000 3.50% 10/2/2023 421,774 0.00%WRKCo, Inc. $400,000 3.75% 15/3/2025 421,345 0.00%General Motors Financial Co., Inc. $400,000 4.25% 15/5/2023 421,067 0.00%Zimmer Biomet Holdings, Inc. $400,000 3.55% 1/4/2025 420,492 0.00%Alexandria Real Estate Equities, Inc. $400,000 3.90% 15/6/2023 419,826 0.00%Boardwalk Pipelines LP $375,000 5.95% 1/6/2026 419,468 0.00%Plains All American Pipeline LP/PAA Finance Corp. $395,000 4.50% 15/12/2026 419,278 0.00%Government National Mortgage Association $400,313 3.50% 20/7/2044 419,263 0.00%General Motors Co. $375,000 6.25% 2/10/2043 419,217 0.00%Truist Bank^ $400,000 3.69% 2/8/2024 419,008 0.00%Regents of the University of California Medical Center
Pooled Revenue $290,000 6.55% 15/5/2048 418,751 0.00%Government National Mortgage Association $397,699 3.50% 15/9/2041 418,653 0.00%Federal Home Loan Mortgage Corp. $417,465 2.00% 1/1/2029 418,381 0.00%Government National Mortgage Association $396,467 4.00% 20/7/2045 418,358 0.00%Boston Scientific Corp. $400,000 3.45% 1/3/2024 418,108 0.00%Government National Mortgage Association $404,089 3.00% 20/9/2043 417,953 0.00%Bristol-Myers Squibb Co. $400,000 3.25% 1/11/2023 417,827 0.00%ONEOK Partners LP $325,000 6.85% 15/10/2037 417,065 0.00%Simon Property Group LP $425,000 2.45% 13/9/2029 416,973 0.00%Anthem, Inc. $375,000 4.65% 15/8/2044 416,536 0.00%3M Co. $400,000 2.88% 15/10/2027 416,533 0.00%Government National Mortgage Association $379,450 4.50% 20/11/2039 416,476 0.00%PepsiCo, Inc. $400,000 2.85% 24/2/2026 416,290 0.00%Arizona Public Service Co. $400,000 3.75% 15/5/2046 415,942 0.00%Federal Home Loan Mortgage Corp. $400,365 3.50% 1/11/2048 415,838 0.00%BP Capital Markets America, Inc. $400,000 3.22% 28/11/2023 415,654 0.00%Union Pacific Corp. $385,000 4.05% 15/11/2045 415,553 0.00%American Tower Corp. $400,000 3.38% 15/10/2026 415,462 0.00%Cardinal Health, Inc. $404,000 3.08% 15/6/2024 415,187 0.00%Virginia Electric & Power Co. $300,000 6.35% 30/11/2037 415,057 0.00%FedEx Corp. $400,000 3.25% 1/4/2026 414,608 0.00%Ford Motor Credit Co. LLC $400,000 4.69% 9/6/2025 414,528 0.00%Occidental Petroleum Corp. $410,000 2.70% 15/8/2022 414,461 0.00%Government National Mortgage Association $388,830 4.50% 15/4/2040 414,331 0.00%Federal Home Loan Mortgage Corp. $408,775 2.50% 1/10/2030 414,241 0.00%Anthem, Inc. $350,000 5.10% 15/1/2044 413,793 0.00%Texas Instruments, Inc. $350,000 4.15% 15/5/2048 413,588 0.00%UnitedHealth Group, Inc. $375,000 3.88% 15/12/2028 413,565 0.00%Prudential Financial, Inc.^ $400,000 4.50% 15/9/2047 413,247 0.00%Ford Motor Credit Co. LLC $400,000 4.25% 20/9/2022 413,137 0.00%Dominion Energy, Inc. $375,000 4.25% 1/6/2028 412,918 0.00%General Motors Financial Co., Inc. $400,000 3.70% 9/5/2023 412,378 0.00%Federal Home Loan Mortgage Corp. $412,368 2.50% 1/3/2037 412,290 0.00%Federal Home Loan Mortgage Corp. $397,371 3.50% 1/11/2025 412,079 0.00%Honeywell International, Inc. $400,000 4.25% 1/3/2021 412,015 0.00%Government National Mortgage Association $380,493 4.50% 15/3/2040 411,908 0.00%Healthpeak Properties, Inc. $386,000 4.25% 15/11/2023 411,852 0.00%Morgan Stanley $400,000 3.13% 27/7/2026 411,725 0.00%Perrigo Finance Unlimited Co. $400,000 3.90% 15/12/2024 411,346 0.00%International Paper Co. $375,000 4.80% 15/6/2044 411,196 0.00%Marsh & McLennan Cos, Inc. $325,000 4.90% 15/3/2049 411,043 0.00%Connecticut Light & Power Co. $350,000 4.30% 15/4/2044 410,859 0.00%Boeing Co. $400,000 3.50% 1/3/2039 410,796 0.00%Occidental Petroleum Corp. $399,000 4.85% 15/3/2021 410,583 0.00%
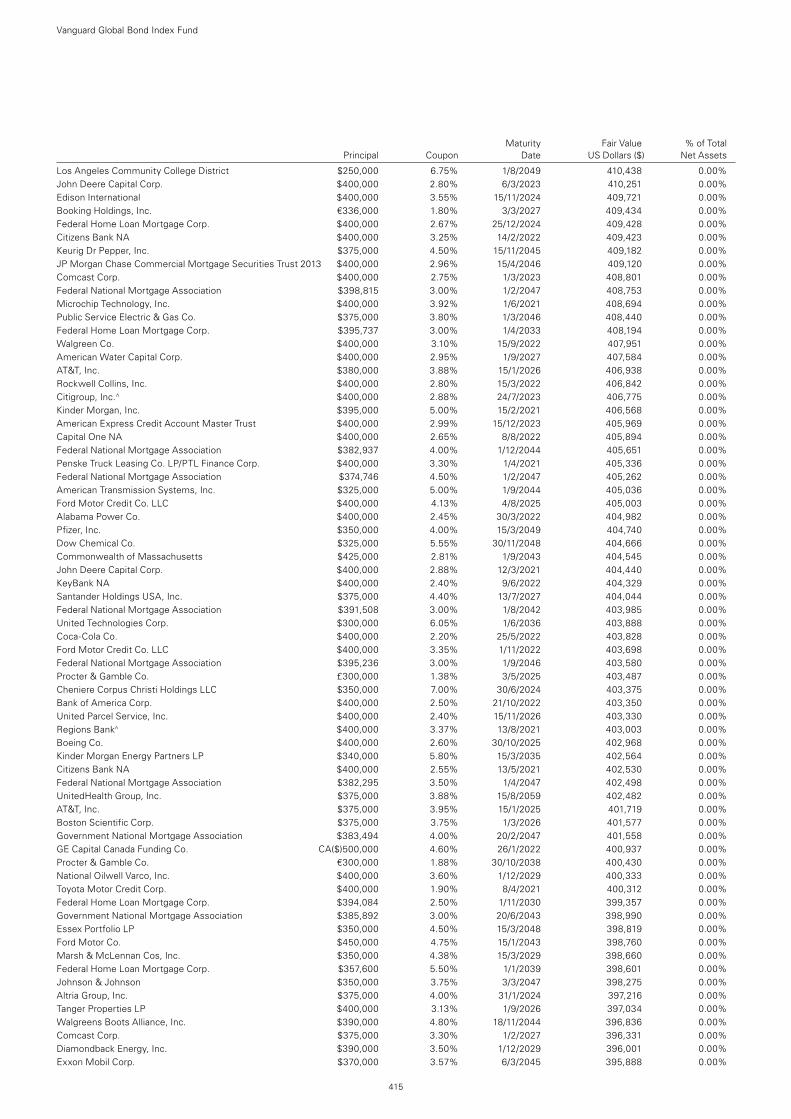
Vanguard Global Bond Index Fund
415
Los Angeles Community College District $250,000 6.75% 1/8/2049 410,438 0.00%John Deere Capital Corp. $400,000 2.80% 6/3/2023 410,251 0.00%Edison International $400,000 3.55% 15/11/2024 409,721 0.00%Booking Holdings, Inc. €336,000 1.80% 3/3/2027 409,434 0.00%Federal Home Loan Mortgage Corp. $400,000 2.67% 25/12/2024 409,428 0.00%Citizens Bank NA $400,000 3.25% 14/2/2022 409,423 0.00%Keurig Dr Pepper, Inc. $375,000 4.50% 15/11/2045 409,182 0.00%JP Morgan Chase Commercial Mortgage Securities Trust 2013 $400,000 2.96% 15/4/2046 409,120 0.00%Comcast Corp. $400,000 2.75% 1/3/2023 408,801 0.00%Federal National Mortgage Association $398,815 3.00% 1/2/2047 408,753 0.00%Microchip Technology, Inc. $400,000 3.92% 1/6/2021 408,694 0.00%Public Service Electric & Gas Co. $375,000 3.80% 1/3/2046 408,440 0.00%Federal Home Loan Mortgage Corp. $395,737 3.00% 1/4/2033 408,194 0.00%Walgreen Co. $400,000 3.10% 15/9/2022 407,951 0.00%American Water Capital Corp. $400,000 2.95% 1/9/2027 407,584 0.00%AT&T, Inc. $380,000 3.88% 15/1/2026 406,938 0.00%Rockwell Collins, Inc. $400,000 2.80% 15/3/2022 406,842 0.00%Citigroup, Inc.^ $400,000 2.88% 24/7/2023 406,775 0.00%Kinder Morgan, Inc. $395,000 5.00% 15/2/2021 406,568 0.00%American Express Credit Account Master Trust $400,000 2.99% 15/12/2023 405,969 0.00%Capital One NA $400,000 2.65% 8/8/2022 405,894 0.00%Federal National Mortgage Association $382,937 4.00% 1/12/2044 405,651 0.00%Penske Truck Leasing Co. LP/PTL Finance Corp. $400,000 3.30% 1/4/2021 405,336 0.00%Federal National Mortgage Association $374,746 4.50% 1/2/2047 405,262 0.00%American Transmission Systems, Inc. $325,000 5.00% 1/9/2044 405,036 0.00%Ford Motor Credit Co. LLC $400,000 4.13% 4/8/2025 405,003 0.00%Alabama Power Co. $400,000 2.45% 30/3/2022 404,982 0.00%Pfizer, Inc. $350,000 4.00% 15/3/2049 404,740 0.00%Dow Chemical Co. $325,000 5.55% 30/11/2048 404,666 0.00%Commonwealth of Massachusetts $425,000 2.81% 1/9/2043 404,545 0.00%John Deere Capital Corp. $400,000 2.88% 12/3/2021 404,440 0.00%KeyBank NA $400,000 2.40% 9/6/2022 404,329 0.00%Santander Holdings USA, Inc. $375,000 4.40% 13/7/2027 404,044 0.00%Federal National Mortgage Association $391,508 3.00% 1/8/2042 403,985 0.00%United Technologies Corp. $300,000 6.05% 1/6/2036 403,888 0.00%Coca-Cola Co. $400,000 2.20% 25/5/2022 403,828 0.00%Ford Motor Credit Co. LLC $400,000 3.35% 1/11/2022 403,698 0.00%Federal National Mortgage Association $395,236 3.00% 1/9/2046 403,580 0.00%Procter & Gamble Co. £300,000 1.38% 3/5/2025 403,487 0.00%Cheniere Corpus Christi Holdings LLC $350,000 7.00% 30/6/2024 403,375 0.00%Bank of America Corp. $400,000 2.50% 21/10/2022 403,350 0.00%United Parcel Service, Inc. $400,000 2.40% 15/11/2026 403,330 0.00%Regions Bank^ $400,000 3.37% 13/8/2021 403,003 0.00%Boeing Co. $400,000 2.60% 30/10/2025 402,968 0.00%Kinder Morgan Energy Partners LP $340,000 5.80% 15/3/2035 402,564 0.00%Citizens Bank NA $400,000 2.55% 13/5/2021 402,530 0.00%Federal National Mortgage Association $382,295 3.50% 1/4/2047 402,498 0.00%UnitedHealth Group, Inc. $375,000 3.88% 15/8/2059 402,482 0.00%AT&T, Inc. $375,000 3.95% 15/1/2025 401,719 0.00%Boston Scientific Corp. $375,000 3.75% 1/3/2026 401,577 0.00%Government National Mortgage Association $383,494 4.00% 20/2/2047 401,558 0.00%GE Capital Canada Funding Co. CA($)500,000 4.60% 26/1/2022 400,937 0.00%Procter & Gamble Co. €300,000 1.88% 30/10/2038 400,430 0.00%National Oilwell Varco, Inc. $400,000 3.60% 1/12/2029 400,333 0.00%Toyota Motor Credit Corp. $400,000 1.90% 8/4/2021 400,312 0.00%Federal Home Loan Mortgage Corp. $394,084 2.50% 1/11/2030 399,357 0.00%Government National Mortgage Association $385,892 3.00% 20/6/2043 398,990 0.00%Essex Portfolio LP $350,000 4.50% 15/3/2048 398,819 0.00%Ford Motor Co. $450,000 4.75% 15/1/2043 398,760 0.00%Marsh & McLennan Cos, Inc. $350,000 4.38% 15/3/2029 398,660 0.00%Federal Home Loan Mortgage Corp. $357,600 5.50% 1/1/2039 398,601 0.00%Johnson & Johnson $350,000 3.75% 3/3/2047 398,275 0.00%Altria Group, Inc. $375,000 4.00% 31/1/2024 397,216 0.00%Tanger Properties LP $400,000 3.13% 1/9/2026 397,034 0.00%Walgreens Boots Alliance, Inc. $390,000 4.80% 18/11/2044 396,836 0.00%Comcast Corp. $375,000 3.30% 1/2/2027 396,331 0.00%Diamondback Energy, Inc. $390,000 3.50% 1/12/2029 396,001 0.00%Exxon Mobil Corp. $370,000 3.57% 6/3/2045 395,888 0.00%
Maturity Fair Value % of Total Principal Coupon Date US Dollars ($) Net Assets
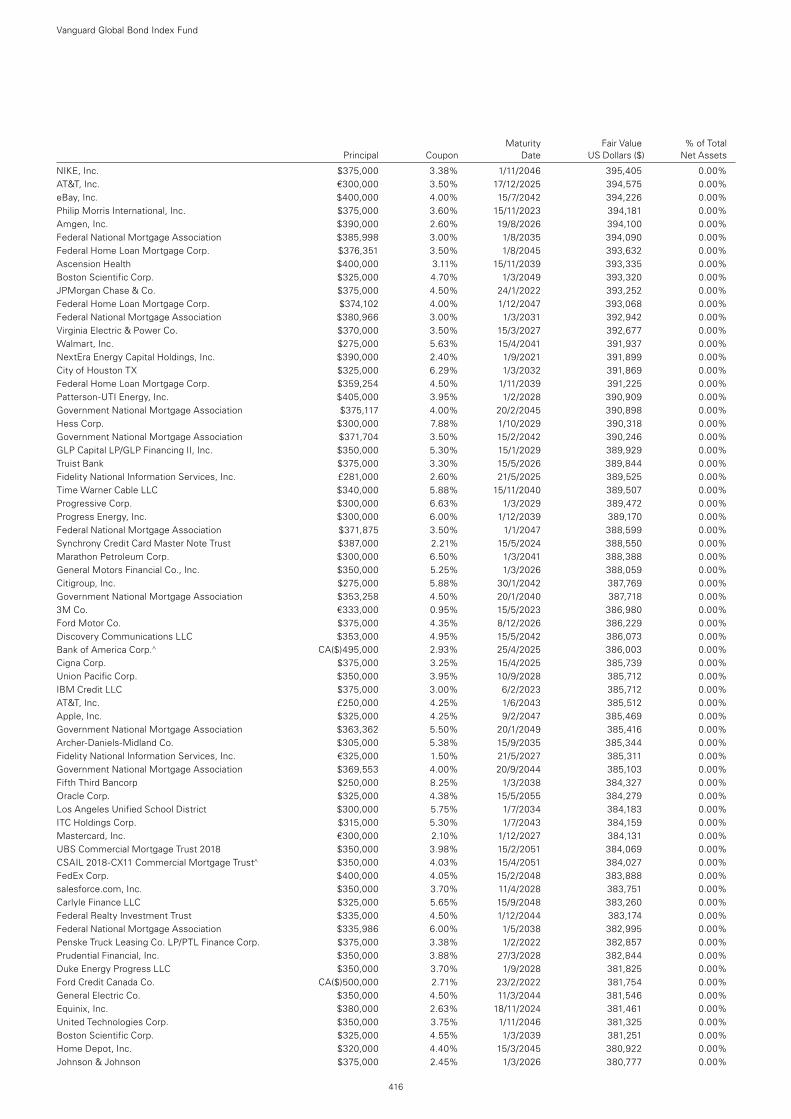
Maturity Fair Value % of Total Principal Coupon Date US Dollars ($) Net Assets
Vanguard Global Bond Index Fund
416
NIKE, Inc. $375,000 3.38% 1/11/2046 395,405 0.00%AT&T, Inc. €300,000 3.50% 17/12/2025 394,575 0.00%eBay, Inc. $400,000 4.00% 15/7/2042 394,226 0.00%Philip Morris International, Inc. $375,000 3.60% 15/11/2023 394,181 0.00%Amgen, Inc. $390,000 2.60% 19/8/2026 394,100 0.00%Federal National Mortgage Association $385,998 3.00% 1/8/2035 394,090 0.00%Federal Home Loan Mortgage Corp. $376,351 3.50% 1/8/2045 393,632 0.00%Ascension Health $400,000 3.11% 15/11/2039 393,335 0.00%Boston Scientific Corp. $325,000 4.70% 1/3/2049 393,320 0.00%JPMorgan Chase & Co. $375,000 4.50% 24/1/2022 393,252 0.00%Federal Home Loan Mortgage Corp. $374,102 4.00% 1/12/2047 393,068 0.00%Federal National Mortgage Association $380,966 3.00% 1/3/2031 392,942 0.00%Virginia Electric & Power Co. $370,000 3.50% 15/3/2027 392,677 0.00%Walmart, Inc. $275,000 5.63% 15/4/2041 391,937 0.00%NextEra Energy Capital Holdings, Inc. $390,000 2.40% 1/9/2021 391,899 0.00%City of Houston TX $325,000 6.29% 1/3/2032 391,869 0.00%Federal Home Loan Mortgage Corp. $359,254 4.50% 1/11/2039 391,225 0.00%Patterson-UTI Energy, Inc. $405,000 3.95% 1/2/2028 390,909 0.00%Government National Mortgage Association $375,117 4.00% 20/2/2045 390,898 0.00%Hess Corp. $300,000 7.88% 1/10/2029 390,318 0.00%Government National Mortgage Association $371,704 3.50% 15/2/2042 390,246 0.00%GLP Capital LP/GLP Financing II, Inc. $350,000 5.30% 15/1/2029 389,929 0.00%Truist Bank $375,000 3.30% 15/5/2026 389,844 0.00%Fidelity National Information Services, Inc. £281,000 2.60% 21/5/2025 389,525 0.00%Time Warner Cable LLC $340,000 5.88% 15/11/2040 389,507 0.00%Progressive Corp. $300,000 6.63% 1/3/2029 389,472 0.00%Progress Energy, Inc. $300,000 6.00% 1/12/2039 389,170 0.00%Federal National Mortgage Association $371,875 3.50% 1/1/2047 388,599 0.00%Synchrony Credit Card Master Note Trust $387,000 2.21% 15/5/2024 388,550 0.00%Marathon Petroleum Corp. $300,000 6.50% 1/3/2041 388,388 0.00%General Motors Financial Co., Inc. $350,000 5.25% 1/3/2026 388,059 0.00%Citigroup, Inc. $275,000 5.88% 30/1/2042 387,769 0.00%Government National Mortgage Association $353,258 4.50% 20/1/2040 387,718 0.00%3M Co. €333,000 0.95% 15/5/2023 386,980 0.00%Ford Motor Co. $375,000 4.35% 8/12/2026 386,229 0.00%Discovery Communications LLC $353,000 4.95% 15/5/2042 386,073 0.00%Bank of America Corp.^ CA($)495,000 2.93% 25/4/2025 386,003 0.00%Cigna Corp. $375,000 3.25% 15/4/2025 385,739 0.00%Union Pacific Corp. $350,000 3.95% 10/9/2028 385,712 0.00%IBM Credit LLC $375,000 3.00% 6/2/2023 385,712 0.00%AT&T, Inc. £250,000 4.25% 1/6/2043 385,512 0.00%Apple, Inc. $325,000 4.25% 9/2/2047 385,469 0.00%Government National Mortgage Association $363,362 5.50% 20/1/2049 385,416 0.00%Archer-Daniels-Midland Co. $305,000 5.38% 15/9/2035 385,344 0.00%Fidelity National Information Services, Inc. €325,000 1.50% 21/5/2027 385,311 0.00%Government National Mortgage Association $369,553 4.00% 20/9/2044 385,103 0.00%Fifth Third Bancorp $250,000 8.25% 1/3/2038 384,327 0.00%Oracle Corp. $325,000 4.38% 15/5/2055 384,279 0.00%Los Angeles Unified School District $300,000 5.75% 1/7/2034 384,183 0.00%ITC Holdings Corp. $315,000 5.30% 1/7/2043 384,159 0.00%Mastercard, Inc. €300,000 2.10% 1/12/2027 384,131 0.00%UBS Commercial Mortgage Trust 2018 $350,000 3.98% 15/2/2051 384,069 0.00%CSAIL 2018-CX11 Commercial Mortgage Trust^ $350,000 4.03% 15/4/2051 384,027 0.00%FedEx Corp. $400,000 4.05% 15/2/2048 383,888 0.00%salesforce.com, Inc. $350,000 3.70% 11/4/2028 383,751 0.00%Carlyle Finance LLC $325,000 5.65% 15/9/2048 383,260 0.00%Federal Realty Investment Trust $335,000 4.50% 1/12/2044 383,174 0.00%Federal National Mortgage Association $335,986 6.00% 1/5/2038 382,995 0.00%Penske Truck Leasing Co. LP/PTL Finance Corp. $375,000 3.38% 1/2/2022 382,857 0.00%Prudential Financial, Inc. $350,000 3.88% 27/3/2028 382,844 0.00%Duke Energy Progress LLC $350,000 3.70% 1/9/2028 381,825 0.00%Ford Credit Canada Co. CA($)500,000 2.71% 23/2/2022 381,754 0.00%General Electric Co. $350,000 4.50% 11/3/2044 381,546 0.00%Equinix, Inc. $380,000 2.63% 18/11/2024 381,461 0.00%United Technologies Corp. $350,000 3.75% 1/11/2046 381,325 0.00%Boston Scientific Corp. $325,000 4.55% 1/3/2039 381,251 0.00%Home Depot, Inc. $320,000 4.40% 15/3/2045 380,922 0.00%Johnson & Johnson $375,000 2.45% 1/3/2026 380,777 0.00%
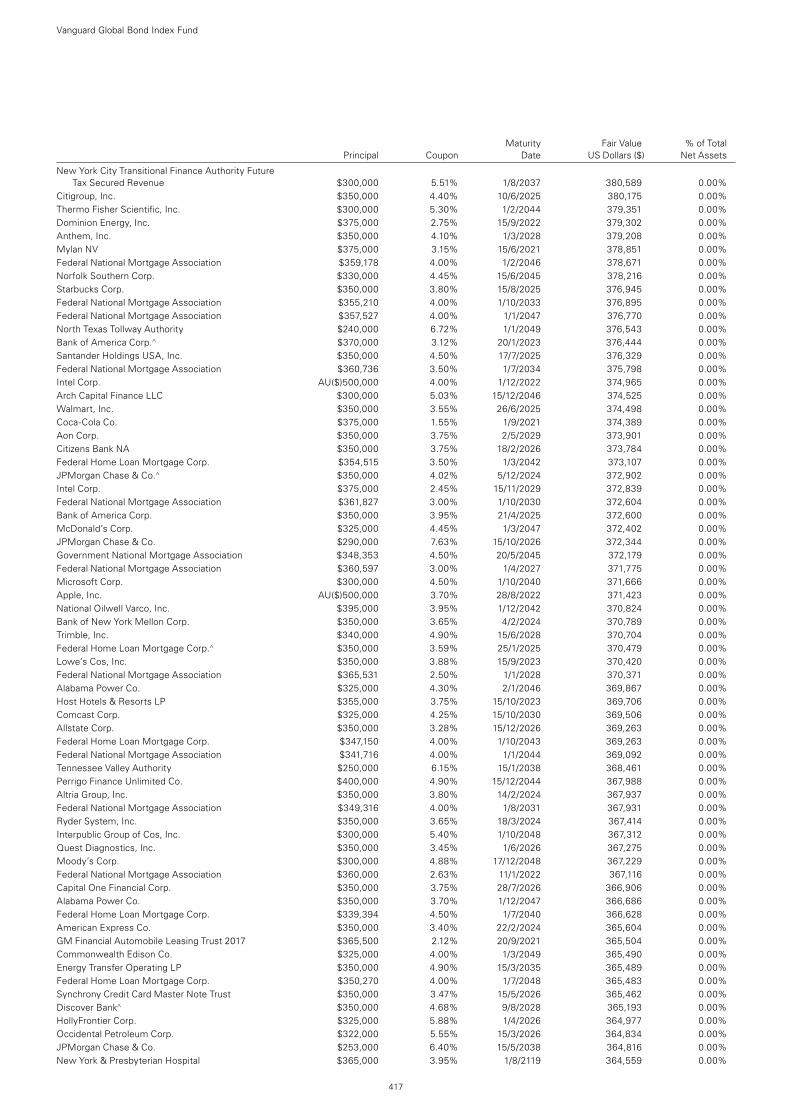
Vanguard Global Bond Index Fund
417
New York City Transitional Finance Authority Future Tax Secured Revenue $300,000 5.51% 1/8/2037 380,589 0.00%
Citigroup, Inc. $350,000 4.40% 10/6/2025 380,175 0.00%Thermo Fisher Scientific, Inc. $300,000 5.30% 1/2/2044 379,351 0.00%Dominion Energy, Inc. $375,000 2.75% 15/9/2022 379,302 0.00%Anthem, Inc. $350,000 4.10% 1/3/2028 379,208 0.00%Mylan NV $375,000 3.15% 15/6/2021 378,851 0.00%Federal National Mortgage Association $359,178 4.00% 1/2/2046 378,671 0.00%Norfolk Southern Corp. $330,000 4.45% 15/6/2045 378,216 0.00%Starbucks Corp. $350,000 3.80% 15/8/2025 376,945 0.00%Federal National Mortgage Association $355,210 4.00% 1/10/2033 376,895 0.00%Federal National Mortgage Association $357,527 4.00% 1/1/2047 376,770 0.00%North Texas Tollway Authority $240,000 6.72% 1/1/2049 376,543 0.00%Bank of America Corp.^ $370,000 3.12% 20/1/2023 376,444 0.00%Santander Holdings USA, Inc. $350,000 4.50% 17/7/2025 376,329 0.00%Federal National Mortgage Association $360,736 3.50% 1/7/2034 375,798 0.00%Intel Corp. AU($)500,000 4.00% 1/12/2022 374,965 0.00%Arch Capital Finance LLC $300,000 5.03% 15/12/2046 374,525 0.00%Walmart, Inc. $350,000 3.55% 26/6/2025 374,498 0.00%Coca-Cola Co. $375,000 1.55% 1/9/2021 374,389 0.00%Aon Corp. $350,000 3.75% 2/5/2029 373,901 0.00%Citizens Bank NA $350,000 3.75% 18/2/2026 373,784 0.00%Federal Home Loan Mortgage Corp. $354,515 3.50% 1/3/2042 373,107 0.00%JPMorgan Chase & Co.^ $350,000 4.02% 5/12/2024 372,902 0.00%Intel Corp. $375,000 2.45% 15/11/2029 372,839 0.00%Federal National Mortgage Association $361,827 3.00% 1/10/2030 372,604 0.00%Bank of America Corp. $350,000 3.95% 21/4/2025 372,600 0.00%McDonald’s Corp. $325,000 4.45% 1/3/2047 372,402 0.00%JPMorgan Chase & Co. $290,000 7.63% 15/10/2026 372,344 0.00%Government National Mortgage Association $348,353 4.50% 20/5/2045 372,179 0.00%Federal National Mortgage Association $360,597 3.00% 1/4/2027 371,775 0.00%Microsoft Corp. $300,000 4.50% 1/10/2040 371,666 0.00%Apple, Inc. AU($)500,000 3.70% 28/8/2022 371,423 0.00%National Oilwell Varco, Inc. $395,000 3.95% 1/12/2042 370,824 0.00%Bank of New York Mellon Corp. $350,000 3.65% 4/2/2024 370,789 0.00%Trimble, Inc. $340,000 4.90% 15/6/2028 370,704 0.00%Federal Home Loan Mortgage Corp.^ $350,000 3.59% 25/1/2025 370,479 0.00%Lowe’s Cos, Inc. $350,000 3.88% 15/9/2023 370,420 0.00%Federal National Mortgage Association $365,531 2.50% 1/1/2028 370,371 0.00%Alabama Power Co. $325,000 4.30% 2/1/2046 369,867 0.00%Host Hotels & Resorts LP $355,000 3.75% 15/10/2023 369,706 0.00%Comcast Corp. $325,000 4.25% 15/10/2030 369,506 0.00%Allstate Corp. $350,000 3.28% 15/12/2026 369,263 0.00%Federal Home Loan Mortgage Corp. $347,150 4.00% 1/10/2043 369,263 0.00%Federal National Mortgage Association $341,716 4.00% 1/1/2044 369,092 0.00%Tennessee Valley Authority $250,000 6.15% 15/1/2038 368,461 0.00%Perrigo Finance Unlimited Co. $400,000 4.90% 15/12/2044 367,988 0.00%Altria Group, Inc. $350,000 3.80% 14/2/2024 367,937 0.00%Federal National Mortgage Association $349,316 4.00% 1/8/2031 367,931 0.00%Ryder System, Inc. $350,000 3.65% 18/3/2024 367,414 0.00%Interpublic Group of Cos, Inc. $300,000 5.40% 1/10/2048 367,312 0.00%Quest Diagnostics, Inc. $350,000 3.45% 1/6/2026 367,275 0.00%Moody’s Corp. $300,000 4.88% 17/12/2048 367,229 0.00%Federal National Mortgage Association $360,000 2.63% 11/1/2022 367,116 0.00%Capital One Financial Corp. $350,000 3.75% 28/7/2026 366,906 0.00%Alabama Power Co. $350,000 3.70% 1/12/2047 366,686 0.00%Federal Home Loan Mortgage Corp. $339,394 4.50% 1/7/2040 366,628 0.00%American Express Co. $350,000 3.40% 22/2/2024 365,604 0.00%GM Financial Automobile Leasing Trust 2017 $365,500 2.12% 20/9/2021 365,504 0.00%Commonwealth Edison Co. $325,000 4.00% 1/3/2049 365,490 0.00%Energy Transfer Operating LP $350,000 4.90% 15/3/2035 365,489 0.00%Federal Home Loan Mortgage Corp. $350,270 4.00% 1/7/2048 365,483 0.00%Synchrony Credit Card Master Note Trust $350,000 3.47% 15/5/2026 365,462 0.00%Discover Bank^ $350,000 4.68% 9/8/2028 365,193 0.00%HollyFrontier Corp. $325,000 5.88% 1/4/2026 364,977 0.00%Occidental Petroleum Corp. $322,000 5.55% 15/3/2026 364,834 0.00%JPMorgan Chase & Co. $253,000 6.40% 15/5/2038 364,816 0.00%New York & Presbyterian Hospital $365,000 3.95% 1/8/2119 364,559 0.00%
Maturity Fair Value % of Total Principal Coupon Date US Dollars ($) Net Assets
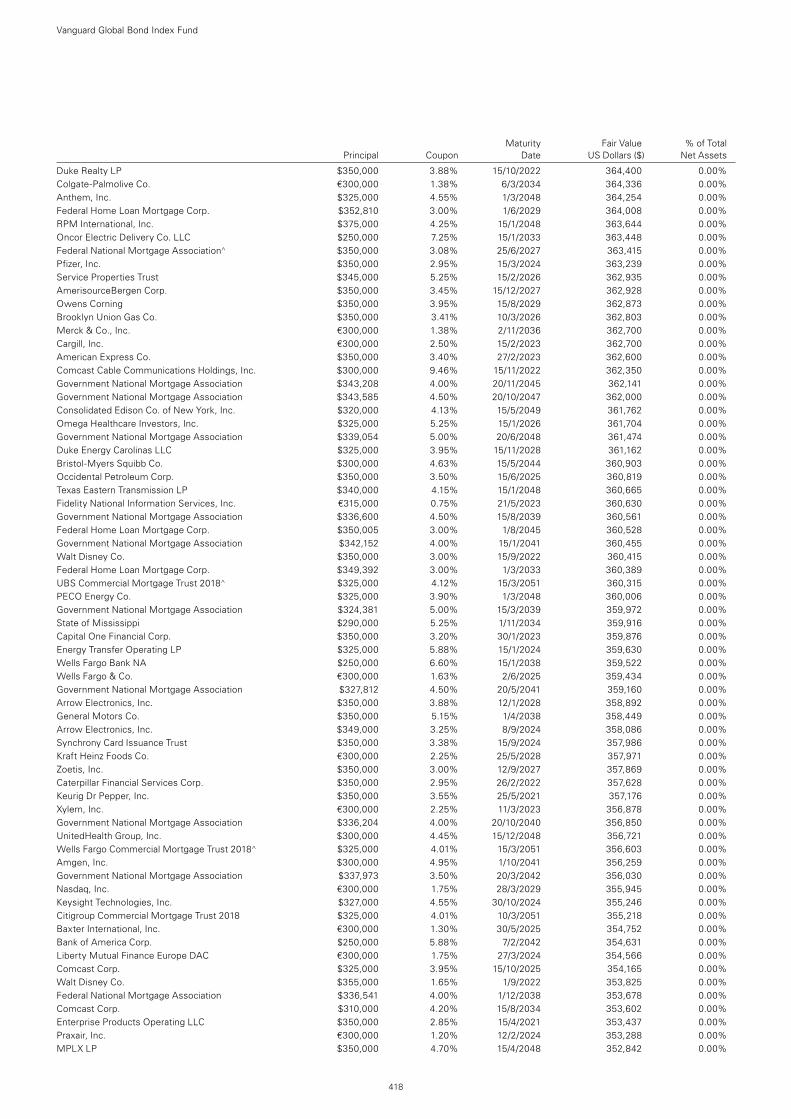
Vanguard Global Bond Index Fund
418
Duke Realty LP $350,000 3.88% 15/10/2022 364,400 0.00%Colgate-Palmolive Co. €300,000 1.38% 6/3/2034 364,336 0.00%Anthem, Inc. $325,000 4.55% 1/3/2048 364,254 0.00%Federal Home Loan Mortgage Corp. $352,810 3.00% 1/6/2029 364,008 0.00%RPM International, Inc. $375,000 4.25% 15/1/2048 363,644 0.00%Oncor Electric Delivery Co. LLC $250,000 7.25% 15/1/2033 363,448 0.00%Federal National Mortgage Association^ $350,000 3.08% 25/6/2027 363,415 0.00%Pfizer, Inc. $350,000 2.95% 15/3/2024 363,239 0.00%Service Properties Trust $345,000 5.25% 15/2/2026 362,935 0.00%AmerisourceBergen Corp. $350,000 3.45% 15/12/2027 362,928 0.00%Owens Corning $350,000 3.95% 15/8/2029 362,873 0.00%Brooklyn Union Gas Co. $350,000 3.41% 10/3/2026 362,803 0.00%Merck & Co., Inc. €300,000 1.38% 2/11/2036 362,700 0.00%Cargill, Inc. €300,000 2.50% 15/2/2023 362,700 0.00%American Express Co. $350,000 3.40% 27/2/2023 362,600 0.00%Comcast Cable Communications Holdings, Inc. $300,000 9.46% 15/11/2022 362,350 0.00%Government National Mortgage Association $343,208 4.00% 20/11/2045 362,141 0.00%Government National Mortgage Association $343,585 4.50% 20/10/2047 362,000 0.00%Consolidated Edison Co. of New York, Inc. $320,000 4.13% 15/5/2049 361,762 0.00%Omega Healthcare Investors, Inc. $325,000 5.25% 15/1/2026 361,704 0.00%Government National Mortgage Association $339,054 5.00% 20/6/2048 361,474 0.00%Duke Energy Carolinas LLC $325,000 3.95% 15/11/2028 361,162 0.00%Bristol-Myers Squibb Co. $300,000 4.63% 15/5/2044 360,903 0.00%Occidental Petroleum Corp. $350,000 3.50% 15/6/2025 360,819 0.00%Texas Eastern Transmission LP $340,000 4.15% 15/1/2048 360,665 0.00%Fidelity National Information Services, Inc. €315,000 0.75% 21/5/2023 360,630 0.00%Government National Mortgage Association $336,600 4.50% 15/8/2039 360,561 0.00%Federal Home Loan Mortgage Corp. $350,005 3.00% 1/8/2045 360,528 0.00%Government National Mortgage Association $342,152 4.00% 15/1/2041 360,455 0.00%Walt Disney Co. $350,000 3.00% 15/9/2022 360,415 0.00%Federal Home Loan Mortgage Corp. $349,392 3.00% 1/3/2033 360,389 0.00%UBS Commercial Mortgage Trust 2018^ $325,000 4.12% 15/3/2051 360,315 0.00%PECO Energy Co. $325,000 3.90% 1/3/2048 360,006 0.00%Government National Mortgage Association $324,381 5.00% 15/3/2039 359,972 0.00%State of Mississippi $290,000 5.25% 1/11/2034 359,916 0.00%Capital One Financial Corp. $350,000 3.20% 30/1/2023 359,876 0.00%Energy Transfer Operating LP $325,000 5.88% 15/1/2024 359,630 0.00%Wells Fargo Bank NA $250,000 6.60% 15/1/2038 359,522 0.00%Wells Fargo & Co. €300,000 1.63% 2/6/2025 359,434 0.00%Government National Mortgage Association $327,812 4.50% 20/5/2041 359,160 0.00%Arrow Electronics, Inc. $350,000 3.88% 12/1/2028 358,892 0.00%General Motors Co. $350,000 5.15% 1/4/2038 358,449 0.00%Arrow Electronics, Inc. $349,000 3.25% 8/9/2024 358,086 0.00%Synchrony Card Issuance Trust $350,000 3.38% 15/9/2024 357,986 0.00%Kraft Heinz Foods Co. €300,000 2.25% 25/5/2028 357,971 0.00%Zoetis, Inc. $350,000 3.00% 12/9/2027 357,869 0.00%Caterpillar Financial Services Corp. $350,000 2.95% 26/2/2022 357,628 0.00%Keurig Dr Pepper, Inc. $350,000 3.55% 25/5/2021 357,176 0.00%Xylem, Inc. €300,000 2.25% 11/3/2023 356,878 0.00%Government National Mortgage Association $336,204 4.00% 20/10/2040 356,850 0.00%UnitedHealth Group, Inc. $300,000 4.45% 15/12/2048 356,721 0.00%Wells Fargo Commercial Mortgage Trust 2018^ $325,000 4.01% 15/3/2051 356,603 0.00%Amgen, Inc. $300,000 4.95% 1/10/2041 356,259 0.00%Government National Mortgage Association $337,973 3.50% 20/3/2042 356,030 0.00%Nasdaq, Inc. €300,000 1.75% 28/3/2029 355,945 0.00%Keysight Technologies, Inc. $327,000 4.55% 30/10/2024 355,246 0.00%Citigroup Commercial Mortgage Trust 2018 $325,000 4.01% 10/3/2051 355,218 0.00%Baxter International, Inc. €300,000 1.30% 30/5/2025 354,752 0.00%Bank of America Corp. $250,000 5.88% 7/2/2042 354,631 0.00%Liberty Mutual Finance Europe DAC €300,000 1.75% 27/3/2024 354,566 0.00%Comcast Corp. $325,000 3.95% 15/10/2025 354,165 0.00%Walt Disney Co. $355,000 1.65% 1/9/2022 353,825 0.00%Federal National Mortgage Association $336,541 4.00% 1/12/2038 353,678 0.00%Comcast Corp. $310,000 4.20% 15/8/2034 353,602 0.00%Enterprise Products Operating LLC $350,000 2.85% 15/4/2021 353,437 0.00%Praxair, Inc. €300,000 1.20% 12/2/2024 353,288 0.00%MPLX LP $350,000 4.70% 15/4/2048 352,842 0.00%
Maturity Fair Value % of Total Principal Coupon Date US Dollars ($) Net Assets
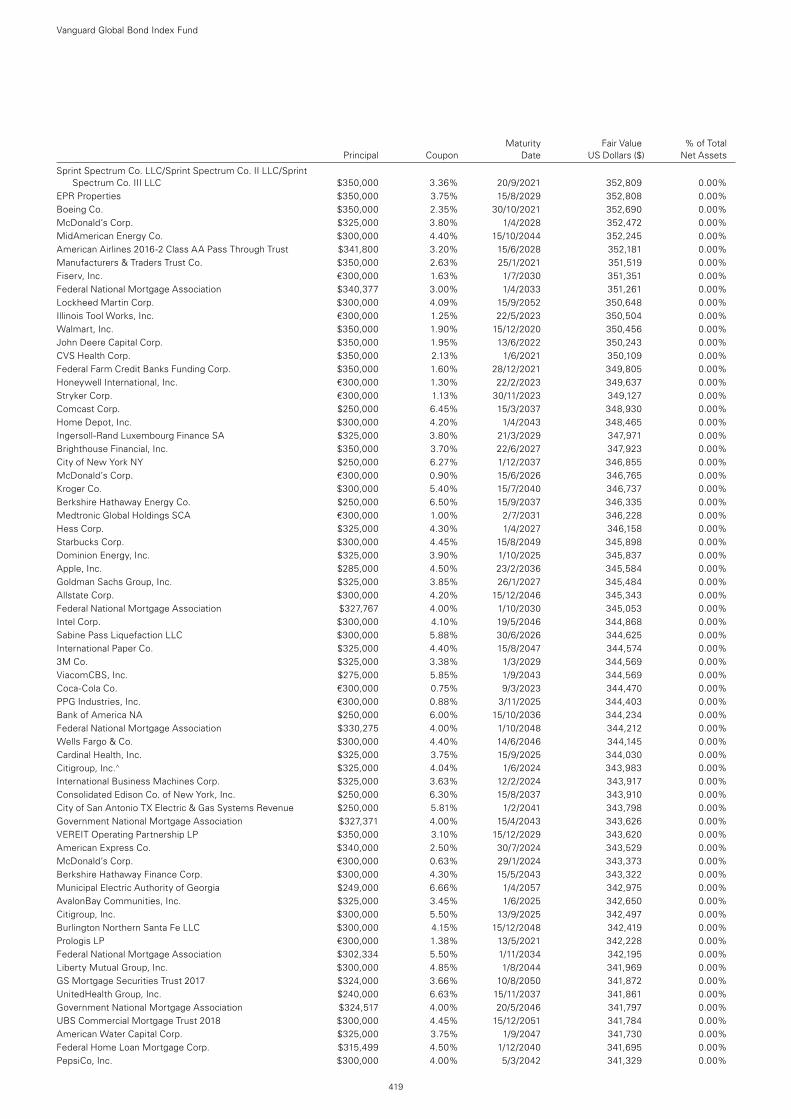
Maturity Fair Value % of Total Principal Coupon Date US Dollars ($) Net Assets
Vanguard Global Bond Index Fund
419
Sprint Spectrum Co. LLC/Sprint Spectrum Co. II LLC/Sprint Spectrum Co. III LLC $350,000 3.36% 20/9/2021 352,809 0.00%
EPR Properties $350,000 3.75% 15/8/2029 352,808 0.00%Boeing Co. $350,000 2.35% 30/10/2021 352,690 0.00%McDonald’s Corp. $325,000 3.80% 1/4/2028 352,472 0.00%MidAmerican Energy Co. $300,000 4.40% 15/10/2044 352,245 0.00%American Airlines 2016-2 Class AA Pass Through Trust $341,800 3.20% 15/6/2028 352,181 0.00%Manufacturers & Traders Trust Co. $350,000 2.63% 25/1/2021 351,519 0.00%Fiserv, Inc. €300,000 1.63% 1/7/2030 351,351 0.00%Federal National Mortgage Association $340,377 3.00% 1/4/2033 351,261 0.00%Lockheed Martin Corp. $300,000 4.09% 15/9/2052 350,648 0.00%Illinois Tool Works, Inc. €300,000 1.25% 22/5/2023 350,504 0.00%Walmart, Inc. $350,000 1.90% 15/12/2020 350,456 0.00%John Deere Capital Corp. $350,000 1.95% 13/6/2022 350,243 0.00%CVS Health Corp. $350,000 2.13% 1/6/2021 350,109 0.00%Federal Farm Credit Banks Funding Corp. $350,000 1.60% 28/12/2021 349,805 0.00%Honeywell International, Inc. €300,000 1.30% 22/2/2023 349,637 0.00%Stryker Corp. €300,000 1.13% 30/11/2023 349,127 0.00%Comcast Corp. $250,000 6.45% 15/3/2037 348,930 0.00%Home Depot, Inc. $300,000 4.20% 1/4/2043 348,465 0.00%Ingersoll-Rand Luxembourg Finance SA $325,000 3.80% 21/3/2029 347,971 0.00%Brighthouse Financial, Inc. $350,000 3.70% 22/6/2027 347,923 0.00%City of New York NY $250,000 6.27% 1/12/2037 346,855 0.00%McDonald’s Corp. €300,000 0.90% 15/6/2026 346,765 0.00%Kroger Co. $300,000 5.40% 15/7/2040 346,737 0.00%Berkshire Hathaway Energy Co. $250,000 6.50% 15/9/2037 346,335 0.00%Medtronic Global Holdings SCA €300,000 1.00% 2/7/2031 346,228 0.00%Hess Corp. $325,000 4.30% 1/4/2027 346,158 0.00%Starbucks Corp. $300,000 4.45% 15/8/2049 345,898 0.00%Dominion Energy, Inc. $325,000 3.90% 1/10/2025 345,837 0.00%Apple, Inc. $285,000 4.50% 23/2/2036 345,584 0.00%Goldman Sachs Group, Inc. $325,000 3.85% 26/1/2027 345,484 0.00%Allstate Corp. $300,000 4.20% 15/12/2046 345,343 0.00%Federal National Mortgage Association $327,767 4.00% 1/10/2030 345,053 0.00%Intel Corp. $300,000 4.10% 19/5/2046 344,868 0.00%Sabine Pass Liquefaction LLC $300,000 5.88% 30/6/2026 344,625 0.00%International Paper Co. $325,000 4.40% 15/8/2047 344,574 0.00%3M Co. $325,000 3.38% 1/3/2029 344,569 0.00%ViacomCBS, Inc. $275,000 5.85% 1/9/2043 344,569 0.00%Coca-Cola Co. €300,000 0.75% 9/3/2023 344,470 0.00%PPG Industries, Inc. €300,000 0.88% 3/11/2025 344,403 0.00%Bank of America NA $250,000 6.00% 15/10/2036 344,234 0.00%Federal National Mortgage Association $330,275 4.00% 1/10/2048 344,212 0.00%Wells Fargo & Co. $300,000 4.40% 14/6/2046 344,145 0.00%Cardinal Health, Inc. $325,000 3.75% 15/9/2025 344,030 0.00%Citigroup, Inc.^ $325,000 4.04% 1/6/2024 343,983 0.00%International Business Machines Corp. $325,000 3.63% 12/2/2024 343,917 0.00%Consolidated Edison Co. of New York, Inc. $250,000 6.30% 15/8/2037 343,910 0.00%City of San Antonio TX Electric & Gas Systems Revenue $250,000 5.81% 1/2/2041 343,798 0.00%Government National Mortgage Association $327,371 4.00% 15/4/2043 343,626 0.00%VEREIT Operating Partnership LP $350,000 3.10% 15/12/2029 343,620 0.00%American Express Co. $340,000 2.50% 30/7/2024 343,529 0.00%McDonald’s Corp. €300,000 0.63% 29/1/2024 343,373 0.00%Berkshire Hathaway Finance Corp. $300,000 4.30% 15/5/2043 343,322 0.00%Municipal Electric Authority of Georgia $249,000 6.66% 1/4/2057 342,975 0.00%AvalonBay Communities, Inc. $325,000 3.45% 1/6/2025 342,650 0.00%Citigroup, Inc. $300,000 5.50% 13/9/2025 342,497 0.00%Burlington Northern Santa Fe LLC $300,000 4.15% 15/12/2048 342,419 0.00%Prologis LP €300,000 1.38% 13/5/2021 342,228 0.00%Federal National Mortgage Association $302,334 5.50% 1/11/2034 342,195 0.00%Liberty Mutual Group, Inc. $300,000 4.85% 1/8/2044 341,969 0.00%GS Mortgage Securities Trust 2017 $324,000 3.66% 10/8/2050 341,872 0.00%UnitedHealth Group, Inc. $240,000 6.63% 15/11/2037 341,861 0.00%Government National Mortgage Association $324,517 4.00% 20/5/2046 341,797 0.00%UBS Commercial Mortgage Trust 2018 $300,000 4.45% 15/12/2051 341,784 0.00%American Water Capital Corp. $325,000 3.75% 1/9/2047 341,730 0.00%Federal Home Loan Mortgage Corp. $315,499 4.50% 1/12/2040 341,695 0.00%PepsiCo, Inc. $300,000 4.00% 5/3/2042 341,329 0.00%
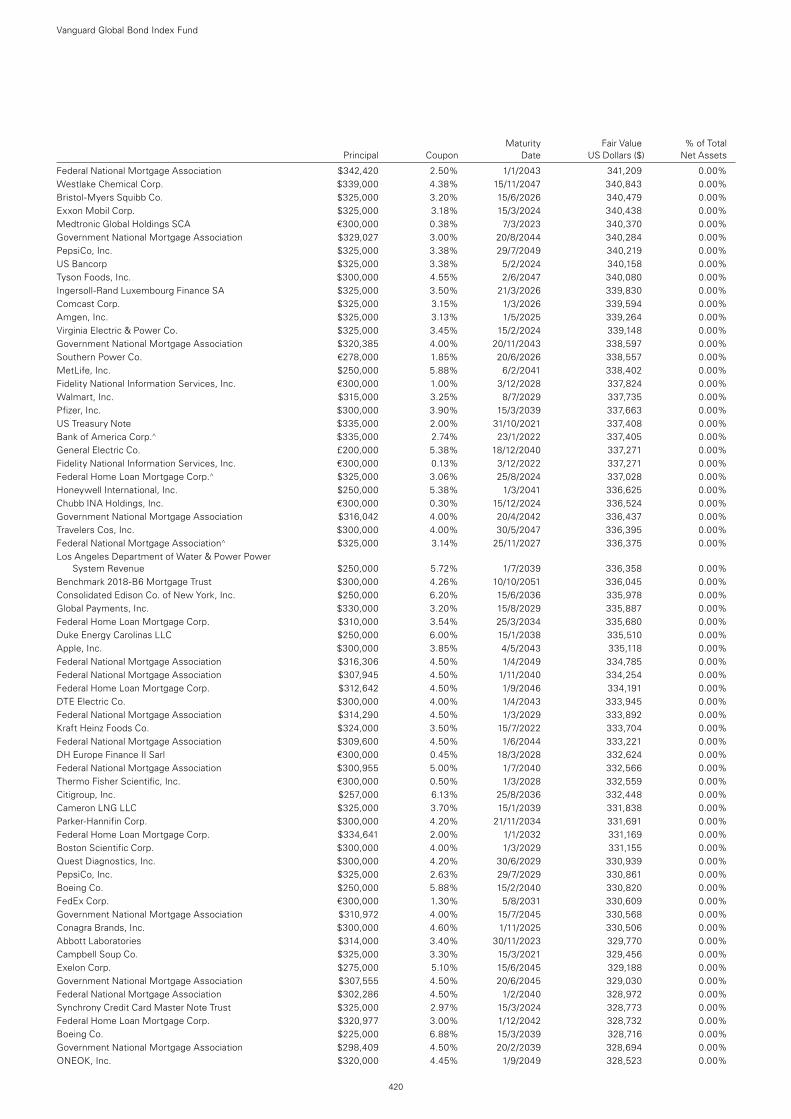
Maturity Fair Value % of Total Principal Coupon Date US Dollars ($) Net Assets
Vanguard Global Bond Index Fund
420
Federal National Mortgage Association $342,420 2.50% 1/1/2043 341,209 0.00%Westlake Chemical Corp. $339,000 4.38% 15/11/2047 340,843 0.00%Bristol-Myers Squibb Co. $325,000 3.20% 15/6/2026 340,479 0.00%Exxon Mobil Corp. $325,000 3.18% 15/3/2024 340,438 0.00%Medtronic Global Holdings SCA €300,000 0.38% 7/3/2023 340,370 0.00%Government National Mortgage Association $329,027 3.00% 20/8/2044 340,284 0.00%PepsiCo, Inc. $325,000 3.38% 29/7/2049 340,219 0.00%US Bancorp $325,000 3.38% 5/2/2024 340,158 0.00%Tyson Foods, Inc. $300,000 4.55% 2/6/2047 340,080 0.00%Ingersoll-Rand Luxembourg Finance SA $325,000 3.50% 21/3/2026 339,830 0.00%Comcast Corp. $325,000 3.15% 1/3/2026 339,594 0.00%Amgen, Inc. $325,000 3.13% 1/5/2025 339,264 0.00%Virginia Electric & Power Co. $325,000 3.45% 15/2/2024 339,148 0.00%Government National Mortgage Association $320,385 4.00% 20/11/2043 338,597 0.00%Southern Power Co. €278,000 1.85% 20/6/2026 338,557 0.00%MetLife, Inc. $250,000 5.88% 6/2/2041 338,402 0.00%Fidelity National Information Services, Inc. €300,000 1.00% 3/12/2028 337,824 0.00%Walmart, Inc. $315,000 3.25% 8/7/2029 337,735 0.00%Pfizer, Inc. $300,000 3.90% 15/3/2039 337,663 0.00%US Treasury Note $335,000 2.00% 31/10/2021 337,408 0.00%Bank of America Corp.^ $335,000 2.74% 23/1/2022 337,405 0.00%General Electric Co. £200,000 5.38% 18/12/2040 337,271 0.00%Fidelity National Information Services, Inc. €300,000 0.13% 3/12/2022 337,271 0.00%Federal Home Loan Mortgage Corp.^ $325,000 3.06% 25/8/2024 337,028 0.00%Honeywell International, Inc. $250,000 5.38% 1/3/2041 336,625 0.00%Chubb INA Holdings, Inc. €300,000 0.30% 15/12/2024 336,524 0.00%Government National Mortgage Association $316,042 4.00% 20/4/2042 336,437 0.00%Travelers Cos, Inc. $300,000 4.00% 30/5/2047 336,395 0.00%Federal National Mortgage Association^ $325,000 3.14% 25/11/2027 336,375 0.00%Los Angeles Department of Water & Power Power
System Revenue $250,000 5.72% 1/7/2039 336,358 0.00%Benchmark 2018-B6 Mortgage Trust $300,000 4.26% 10/10/2051 336,045 0.00%Consolidated Edison Co. of New York, Inc. $250,000 6.20% 15/6/2036 335,978 0.00%Global Payments, Inc. $330,000 3.20% 15/8/2029 335,887 0.00%Federal Home Loan Mortgage Corp. $310,000 3.54% 25/3/2034 335,680 0.00%Duke Energy Carolinas LLC $250,000 6.00% 15/1/2038 335,510 0.00%Apple, Inc. $300,000 3.85% 4/5/2043 335,118 0.00%Federal National Mortgage Association $316,306 4.50% 1/4/2049 334,785 0.00%Federal National Mortgage Association $307,945 4.50% 1/11/2040 334,254 0.00%Federal Home Loan Mortgage Corp. $312,642 4.50% 1/9/2046 334,191 0.00%DTE Electric Co. $300,000 4.00% 1/4/2043 333,945 0.00%Federal National Mortgage Association $314,290 4.50% 1/3/2029 333,892 0.00%Kraft Heinz Foods Co. $324,000 3.50% 15/7/2022 333,704 0.00%Federal National Mortgage Association $309,600 4.50% 1/6/2044 333,221 0.00%DH Europe Finance II Sarl €300,000 0.45% 18/3/2028 332,624 0.00%Federal National Mortgage Association $300,955 5.00% 1/7/2040 332,566 0.00%Thermo Fisher Scientific, Inc. €300,000 0.50% 1/3/2028 332,559 0.00%Citigroup, Inc. $257,000 6.13% 25/8/2036 332,448 0.00%Cameron LNG LLC $325,000 3.70% 15/1/2039 331,838 0.00%Parker-Hannifin Corp. $300,000 4.20% 21/11/2034 331,691 0.00%Federal Home Loan Mortgage Corp. $334,641 2.00% 1/1/2032 331,169 0.00%Boston Scientific Corp. $300,000 4.00% 1/3/2029 331,155 0.00%Quest Diagnostics, Inc. $300,000 4.20% 30/6/2029 330,939 0.00%PepsiCo, Inc. $325,000 2.63% 29/7/2029 330,861 0.00%Boeing Co. $250,000 5.88% 15/2/2040 330,820 0.00%FedEx Corp. €300,000 1.30% 5/8/2031 330,609 0.00%Government National Mortgage Association $310,972 4.00% 15/7/2045 330,568 0.00%Conagra Brands, Inc. $300,000 4.60% 1/11/2025 330,506 0.00%Abbott Laboratories $314,000 3.40% 30/11/2023 329,770 0.00%Campbell Soup Co. $325,000 3.30% 15/3/2021 329,456 0.00%Exelon Corp. $275,000 5.10% 15/6/2045 329,188 0.00%Government National Mortgage Association $307,555 4.50% 20/6/2045 329,030 0.00%Federal National Mortgage Association $302,286 4.50% 1/2/2040 328,972 0.00%Synchrony Credit Card Master Note Trust $325,000 2.97% 15/3/2024 328,773 0.00%Federal Home Loan Mortgage Corp. $320,977 3.00% 1/12/2042 328,732 0.00%Boeing Co. $225,000 6.88% 15/3/2039 328,716 0.00%Government National Mortgage Association $298,409 4.50% 20/2/2039 328,694 0.00%ONEOK, Inc. $320,000 4.45% 1/9/2049 328,523 0.00%
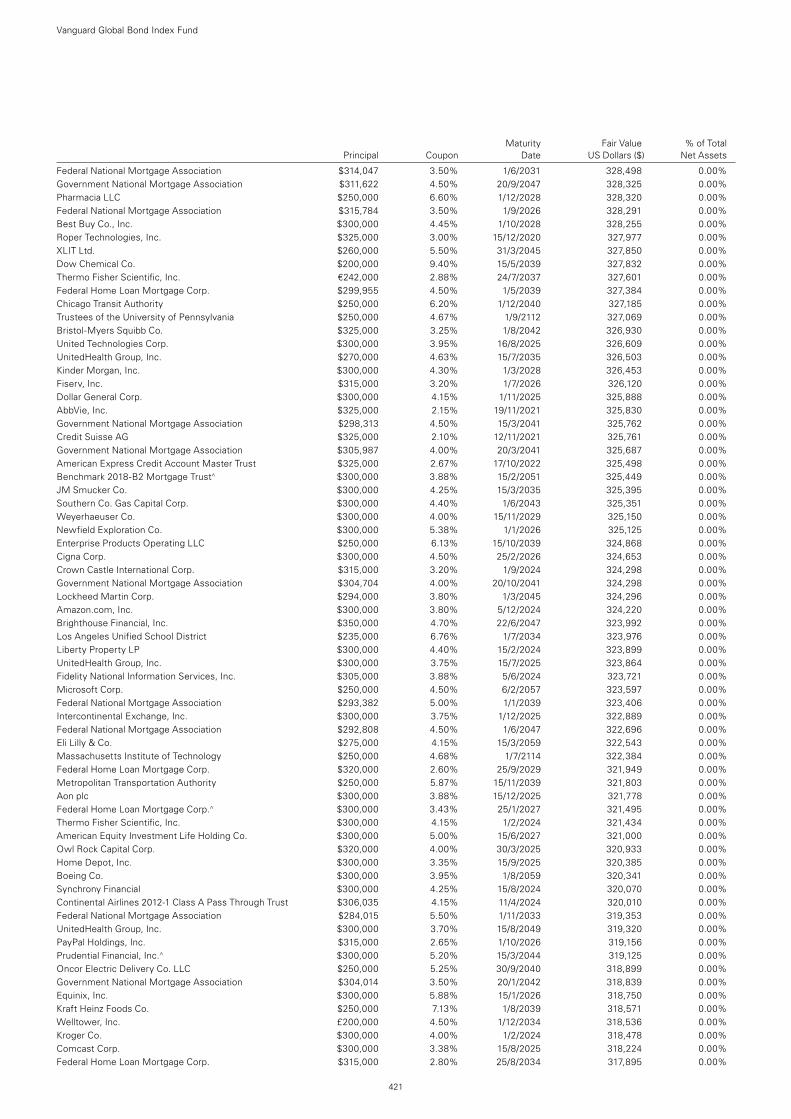
Maturity Fair Value % of Total Principal Coupon Date US Dollars ($) Net Assets
Vanguard Global Bond Index Fund
421
Federal National Mortgage Association $314,047 3.50% 1/6/2031 328,498 0.00%Government National Mortgage Association $311,622 4.50% 20/9/2047 328,325 0.00%Pharmacia LLC $250,000 6.60% 1/12/2028 328,320 0.00%Federal National Mortgage Association $315,784 3.50% 1/9/2026 328,291 0.00%Best Buy Co., Inc. $300,000 4.45% 1/10/2028 328,255 0.00%Roper Technologies, Inc. $325,000 3.00% 15/12/2020 327,977 0.00%XLIT Ltd. $260,000 5.50% 31/3/2045 327,850 0.00%Dow Chemical Co. $200,000 9.40% 15/5/2039 327,832 0.00%Thermo Fisher Scientific, Inc. €242,000 2.88% 24/7/2037 327,601 0.00%Federal Home Loan Mortgage Corp. $299,955 4.50% 1/5/2039 327,384 0.00%Chicago Transit Authority $250,000 6.20% 1/12/2040 327,185 0.00%Trustees of the University of Pennsylvania $250,000 4.67% 1/9/2112 327,069 0.00%Bristol-Myers Squibb Co. $325,000 3.25% 1/8/2042 326,930 0.00%United Technologies Corp. $300,000 3.95% 16/8/2025 326,609 0.00%UnitedHealth Group, Inc. $270,000 4.63% 15/7/2035 326,503 0.00%Kinder Morgan, Inc. $300,000 4.30% 1/3/2028 326,453 0.00%Fiserv, Inc. $315,000 3.20% 1/7/2026 326,120 0.00%Dollar General Corp. $300,000 4.15% 1/11/2025 325,888 0.00%AbbVie, Inc. $325,000 2.15% 19/11/2021 325,830 0.00%Government National Mortgage Association $298,313 4.50% 15/3/2041 325,762 0.00%Credit Suisse AG $325,000 2.10% 12/11/2021 325,761 0.00%Government National Mortgage Association $305,987 4.00% 20/3/2041 325,687 0.00%American Express Credit Account Master Trust $325,000 2.67% 17/10/2022 325,498 0.00%Benchmark 2018-B2 Mortgage Trust^ $300,000 3.88% 15/2/2051 325,449 0.00%JM Smucker Co. $300,000 4.25% 15/3/2035 325,395 0.00%Southern Co. Gas Capital Corp. $300,000 4.40% 1/6/2043 325,351 0.00%Weyerhaeuser Co. $300,000 4.00% 15/11/2029 325,150 0.00%Newfield Exploration Co. $300,000 5.38% 1/1/2026 325,125 0.00%Enterprise Products Operating LLC $250,000 6.13% 15/10/2039 324,868 0.00%Cigna Corp. $300,000 4.50% 25/2/2026 324,653 0.00%Crown Castle International Corp. $315,000 3.20% 1/9/2024 324,298 0.00%Government National Mortgage Association $304,704 4.00% 20/10/2041 324,298 0.00%Lockheed Martin Corp. $294,000 3.80% 1/3/2045 324,296 0.00%Amazon.com, Inc. $300,000 3.80% 5/12/2024 324,220 0.00%Brighthouse Financial, Inc. $350,000 4.70% 22/6/2047 323,992 0.00%Los Angeles Unified School District $235,000 6.76% 1/7/2034 323,976 0.00%Liberty Property LP $300,000 4.40% 15/2/2024 323,899 0.00%UnitedHealth Group, Inc. $300,000 3.75% 15/7/2025 323,864 0.00%Fidelity National Information Services, Inc. $305,000 3.88% 5/6/2024 323,721 0.00%Microsoft Corp. $250,000 4.50% 6/2/2057 323,597 0.00%Federal National Mortgage Association $293,382 5.00% 1/1/2039 323,406 0.00%Intercontinental Exchange, Inc. $300,000 3.75% 1/12/2025 322,889 0.00%Federal National Mortgage Association $292,808 4.50% 1/6/2047 322,696 0.00%Eli Lilly & Co. $275,000 4.15% 15/3/2059 322,543 0.00%Massachusetts Institute of Technology $250,000 4.68% 1/7/2114 322,384 0.00%Federal Home Loan Mortgage Corp. $320,000 2.60% 25/9/2029 321,949 0.00%Metropolitan Transportation Authority $250,000 5.87% 15/11/2039 321,803 0.00%Aon plc $300,000 3.88% 15/12/2025 321,778 0.00%Federal Home Loan Mortgage Corp.^ $300,000 3.43% 25/1/2027 321,495 0.00%Thermo Fisher Scientific, Inc. $300,000 4.15% 1/2/2024 321,434 0.00%American Equity Investment Life Holding Co. $300,000 5.00% 15/6/2027 321,000 0.00%Owl Rock Capital Corp. $320,000 4.00% 30/3/2025 320,933 0.00%Home Depot, Inc. $300,000 3.35% 15/9/2025 320,385 0.00%Boeing Co. $300,000 3.95% 1/8/2059 320,341 0.00%Synchrony Financial $300,000 4.25% 15/8/2024 320,070 0.00%Continental Airlines 2012-1 Class A Pass Through Trust $306,035 4.15% 11/4/2024 320,010 0.00%Federal National Mortgage Association $284,015 5.50% 1/11/2033 319,353 0.00%UnitedHealth Group, Inc. $300,000 3.70% 15/8/2049 319,320 0.00%PayPal Holdings, Inc. $315,000 2.65% 1/10/2026 319,156 0.00%Prudential Financial, Inc.^ $300,000 5.20% 15/3/2044 319,125 0.00%Oncor Electric Delivery Co. LLC $250,000 5.25% 30/9/2040 318,899 0.00%Government National Mortgage Association $304,014 3.50% 20/1/2042 318,839 0.00%Equinix, Inc. $300,000 5.88% 15/1/2026 318,750 0.00%Kraft Heinz Foods Co. $250,000 7.13% 1/8/2039 318,571 0.00%Welltower, Inc. £200,000 4.50% 1/12/2034 318,536 0.00%Kroger Co. $300,000 4.00% 1/2/2024 318,478 0.00%Comcast Corp. $300,000 3.38% 15/8/2025 318,224 0.00%Federal Home Loan Mortgage Corp. $315,000 2.80% 25/8/2034 317,895 0.00%
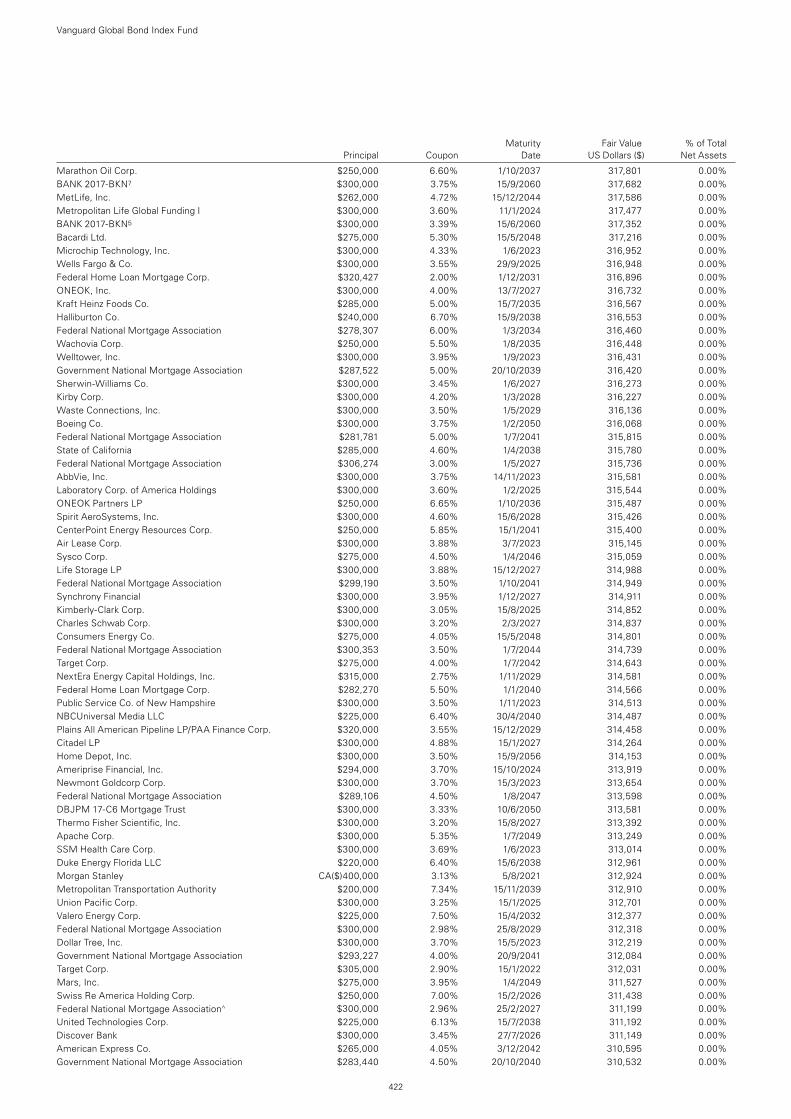
Maturity Fair Value % of Total Principal Coupon Date US Dollars ($) Net Assets
Vanguard Global Bond Index Fund
422
Marathon Oil Corp. $250,000 6.60% 1/10/2037 317,801 0.00%BANK 2017-BKN7 $300,000 3.75% 15/9/2060 317,682 0.00%MetLife, Inc. $262,000 4.72% 15/12/2044 317,586 0.00%Metropolitan Life Global Funding I $300,000 3.60% 11/1/2024 317,477 0.00%BANK 2017-BKN5 $300,000 3.39% 15/6/2060 317,352 0.00%Bacardi Ltd. $275,000 5.30% 15/5/2048 317,216 0.00%Microchip Technology, Inc. $300,000 4.33% 1/6/2023 316,952 0.00%Wells Fargo & Co. $300,000 3.55% 29/9/2025 316,948 0.00%Federal Home Loan Mortgage Corp. $320,427 2.00% 1/12/2031 316,896 0.00%ONEOK, Inc. $300,000 4.00% 13/7/2027 316,732 0.00%Kraft Heinz Foods Co. $285,000 5.00% 15/7/2035 316,567 0.00%Halliburton Co. $240,000 6.70% 15/9/2038 316,553 0.00%Federal National Mortgage Association $278,307 6.00% 1/3/2034 316,460 0.00%Wachovia Corp. $250,000 5.50% 1/8/2035 316,448 0.00%Welltower, Inc. $300,000 3.95% 1/9/2023 316,431 0.00%Government National Mortgage Association $287,522 5.00% 20/10/2039 316,420 0.00%Sherwin-Williams Co. $300,000 3.45% 1/6/2027 316,273 0.00%Kirby Corp. $300,000 4.20% 1/3/2028 316,227 0.00%Waste Connections, Inc. $300,000 3.50% 1/5/2029 316,136 0.00%Boeing Co. $300,000 3.75% 1/2/2050 316,068 0.00%Federal National Mortgage Association $281,781 5.00% 1/7/2041 315,815 0.00%State of California $285,000 4.60% 1/4/2038 315,780 0.00%Federal National Mortgage Association $306,274 3.00% 1/5/2027 315,736 0.00%AbbVie, Inc. $300,000 3.75% 14/11/2023 315,581 0.00%Laboratory Corp. of America Holdings $300,000 3.60% 1/2/2025 315,544 0.00%ONEOK Partners LP $250,000 6.65% 1/10/2036 315,487 0.00%Spirit AeroSystems, Inc. $300,000 4.60% 15/6/2028 315,426 0.00%CenterPoint Energy Resources Corp. $250,000 5.85% 15/1/2041 315,400 0.00%Air Lease Corp. $300,000 3.88% 3/7/2023 315,145 0.00%Sysco Corp. $275,000 4.50% 1/4/2046 315,059 0.00%Life Storage LP $300,000 3.88% 15/12/2027 314,988 0.00%Federal National Mortgage Association $299,190 3.50% 1/10/2041 314,949 0.00%Synchrony Financial $300,000 3.95% 1/12/2027 314,911 0.00%Kimberly-Clark Corp. $300,000 3.05% 15/8/2025 314,852 0.00%Charles Schwab Corp. $300,000 3.20% 2/3/2027 314,837 0.00%Consumers Energy Co. $275,000 4.05% 15/5/2048 314,801 0.00%Federal National Mortgage Association $300,353 3.50% 1/7/2044 314,739 0.00%Target Corp. $275,000 4.00% 1/7/2042 314,643 0.00%NextEra Energy Capital Holdings, Inc. $315,000 2.75% 1/11/2029 314,581 0.00%Federal Home Loan Mortgage Corp. $282,270 5.50% 1/1/2040 314,566 0.00%Public Service Co. of New Hampshire $300,000 3.50% 1/11/2023 314,513 0.00%NBCUniversal Media LLC $225,000 6.40% 30/4/2040 314,487 0.00%Plains All American Pipeline LP/PAA Finance Corp. $320,000 3.55% 15/12/2029 314,458 0.00%Citadel LP $300,000 4.88% 15/1/2027 314,264 0.00%Home Depot, Inc. $300,000 3.50% 15/9/2056 314,153 0.00%Ameriprise Financial, Inc. $294,000 3.70% 15/10/2024 313,919 0.00%Newmont Goldcorp Corp. $300,000 3.70% 15/3/2023 313,654 0.00%Federal National Mortgage Association $289,106 4.50% 1/8/2047 313,598 0.00%DBJPM 17-C6 Mortgage Trust $300,000 3.33% 10/6/2050 313,581 0.00%Thermo Fisher Scientific, Inc. $300,000 3.20% 15/8/2027 313,392 0.00%Apache Corp. $300,000 5.35% 1/7/2049 313,249 0.00%SSM Health Care Corp. $300,000 3.69% 1/6/2023 313,014 0.00%Duke Energy Florida LLC $220,000 6.40% 15/6/2038 312,961 0.00%Morgan Stanley CA($)400,000 3.13% 5/8/2021 312,924 0.00%Metropolitan Transportation Authority $200,000 7.34% 15/11/2039 312,910 0.00%Union Pacific Corp. $300,000 3.25% 15/1/2025 312,701 0.00%Valero Energy Corp. $225,000 7.50% 15/4/2032 312,377 0.00%Federal National Mortgage Association $300,000 2.98% 25/8/2029 312,318 0.00%Dollar Tree, Inc. $300,000 3.70% 15/5/2023 312,219 0.00%Government National Mortgage Association $293,227 4.00% 20/9/2041 312,084 0.00%Target Corp. $305,000 2.90% 15/1/2022 312,031 0.00%Mars, Inc. $275,000 3.95% 1/4/2049 311,527 0.00%Swiss Re America Holding Corp. $250,000 7.00% 15/2/2026 311,438 0.00%Federal National Mortgage Association^ $300,000 2.96% 25/2/2027 311,199 0.00%United Technologies Corp. $225,000 6.13% 15/7/2038 311,192 0.00%Discover Bank $300,000 3.45% 27/7/2026 311,149 0.00%American Express Co. $265,000 4.05% 3/12/2042 310,595 0.00%Government National Mortgage Association $283,440 4.50% 20/10/2040 310,532 0.00%
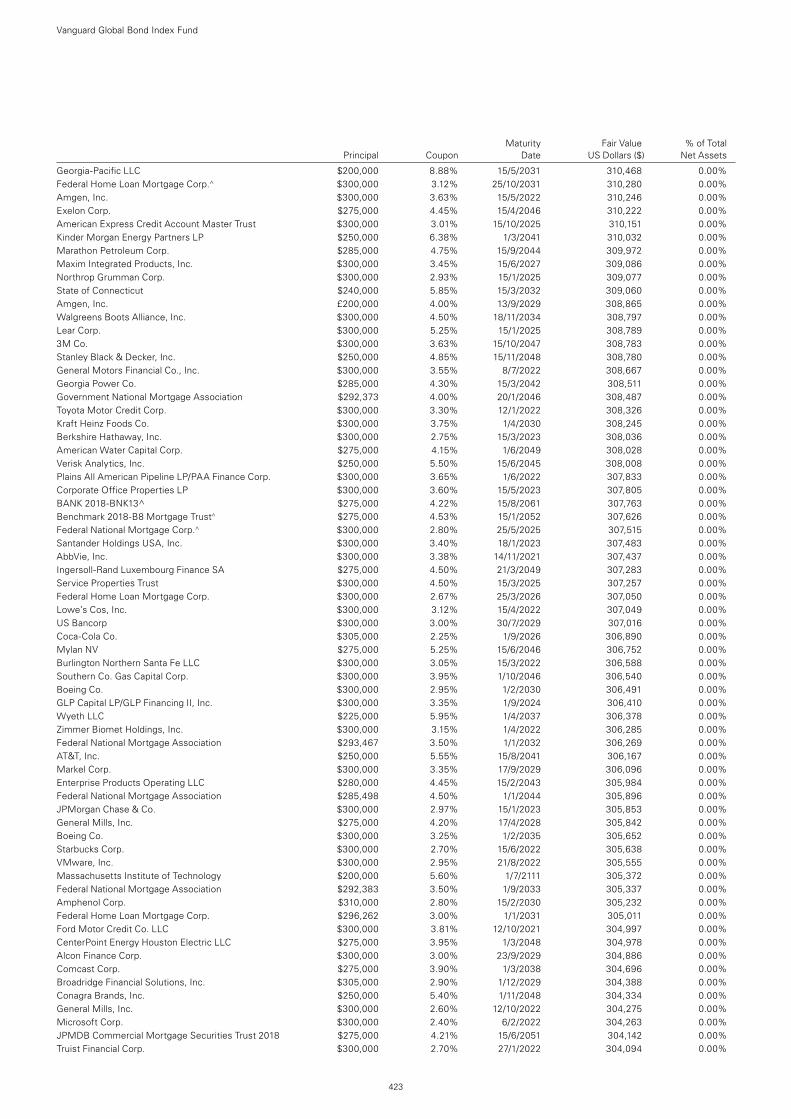
Maturity Fair Value % of Total Principal Coupon Date US Dollars ($) Net Assets
Vanguard Global Bond Index Fund
423
Georgia-Pacific LLC $200,000 8.88% 15/5/2031 310,468 0.00%Federal Home Loan Mortgage Corp.^ $300,000 3.12% 25/10/2031 310,280 0.00%Amgen, Inc. $300,000 3.63% 15/5/2022 310,246 0.00%Exelon Corp. $275,000 4.45% 15/4/2046 310,222 0.00%American Express Credit Account Master Trust $300,000 3.01% 15/10/2025 310,151 0.00%Kinder Morgan Energy Partners LP $250,000 6.38% 1/3/2041 310,032 0.00%Marathon Petroleum Corp. $285,000 4.75% 15/9/2044 309,972 0.00%Maxim Integrated Products, Inc. $300,000 3.45% 15/6/2027 309,086 0.00%Northrop Grumman Corp. $300,000 2.93% 15/1/2025 309,077 0.00%State of Connecticut $240,000 5.85% 15/3/2032 309,060 0.00%Amgen, Inc. £200,000 4.00% 13/9/2029 308,865 0.00%Walgreens Boots Alliance, Inc. $300,000 4.50% 18/11/2034 308,797 0.00%Lear Corp. $300,000 5.25% 15/1/2025 308,789 0.00%3M Co. $300,000 3.63% 15/10/2047 308,783 0.00%Stanley Black & Decker, Inc. $250,000 4.85% 15/11/2048 308,780 0.00%General Motors Financial Co., Inc. $300,000 3.55% 8/7/2022 308,667 0.00%Georgia Power Co. $285,000 4.30% 15/3/2042 308,511 0.00%Government National Mortgage Association $292,373 4.00% 20/1/2046 308,487 0.00%Toyota Motor Credit Corp. $300,000 3.30% 12/1/2022 308,326 0.00%Kraft Heinz Foods Co. $300,000 3.75% 1/4/2030 308,245 0.00%Berkshire Hathaway, Inc. $300,000 2.75% 15/3/2023 308,036 0.00%American Water Capital Corp. $275,000 4.15% 1/6/2049 308,028 0.00%Verisk Analytics, Inc. $250,000 5.50% 15/6/2045 308,008 0.00%Plains All American Pipeline LP/PAA Finance Corp. $300,000 3.65% 1/6/2022 307,833 0.00%Corporate Office Properties LP $300,000 3.60% 15/5/2023 307,805 0.00%BANK 2018-BNK13^ $275,000 4.22% 15/8/2061 307,763 0.00%Benchmark 2018-B8 Mortgage Trust^ $275,000 4.53% 15/1/2052 307,626 0.00%Federal National Mortgage Corp.^ $300,000 2.80% 25/5/2025 307,515 0.00%Santander Holdings USA, Inc. $300,000 3.40% 18/1/2023 307,483 0.00%AbbVie, Inc. $300,000 3.38% 14/11/2021 307,437 0.00%Ingersoll-Rand Luxembourg Finance SA $275,000 4.50% 21/3/2049 307,283 0.00%Service Properties Trust $300,000 4.50% 15/3/2025 307,257 0.00%Federal Home Loan Mortgage Corp. $300,000 2.67% 25/3/2026 307,050 0.00%Lowe’s Cos, Inc. $300,000 3.12% 15/4/2022 307,049 0.00%US Bancorp $300,000 3.00% 30/7/2029 307,016 0.00%Coca-Cola Co. $305,000 2.25% 1/9/2026 306,890 0.00%Mylan NV $275,000 5.25% 15/6/2046 306,752 0.00%Burlington Northern Santa Fe LLC $300,000 3.05% 15/3/2022 306,588 0.00%Southern Co. Gas Capital Corp. $300,000 3.95% 1/10/2046 306,540 0.00%Boeing Co. $300,000 2.95% 1/2/2030 306,491 0.00%GLP Capital LP/GLP Financing II, Inc. $300,000 3.35% 1/9/2024 306,410 0.00%Wyeth LLC $225,000 5.95% 1/4/2037 306,378 0.00%Zimmer Biomet Holdings, Inc. $300,000 3.15% 1/4/2022 306,285 0.00%Federal National Mortgage Association $293,467 3.50% 1/1/2032 306,269 0.00%AT&T, Inc. $250,000 5.55% 15/8/2041 306,167 0.00%Markel Corp. $300,000 3.35% 17/9/2029 306,096 0.00%Enterprise Products Operating LLC $280,000 4.45% 15/2/2043 305,984 0.00%Federal National Mortgage Association $285,498 4.50% 1/1/2044 305,896 0.00%JPMorgan Chase & Co. $300,000 2.97% 15/1/2023 305,853 0.00%General Mills, Inc. $275,000 4.20% 17/4/2028 305,842 0.00%Boeing Co. $300,000 3.25% 1/2/2035 305,652 0.00%Starbucks Corp. $300,000 2.70% 15/6/2022 305,638 0.00%VMware, Inc. $300,000 2.95% 21/8/2022 305,555 0.00%Massachusetts Institute of Technology $200,000 5.60% 1/7/2111 305,372 0.00%Federal National Mortgage Association $292,383 3.50% 1/9/2033 305,337 0.00%Amphenol Corp. $310,000 2.80% 15/2/2030 305,232 0.00%Federal Home Loan Mortgage Corp. $296,262 3.00% 1/1/2031 305,011 0.00%Ford Motor Credit Co. LLC $300,000 3.81% 12/10/2021 304,997 0.00%CenterPoint Energy Houston Electric LLC $275,000 3.95% 1/3/2048 304,978 0.00%Alcon Finance Corp. $300,000 3.00% 23/9/2029 304,886 0.00%Comcast Corp. $275,000 3.90% 1/3/2038 304,696 0.00%Broadridge Financial Solutions, Inc. $305,000 2.90% 1/12/2029 304,388 0.00%Conagra Brands, Inc. $250,000 5.40% 1/11/2048 304,334 0.00%General Mills, Inc. $300,000 2.60% 12/10/2022 304,275 0.00%Microsoft Corp. $300,000 2.40% 6/2/2022 304,263 0.00%JPMDB Commercial Mortgage Securities Trust 2018 $275,000 4.21% 15/6/2051 304,142 0.00%Truist Financial Corp. $300,000 2.70% 27/1/2022 304,094 0.00%
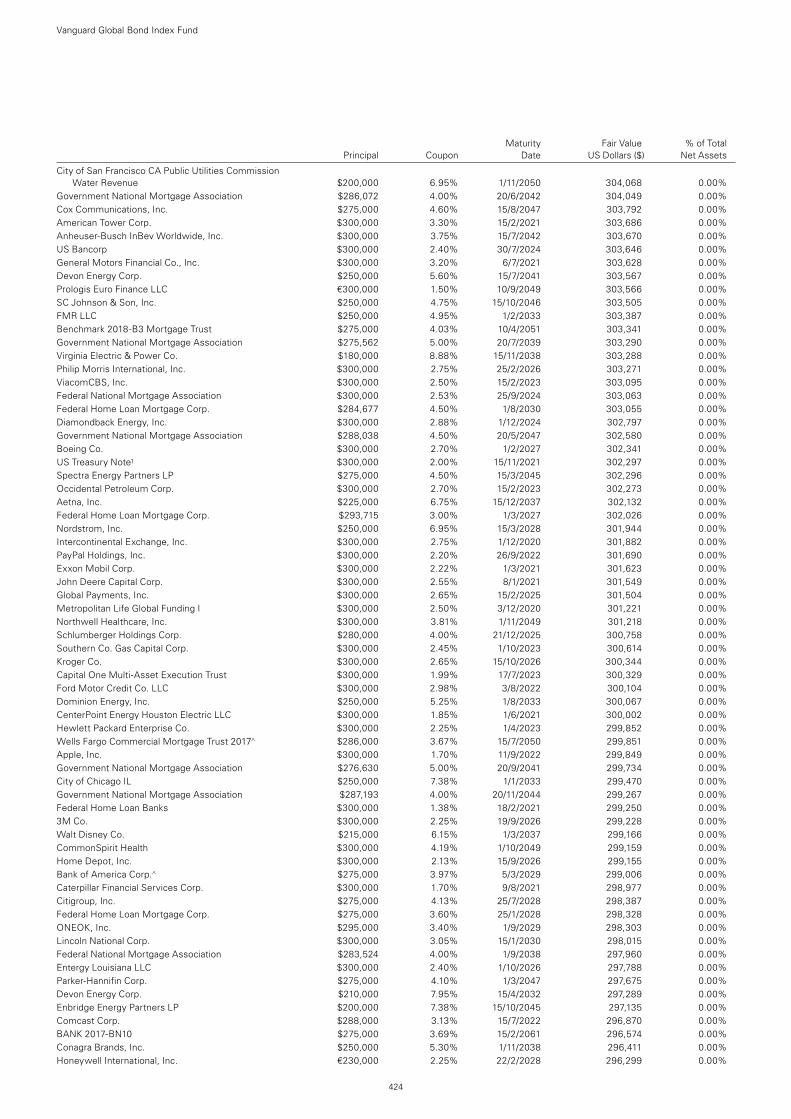
Maturity Fair Value % of Total Principal Coupon Date US Dollars ($) Net Assets
Vanguard Global Bond Index Fund
424
City of San Francisco CA Public Utilities Commission Water Revenue $200,000 6.95% 1/11/2050 304,068 0.00%
Government National Mortgage Association $286,072 4.00% 20/6/2042 304,049 0.00%Cox Communications, Inc. $275,000 4.60% 15/8/2047 303,792 0.00%American Tower Corp. $300,000 3.30% 15/2/2021 303,686 0.00%Anheuser-Busch InBev Worldwide, Inc. $300,000 3.75% 15/7/2042 303,670 0.00%US Bancorp $300,000 2.40% 30/7/2024 303,646 0.00%General Motors Financial Co., Inc. $300,000 3.20% 6/7/2021 303,628 0.00%Devon Energy Corp. $250,000 5.60% 15/7/2041 303,567 0.00%Prologis Euro Finance LLC €300,000 1.50% 10/9/2049 303,566 0.00%SC Johnson & Son, Inc. $250,000 4.75% 15/10/2046 303,505 0.00%FMR LLC $250,000 4.95% 1/2/2033 303,387 0.00%Benchmark 2018-B3 Mortgage Trust $275,000 4.03% 10/4/2051 303,341 0.00%Government National Mortgage Association $275,562 5.00% 20/7/2039 303,290 0.00%Virginia Electric & Power Co. $180,000 8.88% 15/11/2038 303,288 0.00%Philip Morris International, Inc. $300,000 2.75% 25/2/2026 303,271 0.00%ViacomCBS, Inc. $300,000 2.50% 15/2/2023 303,095 0.00%Federal National Mortgage Association $300,000 2.53% 25/9/2024 303,063 0.00%Federal Home Loan Mortgage Corp. $284,677 4.50% 1/8/2030 303,055 0.00%Diamondback Energy, Inc. $300,000 2.88% 1/12/2024 302,797 0.00%Government National Mortgage Association $288,038 4.50% 20/5/2047 302,580 0.00%Boeing Co. $300,000 2.70% 1/2/2027 302,341 0.00%US Treasury Note1 $300,000 2.00% 15/11/2021 302,297 0.00%Spectra Energy Partners LP $275,000 4.50% 15/3/2045 302,296 0.00%Occidental Petroleum Corp. $300,000 2.70% 15/2/2023 302,273 0.00%Aetna, Inc. $225,000 6.75% 15/12/2037 302,132 0.00%Federal Home Loan Mortgage Corp. $293,715 3.00% 1/3/2027 302,026 0.00%Nordstrom, Inc. $250,000 6.95% 15/3/2028 301,944 0.00%Intercontinental Exchange, Inc. $300,000 2.75% 1/12/2020 301,882 0.00%PayPal Holdings, Inc. $300,000 2.20% 26/9/2022 301,690 0.00%Exxon Mobil Corp. $300,000 2.22% 1/3/2021 301,623 0.00%John Deere Capital Corp. $300,000 2.55% 8/1/2021 301,549 0.00%Global Payments, Inc. $300,000 2.65% 15/2/2025 301,504 0.00%Metropolitan Life Global Funding I $300,000 2.50% 3/12/2020 301,221 0.00%Northwell Healthcare, Inc. $300,000 3.81% 1/11/2049 301,218 0.00%Schlumberger Holdings Corp. $280,000 4.00% 21/12/2025 300,758 0.00%Southern Co. Gas Capital Corp. $300,000 2.45% 1/10/2023 300,614 0.00%Kroger Co. $300,000 2.65% 15/10/2026 300,344 0.00%Capital One Multi-Asset Execution Trust $300,000 1.99% 17/7/2023 300,329 0.00%Ford Motor Credit Co. LLC $300,000 2.98% 3/8/2022 300,104 0.00%Dominion Energy, Inc. $250,000 5.25% 1/8/2033 300,067 0.00%CenterPoint Energy Houston Electric LLC $300,000 1.85% 1/6/2021 300,002 0.00%Hewlett Packard Enterprise Co. $300,000 2.25% 1/4/2023 299,852 0.00%Wells Fargo Commercial Mortgage Trust 2017^ $286,000 3.67% 15/7/2050 299,851 0.00%Apple, Inc. $300,000 1.70% 11/9/2022 299,849 0.00%Government National Mortgage Association $276,630 5.00% 20/9/2041 299,734 0.00%City of Chicago IL $250,000 7.38% 1/1/2033 299,470 0.00%Government National Mortgage Association $287,193 4.00% 20/11/2044 299,267 0.00%Federal Home Loan Banks $300,000 1.38% 18/2/2021 299,250 0.00%3M Co. $300,000 2.25% 19/9/2026 299,228 0.00%Walt Disney Co. $215,000 6.15% 1/3/2037 299,166 0.00%CommonSpirit Health $300,000 4.19% 1/10/2049 299,159 0.00%Home Depot, Inc. $300,000 2.13% 15/9/2026 299,155 0.00%Bank of America Corp.^ $275,000 3.97% 5/3/2029 299,006 0.00%Caterpillar Financial Services Corp. $300,000 1.70% 9/8/2021 298,977 0.00%Citigroup, Inc. $275,000 4.13% 25/7/2028 298,387 0.00%Federal Home Loan Mortgage Corp. $275,000 3.60% 25/1/2028 298,328 0.00%ONEOK, Inc. $295,000 3.40% 1/9/2029 298,303 0.00%Lincoln National Corp. $300,000 3.05% 15/1/2030 298,015 0.00%Federal National Mortgage Association $283,524 4.00% 1/9/2038 297,960 0.00%Entergy Louisiana LLC $300,000 2.40% 1/10/2026 297,788 0.00%Parker-Hannifin Corp. $275,000 4.10% 1/3/2047 297,675 0.00%Devon Energy Corp. $210,000 7.95% 15/4/2032 297,289 0.00%Enbridge Energy Partners LP $200,000 7.38% 15/10/2045 297,135 0.00%Comcast Corp. $288,000 3.13% 15/7/2022 296,870 0.00%BANK 2017-BN10 $275,000 3.69% 15/2/2061 296,574 0.00%Conagra Brands, Inc. $250,000 5.30% 1/11/2038 296,411 0.00%Honeywell International, Inc. €230,000 2.25% 22/2/2028 296,299 0.00%
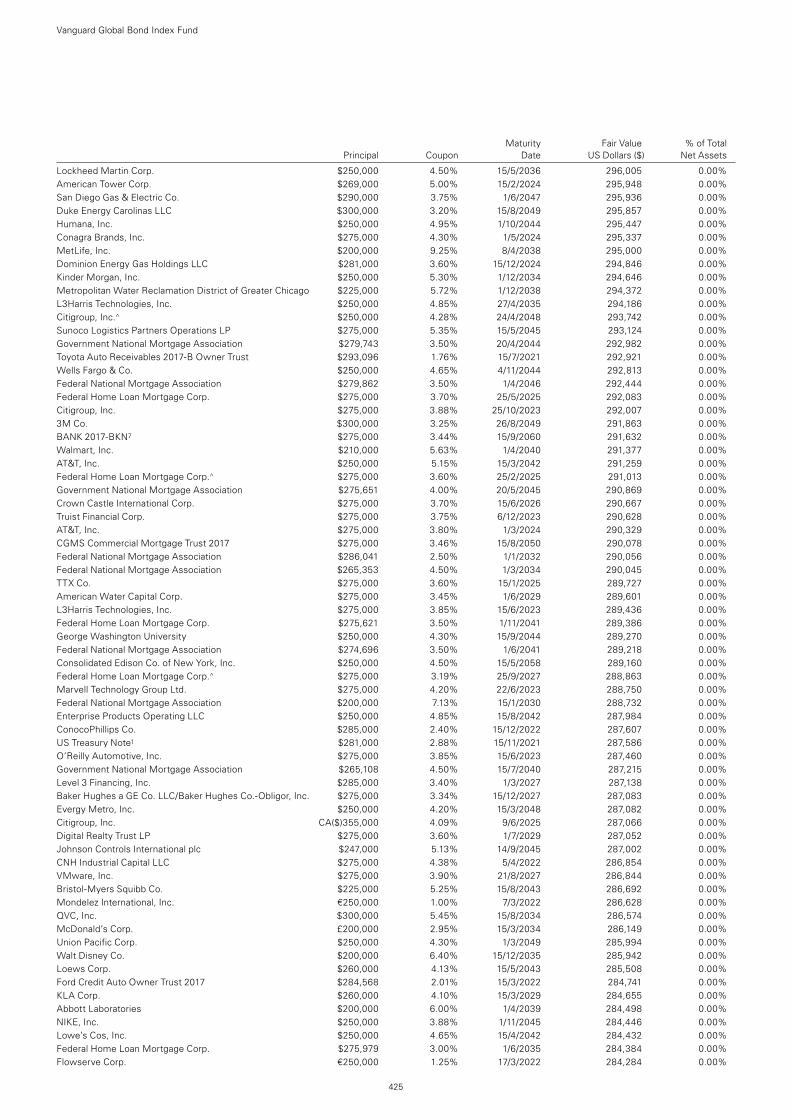
Maturity Fair Value % of Total Principal Coupon Date US Dollars ($) Net Assets
Vanguard Global Bond Index Fund
425
Lockheed Martin Corp. $250,000 4.50% 15/5/2036 296,005 0.00%American Tower Corp. $269,000 5.00% 15/2/2024 295,948 0.00%San Diego Gas & Electric Co. $290,000 3.75% 1/6/2047 295,936 0.00%Duke Energy Carolinas LLC $300,000 3.20% 15/8/2049 295,857 0.00%Humana, Inc. $250,000 4.95% 1/10/2044 295,447 0.00%Conagra Brands, Inc. $275,000 4.30% 1/5/2024 295,337 0.00%MetLife, Inc. $200,000 9.25% 8/4/2038 295,000 0.00%Dominion Energy Gas Holdings LLC $281,000 3.60% 15/12/2024 294,846 0.00%Kinder Morgan, Inc. $250,000 5.30% 1/12/2034 294,646 0.00%Metropolitan Water Reclamation District of Greater Chicago $225,000 5.72% 1/12/2038 294,372 0.00%L3Harris Technologies, Inc. $250,000 4.85% 27/4/2035 294,186 0.00%Citigroup, Inc.^ $250,000 4.28% 24/4/2048 293,742 0.00%Sunoco Logistics Partners Operations LP $275,000 5.35% 15/5/2045 293,124 0.00%Government National Mortgage Association $279,743 3.50% 20/4/2044 292,982 0.00%Toyota Auto Receivables 2017-B Owner Trust $293,096 1.76% 15/7/2021 292,921 0.00%Wells Fargo & Co. $250,000 4.65% 4/11/2044 292,813 0.00%Federal National Mortgage Association $279,862 3.50% 1/4/2046 292,444 0.00%Federal Home Loan Mortgage Corp. $275,000 3.70% 25/5/2025 292,083 0.00%Citigroup, Inc. $275,000 3.88% 25/10/2023 292,007 0.00%3M Co. $300,000 3.25% 26/8/2049 291,863 0.00%BANK 2017-BKN7 $275,000 3.44% 15/9/2060 291,632 0.00%Walmart, Inc. $210,000 5.63% 1/4/2040 291,377 0.00%AT&T, Inc. $250,000 5.15% 15/3/2042 291,259 0.00%Federal Home Loan Mortgage Corp.^ $275,000 3.60% 25/2/2025 291,013 0.00%Government National Mortgage Association $275,651 4.00% 20/5/2045 290,869 0.00%Crown Castle International Corp. $275,000 3.70% 15/6/2026 290,667 0.00%Truist Financial Corp. $275,000 3.75% 6/12/2023 290,628 0.00%AT&T, Inc. $275,000 3.80% 1/3/2024 290,329 0.00%CGMS Commercial Mortgage Trust 2017 $275,000 3.46% 15/8/2050 290,078 0.00%Federal National Mortgage Association $286,041 2.50% 1/1/2032 290,056 0.00%Federal National Mortgage Association $265,353 4.50% 1/3/2034 290,045 0.00%TTX Co. $275,000 3.60% 15/1/2025 289,727 0.00%American Water Capital Corp. $275,000 3.45% 1/6/2029 289,601 0.00%L3Harris Technologies, Inc. $275,000 3.85% 15/6/2023 289,436 0.00%Federal Home Loan Mortgage Corp. $275,621 3.50% 1/11/2041 289,386 0.00%George Washington University $250,000 4.30% 15/9/2044 289,270 0.00%Federal National Mortgage Association $274,696 3.50% 1/6/2041 289,218 0.00%Consolidated Edison Co. of New York, Inc. $250,000 4.50% 15/5/2058 289,160 0.00%Federal Home Loan Mortgage Corp.^ $275,000 3.19% 25/9/2027 288,863 0.00%Marvell Technology Group Ltd. $275,000 4.20% 22/6/2023 288,750 0.00%Federal National Mortgage Association $200,000 7.13% 15/1/2030 288,732 0.00%Enterprise Products Operating LLC $250,000 4.85% 15/8/2042 287,984 0.00%ConocoPhillips Co. $285,000 2.40% 15/12/2022 287,607 0.00%US Treasury Note1 $281,000 2.88% 15/11/2021 287,586 0.00%O’Reilly Automotive, Inc. $275,000 3.85% 15/6/2023 287,460 0.00%Government National Mortgage Association $265,108 4.50% 15/7/2040 287,215 0.00%Level 3 Financing, Inc. $285,000 3.40% 1/3/2027 287,138 0.00%Baker Hughes a GE Co. LLC/Baker Hughes Co.-Obligor, Inc. $275,000 3.34% 15/12/2027 287,083 0.00%Evergy Metro, Inc. $250,000 4.20% 15/3/2048 287,082 0.00%Citigroup, Inc. CA($)355,000 4.09% 9/6/2025 287,066 0.00%Digital Realty Trust LP $275,000 3.60% 1/7/2029 287,052 0.00%Johnson Controls International plc $247,000 5.13% 14/9/2045 287,002 0.00%CNH Industrial Capital LLC $275,000 4.38% 5/4/2022 286,854 0.00%VMware, Inc. $275,000 3.90% 21/8/2027 286,844 0.00%Bristol-Myers Squibb Co. $225,000 5.25% 15/8/2043 286,692 0.00%Mondelez International, Inc. €250,000 1.00% 7/3/2022 286,628 0.00%QVC, Inc. $300,000 5.45% 15/8/2034 286,574 0.00%McDonald’s Corp. £200,000 2.95% 15/3/2034 286,149 0.00%Union Pacific Corp. $250,000 4.30% 1/3/2049 285,994 0.00%Walt Disney Co. $200,000 6.40% 15/12/2035 285,942 0.00%Loews Corp. $260,000 4.13% 15/5/2043 285,508 0.00%Ford Credit Auto Owner Trust 2017 $284,568 2.01% 15/3/2022 284,741 0.00%KLA Corp. $260,000 4.10% 15/3/2029 284,655 0.00%Abbott Laboratories $200,000 6.00% 1/4/2039 284,498 0.00%NIKE, Inc. $250,000 3.88% 1/11/2045 284,446 0.00%Lowe’s Cos, Inc. $250,000 4.65% 15/4/2042 284,432 0.00%Federal Home Loan Mortgage Corp. $275,979 3.00% 1/6/2035 284,384 0.00%Flowserve Corp. €250,000 1.25% 17/3/2022 284,284 0.00%
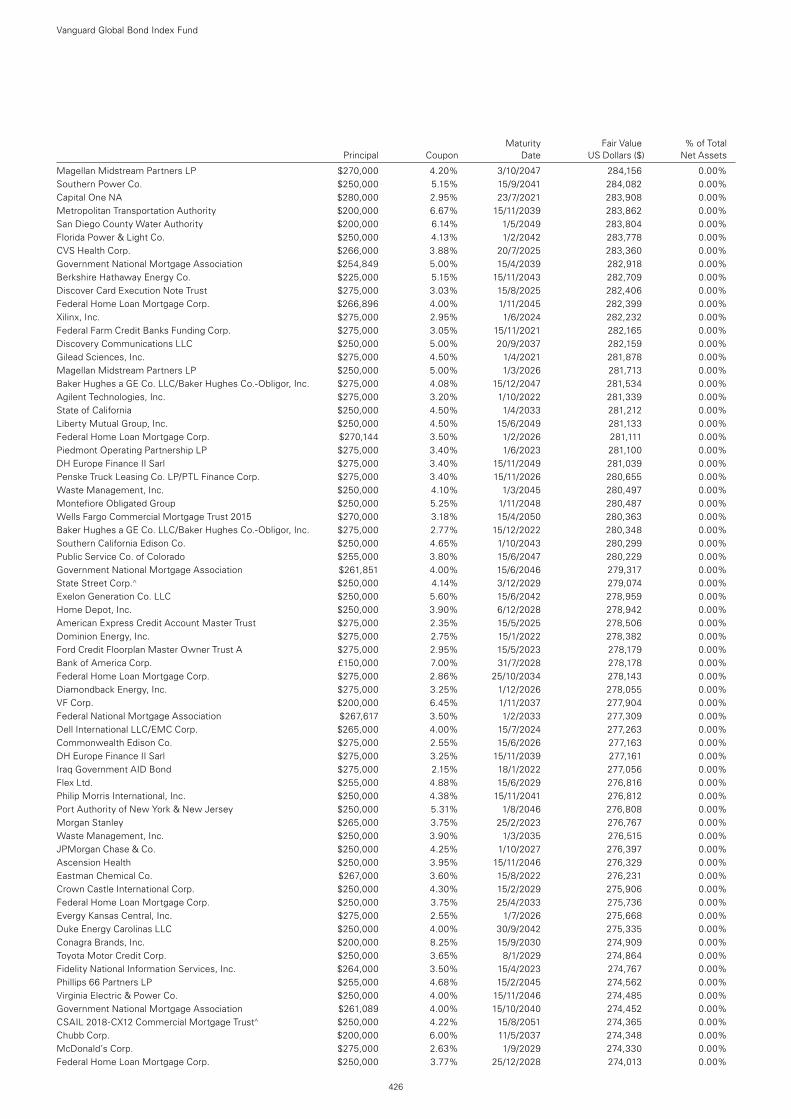
Maturity Fair Value % of Total Principal Coupon Date US Dollars ($) Net Assets
Vanguard Global Bond Index Fund
426
Magellan Midstream Partners LP $270,000 4.20% 3/10/2047 284,156 0.00%Southern Power Co. $250,000 5.15% 15/9/2041 284,082 0.00%Capital One NA $280,000 2.95% 23/7/2021 283,908 0.00%Metropolitan Transportation Authority $200,000 6.67% 15/11/2039 283,862 0.00%San Diego County Water Authority $200,000 6.14% 1/5/2049 283,804 0.00%Florida Power & Light Co. $250,000 4.13% 1/2/2042 283,778 0.00%CVS Health Corp. $266,000 3.88% 20/7/2025 283,360 0.00%Government National Mortgage Association $254,849 5.00% 15/4/2039 282,918 0.00%Berkshire Hathaway Energy Co. $225,000 5.15% 15/11/2043 282,709 0.00%Discover Card Execution Note Trust $275,000 3.03% 15/8/2025 282,406 0.00%Federal Home Loan Mortgage Corp. $266,896 4.00% 1/11/2045 282,399 0.00%Xilinx, Inc. $275,000 2.95% 1/6/2024 282,232 0.00%Federal Farm Credit Banks Funding Corp. $275,000 3.05% 15/11/2021 282,165 0.00%Discovery Communications LLC $250,000 5.00% 20/9/2037 282,159 0.00%Gilead Sciences, Inc. $275,000 4.50% 1/4/2021 281,878 0.00%Magellan Midstream Partners LP $250,000 5.00% 1/3/2026 281,713 0.00%Baker Hughes a GE Co. LLC/Baker Hughes Co.-Obligor, Inc. $275,000 4.08% 15/12/2047 281,534 0.00%Agilent Technologies, Inc. $275,000 3.20% 1/10/2022 281,339 0.00%State of California $250,000 4.50% 1/4/2033 281,212 0.00%Liberty Mutual Group, Inc. $250,000 4.50% 15/6/2049 281,133 0.00%Federal Home Loan Mortgage Corp. $270,144 3.50% 1/2/2026 281,111 0.00%Piedmont Operating Partnership LP $275,000 3.40% 1/6/2023 281,100 0.00%DH Europe Finance II Sarl $275,000 3.40% 15/11/2049 281,039 0.00%Penske Truck Leasing Co. LP/PTL Finance Corp. $275,000 3.40% 15/11/2026 280,655 0.00%Waste Management, Inc. $250,000 4.10% 1/3/2045 280,497 0.00%Montefiore Obligated Group $250,000 5.25% 1/11/2048 280,487 0.00%Wells Fargo Commercial Mortgage Trust 2015 $270,000 3.18% 15/4/2050 280,363 0.00%Baker Hughes a GE Co. LLC/Baker Hughes Co.-Obligor, Inc. $275,000 2.77% 15/12/2022 280,348 0.00%Southern California Edison Co. $250,000 4.65% 1/10/2043 280,299 0.00%Public Service Co. of Colorado $255,000 3.80% 15/6/2047 280,229 0.00%Government National Mortgage Association $261,851 4.00% 15/6/2046 279,317 0.00%State Street Corp.^ $250,000 4.14% 3/12/2029 279,074 0.00%Exelon Generation Co. LLC $250,000 5.60% 15/6/2042 278,959 0.00%Home Depot, Inc. $250,000 3.90% 6/12/2028 278,942 0.00%American Express Credit Account Master Trust $275,000 2.35% 15/5/2025 278,506 0.00%Dominion Energy, Inc. $275,000 2.75% 15/1/2022 278,382 0.00%Ford Credit Floorplan Master Owner Trust A $275,000 2.95% 15/5/2023 278,179 0.00%Bank of America Corp. £150,000 7.00% 31/7/2028 278,178 0.00%Federal Home Loan Mortgage Corp. $275,000 2.86% 25/10/2034 278,143 0.00%Diamondback Energy, Inc. $275,000 3.25% 1/12/2026 278,055 0.00%VF Corp. $200,000 6.45% 1/11/2037 277,904 0.00%Federal National Mortgage Association $267,617 3.50% 1/2/2033 277,309 0.00%Dell International LLC/EMC Corp. $265,000 4.00% 15/7/2024 277,263 0.00%Commonwealth Edison Co. $275,000 2.55% 15/6/2026 277,163 0.00%DH Europe Finance II Sarl $275,000 3.25% 15/11/2039 277,161 0.00%Iraq Government AID Bond $275,000 2.15% 18/1/2022 277,056 0.00%Flex Ltd. $255,000 4.88% 15/6/2029 276,816 0.00%Philip Morris International, Inc. $250,000 4.38% 15/11/2041 276,812 0.00%Port Authority of New York & New Jersey $250,000 5.31% 1/8/2046 276,808 0.00%Morgan Stanley $265,000 3.75% 25/2/2023 276,767 0.00%Waste Management, Inc. $250,000 3.90% 1/3/2035 276,515 0.00%JPMorgan Chase & Co. $250,000 4.25% 1/10/2027 276,397 0.00%Ascension Health $250,000 3.95% 15/11/2046 276,329 0.00%Eastman Chemical Co. $267,000 3.60% 15/8/2022 276,231 0.00%Crown Castle International Corp. $250,000 4.30% 15/2/2029 275,906 0.00%Federal Home Loan Mortgage Corp. $250,000 3.75% 25/4/2033 275,736 0.00%Evergy Kansas Central, Inc. $275,000 2.55% 1/7/2026 275,668 0.00%Duke Energy Carolinas LLC $250,000 4.00% 30/9/2042 275,335 0.00%Conagra Brands, Inc. $200,000 8.25% 15/9/2030 274,909 0.00%Toyota Motor Credit Corp. $250,000 3.65% 8/1/2029 274,864 0.00%Fidelity National Information Services, Inc. $264,000 3.50% 15/4/2023 274,767 0.00%Phillips 66 Partners LP $255,000 4.68% 15/2/2045 274,562 0.00%Virginia Electric & Power Co. $250,000 4.00% 15/11/2046 274,485 0.00%Government National Mortgage Association $261,089 4.00% 15/10/2040 274,452 0.00%CSAIL 2018-CX12 Commercial Mortgage Trust^ $250,000 4.22% 15/8/2051 274,365 0.00%Chubb Corp. $200,000 6.00% 11/5/2037 274,348 0.00%McDonald’s Corp. $275,000 2.63% 1/9/2029 274,330 0.00%Federal Home Loan Mortgage Corp. $250,000 3.77% 25/12/2028 274,013 0.00%
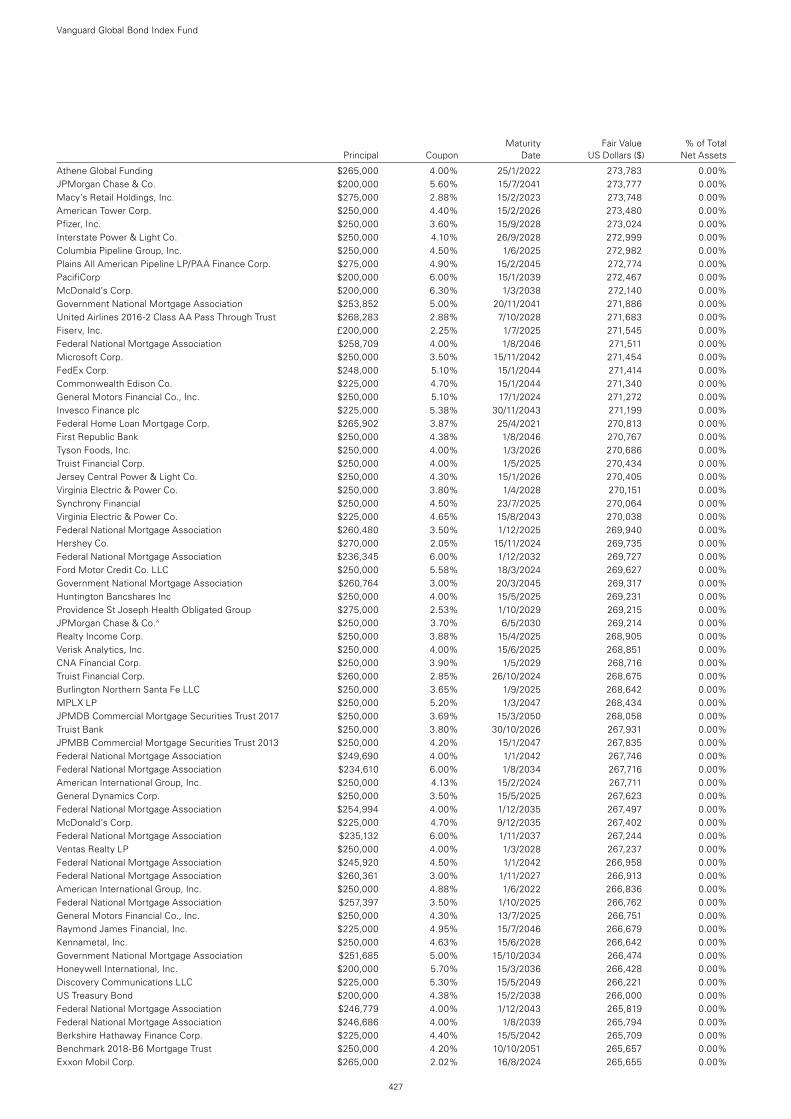
Maturity Fair Value % of Total Principal Coupon Date US Dollars ($) Net Assets
Vanguard Global Bond Index Fund
427
Athene Global Funding $265,000 4.00% 25/1/2022 273,783 0.00%JPMorgan Chase & Co. $200,000 5.60% 15/7/2041 273,777 0.00%Macy’s Retail Holdings, Inc. $275,000 2.88% 15/2/2023 273,748 0.00%American Tower Corp. $250,000 4.40% 15/2/2026 273,480 0.00%Pfizer, Inc. $250,000 3.60% 15/9/2028 273,024 0.00%Interstate Power & Light Co. $250,000 4.10% 26/9/2028 272,999 0.00%Columbia Pipeline Group, Inc. $250,000 4.50% 1/6/2025 272,982 0.00%Plains All American Pipeline LP/PAA Finance Corp. $275,000 4.90% 15/2/2045 272,774 0.00%PacifiCorp $200,000 6.00% 15/1/2039 272,467 0.00%McDonald’s Corp. $200,000 6.30% 1/3/2038 272,140 0.00%Government National Mortgage Association $253,852 5.00% 20/11/2041 271,886 0.00%United Airlines 2016-2 Class AA Pass Through Trust $268,283 2.88% 7/10/2028 271,683 0.00%Fiserv, Inc. £200,000 2.25% 1/7/2025 271,545 0.00%Federal National Mortgage Association $258,709 4.00% 1/8/2046 271,511 0.00%Microsoft Corp. $250,000 3.50% 15/11/2042 271,454 0.00%FedEx Corp. $248,000 5.10% 15/1/2044 271,414 0.00%Commonwealth Edison Co. $225,000 4.70% 15/1/2044 271,340 0.00%General Motors Financial Co., Inc. $250,000 5.10% 17/1/2024 271,272 0.00%Invesco Finance plc $225,000 5.38% 30/11/2043 271,199 0.00%Federal Home Loan Mortgage Corp. $265,902 3.87% 25/4/2021 270,813 0.00%First Republic Bank $250,000 4.38% 1/8/2046 270,767 0.00%Tyson Foods, Inc. $250,000 4.00% 1/3/2026 270,686 0.00%Truist Financial Corp. $250,000 4.00% 1/5/2025 270,434 0.00%Jersey Central Power & Light Co. $250,000 4.30% 15/1/2026 270,405 0.00%Virginia Electric & Power Co. $250,000 3.80% 1/4/2028 270,151 0.00%Synchrony Financial $250,000 4.50% 23/7/2025 270,064 0.00%Virginia Electric & Power Co. $225,000 4.65% 15/8/2043 270,038 0.00%Federal National Mortgage Association $260,480 3.50% 1/12/2025 269,940 0.00%Hershey Co. $270,000 2.05% 15/11/2024 269,735 0.00%Federal National Mortgage Association $236,345 6.00% 1/12/2032 269,727 0.00%Ford Motor Credit Co. LLC $250,000 5.58% 18/3/2024 269,627 0.00%Government National Mortgage Association $260,764 3.00% 20/3/2045 269,317 0.00%Huntington Bancshares Inc $250,000 4.00% 15/5/2025 269,231 0.00%Providence St Joseph Health Obligated Group $275,000 2.53% 1/10/2029 269,215 0.00%JPMorgan Chase & Co.^ $250,000 3.70% 6/5/2030 269,214 0.00%Realty Income Corp. $250,000 3.88% 15/4/2025 268,905 0.00%Verisk Analytics, Inc. $250,000 4.00% 15/6/2025 268,851 0.00%CNA Financial Corp. $250,000 3.90% 1/5/2029 268,716 0.00%Truist Financial Corp. $260,000 2.85% 26/10/2024 268,675 0.00%Burlington Northern Santa Fe LLC $250,000 3.65% 1/9/2025 268,642 0.00%MPLX LP $250,000 5.20% 1/3/2047 268,434 0.00%JPMDB Commercial Mortgage Securities Trust 2017 $250,000 3.69% 15/3/2050 268,058 0.00%Truist Bank $250,000 3.80% 30/10/2026 267,931 0.00%JPMBB Commercial Mortgage Securities Trust 2013 $250,000 4.20% 15/1/2047 267,835 0.00%Federal National Mortgage Association $249,690 4.00% 1/1/2042 267,746 0.00%Federal National Mortgage Association $234,610 6.00% 1/8/2034 267,716 0.00%American International Group, Inc. $250,000 4.13% 15/2/2024 267,711 0.00%General Dynamics Corp. $250,000 3.50% 15/5/2025 267,623 0.00%Federal National Mortgage Association $254,994 4.00% 1/12/2035 267,497 0.00%McDonald’s Corp. $225,000 4.70% 9/12/2035 267,402 0.00%Federal National Mortgage Association $235,132 6.00% 1/11/2037 267,244 0.00%Ventas Realty LP $250,000 4.00% 1/3/2028 267,237 0.00%Federal National Mortgage Association $245,920 4.50% 1/1/2042 266,958 0.00%Federal National Mortgage Association $260,361 3.00% 1/11/2027 266,913 0.00%American International Group, Inc. $250,000 4.88% 1/6/2022 266,836 0.00%Federal National Mortgage Association $257,397 3.50% 1/10/2025 266,762 0.00%General Motors Financial Co., Inc. $250,000 4.30% 13/7/2025 266,751 0.00%Raymond James Financial, Inc. $225,000 4.95% 15/7/2046 266,679 0.00%Kennametal, Inc. $250,000 4.63% 15/6/2028 266,642 0.00%Government National Mortgage Association $251,685 5.00% 15/10/2034 266,474 0.00%Honeywell International, Inc. $200,000 5.70% 15/3/2036 266,428 0.00%Discovery Communications LLC $225,000 5.30% 15/5/2049 266,221 0.00%US Treasury Bond $200,000 4.38% 15/2/2038 266,000 0.00%Federal National Mortgage Association $246,779 4.00% 1/12/2043 265,819 0.00%Federal National Mortgage Association $246,686 4.00% 1/8/2039 265,794 0.00%Berkshire Hathaway Finance Corp. $225,000 4.40% 15/5/2042 265,709 0.00%Benchmark 2018-B6 Mortgage Trust $250,000 4.20% 10/10/2051 265,657 0.00%Exxon Mobil Corp. $265,000 2.02% 16/8/2024 265,655 0.00%
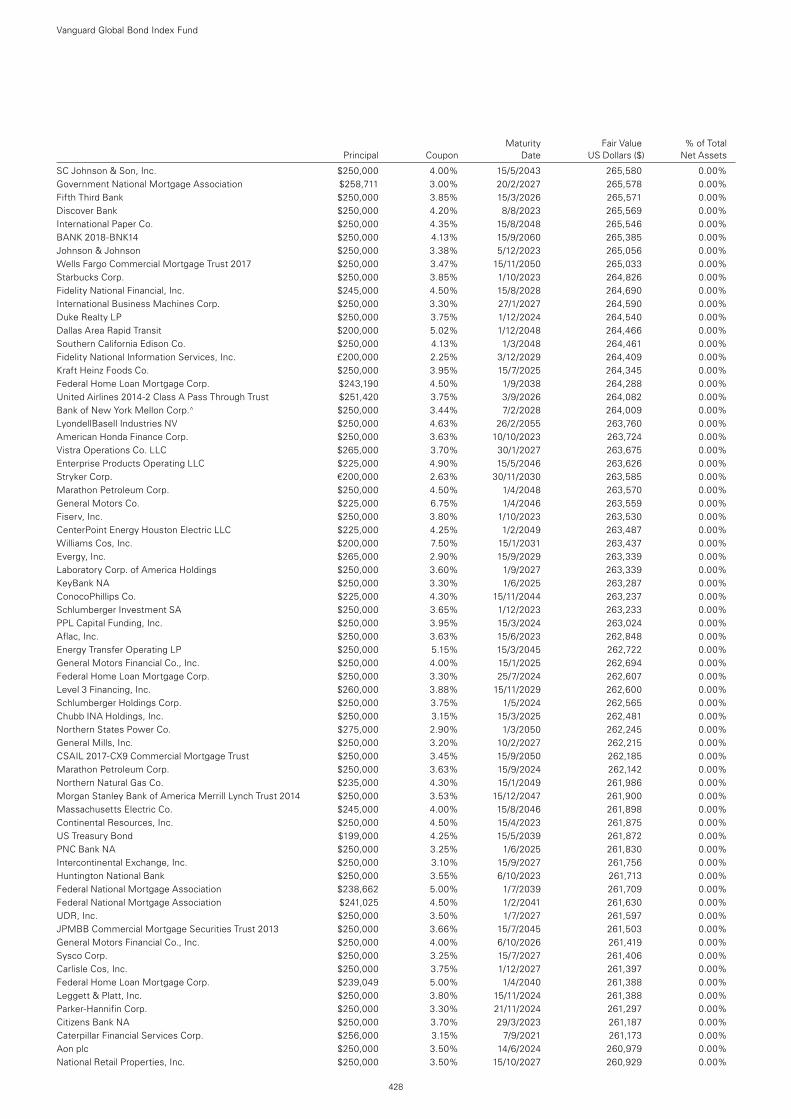
Maturity Fair Value % of Total Principal Coupon Date US Dollars ($) Net Assets
Vanguard Global Bond Index Fund
428
SC Johnson & Son, Inc. $250,000 4.00% 15/5/2043 265,580 0.00%Government National Mortgage Association $258,711 3.00% 20/2/2027 265,578 0.00%Fifth Third Bank $250,000 3.85% 15/3/2026 265,571 0.00%Discover Bank $250,000 4.20% 8/8/2023 265,569 0.00%International Paper Co. $250,000 4.35% 15/8/2048 265,546 0.00%BANK 2018-BNK14 $250,000 4.13% 15/9/2060 265,385 0.00%Johnson & Johnson $250,000 3.38% 5/12/2023 265,056 0.00%Wells Fargo Commercial Mortgage Trust 2017 $250,000 3.47% 15/11/2050 265,033 0.00%Starbucks Corp. $250,000 3.85% 1/10/2023 264,826 0.00%Fidelity National Financial, Inc. $245,000 4.50% 15/8/2028 264,690 0.00%International Business Machines Corp. $250,000 3.30% 27/1/2027 264,590 0.00%Duke Realty LP $250,000 3.75% 1/12/2024 264,540 0.00%Dallas Area Rapid Transit $200,000 5.02% 1/12/2048 264,466 0.00%Southern California Edison Co. $250,000 4.13% 1/3/2048 264,461 0.00%Fidelity National Information Services, Inc. £200,000 2.25% 3/12/2029 264,409 0.00%Kraft Heinz Foods Co. $250,000 3.95% 15/7/2025 264,345 0.00%Federal Home Loan Mortgage Corp. $243,190 4.50% 1/9/2038 264,288 0.00%United Airlines 2014-2 Class A Pass Through Trust $251,420 3.75% 3/9/2026 264,082 0.00%Bank of New York Mellon Corp.^ $250,000 3.44% 7/2/2028 264,009 0.00%LyondellBasell Industries NV $250,000 4.63% 26/2/2055 263,760 0.00%American Honda Finance Corp. $250,000 3.63% 10/10/2023 263,724 0.00%Vistra Operations Co. LLC $265,000 3.70% 30/1/2027 263,675 0.00%Enterprise Products Operating LLC $225,000 4.90% 15/5/2046 263,626 0.00%Stryker Corp. €200,000 2.63% 30/11/2030 263,585 0.00%Marathon Petroleum Corp. $250,000 4.50% 1/4/2048 263,570 0.00%General Motors Co. $225,000 6.75% 1/4/2046 263,559 0.00%Fiserv, Inc. $250,000 3.80% 1/10/2023 263,530 0.00%CenterPoint Energy Houston Electric LLC $225,000 4.25% 1/2/2049 263,487 0.00%Williams Cos, Inc. $200,000 7.50% 15/1/2031 263,437 0.00%Evergy, Inc. $265,000 2.90% 15/9/2029 263,339 0.00%Laboratory Corp. of America Holdings $250,000 3.60% 1/9/2027 263,339 0.00%KeyBank NA $250,000 3.30% 1/6/2025 263,287 0.00%ConocoPhillips Co. $225,000 4.30% 15/11/2044 263,237 0.00%Schlumberger Investment SA $250,000 3.65% 1/12/2023 263,233 0.00%PPL Capital Funding, Inc. $250,000 3.95% 15/3/2024 263,024 0.00%Aflac, Inc. $250,000 3.63% 15/6/2023 262,848 0.00%Energy Transfer Operating LP $250,000 5.15% 15/3/2045 262,722 0.00%General Motors Financial Co., Inc. $250,000 4.00% 15/1/2025 262,694 0.00%Federal Home Loan Mortgage Corp. $250,000 3.30% 25/7/2024 262,607 0.00%Level 3 Financing, Inc. $260,000 3.88% 15/11/2029 262,600 0.00%Schlumberger Holdings Corp. $250,000 3.75% 1/5/2024 262,565 0.00%Chubb INA Holdings, Inc. $250,000 3.15% 15/3/2025 262,481 0.00%Northern States Power Co. $275,000 2.90% 1/3/2050 262,245 0.00%General Mills, Inc. $250,000 3.20% 10/2/2027 262,215 0.00%CSAIL 2017-CX9 Commercial Mortgage Trust $250,000 3.45% 15/9/2050 262,185 0.00%Marathon Petroleum Corp. $250,000 3.63% 15/9/2024 262,142 0.00%Northern Natural Gas Co. $235,000 4.30% 15/1/2049 261,986 0.00%Morgan Stanley Bank of America Merrill Lynch Trust 2014 $250,000 3.53% 15/12/2047 261,900 0.00%Massachusetts Electric Co. $245,000 4.00% 15/8/2046 261,898 0.00%Continental Resources, Inc. $250,000 4.50% 15/4/2023 261,875 0.00%US Treasury Bond $199,000 4.25% 15/5/2039 261,872 0.00%PNC Bank NA $250,000 3.25% 1/6/2025 261,830 0.00%Intercontinental Exchange, Inc. $250,000 3.10% 15/9/2027 261,756 0.00%Huntington National Bank $250,000 3.55% 6/10/2023 261,713 0.00%Federal National Mortgage Association $238,662 5.00% 1/7/2039 261,709 0.00%Federal National Mortgage Association $241,025 4.50% 1/2/2041 261,630 0.00%UDR, Inc. $250,000 3.50% 1/7/2027 261,597 0.00%JPMBB Commercial Mortgage Securities Trust 2013 $250,000 3.66% 15/7/2045 261,503 0.00%General Motors Financial Co., Inc. $250,000 4.00% 6/10/2026 261,419 0.00%Sysco Corp. $250,000 3.25% 15/7/2027 261,406 0.00%Carlisle Cos, Inc. $250,000 3.75% 1/12/2027 261,397 0.00%Federal Home Loan Mortgage Corp. $239,049 5.00% 1/4/2040 261,388 0.00%Leggett & Platt, Inc. $250,000 3.80% 15/11/2024 261,388 0.00%Parker-Hannifin Corp. $250,000 3.30% 21/11/2024 261,297 0.00%Citizens Bank NA $250,000 3.70% 29/3/2023 261,187 0.00%Caterpillar Financial Services Corp. $256,000 3.15% 7/9/2021 261,173 0.00%Aon plc $250,000 3.50% 14/6/2024 260,979 0.00%National Retail Properties, Inc. $250,000 3.50% 15/10/2027 260,929 0.00%
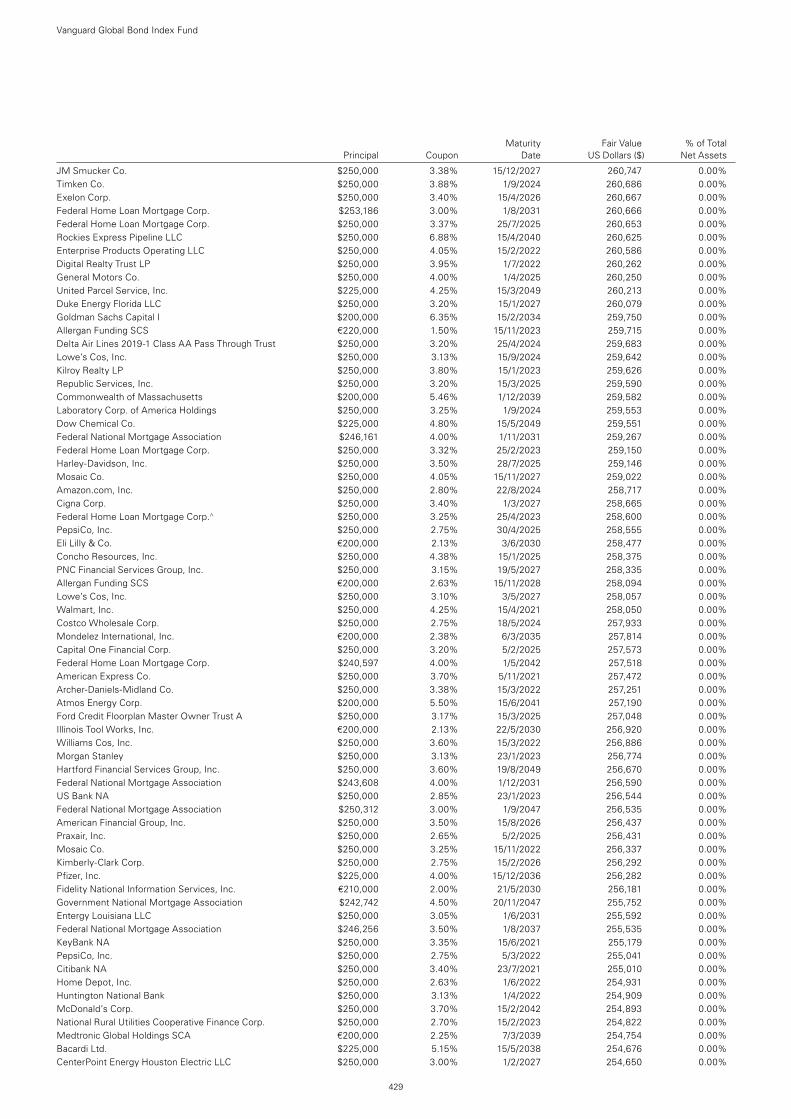
Maturity Fair Value % of Total Principal Coupon Date US Dollars ($) Net Assets
Vanguard Global Bond Index Fund
429
JM Smucker Co. $250,000 3.38% 15/12/2027 260,747 0.00%Timken Co. $250,000 3.88% 1/9/2024 260,686 0.00%Exelon Corp. $250,000 3.40% 15/4/2026 260,667 0.00%Federal Home Loan Mortgage Corp. $253,186 3.00% 1/8/2031 260,666 0.00%Federal Home Loan Mortgage Corp. $250,000 3.37% 25/7/2025 260,653 0.00%Rockies Express Pipeline LLC $250,000 6.88% 15/4/2040 260,625 0.00%Enterprise Products Operating LLC $250,000 4.05% 15/2/2022 260,586 0.00%Digital Realty Trust LP $250,000 3.95% 1/7/2022 260,262 0.00%General Motors Co. $250,000 4.00% 1/4/2025 260,250 0.00%United Parcel Service, Inc. $225,000 4.25% 15/3/2049 260,213 0.00%Duke Energy Florida LLC $250,000 3.20% 15/1/2027 260,079 0.00%Goldman Sachs Capital I $200,000 6.35% 15/2/2034 259,750 0.00%Allergan Funding SCS €220,000 1.50% 15/11/2023 259,715 0.00%Delta Air Lines 2019-1 Class AA Pass Through Trust $250,000 3.20% 25/4/2024 259,683 0.00%Lowe’s Cos, Inc. $250,000 3.13% 15/9/2024 259,642 0.00%Kilroy Realty LP $250,000 3.80% 15/1/2023 259,626 0.00%Republic Services, Inc. $250,000 3.20% 15/3/2025 259,590 0.00%Commonwealth of Massachusetts $200,000 5.46% 1/12/2039 259,582 0.00%Laboratory Corp. of America Holdings $250,000 3.25% 1/9/2024 259,553 0.00%Dow Chemical Co. $225,000 4.80% 15/5/2049 259,551 0.00%Federal National Mortgage Association $246,161 4.00% 1/11/2031 259,267 0.00%Federal Home Loan Mortgage Corp. $250,000 3.32% 25/2/2023 259,150 0.00%Harley-Davidson, Inc. $250,000 3.50% 28/7/2025 259,146 0.00%Mosaic Co. $250,000 4.05% 15/11/2027 259,022 0.00%Amazon.com, Inc. $250,000 2.80% 22/8/2024 258,717 0.00%Cigna Corp. $250,000 3.40% 1/3/2027 258,665 0.00%Federal Home Loan Mortgage Corp.^ $250,000 3.25% 25/4/2023 258,600 0.00%PepsiCo, Inc. $250,000 2.75% 30/4/2025 258,555 0.00%Eli Lilly & Co. €200,000 2.13% 3/6/2030 258,477 0.00%Concho Resources, Inc. $250,000 4.38% 15/1/2025 258,375 0.00%PNC Financial Services Group, Inc. $250,000 3.15% 19/5/2027 258,335 0.00%Allergan Funding SCS €200,000 2.63% 15/11/2028 258,094 0.00%Lowe’s Cos, Inc. $250,000 3.10% 3/5/2027 258,057 0.00%Walmart, Inc. $250,000 4.25% 15/4/2021 258,050 0.00%Costco Wholesale Corp. $250,000 2.75% 18/5/2024 257,933 0.00%Mondelez International, Inc. €200,000 2.38% 6/3/2035 257,814 0.00%Capital One Financial Corp. $250,000 3.20% 5/2/2025 257,573 0.00%Federal Home Loan Mortgage Corp. $240,597 4.00% 1/5/2042 257,518 0.00%American Express Co. $250,000 3.70% 5/11/2021 257,472 0.00%Archer-Daniels-Midland Co. $250,000 3.38% 15/3/2022 257,251 0.00%Atmos Energy Corp. $200,000 5.50% 15/6/2041 257,190 0.00%Ford Credit Floorplan Master Owner Trust A $250,000 3.17% 15/3/2025 257,048 0.00%Illinois Tool Works, Inc. €200,000 2.13% 22/5/2030 256,920 0.00%Williams Cos, Inc. $250,000 3.60% 15/3/2022 256,886 0.00%Morgan Stanley $250,000 3.13% 23/1/2023 256,774 0.00%Hartford Financial Services Group, Inc. $250,000 3.60% 19/8/2049 256,670 0.00%Federal National Mortgage Association $243,608 4.00% 1/12/2031 256,590 0.00%US Bank NA $250,000 2.85% 23/1/2023 256,544 0.00%Federal National Mortgage Association $250,312 3.00% 1/9/2047 256,535 0.00%American Financial Group, Inc. $250,000 3.50% 15/8/2026 256,437 0.00%Praxair, Inc. $250,000 2.65% 5/2/2025 256,431 0.00%Mosaic Co. $250,000 3.25% 15/11/2022 256,337 0.00%Kimberly-Clark Corp. $250,000 2.75% 15/2/2026 256,292 0.00%Pfizer, Inc. $225,000 4.00% 15/12/2036 256,282 0.00%Fidelity National Information Services, Inc. €210,000 2.00% 21/5/2030 256,181 0.00%Government National Mortgage Association $242,742 4.50% 20/11/2047 255,752 0.00%Entergy Louisiana LLC $250,000 3.05% 1/6/2031 255,592 0.00%Federal National Mortgage Association $246,256 3.50% 1/8/2037 255,535 0.00%KeyBank NA $250,000 3.35% 15/6/2021 255,179 0.00%PepsiCo, Inc. $250,000 2.75% 5/3/2022 255,041 0.00%Citibank NA $250,000 3.40% 23/7/2021 255,010 0.00%Home Depot, Inc. $250,000 2.63% 1/6/2022 254,931 0.00%Huntington National Bank $250,000 3.13% 1/4/2022 254,909 0.00%McDonald’s Corp. $250,000 3.70% 15/2/2042 254,893 0.00%National Rural Utilities Cooperative Finance Corp. $250,000 2.70% 15/2/2023 254,822 0.00%Medtronic Global Holdings SCA €200,000 2.25% 7/3/2039 254,754 0.00%Bacardi Ltd. $225,000 5.15% 15/5/2038 254,676 0.00%CenterPoint Energy Houston Electric LLC $250,000 3.00% 1/2/2027 254,650 0.00%

Vanguard Global Bond Index Fund
430
Synchrony Bank $250,000 3.00% 15/6/2022 254,636 0.00%Tampa Electric Co. $225,000 4.35% 15/5/2044 254,624 0.00%GE Capital UK Funding Unlimited Co. £150,000 5.88% 18/1/2033 254,598 0.00%Xcel Energy, Inc. $250,000 3.50% 1/12/2049 254,426 0.00%Associated Bank NA $250,000 3.50% 13/8/2021 254,404 0.00%US Bank NA $250,000 2.65% 23/5/2022 254,325 0.00%NIKE, Inc. $250,000 2.25% 1/5/2023 254,132 0.00%Huntington National Bank $250,000 3.25% 14/5/2021 254,060 0.00%Aon Corp. $200,000 8.21% 1/1/2027 254,000 0.00%Federal National Mortgage Association^ $250,000 2.48% 25/12/2026 253,987 0.00%Ford Credit Canada Co. CA($)330,000 3.35% 19/9/2022 253,889 0.00%McDonald’s Corp. $250,000 3.63% 1/9/2049 253,732 0.00%Fifth Third Bank $250,000 2.88% 1/10/2021 253,678 0.00%Apache Corp. $275,000 4.25% 15/1/2044 253,678 0.00%Toyota Motor Credit Corp. $250,000 2.95% 13/4/2021 253,576 0.00%Ingredion, Inc. $250,000 3.20% 1/10/2026 253,463 0.00%Cigna Corp. $250,000 3.00% 15/7/2023 253,461 0.00%Bristol-Myers Squibb Co. €200,000 1.75% 15/5/2035 253,342 0.00%Republic Services, Inc. $250,000 2.50% 15/8/2024 253,278 0.00%GATX Corp. $250,000 3.25% 15/9/2026 253,257 0.00%AIG Global Funding $250,000 2.70% 15/12/2021 253,237 0.00%Eli Lilly & Co. $250,000 2.35% 15/5/2022 253,172 0.00%Medtronic, Inc. $246,000 3.15% 15/3/2022 252,910 0.00%Capital One Multi-Asset Execution Trust $250,000 2.29% 15/7/2025 252,890 0.00%Federal Home Loan Banks $250,000 2.13% 10/6/2022 252,835 0.00%Essex Portfolio LP $250,000 3.00% 15/1/2030 252,747 0.00%Wells Fargo Bank NA^ $250,000 2.90% 27/5/2022 252,703 0.00%Southern California Edison Co. $245,000 4.05% 15/3/2042 252,669 0.00%Procter & Gamble Co. $225,000 3.50% 25/10/2047 252,645 0.00%Aetna, Inc. $250,000 3.88% 15/8/2047 252,623 0.00%Federal National Mortgage Association $224,696 5.50% 1/9/2041 252,338 0.00%Atmos Energy Corp. $225,000 4.13% 15/10/2044 252,259 0.00%Kraft Heinz Foods Co. $240,000 4.00% 15/6/2023 252,220 0.00%3M Co. $250,000 2.25% 15/3/2023 252,149 0.00%Pricoa Global Funding I $250,000 2.40% 23/9/2024 252,060 0.00%Ford Holdings LLC $200,000 9.30% 1/3/2030 251,930 0.00%Stryker Corp. $250,000 2.63% 15/3/2021 251,659 0.00%Hasbro, Inc. $250,000 3.90% 19/11/2029 251,533 0.00%CommonSpirit Health $250,000 3.35% 1/10/2029 251,483 0.00%Stryker Corp. €200,000 2.13% 30/11/2027 251,355 0.00%Evergy, Inc. $250,000 2.45% 15/9/2024 251,189 0.00%Essex Portfolio LP $230,000 4.00% 1/3/2029 250,862 0.00%UBS Commercial Mortgage Trust 2018 $225,000 4.31% 15/5/2051 250,673 0.00%Exxon Mobil Corp. $250,000 3.00% 16/8/2039 250,467 0.00%Boeing Co. $250,000 2.13% 1/3/2022 250,434 0.00%Wells Fargo & Co. $250,000 2.10% 26/7/2021 250,407 0.00%Wells Fargo Commercial Mortgage Trust 2018 $225,000 4.21% 15/5/2051 250,403 0.00%Quest Diagnostics, Inc. $250,000 2.95% 30/6/2030 250,311 0.00%AmeriCredit Automobile Receivables Trust 2017 $250,248 1.98% 20/12/2021 250,221 0.00%Government National Mortgage Association $228,244 4.50% 20/6/2040 250,044 0.00%Lazard Group LLC $225,000 4.50% 19/9/2028 249,680 0.00%Oncor Electric Delivery Co. LLC $200,000 5.75% 15/3/2029 249,577 0.00%Bank of New York Mellon Corp. $246,000 2.60% 7/2/2022 249,450 0.00%Federal Home Loan Mortgage Corp.^ $240,000 3.30% 25/4/2023 249,329 0.00%Emerson Electric Co. €200,000 2.00% 15/10/2029 249,296 0.00%Hubbell, Inc. $250,000 3.15% 15/8/2027 249,270 0.00%Southwestern Public Service Co. $250,000 3.40% 15/8/2046 249,172 0.00%Federal Home Loan Mortgage Corp.^ $240,000 3.31% 25/5/2023 249,139 0.00%Raytheon Co. $200,000 4.70% 15/12/2041 248,633 0.00%Mastercard, Inc. $250,000 2.00% 3/3/2025 248,622 0.00%Verizon Communications, Inc. €200,000 1.88% 26/10/2029 248,591 0.00%BP Capital Markets America, Inc. $225,000 3.94% 21/9/2028 248,212 0.00%Tyco Electronics Group SA $235,000 3.70% 15/2/2026 247,902 0.00%American Tower Corp. $250,000 3.70% 15/10/2049 247,804 0.00%Government National Mortgage Association $223,982 5.00% 20/6/2040 247,754 0.00%Amgen, Inc. $200,000 5.65% 15/6/2042 247,614 0.00%Johnson & Johnson $175,000 5.85% 15/7/2038 247,590 0.00%ERP Operating LP $250,000 2.50% 15/2/2030 247,388 0.00%
Maturity Fair Value % of Total Principal Coupon Date US Dollars ($) Net Assets
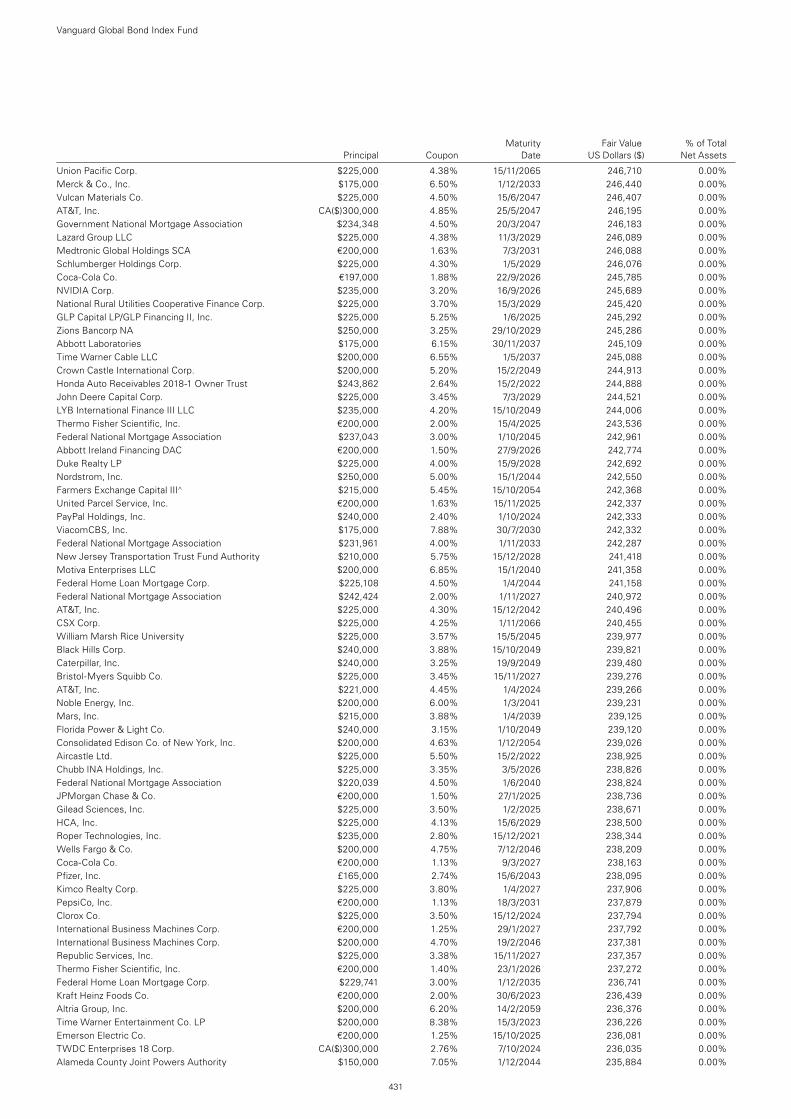
Vanguard Global Bond Index Fund
431
Union Pacific Corp. $225,000 4.38% 15/11/2065 246,710 0.00%Merck & Co., Inc. $175,000 6.50% 1/12/2033 246,440 0.00%Vulcan Materials Co. $225,000 4.50% 15/6/2047 246,407 0.00%AT&T, Inc. CA($)300,000 4.85% 25/5/2047 246,195 0.00%Government National Mortgage Association $234,348 4.50% 20/3/2047 246,183 0.00%Lazard Group LLC $225,000 4.38% 11/3/2029 246,089 0.00%Medtronic Global Holdings SCA €200,000 1.63% 7/3/2031 246,088 0.00%Schlumberger Holdings Corp. $225,000 4.30% 1/5/2029 246,076 0.00%Coca-Cola Co. €197,000 1.88% 22/9/2026 245,785 0.00%NVIDIA Corp. $235,000 3.20% 16/9/2026 245,689 0.00%National Rural Utilities Cooperative Finance Corp. $225,000 3.70% 15/3/2029 245,420 0.00%GLP Capital LP/GLP Financing II, Inc. $225,000 5.25% 1/6/2025 245,292 0.00%Zions Bancorp NA $250,000 3.25% 29/10/2029 245,286 0.00%Abbott Laboratories $175,000 6.15% 30/11/2037 245,109 0.00%Time Warner Cable LLC $200,000 6.55% 1/5/2037 245,088 0.00%Crown Castle International Corp. $200,000 5.20% 15/2/2049 244,913 0.00%Honda Auto Receivables 2018-1 Owner Trust $243,862 2.64% 15/2/2022 244,888 0.00%John Deere Capital Corp. $225,000 3.45% 7/3/2029 244,521 0.00%LYB International Finance III LLC $235,000 4.20% 15/10/2049 244,006 0.00%Thermo Fisher Scientific, Inc. €200,000 2.00% 15/4/2025 243,536 0.00%Federal National Mortgage Association $237,043 3.00% 1/10/2045 242,961 0.00%Abbott Ireland Financing DAC €200,000 1.50% 27/9/2026 242,774 0.00%Duke Realty LP $225,000 4.00% 15/9/2028 242,692 0.00%Nordstrom, Inc. $250,000 5.00% 15/1/2044 242,550 0.00%Farmers Exchange Capital III^ $215,000 5.45% 15/10/2054 242,368 0.00%United Parcel Service, Inc. €200,000 1.63% 15/11/2025 242,337 0.00%PayPal Holdings, Inc. $240,000 2.40% 1/10/2024 242,333 0.00%ViacomCBS, Inc. $175,000 7.88% 30/7/2030 242,332 0.00%Federal National Mortgage Association $231,961 4.00% 1/11/2033 242,287 0.00%New Jersey Transportation Trust Fund Authority $210,000 5.75% 15/12/2028 241,418 0.00%Motiva Enterprises LLC $200,000 6.85% 15/1/2040 241,358 0.00%Federal Home Loan Mortgage Corp. $225,108 4.50% 1/4/2044 241,158 0.00%Federal National Mortgage Association $242,424 2.00% 1/11/2027 240,972 0.00%AT&T, Inc. $225,000 4.30% 15/12/2042 240,496 0.00%CSX Corp. $225,000 4.25% 1/11/2066 240,455 0.00%William Marsh Rice University $225,000 3.57% 15/5/2045 239,977 0.00%Black Hills Corp. $240,000 3.88% 15/10/2049 239,821 0.00%Caterpillar, Inc. $240,000 3.25% 19/9/2049 239,480 0.00%Bristol-Myers Squibb Co. $225,000 3.45% 15/11/2027 239,276 0.00%AT&T, Inc. $221,000 4.45% 1/4/2024 239,266 0.00%Noble Energy, Inc. $200,000 6.00% 1/3/2041 239,231 0.00%Mars, Inc. $215,000 3.88% 1/4/2039 239,125 0.00%Florida Power & Light Co. $240,000 3.15% 1/10/2049 239,120 0.00%Consolidated Edison Co. of New York, Inc. $200,000 4.63% 1/12/2054 239,026 0.00%Aircastle Ltd. $225,000 5.50% 15/2/2022 238,925 0.00%Chubb INA Holdings, Inc. $225,000 3.35% 3/5/2026 238,826 0.00%Federal National Mortgage Association $220,039 4.50% 1/6/2040 238,824 0.00%JPMorgan Chase & Co. €200,000 1.50% 27/1/2025 238,736 0.00%Gilead Sciences, Inc. $225,000 3.50% 1/2/2025 238,671 0.00%HCA, Inc. $225,000 4.13% 15/6/2029 238,500 0.00%Roper Technologies, Inc. $235,000 2.80% 15/12/2021 238,344 0.00%Wells Fargo & Co. $200,000 4.75% 7/12/2046 238,209 0.00%Coca-Cola Co. €200,000 1.13% 9/3/2027 238,163 0.00%Pfizer, Inc. £165,000 2.74% 15/6/2043 238,095 0.00%Kimco Realty Corp. $225,000 3.80% 1/4/2027 237,906 0.00%PepsiCo, Inc. €200,000 1.13% 18/3/2031 237,879 0.00%Clorox Co. $225,000 3.50% 15/12/2024 237,794 0.00%International Business Machines Corp. €200,000 1.25% 29/1/2027 237,792 0.00%International Business Machines Corp. $200,000 4.70% 19/2/2046 237,381 0.00%Republic Services, Inc. $225,000 3.38% 15/11/2027 237,357 0.00%Thermo Fisher Scientific, Inc. €200,000 1.40% 23/1/2026 237,272 0.00%Federal Home Loan Mortgage Corp. $229,741 3.00% 1/12/2035 236,741 0.00%Kraft Heinz Foods Co. €200,000 2.00% 30/6/2023 236,439 0.00%Altria Group, Inc. $200,000 6.20% 14/2/2059 236,376 0.00%Time Warner Entertainment Co. LP $200,000 8.38% 15/3/2023 236,226 0.00%Emerson Electric Co. €200,000 1.25% 15/10/2025 236,081 0.00%TWDC Enterprises 18 Corp. CA($)300,000 2.76% 7/10/2024 236,035 0.00%Alameda County Joint Powers Authority $150,000 7.05% 1/12/2044 235,884 0.00%
Maturity Fair Value % of Total Principal Coupon Date US Dollars ($) Net Assets
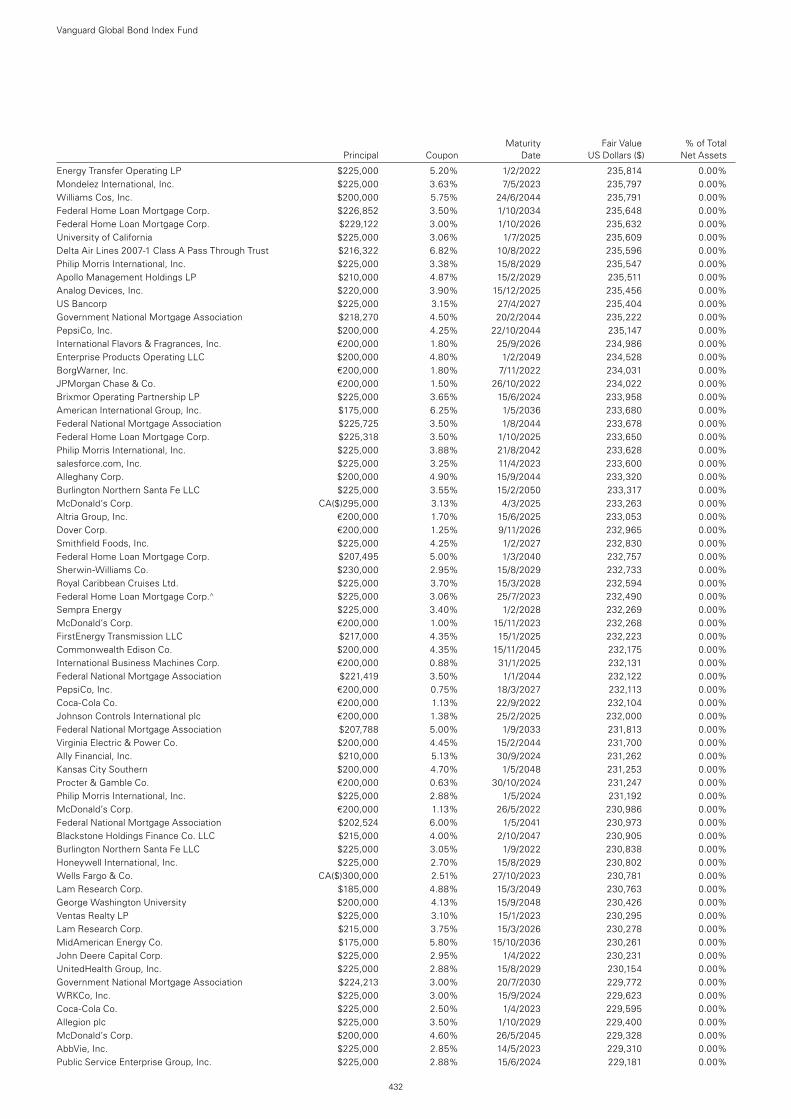
Vanguard Global Bond Index Fund
432
Energy Transfer Operating LP $225,000 5.20% 1/2/2022 235,814 0.00%Mondelez International, Inc. $225,000 3.63% 7/5/2023 235,797 0.00%Williams Cos, Inc. $200,000 5.75% 24/6/2044 235,791 0.00%Federal Home Loan Mortgage Corp. $226,852 3.50% 1/10/2034 235,648 0.00%Federal Home Loan Mortgage Corp. $229,122 3.00% 1/10/2026 235,632 0.00%University of California $225,000 3.06% 1/7/2025 235,609 0.00%Delta Air Lines 2007-1 Class A Pass Through Trust $216,322 6.82% 10/8/2022 235,596 0.00%Philip Morris International, Inc. $225,000 3.38% 15/8/2029 235,547 0.00%Apollo Management Holdings LP $210,000 4.87% 15/2/2029 235,511 0.00%Analog Devices, Inc. $220,000 3.90% 15/12/2025 235,456 0.00%US Bancorp $225,000 3.15% 27/4/2027 235,404 0.00%Government National Mortgage Association $218,270 4.50% 20/2/2044 235,222 0.00%PepsiCo, Inc. $200,000 4.25% 22/10/2044 235,147 0.00%International Flavors & Fragrances, Inc. €200,000 1.80% 25/9/2026 234,986 0.00%Enterprise Products Operating LLC $200,000 4.80% 1/2/2049 234,528 0.00%BorgWarner, Inc. €200,000 1.80% 7/11/2022 234,031 0.00%JPMorgan Chase & Co. €200,000 1.50% 26/10/2022 234,022 0.00%Brixmor Operating Partnership LP $225,000 3.65% 15/6/2024 233,958 0.00%American International Group, Inc. $175,000 6.25% 1/5/2036 233,680 0.00%Federal National Mortgage Association $225,725 3.50% 1/8/2044 233,678 0.00%Federal Home Loan Mortgage Corp. $225,318 3.50% 1/10/2025 233,650 0.00%Philip Morris International, Inc. $225,000 3.88% 21/8/2042 233,628 0.00%salesforce.com, Inc. $225,000 3.25% 11/4/2023 233,600 0.00%Alleghany Corp. $200,000 4.90% 15/9/2044 233,320 0.00%Burlington Northern Santa Fe LLC $225,000 3.55% 15/2/2050 233,317 0.00%McDonald’s Corp. CA($)295,000 3.13% 4/3/2025 233,263 0.00%Altria Group, Inc. €200,000 1.70% 15/6/2025 233,053 0.00%Dover Corp. €200,000 1.25% 9/11/2026 232,965 0.00%Smithfield Foods, Inc. $225,000 4.25% 1/2/2027 232,830 0.00%Federal Home Loan Mortgage Corp. $207,495 5.00% 1/3/2040 232,757 0.00%Sherwin-Williams Co. $230,000 2.95% 15/8/2029 232,733 0.00%Royal Caribbean Cruises Ltd. $225,000 3.70% 15/3/2028 232,594 0.00%Federal Home Loan Mortgage Corp.^ $225,000 3.06% 25/7/2023 232,490 0.00%Sempra Energy $225,000 3.40% 1/2/2028 232,269 0.00%McDonald’s Corp. €200,000 1.00% 15/11/2023 232,268 0.00%FirstEnergy Transmission LLC $217,000 4.35% 15/1/2025 232,223 0.00%Commonwealth Edison Co. $200,000 4.35% 15/11/2045 232,175 0.00%International Business Machines Corp. €200,000 0.88% 31/1/2025 232,131 0.00%Federal National Mortgage Association $221,419 3.50% 1/1/2044 232,122 0.00%PepsiCo, Inc. €200,000 0.75% 18/3/2027 232,113 0.00%Coca-Cola Co. €200,000 1.13% 22/9/2022 232,104 0.00%Johnson Controls International plc €200,000 1.38% 25/2/2025 232,000 0.00%Federal National Mortgage Association $207,788 5.00% 1/9/2033 231,813 0.00%Virginia Electric & Power Co. $200,000 4.45% 15/2/2044 231,700 0.00%Ally Financial, Inc. $210,000 5.13% 30/9/2024 231,262 0.00%Kansas City Southern $200,000 4.70% 1/5/2048 231,253 0.00%Procter & Gamble Co. €200,000 0.63% 30/10/2024 231,247 0.00%Philip Morris International, Inc. $225,000 2.88% 1/5/2024 231,192 0.00%McDonald’s Corp. €200,000 1.13% 26/5/2022 230,986 0.00%Federal National Mortgage Association $202,524 6.00% 1/5/2041 230,973 0.00%Blackstone Holdings Finance Co. LLC $215,000 4.00% 2/10/2047 230,905 0.00%Burlington Northern Santa Fe LLC $225,000 3.05% 1/9/2022 230,838 0.00%Honeywell International, Inc. $225,000 2.70% 15/8/2029 230,802 0.00%Wells Fargo & Co. CA($)300,000 2.51% 27/10/2023 230,781 0.00%Lam Research Corp. $185,000 4.88% 15/3/2049 230,763 0.00%George Washington University $200,000 4.13% 15/9/2048 230,426 0.00%Ventas Realty LP $225,000 3.10% 15/1/2023 230,295 0.00%Lam Research Corp. $215,000 3.75% 15/3/2026 230,278 0.00%MidAmerican Energy Co. $175,000 5.80% 15/10/2036 230,261 0.00%John Deere Capital Corp. $225,000 2.95% 1/4/2022 230,231 0.00%UnitedHealth Group, Inc. $225,000 2.88% 15/8/2029 230,154 0.00%Government National Mortgage Association $224,213 3.00% 20/7/2030 229,772 0.00%WRKCo, Inc. $225,000 3.00% 15/9/2024 229,623 0.00%Coca-Cola Co. $225,000 2.50% 1/4/2023 229,595 0.00%Allegion plc $225,000 3.50% 1/10/2029 229,400 0.00%McDonald’s Corp. $200,000 4.60% 26/5/2045 229,328 0.00%AbbVie, Inc. $225,000 2.85% 14/5/2023 229,310 0.00%Public Service Enterprise Group, Inc. $225,000 2.88% 15/6/2024 229,181 0.00%
Maturity Fair Value % of Total Principal Coupon Date US Dollars ($) Net Assets
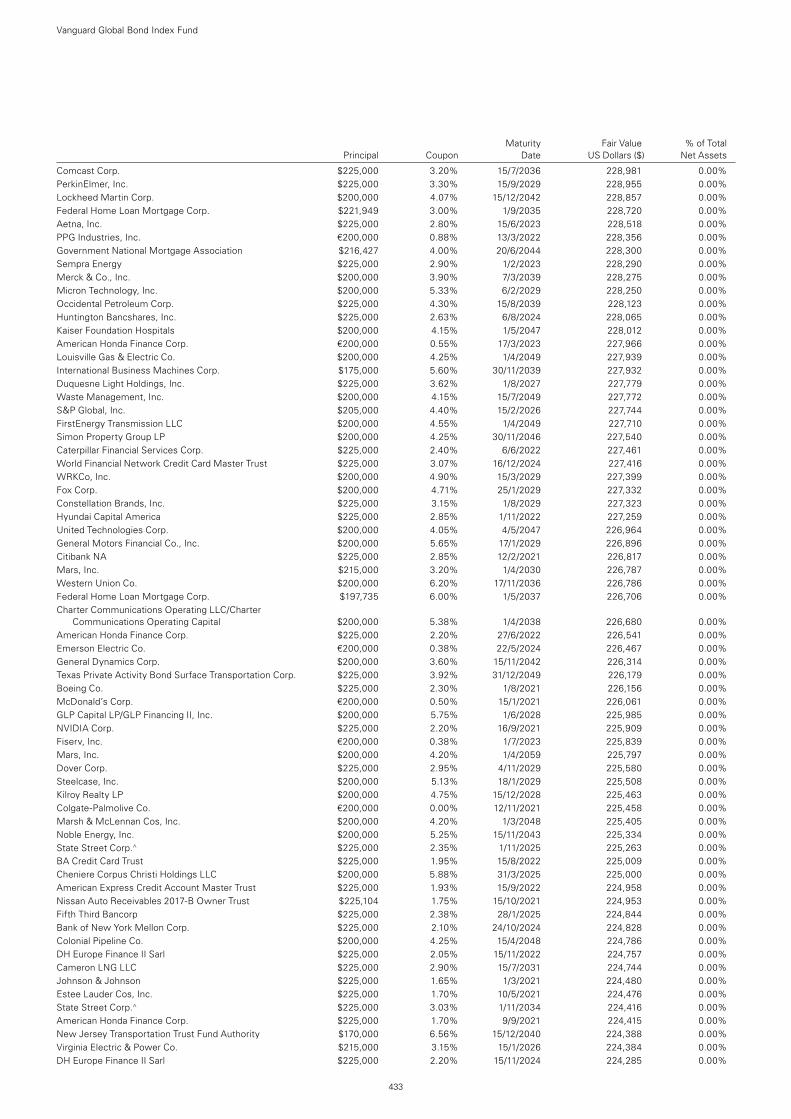
Vanguard Global Bond Index Fund
433
Comcast Corp. $225,000 3.20% 15/7/2036 228,981 0.00%PerkinElmer, Inc. $225,000 3.30% 15/9/2029 228,955 0.00%Lockheed Martin Corp. $200,000 4.07% 15/12/2042 228,857 0.00%Federal Home Loan Mortgage Corp. $221,949 3.00% 1/9/2035 228,720 0.00%Aetna, Inc. $225,000 2.80% 15/6/2023 228,518 0.00%PPG Industries, Inc. €200,000 0.88% 13/3/2022 228,356 0.00%Government National Mortgage Association $216,427 4.00% 20/6/2044 228,300 0.00%Sempra Energy $225,000 2.90% 1/2/2023 228,290 0.00%Merck & Co., Inc. $200,000 3.90% 7/3/2039 228,275 0.00%Micron Technology, Inc. $200,000 5.33% 6/2/2029 228,250 0.00%Occidental Petroleum Corp. $225,000 4.30% 15/8/2039 228,123 0.00%Huntington Bancshares, Inc. $225,000 2.63% 6/8/2024 228,065 0.00%Kaiser Foundation Hospitals $200,000 4.15% 1/5/2047 228,012 0.00%American Honda Finance Corp. €200,000 0.55% 17/3/2023 227,966 0.00%Louisville Gas & Electric Co. $200,000 4.25% 1/4/2049 227,939 0.00%International Business Machines Corp. $175,000 5.60% 30/11/2039 227,932 0.00%Duquesne Light Holdings, Inc. $225,000 3.62% 1/8/2027 227,779 0.00%Waste Management, Inc. $200,000 4.15% 15/7/2049 227,772 0.00%S&P Global, Inc. $205,000 4.40% 15/2/2026 227,744 0.00%FirstEnergy Transmission LLC $200,000 4.55% 1/4/2049 227,710 0.00%Simon Property Group LP $200,000 4.25% 30/11/2046 227,540 0.00%Caterpillar Financial Services Corp. $225,000 2.40% 6/6/2022 227,461 0.00%World Financial Network Credit Card Master Trust $225,000 3.07% 16/12/2024 227,416 0.00%WRKCo, Inc. $200,000 4.90% 15/3/2029 227,399 0.00%Fox Corp. $200,000 4.71% 25/1/2029 227,332 0.00%Constellation Brands, Inc. $225,000 3.15% 1/8/2029 227,323 0.00%Hyundai Capital America $225,000 2.85% 1/11/2022 227,259 0.00%United Technologies Corp. $200,000 4.05% 4/5/2047 226,964 0.00%General Motors Financial Co., Inc. $200,000 5.65% 17/1/2029 226,896 0.00%Citibank NA $225,000 2.85% 12/2/2021 226,817 0.00%Mars, Inc. $215,000 3.20% 1/4/2030 226,787 0.00%Western Union Co. $200,000 6.20% 17/11/2036 226,786 0.00%Federal Home Loan Mortgage Corp. $197,735 6.00% 1/5/2037 226,706 0.00%Charter Communications Operating LLC/Charter
Communications Operating Capital $200,000 5.38% 1/4/2038 226,680 0.00%American Honda Finance Corp. $225,000 2.20% 27/6/2022 226,541 0.00%Emerson Electric Co. €200,000 0.38% 22/5/2024 226,467 0.00%General Dynamics Corp. $200,000 3.60% 15/11/2042 226,314 0.00%Texas Private Activity Bond Surface Transportation Corp. $225,000 3.92% 31/12/2049 226,179 0.00%Boeing Co. $225,000 2.30% 1/8/2021 226,156 0.00%McDonald’s Corp. €200,000 0.50% 15/1/2021 226,061 0.00%GLP Capital LP/GLP Financing II, Inc. $200,000 5.75% 1/6/2028 225,985 0.00%NVIDIA Corp. $225,000 2.20% 16/9/2021 225,909 0.00%Fiserv, Inc. €200,000 0.38% 1/7/2023 225,839 0.00%Mars, Inc. $200,000 4.20% 1/4/2059 225,797 0.00%Dover Corp. $225,000 2.95% 4/11/2029 225,580 0.00%Steelcase, Inc. $200,000 5.13% 18/1/2029 225,508 0.00%Kilroy Realty LP $200,000 4.75% 15/12/2028 225,463 0.00%Colgate-Palmolive Co. €200,000 0.00% 12/11/2021 225,458 0.00%Marsh & McLennan Cos, Inc. $200,000 4.20% 1/3/2048 225,405 0.00%Noble Energy, Inc. $200,000 5.25% 15/11/2043 225,334 0.00%State Street Corp.^ $225,000 2.35% 1/11/2025 225,263 0.00%BA Credit Card Trust $225,000 1.95% 15/8/2022 225,009 0.00%Cheniere Corpus Christi Holdings LLC $200,000 5.88% 31/3/2025 225,000 0.00%American Express Credit Account Master Trust $225,000 1.93% 15/9/2022 224,958 0.00%Nissan Auto Receivables 2017-B Owner Trust $225,104 1.75% 15/10/2021 224,953 0.00%Fifth Third Bancorp $225,000 2.38% 28/1/2025 224,844 0.00%Bank of New York Mellon Corp. $225,000 2.10% 24/10/2024 224,828 0.00%Colonial Pipeline Co. $200,000 4.25% 15/4/2048 224,786 0.00%DH Europe Finance II Sarl $225,000 2.05% 15/11/2022 224,757 0.00%Cameron LNG LLC $225,000 2.90% 15/7/2031 224,744 0.00%Johnson & Johnson $225,000 1.65% 1/3/2021 224,480 0.00%Estee Lauder Cos, Inc. $225,000 1.70% 10/5/2021 224,476 0.00%State Street Corp.^ $225,000 3.03% 1/11/2034 224,416 0.00%American Honda Finance Corp. $225,000 1.70% 9/9/2021 224,415 0.00%New Jersey Transportation Trust Fund Authority $170,000 6.56% 15/12/2040 224,388 0.00%Virginia Electric & Power Co. $215,000 3.15% 15/1/2026 224,384 0.00%DH Europe Finance II Sarl $225,000 2.20% 15/11/2024 224,285 0.00%
Maturity Fair Value % of Total Principal Coupon Date US Dollars ($) Net Assets
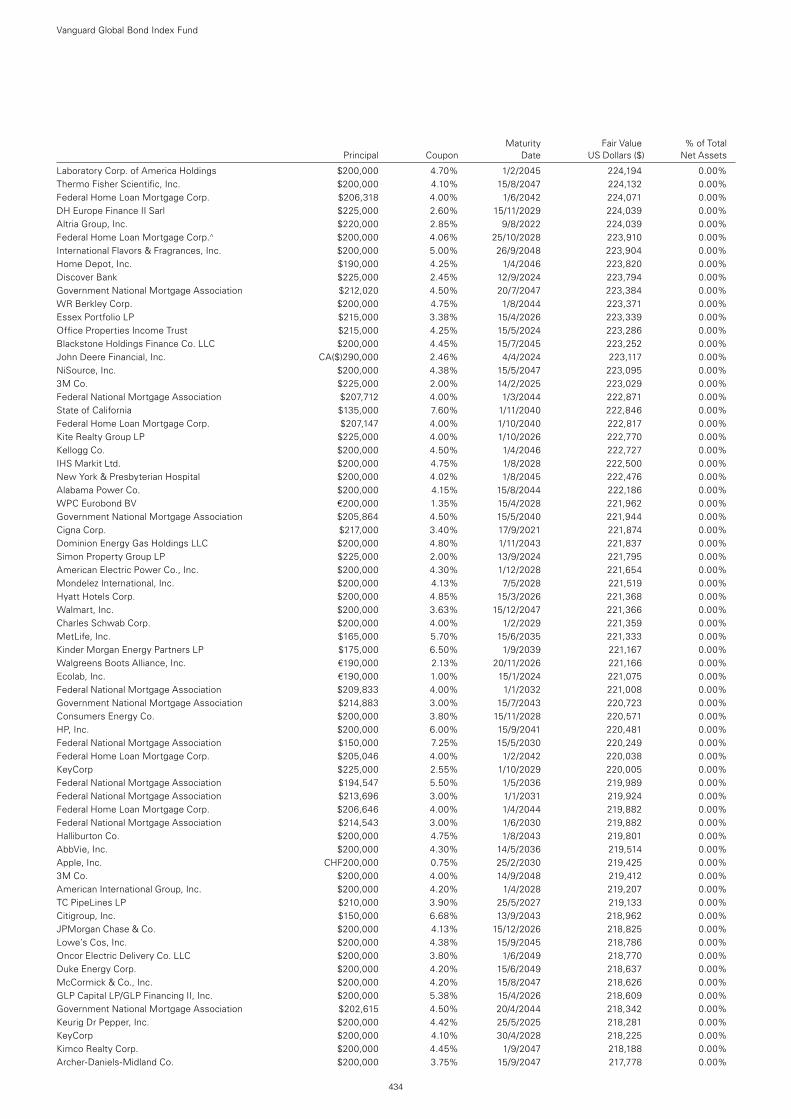
Maturity Fair Value % of Total Principal Coupon Date US Dollars ($) Net Assets
Vanguard Global Bond Index Fund
434
Laboratory Corp. of America Holdings $200,000 4.70% 1/2/2045 224,194 0.00%Thermo Fisher Scientific, Inc. $200,000 4.10% 15/8/2047 224,132 0.00%Federal Home Loan Mortgage Corp. $206,318 4.00% 1/6/2042 224,071 0.00%DH Europe Finance II Sarl $225,000 2.60% 15/11/2029 224,039 0.00%Altria Group, Inc. $220,000 2.85% 9/8/2022 224,039 0.00%Federal Home Loan Mortgage Corp.^ $200,000 4.06% 25/10/2028 223,910 0.00%International Flavors & Fragrances, Inc. $200,000 5.00% 26/9/2048 223,904 0.00%Home Depot, Inc. $190,000 4.25% 1/4/2046 223,820 0.00%Discover Bank $225,000 2.45% 12/9/2024 223,794 0.00%Government National Mortgage Association $212,020 4.50% 20/7/2047 223,384 0.00%WR Berkley Corp. $200,000 4.75% 1/8/2044 223,371 0.00%Essex Portfolio LP $215,000 3.38% 15/4/2026 223,339 0.00%Office Properties Income Trust $215,000 4.25% 15/5/2024 223,286 0.00%Blackstone Holdings Finance Co. LLC $200,000 4.45% 15/7/2045 223,252 0.00%John Deere Financial, Inc. CA($)290,000 2.46% 4/4/2024 223,117 0.00%NiSource, Inc. $200,000 4.38% 15/5/2047 223,095 0.00%3M Co. $225,000 2.00% 14/2/2025 223,029 0.00%Federal National Mortgage Association $207,712 4.00% 1/3/2044 222,871 0.00%State of California $135,000 7.60% 1/11/2040 222,846 0.00%Federal Home Loan Mortgage Corp. $207,147 4.00% 1/10/2040 222,817 0.00%Kite Realty Group LP $225,000 4.00% 1/10/2026 222,770 0.00%Kellogg Co. $200,000 4.50% 1/4/2046 222,727 0.00%IHS Markit Ltd. $200,000 4.75% 1/8/2028 222,500 0.00%New York & Presbyterian Hospital $200,000 4.02% 1/8/2045 222,476 0.00%Alabama Power Co. $200,000 4.15% 15/8/2044 222,186 0.00%WPC Eurobond BV €200,000 1.35% 15/4/2028 221,962 0.00%Government National Mortgage Association $205,864 4.50% 15/5/2040 221,944 0.00%Cigna Corp. $217,000 3.40% 17/9/2021 221,874 0.00%Dominion Energy Gas Holdings LLC $200,000 4.80% 1/11/2043 221,837 0.00%Simon Property Group LP $225,000 2.00% 13/9/2024 221,795 0.00%American Electric Power Co., Inc. $200,000 4.30% 1/12/2028 221,654 0.00%Mondelez International, Inc. $200,000 4.13% 7/5/2028 221,519 0.00%Hyatt Hotels Corp. $200,000 4.85% 15/3/2026 221,368 0.00%Walmart, Inc. $200,000 3.63% 15/12/2047 221,366 0.00%Charles Schwab Corp. $200,000 4.00% 1/2/2029 221,359 0.00%MetLife, Inc. $165,000 5.70% 15/6/2035 221,333 0.00%Kinder Morgan Energy Partners LP $175,000 6.50% 1/9/2039 221,167 0.00%Walgreens Boots Alliance, Inc. €190,000 2.13% 20/11/2026 221,166 0.00%Ecolab, Inc. €190,000 1.00% 15/1/2024 221,075 0.00%Federal National Mortgage Association $209,833 4.00% 1/1/2032 221,008 0.00%Government National Mortgage Association $214,883 3.00% 15/7/2043 220,723 0.00%Consumers Energy Co. $200,000 3.80% 15/11/2028 220,571 0.00%HP, Inc. $200,000 6.00% 15/9/2041 220,481 0.00%Federal National Mortgage Association $150,000 7.25% 15/5/2030 220,249 0.00%Federal Home Loan Mortgage Corp. $205,046 4.00% 1/2/2042 220,038 0.00%KeyCorp $225,000 2.55% 1/10/2029 220,005 0.00%Federal National Mortgage Association $194,547 5.50% 1/5/2036 219,989 0.00%Federal National Mortgage Association $213,696 3.00% 1/1/2031 219,924 0.00%Federal Home Loan Mortgage Corp. $206,646 4.00% 1/4/2044 219,882 0.00%Federal National Mortgage Association $214,543 3.00% 1/6/2030 219,882 0.00%Halliburton Co. $200,000 4.75% 1/8/2043 219,801 0.00%AbbVie, Inc. $200,000 4.30% 14/5/2036 219,514 0.00%Apple, Inc. CHF200,000 0.75% 25/2/2030 219,425 0.00%3M Co. $200,000 4.00% 14/9/2048 219,412 0.00%American International Group, Inc. $200,000 4.20% 1/4/2028 219,207 0.00%TC PipeLines LP $210,000 3.90% 25/5/2027 219,133 0.00%Citigroup, Inc. $150,000 6.68% 13/9/2043 218,962 0.00%JPMorgan Chase & Co. $200,000 4.13% 15/12/2026 218,825 0.00%Lowe’s Cos, Inc. $200,000 4.38% 15/9/2045 218,786 0.00%Oncor Electric Delivery Co. LLC $200,000 3.80% 1/6/2049 218,770 0.00%Duke Energy Corp. $200,000 4.20% 15/6/2049 218,637 0.00%McCormick & Co., Inc. $200,000 4.20% 15/8/2047 218,626 0.00%GLP Capital LP/GLP Financing II, Inc. $200,000 5.38% 15/4/2026 218,609 0.00%Government National Mortgage Association $202,615 4.50% 20/4/2044 218,342 0.00%Keurig Dr Pepper, Inc. $200,000 4.42% 25/5/2025 218,281 0.00%KeyCorp $200,000 4.10% 30/4/2028 218,225 0.00%Kimco Realty Corp. $200,000 4.45% 1/9/2047 218,188 0.00%Archer-Daniels-Midland Co. $200,000 3.75% 15/9/2047 217,778 0.00%
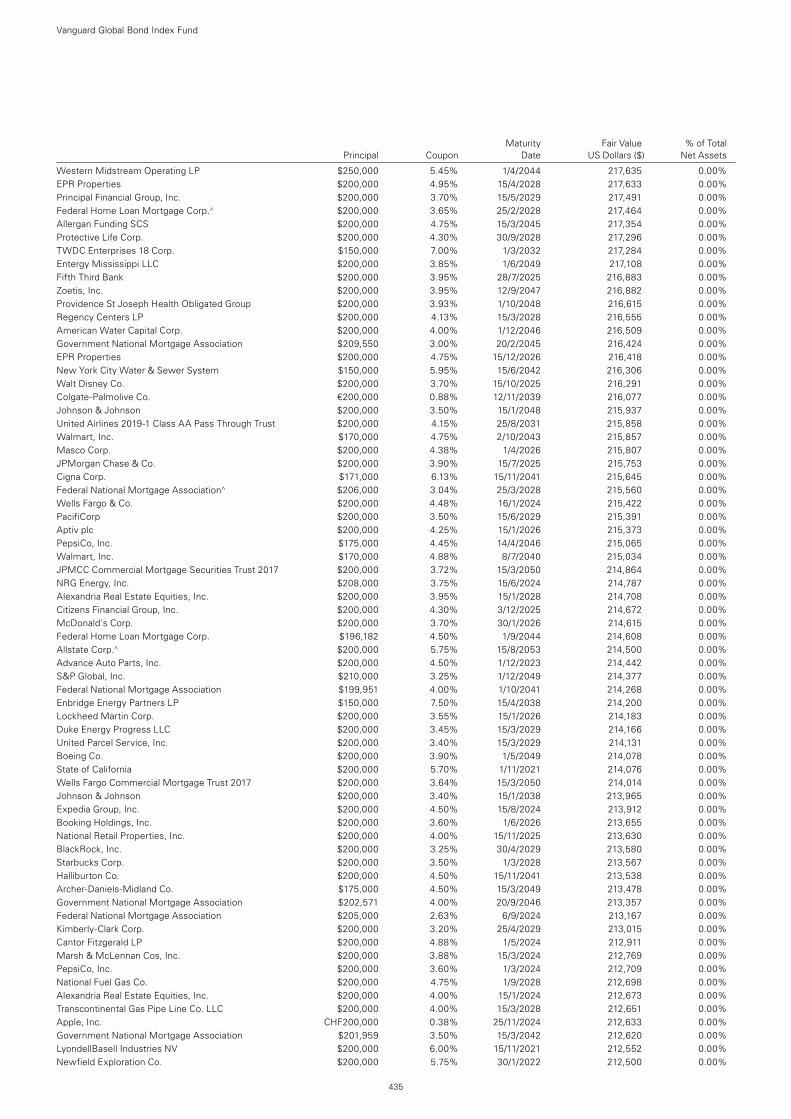
Maturity Fair Value % of Total Principal Coupon Date US Dollars ($) Net Assets
Vanguard Global Bond Index Fund
435
Western Midstream Operating LP $250,000 5.45% 1/4/2044 217,635 0.00%EPR Properties $200,000 4.95% 15/4/2028 217,633 0.00%Principal Financial Group, Inc. $200,000 3.70% 15/5/2029 217,491 0.00%Federal Home Loan Mortgage Corp.^ $200,000 3.65% 25/2/2028 217,464 0.00%Allergan Funding SCS $200,000 4.75% 15/3/2045 217,354 0.00%Protective Life Corp. $200,000 4.30% 30/9/2028 217,296 0.00%TWDC Enterprises 18 Corp. $150,000 7.00% 1/3/2032 217,284 0.00%Entergy Mississippi LLC $200,000 3.85% 1/6/2049 217,108 0.00%Fifth Third Bank $200,000 3.95% 28/7/2025 216,883 0.00%Zoetis, Inc. $200,000 3.95% 12/9/2047 216,882 0.00%Providence St Joseph Health Obligated Group $200,000 3.93% 1/10/2048 216,615 0.00%Regency Centers LP $200,000 4.13% 15/3/2028 216,555 0.00%American Water Capital Corp. $200,000 4.00% 1/12/2046 216,509 0.00%Government National Mortgage Association $209,550 3.00% 20/2/2045 216,424 0.00%EPR Properties $200,000 4.75% 15/12/2026 216,418 0.00%New York City Water & Sewer System $150,000 5.95% 15/6/2042 216,306 0.00%Walt Disney Co. $200,000 3.70% 15/10/2025 216,291 0.00%Colgate-Palmolive Co. €200,000 0.88% 12/11/2039 216,077 0.00%Johnson & Johnson $200,000 3.50% 15/1/2048 215,937 0.00%United Airlines 2019-1 Class AA Pass Through Trust $200,000 4.15% 25/8/2031 215,858 0.00%Walmart, Inc. $170,000 4.75% 2/10/2043 215,857 0.00%Masco Corp. $200,000 4.38% 1/4/2026 215,807 0.00%JPMorgan Chase & Co. $200,000 3.90% 15/7/2025 215,753 0.00%Cigna Corp. $171,000 6.13% 15/11/2041 215,645 0.00%Federal National Mortgage Association^ $206,000 3.04% 25/3/2028 215,560 0.00%Wells Fargo & Co. $200,000 4.48% 16/1/2024 215,422 0.00%PacifiCorp $200,000 3.50% 15/6/2029 215,391 0.00%Aptiv plc $200,000 4.25% 15/1/2026 215,373 0.00%PepsiCo, Inc. $175,000 4.45% 14/4/2046 215,065 0.00%Walmart, Inc. $170,000 4.88% 8/7/2040 215,034 0.00%JPMCC Commercial Mortgage Securities Trust 2017 $200,000 3.72% 15/3/2050 214,864 0.00%NRG Energy, Inc. $208,000 3.75% 15/6/2024 214,787 0.00%Alexandria Real Estate Equities, Inc. $200,000 3.95% 15/1/2028 214,708 0.00%Citizens Financial Group, Inc. $200,000 4.30% 3/12/2025 214,672 0.00%McDonald’s Corp. $200,000 3.70% 30/1/2026 214,615 0.00%Federal Home Loan Mortgage Corp. $196,182 4.50% 1/9/2044 214,608 0.00%Allstate Corp.^ $200,000 5.75% 15/8/2053 214,500 0.00%Advance Auto Parts, Inc. $200,000 4.50% 1/12/2023 214,442 0.00%S&P Global, Inc. $210,000 3.25% 1/12/2049 214,377 0.00%Federal National Mortgage Association $199,951 4.00% 1/10/2041 214,268 0.00%Enbridge Energy Partners LP $150,000 7.50% 15/4/2038 214,200 0.00%Lockheed Martin Corp. $200,000 3.55% 15/1/2026 214,183 0.00%Duke Energy Progress LLC $200,000 3.45% 15/3/2029 214,166 0.00%United Parcel Service, Inc. $200,000 3.40% 15/3/2029 214,131 0.00%Boeing Co. $200,000 3.90% 1/5/2049 214,078 0.00%State of California $200,000 5.70% 1/11/2021 214,076 0.00%Wells Fargo Commercial Mortgage Trust 2017 $200,000 3.64% 15/3/2050 214,014 0.00%Johnson & Johnson $200,000 3.40% 15/1/2038 213,965 0.00%Expedia Group, Inc. $200,000 4.50% 15/8/2024 213,912 0.00%Booking Holdings, Inc. $200,000 3.60% 1/6/2026 213,655 0.00%National Retail Properties, Inc. $200,000 4.00% 15/11/2025 213,630 0.00%BlackRock, Inc. $200,000 3.25% 30/4/2029 213,580 0.00%Starbucks Corp. $200,000 3.50% 1/3/2028 213,567 0.00%Halliburton Co. $200,000 4.50% 15/11/2041 213,538 0.00%Archer-Daniels-Midland Co. $175,000 4.50% 15/3/2049 213,478 0.00%Government National Mortgage Association $202,571 4.00% 20/9/2046 213,357 0.00%Federal National Mortgage Association $205,000 2.63% 6/9/2024 213,167 0.00%Kimberly-Clark Corp. $200,000 3.20% 25/4/2029 213,015 0.00%Cantor Fitzgerald LP $200,000 4.88% 1/5/2024 212,911 0.00%Marsh & McLennan Cos, Inc. $200,000 3.88% 15/3/2024 212,769 0.00%PepsiCo, Inc. $200,000 3.60% 1/3/2024 212,709 0.00%National Fuel Gas Co. $200,000 4.75% 1/9/2028 212,698 0.00%Alexandria Real Estate Equities, Inc. $200,000 4.00% 15/1/2024 212,673 0.00%Transcontinental Gas Pipe Line Co. LLC $200,000 4.00% 15/3/2028 212,651 0.00%Apple, Inc. CHF200,000 0.38% 25/11/2024 212,633 0.00%Government National Mortgage Association $201,959 3.50% 15/3/2042 212,620 0.00%LyondellBasell Industries NV $200,000 6.00% 15/11/2021 212,552 0.00%Newfield Exploration Co. $200,000 5.75% 30/1/2022 212,500 0.00%
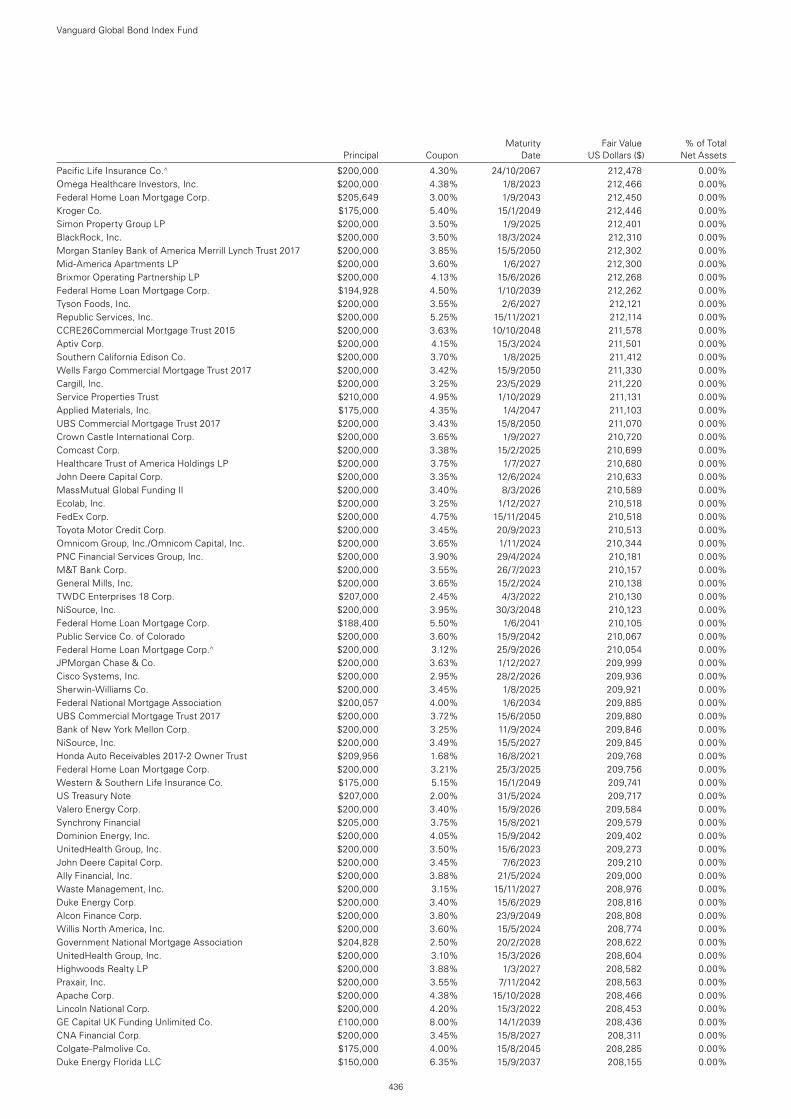
Maturity Fair Value % of Total Principal Coupon Date US Dollars ($) Net Assets
Vanguard Global Bond Index Fund
436
Pacific Life Insurance Co.^ $200,000 4.30% 24/10/2067 212,478 0.00%Omega Healthcare Investors, Inc. $200,000 4.38% 1/8/2023 212,466 0.00%Federal Home Loan Mortgage Corp. $205,649 3.00% 1/9/2043 212,450 0.00%Kroger Co. $175,000 5.40% 15/1/2049 212,446 0.00%Simon Property Group LP $200,000 3.50% 1/9/2025 212,401 0.00%BlackRock, Inc. $200,000 3.50% 18/3/2024 212,310 0.00%Morgan Stanley Bank of America Merrill Lynch Trust 2017 $200,000 3.85% 15/5/2050 212,302 0.00%Mid-America Apartments LP $200,000 3.60% 1/6/2027 212,300 0.00%Brixmor Operating Partnership LP $200,000 4.13% 15/6/2026 212,268 0.00%Federal Home Loan Mortgage Corp. $194,928 4.50% 1/10/2039 212,262 0.00%Tyson Foods, Inc. $200,000 3.55% 2/6/2027 212,121 0.00%Republic Services, Inc. $200,000 5.25% 15/11/2021 212,114 0.00%CCRE26Commercial Mortgage Trust 2015 $200,000 3.63% 10/10/2048 211,578 0.00%Aptiv Corp. $200,000 4.15% 15/3/2024 211,501 0.00%Southern California Edison Co. $200,000 3.70% 1/8/2025 211,412 0.00%Wells Fargo Commercial Mortgage Trust 2017 $200,000 3.42% 15/9/2050 211,330 0.00%Cargill, Inc. $200,000 3.25% 23/5/2029 211,220 0.00%Service Properties Trust $210,000 4.95% 1/10/2029 211,131 0.00%Applied Materials, Inc. $175,000 4.35% 1/4/2047 211,103 0.00%UBS Commercial Mortgage Trust 2017 $200,000 3.43% 15/8/2050 211,070 0.00%Crown Castle International Corp. $200,000 3.65% 1/9/2027 210,720 0.00%Comcast Corp. $200,000 3.38% 15/2/2025 210,699 0.00%Healthcare Trust of America Holdings LP $200,000 3.75% 1/7/2027 210,680 0.00%John Deere Capital Corp. $200,000 3.35% 12/6/2024 210,633 0.00%MassMutual Global Funding II $200,000 3.40% 8/3/2026 210,589 0.00%Ecolab, Inc. $200,000 3.25% 1/12/2027 210,518 0.00%FedEx Corp. $200,000 4.75% 15/11/2045 210,518 0.00%Toyota Motor Credit Corp. $200,000 3.45% 20/9/2023 210,513 0.00%Omnicom Group, Inc./Omnicom Capital, Inc. $200,000 3.65% 1/11/2024 210,344 0.00%PNC Financial Services Group, Inc. $200,000 3.90% 29/4/2024 210,181 0.00%M&T Bank Corp. $200,000 3.55% 26/7/2023 210,157 0.00%General Mills, Inc. $200,000 3.65% 15/2/2024 210,138 0.00%TWDC Enterprises 18 Corp. $207,000 2.45% 4/3/2022 210,130 0.00%NiSource, Inc. $200,000 3.95% 30/3/2048 210,123 0.00%Federal Home Loan Mortgage Corp. $188,400 5.50% 1/6/2041 210,105 0.00%Public Service Co. of Colorado $200,000 3.60% 15/9/2042 210,067 0.00%Federal Home Loan Mortgage Corp.^ $200,000 3.12% 25/9/2026 210,054 0.00%JPMorgan Chase & Co. $200,000 3.63% 1/12/2027 209,999 0.00%Cisco Systems, Inc. $200,000 2.95% 28/2/2026 209,936 0.00%Sherwin-Williams Co. $200,000 3.45% 1/8/2025 209,921 0.00%Federal National Mortgage Association $200,057 4.00% 1/6/2034 209,885 0.00%UBS Commercial Mortgage Trust 2017 $200,000 3.72% 15/6/2050 209,880 0.00%Bank of New York Mellon Corp. $200,000 3.25% 11/9/2024 209,846 0.00%NiSource, Inc. $200,000 3.49% 15/5/2027 209,845 0.00%Honda Auto Receivables 2017-2 Owner Trust $209,956 1.68% 16/8/2021 209,768 0.00%Federal Home Loan Mortgage Corp. $200,000 3.21% 25/3/2025 209,756 0.00%Western & Southern Life Insurance Co. $175,000 5.15% 15/1/2049 209,741 0.00%US Treasury Note $207,000 2.00% 31/5/2024 209,717 0.00%Valero Energy Corp. $200,000 3.40% 15/9/2026 209,584 0.00%Synchrony Financial $205,000 3.75% 15/8/2021 209,579 0.00%Dominion Energy, Inc. $200,000 4.05% 15/9/2042 209,402 0.00%UnitedHealth Group, Inc. $200,000 3.50% 15/6/2023 209,273 0.00%John Deere Capital Corp. $200,000 3.45% 7/6/2023 209,210 0.00%Ally Financial, Inc. $200,000 3.88% 21/5/2024 209,000 0.00%Waste Management, Inc. $200,000 3.15% 15/11/2027 208,976 0.00%Duke Energy Corp. $200,000 3.40% 15/6/2029 208,816 0.00%Alcon Finance Corp. $200,000 3.80% 23/9/2049 208,808 0.00%Willis North America, Inc. $200,000 3.60% 15/5/2024 208,774 0.00%Government National Mortgage Association $204,828 2.50% 20/2/2028 208,622 0.00%UnitedHealth Group, Inc. $200,000 3.10% 15/3/2026 208,604 0.00%Highwoods Realty LP $200,000 3.88% 1/3/2027 208,582 0.00%Praxair, Inc. $200,000 3.55% 7/11/2042 208,563 0.00%Apache Corp. $200,000 4.38% 15/10/2028 208,466 0.00%Lincoln National Corp. $200,000 4.20% 15/3/2022 208,453 0.00%GE Capital UK Funding Unlimited Co. £100,000 8.00% 14/1/2039 208,436 0.00%CNA Financial Corp. $200,000 3.45% 15/8/2027 208,311 0.00%Colgate-Palmolive Co. $175,000 4.00% 15/8/2045 208,285 0.00%Duke Energy Florida LLC $150,000 6.35% 15/9/2037 208,155 0.00%
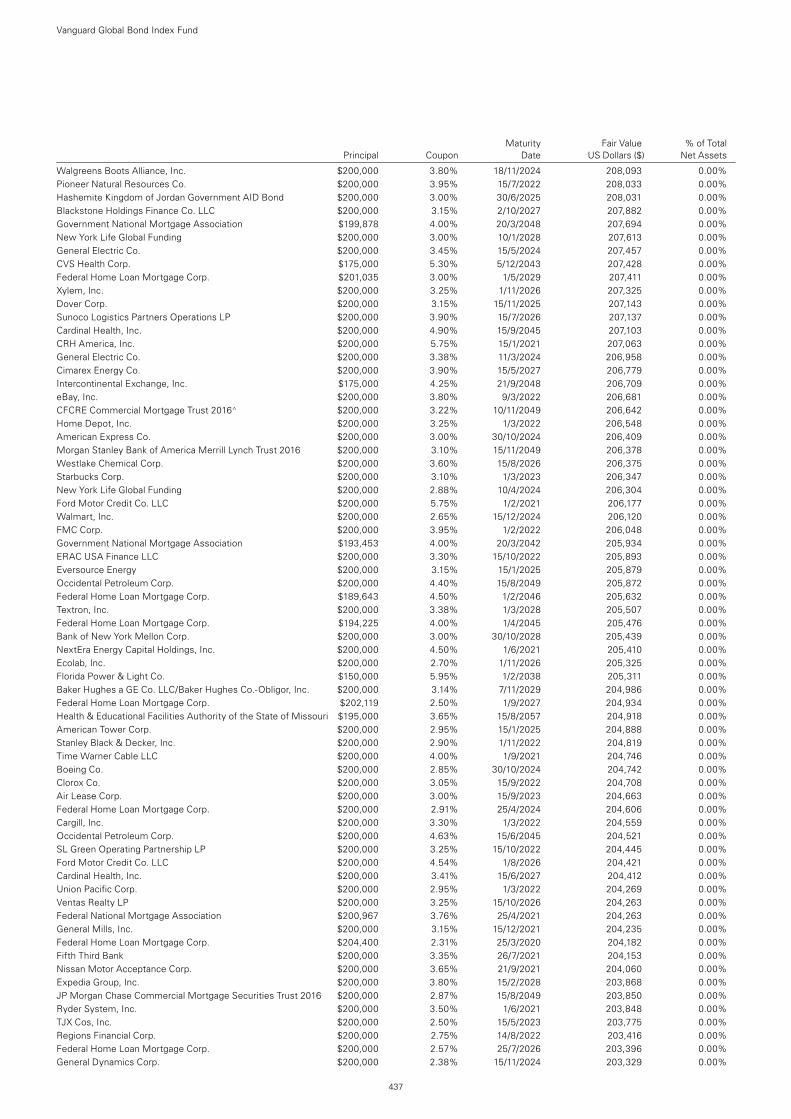
Vanguard Global Bond Index Fund
437
Walgreens Boots Alliance, Inc. $200,000 3.80% 18/11/2024 208,093 0.00%Pioneer Natural Resources Co. $200,000 3.95% 15/7/2022 208,033 0.00%Hashemite Kingdom of Jordan Government AID Bond $200,000 3.00% 30/6/2025 208,031 0.00%Blackstone Holdings Finance Co. LLC $200,000 3.15% 2/10/2027 207,882 0.00%Government National Mortgage Association $199,878 4.00% 20/3/2048 207,694 0.00%New York Life Global Funding $200,000 3.00% 10/1/2028 207,613 0.00%General Electric Co. $200,000 3.45% 15/5/2024 207,457 0.00%CVS Health Corp. $175,000 5.30% 5/12/2043 207,428 0.00%Federal Home Loan Mortgage Corp. $201,035 3.00% 1/5/2029 207,411 0.00%Xylem, Inc. $200,000 3.25% 1/11/2026 207,325 0.00%Dover Corp. $200,000 3.15% 15/11/2025 207,143 0.00%Sunoco Logistics Partners Operations LP $200,000 3.90% 15/7/2026 207,137 0.00%Cardinal Health, Inc. $200,000 4.90% 15/9/2045 207,103 0.00%CRH America, Inc. $200,000 5.75% 15/1/2021 207,063 0.00%General Electric Co. $200,000 3.38% 11/3/2024 206,958 0.00%Cimarex Energy Co. $200,000 3.90% 15/5/2027 206,779 0.00%Intercontinental Exchange, Inc. $175,000 4.25% 21/9/2048 206,709 0.00%eBay, Inc. $200,000 3.80% 9/3/2022 206,681 0.00%CFCRE Commercial Mortgage Trust 2016^ $200,000 3.22% 10/11/2049 206,642 0.00%Home Depot, Inc. $200,000 3.25% 1/3/2022 206,548 0.00%American Express Co. $200,000 3.00% 30/10/2024 206,409 0.00%Morgan Stanley Bank of America Merrill Lynch Trust 2016 $200,000 3.10% 15/11/2049 206,378 0.00%Westlake Chemical Corp. $200,000 3.60% 15/8/2026 206,375 0.00%Starbucks Corp. $200,000 3.10% 1/3/2023 206,347 0.00%New York Life Global Funding $200,000 2.88% 10/4/2024 206,304 0.00%Ford Motor Credit Co. LLC $200,000 5.75% 1/2/2021 206,177 0.00%Walmart, Inc. $200,000 2.65% 15/12/2024 206,120 0.00%FMC Corp. $200,000 3.95% 1/2/2022 206,048 0.00%Government National Mortgage Association $193,453 4.00% 20/3/2042 205,934 0.00%ERAC USA Finance LLC $200,000 3.30% 15/10/2022 205,893 0.00%Eversource Energy $200,000 3.15% 15/1/2025 205,879 0.00%Occidental Petroleum Corp. $200,000 4.40% 15/8/2049 205,872 0.00%Federal Home Loan Mortgage Corp. $189,643 4.50% 1/2/2046 205,632 0.00%Textron, Inc. $200,000 3.38% 1/3/2028 205,507 0.00%Federal Home Loan Mortgage Corp. $194,225 4.00% 1/4/2045 205,476 0.00%Bank of New York Mellon Corp. $200,000 3.00% 30/10/2028 205,439 0.00%NextEra Energy Capital Holdings, Inc. $200,000 4.50% 1/6/2021 205,410 0.00%Ecolab, Inc. $200,000 2.70% 1/11/2026 205,325 0.00%Florida Power & Light Co. $150,000 5.95% 1/2/2038 205,311 0.00%Baker Hughes a GE Co. LLC/Baker Hughes Co.-Obligor, Inc. $200,000 3.14% 7/11/2029 204,986 0.00%Federal Home Loan Mortgage Corp. $202,119 2.50% 1/9/2027 204,934 0.00%Health & Educational Facilities Authority of the State of Missouri $195,000 3.65% 15/8/2057 204,918 0.00%American Tower Corp. $200,000 2.95% 15/1/2025 204,888 0.00%Stanley Black & Decker, Inc. $200,000 2.90% 1/11/2022 204,819 0.00%Time Warner Cable LLC $200,000 4.00% 1/9/2021 204,746 0.00%Boeing Co. $200,000 2.85% 30/10/2024 204,742 0.00%Clorox Co. $200,000 3.05% 15/9/2022 204,708 0.00%Air Lease Corp. $200,000 3.00% 15/9/2023 204,663 0.00%Federal Home Loan Mortgage Corp. $200,000 2.91% 25/4/2024 204,606 0.00%Cargill, Inc. $200,000 3.30% 1/3/2022 204,559 0.00%Occidental Petroleum Corp. $200,000 4.63% 15/6/2045 204,521 0.00%SL Green Operating Partnership LP $200,000 3.25% 15/10/2022 204,445 0.00%Ford Motor Credit Co. LLC $200,000 4.54% 1/8/2026 204,421 0.00%Cardinal Health, Inc. $200,000 3.41% 15/6/2027 204,412 0.00%Union Pacific Corp. $200,000 2.95% 1/3/2022 204,269 0.00%Ventas Realty LP $200,000 3.25% 15/10/2026 204,263 0.00%Federal National Mortgage Association $200,967 3.76% 25/4/2021 204,263 0.00%General Mills, Inc. $200,000 3.15% 15/12/2021 204,235 0.00%Federal Home Loan Mortgage Corp. $204,400 2.31% 25/3/2020 204,182 0.00%Fifth Third Bank $200,000 3.35% 26/7/2021 204,153 0.00%Nissan Motor Acceptance Corp. $200,000 3.65% 21/9/2021 204,060 0.00%Expedia Group, Inc. $200,000 3.80% 15/2/2028 203,868 0.00%JP Morgan Chase Commercial Mortgage Securities Trust 2016 $200,000 2.87% 15/8/2049 203,850 0.00%Ryder System, Inc. $200,000 3.50% 1/6/2021 203,848 0.00%TJX Cos, Inc. $200,000 2.50% 15/5/2023 203,775 0.00%Regions Financial Corp. $200,000 2.75% 14/8/2022 203,416 0.00%Federal Home Loan Mortgage Corp. $200,000 2.57% 25/7/2026 203,396 0.00%General Dynamics Corp. $200,000 2.38% 15/11/2024 203,329 0.00%
Maturity Fair Value % of Total Principal Coupon Date US Dollars ($) Net Assets
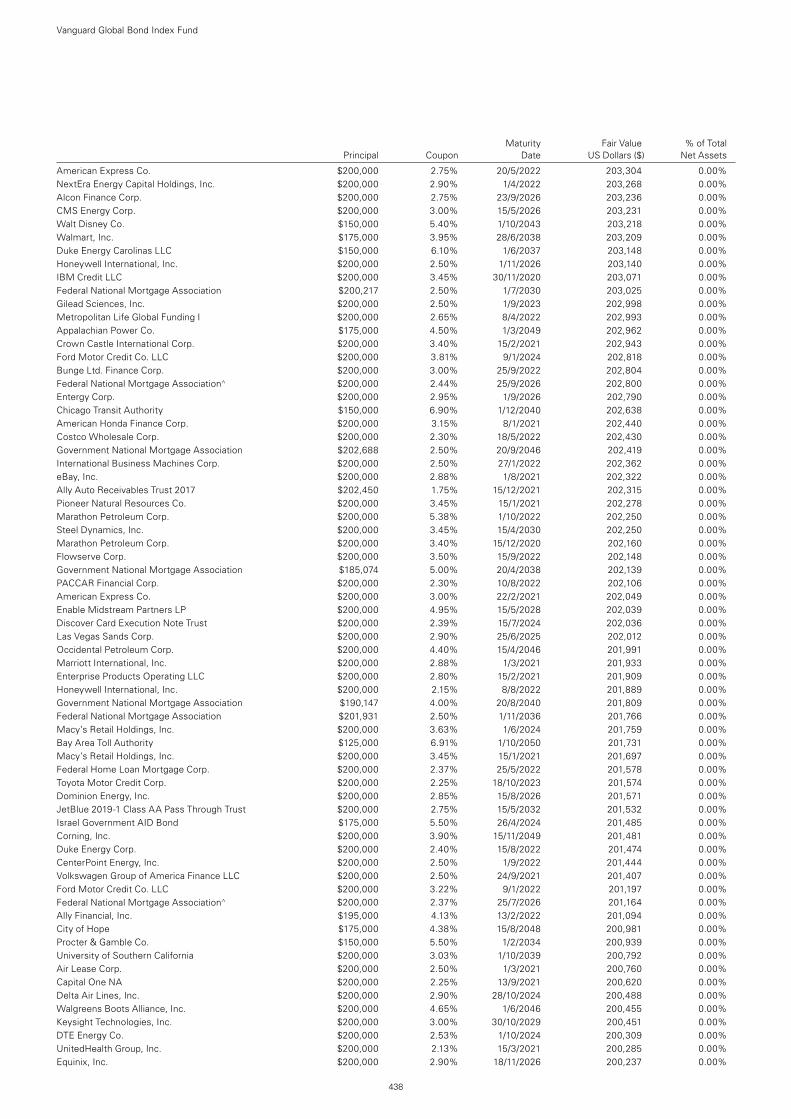
Vanguard Global Bond Index Fund
438
American Express Co. $200,000 2.75% 20/5/2022 203,304 0.00%NextEra Energy Capital Holdings, Inc. $200,000 2.90% 1/4/2022 203,268 0.00%Alcon Finance Corp. $200,000 2.75% 23/9/2026 203,236 0.00%CMS Energy Corp. $200,000 3.00% 15/5/2026 203,231 0.00%Walt Disney Co. $150,000 5.40% 1/10/2043 203,218 0.00%Walmart, Inc. $175,000 3.95% 28/6/2038 203,209 0.00%Duke Energy Carolinas LLC $150,000 6.10% 1/6/2037 203,148 0.00%Honeywell International, Inc. $200,000 2.50% 1/11/2026 203,140 0.00%IBM Credit LLC $200,000 3.45% 30/11/2020 203,071 0.00%Federal National Mortgage Association $200,217 2.50% 1/7/2030 203,025 0.00%Gilead Sciences, Inc. $200,000 2.50% 1/9/2023 202,998 0.00%Metropolitan Life Global Funding I $200,000 2.65% 8/4/2022 202,993 0.00%Appalachian Power Co. $175,000 4.50% 1/3/2049 202,962 0.00%Crown Castle International Corp. $200,000 3.40% 15/2/2021 202,943 0.00%Ford Motor Credit Co. LLC $200,000 3.81% 9/1/2024 202,818 0.00%Bunge Ltd. Finance Corp. $200,000 3.00% 25/9/2022 202,804 0.00%Federal National Mortgage Association^ $200,000 2.44% 25/9/2026 202,800 0.00%Entergy Corp. $200,000 2.95% 1/9/2026 202,790 0.00%Chicago Transit Authority $150,000 6.90% 1/12/2040 202,638 0.00%American Honda Finance Corp. $200,000 3.15% 8/1/2021 202,440 0.00%Costco Wholesale Corp. $200,000 2.30% 18/5/2022 202,430 0.00%Government National Mortgage Association $202,688 2.50% 20/9/2046 202,419 0.00%International Business Machines Corp. $200,000 2.50% 27/1/2022 202,362 0.00%eBay, Inc. $200,000 2.88% 1/8/2021 202,322 0.00%Ally Auto Receivables Trust 2017 $202,450 1.75% 15/12/2021 202,315 0.00%Pioneer Natural Resources Co. $200,000 3.45% 15/1/2021 202,278 0.00%Marathon Petroleum Corp. $200,000 5.38% 1/10/2022 202,250 0.00%Steel Dynamics, Inc. $200,000 3.45% 15/4/2030 202,250 0.00%Marathon Petroleum Corp. $200,000 3.40% 15/12/2020 202,160 0.00%Flowserve Corp. $200,000 3.50% 15/9/2022 202,148 0.00%Government National Mortgage Association $185,074 5.00% 20/4/2038 202,139 0.00%PACCAR Financial Corp. $200,000 2.30% 10/8/2022 202,106 0.00%American Express Co. $200,000 3.00% 22/2/2021 202,049 0.00%Enable Midstream Partners LP $200,000 4.95% 15/5/2028 202,039 0.00%Discover Card Execution Note Trust $200,000 2.39% 15/7/2024 202,036 0.00%Las Vegas Sands Corp. $200,000 2.90% 25/6/2025 202,012 0.00%Occidental Petroleum Corp. $200,000 4.40% 15/4/2046 201,991 0.00%Marriott International, Inc. $200,000 2.88% 1/3/2021 201,933 0.00%Enterprise Products Operating LLC $200,000 2.80% 15/2/2021 201,909 0.00%Honeywell International, Inc. $200,000 2.15% 8/8/2022 201,889 0.00%Government National Mortgage Association $190,147 4.00% 20/8/2040 201,809 0.00%Federal National Mortgage Association $201,931 2.50% 1/11/2036 201,766 0.00%Macy’s Retail Holdings, Inc. $200,000 3.63% 1/6/2024 201,759 0.00%Bay Area Toll Authority $125,000 6.91% 1/10/2050 201,731 0.00%Macy’s Retail Holdings, Inc. $200,000 3.45% 15/1/2021 201,697 0.00%Federal Home Loan Mortgage Corp. $200,000 2.37% 25/5/2022 201,578 0.00%Toyota Motor Credit Corp. $200,000 2.25% 18/10/2023 201,574 0.00%Dominion Energy, Inc. $200,000 2.85% 15/8/2026 201,571 0.00%JetBlue 2019-1 Class AA Pass Through Trust $200,000 2.75% 15/5/2032 201,532 0.00%Israel Government AID Bond $175,000 5.50% 26/4/2024 201,485 0.00%Corning, Inc. $200,000 3.90% 15/11/2049 201,481 0.00%Duke Energy Corp. $200,000 2.40% 15/8/2022 201,474 0.00%CenterPoint Energy, Inc. $200,000 2.50% 1/9/2022 201,444 0.00%Volkswagen Group of America Finance LLC $200,000 2.50% 24/9/2021 201,407 0.00%Ford Motor Credit Co. LLC $200,000 3.22% 9/1/2022 201,197 0.00%Federal National Mortgage Association^ $200,000 2.37% 25/7/2026 201,164 0.00%Ally Financial, Inc. $195,000 4.13% 13/2/2022 201,094 0.00%City of Hope $175,000 4.38% 15/8/2048 200,981 0.00%Procter & Gamble Co. $150,000 5.50% 1/2/2034 200,939 0.00%University of Southern California $200,000 3.03% 1/10/2039 200,792 0.00%Air Lease Corp. $200,000 2.50% 1/3/2021 200,760 0.00%Capital One NA $200,000 2.25% 13/9/2021 200,620 0.00%Delta Air Lines, Inc. $200,000 2.90% 28/10/2024 200,488 0.00%Walgreens Boots Alliance, Inc. $200,000 4.65% 1/6/2046 200,455 0.00%Keysight Technologies, Inc. $200,000 3.00% 30/10/2029 200,451 0.00%DTE Energy Co. $200,000 2.53% 1/10/2024 200,309 0.00%UnitedHealth Group, Inc. $200,000 2.13% 15/3/2021 200,285 0.00%Equinix, Inc. $200,000 2.90% 18/11/2026 200,237 0.00%
Maturity Fair Value % of Total Principal Coupon Date US Dollars ($) Net Assets
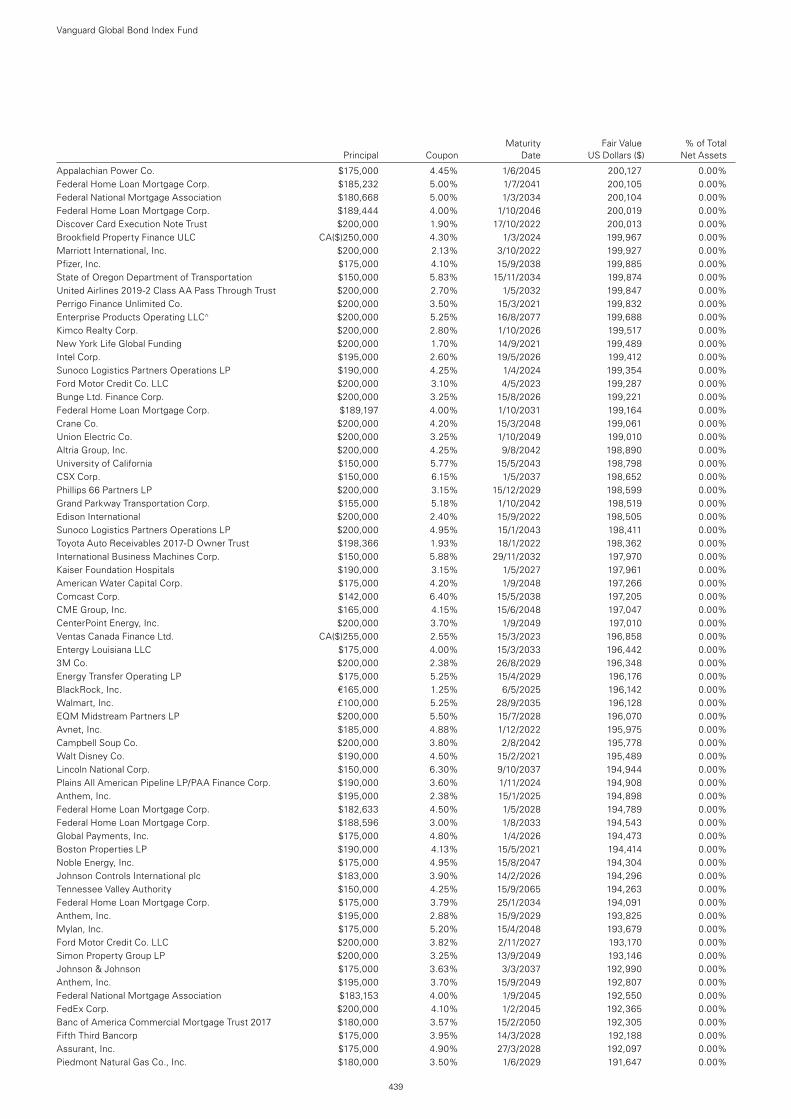
Vanguard Global Bond Index Fund
439
Appalachian Power Co. $175,000 4.45% 1/6/2045 200,127 0.00%Federal Home Loan Mortgage Corp. $185,232 5.00% 1/7/2041 200,105 0.00%Federal National Mortgage Association $180,668 5.00% 1/3/2034 200,104 0.00%Federal Home Loan Mortgage Corp. $189,444 4.00% 1/10/2046 200,019 0.00%Discover Card Execution Note Trust $200,000 1.90% 17/10/2022 200,013 0.00%Brookfield Property Finance ULC CA($)250,000 4.30% 1/3/2024 199,967 0.00%Marriott International, Inc. $200,000 2.13% 3/10/2022 199,927 0.00%Pfizer, Inc. $175,000 4.10% 15/9/2038 199,885 0.00%State of Oregon Department of Transportation $150,000 5.83% 15/11/2034 199,874 0.00%United Airlines 2019-2 Class AA Pass Through Trust $200,000 2.70% 1/5/2032 199,847 0.00%Perrigo Finance Unlimited Co. $200,000 3.50% 15/3/2021 199,832 0.00%Enterprise Products Operating LLC^ $200,000 5.25% 16/8/2077 199,688 0.00%Kimco Realty Corp. $200,000 2.80% 1/10/2026 199,517 0.00%New York Life Global Funding $200,000 1.70% 14/9/2021 199,489 0.00%Intel Corp. $195,000 2.60% 19/5/2026 199,412 0.00%Sunoco Logistics Partners Operations LP $190,000 4.25% 1/4/2024 199,354 0.00%Ford Motor Credit Co. LLC $200,000 3.10% 4/5/2023 199,287 0.00%Bunge Ltd. Finance Corp. $200,000 3.25% 15/8/2026 199,221 0.00%Federal Home Loan Mortgage Corp. $189,197 4.00% 1/10/2031 199,164 0.00%Crane Co. $200,000 4.20% 15/3/2048 199,061 0.00%Union Electric Co. $200,000 3.25% 1/10/2049 199,010 0.00%Altria Group, Inc. $200,000 4.25% 9/8/2042 198,890 0.00%University of California $150,000 5.77% 15/5/2043 198,798 0.00%CSX Corp. $150,000 6.15% 1/5/2037 198,652 0.00%Phillips 66 Partners LP $200,000 3.15% 15/12/2029 198,599 0.00%Grand Parkway Transportation Corp. $155,000 5.18% 1/10/2042 198,519 0.00%Edison International $200,000 2.40% 15/9/2022 198,505 0.00%Sunoco Logistics Partners Operations LP $200,000 4.95% 15/1/2043 198,411 0.00%Toyota Auto Receivables 2017-D Owner Trust $198,366 1.93% 18/1/2022 198,362 0.00%International Business Machines Corp. $150,000 5.88% 29/11/2032 197,970 0.00%Kaiser Foundation Hospitals $190,000 3.15% 1/5/2027 197,961 0.00%American Water Capital Corp. $175,000 4.20% 1/9/2048 197,266 0.00%Comcast Corp. $142,000 6.40% 15/5/2038 197,205 0.00%CME Group, Inc. $165,000 4.15% 15/6/2048 197,047 0.00%CenterPoint Energy, Inc. $200,000 3.70% 1/9/2049 197,010 0.00%Ventas Canada Finance Ltd. CA($)255,000 2.55% 15/3/2023 196,858 0.00%Entergy Louisiana LLC $175,000 4.00% 15/3/2033 196,442 0.00%3M Co. $200,000 2.38% 26/8/2029 196,348 0.00%Energy Transfer Operating LP $175,000 5.25% 15/4/2029 196,176 0.00%BlackRock, Inc. €165,000 1.25% 6/5/2025 196,142 0.00%Walmart, Inc. £100,000 5.25% 28/9/2035 196,128 0.00%EQM Midstream Partners LP $200,000 5.50% 15/7/2028 196,070 0.00%Avnet, Inc. $185,000 4.88% 1/12/2022 195,975 0.00%Campbell Soup Co. $200,000 3.80% 2/8/2042 195,778 0.00%Walt Disney Co. $190,000 4.50% 15/2/2021 195,489 0.00%Lincoln National Corp. $150,000 6.30% 9/10/2037 194,944 0.00%Plains All American Pipeline LP/PAA Finance Corp. $190,000 3.60% 1/11/2024 194,908 0.00%Anthem, Inc. $195,000 2.38% 15/1/2025 194,898 0.00%Federal Home Loan Mortgage Corp. $182,633 4.50% 1/5/2028 194,789 0.00%Federal Home Loan Mortgage Corp. $188,596 3.00% 1/8/2033 194,543 0.00%Global Payments, Inc. $175,000 4.80% 1/4/2026 194,473 0.00%Boston Properties LP $190,000 4.13% 15/5/2021 194,414 0.00%Noble Energy, Inc. $175,000 4.95% 15/8/2047 194,304 0.00%Johnson Controls International plc $183,000 3.90% 14/2/2026 194,296 0.00%Tennessee Valley Authority $150,000 4.25% 15/9/2065 194,263 0.00%Federal Home Loan Mortgage Corp. $175,000 3.79% 25/1/2034 194,091 0.00%Anthem, Inc. $195,000 2.88% 15/9/2029 193,825 0.00%Mylan, Inc. $175,000 5.20% 15/4/2048 193,679 0.00%Ford Motor Credit Co. LLC $200,000 3.82% 2/11/2027 193,170 0.00%Simon Property Group LP $200,000 3.25% 13/9/2049 193,146 0.00%Johnson & Johnson $175,000 3.63% 3/3/2037 192,990 0.00%Anthem, Inc. $195,000 3.70% 15/9/2049 192,807 0.00%Federal National Mortgage Association $183,153 4.00% 1/9/2045 192,550 0.00%FedEx Corp. $200,000 4.10% 1/2/2045 192,365 0.00%Banc of America Commercial Mortgage Trust 2017 $180,000 3.57% 15/2/2050 192,305 0.00%Fifth Third Bancorp $175,000 3.95% 14/3/2028 192,188 0.00%Assurant, Inc. $175,000 4.90% 27/3/2028 192,097 0.00%Piedmont Natural Gas Co., Inc. $180,000 3.50% 1/6/2029 191,647 0.00%
Maturity Fair Value % of Total Principal Coupon Date US Dollars ($) Net Assets
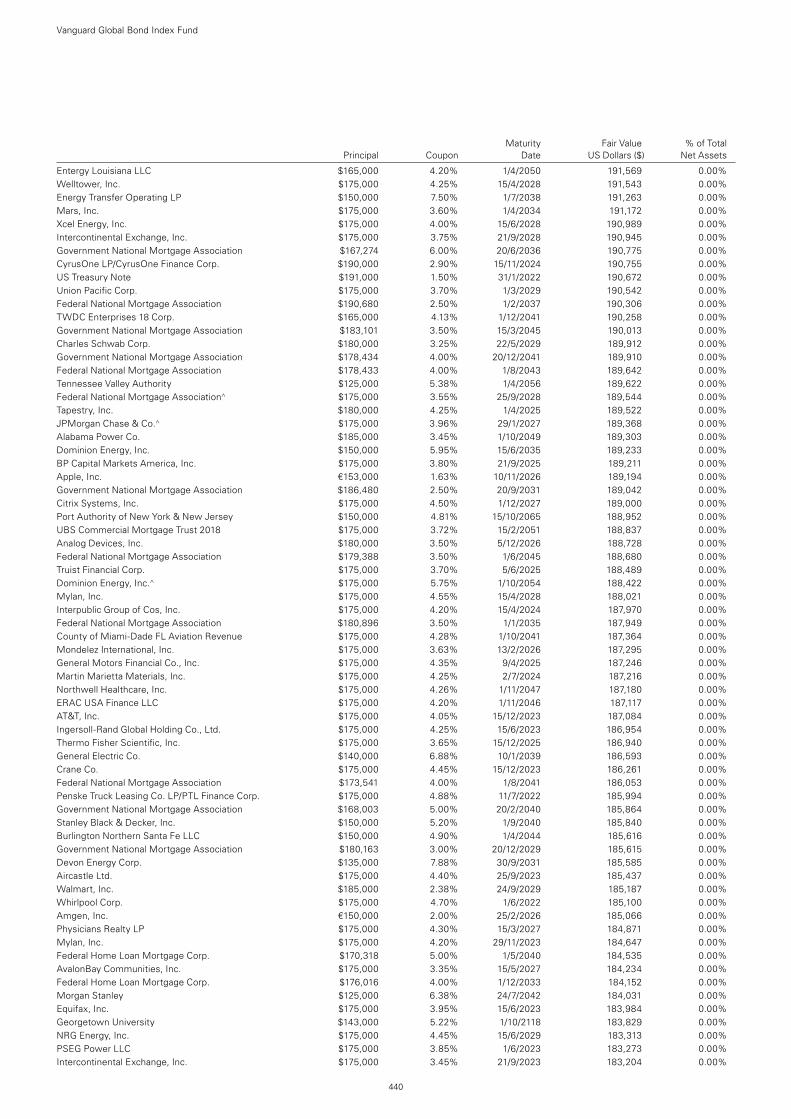
Vanguard Global Bond Index Fund
440
Entergy Louisiana LLC $165,000 4.20% 1/4/2050 191,569 0.00%Welltower, Inc. $175,000 4.25% 15/4/2028 191,543 0.00%Energy Transfer Operating LP $150,000 7.50% 1/7/2038 191,263 0.00%Mars, Inc. $175,000 3.60% 1/4/2034 191,172 0.00%Xcel Energy, Inc. $175,000 4.00% 15/6/2028 190,989 0.00%Intercontinental Exchange, Inc. $175,000 3.75% 21/9/2028 190,945 0.00%Government National Mortgage Association $167,274 6.00% 20/6/2036 190,775 0.00%CyrusOne LP/CyrusOne Finance Corp. $190,000 2.90% 15/11/2024 190,755 0.00%US Treasury Note $191,000 1.50% 31/1/2022 190,672 0.00%Union Pacific Corp. $175,000 3.70% 1/3/2029 190,542 0.00%Federal National Mortgage Association $190,680 2.50% 1/2/2037 190,306 0.00%TWDC Enterprises 18 Corp. $165,000 4.13% 1/12/2041 190,258 0.00%Government National Mortgage Association $183,101 3.50% 15/3/2045 190,013 0.00%Charles Schwab Corp. $180,000 3.25% 22/5/2029 189,912 0.00%Government National Mortgage Association $178,434 4.00% 20/12/2041 189,910 0.00%Federal National Mortgage Association $178,433 4.00% 1/8/2043 189,642 0.00%Tennessee Valley Authority $125,000 5.38% 1/4/2056 189,622 0.00%Federal National Mortgage Association^ $175,000 3.55% 25/9/2028 189,544 0.00%Tapestry, Inc. $180,000 4.25% 1/4/2025 189,522 0.00%JPMorgan Chase & Co.^ $175,000 3.96% 29/1/2027 189,368 0.00%Alabama Power Co. $185,000 3.45% 1/10/2049 189,303 0.00%Dominion Energy, Inc. $150,000 5.95% 15/6/2035 189,233 0.00%BP Capital Markets America, Inc. $175,000 3.80% 21/9/2025 189,211 0.00%Apple, Inc. €153,000 1.63% 10/11/2026 189,194 0.00%Government National Mortgage Association $186,480 2.50% 20/9/2031 189,042 0.00%Citrix Systems, Inc. $175,000 4.50% 1/12/2027 189,000 0.00%Port Authority of New York & New Jersey $150,000 4.81% 15/10/2065 188,952 0.00%UBS Commercial Mortgage Trust 2018 $175,000 3.72% 15/2/2051 188,837 0.00%Analog Devices, Inc. $180,000 3.50% 5/12/2026 188,728 0.00%Federal National Mortgage Association $179,388 3.50% 1/6/2045 188,680 0.00%Truist Financial Corp. $175,000 3.70% 5/6/2025 188,489 0.00%Dominion Energy, Inc.^ $175,000 5.75% 1/10/2054 188,422 0.00%Mylan, Inc. $175,000 4.55% 15/4/2028 188,021 0.00%Interpublic Group of Cos, Inc. $175,000 4.20% 15/4/2024 187,970 0.00%Federal National Mortgage Association $180,896 3.50% 1/1/2035 187,949 0.00%County of Miami-Dade FL Aviation Revenue $175,000 4.28% 1/10/2041 187,364 0.00%Mondelez International, Inc. $175,000 3.63% 13/2/2026 187,295 0.00%General Motors Financial Co., Inc. $175,000 4.35% 9/4/2025 187,246 0.00%Martin Marietta Materials, Inc. $175,000 4.25% 2/7/2024 187,216 0.00%Northwell Healthcare, Inc. $175,000 4.26% 1/11/2047 187,180 0.00%ERAC USA Finance LLC $175,000 4.20% 1/11/2046 187,117 0.00%AT&T, Inc. $175,000 4.05% 15/12/2023 187,084 0.00%Ingersoll-Rand Global Holding Co., Ltd. $175,000 4.25% 15/6/2023 186,954 0.00%Thermo Fisher Scientific, Inc. $175,000 3.65% 15/12/2025 186,940 0.00%General Electric Co. $140,000 6.88% 10/1/2039 186,593 0.00%Crane Co. $175,000 4.45% 15/12/2023 186,261 0.00%Federal National Mortgage Association $173,541 4.00% 1/8/2041 186,053 0.00%Penske Truck Leasing Co. LP/PTL Finance Corp. $175,000 4.88% 11/7/2022 185,994 0.00%Government National Mortgage Association $168,003 5.00% 20/2/2040 185,864 0.00%Stanley Black & Decker, Inc. $150,000 5.20% 1/9/2040 185,840 0.00%Burlington Northern Santa Fe LLC $150,000 4.90% 1/4/2044 185,616 0.00%Government National Mortgage Association $180,163 3.00% 20/12/2029 185,615 0.00%Devon Energy Corp. $135,000 7.88% 30/9/2031 185,585 0.00%Aircastle Ltd. $175,000 4.40% 25/9/2023 185,437 0.00%Walmart, Inc. $185,000 2.38% 24/9/2029 185,187 0.00%Whirlpool Corp. $175,000 4.70% 1/6/2022 185,100 0.00%Amgen, Inc. €150,000 2.00% 25/2/2026 185,066 0.00%Physicians Realty LP $175,000 4.30% 15/3/2027 184,871 0.00%Mylan, Inc. $175,000 4.20% 29/11/2023 184,647 0.00%Federal Home Loan Mortgage Corp. $170,318 5.00% 1/5/2040 184,535 0.00%AvalonBay Communities, Inc. $175,000 3.35% 15/5/2027 184,234 0.00%Federal Home Loan Mortgage Corp. $176,016 4.00% 1/12/2033 184,152 0.00%Morgan Stanley $125,000 6.38% 24/7/2042 184,031 0.00%Equifax, Inc. $175,000 3.95% 15/6/2023 183,984 0.00%Georgetown University $143,000 5.22% 1/10/2118 183,829 0.00%NRG Energy, Inc. $175,000 4.45% 15/6/2029 183,313 0.00%PSEG Power LLC $175,000 3.85% 1/6/2023 183,273 0.00%Intercontinental Exchange, Inc. $175,000 3.45% 21/9/2023 183,204 0.00%
Maturity Fair Value % of Total Principal Coupon Date US Dollars ($) Net Assets
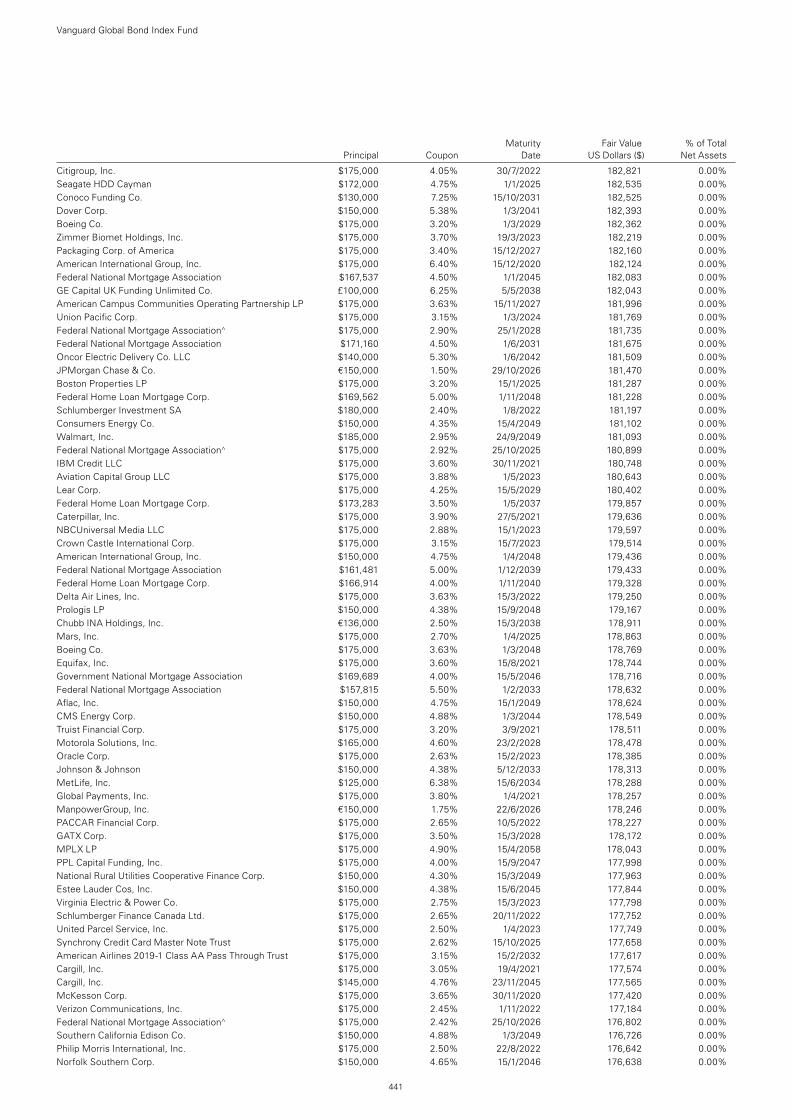
Maturity Fair Value % of Total Principal Coupon Date US Dollars ($) Net Assets
Vanguard Global Bond Index Fund
441
Citigroup, Inc. $175,000 4.05% 30/7/2022 182,821 0.00%Seagate HDD Cayman $172,000 4.75% 1/1/2025 182,535 0.00%Conoco Funding Co. $130,000 7.25% 15/10/2031 182,525 0.00%Dover Corp. $150,000 5.38% 1/3/2041 182,393 0.00%Boeing Co. $175,000 3.20% 1/3/2029 182,362 0.00%Zimmer Biomet Holdings, Inc. $175,000 3.70% 19/3/2023 182,219 0.00%Packaging Corp. of America $175,000 3.40% 15/12/2027 182,160 0.00%American International Group, Inc. $175,000 6.40% 15/12/2020 182,124 0.00%Federal National Mortgage Association $167,537 4.50% 1/1/2045 182,083 0.00%GE Capital UK Funding Unlimited Co. £100,000 6.25% 5/5/2038 182,043 0.00%American Campus Communities Operating Partnership LP $175,000 3.63% 15/11/2027 181,996 0.00%Union Pacific Corp. $175,000 3.15% 1/3/2024 181,769 0.00%Federal National Mortgage Association^ $175,000 2.90% 25/1/2028 181,735 0.00%Federal National Mortgage Association $171,160 4.50% 1/6/2031 181,675 0.00%Oncor Electric Delivery Co. LLC $140,000 5.30% 1/6/2042 181,509 0.00%JPMorgan Chase & Co. €150,000 1.50% 29/10/2026 181,470 0.00%Boston Properties LP $175,000 3.20% 15/1/2025 181,287 0.00%Federal Home Loan Mortgage Corp. $169,562 5.00% 1/11/2048 181,228 0.00%Schlumberger Investment SA $180,000 2.40% 1/8/2022 181,197 0.00%Consumers Energy Co. $150,000 4.35% 15/4/2049 181,102 0.00%Walmart, Inc. $185,000 2.95% 24/9/2049 181,093 0.00%Federal National Mortgage Association^ $175,000 2.92% 25/10/2025 180,899 0.00%IBM Credit LLC $175,000 3.60% 30/11/2021 180,748 0.00%Aviation Capital Group LLC $175,000 3.88% 1/5/2023 180,643 0.00%Lear Corp. $175,000 4.25% 15/5/2029 180,402 0.00%Federal Home Loan Mortgage Corp. $173,283 3.50% 1/5/2037 179,857 0.00%Caterpillar, Inc. $175,000 3.90% 27/5/2021 179,636 0.00%NBCUniversal Media LLC $175,000 2.88% 15/1/2023 179,597 0.00%Crown Castle International Corp. $175,000 3.15% 15/7/2023 179,514 0.00%American International Group, Inc. $150,000 4.75% 1/4/2048 179,436 0.00%Federal National Mortgage Association $161,481 5.00% 1/12/2039 179,433 0.00%Federal Home Loan Mortgage Corp. $166,914 4.00% 1/11/2040 179,328 0.00%Delta Air Lines, Inc. $175,000 3.63% 15/3/2022 179,250 0.00%Prologis LP $150,000 4.38% 15/9/2048 179,167 0.00%Chubb INA Holdings, Inc. €136,000 2.50% 15/3/2038 178,911 0.00%Mars, Inc. $175,000 2.70% 1/4/2025 178,863 0.00%Boeing Co. $175,000 3.63% 1/3/2048 178,769 0.00%Equifax, Inc. $175,000 3.60% 15/8/2021 178,744 0.00%Government National Mortgage Association $169,689 4.00% 15/5/2046 178,716 0.00%Federal National Mortgage Association $157,815 5.50% 1/2/2033 178,632 0.00%Aflac, Inc. $150,000 4.75% 15/1/2049 178,624 0.00%CMS Energy Corp. $150,000 4.88% 1/3/2044 178,549 0.00%Truist Financial Corp. $175,000 3.20% 3/9/2021 178,511 0.00%Motorola Solutions, Inc. $165,000 4.60% 23/2/2028 178,478 0.00%Oracle Corp. $175,000 2.63% 15/2/2023 178,385 0.00%Johnson & Johnson $150,000 4.38% 5/12/2033 178,313 0.00%MetLife, Inc. $125,000 6.38% 15/6/2034 178,288 0.00%Global Payments, Inc. $175,000 3.80% 1/4/2021 178,257 0.00%ManpowerGroup, Inc. €150,000 1.75% 22/6/2026 178,246 0.00%PACCAR Financial Corp. $175,000 2.65% 10/5/2022 178,227 0.00%GATX Corp. $175,000 3.50% 15/3/2028 178,172 0.00%MPLX LP $175,000 4.90% 15/4/2058 178,043 0.00%PPL Capital Funding, Inc. $175,000 4.00% 15/9/2047 177,998 0.00%National Rural Utilities Cooperative Finance Corp. $150,000 4.30% 15/3/2049 177,963 0.00%Estee Lauder Cos, Inc. $150,000 4.38% 15/6/2045 177,844 0.00%Virginia Electric & Power Co. $175,000 2.75% 15/3/2023 177,798 0.00%Schlumberger Finance Canada Ltd. $175,000 2.65% 20/11/2022 177,752 0.00%United Parcel Service, Inc. $175,000 2.50% 1/4/2023 177,749 0.00%Synchrony Credit Card Master Note Trust $175,000 2.62% 15/10/2025 177,658 0.00%American Airlines 2019-1 Class AA Pass Through Trust $175,000 3.15% 15/2/2032 177,617 0.00%Cargill, Inc. $175,000 3.05% 19/4/2021 177,574 0.00%Cargill, Inc. $145,000 4.76% 23/11/2045 177,565 0.00%McKesson Corp. $175,000 3.65% 30/11/2020 177,420 0.00%Verizon Communications, Inc. $175,000 2.45% 1/11/2022 177,184 0.00%Federal National Mortgage Association^ $175,000 2.42% 25/10/2026 176,802 0.00%Southern California Edison Co. $150,000 4.88% 1/3/2049 176,726 0.00%Philip Morris International, Inc. $175,000 2.50% 22/8/2022 176,642 0.00%Norfolk Southern Corp. $150,000 4.65% 15/1/2046 176,638 0.00%
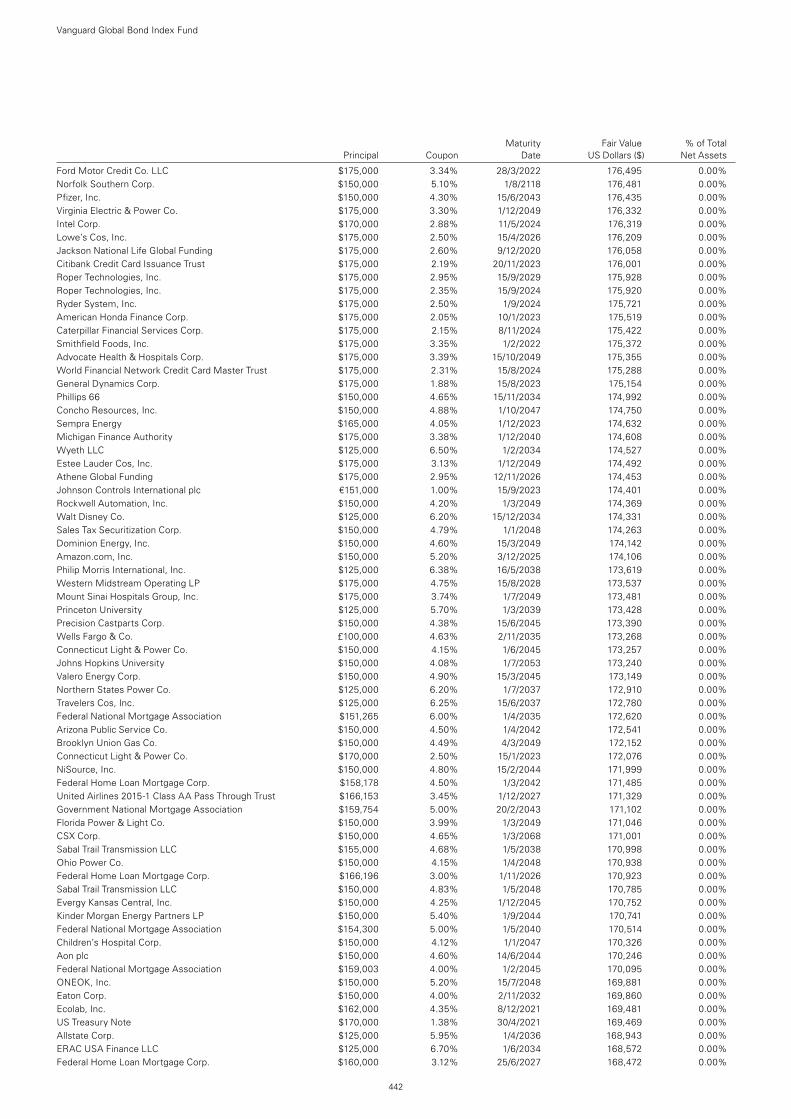
Maturity Fair Value % of Total Principal Coupon Date US Dollars ($) Net Assets
Vanguard Global Bond Index Fund
442
Ford Motor Credit Co. LLC $175,000 3.34% 28/3/2022 176,495 0.00%Norfolk Southern Corp. $150,000 5.10% 1/8/2118 176,481 0.00%Pfizer, Inc. $150,000 4.30% 15/6/2043 176,435 0.00%Virginia Electric & Power Co. $175,000 3.30% 1/12/2049 176,332 0.00%Intel Corp. $170,000 2.88% 11/5/2024 176,319 0.00%Lowe’s Cos, Inc. $175,000 2.50% 15/4/2026 176,209 0.00%Jackson National Life Global Funding $175,000 2.60% 9/12/2020 176,058 0.00%Citibank Credit Card Issuance Trust $175,000 2.19% 20/11/2023 176,001 0.00%Roper Technologies, Inc. $175,000 2.95% 15/9/2029 175,928 0.00%Roper Technologies, Inc. $175,000 2.35% 15/9/2024 175,920 0.00%Ryder System, Inc. $175,000 2.50% 1/9/2024 175,721 0.00%American Honda Finance Corp. $175,000 2.05% 10/1/2023 175,519 0.00%Caterpillar Financial Services Corp. $175,000 2.15% 8/11/2024 175,422 0.00%Smithfield Foods, Inc. $175,000 3.35% 1/2/2022 175,372 0.00%Advocate Health & Hospitals Corp. $175,000 3.39% 15/10/2049 175,355 0.00%World Financial Network Credit Card Master Trust $175,000 2.31% 15/8/2024 175,288 0.00%General Dynamics Corp. $175,000 1.88% 15/8/2023 175,154 0.00%Phillips 66 $150,000 4.65% 15/11/2034 174,992 0.00%Concho Resources, Inc. $150,000 4.88% 1/10/2047 174,750 0.00%Sempra Energy $165,000 4.05% 1/12/2023 174,632 0.00%Michigan Finance Authority $175,000 3.38% 1/12/2040 174,608 0.00%Wyeth LLC $125,000 6.50% 1/2/2034 174,527 0.00%Estee Lauder Cos, Inc. $175,000 3.13% 1/12/2049 174,492 0.00%Athene Global Funding $175,000 2.95% 12/11/2026 174,453 0.00%Johnson Controls International plc €151,000 1.00% 15/9/2023 174,401 0.00%Rockwell Automation, Inc. $150,000 4.20% 1/3/2049 174,369 0.00%Walt Disney Co. $125,000 6.20% 15/12/2034 174,331 0.00%Sales Tax Securitization Corp. $150,000 4.79% 1/1/2048 174,263 0.00%Dominion Energy, Inc. $150,000 4.60% 15/3/2049 174,142 0.00%Amazon.com, Inc. $150,000 5.20% 3/12/2025 174,106 0.00%Philip Morris International, Inc. $125,000 6.38% 16/5/2038 173,619 0.00%Western Midstream Operating LP $175,000 4.75% 15/8/2028 173,537 0.00%Mount Sinai Hospitals Group, Inc. $175,000 3.74% 1/7/2049 173,481 0.00%Princeton University $125,000 5.70% 1/3/2039 173,428 0.00%Precision Castparts Corp. $150,000 4.38% 15/6/2045 173,390 0.00%Wells Fargo & Co. £100,000 4.63% 2/11/2035 173,268 0.00%Connecticut Light & Power Co. $150,000 4.15% 1/6/2045 173,257 0.00%Johns Hopkins University $150,000 4.08% 1/7/2053 173,240 0.00%Valero Energy Corp. $150,000 4.90% 15/3/2045 173,149 0.00%Northern States Power Co. $125,000 6.20% 1/7/2037 172,910 0.00%Travelers Cos, Inc. $125,000 6.25% 15/6/2037 172,780 0.00%Federal National Mortgage Association $151,265 6.00% 1/4/2035 172,620 0.00%Arizona Public Service Co. $150,000 4.50% 1/4/2042 172,541 0.00%Brooklyn Union Gas Co. $150,000 4.49% 4/3/2049 172,152 0.00%Connecticut Light & Power Co. $170,000 2.50% 15/1/2023 172,076 0.00%NiSource, Inc. $150,000 4.80% 15/2/2044 171,999 0.00%Federal Home Loan Mortgage Corp. $158,178 4.50% 1/3/2042 171,485 0.00%United Airlines 2015-1 Class AA Pass Through Trust $166,153 3.45% 1/12/2027 171,329 0.00%Government National Mortgage Association $159,754 5.00% 20/2/2043 171,102 0.00%Florida Power & Light Co. $150,000 3.99% 1/3/2049 171,046 0.00%CSX Corp. $150,000 4.65% 1/3/2068 171,001 0.00%Sabal Trail Transmission LLC $155,000 4.68% 1/5/2038 170,998 0.00%Ohio Power Co. $150,000 4.15% 1/4/2048 170,938 0.00%Federal Home Loan Mortgage Corp. $166,196 3.00% 1/11/2026 170,923 0.00%Sabal Trail Transmission LLC $150,000 4.83% 1/5/2048 170,785 0.00%Evergy Kansas Central, Inc. $150,000 4.25% 1/12/2045 170,752 0.00%Kinder Morgan Energy Partners LP $150,000 5.40% 1/9/2044 170,741 0.00%Federal National Mortgage Association $154,300 5.00% 1/5/2040 170,514 0.00%Children’s Hospital Corp. $150,000 4.12% 1/1/2047 170,326 0.00%Aon plc $150,000 4.60% 14/6/2044 170,246 0.00%Federal National Mortgage Association $159,003 4.00% 1/2/2045 170,095 0.00%ONEOK, Inc. $150,000 5.20% 15/7/2048 169,881 0.00%Eaton Corp. $150,000 4.00% 2/11/2032 169,860 0.00%Ecolab, Inc. $162,000 4.35% 8/12/2021 169,481 0.00%US Treasury Note $170,000 1.38% 30/4/2021 169,469 0.00%Allstate Corp. $125,000 5.95% 1/4/2036 168,943 0.00%ERAC USA Finance LLC $125,000 6.70% 1/6/2034 168,572 0.00%Federal Home Loan Mortgage Corp. $160,000 3.12% 25/6/2027 168,472 0.00%
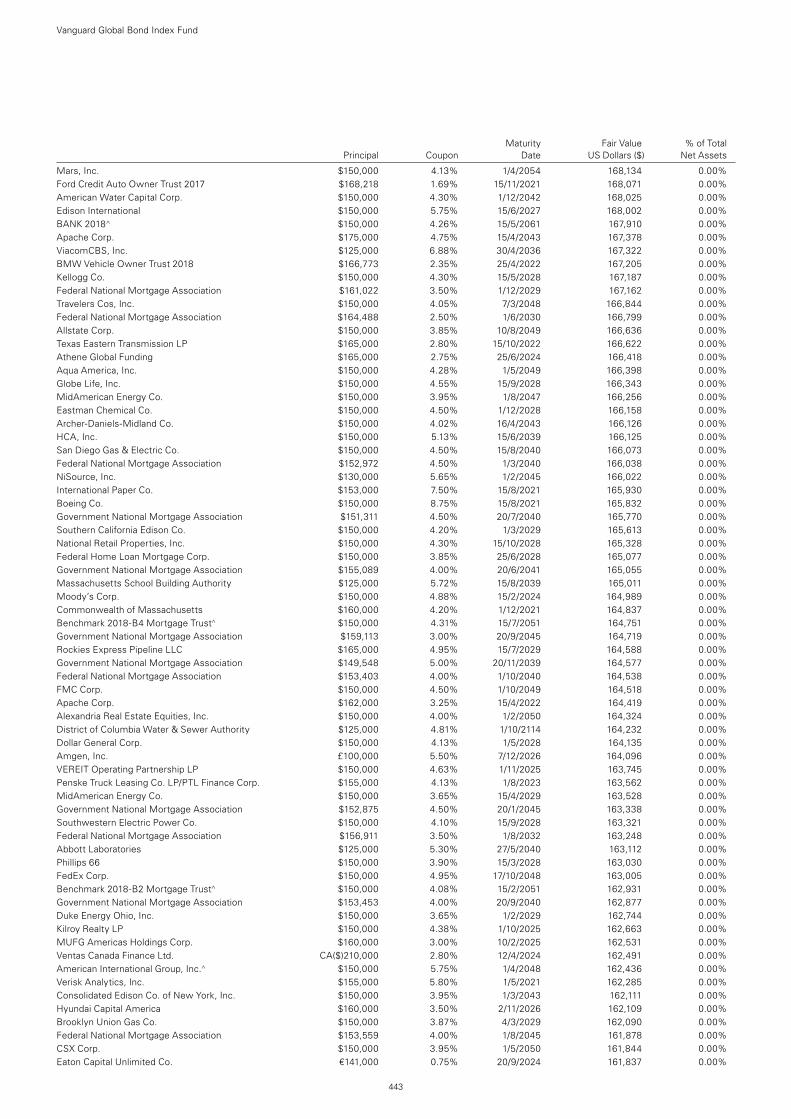
Maturity Fair Value % of Total Principal Coupon Date US Dollars ($) Net Assets
Vanguard Global Bond Index Fund
443
Mars, Inc. $150,000 4.13% 1/4/2054 168,134 0.00%Ford Credit Auto Owner Trust 2017 $168,218 1.69% 15/11/2021 168,071 0.00%American Water Capital Corp. $150,000 4.30% 1/12/2042 168,025 0.00%Edison International $150,000 5.75% 15/6/2027 168,002 0.00%BANK 2018^ $150,000 4.26% 15/5/2061 167,910 0.00%Apache Corp. $175,000 4.75% 15/4/2043 167,378 0.00%ViacomCBS, Inc. $125,000 6.88% 30/4/2036 167,322 0.00%BMW Vehicle Owner Trust 2018 $166,773 2.35% 25/4/2022 167,205 0.00%Kellogg Co. $150,000 4.30% 15/5/2028 167,187 0.00%Federal National Mortgage Association $161,022 3.50% 1/12/2029 167,162 0.00%Travelers Cos, Inc. $150,000 4.05% 7/3/2048 166,844 0.00%Federal National Mortgage Association $164,488 2.50% 1/6/2030 166,799 0.00%Allstate Corp. $150,000 3.85% 10/8/2049 166,636 0.00%Texas Eastern Transmission LP $165,000 2.80% 15/10/2022 166,622 0.00%Athene Global Funding $165,000 2.75% 25/6/2024 166,418 0.00%Aqua America, Inc. $150,000 4.28% 1/5/2049 166,398 0.00%Globe Life, Inc. $150,000 4.55% 15/9/2028 166,343 0.00%MidAmerican Energy Co. $150,000 3.95% 1/8/2047 166,256 0.00%Eastman Chemical Co. $150,000 4.50% 1/12/2028 166,158 0.00%Archer-Daniels-Midland Co. $150,000 4.02% 16/4/2043 166,126 0.00%HCA, Inc. $150,000 5.13% 15/6/2039 166,125 0.00%San Diego Gas & Electric Co. $150,000 4.50% 15/8/2040 166,073 0.00%Federal National Mortgage Association $152,972 4.50% 1/3/2040 166,038 0.00%NiSource, Inc. $130,000 5.65% 1/2/2045 166,022 0.00%International Paper Co. $153,000 7.50% 15/8/2021 165,930 0.00%Boeing Co. $150,000 8.75% 15/8/2021 165,832 0.00%Government National Mortgage Association $151,311 4.50% 20/7/2040 165,770 0.00%Southern California Edison Co. $150,000 4.20% 1/3/2029 165,613 0.00%National Retail Properties, Inc. $150,000 4.30% 15/10/2028 165,328 0.00%Federal Home Loan Mortgage Corp. $150,000 3.85% 25/6/2028 165,077 0.00%Government National Mortgage Association $155,089 4.00% 20/6/2041 165,055 0.00%Massachusetts School Building Authority $125,000 5.72% 15/8/2039 165,011 0.00%Moody’s Corp. $150,000 4.88% 15/2/2024 164,989 0.00%Commonwealth of Massachusetts $160,000 4.20% 1/12/2021 164,837 0.00%Benchmark 2018-B4 Mortgage Trust^ $150,000 4.31% 15/7/2051 164,751 0.00%Government National Mortgage Association $159,113 3.00% 20/9/2045 164,719 0.00%Rockies Express Pipeline LLC $165,000 4.95% 15/7/2029 164,588 0.00%Government National Mortgage Association $149,548 5.00% 20/11/2039 164,577 0.00%Federal National Mortgage Association $153,403 4.00% 1/10/2040 164,538 0.00%FMC Corp. $150,000 4.50% 1/10/2049 164,518 0.00%Apache Corp. $162,000 3.25% 15/4/2022 164,419 0.00%Alexandria Real Estate Equities, Inc. $150,000 4.00% 1/2/2050 164,324 0.00%District of Columbia Water & Sewer Authority $125,000 4.81% 1/10/2114 164,232 0.00%Dollar General Corp. $150,000 4.13% 1/5/2028 164,135 0.00%Amgen, Inc. £100,000 5.50% 7/12/2026 164,096 0.00%VEREIT Operating Partnership LP $150,000 4.63% 1/11/2025 163,745 0.00%Penske Truck Leasing Co. LP/PTL Finance Corp. $155,000 4.13% 1/8/2023 163,562 0.00%MidAmerican Energy Co. $150,000 3.65% 15/4/2029 163,528 0.00%Government National Mortgage Association $152,875 4.50% 20/1/2045 163,338 0.00%Southwestern Electric Power Co. $150,000 4.10% 15/9/2028 163,321 0.00%Federal National Mortgage Association $156,911 3.50% 1/8/2032 163,248 0.00%Abbott Laboratories $125,000 5.30% 27/5/2040 163,112 0.00%Phillips 66 $150,000 3.90% 15/3/2028 163,030 0.00%FedEx Corp. $150,000 4.95% 17/10/2048 163,005 0.00%Benchmark 2018-B2 Mortgage Trust^ $150,000 4.08% 15/2/2051 162,931 0.00%Government National Mortgage Association $153,453 4.00% 20/9/2040 162,877 0.00%Duke Energy Ohio, Inc. $150,000 3.65% 1/2/2029 162,744 0.00%Kilroy Realty LP $150,000 4.38% 1/10/2025 162,663 0.00%MUFG Americas Holdings Corp. $160,000 3.00% 10/2/2025 162,531 0.00%Ventas Canada Finance Ltd. CA($)210,000 2.80% 12/4/2024 162,491 0.00%American International Group, Inc.^ $150,000 5.75% 1/4/2048 162,436 0.00%Verisk Analytics, Inc. $155,000 5.80% 1/5/2021 162,285 0.00%Consolidated Edison Co. of New York, Inc. $150,000 3.95% 1/3/2043 162,111 0.00%Hyundai Capital America $160,000 3.50% 2/11/2026 162,109 0.00%Brooklyn Union Gas Co. $150,000 3.87% 4/3/2029 162,090 0.00%Federal National Mortgage Association $153,559 4.00% 1/8/2045 161,878 0.00%CSX Corp. $150,000 3.95% 1/5/2050 161,844 0.00%Eaton Capital Unlimited Co. €141,000 0.75% 20/9/2024 161,837 0.00%
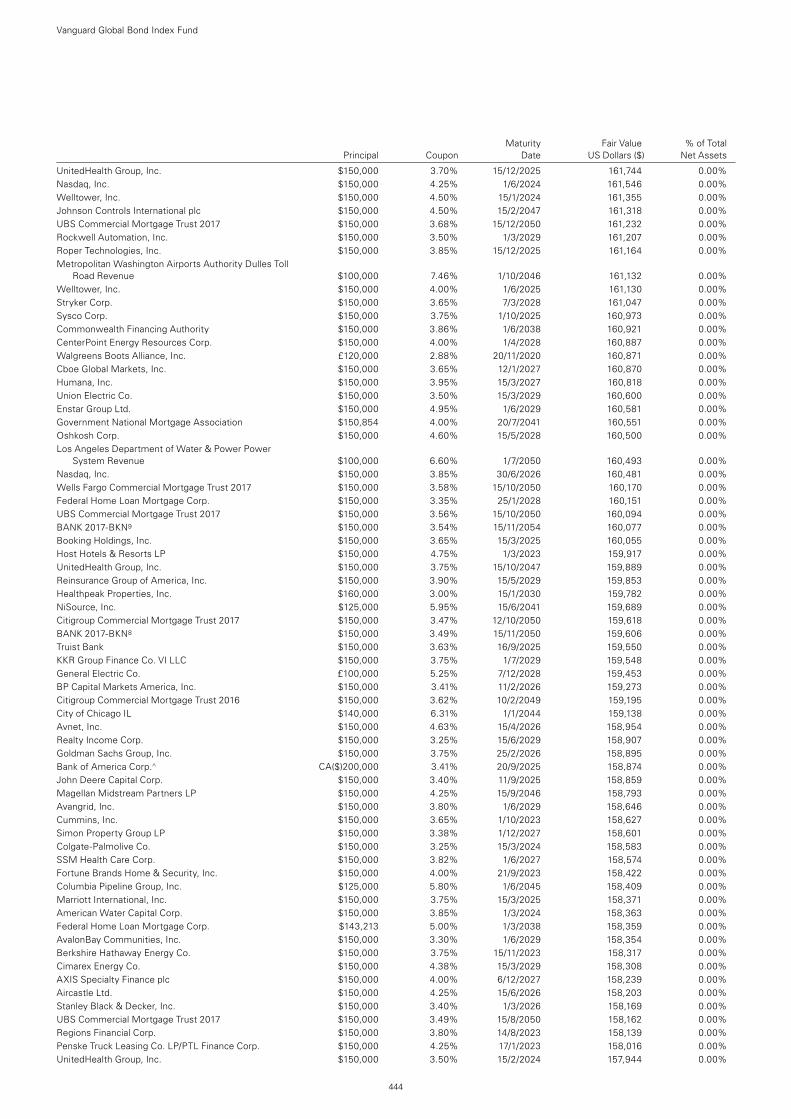
Maturity Fair Value % of Total Principal Coupon Date US Dollars ($) Net Assets
Vanguard Global Bond Index Fund
444
UnitedHealth Group, Inc. $150,000 3.70% 15/12/2025 161,744 0.00%Nasdaq, Inc. $150,000 4.25% 1/6/2024 161,546 0.00%Welltower, Inc. $150,000 4.50% 15/1/2024 161,355 0.00%Johnson Controls International plc $150,000 4.50% 15/2/2047 161,318 0.00%UBS Commercial Mortgage Trust 2017 $150,000 3.68% 15/12/2050 161,232 0.00%Rockwell Automation, Inc. $150,000 3.50% 1/3/2029 161,207 0.00%Roper Technologies, Inc. $150,000 3.85% 15/12/2025 161,164 0.00%Metropolitan Washington Airports Authority Dulles Toll
Road Revenue $100,000 7.46% 1/10/2046 161,132 0.00%Welltower, Inc. $150,000 4.00% 1/6/2025 161,130 0.00%Stryker Corp. $150,000 3.65% 7/3/2028 161,047 0.00%Sysco Corp. $150,000 3.75% 1/10/2025 160,973 0.00%Commonwealth Financing Authority $150,000 3.86% 1/6/2038 160,921 0.00%CenterPoint Energy Resources Corp. $150,000 4.00% 1/4/2028 160,887 0.00%Walgreens Boots Alliance, Inc. £120,000 2.88% 20/11/2020 160,871 0.00%Cboe Global Markets, Inc. $150,000 3.65% 12/1/2027 160,870 0.00%Humana, Inc. $150,000 3.95% 15/3/2027 160,818 0.00%Union Electric Co. $150,000 3.50% 15/3/2029 160,600 0.00%Enstar Group Ltd. $150,000 4.95% 1/6/2029 160,581 0.00%Government National Mortgage Association $150,854 4.00% 20/7/2041 160,551 0.00%Oshkosh Corp. $150,000 4.60% 15/5/2028 160,500 0.00%Los Angeles Department of Water & Power Power
System Revenue $100,000 6.60% 1/7/2050 160,493 0.00%Nasdaq, Inc. $150,000 3.85% 30/6/2026 160,481 0.00%Wells Fargo Commercial Mortgage Trust 2017 $150,000 3.58% 15/10/2050 160,170 0.00%Federal Home Loan Mortgage Corp. $150,000 3.35% 25/1/2028 160,151 0.00%UBS Commercial Mortgage Trust 2017 $150,000 3.56% 15/10/2050 160,094 0.00%BANK 2017-BKN9 $150,000 3.54% 15/11/2054 160,077 0.00%Booking Holdings, Inc. $150,000 3.65% 15/3/2025 160,055 0.00%Host Hotels & Resorts LP $150,000 4.75% 1/3/2023 159,917 0.00%UnitedHealth Group, Inc. $150,000 3.75% 15/10/2047 159,889 0.00%Reinsurance Group of America, Inc. $150,000 3.90% 15/5/2029 159,853 0.00%Healthpeak Properties, Inc. $160,000 3.00% 15/1/2030 159,782 0.00%NiSource, Inc. $125,000 5.95% 15/6/2041 159,689 0.00%Citigroup Commercial Mortgage Trust 2017 $150,000 3.47% 12/10/2050 159,618 0.00%BANK 2017-BKN8 $150,000 3.49% 15/11/2050 159,606 0.00%Truist Bank $150,000 3.63% 16/9/2025 159,550 0.00%KKR Group Finance Co. VI LLC $150,000 3.75% 1/7/2029 159,548 0.00%General Electric Co. £100,000 5.25% 7/12/2028 159,453 0.00%BP Capital Markets America, Inc. $150,000 3.41% 11/2/2026 159,273 0.00%Citigroup Commercial Mortgage Trust 2016 $150,000 3.62% 10/2/2049 159,195 0.00%City of Chicago IL $140,000 6.31% 1/1/2044 159,138 0.00%Avnet, Inc. $150,000 4.63% 15/4/2026 158,954 0.00%Realty Income Corp. $150,000 3.25% 15/6/2029 158,907 0.00%Goldman Sachs Group, Inc. $150,000 3.75% 25/2/2026 158,895 0.00%Bank of America Corp.^ CA($)200,000 3.41% 20/9/2025 158,874 0.00%John Deere Capital Corp. $150,000 3.40% 11/9/2025 158,859 0.00%Magellan Midstream Partners LP $150,000 4.25% 15/9/2046 158,793 0.00%Avangrid, Inc. $150,000 3.80% 1/6/2029 158,646 0.00%Cummins, Inc. $150,000 3.65% 1/10/2023 158,627 0.00%Simon Property Group LP $150,000 3.38% 1/12/2027 158,601 0.00%Colgate-Palmolive Co. $150,000 3.25% 15/3/2024 158,583 0.00%SSM Health Care Corp. $150,000 3.82% 1/6/2027 158,574 0.00%Fortune Brands Home & Security, Inc. $150,000 4.00% 21/9/2023 158,422 0.00%Columbia Pipeline Group, Inc. $125,000 5.80% 1/6/2045 158,409 0.00%Marriott International, Inc. $150,000 3.75% 15/3/2025 158,371 0.00%American Water Capital Corp. $150,000 3.85% 1/3/2024 158,363 0.00%Federal Home Loan Mortgage Corp. $143,213 5.00% 1/3/2038 158,359 0.00%AvalonBay Communities, Inc. $150,000 3.30% 1/6/2029 158,354 0.00%Berkshire Hathaway Energy Co. $150,000 3.75% 15/11/2023 158,317 0.00%Cimarex Energy Co. $150,000 4.38% 15/3/2029 158,308 0.00%AXIS Specialty Finance plc $150,000 4.00% 6/12/2027 158,239 0.00%Aircastle Ltd. $150,000 4.25% 15/6/2026 158,203 0.00%Stanley Black & Decker, Inc. $150,000 3.40% 1/3/2026 158,169 0.00%UBS Commercial Mortgage Trust 2017 $150,000 3.49% 15/8/2050 158,162 0.00%Regions Financial Corp. $150,000 3.80% 14/8/2023 158,139 0.00%Penske Truck Leasing Co. LP/PTL Finance Corp. $150,000 4.25% 17/1/2023 158,016 0.00%UnitedHealth Group, Inc. $150,000 3.50% 15/2/2024 157,944 0.00%
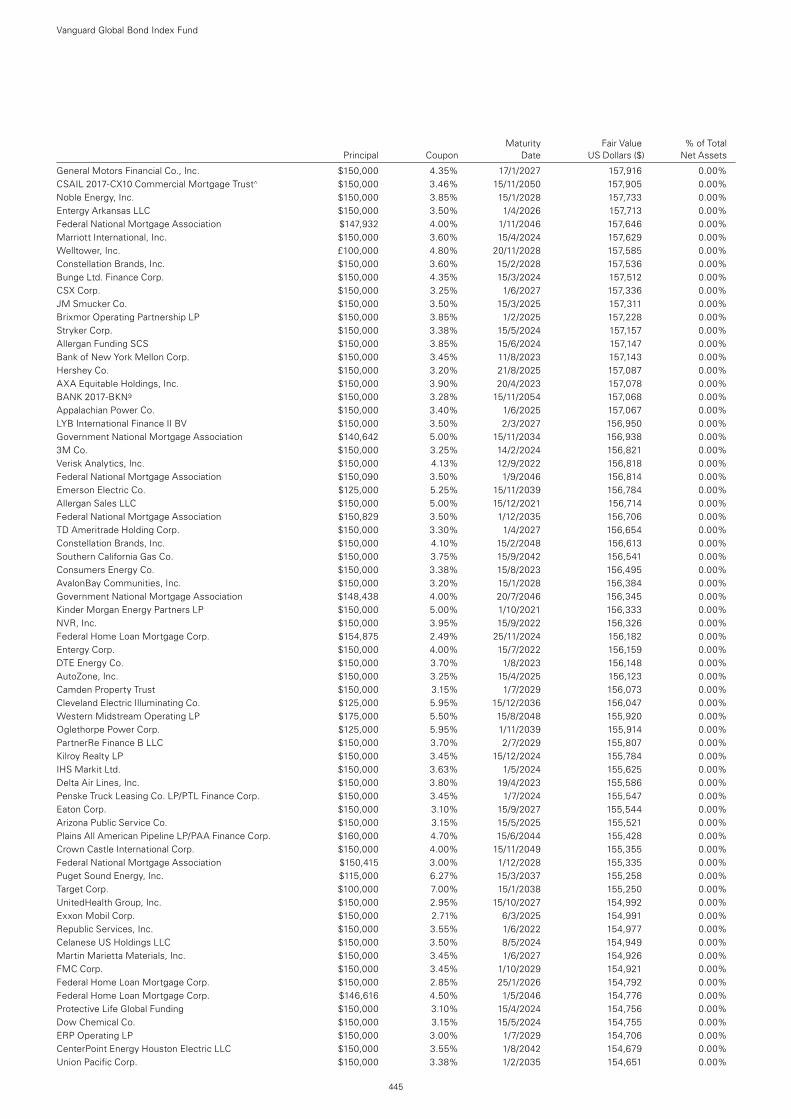
Maturity Fair Value % of Total Principal Coupon Date US Dollars ($) Net Assets
Vanguard Global Bond Index Fund
445
General Motors Financial Co., Inc. $150,000 4.35% 17/1/2027 157,916 0.00%CSAIL 2017-CX10 Commercial Mortgage Trust^ $150,000 3.46% 15/11/2050 157,905 0.00%Noble Energy, Inc. $150,000 3.85% 15/1/2028 157,733 0.00%Entergy Arkansas LLC $150,000 3.50% 1/4/2026 157,713 0.00%Federal National Mortgage Association $147,932 4.00% 1/11/2046 157,646 0.00%Marriott International, Inc. $150,000 3.60% 15/4/2024 157,629 0.00%Welltower, Inc. £100,000 4.80% 20/11/2028 157,585 0.00%Constellation Brands, Inc. $150,000 3.60% 15/2/2028 157,536 0.00%Bunge Ltd. Finance Corp. $150,000 4.35% 15/3/2024 157,512 0.00%CSX Corp. $150,000 3.25% 1/6/2027 157,336 0.00%JM Smucker Co. $150,000 3.50% 15/3/2025 157,311 0.00%Brixmor Operating Partnership LP $150,000 3.85% 1/2/2025 157,228 0.00%Stryker Corp. $150,000 3.38% 15/5/2024 157,157 0.00%Allergan Funding SCS $150,000 3.85% 15/6/2024 157,147 0.00%Bank of New York Mellon Corp. $150,000 3.45% 11/8/2023 157,143 0.00%Hershey Co. $150,000 3.20% 21/8/2025 157,087 0.00%AXA Equitable Holdings, Inc. $150,000 3.90% 20/4/2023 157,078 0.00%BANK 2017-BKN9 $150,000 3.28% 15/11/2054 157,068 0.00%Appalachian Power Co. $150,000 3.40% 1/6/2025 157,067 0.00%LYB International Finance II BV $150,000 3.50% 2/3/2027 156,950 0.00%Government National Mortgage Association $140,642 5.00% 15/11/2034 156,938 0.00%3M Co. $150,000 3.25% 14/2/2024 156,821 0.00%Verisk Analytics, Inc. $150,000 4.13% 12/9/2022 156,818 0.00%Federal National Mortgage Association $150,090 3.50% 1/9/2046 156,814 0.00%Emerson Electric Co. $125,000 5.25% 15/11/2039 156,784 0.00%Allergan Sales LLC $150,000 5.00% 15/12/2021 156,714 0.00%Federal National Mortgage Association $150,829 3.50% 1/12/2035 156,706 0.00%TD Ameritrade Holding Corp. $150,000 3.30% 1/4/2027 156,654 0.00%Constellation Brands, Inc. $150,000 4.10% 15/2/2048 156,613 0.00%Southern California Gas Co. $150,000 3.75% 15/9/2042 156,541 0.00%Consumers Energy Co. $150,000 3.38% 15/8/2023 156,495 0.00%AvalonBay Communities, Inc. $150,000 3.20% 15/1/2028 156,384 0.00%Government National Mortgage Association $148,438 4.00% 20/7/2046 156,345 0.00%Kinder Morgan Energy Partners LP $150,000 5.00% 1/10/2021 156,333 0.00%NVR, Inc. $150,000 3.95% 15/9/2022 156,326 0.00%Federal Home Loan Mortgage Corp. $154,875 2.49% 25/11/2024 156,182 0.00%Entergy Corp. $150,000 4.00% 15/7/2022 156,159 0.00%DTE Energy Co. $150,000 3.70% 1/8/2023 156,148 0.00%AutoZone, Inc. $150,000 3.25% 15/4/2025 156,123 0.00%Camden Property Trust $150,000 3.15% 1/7/2029 156,073 0.00%Cleveland Electric Illuminating Co. $125,000 5.95% 15/12/2036 156,047 0.00%Western Midstream Operating LP $175,000 5.50% 15/8/2048 155,920 0.00%Oglethorpe Power Corp. $125,000 5.95% 1/11/2039 155,914 0.00%PartnerRe Finance B LLC $150,000 3.70% 2/7/2029 155,807 0.00%Kilroy Realty LP $150,000 3.45% 15/12/2024 155,784 0.00%IHS Markit Ltd. $150,000 3.63% 1/5/2024 155,625 0.00%Delta Air Lines, Inc. $150,000 3.80% 19/4/2023 155,586 0.00%Penske Truck Leasing Co. LP/PTL Finance Corp. $150,000 3.45% 1/7/2024 155,547 0.00%Eaton Corp. $150,000 3.10% 15/9/2027 155,544 0.00%Arizona Public Service Co. $150,000 3.15% 15/5/2025 155,521 0.00%Plains All American Pipeline LP/PAA Finance Corp. $160,000 4.70% 15/6/2044 155,428 0.00%Crown Castle International Corp. $150,000 4.00% 15/11/2049 155,355 0.00%Federal National Mortgage Association $150,415 3.00% 1/12/2028 155,335 0.00%Puget Sound Energy, Inc. $115,000 6.27% 15/3/2037 155,258 0.00%Target Corp. $100,000 7.00% 15/1/2038 155,250 0.00%UnitedHealth Group, Inc. $150,000 2.95% 15/10/2027 154,992 0.00%Exxon Mobil Corp. $150,000 2.71% 6/3/2025 154,991 0.00%Republic Services, Inc. $150,000 3.55% 1/6/2022 154,977 0.00%Celanese US Holdings LLC $150,000 3.50% 8/5/2024 154,949 0.00%Martin Marietta Materials, Inc. $150,000 3.45% 1/6/2027 154,926 0.00%FMC Corp. $150,000 3.45% 1/10/2029 154,921 0.00%Federal Home Loan Mortgage Corp. $150,000 2.85% 25/1/2026 154,792 0.00%Federal Home Loan Mortgage Corp. $146,616 4.50% 1/5/2046 154,776 0.00%Protective Life Global Funding $150,000 3.10% 15/4/2024 154,756 0.00%Dow Chemical Co. $150,000 3.15% 15/5/2024 154,755 0.00%ERP Operating LP $150,000 3.00% 1/7/2029 154,706 0.00%CenterPoint Energy Houston Electric LLC $150,000 3.55% 1/8/2042 154,679 0.00%Union Pacific Corp. $150,000 3.38% 1/2/2035 154,651 0.00%
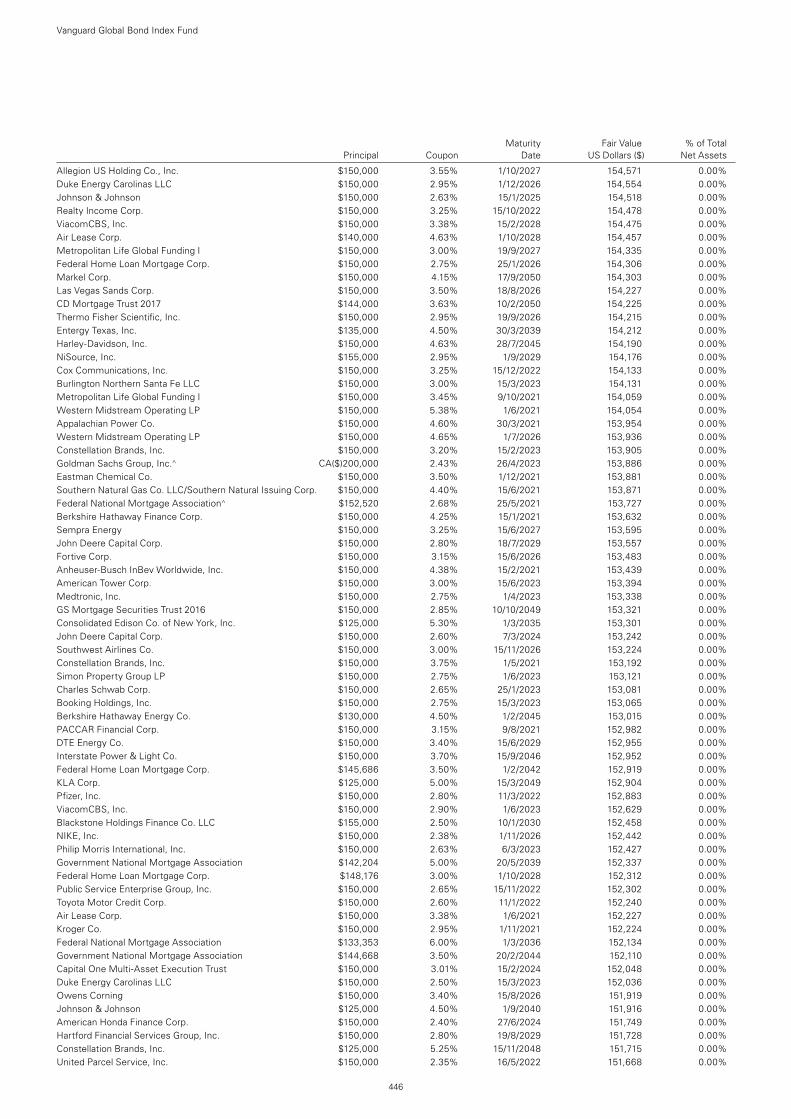
Allegion US Holding Co., Inc. $150,000 3.55% 1/10/2027 154,571 0.00%Duke Energy Carolinas LLC $150,000 2.95% 1/12/2026 154,554 0.00%Johnson & Johnson $150,000 2.63% 15/1/2025 154,518 0.00%Realty Income Corp. $150,000 3.25% 15/10/2022 154,478 0.00%ViacomCBS, Inc. $150,000 3.38% 15/2/2028 154,475 0.00%Air Lease Corp. $140,000 4.63% 1/10/2028 154,457 0.00%Metropolitan Life Global Funding I $150,000 3.00% 19/9/2027 154,335 0.00%Federal Home Loan Mortgage Corp. $150,000 2.75% 25/1/2026 154,306 0.00%Markel Corp. $150,000 4.15% 17/9/2050 154,303 0.00%Las Vegas Sands Corp. $150,000 3.50% 18/8/2026 154,227 0.00%CD Mortgage Trust 2017 $144,000 3.63% 10/2/2050 154,225 0.00%Thermo Fisher Scientific, Inc. $150,000 2.95% 19/9/2026 154,215 0.00%Entergy Texas, Inc. $135,000 4.50% 30/3/2039 154,212 0.00%Harley-Davidson, Inc. $150,000 4.63% 28/7/2045 154,190 0.00%NiSource, Inc. $155,000 2.95% 1/9/2029 154,176 0.00%Cox Communications, Inc. $150,000 3.25% 15/12/2022 154,133 0.00%Burlington Northern Santa Fe LLC $150,000 3.00% 15/3/2023 154,131 0.00%Metropolitan Life Global Funding I $150,000 3.45% 9/10/2021 154,059 0.00%Western Midstream Operating LP $150,000 5.38% 1/6/2021 154,054 0.00%Appalachian Power Co. $150,000 4.60% 30/3/2021 153,954 0.00%Western Midstream Operating LP $150,000 4.65% 1/7/2026 153,936 0.00%Constellation Brands, Inc. $150,000 3.20% 15/2/2023 153,905 0.00%Goldman Sachs Group, Inc.^ CA($)200,000 2.43% 26/4/2023 153,886 0.00%Eastman Chemical Co. $150,000 3.50% 1/12/2021 153,881 0.00%Southern Natural Gas Co. LLC/Southern Natural Issuing Corp. $150,000 4.40% 15/6/2021 153,871 0.00%Federal National Mortgage Association^ $152,520 2.68% 25/5/2021 153,727 0.00%Berkshire Hathaway Finance Corp. $150,000 4.25% 15/1/2021 153,632 0.00%Sempra Energy $150,000 3.25% 15/6/2027 153,595 0.00%John Deere Capital Corp. $150,000 2.80% 18/7/2029 153,557 0.00%Fortive Corp. $150,000 3.15% 15/6/2026 153,483 0.00%Anheuser-Busch InBev Worldwide, Inc. $150,000 4.38% 15/2/2021 153,439 0.00%American Tower Corp. $150,000 3.00% 15/6/2023 153,394 0.00%Medtronic, Inc. $150,000 2.75% 1/4/2023 153,338 0.00%GS Mortgage Securities Trust 2016 $150,000 2.85% 10/10/2049 153,321 0.00%Consolidated Edison Co. of New York, Inc. $125,000 5.30% 1/3/2035 153,301 0.00%John Deere Capital Corp. $150,000 2.60% 7/3/2024 153,242 0.00%Southwest Airlines Co. $150,000 3.00% 15/11/2026 153,224 0.00%Constellation Brands, Inc. $150,000 3.75% 1/5/2021 153,192 0.00%Simon Property Group LP $150,000 2.75% 1/6/2023 153,121 0.00%Charles Schwab Corp. $150,000 2.65% 25/1/2023 153,081 0.00%Booking Holdings, Inc. $150,000 2.75% 15/3/2023 153,065 0.00%Berkshire Hathaway Energy Co. $130,000 4.50% 1/2/2045 153,015 0.00%PACCAR Financial Corp. $150,000 3.15% 9/8/2021 152,982 0.00%DTE Energy Co. $150,000 3.40% 15/6/2029 152,955 0.00%Interstate Power & Light Co. $150,000 3.70% 15/9/2046 152,952 0.00%Federal Home Loan Mortgage Corp. $145,686 3.50% 1/2/2042 152,919 0.00%KLA Corp. $125,000 5.00% 15/3/2049 152,904 0.00%Pfizer, Inc. $150,000 2.80% 11/3/2022 152,883 0.00%ViacomCBS, Inc. $150,000 2.90% 1/6/2023 152,629 0.00%Blackstone Holdings Finance Co. LLC $155,000 2.50% 10/1/2030 152,458 0.00%NIKE, Inc. $150,000 2.38% 1/11/2026 152,442 0.00%Philip Morris International, Inc. $150,000 2.63% 6/3/2023 152,427 0.00%Government National Mortgage Association $142,204 5.00% 20/5/2039 152,337 0.00%Federal Home Loan Mortgage Corp. $148,176 3.00% 1/10/2028 152,312 0.00%Public Service Enterprise Group, Inc. $150,000 2.65% 15/11/2022 152,302 0.00%Toyota Motor Credit Corp. $150,000 2.60% 11/1/2022 152,240 0.00%Air Lease Corp. $150,000 3.38% 1/6/2021 152,227 0.00%Kroger Co. $150,000 2.95% 1/11/2021 152,224 0.00%Federal National Mortgage Association $133,353 6.00% 1/3/2036 152,134 0.00%Government National Mortgage Association $144,668 3.50% 20/2/2044 152,110 0.00%Capital One Multi-Asset Execution Trust $150,000 3.01% 15/2/2024 152,048 0.00%Duke Energy Carolinas LLC $150,000 2.50% 15/3/2023 152,036 0.00%Owens Corning $150,000 3.40% 15/8/2026 151,919 0.00%Johnson & Johnson $125,000 4.50% 1/9/2040 151,916 0.00%American Honda Finance Corp. $150,000 2.40% 27/6/2024 151,749 0.00%Hartford Financial Services Group, Inc. $150,000 2.80% 19/8/2029 151,728 0.00%Constellation Brands, Inc. $125,000 5.25% 15/11/2048 151,715 0.00%United Parcel Service, Inc. $150,000 2.35% 16/5/2022 151,668 0.00%
Vanguard Global Bond Index Fund
446
Maturity Fair Value % of Total Principal Coupon Date US Dollars ($) Net Assets
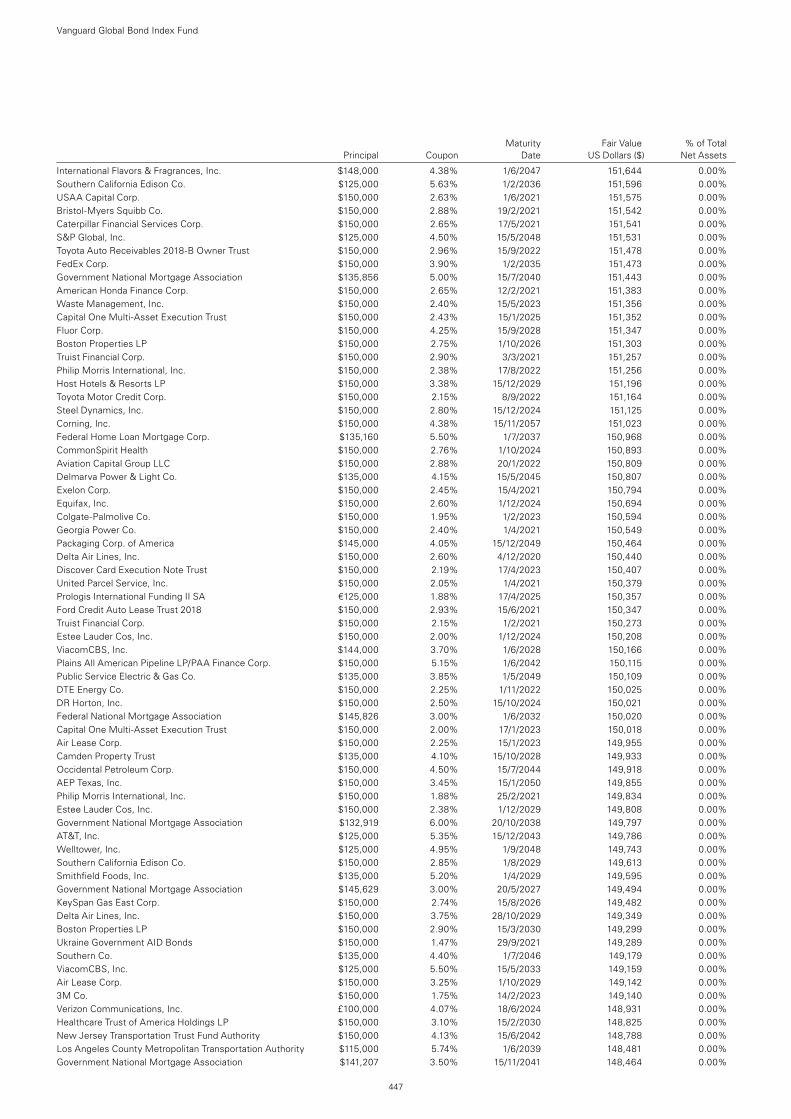
International Flavors & Fragrances, Inc. $148,000 4.38% 1/6/2047 151,644 0.00%Southern California Edison Co. $125,000 5.63% 1/2/2036 151,596 0.00%USAA Capital Corp. $150,000 2.63% 1/6/2021 151,575 0.00%Bristol-Myers Squibb Co. $150,000 2.88% 19/2/2021 151,542 0.00%Caterpillar Financial Services Corp. $150,000 2.65% 17/5/2021 151,541 0.00%S&P Global, Inc. $125,000 4.50% 15/5/2048 151,531 0.00%Toyota Auto Receivables 2018-B Owner Trust $150,000 2.96% 15/9/2022 151,478 0.00%FedEx Corp. $150,000 3.90% 1/2/2035 151,473 0.00%Government National Mortgage Association $135,856 5.00% 15/7/2040 151,443 0.00%American Honda Finance Corp. $150,000 2.65% 12/2/2021 151,383 0.00%Waste Management, Inc. $150,000 2.40% 15/5/2023 151,356 0.00%Capital One Multi-Asset Execution Trust $150,000 2.43% 15/1/2025 151,352 0.00%Fluor Corp. $150,000 4.25% 15/9/2028 151,347 0.00%Boston Properties LP $150,000 2.75% 1/10/2026 151,303 0.00%Truist Financial Corp. $150,000 2.90% 3/3/2021 151,257 0.00%Philip Morris International, Inc. $150,000 2.38% 17/8/2022 151,256 0.00%Host Hotels & Resorts LP $150,000 3.38% 15/12/2029 151,196 0.00%Toyota Motor Credit Corp. $150,000 2.15% 8/9/2022 151,164 0.00%Steel Dynamics, Inc. $150,000 2.80% 15/12/2024 151,125 0.00%Corning, Inc. $150,000 4.38% 15/11/2057 151,023 0.00%Federal Home Loan Mortgage Corp. $135,160 5.50% 1/7/2037 150,968 0.00%CommonSpirit Health $150,000 2.76% 1/10/2024 150,893 0.00%Aviation Capital Group LLC $150,000 2.88% 20/1/2022 150,809 0.00%Delmarva Power & Light Co. $135,000 4.15% 15/5/2045 150,807 0.00%Exelon Corp. $150,000 2.45% 15/4/2021 150,794 0.00%Equifax, Inc. $150,000 2.60% 1/12/2024 150,694 0.00%Colgate-Palmolive Co. $150,000 1.95% 1/2/2023 150,594 0.00%Georgia Power Co. $150,000 2.40% 1/4/2021 150,549 0.00%Packaging Corp. of America $145,000 4.05% 15/12/2049 150,464 0.00%Delta Air Lines, Inc. $150,000 2.60% 4/12/2020 150,440 0.00%Discover Card Execution Note Trust $150,000 2.19% 17/4/2023 150,407 0.00%United Parcel Service, Inc. $150,000 2.05% 1/4/2021 150,379 0.00%Prologis International Funding II SA €125,000 1.88% 17/4/2025 150,357 0.00%Ford Credit Auto Lease Trust 2018 $150,000 2.93% 15/6/2021 150,347 0.00%Truist Financial Corp. $150,000 2.15% 1/2/2021 150,273 0.00%Estee Lauder Cos, Inc. $150,000 2.00% 1/12/2024 150,208 0.00%ViacomCBS, Inc. $144,000 3.70% 1/6/2028 150,166 0.00%Plains All American Pipeline LP/PAA Finance Corp. $150,000 5.15% 1/6/2042 150,115 0.00%Public Service Electric & Gas Co. $135,000 3.85% 1/5/2049 150,109 0.00%DTE Energy Co. $150,000 2.25% 1/11/2022 150,025 0.00%DR Horton, Inc. $150,000 2.50% 15/10/2024 150,021 0.00%Federal National Mortgage Association $145,826 3.00% 1/6/2032 150,020 0.00%Capital One Multi-Asset Execution Trust $150,000 2.00% 17/1/2023 150,018 0.00%Air Lease Corp. $150,000 2.25% 15/1/2023 149,955 0.00%Camden Property Trust $135,000 4.10% 15/10/2028 149,933 0.00%Occidental Petroleum Corp. $150,000 4.50% 15/7/2044 149,918 0.00%AEP Texas, Inc. $150,000 3.45% 15/1/2050 149,855 0.00%Philip Morris International, Inc. $150,000 1.88% 25/2/2021 149,834 0.00%Estee Lauder Cos, Inc. $150,000 2.38% 1/12/2029 149,808 0.00%Government National Mortgage Association $132,919 6.00% 20/10/2038 149,797 0.00%AT&T, Inc. $125,000 5.35% 15/12/2043 149,786 0.00%Welltower, Inc. $125,000 4.95% 1/9/2048 149,743 0.00%Southern California Edison Co. $150,000 2.85% 1/8/2029 149,613 0.00%Smithfield Foods, Inc. $135,000 5.20% 1/4/2029 149,595 0.00%Government National Mortgage Association $145,629 3.00% 20/5/2027 149,494 0.00%KeySpan Gas East Corp. $150,000 2.74% 15/8/2026 149,482 0.00%Delta Air Lines, Inc. $150,000 3.75% 28/10/2029 149,349 0.00%Boston Properties LP $150,000 2.90% 15/3/2030 149,299 0.00%Ukraine Government AID Bonds $150,000 1.47% 29/9/2021 149,289 0.00%Southern Co. $135,000 4.40% 1/7/2046 149,179 0.00%ViacomCBS, Inc. $125,000 5.50% 15/5/2033 149,159 0.00%Air Lease Corp. $150,000 3.25% 1/10/2029 149,142 0.00%3M Co. $150,000 1.75% 14/2/2023 149,140 0.00%Verizon Communications, Inc. £100,000 4.07% 18/6/2024 148,931 0.00%Healthcare Trust of America Holdings LP $150,000 3.10% 15/2/2030 148,825 0.00%New Jersey Transportation Trust Fund Authority $150,000 4.13% 15/6/2042 148,788 0.00%Los Angeles County Metropolitan Transportation Authority $115,000 5.74% 1/6/2039 148,481 0.00%Government National Mortgage Association $141,207 3.50% 15/11/2041 148,464 0.00%
Vanguard Global Bond Index Fund
447
Maturity Fair Value % of Total Principal Coupon Date US Dollars ($) Net Assets
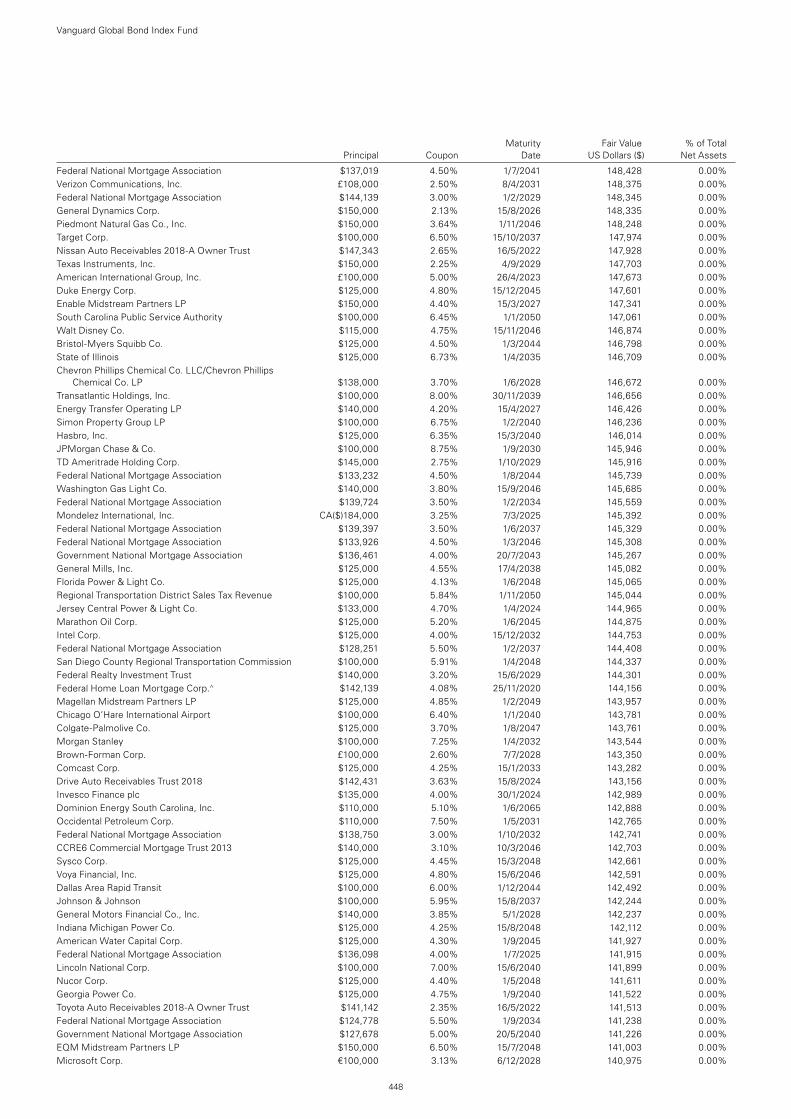
Federal National Mortgage Association $137,019 4.50% 1/7/2041 148,428 0.00%Verizon Communications, Inc. £108,000 2.50% 8/4/2031 148,375 0.00%Federal National Mortgage Association $144,139 3.00% 1/2/2029 148,345 0.00%General Dynamics Corp. $150,000 2.13% 15/8/2026 148,335 0.00%Piedmont Natural Gas Co., Inc. $150,000 3.64% 1/11/2046 148,248 0.00%Target Corp. $100,000 6.50% 15/10/2037 147,974 0.00%Nissan Auto Receivables 2018-A Owner Trust $147,343 2.65% 16/5/2022 147,928 0.00%Texas Instruments, Inc. $150,000 2.25% 4/9/2029 147,703 0.00%American International Group, Inc. £100,000 5.00% 26/4/2023 147,673 0.00%Duke Energy Corp. $125,000 4.80% 15/12/2045 147,601 0.00%Enable Midstream Partners LP $150,000 4.40% 15/3/2027 147,341 0.00%South Carolina Public Service Authority $100,000 6.45% 1/1/2050 147,061 0.00%Walt Disney Co. $115,000 4.75% 15/11/2046 146,874 0.00%Bristol-Myers Squibb Co. $125,000 4.50% 1/3/2044 146,798 0.00%State of Illinois $125,000 6.73% 1/4/2035 146,709 0.00%Chevron Phillips Chemical Co. LLC/Chevron Phillips
Chemical Co. LP $138,000 3.70% 1/6/2028 146,672 0.00%Transatlantic Holdings, Inc. $100,000 8.00% 30/11/2039 146,656 0.00%Energy Transfer Operating LP $140,000 4.20% 15/4/2027 146,426 0.00%Simon Property Group LP $100,000 6.75% 1/2/2040 146,236 0.00%Hasbro, Inc. $125,000 6.35% 15/3/2040 146,014 0.00%JPMorgan Chase & Co. $100,000 8.75% 1/9/2030 145,946 0.00%TD Ameritrade Holding Corp. $145,000 2.75% 1/10/2029 145,916 0.00%Federal National Mortgage Association $133,232 4.50% 1/8/2044 145,739 0.00%Washington Gas Light Co. $140,000 3.80% 15/9/2046 145,685 0.00%Federal National Mortgage Association $139,724 3.50% 1/2/2034 145,559 0.00%Mondelez International, Inc. CA($)184,000 3.25% 7/3/2025 145,392 0.00%Federal National Mortgage Association $139,397 3.50% 1/6/2037 145,329 0.00%Federal National Mortgage Association $133,926 4.50% 1/3/2046 145,308 0.00%Government National Mortgage Association $136,461 4.00% 20/7/2043 145,267 0.00%General Mills, Inc. $125,000 4.55% 17/4/2038 145,082 0.00%Florida Power & Light Co. $125,000 4.13% 1/6/2048 145,065 0.00%Regional Transportation District Sales Tax Revenue $100,000 5.84% 1/11/2050 145,044 0.00%Jersey Central Power & Light Co. $133,000 4.70% 1/4/2024 144,965 0.00%Marathon Oil Corp. $125,000 5.20% 1/6/2045 144,875 0.00%Intel Corp. $125,000 4.00% 15/12/2032 144,753 0.00%Federal National Mortgage Association $128,251 5.50% 1/2/2037 144,408 0.00%San Diego County Regional Transportation Commission $100,000 5.91% 1/4/2048 144,337 0.00%Federal Realty Investment Trust $140,000 3.20% 15/6/2029 144,301 0.00%Federal Home Loan Mortgage Corp.^ $142,139 4.08% 25/11/2020 144,156 0.00%Magellan Midstream Partners LP $125,000 4.85% 1/2/2049 143,957 0.00%Chicago O’Hare International Airport $100,000 6.40% 1/1/2040 143,781 0.00%Colgate-Palmolive Co. $125,000 3.70% 1/8/2047 143,761 0.00%Morgan Stanley $100,000 7.25% 1/4/2032 143,544 0.00%Brown-Forman Corp. £100,000 2.60% 7/7/2028 143,350 0.00%Comcast Corp. $125,000 4.25% 15/1/2033 143,282 0.00%Drive Auto Receivables Trust 2018 $142,431 3.63% 15/8/2024 143,156 0.00%Invesco Finance plc $135,000 4.00% 30/1/2024 142,989 0.00%Dominion Energy South Carolina, Inc. $110,000 5.10% 1/6/2065 142,888 0.00%Occidental Petroleum Corp. $110,000 7.50% 1/5/2031 142,765 0.00%Federal National Mortgage Association $138,750 3.00% 1/10/2032 142,741 0.00%CCRE6 Commercial Mortgage Trust 2013 $140,000 3.10% 10/3/2046 142,703 0.00%Sysco Corp. $125,000 4.45% 15/3/2048 142,661 0.00%Voya Financial, Inc. $125,000 4.80% 15/6/2046 142,591 0.00%Dallas Area Rapid Transit $100,000 6.00% 1/12/2044 142,492 0.00%Johnson & Johnson $100,000 5.95% 15/8/2037 142,244 0.00%General Motors Financial Co., Inc. $140,000 3.85% 5/1/2028 142,237 0.00%Indiana Michigan Power Co. $125,000 4.25% 15/8/2048 142,112 0.00%American Water Capital Corp. $125,000 4.30% 1/9/2045 141,927 0.00%Federal National Mortgage Association $136,098 4.00% 1/7/2025 141,915 0.00%Lincoln National Corp. $100,000 7.00% 15/6/2040 141,899 0.00%Nucor Corp. $125,000 4.40% 1/5/2048 141,611 0.00%Georgia Power Co. $125,000 4.75% 1/9/2040 141,522 0.00%Toyota Auto Receivables 2018-A Owner Trust $141,142 2.35% 16/5/2022 141,513 0.00%Federal National Mortgage Association $124,778 5.50% 1/9/2034 141,238 0.00%Government National Mortgage Association $127,678 5.00% 20/5/2040 141,226 0.00%EQM Midstream Partners LP $150,000 6.50% 15/7/2048 141,003 0.00%Microsoft Corp. €100,000 3.13% 6/12/2028 140,975 0.00%
Vanguard Global Bond Index Fund
448
Maturity Fair Value % of Total Principal Coupon Date US Dollars ($) Net Assets
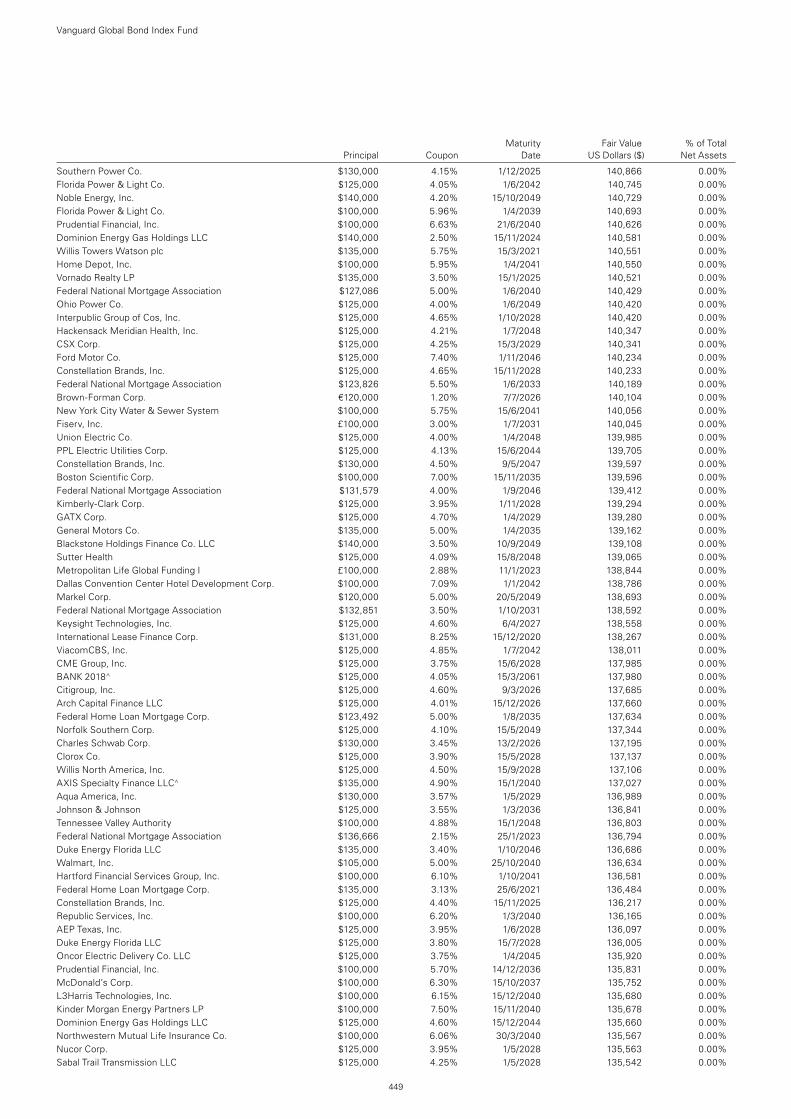
Southern Power Co. $130,000 4.15% 1/12/2025 140,866 0.00%Florida Power & Light Co. $125,000 4.05% 1/6/2042 140,745 0.00%Noble Energy, Inc. $140,000 4.20% 15/10/2049 140,729 0.00%Florida Power & Light Co. $100,000 5.96% 1/4/2039 140,693 0.00%Prudential Financial, Inc. $100,000 6.63% 21/6/2040 140,626 0.00%Dominion Energy Gas Holdings LLC $140,000 2.50% 15/11/2024 140,581 0.00%Willis Towers Watson plc $135,000 5.75% 15/3/2021 140,551 0.00%Home Depot, Inc. $100,000 5.95% 1/4/2041 140,550 0.00%Vornado Realty LP $135,000 3.50% 15/1/2025 140,521 0.00%Federal National Mortgage Association $127,086 5.00% 1/6/2040 140,429 0.00%Ohio Power Co. $125,000 4.00% 1/6/2049 140,420 0.00%Interpublic Group of Cos, Inc. $125,000 4.65% 1/10/2028 140,420 0.00%Hackensack Meridian Health, Inc. $125,000 4.21% 1/7/2048 140,347 0.00%CSX Corp. $125,000 4.25% 15/3/2029 140,341 0.00%Ford Motor Co. $125,000 7.40% 1/11/2046 140,234 0.00%Constellation Brands, Inc. $125,000 4.65% 15/11/2028 140,233 0.00%Federal National Mortgage Association $123,826 5.50% 1/6/2033 140,189 0.00%Brown-Forman Corp. €120,000 1.20% 7/7/2026 140,104 0.00%New York City Water & Sewer System $100,000 5.75% 15/6/2041 140,056 0.00%Fiserv, Inc. £100,000 3.00% 1/7/2031 140,045 0.00%Union Electric Co. $125,000 4.00% 1/4/2048 139,985 0.00%PPL Electric Utilities Corp. $125,000 4.13% 15/6/2044 139,705 0.00%Constellation Brands, Inc. $130,000 4.50% 9/5/2047 139,597 0.00%Boston Scientific Corp. $100,000 7.00% 15/11/2035 139,596 0.00%Federal National Mortgage Association $131,579 4.00% 1/9/2046 139,412 0.00%Kimberly-Clark Corp. $125,000 3.95% 1/11/2028 139,294 0.00%GATX Corp. $125,000 4.70% 1/4/2029 139,280 0.00%General Motors Co. $135,000 5.00% 1/4/2035 139,162 0.00%Blackstone Holdings Finance Co. LLC $140,000 3.50% 10/9/2049 139,108 0.00%Sutter Health $125,000 4.09% 15/8/2048 139,065 0.00%Metropolitan Life Global Funding I £100,000 2.88% 11/1/2023 138,844 0.00%Dallas Convention Center Hotel Development Corp. $100,000 7.09% 1/1/2042 138,786 0.00%Markel Corp. $120,000 5.00% 20/5/2049 138,693 0.00%Federal National Mortgage Association $132,851 3.50% 1/10/2031 138,592 0.00%Keysight Technologies, Inc. $125,000 4.60% 6/4/2027 138,558 0.00%International Lease Finance Corp. $131,000 8.25% 15/12/2020 138,267 0.00%ViacomCBS, Inc. $125,000 4.85% 1/7/2042 138,011 0.00%CME Group, Inc. $125,000 3.75% 15/6/2028 137,985 0.00%BANK 2018^ $125,000 4.05% 15/3/2061 137,980 0.00%Citigroup, Inc. $125,000 4.60% 9/3/2026 137,685 0.00%Arch Capital Finance LLC $125,000 4.01% 15/12/2026 137,660 0.00%Federal Home Loan Mortgage Corp. $123,492 5.00% 1/8/2035 137,634 0.00%Norfolk Southern Corp. $125,000 4.10% 15/5/2049 137,344 0.00%Charles Schwab Corp. $130,000 3.45% 13/2/2026 137,195 0.00%Clorox Co. $125,000 3.90% 15/5/2028 137,137 0.00%Willis North America, Inc. $125,000 4.50% 15/9/2028 137,106 0.00%AXIS Specialty Finance LLC^ $135,000 4.90% 15/1/2040 137,027 0.00%Aqua America, Inc. $130,000 3.57% 1/5/2029 136,989 0.00%Johnson & Johnson $125,000 3.55% 1/3/2036 136,841 0.00%Tennessee Valley Authority $100,000 4.88% 15/1/2048 136,803 0.00%Federal National Mortgage Association $136,666 2.15% 25/1/2023 136,794 0.00%Duke Energy Florida LLC $135,000 3.40% 1/10/2046 136,686 0.00%Walmart, Inc. $105,000 5.00% 25/10/2040 136,634 0.00%Hartford Financial Services Group, Inc. $100,000 6.10% 1/10/2041 136,581 0.00%Federal Home Loan Mortgage Corp. $135,000 3.13% 25/6/2021 136,484 0.00%Constellation Brands, Inc. $125,000 4.40% 15/11/2025 136,217 0.00%Republic Services, Inc. $100,000 6.20% 1/3/2040 136,165 0.00%AEP Texas, Inc. $125,000 3.95% 1/6/2028 136,097 0.00%Duke Energy Florida LLC $125,000 3.80% 15/7/2028 136,005 0.00%Oncor Electric Delivery Co. LLC $125,000 3.75% 1/4/2045 135,920 0.00%Prudential Financial, Inc. $100,000 5.70% 14/12/2036 135,831 0.00%McDonald’s Corp. $100,000 6.30% 15/10/2037 135,752 0.00%L3Harris Technologies, Inc. $100,000 6.15% 15/12/2040 135,680 0.00%Kinder Morgan Energy Partners LP $100,000 7.50% 15/11/2040 135,678 0.00%Dominion Energy Gas Holdings LLC $125,000 4.60% 15/12/2044 135,660 0.00%Northwestern Mutual Life Insurance Co. $100,000 6.06% 30/3/2040 135,567 0.00%Nucor Corp. $125,000 3.95% 1/5/2028 135,563 0.00%Sabal Trail Transmission LLC $125,000 4.25% 1/5/2028 135,542 0.00%
Vanguard Global Bond Index Fund
449
Maturity Fair Value % of Total Principal Coupon Date US Dollars ($) Net Assets
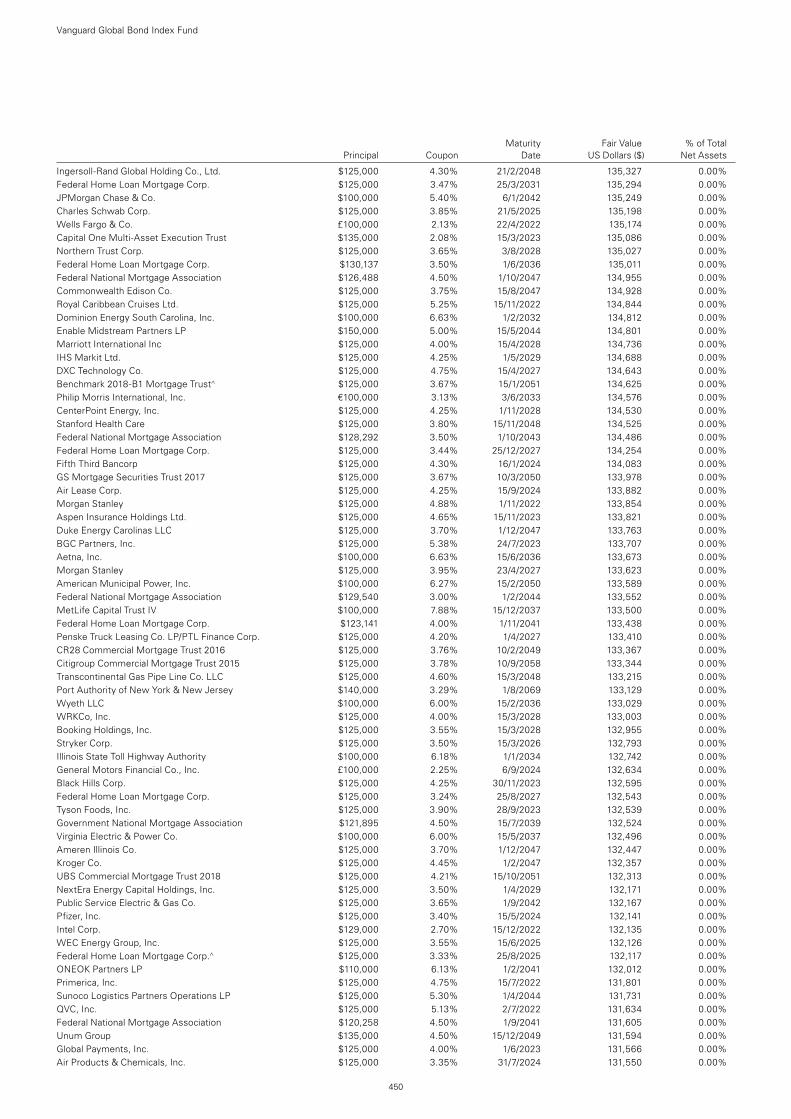
Ingersoll-Rand Global Holding Co., Ltd. $125,000 4.30% 21/2/2048 135,327 0.00%Federal Home Loan Mortgage Corp. $125,000 3.47% 25/3/2031 135,294 0.00%JPMorgan Chase & Co. $100,000 5.40% 6/1/2042 135,249 0.00%Charles Schwab Corp. $125,000 3.85% 21/5/2025 135,198 0.00%Wells Fargo & Co. £100,000 2.13% 22/4/2022 135,174 0.00%Capital One Multi-Asset Execution Trust $135,000 2.08% 15/3/2023 135,086 0.00%Northern Trust Corp. $125,000 3.65% 3/8/2028 135,027 0.00%Federal Home Loan Mortgage Corp. $130,137 3.50% 1/6/2036 135,011 0.00%Federal National Mortgage Association $126,488 4.50% 1/10/2047 134,955 0.00%Commonwealth Edison Co. $125,000 3.75% 15/8/2047 134,928 0.00%Royal Caribbean Cruises Ltd. $125,000 5.25% 15/11/2022 134,844 0.00%Dominion Energy South Carolina, Inc. $100,000 6.63% 1/2/2032 134,812 0.00%Enable Midstream Partners LP $150,000 5.00% 15/5/2044 134,801 0.00%Marriott International Inc $125,000 4.00% 15/4/2028 134,736 0.00%IHS Markit Ltd. $125,000 4.25% 1/5/2029 134,688 0.00%DXC Technology Co. $125,000 4.75% 15/4/2027 134,643 0.00%Benchmark 2018-B1 Mortgage Trust^ $125,000 3.67% 15/1/2051 134,625 0.00%Philip Morris International, Inc. €100,000 3.13% 3/6/2033 134,576 0.00%CenterPoint Energy, Inc. $125,000 4.25% 1/11/2028 134,530 0.00%Stanford Health Care $125,000 3.80% 15/11/2048 134,525 0.00%Federal National Mortgage Association $128,292 3.50% 1/10/2043 134,486 0.00%Federal Home Loan Mortgage Corp. $125,000 3.44% 25/12/2027 134,254 0.00%Fifth Third Bancorp $125,000 4.30% 16/1/2024 134,083 0.00%GS Mortgage Securities Trust 2017 $125,000 3.67% 10/3/2050 133,978 0.00%Air Lease Corp. $125,000 4.25% 15/9/2024 133,882 0.00%Morgan Stanley $125,000 4.88% 1/11/2022 133,854 0.00%Aspen Insurance Holdings Ltd. $125,000 4.65% 15/11/2023 133,821 0.00%Duke Energy Carolinas LLC $125,000 3.70% 1/12/2047 133,763 0.00%BGC Partners, Inc. $125,000 5.38% 24/7/2023 133,707 0.00%Aetna, Inc. $100,000 6.63% 15/6/2036 133,673 0.00%Morgan Stanley $125,000 3.95% 23/4/2027 133,623 0.00%American Municipal Power, Inc. $100,000 6.27% 15/2/2050 133,589 0.00%Federal National Mortgage Association $129,540 3.00% 1/2/2044 133,552 0.00%MetLife Capital Trust IV $100,000 7.88% 15/12/2037 133,500 0.00%Federal Home Loan Mortgage Corp. $123,141 4.00% 1/11/2041 133,438 0.00%Penske Truck Leasing Co. LP/PTL Finance Corp. $125,000 4.20% 1/4/2027 133,410 0.00%CR28 Commercial Mortgage Trust 2016 $125,000 3.76% 10/2/2049 133,367 0.00%Citigroup Commercial Mortgage Trust 2015 $125,000 3.78% 10/9/2058 133,344 0.00%Transcontinental Gas Pipe Line Co. LLC $125,000 4.60% 15/3/2048 133,215 0.00%Port Authority of New York & New Jersey $140,000 3.29% 1/8/2069 133,129 0.00%Wyeth LLC $100,000 6.00% 15/2/2036 133,029 0.00%WRKCo, Inc. $125,000 4.00% 15/3/2028 133,003 0.00%Booking Holdings, Inc. $125,000 3.55% 15/3/2028 132,955 0.00%Stryker Corp. $125,000 3.50% 15/3/2026 132,793 0.00%Illinois State Toll Highway Authority $100,000 6.18% 1/1/2034 132,742 0.00%General Motors Financial Co., Inc. £100,000 2.25% 6/9/2024 132,634 0.00%Black Hills Corp. $125,000 4.25% 30/11/2023 132,595 0.00%Federal Home Loan Mortgage Corp. $125,000 3.24% 25/8/2027 132,543 0.00%Tyson Foods, Inc. $125,000 3.90% 28/9/2023 132,539 0.00%Government National Mortgage Association $121,895 4.50% 15/7/2039 132,524 0.00%Virginia Electric & Power Co. $100,000 6.00% 15/5/2037 132,496 0.00%Ameren Illinois Co. $125,000 3.70% 1/12/2047 132,447 0.00%Kroger Co. $125,000 4.45% 1/2/2047 132,357 0.00%UBS Commercial Mortgage Trust 2018 $125,000 4.21% 15/10/2051 132,313 0.00%NextEra Energy Capital Holdings, Inc. $125,000 3.50% 1/4/2029 132,171 0.00%Public Service Electric & Gas Co. $125,000 3.65% 1/9/2042 132,167 0.00%Pfizer, Inc. $125,000 3.40% 15/5/2024 132,141 0.00%Intel Corp. $129,000 2.70% 15/12/2022 132,135 0.00%WEC Energy Group, Inc. $125,000 3.55% 15/6/2025 132,126 0.00%Federal Home Loan Mortgage Corp.^ $125,000 3.33% 25/8/2025 132,117 0.00%ONEOK Partners LP $110,000 6.13% 1/2/2041 132,012 0.00%Primerica, Inc. $125,000 4.75% 15/7/2022 131,801 0.00%Sunoco Logistics Partners Operations LP $125,000 5.30% 1/4/2044 131,731 0.00%QVC, Inc. $125,000 5.13% 2/7/2022 131,634 0.00%Federal National Mortgage Association $120,258 4.50% 1/9/2041 131,605 0.00%Unum Group $135,000 4.50% 15/12/2049 131,594 0.00%Global Payments, Inc. $125,000 4.00% 1/6/2023 131,566 0.00%Air Products & Chemicals, Inc. $125,000 3.35% 31/7/2024 131,550 0.00%
Vanguard Global Bond Index Fund
450
Maturity Fair Value % of Total Principal Coupon Date US Dollars ($) Net Assets
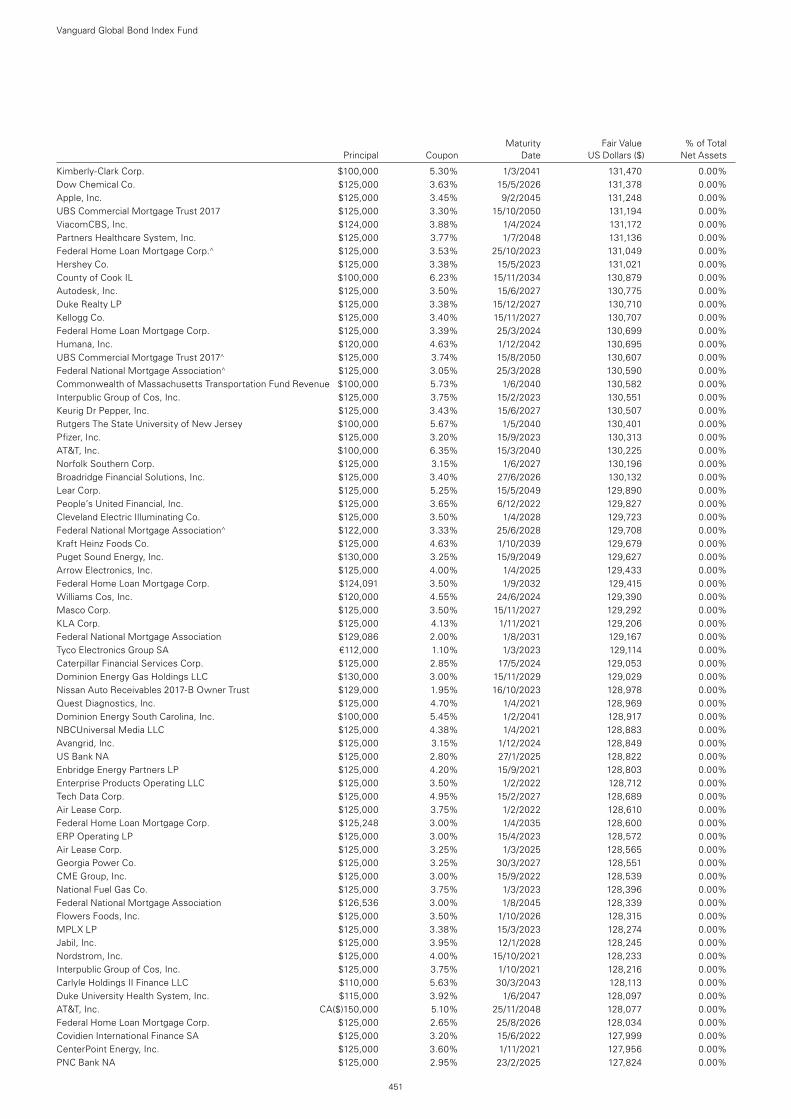
Kimberly-Clark Corp. $100,000 5.30% 1/3/2041 131,470 0.00%Dow Chemical Co. $125,000 3.63% 15/5/2026 131,378 0.00%Apple, Inc. $125,000 3.45% 9/2/2045 131,248 0.00%UBS Commercial Mortgage Trust 2017 $125,000 3.30% 15/10/2050 131,194 0.00%ViacomCBS, Inc. $124,000 3.88% 1/4/2024 131,172 0.00%Partners Healthcare System, Inc. $125,000 3.77% 1/7/2048 131,136 0.00%Federal Home Loan Mortgage Corp.^ $125,000 3.53% 25/10/2023 131,049 0.00%Hershey Co. $125,000 3.38% 15/5/2023 131,021 0.00%County of Cook IL $100,000 6.23% 15/11/2034 130,879 0.00%Autodesk, Inc. $125,000 3.50% 15/6/2027 130,775 0.00%Duke Realty LP $125,000 3.38% 15/12/2027 130,710 0.00%Kellogg Co. $125,000 3.40% 15/11/2027 130,707 0.00%Federal Home Loan Mortgage Corp. $125,000 3.39% 25/3/2024 130,699 0.00%Humana, Inc. $120,000 4.63% 1/12/2042 130,695 0.00%UBS Commercial Mortgage Trust 2017^ $125,000 3.74% 15/8/2050 130,607 0.00%Federal National Mortgage Association^ $125,000 3.05% 25/3/2028 130,590 0.00%Commonwealth of Massachusetts Transportation Fund Revenue $100,000 5.73% 1/6/2040 130,582 0.00%Interpublic Group of Cos, Inc. $125,000 3.75% 15/2/2023 130,551 0.00%Keurig Dr Pepper, Inc. $125,000 3.43% 15/6/2027 130,507 0.00%Rutgers The State University of New Jersey $100,000 5.67% 1/5/2040 130,401 0.00%Pfizer, Inc. $125,000 3.20% 15/9/2023 130,313 0.00%AT&T, Inc. $100,000 6.35% 15/3/2040 130,225 0.00%Norfolk Southern Corp. $125,000 3.15% 1/6/2027 130,196 0.00%Broadridge Financial Solutions, Inc. $125,000 3.40% 27/6/2026 130,132 0.00%Lear Corp. $125,000 5.25% 15/5/2049 129,890 0.00%People’s United Financial, Inc. $125,000 3.65% 6/12/2022 129,827 0.00%Cleveland Electric Illuminating Co. $125,000 3.50% 1/4/2028 129,723 0.00%Federal National Mortgage Association^ $122,000 3.33% 25/6/2028 129,708 0.00%Kraft Heinz Foods Co. $125,000 4.63% 1/10/2039 129,679 0.00%Puget Sound Energy, Inc. $130,000 3.25% 15/9/2049 129,627 0.00%Arrow Electronics, Inc. $125,000 4.00% 1/4/2025 129,433 0.00%Federal Home Loan Mortgage Corp. $124,091 3.50% 1/9/2032 129,415 0.00%Williams Cos, Inc. $120,000 4.55% 24/6/2024 129,390 0.00%Masco Corp. $125,000 3.50% 15/11/2027 129,292 0.00%KLA Corp. $125,000 4.13% 1/11/2021 129,206 0.00%Federal National Mortgage Association $129,086 2.00% 1/8/2031 129,167 0.00%Tyco Electronics Group SA €112,000 1.10% 1/3/2023 129,114 0.00%Caterpillar Financial Services Corp. $125,000 2.85% 17/5/2024 129,053 0.00%Dominion Energy Gas Holdings LLC $130,000 3.00% 15/11/2029 129,029 0.00%Nissan Auto Receivables 2017-B Owner Trust $129,000 1.95% 16/10/2023 128,978 0.00%Quest Diagnostics, Inc. $125,000 4.70% 1/4/2021 128,969 0.00%Dominion Energy South Carolina, Inc. $100,000 5.45% 1/2/2041 128,917 0.00%NBCUniversal Media LLC $125,000 4.38% 1/4/2021 128,883 0.00%Avangrid, Inc. $125,000 3.15% 1/12/2024 128,849 0.00%US Bank NA $125,000 2.80% 27/1/2025 128,822 0.00%Enbridge Energy Partners LP $125,000 4.20% 15/9/2021 128,803 0.00%Enterprise Products Operating LLC $125,000 3.50% 1/2/2022 128,712 0.00%Tech Data Corp. $125,000 4.95% 15/2/2027 128,689 0.00%Air Lease Corp. $125,000 3.75% 1/2/2022 128,610 0.00%Federal Home Loan Mortgage Corp. $125,248 3.00% 1/4/2035 128,600 0.00%ERP Operating LP $125,000 3.00% 15/4/2023 128,572 0.00%Air Lease Corp. $125,000 3.25% 1/3/2025 128,565 0.00%Georgia Power Co. $125,000 3.25% 30/3/2027 128,551 0.00%CME Group, Inc. $125,000 3.00% 15/9/2022 128,539 0.00%National Fuel Gas Co. $125,000 3.75% 1/3/2023 128,396 0.00%Federal National Mortgage Association $126,536 3.00% 1/8/2045 128,339 0.00%Flowers Foods, Inc. $125,000 3.50% 1/10/2026 128,315 0.00%MPLX LP $125,000 3.38% 15/3/2023 128,274 0.00%Jabil, Inc. $125,000 3.95% 12/1/2028 128,245 0.00%Nordstrom, Inc. $125,000 4.00% 15/10/2021 128,233 0.00%Interpublic Group of Cos, Inc. $125,000 3.75% 1/10/2021 128,216 0.00%Carlyle Holdings II Finance LLC $110,000 5.63% 30/3/2043 128,113 0.00%Duke University Health System, Inc. $115,000 3.92% 1/6/2047 128,097 0.00%AT&T, Inc. CA($)150,000 5.10% 25/11/2048 128,077 0.00%Federal Home Loan Mortgage Corp. $125,000 2.65% 25/8/2026 128,034 0.00%Covidien International Finance SA $125,000 3.20% 15/6/2022 127,999 0.00%CenterPoint Energy, Inc. $125,000 3.60% 1/11/2021 127,956 0.00%PNC Bank NA $125,000 2.95% 23/2/2025 127,824 0.00%
Vanguard Global Bond Index Fund
451
Maturity Fair Value % of Total Principal Coupon Date US Dollars ($) Net Assets
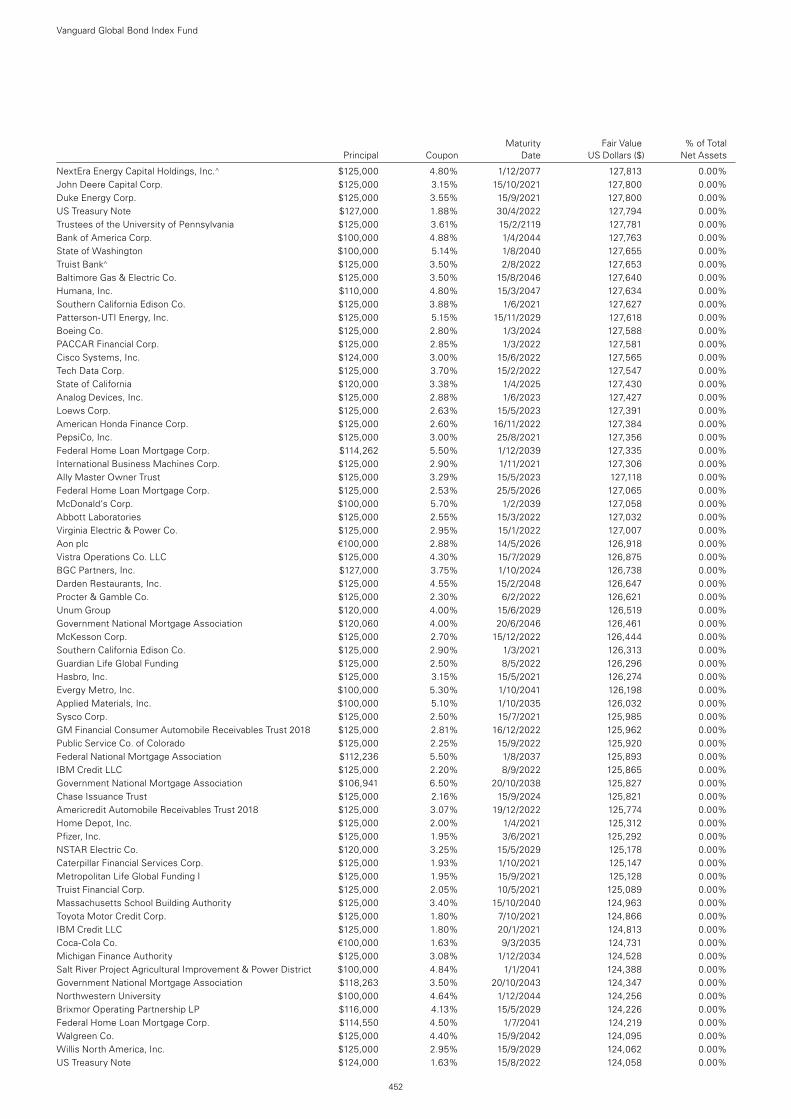
Maturity Fair Value % of Total Principal Coupon Date US Dollars ($) Net Assets
NextEra Energy Capital Holdings, Inc.^ $125,000 4.80% 1/12/2077 127,813 0.00%John Deere Capital Corp. $125,000 3.15% 15/10/2021 127,800 0.00%Duke Energy Corp. $125,000 3.55% 15/9/2021 127,800 0.00%US Treasury Note $127,000 1.88% 30/4/2022 127,794 0.00%Trustees of the University of Pennsylvania $125,000 3.61% 15/2/2119 127,781 0.00%Bank of America Corp. $100,000 4.88% 1/4/2044 127,763 0.00%State of Washington $100,000 5.14% 1/8/2040 127,655 0.00%Truist Bank^ $125,000 3.50% 2/8/2022 127,653 0.00%Baltimore Gas & Electric Co. $125,000 3.50% 15/8/2046 127,640 0.00%Humana, Inc. $110,000 4.80% 15/3/2047 127,634 0.00%Southern California Edison Co. $125,000 3.88% 1/6/2021 127,627 0.00%Patterson-UTI Energy, Inc. $125,000 5.15% 15/11/2029 127,618 0.00%Boeing Co. $125,000 2.80% 1/3/2024 127,588 0.00%PACCAR Financial Corp. $125,000 2.85% 1/3/2022 127,581 0.00%Cisco Systems, Inc. $124,000 3.00% 15/6/2022 127,565 0.00%Tech Data Corp. $125,000 3.70% 15/2/2022 127,547 0.00%State of California $120,000 3.38% 1/4/2025 127,430 0.00%Analog Devices, Inc. $125,000 2.88% 1/6/2023 127,427 0.00%Loews Corp. $125,000 2.63% 15/5/2023 127,391 0.00%American Honda Finance Corp. $125,000 2.60% 16/11/2022 127,384 0.00%PepsiCo, Inc. $125,000 3.00% 25/8/2021 127,356 0.00%Federal Home Loan Mortgage Corp. $114,262 5.50% 1/12/2039 127,335 0.00%International Business Machines Corp. $125,000 2.90% 1/11/2021 127,306 0.00%Ally Master Owner Trust $125,000 3.29% 15/5/2023 127,118 0.00%Federal Home Loan Mortgage Corp. $125,000 2.53% 25/5/2026 127,065 0.00%McDonald’s Corp. $100,000 5.70% 1/2/2039 127,058 0.00%Abbott Laboratories $125,000 2.55% 15/3/2022 127,032 0.00%Virginia Electric & Power Co. $125,000 2.95% 15/1/2022 127,007 0.00%Aon plc €100,000 2.88% 14/5/2026 126,918 0.00%Vistra Operations Co. LLC $125,000 4.30% 15/7/2029 126,875 0.00%BGC Partners, Inc. $127,000 3.75% 1/10/2024 126,738 0.00%Darden Restaurants, Inc. $125,000 4.55% 15/2/2048 126,647 0.00%Procter & Gamble Co. $125,000 2.30% 6/2/2022 126,621 0.00%Unum Group $120,000 4.00% 15/6/2029 126,519 0.00%Government National Mortgage Association $120,060 4.00% 20/6/2046 126,461 0.00%McKesson Corp. $125,000 2.70% 15/12/2022 126,444 0.00%Southern California Edison Co. $125,000 2.90% 1/3/2021 126,313 0.00%Guardian Life Global Funding $125,000 2.50% 8/5/2022 126,296 0.00%Hasbro, Inc. $125,000 3.15% 15/5/2021 126,274 0.00%Evergy Metro, Inc. $100,000 5.30% 1/10/2041 126,198 0.00%Applied Materials, Inc. $100,000 5.10% 1/10/2035 126,032 0.00%Sysco Corp. $125,000 2.50% 15/7/2021 125,985 0.00%GM Financial Consumer Automobile Receivables Trust 2018 $125,000 2.81% 16/12/2022 125,962 0.00%Public Service Co. of Colorado $125,000 2.25% 15/9/2022 125,920 0.00%Federal National Mortgage Association $112,236 5.50% 1/8/2037 125,893 0.00%IBM Credit LLC $125,000 2.20% 8/9/2022 125,865 0.00%Government National Mortgage Association $106,941 6.50% 20/10/2038 125,827 0.00%Chase Issuance Trust $125,000 2.16% 15/9/2024 125,821 0.00%Americredit Automobile Receivables Trust 2018 $125,000 3.07% 19/12/2022 125,774 0.00%Home Depot, Inc. $125,000 2.00% 1/4/2021 125,312 0.00%Pfizer, Inc. $125,000 1.95% 3/6/2021 125,292 0.00%NSTAR Electric Co. $120,000 3.25% 15/5/2029 125,178 0.00%Caterpillar Financial Services Corp. $125,000 1.93% 1/10/2021 125,147 0.00%Metropolitan Life Global Funding I $125,000 1.95% 15/9/2021 125,128 0.00%Truist Financial Corp. $125,000 2.05% 10/5/2021 125,089 0.00%Massachusetts School Building Authority $125,000 3.40% 15/10/2040 124,963 0.00%Toyota Motor Credit Corp. $125,000 1.80% 7/10/2021 124,866 0.00%IBM Credit LLC $125,000 1.80% 20/1/2021 124,813 0.00%Coca-Cola Co. €100,000 1.63% 9/3/2035 124,731 0.00%Michigan Finance Authority $125,000 3.08% 1/12/2034 124,528 0.00%Salt River Project Agricultural Improvement & Power District $100,000 4.84% 1/1/2041 124,388 0.00%Government National Mortgage Association $118,263 3.50% 20/10/2043 124,347 0.00%Northwestern University $100,000 4.64% 1/12/2044 124,256 0.00%Brixmor Operating Partnership LP $116,000 4.13% 15/5/2029 124,226 0.00%Federal Home Loan Mortgage Corp. $114,550 4.50% 1/7/2041 124,219 0.00%Walgreen Co. $125,000 4.40% 15/9/2042 124,095 0.00%Willis North America, Inc. $125,000 2.95% 15/9/2029 124,062 0.00%US Treasury Note $124,000 1.63% 15/8/2022 124,058 0.00%
Vanguard Global Bond Index Fund
452
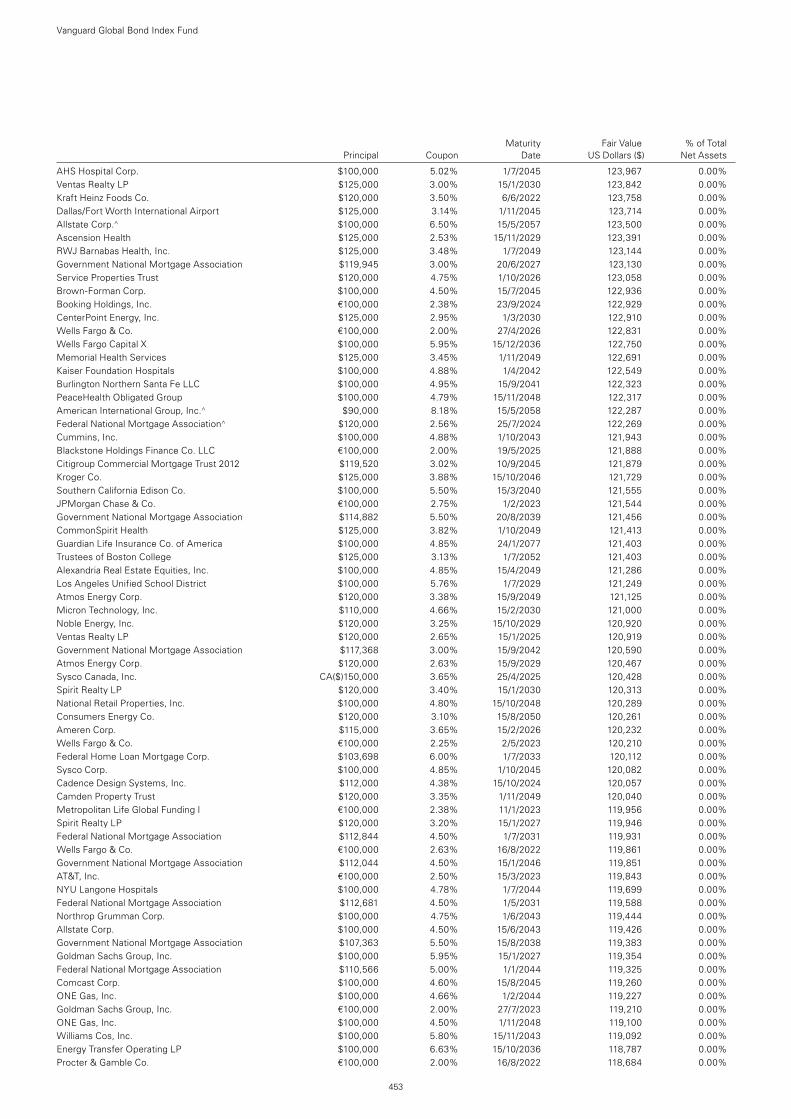
Maturity Fair Value % of Total Principal Coupon Date US Dollars ($) Net Assets
AHS Hospital Corp. $100,000 5.02% 1/7/2045 123,967 0.00%Ventas Realty LP $125,000 3.00% 15/1/2030 123,842 0.00%Kraft Heinz Foods Co. $120,000 3.50% 6/6/2022 123,758 0.00%Dallas/Fort Worth International Airport $125,000 3.14% 1/11/2045 123,714 0.00%Allstate Corp.^ $100,000 6.50% 15/5/2057 123,500 0.00%Ascension Health $125,000 2.53% 15/11/2029 123,391 0.00%RWJ Barnabas Health, Inc. $125,000 3.48% 1/7/2049 123,144 0.00%Government National Mortgage Association $119,945 3.00% 20/6/2027 123,130 0.00%Service Properties Trust $120,000 4.75% 1/10/2026 123,058 0.00%Brown-Forman Corp. $100,000 4.50% 15/7/2045 122,936 0.00%Booking Holdings, Inc. €100,000 2.38% 23/9/2024 122,929 0.00%CenterPoint Energy, Inc. $125,000 2.95% 1/3/2030 122,910 0.00%Wells Fargo & Co. €100,000 2.00% 27/4/2026 122,831 0.00%Wells Fargo Capital X $100,000 5.95% 15/12/2036 122,750 0.00%Memorial Health Services $125,000 3.45% 1/11/2049 122,691 0.00%Kaiser Foundation Hospitals $100,000 4.88% 1/4/2042 122,549 0.00%Burlington Northern Santa Fe LLC $100,000 4.95% 15/9/2041 122,323 0.00%PeaceHealth Obligated Group $100,000 4.79% 15/11/2048 122,317 0.00%American International Group, Inc.^ $90,000 8.18% 15/5/2058 122,287 0.00%Federal National Mortgage Association^ $120,000 2.56% 25/7/2024 122,269 0.00%Cummins, Inc. $100,000 4.88% 1/10/2043 121,943 0.00%Blackstone Holdings Finance Co. LLC €100,000 2.00% 19/5/2025 121,888 0.00%Citigroup Commercial Mortgage Trust 2012 $119,520 3.02% 10/9/2045 121,879 0.00%Kroger Co. $125,000 3.88% 15/10/2046 121,729 0.00%Southern California Edison Co. $100,000 5.50% 15/3/2040 121,555 0.00%JPMorgan Chase & Co. €100,000 2.75% 1/2/2023 121,544 0.00%Government National Mortgage Association $114,882 5.50% 20/8/2039 121,456 0.00%CommonSpirit Health $125,000 3.82% 1/10/2049 121,413 0.00%Guardian Life Insurance Co. of America $100,000 4.85% 24/1/2077 121,403 0.00%Trustees of Boston College $125,000 3.13% 1/7/2052 121,403 0.00%Alexandria Real Estate Equities, Inc. $100,000 4.85% 15/4/2049 121,286 0.00%Los Angeles Unified School District $100,000 5.76% 1/7/2029 121,249 0.00%Atmos Energy Corp. $120,000 3.38% 15/9/2049 121,125 0.00%Micron Technology, Inc. $110,000 4.66% 15/2/2030 121,000 0.00%Noble Energy, Inc. $120,000 3.25% 15/10/2029 120,920 0.00%Ventas Realty LP $120,000 2.65% 15/1/2025 120,919 0.00%Government National Mortgage Association $117,368 3.00% 15/9/2042 120,590 0.00%Atmos Energy Corp. $120,000 2.63% 15/9/2029 120,467 0.00%Sysco Canada, Inc. CA($)150,000 3.65% 25/4/2025 120,428 0.00%Spirit Realty LP $120,000 3.40% 15/1/2030 120,313 0.00%National Retail Properties, Inc. $100,000 4.80% 15/10/2048 120,289 0.00%Consumers Energy Co. $120,000 3.10% 15/8/2050 120,261 0.00%Ameren Corp. $115,000 3.65% 15/2/2026 120,232 0.00%Wells Fargo & Co. €100,000 2.25% 2/5/2023 120,210 0.00%Federal Home Loan Mortgage Corp. $103,698 6.00% 1/7/2033 120,112 0.00%Sysco Corp. $100,000 4.85% 1/10/2045 120,082 0.00%Cadence Design Systems, Inc. $112,000 4.38% 15/10/2024 120,057 0.00%Camden Property Trust $120,000 3.35% 1/11/2049 120,040 0.00%Metropolitan Life Global Funding I €100,000 2.38% 11/1/2023 119,956 0.00%Spirit Realty LP $120,000 3.20% 15/1/2027 119,946 0.00%Federal National Mortgage Association $112,844 4.50% 1/7/2031 119,931 0.00%Wells Fargo & Co. €100,000 2.63% 16/8/2022 119,861 0.00%Government National Mortgage Association $112,044 4.50% 15/1/2046 119,851 0.00%AT&T, Inc. €100,000 2.50% 15/3/2023 119,843 0.00%NYU Langone Hospitals $100,000 4.78% 1/7/2044 119,699 0.00%Federal National Mortgage Association $112,681 4.50% 1/5/2031 119,588 0.00%Northrop Grumman Corp. $100,000 4.75% 1/6/2043 119,444 0.00%Allstate Corp. $100,000 4.50% 15/6/2043 119,426 0.00%Government National Mortgage Association $107,363 5.50% 15/8/2038 119,383 0.00%Goldman Sachs Group, Inc. $100,000 5.95% 15/1/2027 119,354 0.00%Federal National Mortgage Association $110,566 5.00% 1/1/2044 119,325 0.00%Comcast Corp. $100,000 4.60% 15/8/2045 119,260 0.00%ONE Gas, Inc. $100,000 4.66% 1/2/2044 119,227 0.00%Goldman Sachs Group, Inc. €100,000 2.00% 27/7/2023 119,210 0.00%ONE Gas, Inc. $100,000 4.50% 1/11/2048 119,100 0.00%Williams Cos, Inc. $100,000 5.80% 15/11/2043 119,092 0.00%Energy Transfer Operating LP $100,000 6.63% 15/10/2036 118,787 0.00%Procter & Gamble Co. €100,000 2.00% 16/8/2022 118,684 0.00%
Vanguard Global Bond Index Fund
453
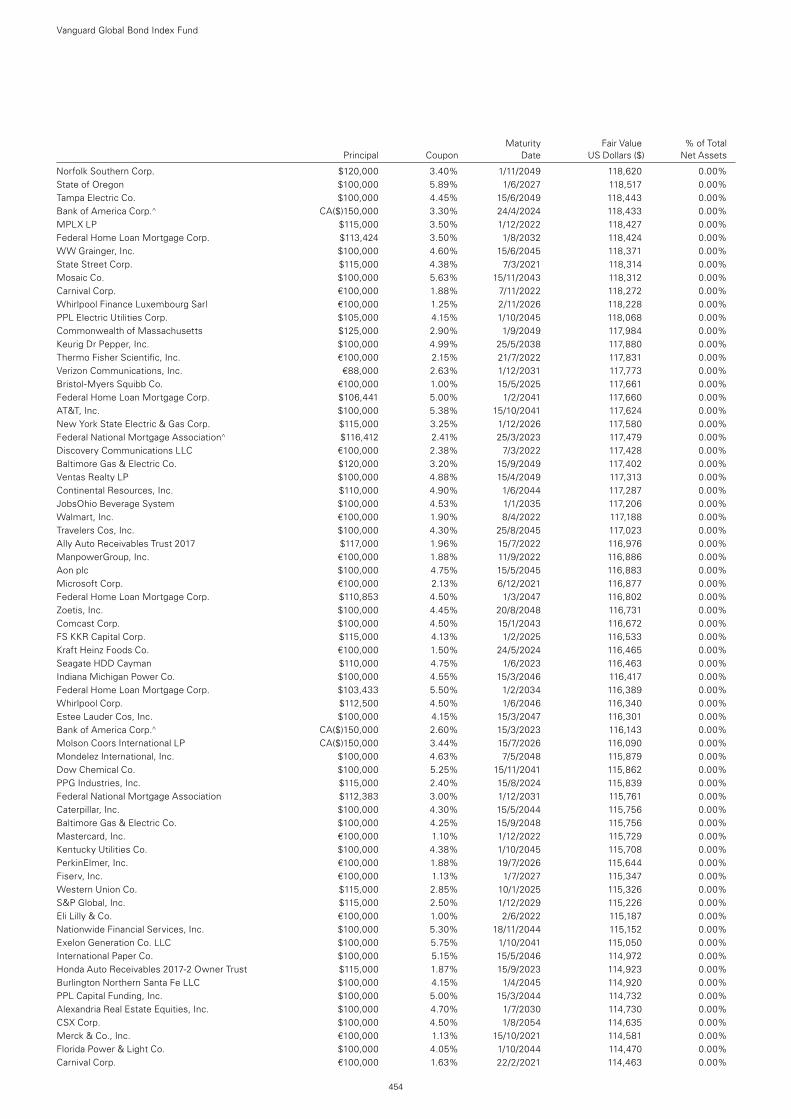
Maturity Fair Value % of Total Principal Coupon Date US Dollars ($) Net Assets
Norfolk Southern Corp. $120,000 3.40% 1/11/2049 118,620 0.00%State of Oregon $100,000 5.89% 1/6/2027 118,517 0.00%Tampa Electric Co. $100,000 4.45% 15/6/2049 118,443 0.00%Bank of America Corp.^ CA($)150,000 3.30% 24/4/2024 118,433 0.00%MPLX LP $115,000 3.50% 1/12/2022 118,427 0.00%Federal Home Loan Mortgage Corp. $113,424 3.50% 1/8/2032 118,424 0.00%WW Grainger, Inc. $100,000 4.60% 15/6/2045 118,371 0.00%State Street Corp. $115,000 4.38% 7/3/2021 118,314 0.00%Mosaic Co. $100,000 5.63% 15/11/2043 118,312 0.00%Carnival Corp. €100,000 1.88% 7/11/2022 118,272 0.00%Whirlpool Finance Luxembourg Sarl €100,000 1.25% 2/11/2026 118,228 0.00%PPL Electric Utilities Corp. $105,000 4.15% 1/10/2045 118,068 0.00%Commonwealth of Massachusetts $125,000 2.90% 1/9/2049 117,984 0.00%Keurig Dr Pepper, Inc. $100,000 4.99% 25/5/2038 117,880 0.00%Thermo Fisher Scientific, Inc. €100,000 2.15% 21/7/2022 117,831 0.00%Verizon Communications, Inc. €88,000 2.63% 1/12/2031 117,773 0.00%Bristol-Myers Squibb Co. €100,000 1.00% 15/5/2025 117,661 0.00%Federal Home Loan Mortgage Corp. $106,441 5.00% 1/2/2041 117,660 0.00%AT&T, Inc. $100,000 5.38% 15/10/2041 117,624 0.00%New York State Electric & Gas Corp. $115,000 3.25% 1/12/2026 117,580 0.00%Federal National Mortgage Association^ $116,412 2.41% 25/3/2023 117,479 0.00%Discovery Communications LLC €100,000 2.38% 7/3/2022 117,428 0.00%Baltimore Gas & Electric Co. $120,000 3.20% 15/9/2049 117,402 0.00%Ventas Realty LP $100,000 4.88% 15/4/2049 117,313 0.00%Continental Resources, Inc. $110,000 4.90% 1/6/2044 117,287 0.00%JobsOhio Beverage System $100,000 4.53% 1/1/2035 117,206 0.00%Walmart, Inc. €100,000 1.90% 8/4/2022 117,188 0.00%Travelers Cos, Inc. $100,000 4.30% 25/8/2045 117,023 0.00%Ally Auto Receivables Trust 2017 $117,000 1.96% 15/7/2022 116,976 0.00%ManpowerGroup, Inc. €100,000 1.88% 11/9/2022 116,886 0.00%Aon plc $100,000 4.75% 15/5/2045 116,883 0.00%Microsoft Corp. €100,000 2.13% 6/12/2021 116,877 0.00%Federal Home Loan Mortgage Corp. $110,853 4.50% 1/3/2047 116,802 0.00%Zoetis, Inc. $100,000 4.45% 20/8/2048 116,731 0.00%Comcast Corp. $100,000 4.50% 15/1/2043 116,672 0.00%FS KKR Capital Corp. $115,000 4.13% 1/2/2025 116,533 0.00%Kraft Heinz Foods Co. €100,000 1.50% 24/5/2024 116,465 0.00%Seagate HDD Cayman $110,000 4.75% 1/6/2023 116,463 0.00%Indiana Michigan Power Co. $100,000 4.55% 15/3/2046 116,417 0.00%Federal Home Loan Mortgage Corp. $103,433 5.50% 1/2/2034 116,389 0.00%Whirlpool Corp. $112,500 4.50% 1/6/2046 116,340 0.00%Estee Lauder Cos, Inc. $100,000 4.15% 15/3/2047 116,301 0.00%Bank of America Corp.^ CA($)150,000 2.60% 15/3/2023 116,143 0.00%Molson Coors International LP CA($)150,000 3.44% 15/7/2026 116,090 0.00%Mondelez International, Inc. $100,000 4.63% 7/5/2048 115,879 0.00%Dow Chemical Co. $100,000 5.25% 15/11/2041 115,862 0.00%PPG Industries, Inc. $115,000 2.40% 15/8/2024 115,839 0.00%Federal National Mortgage Association $112,383 3.00% 1/12/2031 115,761 0.00%Caterpillar, Inc. $100,000 4.30% 15/5/2044 115,756 0.00%Baltimore Gas & Electric Co. $100,000 4.25% 15/9/2048 115,756 0.00%Mastercard, Inc. €100,000 1.10% 1/12/2022 115,729 0.00%Kentucky Utilities Co. $100,000 4.38% 1/10/2045 115,708 0.00%PerkinElmer, Inc. €100,000 1.88% 19/7/2026 115,644 0.00%Fiserv, Inc. €100,000 1.13% 1/7/2027 115,347 0.00%Western Union Co. $115,000 2.85% 10/1/2025 115,326 0.00%S&P Global, Inc. $115,000 2.50% 1/12/2029 115,226 0.00%Eli Lilly & Co. €100,000 1.00% 2/6/2022 115,187 0.00%Nationwide Financial Services, Inc. $100,000 5.30% 18/11/2044 115,152 0.00%Exelon Generation Co. LLC $100,000 5.75% 1/10/2041 115,050 0.00%International Paper Co. $100,000 5.15% 15/5/2046 114,972 0.00%Honda Auto Receivables 2017-2 Owner Trust $115,000 1.87% 15/9/2023 114,923 0.00%Burlington Northern Santa Fe LLC $100,000 4.15% 1/4/2045 114,920 0.00%PPL Capital Funding, Inc. $100,000 5.00% 15/3/2044 114,732 0.00%Alexandria Real Estate Equities, Inc. $100,000 4.70% 1/7/2030 114,730 0.00%CSX Corp. $100,000 4.50% 1/8/2054 114,635 0.00%Merck & Co., Inc. €100,000 1.13% 15/10/2021 114,581 0.00%Florida Power & Light Co. $100,000 4.05% 1/10/2044 114,470 0.00%Carnival Corp. €100,000 1.63% 22/2/2021 114,463 0.00%
Vanguard Global Bond Index Fund
454

Maturity Fair Value % of Total Principal Coupon Date US Dollars ($) Net Assets
Brooklyn Union Gas Co. $100,000 4.50% 10/3/2046 114,338 0.00%Metropolitan Life Global Funding I €100,000 0.88% 20/1/2022 114,328 0.00%Altria Group, Inc. €100,000 1.00% 15/2/2023 114,186 0.00%Union Pacific Corp. $100,000 4.38% 10/9/2038 114,067 0.00%VF Corp. €100,000 0.63% 20/9/2023 113,976 0.00%Massachusetts Institute of Technology $115,000 2.99% 1/7/2050 113,863 0.00%University of Chicago $100,000 4.00% 1/10/2053 113,803 0.00%Advocate Health & Hospitals Corp. $100,000 4.27% 15/8/2048 113,771 0.00%Federal Home Loan Mortgage Corp. $103,929 4.50% 1/3/2039 113,763 0.00%Activision Blizzard, Inc. $100,000 4.50% 15/6/2047 113,599 0.00%Evergy Kansas Central, Inc. $110,000 3.10% 1/4/2027 113,583 0.00%Markel Corp. $100,000 5.00% 5/4/2046 113,352 0.00%Federal Home Loan Mortgage Corp.^ $100,000 3.99% 25/8/2033 113,175 0.00%Avista Corp. $100,000 4.35% 1/6/2048 113,099 0.00%Federal Home Loan Mortgage Corp. $108,761 4.50% 1/10/2024 113,044 0.00%International Flavors & Fragrances, Inc. €100,000 0.50% 25/9/2021 112,903 0.00%US Treasury Bond $86,000 6.13% 15/11/2027 112,902 0.00%Arizona Public Service Co. $100,000 4.25% 1/3/2049 112,865 0.00%Toledo Hospital $100,000 6.02% 15/11/2048 112,829 0.00%Magellan Midstream Partners LP $110,000 3.95% 1/3/2050 112,804 0.00%Mars, Inc. $100,000 3.95% 1/4/2044 112,799 0.00%Liberty Property LP $100,000 4.38% 1/2/2029 112,724 0.00%Federal National Mortgage Association $105,498 4.50% 1/10/2044 112,722 0.00%Fidelity National Information Services, Inc. €100,000 0.13% 21/5/2021 112,577 0.00%Nationwide Mutual Insurance Co. $100,000 4.95% 22/4/2044 112,427 0.00%Deere & Co. $100,000 3.90% 9/6/2042 112,424 0.00%Mayo Clinic $100,000 4.13% 15/11/2052 112,320 0.00%PECO Energy Co. $100,000 4.15% 1/10/2044 112,317 0.00%Indiana University Health, Inc. Obligated Group $100,000 3.97% 1/11/2048 112,253 0.00%Federal Home Loan Mortgage Corp. $107,846 3.50% 1/5/2026 112,219 0.00%Anthem, Inc. $100,000 4.63% 15/5/2042 112,162 0.00%Potomac Electric Power Co. $100,000 4.15% 15/3/2043 112,156 0.00%American Homes 4 Rent LP $100,000 4.90% 15/2/2029 112,033 0.00%Massachusetts Institute of Technology $100,000 3.96% 1/7/2038 111,983 0.00%Federal National Mortgage Association $98,747 6.00% 1/2/2034 111,965 0.00%Mastercard, Inc. $100,000 3.80% 21/11/2046 111,963 0.00%Southern California Gas Co. $100,000 3.95% 15/2/2050 111,956 0.00%ERP Operating LP $100,000 4.15% 1/12/2028 111,925 0.00%Snap-on, Inc. $100,000 4.10% 1/3/2048 111,726 0.00%Government National Mortgage Association $109,872 2.50% 20/6/2028 111,705 0.00%NYU Langone Hospitals $100,000 4.37% 1/7/2047 111,630 0.00%Federal Home Loan Mortgage Corp. $107,404 3.50% 1/9/2029 111,532 0.00%Evergy Kansas Central, Inc. $100,000 4.13% 1/3/2042 111,417 0.00%WW Grainger, Inc. $100,000 4.20% 15/5/2047 111,314 0.00%Evergy Kansas Central, Inc. $100,000 4.10% 1/4/2043 111,295 0.00%Federal Home Loan Mortgage Corp. $103,909 4.50% 1/5/2044 111,285 0.00%Cargill, Inc. $100,000 3.88% 23/5/2049 111,251 0.00%American International Group, Inc. $100,000 4.25% 15/3/2029 111,077 0.00%BANK 2018-BNK14^ $100,000 4.48% 15/9/2060 111,070 0.00%Kroger Co. $100,000 5.00% 15/4/2042 111,022 0.00%Gilead Sciences, Inc. $100,000 4.00% 1/9/2036 110,952 0.00%Digital Realty Trust LP $100,000 4.75% 1/10/2025 110,947 0.00%PacifiCorp $100,000 4.10% 1/2/2042 110,854 0.00%Federal National Mortgage Association $107,257 3.50% 1/5/2045 110,782 0.00%PPL Capital Funding, Inc. $100,000 4.70% 1/6/2043 110,771 0.00%Micron Technology, Inc. $100,000 4.98% 6/2/2026 110,750 0.00%Benchmark 2018-B6 Mortgage Trust $100,000 4.44% 10/10/2051 110,730 0.00%Starbucks Corp. $100,000 4.30% 15/6/2045 110,570 0.00%RPM International, Inc. $100,000 5.25% 1/6/2045 110,541 0.00%Microsoft Corp. $100,000 3.75% 1/5/2043 110,500 0.00%Southern California Gas Co. $100,000 4.13% 1/6/2048 110,446 0.00%Public Service Electric & Gas Co. $100,000 3.95% 1/5/2042 110,400 0.00%STORE Capital Corp. $100,000 4.63% 15/3/2029 110,353 0.00%Marvell Technology Group Ltd. $100,000 4.88% 22/6/2028 110,250 0.00%Noble Energy, Inc. $100,000 5.05% 15/11/2044 110,221 0.00%CHRISTUS Health $100,000 4.34% 1/7/2028 110,119 0.00%Florida Power & Light Co. $100,000 3.70% 1/12/2047 110,101 0.00%MetLife, Inc. $90,000 4.60% 13/5/2046 110,046 0.00%
Vanguard Global Bond Index Fund
455
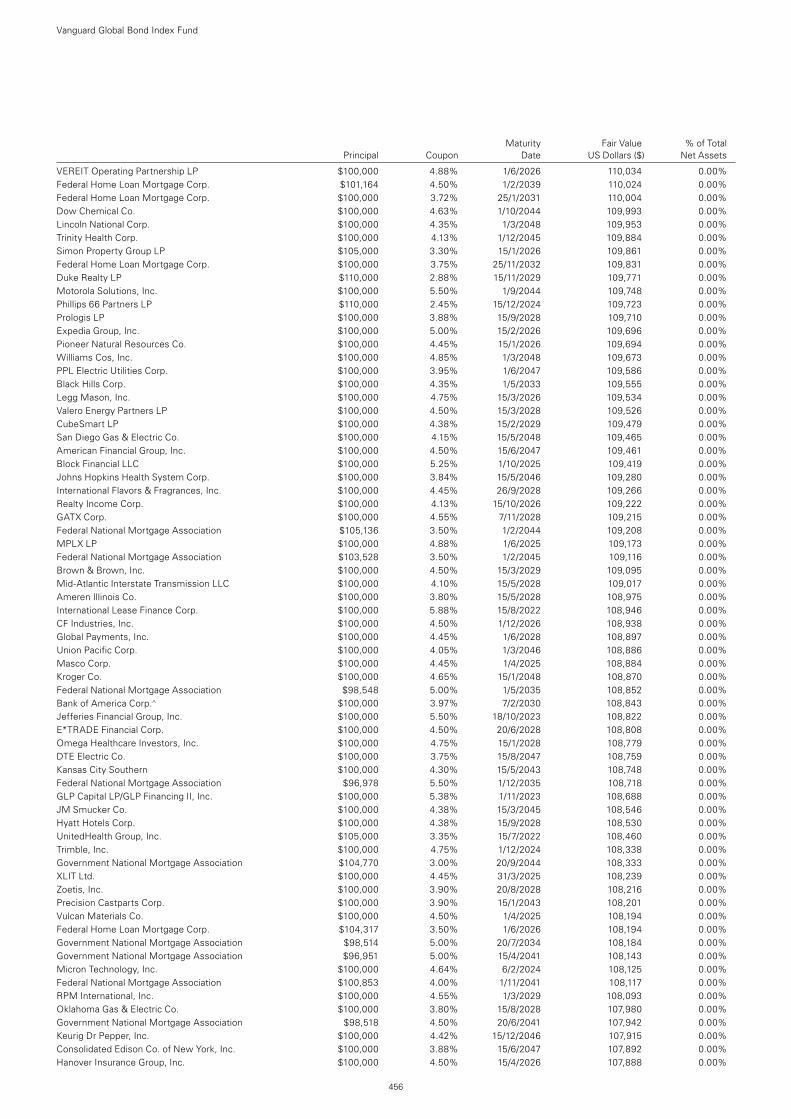
Maturity Fair Value % of Total Principal Coupon Date US Dollars ($) Net Assets
VEREIT Operating Partnership LP $100,000 4.88% 1/6/2026 110,034 0.00%Federal Home Loan Mortgage Corp. $101,164 4.50% 1/2/2039 110,024 0.00%Federal Home Loan Mortgage Corp. $100,000 3.72% 25/1/2031 110,004 0.00%Dow Chemical Co. $100,000 4.63% 1/10/2044 109,993 0.00%Lincoln National Corp. $100,000 4.35% 1/3/2048 109,953 0.00%Trinity Health Corp. $100,000 4.13% 1/12/2045 109,884 0.00%Simon Property Group LP $105,000 3.30% 15/1/2026 109,861 0.00%Federal Home Loan Mortgage Corp. $100,000 3.75% 25/11/2032 109,831 0.00%Duke Realty LP $110,000 2.88% 15/11/2029 109,771 0.00%Motorola Solutions, Inc. $100,000 5.50% 1/9/2044 109,748 0.00%Phillips 66 Partners LP $110,000 2.45% 15/12/2024 109,723 0.00%Prologis LP $100,000 3.88% 15/9/2028 109,710 0.00%Expedia Group, Inc. $100,000 5.00% 15/2/2026 109,696 0.00%Pioneer Natural Resources Co. $100,000 4.45% 15/1/2026 109,694 0.00%Williams Cos, Inc. $100,000 4.85% 1/3/2048 109,673 0.00%PPL Electric Utilities Corp. $100,000 3.95% 1/6/2047 109,586 0.00%Black Hills Corp. $100,000 4.35% 1/5/2033 109,555 0.00%Legg Mason, Inc. $100,000 4.75% 15/3/2026 109,534 0.00%Valero Energy Partners LP $100,000 4.50% 15/3/2028 109,526 0.00%CubeSmart LP $100,000 4.38% 15/2/2029 109,479 0.00%San Diego Gas & Electric Co. $100,000 4.15% 15/5/2048 109,465 0.00%American Financial Group, Inc. $100,000 4.50% 15/6/2047 109,461 0.00%Block Financial LLC $100,000 5.25% 1/10/2025 109,419 0.00%Johns Hopkins Health System Corp. $100,000 3.84% 15/5/2046 109,280 0.00%International Flavors & Fragrances, Inc. $100,000 4.45% 26/9/2028 109,266 0.00%Realty Income Corp. $100,000 4.13% 15/10/2026 109,222 0.00%GATX Corp. $100,000 4.55% 7/11/2028 109,215 0.00%Federal National Mortgage Association $105,136 3.50% 1/2/2044 109,208 0.00%MPLX LP $100,000 4.88% 1/6/2025 109,173 0.00%Federal National Mortgage Association $103,528 3.50% 1/2/2045 109,116 0.00%Brown & Brown, Inc. $100,000 4.50% 15/3/2029 109,095 0.00%Mid-Atlantic Interstate Transmission LLC $100,000 4.10% 15/5/2028 109,017 0.00%Ameren Illinois Co. $100,000 3.80% 15/5/2028 108,975 0.00%International Lease Finance Corp. $100,000 5.88% 15/8/2022 108,946 0.00%CF Industries, Inc. $100,000 4.50% 1/12/2026 108,938 0.00%Global Payments, Inc. $100,000 4.45% 1/6/2028 108,897 0.00%Union Pacific Corp. $100,000 4.05% 1/3/2046 108,886 0.00%Masco Corp. $100,000 4.45% 1/4/2025 108,884 0.00%Kroger Co. $100,000 4.65% 15/1/2048 108,870 0.00%Federal National Mortgage Association $98,548 5.00% 1/5/2035 108,852 0.00%Bank of America Corp.^ $100,000 3.97% 7/2/2030 108,843 0.00%Jefferies Financial Group, Inc. $100,000 5.50% 18/10/2023 108,822 0.00%E*TRADE Financial Corp. $100,000 4.50% 20/6/2028 108,808 0.00%Omega Healthcare Investors, Inc. $100,000 4.75% 15/1/2028 108,779 0.00%DTE Electric Co. $100,000 3.75% 15/8/2047 108,759 0.00%Kansas City Southern $100,000 4.30% 15/5/2043 108,748 0.00%Federal National Mortgage Association $96,978 5.50% 1/12/2035 108,718 0.00%GLP Capital LP/GLP Financing II, Inc. $100,000 5.38% 1/11/2023 108,688 0.00%JM Smucker Co. $100,000 4.38% 15/3/2045 108,546 0.00%Hyatt Hotels Corp. $100,000 4.38% 15/9/2028 108,530 0.00%UnitedHealth Group, Inc. $105,000 3.35% 15/7/2022 108,460 0.00%Trimble, Inc. $100,000 4.75% 1/12/2024 108,338 0.00%Government National Mortgage Association $104,770 3.00% 20/9/2044 108,333 0.00%XLIT Ltd. $100,000 4.45% 31/3/2025 108,239 0.00%Zoetis, Inc. $100,000 3.90% 20/8/2028 108,216 0.00%Precision Castparts Corp. $100,000 3.90% 15/1/2043 108,201 0.00%Vulcan Materials Co. $100,000 4.50% 1/4/2025 108,194 0.00%Federal Home Loan Mortgage Corp. $104,317 3.50% 1/6/2026 108,194 0.00%Government National Mortgage Association $98,514 5.00% 20/7/2034 108,184 0.00%Government National Mortgage Association $96,951 5.00% 15/4/2041 108,143 0.00%Micron Technology, Inc. $100,000 4.64% 6/2/2024 108,125 0.00%Federal National Mortgage Association $100,853 4.00% 1/11/2041 108,117 0.00%RPM International, Inc. $100,000 4.55% 1/3/2029 108,093 0.00%Oklahoma Gas & Electric Co. $100,000 3.80% 15/8/2028 107,980 0.00%Government National Mortgage Association $98,518 4.50% 20/6/2041 107,942 0.00%Keurig Dr Pepper, Inc. $100,000 4.42% 15/12/2046 107,915 0.00%Consolidated Edison Co. of New York, Inc. $100,000 3.88% 15/6/2047 107,892 0.00%Hanover Insurance Group, Inc. $100,000 4.50% 15/4/2026 107,888 0.00%
Vanguard Global Bond Index Fund
456
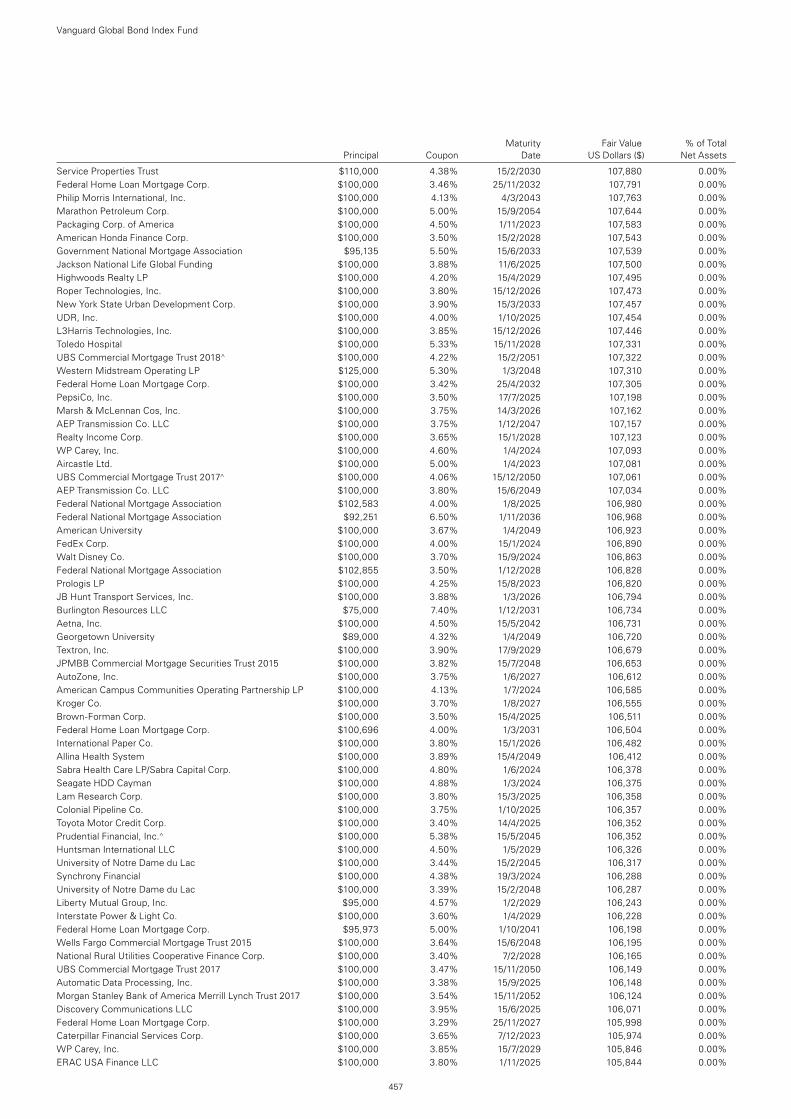
Maturity Fair Value % of Total Principal Coupon Date US Dollars ($) Net Assets
Service Properties Trust $110,000 4.38% 15/2/2030 107,880 0.00%Federal Home Loan Mortgage Corp. $100,000 3.46% 25/11/2032 107,791 0.00%Philip Morris International, Inc. $100,000 4.13% 4/3/2043 107,763 0.00%Marathon Petroleum Corp. $100,000 5.00% 15/9/2054 107,644 0.00%Packaging Corp. of America $100,000 4.50% 1/11/2023 107,583 0.00%American Honda Finance Corp. $100,000 3.50% 15/2/2028 107,543 0.00%Government National Mortgage Association $95,135 5.50% 15/6/2033 107,539 0.00%Jackson National Life Global Funding $100,000 3.88% 11/6/2025 107,500 0.00%Highwoods Realty LP $100,000 4.20% 15/4/2029 107,495 0.00%Roper Technologies, Inc. $100,000 3.80% 15/12/2026 107,473 0.00%New York State Urban Development Corp. $100,000 3.90% 15/3/2033 107,457 0.00%UDR, Inc. $100,000 4.00% 1/10/2025 107,454 0.00%L3Harris Technologies, Inc. $100,000 3.85% 15/12/2026 107,446 0.00%Toledo Hospital $100,000 5.33% 15/11/2028 107,331 0.00%UBS Commercial Mortgage Trust 2018^ $100,000 4.22% 15/2/2051 107,322 0.00%Western Midstream Operating LP $125,000 5.30% 1/3/2048 107,310 0.00%Federal Home Loan Mortgage Corp. $100,000 3.42% 25/4/2032 107,305 0.00%PepsiCo, Inc. $100,000 3.50% 17/7/2025 107,198 0.00%Marsh & McLennan Cos, Inc. $100,000 3.75% 14/3/2026 107,162 0.00%AEP Transmission Co. LLC $100,000 3.75% 1/12/2047 107,157 0.00%Realty Income Corp. $100,000 3.65% 15/1/2028 107,123 0.00%WP Carey, Inc. $100,000 4.60% 1/4/2024 107,093 0.00%Aircastle Ltd. $100,000 5.00% 1/4/2023 107,081 0.00%UBS Commercial Mortgage Trust 2017^ $100,000 4.06% 15/12/2050 107,061 0.00%AEP Transmission Co. LLC $100,000 3.80% 15/6/2049 107,034 0.00%Federal National Mortgage Association $102,583 4.00% 1/8/2025 106,980 0.00%Federal National Mortgage Association $92,251 6.50% 1/11/2036 106,968 0.00%American University $100,000 3.67% 1/4/2049 106,923 0.00%FedEx Corp. $100,000 4.00% 15/1/2024 106,890 0.00%Walt Disney Co. $100,000 3.70% 15/9/2024 106,863 0.00%Federal National Mortgage Association $102,855 3.50% 1/12/2028 106,828 0.00%Prologis LP $100,000 4.25% 15/8/2023 106,820 0.00%JB Hunt Transport Services, Inc. $100,000 3.88% 1/3/2026 106,794 0.00%Burlington Resources LLC $75,000 7.40% 1/12/2031 106,734 0.00%Aetna, Inc. $100,000 4.50% 15/5/2042 106,731 0.00%Georgetown University $89,000 4.32% 1/4/2049 106,720 0.00%Textron, Inc. $100,000 3.90% 17/9/2029 106,679 0.00%JPMBB Commercial Mortgage Securities Trust 2015 $100,000 3.82% 15/7/2048 106,653 0.00%AutoZone, Inc. $100,000 3.75% 1/6/2027 106,612 0.00%American Campus Communities Operating Partnership LP $100,000 4.13% 1/7/2024 106,585 0.00%Kroger Co. $100,000 3.70% 1/8/2027 106,555 0.00%Brown-Forman Corp. $100,000 3.50% 15/4/2025 106,511 0.00%Federal Home Loan Mortgage Corp. $100,696 4.00% 1/3/2031 106,504 0.00%International Paper Co. $100,000 3.80% 15/1/2026 106,482 0.00%Allina Health System $100,000 3.89% 15/4/2049 106,412 0.00%Sabra Health Care LP/Sabra Capital Corp. $100,000 4.80% 1/6/2024 106,378 0.00%Seagate HDD Cayman $100,000 4.88% 1/3/2024 106,375 0.00%Lam Research Corp. $100,000 3.80% 15/3/2025 106,358 0.00%Colonial Pipeline Co. $100,000 3.75% 1/10/2025 106,357 0.00%Toyota Motor Credit Corp. $100,000 3.40% 14/4/2025 106,352 0.00%Prudential Financial, Inc.^ $100,000 5.38% 15/5/2045 106,352 0.00%Huntsman International LLC $100,000 4.50% 1/5/2029 106,326 0.00%University of Notre Dame du Lac $100,000 3.44% 15/2/2045 106,317 0.00%Synchrony Financial $100,000 4.38% 19/3/2024 106,288 0.00%University of Notre Dame du Lac $100,000 3.39% 15/2/2048 106,287 0.00%Liberty Mutual Group, Inc. $95,000 4.57% 1/2/2029 106,243 0.00%Interstate Power & Light Co. $100,000 3.60% 1/4/2029 106,228 0.00%Federal Home Loan Mortgage Corp. $95,973 5.00% 1/10/2041 106,198 0.00%Wells Fargo Commercial Mortgage Trust 2015 $100,000 3.64% 15/6/2048 106,195 0.00%National Rural Utilities Cooperative Finance Corp. $100,000 3.40% 7/2/2028 106,165 0.00%UBS Commercial Mortgage Trust 2017 $100,000 3.47% 15/11/2050 106,149 0.00%Automatic Data Processing, Inc. $100,000 3.38% 15/9/2025 106,148 0.00%Morgan Stanley Bank of America Merrill Lynch Trust 2017 $100,000 3.54% 15/11/2052 106,124 0.00%Discovery Communications LLC $100,000 3.95% 15/6/2025 106,071 0.00%Federal Home Loan Mortgage Corp. $100,000 3.29% 25/11/2027 105,998 0.00%Caterpillar Financial Services Corp. $100,000 3.65% 7/12/2023 105,974 0.00%WP Carey, Inc. $100,000 3.85% 15/7/2029 105,846 0.00%ERAC USA Finance LLC $100,000 3.80% 1/11/2025 105,844 0.00%
Vanguard Global Bond Index Fund
457
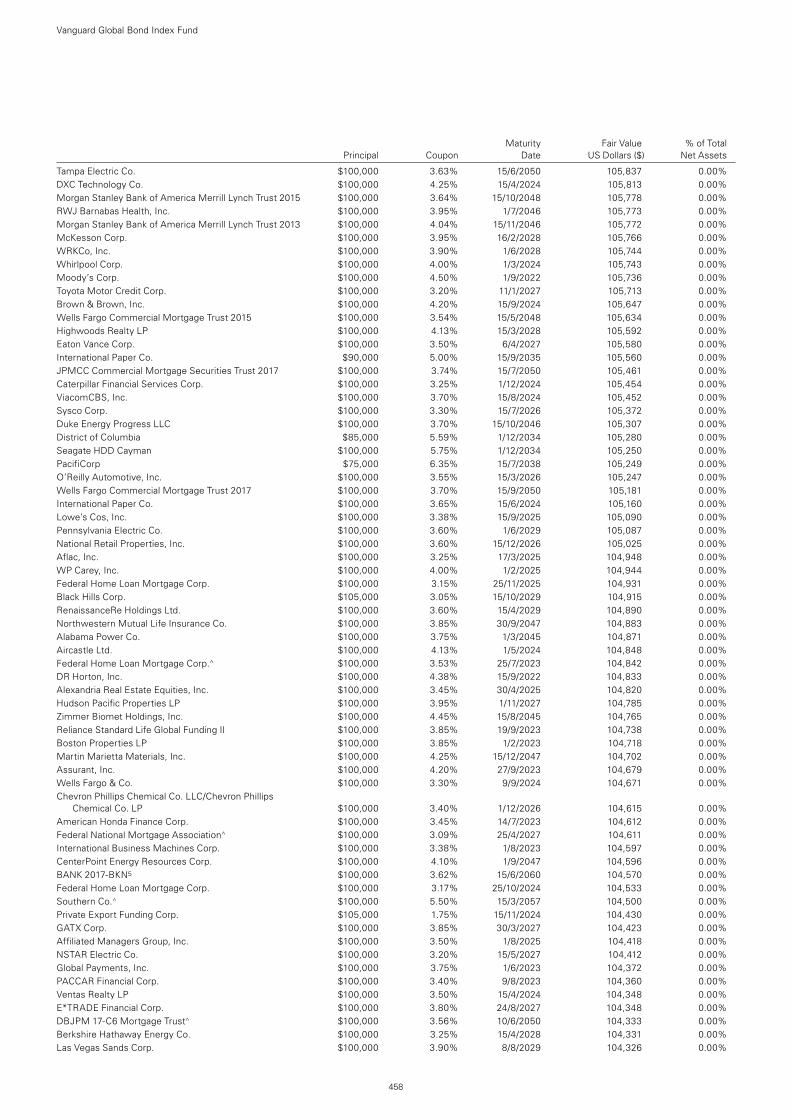
Maturity Fair Value % of Total Principal Coupon Date US Dollars ($) Net Assets
Tampa Electric Co. $100,000 3.63% 15/6/2050 105,837 0.00%DXC Technology Co. $100,000 4.25% 15/4/2024 105,813 0.00%Morgan Stanley Bank of America Merrill Lynch Trust 2015 $100,000 3.64% 15/10/2048 105,778 0.00%RWJ Barnabas Health, Inc. $100,000 3.95% 1/7/2046 105,773 0.00%Morgan Stanley Bank of America Merrill Lynch Trust 2013 $100,000 4.04% 15/11/2046 105,772 0.00%McKesson Corp. $100,000 3.95% 16/2/2028 105,766 0.00%WRKCo, Inc. $100,000 3.90% 1/6/2028 105,744 0.00%Whirlpool Corp. $100,000 4.00% 1/3/2024 105,743 0.00%Moody’s Corp. $100,000 4.50% 1/9/2022 105,736 0.00%Toyota Motor Credit Corp. $100,000 3.20% 11/1/2027 105,713 0.00%Brown & Brown, Inc. $100,000 4.20% 15/9/2024 105,647 0.00%Wells Fargo Commercial Mortgage Trust 2015 $100,000 3.54% 15/5/2048 105,634 0.00%Highwoods Realty LP $100,000 4.13% 15/3/2028 105,592 0.00%Eaton Vance Corp. $100,000 3.50% 6/4/2027 105,580 0.00%International Paper Co. $90,000 5.00% 15/9/2035 105,560 0.00%JPMCC Commercial Mortgage Securities Trust 2017 $100,000 3.74% 15/7/2050 105,461 0.00%Caterpillar Financial Services Corp. $100,000 3.25% 1/12/2024 105,454 0.00%ViacomCBS, Inc. $100,000 3.70% 15/8/2024 105,452 0.00%Sysco Corp. $100,000 3.30% 15/7/2026 105,372 0.00%Duke Energy Progress LLC $100,000 3.70% 15/10/2046 105,307 0.00%District of Columbia $85,000 5.59% 1/12/2034 105,280 0.00%Seagate HDD Cayman $100,000 5.75% 1/12/2034 105,250 0.00%PacifiCorp $75,000 6.35% 15/7/2038 105,249 0.00%O’Reilly Automotive, Inc. $100,000 3.55% 15/3/2026 105,247 0.00%Wells Fargo Commercial Mortgage Trust 2017 $100,000 3.70% 15/9/2050 105,181 0.00%International Paper Co. $100,000 3.65% 15/6/2024 105,160 0.00%Lowe’s Cos, Inc. $100,000 3.38% 15/9/2025 105,090 0.00%Pennsylvania Electric Co. $100,000 3.60% 1/6/2029 105,087 0.00%National Retail Properties, Inc. $100,000 3.60% 15/12/2026 105,025 0.00%Aflac, Inc. $100,000 3.25% 17/3/2025 104,948 0.00%WP Carey, Inc. $100,000 4.00% 1/2/2025 104,944 0.00%Federal Home Loan Mortgage Corp. $100,000 3.15% 25/11/2025 104,931 0.00%Black Hills Corp. $105,000 3.05% 15/10/2029 104,915 0.00%RenaissanceRe Holdings Ltd. $100,000 3.60% 15/4/2029 104,890 0.00%Northwestern Mutual Life Insurance Co. $100,000 3.85% 30/9/2047 104,883 0.00%Alabama Power Co. $100,000 3.75% 1/3/2045 104,871 0.00%Aircastle Ltd. $100,000 4.13% 1/5/2024 104,848 0.00%Federal Home Loan Mortgage Corp.^ $100,000 3.53% 25/7/2023 104,842 0.00%DR Horton, Inc. $100,000 4.38% 15/9/2022 104,833 0.00%Alexandria Real Estate Equities, Inc. $100,000 3.45% 30/4/2025 104,820 0.00%Hudson Pacific Properties LP $100,000 3.95% 1/11/2027 104,785 0.00%Zimmer Biomet Holdings, Inc. $100,000 4.45% 15/8/2045 104,765 0.00%Reliance Standard Life Global Funding II $100,000 3.85% 19/9/2023 104,738 0.00%Boston Properties LP $100,000 3.85% 1/2/2023 104,718 0.00%Martin Marietta Materials, Inc. $100,000 4.25% 15/12/2047 104,702 0.00%Assurant, Inc. $100,000 4.20% 27/9/2023 104,679 0.00%Wells Fargo & Co. $100,000 3.30% 9/9/2024 104,671 0.00%Chevron Phillips Chemical Co. LLC/Chevron Phillips
Chemical Co. LP $100,000 3.40% 1/12/2026 104,615 0.00%American Honda Finance Corp. $100,000 3.45% 14/7/2023 104,612 0.00%Federal National Mortgage Association^ $100,000 3.09% 25/4/2027 104,611 0.00%International Business Machines Corp. $100,000 3.38% 1/8/2023 104,597 0.00%CenterPoint Energy Resources Corp. $100,000 4.10% 1/9/2047 104,596 0.00%BANK 2017-BKN5 $100,000 3.62% 15/6/2060 104,570 0.00%Federal Home Loan Mortgage Corp. $100,000 3.17% 25/10/2024 104,533 0.00%Southern Co.^ $100,000 5.50% 15/3/2057 104,500 0.00%Private Export Funding Corp. $105,000 1.75% 15/11/2024 104,430 0.00%GATX Corp. $100,000 3.85% 30/3/2027 104,423 0.00%Affiliated Managers Group, Inc. $100,000 3.50% 1/8/2025 104,418 0.00%NSTAR Electric Co. $100,000 3.20% 15/5/2027 104,412 0.00%Global Payments, Inc. $100,000 3.75% 1/6/2023 104,372 0.00%PACCAR Financial Corp. $100,000 3.40% 9/8/2023 104,360 0.00%Ventas Realty LP $100,000 3.50% 15/4/2024 104,348 0.00%E*TRADE Financial Corp. $100,000 3.80% 24/8/2027 104,348 0.00%DBJPM 17-C6 Mortgage Trust^ $100,000 3.56% 10/6/2050 104,333 0.00%Berkshire Hathaway Energy Co. $100,000 3.25% 15/4/2028 104,331 0.00%Las Vegas Sands Corp. $100,000 3.90% 8/8/2029 104,326 0.00%
Vanguard Global Bond Index Fund
458
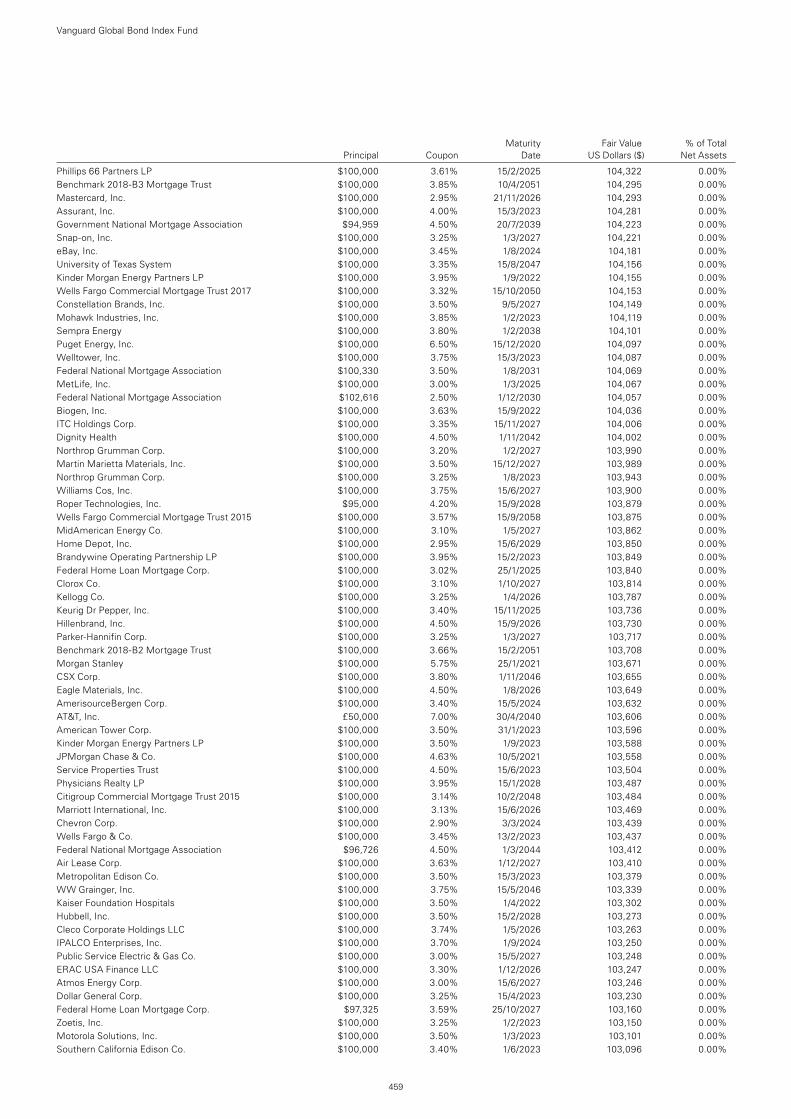
Maturity Fair Value % of Total Principal Coupon Date US Dollars ($) Net Assets
Phillips 66 Partners LP $100,000 3.61% 15/2/2025 104,322 0.00%Benchmark 2018-B3 Mortgage Trust $100,000 3.85% 10/4/2051 104,295 0.00%Mastercard, Inc. $100,000 2.95% 21/11/2026 104,293 0.00%Assurant, Inc. $100,000 4.00% 15/3/2023 104,281 0.00%Government National Mortgage Association $94,959 4.50% 20/7/2039 104,223 0.00%Snap-on, Inc. $100,000 3.25% 1/3/2027 104,221 0.00%eBay, Inc. $100,000 3.45% 1/8/2024 104,181 0.00%University of Texas System $100,000 3.35% 15/8/2047 104,156 0.00%Kinder Morgan Energy Partners LP $100,000 3.95% 1/9/2022 104,155 0.00%Wells Fargo Commercial Mortgage Trust 2017 $100,000 3.32% 15/10/2050 104,153 0.00%Constellation Brands, Inc. $100,000 3.50% 9/5/2027 104,149 0.00%Mohawk Industries, Inc. $100,000 3.85% 1/2/2023 104,119 0.00%Sempra Energy $100,000 3.80% 1/2/2038 104,101 0.00%Puget Energy, Inc. $100,000 6.50% 15/12/2020 104,097 0.00%Welltower, Inc. $100,000 3.75% 15/3/2023 104,087 0.00%Federal National Mortgage Association $100,330 3.50% 1/8/2031 104,069 0.00%MetLife, Inc. $100,000 3.00% 1/3/2025 104,067 0.00%Federal National Mortgage Association $102,616 2.50% 1/12/2030 104,057 0.00%Biogen, Inc. $100,000 3.63% 15/9/2022 104,036 0.00%ITC Holdings Corp. $100,000 3.35% 15/11/2027 104,006 0.00%Dignity Health $100,000 4.50% 1/11/2042 104,002 0.00%Northrop Grumman Corp. $100,000 3.20% 1/2/2027 103,990 0.00%Martin Marietta Materials, Inc. $100,000 3.50% 15/12/2027 103,989 0.00%Northrop Grumman Corp. $100,000 3.25% 1/8/2023 103,943 0.00%Williams Cos, Inc. $100,000 3.75% 15/6/2027 103,900 0.00%Roper Technologies, Inc. $95,000 4.20% 15/9/2028 103,879 0.00%Wells Fargo Commercial Mortgage Trust 2015 $100,000 3.57% 15/9/2058 103,875 0.00%MidAmerican Energy Co. $100,000 3.10% 1/5/2027 103,862 0.00%Home Depot, Inc. $100,000 2.95% 15/6/2029 103,850 0.00%Brandywine Operating Partnership LP $100,000 3.95% 15/2/2023 103,849 0.00%Federal Home Loan Mortgage Corp. $100,000 3.02% 25/1/2025 103,840 0.00%Clorox Co. $100,000 3.10% 1/10/2027 103,814 0.00%Kellogg Co. $100,000 3.25% 1/4/2026 103,787 0.00%Keurig Dr Pepper, Inc. $100,000 3.40% 15/11/2025 103,736 0.00%Hillenbrand, Inc. $100,000 4.50% 15/9/2026 103,730 0.00%Parker-Hannifin Corp. $100,000 3.25% 1/3/2027 103,717 0.00%Benchmark 2018-B2 Mortgage Trust $100,000 3.66% 15/2/2051 103,708 0.00%Morgan Stanley $100,000 5.75% 25/1/2021 103,671 0.00%CSX Corp. $100,000 3.80% 1/11/2046 103,655 0.00%Eagle Materials, Inc. $100,000 4.50% 1/8/2026 103,649 0.00%AmerisourceBergen Corp. $100,000 3.40% 15/5/2024 103,632 0.00%AT&T, Inc. £50,000 7.00% 30/4/2040 103,606 0.00%American Tower Corp. $100,000 3.50% 31/1/2023 103,596 0.00%Kinder Morgan Energy Partners LP $100,000 3.50% 1/9/2023 103,588 0.00%JPMorgan Chase & Co. $100,000 4.63% 10/5/2021 103,558 0.00%Service Properties Trust $100,000 4.50% 15/6/2023 103,504 0.00%Physicians Realty LP $100,000 3.95% 15/1/2028 103,487 0.00%Citigroup Commercial Mortgage Trust 2015 $100,000 3.14% 10/2/2048 103,484 0.00%Marriott International, Inc. $100,000 3.13% 15/6/2026 103,469 0.00%Chevron Corp. $100,000 2.90% 3/3/2024 103,439 0.00%Wells Fargo & Co. $100,000 3.45% 13/2/2023 103,437 0.00%Federal National Mortgage Association $96,726 4.50% 1/3/2044 103,412 0.00%Air Lease Corp. $100,000 3.63% 1/12/2027 103,410 0.00%Metropolitan Edison Co. $100,000 3.50% 15/3/2023 103,379 0.00%WW Grainger, Inc. $100,000 3.75% 15/5/2046 103,339 0.00%Kaiser Foundation Hospitals $100,000 3.50% 1/4/2022 103,302 0.00%Hubbell, Inc. $100,000 3.50% 15/2/2028 103,273 0.00%Cleco Corporate Holdings LLC $100,000 3.74% 1/5/2026 103,263 0.00%IPALCO Enterprises, Inc. $100,000 3.70% 1/9/2024 103,250 0.00%Public Service Electric & Gas Co. $100,000 3.00% 15/5/2027 103,248 0.00%ERAC USA Finance LLC $100,000 3.30% 1/12/2026 103,247 0.00%Atmos Energy Corp. $100,000 3.00% 15/6/2027 103,246 0.00%Dollar General Corp. $100,000 3.25% 15/4/2023 103,230 0.00%Federal Home Loan Mortgage Corp. $97,325 3.59% 25/10/2027 103,160 0.00%Zoetis, Inc. $100,000 3.25% 1/2/2023 103,150 0.00%Motorola Solutions, Inc. $100,000 3.50% 1/3/2023 103,101 0.00%Southern California Edison Co. $100,000 3.40% 1/6/2023 103,096 0.00%
Vanguard Global Bond Index Fund
459
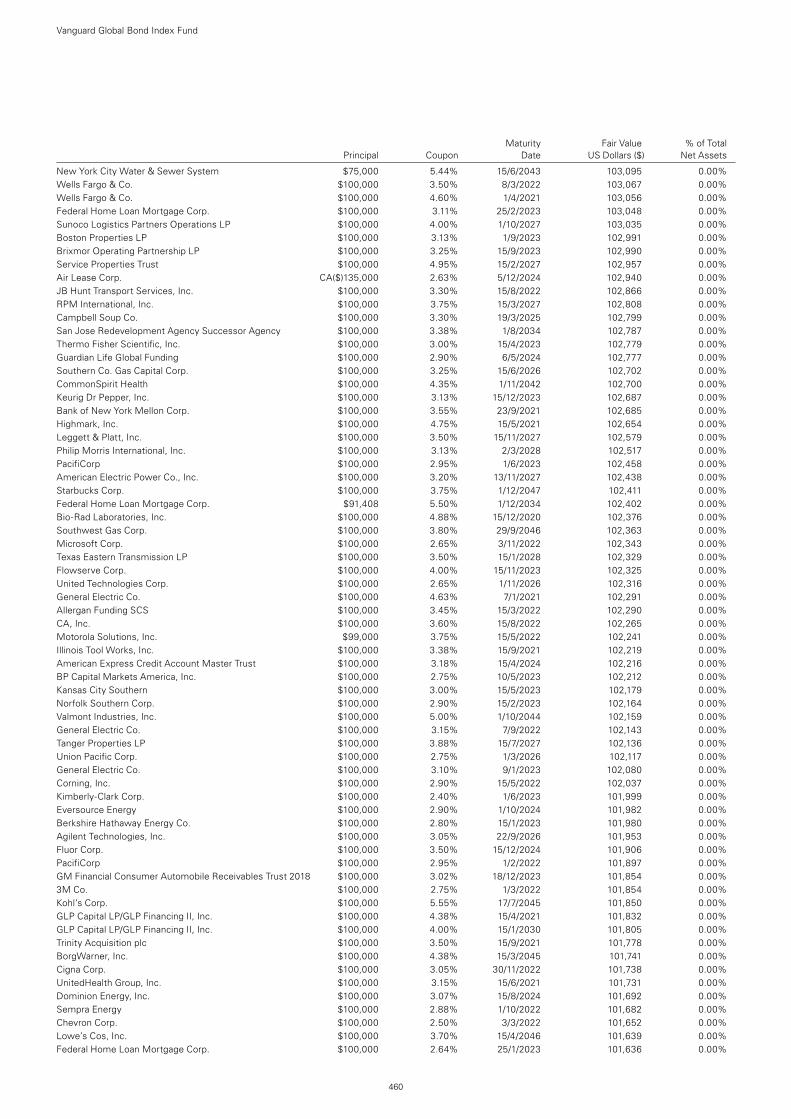
Maturity Fair Value % of Total Principal Coupon Date US Dollars ($) Net Assets
New York City Water & Sewer System $75,000 5.44% 15/6/2043 103,095 0.00%Wells Fargo & Co. $100,000 3.50% 8/3/2022 103,067 0.00%Wells Fargo & Co. $100,000 4.60% 1/4/2021 103,056 0.00%Federal Home Loan Mortgage Corp. $100,000 3.11% 25/2/2023 103,048 0.00%Sunoco Logistics Partners Operations LP $100,000 4.00% 1/10/2027 103,035 0.00%Boston Properties LP $100,000 3.13% 1/9/2023 102,991 0.00%Brixmor Operating Partnership LP $100,000 3.25% 15/9/2023 102,990 0.00%Service Properties Trust $100,000 4.95% 15/2/2027 102,957 0.00%Air Lease Corp. CA($)135,000 2.63% 5/12/2024 102,940 0.00%JB Hunt Transport Services, Inc. $100,000 3.30% 15/8/2022 102,866 0.00%RPM International, Inc. $100,000 3.75% 15/3/2027 102,808 0.00%Campbell Soup Co. $100,000 3.30% 19/3/2025 102,799 0.00%San Jose Redevelopment Agency Successor Agency $100,000 3.38% 1/8/2034 102,787 0.00%Thermo Fisher Scientific, Inc. $100,000 3.00% 15/4/2023 102,779 0.00%Guardian Life Global Funding $100,000 2.90% 6/5/2024 102,777 0.00%Southern Co. Gas Capital Corp. $100,000 3.25% 15/6/2026 102,702 0.00%CommonSpirit Health $100,000 4.35% 1/11/2042 102,700 0.00%Keurig Dr Pepper, Inc. $100,000 3.13% 15/12/2023 102,687 0.00%Bank of New York Mellon Corp. $100,000 3.55% 23/9/2021 102,685 0.00%Highmark, Inc. $100,000 4.75% 15/5/2021 102,654 0.00%Leggett & Platt, Inc. $100,000 3.50% 15/11/2027 102,579 0.00%Philip Morris International, Inc. $100,000 3.13% 2/3/2028 102,517 0.00%PacifiCorp $100,000 2.95% 1/6/2023 102,458 0.00%American Electric Power Co., Inc. $100,000 3.20% 13/11/2027 102,438 0.00%Starbucks Corp. $100,000 3.75% 1/12/2047 102,411 0.00%Federal Home Loan Mortgage Corp. $91,408 5.50% 1/12/2034 102,402 0.00%Bio-Rad Laboratories, Inc. $100,000 4.88% 15/12/2020 102,376 0.00%Southwest Gas Corp. $100,000 3.80% 29/9/2046 102,363 0.00%Microsoft Corp. $100,000 2.65% 3/11/2022 102,343 0.00%Texas Eastern Transmission LP $100,000 3.50% 15/1/2028 102,329 0.00%Flowserve Corp. $100,000 4.00% 15/11/2023 102,325 0.00%United Technologies Corp. $100,000 2.65% 1/11/2026 102,316 0.00%General Electric Co. $100,000 4.63% 7/1/2021 102,291 0.00%Allergan Funding SCS $100,000 3.45% 15/3/2022 102,290 0.00%CA, Inc. $100,000 3.60% 15/8/2022 102,265 0.00%Motorola Solutions, Inc. $99,000 3.75% 15/5/2022 102,241 0.00%Illinois Tool Works, Inc. $100,000 3.38% 15/9/2021 102,219 0.00%American Express Credit Account Master Trust $100,000 3.18% 15/4/2024 102,216 0.00%BP Capital Markets America, Inc. $100,000 2.75% 10/5/2023 102,212 0.00%Kansas City Southern $100,000 3.00% 15/5/2023 102,179 0.00%Norfolk Southern Corp. $100,000 2.90% 15/2/2023 102,164 0.00%Valmont Industries, Inc. $100,000 5.00% 1/10/2044 102,159 0.00%General Electric Co. $100,000 3.15% 7/9/2022 102,143 0.00%Tanger Properties LP $100,000 3.88% 15/7/2027 102,136 0.00%Union Pacific Corp. $100,000 2.75% 1/3/2026 102,117 0.00%General Electric Co. $100,000 3.10% 9/1/2023 102,080 0.00%Corning, Inc. $100,000 2.90% 15/5/2022 102,037 0.00%Kimberly-Clark Corp. $100,000 2.40% 1/6/2023 101,999 0.00%Eversource Energy $100,000 2.90% 1/10/2024 101,982 0.00%Berkshire Hathaway Energy Co. $100,000 2.80% 15/1/2023 101,980 0.00%Agilent Technologies, Inc. $100,000 3.05% 22/9/2026 101,953 0.00%Fluor Corp. $100,000 3.50% 15/12/2024 101,906 0.00%PacifiCorp $100,000 2.95% 1/2/2022 101,897 0.00%GM Financial Consumer Automobile Receivables Trust 2018 $100,000 3.02% 18/12/2023 101,854 0.00%3M Co. $100,000 2.75% 1/3/2022 101,854 0.00%Kohl’s Corp. $100,000 5.55% 17/7/2045 101,850 0.00%GLP Capital LP/GLP Financing II, Inc. $100,000 4.38% 15/4/2021 101,832 0.00%GLP Capital LP/GLP Financing II, Inc. $100,000 4.00% 15/1/2030 101,805 0.00%Trinity Acquisition plc $100,000 3.50% 15/9/2021 101,778 0.00%BorgWarner, Inc. $100,000 4.38% 15/3/2045 101,741 0.00%Cigna Corp. $100,000 3.05% 30/11/2022 101,738 0.00%UnitedHealth Group, Inc. $100,000 3.15% 15/6/2021 101,731 0.00%Dominion Energy, Inc. $100,000 3.07% 15/8/2024 101,692 0.00%Sempra Energy $100,000 2.88% 1/10/2022 101,682 0.00%Chevron Corp. $100,000 2.50% 3/3/2022 101,652 0.00%Lowe’s Cos, Inc. $100,000 3.70% 15/4/2046 101,639 0.00%Federal Home Loan Mortgage Corp. $100,000 2.64% 25/1/2023 101,636 0.00%
Vanguard Global Bond Index Fund
460
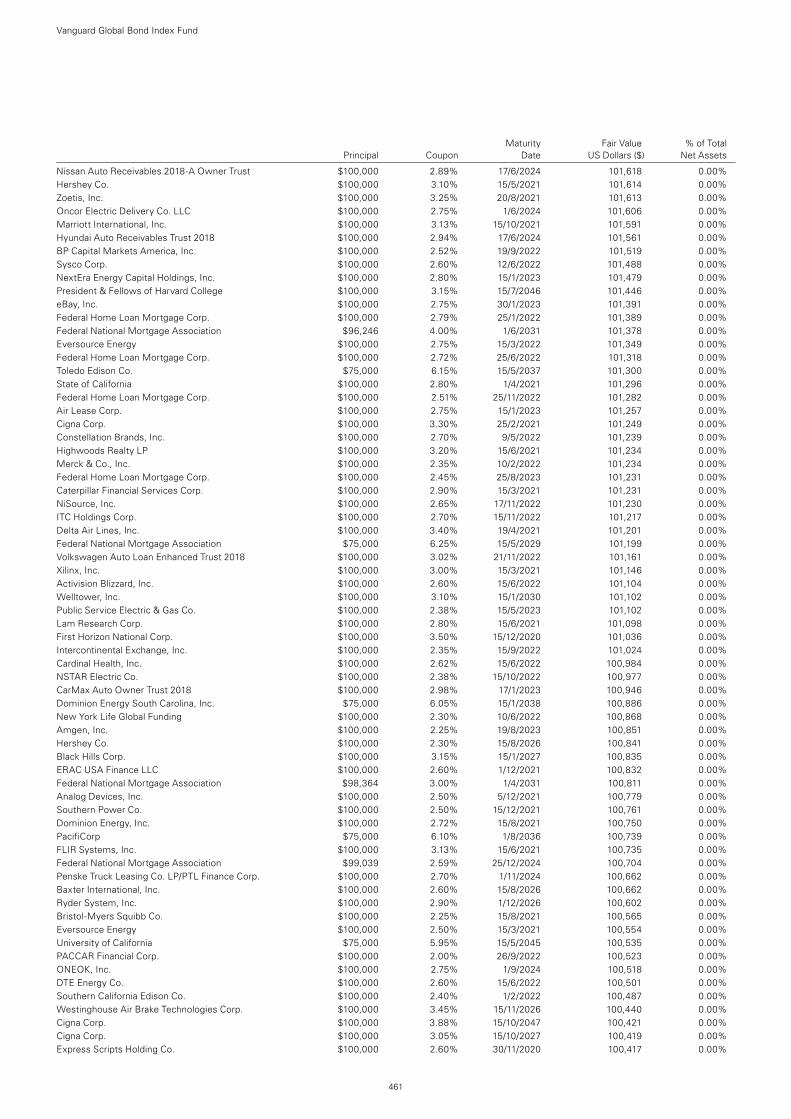
Maturity Fair Value % of Total Principal Coupon Date US Dollars ($) Net Assets
Nissan Auto Receivables 2018-A Owner Trust $100,000 2.89% 17/6/2024 101,618 0.00%Hershey Co. $100,000 3.10% 15/5/2021 101,614 0.00%Zoetis, Inc. $100,000 3.25% 20/8/2021 101,613 0.00%Oncor Electric Delivery Co. LLC $100,000 2.75% 1/6/2024 101,606 0.00%Marriott International, Inc. $100,000 3.13% 15/10/2021 101,591 0.00%Hyundai Auto Receivables Trust 2018 $100,000 2.94% 17/6/2024 101,561 0.00%BP Capital Markets America, Inc. $100,000 2.52% 19/9/2022 101,519 0.00%Sysco Corp. $100,000 2.60% 12/6/2022 101,488 0.00%NextEra Energy Capital Holdings, Inc. $100,000 2.80% 15/1/2023 101,479 0.00%President & Fellows of Harvard College $100,000 3.15% 15/7/2046 101,446 0.00%eBay, Inc. $100,000 2.75% 30/1/2023 101,391 0.00%Federal Home Loan Mortgage Corp. $100,000 2.79% 25/1/2022 101,389 0.00%Federal National Mortgage Association $96,246 4.00% 1/6/2031 101,378 0.00%Eversource Energy $100,000 2.75% 15/3/2022 101,349 0.00%Federal Home Loan Mortgage Corp. $100,000 2.72% 25/6/2022 101,318 0.00%Toledo Edison Co. $75,000 6.15% 15/5/2037 101,300 0.00%State of California $100,000 2.80% 1/4/2021 101,296 0.00%Federal Home Loan Mortgage Corp. $100,000 2.51% 25/11/2022 101,282 0.00%Air Lease Corp. $100,000 2.75% 15/1/2023 101,257 0.00%Cigna Corp. $100,000 3.30% 25/2/2021 101,249 0.00%Constellation Brands, Inc. $100,000 2.70% 9/5/2022 101,239 0.00%Highwoods Realty LP $100,000 3.20% 15/6/2021 101,234 0.00%Merck & Co., Inc. $100,000 2.35% 10/2/2022 101,234 0.00%Federal Home Loan Mortgage Corp. $100,000 2.45% 25/8/2023 101,231 0.00%Caterpillar Financial Services Corp. $100,000 2.90% 15/3/2021 101,231 0.00%NiSource, Inc. $100,000 2.65% 17/11/2022 101,230 0.00%ITC Holdings Corp. $100,000 2.70% 15/11/2022 101,217 0.00%Delta Air Lines, Inc. $100,000 3.40% 19/4/2021 101,201 0.00%Federal National Mortgage Association $75,000 6.25% 15/5/2029 101,199 0.00%Volkswagen Auto Loan Enhanced Trust 2018 $100,000 3.02% 21/11/2022 101,161 0.00%Xilinx, Inc. $100,000 3.00% 15/3/2021 101,146 0.00%Activision Blizzard, Inc. $100,000 2.60% 15/6/2022 101,104 0.00%Welltower, Inc. $100,000 3.10% 15/1/2030 101,102 0.00%Public Service Electric & Gas Co. $100,000 2.38% 15/5/2023 101,102 0.00%Lam Research Corp. $100,000 2.80% 15/6/2021 101,098 0.00%First Horizon National Corp. $100,000 3.50% 15/12/2020 101,036 0.00%Intercontinental Exchange, Inc. $100,000 2.35% 15/9/2022 101,024 0.00%Cardinal Health, Inc. $100,000 2.62% 15/6/2022 100,984 0.00%NSTAR Electric Co. $100,000 2.38% 15/10/2022 100,977 0.00%CarMax Auto Owner Trust 2018 $100,000 2.98% 17/1/2023 100,946 0.00%Dominion Energy South Carolina, Inc. $75,000 6.05% 15/1/2038 100,886 0.00%New York Life Global Funding $100,000 2.30% 10/6/2022 100,868 0.00%Amgen, Inc. $100,000 2.25% 19/8/2023 100,851 0.00%Hershey Co. $100,000 2.30% 15/8/2026 100,841 0.00%Black Hills Corp. $100,000 3.15% 15/1/2027 100,835 0.00%ERAC USA Finance LLC $100,000 2.60% 1/12/2021 100,832 0.00%Federal National Mortgage Association $98,364 3.00% 1/4/2031 100,811 0.00%Analog Devices, Inc. $100,000 2.50% 5/12/2021 100,779 0.00%Southern Power Co. $100,000 2.50% 15/12/2021 100,761 0.00%Dominion Energy, Inc. $100,000 2.72% 15/8/2021 100,750 0.00%PacifiCorp $75,000 6.10% 1/8/2036 100,739 0.00%FLIR Systems, Inc. $100,000 3.13% 15/6/2021 100,735 0.00%Federal National Mortgage Association $99,039 2.59% 25/12/2024 100,704 0.00%Penske Truck Leasing Co. LP/PTL Finance Corp. $100,000 2.70% 1/11/2024 100,662 0.00%Baxter International, Inc. $100,000 2.60% 15/8/2026 100,662 0.00%Ryder System, Inc. $100,000 2.90% 1/12/2026 100,602 0.00%Bristol-Myers Squibb Co. $100,000 2.25% 15/8/2021 100,565 0.00%Eversource Energy $100,000 2.50% 15/3/2021 100,554 0.00%University of California $75,000 5.95% 15/5/2045 100,535 0.00%PACCAR Financial Corp. $100,000 2.00% 26/9/2022 100,523 0.00%ONEOK, Inc. $100,000 2.75% 1/9/2024 100,518 0.00%DTE Energy Co. $100,000 2.60% 15/6/2022 100,501 0.00%Southern California Edison Co. $100,000 2.40% 1/2/2022 100,487 0.00%Westinghouse Air Brake Technologies Corp. $100,000 3.45% 15/11/2026 100,440 0.00%Cigna Corp. $100,000 3.88% 15/10/2047 100,421 0.00%Cigna Corp. $100,000 3.05% 15/10/2027 100,419 0.00%Express Scripts Holding Co. $100,000 2.60% 30/11/2020 100,417 0.00%
Vanguard Global Bond Index Fund
461
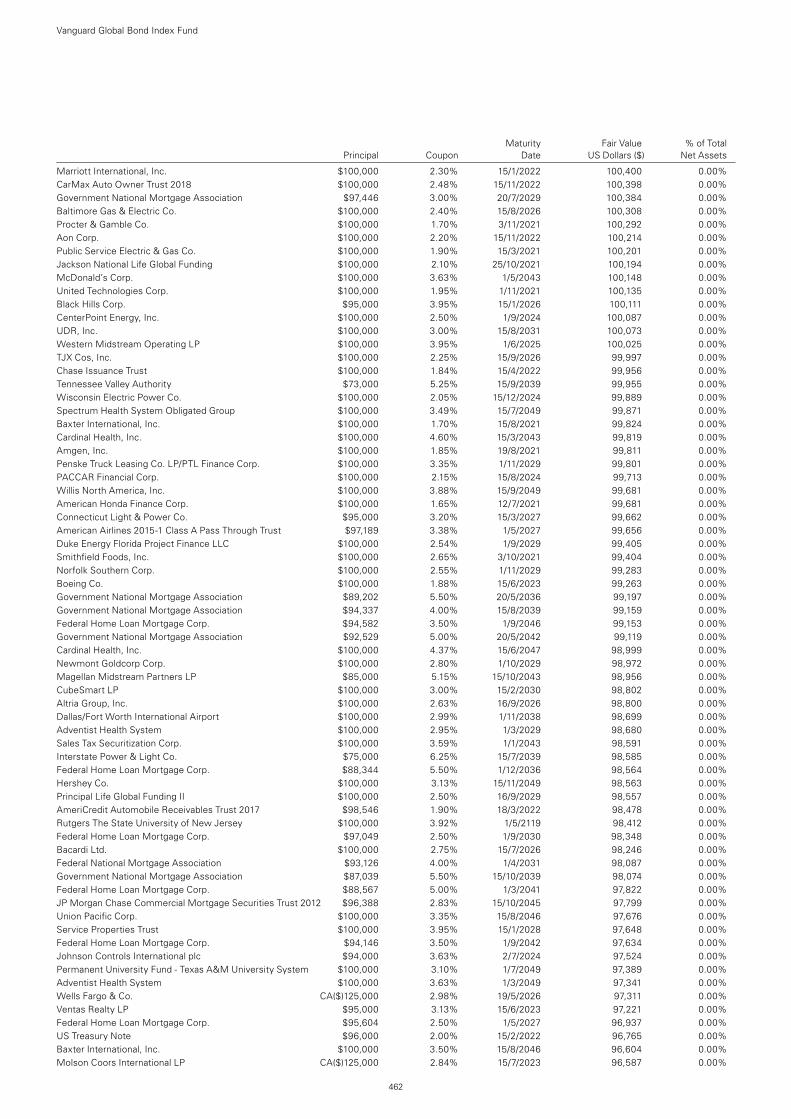
Maturity Fair Value % of Total Principal Coupon Date US Dollars ($) Net Assets
Marriott International, Inc. $100,000 2.30% 15/1/2022 100,400 0.00%CarMax Auto Owner Trust 2018 $100,000 2.48% 15/11/2022 100,398 0.00%Government National Mortgage Association $97,446 3.00% 20/7/2029 100,384 0.00%Baltimore Gas & Electric Co. $100,000 2.40% 15/8/2026 100,308 0.00%Procter & Gamble Co. $100,000 1.70% 3/11/2021 100,292 0.00%Aon Corp. $100,000 2.20% 15/11/2022 100,214 0.00%Public Service Electric & Gas Co. $100,000 1.90% 15/3/2021 100,201 0.00%Jackson National Life Global Funding $100,000 2.10% 25/10/2021 100,194 0.00%McDonald’s Corp. $100,000 3.63% 1/5/2043 100,148 0.00%United Technologies Corp. $100,000 1.95% 1/11/2021 100,135 0.00%Black Hills Corp. $95,000 3.95% 15/1/2026 100,111 0.00%CenterPoint Energy, Inc. $100,000 2.50% 1/9/2024 100,087 0.00%UDR, Inc. $100,000 3.00% 15/8/2031 100,073 0.00%Western Midstream Operating LP $100,000 3.95% 1/6/2025 100,025 0.00%TJX Cos, Inc. $100,000 2.25% 15/9/2026 99,997 0.00%Chase Issuance Trust $100,000 1.84% 15/4/2022 99,956 0.00%Tennessee Valley Authority $73,000 5.25% 15/9/2039 99,955 0.00%Wisconsin Electric Power Co. $100,000 2.05% 15/12/2024 99,889 0.00%Spectrum Health System Obligated Group $100,000 3.49% 15/7/2049 99,871 0.00%Baxter International, Inc. $100,000 1.70% 15/8/2021 99,824 0.00%Cardinal Health, Inc. $100,000 4.60% 15/3/2043 99,819 0.00%Amgen, Inc. $100,000 1.85% 19/8/2021 99,811 0.00%Penske Truck Leasing Co. LP/PTL Finance Corp. $100,000 3.35% 1/11/2029 99,801 0.00%PACCAR Financial Corp. $100,000 2.15% 15/8/2024 99,713 0.00%Willis North America, Inc. $100,000 3.88% 15/9/2049 99,681 0.00%American Honda Finance Corp. $100,000 1.65% 12/7/2021 99,681 0.00%Connecticut Light & Power Co. $95,000 3.20% 15/3/2027 99,662 0.00%American Airlines 2015-1 Class A Pass Through Trust $97,189 3.38% 1/5/2027 99,656 0.00%Duke Energy Florida Project Finance LLC $100,000 2.54% 1/9/2029 99,405 0.00%Smithfield Foods, Inc. $100,000 2.65% 3/10/2021 99,404 0.00%Norfolk Southern Corp. $100,000 2.55% 1/11/2029 99,283 0.00%Boeing Co. $100,000 1.88% 15/6/2023 99,263 0.00%Government National Mortgage Association $89,202 5.50% 20/5/2036 99,197 0.00%Government National Mortgage Association $94,337 4.00% 15/8/2039 99,159 0.00%Federal Home Loan Mortgage Corp. $94,582 3.50% 1/9/2046 99,153 0.00%Government National Mortgage Association $92,529 5.00% 20/5/2042 99,119 0.00%Cardinal Health, Inc. $100,000 4.37% 15/6/2047 98,999 0.00%Newmont Goldcorp Corp. $100,000 2.80% 1/10/2029 98,972 0.00%Magellan Midstream Partners LP $85,000 5.15% 15/10/2043 98,956 0.00%CubeSmart LP $100,000 3.00% 15/2/2030 98,802 0.00%Altria Group, Inc. $100,000 2.63% 16/9/2026 98,800 0.00%Dallas/Fort Worth International Airport $100,000 2.99% 1/11/2038 98,699 0.00%Adventist Health System $100,000 2.95% 1/3/2029 98,680 0.00%Sales Tax Securitization Corp. $100,000 3.59% 1/1/2043 98,591 0.00%Interstate Power & Light Co. $75,000 6.25% 15/7/2039 98,585 0.00%Federal Home Loan Mortgage Corp. $88,344 5.50% 1/12/2036 98,564 0.00%Hershey Co. $100,000 3.13% 15/11/2049 98,563 0.00%Principal Life Global Funding II $100,000 2.50% 16/9/2029 98,557 0.00%AmeriCredit Automobile Receivables Trust 2017 $98,546 1.90% 18/3/2022 98,478 0.00%Rutgers The State University of New Jersey $100,000 3.92% 1/5/2119 98,412 0.00%Federal Home Loan Mortgage Corp. $97,049 2.50% 1/9/2030 98,348 0.00%Bacardi Ltd. $100,000 2.75% 15/7/2026 98,246 0.00%Federal National Mortgage Association $93,126 4.00% 1/4/2031 98,087 0.00%Government National Mortgage Association $87,039 5.50% 15/10/2039 98,074 0.00%Federal Home Loan Mortgage Corp. $88,567 5.00% 1/3/2041 97,822 0.00%JP Morgan Chase Commercial Mortgage Securities Trust 2012 $96,388 2.83% 15/10/2045 97,799 0.00%Union Pacific Corp. $100,000 3.35% 15/8/2046 97,676 0.00%Service Properties Trust $100,000 3.95% 15/1/2028 97,648 0.00%Federal Home Loan Mortgage Corp. $94,146 3.50% 1/9/2042 97,634 0.00%Johnson Controls International plc $94,000 3.63% 2/7/2024 97,524 0.00%Permanent University Fund - Texas A&M University System $100,000 3.10% 1/7/2049 97,389 0.00%Adventist Health System $100,000 3.63% 1/3/2049 97,341 0.00%Wells Fargo & Co. CA($)125,000 2.98% 19/5/2026 97,311 0.00%Ventas Realty LP $95,000 3.13% 15/6/2023 97,221 0.00%Federal Home Loan Mortgage Corp. $95,604 2.50% 1/5/2027 96,937 0.00%US Treasury Note $96,000 2.00% 15/2/2022 96,765 0.00%Baxter International, Inc. $100,000 3.50% 15/8/2046 96,604 0.00%Molson Coors International LP CA($)125,000 2.84% 15/7/2023 96,587 0.00%
Vanguard Global Bond Index Fund
462
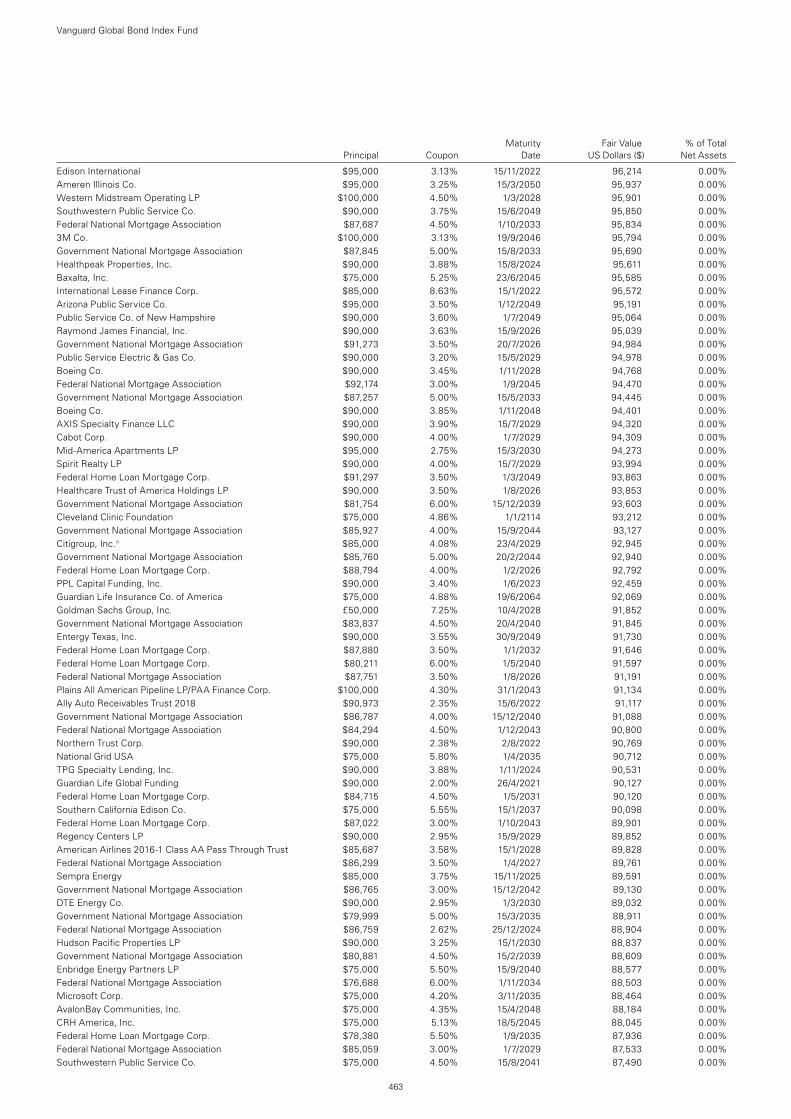
Maturity Fair Value % of Total Principal Coupon Date US Dollars ($) Net Assets
Edison International $95,000 3.13% 15/11/2022 96,214 0.00%Ameren Illinois Co. $95,000 3.25% 15/3/2050 95,937 0.00%Western Midstream Operating LP $100,000 4.50% 1/3/2028 95,901 0.00%Southwestern Public Service Co. $90,000 3.75% 15/6/2049 95,850 0.00%Federal National Mortgage Association $87,687 4.50% 1/10/2033 95,834 0.00%3M Co. $100,000 3.13% 19/9/2046 95,794 0.00%Government National Mortgage Association $87,845 5.00% 15/8/2033 95,690 0.00%Healthpeak Properties, Inc. $90,000 3.88% 15/8/2024 95,611 0.00%Baxalta, Inc. $75,000 5.25% 23/6/2045 95,585 0.00%International Lease Finance Corp. $85,000 8.63% 15/1/2022 95,572 0.00%Arizona Public Service Co. $95,000 3.50% 1/12/2049 95,191 0.00%Public Service Co. of New Hampshire $90,000 3.60% 1/7/2049 95,064 0.00%Raymond James Financial, Inc. $90,000 3.63% 15/9/2026 95,039 0.00%Government National Mortgage Association $91,273 3.50% 20/7/2026 94,984 0.00%Public Service Electric & Gas Co. $90,000 3.20% 15/5/2029 94,978 0.00%Boeing Co. $90,000 3.45% 1/11/2028 94,768 0.00%Federal National Mortgage Association $92,174 3.00% 1/9/2045 94,470 0.00%Government National Mortgage Association $87,257 5.00% 15/5/2033 94,445 0.00%Boeing Co. $90,000 3.85% 1/11/2048 94,401 0.00%AXIS Specialty Finance LLC $90,000 3.90% 15/7/2029 94,320 0.00%Cabot Corp. $90,000 4.00% 1/7/2029 94,309 0.00%Mid-America Apartments LP $95,000 2.75% 15/3/2030 94,273 0.00%Spirit Realty LP $90,000 4.00% 15/7/2029 93,994 0.00%Federal Home Loan Mortgage Corp. $91,297 3.50% 1/3/2049 93,863 0.00%Healthcare Trust of America Holdings LP $90,000 3.50% 1/8/2026 93,853 0.00%Government National Mortgage Association $81,754 6.00% 15/12/2039 93,603 0.00%Cleveland Clinic Foundation $75,000 4.86% 1/1/2114 93,212 0.00%Government National Mortgage Association $85,927 4.00% 15/9/2044 93,127 0.00%Citigroup, Inc.^ $85,000 4.08% 23/4/2029 92,945 0.00%Government National Mortgage Association $85,760 5.00% 20/2/2044 92,940 0.00%Federal Home Loan Mortgage Corp. $88,794 4.00% 1/2/2026 92,792 0.00%PPL Capital Funding, Inc. $90,000 3.40% 1/6/2023 92,459 0.00%Guardian Life Insurance Co. of America $75,000 4.88% 19/6/2064 92,069 0.00%Goldman Sachs Group, Inc. £50,000 7.25% 10/4/2028 91,852 0.00%Government National Mortgage Association $83,837 4.50% 20/4/2040 91,845 0.00%Entergy Texas, Inc. $90,000 3.55% 30/9/2049 91,730 0.00%Federal Home Loan Mortgage Corp. $87,880 3.50% 1/1/2032 91,646 0.00%Federal Home Loan Mortgage Corp. $80,211 6.00% 1/5/2040 91,597 0.00%Federal National Mortgage Association $87,751 3.50% 1/8/2026 91,191 0.00%Plains All American Pipeline LP/PAA Finance Corp. $100,000 4.30% 31/1/2043 91,134 0.00%Ally Auto Receivables Trust 2018 $90,973 2.35% 15/6/2022 91,117 0.00%Government National Mortgage Association $86,787 4.00% 15/12/2040 91,088 0.00%Federal National Mortgage Association $84,294 4.50% 1/12/2043 90,800 0.00%Northern Trust Corp. $90,000 2.38% 2/8/2022 90,769 0.00%National Grid USA $75,000 5.80% 1/4/2035 90,712 0.00%TPG Specialty Lending, Inc. $90,000 3.88% 1/11/2024 90,531 0.00%Guardian Life Global Funding $90,000 2.00% 26/4/2021 90,127 0.00%Federal Home Loan Mortgage Corp. $84,715 4.50% 1/5/2031 90,120 0.00%Southern California Edison Co. $75,000 5.55% 15/1/2037 90,098 0.00%Federal Home Loan Mortgage Corp. $87,022 3.00% 1/10/2043 89,901 0.00%Regency Centers LP $90,000 2.95% 15/9/2029 89,852 0.00%American Airlines 2016-1 Class AA Pass Through Trust $85,687 3.58% 15/1/2028 89,828 0.00%Federal National Mortgage Association $86,299 3.50% 1/4/2027 89,761 0.00%Sempra Energy $85,000 3.75% 15/11/2025 89,591 0.00%Government National Mortgage Association $86,765 3.00% 15/12/2042 89,130 0.00%DTE Energy Co. $90,000 2.95% 1/3/2030 89,032 0.00%Government National Mortgage Association $79,999 5.00% 15/3/2035 88,911 0.00%Federal National Mortgage Association $86,759 2.62% 25/12/2024 88,904 0.00%Hudson Pacific Properties LP $90,000 3.25% 15/1/2030 88,837 0.00%Government National Mortgage Association $80,881 4.50% 15/2/2039 88,609 0.00%Enbridge Energy Partners LP $75,000 5.50% 15/9/2040 88,577 0.00%Federal National Mortgage Association $76,688 6.00% 1/11/2034 88,503 0.00%Microsoft Corp. $75,000 4.20% 3/11/2035 88,464 0.00%AvalonBay Communities, Inc. $75,000 4.35% 15/4/2048 88,184 0.00%CRH America, Inc. $75,000 5.13% 18/5/2045 88,045 0.00%Federal Home Loan Mortgage Corp. $78,380 5.50% 1/9/2035 87,936 0.00%Federal National Mortgage Association $85,059 3.00% 1/7/2029 87,533 0.00%Southwestern Public Service Co. $75,000 4.50% 15/8/2041 87,490 0.00%
Vanguard Global Bond Index Fund
463
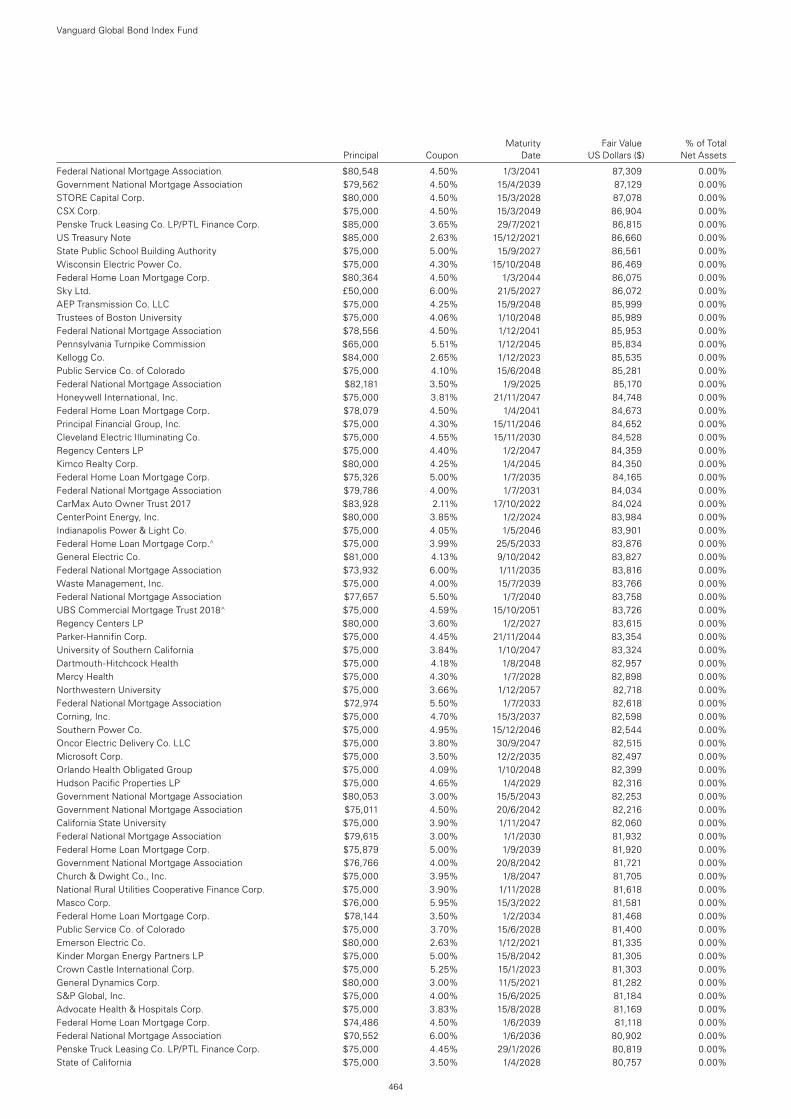
Maturity Fair Value % of Total Principal Coupon Date US Dollars ($) Net Assets
Federal National Mortgage Association $80,548 4.50% 1/3/2041 87,309 0.00%Government National Mortgage Association $79,562 4.50% 15/4/2039 87,129 0.00%STORE Capital Corp. $80,000 4.50% 15/3/2028 87,078 0.00%CSX Corp. $75,000 4.50% 15/3/2049 86,904 0.00%Penske Truck Leasing Co. LP/PTL Finance Corp. $85,000 3.65% 29/7/2021 86,815 0.00%US Treasury Note $85,000 2.63% 15/12/2021 86,660 0.00%State Public School Building Authority $75,000 5.00% 15/9/2027 86,561 0.00%Wisconsin Electric Power Co. $75,000 4.30% 15/10/2048 86,469 0.00%Federal Home Loan Mortgage Corp. $80,364 4.50% 1/3/2044 86,075 0.00%Sky Ltd. £50,000 6.00% 21/5/2027 86,072 0.00%AEP Transmission Co. LLC $75,000 4.25% 15/9/2048 85,999 0.00%Trustees of Boston University $75,000 4.06% 1/10/2048 85,989 0.00%Federal National Mortgage Association $78,556 4.50% 1/12/2041 85,953 0.00%Pennsylvania Turnpike Commission $65,000 5.51% 1/12/2045 85,834 0.00%Kellogg Co. $84,000 2.65% 1/12/2023 85,535 0.00%Public Service Co. of Colorado $75,000 4.10% 15/6/2048 85,281 0.00%Federal National Mortgage Association $82,181 3.50% 1/9/2025 85,170 0.00%Honeywell International, Inc. $75,000 3.81% 21/11/2047 84,748 0.00%Federal Home Loan Mortgage Corp. $78,079 4.50% 1/4/2041 84,673 0.00%Principal Financial Group, Inc. $75,000 4.30% 15/11/2046 84,652 0.00%Cleveland Electric Illuminating Co. $75,000 4.55% 15/11/2030 84,528 0.00%Regency Centers LP $75,000 4.40% 1/2/2047 84,359 0.00%Kimco Realty Corp. $80,000 4.25% 1/4/2045 84,350 0.00%Federal Home Loan Mortgage Corp. $75,326 5.00% 1/7/2035 84,165 0.00%Federal National Mortgage Association $79,786 4.00% 1/7/2031 84,034 0.00%CarMax Auto Owner Trust 2017 $83,928 2.11% 17/10/2022 84,024 0.00%CenterPoint Energy, Inc. $80,000 3.85% 1/2/2024 83,984 0.00%Indianapolis Power & Light Co. $75,000 4.05% 1/5/2046 83,901 0.00%Federal Home Loan Mortgage Corp.^ $75,000 3.99% 25/5/2033 83,876 0.00%General Electric Co. $81,000 4.13% 9/10/2042 83,827 0.00%Federal National Mortgage Association $73,932 6.00% 1/11/2035 83,816 0.00%Waste Management, Inc. $75,000 4.00% 15/7/2039 83,766 0.00%Federal National Mortgage Association $77,657 5.50% 1/7/2040 83,758 0.00%UBS Commercial Mortgage Trust 2018^ $75,000 4.59% 15/10/2051 83,726 0.00%Regency Centers LP $80,000 3.60% 1/2/2027 83,615 0.00%Parker-Hannifin Corp. $75,000 4.45% 21/11/2044 83,354 0.00%University of Southern California $75,000 3.84% 1/10/2047 83,324 0.00%Dartmouth-Hitchcock Health $75,000 4.18% 1/8/2048 82,957 0.00%Mercy Health $75,000 4.30% 1/7/2028 82,898 0.00%Northwestern University $75,000 3.66% 1/12/2057 82,718 0.00%Federal National Mortgage Association $72,974 5.50% 1/7/2033 82,618 0.00%Corning, Inc. $75,000 4.70% 15/3/2037 82,598 0.00%Southern Power Co. $75,000 4.95% 15/12/2046 82,544 0.00%Oncor Electric Delivery Co. LLC $75,000 3.80% 30/9/2047 82,515 0.00%Microsoft Corp. $75,000 3.50% 12/2/2035 82,497 0.00%Orlando Health Obligated Group $75,000 4.09% 1/10/2048 82,399 0.00%Hudson Pacific Properties LP $75,000 4.65% 1/4/2029 82,316 0.00%Government National Mortgage Association $80,053 3.00% 15/5/2043 82,253 0.00%Government National Mortgage Association $75,011 4.50% 20/6/2042 82,216 0.00%California State University $75,000 3.90% 1/11/2047 82,060 0.00%Federal National Mortgage Association $79,615 3.00% 1/1/2030 81,932 0.00%Federal Home Loan Mortgage Corp. $75,879 5.00% 1/9/2039 81,920 0.00%Government National Mortgage Association $76,766 4.00% 20/8/2042 81,721 0.00%Church & Dwight Co., Inc. $75,000 3.95% 1/8/2047 81,705 0.00%National Rural Utilities Cooperative Finance Corp. $75,000 3.90% 1/11/2028 81,618 0.00%Masco Corp. $76,000 5.95% 15/3/2022 81,581 0.00%Federal Home Loan Mortgage Corp. $78,144 3.50% 1/2/2034 81,468 0.00%Public Service Co. of Colorado $75,000 3.70% 15/6/2028 81,400 0.00%Emerson Electric Co. $80,000 2.63% 1/12/2021 81,335 0.00%Kinder Morgan Energy Partners LP $75,000 5.00% 15/8/2042 81,305 0.00%Crown Castle International Corp. $75,000 5.25% 15/1/2023 81,303 0.00%General Dynamics Corp. $80,000 3.00% 11/5/2021 81,282 0.00%S&P Global, Inc. $75,000 4.00% 15/6/2025 81,184 0.00%Advocate Health & Hospitals Corp. $75,000 3.83% 15/8/2028 81,169 0.00%Federal Home Loan Mortgage Corp. $74,486 4.50% 1/6/2039 81,118 0.00%Federal National Mortgage Association $70,552 6.00% 1/6/2036 80,902 0.00%Penske Truck Leasing Co. LP/PTL Finance Corp. $75,000 4.45% 29/1/2026 80,819 0.00%State of California $75,000 3.50% 1/4/2028 80,757 0.00%
Vanguard Global Bond Index Fund
464
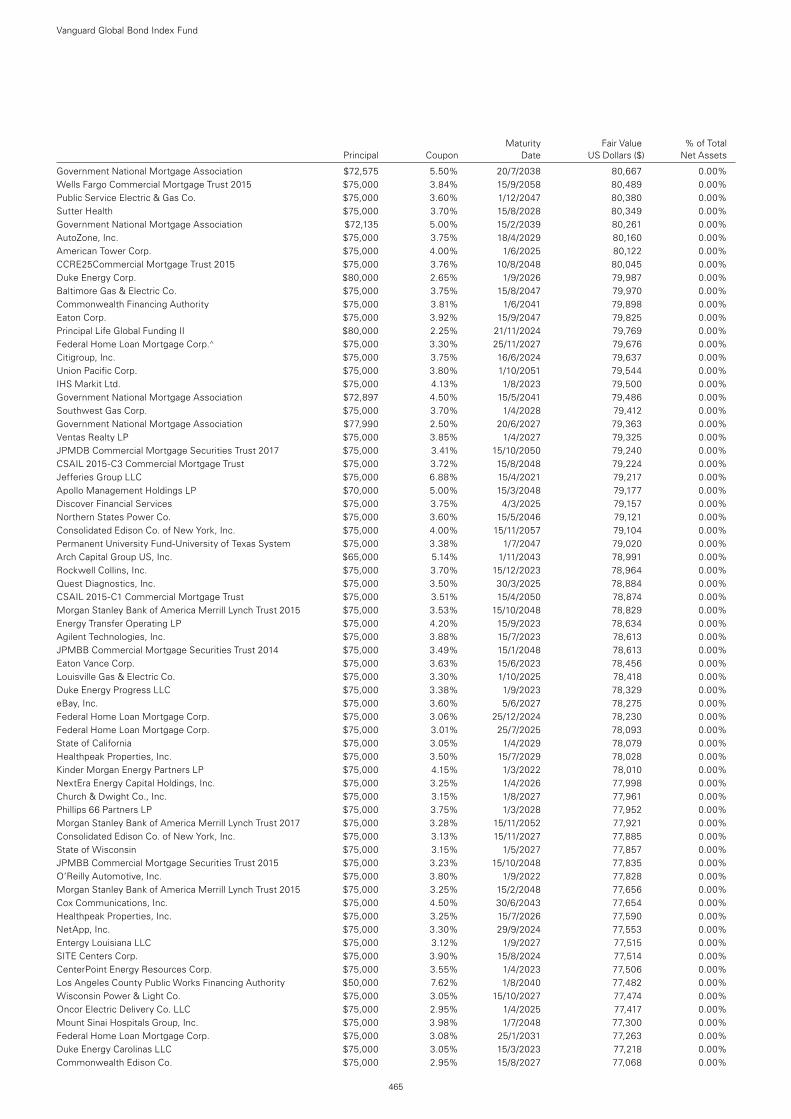
Maturity Fair Value % of Total Principal Coupon Date US Dollars ($) Net Assets
Government National Mortgage Association $72,575 5.50% 20/7/2038 80,667 0.00%Wells Fargo Commercial Mortgage Trust 2015 $75,000 3.84% 15/9/2058 80,489 0.00%Public Service Electric & Gas Co. $75,000 3.60% 1/12/2047 80,380 0.00%Sutter Health $75,000 3.70% 15/8/2028 80,349 0.00%Government National Mortgage Association $72,135 5.00% 15/2/2039 80,261 0.00%AutoZone, Inc. $75,000 3.75% 18/4/2029 80,160 0.00%American Tower Corp. $75,000 4.00% 1/6/2025 80,122 0.00%CCRE25Commercial Mortgage Trust 2015 $75,000 3.76% 10/8/2048 80,045 0.00%Duke Energy Corp. $80,000 2.65% 1/9/2026 79,987 0.00%Baltimore Gas & Electric Co. $75,000 3.75% 15/8/2047 79,970 0.00%Commonwealth Financing Authority $75,000 3.81% 1/6/2041 79,898 0.00%Eaton Corp. $75,000 3.92% 15/9/2047 79,825 0.00%Principal Life Global Funding II $80,000 2.25% 21/11/2024 79,769 0.00%Federal Home Loan Mortgage Corp.^ $75,000 3.30% 25/11/2027 79,676 0.00%Citigroup, Inc. $75,000 3.75% 16/6/2024 79,637 0.00%Union Pacific Corp. $75,000 3.80% 1/10/2051 79,544 0.00%IHS Markit Ltd. $75,000 4.13% 1/8/2023 79,500 0.00%Government National Mortgage Association $72,897 4.50% 15/5/2041 79,486 0.00%Southwest Gas Corp. $75,000 3.70% 1/4/2028 79,412 0.00%Government National Mortgage Association $77,990 2.50% 20/6/2027 79,363 0.00%Ventas Realty LP $75,000 3.85% 1/4/2027 79,325 0.00%JPMDB Commercial Mortgage Securities Trust 2017 $75,000 3.41% 15/10/2050 79,240 0.00%CSAIL 2015-C3 Commercial Mortgage Trust $75,000 3.72% 15/8/2048 79,224 0.00%Jefferies Group LLC $75,000 6.88% 15/4/2021 79,217 0.00%Apollo Management Holdings LP $70,000 5.00% 15/3/2048 79,177 0.00%Discover Financial Services $75,000 3.75% 4/3/2025 79,157 0.00%Northern States Power Co. $75,000 3.60% 15/5/2046 79,121 0.00%Consolidated Edison Co. of New York, Inc. $75,000 4.00% 15/11/2057 79,104 0.00%Permanent University Fund-University of Texas System $75,000 3.38% 1/7/2047 79,020 0.00%Arch Capital Group US, Inc. $65,000 5.14% 1/11/2043 78,991 0.00%Rockwell Collins, Inc. $75,000 3.70% 15/12/2023 78,964 0.00%Quest Diagnostics, Inc. $75,000 3.50% 30/3/2025 78,884 0.00%CSAIL 2015-C1 Commercial Mortgage Trust $75,000 3.51% 15/4/2050 78,874 0.00%Morgan Stanley Bank of America Merrill Lynch Trust 2015 $75,000 3.53% 15/10/2048 78,829 0.00%Energy Transfer Operating LP $75,000 4.20% 15/9/2023 78,634 0.00%Agilent Technologies, Inc. $75,000 3.88% 15/7/2023 78,613 0.00%JPMBB Commercial Mortgage Securities Trust 2014 $75,000 3.49% 15/1/2048 78,613 0.00%Eaton Vance Corp. $75,000 3.63% 15/6/2023 78,456 0.00%Louisville Gas & Electric Co. $75,000 3.30% 1/10/2025 78,418 0.00%Duke Energy Progress LLC $75,000 3.38% 1/9/2023 78,329 0.00%eBay, Inc. $75,000 3.60% 5/6/2027 78,275 0.00%Federal Home Loan Mortgage Corp. $75,000 3.06% 25/12/2024 78,230 0.00%Federal Home Loan Mortgage Corp. $75,000 3.01% 25/7/2025 78,093 0.00%State of California $75,000 3.05% 1/4/2029 78,079 0.00%Healthpeak Properties, Inc. $75,000 3.50% 15/7/2029 78,028 0.00%Kinder Morgan Energy Partners LP $75,000 4.15% 1/3/2022 78,010 0.00%NextEra Energy Capital Holdings, Inc. $75,000 3.25% 1/4/2026 77,998 0.00%Church & Dwight Co., Inc. $75,000 3.15% 1/8/2027 77,961 0.00%Phillips 66 Partners LP $75,000 3.75% 1/3/2028 77,952 0.00%Morgan Stanley Bank of America Merrill Lynch Trust 2017 $75,000 3.28% 15/11/2052 77,921 0.00%Consolidated Edison Co. of New York, Inc. $75,000 3.13% 15/11/2027 77,885 0.00%State of Wisconsin $75,000 3.15% 1/5/2027 77,857 0.00%JPMBB Commercial Mortgage Securities Trust 2015 $75,000 3.23% 15/10/2048 77,835 0.00%O’Reilly Automotive, Inc. $75,000 3.80% 1/9/2022 77,828 0.00%Morgan Stanley Bank of America Merrill Lynch Trust 2015 $75,000 3.25% 15/2/2048 77,656 0.00%Cox Communications, Inc. $75,000 4.50% 30/6/2043 77,654 0.00%Healthpeak Properties, Inc. $75,000 3.25% 15/7/2026 77,590 0.00%NetApp, Inc. $75,000 3.30% 29/9/2024 77,553 0.00%Entergy Louisiana LLC $75,000 3.12% 1/9/2027 77,515 0.00%SITE Centers Corp. $75,000 3.90% 15/8/2024 77,514 0.00%CenterPoint Energy Resources Corp. $75,000 3.55% 1/4/2023 77,506 0.00%Los Angeles County Public Works Financing Authority $50,000 7.62% 1/8/2040 77,482 0.00%Wisconsin Power & Light Co. $75,000 3.05% 15/10/2027 77,474 0.00%Oncor Electric Delivery Co. LLC $75,000 2.95% 1/4/2025 77,417 0.00%Mount Sinai Hospitals Group, Inc. $75,000 3.98% 1/7/2048 77,300 0.00%Federal Home Loan Mortgage Corp. $75,000 3.08% 25/1/2031 77,263 0.00%Duke Energy Carolinas LLC $75,000 3.05% 15/3/2023 77,218 0.00%Commonwealth Edison Co. $75,000 2.95% 15/8/2027 77,068 0.00%
Vanguard Global Bond Index Fund
465
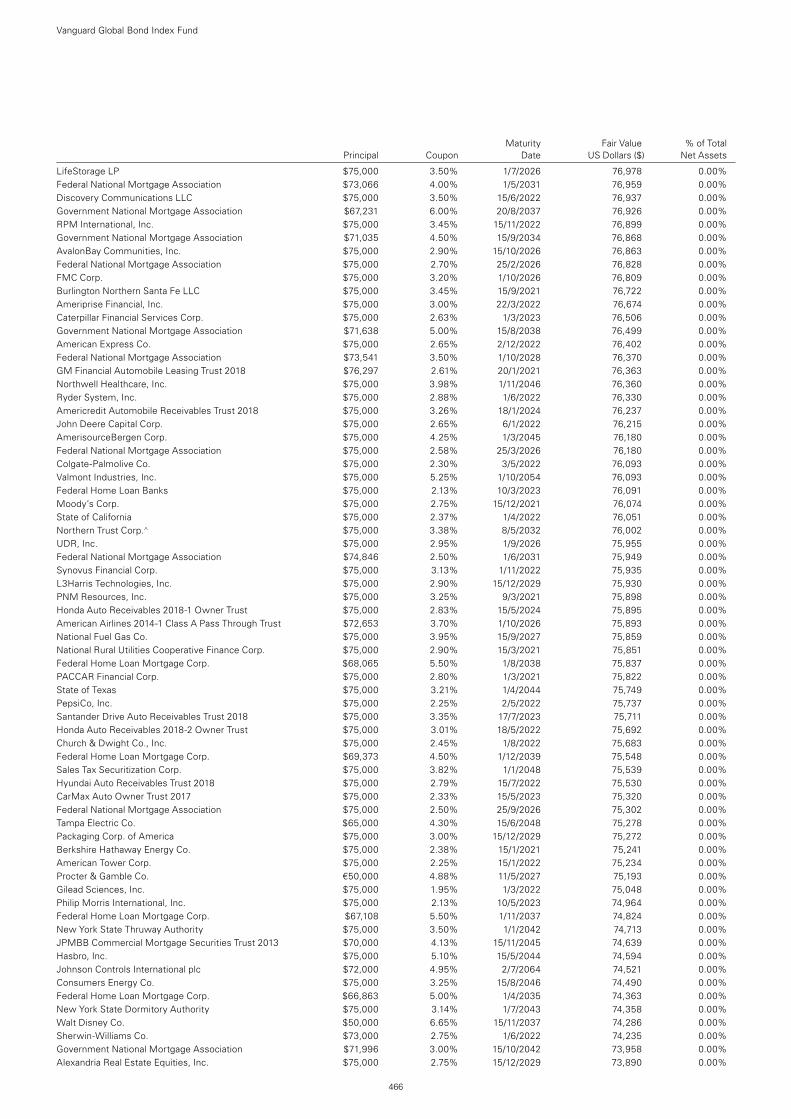
Maturity Fair Value % of Total Principal Coupon Date US Dollars ($) Net Assets
LifeStorage LP $75,000 3.50% 1/7/2026 76,978 0.00%Federal National Mortgage Association $73,066 4.00% 1/5/2031 76,959 0.00%Discovery Communications LLC $75,000 3.50% 15/6/2022 76,937 0.00%Government National Mortgage Association $67,231 6.00% 20/8/2037 76,926 0.00%RPM International, Inc. $75,000 3.45% 15/11/2022 76,899 0.00%Government National Mortgage Association $71,035 4.50% 15/9/2034 76,868 0.00%AvalonBay Communities, Inc. $75,000 2.90% 15/10/2026 76,863 0.00%Federal National Mortgage Association $75,000 2.70% 25/2/2026 76,828 0.00%FMC Corp. $75,000 3.20% 1/10/2026 76,809 0.00%Burlington Northern Santa Fe LLC $75,000 3.45% 15/9/2021 76,722 0.00%Ameriprise Financial, Inc. $75,000 3.00% 22/3/2022 76,674 0.00%Caterpillar Financial Services Corp. $75,000 2.63% 1/3/2023 76,506 0.00%Government National Mortgage Association $71,638 5.00% 15/8/2038 76,499 0.00%American Express Co. $75,000 2.65% 2/12/2022 76,402 0.00%Federal National Mortgage Association $73,541 3.50% 1/10/2028 76,370 0.00%GM Financial Automobile Leasing Trust 2018 $76,297 2.61% 20/1/2021 76,363 0.00%Northwell Healthcare, Inc. $75,000 3.98% 1/11/2046 76,360 0.00%Ryder System, Inc. $75,000 2.88% 1/6/2022 76,330 0.00%Americredit Automobile Receivables Trust 2018 $75,000 3.26% 18/1/2024 76,237 0.00%John Deere Capital Corp. $75,000 2.65% 6/1/2022 76,215 0.00%AmerisourceBergen Corp. $75,000 4.25% 1/3/2045 76,180 0.00%Federal National Mortgage Association $75,000 2.58% 25/3/2026 76,180 0.00%Colgate-Palmolive Co. $75,000 2.30% 3/5/2022 76,093 0.00%Valmont Industries, Inc. $75,000 5.25% 1/10/2054 76,093 0.00%Federal Home Loan Banks $75,000 2.13% 10/3/2023 76,091 0.00%Moody’s Corp. $75,000 2.75% 15/12/2021 76,074 0.00%State of California $75,000 2.37% 1/4/2022 76,051 0.00%Northern Trust Corp.^ $75,000 3.38% 8/5/2032 76,002 0.00%UDR, Inc. $75,000 2.95% 1/9/2026 75,955 0.00%Federal National Mortgage Association $74,846 2.50% 1/6/2031 75,949 0.00%Synovus Financial Corp. $75,000 3.13% 1/11/2022 75,935 0.00%L3Harris Technologies, Inc. $75,000 2.90% 15/12/2029 75,930 0.00%PNM Resources, Inc. $75,000 3.25% 9/3/2021 75,898 0.00%Honda Auto Receivables 2018-1 Owner Trust $75,000 2.83% 15/5/2024 75,895 0.00%American Airlines 2014-1 Class A Pass Through Trust $72,653 3.70% 1/10/2026 75,893 0.00%National Fuel Gas Co. $75,000 3.95% 15/9/2027 75,859 0.00%National Rural Utilities Cooperative Finance Corp. $75,000 2.90% 15/3/2021 75,851 0.00%Federal Home Loan Mortgage Corp. $68,065 5.50% 1/8/2038 75,837 0.00%PACCAR Financial Corp. $75,000 2.80% 1/3/2021 75,822 0.00%State of Texas $75,000 3.21% 1/4/2044 75,749 0.00%PepsiCo, Inc. $75,000 2.25% 2/5/2022 75,737 0.00%Santander Drive Auto Receivables Trust 2018 $75,000 3.35% 17/7/2023 75,711 0.00%Honda Auto Receivables 2018-2 Owner Trust $75,000 3.01% 18/5/2022 75,692 0.00%Church & Dwight Co., Inc. $75,000 2.45% 1/8/2022 75,683 0.00%Federal Home Loan Mortgage Corp. $69,373 4.50% 1/12/2039 75,548 0.00%Sales Tax Securitization Corp. $75,000 3.82% 1/1/2048 75,539 0.00%Hyundai Auto Receivables Trust 2018 $75,000 2.79% 15/7/2022 75,530 0.00%CarMax Auto Owner Trust 2017 $75,000 2.33% 15/5/2023 75,320 0.00%Federal National Mortgage Association $75,000 2.50% 25/9/2026 75,302 0.00%Tampa Electric Co. $65,000 4.30% 15/6/2048 75,278 0.00%Packaging Corp. of America $75,000 3.00% 15/12/2029 75,272 0.00%Berkshire Hathaway Energy Co. $75,000 2.38% 15/1/2021 75,241 0.00%American Tower Corp. $75,000 2.25% 15/1/2022 75,234 0.00%Procter & Gamble Co. €50,000 4.88% 11/5/2027 75,193 0.00%Gilead Sciences, Inc. $75,000 1.95% 1/3/2022 75,048 0.00%Philip Morris International, Inc. $75,000 2.13% 10/5/2023 74,964 0.00%Federal Home Loan Mortgage Corp. $67,108 5.50% 1/11/2037 74,824 0.00%New York State Thruway Authority $75,000 3.50% 1/1/2042 74,713 0.00%JPMBB Commercial Mortgage Securities Trust 2013 $70,000 4.13% 15/11/2045 74,639 0.00%Hasbro, Inc. $75,000 5.10% 15/5/2044 74,594 0.00%Johnson Controls International plc $72,000 4.95% 2/7/2064 74,521 0.00%Consumers Energy Co. $75,000 3.25% 15/8/2046 74,490 0.00%Federal Home Loan Mortgage Corp. $66,863 5.00% 1/4/2035 74,363 0.00%New York State Dormitory Authority $75,000 3.14% 1/7/2043 74,358 0.00%Walt Disney Co. $50,000 6.65% 15/11/2037 74,286 0.00%Sherwin-Williams Co. $73,000 2.75% 1/6/2022 74,235 0.00%Government National Mortgage Association $71,996 3.00% 15/10/2042 73,958 0.00%Alexandria Real Estate Equities, Inc. $75,000 2.75% 15/12/2029 73,890 0.00%
Vanguard Global Bond Index Fund
466
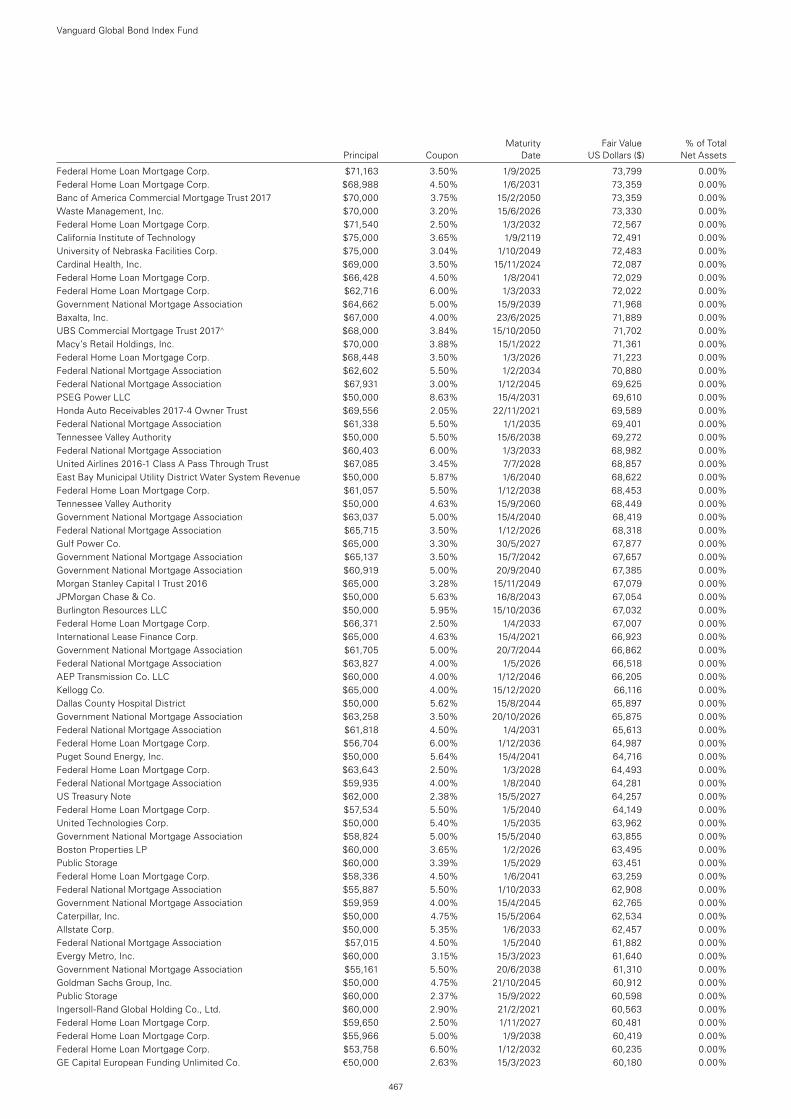
Maturity Fair Value % of Total Principal Coupon Date US Dollars ($) Net Assets
Federal Home Loan Mortgage Corp. $71,163 3.50% 1/9/2025 73,799 0.00%Federal Home Loan Mortgage Corp. $68,988 4.50% 1/6/2031 73,359 0.00%Banc of America Commercial Mortgage Trust 2017 $70,000 3.75% 15/2/2050 73,359 0.00%Waste Management, Inc. $70,000 3.20% 15/6/2026 73,330 0.00%Federal Home Loan Mortgage Corp. $71,540 2.50% 1/3/2032 72,567 0.00%California Institute of Technology $75,000 3.65% 1/9/2119 72,491 0.00%University of Nebraska Facilities Corp. $75,000 3.04% 1/10/2049 72,483 0.00%Cardinal Health, Inc. $69,000 3.50% 15/11/2024 72,087 0.00%Federal Home Loan Mortgage Corp. $66,428 4.50% 1/8/2041 72,029 0.00%Federal Home Loan Mortgage Corp. $62,716 6.00% 1/3/2033 72,022 0.00%Government National Mortgage Association $64,662 5.00% 15/9/2039 71,968 0.00%Baxalta, Inc. $67,000 4.00% 23/6/2025 71,889 0.00%UBS Commercial Mortgage Trust 2017^ $68,000 3.84% 15/10/2050 71,702 0.00%Macy’s Retail Holdings, Inc. $70,000 3.88% 15/1/2022 71,361 0.00%Federal Home Loan Mortgage Corp. $68,448 3.50% 1/3/2026 71,223 0.00%Federal National Mortgage Association $62,602 5.50% 1/2/2034 70,880 0.00%Federal National Mortgage Association $67,931 3.00% 1/12/2045 69,625 0.00%PSEG Power LLC $50,000 8.63% 15/4/2031 69,610 0.00%Honda Auto Receivables 2017-4 Owner Trust $69,556 2.05% 22/11/2021 69,589 0.00%Federal National Mortgage Association $61,338 5.50% 1/1/2035 69,401 0.00%Tennessee Valley Authority $50,000 5.50% 15/6/2038 69,272 0.00%Federal National Mortgage Association $60,403 6.00% 1/3/2033 68,982 0.00%United Airlines 2016-1 Class A Pass Through Trust $67,085 3.45% 7/7/2028 68,857 0.00%East Bay Municipal Utility District Water System Revenue $50,000 5.87% 1/6/2040 68,622 0.00%Federal Home Loan Mortgage Corp. $61,057 5.50% 1/12/2038 68,453 0.00%Tennessee Valley Authority $50,000 4.63% 15/9/2060 68,449 0.00%Government National Mortgage Association $63,037 5.00% 15/4/2040 68,419 0.00%Federal National Mortgage Association $65,715 3.50% 1/12/2026 68,318 0.00%Gulf Power Co. $65,000 3.30% 30/5/2027 67,877 0.00%Government National Mortgage Association $65,137 3.50% 15/7/2042 67,657 0.00%Government National Mortgage Association $60,919 5.00% 20/9/2040 67,385 0.00%Morgan Stanley Capital I Trust 2016 $65,000 3.28% 15/11/2049 67,079 0.00%JPMorgan Chase & Co. $50,000 5.63% 16/8/2043 67,054 0.00%Burlington Resources LLC $50,000 5.95% 15/10/2036 67,032 0.00%Federal Home Loan Mortgage Corp. $66,371 2.50% 1/4/2033 67,007 0.00%International Lease Finance Corp. $65,000 4.63% 15/4/2021 66,923 0.00%Government National Mortgage Association $61,705 5.00% 20/7/2044 66,862 0.00%Federal National Mortgage Association $63,827 4.00% 1/5/2026 66,518 0.00%AEP Transmission Co. LLC $60,000 4.00% 1/12/2046 66,205 0.00%Kellogg Co. $65,000 4.00% 15/12/2020 66,116 0.00%Dallas County Hospital District $50,000 5.62% 15/8/2044 65,897 0.00%Government National Mortgage Association $63,258 3.50% 20/10/2026 65,875 0.00%Federal National Mortgage Association $61,818 4.50% 1/4/2031 65,613 0.00%Federal Home Loan Mortgage Corp. $56,704 6.00% 1/12/2036 64,987 0.00%Puget Sound Energy, Inc. $50,000 5.64% 15/4/2041 64,716 0.00%Federal Home Loan Mortgage Corp. $63,643 2.50% 1/3/2028 64,493 0.00%Federal National Mortgage Association $59,935 4.00% 1/8/2040 64,281 0.00%US Treasury Note $62,000 2.38% 15/5/2027 64,257 0.00%Federal Home Loan Mortgage Corp. $57,534 5.50% 1/5/2040 64,149 0.00%United Technologies Corp. $50,000 5.40% 1/5/2035 63,962 0.00%Government National Mortgage Association $58,824 5.00% 15/5/2040 63,855 0.00%Boston Properties LP $60,000 3.65% 1/2/2026 63,495 0.00%Public Storage $60,000 3.39% 1/5/2029 63,451 0.00%Federal Home Loan Mortgage Corp. $58,336 4.50% 1/6/2041 63,259 0.00%Federal National Mortgage Association $55,887 5.50% 1/10/2033 62,908 0.00%Government National Mortgage Association $59,959 4.00% 15/4/2045 62,765 0.00%Caterpillar, Inc. $50,000 4.75% 15/5/2064 62,534 0.00%Allstate Corp. $50,000 5.35% 1/6/2033 62,457 0.00%Federal National Mortgage Association $57,015 4.50% 1/5/2040 61,882 0.00%Evergy Metro, Inc. $60,000 3.15% 15/3/2023 61,640 0.00%Government National Mortgage Association $55,161 5.50% 20/6/2038 61,310 0.00%Goldman Sachs Group, Inc. $50,000 4.75% 21/10/2045 60,912 0.00%Public Storage $60,000 2.37% 15/9/2022 60,598 0.00%Ingersoll-Rand Global Holding Co., Ltd. $60,000 2.90% 21/2/2021 60,563 0.00%Federal Home Loan Mortgage Corp. $59,650 2.50% 1/11/2027 60,481 0.00%Federal Home Loan Mortgage Corp. $55,966 5.00% 1/9/2038 60,419 0.00%Federal Home Loan Mortgage Corp. $53,758 6.50% 1/12/2032 60,235 0.00%GE Capital European Funding Unlimited Co. €50,000 2.63% 15/3/2023 60,180 0.00%
Vanguard Global Bond Index Fund
467
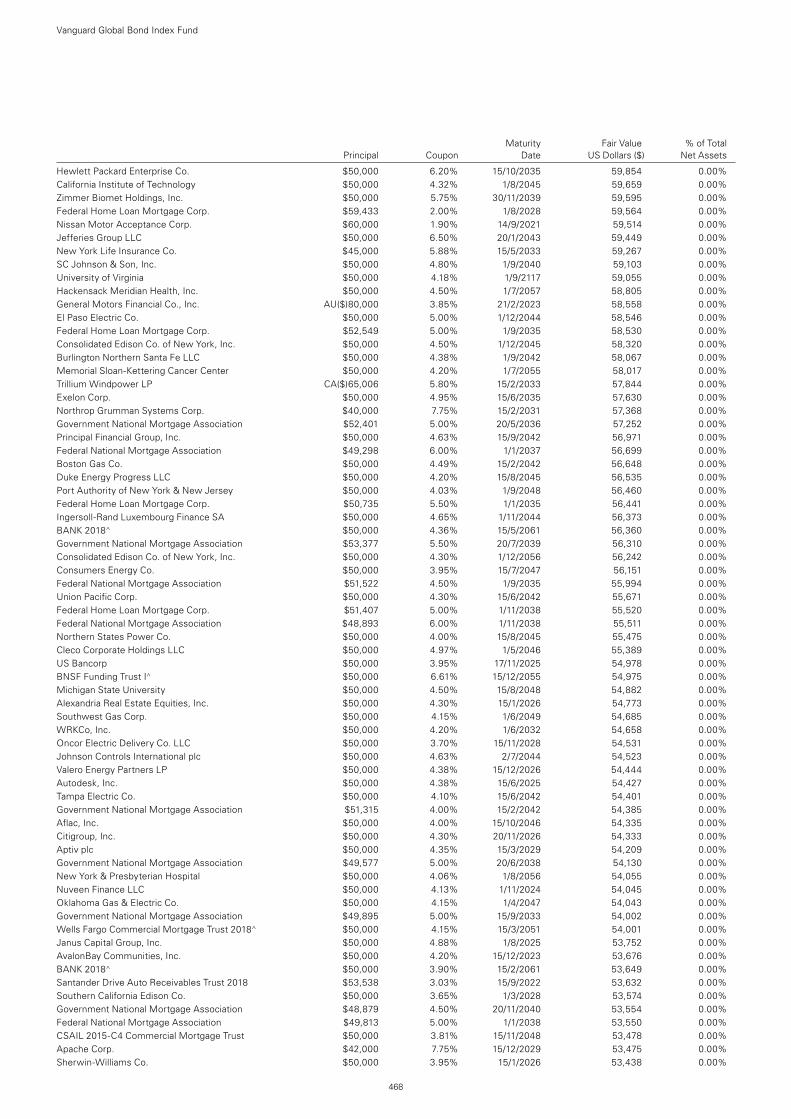
Maturity Fair Value % of Total Principal Coupon Date US Dollars ($) Net Assets
Hewlett Packard Enterprise Co. $50,000 6.20% 15/10/2035 59,854 0.00%California Institute of Technology $50,000 4.32% 1/8/2045 59,659 0.00%Zimmer Biomet Holdings, Inc. $50,000 5.75% 30/11/2039 59,595 0.00%Federal Home Loan Mortgage Corp. $59,433 2.00% 1/8/2028 59,564 0.00%Nissan Motor Acceptance Corp. $60,000 1.90% 14/9/2021 59,514 0.00%Jefferies Group LLC $50,000 6.50% 20/1/2043 59,449 0.00%New York Life Insurance Co. $45,000 5.88% 15/5/2033 59,267 0.00%SC Johnson & Son, Inc. $50,000 4.80% 1/9/2040 59,103 0.00%University of Virginia $50,000 4.18% 1/9/2117 59,055 0.00%Hackensack Meridian Health, Inc. $50,000 4.50% 1/7/2057 58,805 0.00%General Motors Financial Co., Inc. AU($)80,000 3.85% 21/2/2023 58,558 0.00%El Paso Electric Co. $50,000 5.00% 1/12/2044 58,546 0.00%Federal Home Loan Mortgage Corp. $52,549 5.00% 1/9/2035 58,530 0.00%Consolidated Edison Co. of New York, Inc. $50,000 4.50% 1/12/2045 58,320 0.00%Burlington Northern Santa Fe LLC $50,000 4.38% 1/9/2042 58,067 0.00%Memorial Sloan-Kettering Cancer Center $50,000 4.20% 1/7/2055 58,017 0.00%Trillium Windpower LP CA($)65,006 5.80% 15/2/2033 57,844 0.00%Exelon Corp. $50,000 4.95% 15/6/2035 57,630 0.00%Northrop Grumman Systems Corp. $40,000 7.75% 15/2/2031 57,368 0.00%Government National Mortgage Association $52,401 5.00% 20/5/2036 57,252 0.00%Principal Financial Group, Inc. $50,000 4.63% 15/9/2042 56,971 0.00%Federal National Mortgage Association $49,298 6.00% 1/1/2037 56,699 0.00%Boston Gas Co. $50,000 4.49% 15/2/2042 56,648 0.00%Duke Energy Progress LLC $50,000 4.20% 15/8/2045 56,535 0.00%Port Authority of New York & New Jersey $50,000 4.03% 1/9/2048 56,460 0.00%Federal Home Loan Mortgage Corp. $50,735 5.50% 1/1/2035 56,441 0.00%Ingersoll-Rand Luxembourg Finance SA $50,000 4.65% 1/11/2044 56,373 0.00%BANK 2018^ $50,000 4.36% 15/5/2061 56,360 0.00%Government National Mortgage Association $53,377 5.50% 20/7/2039 56,310 0.00%Consolidated Edison Co. of New York, Inc. $50,000 4.30% 1/12/2056 56,242 0.00%Consumers Energy Co. $50,000 3.95% 15/7/2047 56,151 0.00%Federal National Mortgage Association $51,522 4.50% 1/9/2035 55,994 0.00%Union Pacific Corp. $50,000 4.30% 15/6/2042 55,671 0.00%Federal Home Loan Mortgage Corp. $51,407 5.00% 1/11/2038 55,520 0.00%Federal National Mortgage Association $48,893 6.00% 1/11/2038 55,511 0.00%Northern States Power Co. $50,000 4.00% 15/8/2045 55,475 0.00%Cleco Corporate Holdings LLC $50,000 4.97% 1/5/2046 55,389 0.00%US Bancorp $50,000 3.95% 17/11/2025 54,978 0.00%BNSF Funding Trust I^ $50,000 6.61% 15/12/2055 54,975 0.00%Michigan State University $50,000 4.50% 15/8/2048 54,882 0.00%Alexandria Real Estate Equities, Inc. $50,000 4.30% 15/1/2026 54,773 0.00%Southwest Gas Corp. $50,000 4.15% 1/6/2049 54,685 0.00%WRKCo, Inc. $50,000 4.20% 1/6/2032 54,658 0.00%Oncor Electric Delivery Co. LLC $50,000 3.70% 15/11/2028 54,531 0.00%Johnson Controls International plc $50,000 4.63% 2/7/2044 54,523 0.00%Valero Energy Partners LP $50,000 4.38% 15/12/2026 54,444 0.00%Autodesk, Inc. $50,000 4.38% 15/6/2025 54,427 0.00%Tampa Electric Co. $50,000 4.10% 15/6/2042 54,401 0.00%Government National Mortgage Association $51,315 4.00% 15/2/2042 54,385 0.00%Aflac, Inc. $50,000 4.00% 15/10/2046 54,335 0.00%Citigroup, Inc. $50,000 4.30% 20/11/2026 54,333 0.00%Aptiv plc $50,000 4.35% 15/3/2029 54,209 0.00%Government National Mortgage Association $49,577 5.00% 20/6/2038 54,130 0.00%New York & Presbyterian Hospital $50,000 4.06% 1/8/2056 54,055 0.00%Nuveen Finance LLC $50,000 4.13% 1/11/2024 54,045 0.00%Oklahoma Gas & Electric Co. $50,000 4.15% 1/4/2047 54,043 0.00%Government National Mortgage Association $49,895 5.00% 15/9/2033 54,002 0.00%Wells Fargo Commercial Mortgage Trust 2018^ $50,000 4.15% 15/3/2051 54,001 0.00%Janus Capital Group, Inc. $50,000 4.88% 1/8/2025 53,752 0.00%AvalonBay Communities, Inc. $50,000 4.20% 15/12/2023 53,676 0.00%BANK 2018^ $50,000 3.90% 15/2/2061 53,649 0.00%Santander Drive Auto Receivables Trust 2018 $53,538 3.03% 15/9/2022 53,632 0.00%Southern California Edison Co. $50,000 3.65% 1/3/2028 53,574 0.00%Government National Mortgage Association $48,879 4.50% 20/11/2040 53,554 0.00%Federal National Mortgage Association $49,813 5.00% 1/1/2038 53,550 0.00%CSAIL 2015-C4 Commercial Mortgage Trust $50,000 3.81% 15/11/2048 53,478 0.00%Apache Corp. $42,000 7.75% 15/12/2029 53,475 0.00%Sherwin-Williams Co. $50,000 3.95% 15/1/2026 53,438 0.00%
Vanguard Global Bond Index Fund
468
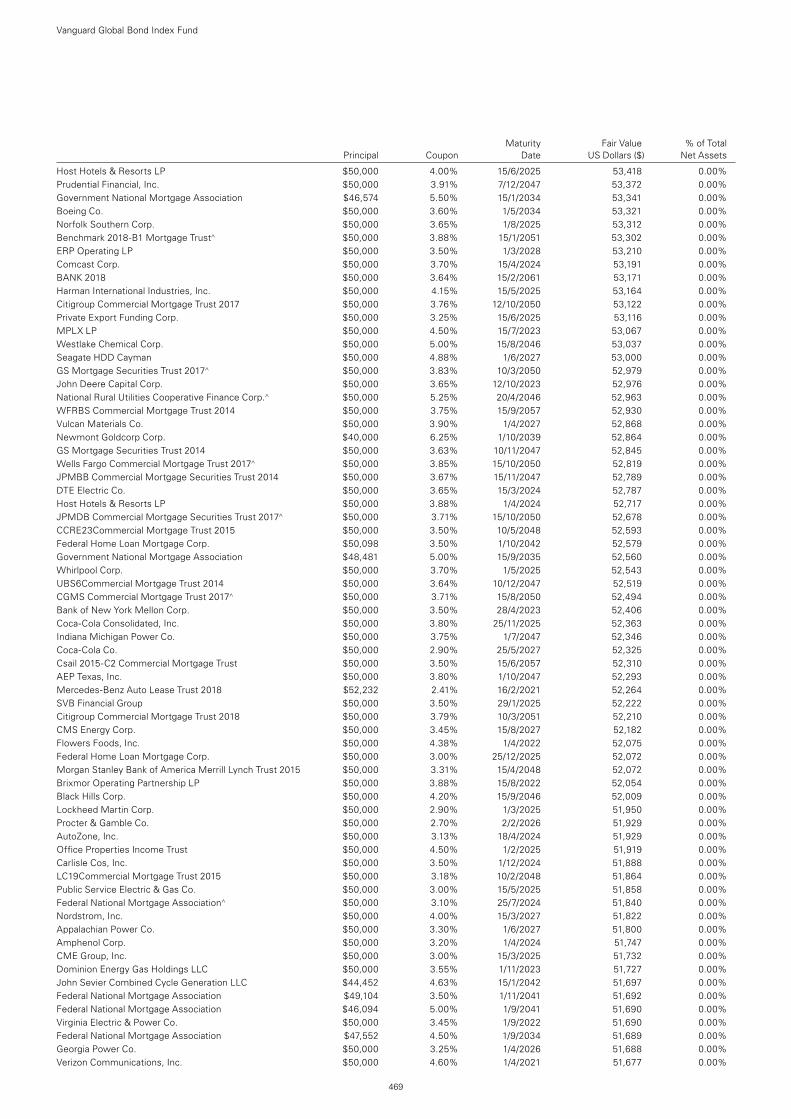
Maturity Fair Value % of Total Principal Coupon Date US Dollars ($) Net Assets
Host Hotels & Resorts LP $50,000 4.00% 15/6/2025 53,418 0.00%Prudential Financial, Inc. $50,000 3.91% 7/12/2047 53,372 0.00%Government National Mortgage Association $46,574 5.50% 15/1/2034 53,341 0.00%Boeing Co. $50,000 3.60% 1/5/2034 53,321 0.00%Norfolk Southern Corp. $50,000 3.65% 1/8/2025 53,312 0.00%Benchmark 2018-B1 Mortgage Trust^ $50,000 3.88% 15/1/2051 53,302 0.00%ERP Operating LP $50,000 3.50% 1/3/2028 53,210 0.00%Comcast Corp. $50,000 3.70% 15/4/2024 53,191 0.00%BANK 2018 $50,000 3.64% 15/2/2061 53,171 0.00%Harman International Industries, Inc. $50,000 4.15% 15/5/2025 53,164 0.00%Citigroup Commercial Mortgage Trust 2017 $50,000 3.76% 12/10/2050 53,122 0.00%Private Export Funding Corp. $50,000 3.25% 15/6/2025 53,116 0.00%MPLX LP $50,000 4.50% 15/7/2023 53,067 0.00%Westlake Chemical Corp. $50,000 5.00% 15/8/2046 53,037 0.00%Seagate HDD Cayman $50,000 4.88% 1/6/2027 53,000 0.00%GS Mortgage Securities Trust 2017^ $50,000 3.83% 10/3/2050 52,979 0.00%John Deere Capital Corp. $50,000 3.65% 12/10/2023 52,976 0.00%National Rural Utilities Cooperative Finance Corp.^ $50,000 5.25% 20/4/2046 52,963 0.00%WFRBS Commercial Mortgage Trust 2014 $50,000 3.75% 15/9/2057 52,930 0.00%Vulcan Materials Co. $50,000 3.90% 1/4/2027 52,868 0.00%Newmont Goldcorp Corp. $40,000 6.25% 1/10/2039 52,864 0.00%GS Mortgage Securities Trust 2014 $50,000 3.63% 10/11/2047 52,845 0.00%Wells Fargo Commercial Mortgage Trust 2017^ $50,000 3.85% 15/10/2050 52,819 0.00%JPMBB Commercial Mortgage Securities Trust 2014 $50,000 3.67% 15/11/2047 52,789 0.00%DTE Electric Co. $50,000 3.65% 15/3/2024 52,787 0.00%Host Hotels & Resorts LP $50,000 3.88% 1/4/2024 52,717 0.00%JPMDB Commercial Mortgage Securities Trust 2017^ $50,000 3.71% 15/10/2050 52,678 0.00%CCRE23Commercial Mortgage Trust 2015 $50,000 3.50% 10/5/2048 52,593 0.00%Federal Home Loan Mortgage Corp. $50,098 3.50% 1/10/2042 52,579 0.00%Government National Mortgage Association $48,481 5.00% 15/9/2035 52,560 0.00%Whirlpool Corp. $50,000 3.70% 1/5/2025 52,543 0.00%UBS6Commercial Mortgage Trust 2014 $50,000 3.64% 10/12/2047 52,519 0.00%CGMS Commercial Mortgage Trust 2017^ $50,000 3.71% 15/8/2050 52,494 0.00%Bank of New York Mellon Corp. $50,000 3.50% 28/4/2023 52,406 0.00%Coca-Cola Consolidated, Inc. $50,000 3.80% 25/11/2025 52,363 0.00%Indiana Michigan Power Co. $50,000 3.75% 1/7/2047 52,346 0.00%Coca-Cola Co. $50,000 2.90% 25/5/2027 52,325 0.00%Csail 2015-C2 Commercial Mortgage Trust $50,000 3.50% 15/6/2057 52,310 0.00%AEP Texas, Inc. $50,000 3.80% 1/10/2047 52,293 0.00%Mercedes-Benz Auto Lease Trust 2018 $52,232 2.41% 16/2/2021 52,264 0.00%SVB Financial Group $50,000 3.50% 29/1/2025 52,222 0.00%Citigroup Commercial Mortgage Trust 2018 $50,000 3.79% 10/3/2051 52,210 0.00%CMS Energy Corp. $50,000 3.45% 15/8/2027 52,182 0.00%Flowers Foods, Inc. $50,000 4.38% 1/4/2022 52,075 0.00%Federal Home Loan Mortgage Corp. $50,000 3.00% 25/12/2025 52,072 0.00%Morgan Stanley Bank of America Merrill Lynch Trust 2015 $50,000 3.31% 15/4/2048 52,072 0.00%Brixmor Operating Partnership LP $50,000 3.88% 15/8/2022 52,054 0.00%Black Hills Corp. $50,000 4.20% 15/9/2046 52,009 0.00%Lockheed Martin Corp. $50,000 2.90% 1/3/2025 51,950 0.00%Procter & Gamble Co. $50,000 2.70% 2/2/2026 51,929 0.00%AutoZone, Inc. $50,000 3.13% 18/4/2024 51,929 0.00%Office Properties Income Trust $50,000 4.50% 1/2/2025 51,919 0.00%Carlisle Cos, Inc. $50,000 3.50% 1/12/2024 51,888 0.00%LC19Commercial Mortgage Trust 2015 $50,000 3.18% 10/2/2048 51,864 0.00%Public Service Electric & Gas Co. $50,000 3.00% 15/5/2025 51,858 0.00%Federal National Mortgage Association^ $50,000 3.10% 25/7/2024 51,840 0.00%Nordstrom, Inc. $50,000 4.00% 15/3/2027 51,822 0.00%Appalachian Power Co. $50,000 3.30% 1/6/2027 51,800 0.00%Amphenol Corp. $50,000 3.20% 1/4/2024 51,747 0.00%CME Group, Inc. $50,000 3.00% 15/3/2025 51,732 0.00%Dominion Energy Gas Holdings LLC $50,000 3.55% 1/11/2023 51,727 0.00%John Sevier Combined Cycle Generation LLC $44,452 4.63% 15/1/2042 51,697 0.00%Federal National Mortgage Association $49,104 3.50% 1/11/2041 51,692 0.00%Federal National Mortgage Association $46,094 5.00% 1/9/2041 51,690 0.00%Virginia Electric & Power Co. $50,000 3.45% 1/9/2022 51,690 0.00%Federal National Mortgage Association $47,552 4.50% 1/9/2034 51,689 0.00%Georgia Power Co. $50,000 3.25% 1/4/2026 51,688 0.00%Verizon Communications, Inc. $50,000 4.60% 1/4/2021 51,677 0.00%
Vanguard Global Bond Index Fund
469
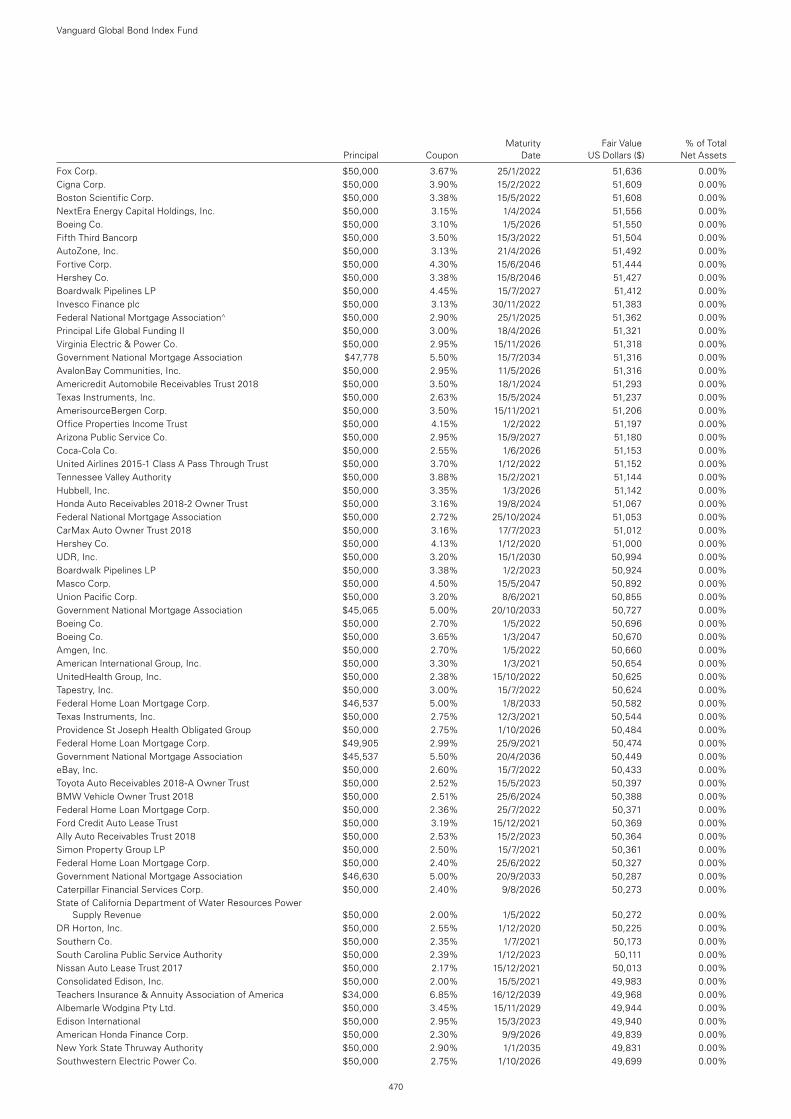
Maturity Fair Value % of Total Principal Coupon Date US Dollars ($) Net Assets
Fox Corp. $50,000 3.67% 25/1/2022 51,636 0.00%Cigna Corp. $50,000 3.90% 15/2/2022 51,609 0.00%Boston Scientific Corp. $50,000 3.38% 15/5/2022 51,608 0.00%NextEra Energy Capital Holdings, Inc. $50,000 3.15% 1/4/2024 51,556 0.00%Boeing Co. $50,000 3.10% 1/5/2026 51,550 0.00%Fifth Third Bancorp $50,000 3.50% 15/3/2022 51,504 0.00%AutoZone, Inc. $50,000 3.13% 21/4/2026 51,492 0.00%Fortive Corp. $50,000 4.30% 15/6/2046 51,444 0.00%Hershey Co. $50,000 3.38% 15/8/2046 51,427 0.00%Boardwalk Pipelines LP $50,000 4.45% 15/7/2027 51,412 0.00%Invesco Finance plc $50,000 3.13% 30/11/2022 51,383 0.00%Federal National Mortgage Association^ $50,000 2.90% 25/1/2025 51,362 0.00%Principal Life Global Funding II $50,000 3.00% 18/4/2026 51,321 0.00%Virginia Electric & Power Co. $50,000 2.95% 15/11/2026 51,318 0.00%Government National Mortgage Association $47,778 5.50% 15/7/2034 51,316 0.00%AvalonBay Communities, Inc. $50,000 2.95% 11/5/2026 51,316 0.00%Americredit Automobile Receivables Trust 2018 $50,000 3.50% 18/1/2024 51,293 0.00%Texas Instruments, Inc. $50,000 2.63% 15/5/2024 51,237 0.00%AmerisourceBergen Corp. $50,000 3.50% 15/11/2021 51,206 0.00%Office Properties Income Trust $50,000 4.15% 1/2/2022 51,197 0.00%Arizona Public Service Co. $50,000 2.95% 15/9/2027 51,180 0.00%Coca-Cola Co. $50,000 2.55% 1/6/2026 51,153 0.00%United Airlines 2015-1 Class A Pass Through Trust $50,000 3.70% 1/12/2022 51,152 0.00%Tennessee Valley Authority $50,000 3.88% 15/2/2021 51,144 0.00%Hubbell, Inc. $50,000 3.35% 1/3/2026 51,142 0.00%Honda Auto Receivables 2018-2 Owner Trust $50,000 3.16% 19/8/2024 51,067 0.00%Federal National Mortgage Association $50,000 2.72% 25/10/2024 51,053 0.00%CarMax Auto Owner Trust 2018 $50,000 3.16% 17/7/2023 51,012 0.00%Hershey Co. $50,000 4.13% 1/12/2020 51,000 0.00%UDR, Inc. $50,000 3.20% 15/1/2030 50,994 0.00%Boardwalk Pipelines LP $50,000 3.38% 1/2/2023 50,924 0.00%Masco Corp. $50,000 4.50% 15/5/2047 50,892 0.00%Union Pacific Corp. $50,000 3.20% 8/6/2021 50,855 0.00%Government National Mortgage Association $45,065 5.00% 20/10/2033 50,727 0.00%Boeing Co. $50,000 2.70% 1/5/2022 50,696 0.00%Boeing Co. $50,000 3.65% 1/3/2047 50,670 0.00%Amgen, Inc. $50,000 2.70% 1/5/2022 50,660 0.00%American International Group, Inc. $50,000 3.30% 1/3/2021 50,654 0.00%UnitedHealth Group, Inc. $50,000 2.38% 15/10/2022 50,625 0.00%Tapestry, Inc. $50,000 3.00% 15/7/2022 50,624 0.00%Federal Home Loan Mortgage Corp. $46,537 5.00% 1/8/2033 50,582 0.00%Texas Instruments, Inc. $50,000 2.75% 12/3/2021 50,544 0.00%Providence St Joseph Health Obligated Group $50,000 2.75% 1/10/2026 50,484 0.00%Federal Home Loan Mortgage Corp. $49,905 2.99% 25/9/2021 50,474 0.00%Government National Mortgage Association $45,537 5.50% 20/4/2036 50,449 0.00%eBay, Inc. $50,000 2.60% 15/7/2022 50,433 0.00%Toyota Auto Receivables 2018-A Owner Trust $50,000 2.52% 15/5/2023 50,397 0.00%BMW Vehicle Owner Trust 2018 $50,000 2.51% 25/6/2024 50,388 0.00%Federal Home Loan Mortgage Corp. $50,000 2.36% 25/7/2022 50,371 0.00%Ford Credit Auto Lease Trust $50,000 3.19% 15/12/2021 50,369 0.00%Ally Auto Receivables Trust 2018 $50,000 2.53% 15/2/2023 50,364 0.00%Simon Property Group LP $50,000 2.50% 15/7/2021 50,361 0.00%Federal Home Loan Mortgage Corp. $50,000 2.40% 25/6/2022 50,327 0.00%Government National Mortgage Association $46,630 5.00% 20/9/2033 50,287 0.00%Caterpillar Financial Services Corp. $50,000 2.40% 9/8/2026 50,273 0.00%State of California Department of Water Resources Power
Supply Revenue $50,000 2.00% 1/5/2022 50,272 0.00%DR Horton, Inc. $50,000 2.55% 1/12/2020 50,225 0.00%Southern Co. $50,000 2.35% 1/7/2021 50,173 0.00%South Carolina Public Service Authority $50,000 2.39% 1/12/2023 50,111 0.00%Nissan Auto Lease Trust 2017 $50,000 2.17% 15/12/2021 50,013 0.00%Consolidated Edison, Inc. $50,000 2.00% 15/5/2021 49,983 0.00%Teachers Insurance & Annuity Association of America $34,000 6.85% 16/12/2039 49,968 0.00%Albemarle Wodgina Pty Ltd. $50,000 3.45% 15/11/2029 49,944 0.00%Edison International $50,000 2.95% 15/3/2023 49,940 0.00%American Honda Finance Corp. $50,000 2.30% 9/9/2026 49,839 0.00%New York State Thruway Authority $50,000 2.90% 1/1/2035 49,831 0.00%Southwestern Electric Power Co. $50,000 2.75% 1/10/2026 49,699 0.00%
Vanguard Global Bond Index Fund
470
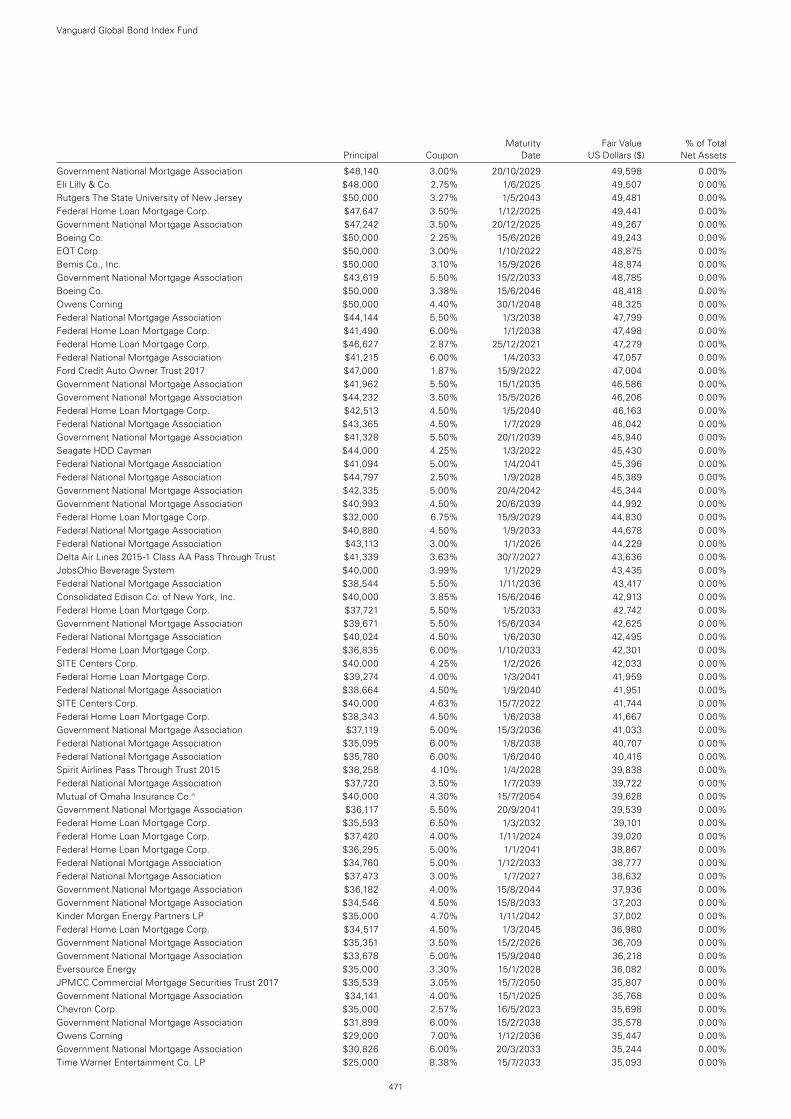
Maturity Fair Value % of Total Principal Coupon Date US Dollars ($) Net Assets
Government National Mortgage Association $48,140 3.00% 20/10/2029 49,598 0.00%Eli Lilly & Co. $48,000 2.75% 1/6/2025 49,507 0.00%Rutgers The State University of New Jersey $50,000 3.27% 1/5/2043 49,481 0.00%Federal Home Loan Mortgage Corp. $47,647 3.50% 1/12/2025 49,441 0.00%Government National Mortgage Association $47,242 3.50% 20/12/2025 49,267 0.00%Boeing Co. $50,000 2.25% 15/6/2026 49,243 0.00%EQT Corp. $50,000 3.00% 1/10/2022 48,875 0.00%Bemis Co., Inc. $50,000 3.10% 15/9/2026 48,874 0.00%Government National Mortgage Association $43,619 5.50% 15/2/2033 48,785 0.00%Boeing Co. $50,000 3.38% 15/6/2046 48,418 0.00%Owens Corning $50,000 4.40% 30/1/2048 48,325 0.00%Federal National Mortgage Association $44,144 5.50% 1/3/2038 47,799 0.00%Federal Home Loan Mortgage Corp. $41,490 6.00% 1/1/2038 47,498 0.00%Federal Home Loan Mortgage Corp. $46,627 2.87% 25/12/2021 47,279 0.00%Federal National Mortgage Association $41,215 6.00% 1/4/2033 47,057 0.00%Ford Credit Auto Owner Trust 2017 $47,000 1.87% 15/9/2022 47,004 0.00%Government National Mortgage Association $41,962 5.50% 15/1/2035 46,586 0.00%Government National Mortgage Association $44,232 3.50% 15/5/2026 46,206 0.00%Federal Home Loan Mortgage Corp. $42,513 4.50% 1/5/2040 46,163 0.00%Federal National Mortgage Association $43,365 4.50% 1/7/2029 46,042 0.00%Government National Mortgage Association $41,328 5.50% 20/1/2039 45,940 0.00%Seagate HDD Cayman $44,000 4.25% 1/3/2022 45,430 0.00%Federal National Mortgage Association $41,094 5.00% 1/4/2041 45,396 0.00%Federal National Mortgage Association $44,797 2.50% 1/9/2028 45,389 0.00%Government National Mortgage Association $42,335 5.00% 20/4/2042 45,344 0.00%Government National Mortgage Association $40,993 4.50% 20/6/2039 44,992 0.00%Federal Home Loan Mortgage Corp. $32,000 6.75% 15/9/2029 44,830 0.00%Federal National Mortgage Association $40,880 4.50% 1/9/2033 44,678 0.00%Federal National Mortgage Association $43,113 3.00% 1/1/2026 44,229 0.00%Delta Air Lines 2015-1 Class AA Pass Through Trust $41,339 3.63% 30/7/2027 43,636 0.00%JobsOhio Beverage System $40,000 3.99% 1/1/2029 43,435 0.00%Federal National Mortgage Association $38,544 5.50% 1/11/2036 43,417 0.00%Consolidated Edison Co. of New York, Inc. $40,000 3.85% 15/6/2046 42,913 0.00%Federal Home Loan Mortgage Corp. $37,721 5.50% 1/5/2033 42,742 0.00%Government National Mortgage Association $39,671 5.50% 15/6/2034 42,625 0.00%Federal National Mortgage Association $40,024 4.50% 1/6/2030 42,495 0.00%Federal Home Loan Mortgage Corp. $36,835 6.00% 1/10/2033 42,301 0.00%SITE Centers Corp. $40,000 4.25% 1/2/2026 42,033 0.00%Federal Home Loan Mortgage Corp. $39,274 4.00% 1/3/2041 41,959 0.00%Federal National Mortgage Association $38,664 4.50% 1/9/2040 41,951 0.00%SITE Centers Corp. $40,000 4.63% 15/7/2022 41,744 0.00%Federal Home Loan Mortgage Corp. $38,343 4.50% 1/6/2038 41,667 0.00%Government National Mortgage Association $37,119 5.00% 15/3/2036 41,033 0.00%Federal National Mortgage Association $35,095 6.00% 1/8/2038 40,707 0.00%Federal National Mortgage Association $35,780 6.00% 1/6/2040 40,415 0.00%Spirit Airlines Pass Through Trust 2015 $38,258 4.10% 1/4/2028 39,838 0.00%Federal National Mortgage Association $37,720 3.50% 1/7/2039 39,722 0.00%Mutual of Omaha Insurance Co.^ $40,000 4.30% 15/7/2054 39,628 0.00%Government National Mortgage Association $36,117 5.50% 20/9/2041 39,539 0.00%Federal Home Loan Mortgage Corp. $35,593 6.50% 1/3/2032 39,101 0.00%Federal Home Loan Mortgage Corp. $37,420 4.00% 1/11/2024 39,020 0.00%Federal Home Loan Mortgage Corp. $36,295 5.00% 1/1/2041 38,867 0.00%Federal National Mortgage Association $34,760 5.00% 1/12/2033 38,777 0.00%Federal National Mortgage Association $37,473 3.00% 1/7/2027 38,632 0.00%Government National Mortgage Association $36,182 4.00% 15/8/2044 37,936 0.00%Government National Mortgage Association $34,546 4.50% 15/8/2033 37,203 0.00%Kinder Morgan Energy Partners LP $35,000 4.70% 1/11/2042 37,002 0.00%Federal Home Loan Mortgage Corp. $34,517 4.50% 1/3/2045 36,980 0.00%Government National Mortgage Association $35,351 3.50% 15/2/2026 36,709 0.00%Government National Mortgage Association $33,678 5.00% 15/9/2040 36,218 0.00%Eversource Energy $35,000 3.30% 15/1/2028 36,082 0.00%JPMCC Commercial Mortgage Securities Trust 2017 $35,539 3.05% 15/7/2050 35,807 0.00%Government National Mortgage Association $34,141 4.00% 15/1/2025 35,768 0.00%Chevron Corp. $35,000 2.57% 16/5/2023 35,698 0.00%Government National Mortgage Association $31,899 6.00% 15/2/2038 35,578 0.00%Owens Corning $29,000 7.00% 1/12/2036 35,447 0.00%Government National Mortgage Association $30,826 6.00% 20/3/2033 35,244 0.00%Time Warner Entertainment Co. LP $25,000 8.38% 15/7/2033 35,093 0.00%
Vanguard Global Bond Index Fund
471
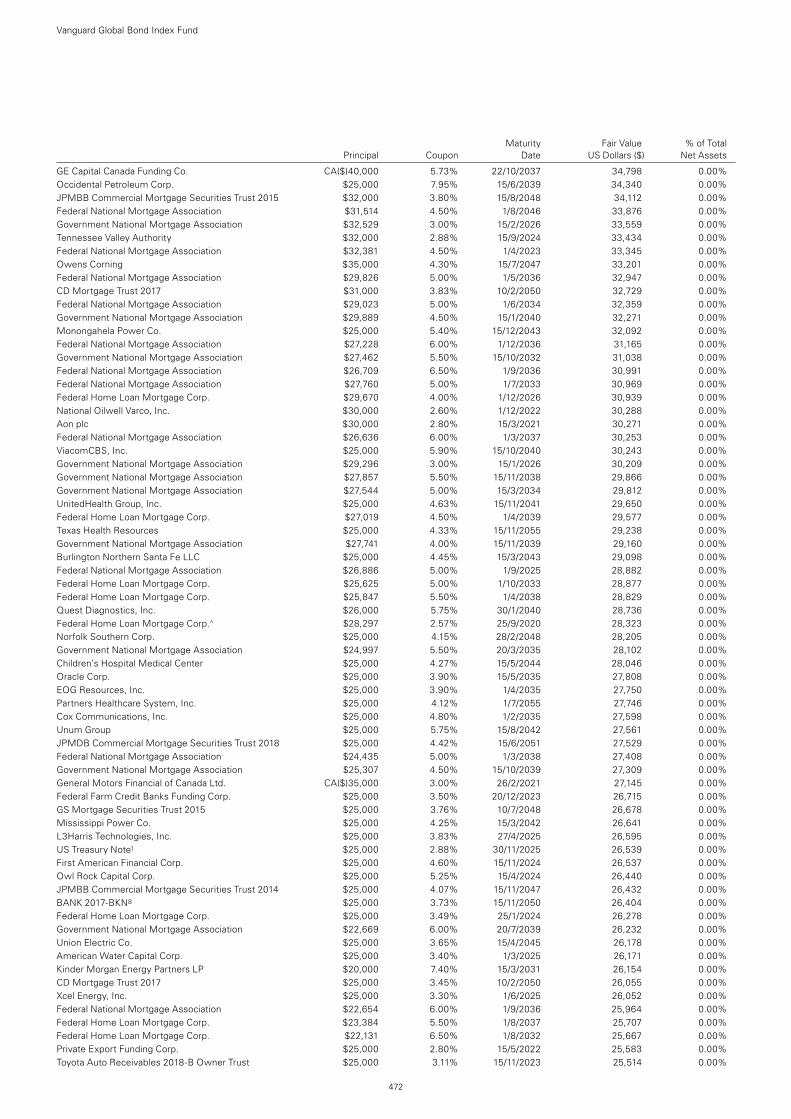
Maturity Fair Value % of Total Principal Coupon Date US Dollars ($) Net Assets
GE Capital Canada Funding Co. CA($)40,000 5.73% 22/10/2037 34,798 0.00%Occidental Petroleum Corp. $25,000 7.95% 15/6/2039 34,340 0.00%JPMBB Commercial Mortgage Securities Trust 2015 $32,000 3.80% 15/8/2048 34,112 0.00%Federal National Mortgage Association $31,514 4.50% 1/8/2046 33,876 0.00%Government National Mortgage Association $32,529 3.00% 15/2/2026 33,559 0.00%Tennessee Valley Authority $32,000 2.88% 15/9/2024 33,434 0.00%Federal National Mortgage Association $32,381 4.50% 1/4/2023 33,345 0.00%Owens Corning $35,000 4.30% 15/7/2047 33,201 0.00%Federal National Mortgage Association $29,826 5.00% 1/5/2036 32,947 0.00%CD Mortgage Trust 2017 $31,000 3.83% 10/2/2050 32,729 0.00%Federal National Mortgage Association $29,023 5.00% 1/6/2034 32,359 0.00%Government National Mortgage Association $29,889 4.50% 15/1/2040 32,271 0.00%Monongahela Power Co. $25,000 5.40% 15/12/2043 32,092 0.00%Federal National Mortgage Association $27,228 6.00% 1/12/2036 31,165 0.00%Government National Mortgage Association $27,462 5.50% 15/10/2032 31,038 0.00%Federal National Mortgage Association $26,709 6.50% 1/9/2036 30,991 0.00%Federal National Mortgage Association $27,760 5.00% 1/7/2033 30,969 0.00%Federal Home Loan Mortgage Corp. $29,670 4.00% 1/12/2026 30,939 0.00%National Oilwell Varco, Inc. $30,000 2.60% 1/12/2022 30,288 0.00%Aon plc $30,000 2.80% 15/3/2021 30,271 0.00%Federal National Mortgage Association $26,636 6.00% 1/3/2037 30,253 0.00%ViacomCBS, Inc. $25,000 5.90% 15/10/2040 30,243 0.00%Government National Mortgage Association $29,296 3.00% 15/1/2026 30,209 0.00%Government National Mortgage Association $27,857 5.50% 15/11/2038 29,866 0.00%Government National Mortgage Association $27,544 5.00% 15/3/2034 29,812 0.00%UnitedHealth Group, Inc. $25,000 4.63% 15/11/2041 29,650 0.00%Federal Home Loan Mortgage Corp. $27,019 4.50% 1/4/2039 29,577 0.00%Texas Health Resources $25,000 4.33% 15/11/2055 29,238 0.00%Government National Mortgage Association $27,741 4.00% 15/11/2039 29,160 0.00%Burlington Northern Santa Fe LLC $25,000 4.45% 15/3/2043 29,098 0.00%Federal National Mortgage Association $26,886 5.00% 1/9/2025 28,882 0.00%Federal Home Loan Mortgage Corp. $25,625 5.00% 1/10/2033 28,877 0.00%Federal Home Loan Mortgage Corp. $25,847 5.50% 1/4/2038 28,829 0.00%Quest Diagnostics, Inc. $26,000 5.75% 30/1/2040 28,736 0.00%Federal Home Loan Mortgage Corp.^ $28,297 2.57% 25/9/2020 28,323 0.00%Norfolk Southern Corp. $25,000 4.15% 28/2/2048 28,205 0.00%Government National Mortgage Association $24,997 5.50% 20/3/2035 28,102 0.00%Children’s Hospital Medical Center $25,000 4.27% 15/5/2044 28,046 0.00%Oracle Corp. $25,000 3.90% 15/5/2035 27,808 0.00%EOG Resources, Inc. $25,000 3.90% 1/4/2035 27,750 0.00%Partners Healthcare System, Inc. $25,000 4.12% 1/7/2055 27,746 0.00%Cox Communications, Inc. $25,000 4.80% 1/2/2035 27,598 0.00%Unum Group $25,000 5.75% 15/8/2042 27,561 0.00%JPMDB Commercial Mortgage Securities Trust 2018 $25,000 4.42% 15/6/2051 27,529 0.00%Federal National Mortgage Association $24,435 5.00% 1/3/2038 27,408 0.00%Government National Mortgage Association $25,307 4.50% 15/10/2039 27,309 0.00%General Motors Financial of Canada Ltd. CA($)35,000 3.00% 26/2/2021 27,145 0.00%Federal Farm Credit Banks Funding Corp. $25,000 3.50% 20/12/2023 26,715 0.00%GS Mortgage Securities Trust 2015 $25,000 3.76% 10/7/2048 26,678 0.00%Mississippi Power Co. $25,000 4.25% 15/3/2042 26,641 0.00%L3Harris Technologies, Inc. $25,000 3.83% 27/4/2025 26,595 0.00%US Treasury Note1 $25,000 2.88% 30/11/2025 26,539 0.00%First American Financial Corp. $25,000 4.60% 15/11/2024 26,537 0.00%Owl Rock Capital Corp. $25,000 5.25% 15/4/2024 26,440 0.00%JPMBB Commercial Mortgage Securities Trust 2014 $25,000 4.07% 15/11/2047 26,432 0.00%BANK 2017-BKN8 $25,000 3.73% 15/11/2050 26,404 0.00%Federal Home Loan Mortgage Corp. $25,000 3.49% 25/1/2024 26,278 0.00%Government National Mortgage Association $22,669 6.00% 20/7/2039 26,232 0.00%Union Electric Co. $25,000 3.65% 15/4/2045 26,178 0.00%American Water Capital Corp. $25,000 3.40% 1/3/2025 26,171 0.00%Kinder Morgan Energy Partners LP $20,000 7.40% 15/3/2031 26,154 0.00%CD Mortgage Trust 2017 $25,000 3.45% 10/2/2050 26,055 0.00%Xcel Energy, Inc. $25,000 3.30% 1/6/2025 26,052 0.00%Federal National Mortgage Association $22,654 6.00% 1/9/2036 25,964 0.00%Federal Home Loan Mortgage Corp. $23,384 5.50% 1/8/2037 25,707 0.00%Federal Home Loan Mortgage Corp. $22,131 6.50% 1/8/2032 25,667 0.00%Private Export Funding Corp. $25,000 2.80% 15/5/2022 25,583 0.00%Toyota Auto Receivables 2018-B Owner Trust $25,000 3.11% 15/11/2023 25,514 0.00%
Vanguard Global Bond Index Fund
472
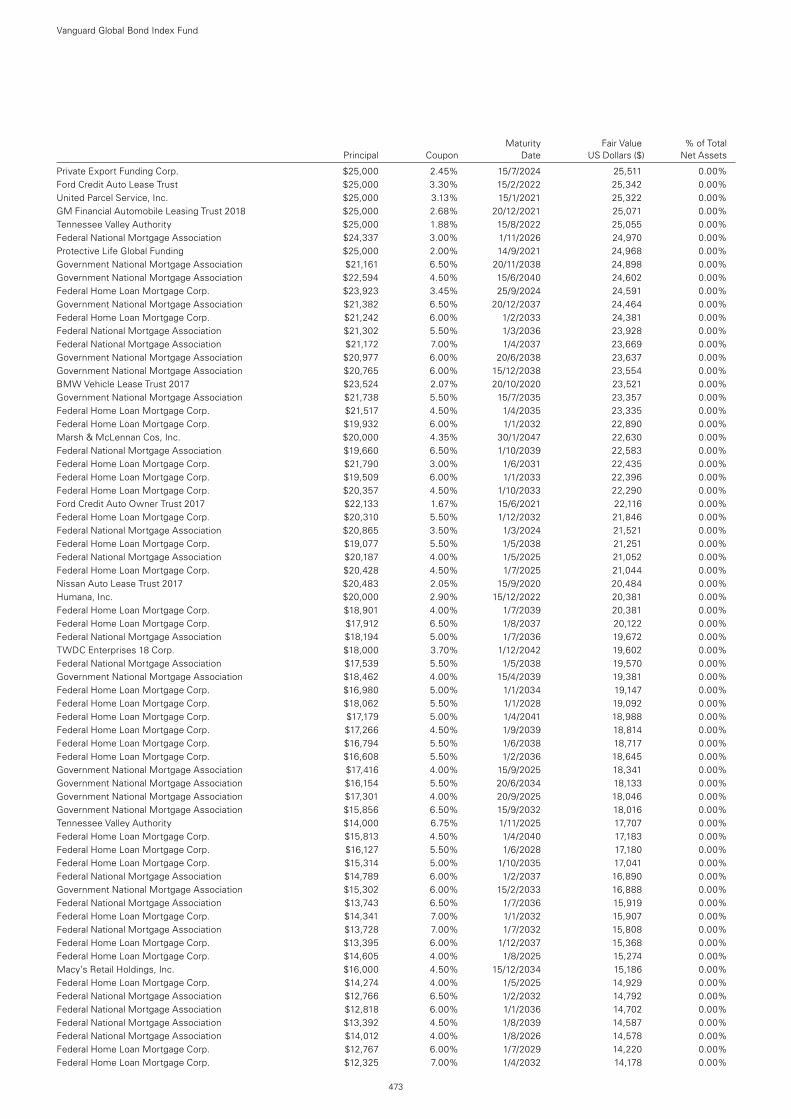
Maturity Fair Value % of Total Principal Coupon Date US Dollars ($) Net Assets
Private Export Funding Corp. $25,000 2.45% 15/7/2024 25,511 0.00%Ford Credit Auto Lease Trust $25,000 3.30% 15/2/2022 25,342 0.00%United Parcel Service, Inc. $25,000 3.13% 15/1/2021 25,322 0.00%GM Financial Automobile Leasing Trust 2018 $25,000 2.68% 20/12/2021 25,071 0.00%Tennessee Valley Authority $25,000 1.88% 15/8/2022 25,055 0.00%Federal National Mortgage Association $24,337 3.00% 1/11/2026 24,970 0.00%Protective Life Global Funding $25,000 2.00% 14/9/2021 24,968 0.00%Government National Mortgage Association $21,161 6.50% 20/11/2038 24,898 0.00%Government National Mortgage Association $22,594 4.50% 15/6/2040 24,602 0.00%Federal Home Loan Mortgage Corp. $23,923 3.45% 25/9/2024 24,591 0.00%Government National Mortgage Association $21,382 6.50% 20/12/2037 24,464 0.00%Federal Home Loan Mortgage Corp. $21,242 6.00% 1/2/2033 24,381 0.00%Federal National Mortgage Association $21,302 5.50% 1/3/2036 23,928 0.00%Federal National Mortgage Association $21,172 7.00% 1/4/2037 23,669 0.00%Government National Mortgage Association $20,977 6.00% 20/6/2038 23,637 0.00%Government National Mortgage Association $20,765 6.00% 15/12/2038 23,554 0.00%BMW Vehicle Lease Trust 2017 $23,524 2.07% 20/10/2020 23,521 0.00%Government National Mortgage Association $21,738 5.50% 15/7/2035 23,357 0.00%Federal Home Loan Mortgage Corp. $21,517 4.50% 1/4/2035 23,335 0.00%Federal Home Loan Mortgage Corp. $19,932 6.00% 1/1/2032 22,890 0.00%Marsh & McLennan Cos, Inc. $20,000 4.35% 30/1/2047 22,630 0.00%Federal National Mortgage Association $19,660 6.50% 1/10/2039 22,583 0.00%Federal Home Loan Mortgage Corp. $21,790 3.00% 1/6/2031 22,435 0.00%Federal Home Loan Mortgage Corp. $19,509 6.00% 1/1/2033 22,396 0.00%Federal Home Loan Mortgage Corp. $20,357 4.50% 1/10/2033 22,290 0.00%Ford Credit Auto Owner Trust 2017 $22,133 1.67% 15/6/2021 22,116 0.00%Federal Home Loan Mortgage Corp. $20,310 5.50% 1/12/2032 21,846 0.00%Federal National Mortgage Association $20,865 3.50% 1/3/2024 21,521 0.00%Federal Home Loan Mortgage Corp. $19,077 5.50% 1/5/2038 21,251 0.00%Federal National Mortgage Association $20,187 4.00% 1/5/2025 21,052 0.00%Federal Home Loan Mortgage Corp. $20,428 4.50% 1/7/2025 21,044 0.00%Nissan Auto Lease Trust 2017 $20,483 2.05% 15/9/2020 20,484 0.00%Humana, Inc. $20,000 2.90% 15/12/2022 20,381 0.00%Federal Home Loan Mortgage Corp. $18,901 4.00% 1/7/2039 20,381 0.00%Federal Home Loan Mortgage Corp. $17,912 6.50% 1/8/2037 20,122 0.00%Federal National Mortgage Association $18,194 5.00% 1/7/2036 19,672 0.00%TWDC Enterprises 18 Corp. $18,000 3.70% 1/12/2042 19,602 0.00%Federal National Mortgage Association $17,539 5.50% 1/5/2038 19,570 0.00%Government National Mortgage Association $18,462 4.00% 15/4/2039 19,381 0.00%Federal Home Loan Mortgage Corp. $16,980 5.00% 1/1/2034 19,147 0.00%Federal Home Loan Mortgage Corp. $18,062 5.50% 1/1/2028 19,092 0.00%Federal Home Loan Mortgage Corp. $17,179 5.00% 1/4/2041 18,988 0.00%Federal Home Loan Mortgage Corp. $17,266 4.50% 1/9/2039 18,814 0.00%Federal Home Loan Mortgage Corp. $16,794 5.50% 1/6/2038 18,717 0.00%Federal Home Loan Mortgage Corp. $16,608 5.50% 1/2/2036 18,645 0.00%Government National Mortgage Association $17,416 4.00% 15/9/2025 18,341 0.00%Government National Mortgage Association $16,154 5.50% 20/6/2034 18,133 0.00%Government National Mortgage Association $17,301 4.00% 20/9/2025 18,046 0.00%Government National Mortgage Association $15,856 6.50% 15/9/2032 18,016 0.00%Tennessee Valley Authority $14,000 6.75% 1/11/2025 17,707 0.00%Federal Home Loan Mortgage Corp. $15,813 4.50% 1/4/2040 17,183 0.00%Federal Home Loan Mortgage Corp. $16,127 5.50% 1/6/2028 17,180 0.00%Federal Home Loan Mortgage Corp. $15,314 5.00% 1/10/2035 17,041 0.00%Federal National Mortgage Association $14,789 6.00% 1/2/2037 16,890 0.00%Government National Mortgage Association $15,302 6.00% 15/2/2033 16,888 0.00%Federal National Mortgage Association $13,743 6.50% 1/7/2036 15,919 0.00%Federal Home Loan Mortgage Corp. $14,341 7.00% 1/1/2032 15,907 0.00%Federal National Mortgage Association $13,728 7.00% 1/7/2032 15,808 0.00%Federal Home Loan Mortgage Corp. $13,395 6.00% 1/12/2037 15,368 0.00%Federal Home Loan Mortgage Corp. $14,605 4.00% 1/8/2025 15,274 0.00%Macy’s Retail Holdings, Inc. $16,000 4.50% 15/12/2034 15,186 0.00%Federal Home Loan Mortgage Corp. $14,274 4.00% 1/5/2025 14,929 0.00%Federal National Mortgage Association $12,766 6.50% 1/2/2032 14,792 0.00%Federal National Mortgage Association $12,818 6.00% 1/1/2036 14,702 0.00%Federal National Mortgage Association $13,392 4.50% 1/8/2039 14,587 0.00%Federal National Mortgage Association $14,012 4.00% 1/8/2026 14,578 0.00%Federal Home Loan Mortgage Corp. $12,767 6.00% 1/7/2029 14,220 0.00%Federal Home Loan Mortgage Corp. $12,325 7.00% 1/4/2032 14,178 0.00%
Vanguard Global Bond Index Fund
473
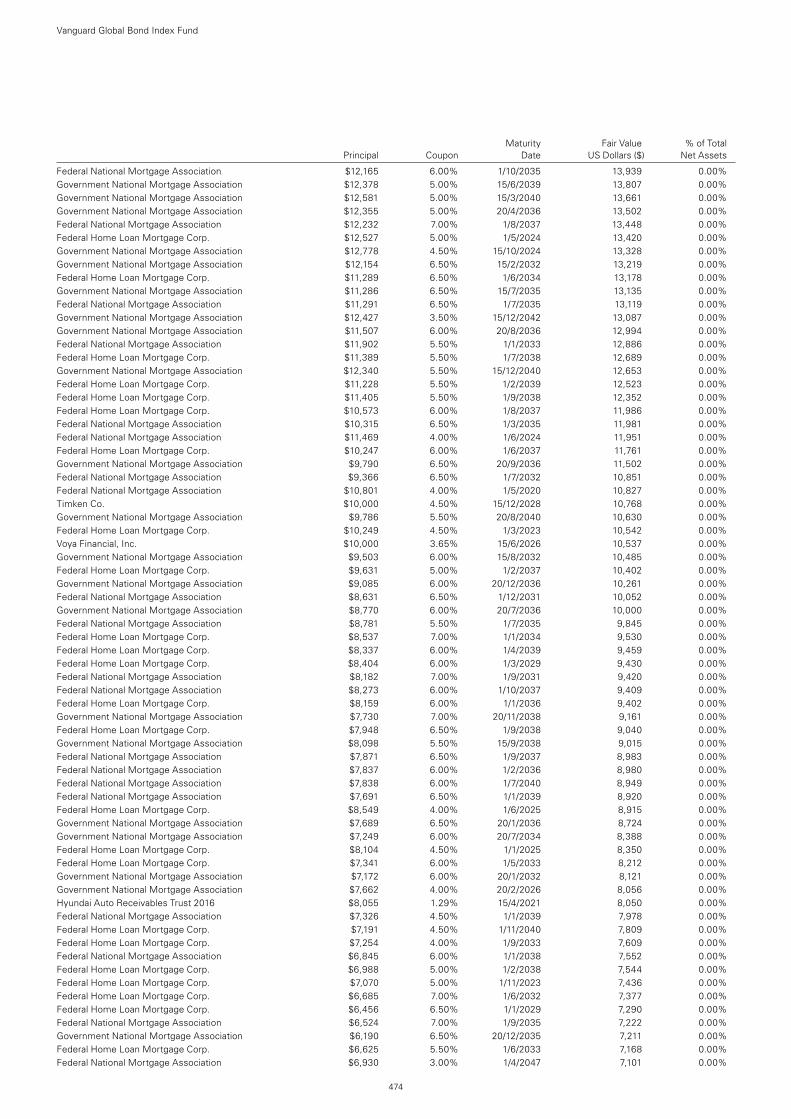
Maturity Fair Value % of Total Principal Coupon Date US Dollars ($) Net Assets
Federal National Mortgage Association $12,165 6.00% 1/10/2035 13,939 0.00%Government National Mortgage Association $12,378 5.00% 15/6/2039 13,807 0.00%Government National Mortgage Association $12,581 5.00% 15/3/2040 13,661 0.00%Government National Mortgage Association $12,355 5.00% 20/4/2036 13,502 0.00%Federal National Mortgage Association $12,232 7.00% 1/8/2037 13,448 0.00%Federal Home Loan Mortgage Corp. $12,527 5.00% 1/5/2024 13,420 0.00%Government National Mortgage Association $12,778 4.50% 15/10/2024 13,328 0.00%Government National Mortgage Association $12,154 6.50% 15/2/2032 13,219 0.00%Federal Home Loan Mortgage Corp. $11,289 6.50% 1/6/2034 13,178 0.00%Government National Mortgage Association $11,286 6.50% 15/7/2035 13,135 0.00%Federal National Mortgage Association $11,291 6.50% 1/7/2035 13,119 0.00%Government National Mortgage Association $12,427 3.50% 15/12/2042 13,087 0.00%Government National Mortgage Association $11,507 6.00% 20/8/2036 12,994 0.00%Federal National Mortgage Association $11,902 5.50% 1/1/2033 12,886 0.00%Federal Home Loan Mortgage Corp. $11,389 5.50% 1/7/2038 12,689 0.00%Government National Mortgage Association $12,340 5.50% 15/12/2040 12,653 0.00%Federal Home Loan Mortgage Corp. $11,228 5.50% 1/2/2039 12,523 0.00%Federal Home Loan Mortgage Corp. $11,405 5.50% 1/9/2038 12,352 0.00%Federal Home Loan Mortgage Corp. $10,573 6.00% 1/8/2037 11,986 0.00%Federal National Mortgage Association $10,315 6.50% 1/3/2035 11,981 0.00%Federal National Mortgage Association $11,469 4.00% 1/6/2024 11,951 0.00%Federal Home Loan Mortgage Corp. $10,247 6.00% 1/6/2037 11,761 0.00%Government National Mortgage Association $9,790 6.50% 20/9/2036 11,502 0.00%Federal National Mortgage Association $9,366 6.50% 1/7/2032 10,851 0.00%Federal National Mortgage Association $10,801 4.00% 1/5/2020 10,827 0.00%Timken Co. $10,000 4.50% 15/12/2028 10,768 0.00%Government National Mortgage Association $9,786 5.50% 20/8/2040 10,630 0.00%Federal Home Loan Mortgage Corp. $10,249 4.50% 1/3/2023 10,542 0.00%Voya Financial, Inc. $10,000 3.65% 15/6/2026 10,537 0.00%Government National Mortgage Association $9,503 6.00% 15/8/2032 10,485 0.00%Federal Home Loan Mortgage Corp. $9,631 5.00% 1/2/2037 10,402 0.00%Government National Mortgage Association $9,085 6.00% 20/12/2036 10,261 0.00%Federal National Mortgage Association $8,631 6.50% 1/12/2031 10,052 0.00%Government National Mortgage Association $8,770 6.00% 20/7/2036 10,000 0.00%Federal National Mortgage Association $8,781 5.50% 1/7/2035 9,845 0.00%Federal Home Loan Mortgage Corp. $8,537 7.00% 1/1/2034 9,530 0.00%Federal Home Loan Mortgage Corp. $8,337 6.00% 1/4/2039 9,459 0.00%Federal Home Loan Mortgage Corp. $8,404 6.00% 1/3/2029 9,430 0.00%Federal National Mortgage Association $8,182 7.00% 1/9/2031 9,420 0.00%Federal National Mortgage Association $8,273 6.00% 1/10/2037 9,409 0.00%Federal Home Loan Mortgage Corp. $8,159 6.00% 1/1/2036 9,402 0.00%Government National Mortgage Association $7,730 7.00% 20/11/2038 9,161 0.00%Federal Home Loan Mortgage Corp. $7,948 6.50% 1/9/2038 9,040 0.00%Government National Mortgage Association $8,098 5.50% 15/9/2038 9,015 0.00%Federal National Mortgage Association $7,871 6.50% 1/9/2037 8,983 0.00%Federal National Mortgage Association $7,837 6.00% 1/2/2036 8,980 0.00%Federal National Mortgage Association $7,838 6.00% 1/7/2040 8,949 0.00%Federal National Mortgage Association $7,691 6.50% 1/1/2039 8,920 0.00%Federal Home Loan Mortgage Corp. $8,549 4.00% 1/6/2025 8,915 0.00%Government National Mortgage Association $7,689 6.50% 20/1/2036 8,724 0.00%Government National Mortgage Association $7,249 6.00% 20/7/2034 8,388 0.00%Federal Home Loan Mortgage Corp. $8,104 4.50% 1/1/2025 8,350 0.00%Federal Home Loan Mortgage Corp. $7,341 6.00% 1/5/2033 8,212 0.00%Government National Mortgage Association $7,172 6.00% 20/1/2032 8,121 0.00%Government National Mortgage Association $7,662 4.00% 20/2/2026 8,056 0.00%Hyundai Auto Receivables Trust 2016 $8,055 1.29% 15/4/2021 8,050 0.00%Federal National Mortgage Association $7,326 4.50% 1/1/2039 7,978 0.00%Federal Home Loan Mortgage Corp. $7,191 4.50% 1/11/2040 7,809 0.00%Federal Home Loan Mortgage Corp. $7,254 4.00% 1/9/2033 7,609 0.00%Federal National Mortgage Association $6,845 6.00% 1/1/2038 7,552 0.00%Federal Home Loan Mortgage Corp. $6,988 5.00% 1/2/2038 7,544 0.00%Federal Home Loan Mortgage Corp. $7,070 5.00% 1/11/2023 7,436 0.00%Federal Home Loan Mortgage Corp. $6,685 7.00% 1/6/2032 7,377 0.00%Federal Home Loan Mortgage Corp. $6,456 6.50% 1/1/2029 7,290 0.00%Federal National Mortgage Association $6,524 7.00% 1/9/2035 7,222 0.00%Government National Mortgage Association $6,190 6.50% 20/12/2035 7,211 0.00%Federal Home Loan Mortgage Corp. $6,625 5.50% 1/6/2033 7,168 0.00%Federal National Mortgage Association $6,930 3.00% 1/4/2047 7,101 0.00%
Vanguard Global Bond Index Fund
474
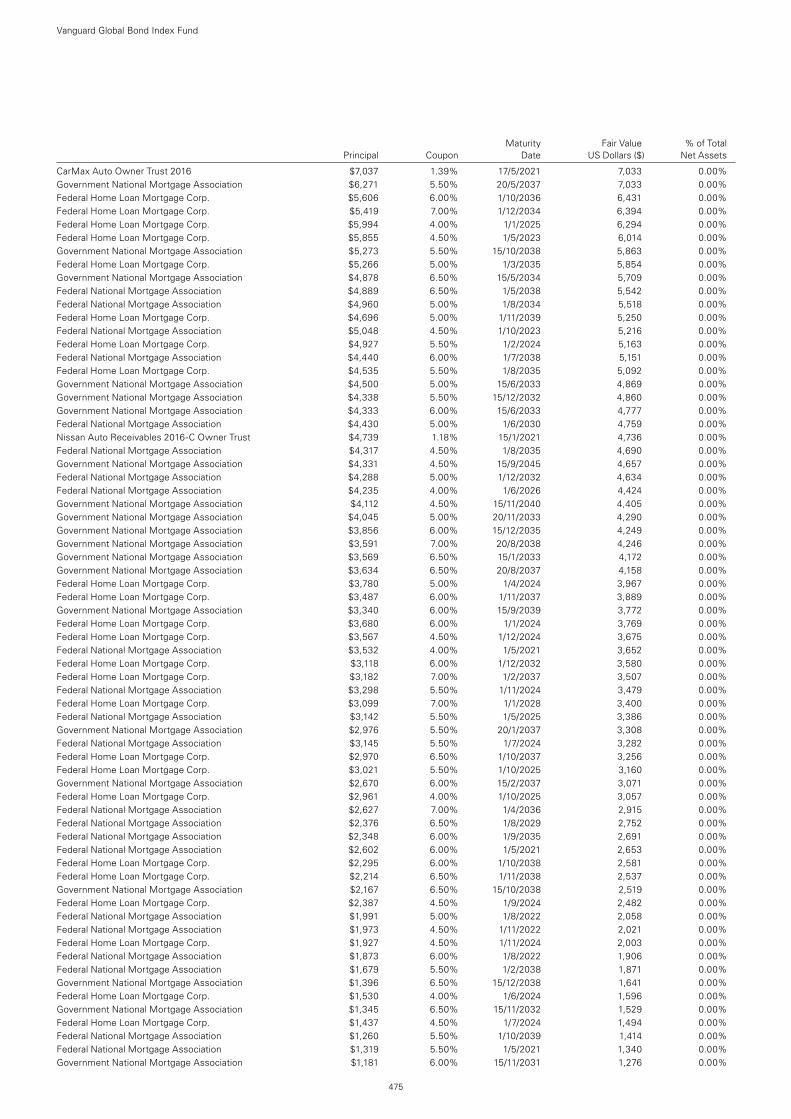
Maturity Fair Value % of Total Principal Coupon Date US Dollars ($) Net Assets
CarMax Auto Owner Trust 2016 $7,037 1.39% 17/5/2021 7,033 0.00%Government National Mortgage Association $6,271 5.50% 20/5/2037 7,033 0.00%Federal Home Loan Mortgage Corp. $5,606 6.00% 1/10/2036 6,431 0.00%Federal Home Loan Mortgage Corp. $5,419 7.00% 1/12/2034 6,394 0.00%Federal Home Loan Mortgage Corp. $5,994 4.00% 1/1/2025 6,294 0.00%Federal Home Loan Mortgage Corp. $5,855 4.50% 1/5/2023 6,014 0.00%Government National Mortgage Association $5,273 5.50% 15/10/2038 5,863 0.00%Federal Home Loan Mortgage Corp. $5,266 5.00% 1/3/2035 5,854 0.00%Government National Mortgage Association $4,878 6.50% 15/5/2034 5,709 0.00%Federal National Mortgage Association $4,889 6.50% 1/5/2038 5,542 0.00%Federal National Mortgage Association $4,960 5.00% 1/8/2034 5,518 0.00%Federal Home Loan Mortgage Corp. $4,696 5.00% 1/11/2039 5,250 0.00%Federal National Mortgage Association $5,048 4.50% 1/10/2023 5,216 0.00%Federal Home Loan Mortgage Corp. $4,927 5.50% 1/2/2024 5,163 0.00%Federal National Mortgage Association $4,440 6.00% 1/7/2038 5,151 0.00%Federal Home Loan Mortgage Corp. $4,535 5.50% 1/8/2035 5,092 0.00%Government National Mortgage Association $4,500 5.00% 15/6/2033 4,869 0.00%Government National Mortgage Association $4,338 5.50% 15/12/2032 4,860 0.00%Government National Mortgage Association $4,333 6.00% 15/6/2033 4,777 0.00%Federal National Mortgage Association $4,430 5.00% 1/6/2030 4,759 0.00%Nissan Auto Receivables 2016-C Owner Trust $4,739 1.18% 15/1/2021 4,736 0.00%Federal National Mortgage Association $4,317 4.50% 1/8/2035 4,690 0.00%Government National Mortgage Association $4,331 4.50% 15/9/2045 4,657 0.00%Federal National Mortgage Association $4,288 5.00% 1/12/2032 4,634 0.00%Federal National Mortgage Association $4,235 4.00% 1/6/2026 4,424 0.00%Government National Mortgage Association $4,112 4.50% 15/11/2040 4,405 0.00%Government National Mortgage Association $4,045 5.00% 20/11/2033 4,290 0.00%Government National Mortgage Association $3,856 6.00% 15/12/2035 4,249 0.00%Government National Mortgage Association $3,591 7.00% 20/8/2038 4,246 0.00%Government National Mortgage Association $3,569 6.50% 15/1/2033 4,172 0.00%Government National Mortgage Association $3,634 6.50% 20/8/2037 4,158 0.00%Federal Home Loan Mortgage Corp. $3,780 5.00% 1/4/2024 3,967 0.00%Federal Home Loan Mortgage Corp. $3,487 6.00% 1/11/2037 3,889 0.00%Government National Mortgage Association $3,340 6.00% 15/9/2039 3,772 0.00%Federal Home Loan Mortgage Corp. $3,680 6.00% 1/1/2024 3,769 0.00%Federal Home Loan Mortgage Corp. $3,567 4.50% 1/12/2024 3,675 0.00%Federal National Mortgage Association $3,532 4.00% 1/5/2021 3,652 0.00%Federal Home Loan Mortgage Corp. $3,118 6.00% 1/12/2032 3,580 0.00%Federal Home Loan Mortgage Corp. $3,182 7.00% 1/2/2037 3,507 0.00%Federal National Mortgage Association $3,298 5.50% 1/11/2024 3,479 0.00%Federal Home Loan Mortgage Corp. $3,099 7.00% 1/1/2028 3,400 0.00%Federal National Mortgage Association $3,142 5.50% 1/5/2025 3,386 0.00%Government National Mortgage Association $2,976 5.50% 20/1/2037 3,308 0.00%Federal National Mortgage Association $3,145 5.50% 1/7/2024 3,282 0.00%Federal Home Loan Mortgage Corp. $2,970 6.50% 1/10/2037 3,256 0.00%Federal Home Loan Mortgage Corp. $3,021 5.50% 1/10/2025 3,160 0.00%Government National Mortgage Association $2,670 6.00% 15/2/2037 3,071 0.00%Federal Home Loan Mortgage Corp. $2,961 4.00% 1/10/2025 3,057 0.00%Federal National Mortgage Association $2,627 7.00% 1/4/2036 2,915 0.00%Federal National Mortgage Association $2,376 6.50% 1/8/2029 2,752 0.00%Federal National Mortgage Association $2,348 6.00% 1/9/2035 2,691 0.00%Federal National Mortgage Association $2,602 6.00% 1/5/2021 2,653 0.00%Federal Home Loan Mortgage Corp. $2,295 6.00% 1/10/2038 2,581 0.00%Federal Home Loan Mortgage Corp. $2,214 6.50% 1/11/2038 2,537 0.00%Government National Mortgage Association $2,167 6.50% 15/10/2038 2,519 0.00%Federal Home Loan Mortgage Corp. $2,387 4.50% 1/9/2024 2,482 0.00%Federal National Mortgage Association $1,991 5.00% 1/8/2022 2,058 0.00%Federal National Mortgage Association $1,973 4.50% 1/11/2022 2,021 0.00%Federal Home Loan Mortgage Corp. $1,927 4.50% 1/11/2024 2,003 0.00%Federal National Mortgage Association $1,873 6.00% 1/8/2022 1,906 0.00%Federal National Mortgage Association $1,679 5.50% 1/2/2038 1,871 0.00%Government National Mortgage Association $1,396 6.50% 15/12/2038 1,641 0.00%Federal Home Loan Mortgage Corp. $1,530 4.00% 1/6/2024 1,596 0.00%Government National Mortgage Association $1,345 6.50% 15/11/2032 1,529 0.00%Federal Home Loan Mortgage Corp. $1,437 4.50% 1/7/2024 1,494 0.00%Federal National Mortgage Association $1,260 5.50% 1/10/2039 1,414 0.00%Federal National Mortgage Association $1,319 5.50% 1/5/2021 1,340 0.00%Government National Mortgage Association $1,181 6.00% 15/11/2031 1,276 0.00%
Vanguard Global Bond Index Fund
475

Maturity Fair Value % of Total Principal Coupon Date US Dollars ($) Net Assets
Federal Home Loan Mortgage Corp. $1,229 5.00% 1/7/2025 1,272 0.00%Federal National Mortgage Association $1,151 5.00% 1/11/2023 1,201 0.00%Federal National Mortgage Association $1,044 7.00% 1/4/2035 1,195 0.00%Federal National Mortgage Association $1,145 4.50% 1/6/2024 1,190 0.00%Federal National Mortgage Association $767 4.50% 1/9/2020 770 0.00%Federal National Mortgage Association $750 6.00% 1/3/2021 762 0.00%Government National Mortgage Association $706 6.50% 15/1/2032 754 0.00%Federal National Mortgage Association $647 4.50% 1/11/2020 661 0.00%Federal National Mortgage Association $629 4.00% 1/4/2024 655 0.00%Federal National Mortgage Association $549 5.50% 1/7/2021 553 0.00%Federal National Mortgage Association $531 5.50% 1/11/2021 553 0.00%Federal Home Loan Mortgage Corp. $537 4.50% 1/10/2020 544 0.00%Federal National Mortgage Association $534 5.50% 1/8/2020 538 0.00%Federal National Mortgage Association $445 6.50% 1/7/2034 525 0.00%Government National Mortgage Association $441 6.00% 15/2/2029 473 0.00%Federal Home Loan Mortgage Corp. $417 4.50% 1/2/2024 433 0.00%Federal National Mortgage Association $262 5.50% 1/6/2020 264 0.00%Federal Home Loan Mortgage Corp. $214 4.50% 1/9/2020 215 0.00%Federal National Mortgage Association $179 5.00% 1/11/2035 197 0.00%Government National Mortgage Association $125 6.00% 15/10/2038 134 0.00%Federal National Mortgage Association $51 4.50% 1/1/2020 51 0.00%Federal Home Loan Mortgage Corp. $30 4.50% 1/5/2021 31 0.00%Government National Mortgage Association $28 4.50% 15/3/2020 28 0.00%Federal National Mortgage Association $1 5.50% 1/3/2020 1 0.00%
7,097,249,726 42.09%
Uruguay 0.03% (2018: 0.03%)
Uruguay Government International Bond $1,400,000 4.98% 20/4/2055 1,649,620 0.01%Uruguay Government International Bond $1,175,000 4.38% 27/10/2027 1,296,906 0.01%Uruguay Government International Bond $575,000 5.10% 18/6/2050 691,438 0.01%Uruguay Government International Bond $350,000 4.50% 14/8/2024 378,400 0.00%Uruguay Government International Bond $250,000 8.00% 18/11/2022 278,750 0.00%Uruguay Government International Bond $100,000 4.13% 20/11/2045 107,375 0.00%
4,402,489 0.03%
Total Bonds 16,514,924,279 97.94%
Financial Assets at Fair Value Through Profit or Loss 16,514,924,279 97.94%
Unrealised Number of Notional Gain/(Loss) % of Total Contracts Amount US Dollars ($) Net Assets
Financial Derivative Instruments
Futures (0.00%) (2018: 0.00%)
Japan 10-Year Bond Futures March 2020 1 1,396,089 4,234 0.00%AUS 10-Year Bond Futures March 2020 14 1,434,371 (27,477) (0.00%)AUS 3-Year Bond Futures March 2020 191 15,546,093 (103,961) (0.00%)
(127,204) (0.00%)
Unrealised Buy (Sell) Settlement Gain/(Loss) % of TotalCurrency Amount Currency Amount Counterparty Date US Dollars ($) Net Assets
Open Forward Currency Exchange Contracts (0.79%) (2018: (0.41%))
KRW 246,008,229,997 USD (211,529,003) BNP Paribas 2/1/2020 1,198,076 0.01%MYR 235,429,976 USD (56,839,685) BNP Paribas 3/1/2020 715,620 0.00%THB 1,852,749,284 USD (61,268,164) BNP Paribas 3/1/2020 585,503 0.00%IDR 750,150,498,463 USD (53,494,295) Standard Chartered Bank 3/1/2020 541,397 0.00%JPY 180,596,390,000 USD (1,661,802,530) Toronto-Dominion Bank 7/1/2020 392,426 0.00%CNH 457,919,838 USD (65,431,141) Standard Chartered Bank 3/1/2020 313,292 0.00%USD 76,071,123 SEK (708,270,000) Barclays Bank plc 4/2/2020 288,394 0.00%EUR 15,000,000 USD (16,731,090) Toronto-Dominion Bank 3/1/2020 106,402 0.00%GBP 6,500,000 USD (8,530,958) BNP Paribas 3/1/2020 79,922 0.00%GBP 2,500,000 USD (3,252,593) JPMorgan Chase Bank 3/1/2020 59,284 0.00%GBP 5,600,000 USD (7,383,354) JPMorgan Chase Bank 3/1/2020 35,250 0.00%USD 52,285,183 MXN (992,195,000) UBS 5/2/2020 14,792 0.00%USD 14,740,372 JPY (1,600,000,000) BNP Paribas 7/1/2020 14,098 0.00%USD 4,610,823 JPY (500,000,000) JPMorgan Chase Bank 7/1/2020 8,863 0.00%GBP 20,000,000 USD (26,514,020) JPMorgan Chase Bank 4/2/2020 6,114 0.00%
Vanguard Global Bond Index Fund
476
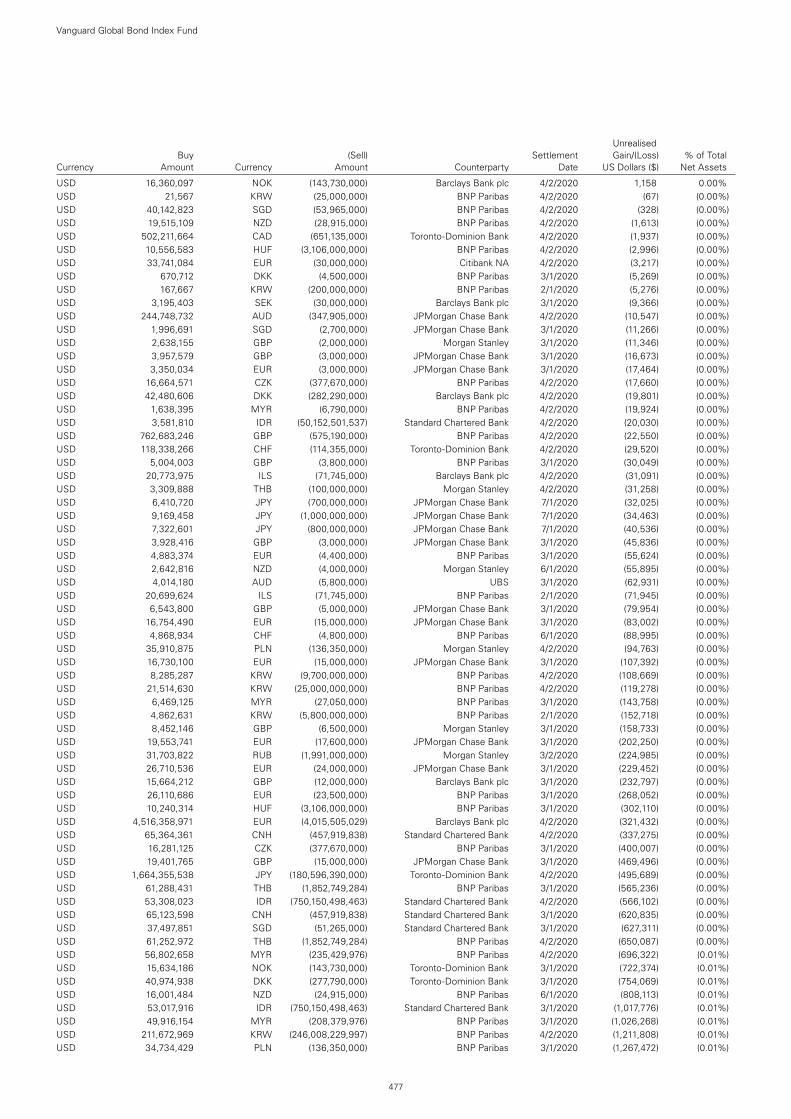
Unrealised Buy (Sell) Settlement Gain/(Loss) % of Total Currency Amount Currency Amount Counterparty Date US Dollars ($) Net Assets
USD 16,360,097 NOK (143,730,000) Barclays Bank plc 4/2/2020 1,158 0.00%USD 21,567 KRW (25,000,000) BNP Paribas 4/2/2020 (67) (0.00%)USD 40,142,823 SGD (53,965,000) BNP Paribas 4/2/2020 (328) (0.00%)USD 19,515,109 NZD (28,915,000) BNP Paribas 4/2/2020 (1,613) (0.00%)USD 502,211,664 CAD (651,135,000) Toronto-Dominion Bank 4/2/2020 (1,937) (0.00%)USD 10,556,583 HUF (3,106,000,000) BNP Paribas 4/2/2020 (2,996) (0.00%)USD 33,741,084 EUR (30,000,000) Citibank NA 4/2/2020 (3,217) (0.00%)USD 670,712 DKK (4,500,000) BNP Paribas 3/1/2020 (5,269) (0.00%)USD 167,667 KRW (200,000,000) BNP Paribas 2/1/2020 (5,276) (0.00%)USD 3,195,403 SEK (30,000,000) Barclays Bank plc 3/1/2020 (9,366) (0.00%)USD 244,748,732 AUD (347,905,000) JPMorgan Chase Bank 4/2/2020 (10,547) (0.00%)USD 1,996,691 SGD (2,700,000) JPMorgan Chase Bank 3/1/2020 (11,266) (0.00%)USD 2,638,155 GBP (2,000,000) Morgan Stanley 3/1/2020 (11,346) (0.00%)USD 3,957,579 GBP (3,000,000) JPMorgan Chase Bank 3/1/2020 (16,673) (0.00%)USD 3,350,034 EUR (3,000,000) JPMorgan Chase Bank 3/1/2020 (17,464) (0.00%)USD 16,664,571 CZK (377,670,000) BNP Paribas 4/2/2020 (17,660) (0.00%)USD 42,480,606 DKK (282,290,000) Barclays Bank plc 4/2/2020 (19,801) (0.00%)USD 1,638,395 MYR (6,790,000) BNP Paribas 4/2/2020 (19,924) (0.00%)USD 3,581,810 IDR (50,152,501,537) Standard Chartered Bank 4/2/2020 (20,030) (0.00%)USD 762,683,246 GBP (575,190,000) BNP Paribas 4/2/2020 (22,550) (0.00%)USD 118,338,266 CHF (114,355,000) Toronto-Dominion Bank 4/2/2020 (29,520) (0.00%)USD 5,004,003 GBP (3,800,000) BNP Paribas 3/1/2020 (30,049) (0.00%)USD 20,773,975 ILS (71,745,000) Barclays Bank plc 4/2/2020 (31,091) (0.00%)USD 3,309,888 THB (100,000,000) Morgan Stanley 4/2/2020 (31,258) (0.00%)USD 6,410,720 JPY (700,000,000) JPMorgan Chase Bank 7/1/2020 (32,025) (0.00%)USD 9,169,458 JPY (1,000,000,000) JPMorgan Chase Bank 7/1/2020 (34,463) (0.00%)USD 7,322,601 JPY (800,000,000) JPMorgan Chase Bank 7/1/2020 (40,536) (0.00%)USD 3,928,416 GBP (3,000,000) JPMorgan Chase Bank 3/1/2020 (45,836) (0.00%)USD 4,883,374 EUR (4,400,000) BNP Paribas 3/1/2020 (55,624) (0.00%)USD 2,642,816 NZD (4,000,000) Morgan Stanley 6/1/2020 (55,895) (0.00%)USD 4,014,180 AUD (5,800,000) UBS 3/1/2020 (62,931) (0.00%)USD 20,699,624 ILS (71,745,000) BNP Paribas 2/1/2020 (71,945) (0.00%)USD 6,543,800 GBP (5,000,000) JPMorgan Chase Bank 3/1/2020 (79,954) (0.00%)USD 16,754,490 EUR (15,000,000) JPMorgan Chase Bank 3/1/2020 (83,002) (0.00%)USD 4,868,934 CHF (4,800,000) BNP Paribas 6/1/2020 (88,995) (0.00%)USD 35,910,875 PLN (136,350,000) Morgan Stanley 4/2/2020 (94,763) (0.00%)USD 16,730,100 EUR (15,000,000) JPMorgan Chase Bank 3/1/2020 (107,392) (0.00%)USD 8,285,287 KRW (9,700,000,000) BNP Paribas 4/2/2020 (108,669) (0.00%)USD 21,514,630 KRW (25,000,000,000) BNP Paribas 4/2/2020 (119,278) (0.00%)USD 6,469,125 MYR (27,050,000) BNP Paribas 3/1/2020 (143,758) (0.00%)USD 4,862,631 KRW (5,800,000,000) BNP Paribas 2/1/2020 (152,718) (0.00%)USD 8,452,146 GBP (6,500,000) Morgan Stanley 3/1/2020 (158,733) (0.00%)USD 19,553,741 EUR (17,600,000) JPMorgan Chase Bank 3/1/2020 (202,250) (0.00%)USD 31,703,822 RUB (1,991,000,000) Morgan Stanley 3/2/2020 (224,985) (0.00%)USD 26,710,536 EUR (24,000,000) JPMorgan Chase Bank 3/1/2020 (229,452) (0.00%)USD 15,664,212 GBP (12,000,000) Barclays Bank plc 3/1/2020 (232,797) (0.00%)USD 26,110,686 EUR (23,500,000) BNP Paribas 3/1/2020 (268,052) (0.00%)USD 10,240,314 HUF (3,106,000,000) BNP Paribas 3/1/2020 (302,110) (0.00%)USD 4,516,358,971 EUR (4,015,505,029) Barclays Bank plc 4/2/2020 (321,432) (0.00%)USD 65,364,361 CNH (457,919,838) Standard Chartered Bank 4/2/2020 (337,275) (0.00%)USD 16,281,125 CZK (377,670,000) BNP Paribas 3/1/2020 (400,007) (0.00%)USD 19,401,765 GBP (15,000,000) JPMorgan Chase Bank 3/1/2020 (469,496) (0.00%)USD 1,664,355,538 JPY (180,596,390,000) Toronto-Dominion Bank 4/2/2020 (495,689) (0.00%)USD 61,288,431 THB (1,852,749,284) BNP Paribas 3/1/2020 (565,236) (0.00%)USD 53,308,023 IDR (750,150,498,463) Standard Chartered Bank 4/2/2020 (566,102) (0.00%)USD 65,123,598 CNH (457,919,838) Standard Chartered Bank 3/1/2020 (620,835) (0.00%)USD 37,497,851 SGD (51,265,000) Standard Chartered Bank 3/1/2020 (627,311) (0.00%)USD 61,252,972 THB (1,852,749,284) BNP Paribas 4/2/2020 (650,087) (0.00%)USD 56,802,658 MYR (235,429,976) BNP Paribas 4/2/2020 (696,322) (0.01%)USD 15,634,186 NOK (143,730,000) Toronto-Dominion Bank 3/1/2020 (722,374) (0.01%)USD 40,974,938 DKK (277,790,000) Toronto-Dominion Bank 3/1/2020 (754,069) (0.01%)USD 16,001,484 NZD (24,915,000) BNP Paribas 6/1/2020 (808,113) (0.01%)USD 53,017,916 IDR (750,150,498,463) Standard Chartered Bank 3/1/2020 (1,017,776) (0.01%)USD 49,916,154 MYR (208,379,976) BNP Paribas 3/1/2020 (1,026,268) (0.01%)USD 211,672,969 KRW (246,008,229,997) BNP Paribas 4/2/2020 (1,211,808) (0.01%)USD 34,734,429 PLN (136,350,000) BNP Paribas 3/1/2020 (1,267,472) (0.01%)
Vanguard Global Bond Index Fund
477
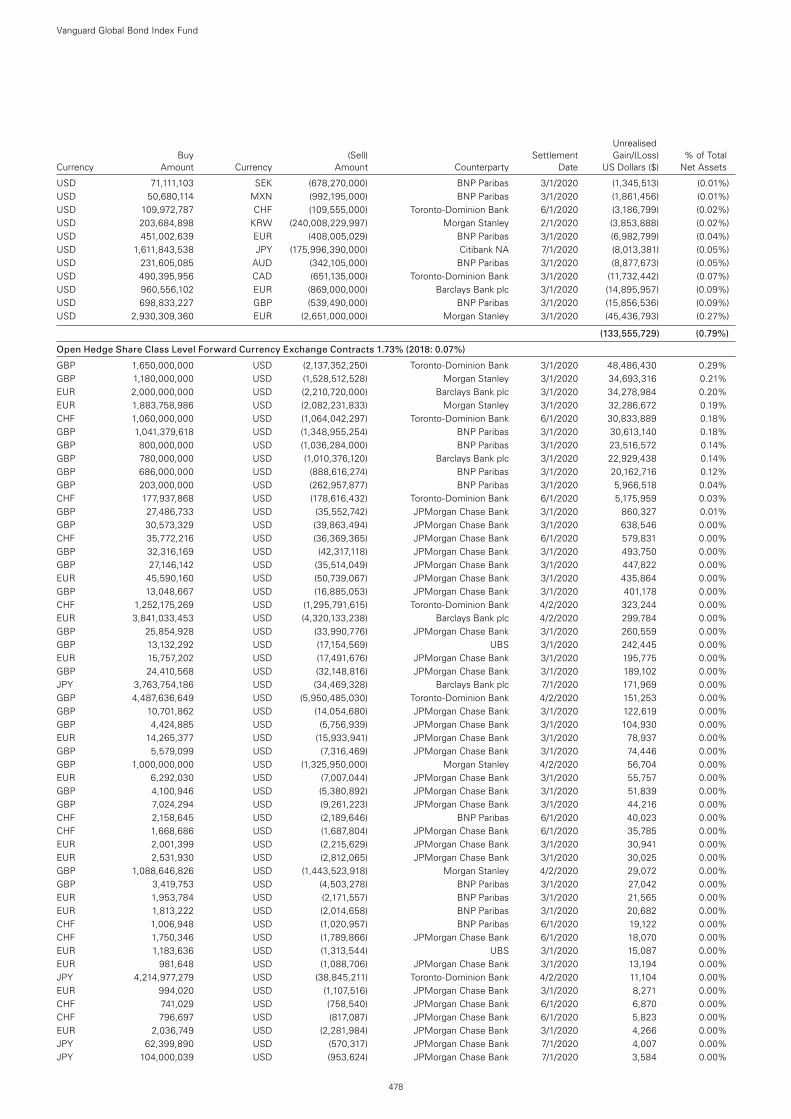
USD 71,111,103 SEK (678,270,000) BNP Paribas 3/1/2020 (1,345,513) (0.01%)USD 50,680,114 MXN (992,195,000) BNP Paribas 3/1/2020 (1,861,456) (0.01%)USD 109,972,787 CHF (109,555,000) Toronto-Dominion Bank 6/1/2020 (3,186,799) (0.02%)USD 203,684,898 KRW (240,008,229,997) Morgan Stanley 2/1/2020 (3,853,888) (0.02%)USD 451,002,639 EUR (408,005,029) BNP Paribas 3/1/2020 (6,982,799) (0.04%)USD 1,611,843,538 JPY (175,996,390,000) Citibank NA 7/1/2020 (8,013,381) (0.05%)USD 231,605,085 AUD (342,105,000) BNP Paribas 3/1/2020 (8,877,673) (0.05%)USD 490,395,956 CAD (651,135,000) Toronto-Dominion Bank 3/1/2020 (11,732,442) (0.07%)USD 960,556,102 EUR (869,000,000) Barclays Bank plc 3/1/2020 (14,895,957) (0.09%)USD 698,833,227 GBP (539,490,000) BNP Paribas 3/1/2020 (15,856,536) (0.09%)USD 2,930,309,360 EUR (2,651,000,000) Morgan Stanley 3/1/2020 (45,436,793) (0.27%)
(133,555,729) (0.79%)
Open Hedge Share Class Level Forward Currency Exchange Contracts 1.73% (2018: 0.07%)
GBP 1,650,000,000 USD (2,137,352,250) Toronto-Dominion Bank 3/1/2020 48,486,430 0.29%GBP 1,180,000,000 USD (1,528,512,528) Morgan Stanley 3/1/2020 34,693,316 0.21%EUR 2,000,000,000 USD (2,210,720,000) Barclays Bank plc 3/1/2020 34,278,984 0.20%EUR 1,883,758,986 USD (2,082,231,833) Morgan Stanley 3/1/2020 32,286,672 0.19%CHF 1,060,000,000 USD (1,064,042,297) Toronto-Dominion Bank 6/1/2020 30,833,889 0.18%GBP 1,041,379,618 USD (1,348,955,254) BNP Paribas 3/1/2020 30,613,140 0.18%GBP 800,000,000 USD (1,036,284,000) BNP Paribas 3/1/2020 23,516,572 0.14%GBP 780,000,000 USD (1,010,376,120) Barclays Bank plc 3/1/2020 22,929,438 0.14%GBP 686,000,000 USD (888,616,274) BNP Paribas 3/1/2020 20,162,716 0.12%GBP 203,000,000 USD (262,957,877) BNP Paribas 3/1/2020 5,966,518 0.04%CHF 177,937,868 USD (178,616,432) Toronto-Dominion Bank 6/1/2020 5,175,959 0.03%GBP 27,486,733 USD (35,552,742) JPMorgan Chase Bank 3/1/2020 860,327 0.01%GBP 30,573,329 USD (39,863,494) JPMorgan Chase Bank 3/1/2020 638,546 0.00%CHF 35,772,216 USD (36,369,365) JPMorgan Chase Bank 6/1/2020 579,831 0.00%GBP 32,316,169 USD (42,317,118) JPMorgan Chase Bank 3/1/2020 493,750 0.00%GBP 27,146,142 USD (35,514,049) JPMorgan Chase Bank 3/1/2020 447,822 0.00%EUR 45,590,160 USD (50,739,067) JPMorgan Chase Bank 3/1/2020 435,864 0.00%GBP 13,048,667 USD (16,885,053) JPMorgan Chase Bank 3/1/2020 401,178 0.00%CHF 1,252,175,269 USD (1,295,791,615) Toronto-Dominion Bank 4/2/2020 323,244 0.00%EUR 3,841,033,453 USD (4,320,133,238) Barclays Bank plc 4/2/2020 299,784 0.00%GBP 25,854,928 USD (33,990,776) JPMorgan Chase Bank 3/1/2020 260,559 0.00%GBP 13,132,292 USD (17,154,569) UBS 3/1/2020 242,445 0.00%EUR 15,757,202 USD (17,491,676) JPMorgan Chase Bank 3/1/2020 195,775 0.00%GBP 24,410,568 USD (32,148,816) JPMorgan Chase Bank 3/1/2020 189,102 0.00%JPY 3,763,754,186 USD (34,469,328) Barclays Bank plc 7/1/2020 171,969 0.00%GBP 4,487,636,649 USD (5,950,485,030) Toronto-Dominion Bank 4/2/2020 151,253 0.00%GBP 10,701,862 USD (14,054,680) JPMorgan Chase Bank 3/1/2020 122,619 0.00%GBP 4,424,885 USD (5,756,939) JPMorgan Chase Bank 3/1/2020 104,930 0.00%EUR 14,265,377 USD (15,933,941) JPMorgan Chase Bank 3/1/2020 78,937 0.00%GBP 5,579,099 USD (7,316,469) JPMorgan Chase Bank 3/1/2020 74,446 0.00%GBP 1,000,000,000 USD (1,325,950,000) Morgan Stanley 4/2/2020 56,704 0.00%EUR 6,292,030 USD (7,007,044) JPMorgan Chase Bank 3/1/2020 55,757 0.00%GBP 4,100,946 USD (5,380,892) JPMorgan Chase Bank 3/1/2020 51,839 0.00%GBP 7,024,294 USD (9,261,223) JPMorgan Chase Bank 3/1/2020 44,216 0.00%CHF 2,158,645 USD (2,189,646) BNP Paribas 6/1/2020 40,023 0.00%CHF 1,668,686 USD (1,687,804) JPMorgan Chase Bank 6/1/2020 35,785 0.00%EUR 2,001,399 USD (2,215,629) JPMorgan Chase Bank 3/1/2020 30,941 0.00%EUR 2,531,930 USD (2,812,065) JPMorgan Chase Bank 3/1/2020 30,025 0.00%GBP 1,088,646,826 USD (1,443,523,918) Morgan Stanley 4/2/2020 29,072 0.00%GBP 3,419,753 USD (4,503,278) BNP Paribas 3/1/2020 27,042 0.00%EUR 1,953,784 USD (2,171,557) BNP Paribas 3/1/2020 21,565 0.00%EUR 1,813,222 USD (2,014,658) BNP Paribas 3/1/2020 20,682 0.00%CHF 1,006,948 USD (1,020,957) BNP Paribas 6/1/2020 19,122 0.00%CHF 1,750,346 USD (1,789,866) JPMorgan Chase Bank 6/1/2020 18,070 0.00%EUR 1,183,636 USD (1,313,544) UBS 3/1/2020 15,087 0.00%EUR 981,648 USD (1,088,706) JPMorgan Chase Bank 3/1/2020 13,194 0.00%JPY 4,214,977,279 USD (38,845,211) Toronto-Dominion Bank 4/2/2020 11,104 0.00%EUR 994,020 USD (1,107,516) JPMorgan Chase Bank 3/1/2020 8,271 0.00%CHF 741,029 USD (758,540) JPMorgan Chase Bank 6/1/2020 6,870 0.00%CHF 796,697 USD (817,087) JPMorgan Chase Bank 6/1/2020 5,823 0.00%EUR 2,036,749 USD (2,281,984) JPMorgan Chase Bank 3/1/2020 4,266 0.00%JPY 62,399,890 USD (570,317) JPMorgan Chase Bank 7/1/2020 4,007 0.00%JPY 104,000,039 USD (953,624) JPMorgan Chase Bank 7/1/2020 3,584 0.00%
Vanguard Global Bond Index Fund
478
Unrealised Buy (Sell) Settlement Gain/(Loss) % of Total Currency Amount Currency Amount Counterparty Date US Dollars ($) Net Assets
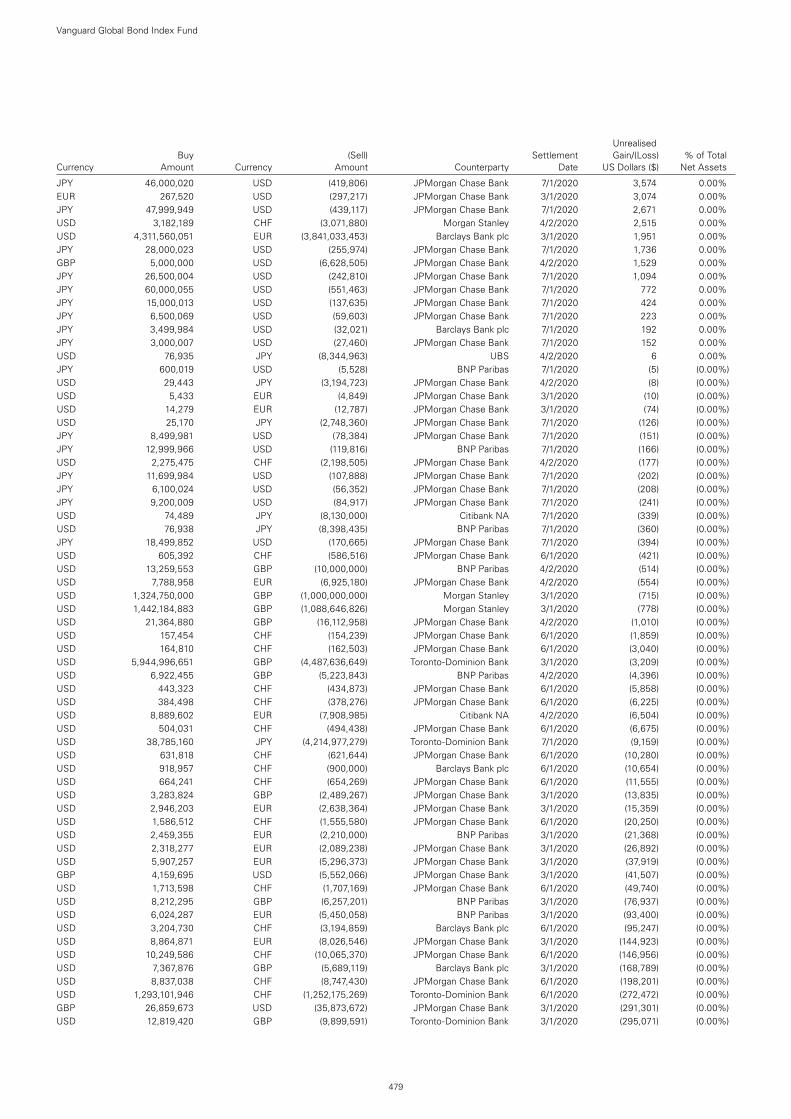
JPY 46,000,020 USD (419,806) JPMorgan Chase Bank 7/1/2020 3,574 0.00%EUR 267,520 USD (297,217) JPMorgan Chase Bank 3/1/2020 3,074 0.00%JPY 47,999,949 USD (439,117) JPMorgan Chase Bank 7/1/2020 2,671 0.00%USD 3,182,189 CHF (3,071,880) Morgan Stanley 4/2/2020 2,515 0.00%USD 4,311,560,051 EUR (3,841,033,453) Barclays Bank plc 3/1/2020 1,951 0.00%JPY 28,000,023 USD (255,974) JPMorgan Chase Bank 7/1/2020 1,736 0.00%GBP 5,000,000 USD (6,628,505) JPMorgan Chase Bank 4/2/2020 1,529 0.00%JPY 26,500,004 USD (242,810) JPMorgan Chase Bank 7/1/2020 1,094 0.00%JPY 60,000,055 USD (551,463) JPMorgan Chase Bank 7/1/2020 772 0.00%JPY 15,000,013 USD (137,635) JPMorgan Chase Bank 7/1/2020 424 0.00%JPY 6,500,069 USD (59,603) JPMorgan Chase Bank 7/1/2020 223 0.00%JPY 3,499,984 USD (32,021) Barclays Bank plc 7/1/2020 192 0.00%JPY 3,000,007 USD (27,460) JPMorgan Chase Bank 7/1/2020 152 0.00%USD 76,935 JPY (8,344,963) UBS 4/2/2020 6 0.00%JPY 600,019 USD (5,528) BNP Paribas 7/1/2020 (5) (0.00%)USD 29,443 JPY (3,194,723) JPMorgan Chase Bank 4/2/2020 (8) (0.00%)USD 5,433 EUR (4,849) JPMorgan Chase Bank 3/1/2020 (10) (0.00%)USD 14,279 EUR (12,787) JPMorgan Chase Bank 3/1/2020 (74) (0.00%)USD 25,170 JPY (2,748,360) JPMorgan Chase Bank 7/1/2020 (126) (0.00%)JPY 8,499,981 USD (78,384) JPMorgan Chase Bank 7/1/2020 (151) (0.00%)JPY 12,999,966 USD (119,816) BNP Paribas 7/1/2020 (166) (0.00%)USD 2,275,475 CHF (2,198,505) JPMorgan Chase Bank 4/2/2020 (177) (0.00%)JPY 11,699,984 USD (107,888) JPMorgan Chase Bank 7/1/2020 (202) (0.00%)JPY 6,100,024 USD (56,352) JPMorgan Chase Bank 7/1/2020 (208) (0.00%)JPY 9,200,009 USD (84,917) JPMorgan Chase Bank 7/1/2020 (241) (0.00%)USD 74,489 JPY (8,130,000) Citibank NA 7/1/2020 (339) (0.00%)USD 76,938 JPY (8,398,435) BNP Paribas 7/1/2020 (360) (0.00%)JPY 18,499,852 USD (170,665) JPMorgan Chase Bank 7/1/2020 (394) (0.00%)USD 605,392 CHF (586,516) JPMorgan Chase Bank 6/1/2020 (421) (0.00%)USD 13,259,553 GBP (10,000,000) BNP Paribas 4/2/2020 (514) (0.00%)USD 7,788,958 EUR (6,925,180) JPMorgan Chase Bank 4/2/2020 (554) (0.00%)USD 1,324,750,000 GBP (1,000,000,000) Morgan Stanley 3/1/2020 (715) (0.00%)USD 1,442,184,883 GBP (1,088,646,826) Morgan Stanley 3/1/2020 (778) (0.00%)USD 21,364,880 GBP (16,112,958) JPMorgan Chase Bank 4/2/2020 (1,010) (0.00%)USD 157,454 CHF (154,239) JPMorgan Chase Bank 6/1/2020 (1,859) (0.00%)USD 164,810 CHF (162,503) JPMorgan Chase Bank 6/1/2020 (3,040) (0.00%)USD 5,944,996,651 GBP (4,487,636,649) Toronto-Dominion Bank 3/1/2020 (3,209) (0.00%)USD 6,922,455 GBP (5,223,843) BNP Paribas 4/2/2020 (4,396) (0.00%)USD 443,323 CHF (434,873) JPMorgan Chase Bank 6/1/2020 (5,858) (0.00%)USD 384,498 CHF (378,276) JPMorgan Chase Bank 6/1/2020 (6,225) (0.00%)USD 8,889,602 EUR (7,908,985) Citibank NA 4/2/2020 (6,504) (0.00%)USD 504,031 CHF (494,438) JPMorgan Chase Bank 6/1/2020 (6,675) (0.00%)USD 38,785,160 JPY (4,214,977,279) Toronto-Dominion Bank 7/1/2020 (9,159) (0.00%)USD 631,818 CHF (621,644) JPMorgan Chase Bank 6/1/2020 (10,280) (0.00%)USD 918,957 CHF (900,000) Barclays Bank plc 6/1/2020 (10,654) (0.00%)USD 664,241 CHF (654,269) JPMorgan Chase Bank 6/1/2020 (11,555) (0.00%)USD 3,283,824 GBP (2,489,267) JPMorgan Chase Bank 3/1/2020 (13,835) (0.00%)USD 2,946,203 EUR (2,638,364) JPMorgan Chase Bank 3/1/2020 (15,359) (0.00%)USD 1,586,512 CHF (1,555,580) JPMorgan Chase Bank 6/1/2020 (20,250) (0.00%)USD 2,459,355 EUR (2,210,000) BNP Paribas 3/1/2020 (21,368) (0.00%)USD 2,318,277 EUR (2,089,238) JPMorgan Chase Bank 3/1/2020 (26,892) (0.00%)USD 5,907,257 EUR (5,296,373) JPMorgan Chase Bank 3/1/2020 (37,919) (0.00%)GBP 4,159,695 USD (5,552,066) JPMorgan Chase Bank 3/1/2020 (41,507) (0.00%)USD 1,713,598 CHF (1,707,169) JPMorgan Chase Bank 6/1/2020 (49,740) (0.00%)USD 8,212,295 GBP (6,257,201) BNP Paribas 3/1/2020 (76,937) (0.00%)USD 6,024,287 EUR (5,450,058) BNP Paribas 3/1/2020 (93,400) (0.00%)USD 3,204,730 CHF (3,194,859) Barclays Bank plc 6/1/2020 (95,247) (0.00%)USD 8,864,871 EUR (8,026,546) JPMorgan Chase Bank 3/1/2020 (144,923) (0.00%)USD 10,249,586 CHF (10,065,370) JPMorgan Chase Bank 6/1/2020 (146,956) (0.00%)USD 7,367,876 GBP (5,689,119) Barclays Bank plc 3/1/2020 (168,789) (0.00%)USD 8,837,038 CHF (8,747,430) JPMorgan Chase Bank 6/1/2020 (198,201) (0.00%)USD 1,293,101,946 CHF (1,252,175,269) Toronto-Dominion Bank 6/1/2020 (272,472) (0.00%)GBP 26,859,673 USD (35,873,672) JPMorgan Chase Bank 3/1/2020 (291,301) (0.00%)USD 12,819,420 GBP (9,899,591) Toronto-Dominion Bank 3/1/2020 (295,071) (0.00%)
Vanguard Global Bond Index Fund
479
Unrealised Buy (Sell) Settlement Gain/(Loss) % of Total Currency Amount Currency Amount Counterparty Date US Dollars ($) Net Assets
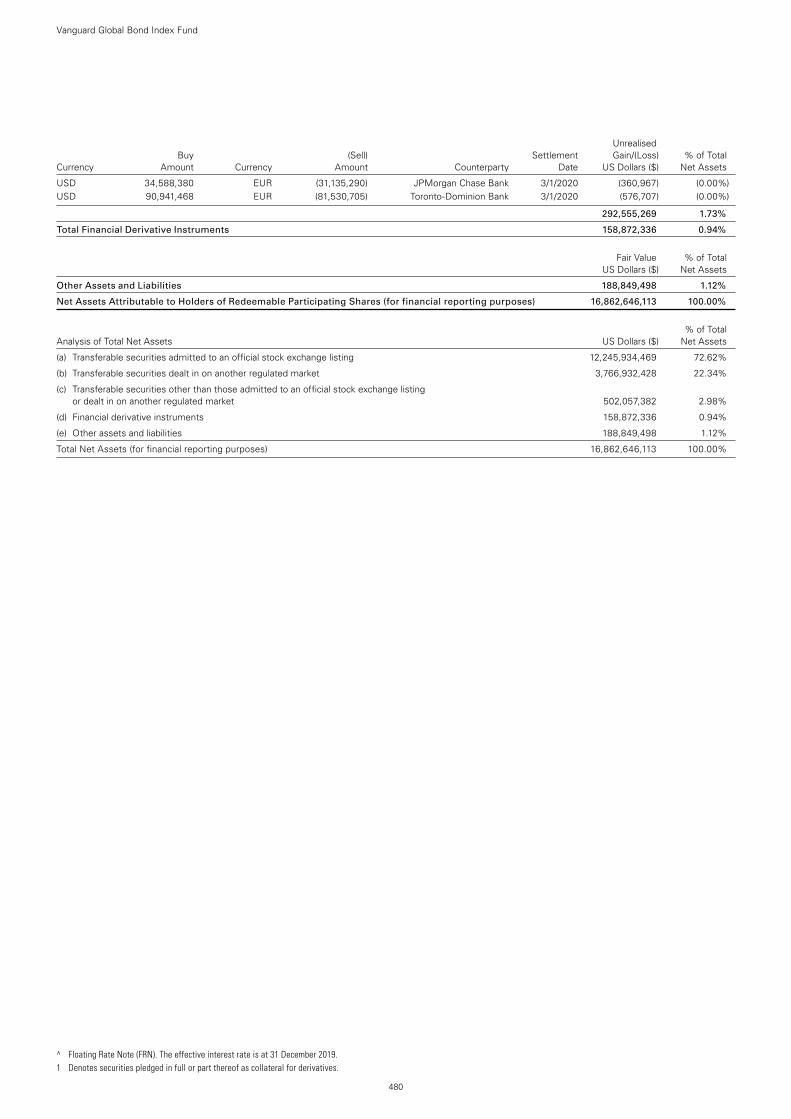
USD 34,588,380 EUR (31,135,290) JPMorgan Chase Bank 3/1/2020 (360,967) (0.00%)USD 90,941,468 EUR (81,530,705) Toronto-Dominion Bank 3/1/2020 (576,707) (0.00%)
292,555,269 1.73%
Total Financial Derivative Instruments 158,872,336 0.94%
Fair Value % of Total US Dollars ($) Net Assets
Other Assets and Liabilities 188,849,498 1.12%
Net Assets Attributable to Holders of Redeemable Participating Shares (for financial reporting purposes) 16,862,646,113 100.00%
% of Total Analysis of Total Net Assets US Dollars ($) Net Assets
(a) Transferable securities admitted to an official stock exchange listing 12,245,934,469 72.62%
(b) Transferable securities dealt in on another regulated market 3,766,932,428 22.34%
(c) Transferable securities other than those admitted to an official stock exchange listing or dealt in on another regulated market 502,057,382 2.98%
(d) Financial derivative instruments 158,872,336 0.94%
(e) Other assets and liabilities 188,849,498 1.12%
Total Net Assets (for financial reporting purposes) 16,862,646,113 100.00%
Vanguard Global Bond Index Fund
480
Unrealised Buy (Sell) Settlement Gain/(Loss) % of Total Currency Amount Currency Amount Counterparty Date US Dollars ($) Net Assets
^ Floating Rate Note (FRN). The effective interest rate is at 31 December 2019. 1 Denotes securities pledged in full or part thereof as collateral for derivatives.
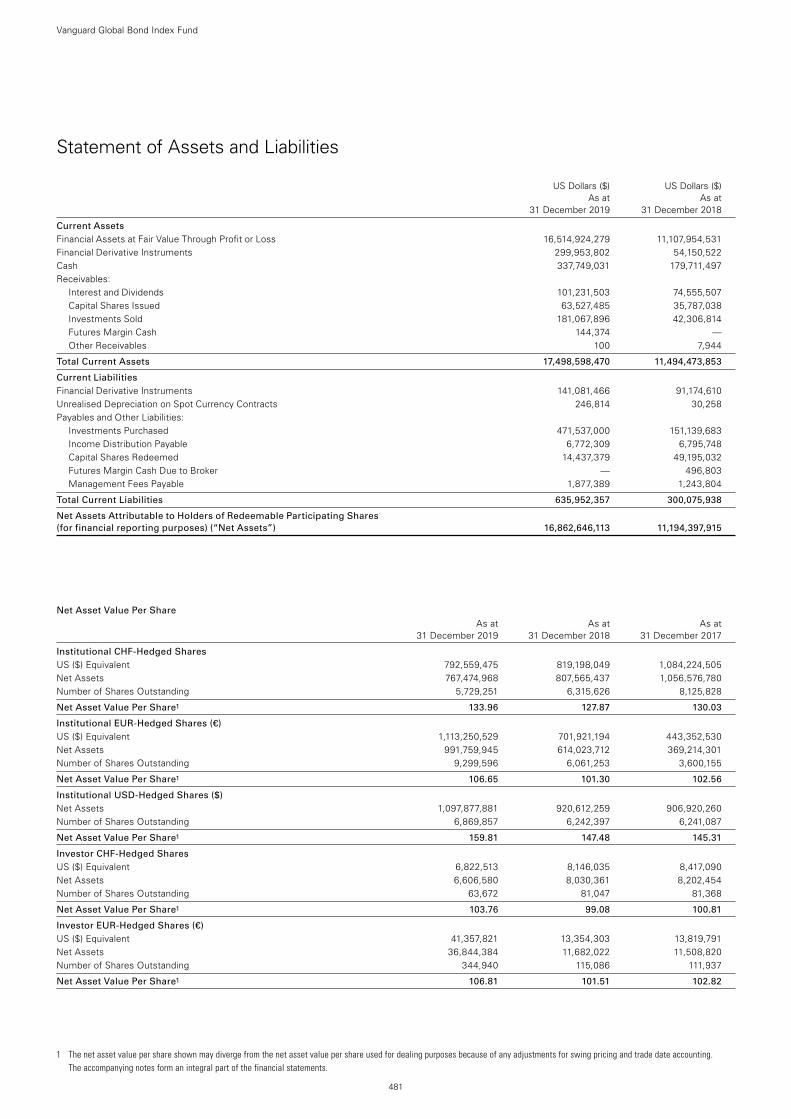
1 The net asset value per share shown may diverge from the net asset value per share used for dealing purposes because of any adjustments for swing pricing and trade date accounting. The accompanying notes form an integral part of the financial statements.
481
Vanguard Global Bond Index Fund
Statement of Assets and Liabilities
US Dollars ($) US Dollars ($) As at As at 31 December 2019 31 December 2018
Current Assets Financial Assets at Fair Value Through Profit or Loss 16,514,924,279 11,107,954,531Financial Derivative Instruments 299,953,802 54,150,522Cash 337,749,031 179,711,497Receivables:
Interest and Dividends 101,231,503 74,555,507Capital Shares Issued 63,527,485 35,787,038Investments Sold 181,067,896 42,306,814Futures Margin Cash 144,374 —Other Receivables 100 7,944
Total Current Assets 17,498,598,470 11,494,473,853
Current Liabilities Financial Derivative Instruments 141,081,466 91,174,610Unrealised Depreciation on Spot Currency Contracts 246,814 30,258Payables and Other Liabilities:
Investments Purchased 471,537,000 151,139,683Income Distribution Payable 6,772,309 6,795,748Capital Shares Redeemed 14,437,379 49,195,032Futures Margin Cash Due to Broker — 496,803Management Fees Payable 1,877,389 1,243,804
Total Current Liabilities 635,952,357 300,075,938
Net Assets Attributable to Holders of Redeemable Participating Shares (for financial reporting purposes) (“Net Assets”) 16,862,646,113 11,194,397,915
Net Asset Value Per Share As at As at As at 31 December 2019 31 December 2018 31 December 2017
Institutional CHF-Hedged Shares US ($) Equivalent 792,559,475 819,198,049 1,084,224,505Net Assets 767,474,968 807,565,437 1,056,576,780Number of Shares Outstanding 5,729,251 6,315,626 8,125,828
Net Asset Value Per Share1 133.96 127.87 130.03
Institutional EUR-Hedged Shares (€) US ($) Equivalent 1,113,250,529 701,921,194 443,352,530Net Assets 991,759,945 614,023,712 369,214,301Number of Shares Outstanding 9,299,596 6,061,253 3,600,155
Net Asset Value Per Share1 106.65 101.30 102.56
Institutional USD-Hedged Shares ($) Net Assets 1,097,877,881 920,612,259 906,920,260Number of Shares Outstanding 6,869,857 6,242,397 6,241,087
Net Asset Value Per Share1 159.81 147.48 145.31
Investor CHF-Hedged Shares US ($) Equivalent 6,822,513 8,146,035 8,417,090Net Assets 6,606,580 8,030,361 8,202,454Number of Shares Outstanding 63,672 81,047 81,368
Net Asset Value Per Share1 103.76 99.08 100.81
Investor EUR-Hedged Shares (€) US ($) Equivalent 41,357,821 13,354,303 13,819,791Net Assets 36,844,384 11,682,022 11,508,820Number of Shares Outstanding 344,940 115,086 111,937
Net Asset Value Per Share1 106.81 101.51 102.82
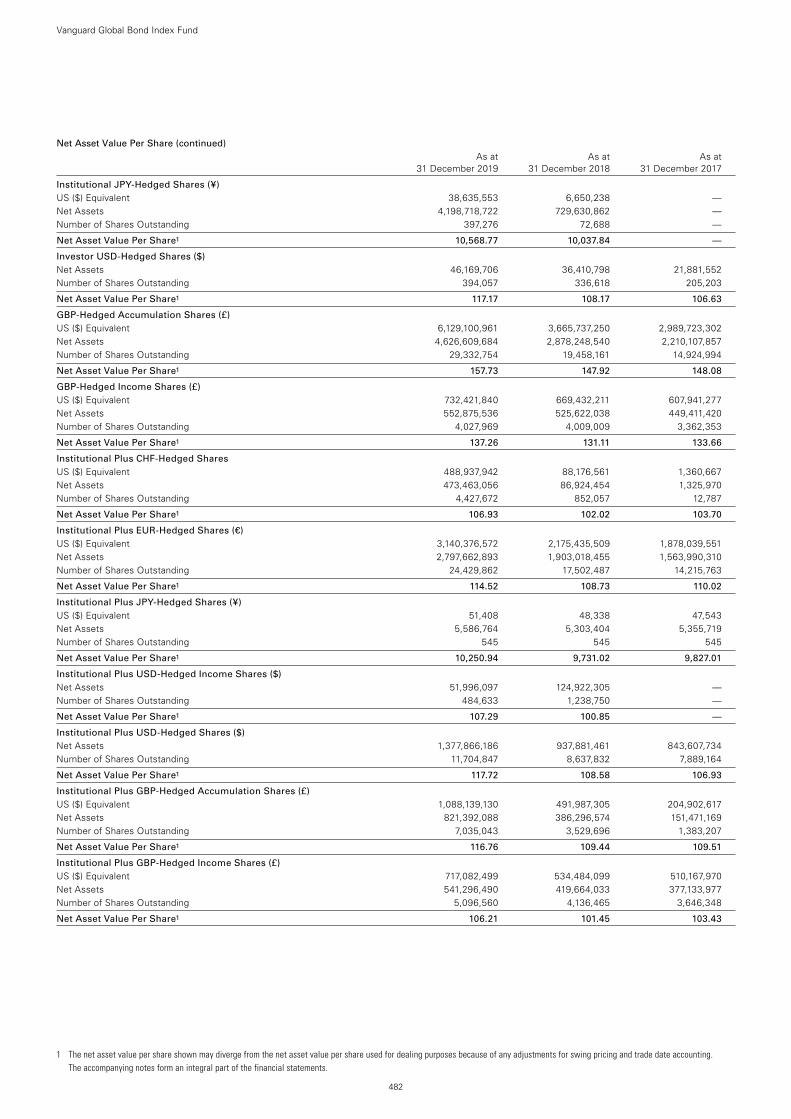
1 The net asset value per share shown may diverge from the net asset value per share used for dealing purposes because of any adjustments for swing pricing and trade date accounting. The accompanying notes form an integral part of the financial statements.
482
Vanguard Global Bond Index Fund
Institutional JPY-Hedged Shares (¥) US ($) Equivalent 38,635,553 6,650,238 —Net Assets 4,198,718,722 729,630,862 —Number of Shares Outstanding 397,276 72,688 —
Net Asset Value Per Share1 10,568.77 10,037.84 —
Investor USD-Hedged Shares ($) Net Assets 46,169,706 36,410,798 21,881,552Number of Shares Outstanding 394,057 336,618 205,203
Net Asset Value Per Share1 117.17 108.17 106.63
GBP-Hedged Accumulation Shares (£) US ($) Equivalent 6,129,100,961 3,665,737,250 2,989,723,302Net Assets 4,626,609,684 2,878,248,540 2,210,107,857Number of Shares Outstanding 29,332,754 19,458,161 14,924,994
Net Asset Value Per Share1 157.73 147.92 148.08
GBP-Hedged Income Shares (£) US ($) Equivalent 732,421,840 669,432,211 607,941,277Net Assets 552,875,536 525,622,038 449,411,420Number of Shares Outstanding 4,027,969 4,009,009 3,362,353
Net Asset Value Per Share1 137.26 131.11 133.66
Institutional Plus CHF-Hedged Shares US ($) Equivalent 488,937,942 88,176,561 1,360,667Net Assets 473,463,056 86,924,454 1,325,970Number of Shares Outstanding 4,427,672 852,057 12,787
Net Asset Value Per Share1 106.93 102.02 103.70
Institutional Plus EUR-Hedged Shares (€) US ($) Equivalent 3,140,376,572 2,175,435,509 1,878,039,551Net Assets 2,797,662,893 1,903,018,455 1,563,990,310Number of Shares Outstanding 24,429,862 17,502,487 14,215,763
Net Asset Value Per Share1 114.52 108.73 110.02
Institutional Plus JPY-Hedged Shares (¥) US ($) Equivalent 51,408 48,338 47,543Net Assets 5,586,764 5,303,404 5,355,719Number of Shares Outstanding 545 545 545
Net Asset Value Per Share1 10,250.94 9,731.02 9,827.01
Institutional Plus USD-Hedged Income Shares ($) Net Assets 51,996,097 124,922,305 —Number of Shares Outstanding 484,633 1,238,750 —
Net Asset Value Per Share1 107.29 100.85 —
Institutional Plus USD-Hedged Shares ($) Net Assets 1,377,866,186 937,881,461 843,607,734Number of Shares Outstanding 11,704,847 8,637,832 7,889,164
Net Asset Value Per Share1 117.72 108.58 106.93
Institutional Plus GBP-Hedged Accumulation Shares (£) US ($) Equivalent 1,088,139,130 491,987,305 204,902,617Net Assets 821,392,088 386,296,574 151,471,169Number of Shares Outstanding 7,035,043 3,529,696 1,383,207
Net Asset Value Per Share1 116.76 109.44 109.51
Institutional Plus GBP-Hedged Income Shares (£) US ($) Equivalent 717,082,499 534,484,099 510,167,970Net Assets 541,296,490 419,664,033 377,133,977Number of Shares Outstanding 5,096,560 4,136,465 3,646,348
Net Asset Value Per Share1 106.21 101.45 103.43
Net Asset Value Per Share (continued) As at As at As at 31 December 2019 31 December 2018 31 December 2017
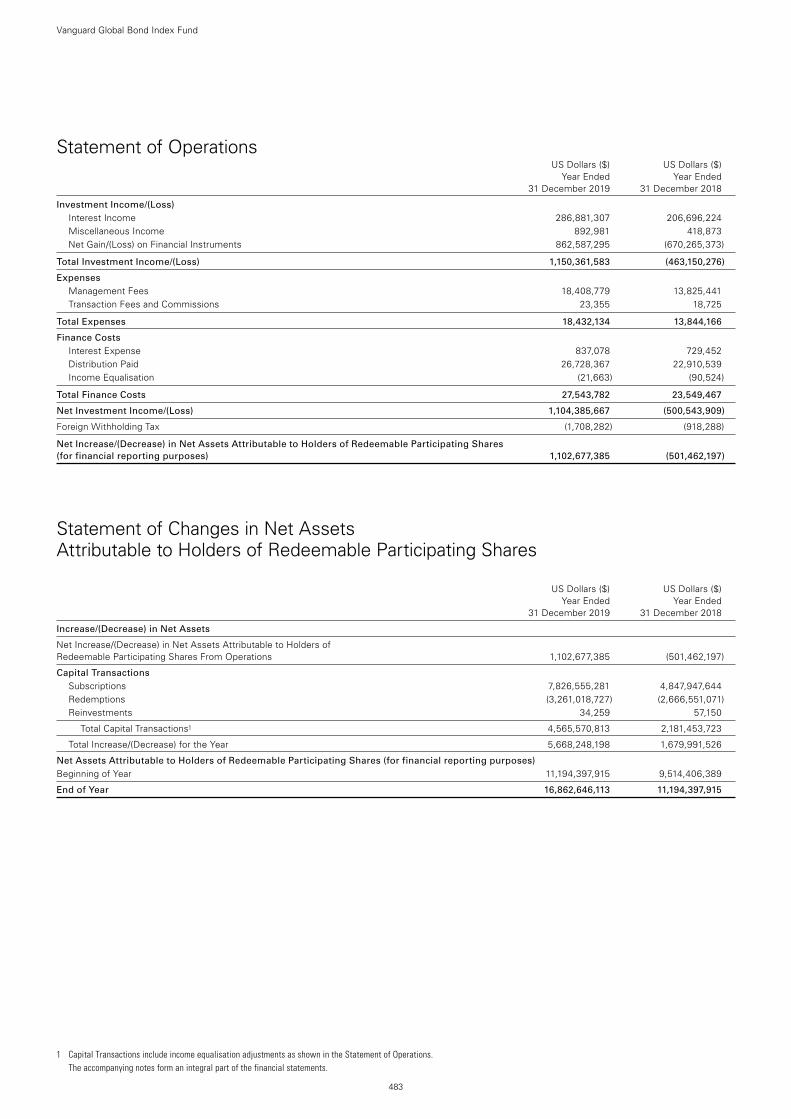
483
Vanguard Global Bond Index Fund
Statement of Operations US Dollars ($) US Dollars ($) Year Ended Year Ended 31 December 2019 31 December 2018
Investment Income/(Loss) Interest Income 286,881,307 206,696,224Miscellaneous Income 892,981 418,873Net Gain/(Loss) on Financial Instruments 862,587,295 (670,265,373)
Total Investment Income/(Loss) 1,150,361,583 (463,150,276)
Expenses Management Fees 18,408,779 13,825,441Transaction Fees and Commissions 23,355 18,725
Total Expenses 18,432,134 13,844,166
Finance Costs Interest Expense 837,078 729,452Distribution Paid 26,728,367 22,910,539Income Equalisation (21,663) (90,524)
Total Finance Costs 27,543,782 23,549,467
Net Investment Income/(Loss) 1,104,385,667 (500,543,909)
Foreign Withholding Tax (1,708,282) (918,288)
Net Increase/(Decrease) in Net Assets Attributable to Holders of Redeemable Participating Shares (for financial reporting purposes) 1,102,677,385 (501,462,197)
Statement of Changes in Net Assets Attributable to Holders of Redeemable Participating Shares
US Dollars ($) US Dollars ($) Year Ended Year Ended 31 December 2019 31 December 2018
Increase/(Decrease) in Net Assets
Net Increase/(Decrease) in Net Assets Attributable to Holders of Redeemable Participating Shares From Operations 1,102,677,385 (501,462,197)
Capital Transactions Subscriptions 7,826,555,281 4,847,947,644Redemptions (3,261,018,727) (2,666,551,071)Reinvestments 34,259 57,150
Total Capital Transactions1 4,565,570,813 2,181,453,723
Total Increase/(Decrease) for the Year 5,668,248,198 1,679,991,526
Net Assets Attributable to Holders of Redeemable Participating Shares (for financial reporting purposes) Beginning of Year 11,194,397,915 9,514,406,389
End of Year 16,862,646,113 11,194,397,915
1 Capital Transactions include income equalisation adjustments as shown in the Statement of Operations. The accompanying notes form an integral part of the financial statements.
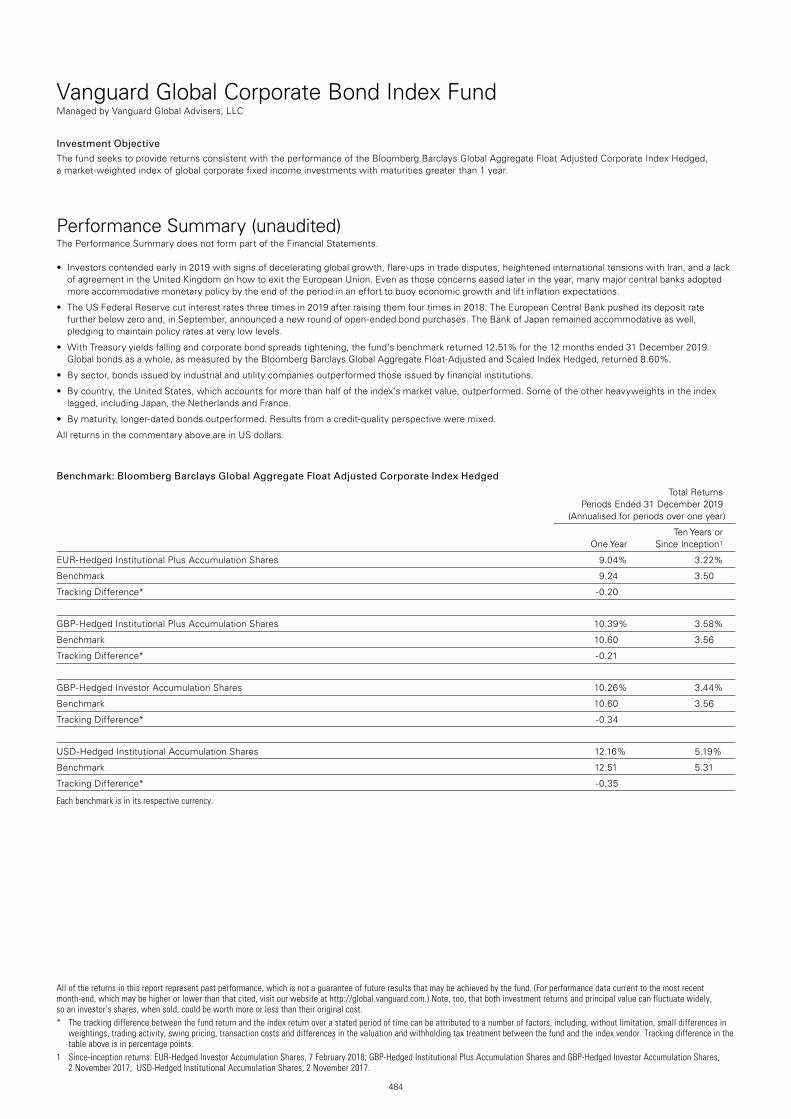
484
Vanguard Global Corporate Bond Index FundManaged by Vanguard Global Advisers, LLC
All of the returns in this report represent past performance, which is not a guarantee of future results that may be achieved by the fund. (For performance data current to the most recent month-end, which may be higher or lower than that cited, visit our website at http://global.vanguard.com.) Note, too, that both investment returns and principal value can fluctuate widely, so an investor’s shares, when sold, could be worth more or less than their original cost.* The tracking difference between the fund return and the index return over a stated period of time can be attributed to a number of factors, including, without limitation, small differences in
weightings, trading activity, swing pricing, transaction costs and differences in the valuation and withholding tax treatment between the fund and the index vendor. Tracking difference in the table above is in percentage points.
1 Since-inception returns: EUR-Hedged Investor Accumulation Shares, 7 February 2018; GBP-Hedged Institutional Plus Accumulation Shares and GBP-Hedged Investor Accumulation Shares, 2 November 2017; USD-Hedged Institutional Accumulation Shares, 2 November 2017.
Investment ObjectiveThe fund seeks to provide returns consistent with the performance of the Bloomberg Barclays Global Aggregate Float Adjusted Corporate Index Hedged, a market-weighted index of global corporate fixed income investments with maturities greater than 1 year.
Performance Summary (unaudited)The Performance Summary does not form part of the Financial Statements.
• Investorscontendedearlyin2019withsignsofdeceleratingglobalgrowth,flare-upsintradedisputes,heightenedinternationaltensionswithIran,andalackof agreement in the United Kingdom on how to exit the European Union. Even as those concerns eased later in the year, many major central banks adopted more accommodative monetary policy by the end of the period in an effort to buoy economic growth and lift inflation expectations.
• TheUSFederalReservecutinterestratesthreetimesin2019afterraisingthemfourtimesin2018.TheEuropeanCentralBankpusheditsdepositratefurther below zero and, in September, announced a new round of open-ended bond purchases. The Bank of Japan remained accommodative as well, pledging to maintain policy rates at very low levels.
• WithTreasuryyieldsfallingandcorporatebondspreadstightening,thefund’sbenchmarkreturned12.51%forthe12monthsended31December2019.Global bonds as a whole, as measured by the Bloomberg Barclays Global Aggregate Float-Adjusted and Scaled Index Hedged, returned 8.60%.
• Bysector,bondsissuedbyindustrialandutilitycompaniesoutperformedthoseissuedbyfinancialinstitutions.
• Bycountry,theUnitedStates,whichaccountsformorethanhalfoftheindex’smarketvalue,outperformed.Someoftheotherheavyweightsintheindexlagged, including Japan, the Netherlands and France.
• Bymaturity,longer-datedbondsoutperformed.Resultsfromacredit-qualityperspectiveweremixed.
All returns in the commentary above are in US dollars.
Benchmark: Bloomberg Barclays Global Aggregate Float Adjusted Corporate Index Hedged
Total Returns Periods Ended 31 December 2019 (Annualised for periods over one year)
Ten Years or One Year Since Inception1
EUR-Hedged Institutional Plus Accumulation Shares 9.04% 3.22%
Benchmark 9.24 3.50
Tracking Difference* -0.20
GBP-Hedged Institutional Plus Accumulation Shares 10.39% 3.58%
Benchmark 10.60 3.56
Tracking Difference* -0.21
GBP-Hedged Investor Accumulation Shares 10.26% 3.44%
Benchmark 10.60 3.56
Tracking Difference* -0.34
USD-Hedged Institutional Accumulation Shares 12.16% 5.19%
Benchmark 12.51 5.31
Tracking Difference* -0.35
Each benchmark is in its respective currency.
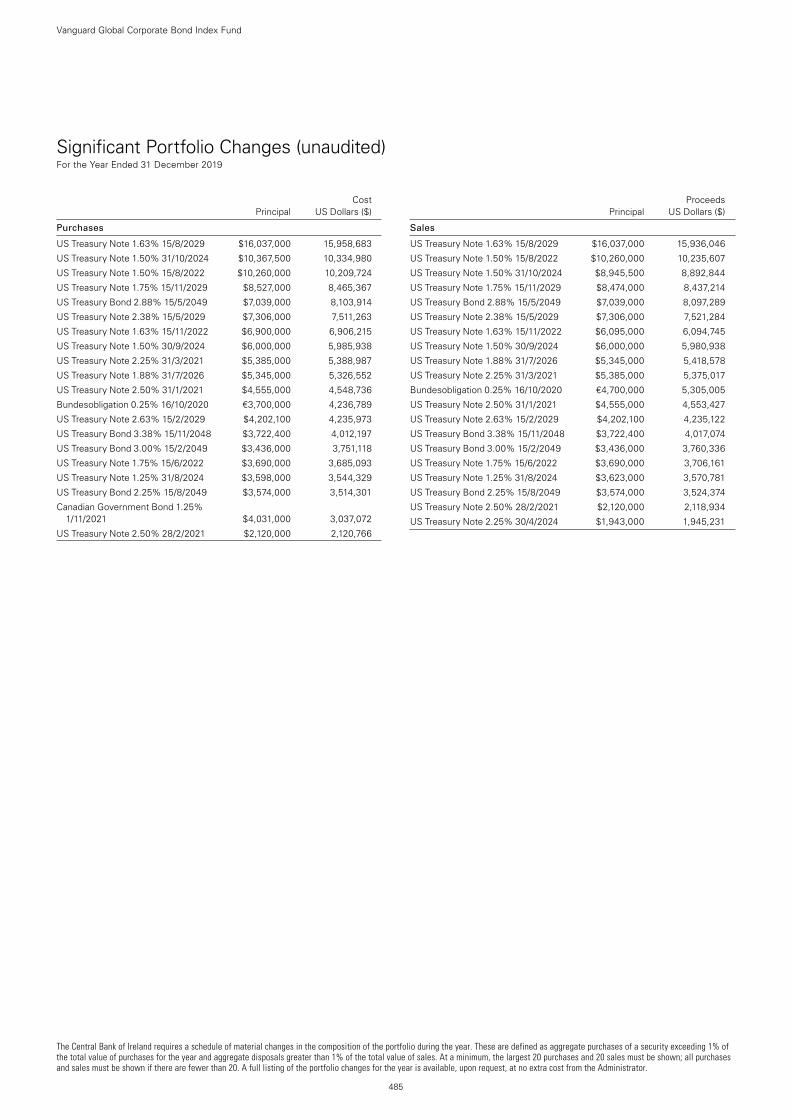
The Central Bank of Ireland requires a schedule of material changes in the composition of the portfolio during the year. These are defined as aggregate purchases of a security exceeding 1% of the total value of purchases for the year and aggregate disposals greater than 1% of the total value of sales. At a minimum, the largest 20 purchases and 20 sales must be shown; all purchases and sales must be shown if there are fewer than 20. A full listing of the portfolio changes for the year is available, upon request, at no extra cost from the Administrator.
485
Vanguard Global Corporate Bond Index Fund
Significant Portfolio Changes (unaudited) For the Year Ended 31 December 2019
Cost Principal US Dollars ($)
Purchases
US Treasury Note 1.63% 15/8/2029 $16,037,000 15,958,683
US Treasury Note 1.50% 31/10/2024 $10,367,500 10,334,980
US Treasury Note 1.50% 15/8/2022 $10,260,000 10,209,724
US Treasury Note 1.75% 15/11/2029 $8,527,000 8,465,367
US Treasury Bond 2.88% 15/5/2049 $7,039,000 8,103,914
US Treasury Note 2.38% 15/5/2029 $7,306,000 7,511,263
US Treasury Note 1.63% 15/11/2022 $6,900,000 6,906,215
US Treasury Note 1.50% 30/9/2024 $6,000,000 5,985,938
US Treasury Note 2.25% 31/3/2021 $5,385,000 5,388,987
US Treasury Note 1.88% 31/7/2026 $5,345,000 5,326,552
US Treasury Note 2.50% 31/1/2021 $4,555,000 4,548,736
Bundesobligation 0.25% 16/10/2020 €3,700,000 4,236,789
US Treasury Note 2.63% 15/2/2029 $4,202,100 4,235,973
US Treasury Bond 3.38% 15/11/2048 $3,722,400 4,012,197
US Treasury Bond 3.00% 15/2/2049 $3,436,000 3,751,118
US Treasury Note 1.75% 15/6/2022 $3,690,000 3,685,093
US Treasury Note 1.25% 31/8/2024 $3,598,000 3,544,329
US Treasury Bond 2.25% 15/8/2049 $3,574,000 3,514,301
Canadian Government Bond 1.25% 1/11/2021 $4,031,000 3,037,072
US Treasury Note 2.50% 28/2/2021 $2,120,000 2,120,766
Proceeds Principal US Dollars ($)
Sales
US Treasury Note 1.63% 15/8/2029 $16,037,000 15,936,046
US Treasury Note 1.50% 15/8/2022 $10,260,000 10,235,607
US Treasury Note 1.50% 31/10/2024 $8,945,500 8,892,844
US Treasury Note 1.75% 15/11/2029 $8,474,000 8,437,214
US Treasury Bond 2.88% 15/5/2049 $7,039,000 8,097,289
US Treasury Note 2.38% 15/5/2029 $7,306,000 7,521,284
US Treasury Note 1.63% 15/11/2022 $6,095,000 6,094,745
US Treasury Note 1.50% 30/9/2024 $6,000,000 5,980,938
US Treasury Note 1.88% 31/7/2026 $5,345,000 5,418,578
US Treasury Note 2.25% 31/3/2021 $5,385,000 5,375,017
Bundesobligation 0.25% 16/10/2020 €4,700,000 5,305,005
US Treasury Note 2.50% 31/1/2021 $4,555,000 4,553,427
US Treasury Note 2.63% 15/2/2029 $4,202,100 4,235,122
US Treasury Bond 3.38% 15/11/2048 $3,722,400 4,017,074
US Treasury Bond 3.00% 15/2/2049 $3,436,000 3,760,336
US Treasury Note 1.75% 15/6/2022 $3,690,000 3,706,161
US Treasury Note 1.25% 31/8/2024 $3,623,000 3,570,781
US Treasury Bond 2.25% 15/8/2049 $3,574,000 3,524,374
US Treasury Note 2.50% 28/2/2021 $2,120,000 2,118,934
US Treasury Note 2.25% 30/4/2024 $1,943,000 1,945,231
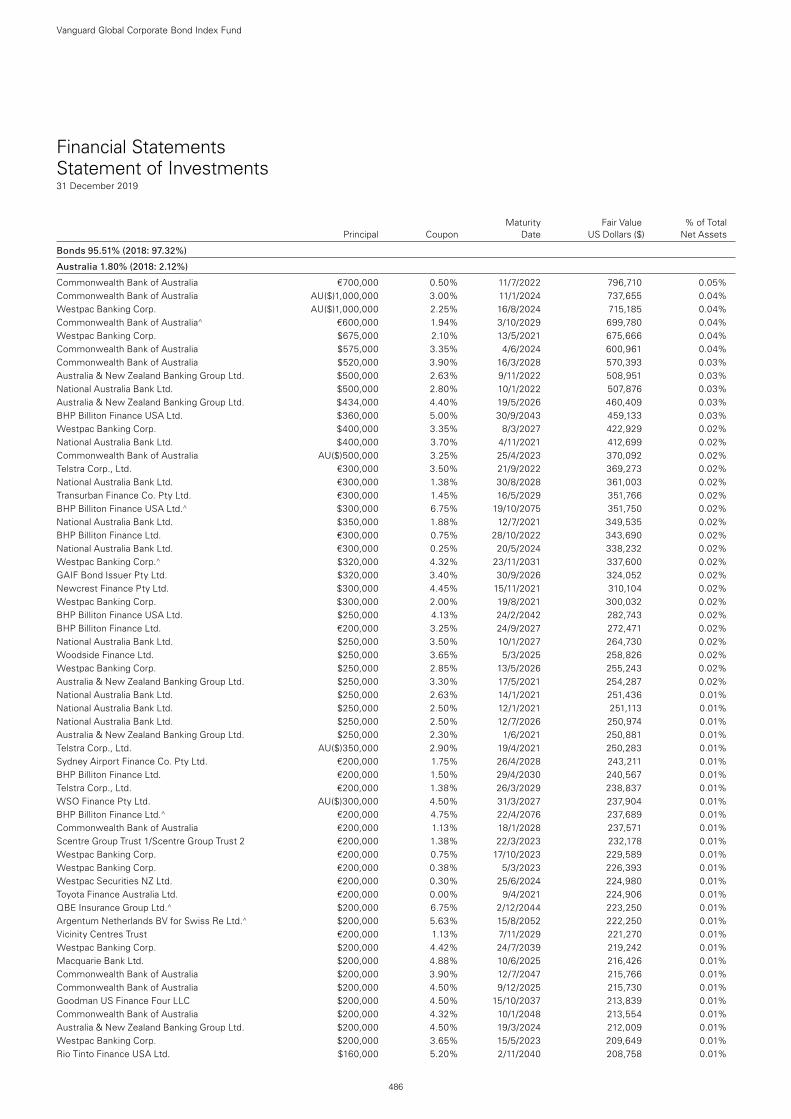
Financial Statements Statement of Investments31 December 2019
Maturity Fair Value % of Total Principal Coupon Date US Dollars ($) Net Assets
Bonds 95.51% (2018: 97.32%)
Australia 1.80% (2018: 2.12%)
Commonwealth Bank of Australia €700,000 0.50% 11/7/2022 796,710 0.05%Commonwealth Bank of Australia AU($)1,000,000 3.00% 11/1/2024 737,655 0.04%Westpac Banking Corp. AU($)1,000,000 2.25% 16/8/2024 715,185 0.04%Commonwealth Bank of Australia^ €600,000 1.94% 3/10/2029 699,780 0.04%Westpac Banking Corp. $675,000 2.10% 13/5/2021 675,666 0.04%Commonwealth Bank of Australia $575,000 3.35% 4/6/2024 600,961 0.04%Commonwealth Bank of Australia $520,000 3.90% 16/3/2028 570,393 0.03%Australia & New Zealand Banking Group Ltd. $500,000 2.63% 9/11/2022 508,951 0.03%National Australia Bank Ltd. $500,000 2.80% 10/1/2022 507,876 0.03%Australia & New Zealand Banking Group Ltd. $434,000 4.40% 19/5/2026 460,409 0.03%BHP Billiton Finance USA Ltd. $360,000 5.00% 30/9/2043 459,133 0.03%Westpac Banking Corp. $400,000 3.35% 8/3/2027 422,929 0.02%National Australia Bank Ltd. $400,000 3.70% 4/11/2021 412,699 0.02%Commonwealth Bank of Australia AU($)500,000 3.25% 25/4/2023 370,092 0.02%Telstra Corp., Ltd. €300,000 3.50% 21/9/2022 369,273 0.02%National Australia Bank Ltd. €300,000 1.38% 30/8/2028 361,003 0.02%Transurban Finance Co. Pty Ltd. €300,000 1.45% 16/5/2029 351,766 0.02%BHP Billiton Finance USA Ltd.^ $300,000 6.75% 19/10/2075 351,750 0.02%National Australia Bank Ltd. $350,000 1.88% 12/7/2021 349,535 0.02%BHP Billiton Finance Ltd. €300,000 0.75% 28/10/2022 343,690 0.02%National Australia Bank Ltd. €300,000 0.25% 20/5/2024 338,232 0.02%Westpac Banking Corp.^ $320,000 4.32% 23/11/2031 337,600 0.02%GAIF Bond Issuer Pty Ltd. $320,000 3.40% 30/9/2026 324,052 0.02%Newcrest Finance Pty Ltd. $300,000 4.45% 15/11/2021 310,104 0.02%Westpac Banking Corp. $300,000 2.00% 19/8/2021 300,032 0.02%BHP Billiton Finance USA Ltd. $250,000 4.13% 24/2/2042 282,743 0.02%BHP Billiton Finance Ltd. €200,000 3.25% 24/9/2027 272,471 0.02%National Australia Bank Ltd. $250,000 3.50% 10/1/2027 264,730 0.02%Woodside Finance Ltd. $250,000 3.65% 5/3/2025 258,826 0.02%Westpac Banking Corp. $250,000 2.85% 13/5/2026 255,243 0.02%Australia & New Zealand Banking Group Ltd. $250,000 3.30% 17/5/2021 254,287 0.02%National Australia Bank Ltd. $250,000 2.63% 14/1/2021 251,436 0.01%National Australia Bank Ltd. $250,000 2.50% 12/1/2021 251,113 0.01%National Australia Bank Ltd. $250,000 2.50% 12/7/2026 250,974 0.01%Australia & New Zealand Banking Group Ltd. $250,000 2.30% 1/6/2021 250,881 0.01%Telstra Corp., Ltd. AU($)350,000 2.90% 19/4/2021 250,283 0.01%Sydney Airport Finance Co. Pty Ltd. €200,000 1.75% 26/4/2028 243,211 0.01%BHP Billiton Finance Ltd. €200,000 1.50% 29/4/2030 240,567 0.01%Telstra Corp., Ltd. €200,000 1.38% 26/3/2029 238,837 0.01%WSO Finance Pty Ltd. AU($)300,000 4.50% 31/3/2027 237,904 0.01%BHP Billiton Finance Ltd.^ €200,000 4.75% 22/4/2076 237,689 0.01%Commonwealth Bank of Australia €200,000 1.13% 18/1/2028 237,571 0.01%Scentre Group Trust 1/Scentre Group Trust 2 €200,000 1.38% 22/3/2023 232,178 0.01%Westpac Banking Corp. €200,000 0.75% 17/10/2023 229,589 0.01%Westpac Banking Corp. €200,000 0.38% 5/3/2023 226,393 0.01%Westpac Securities NZ Ltd. €200,000 0.30% 25/6/2024 224,980 0.01%Toyota Finance Australia Ltd. €200,000 0.00% 9/4/2021 224,906 0.01%QBE Insurance Group Ltd.^ $200,000 6.75% 2/12/2044 223,250 0.01%Argentum Netherlands BV for Swiss Re Ltd.^ $200,000 5.63% 15/8/2052 222,250 0.01%Vicinity Centres Trust €200,000 1.13% 7/11/2029 221,270 0.01%Westpac Banking Corp. $200,000 4.42% 24/7/2039 219,242 0.01%Macquarie Bank Ltd. $200,000 4.88% 10/6/2025 216,426 0.01%Commonwealth Bank of Australia $200,000 3.90% 12/7/2047 215,766 0.01%Commonwealth Bank of Australia $200,000 4.50% 9/12/2025 215,730 0.01%Goodman US Finance Four LLC $200,000 4.50% 15/10/2037 213,839 0.01%Commonwealth Bank of Australia $200,000 4.32% 10/1/2048 213,554 0.01%Australia & New Zealand Banking Group Ltd. $200,000 4.50% 19/3/2024 212,009 0.01%Westpac Banking Corp. $200,000 3.65% 15/5/2023 209,649 0.01%Rio Tinto Finance USA Ltd. $160,000 5.20% 2/11/2040 208,758 0.01%
Vanguard Global Corporate Bond Index Fund
486
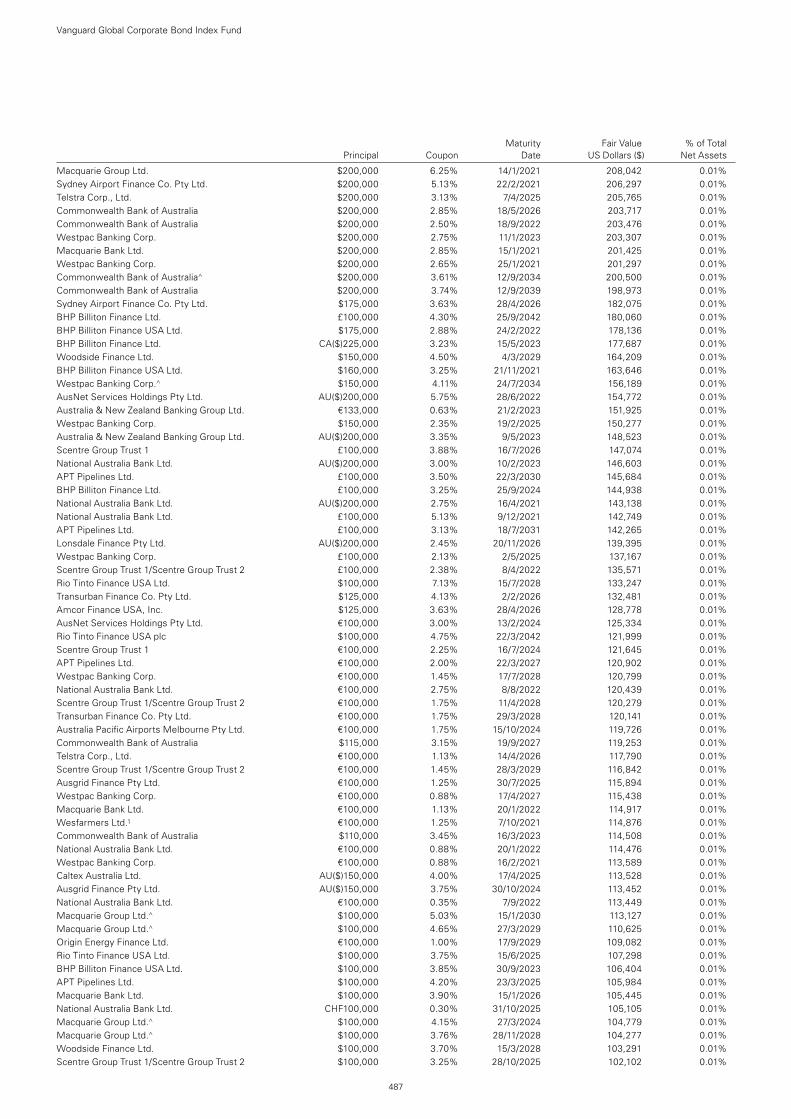
Macquarie Group Ltd. $200,000 6.25% 14/1/2021 208,042 0.01%Sydney Airport Finance Co. Pty Ltd. $200,000 5.13% 22/2/2021 206,297 0.01%Telstra Corp., Ltd. $200,000 3.13% 7/4/2025 205,765 0.01%Commonwealth Bank of Australia $200,000 2.85% 18/5/2026 203,717 0.01%Commonwealth Bank of Australia $200,000 2.50% 18/9/2022 203,476 0.01%Westpac Banking Corp. $200,000 2.75% 11/1/2023 203,307 0.01%Macquarie Bank Ltd. $200,000 2.85% 15/1/2021 201,425 0.01%Westpac Banking Corp. $200,000 2.65% 25/1/2021 201,297 0.01%Commonwealth Bank of Australia^ $200,000 3.61% 12/9/2034 200,500 0.01%Commonwealth Bank of Australia $200,000 3.74% 12/9/2039 198,973 0.01%Sydney Airport Finance Co. Pty Ltd. $175,000 3.63% 28/4/2026 182,075 0.01%BHP Billiton Finance Ltd. £100,000 4.30% 25/9/2042 180,060 0.01%BHP Billiton Finance USA Ltd. $175,000 2.88% 24/2/2022 178,136 0.01%BHP Billiton Finance Ltd. CA($)225,000 3.23% 15/5/2023 177,687 0.01%Woodside Finance Ltd. $150,000 4.50% 4/3/2029 164,209 0.01%BHP Billiton Finance USA Ltd. $160,000 3.25% 21/11/2021 163,646 0.01%Westpac Banking Corp.^ $150,000 4.11% 24/7/2034 156,189 0.01%AusNet Services Holdings Pty Ltd. AU($)200,000 5.75% 28/6/2022 154,772 0.01%Australia & New Zealand Banking Group Ltd. €133,000 0.63% 21/2/2023 151,925 0.01%Westpac Banking Corp. $150,000 2.35% 19/2/2025 150,277 0.01%Australia & New Zealand Banking Group Ltd. AU($)200,000 3.35% 9/5/2023 148,523 0.01%Scentre Group Trust 1 £100,000 3.88% 16/7/2026 147,074 0.01%National Australia Bank Ltd. AU($)200,000 3.00% 10/2/2023 146,603 0.01%APT Pipelines Ltd. £100,000 3.50% 22/3/2030 145,684 0.01%BHP Billiton Finance Ltd. £100,000 3.25% 25/9/2024 144,938 0.01%National Australia Bank Ltd. AU($)200,000 2.75% 16/4/2021 143,138 0.01%National Australia Bank Ltd. £100,000 5.13% 9/12/2021 142,749 0.01%APT Pipelines Ltd. £100,000 3.13% 18/7/2031 142,265 0.01%Lonsdale Finance Pty Ltd. AU($)200,000 2.45% 20/11/2026 139,395 0.01%Westpac Banking Corp. £100,000 2.13% 2/5/2025 137,167 0.01%Scentre Group Trust 1/Scentre Group Trust 2 £100,000 2.38% 8/4/2022 135,571 0.01%Rio Tinto Finance USA Ltd. $100,000 7.13% 15/7/2028 133,247 0.01%Transurban Finance Co. Pty Ltd. $125,000 4.13% 2/2/2026 132,481 0.01%Amcor Finance USA, Inc. $125,000 3.63% 28/4/2026 128,778 0.01%AusNet Services Holdings Pty Ltd. €100,000 3.00% 13/2/2024 125,334 0.01%Rio Tinto Finance USA plc $100,000 4.75% 22/3/2042 121,999 0.01%Scentre Group Trust 1 €100,000 2.25% 16/7/2024 121,645 0.01%APT Pipelines Ltd. €100,000 2.00% 22/3/2027 120,902 0.01%Westpac Banking Corp. €100,000 1.45% 17/7/2028 120,799 0.01%National Australia Bank Ltd. €100,000 2.75% 8/8/2022 120,439 0.01%Scentre Group Trust 1/Scentre Group Trust 2 €100,000 1.75% 11/4/2028 120,279 0.01%Transurban Finance Co. Pty Ltd. €100,000 1.75% 29/3/2028 120,141 0.01%Australia Pacific Airports Melbourne Pty Ltd. €100,000 1.75% 15/10/2024 119,726 0.01%Commonwealth Bank of Australia $115,000 3.15% 19/9/2027 119,253 0.01%Telstra Corp., Ltd. €100,000 1.13% 14/4/2026 117,790 0.01%Scentre Group Trust 1/Scentre Group Trust 2 €100,000 1.45% 28/3/2029 116,842 0.01%Ausgrid Finance Pty Ltd. €100,000 1.25% 30/7/2025 115,894 0.01%Westpac Banking Corp. €100,000 0.88% 17/4/2027 115,438 0.01%Macquarie Bank Ltd. €100,000 1.13% 20/1/2022 114,917 0.01%Wesfarmers Ltd.1 €100,000 1.25% 7/10/2021 114,876 0.01%Commonwealth Bank of Australia $110,000 3.45% 16/3/2023 114,508 0.01%National Australia Bank Ltd. €100,000 0.88% 20/1/2022 114,476 0.01%Westpac Banking Corp. €100,000 0.88% 16/2/2021 113,589 0.01%Caltex Australia Ltd. AU($)150,000 4.00% 17/4/2025 113,528 0.01%Ausgrid Finance Pty Ltd. AU($)150,000 3.75% 30/10/2024 113,452 0.01%National Australia Bank Ltd. €100,000 0.35% 7/9/2022 113,449 0.01%Macquarie Group Ltd.^ $100,000 5.03% 15/1/2030 113,127 0.01%Macquarie Group Ltd.^ $100,000 4.65% 27/3/2029 110,625 0.01%Origin Energy Finance Ltd. €100,000 1.00% 17/9/2029 109,082 0.01%Rio Tinto Finance USA Ltd. $100,000 3.75% 15/6/2025 107,298 0.01%BHP Billiton Finance USA Ltd. $100,000 3.85% 30/9/2023 106,404 0.01%APT Pipelines Ltd. $100,000 4.20% 23/3/2025 105,984 0.01%Macquarie Bank Ltd. $100,000 3.90% 15/1/2026 105,445 0.01%National Australia Bank Ltd. CHF100,000 0.30% 31/10/2025 105,105 0.01%Macquarie Group Ltd.^ $100,000 4.15% 27/3/2024 104,779 0.01%Macquarie Group Ltd.^ $100,000 3.76% 28/11/2028 104,277 0.01%Woodside Finance Ltd. $100,000 3.70% 15/3/2028 103,291 0.01%Scentre Group Trust 1/Scentre Group Trust 2 $100,000 3.25% 28/10/2025 102,102 0.01%
Vanguard Global Corporate Bond Index Fund
487
Maturity Fair Value % of Total Principal Coupon Date US Dollars ($) Net Assets
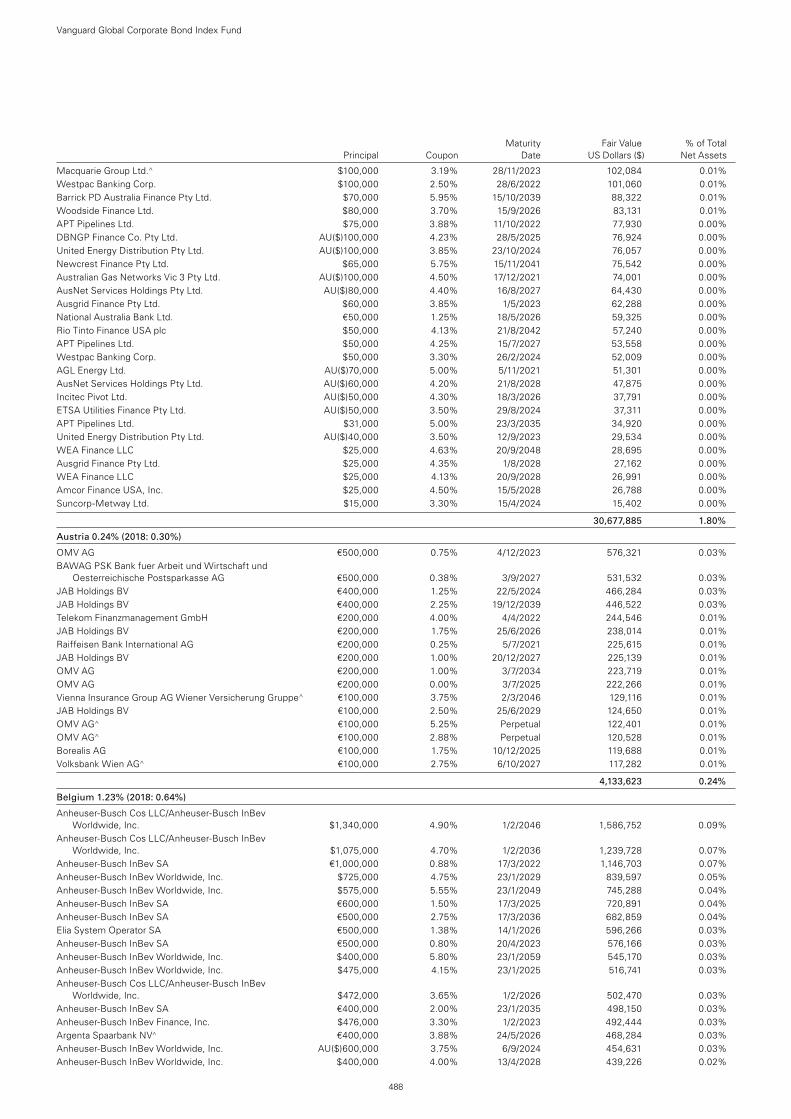
Macquarie Group Ltd.^ $100,000 3.19% 28/11/2023 102,084 0.01%Westpac Banking Corp. $100,000 2.50% 28/6/2022 101,060 0.01%Barrick PD Australia Finance Pty Ltd. $70,000 5.95% 15/10/2039 88,322 0.01%Woodside Finance Ltd. $80,000 3.70% 15/9/2026 83,131 0.01%APT Pipelines Ltd. $75,000 3.88% 11/10/2022 77,930 0.00%DBNGP Finance Co. Pty Ltd. AU($)100,000 4.23% 28/5/2025 76,924 0.00%United Energy Distribution Pty Ltd. AU($)100,000 3.85% 23/10/2024 76,057 0.00%Newcrest Finance Pty Ltd. $65,000 5.75% 15/11/2041 75,542 0.00%Australian Gas Networks Vic 3 Pty Ltd. AU($)100,000 4.50% 17/12/2021 74,001 0.00%AusNet Services Holdings Pty Ltd. AU($)80,000 4.40% 16/8/2027 64,430 0.00%Ausgrid Finance Pty Ltd. $60,000 3.85% 1/5/2023 62,288 0.00%National Australia Bank Ltd. €50,000 1.25% 18/5/2026 59,325 0.00%Rio Tinto Finance USA plc $50,000 4.13% 21/8/2042 57,240 0.00%APT Pipelines Ltd. $50,000 4.25% 15/7/2027 53,558 0.00%Westpac Banking Corp. $50,000 3.30% 26/2/2024 52,009 0.00%AGL Energy Ltd. AU($)70,000 5.00% 5/11/2021 51,301 0.00%AusNet Services Holdings Pty Ltd. AU($)60,000 4.20% 21/8/2028 47,875 0.00%Incitec Pivot Ltd. AU($)50,000 4.30% 18/3/2026 37,791 0.00%ETSA Utilities Finance Pty Ltd. AU($)50,000 3.50% 29/8/2024 37,311 0.00%APT Pipelines Ltd. $31,000 5.00% 23/3/2035 34,920 0.00%United Energy Distribution Pty Ltd. AU($)40,000 3.50% 12/9/2023 29,534 0.00%WEA Finance LLC $25,000 4.63% 20/9/2048 28,695 0.00%Ausgrid Finance Pty Ltd. $25,000 4.35% 1/8/2028 27,162 0.00%WEA Finance LLC $25,000 4.13% 20/9/2028 26,991 0.00%Amcor Finance USA, Inc. $25,000 4.50% 15/5/2028 26,788 0.00%Suncorp-Metway Ltd. $15,000 3.30% 15/4/2024 15,402 0.00%
30,677,885 1.80%
Austria 0.24% (2018: 0.30%)
OMV AG €500,000 0.75% 4/12/2023 576,321 0.03%BAWAG PSK Bank fuer Arbeit und Wirtschaft und
Oesterreichische Postsparkasse AG €500,000 0.38% 3/9/2027 531,532 0.03%JAB Holdings BV €400,000 1.25% 22/5/2024 466,284 0.03%JAB Holdings BV €400,000 2.25% 19/12/2039 446,522 0.03%Telekom Finanzmanagement GmbH €200,000 4.00% 4/4/2022 244,546 0.01%JAB Holdings BV €200,000 1.75% 25/6/2026 238,014 0.01%Raiffeisen Bank International AG €200,000 0.25% 5/7/2021 225,615 0.01%JAB Holdings BV €200,000 1.00% 20/12/2027 225,139 0.01%OMV AG €200,000 1.00% 3/7/2034 223,719 0.01%OMV AG €200,000 0.00% 3/7/2025 222,266 0.01%Vienna Insurance Group AG Wiener Versicherung Gruppe^ €100,000 3.75% 2/3/2046 129,116 0.01%JAB Holdings BV €100,000 2.50% 25/6/2029 124,650 0.01%OMV AG^ €100,000 5.25% Perpetual 122,401 0.01%OMV AG^ €100,000 2.88% Perpetual 120,528 0.01%Borealis AG €100,000 1.75% 10/12/2025 119,688 0.01%Volksbank Wien AG^ €100,000 2.75% 6/10/2027 117,282 0.01%
4,133,623 0.24%
Belgium 1.23% (2018: 0.64%)
Anheuser-Busch Cos LLC/Anheuser-Busch InBev Worldwide, Inc. $1,340,000 4.90% 1/2/2046 1,586,752 0.09%
Anheuser-Busch Cos LLC/Anheuser-Busch InBev Worldwide, Inc. $1,075,000 4.70% 1/2/2036 1,239,728 0.07%
Anheuser-Busch InBev SA €1,000,000 0.88% 17/3/2022 1,146,703 0.07%Anheuser-Busch InBev Worldwide, Inc. $725,000 4.75% 23/1/2029 839,597 0.05%Anheuser-Busch InBev Worldwide, Inc. $575,000 5.55% 23/1/2049 745,288 0.04%Anheuser-Busch InBev SA €600,000 1.50% 17/3/2025 720,891 0.04%Anheuser-Busch InBev SA €500,000 2.75% 17/3/2036 682,859 0.04%Elia System Operator SA €500,000 1.38% 14/1/2026 596,266 0.03%Anheuser-Busch InBev SA €500,000 0.80% 20/4/2023 576,166 0.03%Anheuser-Busch InBev Worldwide, Inc. $400,000 5.80% 23/1/2059 545,170 0.03%Anheuser-Busch InBev Worldwide, Inc. $475,000 4.15% 23/1/2025 516,741 0.03%Anheuser-Busch Cos LLC/Anheuser-Busch InBev
Worldwide, Inc. $472,000 3.65% 1/2/2026 502,470 0.03%Anheuser-Busch InBev SA €400,000 2.00% 23/1/2035 498,150 0.03%Anheuser-Busch InBev Finance, Inc. $476,000 3.30% 1/2/2023 492,444 0.03%Argenta Spaarbank NV^ €400,000 3.88% 24/5/2026 468,284 0.03%Anheuser-Busch InBev Worldwide, Inc. AU($)600,000 3.75% 6/9/2024 454,631 0.03%Anheuser-Busch InBev Worldwide, Inc. $400,000 4.00% 13/4/2028 439,226 0.02%
Vanguard Global Corporate Bond Index Fund
488
Maturity Fair Value % of Total Principal Coupon Date US Dollars ($) Net Assets
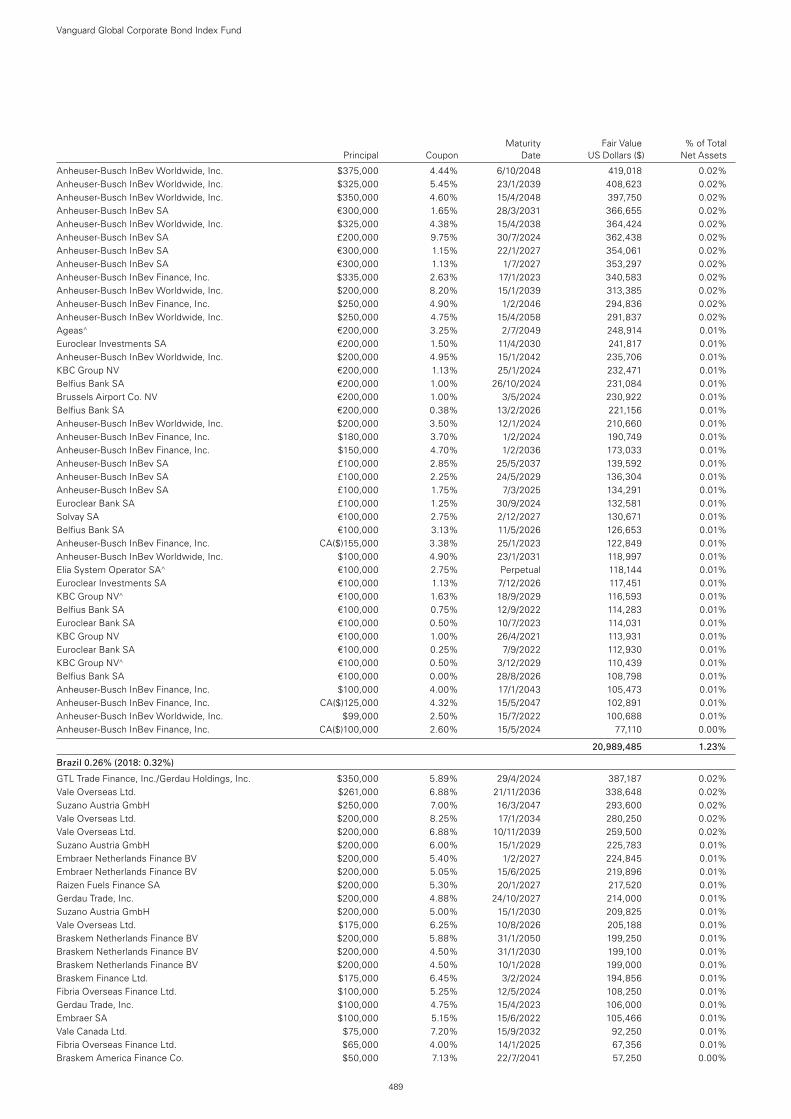
Anheuser-Busch InBev Worldwide, Inc. $375,000 4.44% 6/10/2048 419,018 0.02%Anheuser-Busch InBev Worldwide, Inc. $325,000 5.45% 23/1/2039 408,623 0.02%Anheuser-Busch InBev Worldwide, Inc. $350,000 4.60% 15/4/2048 397,750 0.02%Anheuser-Busch InBev SA €300,000 1.65% 28/3/2031 366,655 0.02%Anheuser-Busch InBev Worldwide, Inc. $325,000 4.38% 15/4/2038 364,424 0.02%Anheuser-Busch InBev SA £200,000 9.75% 30/7/2024 362,438 0.02%Anheuser-Busch InBev SA €300,000 1.15% 22/1/2027 354,061 0.02%Anheuser-Busch InBev SA €300,000 1.13% 1/7/2027 353,297 0.02%Anheuser-Busch InBev Finance, Inc. $335,000 2.63% 17/1/2023 340,583 0.02%Anheuser-Busch InBev Worldwide, Inc. $200,000 8.20% 15/1/2039 313,385 0.02%Anheuser-Busch InBev Finance, Inc. $250,000 4.90% 1/2/2046 294,836 0.02%Anheuser-Busch InBev Worldwide, Inc. $250,000 4.75% 15/4/2058 291,837 0.02%Ageas^ €200,000 3.25% 2/7/2049 248,914 0.01%Euroclear Investments SA €200,000 1.50% 11/4/2030 241,817 0.01%Anheuser-Busch InBev Worldwide, Inc. $200,000 4.95% 15/1/2042 235,706 0.01%KBC Group NV €200,000 1.13% 25/1/2024 232,471 0.01%Belfius Bank SA €200,000 1.00% 26/10/2024 231,084 0.01%Brussels Airport Co. NV €200,000 1.00% 3/5/2024 230,922 0.01%Belfius Bank SA €200,000 0.38% 13/2/2026 221,156 0.01%Anheuser-Busch InBev Worldwide, Inc. $200,000 3.50% 12/1/2024 210,660 0.01%Anheuser-Busch InBev Finance, Inc. $180,000 3.70% 1/2/2024 190,749 0.01%Anheuser-Busch InBev Finance, Inc. $150,000 4.70% 1/2/2036 173,033 0.01%Anheuser-Busch InBev SA £100,000 2.85% 25/5/2037 139,592 0.01%Anheuser-Busch InBev SA £100,000 2.25% 24/5/2029 136,304 0.01%Anheuser-Busch InBev SA £100,000 1.75% 7/3/2025 134,291 0.01%Euroclear Bank SA £100,000 1.25% 30/9/2024 132,581 0.01%Solvay SA €100,000 2.75% 2/12/2027 130,671 0.01%Belfius Bank SA €100,000 3.13% 11/5/2026 126,653 0.01%Anheuser-Busch InBev Finance, Inc. CA($)155,000 3.38% 25/1/2023 122,849 0.01%Anheuser-Busch InBev Worldwide, Inc. $100,000 4.90% 23/1/2031 118,997 0.01%Elia System Operator SA^ €100,000 2.75% Perpetual 118,144 0.01%Euroclear Investments SA €100,000 1.13% 7/12/2026 117,451 0.01%KBC Group NV^ €100,000 1.63% 18/9/2029 116,593 0.01%Belfius Bank SA €100,000 0.75% 12/9/2022 114,283 0.01%Euroclear Bank SA €100,000 0.50% 10/7/2023 114,031 0.01%KBC Group NV €100,000 1.00% 26/4/2021 113,931 0.01%Euroclear Bank SA €100,000 0.25% 7/9/2022 112,930 0.01%KBC Group NV^ €100,000 0.50% 3/12/2029 110,439 0.01%Belfius Bank SA €100,000 0.00% 28/8/2026 108,798 0.01%Anheuser-Busch InBev Finance, Inc. $100,000 4.00% 17/1/2043 105,473 0.01%Anheuser-Busch InBev Finance, Inc. CA($)125,000 4.32% 15/5/2047 102,891 0.01%Anheuser-Busch InBev Worldwide, Inc. $99,000 2.50% 15/7/2022 100,688 0.01%Anheuser-Busch InBev Finance, Inc. CA($)100,000 2.60% 15/5/2024 77,110 0.00%
20,989,485 1.23%
Brazil 0.26% (2018: 0.32%)
GTL Trade Finance, Inc./Gerdau Holdings, Inc. $350,000 5.89% 29/4/2024 387,187 0.02%Vale Overseas Ltd. $261,000 6.88% 21/11/2036 338,648 0.02%Suzano Austria GmbH $250,000 7.00% 16/3/2047 293,600 0.02%Vale Overseas Ltd. $200,000 8.25% 17/1/2034 280,250 0.02%Vale Overseas Ltd. $200,000 6.88% 10/11/2039 259,500 0.02%Suzano Austria GmbH $200,000 6.00% 15/1/2029 225,783 0.01%Embraer Netherlands Finance BV $200,000 5.40% 1/2/2027 224,845 0.01%Embraer Netherlands Finance BV $200,000 5.05% 15/6/2025 219,896 0.01%Raizen Fuels Finance SA $200,000 5.30% 20/1/2027 217,520 0.01%Gerdau Trade, Inc. $200,000 4.88% 24/10/2027 214,000 0.01%Suzano Austria GmbH $200,000 5.00% 15/1/2030 209,825 0.01%Vale Overseas Ltd. $175,000 6.25% 10/8/2026 205,188 0.01%Braskem Netherlands Finance BV $200,000 5.88% 31/1/2050 199,250 0.01%Braskem Netherlands Finance BV $200,000 4.50% 31/1/2030 199,100 0.01%Braskem Netherlands Finance BV $200,000 4.50% 10/1/2028 199,000 0.01%Braskem Finance Ltd. $175,000 6.45% 3/2/2024 194,856 0.01%Fibria Overseas Finance Ltd. $100,000 5.25% 12/5/2024 108,250 0.01%Gerdau Trade, Inc. $100,000 4.75% 15/4/2023 106,000 0.01%Embraer SA $100,000 5.15% 15/6/2022 105,466 0.01%Vale Canada Ltd. $75,000 7.20% 15/9/2032 92,250 0.01%Fibria Overseas Finance Ltd. $65,000 4.00% 14/1/2025 67,356 0.01%Braskem America Finance Co. $50,000 7.13% 22/7/2041 57,250 0.00%
Vanguard Global Corporate Bond Index Fund
489
Maturity Fair Value % of Total Principal Coupon Date US Dollars ($) Net Assets
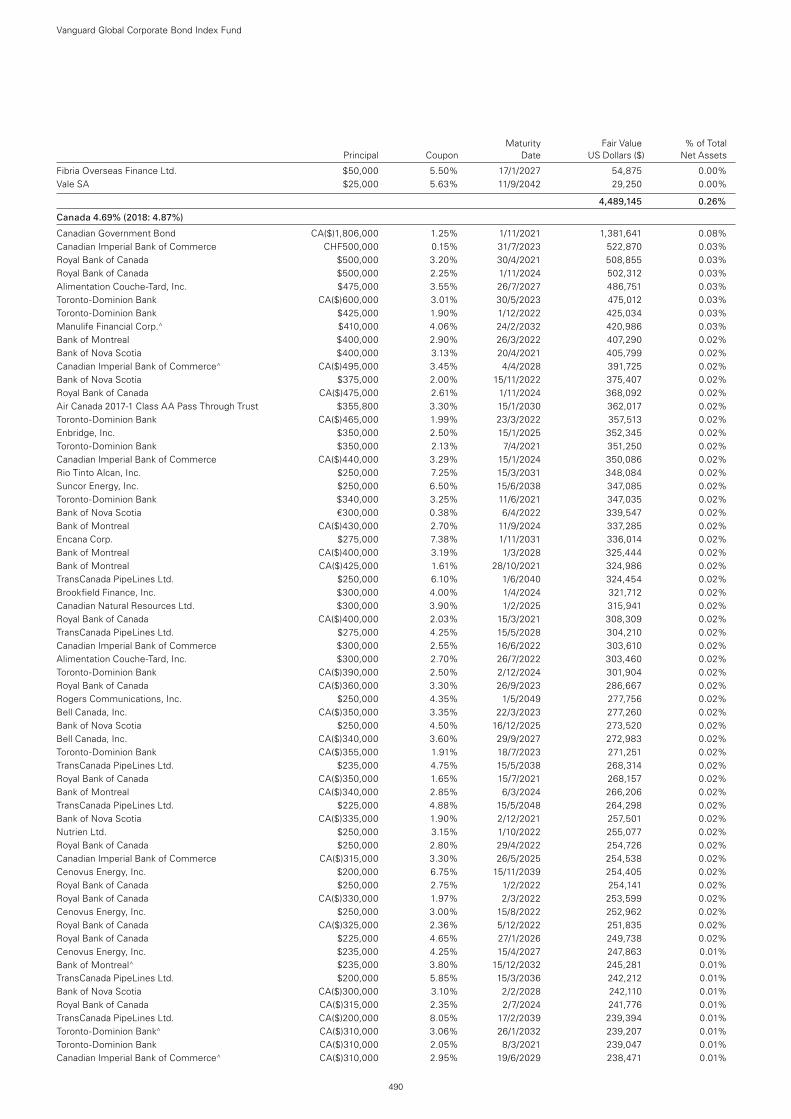
Fibria Overseas Finance Ltd. $50,000 5.50% 17/1/2027 54,875 0.00%Vale SA $25,000 5.63% 11/9/2042 29,250 0.00%
4,489,145 0.26%
Canada 4.69% (2018: 4.87%)
Canadian Government Bond CA($)1,806,000 1.25% 1/11/2021 1,381,641 0.08%Canadian Imperial Bank of Commerce CHF500,000 0.15% 31/7/2023 522,870 0.03%Royal Bank of Canada $500,000 3.20% 30/4/2021 508,855 0.03%Royal Bank of Canada $500,000 2.25% 1/11/2024 502,312 0.03%Alimentation Couche-Tard, Inc. $475,000 3.55% 26/7/2027 486,751 0.03%Toronto-Dominion Bank CA($)600,000 3.01% 30/5/2023 475,012 0.03%Toronto-Dominion Bank $425,000 1.90% 1/12/2022 425,034 0.03%Manulife Financial Corp.^ $410,000 4.06% 24/2/2032 420,986 0.03%Bank of Montreal $400,000 2.90% 26/3/2022 407,290 0.02%Bank of Nova Scotia $400,000 3.13% 20/4/2021 405,799 0.02%Canadian Imperial Bank of Commerce^ CA($)495,000 3.45% 4/4/2028 391,725 0.02%Bank of Nova Scotia $375,000 2.00% 15/11/2022 375,407 0.02%Royal Bank of Canada CA($)475,000 2.61% 1/11/2024 368,092 0.02%Air Canada 2017-1 Class AA Pass Through Trust $355,800 3.30% 15/1/2030 362,017 0.02%Toronto-Dominion Bank CA($)465,000 1.99% 23/3/2022 357,513 0.02%Enbridge, Inc. $350,000 2.50% 15/1/2025 352,345 0.02%Toronto-Dominion Bank $350,000 2.13% 7/4/2021 351,250 0.02%Canadian Imperial Bank of Commerce CA($)440,000 3.29% 15/1/2024 350,086 0.02%Rio Tinto Alcan, Inc. $250,000 7.25% 15/3/2031 348,084 0.02%Suncor Energy, Inc. $250,000 6.50% 15/6/2038 347,085 0.02%Toronto-Dominion Bank $340,000 3.25% 11/6/2021 347,035 0.02%Bank of Nova Scotia €300,000 0.38% 6/4/2022 339,547 0.02%Bank of Montreal CA($)430,000 2.70% 11/9/2024 337,285 0.02%Encana Corp. $275,000 7.38% 1/11/2031 336,014 0.02%Bank of Montreal CA($)400,000 3.19% 1/3/2028 325,444 0.02%Bank of Montreal CA($)425,000 1.61% 28/10/2021 324,986 0.02%TransCanada PipeLines Ltd. $250,000 6.10% 1/6/2040 324,454 0.02%Brookfield Finance, Inc. $300,000 4.00% 1/4/2024 321,712 0.02%Canadian Natural Resources Ltd. $300,000 3.90% 1/2/2025 315,941 0.02%Royal Bank of Canada CA($)400,000 2.03% 15/3/2021 308,309 0.02%TransCanada PipeLines Ltd. $275,000 4.25% 15/5/2028 304,210 0.02%Canadian Imperial Bank of Commerce $300,000 2.55% 16/6/2022 303,610 0.02%Alimentation Couche-Tard, Inc. $300,000 2.70% 26/7/2022 303,460 0.02%Toronto-Dominion Bank CA($)390,000 2.50% 2/12/2024 301,904 0.02%Royal Bank of Canada CA($)360,000 3.30% 26/9/2023 286,667 0.02%Rogers Communications, Inc. $250,000 4.35% 1/5/2049 277,756 0.02%Bell Canada, Inc. CA($)350,000 3.35% 22/3/2023 277,260 0.02%Bank of Nova Scotia $250,000 4.50% 16/12/2025 273,520 0.02%Bell Canada, Inc. CA($)340,000 3.60% 29/9/2027 272,983 0.02%Toronto-Dominion Bank CA($)355,000 1.91% 18/7/2023 271,251 0.02%TransCanada PipeLines Ltd. $235,000 4.75% 15/5/2038 268,314 0.02%Royal Bank of Canada CA($)350,000 1.65% 15/7/2021 268,157 0.02%Bank of Montreal CA($)340,000 2.85% 6/3/2024 266,206 0.02%TransCanada PipeLines Ltd. $225,000 4.88% 15/5/2048 264,298 0.02%Bank of Nova Scotia CA($)335,000 1.90% 2/12/2021 257,501 0.02%Nutrien Ltd. $250,000 3.15% 1/10/2022 255,077 0.02%Royal Bank of Canada $250,000 2.80% 29/4/2022 254,726 0.02%Canadian Imperial Bank of Commerce CA($)315,000 3.30% 26/5/2025 254,538 0.02%Cenovus Energy, Inc. $200,000 6.75% 15/11/2039 254,405 0.02%Royal Bank of Canada $250,000 2.75% 1/2/2022 254,141 0.02%Royal Bank of Canada CA($)330,000 1.97% 2/3/2022 253,599 0.02%Cenovus Energy, Inc. $250,000 3.00% 15/8/2022 252,962 0.02%Royal Bank of Canada CA($)325,000 2.36% 5/12/2022 251,835 0.02%Royal Bank of Canada $225,000 4.65% 27/1/2026 249,738 0.02%Cenovus Energy, Inc. $235,000 4.25% 15/4/2027 247,863 0.01%Bank of Montreal^ $235,000 3.80% 15/12/2032 245,281 0.01%TransCanada PipeLines Ltd. $200,000 5.85% 15/3/2036 242,212 0.01%Bank of Nova Scotia CA($)300,000 3.10% 2/2/2028 242,110 0.01%Royal Bank of Canada CA($)315,000 2.35% 2/7/2024 241,776 0.01%TransCanada PipeLines Ltd. CA($)200,000 8.05% 17/2/2039 239,394 0.01%Toronto-Dominion Bank^ CA($)310,000 3.06% 26/1/2032 239,207 0.01%Toronto-Dominion Bank CA($)310,000 2.05% 8/3/2021 239,047 0.01%Canadian Imperial Bank of Commerce^ CA($)310,000 2.95% 19/6/2029 238,471 0.01%
Vanguard Global Corporate Bond Index Fund
490
Maturity Fair Value % of Total Principal Coupon Date US Dollars ($) Net Assets
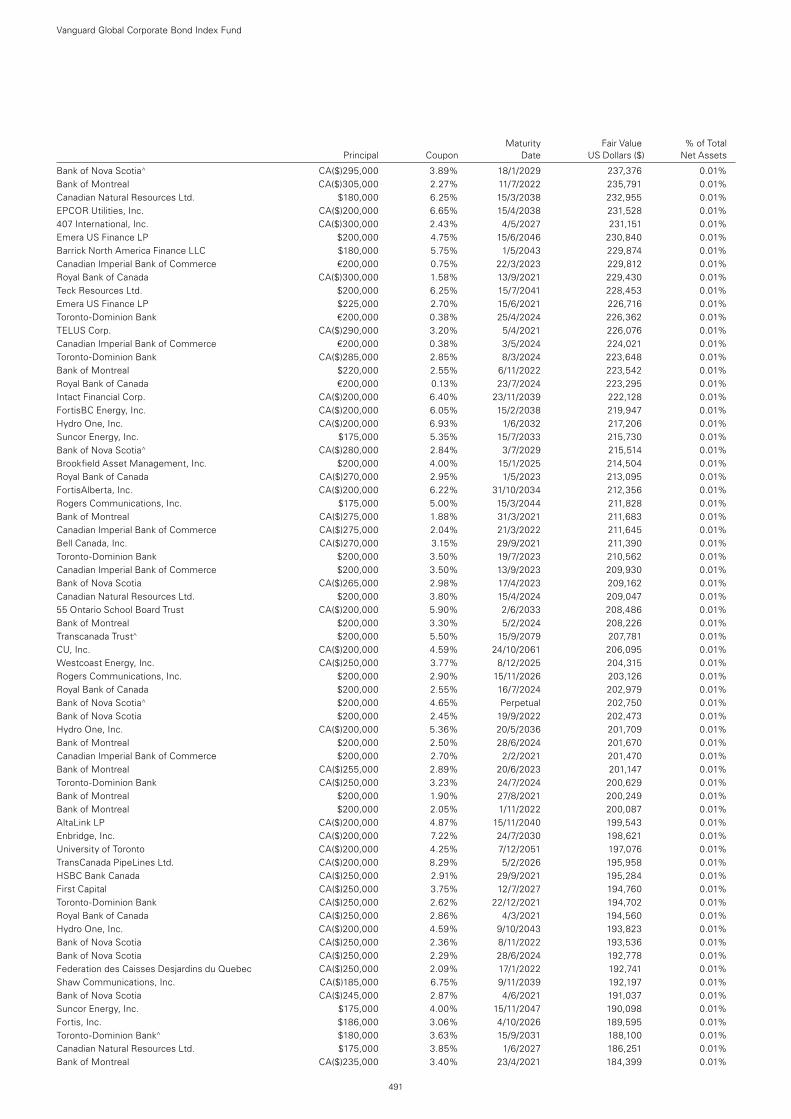
Bank of Nova Scotia^ CA($)295,000 3.89% 18/1/2029 237,376 0.01%Bank of Montreal CA($)305,000 2.27% 11/7/2022 235,791 0.01%Canadian Natural Resources Ltd. $180,000 6.25% 15/3/2038 232,955 0.01%EPCOR Utilities, Inc. CA($)200,000 6.65% 15/4/2038 231,528 0.01%407 International, Inc. CA($)300,000 2.43% 4/5/2027 231,151 0.01%Emera US Finance LP $200,000 4.75% 15/6/2046 230,840 0.01%Barrick North America Finance LLC $180,000 5.75% 1/5/2043 229,874 0.01%Canadian Imperial Bank of Commerce €200,000 0.75% 22/3/2023 229,812 0.01%Royal Bank of Canada CA($)300,000 1.58% 13/9/2021 229,430 0.01%Teck Resources Ltd. $200,000 6.25% 15/7/2041 228,453 0.01%Emera US Finance LP $225,000 2.70% 15/6/2021 226,716 0.01%Toronto-Dominion Bank €200,000 0.38% 25/4/2024 226,362 0.01%TELUS Corp. CA($)290,000 3.20% 5/4/2021 226,076 0.01%Canadian Imperial Bank of Commerce €200,000 0.38% 3/5/2024 224,021 0.01%Toronto-Dominion Bank CA($)285,000 2.85% 8/3/2024 223,648 0.01%Bank of Montreal $220,000 2.55% 6/11/2022 223,542 0.01%Royal Bank of Canada €200,000 0.13% 23/7/2024 223,295 0.01%Intact Financial Corp. CA($)200,000 6.40% 23/11/2039 222,128 0.01%FortisBC Energy, Inc. CA($)200,000 6.05% 15/2/2038 219,947 0.01%Hydro One, Inc. CA($)200,000 6.93% 1/6/2032 217,206 0.01%Suncor Energy, Inc. $175,000 5.35% 15/7/2033 215,730 0.01%Bank of Nova Scotia^ CA($)280,000 2.84% 3/7/2029 215,514 0.01%Brookfield Asset Management, Inc. $200,000 4.00% 15/1/2025 214,504 0.01%Royal Bank of Canada CA($)270,000 2.95% 1/5/2023 213,095 0.01%FortisAlberta, Inc. CA($)200,000 6.22% 31/10/2034 212,356 0.01%Rogers Communications, Inc. $175,000 5.00% 15/3/2044 211,828 0.01%Bank of Montreal CA($)275,000 1.88% 31/3/2021 211,683 0.01%Canadian Imperial Bank of Commerce CA($)275,000 2.04% 21/3/2022 211,645 0.01%Bell Canada, Inc. CA($)270,000 3.15% 29/9/2021 211,390 0.01%Toronto-Dominion Bank $200,000 3.50% 19/7/2023 210,562 0.01%Canadian Imperial Bank of Commerce $200,000 3.50% 13/9/2023 209,930 0.01%Bank of Nova Scotia CA($)265,000 2.98% 17/4/2023 209,162 0.01%Canadian Natural Resources Ltd. $200,000 3.80% 15/4/2024 209,047 0.01%55 Ontario School Board Trust CA($)200,000 5.90% 2/6/2033 208,486 0.01%Bank of Montreal $200,000 3.30% 5/2/2024 208,226 0.01%Transcanada Trust^ $200,000 5.50% 15/9/2079 207,781 0.01%CU, Inc. CA($)200,000 4.59% 24/10/2061 206,095 0.01%Westcoast Energy, Inc. CA($)250,000 3.77% 8/12/2025 204,315 0.01%Rogers Communications, Inc. $200,000 2.90% 15/11/2026 203,126 0.01%Royal Bank of Canada $200,000 2.55% 16/7/2024 202,979 0.01%Bank of Nova Scotia^ $200,000 4.65% Perpetual 202,750 0.01%Bank of Nova Scotia $200,000 2.45% 19/9/2022 202,473 0.01%Hydro One, Inc. CA($)200,000 5.36% 20/5/2036 201,709 0.01%Bank of Montreal $200,000 2.50% 28/6/2024 201,670 0.01%Canadian Imperial Bank of Commerce $200,000 2.70% 2/2/2021 201,470 0.01%Bank of Montreal CA($)255,000 2.89% 20/6/2023 201,147 0.01%Toronto-Dominion Bank CA($)250,000 3.23% 24/7/2024 200,629 0.01%Bank of Montreal $200,000 1.90% 27/8/2021 200,249 0.01%Bank of Montreal $200,000 2.05% 1/11/2022 200,087 0.01%AltaLink LP CA($)200,000 4.87% 15/11/2040 199,543 0.01%Enbridge, Inc. CA($)200,000 7.22% 24/7/2030 198,621 0.01%University of Toronto CA($)200,000 4.25% 7/12/2051 197,076 0.01%TransCanada PipeLines Ltd. CA($)200,000 8.29% 5/2/2026 195,958 0.01%HSBC Bank Canada CA($)250,000 2.91% 29/9/2021 195,284 0.01%First Capital CA($)250,000 3.75% 12/7/2027 194,760 0.01%Toronto-Dominion Bank CA($)250,000 2.62% 22/12/2021 194,702 0.01%Royal Bank of Canada CA($)250,000 2.86% 4/3/2021 194,560 0.01%Hydro One, Inc. CA($)200,000 4.59% 9/10/2043 193,823 0.01%Bank of Nova Scotia CA($)250,000 2.36% 8/11/2022 193,536 0.01%Bank of Nova Scotia CA($)250,000 2.29% 28/6/2024 192,778 0.01%Federation des Caisses Desjardins du Quebec CA($)250,000 2.09% 17/1/2022 192,741 0.01%Shaw Communications, Inc. CA($)185,000 6.75% 9/11/2039 192,197 0.01%Bank of Nova Scotia CA($)245,000 2.87% 4/6/2021 191,037 0.01%Suncor Energy, Inc. $175,000 4.00% 15/11/2047 190,098 0.01%Fortis, Inc. $186,000 3.06% 4/10/2026 189,595 0.01%Toronto-Dominion Bank^ $180,000 3.63% 15/9/2031 188,100 0.01%Canadian Natural Resources Ltd. $175,000 3.85% 1/6/2027 186,251 0.01%Bank of Montreal CA($)235,000 3.40% 23/4/2021 184,399 0.01%
Vanguard Global Corporate Bond Index Fund
491
Maturity Fair Value % of Total Principal Coupon Date US Dollars ($) Net Assets
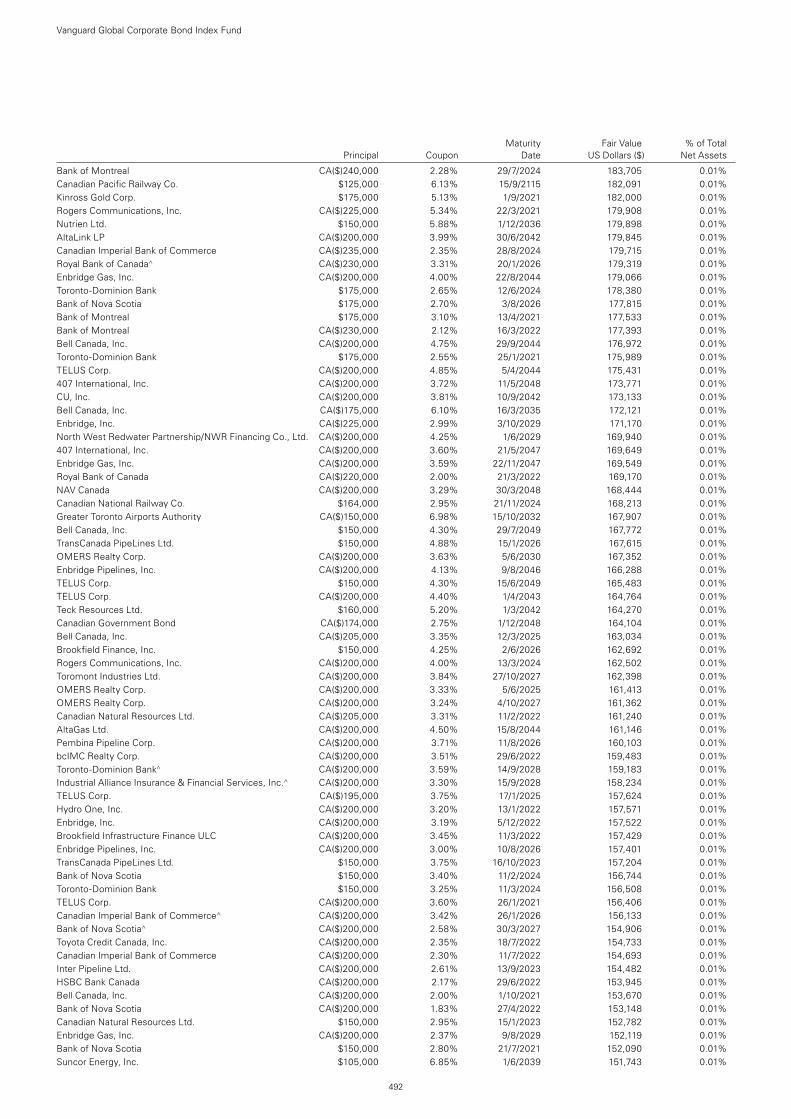
Bank of Montreal CA($)240,000 2.28% 29/7/2024 183,705 0.01%Canadian Pacific Railway Co. $125,000 6.13% 15/9/2115 182,091 0.01%Kinross Gold Corp. $175,000 5.13% 1/9/2021 182,000 0.01%Rogers Communications, Inc. CA($)225,000 5.34% 22/3/2021 179,908 0.01%Nutrien Ltd. $150,000 5.88% 1/12/2036 179,898 0.01%AltaLink LP CA($)200,000 3.99% 30/6/2042 179,845 0.01%Canadian Imperial Bank of Commerce CA($)235,000 2.35% 28/8/2024 179,715 0.01%Royal Bank of Canada^ CA($)230,000 3.31% 20/1/2026 179,319 0.01%Enbridge Gas, Inc. CA($)200,000 4.00% 22/8/2044 179,066 0.01%Toronto-Dominion Bank $175,000 2.65% 12/6/2024 178,380 0.01%Bank of Nova Scotia $175,000 2.70% 3/8/2026 177,815 0.01%Bank of Montreal $175,000 3.10% 13/4/2021 177,533 0.01%Bank of Montreal CA($)230,000 2.12% 16/3/2022 177,393 0.01%Bell Canada, Inc. CA($)200,000 4.75% 29/9/2044 176,972 0.01%Toronto-Dominion Bank $175,000 2.55% 25/1/2021 175,989 0.01%TELUS Corp. CA($)200,000 4.85% 5/4/2044 175,431 0.01%407 International, Inc. CA($)200,000 3.72% 11/5/2048 173,771 0.01%CU, Inc. CA($)200,000 3.81% 10/9/2042 173,133 0.01%Bell Canada, Inc. CA($)175,000 6.10% 16/3/2035 172,121 0.01%Enbridge, Inc. CA($)225,000 2.99% 3/10/2029 171,170 0.01%North West Redwater Partnership/NWR Financing Co., Ltd. CA($)200,000 4.25% 1/6/2029 169,940 0.01%407 International, Inc. CA($)200,000 3.60% 21/5/2047 169,649 0.01%Enbridge Gas, Inc. CA($)200,000 3.59% 22/11/2047 169,549 0.01%Royal Bank of Canada CA($)220,000 2.00% 21/3/2022 169,170 0.01%NAV Canada CA($)200,000 3.29% 30/3/2048 168,444 0.01%Canadian National Railway Co. $164,000 2.95% 21/11/2024 168,213 0.01%Greater Toronto Airports Authority CA($)150,000 6.98% 15/10/2032 167,907 0.01%Bell Canada, Inc. $150,000 4.30% 29/7/2049 167,772 0.01%TransCanada PipeLines Ltd. $150,000 4.88% 15/1/2026 167,615 0.01%OMERS Realty Corp. CA($)200,000 3.63% 5/6/2030 167,352 0.01%Enbridge Pipelines, Inc. CA($)200,000 4.13% 9/8/2046 166,288 0.01%TELUS Corp. $150,000 4.30% 15/6/2049 165,483 0.01%TELUS Corp. CA($)200,000 4.40% 1/4/2043 164,764 0.01%Teck Resources Ltd. $160,000 5.20% 1/3/2042 164,270 0.01%Canadian Government Bond CA($)174,000 2.75% 1/12/2048 164,104 0.01%Bell Canada, Inc. CA($)205,000 3.35% 12/3/2025 163,034 0.01%Brookfield Finance, Inc. $150,000 4.25% 2/6/2026 162,692 0.01%Rogers Communications, Inc. CA($)200,000 4.00% 13/3/2024 162,502 0.01%Toromont Industries Ltd. CA($)200,000 3.84% 27/10/2027 162,398 0.01%OMERS Realty Corp. CA($)200,000 3.33% 5/6/2025 161,413 0.01%OMERS Realty Corp. CA($)200,000 3.24% 4/10/2027 161,362 0.01%Canadian Natural Resources Ltd. CA($)205,000 3.31% 11/2/2022 161,240 0.01%AltaGas Ltd. CA($)200,000 4.50% 15/8/2044 161,146 0.01%Pembina Pipeline Corp. CA($)200,000 3.71% 11/8/2026 160,103 0.01%bcIMC Realty Corp. CA($)200,000 3.51% 29/6/2022 159,483 0.01%Toronto-Dominion Bank^ CA($)200,000 3.59% 14/9/2028 159,183 0.01%Industrial Alliance Insurance & Financial Services, Inc.^ CA($)200,000 3.30% 15/9/2028 158,234 0.01%TELUS Corp. CA($)195,000 3.75% 17/1/2025 157,624 0.01%Hydro One, Inc. CA($)200,000 3.20% 13/1/2022 157,571 0.01%Enbridge, Inc. CA($)200,000 3.19% 5/12/2022 157,522 0.01%Brookfield Infrastructure Finance ULC CA($)200,000 3.45% 11/3/2022 157,429 0.01%Enbridge Pipelines, Inc. CA($)200,000 3.00% 10/8/2026 157,401 0.01%TransCanada PipeLines Ltd. $150,000 3.75% 16/10/2023 157,204 0.01%Bank of Nova Scotia $150,000 3.40% 11/2/2024 156,744 0.01%Toronto-Dominion Bank $150,000 3.25% 11/3/2024 156,508 0.01%TELUS Corp. CA($)200,000 3.60% 26/1/2021 156,406 0.01%Canadian Imperial Bank of Commerce^ CA($)200,000 3.42% 26/1/2026 156,133 0.01%Bank of Nova Scotia^ CA($)200,000 2.58% 30/3/2027 154,906 0.01%Toyota Credit Canada, Inc. CA($)200,000 2.35% 18/7/2022 154,733 0.01%Canadian Imperial Bank of Commerce CA($)200,000 2.30% 11/7/2022 154,693 0.01%Inter Pipeline Ltd. CA($)200,000 2.61% 13/9/2023 154,482 0.01%HSBC Bank Canada CA($)200,000 2.17% 29/6/2022 153,945 0.01%Bell Canada, Inc. CA($)200,000 2.00% 1/10/2021 153,670 0.01%Bank of Nova Scotia CA($)200,000 1.83% 27/4/2022 153,148 0.01%Canadian Natural Resources Ltd. $150,000 2.95% 15/1/2023 152,782 0.01%Enbridge Gas, Inc. CA($)200,000 2.37% 9/8/2029 152,119 0.01%Bank of Nova Scotia $150,000 2.80% 21/7/2021 152,090 0.01%Suncor Energy, Inc. $105,000 6.85% 1/6/2039 151,743 0.01%
Vanguard Global Corporate Bond Index Fund
492
Maturity Fair Value % of Total Principal Coupon Date US Dollars ($) Net Assets
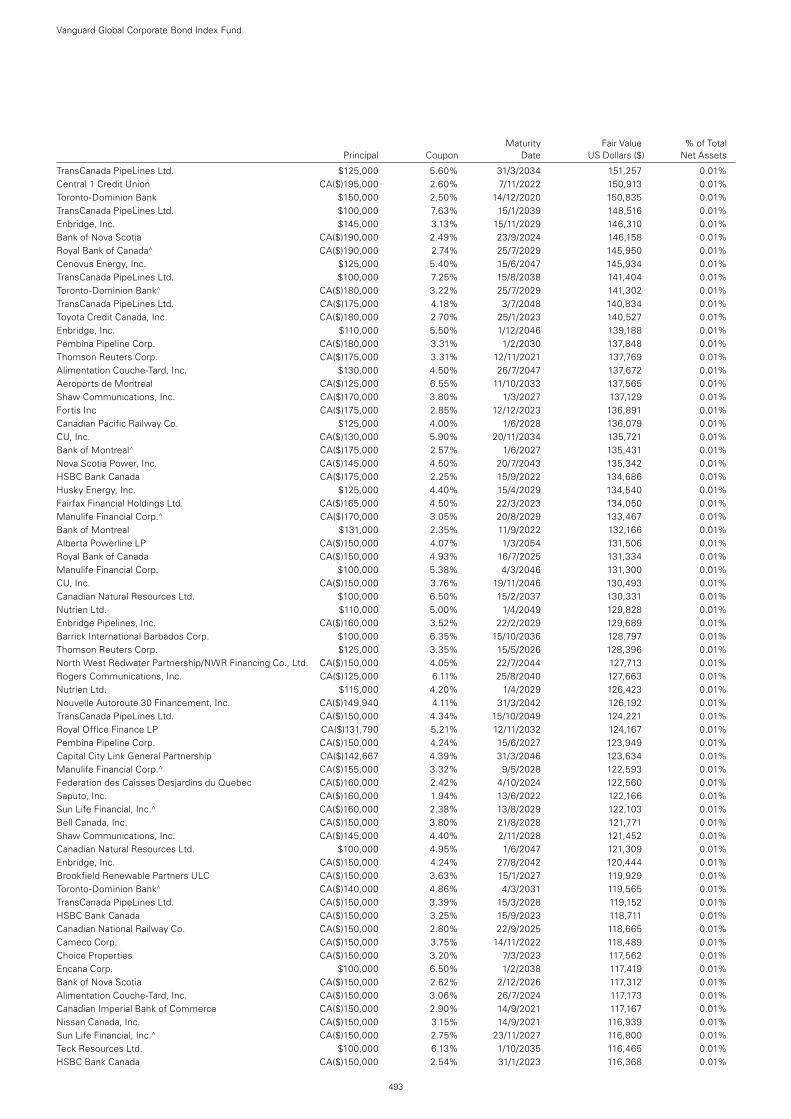
TransCanada PipeLines Ltd. $125,000 5.60% 31/3/2034 151,257 0.01%Central 1 Credit Union CA($)195,000 2.60% 7/11/2022 150,913 0.01%Toronto-Dominion Bank $150,000 2.50% 14/12/2020 150,835 0.01%TransCanada PipeLines Ltd. $100,000 7.63% 15/1/2039 148,516 0.01%Enbridge, Inc. $145,000 3.13% 15/11/2029 146,310 0.01%Bank of Nova Scotia CA($)190,000 2.49% 23/9/2024 146,158 0.01%Royal Bank of Canada^ CA($)190,000 2.74% 25/7/2029 145,950 0.01%Cenovus Energy, Inc. $125,000 5.40% 15/6/2047 145,934 0.01%TransCanada PipeLines Ltd. $100,000 7.25% 15/8/2038 141,404 0.01%Toronto-Dominion Bank^ CA($)180,000 3.22% 25/7/2029 141,302 0.01%TransCanada PipeLines Ltd. CA($)175,000 4.18% 3/7/2048 140,834 0.01%Toyota Credit Canada, Inc. CA($)180,000 2.70% 25/1/2023 140,527 0.01%Enbridge, Inc. $110,000 5.50% 1/12/2046 139,188 0.01%Pembina Pipeline Corp. CA($)180,000 3.31% 1/2/2030 137,848 0.01%Thomson Reuters Corp. CA($)175,000 3.31% 12/11/2021 137,769 0.01%Alimentation Couche-Tard, Inc. $130,000 4.50% 26/7/2047 137,672 0.01%Aeroports de Montreal CA($)125,000 6.55% 11/10/2033 137,565 0.01%Shaw Communications, Inc. CA($)170,000 3.80% 1/3/2027 137,129 0.01%Fortis Inc CA($)175,000 2.85% 12/12/2023 136,891 0.01%Canadian Pacific Railway Co. $125,000 4.00% 1/6/2028 136,079 0.01%CU, Inc. CA($)130,000 5.90% 20/11/2034 135,721 0.01%Bank of Montreal^ CA($)175,000 2.57% 1/6/2027 135,431 0.01%Nova Scotia Power, Inc. CA($)145,000 4.50% 20/7/2043 135,342 0.01%HSBC Bank Canada CA($)175,000 2.25% 15/9/2022 134,686 0.01%Husky Energy, Inc. $125,000 4.40% 15/4/2029 134,540 0.01%Fairfax Financial Holdings Ltd. CA($)165,000 4.50% 22/3/2023 134,050 0.01%Manulife Financial Corp.^ CA($)170,000 3.05% 20/8/2029 133,467 0.01%Bank of Montreal $131,000 2.35% 11/9/2022 132,166 0.01%Alberta Powerline LP CA($)150,000 4.07% 1/3/2054 131,506 0.01%Royal Bank of Canada CA($)150,000 4.93% 16/7/2025 131,334 0.01%Manulife Financial Corp. $100,000 5.38% 4/3/2046 131,300 0.01%CU, Inc. CA($)150,000 3.76% 19/11/2046 130,493 0.01%Canadian Natural Resources Ltd. $100,000 6.50% 15/2/2037 130,331 0.01%Nutrien Ltd. $110,000 5.00% 1/4/2049 129,828 0.01%Enbridge Pipelines, Inc. CA($)160,000 3.52% 22/2/2029 129,689 0.01%Barrick International Barbados Corp. $100,000 6.35% 15/10/2036 128,797 0.01%Thomson Reuters Corp. $125,000 3.35% 15/5/2026 128,396 0.01%North West Redwater Partnership/NWR Financing Co., Ltd. CA($)150,000 4.05% 22/7/2044 127,713 0.01%Rogers Communications, Inc. CA($)125,000 6.11% 25/8/2040 127,663 0.01%Nutrien Ltd. $115,000 4.20% 1/4/2029 126,423 0.01%Nouvelle Autoroute 30 Financement, Inc. CA($)149,940 4.11% 31/3/2042 126,192 0.01%TransCanada PipeLines Ltd. CA($)150,000 4.34% 15/10/2049 124,221 0.01%Royal Office Finance LP CA($)131,790 5.21% 12/11/2032 124,167 0.01%Pembina Pipeline Corp. CA($)150,000 4.24% 15/6/2027 123,949 0.01%Capital City Link General Partnership CA($)142,667 4.39% 31/3/2046 123,634 0.01%Manulife Financial Corp.^ CA($)155,000 3.32% 9/5/2028 122,593 0.01%Federation des Caisses Desjardins du Quebec CA($)160,000 2.42% 4/10/2024 122,560 0.01%Saputo, Inc. CA($)160,000 1.94% 13/6/2022 122,166 0.01%Sun Life Financial, Inc.^ CA($)160,000 2.38% 13/8/2029 122,103 0.01%Bell Canada, Inc. CA($)150,000 3.80% 21/8/2028 121,771 0.01%Shaw Communications, Inc. CA($)145,000 4.40% 2/11/2028 121,452 0.01%Canadian Natural Resources Ltd. $100,000 4.95% 1/6/2047 121,309 0.01%Enbridge, Inc. CA($)150,000 4.24% 27/8/2042 120,444 0.01%Brookfield Renewable Partners ULC CA($)150,000 3.63% 15/1/2027 119,929 0.01%Toronto-Dominion Bank^ CA($)140,000 4.86% 4/3/2031 119,565 0.01%TransCanada PipeLines Ltd. CA($)150,000 3.39% 15/3/2028 119,152 0.01%HSBC Bank Canada CA($)150,000 3.25% 15/9/2023 118,711 0.01%Canadian National Railway Co. CA($)150,000 2.80% 22/9/2025 118,665 0.01%Cameco Corp. CA($)150,000 3.75% 14/11/2022 118,489 0.01%Choice Properties CA($)150,000 3.20% 7/3/2023 117,562 0.01%Encana Corp. $100,000 6.50% 1/2/2038 117,419 0.01%Bank of Nova Scotia CA($)150,000 2.62% 2/12/2026 117,312 0.01%Alimentation Couche-Tard, Inc. CA($)150,000 3.06% 26/7/2024 117,173 0.01%Canadian Imperial Bank of Commerce CA($)150,000 2.90% 14/9/2021 117,167 0.01%Nissan Canada, Inc. CA($)150,000 3.15% 14/9/2021 116,939 0.01%Sun Life Financial, Inc.^ CA($)150,000 2.75% 23/11/2027 116,800 0.01%Teck Resources Ltd. $100,000 6.13% 1/10/2035 116,465 0.01%HSBC Bank Canada CA($)150,000 2.54% 31/1/2023 116,368 0.01%
Vanguard Global Corporate Bond Index Fund
493
Maturity Fair Value % of Total Principal Coupon Date US Dollars ($) Net Assets
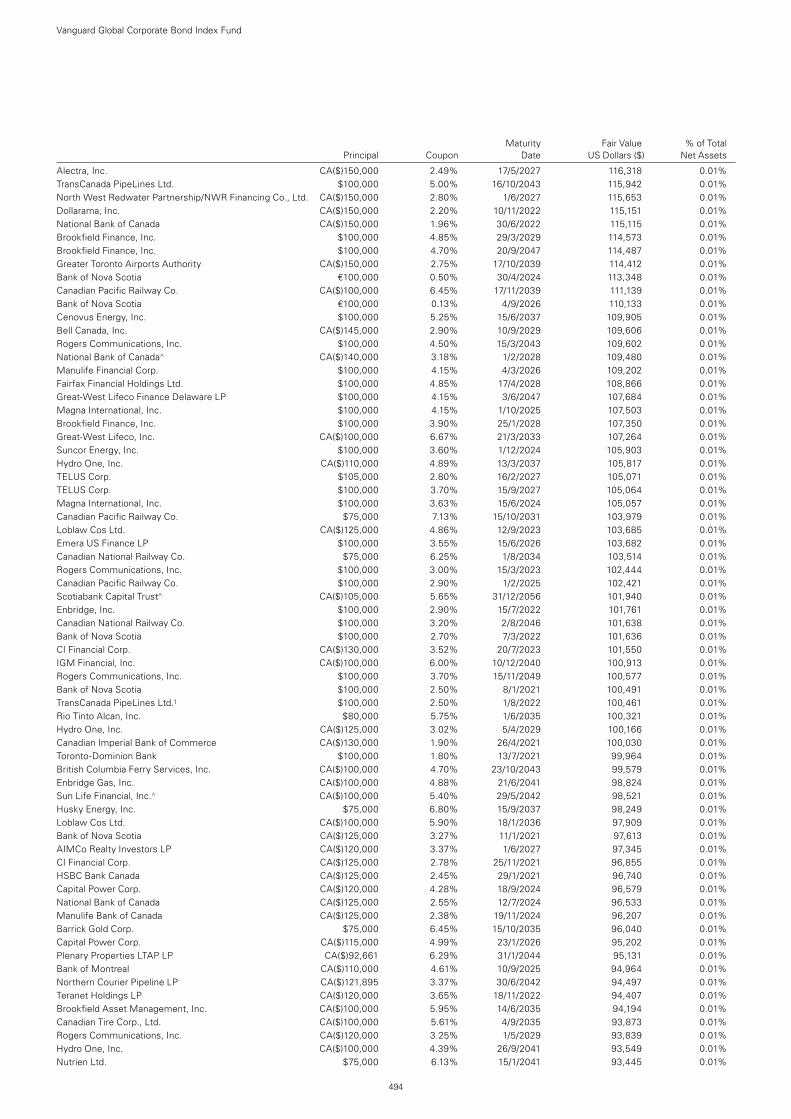
Alectra, Inc. CA($)150,000 2.49% 17/5/2027 116,318 0.01%TransCanada PipeLines Ltd. $100,000 5.00% 16/10/2043 115,942 0.01%North West Redwater Partnership/NWR Financing Co., Ltd. CA($)150,000 2.80% 1/6/2027 115,653 0.01%Dollarama, Inc. CA($)150,000 2.20% 10/11/2022 115,151 0.01%National Bank of Canada CA($)150,000 1.96% 30/6/2022 115,115 0.01%Brookfield Finance, Inc. $100,000 4.85% 29/3/2029 114,573 0.01%Brookfield Finance, Inc. $100,000 4.70% 20/9/2047 114,487 0.01%Greater Toronto Airports Authority CA($)150,000 2.75% 17/10/2039 114,412 0.01%Bank of Nova Scotia €100,000 0.50% 30/4/2024 113,348 0.01%Canadian Pacific Railway Co. CA($)100,000 6.45% 17/11/2039 111,139 0.01%Bank of Nova Scotia €100,000 0.13% 4/9/2026 110,133 0.01%Cenovus Energy, Inc. $100,000 5.25% 15/6/2037 109,905 0.01%Bell Canada, Inc. CA($)145,000 2.90% 10/9/2029 109,606 0.01%Rogers Communications, Inc. $100,000 4.50% 15/3/2043 109,602 0.01%National Bank of Canada^ CA($)140,000 3.18% 1/2/2028 109,480 0.01%Manulife Financial Corp. $100,000 4.15% 4/3/2026 109,202 0.01%Fairfax Financial Holdings Ltd. $100,000 4.85% 17/4/2028 108,866 0.01%Great-West Lifeco Finance Delaware LP $100,000 4.15% 3/6/2047 107,684 0.01%Magna International, Inc. $100,000 4.15% 1/10/2025 107,503 0.01%Brookfield Finance, Inc. $100,000 3.90% 25/1/2028 107,350 0.01%Great-West Lifeco, Inc. CA($)100,000 6.67% 21/3/2033 107,264 0.01%Suncor Energy, Inc. $100,000 3.60% 1/12/2024 105,903 0.01%Hydro One, Inc. CA($)110,000 4.89% 13/3/2037 105,817 0.01%TELUS Corp. $105,000 2.80% 16/2/2027 105,071 0.01%TELUS Corp. $100,000 3.70% 15/9/2027 105,064 0.01%Magna International, Inc. $100,000 3.63% 15/6/2024 105,057 0.01%Canadian Pacific Railway Co. $75,000 7.13% 15/10/2031 103,979 0.01%Loblaw Cos Ltd. CA($)125,000 4.86% 12/9/2023 103,685 0.01%Emera US Finance LP $100,000 3.55% 15/6/2026 103,682 0.01%Canadian National Railway Co. $75,000 6.25% 1/8/2034 103,514 0.01%Rogers Communications, Inc. $100,000 3.00% 15/3/2023 102,444 0.01%Canadian Pacific Railway Co. $100,000 2.90% 1/2/2025 102,421 0.01%Scotiabank Capital Trust^ CA($)105,000 5.65% 31/12/2056 101,940 0.01%Enbridge, Inc. $100,000 2.90% 15/7/2022 101,761 0.01%Canadian National Railway Co. $100,000 3.20% 2/8/2046 101,638 0.01%Bank of Nova Scotia $100,000 2.70% 7/3/2022 101,636 0.01%CI Financial Corp. CA($)130,000 3.52% 20/7/2023 101,550 0.01%IGM Financial, Inc. CA($)100,000 6.00% 10/12/2040 100,913 0.01%Rogers Communications, Inc. $100,000 3.70% 15/11/2049 100,577 0.01%Bank of Nova Scotia $100,000 2.50% 8/1/2021 100,491 0.01%TransCanada PipeLines Ltd.1 $100,000 2.50% 1/8/2022 100,461 0.01%Rio Tinto Alcan, Inc. $80,000 5.75% 1/6/2035 100,321 0.01%Hydro One, Inc. CA($)125,000 3.02% 5/4/2029 100,166 0.01%Canadian Imperial Bank of Commerce CA($)130,000 1.90% 26/4/2021 100,030 0.01%Toronto-Dominion Bank $100,000 1.80% 13/7/2021 99,964 0.01%British Columbia Ferry Services, Inc. CA($)100,000 4.70% 23/10/2043 99,579 0.01%Enbridge Gas, Inc. CA($)100,000 4.88% 21/6/2041 98,824 0.01%Sun Life Financial, Inc.^ CA($)100,000 5.40% 29/5/2042 98,521 0.01%Husky Energy, Inc. $75,000 6.80% 15/9/2037 98,249 0.01%Loblaw Cos Ltd. CA($)100,000 5.90% 18/1/2036 97,909 0.01%Bank of Nova Scotia CA($)125,000 3.27% 11/1/2021 97,613 0.01%AIMCo Realty Investors LP CA($)120,000 3.37% 1/6/2027 97,345 0.01%CI Financial Corp. CA($)125,000 2.78% 25/11/2021 96,855 0.01%HSBC Bank Canada CA($)125,000 2.45% 29/1/2021 96,740 0.01%Capital Power Corp. CA($)120,000 4.28% 18/9/2024 96,579 0.01%National Bank of Canada CA($)125,000 2.55% 12/7/2024 96,533 0.01%Manulife Bank of Canada CA($)125,000 2.38% 19/11/2024 96,207 0.01%Barrick Gold Corp. $75,000 6.45% 15/10/2035 96,040 0.01%Capital Power Corp. CA($)115,000 4.99% 23/1/2026 95,202 0.01%Plenary Properties LTAP LP CA($)92,661 6.29% 31/1/2044 95,131 0.01%Bank of Montreal CA($)110,000 4.61% 10/9/2025 94,964 0.01%Northern Courier Pipeline LP CA($)121,895 3.37% 30/6/2042 94,497 0.01%Teranet Holdings LP CA($)120,000 3.65% 18/11/2022 94,407 0.01%Brookfield Asset Management, Inc. CA($)100,000 5.95% 14/6/2035 94,194 0.01%Canadian Tire Corp., Ltd. CA($)100,000 5.61% 4/9/2035 93,873 0.01%Rogers Communications, Inc. CA($)120,000 3.25% 1/5/2029 93,839 0.01%Hydro One, Inc. CA($)100,000 4.39% 26/9/2041 93,549 0.01%Nutrien Ltd. $75,000 6.13% 15/1/2041 93,445 0.01%
Vanguard Global Corporate Bond Index Fund
494
Maturity Fair Value % of Total Principal Coupon Date US Dollars ($) Net Assets
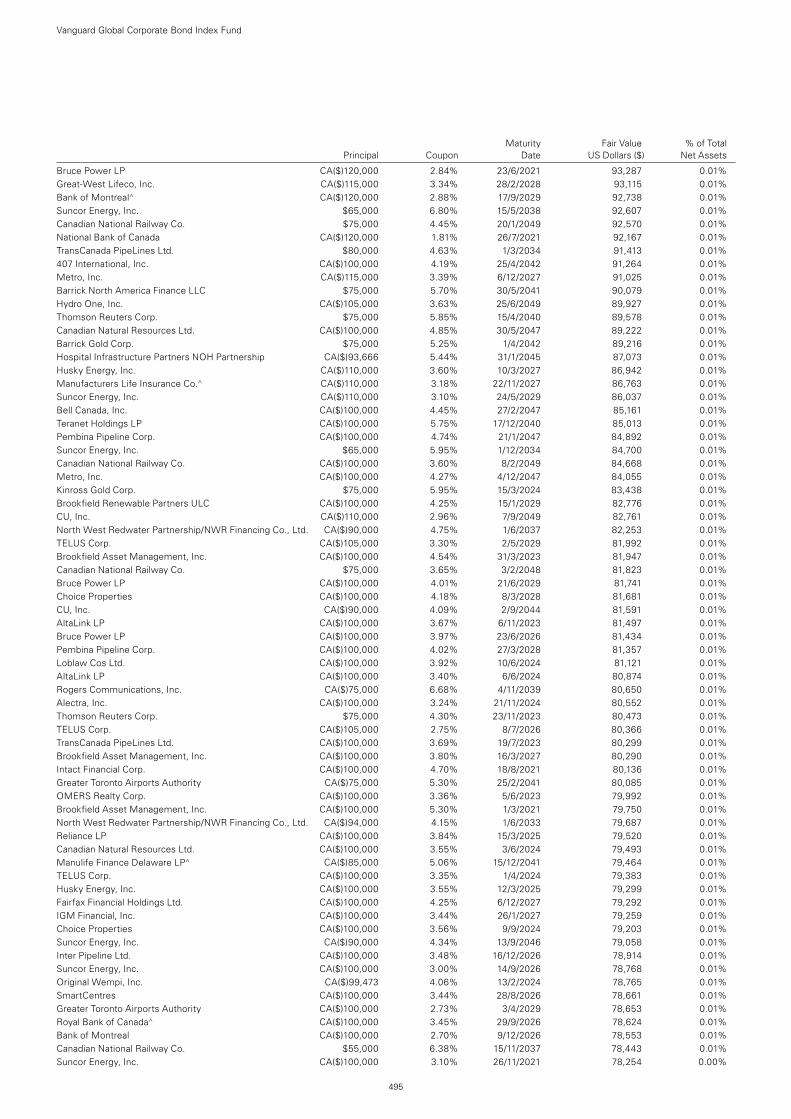
Bruce Power LP CA($)120,000 2.84% 23/6/2021 93,287 0.01%Great-West Lifeco, Inc. CA($)115,000 3.34% 28/2/2028 93,115 0.01%Bank of Montreal^ CA($)120,000 2.88% 17/9/2029 92,738 0.01%Suncor Energy, Inc. $65,000 6.80% 15/5/2038 92,607 0.01%Canadian National Railway Co. $75,000 4.45% 20/1/2049 92,570 0.01%National Bank of Canada CA($)120,000 1.81% 26/7/2021 92,167 0.01%TransCanada PipeLines Ltd. $80,000 4.63% 1/3/2034 91,413 0.01%407 International, Inc. CA($)100,000 4.19% 25/4/2042 91,264 0.01%Metro, Inc. CA($)115,000 3.39% 6/12/2027 91,025 0.01%Barrick North America Finance LLC $75,000 5.70% 30/5/2041 90,079 0.01%Hydro One, Inc. CA($)105,000 3.63% 25/6/2049 89,927 0.01%Thomson Reuters Corp. $75,000 5.85% 15/4/2040 89,578 0.01%Canadian Natural Resources Ltd. CA($)100,000 4.85% 30/5/2047 89,222 0.01%Barrick Gold Corp. $75,000 5.25% 1/4/2042 89,216 0.01%Hospital Infrastructure Partners NOH Partnership CA($)93,666 5.44% 31/1/2045 87,073 0.01%Husky Energy, Inc. CA($)110,000 3.60% 10/3/2027 86,942 0.01%Manufacturers Life Insurance Co.^ CA($)110,000 3.18% 22/11/2027 86,763 0.01%Suncor Energy, Inc. CA($)110,000 3.10% 24/5/2029 86,037 0.01%Bell Canada, Inc. CA($)100,000 4.45% 27/2/2047 85,161 0.01%Teranet Holdings LP CA($)100,000 5.75% 17/12/2040 85,013 0.01%Pembina Pipeline Corp. CA($)100,000 4.74% 21/1/2047 84,892 0.01%Suncor Energy, Inc. $65,000 5.95% 1/12/2034 84,700 0.01%Canadian National Railway Co. CA($)100,000 3.60% 8/2/2049 84,668 0.01%Metro, Inc. CA($)100,000 4.27% 4/12/2047 84,055 0.01%Kinross Gold Corp. $75,000 5.95% 15/3/2024 83,438 0.01%Brookfield Renewable Partners ULC CA($)100,000 4.25% 15/1/2029 82,776 0.01%CU, Inc. CA($)110,000 2.96% 7/9/2049 82,761 0.01%North West Redwater Partnership/NWR Financing Co., Ltd. CA($)90,000 4.75% 1/6/2037 82,253 0.01%TELUS Corp. CA($)105,000 3.30% 2/5/2029 81,992 0.01%Brookfield Asset Management, Inc. CA($)100,000 4.54% 31/3/2023 81,947 0.01%Canadian National Railway Co. $75,000 3.65% 3/2/2048 81,823 0.01%Bruce Power LP CA($)100,000 4.01% 21/6/2029 81,741 0.01%Choice Properties CA($)100,000 4.18% 8/3/2028 81,681 0.01%CU, Inc. CA($)90,000 4.09% 2/9/2044 81,591 0.01%AltaLink LP CA($)100,000 3.67% 6/11/2023 81,497 0.01%Bruce Power LP CA($)100,000 3.97% 23/6/2026 81,434 0.01%Pembina Pipeline Corp. CA($)100,000 4.02% 27/3/2028 81,357 0.01%Loblaw Cos Ltd. CA($)100,000 3.92% 10/6/2024 81,121 0.01%AltaLink LP CA($)100,000 3.40% 6/6/2024 80,874 0.01%Rogers Communications, Inc. CA($)75,000 6.68% 4/11/2039 80,650 0.01%Alectra, Inc. CA($)100,000 3.24% 21/11/2024 80,552 0.01%Thomson Reuters Corp. $75,000 4.30% 23/11/2023 80,473 0.01%TELUS Corp. CA($)105,000 2.75% 8/7/2026 80,366 0.01%TransCanada PipeLines Ltd. CA($)100,000 3.69% 19/7/2023 80,299 0.01%Brookfield Asset Management, Inc. CA($)100,000 3.80% 16/3/2027 80,290 0.01%Intact Financial Corp. CA($)100,000 4.70% 18/8/2021 80,136 0.01%Greater Toronto Airports Authority CA($)75,000 5.30% 25/2/2041 80,085 0.01%OMERS Realty Corp. CA($)100,000 3.36% 5/6/2023 79,992 0.01%Brookfield Asset Management, Inc. CA($)100,000 5.30% 1/3/2021 79,750 0.01%North West Redwater Partnership/NWR Financing Co., Ltd. CA($)94,000 4.15% 1/6/2033 79,687 0.01%Reliance LP CA($)100,000 3.84% 15/3/2025 79,520 0.01%Canadian Natural Resources Ltd. CA($)100,000 3.55% 3/6/2024 79,493 0.01%Manulife Finance Delaware LP^ CA($)85,000 5.06% 15/12/2041 79,464 0.01%TELUS Corp. CA($)100,000 3.35% 1/4/2024 79,383 0.01%Husky Energy, Inc. CA($)100,000 3.55% 12/3/2025 79,299 0.01%Fairfax Financial Holdings Ltd. CA($)100,000 4.25% 6/12/2027 79,292 0.01%IGM Financial, Inc. CA($)100,000 3.44% 26/1/2027 79,259 0.01%Choice Properties CA($)100,000 3.56% 9/9/2024 79,203 0.01%Suncor Energy, Inc. CA($)90,000 4.34% 13/9/2046 79,058 0.01%Inter Pipeline Ltd. CA($)100,000 3.48% 16/12/2026 78,914 0.01%Suncor Energy, Inc. CA($)100,000 3.00% 14/9/2026 78,768 0.01%Original Wempi, Inc. CA($)99,473 4.06% 13/2/2024 78,765 0.01%SmartCentres CA($)100,000 3.44% 28/8/2026 78,661 0.01%Greater Toronto Airports Authority CA($)100,000 2.73% 3/4/2029 78,653 0.01%Royal Bank of Canada^ CA($)100,000 3.45% 29/9/2026 78,624 0.01%Bank of Montreal CA($)100,000 2.70% 9/12/2026 78,553 0.01%Canadian National Railway Co. $55,000 6.38% 15/11/2037 78,443 0.01%Suncor Energy, Inc. CA($)100,000 3.10% 26/11/2021 78,254 0.00%
Vanguard Global Corporate Bond Index Fund
495
Maturity Fair Value % of Total Principal Coupon Date US Dollars ($) Net Assets
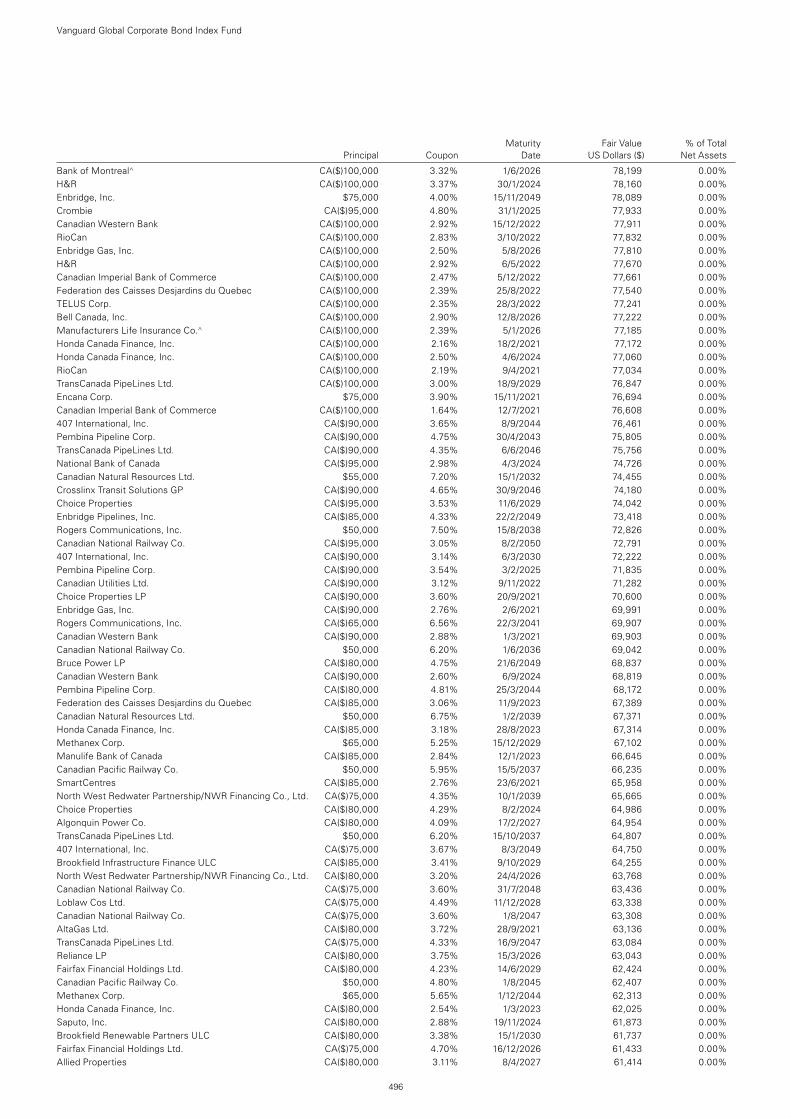
Bank of Montreal^ CA($)100,000 3.32% 1/6/2026 78,199 0.00%H&R CA($)100,000 3.37% 30/1/2024 78,160 0.00%Enbridge, Inc. $75,000 4.00% 15/11/2049 78,089 0.00%Crombie CA($)95,000 4.80% 31/1/2025 77,933 0.00%Canadian Western Bank CA($)100,000 2.92% 15/12/2022 77,911 0.00%RioCan CA($)100,000 2.83% 3/10/2022 77,832 0.00%Enbridge Gas, Inc. CA($)100,000 2.50% 5/8/2026 77,810 0.00%H&R CA($)100,000 2.92% 6/5/2022 77,670 0.00%Canadian Imperial Bank of Commerce CA($)100,000 2.47% 5/12/2022 77,661 0.00%Federation des Caisses Desjardins du Quebec CA($)100,000 2.39% 25/8/2022 77,540 0.00%TELUS Corp. CA($)100,000 2.35% 28/3/2022 77,241 0.00%Bell Canada, Inc. CA($)100,000 2.90% 12/8/2026 77,222 0.00%Manufacturers Life Insurance Co.^ CA($)100,000 2.39% 5/1/2026 77,185 0.00%Honda Canada Finance, Inc. CA($)100,000 2.16% 18/2/2021 77,172 0.00%Honda Canada Finance, Inc. CA($)100,000 2.50% 4/6/2024 77,060 0.00%RioCan CA($)100,000 2.19% 9/4/2021 77,034 0.00%TransCanada PipeLines Ltd. CA($)100,000 3.00% 18/9/2029 76,847 0.00%Encana Corp. $75,000 3.90% 15/11/2021 76,694 0.00%Canadian Imperial Bank of Commerce CA($)100,000 1.64% 12/7/2021 76,608 0.00%407 International, Inc. CA($)90,000 3.65% 8/9/2044 76,461 0.00%Pembina Pipeline Corp. CA($)90,000 4.75% 30/4/2043 75,805 0.00%TransCanada PipeLines Ltd. CA($)90,000 4.35% 6/6/2046 75,756 0.00%National Bank of Canada CA($)95,000 2.98% 4/3/2024 74,726 0.00%Canadian Natural Resources Ltd. $55,000 7.20% 15/1/2032 74,455 0.00%Crosslinx Transit Solutions GP CA($)90,000 4.65% 30/9/2046 74,180 0.00%Choice Properties CA($)95,000 3.53% 11/6/2029 74,042 0.00%Enbridge Pipelines, Inc. CA($)85,000 4.33% 22/2/2049 73,418 0.00%Rogers Communications, Inc. $50,000 7.50% 15/8/2038 72,826 0.00%Canadian National Railway Co. CA($)95,000 3.05% 8/2/2050 72,791 0.00%407 International, Inc. CA($)90,000 3.14% 6/3/2030 72,222 0.00%Pembina Pipeline Corp. CA($)90,000 3.54% 3/2/2025 71,835 0.00%Canadian Utilities Ltd. CA($)90,000 3.12% 9/11/2022 71,282 0.00%Choice Properties LP CA($)90,000 3.60% 20/9/2021 70,600 0.00%Enbridge Gas, Inc. CA($)90,000 2.76% 2/6/2021 69,991 0.00%Rogers Communications, Inc. CA($)65,000 6.56% 22/3/2041 69,907 0.00%Canadian Western Bank CA($)90,000 2.88% 1/3/2021 69,903 0.00%Canadian National Railway Co. $50,000 6.20% 1/6/2036 69,042 0.00%Bruce Power LP CA($)80,000 4.75% 21/6/2049 68,837 0.00%Canadian Western Bank CA($)90,000 2.60% 6/9/2024 68,819 0.00%Pembina Pipeline Corp. CA($)80,000 4.81% 25/3/2044 68,172 0.00%Federation des Caisses Desjardins du Quebec CA($)85,000 3.06% 11/9/2023 67,389 0.00%Canadian Natural Resources Ltd. $50,000 6.75% 1/2/2039 67,371 0.00%Honda Canada Finance, Inc. CA($)85,000 3.18% 28/8/2023 67,314 0.00%Methanex Corp. $65,000 5.25% 15/12/2029 67,102 0.00%Manulife Bank of Canada CA($)85,000 2.84% 12/1/2023 66,645 0.00%Canadian Pacific Railway Co. $50,000 5.95% 15/5/2037 66,235 0.00%SmartCentres CA($)85,000 2.76% 23/6/2021 65,958 0.00%North West Redwater Partnership/NWR Financing Co., Ltd. CA($)75,000 4.35% 10/1/2039 65,665 0.00%Choice Properties CA($)80,000 4.29% 8/2/2024 64,986 0.00%Algonquin Power Co. CA($)80,000 4.09% 17/2/2027 64,954 0.00%TransCanada PipeLines Ltd. $50,000 6.20% 15/10/2037 64,807 0.00%407 International, Inc. CA($)75,000 3.67% 8/3/2049 64,750 0.00%Brookfield Infrastructure Finance ULC CA($)85,000 3.41% 9/10/2029 64,255 0.00%North West Redwater Partnership/NWR Financing Co., Ltd. CA($)80,000 3.20% 24/4/2026 63,768 0.00%Canadian National Railway Co. CA($)75,000 3.60% 31/7/2048 63,436 0.00%Loblaw Cos Ltd. CA($)75,000 4.49% 11/12/2028 63,338 0.00%Canadian National Railway Co. CA($)75,000 3.60% 1/8/2047 63,308 0.00%AltaGas Ltd. CA($)80,000 3.72% 28/9/2021 63,136 0.00%TransCanada PipeLines Ltd. CA($)75,000 4.33% 16/9/2047 63,084 0.00%Reliance LP CA($)80,000 3.75% 15/3/2026 63,043 0.00%Fairfax Financial Holdings Ltd. CA($)80,000 4.23% 14/6/2029 62,424 0.00%Canadian Pacific Railway Co. $50,000 4.80% 1/8/2045 62,407 0.00%Methanex Corp. $65,000 5.65% 1/12/2044 62,313 0.00%Honda Canada Finance, Inc. CA($)80,000 2.54% 1/3/2023 62,025 0.00%Saputo, Inc. CA($)80,000 2.88% 19/11/2024 61,873 0.00%Brookfield Renewable Partners ULC CA($)80,000 3.38% 15/1/2030 61,737 0.00%Fairfax Financial Holdings Ltd. CA($)75,000 4.70% 16/12/2026 61,433 0.00%Allied Properties CA($)80,000 3.11% 8/4/2027 61,414 0.00%
Vanguard Global Corporate Bond Index Fund
496
Maturity Fair Value % of Total Principal Coupon Date US Dollars ($) Net Assets
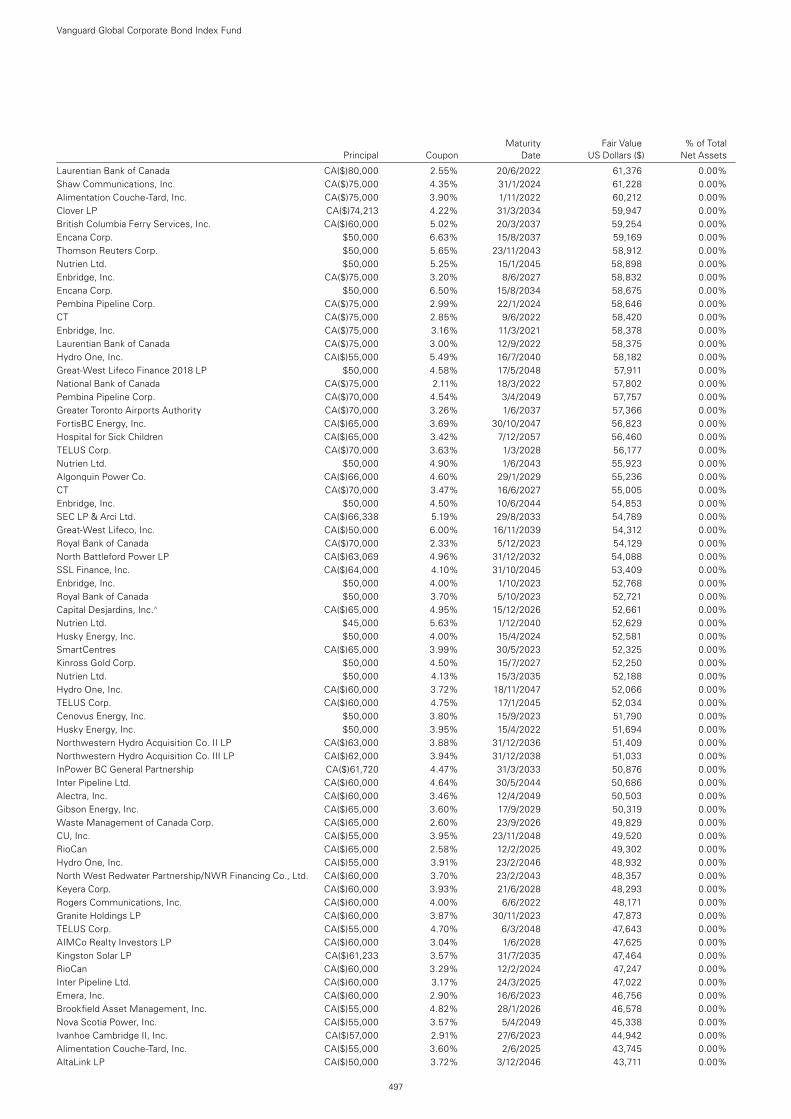
Laurentian Bank of Canada CA($)80,000 2.55% 20/6/2022 61,376 0.00%Shaw Communications, Inc. CA($)75,000 4.35% 31/1/2024 61,228 0.00%Alimentation Couche-Tard, Inc. CA($)75,000 3.90% 1/11/2022 60,212 0.00%Clover LP CA($)74,213 4.22% 31/3/2034 59,947 0.00%British Columbia Ferry Services, Inc. CA($)60,000 5.02% 20/3/2037 59,254 0.00%Encana Corp. $50,000 6.63% 15/8/2037 59,169 0.00%Thomson Reuters Corp. $50,000 5.65% 23/11/2043 58,912 0.00%Nutrien Ltd. $50,000 5.25% 15/1/2045 58,898 0.00%Enbridge, Inc. CA($)75,000 3.20% 8/6/2027 58,832 0.00%Encana Corp. $50,000 6.50% 15/8/2034 58,675 0.00%Pembina Pipeline Corp. CA($)75,000 2.99% 22/1/2024 58,646 0.00%CT CA($)75,000 2.85% 9/6/2022 58,420 0.00%Enbridge, Inc. CA($)75,000 3.16% 11/3/2021 58,378 0.00%Laurentian Bank of Canada CA($)75,000 3.00% 12/9/2022 58,375 0.00%Hydro One, Inc. CA($)55,000 5.49% 16/7/2040 58,182 0.00%Great-West Lifeco Finance 2018 LP $50,000 4.58% 17/5/2048 57,911 0.00%National Bank of Canada CA($)75,000 2.11% 18/3/2022 57,802 0.00%Pembina Pipeline Corp. CA($)70,000 4.54% 3/4/2049 57,757 0.00%Greater Toronto Airports Authority CA($)70,000 3.26% 1/6/2037 57,366 0.00%FortisBC Energy, Inc. CA($)65,000 3.69% 30/10/2047 56,823 0.00%Hospital for Sick Children CA($)65,000 3.42% 7/12/2057 56,460 0.00%TELUS Corp. CA($)70,000 3.63% 1/3/2028 56,177 0.00%Nutrien Ltd. $50,000 4.90% 1/6/2043 55,923 0.00%Algonquin Power Co. CA($)66,000 4.60% 29/1/2029 55,236 0.00%CT CA($)70,000 3.47% 16/6/2027 55,005 0.00%Enbridge, Inc. $50,000 4.50% 10/6/2044 54,853 0.00%SEC LP & Arci Ltd. CA($)66,338 5.19% 29/8/2033 54,789 0.00%Great-West Lifeco, Inc. CA($)50,000 6.00% 16/11/2039 54,312 0.00%Royal Bank of Canada CA($)70,000 2.33% 5/12/2023 54,129 0.00%North Battleford Power LP CA($)63,069 4.96% 31/12/2032 54,088 0.00%SSL Finance, Inc. CA($)64,000 4.10% 31/10/2045 53,409 0.00%Enbridge, Inc. $50,000 4.00% 1/10/2023 52,768 0.00%Royal Bank of Canada $50,000 3.70% 5/10/2023 52,721 0.00%Capital Desjardins, Inc.^ CA($)65,000 4.95% 15/12/2026 52,661 0.00%Nutrien Ltd. $45,000 5.63% 1/12/2040 52,629 0.00%Husky Energy, Inc. $50,000 4.00% 15/4/2024 52,581 0.00%SmartCentres CA($)65,000 3.99% 30/5/2023 52,325 0.00%Kinross Gold Corp. $50,000 4.50% 15/7/2027 52,250 0.00%Nutrien Ltd. $50,000 4.13% 15/3/2035 52,188 0.00%Hydro One, Inc. CA($)60,000 3.72% 18/11/2047 52,066 0.00%TELUS Corp. CA($)60,000 4.75% 17/1/2045 52,034 0.00%Cenovus Energy, Inc. $50,000 3.80% 15/9/2023 51,790 0.00%Husky Energy, Inc. $50,000 3.95% 15/4/2022 51,694 0.00%Northwestern Hydro Acquisition Co. II LP CA($)63,000 3.88% 31/12/2036 51,409 0.00%Northwestern Hydro Acquisition Co. III LP CA($)62,000 3.94% 31/12/2038 51,033 0.00%InPower BC General Partnership CA($)61,720 4.47% 31/3/2033 50,876 0.00%Inter Pipeline Ltd. CA($)60,000 4.64% 30/5/2044 50,686 0.00%Alectra, Inc. CA($)60,000 3.46% 12/4/2049 50,503 0.00%Gibson Energy, Inc. CA($)65,000 3.60% 17/9/2029 50,319 0.00%Waste Management of Canada Corp. CA($)65,000 2.60% 23/9/2026 49,829 0.00%CU, Inc. CA($)55,000 3.95% 23/11/2048 49,520 0.00%RioCan CA($)65,000 2.58% 12/2/2025 49,302 0.00%Hydro One, Inc. CA($)55,000 3.91% 23/2/2046 48,932 0.00%North West Redwater Partnership/NWR Financing Co., Ltd. CA($)60,000 3.70% 23/2/2043 48,357 0.00%Keyera Corp. CA($)60,000 3.93% 21/6/2028 48,293 0.00%Rogers Communications, Inc. CA($)60,000 4.00% 6/6/2022 48,171 0.00%Granite Holdings LP CA($)60,000 3.87% 30/11/2023 47,873 0.00%TELUS Corp. CA($)55,000 4.70% 6/3/2048 47,643 0.00%AIMCo Realty Investors LP CA($)60,000 3.04% 1/6/2028 47,625 0.00%Kingston Solar LP CA($)61,233 3.57% 31/7/2035 47,464 0.00%RioCan CA($)60,000 3.29% 12/2/2024 47,247 0.00%Inter Pipeline Ltd. CA($)60,000 3.17% 24/3/2025 47,022 0.00%Emera, Inc. CA($)60,000 2.90% 16/6/2023 46,756 0.00%Brookfield Asset Management, Inc. CA($)55,000 4.82% 28/1/2026 46,578 0.00%Nova Scotia Power, Inc. CA($)55,000 3.57% 5/4/2049 45,338 0.00%Ivanhoe Cambridge II, Inc. CA($)57,000 2.91% 27/6/2023 44,942 0.00%Alimentation Couche-Tard, Inc. CA($)55,000 3.60% 2/6/2025 43,745 0.00%AltaLink LP CA($)50,000 3.72% 3/12/2046 43,711 0.00%
Vanguard Global Corporate Bond Index Fund
497
Maturity Fair Value % of Total Principal Coupon Date US Dollars ($) Net Assets
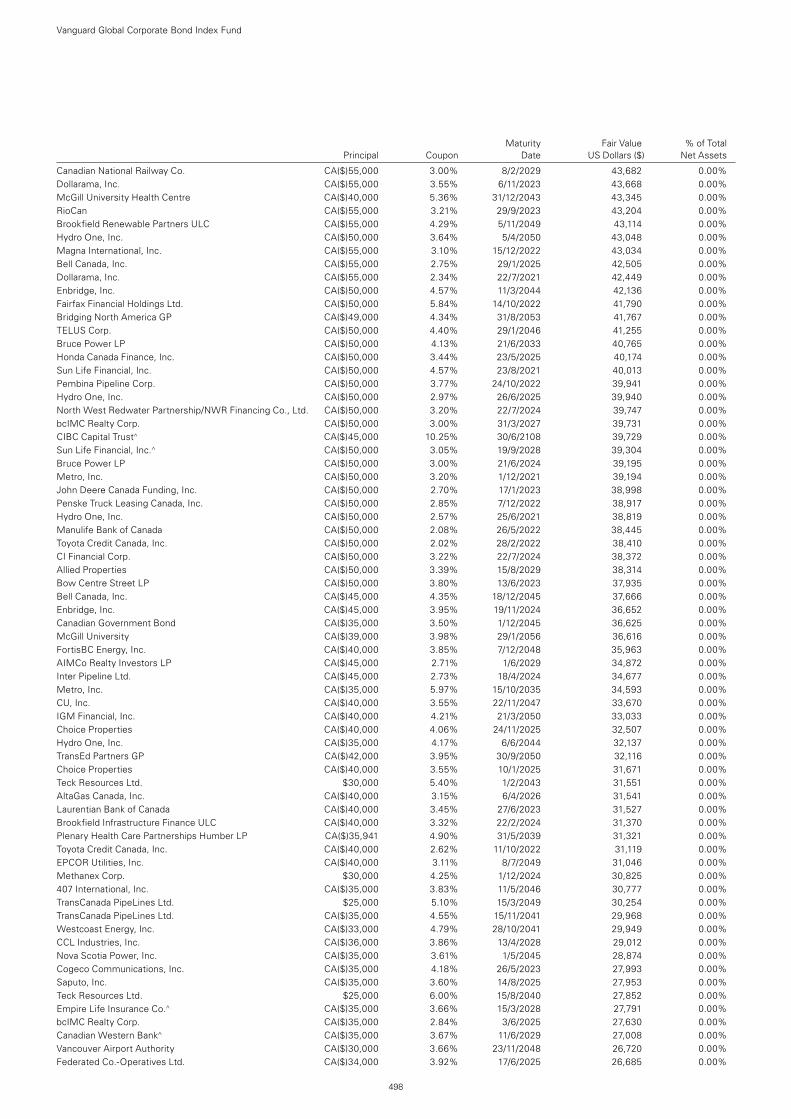
Canadian National Railway Co. CA($)55,000 3.00% 8/2/2029 43,682 0.00%Dollarama, Inc. CA($)55,000 3.55% 6/11/2023 43,668 0.00%McGill University Health Centre CA($)40,000 5.36% 31/12/2043 43,345 0.00%RioCan CA($)55,000 3.21% 29/9/2023 43,204 0.00%Brookfield Renewable Partners ULC CA($)55,000 4.29% 5/11/2049 43,114 0.00%Hydro One, Inc. CA($)50,000 3.64% 5/4/2050 43,048 0.00%Magna International, Inc. CA($)55,000 3.10% 15/12/2022 43,034 0.00%Bell Canada, Inc. CA($)55,000 2.75% 29/1/2025 42,505 0.00%Dollarama, Inc. CA($)55,000 2.34% 22/7/2021 42,449 0.00%Enbridge, Inc. CA($)50,000 4.57% 11/3/2044 42,136 0.00%Fairfax Financial Holdings Ltd. CA($)50,000 5.84% 14/10/2022 41,790 0.00%Bridging North America GP CA($)49,000 4.34% 31/8/2053 41,767 0.00%TELUS Corp. CA($)50,000 4.40% 29/1/2046 41,255 0.00%Bruce Power LP CA($)50,000 4.13% 21/6/2033 40,765 0.00%Honda Canada Finance, Inc. CA($)50,000 3.44% 23/5/2025 40,174 0.00%Sun Life Financial, Inc. CA($)50,000 4.57% 23/8/2021 40,013 0.00%Pembina Pipeline Corp. CA($)50,000 3.77% 24/10/2022 39,941 0.00%Hydro One, Inc. CA($)50,000 2.97% 26/6/2025 39,940 0.00%North West Redwater Partnership/NWR Financing Co., Ltd. CA($)50,000 3.20% 22/7/2024 39,747 0.00%bcIMC Realty Corp. CA($)50,000 3.00% 31/3/2027 39,731 0.00%CIBC Capital Trust^ CA($)45,000 10.25% 30/6/2108 39,729 0.00%Sun Life Financial, Inc.^ CA($)50,000 3.05% 19/9/2028 39,304 0.00%Bruce Power LP CA($)50,000 3.00% 21/6/2024 39,195 0.00%Metro, Inc. CA($)50,000 3.20% 1/12/2021 39,194 0.00%John Deere Canada Funding, Inc. CA($)50,000 2.70% 17/1/2023 38,998 0.00%Penske Truck Leasing Canada, Inc. CA($)50,000 2.85% 7/12/2022 38,917 0.00%Hydro One, Inc. CA($)50,000 2.57% 25/6/2021 38,819 0.00%Manulife Bank of Canada CA($)50,000 2.08% 26/5/2022 38,445 0.00%Toyota Credit Canada, Inc. CA($)50,000 2.02% 28/2/2022 38,410 0.00%CI Financial Corp. CA($)50,000 3.22% 22/7/2024 38,372 0.00%Allied Properties CA($)50,000 3.39% 15/8/2029 38,314 0.00%Bow Centre Street LP CA($)50,000 3.80% 13/6/2023 37,935 0.00%Bell Canada, Inc. CA($)45,000 4.35% 18/12/2045 37,666 0.00%Enbridge, Inc. CA($)45,000 3.95% 19/11/2024 36,652 0.00%Canadian Government Bond CA($)35,000 3.50% 1/12/2045 36,625 0.00%McGill University CA($)39,000 3.98% 29/1/2056 36,616 0.00%FortisBC Energy, Inc. CA($)40,000 3.85% 7/12/2048 35,963 0.00%AIMCo Realty Investors LP CA($)45,000 2.71% 1/6/2029 34,872 0.00%Inter Pipeline Ltd. CA($)45,000 2.73% 18/4/2024 34,677 0.00%Metro, Inc. CA($)35,000 5.97% 15/10/2035 34,593 0.00%CU, Inc. CA($)40,000 3.55% 22/11/2047 33,670 0.00%IGM Financial, Inc. CA($)40,000 4.21% 21/3/2050 33,033 0.00%Choice Properties CA($)40,000 4.06% 24/11/2025 32,507 0.00%Hydro One, Inc. CA($)35,000 4.17% 6/6/2044 32,137 0.00%TransEd Partners GP CA($)42,000 3.95% 30/9/2050 32,116 0.00%Choice Properties CA($)40,000 3.55% 10/1/2025 31,671 0.00%Teck Resources Ltd. $30,000 5.40% 1/2/2043 31,551 0.00%AltaGas Canada, Inc. CA($)40,000 3.15% 6/4/2026 31,541 0.00%Laurentian Bank of Canada CA($)40,000 3.45% 27/6/2023 31,527 0.00%Brookfield Infrastructure Finance ULC CA($)40,000 3.32% 22/2/2024 31,370 0.00%Plenary Health Care Partnerships Humber LP CA($)35,941 4.90% 31/5/2039 31,321 0.00%Toyota Credit Canada, Inc. CA($)40,000 2.62% 11/10/2022 31,119 0.00%EPCOR Utilities, Inc. CA($)40,000 3.11% 8/7/2049 31,046 0.00%Methanex Corp. $30,000 4.25% 1/12/2024 30,825 0.00%407 International, Inc. CA($)35,000 3.83% 11/5/2046 30,777 0.00%TransCanada PipeLines Ltd. $25,000 5.10% 15/3/2049 30,254 0.00%TransCanada PipeLines Ltd. CA($)35,000 4.55% 15/11/2041 29,968 0.00%Westcoast Energy, Inc. CA($)33,000 4.79% 28/10/2041 29,949 0.00%CCL Industries, Inc. CA($)36,000 3.86% 13/4/2028 29,012 0.00%Nova Scotia Power, Inc. CA($)35,000 3.61% 1/5/2045 28,874 0.00%Cogeco Communications, Inc. CA($)35,000 4.18% 26/5/2023 27,993 0.00%Saputo, Inc. CA($)35,000 3.60% 14/8/2025 27,953 0.00%Teck Resources Ltd. $25,000 6.00% 15/8/2040 27,852 0.00%Empire Life Insurance Co.^ CA($)35,000 3.66% 15/3/2028 27,791 0.00%bcIMC Realty Corp. CA($)35,000 2.84% 3/6/2025 27,630 0.00%Canadian Western Bank^ CA($)35,000 3.67% 11/6/2029 27,008 0.00%Vancouver Airport Authority CA($)30,000 3.66% 23/11/2048 26,720 0.00%Federated Co.-Operatives Ltd. CA($)34,000 3.92% 17/6/2025 26,685 0.00%
Vanguard Global Corporate Bond Index Fund
498
Maturity Fair Value % of Total Principal Coupon Date US Dollars ($) Net Assets
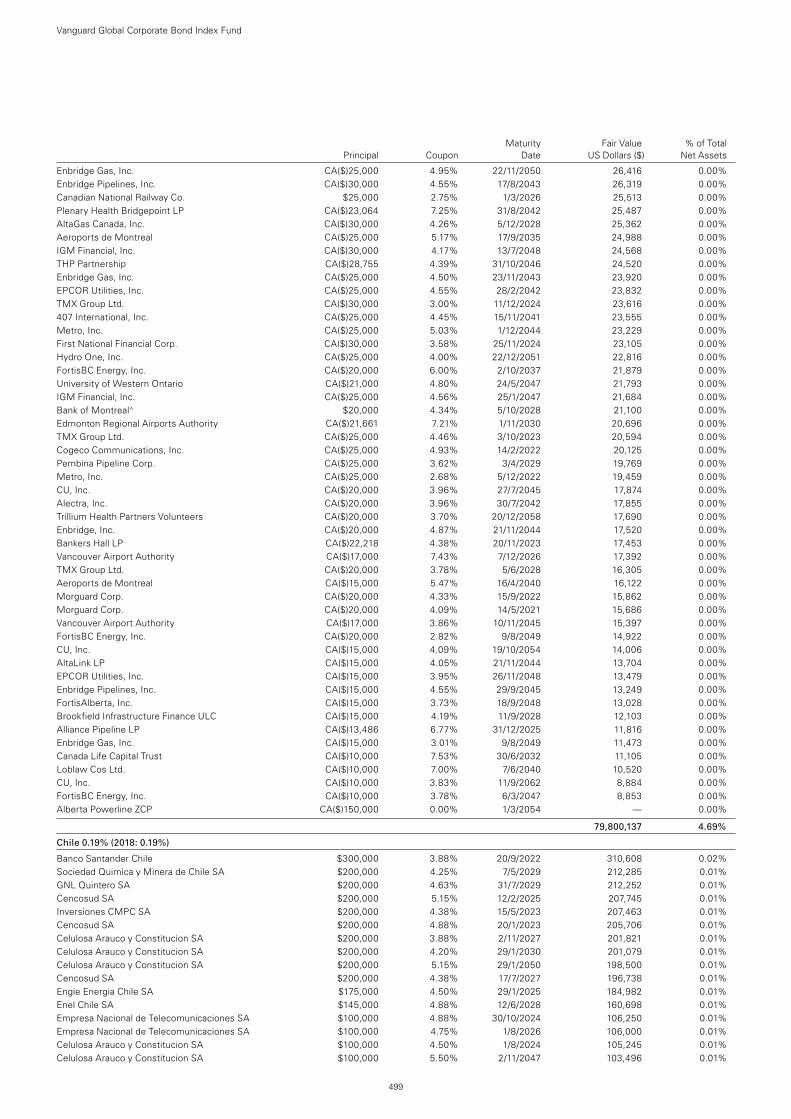
Enbridge Gas, Inc. CA($)25,000 4.95% 22/11/2050 26,416 0.00%Enbridge Pipelines, Inc. CA($)30,000 4.55% 17/8/2043 26,319 0.00%Canadian National Railway Co. $25,000 2.75% 1/3/2026 25,513 0.00%Plenary Health Bridgepoint LP CA($)23,064 7.25% 31/8/2042 25,487 0.00%AltaGas Canada, Inc. CA($)30,000 4.26% 5/12/2028 25,362 0.00%Aeroports de Montreal CA($)25,000 5.17% 17/9/2035 24,988 0.00%IGM Financial, Inc. CA($)30,000 4.17% 13/7/2048 24,568 0.00%THP Partnership CA($)28,755 4.39% 31/10/2046 24,520 0.00%Enbridge Gas, Inc. CA($)25,000 4.50% 23/11/2043 23,920 0.00%EPCOR Utilities, Inc. CA($)25,000 4.55% 28/2/2042 23,832 0.00%TMX Group Ltd. CA($)30,000 3.00% 11/12/2024 23,616 0.00%407 International, Inc. CA($)25,000 4.45% 15/11/2041 23,555 0.00%Metro, Inc. CA($)25,000 5.03% 1/12/2044 23,229 0.00%First National Financial Corp. CA($)30,000 3.58% 25/11/2024 23,105 0.00%Hydro One, Inc. CA($)25,000 4.00% 22/12/2051 22,816 0.00%FortisBC Energy, Inc. CA($)20,000 6.00% 2/10/2037 21,879 0.00%University of Western Ontario CA($)21,000 4.80% 24/5/2047 21,793 0.00%IGM Financial, Inc. CA($)25,000 4.56% 25/1/2047 21,684 0.00%Bank of Montreal^ $20,000 4.34% 5/10/2028 21,100 0.00%Edmonton Regional Airports Authority CA($)21,661 7.21% 1/11/2030 20,696 0.00%TMX Group Ltd. CA($)25,000 4.46% 3/10/2023 20,594 0.00%Cogeco Communications, Inc. CA($)25,000 4.93% 14/2/2022 20,125 0.00%Pembina Pipeline Corp. CA($)25,000 3.62% 3/4/2029 19,769 0.00%Metro, Inc. CA($)25,000 2.68% 5/12/2022 19,459 0.00%CU, Inc. CA($)20,000 3.96% 27/7/2045 17,874 0.00%Alectra, Inc. CA($)20,000 3.96% 30/7/2042 17,855 0.00%Trillium Health Partners Volunteers CA($)20,000 3.70% 20/12/2058 17,690 0.00%Enbridge, Inc. CA($)20,000 4.87% 21/11/2044 17,520 0.00%Bankers Hall LP CA($)22,218 4.38% 20/11/2023 17,453 0.00%Vancouver Airport Authority CA($)17,000 7.43% 7/12/2026 17,392 0.00%TMX Group Ltd. CA($)20,000 3.78% 5/6/2028 16,305 0.00%Aeroports de Montreal CA($)15,000 5.47% 16/4/2040 16,122 0.00%Morguard Corp. CA($)20,000 4.33% 15/9/2022 15,862 0.00%Morguard Corp. CA($)20,000 4.09% 14/5/2021 15,686 0.00%Vancouver Airport Authority CA($)17,000 3.86% 10/11/2045 15,397 0.00%FortisBC Energy, Inc. CA($)20,000 2.82% 9/8/2049 14,922 0.00%CU, Inc. CA($)15,000 4.09% 19/10/2054 14,006 0.00%AltaLink LP CA($)15,000 4.05% 21/11/2044 13,704 0.00%EPCOR Utilities, Inc. CA($)15,000 3.95% 26/11/2048 13,479 0.00%Enbridge Pipelines, Inc. CA($)15,000 4.55% 29/9/2045 13,249 0.00%FortisAlberta, Inc. CA($)15,000 3.73% 18/9/2048 13,028 0.00%Brookfield Infrastructure Finance ULC CA($)15,000 4.19% 11/9/2028 12,103 0.00%Alliance Pipeline LP CA($)13,486 6.77% 31/12/2025 11,816 0.00%Enbridge Gas, Inc. CA($)15,000 3.01% 9/8/2049 11,473 0.00%Canada Life Capital Trust CA($)10,000 7.53% 30/6/2032 11,105 0.00%Loblaw Cos Ltd. CA($)10,000 7.00% 7/6/2040 10,520 0.00%CU, Inc. CA($)10,000 3.83% 11/9/2062 8,884 0.00%FortisBC Energy, Inc. CA($)10,000 3.78% 6/3/2047 8,853 0.00%Alberta Powerline ZCP CA($)150,000 0.00% 1/3/2054 — 0.00%
79,800,137 4.69%
Chile 0.19% (2018: 0.19%)
Banco Santander Chile $300,000 3.88% 20/9/2022 310,608 0.02%Sociedad Quimica y Minera de Chile SA $200,000 4.25% 7/5/2029 212,285 0.01%GNL Quintero SA $200,000 4.63% 31/7/2029 212,252 0.01%Cencosud SA $200,000 5.15% 12/2/2025 207,745 0.01%Inversiones CMPC SA $200,000 4.38% 15/5/2023 207,463 0.01%Cencosud SA $200,000 4.88% 20/1/2023 205,706 0.01%Celulosa Arauco y Constitucion SA $200,000 3.88% 2/11/2027 201,821 0.01%Celulosa Arauco y Constitucion SA $200,000 4.20% 29/1/2030 201,079 0.01%Celulosa Arauco y Constitucion SA $200,000 5.15% 29/1/2050 198,500 0.01%Cencosud SA $200,000 4.38% 17/7/2027 196,738 0.01%Engie Energia Chile SA $175,000 4.50% 29/1/2025 184,982 0.01%Enel Chile SA $145,000 4.88% 12/6/2028 160,698 0.01%Empresa Nacional de Telecomunicaciones SA $100,000 4.88% 30/10/2024 106,250 0.01%Empresa Nacional de Telecomunicaciones SA $100,000 4.75% 1/8/2026 106,000 0.01%Celulosa Arauco y Constitucion SA $100,000 4.50% 1/8/2024 105,245 0.01%Celulosa Arauco y Constitucion SA $100,000 5.50% 2/11/2047 103,496 0.01%
Vanguard Global Corporate Bond Index Fund
499
Maturity Fair Value % of Total Principal Coupon Date US Dollars ($) Net Assets
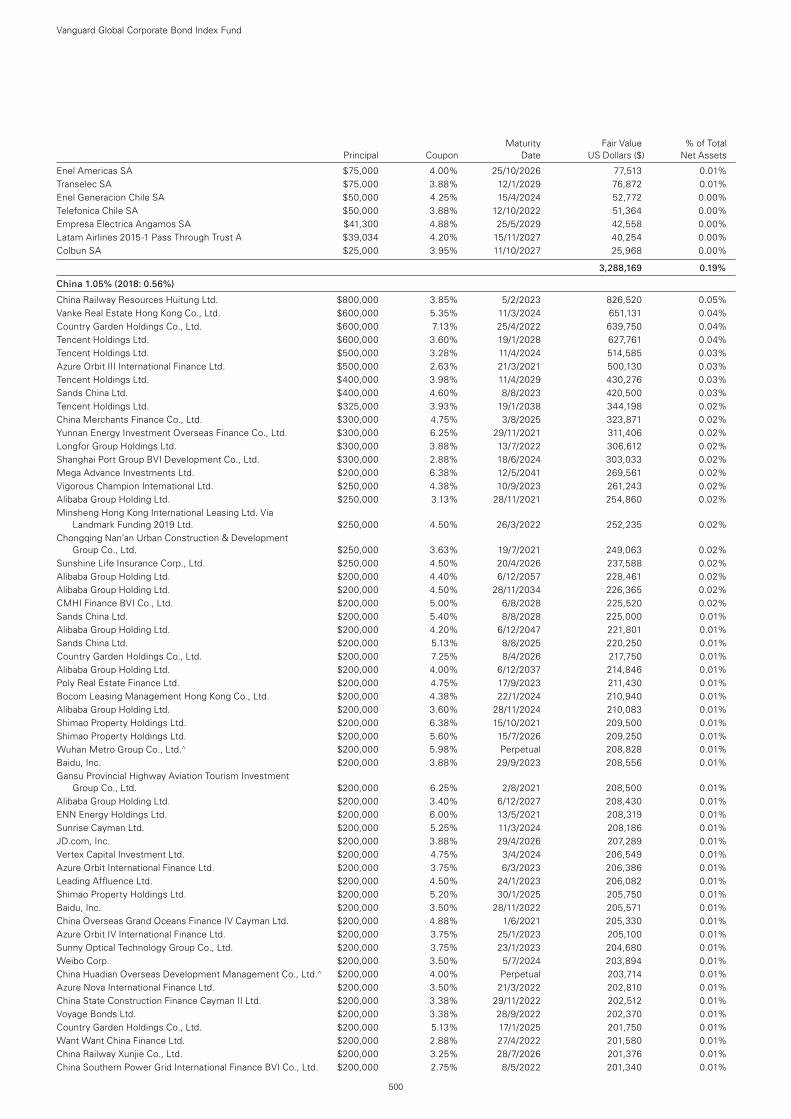
Enel Americas SA $75,000 4.00% 25/10/2026 77,513 0.01%Transelec SA $75,000 3.88% 12/1/2029 76,872 0.01%Enel Generacion Chile SA $50,000 4.25% 15/4/2024 52,772 0.00%Telefonica Chile SA $50,000 3.88% 12/10/2022 51,364 0.00%Empresa Electrica Angamos SA $41,300 4.88% 25/5/2029 42,558 0.00%Latam Airlines 2015-1 Pass Through Trust A $39,034 4.20% 15/11/2027 40,254 0.00%Colbun SA $25,000 3.95% 11/10/2027 25,968 0.00%
3,288,169 0.19%
China 1.05% (2018: 0.56%)
China Railway Resources Huitung Ltd. $800,000 3.85% 5/2/2023 826,520 0.05%Vanke Real Estate Hong Kong Co., Ltd. $600,000 5.35% 11/3/2024 651,131 0.04%Country Garden Holdings Co., Ltd. $600,000 7.13% 25/4/2022 639,750 0.04%Tencent Holdings Ltd. $600,000 3.60% 19/1/2028 627,761 0.04%Tencent Holdings Ltd. $500,000 3.28% 11/4/2024 514,585 0.03%Azure Orbit III International Finance Ltd. $500,000 2.63% 21/3/2021 500,130 0.03%Tencent Holdings Ltd. $400,000 3.98% 11/4/2029 430,276 0.03%Sands China Ltd. $400,000 4.60% 8/8/2023 420,500 0.03%Tencent Holdings Ltd. $325,000 3.93% 19/1/2038 344,198 0.02%China Merchants Finance Co., Ltd. $300,000 4.75% 3/8/2025 323,871 0.02%Yunnan Energy Investment Overseas Finance Co., Ltd. $300,000 6.25% 29/11/2021 311,406 0.02%Longfor Group Holdings Ltd. $300,000 3.88% 13/7/2022 306,612 0.02%Shanghai Port Group BVI Development Co., Ltd. $300,000 2.88% 18/6/2024 303,033 0.02%Mega Advance Investments Ltd. $200,000 6.38% 12/5/2041 269,561 0.02%Vigorous Champion International Ltd. $250,000 4.38% 10/9/2023 261,243 0.02%Alibaba Group Holding Ltd. $250,000 3.13% 28/11/2021 254,860 0.02%Minsheng Hong Kong International Leasing Ltd. Via
Landmark Funding 2019 Ltd. $250,000 4.50% 26/3/2022 252,235 0.02%Chongqing Nan’an Urban Construction & Development
Group Co., Ltd. $250,000 3.63% 19/7/2021 249,063 0.02%Sunshine Life Insurance Corp., Ltd. $250,000 4.50% 20/4/2026 237,588 0.02%Alibaba Group Holding Ltd. $200,000 4.40% 6/12/2057 228,461 0.02%Alibaba Group Holding Ltd. $200,000 4.50% 28/11/2034 226,365 0.02%CMHI Finance BVI Co., Ltd. $200,000 5.00% 6/8/2028 225,520 0.02%Sands China Ltd. $200,000 5.40% 8/8/2028 225,000 0.01%Alibaba Group Holding Ltd. $200,000 4.20% 6/12/2047 221,801 0.01%Sands China Ltd. $200,000 5.13% 8/8/2025 220,250 0.01%Country Garden Holdings Co., Ltd. $200,000 7.25% 8/4/2026 217,750 0.01%Alibaba Group Holding Ltd. $200,000 4.00% 6/12/2037 214,846 0.01%Poly Real Estate Finance Ltd. $200,000 4.75% 17/9/2023 211,430 0.01%Bocom Leasing Management Hong Kong Co., Ltd. $200,000 4.38% 22/1/2024 210,940 0.01%Alibaba Group Holding Ltd. $200,000 3.60% 28/11/2024 210,083 0.01%Shimao Property Holdings Ltd. $200,000 6.38% 15/10/2021 209,500 0.01%Shimao Property Holdings Ltd. $200,000 5.60% 15/7/2026 209,250 0.01%Wuhan Metro Group Co., Ltd.^ $200,000 5.98% Perpetual 208,828 0.01%Baidu, Inc. $200,000 3.88% 29/9/2023 208,556 0.01%Gansu Provincial Highway Aviation Tourism Investment
Group Co., Ltd. $200,000 6.25% 2/8/2021 208,500 0.01%Alibaba Group Holding Ltd. $200,000 3.40% 6/12/2027 208,430 0.01%ENN Energy Holdings Ltd. $200,000 6.00% 13/5/2021 208,319 0.01%Sunrise Cayman Ltd. $200,000 5.25% 11/3/2024 208,186 0.01%JD.com, Inc. $200,000 3.88% 29/4/2026 207,289 0.01%Vertex Capital Investment Ltd. $200,000 4.75% 3/4/2024 206,549 0.01%Azure Orbit International Finance Ltd. $200,000 3.75% 6/3/2023 206,386 0.01%Leading Affluence Ltd. $200,000 4.50% 24/1/2023 206,082 0.01%Shimao Property Holdings Ltd. $200,000 5.20% 30/1/2025 205,750 0.01%Baidu, Inc. $200,000 3.50% 28/11/2022 205,571 0.01%China Overseas Grand Oceans Finance IV Cayman Ltd. $200,000 4.88% 1/6/2021 205,330 0.01%Azure Orbit IV International Finance Ltd. $200,000 3.75% 25/1/2023 205,100 0.01%Sunny Optical Technology Group Co., Ltd. $200,000 3.75% 23/1/2023 204,680 0.01%Weibo Corp. $200,000 3.50% 5/7/2024 203,894 0.01%China Huadian Overseas Development Management Co., Ltd.^ $200,000 4.00% Perpetual 203,714 0.01%Azure Nova International Finance Ltd. $200,000 3.50% 21/3/2022 202,810 0.01%China State Construction Finance Cayman II Ltd. $200,000 3.38% 29/11/2022 202,512 0.01%Voyage Bonds Ltd. $200,000 3.38% 28/9/2022 202,370 0.01%Country Garden Holdings Co., Ltd. $200,000 5.13% 17/1/2025 201,750 0.01%Want Want China Finance Ltd. $200,000 2.88% 27/4/2022 201,580 0.01%China Railway Xunjie Co., Ltd. $200,000 3.25% 28/7/2026 201,376 0.01%China Southern Power Grid International Finance BVI Co., Ltd. $200,000 2.75% 8/5/2022 201,340 0.01%
Vanguard Global Corporate Bond Index Fund
500
Maturity Fair Value % of Total Principal Coupon Date US Dollars ($) Net Assets
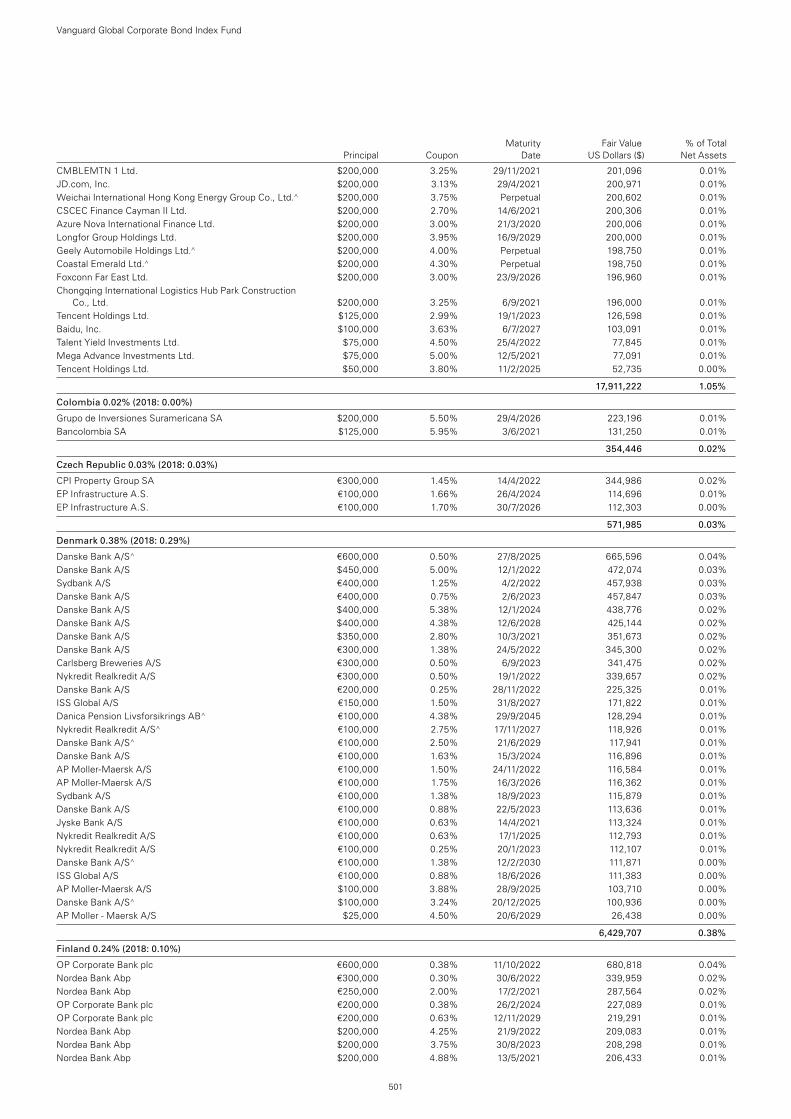
CMBLEMTN 1 Ltd. $200,000 3.25% 29/11/2021 201,096 0.01%JD.com, Inc. $200,000 3.13% 29/4/2021 200,971 0.01%Weichai International Hong Kong Energy Group Co., Ltd.^ $200,000 3.75% Perpetual 200,602 0.01%CSCEC Finance Cayman II Ltd. $200,000 2.70% 14/6/2021 200,306 0.01%Azure Nova International Finance Ltd. $200,000 3.00% 21/3/2020 200,006 0.01%Longfor Group Holdings Ltd. $200,000 3.95% 16/9/2029 200,000 0.01%Geely Automobile Holdings Ltd.^ $200,000 4.00% Perpetual 198,750 0.01%Coastal Emerald Ltd.^ $200,000 4.30% Perpetual 198,750 0.01%Foxconn Far East Ltd. $200,000 3.00% 23/9/2026 196,960 0.01%Chongqing International Logistics Hub Park Construction
Co., Ltd. $200,000 3.25% 6/9/2021 196,000 0.01%Tencent Holdings Ltd. $125,000 2.99% 19/1/2023 126,598 0.01%Baidu, Inc. $100,000 3.63% 6/7/2027 103,091 0.01%Talent Yield Investments Ltd. $75,000 4.50% 25/4/2022 77,845 0.01%Mega Advance Investments Ltd. $75,000 5.00% 12/5/2021 77,091 0.01%Tencent Holdings Ltd. $50,000 3.80% 11/2/2025 52,735 0.00%
17,911,222 1.05%
Colombia 0.02% (2018: 0.00%)
Grupo de Inversiones Suramericana SA $200,000 5.50% 29/4/2026 223,196 0.01%Bancolombia SA $125,000 5.95% 3/6/2021 131,250 0.01%
354,446 0.02%
Czech Republic 0.03% (2018: 0.03%)
CPI Property Group SA €300,000 1.45% 14/4/2022 344,986 0.02%EP Infrastructure A.S. €100,000 1.66% 26/4/2024 114,696 0.01%EP Infrastructure A.S. €100,000 1.70% 30/7/2026 112,303 0.00%
571,985 0.03%
Denmark 0.38% (2018: 0.29%)
Danske Bank A/S^ €600,000 0.50% 27/8/2025 665,596 0.04%Danske Bank A/S $450,000 5.00% 12/1/2022 472,074 0.03%Sydbank A/S €400,000 1.25% 4/2/2022 457,938 0.03%Danske Bank A/S €400,000 0.75% 2/6/2023 457,847 0.03%Danske Bank A/S $400,000 5.38% 12/1/2024 438,776 0.02%Danske Bank A/S $400,000 4.38% 12/6/2028 425,144 0.02%Danske Bank A/S $350,000 2.80% 10/3/2021 351,673 0.02%Danske Bank A/S €300,000 1.38% 24/5/2022 345,300 0.02%Carlsberg Breweries A/S €300,000 0.50% 6/9/2023 341,475 0.02%Nykredit Realkredit A/S €300,000 0.50% 19/1/2022 339,657 0.02%Danske Bank A/S €200,000 0.25% 28/11/2022 225,325 0.01%ISS Global A/S €150,000 1.50% 31/8/2027 171,822 0.01%Danica Pension Livsforsikrings AB^ €100,000 4.38% 29/9/2045 128,294 0.01%Nykredit Realkredit A/S^ €100,000 2.75% 17/11/2027 118,926 0.01%Danske Bank A/S^ €100,000 2.50% 21/6/2029 117,941 0.01%Danske Bank A/S €100,000 1.63% 15/3/2024 116,896 0.01%AP Moller-Maersk A/S €100,000 1.50% 24/11/2022 116,584 0.01%AP Moller-Maersk A/S €100,000 1.75% 16/3/2026 116,362 0.01%Sydbank A/S €100,000 1.38% 18/9/2023 115,879 0.01%Danske Bank A/S €100,000 0.88% 22/5/2023 113,636 0.01%Jyske Bank A/S €100,000 0.63% 14/4/2021 113,324 0.01%Nykredit Realkredit A/S €100,000 0.63% 17/1/2025 112,793 0.01%Nykredit Realkredit A/S €100,000 0.25% 20/1/2023 112,107 0.01%Danske Bank A/S^ €100,000 1.38% 12/2/2030 111,871 0.00%ISS Global A/S €100,000 0.88% 18/6/2026 111,383 0.00%AP Moller-Maersk A/S $100,000 3.88% 28/9/2025 103,710 0.00%Danske Bank A/S^ $100,000 3.24% 20/12/2025 100,936 0.00%AP Moller - Maersk A/S $25,000 4.50% 20/6/2029 26,438 0.00%
6,429,707 0.38%
Finland 0.24% (2018: 0.10%)
OP Corporate Bank plc €600,000 0.38% 11/10/2022 680,818 0.04%Nordea Bank Abp €300,000 0.30% 30/6/2022 339,959 0.02%Nordea Bank Abp €250,000 2.00% 17/2/2021 287,564 0.02%OP Corporate Bank plc €200,000 0.38% 26/2/2024 227,089 0.01%OP Corporate Bank plc €200,000 0.63% 12/11/2029 219,291 0.01%Nordea Bank Abp $200,000 4.25% 21/9/2022 209,083 0.01%Nordea Bank Abp $200,000 3.75% 30/8/2023 208,298 0.01%Nordea Bank Abp $200,000 4.88% 13/5/2021 206,433 0.01%
Vanguard Global Corporate Bond Index Fund
501
Maturity Fair Value % of Total Principal Coupon Date US Dollars ($) Net Assets
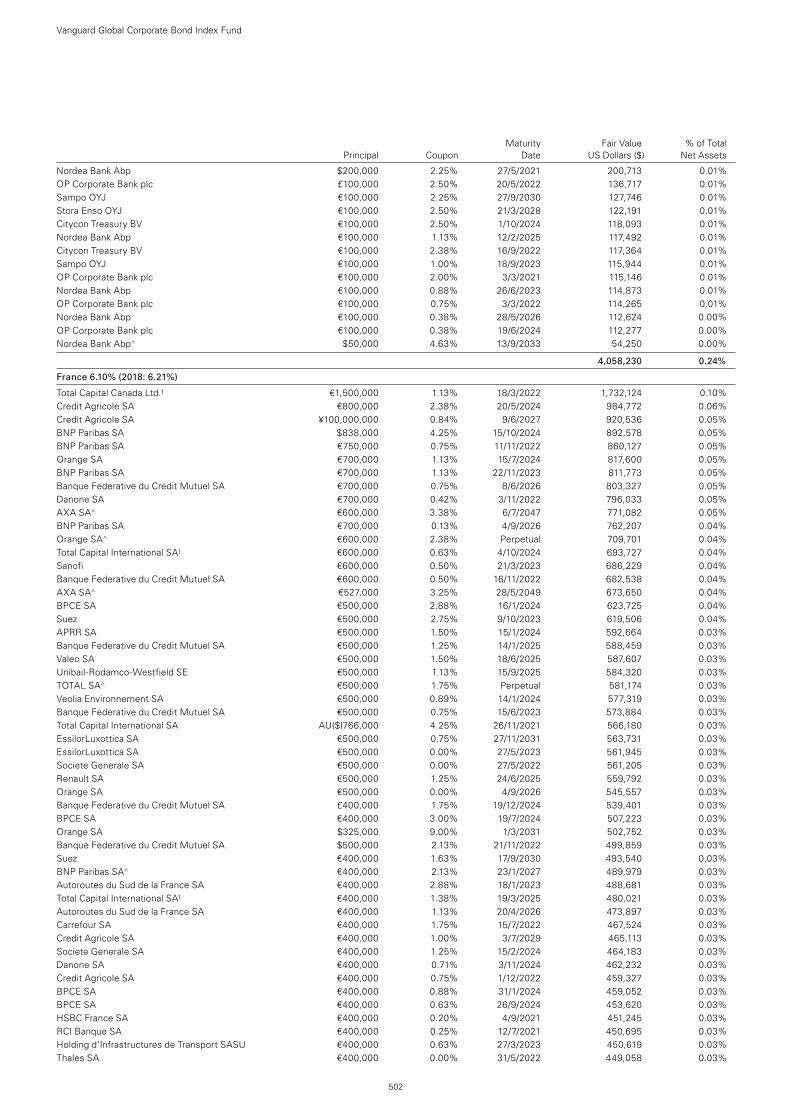
Nordea Bank Abp $200,000 2.25% 27/5/2021 200,713 0.01%OP Corporate Bank plc £100,000 2.50% 20/5/2022 136,717 0.01%Sampo OYJ €100,000 2.25% 27/9/2030 127,746 0.01%Stora Enso OYJ €100,000 2.50% 21/3/2028 122,191 0.01%Citycon Treasury BV €100,000 2.50% 1/10/2024 118,093 0.01%Nordea Bank Abp €100,000 1.13% 12/2/2025 117,492 0.01%Citycon Treasury BV €100,000 2.38% 16/9/2022 117,364 0.01%Sampo OYJ €100,000 1.00% 18/9/2023 115,944 0.01%OP Corporate Bank plc €100,000 2.00% 3/3/2021 115,146 0.01%Nordea Bank Abp €100,000 0.88% 26/6/2023 114,873 0.01%OP Corporate Bank plc €100,000 0.75% 3/3/2022 114,265 0.01%Nordea Bank Abp €100,000 0.38% 28/5/2026 112,624 0.00%OP Corporate Bank plc €100,000 0.38% 19/6/2024 112,277 0.00%Nordea Bank Abp^ $50,000 4.63% 13/9/2033 54,250 0.00%
4,058,230 0.24%
France 6.10% (2018: 6.21%)
Total Capital Canada Ltd.1 €1,500,000 1.13% 18/3/2022 1,732,124 0.10%Credit Agricole SA €800,000 2.38% 20/5/2024 984,772 0.06%Credit Agricole SA ¥100,000,000 0.84% 9/6/2027 920,536 0.05%BNP Paribas SA $838,000 4.25% 15/10/2024 892,578 0.05%BNP Paribas SA €750,000 0.75% 11/11/2022 860,127 0.05%Orange SA €700,000 1.13% 15/7/2024 817,600 0.05%BNP Paribas SA €700,000 1.13% 22/11/2023 811,773 0.05%Banque Federative du Credit Mutuel SA €700,000 0.75% 8/6/2026 803,327 0.05%Danone SA €700,000 0.42% 3/11/2022 796,033 0.05%AXA SA^ €600,000 3.38% 6/7/2047 771,082 0.05%BNP Paribas SA €700,000 0.13% 4/9/2026 762,207 0.04%Orange SA^ €600,000 2.38% Perpetual 709,701 0.04%Total Capital International SA1 €600,000 0.63% 4/10/2024 693,727 0.04%Sanofi €600,000 0.50% 21/3/2023 686,229 0.04%Banque Federative du Credit Mutuel SA €600,000 0.50% 16/11/2022 682,538 0.04%AXA SA^ €527,000 3.25% 28/5/2049 673,650 0.04%BPCE SA €500,000 2.88% 16/1/2024 623,725 0.04%Suez €500,000 2.75% 9/10/2023 619,506 0.04%APRR SA €500,000 1.50% 15/1/2024 592,664 0.03%Banque Federative du Credit Mutuel SA €500,000 1.25% 14/1/2025 588,459 0.03%Valeo SA €500,000 1.50% 18/6/2025 587,607 0.03%Unibail-Rodamco-Westfield SE €500,000 1.13% 15/9/2025 584,320 0.03%TOTAL SA^ €500,000 1.75% Perpetual 581,174 0.03%Veolia Environnement SA €500,000 0.89% 14/1/2024 577,319 0.03%Banque Federative du Credit Mutuel SA €500,000 0.75% 15/6/2023 573,884 0.03%Total Capital International SA AU($)766,000 4.25% 26/11/2021 566,180 0.03%EssilorLuxottica SA €500,000 0.75% 27/11/2031 563,731 0.03%EssilorLuxottica SA €500,000 0.00% 27/5/2023 561,945 0.03%Societe Generale SA €500,000 0.00% 27/5/2022 561,205 0.03%Renault SA €500,000 1.25% 24/6/2025 559,792 0.03%Orange SA €500,000 0.00% 4/9/2026 545,557 0.03%Banque Federative du Credit Mutuel SA £400,000 1.75% 19/12/2024 539,401 0.03%BPCE SA €400,000 3.00% 19/7/2024 507,223 0.03%Orange SA $325,000 9.00% 1/3/2031 502,752 0.03%Banque Federative du Credit Mutuel SA $500,000 2.13% 21/11/2022 499,859 0.03%Suez €400,000 1.63% 17/9/2030 493,540 0.03%BNP Paribas SA^ €400,000 2.13% 23/1/2027 489,979 0.03%Autoroutes du Sud de la France SA €400,000 2.88% 18/1/2023 488,681 0.03%Total Capital International SA1 €400,000 1.38% 19/3/2025 480,021 0.03%Autoroutes du Sud de la France SA €400,000 1.13% 20/4/2026 473,897 0.03%Carrefour SA €400,000 1.75% 15/7/2022 467,524 0.03%Credit Agricole SA €400,000 1.00% 3/7/2029 465,113 0.03%Societe Generale SA €400,000 1.25% 15/2/2024 464,183 0.03%Danone SA €400,000 0.71% 3/11/2024 462,232 0.03%Credit Agricole SA €400,000 0.75% 1/12/2022 459,327 0.03%BPCE SA €400,000 0.88% 31/1/2024 459,052 0.03%BPCE SA €400,000 0.63% 26/9/2024 453,620 0.03%HSBC France SA €400,000 0.20% 4/9/2021 451,245 0.03%RCI Banque SA €400,000 0.25% 12/7/2021 450,695 0.03%Holding d’Infrastructures de Transport SASU €400,000 0.63% 27/3/2023 450,619 0.03%Thales SA €400,000 0.00% 31/5/2022 449,058 0.03%
Vanguard Global Corporate Bond Index Fund
502
Maturity Fair Value % of Total Principal Coupon Date US Dollars ($) Net Assets
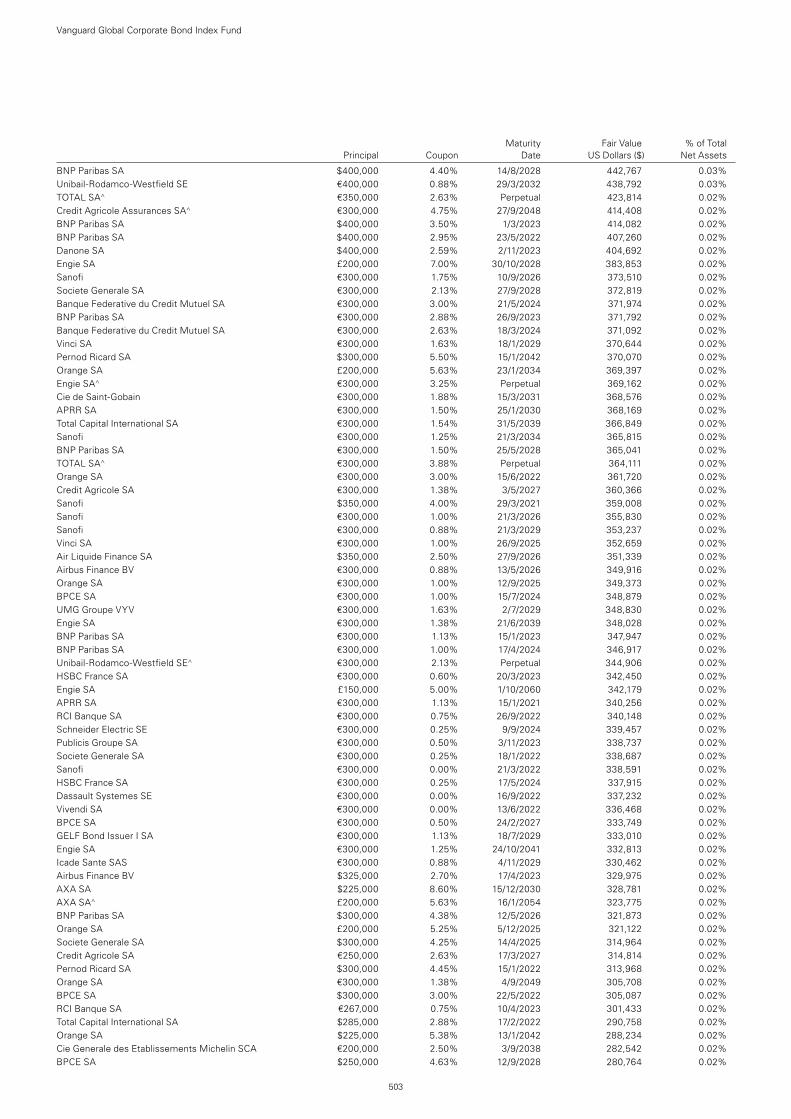
BNP Paribas SA $400,000 4.40% 14/8/2028 442,767 0.03%Unibail-Rodamco-Westfield SE €400,000 0.88% 29/3/2032 438,792 0.03%TOTAL SA^ €350,000 2.63% Perpetual 423,814 0.02%Credit Agricole Assurances SA^ €300,000 4.75% 27/9/2048 414,408 0.02%BNP Paribas SA $400,000 3.50% 1/3/2023 414,082 0.02%BNP Paribas SA $400,000 2.95% 23/5/2022 407,260 0.02%Danone SA $400,000 2.59% 2/11/2023 404,692 0.02%Engie SA £200,000 7.00% 30/10/2028 383,853 0.02%Sanofi €300,000 1.75% 10/9/2026 373,510 0.02%Societe Generale SA €300,000 2.13% 27/9/2028 372,819 0.02%Banque Federative du Credit Mutuel SA €300,000 3.00% 21/5/2024 371,974 0.02%BNP Paribas SA €300,000 2.88% 26/9/2023 371,792 0.02%Banque Federative du Credit Mutuel SA €300,000 2.63% 18/3/2024 371,092 0.02%Vinci SA €300,000 1.63% 18/1/2029 370,644 0.02%Pernod Ricard SA $300,000 5.50% 15/1/2042 370,070 0.02%Orange SA £200,000 5.63% 23/1/2034 369,397 0.02%Engie SA^ €300,000 3.25% Perpetual 369,162 0.02%Cie de Saint-Gobain €300,000 1.88% 15/3/2031 368,576 0.02%APRR SA €300,000 1.50% 25/1/2030 368,169 0.02%Total Capital International SA €300,000 1.54% 31/5/2039 366,849 0.02%Sanofi €300,000 1.25% 21/3/2034 365,815 0.02%BNP Paribas SA €300,000 1.50% 25/5/2028 365,041 0.02%TOTAL SA^ €300,000 3.88% Perpetual 364,111 0.02%Orange SA €300,000 3.00% 15/6/2022 361,720 0.02%Credit Agricole SA €300,000 1.38% 3/5/2027 360,366 0.02%Sanofi $350,000 4.00% 29/3/2021 359,008 0.02%Sanofi €300,000 1.00% 21/3/2026 355,830 0.02%Sanofi €300,000 0.88% 21/3/2029 353,237 0.02%Vinci SA €300,000 1.00% 26/9/2025 352,659 0.02%Air Liquide Finance SA $350,000 2.50% 27/9/2026 351,339 0.02%Airbus Finance BV €300,000 0.88% 13/5/2026 349,916 0.02%Orange SA €300,000 1.00% 12/9/2025 349,373 0.02%BPCE SA €300,000 1.00% 15/7/2024 348,879 0.02%UMG Groupe VYV €300,000 1.63% 2/7/2029 348,830 0.02%Engie SA €300,000 1.38% 21/6/2039 348,028 0.02%BNP Paribas SA €300,000 1.13% 15/1/2023 347,947 0.02%BNP Paribas SA €300,000 1.00% 17/4/2024 346,917 0.02%Unibail-Rodamco-Westfield SE^ €300,000 2.13% Perpetual 344,906 0.02%HSBC France SA €300,000 0.60% 20/3/2023 342,450 0.02%Engie SA £150,000 5.00% 1/10/2060 342,179 0.02%APRR SA €300,000 1.13% 15/1/2021 340,256 0.02%RCI Banque SA €300,000 0.75% 26/9/2022 340,148 0.02%Schneider Electric SE €300,000 0.25% 9/9/2024 339,457 0.02%Publicis Groupe SA €300,000 0.50% 3/11/2023 338,737 0.02%Societe Generale SA €300,000 0.25% 18/1/2022 338,687 0.02%Sanofi €300,000 0.00% 21/3/2022 338,591 0.02%HSBC France SA €300,000 0.25% 17/5/2024 337,915 0.02%Dassault Systemes SE €300,000 0.00% 16/9/2022 337,232 0.02%Vivendi SA €300,000 0.00% 13/6/2022 336,468 0.02%BPCE SA €300,000 0.50% 24/2/2027 333,749 0.02%GELF Bond Issuer I SA €300,000 1.13% 18/7/2029 333,010 0.02%Engie SA €300,000 1.25% 24/10/2041 332,813 0.02%Icade Sante SAS €300,000 0.88% 4/11/2029 330,462 0.02%Airbus Finance BV $325,000 2.70% 17/4/2023 329,975 0.02%AXA SA $225,000 8.60% 15/12/2030 328,781 0.02%AXA SA^ £200,000 5.63% 16/1/2054 323,775 0.02%BNP Paribas SA $300,000 4.38% 12/5/2026 321,873 0.02%Orange SA £200,000 5.25% 5/12/2025 321,122 0.02%Societe Generale SA $300,000 4.25% 14/4/2025 314,964 0.02%Credit Agricole SA €250,000 2.63% 17/3/2027 314,814 0.02%Pernod Ricard SA $300,000 4.45% 15/1/2022 313,968 0.02%Orange SA €300,000 1.38% 4/9/2049 305,708 0.02%BPCE SA $300,000 3.00% 22/5/2022 305,087 0.02%RCI Banque SA €267,000 0.75% 10/4/2023 301,433 0.02%Total Capital International SA $285,000 2.88% 17/2/2022 290,758 0.02%Orange SA $225,000 5.38% 13/1/2042 288,234 0.02%Cie Generale des Etablissements Michelin SCA €200,000 2.50% 3/9/2038 282,542 0.02%BPCE SA $250,000 4.63% 12/9/2028 280,764 0.02%
Vanguard Global Corporate Bond Index Fund
503
Maturity Fair Value % of Total Principal Coupon Date US Dollars ($) Net Assets
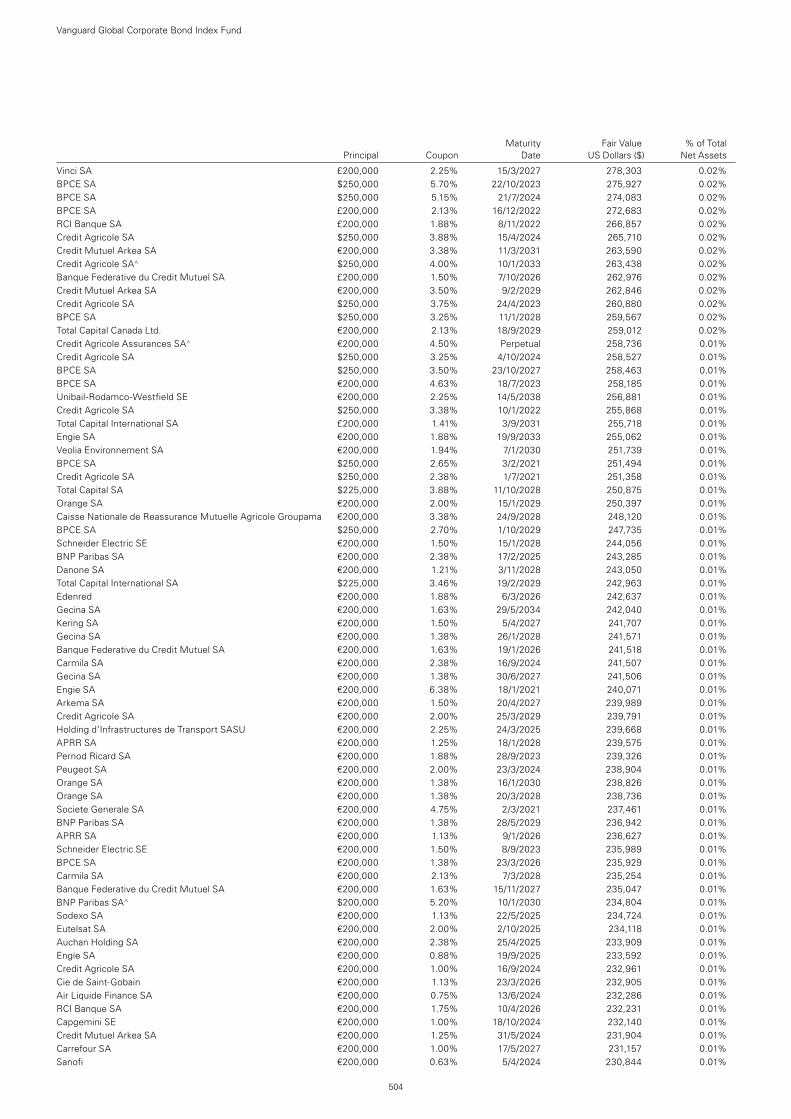
Vinci SA £200,000 2.25% 15/3/2027 278,303 0.02%BPCE SA $250,000 5.70% 22/10/2023 275,927 0.02%BPCE SA $250,000 5.15% 21/7/2024 274,083 0.02%BPCE SA £200,000 2.13% 16/12/2022 272,683 0.02%RCI Banque SA £200,000 1.88% 8/11/2022 266,857 0.02%Credit Agricole SA $250,000 3.88% 15/4/2024 265,710 0.02%Credit Mutuel Arkea SA €200,000 3.38% 11/3/2031 263,590 0.02%Credit Agricole SA^ $250,000 4.00% 10/1/2033 263,438 0.02%Banque Federative du Credit Mutuel SA £200,000 1.50% 7/10/2026 262,976 0.02%Credit Mutuel Arkea SA €200,000 3.50% 9/2/2029 262,846 0.02%Credit Agricole SA $250,000 3.75% 24/4/2023 260,880 0.02%BPCE SA $250,000 3.25% 11/1/2028 259,567 0.02%Total Capital Canada Ltd. €200,000 2.13% 18/9/2029 259,012 0.02%Credit Agricole Assurances SA^ €200,000 4.50% Perpetual 258,736 0.01%Credit Agricole SA $250,000 3.25% 4/10/2024 258,527 0.01%BPCE SA $250,000 3.50% 23/10/2027 258,463 0.01%BPCE SA €200,000 4.63% 18/7/2023 258,185 0.01%Unibail-Rodamco-Westfield SE €200,000 2.25% 14/5/2038 256,881 0.01%Credit Agricole SA $250,000 3.38% 10/1/2022 255,868 0.01%Total Capital International SA £200,000 1.41% 3/9/2031 255,718 0.01%Engie SA €200,000 1.88% 19/9/2033 255,062 0.01%Veolia Environnement SA €200,000 1.94% 7/1/2030 251,739 0.01%BPCE SA $250,000 2.65% 3/2/2021 251,494 0.01%Credit Agricole SA $250,000 2.38% 1/7/2021 251,358 0.01%Total Capital SA $225,000 3.88% 11/10/2028 250,875 0.01%Orange SA €200,000 2.00% 15/1/2029 250,397 0.01%Caisse Nationale de Reassurance Mutuelle Agricole Groupama €200,000 3.38% 24/9/2028 248,120 0.01%BPCE SA $250,000 2.70% 1/10/2029 247,735 0.01%Schneider Electric SE €200,000 1.50% 15/1/2028 244,056 0.01%BNP Paribas SA €200,000 2.38% 17/2/2025 243,285 0.01%Danone SA €200,000 1.21% 3/11/2028 243,050 0.01%Total Capital International SA $225,000 3.46% 19/2/2029 242,963 0.01%Edenred €200,000 1.88% 6/3/2026 242,637 0.01%Gecina SA €200,000 1.63% 29/5/2034 242,040 0.01%Kering SA €200,000 1.50% 5/4/2027 241,707 0.01%Gecina SA €200,000 1.38% 26/1/2028 241,571 0.01%Banque Federative du Credit Mutuel SA €200,000 1.63% 19/1/2026 241,518 0.01%Carmila SA €200,000 2.38% 16/9/2024 241,507 0.01%Gecina SA €200,000 1.38% 30/6/2027 241,506 0.01%Engie SA €200,000 6.38% 18/1/2021 240,071 0.01%Arkema SA €200,000 1.50% 20/4/2027 239,989 0.01%Credit Agricole SA €200,000 2.00% 25/3/2029 239,791 0.01%Holding d’Infrastructures de Transport SASU €200,000 2.25% 24/3/2025 239,668 0.01%APRR SA €200,000 1.25% 18/1/2028 239,575 0.01%Pernod Ricard SA €200,000 1.88% 28/9/2023 239,326 0.01%Peugeot SA €200,000 2.00% 23/3/2024 238,904 0.01%Orange SA €200,000 1.38% 16/1/2030 238,826 0.01%Orange SA €200,000 1.38% 20/3/2028 238,736 0.01%Societe Generale SA €200,000 4.75% 2/3/2021 237,461 0.01%BNP Paribas SA €200,000 1.38% 28/5/2029 236,942 0.01%APRR SA €200,000 1.13% 9/1/2026 236,627 0.01%Schneider Electric SE €200,000 1.50% 8/9/2023 235,989 0.01%BPCE SA €200,000 1.38% 23/3/2026 235,929 0.01%Carmila SA €200,000 2.13% 7/3/2028 235,254 0.01%Banque Federative du Credit Mutuel SA €200,000 1.63% 15/11/2027 235,047 0.01%BNP Paribas SA^ $200,000 5.20% 10/1/2030 234,804 0.01%Sodexo SA €200,000 1.13% 22/5/2025 234,724 0.01%Eutelsat SA €200,000 2.00% 2/10/2025 234,118 0.01%Auchan Holding SA €200,000 2.38% 25/4/2025 233,909 0.01%Engie SA €200,000 0.88% 19/9/2025 233,592 0.01%Credit Agricole SA €200,000 1.00% 16/9/2024 232,961 0.01%Cie de Saint-Gobain €200,000 1.13% 23/3/2026 232,905 0.01%Air Liquide Finance SA €200,000 0.75% 13/6/2024 232,286 0.01%RCI Banque SA €200,000 1.75% 10/4/2026 232,231 0.01%Capgemini SE €200,000 1.00% 18/10/2024 232,140 0.01%Credit Mutuel Arkea SA €200,000 1.25% 31/5/2024 231,904 0.01%Carrefour SA €200,000 1.00% 17/5/2027 231,157 0.01%Sanofi €200,000 0.63% 5/4/2024 230,844 0.01%
Vanguard Global Corporate Bond Index Fund
504
Maturity Fair Value % of Total Principal Coupon Date US Dollars ($) Net Assets
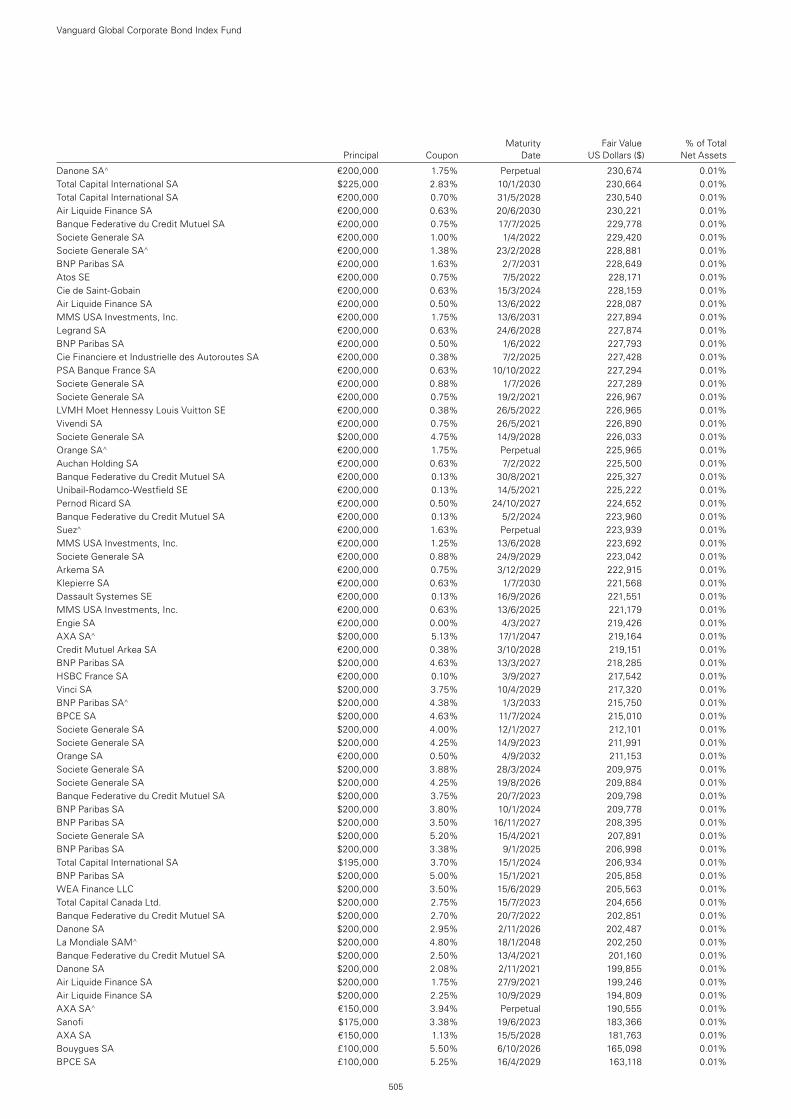
Danone SA^ €200,000 1.75% Perpetual 230,674 0.01%Total Capital International SA $225,000 2.83% 10/1/2030 230,664 0.01%Total Capital International SA €200,000 0.70% 31/5/2028 230,540 0.01%Air Liquide Finance SA €200,000 0.63% 20/6/2030 230,221 0.01%Banque Federative du Credit Mutuel SA €200,000 0.75% 17/7/2025 229,778 0.01%Societe Generale SA €200,000 1.00% 1/4/2022 229,420 0.01%Societe Generale SA^ €200,000 1.38% 23/2/2028 228,881 0.01%BNP Paribas SA €200,000 1.63% 2/7/2031 228,649 0.01%Atos SE €200,000 0.75% 7/5/2022 228,171 0.01%Cie de Saint-Gobain €200,000 0.63% 15/3/2024 228,159 0.01%Air Liquide Finance SA €200,000 0.50% 13/6/2022 228,087 0.01%MMS USA Investments, Inc. €200,000 1.75% 13/6/2031 227,894 0.01%Legrand SA €200,000 0.63% 24/6/2028 227,874 0.01%BNP Paribas SA €200,000 0.50% 1/6/2022 227,793 0.01%Cie Financiere et Industrielle des Autoroutes SA €200,000 0.38% 7/2/2025 227,428 0.01%PSA Banque France SA €200,000 0.63% 10/10/2022 227,294 0.01%Societe Generale SA €200,000 0.88% 1/7/2026 227,289 0.01%Societe Generale SA €200,000 0.75% 19/2/2021 226,967 0.01%LVMH Moet Hennessy Louis Vuitton SE €200,000 0.38% 26/5/2022 226,965 0.01%Vivendi SA €200,000 0.75% 26/5/2021 226,890 0.01%Societe Generale SA $200,000 4.75% 14/9/2028 226,033 0.01%Orange SA^ €200,000 1.75% Perpetual 225,965 0.01%Auchan Holding SA €200,000 0.63% 7/2/2022 225,500 0.01%Banque Federative du Credit Mutuel SA €200,000 0.13% 30/8/2021 225,327 0.01%Unibail-Rodamco-Westfield SE €200,000 0.13% 14/5/2021 225,222 0.01%Pernod Ricard SA €200,000 0.50% 24/10/2027 224,652 0.01%Banque Federative du Credit Mutuel SA €200,000 0.13% 5/2/2024 223,960 0.01%Suez^ €200,000 1.63% Perpetual 223,939 0.01%MMS USA Investments, Inc. €200,000 1.25% 13/6/2028 223,692 0.01%Societe Generale SA €200,000 0.88% 24/9/2029 223,042 0.01%Arkema SA €200,000 0.75% 3/12/2029 222,915 0.01%Klepierre SA €200,000 0.63% 1/7/2030 221,568 0.01%Dassault Systemes SE €200,000 0.13% 16/9/2026 221,551 0.01%MMS USA Investments, Inc. €200,000 0.63% 13/6/2025 221,179 0.01%Engie SA €200,000 0.00% 4/3/2027 219,426 0.01%AXA SA^ $200,000 5.13% 17/1/2047 219,164 0.01%Credit Mutuel Arkea SA €200,000 0.38% 3/10/2028 219,151 0.01%BNP Paribas SA $200,000 4.63% 13/3/2027 218,285 0.01%HSBC France SA €200,000 0.10% 3/9/2027 217,542 0.01%Vinci SA $200,000 3.75% 10/4/2029 217,320 0.01%BNP Paribas SA^ $200,000 4.38% 1/3/2033 215,750 0.01%BPCE SA $200,000 4.63% 11/7/2024 215,010 0.01%Societe Generale SA $200,000 4.00% 12/1/2027 212,101 0.01%Societe Generale SA $200,000 4.25% 14/9/2023 211,991 0.01%Orange SA €200,000 0.50% 4/9/2032 211,153 0.01%Societe Generale SA $200,000 3.88% 28/3/2024 209,975 0.01%Societe Generale SA $200,000 4.25% 19/8/2026 209,884 0.01%Banque Federative du Credit Mutuel SA $200,000 3.75% 20/7/2023 209,798 0.01%BNP Paribas SA $200,000 3.80% 10/1/2024 209,778 0.01%BNP Paribas SA $200,000 3.50% 16/11/2027 208,395 0.01%Societe Generale SA $200,000 5.20% 15/4/2021 207,891 0.01%BNP Paribas SA $200,000 3.38% 9/1/2025 206,998 0.01%Total Capital International SA $195,000 3.70% 15/1/2024 206,934 0.01%BNP Paribas SA $200,000 5.00% 15/1/2021 205,858 0.01%WEA Finance LLC $200,000 3.50% 15/6/2029 205,563 0.01%Total Capital Canada Ltd. $200,000 2.75% 15/7/2023 204,656 0.01%Banque Federative du Credit Mutuel SA $200,000 2.70% 20/7/2022 202,851 0.01%Danone SA $200,000 2.95% 2/11/2026 202,487 0.01%La Mondiale SAM^ $200,000 4.80% 18/1/2048 202,250 0.01%Banque Federative du Credit Mutuel SA $200,000 2.50% 13/4/2021 201,160 0.01%Danone SA $200,000 2.08% 2/11/2021 199,855 0.01%Air Liquide Finance SA $200,000 1.75% 27/9/2021 199,246 0.01%Air Liquide Finance SA $200,000 2.25% 10/9/2029 194,809 0.01%AXA SA^ €150,000 3.94% Perpetual 190,555 0.01%Sanofi $175,000 3.38% 19/6/2023 183,366 0.01%AXA SA €150,000 1.13% 15/5/2028 181,763 0.01%Bouygues SA £100,000 5.50% 6/10/2026 165,098 0.01%BPCE SA £100,000 5.25% 16/4/2029 163,118 0.01%
Vanguard Global Corporate Bond Index Fund
505
Maturity Fair Value % of Total Principal Coupon Date US Dollars ($) Net Assets
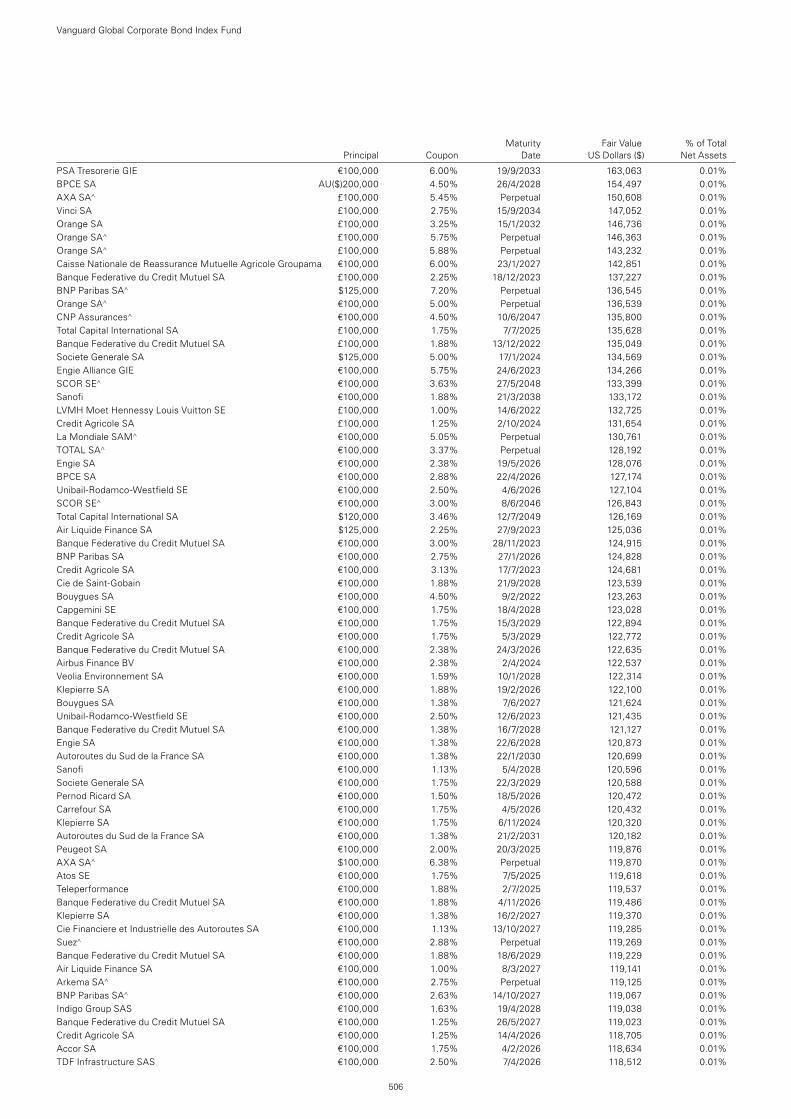
PSA Tresorerie GIE €100,000 6.00% 19/9/2033 163,063 0.01%BPCE SA AU($)200,000 4.50% 26/4/2028 154,497 0.01%AXA SA^ £100,000 5.45% Perpetual 150,608 0.01%Vinci SA £100,000 2.75% 15/9/2034 147,052 0.01%Orange SA £100,000 3.25% 15/1/2032 146,736 0.01%Orange SA^ £100,000 5.75% Perpetual 146,363 0.01%Orange SA^ £100,000 5.88% Perpetual 143,232 0.01%Caisse Nationale de Reassurance Mutuelle Agricole Groupama €100,000 6.00% 23/1/2027 142,851 0.01%Banque Federative du Credit Mutuel SA £100,000 2.25% 18/12/2023 137,227 0.01%BNP Paribas SA^ $125,000 7.20% Perpetual 136,545 0.01%Orange SA^ €100,000 5.00% Perpetual 136,539 0.01%CNP Assurances^ €100,000 4.50% 10/6/2047 135,800 0.01%Total Capital International SA £100,000 1.75% 7/7/2025 135,628 0.01%Banque Federative du Credit Mutuel SA £100,000 1.88% 13/12/2022 135,049 0.01%Societe Generale SA $125,000 5.00% 17/1/2024 134,569 0.01%Engie Alliance GIE €100,000 5.75% 24/6/2023 134,266 0.01%SCOR SE^ €100,000 3.63% 27/5/2048 133,399 0.01%Sanofi €100,000 1.88% 21/3/2038 133,172 0.01%LVMH Moet Hennessy Louis Vuitton SE £100,000 1.00% 14/6/2022 132,725 0.01%Credit Agricole SA £100,000 1.25% 2/10/2024 131,654 0.01%La Mondiale SAM^ €100,000 5.05% Perpetual 130,761 0.01%TOTAL SA^ €100,000 3.37% Perpetual 128,192 0.01%Engie SA €100,000 2.38% 19/5/2026 128,076 0.01%BPCE SA €100,000 2.88% 22/4/2026 127,174 0.01%Unibail-Rodamco-Westfield SE €100,000 2.50% 4/6/2026 127,104 0.01%SCOR SE^ €100,000 3.00% 8/6/2046 126,843 0.01%Total Capital International SA $120,000 3.46% 12/7/2049 126,169 0.01%Air Liquide Finance SA $125,000 2.25% 27/9/2023 125,036 0.01%Banque Federative du Credit Mutuel SA €100,000 3.00% 28/11/2023 124,915 0.01%BNP Paribas SA €100,000 2.75% 27/1/2026 124,828 0.01%Credit Agricole SA €100,000 3.13% 17/7/2023 124,681 0.01%Cie de Saint-Gobain €100,000 1.88% 21/9/2028 123,539 0.01%Bouygues SA €100,000 4.50% 9/2/2022 123,263 0.01%Capgemini SE €100,000 1.75% 18/4/2028 123,028 0.01%Banque Federative du Credit Mutuel SA €100,000 1.75% 15/3/2029 122,894 0.01%Credit Agricole SA €100,000 1.75% 5/3/2029 122,772 0.01%Banque Federative du Credit Mutuel SA €100,000 2.38% 24/3/2026 122,635 0.01%Airbus Finance BV €100,000 2.38% 2/4/2024 122,537 0.01%Veolia Environnement SA €100,000 1.59% 10/1/2028 122,314 0.01%Klepierre SA €100,000 1.88% 19/2/2026 122,100 0.01%Bouygues SA €100,000 1.38% 7/6/2027 121,624 0.01%Unibail-Rodamco-Westfield SE €100,000 2.50% 12/6/2023 121,435 0.01%Banque Federative du Credit Mutuel SA €100,000 1.38% 16/7/2028 121,127 0.01%Engie SA €100,000 1.38% 22/6/2028 120,873 0.01%Autoroutes du Sud de la France SA €100,000 1.38% 22/1/2030 120,699 0.01%Sanofi €100,000 1.13% 5/4/2028 120,596 0.01%Societe Generale SA €100,000 1.75% 22/3/2029 120,588 0.01%Pernod Ricard SA €100,000 1.50% 18/5/2026 120,472 0.01%Carrefour SA €100,000 1.75% 4/5/2026 120,432 0.01%Klepierre SA €100,000 1.75% 6/11/2024 120,320 0.01%Autoroutes du Sud de la France SA €100,000 1.38% 21/2/2031 120,182 0.01%Peugeot SA €100,000 2.00% 20/3/2025 119,876 0.01%AXA SA^ $100,000 6.38% Perpetual 119,870 0.01%Atos SE €100,000 1.75% 7/5/2025 119,618 0.01%Teleperformance €100,000 1.88% 2/7/2025 119,537 0.01%Banque Federative du Credit Mutuel SA €100,000 1.88% 4/11/2026 119,486 0.01%Klepierre SA €100,000 1.38% 16/2/2027 119,370 0.01%Cie Financiere et Industrielle des Autoroutes SA €100,000 1.13% 13/10/2027 119,285 0.01%Suez^ €100,000 2.88% Perpetual 119,269 0.01%Banque Federative du Credit Mutuel SA €100,000 1.88% 18/6/2029 119,229 0.01%Air Liquide Finance SA €100,000 1.00% 8/3/2027 119,141 0.01%Arkema SA^ €100,000 2.75% Perpetual 119,125 0.01%BNP Paribas SA^ €100,000 2.63% 14/10/2027 119,067 0.01%Indigo Group SAS €100,000 1.63% 19/4/2028 119,038 0.01%Banque Federative du Credit Mutuel SA €100,000 1.25% 26/5/2027 119,023 0.01%Credit Agricole SA €100,000 1.25% 14/4/2026 118,705 0.01%Accor SA €100,000 1.75% 4/2/2026 118,634 0.01%TDF Infrastructure SAS €100,000 2.50% 7/4/2026 118,512 0.01%
Vanguard Global Corporate Bond Index Fund
506
Maturity Fair Value % of Total Principal Coupon Date US Dollars ($) Net Assets
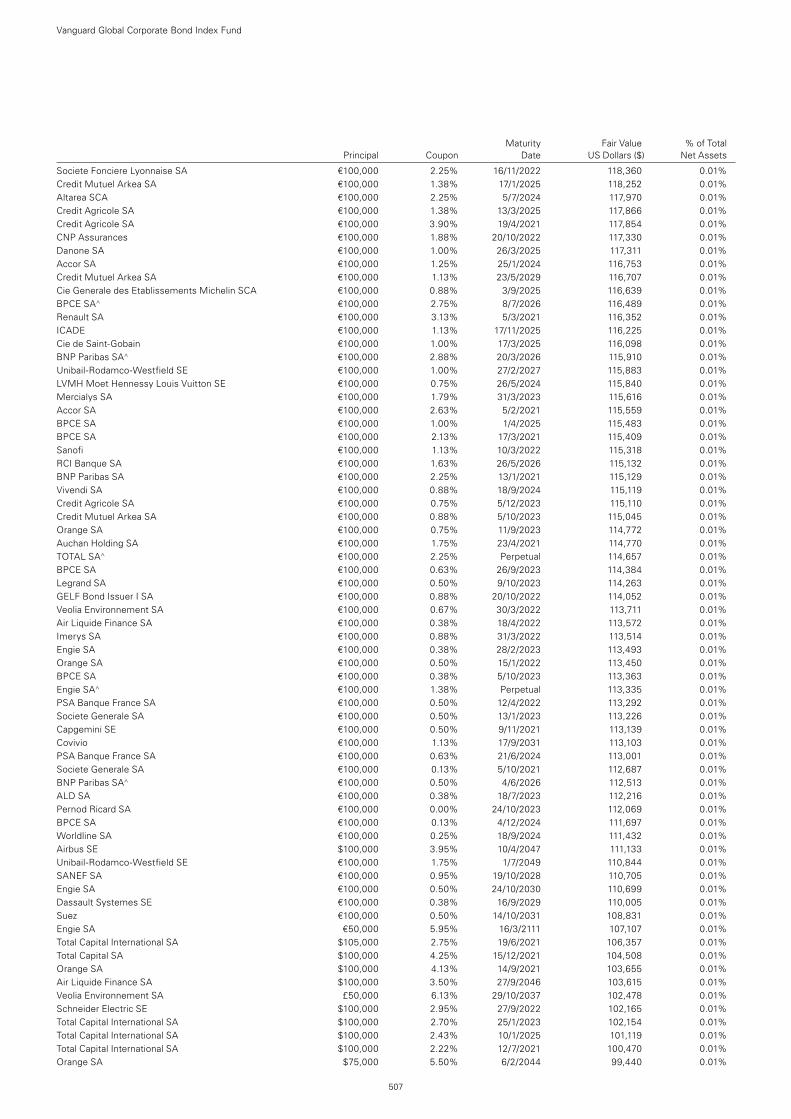
Societe Fonciere Lyonnaise SA €100,000 2.25% 16/11/2022 118,360 0.01%Credit Mutuel Arkea SA €100,000 1.38% 17/1/2025 118,252 0.01%Altarea SCA €100,000 2.25% 5/7/2024 117,970 0.01%Credit Agricole SA €100,000 1.38% 13/3/2025 117,866 0.01%Credit Agricole SA €100,000 3.90% 19/4/2021 117,854 0.01%CNP Assurances €100,000 1.88% 20/10/2022 117,330 0.01%Danone SA €100,000 1.00% 26/3/2025 117,311 0.01%Accor SA €100,000 1.25% 25/1/2024 116,753 0.01%Credit Mutuel Arkea SA €100,000 1.13% 23/5/2029 116,707 0.01%Cie Generale des Etablissements Michelin SCA €100,000 0.88% 3/9/2025 116,639 0.01%BPCE SA^ €100,000 2.75% 8/7/2026 116,489 0.01%Renault SA €100,000 3.13% 5/3/2021 116,352 0.01%ICADE €100,000 1.13% 17/11/2025 116,225 0.01%Cie de Saint-Gobain €100,000 1.00% 17/3/2025 116,098 0.01%BNP Paribas SA^ €100,000 2.88% 20/3/2026 115,910 0.01%Unibail-Rodamco-Westfield SE €100,000 1.00% 27/2/2027 115,883 0.01%LVMH Moet Hennessy Louis Vuitton SE €100,000 0.75% 26/5/2024 115,840 0.01%Mercialys SA €100,000 1.79% 31/3/2023 115,616 0.01%Accor SA €100,000 2.63% 5/2/2021 115,559 0.01%BPCE SA €100,000 1.00% 1/4/2025 115,483 0.01%BPCE SA €100,000 2.13% 17/3/2021 115,409 0.01%Sanofi €100,000 1.13% 10/3/2022 115,318 0.01%RCI Banque SA €100,000 1.63% 26/5/2026 115,132 0.01%BNP Paribas SA €100,000 2.25% 13/1/2021 115,129 0.01%Vivendi SA €100,000 0.88% 18/9/2024 115,119 0.01%Credit Agricole SA €100,000 0.75% 5/12/2023 115,110 0.01%Credit Mutuel Arkea SA €100,000 0.88% 5/10/2023 115,045 0.01%Orange SA €100,000 0.75% 11/9/2023 114,772 0.01%Auchan Holding SA €100,000 1.75% 23/4/2021 114,770 0.01%TOTAL SA^ €100,000 2.25% Perpetual 114,657 0.01%BPCE SA €100,000 0.63% 26/9/2023 114,384 0.01%Legrand SA €100,000 0.50% 9/10/2023 114,263 0.01%GELF Bond Issuer I SA €100,000 0.88% 20/10/2022 114,052 0.01%Veolia Environnement SA €100,000 0.67% 30/3/2022 113,711 0.01%Air Liquide Finance SA €100,000 0.38% 18/4/2022 113,572 0.01%Imerys SA €100,000 0.88% 31/3/2022 113,514 0.01%Engie SA €100,000 0.38% 28/2/2023 113,493 0.01%Orange SA €100,000 0.50% 15/1/2022 113,450 0.01%BPCE SA €100,000 0.38% 5/10/2023 113,363 0.01%Engie SA^ €100,000 1.38% Perpetual 113,335 0.01%PSA Banque France SA €100,000 0.50% 12/4/2022 113,292 0.01%Societe Generale SA €100,000 0.50% 13/1/2023 113,226 0.01%Capgemini SE €100,000 0.50% 9/11/2021 113,139 0.01%Covivio €100,000 1.13% 17/9/2031 113,103 0.01%PSA Banque France SA €100,000 0.63% 21/6/2024 113,001 0.01%Societe Generale SA €100,000 0.13% 5/10/2021 112,687 0.01%BNP Paribas SA^ €100,000 0.50% 4/6/2026 112,513 0.01%ALD SA €100,000 0.38% 18/7/2023 112,216 0.01%Pernod Ricard SA €100,000 0.00% 24/10/2023 112,069 0.01%BPCE SA €100,000 0.13% 4/12/2024 111,697 0.01%Worldline SA €100,000 0.25% 18/9/2024 111,432 0.01%Airbus SE $100,000 3.95% 10/4/2047 111,133 0.01%Unibail-Rodamco-Westfield SE €100,000 1.75% 1/7/2049 110,844 0.01%SANEF SA €100,000 0.95% 19/10/2028 110,705 0.01%Engie SA €100,000 0.50% 24/10/2030 110,699 0.01%Dassault Systemes SE €100,000 0.38% 16/9/2029 110,005 0.01%Suez €100,000 0.50% 14/10/2031 108,831 0.01%Engie SA €50,000 5.95% 16/3/2111 107,107 0.01%Total Capital International SA $105,000 2.75% 19/6/2021 106,357 0.01%Total Capital SA $100,000 4.25% 15/12/2021 104,508 0.01%Orange SA $100,000 4.13% 14/9/2021 103,655 0.01%Air Liquide Finance SA $100,000 3.50% 27/9/2046 103,615 0.01%Veolia Environnement SA £50,000 6.13% 29/10/2037 102,478 0.01%Schneider Electric SE $100,000 2.95% 27/9/2022 102,165 0.01%Total Capital International SA $100,000 2.70% 25/1/2023 102,154 0.01%Total Capital International SA $100,000 2.43% 10/1/2025 101,119 0.01%Total Capital International SA $100,000 2.22% 12/7/2021 100,470 0.01%Orange SA $75,000 5.50% 6/2/2044 99,440 0.01%
Vanguard Global Corporate Bond Index Fund
507
Maturity Fair Value % of Total Principal Coupon Date US Dollars ($) Net Assets
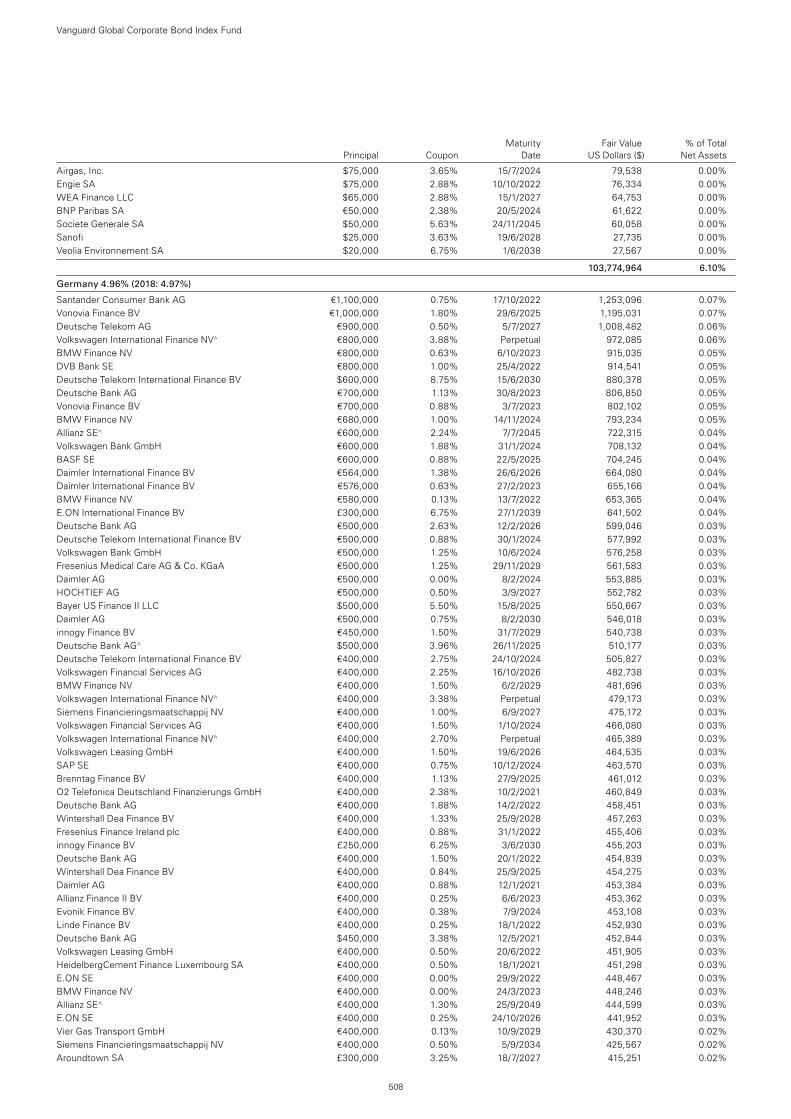
Airgas, Inc. $75,000 3.65% 15/7/2024 79,538 0.00%Engie SA $75,000 2.88% 10/10/2022 76,334 0.00%WEA Finance LLC $65,000 2.88% 15/1/2027 64,753 0.00%BNP Paribas SA €50,000 2.38% 20/5/2024 61,622 0.00%Societe Generale SA $50,000 5.63% 24/11/2045 60,058 0.00%Sanofi $25,000 3.63% 19/6/2028 27,735 0.00%Veolia Environnement SA $20,000 6.75% 1/6/2038 27,567 0.00%
103,774,964 6.10%
Germany 4.96% (2018: 4.97%)
Santander Consumer Bank AG €1,100,000 0.75% 17/10/2022 1,253,096 0.07%Vonovia Finance BV €1,000,000 1.80% 29/6/2025 1,195,031 0.07%Deutsche Telekom AG €900,000 0.50% 5/7/2027 1,008,482 0.06%Volkswagen International Finance NV^ €800,000 3.88% Perpetual 972,085 0.06%BMW Finance NV €800,000 0.63% 6/10/2023 915,035 0.05%DVB Bank SE €800,000 1.00% 25/4/2022 914,541 0.05%Deutsche Telekom International Finance BV $600,000 8.75% 15/6/2030 880,378 0.05%Deutsche Bank AG €700,000 1.13% 30/8/2023 806,850 0.05%Vonovia Finance BV €700,000 0.88% 3/7/2023 802,102 0.05%BMW Finance NV €680,000 1.00% 14/11/2024 793,234 0.05%Allianz SE^ €600,000 2.24% 7/7/2045 722,315 0.04%Volkswagen Bank GmbH €600,000 1.88% 31/1/2024 708,132 0.04%BASF SE €600,000 0.88% 22/5/2025 704,245 0.04%Daimler International Finance BV €564,000 1.38% 26/6/2026 664,080 0.04%Daimler International Finance BV €576,000 0.63% 27/2/2023 655,166 0.04%BMW Finance NV €580,000 0.13% 13/7/2022 653,365 0.04%E.ON International Finance BV £300,000 6.75% 27/1/2039 641,502 0.04%Deutsche Bank AG €500,000 2.63% 12/2/2026 599,046 0.03%Deutsche Telekom International Finance BV €500,000 0.88% 30/1/2024 577,992 0.03%Volkswagen Bank GmbH €500,000 1.25% 10/6/2024 576,258 0.03%Fresenius Medical Care AG & Co. KGaA €500,000 1.25% 29/11/2029 561,583 0.03%Daimler AG €500,000 0.00% 8/2/2024 553,885 0.03%HOCHTIEF AG €500,000 0.50% 3/9/2027 552,782 0.03%Bayer US Finance II LLC $500,000 5.50% 15/8/2025 550,667 0.03%Daimler AG €500,000 0.75% 8/2/2030 546,018 0.03%innogy Finance BV €450,000 1.50% 31/7/2029 540,738 0.03%Deutsche Bank AG^ $500,000 3.96% 26/11/2025 510,177 0.03%Deutsche Telekom International Finance BV €400,000 2.75% 24/10/2024 505,827 0.03%Volkswagen Financial Services AG €400,000 2.25% 16/10/2026 482,738 0.03%BMW Finance NV €400,000 1.50% 6/2/2029 481,696 0.03%Volkswagen International Finance NV^ €400,000 3.38% Perpetual 479,173 0.03%Siemens Financieringsmaatschappij NV €400,000 1.00% 6/9/2027 475,172 0.03%Volkswagen Financial Services AG €400,000 1.50% 1/10/2024 466,080 0.03%Volkswagen International Finance NV^ €400,000 2.70% Perpetual 465,389 0.03%Volkswagen Leasing GmbH €400,000 1.50% 19/6/2026 464,535 0.03%SAP SE €400,000 0.75% 10/12/2024 463,570 0.03%Brenntag Finance BV €400,000 1.13% 27/9/2025 461,012 0.03%O2 Telefonica Deutschland Finanzierungs GmbH €400,000 2.38% 10/2/2021 460,849 0.03%Deutsche Bank AG €400,000 1.88% 14/2/2022 458,451 0.03%Wintershall Dea Finance BV €400,000 1.33% 25/9/2028 457,263 0.03%Fresenius Finance Ireland plc €400,000 0.88% 31/1/2022 455,406 0.03%innogy Finance BV £250,000 6.25% 3/6/2030 455,203 0.03%Deutsche Bank AG €400,000 1.50% 20/1/2022 454,839 0.03%Wintershall Dea Finance BV €400,000 0.84% 25/9/2025 454,275 0.03%Daimler AG €400,000 0.88% 12/1/2021 453,384 0.03%Allianz Finance II BV €400,000 0.25% 6/6/2023 453,362 0.03%Evonik Finance BV €400,000 0.38% 7/9/2024 453,108 0.03%Linde Finance BV €400,000 0.25% 18/1/2022 452,930 0.03%Deutsche Bank AG $450,000 3.38% 12/5/2021 452,844 0.03%Volkswagen Leasing GmbH €400,000 0.50% 20/6/2022 451,905 0.03%HeidelbergCement Finance Luxembourg SA €400,000 0.50% 18/1/2021 451,298 0.03%E.ON SE €400,000 0.00% 29/9/2022 448,467 0.03%BMW Finance NV €400,000 0.00% 24/3/2023 448,246 0.03%Allianz SE^ €400,000 1.30% 25/9/2049 444,599 0.03%E.ON SE €400,000 0.25% 24/10/2026 441,952 0.03%Vier Gas Transport GmbH €400,000 0.13% 10/9/2029 430,370 0.02%Siemens Financieringsmaatschappij NV €400,000 0.50% 5/9/2034 425,567 0.02%Aroundtown SA £300,000 3.25% 18/7/2027 415,251 0.02%
Vanguard Global Corporate Bond Index Fund
508
Maturity Fair Value % of Total Principal Coupon Date US Dollars ($) Net Assets
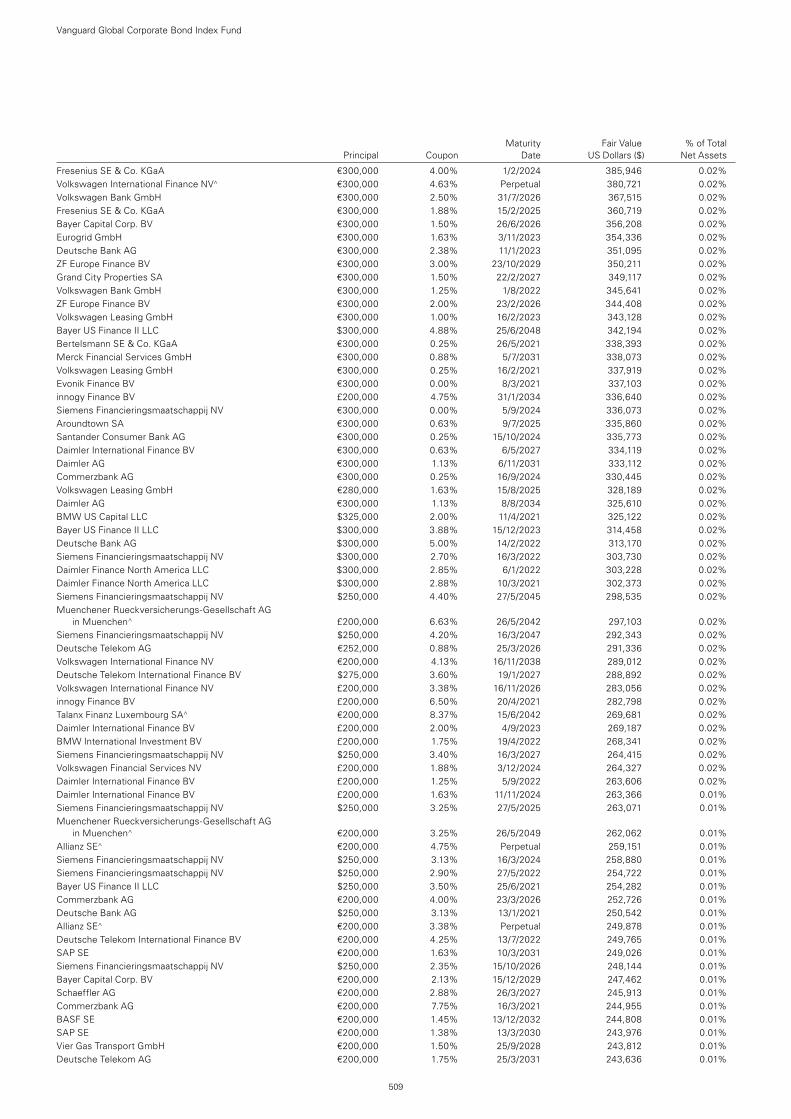
Fresenius SE & Co. KGaA €300,000 4.00% 1/2/2024 385,946 0.02%Volkswagen International Finance NV^ €300,000 4.63% Perpetual 380,721 0.02%Volkswagen Bank GmbH €300,000 2.50% 31/7/2026 367,515 0.02%Fresenius SE & Co. KGaA €300,000 1.88% 15/2/2025 360,719 0.02%Bayer Capital Corp. BV €300,000 1.50% 26/6/2026 356,208 0.02%Eurogrid GmbH €300,000 1.63% 3/11/2023 354,336 0.02%Deutsche Bank AG €300,000 2.38% 11/1/2023 351,095 0.02%ZF Europe Finance BV €300,000 3.00% 23/10/2029 350,211 0.02%Grand City Properties SA €300,000 1.50% 22/2/2027 349,117 0.02%Volkswagen Bank GmbH €300,000 1.25% 1/8/2022 345,641 0.02%ZF Europe Finance BV €300,000 2.00% 23/2/2026 344,408 0.02%Volkswagen Leasing GmbH €300,000 1.00% 16/2/2023 343,128 0.02%Bayer US Finance II LLC $300,000 4.88% 25/6/2048 342,194 0.02%Bertelsmann SE & Co. KGaA €300,000 0.25% 26/5/2021 338,393 0.02%Merck Financial Services GmbH €300,000 0.88% 5/7/2031 338,073 0.02%Volkswagen Leasing GmbH €300,000 0.25% 16/2/2021 337,919 0.02%Evonik Finance BV €300,000 0.00% 8/3/2021 337,103 0.02%innogy Finance BV £200,000 4.75% 31/1/2034 336,640 0.02%Siemens Financieringsmaatschappij NV €300,000 0.00% 5/9/2024 336,073 0.02%Aroundtown SA €300,000 0.63% 9/7/2025 335,860 0.02%Santander Consumer Bank AG €300,000 0.25% 15/10/2024 335,773 0.02%Daimler International Finance BV €300,000 0.63% 6/5/2027 334,119 0.02%Daimler AG €300,000 1.13% 6/11/2031 333,112 0.02%Commerzbank AG €300,000 0.25% 16/9/2024 330,445 0.02%Volkswagen Leasing GmbH €280,000 1.63% 15/8/2025 328,189 0.02%Daimler AG €300,000 1.13% 8/8/2034 325,610 0.02%BMW US Capital LLC $325,000 2.00% 11/4/2021 325,122 0.02%Bayer US Finance II LLC $300,000 3.88% 15/12/2023 314,458 0.02%Deutsche Bank AG $300,000 5.00% 14/2/2022 313,170 0.02%Siemens Financieringsmaatschappij NV $300,000 2.70% 16/3/2022 303,730 0.02%Daimler Finance North America LLC $300,000 2.85% 6/1/2022 303,228 0.02%Daimler Finance North America LLC $300,000 2.88% 10/3/2021 302,373 0.02%Siemens Financieringsmaatschappij NV $250,000 4.40% 27/5/2045 298,535 0.02%Muenchener Rueckversicherungs-Gesellschaft AG
in Muenchen^ £200,000 6.63% 26/5/2042 297,103 0.02%Siemens Financieringsmaatschappij NV $250,000 4.20% 16/3/2047 292,343 0.02%Deutsche Telekom AG €252,000 0.88% 25/3/2026 291,336 0.02%Volkswagen International Finance NV €200,000 4.13% 16/11/2038 289,012 0.02%Deutsche Telekom International Finance BV $275,000 3.60% 19/1/2027 288,892 0.02%Volkswagen International Finance NV £200,000 3.38% 16/11/2026 283,056 0.02%innogy Finance BV £200,000 6.50% 20/4/2021 282,798 0.02%Talanx Finanz Luxembourg SA^ €200,000 8.37% 15/6/2042 269,681 0.02%Daimler International Finance BV £200,000 2.00% 4/9/2023 269,187 0.02%BMW International Investment BV £200,000 1.75% 19/4/2022 268,341 0.02%Siemens Financieringsmaatschappij NV $250,000 3.40% 16/3/2027 264,415 0.02%Volkswagen Financial Services NV £200,000 1.88% 3/12/2024 264,327 0.02%Daimler International Finance BV £200,000 1.25% 5/9/2022 263,606 0.02%Daimler International Finance BV £200,000 1.63% 11/11/2024 263,366 0.01%Siemens Financieringsmaatschappij NV $250,000 3.25% 27/5/2025 263,071 0.01%Muenchener Rueckversicherungs-Gesellschaft AG
in Muenchen^ €200,000 3.25% 26/5/2049 262,062 0.01%Allianz SE^ €200,000 4.75% Perpetual 259,151 0.01%Siemens Financieringsmaatschappij NV $250,000 3.13% 16/3/2024 258,880 0.01%Siemens Financieringsmaatschappij NV $250,000 2.90% 27/5/2022 254,722 0.01%Bayer US Finance II LLC $250,000 3.50% 25/6/2021 254,282 0.01%Commerzbank AG €200,000 4.00% 23/3/2026 252,726 0.01%Deutsche Bank AG $250,000 3.13% 13/1/2021 250,542 0.01%Allianz SE^ €200,000 3.38% Perpetual 249,878 0.01%Deutsche Telekom International Finance BV €200,000 4.25% 13/7/2022 249,765 0.01%SAP SE €200,000 1.63% 10/3/2031 249,026 0.01%Siemens Financieringsmaatschappij NV $250,000 2.35% 15/10/2026 248,144 0.01%Bayer Capital Corp. BV €200,000 2.13% 15/12/2029 247,462 0.01%Schaeffler AG €200,000 2.88% 26/3/2027 245,913 0.01%Commerzbank AG €200,000 7.75% 16/3/2021 244,955 0.01%BASF SE €200,000 1.45% 13/12/2032 244,808 0.01%SAP SE €200,000 1.38% 13/3/2030 243,976 0.01%Vier Gas Transport GmbH €200,000 1.50% 25/9/2028 243,812 0.01%Deutsche Telekom AG €200,000 1.75% 25/3/2031 243,636 0.01%
Vanguard Global Corporate Bond Index Fund
509
Maturity Fair Value % of Total Principal Coupon Date US Dollars ($) Net Assets
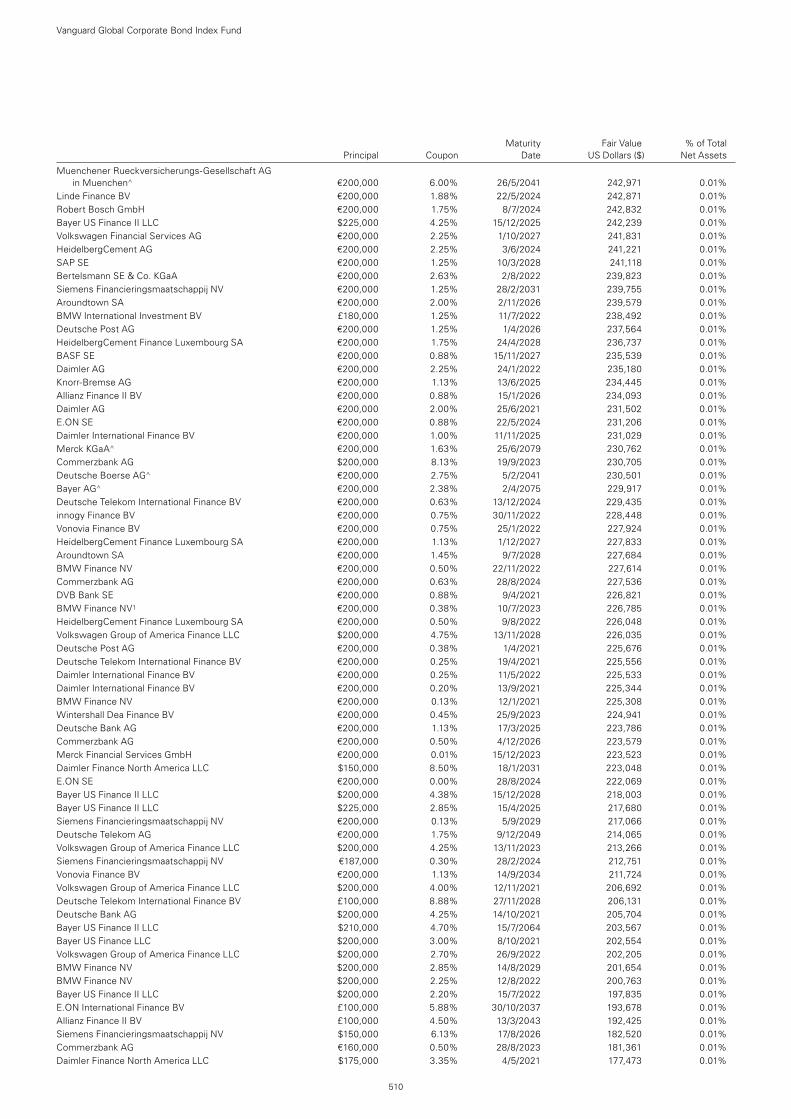
Muenchener Rueckversicherungs-Gesellschaft AG in Muenchen^ €200,000 6.00% 26/5/2041 242,971 0.01%
Linde Finance BV €200,000 1.88% 22/5/2024 242,871 0.01%Robert Bosch GmbH €200,000 1.75% 8/7/2024 242,832 0.01%Bayer US Finance II LLC $225,000 4.25% 15/12/2025 242,239 0.01%Volkswagen Financial Services AG €200,000 2.25% 1/10/2027 241,831 0.01%HeidelbergCement AG €200,000 2.25% 3/6/2024 241,221 0.01%SAP SE €200,000 1.25% 10/3/2028 241,118 0.01%Bertelsmann SE & Co. KGaA €200,000 2.63% 2/8/2022 239,823 0.01%Siemens Financieringsmaatschappij NV €200,000 1.25% 28/2/2031 239,755 0.01%Aroundtown SA €200,000 2.00% 2/11/2026 239,579 0.01%BMW International Investment BV £180,000 1.25% 11/7/2022 238,492 0.01%Deutsche Post AG €200,000 1.25% 1/4/2026 237,564 0.01%HeidelbergCement Finance Luxembourg SA €200,000 1.75% 24/4/2028 236,737 0.01%BASF SE €200,000 0.88% 15/11/2027 235,539 0.01%Daimler AG €200,000 2.25% 24/1/2022 235,180 0.01%Knorr-Bremse AG €200,000 1.13% 13/6/2025 234,445 0.01%Allianz Finance II BV €200,000 0.88% 15/1/2026 234,093 0.01%Daimler AG €200,000 2.00% 25/6/2021 231,502 0.01%E.ON SE €200,000 0.88% 22/5/2024 231,206 0.01%Daimler International Finance BV €200,000 1.00% 11/11/2025 231,029 0.01%Merck KGaA^ €200,000 1.63% 25/6/2079 230,762 0.01%Commerzbank AG $200,000 8.13% 19/9/2023 230,705 0.01%Deutsche Boerse AG^ €200,000 2.75% 5/2/2041 230,501 0.01%Bayer AG^ €200,000 2.38% 2/4/2075 229,917 0.01%Deutsche Telekom International Finance BV €200,000 0.63% 13/12/2024 229,435 0.01%innogy Finance BV €200,000 0.75% 30/11/2022 228,448 0.01%Vonovia Finance BV €200,000 0.75% 25/1/2022 227,924 0.01%HeidelbergCement Finance Luxembourg SA €200,000 1.13% 1/12/2027 227,833 0.01%Aroundtown SA €200,000 1.45% 9/7/2028 227,684 0.01%BMW Finance NV €200,000 0.50% 22/11/2022 227,614 0.01%Commerzbank AG €200,000 0.63% 28/8/2024 227,536 0.01%DVB Bank SE €200,000 0.88% 9/4/2021 226,821 0.01%BMW Finance NV1 €200,000 0.38% 10/7/2023 226,785 0.01%HeidelbergCement Finance Luxembourg SA €200,000 0.50% 9/8/2022 226,048 0.01%Volkswagen Group of America Finance LLC $200,000 4.75% 13/11/2028 226,035 0.01%Deutsche Post AG €200,000 0.38% 1/4/2021 225,676 0.01%Deutsche Telekom International Finance BV €200,000 0.25% 19/4/2021 225,556 0.01%Daimler International Finance BV €200,000 0.25% 11/5/2022 225,533 0.01%Daimler International Finance BV €200,000 0.20% 13/9/2021 225,344 0.01%BMW Finance NV €200,000 0.13% 12/1/2021 225,308 0.01%Wintershall Dea Finance BV €200,000 0.45% 25/9/2023 224,941 0.01%Deutsche Bank AG €200,000 1.13% 17/3/2025 223,786 0.01%Commerzbank AG €200,000 0.50% 4/12/2026 223,579 0.01%Merck Financial Services GmbH €200,000 0.01% 15/12/2023 223,523 0.01%Daimler Finance North America LLC $150,000 8.50% 18/1/2031 223,048 0.01%E.ON SE €200,000 0.00% 28/8/2024 222,069 0.01%Bayer US Finance II LLC $200,000 4.38% 15/12/2028 218,003 0.01%Bayer US Finance II LLC $225,000 2.85% 15/4/2025 217,680 0.01%Siemens Financieringsmaatschappij NV €200,000 0.13% 5/9/2029 217,066 0.01%Deutsche Telekom AG €200,000 1.75% 9/12/2049 214,065 0.01%Volkswagen Group of America Finance LLC $200,000 4.25% 13/11/2023 213,266 0.01%Siemens Financieringsmaatschappij NV €187,000 0.30% 28/2/2024 212,751 0.01%Vonovia Finance BV €200,000 1.13% 14/9/2034 211,724 0.01%Volkswagen Group of America Finance LLC $200,000 4.00% 12/11/2021 206,692 0.01%Deutsche Telekom International Finance BV £100,000 8.88% 27/11/2028 206,131 0.01%Deutsche Bank AG $200,000 4.25% 14/10/2021 205,704 0.01%Bayer US Finance II LLC $210,000 4.70% 15/7/2064 203,567 0.01%Bayer US Finance LLC $200,000 3.00% 8/10/2021 202,554 0.01%Volkswagen Group of America Finance LLC $200,000 2.70% 26/9/2022 202,205 0.01%BMW Finance NV $200,000 2.85% 14/8/2029 201,654 0.01%BMW Finance NV $200,000 2.25% 12/8/2022 200,763 0.01%Bayer US Finance II LLC $200,000 2.20% 15/7/2022 197,835 0.01%E.ON International Finance BV £100,000 5.88% 30/10/2037 193,678 0.01%Allianz Finance II BV £100,000 4.50% 13/3/2043 192,425 0.01%Siemens Financieringsmaatschappij NV $150,000 6.13% 17/8/2026 182,520 0.01%Commerzbank AG €160,000 0.50% 28/8/2023 181,361 0.01%Daimler Finance North America LLC $175,000 3.35% 4/5/2021 177,473 0.01%
Vanguard Global Corporate Bond Index Fund
510
Maturity Fair Value % of Total Principal Coupon Date US Dollars ($) Net Assets

Deutsche Telekom International Finance BV $150,000 4.88% 6/3/2042 177,284 0.01%Siemens Financieringsmaatschappij NV £100,000 3.75% 10/9/2042 175,779 0.01%innogy Finance BV €150,000 1.00% 13/4/2025 174,514 0.01%Daimler Finance North America LLC $175,000 2.00% 6/7/2021 174,306 0.01%Daimler Finance North America LLC $150,000 4.30% 22/2/2029 168,228 0.01%Deutsche Telekom International Finance BV $150,000 4.38% 21/6/2028 166,156 0.01%Deutsche Bank AG $160,000 3.95% 27/2/2023 163,578 0.01%Daimler Finance North America LLC $150,000 3.75% 22/2/2028 159,031 0.01%ZF North America Capital, Inc. $150,000 4.75% 29/4/2025 157,125 0.01%Daimler Finance North America LLC $150,000 3.65% 22/2/2024 156,505 0.01%Daimler Finance North America LLC $150,000 3.50% 3/8/2025 156,319 0.01%Daimler Canada Finance, Inc. CA($)200,000 3.05% 16/5/2022 156,127 0.01%Daimler Finance North America LLC $150,000 3.45% 6/1/2027 155,464 0.01%Daimler Finance North America LLC $150,000 3.30% 19/5/2025 154,988 0.01%ZF North America Capital, Inc. $150,000 4.50% 29/4/2022 154,688 0.01%Daimler Finance North America LLC $150,000 3.88% 15/9/2021 154,318 0.01%Daimler Finance North America LLC $150,000 3.75% 5/11/2021 154,141 0.01%Daimler Finance North America LLC $150,000 3.35% 22/2/2023 154,120 0.01%Fresenius Medical Care US Finance III, Inc. $150,000 3.75% 15/6/2029 153,938 0.01%Linde Finance BV £100,000 5.88% 24/4/2023 153,617 0.01%Deutsche Bank AG $150,000 3.70% 30/5/2024 153,103 0.01%BMW US Capital LLC $150,000 2.95% 14/4/2022 152,860 0.01%Deutsche Telekom International Finance BV $150,000 2.82% 19/1/2022 152,130 0.01%Daimler Finance North America LLC $150,000 3.00% 22/2/2021 151,356 0.01%Daimler Finance North America LLC $150,000 2.70% 14/6/2024 151,176 0.01%Daimler Finance North America LLC $150,000 2.55% 15/8/2022 150,950 0.01%BMW US Capital LLC $150,000 1.85% 15/9/2021 149,502 0.01%Deutsche Bank AG £100,000 3.88% 12/2/2024 139,098 0.01%Aroundtown SA^ £100,000 4.75% Perpetual 138,888 0.01%Deutsche Telekom International Finance BV £100,000 2.50% 10/10/2025 138,639 0.01%Volkswagen Financial Services NV £100,000 2.75% 10/7/2023 136,765 0.01%BASF SE £100,000 1.75% 11/3/2025 135,941 0.01%E.ON International Finance BV $100,000 6.65% 30/4/2038 135,461 0.01%Deutsche Telekom International Finance BV £100,000 2.25% 13/4/2029 134,954 0.01%Aroundtown SA £100,000 3.00% 16/10/2029 134,410 0.01%BASF SE1 £100,000 1.38% 21/6/2022 133,915 0.01%Daimler International Finance BV £100,000 1.50% 18/8/2021 133,042 0.01%BMW International Investment BV £100,000 1.00% 17/11/2021 132,389 0.01%Deutsche Bank AG £100,000 1.75% 16/12/2021 131,856 0.01%BMW Finance NV £100,000 0.88% 16/8/2022 131,442 0.01%Volkswagen International Finance NV €100,000 3.25% 18/11/2030 131,331 0.01%Fresenius SE & Co. KGaA €100,000 2.88% 15/2/2029 129,942 0.01%BMW US Capital LLC $125,000 3.45% 12/4/2023 129,098 0.01%Allianz SE^ €100,000 5.63% 17/10/2042 128,727 0.01%Commerzbank AG €100,000 4.00% 30/3/2027 127,402 0.01%Hannover Rueck SE^ €100,000 3.38% Perpetual 127,134 0.01%Vier Gas Transport GmbH €100,000 3.13% 10/7/2023 124,620 0.01%Deutsche Post AG €100,000 1.63% 5/12/2028 123,280 0.01%Deutsche Boerse AG €100,000 1.63% 8/10/2025 122,792 0.01%Allianz Finance II BV €100,000 1.38% 21/4/2031 122,206 0.01%Bayer AG^ €100,000 3.75% 1/7/2074 120,803 0.01%Vonovia Finance BV €100,000 2.25% 15/12/2023 120,685 0.01%Deutsche Post Finance BV €100,000 2.95% 27/6/2022 120,655 0.01%Merck KGaA^ €100,000 2.88% 25/6/2079 120,262 0.01%Daimler AG €100,000 1.50% 9/3/2026 120,221 0.01%Commerzbank AG €100,000 1.88% 28/2/2028 119,797 0.01%Aroundtown SA €100,000 1.88% 19/1/2026 119,468 0.01%Deutsche Telekom International Finance BV €100,000 1.38% 30/1/2027 119,430 0.01%Deutsche Telekom International Finance BV €100,000 1.38% 1/12/2025 118,964 0.01%Fresenius Medical Care AG & Co. KGaA €100,000 1.50% 11/7/2025 118,531 0.01%Alstria office-AG €100,000 2.13% 12/4/2023 118,124 0.01%Talanx AG^ €100,000 2.25% 5/12/2047 117,968 0.01%Berlin Hyp AG €100,000 1.25% 22/1/2025 117,965 0.01%Bertelsmann SE & Co. KGaA €100,000 1.13% 27/4/2026 117,879 0.01%Vonovia Finance BV €100,000 1.50% 14/1/2028 117,639 0.01%Grand City Properties SA €100,000 1.50% 17/4/2025 117,251 0.01%Volkswagen Leasing GmbH €100,000 2.13% 4/4/2022 117,204 0.01%
Vanguard Global Corporate Bond Index Fund
511
Maturity Fair Value % of Total Principal Coupon Date US Dollars ($) Net Assets
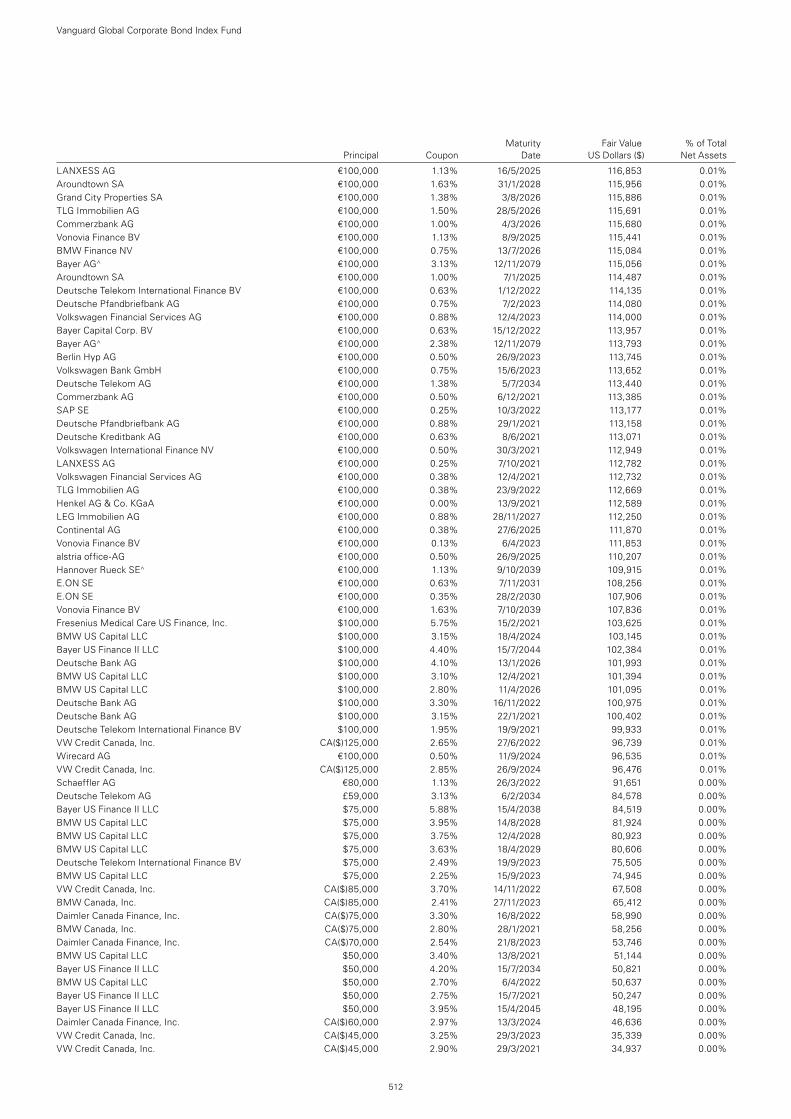
LANXESS AG €100,000 1.13% 16/5/2025 116,853 0.01%Aroundtown SA €100,000 1.63% 31/1/2028 115,956 0.01%Grand City Properties SA €100,000 1.38% 3/8/2026 115,886 0.01%TLG Immobilien AG €100,000 1.50% 28/5/2026 115,691 0.01%Commerzbank AG €100,000 1.00% 4/3/2026 115,680 0.01%Vonovia Finance BV €100,000 1.13% 8/9/2025 115,441 0.01%BMW Finance NV €100,000 0.75% 13/7/2026 115,084 0.01%Bayer AG^ €100,000 3.13% 12/11/2079 115,056 0.01%Aroundtown SA €100,000 1.00% 7/1/2025 114,487 0.01%Deutsche Telekom International Finance BV €100,000 0.63% 1/12/2022 114,135 0.01%Deutsche Pfandbriefbank AG €100,000 0.75% 7/2/2023 114,080 0.01%Volkswagen Financial Services AG €100,000 0.88% 12/4/2023 114,000 0.01%Bayer Capital Corp. BV €100,000 0.63% 15/12/2022 113,957 0.01%Bayer AG^ €100,000 2.38% 12/11/2079 113,793 0.01%Berlin Hyp AG €100,000 0.50% 26/9/2023 113,745 0.01%Volkswagen Bank GmbH €100,000 0.75% 15/6/2023 113,652 0.01%Deutsche Telekom AG €100,000 1.38% 5/7/2034 113,440 0.01%Commerzbank AG €100,000 0.50% 6/12/2021 113,385 0.01%SAP SE €100,000 0.25% 10/3/2022 113,177 0.01%Deutsche Pfandbriefbank AG €100,000 0.88% 29/1/2021 113,158 0.01%Deutsche Kreditbank AG €100,000 0.63% 8/6/2021 113,071 0.01%Volkswagen International Finance NV €100,000 0.50% 30/3/2021 112,949 0.01%LANXESS AG €100,000 0.25% 7/10/2021 112,782 0.01%Volkswagen Financial Services AG €100,000 0.38% 12/4/2021 112,732 0.01%TLG Immobilien AG €100,000 0.38% 23/9/2022 112,669 0.01%Henkel AG & Co. KGaA €100,000 0.00% 13/9/2021 112,589 0.01%LEG Immobilien AG €100,000 0.88% 28/11/2027 112,250 0.01%Continental AG €100,000 0.38% 27/6/2025 111,870 0.01%Vonovia Finance BV €100,000 0.13% 6/4/2023 111,853 0.01%alstria office-AG €100,000 0.50% 26/9/2025 110,207 0.01%Hannover Rueck SE^ €100,000 1.13% 9/10/2039 109,915 0.01%E.ON SE €100,000 0.63% 7/11/2031 108,256 0.01%E.ON SE €100,000 0.35% 28/2/2030 107,906 0.01%Vonovia Finance BV €100,000 1.63% 7/10/2039 107,836 0.01%Fresenius Medical Care US Finance, Inc. $100,000 5.75% 15/2/2021 103,625 0.01%BMW US Capital LLC $100,000 3.15% 18/4/2024 103,145 0.01%Bayer US Finance II LLC $100,000 4.40% 15/7/2044 102,384 0.01%Deutsche Bank AG $100,000 4.10% 13/1/2026 101,993 0.01%BMW US Capital LLC $100,000 3.10% 12/4/2021 101,394 0.01%BMW US Capital LLC $100,000 2.80% 11/4/2026 101,095 0.01%Deutsche Bank AG $100,000 3.30% 16/11/2022 100,975 0.01%Deutsche Bank AG $100,000 3.15% 22/1/2021 100,402 0.01%Deutsche Telekom International Finance BV $100,000 1.95% 19/9/2021 99,933 0.01%VW Credit Canada, Inc. CA($)125,000 2.65% 27/6/2022 96,739 0.01%Wirecard AG €100,000 0.50% 11/9/2024 96,535 0.01%VW Credit Canada, Inc. CA($)125,000 2.85% 26/9/2024 96,476 0.01%Schaeffler AG €80,000 1.13% 26/3/2022 91,651 0.00%Deutsche Telekom AG £59,000 3.13% 6/2/2034 84,578 0.00%Bayer US Finance II LLC $75,000 5.88% 15/4/2038 84,519 0.00%BMW US Capital LLC $75,000 3.95% 14/8/2028 81,924 0.00%BMW US Capital LLC $75,000 3.75% 12/4/2028 80,923 0.00%BMW US Capital LLC $75,000 3.63% 18/4/2029 80,606 0.00%Deutsche Telekom International Finance BV $75,000 2.49% 19/9/2023 75,505 0.00%BMW US Capital LLC $75,000 2.25% 15/9/2023 74,945 0.00%VW Credit Canada, Inc. CA($)85,000 3.70% 14/11/2022 67,508 0.00%BMW Canada, Inc. CA($)85,000 2.41% 27/11/2023 65,412 0.00%Daimler Canada Finance, Inc. CA($)75,000 3.30% 16/8/2022 58,990 0.00%BMW Canada, Inc. CA($)75,000 2.80% 28/1/2021 58,256 0.00%Daimler Canada Finance, Inc. CA($)70,000 2.54% 21/8/2023 53,746 0.00%BMW US Capital LLC $50,000 3.40% 13/8/2021 51,144 0.00%Bayer US Finance II LLC $50,000 4.20% 15/7/2034 50,821 0.00%BMW US Capital LLC $50,000 2.70% 6/4/2022 50,637 0.00%Bayer US Finance II LLC $50,000 2.75% 15/7/2021 50,247 0.00%Bayer US Finance II LLC $50,000 3.95% 15/4/2045 48,195 0.00%Daimler Canada Finance, Inc. CA($)60,000 2.97% 13/3/2024 46,636 0.00%VW Credit Canada, Inc. CA($)45,000 3.25% 29/3/2023 35,339 0.00%VW Credit Canada, Inc. CA($)45,000 2.90% 29/3/2021 34,937 0.00%
Vanguard Global Corporate Bond Index Fund
512
Maturity Fair Value % of Total Principal Coupon Date US Dollars ($) Net Assets
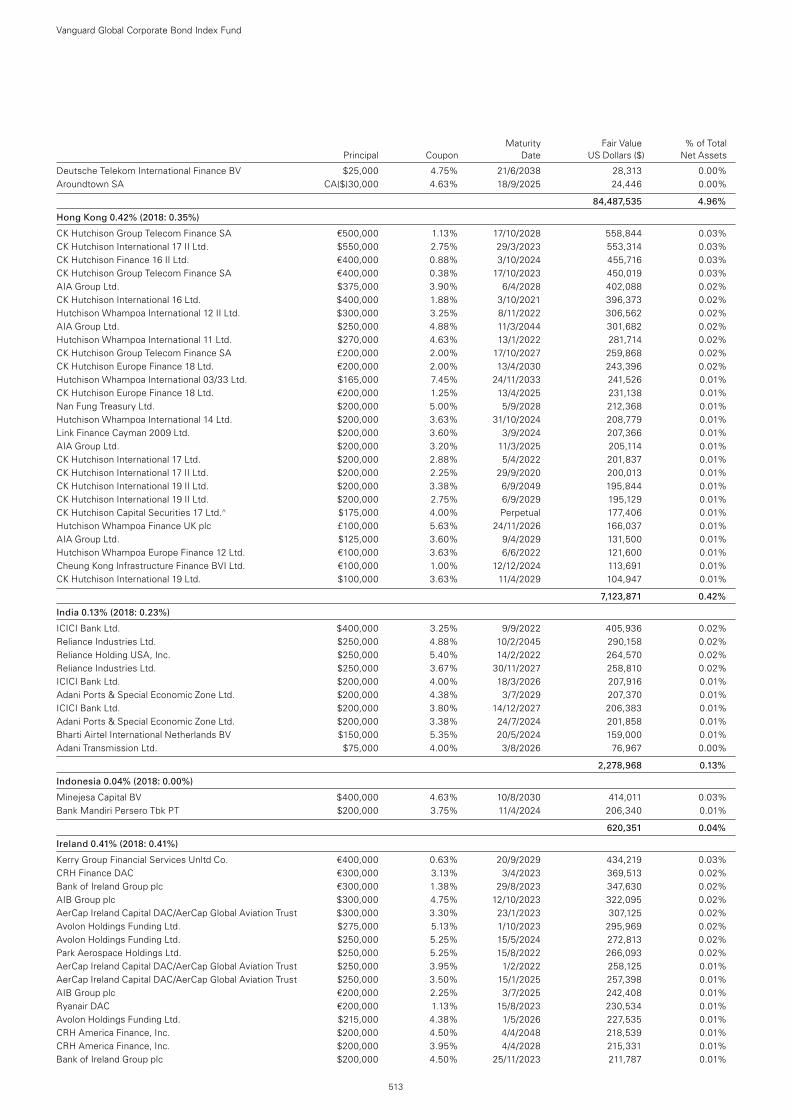
Deutsche Telekom International Finance BV $25,000 4.75% 21/6/2038 28,313 0.00%Aroundtown SA CA($)30,000 4.63% 18/9/2025 24,446 0.00%
84,487,535 4.96%
Hong Kong 0.42% (2018: 0.35%)
CK Hutchison Group Telecom Finance SA €500,000 1.13% 17/10/2028 558,844 0.03%CK Hutchison International 17 II Ltd. $550,000 2.75% 29/3/2023 553,314 0.03%CK Hutchison Finance 16 II Ltd. €400,000 0.88% 3/10/2024 455,716 0.03%CK Hutchison Group Telecom Finance SA €400,000 0.38% 17/10/2023 450,019 0.03%AIA Group Ltd. $375,000 3.90% 6/4/2028 402,088 0.02%CK Hutchison International 16 Ltd. $400,000 1.88% 3/10/2021 396,373 0.02%Hutchison Whampoa International 12 II Ltd. $300,000 3.25% 8/11/2022 306,562 0.02%AIA Group Ltd. $250,000 4.88% 11/3/2044 301,682 0.02%Hutchison Whampoa International 11 Ltd. $270,000 4.63% 13/1/2022 281,714 0.02%CK Hutchison Group Telecom Finance SA £200,000 2.00% 17/10/2027 259,868 0.02%CK Hutchison Europe Finance 18 Ltd. €200,000 2.00% 13/4/2030 243,396 0.02%Hutchison Whampoa International 03/33 Ltd. $165,000 7.45% 24/11/2033 241,526 0.01%CK Hutchison Europe Finance 18 Ltd. €200,000 1.25% 13/4/2025 231,138 0.01%Nan Fung Treasury Ltd. $200,000 5.00% 5/9/2028 212,368 0.01%Hutchison Whampoa International 14 Ltd. $200,000 3.63% 31/10/2024 208,779 0.01%Link Finance Cayman 2009 Ltd. $200,000 3.60% 3/9/2024 207,366 0.01%AIA Group Ltd. $200,000 3.20% 11/3/2025 205,114 0.01%CK Hutchison International 17 Ltd. $200,000 2.88% 5/4/2022 201,837 0.01%CK Hutchison International 17 II Ltd. $200,000 2.25% 29/9/2020 200,013 0.01%CK Hutchison International 19 II Ltd. $200,000 3.38% 6/9/2049 195,844 0.01%CK Hutchison International 19 II Ltd. $200,000 2.75% 6/9/2029 195,129 0.01%CK Hutchison Capital Securities 17 Ltd.^ $175,000 4.00% Perpetual 177,406 0.01%Hutchison Whampoa Finance UK plc £100,000 5.63% 24/11/2026 166,037 0.01%AIA Group Ltd. $125,000 3.60% 9/4/2029 131,500 0.01%Hutchison Whampoa Europe Finance 12 Ltd. €100,000 3.63% 6/6/2022 121,600 0.01%Cheung Kong Infrastructure Finance BVI Ltd. €100,000 1.00% 12/12/2024 113,691 0.01%CK Hutchison International 19 Ltd. $100,000 3.63% 11/4/2029 104,947 0.01%
7,123,871 0.42%
India 0.13% (2018: 0.23%)
ICICI Bank Ltd. $400,000 3.25% 9/9/2022 405,936 0.02%Reliance Industries Ltd. $250,000 4.88% 10/2/2045 290,158 0.02%Reliance Holding USA, Inc. $250,000 5.40% 14/2/2022 264,570 0.02%Reliance Industries Ltd. $250,000 3.67% 30/11/2027 258,810 0.02%ICICI Bank Ltd. $200,000 4.00% 18/3/2026 207,916 0.01%Adani Ports & Special Economic Zone Ltd. $200,000 4.38% 3/7/2029 207,370 0.01%ICICI Bank Ltd. $200,000 3.80% 14/12/2027 206,383 0.01%Adani Ports & Special Economic Zone Ltd. $200,000 3.38% 24/7/2024 201,858 0.01%Bharti Airtel International Netherlands BV $150,000 5.35% 20/5/2024 159,000 0.01%Adani Transmission Ltd. $75,000 4.00% 3/8/2026 76,967 0.00%
2,278,968 0.13%
Indonesia 0.04% (2018: 0.00%)
Minejesa Capital BV $400,000 4.63% 10/8/2030 414,011 0.03%Bank Mandiri Persero Tbk PT $200,000 3.75% 11/4/2024 206,340 0.01%
620,351 0.04%
Ireland 0.41% (2018: 0.41%)
Kerry Group Financial Services Unltd Co. €400,000 0.63% 20/9/2029 434,219 0.03%CRH Finance DAC €300,000 3.13% 3/4/2023 369,513 0.02%Bank of Ireland Group plc €300,000 1.38% 29/8/2023 347,630 0.02%AIB Group plc $300,000 4.75% 12/10/2023 322,095 0.02%AerCap Ireland Capital DAC/AerCap Global Aviation Trust $300,000 3.30% 23/1/2023 307,125 0.02%Avolon Holdings Funding Ltd. $275,000 5.13% 1/10/2023 295,969 0.02%Avolon Holdings Funding Ltd. $250,000 5.25% 15/5/2024 272,813 0.02%Park Aerospace Holdings Ltd. $250,000 5.25% 15/8/2022 266,093 0.02%AerCap Ireland Capital DAC/AerCap Global Aviation Trust $250,000 3.95% 1/2/2022 258,125 0.01%AerCap Ireland Capital DAC/AerCap Global Aviation Trust $250,000 3.50% 15/1/2025 257,398 0.01%AIB Group plc €200,000 2.25% 3/7/2025 242,408 0.01%Ryanair DAC €200,000 1.13% 15/8/2023 230,534 0.01%Avolon Holdings Funding Ltd. $215,000 4.38% 1/5/2026 227,535 0.01%CRH America Finance, Inc. $200,000 4.50% 4/4/2048 218,539 0.01%CRH America Finance, Inc. $200,000 3.95% 4/4/2028 215,331 0.01%Bank of Ireland Group plc $200,000 4.50% 25/11/2023 211,787 0.01%
Vanguard Global Corporate Bond Index Fund
513
Maturity Fair Value % of Total Principal Coupon Date US Dollars ($) Net Assets
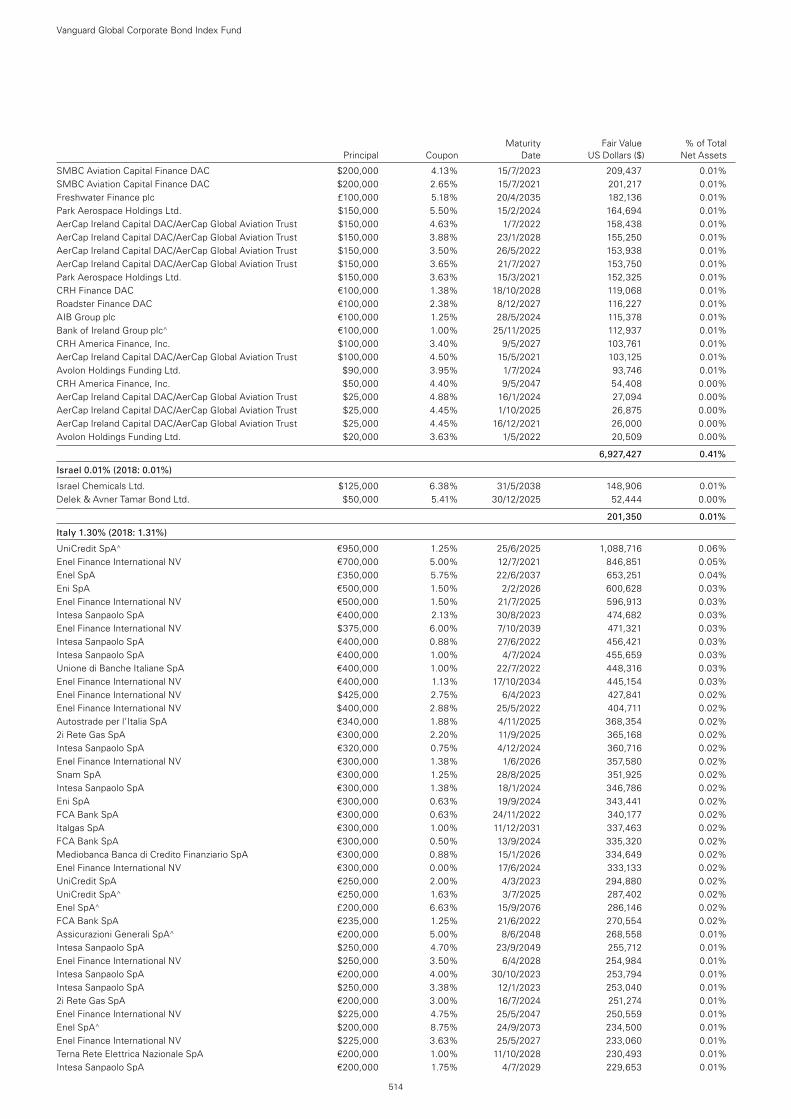
SMBC Aviation Capital Finance DAC $200,000 4.13% 15/7/2023 209,437 0.01%SMBC Aviation Capital Finance DAC $200,000 2.65% 15/7/2021 201,217 0.01%Freshwater Finance plc £100,000 5.18% 20/4/2035 182,136 0.01%Park Aerospace Holdings Ltd. $150,000 5.50% 15/2/2024 164,694 0.01%AerCap Ireland Capital DAC/AerCap Global Aviation Trust $150,000 4.63% 1/7/2022 158,438 0.01%AerCap Ireland Capital DAC/AerCap Global Aviation Trust $150,000 3.88% 23/1/2028 155,250 0.01%AerCap Ireland Capital DAC/AerCap Global Aviation Trust $150,000 3.50% 26/5/2022 153,938 0.01%AerCap Ireland Capital DAC/AerCap Global Aviation Trust $150,000 3.65% 21/7/2027 153,750 0.01%Park Aerospace Holdings Ltd. $150,000 3.63% 15/3/2021 152,325 0.01%CRH Finance DAC €100,000 1.38% 18/10/2028 119,068 0.01%Roadster Finance DAC €100,000 2.38% 8/12/2027 116,227 0.01%AIB Group plc €100,000 1.25% 28/5/2024 115,378 0.01%Bank of Ireland Group plc^ €100,000 1.00% 25/11/2025 112,937 0.01%CRH America Finance, Inc. $100,000 3.40% 9/5/2027 103,761 0.01%AerCap Ireland Capital DAC/AerCap Global Aviation Trust $100,000 4.50% 15/5/2021 103,125 0.01%Avolon Holdings Funding Ltd. $90,000 3.95% 1/7/2024 93,746 0.01%CRH America Finance, Inc. $50,000 4.40% 9/5/2047 54,408 0.00%AerCap Ireland Capital DAC/AerCap Global Aviation Trust $25,000 4.88% 16/1/2024 27,094 0.00%AerCap Ireland Capital DAC/AerCap Global Aviation Trust $25,000 4.45% 1/10/2025 26,875 0.00%AerCap Ireland Capital DAC/AerCap Global Aviation Trust $25,000 4.45% 16/12/2021 26,000 0.00%Avolon Holdings Funding Ltd. $20,000 3.63% 1/5/2022 20,509 0.00%
6,927,427 0.41%
Israel 0.01% (2018: 0.01%)
Israel Chemicals Ltd. $125,000 6.38% 31/5/2038 148,906 0.01%Delek & Avner Tamar Bond Ltd. $50,000 5.41% 30/12/2025 52,444 0.00%
201,350 0.01%
Italy 1.30% (2018: 1.31%)
UniCredit SpA^ €950,000 1.25% 25/6/2025 1,088,716 0.06%Enel Finance International NV €700,000 5.00% 12/7/2021 846,851 0.05%Enel SpA £350,000 5.75% 22/6/2037 653,251 0.04%Eni SpA €500,000 1.50% 2/2/2026 600,628 0.03%Enel Finance International NV €500,000 1.50% 21/7/2025 596,913 0.03%Intesa Sanpaolo SpA €400,000 2.13% 30/8/2023 474,682 0.03%Enel Finance International NV $375,000 6.00% 7/10/2039 471,321 0.03%Intesa Sanpaolo SpA €400,000 0.88% 27/6/2022 456,421 0.03%Intesa Sanpaolo SpA €400,000 1.00% 4/7/2024 455,659 0.03%Unione di Banche Italiane SpA €400,000 1.00% 22/7/2022 448,316 0.03%Enel Finance International NV €400,000 1.13% 17/10/2034 445,154 0.03%Enel Finance International NV $425,000 2.75% 6/4/2023 427,841 0.02%Enel Finance International NV $400,000 2.88% 25/5/2022 404,711 0.02%Autostrade per l’Italia SpA €340,000 1.88% 4/11/2025 368,354 0.02%2i Rete Gas SpA €300,000 2.20% 11/9/2025 365,168 0.02%Intesa Sanpaolo SpA €320,000 0.75% 4/12/2024 360,716 0.02%Enel Finance International NV €300,000 1.38% 1/6/2026 357,580 0.02%Snam SpA €300,000 1.25% 28/8/2025 351,925 0.02%Intesa Sanpaolo SpA €300,000 1.38% 18/1/2024 346,786 0.02%Eni SpA €300,000 0.63% 19/9/2024 343,441 0.02%FCA Bank SpA €300,000 0.63% 24/11/2022 340,177 0.02%Italgas SpA €300,000 1.00% 11/12/2031 337,463 0.02%FCA Bank SpA €300,000 0.50% 13/9/2024 335,320 0.02%Mediobanca Banca di Credito Finanziario SpA €300,000 0.88% 15/1/2026 334,649 0.02%Enel Finance International NV €300,000 0.00% 17/6/2024 333,133 0.02%UniCredit SpA €250,000 2.00% 4/3/2023 294,880 0.02%UniCredit SpA^ €250,000 1.63% 3/7/2025 287,402 0.02%Enel SpA^ £200,000 6.63% 15/9/2076 286,146 0.02%FCA Bank SpA €235,000 1.25% 21/6/2022 270,554 0.02%Assicurazioni Generali SpA^ €200,000 5.00% 8/6/2048 268,558 0.01%Intesa Sanpaolo SpA $250,000 4.70% 23/9/2049 255,712 0.01%Enel Finance International NV $250,000 3.50% 6/4/2028 254,984 0.01%Intesa Sanpaolo SpA €200,000 4.00% 30/10/2023 253,794 0.01%Intesa Sanpaolo SpA $250,000 3.38% 12/1/2023 253,040 0.01%2i Rete Gas SpA €200,000 3.00% 16/7/2024 251,274 0.01%Enel Finance International NV $225,000 4.75% 25/5/2047 250,559 0.01%Enel SpA^ $200,000 8.75% 24/9/2073 234,500 0.01%Enel Finance International NV $225,000 3.63% 25/5/2027 233,060 0.01%Terna Rete Elettrica Nazionale SpA €200,000 1.00% 11/10/2028 230,493 0.01%Intesa Sanpaolo SpA €200,000 1.75% 4/7/2029 229,653 0.01%
Vanguard Global Corporate Bond Index Fund
514
Maturity Fair Value % of Total Principal Coupon Date US Dollars ($) Net Assets
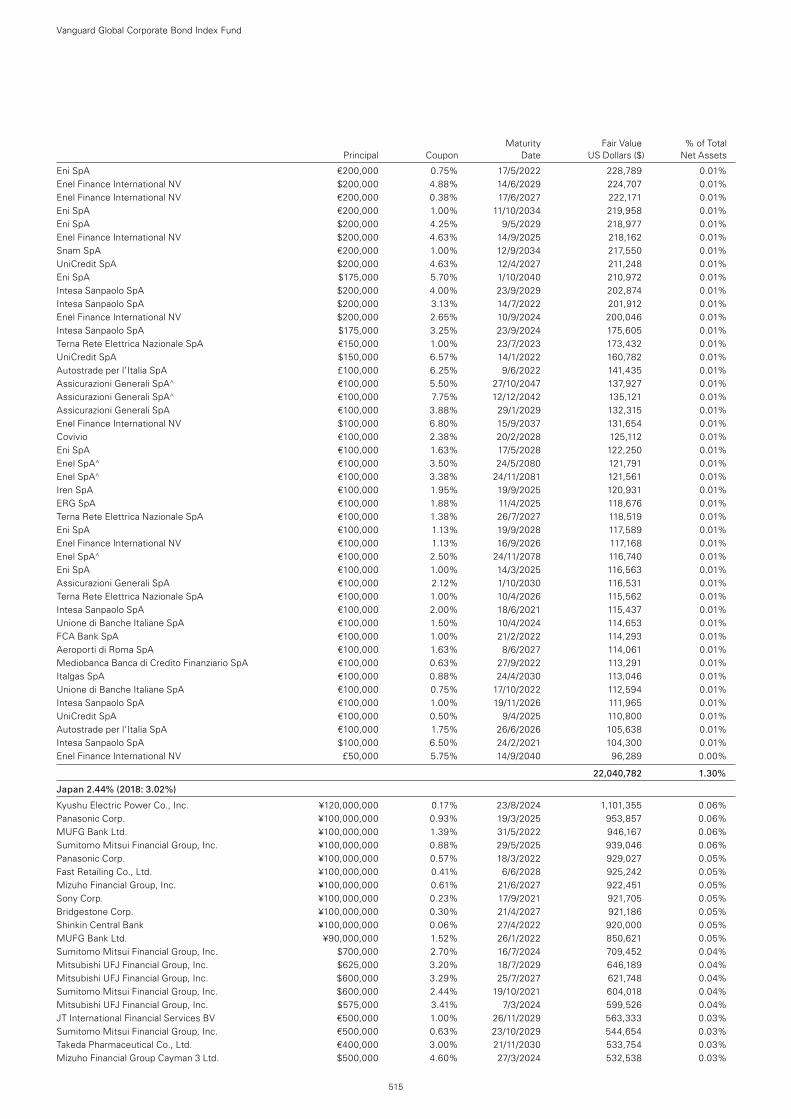
Eni SpA €200,000 0.75% 17/5/2022 228,789 0.01%Enel Finance International NV $200,000 4.88% 14/6/2029 224,707 0.01%Enel Finance International NV €200,000 0.38% 17/6/2027 222,171 0.01%Eni SpA €200,000 1.00% 11/10/2034 219,958 0.01%Eni SpA $200,000 4.25% 9/5/2029 218,977 0.01%Enel Finance International NV $200,000 4.63% 14/9/2025 218,162 0.01%Snam SpA €200,000 1.00% 12/9/2034 217,550 0.01%UniCredit SpA $200,000 4.63% 12/4/2027 211,248 0.01%Eni SpA $175,000 5.70% 1/10/2040 210,972 0.01%Intesa Sanpaolo SpA $200,000 4.00% 23/9/2029 202,874 0.01%Intesa Sanpaolo SpA $200,000 3.13% 14/7/2022 201,912 0.01%Enel Finance International NV $200,000 2.65% 10/9/2024 200,046 0.01%Intesa Sanpaolo SpA $175,000 3.25% 23/9/2024 175,605 0.01%Terna Rete Elettrica Nazionale SpA €150,000 1.00% 23/7/2023 173,432 0.01%UniCredit SpA $150,000 6.57% 14/1/2022 160,782 0.01%Autostrade per l’Italia SpA £100,000 6.25% 9/6/2022 141,435 0.01%Assicurazioni Generali SpA^ €100,000 5.50% 27/10/2047 137,927 0.01%Assicurazioni Generali SpA^ €100,000 7.75% 12/12/2042 135,121 0.01%Assicurazioni Generali SpA €100,000 3.88% 29/1/2029 132,315 0.01%Enel Finance International NV $100,000 6.80% 15/9/2037 131,654 0.01%Covivio €100,000 2.38% 20/2/2028 125,112 0.01%Eni SpA €100,000 1.63% 17/5/2028 122,250 0.01%Enel SpA^ €100,000 3.50% 24/5/2080 121,791 0.01%Enel SpA^ €100,000 3.38% 24/11/2081 121,561 0.01%Iren SpA €100,000 1.95% 19/9/2025 120,931 0.01%ERG SpA €100,000 1.88% 11/4/2025 118,676 0.01%Terna Rete Elettrica Nazionale SpA €100,000 1.38% 26/7/2027 118,519 0.01%Eni SpA €100,000 1.13% 19/9/2028 117,589 0.01%Enel Finance International NV €100,000 1.13% 16/9/2026 117,168 0.01%Enel SpA^ €100,000 2.50% 24/11/2078 116,740 0.01%Eni SpA €100,000 1.00% 14/3/2025 116,563 0.01%Assicurazioni Generali SpA €100,000 2.12% 1/10/2030 116,531 0.01%Terna Rete Elettrica Nazionale SpA €100,000 1.00% 10/4/2026 115,562 0.01%Intesa Sanpaolo SpA €100,000 2.00% 18/6/2021 115,437 0.01%Unione di Banche Italiane SpA €100,000 1.50% 10/4/2024 114,653 0.01%FCA Bank SpA €100,000 1.00% 21/2/2022 114,293 0.01%Aeroporti di Roma SpA €100,000 1.63% 8/6/2027 114,061 0.01%Mediobanca Banca di Credito Finanziario SpA €100,000 0.63% 27/9/2022 113,291 0.01%Italgas SpA €100,000 0.88% 24/4/2030 113,046 0.01%Unione di Banche Italiane SpA €100,000 0.75% 17/10/2022 112,594 0.01%Intesa Sanpaolo SpA €100,000 1.00% 19/11/2026 111,965 0.01%UniCredit SpA €100,000 0.50% 9/4/2025 110,800 0.01%Autostrade per l’Italia SpA €100,000 1.75% 26/6/2026 105,638 0.01%Intesa Sanpaolo SpA $100,000 6.50% 24/2/2021 104,300 0.01%Enel Finance International NV £50,000 5.75% 14/9/2040 96,289 0.00%
22,040,782 1.30%
Japan 2.44% (2018: 3.02%)
Kyushu Electric Power Co., Inc. ¥120,000,000 0.17% 23/8/2024 1,101,355 0.06%Panasonic Corp. ¥100,000,000 0.93% 19/3/2025 953,857 0.06%MUFG Bank Ltd. ¥100,000,000 1.39% 31/5/2022 946,167 0.06%Sumitomo Mitsui Financial Group, Inc. ¥100,000,000 0.88% 29/5/2025 939,046 0.06%Panasonic Corp. ¥100,000,000 0.57% 18/3/2022 929,027 0.05%Fast Retailing Co., Ltd. ¥100,000,000 0.41% 6/6/2028 925,242 0.05%Mizuho Financial Group, Inc. ¥100,000,000 0.61% 21/6/2027 922,451 0.05%Sony Corp. ¥100,000,000 0.23% 17/9/2021 921,705 0.05%Bridgestone Corp. ¥100,000,000 0.30% 21/4/2027 921,186 0.05%Shinkin Central Bank ¥100,000,000 0.06% 27/4/2022 920,000 0.05%MUFG Bank Ltd. ¥90,000,000 1.52% 26/1/2022 850,621 0.05%Sumitomo Mitsui Financial Group, Inc. $700,000 2.70% 16/7/2024 709,452 0.04%Mitsubishi UFJ Financial Group, Inc. $625,000 3.20% 18/7/2029 646,189 0.04%Mitsubishi UFJ Financial Group, Inc. $600,000 3.29% 25/7/2027 621,748 0.04%Sumitomo Mitsui Financial Group, Inc. $600,000 2.44% 19/10/2021 604,018 0.04%Mitsubishi UFJ Financial Group, Inc. $575,000 3.41% 7/3/2024 599,526 0.04%JT International Financial Services BV €500,000 1.00% 26/11/2029 563,333 0.03%Sumitomo Mitsui Financial Group, Inc. €500,000 0.63% 23/10/2029 544,654 0.03%Takeda Pharmaceutical Co., Ltd. €400,000 3.00% 21/11/2030 533,754 0.03%Mizuho Financial Group Cayman 3 Ltd. $500,000 4.60% 27/3/2024 532,538 0.03%
Vanguard Global Corporate Bond Index Fund
515
Maturity Fair Value % of Total Principal Coupon Date US Dollars ($) Net Assets

Sumitomo Mitsui Financial Group, Inc. $500,000 3.10% 17/1/2023 511,373 0.03%Mizuho Financial Group, Inc. $500,000 2.27% 13/9/2021 501,326 0.03%Sumitomo Mitsui Financial Group, Inc. $500,000 2.06% 14/7/2021 500,586 0.03%Sumitomo Mitsui Financial Group, Inc. $450,000 3.54% 17/1/2028 475,031 0.03%Takeda Pharmaceutical Co., Ltd. $400,000 5.00% 26/11/2028 465,473 0.03%Shinkin Central Bank ¥50,000,000 0.03% 25/6/2021 459,871 0.03%Meiji Yasuda Life Insurance Co.^ $400,000 5.20% 20/10/2045 439,357 0.03%Mitsubishi UFJ Financial Group, Inc. $425,000 2.80% 18/7/2024 432,761 0.03%Sumitomo Life Insurance Co.^ $400,000 4.00% 14/9/2077 418,500 0.02%Dai-ichi Life Insurance Co., Ltd.^ $400,000 4.00% Perpetual 413,776 0.02%Sumitomo Mitsui Financial Group, Inc. $400,000 2.78% 12/7/2022 406,772 0.02%ORIX Corp. $400,000 2.90% 18/7/2022 406,598 0.02%Mitsubishi UFJ Financial Group, Inc. $400,000 2.62% 18/7/2022 405,153 0.02%Toyota Motor Finance Netherlands BV £300,000 1.38% 23/5/2023 399,837 0.02%Sumitomo Mitsui Financial Group, Inc. $375,000 3.04% 16/7/2029 381,834 0.02%Mitsubishi UFJ Financial Group, Inc. ¥39,000,000 0.55% 12/1/2028 358,673 0.02%Mitsubishi UFJ Financial Group, Inc. $350,000 2.19% 13/9/2021 350,505 0.02%Mitsubishi UFJ Financial Group, Inc. €300,000 0.98% 9/10/2023 346,026 0.02%Toyota Finance Australia Ltd. €300,000 0.50% 6/4/2023 342,367 0.02%Mitsubishi UFJ Financial Group, Inc. $300,000 4.05% 11/9/2028 330,750 0.02%Sumitomo Mitsui Financial Group, Inc. $300,000 3.94% 19/7/2028 327,000 0.02%Mitsubishi UFJ Financial Group, Inc. ¥35,000,000 0.65% 26/7/2027 324,717 0.02%Mitsubishi UFJ Financial Group, Inc. $300,000 3.85% 1/3/2026 321,812 0.02%Mitsubishi UFJ Lease & Finance Co., Ltd. $300,000 3.96% 19/9/2023 314,398 0.02%Sumitomo Mitsui Financial Group, Inc. $300,000 3.75% 19/7/2023 314,345 0.02%Mitsubishi UFJ Financial Group, Inc. $300,000 3.00% 22/2/2022 305,500 0.02%Mizuho Financial Group, Inc. $300,000 2.95% 28/2/2022 305,128 0.02%Mitsubishi UFJ Financial Group, Inc. $300,000 2.67% 25/7/2022 304,289 0.02%Mizuho Financial Group, Inc.^ $300,000 2.84% 16/7/2025 302,553 0.02%Sumitomo Mitsui Financial Group, Inc. $250,000 4.44% 2/4/2024 265,922 0.02%Mizuho Financial Group, Inc. $250,000 4.35% 20/10/2025 265,754 0.02%Sumitomo Mitsui Banking Corp. $250,000 3.95% 10/1/2024 264,523 0.02%Mizuho Bank Ltd. $250,000 3.75% 16/4/2024 263,044 0.02%Mizuho Financial Group, Inc.^ $250,000 3.92% 11/9/2024 262,126 0.02%Sumitomo Mitsui Banking Corp. $250,000 3.40% 11/7/2024 261,042 0.02%Mitsubishi UFJ Financial Group, Inc. $250,000 3.54% 26/7/2021 255,592 0.02%Takeda Pharmaceutical Co., Ltd. €200,000 2.25% 21/11/2026 250,513 0.02%Sumitomo Mitsui Financial Group, Inc. $250,000 2.45% 27/9/2024 250,381 0.01%Sumitomo Mitsui Financial Group, Inc. $250,000 2.72% 27/9/2029 247,139 0.01%MUFG Bank Ltd. $200,000 4.70% 10/3/2044 243,790 0.01%Sumitomo Mitsui Financial Group, Inc. €200,000 1.55% 15/6/2026 239,427 0.01%Sumitomo Mitsui Financial Group, Inc. €200,000 0.93% 11/10/2024 230,397 0.01%American Honda Finance Corp. €200,000 0.75% 17/1/2024 230,065 0.01%Mitsubishi UFJ Financial Group, Inc. $200,000 4.29% 26/7/2038 230,056 0.01%Nissan Motor Acceptance Corp. $225,000 3.15% 15/3/2021 227,062 0.01%Asahi Group Holdings Ltd. €200,000 0.32% 19/9/2021 225,672 0.01%Mitsubishi UFJ Financial Group, Inc. €200,000 0.34% 19/7/2024 224,440 0.01%Mizuho Financial Group, Inc. €200,000 0.12% 6/9/2024 222,246 0.01%Mizuho Financial Group, Inc.^ $200,000 4.25% 11/9/2029 221,403 0.01%Mizuho Financial Group, Inc. €200,000 0.40% 6/9/2029 217,618 0.01%Nippon Life Insurance Co.^ $200,000 5.10% 16/10/2044 217,500 0.01%Toyota Motor Corp. $215,000 2.16% 2/7/2022 216,660 0.01%Takeda Pharmaceutical Co., Ltd. $200,000 4.40% 26/11/2023 214,452 0.01%Nippon Life Insurance Co.^ $200,000 4.70% 20/1/2046 214,250 0.01%Dai-ichi Life Insurance Co., Ltd.^ $200,000 7.25% Perpetual 212,803 0.01%Nippon Life Insurance Co.^ $200,000 5.00% 18/10/2042 210,302 0.01%Nippon Life Insurance Co.^ $200,000 4.00% 19/9/2047 209,500 0.01%Mizuho Financial Group, Inc. $200,000 3.48% 12/4/2026 208,858 0.01%Mizuho Financial Group, Inc. $200,000 3.55% 5/3/2023 208,244 0.01%MUFG Bank Ltd. $200,000 3.25% 8/9/2024 207,530 0.01%Takeda Pharmaceutical Co., Ltd. $200,000 4.00% 26/11/2021 206,578 0.01%Toyota Industries Corp. $200,000 3.24% 16/3/2023 205,462 0.01%Mizuho Financial Group, Inc. $200,000 3.17% 11/9/2027 205,093 0.01%Mitsubishi UFJ Lease & Finance Co., Ltd. $200,000 3.41% 28/2/2022 204,380 0.01%Seven & i Holdings Co., Ltd. $200,000 3.35% 17/9/2021 203,828 0.01%Sumitomo Mitsui Financial Group, Inc. $200,000 2.78% 18/10/2022 203,063 0.01%Mitsui Fudosan Co., Ltd. $200,000 2.95% 23/1/2023 202,750 0.01%Mizuho Financial Group, Inc. $200,000 2.60% 11/9/2022 202,551 0.01%
Vanguard Global Corporate Bond Index Fund
516
Maturity Fair Value % of Total Principal Coupon Date US Dollars ($) Net Assets
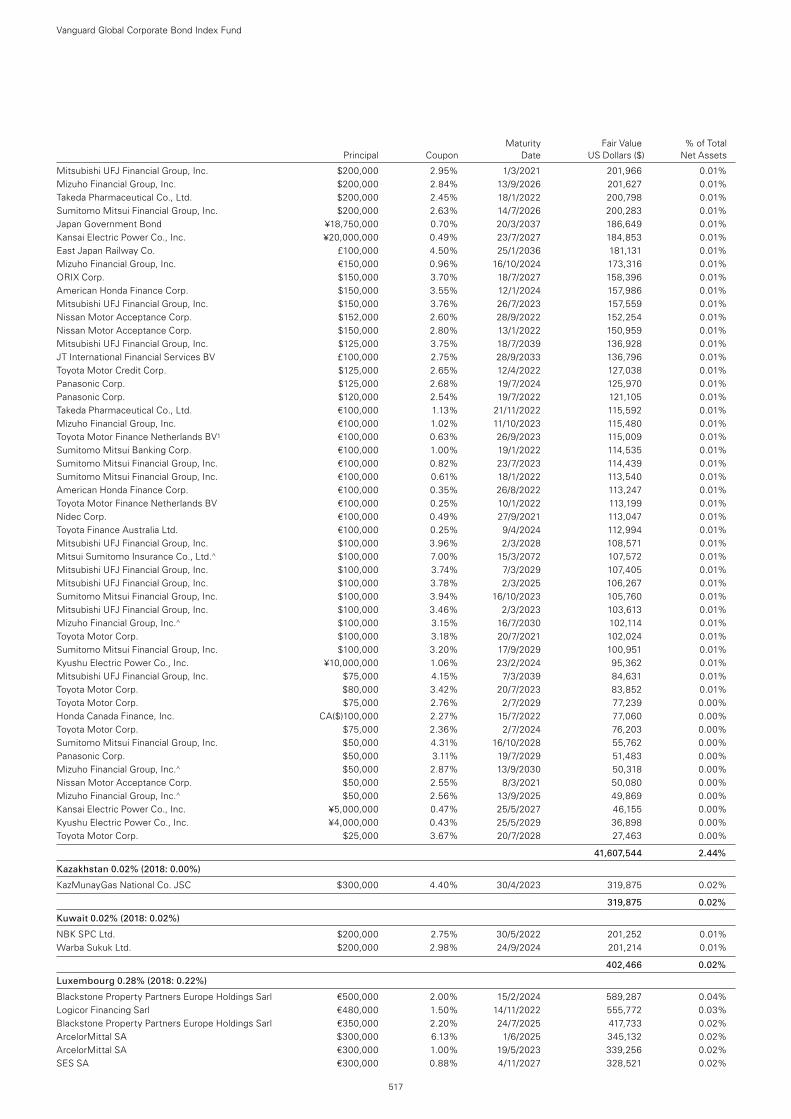
Mitsubishi UFJ Financial Group, Inc. $200,000 2.95% 1/3/2021 201,966 0.01%Mizuho Financial Group, Inc. $200,000 2.84% 13/9/2026 201,627 0.01%Takeda Pharmaceutical Co., Ltd. $200,000 2.45% 18/1/2022 200,798 0.01%Sumitomo Mitsui Financial Group, Inc. $200,000 2.63% 14/7/2026 200,283 0.01%Japan Government Bond ¥18,750,000 0.70% 20/3/2037 186,649 0.01%Kansai Electric Power Co., Inc. ¥20,000,000 0.49% 23/7/2027 184,853 0.01%East Japan Railway Co. £100,000 4.50% 25/1/2036 181,131 0.01%Mizuho Financial Group, Inc. €150,000 0.96% 16/10/2024 173,316 0.01%ORIX Corp. $150,000 3.70% 18/7/2027 158,396 0.01%American Honda Finance Corp. $150,000 3.55% 12/1/2024 157,986 0.01%Mitsubishi UFJ Financial Group, Inc. $150,000 3.76% 26/7/2023 157,559 0.01%Nissan Motor Acceptance Corp. $152,000 2.60% 28/9/2022 152,254 0.01%Nissan Motor Acceptance Corp. $150,000 2.80% 13/1/2022 150,959 0.01%Mitsubishi UFJ Financial Group, Inc. $125,000 3.75% 18/7/2039 136,928 0.01%JT International Financial Services BV £100,000 2.75% 28/9/2033 136,796 0.01%Toyota Motor Credit Corp. $125,000 2.65% 12/4/2022 127,038 0.01%Panasonic Corp. $125,000 2.68% 19/7/2024 125,970 0.01%Panasonic Corp. $120,000 2.54% 19/7/2022 121,105 0.01%Takeda Pharmaceutical Co., Ltd. €100,000 1.13% 21/11/2022 115,592 0.01%Mizuho Financial Group, Inc. €100,000 1.02% 11/10/2023 115,480 0.01%Toyota Motor Finance Netherlands BV1 €100,000 0.63% 26/9/2023 115,009 0.01%Sumitomo Mitsui Banking Corp. €100,000 1.00% 19/1/2022 114,535 0.01%Sumitomo Mitsui Financial Group, Inc. €100,000 0.82% 23/7/2023 114,439 0.01%Sumitomo Mitsui Financial Group, Inc. €100,000 0.61% 18/1/2022 113,540 0.01%American Honda Finance Corp. €100,000 0.35% 26/8/2022 113,247 0.01%Toyota Motor Finance Netherlands BV €100,000 0.25% 10/1/2022 113,199 0.01%Nidec Corp. €100,000 0.49% 27/9/2021 113,047 0.01%Toyota Finance Australia Ltd. €100,000 0.25% 9/4/2024 112,994 0.01%Mitsubishi UFJ Financial Group, Inc. $100,000 3.96% 2/3/2028 108,571 0.01%Mitsui Sumitomo Insurance Co., Ltd.^ $100,000 7.00% 15/3/2072 107,572 0.01%Mitsubishi UFJ Financial Group, Inc. $100,000 3.74% 7/3/2029 107,405 0.01%Mitsubishi UFJ Financial Group, Inc. $100,000 3.78% 2/3/2025 106,267 0.01%Sumitomo Mitsui Financial Group, Inc. $100,000 3.94% 16/10/2023 105,760 0.01%Mitsubishi UFJ Financial Group, Inc. $100,000 3.46% 2/3/2023 103,613 0.01%Mizuho Financial Group, Inc.^ $100,000 3.15% 16/7/2030 102,114 0.01%Toyota Motor Corp. $100,000 3.18% 20/7/2021 102,024 0.01%Sumitomo Mitsui Financial Group, Inc. $100,000 3.20% 17/9/2029 100,951 0.01%Kyushu Electric Power Co., Inc. ¥10,000,000 1.06% 23/2/2024 95,362 0.01%Mitsubishi UFJ Financial Group, Inc. $75,000 4.15% 7/3/2039 84,631 0.01%Toyota Motor Corp. $80,000 3.42% 20/7/2023 83,852 0.01%Toyota Motor Corp. $75,000 2.76% 2/7/2029 77,239 0.00%Honda Canada Finance, Inc. CA($)100,000 2.27% 15/7/2022 77,060 0.00%Toyota Motor Corp. $75,000 2.36% 2/7/2024 76,203 0.00%Sumitomo Mitsui Financial Group, Inc. $50,000 4.31% 16/10/2028 55,762 0.00%Panasonic Corp. $50,000 3.11% 19/7/2029 51,483 0.00%Mizuho Financial Group, Inc.^ $50,000 2.87% 13/9/2030 50,318 0.00%Nissan Motor Acceptance Corp. $50,000 2.55% 8/3/2021 50,080 0.00%Mizuho Financial Group, Inc.^ $50,000 2.56% 13/9/2025 49,869 0.00%Kansai Electric Power Co., Inc. ¥5,000,000 0.47% 25/5/2027 46,155 0.00%Kyushu Electric Power Co., Inc. ¥4,000,000 0.43% 25/5/2029 36,898 0.00%Toyota Motor Corp. $25,000 3.67% 20/7/2028 27,463 0.00%
41,607,544 2.44%
Kazakhstan 0.02% (2018: 0.00%)
KazMunayGas National Co. JSC $300,000 4.40% 30/4/2023 319,875 0.02%
319,875 0.02%
Kuwait 0.02% (2018: 0.02%)
NBK SPC Ltd. $200,000 2.75% 30/5/2022 201,252 0.01%Warba Sukuk Ltd. $200,000 2.98% 24/9/2024 201,214 0.01%
402,466 0.02%
Luxembourg 0.28% (2018: 0.22%)
Blackstone Property Partners Europe Holdings Sarl €500,000 2.00% 15/2/2024 589,287 0.04%Logicor Financing Sarl €480,000 1.50% 14/11/2022 555,772 0.03%Blackstone Property Partners Europe Holdings Sarl €350,000 2.20% 24/7/2025 417,733 0.02%ArcelorMittal SA $300,000 6.13% 1/6/2025 345,132 0.02%ArcelorMittal SA €300,000 1.00% 19/5/2023 339,256 0.02%SES SA €300,000 0.88% 4/11/2027 328,521 0.02%
Vanguard Global Corporate Bond Index Fund
517
Maturity Fair Value % of Total Principal Coupon Date US Dollars ($) Net Assets
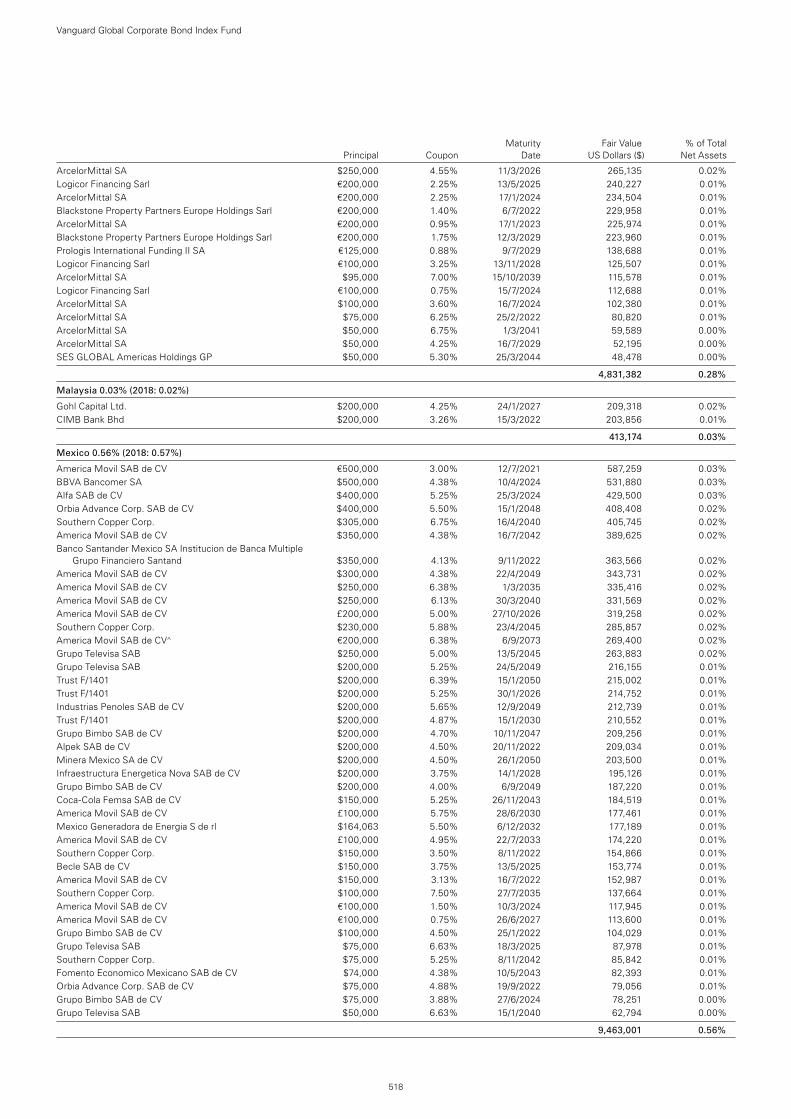
ArcelorMittal SA $250,000 4.55% 11/3/2026 265,135 0.02%Logicor Financing Sarl €200,000 2.25% 13/5/2025 240,227 0.01%ArcelorMittal SA €200,000 2.25% 17/1/2024 234,504 0.01%Blackstone Property Partners Europe Holdings Sarl €200,000 1.40% 6/7/2022 229,958 0.01%ArcelorMittal SA €200,000 0.95% 17/1/2023 225,974 0.01%Blackstone Property Partners Europe Holdings Sarl €200,000 1.75% 12/3/2029 223,960 0.01%Prologis International Funding II SA €125,000 0.88% 9/7/2029 138,688 0.01%Logicor Financing Sarl €100,000 3.25% 13/11/2028 125,507 0.01%ArcelorMittal SA $95,000 7.00% 15/10/2039 115,578 0.01%Logicor Financing Sarl €100,000 0.75% 15/7/2024 112,688 0.01%ArcelorMittal SA $100,000 3.60% 16/7/2024 102,380 0.01%ArcelorMittal SA $75,000 6.25% 25/2/2022 80,820 0.01%ArcelorMittal SA $50,000 6.75% 1/3/2041 59,589 0.00%ArcelorMittal SA $50,000 4.25% 16/7/2029 52,195 0.00%SES GLOBAL Americas Holdings GP $50,000 5.30% 25/3/2044 48,478 0.00%
4,831,382 0.28%
Malaysia 0.03% (2018: 0.02%)
Gohl Capital Ltd. $200,000 4.25% 24/1/2027 209,318 0.02%CIMB Bank Bhd $200,000 3.26% 15/3/2022 203,856 0.01%
413,174 0.03%
Mexico 0.56% (2018: 0.57%)
America Movil SAB de CV €500,000 3.00% 12/7/2021 587,259 0.03%BBVA Bancomer SA $500,000 4.38% 10/4/2024 531,880 0.03%Alfa SAB de CV $400,000 5.25% 25/3/2024 429,500 0.03%Orbia Advance Corp. SAB de CV $400,000 5.50% 15/1/2048 408,408 0.02%Southern Copper Corp. $305,000 6.75% 16/4/2040 405,745 0.02%America Movil SAB de CV $350,000 4.38% 16/7/2042 389,625 0.02%Banco Santander Mexico SA Institucion de Banca Multiple
Grupo Financiero Santand $350,000 4.13% 9/11/2022 363,566 0.02%America Movil SAB de CV $300,000 4.38% 22/4/2049 343,731 0.02%America Movil SAB de CV $250,000 6.38% 1/3/2035 335,416 0.02%America Movil SAB de CV $250,000 6.13% 30/3/2040 331,569 0.02%America Movil SAB de CV £200,000 5.00% 27/10/2026 319,258 0.02%Southern Copper Corp. $230,000 5.88% 23/4/2045 285,857 0.02%America Movil SAB de CV^ €200,000 6.38% 6/9/2073 269,400 0.02%Grupo Televisa SAB $250,000 5.00% 13/5/2045 263,883 0.02%Grupo Televisa SAB $200,000 5.25% 24/5/2049 216,155 0.01%Trust F/1401 $200,000 6.39% 15/1/2050 215,002 0.01%Trust F/1401 $200,000 5.25% 30/1/2026 214,752 0.01%Industrias Penoles SAB de CV $200,000 5.65% 12/9/2049 212,739 0.01%Trust F/1401 $200,000 4.87% 15/1/2030 210,552 0.01%Grupo Bimbo SAB de CV $200,000 4.70% 10/11/2047 209,256 0.01%Alpek SAB de CV $200,000 4.50% 20/11/2022 209,034 0.01%Minera Mexico SA de CV $200,000 4.50% 26/1/2050 203,500 0.01%Infraestructura Energetica Nova SAB de CV $200,000 3.75% 14/1/2028 195,126 0.01%Grupo Bimbo SAB de CV $200,000 4.00% 6/9/2049 187,220 0.01%Coca-Cola Femsa SAB de CV $150,000 5.25% 26/11/2043 184,519 0.01%America Movil SAB de CV £100,000 5.75% 28/6/2030 177,461 0.01%Mexico Generadora de Energia S de rl $164,063 5.50% 6/12/2032 177,189 0.01%America Movil SAB de CV £100,000 4.95% 22/7/2033 174,220 0.01%Southern Copper Corp. $150,000 3.50% 8/11/2022 154,866 0.01%Becle SAB de CV $150,000 3.75% 13/5/2025 153,774 0.01%America Movil SAB de CV $150,000 3.13% 16/7/2022 152,987 0.01%Southern Copper Corp. $100,000 7.50% 27/7/2035 137,664 0.01%America Movil SAB de CV €100,000 1.50% 10/3/2024 117,945 0.01%America Movil SAB de CV €100,000 0.75% 26/6/2027 113,600 0.01%Grupo Bimbo SAB de CV $100,000 4.50% 25/1/2022 104,029 0.01%Grupo Televisa SAB $75,000 6.63% 18/3/2025 87,978 0.01%Southern Copper Corp. $75,000 5.25% 8/11/2042 85,842 0.01%Fomento Economico Mexicano SAB de CV $74,000 4.38% 10/5/2043 82,393 0.01%Orbia Advance Corp. SAB de CV $75,000 4.88% 19/9/2022 79,056 0.01%Grupo Bimbo SAB de CV $75,000 3.88% 27/6/2024 78,251 0.00%Grupo Televisa SAB $50,000 6.63% 15/1/2040 62,794 0.00%
9,463,001 0.56%
Vanguard Global Corporate Bond Index Fund
518
Maturity Fair Value % of Total Principal Coupon Date US Dollars ($) Net Assets
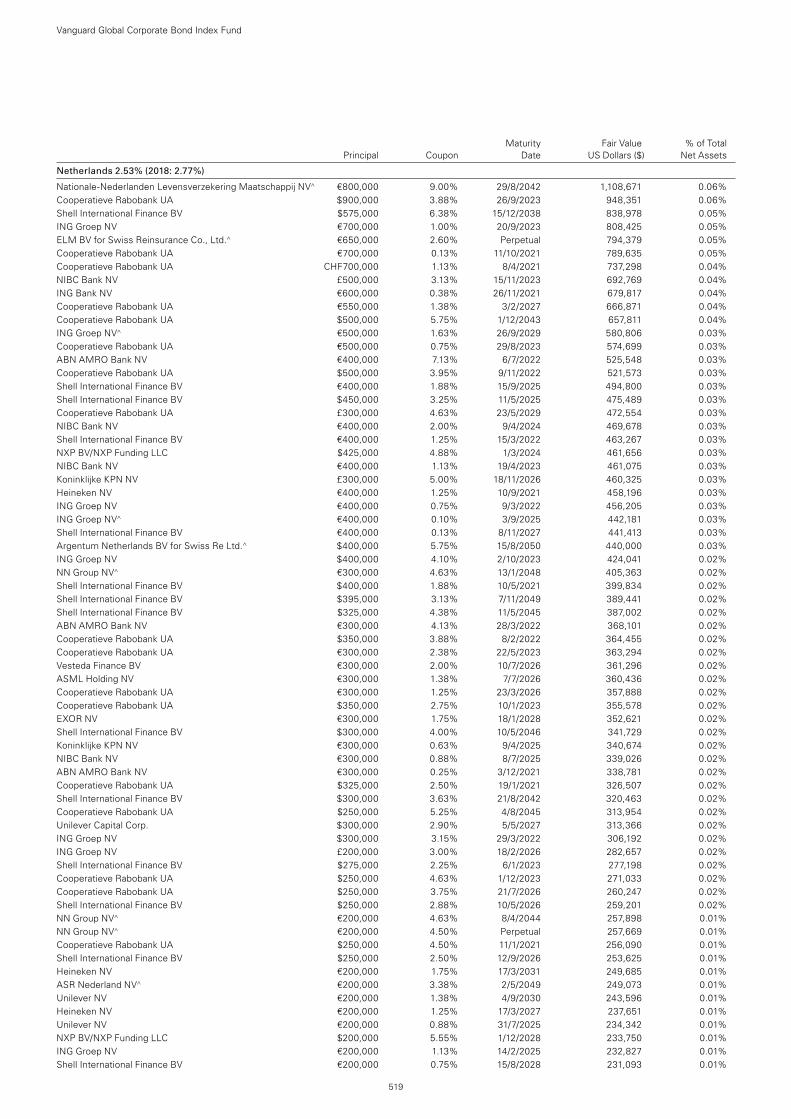
Netherlands 2.53% (2018: 2.77%)
Nationale-Nederlanden Levensverzekering Maatschappij NV^ €800,000 9.00% 29/8/2042 1,108,671 0.06%Cooperatieve Rabobank UA $900,000 3.88% 26/9/2023 948,351 0.06%Shell International Finance BV $575,000 6.38% 15/12/2038 838,978 0.05%ING Groep NV €700,000 1.00% 20/9/2023 808,425 0.05%ELM BV for Swiss Reinsurance Co., Ltd.^ €650,000 2.60% Perpetual 794,379 0.05%Cooperatieve Rabobank UA €700,000 0.13% 11/10/2021 789,635 0.05%Cooperatieve Rabobank UA CHF700,000 1.13% 8/4/2021 737,298 0.04%NIBC Bank NV £500,000 3.13% 15/11/2023 692,769 0.04%ING Bank NV €600,000 0.38% 26/11/2021 679,817 0.04%Cooperatieve Rabobank UA €550,000 1.38% 3/2/2027 666,871 0.04%Cooperatieve Rabobank UA $500,000 5.75% 1/12/2043 657,811 0.04%ING Groep NV^ €500,000 1.63% 26/9/2029 580,806 0.03%Cooperatieve Rabobank UA €500,000 0.75% 29/8/2023 574,699 0.03%ABN AMRO Bank NV €400,000 7.13% 6/7/2022 525,548 0.03%Cooperatieve Rabobank UA $500,000 3.95% 9/11/2022 521,573 0.03%Shell International Finance BV €400,000 1.88% 15/9/2025 494,800 0.03%Shell International Finance BV $450,000 3.25% 11/5/2025 475,489 0.03%Cooperatieve Rabobank UA £300,000 4.63% 23/5/2029 472,554 0.03%NIBC Bank NV €400,000 2.00% 9/4/2024 469,678 0.03%Shell International Finance BV €400,000 1.25% 15/3/2022 463,267 0.03%NXP BV/NXP Funding LLC $425,000 4.88% 1/3/2024 461,656 0.03%NIBC Bank NV €400,000 1.13% 19/4/2023 461,075 0.03%Koninklijke KPN NV £300,000 5.00% 18/11/2026 460,325 0.03%Heineken NV €400,000 1.25% 10/9/2021 458,196 0.03%ING Groep NV €400,000 0.75% 9/3/2022 456,205 0.03%ING Groep NV^ €400,000 0.10% 3/9/2025 442,181 0.03%Shell International Finance BV €400,000 0.13% 8/11/2027 441,413 0.03%Argentum Netherlands BV for Swiss Re Ltd.^ $400,000 5.75% 15/8/2050 440,000 0.03%ING Groep NV $400,000 4.10% 2/10/2023 424,041 0.02%NN Group NV^ €300,000 4.63% 13/1/2048 405,363 0.02%Shell International Finance BV $400,000 1.88% 10/5/2021 399,834 0.02%Shell International Finance BV $395,000 3.13% 7/11/2049 389,441 0.02%Shell International Finance BV $325,000 4.38% 11/5/2045 387,002 0.02%ABN AMRO Bank NV €300,000 4.13% 28/3/2022 368,101 0.02%Cooperatieve Rabobank UA $350,000 3.88% 8/2/2022 364,455 0.02%Cooperatieve Rabobank UA €300,000 2.38% 22/5/2023 363,294 0.02%Vesteda Finance BV €300,000 2.00% 10/7/2026 361,296 0.02%ASML Holding NV €300,000 1.38% 7/7/2026 360,436 0.02%Cooperatieve Rabobank UA €300,000 1.25% 23/3/2026 357,888 0.02%Cooperatieve Rabobank UA $350,000 2.75% 10/1/2023 355,578 0.02%EXOR NV €300,000 1.75% 18/1/2028 352,621 0.02%Shell International Finance BV $300,000 4.00% 10/5/2046 341,729 0.02%Koninklijke KPN NV €300,000 0.63% 9/4/2025 340,674 0.02%NIBC Bank NV €300,000 0.88% 8/7/2025 339,026 0.02%ABN AMRO Bank NV €300,000 0.25% 3/12/2021 338,781 0.02%Cooperatieve Rabobank UA $325,000 2.50% 19/1/2021 326,507 0.02%Shell International Finance BV $300,000 3.63% 21/8/2042 320,463 0.02%Cooperatieve Rabobank UA $250,000 5.25% 4/8/2045 313,954 0.02%Unilever Capital Corp. $300,000 2.90% 5/5/2027 313,366 0.02%ING Groep NV $300,000 3.15% 29/3/2022 306,192 0.02%ING Groep NV £200,000 3.00% 18/2/2026 282,657 0.02%Shell International Finance BV $275,000 2.25% 6/1/2023 277,198 0.02%Cooperatieve Rabobank UA $250,000 4.63% 1/12/2023 271,033 0.02%Cooperatieve Rabobank UA $250,000 3.75% 21/7/2026 260,247 0.02%Shell International Finance BV $250,000 2.88% 10/5/2026 259,201 0.02%NN Group NV^ €200,000 4.63% 8/4/2044 257,898 0.01%NN Group NV^ €200,000 4.50% Perpetual 257,669 0.01%Cooperatieve Rabobank UA $250,000 4.50% 11/1/2021 256,090 0.01%Shell International Finance BV $250,000 2.50% 12/9/2026 253,625 0.01%Heineken NV €200,000 1.75% 17/3/2031 249,685 0.01%ASR Nederland NV^ €200,000 3.38% 2/5/2049 249,073 0.01%Unilever NV €200,000 1.38% 4/9/2030 243,596 0.01%Heineken NV €200,000 1.25% 17/3/2027 237,651 0.01%Unilever NV €200,000 0.88% 31/7/2025 234,342 0.01%NXP BV/NXP Funding LLC $200,000 5.55% 1/12/2028 233,750 0.01%ING Groep NV €200,000 1.13% 14/2/2025 232,827 0.01%Shell International Finance BV €200,000 0.75% 15/8/2028 231,093 0.01%
Vanguard Global Corporate Bond Index Fund
519
Maturity Fair Value % of Total Principal Coupon Date US Dollars ($) Net Assets
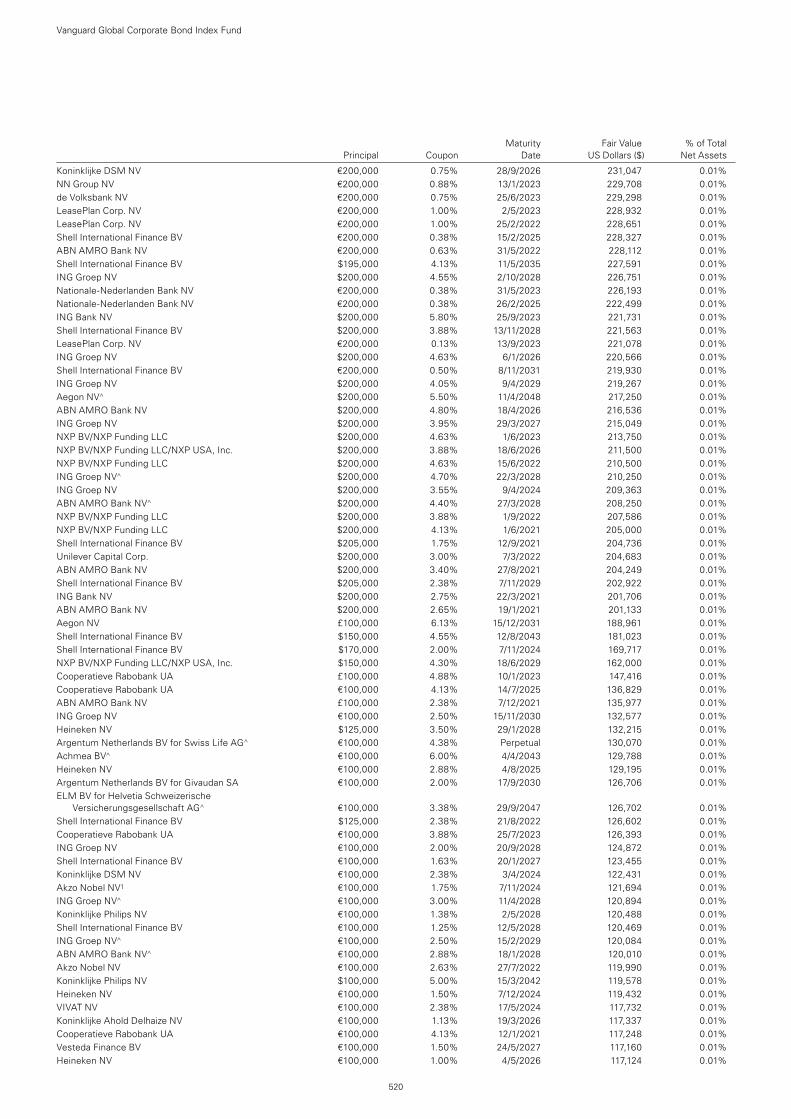
Koninklijke DSM NV €200,000 0.75% 28/9/2026 231,047 0.01%NN Group NV €200,000 0.88% 13/1/2023 229,708 0.01%de Volksbank NV €200,000 0.75% 25/6/2023 229,298 0.01%LeasePlan Corp. NV €200,000 1.00% 2/5/2023 228,932 0.01%LeasePlan Corp. NV €200,000 1.00% 25/2/2022 228,651 0.01%Shell International Finance BV €200,000 0.38% 15/2/2025 228,327 0.01%ABN AMRO Bank NV €200,000 0.63% 31/5/2022 228,112 0.01%Shell International Finance BV $195,000 4.13% 11/5/2035 227,591 0.01%ING Groep NV $200,000 4.55% 2/10/2028 226,751 0.01%Nationale-Nederlanden Bank NV €200,000 0.38% 31/5/2023 226,193 0.01%Nationale-Nederlanden Bank NV €200,000 0.38% 26/2/2025 222,499 0.01%ING Bank NV $200,000 5.80% 25/9/2023 221,731 0.01%Shell International Finance BV $200,000 3.88% 13/11/2028 221,563 0.01%LeasePlan Corp. NV €200,000 0.13% 13/9/2023 221,078 0.01%ING Groep NV $200,000 4.63% 6/1/2026 220,566 0.01%Shell International Finance BV €200,000 0.50% 8/11/2031 219,930 0.01%ING Groep NV $200,000 4.05% 9/4/2029 219,267 0.01%Aegon NV^ $200,000 5.50% 11/4/2048 217,250 0.01%ABN AMRO Bank NV $200,000 4.80% 18/4/2026 216,536 0.01%ING Groep NV $200,000 3.95% 29/3/2027 215,049 0.01%NXP BV/NXP Funding LLC $200,000 4.63% 1/6/2023 213,750 0.01%NXP BV/NXP Funding LLC/NXP USA, Inc. $200,000 3.88% 18/6/2026 211,500 0.01%NXP BV/NXP Funding LLC $200,000 4.63% 15/6/2022 210,500 0.01%ING Groep NV^ $200,000 4.70% 22/3/2028 210,250 0.01%ING Groep NV $200,000 3.55% 9/4/2024 209,363 0.01%ABN AMRO Bank NV^ $200,000 4.40% 27/3/2028 208,250 0.01%NXP BV/NXP Funding LLC $200,000 3.88% 1/9/2022 207,586 0.01%NXP BV/NXP Funding LLC $200,000 4.13% 1/6/2021 205,000 0.01%Shell International Finance BV $205,000 1.75% 12/9/2021 204,736 0.01%Unilever Capital Corp. $200,000 3.00% 7/3/2022 204,683 0.01%ABN AMRO Bank NV $200,000 3.40% 27/8/2021 204,249 0.01%Shell International Finance BV $205,000 2.38% 7/11/2029 202,922 0.01%ING Bank NV $200,000 2.75% 22/3/2021 201,706 0.01%ABN AMRO Bank NV $200,000 2.65% 19/1/2021 201,133 0.01%Aegon NV £100,000 6.13% 15/12/2031 188,961 0.01%Shell International Finance BV $150,000 4.55% 12/8/2043 181,023 0.01%Shell International Finance BV $170,000 2.00% 7/11/2024 169,717 0.01%NXP BV/NXP Funding LLC/NXP USA, Inc. $150,000 4.30% 18/6/2029 162,000 0.01%Cooperatieve Rabobank UA £100,000 4.88% 10/1/2023 147,416 0.01%Cooperatieve Rabobank UA €100,000 4.13% 14/7/2025 136,829 0.01%ABN AMRO Bank NV £100,000 2.38% 7/12/2021 135,977 0.01%ING Groep NV €100,000 2.50% 15/11/2030 132,577 0.01%Heineken NV $125,000 3.50% 29/1/2028 132,215 0.01%Argentum Netherlands BV for Swiss Life AG^ €100,000 4.38% Perpetual 130,070 0.01%Achmea BV^ €100,000 6.00% 4/4/2043 129,788 0.01%Heineken NV €100,000 2.88% 4/8/2025 129,195 0.01%Argentum Netherlands BV for Givaudan SA €100,000 2.00% 17/9/2030 126,706 0.01%ELM BV for Helvetia Schweizerische
Versicherungsgesellschaft AG^ €100,000 3.38% 29/9/2047 126,702 0.01%Shell International Finance BV $125,000 2.38% 21/8/2022 126,602 0.01%Cooperatieve Rabobank UA €100,000 3.88% 25/7/2023 126,393 0.01%ING Groep NV €100,000 2.00% 20/9/2028 124,872 0.01%Shell International Finance BV €100,000 1.63% 20/1/2027 123,455 0.01%Koninklijke DSM NV €100,000 2.38% 3/4/2024 122,431 0.01%Akzo Nobel NV1 €100,000 1.75% 7/11/2024 121,694 0.01%ING Groep NV^ €100,000 3.00% 11/4/2028 120,894 0.01%Koninklijke Philips NV €100,000 1.38% 2/5/2028 120,488 0.01%Shell International Finance BV €100,000 1.25% 12/5/2028 120,469 0.01%ING Groep NV^ €100,000 2.50% 15/2/2029 120,084 0.01%ABN AMRO Bank NV^ €100,000 2.88% 18/1/2028 120,010 0.01%Akzo Nobel NV €100,000 2.63% 27/7/2022 119,990 0.01%Koninklijke Philips NV $100,000 5.00% 15/3/2042 119,578 0.01%Heineken NV €100,000 1.50% 7/12/2024 119,432 0.01%VIVAT NV €100,000 2.38% 17/5/2024 117,732 0.01%Koninklijke Ahold Delhaize NV €100,000 1.13% 19/3/2026 117,337 0.01%Cooperatieve Rabobank UA €100,000 4.13% 12/1/2021 117,248 0.01%Vesteda Finance BV €100,000 1.50% 24/5/2027 117,160 0.01%Heineken NV €100,000 1.00% 4/5/2026 117,124 0.01%
Vanguard Global Corporate Bond Index Fund
520
Maturity Fair Value % of Total Principal Coupon Date US Dollars ($) Net Assets
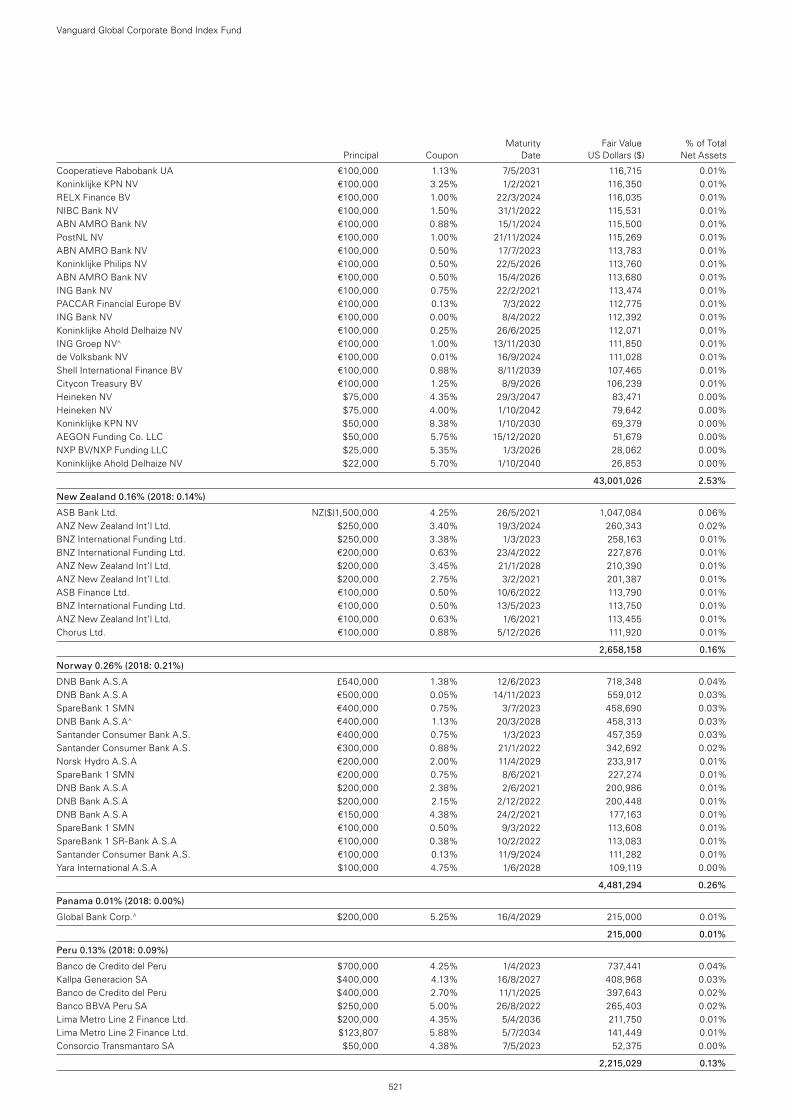
Cooperatieve Rabobank UA €100,000 1.13% 7/5/2031 116,715 0.01%Koninklijke KPN NV €100,000 3.25% 1/2/2021 116,350 0.01%RELX Finance BV €100,000 1.00% 22/3/2024 116,035 0.01%NIBC Bank NV €100,000 1.50% 31/1/2022 115,531 0.01%ABN AMRO Bank NV €100,000 0.88% 15/1/2024 115,500 0.01%PostNL NV €100,000 1.00% 21/11/2024 115,269 0.01%ABN AMRO Bank NV €100,000 0.50% 17/7/2023 113,783 0.01%Koninklijke Philips NV €100,000 0.50% 22/5/2026 113,760 0.01%ABN AMRO Bank NV €100,000 0.50% 15/4/2026 113,680 0.01%ING Bank NV €100,000 0.75% 22/2/2021 113,474 0.01%PACCAR Financial Europe BV €100,000 0.13% 7/3/2022 112,775 0.01%ING Bank NV €100,000 0.00% 8/4/2022 112,392 0.01%Koninklijke Ahold Delhaize NV €100,000 0.25% 26/6/2025 112,071 0.01%ING Groep NV^ €100,000 1.00% 13/11/2030 111,850 0.01%de Volksbank NV €100,000 0.01% 16/9/2024 111,028 0.01%Shell International Finance BV €100,000 0.88% 8/11/2039 107,465 0.01%Citycon Treasury BV €100,000 1.25% 8/9/2026 106,239 0.01%Heineken NV $75,000 4.35% 29/3/2047 83,471 0.00%Heineken NV $75,000 4.00% 1/10/2042 79,642 0.00%Koninklijke KPN NV $50,000 8.38% 1/10/2030 69,379 0.00%AEGON Funding Co. LLC $50,000 5.75% 15/12/2020 51,679 0.00%NXP BV/NXP Funding LLC $25,000 5.35% 1/3/2026 28,062 0.00%Koninklijke Ahold Delhaize NV $22,000 5.70% 1/10/2040 26,853 0.00%
43,001,026 2.53%
New Zealand 0.16% (2018: 0.14%)
ASB Bank Ltd. NZ($)1,500,000 4.25% 26/5/2021 1,047,084 0.06%ANZ New Zealand Int’l Ltd. $250,000 3.40% 19/3/2024 260,343 0.02%BNZ International Funding Ltd. $250,000 3.38% 1/3/2023 258,163 0.01%BNZ International Funding Ltd. €200,000 0.63% 23/4/2022 227,876 0.01%ANZ New Zealand Int’l Ltd. $200,000 3.45% 21/1/2028 210,390 0.01%ANZ New Zealand Int’l Ltd. $200,000 2.75% 3/2/2021 201,387 0.01%ASB Finance Ltd. €100,000 0.50% 10/6/2022 113,790 0.01%BNZ International Funding Ltd. €100,000 0.50% 13/5/2023 113,750 0.01%ANZ New Zealand Int’l Ltd. €100,000 0.63% 1/6/2021 113,455 0.01%Chorus Ltd. €100,000 0.88% 5/12/2026 111,920 0.01%
2,658,158 0.16%
Norway 0.26% (2018: 0.21%)
DNB Bank A.S.A £540,000 1.38% 12/6/2023 718,348 0.04%DNB Bank A.S.A €500,000 0.05% 14/11/2023 559,012 0.03%SpareBank 1 SMN €400,000 0.75% 3/7/2023 458,690 0.03%DNB Bank A.S.A^ €400,000 1.13% 20/3/2028 458,313 0.03%Santander Consumer Bank A.S. €400,000 0.75% 1/3/2023 457,359 0.03%Santander Consumer Bank A.S. €300,000 0.88% 21/1/2022 342,692 0.02%Norsk Hydro A.S.A €200,000 2.00% 11/4/2029 233,917 0.01%SpareBank 1 SMN €200,000 0.75% 8/6/2021 227,274 0.01%DNB Bank A.S.A $200,000 2.38% 2/6/2021 200,986 0.01%DNB Bank A.S.A $200,000 2.15% 2/12/2022 200,448 0.01%DNB Bank A.S.A €150,000 4.38% 24/2/2021 177,163 0.01%SpareBank 1 SMN €100,000 0.50% 9/3/2022 113,608 0.01%SpareBank 1 SR-Bank A.S.A €100,000 0.38% 10/2/2022 113,083 0.01%Santander Consumer Bank A.S. €100,000 0.13% 11/9/2024 111,282 0.01%Yara International A.S.A $100,000 4.75% 1/6/2028 109,119 0.00%
4,481,294 0.26%
Panama 0.01% (2018: 0.00%)
Global Bank Corp.^ $200,000 5.25% 16/4/2029 215,000 0.01%
215,000 0.01%
Peru 0.13% (2018: 0.09%)
Banco de Credito del Peru $700,000 4.25% 1/4/2023 737,441 0.04%Kallpa Generacion SA $400,000 4.13% 16/8/2027 408,968 0.03%Banco de Credito del Peru $400,000 2.70% 11/1/2025 397,643 0.02%Banco BBVA Peru SA $250,000 5.00% 26/8/2022 265,403 0.02%Lima Metro Line 2 Finance Ltd. $200,000 4.35% 5/4/2036 211,750 0.01%Lima Metro Line 2 Finance Ltd. $123,807 5.88% 5/7/2034 141,449 0.01%Consorcio Transmantaro SA $50,000 4.38% 7/5/2023 52,375 0.00%
2,215,029 0.13%
Vanguard Global Corporate Bond Index Fund
521
Maturity Fair Value % of Total Principal Coupon Date US Dollars ($) Net Assets
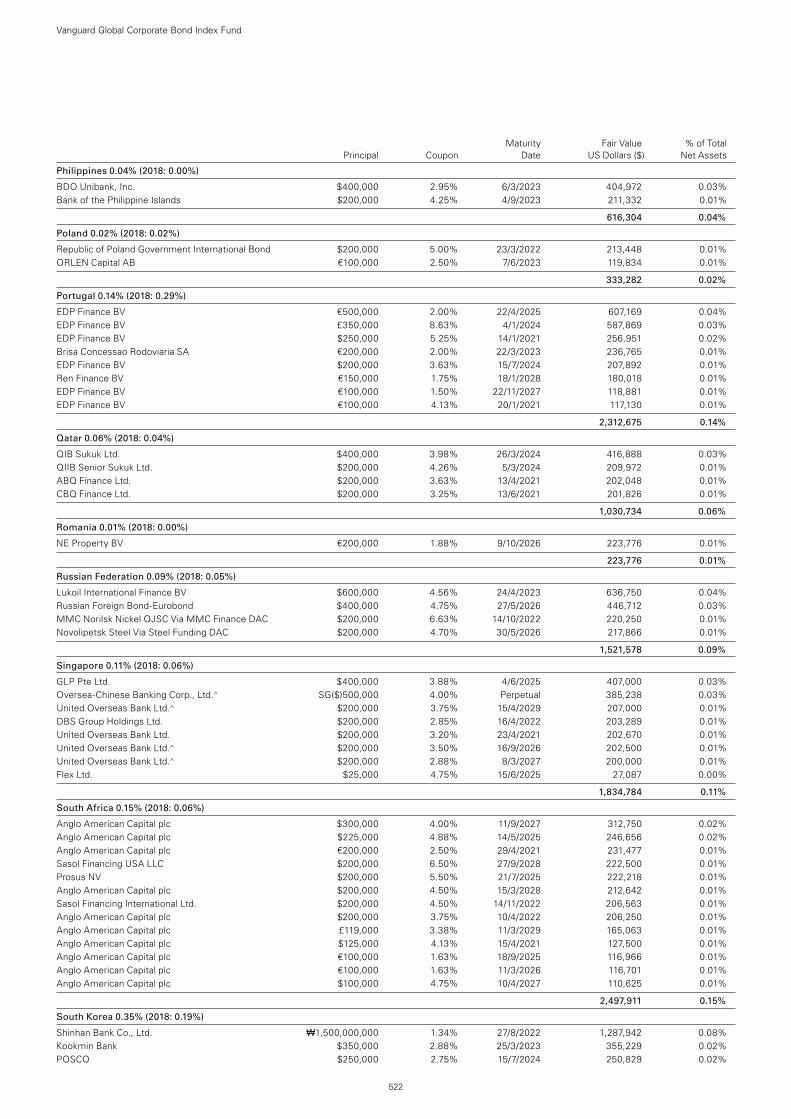
Philippines 0.04% (2018: 0.00%)
BDO Unibank, Inc. $400,000 2.95% 6/3/2023 404,972 0.03%Bank of the Philippine Islands $200,000 4.25% 4/9/2023 211,332 0.01%
616,304 0.04%
Poland 0.02% (2018: 0.02%)
Republic of Poland Government International Bond $200,000 5.00% 23/3/2022 213,448 0.01%ORLEN Capital AB €100,000 2.50% 7/6/2023 119,834 0.01%
333,282 0.02%
Portugal 0.14% (2018: 0.29%)
EDP Finance BV €500,000 2.00% 22/4/2025 607,169 0.04%EDP Finance BV £350,000 8.63% 4/1/2024 587,869 0.03%EDP Finance BV $250,000 5.25% 14/1/2021 256,951 0.02%Brisa Concessao Rodoviaria SA €200,000 2.00% 22/3/2023 236,765 0.01%EDP Finance BV $200,000 3.63% 15/7/2024 207,892 0.01%Ren Finance BV €150,000 1.75% 18/1/2028 180,018 0.01%EDP Finance BV €100,000 1.50% 22/11/2027 118,881 0.01%EDP Finance BV €100,000 4.13% 20/1/2021 117,130 0.01%
2,312,675 0.14%
Qatar 0.06% (2018: 0.04%)
QIB Sukuk Ltd. $400,000 3.98% 26/3/2024 416,888 0.03%QIIB Senior Sukuk Ltd. $200,000 4.26% 5/3/2024 209,972 0.01%ABQ Finance Ltd. $200,000 3.63% 13/4/2021 202,048 0.01%CBQ Finance Ltd. $200,000 3.25% 13/6/2021 201,826 0.01%
1,030,734 0.06%
Romania 0.01% (2018: 0.00%)
NE Property BV €200,000 1.88% 9/10/2026 223,776 0.01%
223,776 0.01%
Russian Federation 0.09% (2018: 0.05%)
Lukoil International Finance BV $600,000 4.56% 24/4/2023 636,750 0.04%Russian Foreign Bond-Eurobond $400,000 4.75% 27/5/2026 446,712 0.03%MMC Norilsk Nickel OJSC Via MMC Finance DAC $200,000 6.63% 14/10/2022 220,250 0.01%Novolipetsk Steel Via Steel Funding DAC $200,000 4.70% 30/5/2026 217,866 0.01%
1,521,578 0.09%
Singapore 0.11% (2018: 0.06%)
GLP Pte Ltd. $400,000 3.88% 4/6/2025 407,000 0.03%Oversea-Chinese Banking Corp., Ltd.^ SG($)500,000 4.00% Perpetual 385,238 0.03%United Overseas Bank Ltd.^ $200,000 3.75% 15/4/2029 207,000 0.01%DBS Group Holdings Ltd. $200,000 2.85% 16/4/2022 203,289 0.01%United Overseas Bank Ltd. $200,000 3.20% 23/4/2021 202,670 0.01%United Overseas Bank Ltd.^ $200,000 3.50% 16/9/2026 202,500 0.01%United Overseas Bank Ltd.^ $200,000 2.88% 8/3/2027 200,000 0.01%Flex Ltd. $25,000 4.75% 15/6/2025 27,087 0.00%
1,834,784 0.11%
South Africa 0.15% (2018: 0.06%)
Anglo American Capital plc $300,000 4.00% 11/9/2027 312,750 0.02%Anglo American Capital plc $225,000 4.88% 14/5/2025 246,656 0.02%Anglo American Capital plc €200,000 2.50% 29/4/2021 231,477 0.01%Sasol Financing USA LLC $200,000 6.50% 27/9/2028 222,500 0.01%Prosus NV $200,000 5.50% 21/7/2025 222,218 0.01%Anglo American Capital plc $200,000 4.50% 15/3/2028 212,642 0.01%Sasol Financing International Ltd. $200,000 4.50% 14/11/2022 206,563 0.01%Anglo American Capital plc $200,000 3.75% 10/4/2022 206,250 0.01%Anglo American Capital plc £119,000 3.38% 11/3/2029 165,063 0.01%Anglo American Capital plc $125,000 4.13% 15/4/2021 127,500 0.01%Anglo American Capital plc €100,000 1.63% 18/9/2025 116,966 0.01%Anglo American Capital plc €100,000 1.63% 11/3/2026 116,701 0.01%Anglo American Capital plc $100,000 4.75% 10/4/2027 110,625 0.01%
2,497,911 0.15%
South Korea 0.35% (2018: 0.19%)
Shinhan Bank Co., Ltd. ₩1,500,000,000 1.34% 27/8/2022 1,287,942 0.08%Kookmin Bank $350,000 2.88% 25/3/2023 355,229 0.02%POSCO $250,000 2.75% 15/7/2024 250,829 0.02%
Vanguard Global Corporate Bond Index Fund
522
Maturity Fair Value % of Total Principal Coupon Date US Dollars ($) Net Assets
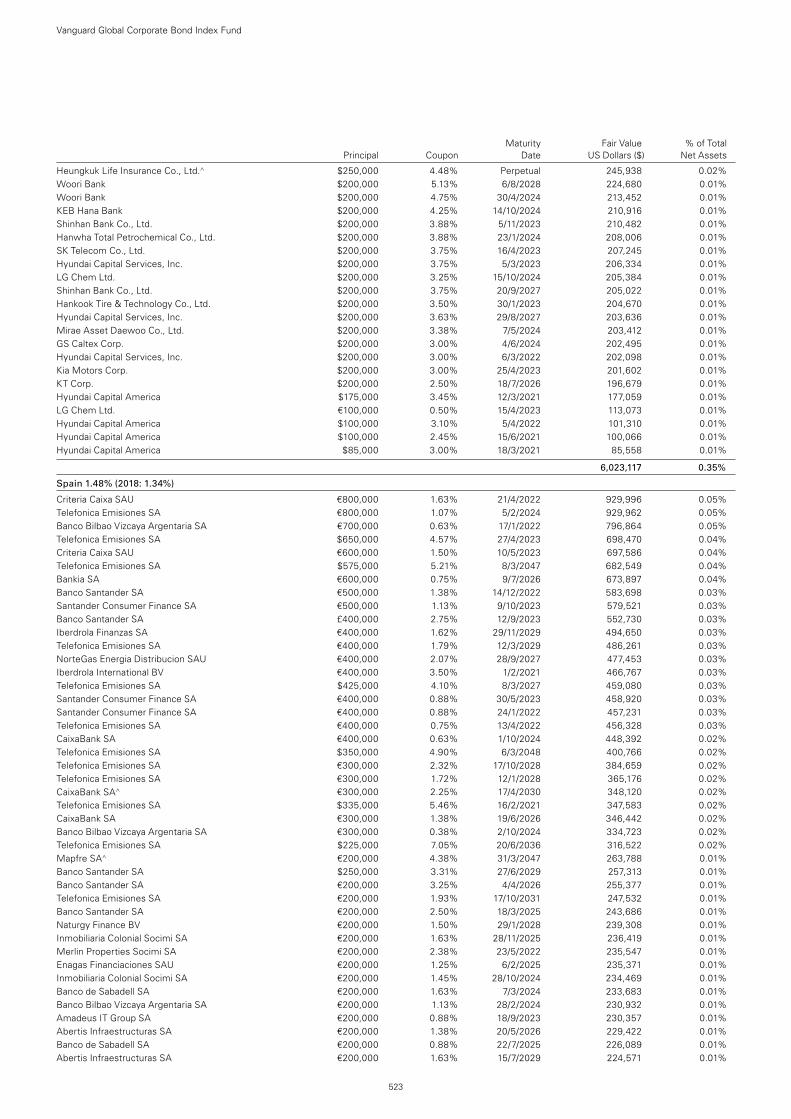
Heungkuk Life Insurance Co., Ltd.^ $250,000 4.48% Perpetual 245,938 0.02%Woori Bank $200,000 5.13% 6/8/2028 224,680 0.01%Woori Bank $200,000 4.75% 30/4/2024 213,452 0.01%KEB Hana Bank $200,000 4.25% 14/10/2024 210,916 0.01%Shinhan Bank Co., Ltd. $200,000 3.88% 5/11/2023 210,482 0.01%Hanwha Total Petrochemical Co., Ltd. $200,000 3.88% 23/1/2024 208,006 0.01%SK Telecom Co., Ltd. $200,000 3.75% 16/4/2023 207,245 0.01%Hyundai Capital Services, Inc. $200,000 3.75% 5/3/2023 206,334 0.01%LG Chem Ltd. $200,000 3.25% 15/10/2024 205,384 0.01%Shinhan Bank Co., Ltd. $200,000 3.75% 20/9/2027 205,022 0.01%Hankook Tire & Technology Co., Ltd. $200,000 3.50% 30/1/2023 204,670 0.01%Hyundai Capital Services, Inc. $200,000 3.63% 29/8/2027 203,636 0.01%Mirae Asset Daewoo Co., Ltd. $200,000 3.38% 7/5/2024 203,412 0.01%GS Caltex Corp. $200,000 3.00% 4/6/2024 202,495 0.01%Hyundai Capital Services, Inc. $200,000 3.00% 6/3/2022 202,098 0.01%Kia Motors Corp. $200,000 3.00% 25/4/2023 201,602 0.01%KT Corp. $200,000 2.50% 18/7/2026 196,679 0.01%Hyundai Capital America $175,000 3.45% 12/3/2021 177,059 0.01%LG Chem Ltd. €100,000 0.50% 15/4/2023 113,073 0.01%Hyundai Capital America $100,000 3.10% 5/4/2022 101,310 0.01%Hyundai Capital America $100,000 2.45% 15/6/2021 100,066 0.01%Hyundai Capital America $85,000 3.00% 18/3/2021 85,558 0.01%
6,023,117 0.35%
Spain 1.48% (2018: 1.34%)
Criteria Caixa SAU €800,000 1.63% 21/4/2022 929,996 0.05%Telefonica Emisiones SA €800,000 1.07% 5/2/2024 929,962 0.05%Banco Bilbao Vizcaya Argentaria SA €700,000 0.63% 17/1/2022 796,864 0.05%Telefonica Emisiones SA $650,000 4.57% 27/4/2023 698,470 0.04%Criteria Caixa SAU €600,000 1.50% 10/5/2023 697,586 0.04%Telefonica Emisiones SA $575,000 5.21% 8/3/2047 682,549 0.04%Bankia SA €600,000 0.75% 9/7/2026 673,897 0.04%Banco Santander SA €500,000 1.38% 14/12/2022 583,698 0.03%Santander Consumer Finance SA €500,000 1.13% 9/10/2023 579,521 0.03%Banco Santander SA £400,000 2.75% 12/9/2023 552,730 0.03%Iberdrola Finanzas SA €400,000 1.62% 29/11/2029 494,650 0.03%Telefonica Emisiones SA €400,000 1.79% 12/3/2029 486,261 0.03%NorteGas Energia Distribucion SAU €400,000 2.07% 28/9/2027 477,453 0.03%Iberdrola International BV €400,000 3.50% 1/2/2021 466,767 0.03%Telefonica Emisiones SA $425,000 4.10% 8/3/2027 459,080 0.03%Santander Consumer Finance SA €400,000 0.88% 30/5/2023 458,920 0.03%Santander Consumer Finance SA €400,000 0.88% 24/1/2022 457,231 0.03%Telefonica Emisiones SA €400,000 0.75% 13/4/2022 456,328 0.03%CaixaBank SA €400,000 0.63% 1/10/2024 448,392 0.02%Telefonica Emisiones SA $350,000 4.90% 6/3/2048 400,766 0.02%Telefonica Emisiones SA €300,000 2.32% 17/10/2028 384,659 0.02%Telefonica Emisiones SA €300,000 1.72% 12/1/2028 365,176 0.02%CaixaBank SA^ €300,000 2.25% 17/4/2030 348,120 0.02%Telefonica Emisiones SA $335,000 5.46% 16/2/2021 347,583 0.02%CaixaBank SA €300,000 1.38% 19/6/2026 346,442 0.02%Banco Bilbao Vizcaya Argentaria SA €300,000 0.38% 2/10/2024 334,723 0.02%Telefonica Emisiones SA $225,000 7.05% 20/6/2036 316,522 0.02%Mapfre SA^ €200,000 4.38% 31/3/2047 263,788 0.01%Banco Santander SA $250,000 3.31% 27/6/2029 257,313 0.01%Banco Santander SA €200,000 3.25% 4/4/2026 255,377 0.01%Telefonica Emisiones SA €200,000 1.93% 17/10/2031 247,532 0.01%Banco Santander SA €200,000 2.50% 18/3/2025 243,686 0.01%Naturgy Finance BV €200,000 1.50% 29/1/2028 239,308 0.01%Inmobiliaria Colonial Socimi SA €200,000 1.63% 28/11/2025 236,419 0.01%Merlin Properties Socimi SA €200,000 2.38% 23/5/2022 235,547 0.01%Enagas Financiaciones SAU €200,000 1.25% 6/2/2025 235,371 0.01%Inmobiliaria Colonial Socimi SA €200,000 1.45% 28/10/2024 234,469 0.01%Banco de Sabadell SA €200,000 1.63% 7/3/2024 233,683 0.01%Banco Bilbao Vizcaya Argentaria SA €200,000 1.13% 28/2/2024 230,932 0.01%Amadeus IT Group SA €200,000 0.88% 18/9/2023 230,357 0.01%Abertis Infraestructuras SA €200,000 1.38% 20/5/2026 229,422 0.01%Banco de Sabadell SA €200,000 0.88% 22/7/2025 226,089 0.01%Abertis Infraestructuras SA €200,000 1.63% 15/7/2029 224,571 0.01%
Vanguard Global Corporate Bond Index Fund
523
Maturity Fair Value % of Total Principal Coupon Date US Dollars ($) Net Assets
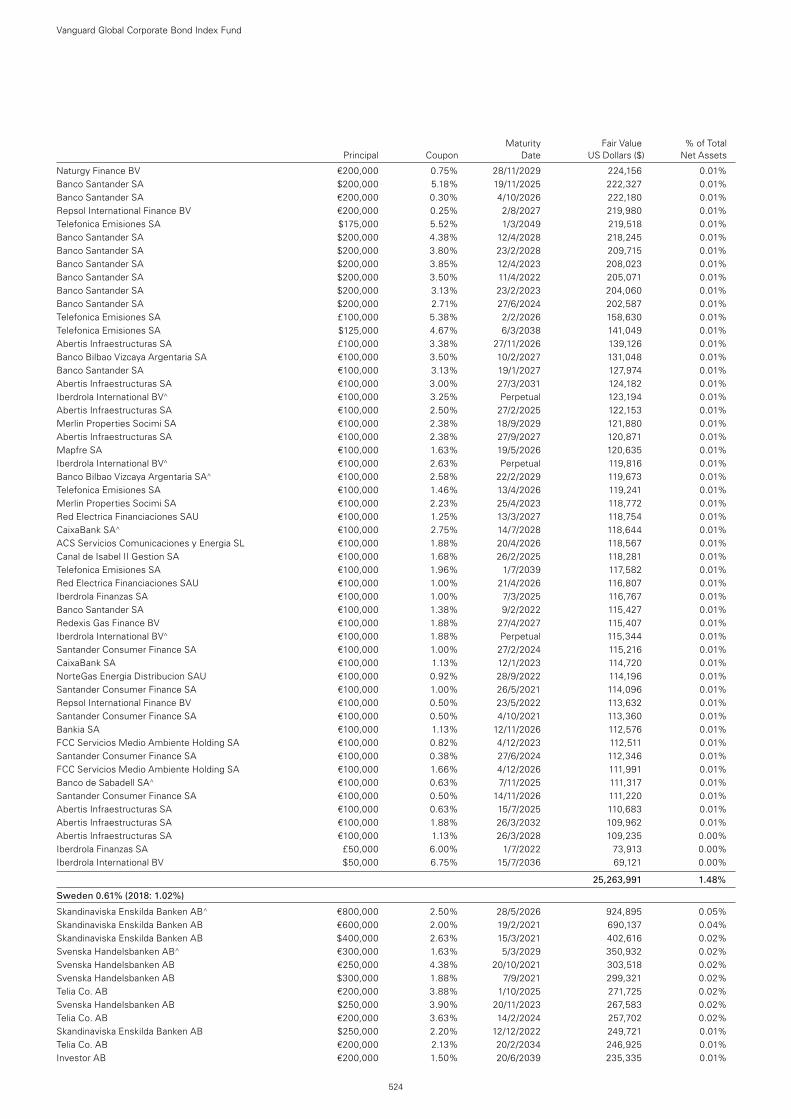
Naturgy Finance BV €200,000 0.75% 28/11/2029 224,156 0.01%Banco Santander SA $200,000 5.18% 19/11/2025 222,327 0.01%Banco Santander SA €200,000 0.30% 4/10/2026 222,180 0.01%Repsol International Finance BV €200,000 0.25% 2/8/2027 219,980 0.01%Telefonica Emisiones SA $175,000 5.52% 1/3/2049 219,518 0.01%Banco Santander SA $200,000 4.38% 12/4/2028 218,245 0.01%Banco Santander SA $200,000 3.80% 23/2/2028 209,715 0.01%Banco Santander SA $200,000 3.85% 12/4/2023 208,023 0.01%Banco Santander SA $200,000 3.50% 11/4/2022 205,071 0.01%Banco Santander SA $200,000 3.13% 23/2/2023 204,060 0.01%Banco Santander SA $200,000 2.71% 27/6/2024 202,587 0.01%Telefonica Emisiones SA £100,000 5.38% 2/2/2026 158,630 0.01%Telefonica Emisiones SA $125,000 4.67% 6/3/2038 141,049 0.01%Abertis Infraestructuras SA £100,000 3.38% 27/11/2026 139,126 0.01%Banco Bilbao Vizcaya Argentaria SA €100,000 3.50% 10/2/2027 131,048 0.01%Banco Santander SA €100,000 3.13% 19/1/2027 127,974 0.01%Abertis Infraestructuras SA €100,000 3.00% 27/3/2031 124,182 0.01%Iberdrola International BV^ €100,000 3.25% Perpetual 123,194 0.01%Abertis Infraestructuras SA €100,000 2.50% 27/2/2025 122,153 0.01%Merlin Properties Socimi SA €100,000 2.38% 18/9/2029 121,880 0.01%Abertis Infraestructuras SA €100,000 2.38% 27/9/2027 120,871 0.01%Mapfre SA €100,000 1.63% 19/5/2026 120,635 0.01%Iberdrola International BV^ €100,000 2.63% Perpetual 119,816 0.01%Banco Bilbao Vizcaya Argentaria SA^ €100,000 2.58% 22/2/2029 119,673 0.01%Telefonica Emisiones SA €100,000 1.46% 13/4/2026 119,241 0.01%Merlin Properties Socimi SA €100,000 2.23% 25/4/2023 118,772 0.01%Red Electrica Financiaciones SAU €100,000 1.25% 13/3/2027 118,754 0.01%CaixaBank SA^ €100,000 2.75% 14/7/2028 118,644 0.01%ACS Servicios Comunicaciones y Energia SL €100,000 1.88% 20/4/2026 118,567 0.01%Canal de Isabel II Gestion SA €100,000 1.68% 26/2/2025 118,281 0.01%Telefonica Emisiones SA €100,000 1.96% 1/7/2039 117,582 0.01%Red Electrica Financiaciones SAU €100,000 1.00% 21/4/2026 116,807 0.01%Iberdrola Finanzas SA €100,000 1.00% 7/3/2025 116,767 0.01%Banco Santander SA €100,000 1.38% 9/2/2022 115,427 0.01%Redexis Gas Finance BV €100,000 1.88% 27/4/2027 115,407 0.01%Iberdrola International BV^ €100,000 1.88% Perpetual 115,344 0.01%Santander Consumer Finance SA €100,000 1.00% 27/2/2024 115,216 0.01%CaixaBank SA €100,000 1.13% 12/1/2023 114,720 0.01%NorteGas Energia Distribucion SAU €100,000 0.92% 28/9/2022 114,196 0.01%Santander Consumer Finance SA €100,000 1.00% 26/5/2021 114,096 0.01%Repsol International Finance BV €100,000 0.50% 23/5/2022 113,632 0.01%Santander Consumer Finance SA €100,000 0.50% 4/10/2021 113,360 0.01%Bankia SA €100,000 1.13% 12/11/2026 112,576 0.01%FCC Servicios Medio Ambiente Holding SA €100,000 0.82% 4/12/2023 112,511 0.01%Santander Consumer Finance SA €100,000 0.38% 27/6/2024 112,346 0.01%FCC Servicios Medio Ambiente Holding SA €100,000 1.66% 4/12/2026 111,991 0.01%Banco de Sabadell SA^ €100,000 0.63% 7/11/2025 111,317 0.01%Santander Consumer Finance SA €100,000 0.50% 14/11/2026 111,220 0.01%Abertis Infraestructuras SA €100,000 0.63% 15/7/2025 110,683 0.01%Abertis Infraestructuras SA €100,000 1.88% 26/3/2032 109,962 0.01%Abertis Infraestructuras SA €100,000 1.13% 26/3/2028 109,235 0.00%Iberdrola Finanzas SA £50,000 6.00% 1/7/2022 73,913 0.00%Iberdrola International BV $50,000 6.75% 15/7/2036 69,121 0.00%
25,263,991 1.48%
Sweden 0.61% (2018: 1.02%)
Skandinaviska Enskilda Banken AB^ €800,000 2.50% 28/5/2026 924,895 0.05%Skandinaviska Enskilda Banken AB €600,000 2.00% 19/2/2021 690,137 0.04%Skandinaviska Enskilda Banken AB $400,000 2.63% 15/3/2021 402,616 0.02%Svenska Handelsbanken AB^ €300,000 1.63% 5/3/2029 350,932 0.02%Svenska Handelsbanken AB €250,000 4.38% 20/10/2021 303,518 0.02%Svenska Handelsbanken AB $300,000 1.88% 7/9/2021 299,321 0.02%Telia Co. AB €200,000 3.88% 1/10/2025 271,725 0.02%Svenska Handelsbanken AB $250,000 3.90% 20/11/2023 267,583 0.02%Telia Co. AB €200,000 3.63% 14/2/2024 257,702 0.02%Skandinaviska Enskilda Banken AB $250,000 2.20% 12/12/2022 249,721 0.01%Telia Co. AB €200,000 2.13% 20/2/2034 246,925 0.01%Investor AB €200,000 1.50% 20/6/2039 235,335 0.01%
Vanguard Global Corporate Bond Index Fund
524
Maturity Fair Value % of Total Principal Coupon Date US Dollars ($) Net Assets
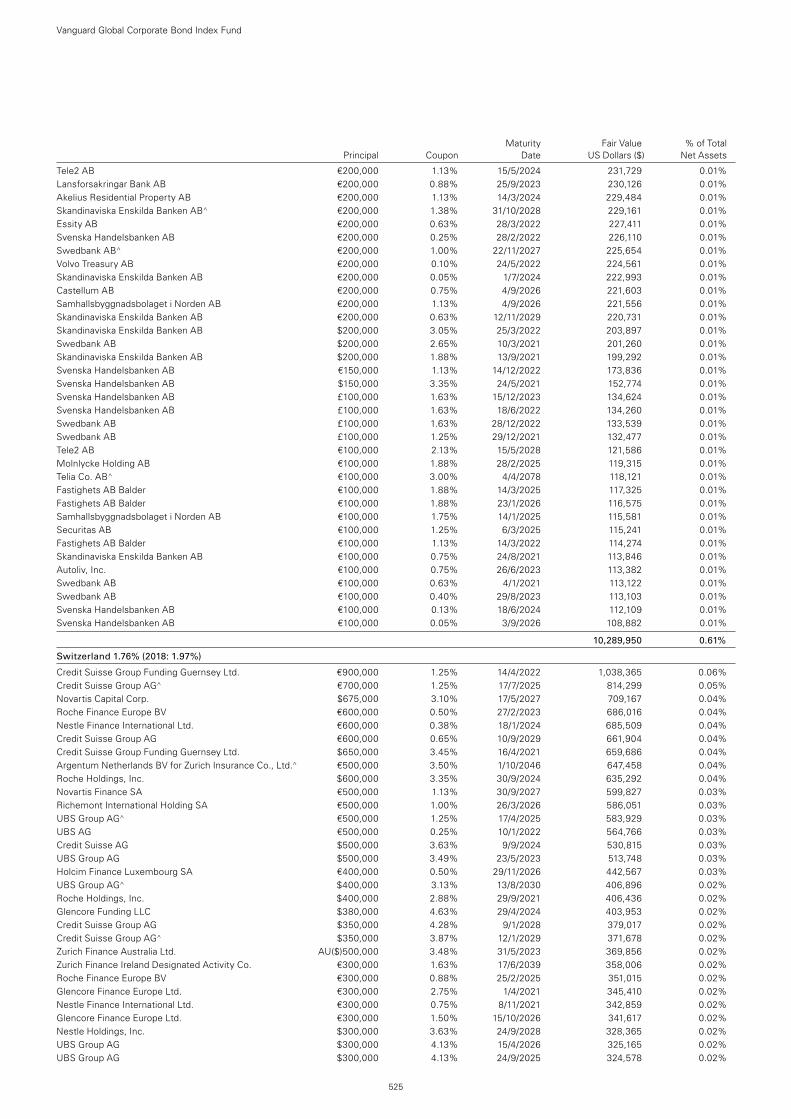
Tele2 AB €200,000 1.13% 15/5/2024 231,729 0.01%Lansforsakringar Bank AB €200,000 0.88% 25/9/2023 230,126 0.01%Akelius Residential Property AB €200,000 1.13% 14/3/2024 229,484 0.01%Skandinaviska Enskilda Banken AB^ €200,000 1.38% 31/10/2028 229,161 0.01%Essity AB €200,000 0.63% 28/3/2022 227,411 0.01%Svenska Handelsbanken AB €200,000 0.25% 28/2/2022 226,110 0.01%Swedbank AB^ €200,000 1.00% 22/11/2027 225,654 0.01%Volvo Treasury AB €200,000 0.10% 24/5/2022 224,561 0.01%Skandinaviska Enskilda Banken AB €200,000 0.05% 1/7/2024 222,993 0.01%Castellum AB €200,000 0.75% 4/9/2026 221,603 0.01%Samhallsbyggnadsbolaget i Norden AB €200,000 1.13% 4/9/2026 221,556 0.01%Skandinaviska Enskilda Banken AB €200,000 0.63% 12/11/2029 220,731 0.01%Skandinaviska Enskilda Banken AB $200,000 3.05% 25/3/2022 203,897 0.01%Swedbank AB $200,000 2.65% 10/3/2021 201,260 0.01%Skandinaviska Enskilda Banken AB $200,000 1.88% 13/9/2021 199,292 0.01%Svenska Handelsbanken AB €150,000 1.13% 14/12/2022 173,836 0.01%Svenska Handelsbanken AB $150,000 3.35% 24/5/2021 152,774 0.01%Svenska Handelsbanken AB £100,000 1.63% 15/12/2023 134,624 0.01%Svenska Handelsbanken AB £100,000 1.63% 18/6/2022 134,260 0.01%Swedbank AB £100,000 1.63% 28/12/2022 133,539 0.01%Swedbank AB £100,000 1.25% 29/12/2021 132,477 0.01%Tele2 AB €100,000 2.13% 15/5/2028 121,586 0.01%Molnlycke Holding AB €100,000 1.88% 28/2/2025 119,315 0.01%Telia Co. AB^ €100,000 3.00% 4/4/2078 118,121 0.01%Fastighets AB Balder €100,000 1.88% 14/3/2025 117,325 0.01%Fastighets AB Balder €100,000 1.88% 23/1/2026 116,575 0.01%Samhallsbyggnadsbolaget i Norden AB €100,000 1.75% 14/1/2025 115,581 0.01%Securitas AB €100,000 1.25% 6/3/2025 115,241 0.01%Fastighets AB Balder €100,000 1.13% 14/3/2022 114,274 0.01%Skandinaviska Enskilda Banken AB €100,000 0.75% 24/8/2021 113,846 0.01%Autoliv, Inc. €100,000 0.75% 26/6/2023 113,382 0.01%Swedbank AB €100,000 0.63% 4/1/2021 113,122 0.01%Swedbank AB €100,000 0.40% 29/8/2023 113,103 0.01%Svenska Handelsbanken AB €100,000 0.13% 18/6/2024 112,109 0.01%Svenska Handelsbanken AB €100,000 0.05% 3/9/2026 108,882 0.01%
10,289,950 0.61%
Switzerland 1.76% (2018: 1.97%)
Credit Suisse Group Funding Guernsey Ltd. €900,000 1.25% 14/4/2022 1,038,365 0.06%Credit Suisse Group AG^ €700,000 1.25% 17/7/2025 814,299 0.05%Novartis Capital Corp. $675,000 3.10% 17/5/2027 709,167 0.04%Roche Finance Europe BV €600,000 0.50% 27/2/2023 686,016 0.04%Nestle Finance International Ltd. €600,000 0.38% 18/1/2024 685,509 0.04%Credit Suisse Group AG €600,000 0.65% 10/9/2029 661,904 0.04%Credit Suisse Group Funding Guernsey Ltd. $650,000 3.45% 16/4/2021 659,686 0.04%Argentum Netherlands BV for Zurich Insurance Co., Ltd.^ €500,000 3.50% 1/10/2046 647,458 0.04%Roche Holdings, Inc. $600,000 3.35% 30/9/2024 635,292 0.04%Novartis Finance SA €500,000 1.13% 30/9/2027 599,827 0.03%Richemont International Holding SA €500,000 1.00% 26/3/2026 586,051 0.03%UBS Group AG^ €500,000 1.25% 17/4/2025 583,929 0.03%UBS AG €500,000 0.25% 10/1/2022 564,766 0.03%Credit Suisse AG $500,000 3.63% 9/9/2024 530,815 0.03%UBS Group AG $500,000 3.49% 23/5/2023 513,748 0.03%Holcim Finance Luxembourg SA €400,000 0.50% 29/11/2026 442,567 0.03%UBS Group AG^ $400,000 3.13% 13/8/2030 406,896 0.02%Roche Holdings, Inc. $400,000 2.88% 29/9/2021 406,436 0.02%Glencore Funding LLC $380,000 4.63% 29/4/2024 403,953 0.02%Credit Suisse Group AG $350,000 4.28% 9/1/2028 379,017 0.02%Credit Suisse Group AG^ $350,000 3.87% 12/1/2029 371,678 0.02%Zurich Finance Australia Ltd. AU($)500,000 3.48% 31/5/2023 369,856 0.02%Zurich Finance Ireland Designated Activity Co. €300,000 1.63% 17/6/2039 358,006 0.02%Roche Finance Europe BV €300,000 0.88% 25/2/2025 351,015 0.02%Glencore Finance Europe Ltd. €300,000 2.75% 1/4/2021 345,410 0.02%Nestle Finance International Ltd. €300,000 0.75% 8/11/2021 342,859 0.02%Glencore Finance Europe Ltd. €300,000 1.50% 15/10/2026 341,617 0.02%Nestle Holdings, Inc. $300,000 3.63% 24/9/2028 328,365 0.02%UBS Group AG $300,000 4.13% 15/4/2026 325,165 0.02%UBS Group AG $300,000 4.13% 24/9/2025 324,578 0.02%
Vanguard Global Corporate Bond Index Fund
525
Maturity Fair Value % of Total Principal Coupon Date US Dollars ($) Net Assets
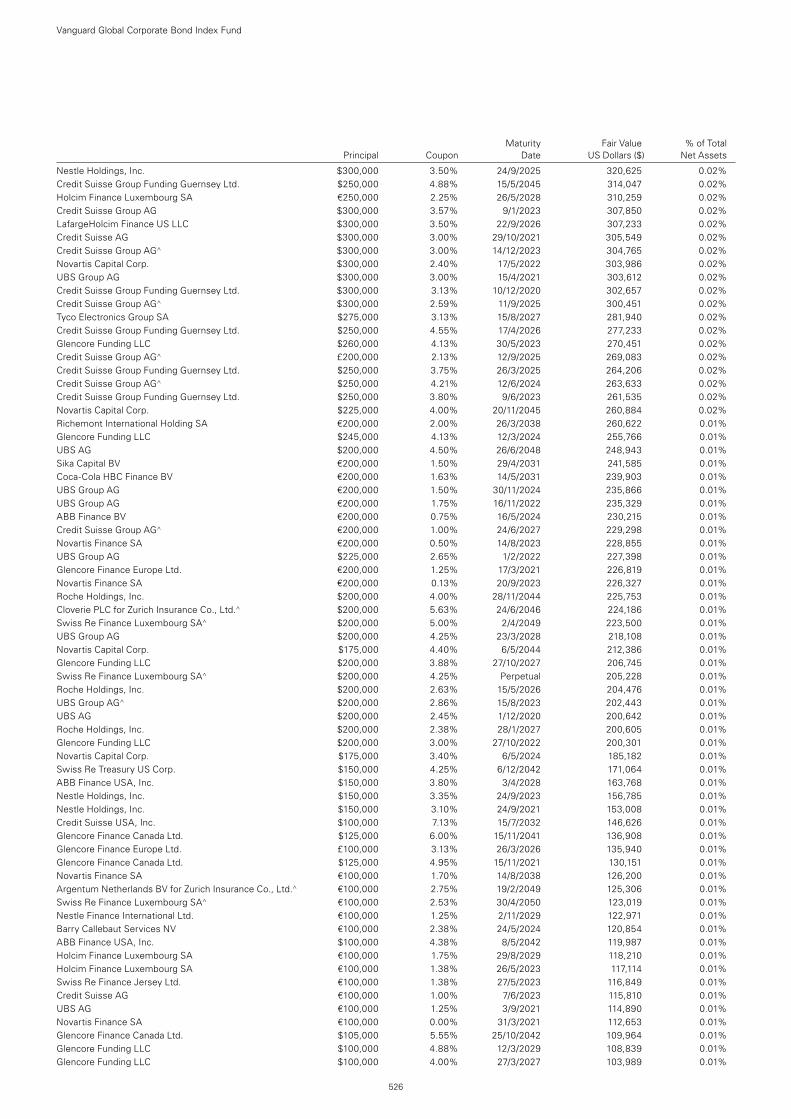
Nestle Holdings, Inc. $300,000 3.50% 24/9/2025 320,625 0.02%Credit Suisse Group Funding Guernsey Ltd. $250,000 4.88% 15/5/2045 314,047 0.02%Holcim Finance Luxembourg SA €250,000 2.25% 26/5/2028 310,259 0.02%Credit Suisse Group AG $300,000 3.57% 9/1/2023 307,850 0.02%LafargeHolcim Finance US LLC $300,000 3.50% 22/9/2026 307,233 0.02%Credit Suisse AG $300,000 3.00% 29/10/2021 305,549 0.02%Credit Suisse Group AG^ $300,000 3.00% 14/12/2023 304,765 0.02%Novartis Capital Corp. $300,000 2.40% 17/5/2022 303,986 0.02%UBS Group AG $300,000 3.00% 15/4/2021 303,612 0.02%Credit Suisse Group Funding Guernsey Ltd. $300,000 3.13% 10/12/2020 302,657 0.02%Credit Suisse Group AG^ $300,000 2.59% 11/9/2025 300,451 0.02%Tyco Electronics Group SA $275,000 3.13% 15/8/2027 281,940 0.02%Credit Suisse Group Funding Guernsey Ltd. $250,000 4.55% 17/4/2026 277,233 0.02%Glencore Funding LLC $260,000 4.13% 30/5/2023 270,451 0.02%Credit Suisse Group AG^ £200,000 2.13% 12/9/2025 269,083 0.02%Credit Suisse Group Funding Guernsey Ltd. $250,000 3.75% 26/3/2025 264,206 0.02%Credit Suisse Group AG^ $250,000 4.21% 12/6/2024 263,633 0.02%Credit Suisse Group Funding Guernsey Ltd. $250,000 3.80% 9/6/2023 261,535 0.02%Novartis Capital Corp. $225,000 4.00% 20/11/2045 260,884 0.02%Richemont International Holding SA €200,000 2.00% 26/3/2038 260,622 0.01%Glencore Funding LLC $245,000 4.13% 12/3/2024 255,766 0.01%UBS AG $200,000 4.50% 26/6/2048 248,943 0.01%Sika Capital BV €200,000 1.50% 29/4/2031 241,585 0.01%Coca-Cola HBC Finance BV €200,000 1.63% 14/5/2031 239,903 0.01%UBS Group AG €200,000 1.50% 30/11/2024 235,866 0.01%UBS Group AG €200,000 1.75% 16/11/2022 235,329 0.01%ABB Finance BV €200,000 0.75% 16/5/2024 230,215 0.01%Credit Suisse Group AG^ €200,000 1.00% 24/6/2027 229,298 0.01%Novartis Finance SA €200,000 0.50% 14/8/2023 228,855 0.01%UBS Group AG $225,000 2.65% 1/2/2022 227,398 0.01%Glencore Finance Europe Ltd. €200,000 1.25% 17/3/2021 226,819 0.01%Novartis Finance SA €200,000 0.13% 20/9/2023 226,327 0.01%Roche Holdings, Inc. $200,000 4.00% 28/11/2044 225,753 0.01%Cloverie PLC for Zurich Insurance Co., Ltd.^ $200,000 5.63% 24/6/2046 224,186 0.01%Swiss Re Finance Luxembourg SA^ $200,000 5.00% 2/4/2049 223,500 0.01%UBS Group AG $200,000 4.25% 23/3/2028 218,108 0.01%Novartis Capital Corp. $175,000 4.40% 6/5/2044 212,386 0.01%Glencore Funding LLC $200,000 3.88% 27/10/2027 206,745 0.01%Swiss Re Finance Luxembourg SA^ $200,000 4.25% Perpetual 205,228 0.01%Roche Holdings, Inc. $200,000 2.63% 15/5/2026 204,476 0.01%UBS Group AG^ $200,000 2.86% 15/8/2023 202,443 0.01%UBS AG $200,000 2.45% 1/12/2020 200,642 0.01%Roche Holdings, Inc. $200,000 2.38% 28/1/2027 200,605 0.01%Glencore Funding LLC $200,000 3.00% 27/10/2022 200,301 0.01%Novartis Capital Corp. $175,000 3.40% 6/5/2024 185,182 0.01%Swiss Re Treasury US Corp. $150,000 4.25% 6/12/2042 171,064 0.01%ABB Finance USA, Inc. $150,000 3.80% 3/4/2028 163,768 0.01%Nestle Holdings, Inc. $150,000 3.35% 24/9/2023 156,785 0.01%Nestle Holdings, Inc. $150,000 3.10% 24/9/2021 153,008 0.01%Credit Suisse USA, Inc. $100,000 7.13% 15/7/2032 146,626 0.01%Glencore Finance Canada Ltd. $125,000 6.00% 15/11/2041 136,908 0.01%Glencore Finance Europe Ltd. £100,000 3.13% 26/3/2026 135,940 0.01%Glencore Finance Canada Ltd. $125,000 4.95% 15/11/2021 130,151 0.01%Novartis Finance SA €100,000 1.70% 14/8/2038 126,200 0.01%Argentum Netherlands BV for Zurich Insurance Co., Ltd.^ €100,000 2.75% 19/2/2049 125,306 0.01%Swiss Re Finance Luxembourg SA^ €100,000 2.53% 30/4/2050 123,019 0.01%Nestle Finance International Ltd. €100,000 1.25% 2/11/2029 122,971 0.01%Barry Callebaut Services NV €100,000 2.38% 24/5/2024 120,854 0.01%ABB Finance USA, Inc. $100,000 4.38% 8/5/2042 119,987 0.01%Holcim Finance Luxembourg SA €100,000 1.75% 29/8/2029 118,210 0.01%Holcim Finance Luxembourg SA €100,000 1.38% 26/5/2023 117,114 0.01%Swiss Re Finance Jersey Ltd. €100,000 1.38% 27/5/2023 116,849 0.01%Credit Suisse AG €100,000 1.00% 7/6/2023 115,810 0.01%UBS AG €100,000 1.25% 3/9/2021 114,890 0.01%Novartis Finance SA €100,000 0.00% 31/3/2021 112,653 0.01%Glencore Finance Canada Ltd. $105,000 5.55% 25/10/2042 109,964 0.01%Glencore Funding LLC $100,000 4.88% 12/3/2029 108,839 0.01%Glencore Funding LLC $100,000 4.00% 27/3/2027 103,989 0.01%
Vanguard Global Corporate Bond Index Fund
526
Maturity Fair Value % of Total Principal Coupon Date US Dollars ($) Net Assets
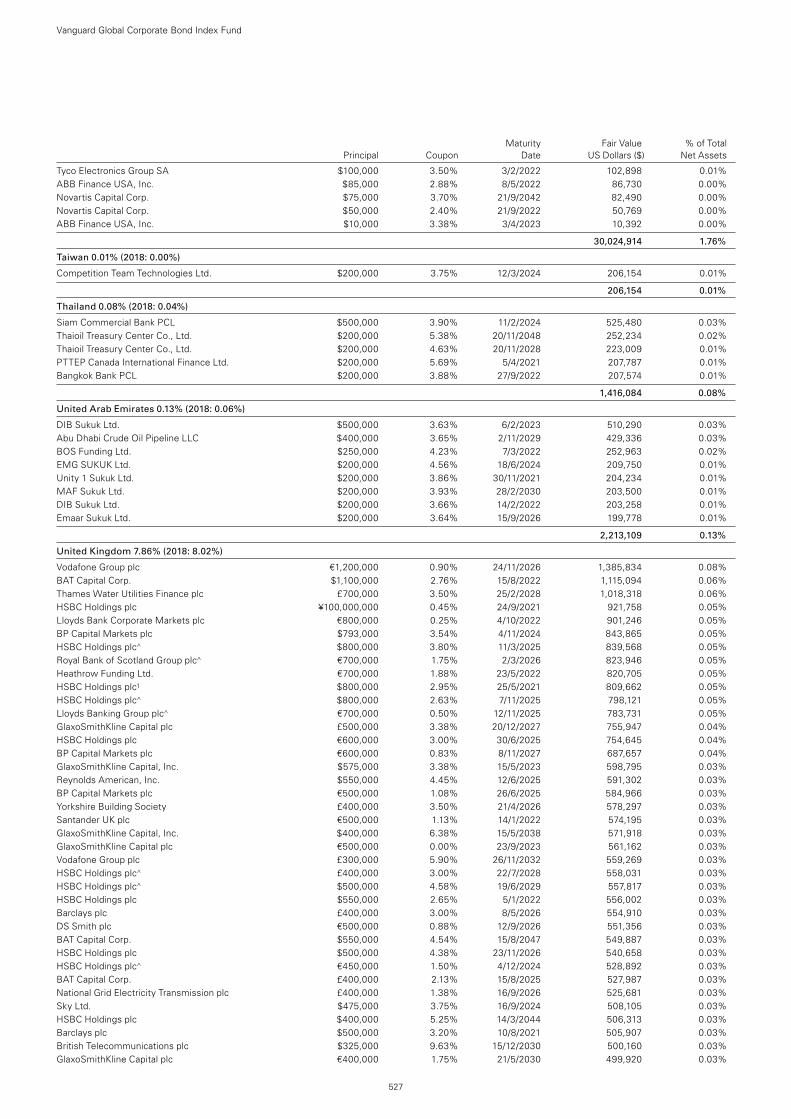
Tyco Electronics Group SA $100,000 3.50% 3/2/2022 102,898 0.01%ABB Finance USA, Inc. $85,000 2.88% 8/5/2022 86,730 0.00%Novartis Capital Corp. $75,000 3.70% 21/9/2042 82,490 0.00%Novartis Capital Corp. $50,000 2.40% 21/9/2022 50,769 0.00%ABB Finance USA, Inc. $10,000 3.38% 3/4/2023 10,392 0.00%
30,024,914 1.76%
Taiwan 0.01% (2018: 0.00%)
Competition Team Technologies Ltd. $200,000 3.75% 12/3/2024 206,154 0.01%
206,154 0.01%
Thailand 0.08% (2018: 0.04%)
Siam Commercial Bank PCL $500,000 3.90% 11/2/2024 525,480 0.03%Thaioil Treasury Center Co., Ltd. $200,000 5.38% 20/11/2048 252,234 0.02%Thaioil Treasury Center Co., Ltd. $200,000 4.63% 20/11/2028 223,009 0.01%PTTEP Canada International Finance Ltd. $200,000 5.69% 5/4/2021 207,787 0.01%Bangkok Bank PCL $200,000 3.88% 27/9/2022 207,574 0.01%
1,416,084 0.08%
United Arab Emirates 0.13% (2018: 0.06%)
DIB Sukuk Ltd. $500,000 3.63% 6/2/2023 510,290 0.03%Abu Dhabi Crude Oil Pipeline LLC $400,000 3.65% 2/11/2029 429,336 0.03%BOS Funding Ltd. $250,000 4.23% 7/3/2022 252,963 0.02%EMG SUKUK Ltd. $200,000 4.56% 18/6/2024 209,750 0.01%Unity 1 Sukuk Ltd. $200,000 3.86% 30/11/2021 204,234 0.01%MAF Sukuk Ltd. $200,000 3.93% 28/2/2030 203,500 0.01%DIB Sukuk Ltd. $200,000 3.66% 14/2/2022 203,258 0.01%Emaar Sukuk Ltd. $200,000 3.64% 15/9/2026 199,778 0.01%
2,213,109 0.13%
United Kingdom 7.86% (2018: 8.02%)
Vodafone Group plc €1,200,000 0.90% 24/11/2026 1,385,834 0.08%BAT Capital Corp. $1,100,000 2.76% 15/8/2022 1,115,094 0.06%Thames Water Utilities Finance plc £700,000 3.50% 25/2/2028 1,018,318 0.06%HSBC Holdings plc ¥100,000,000 0.45% 24/9/2021 921,758 0.05%Lloyds Bank Corporate Markets plc €800,000 0.25% 4/10/2022 901,246 0.05%BP Capital Markets plc $793,000 3.54% 4/11/2024 843,865 0.05%HSBC Holdings plc^ $800,000 3.80% 11/3/2025 839,568 0.05%Royal Bank of Scotland Group plc^ €700,000 1.75% 2/3/2026 823,946 0.05%Heathrow Funding Ltd. €700,000 1.88% 23/5/2022 820,705 0.05%HSBC Holdings plc1 $800,000 2.95% 25/5/2021 809,662 0.05%HSBC Holdings plc^ $800,000 2.63% 7/11/2025 798,121 0.05%Lloyds Banking Group plc^ €700,000 0.50% 12/11/2025 783,731 0.05%GlaxoSmithKline Capital plc £500,000 3.38% 20/12/2027 755,947 0.04%HSBC Holdings plc €600,000 3.00% 30/6/2025 754,645 0.04%BP Capital Markets plc €600,000 0.83% 8/11/2027 687,657 0.04%GlaxoSmithKline Capital, Inc. $575,000 3.38% 15/5/2023 598,795 0.03%Reynolds American, Inc. $550,000 4.45% 12/6/2025 591,302 0.03%BP Capital Markets plc €500,000 1.08% 26/6/2025 584,966 0.03%Yorkshire Building Society £400,000 3.50% 21/4/2026 578,297 0.03%Santander UK plc €500,000 1.13% 14/1/2022 574,195 0.03%GlaxoSmithKline Capital, Inc. $400,000 6.38% 15/5/2038 571,918 0.03%GlaxoSmithKline Capital plc €500,000 0.00% 23/9/2023 561,162 0.03%Vodafone Group plc £300,000 5.90% 26/11/2032 559,269 0.03%HSBC Holdings plc^ £400,000 3.00% 22/7/2028 558,031 0.03%HSBC Holdings plc^ $500,000 4.58% 19/6/2029 557,817 0.03%HSBC Holdings plc $550,000 2.65% 5/1/2022 556,002 0.03%Barclays plc £400,000 3.00% 8/5/2026 554,910 0.03%DS Smith plc €500,000 0.88% 12/9/2026 551,356 0.03%BAT Capital Corp. $550,000 4.54% 15/8/2047 549,887 0.03%HSBC Holdings plc $500,000 4.38% 23/11/2026 540,658 0.03%HSBC Holdings plc^ €450,000 1.50% 4/12/2024 528,892 0.03%BAT Capital Corp. £400,000 2.13% 15/8/2025 527,987 0.03%National Grid Electricity Transmission plc £400,000 1.38% 16/9/2026 525,681 0.03%Sky Ltd. $475,000 3.75% 16/9/2024 508,105 0.03%HSBC Holdings plc $400,000 5.25% 14/3/2044 506,313 0.03%Barclays plc $500,000 3.20% 10/8/2021 505,907 0.03%British Telecommunications plc $325,000 9.63% 15/12/2030 500,160 0.03%GlaxoSmithKline Capital plc €400,000 1.75% 21/5/2030 499,920 0.03%
Vanguard Global Corporate Bond Index Fund
527
Maturity Fair Value % of Total Principal Coupon Date US Dollars ($) Net Assets
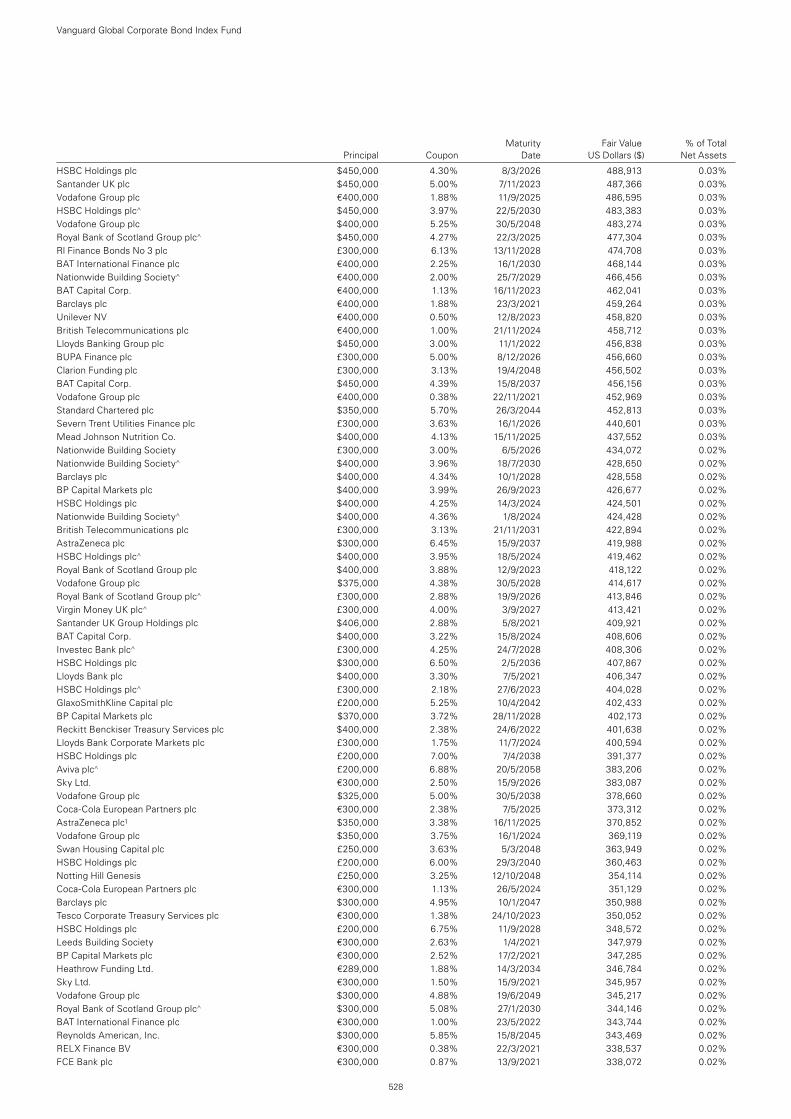
HSBC Holdings plc $450,000 4.30% 8/3/2026 488,913 0.03%Santander UK plc $450,000 5.00% 7/11/2023 487,366 0.03%Vodafone Group plc €400,000 1.88% 11/9/2025 486,595 0.03%HSBC Holdings plc^ $450,000 3.97% 22/5/2030 483,383 0.03%Vodafone Group plc $400,000 5.25% 30/5/2048 483,274 0.03%Royal Bank of Scotland Group plc^ $450,000 4.27% 22/3/2025 477,304 0.03%Rl Finance Bonds No 3 plc £300,000 6.13% 13/11/2028 474,708 0.03%BAT International Finance plc €400,000 2.25% 16/1/2030 468,144 0.03%Nationwide Building Society^ €400,000 2.00% 25/7/2029 466,456 0.03%BAT Capital Corp. €400,000 1.13% 16/11/2023 462,041 0.03%Barclays plc €400,000 1.88% 23/3/2021 459,264 0.03%Unilever NV €400,000 0.50% 12/8/2023 458,820 0.03%British Telecommunications plc €400,000 1.00% 21/11/2024 458,712 0.03%Lloyds Banking Group plc $450,000 3.00% 11/1/2022 456,838 0.03%BUPA Finance plc £300,000 5.00% 8/12/2026 456,660 0.03%Clarion Funding plc £300,000 3.13% 19/4/2048 456,502 0.03%BAT Capital Corp. $450,000 4.39% 15/8/2037 456,156 0.03%Vodafone Group plc €400,000 0.38% 22/11/2021 452,969 0.03%Standard Chartered plc $350,000 5.70% 26/3/2044 452,813 0.03%Severn Trent Utilities Finance plc £300,000 3.63% 16/1/2026 440,601 0.03%Mead Johnson Nutrition Co. $400,000 4.13% 15/11/2025 437,552 0.03%Nationwide Building Society £300,000 3.00% 6/5/2026 434,072 0.02%Nationwide Building Society^ $400,000 3.96% 18/7/2030 428,650 0.02%Barclays plc $400,000 4.34% 10/1/2028 428,558 0.02%BP Capital Markets plc $400,000 3.99% 26/9/2023 426,677 0.02%HSBC Holdings plc $400,000 4.25% 14/3/2024 424,501 0.02%Nationwide Building Society^ $400,000 4.36% 1/8/2024 424,428 0.02%British Telecommunications plc £300,000 3.13% 21/11/2031 422,894 0.02%AstraZeneca plc $300,000 6.45% 15/9/2037 419,988 0.02%HSBC Holdings plc^ $400,000 3.95% 18/5/2024 419,462 0.02%Royal Bank of Scotland Group plc $400,000 3.88% 12/9/2023 418,122 0.02%Vodafone Group plc $375,000 4.38% 30/5/2028 414,617 0.02%Royal Bank of Scotland Group plc^ £300,000 2.88% 19/9/2026 413,846 0.02%Virgin Money UK plc^ £300,000 4.00% 3/9/2027 413,421 0.02%Santander UK Group Holdings plc $406,000 2.88% 5/8/2021 409,921 0.02%BAT Capital Corp. $400,000 3.22% 15/8/2024 408,606 0.02%Investec Bank plc^ £300,000 4.25% 24/7/2028 408,306 0.02%HSBC Holdings plc $300,000 6.50% 2/5/2036 407,867 0.02%Lloyds Bank plc $400,000 3.30% 7/5/2021 406,347 0.02%HSBC Holdings plc^ £300,000 2.18% 27/6/2023 404,028 0.02%GlaxoSmithKline Capital plc £200,000 5.25% 10/4/2042 402,433 0.02%BP Capital Markets plc $370,000 3.72% 28/11/2028 402,173 0.02%Reckitt Benckiser Treasury Services plc $400,000 2.38% 24/6/2022 401,638 0.02%Lloyds Bank Corporate Markets plc £300,000 1.75% 11/7/2024 400,594 0.02%HSBC Holdings plc £200,000 7.00% 7/4/2038 391,377 0.02%Aviva plc^ £200,000 6.88% 20/5/2058 383,206 0.02%Sky Ltd. €300,000 2.50% 15/9/2026 383,087 0.02%Vodafone Group plc $325,000 5.00% 30/5/2038 378,660 0.02%Coca-Cola European Partners plc €300,000 2.38% 7/5/2025 373,312 0.02%AstraZeneca plc1 $350,000 3.38% 16/11/2025 370,852 0.02%Vodafone Group plc $350,000 3.75% 16/1/2024 369,119 0.02%Swan Housing Capital plc £250,000 3.63% 5/3/2048 363,949 0.02%HSBC Holdings plc £200,000 6.00% 29/3/2040 360,463 0.02%Notting Hill Genesis £250,000 3.25% 12/10/2048 354,114 0.02%Coca-Cola European Partners plc €300,000 1.13% 26/5/2024 351,129 0.02%Barclays plc $300,000 4.95% 10/1/2047 350,988 0.02%Tesco Corporate Treasury Services plc €300,000 1.38% 24/10/2023 350,052 0.02%HSBC Holdings plc £200,000 6.75% 11/9/2028 348,572 0.02%Leeds Building Society €300,000 2.63% 1/4/2021 347,979 0.02%BP Capital Markets plc €300,000 2.52% 17/2/2021 347,285 0.02%Heathrow Funding Ltd. €289,000 1.88% 14/3/2034 346,784 0.02%Sky Ltd. €300,000 1.50% 15/9/2021 345,957 0.02%Vodafone Group plc $300,000 4.88% 19/6/2049 345,217 0.02%Royal Bank of Scotland Group plc^ $300,000 5.08% 27/1/2030 344,146 0.02%BAT International Finance plc €300,000 1.00% 23/5/2022 343,744 0.02%Reynolds American, Inc. $300,000 5.85% 15/8/2045 343,469 0.02%RELX Finance BV €300,000 0.38% 22/3/2021 338,537 0.02%FCE Bank plc €300,000 0.87% 13/9/2021 338,072 0.02%
Vanguard Global Corporate Bond Index Fund
528
Maturity Fair Value % of Total Principal Coupon Date US Dollars ($) Net Assets
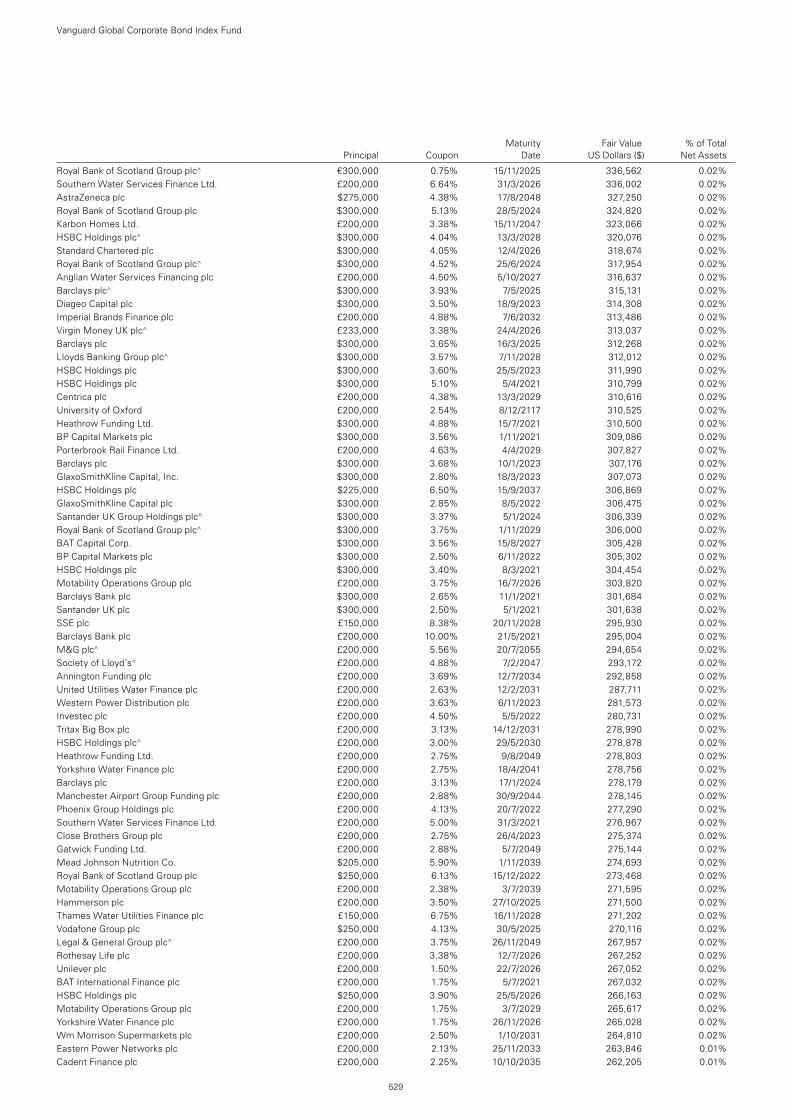
Royal Bank of Scotland Group plc^ €300,000 0.75% 15/11/2025 336,562 0.02%Southern Water Services Finance Ltd. £200,000 6.64% 31/3/2026 336,002 0.02%AstraZeneca plc $275,000 4.38% 17/8/2048 327,250 0.02%Royal Bank of Scotland Group plc $300,000 5.13% 28/5/2024 324,820 0.02%Karbon Homes Ltd. £200,000 3.38% 15/11/2047 323,066 0.02%HSBC Holdings plc^ $300,000 4.04% 13/3/2028 320,076 0.02%Standard Chartered plc $300,000 4.05% 12/4/2026 318,674 0.02%Royal Bank of Scotland Group plc^ $300,000 4.52% 25/6/2024 317,954 0.02%Anglian Water Services Financing plc £200,000 4.50% 5/10/2027 316,637 0.02%Barclays plc^ $300,000 3.93% 7/5/2025 315,131 0.02%Diageo Capital plc $300,000 3.50% 18/9/2023 314,308 0.02%Imperial Brands Finance plc £200,000 4.88% 7/6/2032 313,486 0.02%Virgin Money UK plc^ £233,000 3.38% 24/4/2026 313,037 0.02%Barclays plc $300,000 3.65% 16/3/2025 312,268 0.02%Lloyds Banking Group plc^ $300,000 3.57% 7/11/2028 312,012 0.02%HSBC Holdings plc $300,000 3.60% 25/5/2023 311,990 0.02%HSBC Holdings plc $300,000 5.10% 5/4/2021 310,799 0.02%Centrica plc £200,000 4.38% 13/3/2029 310,616 0.02%University of Oxford £200,000 2.54% 8/12/2117 310,525 0.02%Heathrow Funding Ltd. $300,000 4.88% 15/7/2021 310,500 0.02%BP Capital Markets plc $300,000 3.56% 1/11/2021 309,086 0.02%Porterbrook Rail Finance Ltd. £200,000 4.63% 4/4/2029 307,827 0.02%Barclays plc $300,000 3.68% 10/1/2023 307,176 0.02%GlaxoSmithKline Capital, Inc. $300,000 2.80% 18/3/2023 307,073 0.02%HSBC Holdings plc $225,000 6.50% 15/9/2037 306,869 0.02%GlaxoSmithKline Capital plc $300,000 2.85% 8/5/2022 306,475 0.02%Santander UK Group Holdings plc^ $300,000 3.37% 5/1/2024 306,339 0.02%Royal Bank of Scotland Group plc^ $300,000 3.75% 1/11/2029 306,000 0.02%BAT Capital Corp. $300,000 3.56% 15/8/2027 305,428 0.02%BP Capital Markets plc $300,000 2.50% 6/11/2022 305,302 0.02%HSBC Holdings plc $300,000 3.40% 8/3/2021 304,454 0.02%Motability Operations Group plc £200,000 3.75% 16/7/2026 303,820 0.02%Barclays Bank plc $300,000 2.65% 11/1/2021 301,684 0.02%Santander UK plc $300,000 2.50% 5/1/2021 301,638 0.02%SSE plc £150,000 8.38% 20/11/2028 295,930 0.02%Barclays Bank plc £200,000 10.00% 21/5/2021 295,004 0.02%M&G plc^ £200,000 5.56% 20/7/2055 294,654 0.02%Society of Lloyd’s^ £200,000 4.88% 7/2/2047 293,172 0.02%Annington Funding plc £200,000 3.69% 12/7/2034 292,858 0.02%United Utilities Water Finance plc £200,000 2.63% 12/2/2031 287,711 0.02%Western Power Distribution plc £200,000 3.63% 6/11/2023 281,573 0.02%Investec plc £200,000 4.50% 5/5/2022 280,731 0.02%Tritax Big Box plc £200,000 3.13% 14/12/2031 278,990 0.02%HSBC Holdings plc^ £200,000 3.00% 29/5/2030 278,878 0.02%Heathrow Funding Ltd. £200,000 2.75% 9/8/2049 278,803 0.02%Yorkshire Water Finance plc £200,000 2.75% 18/4/2041 278,756 0.02%Barclays plc £200,000 3.13% 17/1/2024 278,179 0.02%Manchester Airport Group Funding plc £200,000 2.88% 30/9/2044 278,145 0.02%Phoenix Group Holdings plc £200,000 4.13% 20/7/2022 277,290 0.02%Southern Water Services Finance Ltd. £200,000 5.00% 31/3/2021 276,967 0.02%Close Brothers Group plc £200,000 2.75% 26/4/2023 275,374 0.02%Gatwick Funding Ltd. £200,000 2.88% 5/7/2049 275,144 0.02%Mead Johnson Nutrition Co. $205,000 5.90% 1/11/2039 274,693 0.02%Royal Bank of Scotland Group plc $250,000 6.13% 15/12/2022 273,468 0.02%Motability Operations Group plc £200,000 2.38% 3/7/2039 271,595 0.02%Hammerson plc £200,000 3.50% 27/10/2025 271,500 0.02%Thames Water Utilities Finance plc £150,000 6.75% 16/11/2028 271,202 0.02%Vodafone Group plc $250,000 4.13% 30/5/2025 270,116 0.02%Legal & General Group plc^ £200,000 3.75% 26/11/2049 267,957 0.02%Rothesay Life plc £200,000 3.38% 12/7/2026 267,252 0.02%Unilever plc £200,000 1.50% 22/7/2026 267,052 0.02%BAT International Finance plc £200,000 1.75% 5/7/2021 267,032 0.02%HSBC Holdings plc $250,000 3.90% 25/5/2026 266,163 0.02%Motability Operations Group plc £200,000 1.75% 3/7/2029 265,617 0.02%Yorkshire Water Finance plc £200,000 1.75% 26/11/2026 265,028 0.02%Wm Morrison Supermarkets plc £200,000 2.50% 1/10/2031 264,810 0.02%Eastern Power Networks plc £200,000 2.13% 25/11/2033 263,846 0.01%Cadent Finance plc £200,000 2.25% 10/10/2035 262,205 0.01%
Vanguard Global Corporate Bond Index Fund
529
Maturity Fair Value % of Total Principal Coupon Date US Dollars ($) Net Assets
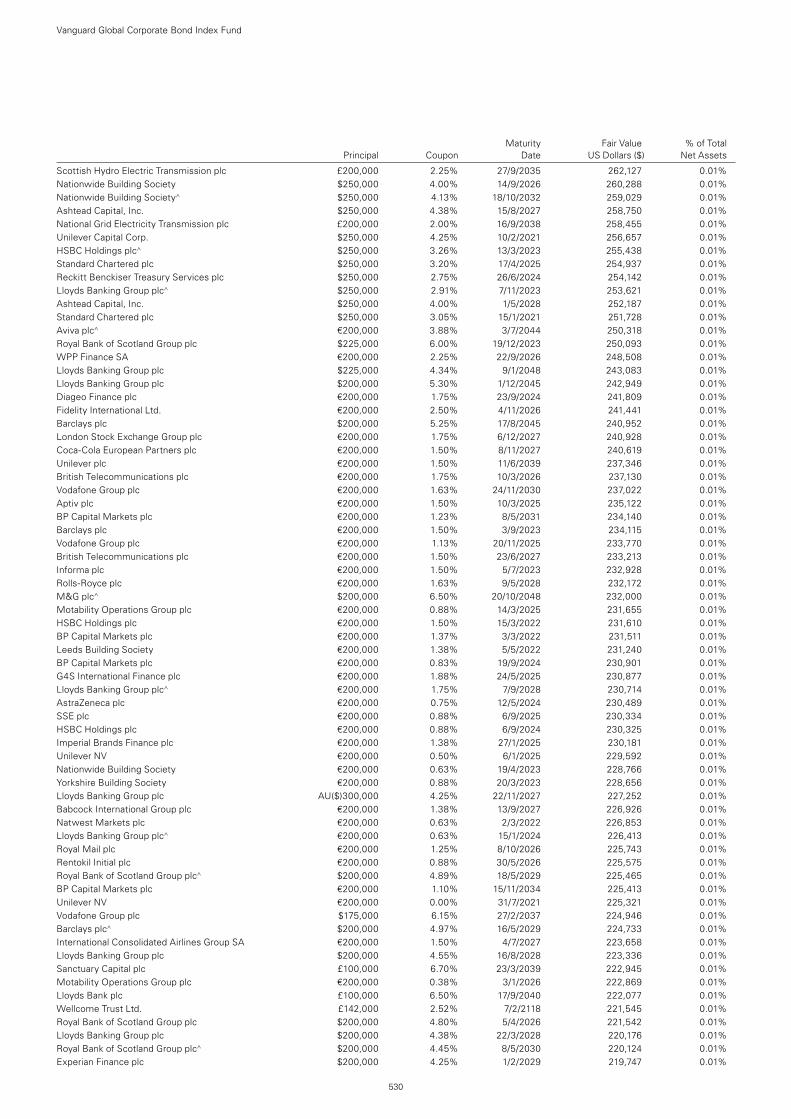
Scottish Hydro Electric Transmission plc £200,000 2.25% 27/9/2035 262,127 0.01%Nationwide Building Society $250,000 4.00% 14/9/2026 260,288 0.01%Nationwide Building Society^ $250,000 4.13% 18/10/2032 259,029 0.01%Ashtead Capital, Inc. $250,000 4.38% 15/8/2027 258,750 0.01%National Grid Electricity Transmission plc £200,000 2.00% 16/9/2038 258,455 0.01%Unilever Capital Corp. $250,000 4.25% 10/2/2021 256,657 0.01%HSBC Holdings plc^ $250,000 3.26% 13/3/2023 255,438 0.01%Standard Chartered plc $250,000 3.20% 17/4/2025 254,937 0.01%Reckitt Benckiser Treasury Services plc $250,000 2.75% 26/6/2024 254,142 0.01%Lloyds Banking Group plc^ $250,000 2.91% 7/11/2023 253,621 0.01%Ashtead Capital, Inc. $250,000 4.00% 1/5/2028 252,187 0.01%Standard Chartered plc $250,000 3.05% 15/1/2021 251,728 0.01%Aviva plc^ €200,000 3.88% 3/7/2044 250,318 0.01%Royal Bank of Scotland Group plc $225,000 6.00% 19/12/2023 250,093 0.01%WPP Finance SA €200,000 2.25% 22/9/2026 248,508 0.01%Lloyds Banking Group plc $225,000 4.34% 9/1/2048 243,083 0.01%Lloyds Banking Group plc $200,000 5.30% 1/12/2045 242,949 0.01%Diageo Finance plc €200,000 1.75% 23/9/2024 241,809 0.01%Fidelity International Ltd. €200,000 2.50% 4/11/2026 241,441 0.01%Barclays plc $200,000 5.25% 17/8/2045 240,952 0.01%London Stock Exchange Group plc €200,000 1.75% 6/12/2027 240,928 0.01%Coca-Cola European Partners plc €200,000 1.50% 8/11/2027 240,619 0.01%Unilever plc €200,000 1.50% 11/6/2039 237,346 0.01%British Telecommunications plc €200,000 1.75% 10/3/2026 237,130 0.01%Vodafone Group plc €200,000 1.63% 24/11/2030 237,022 0.01%Aptiv plc €200,000 1.50% 10/3/2025 235,122 0.01%BP Capital Markets plc €200,000 1.23% 8/5/2031 234,140 0.01%Barclays plc €200,000 1.50% 3/9/2023 234,115 0.01%Vodafone Group plc €200,000 1.13% 20/11/2025 233,770 0.01%British Telecommunications plc €200,000 1.50% 23/6/2027 233,213 0.01%Informa plc €200,000 1.50% 5/7/2023 232,928 0.01%Rolls-Royce plc €200,000 1.63% 9/5/2028 232,172 0.01%M&G plc^ $200,000 6.50% 20/10/2048 232,000 0.01%Motability Operations Group plc €200,000 0.88% 14/3/2025 231,655 0.01%HSBC Holdings plc €200,000 1.50% 15/3/2022 231,610 0.01%BP Capital Markets plc €200,000 1.37% 3/3/2022 231,511 0.01%Leeds Building Society €200,000 1.38% 5/5/2022 231,240 0.01%BP Capital Markets plc €200,000 0.83% 19/9/2024 230,901 0.01%G4S International Finance plc €200,000 1.88% 24/5/2025 230,877 0.01%Lloyds Banking Group plc^ €200,000 1.75% 7/9/2028 230,714 0.01%AstraZeneca plc €200,000 0.75% 12/5/2024 230,489 0.01%SSE plc €200,000 0.88% 6/9/2025 230,334 0.01%HSBC Holdings plc €200,000 0.88% 6/9/2024 230,325 0.01%Imperial Brands Finance plc €200,000 1.38% 27/1/2025 230,181 0.01%Unilever NV €200,000 0.50% 6/1/2025 229,592 0.01%Nationwide Building Society €200,000 0.63% 19/4/2023 228,766 0.01%Yorkshire Building Society €200,000 0.88% 20/3/2023 228,656 0.01%Lloyds Banking Group plc AU($)300,000 4.25% 22/11/2027 227,252 0.01%Babcock International Group plc €200,000 1.38% 13/9/2027 226,926 0.01%Natwest Markets plc €200,000 0.63% 2/3/2022 226,853 0.01%Lloyds Banking Group plc^ €200,000 0.63% 15/1/2024 226,413 0.01%Royal Mail plc €200,000 1.25% 8/10/2026 225,743 0.01%Rentokil Initial plc €200,000 0.88% 30/5/2026 225,575 0.01%Royal Bank of Scotland Group plc^ $200,000 4.89% 18/5/2029 225,465 0.01%BP Capital Markets plc €200,000 1.10% 15/11/2034 225,413 0.01%Unilever NV €200,000 0.00% 31/7/2021 225,321 0.01%Vodafone Group plc $175,000 6.15% 27/2/2037 224,946 0.01%Barclays plc^ $200,000 4.97% 16/5/2029 224,733 0.01%International Consolidated Airlines Group SA €200,000 1.50% 4/7/2027 223,658 0.01%Lloyds Banking Group plc $200,000 4.55% 16/8/2028 223,336 0.01%Sanctuary Capital plc £100,000 6.70% 23/3/2039 222,945 0.01%Motability Operations Group plc €200,000 0.38% 3/1/2026 222,869 0.01%Lloyds Bank plc £100,000 6.50% 17/9/2040 222,077 0.01%Wellcome Trust Ltd. £142,000 2.52% 7/2/2118 221,545 0.01%Royal Bank of Scotland Group plc $200,000 4.80% 5/4/2026 221,542 0.01%Lloyds Banking Group plc $200,000 4.38% 22/3/2028 220,176 0.01%Royal Bank of Scotland Group plc^ $200,000 4.45% 8/5/2030 220,124 0.01%Experian Finance plc $200,000 4.25% 1/2/2029 219,747 0.01%
Vanguard Global Corporate Bond Index Fund
530
Maturity Fair Value % of Total Principal Coupon Date US Dollars ($) Net Assets
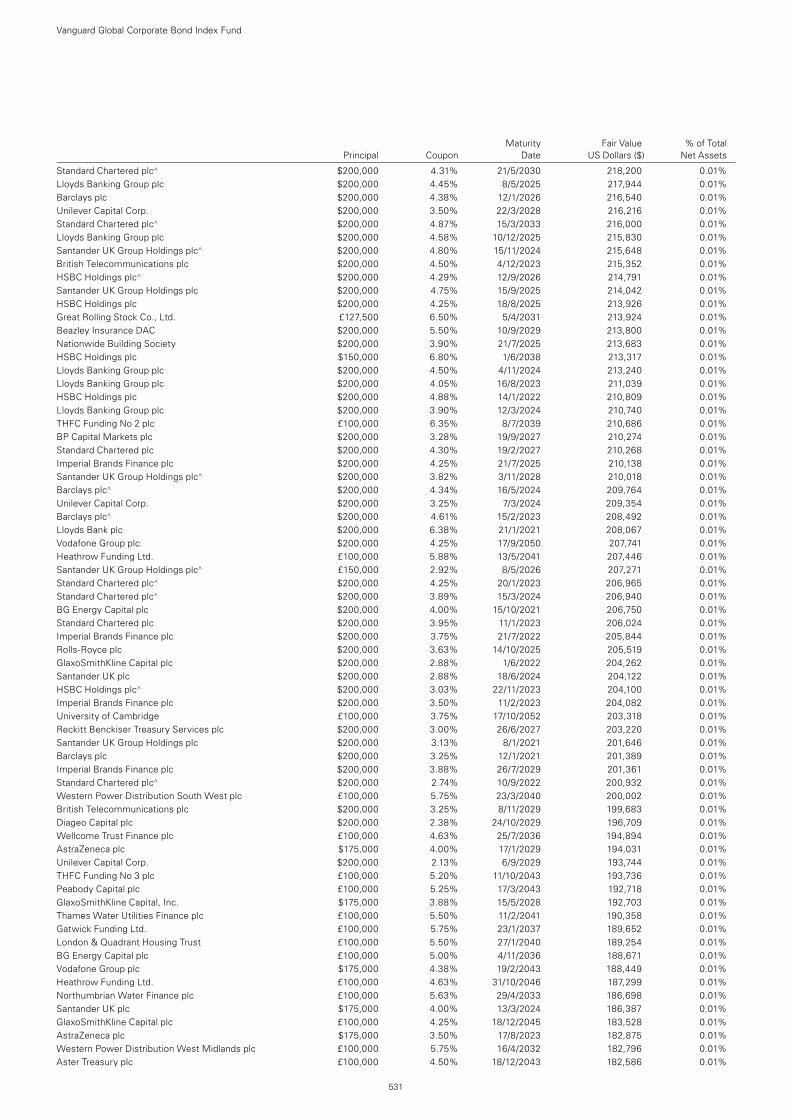
Standard Chartered plc^ $200,000 4.31% 21/5/2030 218,200 0.01%Lloyds Banking Group plc $200,000 4.45% 8/5/2025 217,944 0.01%Barclays plc $200,000 4.38% 12/1/2026 216,540 0.01%Unilever Capital Corp. $200,000 3.50% 22/3/2028 216,216 0.01%Standard Chartered plc^ $200,000 4.87% 15/3/2033 216,000 0.01%Lloyds Banking Group plc $200,000 4.58% 10/12/2025 215,830 0.01%Santander UK Group Holdings plc^ $200,000 4.80% 15/11/2024 215,648 0.01%British Telecommunications plc $200,000 4.50% 4/12/2023 215,352 0.01%HSBC Holdings plc^ $200,000 4.29% 12/9/2026 214,791 0.01%Santander UK Group Holdings plc $200,000 4.75% 15/9/2025 214,042 0.01%HSBC Holdings plc $200,000 4.25% 18/8/2025 213,926 0.01%Great Rolling Stock Co., Ltd. £127,500 6.50% 5/4/2031 213,924 0.01%Beazley Insurance DAC $200,000 5.50% 10/9/2029 213,800 0.01%Nationwide Building Society $200,000 3.90% 21/7/2025 213,683 0.01%HSBC Holdings plc $150,000 6.80% 1/6/2038 213,317 0.01%Lloyds Banking Group plc $200,000 4.50% 4/11/2024 213,240 0.01%Lloyds Banking Group plc $200,000 4.05% 16/8/2023 211,039 0.01%HSBC Holdings plc $200,000 4.88% 14/1/2022 210,809 0.01%Lloyds Banking Group plc $200,000 3.90% 12/3/2024 210,740 0.01%THFC Funding No 2 plc £100,000 6.35% 8/7/2039 210,686 0.01%BP Capital Markets plc $200,000 3.28% 19/9/2027 210,274 0.01%Standard Chartered plc $200,000 4.30% 19/2/2027 210,268 0.01%Imperial Brands Finance plc $200,000 4.25% 21/7/2025 210,138 0.01%Santander UK Group Holdings plc^ $200,000 3.82% 3/11/2028 210,018 0.01%Barclays plc^ $200,000 4.34% 16/5/2024 209,764 0.01%Unilever Capital Corp. $200,000 3.25% 7/3/2024 209,354 0.01%Barclays plc^ $200,000 4.61% 15/2/2023 208,492 0.01%Lloyds Bank plc $200,000 6.38% 21/1/2021 208,067 0.01%Vodafone Group plc $200,000 4.25% 17/9/2050 207,741 0.01%Heathrow Funding Ltd. £100,000 5.88% 13/5/2041 207,446 0.01%Santander UK Group Holdings plc^ £150,000 2.92% 8/5/2026 207,271 0.01%Standard Chartered plc^ $200,000 4.25% 20/1/2023 206,965 0.01%Standard Chartered plc^ $200,000 3.89% 15/3/2024 206,940 0.01%BG Energy Capital plc $200,000 4.00% 15/10/2021 206,750 0.01%Standard Chartered plc $200,000 3.95% 11/1/2023 206,024 0.01%Imperial Brands Finance plc $200,000 3.75% 21/7/2022 205,844 0.01%Rolls-Royce plc $200,000 3.63% 14/10/2025 205,519 0.01%GlaxoSmithKline Capital plc $200,000 2.88% 1/6/2022 204,262 0.01%Santander UK plc $200,000 2.88% 18/6/2024 204,122 0.01%HSBC Holdings plc^ $200,000 3.03% 22/11/2023 204,100 0.01%Imperial Brands Finance plc $200,000 3.50% 11/2/2023 204,082 0.01%University of Cambridge £100,000 3.75% 17/10/2052 203,318 0.01%Reckitt Benckiser Treasury Services plc $200,000 3.00% 26/6/2027 203,220 0.01%Santander UK Group Holdings plc $200,000 3.13% 8/1/2021 201,646 0.01%Barclays plc $200,000 3.25% 12/1/2021 201,389 0.01%Imperial Brands Finance plc $200,000 3.88% 26/7/2029 201,361 0.01%Standard Chartered plc^ $200,000 2.74% 10/9/2022 200,932 0.01%Western Power Distribution South West plc £100,000 5.75% 23/3/2040 200,002 0.01%British Telecommunications plc $200,000 3.25% 8/11/2029 199,683 0.01%Diageo Capital plc $200,000 2.38% 24/10/2029 196,709 0.01%Wellcome Trust Finance plc £100,000 4.63% 25/7/2036 194,894 0.01%AstraZeneca plc $175,000 4.00% 17/1/2029 194,031 0.01%Unilever Capital Corp. $200,000 2.13% 6/9/2029 193,744 0.01%THFC Funding No 3 plc £100,000 5.20% 11/10/2043 193,736 0.01%Peabody Capital plc £100,000 5.25% 17/3/2043 192,718 0.01%GlaxoSmithKline Capital, Inc. $175,000 3.88% 15/5/2028 192,703 0.01%Thames Water Utilities Finance plc £100,000 5.50% 11/2/2041 190,358 0.01%Gatwick Funding Ltd. £100,000 5.75% 23/1/2037 189,652 0.01%London & Quadrant Housing Trust £100,000 5.50% 27/1/2040 189,254 0.01%BG Energy Capital plc £100,000 5.00% 4/11/2036 188,671 0.01%Vodafone Group plc $175,000 4.38% 19/2/2043 188,449 0.01%Heathrow Funding Ltd. £100,000 4.63% 31/10/2046 187,299 0.01%Northumbrian Water Finance plc £100,000 5.63% 29/4/2033 186,698 0.01%Santander UK plc $175,000 4.00% 13/3/2024 186,387 0.01%GlaxoSmithKline Capital plc £100,000 4.25% 18/12/2045 183,528 0.01%AstraZeneca plc $175,000 3.50% 17/8/2023 182,875 0.01%Western Power Distribution West Midlands plc £100,000 5.75% 16/4/2032 182,796 0.01%Aster Treasury plc £100,000 4.50% 18/12/2043 182,586 0.01%
Vanguard Global Corporate Bond Index Fund
531
Maturity Fair Value % of Total Principal Coupon Date US Dollars ($) Net Assets
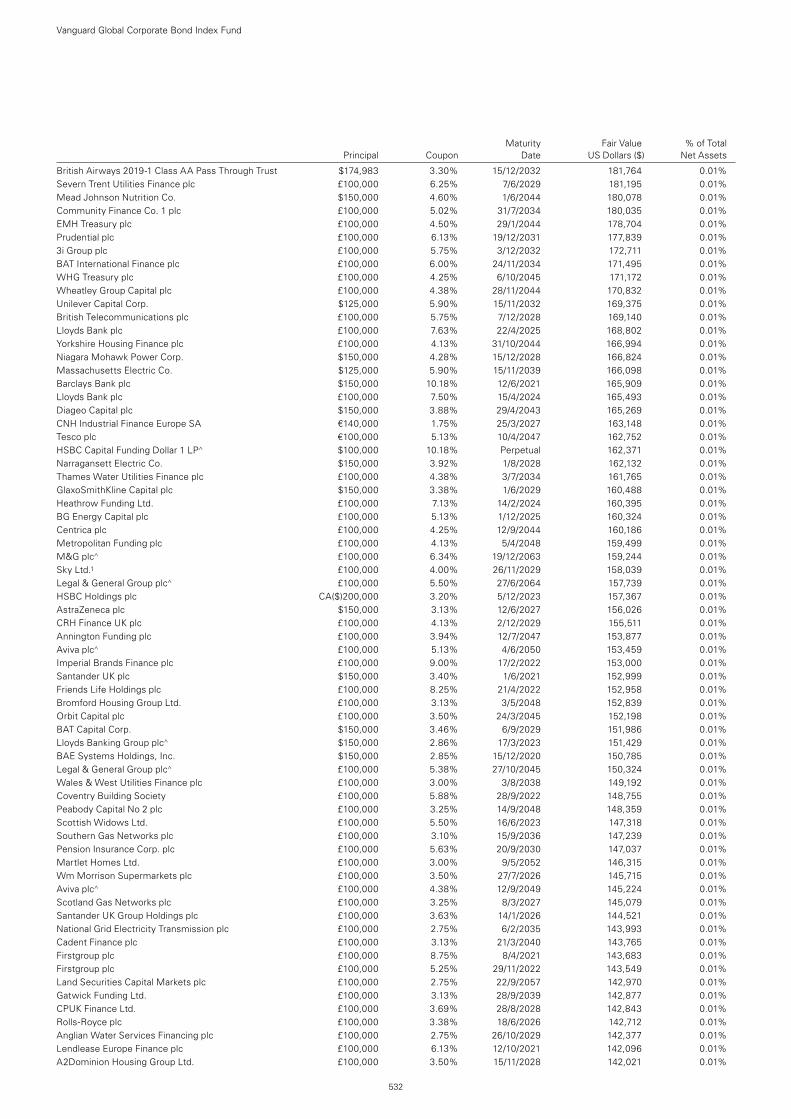
British Airways 2019-1 Class AA Pass Through Trust $174,983 3.30% 15/12/2032 181,764 0.01%Severn Trent Utilities Finance plc £100,000 6.25% 7/6/2029 181,195 0.01%Mead Johnson Nutrition Co. $150,000 4.60% 1/6/2044 180,078 0.01%Community Finance Co. 1 plc £100,000 5.02% 31/7/2034 180,035 0.01%EMH Treasury plc £100,000 4.50% 29/1/2044 178,704 0.01%Prudential plc £100,000 6.13% 19/12/2031 177,839 0.01%3i Group plc £100,000 5.75% 3/12/2032 172,711 0.01%BAT International Finance plc £100,000 6.00% 24/11/2034 171,495 0.01%WHG Treasury plc £100,000 4.25% 6/10/2045 171,172 0.01%Wheatley Group Capital plc £100,000 4.38% 28/11/2044 170,832 0.01%Unilever Capital Corp. $125,000 5.90% 15/11/2032 169,375 0.01%British Telecommunications plc £100,000 5.75% 7/12/2028 169,140 0.01%Lloyds Bank plc £100,000 7.63% 22/4/2025 168,802 0.01%Yorkshire Housing Finance plc £100,000 4.13% 31/10/2044 166,994 0.01%Niagara Mohawk Power Corp. $150,000 4.28% 15/12/2028 166,824 0.01%Massachusetts Electric Co. $125,000 5.90% 15/11/2039 166,098 0.01%Barclays Bank plc $150,000 10.18% 12/6/2021 165,909 0.01%Lloyds Bank plc £100,000 7.50% 15/4/2024 165,493 0.01%Diageo Capital plc $150,000 3.88% 29/4/2043 165,269 0.01%CNH Industrial Finance Europe SA €140,000 1.75% 25/3/2027 163,148 0.01%Tesco plc €100,000 5.13% 10/4/2047 162,752 0.01%HSBC Capital Funding Dollar 1 LP^ $100,000 10.18% Perpetual 162,371 0.01%Narragansett Electric Co. $150,000 3.92% 1/8/2028 162,132 0.01%Thames Water Utilities Finance plc £100,000 4.38% 3/7/2034 161,765 0.01%GlaxoSmithKline Capital plc $150,000 3.38% 1/6/2029 160,488 0.01%Heathrow Funding Ltd. £100,000 7.13% 14/2/2024 160,395 0.01%BG Energy Capital plc £100,000 5.13% 1/12/2025 160,324 0.01%Centrica plc £100,000 4.25% 12/9/2044 160,186 0.01%Metropolitan Funding plc £100,000 4.13% 5/4/2048 159,499 0.01%M&G plc^ £100,000 6.34% 19/12/2063 159,244 0.01%Sky Ltd.1 £100,000 4.00% 26/11/2029 158,039 0.01%Legal & General Group plc^ £100,000 5.50% 27/6/2064 157,739 0.01%HSBC Holdings plc CA($)200,000 3.20% 5/12/2023 157,367 0.01%AstraZeneca plc $150,000 3.13% 12/6/2027 156,026 0.01%CRH Finance UK plc £100,000 4.13% 2/12/2029 155,511 0.01%Annington Funding plc £100,000 3.94% 12/7/2047 153,877 0.01%Aviva plc^ £100,000 5.13% 4/6/2050 153,459 0.01%Imperial Brands Finance plc £100,000 9.00% 17/2/2022 153,000 0.01%Santander UK plc $150,000 3.40% 1/6/2021 152,999 0.01%Friends Life Holdings plc £100,000 8.25% 21/4/2022 152,958 0.01%Bromford Housing Group Ltd. £100,000 3.13% 3/5/2048 152,839 0.01%Orbit Capital plc £100,000 3.50% 24/3/2045 152,198 0.01%BAT Capital Corp. $150,000 3.46% 6/9/2029 151,986 0.01%Lloyds Banking Group plc^ $150,000 2.86% 17/3/2023 151,429 0.01%BAE Systems Holdings, Inc. $150,000 2.85% 15/12/2020 150,785 0.01%Legal & General Group plc^ £100,000 5.38% 27/10/2045 150,324 0.01%Wales & West Utilities Finance plc £100,000 3.00% 3/8/2038 149,192 0.01%Coventry Building Society £100,000 5.88% 28/9/2022 148,755 0.01%Peabody Capital No 2 plc £100,000 3.25% 14/9/2048 148,359 0.01%Scottish Widows Ltd. £100,000 5.50% 16/6/2023 147,318 0.01%Southern Gas Networks plc £100,000 3.10% 15/9/2036 147,239 0.01%Pension Insurance Corp. plc £100,000 5.63% 20/9/2030 147,037 0.01%Martlet Homes Ltd. £100,000 3.00% 9/5/2052 146,315 0.01%Wm Morrison Supermarkets plc £100,000 3.50% 27/7/2026 145,715 0.01%Aviva plc^ £100,000 4.38% 12/9/2049 145,224 0.01%Scotland Gas Networks plc £100,000 3.25% 8/3/2027 145,079 0.01%Santander UK Group Holdings plc £100,000 3.63% 14/1/2026 144,521 0.01%National Grid Electricity Transmission plc £100,000 2.75% 6/2/2035 143,993 0.01%Cadent Finance plc £100,000 3.13% 21/3/2040 143,765 0.01%Firstgroup plc £100,000 8.75% 8/4/2021 143,683 0.01%Firstgroup plc £100,000 5.25% 29/11/2022 143,549 0.01%Land Securities Capital Markets plc £100,000 2.75% 22/9/2057 142,970 0.01%Gatwick Funding Ltd. £100,000 3.13% 28/9/2039 142,877 0.01%CPUK Finance Ltd. £100,000 3.69% 28/8/2028 142,843 0.01%Rolls-Royce plc £100,000 3.38% 18/6/2026 142,712 0.01%Anglian Water Services Financing plc £100,000 2.75% 26/10/2029 142,377 0.01%Lendlease Europe Finance plc £100,000 6.13% 12/10/2021 142,096 0.01%A2Dominion Housing Group Ltd. £100,000 3.50% 15/11/2028 142,021 0.01%
Vanguard Global Corporate Bond Index Fund
532
Maturity Fair Value % of Total Principal Coupon Date US Dollars ($) Net Assets
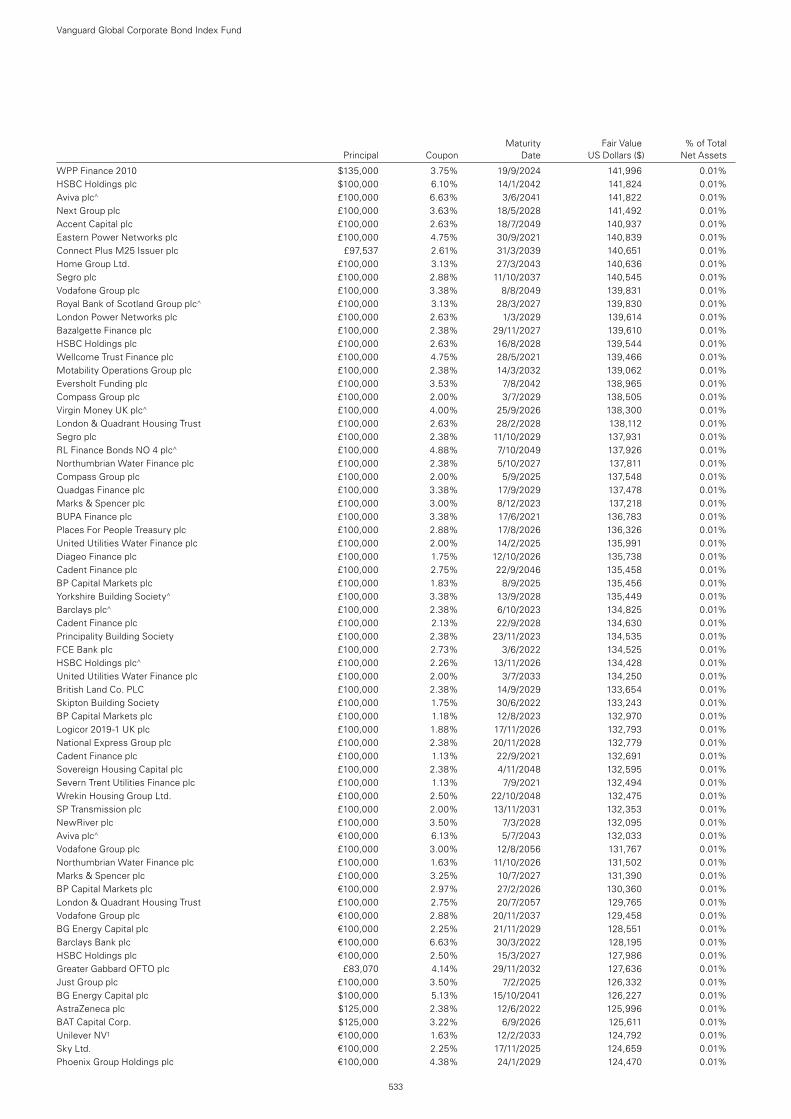
WPP Finance 2010 $135,000 3.75% 19/9/2024 141,996 0.01%HSBC Holdings plc $100,000 6.10% 14/1/2042 141,824 0.01%Aviva plc^ £100,000 6.63% 3/6/2041 141,822 0.01%Next Group plc £100,000 3.63% 18/5/2028 141,492 0.01%Accent Capital plc £100,000 2.63% 18/7/2049 140,937 0.01%Eastern Power Networks plc £100,000 4.75% 30/9/2021 140,839 0.01%Connect Plus M25 Issuer plc £97,537 2.61% 31/3/2039 140,651 0.01%Home Group Ltd. £100,000 3.13% 27/3/2043 140,636 0.01%Segro plc £100,000 2.88% 11/10/2037 140,545 0.01%Vodafone Group plc £100,000 3.38% 8/8/2049 139,831 0.01%Royal Bank of Scotland Group plc^ £100,000 3.13% 28/3/2027 139,830 0.01%London Power Networks plc £100,000 2.63% 1/3/2029 139,614 0.01%Bazalgette Finance plc £100,000 2.38% 29/11/2027 139,610 0.01%HSBC Holdings plc £100,000 2.63% 16/8/2028 139,544 0.01%Wellcome Trust Finance plc £100,000 4.75% 28/5/2021 139,466 0.01%Motability Operations Group plc £100,000 2.38% 14/3/2032 139,062 0.01%Eversholt Funding plc £100,000 3.53% 7/8/2042 138,965 0.01%Compass Group plc £100,000 2.00% 3/7/2029 138,505 0.01%Virgin Money UK plc^ £100,000 4.00% 25/9/2026 138,300 0.01%London & Quadrant Housing Trust £100,000 2.63% 28/2/2028 138,112 0.01%Segro plc £100,000 2.38% 11/10/2029 137,931 0.01%RL Finance Bonds NO 4 plc^ £100,000 4.88% 7/10/2049 137,926 0.01%Northumbrian Water Finance plc £100,000 2.38% 5/10/2027 137,811 0.01%Compass Group plc £100,000 2.00% 5/9/2025 137,548 0.01%Quadgas Finance plc £100,000 3.38% 17/9/2029 137,478 0.01%Marks & Spencer plc £100,000 3.00% 8/12/2023 137,218 0.01%BUPA Finance plc £100,000 3.38% 17/6/2021 136,783 0.01%Places For People Treasury plc £100,000 2.88% 17/8/2026 136,326 0.01%United Utilities Water Finance plc £100,000 2.00% 14/2/2025 135,991 0.01%Diageo Finance plc £100,000 1.75% 12/10/2026 135,738 0.01%Cadent Finance plc £100,000 2.75% 22/9/2046 135,458 0.01%BP Capital Markets plc £100,000 1.83% 8/9/2025 135,456 0.01%Yorkshire Building Society^ £100,000 3.38% 13/9/2028 135,449 0.01%Barclays plc^ £100,000 2.38% 6/10/2023 134,825 0.01%Cadent Finance plc £100,000 2.13% 22/9/2028 134,630 0.01%Principality Building Society £100,000 2.38% 23/11/2023 134,535 0.01%FCE Bank plc £100,000 2.73% 3/6/2022 134,525 0.01%HSBC Holdings plc^ £100,000 2.26% 13/11/2026 134,428 0.01%United Utilities Water Finance plc £100,000 2.00% 3/7/2033 134,250 0.01%British Land Co. PLC £100,000 2.38% 14/9/2029 133,654 0.01%Skipton Building Society £100,000 1.75% 30/6/2022 133,243 0.01%BP Capital Markets plc £100,000 1.18% 12/8/2023 132,970 0.01%Logicor 2019-1 UK plc £100,000 1.88% 17/11/2026 132,793 0.01%National Express Group plc £100,000 2.38% 20/11/2028 132,779 0.01%Cadent Finance plc £100,000 1.13% 22/9/2021 132,691 0.01%Sovereign Housing Capital plc £100,000 2.38% 4/11/2048 132,595 0.01%Severn Trent Utilities Finance plc £100,000 1.13% 7/9/2021 132,494 0.01%Wrekin Housing Group Ltd. £100,000 2.50% 22/10/2048 132,475 0.01%SP Transmission plc £100,000 2.00% 13/11/2031 132,353 0.01%NewRiver plc £100,000 3.50% 7/3/2028 132,095 0.01%Aviva plc^ €100,000 6.13% 5/7/2043 132,033 0.01%Vodafone Group plc £100,000 3.00% 12/8/2056 131,767 0.01%Northumbrian Water Finance plc £100,000 1.63% 11/10/2026 131,502 0.01%Marks & Spencer plc £100,000 3.25% 10/7/2027 131,390 0.01%BP Capital Markets plc €100,000 2.97% 27/2/2026 130,360 0.01%London & Quadrant Housing Trust £100,000 2.75% 20/7/2057 129,765 0.01%Vodafone Group plc €100,000 2.88% 20/11/2037 129,458 0.01%BG Energy Capital plc €100,000 2.25% 21/11/2029 128,551 0.01%Barclays Bank plc €100,000 6.63% 30/3/2022 128,195 0.01%HSBC Holdings plc €100,000 2.50% 15/3/2027 127,986 0.01%Greater Gabbard OFTO plc £83,070 4.14% 29/11/2032 127,636 0.01%Just Group plc £100,000 3.50% 7/2/2025 126,332 0.01%BG Energy Capital plc $100,000 5.13% 15/10/2041 126,227 0.01%AstraZeneca plc $125,000 2.38% 12/6/2022 125,996 0.01%BAT Capital Corp. $125,000 3.22% 6/9/2026 125,611 0.01%Unilever NV1 €100,000 1.63% 12/2/2033 124,792 0.01%Sky Ltd. €100,000 2.25% 17/11/2025 124,659 0.01%Phoenix Group Holdings plc €100,000 4.38% 24/1/2029 124,470 0.01%
Vanguard Global Corporate Bond Index Fund
533
Maturity Fair Value % of Total Principal Coupon Date US Dollars ($) Net Assets

Aviva plc €100,000 1.88% 13/11/2027 122,870 0.01%British Telecommunications plc €100,000 2.13% 26/9/2028 121,971 0.01%Diageo Finance plc €100,000 1.50% 22/10/2027 121,912 0.01%Royal Bank of Scotland Group plc €100,000 2.50% 22/3/2023 119,910 0.01%Vodafone Group plc €100,000 1.50% 24/7/2027 119,563 0.01%Heathrow Funding Ltd. CA($)150,000 3.25% 21/5/2025 119,129 0.01%SSE plc €100,000 1.75% 8/9/2023 118,895 0.01%CNH Industrial Finance Europe SA €100,000 1.88% 19/1/2026 118,272 0.01%Lloyds Bank plc €100,000 1.25% 13/1/2025 118,014 0.01%CNH Industrial Finance Europe SA €100,000 1.75% 12/9/2025 117,976 0.01%DS Smith plc €100,000 2.25% 16/9/2022 117,949 0.01%GlaxoSmithKline Capital plc €100,000 1.00% 12/9/2026 117,886 0.01%Mondi Finance plc €100,000 1.63% 27/4/2026 117,860 0.01%Nationwide Building Society^ €100,000 1.50% 8/3/2026 117,442 0.01%Imperial Brands Finance plc €100,000 2.13% 12/2/2027 117,242 0.01%HSBC Bank plc €100,000 4.00% 15/1/2021 117,217 0.01%Diageo Finance plc €100,000 1.00% 22/4/2025 117,188 0.01%AstraZeneca plc $100,000 4.38% 16/11/2045 117,086 0.01%Mondi Finance plc €100,000 1.50% 15/4/2024 117,072 0.01%Santander UK plc €100,000 1.13% 10/3/2025 116,870 0.01%WPP Finance 2016 €100,000 1.38% 20/3/2025 116,667 0.01%Reynolds American, Inc. $100,000 6.15% 15/9/2043 116,408 0.01%Royal Bank of Scotland Group plc^ €100,000 2.00% 8/3/2023 116,356 0.01%Annington Funding plc €100,000 1.65% 12/7/2024 116,336 0.01%SELP Finance Sarl €100,000 1.50% 20/11/2025 116,112 0.01%Hammerson plc €100,000 1.75% 15/3/2023 116,037 0.01%GlaxoSmithKline Capital, Inc. $100,000 4.20% 18/3/2043 115,992 0.01%BP Capital Markets plc €100,000 0.90% 3/7/2024 115,944 0.01%BG Energy Capital plc €100,000 1.25% 21/11/2022 115,903 0.01%BAE Systems Holdings, Inc. $100,000 4.75% 7/10/2044 115,699 0.01%Rolls-Royce plc €100,000 2.13% 18/6/2021 115,612 0.01%Nationwide Building Society €100,000 1.13% 3/6/2022 115,436 0.01%easyJet plc €100,000 1.13% 18/10/2023 115,359 0.01%Reynolds American, Inc. $100,000 5.70% 15/8/2035 115,326 0.01%London Stock Exchange Group plc €100,000 0.88% 19/9/2024 115,193 0.01%Standard Chartered plc €100,000 1.63% 13/6/2021 115,048 0.01%Imperial Brands Finance plc €100,000 1.13% 14/8/2023 114,761 0.01%Compass Group International BV €100,000 0.63% 3/7/2024 114,729 0.01%Lloyds Bank plc €100,000 1.00% 19/11/2021 114,499 0.01%NatWest Markets plc €100,000 1.00% 28/5/2024 114,373 0.01%CNH Industrial Finance Europe SA €100,000 1.63% 3/7/2029 114,277 0.01%Lloyds Banking Group plc €100,000 0.75% 9/11/2021 113,905 0.01%NGG Finance plc^ €100,000 1.63% 5/12/2079 113,662 0.01%Standard Chartered plc^ €100,000 0.90% 2/7/2027 113,520 0.01%Rolls-Royce plc €100,000 0.88% 9/5/2024 113,063 0.01%Diageo Finance plc €100,000 0.25% 22/10/2021 113,007 0.01%Imperial Brands Finance plc €100,000 0.50% 27/7/2021 112,978 0.01%FCE Bank plc €100,000 1.13% 10/2/2022 112,936 0.01%ITV plc €100,000 1.38% 26/9/2026 112,507 0.01%Tesco Corporate Treasury Services plc €100,000 0.88% 29/5/2026 112,486 0.01%Barclays plc^ €100,000 0.75% 9/6/2025 112,371 0.01%Electricity North West Ltd. £60,000 8.88% 25/3/2026 112,333 0.01%British Telecommunications plc €100,000 0.50% 12/9/2025 111,340 0.01%British Telecommunications plc €100,000 1.13% 12/9/2029 111,175 0.01%Informa plc €100,000 1.25% 22/4/2028 110,542 0.01%AstraZeneca plc $100,000 4.00% 18/9/2042 110,293 0.01%Royal Bank of Scotland Group plc $100,000 6.10% 10/6/2023 109,879 0.01%Yorkshire Water Finance plc £50,000 6.38% 19/8/2039 108,946 0.01%Trinity Acquisition plc $100,000 4.40% 15/3/2026 108,162 0.01%HSBC USA, Inc. $100,000 3.50% 23/6/2024 105,807 0.01%BAE Systems Holdings, Inc. $100,000 3.80% 7/10/2024 105,181 0.01%CNH Industrial NV $100,000 3.85% 15/11/2027 104,109 0.01%GlaxoSmithKline Capital plc $100,000 3.00% 1/6/2024 103,660 0.01%RELX Capital, Inc. $100,000 3.13% 15/10/2022 103,393 0.01%Unilever Capital Corp. $100,000 2.60% 5/5/2024 102,204 0.01%Diageo Capital plc $75,000 5.88% 30/9/2036 102,032 0.01%Diageo Investment Corp. $100,000 2.88% 11/5/2022 101,890 0.01%Diageo Capital plc $100,000 2.63% 29/4/2023 101,661 0.01%
Vanguard Global Corporate Bond Index Fund
534
Maturity Fair Value % of Total Principal Coupon Date US Dollars ($) Net Assets
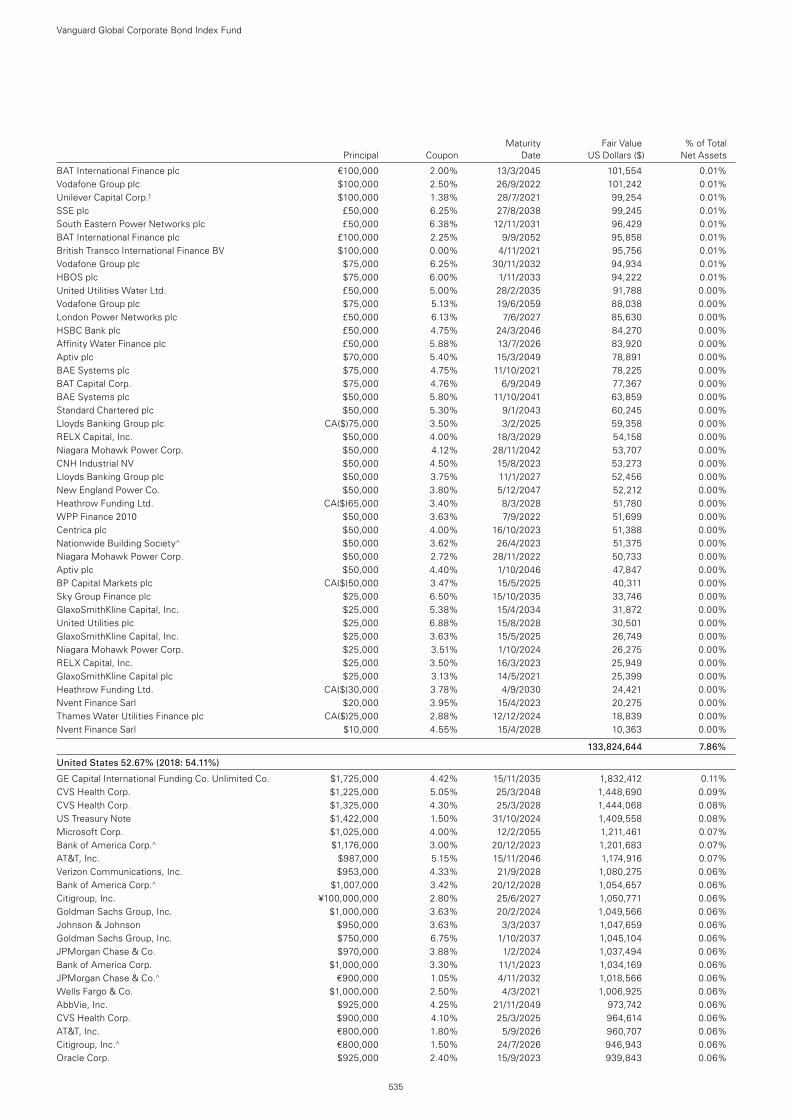
BAT International Finance plc €100,000 2.00% 13/3/2045 101,554 0.01%Vodafone Group plc $100,000 2.50% 26/9/2022 101,242 0.01%Unilever Capital Corp.1 $100,000 1.38% 28/7/2021 99,254 0.01%SSE plc £50,000 6.25% 27/8/2038 99,245 0.01%South Eastern Power Networks plc £50,000 6.38% 12/11/2031 96,429 0.01%BAT International Finance plc £100,000 2.25% 9/9/2052 95,858 0.01%British Transco International Finance BV $100,000 0.00% 4/11/2021 95,756 0.01%Vodafone Group plc $75,000 6.25% 30/11/2032 94,934 0.01%HBOS plc $75,000 6.00% 1/11/2033 94,222 0.01%United Utilities Water Ltd. £50,000 5.00% 28/2/2035 91,788 0.00%Vodafone Group plc $75,000 5.13% 19/6/2059 88,038 0.00%London Power Networks plc £50,000 6.13% 7/6/2027 85,630 0.00%HSBC Bank plc £50,000 4.75% 24/3/2046 84,270 0.00%Affinity Water Finance plc £50,000 5.88% 13/7/2026 83,920 0.00%Aptiv plc $70,000 5.40% 15/3/2049 78,891 0.00%BAE Systems plc $75,000 4.75% 11/10/2021 78,225 0.00%BAT Capital Corp. $75,000 4.76% 6/9/2049 77,367 0.00%BAE Systems plc $50,000 5.80% 11/10/2041 63,859 0.00%Standard Chartered plc $50,000 5.30% 9/1/2043 60,245 0.00%Lloyds Banking Group plc CA($)75,000 3.50% 3/2/2025 59,358 0.00%RELX Capital, Inc. $50,000 4.00% 18/3/2029 54,158 0.00%Niagara Mohawk Power Corp. $50,000 4.12% 28/11/2042 53,707 0.00%CNH Industrial NV $50,000 4.50% 15/8/2023 53,273 0.00%Lloyds Banking Group plc $50,000 3.75% 11/1/2027 52,456 0.00%New England Power Co. $50,000 3.80% 5/12/2047 52,212 0.00%Heathrow Funding Ltd. CA($)65,000 3.40% 8/3/2028 51,780 0.00%WPP Finance 2010 $50,000 3.63% 7/9/2022 51,699 0.00%Centrica plc $50,000 4.00% 16/10/2023 51,388 0.00%Nationwide Building Society^ $50,000 3.62% 26/4/2023 51,375 0.00%Niagara Mohawk Power Corp. $50,000 2.72% 28/11/2022 50,733 0.00%Aptiv plc $50,000 4.40% 1/10/2046 47,847 0.00%BP Capital Markets plc CA($)50,000 3.47% 15/5/2025 40,311 0.00%Sky Group Finance plc $25,000 6.50% 15/10/2035 33,746 0.00%GlaxoSmithKline Capital, Inc. $25,000 5.38% 15/4/2034 31,872 0.00%United Utilities plc $25,000 6.88% 15/8/2028 30,501 0.00%GlaxoSmithKline Capital, Inc. $25,000 3.63% 15/5/2025 26,749 0.00%Niagara Mohawk Power Corp. $25,000 3.51% 1/10/2024 26,275 0.00%RELX Capital, Inc. $25,000 3.50% 16/3/2023 25,949 0.00%GlaxoSmithKline Capital plc $25,000 3.13% 14/5/2021 25,399 0.00%Heathrow Funding Ltd. CA($)30,000 3.78% 4/9/2030 24,421 0.00%Nvent Finance Sarl $20,000 3.95% 15/4/2023 20,275 0.00%Thames Water Utilities Finance plc CA($)25,000 2.88% 12/12/2024 18,839 0.00%Nvent Finance Sarl $10,000 4.55% 15/4/2028 10,363 0.00%
133,824,644 7.86%
United States 52.67% (2018: 54.11%)
GE Capital International Funding Co. Unlimited Co. $1,725,000 4.42% 15/11/2035 1,832,412 0.11%CVS Health Corp. $1,225,000 5.05% 25/3/2048 1,448,690 0.09%CVS Health Corp. $1,325,000 4.30% 25/3/2028 1,444,068 0.08%US Treasury Note $1,422,000 1.50% 31/10/2024 1,409,558 0.08%Microsoft Corp. $1,025,000 4.00% 12/2/2055 1,211,461 0.07%Bank of America Corp.^ $1,176,000 3.00% 20/12/2023 1,201,683 0.07%AT&T, Inc. $987,000 5.15% 15/11/2046 1,174,916 0.07%Verizon Communications, Inc. $953,000 4.33% 21/9/2028 1,080,275 0.06%Bank of America Corp.^ $1,007,000 3.42% 20/12/2028 1,054,657 0.06%Citigroup, Inc. ¥100,000,000 2.80% 25/6/2027 1,050,771 0.06%Goldman Sachs Group, Inc. $1,000,000 3.63% 20/2/2024 1,049,566 0.06%Johnson & Johnson $950,000 3.63% 3/3/2037 1,047,659 0.06%Goldman Sachs Group, Inc. $750,000 6.75% 1/10/2037 1,045,104 0.06%JPMorgan Chase & Co. $970,000 3.88% 1/2/2024 1,037,494 0.06%Bank of America Corp. $1,000,000 3.30% 11/1/2023 1,034,169 0.06%JPMorgan Chase & Co.^ €900,000 1.05% 4/11/2032 1,018,566 0.06%Wells Fargo & Co. $1,000,000 2.50% 4/3/2021 1,006,925 0.06%AbbVie, Inc. $925,000 4.25% 21/11/2049 973,742 0.06%CVS Health Corp. $900,000 4.10% 25/3/2025 964,614 0.06%AT&T, Inc. €800,000 1.80% 5/9/2026 960,707 0.06%Citigroup, Inc.^ €800,000 1.50% 24/7/2026 946,943 0.06%Oracle Corp. $925,000 2.40% 15/9/2023 939,843 0.06%
Vanguard Global Corporate Bond Index Fund
535
Maturity Fair Value % of Total Principal Coupon Date US Dollars ($) Net Assets
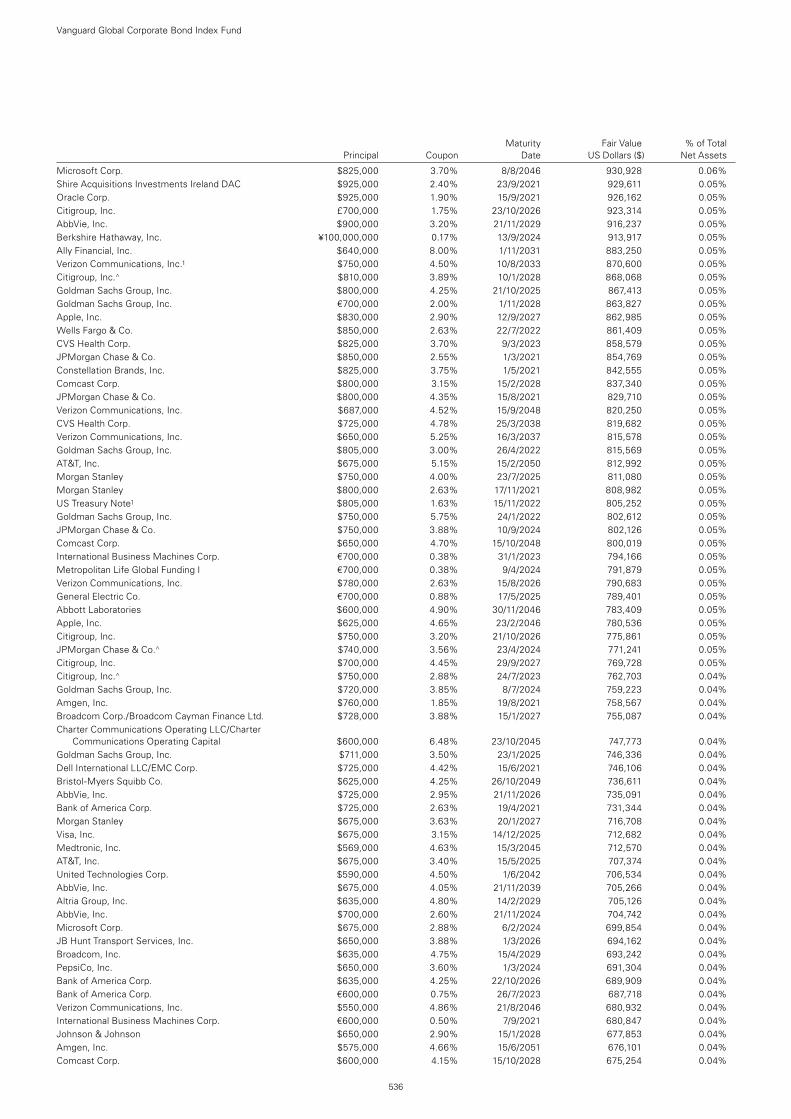
Microsoft Corp. $825,000 3.70% 8/8/2046 930,928 0.06%Shire Acquisitions Investments Ireland DAC $925,000 2.40% 23/9/2021 929,611 0.05%Oracle Corp. $925,000 1.90% 15/9/2021 926,162 0.05%Citigroup, Inc. £700,000 1.75% 23/10/2026 923,314 0.05%AbbVie, Inc. $900,000 3.20% 21/11/2029 916,237 0.05%Berkshire Hathaway, Inc. ¥100,000,000 0.17% 13/9/2024 913,917 0.05%Ally Financial, Inc. $640,000 8.00% 1/11/2031 883,250 0.05%Verizon Communications, Inc.1 $750,000 4.50% 10/8/2033 870,600 0.05%Citigroup, Inc.^ $810,000 3.89% 10/1/2028 868,068 0.05%Goldman Sachs Group, Inc. $800,000 4.25% 21/10/2025 867,413 0.05%Goldman Sachs Group, Inc. €700,000 2.00% 1/11/2028 863,827 0.05%Apple, Inc. $830,000 2.90% 12/9/2027 862,985 0.05%Wells Fargo & Co. $850,000 2.63% 22/7/2022 861,409 0.05%CVS Health Corp. $825,000 3.70% 9/3/2023 858,579 0.05%JPMorgan Chase & Co. $850,000 2.55% 1/3/2021 854,769 0.05%Constellation Brands, Inc. $825,000 3.75% 1/5/2021 842,555 0.05%Comcast Corp. $800,000 3.15% 15/2/2028 837,340 0.05%JPMorgan Chase & Co. $800,000 4.35% 15/8/2021 829,710 0.05%Verizon Communications, Inc. $687,000 4.52% 15/9/2048 820,250 0.05%CVS Health Corp. $725,000 4.78% 25/3/2038 819,682 0.05%Verizon Communications, Inc. $650,000 5.25% 16/3/2037 815,578 0.05%Goldman Sachs Group, Inc. $805,000 3.00% 26/4/2022 815,569 0.05%AT&T, Inc. $675,000 5.15% 15/2/2050 812,992 0.05%Morgan Stanley $750,000 4.00% 23/7/2025 811,080 0.05%Morgan Stanley $800,000 2.63% 17/11/2021 808,982 0.05%US Treasury Note1 $805,000 1.63% 15/11/2022 805,252 0.05%Goldman Sachs Group, Inc. $750,000 5.75% 24/1/2022 802,612 0.05%JPMorgan Chase & Co. $750,000 3.88% 10/9/2024 802,126 0.05%Comcast Corp. $650,000 4.70% 15/10/2048 800,019 0.05%International Business Machines Corp. €700,000 0.38% 31/1/2023 794,166 0.05%Metropolitan Life Global Funding I €700,000 0.38% 9/4/2024 791,879 0.05%Verizon Communications, Inc. $780,000 2.63% 15/8/2026 790,683 0.05%General Electric Co. €700,000 0.88% 17/5/2025 789,401 0.05%Abbott Laboratories $600,000 4.90% 30/11/2046 783,409 0.05%Apple, Inc. $625,000 4.65% 23/2/2046 780,536 0.05%Citigroup, Inc. $750,000 3.20% 21/10/2026 775,861 0.05%JPMorgan Chase & Co.^ $740,000 3.56% 23/4/2024 771,241 0.05%Citigroup, Inc. $700,000 4.45% 29/9/2027 769,728 0.05%Citigroup, Inc.^ $750,000 2.88% 24/7/2023 762,703 0.04%Goldman Sachs Group, Inc. $720,000 3.85% 8/7/2024 759,223 0.04%Amgen, Inc. $760,000 1.85% 19/8/2021 758,567 0.04%Broadcom Corp./Broadcom Cayman Finance Ltd. $728,000 3.88% 15/1/2027 755,087 0.04%Charter Communications Operating LLC/Charter
Communications Operating Capital $600,000 6.48% 23/10/2045 747,773 0.04%Goldman Sachs Group, Inc. $711,000 3.50% 23/1/2025 746,336 0.04%Dell International LLC/EMC Corp. $725,000 4.42% 15/6/2021 746,106 0.04%Bristol-Myers Squibb Co. $625,000 4.25% 26/10/2049 736,611 0.04%AbbVie, Inc. $725,000 2.95% 21/11/2026 735,091 0.04%Bank of America Corp. $725,000 2.63% 19/4/2021 731,344 0.04%Morgan Stanley $675,000 3.63% 20/1/2027 716,708 0.04%Visa, Inc. $675,000 3.15% 14/12/2025 712,682 0.04%Medtronic, Inc. $569,000 4.63% 15/3/2045 712,570 0.04%AT&T, Inc. $675,000 3.40% 15/5/2025 707,374 0.04%United Technologies Corp. $590,000 4.50% 1/6/2042 706,534 0.04%AbbVie, Inc. $675,000 4.05% 21/11/2039 705,266 0.04%Altria Group, Inc. $635,000 4.80% 14/2/2029 705,126 0.04%AbbVie, Inc. $700,000 2.60% 21/11/2024 704,742 0.04%Microsoft Corp. $675,000 2.88% 6/2/2024 699,854 0.04%JB Hunt Transport Services, Inc. $650,000 3.88% 1/3/2026 694,162 0.04%Broadcom, Inc. $635,000 4.75% 15/4/2029 693,242 0.04%PepsiCo, Inc. $650,000 3.60% 1/3/2024 691,304 0.04%Bank of America Corp. $635,000 4.25% 22/10/2026 689,909 0.04%Bank of America Corp. €600,000 0.75% 26/7/2023 687,718 0.04%Verizon Communications, Inc. $550,000 4.86% 21/8/2046 680,932 0.04%International Business Machines Corp. €600,000 0.50% 7/9/2021 680,847 0.04%Johnson & Johnson $650,000 2.90% 15/1/2028 677,853 0.04%Amgen, Inc. $575,000 4.66% 15/6/2051 676,101 0.04%Comcast Corp. $600,000 4.15% 15/10/2028 675,254 0.04%
Vanguard Global Corporate Bond Index Fund
536
Maturity Fair Value % of Total Principal Coupon Date US Dollars ($) Net Assets
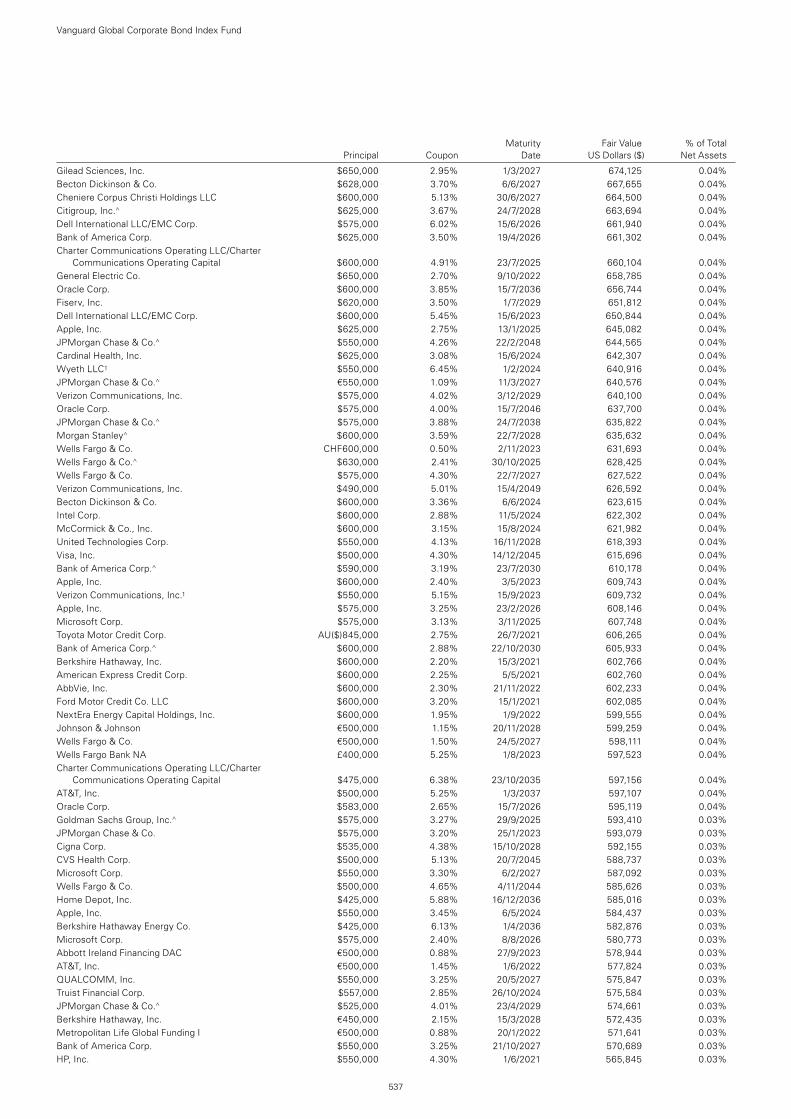
Gilead Sciences, Inc. $650,000 2.95% 1/3/2027 674,125 0.04%Becton Dickinson & Co. $628,000 3.70% 6/6/2027 667,655 0.04%Cheniere Corpus Christi Holdings LLC $600,000 5.13% 30/6/2027 664,500 0.04%Citigroup, Inc.^ $625,000 3.67% 24/7/2028 663,694 0.04%Dell International LLC/EMC Corp. $575,000 6.02% 15/6/2026 661,940 0.04%Bank of America Corp. $625,000 3.50% 19/4/2026 661,302 0.04%Charter Communications Operating LLC/Charter
Communications Operating Capital $600,000 4.91% 23/7/2025 660,104 0.04%General Electric Co. $650,000 2.70% 9/10/2022 658,785 0.04%Oracle Corp. $600,000 3.85% 15/7/2036 656,744 0.04%Fiserv, Inc. $620,000 3.50% 1/7/2029 651,812 0.04%Dell International LLC/EMC Corp. $600,000 5.45% 15/6/2023 650,844 0.04%Apple, Inc. $625,000 2.75% 13/1/2025 645,082 0.04%JPMorgan Chase & Co.^ $550,000 4.26% 22/2/2048 644,565 0.04%Cardinal Health, Inc. $625,000 3.08% 15/6/2024 642,307 0.04%Wyeth LLC1 $550,000 6.45% 1/2/2024 640,916 0.04%JPMorgan Chase & Co.^ €550,000 1.09% 11/3/2027 640,576 0.04%Verizon Communications, Inc. $575,000 4.02% 3/12/2029 640,100 0.04%Oracle Corp. $575,000 4.00% 15/7/2046 637,700 0.04%JPMorgan Chase & Co.^ $575,000 3.88% 24/7/2038 635,822 0.04%Morgan Stanley^ $600,000 3.59% 22/7/2028 635,632 0.04%Wells Fargo & Co. CHF600,000 0.50% 2/11/2023 631,693 0.04%Wells Fargo & Co.^ $630,000 2.41% 30/10/2025 628,425 0.04%Wells Fargo & Co. $575,000 4.30% 22/7/2027 627,522 0.04%Verizon Communications, Inc. $490,000 5.01% 15/4/2049 626,592 0.04%Becton Dickinson & Co. $600,000 3.36% 6/6/2024 623,615 0.04%Intel Corp. $600,000 2.88% 11/5/2024 622,302 0.04%McCormick & Co., Inc. $600,000 3.15% 15/8/2024 621,982 0.04%United Technologies Corp. $550,000 4.13% 16/11/2028 618,393 0.04%Visa, Inc. $500,000 4.30% 14/12/2045 615,696 0.04%Bank of America Corp.^ $590,000 3.19% 23/7/2030 610,178 0.04%Apple, Inc. $600,000 2.40% 3/5/2023 609,743 0.04%Verizon Communications, Inc.1 $550,000 5.15% 15/9/2023 609,732 0.04%Apple, Inc. $575,000 3.25% 23/2/2026 608,146 0.04%Microsoft Corp. $575,000 3.13% 3/11/2025 607,748 0.04%Toyota Motor Credit Corp. AU($)845,000 2.75% 26/7/2021 606,265 0.04%Bank of America Corp.^ $600,000 2.88% 22/10/2030 605,933 0.04%Berkshire Hathaway, Inc. $600,000 2.20% 15/3/2021 602,766 0.04%American Express Credit Corp. $600,000 2.25% 5/5/2021 602,760 0.04%AbbVie, Inc. $600,000 2.30% 21/11/2022 602,233 0.04%Ford Motor Credit Co. LLC $600,000 3.20% 15/1/2021 602,085 0.04%NextEra Energy Capital Holdings, Inc. $600,000 1.95% 1/9/2022 599,555 0.04%Johnson & Johnson €500,000 1.15% 20/11/2028 599,259 0.04%Wells Fargo & Co. €500,000 1.50% 24/5/2027 598,111 0.04%Wells Fargo Bank NA £400,000 5.25% 1/8/2023 597,523 0.04%Charter Communications Operating LLC/Charter
Communications Operating Capital $475,000 6.38% 23/10/2035 597,156 0.04%AT&T, Inc. $500,000 5.25% 1/3/2037 597,107 0.04%Oracle Corp. $583,000 2.65% 15/7/2026 595,119 0.04%Goldman Sachs Group, Inc.^ $575,000 3.27% 29/9/2025 593,410 0.03%JPMorgan Chase & Co. $575,000 3.20% 25/1/2023 593,079 0.03%Cigna Corp. $535,000 4.38% 15/10/2028 592,155 0.03%CVS Health Corp. $500,000 5.13% 20/7/2045 588,737 0.03%Microsoft Corp. $550,000 3.30% 6/2/2027 587,092 0.03%Wells Fargo & Co. $500,000 4.65% 4/11/2044 585,626 0.03%Home Depot, Inc. $425,000 5.88% 16/12/2036 585,016 0.03%Apple, Inc. $550,000 3.45% 6/5/2024 584,437 0.03%Berkshire Hathaway Energy Co. $425,000 6.13% 1/4/2036 582,876 0.03%Microsoft Corp. $575,000 2.40% 8/8/2026 580,773 0.03%Abbott Ireland Financing DAC €500,000 0.88% 27/9/2023 578,944 0.03%AT&T, Inc. €500,000 1.45% 1/6/2022 577,824 0.03%QUALCOMM, Inc. $550,000 3.25% 20/5/2027 575,847 0.03%Truist Financial Corp. $557,000 2.85% 26/10/2024 575,584 0.03%JPMorgan Chase & Co.^ $525,000 4.01% 23/4/2029 574,661 0.03%Berkshire Hathaway, Inc. €450,000 2.15% 15/3/2028 572,435 0.03%Metropolitan Life Global Funding I €500,000 0.88% 20/1/2022 571,641 0.03%Bank of America Corp. $550,000 3.25% 21/10/2027 570,689 0.03%HP, Inc. $550,000 4.30% 1/6/2021 565,845 0.03%
Vanguard Global Corporate Bond Index Fund
537
Maturity Fair Value % of Total Principal Coupon Date US Dollars ($) Net Assets
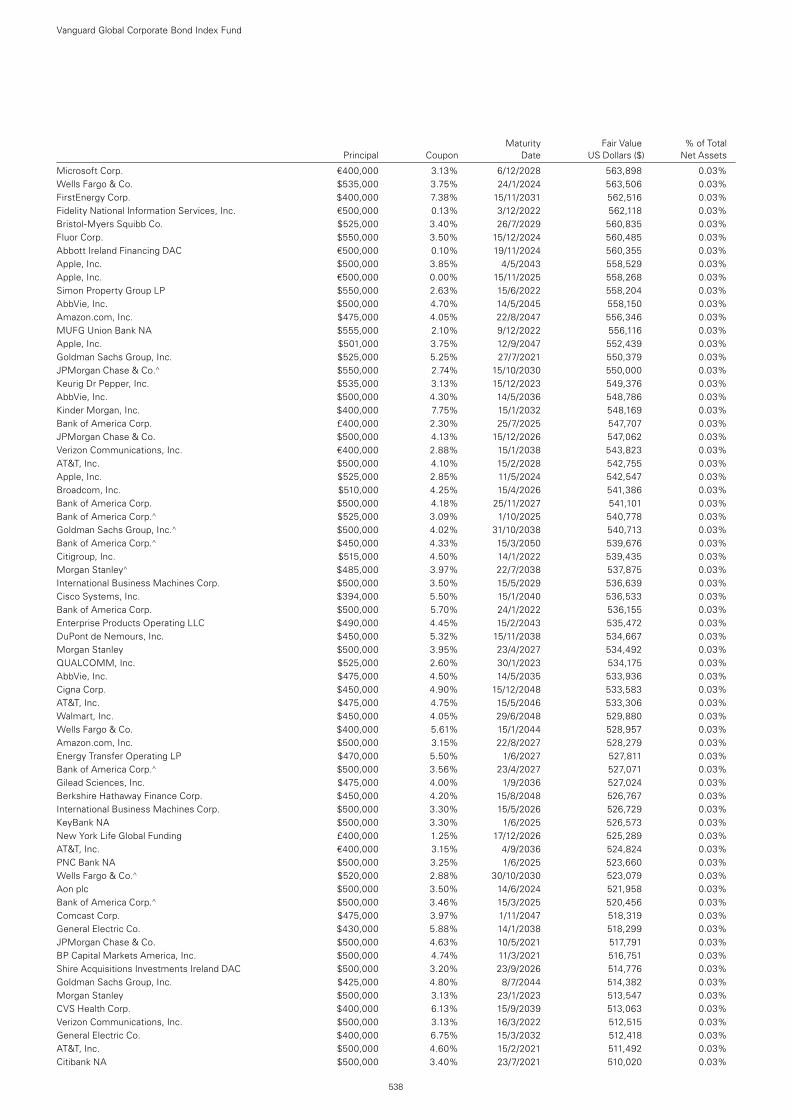
Microsoft Corp. €400,000 3.13% 6/12/2028 563,898 0.03%Wells Fargo & Co. $535,000 3.75% 24/1/2024 563,506 0.03%FirstEnergy Corp. $400,000 7.38% 15/11/2031 562,516 0.03%Fidelity National Information Services, Inc. €500,000 0.13% 3/12/2022 562,118 0.03%Bristol-Myers Squibb Co. $525,000 3.40% 26/7/2029 560,835 0.03%Fluor Corp. $550,000 3.50% 15/12/2024 560,485 0.03%Abbott Ireland Financing DAC €500,000 0.10% 19/11/2024 560,355 0.03%Apple, Inc. $500,000 3.85% 4/5/2043 558,529 0.03%Apple, Inc. €500,000 0.00% 15/11/2025 558,268 0.03%Simon Property Group LP $550,000 2.63% 15/6/2022 558,204 0.03%AbbVie, Inc. $500,000 4.70% 14/5/2045 558,150 0.03%Amazon.com, Inc. $475,000 4.05% 22/8/2047 556,346 0.03%MUFG Union Bank NA $555,000 2.10% 9/12/2022 556,116 0.03%Apple, Inc. $501,000 3.75% 12/9/2047 552,439 0.03%Goldman Sachs Group, Inc. $525,000 5.25% 27/7/2021 550,379 0.03%JPMorgan Chase & Co.^ $550,000 2.74% 15/10/2030 550,000 0.03%Keurig Dr Pepper, Inc. $535,000 3.13% 15/12/2023 549,376 0.03%AbbVie, Inc. $500,000 4.30% 14/5/2036 548,786 0.03%Kinder Morgan, Inc. $400,000 7.75% 15/1/2032 548,169 0.03%Bank of America Corp. £400,000 2.30% 25/7/2025 547,707 0.03%JPMorgan Chase & Co. $500,000 4.13% 15/12/2026 547,062 0.03%Verizon Communications, Inc. €400,000 2.88% 15/1/2038 543,823 0.03%AT&T, Inc. $500,000 4.10% 15/2/2028 542,755 0.03%Apple, Inc. $525,000 2.85% 11/5/2024 542,547 0.03%Broadcom, Inc. $510,000 4.25% 15/4/2026 541,386 0.03%Bank of America Corp. $500,000 4.18% 25/11/2027 541,101 0.03%Bank of America Corp.^ $525,000 3.09% 1/10/2025 540,778 0.03%Goldman Sachs Group, Inc.^ $500,000 4.02% 31/10/2038 540,713 0.03%Bank of America Corp.^ $450,000 4.33% 15/3/2050 539,676 0.03%Citigroup, Inc. $515,000 4.50% 14/1/2022 539,435 0.03%Morgan Stanley^ $485,000 3.97% 22/7/2038 537,875 0.03%International Business Machines Corp. $500,000 3.50% 15/5/2029 536,639 0.03%Cisco Systems, Inc. $394,000 5.50% 15/1/2040 536,533 0.03%Bank of America Corp. $500,000 5.70% 24/1/2022 536,155 0.03%Enterprise Products Operating LLC $490,000 4.45% 15/2/2043 535,472 0.03%DuPont de Nemours, Inc. $450,000 5.32% 15/11/2038 534,667 0.03%Morgan Stanley $500,000 3.95% 23/4/2027 534,492 0.03%QUALCOMM, Inc. $525,000 2.60% 30/1/2023 534,175 0.03%AbbVie, Inc. $475,000 4.50% 14/5/2035 533,936 0.03%Cigna Corp. $450,000 4.90% 15/12/2048 533,583 0.03%AT&T, Inc. $475,000 4.75% 15/5/2046 533,306 0.03%Walmart, Inc. $450,000 4.05% 29/6/2048 529,880 0.03%Wells Fargo & Co. $400,000 5.61% 15/1/2044 528,957 0.03%Amazon.com, Inc. $500,000 3.15% 22/8/2027 528,279 0.03%Energy Transfer Operating LP $470,000 5.50% 1/6/2027 527,811 0.03%Bank of America Corp.^ $500,000 3.56% 23/4/2027 527,071 0.03%Gilead Sciences, Inc. $475,000 4.00% 1/9/2036 527,024 0.03%Berkshire Hathaway Finance Corp. $450,000 4.20% 15/8/2048 526,767 0.03%International Business Machines Corp. $500,000 3.30% 15/5/2026 526,729 0.03%KeyBank NA $500,000 3.30% 1/6/2025 526,573 0.03%New York Life Global Funding £400,000 1.25% 17/12/2026 525,289 0.03%AT&T, Inc. €400,000 3.15% 4/9/2036 524,824 0.03%PNC Bank NA $500,000 3.25% 1/6/2025 523,660 0.03%Wells Fargo & Co.^ $520,000 2.88% 30/10/2030 523,079 0.03%Aon plc $500,000 3.50% 14/6/2024 521,958 0.03%Bank of America Corp.^ $500,000 3.46% 15/3/2025 520,456 0.03%Comcast Corp. $475,000 3.97% 1/11/2047 518,319 0.03%General Electric Co. $430,000 5.88% 14/1/2038 518,299 0.03%JPMorgan Chase & Co. $500,000 4.63% 10/5/2021 517,791 0.03%BP Capital Markets America, Inc. $500,000 4.74% 11/3/2021 516,751 0.03%Shire Acquisitions Investments Ireland DAC $500,000 3.20% 23/9/2026 514,776 0.03%Goldman Sachs Group, Inc. $425,000 4.80% 8/7/2044 514,382 0.03%Morgan Stanley $500,000 3.13% 23/1/2023 513,547 0.03%CVS Health Corp. $400,000 6.13% 15/9/2039 513,063 0.03%Verizon Communications, Inc. $500,000 3.13% 16/3/2022 512,515 0.03%General Electric Co. $400,000 6.75% 15/3/2032 512,418 0.03%AT&T, Inc. $500,000 4.60% 15/2/2021 511,492 0.03%Citibank NA $500,000 3.40% 23/7/2021 510,020 0.03%
Vanguard Global Corporate Bond Index Fund
538
Maturity Fair Value % of Total Principal Coupon Date US Dollars ($) Net Assets
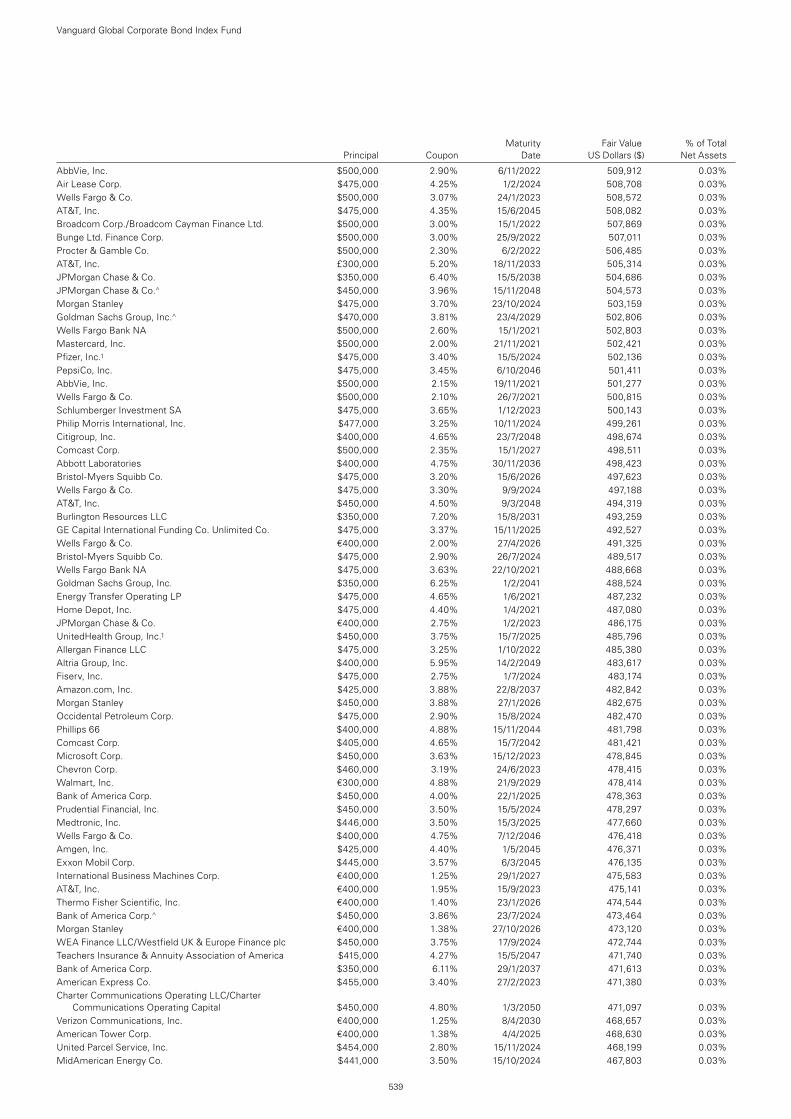
AbbVie, Inc. $500,000 2.90% 6/11/2022 509,912 0.03%Air Lease Corp. $475,000 4.25% 1/2/2024 508,708 0.03%Wells Fargo & Co. $500,000 3.07% 24/1/2023 508,572 0.03%AT&T, Inc. $475,000 4.35% 15/6/2045 508,082 0.03%Broadcom Corp./Broadcom Cayman Finance Ltd. $500,000 3.00% 15/1/2022 507,869 0.03%Bunge Ltd. Finance Corp. $500,000 3.00% 25/9/2022 507,011 0.03%Procter & Gamble Co. $500,000 2.30% 6/2/2022 506,485 0.03%AT&T, Inc. £300,000 5.20% 18/11/2033 505,314 0.03%JPMorgan Chase & Co. $350,000 6.40% 15/5/2038 504,686 0.03%JPMorgan Chase & Co.^ $450,000 3.96% 15/11/2048 504,573 0.03%Morgan Stanley $475,000 3.70% 23/10/2024 503,159 0.03%Goldman Sachs Group, Inc.^ $470,000 3.81% 23/4/2029 502,806 0.03%Wells Fargo Bank NA $500,000 2.60% 15/1/2021 502,803 0.03%Mastercard, Inc. $500,000 2.00% 21/11/2021 502,421 0.03%Pfizer, Inc.1 $475,000 3.40% 15/5/2024 502,136 0.03%PepsiCo, Inc. $475,000 3.45% 6/10/2046 501,411 0.03%AbbVie, Inc. $500,000 2.15% 19/11/2021 501,277 0.03%Wells Fargo & Co. $500,000 2.10% 26/7/2021 500,815 0.03%Schlumberger Investment SA $475,000 3.65% 1/12/2023 500,143 0.03%Philip Morris International, Inc. $477,000 3.25% 10/11/2024 499,261 0.03%Citigroup, Inc. $400,000 4.65% 23/7/2048 498,674 0.03%Comcast Corp. $500,000 2.35% 15/1/2027 498,511 0.03%Abbott Laboratories $400,000 4.75% 30/11/2036 498,423 0.03%Bristol-Myers Squibb Co. $475,000 3.20% 15/6/2026 497,623 0.03%Wells Fargo & Co. $475,000 3.30% 9/9/2024 497,188 0.03%AT&T, Inc. $450,000 4.50% 9/3/2048 494,319 0.03%Burlington Resources LLC $350,000 7.20% 15/8/2031 493,259 0.03%GE Capital International Funding Co. Unlimited Co. $475,000 3.37% 15/11/2025 492,527 0.03%Wells Fargo & Co. €400,000 2.00% 27/4/2026 491,325 0.03%Bristol-Myers Squibb Co. $475,000 2.90% 26/7/2024 489,517 0.03%Wells Fargo Bank NA $475,000 3.63% 22/10/2021 488,668 0.03%Goldman Sachs Group, Inc. $350,000 6.25% 1/2/2041 488,524 0.03%Energy Transfer Operating LP $475,000 4.65% 1/6/2021 487,232 0.03%Home Depot, Inc. $475,000 4.40% 1/4/2021 487,080 0.03%JPMorgan Chase & Co. €400,000 2.75% 1/2/2023 486,175 0.03%UnitedHealth Group, Inc.1 $450,000 3.75% 15/7/2025 485,796 0.03%Allergan Finance LLC $475,000 3.25% 1/10/2022 485,380 0.03%Altria Group, Inc. $400,000 5.95% 14/2/2049 483,617 0.03%Fiserv, Inc. $475,000 2.75% 1/7/2024 483,174 0.03%Amazon.com, Inc. $425,000 3.88% 22/8/2037 482,842 0.03%Morgan Stanley $450,000 3.88% 27/1/2026 482,675 0.03%Occidental Petroleum Corp. $475,000 2.90% 15/8/2024 482,470 0.03%Phillips 66 $400,000 4.88% 15/11/2044 481,798 0.03%Comcast Corp. $405,000 4.65% 15/7/2042 481,421 0.03%Microsoft Corp. $450,000 3.63% 15/12/2023 478,845 0.03%Chevron Corp. $460,000 3.19% 24/6/2023 478,415 0.03%Walmart, Inc. €300,000 4.88% 21/9/2029 478,414 0.03%Bank of America Corp. $450,000 4.00% 22/1/2025 478,363 0.03%Prudential Financial, Inc. $450,000 3.50% 15/5/2024 478,297 0.03%Medtronic, Inc. $446,000 3.50% 15/3/2025 477,660 0.03%Wells Fargo & Co. $400,000 4.75% 7/12/2046 476,418 0.03%Amgen, Inc. $425,000 4.40% 1/5/2045 476,371 0.03%Exxon Mobil Corp. $445,000 3.57% 6/3/2045 476,135 0.03%International Business Machines Corp. €400,000 1.25% 29/1/2027 475,583 0.03%AT&T, Inc. €400,000 1.95% 15/9/2023 475,141 0.03%Thermo Fisher Scientific, Inc. €400,000 1.40% 23/1/2026 474,544 0.03%Bank of America Corp.^ $450,000 3.86% 23/7/2024 473,464 0.03%Morgan Stanley €400,000 1.38% 27/10/2026 473,120 0.03%WEA Finance LLC/Westfield UK & Europe Finance plc $450,000 3.75% 17/9/2024 472,744 0.03%Teachers Insurance & Annuity Association of America $415,000 4.27% 15/5/2047 471,740 0.03%Bank of America Corp. $350,000 6.11% 29/1/2037 471,613 0.03%American Express Co. $455,000 3.40% 27/2/2023 471,380 0.03%Charter Communications Operating LLC/Charter
Communications Operating Capital $450,000 4.80% 1/3/2050 471,097 0.03%Verizon Communications, Inc. €400,000 1.25% 8/4/2030 468,657 0.03%American Tower Corp. €400,000 1.38% 4/4/2025 468,630 0.03%United Parcel Service, Inc. $454,000 2.80% 15/11/2024 468,199 0.03%MidAmerican Energy Co. $441,000 3.50% 15/10/2024 467,803 0.03%
Vanguard Global Corporate Bond Index Fund
539
Maturity Fair Value % of Total Principal Coupon Date US Dollars ($) Net Assets
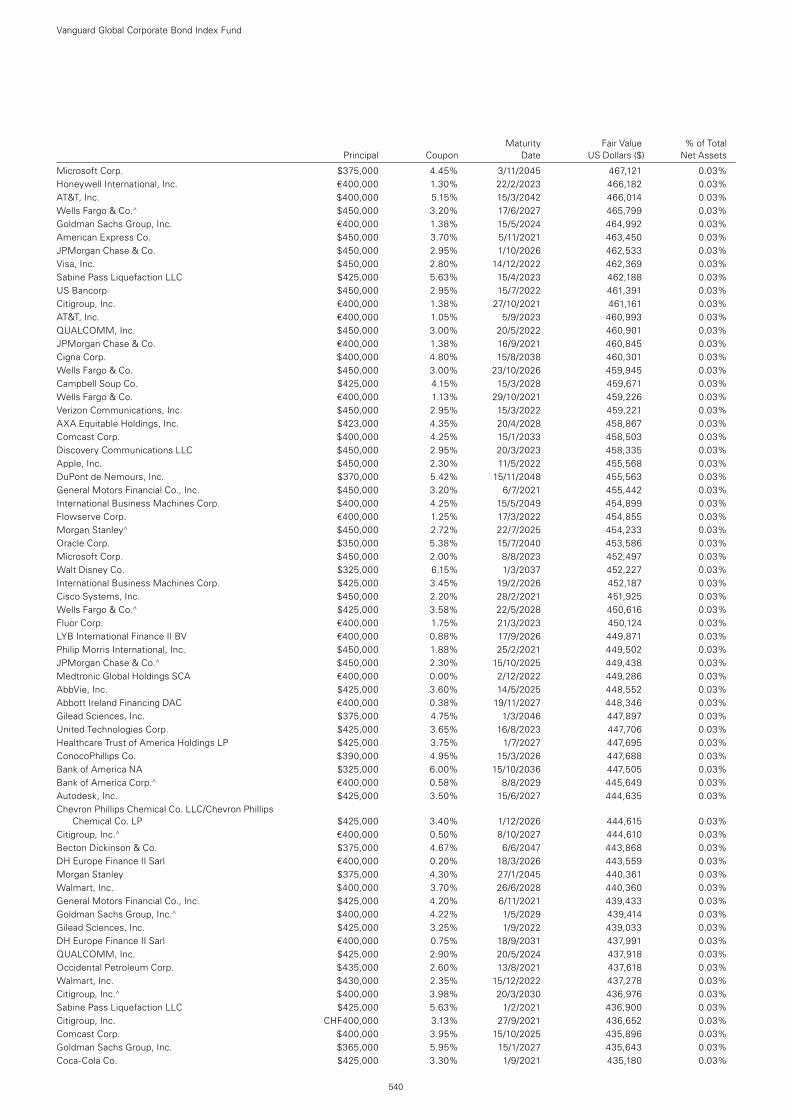
Microsoft Corp. $375,000 4.45% 3/11/2045 467,121 0.03%Honeywell International, Inc. €400,000 1.30% 22/2/2023 466,182 0.03%AT&T, Inc. $400,000 5.15% 15/3/2042 466,014 0.03%Wells Fargo & Co.^ $450,000 3.20% 17/6/2027 465,799 0.03%Goldman Sachs Group, Inc. €400,000 1.38% 15/5/2024 464,992 0.03%American Express Co. $450,000 3.70% 5/11/2021 463,450 0.03%JPMorgan Chase & Co. $450,000 2.95% 1/10/2026 462,533 0.03%Visa, Inc. $450,000 2.80% 14/12/2022 462,369 0.03%Sabine Pass Liquefaction LLC $425,000 5.63% 15/4/2023 462,188 0.03%US Bancorp $450,000 2.95% 15/7/2022 461,391 0.03%Citigroup, Inc. €400,000 1.38% 27/10/2021 461,161 0.03%AT&T, Inc. €400,000 1.05% 5/9/2023 460,993 0.03%QUALCOMM, Inc. $450,000 3.00% 20/5/2022 460,901 0.03%JPMorgan Chase & Co. €400,000 1.38% 16/9/2021 460,845 0.03%Cigna Corp. $400,000 4.80% 15/8/2038 460,301 0.03%Wells Fargo & Co. $450,000 3.00% 23/10/2026 459,945 0.03%Campbell Soup Co. $425,000 4.15% 15/3/2028 459,671 0.03%Wells Fargo & Co. €400,000 1.13% 29/10/2021 459,226 0.03%Verizon Communications, Inc. $450,000 2.95% 15/3/2022 459,221 0.03%AXA Equitable Holdings, Inc. $423,000 4.35% 20/4/2028 458,867 0.03%Comcast Corp. $400,000 4.25% 15/1/2033 458,503 0.03%Discovery Communications LLC $450,000 2.95% 20/3/2023 458,335 0.03%Apple, Inc. $450,000 2.30% 11/5/2022 455,568 0.03%DuPont de Nemours, Inc. $370,000 5.42% 15/11/2048 455,563 0.03%General Motors Financial Co., Inc. $450,000 3.20% 6/7/2021 455,442 0.03%International Business Machines Corp. $400,000 4.25% 15/5/2049 454,899 0.03%Flowserve Corp. €400,000 1.25% 17/3/2022 454,855 0.03%Morgan Stanley^ $450,000 2.72% 22/7/2025 454,233 0.03%Oracle Corp. $350,000 5.38% 15/7/2040 453,586 0.03%Microsoft Corp. $450,000 2.00% 8/8/2023 452,497 0.03%Walt Disney Co. $325,000 6.15% 1/3/2037 452,227 0.03%International Business Machines Corp. $425,000 3.45% 19/2/2026 452,187 0.03%Cisco Systems, Inc. $450,000 2.20% 28/2/2021 451,925 0.03%Wells Fargo & Co.^ $425,000 3.58% 22/5/2028 450,616 0.03%Fluor Corp. €400,000 1.75% 21/3/2023 450,124 0.03%LYB International Finance II BV €400,000 0.88% 17/9/2026 449,871 0.03%Philip Morris International, Inc. $450,000 1.88% 25/2/2021 449,502 0.03%JPMorgan Chase & Co.^ $450,000 2.30% 15/10/2025 449,438 0.03%Medtronic Global Holdings SCA €400,000 0.00% 2/12/2022 449,286 0.03%AbbVie, Inc. $425,000 3.60% 14/5/2025 448,552 0.03%Abbott Ireland Financing DAC €400,000 0.38% 19/11/2027 448,346 0.03%Gilead Sciences, Inc. $375,000 4.75% 1/3/2046 447,897 0.03%United Technologies Corp. $425,000 3.65% 16/8/2023 447,706 0.03%Healthcare Trust of America Holdings LP $425,000 3.75% 1/7/2027 447,695 0.03%ConocoPhillips Co. $390,000 4.95% 15/3/2026 447,688 0.03%Bank of America NA $325,000 6.00% 15/10/2036 447,505 0.03%Bank of America Corp.^ €400,000 0.58% 8/8/2029 445,649 0.03%Autodesk, Inc. $425,000 3.50% 15/6/2027 444,635 0.03%Chevron Phillips Chemical Co. LLC/Chevron Phillips
Chemical Co. LP $425,000 3.40% 1/12/2026 444,615 0.03%Citigroup, Inc.^ €400,000 0.50% 8/10/2027 444,610 0.03%Becton Dickinson & Co. $375,000 4.67% 6/6/2047 443,868 0.03%DH Europe Finance II Sarl €400,000 0.20% 18/3/2026 443,559 0.03%Morgan Stanley $375,000 4.30% 27/1/2045 440,361 0.03%Walmart, Inc. $400,000 3.70% 26/6/2028 440,360 0.03%General Motors Financial Co., Inc. $425,000 4.20% 6/11/2021 439,433 0.03%Goldman Sachs Group, Inc.^ $400,000 4.22% 1/5/2029 439,414 0.03%Gilead Sciences, Inc. $425,000 3.25% 1/9/2022 439,033 0.03%DH Europe Finance II Sarl €400,000 0.75% 18/9/2031 437,991 0.03%QUALCOMM, Inc. $425,000 2.90% 20/5/2024 437,918 0.03%Occidental Petroleum Corp. $435,000 2.60% 13/8/2021 437,618 0.03%Walmart, Inc. $430,000 2.35% 15/12/2022 437,278 0.03%Citigroup, Inc.^ $400,000 3.98% 20/3/2030 436,976 0.03%Sabine Pass Liquefaction LLC $425,000 5.63% 1/2/2021 436,900 0.03%Citigroup, Inc. CHF400,000 3.13% 27/9/2021 436,652 0.03%Comcast Corp. $400,000 3.95% 15/10/2025 435,896 0.03%Goldman Sachs Group, Inc. $365,000 5.95% 15/1/2027 435,643 0.03%Coca-Cola Co. $425,000 3.30% 1/9/2021 435,180 0.03%
Vanguard Global Corporate Bond Index Fund
540
Maturity Fair Value % of Total Principal Coupon Date US Dollars ($) Net Assets
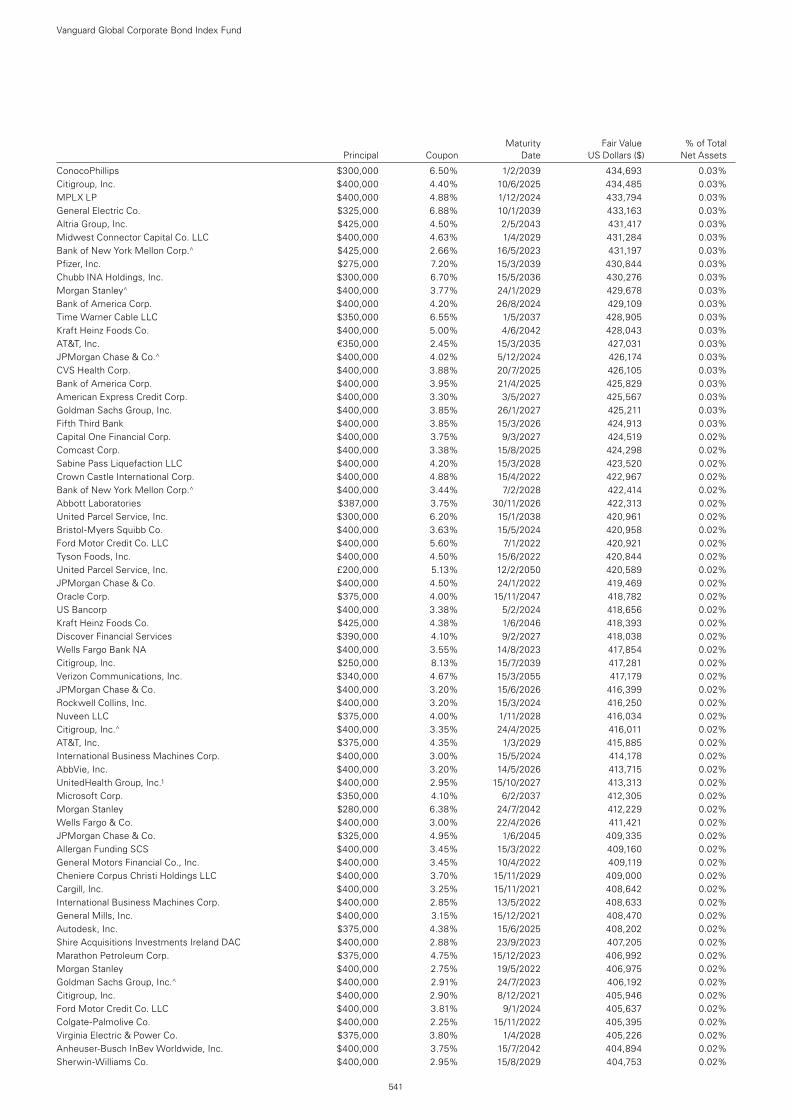
ConocoPhillips $300,000 6.50% 1/2/2039 434,693 0.03%Citigroup, Inc. $400,000 4.40% 10/6/2025 434,485 0.03%MPLX LP $400,000 4.88% 1/12/2024 433,794 0.03%General Electric Co. $325,000 6.88% 10/1/2039 433,163 0.03%Altria Group, Inc. $425,000 4.50% 2/5/2043 431,417 0.03%Midwest Connector Capital Co. LLC $400,000 4.63% 1/4/2029 431,284 0.03%Bank of New York Mellon Corp.^ $425,000 2.66% 16/5/2023 431,197 0.03%Pfizer, Inc. $275,000 7.20% 15/3/2039 430,844 0.03%Chubb INA Holdings, Inc. $300,000 6.70% 15/5/2036 430,276 0.03%Morgan Stanley^ $400,000 3.77% 24/1/2029 429,678 0.03%Bank of America Corp. $400,000 4.20% 26/8/2024 429,109 0.03%Time Warner Cable LLC $350,000 6.55% 1/5/2037 428,905 0.03%Kraft Heinz Foods Co. $400,000 5.00% 4/6/2042 428,043 0.03%AT&T, Inc. €350,000 2.45% 15/3/2035 427,031 0.03%JPMorgan Chase & Co.^ $400,000 4.02% 5/12/2024 426,174 0.03%CVS Health Corp. $400,000 3.88% 20/7/2025 426,105 0.03%Bank of America Corp. $400,000 3.95% 21/4/2025 425,829 0.03%American Express Credit Corp. $400,000 3.30% 3/5/2027 425,567 0.03%Goldman Sachs Group, Inc. $400,000 3.85% 26/1/2027 425,211 0.03%Fifth Third Bank $400,000 3.85% 15/3/2026 424,913 0.03%Capital One Financial Corp. $400,000 3.75% 9/3/2027 424,519 0.02%Comcast Corp. $400,000 3.38% 15/8/2025 424,298 0.02%Sabine Pass Liquefaction LLC $400,000 4.20% 15/3/2028 423,520 0.02%Crown Castle International Corp. $400,000 4.88% 15/4/2022 422,967 0.02%Bank of New York Mellon Corp.^ $400,000 3.44% 7/2/2028 422,414 0.02%Abbott Laboratories $387,000 3.75% 30/11/2026 422,313 0.02%United Parcel Service, Inc. $300,000 6.20% 15/1/2038 420,961 0.02%Bristol-Myers Squibb Co. $400,000 3.63% 15/5/2024 420,958 0.02%Ford Motor Credit Co. LLC $400,000 5.60% 7/1/2022 420,921 0.02%Tyson Foods, Inc. $400,000 4.50% 15/6/2022 420,844 0.02%United Parcel Service, Inc. £200,000 5.13% 12/2/2050 420,589 0.02%JPMorgan Chase & Co. $400,000 4.50% 24/1/2022 419,469 0.02%Oracle Corp. $375,000 4.00% 15/11/2047 418,782 0.02%US Bancorp $400,000 3.38% 5/2/2024 418,656 0.02%Kraft Heinz Foods Co. $425,000 4.38% 1/6/2046 418,393 0.02%Discover Financial Services $390,000 4.10% 9/2/2027 418,038 0.02%Wells Fargo Bank NA $400,000 3.55% 14/8/2023 417,854 0.02%Citigroup, Inc. $250,000 8.13% 15/7/2039 417,281 0.02%Verizon Communications, Inc. $340,000 4.67% 15/3/2055 417,179 0.02%JPMorgan Chase & Co. $400,000 3.20% 15/6/2026 416,399 0.02%Rockwell Collins, Inc. $400,000 3.20% 15/3/2024 416,250 0.02%Nuveen LLC $375,000 4.00% 1/11/2028 416,034 0.02%Citigroup, Inc.^ $400,000 3.35% 24/4/2025 416,011 0.02%AT&T, Inc. $375,000 4.35% 1/3/2029 415,885 0.02%International Business Machines Corp. $400,000 3.00% 15/5/2024 414,178 0.02%AbbVie, Inc. $400,000 3.20% 14/5/2026 413,715 0.02%UnitedHealth Group, Inc.1 $400,000 2.95% 15/10/2027 413,313 0.02%Microsoft Corp. $350,000 4.10% 6/2/2037 412,305 0.02%Morgan Stanley $280,000 6.38% 24/7/2042 412,229 0.02%Wells Fargo & Co. $400,000 3.00% 22/4/2026 411,421 0.02%JPMorgan Chase & Co. $325,000 4.95% 1/6/2045 409,335 0.02%Allergan Funding SCS $400,000 3.45% 15/3/2022 409,160 0.02%General Motors Financial Co., Inc. $400,000 3.45% 10/4/2022 409,119 0.02%Cheniere Corpus Christi Holdings LLC $400,000 3.70% 15/11/2029 409,000 0.02%Cargill, Inc. $400,000 3.25% 15/11/2021 408,642 0.02%International Business Machines Corp. $400,000 2.85% 13/5/2022 408,633 0.02%General Mills, Inc. $400,000 3.15% 15/12/2021 408,470 0.02%Autodesk, Inc. $375,000 4.38% 15/6/2025 408,202 0.02%Shire Acquisitions Investments Ireland DAC $400,000 2.88% 23/9/2023 407,205 0.02%Marathon Petroleum Corp. $375,000 4.75% 15/12/2023 406,992 0.02%Morgan Stanley $400,000 2.75% 19/5/2022 406,975 0.02%Goldman Sachs Group, Inc.^ $400,000 2.91% 24/7/2023 406,192 0.02%Citigroup, Inc. $400,000 2.90% 8/12/2021 405,946 0.02%Ford Motor Credit Co. LLC $400,000 3.81% 9/1/2024 405,637 0.02%Colgate-Palmolive Co. $400,000 2.25% 15/11/2022 405,395 0.02%Virginia Electric & Power Co. $375,000 3.80% 1/4/2028 405,226 0.02%Anheuser-Busch InBev Worldwide, Inc. $400,000 3.75% 15/7/2042 404,894 0.02%Sherwin-Williams Co. $400,000 2.95% 15/8/2029 404,753 0.02%
Vanguard Global Corporate Bond Index Fund
541
Maturity Fair Value % of Total Principal Coupon Date US Dollars ($) Net Assets
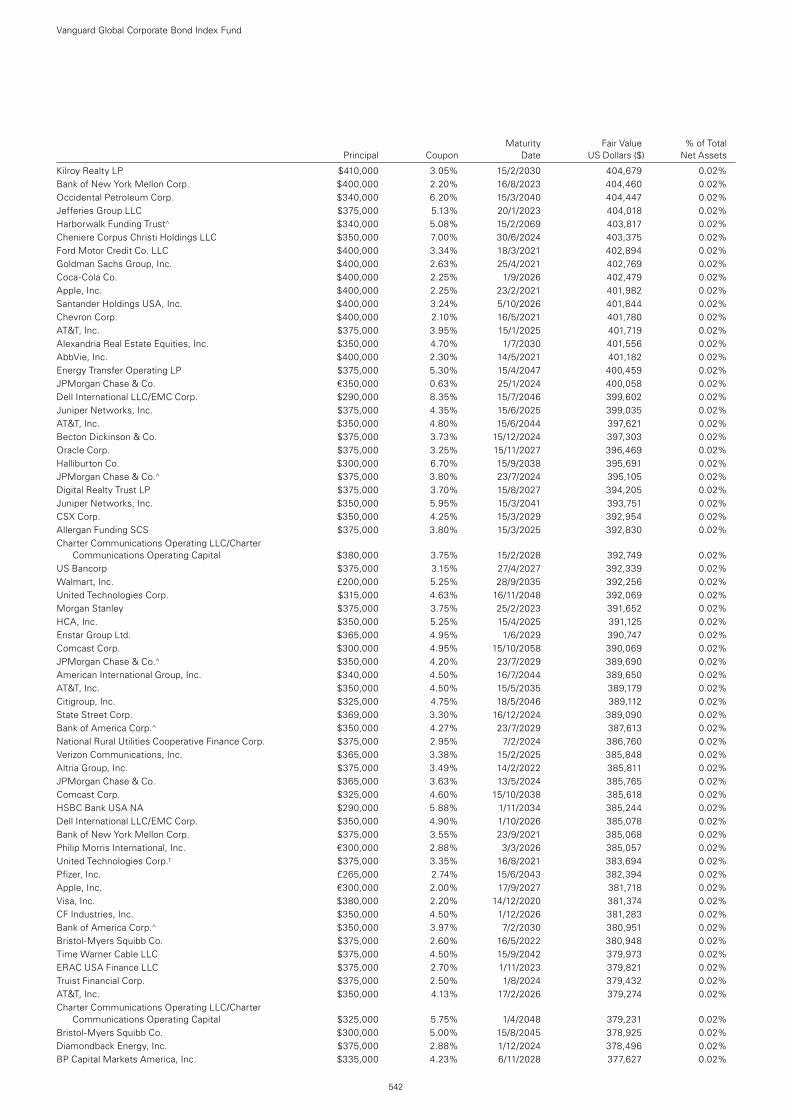
Kilroy Realty LP $410,000 3.05% 15/2/2030 404,679 0.02%Bank of New York Mellon Corp. $400,000 2.20% 16/8/2023 404,460 0.02%Occidental Petroleum Corp. $340,000 6.20% 15/3/2040 404,447 0.02%Jefferies Group LLC $375,000 5.13% 20/1/2023 404,018 0.02%Harborwalk Funding Trust^ $340,000 5.08% 15/2/2069 403,817 0.02%Cheniere Corpus Christi Holdings LLC $350,000 7.00% 30/6/2024 403,375 0.02%Ford Motor Credit Co. LLC $400,000 3.34% 18/3/2021 402,894 0.02%Goldman Sachs Group, Inc. $400,000 2.63% 25/4/2021 402,769 0.02%Coca-Cola Co. $400,000 2.25% 1/9/2026 402,479 0.02%Apple, Inc. $400,000 2.25% 23/2/2021 401,982 0.02%Santander Holdings USA, Inc. $400,000 3.24% 5/10/2026 401,844 0.02%Chevron Corp. $400,000 2.10% 16/5/2021 401,780 0.02%AT&T, Inc. $375,000 3.95% 15/1/2025 401,719 0.02%Alexandria Real Estate Equities, Inc. $350,000 4.70% 1/7/2030 401,556 0.02%AbbVie, Inc. $400,000 2.30% 14/5/2021 401,182 0.02%Energy Transfer Operating LP $375,000 5.30% 15/4/2047 400,459 0.02%JPMorgan Chase & Co. €350,000 0.63% 25/1/2024 400,058 0.02%Dell International LLC/EMC Corp. $290,000 8.35% 15/7/2046 399,602 0.02%Juniper Networks, Inc. $375,000 4.35% 15/6/2025 399,035 0.02%AT&T, Inc. $350,000 4.80% 15/6/2044 397,621 0.02%Becton Dickinson & Co. $375,000 3.73% 15/12/2024 397,303 0.02%Oracle Corp. $375,000 3.25% 15/11/2027 396,469 0.02%Halliburton Co. $300,000 6.70% 15/9/2038 395,691 0.02%JPMorgan Chase & Co.^ $375,000 3.80% 23/7/2024 395,105 0.02%Digital Realty Trust LP $375,000 3.70% 15/8/2027 394,205 0.02%Juniper Networks, Inc. $350,000 5.95% 15/3/2041 393,751 0.02%CSX Corp. $350,000 4.25% 15/3/2029 392,954 0.02%Allergan Funding SCS $375,000 3.80% 15/3/2025 392,830 0.02%Charter Communications Operating LLC/Charter
Communications Operating Capital $380,000 3.75% 15/2/2028 392,749 0.02%US Bancorp $375,000 3.15% 27/4/2027 392,339 0.02%Walmart, Inc. £200,000 5.25% 28/9/2035 392,256 0.02%United Technologies Corp. $315,000 4.63% 16/11/2048 392,069 0.02%Morgan Stanley $375,000 3.75% 25/2/2023 391,652 0.02%HCA, Inc. $350,000 5.25% 15/4/2025 391,125 0.02%Enstar Group Ltd. $365,000 4.95% 1/6/2029 390,747 0.02%Comcast Corp. $300,000 4.95% 15/10/2058 390,069 0.02%JPMorgan Chase & Co.^ $350,000 4.20% 23/7/2029 389,690 0.02%American International Group, Inc. $340,000 4.50% 16/7/2044 389,650 0.02%AT&T, Inc. $350,000 4.50% 15/5/2035 389,179 0.02%Citigroup, Inc. $325,000 4.75% 18/5/2046 389,112 0.02%State Street Corp. $369,000 3.30% 16/12/2024 389,090 0.02%Bank of America Corp.^ $350,000 4.27% 23/7/2029 387,613 0.02%National Rural Utilities Cooperative Finance Corp. $375,000 2.95% 7/2/2024 386,760 0.02%Verizon Communications, Inc. $365,000 3.38% 15/2/2025 385,848 0.02%Altria Group, Inc. $375,000 3.49% 14/2/2022 385,811 0.02%JPMorgan Chase & Co. $365,000 3.63% 13/5/2024 385,765 0.02%Comcast Corp. $325,000 4.60% 15/10/2038 385,618 0.02%HSBC Bank USA NA $290,000 5.88% 1/11/2034 385,244 0.02%Dell International LLC/EMC Corp. $350,000 4.90% 1/10/2026 385,078 0.02%Bank of New York Mellon Corp. $375,000 3.55% 23/9/2021 385,068 0.02%Philip Morris International, Inc. €300,000 2.88% 3/3/2026 385,057 0.02%United Technologies Corp.1 $375,000 3.35% 16/8/2021 383,694 0.02%Pfizer, Inc. £265,000 2.74% 15/6/2043 382,394 0.02%Apple, Inc. €300,000 2.00% 17/9/2027 381,718 0.02%Visa, Inc. $380,000 2.20% 14/12/2020 381,374 0.02%CF Industries, Inc. $350,000 4.50% 1/12/2026 381,283 0.02%Bank of America Corp.^ $350,000 3.97% 7/2/2030 380,951 0.02%Bristol-Myers Squibb Co. $375,000 2.60% 16/5/2022 380,948 0.02%Time Warner Cable LLC $375,000 4.50% 15/9/2042 379,973 0.02%ERAC USA Finance LLC $375,000 2.70% 1/11/2023 379,821 0.02%Truist Financial Corp. $375,000 2.50% 1/8/2024 379,432 0.02%AT&T, Inc. $350,000 4.13% 17/2/2026 379,274 0.02%Charter Communications Operating LLC/Charter
Communications Operating Capital $325,000 5.75% 1/4/2048 379,231 0.02%Bristol-Myers Squibb Co. $300,000 5.00% 15/8/2045 378,925 0.02%Diamondback Energy, Inc. $375,000 2.88% 1/12/2024 378,496 0.02%BP Capital Markets America, Inc. $335,000 4.23% 6/11/2028 377,627 0.02%
Vanguard Global Corporate Bond Index Fund
542
Maturity Fair Value % of Total Principal Coupon Date US Dollars ($) Net Assets
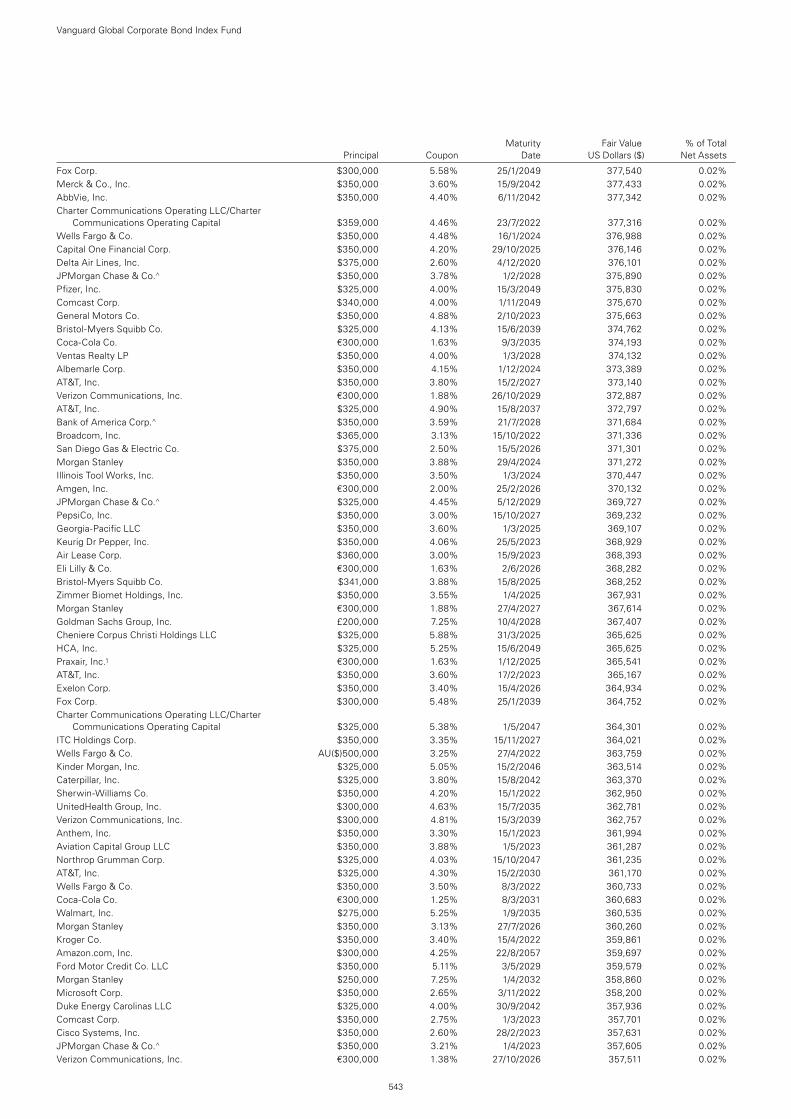
Fox Corp. $300,000 5.58% 25/1/2049 377,540 0.02%Merck & Co., Inc. $350,000 3.60% 15/9/2042 377,433 0.02%AbbVie, Inc. $350,000 4.40% 6/11/2042 377,342 0.02%Charter Communications Operating LLC/Charter
Communications Operating Capital $359,000 4.46% 23/7/2022 377,316 0.02%Wells Fargo & Co. $350,000 4.48% 16/1/2024 376,988 0.02%Capital One Financial Corp. $350,000 4.20% 29/10/2025 376,146 0.02%Delta Air Lines, Inc. $375,000 2.60% 4/12/2020 376,101 0.02%JPMorgan Chase & Co.^ $350,000 3.78% 1/2/2028 375,890 0.02%Pfizer, Inc. $325,000 4.00% 15/3/2049 375,830 0.02%Comcast Corp. $340,000 4.00% 1/11/2049 375,670 0.02%General Motors Co. $350,000 4.88% 2/10/2023 375,663 0.02%Bristol-Myers Squibb Co. $325,000 4.13% 15/6/2039 374,762 0.02%Coca-Cola Co. €300,000 1.63% 9/3/2035 374,193 0.02%Ventas Realty LP $350,000 4.00% 1/3/2028 374,132 0.02%Albemarle Corp. $350,000 4.15% 1/12/2024 373,389 0.02%AT&T, Inc. $350,000 3.80% 15/2/2027 373,140 0.02%Verizon Communications, Inc. €300,000 1.88% 26/10/2029 372,887 0.02%AT&T, Inc. $325,000 4.90% 15/8/2037 372,797 0.02%Bank of America Corp.^ $350,000 3.59% 21/7/2028 371,684 0.02%Broadcom, Inc. $365,000 3.13% 15/10/2022 371,336 0.02%San Diego Gas & Electric Co. $375,000 2.50% 15/5/2026 371,301 0.02%Morgan Stanley $350,000 3.88% 29/4/2024 371,272 0.02%Illinois Tool Works, Inc. $350,000 3.50% 1/3/2024 370,447 0.02%Amgen, Inc. €300,000 2.00% 25/2/2026 370,132 0.02%JPMorgan Chase & Co.^ $325,000 4.45% 5/12/2029 369,727 0.02%PepsiCo, Inc. $350,000 3.00% 15/10/2027 369,232 0.02%Georgia-Pacific LLC $350,000 3.60% 1/3/2025 369,107 0.02%Keurig Dr Pepper, Inc. $350,000 4.06% 25/5/2023 368,929 0.02%Air Lease Corp. $360,000 3.00% 15/9/2023 368,393 0.02%Eli Lilly & Co. €300,000 1.63% 2/6/2026 368,282 0.02%Bristol-Myers Squibb Co. $341,000 3.88% 15/8/2025 368,252 0.02%Zimmer Biomet Holdings, Inc. $350,000 3.55% 1/4/2025 367,931 0.02%Morgan Stanley €300,000 1.88% 27/4/2027 367,614 0.02%Goldman Sachs Group, Inc. £200,000 7.25% 10/4/2028 367,407 0.02%Cheniere Corpus Christi Holdings LLC $325,000 5.88% 31/3/2025 365,625 0.02%HCA, Inc. $325,000 5.25% 15/6/2049 365,625 0.02%Praxair, Inc.1 €300,000 1.63% 1/12/2025 365,541 0.02%AT&T, Inc. $350,000 3.60% 17/2/2023 365,167 0.02%Exelon Corp. $350,000 3.40% 15/4/2026 364,934 0.02%Fox Corp. $300,000 5.48% 25/1/2039 364,752 0.02%Charter Communications Operating LLC/Charter
Communications Operating Capital $325,000 5.38% 1/5/2047 364,301 0.02%ITC Holdings Corp. $350,000 3.35% 15/11/2027 364,021 0.02%Wells Fargo & Co. AU($)500,000 3.25% 27/4/2022 363,759 0.02%Kinder Morgan, Inc. $325,000 5.05% 15/2/2046 363,514 0.02%Caterpillar, Inc. $325,000 3.80% 15/8/2042 363,370 0.02%Sherwin-Williams Co. $350,000 4.20% 15/1/2022 362,950 0.02%UnitedHealth Group, Inc. $300,000 4.63% 15/7/2035 362,781 0.02%Verizon Communications, Inc. $300,000 4.81% 15/3/2039 362,757 0.02%Anthem, Inc. $350,000 3.30% 15/1/2023 361,994 0.02%Aviation Capital Group LLC $350,000 3.88% 1/5/2023 361,287 0.02%Northrop Grumman Corp. $325,000 4.03% 15/10/2047 361,235 0.02%AT&T, Inc. $325,000 4.30% 15/2/2030 361,170 0.02%Wells Fargo & Co. $350,000 3.50% 8/3/2022 360,733 0.02%Coca-Cola Co. €300,000 1.25% 8/3/2031 360,683 0.02%Walmart, Inc. $275,000 5.25% 1/9/2035 360,535 0.02%Morgan Stanley $350,000 3.13% 27/7/2026 360,260 0.02%Kroger Co. $350,000 3.40% 15/4/2022 359,861 0.02%Amazon.com, Inc. $300,000 4.25% 22/8/2057 359,697 0.02%Ford Motor Credit Co. LLC $350,000 5.11% 3/5/2029 359,579 0.02%Morgan Stanley $250,000 7.25% 1/4/2032 358,860 0.02%Microsoft Corp. $350,000 2.65% 3/11/2022 358,200 0.02%Duke Energy Carolinas LLC $325,000 4.00% 30/9/2042 357,936 0.02%Comcast Corp. $350,000 2.75% 1/3/2023 357,701 0.02%Cisco Systems, Inc. $350,000 2.60% 28/2/2023 357,631 0.02%JPMorgan Chase & Co.^ $350,000 3.21% 1/4/2023 357,605 0.02%Verizon Communications, Inc. €300,000 1.38% 27/10/2026 357,511 0.02%
Vanguard Global Corporate Bond Index Fund
543
Maturity Fair Value % of Total Principal Coupon Date US Dollars ($) Net Assets
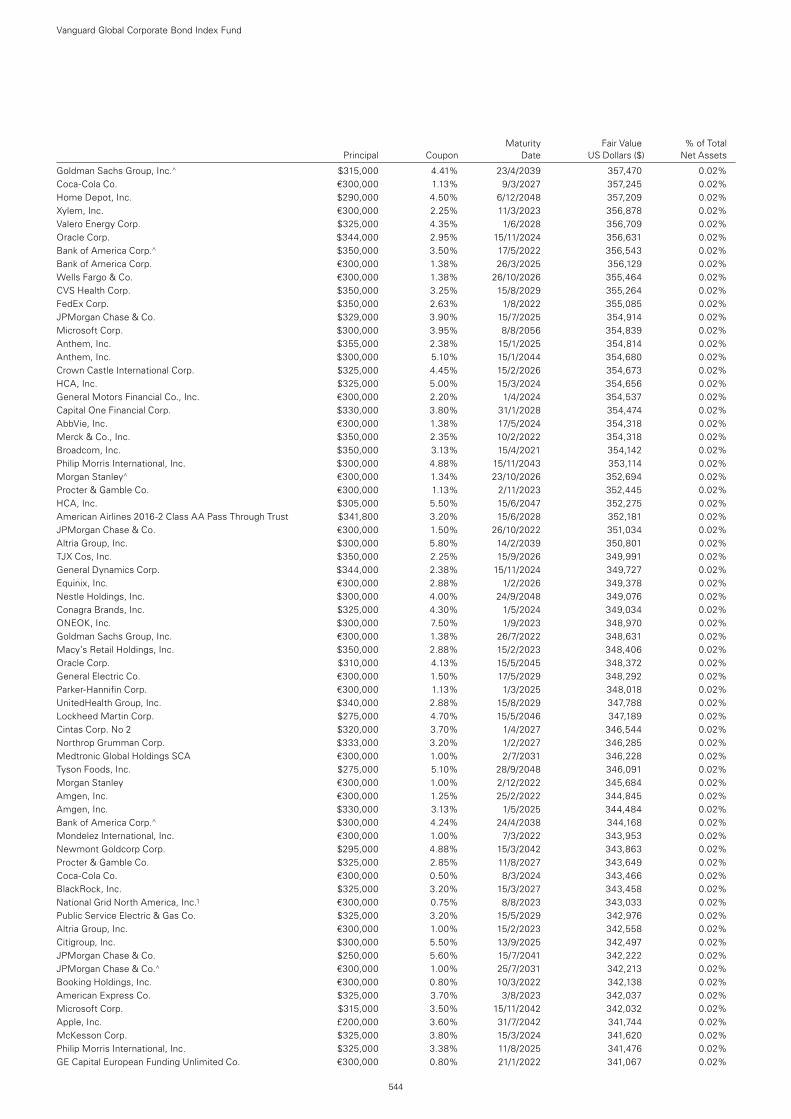
Goldman Sachs Group, Inc.^ $315,000 4.41% 23/4/2039 357,470 0.02%Coca-Cola Co. €300,000 1.13% 9/3/2027 357,245 0.02%Home Depot, Inc. $290,000 4.50% 6/12/2048 357,209 0.02%Xylem, Inc. €300,000 2.25% 11/3/2023 356,878 0.02%Valero Energy Corp. $325,000 4.35% 1/6/2028 356,709 0.02%Oracle Corp. $344,000 2.95% 15/11/2024 356,631 0.02%Bank of America Corp.^ $350,000 3.50% 17/5/2022 356,543 0.02%Bank of America Corp. €300,000 1.38% 26/3/2025 356,129 0.02%Wells Fargo & Co. €300,000 1.38% 26/10/2026 355,464 0.02%CVS Health Corp. $350,000 3.25% 15/8/2029 355,264 0.02%FedEx Corp. $350,000 2.63% 1/8/2022 355,085 0.02%JPMorgan Chase & Co. $329,000 3.90% 15/7/2025 354,914 0.02%Microsoft Corp. $300,000 3.95% 8/8/2056 354,839 0.02%Anthem, Inc. $355,000 2.38% 15/1/2025 354,814 0.02%Anthem, Inc. $300,000 5.10% 15/1/2044 354,680 0.02%Crown Castle International Corp. $325,000 4.45% 15/2/2026 354,673 0.02%HCA, Inc. $325,000 5.00% 15/3/2024 354,656 0.02%General Motors Financial Co., Inc. €300,000 2.20% 1/4/2024 354,537 0.02%Capital One Financial Corp. $330,000 3.80% 31/1/2028 354,474 0.02%AbbVie, Inc. €300,000 1.38% 17/5/2024 354,318 0.02%Merck & Co., Inc. $350,000 2.35% 10/2/2022 354,318 0.02%Broadcom, Inc. $350,000 3.13% 15/4/2021 354,142 0.02%Philip Morris International, Inc. $300,000 4.88% 15/11/2043 353,114 0.02%Morgan Stanley^ €300,000 1.34% 23/10/2026 352,694 0.02%Procter & Gamble Co. €300,000 1.13% 2/11/2023 352,445 0.02%HCA, Inc. $305,000 5.50% 15/6/2047 352,275 0.02%American Airlines 2016-2 Class AA Pass Through Trust $341,800 3.20% 15/6/2028 352,181 0.02%JPMorgan Chase & Co. €300,000 1.50% 26/10/2022 351,034 0.02%Altria Group, Inc. $300,000 5.80% 14/2/2039 350,801 0.02%TJX Cos, Inc. $350,000 2.25% 15/9/2026 349,991 0.02%General Dynamics Corp. $344,000 2.38% 15/11/2024 349,727 0.02%Equinix, Inc. €300,000 2.88% 1/2/2026 349,378 0.02%Nestle Holdings, Inc. $300,000 4.00% 24/9/2048 349,076 0.02%Conagra Brands, Inc. $325,000 4.30% 1/5/2024 349,034 0.02%ONEOK, Inc. $300,000 7.50% 1/9/2023 348,970 0.02%Goldman Sachs Group, Inc. €300,000 1.38% 26/7/2022 348,631 0.02%Macy’s Retail Holdings, Inc. $350,000 2.88% 15/2/2023 348,406 0.02%Oracle Corp. $310,000 4.13% 15/5/2045 348,372 0.02%General Electric Co. €300,000 1.50% 17/5/2029 348,292 0.02%Parker-Hannifin Corp. €300,000 1.13% 1/3/2025 348,018 0.02%UnitedHealth Group, Inc. $340,000 2.88% 15/8/2029 347,788 0.02%Lockheed Martin Corp. $275,000 4.70% 15/5/2046 347,189 0.02%Cintas Corp. No 2 $320,000 3.70% 1/4/2027 346,544 0.02%Northrop Grumman Corp. $333,000 3.20% 1/2/2027 346,285 0.02%Medtronic Global Holdings SCA €300,000 1.00% 2/7/2031 346,228 0.02%Tyson Foods, Inc. $275,000 5.10% 28/9/2048 346,091 0.02%Morgan Stanley €300,000 1.00% 2/12/2022 345,684 0.02%Amgen, Inc. €300,000 1.25% 25/2/2022 344,845 0.02%Amgen, Inc. $330,000 3.13% 1/5/2025 344,484 0.02%Bank of America Corp.^ $300,000 4.24% 24/4/2038 344,168 0.02%Mondelez International, Inc. €300,000 1.00% 7/3/2022 343,953 0.02%Newmont Goldcorp Corp. $295,000 4.88% 15/3/2042 343,863 0.02%Procter & Gamble Co. $325,000 2.85% 11/8/2027 343,649 0.02%Coca-Cola Co. €300,000 0.50% 8/3/2024 343,466 0.02%BlackRock, Inc. $325,000 3.20% 15/3/2027 343,458 0.02%National Grid North America, Inc.1 €300,000 0.75% 8/8/2023 343,033 0.02%Public Service Electric & Gas Co. $325,000 3.20% 15/5/2029 342,976 0.02%Altria Group, Inc. €300,000 1.00% 15/2/2023 342,558 0.02%Citigroup, Inc. $300,000 5.50% 13/9/2025 342,497 0.02%JPMorgan Chase & Co. $250,000 5.60% 15/7/2041 342,222 0.02%JPMorgan Chase & Co.^ €300,000 1.00% 25/7/2031 342,213 0.02%Booking Holdings, Inc. €300,000 0.80% 10/3/2022 342,138 0.02%American Express Co. $325,000 3.70% 3/8/2023 342,037 0.02%Microsoft Corp. $315,000 3.50% 15/11/2042 342,032 0.02%Apple, Inc. £200,000 3.60% 31/7/2042 341,744 0.02%McKesson Corp. $325,000 3.80% 15/3/2024 341,620 0.02%Philip Morris International, Inc. $325,000 3.38% 11/8/2025 341,476 0.02%GE Capital European Funding Unlimited Co. €300,000 0.80% 21/1/2022 341,067 0.02%
Vanguard Global Corporate Bond Index Fund
544
Maturity Fair Value % of Total Principal Coupon Date US Dollars ($) Net Assets
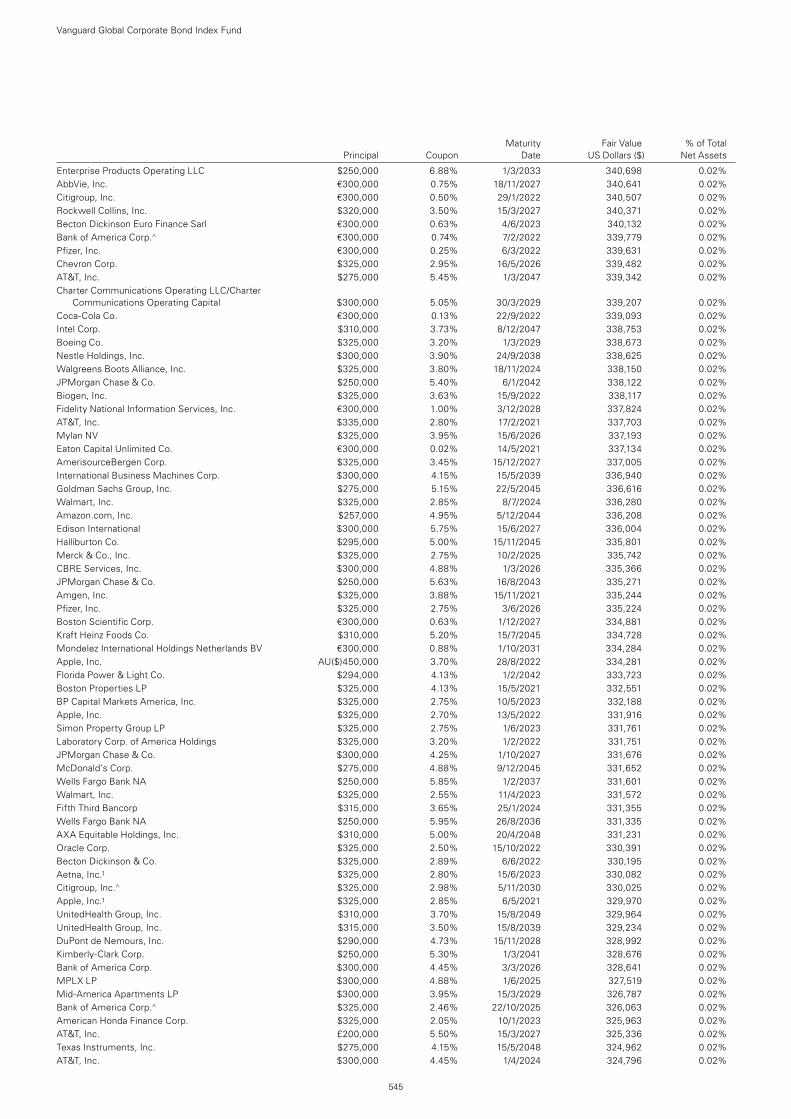
Enterprise Products Operating LLC $250,000 6.88% 1/3/2033 340,698 0.02%AbbVie, Inc. €300,000 0.75% 18/11/2027 340,641 0.02%Citigroup, Inc. €300,000 0.50% 29/1/2022 340,507 0.02%Rockwell Collins, Inc. $320,000 3.50% 15/3/2027 340,371 0.02%Becton Dickinson Euro Finance Sarl €300,000 0.63% 4/6/2023 340,132 0.02%Bank of America Corp.^ €300,000 0.74% 7/2/2022 339,779 0.02%Pfizer, Inc. €300,000 0.25% 6/3/2022 339,631 0.02%Chevron Corp. $325,000 2.95% 16/5/2026 339,482 0.02%AT&T, Inc. $275,000 5.45% 1/3/2047 339,342 0.02%Charter Communications Operating LLC/Charter
Communications Operating Capital $300,000 5.05% 30/3/2029 339,207 0.02%Coca-Cola Co. €300,000 0.13% 22/9/2022 339,093 0.02%Intel Corp. $310,000 3.73% 8/12/2047 338,753 0.02%Boeing Co. $325,000 3.20% 1/3/2029 338,673 0.02%Nestle Holdings, Inc. $300,000 3.90% 24/9/2038 338,625 0.02%Walgreens Boots Alliance, Inc. $325,000 3.80% 18/11/2024 338,150 0.02%JPMorgan Chase & Co. $250,000 5.40% 6/1/2042 338,122 0.02%Biogen, Inc. $325,000 3.63% 15/9/2022 338,117 0.02%Fidelity National Information Services, Inc. €300,000 1.00% 3/12/2028 337,824 0.02%AT&T, Inc. $335,000 2.80% 17/2/2021 337,703 0.02%Mylan NV $325,000 3.95% 15/6/2026 337,193 0.02%Eaton Capital Unlimited Co. €300,000 0.02% 14/5/2021 337,134 0.02%AmerisourceBergen Corp. $325,000 3.45% 15/12/2027 337,005 0.02%International Business Machines Corp. $300,000 4.15% 15/5/2039 336,940 0.02%Goldman Sachs Group, Inc. $275,000 5.15% 22/5/2045 336,616 0.02%Walmart, Inc. $325,000 2.85% 8/7/2024 336,280 0.02%Amazon.com, Inc. $257,000 4.95% 5/12/2044 336,208 0.02%Edison International $300,000 5.75% 15/6/2027 336,004 0.02%Halliburton Co. $295,000 5.00% 15/11/2045 335,801 0.02%Merck & Co., Inc. $325,000 2.75% 10/2/2025 335,742 0.02%CBRE Services, Inc. $300,000 4.88% 1/3/2026 335,366 0.02%JPMorgan Chase & Co. $250,000 5.63% 16/8/2043 335,271 0.02%Amgen, Inc. $325,000 3.88% 15/11/2021 335,244 0.02%Pfizer, Inc. $325,000 2.75% 3/6/2026 335,224 0.02%Boston Scientific Corp. €300,000 0.63% 1/12/2027 334,881 0.02%Kraft Heinz Foods Co. $310,000 5.20% 15/7/2045 334,728 0.02%Mondelez International Holdings Netherlands BV €300,000 0.88% 1/10/2031 334,284 0.02%Apple, Inc. AU($)450,000 3.70% 28/8/2022 334,281 0.02%Florida Power & Light Co. $294,000 4.13% 1/2/2042 333,723 0.02%Boston Properties LP $325,000 4.13% 15/5/2021 332,551 0.02%BP Capital Markets America, Inc. $325,000 2.75% 10/5/2023 332,188 0.02%Apple, Inc. $325,000 2.70% 13/5/2022 331,916 0.02%Simon Property Group LP $325,000 2.75% 1/6/2023 331,761 0.02%Laboratory Corp. of America Holdings $325,000 3.20% 1/2/2022 331,751 0.02%JPMorgan Chase & Co. $300,000 4.25% 1/10/2027 331,676 0.02%McDonald’s Corp. $275,000 4.88% 9/12/2045 331,652 0.02%Wells Fargo Bank NA $250,000 5.85% 1/2/2037 331,601 0.02%Walmart, Inc. $325,000 2.55% 11/4/2023 331,572 0.02%Fifth Third Bancorp $315,000 3.65% 25/1/2024 331,355 0.02%Wells Fargo Bank NA $250,000 5.95% 26/8/2036 331,335 0.02%AXA Equitable Holdings, Inc. $310,000 5.00% 20/4/2048 331,231 0.02%Oracle Corp. $325,000 2.50% 15/10/2022 330,391 0.02%Becton Dickinson & Co. $325,000 2.89% 6/6/2022 330,195 0.02%Aetna, Inc.1 $325,000 2.80% 15/6/2023 330,082 0.02%Citigroup, Inc.^ $325,000 2.98% 5/11/2030 330,025 0.02%Apple, Inc.1 $325,000 2.85% 6/5/2021 329,970 0.02%UnitedHealth Group, Inc. $310,000 3.70% 15/8/2049 329,964 0.02%UnitedHealth Group, Inc. $315,000 3.50% 15/8/2039 329,234 0.02%DuPont de Nemours, Inc. $290,000 4.73% 15/11/2028 328,992 0.02%Kimberly-Clark Corp. $250,000 5.30% 1/3/2041 328,676 0.02%Bank of America Corp. $300,000 4.45% 3/3/2026 328,641 0.02%MPLX LP $300,000 4.88% 1/6/2025 327,519 0.02%Mid-America Apartments LP $300,000 3.95% 15/3/2029 326,787 0.02%Bank of America Corp.^ $325,000 2.46% 22/10/2025 326,063 0.02%American Honda Finance Corp. $325,000 2.05% 10/1/2023 325,963 0.02%AT&T, Inc. £200,000 5.50% 15/3/2027 325,336 0.02%Texas Instruments, Inc. $275,000 4.15% 15/5/2048 324,962 0.02%AT&T, Inc. $300,000 4.45% 1/4/2024 324,796 0.02%
Vanguard Global Corporate Bond Index Fund
545
Maturity Fair Value % of Total Principal Coupon Date US Dollars ($) Net Assets

Intel Corp. $300,000 3.70% 29/7/2025 324,108 0.02%Bristol-Myers Squibb Co. $275,000 4.35% 15/11/2047 322,978 0.02%Comcast Corp. $300,000 3.55% 1/5/2028 322,884 0.02%Bank of America Corp. $300,000 4.13% 22/1/2024 322,697 0.02%Santander Holdings USA, Inc. $300,000 4.50% 17/7/2025 322,568 0.02%Welltower, Inc. $300,000 4.00% 1/6/2025 322,259 0.02%McDonald’s Corp. $300,000 3.70% 30/1/2026 321,922 0.02%Bank of America Corp.^ $300,000 3.82% 20/1/2028 321,590 0.02%Atmos Energy Corp. $250,000 5.50% 15/6/2041 321,487 0.02%Rockwell Collins, Inc. $275,000 4.35% 15/4/2047 321,459 0.02%WP Carey, Inc. $300,000 4.60% 1/4/2024 321,280 0.02%Medtronic, Inc. $272,000 4.38% 15/3/2035 320,971 0.02%Phillips 66 $275,000 4.65% 15/11/2034 320,819 0.02%Kinder Morgan Energy Partners LP $300,000 4.30% 1/5/2024 320,557 0.02%High Street Funding Trust I $300,000 4.11% 15/2/2028 319,866 0.02%Fox Corp. $300,000 4.03% 25/1/2024 319,492 0.02%Amazon.com, Inc. $275,000 5.20% 3/12/2025 319,194 0.02%Goldman Sachs Group, Inc. $300,000 4.00% 3/3/2024 318,553 0.02%Discovery Communications LLC $275,000 5.20% 20/9/2047 318,459 0.02%Energy Transfer Operating LP $300,000 4.50% 15/4/2024 318,415 0.02%Tyson Foods, Inc. $300,000 3.55% 2/6/2027 318,181 0.02%HCA, Inc. $300,000 4.13% 15/6/2029 318,000 0.02%International Business Machines Corp. $300,000 3.30% 27/1/2027 317,508 0.02%Gilead Sciences, Inc. $275,000 4.50% 1/2/2045 317,415 0.02%Kraft Heinz Foods Co. $300,000 3.95% 15/7/2025 317,214 0.02%Wells Fargo & Co. $300,000 3.55% 29/9/2025 316,948 0.02%ONEOK, Inc. $300,000 4.00% 13/7/2027 316,732 0.02%Eli Lilly & Co. $275,000 3.95% 15/3/2049 316,666 0.02%Kirby Corp. $300,000 4.20% 1/3/2028 316,227 0.02%Morgan Stanley $300,000 4.10% 22/5/2023 315,716 0.02%AbbVie, Inc. $300,000 3.75% 14/11/2023 315,581 0.02%Diamondback Energy, Inc. $300,000 5.38% 31/5/2025 315,375 0.02%Union Electric Co. $300,000 3.50% 15/4/2024 315,170 0.02%Welltower, Inc. £200,000 4.80% 20/11/2028 315,169 0.02%Abbott Laboratories $300,000 3.40% 30/11/2023 315,067 0.02%Apple, Inc. $300,000 3.45% 9/2/2045 314,996 0.02%United Technologies Corp. $275,000 4.15% 15/5/2045 314,987 0.02%Walt Disney Co. $250,000 4.75% 15/9/2044 314,934 0.02%Connecticut Light & Power Co. $300,000 3.20% 15/3/2027 314,722 0.02%Exxon Mobil Corp. $300,000 3.04% 1/3/2026 314,718 0.02%Concho Resources, Inc. $300,000 3.75% 1/10/2027 314,625 0.02%Target Corp. $225,000 6.35% 1/11/2032 314,493 0.02%Conagra Brands, Inc. $275,000 4.85% 1/11/2028 313,865 0.02%Walt Disney Co. $225,000 6.20% 15/12/2034 313,795 0.02%Comcast Corp. $300,000 3.15% 1/3/2026 313,471 0.02%PacifiCorp $275,000 4.13% 15/1/2049 313,319 0.02%Omega Healthcare Investors, Inc. $312,000 3.63% 1/10/2029 313,242 0.02%Baker Hughes a GE Co. LLC/Baker Hughes Co.-Obligor, Inc. $300,000 3.34% 15/12/2027 313,182 0.02%Berkshire Hathaway Finance Corp. $265,000 4.25% 15/1/2049 313,042 0.02%WRKCo, Inc. $275,000 4.90% 15/3/2029 312,674 0.02%Fox Corp. $275,000 4.71% 25/1/2029 312,582 0.02%Northrop Grumman Corp. $300,000 3.25% 15/1/2028 312,562 0.02%Kinder Morgan Energy Partners LP $300,000 3.95% 1/9/2022 312,466 0.02%Morgan Stanley^ $300,000 3.74% 24/4/2024 312,398 0.02%Visa, Inc. $265,000 4.15% 14/12/2035 312,370 0.02%Sempra Energy $300,000 3.80% 1/2/2038 312,302 0.02%Fiserv, Inc. $275,000 4.40% 1/7/2049 311,786 0.02%Lockheed Martin Corp. $300,000 2.90% 1/3/2025 311,699 0.02%Lowe’s Cos, Inc. $300,000 3.13% 15/9/2024 311,570 0.02%CVS Health Corp. $307,000 3.35% 9/3/2021 311,531 0.02%American Tower Corp. $300,000 3.50% 31/1/2023 310,787 0.02%MPLX LP $300,000 4.00% 15/3/2028 310,753 0.02%Burlington Northern Santa Fe LLC $275,000 4.13% 15/6/2047 310,699 0.02%General Motors Financial Co., Inc. $300,000 4.38% 25/9/2021 310,659 0.02%Broadcom Corp./Broadcom Cayman Finance Ltd. $300,000 3.63% 15/1/2024 310,604 0.02%Cargill, Inc. $300,000 3.25% 1/3/2023 310,275 0.02%JPMorgan Chase & Co. $300,000 3.25% 23/9/2022 310,050 0.02%Exxon Mobil Corp. $300,000 2.71% 6/3/2025 309,982 0.02%
Vanguard Global Corporate Bond Index Fund
546
Maturity Fair Value % of Total Principal Coupon Date US Dollars ($) Net Assets
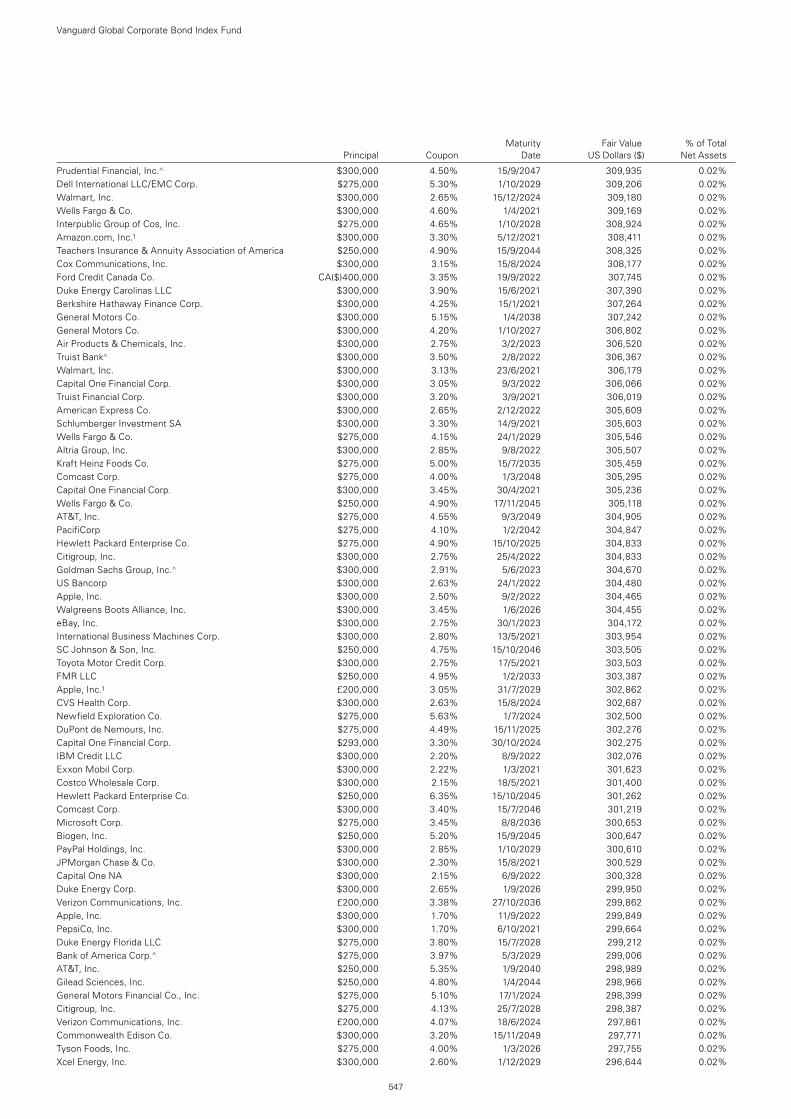
Prudential Financial, Inc.^ $300,000 4.50% 15/9/2047 309,935 0.02%Dell International LLC/EMC Corp. $275,000 5.30% 1/10/2029 309,206 0.02%Walmart, Inc. $300,000 2.65% 15/12/2024 309,180 0.02%Wells Fargo & Co. $300,000 4.60% 1/4/2021 309,169 0.02%Interpublic Group of Cos, Inc. $275,000 4.65% 1/10/2028 308,924 0.02%Amazon.com, Inc.1 $300,000 3.30% 5/12/2021 308,411 0.02%Teachers Insurance & Annuity Association of America $250,000 4.90% 15/9/2044 308,325 0.02%Cox Communications, Inc. $300,000 3.15% 15/8/2024 308,177 0.02%Ford Credit Canada Co. CA($)400,000 3.35% 19/9/2022 307,745 0.02%Duke Energy Carolinas LLC $300,000 3.90% 15/6/2021 307,390 0.02%Berkshire Hathaway Finance Corp. $300,000 4.25% 15/1/2021 307,264 0.02%General Motors Co. $300,000 5.15% 1/4/2038 307,242 0.02%General Motors Co. $300,000 4.20% 1/10/2027 306,802 0.02%Air Products & Chemicals, Inc. $300,000 2.75% 3/2/2023 306,520 0.02%Truist Bank^ $300,000 3.50% 2/8/2022 306,367 0.02%Walmart, Inc. $300,000 3.13% 23/6/2021 306,179 0.02%Capital One Financial Corp. $300,000 3.05% 9/3/2022 306,066 0.02%Truist Financial Corp. $300,000 3.20% 3/9/2021 306,019 0.02%American Express Co. $300,000 2.65% 2/12/2022 305,609 0.02%Schlumberger Investment SA $300,000 3.30% 14/9/2021 305,603 0.02%Wells Fargo & Co. $275,000 4.15% 24/1/2029 305,546 0.02%Altria Group, Inc. $300,000 2.85% 9/8/2022 305,507 0.02%Kraft Heinz Foods Co. $275,000 5.00% 15/7/2035 305,459 0.02%Comcast Corp. $275,000 4.00% 1/3/2048 305,295 0.02%Capital One Financial Corp. $300,000 3.45% 30/4/2021 305,236 0.02%Wells Fargo & Co. $250,000 4.90% 17/11/2045 305,118 0.02%AT&T, Inc. $275,000 4.55% 9/3/2049 304,905 0.02%PacifiCorp $275,000 4.10% 1/2/2042 304,847 0.02%Hewlett Packard Enterprise Co. $275,000 4.90% 15/10/2025 304,833 0.02%Citigroup, Inc. $300,000 2.75% 25/4/2022 304,833 0.02%Goldman Sachs Group, Inc.^ $300,000 2.91% 5/6/2023 304,670 0.02%US Bancorp $300,000 2.63% 24/1/2022 304,480 0.02%Apple, Inc. $300,000 2.50% 9/2/2022 304,465 0.02%Walgreens Boots Alliance, Inc. $300,000 3.45% 1/6/2026 304,455 0.02%eBay, Inc. $300,000 2.75% 30/1/2023 304,172 0.02%International Business Machines Corp. $300,000 2.80% 13/5/2021 303,954 0.02%SC Johnson & Son, Inc. $250,000 4.75% 15/10/2046 303,505 0.02%Toyota Motor Credit Corp. $300,000 2.75% 17/5/2021 303,503 0.02%FMR LLC $250,000 4.95% 1/2/2033 303,387 0.02%Apple, Inc.1 £200,000 3.05% 31/7/2029 302,862 0.02%CVS Health Corp. $300,000 2.63% 15/8/2024 302,687 0.02%Newfield Exploration Co. $275,000 5.63% 1/7/2024 302,500 0.02%DuPont de Nemours, Inc. $275,000 4.49% 15/11/2025 302,276 0.02%Capital One Financial Corp. $293,000 3.30% 30/10/2024 302,275 0.02%IBM Credit LLC $300,000 2.20% 8/9/2022 302,076 0.02%Exxon Mobil Corp. $300,000 2.22% 1/3/2021 301,623 0.02%Costco Wholesale Corp. $300,000 2.15% 18/5/2021 301,400 0.02%Hewlett Packard Enterprise Co. $250,000 6.35% 15/10/2045 301,262 0.02%Comcast Corp. $300,000 3.40% 15/7/2046 301,219 0.02%Microsoft Corp. $275,000 3.45% 8/8/2036 300,653 0.02%Biogen, Inc. $250,000 5.20% 15/9/2045 300,647 0.02%PayPal Holdings, Inc. $300,000 2.85% 1/10/2029 300,610 0.02%JPMorgan Chase & Co. $300,000 2.30% 15/8/2021 300,529 0.02%Capital One NA $300,000 2.15% 6/9/2022 300,328 0.02%Duke Energy Corp. $300,000 2.65% 1/9/2026 299,950 0.02%Verizon Communications, Inc. £200,000 3.38% 27/10/2036 299,862 0.02%Apple, Inc. $300,000 1.70% 11/9/2022 299,849 0.02%PepsiCo, Inc. $300,000 1.70% 6/10/2021 299,664 0.02%Duke Energy Florida LLC $275,000 3.80% 15/7/2028 299,212 0.02%Bank of America Corp.^ $275,000 3.97% 5/3/2029 299,006 0.02%AT&T, Inc. $250,000 5.35% 1/9/2040 298,989 0.02%Gilead Sciences, Inc. $250,000 4.80% 1/4/2044 298,966 0.02%General Motors Financial Co., Inc. $275,000 5.10% 17/1/2024 298,399 0.02%Citigroup, Inc. $275,000 4.13% 25/7/2028 298,387 0.02%Verizon Communications, Inc. £200,000 4.07% 18/6/2024 297,861 0.02%Commonwealth Edison Co. $300,000 3.20% 15/11/2049 297,771 0.02%Tyson Foods, Inc. $275,000 4.00% 1/3/2026 297,755 0.02%Xcel Energy, Inc. $300,000 2.60% 1/12/2029 296,644 0.02%
Vanguard Global Corporate Bond Index Fund
547
Maturity Fair Value % of Total Principal Coupon Date US Dollars ($) Net Assets

Apple, Inc. €250,000 1.38% 17/1/2024 296,424 0.02%JPMorgan Chase & Co.^ $275,000 3.70% 6/5/2030 296,135 0.02%AbbVie, Inc. $275,000 4.45% 14/5/2046 296,038 0.02%Dell International LLC/EMC Corp. $225,000 8.10% 15/7/2036 295,861 0.02%American Tower Corp. $275,000 3.95% 15/3/2029 295,860 0.02%QUALCOMM, Inc. $250,000 4.65% 20/5/2035 295,805 0.02%Discovery Communications LLC $250,000 5.30% 15/5/2049 295,801 0.02%Microsoft Corp. $250,000 4.20% 3/11/2035 294,879 0.02%EPR Properties $275,000 4.50% 1/6/2027 294,677 0.02%Target Corp. $275,000 3.50% 1/7/2024 294,491 0.02%Praxair, Inc. €250,000 1.20% 12/2/2024 294,406 0.02%DuPont de Nemours, Inc. $275,000 4.21% 15/11/2023 293,965 0.02%AT&T, Inc. $275,000 4.30% 15/12/2042 293,940 0.02%Bristol-Myers Squibb Co. $275,000 3.25% 27/2/2027 293,911 0.02%Booking Holdings, Inc. $275,000 3.60% 1/6/2026 293,776 0.02%Anheuser-Busch InBev Finance, Inc. $275,000 3.65% 1/2/2026 293,746 0.02%Citigroup, Inc.^ $250,000 4.28% 24/4/2048 293,742 0.02%Citigroup, Inc. €250,000 1.25% 10/4/2029 293,701 0.02%Lowe’s Cos, Inc. $275,000 3.65% 5/4/2029 293,575 0.02%Williams Cos, Inc. $275,000 4.50% 15/11/2023 293,500 0.02%Discovery Communications LLC $275,000 3.95% 20/3/2028 293,341 0.02%Walt Disney Co. $285,000 4.50% 15/2/2021 293,234 0.02%Illinois Tool Works, Inc. $285,000 2.65% 15/11/2026 292,904 0.02%Citigroup, Inc. $275,000 3.70% 12/1/2026 292,552 0.02%Cigna Corp. $280,000 3.75% 15/7/2023 292,128 0.02%General Electric Co. $286,000 3.15% 7/9/2022 292,128 0.02%Consolidated Edison Co. of New York, Inc. $250,000 4.50% 1/12/2045 291,602 0.02%Wells Fargo & Co. $275,000 4.13% 15/8/2023 291,564 0.02%Progressive Corp. $250,000 4.13% 15/4/2047 291,552 0.02%Sempra Energy $275,000 4.05% 1/12/2023 291,054 0.02%Goldman Sachs Group, Inc. €250,000 1.25% 1/5/2025 290,436 0.02%UDR, Inc. $275,000 3.75% 1/7/2024 290,310 0.02%Wells Fargo & Co. $225,000 5.38% 7/2/2035 290,086 0.02%Rockwell Collins, Inc. $275,000 3.70% 15/12/2023 289,535 0.02%Verizon Communications, Inc. $250,000 4.40% 1/11/2034 289,174 0.02%Kansas City Southern $250,000 4.70% 1/5/2048 289,066 0.02%Public Service Co. of Colorado $275,000 3.60% 15/9/2042 288,842 0.02%Phillips 66 $275,000 4.30% 1/4/2022 288,440 0.02%Mastercard, Inc. $250,000 3.95% 26/2/2048 288,394 0.02%Altria Group, Inc. $265,000 4.40% 14/2/2026 287,794 0.02%Boston Scientific Corp. $275,000 3.45% 1/3/2024 287,449 0.02%QUALCOMM, Inc. $250,000 4.30% 20/5/2047 286,791 0.02%Goldman Sachs Group, Inc. £200,000 3.13% 25/7/2029 285,849 0.02%Pfizer, Inc. $250,000 4.00% 15/12/2036 284,758 0.02%Newmont Goldcorp Corp. $230,000 5.45% 9/6/2044 284,624 0.02%Amazon.com, Inc. $275,000 2.80% 22/8/2024 284,589 0.02%Waste Management, Inc. $282,000 2.40% 15/5/2023 284,549 0.02%Bank of America Corp.^ $275,000 3.55% 5/3/2024 284,460 0.02%TWDC Enterprises 18 Corp. $290,000 1.85% 30/7/2026 284,440 0.02%Omnicom Group, Inc./Omnicom Capital, Inc. $275,000 3.63% 1/5/2022 284,404 0.02%Bank of America Corp. $200,000 5.88% 7/2/2042 283,705 0.02%NBCUniversal Media LLC $275,000 4.38% 1/4/2021 283,543 0.02%Citigroup, Inc.^ $270,000 3.52% 27/10/2028 283,510 0.02%Wells Fargo & Co. $225,000 5.38% 2/11/2043 283,454 0.02%Union Pacific Corp. $269,000 3.65% 15/2/2024 283,134 0.02%MetLife, Inc. $250,000 4.13% 13/8/2042 283,127 0.02%AT&T, Inc. $275,000 3.88% 15/8/2021 283,117 0.02%Illinois Tool Works, Inc. $225,000 4.88% 15/9/2041 282,888 0.02%Exxon Mobil Corp. $270,000 3.18% 15/3/2024 282,826 0.02%Medtronic, Inc. $275,000 3.15% 15/3/2022 282,724 0.02%Home Depot, Inc. $240,000 4.25% 1/4/2046 282,720 0.02%United Technologies Corp. $275,000 3.10% 1/6/2022 282,343 0.02%Deere & Co. $200,000 7.13% 3/3/2031 282,266 0.02%Discovery Communications LLC $250,000 5.00% 20/9/2037 282,159 0.02%Johnson & Johnson $250,000 3.70% 1/3/2046 282,054 0.02%Apple, Inc. $290,000 2.95% 11/9/2049 281,820 0.02%Verizon Communications, Inc. $250,000 4.13% 15/8/2046 281,733 0.02%Sempra Energy $275,000 3.25% 15/6/2027 281,591 0.02%
Vanguard Global Corporate Bond Index Fund
548
Maturity Fair Value % of Total Principal Coupon Date US Dollars ($) Net Assets
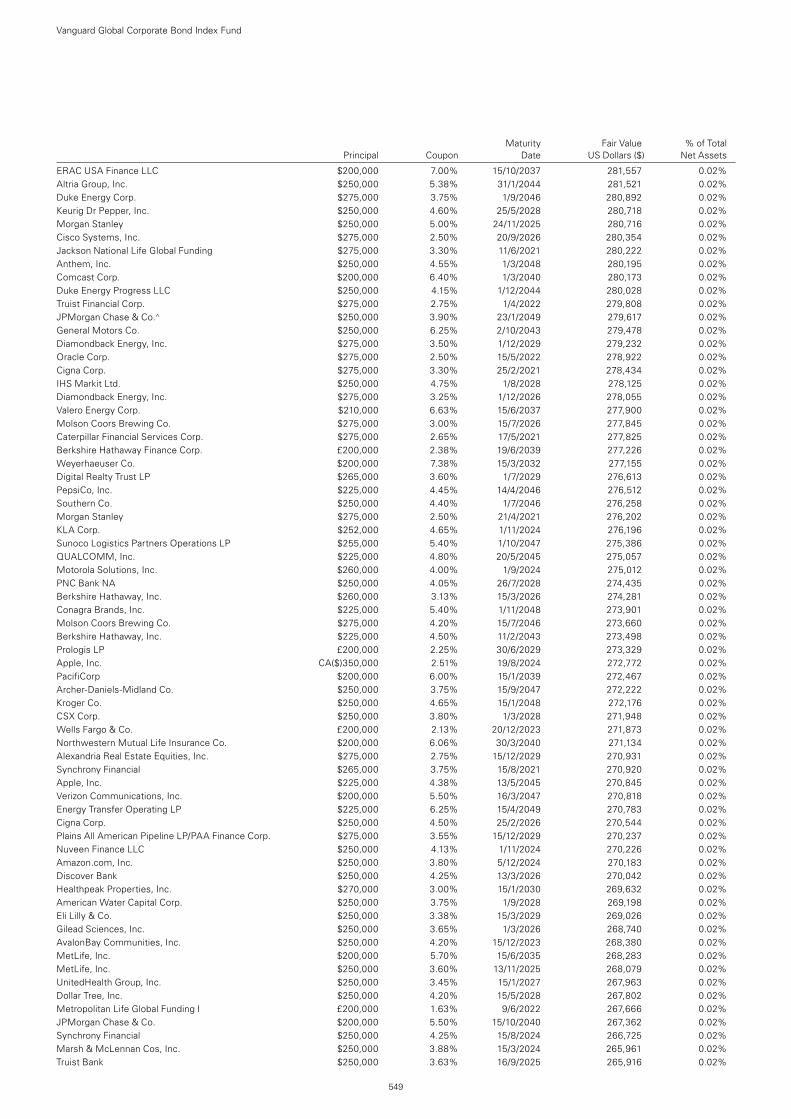
ERAC USA Finance LLC $200,000 7.00% 15/10/2037 281,557 0.02%Altria Group, Inc. $250,000 5.38% 31/1/2044 281,521 0.02%Duke Energy Corp. $275,000 3.75% 1/9/2046 280,892 0.02%Keurig Dr Pepper, Inc. $250,000 4.60% 25/5/2028 280,718 0.02%Morgan Stanley $250,000 5.00% 24/11/2025 280,716 0.02%Cisco Systems, Inc. $275,000 2.50% 20/9/2026 280,354 0.02%Jackson National Life Global Funding $275,000 3.30% 11/6/2021 280,222 0.02%Anthem, Inc. $250,000 4.55% 1/3/2048 280,195 0.02%Comcast Corp. $200,000 6.40% 1/3/2040 280,173 0.02%Duke Energy Progress LLC $250,000 4.15% 1/12/2044 280,028 0.02%Truist Financial Corp. $275,000 2.75% 1/4/2022 279,808 0.02%JPMorgan Chase & Co.^ $250,000 3.90% 23/1/2049 279,617 0.02%General Motors Co. $250,000 6.25% 2/10/2043 279,478 0.02%Diamondback Energy, Inc. $275,000 3.50% 1/12/2029 279,232 0.02%Oracle Corp. $275,000 2.50% 15/5/2022 278,922 0.02%Cigna Corp. $275,000 3.30% 25/2/2021 278,434 0.02%IHS Markit Ltd. $250,000 4.75% 1/8/2028 278,125 0.02%Diamondback Energy, Inc. $275,000 3.25% 1/12/2026 278,055 0.02%Valero Energy Corp. $210,000 6.63% 15/6/2037 277,900 0.02%Molson Coors Brewing Co. $275,000 3.00% 15/7/2026 277,845 0.02%Caterpillar Financial Services Corp. $275,000 2.65% 17/5/2021 277,825 0.02%Berkshire Hathaway Finance Corp. £200,000 2.38% 19/6/2039 277,226 0.02%Weyerhaeuser Co. $200,000 7.38% 15/3/2032 277,155 0.02%Digital Realty Trust LP $265,000 3.60% 1/7/2029 276,613 0.02%PepsiCo, Inc. $225,000 4.45% 14/4/2046 276,512 0.02%Southern Co. $250,000 4.40% 1/7/2046 276,258 0.02%Morgan Stanley $275,000 2.50% 21/4/2021 276,202 0.02%KLA Corp. $252,000 4.65% 1/11/2024 276,196 0.02%Sunoco Logistics Partners Operations LP $255,000 5.40% 1/10/2047 275,386 0.02%QUALCOMM, Inc. $225,000 4.80% 20/5/2045 275,057 0.02%Motorola Solutions, Inc. $260,000 4.00% 1/9/2024 275,012 0.02%PNC Bank NA $250,000 4.05% 26/7/2028 274,435 0.02%Berkshire Hathaway, Inc. $260,000 3.13% 15/3/2026 274,281 0.02%Conagra Brands, Inc. $225,000 5.40% 1/11/2048 273,901 0.02%Molson Coors Brewing Co. $275,000 4.20% 15/7/2046 273,660 0.02%Berkshire Hathaway, Inc. $225,000 4.50% 11/2/2043 273,498 0.02%Prologis LP £200,000 2.25% 30/6/2029 273,329 0.02%Apple, Inc. CA($)350,000 2.51% 19/8/2024 272,772 0.02%PacifiCorp $200,000 6.00% 15/1/2039 272,467 0.02%Archer-Daniels-Midland Co. $250,000 3.75% 15/9/2047 272,222 0.02%Kroger Co. $250,000 4.65% 15/1/2048 272,176 0.02%CSX Corp. $250,000 3.80% 1/3/2028 271,948 0.02%Wells Fargo & Co. £200,000 2.13% 20/12/2023 271,873 0.02%Northwestern Mutual Life Insurance Co. $200,000 6.06% 30/3/2040 271,134 0.02%Alexandria Real Estate Equities, Inc. $275,000 2.75% 15/12/2029 270,931 0.02%Synchrony Financial $265,000 3.75% 15/8/2021 270,920 0.02%Apple, Inc. $225,000 4.38% 13/5/2045 270,845 0.02%Verizon Communications, Inc. $200,000 5.50% 16/3/2047 270,818 0.02%Energy Transfer Operating LP $225,000 6.25% 15/4/2049 270,783 0.02%Cigna Corp. $250,000 4.50% 25/2/2026 270,544 0.02%Plains All American Pipeline LP/PAA Finance Corp. $275,000 3.55% 15/12/2029 270,237 0.02%Nuveen Finance LLC $250,000 4.13% 1/11/2024 270,226 0.02%Amazon.com, Inc. $250,000 3.80% 5/12/2024 270,183 0.02%Discover Bank $250,000 4.25% 13/3/2026 270,042 0.02%Healthpeak Properties, Inc. $270,000 3.00% 15/1/2030 269,632 0.02%American Water Capital Corp. $250,000 3.75% 1/9/2028 269,198 0.02%Eli Lilly & Co. $250,000 3.38% 15/3/2029 269,026 0.02%Gilead Sciences, Inc. $250,000 3.65% 1/3/2026 268,740 0.02%AvalonBay Communities, Inc. $250,000 4.20% 15/12/2023 268,380 0.02%MetLife, Inc. $200,000 5.70% 15/6/2035 268,283 0.02%MetLife, Inc. $250,000 3.60% 13/11/2025 268,079 0.02%UnitedHealth Group, Inc. $250,000 3.45% 15/1/2027 267,963 0.02%Dollar Tree, Inc. $250,000 4.20% 15/5/2028 267,802 0.02%Metropolitan Life Global Funding I £200,000 1.63% 9/6/2022 267,666 0.02%JPMorgan Chase & Co. $200,000 5.50% 15/10/2040 267,362 0.02%Synchrony Financial $250,000 4.25% 15/8/2024 266,725 0.02%Marsh & McLennan Cos, Inc. $250,000 3.88% 15/3/2024 265,961 0.02%Truist Bank $250,000 3.63% 16/9/2025 265,916 0.02%
Vanguard Global Corporate Bond Index Fund
549
Maturity Fair Value % of Total Principal Coupon Date US Dollars ($) Net Assets

Rohm & Haas Co. $200,000 7.85% 15/7/2029 265,791 0.02%US Bancorp $250,000 3.70% 30/1/2024 265,685 0.02%Discover Bank $250,000 4.20% 8/8/2023 265,569 0.02%S&P Global, Inc. $265,000 2.50% 1/12/2029 265,520 0.02%Chubb INA Holdings, Inc. $250,000 3.35% 3/5/2026 265,362 0.02%Applied Materials, Inc. $250,000 3.30% 1/4/2027 265,245 0.02%Mastercard, Inc. $250,000 3.38% 1/4/2024 264,976 0.02%Medtronic Global Holdings SCA $250,000 3.35% 1/4/2027 264,875 0.02%ViacomCBS, Inc. $250,000 4.38% 15/3/2043 264,644 0.02%ERAC USA Finance LLC $250,000 3.80% 1/11/2025 264,609 0.02%Citigroup, Inc.^ $250,000 4.04% 1/6/2024 264,602 0.02%Manufacturers & Traders Trust Co. $250,000 3.40% 17/8/2027 264,556 0.02%MPLX LP $260,000 4.50% 15/4/2038 264,412 0.02%Simon Property Group LP $250,000 3.38% 1/12/2027 264,334 0.02%Wells Fargo & Co. £200,000 2.13% 24/9/2031 264,331 0.02%Toyota Motor Credit Corp. $250,000 3.20% 11/1/2027 264,282 0.02%Citibank NA $250,000 3.65% 23/1/2024 263,940 0.02%Apple, Inc. $250,000 3.20% 13/5/2025 263,893 0.02%Spectra Energy Partners LP $255,000 3.38% 15/10/2026 263,864 0.02%Charles Schwab Corp. $250,000 3.45% 13/2/2026 263,836 0.02%QUALCOMM, Inc. $250,000 3.45% 20/5/2025 263,538 0.02%TTX Co. $250,000 3.60% 15/1/2025 263,389 0.02%Apple, Inc. $250,000 3.20% 11/5/2027 263,329 0.02%UnitedHealth Group, Inc. $260,000 2.38% 15/10/2022 263,252 0.02%Lockheed Martin Corp. $225,000 4.09% 15/9/2052 262,986 0.02%ERP Operating LP $250,000 3.38% 1/6/2025 262,760 0.02%Constellation Brands, Inc. $250,000 3.60% 15/2/2028 262,560 0.02%Lowe’s Cos, Inc. $225,000 4.55% 5/4/2049 262,533 0.02%Walmart, Inc. $250,000 3.40% 26/6/2023 262,513 0.02%Walmart, Inc. $250,000 3.30% 22/4/2024 262,462 0.02%Concho Resources, Inc. $225,000 4.88% 1/10/2047 262,125 0.02%Pfizer, Inc. $250,000 3.00% 15/12/2026 262,116 0.02%Energy Transfer Operating LP $250,000 4.05% 15/3/2025 262,109 0.02%Clorox Co. $248,000 3.50% 15/12/2024 262,102 0.02%Agilent Technologies, Inc. $250,000 3.88% 15/7/2023 262,044 0.02%Merck & Co., Inc. $225,000 4.00% 7/3/2049 261,894 0.02%Continental Resources, Inc. $250,000 4.50% 15/4/2023 261,875 0.02%PNC Bank NA $250,000 3.80% 25/7/2023 261,760 0.02%Huntington National Bank $250,000 3.55% 6/10/2023 261,713 0.02%Louisville Gas & Electric Co. $250,000 3.30% 1/10/2025 261,394 0.02%Virginia Electric & Power Co. $200,000 6.00% 15/1/2036 261,272 0.02%Walmart, Inc. $225,000 3.95% 28/6/2038 261,269 0.02%Bank of America Corp. $200,000 5.00% 21/1/2044 261,173 0.02%Mastercard, Inc. $250,000 2.95% 21/11/2026 260,732 0.02%Quest Diagnostics, Inc. $260,000 2.95% 30/6/2030 260,323 0.02%PNC Bank NA $250,000 3.50% 8/6/2023 260,287 0.02%Walmart, Inc. $235,000 3.63% 15/12/2047 260,105 0.02%National Rural Utilities Cooperative Finance Corp.^ $250,000 4.75% 30/4/2043 260,000 0.02%BP Capital Markets America, Inc. $250,000 3.22% 28/11/2023 259,784 0.02%Occidental Petroleum Corp. $200,000 7.50% 1/5/2031 259,573 0.02%Amgen, Inc. $225,000 4.56% 15/6/2048 259,565 0.02%Morgan Stanley^ $230,000 4.43% 23/1/2030 259,552 0.02%UnitedHealth Group, Inc. $175,000 6.88% 15/2/2038 259,488 0.02%PepsiCo, Inc. €200,000 2.63% 28/4/2026 259,469 0.02%Kellogg Co. $250,000 3.25% 1/4/2026 259,467 0.02%Brighthouse Financial, Inc. $280,000 4.70% 22/6/2047 259,194 0.02%Southern Co. $250,000 3.25% 1/7/2026 259,037 0.02%Prudential Financial, Inc. $225,000 4.35% 25/2/2050 258,923 0.02%Microsoft Corp. $200,000 4.50% 6/2/2057 258,877 0.02%Verizon Communications, Inc. £200,000 1.88% 19/9/2030 258,876 0.02%MetLife, Inc. $250,000 3.05% 15/12/2022 258,699 0.02%Cimarex Energy Co. $250,000 3.90% 15/5/2027 258,473 0.02%Autodesk, Inc. $250,000 3.60% 15/12/2022 258,236 0.02%ERAC USA Finance LLC $250,000 3.30% 1/12/2026 258,116 0.02%BP Capital Markets America, Inc. $250,000 3.25% 6/5/2022 258,043 0.02%Westlake Chemical Corp. $250,000 3.60% 15/8/2026 257,969 0.02%Las Vegas Sands Corp. $250,000 3.20% 8/8/2024 257,896 0.02%Wells Fargo & Co. $250,000 3.00% 19/2/2025 257,831 0.02%
Vanguard Global Corporate Bond Index Fund
550
Maturity Fair Value % of Total Principal Coupon Date US Dollars ($) Net Assets
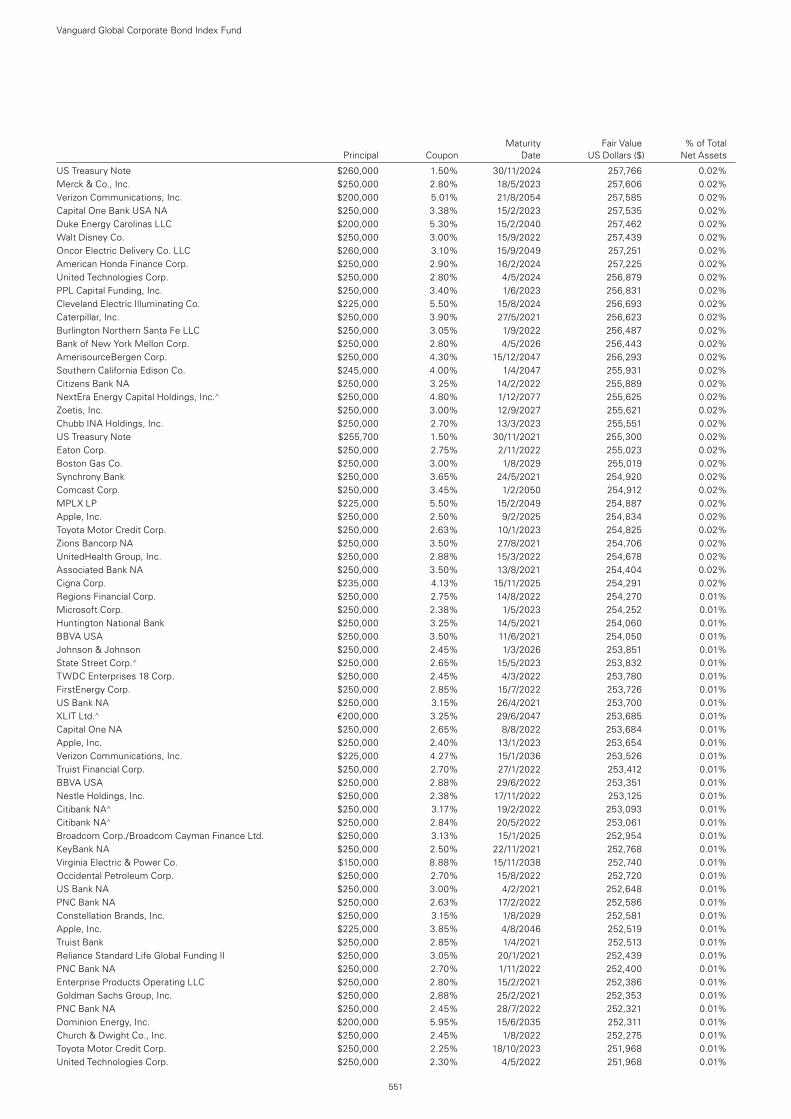
US Treasury Note $260,000 1.50% 30/11/2024 257,766 0.02%Merck & Co., Inc. $250,000 2.80% 18/5/2023 257,606 0.02%Verizon Communications, Inc. $200,000 5.01% 21/8/2054 257,585 0.02%Capital One Bank USA NA $250,000 3.38% 15/2/2023 257,535 0.02%Duke Energy Carolinas LLC $200,000 5.30% 15/2/2040 257,462 0.02%Walt Disney Co. $250,000 3.00% 15/9/2022 257,439 0.02%Oncor Electric Delivery Co. LLC $260,000 3.10% 15/9/2049 257,251 0.02%American Honda Finance Corp. $250,000 2.90% 16/2/2024 257,225 0.02%United Technologies Corp. $250,000 2.80% 4/5/2024 256,879 0.02%PPL Capital Funding, Inc. $250,000 3.40% 1/6/2023 256,831 0.02%Cleveland Electric Illuminating Co. $225,000 5.50% 15/8/2024 256,693 0.02%Caterpillar, Inc. $250,000 3.90% 27/5/2021 256,623 0.02%Burlington Northern Santa Fe LLC $250,000 3.05% 1/9/2022 256,487 0.02%Bank of New York Mellon Corp. $250,000 2.80% 4/5/2026 256,443 0.02%AmerisourceBergen Corp. $250,000 4.30% 15/12/2047 256,293 0.02%Southern California Edison Co. $245,000 4.00% 1/4/2047 255,931 0.02%Citizens Bank NA $250,000 3.25% 14/2/2022 255,889 0.02%NextEra Energy Capital Holdings, Inc.^ $250,000 4.80% 1/12/2077 255,625 0.02%Zoetis, Inc. $250,000 3.00% 12/9/2027 255,621 0.02%Chubb INA Holdings, Inc. $250,000 2.70% 13/3/2023 255,551 0.02%US Treasury Note $255,700 1.50% 30/11/2021 255,300 0.02%Eaton Corp. $250,000 2.75% 2/11/2022 255,023 0.02%Boston Gas Co. $250,000 3.00% 1/8/2029 255,019 0.02%Synchrony Bank $250,000 3.65% 24/5/2021 254,920 0.02%Comcast Corp. $250,000 3.45% 1/2/2050 254,912 0.02%MPLX LP $225,000 5.50% 15/2/2049 254,887 0.02%Apple, Inc. $250,000 2.50% 9/2/2025 254,834 0.02%Toyota Motor Credit Corp. $250,000 2.63% 10/1/2023 254,825 0.02%Zions Bancorp NA $250,000 3.50% 27/8/2021 254,706 0.02%UnitedHealth Group, Inc. $250,000 2.88% 15/3/2022 254,678 0.02%Associated Bank NA $250,000 3.50% 13/8/2021 254,404 0.02%Cigna Corp. $235,000 4.13% 15/11/2025 254,291 0.02%Regions Financial Corp. $250,000 2.75% 14/8/2022 254,270 0.01%Microsoft Corp. $250,000 2.38% 1/5/2023 254,252 0.01%Huntington National Bank $250,000 3.25% 14/5/2021 254,060 0.01%BBVA USA $250,000 3.50% 11/6/2021 254,050 0.01%Johnson & Johnson $250,000 2.45% 1/3/2026 253,851 0.01%State Street Corp.^ $250,000 2.65% 15/5/2023 253,832 0.01%TWDC Enterprises 18 Corp. $250,000 2.45% 4/3/2022 253,780 0.01%FirstEnergy Corp. $250,000 2.85% 15/7/2022 253,726 0.01%US Bank NA $250,000 3.15% 26/4/2021 253,700 0.01%XLIT Ltd.^ €200,000 3.25% 29/6/2047 253,685 0.01%Capital One NA $250,000 2.65% 8/8/2022 253,684 0.01%Apple, Inc. $250,000 2.40% 13/1/2023 253,654 0.01%Verizon Communications, Inc. $225,000 4.27% 15/1/2036 253,526 0.01%Truist Financial Corp. $250,000 2.70% 27/1/2022 253,412 0.01%BBVA USA $250,000 2.88% 29/6/2022 253,351 0.01%Nestle Holdings, Inc. $250,000 2.38% 17/11/2022 253,125 0.01%Citibank NA^ $250,000 3.17% 19/2/2022 253,093 0.01%Citibank NA^ $250,000 2.84% 20/5/2022 253,061 0.01%Broadcom Corp./Broadcom Cayman Finance Ltd. $250,000 3.13% 15/1/2025 252,954 0.01%KeyBank NA $250,000 2.50% 22/11/2021 252,768 0.01%Virginia Electric & Power Co. $150,000 8.88% 15/11/2038 252,740 0.01%Occidental Petroleum Corp. $250,000 2.70% 15/8/2022 252,720 0.01%US Bank NA $250,000 3.00% 4/2/2021 252,648 0.01%PNC Bank NA $250,000 2.63% 17/2/2022 252,586 0.01%Constellation Brands, Inc. $250,000 3.15% 1/8/2029 252,581 0.01%Apple, Inc. $225,000 3.85% 4/8/2046 252,519 0.01%Truist Bank $250,000 2.85% 1/4/2021 252,513 0.01%Reliance Standard Life Global Funding II $250,000 3.05% 20/1/2021 252,439 0.01%PNC Bank NA $250,000 2.70% 1/11/2022 252,400 0.01%Enterprise Products Operating LLC $250,000 2.80% 15/2/2021 252,386 0.01%Goldman Sachs Group, Inc. $250,000 2.88% 25/2/2021 252,353 0.01%PNC Bank NA $250,000 2.45% 28/7/2022 252,321 0.01%Dominion Energy, Inc. $200,000 5.95% 15/6/2035 252,311 0.01%Church & Dwight Co., Inc. $250,000 2.45% 1/8/2022 252,275 0.01%Toyota Motor Credit Corp. $250,000 2.25% 18/10/2023 251,968 0.01%United Technologies Corp. $250,000 2.30% 4/5/2022 251,968 0.01%
Vanguard Global Corporate Bond Index Fund
551
Maturity Fair Value % of Total Principal Coupon Date US Dollars ($) Net Assets
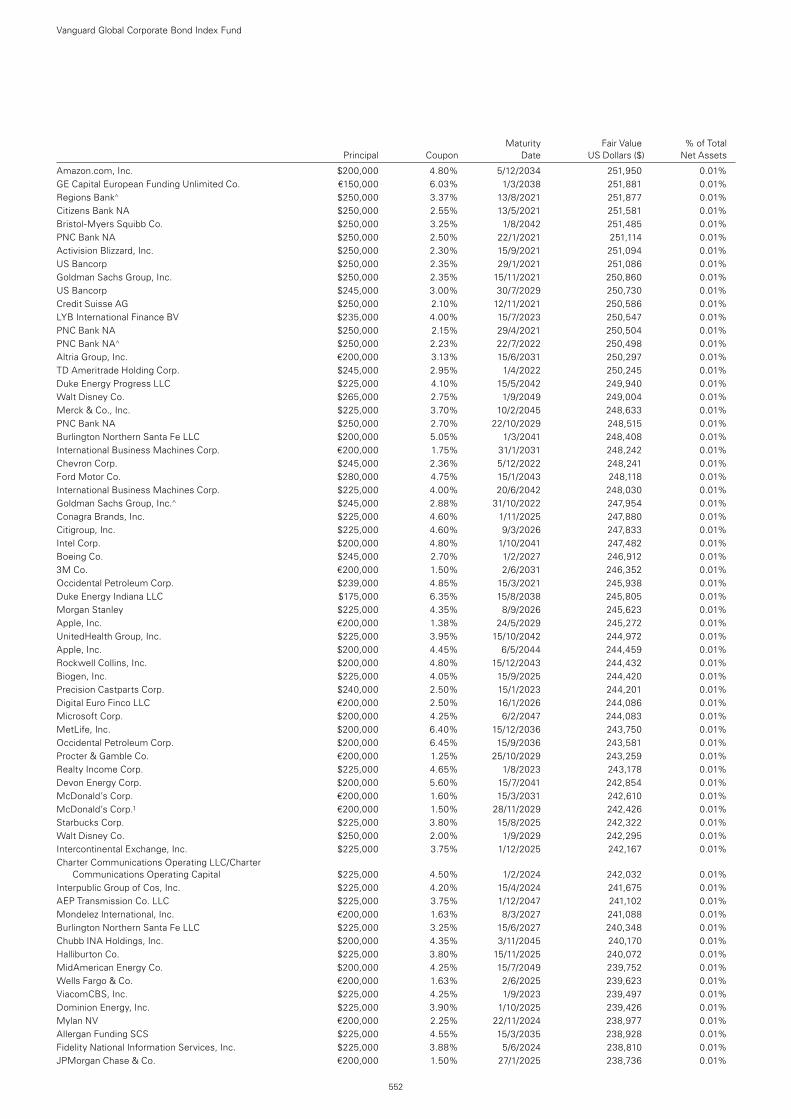
Amazon.com, Inc. $200,000 4.80% 5/12/2034 251,950 0.01%GE Capital European Funding Unlimited Co. €150,000 6.03% 1/3/2038 251,881 0.01%Regions Bank^ $250,000 3.37% 13/8/2021 251,877 0.01%Citizens Bank NA $250,000 2.55% 13/5/2021 251,581 0.01%Bristol-Myers Squibb Co. $250,000 3.25% 1/8/2042 251,485 0.01%PNC Bank NA $250,000 2.50% 22/1/2021 251,114 0.01%Activision Blizzard, Inc. $250,000 2.30% 15/9/2021 251,094 0.01%US Bancorp $250,000 2.35% 29/1/2021 251,086 0.01%Goldman Sachs Group, Inc. $250,000 2.35% 15/11/2021 250,860 0.01%US Bancorp $245,000 3.00% 30/7/2029 250,730 0.01%Credit Suisse AG $250,000 2.10% 12/11/2021 250,586 0.01%LYB International Finance BV $235,000 4.00% 15/7/2023 250,547 0.01%PNC Bank NA $250,000 2.15% 29/4/2021 250,504 0.01%PNC Bank NA^ $250,000 2.23% 22/7/2022 250,498 0.01%Altria Group, Inc. €200,000 3.13% 15/6/2031 250,297 0.01%TD Ameritrade Holding Corp. $245,000 2.95% 1/4/2022 250,245 0.01%Duke Energy Progress LLC $225,000 4.10% 15/5/2042 249,940 0.01%Walt Disney Co. $265,000 2.75% 1/9/2049 249,004 0.01%Merck & Co., Inc. $225,000 3.70% 10/2/2045 248,633 0.01%PNC Bank NA $250,000 2.70% 22/10/2029 248,515 0.01%Burlington Northern Santa Fe LLC $200,000 5.05% 1/3/2041 248,408 0.01%International Business Machines Corp. €200,000 1.75% 31/1/2031 248,242 0.01%Chevron Corp. $245,000 2.36% 5/12/2022 248,241 0.01%Ford Motor Co. $280,000 4.75% 15/1/2043 248,118 0.01%International Business Machines Corp. $225,000 4.00% 20/6/2042 248,030 0.01%Goldman Sachs Group, Inc.^ $245,000 2.88% 31/10/2022 247,954 0.01%Conagra Brands, Inc. $225,000 4.60% 1/11/2025 247,880 0.01%Citigroup, Inc. $225,000 4.60% 9/3/2026 247,833 0.01%Intel Corp. $200,000 4.80% 1/10/2041 247,482 0.01%Boeing Co. $245,000 2.70% 1/2/2027 246,912 0.01%3M Co. €200,000 1.50% 2/6/2031 246,352 0.01%Occidental Petroleum Corp. $239,000 4.85% 15/3/2021 245,938 0.01%Duke Energy Indiana LLC $175,000 6.35% 15/8/2038 245,805 0.01%Morgan Stanley $225,000 4.35% 8/9/2026 245,623 0.01%Apple, Inc. €200,000 1.38% 24/5/2029 245,272 0.01%UnitedHealth Group, Inc. $225,000 3.95% 15/10/2042 244,972 0.01%Apple, Inc. $200,000 4.45% 6/5/2044 244,459 0.01%Rockwell Collins, Inc. $200,000 4.80% 15/12/2043 244,432 0.01%Biogen, Inc. $225,000 4.05% 15/9/2025 244,420 0.01%Precision Castparts Corp. $240,000 2.50% 15/1/2023 244,201 0.01%Digital Euro Finco LLC €200,000 2.50% 16/1/2026 244,086 0.01%Microsoft Corp. $200,000 4.25% 6/2/2047 244,083 0.01%MetLife, Inc. $200,000 6.40% 15/12/2036 243,750 0.01%Occidental Petroleum Corp. $200,000 6.45% 15/9/2036 243,581 0.01%Procter & Gamble Co. €200,000 1.25% 25/10/2029 243,259 0.01%Realty Income Corp. $225,000 4.65% 1/8/2023 243,178 0.01%Devon Energy Corp. $200,000 5.60% 15/7/2041 242,854 0.01%McDonald’s Corp. €200,000 1.60% 15/3/2031 242,610 0.01%McDonald’s Corp.1 €200,000 1.50% 28/11/2029 242,426 0.01%Starbucks Corp. $225,000 3.80% 15/8/2025 242,322 0.01%Walt Disney Co. $250,000 2.00% 1/9/2029 242,295 0.01%Intercontinental Exchange, Inc. $225,000 3.75% 1/12/2025 242,167 0.01%Charter Communications Operating LLC/Charter
Communications Operating Capital $225,000 4.50% 1/2/2024 242,032 0.01%Interpublic Group of Cos, Inc. $225,000 4.20% 15/4/2024 241,675 0.01%AEP Transmission Co. LLC $225,000 3.75% 1/12/2047 241,102 0.01%Mondelez International, Inc. €200,000 1.63% 8/3/2027 241,088 0.01%Burlington Northern Santa Fe LLC $225,000 3.25% 15/6/2027 240,348 0.01%Chubb INA Holdings, Inc. $200,000 4.35% 3/11/2045 240,170 0.01%Halliburton Co. $225,000 3.80% 15/11/2025 240,072 0.01%MidAmerican Energy Co. $200,000 4.25% 15/7/2049 239,752 0.01%Wells Fargo & Co. €200,000 1.63% 2/6/2025 239,623 0.01%ViacomCBS, Inc. $225,000 4.25% 1/9/2023 239,497 0.01%Dominion Energy, Inc. $225,000 3.90% 1/10/2025 239,426 0.01%Mylan NV €200,000 2.25% 22/11/2024 238,977 0.01%Allergan Funding SCS $225,000 4.55% 15/3/2035 238,928 0.01%Fidelity National Information Services, Inc. $225,000 3.88% 5/6/2024 238,810 0.01%JPMorgan Chase & Co. €200,000 1.50% 27/1/2025 238,736 0.01%
Vanguard Global Corporate Bond Index Fund
552
Maturity Fair Value % of Total Principal Coupon Date US Dollars ($) Net Assets
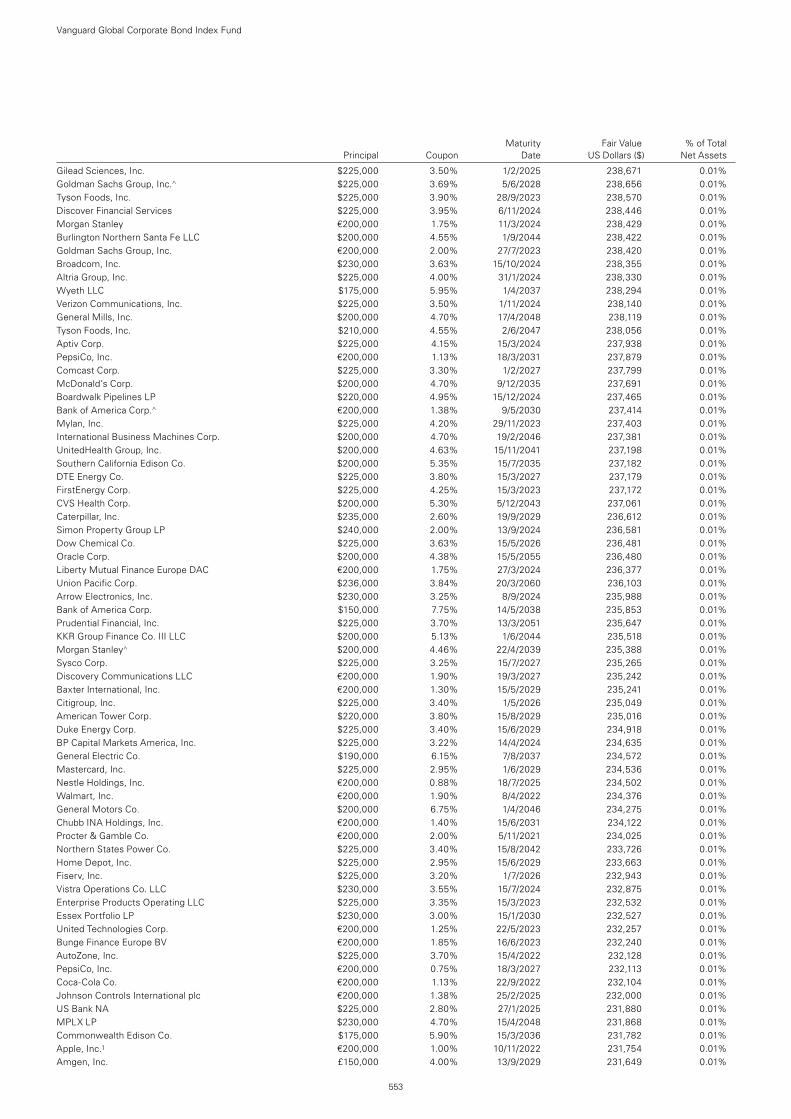
Gilead Sciences, Inc. $225,000 3.50% 1/2/2025 238,671 0.01%Goldman Sachs Group, Inc.^ $225,000 3.69% 5/6/2028 238,656 0.01%Tyson Foods, Inc. $225,000 3.90% 28/9/2023 238,570 0.01%Discover Financial Services $225,000 3.95% 6/11/2024 238,446 0.01%Morgan Stanley €200,000 1.75% 11/3/2024 238,429 0.01%Burlington Northern Santa Fe LLC $200,000 4.55% 1/9/2044 238,422 0.01%Goldman Sachs Group, Inc. €200,000 2.00% 27/7/2023 238,420 0.01%Broadcom, Inc. $230,000 3.63% 15/10/2024 238,355 0.01%Altria Group, Inc. $225,000 4.00% 31/1/2024 238,330 0.01%Wyeth LLC $175,000 5.95% 1/4/2037 238,294 0.01%Verizon Communications, Inc. $225,000 3.50% 1/11/2024 238,140 0.01%General Mills, Inc. $200,000 4.70% 17/4/2048 238,119 0.01%Tyson Foods, Inc. $210,000 4.55% 2/6/2047 238,056 0.01%Aptiv Corp. $225,000 4.15% 15/3/2024 237,938 0.01%PepsiCo, Inc. €200,000 1.13% 18/3/2031 237,879 0.01%Comcast Corp. $225,000 3.30% 1/2/2027 237,799 0.01%McDonald’s Corp. $200,000 4.70% 9/12/2035 237,691 0.01%Boardwalk Pipelines LP $220,000 4.95% 15/12/2024 237,465 0.01%Bank of America Corp.^ €200,000 1.38% 9/5/2030 237,414 0.01%Mylan, Inc. $225,000 4.20% 29/11/2023 237,403 0.01%International Business Machines Corp. $200,000 4.70% 19/2/2046 237,381 0.01%UnitedHealth Group, Inc. $200,000 4.63% 15/11/2041 237,198 0.01%Southern California Edison Co. $200,000 5.35% 15/7/2035 237,182 0.01%DTE Energy Co. $225,000 3.80% 15/3/2027 237,179 0.01%FirstEnergy Corp. $225,000 4.25% 15/3/2023 237,172 0.01%CVS Health Corp. $200,000 5.30% 5/12/2043 237,061 0.01%Caterpillar, Inc. $235,000 2.60% 19/9/2029 236,612 0.01%Simon Property Group LP $240,000 2.00% 13/9/2024 236,581 0.01%Dow Chemical Co. $225,000 3.63% 15/5/2026 236,481 0.01%Oracle Corp. $200,000 4.38% 15/5/2055 236,480 0.01%Liberty Mutual Finance Europe DAC €200,000 1.75% 27/3/2024 236,377 0.01%Union Pacific Corp. $236,000 3.84% 20/3/2060 236,103 0.01%Arrow Electronics, Inc. $230,000 3.25% 8/9/2024 235,988 0.01%Bank of America Corp. $150,000 7.75% 14/5/2038 235,853 0.01%Prudential Financial, Inc. $225,000 3.70% 13/3/2051 235,647 0.01%KKR Group Finance Co. III LLC $200,000 5.13% 1/6/2044 235,518 0.01%Morgan Stanley^ $200,000 4.46% 22/4/2039 235,388 0.01%Sysco Corp. $225,000 3.25% 15/7/2027 235,265 0.01%Discovery Communications LLC €200,000 1.90% 19/3/2027 235,242 0.01%Baxter International, Inc. €200,000 1.30% 15/5/2029 235,241 0.01%Citigroup, Inc. $225,000 3.40% 1/5/2026 235,049 0.01%American Tower Corp. $220,000 3.80% 15/8/2029 235,016 0.01%Duke Energy Corp. $225,000 3.40% 15/6/2029 234,918 0.01%BP Capital Markets America, Inc. $225,000 3.22% 14/4/2024 234,635 0.01%General Electric Co. $190,000 6.15% 7/8/2037 234,572 0.01%Mastercard, Inc. $225,000 2.95% 1/6/2029 234,536 0.01%Nestle Holdings, Inc. €200,000 0.88% 18/7/2025 234,502 0.01%Walmart, Inc. €200,000 1.90% 8/4/2022 234,376 0.01%General Motors Co. $200,000 6.75% 1/4/2046 234,275 0.01%Chubb INA Holdings, Inc. €200,000 1.40% 15/6/2031 234,122 0.01%Procter & Gamble Co. €200,000 2.00% 5/11/2021 234,025 0.01%Northern States Power Co. $225,000 3.40% 15/8/2042 233,726 0.01%Home Depot, Inc. $225,000 2.95% 15/6/2029 233,663 0.01%Fiserv, Inc. $225,000 3.20% 1/7/2026 232,943 0.01%Vistra Operations Co. LLC $230,000 3.55% 15/7/2024 232,875 0.01%Enterprise Products Operating LLC $225,000 3.35% 15/3/2023 232,532 0.01%Essex Portfolio LP $230,000 3.00% 15/1/2030 232,527 0.01%United Technologies Corp. €200,000 1.25% 22/5/2023 232,257 0.01%Bunge Finance Europe BV €200,000 1.85% 16/6/2023 232,240 0.01%AutoZone, Inc. $225,000 3.70% 15/4/2022 232,128 0.01%PepsiCo, Inc. €200,000 0.75% 18/3/2027 232,113 0.01%Coca-Cola Co. €200,000 1.13% 22/9/2022 232,104 0.01%Johnson Controls International plc €200,000 1.38% 25/2/2025 232,000 0.01%US Bank NA $225,000 2.80% 27/1/2025 231,880 0.01%MPLX LP $230,000 4.70% 15/4/2048 231,868 0.01%Commonwealth Edison Co. $175,000 5.90% 15/3/2036 231,782 0.01%Apple, Inc.1 €200,000 1.00% 10/11/2022 231,754 0.01%Amgen, Inc. £150,000 4.00% 13/9/2029 231,649 0.01%
Vanguard Global Corporate Bond Index Fund
553
Maturity Fair Value % of Total Principal Coupon Date US Dollars ($) Net Assets
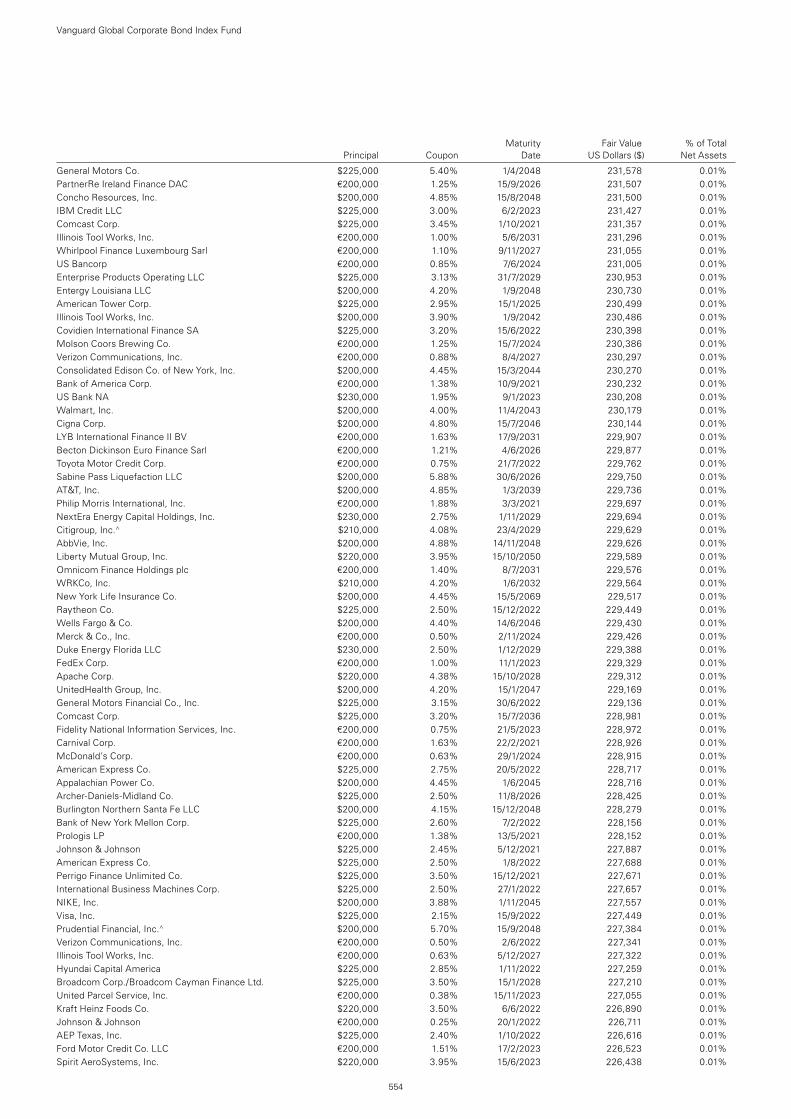
General Motors Co. $225,000 5.40% 1/4/2048 231,578 0.01%PartnerRe Ireland Finance DAC €200,000 1.25% 15/9/2026 231,507 0.01%Concho Resources, Inc. $200,000 4.85% 15/8/2048 231,500 0.01%IBM Credit LLC $225,000 3.00% 6/2/2023 231,427 0.01%Comcast Corp. $225,000 3.45% 1/10/2021 231,357 0.01%Illinois Tool Works, Inc. €200,000 1.00% 5/6/2031 231,296 0.01%Whirlpool Finance Luxembourg Sarl €200,000 1.10% 9/11/2027 231,055 0.01%US Bancorp €200,000 0.85% 7/6/2024 231,005 0.01%Enterprise Products Operating LLC $225,000 3.13% 31/7/2029 230,953 0.01%Entergy Louisiana LLC $200,000 4.20% 1/9/2048 230,730 0.01%American Tower Corp. $225,000 2.95% 15/1/2025 230,499 0.01%Illinois Tool Works, Inc. $200,000 3.90% 1/9/2042 230,486 0.01%Covidien International Finance SA $225,000 3.20% 15/6/2022 230,398 0.01%Molson Coors Brewing Co. €200,000 1.25% 15/7/2024 230,386 0.01%Verizon Communications, Inc. €200,000 0.88% 8/4/2027 230,297 0.01%Consolidated Edison Co. of New York, Inc. $200,000 4.45% 15/3/2044 230,270 0.01%Bank of America Corp. €200,000 1.38% 10/9/2021 230,232 0.01%US Bank NA $230,000 1.95% 9/1/2023 230,208 0.01%Walmart, Inc. $200,000 4.00% 11/4/2043 230,179 0.01%Cigna Corp. $200,000 4.80% 15/7/2046 230,144 0.01%LYB International Finance II BV €200,000 1.63% 17/9/2031 229,907 0.01%Becton Dickinson Euro Finance Sarl €200,000 1.21% 4/6/2026 229,877 0.01%Toyota Motor Credit Corp. €200,000 0.75% 21/7/2022 229,762 0.01%Sabine Pass Liquefaction LLC $200,000 5.88% 30/6/2026 229,750 0.01%AT&T, Inc. $200,000 4.85% 1/3/2039 229,736 0.01%Philip Morris International, Inc. €200,000 1.88% 3/3/2021 229,697 0.01%NextEra Energy Capital Holdings, Inc. $230,000 2.75% 1/11/2029 229,694 0.01%Citigroup, Inc.^ $210,000 4.08% 23/4/2029 229,629 0.01%AbbVie, Inc. $200,000 4.88% 14/11/2048 229,626 0.01%Liberty Mutual Group, Inc. $220,000 3.95% 15/10/2050 229,589 0.01%Omnicom Finance Holdings plc €200,000 1.40% 8/7/2031 229,576 0.01%WRKCo, Inc. $210,000 4.20% 1/6/2032 229,564 0.01%New York Life Insurance Co. $200,000 4.45% 15/5/2069 229,517 0.01%Raytheon Co. $225,000 2.50% 15/12/2022 229,449 0.01%Wells Fargo & Co. $200,000 4.40% 14/6/2046 229,430 0.01%Merck & Co., Inc. €200,000 0.50% 2/11/2024 229,426 0.01%Duke Energy Florida LLC $230,000 2.50% 1/12/2029 229,388 0.01%FedEx Corp. €200,000 1.00% 11/1/2023 229,329 0.01%Apache Corp. $220,000 4.38% 15/10/2028 229,312 0.01%UnitedHealth Group, Inc. $200,000 4.20% 15/1/2047 229,169 0.01%General Motors Financial Co., Inc. $225,000 3.15% 30/6/2022 229,136 0.01%Comcast Corp. $225,000 3.20% 15/7/2036 228,981 0.01%Fidelity National Information Services, Inc. €200,000 0.75% 21/5/2023 228,972 0.01%Carnival Corp. €200,000 1.63% 22/2/2021 228,926 0.01%McDonald’s Corp. €200,000 0.63% 29/1/2024 228,915 0.01%American Express Co. $225,000 2.75% 20/5/2022 228,717 0.01%Appalachian Power Co. $200,000 4.45% 1/6/2045 228,716 0.01%Archer-Daniels-Midland Co. $225,000 2.50% 11/8/2026 228,425 0.01%Burlington Northern Santa Fe LLC $200,000 4.15% 15/12/2048 228,279 0.01%Bank of New York Mellon Corp. $225,000 2.60% 7/2/2022 228,156 0.01%Prologis LP €200,000 1.38% 13/5/2021 228,152 0.01%Johnson & Johnson $225,000 2.45% 5/12/2021 227,887 0.01%American Express Co. $225,000 2.50% 1/8/2022 227,688 0.01%Perrigo Finance Unlimited Co. $225,000 3.50% 15/12/2021 227,671 0.01%International Business Machines Corp. $225,000 2.50% 27/1/2022 227,657 0.01%NIKE, Inc. $200,000 3.88% 1/11/2045 227,557 0.01%Visa, Inc. $225,000 2.15% 15/9/2022 227,449 0.01%Prudential Financial, Inc.^ $200,000 5.70% 15/9/2048 227,384 0.01%Verizon Communications, Inc. €200,000 0.50% 2/6/2022 227,341 0.01%Illinois Tool Works, Inc. €200,000 0.63% 5/12/2027 227,322 0.01%Hyundai Capital America $225,000 2.85% 1/11/2022 227,259 0.01%Broadcom Corp./Broadcom Cayman Finance Ltd. $225,000 3.50% 15/1/2028 227,210 0.01%United Parcel Service, Inc. €200,000 0.38% 15/11/2023 227,055 0.01%Kraft Heinz Foods Co. $220,000 3.50% 6/6/2022 226,890 0.01%Johnson & Johnson €200,000 0.25% 20/1/2022 226,711 0.01%AEP Texas, Inc. $225,000 2.40% 1/10/2022 226,616 0.01%Ford Motor Credit Co. LLC €200,000 1.51% 17/2/2023 226,523 0.01%Spirit AeroSystems, Inc. $220,000 3.95% 15/6/2023 226,438 0.01%
Vanguard Global Corporate Bond Index Fund
554
Maturity Fair Value % of Total Principal Coupon Date US Dollars ($) Net Assets
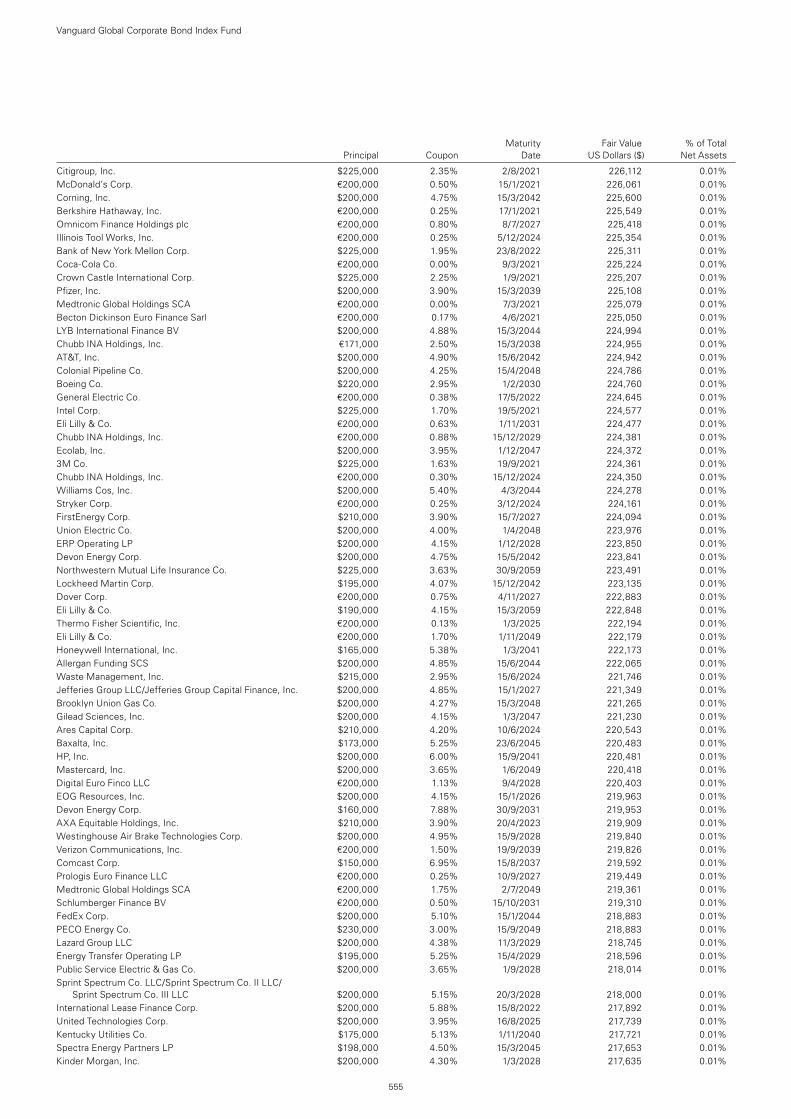
Citigroup, Inc. $225,000 2.35% 2/8/2021 226,112 0.01%McDonald’s Corp. €200,000 0.50% 15/1/2021 226,061 0.01%Corning, Inc. $200,000 4.75% 15/3/2042 225,600 0.01%Berkshire Hathaway, Inc. €200,000 0.25% 17/1/2021 225,549 0.01%Omnicom Finance Holdings plc €200,000 0.80% 8/7/2027 225,418 0.01%Illinois Tool Works, Inc. €200,000 0.25% 5/12/2024 225,354 0.01%Bank of New York Mellon Corp. $225,000 1.95% 23/8/2022 225,311 0.01%Coca-Cola Co. €200,000 0.00% 9/3/2021 225,224 0.01%Crown Castle International Corp. $225,000 2.25% 1/9/2021 225,207 0.01%Pfizer, Inc. $200,000 3.90% 15/3/2039 225,108 0.01%Medtronic Global Holdings SCA €200,000 0.00% 7/3/2021 225,079 0.01%Becton Dickinson Euro Finance Sarl €200,000 0.17% 4/6/2021 225,050 0.01%LYB International Finance BV $200,000 4.88% 15/3/2044 224,994 0.01%Chubb INA Holdings, Inc. €171,000 2.50% 15/3/2038 224,955 0.01%AT&T, Inc. $200,000 4.90% 15/6/2042 224,942 0.01%Colonial Pipeline Co. $200,000 4.25% 15/4/2048 224,786 0.01%Boeing Co. $220,000 2.95% 1/2/2030 224,760 0.01%General Electric Co. €200,000 0.38% 17/5/2022 224,645 0.01%Intel Corp. $225,000 1.70% 19/5/2021 224,577 0.01%Eli Lilly & Co. €200,000 0.63% 1/11/2031 224,477 0.01%Chubb INA Holdings, Inc. €200,000 0.88% 15/12/2029 224,381 0.01%Ecolab, Inc. $200,000 3.95% 1/12/2047 224,372 0.01%3M Co. $225,000 1.63% 19/9/2021 224,361 0.01%Chubb INA Holdings, Inc. €200,000 0.30% 15/12/2024 224,350 0.01%Williams Cos, Inc. $200,000 5.40% 4/3/2044 224,278 0.01%Stryker Corp. €200,000 0.25% 3/12/2024 224,161 0.01%FirstEnergy Corp. $210,000 3.90% 15/7/2027 224,094 0.01%Union Electric Co. $200,000 4.00% 1/4/2048 223,976 0.01%ERP Operating LP $200,000 4.15% 1/12/2028 223,850 0.01%Devon Energy Corp. $200,000 4.75% 15/5/2042 223,841 0.01%Northwestern Mutual Life Insurance Co. $225,000 3.63% 30/9/2059 223,491 0.01%Lockheed Martin Corp. $195,000 4.07% 15/12/2042 223,135 0.01%Dover Corp. €200,000 0.75% 4/11/2027 222,883 0.01%Eli Lilly & Co. $190,000 4.15% 15/3/2059 222,848 0.01%Thermo Fisher Scientific, Inc. €200,000 0.13% 1/3/2025 222,194 0.01%Eli Lilly & Co. €200,000 1.70% 1/11/2049 222,179 0.01%Honeywell International, Inc. $165,000 5.38% 1/3/2041 222,173 0.01%Allergan Funding SCS $200,000 4.85% 15/6/2044 222,065 0.01%Waste Management, Inc. $215,000 2.95% 15/6/2024 221,746 0.01%Jefferies Group LLC/Jefferies Group Capital Finance, Inc. $200,000 4.85% 15/1/2027 221,349 0.01%Brooklyn Union Gas Co. $200,000 4.27% 15/3/2048 221,265 0.01%Gilead Sciences, Inc. $200,000 4.15% 1/3/2047 221,230 0.01%Ares Capital Corp. $210,000 4.20% 10/6/2024 220,543 0.01%Baxalta, Inc. $173,000 5.25% 23/6/2045 220,483 0.01%HP, Inc. $200,000 6.00% 15/9/2041 220,481 0.01%Mastercard, Inc. $200,000 3.65% 1/6/2049 220,418 0.01%Digital Euro Finco LLC €200,000 1.13% 9/4/2028 220,403 0.01%EOG Resources, Inc. $200,000 4.15% 15/1/2026 219,963 0.01%Devon Energy Corp. $160,000 7.88% 30/9/2031 219,953 0.01%AXA Equitable Holdings, Inc. $210,000 3.90% 20/4/2023 219,909 0.01%Westinghouse Air Brake Technologies Corp. $200,000 4.95% 15/9/2028 219,840 0.01%Verizon Communications, Inc. €200,000 1.50% 19/9/2039 219,826 0.01%Comcast Corp. $150,000 6.95% 15/8/2037 219,592 0.01%Prologis Euro Finance LLC €200,000 0.25% 10/9/2027 219,449 0.01%Medtronic Global Holdings SCA €200,000 1.75% 2/7/2049 219,361 0.01%Schlumberger Finance BV €200,000 0.50% 15/10/2031 219,310 0.01%FedEx Corp. $200,000 5.10% 15/1/2044 218,883 0.01%PECO Energy Co. $230,000 3.00% 15/9/2049 218,883 0.01%Lazard Group LLC $200,000 4.38% 11/3/2029 218,745 0.01%Energy Transfer Operating LP $195,000 5.25% 15/4/2029 218,596 0.01%Public Service Electric & Gas Co. $200,000 3.65% 1/9/2028 218,014 0.01%Sprint Spectrum Co. LLC/Sprint Spectrum Co. II LLC/
Sprint Spectrum Co. III LLC $200,000 5.15% 20/3/2028 218,000 0.01%International Lease Finance Corp. $200,000 5.88% 15/8/2022 217,892 0.01%United Technologies Corp. $200,000 3.95% 16/8/2025 217,739 0.01%Kentucky Utilities Co. $175,000 5.13% 1/11/2040 217,721 0.01%Spectra Energy Partners LP $198,000 4.50% 15/3/2045 217,653 0.01%Kinder Morgan, Inc. $200,000 4.30% 1/3/2028 217,635 0.01%
Vanguard Global Corporate Bond Index Fund
555
Maturity Fair Value % of Total Principal Coupon Date US Dollars ($) Net Assets
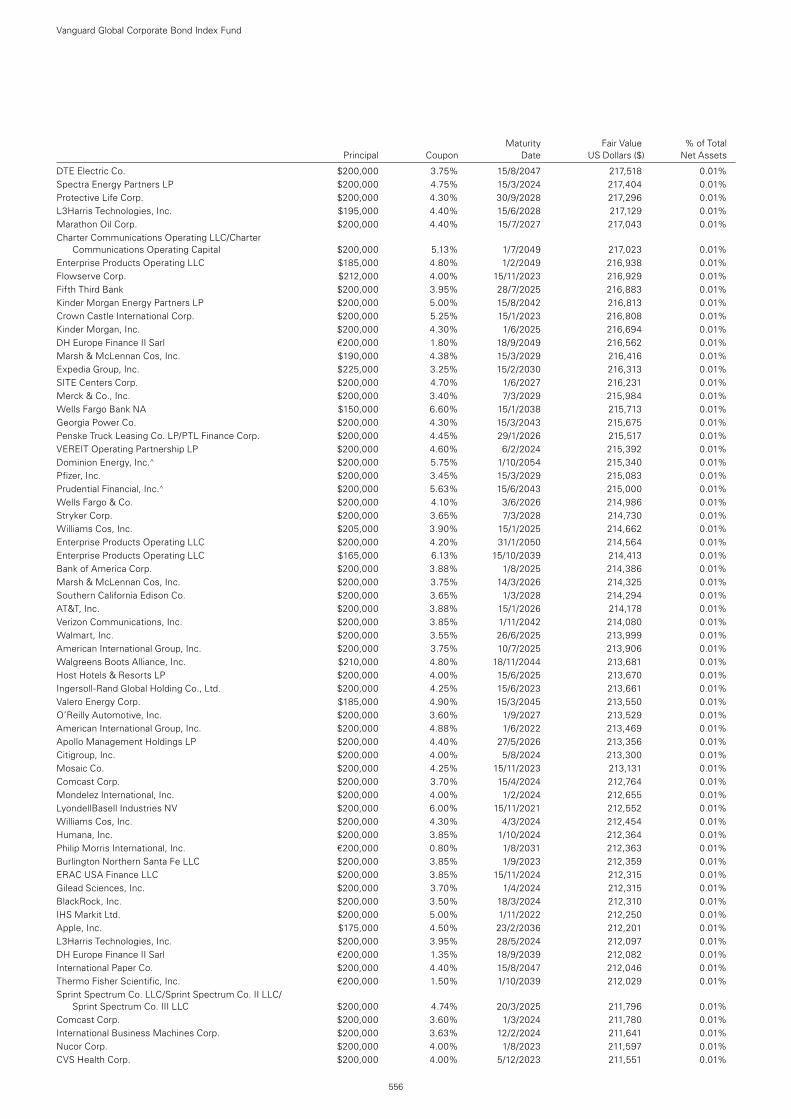
DTE Electric Co. $200,000 3.75% 15/8/2047 217,518 0.01%Spectra Energy Partners LP $200,000 4.75% 15/3/2024 217,404 0.01%Protective Life Corp. $200,000 4.30% 30/9/2028 217,296 0.01%L3Harris Technologies, Inc. $195,000 4.40% 15/6/2028 217,129 0.01%Marathon Oil Corp. $200,000 4.40% 15/7/2027 217,043 0.01%Charter Communications Operating LLC/Charter
Communications Operating Capital $200,000 5.13% 1/7/2049 217,023 0.01%Enterprise Products Operating LLC $185,000 4.80% 1/2/2049 216,938 0.01%Flowserve Corp. $212,000 4.00% 15/11/2023 216,929 0.01%Fifth Third Bank $200,000 3.95% 28/7/2025 216,883 0.01%Kinder Morgan Energy Partners LP $200,000 5.00% 15/8/2042 216,813 0.01%Crown Castle International Corp. $200,000 5.25% 15/1/2023 216,808 0.01%Kinder Morgan, Inc. $200,000 4.30% 1/6/2025 216,694 0.01%DH Europe Finance II Sarl €200,000 1.80% 18/9/2049 216,562 0.01%Marsh & McLennan Cos, Inc. $190,000 4.38% 15/3/2029 216,416 0.01%Expedia Group, Inc. $225,000 3.25% 15/2/2030 216,313 0.01%SITE Centers Corp. $200,000 4.70% 1/6/2027 216,231 0.01%Merck & Co., Inc. $200,000 3.40% 7/3/2029 215,984 0.01%Wells Fargo Bank NA $150,000 6.60% 15/1/2038 215,713 0.01%Georgia Power Co. $200,000 4.30% 15/3/2043 215,675 0.01%Penske Truck Leasing Co. LP/PTL Finance Corp. $200,000 4.45% 29/1/2026 215,517 0.01%VEREIT Operating Partnership LP $200,000 4.60% 6/2/2024 215,392 0.01%Dominion Energy, Inc.^ $200,000 5.75% 1/10/2054 215,340 0.01%Pfizer, Inc. $200,000 3.45% 15/3/2029 215,083 0.01%Prudential Financial, Inc.^ $200,000 5.63% 15/6/2043 215,000 0.01%Wells Fargo & Co. $200,000 4.10% 3/6/2026 214,986 0.01%Stryker Corp. $200,000 3.65% 7/3/2028 214,730 0.01%Williams Cos, Inc. $205,000 3.90% 15/1/2025 214,662 0.01%Enterprise Products Operating LLC $200,000 4.20% 31/1/2050 214,564 0.01%Enterprise Products Operating LLC $165,000 6.13% 15/10/2039 214,413 0.01%Bank of America Corp. $200,000 3.88% 1/8/2025 214,386 0.01%Marsh & McLennan Cos, Inc. $200,000 3.75% 14/3/2026 214,325 0.01%Southern California Edison Co. $200,000 3.65% 1/3/2028 214,294 0.01%AT&T, Inc. $200,000 3.88% 15/1/2026 214,178 0.01%Verizon Communications, Inc. $200,000 3.85% 1/11/2042 214,080 0.01%Walmart, Inc. $200,000 3.55% 26/6/2025 213,999 0.01%American International Group, Inc. $200,000 3.75% 10/7/2025 213,906 0.01%Walgreens Boots Alliance, Inc. $210,000 4.80% 18/11/2044 213,681 0.01%Host Hotels & Resorts LP $200,000 4.00% 15/6/2025 213,670 0.01%Ingersoll-Rand Global Holding Co., Ltd. $200,000 4.25% 15/6/2023 213,661 0.01%Valero Energy Corp. $185,000 4.90% 15/3/2045 213,550 0.01%O’Reilly Automotive, Inc. $200,000 3.60% 1/9/2027 213,529 0.01%American International Group, Inc. $200,000 4.88% 1/6/2022 213,469 0.01%Apollo Management Holdings LP $200,000 4.40% 27/5/2026 213,356 0.01%Citigroup, Inc. $200,000 4.00% 5/8/2024 213,300 0.01%Mosaic Co. $200,000 4.25% 15/11/2023 213,131 0.01%Comcast Corp. $200,000 3.70% 15/4/2024 212,764 0.01%Mondelez International, Inc. $200,000 4.00% 1/2/2024 212,655 0.01%LyondellBasell Industries NV $200,000 6.00% 15/11/2021 212,552 0.01%Williams Cos, Inc. $200,000 4.30% 4/3/2024 212,454 0.01%Humana, Inc. $200,000 3.85% 1/10/2024 212,364 0.01%Philip Morris International, Inc. €200,000 0.80% 1/8/2031 212,363 0.01%Burlington Northern Santa Fe LLC $200,000 3.85% 1/9/2023 212,359 0.01%ERAC USA Finance LLC $200,000 3.85% 15/11/2024 212,315 0.01%Gilead Sciences, Inc. $200,000 3.70% 1/4/2024 212,315 0.01%BlackRock, Inc. $200,000 3.50% 18/3/2024 212,310 0.01%IHS Markit Ltd. $200,000 5.00% 1/11/2022 212,250 0.01%Apple, Inc. $175,000 4.50% 23/2/2036 212,201 0.01%L3Harris Technologies, Inc. $200,000 3.95% 28/5/2024 212,097 0.01%DH Europe Finance II Sarl €200,000 1.35% 18/9/2039 212,082 0.01%International Paper Co. $200,000 4.40% 15/8/2047 212,046 0.01%Thermo Fisher Scientific, Inc. €200,000 1.50% 1/10/2039 212,029 0.01%Sprint Spectrum Co. LLC/Sprint Spectrum Co. II LLC/
Sprint Spectrum Co. III LLC $200,000 4.74% 20/3/2025 211,796 0.01%Comcast Corp. $200,000 3.60% 1/3/2024 211,780 0.01%International Business Machines Corp. $200,000 3.63% 12/2/2024 211,641 0.01%Nucor Corp. $200,000 4.00% 1/8/2023 211,597 0.01%CVS Health Corp. $200,000 4.00% 5/12/2023 211,551 0.01%
Vanguard Global Corporate Bond Index Fund
556
Maturity Fair Value % of Total Principal Coupon Date US Dollars ($) Net Assets
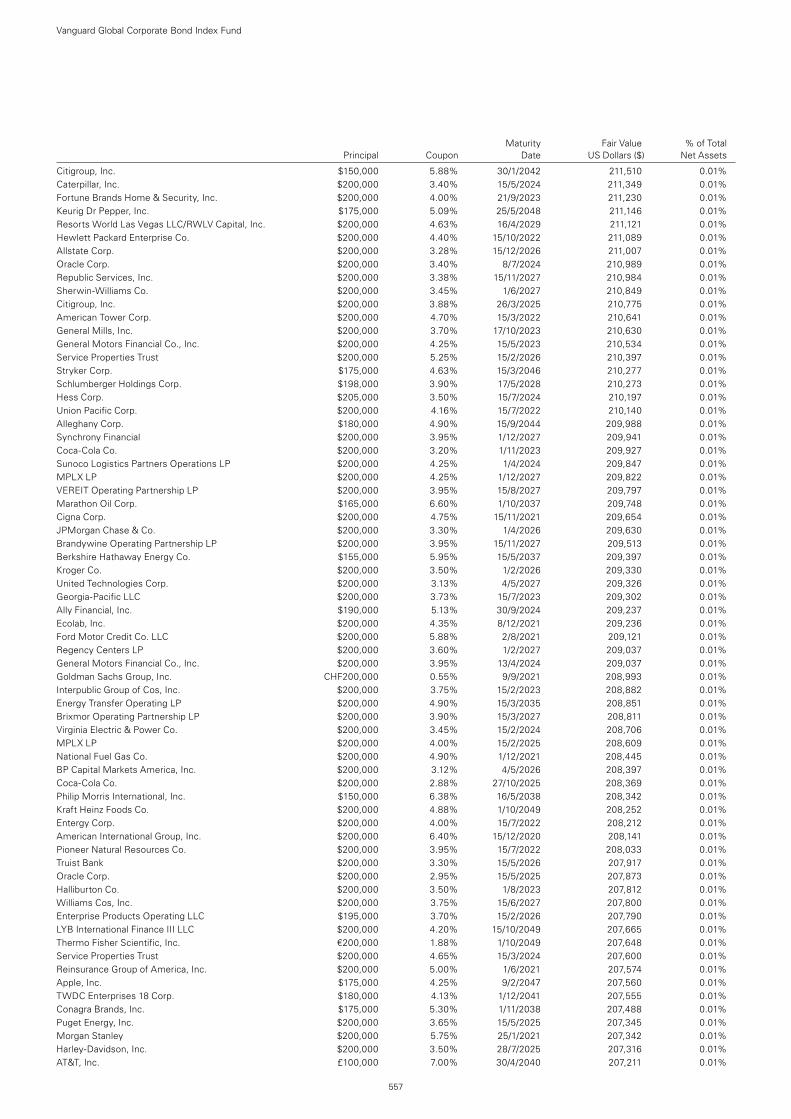
Citigroup, Inc. $150,000 5.88% 30/1/2042 211,510 0.01%Caterpillar, Inc. $200,000 3.40% 15/5/2024 211,349 0.01%Fortune Brands Home & Security, Inc. $200,000 4.00% 21/9/2023 211,230 0.01%Keurig Dr Pepper, Inc. $175,000 5.09% 25/5/2048 211,146 0.01%Resorts World Las Vegas LLC/RWLV Capital, Inc. $200,000 4.63% 16/4/2029 211,121 0.01%Hewlett Packard Enterprise Co. $200,000 4.40% 15/10/2022 211,089 0.01%Allstate Corp. $200,000 3.28% 15/12/2026 211,007 0.01%Oracle Corp. $200,000 3.40% 8/7/2024 210,989 0.01%Republic Services, Inc. $200,000 3.38% 15/11/2027 210,984 0.01%Sherwin-Williams Co. $200,000 3.45% 1/6/2027 210,849 0.01%Citigroup, Inc. $200,000 3.88% 26/3/2025 210,775 0.01%American Tower Corp. $200,000 4.70% 15/3/2022 210,641 0.01%General Mills, Inc. $200,000 3.70% 17/10/2023 210,630 0.01%General Motors Financial Co., Inc. $200,000 4.25% 15/5/2023 210,534 0.01%Service Properties Trust $200,000 5.25% 15/2/2026 210,397 0.01%Stryker Corp. $175,000 4.63% 15/3/2046 210,277 0.01%Schlumberger Holdings Corp. $198,000 3.90% 17/5/2028 210,273 0.01%Hess Corp. $205,000 3.50% 15/7/2024 210,197 0.01%Union Pacific Corp. $200,000 4.16% 15/7/2022 210,140 0.01%Alleghany Corp. $180,000 4.90% 15/9/2044 209,988 0.01%Synchrony Financial $200,000 3.95% 1/12/2027 209,941 0.01%Coca-Cola Co. $200,000 3.20% 1/11/2023 209,927 0.01%Sunoco Logistics Partners Operations LP $200,000 4.25% 1/4/2024 209,847 0.01%MPLX LP $200,000 4.25% 1/12/2027 209,822 0.01%VEREIT Operating Partnership LP $200,000 3.95% 15/8/2027 209,797 0.01%Marathon Oil Corp. $165,000 6.60% 1/10/2037 209,748 0.01%Cigna Corp. $200,000 4.75% 15/11/2021 209,654 0.01%JPMorgan Chase & Co. $200,000 3.30% 1/4/2026 209,630 0.01%Brandywine Operating Partnership LP $200,000 3.95% 15/11/2027 209,513 0.01%Berkshire Hathaway Energy Co. $155,000 5.95% 15/5/2037 209,397 0.01%Kroger Co. $200,000 3.50% 1/2/2026 209,330 0.01%United Technologies Corp. $200,000 3.13% 4/5/2027 209,326 0.01%Georgia-Pacific LLC $200,000 3.73% 15/7/2023 209,302 0.01%Ally Financial, Inc. $190,000 5.13% 30/9/2024 209,237 0.01%Ecolab, Inc. $200,000 4.35% 8/12/2021 209,236 0.01%Ford Motor Credit Co. LLC $200,000 5.88% 2/8/2021 209,121 0.01%Regency Centers LP $200,000 3.60% 1/2/2027 209,037 0.01%General Motors Financial Co., Inc. $200,000 3.95% 13/4/2024 209,037 0.01%Goldman Sachs Group, Inc. CHF200,000 0.55% 9/9/2021 208,993 0.01%Interpublic Group of Cos, Inc. $200,000 3.75% 15/2/2023 208,882 0.01%Energy Transfer Operating LP $200,000 4.90% 15/3/2035 208,851 0.01%Brixmor Operating Partnership LP $200,000 3.90% 15/3/2027 208,811 0.01%Virginia Electric & Power Co. $200,000 3.45% 15/2/2024 208,706 0.01%MPLX LP $200,000 4.00% 15/2/2025 208,609 0.01%National Fuel Gas Co. $200,000 4.90% 1/12/2021 208,445 0.01%BP Capital Markets America, Inc. $200,000 3.12% 4/5/2026 208,397 0.01%Coca-Cola Co. $200,000 2.88% 27/10/2025 208,369 0.01%Philip Morris International, Inc. $150,000 6.38% 16/5/2038 208,342 0.01%Kraft Heinz Foods Co. $200,000 4.88% 1/10/2049 208,252 0.01%Entergy Corp. $200,000 4.00% 15/7/2022 208,212 0.01%American International Group, Inc. $200,000 6.40% 15/12/2020 208,141 0.01%Pioneer Natural Resources Co. $200,000 3.95% 15/7/2022 208,033 0.01%Truist Bank $200,000 3.30% 15/5/2026 207,917 0.01%Oracle Corp. $200,000 2.95% 15/5/2025 207,873 0.01%Halliburton Co. $200,000 3.50% 1/8/2023 207,812 0.01%Williams Cos, Inc. $200,000 3.75% 15/6/2027 207,800 0.01%Enterprise Products Operating LLC $195,000 3.70% 15/2/2026 207,790 0.01%LYB International Finance III LLC $200,000 4.20% 15/10/2049 207,665 0.01%Thermo Fisher Scientific, Inc. €200,000 1.88% 1/10/2049 207,648 0.01%Service Properties Trust $200,000 4.65% 15/3/2024 207,600 0.01%Reinsurance Group of America, Inc. $200,000 5.00% 1/6/2021 207,574 0.01%Apple, Inc. $175,000 4.25% 9/2/2047 207,560 0.01%TWDC Enterprises 18 Corp. $180,000 4.13% 1/12/2041 207,555 0.01%Conagra Brands, Inc. $175,000 5.30% 1/11/2038 207,488 0.01%Puget Energy, Inc. $200,000 3.65% 15/5/2025 207,345 0.01%Morgan Stanley $200,000 5.75% 25/1/2021 207,342 0.01%Harley-Davidson, Inc. $200,000 3.50% 28/7/2025 207,316 0.01%AT&T, Inc. £100,000 7.00% 30/4/2040 207,211 0.01%
Vanguard Global Corporate Bond Index Fund
557
Maturity Fair Value % of Total Principal Coupon Date US Dollars ($) Net Assets
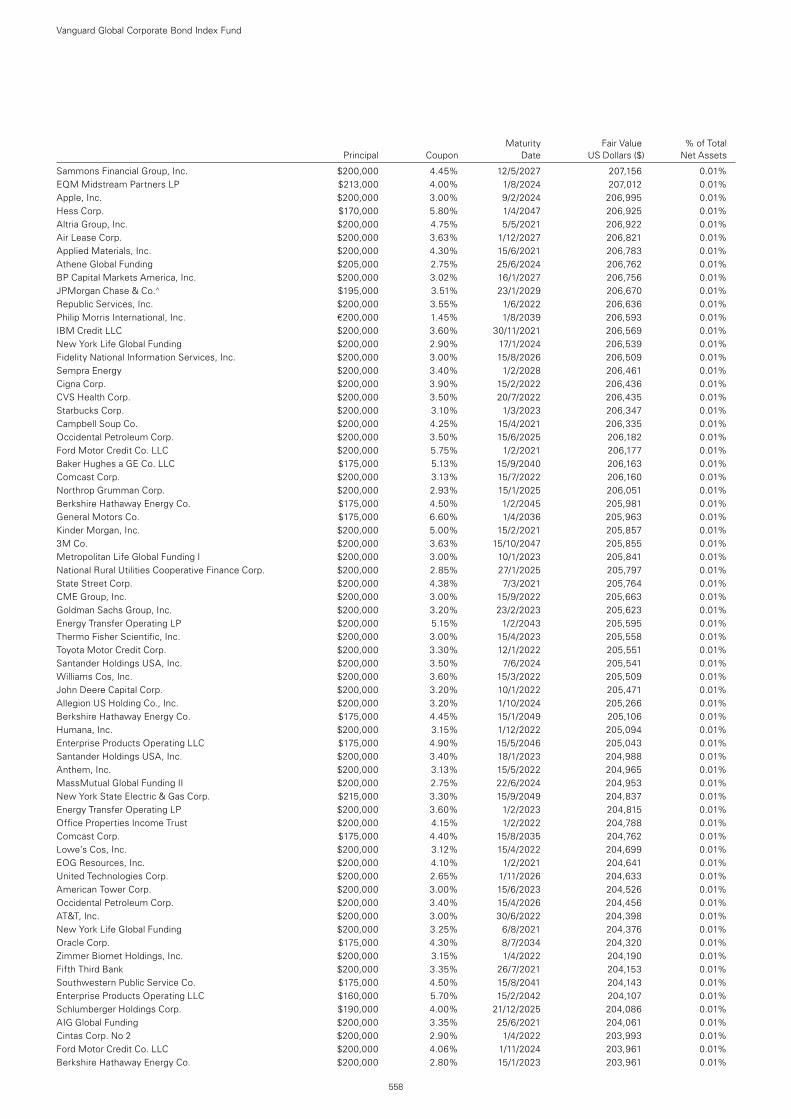
Sammons Financial Group, Inc. $200,000 4.45% 12/5/2027 207,156 0.01%EQM Midstream Partners LP $213,000 4.00% 1/8/2024 207,012 0.01%Apple, Inc. $200,000 3.00% 9/2/2024 206,995 0.01%Hess Corp. $170,000 5.80% 1/4/2047 206,925 0.01%Altria Group, Inc. $200,000 4.75% 5/5/2021 206,922 0.01%Air Lease Corp. $200,000 3.63% 1/12/2027 206,821 0.01%Applied Materials, Inc. $200,000 4.30% 15/6/2021 206,783 0.01%Athene Global Funding $205,000 2.75% 25/6/2024 206,762 0.01%BP Capital Markets America, Inc. $200,000 3.02% 16/1/2027 206,756 0.01%JPMorgan Chase & Co.^ $195,000 3.51% 23/1/2029 206,670 0.01%Republic Services, Inc. $200,000 3.55% 1/6/2022 206,636 0.01%Philip Morris International, Inc. €200,000 1.45% 1/8/2039 206,593 0.01%IBM Credit LLC $200,000 3.60% 30/11/2021 206,569 0.01%New York Life Global Funding $200,000 2.90% 17/1/2024 206,539 0.01%Fidelity National Information Services, Inc. $200,000 3.00% 15/8/2026 206,509 0.01%Sempra Energy $200,000 3.40% 1/2/2028 206,461 0.01%Cigna Corp. $200,000 3.90% 15/2/2022 206,436 0.01%CVS Health Corp. $200,000 3.50% 20/7/2022 206,435 0.01%Starbucks Corp. $200,000 3.10% 1/3/2023 206,347 0.01%Campbell Soup Co. $200,000 4.25% 15/4/2021 206,335 0.01%Occidental Petroleum Corp. $200,000 3.50% 15/6/2025 206,182 0.01%Ford Motor Credit Co. LLC $200,000 5.75% 1/2/2021 206,177 0.01%Baker Hughes a GE Co. LLC $175,000 5.13% 15/9/2040 206,163 0.01%Comcast Corp. $200,000 3.13% 15/7/2022 206,160 0.01%Northrop Grumman Corp. $200,000 2.93% 15/1/2025 206,051 0.01%Berkshire Hathaway Energy Co. $175,000 4.50% 1/2/2045 205,981 0.01%General Motors Co. $175,000 6.60% 1/4/2036 205,963 0.01%Kinder Morgan, Inc. $200,000 5.00% 15/2/2021 205,857 0.01%3M Co. $200,000 3.63% 15/10/2047 205,855 0.01%Metropolitan Life Global Funding I $200,000 3.00% 10/1/2023 205,841 0.01%National Rural Utilities Cooperative Finance Corp. $200,000 2.85% 27/1/2025 205,797 0.01%State Street Corp. $200,000 4.38% 7/3/2021 205,764 0.01%CME Group, Inc. $200,000 3.00% 15/9/2022 205,663 0.01%Goldman Sachs Group, Inc. $200,000 3.20% 23/2/2023 205,623 0.01%Energy Transfer Operating LP $200,000 5.15% 1/2/2043 205,595 0.01%Thermo Fisher Scientific, Inc. $200,000 3.00% 15/4/2023 205,558 0.01%Toyota Motor Credit Corp. $200,000 3.30% 12/1/2022 205,551 0.01%Santander Holdings USA, Inc. $200,000 3.50% 7/6/2024 205,541 0.01%Williams Cos, Inc. $200,000 3.60% 15/3/2022 205,509 0.01%John Deere Capital Corp. $200,000 3.20% 10/1/2022 205,471 0.01%Allegion US Holding Co., Inc. $200,000 3.20% 1/10/2024 205,266 0.01%Berkshire Hathaway Energy Co. $175,000 4.45% 15/1/2049 205,106 0.01%Humana, Inc. $200,000 3.15% 1/12/2022 205,094 0.01%Enterprise Products Operating LLC $175,000 4.90% 15/5/2046 205,043 0.01%Santander Holdings USA, Inc. $200,000 3.40% 18/1/2023 204,988 0.01%Anthem, Inc. $200,000 3.13% 15/5/2022 204,965 0.01%MassMutual Global Funding II $200,000 2.75% 22/6/2024 204,953 0.01%New York State Electric & Gas Corp. $215,000 3.30% 15/9/2049 204,837 0.01%Energy Transfer Operating LP $200,000 3.60% 1/2/2023 204,815 0.01%Office Properties Income Trust $200,000 4.15% 1/2/2022 204,788 0.01%Comcast Corp. $175,000 4.40% 15/8/2035 204,762 0.01%Lowe’s Cos, Inc. $200,000 3.12% 15/4/2022 204,699 0.01%EOG Resources, Inc. $200,000 4.10% 1/2/2021 204,641 0.01%United Technologies Corp. $200,000 2.65% 1/11/2026 204,633 0.01%American Tower Corp. $200,000 3.00% 15/6/2023 204,526 0.01%Occidental Petroleum Corp. $200,000 3.40% 15/4/2026 204,456 0.01%AT&T, Inc. $200,000 3.00% 30/6/2022 204,398 0.01%New York Life Global Funding $200,000 3.25% 6/8/2021 204,376 0.01%Oracle Corp. $175,000 4.30% 8/7/2034 204,320 0.01%Zimmer Biomet Holdings, Inc. $200,000 3.15% 1/4/2022 204,190 0.01%Fifth Third Bank $200,000 3.35% 26/7/2021 204,153 0.01%Southwestern Public Service Co. $175,000 4.50% 15/8/2041 204,143 0.01%Enterprise Products Operating LLC $160,000 5.70% 15/2/2042 204,107 0.01%Schlumberger Holdings Corp. $190,000 4.00% 21/12/2025 204,086 0.01%AIG Global Funding $200,000 3.35% 25/6/2021 204,061 0.01%Cintas Corp. No 2 $200,000 2.90% 1/4/2022 203,993 0.01%Ford Motor Credit Co. LLC $200,000 4.06% 1/11/2024 203,961 0.01%Berkshire Hathaway Energy Co. $200,000 2.80% 15/1/2023 203,961 0.01%
Vanguard Global Corporate Bond Index Fund
558
Maturity Fair Value % of Total Principal Coupon Date US Dollars ($) Net Assets
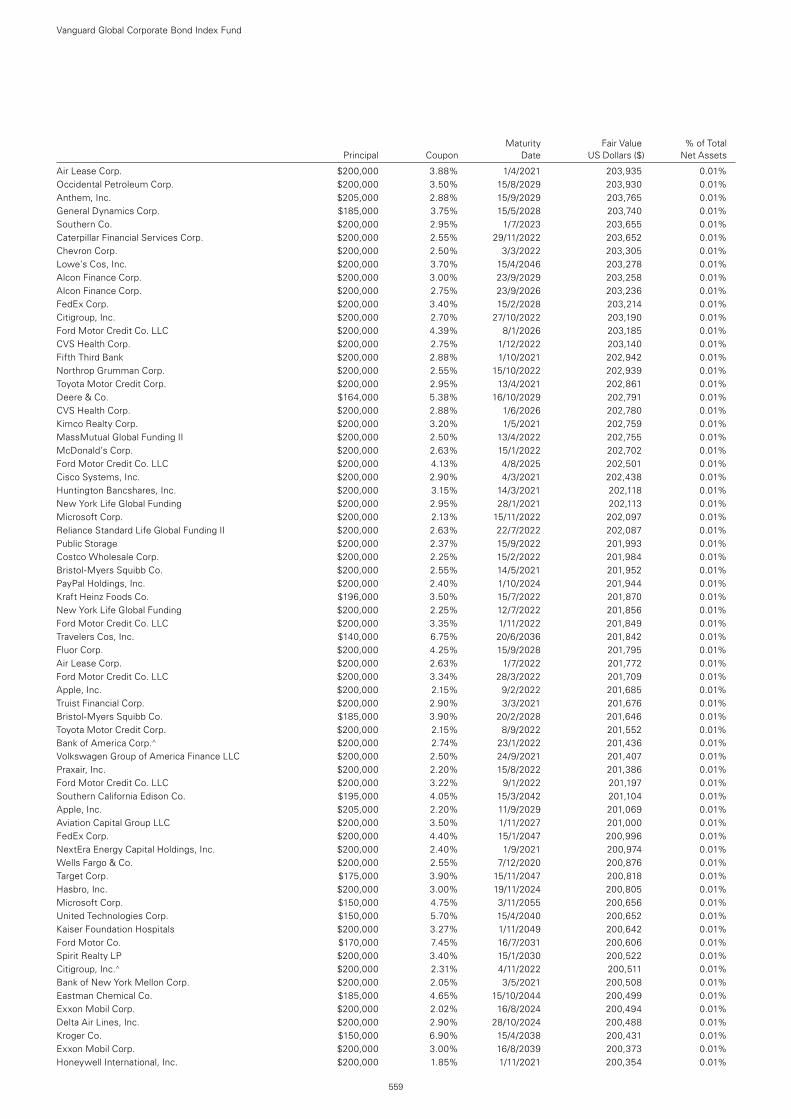
Air Lease Corp. $200,000 3.88% 1/4/2021 203,935 0.01%Occidental Petroleum Corp. $200,000 3.50% 15/8/2029 203,930 0.01%Anthem, Inc. $205,000 2.88% 15/9/2029 203,765 0.01%General Dynamics Corp. $185,000 3.75% 15/5/2028 203,740 0.01%Southern Co. $200,000 2.95% 1/7/2023 203,655 0.01%Caterpillar Financial Services Corp. $200,000 2.55% 29/11/2022 203,652 0.01%Chevron Corp. $200,000 2.50% 3/3/2022 203,305 0.01%Lowe’s Cos, Inc. $200,000 3.70% 15/4/2046 203,278 0.01%Alcon Finance Corp. $200,000 3.00% 23/9/2029 203,258 0.01%Alcon Finance Corp. $200,000 2.75% 23/9/2026 203,236 0.01%FedEx Corp. $200,000 3.40% 15/2/2028 203,214 0.01%Citigroup, Inc. $200,000 2.70% 27/10/2022 203,190 0.01%Ford Motor Credit Co. LLC $200,000 4.39% 8/1/2026 203,185 0.01%CVS Health Corp. $200,000 2.75% 1/12/2022 203,140 0.01%Fifth Third Bank $200,000 2.88% 1/10/2021 202,942 0.01%Northrop Grumman Corp. $200,000 2.55% 15/10/2022 202,939 0.01%Toyota Motor Credit Corp. $200,000 2.95% 13/4/2021 202,861 0.01%Deere & Co. $164,000 5.38% 16/10/2029 202,791 0.01%CVS Health Corp. $200,000 2.88% 1/6/2026 202,780 0.01%Kimco Realty Corp. $200,000 3.20% 1/5/2021 202,759 0.01%MassMutual Global Funding II $200,000 2.50% 13/4/2022 202,755 0.01%McDonald’s Corp. $200,000 2.63% 15/1/2022 202,702 0.01%Ford Motor Credit Co. LLC $200,000 4.13% 4/8/2025 202,501 0.01%Cisco Systems, Inc. $200,000 2.90% 4/3/2021 202,438 0.01%Huntington Bancshares, Inc. $200,000 3.15% 14/3/2021 202,118 0.01%New York Life Global Funding $200,000 2.95% 28/1/2021 202,113 0.01%Microsoft Corp. $200,000 2.13% 15/11/2022 202,097 0.01%Reliance Standard Life Global Funding II $200,000 2.63% 22/7/2022 202,087 0.01%Public Storage $200,000 2.37% 15/9/2022 201,993 0.01%Costco Wholesale Corp. $200,000 2.25% 15/2/2022 201,984 0.01%Bristol-Myers Squibb Co. $200,000 2.55% 14/5/2021 201,952 0.01%PayPal Holdings, Inc. $200,000 2.40% 1/10/2024 201,944 0.01%Kraft Heinz Foods Co. $196,000 3.50% 15/7/2022 201,870 0.01%New York Life Global Funding $200,000 2.25% 12/7/2022 201,856 0.01%Ford Motor Credit Co. LLC $200,000 3.35% 1/11/2022 201,849 0.01%Travelers Cos, Inc. $140,000 6.75% 20/6/2036 201,842 0.01%Fluor Corp. $200,000 4.25% 15/9/2028 201,795 0.01%Air Lease Corp. $200,000 2.63% 1/7/2022 201,772 0.01%Ford Motor Credit Co. LLC $200,000 3.34% 28/3/2022 201,709 0.01%Apple, Inc. $200,000 2.15% 9/2/2022 201,685 0.01%Truist Financial Corp. $200,000 2.90% 3/3/2021 201,676 0.01%Bristol-Myers Squibb Co. $185,000 3.90% 20/2/2028 201,646 0.01%Toyota Motor Credit Corp. $200,000 2.15% 8/9/2022 201,552 0.01%Bank of America Corp.^ $200,000 2.74% 23/1/2022 201,436 0.01%Volkswagen Group of America Finance LLC $200,000 2.50% 24/9/2021 201,407 0.01%Praxair, Inc. $200,000 2.20% 15/8/2022 201,386 0.01%Ford Motor Credit Co. LLC $200,000 3.22% 9/1/2022 201,197 0.01%Southern California Edison Co. $195,000 4.05% 15/3/2042 201,104 0.01%Apple, Inc. $205,000 2.20% 11/9/2029 201,069 0.01%Aviation Capital Group LLC $200,000 3.50% 1/11/2027 201,000 0.01%FedEx Corp. $200,000 4.40% 15/1/2047 200,996 0.01%NextEra Energy Capital Holdings, Inc. $200,000 2.40% 1/9/2021 200,974 0.01%Wells Fargo & Co. $200,000 2.55% 7/12/2020 200,876 0.01%Target Corp. $175,000 3.90% 15/11/2047 200,818 0.01%Hasbro, Inc. $200,000 3.00% 19/11/2024 200,805 0.01%Microsoft Corp. $150,000 4.75% 3/11/2055 200,656 0.01%United Technologies Corp. $150,000 5.70% 15/4/2040 200,652 0.01%Kaiser Foundation Hospitals $200,000 3.27% 1/11/2049 200,642 0.01%Ford Motor Co. $170,000 7.45% 16/7/2031 200,606 0.01%Spirit Realty LP $200,000 3.40% 15/1/2030 200,522 0.01%Citigroup, Inc.^ $200,000 2.31% 4/11/2022 200,511 0.01%Bank of New York Mellon Corp. $200,000 2.05% 3/5/2021 200,508 0.01%Eastman Chemical Co. $185,000 4.65% 15/10/2044 200,499 0.01%Exxon Mobil Corp. $200,000 2.02% 16/8/2024 200,494 0.01%Delta Air Lines, Inc. $200,000 2.90% 28/10/2024 200,488 0.01%Kroger Co. $150,000 6.90% 15/4/2038 200,431 0.01%Exxon Mobil Corp. $200,000 3.00% 16/8/2039 200,373 0.01%Honeywell International, Inc. $200,000 1.85% 1/11/2021 200,354 0.01%
Vanguard Global Corporate Bond Index Fund
559
Maturity Fair Value % of Total Principal Coupon Date US Dollars ($) Net Assets
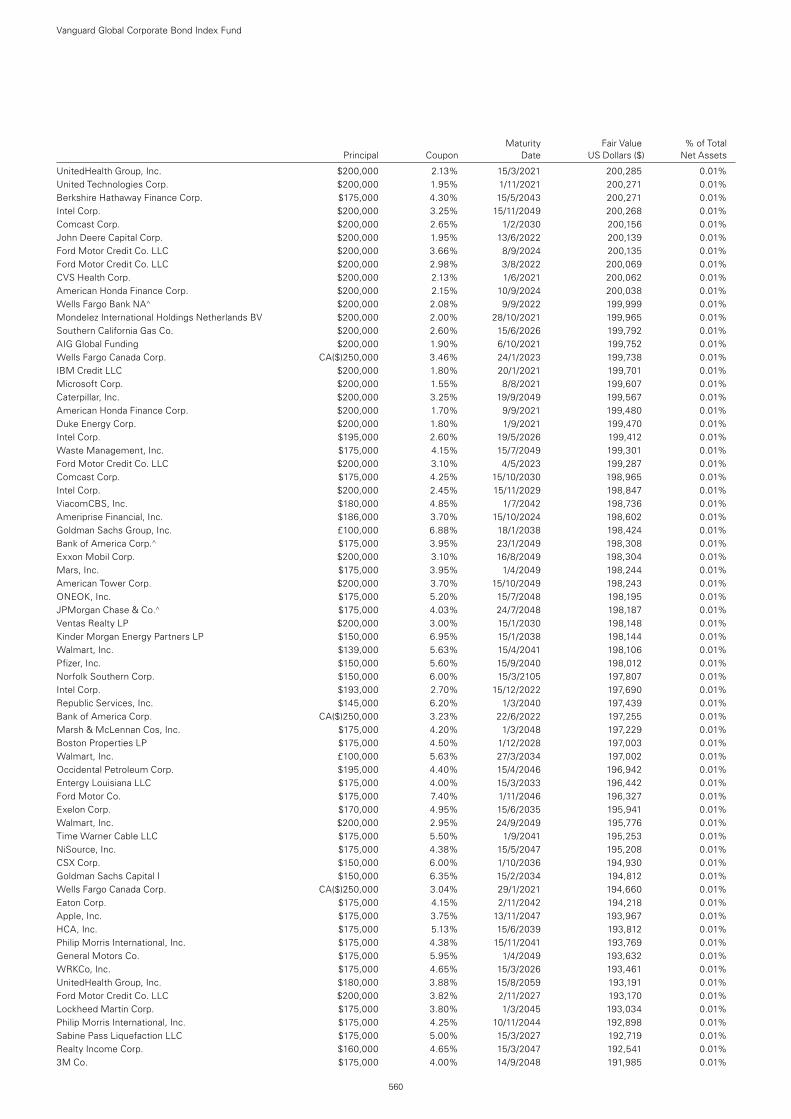
UnitedHealth Group, Inc. $200,000 2.13% 15/3/2021 200,285 0.01%United Technologies Corp. $200,000 1.95% 1/11/2021 200,271 0.01%Berkshire Hathaway Finance Corp. $175,000 4.30% 15/5/2043 200,271 0.01%Intel Corp. $200,000 3.25% 15/11/2049 200,268 0.01%Comcast Corp. $200,000 2.65% 1/2/2030 200,156 0.01%John Deere Capital Corp. $200,000 1.95% 13/6/2022 200,139 0.01%Ford Motor Credit Co. LLC $200,000 3.66% 8/9/2024 200,135 0.01%Ford Motor Credit Co. LLC $200,000 2.98% 3/8/2022 200,069 0.01%CVS Health Corp. $200,000 2.13% 1/6/2021 200,062 0.01%American Honda Finance Corp. $200,000 2.15% 10/9/2024 200,038 0.01%Wells Fargo Bank NA^ $200,000 2.08% 9/9/2022 199,999 0.01%Mondelez International Holdings Netherlands BV $200,000 2.00% 28/10/2021 199,965 0.01%Southern California Gas Co. $200,000 2.60% 15/6/2026 199,792 0.01%AIG Global Funding $200,000 1.90% 6/10/2021 199,752 0.01%Wells Fargo Canada Corp. CA($)250,000 3.46% 24/1/2023 199,738 0.01%IBM Credit LLC $200,000 1.80% 20/1/2021 199,701 0.01%Microsoft Corp. $200,000 1.55% 8/8/2021 199,607 0.01%Caterpillar, Inc. $200,000 3.25% 19/9/2049 199,567 0.01%American Honda Finance Corp. $200,000 1.70% 9/9/2021 199,480 0.01%Duke Energy Corp. $200,000 1.80% 1/9/2021 199,470 0.01%Intel Corp. $195,000 2.60% 19/5/2026 199,412 0.01%Waste Management, Inc. $175,000 4.15% 15/7/2049 199,301 0.01%Ford Motor Credit Co. LLC $200,000 3.10% 4/5/2023 199,287 0.01%Comcast Corp. $175,000 4.25% 15/10/2030 198,965 0.01%Intel Corp. $200,000 2.45% 15/11/2029 198,847 0.01%ViacomCBS, Inc. $180,000 4.85% 1/7/2042 198,736 0.01%Ameriprise Financial, Inc. $186,000 3.70% 15/10/2024 198,602 0.01%Goldman Sachs Group, Inc. £100,000 6.88% 18/1/2038 198,424 0.01%Bank of America Corp.^ $175,000 3.95% 23/1/2049 198,308 0.01%Exxon Mobil Corp. $200,000 3.10% 16/8/2049 198,304 0.01%Mars, Inc. $175,000 3.95% 1/4/2049 198,244 0.01%American Tower Corp. $200,000 3.70% 15/10/2049 198,243 0.01%ONEOK, Inc. $175,000 5.20% 15/7/2048 198,195 0.01%JPMorgan Chase & Co.^ $175,000 4.03% 24/7/2048 198,187 0.01%Ventas Realty LP $200,000 3.00% 15/1/2030 198,148 0.01%Kinder Morgan Energy Partners LP $150,000 6.95% 15/1/2038 198,144 0.01%Walmart, Inc. $139,000 5.63% 15/4/2041 198,106 0.01%Pfizer, Inc. $150,000 5.60% 15/9/2040 198,012 0.01%Norfolk Southern Corp. $150,000 6.00% 15/3/2105 197,807 0.01%Intel Corp. $193,000 2.70% 15/12/2022 197,690 0.01%Republic Services, Inc. $145,000 6.20% 1/3/2040 197,439 0.01%Bank of America Corp. CA($)250,000 3.23% 22/6/2022 197,255 0.01%Marsh & McLennan Cos, Inc. $175,000 4.20% 1/3/2048 197,229 0.01%Boston Properties LP $175,000 4.50% 1/12/2028 197,003 0.01%Walmart, Inc. £100,000 5.63% 27/3/2034 197,002 0.01%Occidental Petroleum Corp. $195,000 4.40% 15/4/2046 196,942 0.01%Entergy Louisiana LLC $175,000 4.00% 15/3/2033 196,442 0.01%Ford Motor Co. $175,000 7.40% 1/11/2046 196,327 0.01%Exelon Corp. $170,000 4.95% 15/6/2035 195,941 0.01%Walmart, Inc. $200,000 2.95% 24/9/2049 195,776 0.01%Time Warner Cable LLC $175,000 5.50% 1/9/2041 195,253 0.01%NiSource, Inc. $175,000 4.38% 15/5/2047 195,208 0.01%CSX Corp. $150,000 6.00% 1/10/2036 194,930 0.01%Goldman Sachs Capital I $150,000 6.35% 15/2/2034 194,812 0.01%Wells Fargo Canada Corp. CA($)250,000 3.04% 29/1/2021 194,660 0.01%Eaton Corp. $175,000 4.15% 2/11/2042 194,218 0.01%Apple, Inc. $175,000 3.75% 13/11/2047 193,967 0.01%HCA, Inc. $175,000 5.13% 15/6/2039 193,812 0.01%Philip Morris International, Inc. $175,000 4.38% 15/11/2041 193,769 0.01%General Motors Co. $175,000 5.95% 1/4/2049 193,632 0.01%WRKCo, Inc. $175,000 4.65% 15/3/2026 193,461 0.01%UnitedHealth Group, Inc. $180,000 3.88% 15/8/2059 193,191 0.01%Ford Motor Credit Co. LLC $200,000 3.82% 2/11/2027 193,170 0.01%Lockheed Martin Corp. $175,000 3.80% 1/3/2045 193,034 0.01%Philip Morris International, Inc. $175,000 4.25% 10/11/2044 192,898 0.01%Sabine Pass Liquefaction LLC $175,000 5.00% 15/3/2027 192,719 0.01%Realty Income Corp. $160,000 4.65% 15/3/2047 192,541 0.01%3M Co. $175,000 4.00% 14/9/2048 191,985 0.01%
Vanguard Global Corporate Bond Index Fund
560
Maturity Fair Value % of Total Principal Coupon Date US Dollars ($) Net Assets

Maturity Fair Value % of Total Principal Coupon Date US Dollars ($) Net Assets
CF Industries, Inc. $187,000 3.40% 1/12/2021 191,748 0.01%Home Depot, Inc. $170,000 3.90% 15/6/2047 191,586 0.01%Kinder Morgan, Inc. $160,000 5.55% 1/6/2045 191,445 0.01%Kraft Heinz Foods Co. $175,000 4.63% 30/1/2029 191,353 0.01%Target Corp. $175,000 3.63% 15/4/2046 191,302 0.01%Apache Corp. $200,000 4.75% 15/4/2043 191,290 0.01%Xylem, Inc. $175,000 4.38% 1/11/2046 191,062 0.01%Massachusetts Institute of Technology $125,000 5.60% 1/7/2111 190,858 0.01%United Technologies Corp. $175,000 3.75% 1/11/2046 190,662 0.01%Enterprise Products Operating LLC $185,000 3.50% 1/2/2022 190,494 0.01%HCA, Inc. $170,000 5.25% 15/6/2026 190,400 0.01%Mars, Inc. $180,000 3.20% 1/4/2030 189,868 0.01%ViacomCBS, Inc. $190,000 2.90% 15/1/2027 189,865 0.01%Thermo Fisher Scientific, Inc. $150,000 5.30% 1/2/2044 189,675 0.01%Starbucks Corp. $175,000 3.55% 15/8/2029 189,667 0.01%American International Group, Inc.^ $175,000 5.75% 1/4/2048 189,509 0.01%Mastercard, Inc. $175,000 3.50% 26/2/2028 189,319 0.01%Time Warner Cable LLC $150,000 6.75% 15/6/2039 189,310 0.01%Kraft Heinz Foods Co. $180,000 4.00% 15/6/2023 189,165 0.01%Ford Motor Co. $200,000 5.29% 8/12/2046 189,091 0.01%Lowe’s Cos, Inc. $175,000 4.05% 3/5/2047 188,703 0.01%Marsh & McLennan Cos, Inc. $180,000 3.50% 3/6/2024 188,695 0.01%Apple, Inc. $190,000 1.80% 11/9/2024 188,259 0.01%Johnson Controls International plc $175,000 4.50% 15/2/2047 188,205 0.01%Mylan, Inc. $175,000 4.55% 15/4/2028 188,021 0.01%ViacomCBS, Inc. $150,000 5.85% 1/9/2043 187,947 0.01%Duke Energy Carolinas LLC $175,000 3.70% 1/12/2047 187,268 0.01%Cisco Systems, Inc. $175,000 3.63% 4/3/2024 186,979 0.01%American Tower Corp. $175,000 4.00% 1/6/2025 186,952 0.01%Micron Technology, Inc. $175,000 4.19% 15/2/2027 186,813 0.01%Dow Chemical Co. $150,000 5.55% 30/11/2048 186,769 0.01%Bank of America Corp.^ $175,000 3.71% 24/4/2028 186,753 0.01%Ameriprise Financial, Inc. $175,000 4.00% 15/10/2023 186,695 0.01%Hess Corp. $175,000 4.30% 1/4/2027 186,393 0.01%Bank of America Corp. $175,000 4.10% 24/7/2023 186,349 0.01%Altria Group, Inc. $200,000 3.88% 16/9/2046 185,740 0.01%Burlington Northern Santa Fe LLC $150,000 4.90% 1/4/2044 185,616 0.01%Union Pacific Corp. $175,000 3.80% 1/10/2051 185,603 0.01%Aircastle Ltd. $175,000 4.40% 25/9/2023 185,437 0.01%Bank of New York Mellon Corp. $175,000 3.40% 15/5/2024 184,308 0.01%UnitedHealth Group, Inc. $155,000 4.45% 15/12/2048 184,306 0.01%Bristol-Myers Squibb Co. $150,000 4.55% 20/2/2048 184,158 0.01%Entergy Arkansas LLC $175,000 3.50% 1/4/2026 183,999 0.01%Honeywell International, Inc. $175,000 3.35% 1/12/2023 183,891 0.01%Kaiser Foundation Hospitals $150,000 4.88% 1/4/2042 183,823 0.01%Marsh & McLennan Cos, Inc. $145,000 4.90% 15/3/2049 183,388 0.01%Truist Bank^ $175,000 3.69% 2/8/2024 183,316 0.01%American Water Capital Corp. $175,000 3.40% 1/3/2025 183,196 0.01%Principal Financial Group, Inc. $175,000 3.40% 15/5/2025 183,150 0.01%Prudential Financial, Inc. $168,000 3.94% 7/12/2049 183,066 0.01%Goldman Sachs Group, Inc. $150,000 4.75% 21/10/2045 182,736 0.01%AT&T, Inc. CA($)225,000 4.00% 25/11/2025 182,577 0.01%Cox Communications, Inc. $175,000 3.50% 15/8/2027 182,562 0.01%Citigroup, Inc. $125,000 6.68% 13/9/2043 182,468 0.01%Huntington Ingalls Industries, Inc. $175,000 3.48% 1/12/2027 182,437 0.01%Campbell Soup Co. $175,000 3.65% 15/3/2023 182,260 0.01%Consolidated Edison Co. of New York, Inc. $150,000 4.65% 1/12/2048 182,249 0.01%Teachers Insurance & Annuity Association of America $124,000 6.85% 16/12/2039 182,235 0.01%McDonald’s Corp. $175,000 3.35% 1/4/2023 182,208 0.01%Duke Realty LP $175,000 3.88% 15/10/2022 182,200 0.01%Becton Dickinson & Co. $157,000 4.69% 15/12/2044 182,149 0.01%MetLife, Inc. $175,000 3.00% 1/3/2025 182,118 0.01%GE Capital UK Funding Unlimited Co. £100,000 6.25% 5/5/2038 182,043 0.01%Noble Energy, Inc. $165,000 5.05% 15/11/2044 181,865 0.01%Travelers Cos, Inc. $150,000 4.60% 1/8/2043 181,544 0.01%Boston Scientific Corp. $150,000 4.70% 1/3/2049 181,532 0.01%AT&T, Inc. $175,000 4.00% 15/1/2022 181,518 0.01%Brooklyn Union Gas Co. $175,000 3.41% 10/3/2026 181,401 0.01%
Vanguard Global Corporate Bond Index Fund
561
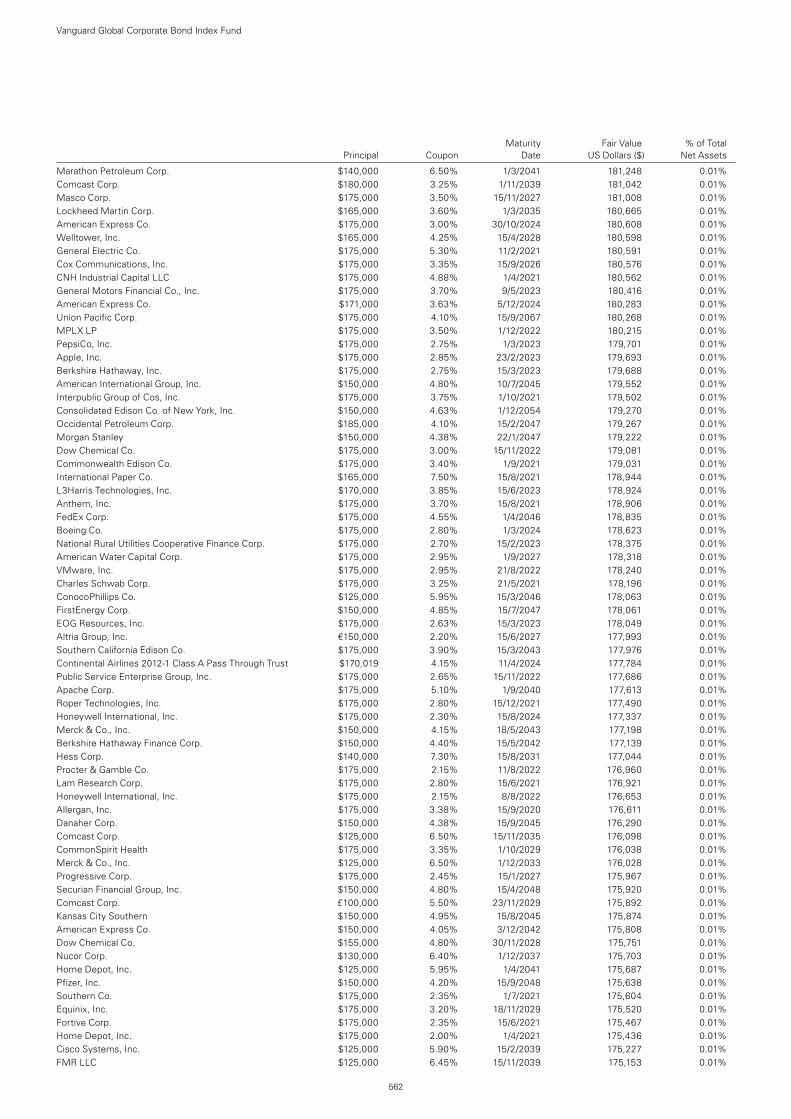
Maturity Fair Value % of Total Principal Coupon Date US Dollars ($) Net Assets
Marathon Petroleum Corp. $140,000 6.50% 1/3/2041 181,248 0.01%Comcast Corp. $180,000 3.25% 1/11/2039 181,042 0.01%Masco Corp. $175,000 3.50% 15/11/2027 181,008 0.01%Lockheed Martin Corp. $165,000 3.60% 1/3/2035 180,665 0.01%American Express Co. $175,000 3.00% 30/10/2024 180,608 0.01%Welltower, Inc. $165,000 4.25% 15/4/2028 180,598 0.01%General Electric Co. $175,000 5.30% 11/2/2021 180,591 0.01%Cox Communications, Inc. $175,000 3.35% 15/9/2026 180,576 0.01%CNH Industrial Capital LLC $175,000 4.88% 1/4/2021 180,562 0.01%General Motors Financial Co., Inc. $175,000 3.70% 9/5/2023 180,416 0.01%American Express Co. $171,000 3.63% 5/12/2024 180,283 0.01%Union Pacific Corp. $175,000 4.10% 15/9/2067 180,268 0.01%MPLX LP $175,000 3.50% 1/12/2022 180,215 0.01%PepsiCo, Inc. $175,000 2.75% 1/3/2023 179,701 0.01%Apple, Inc. $175,000 2.85% 23/2/2023 179,693 0.01%Berkshire Hathaway, Inc. $175,000 2.75% 15/3/2023 179,688 0.01%American International Group, Inc. $150,000 4.80% 10/7/2045 179,552 0.01%Interpublic Group of Cos, Inc. $175,000 3.75% 1/10/2021 179,502 0.01%Consolidated Edison Co. of New York, Inc. $150,000 4.63% 1/12/2054 179,270 0.01%Occidental Petroleum Corp. $185,000 4.10% 15/2/2047 179,267 0.01%Morgan Stanley $150,000 4.38% 22/1/2047 179,222 0.01%Dow Chemical Co. $175,000 3.00% 15/11/2022 179,081 0.01%Commonwealth Edison Co. $175,000 3.40% 1/9/2021 179,031 0.01%International Paper Co. $165,000 7.50% 15/8/2021 178,944 0.01%L3Harris Technologies, Inc. $170,000 3.85% 15/6/2023 178,924 0.01%Anthem, Inc. $175,000 3.70% 15/8/2021 178,906 0.01%FedEx Corp. $175,000 4.55% 1/4/2046 178,835 0.01%Boeing Co. $175,000 2.80% 1/3/2024 178,623 0.01%National Rural Utilities Cooperative Finance Corp. $175,000 2.70% 15/2/2023 178,375 0.01%American Water Capital Corp. $175,000 2.95% 1/9/2027 178,318 0.01%VMware, Inc. $175,000 2.95% 21/8/2022 178,240 0.01%Charles Schwab Corp. $175,000 3.25% 21/5/2021 178,196 0.01%ConocoPhillips Co. $125,000 5.95% 15/3/2046 178,063 0.01%FirstEnergy Corp. $150,000 4.85% 15/7/2047 178,061 0.01%EOG Resources, Inc. $175,000 2.63% 15/3/2023 178,049 0.01%Altria Group, Inc. €150,000 2.20% 15/6/2027 177,993 0.01%Southern California Edison Co. $175,000 3.90% 15/3/2043 177,976 0.01%Continental Airlines 2012-1 Class A Pass Through Trust $170,019 4.15% 11/4/2024 177,784 0.01%Public Service Enterprise Group, Inc. $175,000 2.65% 15/11/2022 177,686 0.01%Apache Corp. $175,000 5.10% 1/9/2040 177,613 0.01%Roper Technologies, Inc. $175,000 2.80% 15/12/2021 177,490 0.01%Honeywell International, Inc. $175,000 2.30% 15/8/2024 177,337 0.01%Merck & Co., Inc. $150,000 4.15% 18/5/2043 177,198 0.01%Berkshire Hathaway Finance Corp. $150,000 4.40% 15/5/2042 177,139 0.01%Hess Corp. $140,000 7.30% 15/8/2031 177,044 0.01%Procter & Gamble Co. $175,000 2.15% 11/8/2022 176,960 0.01%Lam Research Corp. $175,000 2.80% 15/6/2021 176,921 0.01%Honeywell International, Inc. $175,000 2.15% 8/8/2022 176,653 0.01%Allergan, Inc. $175,000 3.38% 15/9/2020 176,611 0.01%Danaher Corp. $150,000 4.38% 15/9/2045 176,290 0.01%Comcast Corp. $125,000 6.50% 15/11/2035 176,098 0.01%CommonSpirit Health $175,000 3.35% 1/10/2029 176,038 0.01%Merck & Co., Inc. $125,000 6.50% 1/12/2033 176,028 0.01%Progressive Corp. $175,000 2.45% 15/1/2027 175,967 0.01%Securian Financial Group, Inc. $150,000 4.80% 15/4/2048 175,920 0.01%Comcast Corp. £100,000 5.50% 23/11/2029 175,892 0.01%Kansas City Southern $150,000 4.95% 15/8/2045 175,874 0.01%American Express Co. $150,000 4.05% 3/12/2042 175,808 0.01%Dow Chemical Co. $155,000 4.80% 30/11/2028 175,751 0.01%Nucor Corp. $130,000 6.40% 1/12/2037 175,703 0.01%Home Depot, Inc. $125,000 5.95% 1/4/2041 175,687 0.01%Pfizer, Inc. $150,000 4.20% 15/9/2048 175,638 0.01%Southern Co. $175,000 2.35% 1/7/2021 175,604 0.01%Equinix, Inc. $175,000 3.20% 18/11/2029 175,520 0.01%Fortive Corp. $175,000 2.35% 15/6/2021 175,467 0.01%Home Depot, Inc. $175,000 2.00% 1/4/2021 175,436 0.01%Cisco Systems, Inc. $125,000 5.90% 15/2/2039 175,227 0.01%FMR LLC $125,000 6.45% 15/11/2039 175,153 0.01%
Vanguard Global Corporate Bond Index Fund
562
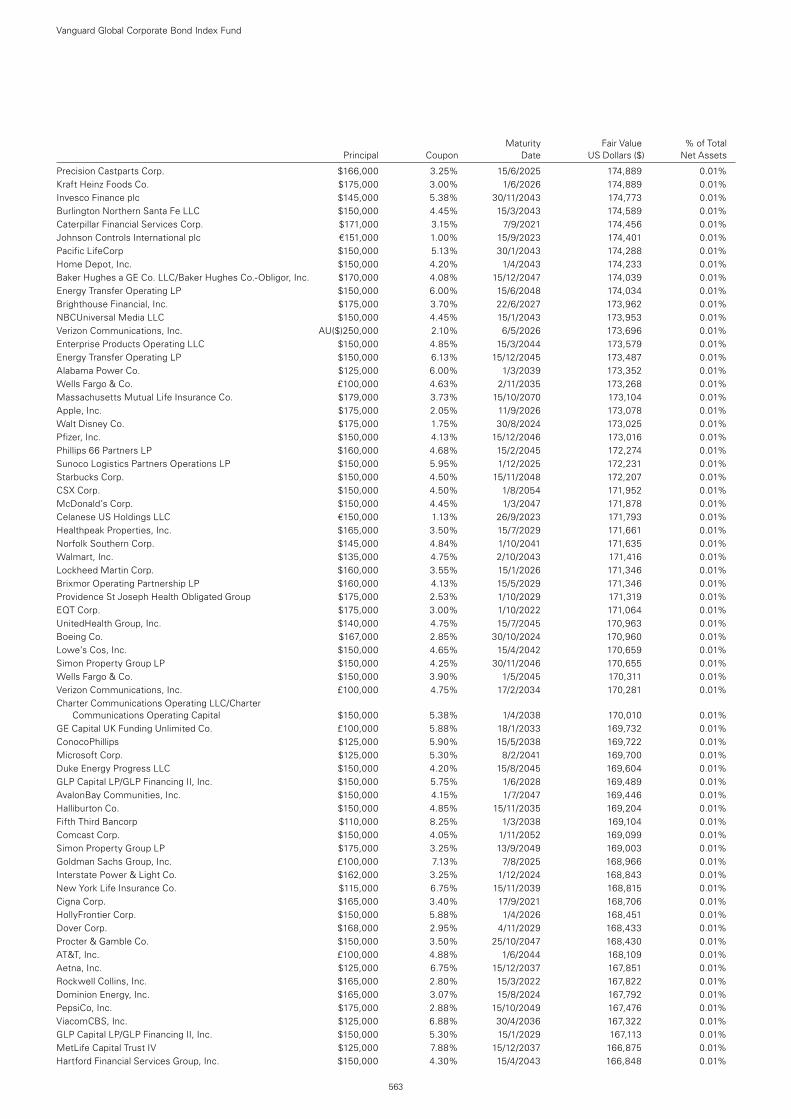
Maturity Fair Value % of Total Principal Coupon Date US Dollars ($) Net Assets
Precision Castparts Corp. $166,000 3.25% 15/6/2025 174,889 0.01%Kraft Heinz Foods Co. $175,000 3.00% 1/6/2026 174,889 0.01%Invesco Finance plc $145,000 5.38% 30/11/2043 174,773 0.01%Burlington Northern Santa Fe LLC $150,000 4.45% 15/3/2043 174,589 0.01%Caterpillar Financial Services Corp. $171,000 3.15% 7/9/2021 174,456 0.01%Johnson Controls International plc €151,000 1.00% 15/9/2023 174,401 0.01%Pacific LifeCorp $150,000 5.13% 30/1/2043 174,288 0.01%Home Depot, Inc. $150,000 4.20% 1/4/2043 174,233 0.01%Baker Hughes a GE Co. LLC/Baker Hughes Co.-Obligor, Inc. $170,000 4.08% 15/12/2047 174,039 0.01%Energy Transfer Operating LP $150,000 6.00% 15/6/2048 174,034 0.01%Brighthouse Financial, Inc. $175,000 3.70% 22/6/2027 173,962 0.01%NBCUniversal Media LLC $150,000 4.45% 15/1/2043 173,953 0.01%Verizon Communications, Inc. AU($)250,000 2.10% 6/5/2026 173,696 0.01%Enterprise Products Operating LLC $150,000 4.85% 15/3/2044 173,579 0.01%Energy Transfer Operating LP $150,000 6.13% 15/12/2045 173,487 0.01%Alabama Power Co. $125,000 6.00% 1/3/2039 173,352 0.01%Wells Fargo & Co. £100,000 4.63% 2/11/2035 173,268 0.01%Massachusetts Mutual Life Insurance Co. $179,000 3.73% 15/10/2070 173,104 0.01%Apple, Inc. $175,000 2.05% 11/9/2026 173,078 0.01%Walt Disney Co. $175,000 1.75% 30/8/2024 173,025 0.01%Pfizer, Inc. $150,000 4.13% 15/12/2046 173,016 0.01%Phillips 66 Partners LP $160,000 4.68% 15/2/2045 172,274 0.01%Sunoco Logistics Partners Operations LP $150,000 5.95% 1/12/2025 172,231 0.01%Starbucks Corp. $150,000 4.50% 15/11/2048 172,207 0.01%CSX Corp. $150,000 4.50% 1/8/2054 171,952 0.01%McDonald’s Corp. $150,000 4.45% 1/3/2047 171,878 0.01%Celanese US Holdings LLC €150,000 1.13% 26/9/2023 171,793 0.01%Healthpeak Properties, Inc. $165,000 3.50% 15/7/2029 171,661 0.01%Norfolk Southern Corp. $145,000 4.84% 1/10/2041 171,635 0.01%Walmart, Inc. $135,000 4.75% 2/10/2043 171,416 0.01%Lockheed Martin Corp. $160,000 3.55% 15/1/2026 171,346 0.01%Brixmor Operating Partnership LP $160,000 4.13% 15/5/2029 171,346 0.01%Providence St Joseph Health Obligated Group $175,000 2.53% 1/10/2029 171,319 0.01%EQT Corp. $175,000 3.00% 1/10/2022 171,064 0.01%UnitedHealth Group, Inc. $140,000 4.75% 15/7/2045 170,963 0.01%Boeing Co. $167,000 2.85% 30/10/2024 170,960 0.01%Lowe’s Cos, Inc. $150,000 4.65% 15/4/2042 170,659 0.01%Simon Property Group LP $150,000 4.25% 30/11/2046 170,655 0.01%Wells Fargo & Co. $150,000 3.90% 1/5/2045 170,311 0.01%Verizon Communications, Inc. £100,000 4.75% 17/2/2034 170,281 0.01%Charter Communications Operating LLC/Charter
Communications Operating Capital $150,000 5.38% 1/4/2038 170,010 0.01%GE Capital UK Funding Unlimited Co. £100,000 5.88% 18/1/2033 169,732 0.01%ConocoPhillips $125,000 5.90% 15/5/2038 169,722 0.01%Microsoft Corp. $125,000 5.30% 8/2/2041 169,700 0.01%Duke Energy Progress LLC $150,000 4.20% 15/8/2045 169,604 0.01%GLP Capital LP/GLP Financing II, Inc. $150,000 5.75% 1/6/2028 169,489 0.01%AvalonBay Communities, Inc. $150,000 4.15% 1/7/2047 169,446 0.01%Halliburton Co. $150,000 4.85% 15/11/2035 169,204 0.01%Fifth Third Bancorp $110,000 8.25% 1/3/2038 169,104 0.01%Comcast Corp. $150,000 4.05% 1/11/2052 169,099 0.01%Simon Property Group LP $175,000 3.25% 13/9/2049 169,003 0.01%Goldman Sachs Group, Inc. £100,000 7.13% 7/8/2025 168,966 0.01%Interstate Power & Light Co. $162,000 3.25% 1/12/2024 168,843 0.01%New York Life Insurance Co. $115,000 6.75% 15/11/2039 168,815 0.01%Cigna Corp. $165,000 3.40% 17/9/2021 168,706 0.01%HollyFrontier Corp. $150,000 5.88% 1/4/2026 168,451 0.01%Dover Corp. $168,000 2.95% 4/11/2029 168,433 0.01%Procter & Gamble Co. $150,000 3.50% 25/10/2047 168,430 0.01%AT&T, Inc. £100,000 4.88% 1/6/2044 168,109 0.01%Aetna, Inc. $125,000 6.75% 15/12/2037 167,851 0.01%Rockwell Collins, Inc. $165,000 2.80% 15/3/2022 167,822 0.01%Dominion Energy, Inc. $165,000 3.07% 15/8/2024 167,792 0.01%PepsiCo, Inc. $175,000 2.88% 15/10/2049 167,476 0.01%ViacomCBS, Inc. $125,000 6.88% 30/4/2036 167,322 0.01%GLP Capital LP/GLP Financing II, Inc. $150,000 5.30% 15/1/2029 167,113 0.01%MetLife Capital Trust IV $125,000 7.88% 15/12/2037 166,875 0.01%Hartford Financial Services Group, Inc. $150,000 4.30% 15/4/2043 166,848 0.01%
Vanguard Global Corporate Bond Index Fund
563
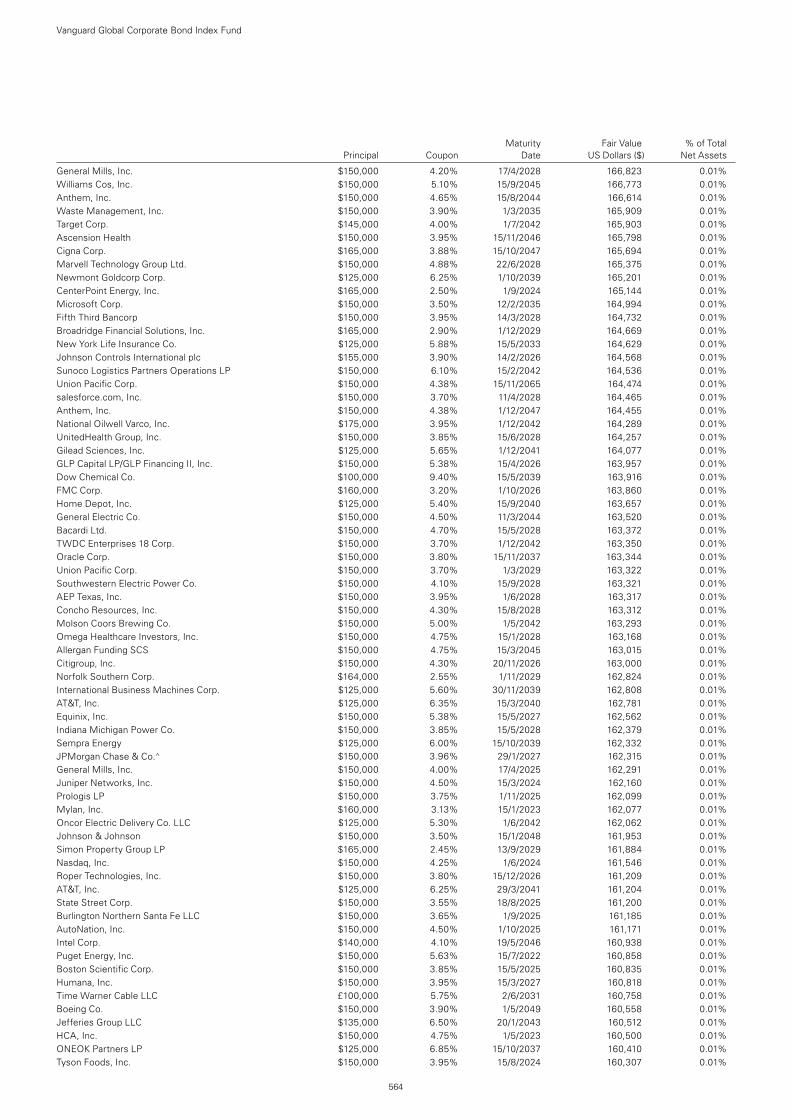
Maturity Fair Value % of Total Principal Coupon Date US Dollars ($) Net Assets
General Mills, Inc. $150,000 4.20% 17/4/2028 166,823 0.01%Williams Cos, Inc. $150,000 5.10% 15/9/2045 166,773 0.01%Anthem, Inc. $150,000 4.65% 15/8/2044 166,614 0.01%Waste Management, Inc. $150,000 3.90% 1/3/2035 165,909 0.01%Target Corp. $145,000 4.00% 1/7/2042 165,903 0.01%Ascension Health $150,000 3.95% 15/11/2046 165,798 0.01%Cigna Corp. $165,000 3.88% 15/10/2047 165,694 0.01%Marvell Technology Group Ltd. $150,000 4.88% 22/6/2028 165,375 0.01%Newmont Goldcorp Corp. $125,000 6.25% 1/10/2039 165,201 0.01%CenterPoint Energy, Inc. $165,000 2.50% 1/9/2024 165,144 0.01%Microsoft Corp. $150,000 3.50% 12/2/2035 164,994 0.01%Fifth Third Bancorp $150,000 3.95% 14/3/2028 164,732 0.01%Broadridge Financial Solutions, Inc. $165,000 2.90% 1/12/2029 164,669 0.01%New York Life Insurance Co. $125,000 5.88% 15/5/2033 164,629 0.01%Johnson Controls International plc $155,000 3.90% 14/2/2026 164,568 0.01%Sunoco Logistics Partners Operations LP $150,000 6.10% 15/2/2042 164,536 0.01%Union Pacific Corp. $150,000 4.38% 15/11/2065 164,474 0.01%salesforce.com, Inc. $150,000 3.70% 11/4/2028 164,465 0.01%Anthem, Inc. $150,000 4.38% 1/12/2047 164,455 0.01%National Oilwell Varco, Inc. $175,000 3.95% 1/12/2042 164,289 0.01%UnitedHealth Group, Inc. $150,000 3.85% 15/6/2028 164,257 0.01%Gilead Sciences, Inc. $125,000 5.65% 1/12/2041 164,077 0.01%GLP Capital LP/GLP Financing II, Inc. $150,000 5.38% 15/4/2026 163,957 0.01%Dow Chemical Co. $100,000 9.40% 15/5/2039 163,916 0.01%FMC Corp. $160,000 3.20% 1/10/2026 163,860 0.01%Home Depot, Inc. $125,000 5.40% 15/9/2040 163,657 0.01%General Electric Co. $150,000 4.50% 11/3/2044 163,520 0.01%Bacardi Ltd. $150,000 4.70% 15/5/2028 163,372 0.01%TWDC Enterprises 18 Corp. $150,000 3.70% 1/12/2042 163,350 0.01%Oracle Corp. $150,000 3.80% 15/11/2037 163,344 0.01%Union Pacific Corp. $150,000 3.70% 1/3/2029 163,322 0.01%Southwestern Electric Power Co. $150,000 4.10% 15/9/2028 163,321 0.01%AEP Texas, Inc. $150,000 3.95% 1/6/2028 163,317 0.01%Concho Resources, Inc. $150,000 4.30% 15/8/2028 163,312 0.01%Molson Coors Brewing Co. $150,000 5.00% 1/5/2042 163,293 0.01%Omega Healthcare Investors, Inc. $150,000 4.75% 15/1/2028 163,168 0.01%Allergan Funding SCS $150,000 4.75% 15/3/2045 163,015 0.01%Citigroup, Inc. $150,000 4.30% 20/11/2026 163,000 0.01%Norfolk Southern Corp. $164,000 2.55% 1/11/2029 162,824 0.01%International Business Machines Corp. $125,000 5.60% 30/11/2039 162,808 0.01%AT&T, Inc. $125,000 6.35% 15/3/2040 162,781 0.01%Equinix, Inc. $150,000 5.38% 15/5/2027 162,562 0.01%Indiana Michigan Power Co. $150,000 3.85% 15/5/2028 162,379 0.01%Sempra Energy $125,000 6.00% 15/10/2039 162,332 0.01%JPMorgan Chase & Co.^ $150,000 3.96% 29/1/2027 162,315 0.01%General Mills, Inc. $150,000 4.00% 17/4/2025 162,291 0.01%Juniper Networks, Inc. $150,000 4.50% 15/3/2024 162,160 0.01%Prologis LP $150,000 3.75% 1/11/2025 162,099 0.01%Mylan, Inc. $160,000 3.13% 15/1/2023 162,077 0.01%Oncor Electric Delivery Co. LLC $125,000 5.30% 1/6/2042 162,062 0.01%Johnson & Johnson $150,000 3.50% 15/1/2048 161,953 0.01%Simon Property Group LP $165,000 2.45% 13/9/2029 161,884 0.01%Nasdaq, Inc. $150,000 4.25% 1/6/2024 161,546 0.01%Roper Technologies, Inc. $150,000 3.80% 15/12/2026 161,209 0.01%AT&T, Inc. $125,000 6.25% 29/3/2041 161,204 0.01%State Street Corp. $150,000 3.55% 18/8/2025 161,200 0.01%Burlington Northern Santa Fe LLC $150,000 3.65% 1/9/2025 161,185 0.01%AutoNation, Inc. $150,000 4.50% 1/10/2025 161,171 0.01%Intel Corp. $140,000 4.10% 19/5/2046 160,938 0.01%Puget Energy, Inc. $150,000 5.63% 15/7/2022 160,858 0.01%Boston Scientific Corp. $150,000 3.85% 15/5/2025 160,835 0.01%Humana, Inc. $150,000 3.95% 15/3/2027 160,818 0.01%Time Warner Cable LLC £100,000 5.75% 2/6/2031 160,758 0.01%Boeing Co. $150,000 3.90% 1/5/2049 160,558 0.01%Jefferies Group LLC $135,000 6.50% 20/1/2043 160,512 0.01%HCA, Inc. $150,000 4.75% 1/5/2023 160,500 0.01%ONEOK Partners LP $125,000 6.85% 15/10/2037 160,410 0.01%Tyson Foods, Inc. $150,000 3.95% 15/8/2024 160,307 0.01%
Vanguard Global Corporate Bond Index Fund
564
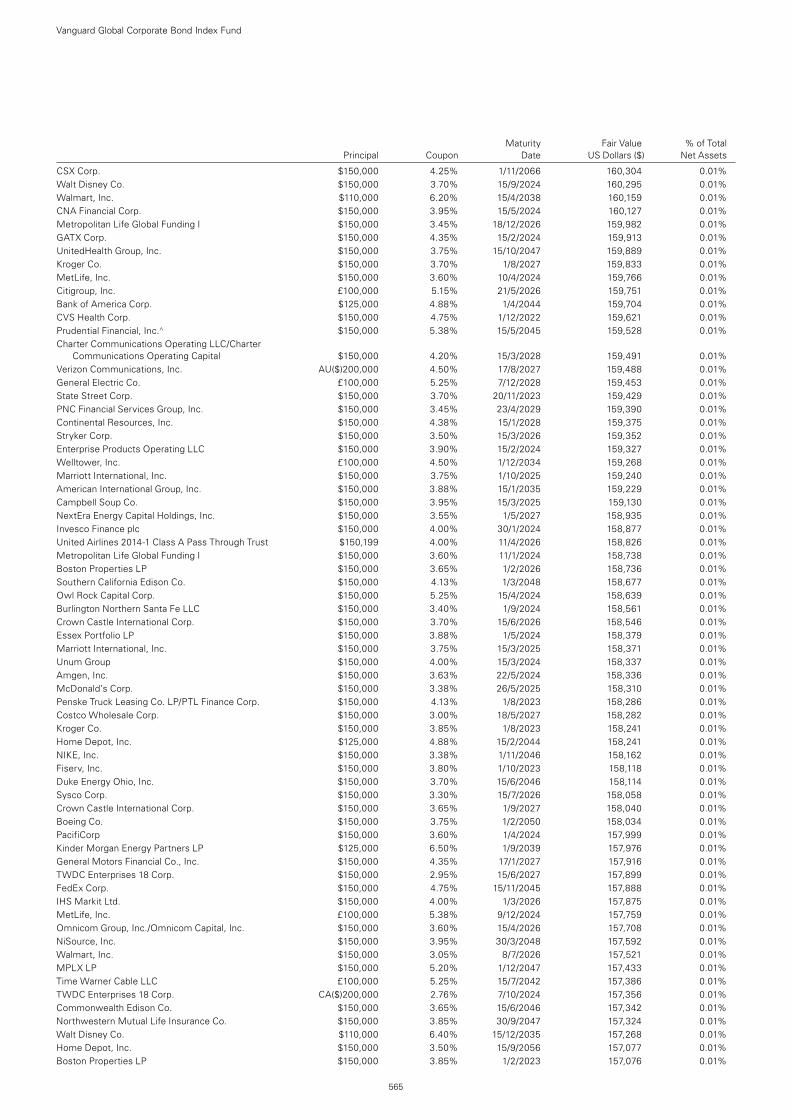
Maturity Fair Value % of Total Principal Coupon Date US Dollars ($) Net Assets
CSX Corp. $150,000 4.25% 1/11/2066 160,304 0.01%Walt Disney Co. $150,000 3.70% 15/9/2024 160,295 0.01%Walmart, Inc. $110,000 6.20% 15/4/2038 160,159 0.01%CNA Financial Corp. $150,000 3.95% 15/5/2024 160,127 0.01%Metropolitan Life Global Funding I $150,000 3.45% 18/12/2026 159,982 0.01%GATX Corp. $150,000 4.35% 15/2/2024 159,913 0.01%UnitedHealth Group, Inc. $150,000 3.75% 15/10/2047 159,889 0.01%Kroger Co. $150,000 3.70% 1/8/2027 159,833 0.01%MetLife, Inc. $150,000 3.60% 10/4/2024 159,766 0.01%Citigroup, Inc. £100,000 5.15% 21/5/2026 159,751 0.01%Bank of America Corp. $125,000 4.88% 1/4/2044 159,704 0.01%CVS Health Corp. $150,000 4.75% 1/12/2022 159,621 0.01%Prudential Financial, Inc.^ $150,000 5.38% 15/5/2045 159,528 0.01%Charter Communications Operating LLC/Charter
Communications Operating Capital $150,000 4.20% 15/3/2028 159,491 0.01%Verizon Communications, Inc. AU($)200,000 4.50% 17/8/2027 159,488 0.01%General Electric Co. £100,000 5.25% 7/12/2028 159,453 0.01%State Street Corp. $150,000 3.70% 20/11/2023 159,429 0.01%PNC Financial Services Group, Inc. $150,000 3.45% 23/4/2029 159,390 0.01%Continental Resources, Inc. $150,000 4.38% 15/1/2028 159,375 0.01%Stryker Corp. $150,000 3.50% 15/3/2026 159,352 0.01%Enterprise Products Operating LLC $150,000 3.90% 15/2/2024 159,327 0.01%Welltower, Inc. £100,000 4.50% 1/12/2034 159,268 0.01%Marriott International, Inc. $150,000 3.75% 1/10/2025 159,240 0.01%American International Group, Inc. $150,000 3.88% 15/1/2035 159,229 0.01%Campbell Soup Co. $150,000 3.95% 15/3/2025 159,130 0.01%NextEra Energy Capital Holdings, Inc. $150,000 3.55% 1/5/2027 158,935 0.01%Invesco Finance plc $150,000 4.00% 30/1/2024 158,877 0.01%United Airlines 2014-1 Class A Pass Through Trust $150,199 4.00% 11/4/2026 158,826 0.01%Metropolitan Life Global Funding I $150,000 3.60% 11/1/2024 158,738 0.01%Boston Properties LP $150,000 3.65% 1/2/2026 158,736 0.01%Southern California Edison Co. $150,000 4.13% 1/3/2048 158,677 0.01%Owl Rock Capital Corp. $150,000 5.25% 15/4/2024 158,639 0.01%Burlington Northern Santa Fe LLC $150,000 3.40% 1/9/2024 158,561 0.01%Crown Castle International Corp. $150,000 3.70% 15/6/2026 158,546 0.01%Essex Portfolio LP $150,000 3.88% 1/5/2024 158,379 0.01%Marriott International, Inc. $150,000 3.75% 15/3/2025 158,371 0.01%Unum Group $150,000 4.00% 15/3/2024 158,337 0.01%Amgen, Inc. $150,000 3.63% 22/5/2024 158,336 0.01%McDonald’s Corp. $150,000 3.38% 26/5/2025 158,310 0.01%Penske Truck Leasing Co. LP/PTL Finance Corp. $150,000 4.13% 1/8/2023 158,286 0.01%Costco Wholesale Corp. $150,000 3.00% 18/5/2027 158,282 0.01%Kroger Co. $150,000 3.85% 1/8/2023 158,241 0.01%Home Depot, Inc. $125,000 4.88% 15/2/2044 158,241 0.01%NIKE, Inc. $150,000 3.38% 1/11/2046 158,162 0.01%Fiserv, Inc. $150,000 3.80% 1/10/2023 158,118 0.01%Duke Energy Ohio, Inc. $150,000 3.70% 15/6/2046 158,114 0.01%Sysco Corp. $150,000 3.30% 15/7/2026 158,058 0.01%Crown Castle International Corp. $150,000 3.65% 1/9/2027 158,040 0.01%Boeing Co. $150,000 3.75% 1/2/2050 158,034 0.01%PacifiCorp $150,000 3.60% 1/4/2024 157,999 0.01%Kinder Morgan Energy Partners LP $125,000 6.50% 1/9/2039 157,976 0.01%General Motors Financial Co., Inc. $150,000 4.35% 17/1/2027 157,916 0.01%TWDC Enterprises 18 Corp. $150,000 2.95% 15/6/2027 157,899 0.01%FedEx Corp. $150,000 4.75% 15/11/2045 157,888 0.01%IHS Markit Ltd. $150,000 4.00% 1/3/2026 157,875 0.01%MetLife, Inc. £100,000 5.38% 9/12/2024 157,759 0.01%Omnicom Group, Inc./Omnicom Capital, Inc. $150,000 3.60% 15/4/2026 157,708 0.01%NiSource, Inc. $150,000 3.95% 30/3/2048 157,592 0.01%Walmart, Inc. $150,000 3.05% 8/7/2026 157,521 0.01%MPLX LP $150,000 5.20% 1/12/2047 157,433 0.01%Time Warner Cable LLC £100,000 5.25% 15/7/2042 157,386 0.01%TWDC Enterprises 18 Corp. CA($)200,000 2.76% 7/10/2024 157,356 0.01%Commonwealth Edison Co. $150,000 3.65% 15/6/2046 157,342 0.01%Northwestern Mutual Life Insurance Co. $150,000 3.85% 30/9/2047 157,324 0.01%Walt Disney Co. $110,000 6.40% 15/12/2035 157,268 0.01%Home Depot, Inc. $150,000 3.50% 15/9/2056 157,077 0.01%Boston Properties LP $150,000 3.85% 1/2/2023 157,076 0.01%
Vanguard Global Corporate Bond Index Fund
565
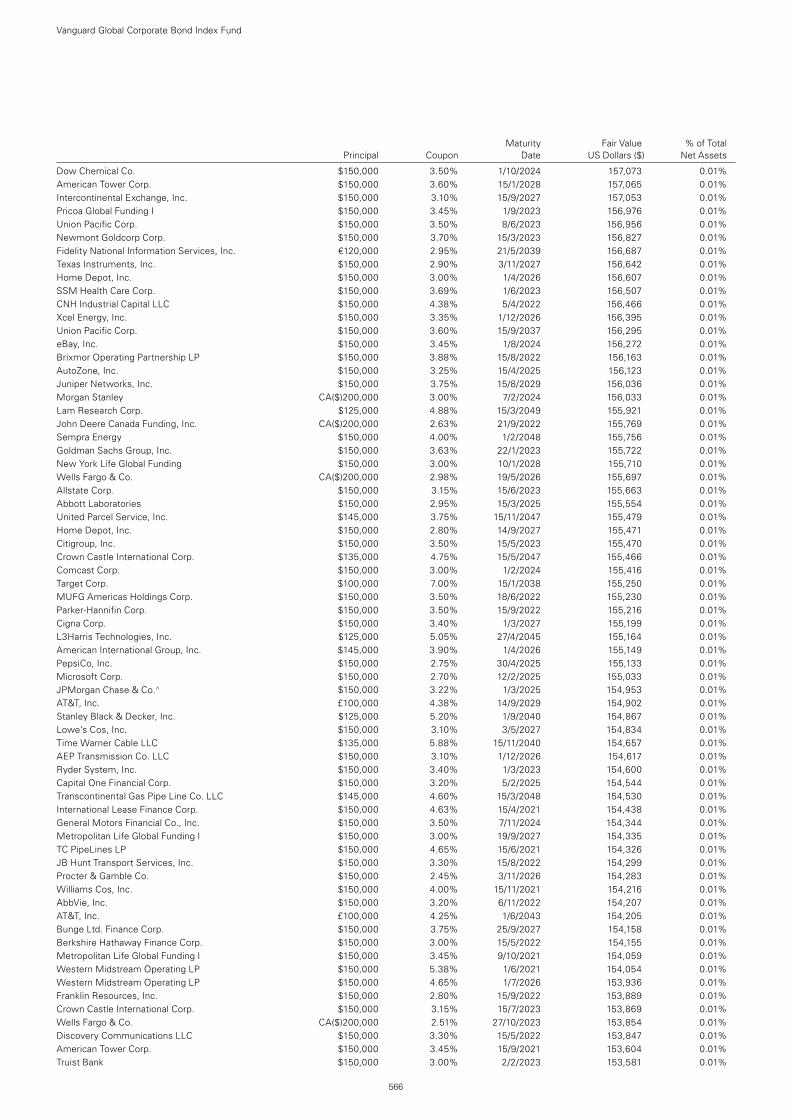
Maturity Fair Value % of Total Principal Coupon Date US Dollars ($) Net Assets
Dow Chemical Co. $150,000 3.50% 1/10/2024 157,073 0.01%American Tower Corp. $150,000 3.60% 15/1/2028 157,065 0.01%Intercontinental Exchange, Inc. $150,000 3.10% 15/9/2027 157,053 0.01%Pricoa Global Funding I $150,000 3.45% 1/9/2023 156,976 0.01%Union Pacific Corp. $150,000 3.50% 8/6/2023 156,956 0.01%Newmont Goldcorp Corp. $150,000 3.70% 15/3/2023 156,827 0.01%Fidelity National Information Services, Inc. €120,000 2.95% 21/5/2039 156,687 0.01%Texas Instruments, Inc. $150,000 2.90% 3/11/2027 156,642 0.01%Home Depot, Inc. $150,000 3.00% 1/4/2026 156,607 0.01%SSM Health Care Corp. $150,000 3.69% 1/6/2023 156,507 0.01%CNH Industrial Capital LLC $150,000 4.38% 5/4/2022 156,466 0.01%Xcel Energy, Inc. $150,000 3.35% 1/12/2026 156,395 0.01%Union Pacific Corp. $150,000 3.60% 15/9/2037 156,295 0.01%eBay, Inc. $150,000 3.45% 1/8/2024 156,272 0.01%Brixmor Operating Partnership LP $150,000 3.88% 15/8/2022 156,163 0.01%AutoZone, Inc. $150,000 3.25% 15/4/2025 156,123 0.01%Juniper Networks, Inc. $150,000 3.75% 15/8/2029 156,036 0.01%Morgan Stanley CA($)200,000 3.00% 7/2/2024 156,033 0.01%Lam Research Corp. $125,000 4.88% 15/3/2049 155,921 0.01%John Deere Canada Funding, Inc. CA($)200,000 2.63% 21/9/2022 155,769 0.01%Sempra Energy $150,000 4.00% 1/2/2048 155,756 0.01%Goldman Sachs Group, Inc. $150,000 3.63% 22/1/2023 155,722 0.01%New York Life Global Funding $150,000 3.00% 10/1/2028 155,710 0.01%Wells Fargo & Co. CA($)200,000 2.98% 19/5/2026 155,697 0.01%Allstate Corp. $150,000 3.15% 15/6/2023 155,663 0.01%Abbott Laboratories $150,000 2.95% 15/3/2025 155,554 0.01%United Parcel Service, Inc. $145,000 3.75% 15/11/2047 155,479 0.01%Home Depot, Inc. $150,000 2.80% 14/9/2027 155,471 0.01%Citigroup, Inc. $150,000 3.50% 15/5/2023 155,470 0.01%Crown Castle International Corp. $135,000 4.75% 15/5/2047 155,466 0.01%Comcast Corp. $150,000 3.00% 1/2/2024 155,416 0.01%Target Corp. $100,000 7.00% 15/1/2038 155,250 0.01%MUFG Americas Holdings Corp. $150,000 3.50% 18/6/2022 155,230 0.01%Parker-Hannifin Corp. $150,000 3.50% 15/9/2022 155,216 0.01%Cigna Corp. $150,000 3.40% 1/3/2027 155,199 0.01%L3Harris Technologies, Inc. $125,000 5.05% 27/4/2045 155,164 0.01%American International Group, Inc. $145,000 3.90% 1/4/2026 155,149 0.01%PepsiCo, Inc. $150,000 2.75% 30/4/2025 155,133 0.01%Microsoft Corp. $150,000 2.70% 12/2/2025 155,033 0.01%JPMorgan Chase & Co.^ $150,000 3.22% 1/3/2025 154,953 0.01%AT&T, Inc. £100,000 4.38% 14/9/2029 154,902 0.01%Stanley Black & Decker, Inc. $125,000 5.20% 1/9/2040 154,867 0.01%Lowe’s Cos, Inc. $150,000 3.10% 3/5/2027 154,834 0.01%Time Warner Cable LLC $135,000 5.88% 15/11/2040 154,657 0.01%AEP Transmission Co. LLC $150,000 3.10% 1/12/2026 154,617 0.01%Ryder System, Inc. $150,000 3.40% 1/3/2023 154,600 0.01%Capital One Financial Corp. $150,000 3.20% 5/2/2025 154,544 0.01%Transcontinental Gas Pipe Line Co. LLC $145,000 4.60% 15/3/2048 154,530 0.01%International Lease Finance Corp. $150,000 4.63% 15/4/2021 154,438 0.01%General Motors Financial Co., Inc. $150,000 3.50% 7/11/2024 154,344 0.01%Metropolitan Life Global Funding I $150,000 3.00% 19/9/2027 154,335 0.01%TC PipeLines LP $150,000 4.65% 15/6/2021 154,326 0.01%JB Hunt Transport Services, Inc. $150,000 3.30% 15/8/2022 154,299 0.01%Procter & Gamble Co. $150,000 2.45% 3/11/2026 154,283 0.01%Williams Cos, Inc. $150,000 4.00% 15/11/2021 154,216 0.01%AbbVie, Inc. $150,000 3.20% 6/11/2022 154,207 0.01%AT&T, Inc. £100,000 4.25% 1/6/2043 154,205 0.01%Bunge Ltd. Finance Corp. $150,000 3.75% 25/9/2027 154,158 0.01%Berkshire Hathaway Finance Corp. $150,000 3.00% 15/5/2022 154,155 0.01%Metropolitan Life Global Funding I $150,000 3.45% 9/10/2021 154,059 0.01%Western Midstream Operating LP $150,000 5.38% 1/6/2021 154,054 0.01%Western Midstream Operating LP $150,000 4.65% 1/7/2026 153,936 0.01%Franklin Resources, Inc. $150,000 2.80% 15/9/2022 153,889 0.01%Crown Castle International Corp. $150,000 3.15% 15/7/2023 153,869 0.01%Wells Fargo & Co. CA($)200,000 2.51% 27/10/2023 153,854 0.01%Discovery Communications LLC $150,000 3.30% 15/5/2022 153,847 0.01%American Tower Corp. $150,000 3.45% 15/9/2021 153,604 0.01%Truist Bank $150,000 3.00% 2/2/2023 153,581 0.01%
Vanguard Global Corporate Bond Index Fund
566
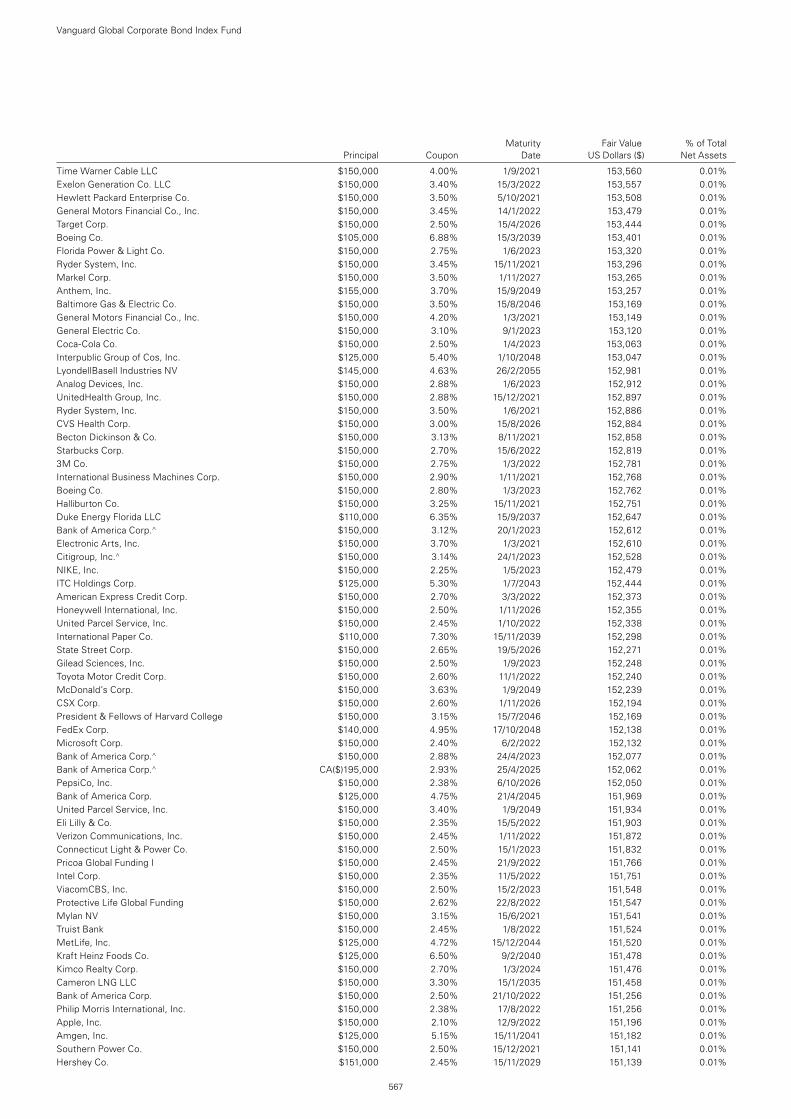
Maturity Fair Value % of Total Principal Coupon Date US Dollars ($) Net Assets
Time Warner Cable LLC $150,000 4.00% 1/9/2021 153,560 0.01%Exelon Generation Co. LLC $150,000 3.40% 15/3/2022 153,557 0.01%Hewlett Packard Enterprise Co. $150,000 3.50% 5/10/2021 153,508 0.01%General Motors Financial Co., Inc. $150,000 3.45% 14/1/2022 153,479 0.01%Target Corp. $150,000 2.50% 15/4/2026 153,444 0.01%Boeing Co. $105,000 6.88% 15/3/2039 153,401 0.01%Florida Power & Light Co. $150,000 2.75% 1/6/2023 153,320 0.01%Ryder System, Inc. $150,000 3.45% 15/11/2021 153,296 0.01%Markel Corp. $150,000 3.50% 1/11/2027 153,265 0.01%Anthem, Inc. $155,000 3.70% 15/9/2049 153,257 0.01%Baltimore Gas & Electric Co. $150,000 3.50% 15/8/2046 153,169 0.01%General Motors Financial Co., Inc. $150,000 4.20% 1/3/2021 153,149 0.01%General Electric Co. $150,000 3.10% 9/1/2023 153,120 0.01%Coca-Cola Co. $150,000 2.50% 1/4/2023 153,063 0.01%Interpublic Group of Cos, Inc. $125,000 5.40% 1/10/2048 153,047 0.01%LyondellBasell Industries NV $145,000 4.63% 26/2/2055 152,981 0.01%Analog Devices, Inc. $150,000 2.88% 1/6/2023 152,912 0.01%UnitedHealth Group, Inc. $150,000 2.88% 15/12/2021 152,897 0.01%Ryder System, Inc. $150,000 3.50% 1/6/2021 152,886 0.01%CVS Health Corp. $150,000 3.00% 15/8/2026 152,884 0.01%Becton Dickinson & Co. $150,000 3.13% 8/11/2021 152,858 0.01%Starbucks Corp. $150,000 2.70% 15/6/2022 152,819 0.01%3M Co. $150,000 2.75% 1/3/2022 152,781 0.01%International Business Machines Corp. $150,000 2.90% 1/11/2021 152,768 0.01%Boeing Co. $150,000 2.80% 1/3/2023 152,762 0.01%Halliburton Co. $150,000 3.25% 15/11/2021 152,751 0.01%Duke Energy Florida LLC $110,000 6.35% 15/9/2037 152,647 0.01%Bank of America Corp.^ $150,000 3.12% 20/1/2023 152,612 0.01%Electronic Arts, Inc. $150,000 3.70% 1/3/2021 152,610 0.01%Citigroup, Inc.^ $150,000 3.14% 24/1/2023 152,528 0.01%NIKE, Inc. $150,000 2.25% 1/5/2023 152,479 0.01%ITC Holdings Corp. $125,000 5.30% 1/7/2043 152,444 0.01%American Express Credit Corp. $150,000 2.70% 3/3/2022 152,373 0.01%Honeywell International, Inc. $150,000 2.50% 1/11/2026 152,355 0.01%United Parcel Service, Inc. $150,000 2.45% 1/10/2022 152,338 0.01%International Paper Co. $110,000 7.30% 15/11/2039 152,298 0.01%State Street Corp. $150,000 2.65% 19/5/2026 152,271 0.01%Gilead Sciences, Inc. $150,000 2.50% 1/9/2023 152,248 0.01%Toyota Motor Credit Corp. $150,000 2.60% 11/1/2022 152,240 0.01%McDonald’s Corp. $150,000 3.63% 1/9/2049 152,239 0.01%CSX Corp. $150,000 2.60% 1/11/2026 152,194 0.01%President & Fellows of Harvard College $150,000 3.15% 15/7/2046 152,169 0.01%FedEx Corp. $140,000 4.95% 17/10/2048 152,138 0.01%Microsoft Corp. $150,000 2.40% 6/2/2022 152,132 0.01%Bank of America Corp.^ $150,000 2.88% 24/4/2023 152,077 0.01%Bank of America Corp.^ CA($)195,000 2.93% 25/4/2025 152,062 0.01%PepsiCo, Inc. $150,000 2.38% 6/10/2026 152,050 0.01%Bank of America Corp. $125,000 4.75% 21/4/2045 151,969 0.01%United Parcel Service, Inc. $150,000 3.40% 1/9/2049 151,934 0.01%Eli Lilly & Co. $150,000 2.35% 15/5/2022 151,903 0.01%Verizon Communications, Inc. $150,000 2.45% 1/11/2022 151,872 0.01%Connecticut Light & Power Co. $150,000 2.50% 15/1/2023 151,832 0.01%Pricoa Global Funding I $150,000 2.45% 21/9/2022 151,766 0.01%Intel Corp. $150,000 2.35% 11/5/2022 151,751 0.01%ViacomCBS, Inc. $150,000 2.50% 15/2/2023 151,548 0.01%Protective Life Global Funding $150,000 2.62% 22/8/2022 151,547 0.01%Mylan NV $150,000 3.15% 15/6/2021 151,541 0.01%Truist Bank $150,000 2.45% 1/8/2022 151,524 0.01%MetLife, Inc. $125,000 4.72% 15/12/2044 151,520 0.01%Kraft Heinz Foods Co. $125,000 6.50% 9/2/2040 151,478 0.01%Kimco Realty Corp. $150,000 2.70% 1/3/2024 151,476 0.01%Cameron LNG LLC $150,000 3.30% 15/1/2035 151,458 0.01%Bank of America Corp. $150,000 2.50% 21/10/2022 151,256 0.01%Philip Morris International, Inc. $150,000 2.38% 17/8/2022 151,256 0.01%Apple, Inc. $150,000 2.10% 12/9/2022 151,196 0.01%Amgen, Inc. $125,000 5.15% 15/11/2041 151,182 0.01%Southern Power Co. $150,000 2.50% 15/12/2021 151,141 0.01%Hershey Co. $151,000 2.45% 15/11/2029 151,139 0.01%
Vanguard Global Corporate Bond Index Fund
567

Maturity Fair Value % of Total Principal Coupon Date US Dollars ($) Net Assets
International Flavors & Fragrances, Inc. $135,000 5.00% 26/9/2048 151,135 0.01%Duke Energy Corp. $150,000 2.40% 15/8/2022 151,105 0.01%CSX Corp. $125,000 4.75% 15/11/2048 151,091 0.01%Simon Property Group LP $150,000 2.50% 15/7/2021 151,083 0.01%Citigroup, Inc. $150,000 2.70% 30/3/2021 151,083 0.01%Verizon Communications, Inc. $125,000 4.75% 1/11/2041 151,064 0.01%Lowe’s Cos, Inc. $150,000 2.50% 15/4/2026 151,036 0.01%Corning, Inc. $150,000 4.38% 15/11/2057 151,023 0.01%Exelon Generation Co. LLC $125,000 6.25% 1/10/2039 150,968 0.01%Exxon Mobil Corp. $150,000 1.90% 16/8/2022 150,945 0.01%John Deere Capital Corp. $150,000 2.15% 8/9/2022 150,945 0.01%Intercontinental Exchange, Inc. $150,000 2.75% 1/12/2020 150,941 0.01%JPMorgan Chase & Co. $150,000 2.40% 7/6/2021 150,935 0.01%Consumers Energy Co. $125,000 4.35% 15/4/2049 150,918 0.01%Board of Trustees of The Leland Stanford Junior University $135,000 3.65% 1/5/2048 150,876 0.01%Exxon Mobil Corp. $150,000 2.44% 16/8/2029 150,729 0.01%Metropolitan Life Global Funding I $150,000 2.50% 3/12/2020 150,611 0.01%Marriott International, Inc. $150,000 2.30% 15/1/2022 150,599 0.01%Equinix, Inc. $150,000 2.63% 18/11/2024 150,577 0.01%Metropolitan Life Global Funding I $150,000 2.40% 8/1/2021 150,562 0.01%Laboratory Corp. of America Holdings $150,000 2.95% 1/12/2029 150,236 0.01%Truist Financial Corp. $150,000 2.05% 10/5/2021 150,107 0.01%Molson Coors Brewing Co. $150,000 2.10% 15/7/2021 149,967 0.01%Hewlett Packard Enterprise Co. $150,000 2.25% 1/4/2023 149,926 0.01%Protective Life Global Funding $150,000 2.00% 14/9/2021 149,809 0.01%Sabra Health Care LP/Sabra Capital Corp. $150,000 3.90% 15/10/2029 149,801 0.01%Enterprise Products Operating LLC^ $150,000 5.25% 16/8/2077 149,766 0.01%Wells Fargo & Co. £100,000 3.50% 12/9/2029 149,762 0.01%Athene Holding Ltd. $145,000 4.13% 12/1/2028 149,761 0.01%Truist Bank $150,000 2.15% 6/12/2024 149,710 0.01%Apple, Inc. $150,000 1.55% 4/8/2021 149,669 0.01%McDonald’s Corp. $150,000 2.63% 1/9/2029 149,634 0.01%Home Depot, Inc. $150,000 2.13% 15/9/2026 149,577 0.01%Puget Sound Energy, Inc. $150,000 3.25% 15/9/2049 149,570 0.01%American International Group, Inc. $125,000 4.75% 1/4/2048 149,530 0.01%DH Europe Finance II Sarl $150,000 2.20% 15/11/2024 149,524 0.01%Willis North America, Inc. $150,000 3.88% 15/9/2049 149,521 0.01%Walt Disney Co. $150,000 1.65% 1/9/2022 149,503 0.01%International Paper Co. $130,000 5.15% 15/5/2046 149,464 0.01%Florida Power & Light Co. $150,000 3.15% 1/10/2049 149,450 0.01%Simon Property Group LP $125,000 4.75% 15/3/2042 149,427 0.01%Delta Air Lines, Inc. $150,000 3.75% 28/10/2029 149,349 0.01%Pfizer, Inc. $125,000 4.40% 15/5/2044 149,210 0.01%Global Atlantic Finance Co. $150,000 4.40% 15/10/2029 148,909 0.01%Valero Energy Corp. $140,000 3.65% 15/3/2025 148,890 0.01%Aflac, Inc. $125,000 4.75% 15/1/2049 148,853 0.01%Home Depot, Inc. $125,000 4.40% 15/3/2045 148,798 0.01%Comcast Corp. $130,000 4.20% 15/8/2034 148,285 0.01%Zoetis, Inc. $125,000 4.70% 1/2/2043 148,270 0.01%Thermo Fisher Scientific, Inc. $150,000 2.60% 1/10/2029 148,204 0.01%Fidelity National Information Services, Inc. €125,000 1.50% 21/5/2027 148,197 0.01%Raymond James Financial, Inc. $125,000 4.95% 15/7/2046 148,155 0.01%Energy Transfer Partners LP/Regency Energy Finance Corp. $140,000 4.50% 1/11/2023 148,050 0.01%Vulcan Materials Co. $140,000 3.90% 1/4/2027 148,030 0.01%Amphenol Corp. $150,000 2.80% 15/2/2030 147,693 0.01%American International Group, Inc. £100,000 5.00% 26/4/2023 147,673 0.01%Intercontinental Exchange, Inc. $125,000 4.25% 21/9/2048 147,649 0.01%MetLife, Inc. $100,000 9.25% 8/4/2038 147,500 0.01%Bacardi Ltd. $150,000 2.75% 15/7/2026 147,369 0.01%Dominion Energy South Carolina, Inc. $125,000 4.60% 15/6/2043 147,354 0.01%Tyco Electronics Group SA $100,000 7.13% 1/10/2037 146,943 0.01%United Technologies Corp. $125,000 4.45% 16/11/2038 146,755 0.01%Connecticut Light & Power Co. $125,000 4.30% 15/4/2044 146,735 0.01%Dominion Energy Gas Holdings LLC $139,000 3.60% 15/12/2024 145,849 0.01%Verizon Communications, Inc. £100,000 3.13% 2/11/2035 145,792 0.01%Mosaic Co. $140,000 4.88% 15/11/2041 145,443 0.01%Berkshire Hathaway Finance Corp. £100,000 2.63% 19/6/2059 145,290 0.01%American Tower Corp. $140,000 3.38% 15/5/2024 145,112 0.01%
Vanguard Global Corporate Bond Index Fund
568
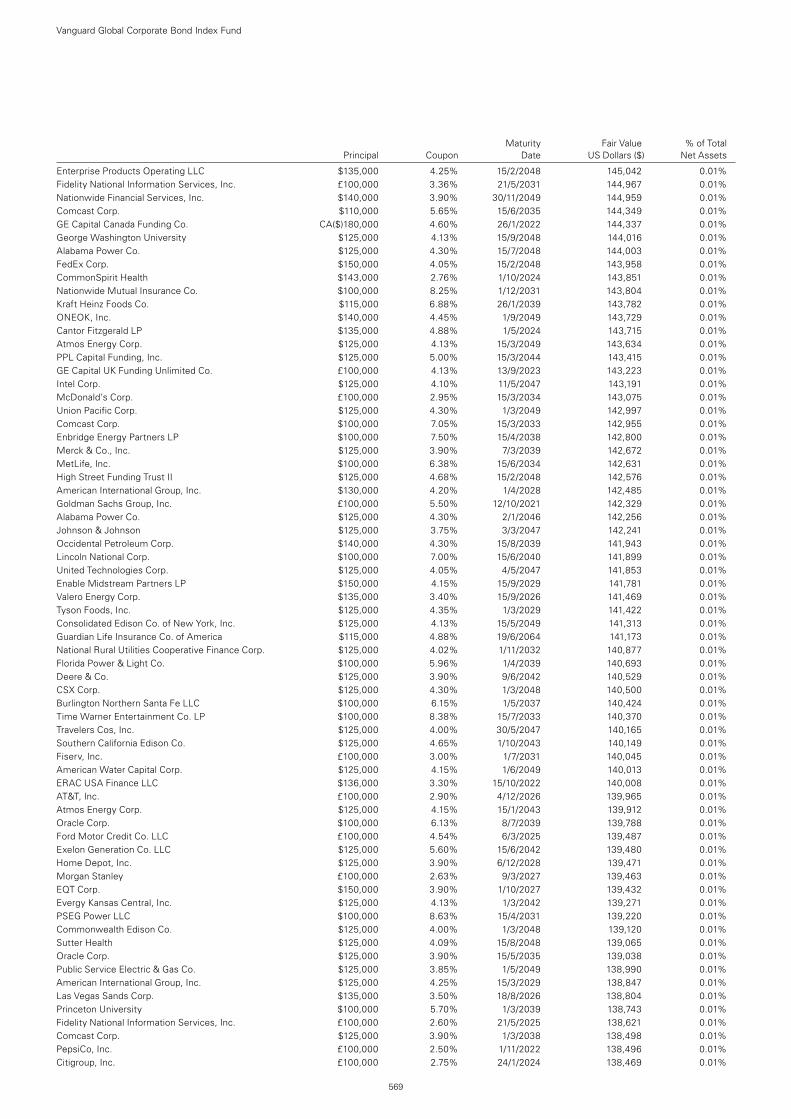
Maturity Fair Value % of Total Principal Coupon Date US Dollars ($) Net Assets
Enterprise Products Operating LLC $135,000 4.25% 15/2/2048 145,042 0.01%Fidelity National Information Services, Inc. £100,000 3.36% 21/5/2031 144,967 0.01%Nationwide Financial Services, Inc. $140,000 3.90% 30/11/2049 144,959 0.01%Comcast Corp. $110,000 5.65% 15/6/2035 144,349 0.01%GE Capital Canada Funding Co. CA($)180,000 4.60% 26/1/2022 144,337 0.01%George Washington University $125,000 4.13% 15/9/2048 144,016 0.01%Alabama Power Co. $125,000 4.30% 15/7/2048 144,003 0.01%FedEx Corp. $150,000 4.05% 15/2/2048 143,958 0.01%CommonSpirit Health $143,000 2.76% 1/10/2024 143,851 0.01%Nationwide Mutual Insurance Co. $100,000 8.25% 1/12/2031 143,804 0.01%Kraft Heinz Foods Co. $115,000 6.88% 26/1/2039 143,782 0.01%ONEOK, Inc. $140,000 4.45% 1/9/2049 143,729 0.01%Cantor Fitzgerald LP $135,000 4.88% 1/5/2024 143,715 0.01%Atmos Energy Corp. $125,000 4.13% 15/3/2049 143,634 0.01%PPL Capital Funding, Inc. $125,000 5.00% 15/3/2044 143,415 0.01%GE Capital UK Funding Unlimited Co. £100,000 4.13% 13/9/2023 143,223 0.01%Intel Corp. $125,000 4.10% 11/5/2047 143,191 0.01%McDonald’s Corp. £100,000 2.95% 15/3/2034 143,075 0.01%Union Pacific Corp. $125,000 4.30% 1/3/2049 142,997 0.01%Comcast Corp. $100,000 7.05% 15/3/2033 142,955 0.01%Enbridge Energy Partners LP $100,000 7.50% 15/4/2038 142,800 0.01%Merck & Co., Inc. $125,000 3.90% 7/3/2039 142,672 0.01%MetLife, Inc. $100,000 6.38% 15/6/2034 142,631 0.01%High Street Funding Trust II $125,000 4.68% 15/2/2048 142,576 0.01%American International Group, Inc. $130,000 4.20% 1/4/2028 142,485 0.01%Goldman Sachs Group, Inc. £100,000 5.50% 12/10/2021 142,329 0.01%Alabama Power Co. $125,000 4.30% 2/1/2046 142,256 0.01%Johnson & Johnson $125,000 3.75% 3/3/2047 142,241 0.01%Occidental Petroleum Corp. $140,000 4.30% 15/8/2039 141,943 0.01%Lincoln National Corp. $100,000 7.00% 15/6/2040 141,899 0.01%United Technologies Corp. $125,000 4.05% 4/5/2047 141,853 0.01%Enable Midstream Partners LP $150,000 4.15% 15/9/2029 141,781 0.01%Valero Energy Corp. $135,000 3.40% 15/9/2026 141,469 0.01%Tyson Foods, Inc. $125,000 4.35% 1/3/2029 141,422 0.01%Consolidated Edison Co. of New York, Inc. $125,000 4.13% 15/5/2049 141,313 0.01%Guardian Life Insurance Co. of America $115,000 4.88% 19/6/2064 141,173 0.01%National Rural Utilities Cooperative Finance Corp. $125,000 4.02% 1/11/2032 140,877 0.01%Florida Power & Light Co. $100,000 5.96% 1/4/2039 140,693 0.01%Deere & Co. $125,000 3.90% 9/6/2042 140,529 0.01%CSX Corp. $125,000 4.30% 1/3/2048 140,500 0.01%Burlington Northern Santa Fe LLC $100,000 6.15% 1/5/2037 140,424 0.01%Time Warner Entertainment Co. LP $100,000 8.38% 15/7/2033 140,370 0.01%Travelers Cos, Inc. $125,000 4.00% 30/5/2047 140,165 0.01%Southern California Edison Co. $125,000 4.65% 1/10/2043 140,149 0.01%Fiserv, Inc. £100,000 3.00% 1/7/2031 140,045 0.01%American Water Capital Corp. $125,000 4.15% 1/6/2049 140,013 0.01%ERAC USA Finance LLC $136,000 3.30% 15/10/2022 140,008 0.01%AT&T, Inc. £100,000 2.90% 4/12/2026 139,965 0.01%Atmos Energy Corp. $125,000 4.15% 15/1/2043 139,912 0.01%Oracle Corp. $100,000 6.13% 8/7/2039 139,788 0.01%Ford Motor Credit Co. LLC £100,000 4.54% 6/3/2025 139,487 0.01%Exelon Generation Co. LLC $125,000 5.60% 15/6/2042 139,480 0.01%Home Depot, Inc. $125,000 3.90% 6/12/2028 139,471 0.01%Morgan Stanley £100,000 2.63% 9/3/2027 139,463 0.01%EQT Corp. $150,000 3.90% 1/10/2027 139,432 0.01%Evergy Kansas Central, Inc. $125,000 4.13% 1/3/2042 139,271 0.01%PSEG Power LLC $100,000 8.63% 15/4/2031 139,220 0.01%Commonwealth Edison Co. $125,000 4.00% 1/3/2048 139,120 0.01%Sutter Health $125,000 4.09% 15/8/2048 139,065 0.01%Oracle Corp. $125,000 3.90% 15/5/2035 139,038 0.01%Public Service Electric & Gas Co. $125,000 3.85% 1/5/2049 138,990 0.01%American International Group, Inc. $125,000 4.25% 15/3/2029 138,847 0.01%Las Vegas Sands Corp. $135,000 3.50% 18/8/2026 138,804 0.01%Princeton University $100,000 5.70% 1/3/2039 138,743 0.01%Fidelity National Information Services, Inc. £100,000 2.60% 21/5/2025 138,621 0.01%Comcast Corp. $125,000 3.90% 1/3/2038 138,498 0.01%PepsiCo, Inc. £100,000 2.50% 1/11/2022 138,496 0.01%Citigroup, Inc. £100,000 2.75% 24/1/2024 138,469 0.01%
Vanguard Global Corporate Bond Index Fund
569
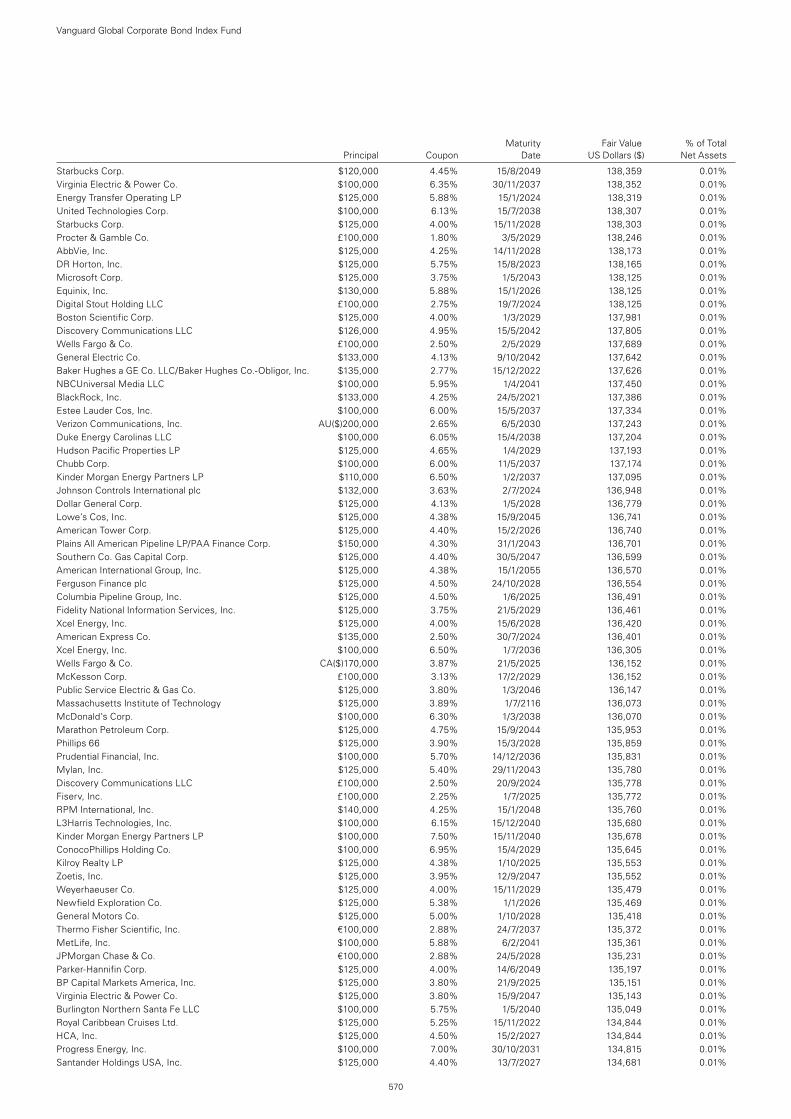
Maturity Fair Value % of Total Principal Coupon Date US Dollars ($) Net Assets
Starbucks Corp. $120,000 4.45% 15/8/2049 138,359 0.01%Virginia Electric & Power Co. $100,000 6.35% 30/11/2037 138,352 0.01%Energy Transfer Operating LP $125,000 5.88% 15/1/2024 138,319 0.01%United Technologies Corp. $100,000 6.13% 15/7/2038 138,307 0.01%Starbucks Corp. $125,000 4.00% 15/11/2028 138,303 0.01%Procter & Gamble Co. £100,000 1.80% 3/5/2029 138,246 0.01%AbbVie, Inc. $125,000 4.25% 14/11/2028 138,173 0.01%DR Horton, Inc. $125,000 5.75% 15/8/2023 138,165 0.01%Microsoft Corp. $125,000 3.75% 1/5/2043 138,125 0.01%Equinix, Inc. $130,000 5.88% 15/1/2026 138,125 0.01%Digital Stout Holding LLC £100,000 2.75% 19/7/2024 138,125 0.01%Boston Scientific Corp. $125,000 4.00% 1/3/2029 137,981 0.01%Discovery Communications LLC $126,000 4.95% 15/5/2042 137,805 0.01%Wells Fargo & Co. £100,000 2.50% 2/5/2029 137,689 0.01%General Electric Co. $133,000 4.13% 9/10/2042 137,642 0.01%Baker Hughes a GE Co. LLC/Baker Hughes Co.-Obligor, Inc. $135,000 2.77% 15/12/2022 137,626 0.01%NBCUniversal Media LLC $100,000 5.95% 1/4/2041 137,450 0.01%BlackRock, Inc. $133,000 4.25% 24/5/2021 137,386 0.01%Estee Lauder Cos, Inc. $100,000 6.00% 15/5/2037 137,334 0.01%Verizon Communications, Inc. AU($)200,000 2.65% 6/5/2030 137,243 0.01%Duke Energy Carolinas LLC $100,000 6.05% 15/4/2038 137,204 0.01%Hudson Pacific Properties LP $125,000 4.65% 1/4/2029 137,193 0.01%Chubb Corp. $100,000 6.00% 11/5/2037 137,174 0.01%Kinder Morgan Energy Partners LP $110,000 6.50% 1/2/2037 137,095 0.01%Johnson Controls International plc $132,000 3.63% 2/7/2024 136,948 0.01%Dollar General Corp. $125,000 4.13% 1/5/2028 136,779 0.01%Lowe’s Cos, Inc. $125,000 4.38% 15/9/2045 136,741 0.01%American Tower Corp. $125,000 4.40% 15/2/2026 136,740 0.01%Plains All American Pipeline LP/PAA Finance Corp. $150,000 4.30% 31/1/2043 136,701 0.01%Southern Co. Gas Capital Corp. $125,000 4.40% 30/5/2047 136,599 0.01%American International Group, Inc. $125,000 4.38% 15/1/2055 136,570 0.01%Ferguson Finance plc $125,000 4.50% 24/10/2028 136,554 0.01%Columbia Pipeline Group, Inc. $125,000 4.50% 1/6/2025 136,491 0.01%Fidelity National Information Services, Inc. $125,000 3.75% 21/5/2029 136,461 0.01%Xcel Energy, Inc. $125,000 4.00% 15/6/2028 136,420 0.01%American Express Co. $135,000 2.50% 30/7/2024 136,401 0.01%Xcel Energy, Inc. $100,000 6.50% 1/7/2036 136,305 0.01%Wells Fargo & Co. CA($)170,000 3.87% 21/5/2025 136,152 0.01%McKesson Corp. £100,000 3.13% 17/2/2029 136,152 0.01%Public Service Electric & Gas Co. $125,000 3.80% 1/3/2046 136,147 0.01%Massachusetts Institute of Technology $125,000 3.89% 1/7/2116 136,073 0.01%McDonald’s Corp. $100,000 6.30% 1/3/2038 136,070 0.01%Marathon Petroleum Corp. $125,000 4.75% 15/9/2044 135,953 0.01%Phillips 66 $125,000 3.90% 15/3/2028 135,859 0.01%Prudential Financial, Inc. $100,000 5.70% 14/12/2036 135,831 0.01%Mylan, Inc. $125,000 5.40% 29/11/2043 135,780 0.01%Discovery Communications LLC £100,000 2.50% 20/9/2024 135,778 0.01%Fiserv, Inc. £100,000 2.25% 1/7/2025 135,772 0.01%RPM International, Inc. $140,000 4.25% 15/1/2048 135,760 0.01%L3Harris Technologies, Inc. $100,000 6.15% 15/12/2040 135,680 0.01%Kinder Morgan Energy Partners LP $100,000 7.50% 15/11/2040 135,678 0.01%ConocoPhillips Holding Co. $100,000 6.95% 15/4/2029 135,645 0.01%Kilroy Realty LP $125,000 4.38% 1/10/2025 135,553 0.01%Zoetis, Inc. $125,000 3.95% 12/9/2047 135,552 0.01%Weyerhaeuser Co. $125,000 4.00% 15/11/2029 135,479 0.01%Newfield Exploration Co. $125,000 5.38% 1/1/2026 135,469 0.01%General Motors Co. $125,000 5.00% 1/10/2028 135,418 0.01%Thermo Fisher Scientific, Inc. €100,000 2.88% 24/7/2037 135,372 0.01%MetLife, Inc. $100,000 5.88% 6/2/2041 135,361 0.01%JPMorgan Chase & Co. €100,000 2.88% 24/5/2028 135,231 0.01%Parker-Hannifin Corp. $125,000 4.00% 14/6/2049 135,197 0.01%BP Capital Markets America, Inc. $125,000 3.80% 21/9/2025 135,151 0.01%Virginia Electric & Power Co. $125,000 3.80% 15/9/2047 135,143 0.01%Burlington Northern Santa Fe LLC $100,000 5.75% 1/5/2040 135,049 0.01%Royal Caribbean Cruises Ltd. $125,000 5.25% 15/11/2022 134,844 0.01%HCA, Inc. $125,000 4.50% 15/2/2027 134,844 0.01%Progress Energy, Inc. $100,000 7.00% 30/10/2031 134,815 0.01%Santander Holdings USA, Inc. $125,000 4.40% 13/7/2027 134,681 0.01%
Vanguard Global Corporate Bond Index Fund
570
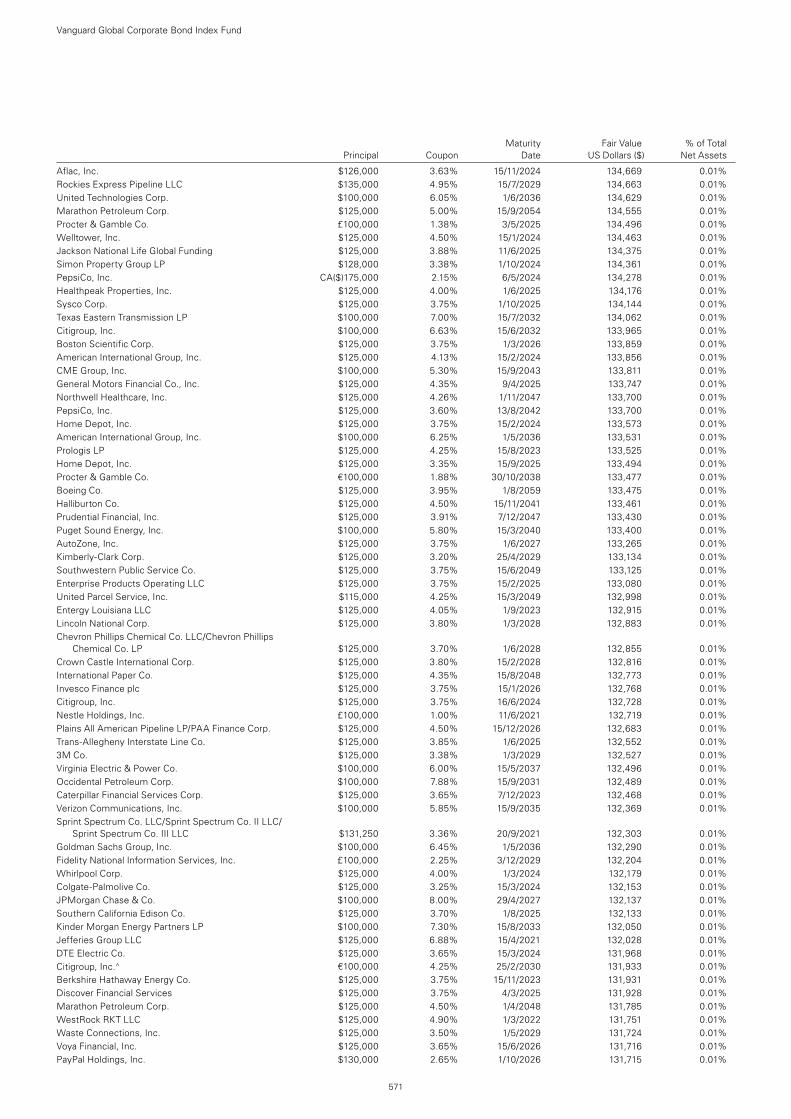
Maturity Fair Value % of Total Principal Coupon Date US Dollars ($) Net Assets
Aflac, Inc. $126,000 3.63% 15/11/2024 134,669 0.01%Rockies Express Pipeline LLC $135,000 4.95% 15/7/2029 134,663 0.01%United Technologies Corp. $100,000 6.05% 1/6/2036 134,629 0.01%Marathon Petroleum Corp. $125,000 5.00% 15/9/2054 134,555 0.01%Procter & Gamble Co. £100,000 1.38% 3/5/2025 134,496 0.01%Welltower, Inc. $125,000 4.50% 15/1/2024 134,463 0.01%Jackson National Life Global Funding $125,000 3.88% 11/6/2025 134,375 0.01%Simon Property Group LP $128,000 3.38% 1/10/2024 134,361 0.01%PepsiCo, Inc. CA($)175,000 2.15% 6/5/2024 134,278 0.01%Healthpeak Properties, Inc. $125,000 4.00% 1/6/2025 134,176 0.01%Sysco Corp. $125,000 3.75% 1/10/2025 134,144 0.01%Texas Eastern Transmission LP $100,000 7.00% 15/7/2032 134,062 0.01%Citigroup, Inc. $100,000 6.63% 15/6/2032 133,965 0.01%Boston Scientific Corp. $125,000 3.75% 1/3/2026 133,859 0.01%American International Group, Inc. $125,000 4.13% 15/2/2024 133,856 0.01%CME Group, Inc. $100,000 5.30% 15/9/2043 133,811 0.01%General Motors Financial Co., Inc. $125,000 4.35% 9/4/2025 133,747 0.01%Northwell Healthcare, Inc. $125,000 4.26% 1/11/2047 133,700 0.01%PepsiCo, Inc. $125,000 3.60% 13/8/2042 133,700 0.01%Home Depot, Inc. $125,000 3.75% 15/2/2024 133,573 0.01%American International Group, Inc. $100,000 6.25% 1/5/2036 133,531 0.01%Prologis LP $125,000 4.25% 15/8/2023 133,525 0.01%Home Depot, Inc. $125,000 3.35% 15/9/2025 133,494 0.01%Procter & Gamble Co. €100,000 1.88% 30/10/2038 133,477 0.01%Boeing Co. $125,000 3.95% 1/8/2059 133,475 0.01%Halliburton Co. $125,000 4.50% 15/11/2041 133,461 0.01%Prudential Financial, Inc. $125,000 3.91% 7/12/2047 133,430 0.01%Puget Sound Energy, Inc. $100,000 5.80% 15/3/2040 133,400 0.01%AutoZone, Inc. $125,000 3.75% 1/6/2027 133,265 0.01%Kimberly-Clark Corp. $125,000 3.20% 25/4/2029 133,134 0.01%Southwestern Public Service Co. $125,000 3.75% 15/6/2049 133,125 0.01%Enterprise Products Operating LLC $125,000 3.75% 15/2/2025 133,080 0.01%United Parcel Service, Inc. $115,000 4.25% 15/3/2049 132,998 0.01%Entergy Louisiana LLC $125,000 4.05% 1/9/2023 132,915 0.01%Lincoln National Corp. $125,000 3.80% 1/3/2028 132,883 0.01%Chevron Phillips Chemical Co. LLC/Chevron Phillips
Chemical Co. LP $125,000 3.70% 1/6/2028 132,855 0.01%Crown Castle International Corp. $125,000 3.80% 15/2/2028 132,816 0.01%International Paper Co. $125,000 4.35% 15/8/2048 132,773 0.01%Invesco Finance plc $125,000 3.75% 15/1/2026 132,768 0.01%Citigroup, Inc. $125,000 3.75% 16/6/2024 132,728 0.01%Nestle Holdings, Inc. £100,000 1.00% 11/6/2021 132,719 0.01%Plains All American Pipeline LP/PAA Finance Corp. $125,000 4.50% 15/12/2026 132,683 0.01%Trans-Allegheny Interstate Line Co. $125,000 3.85% 1/6/2025 132,552 0.01%3M Co. $125,000 3.38% 1/3/2029 132,527 0.01%Virginia Electric & Power Co. $100,000 6.00% 15/5/2037 132,496 0.01%Occidental Petroleum Corp. $100,000 7.88% 15/9/2031 132,489 0.01%Caterpillar Financial Services Corp. $125,000 3.65% 7/12/2023 132,468 0.01%Verizon Communications, Inc. $100,000 5.85% 15/9/2035 132,369 0.01%Sprint Spectrum Co. LLC/Sprint Spectrum Co. II LLC/
Sprint Spectrum Co. III LLC $131,250 3.36% 20/9/2021 132,303 0.01%Goldman Sachs Group, Inc. $100,000 6.45% 1/5/2036 132,290 0.01%Fidelity National Information Services, Inc. £100,000 2.25% 3/12/2029 132,204 0.01%Whirlpool Corp. $125,000 4.00% 1/3/2024 132,179 0.01%Colgate-Palmolive Co. $125,000 3.25% 15/3/2024 132,153 0.01%JPMorgan Chase & Co. $100,000 8.00% 29/4/2027 132,137 0.01%Southern California Edison Co. $125,000 3.70% 1/8/2025 132,133 0.01%Kinder Morgan Energy Partners LP $100,000 7.30% 15/8/2033 132,050 0.01%Jefferies Group LLC $125,000 6.88% 15/4/2021 132,028 0.01%DTE Electric Co. $125,000 3.65% 15/3/2024 131,968 0.01%Citigroup, Inc.^ €100,000 4.25% 25/2/2030 131,933 0.01%Berkshire Hathaway Energy Co. $125,000 3.75% 15/11/2023 131,931 0.01%Discover Financial Services $125,000 3.75% 4/3/2025 131,928 0.01%Marathon Petroleum Corp. $125,000 4.50% 1/4/2048 131,785 0.01%WestRock RKT LLC $125,000 4.90% 1/3/2022 131,751 0.01%Waste Connections, Inc. $125,000 3.50% 1/5/2029 131,724 0.01%Voya Financial, Inc. $125,000 3.65% 15/6/2026 131,716 0.01%PayPal Holdings, Inc. $130,000 2.65% 1/10/2026 131,715 0.01%
Vanguard Global Corporate Bond Index Fund
571
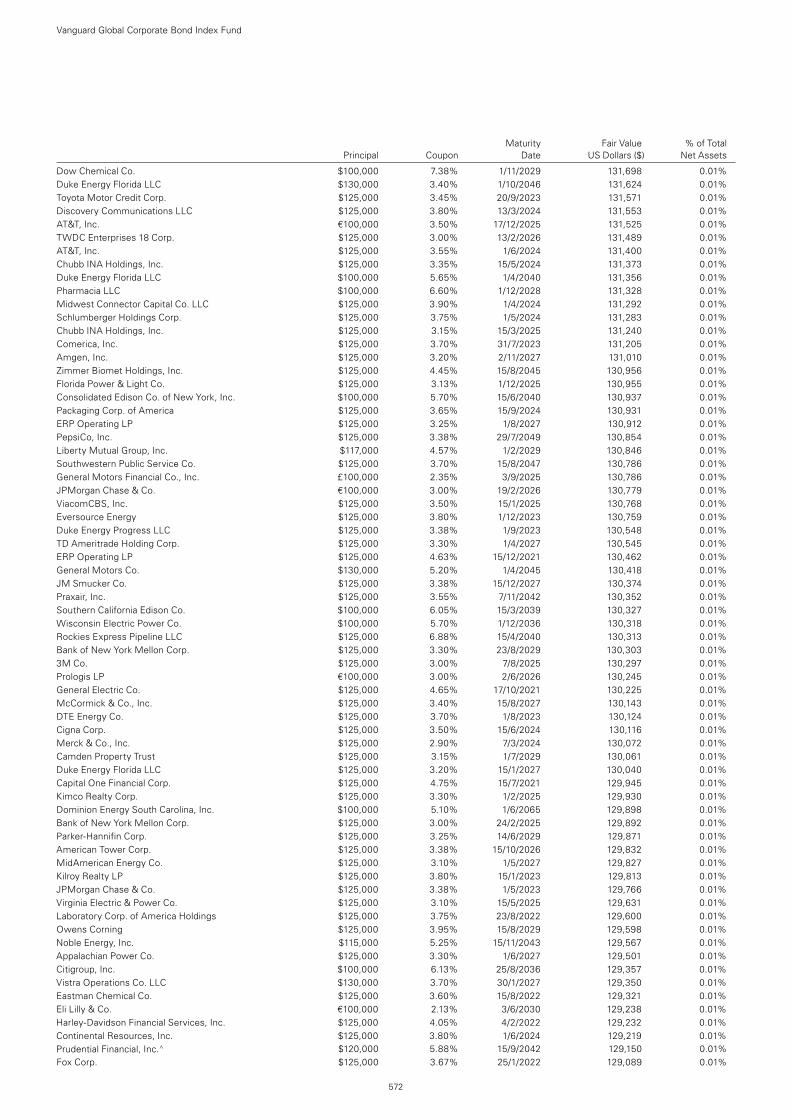
Maturity Fair Value % of Total Principal Coupon Date US Dollars ($) Net Assets
Dow Chemical Co. $100,000 7.38% 1/11/2029 131,698 0.01%Duke Energy Florida LLC $130,000 3.40% 1/10/2046 131,624 0.01%Toyota Motor Credit Corp. $125,000 3.45% 20/9/2023 131,571 0.01%Discovery Communications LLC $125,000 3.80% 13/3/2024 131,553 0.01%AT&T, Inc. €100,000 3.50% 17/12/2025 131,525 0.01%TWDC Enterprises 18 Corp. $125,000 3.00% 13/2/2026 131,489 0.01%AT&T, Inc. $125,000 3.55% 1/6/2024 131,400 0.01%Chubb INA Holdings, Inc. $125,000 3.35% 15/5/2024 131,373 0.01%Duke Energy Florida LLC $100,000 5.65% 1/4/2040 131,356 0.01%Pharmacia LLC $100,000 6.60% 1/12/2028 131,328 0.01%Midwest Connector Capital Co. LLC $125,000 3.90% 1/4/2024 131,292 0.01%Schlumberger Holdings Corp. $125,000 3.75% 1/5/2024 131,283 0.01%Chubb INA Holdings, Inc. $125,000 3.15% 15/3/2025 131,240 0.01%Comerica, Inc. $125,000 3.70% 31/7/2023 131,205 0.01%Amgen, Inc. $125,000 3.20% 2/11/2027 131,010 0.01%Zimmer Biomet Holdings, Inc. $125,000 4.45% 15/8/2045 130,956 0.01%Florida Power & Light Co. $125,000 3.13% 1/12/2025 130,955 0.01%Consolidated Edison Co. of New York, Inc. $100,000 5.70% 15/6/2040 130,937 0.01%Packaging Corp. of America $125,000 3.65% 15/9/2024 130,931 0.01%ERP Operating LP $125,000 3.25% 1/8/2027 130,912 0.01%PepsiCo, Inc. $125,000 3.38% 29/7/2049 130,854 0.01%Liberty Mutual Group, Inc. $117,000 4.57% 1/2/2029 130,846 0.01%Southwestern Public Service Co. $125,000 3.70% 15/8/2047 130,786 0.01%General Motors Financial Co., Inc. £100,000 2.35% 3/9/2025 130,786 0.01%JPMorgan Chase & Co. €100,000 3.00% 19/2/2026 130,779 0.01%ViacomCBS, Inc. $125,000 3.50% 15/1/2025 130,768 0.01%Eversource Energy $125,000 3.80% 1/12/2023 130,759 0.01%Duke Energy Progress LLC $125,000 3.38% 1/9/2023 130,548 0.01%TD Ameritrade Holding Corp. $125,000 3.30% 1/4/2027 130,545 0.01%ERP Operating LP $125,000 4.63% 15/12/2021 130,462 0.01%General Motors Co. $130,000 5.20% 1/4/2045 130,418 0.01%JM Smucker Co. $125,000 3.38% 15/12/2027 130,374 0.01%Praxair, Inc. $125,000 3.55% 7/11/2042 130,352 0.01%Southern California Edison Co. $100,000 6.05% 15/3/2039 130,327 0.01%Wisconsin Electric Power Co. $100,000 5.70% 1/12/2036 130,318 0.01%Rockies Express Pipeline LLC $125,000 6.88% 15/4/2040 130,313 0.01%Bank of New York Mellon Corp. $125,000 3.30% 23/8/2029 130,303 0.01%3M Co. $125,000 3.00% 7/8/2025 130,297 0.01%Prologis LP €100,000 3.00% 2/6/2026 130,245 0.01%General Electric Co. $125,000 4.65% 17/10/2021 130,225 0.01%McCormick & Co., Inc. $125,000 3.40% 15/8/2027 130,143 0.01%DTE Energy Co. $125,000 3.70% 1/8/2023 130,124 0.01%Cigna Corp. $125,000 3.50% 15/6/2024 130,116 0.01%Merck & Co., Inc. $125,000 2.90% 7/3/2024 130,072 0.01%Camden Property Trust $125,000 3.15% 1/7/2029 130,061 0.01%Duke Energy Florida LLC $125,000 3.20% 15/1/2027 130,040 0.01%Capital One Financial Corp. $125,000 4.75% 15/7/2021 129,945 0.01%Kimco Realty Corp. $125,000 3.30% 1/2/2025 129,930 0.01%Dominion Energy South Carolina, Inc. $100,000 5.10% 1/6/2065 129,898 0.01%Bank of New York Mellon Corp. $125,000 3.00% 24/2/2025 129,892 0.01%Parker-Hannifin Corp. $125,000 3.25% 14/6/2029 129,871 0.01%American Tower Corp. $125,000 3.38% 15/10/2026 129,832 0.01%MidAmerican Energy Co. $125,000 3.10% 1/5/2027 129,827 0.01%Kilroy Realty LP $125,000 3.80% 15/1/2023 129,813 0.01%JPMorgan Chase & Co. $125,000 3.38% 1/5/2023 129,766 0.01%Virginia Electric & Power Co. $125,000 3.10% 15/5/2025 129,631 0.01%Laboratory Corp. of America Holdings $125,000 3.75% 23/8/2022 129,600 0.01%Owens Corning $125,000 3.95% 15/8/2029 129,598 0.01%Noble Energy, Inc. $115,000 5.25% 15/11/2043 129,567 0.01%Appalachian Power Co. $125,000 3.30% 1/6/2027 129,501 0.01%Citigroup, Inc. $100,000 6.13% 25/8/2036 129,357 0.01%Vistra Operations Co. LLC $130,000 3.70% 30/1/2027 129,350 0.01%Eastman Chemical Co. $125,000 3.60% 15/8/2022 129,321 0.01%Eli Lilly & Co. €100,000 2.13% 3/6/2030 129,238 0.01%Harley-Davidson Financial Services, Inc. $125,000 4.05% 4/2/2022 129,232 0.01%Continental Resources, Inc. $125,000 3.80% 1/6/2024 129,219 0.01%Prudential Financial, Inc.^ $120,000 5.88% 15/9/2042 129,150 0.01%Fox Corp. $125,000 3.67% 25/1/2022 129,089 0.01%
Vanguard Global Corporate Bond Index Fund
572
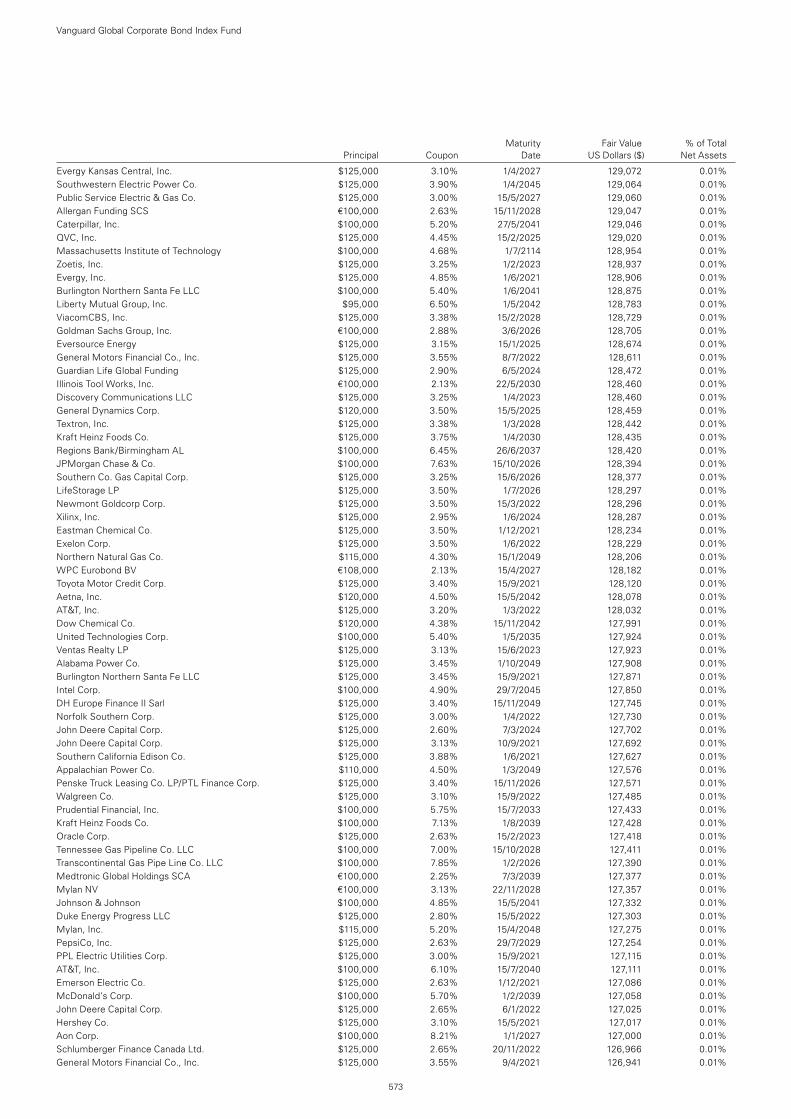
Maturity Fair Value % of Total Principal Coupon Date US Dollars ($) Net Assets
Evergy Kansas Central, Inc. $125,000 3.10% 1/4/2027 129,072 0.01%Southwestern Electric Power Co. $125,000 3.90% 1/4/2045 129,064 0.01%Public Service Electric & Gas Co. $125,000 3.00% 15/5/2027 129,060 0.01%Allergan Funding SCS €100,000 2.63% 15/11/2028 129,047 0.01%Caterpillar, Inc. $100,000 5.20% 27/5/2041 129,046 0.01%QVC, Inc. $125,000 4.45% 15/2/2025 129,020 0.01%Massachusetts Institute of Technology $100,000 4.68% 1/7/2114 128,954 0.01%Zoetis, Inc. $125,000 3.25% 1/2/2023 128,937 0.01%Evergy, Inc. $125,000 4.85% 1/6/2021 128,906 0.01%Burlington Northern Santa Fe LLC $100,000 5.40% 1/6/2041 128,875 0.01%Liberty Mutual Group, Inc. $95,000 6.50% 1/5/2042 128,783 0.01%ViacomCBS, Inc. $125,000 3.38% 15/2/2028 128,729 0.01%Goldman Sachs Group, Inc. €100,000 2.88% 3/6/2026 128,705 0.01%Eversource Energy $125,000 3.15% 15/1/2025 128,674 0.01%General Motors Financial Co., Inc. $125,000 3.55% 8/7/2022 128,611 0.01%Guardian Life Global Funding $125,000 2.90% 6/5/2024 128,472 0.01%Illinois Tool Works, Inc. €100,000 2.13% 22/5/2030 128,460 0.01%Discovery Communications LLC $125,000 3.25% 1/4/2023 128,460 0.01%General Dynamics Corp. $120,000 3.50% 15/5/2025 128,459 0.01%Textron, Inc. $125,000 3.38% 1/3/2028 128,442 0.01%Kraft Heinz Foods Co. $125,000 3.75% 1/4/2030 128,435 0.01%Regions Bank/Birmingham AL $100,000 6.45% 26/6/2037 128,420 0.01%JPMorgan Chase & Co. $100,000 7.63% 15/10/2026 128,394 0.01%Southern Co. Gas Capital Corp. $125,000 3.25% 15/6/2026 128,377 0.01%LifeStorage LP $125,000 3.50% 1/7/2026 128,297 0.01%Newmont Goldcorp Corp. $125,000 3.50% 15/3/2022 128,296 0.01%Xilinx, Inc. $125,000 2.95% 1/6/2024 128,287 0.01%Eastman Chemical Co. $125,000 3.50% 1/12/2021 128,234 0.01%Exelon Corp. $125,000 3.50% 1/6/2022 128,229 0.01%Northern Natural Gas Co. $115,000 4.30% 15/1/2049 128,206 0.01%WPC Eurobond BV €108,000 2.13% 15/4/2027 128,182 0.01%Toyota Motor Credit Corp. $125,000 3.40% 15/9/2021 128,120 0.01%Aetna, Inc. $120,000 4.50% 15/5/2042 128,078 0.01%AT&T, Inc. $125,000 3.20% 1/3/2022 128,032 0.01%Dow Chemical Co. $120,000 4.38% 15/11/2042 127,991 0.01%United Technologies Corp. $100,000 5.40% 1/5/2035 127,924 0.01%Ventas Realty LP $125,000 3.13% 15/6/2023 127,923 0.01%Alabama Power Co. $125,000 3.45% 1/10/2049 127,908 0.01%Burlington Northern Santa Fe LLC $125,000 3.45% 15/9/2021 127,871 0.01%Intel Corp. $100,000 4.90% 29/7/2045 127,850 0.01%DH Europe Finance II Sarl $125,000 3.40% 15/11/2049 127,745 0.01%Norfolk Southern Corp. $125,000 3.00% 1/4/2022 127,730 0.01%John Deere Capital Corp. $125,000 2.60% 7/3/2024 127,702 0.01%John Deere Capital Corp. $125,000 3.13% 10/9/2021 127,692 0.01%Southern California Edison Co. $125,000 3.88% 1/6/2021 127,627 0.01%Appalachian Power Co. $110,000 4.50% 1/3/2049 127,576 0.01%Penske Truck Leasing Co. LP/PTL Finance Corp. $125,000 3.40% 15/11/2026 127,571 0.01%Walgreen Co. $125,000 3.10% 15/9/2022 127,485 0.01%Prudential Financial, Inc. $100,000 5.75% 15/7/2033 127,433 0.01%Kraft Heinz Foods Co. $100,000 7.13% 1/8/2039 127,428 0.01%Oracle Corp. $125,000 2.63% 15/2/2023 127,418 0.01%Tennessee Gas Pipeline Co. LLC $100,000 7.00% 15/10/2028 127,411 0.01%Transcontinental Gas Pipe Line Co. LLC $100,000 7.85% 1/2/2026 127,390 0.01%Medtronic Global Holdings SCA €100,000 2.25% 7/3/2039 127,377 0.01%Mylan NV €100,000 3.13% 22/11/2028 127,357 0.01%Johnson & Johnson $100,000 4.85% 15/5/2041 127,332 0.01%Duke Energy Progress LLC $125,000 2.80% 15/5/2022 127,303 0.01%Mylan, Inc. $115,000 5.20% 15/4/2048 127,275 0.01%PepsiCo, Inc. $125,000 2.63% 29/7/2029 127,254 0.01%PPL Electric Utilities Corp. $125,000 3.00% 15/9/2021 127,115 0.01%AT&T, Inc. $100,000 6.10% 15/7/2040 127,111 0.01%Emerson Electric Co. $125,000 2.63% 1/12/2021 127,086 0.01%McDonald’s Corp. $100,000 5.70% 1/2/2039 127,058 0.01%John Deere Capital Corp. $125,000 2.65% 6/1/2022 127,025 0.01%Hershey Co. $125,000 3.10% 15/5/2021 127,017 0.01%Aon Corp. $100,000 8.21% 1/1/2027 127,000 0.01%Schlumberger Finance Canada Ltd. $125,000 2.65% 20/11/2022 126,966 0.01%General Motors Financial Co., Inc. $125,000 3.55% 9/4/2021 126,941 0.01%
Vanguard Global Corporate Bond Index Fund
573
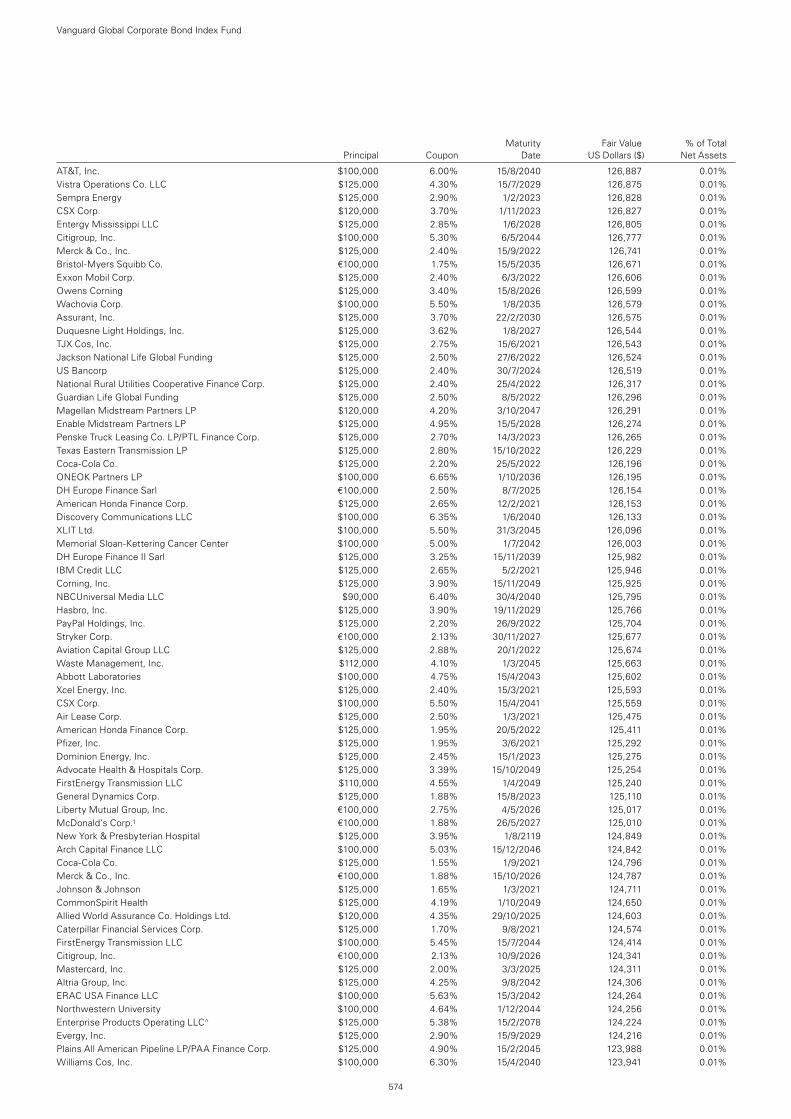
Maturity Fair Value % of Total Principal Coupon Date US Dollars ($) Net Assets
AT&T, Inc. $100,000 6.00% 15/8/2040 126,887 0.01%Vistra Operations Co. LLC $125,000 4.30% 15/7/2029 126,875 0.01%Sempra Energy $125,000 2.90% 1/2/2023 126,828 0.01%CSX Corp. $120,000 3.70% 1/11/2023 126,827 0.01%Entergy Mississippi LLC $125,000 2.85% 1/6/2028 126,805 0.01%Citigroup, Inc. $100,000 5.30% 6/5/2044 126,777 0.01%Merck & Co., Inc. $125,000 2.40% 15/9/2022 126,741 0.01%Bristol-Myers Squibb Co. €100,000 1.75% 15/5/2035 126,671 0.01%Exxon Mobil Corp. $125,000 2.40% 6/3/2022 126,606 0.01%Owens Corning $125,000 3.40% 15/8/2026 126,599 0.01%Wachovia Corp. $100,000 5.50% 1/8/2035 126,579 0.01%Assurant, Inc. $125,000 3.70% 22/2/2030 126,575 0.01%Duquesne Light Holdings, Inc. $125,000 3.62% 1/8/2027 126,544 0.01%TJX Cos, Inc. $125,000 2.75% 15/6/2021 126,543 0.01%Jackson National Life Global Funding $125,000 2.50% 27/6/2022 126,524 0.01%US Bancorp $125,000 2.40% 30/7/2024 126,519 0.01%National Rural Utilities Cooperative Finance Corp. $125,000 2.40% 25/4/2022 126,317 0.01%Guardian Life Global Funding $125,000 2.50% 8/5/2022 126,296 0.01%Magellan Midstream Partners LP $120,000 4.20% 3/10/2047 126,291 0.01%Enable Midstream Partners LP $125,000 4.95% 15/5/2028 126,274 0.01%Penske Truck Leasing Co. LP/PTL Finance Corp. $125,000 2.70% 14/3/2023 126,265 0.01%Texas Eastern Transmission LP $125,000 2.80% 15/10/2022 126,229 0.01%Coca-Cola Co. $125,000 2.20% 25/5/2022 126,196 0.01%ONEOK Partners LP $100,000 6.65% 1/10/2036 126,195 0.01%DH Europe Finance Sarl €100,000 2.50% 8/7/2025 126,154 0.01%American Honda Finance Corp. $125,000 2.65% 12/2/2021 126,153 0.01%Discovery Communications LLC $100,000 6.35% 1/6/2040 126,133 0.01%XLIT Ltd. $100,000 5.50% 31/3/2045 126,096 0.01%Memorial Sloan-Kettering Cancer Center $100,000 5.00% 1/7/2042 126,003 0.01%DH Europe Finance II Sarl $125,000 3.25% 15/11/2039 125,982 0.01%IBM Credit LLC $125,000 2.65% 5/2/2021 125,946 0.01%Corning, Inc. $125,000 3.90% 15/11/2049 125,925 0.01%NBCUniversal Media LLC $90,000 6.40% 30/4/2040 125,795 0.01%Hasbro, Inc. $125,000 3.90% 19/11/2029 125,766 0.01%PayPal Holdings, Inc. $125,000 2.20% 26/9/2022 125,704 0.01%Stryker Corp. €100,000 2.13% 30/11/2027 125,677 0.01%Aviation Capital Group LLC $125,000 2.88% 20/1/2022 125,674 0.01%Waste Management, Inc. $112,000 4.10% 1/3/2045 125,663 0.01%Abbott Laboratories $100,000 4.75% 15/4/2043 125,602 0.01%Xcel Energy, Inc. $125,000 2.40% 15/3/2021 125,593 0.01%CSX Corp. $100,000 5.50% 15/4/2041 125,559 0.01%Air Lease Corp. $125,000 2.50% 1/3/2021 125,475 0.01%American Honda Finance Corp. $125,000 1.95% 20/5/2022 125,411 0.01%Pfizer, Inc. $125,000 1.95% 3/6/2021 125,292 0.01%Dominion Energy, Inc. $125,000 2.45% 15/1/2023 125,275 0.01%Advocate Health & Hospitals Corp. $125,000 3.39% 15/10/2049 125,254 0.01%FirstEnergy Transmission LLC $110,000 4.55% 1/4/2049 125,240 0.01%General Dynamics Corp. $125,000 1.88% 15/8/2023 125,110 0.01%Liberty Mutual Group, Inc. €100,000 2.75% 4/5/2026 125,017 0.01%McDonald’s Corp.1 €100,000 1.88% 26/5/2027 125,010 0.01%New York & Presbyterian Hospital $125,000 3.95% 1/8/2119 124,849 0.01%Arch Capital Finance LLC $100,000 5.03% 15/12/2046 124,842 0.01%Coca-Cola Co. $125,000 1.55% 1/9/2021 124,796 0.01%Merck & Co., Inc. €100,000 1.88% 15/10/2026 124,787 0.01%Johnson & Johnson $125,000 1.65% 1/3/2021 124,711 0.01%CommonSpirit Health $125,000 4.19% 1/10/2049 124,650 0.01%Allied World Assurance Co. Holdings Ltd. $120,000 4.35% 29/10/2025 124,603 0.01%Caterpillar Financial Services Corp. $125,000 1.70% 9/8/2021 124,574 0.01%FirstEnergy Transmission LLC $100,000 5.45% 15/7/2044 124,414 0.01%Citigroup, Inc. €100,000 2.13% 10/9/2026 124,341 0.01%Mastercard, Inc. $125,000 2.00% 3/3/2025 124,311 0.01%Altria Group, Inc. $125,000 4.25% 9/8/2042 124,306 0.01%ERAC USA Finance LLC $100,000 5.63% 15/3/2042 124,264 0.01%Northwestern University $100,000 4.64% 1/12/2044 124,256 0.01%Enterprise Products Operating LLC^ $125,000 5.38% 15/2/2078 124,224 0.01%Evergy, Inc. $125,000 2.90% 15/9/2029 124,216 0.01%Plains All American Pipeline LP/PAA Finance Corp. $125,000 4.90% 15/2/2045 123,988 0.01%Williams Cos, Inc. $100,000 6.30% 15/4/2040 123,941 0.01%
Vanguard Global Corporate Bond Index Fund
574
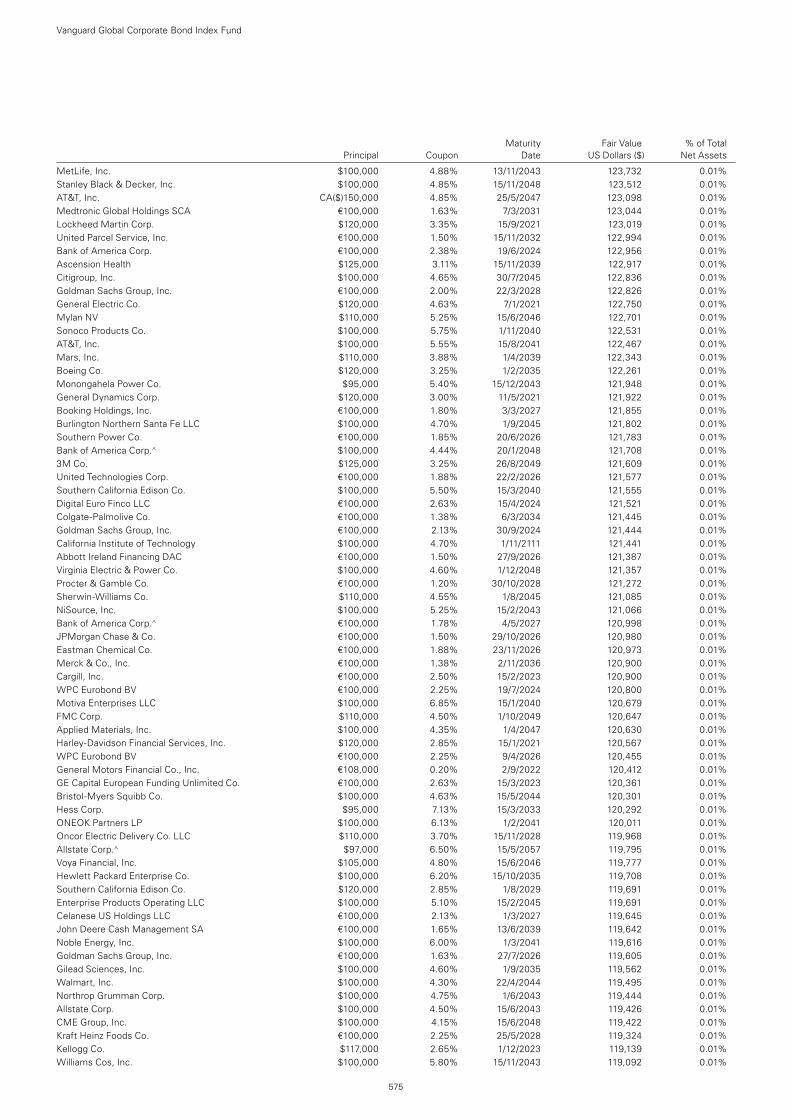
Maturity Fair Value % of Total Principal Coupon Date US Dollars ($) Net Assets
MetLife, Inc. $100,000 4.88% 13/11/2043 123,732 0.01%Stanley Black & Decker, Inc. $100,000 4.85% 15/11/2048 123,512 0.01%AT&T, Inc. CA($)150,000 4.85% 25/5/2047 123,098 0.01%Medtronic Global Holdings SCA €100,000 1.63% 7/3/2031 123,044 0.01%Lockheed Martin Corp. $120,000 3.35% 15/9/2021 123,019 0.01%United Parcel Service, Inc. €100,000 1.50% 15/11/2032 122,994 0.01%Bank of America Corp. €100,000 2.38% 19/6/2024 122,956 0.01%Ascension Health $125,000 3.11% 15/11/2039 122,917 0.01%Citigroup, Inc. $100,000 4.65% 30/7/2045 122,836 0.01%Goldman Sachs Group, Inc. €100,000 2.00% 22/3/2028 122,826 0.01%General Electric Co. $120,000 4.63% 7/1/2021 122,750 0.01%Mylan NV $110,000 5.25% 15/6/2046 122,701 0.01%Sonoco Products Co. $100,000 5.75% 1/11/2040 122,531 0.01%AT&T, Inc. $100,000 5.55% 15/8/2041 122,467 0.01%Mars, Inc. $110,000 3.88% 1/4/2039 122,343 0.01%Boeing Co. $120,000 3.25% 1/2/2035 122,261 0.01%Monongahela Power Co. $95,000 5.40% 15/12/2043 121,948 0.01%General Dynamics Corp. $120,000 3.00% 11/5/2021 121,922 0.01%Booking Holdings, Inc. €100,000 1.80% 3/3/2027 121,855 0.01%Burlington Northern Santa Fe LLC $100,000 4.70% 1/9/2045 121,802 0.01%Southern Power Co. €100,000 1.85% 20/6/2026 121,783 0.01%Bank of America Corp.^ $100,000 4.44% 20/1/2048 121,708 0.01%3M Co. $125,000 3.25% 26/8/2049 121,609 0.01%United Technologies Corp. €100,000 1.88% 22/2/2026 121,577 0.01%Southern California Edison Co. $100,000 5.50% 15/3/2040 121,555 0.01%Digital Euro Finco LLC €100,000 2.63% 15/4/2024 121,521 0.01%Colgate-Palmolive Co. €100,000 1.38% 6/3/2034 121,445 0.01%Goldman Sachs Group, Inc. €100,000 2.13% 30/9/2024 121,444 0.01%California Institute of Technology $100,000 4.70% 1/11/2111 121,441 0.01%Abbott Ireland Financing DAC €100,000 1.50% 27/9/2026 121,387 0.01%Virginia Electric & Power Co. $100,000 4.60% 1/12/2048 121,357 0.01%Procter & Gamble Co. €100,000 1.20% 30/10/2028 121,272 0.01%Sherwin-Williams Co. $110,000 4.55% 1/8/2045 121,085 0.01%NiSource, Inc. $100,000 5.25% 15/2/2043 121,066 0.01%Bank of America Corp.^ €100,000 1.78% 4/5/2027 120,998 0.01%JPMorgan Chase & Co. €100,000 1.50% 29/10/2026 120,980 0.01%Eastman Chemical Co. €100,000 1.88% 23/11/2026 120,973 0.01%Merck & Co., Inc. €100,000 1.38% 2/11/2036 120,900 0.01%Cargill, Inc. €100,000 2.50% 15/2/2023 120,900 0.01%WPC Eurobond BV €100,000 2.25% 19/7/2024 120,800 0.01%Motiva Enterprises LLC $100,000 6.85% 15/1/2040 120,679 0.01%FMC Corp. $110,000 4.50% 1/10/2049 120,647 0.01%Applied Materials, Inc. $100,000 4.35% 1/4/2047 120,630 0.01%Harley-Davidson Financial Services, Inc. $120,000 2.85% 15/1/2021 120,567 0.01%WPC Eurobond BV €100,000 2.25% 9/4/2026 120,455 0.01%General Motors Financial Co., Inc. €108,000 0.20% 2/9/2022 120,412 0.01%GE Capital European Funding Unlimited Co. €100,000 2.63% 15/3/2023 120,361 0.01%Bristol-Myers Squibb Co. $100,000 4.63% 15/5/2044 120,301 0.01%Hess Corp. $95,000 7.13% 15/3/2033 120,292 0.01%ONEOK Partners LP $100,000 6.13% 1/2/2041 120,011 0.01%Oncor Electric Delivery Co. LLC $110,000 3.70% 15/11/2028 119,968 0.01%Allstate Corp.^ $97,000 6.50% 15/5/2057 119,795 0.01%Voya Financial, Inc. $105,000 4.80% 15/6/2046 119,777 0.01%Hewlett Packard Enterprise Co. $100,000 6.20% 15/10/2035 119,708 0.01%Southern California Edison Co. $120,000 2.85% 1/8/2029 119,691 0.01%Enterprise Products Operating LLC $100,000 5.10% 15/2/2045 119,691 0.01%Celanese US Holdings LLC €100,000 2.13% 1/3/2027 119,645 0.01%John Deere Cash Management SA €100,000 1.65% 13/6/2039 119,642 0.01%Noble Energy, Inc. $100,000 6.00% 1/3/2041 119,616 0.01%Goldman Sachs Group, Inc. €100,000 1.63% 27/7/2026 119,605 0.01%Gilead Sciences, Inc. $100,000 4.60% 1/9/2035 119,562 0.01%Walmart, Inc. $100,000 4.30% 22/4/2044 119,495 0.01%Northrop Grumman Corp. $100,000 4.75% 1/6/2043 119,444 0.01%Allstate Corp. $100,000 4.50% 15/6/2043 119,426 0.01%CME Group, Inc. $100,000 4.15% 15/6/2048 119,422 0.01%Kraft Heinz Foods Co. €100,000 2.25% 25/5/2028 119,324 0.01%Kellogg Co. $117,000 2.65% 1/12/2023 119,139 0.01%Williams Cos, Inc. $100,000 5.80% 15/11/2043 119,092 0.01%
Vanguard Global Corporate Bond Index Fund
575
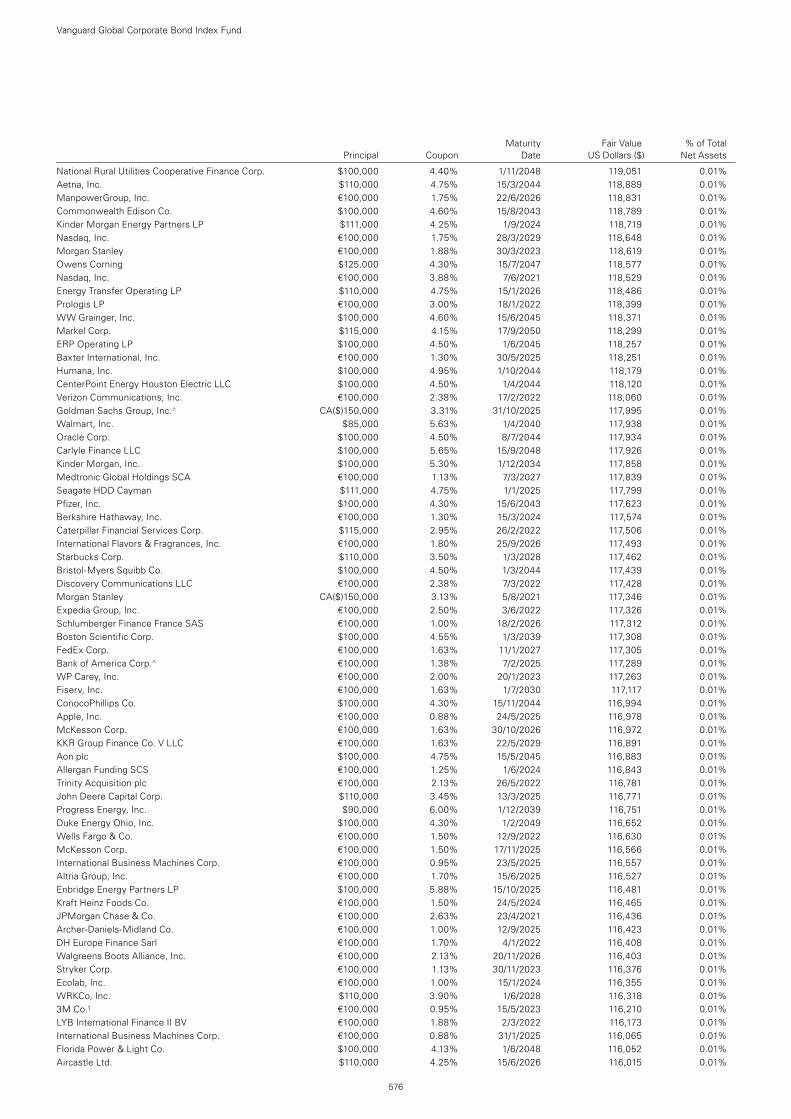
Maturity Fair Value % of Total Principal Coupon Date US Dollars ($) Net Assets
National Rural Utilities Cooperative Finance Corp. $100,000 4.40% 1/11/2048 119,051 0.01%Aetna, Inc. $110,000 4.75% 15/3/2044 118,889 0.01%ManpowerGroup, Inc. €100,000 1.75% 22/6/2026 118,831 0.01%Commonwealth Edison Co. $100,000 4.60% 15/8/2043 118,789 0.01%Kinder Morgan Energy Partners LP $111,000 4.25% 1/9/2024 118,719 0.01%Nasdaq, Inc. €100,000 1.75% 28/3/2029 118,648 0.01%Morgan Stanley €100,000 1.88% 30/3/2023 118,619 0.01%Owens Corning $125,000 4.30% 15/7/2047 118,577 0.01%Nasdaq, Inc. €100,000 3.88% 7/6/2021 118,529 0.01%Energy Transfer Operating LP $110,000 4.75% 15/1/2026 118,486 0.01%Prologis LP €100,000 3.00% 18/1/2022 118,399 0.01%WW Grainger, Inc. $100,000 4.60% 15/6/2045 118,371 0.01%Markel Corp. $115,000 4.15% 17/9/2050 118,299 0.01%ERP Operating LP $100,000 4.50% 1/6/2045 118,257 0.01%Baxter International, Inc. €100,000 1.30% 30/5/2025 118,251 0.01%Humana, Inc. $100,000 4.95% 1/10/2044 118,179 0.01%CenterPoint Energy Houston Electric LLC $100,000 4.50% 1/4/2044 118,120 0.01%Verizon Communications, Inc. €100,000 2.38% 17/2/2022 118,060 0.01%Goldman Sachs Group, Inc.^ CA($)150,000 3.31% 31/10/2025 117,995 0.01%Walmart, Inc. $85,000 5.63% 1/4/2040 117,938 0.01%Oracle Corp. $100,000 4.50% 8/7/2044 117,934 0.01%Carlyle Finance LLC $100,000 5.65% 15/9/2048 117,926 0.01%Kinder Morgan, Inc. $100,000 5.30% 1/12/2034 117,858 0.01%Medtronic Global Holdings SCA €100,000 1.13% 7/3/2027 117,839 0.01%Seagate HDD Cayman $111,000 4.75% 1/1/2025 117,799 0.01%Pfizer, Inc. $100,000 4.30% 15/6/2043 117,623 0.01%Berkshire Hathaway, Inc. €100,000 1.30% 15/3/2024 117,574 0.01%Caterpillar Financial Services Corp. $115,000 2.95% 26/2/2022 117,506 0.01%International Flavors & Fragrances, Inc. €100,000 1.80% 25/9/2026 117,493 0.01%Starbucks Corp. $110,000 3.50% 1/3/2028 117,462 0.01%Bristol-Myers Squibb Co. $100,000 4.50% 1/3/2044 117,439 0.01%Discovery Communications LLC €100,000 2.38% 7/3/2022 117,428 0.01%Morgan Stanley CA($)150,000 3.13% 5/8/2021 117,346 0.01%Expedia Group, Inc. €100,000 2.50% 3/6/2022 117,326 0.01%Schlumberger Finance France SAS €100,000 1.00% 18/2/2026 117,312 0.01%Boston Scientific Corp. $100,000 4.55% 1/3/2039 117,308 0.01%FedEx Corp. €100,000 1.63% 11/1/2027 117,305 0.01%Bank of America Corp.^ €100,000 1.38% 7/2/2025 117,289 0.01%WP Carey, Inc. €100,000 2.00% 20/1/2023 117,263 0.01%Fiserv, Inc. €100,000 1.63% 1/7/2030 117,117 0.01%ConocoPhillips Co. $100,000 4.30% 15/11/2044 116,994 0.01%Apple, Inc. €100,000 0.88% 24/5/2025 116,978 0.01%McKesson Corp. €100,000 1.63% 30/10/2026 116,972 0.01%KKR Group Finance Co. V LLC €100,000 1.63% 22/5/2029 116,891 0.01%Aon plc $100,000 4.75% 15/5/2045 116,883 0.01%Allergan Funding SCS €100,000 1.25% 1/6/2024 116,843 0.01%Trinity Acquisition plc €100,000 2.13% 26/5/2022 116,781 0.01%John Deere Capital Corp. $110,000 3.45% 13/3/2025 116,771 0.01%Progress Energy, Inc. $90,000 6.00% 1/12/2039 116,751 0.01%Duke Energy Ohio, Inc. $100,000 4.30% 1/2/2049 116,652 0.01%Wells Fargo & Co. €100,000 1.50% 12/9/2022 116,630 0.01%McKesson Corp. €100,000 1.50% 17/11/2025 116,566 0.01%International Business Machines Corp. €100,000 0.95% 23/5/2025 116,557 0.01%Altria Group, Inc. €100,000 1.70% 15/6/2025 116,527 0.01%Enbridge Energy Partners LP $100,000 5.88% 15/10/2025 116,481 0.01%Kraft Heinz Foods Co. €100,000 1.50% 24/5/2024 116,465 0.01%JPMorgan Chase & Co. €100,000 2.63% 23/4/2021 116,436 0.01%Archer-Daniels-Midland Co. €100,000 1.00% 12/9/2025 116,423 0.01%DH Europe Finance Sarl €100,000 1.70% 4/1/2022 116,408 0.01%Walgreens Boots Alliance, Inc. €100,000 2.13% 20/11/2026 116,403 0.01%Stryker Corp. €100,000 1.13% 30/11/2023 116,376 0.01%Ecolab, Inc. €100,000 1.00% 15/1/2024 116,355 0.01%WRKCo, Inc. $110,000 3.90% 1/6/2028 116,318 0.01%3M Co.1 €100,000 0.95% 15/5/2023 116,210 0.01%LYB International Finance II BV €100,000 1.88% 2/3/2022 116,173 0.01%International Business Machines Corp. €100,000 0.88% 31/1/2025 116,065 0.01%Florida Power & Light Co. $100,000 4.13% 1/6/2048 116,052 0.01%Aircastle Ltd. $110,000 4.25% 15/6/2026 116,015 0.01%
Vanguard Global Corporate Bond Index Fund
576
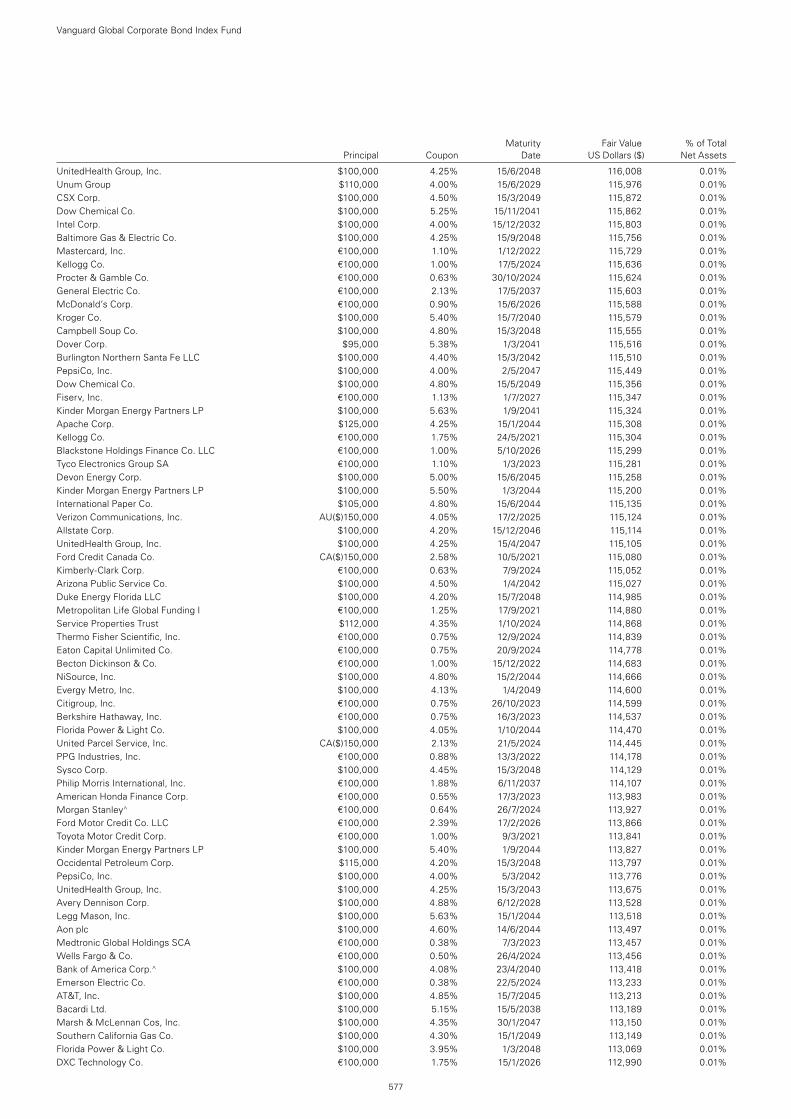
Maturity Fair Value % of Total Principal Coupon Date US Dollars ($) Net Assets
UnitedHealth Group, Inc. $100,000 4.25% 15/6/2048 116,008 0.01%Unum Group $110,000 4.00% 15/6/2029 115,976 0.01%CSX Corp. $100,000 4.50% 15/3/2049 115,872 0.01%Dow Chemical Co. $100,000 5.25% 15/11/2041 115,862 0.01%Intel Corp. $100,000 4.00% 15/12/2032 115,803 0.01%Baltimore Gas & Electric Co. $100,000 4.25% 15/9/2048 115,756 0.01%Mastercard, Inc. €100,000 1.10% 1/12/2022 115,729 0.01%Kellogg Co. €100,000 1.00% 17/5/2024 115,636 0.01%Procter & Gamble Co. €100,000 0.63% 30/10/2024 115,624 0.01%General Electric Co. €100,000 2.13% 17/5/2037 115,603 0.01%McDonald’s Corp. €100,000 0.90% 15/6/2026 115,588 0.01%Kroger Co. $100,000 5.40% 15/7/2040 115,579 0.01%Campbell Soup Co. $100,000 4.80% 15/3/2048 115,555 0.01%Dover Corp. $95,000 5.38% 1/3/2041 115,516 0.01%Burlington Northern Santa Fe LLC $100,000 4.40% 15/3/2042 115,510 0.01%PepsiCo, Inc. $100,000 4.00% 2/5/2047 115,449 0.01%Dow Chemical Co. $100,000 4.80% 15/5/2049 115,356 0.01%Fiserv, Inc. €100,000 1.13% 1/7/2027 115,347 0.01%Kinder Morgan Energy Partners LP $100,000 5.63% 1/9/2041 115,324 0.01%Apache Corp. $125,000 4.25% 15/1/2044 115,308 0.01%Kellogg Co. €100,000 1.75% 24/5/2021 115,304 0.01%Blackstone Holdings Finance Co. LLC €100,000 1.00% 5/10/2026 115,299 0.01%Tyco Electronics Group SA €100,000 1.10% 1/3/2023 115,281 0.01%Devon Energy Corp. $100,000 5.00% 15/6/2045 115,258 0.01%Kinder Morgan Energy Partners LP $100,000 5.50% 1/3/2044 115,200 0.01%International Paper Co. $105,000 4.80% 15/6/2044 115,135 0.01%Verizon Communications, Inc. AU($)150,000 4.05% 17/2/2025 115,124 0.01%Allstate Corp. $100,000 4.20% 15/12/2046 115,114 0.01%UnitedHealth Group, Inc. $100,000 4.25% 15/4/2047 115,105 0.01%Ford Credit Canada Co. CA($)150,000 2.58% 10/5/2021 115,080 0.01%Kimberly-Clark Corp. €100,000 0.63% 7/9/2024 115,052 0.01%Arizona Public Service Co. $100,000 4.50% 1/4/2042 115,027 0.01%Duke Energy Florida LLC $100,000 4.20% 15/7/2048 114,985 0.01%Metropolitan Life Global Funding I €100,000 1.25% 17/9/2021 114,880 0.01%Service Properties Trust $112,000 4.35% 1/10/2024 114,868 0.01%Thermo Fisher Scientific, Inc. €100,000 0.75% 12/9/2024 114,839 0.01%Eaton Capital Unlimited Co. €100,000 0.75% 20/9/2024 114,778 0.01%Becton Dickinson & Co. €100,000 1.00% 15/12/2022 114,683 0.01%NiSource, Inc. $100,000 4.80% 15/2/2044 114,666 0.01%Evergy Metro, Inc. $100,000 4.13% 1/4/2049 114,600 0.01%Citigroup, Inc. €100,000 0.75% 26/10/2023 114,599 0.01%Berkshire Hathaway, Inc. €100,000 0.75% 16/3/2023 114,537 0.01%Florida Power & Light Co. $100,000 4.05% 1/10/2044 114,470 0.01%United Parcel Service, Inc. CA($)150,000 2.13% 21/5/2024 114,445 0.01%PPG Industries, Inc. €100,000 0.88% 13/3/2022 114,178 0.01%Sysco Corp. $100,000 4.45% 15/3/2048 114,129 0.01%Philip Morris International, Inc. €100,000 1.88% 6/11/2037 114,107 0.01%American Honda Finance Corp. €100,000 0.55% 17/3/2023 113,983 0.01%Morgan Stanley^ €100,000 0.64% 26/7/2024 113,927 0.01%Ford Motor Credit Co. LLC €100,000 2.39% 17/2/2026 113,866 0.01%Toyota Motor Credit Corp. €100,000 1.00% 9/3/2021 113,841 0.01%Kinder Morgan Energy Partners LP $100,000 5.40% 1/9/2044 113,827 0.01%Occidental Petroleum Corp. $115,000 4.20% 15/3/2048 113,797 0.01%PepsiCo, Inc. $100,000 4.00% 5/3/2042 113,776 0.01%UnitedHealth Group, Inc. $100,000 4.25% 15/3/2043 113,675 0.01%Avery Dennison Corp. $100,000 4.88% 6/12/2028 113,528 0.01%Legg Mason, Inc. $100,000 5.63% 15/1/2044 113,518 0.01%Aon plc $100,000 4.60% 14/6/2044 113,497 0.01%Medtronic Global Holdings SCA €100,000 0.38% 7/3/2023 113,457 0.01%Wells Fargo & Co. €100,000 0.50% 26/4/2024 113,456 0.01%Bank of America Corp.^ $100,000 4.08% 23/4/2040 113,418 0.01%Emerson Electric Co. €100,000 0.38% 22/5/2024 113,233 0.01%AT&T, Inc. $100,000 4.85% 15/7/2045 113,213 0.01%Bacardi Ltd. $100,000 5.15% 15/5/2038 113,189 0.01%Marsh & McLennan Cos, Inc. $100,000 4.35% 30/1/2047 113,150 0.01%Southern California Gas Co. $100,000 4.30% 15/1/2049 113,149 0.01%Florida Power & Light Co. $100,000 3.95% 1/3/2048 113,069 0.01%DXC Technology Co. €100,000 1.75% 15/1/2026 112,990 0.01%
Vanguard Global Corporate Bond Index Fund
577
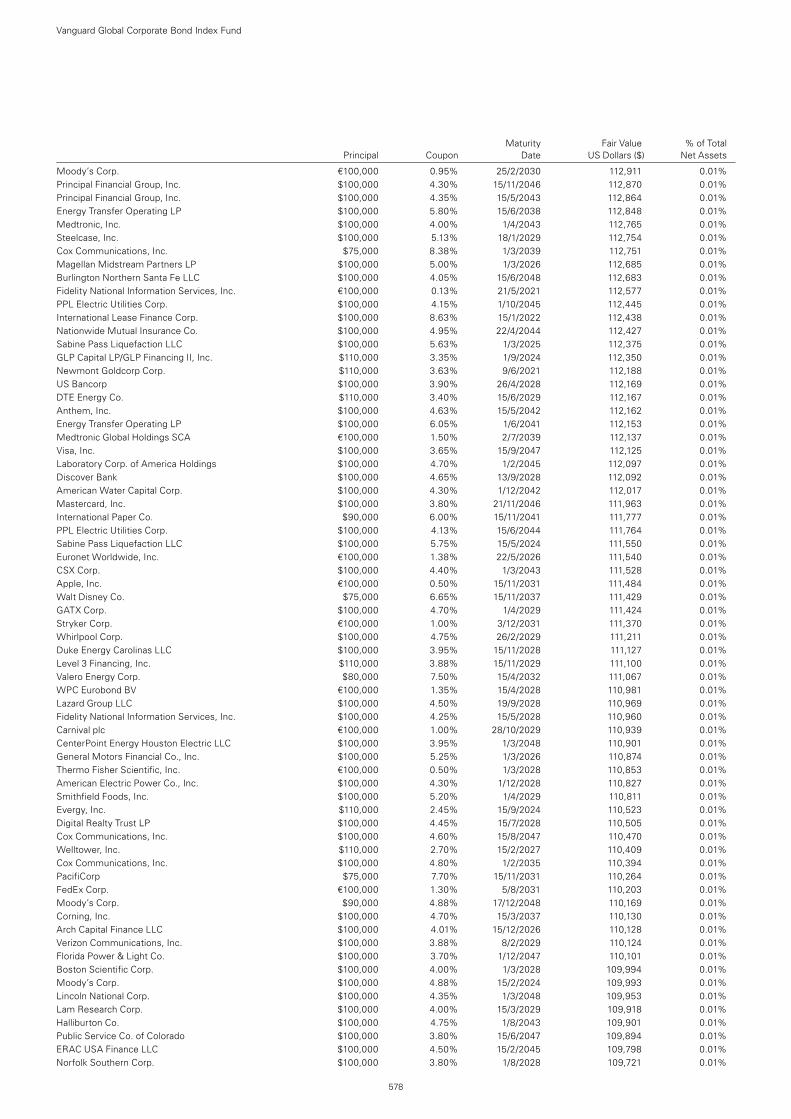
Maturity Fair Value % of Total Principal Coupon Date US Dollars ($) Net Assets
Moody’s Corp. €100,000 0.95% 25/2/2030 112,911 0.01%Principal Financial Group, Inc. $100,000 4.30% 15/11/2046 112,870 0.01%Principal Financial Group, Inc. $100,000 4.35% 15/5/2043 112,864 0.01%Energy Transfer Operating LP $100,000 5.80% 15/6/2038 112,848 0.01%Medtronic, Inc. $100,000 4.00% 1/4/2043 112,765 0.01%Steelcase, Inc. $100,000 5.13% 18/1/2029 112,754 0.01%Cox Communications, Inc. $75,000 8.38% 1/3/2039 112,751 0.01%Magellan Midstream Partners LP $100,000 5.00% 1/3/2026 112,685 0.01%Burlington Northern Santa Fe LLC $100,000 4.05% 15/6/2048 112,683 0.01%Fidelity National Information Services, Inc. €100,000 0.13% 21/5/2021 112,577 0.01%PPL Electric Utilities Corp. $100,000 4.15% 1/10/2045 112,445 0.01%International Lease Finance Corp. $100,000 8.63% 15/1/2022 112,438 0.01%Nationwide Mutual Insurance Co. $100,000 4.95% 22/4/2044 112,427 0.01%Sabine Pass Liquefaction LLC $100,000 5.63% 1/3/2025 112,375 0.01%GLP Capital LP/GLP Financing II, Inc. $110,000 3.35% 1/9/2024 112,350 0.01%Newmont Goldcorp Corp. $110,000 3.63% 9/6/2021 112,188 0.01%US Bancorp $100,000 3.90% 26/4/2028 112,169 0.01%DTE Energy Co. $110,000 3.40% 15/6/2029 112,167 0.01%Anthem, Inc. $100,000 4.63% 15/5/2042 112,162 0.01%Energy Transfer Operating LP $100,000 6.05% 1/6/2041 112,153 0.01%Medtronic Global Holdings SCA €100,000 1.50% 2/7/2039 112,137 0.01%Visa, Inc. $100,000 3.65% 15/9/2047 112,125 0.01%Laboratory Corp. of America Holdings $100,000 4.70% 1/2/2045 112,097 0.01%Discover Bank $100,000 4.65% 13/9/2028 112,092 0.01%American Water Capital Corp. $100,000 4.30% 1/12/2042 112,017 0.01%Mastercard, Inc. $100,000 3.80% 21/11/2046 111,963 0.01%International Paper Co. $90,000 6.00% 15/11/2041 111,777 0.01%PPL Electric Utilities Corp. $100,000 4.13% 15/6/2044 111,764 0.01%Sabine Pass Liquefaction LLC $100,000 5.75% 15/5/2024 111,550 0.01%Euronet Worldwide, Inc. €100,000 1.38% 22/5/2026 111,540 0.01%CSX Corp. $100,000 4.40% 1/3/2043 111,528 0.01%Apple, Inc. €100,000 0.50% 15/11/2031 111,484 0.01%Walt Disney Co. $75,000 6.65% 15/11/2037 111,429 0.01%GATX Corp. $100,000 4.70% 1/4/2029 111,424 0.01%Stryker Corp. €100,000 1.00% 3/12/2031 111,370 0.01%Whirlpool Corp. $100,000 4.75% 26/2/2029 111,211 0.01%Duke Energy Carolinas LLC $100,000 3.95% 15/11/2028 111,127 0.01%Level 3 Financing, Inc. $110,000 3.88% 15/11/2029 111,100 0.01%Valero Energy Corp. $80,000 7.50% 15/4/2032 111,067 0.01%WPC Eurobond BV €100,000 1.35% 15/4/2028 110,981 0.01%Lazard Group LLC $100,000 4.50% 19/9/2028 110,969 0.01%Fidelity National Information Services, Inc. $100,000 4.25% 15/5/2028 110,960 0.01%Carnival plc €100,000 1.00% 28/10/2029 110,939 0.01%CenterPoint Energy Houston Electric LLC $100,000 3.95% 1/3/2048 110,901 0.01%General Motors Financial Co., Inc. $100,000 5.25% 1/3/2026 110,874 0.01%Thermo Fisher Scientific, Inc. €100,000 0.50% 1/3/2028 110,853 0.01%American Electric Power Co., Inc. $100,000 4.30% 1/12/2028 110,827 0.01%Smithfield Foods, Inc. $100,000 5.20% 1/4/2029 110,811 0.01%Evergy, Inc. $110,000 2.45% 15/9/2024 110,523 0.01%Digital Realty Trust LP $100,000 4.45% 15/7/2028 110,505 0.01%Cox Communications, Inc. $100,000 4.60% 15/8/2047 110,470 0.01%Welltower, Inc. $110,000 2.70% 15/2/2027 110,409 0.01%Cox Communications, Inc. $100,000 4.80% 1/2/2035 110,394 0.01%PacifiCorp $75,000 7.70% 15/11/2031 110,264 0.01%FedEx Corp. €100,000 1.30% 5/8/2031 110,203 0.01%Moody’s Corp. $90,000 4.88% 17/12/2048 110,169 0.01%Corning, Inc. $100,000 4.70% 15/3/2037 110,130 0.01%Arch Capital Finance LLC $100,000 4.01% 15/12/2026 110,128 0.01%Verizon Communications, Inc. $100,000 3.88% 8/2/2029 110,124 0.01%Florida Power & Light Co. $100,000 3.70% 1/12/2047 110,101 0.01%Boston Scientific Corp. $100,000 4.00% 1/3/2028 109,994 0.01%Moody’s Corp. $100,000 4.88% 15/2/2024 109,993 0.01%Lincoln National Corp. $100,000 4.35% 1/3/2048 109,953 0.01%Lam Research Corp. $100,000 4.00% 15/3/2029 109,918 0.01%Halliburton Co. $100,000 4.75% 1/8/2043 109,901 0.01%Public Service Co. of Colorado $100,000 3.80% 15/6/2047 109,894 0.01%ERAC USA Finance LLC $100,000 4.50% 15/2/2045 109,798 0.01%Norfolk Southern Corp. $100,000 3.80% 1/8/2028 109,721 0.01%
Vanguard Global Corporate Bond Index Fund
578
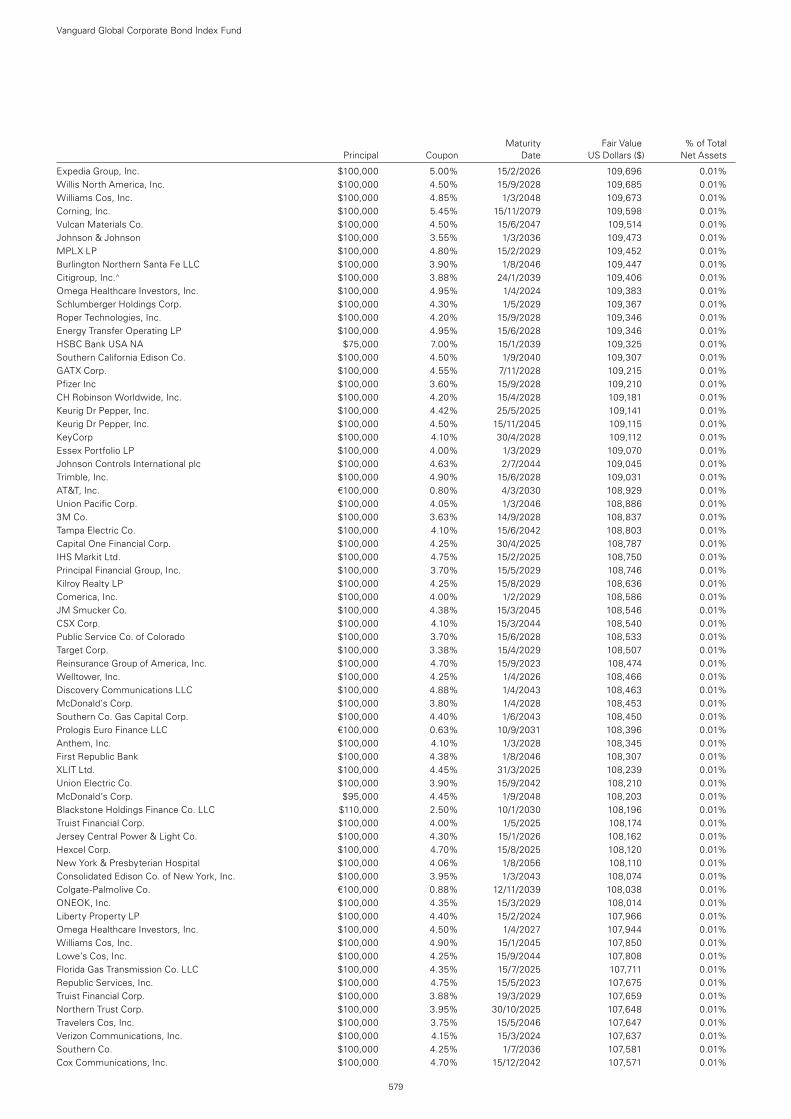
Maturity Fair Value % of Total Principal Coupon Date US Dollars ($) Net Assets
Expedia Group, Inc. $100,000 5.00% 15/2/2026 109,696 0.01%Willis North America, Inc. $100,000 4.50% 15/9/2028 109,685 0.01%Williams Cos, Inc. $100,000 4.85% 1/3/2048 109,673 0.01%Corning, Inc. $100,000 5.45% 15/11/2079 109,598 0.01%Vulcan Materials Co. $100,000 4.50% 15/6/2047 109,514 0.01%Johnson & Johnson $100,000 3.55% 1/3/2036 109,473 0.01%MPLX LP $100,000 4.80% 15/2/2029 109,452 0.01%Burlington Northern Santa Fe LLC $100,000 3.90% 1/8/2046 109,447 0.01%Citigroup, Inc.^ $100,000 3.88% 24/1/2039 109,406 0.01%Omega Healthcare Investors, Inc. $100,000 4.95% 1/4/2024 109,383 0.01%Schlumberger Holdings Corp. $100,000 4.30% 1/5/2029 109,367 0.01%Roper Technologies, Inc. $100,000 4.20% 15/9/2028 109,346 0.01%Energy Transfer Operating LP $100,000 4.95% 15/6/2028 109,346 0.01%HSBC Bank USA NA $75,000 7.00% 15/1/2039 109,325 0.01%Southern California Edison Co. $100,000 4.50% 1/9/2040 109,307 0.01%GATX Corp. $100,000 4.55% 7/11/2028 109,215 0.01%Pfizer Inc $100,000 3.60% 15/9/2028 109,210 0.01%CH Robinson Worldwide, Inc. $100,000 4.20% 15/4/2028 109,181 0.01%Keurig Dr Pepper, Inc. $100,000 4.42% 25/5/2025 109,141 0.01%Keurig Dr Pepper, Inc. $100,000 4.50% 15/11/2045 109,115 0.01%KeyCorp $100,000 4.10% 30/4/2028 109,112 0.01%Essex Portfolio LP $100,000 4.00% 1/3/2029 109,070 0.01%Johnson Controls International plc $100,000 4.63% 2/7/2044 109,045 0.01%Trimble, Inc. $100,000 4.90% 15/6/2028 109,031 0.01%AT&T, Inc. €100,000 0.80% 4/3/2030 108,929 0.01%Union Pacific Corp. $100,000 4.05% 1/3/2046 108,886 0.01%3M Co. $100,000 3.63% 14/9/2028 108,837 0.01%Tampa Electric Co. $100,000 4.10% 15/6/2042 108,803 0.01%Capital One Financial Corp. $100,000 4.25% 30/4/2025 108,787 0.01%IHS Markit Ltd. $100,000 4.75% 15/2/2025 108,750 0.01%Principal Financial Group, Inc. $100,000 3.70% 15/5/2029 108,746 0.01%Kilroy Realty LP $100,000 4.25% 15/8/2029 108,636 0.01%Comerica, Inc. $100,000 4.00% 1/2/2029 108,586 0.01%JM Smucker Co. $100,000 4.38% 15/3/2045 108,546 0.01%CSX Corp. $100,000 4.10% 15/3/2044 108,540 0.01%Public Service Co. of Colorado $100,000 3.70% 15/6/2028 108,533 0.01%Target Corp. $100,000 3.38% 15/4/2029 108,507 0.01%Reinsurance Group of America, Inc. $100,000 4.70% 15/9/2023 108,474 0.01%Welltower, Inc. $100,000 4.25% 1/4/2026 108,466 0.01%Discovery Communications LLC $100,000 4.88% 1/4/2043 108,463 0.01%McDonald’s Corp. $100,000 3.80% 1/4/2028 108,453 0.01%Southern Co. Gas Capital Corp. $100,000 4.40% 1/6/2043 108,450 0.01%Prologis Euro Finance LLC €100,000 0.63% 10/9/2031 108,396 0.01%Anthem, Inc. $100,000 4.10% 1/3/2028 108,345 0.01%First Republic Bank $100,000 4.38% 1/8/2046 108,307 0.01%XLIT Ltd. $100,000 4.45% 31/3/2025 108,239 0.01%Union Electric Co. $100,000 3.90% 15/9/2042 108,210 0.01%McDonald’s Corp. $95,000 4.45% 1/9/2048 108,203 0.01%Blackstone Holdings Finance Co. LLC $110,000 2.50% 10/1/2030 108,196 0.01%Truist Financial Corp. $100,000 4.00% 1/5/2025 108,174 0.01%Jersey Central Power & Light Co. $100,000 4.30% 15/1/2026 108,162 0.01%Hexcel Corp. $100,000 4.70% 15/8/2025 108,120 0.01%New York & Presbyterian Hospital $100,000 4.06% 1/8/2056 108,110 0.01%Consolidated Edison Co. of New York, Inc. $100,000 3.95% 1/3/2043 108,074 0.01%Colgate-Palmolive Co. €100,000 0.88% 12/11/2039 108,038 0.01%ONEOK, Inc. $100,000 4.35% 15/3/2029 108,014 0.01%Liberty Property LP $100,000 4.40% 15/2/2024 107,966 0.01%Omega Healthcare Investors, Inc. $100,000 4.50% 1/4/2027 107,944 0.01%Williams Cos, Inc. $100,000 4.90% 15/1/2045 107,850 0.01%Lowe’s Cos, Inc. $100,000 4.25% 15/9/2044 107,808 0.01%Florida Gas Transmission Co. LLC $100,000 4.35% 15/7/2025 107,711 0.01%Republic Services, Inc. $100,000 4.75% 15/5/2023 107,675 0.01%Truist Financial Corp. $100,000 3.88% 19/3/2029 107,659 0.01%Northern Trust Corp. $100,000 3.95% 30/10/2025 107,648 0.01%Travelers Cos, Inc. $100,000 3.75% 15/5/2046 107,647 0.01%Verizon Communications, Inc. $100,000 4.15% 15/3/2024 107,637 0.01%Southern Co. $100,000 4.25% 1/7/2036 107,581 0.01%Cox Communications, Inc. $100,000 4.70% 15/12/2042 107,571 0.01%
Vanguard Global Corporate Bond Index Fund
579
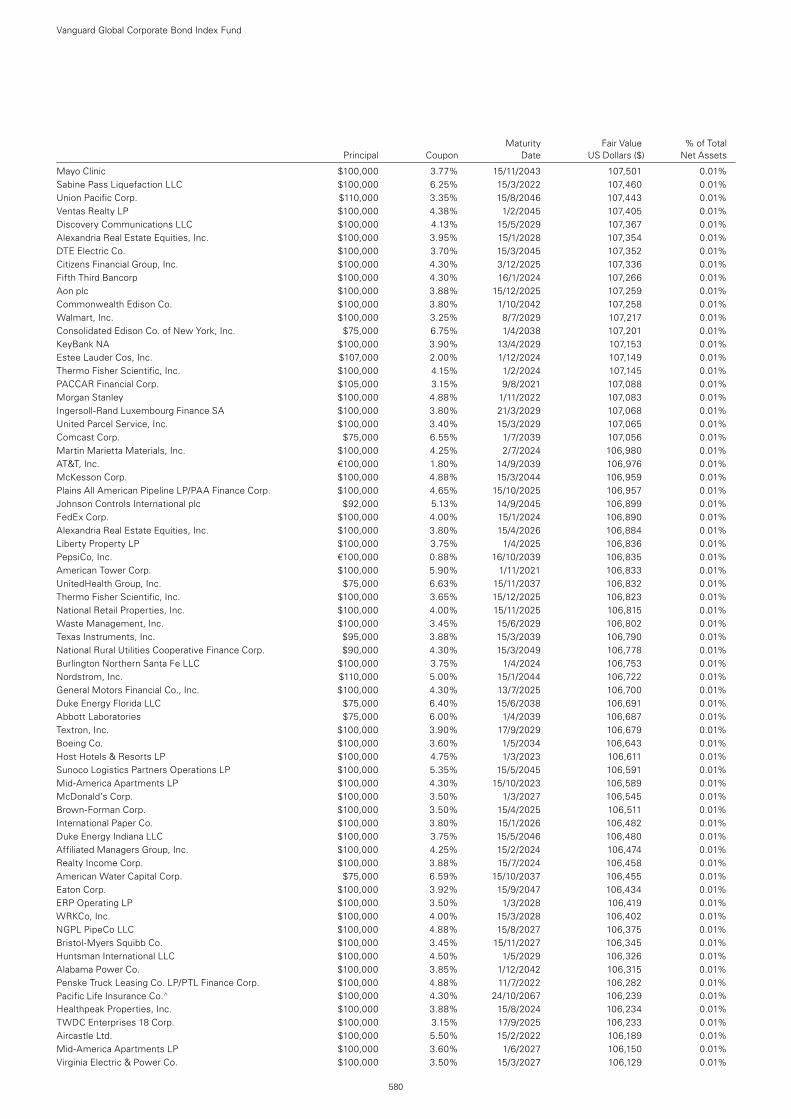
Maturity Fair Value % of Total Principal Coupon Date US Dollars ($) Net Assets
Mayo Clinic $100,000 3.77% 15/11/2043 107,501 0.01%Sabine Pass Liquefaction LLC $100,000 6.25% 15/3/2022 107,460 0.01%Union Pacific Corp. $110,000 3.35% 15/8/2046 107,443 0.01%Ventas Realty LP $100,000 4.38% 1/2/2045 107,405 0.01%Discovery Communications LLC $100,000 4.13% 15/5/2029 107,367 0.01%Alexandria Real Estate Equities, Inc. $100,000 3.95% 15/1/2028 107,354 0.01%DTE Electric Co. $100,000 3.70% 15/3/2045 107,352 0.01%Citizens Financial Group, Inc. $100,000 4.30% 3/12/2025 107,336 0.01%Fifth Third Bancorp $100,000 4.30% 16/1/2024 107,266 0.01%Aon plc $100,000 3.88% 15/12/2025 107,259 0.01%Commonwealth Edison Co. $100,000 3.80% 1/10/2042 107,258 0.01%Walmart, Inc. $100,000 3.25% 8/7/2029 107,217 0.01%Consolidated Edison Co. of New York, Inc. $75,000 6.75% 1/4/2038 107,201 0.01%KeyBank NA $100,000 3.90% 13/4/2029 107,153 0.01%Estee Lauder Cos, Inc. $107,000 2.00% 1/12/2024 107,149 0.01%Thermo Fisher Scientific, Inc. $100,000 4.15% 1/2/2024 107,145 0.01%PACCAR Financial Corp. $105,000 3.15% 9/8/2021 107,088 0.01%Morgan Stanley $100,000 4.88% 1/11/2022 107,083 0.01%Ingersoll-Rand Luxembourg Finance SA $100,000 3.80% 21/3/2029 107,068 0.01%United Parcel Service, Inc. $100,000 3.40% 15/3/2029 107,065 0.01%Comcast Corp. $75,000 6.55% 1/7/2039 107,056 0.01%Martin Marietta Materials, Inc. $100,000 4.25% 2/7/2024 106,980 0.01%AT&T, Inc. €100,000 1.80% 14/9/2039 106,976 0.01%McKesson Corp. $100,000 4.88% 15/3/2044 106,959 0.01%Plains All American Pipeline LP/PAA Finance Corp. $100,000 4.65% 15/10/2025 106,957 0.01%Johnson Controls International plc $92,000 5.13% 14/9/2045 106,899 0.01%FedEx Corp. $100,000 4.00% 15/1/2024 106,890 0.01%Alexandria Real Estate Equities, Inc. $100,000 3.80% 15/4/2026 106,884 0.01%Liberty Property LP $100,000 3.75% 1/4/2025 106,836 0.01%PepsiCo, Inc. €100,000 0.88% 16/10/2039 106,835 0.01%American Tower Corp. $100,000 5.90% 1/11/2021 106,833 0.01%UnitedHealth Group, Inc. $75,000 6.63% 15/11/2037 106,832 0.01%Thermo Fisher Scientific, Inc. $100,000 3.65% 15/12/2025 106,823 0.01%National Retail Properties, Inc. $100,000 4.00% 15/11/2025 106,815 0.01%Waste Management, Inc. $100,000 3.45% 15/6/2029 106,802 0.01%Texas Instruments, Inc. $95,000 3.88% 15/3/2039 106,790 0.01%National Rural Utilities Cooperative Finance Corp. $90,000 4.30% 15/3/2049 106,778 0.01%Burlington Northern Santa Fe LLC $100,000 3.75% 1/4/2024 106,753 0.01%Nordstrom, Inc. $110,000 5.00% 15/1/2044 106,722 0.01%General Motors Financial Co., Inc. $100,000 4.30% 13/7/2025 106,700 0.01%Duke Energy Florida LLC $75,000 6.40% 15/6/2038 106,691 0.01%Abbott Laboratories $75,000 6.00% 1/4/2039 106,687 0.01%Textron, Inc. $100,000 3.90% 17/9/2029 106,679 0.01%Boeing Co. $100,000 3.60% 1/5/2034 106,643 0.01%Host Hotels & Resorts LP $100,000 4.75% 1/3/2023 106,611 0.01%Sunoco Logistics Partners Operations LP $100,000 5.35% 15/5/2045 106,591 0.01%Mid-America Apartments LP $100,000 4.30% 15/10/2023 106,589 0.01%McDonald’s Corp. $100,000 3.50% 1/3/2027 106,545 0.01%Brown-Forman Corp. $100,000 3.50% 15/4/2025 106,511 0.01%International Paper Co. $100,000 3.80% 15/1/2026 106,482 0.01%Duke Energy Indiana LLC $100,000 3.75% 15/5/2046 106,480 0.01%Affiliated Managers Group, Inc. $100,000 4.25% 15/2/2024 106,474 0.01%Realty Income Corp. $100,000 3.88% 15/7/2024 106,458 0.01%American Water Capital Corp. $75,000 6.59% 15/10/2037 106,455 0.01%Eaton Corp. $100,000 3.92% 15/9/2047 106,434 0.01%ERP Operating LP $100,000 3.50% 1/3/2028 106,419 0.01%WRKCo, Inc. $100,000 4.00% 15/3/2028 106,402 0.01%NGPL PipeCo LLC $100,000 4.88% 15/8/2027 106,375 0.01%Bristol-Myers Squibb Co. $100,000 3.45% 15/11/2027 106,345 0.01%Huntsman International LLC $100,000 4.50% 1/5/2029 106,326 0.01%Alabama Power Co. $100,000 3.85% 1/12/2042 106,315 0.01%Penske Truck Leasing Co. LP/PTL Finance Corp. $100,000 4.88% 11/7/2022 106,282 0.01%Pacific Life Insurance Co.^ $100,000 4.30% 24/10/2067 106,239 0.01%Healthpeak Properties, Inc. $100,000 3.88% 15/8/2024 106,234 0.01%TWDC Enterprises 18 Corp. $100,000 3.15% 17/9/2025 106,233 0.01%Aircastle Ltd. $100,000 5.50% 15/2/2022 106,189 0.01%Mid-America Apartments LP $100,000 3.60% 1/6/2027 106,150 0.01%Virginia Electric & Power Co. $100,000 3.50% 15/3/2027 106,129 0.01%
Vanguard Global Corporate Bond Index Fund
580
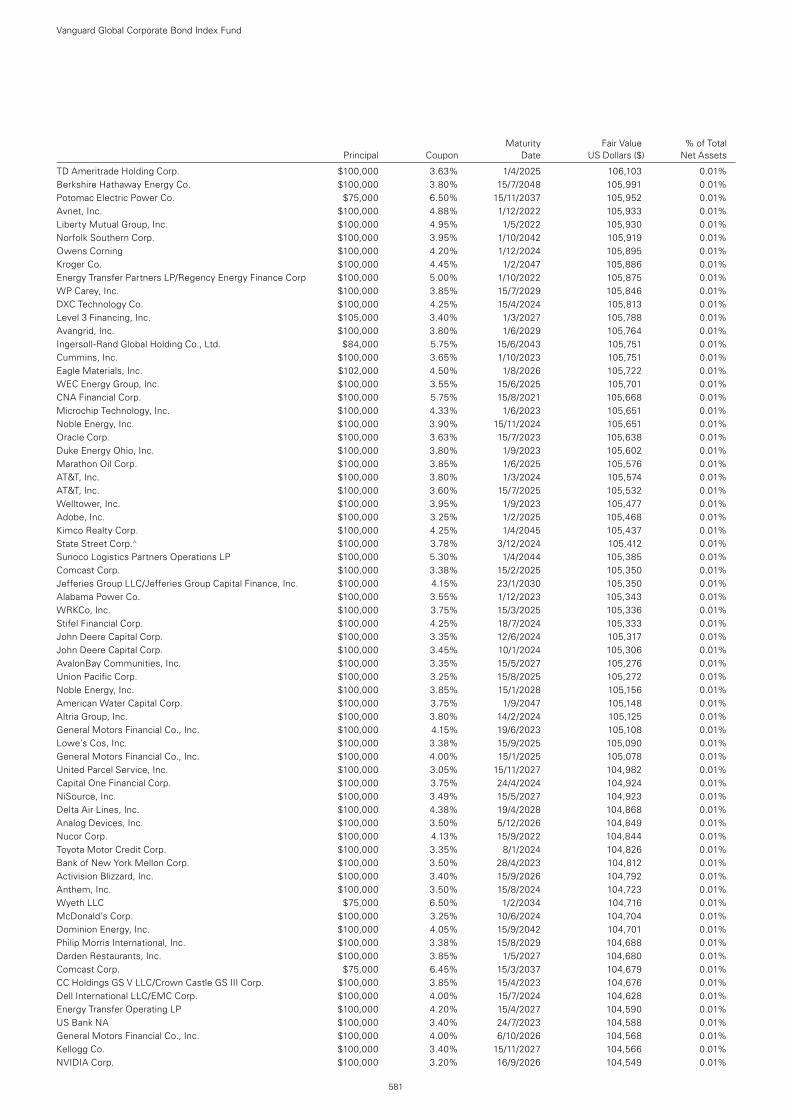
Maturity Fair Value % of Total Principal Coupon Date US Dollars ($) Net Assets
TD Ameritrade Holding Corp. $100,000 3.63% 1/4/2025 106,103 0.01%Berkshire Hathaway Energy Co. $100,000 3.80% 15/7/2048 105,991 0.01%Potomac Electric Power Co. $75,000 6.50% 15/11/2037 105,952 0.01%Avnet, Inc. $100,000 4.88% 1/12/2022 105,933 0.01%Liberty Mutual Group, Inc. $100,000 4.95% 1/5/2022 105,930 0.01%Norfolk Southern Corp. $100,000 3.95% 1/10/2042 105,919 0.01%Owens Corning $100,000 4.20% 1/12/2024 105,895 0.01%Kroger Co. $100,000 4.45% 1/2/2047 105,886 0.01%Energy Transfer Partners LP/Regency Energy Finance Corp $100,000 5.00% 1/10/2022 105,875 0.01%WP Carey, Inc. $100,000 3.85% 15/7/2029 105,846 0.01%DXC Technology Co. $100,000 4.25% 15/4/2024 105,813 0.01%Level 3 Financing, Inc. $105,000 3.40% 1/3/2027 105,788 0.01%Avangrid, Inc. $100,000 3.80% 1/6/2029 105,764 0.01%Ingersoll-Rand Global Holding Co., Ltd. $84,000 5.75% 15/6/2043 105,751 0.01%Cummins, Inc. $100,000 3.65% 1/10/2023 105,751 0.01%Eagle Materials, Inc. $102,000 4.50% 1/8/2026 105,722 0.01%WEC Energy Group, Inc. $100,000 3.55% 15/6/2025 105,701 0.01%CNA Financial Corp. $100,000 5.75% 15/8/2021 105,668 0.01%Microchip Technology, Inc. $100,000 4.33% 1/6/2023 105,651 0.01%Noble Energy, Inc. $100,000 3.90% 15/11/2024 105,651 0.01%Oracle Corp. $100,000 3.63% 15/7/2023 105,638 0.01%Duke Energy Ohio, Inc. $100,000 3.80% 1/9/2023 105,602 0.01%Marathon Oil Corp. $100,000 3.85% 1/6/2025 105,576 0.01%AT&T, Inc. $100,000 3.80% 1/3/2024 105,574 0.01%AT&T, Inc. $100,000 3.60% 15/7/2025 105,532 0.01%Welltower, Inc. $100,000 3.95% 1/9/2023 105,477 0.01%Adobe, Inc. $100,000 3.25% 1/2/2025 105,468 0.01%Kimco Realty Corp. $100,000 4.25% 1/4/2045 105,437 0.01%State Street Corp.^ $100,000 3.78% 3/12/2024 105,412 0.01%Sunoco Logistics Partners Operations LP $100,000 5.30% 1/4/2044 105,385 0.01%Comcast Corp. $100,000 3.38% 15/2/2025 105,350 0.01%Jefferies Group LLC/Jefferies Group Capital Finance, Inc. $100,000 4.15% 23/1/2030 105,350 0.01%Alabama Power Co. $100,000 3.55% 1/12/2023 105,343 0.01%WRKCo, Inc. $100,000 3.75% 15/3/2025 105,336 0.01%Stifel Financial Corp. $100,000 4.25% 18/7/2024 105,333 0.01%John Deere Capital Corp. $100,000 3.35% 12/6/2024 105,317 0.01%John Deere Capital Corp. $100,000 3.45% 10/1/2024 105,306 0.01%AvalonBay Communities, Inc. $100,000 3.35% 15/5/2027 105,276 0.01%Union Pacific Corp. $100,000 3.25% 15/8/2025 105,272 0.01%Noble Energy, Inc. $100,000 3.85% 15/1/2028 105,156 0.01%American Water Capital Corp. $100,000 3.75% 1/9/2047 105,148 0.01%Altria Group, Inc. $100,000 3.80% 14/2/2024 105,125 0.01%General Motors Financial Co., Inc. $100,000 4.15% 19/6/2023 105,108 0.01%Lowe’s Cos, Inc. $100,000 3.38% 15/9/2025 105,090 0.01%General Motors Financial Co., Inc. $100,000 4.00% 15/1/2025 105,078 0.01%United Parcel Service, Inc. $100,000 3.05% 15/11/2027 104,982 0.01%Capital One Financial Corp. $100,000 3.75% 24/4/2024 104,924 0.01%NiSource, Inc. $100,000 3.49% 15/5/2027 104,923 0.01%Delta Air Lines, Inc. $100,000 4.38% 19/4/2028 104,868 0.01%Analog Devices, Inc. $100,000 3.50% 5/12/2026 104,849 0.01%Nucor Corp. $100,000 4.13% 15/9/2022 104,844 0.01%Toyota Motor Credit Corp. $100,000 3.35% 8/1/2024 104,826 0.01%Bank of New York Mellon Corp. $100,000 3.50% 28/4/2023 104,812 0.01%Activision Blizzard, Inc. $100,000 3.40% 15/9/2026 104,792 0.01%Anthem, Inc. $100,000 3.50% 15/8/2024 104,723 0.01%Wyeth LLC $75,000 6.50% 1/2/2034 104,716 0.01%McDonald’s Corp. $100,000 3.25% 10/6/2024 104,704 0.01%Dominion Energy, Inc. $100,000 4.05% 15/9/2042 104,701 0.01%Philip Morris International, Inc. $100,000 3.38% 15/8/2029 104,688 0.01%Darden Restaurants, Inc. $100,000 3.85% 1/5/2027 104,680 0.01%Comcast Corp. $75,000 6.45% 15/3/2037 104,679 0.01%CC Holdings GS V LLC/Crown Castle GS III Corp. $100,000 3.85% 15/4/2023 104,676 0.01%Dell International LLC/EMC Corp. $100,000 4.00% 15/7/2024 104,628 0.01%Energy Transfer Operating LP $100,000 4.20% 15/4/2027 104,590 0.01%US Bank NA $100,000 3.40% 24/7/2023 104,588 0.01%General Motors Financial Co., Inc. $100,000 4.00% 6/10/2026 104,568 0.01%Kellogg Co. $100,000 3.40% 15/11/2027 104,566 0.01%NVIDIA Corp. $100,000 3.20% 16/9/2026 104,549 0.01%
Vanguard Global Corporate Bond Index Fund
581
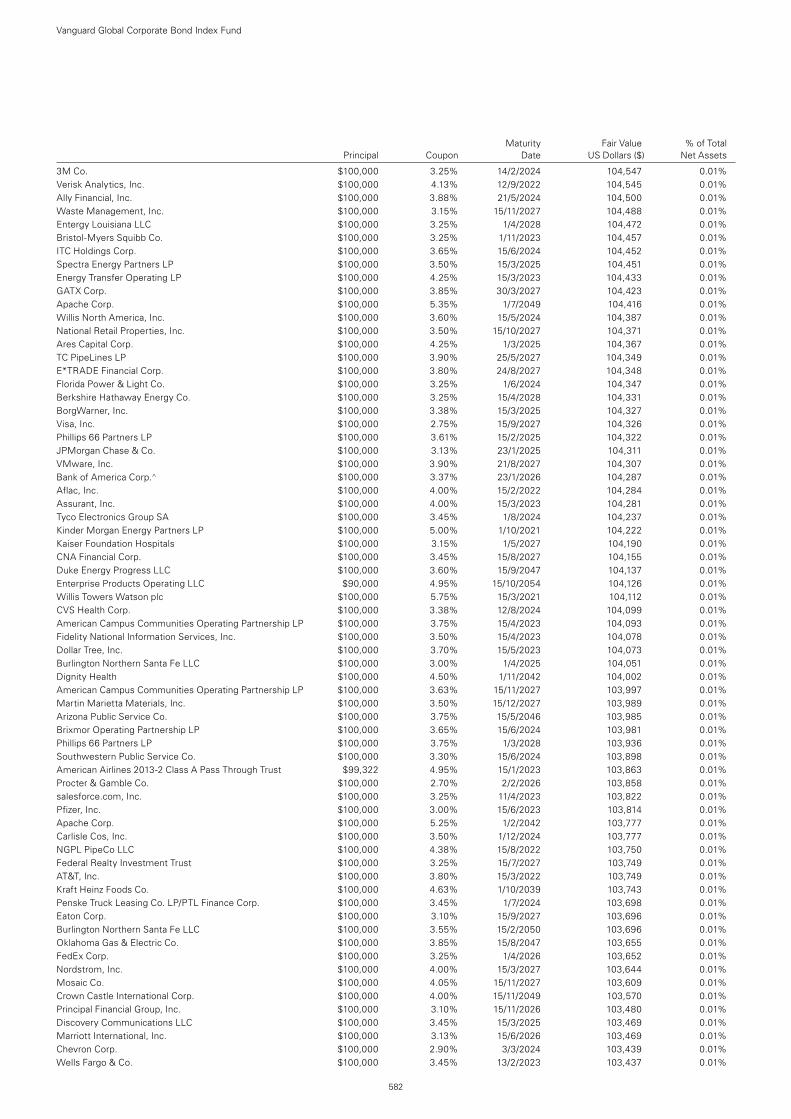
Maturity Fair Value % of Total Principal Coupon Date US Dollars ($) Net Assets
3M Co. $100,000 3.25% 14/2/2024 104,547 0.01%Verisk Analytics, Inc. $100,000 4.13% 12/9/2022 104,545 0.01%Ally Financial, Inc. $100,000 3.88% 21/5/2024 104,500 0.01%Waste Management, Inc. $100,000 3.15% 15/11/2027 104,488 0.01%Entergy Louisiana LLC $100,000 3.25% 1/4/2028 104,472 0.01%Bristol-Myers Squibb Co. $100,000 3.25% 1/11/2023 104,457 0.01%ITC Holdings Corp. $100,000 3.65% 15/6/2024 104,452 0.01%Spectra Energy Partners LP $100,000 3.50% 15/3/2025 104,451 0.01%Energy Transfer Operating LP $100,000 4.25% 15/3/2023 104,433 0.01%GATX Corp. $100,000 3.85% 30/3/2027 104,423 0.01%Apache Corp. $100,000 5.35% 1/7/2049 104,416 0.01%Willis North America, Inc. $100,000 3.60% 15/5/2024 104,387 0.01%National Retail Properties, Inc. $100,000 3.50% 15/10/2027 104,371 0.01%Ares Capital Corp. $100,000 4.25% 1/3/2025 104,367 0.01%TC PipeLines LP $100,000 3.90% 25/5/2027 104,349 0.01%E*TRADE Financial Corp. $100,000 3.80% 24/8/2027 104,348 0.01%Florida Power & Light Co. $100,000 3.25% 1/6/2024 104,347 0.01%Berkshire Hathaway Energy Co. $100,000 3.25% 15/4/2028 104,331 0.01%BorgWarner, Inc. $100,000 3.38% 15/3/2025 104,327 0.01%Visa, Inc. $100,000 2.75% 15/9/2027 104,326 0.01%Phillips 66 Partners LP $100,000 3.61% 15/2/2025 104,322 0.01%JPMorgan Chase & Co. $100,000 3.13% 23/1/2025 104,311 0.01%VMware, Inc. $100,000 3.90% 21/8/2027 104,307 0.01%Bank of America Corp.^ $100,000 3.37% 23/1/2026 104,287 0.01%Aflac, Inc. $100,000 4.00% 15/2/2022 104,284 0.01%Assurant, Inc. $100,000 4.00% 15/3/2023 104,281 0.01%Tyco Electronics Group SA $100,000 3.45% 1/8/2024 104,237 0.01%Kinder Morgan Energy Partners LP $100,000 5.00% 1/10/2021 104,222 0.01%Kaiser Foundation Hospitals $100,000 3.15% 1/5/2027 104,190 0.01%CNA Financial Corp. $100,000 3.45% 15/8/2027 104,155 0.01%Duke Energy Progress LLC $100,000 3.60% 15/9/2047 104,137 0.01%Enterprise Products Operating LLC $90,000 4.95% 15/10/2054 104,126 0.01%Willis Towers Watson plc $100,000 5.75% 15/3/2021 104,112 0.01%CVS Health Corp. $100,000 3.38% 12/8/2024 104,099 0.01%American Campus Communities Operating Partnership LP $100,000 3.75% 15/4/2023 104,093 0.01%Fidelity National Information Services, Inc. $100,000 3.50% 15/4/2023 104,078 0.01%Dollar Tree, Inc. $100,000 3.70% 15/5/2023 104,073 0.01%Burlington Northern Santa Fe LLC $100,000 3.00% 1/4/2025 104,051 0.01%Dignity Health $100,000 4.50% 1/11/2042 104,002 0.01%American Campus Communities Operating Partnership LP $100,000 3.63% 15/11/2027 103,997 0.01%Martin Marietta Materials, Inc. $100,000 3.50% 15/12/2027 103,989 0.01%Arizona Public Service Co. $100,000 3.75% 15/5/2046 103,985 0.01%Brixmor Operating Partnership LP $100,000 3.65% 15/6/2024 103,981 0.01%Phillips 66 Partners LP $100,000 3.75% 1/3/2028 103,936 0.01%Southwestern Public Service Co. $100,000 3.30% 15/6/2024 103,898 0.01%American Airlines 2013-2 Class A Pass Through Trust $99,322 4.95% 15/1/2023 103,863 0.01%Procter & Gamble Co. $100,000 2.70% 2/2/2026 103,858 0.01%salesforce.com, Inc. $100,000 3.25% 11/4/2023 103,822 0.01%Pfizer, Inc. $100,000 3.00% 15/6/2023 103,814 0.01%Apache Corp. $100,000 5.25% 1/2/2042 103,777 0.01%Carlisle Cos, Inc. $100,000 3.50% 1/12/2024 103,777 0.01%NGPL PipeCo LLC $100,000 4.38% 15/8/2022 103,750 0.01%Federal Realty Investment Trust $100,000 3.25% 15/7/2027 103,749 0.01%AT&T, Inc. $100,000 3.80% 15/3/2022 103,749 0.01%Kraft Heinz Foods Co. $100,000 4.63% 1/10/2039 103,743 0.01%Penske Truck Leasing Co. LP/PTL Finance Corp. $100,000 3.45% 1/7/2024 103,698 0.01%Eaton Corp. $100,000 3.10% 15/9/2027 103,696 0.01%Burlington Northern Santa Fe LLC $100,000 3.55% 15/2/2050 103,696 0.01%Oklahoma Gas & Electric Co. $100,000 3.85% 15/8/2047 103,655 0.01%FedEx Corp. $100,000 3.25% 1/4/2026 103,652 0.01%Nordstrom, Inc. $100,000 4.00% 15/3/2027 103,644 0.01%Mosaic Co. $100,000 4.05% 15/11/2027 103,609 0.01%Crown Castle International Corp. $100,000 4.00% 15/11/2049 103,570 0.01%Principal Financial Group, Inc. $100,000 3.10% 15/11/2026 103,480 0.01%Discovery Communications LLC $100,000 3.45% 15/3/2025 103,469 0.01%Marriott International, Inc. $100,000 3.13% 15/6/2026 103,469 0.01%Chevron Corp. $100,000 2.90% 3/3/2024 103,439 0.01%Wells Fargo & Co. $100,000 3.45% 13/2/2023 103,437 0.01%
Vanguard Global Corporate Bond Index Fund
582
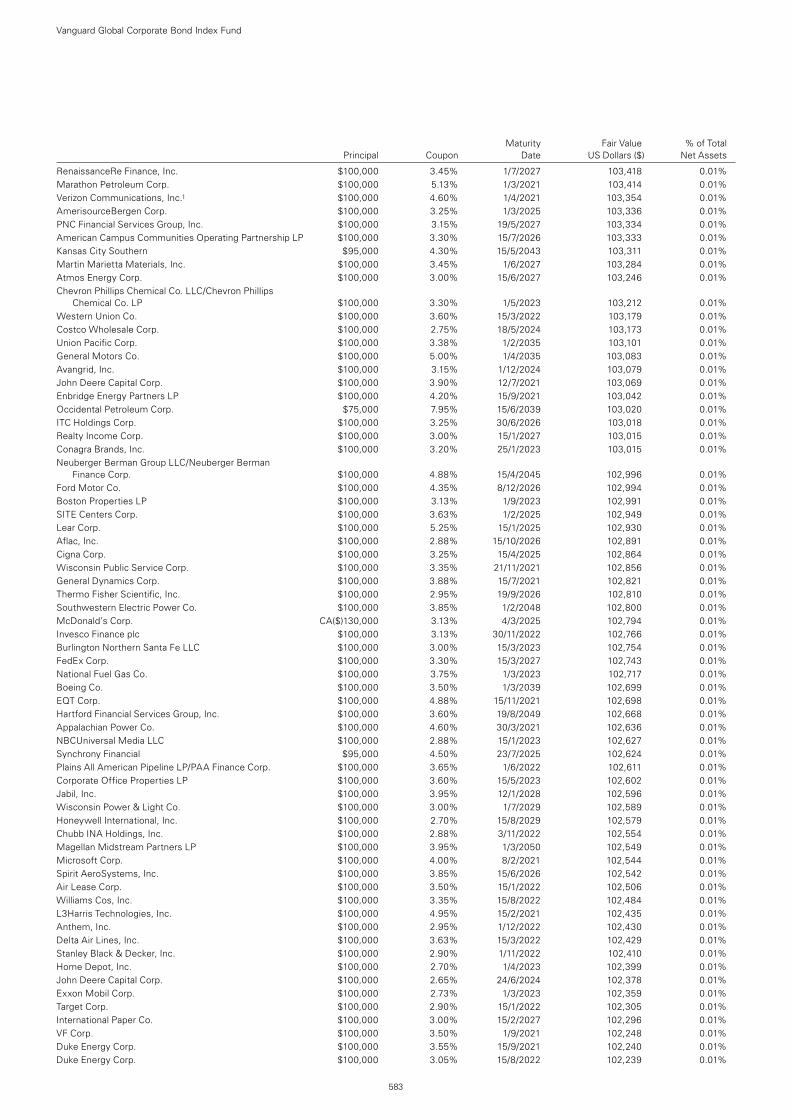
Maturity Fair Value % of Total Principal Coupon Date US Dollars ($) Net Assets
RenaissanceRe Finance, Inc. $100,000 3.45% 1/7/2027 103,418 0.01%Marathon Petroleum Corp. $100,000 5.13% 1/3/2021 103,414 0.01%Verizon Communications, Inc.1 $100,000 4.60% 1/4/2021 103,354 0.01%AmerisourceBergen Corp. $100,000 3.25% 1/3/2025 103,336 0.01%PNC Financial Services Group, Inc. $100,000 3.15% 19/5/2027 103,334 0.01%American Campus Communities Operating Partnership LP $100,000 3.30% 15/7/2026 103,333 0.01%Kansas City Southern $95,000 4.30% 15/5/2043 103,311 0.01%Martin Marietta Materials, Inc. $100,000 3.45% 1/6/2027 103,284 0.01%Atmos Energy Corp. $100,000 3.00% 15/6/2027 103,246 0.01%Chevron Phillips Chemical Co. LLC/Chevron Phillips
Chemical Co. LP $100,000 3.30% 1/5/2023 103,212 0.01%Western Union Co. $100,000 3.60% 15/3/2022 103,179 0.01%Costco Wholesale Corp. $100,000 2.75% 18/5/2024 103,173 0.01%Union Pacific Corp. $100,000 3.38% 1/2/2035 103,101 0.01%General Motors Co. $100,000 5.00% 1/4/2035 103,083 0.01%Avangrid, Inc. $100,000 3.15% 1/12/2024 103,079 0.01%John Deere Capital Corp. $100,000 3.90% 12/7/2021 103,069 0.01%Enbridge Energy Partners LP $100,000 4.20% 15/9/2021 103,042 0.01%Occidental Petroleum Corp. $75,000 7.95% 15/6/2039 103,020 0.01%ITC Holdings Corp. $100,000 3.25% 30/6/2026 103,018 0.01%Realty Income Corp. $100,000 3.00% 15/1/2027 103,015 0.01%Conagra Brands, Inc. $100,000 3.20% 25/1/2023 103,015 0.01%Neuberger Berman Group LLC/Neuberger Berman
Finance Corp. $100,000 4.88% 15/4/2045 102,996 0.01%Ford Motor Co. $100,000 4.35% 8/12/2026 102,994 0.01%Boston Properties LP $100,000 3.13% 1/9/2023 102,991 0.01%SITE Centers Corp. $100,000 3.63% 1/2/2025 102,949 0.01%Lear Corp. $100,000 5.25% 15/1/2025 102,930 0.01%Aflac, Inc. $100,000 2.88% 15/10/2026 102,891 0.01%Cigna Corp. $100,000 3.25% 15/4/2025 102,864 0.01%Wisconsin Public Service Corp. $100,000 3.35% 21/11/2021 102,856 0.01%General Dynamics Corp. $100,000 3.88% 15/7/2021 102,821 0.01%Thermo Fisher Scientific, Inc. $100,000 2.95% 19/9/2026 102,810 0.01%Southwestern Electric Power Co. $100,000 3.85% 1/2/2048 102,800 0.01%McDonald’s Corp. CA($)130,000 3.13% 4/3/2025 102,794 0.01%Invesco Finance plc $100,000 3.13% 30/11/2022 102,766 0.01%Burlington Northern Santa Fe LLC $100,000 3.00% 15/3/2023 102,754 0.01%FedEx Corp. $100,000 3.30% 15/3/2027 102,743 0.01%National Fuel Gas Co. $100,000 3.75% 1/3/2023 102,717 0.01%Boeing Co. $100,000 3.50% 1/3/2039 102,699 0.01%EQT Corp. $100,000 4.88% 15/11/2021 102,698 0.01%Hartford Financial Services Group, Inc. $100,000 3.60% 19/8/2049 102,668 0.01%Appalachian Power Co. $100,000 4.60% 30/3/2021 102,636 0.01%NBCUniversal Media LLC $100,000 2.88% 15/1/2023 102,627 0.01%Synchrony Financial $95,000 4.50% 23/7/2025 102,624 0.01%Plains All American Pipeline LP/PAA Finance Corp. $100,000 3.65% 1/6/2022 102,611 0.01%Corporate Office Properties LP $100,000 3.60% 15/5/2023 102,602 0.01%Jabil, Inc. $100,000 3.95% 12/1/2028 102,596 0.01%Wisconsin Power & Light Co. $100,000 3.00% 1/7/2029 102,589 0.01%Honeywell International, Inc. $100,000 2.70% 15/8/2029 102,579 0.01%Chubb INA Holdings, Inc. $100,000 2.88% 3/11/2022 102,554 0.01%Magellan Midstream Partners LP $100,000 3.95% 1/3/2050 102,549 0.01%Microsoft Corp. $100,000 4.00% 8/2/2021 102,544 0.01%Spirit AeroSystems, Inc. $100,000 3.85% 15/6/2026 102,542 0.01%Air Lease Corp. $100,000 3.50% 15/1/2022 102,506 0.01%Williams Cos, Inc. $100,000 3.35% 15/8/2022 102,484 0.01%L3Harris Technologies, Inc. $100,000 4.95% 15/2/2021 102,435 0.01%Anthem, Inc. $100,000 2.95% 1/12/2022 102,430 0.01%Delta Air Lines, Inc. $100,000 3.63% 15/3/2022 102,429 0.01%Stanley Black & Decker, Inc. $100,000 2.90% 1/11/2022 102,410 0.01%Home Depot, Inc. $100,000 2.70% 1/4/2023 102,399 0.01%John Deere Capital Corp. $100,000 2.65% 24/6/2024 102,378 0.01%Exxon Mobil Corp. $100,000 2.73% 1/3/2023 102,359 0.01%Target Corp. $100,000 2.90% 15/1/2022 102,305 0.01%International Paper Co. $100,000 3.00% 15/2/2027 102,296 0.01%VF Corp. $100,000 3.50% 1/9/2021 102,248 0.01%Duke Energy Corp. $100,000 3.55% 15/9/2021 102,240 0.01%Duke Energy Corp. $100,000 3.05% 15/8/2022 102,239 0.01%
Vanguard Global Corporate Bond Index Fund
583
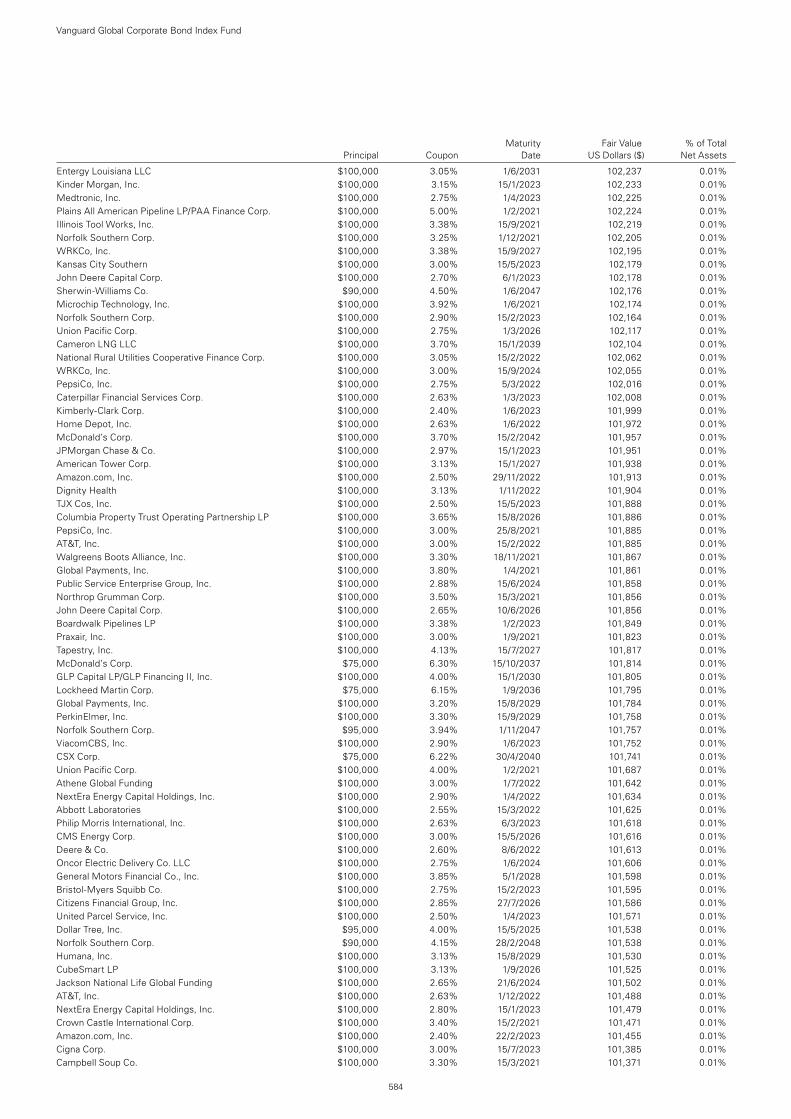
Maturity Fair Value % of Total Principal Coupon Date US Dollars ($) Net Assets
Entergy Louisiana LLC $100,000 3.05% 1/6/2031 102,237 0.01%Kinder Morgan, Inc. $100,000 3.15% 15/1/2023 102,233 0.01%Medtronic, Inc. $100,000 2.75% 1/4/2023 102,225 0.01%Plains All American Pipeline LP/PAA Finance Corp. $100,000 5.00% 1/2/2021 102,224 0.01%Illinois Tool Works, Inc. $100,000 3.38% 15/9/2021 102,219 0.01%Norfolk Southern Corp. $100,000 3.25% 1/12/2021 102,205 0.01%WRKCo, Inc. $100,000 3.38% 15/9/2027 102,195 0.01%Kansas City Southern $100,000 3.00% 15/5/2023 102,179 0.01%John Deere Capital Corp. $100,000 2.70% 6/1/2023 102,178 0.01%Sherwin-Williams Co. $90,000 4.50% 1/6/2047 102,176 0.01%Microchip Technology, Inc. $100,000 3.92% 1/6/2021 102,174 0.01%Norfolk Southern Corp. $100,000 2.90% 15/2/2023 102,164 0.01%Union Pacific Corp. $100,000 2.75% 1/3/2026 102,117 0.01%Cameron LNG LLC $100,000 3.70% 15/1/2039 102,104 0.01%National Rural Utilities Cooperative Finance Corp. $100,000 3.05% 15/2/2022 102,062 0.01%WRKCo, Inc. $100,000 3.00% 15/9/2024 102,055 0.01%PepsiCo, Inc. $100,000 2.75% 5/3/2022 102,016 0.01%Caterpillar Financial Services Corp. $100,000 2.63% 1/3/2023 102,008 0.01%Kimberly-Clark Corp. $100,000 2.40% 1/6/2023 101,999 0.01%Home Depot, Inc. $100,000 2.63% 1/6/2022 101,972 0.01%McDonald’s Corp. $100,000 3.70% 15/2/2042 101,957 0.01%JPMorgan Chase & Co. $100,000 2.97% 15/1/2023 101,951 0.01%American Tower Corp. $100,000 3.13% 15/1/2027 101,938 0.01%Amazon.com, Inc. $100,000 2.50% 29/11/2022 101,913 0.01%Dignity Health $100,000 3.13% 1/11/2022 101,904 0.01%TJX Cos, Inc. $100,000 2.50% 15/5/2023 101,888 0.01%Columbia Property Trust Operating Partnership LP $100,000 3.65% 15/8/2026 101,886 0.01%PepsiCo, Inc. $100,000 3.00% 25/8/2021 101,885 0.01%AT&T, Inc. $100,000 3.00% 15/2/2022 101,885 0.01%Walgreens Boots Alliance, Inc. $100,000 3.30% 18/11/2021 101,867 0.01%Global Payments, Inc. $100,000 3.80% 1/4/2021 101,861 0.01%Public Service Enterprise Group, Inc. $100,000 2.88% 15/6/2024 101,858 0.01%Northrop Grumman Corp. $100,000 3.50% 15/3/2021 101,856 0.01%John Deere Capital Corp. $100,000 2.65% 10/6/2026 101,856 0.01%Boardwalk Pipelines LP $100,000 3.38% 1/2/2023 101,849 0.01%Praxair, Inc. $100,000 3.00% 1/9/2021 101,823 0.01%Tapestry, Inc. $100,000 4.13% 15/7/2027 101,817 0.01%McDonald’s Corp. $75,000 6.30% 15/10/2037 101,814 0.01%GLP Capital LP/GLP Financing II, Inc. $100,000 4.00% 15/1/2030 101,805 0.01%Lockheed Martin Corp. $75,000 6.15% 1/9/2036 101,795 0.01%Global Payments, Inc. $100,000 3.20% 15/8/2029 101,784 0.01%PerkinElmer, Inc. $100,000 3.30% 15/9/2029 101,758 0.01%Norfolk Southern Corp. $95,000 3.94% 1/11/2047 101,757 0.01%ViacomCBS, Inc. $100,000 2.90% 1/6/2023 101,752 0.01%CSX Corp. $75,000 6.22% 30/4/2040 101,741 0.01%Union Pacific Corp. $100,000 4.00% 1/2/2021 101,687 0.01%Athene Global Funding $100,000 3.00% 1/7/2022 101,642 0.01%NextEra Energy Capital Holdings, Inc. $100,000 2.90% 1/4/2022 101,634 0.01%Abbott Laboratories $100,000 2.55% 15/3/2022 101,625 0.01%Philip Morris International, Inc. $100,000 2.63% 6/3/2023 101,618 0.01%CMS Energy Corp. $100,000 3.00% 15/5/2026 101,616 0.01%Deere & Co. $100,000 2.60% 8/6/2022 101,613 0.01%Oncor Electric Delivery Co. LLC $100,000 2.75% 1/6/2024 101,606 0.01%General Motors Financial Co., Inc. $100,000 3.85% 5/1/2028 101,598 0.01%Bristol-Myers Squibb Co. $100,000 2.75% 15/2/2023 101,595 0.01%Citizens Financial Group, Inc. $100,000 2.85% 27/7/2026 101,586 0.01%United Parcel Service, Inc. $100,000 2.50% 1/4/2023 101,571 0.01%Dollar Tree, Inc. $95,000 4.00% 15/5/2025 101,538 0.01%Norfolk Southern Corp. $90,000 4.15% 28/2/2048 101,538 0.01%Humana, Inc. $100,000 3.13% 15/8/2029 101,530 0.01%CubeSmart LP $100,000 3.13% 1/9/2026 101,525 0.01%Jackson National Life Global Funding $100,000 2.65% 21/6/2024 101,502 0.01%AT&T, Inc. $100,000 2.63% 1/12/2022 101,488 0.01%NextEra Energy Capital Holdings, Inc. $100,000 2.80% 15/1/2023 101,479 0.01%Crown Castle International Corp. $100,000 3.40% 15/2/2021 101,471 0.01%Amazon.com, Inc. $100,000 2.40% 22/2/2023 101,455 0.01%Cigna Corp. $100,000 3.00% 15/7/2023 101,385 0.01%Campbell Soup Co. $100,000 3.30% 15/3/2021 101,371 0.01%
Vanguard Global Corporate Bond Index Fund
584
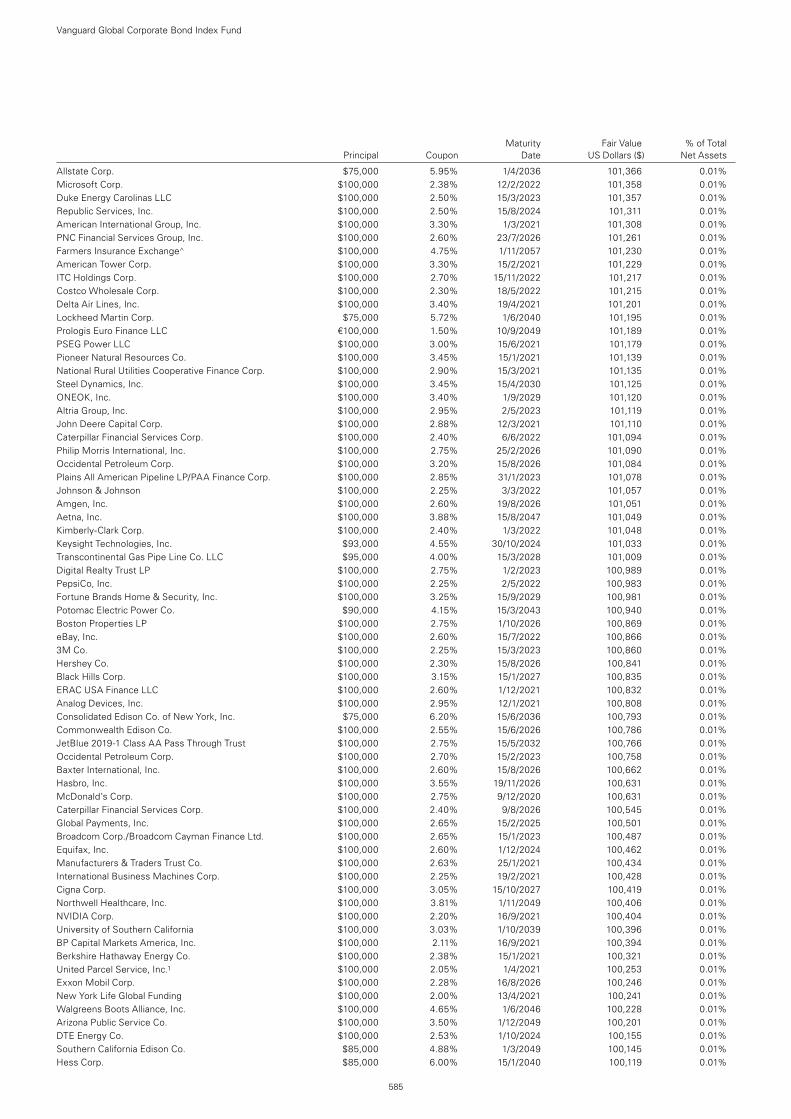
Maturity Fair Value % of Total Principal Coupon Date US Dollars ($) Net Assets
Allstate Corp. $75,000 5.95% 1/4/2036 101,366 0.01%Microsoft Corp. $100,000 2.38% 12/2/2022 101,358 0.01%Duke Energy Carolinas LLC $100,000 2.50% 15/3/2023 101,357 0.01%Republic Services, Inc. $100,000 2.50% 15/8/2024 101,311 0.01%American International Group, Inc. $100,000 3.30% 1/3/2021 101,308 0.01%PNC Financial Services Group, Inc. $100,000 2.60% 23/7/2026 101,261 0.01%Farmers Insurance Exchange^ $100,000 4.75% 1/11/2057 101,230 0.01%American Tower Corp. $100,000 3.30% 15/2/2021 101,229 0.01%ITC Holdings Corp. $100,000 2.70% 15/11/2022 101,217 0.01%Costco Wholesale Corp. $100,000 2.30% 18/5/2022 101,215 0.01%Delta Air Lines, Inc. $100,000 3.40% 19/4/2021 101,201 0.01%Lockheed Martin Corp. $75,000 5.72% 1/6/2040 101,195 0.01%Prologis Euro Finance LLC €100,000 1.50% 10/9/2049 101,189 0.01%PSEG Power LLC $100,000 3.00% 15/6/2021 101,179 0.01%Pioneer Natural Resources Co. $100,000 3.45% 15/1/2021 101,139 0.01%National Rural Utilities Cooperative Finance Corp. $100,000 2.90% 15/3/2021 101,135 0.01%Steel Dynamics, Inc. $100,000 3.45% 15/4/2030 101,125 0.01%ONEOK, Inc. $100,000 3.40% 1/9/2029 101,120 0.01%Altria Group, Inc. $100,000 2.95% 2/5/2023 101,119 0.01%John Deere Capital Corp. $100,000 2.88% 12/3/2021 101,110 0.01%Caterpillar Financial Services Corp. $100,000 2.40% 6/6/2022 101,094 0.01%Philip Morris International, Inc. $100,000 2.75% 25/2/2026 101,090 0.01%Occidental Petroleum Corp. $100,000 3.20% 15/8/2026 101,084 0.01%Plains All American Pipeline LP/PAA Finance Corp. $100,000 2.85% 31/1/2023 101,078 0.01%Johnson & Johnson $100,000 2.25% 3/3/2022 101,057 0.01%Amgen, Inc. $100,000 2.60% 19/8/2026 101,051 0.01%Aetna, Inc. $100,000 3.88% 15/8/2047 101,049 0.01%Kimberly-Clark Corp. $100,000 2.40% 1/3/2022 101,048 0.01%Keysight Technologies, Inc. $93,000 4.55% 30/10/2024 101,033 0.01%Transcontinental Gas Pipe Line Co. LLC $95,000 4.00% 15/3/2028 101,009 0.01%Digital Realty Trust LP $100,000 2.75% 1/2/2023 100,989 0.01%PepsiCo, Inc. $100,000 2.25% 2/5/2022 100,983 0.01%Fortune Brands Home & Security, Inc. $100,000 3.25% 15/9/2029 100,981 0.01%Potomac Electric Power Co. $90,000 4.15% 15/3/2043 100,940 0.01%Boston Properties LP $100,000 2.75% 1/10/2026 100,869 0.01%eBay, Inc. $100,000 2.60% 15/7/2022 100,866 0.01%3M Co. $100,000 2.25% 15/3/2023 100,860 0.01%Hershey Co. $100,000 2.30% 15/8/2026 100,841 0.01%Black Hills Corp. $100,000 3.15% 15/1/2027 100,835 0.01%ERAC USA Finance LLC $100,000 2.60% 1/12/2021 100,832 0.01%Analog Devices, Inc. $100,000 2.95% 12/1/2021 100,808 0.01%Consolidated Edison Co. of New York, Inc. $75,000 6.20% 15/6/2036 100,793 0.01%Commonwealth Edison Co. $100,000 2.55% 15/6/2026 100,786 0.01%JetBlue 2019-1 Class AA Pass Through Trust $100,000 2.75% 15/5/2032 100,766 0.01%Occidental Petroleum Corp. $100,000 2.70% 15/2/2023 100,758 0.01%Baxter International, Inc. $100,000 2.60% 15/8/2026 100,662 0.01%Hasbro, Inc. $100,000 3.55% 19/11/2026 100,631 0.01%McDonald’s Corp. $100,000 2.75% 9/12/2020 100,631 0.01%Caterpillar Financial Services Corp. $100,000 2.40% 9/8/2026 100,545 0.01%Global Payments, Inc. $100,000 2.65% 15/2/2025 100,501 0.01%Broadcom Corp./Broadcom Cayman Finance Ltd. $100,000 2.65% 15/1/2023 100,487 0.01%Equifax, Inc. $100,000 2.60% 1/12/2024 100,462 0.01%Manufacturers & Traders Trust Co. $100,000 2.63% 25/1/2021 100,434 0.01%International Business Machines Corp. $100,000 2.25% 19/2/2021 100,428 0.01%Cigna Corp. $100,000 3.05% 15/10/2027 100,419 0.01%Northwell Healthcare, Inc. $100,000 3.81% 1/11/2049 100,406 0.01%NVIDIA Corp. $100,000 2.20% 16/9/2021 100,404 0.01%University of Southern California $100,000 3.03% 1/10/2039 100,396 0.01%BP Capital Markets America, Inc. $100,000 2.11% 16/9/2021 100,394 0.01%Berkshire Hathaway Energy Co. $100,000 2.38% 15/1/2021 100,321 0.01%United Parcel Service, Inc.1 $100,000 2.05% 1/4/2021 100,253 0.01%Exxon Mobil Corp. $100,000 2.28% 16/8/2026 100,246 0.01%New York Life Global Funding $100,000 2.00% 13/4/2021 100,241 0.01%Walgreens Boots Alliance, Inc. $100,000 4.65% 1/6/2046 100,228 0.01%Arizona Public Service Co. $100,000 3.50% 1/12/2049 100,201 0.01%DTE Energy Co. $100,000 2.53% 1/10/2024 100,155 0.01%Southern California Edison Co. $85,000 4.88% 1/3/2049 100,145 0.01%Hess Corp. $85,000 6.00% 15/1/2040 100,119 0.01%
Vanguard Global Corporate Bond Index Fund
585
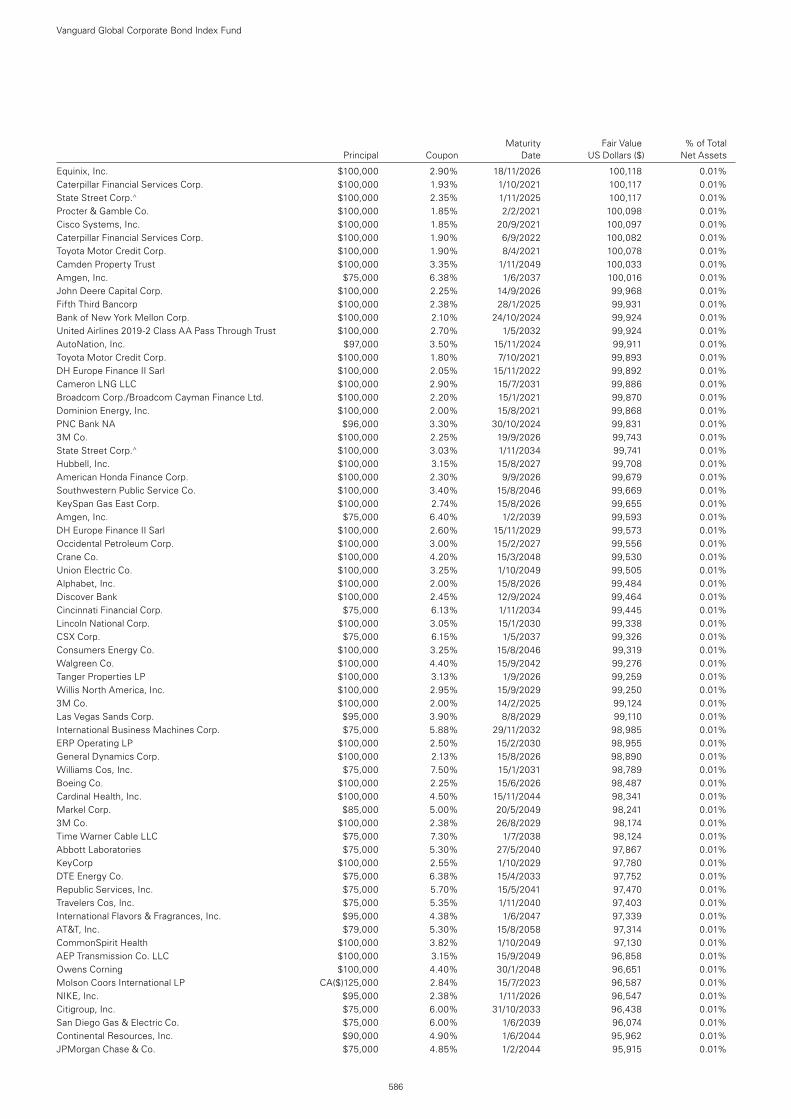
Maturity Fair Value % of Total Principal Coupon Date US Dollars ($) Net Assets
Equinix, Inc. $100,000 2.90% 18/11/2026 100,118 0.01%Caterpillar Financial Services Corp. $100,000 1.93% 1/10/2021 100,117 0.01%State Street Corp.^ $100,000 2.35% 1/11/2025 100,117 0.01%Procter & Gamble Co. $100,000 1.85% 2/2/2021 100,098 0.01%Cisco Systems, Inc. $100,000 1.85% 20/9/2021 100,097 0.01%Caterpillar Financial Services Corp. $100,000 1.90% 6/9/2022 100,082 0.01%Toyota Motor Credit Corp. $100,000 1.90% 8/4/2021 100,078 0.01%Camden Property Trust $100,000 3.35% 1/11/2049 100,033 0.01%Amgen, Inc. $75,000 6.38% 1/6/2037 100,016 0.01%John Deere Capital Corp. $100,000 2.25% 14/9/2026 99,968 0.01%Fifth Third Bancorp $100,000 2.38% 28/1/2025 99,931 0.01%Bank of New York Mellon Corp. $100,000 2.10% 24/10/2024 99,924 0.01%United Airlines 2019-2 Class AA Pass Through Trust $100,000 2.70% 1/5/2032 99,924 0.01%AutoNation, Inc. $97,000 3.50% 15/11/2024 99,911 0.01%Toyota Motor Credit Corp. $100,000 1.80% 7/10/2021 99,893 0.01%DH Europe Finance II Sarl $100,000 2.05% 15/11/2022 99,892 0.01%Cameron LNG LLC $100,000 2.90% 15/7/2031 99,886 0.01%Broadcom Corp./Broadcom Cayman Finance Ltd. $100,000 2.20% 15/1/2021 99,870 0.01%Dominion Energy, Inc. $100,000 2.00% 15/8/2021 99,868 0.01%PNC Bank NA $96,000 3.30% 30/10/2024 99,831 0.01%3M Co. $100,000 2.25% 19/9/2026 99,743 0.01%State Street Corp.^ $100,000 3.03% 1/11/2034 99,741 0.01%Hubbell, Inc. $100,000 3.15% 15/8/2027 99,708 0.01%American Honda Finance Corp. $100,000 2.30% 9/9/2026 99,679 0.01%Southwestern Public Service Co. $100,000 3.40% 15/8/2046 99,669 0.01%KeySpan Gas East Corp. $100,000 2.74% 15/8/2026 99,655 0.01%Amgen, Inc. $75,000 6.40% 1/2/2039 99,593 0.01%DH Europe Finance II Sarl $100,000 2.60% 15/11/2029 99,573 0.01%Occidental Petroleum Corp. $100,000 3.00% 15/2/2027 99,556 0.01%Crane Co. $100,000 4.20% 15/3/2048 99,530 0.01%Union Electric Co. $100,000 3.25% 1/10/2049 99,505 0.01%Alphabet, Inc. $100,000 2.00% 15/8/2026 99,484 0.01%Discover Bank $100,000 2.45% 12/9/2024 99,464 0.01%Cincinnati Financial Corp. $75,000 6.13% 1/11/2034 99,445 0.01%Lincoln National Corp. $100,000 3.05% 15/1/2030 99,338 0.01%CSX Corp. $75,000 6.15% 1/5/2037 99,326 0.01%Consumers Energy Co. $100,000 3.25% 15/8/2046 99,319 0.01%Walgreen Co. $100,000 4.40% 15/9/2042 99,276 0.01%Tanger Properties LP $100,000 3.13% 1/9/2026 99,259 0.01%Willis North America, Inc. $100,000 2.95% 15/9/2029 99,250 0.01%3M Co. $100,000 2.00% 14/2/2025 99,124 0.01%Las Vegas Sands Corp. $95,000 3.90% 8/8/2029 99,110 0.01%International Business Machines Corp. $75,000 5.88% 29/11/2032 98,985 0.01%ERP Operating LP $100,000 2.50% 15/2/2030 98,955 0.01%General Dynamics Corp. $100,000 2.13% 15/8/2026 98,890 0.01%Williams Cos, Inc. $75,000 7.50% 15/1/2031 98,789 0.01%Boeing Co. $100,000 2.25% 15/6/2026 98,487 0.01%Cardinal Health, Inc. $100,000 4.50% 15/11/2044 98,341 0.01%Markel Corp. $85,000 5.00% 20/5/2049 98,241 0.01%3M Co. $100,000 2.38% 26/8/2029 98,174 0.01%Time Warner Cable LLC $75,000 7.30% 1/7/2038 98,124 0.01%Abbott Laboratories $75,000 5.30% 27/5/2040 97,867 0.01%KeyCorp $100,000 2.55% 1/10/2029 97,780 0.01%DTE Energy Co. $75,000 6.38% 15/4/2033 97,752 0.01%Republic Services, Inc. $75,000 5.70% 15/5/2041 97,470 0.01%Travelers Cos, Inc. $75,000 5.35% 1/11/2040 97,403 0.01%International Flavors & Fragrances, Inc. $95,000 4.38% 1/6/2047 97,339 0.01%AT&T, Inc. $79,000 5.30% 15/8/2058 97,314 0.01%CommonSpirit Health $100,000 3.82% 1/10/2049 97,130 0.01%AEP Transmission Co. LLC $100,000 3.15% 15/9/2049 96,858 0.01%Owens Corning $100,000 4.40% 30/1/2048 96,651 0.01%Molson Coors International LP CA($)125,000 2.84% 15/7/2023 96,587 0.01%NIKE, Inc. $95,000 2.38% 1/11/2026 96,547 0.01%Citigroup, Inc. $75,000 6.00% 31/10/2033 96,438 0.01%San Diego Gas & Electric Co. $75,000 6.00% 1/6/2039 96,074 0.01%Continental Resources, Inc. $90,000 4.90% 1/6/2044 95,962 0.01%JPMorgan Chase & Co. $75,000 4.85% 1/2/2044 95,915 0.01%
Vanguard Global Corporate Bond Index Fund
586
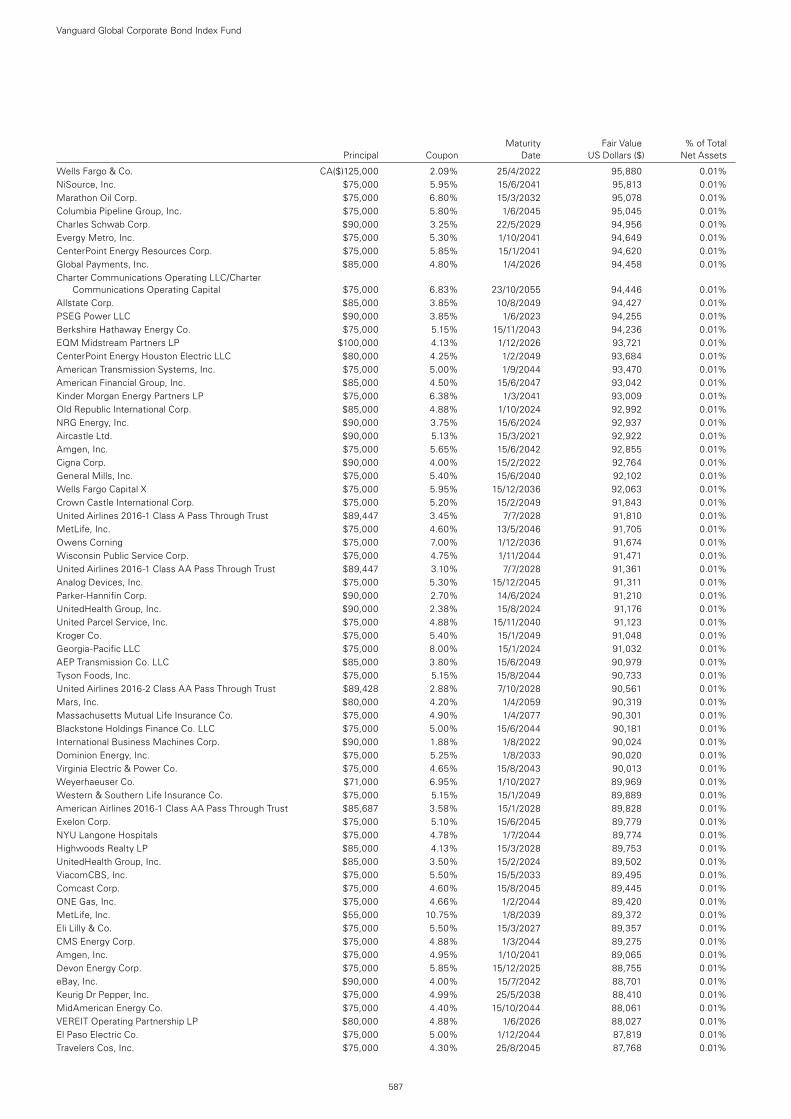
Maturity Fair Value % of Total Principal Coupon Date US Dollars ($) Net Assets
Wells Fargo & Co. CA($)125,000 2.09% 25/4/2022 95,880 0.01%NiSource, Inc. $75,000 5.95% 15/6/2041 95,813 0.01%Marathon Oil Corp. $75,000 6.80% 15/3/2032 95,078 0.01%Columbia Pipeline Group, Inc. $75,000 5.80% 1/6/2045 95,045 0.01%Charles Schwab Corp. $90,000 3.25% 22/5/2029 94,956 0.01%Evergy Metro, Inc. $75,000 5.30% 1/10/2041 94,649 0.01%CenterPoint Energy Resources Corp. $75,000 5.85% 15/1/2041 94,620 0.01%Global Payments, Inc. $85,000 4.80% 1/4/2026 94,458 0.01%Charter Communications Operating LLC/Charter
Communications Operating Capital $75,000 6.83% 23/10/2055 94,446 0.01%Allstate Corp. $85,000 3.85% 10/8/2049 94,427 0.01%PSEG Power LLC $90,000 3.85% 1/6/2023 94,255 0.01%Berkshire Hathaway Energy Co. $75,000 5.15% 15/11/2043 94,236 0.01%EQM Midstream Partners LP $100,000 4.13% 1/12/2026 93,721 0.01%CenterPoint Energy Houston Electric LLC $80,000 4.25% 1/2/2049 93,684 0.01%American Transmission Systems, Inc. $75,000 5.00% 1/9/2044 93,470 0.01%American Financial Group, Inc. $85,000 4.50% 15/6/2047 93,042 0.01%Kinder Morgan Energy Partners LP $75,000 6.38% 1/3/2041 93,009 0.01%Old Republic International Corp. $85,000 4.88% 1/10/2024 92,992 0.01%NRG Energy, Inc. $90,000 3.75% 15/6/2024 92,937 0.01%Aircastle Ltd. $90,000 5.13% 15/3/2021 92,922 0.01%Amgen, Inc. $75,000 5.65% 15/6/2042 92,855 0.01%Cigna Corp. $90,000 4.00% 15/2/2022 92,764 0.01%General Mills, Inc. $75,000 5.40% 15/6/2040 92,102 0.01%Wells Fargo Capital X $75,000 5.95% 15/12/2036 92,063 0.01%Crown Castle International Corp. $75,000 5.20% 15/2/2049 91,843 0.01%United Airlines 2016-1 Class A Pass Through Trust $89,447 3.45% 7/7/2028 91,810 0.01%MetLife, Inc. $75,000 4.60% 13/5/2046 91,705 0.01%Owens Corning $75,000 7.00% 1/12/2036 91,674 0.01%Wisconsin Public Service Corp. $75,000 4.75% 1/11/2044 91,471 0.01%United Airlines 2016-1 Class AA Pass Through Trust $89,447 3.10% 7/7/2028 91,361 0.01%Analog Devices, Inc. $75,000 5.30% 15/12/2045 91,311 0.01%Parker-Hannifin Corp. $90,000 2.70% 14/6/2024 91,210 0.01%UnitedHealth Group, Inc. $90,000 2.38% 15/8/2024 91,176 0.01%United Parcel Service, Inc. $75,000 4.88% 15/11/2040 91,123 0.01%Kroger Co. $75,000 5.40% 15/1/2049 91,048 0.01%Georgia-Pacific LLC $75,000 8.00% 15/1/2024 91,032 0.01%AEP Transmission Co. LLC $85,000 3.80% 15/6/2049 90,979 0.01%Tyson Foods, Inc. $75,000 5.15% 15/8/2044 90,733 0.01%United Airlines 2016-2 Class AA Pass Through Trust $89,428 2.88% 7/10/2028 90,561 0.01%Mars, Inc. $80,000 4.20% 1/4/2059 90,319 0.01%Massachusetts Mutual Life Insurance Co. $75,000 4.90% 1/4/2077 90,301 0.01%Blackstone Holdings Finance Co. LLC $75,000 5.00% 15/6/2044 90,181 0.01%International Business Machines Corp. $90,000 1.88% 1/8/2022 90,024 0.01%Dominion Energy, Inc. $75,000 5.25% 1/8/2033 90,020 0.01%Virginia Electric & Power Co. $75,000 4.65% 15/8/2043 90,013 0.01%Weyerhaeuser Co. $71,000 6.95% 1/10/2027 89,969 0.01%Western & Southern Life Insurance Co. $75,000 5.15% 15/1/2049 89,889 0.01%American Airlines 2016-1 Class AA Pass Through Trust $85,687 3.58% 15/1/2028 89,828 0.01%Exelon Corp. $75,000 5.10% 15/6/2045 89,779 0.01%NYU Langone Hospitals $75,000 4.78% 1/7/2044 89,774 0.01%Highwoods Realty LP $85,000 4.13% 15/3/2028 89,753 0.01%UnitedHealth Group, Inc. $85,000 3.50% 15/2/2024 89,502 0.01%ViacomCBS, Inc. $75,000 5.50% 15/5/2033 89,495 0.01%Comcast Corp. $75,000 4.60% 15/8/2045 89,445 0.01%ONE Gas, Inc. $75,000 4.66% 1/2/2044 89,420 0.01%MetLife, Inc. $55,000 10.75% 1/8/2039 89,372 0.01%Eli Lilly & Co. $75,000 5.50% 15/3/2027 89,357 0.01%CMS Energy Corp. $75,000 4.88% 1/3/2044 89,275 0.01%Amgen, Inc. $75,000 4.95% 1/10/2041 89,065 0.01%Devon Energy Corp. $75,000 5.85% 15/12/2025 88,755 0.01%eBay, Inc. $90,000 4.00% 15/7/2042 88,701 0.01%Keurig Dr Pepper, Inc. $75,000 4.99% 25/5/2038 88,410 0.01%MidAmerican Energy Co. $75,000 4.40% 15/10/2044 88,061 0.01%VEREIT Operating Partnership LP $80,000 4.88% 1/6/2026 88,027 0.01%El Paso Electric Co. $75,000 5.00% 1/12/2044 87,819 0.01%Travelers Cos, Inc. $75,000 4.30% 25/8/2045 87,768 0.01%
Vanguard Global Corporate Bond Index Fund
587
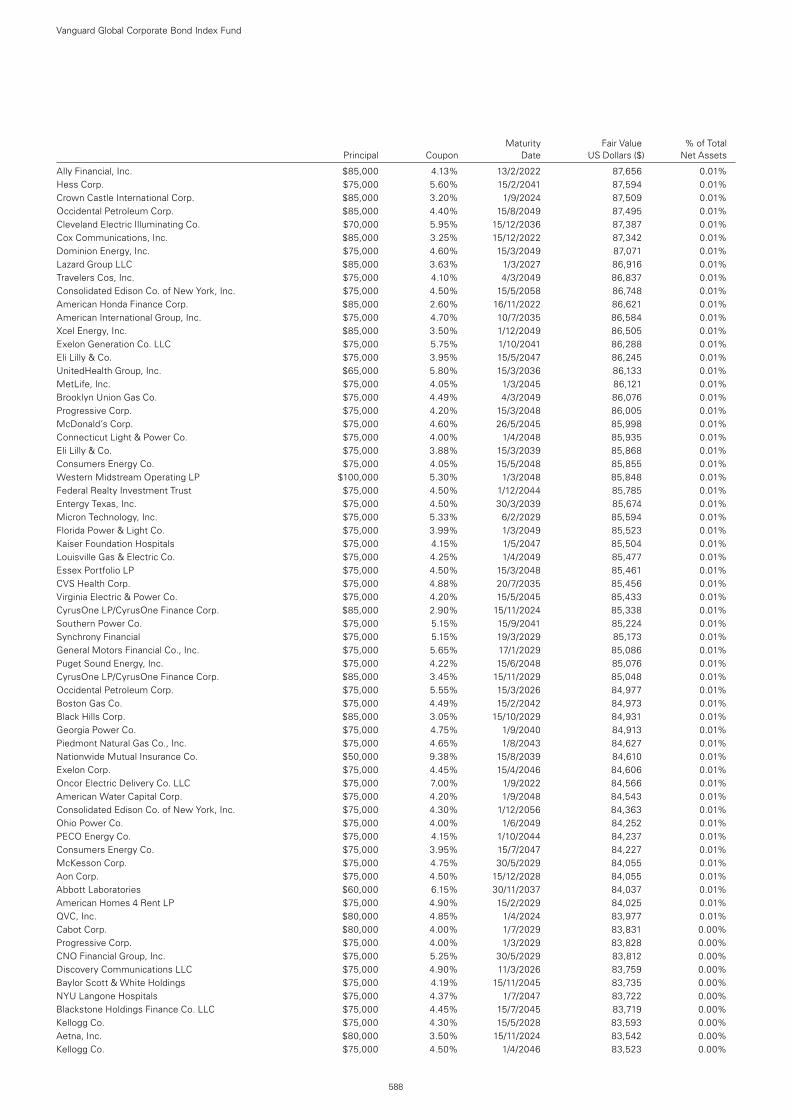
Maturity Fair Value % of Total Principal Coupon Date US Dollars ($) Net Assets
Ally Financial, Inc. $85,000 4.13% 13/2/2022 87,656 0.01%Hess Corp. $75,000 5.60% 15/2/2041 87,594 0.01%Crown Castle International Corp. $85,000 3.20% 1/9/2024 87,509 0.01%Occidental Petroleum Corp. $85,000 4.40% 15/8/2049 87,495 0.01%Cleveland Electric Illuminating Co. $70,000 5.95% 15/12/2036 87,387 0.01%Cox Communications, Inc. $85,000 3.25% 15/12/2022 87,342 0.01%Dominion Energy, Inc. $75,000 4.60% 15/3/2049 87,071 0.01%Lazard Group LLC $85,000 3.63% 1/3/2027 86,916 0.01%Travelers Cos, Inc. $75,000 4.10% 4/3/2049 86,837 0.01%Consolidated Edison Co. of New York, Inc. $75,000 4.50% 15/5/2058 86,748 0.01%American Honda Finance Corp. $85,000 2.60% 16/11/2022 86,621 0.01%American International Group, Inc. $75,000 4.70% 10/7/2035 86,584 0.01%Xcel Energy, Inc. $85,000 3.50% 1/12/2049 86,505 0.01%Exelon Generation Co. LLC $75,000 5.75% 1/10/2041 86,288 0.01%Eli Lilly & Co. $75,000 3.95% 15/5/2047 86,245 0.01%UnitedHealth Group, Inc. $65,000 5.80% 15/3/2036 86,133 0.01%MetLife, Inc. $75,000 4.05% 1/3/2045 86,121 0.01%Brooklyn Union Gas Co. $75,000 4.49% 4/3/2049 86,076 0.01%Progressive Corp. $75,000 4.20% 15/3/2048 86,005 0.01%McDonald’s Corp. $75,000 4.60% 26/5/2045 85,998 0.01%Connecticut Light & Power Co. $75,000 4.00% 1/4/2048 85,935 0.01%Eli Lilly & Co. $75,000 3.88% 15/3/2039 85,868 0.01%Consumers Energy Co. $75,000 4.05% 15/5/2048 85,855 0.01%Western Midstream Operating LP $100,000 5.30% 1/3/2048 85,848 0.01%Federal Realty Investment Trust $75,000 4.50% 1/12/2044 85,785 0.01%Entergy Texas, Inc. $75,000 4.50% 30/3/2039 85,674 0.01%Micron Technology, Inc. $75,000 5.33% 6/2/2029 85,594 0.01%Florida Power & Light Co. $75,000 3.99% 1/3/2049 85,523 0.01%Kaiser Foundation Hospitals $75,000 4.15% 1/5/2047 85,504 0.01%Louisville Gas & Electric Co. $75,000 4.25% 1/4/2049 85,477 0.01%Essex Portfolio LP $75,000 4.50% 15/3/2048 85,461 0.01%CVS Health Corp. $75,000 4.88% 20/7/2035 85,456 0.01%Virginia Electric & Power Co. $75,000 4.20% 15/5/2045 85,433 0.01%CyrusOne LP/CyrusOne Finance Corp. $85,000 2.90% 15/11/2024 85,338 0.01%Southern Power Co. $75,000 5.15% 15/9/2041 85,224 0.01%Synchrony Financial $75,000 5.15% 19/3/2029 85,173 0.01%General Motors Financial Co., Inc. $75,000 5.65% 17/1/2029 85,086 0.01%Puget Sound Energy, Inc. $75,000 4.22% 15/6/2048 85,076 0.01%CyrusOne LP/CyrusOne Finance Corp. $85,000 3.45% 15/11/2029 85,048 0.01%Occidental Petroleum Corp. $75,000 5.55% 15/3/2026 84,977 0.01%Boston Gas Co. $75,000 4.49% 15/2/2042 84,973 0.01%Black Hills Corp. $85,000 3.05% 15/10/2029 84,931 0.01%Georgia Power Co. $75,000 4.75% 1/9/2040 84,913 0.01%Piedmont Natural Gas Co., Inc. $75,000 4.65% 1/8/2043 84,627 0.01%Nationwide Mutual Insurance Co. $50,000 9.38% 15/8/2039 84,610 0.01%Exelon Corp. $75,000 4.45% 15/4/2046 84,606 0.01%Oncor Electric Delivery Co. LLC $75,000 7.00% 1/9/2022 84,566 0.01%American Water Capital Corp. $75,000 4.20% 1/9/2048 84,543 0.01%Consolidated Edison Co. of New York, Inc. $75,000 4.30% 1/12/2056 84,363 0.01%Ohio Power Co. $75,000 4.00% 1/6/2049 84,252 0.01%PECO Energy Co. $75,000 4.15% 1/10/2044 84,237 0.01%Consumers Energy Co. $75,000 3.95% 15/7/2047 84,227 0.01%McKesson Corp. $75,000 4.75% 30/5/2029 84,055 0.01%Aon Corp. $75,000 4.50% 15/12/2028 84,055 0.01%Abbott Laboratories $60,000 6.15% 30/11/2037 84,037 0.01%American Homes 4 Rent LP $75,000 4.90% 15/2/2029 84,025 0.01%QVC, Inc. $80,000 4.85% 1/4/2024 83,977 0.01%Cabot Corp. $80,000 4.00% 1/7/2029 83,831 0.00%Progressive Corp. $75,000 4.00% 1/3/2029 83,828 0.00%CNO Financial Group, Inc. $75,000 5.25% 30/5/2029 83,812 0.00%Discovery Communications LLC $75,000 4.90% 11/3/2026 83,759 0.00%Baylor Scott & White Holdings $75,000 4.19% 15/11/2045 83,735 0.00%NYU Langone Hospitals $75,000 4.37% 1/7/2047 83,722 0.00%Blackstone Holdings Finance Co. LLC $75,000 4.45% 15/7/2045 83,719 0.00%Kellogg Co. $75,000 4.30% 15/5/2028 83,593 0.00%Aetna, Inc. $80,000 3.50% 15/11/2024 83,542 0.00%Kellogg Co. $75,000 4.50% 1/4/2046 83,523 0.00%
Vanguard Global Corporate Bond Index Fund
588
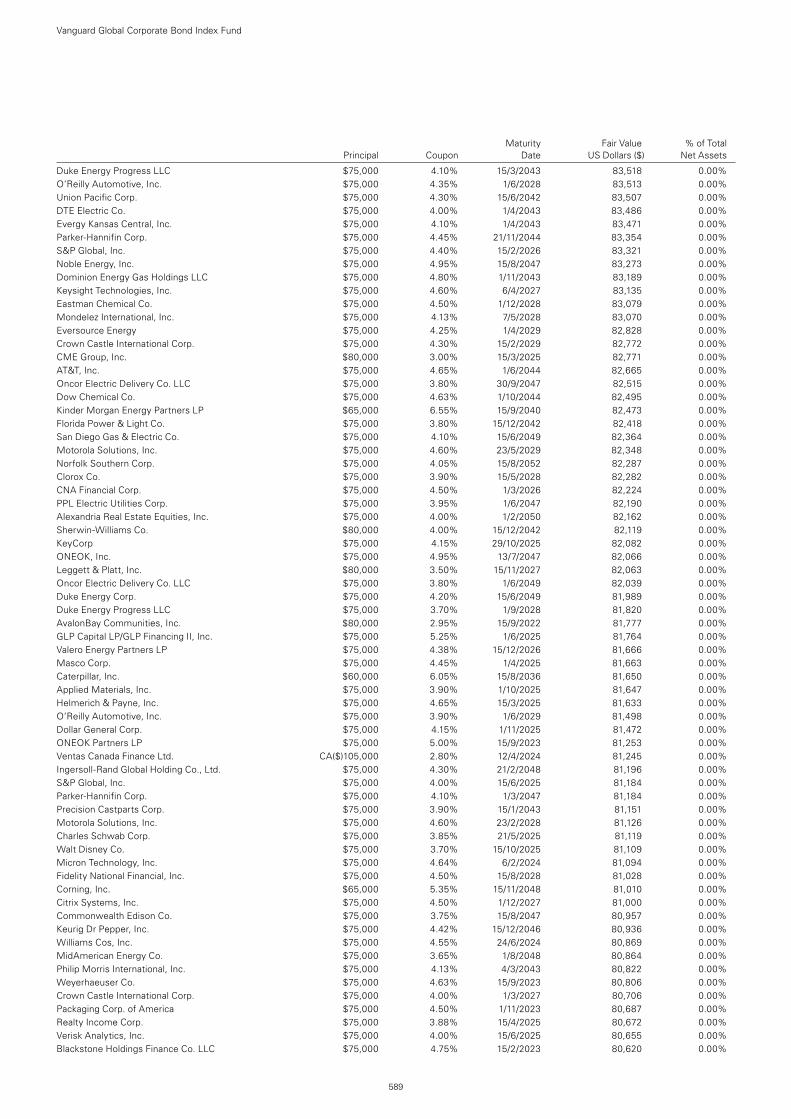
Maturity Fair Value % of Total Principal Coupon Date US Dollars ($) Net Assets
Duke Energy Progress LLC $75,000 4.10% 15/3/2043 83,518 0.00%O’Reilly Automotive, Inc. $75,000 4.35% 1/6/2028 83,513 0.00%Union Pacific Corp. $75,000 4.30% 15/6/2042 83,507 0.00%DTE Electric Co. $75,000 4.00% 1/4/2043 83,486 0.00%Evergy Kansas Central, Inc. $75,000 4.10% 1/4/2043 83,471 0.00%Parker-Hannifin Corp. $75,000 4.45% 21/11/2044 83,354 0.00%S&P Global, Inc. $75,000 4.40% 15/2/2026 83,321 0.00%Noble Energy, Inc. $75,000 4.95% 15/8/2047 83,273 0.00%Dominion Energy Gas Holdings LLC $75,000 4.80% 1/11/2043 83,189 0.00%Keysight Technologies, Inc. $75,000 4.60% 6/4/2027 83,135 0.00%Eastman Chemical Co. $75,000 4.50% 1/12/2028 83,079 0.00%Mondelez International, Inc. $75,000 4.13% 7/5/2028 83,070 0.00%Eversource Energy $75,000 4.25% 1/4/2029 82,828 0.00%Crown Castle International Corp. $75,000 4.30% 15/2/2029 82,772 0.00%CME Group, Inc. $80,000 3.00% 15/3/2025 82,771 0.00%AT&T, Inc. $75,000 4.65% 1/6/2044 82,665 0.00%Oncor Electric Delivery Co. LLC $75,000 3.80% 30/9/2047 82,515 0.00%Dow Chemical Co. $75,000 4.63% 1/10/2044 82,495 0.00%Kinder Morgan Energy Partners LP $65,000 6.55% 15/9/2040 82,473 0.00%Florida Power & Light Co. $75,000 3.80% 15/12/2042 82,418 0.00%San Diego Gas & Electric Co. $75,000 4.10% 15/6/2049 82,364 0.00%Motorola Solutions, Inc. $75,000 4.60% 23/5/2029 82,348 0.00%Norfolk Southern Corp. $75,000 4.05% 15/8/2052 82,287 0.00%Clorox Co. $75,000 3.90% 15/5/2028 82,282 0.00%CNA Financial Corp. $75,000 4.50% 1/3/2026 82,224 0.00%PPL Electric Utilities Corp. $75,000 3.95% 1/6/2047 82,190 0.00%Alexandria Real Estate Equities, Inc. $75,000 4.00% 1/2/2050 82,162 0.00%Sherwin-Williams Co. $80,000 4.00% 15/12/2042 82,119 0.00%KeyCorp $75,000 4.15% 29/10/2025 82,082 0.00%ONEOK, Inc. $75,000 4.95% 13/7/2047 82,066 0.00%Leggett & Platt, Inc. $80,000 3.50% 15/11/2027 82,063 0.00%Oncor Electric Delivery Co. LLC $75,000 3.80% 1/6/2049 82,039 0.00%Duke Energy Corp. $75,000 4.20% 15/6/2049 81,989 0.00%Duke Energy Progress LLC $75,000 3.70% 1/9/2028 81,820 0.00%AvalonBay Communities, Inc. $80,000 2.95% 15/9/2022 81,777 0.00%GLP Capital LP/GLP Financing II, Inc. $75,000 5.25% 1/6/2025 81,764 0.00%Valero Energy Partners LP $75,000 4.38% 15/12/2026 81,666 0.00%Masco Corp. $75,000 4.45% 1/4/2025 81,663 0.00%Caterpillar, Inc. $60,000 6.05% 15/8/2036 81,650 0.00%Applied Materials, Inc. $75,000 3.90% 1/10/2025 81,647 0.00%Helmerich & Payne, Inc. $75,000 4.65% 15/3/2025 81,633 0.00%O’Reilly Automotive, Inc. $75,000 3.90% 1/6/2029 81,498 0.00%Dollar General Corp. $75,000 4.15% 1/11/2025 81,472 0.00%ONEOK Partners LP $75,000 5.00% 15/9/2023 81,253 0.00%Ventas Canada Finance Ltd. CA($)105,000 2.80% 12/4/2024 81,245 0.00%Ingersoll-Rand Global Holding Co., Ltd. $75,000 4.30% 21/2/2048 81,196 0.00%S&P Global, Inc. $75,000 4.00% 15/6/2025 81,184 0.00%Parker-Hannifin Corp. $75,000 4.10% 1/3/2047 81,184 0.00%Precision Castparts Corp. $75,000 3.90% 15/1/2043 81,151 0.00%Motorola Solutions, Inc. $75,000 4.60% 23/2/2028 81,126 0.00%Charles Schwab Corp. $75,000 3.85% 21/5/2025 81,119 0.00%Walt Disney Co. $75,000 3.70% 15/10/2025 81,109 0.00%Micron Technology, Inc. $75,000 4.64% 6/2/2024 81,094 0.00%Fidelity National Financial, Inc. $75,000 4.50% 15/8/2028 81,028 0.00%Corning, Inc. $65,000 5.35% 15/11/2048 81,010 0.00%Citrix Systems, Inc. $75,000 4.50% 1/12/2027 81,000 0.00%Commonwealth Edison Co. $75,000 3.75% 15/8/2047 80,957 0.00%Keurig Dr Pepper, Inc. $75,000 4.42% 15/12/2046 80,936 0.00%Williams Cos, Inc. $75,000 4.55% 24/6/2024 80,869 0.00%MidAmerican Energy Co. $75,000 3.65% 1/8/2048 80,864 0.00%Philip Morris International, Inc. $75,000 4.13% 4/3/2043 80,822 0.00%Weyerhaeuser Co. $75,000 4.63% 15/9/2023 80,806 0.00%Crown Castle International Corp. $75,000 4.00% 1/3/2027 80,706 0.00%Packaging Corp. of America $75,000 4.50% 1/11/2023 80,687 0.00%Realty Income Corp. $75,000 3.88% 15/4/2025 80,672 0.00%Verisk Analytics, Inc. $75,000 4.00% 15/6/2025 80,655 0.00%Blackstone Holdings Finance Co. LLC $75,000 4.75% 15/2/2023 80,620 0.00%
Vanguard Global Corporate Bond Index Fund
589
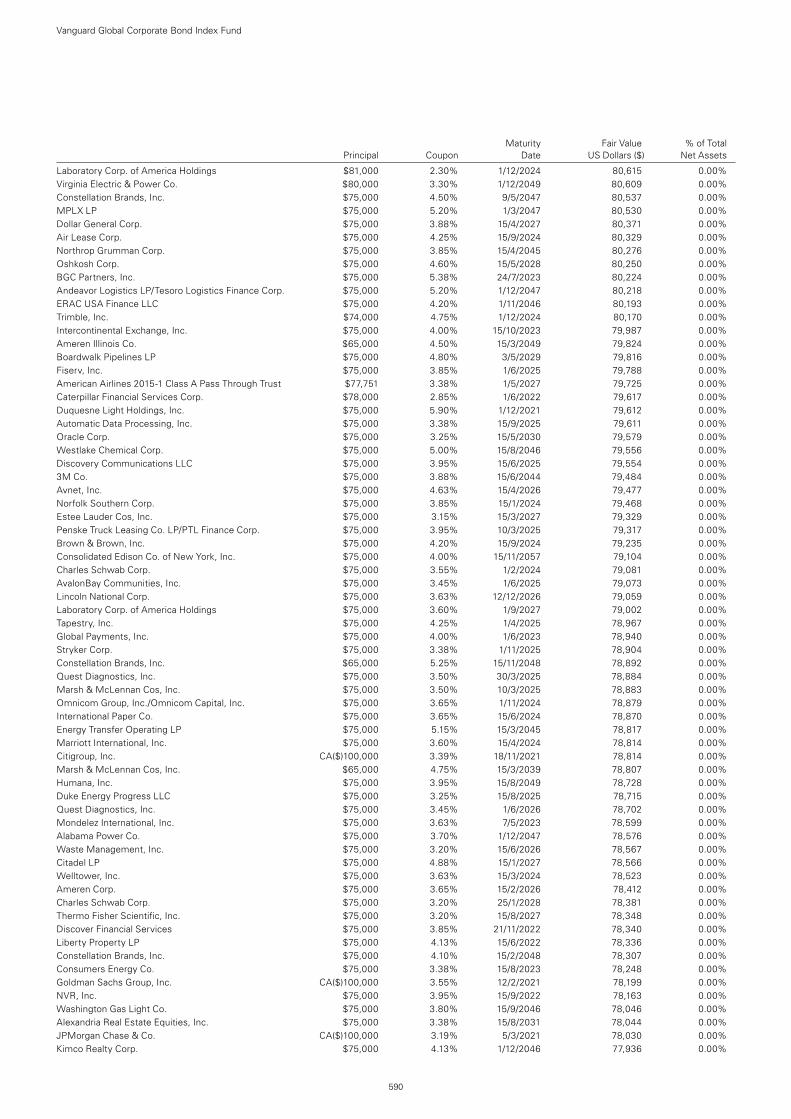
Maturity Fair Value % of Total Principal Coupon Date US Dollars ($) Net Assets
Laboratory Corp. of America Holdings $81,000 2.30% 1/12/2024 80,615 0.00%Virginia Electric & Power Co. $80,000 3.30% 1/12/2049 80,609 0.00%Constellation Brands, Inc. $75,000 4.50% 9/5/2047 80,537 0.00%MPLX LP $75,000 5.20% 1/3/2047 80,530 0.00%Dollar General Corp. $75,000 3.88% 15/4/2027 80,371 0.00%Air Lease Corp. $75,000 4.25% 15/9/2024 80,329 0.00%Northrop Grumman Corp. $75,000 3.85% 15/4/2045 80,276 0.00%Oshkosh Corp. $75,000 4.60% 15/5/2028 80,250 0.00%BGC Partners, Inc. $75,000 5.38% 24/7/2023 80,224 0.00%Andeavor Logistics LP/Tesoro Logistics Finance Corp. $75,000 5.20% 1/12/2047 80,218 0.00%ERAC USA Finance LLC $75,000 4.20% 1/11/2046 80,193 0.00%Trimble, Inc. $74,000 4.75% 1/12/2024 80,170 0.00%Intercontinental Exchange, Inc. $75,000 4.00% 15/10/2023 79,987 0.00%Ameren Illinois Co. $65,000 4.50% 15/3/2049 79,824 0.00%Boardwalk Pipelines LP $75,000 4.80% 3/5/2029 79,816 0.00%Fiserv, Inc. $75,000 3.85% 1/6/2025 79,788 0.00%American Airlines 2015-1 Class A Pass Through Trust $77,751 3.38% 1/5/2027 79,725 0.00%Caterpillar Financial Services Corp. $78,000 2.85% 1/6/2022 79,617 0.00%Duquesne Light Holdings, Inc. $75,000 5.90% 1/12/2021 79,612 0.00%Automatic Data Processing, Inc. $75,000 3.38% 15/9/2025 79,611 0.00%Oracle Corp. $75,000 3.25% 15/5/2030 79,579 0.00%Westlake Chemical Corp. $75,000 5.00% 15/8/2046 79,556 0.00%Discovery Communications LLC $75,000 3.95% 15/6/2025 79,554 0.00%3M Co. $75,000 3.88% 15/6/2044 79,484 0.00%Avnet, Inc. $75,000 4.63% 15/4/2026 79,477 0.00%Norfolk Southern Corp. $75,000 3.85% 15/1/2024 79,468 0.00%Estee Lauder Cos, Inc. $75,000 3.15% 15/3/2027 79,329 0.00%Penske Truck Leasing Co. LP/PTL Finance Corp. $75,000 3.95% 10/3/2025 79,317 0.00%Brown & Brown, Inc. $75,000 4.20% 15/9/2024 79,235 0.00%Consolidated Edison Co. of New York, Inc. $75,000 4.00% 15/11/2057 79,104 0.00%Charles Schwab Corp. $75,000 3.55% 1/2/2024 79,081 0.00%AvalonBay Communities, Inc. $75,000 3.45% 1/6/2025 79,073 0.00%Lincoln National Corp. $75,000 3.63% 12/12/2026 79,059 0.00%Laboratory Corp. of America Holdings $75,000 3.60% 1/9/2027 79,002 0.00%Tapestry, Inc. $75,000 4.25% 1/4/2025 78,967 0.00%Global Payments, Inc. $75,000 4.00% 1/6/2023 78,940 0.00%Stryker Corp. $75,000 3.38% 1/11/2025 78,904 0.00%Constellation Brands, Inc. $65,000 5.25% 15/11/2048 78,892 0.00%Quest Diagnostics, Inc. $75,000 3.50% 30/3/2025 78,884 0.00%Marsh & McLennan Cos, Inc. $75,000 3.50% 10/3/2025 78,883 0.00%Omnicom Group, Inc./Omnicom Capital, Inc. $75,000 3.65% 1/11/2024 78,879 0.00%International Paper Co. $75,000 3.65% 15/6/2024 78,870 0.00%Energy Transfer Operating LP $75,000 5.15% 15/3/2045 78,817 0.00%Marriott International, Inc. $75,000 3.60% 15/4/2024 78,814 0.00%Citigroup, Inc. CA($)100,000 3.39% 18/11/2021 78,814 0.00%Marsh & McLennan Cos, Inc. $65,000 4.75% 15/3/2039 78,807 0.00%Humana, Inc. $75,000 3.95% 15/8/2049 78,728 0.00%Duke Energy Progress LLC $75,000 3.25% 15/8/2025 78,715 0.00%Quest Diagnostics, Inc. $75,000 3.45% 1/6/2026 78,702 0.00%Mondelez International, Inc. $75,000 3.63% 7/5/2023 78,599 0.00%Alabama Power Co. $75,000 3.70% 1/12/2047 78,576 0.00%Waste Management, Inc. $75,000 3.20% 15/6/2026 78,567 0.00%Citadel LP $75,000 4.88% 15/1/2027 78,566 0.00%Welltower, Inc. $75,000 3.63% 15/3/2024 78,523 0.00%Ameren Corp. $75,000 3.65% 15/2/2026 78,412 0.00%Charles Schwab Corp. $75,000 3.20% 25/1/2028 78,381 0.00%Thermo Fisher Scientific, Inc. $75,000 3.20% 15/8/2027 78,348 0.00%Discover Financial Services $75,000 3.85% 21/11/2022 78,340 0.00%Liberty Property LP $75,000 4.13% 15/6/2022 78,336 0.00%Constellation Brands, Inc. $75,000 4.10% 15/2/2048 78,307 0.00%Consumers Energy Co. $75,000 3.38% 15/8/2023 78,248 0.00%Goldman Sachs Group, Inc. CA($)100,000 3.55% 12/2/2021 78,199 0.00%NVR, Inc. $75,000 3.95% 15/9/2022 78,163 0.00%Washington Gas Light Co. $75,000 3.80% 15/9/2046 78,046 0.00%Alexandria Real Estate Equities, Inc. $75,000 3.38% 15/8/2031 78,044 0.00%JPMorgan Chase & Co. CA($)100,000 3.19% 5/3/2021 78,030 0.00%Kimco Realty Corp. $75,000 4.13% 1/12/2046 77,936 0.00%
Vanguard Global Corporate Bond Index Fund
590
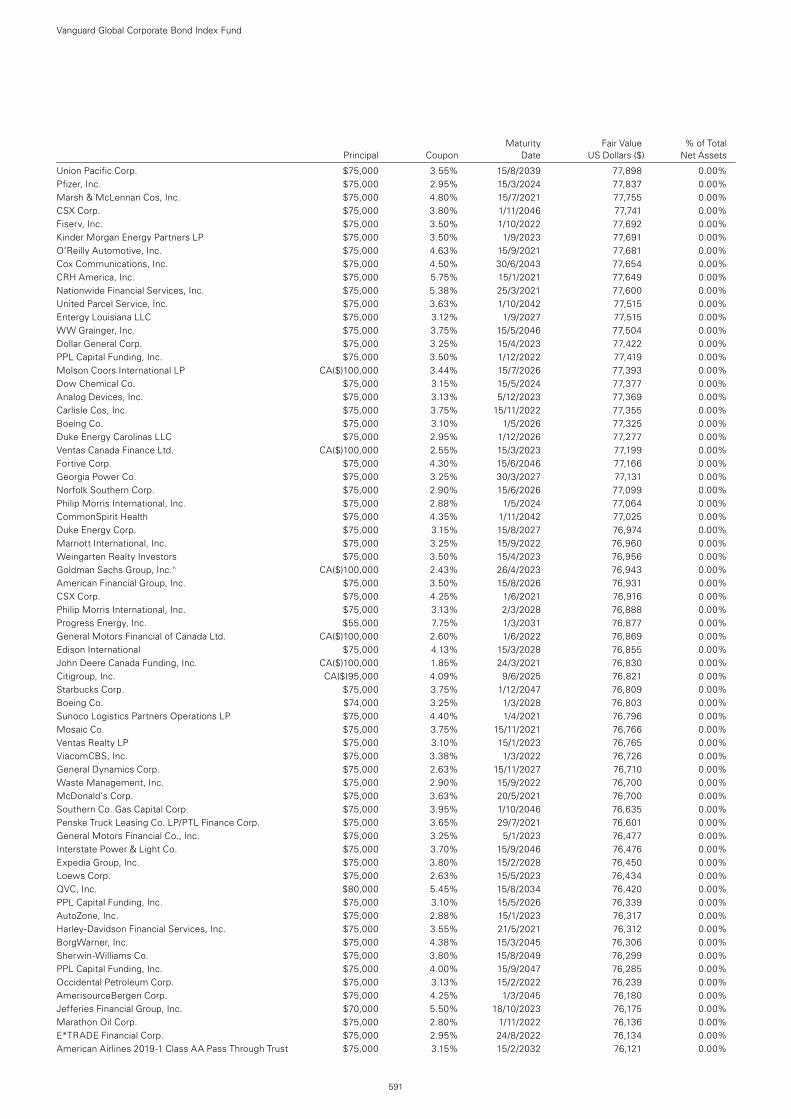
Union Pacific Corp. $75,000 3.55% 15/8/2039 77,898 0.00%Pfizer, Inc. $75,000 2.95% 15/3/2024 77,837 0.00%Marsh & McLennan Cos, Inc. $75,000 4.80% 15/7/2021 77,755 0.00%CSX Corp. $75,000 3.80% 1/11/2046 77,741 0.00%Fiserv, Inc. $75,000 3.50% 1/10/2022 77,692 0.00%Kinder Morgan Energy Partners LP $75,000 3.50% 1/9/2023 77,691 0.00%O’Reilly Automotive, Inc. $75,000 4.63% 15/9/2021 77,681 0.00%Cox Communications, Inc. $75,000 4.50% 30/6/2043 77,654 0.00%CRH America, Inc. $75,000 5.75% 15/1/2021 77,649 0.00%Nationwide Financial Services, Inc. $75,000 5.38% 25/3/2021 77,600 0.00%United Parcel Service, Inc. $75,000 3.63% 1/10/2042 77,515 0.00%Entergy Louisiana LLC $75,000 3.12% 1/9/2027 77,515 0.00%WW Grainger, Inc. $75,000 3.75% 15/5/2046 77,504 0.00%Dollar General Corp. $75,000 3.25% 15/4/2023 77,422 0.00%PPL Capital Funding, Inc. $75,000 3.50% 1/12/2022 77,419 0.00%Molson Coors International LP CA($)100,000 3.44% 15/7/2026 77,393 0.00%Dow Chemical Co. $75,000 3.15% 15/5/2024 77,377 0.00%Analog Devices, Inc. $75,000 3.13% 5/12/2023 77,369 0.00%Carlisle Cos, Inc. $75,000 3.75% 15/11/2022 77,355 0.00%Boeing Co. $75,000 3.10% 1/5/2026 77,325 0.00%Duke Energy Carolinas LLC $75,000 2.95% 1/12/2026 77,277 0.00%Ventas Canada Finance Ltd. CA($)100,000 2.55% 15/3/2023 77,199 0.00%Fortive Corp. $75,000 4.30% 15/6/2046 77,166 0.00%Georgia Power Co. $75,000 3.25% 30/3/2027 77,131 0.00%Norfolk Southern Corp. $75,000 2.90% 15/6/2026 77,099 0.00%Philip Morris International, Inc. $75,000 2.88% 1/5/2024 77,064 0.00%CommonSpirit Health $75,000 4.35% 1/11/2042 77,025 0.00%Duke Energy Corp. $75,000 3.15% 15/8/2027 76,974 0.00%Marriott International, Inc. $75,000 3.25% 15/9/2022 76,960 0.00%Weingarten Realty Investors $75,000 3.50% 15/4/2023 76,956 0.00%Goldman Sachs Group, Inc.^ CA($)100,000 2.43% 26/4/2023 76,943 0.00%American Financial Group, Inc. $75,000 3.50% 15/8/2026 76,931 0.00%CSX Corp. $75,000 4.25% 1/6/2021 76,916 0.00%Philip Morris International, Inc. $75,000 3.13% 2/3/2028 76,888 0.00%Progress Energy, Inc. $55,000 7.75% 1/3/2031 76,877 0.00%General Motors Financial of Canada Ltd. CA($)100,000 2.60% 1/6/2022 76,869 0.00%Edison International $75,000 4.13% 15/3/2028 76,855 0.00%John Deere Canada Funding, Inc. CA($)100,000 1.85% 24/3/2021 76,830 0.00%Citigroup, Inc. CA($)95,000 4.09% 9/6/2025 76,821 0.00%Starbucks Corp. $75,000 3.75% 1/12/2047 76,809 0.00%Boeing Co. $74,000 3.25% 1/3/2028 76,803 0.00%Sunoco Logistics Partners Operations LP $75,000 4.40% 1/4/2021 76,796 0.00%Mosaic Co. $75,000 3.75% 15/11/2021 76,766 0.00%Ventas Realty LP $75,000 3.10% 15/1/2023 76,765 0.00%ViacomCBS, Inc. $75,000 3.38% 1/3/2022 76,726 0.00%General Dynamics Corp. $75,000 2.63% 15/11/2027 76,710 0.00%Waste Management, Inc. $75,000 2.90% 15/9/2022 76,700 0.00%McDonald’s Corp. $75,000 3.63% 20/5/2021 76,700 0.00%Southern Co. Gas Capital Corp. $75,000 3.95% 1/10/2046 76,635 0.00%Penske Truck Leasing Co. LP/PTL Finance Corp. $75,000 3.65% 29/7/2021 76,601 0.00%General Motors Financial Co., Inc. $75,000 3.25% 5/1/2023 76,477 0.00%Interstate Power & Light Co. $75,000 3.70% 15/9/2046 76,476 0.00%Expedia Group, Inc. $75,000 3.80% 15/2/2028 76,450 0.00%Loews Corp. $75,000 2.63% 15/5/2023 76,434 0.00%QVC, Inc. $80,000 5.45% 15/8/2034 76,420 0.00%PPL Capital Funding, Inc. $75,000 3.10% 15/5/2026 76,339 0.00%AutoZone, Inc. $75,000 2.88% 15/1/2023 76,317 0.00%Harley-Davidson Financial Services, Inc. $75,000 3.55% 21/5/2021 76,312 0.00%BorgWarner, Inc. $75,000 4.38% 15/3/2045 76,306 0.00%Sherwin-Williams Co. $75,000 3.80% 15/8/2049 76,299 0.00%PPL Capital Funding, Inc. $75,000 4.00% 15/9/2047 76,285 0.00%Occidental Petroleum Corp. $75,000 3.13% 15/2/2022 76,239 0.00%AmerisourceBergen Corp. $75,000 4.25% 1/3/2045 76,180 0.00%Jefferies Financial Group, Inc. $70,000 5.50% 18/10/2023 76,175 0.00%Marathon Oil Corp. $75,000 2.80% 1/11/2022 76,136 0.00%E*TRADE Financial Corp. $75,000 2.95% 24/8/2022 76,134 0.00%American Airlines 2019-1 Class AA Pass Through Trust $75,000 3.15% 15/2/2032 76,121 0.00%
Vanguard Global Corporate Bond Index Fund
591
Maturity Fair Value % of Total Principal Coupon Date US Dollars ($) Net Assets
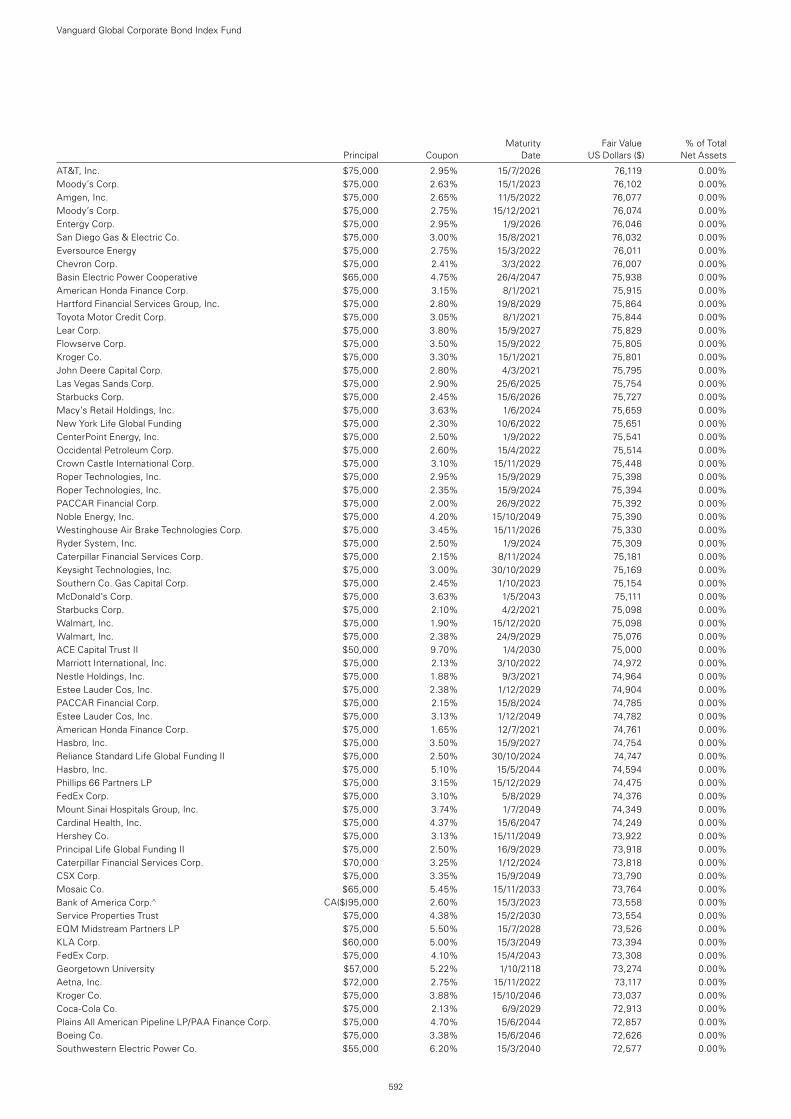
AT&T, Inc. $75,000 2.95% 15/7/2026 76,119 0.00%Moody’s Corp. $75,000 2.63% 15/1/2023 76,102 0.00%Amgen, Inc. $75,000 2.65% 11/5/2022 76,077 0.00%Moody’s Corp. $75,000 2.75% 15/12/2021 76,074 0.00%Entergy Corp. $75,000 2.95% 1/9/2026 76,046 0.00%San Diego Gas & Electric Co. $75,000 3.00% 15/8/2021 76,032 0.00%Eversource Energy $75,000 2.75% 15/3/2022 76,011 0.00%Chevron Corp. $75,000 2.41% 3/3/2022 76,007 0.00%Basin Electric Power Cooperative $65,000 4.75% 26/4/2047 75,938 0.00%American Honda Finance Corp. $75,000 3.15% 8/1/2021 75,915 0.00%Hartford Financial Services Group, Inc. $75,000 2.80% 19/8/2029 75,864 0.00%Toyota Motor Credit Corp. $75,000 3.05% 8/1/2021 75,844 0.00%Lear Corp. $75,000 3.80% 15/9/2027 75,829 0.00%Flowserve Corp. $75,000 3.50% 15/9/2022 75,805 0.00%Kroger Co. $75,000 3.30% 15/1/2021 75,801 0.00%John Deere Capital Corp. $75,000 2.80% 4/3/2021 75,795 0.00%Las Vegas Sands Corp. $75,000 2.90% 25/6/2025 75,754 0.00%Starbucks Corp. $75,000 2.45% 15/6/2026 75,727 0.00%Macy’s Retail Holdings, Inc. $75,000 3.63% 1/6/2024 75,659 0.00%New York Life Global Funding $75,000 2.30% 10/6/2022 75,651 0.00%CenterPoint Energy, Inc. $75,000 2.50% 1/9/2022 75,541 0.00%Occidental Petroleum Corp. $75,000 2.60% 15/4/2022 75,514 0.00%Crown Castle International Corp. $75,000 3.10% 15/11/2029 75,448 0.00%Roper Technologies, Inc. $75,000 2.95% 15/9/2029 75,398 0.00%Roper Technologies, Inc. $75,000 2.35% 15/9/2024 75,394 0.00%PACCAR Financial Corp. $75,000 2.00% 26/9/2022 75,392 0.00%Noble Energy, Inc. $75,000 4.20% 15/10/2049 75,390 0.00%Westinghouse Air Brake Technologies Corp. $75,000 3.45% 15/11/2026 75,330 0.00%Ryder System, Inc. $75,000 2.50% 1/9/2024 75,309 0.00%Caterpillar Financial Services Corp. $75,000 2.15% 8/11/2024 75,181 0.00%Keysight Technologies, Inc. $75,000 3.00% 30/10/2029 75,169 0.00%Southern Co. Gas Capital Corp. $75,000 2.45% 1/10/2023 75,154 0.00%McDonald’s Corp. $75,000 3.63% 1/5/2043 75,111 0.00%Starbucks Corp. $75,000 2.10% 4/2/2021 75,098 0.00%Walmart, Inc. $75,000 1.90% 15/12/2020 75,098 0.00%Walmart, Inc. $75,000 2.38% 24/9/2029 75,076 0.00%ACE Capital Trust II $50,000 9.70% 1/4/2030 75,000 0.00%Marriott International, Inc. $75,000 2.13% 3/10/2022 74,972 0.00%Nestle Holdings, Inc. $75,000 1.88% 9/3/2021 74,964 0.00%Estee Lauder Cos, Inc. $75,000 2.38% 1/12/2029 74,904 0.00%PACCAR Financial Corp. $75,000 2.15% 15/8/2024 74,785 0.00%Estee Lauder Cos, Inc. $75,000 3.13% 1/12/2049 74,782 0.00%American Honda Finance Corp. $75,000 1.65% 12/7/2021 74,761 0.00%Hasbro, Inc. $75,000 3.50% 15/9/2027 74,754 0.00%Reliance Standard Life Global Funding II $75,000 2.50% 30/10/2024 74,747 0.00%Hasbro, Inc. $75,000 5.10% 15/5/2044 74,594 0.00%Phillips 66 Partners LP $75,000 3.15% 15/12/2029 74,475 0.00%FedEx Corp. $75,000 3.10% 5/8/2029 74,376 0.00%Mount Sinai Hospitals Group, Inc. $75,000 3.74% 1/7/2049 74,349 0.00%Cardinal Health, Inc. $75,000 4.37% 15/6/2047 74,249 0.00%Hershey Co. $75,000 3.13% 15/11/2049 73,922 0.00%Principal Life Global Funding II $75,000 2.50% 16/9/2029 73,918 0.00%Caterpillar Financial Services Corp. $70,000 3.25% 1/12/2024 73,818 0.00%CSX Corp. $75,000 3.35% 15/9/2049 73,790 0.00%Mosaic Co. $65,000 5.45% 15/11/2033 73,764 0.00%Bank of America Corp.^ CA($)95,000 2.60% 15/3/2023 73,558 0.00%Service Properties Trust $75,000 4.38% 15/2/2030 73,554 0.00%EQM Midstream Partners LP $75,000 5.50% 15/7/2028 73,526 0.00%KLA Corp. $60,000 5.00% 15/3/2049 73,394 0.00%FedEx Corp. $75,000 4.10% 15/4/2043 73,308 0.00%Georgetown University $57,000 5.22% 1/10/2118 73,274 0.00%Aetna, Inc. $72,000 2.75% 15/11/2022 73,117 0.00%Kroger Co. $75,000 3.88% 15/10/2046 73,037 0.00%Coca-Cola Co. $75,000 2.13% 6/9/2029 72,913 0.00%Plains All American Pipeline LP/PAA Finance Corp. $75,000 4.70% 15/6/2044 72,857 0.00%Boeing Co. $75,000 3.38% 15/6/2046 72,626 0.00%Southwestern Electric Power Co. $55,000 6.20% 15/3/2040 72,577 0.00%
Vanguard Global Corporate Bond Index Fund
592
Maturity Fair Value % of Total Principal Coupon Date US Dollars ($) Net Assets
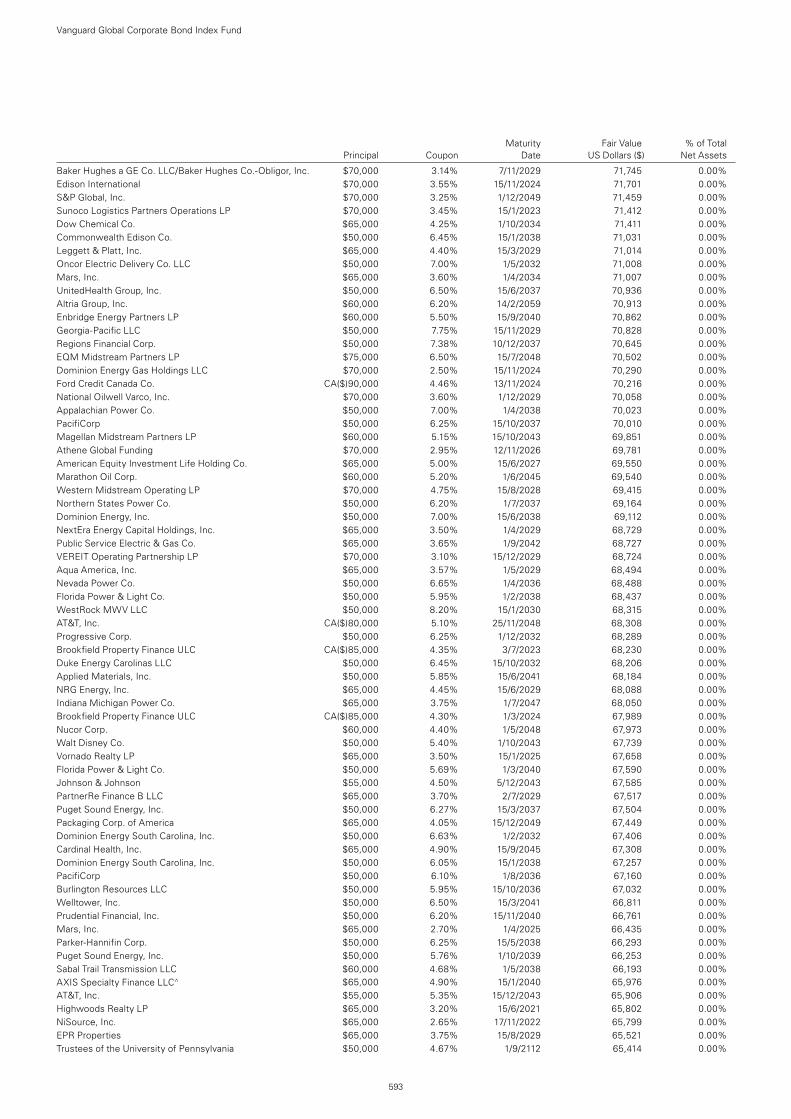
Baker Hughes a GE Co. LLC/Baker Hughes Co.-Obligor, Inc. $70,000 3.14% 7/11/2029 71,745 0.00%Edison International $70,000 3.55% 15/11/2024 71,701 0.00%S&P Global, Inc. $70,000 3.25% 1/12/2049 71,459 0.00%Sunoco Logistics Partners Operations LP $70,000 3.45% 15/1/2023 71,412 0.00%Dow Chemical Co. $65,000 4.25% 1/10/2034 71,411 0.00%Commonwealth Edison Co. $50,000 6.45% 15/1/2038 71,031 0.00%Leggett & Platt, Inc. $65,000 4.40% 15/3/2029 71,014 0.00%Oncor Electric Delivery Co. LLC $50,000 7.00% 1/5/2032 71,008 0.00%Mars, Inc. $65,000 3.60% 1/4/2034 71,007 0.00%UnitedHealth Group, Inc. $50,000 6.50% 15/6/2037 70,936 0.00%Altria Group, Inc. $60,000 6.20% 14/2/2059 70,913 0.00%Enbridge Energy Partners LP $60,000 5.50% 15/9/2040 70,862 0.00%Georgia-Pacific LLC $50,000 7.75% 15/11/2029 70,828 0.00%Regions Financial Corp. $50,000 7.38% 10/12/2037 70,645 0.00%EQM Midstream Partners LP $75,000 6.50% 15/7/2048 70,502 0.00%Dominion Energy Gas Holdings LLC $70,000 2.50% 15/11/2024 70,290 0.00%Ford Credit Canada Co. CA($)90,000 4.46% 13/11/2024 70,216 0.00%National Oilwell Varco, Inc. $70,000 3.60% 1/12/2029 70,058 0.00%Appalachian Power Co. $50,000 7.00% 1/4/2038 70,023 0.00%PacifiCorp $50,000 6.25% 15/10/2037 70,010 0.00%Magellan Midstream Partners LP $60,000 5.15% 15/10/2043 69,851 0.00%Athene Global Funding $70,000 2.95% 12/11/2026 69,781 0.00%American Equity Investment Life Holding Co. $65,000 5.00% 15/6/2027 69,550 0.00%Marathon Oil Corp. $60,000 5.20% 1/6/2045 69,540 0.00%Western Midstream Operating LP $70,000 4.75% 15/8/2028 69,415 0.00%Northern States Power Co. $50,000 6.20% 1/7/2037 69,164 0.00%Dominion Energy, Inc. $50,000 7.00% 15/6/2038 69,112 0.00%NextEra Energy Capital Holdings, Inc. $65,000 3.50% 1/4/2029 68,729 0.00%Public Service Electric & Gas Co. $65,000 3.65% 1/9/2042 68,727 0.00%VEREIT Operating Partnership LP $70,000 3.10% 15/12/2029 68,724 0.00%Aqua America, Inc. $65,000 3.57% 1/5/2029 68,494 0.00%Nevada Power Co. $50,000 6.65% 1/4/2036 68,488 0.00%Florida Power & Light Co. $50,000 5.95% 1/2/2038 68,437 0.00%WestRock MWV LLC $50,000 8.20% 15/1/2030 68,315 0.00%AT&T, Inc. CA($)80,000 5.10% 25/11/2048 68,308 0.00%Progressive Corp. $50,000 6.25% 1/12/2032 68,289 0.00%Brookfield Property Finance ULC CA($)85,000 4.35% 3/7/2023 68,230 0.00%Duke Energy Carolinas LLC $50,000 6.45% 15/10/2032 68,206 0.00%Applied Materials, Inc. $50,000 5.85% 15/6/2041 68,184 0.00%NRG Energy, Inc. $65,000 4.45% 15/6/2029 68,088 0.00%Indiana Michigan Power Co. $65,000 3.75% 1/7/2047 68,050 0.00%Brookfield Property Finance ULC CA($)85,000 4.30% 1/3/2024 67,989 0.00%Nucor Corp. $60,000 4.40% 1/5/2048 67,973 0.00%Walt Disney Co. $50,000 5.40% 1/10/2043 67,739 0.00%Vornado Realty LP $65,000 3.50% 15/1/2025 67,658 0.00%Florida Power & Light Co. $50,000 5.69% 1/3/2040 67,590 0.00%Johnson & Johnson $55,000 4.50% 5/12/2043 67,585 0.00%PartnerRe Finance B LLC $65,000 3.70% 2/7/2029 67,517 0.00%Puget Sound Energy, Inc. $50,000 6.27% 15/3/2037 67,504 0.00%Packaging Corp. of America $65,000 4.05% 15/12/2049 67,449 0.00%Dominion Energy South Carolina, Inc. $50,000 6.63% 1/2/2032 67,406 0.00%Cardinal Health, Inc. $65,000 4.90% 15/9/2045 67,308 0.00%Dominion Energy South Carolina, Inc. $50,000 6.05% 15/1/2038 67,257 0.00%PacifiCorp $50,000 6.10% 1/8/2036 67,160 0.00%Burlington Resources LLC $50,000 5.95% 15/10/2036 67,032 0.00%Welltower, Inc. $50,000 6.50% 15/3/2041 66,811 0.00%Prudential Financial, Inc. $50,000 6.20% 15/11/2040 66,761 0.00%Mars, Inc. $65,000 2.70% 1/4/2025 66,435 0.00%Parker-Hannifin Corp. $50,000 6.25% 15/5/2038 66,293 0.00%Puget Sound Energy, Inc. $50,000 5.76% 1/10/2039 66,253 0.00%Sabal Trail Transmission LLC $60,000 4.68% 1/5/2038 66,193 0.00%AXIS Specialty Finance LLC^ $65,000 4.90% 15/1/2040 65,976 0.00%AT&T, Inc. $55,000 5.35% 15/12/2043 65,906 0.00%Highwoods Realty LP $65,000 3.20% 15/6/2021 65,802 0.00%NiSource, Inc. $65,000 2.65% 17/11/2022 65,799 0.00%EPR Properties $65,000 3.75% 15/8/2029 65,521 0.00%Trustees of the University of Pennsylvania $50,000 4.67% 1/9/2112 65,414 0.00%
Maturity Fair Value % of Total Principal Coupon Date US Dollars ($) Net Assets
Vanguard Global Corporate Bond Index Fund
593
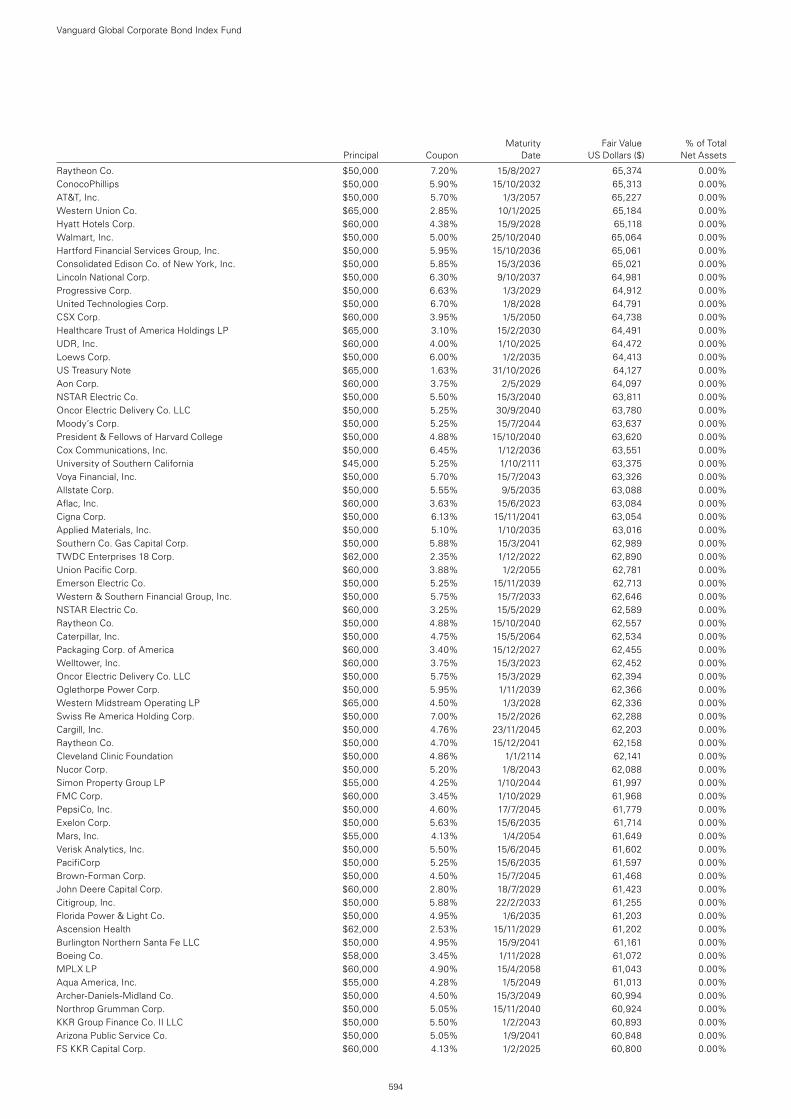
Raytheon Co. $50,000 7.20% 15/8/2027 65,374 0.00%ConocoPhillips $50,000 5.90% 15/10/2032 65,313 0.00%AT&T, Inc. $50,000 5.70% 1/3/2057 65,227 0.00%Western Union Co. $65,000 2.85% 10/1/2025 65,184 0.00%Hyatt Hotels Corp. $60,000 4.38% 15/9/2028 65,118 0.00%Walmart, Inc. $50,000 5.00% 25/10/2040 65,064 0.00%Hartford Financial Services Group, Inc. $50,000 5.95% 15/10/2036 65,061 0.00%Consolidated Edison Co. of New York, Inc. $50,000 5.85% 15/3/2036 65,021 0.00%Lincoln National Corp. $50,000 6.30% 9/10/2037 64,981 0.00%Progressive Corp. $50,000 6.63% 1/3/2029 64,912 0.00%United Technologies Corp. $50,000 6.70% 1/8/2028 64,791 0.00%CSX Corp. $60,000 3.95% 1/5/2050 64,738 0.00%Healthcare Trust of America Holdings LP $65,000 3.10% 15/2/2030 64,491 0.00%UDR, Inc. $60,000 4.00% 1/10/2025 64,472 0.00%Loews Corp. $50,000 6.00% 1/2/2035 64,413 0.00%US Treasury Note $65,000 1.63% 31/10/2026 64,127 0.00%Aon Corp. $60,000 3.75% 2/5/2029 64,097 0.00%NSTAR Electric Co. $50,000 5.50% 15/3/2040 63,811 0.00%Oncor Electric Delivery Co. LLC $50,000 5.25% 30/9/2040 63,780 0.00%Moody’s Corp. $50,000 5.25% 15/7/2044 63,637 0.00%President & Fellows of Harvard College $50,000 4.88% 15/10/2040 63,620 0.00%Cox Communications, Inc. $50,000 6.45% 1/12/2036 63,551 0.00%University of Southern California $45,000 5.25% 1/10/2111 63,375 0.00%Voya Financial, Inc. $50,000 5.70% 15/7/2043 63,326 0.00%Allstate Corp. $50,000 5.55% 9/5/2035 63,088 0.00%Aflac, Inc. $60,000 3.63% 15/6/2023 63,084 0.00%Cigna Corp. $50,000 6.13% 15/11/2041 63,054 0.00%Applied Materials, Inc. $50,000 5.10% 1/10/2035 63,016 0.00%Southern Co. Gas Capital Corp. $50,000 5.88% 15/3/2041 62,989 0.00%TWDC Enterprises 18 Corp. $62,000 2.35% 1/12/2022 62,890 0.00%Union Pacific Corp. $60,000 3.88% 1/2/2055 62,781 0.00%Emerson Electric Co. $50,000 5.25% 15/11/2039 62,713 0.00%Western & Southern Financial Group, Inc. $50,000 5.75% 15/7/2033 62,646 0.00%NSTAR Electric Co. $60,000 3.25% 15/5/2029 62,589 0.00%Raytheon Co. $50,000 4.88% 15/10/2040 62,557 0.00%Caterpillar, Inc. $50,000 4.75% 15/5/2064 62,534 0.00%Packaging Corp. of America $60,000 3.40% 15/12/2027 62,455 0.00%Welltower, Inc. $60,000 3.75% 15/3/2023 62,452 0.00%Oncor Electric Delivery Co. LLC $50,000 5.75% 15/3/2029 62,394 0.00%Oglethorpe Power Corp. $50,000 5.95% 1/11/2039 62,366 0.00%Western Midstream Operating LP $65,000 4.50% 1/3/2028 62,336 0.00%Swiss Re America Holding Corp. $50,000 7.00% 15/2/2026 62,288 0.00%Cargill, Inc. $50,000 4.76% 23/11/2045 62,203 0.00%Raytheon Co. $50,000 4.70% 15/12/2041 62,158 0.00%Cleveland Clinic Foundation $50,000 4.86% 1/1/2114 62,141 0.00%Nucor Corp. $50,000 5.20% 1/8/2043 62,088 0.00%Simon Property Group LP $55,000 4.25% 1/10/2044 61,997 0.00%FMC Corp. $60,000 3.45% 1/10/2029 61,968 0.00%PepsiCo, Inc. $50,000 4.60% 17/7/2045 61,779 0.00%Exelon Corp. $50,000 5.63% 15/6/2035 61,714 0.00%Mars, Inc. $55,000 4.13% 1/4/2054 61,649 0.00%Verisk Analytics, Inc. $50,000 5.50% 15/6/2045 61,602 0.00%PacifiCorp $50,000 5.25% 15/6/2035 61,597 0.00%Brown-Forman Corp. $50,000 4.50% 15/7/2045 61,468 0.00%John Deere Capital Corp. $60,000 2.80% 18/7/2029 61,423 0.00%Citigroup, Inc. $50,000 5.88% 22/2/2033 61,255 0.00%Florida Power & Light Co. $50,000 4.95% 1/6/2035 61,203 0.00%Ascension Health $62,000 2.53% 15/11/2029 61,202 0.00%Burlington Northern Santa Fe LLC $50,000 4.95% 15/9/2041 61,161 0.00%Boeing Co. $58,000 3.45% 1/11/2028 61,072 0.00%MPLX LP $60,000 4.90% 15/4/2058 61,043 0.00%Aqua America, Inc. $55,000 4.28% 1/5/2049 61,013 0.00%Archer-Daniels-Midland Co. $50,000 4.50% 15/3/2049 60,994 0.00%Northrop Grumman Corp. $50,000 5.05% 15/11/2040 60,924 0.00%KKR Group Finance Co. II LLC $50,000 5.50% 1/2/2043 60,893 0.00%Arizona Public Service Co. $50,000 5.05% 1/9/2041 60,848 0.00%FS KKR Capital Corp. $60,000 4.13% 1/2/2025 60,800 0.00%
Maturity Fair Value % of Total Principal Coupon Date US Dollars ($) Net Assets
Vanguard Global Corporate Bond Index Fund
594
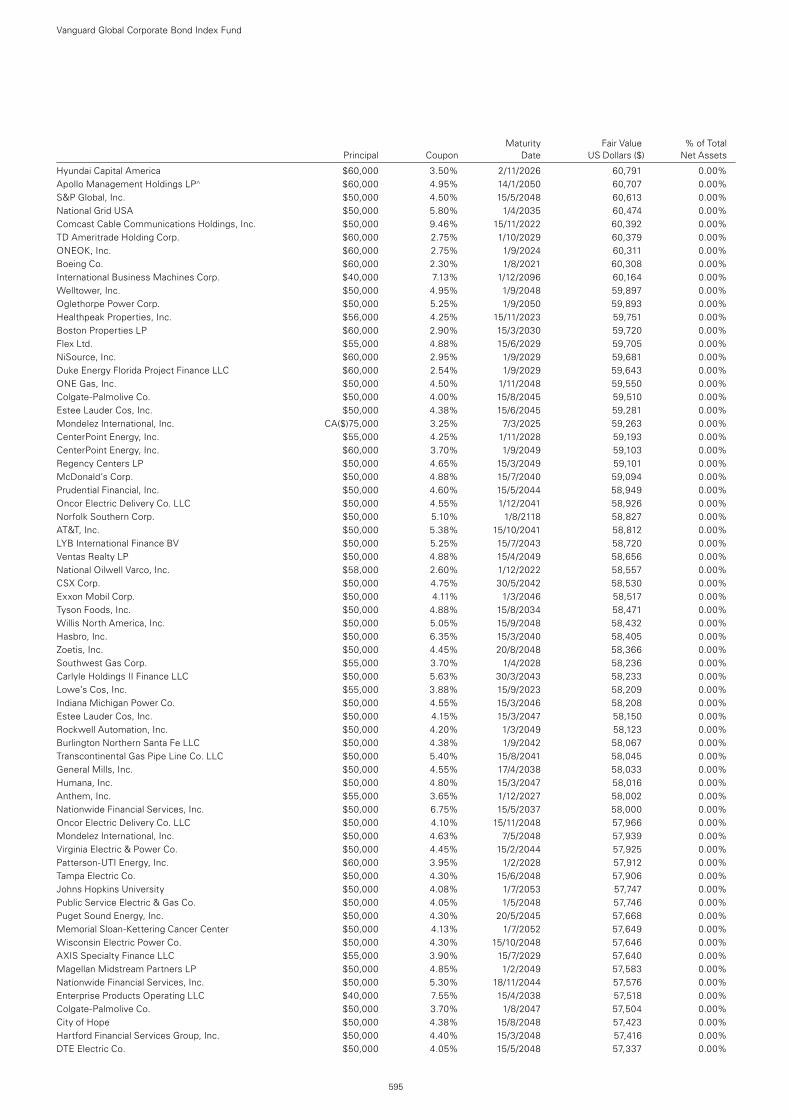
Hyundai Capital America $60,000 3.50% 2/11/2026 60,791 0.00%Apollo Management Holdings LP^ $60,000 4.95% 14/1/2050 60,707 0.00%S&P Global, Inc. $50,000 4.50% 15/5/2048 60,613 0.00%National Grid USA $50,000 5.80% 1/4/2035 60,474 0.00%Comcast Cable Communications Holdings, Inc. $50,000 9.46% 15/11/2022 60,392 0.00%TD Ameritrade Holding Corp. $60,000 2.75% 1/10/2029 60,379 0.00%ONEOK, Inc. $60,000 2.75% 1/9/2024 60,311 0.00%Boeing Co. $60,000 2.30% 1/8/2021 60,308 0.00%International Business Machines Corp. $40,000 7.13% 1/12/2096 60,164 0.00%Welltower, Inc. $50,000 4.95% 1/9/2048 59,897 0.00%Oglethorpe Power Corp. $50,000 5.25% 1/9/2050 59,893 0.00%Healthpeak Properties, Inc. $56,000 4.25% 15/11/2023 59,751 0.00%Boston Properties LP $60,000 2.90% 15/3/2030 59,720 0.00%Flex Ltd. $55,000 4.88% 15/6/2029 59,705 0.00%NiSource, Inc. $60,000 2.95% 1/9/2029 59,681 0.00%Duke Energy Florida Project Finance LLC $60,000 2.54% 1/9/2029 59,643 0.00%ONE Gas, Inc. $50,000 4.50% 1/11/2048 59,550 0.00%Colgate-Palmolive Co. $50,000 4.00% 15/8/2045 59,510 0.00%Estee Lauder Cos, Inc. $50,000 4.38% 15/6/2045 59,281 0.00%Mondelez International, Inc. CA($)75,000 3.25% 7/3/2025 59,263 0.00%CenterPoint Energy, Inc. $55,000 4.25% 1/11/2028 59,193 0.00%CenterPoint Energy, Inc. $60,000 3.70% 1/9/2049 59,103 0.00%Regency Centers LP $50,000 4.65% 15/3/2049 59,101 0.00%McDonald’s Corp. $50,000 4.88% 15/7/2040 59,094 0.00%Prudential Financial, Inc. $50,000 4.60% 15/5/2044 58,949 0.00%Oncor Electric Delivery Co. LLC $50,000 4.55% 1/12/2041 58,926 0.00%Norfolk Southern Corp. $50,000 5.10% 1/8/2118 58,827 0.00%AT&T, Inc. $50,000 5.38% 15/10/2041 58,812 0.00%LYB International Finance BV $50,000 5.25% 15/7/2043 58,720 0.00%Ventas Realty LP $50,000 4.88% 15/4/2049 58,656 0.00%National Oilwell Varco, Inc. $58,000 2.60% 1/12/2022 58,557 0.00%CSX Corp. $50,000 4.75% 30/5/2042 58,530 0.00%Exxon Mobil Corp. $50,000 4.11% 1/3/2046 58,517 0.00%Tyson Foods, Inc. $50,000 4.88% 15/8/2034 58,471 0.00%Willis North America, Inc. $50,000 5.05% 15/9/2048 58,432 0.00%Hasbro, Inc. $50,000 6.35% 15/3/2040 58,405 0.00%Zoetis, Inc. $50,000 4.45% 20/8/2048 58,366 0.00%Southwest Gas Corp. $55,000 3.70% 1/4/2028 58,236 0.00%Carlyle Holdings II Finance LLC $50,000 5.63% 30/3/2043 58,233 0.00%Lowe’s Cos, Inc. $55,000 3.88% 15/9/2023 58,209 0.00%Indiana Michigan Power Co. $50,000 4.55% 15/3/2046 58,208 0.00%Estee Lauder Cos, Inc. $50,000 4.15% 15/3/2047 58,150 0.00%Rockwell Automation, Inc. $50,000 4.20% 1/3/2049 58,123 0.00%Burlington Northern Santa Fe LLC $50,000 4.38% 1/9/2042 58,067 0.00%Transcontinental Gas Pipe Line Co. LLC $50,000 5.40% 15/8/2041 58,045 0.00%General Mills, Inc. $50,000 4.55% 17/4/2038 58,033 0.00%Humana, Inc. $50,000 4.80% 15/3/2047 58,016 0.00%Anthem, Inc. $55,000 3.65% 1/12/2027 58,002 0.00%Nationwide Financial Services, Inc. $50,000 6.75% 15/5/2037 58,000 0.00%Oncor Electric Delivery Co. LLC $50,000 4.10% 15/11/2048 57,966 0.00%Mondelez International, Inc. $50,000 4.63% 7/5/2048 57,939 0.00%Virginia Electric & Power Co. $50,000 4.45% 15/2/2044 57,925 0.00%Patterson-UTI Energy, Inc. $60,000 3.95% 1/2/2028 57,912 0.00%Tampa Electric Co. $50,000 4.30% 15/6/2048 57,906 0.00%Johns Hopkins University $50,000 4.08% 1/7/2053 57,747 0.00%Public Service Electric & Gas Co. $50,000 4.05% 1/5/2048 57,746 0.00%Puget Sound Energy, Inc. $50,000 4.30% 20/5/2045 57,668 0.00%Memorial Sloan-Kettering Cancer Center $50,000 4.13% 1/7/2052 57,649 0.00%Wisconsin Electric Power Co. $50,000 4.30% 15/10/2048 57,646 0.00%AXIS Specialty Finance LLC $55,000 3.90% 15/7/2029 57,640 0.00%Magellan Midstream Partners LP $50,000 4.85% 1/2/2049 57,583 0.00%Nationwide Financial Services, Inc. $50,000 5.30% 18/11/2044 57,576 0.00%Enterprise Products Operating LLC $40,000 7.55% 15/4/2038 57,518 0.00%Colgate-Palmolive Co. $50,000 3.70% 1/8/2047 57,504 0.00%City of Hope $50,000 4.38% 15/8/2048 57,423 0.00%Hartford Financial Services Group, Inc. $50,000 4.40% 15/3/2048 57,416 0.00%DTE Electric Co. $50,000 4.05% 15/5/2048 57,337 0.00%
Maturity Fair Value % of Total Principal Coupon Date US Dollars ($) Net Assets
Vanguard Global Corporate Bond Index Fund
595
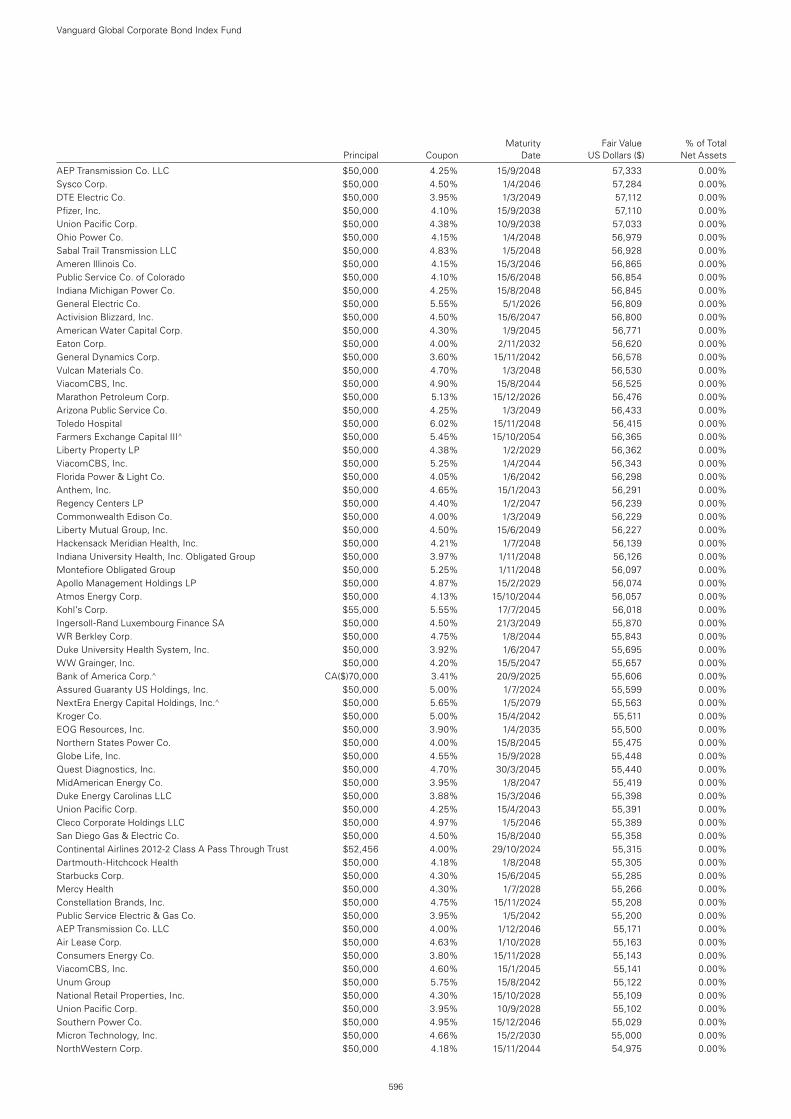
AEP Transmission Co. LLC $50,000 4.25% 15/9/2048 57,333 0.00%Sysco Corp. $50,000 4.50% 1/4/2046 57,284 0.00%DTE Electric Co. $50,000 3.95% 1/3/2049 57,112 0.00%Pfizer, Inc. $50,000 4.10% 15/9/2038 57,110 0.00%Union Pacific Corp. $50,000 4.38% 10/9/2038 57,033 0.00%Ohio Power Co. $50,000 4.15% 1/4/2048 56,979 0.00%Sabal Trail Transmission LLC $50,000 4.83% 1/5/2048 56,928 0.00%Ameren Illinois Co. $50,000 4.15% 15/3/2046 56,865 0.00%Public Service Co. of Colorado $50,000 4.10% 15/6/2048 56,854 0.00%Indiana Michigan Power Co. $50,000 4.25% 15/8/2048 56,845 0.00%General Electric Co. $50,000 5.55% 5/1/2026 56,809 0.00%Activision Blizzard, Inc. $50,000 4.50% 15/6/2047 56,800 0.00%American Water Capital Corp. $50,000 4.30% 1/9/2045 56,771 0.00%Eaton Corp. $50,000 4.00% 2/11/2032 56,620 0.00%General Dynamics Corp. $50,000 3.60% 15/11/2042 56,578 0.00%Vulcan Materials Co. $50,000 4.70% 1/3/2048 56,530 0.00%ViacomCBS, Inc. $50,000 4.90% 15/8/2044 56,525 0.00%Marathon Petroleum Corp. $50,000 5.13% 15/12/2026 56,476 0.00%Arizona Public Service Co. $50,000 4.25% 1/3/2049 56,433 0.00%Toledo Hospital $50,000 6.02% 15/11/2048 56,415 0.00%Farmers Exchange Capital III^ $50,000 5.45% 15/10/2054 56,365 0.00%Liberty Property LP $50,000 4.38% 1/2/2029 56,362 0.00%ViacomCBS, Inc. $50,000 5.25% 1/4/2044 56,343 0.00%Florida Power & Light Co. $50,000 4.05% 1/6/2042 56,298 0.00%Anthem, Inc. $50,000 4.65% 15/1/2043 56,291 0.00%Regency Centers LP $50,000 4.40% 1/2/2047 56,239 0.00%Commonwealth Edison Co. $50,000 4.00% 1/3/2049 56,229 0.00%Liberty Mutual Group, Inc. $50,000 4.50% 15/6/2049 56,227 0.00%Hackensack Meridian Health, Inc. $50,000 4.21% 1/7/2048 56,139 0.00%Indiana University Health, Inc. Obligated Group $50,000 3.97% 1/11/2048 56,126 0.00%Montefiore Obligated Group $50,000 5.25% 1/11/2048 56,097 0.00%Apollo Management Holdings LP $50,000 4.87% 15/2/2029 56,074 0.00%Atmos Energy Corp. $50,000 4.13% 15/10/2044 56,057 0.00%Kohl’s Corp. $55,000 5.55% 17/7/2045 56,018 0.00%Ingersoll-Rand Luxembourg Finance SA $50,000 4.50% 21/3/2049 55,870 0.00%WR Berkley Corp. $50,000 4.75% 1/8/2044 55,843 0.00%Duke University Health System, Inc. $50,000 3.92% 1/6/2047 55,695 0.00%WW Grainger, Inc. $50,000 4.20% 15/5/2047 55,657 0.00%Bank of America Corp.^ CA($)70,000 3.41% 20/9/2025 55,606 0.00%Assured Guaranty US Holdings, Inc. $50,000 5.00% 1/7/2024 55,599 0.00%NextEra Energy Capital Holdings, Inc.^ $50,000 5.65% 1/5/2079 55,563 0.00%Kroger Co. $50,000 5.00% 15/4/2042 55,511 0.00%EOG Resources, Inc. $50,000 3.90% 1/4/2035 55,500 0.00%Northern States Power Co. $50,000 4.00% 15/8/2045 55,475 0.00%Globe Life, Inc. $50,000 4.55% 15/9/2028 55,448 0.00%Quest Diagnostics, Inc. $50,000 4.70% 30/3/2045 55,440 0.00%MidAmerican Energy Co. $50,000 3.95% 1/8/2047 55,419 0.00%Duke Energy Carolinas LLC $50,000 3.88% 15/3/2046 55,398 0.00%Union Pacific Corp. $50,000 4.25% 15/4/2043 55,391 0.00%Cleco Corporate Holdings LLC $50,000 4.97% 1/5/2046 55,389 0.00%San Diego Gas & Electric Co. $50,000 4.50% 15/8/2040 55,358 0.00%Continental Airlines 2012-2 Class A Pass Through Trust $52,456 4.00% 29/10/2024 55,315 0.00%Dartmouth-Hitchcock Health $50,000 4.18% 1/8/2048 55,305 0.00%Starbucks Corp. $50,000 4.30% 15/6/2045 55,285 0.00%Mercy Health $50,000 4.30% 1/7/2028 55,266 0.00%Constellation Brands, Inc. $50,000 4.75% 15/11/2024 55,208 0.00%Public Service Electric & Gas Co. $50,000 3.95% 1/5/2042 55,200 0.00%AEP Transmission Co. LLC $50,000 4.00% 1/12/2046 55,171 0.00%Air Lease Corp. $50,000 4.63% 1/10/2028 55,163 0.00%Consumers Energy Co. $50,000 3.80% 15/11/2028 55,143 0.00%ViacomCBS, Inc. $50,000 4.60% 15/1/2045 55,141 0.00%Unum Group $50,000 5.75% 15/8/2042 55,122 0.00%National Retail Properties, Inc. $50,000 4.30% 15/10/2028 55,109 0.00%Union Pacific Corp. $50,000 3.95% 10/9/2028 55,102 0.00%Southern Power Co. $50,000 4.95% 15/12/2046 55,029 0.00%Micron Technology, Inc. $50,000 4.66% 15/2/2030 55,000 0.00%NorthWestern Corp. $50,000 4.18% 15/11/2044 54,975 0.00%
Maturity Fair Value % of Total Principal Coupon Date US Dollars ($) Net Assets
Vanguard Global Corporate Bond Index Fund
596
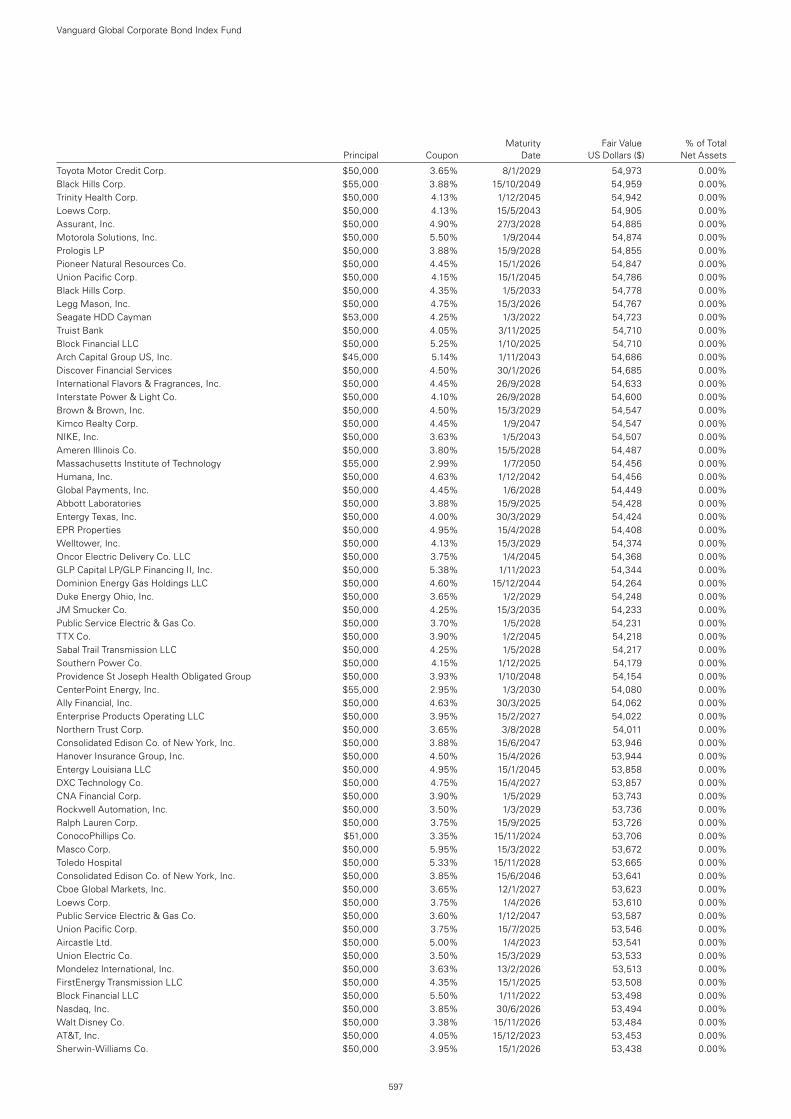
Toyota Motor Credit Corp. $50,000 3.65% 8/1/2029 54,973 0.00%Black Hills Corp. $55,000 3.88% 15/10/2049 54,959 0.00%Trinity Health Corp. $50,000 4.13% 1/12/2045 54,942 0.00%Loews Corp. $50,000 4.13% 15/5/2043 54,905 0.00%Assurant, Inc. $50,000 4.90% 27/3/2028 54,885 0.00%Motorola Solutions, Inc. $50,000 5.50% 1/9/2044 54,874 0.00%Prologis LP $50,000 3.88% 15/9/2028 54,855 0.00%Pioneer Natural Resources Co. $50,000 4.45% 15/1/2026 54,847 0.00%Union Pacific Corp. $50,000 4.15% 15/1/2045 54,786 0.00%Black Hills Corp. $50,000 4.35% 1/5/2033 54,778 0.00%Legg Mason, Inc. $50,000 4.75% 15/3/2026 54,767 0.00%Seagate HDD Cayman $53,000 4.25% 1/3/2022 54,723 0.00%Truist Bank $50,000 4.05% 3/11/2025 54,710 0.00%Block Financial LLC $50,000 5.25% 1/10/2025 54,710 0.00%Arch Capital Group US, Inc. $45,000 5.14% 1/11/2043 54,686 0.00%Discover Financial Services $50,000 4.50% 30/1/2026 54,685 0.00%International Flavors & Fragrances, Inc. $50,000 4.45% 26/9/2028 54,633 0.00%Interstate Power & Light Co. $50,000 4.10% 26/9/2028 54,600 0.00%Brown & Brown, Inc. $50,000 4.50% 15/3/2029 54,547 0.00%Kimco Realty Corp. $50,000 4.45% 1/9/2047 54,547 0.00%NIKE, Inc. $50,000 3.63% 1/5/2043 54,507 0.00%Ameren Illinois Co. $50,000 3.80% 15/5/2028 54,487 0.00%Massachusetts Institute of Technology $55,000 2.99% 1/7/2050 54,456 0.00%Humana, Inc. $50,000 4.63% 1/12/2042 54,456 0.00%Global Payments, Inc. $50,000 4.45% 1/6/2028 54,449 0.00%Abbott Laboratories $50,000 3.88% 15/9/2025 54,428 0.00%Entergy Texas, Inc. $50,000 4.00% 30/3/2029 54,424 0.00%EPR Properties $50,000 4.95% 15/4/2028 54,408 0.00%Welltower, Inc. $50,000 4.13% 15/3/2029 54,374 0.00%Oncor Electric Delivery Co. LLC $50,000 3.75% 1/4/2045 54,368 0.00%GLP Capital LP/GLP Financing II, Inc. $50,000 5.38% 1/11/2023 54,344 0.00%Dominion Energy Gas Holdings LLC $50,000 4.60% 15/12/2044 54,264 0.00%Duke Energy Ohio, Inc. $50,000 3.65% 1/2/2029 54,248 0.00%JM Smucker Co. $50,000 4.25% 15/3/2035 54,233 0.00%Public Service Electric & Gas Co. $50,000 3.70% 1/5/2028 54,231 0.00%TTX Co. $50,000 3.90% 1/2/2045 54,218 0.00%Sabal Trail Transmission LLC $50,000 4.25% 1/5/2028 54,217 0.00%Southern Power Co. $50,000 4.15% 1/12/2025 54,179 0.00%Providence St Joseph Health Obligated Group $50,000 3.93% 1/10/2048 54,154 0.00%CenterPoint Energy, Inc. $55,000 2.95% 1/3/2030 54,080 0.00%Ally Financial, Inc. $50,000 4.63% 30/3/2025 54,062 0.00%Enterprise Products Operating LLC $50,000 3.95% 15/2/2027 54,022 0.00%Northern Trust Corp. $50,000 3.65% 3/8/2028 54,011 0.00%Consolidated Edison Co. of New York, Inc. $50,000 3.88% 15/6/2047 53,946 0.00%Hanover Insurance Group, Inc. $50,000 4.50% 15/4/2026 53,944 0.00%Entergy Louisiana LLC $50,000 4.95% 15/1/2045 53,858 0.00%DXC Technology Co. $50,000 4.75% 15/4/2027 53,857 0.00%CNA Financial Corp. $50,000 3.90% 1/5/2029 53,743 0.00%Rockwell Automation, Inc. $50,000 3.50% 1/3/2029 53,736 0.00%Ralph Lauren Corp. $50,000 3.75% 15/9/2025 53,726 0.00%ConocoPhillips Co. $51,000 3.35% 15/11/2024 53,706 0.00%Masco Corp. $50,000 5.95% 15/3/2022 53,672 0.00%Toledo Hospital $50,000 5.33% 15/11/2028 53,665 0.00%Consolidated Edison Co. of New York, Inc. $50,000 3.85% 15/6/2046 53,641 0.00%Cboe Global Markets, Inc. $50,000 3.65% 12/1/2027 53,623 0.00%Loews Corp. $50,000 3.75% 1/4/2026 53,610 0.00%Public Service Electric & Gas Co. $50,000 3.60% 1/12/2047 53,587 0.00%Union Pacific Corp. $50,000 3.75% 15/7/2025 53,546 0.00%Aircastle Ltd. $50,000 5.00% 1/4/2023 53,541 0.00%Union Electric Co. $50,000 3.50% 15/3/2029 53,533 0.00%Mondelez International, Inc. $50,000 3.63% 13/2/2026 53,513 0.00%FirstEnergy Transmission LLC $50,000 4.35% 15/1/2025 53,508 0.00%Block Financial LLC $50,000 5.50% 1/11/2022 53,498 0.00%Nasdaq, Inc. $50,000 3.85% 30/6/2026 53,494 0.00%Walt Disney Co. $50,000 3.38% 15/11/2026 53,484 0.00%AT&T, Inc. $50,000 4.05% 15/12/2023 53,453 0.00%Sherwin-Williams Co. $50,000 3.95% 15/1/2026 53,438 0.00%
Maturity Fair Value % of Total Principal Coupon Date US Dollars ($) Net Assets
Vanguard Global Corporate Bond Index Fund
597
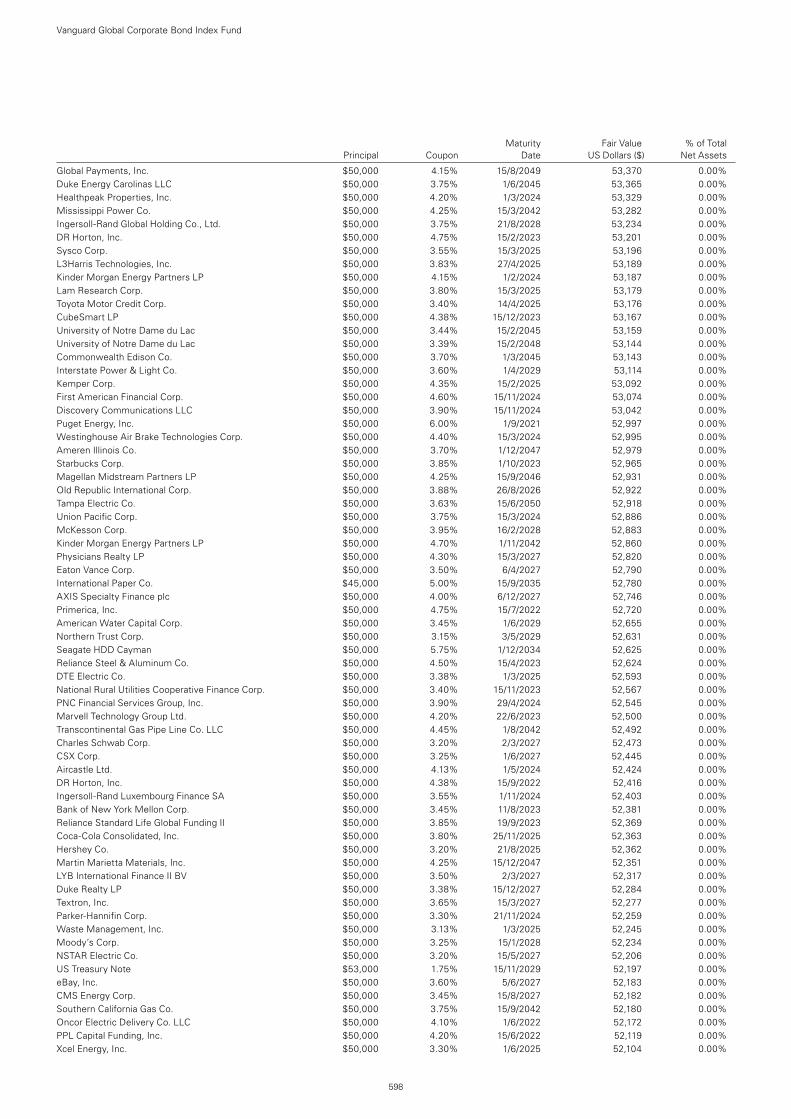
Global Payments, Inc. $50,000 4.15% 15/8/2049 53,370 0.00%Duke Energy Carolinas LLC $50,000 3.75% 1/6/2045 53,365 0.00%Healthpeak Properties, Inc. $50,000 4.20% 1/3/2024 53,329 0.00%Mississippi Power Co. $50,000 4.25% 15/3/2042 53,282 0.00%Ingersoll-Rand Global Holding Co., Ltd. $50,000 3.75% 21/8/2028 53,234 0.00%DR Horton, Inc. $50,000 4.75% 15/2/2023 53,201 0.00%Sysco Corp. $50,000 3.55% 15/3/2025 53,196 0.00%L3Harris Technologies, Inc. $50,000 3.83% 27/4/2025 53,189 0.00%Kinder Morgan Energy Partners LP $50,000 4.15% 1/2/2024 53,187 0.00%Lam Research Corp. $50,000 3.80% 15/3/2025 53,179 0.00%Toyota Motor Credit Corp. $50,000 3.40% 14/4/2025 53,176 0.00%CubeSmart LP $50,000 4.38% 15/12/2023 53,167 0.00%University of Notre Dame du Lac $50,000 3.44% 15/2/2045 53,159 0.00%University of Notre Dame du Lac $50,000 3.39% 15/2/2048 53,144 0.00%Commonwealth Edison Co. $50,000 3.70% 1/3/2045 53,143 0.00%Interstate Power & Light Co. $50,000 3.60% 1/4/2029 53,114 0.00%Kemper Corp. $50,000 4.35% 15/2/2025 53,092 0.00%First American Financial Corp. $50,000 4.60% 15/11/2024 53,074 0.00%Discovery Communications LLC $50,000 3.90% 15/11/2024 53,042 0.00%Puget Energy, Inc. $50,000 6.00% 1/9/2021 52,997 0.00%Westinghouse Air Brake Technologies Corp. $50,000 4.40% 15/3/2024 52,995 0.00%Ameren Illinois Co. $50,000 3.70% 1/12/2047 52,979 0.00%Starbucks Corp. $50,000 3.85% 1/10/2023 52,965 0.00%Magellan Midstream Partners LP $50,000 4.25% 15/9/2046 52,931 0.00%Old Republic International Corp. $50,000 3.88% 26/8/2026 52,922 0.00%Tampa Electric Co. $50,000 3.63% 15/6/2050 52,918 0.00%Union Pacific Corp. $50,000 3.75% 15/3/2024 52,886 0.00%McKesson Corp. $50,000 3.95% 16/2/2028 52,883 0.00%Kinder Morgan Energy Partners LP $50,000 4.70% 1/11/2042 52,860 0.00%Physicians Realty LP $50,000 4.30% 15/3/2027 52,820 0.00%Eaton Vance Corp. $50,000 3.50% 6/4/2027 52,790 0.00%International Paper Co. $45,000 5.00% 15/9/2035 52,780 0.00%AXIS Specialty Finance plc $50,000 4.00% 6/12/2027 52,746 0.00%Primerica, Inc. $50,000 4.75% 15/7/2022 52,720 0.00%American Water Capital Corp. $50,000 3.45% 1/6/2029 52,655 0.00%Northern Trust Corp. $50,000 3.15% 3/5/2029 52,631 0.00%Seagate HDD Cayman $50,000 5.75% 1/12/2034 52,625 0.00%Reliance Steel & Aluminum Co. $50,000 4.50% 15/4/2023 52,624 0.00%DTE Electric Co. $50,000 3.38% 1/3/2025 52,593 0.00%National Rural Utilities Cooperative Finance Corp. $50,000 3.40% 15/11/2023 52,567 0.00%PNC Financial Services Group, Inc. $50,000 3.90% 29/4/2024 52,545 0.00%Marvell Technology Group Ltd. $50,000 4.20% 22/6/2023 52,500 0.00%Transcontinental Gas Pipe Line Co. LLC $50,000 4.45% 1/8/2042 52,492 0.00%Charles Schwab Corp. $50,000 3.20% 2/3/2027 52,473 0.00%CSX Corp. $50,000 3.25% 1/6/2027 52,445 0.00%Aircastle Ltd. $50,000 4.13% 1/5/2024 52,424 0.00%DR Horton, Inc. $50,000 4.38% 15/9/2022 52,416 0.00%Ingersoll-Rand Luxembourg Finance SA $50,000 3.55% 1/11/2024 52,403 0.00%Bank of New York Mellon Corp. $50,000 3.45% 11/8/2023 52,381 0.00%Reliance Standard Life Global Funding II $50,000 3.85% 19/9/2023 52,369 0.00%Coca-Cola Consolidated, Inc. $50,000 3.80% 25/11/2025 52,363 0.00%Hershey Co. $50,000 3.20% 21/8/2025 52,362 0.00%Martin Marietta Materials, Inc. $50,000 4.25% 15/12/2047 52,351 0.00%LYB International Finance II BV $50,000 3.50% 2/3/2027 52,317 0.00%Duke Realty LP $50,000 3.38% 15/12/2027 52,284 0.00%Textron, Inc. $50,000 3.65% 15/3/2027 52,277 0.00%Parker-Hannifin Corp. $50,000 3.30% 21/11/2024 52,259 0.00%Waste Management, Inc. $50,000 3.13% 1/3/2025 52,245 0.00%Moody’s Corp. $50,000 3.25% 15/1/2028 52,234 0.00%NSTAR Electric Co. $50,000 3.20% 15/5/2027 52,206 0.00%US Treasury Note $53,000 1.75% 15/11/2029 52,197 0.00%eBay, Inc. $50,000 3.60% 5/6/2027 52,183 0.00%CMS Energy Corp. $50,000 3.45% 15/8/2027 52,182 0.00%Southern California Gas Co. $50,000 3.75% 15/9/2042 52,180 0.00%Oncor Electric Delivery Co. LLC $50,000 4.10% 1/6/2022 52,172 0.00%PPL Capital Funding, Inc. $50,000 4.20% 15/6/2022 52,119 0.00%Xcel Energy, Inc. $50,000 3.30% 1/6/2025 52,104 0.00%
Maturity Fair Value % of Total Principal Coupon Date US Dollars ($) Net Assets
Vanguard Global Corporate Bond Index Fund
598
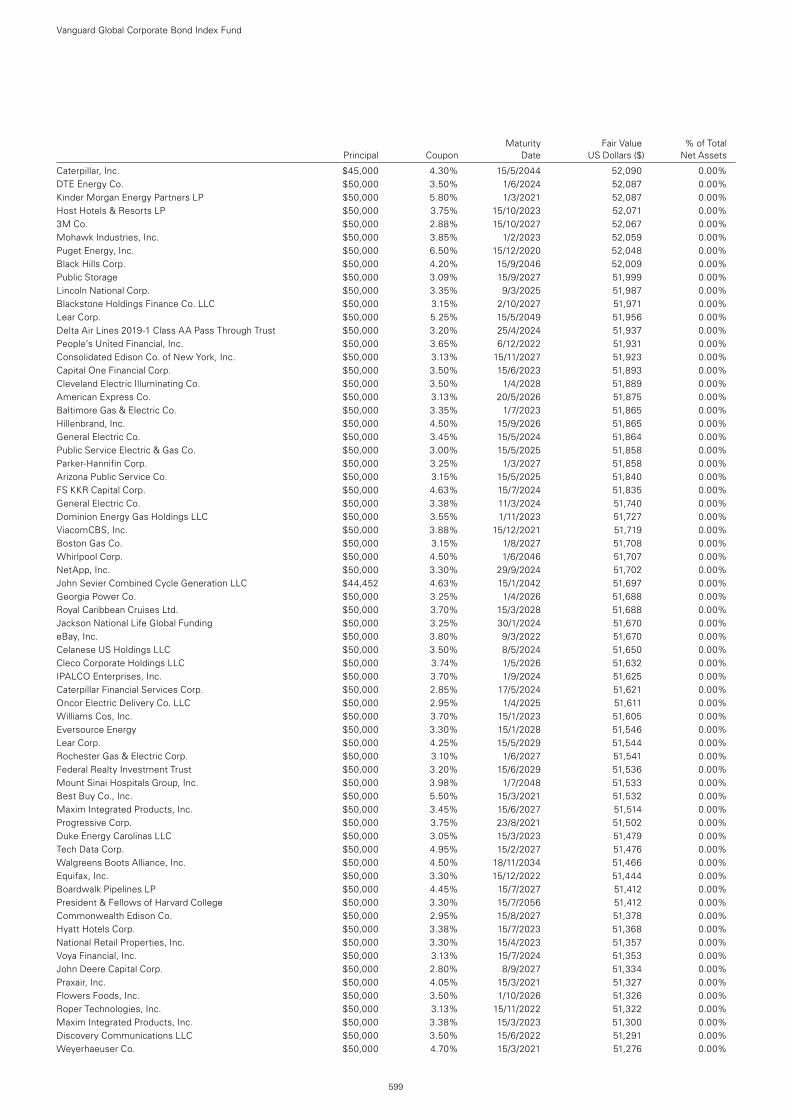
Caterpillar, Inc. $45,000 4.30% 15/5/2044 52,090 0.00%DTE Energy Co. $50,000 3.50% 1/6/2024 52,087 0.00%Kinder Morgan Energy Partners LP $50,000 5.80% 1/3/2021 52,087 0.00%Host Hotels & Resorts LP $50,000 3.75% 15/10/2023 52,071 0.00%3M Co. $50,000 2.88% 15/10/2027 52,067 0.00%Mohawk Industries, Inc. $50,000 3.85% 1/2/2023 52,059 0.00%Puget Energy, Inc. $50,000 6.50% 15/12/2020 52,048 0.00%Black Hills Corp. $50,000 4.20% 15/9/2046 52,009 0.00%Public Storage $50,000 3.09% 15/9/2027 51,999 0.00%Lincoln National Corp. $50,000 3.35% 9/3/2025 51,987 0.00%Blackstone Holdings Finance Co. LLC $50,000 3.15% 2/10/2027 51,971 0.00%Lear Corp. $50,000 5.25% 15/5/2049 51,956 0.00%Delta Air Lines 2019-1 Class AA Pass Through Trust $50,000 3.20% 25/4/2024 51,937 0.00%People’s United Financial, Inc. $50,000 3.65% 6/12/2022 51,931 0.00%Consolidated Edison Co. of New York, Inc. $50,000 3.13% 15/11/2027 51,923 0.00%Capital One Financial Corp. $50,000 3.50% 15/6/2023 51,893 0.00%Cleveland Electric Illuminating Co. $50,000 3.50% 1/4/2028 51,889 0.00%American Express Co. $50,000 3.13% 20/5/2026 51,875 0.00%Baltimore Gas & Electric Co. $50,000 3.35% 1/7/2023 51,865 0.00%Hillenbrand, Inc. $50,000 4.50% 15/9/2026 51,865 0.00%General Electric Co. $50,000 3.45% 15/5/2024 51,864 0.00%Public Service Electric & Gas Co. $50,000 3.00% 15/5/2025 51,858 0.00%Parker-Hannifin Corp. $50,000 3.25% 1/3/2027 51,858 0.00%Arizona Public Service Co. $50,000 3.15% 15/5/2025 51,840 0.00%FS KKR Capital Corp. $50,000 4.63% 15/7/2024 51,835 0.00%General Electric Co. $50,000 3.38% 11/3/2024 51,740 0.00%Dominion Energy Gas Holdings LLC $50,000 3.55% 1/11/2023 51,727 0.00%ViacomCBS, Inc. $50,000 3.88% 15/12/2021 51,719 0.00%Boston Gas Co. $50,000 3.15% 1/8/2027 51,708 0.00%Whirlpool Corp. $50,000 4.50% 1/6/2046 51,707 0.00%NetApp, Inc. $50,000 3.30% 29/9/2024 51,702 0.00%John Sevier Combined Cycle Generation LLC $44,452 4.63% 15/1/2042 51,697 0.00%Georgia Power Co. $50,000 3.25% 1/4/2026 51,688 0.00%Royal Caribbean Cruises Ltd. $50,000 3.70% 15/3/2028 51,688 0.00%Jackson National Life Global Funding $50,000 3.25% 30/1/2024 51,670 0.00%eBay, Inc. $50,000 3.80% 9/3/2022 51,670 0.00%Celanese US Holdings LLC $50,000 3.50% 8/5/2024 51,650 0.00%Cleco Corporate Holdings LLC $50,000 3.74% 1/5/2026 51,632 0.00%IPALCO Enterprises, Inc. $50,000 3.70% 1/9/2024 51,625 0.00%Caterpillar Financial Services Corp. $50,000 2.85% 17/5/2024 51,621 0.00%Oncor Electric Delivery Co. LLC $50,000 2.95% 1/4/2025 51,611 0.00%Williams Cos, Inc. $50,000 3.70% 15/1/2023 51,605 0.00%Eversource Energy $50,000 3.30% 15/1/2028 51,546 0.00%Lear Corp. $50,000 4.25% 15/5/2029 51,544 0.00%Rochester Gas & Electric Corp. $50,000 3.10% 1/6/2027 51,541 0.00%Federal Realty Investment Trust $50,000 3.20% 15/6/2029 51,536 0.00%Mount Sinai Hospitals Group, Inc. $50,000 3.98% 1/7/2048 51,533 0.00%Best Buy Co., Inc. $50,000 5.50% 15/3/2021 51,532 0.00%Maxim Integrated Products, Inc. $50,000 3.45% 15/6/2027 51,514 0.00%Progressive Corp. $50,000 3.75% 23/8/2021 51,502 0.00%Duke Energy Carolinas LLC $50,000 3.05% 15/3/2023 51,479 0.00%Tech Data Corp. $50,000 4.95% 15/2/2027 51,476 0.00%Walgreens Boots Alliance, Inc. $50,000 4.50% 18/11/2034 51,466 0.00%Equifax, Inc. $50,000 3.30% 15/12/2022 51,444 0.00%Boardwalk Pipelines LP $50,000 4.45% 15/7/2027 51,412 0.00%President & Fellows of Harvard College $50,000 3.30% 15/7/2056 51,412 0.00%Commonwealth Edison Co. $50,000 2.95% 15/8/2027 51,378 0.00%Hyatt Hotels Corp. $50,000 3.38% 15/7/2023 51,368 0.00%National Retail Properties, Inc. $50,000 3.30% 15/4/2023 51,357 0.00%Voya Financial, Inc. $50,000 3.13% 15/7/2024 51,353 0.00%John Deere Capital Corp. $50,000 2.80% 8/9/2027 51,334 0.00%Praxair, Inc. $50,000 4.05% 15/3/2021 51,327 0.00%Flowers Foods, Inc. $50,000 3.50% 1/10/2026 51,326 0.00%Roper Technologies, Inc. $50,000 3.13% 15/11/2022 51,322 0.00%Maxim Integrated Products, Inc. $50,000 3.38% 15/3/2023 51,300 0.00%Discovery Communications LLC $50,000 3.50% 15/6/2022 51,291 0.00%Weyerhaeuser Co. $50,000 4.70% 15/3/2021 51,276 0.00%
Maturity Fair Value % of Total Principal Coupon Date US Dollars ($) Net Assets
Vanguard Global Corporate Bond Index Fund
599
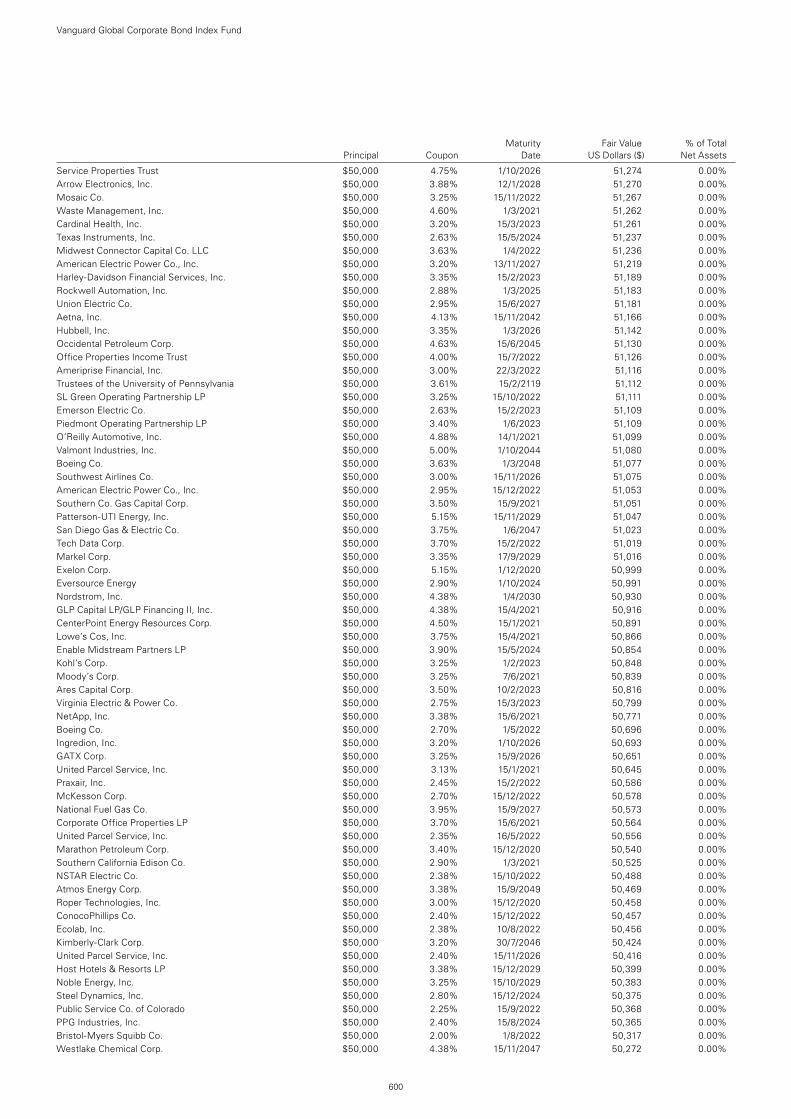
Service Properties Trust $50,000 4.75% 1/10/2026 51,274 0.00%Arrow Electronics, Inc. $50,000 3.88% 12/1/2028 51,270 0.00%Mosaic Co. $50,000 3.25% 15/11/2022 51,267 0.00%Waste Management, Inc. $50,000 4.60% 1/3/2021 51,262 0.00%Cardinal Health, Inc. $50,000 3.20% 15/3/2023 51,261 0.00%Texas Instruments, Inc. $50,000 2.63% 15/5/2024 51,237 0.00%Midwest Connector Capital Co. LLC $50,000 3.63% 1/4/2022 51,236 0.00%American Electric Power Co., Inc. $50,000 3.20% 13/11/2027 51,219 0.00%Harley-Davidson Financial Services, Inc. $50,000 3.35% 15/2/2023 51,189 0.00%Rockwell Automation, Inc. $50,000 2.88% 1/3/2025 51,183 0.00%Union Electric Co. $50,000 2.95% 15/6/2027 51,181 0.00%Aetna, Inc. $50,000 4.13% 15/11/2042 51,166 0.00%Hubbell, Inc. $50,000 3.35% 1/3/2026 51,142 0.00%Occidental Petroleum Corp. $50,000 4.63% 15/6/2045 51,130 0.00%Office Properties Income Trust $50,000 4.00% 15/7/2022 51,126 0.00%Ameriprise Financial, Inc. $50,000 3.00% 22/3/2022 51,116 0.00%Trustees of the University of Pennsylvania $50,000 3.61% 15/2/2119 51,112 0.00%SL Green Operating Partnership LP $50,000 3.25% 15/10/2022 51,111 0.00%Emerson Electric Co. $50,000 2.63% 15/2/2023 51,109 0.00%Piedmont Operating Partnership LP $50,000 3.40% 1/6/2023 51,109 0.00%O’Reilly Automotive, Inc. $50,000 4.88% 14/1/2021 51,099 0.00%Valmont Industries, Inc. $50,000 5.00% 1/10/2044 51,080 0.00%Boeing Co. $50,000 3.63% 1/3/2048 51,077 0.00%Southwest Airlines Co. $50,000 3.00% 15/11/2026 51,075 0.00%American Electric Power Co., Inc. $50,000 2.95% 15/12/2022 51,053 0.00%Southern Co. Gas Capital Corp. $50,000 3.50% 15/9/2021 51,051 0.00%Patterson-UTI Energy, Inc. $50,000 5.15% 15/11/2029 51,047 0.00%San Diego Gas & Electric Co. $50,000 3.75% 1/6/2047 51,023 0.00%Tech Data Corp. $50,000 3.70% 15/2/2022 51,019 0.00%Markel Corp. $50,000 3.35% 17/9/2029 51,016 0.00%Exelon Corp. $50,000 5.15% 1/12/2020 50,999 0.00%Eversource Energy $50,000 2.90% 1/10/2024 50,991 0.00%Nordstrom, Inc. $50,000 4.38% 1/4/2030 50,930 0.00%GLP Capital LP/GLP Financing II, Inc. $50,000 4.38% 15/4/2021 50,916 0.00%CenterPoint Energy Resources Corp. $50,000 4.50% 15/1/2021 50,891 0.00%Lowe’s Cos, Inc. $50,000 3.75% 15/4/2021 50,866 0.00%Enable Midstream Partners LP $50,000 3.90% 15/5/2024 50,854 0.00%Kohl’s Corp. $50,000 3.25% 1/2/2023 50,848 0.00%Moody’s Corp. $50,000 3.25% 7/6/2021 50,839 0.00%Ares Capital Corp. $50,000 3.50% 10/2/2023 50,816 0.00%Virginia Electric & Power Co. $50,000 2.75% 15/3/2023 50,799 0.00%NetApp, Inc. $50,000 3.38% 15/6/2021 50,771 0.00%Boeing Co. $50,000 2.70% 1/5/2022 50,696 0.00%Ingredion, Inc. $50,000 3.20% 1/10/2026 50,693 0.00%GATX Corp. $50,000 3.25% 15/9/2026 50,651 0.00%United Parcel Service, Inc. $50,000 3.13% 15/1/2021 50,645 0.00%Praxair, Inc. $50,000 2.45% 15/2/2022 50,586 0.00%McKesson Corp. $50,000 2.70% 15/12/2022 50,578 0.00%National Fuel Gas Co. $50,000 3.95% 15/9/2027 50,573 0.00%Corporate Office Properties LP $50,000 3.70% 15/6/2021 50,564 0.00%United Parcel Service, Inc. $50,000 2.35% 16/5/2022 50,556 0.00%Marathon Petroleum Corp. $50,000 3.40% 15/12/2020 50,540 0.00%Southern California Edison Co. $50,000 2.90% 1/3/2021 50,525 0.00%NSTAR Electric Co. $50,000 2.38% 15/10/2022 50,488 0.00%Atmos Energy Corp. $50,000 3.38% 15/9/2049 50,469 0.00%Roper Technologies, Inc. $50,000 3.00% 15/12/2020 50,458 0.00%ConocoPhillips Co. $50,000 2.40% 15/12/2022 50,457 0.00%Ecolab, Inc. $50,000 2.38% 10/8/2022 50,456 0.00%Kimberly-Clark Corp. $50,000 3.20% 30/7/2046 50,424 0.00%United Parcel Service, Inc. $50,000 2.40% 15/11/2026 50,416 0.00%Host Hotels & Resorts LP $50,000 3.38% 15/12/2029 50,399 0.00%Noble Energy, Inc. $50,000 3.25% 15/10/2029 50,383 0.00%Steel Dynamics, Inc. $50,000 2.80% 15/12/2024 50,375 0.00%Public Service Co. of Colorado $50,000 2.25% 15/9/2022 50,368 0.00%PPG Industries, Inc. $50,000 2.40% 15/8/2024 50,365 0.00%Bristol-Myers Squibb Co. $50,000 2.00% 1/8/2022 50,317 0.00%Westlake Chemical Corp. $50,000 4.38% 15/11/2047 50,272 0.00%
Maturity Fair Value % of Total Principal Coupon Date US Dollars ($) Net Assets
Vanguard Global Corporate Bond Index Fund
600
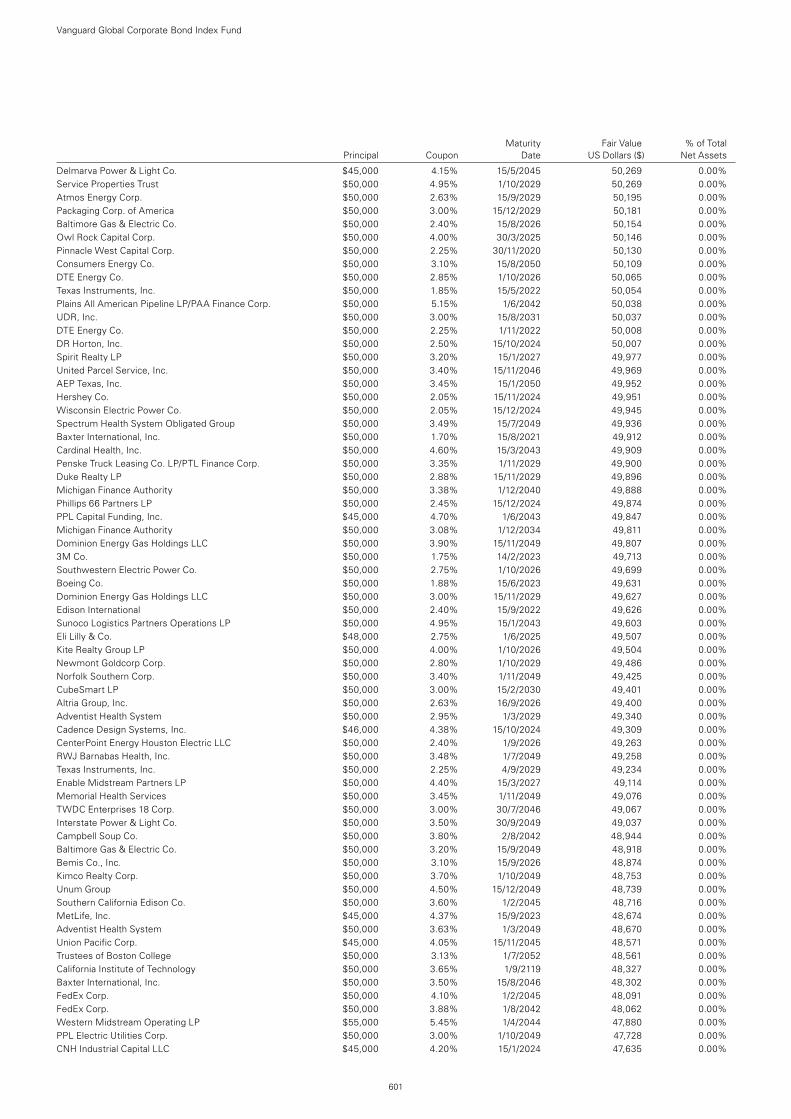
Delmarva Power & Light Co. $45,000 4.15% 15/5/2045 50,269 0.00%Service Properties Trust $50,000 4.95% 1/10/2029 50,269 0.00%Atmos Energy Corp. $50,000 2.63% 15/9/2029 50,195 0.00%Packaging Corp. of America $50,000 3.00% 15/12/2029 50,181 0.00%Baltimore Gas & Electric Co. $50,000 2.40% 15/8/2026 50,154 0.00%Owl Rock Capital Corp. $50,000 4.00% 30/3/2025 50,146 0.00%Pinnacle West Capital Corp. $50,000 2.25% 30/11/2020 50,130 0.00%Consumers Energy Co. $50,000 3.10% 15/8/2050 50,109 0.00%DTE Energy Co. $50,000 2.85% 1/10/2026 50,065 0.00%Texas Instruments, Inc. $50,000 1.85% 15/5/2022 50,054 0.00%Plains All American Pipeline LP/PAA Finance Corp. $50,000 5.15% 1/6/2042 50,038 0.00%UDR, Inc. $50,000 3.00% 15/8/2031 50,037 0.00%DTE Energy Co. $50,000 2.25% 1/11/2022 50,008 0.00%DR Horton, Inc. $50,000 2.50% 15/10/2024 50,007 0.00%Spirit Realty LP $50,000 3.20% 15/1/2027 49,977 0.00%United Parcel Service, Inc. $50,000 3.40% 15/11/2046 49,969 0.00%AEP Texas, Inc. $50,000 3.45% 15/1/2050 49,952 0.00%Hershey Co. $50,000 2.05% 15/11/2024 49,951 0.00%Wisconsin Electric Power Co. $50,000 2.05% 15/12/2024 49,945 0.00%Spectrum Health System Obligated Group $50,000 3.49% 15/7/2049 49,936 0.00%Baxter International, Inc. $50,000 1.70% 15/8/2021 49,912 0.00%Cardinal Health, Inc. $50,000 4.60% 15/3/2043 49,909 0.00%Penske Truck Leasing Co. LP/PTL Finance Corp. $50,000 3.35% 1/11/2029 49,900 0.00%Duke Realty LP $50,000 2.88% 15/11/2029 49,896 0.00%Michigan Finance Authority $50,000 3.38% 1/12/2040 49,888 0.00%Phillips 66 Partners LP $50,000 2.45% 15/12/2024 49,874 0.00%PPL Capital Funding, Inc. $45,000 4.70% 1/6/2043 49,847 0.00%Michigan Finance Authority $50,000 3.08% 1/12/2034 49,811 0.00%Dominion Energy Gas Holdings LLC $50,000 3.90% 15/11/2049 49,807 0.00%3M Co. $50,000 1.75% 14/2/2023 49,713 0.00%Southwestern Electric Power Co. $50,000 2.75% 1/10/2026 49,699 0.00%Boeing Co. $50,000 1.88% 15/6/2023 49,631 0.00%Dominion Energy Gas Holdings LLC $50,000 3.00% 15/11/2029 49,627 0.00%Edison International $50,000 2.40% 15/9/2022 49,626 0.00%Sunoco Logistics Partners Operations LP $50,000 4.95% 15/1/2043 49,603 0.00%Eli Lilly & Co. $48,000 2.75% 1/6/2025 49,507 0.00%Kite Realty Group LP $50,000 4.00% 1/10/2026 49,504 0.00%Newmont Goldcorp Corp. $50,000 2.80% 1/10/2029 49,486 0.00%Norfolk Southern Corp. $50,000 3.40% 1/11/2049 49,425 0.00%CubeSmart LP $50,000 3.00% 15/2/2030 49,401 0.00%Altria Group, Inc. $50,000 2.63% 16/9/2026 49,400 0.00%Adventist Health System $50,000 2.95% 1/3/2029 49,340 0.00%Cadence Design Systems, Inc. $46,000 4.38% 15/10/2024 49,309 0.00%CenterPoint Energy Houston Electric LLC $50,000 2.40% 1/9/2026 49,263 0.00%RWJ Barnabas Health, Inc. $50,000 3.48% 1/7/2049 49,258 0.00%Texas Instruments, Inc. $50,000 2.25% 4/9/2029 49,234 0.00%Enable Midstream Partners LP $50,000 4.40% 15/3/2027 49,114 0.00%Memorial Health Services $50,000 3.45% 1/11/2049 49,076 0.00%TWDC Enterprises 18 Corp. $50,000 3.00% 30/7/2046 49,067 0.00%Interstate Power & Light Co. $50,000 3.50% 30/9/2049 49,037 0.00%Campbell Soup Co. $50,000 3.80% 2/8/2042 48,944 0.00%Baltimore Gas & Electric Co. $50,000 3.20% 15/9/2049 48,918 0.00%Bemis Co., Inc. $50,000 3.10% 15/9/2026 48,874 0.00%Kimco Realty Corp. $50,000 3.70% 1/10/2049 48,753 0.00%Unum Group $50,000 4.50% 15/12/2049 48,739 0.00%Southern California Edison Co. $50,000 3.60% 1/2/2045 48,716 0.00%MetLife, Inc. $45,000 4.37% 15/9/2023 48,674 0.00%Adventist Health System $50,000 3.63% 1/3/2049 48,670 0.00%Union Pacific Corp. $45,000 4.05% 15/11/2045 48,571 0.00%Trustees of Boston College $50,000 3.13% 1/7/2052 48,561 0.00%California Institute of Technology $50,000 3.65% 1/9/2119 48,327 0.00%Baxter International, Inc. $50,000 3.50% 15/8/2046 48,302 0.00%FedEx Corp. $50,000 4.10% 1/2/2045 48,091 0.00%FedEx Corp. $50,000 3.88% 1/8/2042 48,062 0.00%Western Midstream Operating LP $55,000 5.45% 1/4/2044 47,880 0.00%PPL Electric Utilities Corp. $50,000 3.00% 1/10/2049 47,728 0.00%CNH Industrial Capital LLC $45,000 4.20% 15/1/2024 47,635 0.00%
Maturity Fair Value % of Total Principal Coupon Date US Dollars ($) Net Assets
Vanguard Global Corporate Bond Index Fund
601
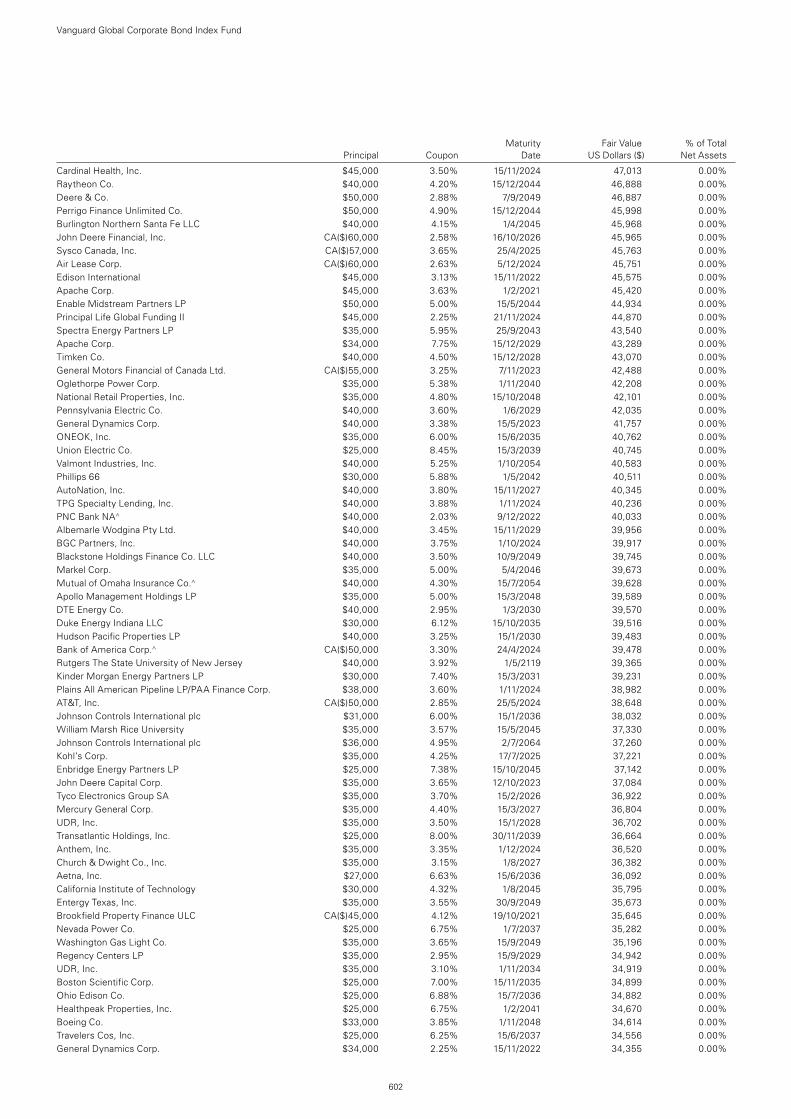
Cardinal Health, Inc. $45,000 3.50% 15/11/2024 47,013 0.00%Raytheon Co. $40,000 4.20% 15/12/2044 46,888 0.00%Deere & Co. $50,000 2.88% 7/9/2049 46,887 0.00%Perrigo Finance Unlimited Co. $50,000 4.90% 15/12/2044 45,998 0.00%Burlington Northern Santa Fe LLC $40,000 4.15% 1/4/2045 45,968 0.00%John Deere Financial, Inc. CA($)60,000 2.58% 16/10/2026 45,965 0.00%Sysco Canada, Inc. CA($)57,000 3.65% 25/4/2025 45,763 0.00%Air Lease Corp. CA($)60,000 2.63% 5/12/2024 45,751 0.00%Edison International $45,000 3.13% 15/11/2022 45,575 0.00%Apache Corp. $45,000 3.63% 1/2/2021 45,420 0.00%Enable Midstream Partners LP $50,000 5.00% 15/5/2044 44,934 0.00%Principal Life Global Funding II $45,000 2.25% 21/11/2024 44,870 0.00%Spectra Energy Partners LP $35,000 5.95% 25/9/2043 43,540 0.00%Apache Corp. $34,000 7.75% 15/12/2029 43,289 0.00%Timken Co. $40,000 4.50% 15/12/2028 43,070 0.00%General Motors Financial of Canada Ltd. CA($)55,000 3.25% 7/11/2023 42,488 0.00%Oglethorpe Power Corp. $35,000 5.38% 1/11/2040 42,208 0.00%National Retail Properties, Inc. $35,000 4.80% 15/10/2048 42,101 0.00%Pennsylvania Electric Co. $40,000 3.60% 1/6/2029 42,035 0.00%General Dynamics Corp. $40,000 3.38% 15/5/2023 41,757 0.00%ONEOK, Inc. $35,000 6.00% 15/6/2035 40,762 0.00%Union Electric Co. $25,000 8.45% 15/3/2039 40,745 0.00%Valmont Industries, Inc. $40,000 5.25% 1/10/2054 40,583 0.00%Phillips 66 $30,000 5.88% 1/5/2042 40,511 0.00%AutoNation, Inc. $40,000 3.80% 15/11/2027 40,345 0.00%TPG Specialty Lending, Inc. $40,000 3.88% 1/11/2024 40,236 0.00%PNC Bank NA^ $40,000 2.03% 9/12/2022 40,033 0.00%Albemarle Wodgina Pty Ltd. $40,000 3.45% 15/11/2029 39,956 0.00%BGC Partners, Inc. $40,000 3.75% 1/10/2024 39,917 0.00%Blackstone Holdings Finance Co. LLC $40,000 3.50% 10/9/2049 39,745 0.00%Markel Corp. $35,000 5.00% 5/4/2046 39,673 0.00%Mutual of Omaha Insurance Co.^ $40,000 4.30% 15/7/2054 39,628 0.00%Apollo Management Holdings LP $35,000 5.00% 15/3/2048 39,589 0.00%DTE Energy Co. $40,000 2.95% 1/3/2030 39,570 0.00%Duke Energy Indiana LLC $30,000 6.12% 15/10/2035 39,516 0.00%Hudson Pacific Properties LP $40,000 3.25% 15/1/2030 39,483 0.00%Bank of America Corp.^ CA($)50,000 3.30% 24/4/2024 39,478 0.00%Rutgers The State University of New Jersey $40,000 3.92% 1/5/2119 39,365 0.00%Kinder Morgan Energy Partners LP $30,000 7.40% 15/3/2031 39,231 0.00%Plains All American Pipeline LP/PAA Finance Corp. $38,000 3.60% 1/11/2024 38,982 0.00%AT&T, Inc. CA($)50,000 2.85% 25/5/2024 38,648 0.00%Johnson Controls International plc $31,000 6.00% 15/1/2036 38,032 0.00%William Marsh Rice University $35,000 3.57% 15/5/2045 37,330 0.00%Johnson Controls International plc $36,000 4.95% 2/7/2064 37,260 0.00%Kohl’s Corp. $35,000 4.25% 17/7/2025 37,221 0.00%Enbridge Energy Partners LP $25,000 7.38% 15/10/2045 37,142 0.00%John Deere Capital Corp. $35,000 3.65% 12/10/2023 37,084 0.00%Tyco Electronics Group SA $35,000 3.70% 15/2/2026 36,922 0.00%Mercury General Corp. $35,000 4.40% 15/3/2027 36,804 0.00%UDR, Inc. $35,000 3.50% 15/1/2028 36,702 0.00%Transatlantic Holdings, Inc. $25,000 8.00% 30/11/2039 36,664 0.00%Anthem, Inc. $35,000 3.35% 1/12/2024 36,520 0.00%Church & Dwight Co., Inc. $35,000 3.15% 1/8/2027 36,382 0.00%Aetna, Inc. $27,000 6.63% 15/6/2036 36,092 0.00%California Institute of Technology $30,000 4.32% 1/8/2045 35,795 0.00%Entergy Texas, Inc. $35,000 3.55% 30/9/2049 35,673 0.00%Brookfield Property Finance ULC CA($)45,000 4.12% 19/10/2021 35,645 0.00%Nevada Power Co. $25,000 6.75% 1/7/2037 35,282 0.00%Washington Gas Light Co. $35,000 3.65% 15/9/2049 35,196 0.00%Regency Centers LP $35,000 2.95% 15/9/2029 34,942 0.00%UDR, Inc. $35,000 3.10% 1/11/2034 34,919 0.00%Boston Scientific Corp. $25,000 7.00% 15/11/2035 34,899 0.00%Ohio Edison Co. $25,000 6.88% 15/7/2036 34,882 0.00%Healthpeak Properties, Inc. $25,000 6.75% 1/2/2041 34,670 0.00%Boeing Co. $33,000 3.85% 1/11/2048 34,614 0.00%Travelers Cos, Inc. $25,000 6.25% 15/6/2037 34,556 0.00%General Dynamics Corp. $34,000 2.25% 15/11/2022 34,355 0.00%
Maturity Fair Value % of Total Principal Coupon Date US Dollars ($) Net Assets
Vanguard Global Corporate Bond Index Fund
602
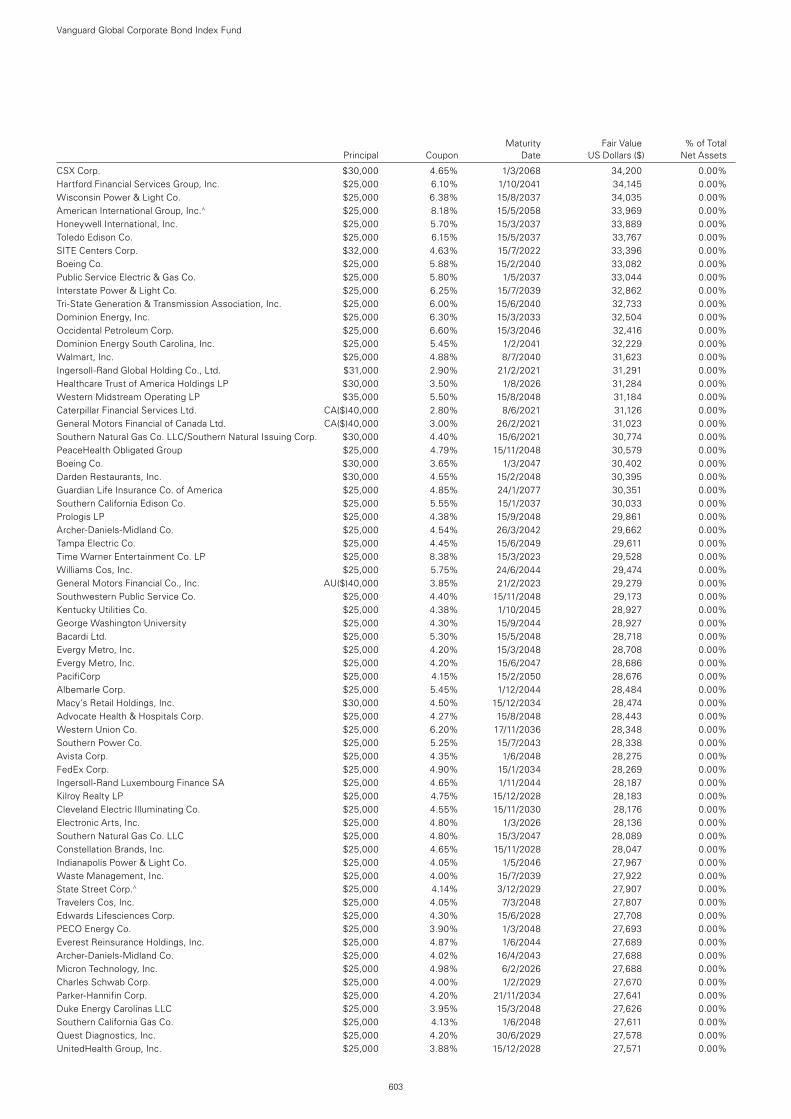
CSX Corp. $30,000 4.65% 1/3/2068 34,200 0.00%Hartford Financial Services Group, Inc. $25,000 6.10% 1/10/2041 34,145 0.00%Wisconsin Power & Light Co. $25,000 6.38% 15/8/2037 34,035 0.00%American International Group, Inc.^ $25,000 8.18% 15/5/2058 33,969 0.00%Honeywell International, Inc. $25,000 5.70% 15/3/2037 33,889 0.00%Toledo Edison Co. $25,000 6.15% 15/5/2037 33,767 0.00%SITE Centers Corp. $32,000 4.63% 15/7/2022 33,396 0.00%Boeing Co. $25,000 5.88% 15/2/2040 33,082 0.00%Public Service Electric & Gas Co. $25,000 5.80% 1/5/2037 33,044 0.00%Interstate Power & Light Co. $25,000 6.25% 15/7/2039 32,862 0.00%Tri-State Generation & Transmission Association, Inc. $25,000 6.00% 15/6/2040 32,733 0.00%Dominion Energy, Inc. $25,000 6.30% 15/3/2033 32,504 0.00%Occidental Petroleum Corp. $25,000 6.60% 15/3/2046 32,416 0.00%Dominion Energy South Carolina, Inc. $25,000 5.45% 1/2/2041 32,229 0.00%Walmart, Inc. $25,000 4.88% 8/7/2040 31,623 0.00%Ingersoll-Rand Global Holding Co., Ltd. $31,000 2.90% 21/2/2021 31,291 0.00%Healthcare Trust of America Holdings LP $30,000 3.50% 1/8/2026 31,284 0.00%Western Midstream Operating LP $35,000 5.50% 15/8/2048 31,184 0.00%Caterpillar Financial Services Ltd. CA($)40,000 2.80% 8/6/2021 31,126 0.00%General Motors Financial of Canada Ltd. CA($)40,000 3.00% 26/2/2021 31,023 0.00%Southern Natural Gas Co. LLC/Southern Natural Issuing Corp. $30,000 4.40% 15/6/2021 30,774 0.00%PeaceHealth Obligated Group $25,000 4.79% 15/11/2048 30,579 0.00%Boeing Co. $30,000 3.65% 1/3/2047 30,402 0.00%Darden Restaurants, Inc. $30,000 4.55% 15/2/2048 30,395 0.00%Guardian Life Insurance Co. of America $25,000 4.85% 24/1/2077 30,351 0.00%Southern California Edison Co. $25,000 5.55% 15/1/2037 30,033 0.00%Prologis LP $25,000 4.38% 15/9/2048 29,861 0.00%Archer-Daniels-Midland Co. $25,000 4.54% 26/3/2042 29,662 0.00%Tampa Electric Co. $25,000 4.45% 15/6/2049 29,611 0.00%Time Warner Entertainment Co. LP $25,000 8.38% 15/3/2023 29,528 0.00%Williams Cos, Inc. $25,000 5.75% 24/6/2044 29,474 0.00%General Motors Financial Co., Inc. AU($)40,000 3.85% 21/2/2023 29,279 0.00%Southwestern Public Service Co. $25,000 4.40% 15/11/2048 29,173 0.00%Kentucky Utilities Co. $25,000 4.38% 1/10/2045 28,927 0.00%George Washington University $25,000 4.30% 15/9/2044 28,927 0.00%Bacardi Ltd. $25,000 5.30% 15/5/2048 28,718 0.00%Evergy Metro, Inc. $25,000 4.20% 15/3/2048 28,708 0.00%Evergy Metro, Inc. $25,000 4.20% 15/6/2047 28,686 0.00%PacifiCorp $25,000 4.15% 15/2/2050 28,676 0.00%Albemarle Corp. $25,000 5.45% 1/12/2044 28,484 0.00%Macy’s Retail Holdings, Inc. $30,000 4.50% 15/12/2034 28,474 0.00%Advocate Health & Hospitals Corp. $25,000 4.27% 15/8/2048 28,443 0.00%Western Union Co. $25,000 6.20% 17/11/2036 28,348 0.00%Southern Power Co. $25,000 5.25% 15/7/2043 28,338 0.00%Avista Corp. $25,000 4.35% 1/6/2048 28,275 0.00%FedEx Corp. $25,000 4.90% 15/1/2034 28,269 0.00%Ingersoll-Rand Luxembourg Finance SA $25,000 4.65% 1/11/2044 28,187 0.00%Kilroy Realty LP $25,000 4.75% 15/12/2028 28,183 0.00%Cleveland Electric Illuminating Co. $25,000 4.55% 15/11/2030 28,176 0.00%Electronic Arts, Inc. $25,000 4.80% 1/3/2026 28,136 0.00%Southern Natural Gas Co. LLC $25,000 4.80% 15/3/2047 28,089 0.00%Constellation Brands, Inc. $25,000 4.65% 15/11/2028 28,047 0.00%Indianapolis Power & Light Co. $25,000 4.05% 1/5/2046 27,967 0.00%Waste Management, Inc. $25,000 4.00% 15/7/2039 27,922 0.00%State Street Corp.^ $25,000 4.14% 3/12/2029 27,907 0.00%Travelers Cos, Inc. $25,000 4.05% 7/3/2048 27,807 0.00%Edwards Lifesciences Corp. $25,000 4.30% 15/6/2028 27,708 0.00%PECO Energy Co. $25,000 3.90% 1/3/2048 27,693 0.00%Everest Reinsurance Holdings, Inc. $25,000 4.87% 1/6/2044 27,689 0.00%Archer-Daniels-Midland Co. $25,000 4.02% 16/4/2043 27,688 0.00%Micron Technology, Inc. $25,000 4.98% 6/2/2026 27,688 0.00%Charles Schwab Corp. $25,000 4.00% 1/2/2029 27,670 0.00%Parker-Hannifin Corp. $25,000 4.20% 21/11/2034 27,641 0.00%Duke Energy Carolinas LLC $25,000 3.95% 15/3/2048 27,626 0.00%Southern California Gas Co. $25,000 4.13% 1/6/2048 27,611 0.00%Quest Diagnostics, Inc. $25,000 4.20% 30/6/2029 27,578 0.00%UnitedHealth Group, Inc. $25,000 3.88% 15/12/2028 27,571 0.00%
Maturity Fair Value % of Total Principal Coupon Date US Dollars ($) Net Assets
Vanguard Global Corporate Bond Index Fund
603
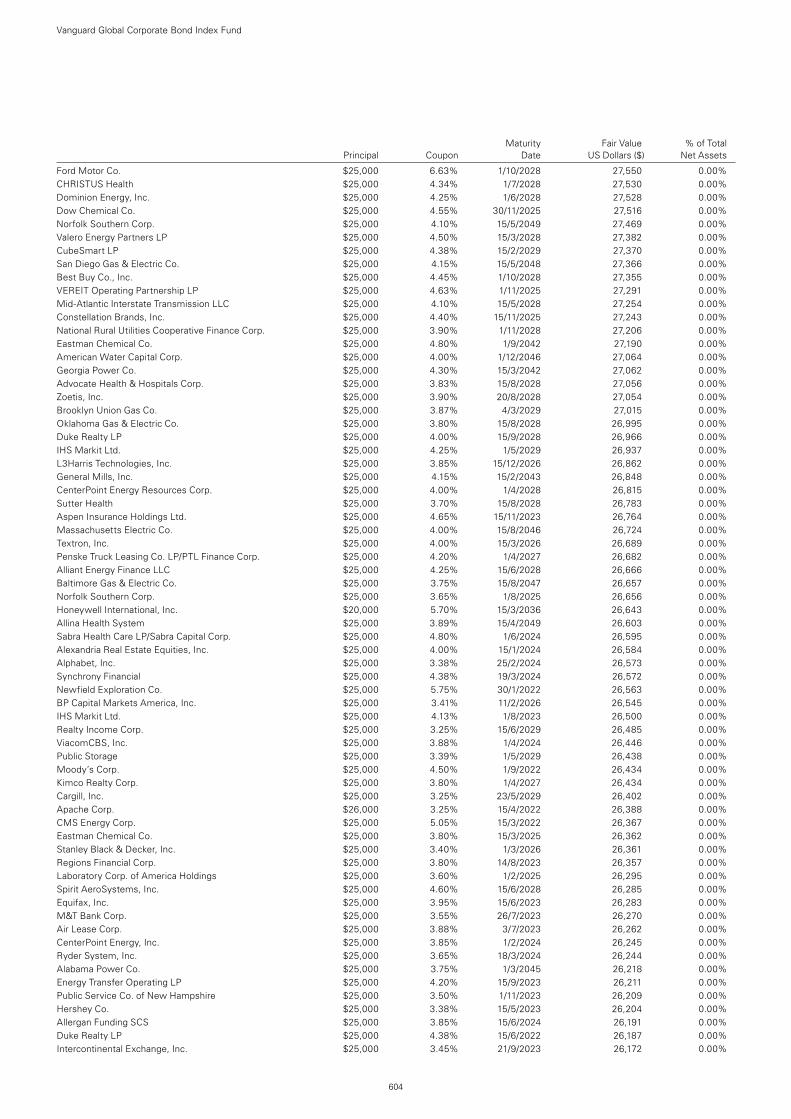
Ford Motor Co. $25,000 6.63% 1/10/2028 27,550 0.00%CHRISTUS Health $25,000 4.34% 1/7/2028 27,530 0.00%Dominion Energy, Inc. $25,000 4.25% 1/6/2028 27,528 0.00%Dow Chemical Co. $25,000 4.55% 30/11/2025 27,516 0.00%Norfolk Southern Corp. $25,000 4.10% 15/5/2049 27,469 0.00%Valero Energy Partners LP $25,000 4.50% 15/3/2028 27,382 0.00%CubeSmart LP $25,000 4.38% 15/2/2029 27,370 0.00%San Diego Gas & Electric Co. $25,000 4.15% 15/5/2048 27,366 0.00%Best Buy Co., Inc. $25,000 4.45% 1/10/2028 27,355 0.00%VEREIT Operating Partnership LP $25,000 4.63% 1/11/2025 27,291 0.00%Mid-Atlantic Interstate Transmission LLC $25,000 4.10% 15/5/2028 27,254 0.00%Constellation Brands, Inc. $25,000 4.40% 15/11/2025 27,243 0.00%National Rural Utilities Cooperative Finance Corp. $25,000 3.90% 1/11/2028 27,206 0.00%Eastman Chemical Co. $25,000 4.80% 1/9/2042 27,190 0.00%American Water Capital Corp. $25,000 4.00% 1/12/2046 27,064 0.00%Georgia Power Co. $25,000 4.30% 15/3/2042 27,062 0.00%Advocate Health & Hospitals Corp. $25,000 3.83% 15/8/2028 27,056 0.00%Zoetis, Inc. $25,000 3.90% 20/8/2028 27,054 0.00%Brooklyn Union Gas Co. $25,000 3.87% 4/3/2029 27,015 0.00%Oklahoma Gas & Electric Co. $25,000 3.80% 15/8/2028 26,995 0.00%Duke Realty LP $25,000 4.00% 15/9/2028 26,966 0.00%IHS Markit Ltd. $25,000 4.25% 1/5/2029 26,937 0.00%L3Harris Technologies, Inc. $25,000 3.85% 15/12/2026 26,862 0.00%General Mills, Inc. $25,000 4.15% 15/2/2043 26,848 0.00%CenterPoint Energy Resources Corp. $25,000 4.00% 1/4/2028 26,815 0.00%Sutter Health $25,000 3.70% 15/8/2028 26,783 0.00%Aspen Insurance Holdings Ltd. $25,000 4.65% 15/11/2023 26,764 0.00%Massachusetts Electric Co. $25,000 4.00% 15/8/2046 26,724 0.00%Textron, Inc. $25,000 4.00% 15/3/2026 26,689 0.00%Penske Truck Leasing Co. LP/PTL Finance Corp. $25,000 4.20% 1/4/2027 26,682 0.00%Alliant Energy Finance LLC $25,000 4.25% 15/6/2028 26,666 0.00%Baltimore Gas & Electric Co. $25,000 3.75% 15/8/2047 26,657 0.00%Norfolk Southern Corp. $25,000 3.65% 1/8/2025 26,656 0.00%Honeywell International, Inc. $20,000 5.70% 15/3/2036 26,643 0.00%Allina Health System $25,000 3.89% 15/4/2049 26,603 0.00%Sabra Health Care LP/Sabra Capital Corp. $25,000 4.80% 1/6/2024 26,595 0.00%Alexandria Real Estate Equities, Inc. $25,000 4.00% 15/1/2024 26,584 0.00%Alphabet, Inc. $25,000 3.38% 25/2/2024 26,573 0.00%Synchrony Financial $25,000 4.38% 19/3/2024 26,572 0.00%Newfield Exploration Co. $25,000 5.75% 30/1/2022 26,563 0.00%BP Capital Markets America, Inc. $25,000 3.41% 11/2/2026 26,545 0.00%IHS Markit Ltd. $25,000 4.13% 1/8/2023 26,500 0.00%Realty Income Corp. $25,000 3.25% 15/6/2029 26,485 0.00%ViacomCBS, Inc. $25,000 3.88% 1/4/2024 26,446 0.00%Public Storage $25,000 3.39% 1/5/2029 26,438 0.00%Moody’s Corp. $25,000 4.50% 1/9/2022 26,434 0.00%Kimco Realty Corp. $25,000 3.80% 1/4/2027 26,434 0.00%Cargill, Inc. $25,000 3.25% 23/5/2029 26,402 0.00%Apache Corp. $26,000 3.25% 15/4/2022 26,388 0.00%CMS Energy Corp. $25,000 5.05% 15/3/2022 26,367 0.00%Eastman Chemical Co. $25,000 3.80% 15/3/2025 26,362 0.00%Stanley Black & Decker, Inc. $25,000 3.40% 1/3/2026 26,361 0.00%Regions Financial Corp. $25,000 3.80% 14/8/2023 26,357 0.00%Laboratory Corp. of America Holdings $25,000 3.60% 1/2/2025 26,295 0.00%Spirit AeroSystems, Inc. $25,000 4.60% 15/6/2028 26,285 0.00%Equifax, Inc. $25,000 3.95% 15/6/2023 26,283 0.00%M&T Bank Corp. $25,000 3.55% 26/7/2023 26,270 0.00%Air Lease Corp. $25,000 3.88% 3/7/2023 26,262 0.00%CenterPoint Energy, Inc. $25,000 3.85% 1/2/2024 26,245 0.00%Ryder System, Inc. $25,000 3.65% 18/3/2024 26,244 0.00%Alabama Power Co. $25,000 3.75% 1/3/2045 26,218 0.00%Energy Transfer Operating LP $25,000 4.20% 15/9/2023 26,211 0.00%Public Service Co. of New Hampshire $25,000 3.50% 1/11/2023 26,209 0.00%Hershey Co. $25,000 3.38% 15/5/2023 26,204 0.00%Allergan Funding SCS $25,000 3.85% 15/6/2024 26,191 0.00%Duke Realty LP $25,000 4.38% 15/6/2022 26,187 0.00%Intercontinental Exchange, Inc. $25,000 3.45% 21/9/2023 26,172 0.00%
Maturity Fair Value % of Total Principal Coupon Date US Dollars ($) Net Assets
Vanguard Global Corporate Bond Index Fund
604
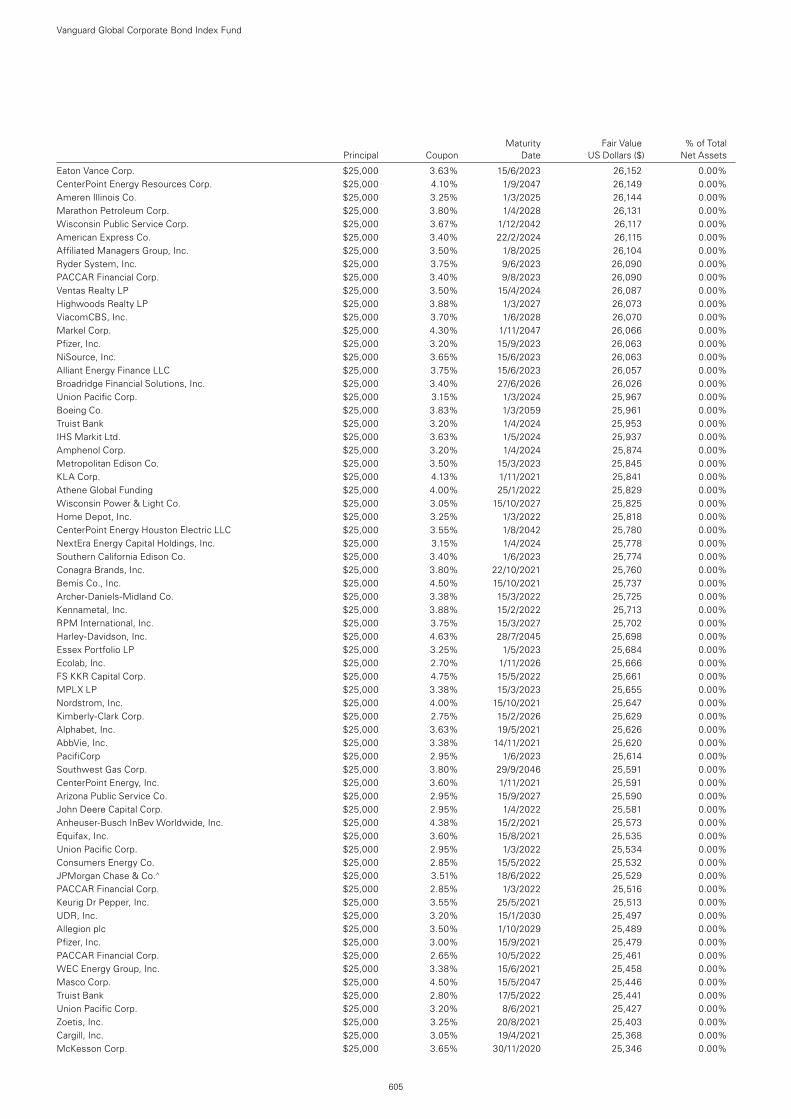
Eaton Vance Corp. $25,000 3.63% 15/6/2023 26,152 0.00%CenterPoint Energy Resources Corp. $25,000 4.10% 1/9/2047 26,149 0.00%Ameren Illinois Co. $25,000 3.25% 1/3/2025 26,144 0.00%Marathon Petroleum Corp. $25,000 3.80% 1/4/2028 26,131 0.00%Wisconsin Public Service Corp. $25,000 3.67% 1/12/2042 26,117 0.00%American Express Co. $25,000 3.40% 22/2/2024 26,115 0.00%Affiliated Managers Group, Inc. $25,000 3.50% 1/8/2025 26,104 0.00%Ryder System, Inc. $25,000 3.75% 9/6/2023 26,090 0.00%PACCAR Financial Corp. $25,000 3.40% 9/8/2023 26,090 0.00%Ventas Realty LP $25,000 3.50% 15/4/2024 26,087 0.00%Highwoods Realty LP $25,000 3.88% 1/3/2027 26,073 0.00%ViacomCBS, Inc. $25,000 3.70% 1/6/2028 26,070 0.00%Markel Corp. $25,000 4.30% 1/11/2047 26,066 0.00%Pfizer, Inc. $25,000 3.20% 15/9/2023 26,063 0.00%NiSource, Inc. $25,000 3.65% 15/6/2023 26,063 0.00%Alliant Energy Finance LLC $25,000 3.75% 15/6/2023 26,057 0.00%Broadridge Financial Solutions, Inc. $25,000 3.40% 27/6/2026 26,026 0.00%Union Pacific Corp. $25,000 3.15% 1/3/2024 25,967 0.00%Boeing Co. $25,000 3.83% 1/3/2059 25,961 0.00%Truist Bank $25,000 3.20% 1/4/2024 25,953 0.00%IHS Markit Ltd. $25,000 3.63% 1/5/2024 25,937 0.00%Amphenol Corp. $25,000 3.20% 1/4/2024 25,874 0.00%Metropolitan Edison Co. $25,000 3.50% 15/3/2023 25,845 0.00%KLA Corp. $25,000 4.13% 1/11/2021 25,841 0.00%Athene Global Funding $25,000 4.00% 25/1/2022 25,829 0.00%Wisconsin Power & Light Co. $25,000 3.05% 15/10/2027 25,825 0.00%Home Depot, Inc. $25,000 3.25% 1/3/2022 25,818 0.00%CenterPoint Energy Houston Electric LLC $25,000 3.55% 1/8/2042 25,780 0.00%NextEra Energy Capital Holdings, Inc. $25,000 3.15% 1/4/2024 25,778 0.00%Southern California Edison Co. $25,000 3.40% 1/6/2023 25,774 0.00%Conagra Brands, Inc. $25,000 3.80% 22/10/2021 25,760 0.00%Bemis Co., Inc. $25,000 4.50% 15/10/2021 25,737 0.00%Archer-Daniels-Midland Co. $25,000 3.38% 15/3/2022 25,725 0.00%Kennametal, Inc. $25,000 3.88% 15/2/2022 25,713 0.00%RPM International, Inc. $25,000 3.75% 15/3/2027 25,702 0.00%Harley-Davidson, Inc. $25,000 4.63% 28/7/2045 25,698 0.00%Essex Portfolio LP $25,000 3.25% 1/5/2023 25,684 0.00%Ecolab, Inc. $25,000 2.70% 1/11/2026 25,666 0.00%FS KKR Capital Corp. $25,000 4.75% 15/5/2022 25,661 0.00%MPLX LP $25,000 3.38% 15/3/2023 25,655 0.00%Nordstrom, Inc. $25,000 4.00% 15/10/2021 25,647 0.00%Kimberly-Clark Corp. $25,000 2.75% 15/2/2026 25,629 0.00%Alphabet, Inc. $25,000 3.63% 19/5/2021 25,626 0.00%AbbVie, Inc. $25,000 3.38% 14/11/2021 25,620 0.00%PacifiCorp $25,000 2.95% 1/6/2023 25,614 0.00%Southwest Gas Corp. $25,000 3.80% 29/9/2046 25,591 0.00%CenterPoint Energy, Inc. $25,000 3.60% 1/11/2021 25,591 0.00%Arizona Public Service Co. $25,000 2.95% 15/9/2027 25,590 0.00%John Deere Capital Corp. $25,000 2.95% 1/4/2022 25,581 0.00%Anheuser-Busch InBev Worldwide, Inc. $25,000 4.38% 15/2/2021 25,573 0.00%Equifax, Inc. $25,000 3.60% 15/8/2021 25,535 0.00%Union Pacific Corp. $25,000 2.95% 1/3/2022 25,534 0.00%Consumers Energy Co. $25,000 2.85% 15/5/2022 25,532 0.00%JPMorgan Chase & Co.^ $25,000 3.51% 18/6/2022 25,529 0.00%PACCAR Financial Corp. $25,000 2.85% 1/3/2022 25,516 0.00%Keurig Dr Pepper, Inc. $25,000 3.55% 25/5/2021 25,513 0.00%UDR, Inc. $25,000 3.20% 15/1/2030 25,497 0.00%Allegion plc $25,000 3.50% 1/10/2029 25,489 0.00%Pfizer, Inc. $25,000 3.00% 15/9/2021 25,479 0.00%PACCAR Financial Corp. $25,000 2.65% 10/5/2022 25,461 0.00%WEC Energy Group, Inc. $25,000 3.38% 15/6/2021 25,458 0.00%Masco Corp. $25,000 4.50% 15/5/2047 25,446 0.00%Truist Bank $25,000 2.80% 17/5/2022 25,441 0.00%Union Pacific Corp. $25,000 3.20% 8/6/2021 25,427 0.00%Zoetis, Inc. $25,000 3.25% 20/8/2021 25,403 0.00%Cargill, Inc. $25,000 3.05% 19/4/2021 25,368 0.00%McKesson Corp. $25,000 3.65% 30/11/2020 25,346 0.00%
Maturity Fair Value % of Total Principal Coupon Date US Dollars ($) Net Assets
Vanguard Global Corporate Bond Index Fund
605
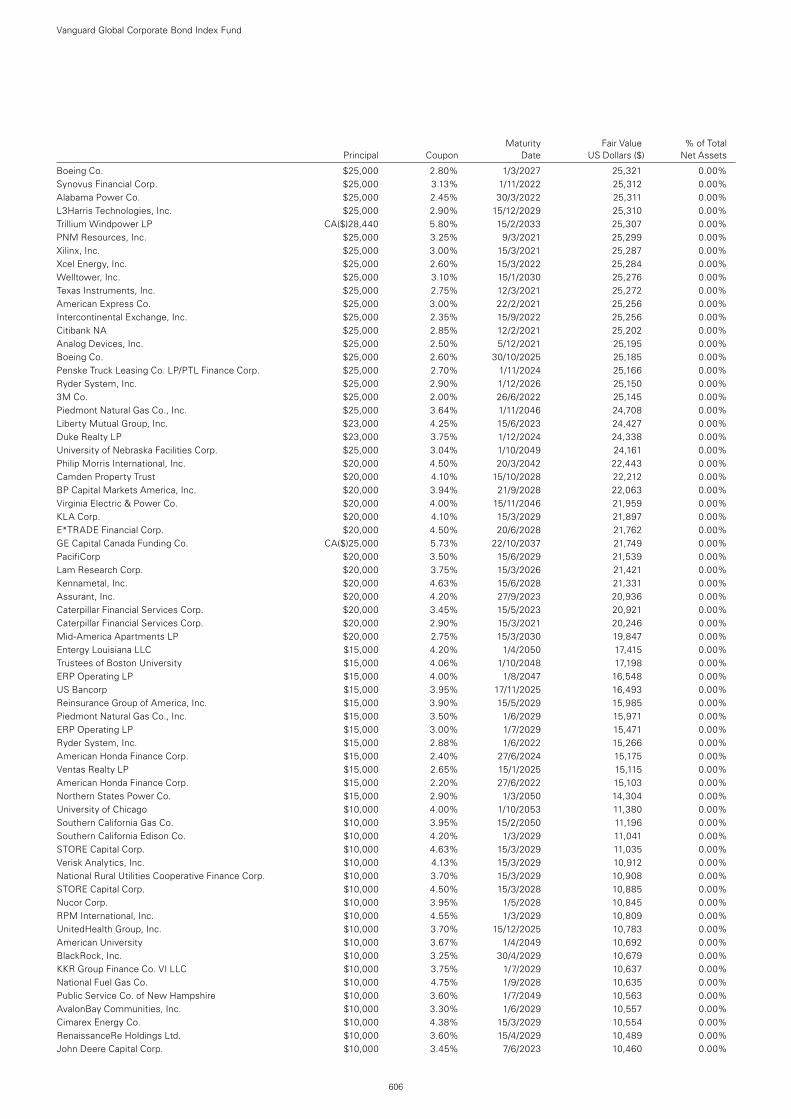
Boeing Co. $25,000 2.80% 1/3/2027 25,321 0.00%Synovus Financial Corp. $25,000 3.13% 1/11/2022 25,312 0.00%Alabama Power Co. $25,000 2.45% 30/3/2022 25,311 0.00%L3Harris Technologies, Inc. $25,000 2.90% 15/12/2029 25,310 0.00%Trillium Windpower LP CA($)28,440 5.80% 15/2/2033 25,307 0.00%PNM Resources, Inc. $25,000 3.25% 9/3/2021 25,299 0.00%Xilinx, Inc. $25,000 3.00% 15/3/2021 25,287 0.00%Xcel Energy, Inc. $25,000 2.60% 15/3/2022 25,284 0.00%Welltower, Inc. $25,000 3.10% 15/1/2030 25,276 0.00%Texas Instruments, Inc. $25,000 2.75% 12/3/2021 25,272 0.00%American Express Co. $25,000 3.00% 22/2/2021 25,256 0.00%Intercontinental Exchange, Inc. $25,000 2.35% 15/9/2022 25,256 0.00%Citibank NA $25,000 2.85% 12/2/2021 25,202 0.00%Analog Devices, Inc. $25,000 2.50% 5/12/2021 25,195 0.00%Boeing Co. $25,000 2.60% 30/10/2025 25,185 0.00%Penske Truck Leasing Co. LP/PTL Finance Corp. $25,000 2.70% 1/11/2024 25,166 0.00%Ryder System, Inc. $25,000 2.90% 1/12/2026 25,150 0.00%3M Co. $25,000 2.00% 26/6/2022 25,145 0.00%Piedmont Natural Gas Co., Inc. $25,000 3.64% 1/11/2046 24,708 0.00%Liberty Mutual Group, Inc. $23,000 4.25% 15/6/2023 24,427 0.00%Duke Realty LP $23,000 3.75% 1/12/2024 24,338 0.00%University of Nebraska Facilities Corp. $25,000 3.04% 1/10/2049 24,161 0.00%Philip Morris International, Inc. $20,000 4.50% 20/3/2042 22,443 0.00%Camden Property Trust $20,000 4.10% 15/10/2028 22,212 0.00%BP Capital Markets America, Inc. $20,000 3.94% 21/9/2028 22,063 0.00%Virginia Electric & Power Co. $20,000 4.00% 15/11/2046 21,959 0.00%KLA Corp. $20,000 4.10% 15/3/2029 21,897 0.00%E*TRADE Financial Corp. $20,000 4.50% 20/6/2028 21,762 0.00%GE Capital Canada Funding Co. CA($)25,000 5.73% 22/10/2037 21,749 0.00%PacifiCorp $20,000 3.50% 15/6/2029 21,539 0.00%Lam Research Corp. $20,000 3.75% 15/3/2026 21,421 0.00%Kennametal, Inc. $20,000 4.63% 15/6/2028 21,331 0.00%Assurant, Inc. $20,000 4.20% 27/9/2023 20,936 0.00%Caterpillar Financial Services Corp. $20,000 3.45% 15/5/2023 20,921 0.00%Caterpillar Financial Services Corp. $20,000 2.90% 15/3/2021 20,246 0.00%Mid-America Apartments LP $20,000 2.75% 15/3/2030 19,847 0.00%Entergy Louisiana LLC $15,000 4.20% 1/4/2050 17,415 0.00%Trustees of Boston University $15,000 4.06% 1/10/2048 17,198 0.00%ERP Operating LP $15,000 4.00% 1/8/2047 16,548 0.00%US Bancorp $15,000 3.95% 17/11/2025 16,493 0.00%Reinsurance Group of America, Inc. $15,000 3.90% 15/5/2029 15,985 0.00%Piedmont Natural Gas Co., Inc. $15,000 3.50% 1/6/2029 15,971 0.00%ERP Operating LP $15,000 3.00% 1/7/2029 15,471 0.00%Ryder System, Inc. $15,000 2.88% 1/6/2022 15,266 0.00%American Honda Finance Corp. $15,000 2.40% 27/6/2024 15,175 0.00%Ventas Realty LP $15,000 2.65% 15/1/2025 15,115 0.00%American Honda Finance Corp. $15,000 2.20% 27/6/2022 15,103 0.00%Northern States Power Co. $15,000 2.90% 1/3/2050 14,304 0.00%University of Chicago $10,000 4.00% 1/10/2053 11,380 0.00%Southern California Gas Co. $10,000 3.95% 15/2/2050 11,196 0.00%Southern California Edison Co. $10,000 4.20% 1/3/2029 11,041 0.00%STORE Capital Corp. $10,000 4.63% 15/3/2029 11,035 0.00%Verisk Analytics, Inc. $10,000 4.13% 15/3/2029 10,912 0.00%National Rural Utilities Cooperative Finance Corp. $10,000 3.70% 15/3/2029 10,908 0.00%STORE Capital Corp. $10,000 4.50% 15/3/2028 10,885 0.00%Nucor Corp. $10,000 3.95% 1/5/2028 10,845 0.00%RPM International, Inc. $10,000 4.55% 1/3/2029 10,809 0.00%UnitedHealth Group, Inc. $10,000 3.70% 15/12/2025 10,783 0.00%American University $10,000 3.67% 1/4/2049 10,692 0.00%BlackRock, Inc. $10,000 3.25% 30/4/2029 10,679 0.00%KKR Group Finance Co. VI LLC $10,000 3.75% 1/7/2029 10,637 0.00%National Fuel Gas Co. $10,000 4.75% 1/9/2028 10,635 0.00%Public Service Co. of New Hampshire $10,000 3.60% 1/7/2049 10,563 0.00%AvalonBay Communities, Inc. $10,000 3.30% 1/6/2029 10,557 0.00%Cimarex Energy Co. $10,000 4.38% 15/3/2029 10,554 0.00%RenaissanceRe Holdings Ltd. $10,000 3.60% 15/4/2029 10,489 0.00%John Deere Capital Corp. $10,000 3.45% 7/6/2023 10,460 0.00%
Maturity Fair Value % of Total Principal Coupon Date US Dollars ($) Net Assets
Vanguard Global Corporate Bond Index Fund
606
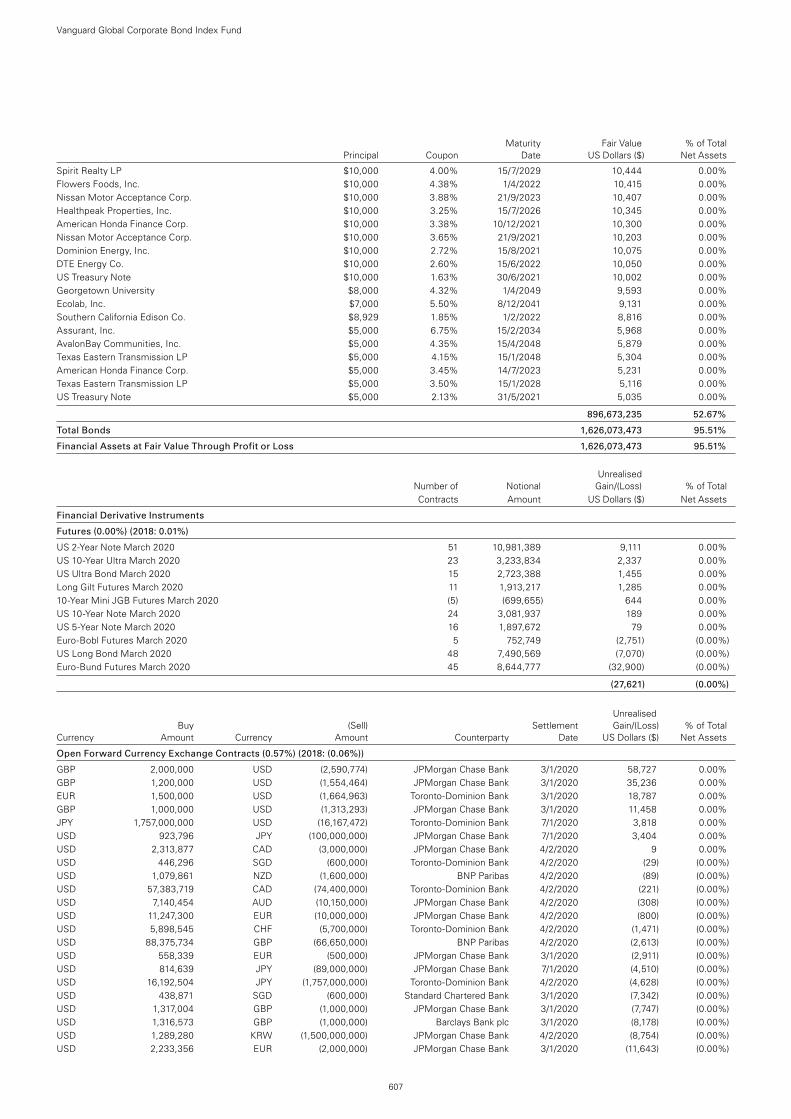
Spirit Realty LP $10,000 4.00% 15/7/2029 10,444 0.00%Flowers Foods, Inc. $10,000 4.38% 1/4/2022 10,415 0.00%Nissan Motor Acceptance Corp. $10,000 3.88% 21/9/2023 10,407 0.00%Healthpeak Properties, Inc. $10,000 3.25% 15/7/2026 10,345 0.00%American Honda Finance Corp. $10,000 3.38% 10/12/2021 10,300 0.00%Nissan Motor Acceptance Corp. $10,000 3.65% 21/9/2021 10,203 0.00%Dominion Energy, Inc. $10,000 2.72% 15/8/2021 10,075 0.00%DTE Energy Co. $10,000 2.60% 15/6/2022 10,050 0.00%US Treasury Note $10,000 1.63% 30/6/2021 10,002 0.00%Georgetown University $8,000 4.32% 1/4/2049 9,593 0.00%Ecolab, Inc. $7,000 5.50% 8/12/2041 9,131 0.00%Southern California Edison Co. $8,929 1.85% 1/2/2022 8,816 0.00%Assurant, Inc. $5,000 6.75% 15/2/2034 5,968 0.00%AvalonBay Communities, Inc. $5,000 4.35% 15/4/2048 5,879 0.00%Texas Eastern Transmission LP $5,000 4.15% 15/1/2048 5,304 0.00%American Honda Finance Corp. $5,000 3.45% 14/7/2023 5,231 0.00%Texas Eastern Transmission LP $5,000 3.50% 15/1/2028 5,116 0.00%US Treasury Note $5,000 2.13% 31/5/2021 5,035 0.00%
896,673,235 52.67%
Total Bonds 1,626,073,473 95.51%
Financial Assets at Fair Value Through Profit or Loss 1,626,073,473 95.51%
Unrealised Number of Notional Gain/(Loss) % of Total Contracts Amount US Dollars ($) Net Assets
Financial Derivative Instruments
Futures (0.00%) (2018: 0.01%)
US 2-Year Note March 2020 51 10,981,389 9,111 0.00%US 10-Year Ultra March 2020 23 3,233,834 2,337 0.00%US Ultra Bond March 2020 15 2,723,388 1,455 0.00%Long Gilt Futures March 2020 11 1,913,217 1,285 0.00%10-Year Mini JGB Futures March 2020 (5) (699,655) 644 0.00%US 10-Year Note March 2020 24 3,081,937 189 0.00%US 5-Year Note March 2020 16 1,897,672 79 0.00%Euro-Bobl Futures March 2020 5 752,749 (2,751) (0.00%)US Long Bond March 2020 48 7,490,569 (7,070) (0.00%)Euro-Bund Futures March 2020 45 8,644,777 (32,900) (0.00%)
(27,621) (0.00%)
Unrealised Buy (Sell) Settlement Gain/(Loss) % of Total Currency Amount Currency Amount Counterparty Date US Dollars ($) Net Assets
Open Forward Currency Exchange Contracts (0.57%) (2018: (0.06%))
GBP 2,000,000 USD (2,590,774) JPMorgan Chase Bank 3/1/2020 58,727 0.00%GBP 1,200,000 USD (1,554,464) JPMorgan Chase Bank 3/1/2020 35,236 0.00%EUR 1,500,000 USD (1,664,963) Toronto-Dominion Bank 3/1/2020 18,787 0.00%GBP 1,000,000 USD (1,313,293) JPMorgan Chase Bank 3/1/2020 11,458 0.00%JPY 1,757,000,000 USD (16,167,472) Toronto-Dominion Bank 7/1/2020 3,818 0.00%USD 923,796 JPY (100,000,000) JPMorgan Chase Bank 7/1/2020 3,404 0.00%USD 2,313,877 CAD (3,000,000) JPMorgan Chase Bank 4/2/2020 9 0.00%USD 446,296 SGD (600,000) Toronto-Dominion Bank 4/2/2020 (29) (0.00%)USD 1,079,861 NZD (1,600,000) BNP Paribas 4/2/2020 (89) (0.00%)USD 57,383,719 CAD (74,400,000) Toronto-Dominion Bank 4/2/2020 (221) (0.00%)USD 7,140,454 AUD (10,150,000) JPMorgan Chase Bank 4/2/2020 (308) (0.00%)USD 11,247,300 EUR (10,000,000) JPMorgan Chase Bank 4/2/2020 (800) (0.00%)USD 5,898,545 CHF (5,700,000) Toronto-Dominion Bank 4/2/2020 (1,471) (0.00%)USD 88,375,734 GBP (66,650,000) BNP Paribas 4/2/2020 (2,613) (0.00%)USD 558,339 EUR (500,000) JPMorgan Chase Bank 3/1/2020 (2,911) (0.00%)USD 814,639 JPY (89,000,000) JPMorgan Chase Bank 7/1/2020 (4,510) (0.00%)USD 16,192,504 JPY (1,757,000,000) Toronto-Dominion Bank 4/2/2020 (4,628) (0.00%)USD 438,871 SGD (600,000) Standard Chartered Bank 3/1/2020 (7,342) (0.00%)USD 1,317,004 GBP (1,000,000) JPMorgan Chase Bank 3/1/2020 (7,747) (0.00%)USD 1,316,573 GBP (1,000,000) Barclays Bank plc 3/1/2020 (8,178) (0.00%)USD 1,289,280 KRW (1,500,000,000) JPMorgan Chase Bank 4/2/2020 (8,754) (0.00%)USD 2,233,356 EUR (2,000,000) JPMorgan Chase Bank 3/1/2020 (11,643) (0.00%)
Maturity Fair Value % of Total Principal Coupon Date US Dollars ($) Net Assets
Vanguard Global Corporate Bond Index Fund
607
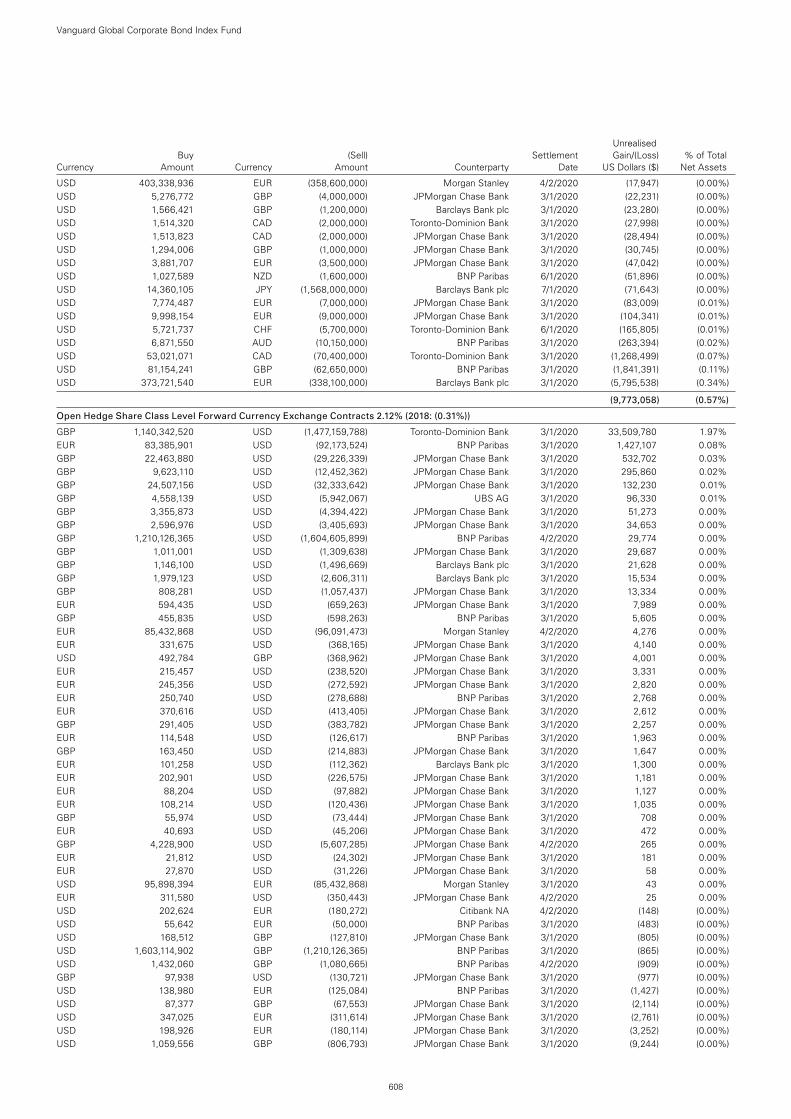
USD 403,338,936 EUR (358,600,000) Morgan Stanley 4/2/2020 (17,947) (0.00%)USD 5,276,772 GBP (4,000,000) JPMorgan Chase Bank 3/1/2020 (22,231) (0.00%)USD 1,566,421 GBP (1,200,000) Barclays Bank plc 3/1/2020 (23,280) (0.00%)USD 1,514,320 CAD (2,000,000) Toronto-Dominion Bank 3/1/2020 (27,998) (0.00%)USD 1,513,823 CAD (2,000,000) JPMorgan Chase Bank 3/1/2020 (28,494) (0.00%)USD 1,294,006 GBP (1,000,000) JPMorgan Chase Bank 3/1/2020 (30,745) (0.00%)USD 3,881,707 EUR (3,500,000) JPMorgan Chase Bank 3/1/2020 (47,042) (0.00%)USD 1,027,589 NZD (1,600,000) BNP Paribas 6/1/2020 (51,896) (0.00%)USD 14,360,105 JPY (1,568,000,000) Barclays Bank plc 7/1/2020 (71,643) (0.00%)USD 7,774,487 EUR (7,000,000) JPMorgan Chase Bank 3/1/2020 (83,009) (0.01%)USD 9,998,154 EUR (9,000,000) JPMorgan Chase Bank 3/1/2020 (104,341) (0.01%)USD 5,721,737 CHF (5,700,000) Toronto-Dominion Bank 6/1/2020 (165,805) (0.01%)USD 6,871,550 AUD (10,150,000) BNP Paribas 3/1/2020 (263,394) (0.02%)USD 53,021,071 CAD (70,400,000) Toronto-Dominion Bank 3/1/2020 (1,268,499) (0.07%)USD 81,154,241 GBP (62,650,000) BNP Paribas 3/1/2020 (1,841,391) (0.11%)USD 373,721,540 EUR (338,100,000) Barclays Bank plc 3/1/2020 (5,795,538) (0.34%)
(9,773,058) (0.57%)
Open Hedge Share Class Level Forward Currency Exchange Contracts 2.12% (2018: (0.31%))
GBP 1,140,342,520 USD (1,477,159,788) Toronto-Dominion Bank 3/1/2020 33,509,780 1.97%EUR 83,385,901 USD (92,173,524) BNP Paribas 3/1/2020 1,427,107 0.08%GBP 22,463,880 USD (29,226,339) JPMorgan Chase Bank 3/1/2020 532,702 0.03%GBP 9,623,110 USD (12,452,362) JPMorgan Chase Bank 3/1/2020 295,860 0.02%GBP 24,507,156 USD (32,333,642) JPMorgan Chase Bank 3/1/2020 132,230 0.01%GBP 4,558,139 USD (5,942,067) UBS AG 3/1/2020 96,330 0.01%GBP 3,355,873 USD (4,394,422) JPMorgan Chase Bank 3/1/2020 51,273 0.00%GBP 2,596,976 USD (3,405,693) JPMorgan Chase Bank 3/1/2020 34,653 0.00%GBP 1,210,126,365 USD (1,604,605,899) BNP Paribas 4/2/2020 29,774 0.00%GBP 1,011,001 USD (1,309,638) JPMorgan Chase Bank 3/1/2020 29,687 0.00%GBP 1,146,100 USD (1,496,669) Barclays Bank plc 3/1/2020 21,628 0.00%GBP 1,979,123 USD (2,606,311) Barclays Bank plc 3/1/2020 15,534 0.00%GBP 808,281 USD (1,057,437) JPMorgan Chase Bank 3/1/2020 13,334 0.00%EUR 594,435 USD (659,263) JPMorgan Chase Bank 3/1/2020 7,989 0.00%GBP 455,835 USD (598,263) BNP Paribas 3/1/2020 5,605 0.00%EUR 85,432,868 USD (96,091,473) Morgan Stanley 4/2/2020 4,276 0.00%EUR 331,675 USD (368,165) JPMorgan Chase Bank 3/1/2020 4,140 0.00%USD 492,784 GBP (368,962) JPMorgan Chase Bank 3/1/2020 4,001 0.00%EUR 215,457 USD (238,520) JPMorgan Chase Bank 3/1/2020 3,331 0.00%EUR 245,356 USD (272,592) JPMorgan Chase Bank 3/1/2020 2,820 0.00%EUR 250,740 USD (278,688) BNP Paribas 3/1/2020 2,768 0.00%EUR 370,616 USD (413,405) JPMorgan Chase Bank 3/1/2020 2,612 0.00%GBP 291,405 USD (383,782) JPMorgan Chase Bank 3/1/2020 2,257 0.00%EUR 114,548 USD (126,617) BNP Paribas 3/1/2020 1,963 0.00%GBP 163,450 USD (214,883) JPMorgan Chase Bank 3/1/2020 1,647 0.00%EUR 101,258 USD (112,362) Barclays Bank plc 3/1/2020 1,300 0.00%EUR 202,901 USD (226,575) JPMorgan Chase Bank 3/1/2020 1,181 0.00%EUR 88,204 USD (97,882) JPMorgan Chase Bank 3/1/2020 1,127 0.00%EUR 108,214 USD (120,436) JPMorgan Chase Bank 3/1/2020 1,035 0.00%GBP 55,974 USD (73,444) JPMorgan Chase Bank 3/1/2020 708 0.00%EUR 40,693 USD (45,206) JPMorgan Chase Bank 3/1/2020 472 0.00%GBP 4,228,900 USD (5,607,285) JPMorgan Chase Bank 4/2/2020 265 0.00%EUR 21,812 USD (24,302) JPMorgan Chase Bank 3/1/2020 181 0.00%EUR 27,870 USD (31,226) JPMorgan Chase Bank 3/1/2020 58 0.00%USD 95,898,394 EUR (85,432,868) Morgan Stanley 3/1/2020 43 0.00%EUR 311,580 USD (350,443) JPMorgan Chase Bank 4/2/2020 25 0.00%USD 202,624 EUR (180,272) Citibank NA 4/2/2020 (148) (0.00%)USD 55,642 EUR (50,000) BNP Paribas 3/1/2020 (483) (0.00%)USD 168,512 GBP (127,810) JPMorgan Chase Bank 3/1/2020 (805) (0.00%)USD 1,603,114,902 GBP (1,210,126,365) BNP Paribas 3/1/2020 (865) (0.00%)USD 1,432,060 GBP (1,080,665) BNP Paribas 4/2/2020 (909) (0.00%)GBP 97,938 USD (130,721) JPMorgan Chase Bank 3/1/2020 (977) (0.00%)USD 138,980 EUR (125,084) BNP Paribas 3/1/2020 (1,427) (0.00%)USD 87,377 GBP (67,553) JPMorgan Chase Bank 3/1/2020 (2,114) (0.00%)USD 347,025 EUR (311,614) JPMorgan Chase Bank 3/1/2020 (2,761) (0.00%)USD 198,926 EUR (180,114) JPMorgan Chase Bank 3/1/2020 (3,252) (0.00%)USD 1,059,556 GBP (806,793) JPMorgan Chase Bank 3/1/2020 (9,244) (0.00%)
Unrealised Buy (Sell) Settlement Gain/(Loss) % of Total Currency Amount Currency Amount Counterparty Date US Dollars ($) Net Assets
Vanguard Global Corporate Bond Index Fund
608
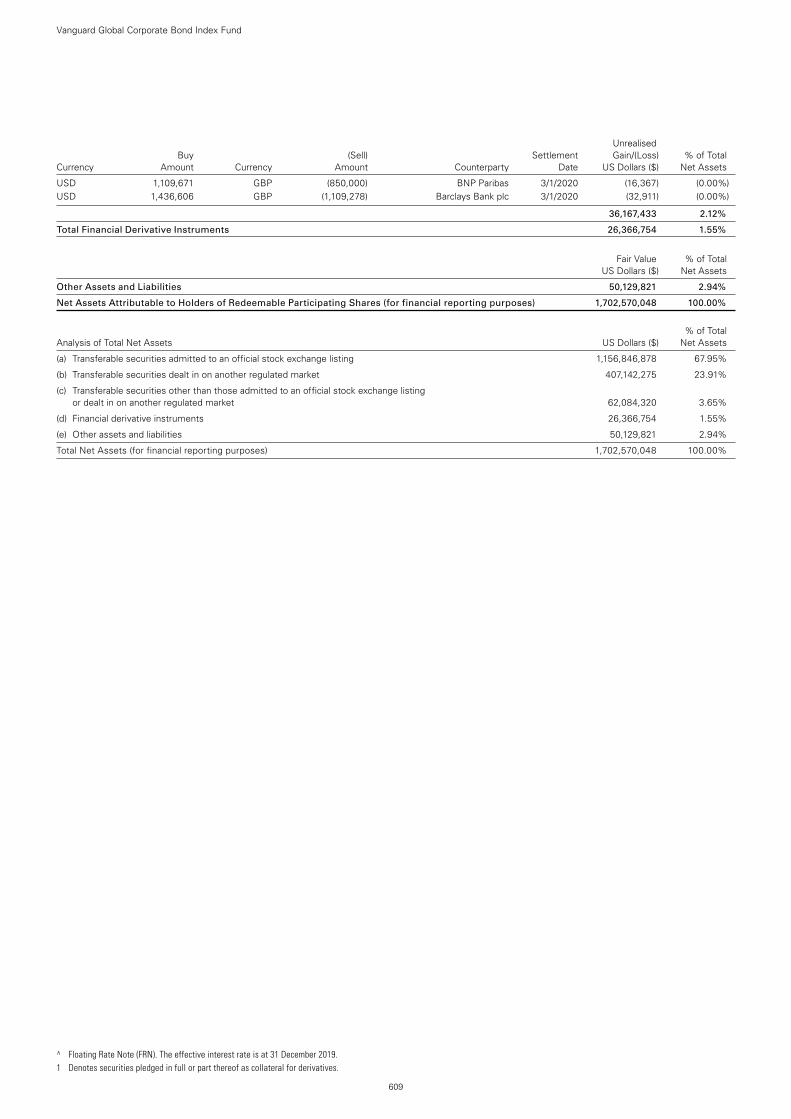
USD 1,109,671 GBP (850,000) BNP Paribas 3/1/2020 (16,367) (0.00%)USD 1,436,606 GBP (1,109,278) Barclays Bank plc 3/1/2020 (32,911) (0.00%)
36,167,433 2.12%
Total Financial Derivative Instruments 26,366,754 1.55%
Fair Value % of Total US Dollars ($) Net Assets
Other Assets and Liabilities 50,129,821 2.94%
Net Assets Attributable to Holders of Redeemable Participating Shares (for financial reporting purposes) 1,702,570,048 100.00%
% of Total Analysis of Total Net Assets US Dollars ($) Net Assets
(a) Transferable securities admitted to an official stock exchange listing 1,156,846,878 67.95%
(b) Transferable securities dealt in on another regulated market 407,142,275 23.91%
(c) Transferable securities other than those admitted to an official stock exchange listing or dealt in on another regulated market 62,084,320 3.65%
(d) Financial derivative instruments 26,366,754 1.55%
(e) Other assets and liabilities 50,129,821 2.94%
Total Net Assets (for financial reporting purposes) 1,702,570,048 100.00%
Unrealised Buy (Sell) Settlement Gain/(Loss) % of Total Currency Amount Currency Amount Counterparty Date US Dollars ($) Net Assets
Vanguard Global Corporate Bond Index Fund
609
^ Floating Rate Note (FRN). The effective interest rate is at 31 December 2019. 1 Denotes securities pledged in full or part thereof as collateral for derivatives.
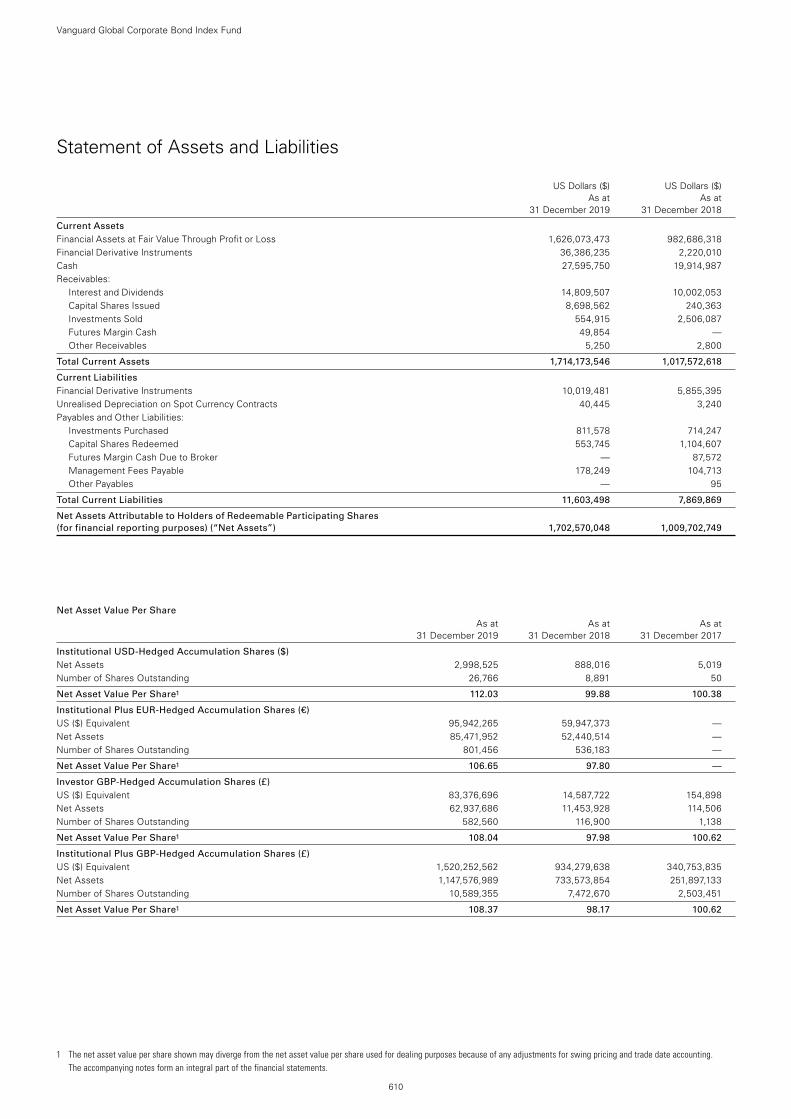
1 The net asset value per share shown may diverge from the net asset value per share used for dealing purposes because of any adjustments for swing pricing and trade date accounting. The accompanying notes form an integral part of the financial statements.
610
Vanguard Global Corporate Bond Index Fund
Statement of Assets and Liabilities
US Dollars ($) US Dollars ($) As at As at 31 December 2019 31 December 2018
Current Assets Financial Assets at Fair Value Through Profit or Loss 1,626,073,473 982,686,318Financial Derivative Instruments 36,386,235 2,220,010Cash 27,595,750 19,914,987Receivables:
Interest and Dividends 14,809,507 10,002,053Capital Shares Issued 8,698,562 240,363Investments Sold 554,915 2,506,087Futures Margin Cash 49,854 —Other Receivables 5,250 2,800
Total Current Assets 1,714,173,546 1,017,572,618
Current Liabilities Financial Derivative Instruments 10,019,481 5,855,395Unrealised Depreciation on Spot Currency Contracts 40,445 3,240Payables and Other Liabilities:
Investments Purchased 811,578 714,247Capital Shares Redeemed 553,745 1,104,607Futures Margin Cash Due to Broker — 87,572Management Fees Payable 178,249 104,713Other Payables — 95
Total Current Liabilities 11,603,498 7,869,869
Net Assets Attributable to Holders of Redeemable Participating Shares (for financial reporting purposes) (“Net Assets”) 1,702,570,048 1,009,702,749
Net Asset Value Per Share As at As at As at 31 December 2019 31 December 2018 31 December 2017
Institutional USD-Hedged Accumulation Shares ($) Net Assets 2,998,525 888,016 5,019Number of Shares Outstanding 26,766 8,891 50
Net Asset Value Per Share1 112.03 99.88 100.38
Institutional Plus EUR-Hedged Accumulation Shares (€) US ($) Equivalent 95,942,265 59,947,373 —Net Assets 85,471,952 52,440,514 —Number of Shares Outstanding 801,456 536,183 —
Net Asset Value Per Share1 106.65 97.80 —
Investor GBP-Hedged Accumulation Shares (£) US ($) Equivalent 83,376,696 14,587,722 154,898Net Assets 62,937,686 11,453,928 114,506Number of Shares Outstanding 582,560 116,900 1,138
Net Asset Value Per Share1 108.04 97.98 100.62
Institutional Plus GBP-Hedged Accumulation Shares (£) US ($) Equivalent 1,520,252,562 934,279,638 340,753,835Net Assets 1,147,576,989 733,573,854 251,897,133Number of Shares Outstanding 10,589,355 7,472,670 2,503,451
Net Asset Value Per Share1 108.37 98.17 100.62
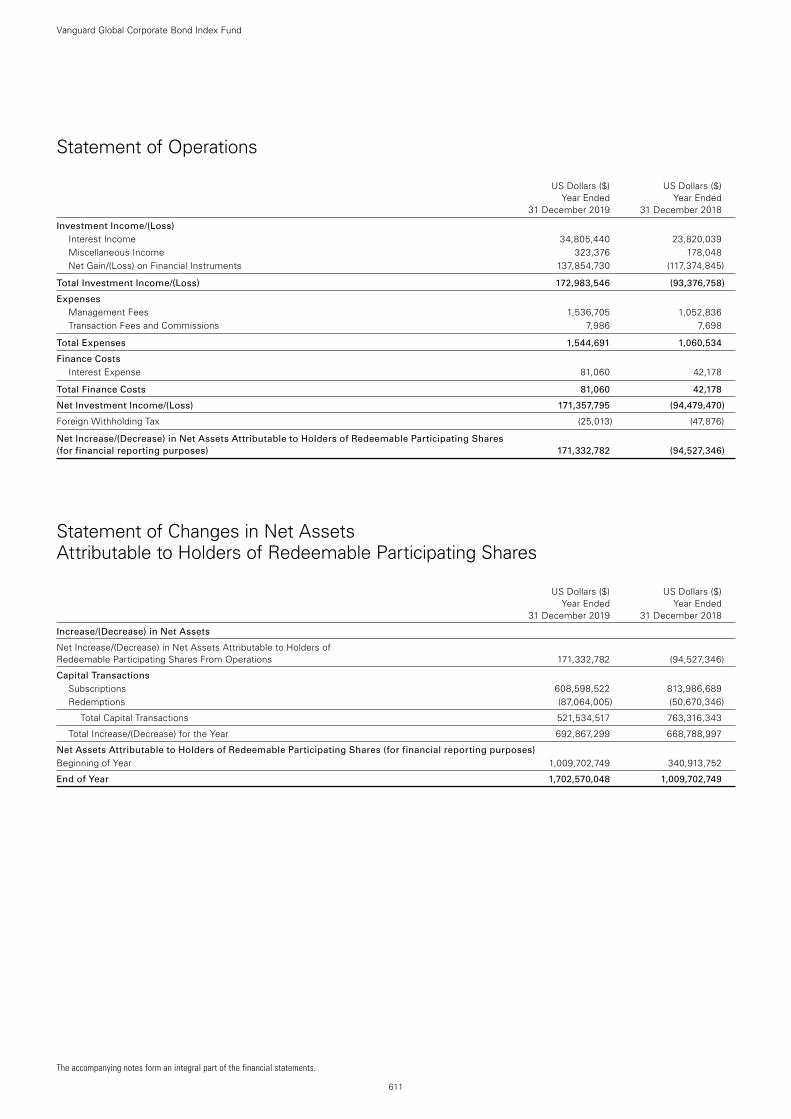
611
Vanguard Global Corporate Bond Index Fund
Statement of Operations
US Dollars ($) US Dollars ($) Year Ended Year Ended 31 December 2019 31 December 2018
Investment Income/(Loss) Interest Income 34,805,440 23,820,039Miscellaneous Income 323,376 178,048Net Gain/(Loss) on Financial Instruments 137,854,730 (117,374,845)
Total Investment Income/(Loss) 172,983,546 (93,376,758)
Expenses Management Fees 1,536,705 1,052,836Transaction Fees and Commissions 7,986 7,698
Total Expenses 1,544,691 1,060,534
Finance Costs Interest Expense 81,060 42,178
Total Finance Costs 81,060 42,178
Net Investment Income/(Loss) 171,357,795 (94,479,470)
Foreign Withholding Tax (25,013) (47,876)
Net Increase/(Decrease) in Net Assets Attributable to Holders of Redeemable Participating Shares (for financial reporting purposes) 171,332,782 (94,527,346)
Statement of Changes in Net Assets Attributable to Holders of Redeemable Participating Shares
US Dollars ($) US Dollars ($) Year Ended Year Ended 31 December 2019 31 December 2018
Increase/(Decrease) in Net Assets
Net Increase/(Decrease) in Net Assets Attributable to Holders of Redeemable Participating Shares From Operations 171,332,782 (94,527,346)
Capital Transactions Subscriptions 608,598,522 813,986,689Redemptions (87,064,005) (50,670,346)
Total Capital Transactions 521,534,517 763,316,343
Total Increase/(Decrease) for the Year 692,867,299 668,788,997
Net Assets Attributable to Holders of Redeemable Participating Shares (for financial reporting purposes) Beginning of Year 1,009,702,749 340,913,752
End of Year 1,702,570,048 1,009,702,749
The accompanying notes form an integral part of the financial statements.
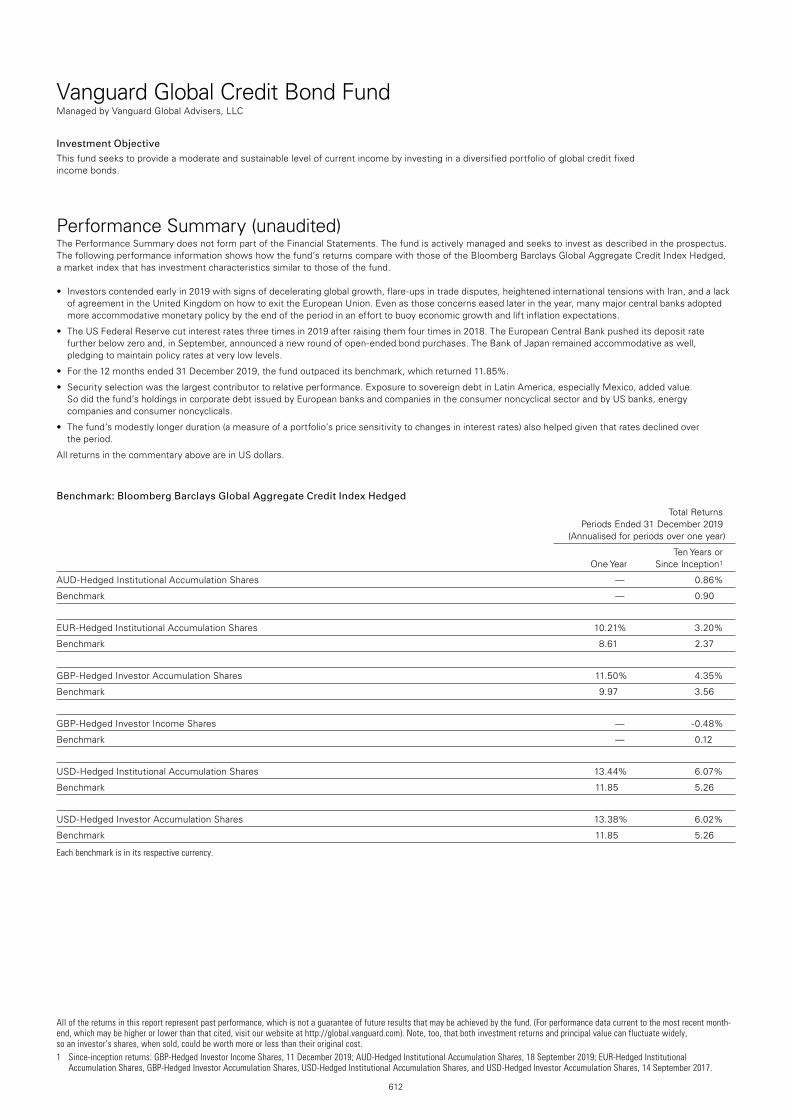
612
Vanguard Global Credit Bond FundManaged by Vanguard Global Advisers, LLC
Investment ObjectiveThis fund seeks to provide a moderate and sustainable level of current income by investing in a diversified portfolio of global credit fixed income bonds.
Performance Summary (unaudited)The Performance Summary does not form part of the Financial Statements. The fund is actively managed and seeks to invest as described in the prospectus. The following performance information shows how the fund’s returns compare with those of the Bloomberg Barclays Global Aggregate Credit Index Hedged, a market index that has investment characteristics similar to those of the fund.
• Investorscontendedearlyin2019withsignsofdeceleratingglobalgrowth,flare-upsintradedisputes,heightenedinternationaltensionswithIran,andalackof agreement in the United Kingdom on how to exit the European Union. Even as those concerns eased later in the year, many major central banks adopted more accommodative monetary policy by the end of the period in an effort to buoy economic growth and lift inflation expectations.
• TheUSFederalReservecutinterestratesthreetimesin2019afterraisingthemfourtimesin2018.TheEuropeanCentralBankpusheditsdepositratefurther below zero and, in September, announced a new round of open-ended bond purchases. The Bank of Japan remained accommodative as well, pledging to maintain policy rates at very low levels.
• Forthe12monthsended31December2019,thefundoutpaceditsbenchmark,whichreturned11.85%.
• Securityselectionwasthelargestcontributortorelativeperformance.ExposuretosovereigndebtinLatinAmerica,especiallyMexico,addedvalue. So did the fund’s holdings in corporate debt issued by European banks and companies in the consumer noncyclical sector and by US banks, energy companies and consumer noncyclicals.
• Thefund’smodestlylongerduration(ameasureofaportfolio’spricesensitivitytochangesininterestrates)alsohelpedgiventhatratesdeclinedover the period.
All returns in the commentary above are in US dollars.
Benchmark: Bloomberg Barclays Global Aggregate Credit Index Hedged
Total Returns Periods Ended 31 December 2019 (Annualised for periods over one year)
Ten Years or One Year Since Inception1
AUD-Hedged Institutional Accumulation Shares — 0.86%
Benchmark — 0.90
EUR-Hedged Institutional Accumulation Shares 10.21% 3.20%
Benchmark 8.61 2.37
GBP-Hedged Investor Accumulation Shares 11.50% 4.35%
Benchmark 9.97 3.56
GBP-Hedged Investor Income Shares — -0.48%
Benchmark — 0.12
USD-Hedged Institutional Accumulation Shares 13.44% 6.07%
Benchmark 11.85 5.26
USD-Hedged Investor Accumulation Shares 13.38% 6.02%
Benchmark 11.85 5.26
Each benchmark is in its respective currency.
All of the returns in this report represent past performance, which is not a guarantee of future results that may be achieved by the fund. (For performance data current to the most recent month-end, which may be higher or lower than that cited, visit our website at http://global.vanguard.com). Note, too, that both investment returns and principal value can fluctuate widely, so an investor’s shares, when sold, could be worth more or less than their original cost. 1 Since-inception returns: GBP-Hedged Investor Income Shares, 11 December 2019; AUD-Hedged Institutional Accumulation Shares, 18 September 2019; EUR-Hedged Institutional
Accumulation Shares, GBP-Hedged Investor Accumulation Shares, USD-Hedged Institutional Accumulation Shares, and USD-Hedged Investor Accumulation Shares, 14 September 2017.
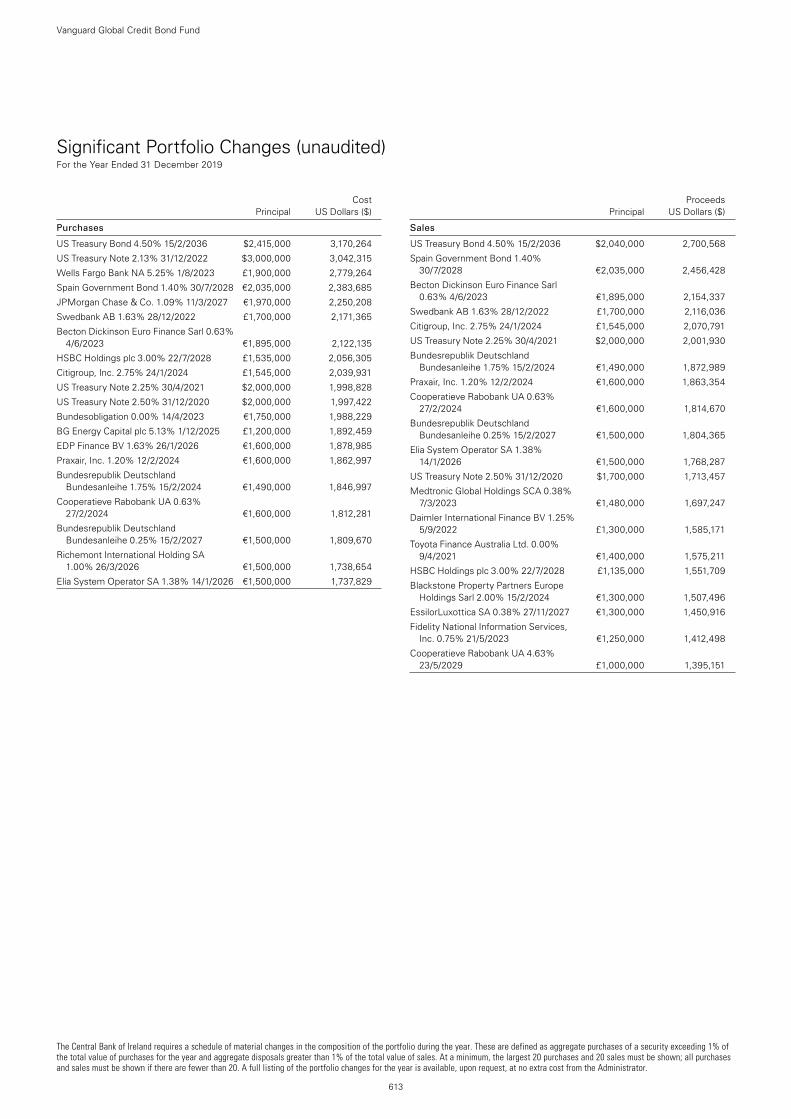
The Central Bank of Ireland requires a schedule of material changes in the composition of the portfolio during the year. These are defined as aggregate purchases of a security exceeding 1% of the total value of purchases for the year and aggregate disposals greater than 1% of the total value of sales. At a minimum, the largest 20 purchases and 20 sales must be shown; all purchases and sales must be shown if there are fewer than 20. A full listing of the portfolio changes for the year is available, upon request, at no extra cost from the Administrator.
613
Vanguard Global Credit Bond Fund
Significant Portfolio Changes (unaudited) For the Year Ended 31 December 2019
Cost Principal US Dollars ($)
Purchases
US Treasury Bond 4.50% 15/2/2036 $2,415,000 3,170,264
US Treasury Note 2.13% 31/12/2022 $3,000,000 3,042,315
Wells Fargo Bank NA 5.25% 1/8/2023 £1,900,000 2,779,264
Spain Government Bond 1.40% 30/7/2028 €2,035,000 2,383,685
JPMorgan Chase & Co. 1.09% 11/3/2027 €1,970,000 2,250,208
Swedbank AB 1.63% 28/12/2022 £1,700,000 2,171,365
Becton Dickinson Euro Finance Sarl 0.63% 4/6/2023 €1,895,000 2,122,135
HSBC Holdings plc 3.00% 22/7/2028 £1,535,000 2,056,305
Citigroup, Inc. 2.75% 24/1/2024 £1,545,000 2,039,931
US Treasury Note 2.25% 30/4/2021 $2,000,000 1,998,828
US Treasury Note 2.50% 31/12/2020 $2,000,000 1,997,422
Bundesobligation 0.00% 14/4/2023 €1,750,000 1,988,229
BG Energy Capital plc 5.13% 1/12/2025 £1,200,000 1,892,459
EDP Finance BV 1.63% 26/1/2026 €1,600,000 1,878,985
Praxair, Inc. 1.20% 12/2/2024 €1,600,000 1,862,997
Bundesrepublik Deutschland Bundesanleihe 1.75% 15/2/2024 €1,490,000 1,846,997
Cooperatieve Rabobank UA 0.63% 27/2/2024 €1,600,000 1,812,281
Bundesrepublik Deutschland Bundesanleihe 0.25% 15/2/2027 €1,500,000 1,809,670
Richemont International Holding SA 1.00% 26/3/2026 €1,500,000 1,738,654
Elia System Operator SA 1.38% 14/1/2026 €1,500,000 1,737,829
Proceeds Principal US Dollars ($)
Sales
US Treasury Bond 4.50% 15/2/2036 $2,040,000 2,700,568
Spain Government Bond 1.40% 30/7/2028 €2,035,000 2,456,428
Becton Dickinson Euro Finance Sarl 0.63% 4/6/2023 €1,895,000 2,154,337
Swedbank AB 1.63% 28/12/2022 £1,700,000 2,116,036
Citigroup, Inc. 2.75% 24/1/2024 £1,545,000 2,070,791
US Treasury Note 2.25% 30/4/2021 $2,000,000 2,001,930
Bundesrepublik Deutschland Bundesanleihe 1.75% 15/2/2024 €1,490,000 1,872,989
Praxair, Inc. 1.20% 12/2/2024 €1,600,000 1,863,354
Cooperatieve Rabobank UA 0.63% 27/2/2024 €1,600,000 1,814,670
Bundesrepublik Deutschland Bundesanleihe 0.25% 15/2/2027 €1,500,000 1,804,365
Elia System Operator SA 1.38% 14/1/2026 €1,500,000 1,768,287
US Treasury Note 2.50% 31/12/2020 $1,700,000 1,713,457
Medtronic Global Holdings SCA 0.38% 7/3/2023 €1,480,000 1,697,247
Daimler International Finance BV 1.25% 5/9/2022 £1,300,000 1,585,171
Toyota Finance Australia Ltd. 0.00% 9/4/2021 €1,400,000 1,575,211
HSBC Holdings plc 3.00% 22/7/2028 £1,135,000 1,551,709
Blackstone Property Partners Europe Holdings Sarl 2.00% 15/2/2024 €1,300,000 1,507,496
EssilorLuxottica SA 0.38% 27/11/2027 €1,300,000 1,450,916
Fidelity National Information Services, Inc. 0.75% 21/5/2023 €1,250,000 1,412,498
Cooperatieve Rabobank UA 4.63% 23/5/2029 £1,000,000 1,395,151
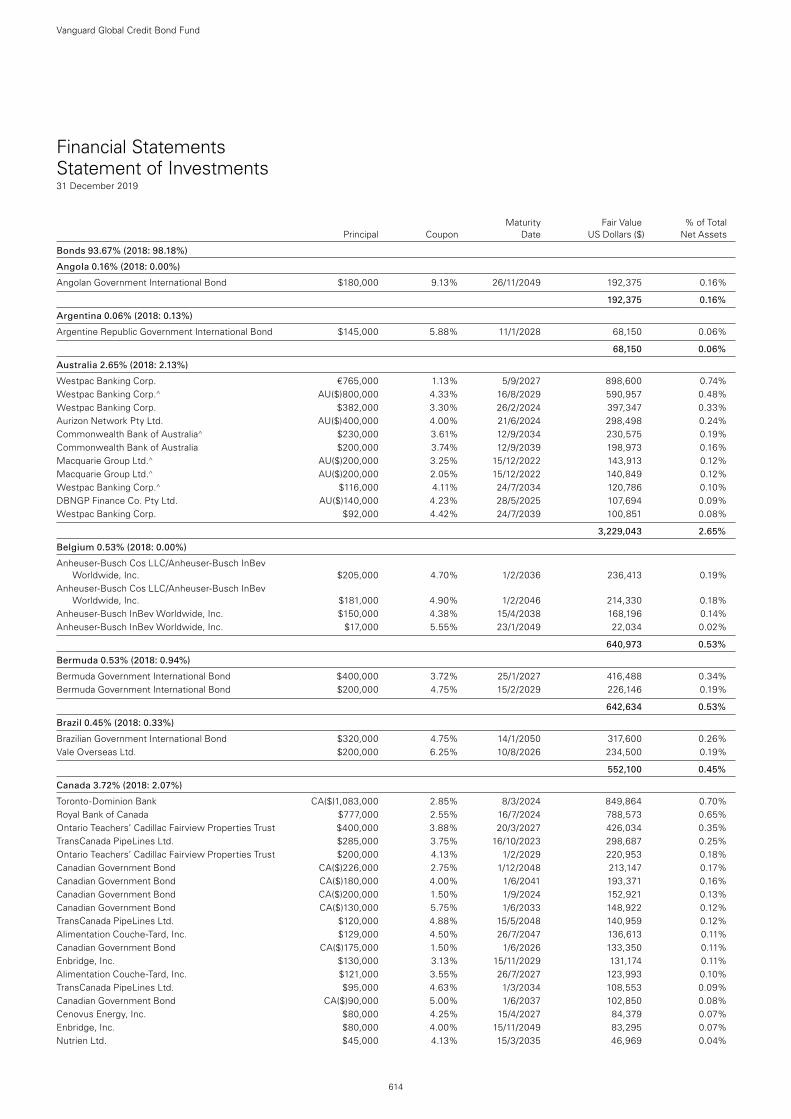
Financial Statements Statement of Investments31 December 2019
Maturity Fair Value % of Total Principal Coupon Date US Dollars ($) Net Assets
Bonds 93.67% (2018: 98.18%)
Angola 0.16% (2018: 0.00%)
Angolan Government International Bond $180,000 9.13% 26/11/2049 192,375 0.16%
192,375 0.16%
Argentina 0.06% (2018: 0.13%)
Argentine Republic Government International Bond $145,000 5.88% 11/1/2028 68,150 0.06%
68,150 0.06%
Australia 2.65% (2018: 2.13%)
Westpac Banking Corp. €765,000 1.13% 5/9/2027 898,600 0.74%Westpac Banking Corp.^ AU($)800,000 4.33% 16/8/2029 590,957 0.48%Westpac Banking Corp. $382,000 3.30% 26/2/2024 397,347 0.33%Aurizon Network Pty Ltd. AU($)400,000 4.00% 21/6/2024 298,498 0.24%Commonwealth Bank of Australia^ $230,000 3.61% 12/9/2034 230,575 0.19%Commonwealth Bank of Australia $200,000 3.74% 12/9/2039 198,973 0.16%Macquarie Group Ltd.^ AU($)200,000 3.25% 15/12/2022 143,913 0.12%Macquarie Group Ltd.^ AU($)200,000 2.05% 15/12/2022 140,849 0.12%Westpac Banking Corp.^ $116,000 4.11% 24/7/2034 120,786 0.10%DBNGP Finance Co. Pty Ltd. AU($)140,000 4.23% 28/5/2025 107,694 0.09%Westpac Banking Corp. $92,000 4.42% 24/7/2039 100,851 0.08%
3,229,043 2.65%
Belgium 0.53% (2018: 0.00%)
Anheuser-Busch Cos LLC/Anheuser-Busch InBev Worldwide, Inc. $205,000 4.70% 1/2/2036 236,413 0.19%
Anheuser-Busch Cos LLC/Anheuser-Busch InBev Worldwide, Inc. $181,000 4.90% 1/2/2046 214,330 0.18%
Anheuser-Busch InBev Worldwide, Inc. $150,000 4.38% 15/4/2038 168,196 0.14%Anheuser-Busch InBev Worldwide, Inc. $17,000 5.55% 23/1/2049 22,034 0.02%
640,973 0.53%
Bermuda 0.53% (2018: 0.94%)
Bermuda Government International Bond $400,000 3.72% 25/1/2027 416,488 0.34%Bermuda Government International Bond $200,000 4.75% 15/2/2029 226,146 0.19%
642,634 0.53%
Brazil 0.45% (2018: 0.33%)
Brazilian Government International Bond $320,000 4.75% 14/1/2050 317,600 0.26%Vale Overseas Ltd. $200,000 6.25% 10/8/2026 234,500 0.19%
552,100 0.45%
Canada 3.72% (2018: 2.07%)
Toronto-Dominion Bank CA($)1,083,000 2.85% 8/3/2024 849,864 0.70%Royal Bank of Canada $777,000 2.55% 16/7/2024 788,573 0.65%Ontario Teachers’ Cadillac Fairview Properties Trust $400,000 3.88% 20/3/2027 426,034 0.35%TransCanada PipeLines Ltd. $285,000 3.75% 16/10/2023 298,687 0.25%Ontario Teachers’ Cadillac Fairview Properties Trust $200,000 4.13% 1/2/2029 220,953 0.18%Canadian Government Bond CA($)226,000 2.75% 1/12/2048 213,147 0.17%Canadian Government Bond CA($)180,000 4.00% 1/6/2041 193,371 0.16%Canadian Government Bond CA($)200,000 1.50% 1/9/2024 152,921 0.13%Canadian Government Bond CA($)130,000 5.75% 1/6/2033 148,922 0.12%TransCanada PipeLines Ltd. $120,000 4.88% 15/5/2048 140,959 0.12%Alimentation Couche-Tard, Inc. $129,000 4.50% 26/7/2047 136,613 0.11%Canadian Government Bond CA($)175,000 1.50% 1/6/2026 133,350 0.11%Enbridge, Inc. $130,000 3.13% 15/11/2029 131,174 0.11%Alimentation Couche-Tard, Inc. $121,000 3.55% 26/7/2027 123,993 0.10%TransCanada PipeLines Ltd. $95,000 4.63% 1/3/2034 108,553 0.09%Canadian Government Bond CA($)90,000 5.00% 1/6/2037 102,850 0.08%Cenovus Energy, Inc. $80,000 4.25% 15/4/2027 84,379 0.07%Enbridge, Inc. $80,000 4.00% 15/11/2049 83,295 0.07%Nutrien Ltd. $45,000 4.13% 15/3/2035 46,969 0.04%
Vanguard Global Credit Bond Fund
614
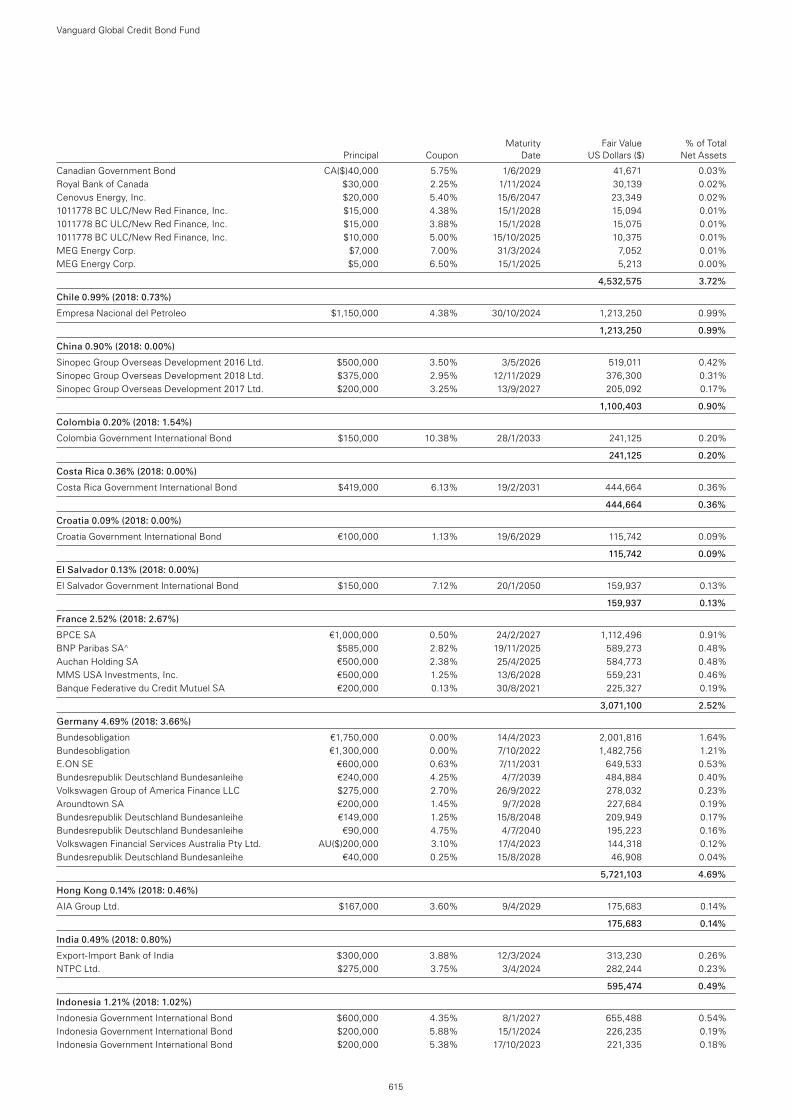
Vanguard Global Credit Bond Fund
615
Canadian Government Bond CA($)40,000 5.75% 1/6/2029 41,671 0.03%Royal Bank of Canada $30,000 2.25% 1/11/2024 30,139 0.02%Cenovus Energy, Inc. $20,000 5.40% 15/6/2047 23,349 0.02%1011778 BC ULC/New Red Finance, Inc. $15,000 4.38% 15/1/2028 15,094 0.01%1011778 BC ULC/New Red Finance, Inc. $15,000 3.88% 15/1/2028 15,075 0.01%1011778 BC ULC/New Red Finance, Inc. $10,000 5.00% 15/10/2025 10,375 0.01%MEG Energy Corp. $7,000 7.00% 31/3/2024 7,052 0.01%MEG Energy Corp. $5,000 6.50% 15/1/2025 5,213 0.00%
4,532,575 3.72%
Chile 0.99% (2018: 0.73%)
Empresa Nacional del Petroleo $1,150,000 4.38% 30/10/2024 1,213,250 0.99%
1,213,250 0.99%
China 0.90% (2018: 0.00%)
Sinopec Group Overseas Development 2016 Ltd. $500,000 3.50% 3/5/2026 519,011 0.42%Sinopec Group Overseas Development 2018 Ltd. $375,000 2.95% 12/11/2029 376,300 0.31%Sinopec Group Overseas Development 2017 Ltd. $200,000 3.25% 13/9/2027 205,092 0.17%
1,100,403 0.90%
Colombia 0.20% (2018: 1.54%)
Colombia Government International Bond $150,000 10.38% 28/1/2033 241,125 0.20%
241,125 0.20%
Costa Rica 0.36% (2018: 0.00%)
Costa Rica Government International Bond $419,000 6.13% 19/2/2031 444,664 0.36%
444,664 0.36%
Croatia 0.09% (2018: 0.00%)
Croatia Government International Bond €100,000 1.13% 19/6/2029 115,742 0.09%
115,742 0.09%
El Salvador 0.13% (2018: 0.00%)
El Salvador Government International Bond $150,000 7.12% 20/1/2050 159,937 0.13%
159,937 0.13%
France 2.52% (2018: 2.67%)
BPCE SA €1,000,000 0.50% 24/2/2027 1,112,496 0.91%BNP Paribas SA^ $585,000 2.82% 19/11/2025 589,273 0.48%Auchan Holding SA €500,000 2.38% 25/4/2025 584,773 0.48%MMS USA Investments, Inc. €500,000 1.25% 13/6/2028 559,231 0.46%Banque Federative du Credit Mutuel SA €200,000 0.13% 30/8/2021 225,327 0.19%
3,071,100 2.52%
Germany 4.69% (2018: 3.66%)
Bundesobligation €1,750,000 0.00% 14/4/2023 2,001,816 1.64%Bundesobligation €1,300,000 0.00% 7/10/2022 1,482,756 1.21%E.ON SE €600,000 0.63% 7/11/2031 649,533 0.53%Bundesrepublik Deutschland Bundesanleihe €240,000 4.25% 4/7/2039 484,884 0.40%Volkswagen Group of America Finance LLC $275,000 2.70% 26/9/2022 278,032 0.23%Aroundtown SA €200,000 1.45% 9/7/2028 227,684 0.19%Bundesrepublik Deutschland Bundesanleihe €149,000 1.25% 15/8/2048 209,949 0.17%Bundesrepublik Deutschland Bundesanleihe €90,000 4.75% 4/7/2040 195,223 0.16%Volkswagen Financial Services Australia Pty Ltd. AU($)200,000 3.10% 17/4/2023 144,318 0.12%Bundesrepublik Deutschland Bundesanleihe €40,000 0.25% 15/8/2028 46,908 0.04%
5,721,103 4.69%
Hong Kong 0.14% (2018: 0.46%)
AIA Group Ltd. $167,000 3.60% 9/4/2029 175,683 0.14%
175,683 0.14%
India 0.49% (2018: 0.80%)
Export-Import Bank of India $300,000 3.88% 12/3/2024 313,230 0.26%NTPC Ltd. $275,000 3.75% 3/4/2024 282,244 0.23%
595,474 0.49%
Indonesia 1.21% (2018: 1.02%)
Indonesia Government International Bond $600,000 4.35% 8/1/2027 655,488 0.54%Indonesia Government International Bond $200,000 5.88% 15/1/2024 226,235 0.19%Indonesia Government International Bond $200,000 5.38% 17/10/2023 221,335 0.18%
Maturity Fair Value % of Total Principal Coupon Date US Dollars ($) Net Assets
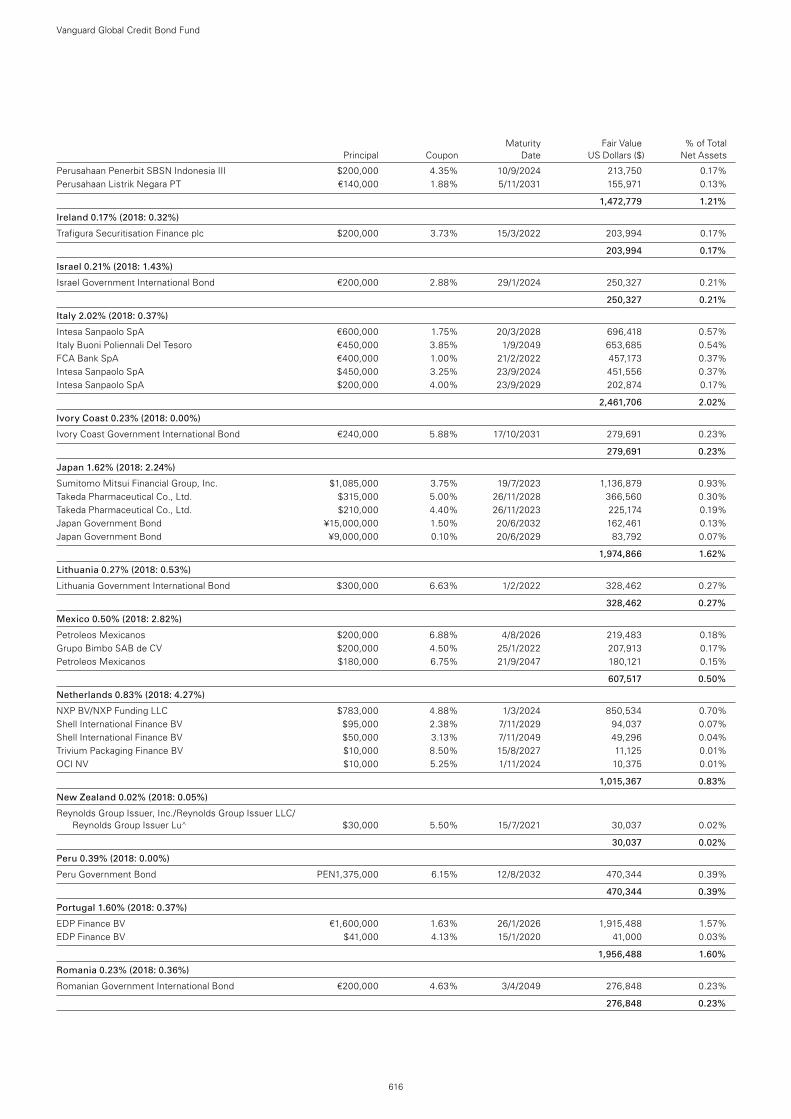
Perusahaan Penerbit SBSN Indonesia III $200,000 4.35% 10/9/2024 213,750 0.17%Perusahaan Listrik Negara PT €140,000 1.88% 5/11/2031 155,971 0.13%
1,472,779 1.21%
Ireland 0.17% (2018: 0.32%)
Trafigura Securitisation Finance plc $200,000 3.73% 15/3/2022 203,994 0.17%
203,994 0.17%
Israel 0.21% (2018: 1.43%)
Israel Government International Bond €200,000 2.88% 29/1/2024 250,327 0.21%
250,327 0.21%
Italy 2.02% (2018: 0.37%)
Intesa Sanpaolo SpA €600,000 1.75% 20/3/2028 696,418 0.57%Italy Buoni Poliennali Del Tesoro €450,000 3.85% 1/9/2049 653,685 0.54%FCA Bank SpA €400,000 1.00% 21/2/2022 457,173 0.37%Intesa Sanpaolo SpA $450,000 3.25% 23/9/2024 451,556 0.37%Intesa Sanpaolo SpA $200,000 4.00% 23/9/2029 202,874 0.17%
2,461,706 2.02%
Ivory Coast 0.23% (2018: 0.00%)
Ivory Coast Government International Bond €240,000 5.88% 17/10/2031 279,691 0.23%
279,691 0.23%
Japan 1.62% (2018: 2.24%)
Sumitomo Mitsui Financial Group, Inc. $1,085,000 3.75% 19/7/2023 1,136,879 0.93%Takeda Pharmaceutical Co., Ltd. $315,000 5.00% 26/11/2028 366,560 0.30%Takeda Pharmaceutical Co., Ltd. $210,000 4.40% 26/11/2023 225,174 0.19%Japan Government Bond ¥15,000,000 1.50% 20/6/2032 162,461 0.13%Japan Government Bond ¥9,000,000 0.10% 20/6/2029 83,792 0.07%
1,974,866 1.62%
Lithuania 0.27% (2018: 0.53%)
Lithuania Government International Bond $300,000 6.63% 1/2/2022 328,462 0.27%
328,462 0.27%
Mexico 0.50% (2018: 2.82%)
Petroleos Mexicanos $200,000 6.88% 4/8/2026 219,483 0.18%Grupo Bimbo SAB de CV $200,000 4.50% 25/1/2022 207,913 0.17%Petroleos Mexicanos $180,000 6.75% 21/9/2047 180,121 0.15%
607,517 0.50%
Netherlands 0.83% (2018: 4.27%)
NXP BV/NXP Funding LLC $783,000 4.88% 1/3/2024 850,534 0.70%Shell International Finance BV $95,000 2.38% 7/11/2029 94,037 0.07%Shell International Finance BV $50,000 3.13% 7/11/2049 49,296 0.04%Trivium Packaging Finance BV $10,000 8.50% 15/8/2027 11,125 0.01%OCI NV $10,000 5.25% 1/11/2024 10,375 0.01%
1,015,367 0.83%
New Zealand 0.02% (2018: 0.05%)
Reynolds Group Issuer, Inc./Reynolds Group Issuer LLC/ Reynolds Group Issuer Lu^ $30,000 5.50% 15/7/2021 30,037 0.02%
30,037 0.02%
Peru 0.39% (2018: 0.00%)
Peru Government Bond PEN1,375,000 6.15% 12/8/2032 470,344 0.39%
470,344 0.39%
Portugal 1.60% (2018: 0.37%)
EDP Finance BV €1,600,000 1.63% 26/1/2026 1,915,488 1.57%EDP Finance BV $41,000 4.13% 15/1/2020 41,000 0.03%
1,956,488 1.60%
Romania 0.23% (2018: 0.36%)
Romanian Government International Bond €200,000 4.63% 3/4/2049 276,848 0.23%
276,848 0.23%
Vanguard Global Credit Bond Fund
616
Maturity Fair Value % of Total Principal Coupon Date US Dollars ($) Net Assets
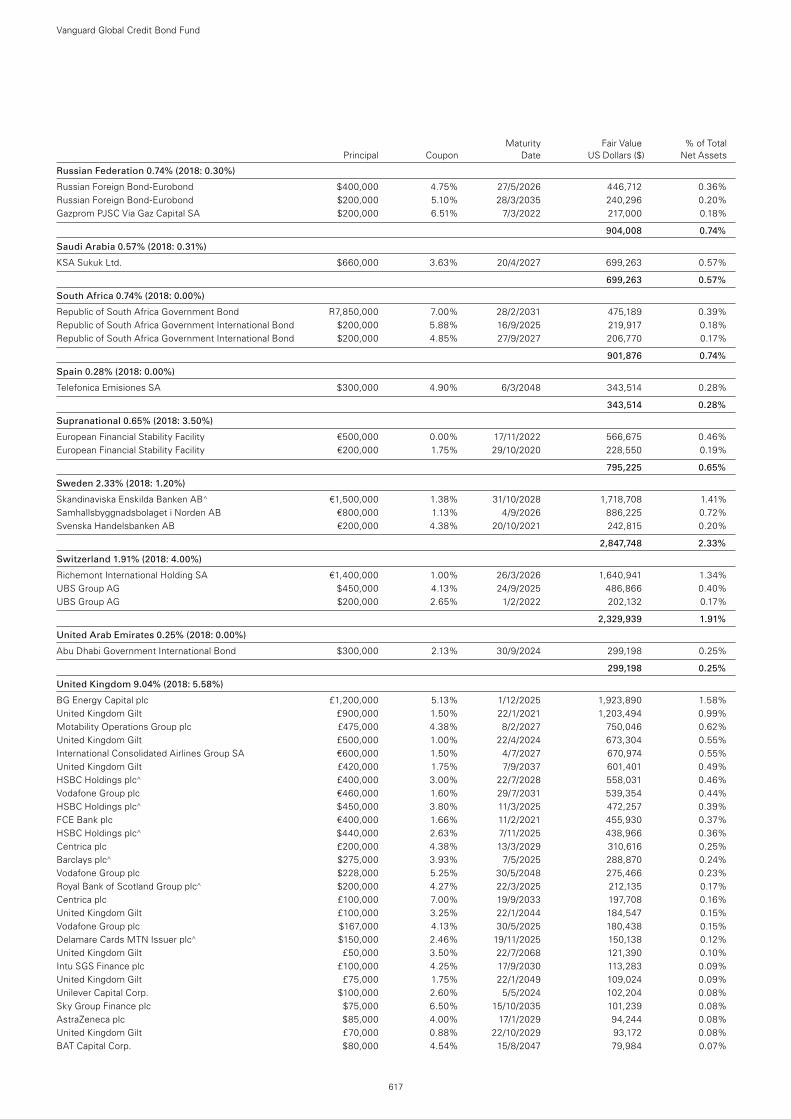
Russian Federation 0.74% (2018: 0.30%)
Russian Foreign Bond-Eurobond $400,000 4.75% 27/5/2026 446,712 0.36%Russian Foreign Bond-Eurobond $200,000 5.10% 28/3/2035 240,296 0.20%Gazprom PJSC Via Gaz Capital SA $200,000 6.51% 7/3/2022 217,000 0.18%
904,008 0.74%
Saudi Arabia 0.57% (2018: 0.31%)
KSA Sukuk Ltd. $660,000 3.63% 20/4/2027 699,263 0.57%
699,263 0.57%
South Africa 0.74% (2018: 0.00%)
Republic of South Africa Government Bond R7,850,000 7.00% 28/2/2031 475,189 0.39%Republic of South Africa Government International Bond $200,000 5.88% 16/9/2025 219,917 0.18%Republic of South Africa Government International Bond $200,000 4.85% 27/9/2027 206,770 0.17%
901,876 0.74%
Spain 0.28% (2018: 0.00%)
Telefonica Emisiones SA $300,000 4.90% 6/3/2048 343,514 0.28%
343,514 0.28%
Supranational 0.65% (2018: 3.50%)
European Financial Stability Facility €500,000 0.00% 17/11/2022 566,675 0.46%European Financial Stability Facility €200,000 1.75% 29/10/2020 228,550 0.19%
795,225 0.65%
Sweden 2.33% (2018: 1.20%)
Skandinaviska Enskilda Banken AB^ €1,500,000 1.38% 31/10/2028 1,718,708 1.41%Samhallsbyggnadsbolaget i Norden AB €800,000 1.13% 4/9/2026 886,225 0.72%Svenska Handelsbanken AB €200,000 4.38% 20/10/2021 242,815 0.20%
2,847,748 2.33%
Switzerland 1.91% (2018: 4.00%)
Richemont International Holding SA €1,400,000 1.00% 26/3/2026 1,640,941 1.34%UBS Group AG $450,000 4.13% 24/9/2025 486,866 0.40%UBS Group AG $200,000 2.65% 1/2/2022 202,132 0.17%
2,329,939 1.91%
United Arab Emirates 0.25% (2018: 0.00%)
Abu Dhabi Government International Bond $300,000 2.13% 30/9/2024 299,198 0.25%
299,198 0.25%
United Kingdom 9.04% (2018: 5.58%)
BG Energy Capital plc £1,200,000 5.13% 1/12/2025 1,923,890 1.58%United Kingdom Gilt £900,000 1.50% 22/1/2021 1,203,494 0.99%Motability Operations Group plc £475,000 4.38% 8/2/2027 750,046 0.62%United Kingdom Gilt £500,000 1.00% 22/4/2024 673,304 0.55%International Consolidated Airlines Group SA €600,000 1.50% 4/7/2027 670,974 0.55%United Kingdom Gilt £420,000 1.75% 7/9/2037 601,401 0.49%HSBC Holdings plc^ £400,000 3.00% 22/7/2028 558,031 0.46%Vodafone Group plc €460,000 1.60% 29/7/2031 539,354 0.44%HSBC Holdings plc^ $450,000 3.80% 11/3/2025 472,257 0.39%FCE Bank plc €400,000 1.66% 11/2/2021 455,930 0.37%HSBC Holdings plc^ $440,000 2.63% 7/11/2025 438,966 0.36%Centrica plc £200,000 4.38% 13/3/2029 310,616 0.25%Barclays plc^ $275,000 3.93% 7/5/2025 288,870 0.24%Vodafone Group plc $228,000 5.25% 30/5/2048 275,466 0.23%Royal Bank of Scotland Group plc^ $200,000 4.27% 22/3/2025 212,135 0.17%Centrica plc £100,000 7.00% 19/9/2033 197,708 0.16%United Kingdom Gilt £100,000 3.25% 22/1/2044 184,547 0.15%Vodafone Group plc $167,000 4.13% 30/5/2025 180,438 0.15%Delamare Cards MTN Issuer plc^ $150,000 2.46% 19/11/2025 150,138 0.12%United Kingdom Gilt £50,000 3.50% 22/7/2068 121,390 0.10%Intu SGS Finance plc £100,000 4.25% 17/9/2030 113,283 0.09%United Kingdom Gilt £75,000 1.75% 22/1/2049 109,024 0.09%Unilever Capital Corp. $100,000 2.60% 5/5/2024 102,204 0.08%Sky Group Finance plc $75,000 6.50% 15/10/2035 101,239 0.08%AstraZeneca plc $85,000 4.00% 17/1/2029 94,244 0.08%United Kingdom Gilt £70,000 0.88% 22/10/2029 93,172 0.08%BAT Capital Corp. $80,000 4.54% 15/8/2047 79,984 0.07%
Vanguard Global Credit Bond Fund
617
Maturity Fair Value % of Total Principal Coupon Date US Dollars ($) Net Assets
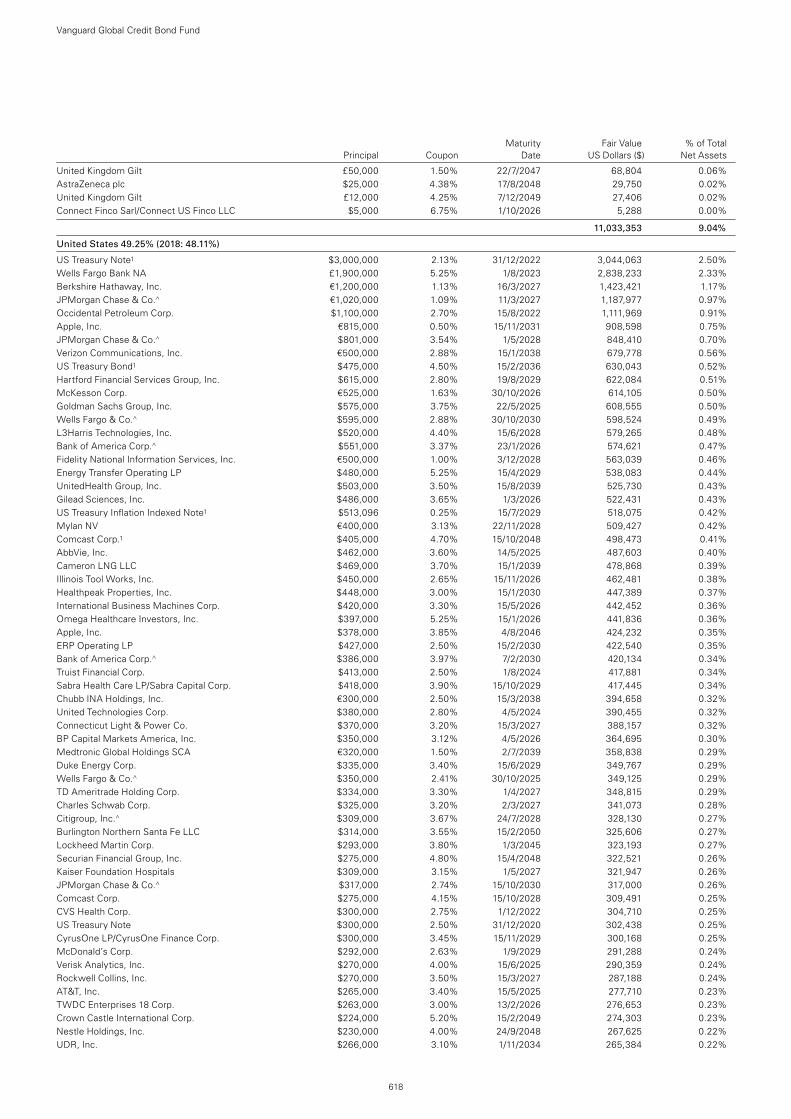
United Kingdom Gilt £50,000 1.50% 22/7/2047 68,804 0.06%AstraZeneca plc $25,000 4.38% 17/8/2048 29,750 0.02%United Kingdom Gilt £12,000 4.25% 7/12/2049 27,406 0.02%Connect Finco Sarl/Connect US Finco LLC $5,000 6.75% 1/10/2026 5,288 0.00%
11,033,353 9.04%
United States 49.25% (2018: 48.11%)
US Treasury Note1 $3,000,000 2.13% 31/12/2022 3,044,063 2.50%Wells Fargo Bank NA £1,900,000 5.25% 1/8/2023 2,838,233 2.33%Berkshire Hathaway, Inc. €1,200,000 1.13% 16/3/2027 1,423,421 1.17%JPMorgan Chase & Co.^ €1,020,000 1.09% 11/3/2027 1,187,977 0.97%Occidental Petroleum Corp. $1,100,000 2.70% 15/8/2022 1,111,969 0.91%Apple, Inc. €815,000 0.50% 15/11/2031 908,598 0.75%JPMorgan Chase & Co.^ $801,000 3.54% 1/5/2028 848,410 0.70%Verizon Communications, Inc. €500,000 2.88% 15/1/2038 679,778 0.56%US Treasury Bond1 $475,000 4.50% 15/2/2036 630,043 0.52%Hartford Financial Services Group, Inc. $615,000 2.80% 19/8/2029 622,084 0.51%McKesson Corp. €525,000 1.63% 30/10/2026 614,105 0.50%Goldman Sachs Group, Inc. $575,000 3.75% 22/5/2025 608,555 0.50%Wells Fargo & Co.^ $595,000 2.88% 30/10/2030 598,524 0.49%L3Harris Technologies, Inc. $520,000 4.40% 15/6/2028 579,265 0.48%Bank of America Corp.^ $551,000 3.37% 23/1/2026 574,621 0.47%Fidelity National Information Services, Inc. €500,000 1.00% 3/12/2028 563,039 0.46%Energy Transfer Operating LP $480,000 5.25% 15/4/2029 538,083 0.44%UnitedHealth Group, Inc. $503,000 3.50% 15/8/2039 525,730 0.43%Gilead Sciences, Inc. $486,000 3.65% 1/3/2026 522,431 0.43%US Treasury Inflation Indexed Note1 $513,096 0.25% 15/7/2029 518,075 0.42%Mylan NV €400,000 3.13% 22/11/2028 509,427 0.42%Comcast Corp.1 $405,000 4.70% 15/10/2048 498,473 0.41%AbbVie, Inc. $462,000 3.60% 14/5/2025 487,603 0.40%Cameron LNG LLC $469,000 3.70% 15/1/2039 478,868 0.39%Illinois Tool Works, Inc. $450,000 2.65% 15/11/2026 462,481 0.38%Healthpeak Properties, Inc. $448,000 3.00% 15/1/2030 447,389 0.37%International Business Machines Corp. $420,000 3.30% 15/5/2026 442,452 0.36%Omega Healthcare Investors, Inc. $397,000 5.25% 15/1/2026 441,836 0.36%Apple, Inc. $378,000 3.85% 4/8/2046 424,232 0.35%ERP Operating LP $427,000 2.50% 15/2/2030 422,540 0.35%Bank of America Corp.^ $386,000 3.97% 7/2/2030 420,134 0.34%Truist Financial Corp. $413,000 2.50% 1/8/2024 417,881 0.34%Sabra Health Care LP/Sabra Capital Corp. $418,000 3.90% 15/10/2029 417,445 0.34%Chubb INA Holdings, Inc. €300,000 2.50% 15/3/2038 394,658 0.32%United Technologies Corp. $380,000 2.80% 4/5/2024 390,455 0.32%Connecticut Light & Power Co. $370,000 3.20% 15/3/2027 388,157 0.32%BP Capital Markets America, Inc. $350,000 3.12% 4/5/2026 364,695 0.30%Medtronic Global Holdings SCA €320,000 1.50% 2/7/2039 358,838 0.29%Duke Energy Corp. $335,000 3.40% 15/6/2029 349,767 0.29%Wells Fargo & Co.^ $350,000 2.41% 30/10/2025 349,125 0.29%TD Ameritrade Holding Corp. $334,000 3.30% 1/4/2027 348,815 0.29%Charles Schwab Corp. $325,000 3.20% 2/3/2027 341,073 0.28%Citigroup, Inc.^ $309,000 3.67% 24/7/2028 328,130 0.27%Burlington Northern Santa Fe LLC $314,000 3.55% 15/2/2050 325,606 0.27%Lockheed Martin Corp. $293,000 3.80% 1/3/2045 323,193 0.27%Securian Financial Group, Inc. $275,000 4.80% 15/4/2048 322,521 0.26%Kaiser Foundation Hospitals $309,000 3.15% 1/5/2027 321,947 0.26%JPMorgan Chase & Co.^ $317,000 2.74% 15/10/2030 317,000 0.26%Comcast Corp. $275,000 4.15% 15/10/2028 309,491 0.25%CVS Health Corp. $300,000 2.75% 1/12/2022 304,710 0.25%US Treasury Note $300,000 2.50% 31/12/2020 302,438 0.25%CyrusOne LP/CyrusOne Finance Corp. $300,000 3.45% 15/11/2029 300,168 0.25%McDonald’s Corp. $292,000 2.63% 1/9/2029 291,288 0.24%Verisk Analytics, Inc. $270,000 4.00% 15/6/2025 290,359 0.24%Rockwell Collins, Inc. $270,000 3.50% 15/3/2027 287,188 0.24%AT&T, Inc. $265,000 3.40% 15/5/2025 277,710 0.23%TWDC Enterprises 18 Corp. $263,000 3.00% 13/2/2026 276,653 0.23%Crown Castle International Corp. $224,000 5.20% 15/2/2049 274,303 0.23%Nestle Holdings, Inc. $230,000 4.00% 24/9/2048 267,625 0.22%UDR, Inc. $266,000 3.10% 1/11/2034 265,384 0.22%
Vanguard Global Credit Bond Fund
618
Maturity Fair Value % of Total Principal Coupon Date US Dollars ($) Net Assets
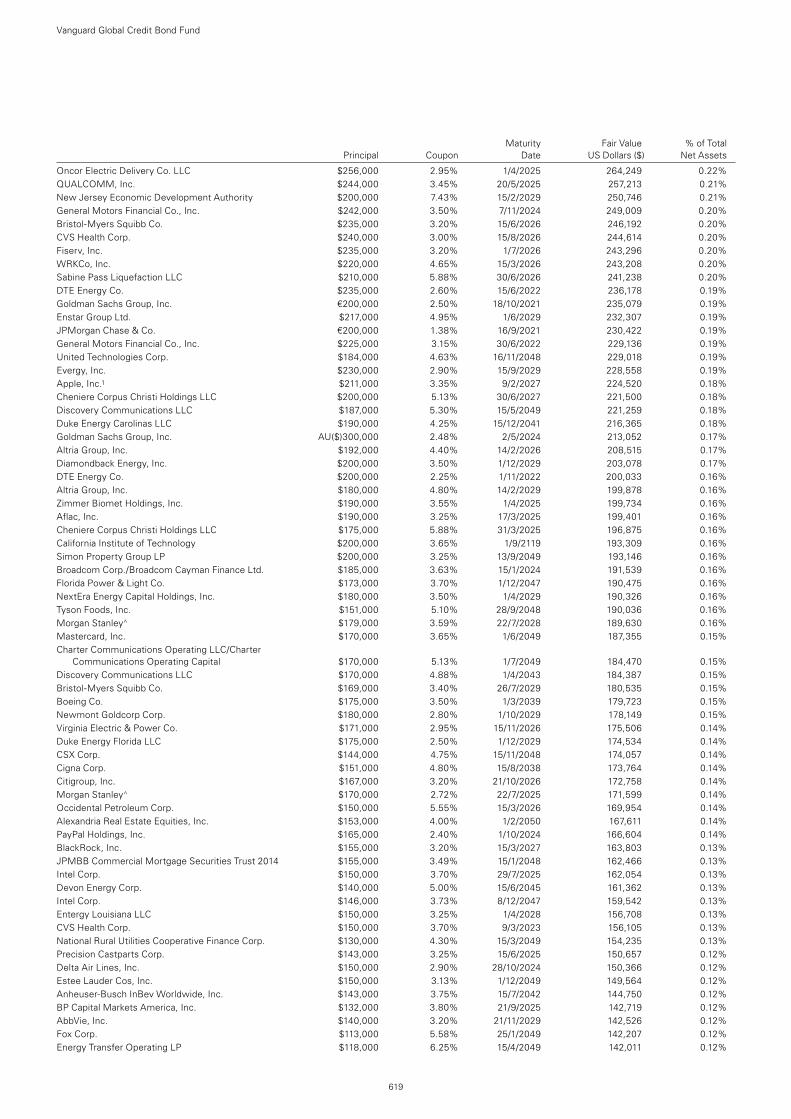
Oncor Electric Delivery Co. LLC $256,000 2.95% 1/4/2025 264,249 0.22%QUALCOMM, Inc. $244,000 3.45% 20/5/2025 257,213 0.21%New Jersey Economic Development Authority $200,000 7.43% 15/2/2029 250,746 0.21%General Motors Financial Co., Inc. $242,000 3.50% 7/11/2024 249,009 0.20%Bristol-Myers Squibb Co. $235,000 3.20% 15/6/2026 246,192 0.20%CVS Health Corp. $240,000 3.00% 15/8/2026 244,614 0.20%Fiserv, Inc. $235,000 3.20% 1/7/2026 243,296 0.20%WRKCo, Inc. $220,000 4.65% 15/3/2026 243,208 0.20%Sabine Pass Liquefaction LLC $210,000 5.88% 30/6/2026 241,238 0.20%DTE Energy Co. $235,000 2.60% 15/6/2022 236,178 0.19%Goldman Sachs Group, Inc. €200,000 2.50% 18/10/2021 235,079 0.19%Enstar Group Ltd. $217,000 4.95% 1/6/2029 232,307 0.19%JPMorgan Chase & Co. €200,000 1.38% 16/9/2021 230,422 0.19%General Motors Financial Co., Inc. $225,000 3.15% 30/6/2022 229,136 0.19%United Technologies Corp. $184,000 4.63% 16/11/2048 229,018 0.19%Evergy, Inc. $230,000 2.90% 15/9/2029 228,558 0.19%Apple, Inc.1 $211,000 3.35% 9/2/2027 224,520 0.18%Cheniere Corpus Christi Holdings LLC $200,000 5.13% 30/6/2027 221,500 0.18%Discovery Communications LLC $187,000 5.30% 15/5/2049 221,259 0.18%Duke Energy Carolinas LLC $190,000 4.25% 15/12/2041 216,365 0.18%Goldman Sachs Group, Inc. AU($)300,000 2.48% 2/5/2024 213,052 0.17%Altria Group, Inc. $192,000 4.40% 14/2/2026 208,515 0.17%Diamondback Energy, Inc. $200,000 3.50% 1/12/2029 203,078 0.17%DTE Energy Co. $200,000 2.25% 1/11/2022 200,033 0.16%Altria Group, Inc. $180,000 4.80% 14/2/2029 199,878 0.16%Zimmer Biomet Holdings, Inc. $190,000 3.55% 1/4/2025 199,734 0.16%Aflac, Inc. $190,000 3.25% 17/3/2025 199,401 0.16%Cheniere Corpus Christi Holdings LLC $175,000 5.88% 31/3/2025 196,875 0.16%California Institute of Technology $200,000 3.65% 1/9/2119 193,309 0.16%Simon Property Group LP $200,000 3.25% 13/9/2049 193,146 0.16%Broadcom Corp./Broadcom Cayman Finance Ltd. $185,000 3.63% 15/1/2024 191,539 0.16%Florida Power & Light Co. $173,000 3.70% 1/12/2047 190,475 0.16%NextEra Energy Capital Holdings, Inc. $180,000 3.50% 1/4/2029 190,326 0.16%Tyson Foods, Inc. $151,000 5.10% 28/9/2048 190,036 0.16%Morgan Stanley^ $179,000 3.59% 22/7/2028 189,630 0.16%Mastercard, Inc. $170,000 3.65% 1/6/2049 187,355 0.15%Charter Communications Operating LLC/Charter
Communications Operating Capital $170,000 5.13% 1/7/2049 184,470 0.15%Discovery Communications LLC $170,000 4.88% 1/4/2043 184,387 0.15%Bristol-Myers Squibb Co. $169,000 3.40% 26/7/2029 180,535 0.15%Boeing Co. $175,000 3.50% 1/3/2039 179,723 0.15%Newmont Goldcorp Corp. $180,000 2.80% 1/10/2029 178,149 0.15%Virginia Electric & Power Co. $171,000 2.95% 15/11/2026 175,506 0.14%Duke Energy Florida LLC $175,000 2.50% 1/12/2029 174,534 0.14%CSX Corp. $144,000 4.75% 15/11/2048 174,057 0.14%Cigna Corp. $151,000 4.80% 15/8/2038 173,764 0.14%Citigroup, Inc. $167,000 3.20% 21/10/2026 172,758 0.14%Morgan Stanley^ $170,000 2.72% 22/7/2025 171,599 0.14%Occidental Petroleum Corp. $150,000 5.55% 15/3/2026 169,954 0.14%Alexandria Real Estate Equities, Inc. $153,000 4.00% 1/2/2050 167,611 0.14%PayPal Holdings, Inc. $165,000 2.40% 1/10/2024 166,604 0.14%BlackRock, Inc. $155,000 3.20% 15/3/2027 163,803 0.13%JPMBB Commercial Mortgage Securities Trust 2014 $155,000 3.49% 15/1/2048 162,466 0.13%Intel Corp. $150,000 3.70% 29/7/2025 162,054 0.13%Devon Energy Corp. $140,000 5.00% 15/6/2045 161,362 0.13%Intel Corp. $146,000 3.73% 8/12/2047 159,542 0.13%Entergy Louisiana LLC $150,000 3.25% 1/4/2028 156,708 0.13%CVS Health Corp. $150,000 3.70% 9/3/2023 156,105 0.13%National Rural Utilities Cooperative Finance Corp. $130,000 4.30% 15/3/2049 154,235 0.13%Precision Castparts Corp. $143,000 3.25% 15/6/2025 150,657 0.12%Delta Air Lines, Inc. $150,000 2.90% 28/10/2024 150,366 0.12%Estee Lauder Cos, Inc. $150,000 3.13% 1/12/2049 149,564 0.12%Anheuser-Busch InBev Worldwide, Inc. $143,000 3.75% 15/7/2042 144,750 0.12%BP Capital Markets America, Inc. $132,000 3.80% 21/9/2025 142,719 0.12%AbbVie, Inc. $140,000 3.20% 21/11/2029 142,526 0.12%Fox Corp. $113,000 5.58% 25/1/2049 142,207 0.12%Energy Transfer Operating LP $118,000 6.25% 15/4/2049 142,011 0.12%
Vanguard Global Credit Bond Fund
619
Maturity Fair Value % of Total Principal Coupon Date US Dollars ($) Net Assets
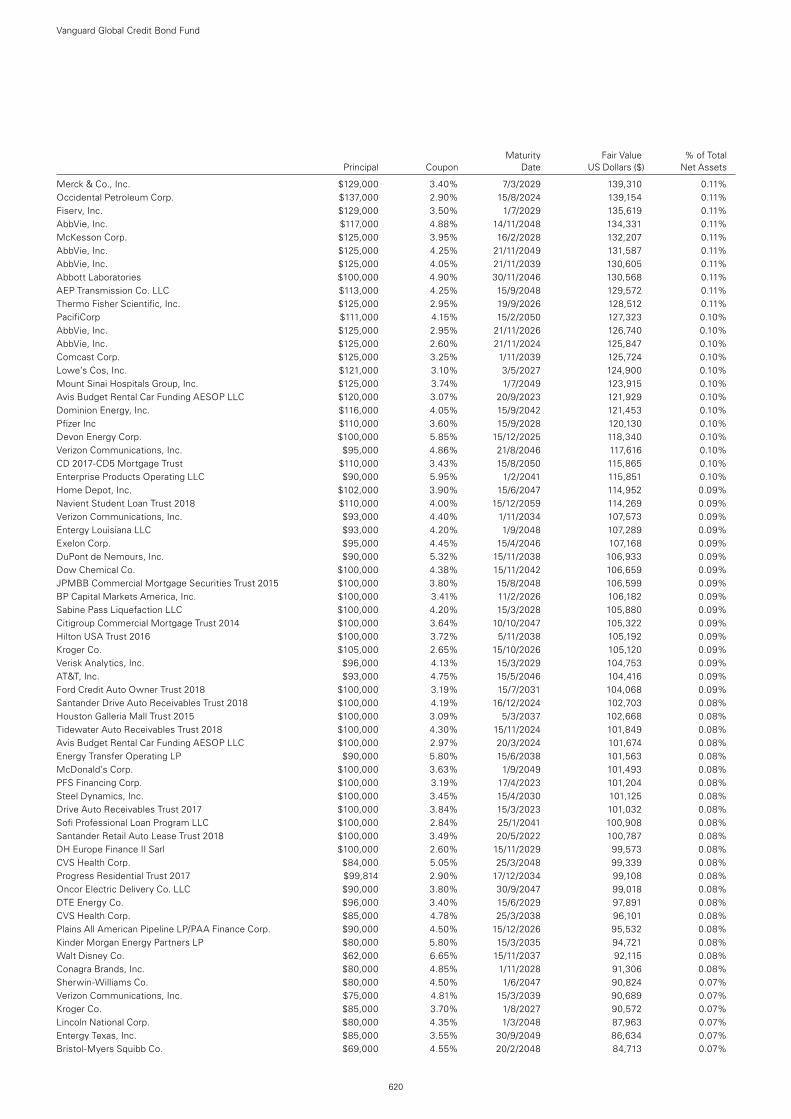
Merck & Co., Inc. $129,000 3.40% 7/3/2029 139,310 0.11%Occidental Petroleum Corp. $137,000 2.90% 15/8/2024 139,154 0.11%Fiserv, Inc. $129,000 3.50% 1/7/2029 135,619 0.11%AbbVie, Inc. $117,000 4.88% 14/11/2048 134,331 0.11%McKesson Corp. $125,000 3.95% 16/2/2028 132,207 0.11%AbbVie, Inc. $125,000 4.25% 21/11/2049 131,587 0.11%AbbVie, Inc. $125,000 4.05% 21/11/2039 130,605 0.11%Abbott Laboratories $100,000 4.90% 30/11/2046 130,568 0.11%AEP Transmission Co. LLC $113,000 4.25% 15/9/2048 129,572 0.11%Thermo Fisher Scientific, Inc. $125,000 2.95% 19/9/2026 128,512 0.11%PacifiCorp $111,000 4.15% 15/2/2050 127,323 0.10%AbbVie, Inc. $125,000 2.95% 21/11/2026 126,740 0.10%AbbVie, Inc. $125,000 2.60% 21/11/2024 125,847 0.10%Comcast Corp. $125,000 3.25% 1/11/2039 125,724 0.10%Lowe’s Cos, Inc. $121,000 3.10% 3/5/2027 124,900 0.10%Mount Sinai Hospitals Group, Inc. $125,000 3.74% 1/7/2049 123,915 0.10%Avis Budget Rental Car Funding AESOP LLC $120,000 3.07% 20/9/2023 121,929 0.10%Dominion Energy, Inc. $116,000 4.05% 15/9/2042 121,453 0.10%Pfizer Inc $110,000 3.60% 15/9/2028 120,130 0.10%Devon Energy Corp. $100,000 5.85% 15/12/2025 118,340 0.10%Verizon Communications, Inc. $95,000 4.86% 21/8/2046 117,616 0.10%CD 2017-CD5 Mortgage Trust $110,000 3.43% 15/8/2050 115,865 0.10%Enterprise Products Operating LLC $90,000 5.95% 1/2/2041 115,851 0.10%Home Depot, Inc. $102,000 3.90% 15/6/2047 114,952 0.09%Navient Student Loan Trust 2018 $110,000 4.00% 15/12/2059 114,269 0.09%Verizon Communications, Inc. $93,000 4.40% 1/11/2034 107,573 0.09%Entergy Louisiana LLC $93,000 4.20% 1/9/2048 107,289 0.09%Exelon Corp. $95,000 4.45% 15/4/2046 107,168 0.09%DuPont de Nemours, Inc. $90,000 5.32% 15/11/2038 106,933 0.09%Dow Chemical Co. $100,000 4.38% 15/11/2042 106,659 0.09%JPMBB Commercial Mortgage Securities Trust 2015 $100,000 3.80% 15/8/2048 106,599 0.09%BP Capital Markets America, Inc. $100,000 3.41% 11/2/2026 106,182 0.09%Sabine Pass Liquefaction LLC $100,000 4.20% 15/3/2028 105,880 0.09%Citigroup Commercial Mortgage Trust 2014 $100,000 3.64% 10/10/2047 105,322 0.09%Hilton USA Trust 2016 $100,000 3.72% 5/11/2038 105,192 0.09%Kroger Co. $105,000 2.65% 15/10/2026 105,120 0.09%Verisk Analytics, Inc. $96,000 4.13% 15/3/2029 104,753 0.09%AT&T, Inc. $93,000 4.75% 15/5/2046 104,416 0.09%Ford Credit Auto Owner Trust 2018 $100,000 3.19% 15/7/2031 104,068 0.09%Santander Drive Auto Receivables Trust 2018 $100,000 4.19% 16/12/2024 102,703 0.08%Houston Galleria Mall Trust 2015 $100,000 3.09% 5/3/2037 102,668 0.08%Tidewater Auto Receivables Trust 2018 $100,000 4.30% 15/11/2024 101,849 0.08%Avis Budget Rental Car Funding AESOP LLC $100,000 2.97% 20/3/2024 101,674 0.08%Energy Transfer Operating LP $90,000 5.80% 15/6/2038 101,563 0.08%McDonald’s Corp. $100,000 3.63% 1/9/2049 101,493 0.08%PFS Financing Corp. $100,000 3.19% 17/4/2023 101,204 0.08%Steel Dynamics, Inc. $100,000 3.45% 15/4/2030 101,125 0.08%Drive Auto Receivables Trust 2017 $100,000 3.84% 15/3/2023 101,032 0.08%Sofi Professional Loan Program LLC $100,000 2.84% 25/1/2041 100,908 0.08%Santander Retail Auto Lease Trust 2018 $100,000 3.49% 20/5/2022 100,787 0.08%DH Europe Finance II Sarl $100,000 2.60% 15/11/2029 99,573 0.08%CVS Health Corp. $84,000 5.05% 25/3/2048 99,339 0.08%Progress Residential Trust 2017 $99,814 2.90% 17/12/2034 99,108 0.08%Oncor Electric Delivery Co. LLC $90,000 3.80% 30/9/2047 99,018 0.08%DTE Energy Co. $96,000 3.40% 15/6/2029 97,891 0.08%CVS Health Corp. $85,000 4.78% 25/3/2038 96,101 0.08%Plains All American Pipeline LP/PAA Finance Corp. $90,000 4.50% 15/12/2026 95,532 0.08%Kinder Morgan Energy Partners LP $80,000 5.80% 15/3/2035 94,721 0.08%Walt Disney Co. $62,000 6.65% 15/11/2037 92,115 0.08%Conagra Brands, Inc. $80,000 4.85% 1/11/2028 91,306 0.08%Sherwin-Williams Co. $80,000 4.50% 1/6/2047 90,824 0.07%Verizon Communications, Inc. $75,000 4.81% 15/3/2039 90,689 0.07%Kroger Co. $85,000 3.70% 1/8/2027 90,572 0.07%Lincoln National Corp. $80,000 4.35% 1/3/2048 87,963 0.07%Entergy Texas, Inc. $85,000 3.55% 30/9/2049 86,634 0.07%Bristol-Myers Squibb Co. $69,000 4.55% 20/2/2048 84,713 0.07%
Vanguard Global Credit Bond Fund
620
Maturity Fair Value % of Total Principal Coupon Date US Dollars ($) Net Assets
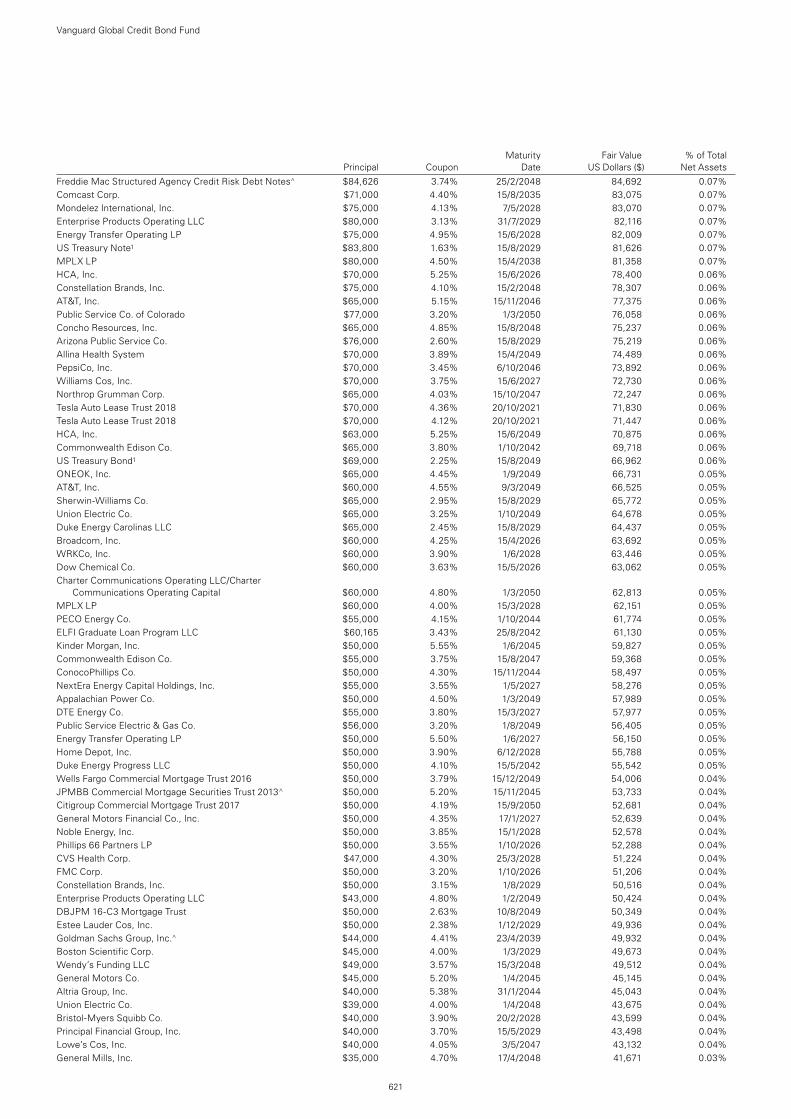
Freddie Mac Structured Agency Credit Risk Debt Notes^ $84,626 3.74% 25/2/2048 84,692 0.07%Comcast Corp. $71,000 4.40% 15/8/2035 83,075 0.07%Mondelez International, Inc. $75,000 4.13% 7/5/2028 83,070 0.07%Enterprise Products Operating LLC $80,000 3.13% 31/7/2029 82,116 0.07%Energy Transfer Operating LP $75,000 4.95% 15/6/2028 82,009 0.07%US Treasury Note1 $83,800 1.63% 15/8/2029 81,626 0.07%MPLX LP $80,000 4.50% 15/4/2038 81,358 0.07%HCA, Inc. $70,000 5.25% 15/6/2026 78,400 0.06%Constellation Brands, Inc. $75,000 4.10% 15/2/2048 78,307 0.06%AT&T, Inc. $65,000 5.15% 15/11/2046 77,375 0.06%Public Service Co. of Colorado $77,000 3.20% 1/3/2050 76,058 0.06%Concho Resources, Inc. $65,000 4.85% 15/8/2048 75,237 0.06%Arizona Public Service Co. $76,000 2.60% 15/8/2029 75,219 0.06%Allina Health System $70,000 3.89% 15/4/2049 74,489 0.06%PepsiCo, Inc. $70,000 3.45% 6/10/2046 73,892 0.06%Williams Cos, Inc. $70,000 3.75% 15/6/2027 72,730 0.06%Northrop Grumman Corp. $65,000 4.03% 15/10/2047 72,247 0.06%Tesla Auto Lease Trust 2018 $70,000 4.36% 20/10/2021 71,830 0.06%Tesla Auto Lease Trust 2018 $70,000 4.12% 20/10/2021 71,447 0.06%HCA, Inc. $63,000 5.25% 15/6/2049 70,875 0.06%Commonwealth Edison Co. $65,000 3.80% 1/10/2042 69,718 0.06%US Treasury Bond1 $69,000 2.25% 15/8/2049 66,962 0.06%ONEOK, Inc. $65,000 4.45% 1/9/2049 66,731 0.05%AT&T, Inc. $60,000 4.55% 9/3/2049 66,525 0.05%Sherwin-Williams Co. $65,000 2.95% 15/8/2029 65,772 0.05%Union Electric Co. $65,000 3.25% 1/10/2049 64,678 0.05%Duke Energy Carolinas LLC $65,000 2.45% 15/8/2029 64,437 0.05%Broadcom, Inc. $60,000 4.25% 15/4/2026 63,692 0.05%WRKCo, Inc. $60,000 3.90% 1/6/2028 63,446 0.05%Dow Chemical Co. $60,000 3.63% 15/5/2026 63,062 0.05%Charter Communications Operating LLC/Charter
Communications Operating Capital $60,000 4.80% 1/3/2050 62,813 0.05%MPLX LP $60,000 4.00% 15/3/2028 62,151 0.05%PECO Energy Co. $55,000 4.15% 1/10/2044 61,774 0.05%ELFI Graduate Loan Program LLC $60,165 3.43% 25/8/2042 61,130 0.05%Kinder Morgan, Inc. $50,000 5.55% 1/6/2045 59,827 0.05%Commonwealth Edison Co. $55,000 3.75% 15/8/2047 59,368 0.05%ConocoPhillips Co. $50,000 4.30% 15/11/2044 58,497 0.05%NextEra Energy Capital Holdings, Inc. $55,000 3.55% 1/5/2027 58,276 0.05%Appalachian Power Co. $50,000 4.50% 1/3/2049 57,989 0.05%DTE Energy Co. $55,000 3.80% 15/3/2027 57,977 0.05%Public Service Electric & Gas Co. $56,000 3.20% 1/8/2049 56,405 0.05%Energy Transfer Operating LP $50,000 5.50% 1/6/2027 56,150 0.05%Home Depot, Inc. $50,000 3.90% 6/12/2028 55,788 0.05%Duke Energy Progress LLC $50,000 4.10% 15/5/2042 55,542 0.05%Wells Fargo Commercial Mortgage Trust 2016 $50,000 3.79% 15/12/2049 54,006 0.04%JPMBB Commercial Mortgage Securities Trust 2013^ $50,000 5.20% 15/11/2045 53,733 0.04%Citigroup Commercial Mortgage Trust 2017 $50,000 4.19% 15/9/2050 52,681 0.04%General Motors Financial Co., Inc. $50,000 4.35% 17/1/2027 52,639 0.04%Noble Energy, Inc. $50,000 3.85% 15/1/2028 52,578 0.04%Phillips 66 Partners LP $50,000 3.55% 1/10/2026 52,288 0.04%CVS Health Corp. $47,000 4.30% 25/3/2028 51,224 0.04%FMC Corp. $50,000 3.20% 1/10/2026 51,206 0.04%Constellation Brands, Inc. $50,000 3.15% 1/8/2029 50,516 0.04%Enterprise Products Operating LLC $43,000 4.80% 1/2/2049 50,424 0.04%DBJPM 16-C3 Mortgage Trust $50,000 2.63% 10/8/2049 50,349 0.04%Estee Lauder Cos, Inc. $50,000 2.38% 1/12/2029 49,936 0.04%Goldman Sachs Group, Inc.^ $44,000 4.41% 23/4/2039 49,932 0.04%Boston Scientific Corp. $45,000 4.00% 1/3/2029 49,673 0.04%Wendy’s Funding LLC $49,000 3.57% 15/3/2048 49,512 0.04%General Motors Co. $45,000 5.20% 1/4/2045 45,145 0.04%Altria Group, Inc. $40,000 5.38% 31/1/2044 45,043 0.04%Union Electric Co. $39,000 4.00% 1/4/2048 43,675 0.04%Bristol-Myers Squibb Co. $40,000 3.90% 20/2/2028 43,599 0.04%Principal Financial Group, Inc. $40,000 3.70% 15/5/2029 43,498 0.04%Lowe’s Cos, Inc. $40,000 4.05% 3/5/2047 43,132 0.04%General Mills, Inc. $35,000 4.70% 17/4/2048 41,671 0.03%
Vanguard Global Credit Bond Fund
621
Maturity Fair Value % of Total Principal Coupon Date US Dollars ($) Net Assets
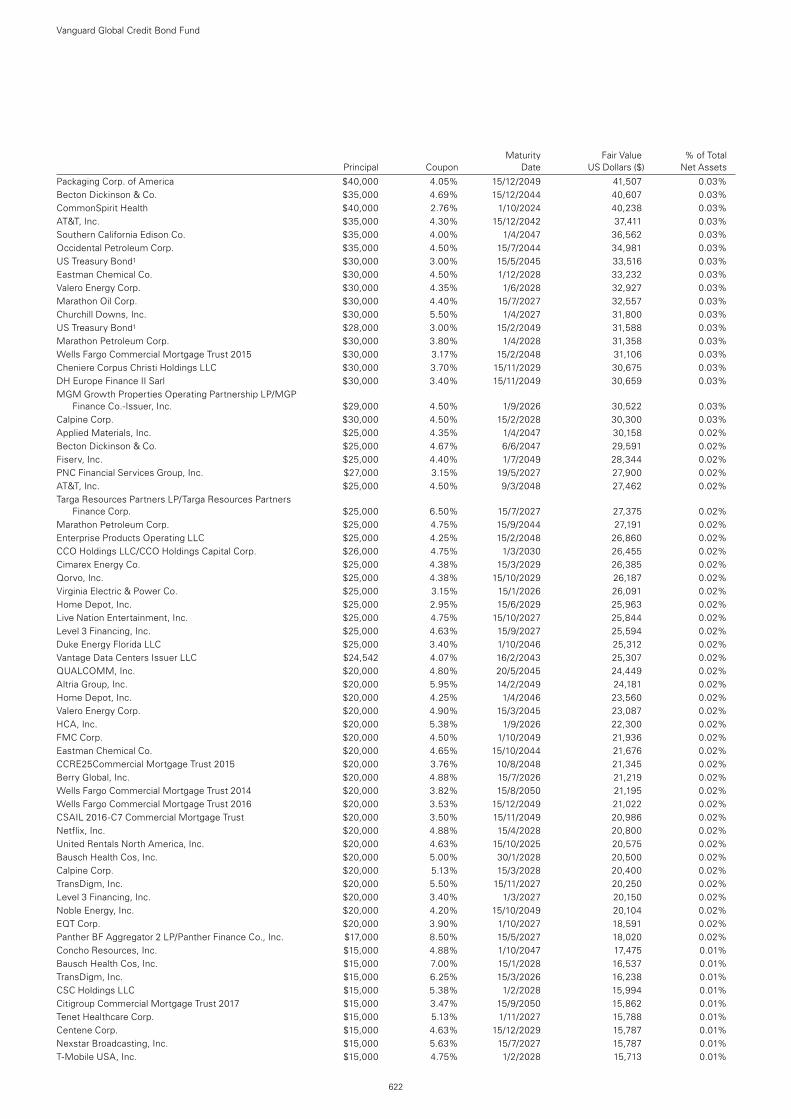
Packaging Corp. of America $40,000 4.05% 15/12/2049 41,507 0.03%Becton Dickinson & Co. $35,000 4.69% 15/12/2044 40,607 0.03%CommonSpirit Health $40,000 2.76% 1/10/2024 40,238 0.03%AT&T, Inc. $35,000 4.30% 15/12/2042 37,411 0.03%Southern California Edison Co. $35,000 4.00% 1/4/2047 36,562 0.03%Occidental Petroleum Corp. $35,000 4.50% 15/7/2044 34,981 0.03%US Treasury Bond1 $30,000 3.00% 15/5/2045 33,516 0.03%Eastman Chemical Co. $30,000 4.50% 1/12/2028 33,232 0.03%Valero Energy Corp. $30,000 4.35% 1/6/2028 32,927 0.03%Marathon Oil Corp. $30,000 4.40% 15/7/2027 32,557 0.03%Churchill Downs, Inc. $30,000 5.50% 1/4/2027 31,800 0.03%US Treasury Bond1 $28,000 3.00% 15/2/2049 31,588 0.03%Marathon Petroleum Corp. $30,000 3.80% 1/4/2028 31,358 0.03%Wells Fargo Commercial Mortgage Trust 2015 $30,000 3.17% 15/2/2048 31,106 0.03%Cheniere Corpus Christi Holdings LLC $30,000 3.70% 15/11/2029 30,675 0.03%DH Europe Finance II Sarl $30,000 3.40% 15/11/2049 30,659 0.03%MGM Growth Properties Operating Partnership LP/MGP
Finance Co.-Issuer, Inc. $29,000 4.50% 1/9/2026 30,522 0.03%Calpine Corp. $30,000 4.50% 15/2/2028 30,300 0.03%Applied Materials, Inc. $25,000 4.35% 1/4/2047 30,158 0.02%Becton Dickinson & Co. $25,000 4.67% 6/6/2047 29,591 0.02%Fiserv, Inc. $25,000 4.40% 1/7/2049 28,344 0.02%PNC Financial Services Group, Inc. $27,000 3.15% 19/5/2027 27,900 0.02%AT&T, Inc. $25,000 4.50% 9/3/2048 27,462 0.02%Targa Resources Partners LP/Targa Resources Partners
Finance Corp. $25,000 6.50% 15/7/2027 27,375 0.02%Marathon Petroleum Corp. $25,000 4.75% 15/9/2044 27,191 0.02%Enterprise Products Operating LLC $25,000 4.25% 15/2/2048 26,860 0.02%CCO Holdings LLC/CCO Holdings Capital Corp. $26,000 4.75% 1/3/2030 26,455 0.02%Cimarex Energy Co. $25,000 4.38% 15/3/2029 26,385 0.02%Qorvo, Inc. $25,000 4.38% 15/10/2029 26,187 0.02%Virginia Electric & Power Co. $25,000 3.15% 15/1/2026 26,091 0.02%Home Depot, Inc. $25,000 2.95% 15/6/2029 25,963 0.02%Live Nation Entertainment, Inc. $25,000 4.75% 15/10/2027 25,844 0.02%Level 3 Financing, Inc. $25,000 4.63% 15/9/2027 25,594 0.02%Duke Energy Florida LLC $25,000 3.40% 1/10/2046 25,312 0.02%Vantage Data Centers Issuer LLC $24,542 4.07% 16/2/2043 25,307 0.02%QUALCOMM, Inc. $20,000 4.80% 20/5/2045 24,449 0.02%Altria Group, Inc. $20,000 5.95% 14/2/2049 24,181 0.02%Home Depot, Inc. $20,000 4.25% 1/4/2046 23,560 0.02%Valero Energy Corp. $20,000 4.90% 15/3/2045 23,087 0.02%HCA, Inc. $20,000 5.38% 1/9/2026 22,300 0.02%FMC Corp. $20,000 4.50% 1/10/2049 21,936 0.02%Eastman Chemical Co. $20,000 4.65% 15/10/2044 21,676 0.02%CCRE25Commercial Mortgage Trust 2015 $20,000 3.76% 10/8/2048 21,345 0.02%Berry Global, Inc. $20,000 4.88% 15/7/2026 21,219 0.02%Wells Fargo Commercial Mortgage Trust 2014 $20,000 3.82% 15/8/2050 21,195 0.02%Wells Fargo Commercial Mortgage Trust 2016 $20,000 3.53% 15/12/2049 21,022 0.02%CSAIL 2016-C7 Commercial Mortgage Trust $20,000 3.50% 15/11/2049 20,986 0.02%Netflix, Inc. $20,000 4.88% 15/4/2028 20,800 0.02%United Rentals North America, Inc. $20,000 4.63% 15/10/2025 20,575 0.02%Bausch Health Cos, Inc. $20,000 5.00% 30/1/2028 20,500 0.02%Calpine Corp. $20,000 5.13% 15/3/2028 20,400 0.02%TransDigm, Inc. $20,000 5.50% 15/11/2027 20,250 0.02%Level 3 Financing, Inc. $20,000 3.40% 1/3/2027 20,150 0.02%Noble Energy, Inc. $20,000 4.20% 15/10/2049 20,104 0.02%EQT Corp. $20,000 3.90% 1/10/2027 18,591 0.02%Panther BF Aggregator 2 LP/Panther Finance Co., Inc. $17,000 8.50% 15/5/2027 18,020 0.02%Concho Resources, Inc. $15,000 4.88% 1/10/2047 17,475 0.01%Bausch Health Cos, Inc. $15,000 7.00% 15/1/2028 16,537 0.01%TransDigm, Inc. $15,000 6.25% 15/3/2026 16,238 0.01%CSC Holdings LLC $15,000 5.38% 1/2/2028 15,994 0.01%Citigroup Commercial Mortgage Trust 2017 $15,000 3.47% 15/9/2050 15,862 0.01%Tenet Healthcare Corp. $15,000 5.13% 1/11/2027 15,788 0.01%Centene Corp. $15,000 4.63% 15/12/2029 15,787 0.01%Nexstar Broadcasting, Inc. $15,000 5.63% 15/7/2027 15,787 0.01%T-Mobile USA, Inc. $15,000 4.75% 1/2/2028 15,713 0.01%
Vanguard Global Credit Bond Fund
622
Maturity Fair Value % of Total Principal Coupon Date US Dollars ($) Net Assets
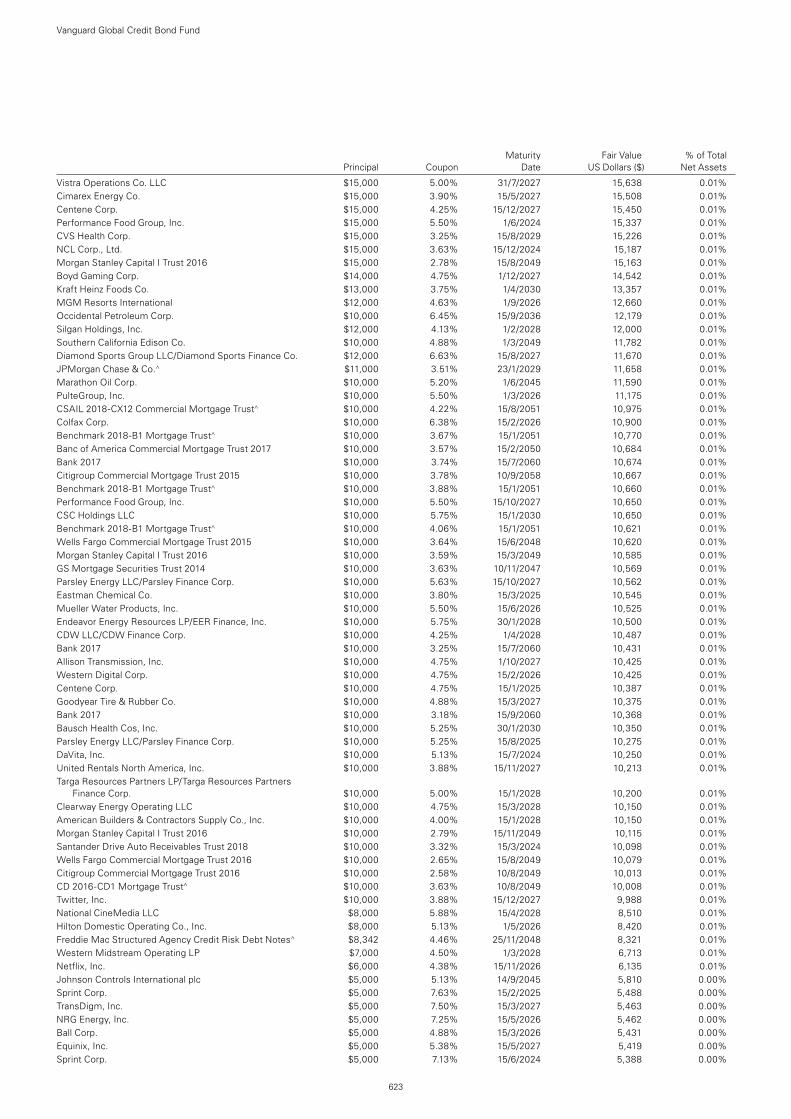
Maturity Fair Value % of Total Principal Coupon Date US Dollars ($) Net Assets
Vistra Operations Co. LLC $15,000 5.00% 31/7/2027 15,638 0.01%Cimarex Energy Co. $15,000 3.90% 15/5/2027 15,508 0.01%Centene Corp. $15,000 4.25% 15/12/2027 15,450 0.01%Performance Food Group, Inc. $15,000 5.50% 1/6/2024 15,337 0.01%CVS Health Corp. $15,000 3.25% 15/8/2029 15,226 0.01%NCL Corp., Ltd. $15,000 3.63% 15/12/2024 15,187 0.01%Morgan Stanley Capital I Trust 2016 $15,000 2.78% 15/8/2049 15,163 0.01%Boyd Gaming Corp. $14,000 4.75% 1/12/2027 14,542 0.01%Kraft Heinz Foods Co. $13,000 3.75% 1/4/2030 13,357 0.01%MGM Resorts International $12,000 4.63% 1/9/2026 12,660 0.01%Occidental Petroleum Corp. $10,000 6.45% 15/9/2036 12,179 0.01%Silgan Holdings, Inc. $12,000 4.13% 1/2/2028 12,000 0.01%Southern California Edison Co. $10,000 4.88% 1/3/2049 11,782 0.01%Diamond Sports Group LLC/Diamond Sports Finance Co. $12,000 6.63% 15/8/2027 11,670 0.01%JPMorgan Chase & Co.^ $11,000 3.51% 23/1/2029 11,658 0.01%Marathon Oil Corp. $10,000 5.20% 1/6/2045 11,590 0.01%PulteGroup, Inc. $10,000 5.50% 1/3/2026 11,175 0.01%CSAIL 2018-CX12 Commercial Mortgage Trust^ $10,000 4.22% 15/8/2051 10,975 0.01%Colfax Corp. $10,000 6.38% 15/2/2026 10,900 0.01%Benchmark 2018-B1 Mortgage Trust^ $10,000 3.67% 15/1/2051 10,770 0.01%Banc of America Commercial Mortgage Trust 2017 $10,000 3.57% 15/2/2050 10,684 0.01%Bank 2017 $10,000 3.74% 15/7/2060 10,674 0.01%Citigroup Commercial Mortgage Trust 2015 $10,000 3.78% 10/9/2058 10,667 0.01%Benchmark 2018-B1 Mortgage Trust^ $10,000 3.88% 15/1/2051 10,660 0.01%Performance Food Group, Inc. $10,000 5.50% 15/10/2027 10,650 0.01%CSC Holdings LLC $10,000 5.75% 15/1/2030 10,650 0.01%Benchmark 2018-B1 Mortgage Trust^ $10,000 4.06% 15/1/2051 10,621 0.01%Wells Fargo Commercial Mortgage Trust 2015 $10,000 3.64% 15/6/2048 10,620 0.01%Morgan Stanley Capital I Trust 2016 $10,000 3.59% 15/3/2049 10,585 0.01%GS Mortgage Securities Trust 2014 $10,000 3.63% 10/11/2047 10,569 0.01%Parsley Energy LLC/Parsley Finance Corp. $10,000 5.63% 15/10/2027 10,562 0.01%Eastman Chemical Co. $10,000 3.80% 15/3/2025 10,545 0.01%Mueller Water Products, Inc. $10,000 5.50% 15/6/2026 10,525 0.01%Endeavor Energy Resources LP/EER Finance, Inc. $10,000 5.75% 30/1/2028 10,500 0.01%CDW LLC/CDW Finance Corp. $10,000 4.25% 1/4/2028 10,487 0.01%Bank 2017 $10,000 3.25% 15/7/2060 10,431 0.01%Allison Transmission, Inc. $10,000 4.75% 1/10/2027 10,425 0.01%Western Digital Corp. $10,000 4.75% 15/2/2026 10,425 0.01%Centene Corp. $10,000 4.75% 15/1/2025 10,387 0.01%Goodyear Tire & Rubber Co. $10,000 4.88% 15/3/2027 10,375 0.01%Bank 2017 $10,000 3.18% 15/9/2060 10,368 0.01%Bausch Health Cos, Inc. $10,000 5.25% 30/1/2030 10,350 0.01%Parsley Energy LLC/Parsley Finance Corp. $10,000 5.25% 15/8/2025 10,275 0.01%DaVita, Inc. $10,000 5.13% 15/7/2024 10,250 0.01%United Rentals North America, Inc. $10,000 3.88% 15/11/2027 10,213 0.01%Targa Resources Partners LP/Targa Resources Partners
Finance Corp. $10,000 5.00% 15/1/2028 10,200 0.01%Clearway Energy Operating LLC $10,000 4.75% 15/3/2028 10,150 0.01%American Builders & Contractors Supply Co., Inc. $10,000 4.00% 15/1/2028 10,150 0.01%Morgan Stanley Capital I Trust 2016 $10,000 2.79% 15/11/2049 10,115 0.01%Santander Drive Auto Receivables Trust 2018 $10,000 3.32% 15/3/2024 10,098 0.01%Wells Fargo Commercial Mortgage Trust 2016 $10,000 2.65% 15/8/2049 10,079 0.01%Citigroup Commercial Mortgage Trust 2016 $10,000 2.58% 10/8/2049 10,013 0.01%CD 2016-CD1 Mortgage Trust^ $10,000 3.63% 10/8/2049 10,008 0.01%Twitter, Inc. $10,000 3.88% 15/12/2027 9,988 0.01%National CineMedia LLC $8,000 5.88% 15/4/2028 8,510 0.01%Hilton Domestic Operating Co., Inc. $8,000 5.13% 1/5/2026 8,420 0.01%Freddie Mac Structured Agency Credit Risk Debt Notes^ $8,342 4.46% 25/11/2048 8,321 0.01%Western Midstream Operating LP $7,000 4.50% 1/3/2028 6,713 0.01%Netflix, Inc. $6,000 4.38% 15/11/2026 6,135 0.01%Johnson Controls International plc $5,000 5.13% 14/9/2045 5,810 0.00%Sprint Corp. $5,000 7.63% 15/2/2025 5,488 0.00%TransDigm, Inc. $5,000 7.50% 15/3/2027 5,463 0.00%NRG Energy, Inc. $5,000 7.25% 15/5/2026 5,462 0.00%Ball Corp. $5,000 4.88% 15/3/2026 5,431 0.00%Equinix, Inc. $5,000 5.38% 15/5/2027 5,419 0.00%Sprint Corp. $5,000 7.13% 15/6/2024 5,388 0.00%
Vanguard Global Credit Bond Fund
623
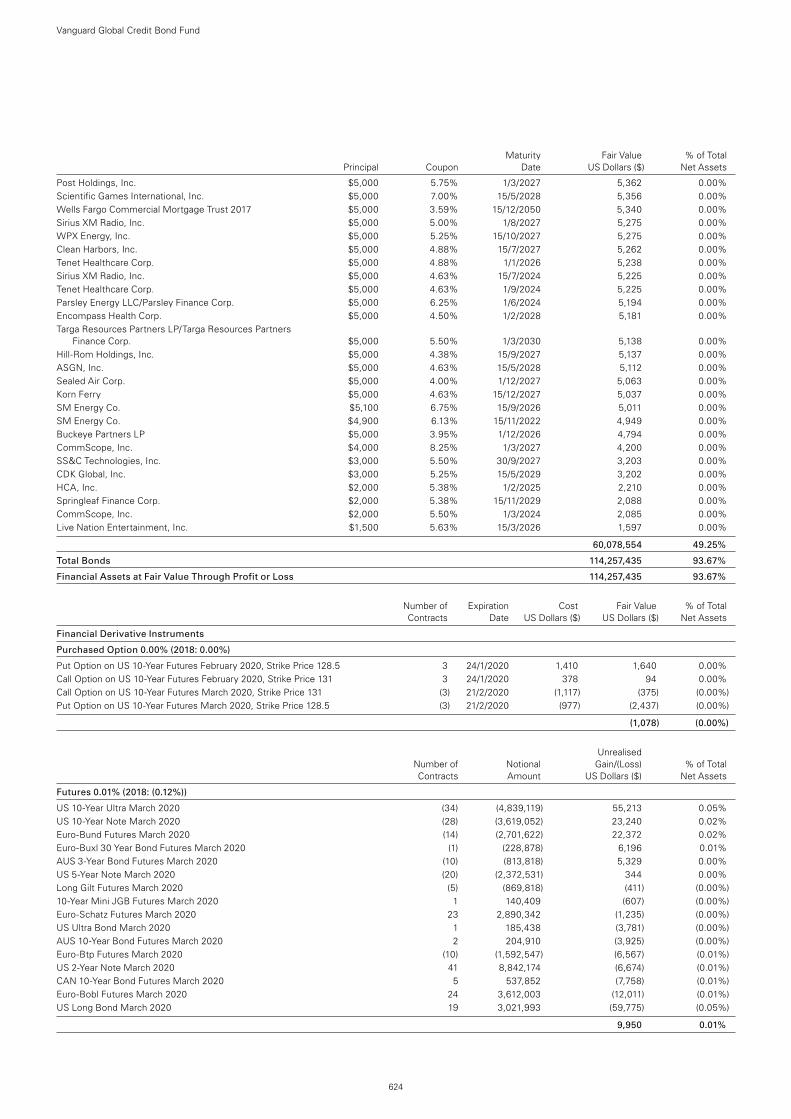
Maturity Fair Value % of Total Principal Coupon Date US Dollars ($) Net Assets
Post Holdings, Inc. $5,000 5.75% 1/3/2027 5,362 0.00%Scientific Games International, Inc. $5,000 7.00% 15/5/2028 5,356 0.00%Wells Fargo Commercial Mortgage Trust 2017 $5,000 3.59% 15/12/2050 5,340 0.00%Sirius XM Radio, Inc. $5,000 5.00% 1/8/2027 5,275 0.00%WPX Energy, Inc. $5,000 5.25% 15/10/2027 5,275 0.00%Clean Harbors, Inc. $5,000 4.88% 15/7/2027 5,262 0.00%Tenet Healthcare Corp. $5,000 4.88% 1/1/2026 5,238 0.00%Sirius XM Radio, Inc. $5,000 4.63% 15/7/2024 5,225 0.00%Tenet Healthcare Corp. $5,000 4.63% 1/9/2024 5,225 0.00%Parsley Energy LLC/Parsley Finance Corp. $5,000 6.25% 1/6/2024 5,194 0.00%Encompass Health Corp. $5,000 4.50% 1/2/2028 5,181 0.00%Targa Resources Partners LP/Targa Resources Partners
Finance Corp. $5,000 5.50% 1/3/2030 5,138 0.00%Hill-Rom Holdings, Inc. $5,000 4.38% 15/9/2027 5,137 0.00%ASGN, Inc. $5,000 4.63% 15/5/2028 5,112 0.00%Sealed Air Corp. $5,000 4.00% 1/12/2027 5,063 0.00%Korn Ferry $5,000 4.63% 15/12/2027 5,037 0.00%SM Energy Co. $5,100 6.75% 15/9/2026 5,011 0.00%SM Energy Co. $4,900 6.13% 15/11/2022 4,949 0.00%Buckeye Partners LP $5,000 3.95% 1/12/2026 4,794 0.00%CommScope, Inc. $4,000 8.25% 1/3/2027 4,200 0.00%SS&C Technologies, Inc. $3,000 5.50% 30/9/2027 3,203 0.00%CDK Global, Inc. $3,000 5.25% 15/5/2029 3,202 0.00%HCA, Inc. $2,000 5.38% 1/2/2025 2,210 0.00%Springleaf Finance Corp. $2,000 5.38% 15/11/2029 2,088 0.00%CommScope, Inc. $2,000 5.50% 1/3/2024 2,085 0.00%Live Nation Entertainment, Inc. $1,500 5.63% 15/3/2026 1,597 0.00%
60,078,554 49.25%
Total Bonds 114,257,435 93.67%
Financial Assets at Fair Value Through Profit or Loss 114,257,435 93.67%
Number of Expiration Cost Fair Value % of Total Contracts Date US Dollars ($) US Dollars ($) Net Assets
Financial Derivative Instruments
Purchased Option 0.00% (2018: 0.00%)
Put Option on US 10-Year Futures February 2020, Strike Price 128.5 3 24/1/2020 1,410 1,640 0.00%Call Option on US 10-Year Futures February 2020, Strike Price 131 3 24/1/2020 378 94 0.00%Call Option on US 10-Year Futures March 2020, Strike Price 131 (3) 21/2/2020 (1,117) (375) (0.00%)Put Option on US 10-Year Futures March 2020, Strike Price 128.5 (3) 21/2/2020 (977) (2,437) (0.00%)
(1,078) (0.00%)
Unrealised Number of Notional Gain/(Loss) % of Total Contracts Amount US Dollars ($) Net Assets
Futures 0.01% (2018: (0.12%))
US 10-Year Ultra March 2020 (34) (4,839,119) 55,213 0.05%US 10-Year Note March 2020 (28) (3,619,052) 23,240 0.02%Euro-Bund Futures March 2020 (14) (2,701,622) 22,372 0.02%Euro-Buxl 30 Year Bond Futures March 2020 (1) (228,878) 6,196 0.01%AUS 3-Year Bond Futures March 2020 (10) (813,818) 5,329 0.00%US 5-Year Note March 2020 (20) (2,372,531) 344 0.00%Long Gilt Futures March 2020 (5) (869,818) (411) (0.00%)10-Year Mini JGB Futures March 2020 1 140,409 (607) (0.00%)Euro-Schatz Futures March 2020 23 2,890,342 (1,235) (0.00%)US Ultra Bond March 2020 1 185,438 (3,781) (0.00%)AUS 10-Year Bond Futures March 2020 2 204,910 (3,925) (0.00%)Euro-Btp Futures March 2020 (10) (1,592,547) (6,567) (0.01%)US 2-Year Note March 2020 41 8,842,174 (6,674) (0.01%)CAN 10-Year Bond Futures March 2020 5 537,852 (7,758) (0.01%)Euro-Bobl Futures March 2020 24 3,612,003 (12,011) (0.01%)US Long Bond March 2020 19 3,021,993 (59,775) (0.05%)
9,950 0.01%
Vanguard Global Credit Bond Fund
624
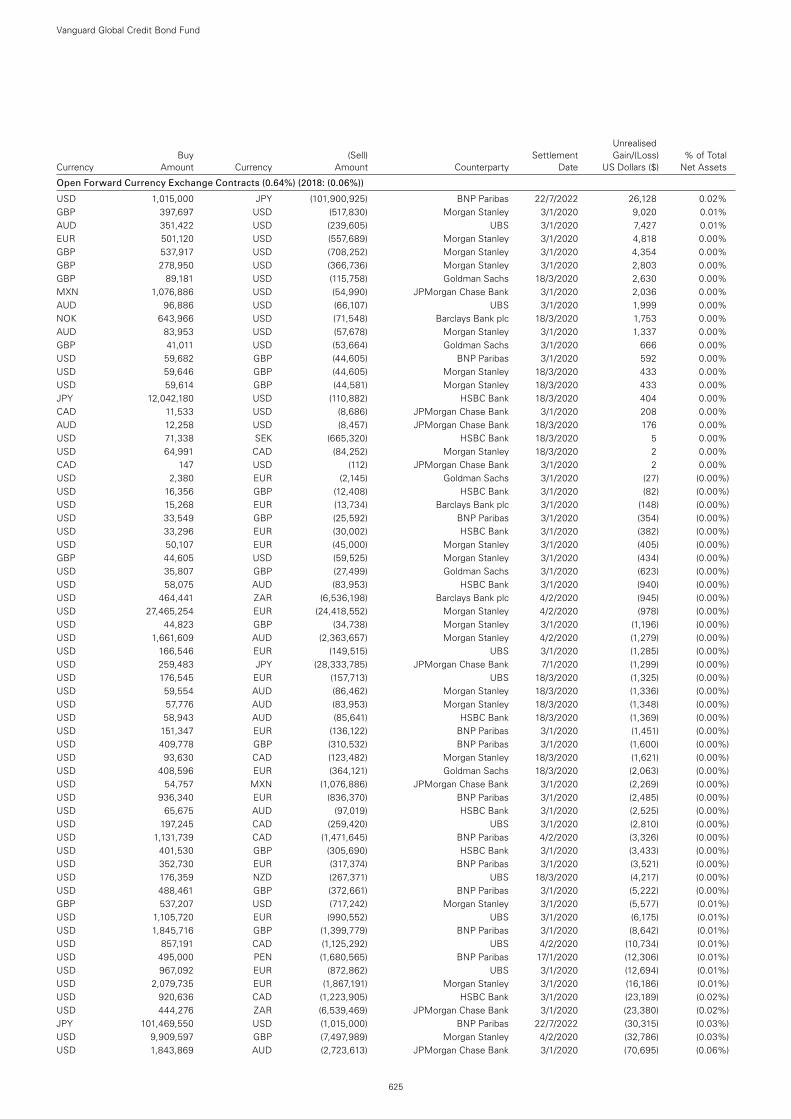
Open Forward Currency Exchange Contracts (0.64%) (2018: (0.06%))
USD 1,015,000 JPY (101,900,925) BNP Paribas 22/7/2022 26,128 0.02%GBP 397,697 USD (517,830) Morgan Stanley 3/1/2020 9,020 0.01%AUD 351,422 USD (239,605) UBS 3/1/2020 7,427 0.01%EUR 501,120 USD (557,689) Morgan Stanley 3/1/2020 4,818 0.00%GBP 537,917 USD (708,252) Morgan Stanley 3/1/2020 4,354 0.00%GBP 278,950 USD (366,736) Morgan Stanley 3/1/2020 2,803 0.00%GBP 89,181 USD (115,758) Goldman Sachs 18/3/2020 2,630 0.00%MXN 1,076,886 USD (54,990) JPMorgan Chase Bank 3/1/2020 2,036 0.00%AUD 96,886 USD (66,107) UBS 3/1/2020 1,999 0.00%NOK 643,966 USD (71,548) Barclays Bank plc 18/3/2020 1,753 0.00%AUD 83,953 USD (57,678) Morgan Stanley 3/1/2020 1,337 0.00%GBP 41,011 USD (53,664) Goldman Sachs 3/1/2020 666 0.00%USD 59,682 GBP (44,605) BNP Paribas 3/1/2020 592 0.00%USD 59,646 GBP (44,605) Morgan Stanley 18/3/2020 433 0.00%USD 59,614 GBP (44,581) Morgan Stanley 18/3/2020 433 0.00%JPY 12,042,180 USD (110,882) HSBC Bank 18/3/2020 404 0.00%CAD 11,533 USD (8,686) JPMorgan Chase Bank 3/1/2020 208 0.00%AUD 12,258 USD (8,457) JPMorgan Chase Bank 18/3/2020 176 0.00%USD 71,338 SEK (665,320) HSBC Bank 18/3/2020 5 0.00%USD 64,991 CAD (84,252) Morgan Stanley 18/3/2020 2 0.00%CAD 147 USD (112) JPMorgan Chase Bank 3/1/2020 2 0.00%USD 2,380 EUR (2,145) Goldman Sachs 3/1/2020 (27) (0.00%)USD 16,356 GBP (12,408) HSBC Bank 3/1/2020 (82) (0.00%)USD 15,268 EUR (13,734) Barclays Bank plc 3/1/2020 (148) (0.00%)USD 33,549 GBP (25,592) BNP Paribas 3/1/2020 (354) (0.00%)USD 33,296 EUR (30,002) HSBC Bank 3/1/2020 (382) (0.00%)USD 50,107 EUR (45,000) Morgan Stanley 3/1/2020 (405) (0.00%)GBP 44,605 USD (59,525) Morgan Stanley 3/1/2020 (434) (0.00%)USD 35,807 GBP (27,499) Goldman Sachs 3/1/2020 (623) (0.00%)USD 58,075 AUD (83,953) HSBC Bank 3/1/2020 (940) (0.00%)USD 464,441 ZAR (6,536,198) Barclays Bank plc 4/2/2020 (945) (0.00%)USD 27,465,254 EUR (24,418,552) Morgan Stanley 4/2/2020 (978) (0.00%)USD 44,823 GBP (34,738) Morgan Stanley 3/1/2020 (1,196) (0.00%)USD 1,661,609 AUD (2,363,657) Morgan Stanley 4/2/2020 (1,279) (0.00%)USD 166,546 EUR (149,515) UBS 3/1/2020 (1,285) (0.00%)USD 259,483 JPY (28,333,785) JPMorgan Chase Bank 7/1/2020 (1,299) (0.00%)USD 176,545 EUR (157,713) UBS 18/3/2020 (1,325) (0.00%)USD 59,554 AUD (86,462) Morgan Stanley 18/3/2020 (1,336) (0.00%)USD 57,776 AUD (83,953) Morgan Stanley 18/3/2020 (1,348) (0.00%)USD 58,943 AUD (85,641) HSBC Bank 18/3/2020 (1,369) (0.00%)USD 151,347 EUR (136,122) BNP Paribas 3/1/2020 (1,451) (0.00%)USD 409,778 GBP (310,532) BNP Paribas 3/1/2020 (1,600) (0.00%)USD 93,630 CAD (123,482) Morgan Stanley 18/3/2020 (1,621) (0.00%)USD 408,596 EUR (364,121) Goldman Sachs 18/3/2020 (2,063) (0.00%)USD 54,757 MXN (1,076,886) JPMorgan Chase Bank 3/1/2020 (2,269) (0.00%)USD 936,340 EUR (836,370) BNP Paribas 3/1/2020 (2,485) (0.00%)USD 65,675 AUD (97,019) HSBC Bank 3/1/2020 (2,525) (0.00%)USD 197,245 CAD (259,420) UBS 3/1/2020 (2,810) (0.00%)USD 1,131,739 CAD (1,471,645) BNP Paribas 4/2/2020 (3,326) (0.00%)USD 401,530 GBP (305,690) HSBC Bank 3/1/2020 (3,433) (0.00%)USD 352,730 EUR (317,374) BNP Paribas 3/1/2020 (3,521) (0.00%)USD 176,359 NZD (267,371) UBS 18/3/2020 (4,217) (0.00%)USD 488,461 GBP (372,661) BNP Paribas 3/1/2020 (5,222) (0.00%)GBP 537,207 USD (717,242) Morgan Stanley 3/1/2020 (5,577) (0.01%)USD 1,105,720 EUR (990,552) UBS 3/1/2020 (6,175) (0.01%)USD 1,845,716 GBP (1,399,779) BNP Paribas 3/1/2020 (8,642) (0.01%)USD 857,191 CAD (1,125,292) UBS 4/2/2020 (10,734) (0.01%)USD 495,000 PEN (1,680,565) BNP Paribas 17/1/2020 (12,306) (0.01%)USD 967,092 EUR (872,862) UBS 3/1/2020 (12,694) (0.01%)USD 2,079,735 EUR (1,867,191) Morgan Stanley 3/1/2020 (16,186) (0.01%)USD 920,636 CAD (1,223,905) HSBC Bank 3/1/2020 (23,189) (0.02%)USD 444,276 ZAR (6,539,469) JPMorgan Chase Bank 3/1/2020 (23,380) (0.02%)JPY 101,469,550 USD (1,015,000) BNP Paribas 22/7/2022 (30,315) (0.03%)USD 9,909,597 GBP (7,497,989) Morgan Stanley 4/2/2020 (32,786) (0.03%)USD 1,843,869 AUD (2,723,613) JPMorgan Chase Bank 3/1/2020 (70,695) (0.06%)
Unrealised Buy (Sell) Settlement Gain/(Loss) % of Total Currency Amount Currency Amount Counterparty Date US Dollars ($) Net Assets
Vanguard Global Credit Bond Fund
625
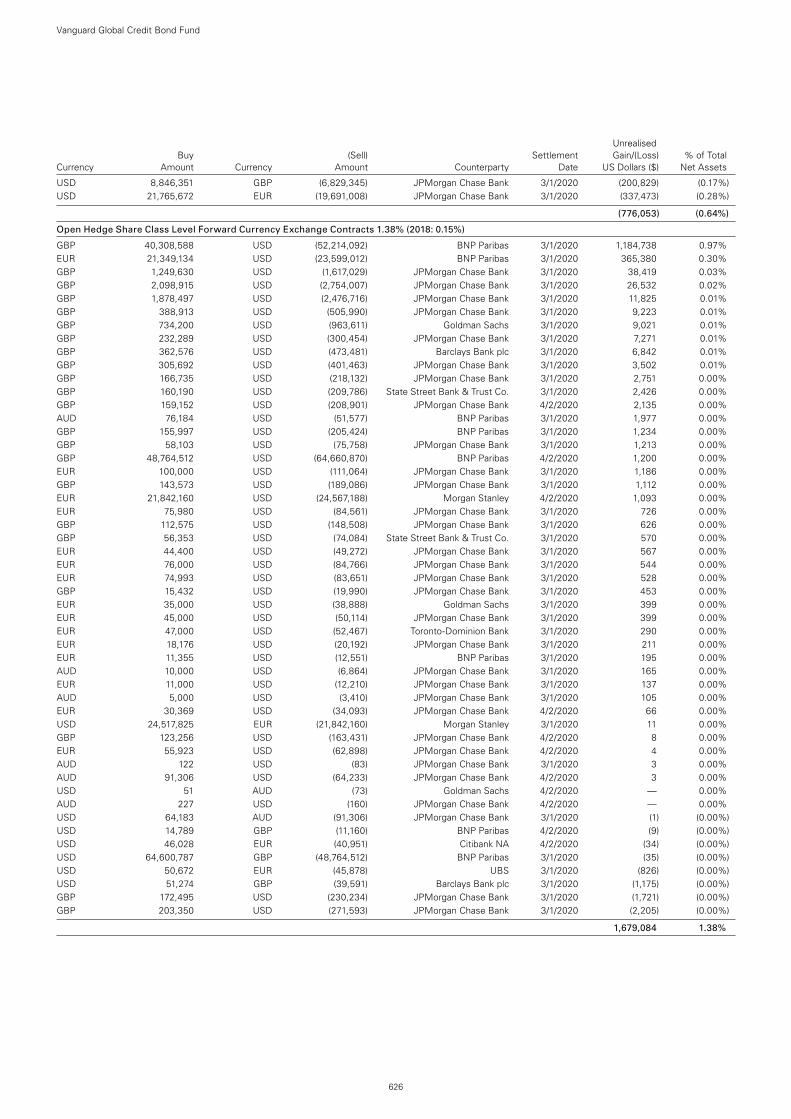
USD 8,846,351 GBP (6,829,345) JPMorgan Chase Bank 3/1/2020 (200,829) (0.17%)USD 21,765,672 EUR (19,691,008) JPMorgan Chase Bank 3/1/2020 (337,473) (0.28%)
(776,053) (0.64%)
Open Hedge Share Class Level Forward Currency Exchange Contracts 1.38% (2018: 0.15%)
GBP 40,308,588 USD (52,214,092) BNP Paribas 3/1/2020 1,184,738 0.97%EUR 21,349,134 USD (23,599,012) BNP Paribas 3/1/2020 365,380 0.30%GBP 1,249,630 USD (1,617,029) JPMorgan Chase Bank 3/1/2020 38,419 0.03%GBP 2,098,915 USD (2,754,007) JPMorgan Chase Bank 3/1/2020 26,532 0.02%GBP 1,878,497 USD (2,476,716) JPMorgan Chase Bank 3/1/2020 11,825 0.01%GBP 388,913 USD (505,990) JPMorgan Chase Bank 3/1/2020 9,223 0.01%GBP 734,200 USD (963,611) Goldman Sachs 3/1/2020 9,021 0.01%GBP 232,289 USD (300,454) JPMorgan Chase Bank 3/1/2020 7,271 0.01%GBP 362,576 USD (473,481) Barclays Bank plc 3/1/2020 6,842 0.01%GBP 305,692 USD (401,463) JPMorgan Chase Bank 3/1/2020 3,502 0.01%GBP 166,735 USD (218,132) JPMorgan Chase Bank 3/1/2020 2,751 0.00%GBP 160,190 USD (209,786) State Street Bank & Trust Co. 3/1/2020 2,426 0.00%GBP 159,152 USD (208,901) JPMorgan Chase Bank 4/2/2020 2,135 0.00%AUD 76,184 USD (51,577) BNP Paribas 3/1/2020 1,977 0.00%GBP 155,997 USD (205,424) BNP Paribas 3/1/2020 1,234 0.00%GBP 58,103 USD (75,758) JPMorgan Chase Bank 3/1/2020 1,213 0.00%GBP 48,764,512 USD (64,660,870) BNP Paribas 4/2/2020 1,200 0.00%EUR 100,000 USD (111,064) JPMorgan Chase Bank 3/1/2020 1,186 0.00%GBP 143,573 USD (189,086) JPMorgan Chase Bank 3/1/2020 1,112 0.00%EUR 21,842,160 USD (24,567,188) Morgan Stanley 4/2/2020 1,093 0.00%EUR 75,980 USD (84,561) JPMorgan Chase Bank 3/1/2020 726 0.00%GBP 112,575 USD (148,508) JPMorgan Chase Bank 3/1/2020 626 0.00%GBP 56,353 USD (74,084) State Street Bank & Trust Co. 3/1/2020 570 0.00%EUR 44,400 USD (49,272) JPMorgan Chase Bank 3/1/2020 567 0.00%EUR 76,000 USD (84,766) JPMorgan Chase Bank 3/1/2020 544 0.00%EUR 74,993 USD (83,651) JPMorgan Chase Bank 3/1/2020 528 0.00%GBP 15,432 USD (19,990) JPMorgan Chase Bank 3/1/2020 453 0.00%EUR 35,000 USD (38,888) Goldman Sachs 3/1/2020 399 0.00%EUR 45,000 USD (50,114) JPMorgan Chase Bank 3/1/2020 399 0.00%EUR 47,000 USD (52,467) Toronto-Dominion Bank 3/1/2020 290 0.00%EUR 18,176 USD (20,192) JPMorgan Chase Bank 3/1/2020 211 0.00%EUR 11,355 USD (12,551) BNP Paribas 3/1/2020 195 0.00%AUD 10,000 USD (6,864) JPMorgan Chase Bank 3/1/2020 165 0.00%EUR 11,000 USD (12,210) JPMorgan Chase Bank 3/1/2020 137 0.00%AUD 5,000 USD (3,410) JPMorgan Chase Bank 3/1/2020 105 0.00%EUR 30,369 USD (34,093) JPMorgan Chase Bank 4/2/2020 66 0.00%USD 24,517,825 EUR (21,842,160) Morgan Stanley 3/1/2020 11 0.00%GBP 123,256 USD (163,431) JPMorgan Chase Bank 4/2/2020 8 0.00%EUR 55,923 USD (62,898) JPMorgan Chase Bank 4/2/2020 4 0.00%AUD 122 USD (83) JPMorgan Chase Bank 3/1/2020 3 0.00%AUD 91,306 USD (64,233) JPMorgan Chase Bank 4/2/2020 3 0.00%USD 51 AUD (73) Goldman Sachs 4/2/2020 — 0.00%AUD 227 USD (160) JPMorgan Chase Bank 4/2/2020 — 0.00%USD 64,183 AUD (91,306) JPMorgan Chase Bank 3/1/2020 (1) (0.00%)USD 14,789 GBP (11,160) BNP Paribas 4/2/2020 (9) (0.00%)USD 46,028 EUR (40,951) Citibank NA 4/2/2020 (34) (0.00%)USD 64,600,787 GBP (48,764,512) BNP Paribas 3/1/2020 (35) (0.00%)USD 50,672 EUR (45,878) UBS 3/1/2020 (826) (0.00%)USD 51,274 GBP (39,591) Barclays Bank plc 3/1/2020 (1,175) (0.00%)GBP 172,495 USD (230,234) JPMorgan Chase Bank 3/1/2020 (1,721) (0.00%)GBP 203,350 USD (271,593) JPMorgan Chase Bank 3/1/2020 (2,205) (0.00%)
1,679,084 1.38%
Unrealised Buy (Sell) Settlement Gain/(Loss) % of Total Currency Amount Currency Amount Counterparty Date US Dollars ($) Net Assets
Vanguard Global Credit Bond Fund
626
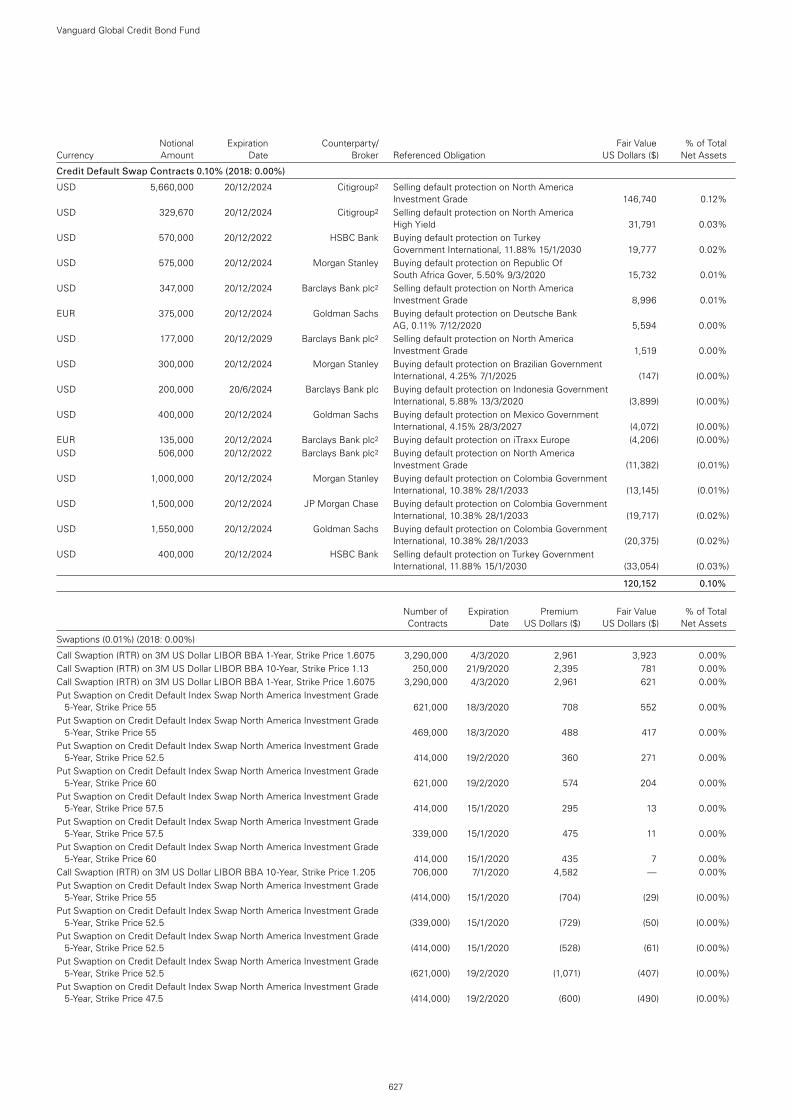
Notional Expiration Counterparty/ Fair Value % of Total Currency Amount Date Broker Referenced Obligation US Dollars ($) Net Assets
Credit Default Swap Contracts 0.10% (2018: 0.00%)
USD 5,660,000 20/12/2024 Citigroup2 Selling default protection on North America Investment Grade 146,740 0.12%
USD 329,670 20/12/2024 Citigroup2 Selling default protection on North America High Yield 31,791 0.03%
USD 570,000 20/12/2022 HSBC Bank Buying default protection on Turkey Government International, 11.88% 15/1/2030 19,777 0.02%
USD 575,000 20/12/2024 Morgan Stanley Buying default protection on Republic Of South Africa Gover, 5.50% 9/3/2020 15,732 0.01%
USD 347,000 20/12/2024 Barclays Bank plc2 Selling default protection on North America Investment Grade 8,996 0.01%
EUR 375,000 20/12/2024 Goldman Sachs Buying default protection on Deutsche Bank AG, 0.11% 7/12/2020 5,594 0.00%
USD 177,000 20/12/2029 Barclays Bank plc2 Selling default protection on North America Investment Grade 1,519 0.00%
USD 300,000 20/12/2024 Morgan Stanley Buying default protection on Brazilian Government International, 4.25% 7/1/2025 (147) (0.00%)
USD 200,000 20/6/2024 Barclays Bank plc Buying default protection on Indonesia Government International, 5.88% 13/3/2020 (3,899) (0.00%)
USD 400,000 20/12/2024 Goldman Sachs Buying default protection on Mexico Government International, 4.15% 28/3/2027 (4,072) (0.00%)
EUR 135,000 20/12/2024 Barclays Bank plc2 Buying default protection on iTraxx Europe (4,206) (0.00%)USD 506,000 20/12/2022 Barclays Bank plc2 Buying default protection on North America
Investment Grade (11,382) (0.01%)USD 1,000,000 20/12/2024 Morgan Stanley Buying default protection on Colombia Government
International, 10.38% 28/1/2033 (13,145) (0.01%)USD 1,500,000 20/12/2024 JP Morgan Chase Buying default protection on Colombia Government
International, 10.38% 28/1/2033 (19,717) (0.02%)USD 1,550,000 20/12/2024 Goldman Sachs Buying default protection on Colombia Government
International, 10.38% 28/1/2033 (20,375) (0.02%)USD 400,000 20/12/2024 HSBC Bank Selling default protection on Turkey Government
International, 11.88% 15/1/2030 (33,054) (0.03%)
120,152 0.10%
Number of Expiration Premium Fair Value % of Total Contracts Date US Dollars ($) US Dollars ($) Net Assets
Swaptions (0.01%) (2018: 0.00%)
Call Swaption (RTR) on 3M US Dollar LIBOR BBA 1-Year, Strike Price 1.6075 3,290,000 4/3/2020 2,961 3,923 0.00%Call Swaption (RTR) on 3M US Dollar LIBOR BBA 10-Year, Strike Price 1.13 250,000 21/9/2020 2,395 781 0.00%Call Swaption (RTR) on 3M US Dollar LIBOR BBA 1-Year, Strike Price 1.6075 3,290,000 4/3/2020 2,961 621 0.00%Put Swaption on Credit Default Index Swap North America Investment Grade
5-Year, Strike Price 55 621,000 18/3/2020 708 552 0.00%Put Swaption on Credit Default Index Swap North America Investment Grade
5-Year, Strike Price 55 469,000 18/3/2020 488 417 0.00%Put Swaption on Credit Default Index Swap North America Investment Grade
5-Year, Strike Price 52.5 414,000 19/2/2020 360 271 0.00%Put Swaption on Credit Default Index Swap North America Investment Grade
5-Year, Strike Price 60 621,000 19/2/2020 574 204 0.00%Put Swaption on Credit Default Index Swap North America Investment Grade
5-Year, Strike Price 57.5 414,000 15/1/2020 295 13 0.00%Put Swaption on Credit Default Index Swap North America Investment Grade
5-Year, Strike Price 57.5 339,000 15/1/2020 475 11 0.00%Put Swaption on Credit Default Index Swap North America Investment Grade
5-Year, Strike Price 60 414,000 15/1/2020 435 7 0.00%Call Swaption (RTR) on 3M US Dollar LIBOR BBA 10-Year, Strike Price 1.205 706,000 7/1/2020 4,582 — 0.00%Put Swaption on Credit Default Index Swap North America Investment Grade
5-Year, Strike Price 55 (414,000) 15/1/2020 (704) (29) (0.00%)Put Swaption on Credit Default Index Swap North America Investment Grade
5-Year, Strike Price 52.5 (339,000) 15/1/2020 (729) (50) (0.00%)Put Swaption on Credit Default Index Swap North America Investment Grade
5-Year, Strike Price 52.5 (414,000) 15/1/2020 (528) (61) (0.00%)Put Swaption on Credit Default Index Swap North America Investment Grade
5-Year, Strike Price 52.5 (621,000) 19/2/2020 (1,071) (407) (0.00%)Put Swaption on Credit Default Index Swap North America Investment Grade
5-Year, Strike Price 47.5 (414,000) 19/2/2020 (600) (490) (0.00%)
Vanguard Global Credit Bond Fund
627
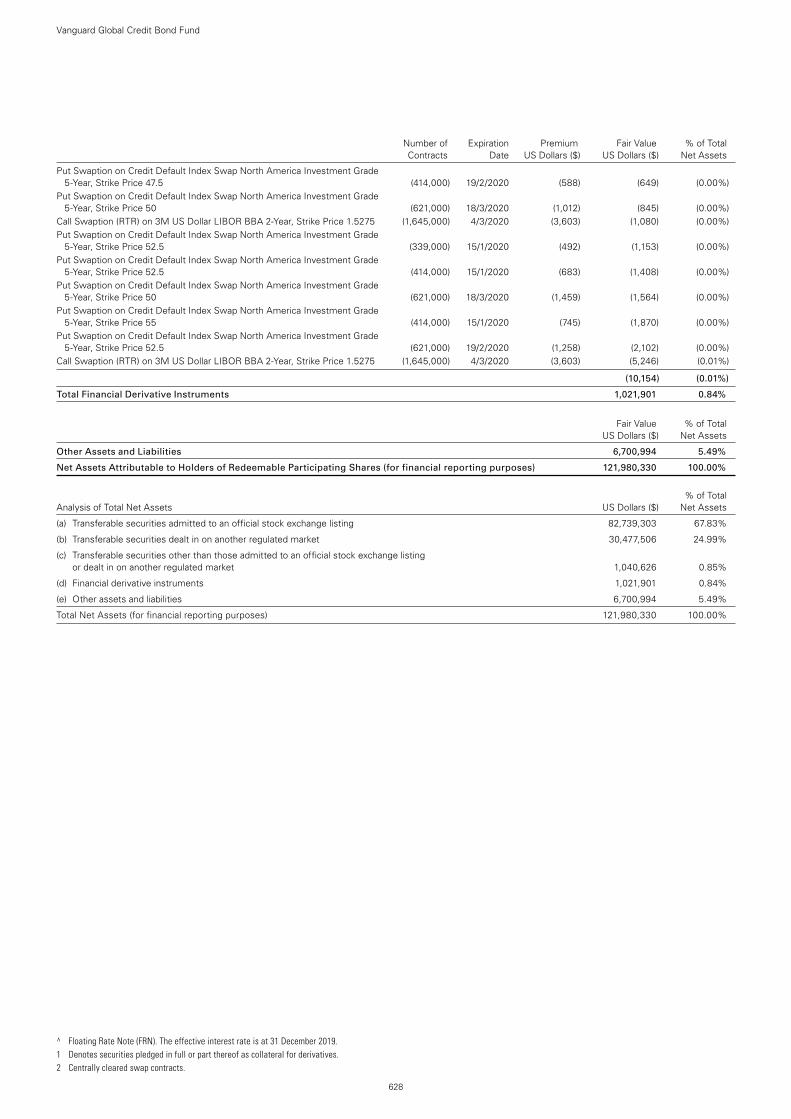
Number of Expiration Premium Fair Value % of Total Contracts Date US Dollars ($) US Dollars ($) Net Assets
Put Swaption on Credit Default Index Swap North America Investment Grade 5-Year, Strike Price 47.5 (414,000) 19/2/2020 (588) (649) (0.00%)
Put Swaption on Credit Default Index Swap North America Investment Grade 5-Year, Strike Price 50 (621,000) 18/3/2020 (1,012) (845) (0.00%)
Call Swaption (RTR) on 3M US Dollar LIBOR BBA 2-Year, Strike Price 1.5275 (1,645,000) 4/3/2020 (3,603) (1,080) (0.00%)Put Swaption on Credit Default Index Swap North America Investment Grade
5-Year, Strike Price 52.5 (339,000) 15/1/2020 (492) (1,153) (0.00%)Put Swaption on Credit Default Index Swap North America Investment Grade
5-Year, Strike Price 52.5 (414,000) 15/1/2020 (683) (1,408) (0.00%)Put Swaption on Credit Default Index Swap North America Investment Grade
5-Year, Strike Price 50 (621,000) 18/3/2020 (1,459) (1,564) (0.00%)Put Swaption on Credit Default Index Swap North America Investment Grade
5-Year, Strike Price 55 (414,000) 15/1/2020 (745) (1,870) (0.00%)Put Swaption on Credit Default Index Swap North America Investment Grade
5-Year, Strike Price 52.5 (621,000) 19/2/2020 (1,258) (2,102) (0.00%)Call Swaption (RTR) on 3M US Dollar LIBOR BBA 2-Year, Strike Price 1.5275 (1,645,000) 4/3/2020 (3,603) (5,246) (0.01%)
(10,154) (0.01%)
Total Financial Derivative Instruments 1,021,901 0.84%
Fair Value % of Total US Dollars ($) Net Assets
Other Assets and Liabilities 6,700,994 5.49%
Net Assets Attributable to Holders of Redeemable Participating Shares (for financial reporting purposes) 121,980,330 100.00%
% of Total Analysis of Total Net Assets US Dollars ($) Net Assets
(a) Transferable securities admitted to an official stock exchange listing 82,739,303 67.83%
(b) Transferable securities dealt in on another regulated market 30,477,506 24.99%
(c) Transferable securities other than those admitted to an official stock exchange listing or dealt in on another regulated market 1,040,626 0.85%
(d) Financial derivative instruments 1,021,901 0.84%
(e) Other assets and liabilities 6,700,994 5.49%
Total Net Assets (for financial reporting purposes) 121,980,330 100.00%
Vanguard Global Credit Bond Fund
628
^ Floating Rate Note (FRN). The effective interest rate is at 31 December 2019. 1 Denotes securities pledged in full or part thereof as collateral for derivatives. 2 Centrally cleared swap contracts.
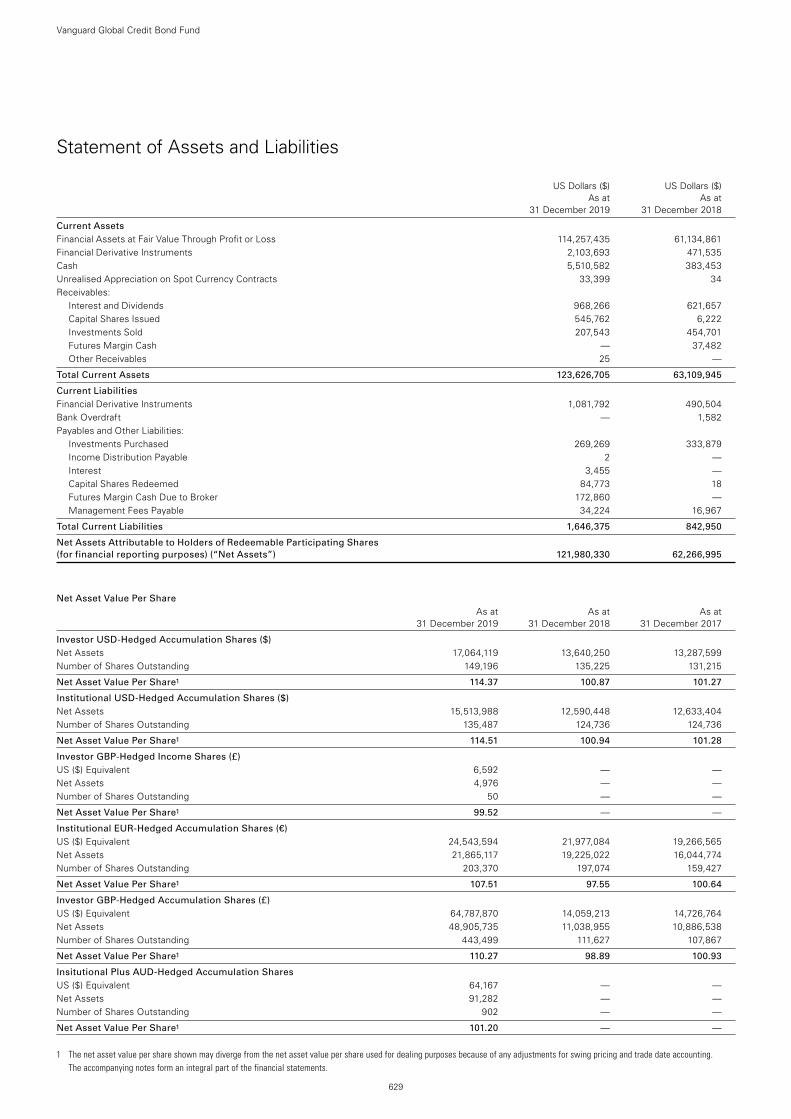
1 The net asset value per share shown may diverge from the net asset value per share used for dealing purposes because of any adjustments for swing pricing and trade date accounting. The accompanying notes form an integral part of the financial statements.
629
Vanguard Global Credit Bond Fund
Statement of Assets and Liabilities
US Dollars ($) US Dollars ($) As at As at 31 December 2019 31 December 2018
Current Assets Financial Assets at Fair Value Through Profit or Loss 114,257,435 61,134,861Financial Derivative Instruments 2,103,693 471,535Cash 5,510,582 383,453Unrealised Appreciation on Spot Currency Contracts 33,399 34Receivables:
Interest and Dividends 968,266 621,657Capital Shares Issued 545,762 6,222Investments Sold 207,543 454,701Futures Margin Cash — 37,482Other Receivables 25 —
Total Current Assets 123,626,705 63,109,945
Current Liabilities Financial Derivative Instruments 1,081,792 490,504Bank Overdraft — 1,582Payables and Other Liabilities:
Investments Purchased 269,269 333,879Income Distribution Payable 2 —Interest 3,455 —Capital Shares Redeemed 84,773 18Futures Margin Cash Due to Broker 172,860 —Management Fees Payable 34,224 16,967
Total Current Liabilities 1,646,375 842,950
Net Assets Attributable to Holders of Redeemable Participating Shares (for financial reporting purposes) (“Net Assets”) 121,980,330 62,266,995
Net Asset Value Per Share As at As at As at 31 December 2019 31 December 2018 31 December 2017
Investor USD-Hedged Accumulation Shares ($) Net Assets 17,064,119 13,640,250 13,287,599Number of Shares Outstanding 149,196 135,225 131,215
Net Asset Value Per Share1 114.37 100.87 101.27
Institutional USD-Hedged Accumulation Shares ($) Net Assets 15,513,988 12,590,448 12,633,404Number of Shares Outstanding 135,487 124,736 124,736
Net Asset Value Per Share1 114.51 100.94 101.28
Investor GBP-Hedged Income Shares (£) US ($) Equivalent 6,592 — —Net Assets 4,976 — —Number of Shares Outstanding 50 — —
Net Asset Value Per Share1 99.52 — —
Institutional EUR-Hedged Accumulation Shares (€) US ($) Equivalent 24,543,594 21,977,084 19,266,565Net Assets 21,865,117 19,225,022 16,044,774Number of Shares Outstanding 203,370 197,074 159,427
Net Asset Value Per Share1 107.51 97.55 100.64
Investor GBP-Hedged Accumulation Shares (£) US ($) Equivalent 64,787,870 14,059,213 14,726,764Net Assets 48,905,735 11,038,955 10,886,538Number of Shares Outstanding 443,499 111,627 107,867
Net Asset Value Per Share1 110.27 98.89 100.93
Insitutional Plus AUD-Hedged Accumulation Shares US ($) Equivalent 64,167 — —Net Assets 91,282 — —Number of Shares Outstanding 902 — —
Net Asset Value Per Share1 101.20 — —
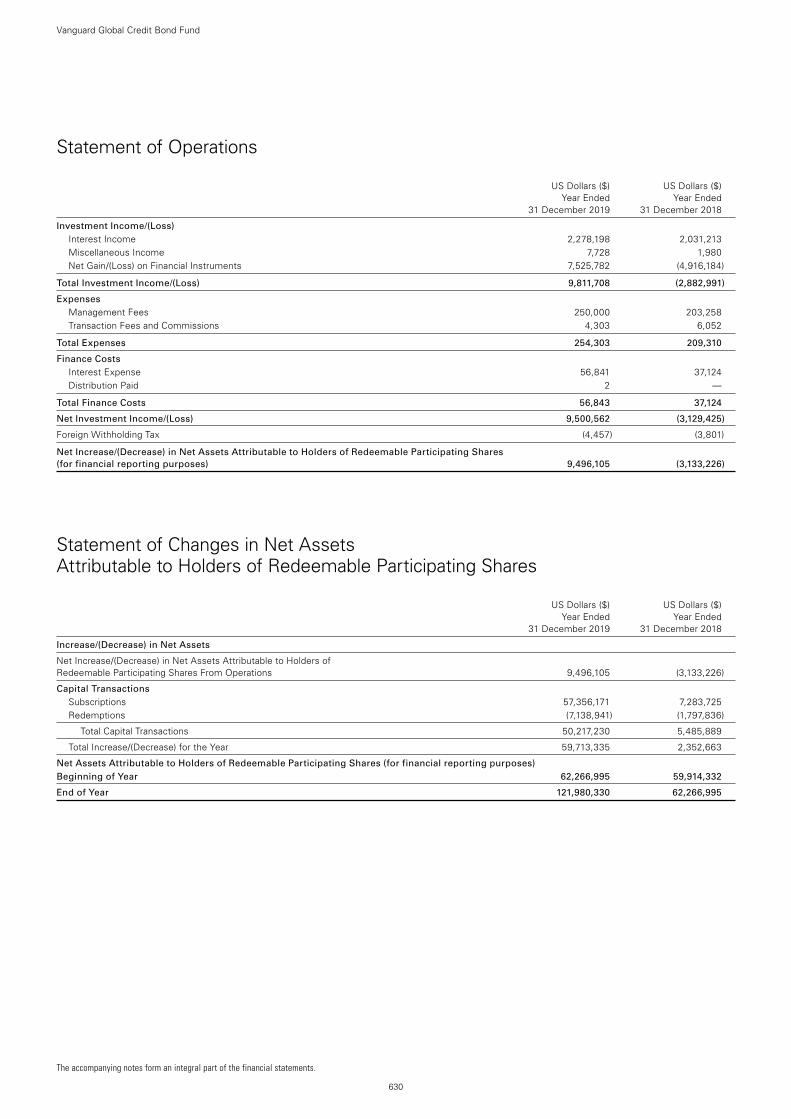
630
Vanguard Global Credit Bond Fund
Statement of Operations
US Dollars ($) US Dollars ($) Year Ended Year Ended 31 December 2019 31 December 2018
Investment Income/(Loss) Interest Income 2,278,198 2,031,213Miscellaneous Income 7,728 1,980Net Gain/(Loss) on Financial Instruments 7,525,782 (4,916,184)
Total Investment Income/(Loss) 9,811,708 (2,882,991)
Expenses Management Fees 250,000 203,258Transaction Fees and Commissions 4,303 6,052
Total Expenses 254,303 209,310
Finance Costs Interest Expense 56,841 37,124 Distribution Paid 2 —
Total Finance Costs 56,843 37,124
Net Investment Income/(Loss) 9,500,562 (3,129,425)
Foreign Withholding Tax (4,457) (3,801)
Net Increase/(Decrease) in Net Assets Attributable to Holders of Redeemable Participating Shares (for financial reporting purposes) 9,496,105 (3,133,226)
Statement of Changes in Net Assets Attributable to Holders of Redeemable Participating Shares
US Dollars ($) US Dollars ($) Year Ended Year Ended 31 December 2019 31 December 2018
Increase/(Decrease) in Net Assets
Net Increase/(Decrease) in Net Assets Attributable to Holders of Redeemable Participating Shares From Operations 9,496,105 (3,133,226)
Capital Transactions Subscriptions 57,356,171 7,283,725Redemptions (7,138,941) (1,797,836)
Total Capital Transactions 50,217,230 5,485,889
Total Increase/(Decrease) for the Year 59,713,335 2,352,663
Net Assets Attributable to Holders of Redeemable Participating Shares (for financial reporting purposes) Beginning of Year 62,266,995 59,914,332
End of Year 121,980,330 62,266,995
The accompanying notes form an integral part of the financial statements.
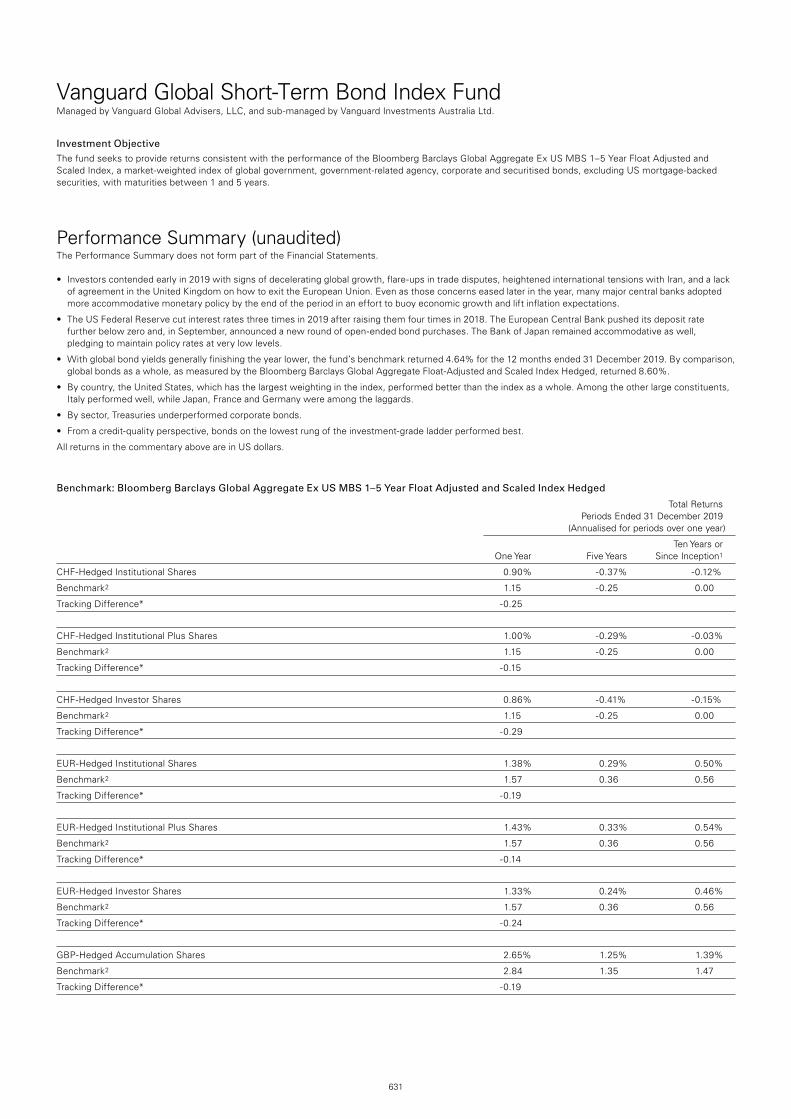
631
Vanguard Global Short-Term Bond Index Fund Managed by Vanguard Global Advisers, LLC, and sub-managed by Vanguard Investments Australia Ltd.
Investment ObjectiveThe fund seeks to provide returns consistent with the performance of the Bloomberg Barclays Global Aggregate Ex US MBS 1–5 Year Float Adjusted and Scaled Index, a market-weighted index of global government, government-related agency, corporate and securitised bonds, excluding US mortgage-backed securities, with maturities between 1 and 5 years.
Performance Summary (unaudited)The Performance Summary does not form part of the Financial Statements.
• Investorscontendedearlyin2019withsignsofdeceleratingglobalgrowth,flare-upsintradedisputes,heightenedinternationaltensionswithIran,andalackof agreement in the United Kingdom on how to exit the European Union. Even as those concerns eased later in the year, many major central banks adopted more accommodative monetary policy by the end of the period in an effort to buoy economic growth and lift inflation expectations.
• TheUSFederalReservecutinterestratesthreetimesin2019afterraisingthemfourtimesin2018.TheEuropeanCentralBankpusheditsdepositratefurther below zero and, in September, announced a new round of open-ended bond purchases. The Bank of Japan remained accommodative as well, pledging to maintain policy rates at very low levels.
• Withglobalbondyieldsgenerallyfinishingtheyearlower,thefund’sbenchmarkreturned4.64%forthe12monthsended31December2019.Bycomparison,global bonds as a whole, as measured by the Bloomberg Barclays Global Aggregate Float-Adjusted and Scaled Index Hedged, returned 8.60%.
• Bycountry,theUnitedStates,whichhasthelargestweightingintheindex,performedbetterthantheindexasawhole.Amongtheotherlargeconstituents,Italy performed well, while Japan, France and Germany were among the laggards.
• Bysector,Treasuriesunderperformedcorporatebonds.
• Fromacredit-qualityperspective,bondsonthelowestrungoftheinvestment-gradeladderperformedbest.
All returns in the commentary above are in US dollars.
Benchmark: Bloomberg Barclays Global Aggregate Ex US MBS 1–5 Year Float Adjusted and Scaled Index Hedged
Total Returns Periods Ended 31 December 2019 (Annualised for periods over one year)
Ten Years or One Year Five Years Since Inception1
CHF-Hedged Institutional Shares 0.90% -0.37% -0.12%
Benchmark2 1.15 -0.25 0.00
Tracking Difference* -0.25
CHF-Hedged Institutional Plus Shares 1.00% -0.29% -0.03%
Benchmark2 1.15 -0.25 0.00
Tracking Difference* -0.15
CHF-Hedged Investor Shares 0.86% -0.41% -0.15%
Benchmark2 1.15 -0.25 0.00
Tracking Difference* -0.29
EUR-Hedged Institutional Shares 1.38% 0.29% 0.50%
Benchmark2 1.57 0.36 0.56
Tracking Difference* -0.19
EUR-Hedged Institutional Plus Shares 1.43% 0.33% 0.54%
Benchmark2 1.57 0.36 0.56
Tracking Difference* -0.14
EUR-Hedged Investor Shares 1.33% 0.24% 0.46%
Benchmark2 1.57 0.36 0.56
Tracking Difference* -0.24
GBP-Hedged Accumulation Shares 2.65% 1.25% 1.39%
Benchmark2 2.84 1.35 1.47
Tracking Difference* -0.19
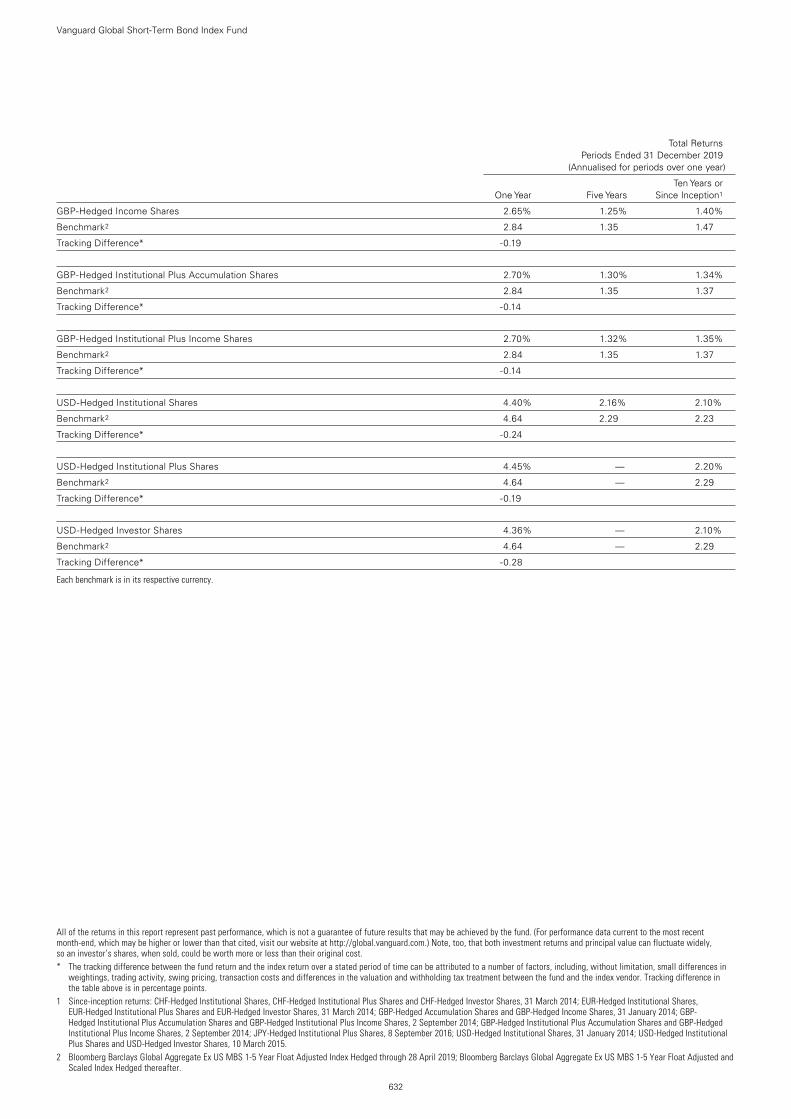
Vanguard Global Short-Term Bond Index Fund
632
All of the returns in this report represent past performance, which is not a guarantee of future results that may be achieved by the fund. (For performance data current to the most recent month-end, which may be higher or lower than that cited, visit our website at http://global.vanguard.com.) Note, too, that both investment returns and principal value can fluctuate widely, so an investor’s shares, when sold, could be worth more or less than their original cost.* The tracking difference between the fund return and the index return over a stated period of time can be attributed to a number of factors, including, without limitation, small differences in
weightings, trading activity, swing pricing, transaction costs and differences in the valuation and withholding tax treatment between the fund and the index vendor. Tracking difference in the table above is in percentage points.
1 Since-inception returns: CHF-Hedged Institutional Shares, CHF-Hedged Institutional Plus Shares and CHF-Hedged Investor Shares, 31 March 2014; EUR-Hedged Institutional Shares, EUR-Hedged Institutional Plus Shares and EUR-Hedged Investor Shares, 31 March 2014; GBP-Hedged Accumulation Shares and GBP-Hedged Income Shares, 31 January 2014; GBP-Hedged Institutional Plus Accumulation Shares and GBP-Hedged Institutional Plus Income Shares, 2 September 2014; GBP-Hedged Institutional Plus Accumulation Shares and GBP-Hedged Institutional Plus Income Shares, 2 September 2014; JPY-Hedged Institutional Plus Shares, 8 September 2016; USD-Hedged Institutional Shares, 31 January 2014; USD-Hedged Institutional Plus Shares and USD-Hedged Investor Shares, 10 March 2015.
2 Bloomberg Barclays Global Aggregate Ex US MBS 1-5 Year Float Adjusted Index Hedged through 28 April 2019; Bloomberg Barclays Global Aggregate Ex US MBS 1-5 Year Float Adjusted and Scaled Index Hedged thereafter.
Total Returns Periods Ended 31 December 2019 (Annualised for periods over one year)
Ten Years or One Year Five Years Since Inception1
GBP-Hedged Income Shares 2.65% 1.25% 1.40%
Benchmark2 2.84 1.35 1.47
Tracking Difference* -0.19
GBP-Hedged Institutional Plus Accumulation Shares 2.70% 1.30% 1.34%
Benchmark2 2.84 1.35 1.37
Tracking Difference* -0.14
GBP-Hedged Institutional Plus Income Shares 2.70% 1.32% 1.35%
Benchmark2 2.84 1.35 1.37
Tracking Difference* -0.14
USD-Hedged Institutional Shares 4.40% 2.16% 2.10%
Benchmark2 4.64 2.29 2.23
Tracking Difference* -0.24
USD-Hedged Institutional Plus Shares 4.45% — 2.20%
Benchmark2 4.64 — 2.29
Tracking Difference* -0.19
USD-Hedged Investor Shares 4.36% — 2.10%
Benchmark2 4.64 — 2.29
Tracking Difference* -0.28
Each benchmark is in its respective currency.
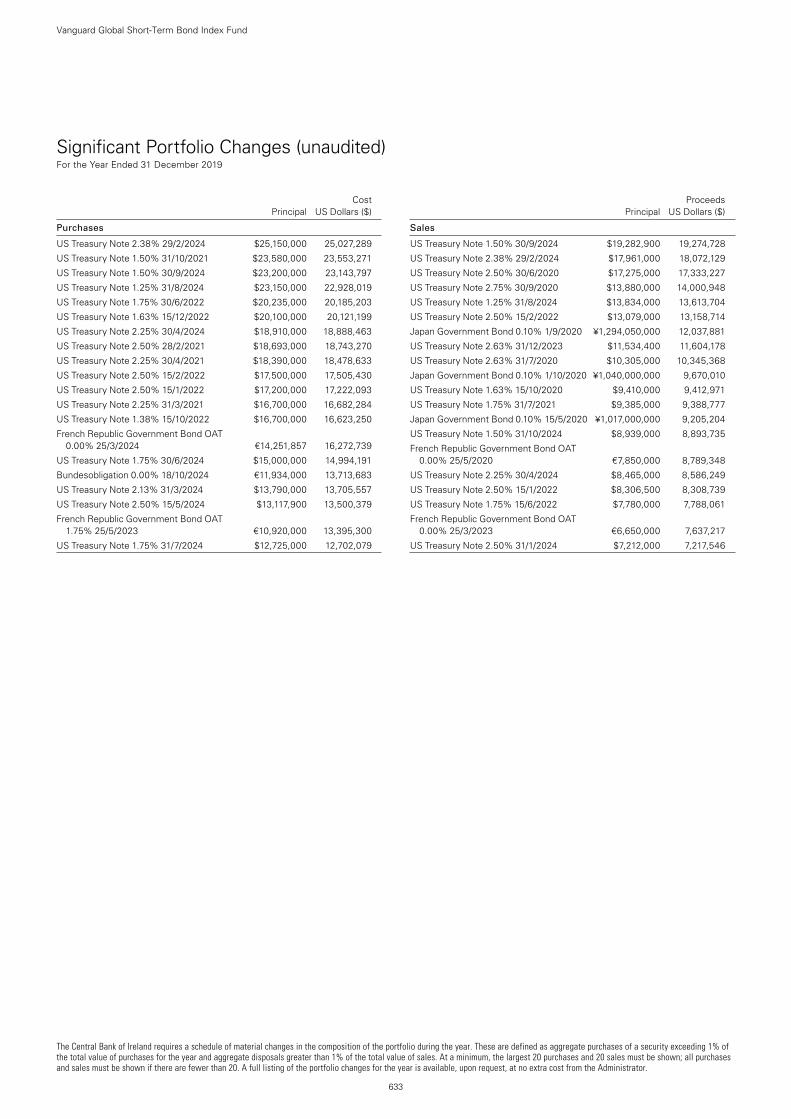
The Central Bank of Ireland requires a schedule of material changes in the composition of the portfolio during the year. These are defined as aggregate purchases of a security exceeding 1% of the total value of purchases for the year and aggregate disposals greater than 1% of the total value of sales. At a minimum, the largest 20 purchases and 20 sales must be shown; all purchases and sales must be shown if there are fewer than 20. A full listing of the portfolio changes for the year is available, upon request, at no extra cost from the Administrator.
633
Vanguard Global Short-Term Bond Index Fund
Significant Portfolio Changes (unaudited) For the Year Ended 31 December 2019
Cost Principal US Dollars ($)
Purchases
US Treasury Note 2.38% 29/2/2024 $25,150,000 25,027,289
US Treasury Note 1.50% 31/10/2021 $23,580,000 23,553,271
US Treasury Note 1.50% 30/9/2024 $23,200,000 23,143,797
US Treasury Note 1.25% 31/8/2024 $23,150,000 22,928,019
US Treasury Note 1.75% 30/6/2022 $20,235,000 20,185,203
US Treasury Note 1.63% 15/12/2022 $20,100,000 20,121,199
US Treasury Note 2.25% 30/4/2024 $18,910,000 18,888,463
US Treasury Note 2.50% 28/2/2021 $18,693,000 18,743,270
US Treasury Note 2.25% 30/4/2021 $18,390,000 18,478,633
US Treasury Note 2.50% 15/2/2022 $17,500,000 17,505,430
US Treasury Note 2.50% 15/1/2022 $17,200,000 17,222,093
US Treasury Note 2.25% 31/3/2021 $16,700,000 16,682,284
US Treasury Note 1.38% 15/10/2022 $16,700,000 16,623,250
French Republic Government Bond OAT 0.00% 25/3/2024 €14,251,857 16,272,739
US Treasury Note 1.75% 30/6/2024 $15,000,000 14,994,191
Bundesobligation 0.00% 18/10/2024 €11,934,000 13,713,683
US Treasury Note 2.13% 31/3/2024 $13,790,000 13,705,557
US Treasury Note 2.50% 15/5/2024 $13,117,900 13,500,379
French Republic Government Bond OAT 1.75% 25/5/2023 €10,920,000 13,395,300
US Treasury Note 1.75% 31/7/2024 $12,725,000 12,702,079
Proceeds Principal US Dollars ($)
Sales
US Treasury Note 1.50% 30/9/2024 $19,282,900 19,274,728
US Treasury Note 2.38% 29/2/2024 $17,961,000 18,072,129
US Treasury Note 2.50% 30/6/2020 $17,275,000 17,333,227
US Treasury Note 2.75% 30/9/2020 $13,880,000 14,000,948
US Treasury Note 1.25% 31/8/2024 $13,834,000 13,613,704
US Treasury Note 2.50% 15/2/2022 $13,079,000 13,158,714
Japan Government Bond 0.10% 1/9/2020 ¥1,294,050,000 12,037,881
US Treasury Note 2.63% 31/12/2023 $11,534,400 11,604,178
US Treasury Note 2.63% 31/7/2020 $10,305,000 10,345,368
Japan Government Bond 0.10% 1/10/2020 ¥1,040,000,000 9,670,010
US Treasury Note 1.63% 15/10/2020 $9,410,000 9,412,971
US Treasury Note 1.75% 31/7/2021 $9,385,000 9,388,777
Japan Government Bond 0.10% 15/5/2020 ¥1,017,000,000 9,205,204
US Treasury Note 1.50% 31/10/2024 $8,939,000 8,893,735
French Republic Government Bond OAT 0.00% 25/5/2020 €7,850,000 8,789,348
US Treasury Note 2.25% 30/4/2024 $8,465,000 8,586,249
US Treasury Note 2.50% 15/1/2022 $8,306,500 8,308,739
US Treasury Note 1.75% 15/6/2022 $7,780,000 7,788,061
French Republic Government Bond OAT 0.00% 25/3/2023 €6,650,000 7,637,217
US Treasury Note 2.50% 31/1/2024 $7,212,000 7,217,546
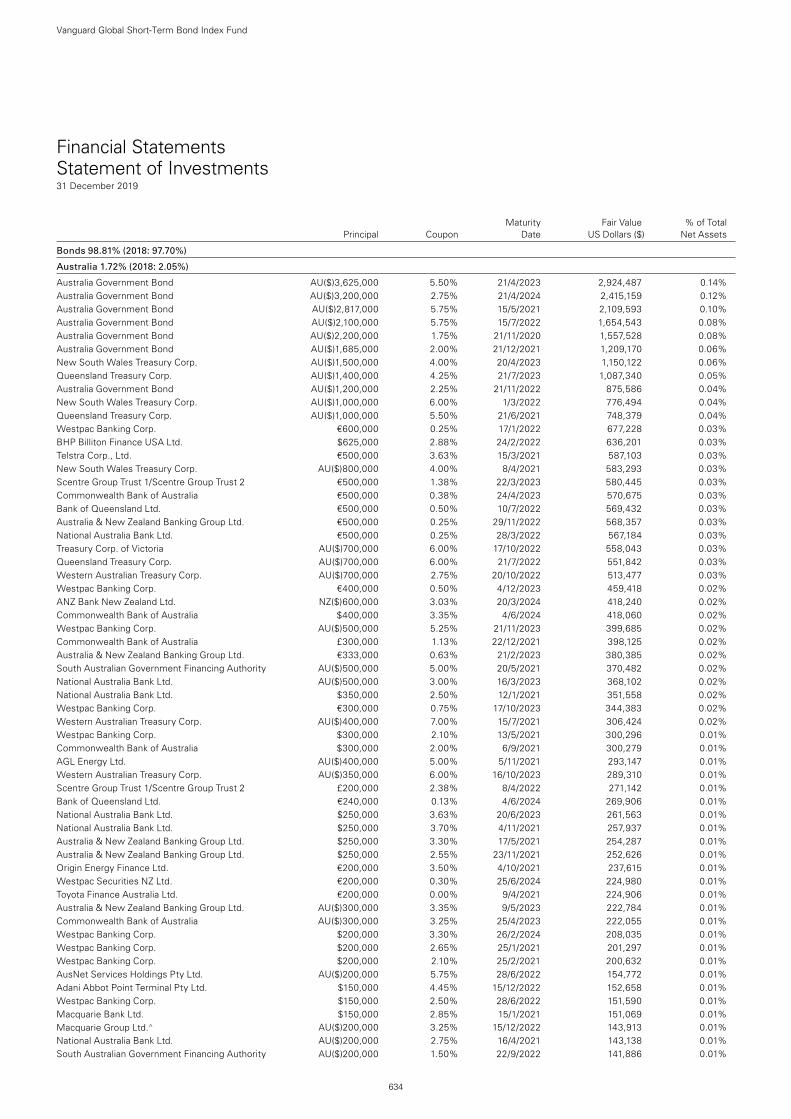
Financial Statements Statement of Investments31 December 2019
Maturity Fair Value % of Total Principal Coupon Date US Dollars ($) Net Assets
Bonds 98.81% (2018: 97.70%)
Australia 1.72% (2018: 2.05%)
Australia Government Bond AU($)3,625,000 5.50% 21/4/2023 2,924,487 0.14%Australia Government Bond AU($)3,200,000 2.75% 21/4/2024 2,415,159 0.12%Australia Government Bond AU($)2,817,000 5.75% 15/5/2021 2,109,593 0.10%Australia Government Bond AU($)2,100,000 5.75% 15/7/2022 1,654,543 0.08%Australia Government Bond AU($)2,200,000 1.75% 21/11/2020 1,557,528 0.08%Australia Government Bond AU($)1,685,000 2.00% 21/12/2021 1,209,170 0.06%New South Wales Treasury Corp. AU($)1,500,000 4.00% 20/4/2023 1,150,122 0.06%Queensland Treasury Corp. AU($)1,400,000 4.25% 21/7/2023 1,087,340 0.05%Australia Government Bond AU($)1,200,000 2.25% 21/11/2022 875,586 0.04%New South Wales Treasury Corp. AU($)1,000,000 6.00% 1/3/2022 776,494 0.04%Queensland Treasury Corp. AU($)1,000,000 5.50% 21/6/2021 748,379 0.04%Westpac Banking Corp. €600,000 0.25% 17/1/2022 677,228 0.03%BHP Billiton Finance USA Ltd. $625,000 2.88% 24/2/2022 636,201 0.03%Telstra Corp., Ltd. €500,000 3.63% 15/3/2021 587,103 0.03%New South Wales Treasury Corp. AU($)800,000 4.00% 8/4/2021 583,293 0.03%Scentre Group Trust 1/Scentre Group Trust 2 €500,000 1.38% 22/3/2023 580,445 0.03%Commonwealth Bank of Australia €500,000 0.38% 24/4/2023 570,675 0.03%Bank of Queensland Ltd. €500,000 0.50% 10/7/2022 569,432 0.03%Australia & New Zealand Banking Group Ltd. €500,000 0.25% 29/11/2022 568,357 0.03%National Australia Bank Ltd. €500,000 0.25% 28/3/2022 567,184 0.03%Treasury Corp. of Victoria AU($)700,000 6.00% 17/10/2022 558,043 0.03%Queensland Treasury Corp. AU($)700,000 6.00% 21/7/2022 551,842 0.03%Western Australian Treasury Corp. AU($)700,000 2.75% 20/10/2022 513,477 0.03%Westpac Banking Corp. €400,000 0.50% 4/12/2023 459,418 0.02%ANZ Bank New Zealand Ltd. NZ($)600,000 3.03% 20/3/2024 418,240 0.02%Commonwealth Bank of Australia $400,000 3.35% 4/6/2024 418,060 0.02%Westpac Banking Corp. AU($)500,000 5.25% 21/11/2023 399,685 0.02%Commonwealth Bank of Australia £300,000 1.13% 22/12/2021 398,125 0.02%Australia & New Zealand Banking Group Ltd. €333,000 0.63% 21/2/2023 380,385 0.02%South Australian Government Financing Authority AU($)500,000 5.00% 20/5/2021 370,482 0.02%National Australia Bank Ltd. AU($)500,000 3.00% 16/3/2023 368,102 0.02%National Australia Bank Ltd. $350,000 2.50% 12/1/2021 351,558 0.02%Westpac Banking Corp. €300,000 0.75% 17/10/2023 344,383 0.02%Western Australian Treasury Corp. AU($)400,000 7.00% 15/7/2021 306,424 0.02%Westpac Banking Corp. $300,000 2.10% 13/5/2021 300,296 0.01%Commonwealth Bank of Australia $300,000 2.00% 6/9/2021 300,279 0.01%AGL Energy Ltd. AU($)400,000 5.00% 5/11/2021 293,147 0.01%Western Australian Treasury Corp. AU($)350,000 6.00% 16/10/2023 289,310 0.01%Scentre Group Trust 1/Scentre Group Trust 2 £200,000 2.38% 8/4/2022 271,142 0.01%Bank of Queensland Ltd. €240,000 0.13% 4/6/2024 269,906 0.01%National Australia Bank Ltd. $250,000 3.63% 20/6/2023 261,563 0.01%National Australia Bank Ltd. $250,000 3.70% 4/11/2021 257,937 0.01%Australia & New Zealand Banking Group Ltd. $250,000 3.30% 17/5/2021 254,287 0.01%Australia & New Zealand Banking Group Ltd. $250,000 2.55% 23/11/2021 252,626 0.01%Origin Energy Finance Ltd. €200,000 3.50% 4/10/2021 237,615 0.01%Westpac Securities NZ Ltd. €200,000 0.30% 25/6/2024 224,980 0.01%Toyota Finance Australia Ltd. €200,000 0.00% 9/4/2021 224,906 0.01%Australia & New Zealand Banking Group Ltd. AU($)300,000 3.35% 9/5/2023 222,784 0.01%Commonwealth Bank of Australia AU($)300,000 3.25% 25/4/2023 222,055 0.01%Westpac Banking Corp. $200,000 3.30% 26/2/2024 208,035 0.01%Westpac Banking Corp. $200,000 2.65% 25/1/2021 201,297 0.01%Westpac Banking Corp. $200,000 2.10% 25/2/2021 200,632 0.01%AusNet Services Holdings Pty Ltd. AU($)200,000 5.75% 28/6/2022 154,772 0.01%Adani Abbot Point Terminal Pty Ltd. $150,000 4.45% 15/12/2022 152,658 0.01%Westpac Banking Corp. $150,000 2.50% 28/6/2022 151,590 0.01%Macquarie Bank Ltd. $150,000 2.85% 15/1/2021 151,069 0.01%Macquarie Group Ltd.^ AU($)200,000 3.25% 15/12/2022 143,913 0.01%National Australia Bank Ltd. AU($)200,000 2.75% 16/4/2021 143,138 0.01%South Australian Government Financing Authority AU($)200,000 1.50% 22/9/2022 141,886 0.01%
Vanguard Global Short-Term Bond Index Fund
634

Maturity Fair Value % of Total Principal Coupon Date US Dollars ($) Net Assets
Toyota Finance Australia Ltd. AU($)180,000 3.30% 22/11/2023 133,492 0.01%Australia Pacific Airports Melbourne Pty Ltd. €100,000 3.13% 26/9/2023 124,667 0.01%Scentre Group Trust 2 €100,000 3.25% 11/9/2023 124,619 0.01%BHP Billiton Finance Ltd.^ €100,000 4.75% 22/4/2076 118,845 0.01%BHP Billiton Finance Ltd. €100,000 0.75% 28/10/2022 114,563 0.01%Macquarie Bank Ltd. €100,000 0.38% 3/3/2021 113,070 0.01%Volkswagen Financial Services Australia Pty Ltd. AU($)150,000 3.25% 13/4/2021 107,078 0.01%Macquarie Group Ltd.^ $100,000 4.15% 27/3/2024 104,779 0.01%Macquarie Group Ltd.^ $100,000 3.19% 28/11/2023 102,084 0.00%Westpac Banking Corp. $100,000 2.75% 11/1/2023 101,654 0.00%Westpac Banking Corp. $100,000 2.35% 19/2/2025 100,184 0.00%Westpac Banking Corp. $75,000 3.65% 15/5/2023 78,618 0.00%APT Pipelines Ltd. $75,000 3.88% 11/10/2022 77,930 0.00%Westpac Banking Corp. $75,000 2.00% 19/8/2021 75,008 0.00%Commonwealth Bank of Australia $65,000 3.45% 16/3/2023 67,664 0.00%BHP Billiton Finance Ltd. CA($)75,000 3.23% 15/5/2023 59,229 0.00%Ausgrid Finance Pty Ltd. $50,000 3.85% 1/5/2023 51,907 0.00%Suncorp-Metway Ltd. $50,000 3.30% 15/4/2024 51,339 0.00%Australia & New Zealand Banking Group Ltd. $50,000 2.63% 9/11/2022 50,895 0.00%Commonwealth Bank of Australia $50,000 2.75% 10/3/2022 50,843 0.00%Commonwealth Bank of Australia $25,000 2.50% 18/9/2022 25,434 0.00%Australian Gas Networks Vic 3 Pty Ltd. AU($)30,000 4.50% 17/12/2021 22,200 0.00%United Energy Distribution Pty Ltd. AU($)30,000 3.50% 12/9/2023 22,150 0.00%
35,096,618 1.72%
Austria 0.68% (2018: 0.70%)
Republic of Austria Government Bond €1,600,000 3.40% 22/11/2022 2,001,523 0.10%Republic of Austria Government Bond €1,600,000 1.75% 20/10/2023 1,948,067 0.09%Republic of Austria Government Bond €1,300,000 3.50% 15/9/2021 1,560,881 0.08%Republic of Austria Government Bond €1,000,000 3.65% 20/4/2022 1,232,220 0.06%Republic of Austria Government Bond €1,000,000 1.65% 21/10/2024 1,230,947 0.06%Republic of Austria Government Bond €900,000 0.00% 15/7/2023 1,027,382 0.05%Oesterreichische Kontrollbank AG £600,000 1.13% 15/12/2022 799,931 0.04%UNIQA Insurance Group AG^ €400,000 6.88% 31/7/2043 537,116 0.03%Oesterreichische Kontrollbank AG CHF400,000 2.63% 22/11/2024 476,274 0.02%OMV AG €400,000 0.75% 4/12/2023 461,057 0.02%Raiffeisenlandesbank Niederoesterreich-Wien AG €400,000 0.38% 13/9/2024 459,553 0.02%OeBB-Infrastruktur AG €300,000 4.88% 27/6/2022 381,335 0.02%Oesterreichische Kontrollbank AG $350,000 2.63% 31/1/2022 356,204 0.02%Erste Group Bank AG €300,000 4.00% 20/1/2021 351,950 0.02%Oesterreichische Kontrollbank AG $335,000 3.13% 7/11/2023 351,844 0.02%Raiffeisen Bank International AG €300,000 0.25% 5/7/2021 338,423 0.02%Oesterreichische Kontrollbank AG $170,000 2.88% 13/3/2023 175,999 0.01%Telekom Finanzmanagement GmbH €100,000 3.50% 4/7/2023 125,261 0.00%Oesterreichische Kontrollbank AG $100,000 2.88% 7/9/2021 101,902 0.00%
13,917,869 0.68%
Belgium 0.98% (2018: 0.98%)
Kingdom of Belgium Government Bond €2,800,000 4.00% 28/3/2022 3,468,527 0.17%Kingdom of Belgium Government Bond €1,500,000 2.60% 22/6/2024 1,909,457 0.09%Kingdom of Belgium Government Bond €1,500,000 2.25% 22/6/2023 1,846,232 0.09%Kingdom of Belgium Government Bond €1,500,000 0.50% 22/10/2024 1,750,763 0.09%Kingdom of Belgium Government Bond €1,300,000 0.20% 22/10/2023 1,494,844 0.07%Kingdom of Belgium Government Bond €965,000 4.25% 28/9/2021 1,175,129 0.06%Kingdom of Belgium Government Bond €662,000 3.75% 28/9/2020 767,082 0.04%Dexia Credit Local SA £500,000 0.88% 7/9/2021 661,371 0.03%Kingdom of Belgium Government Bond €500,000 4.25% 28/9/2022 635,892 0.03%Anheuser-Busch InBev Finance, Inc. $595,000 3.30% 1/2/2023 615,555 0.03%Argenta Spaarbank NV^ €500,000 3.88% 24/5/2026 585,355 0.03%Belfius Bank SA €500,000 0.38% 24/10/2023 573,182 0.03%Anheuser-Busch InBev Finance, Inc. $449,000 3.70% 1/2/2024 475,812 0.02%KBC Group NV €400,000 1.13% 25/1/2024 464,942 0.02%Dexia Credit Local SA €400,000 0.00% 29/5/2024 450,706 0.02%Anheuser-Busch InBev SA €300,000 0.88% 17/3/2022 344,011 0.02%Belfius Bank SA €300,000 0.75% 12/9/2022 342,848 0.02%Dexia Credit Local SA $250,000 3.25% 26/9/2023 261,411 0.01%Dexia Credit Local SA $250,000 1.88% 15/9/2021 249,925 0.01%Dexia Credit Local SA $240,000 2.38% 20/9/2022 242,940 0.01%KBC Group NV €200,000 1.00% 26/4/2021 227,863 0.01%
Vanguard Global Short-Term Bond Index Fund
635
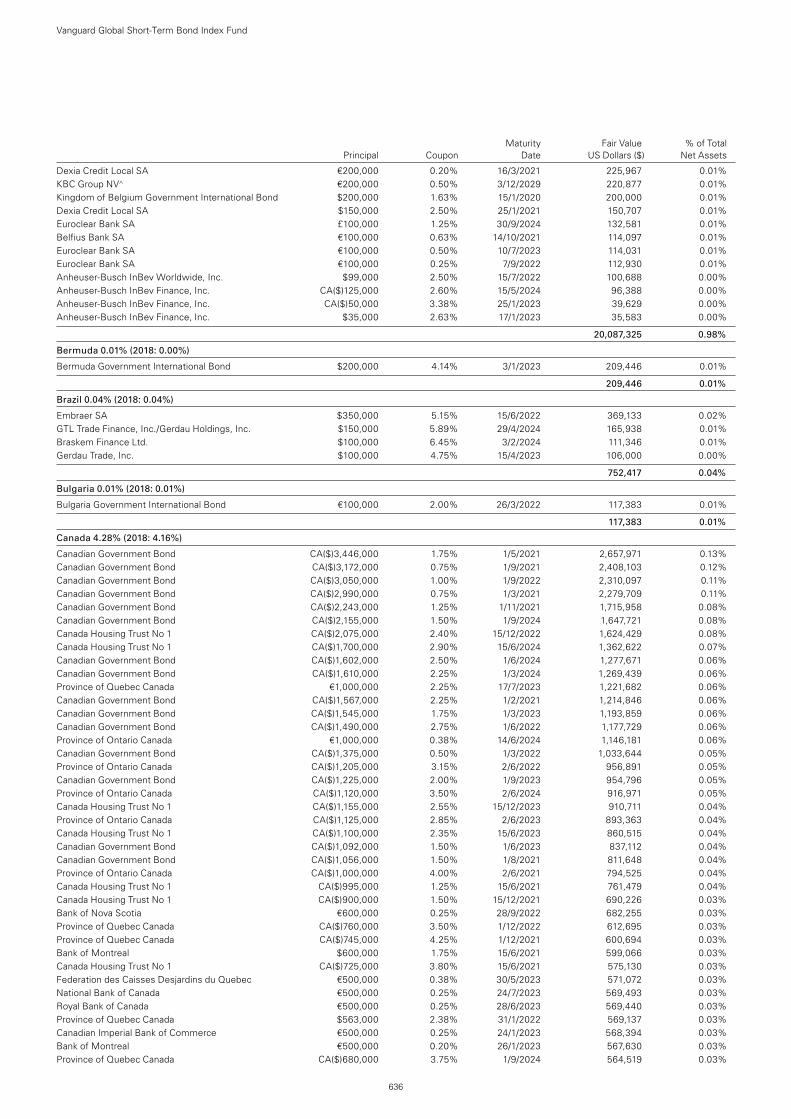
Maturity Fair Value % of Total Principal Coupon Date US Dollars ($) Net Assets
Dexia Credit Local SA €200,000 0.20% 16/3/2021 225,967 0.01%KBC Group NV^ €200,000 0.50% 3/12/2029 220,877 0.01%Kingdom of Belgium Government International Bond $200,000 1.63% 15/1/2020 200,000 0.01%Dexia Credit Local SA $150,000 2.50% 25/1/2021 150,707 0.01%Euroclear Bank SA £100,000 1.25% 30/9/2024 132,581 0.01%Belfius Bank SA €100,000 0.63% 14/10/2021 114,097 0.01%Euroclear Bank SA €100,000 0.50% 10/7/2023 114,031 0.01%Euroclear Bank SA €100,000 0.25% 7/9/2022 112,930 0.01%Anheuser-Busch InBev Worldwide, Inc. $99,000 2.50% 15/7/2022 100,688 0.00%Anheuser-Busch InBev Finance, Inc. CA($)125,000 2.60% 15/5/2024 96,388 0.00%Anheuser-Busch InBev Finance, Inc. CA($)50,000 3.38% 25/1/2023 39,629 0.00%Anheuser-Busch InBev Finance, Inc. $35,000 2.63% 17/1/2023 35,583 0.00%
20,087,325 0.98%
Bermuda 0.01% (2018: 0.00%)
Bermuda Government International Bond $200,000 4.14% 3/1/2023 209,446 0.01%
209,446 0.01%
Brazil 0.04% (2018: 0.04%)
Embraer SA $350,000 5.15% 15/6/2022 369,133 0.02%GTL Trade Finance, Inc./Gerdau Holdings, Inc. $150,000 5.89% 29/4/2024 165,938 0.01%Braskem Finance Ltd. $100,000 6.45% 3/2/2024 111,346 0.01%Gerdau Trade, Inc. $100,000 4.75% 15/4/2023 106,000 0.00%
752,417 0.04%
Bulgaria 0.01% (2018: 0.01%)
Bulgaria Government International Bond €100,000 2.00% 26/3/2022 117,383 0.01%
117,383 0.01%
Canada 4.28% (2018: 4.16%)
Canadian Government Bond CA($)3,446,000 1.75% 1/5/2021 2,657,971 0.13%Canadian Government Bond CA($)3,172,000 0.75% 1/9/2021 2,408,103 0.12%Canadian Government Bond CA($)3,050,000 1.00% 1/9/2022 2,310,097 0.11%Canadian Government Bond CA($)2,990,000 0.75% 1/3/2021 2,279,709 0.11%Canadian Government Bond CA($)2,243,000 1.25% 1/11/2021 1,715,958 0.08%Canadian Government Bond CA($)2,155,000 1.50% 1/9/2024 1,647,721 0.08%Canada Housing Trust No 1 CA($)2,075,000 2.40% 15/12/2022 1,624,429 0.08%Canada Housing Trust No 1 CA($)1,700,000 2.90% 15/6/2024 1,362,622 0.07%Canadian Government Bond CA($)1,602,000 2.50% 1/6/2024 1,277,671 0.06%Canadian Government Bond CA($)1,610,000 2.25% 1/3/2024 1,269,439 0.06%Province of Quebec Canada €1,000,000 2.25% 17/7/2023 1,221,682 0.06%Canadian Government Bond CA($)1,567,000 2.25% 1/2/2021 1,214,846 0.06%Canadian Government Bond CA($)1,545,000 1.75% 1/3/2023 1,193,859 0.06%Canadian Government Bond CA($)1,490,000 2.75% 1/6/2022 1,177,729 0.06%Province of Ontario Canada €1,000,000 0.38% 14/6/2024 1,146,181 0.06%Canadian Government Bond CA($)1,375,000 0.50% 1/3/2022 1,033,644 0.05%Province of Ontario Canada CA($)1,205,000 3.15% 2/6/2022 956,891 0.05%Canadian Government Bond CA($)1,225,000 2.00% 1/9/2023 954,796 0.05%Province of Ontario Canada CA($)1,120,000 3.50% 2/6/2024 916,971 0.05%Canada Housing Trust No 1 CA($)1,155,000 2.55% 15/12/2023 910,711 0.04%Province of Ontario Canada CA($)1,125,000 2.85% 2/6/2023 893,363 0.04%Canada Housing Trust No 1 CA($)1,100,000 2.35% 15/6/2023 860,515 0.04%Canadian Government Bond CA($)1,092,000 1.50% 1/6/2023 837,112 0.04%Canadian Government Bond CA($)1,056,000 1.50% 1/8/2021 811,648 0.04%Province of Ontario Canada CA($)1,000,000 4.00% 2/6/2021 794,525 0.04%Canada Housing Trust No 1 CA($)995,000 1.25% 15/6/2021 761,479 0.04%Canada Housing Trust No 1 CA($)900,000 1.50% 15/12/2021 690,226 0.03%Bank of Nova Scotia €600,000 0.25% 28/9/2022 682,255 0.03%Province of Quebec Canada CA($)760,000 3.50% 1/12/2022 612,695 0.03%Province of Quebec Canada CA($)745,000 4.25% 1/12/2021 600,694 0.03%Bank of Montreal $600,000 1.75% 15/6/2021 599,066 0.03%Canada Housing Trust No 1 CA($)725,000 3.80% 15/6/2021 575,130 0.03%Federation des Caisses Desjardins du Quebec €500,000 0.38% 30/5/2023 571,072 0.03%National Bank of Canada €500,000 0.25% 24/7/2023 569,493 0.03%Royal Bank of Canada €500,000 0.25% 28/6/2023 569,440 0.03%Province of Quebec Canada $563,000 2.38% 31/1/2022 569,137 0.03%Canadian Imperial Bank of Commerce €500,000 0.25% 24/1/2023 568,394 0.03%Bank of Montreal €500,000 0.20% 26/1/2023 567,630 0.03%Province of Quebec Canada CA($)680,000 3.75% 1/9/2024 564,519 0.03%
Vanguard Global Short-Term Bond Index Fund
636
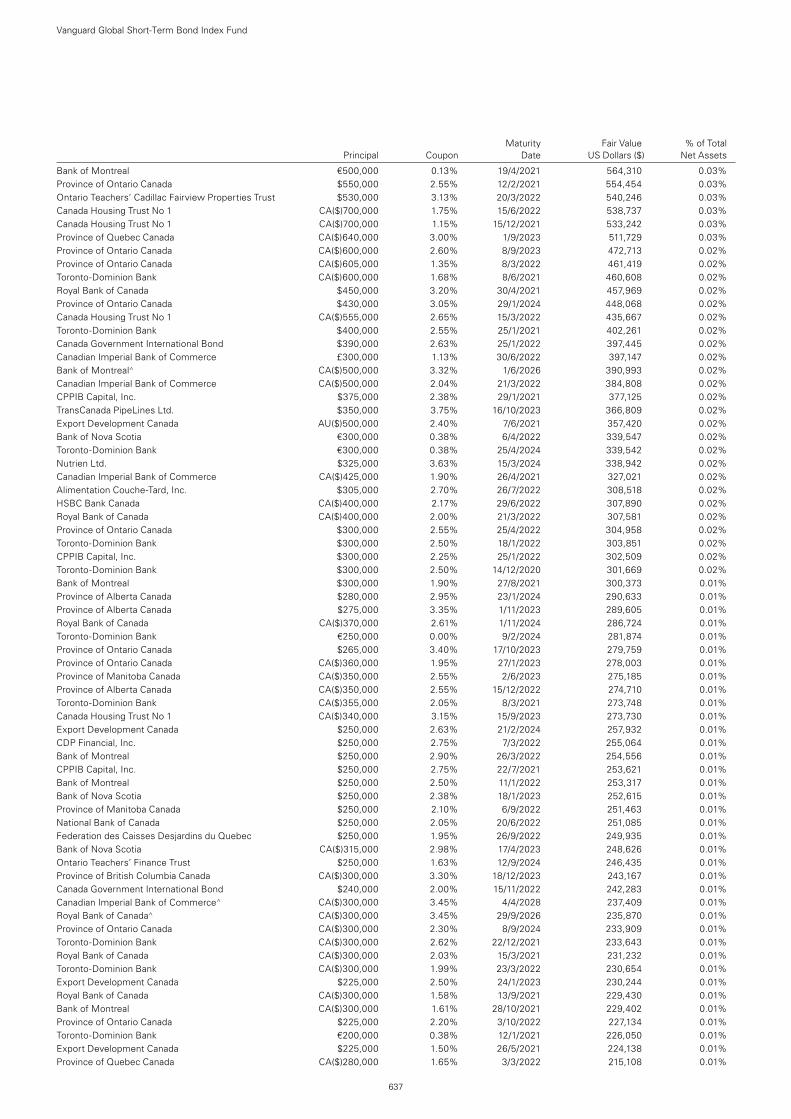
Maturity Fair Value % of Total Principal Coupon Date US Dollars ($) Net Assets
Bank of Montreal €500,000 0.13% 19/4/2021 564,310 0.03%Province of Ontario Canada $550,000 2.55% 12/2/2021 554,454 0.03%Ontario Teachers’ Cadillac Fairview Properties Trust $530,000 3.13% 20/3/2022 540,246 0.03%Canada Housing Trust No 1 CA($)700,000 1.75% 15/6/2022 538,737 0.03%Canada Housing Trust No 1 CA($)700,000 1.15% 15/12/2021 533,242 0.03%Province of Quebec Canada CA($)640,000 3.00% 1/9/2023 511,729 0.03%Province of Ontario Canada CA($)600,000 2.60% 8/9/2023 472,713 0.02%Province of Ontario Canada CA($)605,000 1.35% 8/3/2022 461,419 0.02%Toronto-Dominion Bank CA($)600,000 1.68% 8/6/2021 460,608 0.02%Royal Bank of Canada $450,000 3.20% 30/4/2021 457,969 0.02%Province of Ontario Canada $430,000 3.05% 29/1/2024 448,068 0.02%Canada Housing Trust No 1 CA($)555,000 2.65% 15/3/2022 435,667 0.02%Toronto-Dominion Bank $400,000 2.55% 25/1/2021 402,261 0.02%Canada Government International Bond $390,000 2.63% 25/1/2022 397,445 0.02%Canadian Imperial Bank of Commerce £300,000 1.13% 30/6/2022 397,147 0.02%Bank of Montreal^ CA($)500,000 3.32% 1/6/2026 390,993 0.02%Canadian Imperial Bank of Commerce CA($)500,000 2.04% 21/3/2022 384,808 0.02%CPPIB Capital, Inc. $375,000 2.38% 29/1/2021 377,125 0.02%TransCanada PipeLines Ltd. $350,000 3.75% 16/10/2023 366,809 0.02%Export Development Canada AU($)500,000 2.40% 7/6/2021 357,420 0.02%Bank of Nova Scotia €300,000 0.38% 6/4/2022 339,547 0.02%Toronto-Dominion Bank €300,000 0.38% 25/4/2024 339,542 0.02%Nutrien Ltd. $325,000 3.63% 15/3/2024 338,942 0.02%Canadian Imperial Bank of Commerce CA($)425,000 1.90% 26/4/2021 327,021 0.02%Alimentation Couche-Tard, Inc. $305,000 2.70% 26/7/2022 308,518 0.02%HSBC Bank Canada CA($)400,000 2.17% 29/6/2022 307,890 0.02%Royal Bank of Canada CA($)400,000 2.00% 21/3/2022 307,581 0.02%Province of Ontario Canada $300,000 2.55% 25/4/2022 304,958 0.02%Toronto-Dominion Bank $300,000 2.50% 18/1/2022 303,851 0.02%CPPIB Capital, Inc. $300,000 2.25% 25/1/2022 302,509 0.02%Toronto-Dominion Bank $300,000 2.50% 14/12/2020 301,669 0.02%Bank of Montreal $300,000 1.90% 27/8/2021 300,373 0.01%Province of Alberta Canada $280,000 2.95% 23/1/2024 290,633 0.01%Province of Alberta Canada $275,000 3.35% 1/11/2023 289,605 0.01%Royal Bank of Canada CA($)370,000 2.61% 1/11/2024 286,724 0.01%Toronto-Dominion Bank €250,000 0.00% 9/2/2024 281,874 0.01%Province of Ontario Canada $265,000 3.40% 17/10/2023 279,759 0.01%Province of Ontario Canada CA($)360,000 1.95% 27/1/2023 278,003 0.01%Province of Manitoba Canada CA($)350,000 2.55% 2/6/2023 275,185 0.01%Province of Alberta Canada CA($)350,000 2.55% 15/12/2022 274,710 0.01%Toronto-Dominion Bank CA($)355,000 2.05% 8/3/2021 273,748 0.01%Canada Housing Trust No 1 CA($)340,000 3.15% 15/9/2023 273,730 0.01%Export Development Canada $250,000 2.63% 21/2/2024 257,932 0.01%CDP Financial, Inc. $250,000 2.75% 7/3/2022 255,064 0.01%Bank of Montreal $250,000 2.90% 26/3/2022 254,556 0.01%CPPIB Capital, Inc. $250,000 2.75% 22/7/2021 253,621 0.01%Bank of Montreal $250,000 2.50% 11/1/2022 253,317 0.01%Bank of Nova Scotia $250,000 2.38% 18/1/2023 252,615 0.01%Province of Manitoba Canada $250,000 2.10% 6/9/2022 251,463 0.01%National Bank of Canada $250,000 2.05% 20/6/2022 251,085 0.01%Federation des Caisses Desjardins du Quebec $250,000 1.95% 26/9/2022 249,935 0.01%Bank of Nova Scotia CA($)315,000 2.98% 17/4/2023 248,626 0.01%Ontario Teachers’ Finance Trust $250,000 1.63% 12/9/2024 246,435 0.01%Province of British Columbia Canada CA($)300,000 3.30% 18/12/2023 243,167 0.01%Canada Government International Bond $240,000 2.00% 15/11/2022 242,283 0.01%Canadian Imperial Bank of Commerce^ CA($)300,000 3.45% 4/4/2028 237,409 0.01%Royal Bank of Canada^ CA($)300,000 3.45% 29/9/2026 235,870 0.01%Province of Ontario Canada CA($)300,000 2.30% 8/9/2024 233,909 0.01%Toronto-Dominion Bank CA($)300,000 2.62% 22/12/2021 233,643 0.01%Royal Bank of Canada CA($)300,000 2.03% 15/3/2021 231,232 0.01%Toronto-Dominion Bank CA($)300,000 1.99% 23/3/2022 230,654 0.01%Export Development Canada $225,000 2.50% 24/1/2023 230,244 0.01%Royal Bank of Canada CA($)300,000 1.58% 13/9/2021 229,430 0.01%Bank of Montreal CA($)300,000 1.61% 28/10/2021 229,402 0.01%Province of Ontario Canada $225,000 2.20% 3/10/2022 227,134 0.01%Toronto-Dominion Bank €200,000 0.38% 12/1/2021 226,050 0.01%Export Development Canada $225,000 1.50% 26/5/2021 224,138 0.01%Province of Quebec Canada CA($)280,000 1.65% 3/3/2022 215,108 0.01%
Vanguard Global Short-Term Bond Index Fund
637
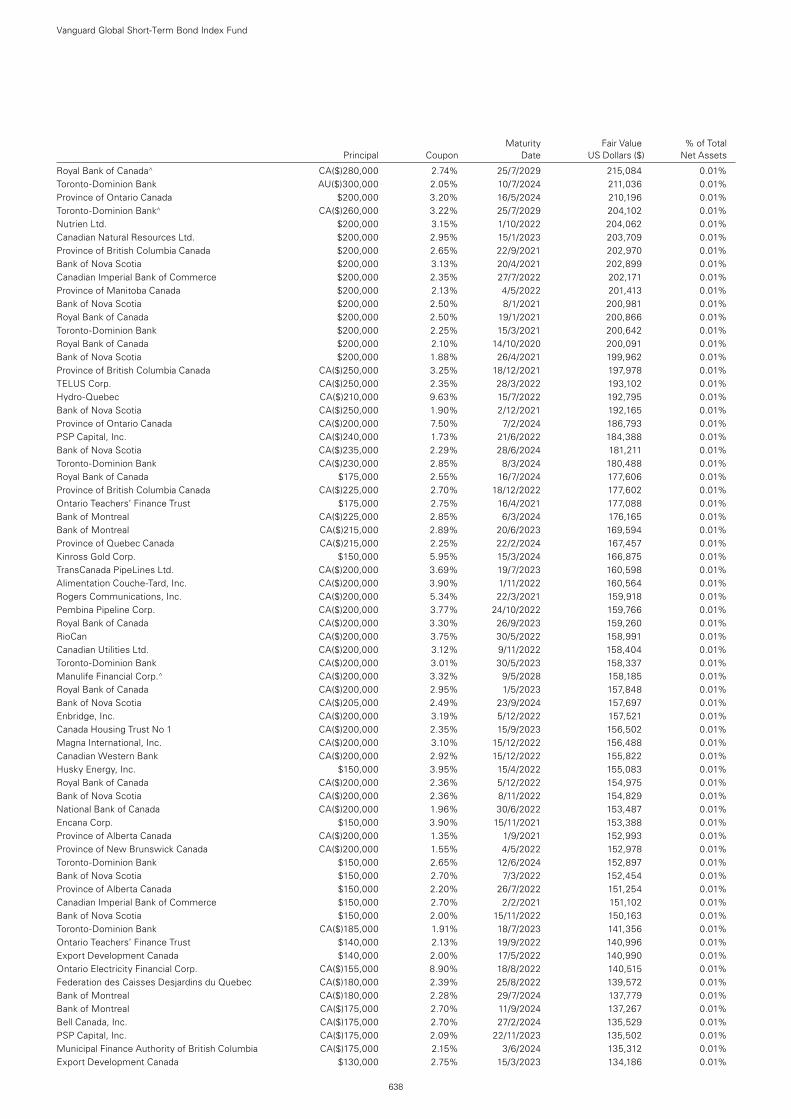
Maturity Fair Value % of Total Principal Coupon Date US Dollars ($) Net Assets
Royal Bank of Canada^ CA($)280,000 2.74% 25/7/2029 215,084 0.01%Toronto-Dominion Bank AU($)300,000 2.05% 10/7/2024 211,036 0.01%Province of Ontario Canada $200,000 3.20% 16/5/2024 210,196 0.01%Toronto-Dominion Bank^ CA($)260,000 3.22% 25/7/2029 204,102 0.01%Nutrien Ltd. $200,000 3.15% 1/10/2022 204,062 0.01%Canadian Natural Resources Ltd. $200,000 2.95% 15/1/2023 203,709 0.01%Province of British Columbia Canada $200,000 2.65% 22/9/2021 202,970 0.01%Bank of Nova Scotia $200,000 3.13% 20/4/2021 202,899 0.01%Canadian Imperial Bank of Commerce $200,000 2.35% 27/7/2022 202,171 0.01%Province of Manitoba Canada $200,000 2.13% 4/5/2022 201,413 0.01%Bank of Nova Scotia $200,000 2.50% 8/1/2021 200,981 0.01%Royal Bank of Canada $200,000 2.50% 19/1/2021 200,866 0.01%Toronto-Dominion Bank $200,000 2.25% 15/3/2021 200,642 0.01%Royal Bank of Canada $200,000 2.10% 14/10/2020 200,091 0.01%Bank of Nova Scotia $200,000 1.88% 26/4/2021 199,962 0.01%Province of British Columbia Canada CA($)250,000 3.25% 18/12/2021 197,978 0.01%TELUS Corp. CA($)250,000 2.35% 28/3/2022 193,102 0.01%Hydro-Quebec CA($)210,000 9.63% 15/7/2022 192,795 0.01%Bank of Nova Scotia CA($)250,000 1.90% 2/12/2021 192,165 0.01%Province of Ontario Canada CA($)200,000 7.50% 7/2/2024 186,793 0.01%PSP Capital, Inc. CA($)240,000 1.73% 21/6/2022 184,388 0.01%Bank of Nova Scotia CA($)235,000 2.29% 28/6/2024 181,211 0.01%Toronto-Dominion Bank CA($)230,000 2.85% 8/3/2024 180,488 0.01%Royal Bank of Canada $175,000 2.55% 16/7/2024 177,606 0.01%Province of British Columbia Canada CA($)225,000 2.70% 18/12/2022 177,602 0.01%Ontario Teachers’ Finance Trust $175,000 2.75% 16/4/2021 177,088 0.01%Bank of Montreal CA($)225,000 2.85% 6/3/2024 176,165 0.01%Bank of Montreal CA($)215,000 2.89% 20/6/2023 169,594 0.01%Province of Quebec Canada CA($)215,000 2.25% 22/2/2024 167,457 0.01%Kinross Gold Corp. $150,000 5.95% 15/3/2024 166,875 0.01%TransCanada PipeLines Ltd. CA($)200,000 3.69% 19/7/2023 160,598 0.01%Alimentation Couche-Tard, Inc. CA($)200,000 3.90% 1/11/2022 160,564 0.01%Rogers Communications, Inc. CA($)200,000 5.34% 22/3/2021 159,918 0.01%Pembina Pipeline Corp. CA($)200,000 3.77% 24/10/2022 159,766 0.01%Royal Bank of Canada CA($)200,000 3.30% 26/9/2023 159,260 0.01%RioCan CA($)200,000 3.75% 30/5/2022 158,991 0.01%Canadian Utilities Ltd. CA($)200,000 3.12% 9/11/2022 158,404 0.01%Toronto-Dominion Bank CA($)200,000 3.01% 30/5/2023 158,337 0.01%Manulife Financial Corp.^ CA($)200,000 3.32% 9/5/2028 158,185 0.01%Royal Bank of Canada CA($)200,000 2.95% 1/5/2023 157,848 0.01%Bank of Nova Scotia CA($)205,000 2.49% 23/9/2024 157,697 0.01%Enbridge, Inc. CA($)200,000 3.19% 5/12/2022 157,521 0.01%Canada Housing Trust No 1 CA($)200,000 2.35% 15/9/2023 156,502 0.01%Magna International, Inc. CA($)200,000 3.10% 15/12/2022 156,488 0.01%Canadian Western Bank CA($)200,000 2.92% 15/12/2022 155,822 0.01%Husky Energy, Inc. $150,000 3.95% 15/4/2022 155,083 0.01%Royal Bank of Canada CA($)200,000 2.36% 5/12/2022 154,975 0.01%Bank of Nova Scotia CA($)200,000 2.36% 8/11/2022 154,829 0.01%National Bank of Canada CA($)200,000 1.96% 30/6/2022 153,487 0.01%Encana Corp. $150,000 3.90% 15/11/2021 153,388 0.01%Province of Alberta Canada CA($)200,000 1.35% 1/9/2021 152,993 0.01%Province of New Brunswick Canada CA($)200,000 1.55% 4/5/2022 152,978 0.01%Toronto-Dominion Bank $150,000 2.65% 12/6/2024 152,897 0.01%Bank of Nova Scotia $150,000 2.70% 7/3/2022 152,454 0.01%Province of Alberta Canada $150,000 2.20% 26/7/2022 151,254 0.01%Canadian Imperial Bank of Commerce $150,000 2.70% 2/2/2021 151,102 0.01%Bank of Nova Scotia $150,000 2.00% 15/11/2022 150,163 0.01%Toronto-Dominion Bank CA($)185,000 1.91% 18/7/2023 141,356 0.01%Ontario Teachers’ Finance Trust $140,000 2.13% 19/9/2022 140,996 0.01%Export Development Canada $140,000 2.00% 17/5/2022 140,990 0.01%Ontario Electricity Financial Corp. CA($)155,000 8.90% 18/8/2022 140,515 0.01%Federation des Caisses Desjardins du Quebec CA($)180,000 2.39% 25/8/2022 139,572 0.01%Bank of Montreal CA($)180,000 2.28% 29/7/2024 137,779 0.01%Bank of Montreal CA($)175,000 2.70% 11/9/2024 137,267 0.01%Bell Canada, Inc. CA($)175,000 2.70% 27/2/2024 135,529 0.01%PSP Capital, Inc. CA($)175,000 2.09% 22/11/2023 135,502 0.01%Municipal Finance Authority of British Columbia CA($)175,000 2.15% 3/6/2024 135,312 0.01%Export Development Canada $130,000 2.75% 15/3/2023 134,186 0.01%
Vanguard Global Short-Term Bond Index Fund
638
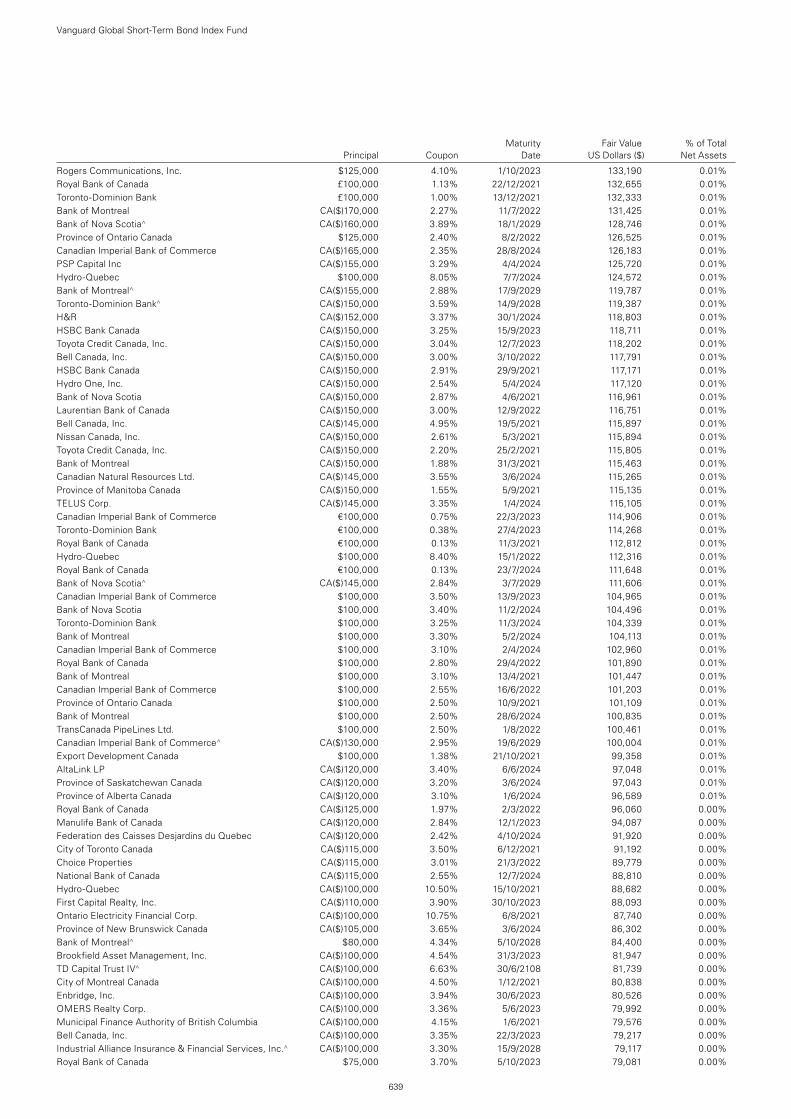
Maturity Fair Value % of Total Principal Coupon Date US Dollars ($) Net Assets
Rogers Communications, Inc. $125,000 4.10% 1/10/2023 133,190 0.01%Royal Bank of Canada £100,000 1.13% 22/12/2021 132,655 0.01%Toronto-Dominion Bank £100,000 1.00% 13/12/2021 132,333 0.01%Bank of Montreal CA($)170,000 2.27% 11/7/2022 131,425 0.01%Bank of Nova Scotia^ CA($)160,000 3.89% 18/1/2029 128,746 0.01%Province of Ontario Canada $125,000 2.40% 8/2/2022 126,525 0.01%Canadian Imperial Bank of Commerce CA($)165,000 2.35% 28/8/2024 126,183 0.01%PSP Capital Inc CA($)155,000 3.29% 4/4/2024 125,720 0.01%Hydro-Quebec $100,000 8.05% 7/7/2024 124,572 0.01%Bank of Montreal^ CA($)155,000 2.88% 17/9/2029 119,787 0.01%Toronto-Dominion Bank^ CA($)150,000 3.59% 14/9/2028 119,387 0.01%H&R CA($)152,000 3.37% 30/1/2024 118,803 0.01%HSBC Bank Canada CA($)150,000 3.25% 15/9/2023 118,711 0.01%Toyota Credit Canada, Inc. CA($)150,000 3.04% 12/7/2023 118,202 0.01%Bell Canada, Inc. CA($)150,000 3.00% 3/10/2022 117,791 0.01%HSBC Bank Canada CA($)150,000 2.91% 29/9/2021 117,171 0.01%Hydro One, Inc. CA($)150,000 2.54% 5/4/2024 117,120 0.01%Bank of Nova Scotia CA($)150,000 2.87% 4/6/2021 116,961 0.01%Laurentian Bank of Canada CA($)150,000 3.00% 12/9/2022 116,751 0.01%Bell Canada, Inc. CA($)145,000 4.95% 19/5/2021 115,897 0.01%Nissan Canada, Inc. CA($)150,000 2.61% 5/3/2021 115,894 0.01%Toyota Credit Canada, Inc. CA($)150,000 2.20% 25/2/2021 115,805 0.01%Bank of Montreal CA($)150,000 1.88% 31/3/2021 115,463 0.01%Canadian Natural Resources Ltd. CA($)145,000 3.55% 3/6/2024 115,265 0.01%Province of Manitoba Canada CA($)150,000 1.55% 5/9/2021 115,135 0.01%TELUS Corp. CA($)145,000 3.35% 1/4/2024 115,105 0.01%Canadian Imperial Bank of Commerce €100,000 0.75% 22/3/2023 114,906 0.01%Toronto-Dominion Bank €100,000 0.38% 27/4/2023 114,268 0.01%Royal Bank of Canada €100,000 0.13% 11/3/2021 112,812 0.01%Hydro-Quebec $100,000 8.40% 15/1/2022 112,316 0.01%Royal Bank of Canada €100,000 0.13% 23/7/2024 111,648 0.01%Bank of Nova Scotia^ CA($)145,000 2.84% 3/7/2029 111,606 0.01%Canadian Imperial Bank of Commerce $100,000 3.50% 13/9/2023 104,965 0.01%Bank of Nova Scotia $100,000 3.40% 11/2/2024 104,496 0.01%Toronto-Dominion Bank $100,000 3.25% 11/3/2024 104,339 0.01%Bank of Montreal $100,000 3.30% 5/2/2024 104,113 0.01%Canadian Imperial Bank of Commerce $100,000 3.10% 2/4/2024 102,960 0.01%Royal Bank of Canada $100,000 2.80% 29/4/2022 101,890 0.01%Bank of Montreal $100,000 3.10% 13/4/2021 101,447 0.01%Canadian Imperial Bank of Commerce $100,000 2.55% 16/6/2022 101,203 0.01%Province of Ontario Canada $100,000 2.50% 10/9/2021 101,109 0.01%Bank of Montreal $100,000 2.50% 28/6/2024 100,835 0.01%TransCanada PipeLines Ltd. $100,000 2.50% 1/8/2022 100,461 0.01%Canadian Imperial Bank of Commerce^ CA($)130,000 2.95% 19/6/2029 100,004 0.01%Export Development Canada $100,000 1.38% 21/10/2021 99,358 0.01%AltaLink LP CA($)120,000 3.40% 6/6/2024 97,048 0.01%Province of Saskatchewan Canada CA($)120,000 3.20% 3/6/2024 97,043 0.01%Province of Alberta Canada CA($)120,000 3.10% 1/6/2024 96,589 0.01%Royal Bank of Canada CA($)125,000 1.97% 2/3/2022 96,060 0.00%Manulife Bank of Canada CA($)120,000 2.84% 12/1/2023 94,087 0.00%Federation des Caisses Desjardins du Quebec CA($)120,000 2.42% 4/10/2024 91,920 0.00%City of Toronto Canada CA($)115,000 3.50% 6/12/2021 91,192 0.00%Choice Properties CA($)115,000 3.01% 21/3/2022 89,779 0.00%National Bank of Canada CA($)115,000 2.55% 12/7/2024 88,810 0.00%Hydro-Quebec CA($)100,000 10.50% 15/10/2021 88,682 0.00%First Capital Realty, Inc. CA($)110,000 3.90% 30/10/2023 88,093 0.00%Ontario Electricity Financial Corp. CA($)100,000 10.75% 6/8/2021 87,740 0.00%Province of New Brunswick Canada CA($)105,000 3.65% 3/6/2024 86,302 0.00%Bank of Montreal^ $80,000 4.34% 5/10/2028 84,400 0.00%Brookfield Asset Management, Inc. CA($)100,000 4.54% 31/3/2023 81,947 0.00%TD Capital Trust IV^ CA($)100,000 6.63% 30/6/2108 81,739 0.00%City of Montreal Canada CA($)100,000 4.50% 1/12/2021 80,838 0.00%Enbridge, Inc. CA($)100,000 3.94% 30/6/2023 80,526 0.00%OMERS Realty Corp. CA($)100,000 3.36% 5/6/2023 79,992 0.00%Municipal Finance Authority of British Columbia CA($)100,000 4.15% 1/6/2021 79,576 0.00%Bell Canada, Inc. CA($)100,000 3.35% 22/3/2023 79,217 0.00%Industrial Alliance Insurance & Financial Services, Inc.^ CA($)100,000 3.30% 15/9/2028 79,117 0.00%Royal Bank of Canada $75,000 3.70% 5/10/2023 79,081 0.00%
Vanguard Global Short-Term Bond Index Fund
639
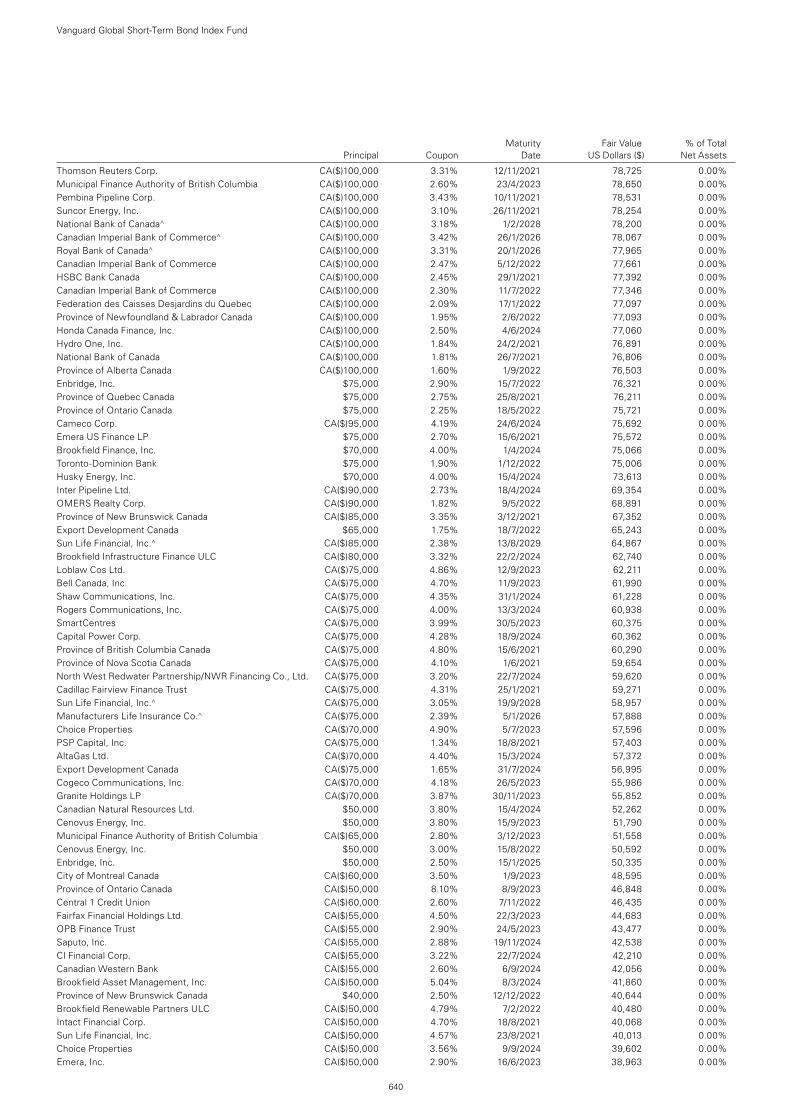
Maturity Fair Value % of Total Principal Coupon Date US Dollars ($) Net Assets
Thomson Reuters Corp. CA($)100,000 3.31% 12/11/2021 78,725 0.00%Municipal Finance Authority of British Columbia CA($)100,000 2.60% 23/4/2023 78,650 0.00%Pembina Pipeline Corp. CA($)100,000 3.43% 10/11/2021 78,531 0.00%Suncor Energy, Inc. CA($)100,000 3.10% 26/11/2021 78,254 0.00%National Bank of Canada^ CA($)100,000 3.18% 1/2/2028 78,200 0.00%Canadian Imperial Bank of Commerce^ CA($)100,000 3.42% 26/1/2026 78,067 0.00%Royal Bank of Canada^ CA($)100,000 3.31% 20/1/2026 77,965 0.00%Canadian Imperial Bank of Commerce CA($)100,000 2.47% 5/12/2022 77,661 0.00%HSBC Bank Canada CA($)100,000 2.45% 29/1/2021 77,392 0.00%Canadian Imperial Bank of Commerce CA($)100,000 2.30% 11/7/2022 77,346 0.00%Federation des Caisses Desjardins du Quebec CA($)100,000 2.09% 17/1/2022 77,097 0.00%Province of Newfoundland & Labrador Canada CA($)100,000 1.95% 2/6/2022 77,093 0.00%Honda Canada Finance, Inc. CA($)100,000 2.50% 4/6/2024 77,060 0.00%Hydro One, Inc. CA($)100,000 1.84% 24/2/2021 76,891 0.00%National Bank of Canada CA($)100,000 1.81% 26/7/2021 76,806 0.00%Province of Alberta Canada CA($)100,000 1.60% 1/9/2022 76,503 0.00%Enbridge, Inc. $75,000 2.90% 15/7/2022 76,321 0.00%Province of Quebec Canada $75,000 2.75% 25/8/2021 76,211 0.00%Province of Ontario Canada $75,000 2.25% 18/5/2022 75,721 0.00%Cameco Corp. CA($)95,000 4.19% 24/6/2024 75,692 0.00%Emera US Finance LP $75,000 2.70% 15/6/2021 75,572 0.00%Brookfield Finance, Inc. $70,000 4.00% 1/4/2024 75,066 0.00%Toronto-Dominion Bank $75,000 1.90% 1/12/2022 75,006 0.00%Husky Energy, Inc. $70,000 4.00% 15/4/2024 73,613 0.00%Inter Pipeline Ltd. CA($)90,000 2.73% 18/4/2024 69,354 0.00%OMERS Realty Corp. CA($)90,000 1.82% 9/5/2022 68,891 0.00%Province of New Brunswick Canada CA($)85,000 3.35% 3/12/2021 67,352 0.00%Export Development Canada $65,000 1.75% 18/7/2022 65,243 0.00%Sun Life Financial, Inc.^ CA($)85,000 2.38% 13/8/2029 64,867 0.00%Brookfield Infrastructure Finance ULC CA($)80,000 3.32% 22/2/2024 62,740 0.00%Loblaw Cos Ltd. CA($)75,000 4.86% 12/9/2023 62,211 0.00%Bell Canada, Inc. CA($)75,000 4.70% 11/9/2023 61,990 0.00%Shaw Communications, Inc. CA($)75,000 4.35% 31/1/2024 61,228 0.00%Rogers Communications, Inc. CA($)75,000 4.00% 13/3/2024 60,938 0.00%SmartCentres CA($)75,000 3.99% 30/5/2023 60,375 0.00%Capital Power Corp. CA($)75,000 4.28% 18/9/2024 60,362 0.00%Province of British Columbia Canada CA($)75,000 4.80% 15/6/2021 60,290 0.00%Province of Nova Scotia Canada CA($)75,000 4.10% 1/6/2021 59,654 0.00%North West Redwater Partnership/NWR Financing Co., Ltd. CA($)75,000 3.20% 22/7/2024 59,620 0.00%Cadillac Fairview Finance Trust CA($)75,000 4.31% 25/1/2021 59,271 0.00%Sun Life Financial, Inc.^ CA($)75,000 3.05% 19/9/2028 58,957 0.00%Manufacturers Life Insurance Co.^ CA($)75,000 2.39% 5/1/2026 57,888 0.00%Choice Properties CA($)70,000 4.90% 5/7/2023 57,596 0.00%PSP Capital, Inc. CA($)75,000 1.34% 18/8/2021 57,403 0.00%AltaGas Ltd. CA($)70,000 4.40% 15/3/2024 57,372 0.00%Export Development Canada CA($)75,000 1.65% 31/7/2024 56,995 0.00%Cogeco Communications, Inc. CA($)70,000 4.18% 26/5/2023 55,986 0.00%Granite Holdings LP CA($)70,000 3.87% 30/11/2023 55,852 0.00%Canadian Natural Resources Ltd. $50,000 3.80% 15/4/2024 52,262 0.00%Cenovus Energy, Inc. $50,000 3.80% 15/9/2023 51,790 0.00%Municipal Finance Authority of British Columbia CA($)65,000 2.80% 3/12/2023 51,558 0.00%Cenovus Energy, Inc. $50,000 3.00% 15/8/2022 50,592 0.00%Enbridge, Inc. $50,000 2.50% 15/1/2025 50,335 0.00%City of Montreal Canada CA($)60,000 3.50% 1/9/2023 48,595 0.00%Province of Ontario Canada CA($)50,000 8.10% 8/9/2023 46,848 0.00%Central 1 Credit Union CA($)60,000 2.60% 7/11/2022 46,435 0.00%Fairfax Financial Holdings Ltd. CA($)55,000 4.50% 22/3/2023 44,683 0.00%OPB Finance Trust CA($)55,000 2.90% 24/5/2023 43,477 0.00%Saputo, Inc. CA($)55,000 2.88% 19/11/2024 42,538 0.00%CI Financial Corp. CA($)55,000 3.22% 22/7/2024 42,210 0.00%Canadian Western Bank CA($)55,000 2.60% 6/9/2024 42,056 0.00%Brookfield Asset Management, Inc. CA($)50,000 5.04% 8/3/2024 41,860 0.00%Province of New Brunswick Canada $40,000 2.50% 12/12/2022 40,644 0.00%Brookfield Renewable Partners ULC CA($)50,000 4.79% 7/2/2022 40,480 0.00%Intact Financial Corp. CA($)50,000 4.70% 18/8/2021 40,068 0.00%Sun Life Financial, Inc. CA($)50,000 4.57% 23/8/2021 40,013 0.00%Choice Properties CA($)50,000 3.56% 9/9/2024 39,602 0.00%Emera, Inc. CA($)50,000 2.90% 16/6/2023 38,963 0.00%
Vanguard Global Short-Term Bond Index Fund
640
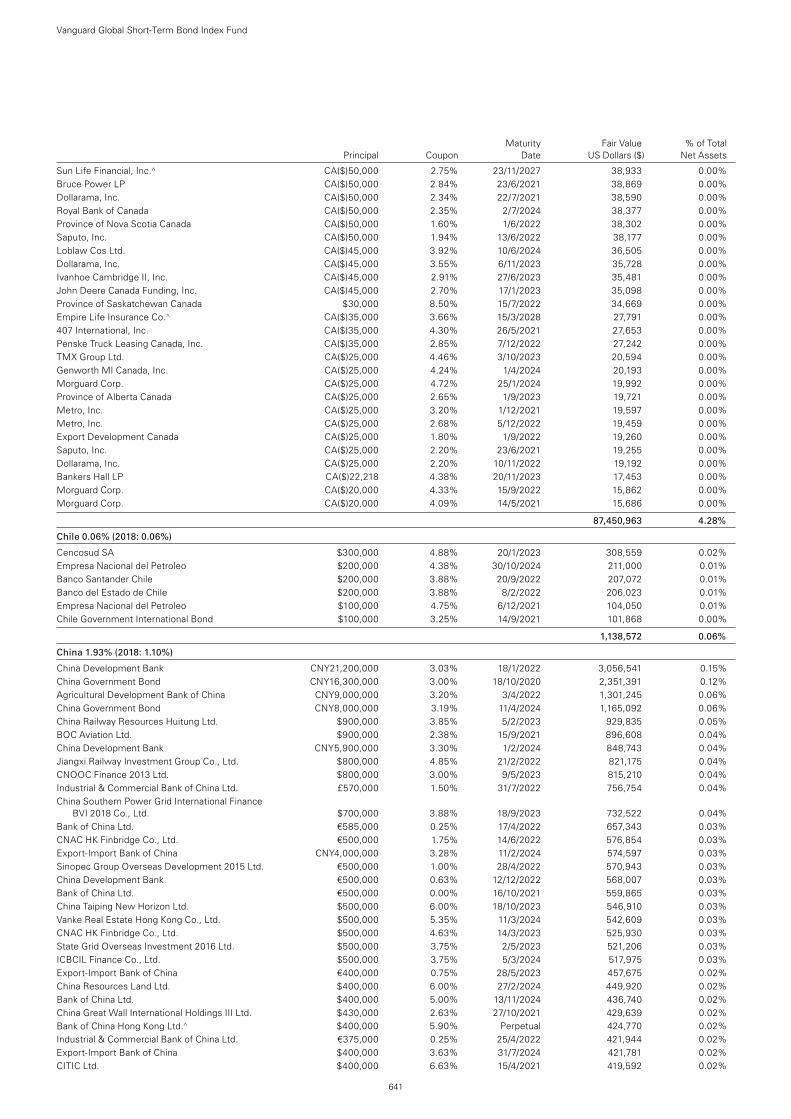
Maturity Fair Value % of Total Principal Coupon Date US Dollars ($) Net Assets
Sun Life Financial, Inc.^ CA($)50,000 2.75% 23/11/2027 38,933 0.00%Bruce Power LP CA($)50,000 2.84% 23/6/2021 38,869 0.00%Dollarama, Inc. CA($)50,000 2.34% 22/7/2021 38,590 0.00%Royal Bank of Canada CA($)50,000 2.35% 2/7/2024 38,377 0.00%Province of Nova Scotia Canada CA($)50,000 1.60% 1/6/2022 38,302 0.00%Saputo, Inc. CA($)50,000 1.94% 13/6/2022 38,177 0.00%Loblaw Cos Ltd. CA($)45,000 3.92% 10/6/2024 36,505 0.00%Dollarama, Inc. CA($)45,000 3.55% 6/11/2023 35,728 0.00%Ivanhoe Cambridge II, Inc. CA($)45,000 2.91% 27/6/2023 35,481 0.00%John Deere Canada Funding, Inc. CA($)45,000 2.70% 17/1/2023 35,098 0.00%Province of Saskatchewan Canada $30,000 8.50% 15/7/2022 34,669 0.00%Empire Life Insurance Co.^ CA($)35,000 3.66% 15/3/2028 27,791 0.00%407 International, Inc. CA($)35,000 4.30% 26/5/2021 27,653 0.00%Penske Truck Leasing Canada, Inc. CA($)35,000 2.85% 7/12/2022 27,242 0.00%TMX Group Ltd. CA($)25,000 4.46% 3/10/2023 20,594 0.00%Genworth MI Canada, Inc. CA($)25,000 4.24% 1/4/2024 20,193 0.00%Morguard Corp. CA($)25,000 4.72% 25/1/2024 19,992 0.00%Province of Alberta Canada CA($)25,000 2.65% 1/9/2023 19,721 0.00%Metro, Inc. CA($)25,000 3.20% 1/12/2021 19,597 0.00%Metro, Inc. CA($)25,000 2.68% 5/12/2022 19,459 0.00%Export Development Canada CA($)25,000 1.80% 1/9/2022 19,260 0.00%Saputo, Inc. CA($)25,000 2.20% 23/6/2021 19,255 0.00%Dollarama, Inc. CA($)25,000 2.20% 10/11/2022 19,192 0.00%Bankers Hall LP CA($)22,218 4.38% 20/11/2023 17,453 0.00%Morguard Corp. CA($)20,000 4.33% 15/9/2022 15,862 0.00%Morguard Corp. CA($)20,000 4.09% 14/5/2021 15,686 0.00%
87,450,963 4.28%
Chile 0.06% (2018: 0.06%)
Cencosud SA $300,000 4.88% 20/1/2023 308,559 0.02%Empresa Nacional del Petroleo $200,000 4.38% 30/10/2024 211,000 0.01%Banco Santander Chile $200,000 3.88% 20/9/2022 207,072 0.01%Banco del Estado de Chile $200,000 3.88% 8/2/2022 206,023 0.01%Empresa Nacional del Petroleo $100,000 4.75% 6/12/2021 104,050 0.01%Chile Government International Bond $100,000 3.25% 14/9/2021 101,868 0.00%
1,138,572 0.06%
China 1.93% (2018: 1.10%)
China Development Bank CNY21,200,000 3.03% 18/1/2022 3,056,541 0.15%China Government Bond CNY16,300,000 3.00% 18/10/2020 2,351,391 0.12%Agricultural Development Bank of China CNY9,000,000 3.20% 3/4/2022 1,301,245 0.06%China Government Bond CNY8,000,000 3.19% 11/4/2024 1,165,092 0.06%China Railway Resources Huitung Ltd. $900,000 3.85% 5/2/2023 929,835 0.05%BOC Aviation Ltd. $900,000 2.38% 15/9/2021 896,608 0.04%China Development Bank CNY5,900,000 3.30% 1/2/2024 848,743 0.04%Jiangxi Railway Investment Group Co., Ltd. $800,000 4.85% 21/2/2022 821,175 0.04%CNOOC Finance 2013 Ltd. $800,000 3.00% 9/5/2023 815,210 0.04%Industrial & Commercial Bank of China Ltd. £570,000 1.50% 31/7/2022 756,754 0.04%China Southern Power Grid International Finance
BVI 2018 Co., Ltd. $700,000 3.88% 18/9/2023 732,522 0.04%Bank of China Ltd. €585,000 0.25% 17/4/2022 657,343 0.03%CNAC HK Finbridge Co., Ltd. €500,000 1.75% 14/6/2022 576,854 0.03%Export-Import Bank of China CNY4,000,000 3.28% 11/2/2024 574,597 0.03%Sinopec Group Overseas Development 2015 Ltd. €500,000 1.00% 28/4/2022 570,943 0.03%China Development Bank €500,000 0.63% 12/12/2022 568,007 0.03%Bank of China Ltd. €500,000 0.00% 16/10/2021 559,865 0.03%China Taiping New Horizon Ltd. $500,000 6.00% 18/10/2023 546,910 0.03%Vanke Real Estate Hong Kong Co., Ltd. $500,000 5.35% 11/3/2024 542,609 0.03%CNAC HK Finbridge Co., Ltd. $500,000 4.63% 14/3/2023 525,930 0.03%State Grid Overseas Investment 2016 Ltd. $500,000 3.75% 2/5/2023 521,206 0.03%ICBCIL Finance Co., Ltd. $500,000 3.75% 5/3/2024 517,975 0.03%Export-Import Bank of China €400,000 0.75% 28/5/2023 457,675 0.02%China Resources Land Ltd. $400,000 6.00% 27/2/2024 449,920 0.02%Bank of China Ltd. $400,000 5.00% 13/11/2024 436,740 0.02%China Great Wall International Holdings III Ltd. $430,000 2.63% 27/10/2021 429,639 0.02%Bank of China Hong Kong Ltd.^ $400,000 5.90% Perpetual 424,770 0.02%Industrial & Commercial Bank of China Ltd. €375,000 0.25% 25/4/2022 421,944 0.02%Export-Import Bank of China $400,000 3.63% 31/7/2024 421,781 0.02%CITIC Ltd. $400,000 6.63% 15/4/2021 419,592 0.02%
Vanguard Global Short-Term Bond Index Fund
641
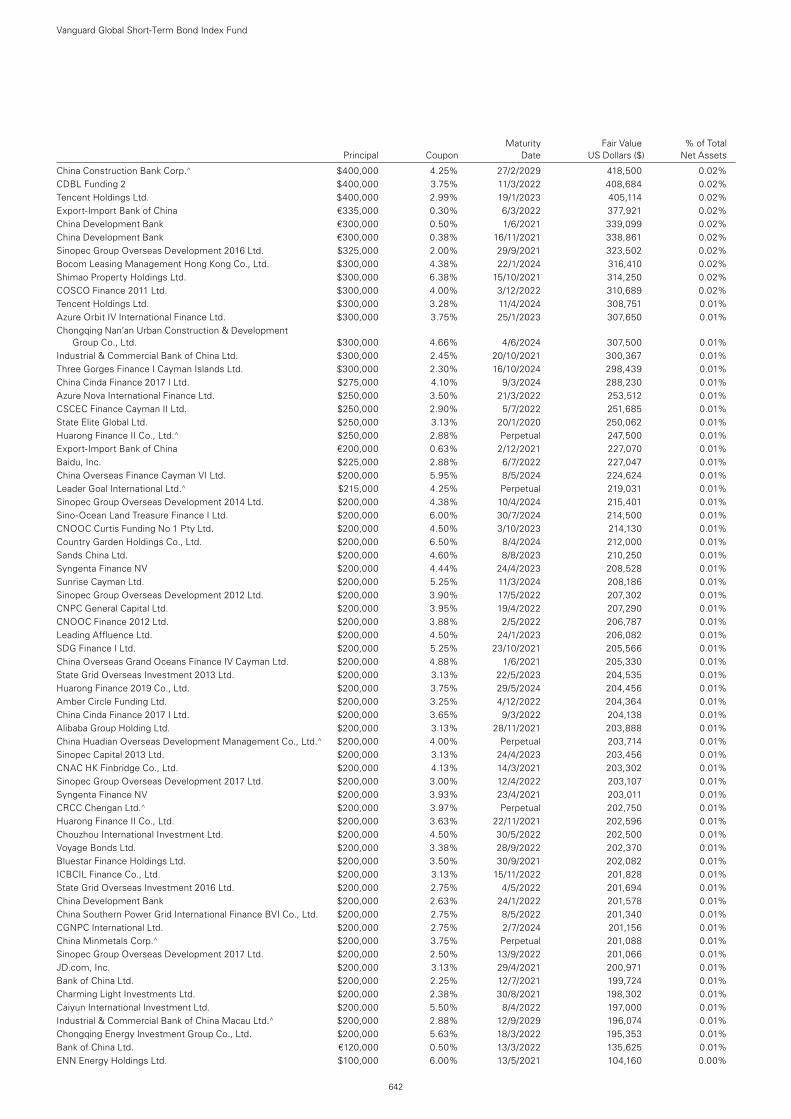
Maturity Fair Value % of Total Principal Coupon Date US Dollars ($) Net Assets
China Construction Bank Corp.^ $400,000 4.25% 27/2/2029 418,500 0.02%CDBL Funding 2 $400,000 3.75% 11/3/2022 408,684 0.02%Tencent Holdings Ltd. $400,000 2.99% 19/1/2023 405,114 0.02%Export-Import Bank of China €335,000 0.30% 6/3/2022 377,921 0.02%China Development Bank €300,000 0.50% 1/6/2021 339,099 0.02%China Development Bank €300,000 0.38% 16/11/2021 338,861 0.02%Sinopec Group Overseas Development 2016 Ltd. $325,000 2.00% 29/9/2021 323,502 0.02%Bocom Leasing Management Hong Kong Co., Ltd. $300,000 4.38% 22/1/2024 316,410 0.02%Shimao Property Holdings Ltd. $300,000 6.38% 15/10/2021 314,250 0.02%COSCO Finance 2011 Ltd. $300,000 4.00% 3/12/2022 310,689 0.02%Tencent Holdings Ltd. $300,000 3.28% 11/4/2024 308,751 0.01%Azure Orbit IV International Finance Ltd. $300,000 3.75% 25/1/2023 307,650 0.01%Chongqing Nan’an Urban Construction & Development
Group Co., Ltd. $300,000 4.66% 4/6/2024 307,500 0.01%Industrial & Commercial Bank of China Ltd. $300,000 2.45% 20/10/2021 300,367 0.01%Three Gorges Finance I Cayman Islands Ltd. $300,000 2.30% 16/10/2024 298,439 0.01%China Cinda Finance 2017 I Ltd. $275,000 4.10% 9/3/2024 288,230 0.01%Azure Nova International Finance Ltd. $250,000 3.50% 21/3/2022 253,512 0.01%CSCEC Finance Cayman II Ltd. $250,000 2.90% 5/7/2022 251,685 0.01%State Elite Global Ltd. $250,000 3.13% 20/1/2020 250,062 0.01%Huarong Finance II Co., Ltd.^ $250,000 2.88% Perpetual 247,500 0.01%Export-Import Bank of China €200,000 0.63% 2/12/2021 227,070 0.01%Baidu, Inc. $225,000 2.88% 6/7/2022 227,047 0.01%China Overseas Finance Cayman VI Ltd. $200,000 5.95% 8/5/2024 224,624 0.01%Leader Goal International Ltd.^ $215,000 4.25% Perpetual 219,031 0.01%Sinopec Group Overseas Development 2014 Ltd. $200,000 4.38% 10/4/2024 215,401 0.01%Sino-Ocean Land Treasure Finance I Ltd. $200,000 6.00% 30/7/2024 214,500 0.01%CNOOC Curtis Funding No 1 Pty Ltd. $200,000 4.50% 3/10/2023 214,130 0.01%Country Garden Holdings Co., Ltd. $200,000 6.50% 8/4/2024 212,000 0.01%Sands China Ltd. $200,000 4.60% 8/8/2023 210,250 0.01%Syngenta Finance NV $200,000 4.44% 24/4/2023 208,528 0.01%Sunrise Cayman Ltd. $200,000 5.25% 11/3/2024 208,186 0.01%Sinopec Group Overseas Development 2012 Ltd. $200,000 3.90% 17/5/2022 207,302 0.01%CNPC General Capital Ltd. $200,000 3.95% 19/4/2022 207,290 0.01%CNOOC Finance 2012 Ltd. $200,000 3.88% 2/5/2022 206,787 0.01%Leading Affluence Ltd. $200,000 4.50% 24/1/2023 206,082 0.01%SDG Finance I Ltd. $200,000 5.25% 23/10/2021 205,566 0.01%China Overseas Grand Oceans Finance IV Cayman Ltd. $200,000 4.88% 1/6/2021 205,330 0.01%State Grid Overseas Investment 2013 Ltd. $200,000 3.13% 22/5/2023 204,535 0.01%Huarong Finance 2019 Co., Ltd. $200,000 3.75% 29/5/2024 204,456 0.01%Amber Circle Funding Ltd. $200,000 3.25% 4/12/2022 204,364 0.01%China Cinda Finance 2017 I Ltd. $200,000 3.65% 9/3/2022 204,138 0.01%Alibaba Group Holding Ltd. $200,000 3.13% 28/11/2021 203,888 0.01%China Huadian Overseas Development Management Co., Ltd.^ $200,000 4.00% Perpetual 203,714 0.01%Sinopec Capital 2013 Ltd. $200,000 3.13% 24/4/2023 203,456 0.01%CNAC HK Finbridge Co., Ltd. $200,000 4.13% 14/3/2021 203,302 0.01%Sinopec Group Overseas Development 2017 Ltd. $200,000 3.00% 12/4/2022 203,107 0.01%Syngenta Finance NV $200,000 3.93% 23/4/2021 203,011 0.01%CRCC Chengan Ltd.^ $200,000 3.97% Perpetual 202,750 0.01%Huarong Finance II Co., Ltd. $200,000 3.63% 22/11/2021 202,596 0.01%Chouzhou International Investment Ltd. $200,000 4.50% 30/5/2022 202,500 0.01%Voyage Bonds Ltd. $200,000 3.38% 28/9/2022 202,370 0.01%Bluestar Finance Holdings Ltd. $200,000 3.50% 30/9/2021 202,082 0.01%ICBCIL Finance Co., Ltd. $200,000 3.13% 15/11/2022 201,828 0.01%State Grid Overseas Investment 2016 Ltd. $200,000 2.75% 4/5/2022 201,694 0.01%China Development Bank $200,000 2.63% 24/1/2022 201,578 0.01%China Southern Power Grid International Finance BVI Co., Ltd. $200,000 2.75% 8/5/2022 201,340 0.01%CGNPC International Ltd. $200,000 2.75% 2/7/2024 201,156 0.01%China Minmetals Corp.^ $200,000 3.75% Perpetual 201,088 0.01%Sinopec Group Overseas Development 2017 Ltd. $200,000 2.50% 13/9/2022 201,066 0.01%JD.com, Inc. $200,000 3.13% 29/4/2021 200,971 0.01%Bank of China Ltd. $200,000 2.25% 12/7/2021 199,724 0.01%Charming Light Investments Ltd. $200,000 2.38% 30/8/2021 198,302 0.01%Caiyun International Investment Ltd. $200,000 5.50% 8/4/2022 197,000 0.01%Industrial & Commercial Bank of China Macau Ltd.^ $200,000 2.88% 12/9/2029 196,074 0.01%Chongqing Energy Investment Group Co., Ltd. $200,000 5.63% 18/3/2022 195,353 0.01%Bank of China Ltd. €120,000 0.50% 13/3/2022 135,625 0.01%ENN Energy Holdings Ltd. $100,000 6.00% 13/5/2021 104,160 0.00%
Vanguard Global Short-Term Bond Index Fund
642
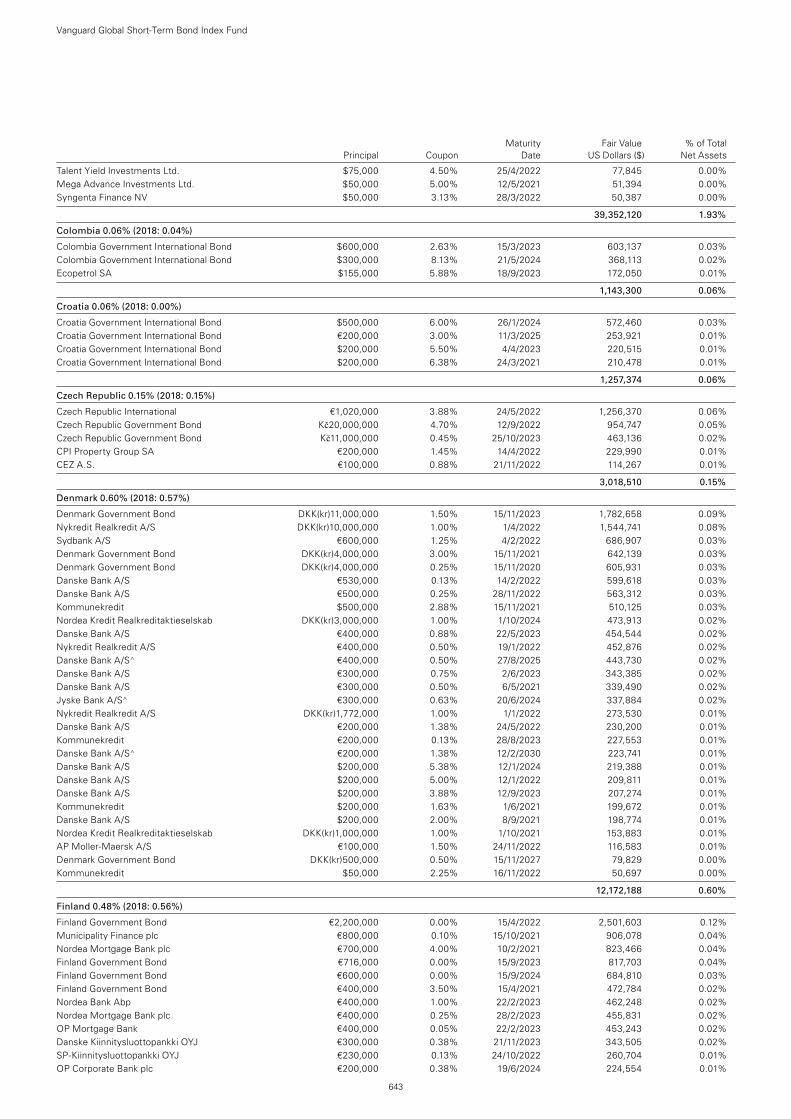
Maturity Fair Value % of Total Principal Coupon Date US Dollars ($) Net Assets
Talent Yield Investments Ltd. $75,000 4.50% 25/4/2022 77,845 0.00%Mega Advance Investments Ltd. $50,000 5.00% 12/5/2021 51,394 0.00%Syngenta Finance NV $50,000 3.13% 28/3/2022 50,387 0.00%
39,352,120 1.93%
Colombia 0.06% (2018: 0.04%)
Colombia Government International Bond $600,000 2.63% 15/3/2023 603,137 0.03%Colombia Government International Bond $300,000 8.13% 21/5/2024 368,113 0.02%Ecopetrol SA $155,000 5.88% 18/9/2023 172,050 0.01%
1,143,300 0.06%
Croatia 0.06% (2018: 0.00%)
Croatia Government International Bond $500,000 6.00% 26/1/2024 572,460 0.03%Croatia Government International Bond €200,000 3.00% 11/3/2025 253,921 0.01%Croatia Government International Bond $200,000 5.50% 4/4/2023 220,515 0.01%Croatia Government International Bond $200,000 6.38% 24/3/2021 210,478 0.01%
1,257,374 0.06%
Czech Republic 0.15% (2018: 0.15%)
Czech Republic International €1,020,000 3.88% 24/5/2022 1,256,370 0.06%Czech Republic Government Bond Kč20,000,000 4.70% 12/9/2022 954,747 0.05%Czech Republic Government Bond Kč11,000,000 0.45% 25/10/2023 463,136 0.02%CPI Property Group SA €200,000 1.45% 14/4/2022 229,990 0.01%CEZ A.S. €100,000 0.88% 21/11/2022 114,267 0.01%
3,018,510 0.15%
Denmark 0.60% (2018: 0.57%)
Denmark Government Bond DKK(kr)11,000,000 1.50% 15/11/2023 1,782,658 0.09%Nykredit Realkredit A/S DKK(kr)10,000,000 1.00% 1/4/2022 1,544,741 0.08%Sydbank A/S €600,000 1.25% 4/2/2022 686,907 0.03%Denmark Government Bond DKK(kr)4,000,000 3.00% 15/11/2021 642,139 0.03%Denmark Government Bond DKK(kr)4,000,000 0.25% 15/11/2020 605,931 0.03%Danske Bank A/S €530,000 0.13% 14/2/2022 599,618 0.03%Danske Bank A/S €500,000 0.25% 28/11/2022 563,312 0.03%Kommunekredit $500,000 2.88% 15/11/2021 510,125 0.03%Nordea Kredit Realkreditaktieselskab DKK(kr)3,000,000 1.00% 1/10/2024 473,913 0.02%Danske Bank A/S €400,000 0.88% 22/5/2023 454,544 0.02%Nykredit Realkredit A/S €400,000 0.50% 19/1/2022 452,876 0.02%Danske Bank A/S^ €400,000 0.50% 27/8/2025 443,730 0.02%Danske Bank A/S €300,000 0.75% 2/6/2023 343,385 0.02%Danske Bank A/S €300,000 0.50% 6/5/2021 339,490 0.02%Jyske Bank A/S^ €300,000 0.63% 20/6/2024 337,884 0.02%Nykredit Realkredit A/S DKK(kr)1,772,000 1.00% 1/1/2022 273,530 0.01%Danske Bank A/S €200,000 1.38% 24/5/2022 230,200 0.01%Kommunekredit €200,000 0.13% 28/8/2023 227,553 0.01%Danske Bank A/S^ €200,000 1.38% 12/2/2030 223,741 0.01%Danske Bank A/S $200,000 5.38% 12/1/2024 219,388 0.01%Danske Bank A/S $200,000 5.00% 12/1/2022 209,811 0.01%Danske Bank A/S $200,000 3.88% 12/9/2023 207,274 0.01%Kommunekredit $200,000 1.63% 1/6/2021 199,672 0.01%Danske Bank A/S $200,000 2.00% 8/9/2021 198,774 0.01%Nordea Kredit Realkreditaktieselskab DKK(kr)1,000,000 1.00% 1/10/2021 153,883 0.01%AP Moller-Maersk A/S €100,000 1.50% 24/11/2022 116,583 0.01%Denmark Government Bond DKK(kr)500,000 0.50% 15/11/2027 79,829 0.00%Kommunekredit $50,000 2.25% 16/11/2022 50,697 0.00%
12,172,188 0.60%
Finland 0.48% (2018: 0.56%)
Finland Government Bond €2,200,000 0.00% 15/4/2022 2,501,603 0.12%Municipality Finance plc €800,000 0.10% 15/10/2021 906,078 0.04%Nordea Mortgage Bank plc €700,000 4.00% 10/2/2021 823,466 0.04%Finland Government Bond €716,000 0.00% 15/9/2023 817,703 0.04%Finland Government Bond €600,000 0.00% 15/9/2024 684,810 0.03%Finland Government Bond €400,000 3.50% 15/4/2021 472,784 0.02%Nordea Bank Abp €400,000 1.00% 22/2/2023 462,248 0.02%Nordea Mortgage Bank plc €400,000 0.25% 28/2/2023 455,831 0.02%OP Mortgage Bank €400,000 0.05% 22/2/2023 453,243 0.02%Danske Kiinnitysluottopankki OYJ €300,000 0.38% 21/11/2023 343,505 0.02%SP-Kiinnitysluottopankki OYJ €230,000 0.13% 24/10/2022 260,704 0.01%OP Corporate Bank plc €200,000 0.38% 19/6/2024 224,554 0.01%
Vanguard Global Short-Term Bond Index Fund
643
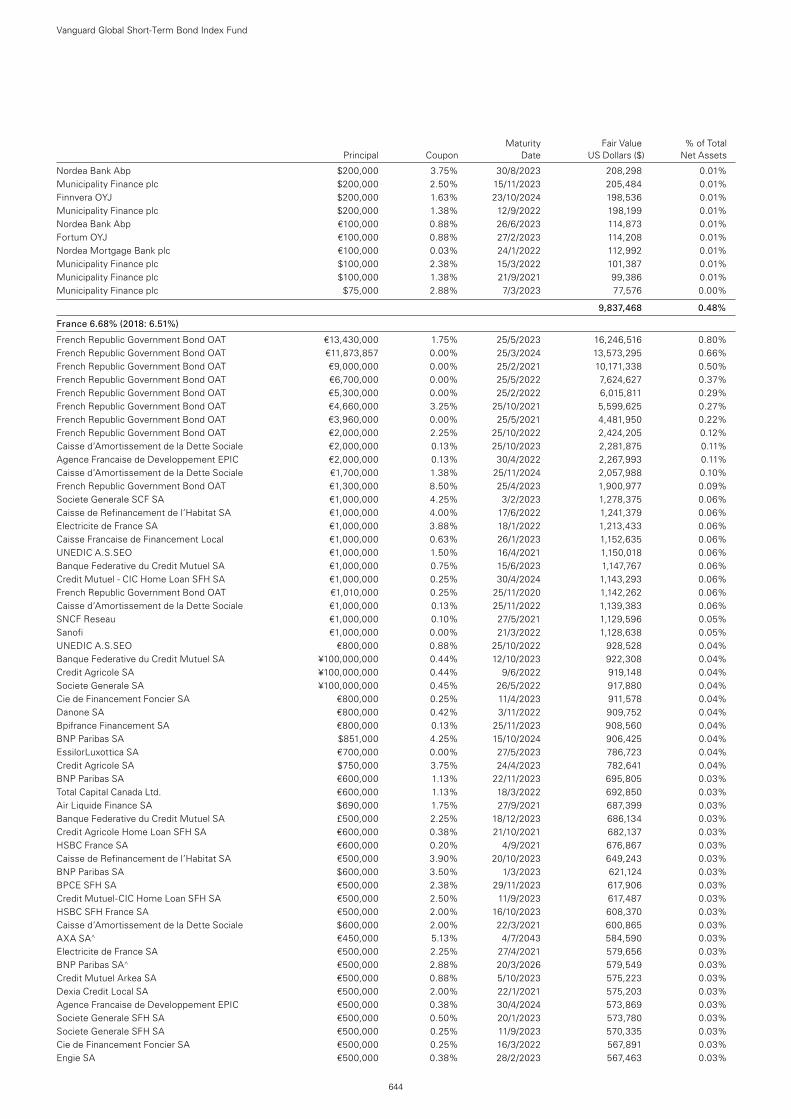
Maturity Fair Value % of Total Principal Coupon Date US Dollars ($) Net Assets
Nordea Bank Abp $200,000 3.75% 30/8/2023 208,298 0.01%Municipality Finance plc $200,000 2.50% 15/11/2023 205,484 0.01%Finnvera OYJ $200,000 1.63% 23/10/2024 198,536 0.01%Municipality Finance plc $200,000 1.38% 12/9/2022 198,199 0.01%Nordea Bank Abp €100,000 0.88% 26/6/2023 114,873 0.01%Fortum OYJ €100,000 0.88% 27/2/2023 114,208 0.01%Nordea Mortgage Bank plc €100,000 0.03% 24/1/2022 112,992 0.01%Municipality Finance plc $100,000 2.38% 15/3/2022 101,387 0.01%Municipality Finance plc $100,000 1.38% 21/9/2021 99,386 0.01%Municipality Finance plc $75,000 2.88% 7/3/2023 77,576 0.00%
9,837,468 0.48%
France 6.68% (2018: 6.51%)
French Republic Government Bond OAT €13,430,000 1.75% 25/5/2023 16,246,516 0.80%French Republic Government Bond OAT €11,873,857 0.00% 25/3/2024 13,573,295 0.66%French Republic Government Bond OAT €9,000,000 0.00% 25/2/2021 10,171,338 0.50%French Republic Government Bond OAT €6,700,000 0.00% 25/5/2022 7,624,627 0.37%French Republic Government Bond OAT €5,300,000 0.00% 25/2/2022 6,015,811 0.29%French Republic Government Bond OAT €4,660,000 3.25% 25/10/2021 5,599,625 0.27%French Republic Government Bond OAT €3,960,000 0.00% 25/5/2021 4,481,950 0.22%French Republic Government Bond OAT €2,000,000 2.25% 25/10/2022 2,424,205 0.12%Caisse d’Amortissement de la Dette Sociale €2,000,000 0.13% 25/10/2023 2,281,875 0.11%Agence Francaise de Developpement EPIC €2,000,000 0.13% 30/4/2022 2,267,993 0.11%Caisse d’Amortissement de la Dette Sociale €1,700,000 1.38% 25/11/2024 2,057,988 0.10%French Republic Government Bond OAT €1,300,000 8.50% 25/4/2023 1,900,977 0.09%Societe Generale SCF SA €1,000,000 4.25% 3/2/2023 1,278,375 0.06%Caisse de Refinancement de l’Habitat SA €1,000,000 4.00% 17/6/2022 1,241,379 0.06%Electricite de France SA €1,000,000 3.88% 18/1/2022 1,213,433 0.06%Caisse Francaise de Financement Local €1,000,000 0.63% 26/1/2023 1,152,635 0.06%UNEDIC A.S.SEO €1,000,000 1.50% 16/4/2021 1,150,018 0.06%Banque Federative du Credit Mutuel SA €1,000,000 0.75% 15/6/2023 1,147,767 0.06%Credit Mutuel - CIC Home Loan SFH SA €1,000,000 0.25% 30/4/2024 1,143,293 0.06%French Republic Government Bond OAT €1,010,000 0.25% 25/11/2020 1,142,262 0.06%Caisse d’Amortissement de la Dette Sociale €1,000,000 0.13% 25/11/2022 1,139,383 0.06%SNCF Reseau €1,000,000 0.10% 27/5/2021 1,129,596 0.05%Sanofi €1,000,000 0.00% 21/3/2022 1,128,638 0.05%UNEDIC A.S.SEO €800,000 0.88% 25/10/2022 928,528 0.04%Banque Federative du Credit Mutuel SA ¥100,000,000 0.44% 12/10/2023 922,308 0.04%Credit Agricole SA ¥100,000,000 0.44% 9/6/2022 919,148 0.04%Societe Generale SA ¥100,000,000 0.45% 26/5/2022 917,880 0.04%Cie de Financement Foncier SA €800,000 0.25% 11/4/2023 911,578 0.04%Danone SA €800,000 0.42% 3/11/2022 909,752 0.04%Bpifrance Financement SA €800,000 0.13% 25/11/2023 908,560 0.04%BNP Paribas SA $851,000 4.25% 15/10/2024 906,425 0.04%EssilorLuxottica SA €700,000 0.00% 27/5/2023 786,723 0.04%Credit Agricole SA $750,000 3.75% 24/4/2023 782,641 0.04%BNP Paribas SA €600,000 1.13% 22/11/2023 695,805 0.03%Total Capital Canada Ltd. €600,000 1.13% 18/3/2022 692,850 0.03%Air Liquide Finance SA $690,000 1.75% 27/9/2021 687,399 0.03%Banque Federative du Credit Mutuel SA £500,000 2.25% 18/12/2023 686,134 0.03%Credit Agricole Home Loan SFH SA €600,000 0.38% 21/10/2021 682,137 0.03%HSBC France SA €600,000 0.20% 4/9/2021 676,867 0.03%Caisse de Refinancement de l’Habitat SA €500,000 3.90% 20/10/2023 649,243 0.03%BNP Paribas SA $600,000 3.50% 1/3/2023 621,124 0.03%BPCE SFH SA €500,000 2.38% 29/11/2023 617,906 0.03%Credit Mutuel-CIC Home Loan SFH SA €500,000 2.50% 11/9/2023 617,487 0.03%HSBC SFH France SA €500,000 2.00% 16/10/2023 608,370 0.03%Caisse d’Amortissement de la Dette Sociale $600,000 2.00% 22/3/2021 600,865 0.03%AXA SA^ €450,000 5.13% 4/7/2043 584,590 0.03%Electricite de France SA €500,000 2.25% 27/4/2021 579,656 0.03%BNP Paribas SA^ €500,000 2.88% 20/3/2026 579,549 0.03%Credit Mutuel Arkea SA €500,000 0.88% 5/10/2023 575,223 0.03%Dexia Credit Local SA €500,000 2.00% 22/1/2021 575,203 0.03%Agence Francaise de Developpement EPIC €500,000 0.38% 30/4/2024 573,869 0.03%Societe Generale SFH SA €500,000 0.50% 20/1/2023 573,780 0.03%Societe Generale SFH SA €500,000 0.25% 11/9/2023 570,335 0.03%Cie de Financement Foncier SA €500,000 0.25% 16/3/2022 567,891 0.03%Engie SA €500,000 0.38% 28/2/2023 567,463 0.03%
Vanguard Global Short-Term Bond Index Fund
644
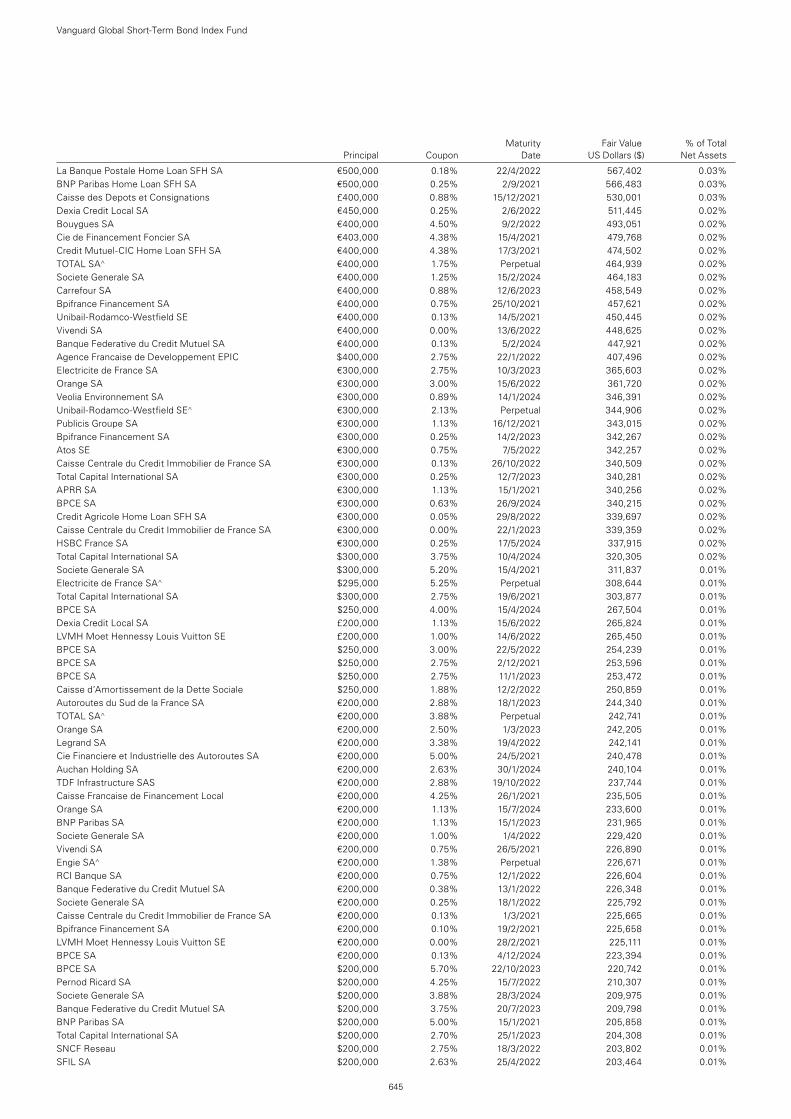
Maturity Fair Value % of Total Principal Coupon Date US Dollars ($) Net Assets
La Banque Postale Home Loan SFH SA €500,000 0.18% 22/4/2022 567,402 0.03%BNP Paribas Home Loan SFH SA €500,000 0.25% 2/9/2021 566,483 0.03%Caisse des Depots et Consignations £400,000 0.88% 15/12/2021 530,001 0.03%Dexia Credit Local SA €450,000 0.25% 2/6/2022 511,445 0.02%Bouygues SA €400,000 4.50% 9/2/2022 493,051 0.02%Cie de Financement Foncier SA €403,000 4.38% 15/4/2021 479,768 0.02%Credit Mutuel-CIC Home Loan SFH SA €400,000 4.38% 17/3/2021 474,502 0.02%TOTAL SA^ €400,000 1.75% Perpetual 464,939 0.02%Societe Generale SA €400,000 1.25% 15/2/2024 464,183 0.02%Carrefour SA €400,000 0.88% 12/6/2023 458,549 0.02%Bpifrance Financement SA €400,000 0.75% 25/10/2021 457,621 0.02%Unibail-Rodamco-Westfield SE €400,000 0.13% 14/5/2021 450,445 0.02%Vivendi SA €400,000 0.00% 13/6/2022 448,625 0.02%Banque Federative du Credit Mutuel SA €400,000 0.13% 5/2/2024 447,921 0.02%Agence Francaise de Developpement EPIC $400,000 2.75% 22/1/2022 407,496 0.02%Electricite de France SA €300,000 2.75% 10/3/2023 365,603 0.02%Orange SA €300,000 3.00% 15/6/2022 361,720 0.02%Veolia Environnement SA €300,000 0.89% 14/1/2024 346,391 0.02%Unibail-Rodamco-Westfield SE^ €300,000 2.13% Perpetual 344,906 0.02%Publicis Groupe SA €300,000 1.13% 16/12/2021 343,015 0.02%Bpifrance Financement SA €300,000 0.25% 14/2/2023 342,267 0.02%Atos SE €300,000 0.75% 7/5/2022 342,257 0.02%Caisse Centrale du Credit Immobilier de France SA €300,000 0.13% 26/10/2022 340,509 0.02%Total Capital International SA €300,000 0.25% 12/7/2023 340,281 0.02%APRR SA €300,000 1.13% 15/1/2021 340,256 0.02%BPCE SA €300,000 0.63% 26/9/2024 340,215 0.02%Credit Agricole Home Loan SFH SA €300,000 0.05% 29/8/2022 339,697 0.02%Caisse Centrale du Credit Immobilier de France SA €300,000 0.00% 22/1/2023 339,359 0.02%HSBC France SA €300,000 0.25% 17/5/2024 337,915 0.02%Total Capital International SA $300,000 3.75% 10/4/2024 320,305 0.02%Societe Generale SA $300,000 5.20% 15/4/2021 311,837 0.01%Electricite de France SA^ $295,000 5.25% Perpetual 308,644 0.01%Total Capital International SA $300,000 2.75% 19/6/2021 303,877 0.01%BPCE SA $250,000 4.00% 15/4/2024 267,504 0.01%Dexia Credit Local SA £200,000 1.13% 15/6/2022 265,824 0.01%LVMH Moet Hennessy Louis Vuitton SE £200,000 1.00% 14/6/2022 265,450 0.01%BPCE SA $250,000 3.00% 22/5/2022 254,239 0.01%BPCE SA $250,000 2.75% 2/12/2021 253,596 0.01%BPCE SA $250,000 2.75% 11/1/2023 253,472 0.01%Caisse d’Amortissement de la Dette Sociale $250,000 1.88% 12/2/2022 250,859 0.01%Autoroutes du Sud de la France SA €200,000 2.88% 18/1/2023 244,340 0.01%TOTAL SA^ €200,000 3.88% Perpetual 242,741 0.01%Orange SA €200,000 2.50% 1/3/2023 242,205 0.01%Legrand SA €200,000 3.38% 19/4/2022 242,141 0.01%Cie Financiere et Industrielle des Autoroutes SA €200,000 5.00% 24/5/2021 240,478 0.01%Auchan Holding SA €200,000 2.63% 30/1/2024 240,104 0.01%TDF Infrastructure SAS €200,000 2.88% 19/10/2022 237,744 0.01%Caisse Francaise de Financement Local €200,000 4.25% 26/1/2021 235,505 0.01%Orange SA €200,000 1.13% 15/7/2024 233,600 0.01%BNP Paribas SA €200,000 1.13% 15/1/2023 231,965 0.01%Societe Generale SA €200,000 1.00% 1/4/2022 229,420 0.01%Vivendi SA €200,000 0.75% 26/5/2021 226,890 0.01%Engie SA^ €200,000 1.38% Perpetual 226,671 0.01%RCI Banque SA €200,000 0.75% 12/1/2022 226,604 0.01%Banque Federative du Credit Mutuel SA €200,000 0.38% 13/1/2022 226,348 0.01%Societe Generale SA €200,000 0.25% 18/1/2022 225,792 0.01%Caisse Centrale du Credit Immobilier de France SA €200,000 0.13% 1/3/2021 225,665 0.01%Bpifrance Financement SA €200,000 0.10% 19/2/2021 225,658 0.01%LVMH Moet Hennessy Louis Vuitton SE €200,000 0.00% 28/2/2021 225,111 0.01%BPCE SA €200,000 0.13% 4/12/2024 223,394 0.01%BPCE SA $200,000 5.70% 22/10/2023 220,742 0.01%Pernod Ricard SA $200,000 4.25% 15/7/2022 210,307 0.01%Societe Generale SA $200,000 3.88% 28/3/2024 209,975 0.01%Banque Federative du Credit Mutuel SA $200,000 3.75% 20/7/2023 209,798 0.01%BNP Paribas SA $200,000 5.00% 15/1/2021 205,858 0.01%Total Capital International SA $200,000 2.70% 25/1/2023 204,308 0.01%SNCF Reseau $200,000 2.75% 18/3/2022 203,802 0.01%SFIL SA $200,000 2.63% 25/4/2022 203,464 0.01%
Vanguard Global Short-Term Bond Index Fund
645
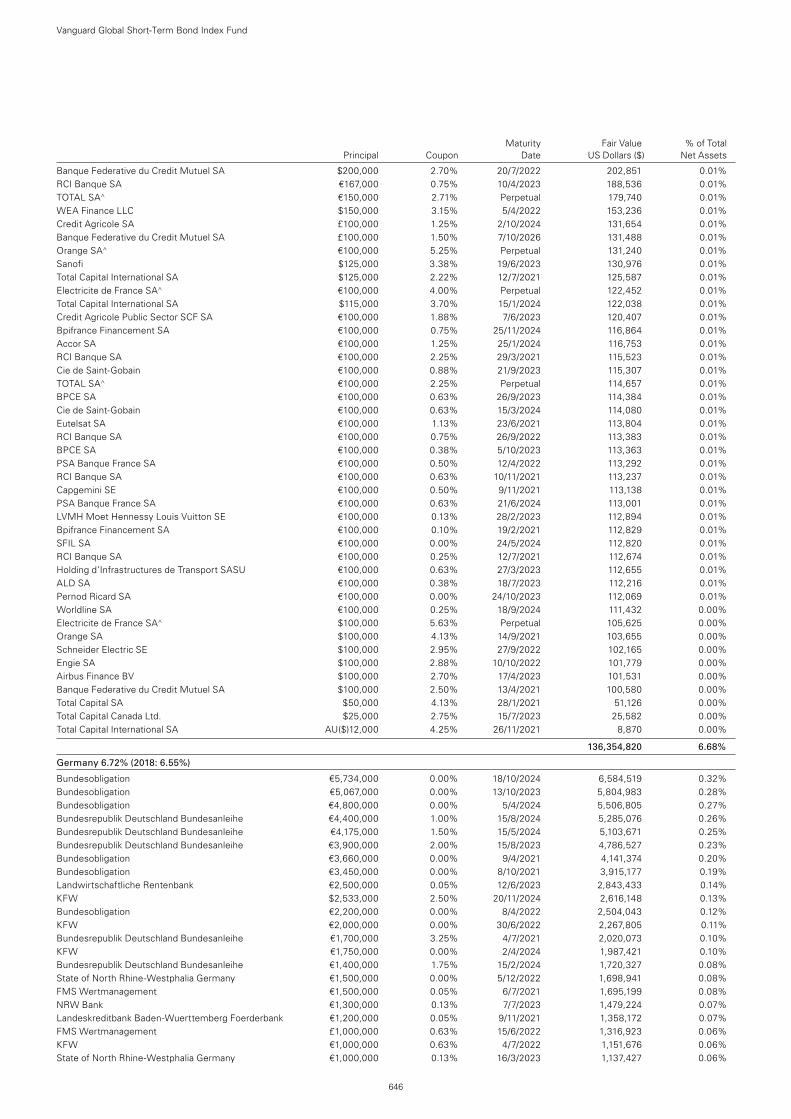
Maturity Fair Value % of Total Principal Coupon Date US Dollars ($) Net Assets
Banque Federative du Credit Mutuel SA $200,000 2.70% 20/7/2022 202,851 0.01%RCI Banque SA €167,000 0.75% 10/4/2023 188,536 0.01%TOTAL SA^ €150,000 2.71% Perpetual 179,740 0.01%WEA Finance LLC $150,000 3.15% 5/4/2022 153,236 0.01%Credit Agricole SA £100,000 1.25% 2/10/2024 131,654 0.01%Banque Federative du Credit Mutuel SA £100,000 1.50% 7/10/2026 131,488 0.01%Orange SA^ €100,000 5.25% Perpetual 131,240 0.01%Sanofi $125,000 3.38% 19/6/2023 130,976 0.01%Total Capital International SA $125,000 2.22% 12/7/2021 125,587 0.01%Electricite de France SA^ €100,000 4.00% Perpetual 122,452 0.01%Total Capital International SA $115,000 3.70% 15/1/2024 122,038 0.01%Credit Agricole Public Sector SCF SA €100,000 1.88% 7/6/2023 120,407 0.01%Bpifrance Financement SA €100,000 0.75% 25/11/2024 116,864 0.01%Accor SA €100,000 1.25% 25/1/2024 116,753 0.01%RCI Banque SA €100,000 2.25% 29/3/2021 115,523 0.01%Cie de Saint-Gobain €100,000 0.88% 21/9/2023 115,307 0.01%TOTAL SA^ €100,000 2.25% Perpetual 114,657 0.01%BPCE SA €100,000 0.63% 26/9/2023 114,384 0.01%Cie de Saint-Gobain €100,000 0.63% 15/3/2024 114,080 0.01%Eutelsat SA €100,000 1.13% 23/6/2021 113,804 0.01%RCI Banque SA €100,000 0.75% 26/9/2022 113,383 0.01%BPCE SA €100,000 0.38% 5/10/2023 113,363 0.01%PSA Banque France SA €100,000 0.50% 12/4/2022 113,292 0.01%RCI Banque SA €100,000 0.63% 10/11/2021 113,237 0.01%Capgemini SE €100,000 0.50% 9/11/2021 113,138 0.01%PSA Banque France SA €100,000 0.63% 21/6/2024 113,001 0.01%LVMH Moet Hennessy Louis Vuitton SE €100,000 0.13% 28/2/2023 112,894 0.01%Bpifrance Financement SA €100,000 0.10% 19/2/2021 112,829 0.01%SFIL SA €100,000 0.00% 24/5/2024 112,820 0.01%RCI Banque SA €100,000 0.25% 12/7/2021 112,674 0.01%Holding d’Infrastructures de Transport SASU €100,000 0.63% 27/3/2023 112,655 0.01%ALD SA €100,000 0.38% 18/7/2023 112,216 0.01%Pernod Ricard SA €100,000 0.00% 24/10/2023 112,069 0.01%Worldline SA €100,000 0.25% 18/9/2024 111,432 0.00%Electricite de France SA^ $100,000 5.63% Perpetual 105,625 0.00%Orange SA $100,000 4.13% 14/9/2021 103,655 0.00%Schneider Electric SE $100,000 2.95% 27/9/2022 102,165 0.00%Engie SA $100,000 2.88% 10/10/2022 101,779 0.00%Airbus Finance BV $100,000 2.70% 17/4/2023 101,531 0.00%Banque Federative du Credit Mutuel SA $100,000 2.50% 13/4/2021 100,580 0.00%Total Capital SA $50,000 4.13% 28/1/2021 51,126 0.00%Total Capital Canada Ltd. $25,000 2.75% 15/7/2023 25,582 0.00%Total Capital International SA AU($)12,000 4.25% 26/11/2021 8,870 0.00%
136,354,820 6.68%
Germany 6.72% (2018: 6.55%)
Bundesobligation €5,734,000 0.00% 18/10/2024 6,584,519 0.32%Bundesobligation €5,067,000 0.00% 13/10/2023 5,804,983 0.28%Bundesobligation €4,800,000 0.00% 5/4/2024 5,506,805 0.27%Bundesrepublik Deutschland Bundesanleihe €4,400,000 1.00% 15/8/2024 5,285,076 0.26%Bundesrepublik Deutschland Bundesanleihe €4,175,000 1.50% 15/5/2024 5,103,671 0.25%Bundesrepublik Deutschland Bundesanleihe €3,900,000 2.00% 15/8/2023 4,786,527 0.23%Bundesobligation €3,660,000 0.00% 9/4/2021 4,141,374 0.20%Bundesobligation €3,450,000 0.00% 8/10/2021 3,915,177 0.19%Landwirtschaftliche Rentenbank €2,500,000 0.05% 12/6/2023 2,843,433 0.14%KFW $2,533,000 2.50% 20/11/2024 2,616,148 0.13%Bundesobligation €2,200,000 0.00% 8/4/2022 2,504,043 0.12%KFW €2,000,000 0.00% 30/6/2022 2,267,805 0.11%Bundesrepublik Deutschland Bundesanleihe €1,700,000 3.25% 4/7/2021 2,020,073 0.10%KFW €1,750,000 0.00% 2/4/2024 1,987,421 0.10%Bundesrepublik Deutschland Bundesanleihe €1,400,000 1.75% 15/2/2024 1,720,327 0.08%State of North Rhine-Westphalia Germany €1,500,000 0.00% 5/12/2022 1,698,941 0.08%FMS Wertmanagement €1,500,000 0.05% 6/7/2021 1,695,199 0.08%NRW Bank €1,300,000 0.13% 7/7/2023 1,479,224 0.07%Landeskreditbank Baden-Wuerttemberg Foerderbank €1,200,000 0.05% 9/11/2021 1,358,172 0.07%FMS Wertmanagement £1,000,000 0.63% 15/6/2022 1,316,923 0.06%KFW €1,000,000 0.63% 4/7/2022 1,151,676 0.06%State of North Rhine-Westphalia Germany €1,000,000 0.13% 16/3/2023 1,137,427 0.06%
Vanguard Global Short-Term Bond Index Fund
646
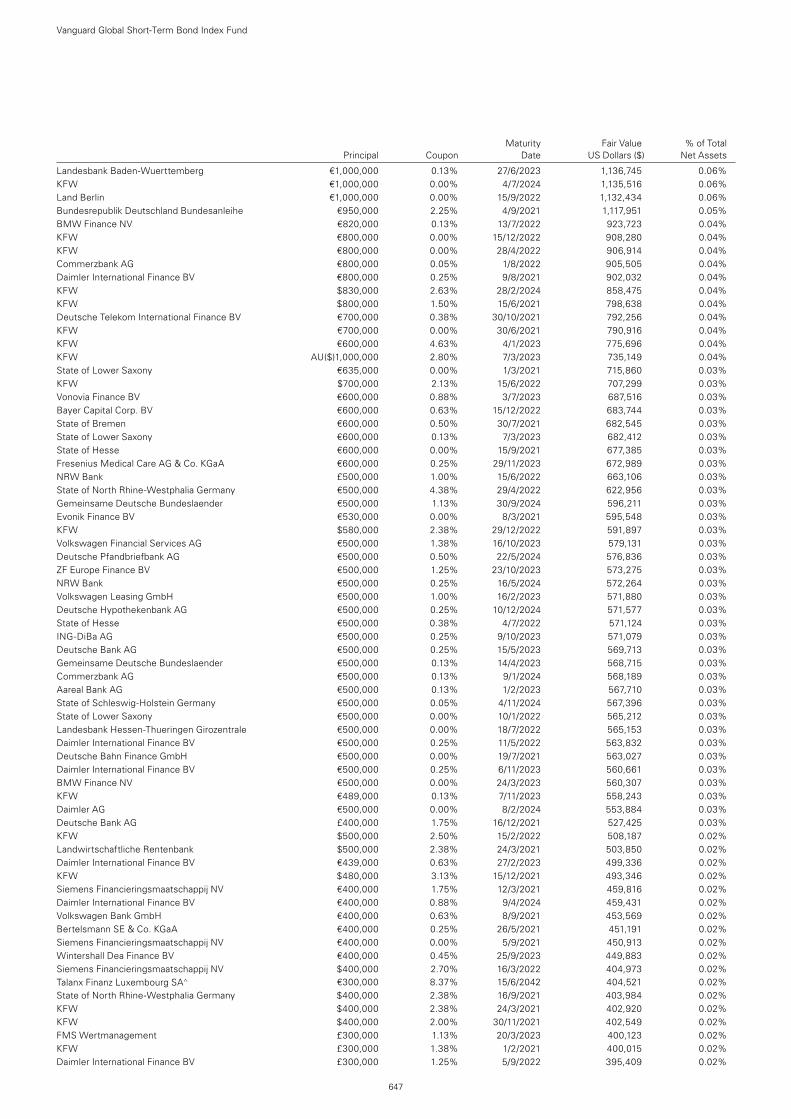
Maturity Fair Value % of Total Principal Coupon Date US Dollars ($) Net Assets
Landesbank Baden-Wuerttemberg €1,000,000 0.13% 27/6/2023 1,136,745 0.06%KFW €1,000,000 0.00% 4/7/2024 1,135,516 0.06%Land Berlin €1,000,000 0.00% 15/9/2022 1,132,434 0.06%Bundesrepublik Deutschland Bundesanleihe €950,000 2.25% 4/9/2021 1,117,951 0.05%BMW Finance NV €820,000 0.13% 13/7/2022 923,723 0.04%KFW €800,000 0.00% 15/12/2022 908,280 0.04%KFW €800,000 0.00% 28/4/2022 906,914 0.04%Commerzbank AG €800,000 0.05% 1/8/2022 905,505 0.04%Daimler International Finance BV €800,000 0.25% 9/8/2021 902,032 0.04%KFW $830,000 2.63% 28/2/2024 858,475 0.04%KFW $800,000 1.50% 15/6/2021 798,638 0.04%Deutsche Telekom International Finance BV €700,000 0.38% 30/10/2021 792,256 0.04%KFW €700,000 0.00% 30/6/2021 790,916 0.04%KFW €600,000 4.63% 4/1/2023 775,696 0.04%KFW AU($)1,000,000 2.80% 7/3/2023 735,149 0.04%State of Lower Saxony €635,000 0.00% 1/3/2021 715,860 0.03%KFW $700,000 2.13% 15/6/2022 707,299 0.03%Vonovia Finance BV €600,000 0.88% 3/7/2023 687,516 0.03%Bayer Capital Corp. BV €600,000 0.63% 15/12/2022 683,744 0.03%State of Bremen €600,000 0.50% 30/7/2021 682,545 0.03%State of Lower Saxony €600,000 0.13% 7/3/2023 682,412 0.03%State of Hesse €600,000 0.00% 15/9/2021 677,385 0.03%Fresenius Medical Care AG & Co. KGaA €600,000 0.25% 29/11/2023 672,989 0.03%NRW Bank £500,000 1.00% 15/6/2022 663,106 0.03%State of North Rhine-Westphalia Germany €500,000 4.38% 29/4/2022 622,956 0.03%Gemeinsame Deutsche Bundeslaender €500,000 1.13% 30/9/2024 596,211 0.03%Evonik Finance BV €530,000 0.00% 8/3/2021 595,548 0.03%KFW $580,000 2.38% 29/12/2022 591,897 0.03%Volkswagen Financial Services AG €500,000 1.38% 16/10/2023 579,131 0.03%Deutsche Pfandbriefbank AG €500,000 0.50% 22/5/2024 576,836 0.03%ZF Europe Finance BV €500,000 1.25% 23/10/2023 573,275 0.03%NRW Bank €500,000 0.25% 16/5/2024 572,264 0.03%Volkswagen Leasing GmbH €500,000 1.00% 16/2/2023 571,880 0.03%Deutsche Hypothekenbank AG €500,000 0.25% 10/12/2024 571,577 0.03%State of Hesse €500,000 0.38% 4/7/2022 571,124 0.03%ING-DiBa AG €500,000 0.25% 9/10/2023 571,079 0.03%Deutsche Bank AG €500,000 0.25% 15/5/2023 569,713 0.03%Gemeinsame Deutsche Bundeslaender €500,000 0.13% 14/4/2023 568,715 0.03%Commerzbank AG €500,000 0.13% 9/1/2024 568,189 0.03%Aareal Bank AG €500,000 0.13% 1/2/2023 567,710 0.03%State of Schleswig-Holstein Germany €500,000 0.05% 4/11/2024 567,396 0.03%State of Lower Saxony €500,000 0.00% 10/1/2022 565,212 0.03%Landesbank Hessen-Thueringen Girozentrale €500,000 0.00% 18/7/2022 565,153 0.03%Daimler International Finance BV €500,000 0.25% 11/5/2022 563,832 0.03%Deutsche Bahn Finance GmbH €500,000 0.00% 19/7/2021 563,027 0.03%Daimler International Finance BV €500,000 0.25% 6/11/2023 560,661 0.03%BMW Finance NV €500,000 0.00% 24/3/2023 560,307 0.03%KFW €489,000 0.13% 7/11/2023 558,243 0.03%Daimler AG €500,000 0.00% 8/2/2024 553,884 0.03%Deutsche Bank AG £400,000 1.75% 16/12/2021 527,425 0.03%KFW $500,000 2.50% 15/2/2022 508,187 0.02%Landwirtschaftliche Rentenbank $500,000 2.38% 24/3/2021 503,850 0.02%Daimler International Finance BV €439,000 0.63% 27/2/2023 499,336 0.02%KFW $480,000 3.13% 15/12/2021 493,346 0.02%Siemens Financieringsmaatschappij NV €400,000 1.75% 12/3/2021 459,816 0.02%Daimler International Finance BV €400,000 0.88% 9/4/2024 459,431 0.02%Volkswagen Bank GmbH €400,000 0.63% 8/9/2021 453,569 0.02%Bertelsmann SE & Co. KGaA €400,000 0.25% 26/5/2021 451,191 0.02%Siemens Financieringsmaatschappij NV €400,000 0.00% 5/9/2021 450,913 0.02%Wintershall Dea Finance BV €400,000 0.45% 25/9/2023 449,883 0.02%Siemens Financieringsmaatschappij NV $400,000 2.70% 16/3/2022 404,973 0.02%Talanx Finanz Luxembourg SA^ €300,000 8.37% 15/6/2042 404,521 0.02%State of North Rhine-Westphalia Germany $400,000 2.38% 16/9/2021 403,984 0.02%KFW $400,000 2.38% 24/3/2021 402,920 0.02%KFW $400,000 2.00% 30/11/2021 402,549 0.02%FMS Wertmanagement £300,000 1.13% 20/3/2023 400,123 0.02%KFW £300,000 1.38% 1/2/2021 400,015 0.02%Daimler International Finance BV £300,000 1.25% 5/9/2022 395,409 0.02%
Vanguard Global Short-Term Bond Index Fund
647
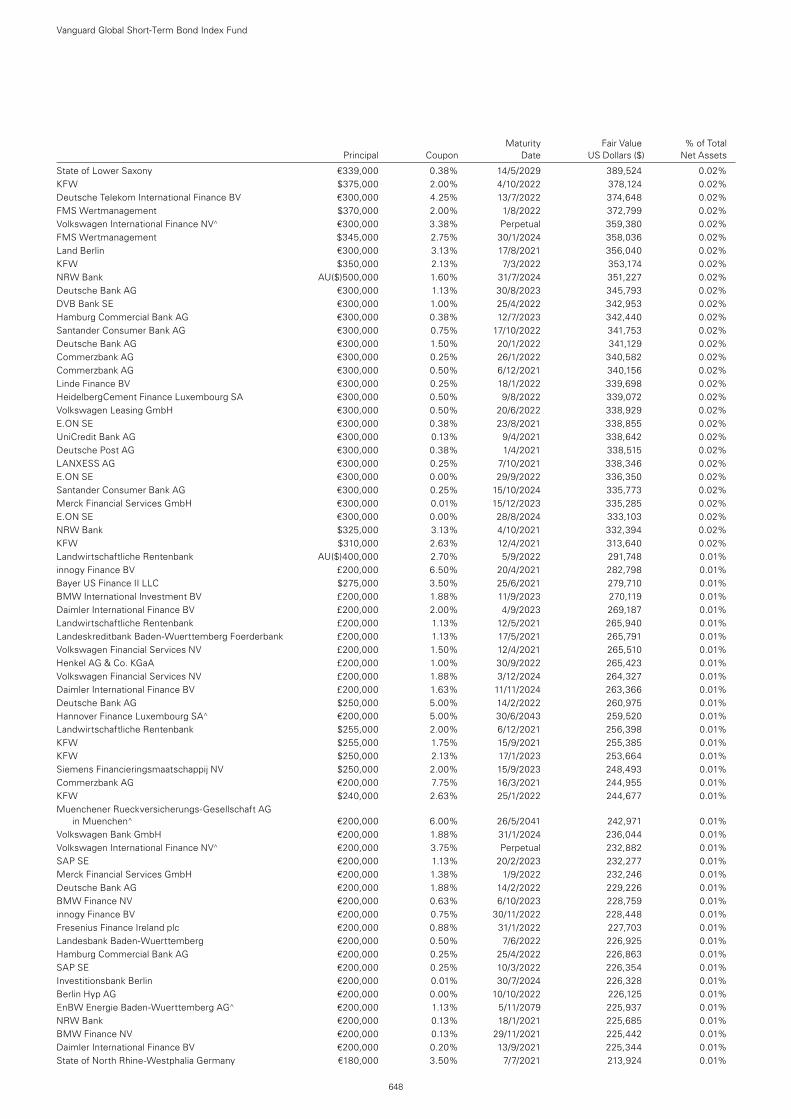
Maturity Fair Value % of Total Principal Coupon Date US Dollars ($) Net Assets
State of Lower Saxony €339,000 0.38% 14/5/2029 389,524 0.02%KFW $375,000 2.00% 4/10/2022 378,124 0.02%Deutsche Telekom International Finance BV €300,000 4.25% 13/7/2022 374,648 0.02%FMS Wertmanagement $370,000 2.00% 1/8/2022 372,799 0.02%Volkswagen International Finance NV^ €300,000 3.38% Perpetual 359,380 0.02%FMS Wertmanagement $345,000 2.75% 30/1/2024 358,036 0.02%Land Berlin €300,000 3.13% 17/8/2021 356,040 0.02%KFW $350,000 2.13% 7/3/2022 353,174 0.02%NRW Bank AU($)500,000 1.60% 31/7/2024 351,227 0.02%Deutsche Bank AG €300,000 1.13% 30/8/2023 345,793 0.02%DVB Bank SE €300,000 1.00% 25/4/2022 342,953 0.02%Hamburg Commercial Bank AG €300,000 0.38% 12/7/2023 342,440 0.02%Santander Consumer Bank AG €300,000 0.75% 17/10/2022 341,753 0.02%Deutsche Bank AG €300,000 1.50% 20/1/2022 341,129 0.02%Commerzbank AG €300,000 0.25% 26/1/2022 340,582 0.02%Commerzbank AG €300,000 0.50% 6/12/2021 340,156 0.02%Linde Finance BV €300,000 0.25% 18/1/2022 339,698 0.02%HeidelbergCement Finance Luxembourg SA €300,000 0.50% 9/8/2022 339,072 0.02%Volkswagen Leasing GmbH €300,000 0.50% 20/6/2022 338,929 0.02%E.ON SE €300,000 0.38% 23/8/2021 338,855 0.02%UniCredit Bank AG €300,000 0.13% 9/4/2021 338,642 0.02%Deutsche Post AG €300,000 0.38% 1/4/2021 338,515 0.02%LANXESS AG €300,000 0.25% 7/10/2021 338,346 0.02%E.ON SE €300,000 0.00% 29/9/2022 336,350 0.02%Santander Consumer Bank AG €300,000 0.25% 15/10/2024 335,773 0.02%Merck Financial Services GmbH €300,000 0.01% 15/12/2023 335,285 0.02%E.ON SE €300,000 0.00% 28/8/2024 333,103 0.02%NRW Bank $325,000 3.13% 4/10/2021 332,394 0.02%KFW $310,000 2.63% 12/4/2021 313,640 0.02%Landwirtschaftliche Rentenbank AU($)400,000 2.70% 5/9/2022 291,748 0.01%innogy Finance BV £200,000 6.50% 20/4/2021 282,798 0.01%Bayer US Finance II LLC $275,000 3.50% 25/6/2021 279,710 0.01%BMW International Investment BV £200,000 1.88% 11/9/2023 270,119 0.01%Daimler International Finance BV £200,000 2.00% 4/9/2023 269,187 0.01%Landwirtschaftliche Rentenbank £200,000 1.13% 12/5/2021 265,940 0.01%Landeskreditbank Baden-Wuerttemberg Foerderbank £200,000 1.13% 17/5/2021 265,791 0.01%Volkswagen Financial Services NV £200,000 1.50% 12/4/2021 265,510 0.01%Henkel AG & Co. KGaA £200,000 1.00% 30/9/2022 265,423 0.01%Volkswagen Financial Services NV £200,000 1.88% 3/12/2024 264,327 0.01%Daimler International Finance BV £200,000 1.63% 11/11/2024 263,366 0.01%Deutsche Bank AG $250,000 5.00% 14/2/2022 260,975 0.01%Hannover Finance Luxembourg SA^ €200,000 5.00% 30/6/2043 259,520 0.01%Landwirtschaftliche Rentenbank $255,000 2.00% 6/12/2021 256,398 0.01%KFW $255,000 1.75% 15/9/2021 255,385 0.01%KFW $250,000 2.13% 17/1/2023 253,664 0.01%Siemens Financieringsmaatschappij NV $250,000 2.00% 15/9/2023 248,493 0.01%Commerzbank AG €200,000 7.75% 16/3/2021 244,955 0.01%KFW $240,000 2.63% 25/1/2022 244,677 0.01%Muenchener Rueckversicherungs-Gesellschaft AG
in Muenchen^ €200,000 6.00% 26/5/2041 242,971 0.01%Volkswagen Bank GmbH €200,000 1.88% 31/1/2024 236,044 0.01%Volkswagen International Finance NV^ €200,000 3.75% Perpetual 232,882 0.01%SAP SE €200,000 1.13% 20/2/2023 232,277 0.01%Merck Financial Services GmbH €200,000 1.38% 1/9/2022 232,246 0.01%Deutsche Bank AG €200,000 1.88% 14/2/2022 229,226 0.01%BMW Finance NV €200,000 0.63% 6/10/2023 228,759 0.01%innogy Finance BV €200,000 0.75% 30/11/2022 228,448 0.01%Fresenius Finance Ireland plc €200,000 0.88% 31/1/2022 227,703 0.01%Landesbank Baden-Wuerttemberg €200,000 0.50% 7/6/2022 226,925 0.01%Hamburg Commercial Bank AG €200,000 0.25% 25/4/2022 226,863 0.01%SAP SE €200,000 0.25% 10/3/2022 226,354 0.01%Investitionsbank Berlin €200,000 0.01% 30/7/2024 226,328 0.01%Berlin Hyp AG €200,000 0.00% 10/10/2022 226,125 0.01%EnBW Energie Baden-Wuerttemberg AG^ €200,000 1.13% 5/11/2079 225,937 0.01%NRW Bank €200,000 0.13% 18/1/2021 225,685 0.01%BMW Finance NV €200,000 0.13% 29/11/2021 225,442 0.01%Daimler International Finance BV €200,000 0.20% 13/9/2021 225,344 0.01%State of North Rhine-Westphalia Germany €180,000 3.50% 7/7/2021 213,924 0.01%
Vanguard Global Short-Term Bond Index Fund
648
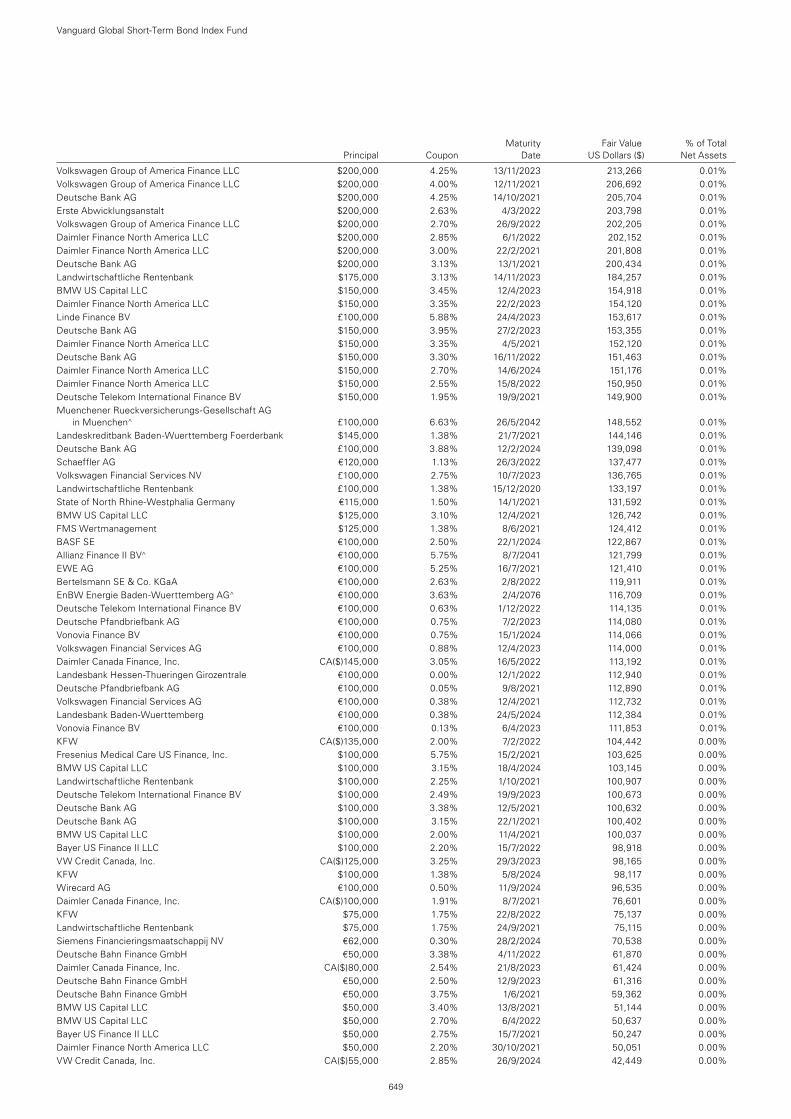
Maturity Fair Value % of Total Principal Coupon Date US Dollars ($) Net Assets
Volkswagen Group of America Finance LLC $200,000 4.25% 13/11/2023 213,266 0.01%Volkswagen Group of America Finance LLC $200,000 4.00% 12/11/2021 206,692 0.01%Deutsche Bank AG $200,000 4.25% 14/10/2021 205,704 0.01%Erste Abwicklungsanstalt $200,000 2.63% 4/3/2022 203,798 0.01%Volkswagen Group of America Finance LLC $200,000 2.70% 26/9/2022 202,205 0.01%Daimler Finance North America LLC $200,000 2.85% 6/1/2022 202,152 0.01%Daimler Finance North America LLC $200,000 3.00% 22/2/2021 201,808 0.01%Deutsche Bank AG $200,000 3.13% 13/1/2021 200,434 0.01%Landwirtschaftliche Rentenbank $175,000 3.13% 14/11/2023 184,257 0.01%BMW US Capital LLC $150,000 3.45% 12/4/2023 154,918 0.01%Daimler Finance North America LLC $150,000 3.35% 22/2/2023 154,120 0.01%Linde Finance BV £100,000 5.88% 24/4/2023 153,617 0.01%Deutsche Bank AG $150,000 3.95% 27/2/2023 153,355 0.01%Daimler Finance North America LLC $150,000 3.35% 4/5/2021 152,120 0.01%Deutsche Bank AG $150,000 3.30% 16/11/2022 151,463 0.01%Daimler Finance North America LLC $150,000 2.70% 14/6/2024 151,176 0.01%Daimler Finance North America LLC $150,000 2.55% 15/8/2022 150,950 0.01%Deutsche Telekom International Finance BV $150,000 1.95% 19/9/2021 149,900 0.01%Muenchener Rueckversicherungs-Gesellschaft AG
in Muenchen^ £100,000 6.63% 26/5/2042 148,552 0.01%Landeskreditbank Baden-Wuerttemberg Foerderbank $145,000 1.38% 21/7/2021 144,146 0.01%Deutsche Bank AG £100,000 3.88% 12/2/2024 139,098 0.01%Schaeffler AG €120,000 1.13% 26/3/2022 137,477 0.01%Volkswagen Financial Services NV £100,000 2.75% 10/7/2023 136,765 0.01%Landwirtschaftliche Rentenbank £100,000 1.38% 15/12/2020 133,197 0.01%State of North Rhine-Westphalia Germany €115,000 1.50% 14/1/2021 131,592 0.01%BMW US Capital LLC $125,000 3.10% 12/4/2021 126,742 0.01%FMS Wertmanagement $125,000 1.38% 8/6/2021 124,412 0.01%BASF SE €100,000 2.50% 22/1/2024 122,867 0.01%Allianz Finance II BV^ €100,000 5.75% 8/7/2041 121,799 0.01%EWE AG €100,000 5.25% 16/7/2021 121,410 0.01%Bertelsmann SE & Co. KGaA €100,000 2.63% 2/8/2022 119,911 0.01%EnBW Energie Baden-Wuerttemberg AG^ €100,000 3.63% 2/4/2076 116,709 0.01%Deutsche Telekom International Finance BV €100,000 0.63% 1/12/2022 114,135 0.01%Deutsche Pfandbriefbank AG €100,000 0.75% 7/2/2023 114,080 0.01%Vonovia Finance BV €100,000 0.75% 15/1/2024 114,066 0.01%Volkswagen Financial Services AG €100,000 0.88% 12/4/2023 114,000 0.01%Daimler Canada Finance, Inc. CA($)145,000 3.05% 16/5/2022 113,192 0.01%Landesbank Hessen-Thueringen Girozentrale €100,000 0.00% 12/1/2022 112,940 0.01%Deutsche Pfandbriefbank AG €100,000 0.05% 9/8/2021 112,890 0.01%Volkswagen Financial Services AG €100,000 0.38% 12/4/2021 112,732 0.01%Landesbank Baden-Wuerttemberg €100,000 0.38% 24/5/2024 112,384 0.01%Vonovia Finance BV €100,000 0.13% 6/4/2023 111,853 0.01%KFW CA($)135,000 2.00% 7/2/2022 104,442 0.00%Fresenius Medical Care US Finance, Inc. $100,000 5.75% 15/2/2021 103,625 0.00%BMW US Capital LLC $100,000 3.15% 18/4/2024 103,145 0.00%Landwirtschaftliche Rentenbank $100,000 2.25% 1/10/2021 100,907 0.00%Deutsche Telekom International Finance BV $100,000 2.49% 19/9/2023 100,673 0.00%Deutsche Bank AG $100,000 3.38% 12/5/2021 100,632 0.00%Deutsche Bank AG $100,000 3.15% 22/1/2021 100,402 0.00%BMW US Capital LLC $100,000 2.00% 11/4/2021 100,037 0.00%Bayer US Finance II LLC $100,000 2.20% 15/7/2022 98,918 0.00%VW Credit Canada, Inc. CA($)125,000 3.25% 29/3/2023 98,165 0.00%KFW $100,000 1.38% 5/8/2024 98,117 0.00%Wirecard AG €100,000 0.50% 11/9/2024 96,535 0.00%Daimler Canada Finance, Inc. CA($)100,000 1.91% 8/7/2021 76,601 0.00%KFW $75,000 1.75% 22/8/2022 75,137 0.00%Landwirtschaftliche Rentenbank $75,000 1.75% 24/9/2021 75,115 0.00%Siemens Financieringsmaatschappij NV €62,000 0.30% 28/2/2024 70,538 0.00%Deutsche Bahn Finance GmbH €50,000 3.38% 4/11/2022 61,870 0.00%Daimler Canada Finance, Inc. CA($)80,000 2.54% 21/8/2023 61,424 0.00%Deutsche Bahn Finance GmbH €50,000 2.50% 12/9/2023 61,316 0.00%Deutsche Bahn Finance GmbH €50,000 3.75% 1/6/2021 59,362 0.00%BMW US Capital LLC $50,000 3.40% 13/8/2021 51,144 0.00%BMW US Capital LLC $50,000 2.70% 6/4/2022 50,637 0.00%Bayer US Finance II LLC $50,000 2.75% 15/7/2021 50,247 0.00%Daimler Finance North America LLC $50,000 2.20% 30/10/2021 50,051 0.00%VW Credit Canada, Inc. CA($)55,000 2.85% 26/9/2024 42,449 0.00%
Vanguard Global Short-Term Bond Index Fund
649
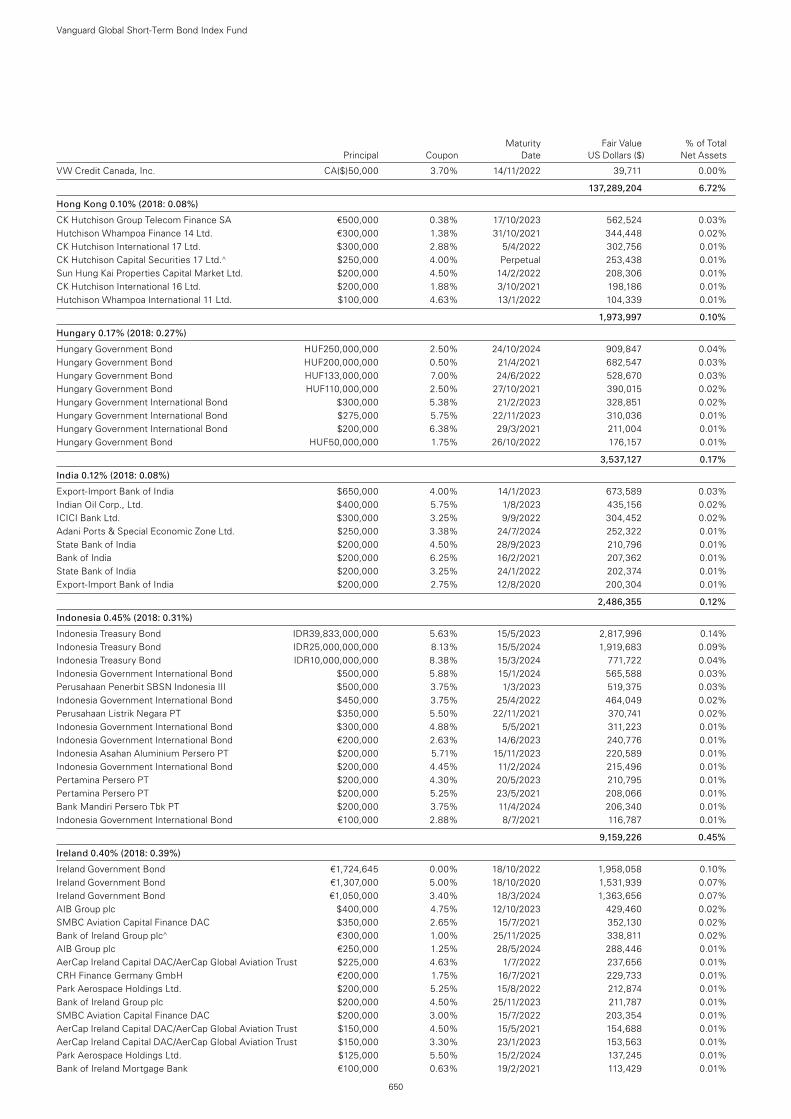
Maturity Fair Value % of Total Principal Coupon Date US Dollars ($) Net Assets
VW Credit Canada, Inc. CA($)50,000 3.70% 14/11/2022 39,711 0.00%
137,289,204 6.72%
Hong Kong 0.10% (2018: 0.08%)
CK Hutchison Group Telecom Finance SA €500,000 0.38% 17/10/2023 562,524 0.03%Hutchison Whampoa Finance 14 Ltd. €300,000 1.38% 31/10/2021 344,448 0.02%CK Hutchison International 17 Ltd. $300,000 2.88% 5/4/2022 302,756 0.01%CK Hutchison Capital Securities 17 Ltd.^ $250,000 4.00% Perpetual 253,438 0.01%Sun Hung Kai Properties Capital Market Ltd. $200,000 4.50% 14/2/2022 208,306 0.01%CK Hutchison International 16 Ltd. $200,000 1.88% 3/10/2021 198,186 0.01%Hutchison Whampoa International 11 Ltd. $100,000 4.63% 13/1/2022 104,339 0.01%
1,973,997 0.10%
Hungary 0.17% (2018: 0.27%)
Hungary Government Bond HUF250,000,000 2.50% 24/10/2024 909,847 0.04%Hungary Government Bond HUF200,000,000 0.50% 21/4/2021 682,547 0.03%Hungary Government Bond HUF133,000,000 7.00% 24/6/2022 528,670 0.03%Hungary Government Bond HUF110,000,000 2.50% 27/10/2021 390,015 0.02%Hungary Government International Bond $300,000 5.38% 21/2/2023 328,851 0.02%Hungary Government International Bond $275,000 5.75% 22/11/2023 310,036 0.01%Hungary Government International Bond $200,000 6.38% 29/3/2021 211,004 0.01%Hungary Government Bond HUF50,000,000 1.75% 26/10/2022 176,157 0.01%
3,537,127 0.17%
India 0.12% (2018: 0.08%)
Export-Import Bank of India $650,000 4.00% 14/1/2023 673,589 0.03%Indian Oil Corp., Ltd. $400,000 5.75% 1/8/2023 435,156 0.02%ICICI Bank Ltd. $300,000 3.25% 9/9/2022 304,452 0.02%Adani Ports & Special Economic Zone Ltd. $250,000 3.38% 24/7/2024 252,322 0.01%State Bank of India $200,000 4.50% 28/9/2023 210,796 0.01%Bank of India $200,000 6.25% 16/2/2021 207,362 0.01%State Bank of India $200,000 3.25% 24/1/2022 202,374 0.01%Export-Import Bank of India $200,000 2.75% 12/8/2020 200,304 0.01%
2,486,355 0.12%
Indonesia 0.45% (2018: 0.31%)
Indonesia Treasury Bond IDR39,833,000,000 5.63% 15/5/2023 2,817,996 0.14%Indonesia Treasury Bond IDR25,000,000,000 8.13% 15/5/2024 1,919,683 0.09%Indonesia Treasury Bond IDR10,000,000,000 8.38% 15/3/2024 771,722 0.04%Indonesia Government International Bond $500,000 5.88% 15/1/2024 565,588 0.03%Perusahaan Penerbit SBSN Indonesia III $500,000 3.75% 1/3/2023 519,375 0.03%Indonesia Government International Bond $450,000 3.75% 25/4/2022 464,049 0.02%Perusahaan Listrik Negara PT $350,000 5.50% 22/11/2021 370,741 0.02%Indonesia Government International Bond $300,000 4.88% 5/5/2021 311,223 0.01%Indonesia Government International Bond €200,000 2.63% 14/6/2023 240,776 0.01%Indonesia Asahan Aluminium Persero PT $200,000 5.71% 15/11/2023 220,589 0.01%Indonesia Government International Bond $200,000 4.45% 11/2/2024 215,496 0.01%Pertamina Persero PT $200,000 4.30% 20/5/2023 210,795 0.01%Pertamina Persero PT $200,000 5.25% 23/5/2021 208,066 0.01%Bank Mandiri Persero Tbk PT $200,000 3.75% 11/4/2024 206,340 0.01%Indonesia Government International Bond €100,000 2.88% 8/7/2021 116,787 0.01%
9,159,226 0.45%
Ireland 0.40% (2018: 0.39%)
Ireland Government Bond €1,724,645 0.00% 18/10/2022 1,958,058 0.10%Ireland Government Bond €1,307,000 5.00% 18/10/2020 1,531,939 0.07%Ireland Government Bond €1,050,000 3.40% 18/3/2024 1,363,656 0.07%AIB Group plc $400,000 4.75% 12/10/2023 429,460 0.02%SMBC Aviation Capital Finance DAC $350,000 2.65% 15/7/2021 352,130 0.02%Bank of Ireland Group plc^ €300,000 1.00% 25/11/2025 338,811 0.02%AIB Group plc €250,000 1.25% 28/5/2024 288,446 0.01%AerCap Ireland Capital DAC/AerCap Global Aviation Trust $225,000 4.63% 1/7/2022 237,656 0.01%CRH Finance Germany GmbH €200,000 1.75% 16/7/2021 229,733 0.01%Park Aerospace Holdings Ltd. $200,000 5.25% 15/8/2022 212,874 0.01%Bank of Ireland Group plc $200,000 4.50% 25/11/2023 211,787 0.01%SMBC Aviation Capital Finance DAC $200,000 3.00% 15/7/2022 203,354 0.01%AerCap Ireland Capital DAC/AerCap Global Aviation Trust $150,000 4.50% 15/5/2021 154,688 0.01%AerCap Ireland Capital DAC/AerCap Global Aviation Trust $150,000 3.30% 23/1/2023 153,563 0.01%Park Aerospace Holdings Ltd. $125,000 5.50% 15/2/2024 137,245 0.01%Bank of Ireland Mortgage Bank €100,000 0.63% 19/2/2021 113,429 0.01%
Vanguard Global Short-Term Bond Index Fund
650
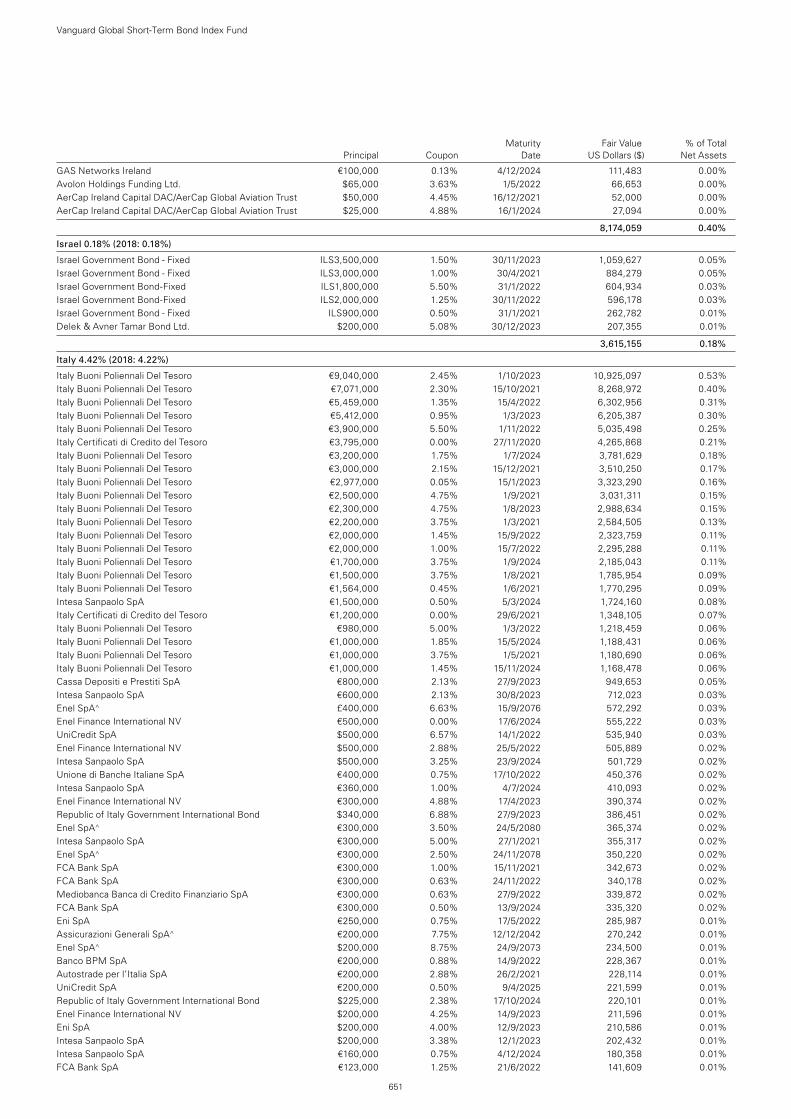
Maturity Fair Value % of Total Principal Coupon Date US Dollars ($) Net Assets
Vanguard Global Short-Term Bond Index Fund
651
GAS Networks Ireland €100,000 0.13% 4/12/2024 111,483 0.00%Avolon Holdings Funding Ltd. $65,000 3.63% 1/5/2022 66,653 0.00%AerCap Ireland Capital DAC/AerCap Global Aviation Trust $50,000 4.45% 16/12/2021 52,000 0.00%AerCap Ireland Capital DAC/AerCap Global Aviation Trust $25,000 4.88% 16/1/2024 27,094 0.00%
8,174,059 0.40%
Israel 0.18% (2018: 0.18%)
Israel Government Bond - Fixed ILS3,500,000 1.50% 30/11/2023 1,059,627 0.05%Israel Government Bond - Fixed ILS3,000,000 1.00% 30/4/2021 884,279 0.05%Israel Government Bond-Fixed ILS1,800,000 5.50% 31/1/2022 604,934 0.03%Israel Government Bond-Fixed ILS2,000,000 1.25% 30/11/2022 596,178 0.03%Israel Government Bond - Fixed ILS900,000 0.50% 31/1/2021 262,782 0.01%Delek & Avner Tamar Bond Ltd. $200,000 5.08% 30/12/2023 207,355 0.01%
3,615,155 0.18%
Italy 4.42% (2018: 4.22%)
Italy Buoni Poliennali Del Tesoro €9,040,000 2.45% 1/10/2023 10,925,097 0.53%Italy Buoni Poliennali Del Tesoro €7,071,000 2.30% 15/10/2021 8,268,972 0.40%Italy Buoni Poliennali Del Tesoro €5,459,000 1.35% 15/4/2022 6,302,956 0.31%Italy Buoni Poliennali Del Tesoro €5,412,000 0.95% 1/3/2023 6,205,387 0.30%Italy Buoni Poliennali Del Tesoro €3,900,000 5.50% 1/11/2022 5,035,498 0.25%Italy Certificati di Credito del Tesoro €3,795,000 0.00% 27/11/2020 4,265,868 0.21%Italy Buoni Poliennali Del Tesoro €3,200,000 1.75% 1/7/2024 3,781,629 0.18%Italy Buoni Poliennali Del Tesoro €3,000,000 2.15% 15/12/2021 3,510,250 0.17%Italy Buoni Poliennali Del Tesoro €2,977,000 0.05% 15/1/2023 3,323,290 0.16%Italy Buoni Poliennali Del Tesoro €2,500,000 4.75% 1/9/2021 3,031,311 0.15%Italy Buoni Poliennali Del Tesoro €2,300,000 4.75% 1/8/2023 2,988,634 0.15%Italy Buoni Poliennali Del Tesoro €2,200,000 3.75% 1/3/2021 2,584,505 0.13%Italy Buoni Poliennali Del Tesoro €2,000,000 1.45% 15/9/2022 2,323,759 0.11%Italy Buoni Poliennali Del Tesoro €2,000,000 1.00% 15/7/2022 2,295,288 0.11%Italy Buoni Poliennali Del Tesoro €1,700,000 3.75% 1/9/2024 2,185,043 0.11%Italy Buoni Poliennali Del Tesoro €1,500,000 3.75% 1/8/2021 1,785,954 0.09%Italy Buoni Poliennali Del Tesoro €1,564,000 0.45% 1/6/2021 1,770,295 0.09%Intesa Sanpaolo SpA €1,500,000 0.50% 5/3/2024 1,724,160 0.08%Italy Certificati di Credito del Tesoro €1,200,000 0.00% 29/6/2021 1,348,105 0.07%Italy Buoni Poliennali Del Tesoro €980,000 5.00% 1/3/2022 1,218,459 0.06%Italy Buoni Poliennali Del Tesoro €1,000,000 1.85% 15/5/2024 1,188,431 0.06%Italy Buoni Poliennali Del Tesoro €1,000,000 3.75% 1/5/2021 1,180,690 0.06%Italy Buoni Poliennali Del Tesoro €1,000,000 1.45% 15/11/2024 1,168,478 0.06%Cassa Depositi e Prestiti SpA €800,000 2.13% 27/9/2023 949,653 0.05%Intesa Sanpaolo SpA €600,000 2.13% 30/8/2023 712,023 0.03%Enel SpA^ £400,000 6.63% 15/9/2076 572,292 0.03%Enel Finance International NV €500,000 0.00% 17/6/2024 555,222 0.03%UniCredit SpA $500,000 6.57% 14/1/2022 535,940 0.03%Enel Finance International NV $500,000 2.88% 25/5/2022 505,889 0.02%Intesa Sanpaolo SpA $500,000 3.25% 23/9/2024 501,729 0.02%Unione di Banche Italiane SpA €400,000 0.75% 17/10/2022 450,376 0.02%Intesa Sanpaolo SpA €360,000 1.00% 4/7/2024 410,093 0.02%Enel Finance International NV €300,000 4.88% 17/4/2023 390,374 0.02%Republic of Italy Government International Bond $340,000 6.88% 27/9/2023 386,451 0.02%Enel SpA^ €300,000 3.50% 24/5/2080 365,374 0.02%Intesa Sanpaolo SpA €300,000 5.00% 27/1/2021 355,317 0.02%Enel SpA^ €300,000 2.50% 24/11/2078 350,220 0.02%FCA Bank SpA €300,000 1.00% 15/11/2021 342,673 0.02%FCA Bank SpA €300,000 0.63% 24/11/2022 340,178 0.02%Mediobanca Banca di Credito Finanziario SpA €300,000 0.63% 27/9/2022 339,872 0.02%FCA Bank SpA €300,000 0.50% 13/9/2024 335,320 0.02%Eni SpA €250,000 0.75% 17/5/2022 285,987 0.01%Assicurazioni Generali SpA^ €200,000 7.75% 12/12/2042 270,242 0.01%Enel SpA^ $200,000 8.75% 24/9/2073 234,500 0.01%Banco BPM SpA €200,000 0.88% 14/9/2022 228,367 0.01%Autostrade per l’Italia SpA €200,000 2.88% 26/2/2021 228,114 0.01%UniCredit SpA €200,000 0.50% 9/4/2025 221,599 0.01%Republic of Italy Government International Bond $225,000 2.38% 17/10/2024 220,101 0.01%Enel Finance International NV $200,000 4.25% 14/9/2023 211,596 0.01%Eni SpA $200,000 4.00% 12/9/2023 210,586 0.01%Intesa Sanpaolo SpA $200,000 3.38% 12/1/2023 202,432 0.01%Intesa Sanpaolo SpA €160,000 0.75% 4/12/2024 180,358 0.01%FCA Bank SpA €123,000 1.25% 21/6/2022 141,609 0.01%
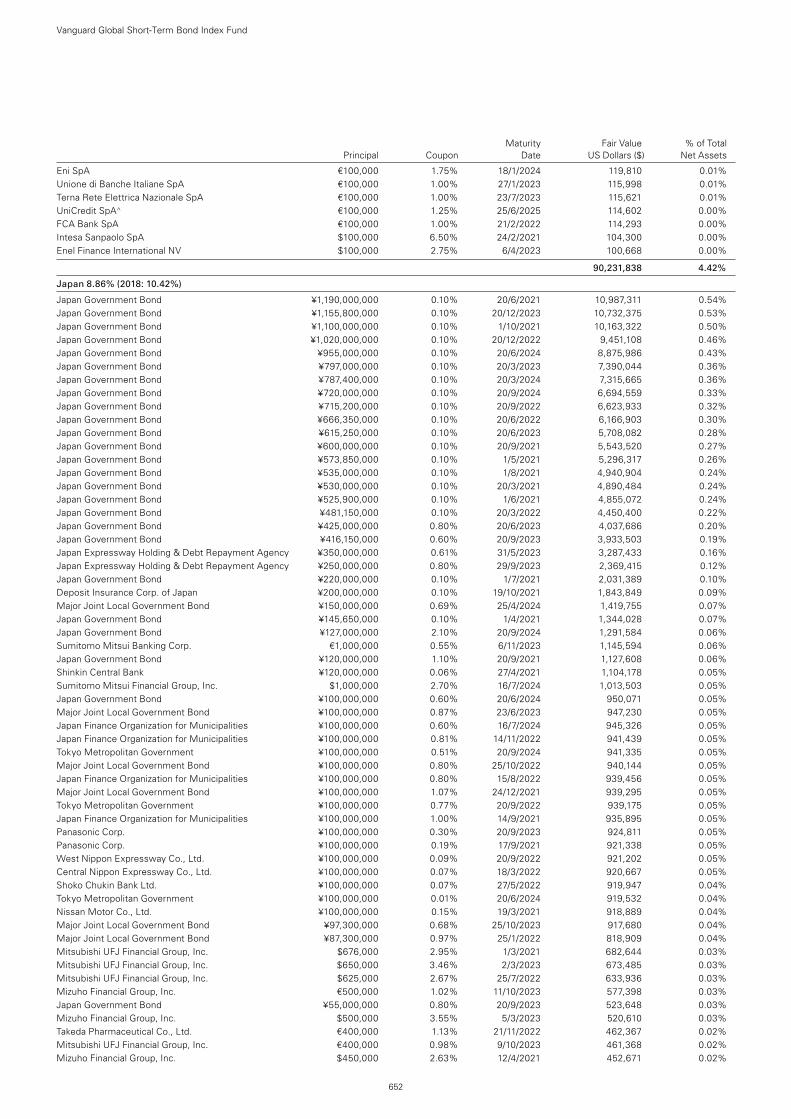
Maturity Fair Value % of Total Principal Coupon Date US Dollars ($) Net Assets
Vanguard Global Short-Term Bond Index Fund
652
Eni SpA €100,000 1.75% 18/1/2024 119,810 0.01%Unione di Banche Italiane SpA €100,000 1.00% 27/1/2023 115,998 0.01%Terna Rete Elettrica Nazionale SpA €100,000 1.00% 23/7/2023 115,621 0.01%UniCredit SpA^ €100,000 1.25% 25/6/2025 114,602 0.00%FCA Bank SpA €100,000 1.00% 21/2/2022 114,293 0.00%Intesa Sanpaolo SpA $100,000 6.50% 24/2/2021 104,300 0.00%Enel Finance International NV $100,000 2.75% 6/4/2023 100,668 0.00%
90,231,838 4.42%
Japan 8.86% (2018: 10.42%)
Japan Government Bond ¥1,190,000,000 0.10% 20/6/2021 10,987,311 0.54%Japan Government Bond ¥1,155,800,000 0.10% 20/12/2023 10,732,375 0.53%Japan Government Bond ¥1,100,000,000 0.10% 1/10/2021 10,163,322 0.50%Japan Government Bond ¥1,020,000,000 0.10% 20/12/2022 9,451,108 0.46%Japan Government Bond ¥955,000,000 0.10% 20/6/2024 8,875,986 0.43%Japan Government Bond ¥797,000,000 0.10% 20/3/2023 7,390,044 0.36%Japan Government Bond ¥787,400,000 0.10% 20/3/2024 7,315,665 0.36%Japan Government Bond ¥720,000,000 0.10% 20/9/2024 6,694,559 0.33%Japan Government Bond ¥715,200,000 0.10% 20/9/2022 6,623,933 0.32%Japan Government Bond ¥666,350,000 0.10% 20/6/2022 6,166,903 0.30%Japan Government Bond ¥615,250,000 0.10% 20/6/2023 5,708,082 0.28%Japan Government Bond ¥600,000,000 0.10% 20/9/2021 5,543,520 0.27%Japan Government Bond ¥573,850,000 0.10% 1/5/2021 5,296,317 0.26%Japan Government Bond ¥535,000,000 0.10% 1/8/2021 4,940,904 0.24%Japan Government Bond ¥530,000,000 0.10% 20/3/2021 4,890,484 0.24%Japan Government Bond ¥525,900,000 0.10% 1/6/2021 4,855,072 0.24%Japan Government Bond ¥481,150,000 0.10% 20/3/2022 4,450,400 0.22%Japan Government Bond ¥425,000,000 0.80% 20/6/2023 4,037,686 0.20%Japan Government Bond ¥416,150,000 0.60% 20/9/2023 3,933,503 0.19%Japan Expressway Holding & Debt Repayment Agency ¥350,000,000 0.61% 31/5/2023 3,287,433 0.16%Japan Expressway Holding & Debt Repayment Agency ¥250,000,000 0.80% 29/9/2023 2,369,415 0.12%Japan Government Bond ¥220,000,000 0.10% 1/7/2021 2,031,389 0.10%Deposit Insurance Corp. of Japan ¥200,000,000 0.10% 19/10/2021 1,843,849 0.09%Major Joint Local Government Bond ¥150,000,000 0.69% 25/4/2024 1,419,755 0.07%Japan Government Bond ¥145,650,000 0.10% 1/4/2021 1,344,028 0.07%Japan Government Bond ¥127,000,000 2.10% 20/9/2024 1,291,584 0.06%Sumitomo Mitsui Banking Corp. €1,000,000 0.55% 6/11/2023 1,145,594 0.06%Japan Government Bond ¥120,000,000 1.10% 20/9/2021 1,127,608 0.06%Shinkin Central Bank ¥120,000,000 0.06% 27/4/2021 1,104,178 0.05%Sumitomo Mitsui Financial Group, Inc. $1,000,000 2.70% 16/7/2024 1,013,503 0.05%Japan Government Bond ¥100,000,000 0.60% 20/6/2024 950,071 0.05%Major Joint Local Government Bond ¥100,000,000 0.87% 23/6/2023 947,230 0.05%Japan Finance Organization for Municipalities ¥100,000,000 0.60% 16/7/2024 945,326 0.05%Japan Finance Organization for Municipalities ¥100,000,000 0.81% 14/11/2022 941,439 0.05%Tokyo Metropolitan Government ¥100,000,000 0.51% 20/9/2024 941,335 0.05%Major Joint Local Government Bond ¥100,000,000 0.80% 25/10/2022 940,144 0.05%Japan Finance Organization for Municipalities ¥100,000,000 0.80% 15/8/2022 939,456 0.05%Major Joint Local Government Bond ¥100,000,000 1.07% 24/12/2021 939,295 0.05%Tokyo Metropolitan Government ¥100,000,000 0.77% 20/9/2022 939,175 0.05%Japan Finance Organization for Municipalities ¥100,000,000 1.00% 14/9/2021 935,895 0.05%Panasonic Corp. ¥100,000,000 0.30% 20/9/2023 924,811 0.05%Panasonic Corp. ¥100,000,000 0.19% 17/9/2021 921,338 0.05%West Nippon Expressway Co., Ltd. ¥100,000,000 0.09% 20/9/2022 921,202 0.05%Central Nippon Expressway Co., Ltd. ¥100,000,000 0.07% 18/3/2022 920,667 0.05%Shoko Chukin Bank Ltd. ¥100,000,000 0.07% 27/5/2022 919,947 0.04%Tokyo Metropolitan Government ¥100,000,000 0.01% 20/6/2024 919,532 0.04%Nissan Motor Co., Ltd. ¥100,000,000 0.15% 19/3/2021 918,889 0.04%Major Joint Local Government Bond ¥97,300,000 0.68% 25/10/2023 917,680 0.04%Major Joint Local Government Bond ¥87,300,000 0.97% 25/1/2022 818,909 0.04%Mitsubishi UFJ Financial Group, Inc. $676,000 2.95% 1/3/2021 682,644 0.03%Mitsubishi UFJ Financial Group, Inc. $650,000 3.46% 2/3/2023 673,485 0.03%Mitsubishi UFJ Financial Group, Inc. $625,000 2.67% 25/7/2022 633,936 0.03%Mizuho Financial Group, Inc. €500,000 1.02% 11/10/2023 577,398 0.03%Japan Government Bond ¥55,000,000 0.80% 20/9/2023 523,648 0.03%Mizuho Financial Group, Inc. $500,000 3.55% 5/3/2023 520,610 0.03%Takeda Pharmaceutical Co., Ltd. €400,000 1.13% 21/11/2022 462,367 0.02%Mitsubishi UFJ Financial Group, Inc. €400,000 0.98% 9/10/2023 461,368 0.02%Mizuho Financial Group, Inc. $450,000 2.63% 12/4/2021 452,671 0.02%
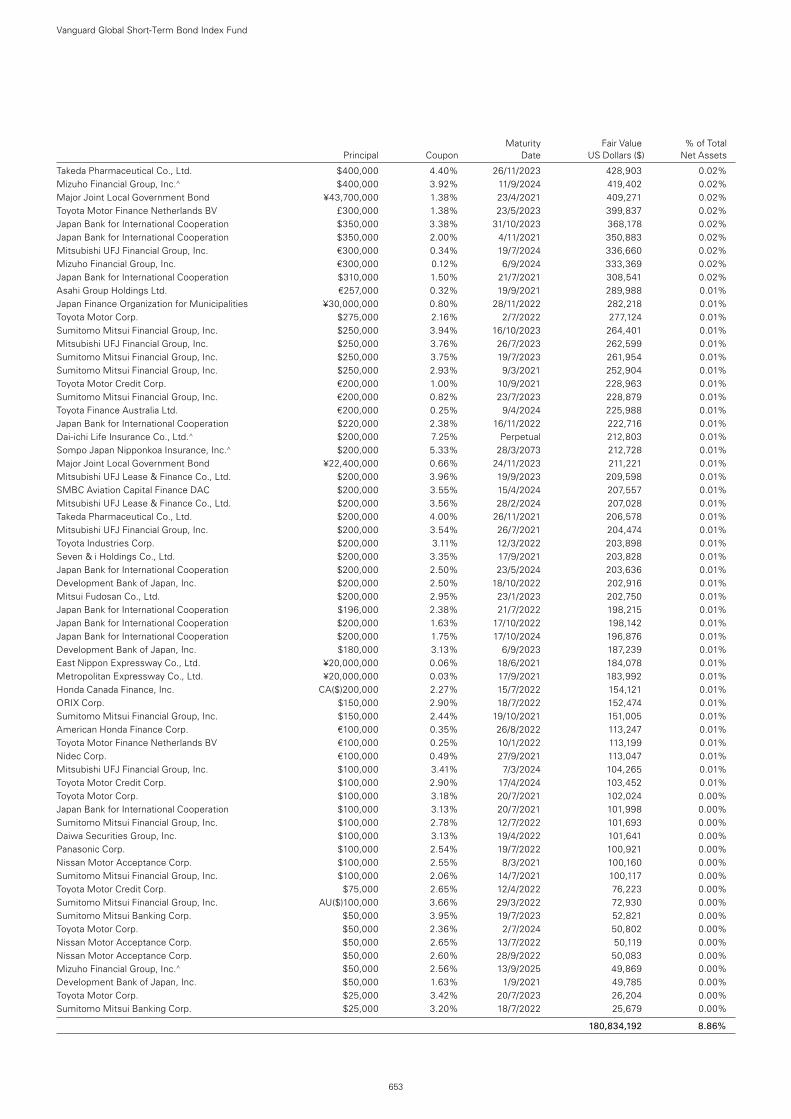
Maturity Fair Value % of Total Principal Coupon Date US Dollars ($) Net Assets
Vanguard Global Short-Term Bond Index Fund
653
Takeda Pharmaceutical Co., Ltd. $400,000 4.40% 26/11/2023 428,903 0.02%Mizuho Financial Group, Inc.^ $400,000 3.92% 11/9/2024 419,402 0.02%Major Joint Local Government Bond ¥43,700,000 1.38% 23/4/2021 409,271 0.02%Toyota Motor Finance Netherlands BV £300,000 1.38% 23/5/2023 399,837 0.02%Japan Bank for International Cooperation $350,000 3.38% 31/10/2023 368,178 0.02%Japan Bank for International Cooperation $350,000 2.00% 4/11/2021 350,883 0.02%Mitsubishi UFJ Financial Group, Inc. €300,000 0.34% 19/7/2024 336,660 0.02%Mizuho Financial Group, Inc. €300,000 0.12% 6/9/2024 333,369 0.02%Japan Bank for International Cooperation $310,000 1.50% 21/7/2021 308,541 0.02%Asahi Group Holdings Ltd. €257,000 0.32% 19/9/2021 289,988 0.01%Japan Finance Organization for Municipalities ¥30,000,000 0.80% 28/11/2022 282,218 0.01%Toyota Motor Corp. $275,000 2.16% 2/7/2022 277,124 0.01%Sumitomo Mitsui Financial Group, Inc. $250,000 3.94% 16/10/2023 264,401 0.01%Mitsubishi UFJ Financial Group, Inc. $250,000 3.76% 26/7/2023 262,599 0.01%Sumitomo Mitsui Financial Group, Inc. $250,000 3.75% 19/7/2023 261,954 0.01%Sumitomo Mitsui Financial Group, Inc. $250,000 2.93% 9/3/2021 252,904 0.01%Toyota Motor Credit Corp. €200,000 1.00% 10/9/2021 228,963 0.01%Sumitomo Mitsui Financial Group, Inc. €200,000 0.82% 23/7/2023 228,879 0.01%Toyota Finance Australia Ltd. €200,000 0.25% 9/4/2024 225,988 0.01%Japan Bank for International Cooperation $220,000 2.38% 16/11/2022 222,716 0.01%Dai-ichi Life Insurance Co., Ltd.^ $200,000 7.25% Perpetual 212,803 0.01%Sompo Japan Nipponkoa Insurance, Inc.^ $200,000 5.33% 28/3/2073 212,728 0.01%Major Joint Local Government Bond ¥22,400,000 0.66% 24/11/2023 211,221 0.01%Mitsubishi UFJ Lease & Finance Co., Ltd. $200,000 3.96% 19/9/2023 209,598 0.01%SMBC Aviation Capital Finance DAC $200,000 3.55% 15/4/2024 207,557 0.01%Mitsubishi UFJ Lease & Finance Co., Ltd. $200,000 3.56% 28/2/2024 207,028 0.01%Takeda Pharmaceutical Co., Ltd. $200,000 4.00% 26/11/2021 206,578 0.01%Mitsubishi UFJ Financial Group, Inc. $200,000 3.54% 26/7/2021 204,474 0.01%Toyota Industries Corp. $200,000 3.11% 12/3/2022 203,898 0.01%Seven & i Holdings Co., Ltd. $200,000 3.35% 17/9/2021 203,828 0.01%Japan Bank for International Cooperation $200,000 2.50% 23/5/2024 203,636 0.01%Development Bank of Japan, Inc. $200,000 2.50% 18/10/2022 202,916 0.01%Mitsui Fudosan Co., Ltd. $200,000 2.95% 23/1/2023 202,750 0.01%Japan Bank for International Cooperation $196,000 2.38% 21/7/2022 198,215 0.01%Japan Bank for International Cooperation $200,000 1.63% 17/10/2022 198,142 0.01%Japan Bank for International Cooperation $200,000 1.75% 17/10/2024 196,876 0.01%Development Bank of Japan, Inc. $180,000 3.13% 6/9/2023 187,239 0.01%East Nippon Expressway Co., Ltd. ¥20,000,000 0.06% 18/6/2021 184,078 0.01%Metropolitan Expressway Co., Ltd. ¥20,000,000 0.03% 17/9/2021 183,992 0.01%Honda Canada Finance, Inc. CA($)200,000 2.27% 15/7/2022 154,121 0.01%ORIX Corp. $150,000 2.90% 18/7/2022 152,474 0.01%Sumitomo Mitsui Financial Group, Inc. $150,000 2.44% 19/10/2021 151,005 0.01%American Honda Finance Corp. €100,000 0.35% 26/8/2022 113,247 0.01%Toyota Motor Finance Netherlands BV €100,000 0.25% 10/1/2022 113,199 0.01%Nidec Corp. €100,000 0.49% 27/9/2021 113,047 0.01%Mitsubishi UFJ Financial Group, Inc. $100,000 3.41% 7/3/2024 104,265 0.01%Toyota Motor Credit Corp. $100,000 2.90% 17/4/2024 103,452 0.01%Toyota Motor Corp. $100,000 3.18% 20/7/2021 102,024 0.00%Japan Bank for International Cooperation $100,000 3.13% 20/7/2021 101,998 0.00%Sumitomo Mitsui Financial Group, Inc. $100,000 2.78% 12/7/2022 101,693 0.00%Daiwa Securities Group, Inc. $100,000 3.13% 19/4/2022 101,641 0.00%Panasonic Corp. $100,000 2.54% 19/7/2022 100,921 0.00%Nissan Motor Acceptance Corp. $100,000 2.55% 8/3/2021 100,160 0.00%Sumitomo Mitsui Financial Group, Inc. $100,000 2.06% 14/7/2021 100,117 0.00%Toyota Motor Credit Corp. $75,000 2.65% 12/4/2022 76,223 0.00%Sumitomo Mitsui Financial Group, Inc. AU($)100,000 3.66% 29/3/2022 72,930 0.00%Sumitomo Mitsui Banking Corp. $50,000 3.95% 19/7/2023 52,821 0.00%Toyota Motor Corp. $50,000 2.36% 2/7/2024 50,802 0.00%Nissan Motor Acceptance Corp. $50,000 2.65% 13/7/2022 50,119 0.00%Nissan Motor Acceptance Corp. $50,000 2.60% 28/9/2022 50,083 0.00%Mizuho Financial Group, Inc.^ $50,000 2.56% 13/9/2025 49,869 0.00%Development Bank of Japan, Inc. $50,000 1.63% 1/9/2021 49,785 0.00%Toyota Motor Corp. $25,000 3.42% 20/7/2023 26,204 0.00%Sumitomo Mitsui Banking Corp. $25,000 3.20% 18/7/2022 25,679 0.00%
180,834,192 8.86%
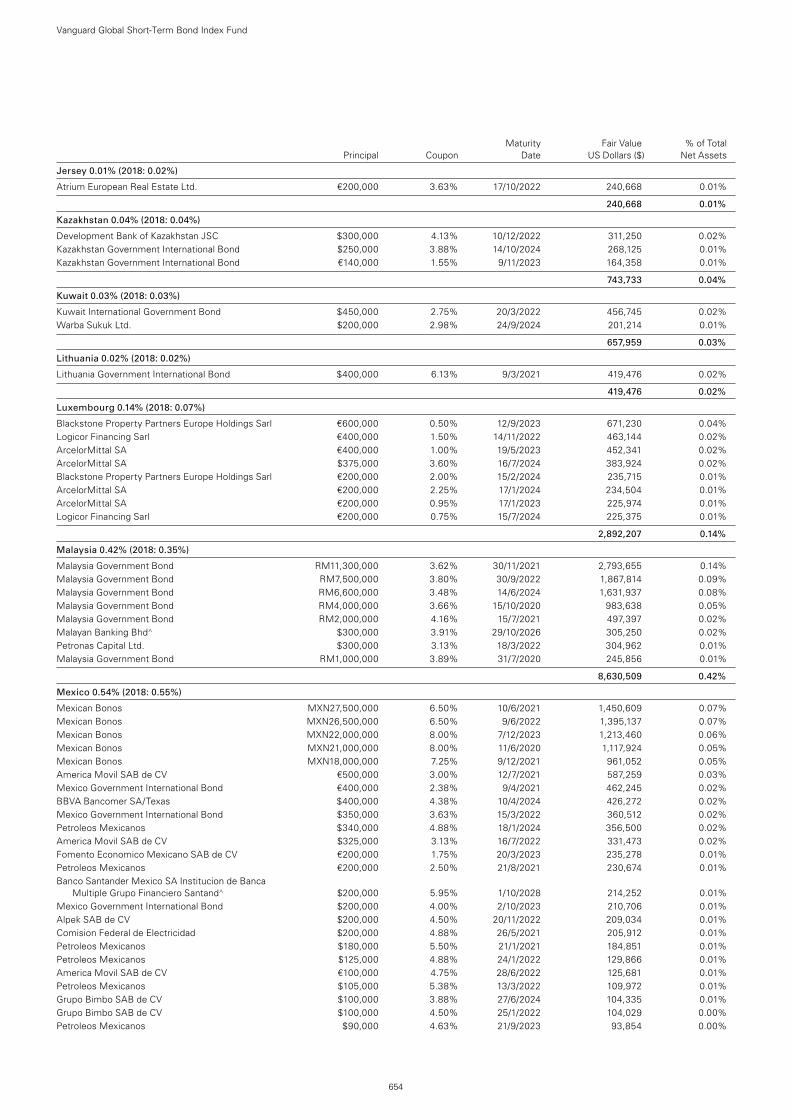
Maturity Fair Value % of Total Principal Coupon Date US Dollars ($) Net Assets
Vanguard Global Short-Term Bond Index Fund
654
Jersey 0.01% (2018: 0.02%)
Atrium European Real Estate Ltd. €200,000 3.63% 17/10/2022 240,668 0.01%
240,668 0.01%
Kazakhstan 0.04% (2018: 0.04%)
Development Bank of Kazakhstan JSC $300,000 4.13% 10/12/2022 311,250 0.02%Kazakhstan Government International Bond $250,000 3.88% 14/10/2024 268,125 0.01%Kazakhstan Government International Bond €140,000 1.55% 9/11/2023 164,358 0.01%
743,733 0.04%
Kuwait 0.03% (2018: 0.03%)
Kuwait International Government Bond $450,000 2.75% 20/3/2022 456,745 0.02%Warba Sukuk Ltd. $200,000 2.98% 24/9/2024 201,214 0.01%
657,959 0.03%
Lithuania 0.02% (2018: 0.02%)
Lithuania Government International Bond $400,000 6.13% 9/3/2021 419,476 0.02%
419,476 0.02%
Luxembourg 0.14% (2018: 0.07%)
Blackstone Property Partners Europe Holdings Sarl €600,000 0.50% 12/9/2023 671,230 0.04%Logicor Financing Sarl €400,000 1.50% 14/11/2022 463,144 0.02%ArcelorMittal SA €400,000 1.00% 19/5/2023 452,341 0.02%ArcelorMittal SA $375,000 3.60% 16/7/2024 383,924 0.02%Blackstone Property Partners Europe Holdings Sarl €200,000 2.00% 15/2/2024 235,715 0.01%ArcelorMittal SA €200,000 2.25% 17/1/2024 234,504 0.01%ArcelorMittal SA €200,000 0.95% 17/1/2023 225,974 0.01%Logicor Financing Sarl €200,000 0.75% 15/7/2024 225,375 0.01%
2,892,207 0.14%
Malaysia 0.42% (2018: 0.35%)
Malaysia Government Bond RM11,300,000 3.62% 30/11/2021 2,793,655 0.14%Malaysia Government Bond RM7,500,000 3.80% 30/9/2022 1,867,814 0.09%Malaysia Government Bond RM6,600,000 3.48% 14/6/2024 1,631,937 0.08%Malaysia Government Bond RM4,000,000 3.66% 15/10/2020 983,638 0.05%Malaysia Government Bond RM2,000,000 4.16% 15/7/2021 497,397 0.02%Malayan Banking Bhd^ $300,000 3.91% 29/10/2026 305,250 0.02%Petronas Capital Ltd. $300,000 3.13% 18/3/2022 304,962 0.01%Malaysia Government Bond RM1,000,000 3.89% 31/7/2020 245,856 0.01%
8,630,509 0.42%
Mexico 0.54% (2018: 0.55%)
Mexican Bonos MXN27,500,000 6.50% 10/6/2021 1,450,609 0.07%Mexican Bonos MXN26,500,000 6.50% 9/6/2022 1,395,137 0.07%Mexican Bonos MXN22,000,000 8.00% 7/12/2023 1,213,460 0.06%Mexican Bonos MXN21,000,000 8.00% 11/6/2020 1,117,924 0.05%Mexican Bonos MXN18,000,000 7.25% 9/12/2021 961,052 0.05%America Movil SAB de CV €500,000 3.00% 12/7/2021 587,259 0.03%Mexico Government International Bond €400,000 2.38% 9/4/2021 462,245 0.02%BBVA Bancomer SA/Texas $400,000 4.38% 10/4/2024 426,272 0.02%Mexico Government International Bond $350,000 3.63% 15/3/2022 360,512 0.02%Petroleos Mexicanos $340,000 4.88% 18/1/2024 356,500 0.02%America Movil SAB de CV $325,000 3.13% 16/7/2022 331,473 0.02%Fomento Economico Mexicano SAB de CV €200,000 1.75% 20/3/2023 235,278 0.01%Petroleos Mexicanos €200,000 2.50% 21/8/2021 230,674 0.01%Banco Santander Mexico SA Institucion de Banca
Multiple Grupo Financiero Santand^ $200,000 5.95% 1/10/2028 214,252 0.01%Mexico Government International Bond $200,000 4.00% 2/10/2023 210,706 0.01%Alpek SAB de CV $200,000 4.50% 20/11/2022 209,034 0.01%Comision Federal de Electricidad $200,000 4.88% 26/5/2021 205,912 0.01%Petroleos Mexicanos $180,000 5.50% 21/1/2021 184,851 0.01%Petroleos Mexicanos $125,000 4.88% 24/1/2022 129,866 0.01%America Movil SAB de CV €100,000 4.75% 28/6/2022 125,681 0.01%Petroleos Mexicanos $105,000 5.38% 13/3/2022 109,972 0.01%Grupo Bimbo SAB de CV $100,000 3.88% 27/6/2024 104,335 0.01%Grupo Bimbo SAB de CV $100,000 4.50% 25/1/2022 104,029 0.00%Petroleos Mexicanos $90,000 4.63% 21/9/2023 93,854 0.00%
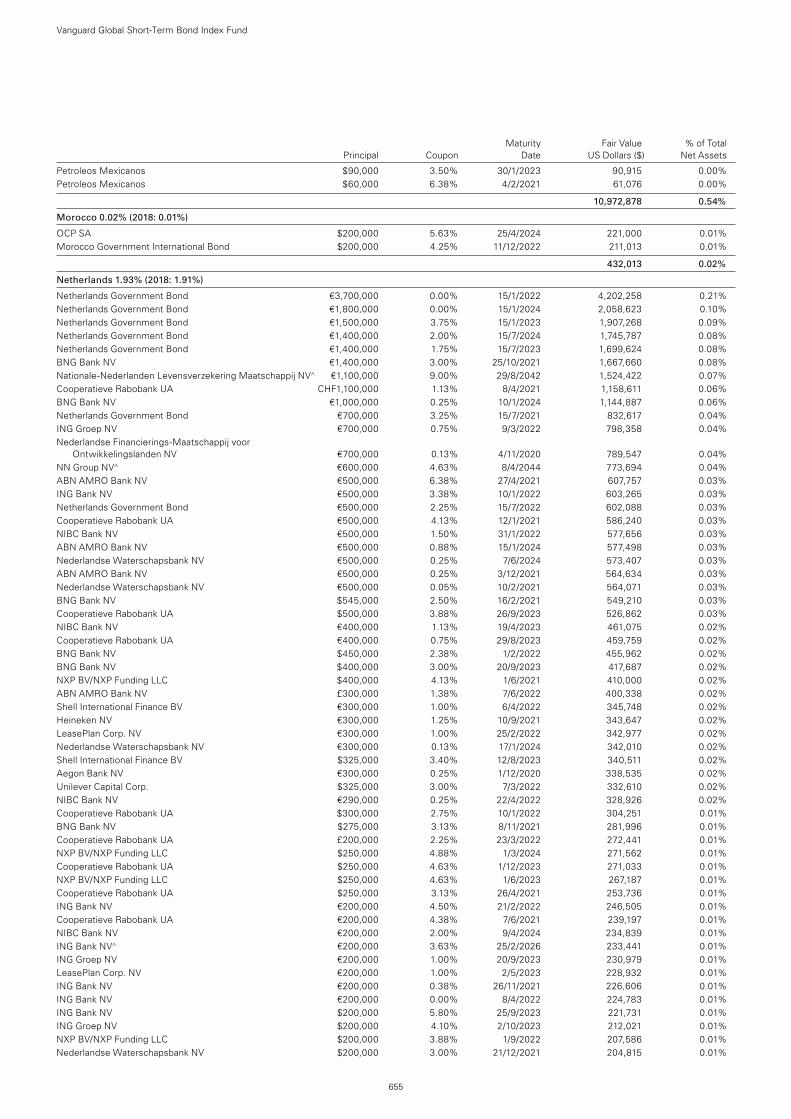
Maturity Fair Value % of Total Principal Coupon Date US Dollars ($) Net Assets
Vanguard Global Short-Term Bond Index Fund
655
Petroleos Mexicanos $90,000 3.50% 30/1/2023 90,915 0.00%Petroleos Mexicanos $60,000 6.38% 4/2/2021 61,076 0.00%
10,972,878 0.54%
Morocco 0.02% (2018: 0.01%)
OCP SA $200,000 5.63% 25/4/2024 221,000 0.01%Morocco Government International Bond $200,000 4.25% 11/12/2022 211,013 0.01%
432,013 0.02%
Netherlands 1.93% (2018: 1.91%)
Netherlands Government Bond €3,700,000 0.00% 15/1/2022 4,202,258 0.21%Netherlands Government Bond €1,800,000 0.00% 15/1/2024 2,058,623 0.10%Netherlands Government Bond €1,500,000 3.75% 15/1/2023 1,907,268 0.09%Netherlands Government Bond €1,400,000 2.00% 15/7/2024 1,745,787 0.08%Netherlands Government Bond €1,400,000 1.75% 15/7/2023 1,699,624 0.08%BNG Bank NV €1,400,000 3.00% 25/10/2021 1,667,660 0.08%Nationale-Nederlanden Levensverzekering Maatschappij NV^ €1,100,000 9.00% 29/8/2042 1,524,422 0.07%Cooperatieve Rabobank UA CHF1,100,000 1.13% 8/4/2021 1,158,611 0.06%BNG Bank NV €1,000,000 0.25% 10/1/2024 1,144,887 0.06%Netherlands Government Bond €700,000 3.25% 15/7/2021 832,617 0.04%ING Groep NV €700,000 0.75% 9/3/2022 798,358 0.04%Nederlandse Financierings-Maatschappij voor
Ontwikkelingslanden NV €700,000 0.13% 4/11/2020 789,547 0.04%NN Group NV^ €600,000 4.63% 8/4/2044 773,694 0.04%ABN AMRO Bank NV €500,000 6.38% 27/4/2021 607,757 0.03%ING Bank NV €500,000 3.38% 10/1/2022 603,265 0.03%Netherlands Government Bond €500,000 2.25% 15/7/2022 602,088 0.03%Cooperatieve Rabobank UA €500,000 4.13% 12/1/2021 586,240 0.03%NIBC Bank NV €500,000 1.50% 31/1/2022 577,656 0.03%ABN AMRO Bank NV €500,000 0.88% 15/1/2024 577,498 0.03%Nederlandse Waterschapsbank NV €500,000 0.25% 7/6/2024 573,407 0.03%ABN AMRO Bank NV €500,000 0.25% 3/12/2021 564,634 0.03%Nederlandse Waterschapsbank NV €500,000 0.05% 10/2/2021 564,071 0.03%BNG Bank NV $545,000 2.50% 16/2/2021 549,210 0.03%Cooperatieve Rabobank UA $500,000 3.88% 26/9/2023 526,862 0.03%NIBC Bank NV €400,000 1.13% 19/4/2023 461,075 0.02%Cooperatieve Rabobank UA €400,000 0.75% 29/8/2023 459,759 0.02%BNG Bank NV $450,000 2.38% 1/2/2022 455,962 0.02%BNG Bank NV $400,000 3.00% 20/9/2023 417,687 0.02%NXP BV/NXP Funding LLC $400,000 4.13% 1/6/2021 410,000 0.02%ABN AMRO Bank NV £300,000 1.38% 7/6/2022 400,338 0.02%Shell International Finance BV €300,000 1.00% 6/4/2022 345,748 0.02%Heineken NV €300,000 1.25% 10/9/2021 343,647 0.02%LeasePlan Corp. NV €300,000 1.00% 25/2/2022 342,977 0.02%Nederlandse Waterschapsbank NV €300,000 0.13% 17/1/2024 342,010 0.02%Shell International Finance BV $325,000 3.40% 12/8/2023 340,511 0.02%Aegon Bank NV €300,000 0.25% 1/12/2020 338,535 0.02%Unilever Capital Corp. $325,000 3.00% 7/3/2022 332,610 0.02%NIBC Bank NV €290,000 0.25% 22/4/2022 328,926 0.02%Cooperatieve Rabobank UA $300,000 2.75% 10/1/2022 304,251 0.01%BNG Bank NV $275,000 3.13% 8/11/2021 281,996 0.01%Cooperatieve Rabobank UA £200,000 2.25% 23/3/2022 272,441 0.01%NXP BV/NXP Funding LLC $250,000 4.88% 1/3/2024 271,562 0.01%Cooperatieve Rabobank UA $250,000 4.63% 1/12/2023 271,033 0.01%NXP BV/NXP Funding LLC $250,000 4.63% 1/6/2023 267,187 0.01%Cooperatieve Rabobank UA $250,000 3.13% 26/4/2021 253,736 0.01%ING Bank NV €200,000 4.50% 21/2/2022 246,505 0.01%Cooperatieve Rabobank UA €200,000 4.38% 7/6/2021 239,197 0.01%NIBC Bank NV €200,000 2.00% 9/4/2024 234,839 0.01%ING Bank NV^ €200,000 3.63% 25/2/2026 233,441 0.01%ING Groep NV €200,000 1.00% 20/9/2023 230,979 0.01%LeasePlan Corp. NV €200,000 1.00% 2/5/2023 228,932 0.01%ING Bank NV €200,000 0.38% 26/11/2021 226,606 0.01%ING Bank NV €200,000 0.00% 8/4/2022 224,783 0.01%ING Bank NV $200,000 5.80% 25/9/2023 221,731 0.01%ING Groep NV $200,000 4.10% 2/10/2023 212,021 0.01%NXP BV/NXP Funding LLC $200,000 3.88% 1/9/2022 207,586 0.01%Nederlandse Waterschapsbank NV $200,000 3.00% 21/12/2021 204,815 0.01%
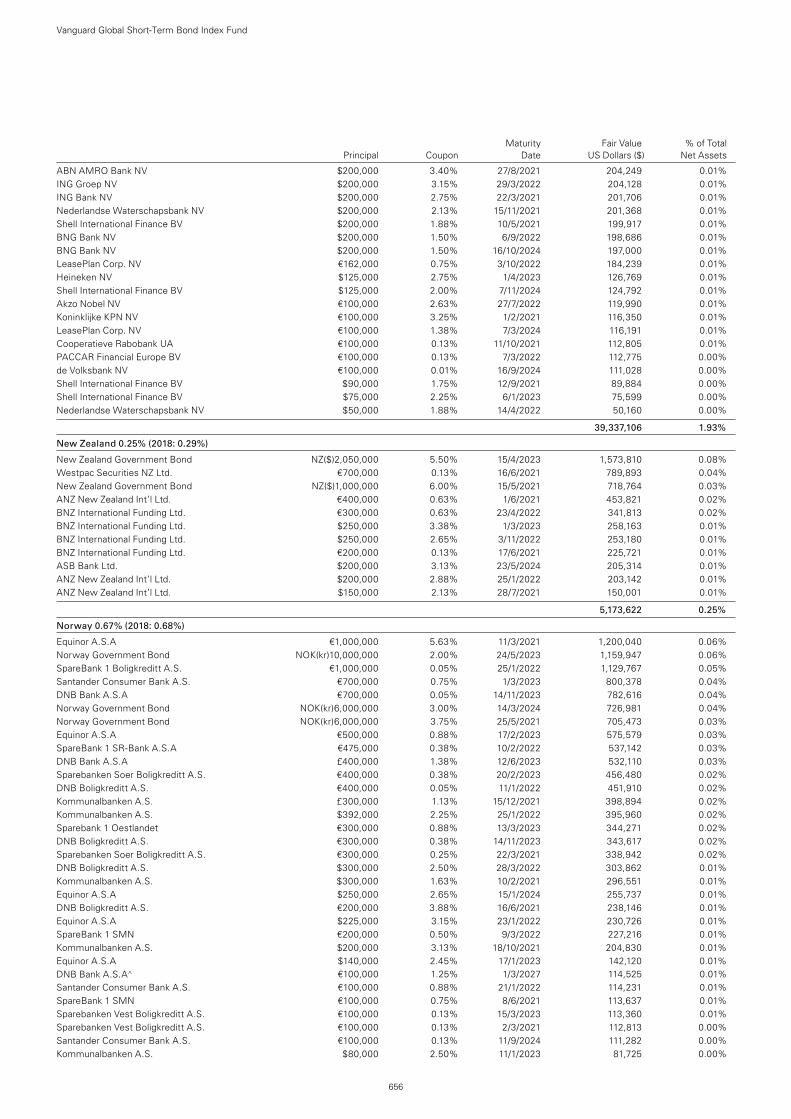
Maturity Fair Value % of Total Principal Coupon Date US Dollars ($) Net Assets
Vanguard Global Short-Term Bond Index Fund
656
ABN AMRO Bank NV $200,000 3.40% 27/8/2021 204,249 0.01%ING Groep NV $200,000 3.15% 29/3/2022 204,128 0.01%ING Bank NV $200,000 2.75% 22/3/2021 201,706 0.01%Nederlandse Waterschapsbank NV $200,000 2.13% 15/11/2021 201,368 0.01%Shell International Finance BV $200,000 1.88% 10/5/2021 199,917 0.01%BNG Bank NV $200,000 1.50% 6/9/2022 198,686 0.01%BNG Bank NV $200,000 1.50% 16/10/2024 197,000 0.01%LeasePlan Corp. NV €162,000 0.75% 3/10/2022 184,239 0.01%Heineken NV $125,000 2.75% 1/4/2023 126,769 0.01%Shell International Finance BV $125,000 2.00% 7/11/2024 124,792 0.01%Akzo Nobel NV €100,000 2.63% 27/7/2022 119,990 0.01%Koninklijke KPN NV €100,000 3.25% 1/2/2021 116,350 0.01%LeasePlan Corp. NV €100,000 1.38% 7/3/2024 116,191 0.01%Cooperatieve Rabobank UA €100,000 0.13% 11/10/2021 112,805 0.01%PACCAR Financial Europe BV €100,000 0.13% 7/3/2022 112,775 0.00%de Volksbank NV €100,000 0.01% 16/9/2024 111,028 0.00%Shell International Finance BV $90,000 1.75% 12/9/2021 89,884 0.00%Shell International Finance BV $75,000 2.25% 6/1/2023 75,599 0.00%Nederlandse Waterschapsbank NV $50,000 1.88% 14/4/2022 50,160 0.00%
39,337,106 1.93%
New Zealand 0.25% (2018: 0.29%)
New Zealand Government Bond NZ($)2,050,000 5.50% 15/4/2023 1,573,810 0.08%Westpac Securities NZ Ltd. €700,000 0.13% 16/6/2021 789,893 0.04%New Zealand Government Bond NZ($)1,000,000 6.00% 15/5/2021 718,764 0.03%ANZ New Zealand Int’l Ltd. €400,000 0.63% 1/6/2021 453,821 0.02%BNZ International Funding Ltd. €300,000 0.63% 23/4/2022 341,813 0.02%BNZ International Funding Ltd. $250,000 3.38% 1/3/2023 258,163 0.01%BNZ International Funding Ltd. $250,000 2.65% 3/11/2022 253,180 0.01%BNZ International Funding Ltd. €200,000 0.13% 17/6/2021 225,721 0.01%ASB Bank Ltd. $200,000 3.13% 23/5/2024 205,314 0.01%ANZ New Zealand Int’l Ltd. $200,000 2.88% 25/1/2022 203,142 0.01%ANZ New Zealand Int’l Ltd. $150,000 2.13% 28/7/2021 150,001 0.01%
5,173,622 0.25%
Norway 0.67% (2018: 0.68%)
Equinor A.S.A €1,000,000 5.63% 11/3/2021 1,200,040 0.06%Norway Government Bond NOK(kr)10,000,000 2.00% 24/5/2023 1,159,947 0.06%SpareBank 1 Boligkreditt A.S. €1,000,000 0.05% 25/1/2022 1,129,767 0.05%Santander Consumer Bank A.S. €700,000 0.75% 1/3/2023 800,378 0.04%DNB Bank A.S.A €700,000 0.05% 14/11/2023 782,616 0.04%Norway Government Bond NOK(kr)6,000,000 3.00% 14/3/2024 726,981 0.04%Norway Government Bond NOK(kr)6,000,000 3.75% 25/5/2021 705,473 0.03%Equinor A.S.A €500,000 0.88% 17/2/2023 575,579 0.03%SpareBank 1 SR-Bank A.S.A €475,000 0.38% 10/2/2022 537,142 0.03%DNB Bank A.S.A £400,000 1.38% 12/6/2023 532,110 0.03%Sparebanken Soer Boligkreditt A.S. €400,000 0.38% 20/2/2023 456,480 0.02%DNB Boligkreditt A.S. €400,000 0.05% 11/1/2022 451,910 0.02%Kommunalbanken A.S. £300,000 1.13% 15/12/2021 398,894 0.02%Kommunalbanken A.S. $392,000 2.25% 25/1/2022 395,960 0.02%Sparebank 1 Oestlandet €300,000 0.88% 13/3/2023 344,271 0.02%DNB Boligkreditt A.S. €300,000 0.38% 14/11/2023 343,617 0.02%Sparebanken Soer Boligkreditt A.S. €300,000 0.25% 22/3/2021 338,942 0.02%DNB Boligkreditt A.S. $300,000 2.50% 28/3/2022 303,862 0.01%Kommunalbanken A.S. $300,000 1.63% 10/2/2021 296,551 0.01%Equinor A.S.A $250,000 2.65% 15/1/2024 255,737 0.01%DNB Boligkreditt A.S. €200,000 3.88% 16/6/2021 238,146 0.01%Equinor A.S.A $225,000 3.15% 23/1/2022 230,726 0.01%SpareBank 1 SMN €200,000 0.50% 9/3/2022 227,216 0.01%Kommunalbanken A.S. $200,000 3.13% 18/10/2021 204,830 0.01%Equinor A.S.A $140,000 2.45% 17/1/2023 142,120 0.01%DNB Bank A.S.A^ €100,000 1.25% 1/3/2027 114,525 0.01%Santander Consumer Bank A.S. €100,000 0.88% 21/1/2022 114,231 0.01%SpareBank 1 SMN €100,000 0.75% 8/6/2021 113,637 0.01%Sparebanken Vest Boligkreditt A.S. €100,000 0.13% 15/3/2023 113,360 0.01%Sparebanken Vest Boligkreditt A.S. €100,000 0.13% 2/3/2021 112,813 0.00%Santander Consumer Bank A.S. €100,000 0.13% 11/9/2024 111,282 0.00%Kommunalbanken A.S. $80,000 2.50% 11/1/2023 81,725 0.00%
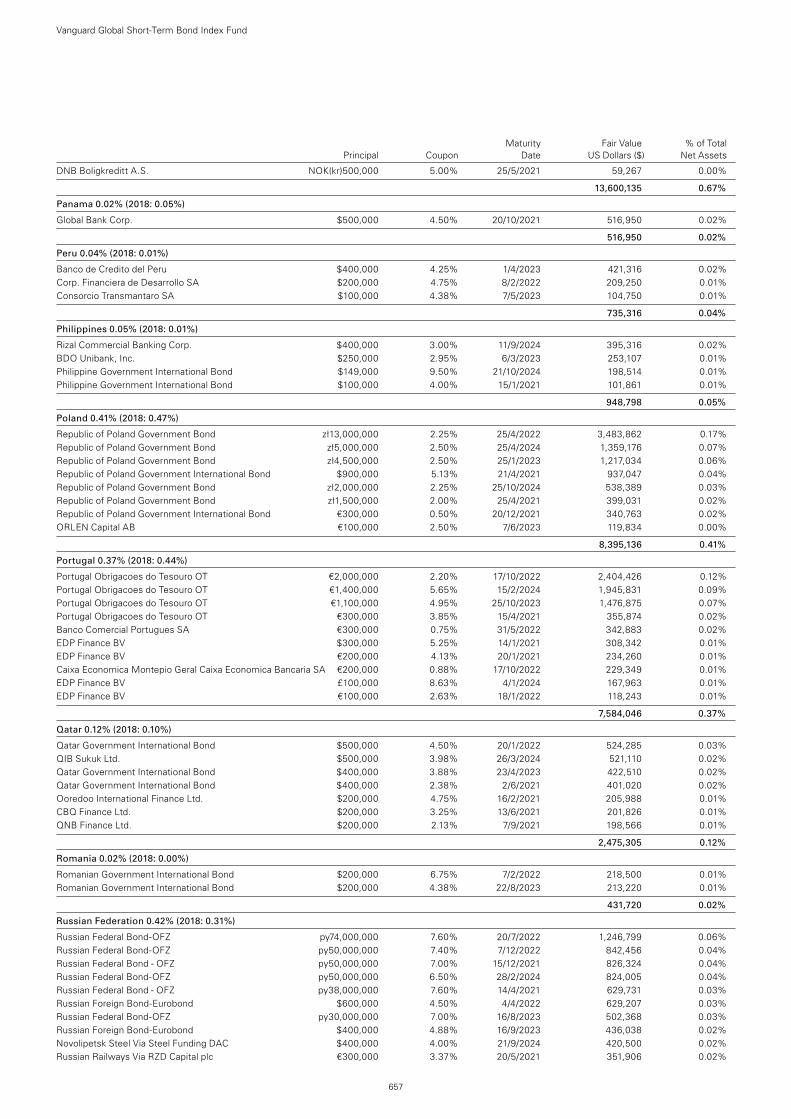
Maturity Fair Value % of Total Principal Coupon Date US Dollars ($) Net Assets
DNB Boligkreditt A.S. NOK(kr)500,000 5.00% 25/5/2021 59,267 0.00%
13,600,135 0.67%
Panama 0.02% (2018: 0.05%)
Global Bank Corp. $500,000 4.50% 20/10/2021 516,950 0.02%
516,950 0.02%
Peru 0.04% (2018: 0.01%)
Banco de Credito del Peru $400,000 4.25% 1/4/2023 421,316 0.02%Corp. Financiera de Desarrollo SA $200,000 4.75% 8/2/2022 209,250 0.01%Consorcio Transmantaro SA $100,000 4.38% 7/5/2023 104,750 0.01%
735,316 0.04%
Philippines 0.05% (2018: 0.01%)
Rizal Commercial Banking Corp. $400,000 3.00% 11/9/2024 395,316 0.02%BDO Unibank, Inc. $250,000 2.95% 6/3/2023 253,107 0.01%Philippine Government International Bond $149,000 9.50% 21/10/2024 198,514 0.01%Philippine Government International Bond $100,000 4.00% 15/1/2021 101,861 0.01%
948,798 0.05%
Poland 0.41% (2018: 0.47%)
Republic of Poland Government Bond zł13,000,000 2.25% 25/4/2022 3,483,862 0.17%Republic of Poland Government Bond zł5,000,000 2.50% 25/4/2024 1,359,176 0.07%Republic of Poland Government Bond zł4,500,000 2.50% 25/1/2023 1,217,034 0.06%Republic of Poland Government International Bond $900,000 5.13% 21/4/2021 937,047 0.04%Republic of Poland Government Bond zł2,000,000 2.25% 25/10/2024 538,389 0.03%Republic of Poland Government Bond zł1,500,000 2.00% 25/4/2021 399,031 0.02%Republic of Poland Government International Bond €300,000 0.50% 20/12/2021 340,763 0.02%ORLEN Capital AB €100,000 2.50% 7/6/2023 119,834 0.00%
8,395,136 0.41%
Portugal 0.37% (2018: 0.44%)
Portugal Obrigacoes do Tesouro OT €2,000,000 2.20% 17/10/2022 2,404,426 0.12%Portugal Obrigacoes do Tesouro OT €1,400,000 5.65% 15/2/2024 1,945,831 0.09%Portugal Obrigacoes do Tesouro OT €1,100,000 4.95% 25/10/2023 1,476,875 0.07%Portugal Obrigacoes do Tesouro OT €300,000 3.85% 15/4/2021 355,874 0.02%Banco Comercial Portugues SA €300,000 0.75% 31/5/2022 342,883 0.02%EDP Finance BV $300,000 5.25% 14/1/2021 308,342 0.01%EDP Finance BV €200,000 4.13% 20/1/2021 234,260 0.01%Caixa Economica Montepio Geral Caixa Economica Bancaria SA €200,000 0.88% 17/10/2022 229,349 0.01%EDP Finance BV £100,000 8.63% 4/1/2024 167,963 0.01%EDP Finance BV €100,000 2.63% 18/1/2022 118,243 0.01%
7,584,046 0.37%
Qatar 0.12% (2018: 0.10%)
Qatar Government International Bond $500,000 4.50% 20/1/2022 524,285 0.03%QIB Sukuk Ltd. $500,000 3.98% 26/3/2024 521,110 0.02%Qatar Government International Bond $400,000 3.88% 23/4/2023 422,510 0.02%Qatar Government International Bond $400,000 2.38% 2/6/2021 401,020 0.02%Ooredoo International Finance Ltd. $200,000 4.75% 16/2/2021 205,988 0.01%CBQ Finance Ltd. $200,000 3.25% 13/6/2021 201,826 0.01%QNB Finance Ltd. $200,000 2.13% 7/9/2021 198,566 0.01%
2,475,305 0.12%
Romania 0.02% (2018: 0.00%)
Romanian Government International Bond $200,000 6.75% 7/2/2022 218,500 0.01%Romanian Government International Bond $200,000 4.38% 22/8/2023 213,220 0.01%
431,720 0.02%
Russian Federation 0.42% (2018: 0.31%)
Russian Federal Bond-OFZ py74,000,000 7.60% 20/7/2022 1,246,799 0.06%Russian Federal Bond-OFZ py50,000,000 7.40% 7/12/2022 842,456 0.04%Russian Federal Bond - OFZ py50,000,000 7.00% 15/12/2021 826,324 0.04%Russian Federal Bond-OFZ py50,000,000 6.50% 28/2/2024 824,005 0.04%Russian Federal Bond - OFZ py38,000,000 7.60% 14/4/2021 629,731 0.03%Russian Foreign Bond-Eurobond $600,000 4.50% 4/4/2022 629,207 0.03%Russian Federal Bond-OFZ py30,000,000 7.00% 16/8/2023 502,368 0.03%Russian Foreign Bond-Eurobond $400,000 4.88% 16/9/2023 436,038 0.02%Novolipetsk Steel Via Steel Funding DAC $400,000 4.00% 21/9/2024 420,500 0.02%Russian Railways Via RZD Capital plc €300,000 3.37% 20/5/2021 351,906 0.02%
Vanguard Global Short-Term Bond Index Fund
657
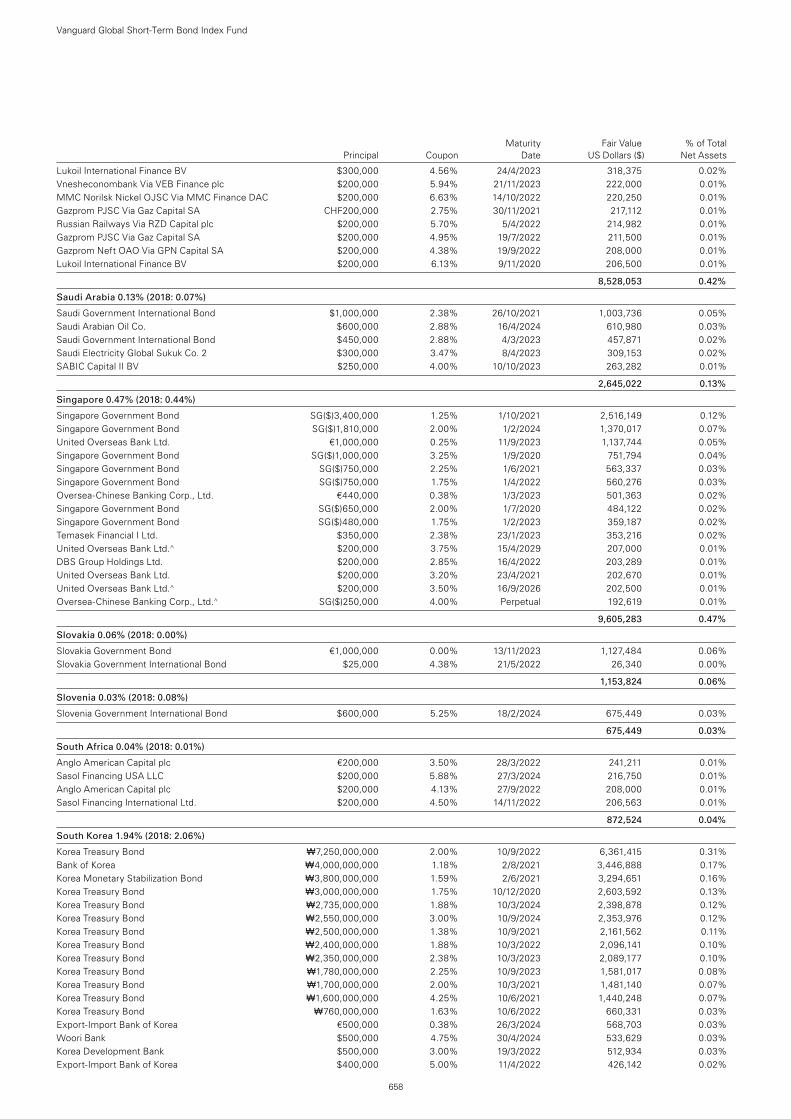
Maturity Fair Value % of Total Principal Coupon Date US Dollars ($) Net Assets
Lukoil International Finance BV $300,000 4.56% 24/4/2023 318,375 0.02%Vnesheconombank Via VEB Finance plc $200,000 5.94% 21/11/2023 222,000 0.01%MMC Norilsk Nickel OJSC Via MMC Finance DAC $200,000 6.63% 14/10/2022 220,250 0.01%Gazprom PJSC Via Gaz Capital SA CHF200,000 2.75% 30/11/2021 217,112 0.01%Russian Railways Via RZD Capital plc $200,000 5.70% 5/4/2022 214,982 0.01%Gazprom PJSC Via Gaz Capital SA $200,000 4.95% 19/7/2022 211,500 0.01%Gazprom Neft OAO Via GPN Capital SA $200,000 4.38% 19/9/2022 208,000 0.01%Lukoil International Finance BV $200,000 6.13% 9/11/2020 206,500 0.01%
8,528,053 0.42%
Saudi Arabia 0.13% (2018: 0.07%)
Saudi Government International Bond $1,000,000 2.38% 26/10/2021 1,003,736 0.05%Saudi Arabian Oil Co. $600,000 2.88% 16/4/2024 610,980 0.03%Saudi Government International Bond $450,000 2.88% 4/3/2023 457,871 0.02%Saudi Electricity Global Sukuk Co. 2 $300,000 3.47% 8/4/2023 309,153 0.02%SABIC Capital II BV $250,000 4.00% 10/10/2023 263,282 0.01%
2,645,022 0.13%
Singapore 0.47% (2018: 0.44%)
Singapore Government Bond SG($)3,400,000 1.25% 1/10/2021 2,516,149 0.12%Singapore Government Bond SG($)1,810,000 2.00% 1/2/2024 1,370,017 0.07%United Overseas Bank Ltd. €1,000,000 0.25% 11/9/2023 1,137,744 0.05%Singapore Government Bond SG($)1,000,000 3.25% 1/9/2020 751,794 0.04%Singapore Government Bond SG($)750,000 2.25% 1/6/2021 563,337 0.03%Singapore Government Bond SG($)750,000 1.75% 1/4/2022 560,276 0.03%Oversea-Chinese Banking Corp., Ltd. €440,000 0.38% 1/3/2023 501,363 0.02%Singapore Government Bond SG($)650,000 2.00% 1/7/2020 484,122 0.02%Singapore Government Bond SG($)480,000 1.75% 1/2/2023 359,187 0.02%Temasek Financial I Ltd. $350,000 2.38% 23/1/2023 353,216 0.02%United Overseas Bank Ltd.^ $200,000 3.75% 15/4/2029 207,000 0.01%DBS Group Holdings Ltd. $200,000 2.85% 16/4/2022 203,289 0.01%United Overseas Bank Ltd. $200,000 3.20% 23/4/2021 202,670 0.01%United Overseas Bank Ltd.^ $200,000 3.50% 16/9/2026 202,500 0.01%Oversea-Chinese Banking Corp., Ltd.^ SG($)250,000 4.00% Perpetual 192,619 0.01%
9,605,283 0.47%
Slovakia 0.06% (2018: 0.00%)
Slovakia Government Bond €1,000,000 0.00% 13/11/2023 1,127,484 0.06%Slovakia Government International Bond $25,000 4.38% 21/5/2022 26,340 0.00%
1,153,824 0.06%
Slovenia 0.03% (2018: 0.08%)
Slovenia Government International Bond $600,000 5.25% 18/2/2024 675,449 0.03%
675,449 0.03%
South Africa 0.04% (2018: 0.01%)
Anglo American Capital plc €200,000 3.50% 28/3/2022 241,211 0.01%Sasol Financing USA LLC $200,000 5.88% 27/3/2024 216,750 0.01%Anglo American Capital plc $200,000 4.13% 27/9/2022 208,000 0.01%Sasol Financing International Ltd. $200,000 4.50% 14/11/2022 206,563 0.01%
872,524 0.04%
South Korea 1.94% (2018: 2.06%)
Korea Treasury Bond ₩7,250,000,000 2.00% 10/9/2022 6,361,415 0.31%Bank of Korea ₩4,000,000,000 1.18% 2/8/2021 3,446,888 0.17%Korea Monetary Stabilization Bond ₩3,800,000,000 1.59% 2/6/2021 3,294,651 0.16%Korea Treasury Bond ₩3,000,000,000 1.75% 10/12/2020 2,603,592 0.13%Korea Treasury Bond ₩2,735,000,000 1.88% 10/3/2024 2,398,878 0.12%Korea Treasury Bond ₩2,550,000,000 3.00% 10/9/2024 2,353,976 0.12%Korea Treasury Bond ₩2,500,000,000 1.38% 10/9/2021 2,161,562 0.11%Korea Treasury Bond ₩2,400,000,000 1.88% 10/3/2022 2,096,141 0.10%Korea Treasury Bond ₩2,350,000,000 2.38% 10/3/2023 2,089,177 0.10%Korea Treasury Bond ₩1,780,000,000 2.25% 10/9/2023 1,581,017 0.08%Korea Treasury Bond ₩1,700,000,000 2.00% 10/3/2021 1,481,140 0.07%Korea Treasury Bond ₩1,600,000,000 4.25% 10/6/2021 1,440,248 0.07%Korea Treasury Bond ₩760,000,000 1.63% 10/6/2022 660,331 0.03%Export-Import Bank of Korea €500,000 0.38% 26/3/2024 568,703 0.03%Woori Bank $500,000 4.75% 30/4/2024 533,629 0.03%Korea Development Bank $500,000 3.00% 19/3/2022 512,934 0.03%Export-Import Bank of Korea $400,000 5.00% 11/4/2022 426,142 0.02%
Vanguard Global Short-Term Bond Index Fund
658
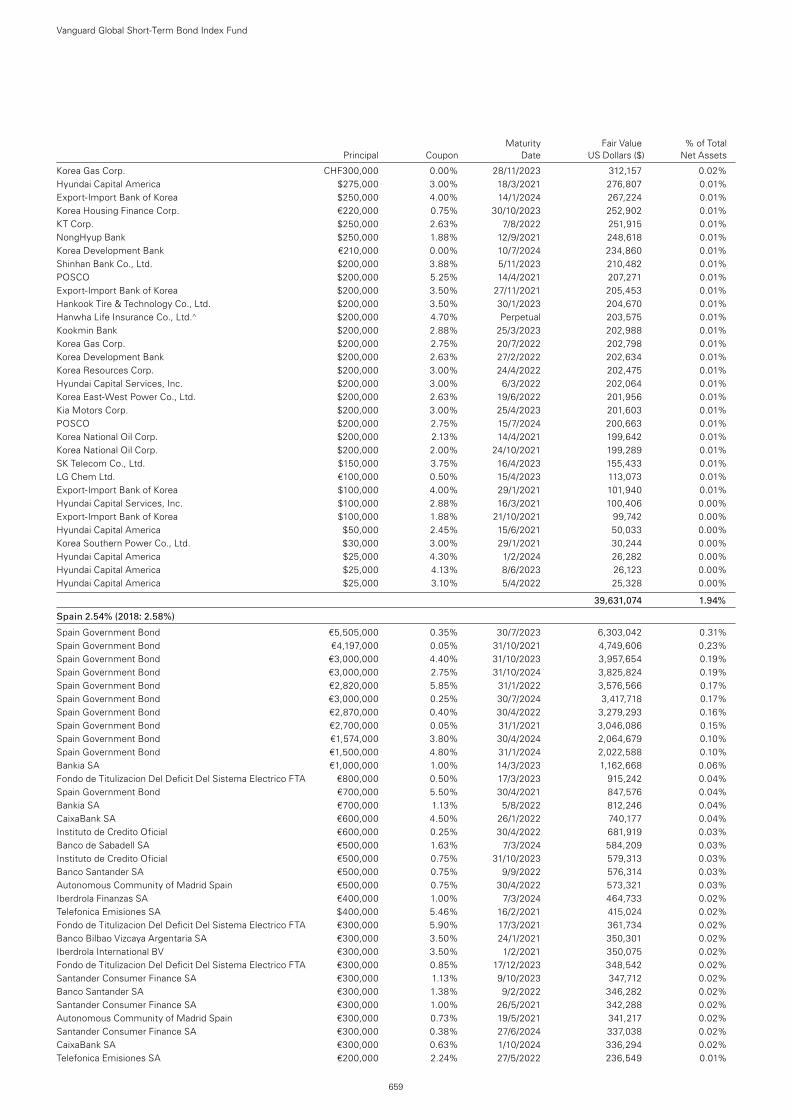
Maturity Fair Value % of Total Principal Coupon Date US Dollars ($) Net Assets
Korea Gas Corp. CHF300,000 0.00% 28/11/2023 312,157 0.02%Hyundai Capital America $275,000 3.00% 18/3/2021 276,807 0.01%Export-Import Bank of Korea $250,000 4.00% 14/1/2024 267,224 0.01%Korea Housing Finance Corp. €220,000 0.75% 30/10/2023 252,902 0.01%KT Corp. $250,000 2.63% 7/8/2022 251,915 0.01%NongHyup Bank $250,000 1.88% 12/9/2021 248,618 0.01%Korea Development Bank €210,000 0.00% 10/7/2024 234,860 0.01%Shinhan Bank Co., Ltd. $200,000 3.88% 5/11/2023 210,482 0.01%POSCO $200,000 5.25% 14/4/2021 207,271 0.01%Export-Import Bank of Korea $200,000 3.50% 27/11/2021 205,453 0.01%Hankook Tire & Technology Co., Ltd. $200,000 3.50% 30/1/2023 204,670 0.01%Hanwha Life Insurance Co., Ltd.^ $200,000 4.70% Perpetual 203,575 0.01%Kookmin Bank $200,000 2.88% 25/3/2023 202,988 0.01%Korea Gas Corp. $200,000 2.75% 20/7/2022 202,798 0.01%Korea Development Bank $200,000 2.63% 27/2/2022 202,634 0.01%Korea Resources Corp. $200,000 3.00% 24/4/2022 202,475 0.01%Hyundai Capital Services, Inc. $200,000 3.00% 6/3/2022 202,064 0.01%Korea East-West Power Co., Ltd. $200,000 2.63% 19/6/2022 201,956 0.01%Kia Motors Corp. $200,000 3.00% 25/4/2023 201,603 0.01%POSCO $200,000 2.75% 15/7/2024 200,663 0.01%Korea National Oil Corp. $200,000 2.13% 14/4/2021 199,642 0.01%Korea National Oil Corp. $200,000 2.00% 24/10/2021 199,289 0.01%SK Telecom Co., Ltd. $150,000 3.75% 16/4/2023 155,433 0.01%LG Chem Ltd. €100,000 0.50% 15/4/2023 113,073 0.01%Export-Import Bank of Korea $100,000 4.00% 29/1/2021 101,940 0.01%Hyundai Capital Services, Inc. $100,000 2.88% 16/3/2021 100,406 0.00%Export-Import Bank of Korea $100,000 1.88% 21/10/2021 99,742 0.00%Hyundai Capital America $50,000 2.45% 15/6/2021 50,033 0.00%Korea Southern Power Co., Ltd. $30,000 3.00% 29/1/2021 30,244 0.00%Hyundai Capital America $25,000 4.30% 1/2/2024 26,282 0.00%Hyundai Capital America $25,000 4.13% 8/6/2023 26,123 0.00%Hyundai Capital America $25,000 3.10% 5/4/2022 25,328 0.00%
39,631,074 1.94%
Spain 2.54% (2018: 2.58%)
Spain Government Bond €5,505,000 0.35% 30/7/2023 6,303,042 0.31%Spain Government Bond €4,197,000 0.05% 31/10/2021 4,749,606 0.23%Spain Government Bond €3,000,000 4.40% 31/10/2023 3,957,654 0.19%Spain Government Bond €3,000,000 2.75% 31/10/2024 3,825,824 0.19%Spain Government Bond €2,820,000 5.85% 31/1/2022 3,576,566 0.17%Spain Government Bond €3,000,000 0.25% 30/7/2024 3,417,718 0.17%Spain Government Bond €2,870,000 0.40% 30/4/2022 3,279,293 0.16%Spain Government Bond €2,700,000 0.05% 31/1/2021 3,046,086 0.15%Spain Government Bond €1,574,000 3.80% 30/4/2024 2,064,679 0.10%Spain Government Bond €1,500,000 4.80% 31/1/2024 2,022,588 0.10%Bankia SA €1,000,000 1.00% 14/3/2023 1,162,668 0.06%Fondo de Titulizacion Del Deficit Del Sistema Electrico FTA €800,000 0.50% 17/3/2023 915,242 0.04%Spain Government Bond €700,000 5.50% 30/4/2021 847,576 0.04%Bankia SA €700,000 1.13% 5/8/2022 812,246 0.04%CaixaBank SA €600,000 4.50% 26/1/2022 740,177 0.04%Instituto de Credito Oficial €600,000 0.25% 30/4/2022 681,919 0.03%Banco de Sabadell SA €500,000 1.63% 7/3/2024 584,209 0.03%Instituto de Credito Oficial €500,000 0.75% 31/10/2023 579,313 0.03%Banco Santander SA €500,000 0.75% 9/9/2022 576,314 0.03%Autonomous Community of Madrid Spain €500,000 0.75% 30/4/2022 573,321 0.03%Iberdrola Finanzas SA €400,000 1.00% 7/3/2024 464,733 0.02%Telefonica Emisiones SA $400,000 5.46% 16/2/2021 415,024 0.02%Fondo de Titulizacion Del Deficit Del Sistema Electrico FTA €300,000 5.90% 17/3/2021 361,734 0.02%Banco Bilbao Vizcaya Argentaria SA €300,000 3.50% 24/1/2021 350,301 0.02%Iberdrola International BV €300,000 3.50% 1/2/2021 350,075 0.02%Fondo de Titulizacion Del Deficit Del Sistema Electrico FTA €300,000 0.85% 17/12/2023 348,542 0.02%Santander Consumer Finance SA €300,000 1.13% 9/10/2023 347,712 0.02%Banco Santander SA €300,000 1.38% 9/2/2022 346,282 0.02%Santander Consumer Finance SA €300,000 1.00% 26/5/2021 342,288 0.02%Autonomous Community of Madrid Spain €300,000 0.73% 19/5/2021 341,217 0.02%Santander Consumer Finance SA €300,000 0.38% 27/6/2024 337,038 0.02%CaixaBank SA €300,000 0.63% 1/10/2024 336,294 0.02%Telefonica Emisiones SA €200,000 2.24% 27/5/2022 236,549 0.01%
Vanguard Global Short-Term Bond Index Fund
659
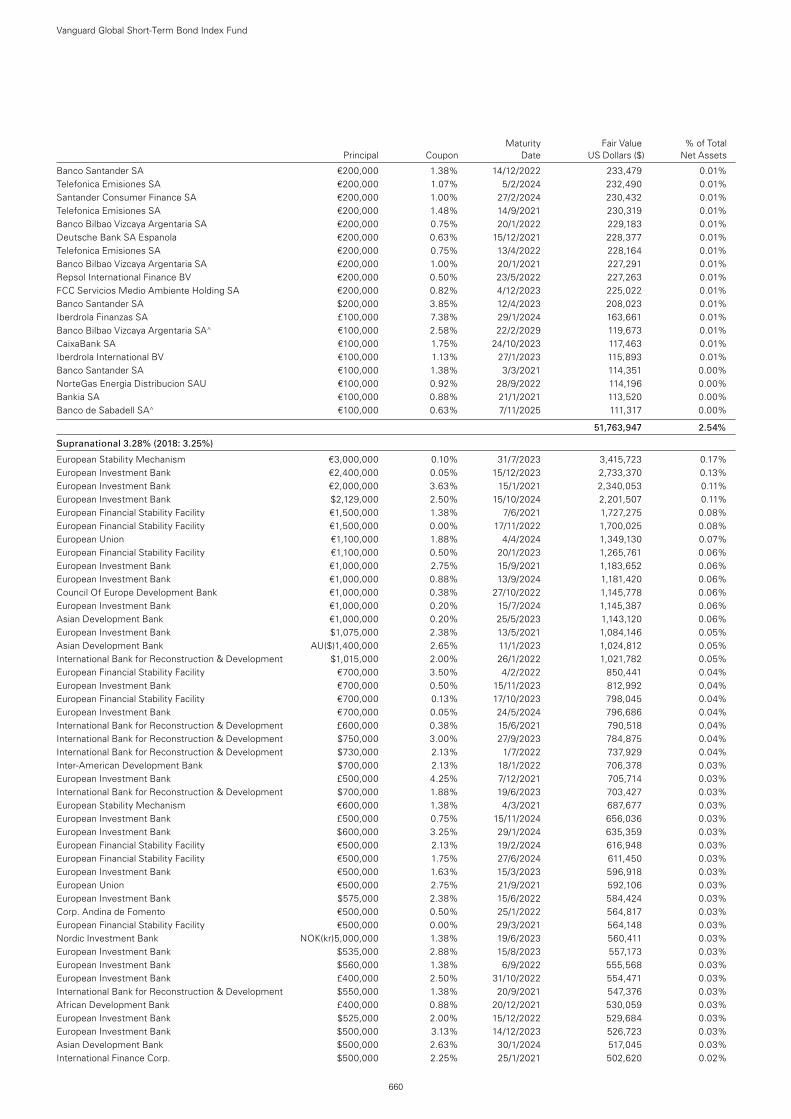
Maturity Fair Value % of Total Principal Coupon Date US Dollars ($) Net Assets
Banco Santander SA €200,000 1.38% 14/12/2022 233,479 0.01%Telefonica Emisiones SA €200,000 1.07% 5/2/2024 232,490 0.01%Santander Consumer Finance SA €200,000 1.00% 27/2/2024 230,432 0.01%Telefonica Emisiones SA €200,000 1.48% 14/9/2021 230,319 0.01%Banco Bilbao Vizcaya Argentaria SA €200,000 0.75% 20/1/2022 229,183 0.01%Deutsche Bank SA Espanola €200,000 0.63% 15/12/2021 228,377 0.01%Telefonica Emisiones SA €200,000 0.75% 13/4/2022 228,164 0.01%Banco Bilbao Vizcaya Argentaria SA €200,000 1.00% 20/1/2021 227,291 0.01%Repsol International Finance BV €200,000 0.50% 23/5/2022 227,263 0.01%FCC Servicios Medio Ambiente Holding SA €200,000 0.82% 4/12/2023 225,022 0.01%Banco Santander SA $200,000 3.85% 12/4/2023 208,023 0.01%Iberdrola Finanzas SA £100,000 7.38% 29/1/2024 163,661 0.01%Banco Bilbao Vizcaya Argentaria SA^ €100,000 2.58% 22/2/2029 119,673 0.01%CaixaBank SA €100,000 1.75% 24/10/2023 117,463 0.01%Iberdrola International BV €100,000 1.13% 27/1/2023 115,893 0.01%Banco Santander SA €100,000 1.38% 3/3/2021 114,351 0.00%NorteGas Energia Distribucion SAU €100,000 0.92% 28/9/2022 114,196 0.00%Bankia SA €100,000 0.88% 21/1/2021 113,520 0.00%Banco de Sabadell SA^ €100,000 0.63% 7/11/2025 111,317 0.00%
51,763,947 2.54%
Supranational 3.28% (2018: 3.25%)
European Stability Mechanism €3,000,000 0.10% 31/7/2023 3,415,723 0.17%European Investment Bank €2,400,000 0.05% 15/12/2023 2,733,370 0.13%European Investment Bank €2,000,000 3.63% 15/1/2021 2,340,053 0.11%European Investment Bank $2,129,000 2.50% 15/10/2024 2,201,507 0.11%European Financial Stability Facility €1,500,000 1.38% 7/6/2021 1,727,275 0.08%European Financial Stability Facility €1,500,000 0.00% 17/11/2022 1,700,025 0.08%European Union €1,100,000 1.88% 4/4/2024 1,349,130 0.07%European Financial Stability Facility €1,100,000 0.50% 20/1/2023 1,265,761 0.06%European Investment Bank €1,000,000 2.75% 15/9/2021 1,183,652 0.06%European Investment Bank €1,000,000 0.88% 13/9/2024 1,181,420 0.06%Council Of Europe Development Bank €1,000,000 0.38% 27/10/2022 1,145,778 0.06%European Investment Bank €1,000,000 0.20% 15/7/2024 1,145,387 0.06%Asian Development Bank €1,000,000 0.20% 25/5/2023 1,143,120 0.06%European Investment Bank $1,075,000 2.38% 13/5/2021 1,084,146 0.05%Asian Development Bank AU($)1,400,000 2.65% 11/1/2023 1,024,812 0.05%International Bank for Reconstruction & Development $1,015,000 2.00% 26/1/2022 1,021,782 0.05%European Financial Stability Facility €700,000 3.50% 4/2/2022 850,441 0.04%European Investment Bank €700,000 0.50% 15/11/2023 812,992 0.04%European Financial Stability Facility €700,000 0.13% 17/10/2023 798,045 0.04%European Investment Bank €700,000 0.05% 24/5/2024 796,686 0.04%International Bank for Reconstruction & Development £600,000 0.38% 15/6/2021 790,518 0.04%International Bank for Reconstruction & Development $750,000 3.00% 27/9/2023 784,875 0.04%International Bank for Reconstruction & Development $730,000 2.13% 1/7/2022 737,929 0.04%Inter-American Development Bank $700,000 2.13% 18/1/2022 706,378 0.03%European Investment Bank £500,000 4.25% 7/12/2021 705,714 0.03%International Bank for Reconstruction & Development $700,000 1.88% 19/6/2023 703,427 0.03%European Stability Mechanism €600,000 1.38% 4/3/2021 687,677 0.03%European Investment Bank £500,000 0.75% 15/11/2024 656,036 0.03%European Investment Bank $600,000 3.25% 29/1/2024 635,359 0.03%European Financial Stability Facility €500,000 2.13% 19/2/2024 616,948 0.03%European Financial Stability Facility €500,000 1.75% 27/6/2024 611,450 0.03%European Investment Bank €500,000 1.63% 15/3/2023 596,918 0.03%European Union €500,000 2.75% 21/9/2021 592,106 0.03%European Investment Bank $575,000 2.38% 15/6/2022 584,424 0.03%Corp. Andina de Fomento €500,000 0.50% 25/1/2022 564,817 0.03%European Financial Stability Facility €500,000 0.00% 29/3/2021 564,148 0.03%Nordic Investment Bank NOK(kr)5,000,000 1.38% 19/6/2023 560,411 0.03%European Investment Bank $535,000 2.88% 15/8/2023 557,173 0.03%European Investment Bank $560,000 1.38% 6/9/2022 555,568 0.03%European Investment Bank £400,000 2.50% 31/10/2022 554,471 0.03%International Bank for Reconstruction & Development $550,000 1.38% 20/9/2021 547,376 0.03%African Development Bank £400,000 0.88% 20/12/2021 530,059 0.03%European Investment Bank $525,000 2.00% 15/12/2022 529,684 0.03%European Investment Bank $500,000 3.13% 14/12/2023 526,723 0.03%Asian Development Bank $500,000 2.63% 30/1/2024 517,045 0.03%International Finance Corp. $500,000 2.25% 25/1/2021 502,620 0.02%
Vanguard Global Short-Term Bond Index Fund
660
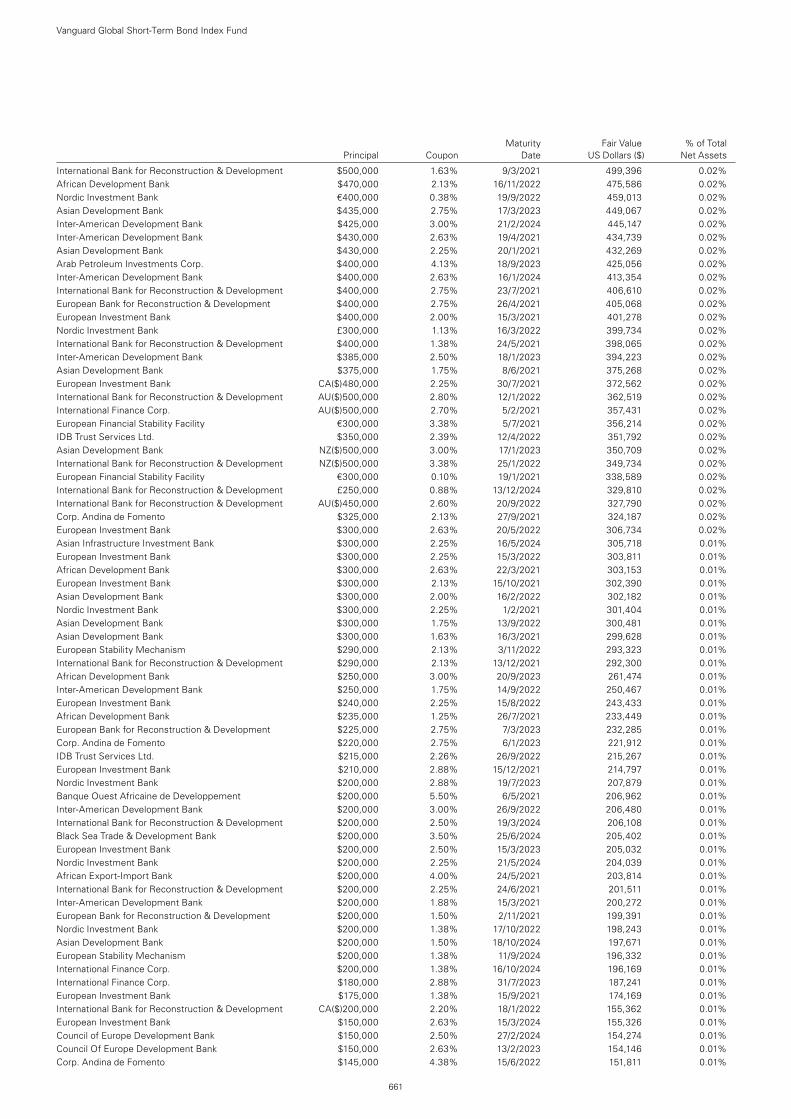
Maturity Fair Value % of Total Principal Coupon Date US Dollars ($) Net Assets
International Bank for Reconstruction & Development $500,000 1.63% 9/3/2021 499,396 0.02%African Development Bank $470,000 2.13% 16/11/2022 475,586 0.02%Nordic Investment Bank €400,000 0.38% 19/9/2022 459,013 0.02%Asian Development Bank $435,000 2.75% 17/3/2023 449,067 0.02%Inter-American Development Bank $425,000 3.00% 21/2/2024 445,147 0.02%Inter-American Development Bank $430,000 2.63% 19/4/2021 434,739 0.02%Asian Development Bank $430,000 2.25% 20/1/2021 432,269 0.02%Arab Petroleum Investments Corp. $400,000 4.13% 18/9/2023 425,056 0.02%Inter-American Development Bank $400,000 2.63% 16/1/2024 413,354 0.02%International Bank for Reconstruction & Development $400,000 2.75% 23/7/2021 406,610 0.02%European Bank for Reconstruction & Development $400,000 2.75% 26/4/2021 405,068 0.02%European Investment Bank $400,000 2.00% 15/3/2021 401,278 0.02%Nordic Investment Bank £300,000 1.13% 16/3/2022 399,734 0.02%International Bank for Reconstruction & Development $400,000 1.38% 24/5/2021 398,065 0.02%Inter-American Development Bank $385,000 2.50% 18/1/2023 394,223 0.02%Asian Development Bank $375,000 1.75% 8/6/2021 375,268 0.02%European Investment Bank CA($)480,000 2.25% 30/7/2021 372,562 0.02%International Bank for Reconstruction & Development AU($)500,000 2.80% 12/1/2022 362,519 0.02%International Finance Corp. AU($)500,000 2.70% 5/2/2021 357,431 0.02%European Financial Stability Facility €300,000 3.38% 5/7/2021 356,214 0.02%IDB Trust Services Ltd. $350,000 2.39% 12/4/2022 351,792 0.02%Asian Development Bank NZ($)500,000 3.00% 17/1/2023 350,709 0.02%International Bank for Reconstruction & Development NZ($)500,000 3.38% 25/1/2022 349,734 0.02%European Financial Stability Facility €300,000 0.10% 19/1/2021 338,589 0.02%International Bank for Reconstruction & Development £250,000 0.88% 13/12/2024 329,810 0.02%International Bank for Reconstruction & Development AU($)450,000 2.60% 20/9/2022 327,790 0.02%Corp. Andina de Fomento $325,000 2.13% 27/9/2021 324,187 0.02%European Investment Bank $300,000 2.63% 20/5/2022 306,734 0.02%Asian Infrastructure Investment Bank $300,000 2.25% 16/5/2024 305,718 0.01%European Investment Bank $300,000 2.25% 15/3/2022 303,811 0.01%African Development Bank $300,000 2.63% 22/3/2021 303,153 0.01%European Investment Bank $300,000 2.13% 15/10/2021 302,390 0.01%Asian Development Bank $300,000 2.00% 16/2/2022 302,182 0.01%Nordic Investment Bank $300,000 2.25% 1/2/2021 301,404 0.01%Asian Development Bank $300,000 1.75% 13/9/2022 300,481 0.01%Asian Development Bank $300,000 1.63% 16/3/2021 299,628 0.01%European Stability Mechanism $290,000 2.13% 3/11/2022 293,323 0.01%International Bank for Reconstruction & Development $290,000 2.13% 13/12/2021 292,300 0.01%African Development Bank $250,000 3.00% 20/9/2023 261,474 0.01%Inter-American Development Bank $250,000 1.75% 14/9/2022 250,467 0.01%European Investment Bank $240,000 2.25% 15/8/2022 243,433 0.01%African Development Bank $235,000 1.25% 26/7/2021 233,449 0.01%European Bank for Reconstruction & Development $225,000 2.75% 7/3/2023 232,285 0.01%Corp. Andina de Fomento $220,000 2.75% 6/1/2023 221,912 0.01%IDB Trust Services Ltd. $215,000 2.26% 26/9/2022 215,267 0.01%European Investment Bank $210,000 2.88% 15/12/2021 214,797 0.01%Nordic Investment Bank $200,000 2.88% 19/7/2023 207,879 0.01%Banque Ouest Africaine de Developpement $200,000 5.50% 6/5/2021 206,962 0.01%Inter-American Development Bank $200,000 3.00% 26/9/2022 206,480 0.01%International Bank for Reconstruction & Development $200,000 2.50% 19/3/2024 206,108 0.01%Black Sea Trade & Development Bank $200,000 3.50% 25/6/2024 205,402 0.01%European Investment Bank $200,000 2.50% 15/3/2023 205,032 0.01%Nordic Investment Bank $200,000 2.25% 21/5/2024 204,039 0.01%African Export-Import Bank $200,000 4.00% 24/5/2021 203,814 0.01%International Bank for Reconstruction & Development $200,000 2.25% 24/6/2021 201,511 0.01%Inter-American Development Bank $200,000 1.88% 15/3/2021 200,272 0.01%European Bank for Reconstruction & Development $200,000 1.50% 2/11/2021 199,391 0.01%Nordic Investment Bank $200,000 1.38% 17/10/2022 198,243 0.01%Asian Development Bank $200,000 1.50% 18/10/2024 197,671 0.01%European Stability Mechanism $200,000 1.38% 11/9/2024 196,332 0.01%International Finance Corp. $200,000 1.38% 16/10/2024 196,169 0.01%International Finance Corp. $180,000 2.88% 31/7/2023 187,241 0.01%European Investment Bank $175,000 1.38% 15/9/2021 174,169 0.01%International Bank for Reconstruction & Development CA($)200,000 2.20% 18/1/2022 155,362 0.01%European Investment Bank $150,000 2.63% 15/3/2024 155,326 0.01%Council of Europe Development Bank $150,000 2.50% 27/2/2024 154,274 0.01%Council Of Europe Development Bank $150,000 2.63% 13/2/2023 154,146 0.01%Corp. Andina de Fomento $145,000 4.38% 15/6/2022 151,811 0.01%
Vanguard Global Short-Term Bond Index Fund
661
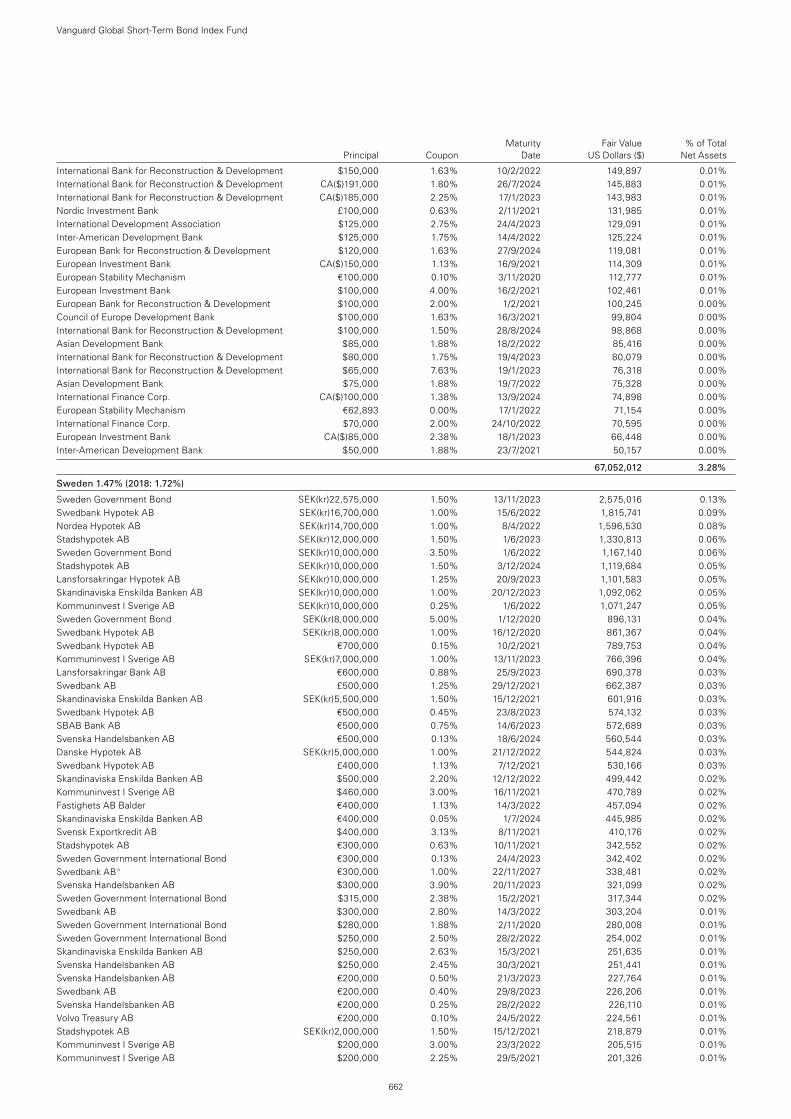
Maturity Fair Value % of Total Principal Coupon Date US Dollars ($) Net Assets
International Bank for Reconstruction & Development $150,000 1.63% 10/2/2022 149,897 0.01%International Bank for Reconstruction & Development CA($)191,000 1.80% 26/7/2024 145,883 0.01%International Bank for Reconstruction & Development CA($)185,000 2.25% 17/1/2023 143,983 0.01%Nordic Investment Bank £100,000 0.63% 2/11/2021 131,985 0.01%International Development Association $125,000 2.75% 24/4/2023 129,091 0.01%Inter-American Development Bank $125,000 1.75% 14/4/2022 125,224 0.01%European Bank for Reconstruction & Development $120,000 1.63% 27/9/2024 119,081 0.01%European Investment Bank CA($)150,000 1.13% 16/9/2021 114,309 0.01%European Stability Mechanism €100,000 0.10% 3/11/2020 112,777 0.01%European Investment Bank $100,000 4.00% 16/2/2021 102,461 0.01%European Bank for Reconstruction & Development $100,000 2.00% 1/2/2021 100,245 0.00%Council of Europe Development Bank $100,000 1.63% 16/3/2021 99,804 0.00%International Bank for Reconstruction & Development $100,000 1.50% 28/8/2024 98,868 0.00%Asian Development Bank $85,000 1.88% 18/2/2022 85,416 0.00%International Bank for Reconstruction & Development $80,000 1.75% 19/4/2023 80,079 0.00%International Bank for Reconstruction & Development $65,000 7.63% 19/1/2023 76,318 0.00%Asian Development Bank $75,000 1.88% 19/7/2022 75,328 0.00%International Finance Corp. CA($)100,000 1.38% 13/9/2024 74,898 0.00%European Stability Mechanism €62,893 0.00% 17/1/2022 71,154 0.00%International Finance Corp. $70,000 2.00% 24/10/2022 70,595 0.00%European Investment Bank CA($)85,000 2.38% 18/1/2023 66,448 0.00%Inter-American Development Bank $50,000 1.88% 23/7/2021 50,157 0.00%
67,052,012 3.28%
Sweden 1.47% (2018: 1.72%)
Sweden Government Bond SEK(kr)22,575,000 1.50% 13/11/2023 2,575,016 0.13%Swedbank Hypotek AB SEK(kr)16,700,000 1.00% 15/6/2022 1,815,741 0.09%Nordea Hypotek AB SEK(kr)14,700,000 1.00% 8/4/2022 1,596,530 0.08%Stadshypotek AB SEK(kr)12,000,000 1.50% 1/6/2023 1,330,813 0.06%Sweden Government Bond SEK(kr)10,000,000 3.50% 1/6/2022 1,167,140 0.06%Stadshypotek AB SEK(kr)10,000,000 1.50% 3/12/2024 1,119,684 0.05%Lansforsakringar Hypotek AB SEK(kr)10,000,000 1.25% 20/9/2023 1,101,583 0.05%Skandinaviska Enskilda Banken AB SEK(kr)10,000,000 1.00% 20/12/2023 1,092,062 0.05%Kommuninvest I Sverige AB SEK(kr)10,000,000 0.25% 1/6/2022 1,071,247 0.05%Sweden Government Bond SEK(kr)8,000,000 5.00% 1/12/2020 896,131 0.04%Swedbank Hypotek AB SEK(kr)8,000,000 1.00% 16/12/2020 861,367 0.04%Swedbank Hypotek AB €700,000 0.15% 10/2/2021 789,753 0.04%Kommuninvest I Sverige AB SEK(kr)7,000,000 1.00% 13/11/2023 766,396 0.04%Lansforsakringar Bank AB €600,000 0.88% 25/9/2023 690,378 0.03%Swedbank AB £500,000 1.25% 29/12/2021 662,387 0.03%Skandinaviska Enskilda Banken AB SEK(kr)5,500,000 1.50% 15/12/2021 601,916 0.03%Swedbank Hypotek AB €500,000 0.45% 23/8/2023 574,132 0.03%SBAB Bank AB €500,000 0.75% 14/6/2023 572,689 0.03%Svenska Handelsbanken AB €500,000 0.13% 18/6/2024 560,544 0.03%Danske Hypotek AB SEK(kr)5,000,000 1.00% 21/12/2022 544,824 0.03%Swedbank Hypotek AB £400,000 1.13% 7/12/2021 530,166 0.03%Skandinaviska Enskilda Banken AB $500,000 2.20% 12/12/2022 499,442 0.02%Kommuninvest I Sverige AB $460,000 3.00% 16/11/2021 470,789 0.02%Fastighets AB Balder €400,000 1.13% 14/3/2022 457,094 0.02%Skandinaviska Enskilda Banken AB €400,000 0.05% 1/7/2024 445,985 0.02%Svensk Exportkredit AB $400,000 3.13% 8/11/2021 410,176 0.02%Stadshypotek AB €300,000 0.63% 10/11/2021 342,552 0.02%Sweden Government International Bond €300,000 0.13% 24/4/2023 342,402 0.02%Swedbank AB^ €300,000 1.00% 22/11/2027 338,481 0.02%Svenska Handelsbanken AB $300,000 3.90% 20/11/2023 321,099 0.02%Sweden Government International Bond $315,000 2.38% 15/2/2021 317,344 0.02%Swedbank AB $300,000 2.80% 14/3/2022 303,204 0.01%Sweden Government International Bond $280,000 1.88% 2/11/2020 280,008 0.01%Sweden Government International Bond $250,000 2.50% 28/2/2022 254,002 0.01%Skandinaviska Enskilda Banken AB $250,000 2.63% 15/3/2021 251,635 0.01%Svenska Handelsbanken AB $250,000 2.45% 30/3/2021 251,441 0.01%Svenska Handelsbanken AB €200,000 0.50% 21/3/2023 227,764 0.01%Swedbank AB €200,000 0.40% 29/8/2023 226,206 0.01%Svenska Handelsbanken AB €200,000 0.25% 28/2/2022 226,110 0.01%Volvo Treasury AB €200,000 0.10% 24/5/2022 224,561 0.01%Stadshypotek AB SEK(kr)2,000,000 1.50% 15/12/2021 218,879 0.01%Kommuninvest I Sverige AB $200,000 3.00% 23/3/2022 205,515 0.01%Kommuninvest I Sverige AB $200,000 2.25% 29/5/2021 201,326 0.01%
Vanguard Global Short-Term Bond Index Fund
662
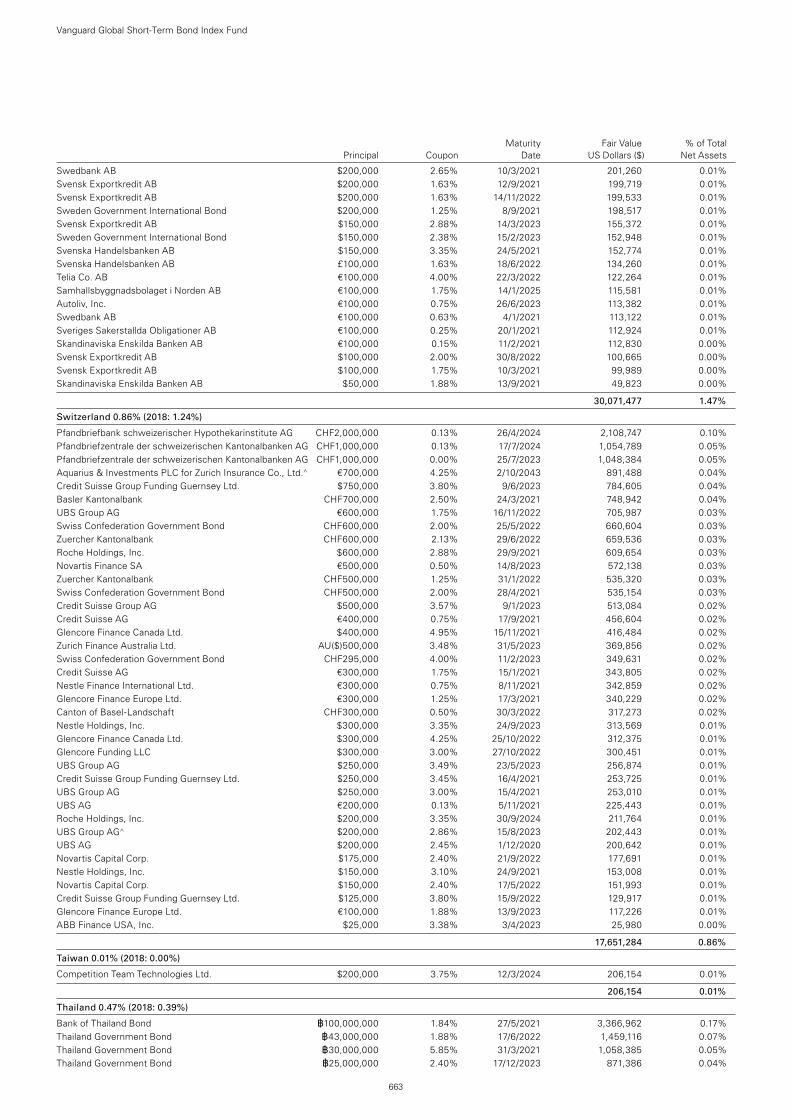
Maturity Fair Value % of Total Principal Coupon Date US Dollars ($) Net Assets
Swedbank AB $200,000 2.65% 10/3/2021 201,260 0.01%Svensk Exportkredit AB $200,000 1.63% 12/9/2021 199,719 0.01%Svensk Exportkredit AB $200,000 1.63% 14/11/2022 199,533 0.01%Sweden Government International Bond $200,000 1.25% 8/9/2021 198,517 0.01%Svensk Exportkredit AB $150,000 2.88% 14/3/2023 155,372 0.01%Sweden Government International Bond $150,000 2.38% 15/2/2023 152,948 0.01%Svenska Handelsbanken AB $150,000 3.35% 24/5/2021 152,774 0.01%Svenska Handelsbanken AB £100,000 1.63% 18/6/2022 134,260 0.01%Telia Co. AB €100,000 4.00% 22/3/2022 122,264 0.01%Samhallsbyggnadsbolaget i Norden AB €100,000 1.75% 14/1/2025 115,581 0.01%Autoliv, Inc. €100,000 0.75% 26/6/2023 113,382 0.01%Swedbank AB €100,000 0.63% 4/1/2021 113,122 0.01%Sveriges Sakerstallda Obligationer AB €100,000 0.25% 20/1/2021 112,924 0.01%Skandinaviska Enskilda Banken AB €100,000 0.15% 11/2/2021 112,830 0.00%Svensk Exportkredit AB $100,000 2.00% 30/8/2022 100,665 0.00%Svensk Exportkredit AB $100,000 1.75% 10/3/2021 99,989 0.00%Skandinaviska Enskilda Banken AB $50,000 1.88% 13/9/2021 49,823 0.00%
30,071,477 1.47%
Switzerland 0.86% (2018: 1.24%)
Pfandbriefbank schweizerischer Hypothekarinstitute AG CHF2,000,000 0.13% 26/4/2024 2,108,747 0.10%Pfandbriefzentrale der schweizerischen Kantonalbanken AG CHF1,000,000 0.13% 17/7/2024 1,054,789 0.05%Pfandbriefzentrale der schweizerischen Kantonalbanken AG CHF1,000,000 0.00% 25/7/2023 1,048,384 0.05%Aquarius & Investments PLC for Zurich Insurance Co., Ltd.^ €700,000 4.25% 2/10/2043 891,488 0.04%Credit Suisse Group Funding Guernsey Ltd. $750,000 3.80% 9/6/2023 784,605 0.04%Basler Kantonalbank CHF700,000 2.50% 24/3/2021 748,942 0.04%UBS Group AG €600,000 1.75% 16/11/2022 705,987 0.03%Swiss Confederation Government Bond CHF600,000 2.00% 25/5/2022 660,604 0.03%Zuercher Kantonalbank CHF600,000 2.13% 29/6/2022 659,536 0.03%Roche Holdings, Inc. $600,000 2.88% 29/9/2021 609,654 0.03%Novartis Finance SA €500,000 0.50% 14/8/2023 572,138 0.03%Zuercher Kantonalbank CHF500,000 1.25% 31/1/2022 535,320 0.03%Swiss Confederation Government Bond CHF500,000 2.00% 28/4/2021 535,154 0.03%Credit Suisse Group AG $500,000 3.57% 9/1/2023 513,084 0.02%Credit Suisse AG €400,000 0.75% 17/9/2021 456,604 0.02%Glencore Finance Canada Ltd. $400,000 4.95% 15/11/2021 416,484 0.02%Zurich Finance Australia Ltd. AU($)500,000 3.48% 31/5/2023 369,856 0.02%Swiss Confederation Government Bond CHF295,000 4.00% 11/2/2023 349,631 0.02%Credit Suisse AG €300,000 1.75% 15/1/2021 343,805 0.02%Nestle Finance International Ltd. €300,000 0.75% 8/11/2021 342,859 0.02%Glencore Finance Europe Ltd. €300,000 1.25% 17/3/2021 340,229 0.02%Canton of Basel-Landschaft CHF300,000 0.50% 30/3/2022 317,273 0.02%Nestle Holdings, Inc. $300,000 3.35% 24/9/2023 313,569 0.01%Glencore Finance Canada Ltd. $300,000 4.25% 25/10/2022 312,375 0.01%Glencore Funding LLC $300,000 3.00% 27/10/2022 300,451 0.01%UBS Group AG $250,000 3.49% 23/5/2023 256,874 0.01%Credit Suisse Group Funding Guernsey Ltd. $250,000 3.45% 16/4/2021 253,725 0.01%UBS Group AG $250,000 3.00% 15/4/2021 253,010 0.01%UBS AG €200,000 0.13% 5/11/2021 225,443 0.01%Roche Holdings, Inc. $200,000 3.35% 30/9/2024 211,764 0.01%UBS Group AG^ $200,000 2.86% 15/8/2023 202,443 0.01%UBS AG $200,000 2.45% 1/12/2020 200,642 0.01%Novartis Capital Corp. $175,000 2.40% 21/9/2022 177,691 0.01%Nestle Holdings, Inc. $150,000 3.10% 24/9/2021 153,008 0.01%Novartis Capital Corp. $150,000 2.40% 17/5/2022 151,993 0.01%Credit Suisse Group Funding Guernsey Ltd. $125,000 3.80% 15/9/2022 129,917 0.01%Glencore Finance Europe Ltd. €100,000 1.88% 13/9/2023 117,226 0.01%ABB Finance USA, Inc. $25,000 3.38% 3/4/2023 25,980 0.00%
17,651,284 0.86%
Taiwan 0.01% (2018: 0.00%)
Competition Team Technologies Ltd. $200,000 3.75% 12/3/2024 206,154 0.01%
206,154 0.01%
Thailand 0.47% (2018: 0.39%)
Bank of Thailand Bond ฿100,000,000 1.84% 27/5/2021 3,366,962 0.17%Thailand Government Bond ฿43,000,000 1.88% 17/6/2022 1,459,116 0.07%Thailand Government Bond ฿30,000,000 5.85% 31/3/2021 1,058,385 0.05%Thailand Government Bond ฿25,000,000 2.40% 17/12/2023 871,386 0.04%
Vanguard Global Short-Term Bond Index Fund
663
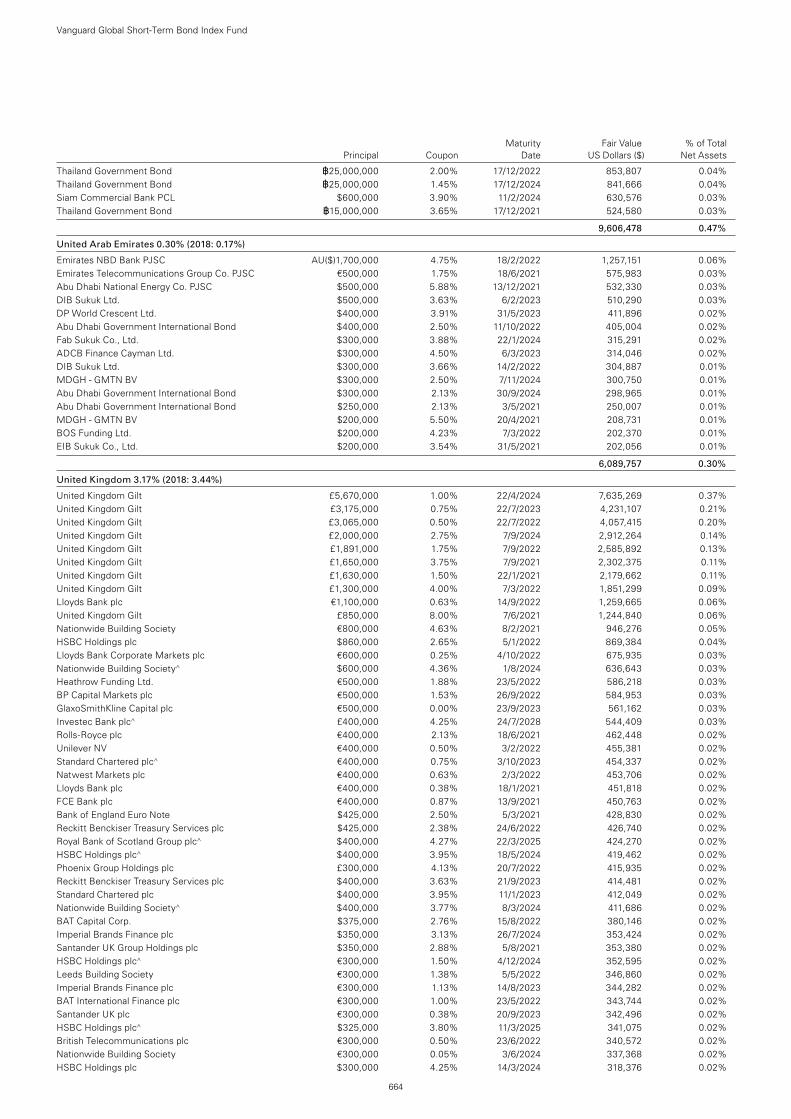
Maturity Fair Value % of Total Principal Coupon Date US Dollars ($) Net Assets
Thailand Government Bond ฿25,000,000 2.00% 17/12/2022 853,807 0.04%Thailand Government Bond ฿25,000,000 1.45% 17/12/2024 841,666 0.04%Siam Commercial Bank PCL $600,000 3.90% 11/2/2024 630,576 0.03%Thailand Government Bond ฿15,000,000 3.65% 17/12/2021 524,580 0.03%
9,606,478 0.47%
United Arab Emirates 0.30% (2018: 0.17%)
Emirates NBD Bank PJSC AU($)1,700,000 4.75% 18/2/2022 1,257,151 0.06%Emirates Telecommunications Group Co. PJSC €500,000 1.75% 18/6/2021 575,983 0.03%Abu Dhabi National Energy Co. PJSC $500,000 5.88% 13/12/2021 532,330 0.03%DIB Sukuk Ltd. $500,000 3.63% 6/2/2023 510,290 0.03%DP World Crescent Ltd. $400,000 3.91% 31/5/2023 411,896 0.02%Abu Dhabi Government International Bond $400,000 2.50% 11/10/2022 405,004 0.02%Fab Sukuk Co., Ltd. $300,000 3.88% 22/1/2024 315,291 0.02%ADCB Finance Cayman Ltd. $300,000 4.50% 6/3/2023 314,046 0.02%DIB Sukuk Ltd. $300,000 3.66% 14/2/2022 304,887 0.01%MDGH - GMTN BV $300,000 2.50% 7/11/2024 300,750 0.01%Abu Dhabi Government International Bond $300,000 2.13% 30/9/2024 298,965 0.01%Abu Dhabi Government International Bond $250,000 2.13% 3/5/2021 250,007 0.01%MDGH - GMTN BV $200,000 5.50% 20/4/2021 208,731 0.01%BOS Funding Ltd. $200,000 4.23% 7/3/2022 202,370 0.01%EIB Sukuk Co., Ltd. $200,000 3.54% 31/5/2021 202,056 0.01%
6,089,757 0.30%
United Kingdom 3.17% (2018: 3.44%)
United Kingdom Gilt £5,670,000 1.00% 22/4/2024 7,635,269 0.37%United Kingdom Gilt £3,175,000 0.75% 22/7/2023 4,231,107 0.21%United Kingdom Gilt £3,065,000 0.50% 22/7/2022 4,057,415 0.20%United Kingdom Gilt £2,000,000 2.75% 7/9/2024 2,912,264 0.14%United Kingdom Gilt £1,891,000 1.75% 7/9/2022 2,585,892 0.13%United Kingdom Gilt £1,650,000 3.75% 7/9/2021 2,302,375 0.11%United Kingdom Gilt £1,630,000 1.50% 22/1/2021 2,179,662 0.11%United Kingdom Gilt £1,300,000 4.00% 7/3/2022 1,851,299 0.09%Lloyds Bank plc €1,100,000 0.63% 14/9/2022 1,259,665 0.06%United Kingdom Gilt £850,000 8.00% 7/6/2021 1,244,840 0.06%Nationwide Building Society €800,000 4.63% 8/2/2021 946,276 0.05%HSBC Holdings plc $860,000 2.65% 5/1/2022 869,384 0.04%Lloyds Bank Corporate Markets plc €600,000 0.25% 4/10/2022 675,935 0.03%Nationwide Building Society^ $600,000 4.36% 1/8/2024 636,643 0.03%Heathrow Funding Ltd. €500,000 1.88% 23/5/2022 586,218 0.03%BP Capital Markets plc €500,000 1.53% 26/9/2022 584,953 0.03%GlaxoSmithKline Capital plc €500,000 0.00% 23/9/2023 561,162 0.03%Investec Bank plc^ £400,000 4.25% 24/7/2028 544,409 0.03%Rolls-Royce plc €400,000 2.13% 18/6/2021 462,448 0.02%Unilever NV €400,000 0.50% 3/2/2022 455,381 0.02%Standard Chartered plc^ €400,000 0.75% 3/10/2023 454,337 0.02%Natwest Markets plc €400,000 0.63% 2/3/2022 453,706 0.02%Lloyds Bank plc €400,000 0.38% 18/1/2021 451,818 0.02%FCE Bank plc €400,000 0.87% 13/9/2021 450,763 0.02%Bank of England Euro Note $425,000 2.50% 5/3/2021 428,830 0.02%Reckitt Benckiser Treasury Services plc $425,000 2.38% 24/6/2022 426,740 0.02%Royal Bank of Scotland Group plc^ $400,000 4.27% 22/3/2025 424,270 0.02%HSBC Holdings plc^ $400,000 3.95% 18/5/2024 419,462 0.02%Phoenix Group Holdings plc £300,000 4.13% 20/7/2022 415,935 0.02%Reckitt Benckiser Treasury Services plc $400,000 3.63% 21/9/2023 414,481 0.02%Standard Chartered plc $400,000 3.95% 11/1/2023 412,049 0.02%Nationwide Building Society^ $400,000 3.77% 8/3/2024 411,686 0.02%BAT Capital Corp. $375,000 2.76% 15/8/2022 380,146 0.02%Imperial Brands Finance plc $350,000 3.13% 26/7/2024 353,424 0.02%Santander UK Group Holdings plc $350,000 2.88% 5/8/2021 353,380 0.02%HSBC Holdings plc^ €300,000 1.50% 4/12/2024 352,595 0.02%Leeds Building Society €300,000 1.38% 5/5/2022 346,860 0.02%Imperial Brands Finance plc €300,000 1.13% 14/8/2023 344,282 0.02%BAT International Finance plc €300,000 1.00% 23/5/2022 343,744 0.02%Santander UK plc €300,000 0.38% 20/9/2023 342,496 0.02%HSBC Holdings plc^ $325,000 3.80% 11/3/2025 341,075 0.02%British Telecommunications plc €300,000 0.50% 23/6/2022 340,572 0.02%Nationwide Building Society €300,000 0.05% 3/6/2024 337,368 0.02%HSBC Holdings plc $300,000 4.25% 14/3/2024 318,376 0.02%
Vanguard Global Short-Term Bond Index Fund
664
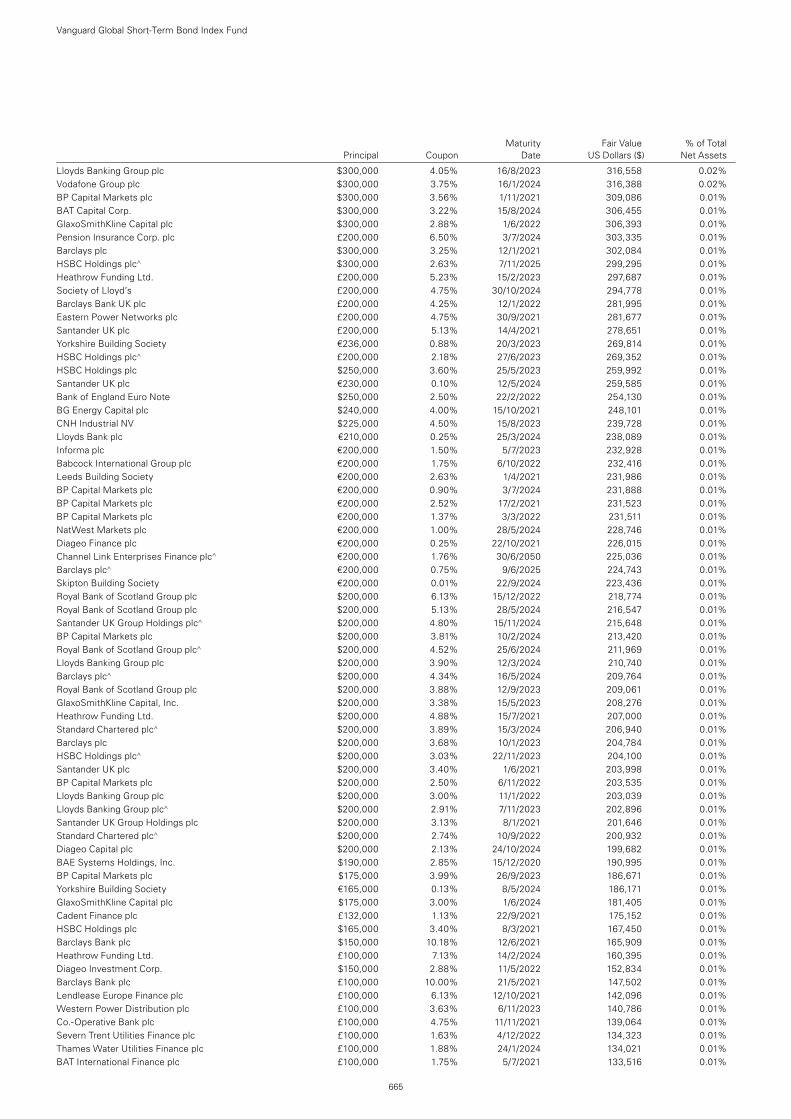
Maturity Fair Value % of Total Principal Coupon Date US Dollars ($) Net Assets
Lloyds Banking Group plc $300,000 4.05% 16/8/2023 316,558 0.02%Vodafone Group plc $300,000 3.75% 16/1/2024 316,388 0.02%BP Capital Markets plc $300,000 3.56% 1/11/2021 309,086 0.01%BAT Capital Corp. $300,000 3.22% 15/8/2024 306,455 0.01%GlaxoSmithKline Capital plc $300,000 2.88% 1/6/2022 306,393 0.01%Pension Insurance Corp. plc £200,000 6.50% 3/7/2024 303,335 0.01%Barclays plc $300,000 3.25% 12/1/2021 302,084 0.01%HSBC Holdings plc^ $300,000 2.63% 7/11/2025 299,295 0.01%Heathrow Funding Ltd. £200,000 5.23% 15/2/2023 297,687 0.01%Society of Lloyd’s £200,000 4.75% 30/10/2024 294,778 0.01%Barclays Bank UK plc £200,000 4.25% 12/1/2022 281,995 0.01%Eastern Power Networks plc £200,000 4.75% 30/9/2021 281,677 0.01%Santander UK plc £200,000 5.13% 14/4/2021 278,651 0.01%Yorkshire Building Society €236,000 0.88% 20/3/2023 269,814 0.01%HSBC Holdings plc^ £200,000 2.18% 27/6/2023 269,352 0.01%HSBC Holdings plc $250,000 3.60% 25/5/2023 259,992 0.01%Santander UK plc €230,000 0.10% 12/5/2024 259,585 0.01%Bank of England Euro Note $250,000 2.50% 22/2/2022 254,130 0.01%BG Energy Capital plc $240,000 4.00% 15/10/2021 248,101 0.01%CNH Industrial NV $225,000 4.50% 15/8/2023 239,728 0.01%Lloyds Bank plc €210,000 0.25% 25/3/2024 238,089 0.01%Informa plc €200,000 1.50% 5/7/2023 232,928 0.01%Babcock International Group plc €200,000 1.75% 6/10/2022 232,416 0.01%Leeds Building Society €200,000 2.63% 1/4/2021 231,986 0.01%BP Capital Markets plc €200,000 0.90% 3/7/2024 231,888 0.01%BP Capital Markets plc €200,000 2.52% 17/2/2021 231,523 0.01%BP Capital Markets plc €200,000 1.37% 3/3/2022 231,511 0.01%NatWest Markets plc €200,000 1.00% 28/5/2024 228,746 0.01%Diageo Finance plc €200,000 0.25% 22/10/2021 226,015 0.01%Channel Link Enterprises Finance plc^ €200,000 1.76% 30/6/2050 225,036 0.01%Barclays plc^ €200,000 0.75% 9/6/2025 224,743 0.01%Skipton Building Society €200,000 0.01% 22/9/2024 223,436 0.01%Royal Bank of Scotland Group plc $200,000 6.13% 15/12/2022 218,774 0.01%Royal Bank of Scotland Group plc $200,000 5.13% 28/5/2024 216,547 0.01%Santander UK Group Holdings plc^ $200,000 4.80% 15/11/2024 215,648 0.01%BP Capital Markets plc $200,000 3.81% 10/2/2024 213,420 0.01%Royal Bank of Scotland Group plc^ $200,000 4.52% 25/6/2024 211,969 0.01%Lloyds Banking Group plc $200,000 3.90% 12/3/2024 210,740 0.01%Barclays plc^ $200,000 4.34% 16/5/2024 209,764 0.01%Royal Bank of Scotland Group plc $200,000 3.88% 12/9/2023 209,061 0.01%GlaxoSmithKline Capital, Inc. $200,000 3.38% 15/5/2023 208,276 0.01%Heathrow Funding Ltd. $200,000 4.88% 15/7/2021 207,000 0.01%Standard Chartered plc^ $200,000 3.89% 15/3/2024 206,940 0.01%Barclays plc $200,000 3.68% 10/1/2023 204,784 0.01%HSBC Holdings plc^ $200,000 3.03% 22/11/2023 204,100 0.01%Santander UK plc $200,000 3.40% 1/6/2021 203,998 0.01%BP Capital Markets plc $200,000 2.50% 6/11/2022 203,535 0.01%Lloyds Banking Group plc $200,000 3.00% 11/1/2022 203,039 0.01%Lloyds Banking Group plc^ $200,000 2.91% 7/11/2023 202,896 0.01%Santander UK Group Holdings plc $200,000 3.13% 8/1/2021 201,646 0.01%Standard Chartered plc^ $200,000 2.74% 10/9/2022 200,932 0.01%Diageo Capital plc $200,000 2.13% 24/10/2024 199,682 0.01%BAE Systems Holdings, Inc. $190,000 2.85% 15/12/2020 190,995 0.01%BP Capital Markets plc $175,000 3.99% 26/9/2023 186,671 0.01%Yorkshire Building Society €165,000 0.13% 8/5/2024 186,171 0.01%GlaxoSmithKline Capital plc $175,000 3.00% 1/6/2024 181,405 0.01%Cadent Finance plc £132,000 1.13% 22/9/2021 175,152 0.01%HSBC Holdings plc $165,000 3.40% 8/3/2021 167,450 0.01%Barclays Bank plc $150,000 10.18% 12/6/2021 165,909 0.01%Heathrow Funding Ltd. £100,000 7.13% 14/2/2024 160,395 0.01%Diageo Investment Corp. $150,000 2.88% 11/5/2022 152,834 0.01%Barclays Bank plc £100,000 10.00% 21/5/2021 147,502 0.01%Lendlease Europe Finance plc £100,000 6.13% 12/10/2021 142,096 0.01%Western Power Distribution plc £100,000 3.63% 6/11/2023 140,786 0.01%Co.-Operative Bank plc £100,000 4.75% 11/11/2021 139,064 0.01%Severn Trent Utilities Finance plc £100,000 1.63% 4/12/2022 134,323 0.01%Thames Water Utilities Finance plc £100,000 1.88% 24/1/2024 134,021 0.01%BAT International Finance plc £100,000 1.75% 5/7/2021 133,516 0.01%
Vanguard Global Short-Term Bond Index Fund
665
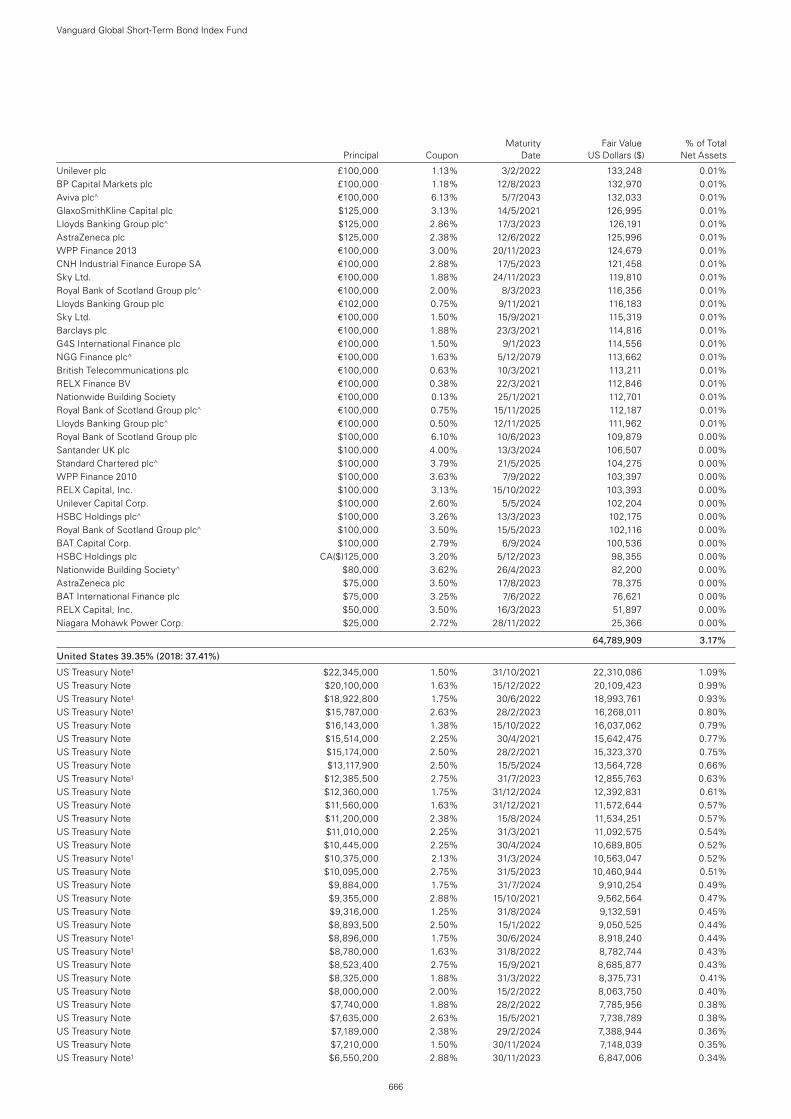
Maturity Fair Value % of Total Principal Coupon Date US Dollars ($) Net Assets
Unilever plc £100,000 1.13% 3/2/2022 133,248 0.01%BP Capital Markets plc £100,000 1.18% 12/8/2023 132,970 0.01%Aviva plc^ €100,000 6.13% 5/7/2043 132,033 0.01%GlaxoSmithKline Capital plc $125,000 3.13% 14/5/2021 126,995 0.01%Lloyds Banking Group plc^ $125,000 2.86% 17/3/2023 126,191 0.01%AstraZeneca plc $125,000 2.38% 12/6/2022 125,996 0.01%WPP Finance 2013 €100,000 3.00% 20/11/2023 124,679 0.01%CNH Industrial Finance Europe SA €100,000 2.88% 17/5/2023 121,458 0.01%Sky Ltd. €100,000 1.88% 24/11/2023 119,810 0.01%Royal Bank of Scotland Group plc^ €100,000 2.00% 8/3/2023 116,356 0.01%Lloyds Banking Group plc €102,000 0.75% 9/11/2021 116,183 0.01%Sky Ltd. €100,000 1.50% 15/9/2021 115,319 0.01%Barclays plc €100,000 1.88% 23/3/2021 114,816 0.01%G4S International Finance plc €100,000 1.50% 9/1/2023 114,556 0.01%NGG Finance plc^ €100,000 1.63% 5/12/2079 113,662 0.01%British Telecommunications plc €100,000 0.63% 10/3/2021 113,211 0.01%RELX Finance BV €100,000 0.38% 22/3/2021 112,846 0.01%Nationwide Building Society €100,000 0.13% 25/1/2021 112,701 0.01%Royal Bank of Scotland Group plc^ €100,000 0.75% 15/11/2025 112,187 0.01%Lloyds Banking Group plc^ €100,000 0.50% 12/11/2025 111,962 0.01%Royal Bank of Scotland Group plc $100,000 6.10% 10/6/2023 109,879 0.00%Santander UK plc $100,000 4.00% 13/3/2024 106,507 0.00%Standard Chartered plc^ $100,000 3.79% 21/5/2025 104,275 0.00%WPP Finance 2010 $100,000 3.63% 7/9/2022 103,397 0.00%RELX Capital, Inc. $100,000 3.13% 15/10/2022 103,393 0.00%Unilever Capital Corp. $100,000 2.60% 5/5/2024 102,204 0.00%HSBC Holdings plc^ $100,000 3.26% 13/3/2023 102,175 0.00%Royal Bank of Scotland Group plc^ $100,000 3.50% 15/5/2023 102,116 0.00%BAT Capital Corp. $100,000 2.79% 6/9/2024 100,536 0.00%HSBC Holdings plc CA($)125,000 3.20% 5/12/2023 98,355 0.00%Nationwide Building Society^ $80,000 3.62% 26/4/2023 82,200 0.00%AstraZeneca plc $75,000 3.50% 17/8/2023 78,375 0.00%BAT International Finance plc $75,000 3.25% 7/6/2022 76,621 0.00%RELX Capital, Inc. $50,000 3.50% 16/3/2023 51,897 0.00%Niagara Mohawk Power Corp. $25,000 2.72% 28/11/2022 25,366 0.00%
64,789,909 3.17%
United States 39.35% (2018: 37.41%)
US Treasury Note1 $22,345,000 1.50% 31/10/2021 22,310,086 1.09%US Treasury Note $20,100,000 1.63% 15/12/2022 20,109,423 0.99%US Treasury Note1 $18,922,800 1.75% 30/6/2022 18,993,761 0.93%US Treasury Note1 $15,787,000 2.63% 28/2/2023 16,268,011 0.80%US Treasury Note $16,143,000 1.38% 15/10/2022 16,037,062 0.79%US Treasury Note $15,514,000 2.25% 30/4/2021 15,642,475 0.77%US Treasury Note $15,174,000 2.50% 28/2/2021 15,323,370 0.75%US Treasury Note $13,117,900 2.50% 15/5/2024 13,564,728 0.66%US Treasury Note1 $12,385,500 2.75% 31/7/2023 12,855,763 0.63%US Treasury Note $12,360,000 1.75% 31/12/2024 12,392,831 0.61%US Treasury Note $11,560,000 1.63% 31/12/2021 11,572,644 0.57%US Treasury Note $11,200,000 2.38% 15/8/2024 11,534,251 0.57%US Treasury Note $11,010,000 2.25% 31/3/2021 11,092,575 0.54%US Treasury Note $10,445,000 2.25% 30/4/2024 10,689,805 0.52%US Treasury Note1 $10,375,000 2.13% 31/3/2024 10,563,047 0.52%US Treasury Note $10,095,000 2.75% 31/5/2023 10,460,944 0.51%US Treasury Note $9,884,000 1.75% 31/7/2024 9,910,254 0.49%US Treasury Note $9,355,000 2.88% 15/10/2021 9,562,564 0.47%US Treasury Note $9,316,000 1.25% 31/8/2024 9,132,591 0.45%US Treasury Note $8,893,500 2.50% 15/1/2022 9,050,525 0.44%US Treasury Note1 $8,896,000 1.75% 30/6/2024 8,918,240 0.44%US Treasury Note1 $8,780,000 1.63% 31/8/2022 8,782,744 0.43%US Treasury Note $8,523,400 2.75% 15/9/2021 8,685,877 0.43%US Treasury Note $8,325,000 1.88% 31/3/2022 8,375,731 0.41%US Treasury Note $8,000,000 2.00% 15/2/2022 8,063,750 0.40%US Treasury Note $7,740,000 1.88% 28/2/2022 7,785,956 0.38%US Treasury Note $7,635,000 2.63% 15/5/2021 7,738,789 0.38%US Treasury Note $7,189,000 2.38% 29/2/2024 7,388,944 0.36%US Treasury Note $7,210,000 1.50% 30/11/2024 7,148,039 0.35%US Treasury Note1 $6,550,200 2.88% 30/11/2023 6,847,006 0.34%
Vanguard Global Short-Term Bond Index Fund
666
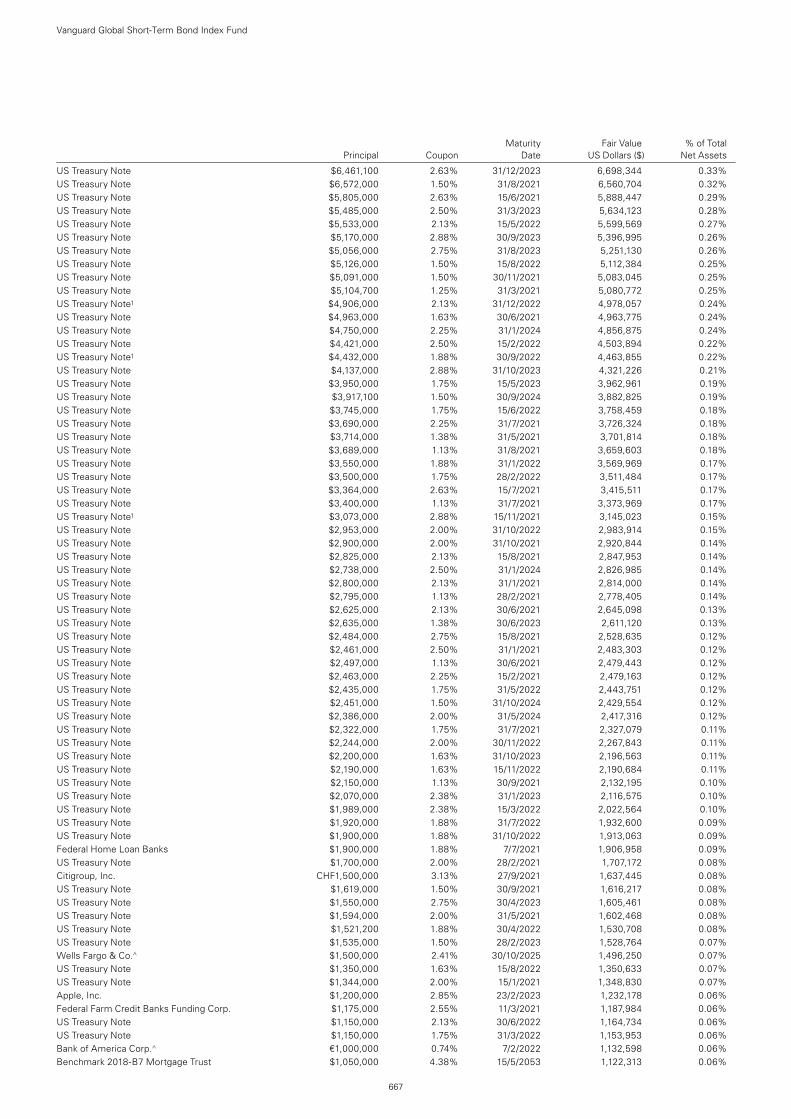
Maturity Fair Value % of Total Principal Coupon Date US Dollars ($) Net Assets
US Treasury Note $6,461,100 2.63% 31/12/2023 6,698,344 0.33%US Treasury Note $6,572,000 1.50% 31/8/2021 6,560,704 0.32%US Treasury Note $5,805,000 2.63% 15/6/2021 5,888,447 0.29%US Treasury Note $5,485,000 2.50% 31/3/2023 5,634,123 0.28%US Treasury Note $5,533,000 2.13% 15/5/2022 5,599,569 0.27%US Treasury Note $5,170,000 2.88% 30/9/2023 5,396,995 0.26%US Treasury Note $5,056,000 2.75% 31/8/2023 5,251,130 0.26%US Treasury Note $5,126,000 1.50% 15/8/2022 5,112,384 0.25%US Treasury Note $5,091,000 1.50% 30/11/2021 5,083,045 0.25%US Treasury Note $5,104,700 1.25% 31/3/2021 5,080,772 0.25%US Treasury Note1 $4,906,000 2.13% 31/12/2022 4,978,057 0.24%US Treasury Note $4,963,000 1.63% 30/6/2021 4,963,775 0.24%US Treasury Note $4,750,000 2.25% 31/1/2024 4,856,875 0.24%US Treasury Note $4,421,000 2.50% 15/2/2022 4,503,894 0.22%US Treasury Note1 $4,432,000 1.88% 30/9/2022 4,463,855 0.22%US Treasury Note $4,137,000 2.88% 31/10/2023 4,321,226 0.21%US Treasury Note $3,950,000 1.75% 15/5/2023 3,962,961 0.19%US Treasury Note $3,917,100 1.50% 30/9/2024 3,882,825 0.19%US Treasury Note $3,745,000 1.75% 15/6/2022 3,758,459 0.18%US Treasury Note $3,690,000 2.25% 31/7/2021 3,726,324 0.18%US Treasury Note $3,714,000 1.38% 31/5/2021 3,701,814 0.18%US Treasury Note $3,689,000 1.13% 31/8/2021 3,659,603 0.18%US Treasury Note $3,550,000 1.88% 31/1/2022 3,569,969 0.17%US Treasury Note $3,500,000 1.75% 28/2/2022 3,511,484 0.17%US Treasury Note $3,364,000 2.63% 15/7/2021 3,415,511 0.17%US Treasury Note $3,400,000 1.13% 31/7/2021 3,373,969 0.17%US Treasury Note1 $3,073,000 2.88% 15/11/2021 3,145,023 0.15%US Treasury Note $2,953,000 2.00% 31/10/2022 2,983,914 0.15%US Treasury Note $2,900,000 2.00% 31/10/2021 2,920,844 0.14%US Treasury Note $2,825,000 2.13% 15/8/2021 2,847,953 0.14%US Treasury Note $2,738,000 2.50% 31/1/2024 2,826,985 0.14%US Treasury Note $2,800,000 2.13% 31/1/2021 2,814,000 0.14%US Treasury Note $2,795,000 1.13% 28/2/2021 2,778,405 0.14%US Treasury Note $2,625,000 2.13% 30/6/2021 2,645,098 0.13%US Treasury Note $2,635,000 1.38% 30/6/2023 2,611,120 0.13%US Treasury Note $2,484,000 2.75% 15/8/2021 2,528,635 0.12%US Treasury Note $2,461,000 2.50% 31/1/2021 2,483,303 0.12%US Treasury Note $2,497,000 1.13% 30/6/2021 2,479,443 0.12%US Treasury Note $2,463,000 2.25% 15/2/2021 2,479,163 0.12%US Treasury Note $2,435,000 1.75% 31/5/2022 2,443,751 0.12%US Treasury Note $2,451,000 1.50% 31/10/2024 2,429,554 0.12%US Treasury Note $2,386,000 2.00% 31/5/2024 2,417,316 0.12%US Treasury Note $2,322,000 1.75% 31/7/2021 2,327,079 0.11%US Treasury Note $2,244,000 2.00% 30/11/2022 2,267,843 0.11%US Treasury Note $2,200,000 1.63% 31/10/2023 2,196,563 0.11%US Treasury Note $2,190,000 1.63% 15/11/2022 2,190,684 0.11%US Treasury Note $2,150,000 1.13% 30/9/2021 2,132,195 0.10%US Treasury Note $2,070,000 2.38% 31/1/2023 2,116,575 0.10%US Treasury Note $1,989,000 2.38% 15/3/2022 2,022,564 0.10%US Treasury Note $1,920,000 1.88% 31/7/2022 1,932,600 0.09%US Treasury Note $1,900,000 1.88% 31/10/2022 1,913,063 0.09%Federal Home Loan Banks $1,900,000 1.88% 7/7/2021 1,906,958 0.09%US Treasury Note $1,700,000 2.00% 28/2/2021 1,707,172 0.08%Citigroup, Inc. CHF1,500,000 3.13% 27/9/2021 1,637,445 0.08%US Treasury Note $1,619,000 1.50% 30/9/2021 1,616,217 0.08%US Treasury Note $1,550,000 2.75% 30/4/2023 1,605,461 0.08%US Treasury Note $1,594,000 2.00% 31/5/2021 1,602,468 0.08%US Treasury Note $1,521,200 1.88% 30/4/2022 1,530,708 0.08%US Treasury Note $1,535,000 1.50% 28/2/2023 1,528,764 0.07%Wells Fargo & Co.^ $1,500,000 2.41% 30/10/2025 1,496,250 0.07%US Treasury Note $1,350,000 1.63% 15/8/2022 1,350,633 0.07%US Treasury Note $1,344,000 2.00% 15/1/2021 1,348,830 0.07%Apple, Inc. $1,200,000 2.85% 23/2/2023 1,232,178 0.06%Federal Farm Credit Banks Funding Corp. $1,175,000 2.55% 11/3/2021 1,187,984 0.06%US Treasury Note $1,150,000 2.13% 30/6/2022 1,164,734 0.06%US Treasury Note $1,150,000 1.75% 31/3/2022 1,153,953 0.06%Bank of America Corp.^ €1,000,000 0.74% 7/2/2022 1,132,598 0.06%Benchmark 2018-B7 Mortgage Trust $1,050,000 4.38% 15/5/2053 1,122,313 0.06%
Vanguard Global Short-Term Bond Index Fund
667
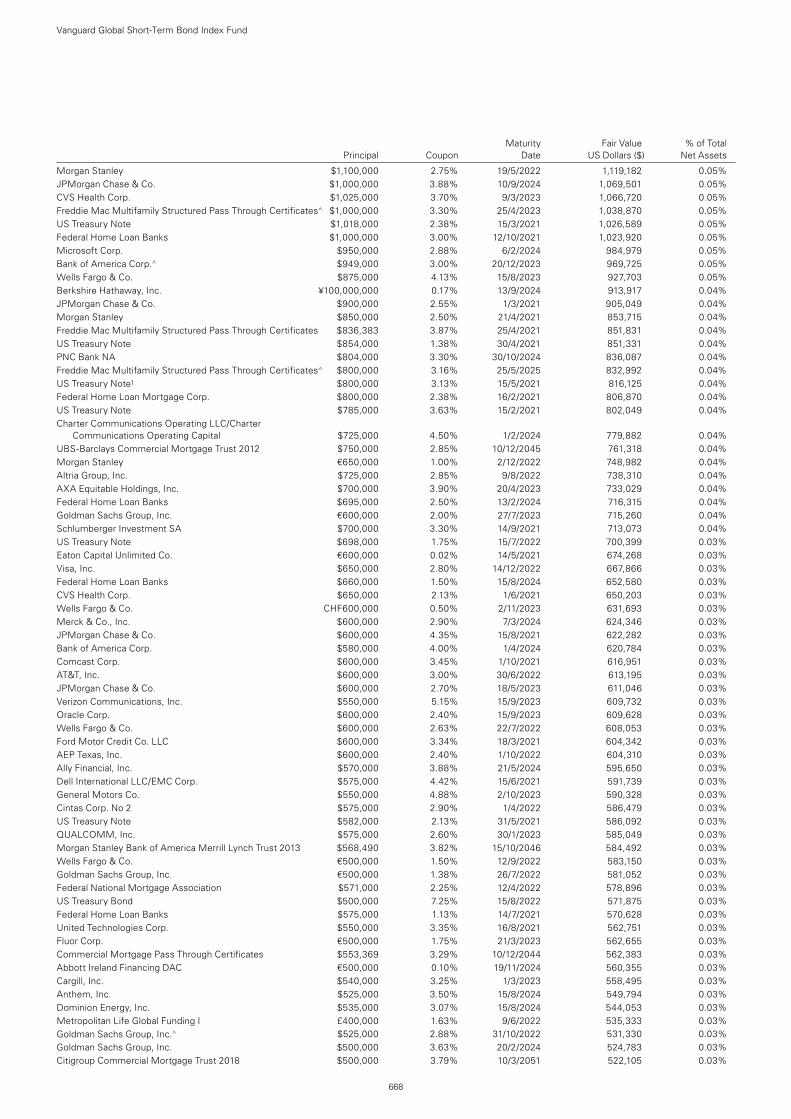
Maturity Fair Value % of Total Principal Coupon Date US Dollars ($) Net Assets
Morgan Stanley $1,100,000 2.75% 19/5/2022 1,119,182 0.05%JPMorgan Chase & Co. $1,000,000 3.88% 10/9/2024 1,069,501 0.05%CVS Health Corp. $1,025,000 3.70% 9/3/2023 1,066,720 0.05%Freddie Mac Multifamily Structured Pass Through Certificates^ $1,000,000 3.30% 25/4/2023 1,038,870 0.05%US Treasury Note $1,018,000 2.38% 15/3/2021 1,026,589 0.05%Federal Home Loan Banks $1,000,000 3.00% 12/10/2021 1,023,920 0.05%Microsoft Corp. $950,000 2.88% 6/2/2024 984,979 0.05%Bank of America Corp.^ $949,000 3.00% 20/12/2023 969,725 0.05%Wells Fargo & Co. $875,000 4.13% 15/8/2023 927,703 0.05%Berkshire Hathaway, Inc. ¥100,000,000 0.17% 13/9/2024 913,917 0.04%JPMorgan Chase & Co. $900,000 2.55% 1/3/2021 905,049 0.04%Morgan Stanley $850,000 2.50% 21/4/2021 853,715 0.04%Freddie Mac Multifamily Structured Pass Through Certificates $836,383 3.87% 25/4/2021 851,831 0.04%US Treasury Note $854,000 1.38% 30/4/2021 851,331 0.04%PNC Bank NA $804,000 3.30% 30/10/2024 836,087 0.04%Freddie Mac Multifamily Structured Pass Through Certificates^ $800,000 3.16% 25/5/2025 832,992 0.04%US Treasury Note1 $800,000 3.13% 15/5/2021 816,125 0.04%Federal Home Loan Mortgage Corp. $800,000 2.38% 16/2/2021 806,870 0.04%US Treasury Note $785,000 3.63% 15/2/2021 802,049 0.04%Charter Communications Operating LLC/Charter
Communications Operating Capital $725,000 4.50% 1/2/2024 779,882 0.04%UBS-Barclays Commercial Mortgage Trust 2012 $750,000 2.85% 10/12/2045 761,318 0.04%Morgan Stanley €650,000 1.00% 2/12/2022 748,982 0.04%Altria Group, Inc. $725,000 2.85% 9/8/2022 738,310 0.04%AXA Equitable Holdings, Inc. $700,000 3.90% 20/4/2023 733,029 0.04%Federal Home Loan Banks $695,000 2.50% 13/2/2024 716,315 0.04%Goldman Sachs Group, Inc. €600,000 2.00% 27/7/2023 715,260 0.04%Schlumberger Investment SA $700,000 3.30% 14/9/2021 713,073 0.04%US Treasury Note $698,000 1.75% 15/7/2022 700,399 0.03%Eaton Capital Unlimited Co. €600,000 0.02% 14/5/2021 674,268 0.03%Visa, Inc. $650,000 2.80% 14/12/2022 667,866 0.03%Federal Home Loan Banks $660,000 1.50% 15/8/2024 652,580 0.03%CVS Health Corp. $650,000 2.13% 1/6/2021 650,203 0.03%Wells Fargo & Co. CHF600,000 0.50% 2/11/2023 631,693 0.03%Merck & Co., Inc. $600,000 2.90% 7/3/2024 624,346 0.03%JPMorgan Chase & Co. $600,000 4.35% 15/8/2021 622,282 0.03%Bank of America Corp. $580,000 4.00% 1/4/2024 620,784 0.03%Comcast Corp. $600,000 3.45% 1/10/2021 616,951 0.03%AT&T, Inc. $600,000 3.00% 30/6/2022 613,195 0.03%JPMorgan Chase & Co. $600,000 2.70% 18/5/2023 611,046 0.03%Verizon Communications, Inc. $550,000 5.15% 15/9/2023 609,732 0.03%Oracle Corp. $600,000 2.40% 15/9/2023 609,628 0.03%Wells Fargo & Co. $600,000 2.63% 22/7/2022 608,053 0.03%Ford Motor Credit Co. LLC $600,000 3.34% 18/3/2021 604,342 0.03%AEP Texas, Inc. $600,000 2.40% 1/10/2022 604,310 0.03%Ally Financial, Inc. $570,000 3.88% 21/5/2024 595,650 0.03%Dell International LLC/EMC Corp. $575,000 4.42% 15/6/2021 591,739 0.03%General Motors Co. $550,000 4.88% 2/10/2023 590,328 0.03%Cintas Corp. No 2 $575,000 2.90% 1/4/2022 586,479 0.03%US Treasury Note $582,000 2.13% 31/5/2021 586,092 0.03%QUALCOMM, Inc. $575,000 2.60% 30/1/2023 585,049 0.03%Morgan Stanley Bank of America Merrill Lynch Trust 2013 $568,490 3.82% 15/10/2046 584,492 0.03%Wells Fargo & Co. €500,000 1.50% 12/9/2022 583,150 0.03%Goldman Sachs Group, Inc. €500,000 1.38% 26/7/2022 581,052 0.03%Federal National Mortgage Association $571,000 2.25% 12/4/2022 578,896 0.03%US Treasury Bond $500,000 7.25% 15/8/2022 571,875 0.03%Federal Home Loan Banks $575,000 1.13% 14/7/2021 570,628 0.03%United Technologies Corp. $550,000 3.35% 16/8/2021 562,751 0.03%Fluor Corp. €500,000 1.75% 21/3/2023 562,655 0.03%Commercial Mortgage Pass Through Certificates $553,369 3.29% 10/12/2044 562,383 0.03%Abbott Ireland Financing DAC €500,000 0.10% 19/11/2024 560,355 0.03%Cargill, Inc. $540,000 3.25% 1/3/2023 558,495 0.03%Anthem, Inc. $525,000 3.50% 15/8/2024 549,794 0.03%Dominion Energy, Inc. $535,000 3.07% 15/8/2024 544,053 0.03%Metropolitan Life Global Funding I £400,000 1.63% 9/6/2022 535,333 0.03%Goldman Sachs Group, Inc.^ $525,000 2.88% 31/10/2022 531,330 0.03%Goldman Sachs Group, Inc. $500,000 3.63% 20/2/2024 524,783 0.03%Citigroup Commercial Mortgage Trust 2018 $500,000 3.79% 10/3/2051 522,105 0.03%
Vanguard Global Short-Term Bond Index Fund
668

Maturity Fair Value % of Total Principal Coupon Date US Dollars ($) Net Assets
Federal National Mortgage Association $500,000 2.88% 12/9/2023 521,596 0.03%Benchmark 2018-B3 Mortgage Trust $500,000 3.85% 10/4/2051 521,475 0.03%JPMorgan Chase & Co.^ $500,000 3.56% 23/4/2024 521,109 0.03%BP Capital Markets America, Inc. $500,000 4.74% 11/3/2021 516,751 0.03%Freddie Mac Multifamily Structured Pass Through Certificates^ $500,000 3.06% 25/11/2023 516,655 0.03%Walt Disney Co. $500,000 4.50% 15/2/2021 514,446 0.03%Wells Fargo Bank NA $500,000 3.63% 22/10/2021 514,387 0.03%Federal National Mortgage Association $514,000 1.75% 2/7/2024 514,126 0.03%Capital One Financial Corp. $500,000 3.20% 30/1/2023 514,109 0.03%International Business Machines Corp. $500,000 2.85% 13/5/2022 510,791 0.03%Morgan Stanley Bank of America Merrill Lynch Trust 2012 $500,000 3.18% 15/8/2045 510,405 0.03%JP Morgan Chase Commercial Mortgage Securities Trust 2012 $500,949 2.84% 15/12/2047 508,368 0.02%Federal Home Loan Mortgage Corp. $500,000 2.38% 13/1/2022 507,423 0.02%Commercial Mortgage Pass Through Certificates $490,000 3.40% 10/10/2048 506,302 0.02%Federal National Mortgage Association $500,000 2.50% 13/4/2021 505,490 0.02%Bristol-Myers Squibb Co. $500,000 2.55% 14/5/2021 504,880 0.02%Morgan Stanley^ $500,000 2.72% 22/7/2025 504,703 0.02%Pfizer, Inc. $500,000 2.20% 15/12/2021 503,809 0.02%Federal National Mortgage Association $500,000 2.00% 5/1/2022 503,654 0.02%US Treasury Note1 $500,000 1.88% 31/5/2022 503,281 0.02%US Treasury Note $503,000 1.50% 15/9/2022 501,585 0.02%Freddie Mac Multifamily Structured Pass Through Certificates $498,266 2.27% 25/3/2022 500,608 0.02%US Bank NA $500,000 1.95% 9/1/2023 500,452 0.02%American Express Credit Account Master Trust $500,000 1.77% 15/11/2022 499,836 0.02%Brixmor Operating Partnership LP $475,000 3.65% 15/6/2024 493,912 0.02%Freddie Mac Multifamily Structured Pass Through Certificates $478,461 3.45% 25/9/2024 491,815 0.02%Truist Financial Corp. $480,000 3.05% 20/6/2022 489,631 0.02%Federal National Mortgage Association $479,000 2.38% 19/1/2023 489,216 0.02%Federal National Mortgage Association $490,000 1.63% 15/10/2024 486,876 0.02%Air Lease Corp. $450,000 4.25% 1/2/2024 481,934 0.02%Verizon Communications, Inc. $470,000 3.13% 16/3/2022 481,764 0.02%Goldman Sachs Group, Inc. $450,000 5.75% 24/1/2022 481,567 0.02%General Electric Co. $475,000 2.70% 9/10/2022 481,420 0.02%US Treasury Note $479,000 1.38% 31/1/2021 477,578 0.02%Bank of America Corp.^ $460,000 3.55% 5/3/2024 475,824 0.02%Exxon Mobil Corp. $464,000 2.73% 1/3/2023 474,945 0.02%CSX Corp. $450,000 3.40% 1/8/2024 473,653 0.02%Charter Communications Operating LLC/Charter
Communications Operating Capital $450,000 4.46% 23/7/2022 472,959 0.02%Becton Dickinson & Co. $450,000 3.36% 6/6/2024 467,711 0.02%Honeywell International, Inc. €400,000 1.30% 22/2/2023 466,182 0.02%Apple, Inc. $450,000 2.85% 11/5/2024 465,040 0.02%AT&T, Inc. €400,000 1.30% 5/9/2023 464,981 0.02%JPMorgan Chase & Co.^ $450,000 3.22% 1/3/2025 464,858 0.02%US Treasury Note $450,000 2.50% 15/8/2023 463,289 0.02%Comcast Corp. $430,000 3.70% 15/4/2024 457,442 0.02%Broadcom, Inc. $450,000 3.13% 15/4/2021 455,326 0.02%International Business Machines Corp. €400,000 0.50% 7/9/2021 453,898 0.02%Shire Acquisitions Investments Ireland DAC $450,000 2.40% 23/9/2021 452,243 0.02%Apple, Inc. $450,000 2.25% 23/2/2021 452,230 0.02%Goldman Sachs Group, Inc. $450,000 2.35% 15/11/2021 451,548 0.02%Wells Fargo Bank NA £300,000 5.25% 1/8/2023 448,142 0.02%United Technologies Corp. $420,000 3.65% 16/8/2023 442,439 0.02%Johnson Controls International plc €376,000 1.00% 15/9/2023 434,269 0.02%Federal National Mortgage Association $425,000 2.00% 5/10/2022 429,007 0.02%Morgan Stanley $400,000 4.88% 1/11/2022 428,332 0.02%Tyson Foods, Inc. $400,000 3.90% 28/9/2023 424,125 0.02%American Express Credit Corp. €370,000 0.63% 22/11/2021 420,778 0.02%Citigroup, Inc. $400,000 4.50% 14/1/2022 418,979 0.02%Freddie Mac Multifamily Structured Pass Through Certificates $389,295 3.74% 25/4/2028 417,884 0.02%ITC Holdings Corp. $400,000 3.65% 15/6/2024 417,807 0.02%International Business Machines Corp. $400,000 3.00% 15/5/2024 414,178 0.02%National Rural Utilities Cooperative Finance Corp. $400,000 2.95% 7/2/2024 412,544 0.02%AutoZone, Inc. $400,000 3.13% 15/7/2023 410,871 0.02%Comcast Corp. $400,000 2.75% 1/3/2023 408,801 0.02%JPMorgan Chase & Co.^ $400,000 3.51% 18/6/2022 408,466 0.02%Caterpillar Financial Services Corp. $400,000 3.15% 7/9/2021 408,083 0.02%AbbVie, Inc. $400,000 2.90% 6/11/2022 407,930 0.02%
Vanguard Global Short-Term Bond Index Fund
669
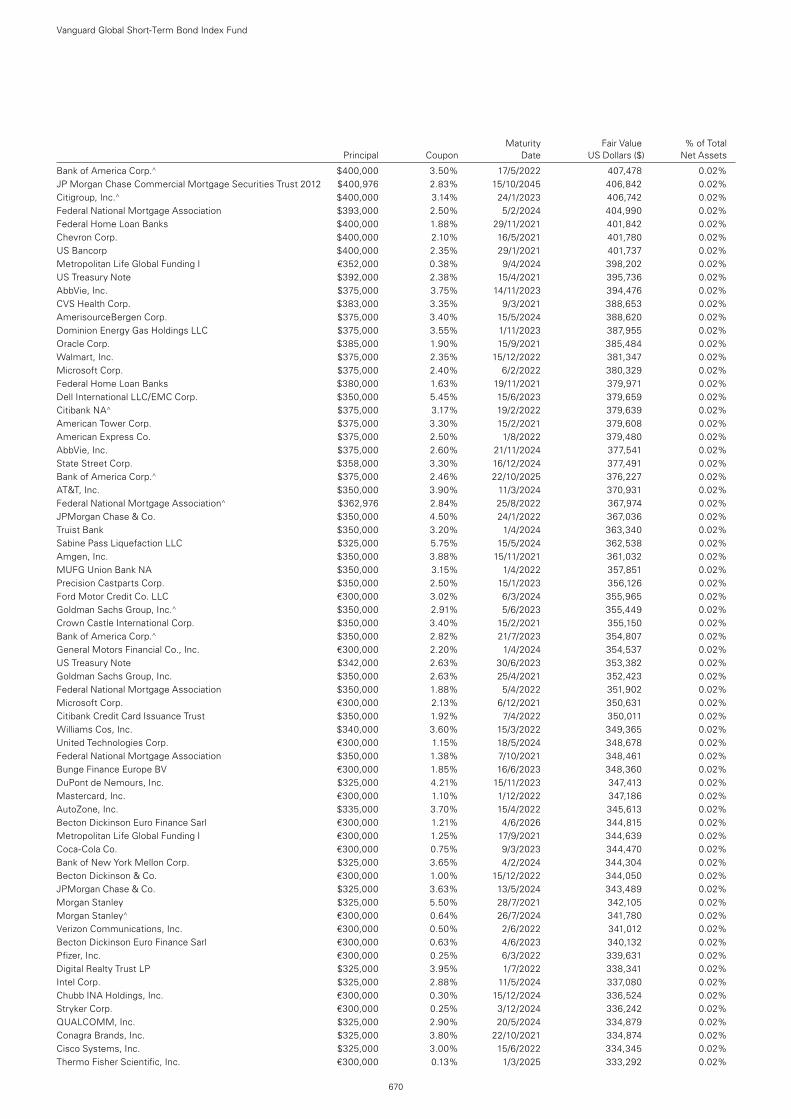
Maturity Fair Value % of Total Principal Coupon Date US Dollars ($) Net Assets
Vanguard Global Short-Term Bond Index Fund
670
Bank of America Corp.^ $400,000 3.50% 17/5/2022 407,478 0.02%JP Morgan Chase Commercial Mortgage Securities Trust 2012 $400,976 2.83% 15/10/2045 406,842 0.02%Citigroup, Inc.^ $400,000 3.14% 24/1/2023 406,742 0.02%Federal National Mortgage Association $393,000 2.50% 5/2/2024 404,990 0.02%Federal Home Loan Banks $400,000 1.88% 29/11/2021 401,842 0.02%Chevron Corp. $400,000 2.10% 16/5/2021 401,780 0.02%US Bancorp $400,000 2.35% 29/1/2021 401,737 0.02%Metropolitan Life Global Funding I €352,000 0.38% 9/4/2024 398,202 0.02%US Treasury Note $392,000 2.38% 15/4/2021 395,736 0.02%AbbVie, Inc. $375,000 3.75% 14/11/2023 394,476 0.02%CVS Health Corp. $383,000 3.35% 9/3/2021 388,653 0.02%AmerisourceBergen Corp. $375,000 3.40% 15/5/2024 388,620 0.02%Dominion Energy Gas Holdings LLC $375,000 3.55% 1/11/2023 387,955 0.02%Oracle Corp. $385,000 1.90% 15/9/2021 385,484 0.02%Walmart, Inc. $375,000 2.35% 15/12/2022 381,347 0.02%Microsoft Corp. $375,000 2.40% 6/2/2022 380,329 0.02%Federal Home Loan Banks $380,000 1.63% 19/11/2021 379,971 0.02%Dell International LLC/EMC Corp. $350,000 5.45% 15/6/2023 379,659 0.02%Citibank NA^ $375,000 3.17% 19/2/2022 379,639 0.02%American Tower Corp. $375,000 3.30% 15/2/2021 379,608 0.02%American Express Co. $375,000 2.50% 1/8/2022 379,480 0.02%AbbVie, Inc. $375,000 2.60% 21/11/2024 377,541 0.02%State Street Corp. $358,000 3.30% 16/12/2024 377,491 0.02%Bank of America Corp.^ $375,000 2.46% 22/10/2025 376,227 0.02%AT&T, Inc. $350,000 3.90% 11/3/2024 370,931 0.02%Federal National Mortgage Association^ $362,976 2.84% 25/8/2022 367,974 0.02%JPMorgan Chase & Co. $350,000 4.50% 24/1/2022 367,036 0.02%Truist Bank $350,000 3.20% 1/4/2024 363,340 0.02%Sabine Pass Liquefaction LLC $325,000 5.75% 15/5/2024 362,538 0.02%Amgen, Inc. $350,000 3.88% 15/11/2021 361,032 0.02%MUFG Union Bank NA $350,000 3.15% 1/4/2022 357,851 0.02%Precision Castparts Corp. $350,000 2.50% 15/1/2023 356,126 0.02%Ford Motor Credit Co. LLC €300,000 3.02% 6/3/2024 355,965 0.02%Goldman Sachs Group, Inc.^ $350,000 2.91% 5/6/2023 355,449 0.02%Crown Castle International Corp. $350,000 3.40% 15/2/2021 355,150 0.02%Bank of America Corp.^ $350,000 2.82% 21/7/2023 354,807 0.02%General Motors Financial Co., Inc. €300,000 2.20% 1/4/2024 354,537 0.02%US Treasury Note $342,000 2.63% 30/6/2023 353,382 0.02%Goldman Sachs Group, Inc. $350,000 2.63% 25/4/2021 352,423 0.02%Federal National Mortgage Association $350,000 1.88% 5/4/2022 351,902 0.02%Microsoft Corp. €300,000 2.13% 6/12/2021 350,631 0.02%Citibank Credit Card Issuance Trust $350,000 1.92% 7/4/2022 350,011 0.02%Williams Cos, Inc. $340,000 3.60% 15/3/2022 349,365 0.02%United Technologies Corp. €300,000 1.15% 18/5/2024 348,678 0.02%Federal National Mortgage Association $350,000 1.38% 7/10/2021 348,461 0.02%Bunge Finance Europe BV €300,000 1.85% 16/6/2023 348,360 0.02%DuPont de Nemours, Inc. $325,000 4.21% 15/11/2023 347,413 0.02%Mastercard, Inc. €300,000 1.10% 1/12/2022 347,186 0.02%AutoZone, Inc. $335,000 3.70% 15/4/2022 345,613 0.02%Becton Dickinson Euro Finance Sarl €300,000 1.21% 4/6/2026 344,815 0.02%Metropolitan Life Global Funding I €300,000 1.25% 17/9/2021 344,639 0.02%Coca-Cola Co. €300,000 0.75% 9/3/2023 344,470 0.02%Bank of New York Mellon Corp. $325,000 3.65% 4/2/2024 344,304 0.02%Becton Dickinson & Co. €300,000 1.00% 15/12/2022 344,050 0.02%JPMorgan Chase & Co. $325,000 3.63% 13/5/2024 343,489 0.02%Morgan Stanley $325,000 5.50% 28/7/2021 342,105 0.02%Morgan Stanley^ €300,000 0.64% 26/7/2024 341,780 0.02%Verizon Communications, Inc. €300,000 0.50% 2/6/2022 341,012 0.02%Becton Dickinson Euro Finance Sarl €300,000 0.63% 4/6/2023 340,132 0.02%Pfizer, Inc. €300,000 0.25% 6/3/2022 339,631 0.02%Digital Realty Trust LP $325,000 3.95% 1/7/2022 338,341 0.02%Intel Corp. $325,000 2.88% 11/5/2024 337,080 0.02%Chubb INA Holdings, Inc. €300,000 0.30% 15/12/2024 336,524 0.02%Stryker Corp. €300,000 0.25% 3/12/2024 336,242 0.02%QUALCOMM, Inc. $325,000 2.90% 20/5/2024 334,879 0.02%Conagra Brands, Inc. $325,000 3.80% 22/10/2021 334,874 0.02%Cisco Systems, Inc. $325,000 3.00% 15/6/2022 334,345 0.02%Thermo Fisher Scientific, Inc. €300,000 0.13% 1/3/2025 333,292 0.02%
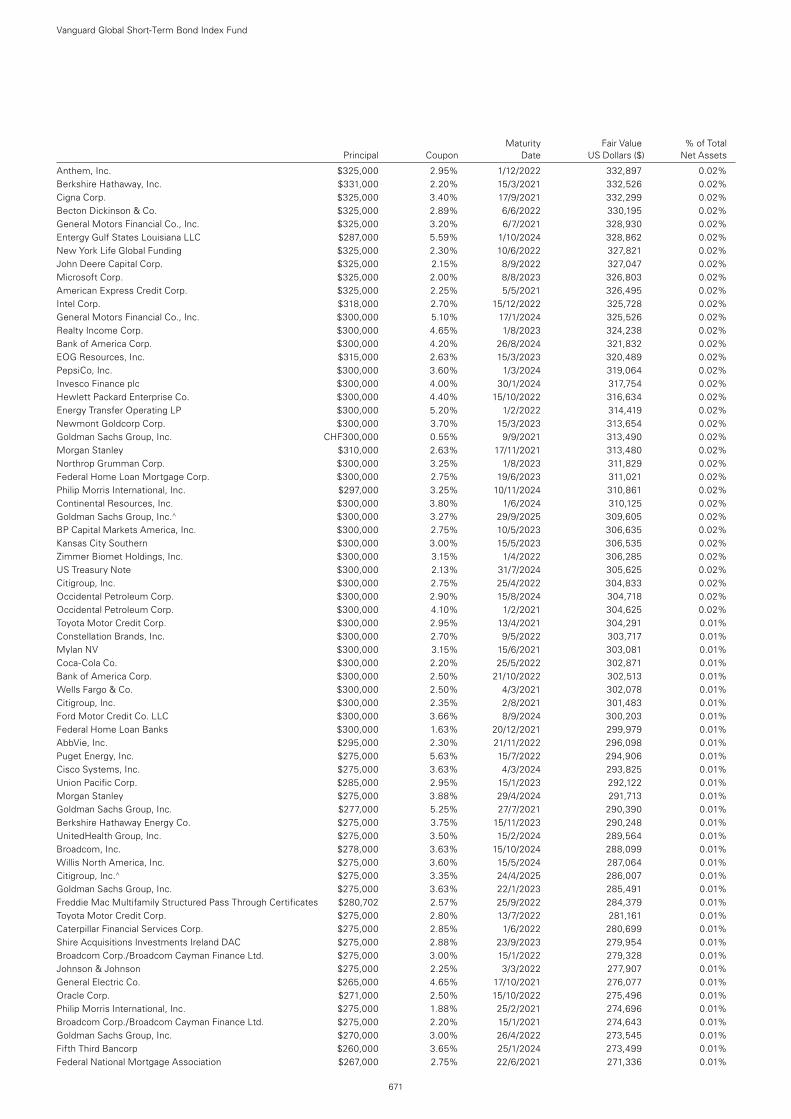
Maturity Fair Value % of Total Principal Coupon Date US Dollars ($) Net Assets
Vanguard Global Short-Term Bond Index Fund
671
Anthem, Inc. $325,000 2.95% 1/12/2022 332,897 0.02%Berkshire Hathaway, Inc. $331,000 2.20% 15/3/2021 332,526 0.02%Cigna Corp. $325,000 3.40% 17/9/2021 332,299 0.02%Becton Dickinson & Co. $325,000 2.89% 6/6/2022 330,195 0.02%General Motors Financial Co., Inc. $325,000 3.20% 6/7/2021 328,930 0.02%Entergy Gulf States Louisiana LLC $287,000 5.59% 1/10/2024 328,862 0.02%New York Life Global Funding $325,000 2.30% 10/6/2022 327,821 0.02%John Deere Capital Corp. $325,000 2.15% 8/9/2022 327,047 0.02%Microsoft Corp. $325,000 2.00% 8/8/2023 326,803 0.02%American Express Credit Corp. $325,000 2.25% 5/5/2021 326,495 0.02%Intel Corp. $318,000 2.70% 15/12/2022 325,728 0.02%General Motors Financial Co., Inc. $300,000 5.10% 17/1/2024 325,526 0.02%Realty Income Corp. $300,000 4.65% 1/8/2023 324,238 0.02%Bank of America Corp. $300,000 4.20% 26/8/2024 321,832 0.02%EOG Resources, Inc. $315,000 2.63% 15/3/2023 320,489 0.02%PepsiCo, Inc. $300,000 3.60% 1/3/2024 319,064 0.02%Invesco Finance plc $300,000 4.00% 30/1/2024 317,754 0.02%Hewlett Packard Enterprise Co. $300,000 4.40% 15/10/2022 316,634 0.02%Energy Transfer Operating LP $300,000 5.20% 1/2/2022 314,419 0.02%Newmont Goldcorp Corp. $300,000 3.70% 15/3/2023 313,654 0.02%Goldman Sachs Group, Inc. CHF300,000 0.55% 9/9/2021 313,490 0.02%Morgan Stanley $310,000 2.63% 17/11/2021 313,480 0.02%Northrop Grumman Corp. $300,000 3.25% 1/8/2023 311,829 0.02%Federal Home Loan Mortgage Corp. $300,000 2.75% 19/6/2023 311,021 0.02%Philip Morris International, Inc. $297,000 3.25% 10/11/2024 310,861 0.02%Continental Resources, Inc. $300,000 3.80% 1/6/2024 310,125 0.02%Goldman Sachs Group, Inc.^ $300,000 3.27% 29/9/2025 309,605 0.02%BP Capital Markets America, Inc. $300,000 2.75% 10/5/2023 306,635 0.02%Kansas City Southern $300,000 3.00% 15/5/2023 306,535 0.02%Zimmer Biomet Holdings, Inc. $300,000 3.15% 1/4/2022 306,285 0.02%US Treasury Note $300,000 2.13% 31/7/2024 305,625 0.02%Citigroup, Inc. $300,000 2.75% 25/4/2022 304,833 0.02%Occidental Petroleum Corp. $300,000 2.90% 15/8/2024 304,718 0.02%Occidental Petroleum Corp. $300,000 4.10% 1/2/2021 304,625 0.02%Toyota Motor Credit Corp. $300,000 2.95% 13/4/2021 304,291 0.01%Constellation Brands, Inc. $300,000 2.70% 9/5/2022 303,717 0.01%Mylan NV $300,000 3.15% 15/6/2021 303,081 0.01%Coca-Cola Co. $300,000 2.20% 25/5/2022 302,871 0.01%Bank of America Corp. $300,000 2.50% 21/10/2022 302,513 0.01%Wells Fargo & Co. $300,000 2.50% 4/3/2021 302,078 0.01%Citigroup, Inc. $300,000 2.35% 2/8/2021 301,483 0.01%Ford Motor Credit Co. LLC $300,000 3.66% 8/9/2024 300,203 0.01%Federal Home Loan Banks $300,000 1.63% 20/12/2021 299,979 0.01%AbbVie, Inc. $295,000 2.30% 21/11/2022 296,098 0.01%Puget Energy, Inc. $275,000 5.63% 15/7/2022 294,906 0.01%Cisco Systems, Inc. $275,000 3.63% 4/3/2024 293,825 0.01%Union Pacific Corp. $285,000 2.95% 15/1/2023 292,122 0.01%Morgan Stanley $275,000 3.88% 29/4/2024 291,713 0.01%Goldman Sachs Group, Inc. $277,000 5.25% 27/7/2021 290,390 0.01%Berkshire Hathaway Energy Co. $275,000 3.75% 15/11/2023 290,248 0.01%UnitedHealth Group, Inc. $275,000 3.50% 15/2/2024 289,564 0.01%Broadcom, Inc. $278,000 3.63% 15/10/2024 288,099 0.01%Willis North America, Inc. $275,000 3.60% 15/5/2024 287,064 0.01%Citigroup, Inc.^ $275,000 3.35% 24/4/2025 286,007 0.01%Goldman Sachs Group, Inc. $275,000 3.63% 22/1/2023 285,491 0.01%Freddie Mac Multifamily Structured Pass Through Certificates $280,702 2.57% 25/9/2022 284,379 0.01%Toyota Motor Credit Corp. $275,000 2.80% 13/7/2022 281,161 0.01%Caterpillar Financial Services Corp. $275,000 2.85% 1/6/2022 280,699 0.01%Shire Acquisitions Investments Ireland DAC $275,000 2.88% 23/9/2023 279,954 0.01%Broadcom Corp./Broadcom Cayman Finance Ltd. $275,000 3.00% 15/1/2022 279,328 0.01%Johnson & Johnson $275,000 2.25% 3/3/2022 277,907 0.01%General Electric Co. $265,000 4.65% 17/10/2021 276,077 0.01%Oracle Corp. $271,000 2.50% 15/10/2022 275,496 0.01%Philip Morris International, Inc. $275,000 1.88% 25/2/2021 274,696 0.01%Broadcom Corp./Broadcom Cayman Finance Ltd. $275,000 2.20% 15/1/2021 274,643 0.01%Goldman Sachs Group, Inc. $270,000 3.00% 26/4/2022 273,545 0.01%Fifth Third Bancorp $260,000 3.65% 25/1/2024 273,499 0.01%Federal National Mortgage Association $267,000 2.75% 22/6/2021 271,336 0.01%

Vanguard Global Short-Term Bond Index Fund
672
Macy’s Retail Holdings, Inc. $268,000 3.45% 15/1/2021 270,274 0.01%Kinder Morgan Energy Partners LP $250,000 4.15% 1/2/2024 265,935 0.01%Burlington Northern Santa Fe LLC $260,000 3.05% 15/3/2022 265,710 0.01%Benchmark 2018-B6 Mortgage Trust $250,000 4.20% 10/10/2051 265,657 0.01%Discover Bank $250,000 4.20% 8/8/2023 265,569 0.01%TD Ameritrade Holding Corp. $260,000 2.95% 1/4/2022 265,566 0.01%Nestle Holdings, Inc. £200,000 1.00% 11/6/2021 265,438 0.01%IHS Markit Ltd. $247,000 5.00% 1/11/2022 262,129 0.01%Huntington National Bank $250,000 3.55% 6/10/2023 261,713 0.01%MUFG Union Bank NA $260,000 2.10% 9/12/2022 260,523 0.01%Truist Bank $260,000 2.15% 6/12/2024 259,498 0.01%Allstate Corp. $250,000 3.15% 15/6/2023 259,439 0.01%Morgan Stanley $250,000 5.75% 25/1/2021 259,178 0.01%Broadcom Corp./Broadcom Cayman Finance Ltd. $250,000 3.63% 15/1/2024 258,836 0.01%Berkshire Hathaway, Inc. $250,000 3.75% 15/8/2021 257,694 0.01%Wells Fargo & Co. $250,000 3.50% 8/3/2022 257,667 0.01%Spirit AeroSystems, Inc. $250,000 3.95% 15/6/2023 257,316 0.01%ONEOK Partners LP $250,000 3.38% 1/10/2022 257,195 0.01%US Bank NA $250,000 2.85% 23/1/2023 256,544 0.01%Citizens Bank NA $250,000 3.25% 14/2/2022 255,889 0.01%Lowe’s Cos, Inc. $250,000 3.12% 15/4/2022 255,874 0.01%Chubb INA Holdings, Inc. $250,000 2.70% 13/3/2023 255,551 0.01%KeyBank NA $250,000 3.35% 15/6/2021 255,178 0.01%Synchrony Bank $250,000 3.65% 24/5/2021 254,920 0.01%American Honda Finance Corp. $250,000 2.60% 16/11/2022 254,769 0.01%Zions Bancorp NA $250,000 3.50% 27/8/2021 254,706 0.01%Global Payments, Inc. $250,000 3.80% 1/4/2021 254,653 0.01%Public Service Enterprise Group, Inc. $250,000 2.88% 15/6/2024 254,646 0.01%Associated Bank NA $250,000 3.50% 13/8/2021 254,404 0.01%Cigna Corp. $250,000 3.05% 30/11/2022 254,346 0.01%Broadcom, Inc. $250,000 3.13% 15/10/2022 254,340 0.01%US Bank NA $250,000 2.65% 23/5/2022 254,325 0.01%Huntington National Bank $250,000 3.25% 14/5/2021 254,060 0.01%US Bank NA $250,000 3.15% 26/4/2021 253,700 0.01%Bank of America Corp.^ $250,000 2.88% 24/4/2023 253,461 0.01%McDonald’s Corp. $250,000 2.63% 15/1/2022 253,377 0.01%Parker-Hannifin Corp. $250,000 2.70% 14/6/2024 253,362 0.01%BBVA USA $250,000 2.88% 29/6/2022 253,351 0.01%Citibank NA^ $250,000 2.84% 20/5/2022 253,061 0.01%Huntington National Bank $250,000 2.50% 7/8/2022 252,801 0.01%Wells Fargo Bank NA^ $250,000 2.90% 27/5/2022 252,703 0.01%Reliance Standard Life Global Funding II $250,000 3.05% 20/1/2021 252,439 0.01%Macy’s Retail Holdings, Inc. $250,000 3.63% 1/6/2024 252,198 0.01%Regions Bank^ $250,000 3.37% 13/8/2021 251,877 0.01%Citigroup, Inc. $250,000 2.70% 30/3/2021 251,804 0.01%Regions Bank $250,000 2.75% 1/4/2021 251,731 0.01%Citizens Bank NA $250,000 2.55% 13/5/2021 251,581 0.01%Wells Fargo Bank NA $250,000 2.60% 15/1/2021 251,401 0.01%Fifth Third Bank $250,000 2.25% 14/6/2021 250,977 0.01%Visa, Inc. $250,000 2.20% 14/12/2020 250,904 0.01%Credit Suisse AG $250,000 2.10% 12/11/2021 250,586 0.01%Ryder System, Inc. $250,000 2.25% 1/9/2021 250,271 0.01%State Street Corp. $250,000 1.95% 19/5/2021 250,184 0.01%Truist Bank^ $250,000 2.59% 29/1/2021 250,076 0.01%Ford Credit Floorplan Master Owner Trust A $250,000 2.07% 15/5/2022 250,024 0.01%American Honda Finance Corp. $250,000 1.70% 9/9/2021 249,349 0.01%Occidental Petroleum Corp. $239,000 4.85% 15/3/2021 245,938 0.01%Expedia Group, Inc. $225,000 4.50% 15/8/2024 240,651 0.01%JPMorgan Chase & Co.^ $225,000 4.02% 5/12/2024 239,723 0.01%AT&T, Inc. €200,000 2.50% 15/3/2023 239,687 0.01%Verizon Communications, Inc. €200,000 1.63% 1/3/2024 238,830 0.01%Citigroup, Inc. $235,000 2.90% 8/12/2021 238,493 0.01%Apple, Inc. €200,000 1.38% 17/1/2024 237,139 0.01%JPMorgan Chase & Co.^ $225,000 3.80% 23/7/2024 237,063 0.01%ERAC USA Finance LLC $225,000 4.50% 16/8/2021 233,294 0.01%LYB International Finance II BV €200,000 1.88% 2/3/2022 232,346 0.01%Bank of America Corp. $230,000 2.63% 19/4/2021 232,013 0.01%Ford Credit Canada Co. CA($)300,000 3.74% 8/5/2023 231,979 0.01%
Maturity Fair Value % of Total Principal Coupon Date US Dollars ($) Net Assets
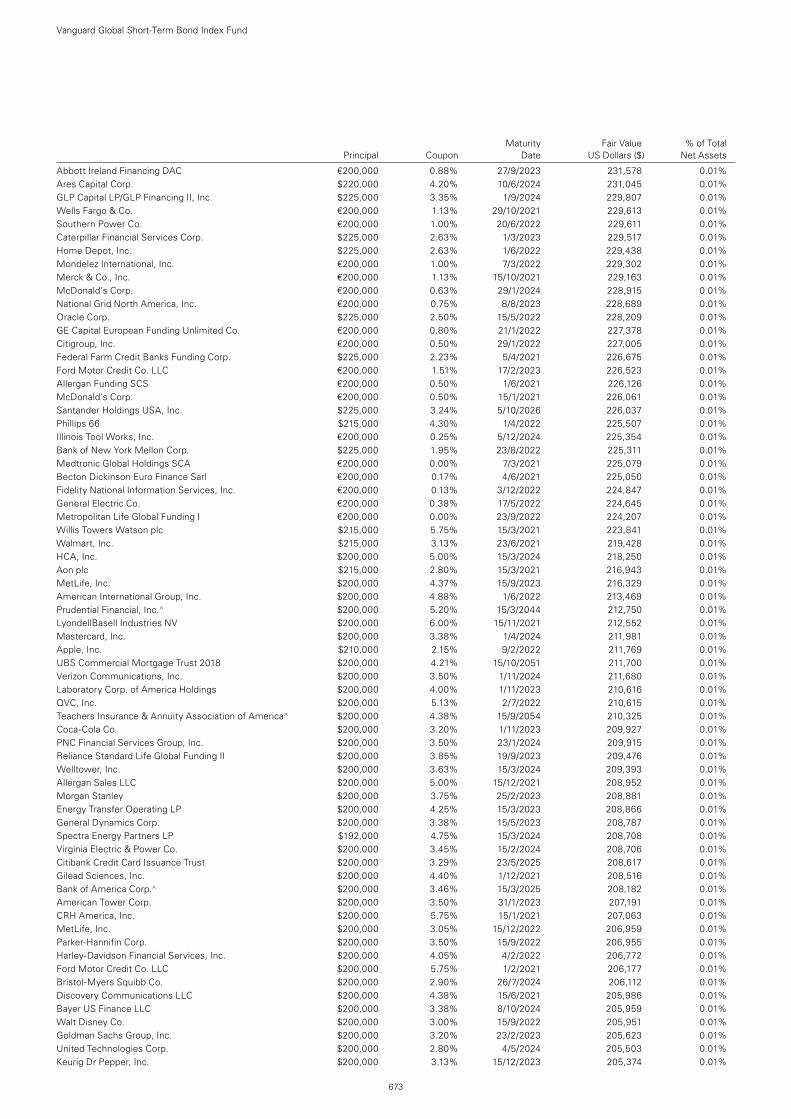
Maturity Fair Value % of Total Principal Coupon Date US Dollars ($) Net Assets
Abbott Ireland Financing DAC €200,000 0.88% 27/9/2023 231,578 0.01%Ares Capital Corp. $220,000 4.20% 10/6/2024 231,045 0.01%GLP Capital LP/GLP Financing II, Inc. $225,000 3.35% 1/9/2024 229,807 0.01%Wells Fargo & Co. €200,000 1.13% 29/10/2021 229,613 0.01%Southern Power Co. €200,000 1.00% 20/6/2022 229,611 0.01%Caterpillar Financial Services Corp. $225,000 2.63% 1/3/2023 229,517 0.01%Home Depot, Inc. $225,000 2.63% 1/6/2022 229,438 0.01%Mondelez International, Inc. €200,000 1.00% 7/3/2022 229,302 0.01%Merck & Co., Inc. €200,000 1.13% 15/10/2021 229,163 0.01%McDonald’s Corp. €200,000 0.63% 29/1/2024 228,915 0.01%National Grid North America, Inc. €200,000 0.75% 8/8/2023 228,689 0.01%Oracle Corp. $225,000 2.50% 15/5/2022 228,209 0.01%GE Capital European Funding Unlimited Co. €200,000 0.80% 21/1/2022 227,378 0.01%Citigroup, Inc. €200,000 0.50% 29/1/2022 227,005 0.01%Federal Farm Credit Banks Funding Corp. $225,000 2.23% 5/4/2021 226,675 0.01%Ford Motor Credit Co. LLC €200,000 1.51% 17/2/2023 226,523 0.01%Allergan Funding SCS €200,000 0.50% 1/6/2021 226,126 0.01%McDonald’s Corp. €200,000 0.50% 15/1/2021 226,061 0.01%Santander Holdings USA, Inc. $225,000 3.24% 5/10/2026 226,037 0.01%Phillips 66 $215,000 4.30% 1/4/2022 225,507 0.01%Illinois Tool Works, Inc. €200,000 0.25% 5/12/2024 225,354 0.01%Bank of New York Mellon Corp. $225,000 1.95% 23/8/2022 225,311 0.01%Medtronic Global Holdings SCA €200,000 0.00% 7/3/2021 225,079 0.01%Becton Dickinson Euro Finance Sarl €200,000 0.17% 4/6/2021 225,050 0.01%Fidelity National Information Services, Inc. €200,000 0.13% 3/12/2022 224,847 0.01%General Electric Co. €200,000 0.38% 17/5/2022 224,645 0.01%Metropolitan Life Global Funding I €200,000 0.00% 23/9/2022 224,207 0.01%Willis Towers Watson plc $215,000 5.75% 15/3/2021 223,841 0.01%Walmart, Inc. $215,000 3.13% 23/6/2021 219,428 0.01%HCA, Inc. $200,000 5.00% 15/3/2024 218,250 0.01%Aon plc $215,000 2.80% 15/3/2021 216,943 0.01%MetLife, Inc. $200,000 4.37% 15/9/2023 216,329 0.01%American International Group, Inc. $200,000 4.88% 1/6/2022 213,469 0.01%Prudential Financial, Inc.^ $200,000 5.20% 15/3/2044 212,750 0.01%LyondellBasell Industries NV $200,000 6.00% 15/11/2021 212,552 0.01%Mastercard, Inc. $200,000 3.38% 1/4/2024 211,981 0.01%Apple, Inc. $210,000 2.15% 9/2/2022 211,769 0.01%UBS Commercial Mortgage Trust 2018 $200,000 4.21% 15/10/2051 211,700 0.01%Verizon Communications, Inc. $200,000 3.50% 1/11/2024 211,680 0.01%Laboratory Corp. of America Holdings $200,000 4.00% 1/11/2023 210,616 0.01%QVC, Inc. $200,000 5.13% 2/7/2022 210,615 0.01%Teachers Insurance & Annuity Association of America^ $200,000 4.38% 15/9/2054 210,325 0.01%Coca-Cola Co. $200,000 3.20% 1/11/2023 209,927 0.01%PNC Financial Services Group, Inc. $200,000 3.50% 23/1/2024 209,915 0.01%Reliance Standard Life Global Funding II $200,000 3.85% 19/9/2023 209,476 0.01%Welltower, Inc. $200,000 3.63% 15/3/2024 209,393 0.01%Allergan Sales LLC $200,000 5.00% 15/12/2021 208,952 0.01%Morgan Stanley $200,000 3.75% 25/2/2023 208,881 0.01%Energy Transfer Operating LP $200,000 4.25% 15/3/2023 208,866 0.01%General Dynamics Corp. $200,000 3.38% 15/5/2023 208,787 0.01%Spectra Energy Partners LP $192,000 4.75% 15/3/2024 208,708 0.01%Virginia Electric & Power Co. $200,000 3.45% 15/2/2024 208,706 0.01%Citibank Credit Card Issuance Trust $200,000 3.29% 23/5/2025 208,617 0.01%Gilead Sciences, Inc. $200,000 4.40% 1/12/2021 208,516 0.01%Bank of America Corp.^ $200,000 3.46% 15/3/2025 208,182 0.01%American Tower Corp. $200,000 3.50% 31/1/2023 207,191 0.01%CRH America, Inc. $200,000 5.75% 15/1/2021 207,063 0.01%MetLife, Inc. $200,000 3.05% 15/12/2022 206,959 0.01%Parker-Hannifin Corp. $200,000 3.50% 15/9/2022 206,955 0.01%Harley-Davidson Financial Services, Inc. $200,000 4.05% 4/2/2022 206,772 0.01%Ford Motor Credit Co. LLC $200,000 5.75% 1/2/2021 206,177 0.01%Bristol-Myers Squibb Co. $200,000 2.90% 26/7/2024 206,112 0.01%Discovery Communications LLC $200,000 4.38% 15/6/2021 205,986 0.01%Bayer US Finance LLC $200,000 3.38% 8/10/2024 205,959 0.01%Walt Disney Co. $200,000 3.00% 15/9/2022 205,951 0.01%Goldman Sachs Group, Inc. $200,000 3.20% 23/2/2023 205,623 0.01%United Technologies Corp. $200,000 2.80% 4/5/2024 205,503 0.01%Keurig Dr Pepper, Inc. $200,000 3.13% 15/12/2023 205,374 0.01%
Vanguard Global Short-Term Bond Index Fund
673
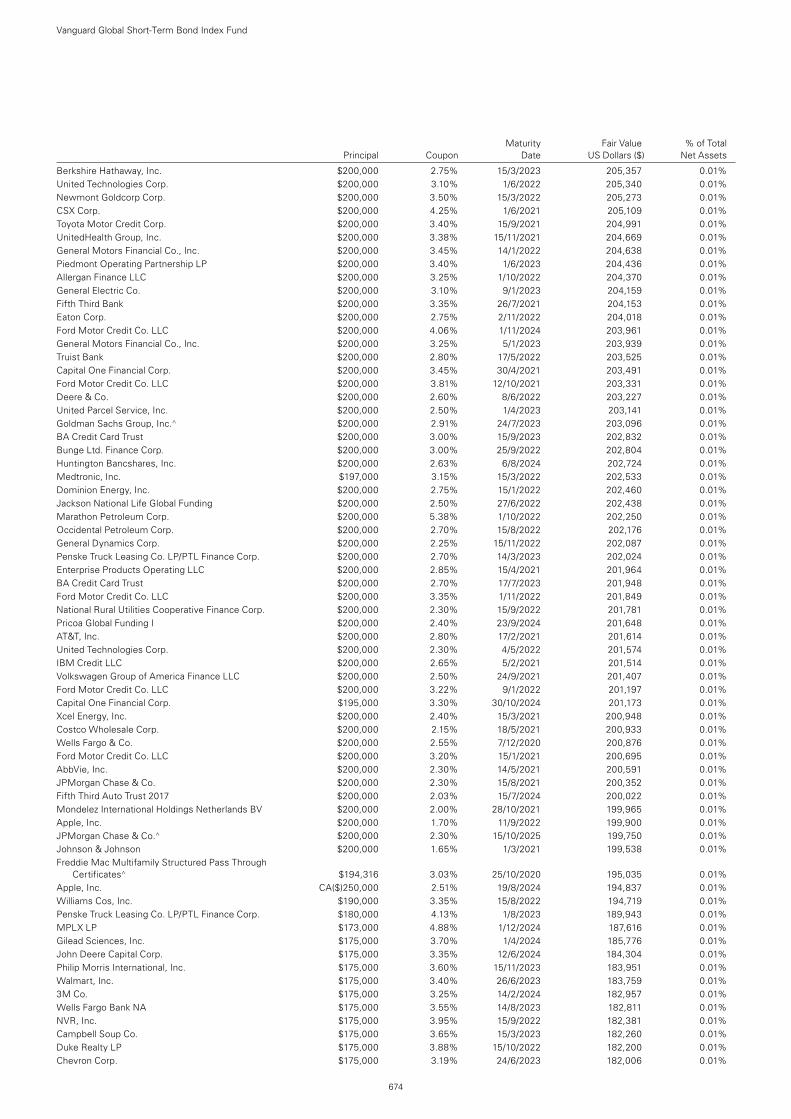
Maturity Fair Value % of Total Principal Coupon Date US Dollars ($) Net Assets
Berkshire Hathaway, Inc. $200,000 2.75% 15/3/2023 205,357 0.01%United Technologies Corp. $200,000 3.10% 1/6/2022 205,340 0.01%Newmont Goldcorp Corp. $200,000 3.50% 15/3/2022 205,273 0.01%CSX Corp. $200,000 4.25% 1/6/2021 205,109 0.01%Toyota Motor Credit Corp. $200,000 3.40% 15/9/2021 204,991 0.01%UnitedHealth Group, Inc. $200,000 3.38% 15/11/2021 204,669 0.01%General Motors Financial Co., Inc. $200,000 3.45% 14/1/2022 204,638 0.01%Piedmont Operating Partnership LP $200,000 3.40% 1/6/2023 204,436 0.01%Allergan Finance LLC $200,000 3.25% 1/10/2022 204,370 0.01%General Electric Co. $200,000 3.10% 9/1/2023 204,159 0.01%Fifth Third Bank $200,000 3.35% 26/7/2021 204,153 0.01%Eaton Corp. $200,000 2.75% 2/11/2022 204,018 0.01%Ford Motor Credit Co. LLC $200,000 4.06% 1/11/2024 203,961 0.01%General Motors Financial Co., Inc. $200,000 3.25% 5/1/2023 203,939 0.01%Truist Bank $200,000 2.80% 17/5/2022 203,525 0.01%Capital One Financial Corp. $200,000 3.45% 30/4/2021 203,491 0.01%Ford Motor Credit Co. LLC $200,000 3.81% 12/10/2021 203,331 0.01%Deere & Co. $200,000 2.60% 8/6/2022 203,227 0.01%United Parcel Service, Inc. $200,000 2.50% 1/4/2023 203,141 0.01%Goldman Sachs Group, Inc.^ $200,000 2.91% 24/7/2023 203,096 0.01%BA Credit Card Trust $200,000 3.00% 15/9/2023 202,832 0.01%Bunge Ltd. Finance Corp. $200,000 3.00% 25/9/2022 202,804 0.01%Huntington Bancshares, Inc. $200,000 2.63% 6/8/2024 202,724 0.01%Medtronic, Inc. $197,000 3.15% 15/3/2022 202,533 0.01%Dominion Energy, Inc. $200,000 2.75% 15/1/2022 202,460 0.01%Jackson National Life Global Funding $200,000 2.50% 27/6/2022 202,438 0.01%Marathon Petroleum Corp. $200,000 5.38% 1/10/2022 202,250 0.01%Occidental Petroleum Corp. $200,000 2.70% 15/8/2022 202,176 0.01%General Dynamics Corp. $200,000 2.25% 15/11/2022 202,087 0.01%Penske Truck Leasing Co. LP/PTL Finance Corp. $200,000 2.70% 14/3/2023 202,024 0.01%Enterprise Products Operating LLC $200,000 2.85% 15/4/2021 201,964 0.01%BA Credit Card Trust $200,000 2.70% 17/7/2023 201,948 0.01%Ford Motor Credit Co. LLC $200,000 3.35% 1/11/2022 201,849 0.01%National Rural Utilities Cooperative Finance Corp. $200,000 2.30% 15/9/2022 201,781 0.01%Pricoa Global Funding I $200,000 2.40% 23/9/2024 201,648 0.01%AT&T, Inc. $200,000 2.80% 17/2/2021 201,614 0.01%United Technologies Corp. $200,000 2.30% 4/5/2022 201,574 0.01%IBM Credit LLC $200,000 2.65% 5/2/2021 201,514 0.01%Volkswagen Group of America Finance LLC $200,000 2.50% 24/9/2021 201,407 0.01%Ford Motor Credit Co. LLC $200,000 3.22% 9/1/2022 201,197 0.01%Capital One Financial Corp. $195,000 3.30% 30/10/2024 201,173 0.01%Xcel Energy, Inc. $200,000 2.40% 15/3/2021 200,948 0.01%Costco Wholesale Corp. $200,000 2.15% 18/5/2021 200,933 0.01%Wells Fargo & Co. $200,000 2.55% 7/12/2020 200,876 0.01%Ford Motor Credit Co. LLC $200,000 3.20% 15/1/2021 200,695 0.01%AbbVie, Inc. $200,000 2.30% 14/5/2021 200,591 0.01%JPMorgan Chase & Co. $200,000 2.30% 15/8/2021 200,352 0.01%Fifth Third Auto Trust 2017 $200,000 2.03% 15/7/2024 200,022 0.01%Mondelez International Holdings Netherlands BV $200,000 2.00% 28/10/2021 199,965 0.01%Apple, Inc. $200,000 1.70% 11/9/2022 199,900 0.01%JPMorgan Chase & Co.^ $200,000 2.30% 15/10/2025 199,750 0.01%Johnson & Johnson $200,000 1.65% 1/3/2021 199,538 0.01%Freddie Mac Multifamily Structured Pass Through
Certificates^ $194,316 3.03% 25/10/2020 195,035 0.01%Apple, Inc. CA($)250,000 2.51% 19/8/2024 194,837 0.01%Williams Cos, Inc. $190,000 3.35% 15/8/2022 194,719 0.01%Penske Truck Leasing Co. LP/PTL Finance Corp. $180,000 4.13% 1/8/2023 189,943 0.01%MPLX LP $173,000 4.88% 1/12/2024 187,616 0.01%Gilead Sciences, Inc. $175,000 3.70% 1/4/2024 185,776 0.01%John Deere Capital Corp. $175,000 3.35% 12/6/2024 184,304 0.01%Philip Morris International, Inc. $175,000 3.60% 15/11/2023 183,951 0.01%Walmart, Inc. $175,000 3.40% 26/6/2023 183,759 0.01%3M Co. $175,000 3.25% 14/2/2024 182,957 0.01%Wells Fargo Bank NA $175,000 3.55% 14/8/2023 182,811 0.01%NVR, Inc. $175,000 3.95% 15/9/2022 182,381 0.01%Campbell Soup Co. $175,000 3.65% 15/3/2023 182,260 0.01%Duke Realty LP $175,000 3.88% 15/10/2022 182,200 0.01%Chevron Corp. $175,000 3.19% 24/6/2023 182,006 0.01%
Vanguard Global Short-Term Bond Index Fund
674
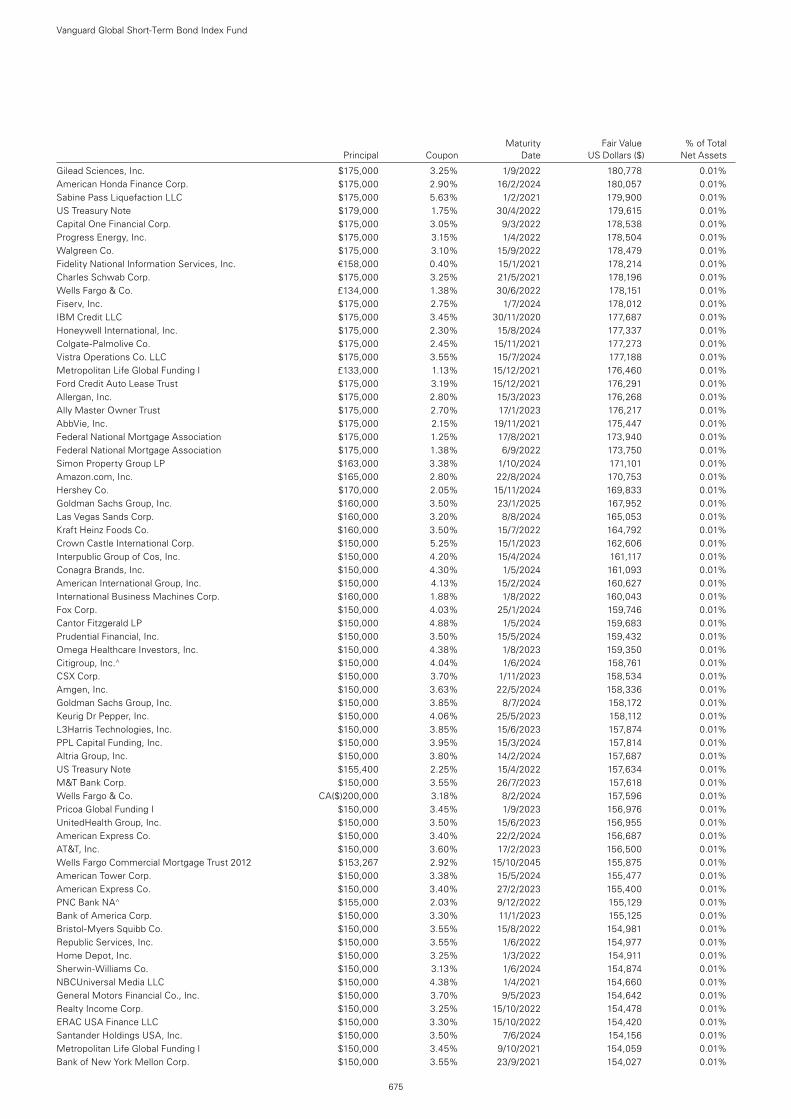
Maturity Fair Value % of Total Principal Coupon Date US Dollars ($) Net Assets
Gilead Sciences, Inc. $175,000 3.25% 1/9/2022 180,778 0.01%American Honda Finance Corp. $175,000 2.90% 16/2/2024 180,057 0.01%Sabine Pass Liquefaction LLC $175,000 5.63% 1/2/2021 179,900 0.01%US Treasury Note $179,000 1.75% 30/4/2022 179,615 0.01%Capital One Financial Corp. $175,000 3.05% 9/3/2022 178,538 0.01%Progress Energy, Inc. $175,000 3.15% 1/4/2022 178,504 0.01%Walgreen Co. $175,000 3.10% 15/9/2022 178,479 0.01%Fidelity National Information Services, Inc. €158,000 0.40% 15/1/2021 178,214 0.01%Charles Schwab Corp. $175,000 3.25% 21/5/2021 178,196 0.01%Wells Fargo & Co. £134,000 1.38% 30/6/2022 178,151 0.01%Fiserv, Inc. $175,000 2.75% 1/7/2024 178,012 0.01%IBM Credit LLC $175,000 3.45% 30/11/2020 177,687 0.01%Honeywell International, Inc. $175,000 2.30% 15/8/2024 177,337 0.01%Colgate-Palmolive Co. $175,000 2.45% 15/11/2021 177,273 0.01%Vistra Operations Co. LLC $175,000 3.55% 15/7/2024 177,188 0.01%Metropolitan Life Global Funding I £133,000 1.13% 15/12/2021 176,460 0.01%Ford Credit Auto Lease Trust $175,000 3.19% 15/12/2021 176,291 0.01%Allergan, Inc. $175,000 2.80% 15/3/2023 176,268 0.01%Ally Master Owner Trust $175,000 2.70% 17/1/2023 176,217 0.01%AbbVie, Inc. $175,000 2.15% 19/11/2021 175,447 0.01%Federal National Mortgage Association $175,000 1.25% 17/8/2021 173,940 0.01%Federal National Mortgage Association $175,000 1.38% 6/9/2022 173,750 0.01%Simon Property Group LP $163,000 3.38% 1/10/2024 171,101 0.01%Amazon.com, Inc. $165,000 2.80% 22/8/2024 170,753 0.01%Hershey Co. $170,000 2.05% 15/11/2024 169,833 0.01%Goldman Sachs Group, Inc. $160,000 3.50% 23/1/2025 167,952 0.01%Las Vegas Sands Corp. $160,000 3.20% 8/8/2024 165,053 0.01%Kraft Heinz Foods Co. $160,000 3.50% 15/7/2022 164,792 0.01%Crown Castle International Corp. $150,000 5.25% 15/1/2023 162,606 0.01%Interpublic Group of Cos, Inc. $150,000 4.20% 15/4/2024 161,117 0.01%Conagra Brands, Inc. $150,000 4.30% 1/5/2024 161,093 0.01%American International Group, Inc. $150,000 4.13% 15/2/2024 160,627 0.01%International Business Machines Corp. $160,000 1.88% 1/8/2022 160,043 0.01%Fox Corp. $150,000 4.03% 25/1/2024 159,746 0.01%Cantor Fitzgerald LP $150,000 4.88% 1/5/2024 159,683 0.01%Prudential Financial, Inc. $150,000 3.50% 15/5/2024 159,432 0.01%Omega Healthcare Investors, Inc. $150,000 4.38% 1/8/2023 159,350 0.01%Citigroup, Inc.^ $150,000 4.04% 1/6/2024 158,761 0.01%CSX Corp. $150,000 3.70% 1/11/2023 158,534 0.01%Amgen, Inc. $150,000 3.63% 22/5/2024 158,336 0.01%Goldman Sachs Group, Inc. $150,000 3.85% 8/7/2024 158,172 0.01%Keurig Dr Pepper, Inc. $150,000 4.06% 25/5/2023 158,112 0.01%L3Harris Technologies, Inc. $150,000 3.85% 15/6/2023 157,874 0.01%PPL Capital Funding, Inc. $150,000 3.95% 15/3/2024 157,814 0.01%Altria Group, Inc. $150,000 3.80% 14/2/2024 157,687 0.01%US Treasury Note $155,400 2.25% 15/4/2022 157,634 0.01%M&T Bank Corp. $150,000 3.55% 26/7/2023 157,618 0.01%Wells Fargo & Co. CA($)200,000 3.18% 8/2/2024 157,596 0.01%Pricoa Global Funding I $150,000 3.45% 1/9/2023 156,976 0.01%UnitedHealth Group, Inc. $150,000 3.50% 15/6/2023 156,955 0.01%American Express Co. $150,000 3.40% 22/2/2024 156,687 0.01%AT&T, Inc. $150,000 3.60% 17/2/2023 156,500 0.01%Wells Fargo Commercial Mortgage Trust 2012 $153,267 2.92% 15/10/2045 155,875 0.01%American Tower Corp. $150,000 3.38% 15/5/2024 155,477 0.01%American Express Co. $150,000 3.40% 27/2/2023 155,400 0.01%PNC Bank NA^ $155,000 2.03% 9/12/2022 155,129 0.01%Bank of America Corp. $150,000 3.30% 11/1/2023 155,125 0.01%Bristol-Myers Squibb Co. $150,000 3.55% 15/8/2022 154,981 0.01%Republic Services, Inc. $150,000 3.55% 1/6/2022 154,977 0.01%Home Depot, Inc. $150,000 3.25% 1/3/2022 154,911 0.01%Sherwin-Williams Co. $150,000 3.13% 1/6/2024 154,874 0.01%NBCUniversal Media LLC $150,000 4.38% 1/4/2021 154,660 0.01%General Motors Financial Co., Inc. $150,000 3.70% 9/5/2023 154,642 0.01%Realty Income Corp. $150,000 3.25% 15/10/2022 154,478 0.01%ERAC USA Finance LLC $150,000 3.30% 15/10/2022 154,420 0.01%Santander Holdings USA, Inc. $150,000 3.50% 7/6/2024 154,156 0.01%Metropolitan Life Global Funding I $150,000 3.45% 9/10/2021 154,059 0.01%Bank of New York Mellon Corp. $150,000 3.55% 23/9/2021 154,027 0.01%
Vanguard Global Short-Term Bond Index Fund
675
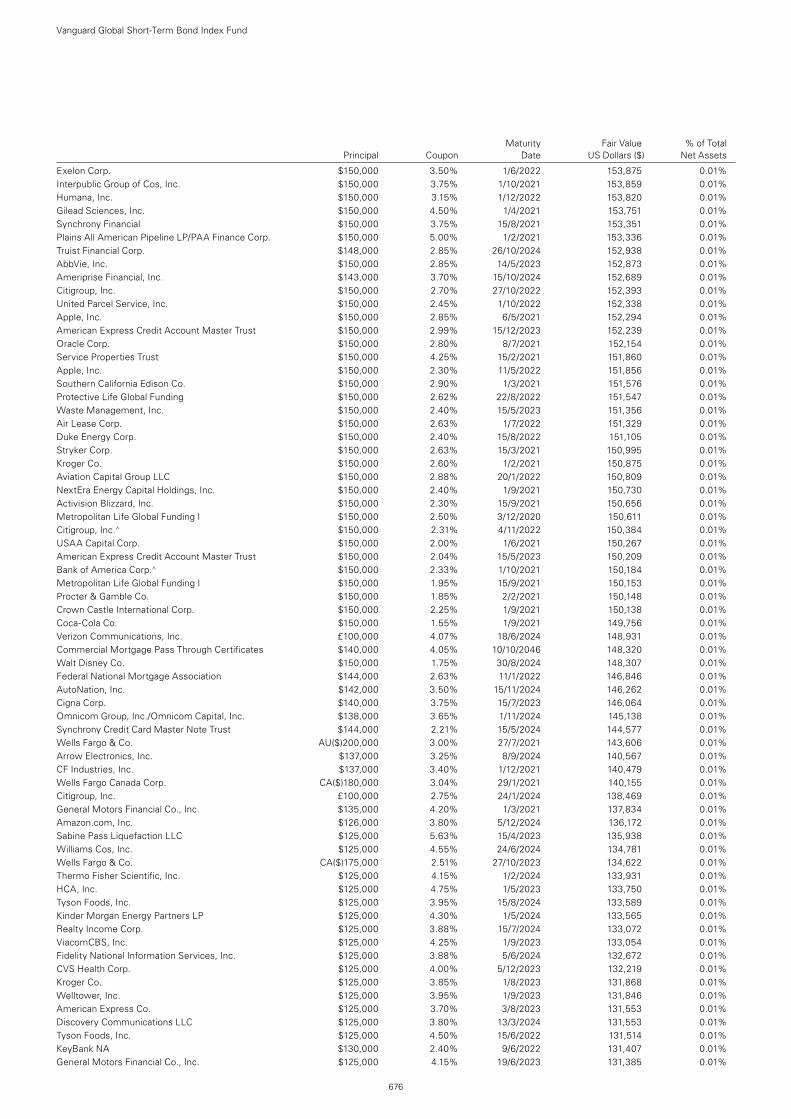
Exelon Corp. $150,000 3.50% 1/6/2022 153,875 0.01%Interpublic Group of Cos, Inc. $150,000 3.75% 1/10/2021 153,859 0.01%Humana, Inc. $150,000 3.15% 1/12/2022 153,820 0.01%Gilead Sciences, Inc. $150,000 4.50% 1/4/2021 153,751 0.01%Synchrony Financial $150,000 3.75% 15/8/2021 153,351 0.01%Plains All American Pipeline LP/PAA Finance Corp. $150,000 5.00% 1/2/2021 153,336 0.01%Truist Financial Corp. $148,000 2.85% 26/10/2024 152,938 0.01%AbbVie, Inc. $150,000 2.85% 14/5/2023 152,873 0.01%Ameriprise Financial, Inc. $143,000 3.70% 15/10/2024 152,689 0.01%Citigroup, Inc. $150,000 2.70% 27/10/2022 152,393 0.01%United Parcel Service, Inc. $150,000 2.45% 1/10/2022 152,338 0.01%Apple, Inc. $150,000 2.85% 6/5/2021 152,294 0.01%American Express Credit Account Master Trust $150,000 2.99% 15/12/2023 152,239 0.01%Oracle Corp. $150,000 2.80% 8/7/2021 152,154 0.01%Service Properties Trust $150,000 4.25% 15/2/2021 151,860 0.01%Apple, Inc. $150,000 2.30% 11/5/2022 151,856 0.01%Southern California Edison Co. $150,000 2.90% 1/3/2021 151,576 0.01%Protective Life Global Funding $150,000 2.62% 22/8/2022 151,547 0.01%Waste Management, Inc. $150,000 2.40% 15/5/2023 151,356 0.01%Air Lease Corp. $150,000 2.63% 1/7/2022 151,329 0.01%Duke Energy Corp. $150,000 2.40% 15/8/2022 151,105 0.01%Stryker Corp. $150,000 2.63% 15/3/2021 150,995 0.01%Kroger Co. $150,000 2.60% 1/2/2021 150,875 0.01%Aviation Capital Group LLC $150,000 2.88% 20/1/2022 150,809 0.01%NextEra Energy Capital Holdings, Inc. $150,000 2.40% 1/9/2021 150,730 0.01%Activision Blizzard, Inc. $150,000 2.30% 15/9/2021 150,656 0.01%Metropolitan Life Global Funding I $150,000 2.50% 3/12/2020 150,611 0.01%Citigroup, Inc.^ $150,000 2.31% 4/11/2022 150,384 0.01%USAA Capital Corp. $150,000 2.00% 1/6/2021 150,267 0.01%American Express Credit Account Master Trust $150,000 2.04% 15/5/2023 150,209 0.01%Bank of America Corp.^ $150,000 2.33% 1/10/2021 150,184 0.01%Metropolitan Life Global Funding I $150,000 1.95% 15/9/2021 150,153 0.01%Procter & Gamble Co. $150,000 1.85% 2/2/2021 150,148 0.01%Crown Castle International Corp. $150,000 2.25% 1/9/2021 150,138 0.01%Coca-Cola Co. $150,000 1.55% 1/9/2021 149,756 0.01%Verizon Communications, Inc. £100,000 4.07% 18/6/2024 148,931 0.01%Commercial Mortgage Pass Through Certificates $140,000 4.05% 10/10/2046 148,320 0.01%Walt Disney Co. $150,000 1.75% 30/8/2024 148,307 0.01%Federal National Mortgage Association $144,000 2.63% 11/1/2022 146,846 0.01%AutoNation, Inc. $142,000 3.50% 15/11/2024 146,262 0.01%Cigna Corp. $140,000 3.75% 15/7/2023 146,064 0.01%Omnicom Group, Inc./Omnicom Capital, Inc. $138,000 3.65% 1/11/2024 145,138 0.01%Synchrony Credit Card Master Note Trust $144,000 2.21% 15/5/2024 144,577 0.01%Wells Fargo & Co. AU($)200,000 3.00% 27/7/2021 143,606 0.01%Arrow Electronics, Inc. $137,000 3.25% 8/9/2024 140,567 0.01%CF Industries, Inc. $137,000 3.40% 1/12/2021 140,479 0.01%Wells Fargo Canada Corp. CA($)180,000 3.04% 29/1/2021 140,155 0.01%Citigroup, Inc. £100,000 2.75% 24/1/2024 138,469 0.01%General Motors Financial Co., Inc. $135,000 4.20% 1/3/2021 137,834 0.01%Amazon.com, Inc. $126,000 3.80% 5/12/2024 136,172 0.01%Sabine Pass Liquefaction LLC $125,000 5.63% 15/4/2023 135,938 0.01%Williams Cos, Inc. $125,000 4.55% 24/6/2024 134,781 0.01%Wells Fargo & Co. CA($)175,000 2.51% 27/10/2023 134,622 0.01%Thermo Fisher Scientific, Inc. $125,000 4.15% 1/2/2024 133,931 0.01%HCA, Inc. $125,000 4.75% 1/5/2023 133,750 0.01%Tyson Foods, Inc. $125,000 3.95% 15/8/2024 133,589 0.01%Kinder Morgan Energy Partners LP $125,000 4.30% 1/5/2024 133,565 0.01%Realty Income Corp. $125,000 3.88% 15/7/2024 133,072 0.01%ViacomCBS, Inc. $125,000 4.25% 1/9/2023 133,054 0.01%Fidelity National Information Services, Inc. $125,000 3.88% 5/6/2024 132,672 0.01%CVS Health Corp. $125,000 4.00% 5/12/2023 132,219 0.01%Kroger Co. $125,000 3.85% 1/8/2023 131,868 0.01%Welltower, Inc. $125,000 3.95% 1/9/2023 131,846 0.01%American Express Co. $125,000 3.70% 3/8/2023 131,553 0.01%Discovery Communications LLC $125,000 3.80% 13/3/2024 131,553 0.01%Tyson Foods, Inc. $125,000 4.50% 15/6/2022 131,514 0.01%KeyBank NA $130,000 2.40% 9/6/2022 131,407 0.01%General Motors Financial Co., Inc. $125,000 4.15% 19/6/2023 131,385 0.01%
Vanguard Global Short-Term Bond Index Fund
676
Maturity Fair Value % of Total Principal Coupon Date US Dollars ($) Net Assets
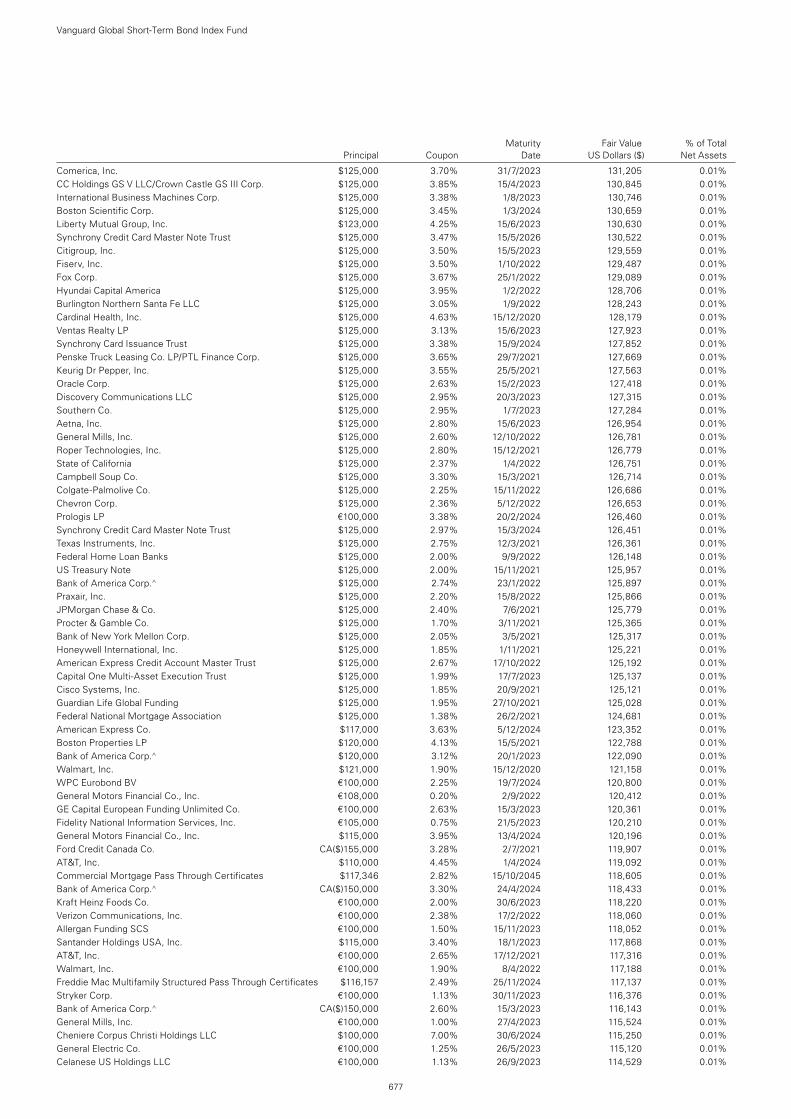
Maturity Fair Value % of Total Principal Coupon Date US Dollars ($) Net Assets
Comerica, Inc. $125,000 3.70% 31/7/2023 131,205 0.01%CC Holdings GS V LLC/Crown Castle GS III Corp. $125,000 3.85% 15/4/2023 130,845 0.01%International Business Machines Corp. $125,000 3.38% 1/8/2023 130,746 0.01%Boston Scientific Corp. $125,000 3.45% 1/3/2024 130,659 0.01%Liberty Mutual Group, Inc. $123,000 4.25% 15/6/2023 130,630 0.01%Synchrony Credit Card Master Note Trust $125,000 3.47% 15/5/2026 130,522 0.01%Citigroup, Inc. $125,000 3.50% 15/5/2023 129,559 0.01%Fiserv, Inc. $125,000 3.50% 1/10/2022 129,487 0.01%Fox Corp. $125,000 3.67% 25/1/2022 129,089 0.01%Hyundai Capital America $125,000 3.95% 1/2/2022 128,706 0.01%Burlington Northern Santa Fe LLC $125,000 3.05% 1/9/2022 128,243 0.01%Cardinal Health, Inc. $125,000 4.63% 15/12/2020 128,179 0.01%Ventas Realty LP $125,000 3.13% 15/6/2023 127,923 0.01%Synchrony Card Issuance Trust $125,000 3.38% 15/9/2024 127,852 0.01%Penske Truck Leasing Co. LP/PTL Finance Corp. $125,000 3.65% 29/7/2021 127,669 0.01%Keurig Dr Pepper, Inc. $125,000 3.55% 25/5/2021 127,563 0.01%Oracle Corp. $125,000 2.63% 15/2/2023 127,418 0.01%Discovery Communications LLC $125,000 2.95% 20/3/2023 127,315 0.01%Southern Co. $125,000 2.95% 1/7/2023 127,284 0.01%Aetna, Inc. $125,000 2.80% 15/6/2023 126,954 0.01%General Mills, Inc. $125,000 2.60% 12/10/2022 126,781 0.01%Roper Technologies, Inc. $125,000 2.80% 15/12/2021 126,779 0.01%State of California $125,000 2.37% 1/4/2022 126,751 0.01%Campbell Soup Co. $125,000 3.30% 15/3/2021 126,714 0.01%Colgate-Palmolive Co. $125,000 2.25% 15/11/2022 126,686 0.01%Chevron Corp. $125,000 2.36% 5/12/2022 126,653 0.01%Prologis LP €100,000 3.38% 20/2/2024 126,460 0.01%Synchrony Credit Card Master Note Trust $125,000 2.97% 15/3/2024 126,451 0.01%Texas Instruments, Inc. $125,000 2.75% 12/3/2021 126,361 0.01%Federal Home Loan Banks $125,000 2.00% 9/9/2022 126,148 0.01%US Treasury Note $125,000 2.00% 15/11/2021 125,957 0.01%Bank of America Corp.^ $125,000 2.74% 23/1/2022 125,897 0.01%Praxair, Inc. $125,000 2.20% 15/8/2022 125,866 0.01%JPMorgan Chase & Co. $125,000 2.40% 7/6/2021 125,779 0.01%Procter & Gamble Co. $125,000 1.70% 3/11/2021 125,365 0.01%Bank of New York Mellon Corp. $125,000 2.05% 3/5/2021 125,317 0.01%Honeywell International, Inc. $125,000 1.85% 1/11/2021 125,221 0.01%American Express Credit Account Master Trust $125,000 2.67% 17/10/2022 125,192 0.01%Capital One Multi-Asset Execution Trust $125,000 1.99% 17/7/2023 125,137 0.01%Cisco Systems, Inc. $125,000 1.85% 20/9/2021 125,121 0.01%Guardian Life Global Funding $125,000 1.95% 27/10/2021 125,028 0.01%Federal National Mortgage Association $125,000 1.38% 26/2/2021 124,681 0.01%American Express Co. $117,000 3.63% 5/12/2024 123,352 0.01%Boston Properties LP $120,000 4.13% 15/5/2021 122,788 0.01%Bank of America Corp.^ $120,000 3.12% 20/1/2023 122,090 0.01%Walmart, Inc. $121,000 1.90% 15/12/2020 121,158 0.01%WPC Eurobond BV €100,000 2.25% 19/7/2024 120,800 0.01%General Motors Financial Co., Inc. €108,000 0.20% 2/9/2022 120,412 0.01%GE Capital European Funding Unlimited Co. €100,000 2.63% 15/3/2023 120,361 0.01%Fidelity National Information Services, Inc. €105,000 0.75% 21/5/2023 120,210 0.01%General Motors Financial Co., Inc. $115,000 3.95% 13/4/2024 120,196 0.01%Ford Credit Canada Co. CA($)155,000 3.28% 2/7/2021 119,907 0.01%AT&T, Inc. $110,000 4.45% 1/4/2024 119,092 0.01%Commercial Mortgage Pass Through Certificates $117,346 2.82% 15/10/2045 118,605 0.01%Bank of America Corp.^ CA($)150,000 3.30% 24/4/2024 118,433 0.01%Kraft Heinz Foods Co. €100,000 2.00% 30/6/2023 118,220 0.01%Verizon Communications, Inc. €100,000 2.38% 17/2/2022 118,060 0.01%Allergan Funding SCS €100,000 1.50% 15/11/2023 118,052 0.01%Santander Holdings USA, Inc. $115,000 3.40% 18/1/2023 117,868 0.01%AT&T, Inc. €100,000 2.65% 17/12/2021 117,316 0.01%Walmart, Inc. €100,000 1.90% 8/4/2022 117,188 0.01%Freddie Mac Multifamily Structured Pass Through Certificates $116,157 2.49% 25/11/2024 117,137 0.01%Stryker Corp. €100,000 1.13% 30/11/2023 116,376 0.01%Bank of America Corp.^ CA($)150,000 2.60% 15/3/2023 116,143 0.01%General Mills, Inc. €100,000 1.00% 27/4/2023 115,524 0.01%Cheniere Corpus Christi Holdings LLC $100,000 7.00% 30/6/2024 115,250 0.01%General Electric Co. €100,000 1.25% 26/5/2023 115,120 0.01%Celanese US Holdings LLC €100,000 1.13% 26/9/2023 114,529 0.01%
Vanguard Global Short-Term Bond Index Fund
677
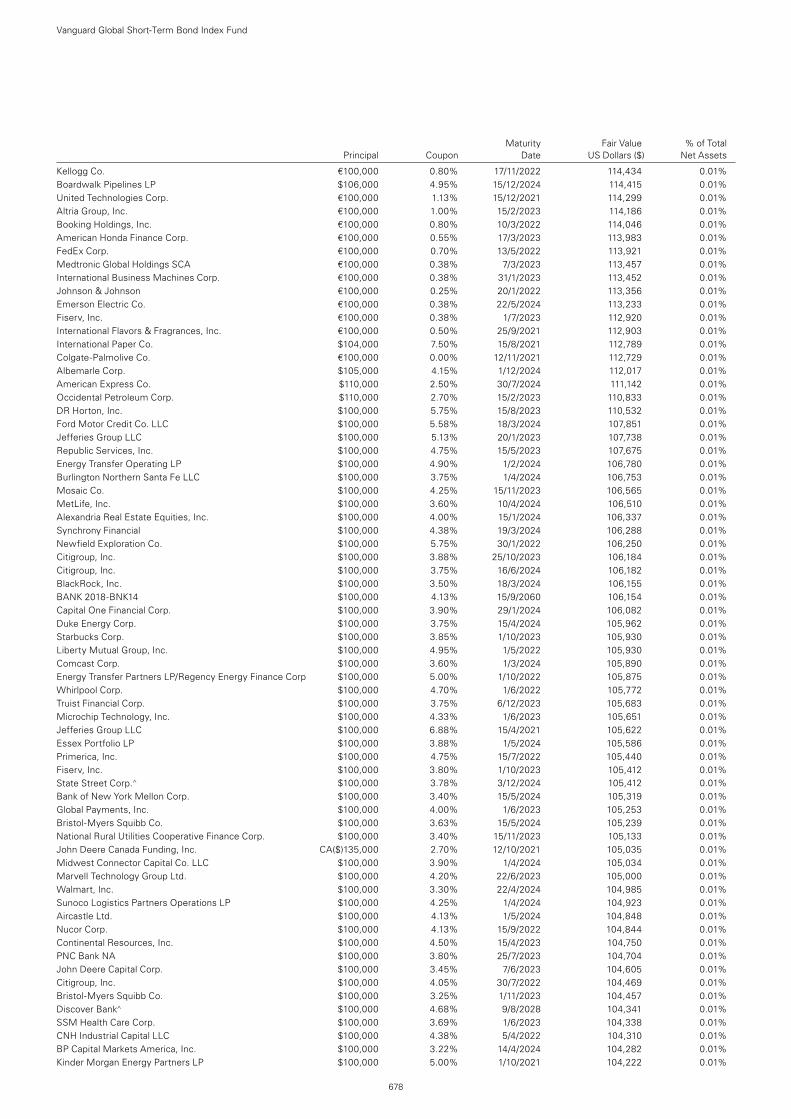
Maturity Fair Value % of Total Principal Coupon Date US Dollars ($) Net Assets
Vanguard Global Short-Term Bond Index Fund
678
Kellogg Co. €100,000 0.80% 17/11/2022 114,434 0.01%Boardwalk Pipelines LP $106,000 4.95% 15/12/2024 114,415 0.01%United Technologies Corp. €100,000 1.13% 15/12/2021 114,299 0.01%Altria Group, Inc. €100,000 1.00% 15/2/2023 114,186 0.01%Booking Holdings, Inc. €100,000 0.80% 10/3/2022 114,046 0.01%American Honda Finance Corp. €100,000 0.55% 17/3/2023 113,983 0.01%FedEx Corp. €100,000 0.70% 13/5/2022 113,921 0.01%Medtronic Global Holdings SCA €100,000 0.38% 7/3/2023 113,457 0.01%International Business Machines Corp. €100,000 0.38% 31/1/2023 113,452 0.01%Johnson & Johnson €100,000 0.25% 20/1/2022 113,356 0.01%Emerson Electric Co. €100,000 0.38% 22/5/2024 113,233 0.01%Fiserv, Inc. €100,000 0.38% 1/7/2023 112,920 0.01%International Flavors & Fragrances, Inc. €100,000 0.50% 25/9/2021 112,903 0.01%International Paper Co. $104,000 7.50% 15/8/2021 112,789 0.01%Colgate-Palmolive Co. €100,000 0.00% 12/11/2021 112,729 0.01%Albemarle Corp. $105,000 4.15% 1/12/2024 112,017 0.01%American Express Co. $110,000 2.50% 30/7/2024 111,142 0.01%Occidental Petroleum Corp. $110,000 2.70% 15/2/2023 110,833 0.01%DR Horton, Inc. $100,000 5.75% 15/8/2023 110,532 0.01%Ford Motor Credit Co. LLC $100,000 5.58% 18/3/2024 107,851 0.01%Jefferies Group LLC $100,000 5.13% 20/1/2023 107,738 0.01%Republic Services, Inc. $100,000 4.75% 15/5/2023 107,675 0.01%Energy Transfer Operating LP $100,000 4.90% 1/2/2024 106,780 0.01%Burlington Northern Santa Fe LLC $100,000 3.75% 1/4/2024 106,753 0.01%Mosaic Co. $100,000 4.25% 15/11/2023 106,565 0.01%MetLife, Inc. $100,000 3.60% 10/4/2024 106,510 0.01%Alexandria Real Estate Equities, Inc. $100,000 4.00% 15/1/2024 106,337 0.01%Synchrony Financial $100,000 4.38% 19/3/2024 106,288 0.01%Newfield Exploration Co. $100,000 5.75% 30/1/2022 106,250 0.01%Citigroup, Inc. $100,000 3.88% 25/10/2023 106,184 0.01%Citigroup, Inc. $100,000 3.75% 16/6/2024 106,182 0.01%BlackRock, Inc. $100,000 3.50% 18/3/2024 106,155 0.01%BANK 2018-BNK14 $100,000 4.13% 15/9/2060 106,154 0.01%Capital One Financial Corp. $100,000 3.90% 29/1/2024 106,082 0.01%Duke Energy Corp. $100,000 3.75% 15/4/2024 105,962 0.01%Starbucks Corp. $100,000 3.85% 1/10/2023 105,930 0.01%Liberty Mutual Group, Inc. $100,000 4.95% 1/5/2022 105,930 0.01%Comcast Corp. $100,000 3.60% 1/3/2024 105,890 0.01%Energy Transfer Partners LP/Regency Energy Finance Corp $100,000 5.00% 1/10/2022 105,875 0.01%Whirlpool Corp. $100,000 4.70% 1/6/2022 105,772 0.01%Truist Financial Corp. $100,000 3.75% 6/12/2023 105,683 0.01%Microchip Technology, Inc. $100,000 4.33% 1/6/2023 105,651 0.01%Jefferies Group LLC $100,000 6.88% 15/4/2021 105,622 0.01%Essex Portfolio LP $100,000 3.88% 1/5/2024 105,586 0.01%Primerica, Inc. $100,000 4.75% 15/7/2022 105,440 0.01%Fiserv, Inc. $100,000 3.80% 1/10/2023 105,412 0.01%State Street Corp.^ $100,000 3.78% 3/12/2024 105,412 0.01%Bank of New York Mellon Corp. $100,000 3.40% 15/5/2024 105,319 0.01%Global Payments, Inc. $100,000 4.00% 1/6/2023 105,253 0.01%Bristol-Myers Squibb Co. $100,000 3.63% 15/5/2024 105,239 0.01%National Rural Utilities Cooperative Finance Corp. $100,000 3.40% 15/11/2023 105,133 0.01%John Deere Canada Funding, Inc. CA($)135,000 2.70% 12/10/2021 105,035 0.01%Midwest Connector Capital Co. LLC $100,000 3.90% 1/4/2024 105,034 0.01%Marvell Technology Group Ltd. $100,000 4.20% 22/6/2023 105,000 0.01%Walmart, Inc. $100,000 3.30% 22/4/2024 104,985 0.01%Sunoco Logistics Partners Operations LP $100,000 4.25% 1/4/2024 104,923 0.01%Aircastle Ltd. $100,000 4.13% 1/5/2024 104,848 0.01%Nucor Corp. $100,000 4.13% 15/9/2022 104,844 0.01%Continental Resources, Inc. $100,000 4.50% 15/4/2023 104,750 0.01%PNC Bank NA $100,000 3.80% 25/7/2023 104,704 0.01%John Deere Capital Corp. $100,000 3.45% 7/6/2023 104,605 0.01%Citigroup, Inc. $100,000 4.05% 30/7/2022 104,469 0.01%Bristol-Myers Squibb Co. $100,000 3.25% 1/11/2023 104,457 0.01%Discover Bank^ $100,000 4.68% 9/8/2028 104,341 0.01%SSM Health Care Corp. $100,000 3.69% 1/6/2023 104,338 0.01%CNH Industrial Capital LLC $100,000 4.38% 5/4/2022 104,310 0.01%BP Capital Markets America, Inc. $100,000 3.22% 14/4/2024 104,282 0.01%Kinder Morgan Energy Partners LP $100,000 5.00% 1/10/2021 104,222 0.01%
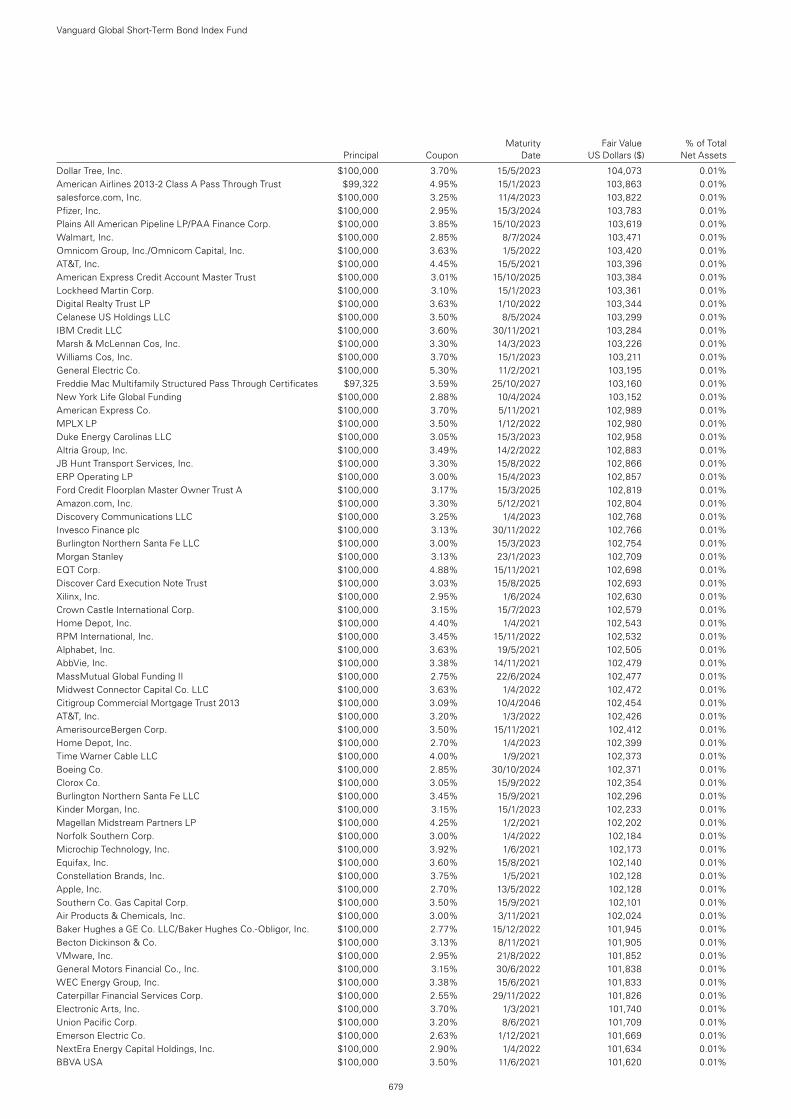
Vanguard Global Short-Term Bond Index Fund
679
Dollar Tree, Inc. $100,000 3.70% 15/5/2023 104,073 0.01%American Airlines 2013-2 Class A Pass Through Trust $99,322 4.95% 15/1/2023 103,863 0.01%salesforce.com, Inc. $100,000 3.25% 11/4/2023 103,822 0.01%Pfizer, Inc. $100,000 2.95% 15/3/2024 103,783 0.01%Plains All American Pipeline LP/PAA Finance Corp. $100,000 3.85% 15/10/2023 103,619 0.01%Walmart, Inc. $100,000 2.85% 8/7/2024 103,471 0.01%Omnicom Group, Inc./Omnicom Capital, Inc. $100,000 3.63% 1/5/2022 103,420 0.01%AT&T, Inc. $100,000 4.45% 15/5/2021 103,396 0.01%American Express Credit Account Master Trust $100,000 3.01% 15/10/2025 103,384 0.01%Lockheed Martin Corp. $100,000 3.10% 15/1/2023 103,361 0.01%Digital Realty Trust LP $100,000 3.63% 1/10/2022 103,344 0.01%Celanese US Holdings LLC $100,000 3.50% 8/5/2024 103,299 0.01%IBM Credit LLC $100,000 3.60% 30/11/2021 103,284 0.01%Marsh & McLennan Cos, Inc. $100,000 3.30% 14/3/2023 103,226 0.01%Williams Cos, Inc. $100,000 3.70% 15/1/2023 103,211 0.01%General Electric Co. $100,000 5.30% 11/2/2021 103,195 0.01%Freddie Mac Multifamily Structured Pass Through Certificates $97,325 3.59% 25/10/2027 103,160 0.01%New York Life Global Funding $100,000 2.88% 10/4/2024 103,152 0.01%American Express Co. $100,000 3.70% 5/11/2021 102,989 0.01%MPLX LP $100,000 3.50% 1/12/2022 102,980 0.01%Duke Energy Carolinas LLC $100,000 3.05% 15/3/2023 102,958 0.01%Altria Group, Inc. $100,000 3.49% 14/2/2022 102,883 0.01%JB Hunt Transport Services, Inc. $100,000 3.30% 15/8/2022 102,866 0.01%ERP Operating LP $100,000 3.00% 15/4/2023 102,857 0.01%Ford Credit Floorplan Master Owner Trust A $100,000 3.17% 15/3/2025 102,819 0.01%Amazon.com, Inc. $100,000 3.30% 5/12/2021 102,804 0.01%Discovery Communications LLC $100,000 3.25% 1/4/2023 102,768 0.01%Invesco Finance plc $100,000 3.13% 30/11/2022 102,766 0.01%Burlington Northern Santa Fe LLC $100,000 3.00% 15/3/2023 102,754 0.01%Morgan Stanley $100,000 3.13% 23/1/2023 102,709 0.01%EQT Corp. $100,000 4.88% 15/11/2021 102,698 0.01%Discover Card Execution Note Trust $100,000 3.03% 15/8/2025 102,693 0.01%Xilinx, Inc. $100,000 2.95% 1/6/2024 102,630 0.01%Crown Castle International Corp. $100,000 3.15% 15/7/2023 102,579 0.01%Home Depot, Inc. $100,000 4.40% 1/4/2021 102,543 0.01%RPM International, Inc. $100,000 3.45% 15/11/2022 102,532 0.01%Alphabet, Inc. $100,000 3.63% 19/5/2021 102,505 0.01%AbbVie, Inc. $100,000 3.38% 14/11/2021 102,479 0.01%MassMutual Global Funding II $100,000 2.75% 22/6/2024 102,477 0.01%Midwest Connector Capital Co. LLC $100,000 3.63% 1/4/2022 102,472 0.01%Citigroup Commercial Mortgage Trust 2013 $100,000 3.09% 10/4/2046 102,454 0.01%AT&T, Inc. $100,000 3.20% 1/3/2022 102,426 0.01%AmerisourceBergen Corp. $100,000 3.50% 15/11/2021 102,412 0.01%Home Depot, Inc. $100,000 2.70% 1/4/2023 102,399 0.01%Time Warner Cable LLC $100,000 4.00% 1/9/2021 102,373 0.01%Boeing Co. $100,000 2.85% 30/10/2024 102,371 0.01%Clorox Co. $100,000 3.05% 15/9/2022 102,354 0.01%Burlington Northern Santa Fe LLC $100,000 3.45% 15/9/2021 102,296 0.01%Kinder Morgan, Inc. $100,000 3.15% 15/1/2023 102,233 0.01%Magellan Midstream Partners LP $100,000 4.25% 1/2/2021 102,202 0.01%Norfolk Southern Corp. $100,000 3.00% 1/4/2022 102,184 0.01%Microchip Technology, Inc. $100,000 3.92% 1/6/2021 102,173 0.01%Equifax, Inc. $100,000 3.60% 15/8/2021 102,140 0.01%Constellation Brands, Inc. $100,000 3.75% 1/5/2021 102,128 0.01%Apple, Inc. $100,000 2.70% 13/5/2022 102,128 0.01%Southern Co. Gas Capital Corp. $100,000 3.50% 15/9/2021 102,101 0.01%Air Products & Chemicals, Inc. $100,000 3.00% 3/11/2021 102,024 0.01%Baker Hughes a GE Co. LLC/Baker Hughes Co.-Obligor, Inc. $100,000 2.77% 15/12/2022 101,945 0.01%Becton Dickinson & Co. $100,000 3.13% 8/11/2021 101,905 0.01%VMware, Inc. $100,000 2.95% 21/8/2022 101,852 0.01%General Motors Financial Co., Inc. $100,000 3.15% 30/6/2022 101,838 0.01%WEC Energy Group, Inc. $100,000 3.38% 15/6/2021 101,833 0.01%Caterpillar Financial Services Corp. $100,000 2.55% 29/11/2022 101,826 0.01%Electronic Arts, Inc. $100,000 3.70% 1/3/2021 101,740 0.01%Union Pacific Corp. $100,000 3.20% 8/6/2021 101,709 0.01%Emerson Electric Co. $100,000 2.63% 1/12/2021 101,669 0.01%NextEra Energy Capital Holdings, Inc. $100,000 2.90% 1/4/2022 101,634 0.01%BBVA USA $100,000 3.50% 11/6/2021 101,620 0.01%
Maturity Fair Value % of Total Principal Coupon Date US Dollars ($) Net Assets
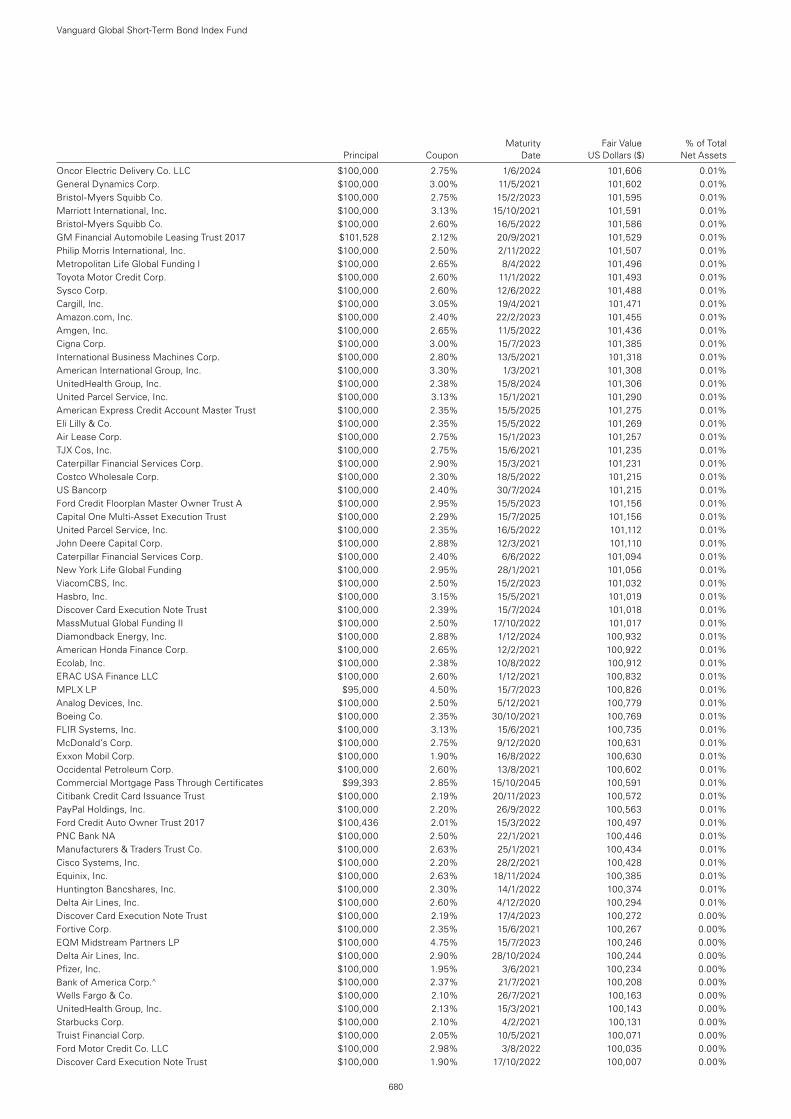
Vanguard Global Short-Term Bond Index Fund
680
Oncor Electric Delivery Co. LLC $100,000 2.75% 1/6/2024 101,606 0.01%General Dynamics Corp. $100,000 3.00% 11/5/2021 101,602 0.01%Bristol-Myers Squibb Co. $100,000 2.75% 15/2/2023 101,595 0.01%Marriott International, Inc. $100,000 3.13% 15/10/2021 101,591 0.01%Bristol-Myers Squibb Co. $100,000 2.60% 16/5/2022 101,586 0.01%GM Financial Automobile Leasing Trust 2017 $101,528 2.12% 20/9/2021 101,529 0.01%Philip Morris International, Inc. $100,000 2.50% 2/11/2022 101,507 0.01%Metropolitan Life Global Funding I $100,000 2.65% 8/4/2022 101,496 0.01%Toyota Motor Credit Corp. $100,000 2.60% 11/1/2022 101,493 0.01%Sysco Corp. $100,000 2.60% 12/6/2022 101,488 0.01%Cargill, Inc. $100,000 3.05% 19/4/2021 101,471 0.01%Amazon.com, Inc. $100,000 2.40% 22/2/2023 101,455 0.01%Amgen, Inc. $100,000 2.65% 11/5/2022 101,436 0.01%Cigna Corp. $100,000 3.00% 15/7/2023 101,385 0.01%International Business Machines Corp. $100,000 2.80% 13/5/2021 101,318 0.01%American International Group, Inc. $100,000 3.30% 1/3/2021 101,308 0.01%UnitedHealth Group, Inc. $100,000 2.38% 15/8/2024 101,306 0.01%United Parcel Service, Inc. $100,000 3.13% 15/1/2021 101,290 0.01%American Express Credit Account Master Trust $100,000 2.35% 15/5/2025 101,275 0.01%Eli Lilly & Co. $100,000 2.35% 15/5/2022 101,269 0.01%Air Lease Corp. $100,000 2.75% 15/1/2023 101,257 0.01%TJX Cos, Inc. $100,000 2.75% 15/6/2021 101,235 0.01%Caterpillar Financial Services Corp. $100,000 2.90% 15/3/2021 101,231 0.01%Costco Wholesale Corp. $100,000 2.30% 18/5/2022 101,215 0.01%US Bancorp $100,000 2.40% 30/7/2024 101,215 0.01%Ford Credit Floorplan Master Owner Trust A $100,000 2.95% 15/5/2023 101,156 0.01%Capital One Multi-Asset Execution Trust $100,000 2.29% 15/7/2025 101,156 0.01%United Parcel Service, Inc. $100,000 2.35% 16/5/2022 101,112 0.01%John Deere Capital Corp. $100,000 2.88% 12/3/2021 101,110 0.01%Caterpillar Financial Services Corp. $100,000 2.40% 6/6/2022 101,094 0.01%New York Life Global Funding $100,000 2.95% 28/1/2021 101,056 0.01%ViacomCBS, Inc. $100,000 2.50% 15/2/2023 101,032 0.01%Hasbro, Inc. $100,000 3.15% 15/5/2021 101,019 0.01%Discover Card Execution Note Trust $100,000 2.39% 15/7/2024 101,018 0.01%MassMutual Global Funding II $100,000 2.50% 17/10/2022 101,017 0.01%Diamondback Energy, Inc. $100,000 2.88% 1/12/2024 100,932 0.01%American Honda Finance Corp. $100,000 2.65% 12/2/2021 100,922 0.01%Ecolab, Inc. $100,000 2.38% 10/8/2022 100,912 0.01%ERAC USA Finance LLC $100,000 2.60% 1/12/2021 100,832 0.01%MPLX LP $95,000 4.50% 15/7/2023 100,826 0.01%Analog Devices, Inc. $100,000 2.50% 5/12/2021 100,779 0.01%Boeing Co. $100,000 2.35% 30/10/2021 100,769 0.01%FLIR Systems, Inc. $100,000 3.13% 15/6/2021 100,735 0.01%McDonald’s Corp. $100,000 2.75% 9/12/2020 100,631 0.01%Exxon Mobil Corp. $100,000 1.90% 16/8/2022 100,630 0.01%Occidental Petroleum Corp. $100,000 2.60% 13/8/2021 100,602 0.01%Commercial Mortgage Pass Through Certificates $99,393 2.85% 15/10/2045 100,591 0.01%Citibank Credit Card Issuance Trust $100,000 2.19% 20/11/2023 100,572 0.01%PayPal Holdings, Inc. $100,000 2.20% 26/9/2022 100,563 0.01%Ford Credit Auto Owner Trust 2017 $100,436 2.01% 15/3/2022 100,497 0.01%PNC Bank NA $100,000 2.50% 22/1/2021 100,446 0.01%Manufacturers & Traders Trust Co. $100,000 2.63% 25/1/2021 100,434 0.01%Cisco Systems, Inc. $100,000 2.20% 28/2/2021 100,428 0.01%Equinix, Inc. $100,000 2.63% 18/11/2024 100,385 0.01%Huntington Bancshares, Inc. $100,000 2.30% 14/1/2022 100,374 0.01%Delta Air Lines, Inc. $100,000 2.60% 4/12/2020 100,294 0.01%Discover Card Execution Note Trust $100,000 2.19% 17/4/2023 100,272 0.00%Fortive Corp. $100,000 2.35% 15/6/2021 100,267 0.00%EQM Midstream Partners LP $100,000 4.75% 15/7/2023 100,246 0.00%Delta Air Lines, Inc. $100,000 2.90% 28/10/2024 100,244 0.00%Pfizer, Inc. $100,000 1.95% 3/6/2021 100,234 0.00%Bank of America Corp.^ $100,000 2.37% 21/7/2021 100,208 0.00%Wells Fargo & Co. $100,000 2.10% 26/7/2021 100,163 0.00%UnitedHealth Group, Inc. $100,000 2.13% 15/3/2021 100,143 0.00%Starbucks Corp. $100,000 2.10% 4/2/2021 100,131 0.00%Truist Financial Corp. $100,000 2.05% 10/5/2021 100,071 0.00%Ford Motor Credit Co. LLC $100,000 2.98% 3/8/2022 100,035 0.00%Discover Card Execution Note Trust $100,000 1.90% 17/10/2022 100,007 0.00%
Maturity Fair Value % of Total Principal Coupon Date US Dollars ($) Net Assets
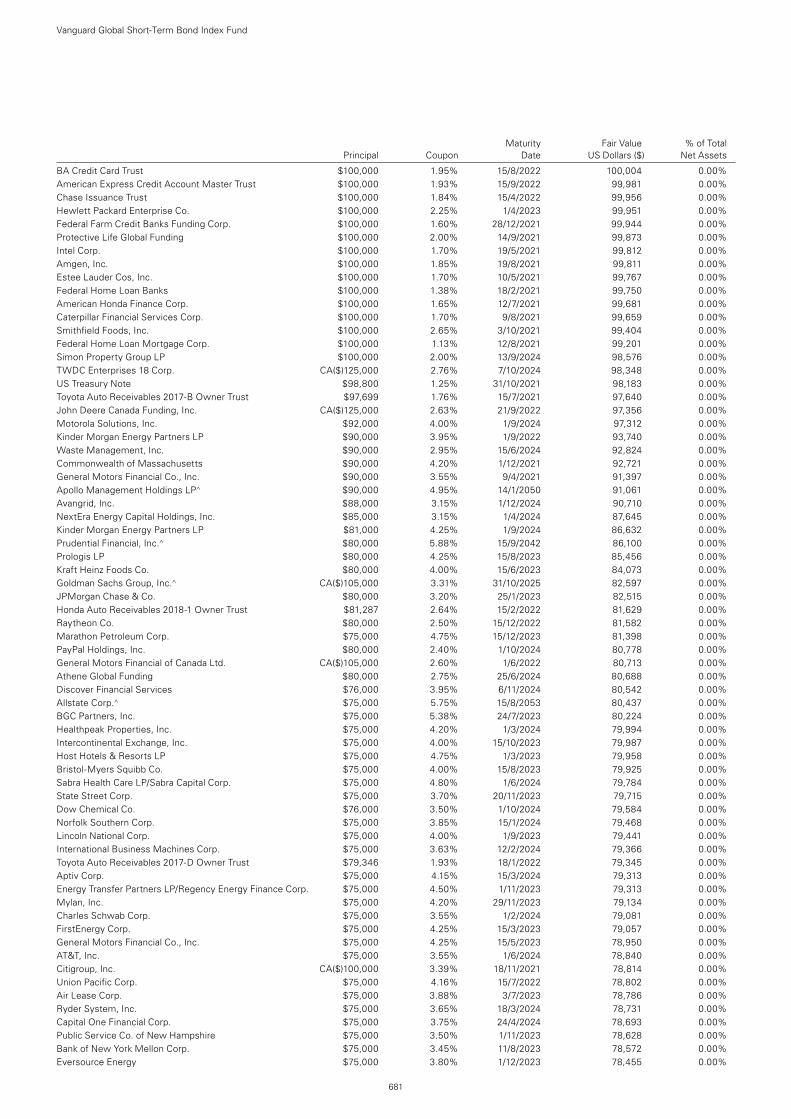
Maturity Fair Value % of Total Principal Coupon Date US Dollars ($) Net Assets
Vanguard Global Short-Term Bond Index Fund
681
BA Credit Card Trust $100,000 1.95% 15/8/2022 100,004 0.00%American Express Credit Account Master Trust $100,000 1.93% 15/9/2022 99,981 0.00%Chase Issuance Trust $100,000 1.84% 15/4/2022 99,956 0.00%Hewlett Packard Enterprise Co. $100,000 2.25% 1/4/2023 99,951 0.00%Federal Farm Credit Banks Funding Corp. $100,000 1.60% 28/12/2021 99,944 0.00%Protective Life Global Funding $100,000 2.00% 14/9/2021 99,873 0.00%Intel Corp. $100,000 1.70% 19/5/2021 99,812 0.00%Amgen, Inc. $100,000 1.85% 19/8/2021 99,811 0.00%Estee Lauder Cos, Inc. $100,000 1.70% 10/5/2021 99,767 0.00%Federal Home Loan Banks $100,000 1.38% 18/2/2021 99,750 0.00%American Honda Finance Corp. $100,000 1.65% 12/7/2021 99,681 0.00%Caterpillar Financial Services Corp. $100,000 1.70% 9/8/2021 99,659 0.00%Smithfield Foods, Inc. $100,000 2.65% 3/10/2021 99,404 0.00%Federal Home Loan Mortgage Corp. $100,000 1.13% 12/8/2021 99,201 0.00%Simon Property Group LP $100,000 2.00% 13/9/2024 98,576 0.00%TWDC Enterprises 18 Corp. CA($)125,000 2.76% 7/10/2024 98,348 0.00%US Treasury Note $98,800 1.25% 31/10/2021 98,183 0.00%Toyota Auto Receivables 2017-B Owner Trust $97,699 1.76% 15/7/2021 97,640 0.00%John Deere Canada Funding, Inc. CA($)125,000 2.63% 21/9/2022 97,356 0.00%Motorola Solutions, Inc. $92,000 4.00% 1/9/2024 97,312 0.00%Kinder Morgan Energy Partners LP $90,000 3.95% 1/9/2022 93,740 0.00%Waste Management, Inc. $90,000 2.95% 15/6/2024 92,824 0.00%Commonwealth of Massachusetts $90,000 4.20% 1/12/2021 92,721 0.00%General Motors Financial Co., Inc. $90,000 3.55% 9/4/2021 91,397 0.00%Apollo Management Holdings LP^ $90,000 4.95% 14/1/2050 91,061 0.00%Avangrid, Inc. $88,000 3.15% 1/12/2024 90,710 0.00%NextEra Energy Capital Holdings, Inc. $85,000 3.15% 1/4/2024 87,645 0.00%Kinder Morgan Energy Partners LP $81,000 4.25% 1/9/2024 86,632 0.00%Prudential Financial, Inc.^ $80,000 5.88% 15/9/2042 86,100 0.00%Prologis LP $80,000 4.25% 15/8/2023 85,456 0.00%Kraft Heinz Foods Co. $80,000 4.00% 15/6/2023 84,073 0.00%Goldman Sachs Group, Inc.^ CA($)105,000 3.31% 31/10/2025 82,597 0.00%JPMorgan Chase & Co. $80,000 3.20% 25/1/2023 82,515 0.00%Honda Auto Receivables 2018-1 Owner Trust $81,287 2.64% 15/2/2022 81,629 0.00%Raytheon Co. $80,000 2.50% 15/12/2022 81,582 0.00%Marathon Petroleum Corp. $75,000 4.75% 15/12/2023 81,398 0.00%PayPal Holdings, Inc. $80,000 2.40% 1/10/2024 80,778 0.00%General Motors Financial of Canada Ltd. CA($)105,000 2.60% 1/6/2022 80,713 0.00%Athene Global Funding $80,000 2.75% 25/6/2024 80,688 0.00%Discover Financial Services $76,000 3.95% 6/11/2024 80,542 0.00%Allstate Corp.^ $75,000 5.75% 15/8/2053 80,437 0.00%BGC Partners, Inc. $75,000 5.38% 24/7/2023 80,224 0.00%Healthpeak Properties, Inc. $75,000 4.20% 1/3/2024 79,994 0.00%Intercontinental Exchange, Inc. $75,000 4.00% 15/10/2023 79,987 0.00%Host Hotels & Resorts LP $75,000 4.75% 1/3/2023 79,958 0.00%Bristol-Myers Squibb Co. $75,000 4.00% 15/8/2023 79,925 0.00%Sabra Health Care LP/Sabra Capital Corp. $75,000 4.80% 1/6/2024 79,784 0.00%State Street Corp. $75,000 3.70% 20/11/2023 79,715 0.00%Dow Chemical Co. $76,000 3.50% 1/10/2024 79,584 0.00%Norfolk Southern Corp. $75,000 3.85% 15/1/2024 79,468 0.00%Lincoln National Corp. $75,000 4.00% 1/9/2023 79,441 0.00%International Business Machines Corp. $75,000 3.63% 12/2/2024 79,366 0.00%Toyota Auto Receivables 2017-D Owner Trust $79,346 1.93% 18/1/2022 79,345 0.00%Aptiv Corp. $75,000 4.15% 15/3/2024 79,313 0.00%Energy Transfer Partners LP/Regency Energy Finance Corp. $75,000 4.50% 1/11/2023 79,313 0.00%Mylan, Inc. $75,000 4.20% 29/11/2023 79,134 0.00%Charles Schwab Corp. $75,000 3.55% 1/2/2024 79,081 0.00%FirstEnergy Corp. $75,000 4.25% 15/3/2023 79,057 0.00%General Motors Financial Co., Inc. $75,000 4.25% 15/5/2023 78,950 0.00%AT&T, Inc. $75,000 3.55% 1/6/2024 78,840 0.00%Citigroup, Inc. CA($)100,000 3.39% 18/11/2021 78,814 0.00%Union Pacific Corp. $75,000 4.16% 15/7/2022 78,802 0.00%Air Lease Corp. $75,000 3.88% 3/7/2023 78,786 0.00%Ryder System, Inc. $75,000 3.65% 18/3/2024 78,731 0.00%Capital One Financial Corp. $75,000 3.75% 24/4/2024 78,693 0.00%Public Service Co. of New Hampshire $75,000 3.50% 1/11/2023 78,628 0.00%Bank of New York Mellon Corp. $75,000 3.45% 11/8/2023 78,572 0.00%Eversource Energy $75,000 3.80% 1/12/2023 78,455 0.00%
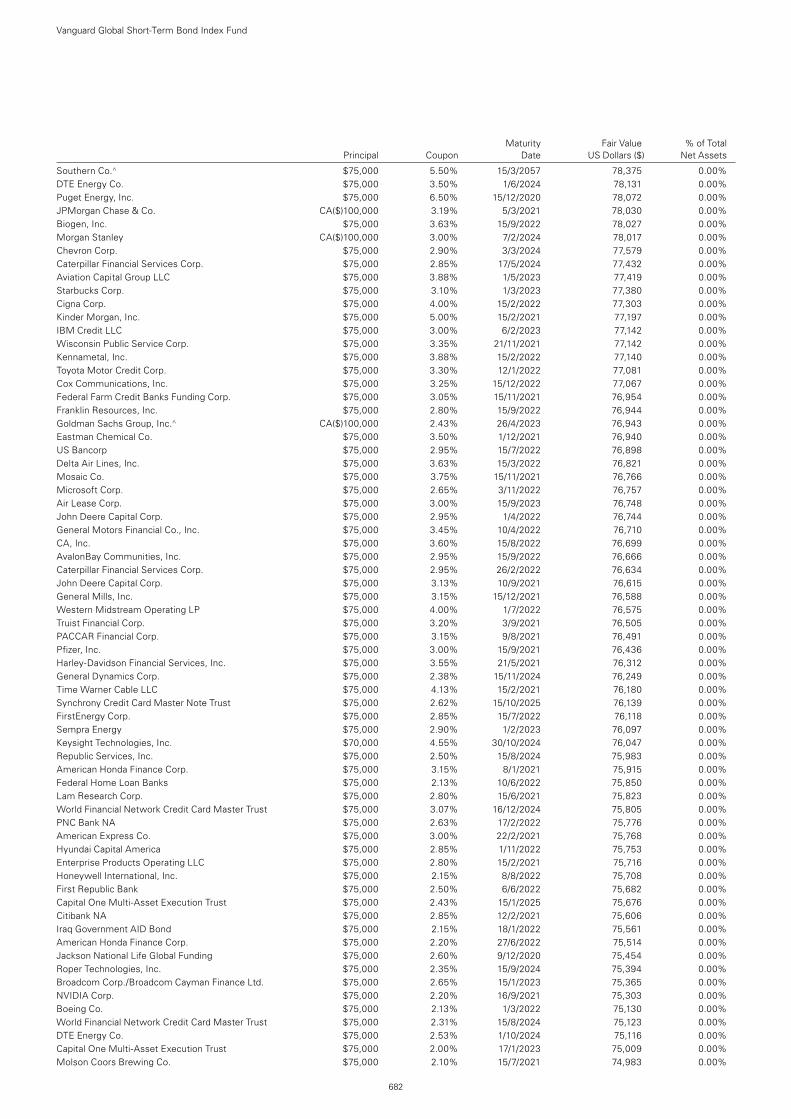
Southern Co.^ $75,000 5.50% 15/3/2057 78,375 0.00%DTE Energy Co. $75,000 3.50% 1/6/2024 78,131 0.00%Puget Energy, Inc. $75,000 6.50% 15/12/2020 78,072 0.00%JPMorgan Chase & Co. CA($)100,000 3.19% 5/3/2021 78,030 0.00%Biogen, Inc. $75,000 3.63% 15/9/2022 78,027 0.00%Morgan Stanley CA($)100,000 3.00% 7/2/2024 78,017 0.00%Chevron Corp. $75,000 2.90% 3/3/2024 77,579 0.00%Caterpillar Financial Services Corp. $75,000 2.85% 17/5/2024 77,432 0.00%Aviation Capital Group LLC $75,000 3.88% 1/5/2023 77,419 0.00%Starbucks Corp. $75,000 3.10% 1/3/2023 77,380 0.00%Cigna Corp. $75,000 4.00% 15/2/2022 77,303 0.00%Kinder Morgan, Inc. $75,000 5.00% 15/2/2021 77,197 0.00%IBM Credit LLC $75,000 3.00% 6/2/2023 77,142 0.00%Wisconsin Public Service Corp. $75,000 3.35% 21/11/2021 77,142 0.00%Kennametal, Inc. $75,000 3.88% 15/2/2022 77,140 0.00%Toyota Motor Credit Corp. $75,000 3.30% 12/1/2022 77,081 0.00%Cox Communications, Inc. $75,000 3.25% 15/12/2022 77,067 0.00%Federal Farm Credit Banks Funding Corp. $75,000 3.05% 15/11/2021 76,954 0.00%Franklin Resources, Inc. $75,000 2.80% 15/9/2022 76,944 0.00%Goldman Sachs Group, Inc.^ CA($)100,000 2.43% 26/4/2023 76,943 0.00%Eastman Chemical Co. $75,000 3.50% 1/12/2021 76,940 0.00%US Bancorp $75,000 2.95% 15/7/2022 76,898 0.00%Delta Air Lines, Inc. $75,000 3.63% 15/3/2022 76,821 0.00%Mosaic Co. $75,000 3.75% 15/11/2021 76,766 0.00%Microsoft Corp. $75,000 2.65% 3/11/2022 76,757 0.00%Air Lease Corp. $75,000 3.00% 15/9/2023 76,748 0.00%John Deere Capital Corp. $75,000 2.95% 1/4/2022 76,744 0.00%General Motors Financial Co., Inc. $75,000 3.45% 10/4/2022 76,710 0.00%CA, Inc. $75,000 3.60% 15/8/2022 76,699 0.00%AvalonBay Communities, Inc. $75,000 2.95% 15/9/2022 76,666 0.00%Caterpillar Financial Services Corp. $75,000 2.95% 26/2/2022 76,634 0.00%John Deere Capital Corp. $75,000 3.13% 10/9/2021 76,615 0.00%General Mills, Inc. $75,000 3.15% 15/12/2021 76,588 0.00%Western Midstream Operating LP $75,000 4.00% 1/7/2022 76,575 0.00%Truist Financial Corp. $75,000 3.20% 3/9/2021 76,505 0.00%PACCAR Financial Corp. $75,000 3.15% 9/8/2021 76,491 0.00%Pfizer, Inc. $75,000 3.00% 15/9/2021 76,436 0.00%Harley-Davidson Financial Services, Inc. $75,000 3.55% 21/5/2021 76,312 0.00%General Dynamics Corp. $75,000 2.38% 15/11/2024 76,249 0.00%Time Warner Cable LLC $75,000 4.13% 15/2/2021 76,180 0.00%Synchrony Credit Card Master Note Trust $75,000 2.62% 15/10/2025 76,139 0.00%FirstEnergy Corp. $75,000 2.85% 15/7/2022 76,118 0.00%Sempra Energy $75,000 2.90% 1/2/2023 76,097 0.00%Keysight Technologies, Inc. $70,000 4.55% 30/10/2024 76,047 0.00%Republic Services, Inc. $75,000 2.50% 15/8/2024 75,983 0.00%American Honda Finance Corp. $75,000 3.15% 8/1/2021 75,915 0.00%Federal Home Loan Banks $75,000 2.13% 10/6/2022 75,850 0.00%Lam Research Corp. $75,000 2.80% 15/6/2021 75,823 0.00%World Financial Network Credit Card Master Trust $75,000 3.07% 16/12/2024 75,805 0.00%PNC Bank NA $75,000 2.63% 17/2/2022 75,776 0.00%American Express Co. $75,000 3.00% 22/2/2021 75,768 0.00%Hyundai Capital America $75,000 2.85% 1/11/2022 75,753 0.00%Enterprise Products Operating LLC $75,000 2.80% 15/2/2021 75,716 0.00%Honeywell International, Inc. $75,000 2.15% 8/8/2022 75,708 0.00%First Republic Bank $75,000 2.50% 6/6/2022 75,682 0.00%Capital One Multi-Asset Execution Trust $75,000 2.43% 15/1/2025 75,676 0.00%Citibank NA $75,000 2.85% 12/2/2021 75,606 0.00%Iraq Government AID Bond $75,000 2.15% 18/1/2022 75,561 0.00%American Honda Finance Corp. $75,000 2.20% 27/6/2022 75,514 0.00%Jackson National Life Global Funding $75,000 2.60% 9/12/2020 75,454 0.00%Roper Technologies, Inc. $75,000 2.35% 15/9/2024 75,394 0.00%Broadcom Corp./Broadcom Cayman Finance Ltd. $75,000 2.65% 15/1/2023 75,365 0.00%NVIDIA Corp. $75,000 2.20% 16/9/2021 75,303 0.00%Boeing Co. $75,000 2.13% 1/3/2022 75,130 0.00%World Financial Network Credit Card Master Trust $75,000 2.31% 15/8/2024 75,123 0.00%DTE Energy Co. $75,000 2.53% 1/10/2024 75,116 0.00%Capital One Multi-Asset Execution Trust $75,000 2.00% 17/1/2023 75,009 0.00%Molson Coors Brewing Co. $75,000 2.10% 15/7/2021 74,983 0.00%
Vanguard Global Short-Term Bond Index Fund
682
Maturity Fair Value % of Total Principal Coupon Date US Dollars ($) Net Assets
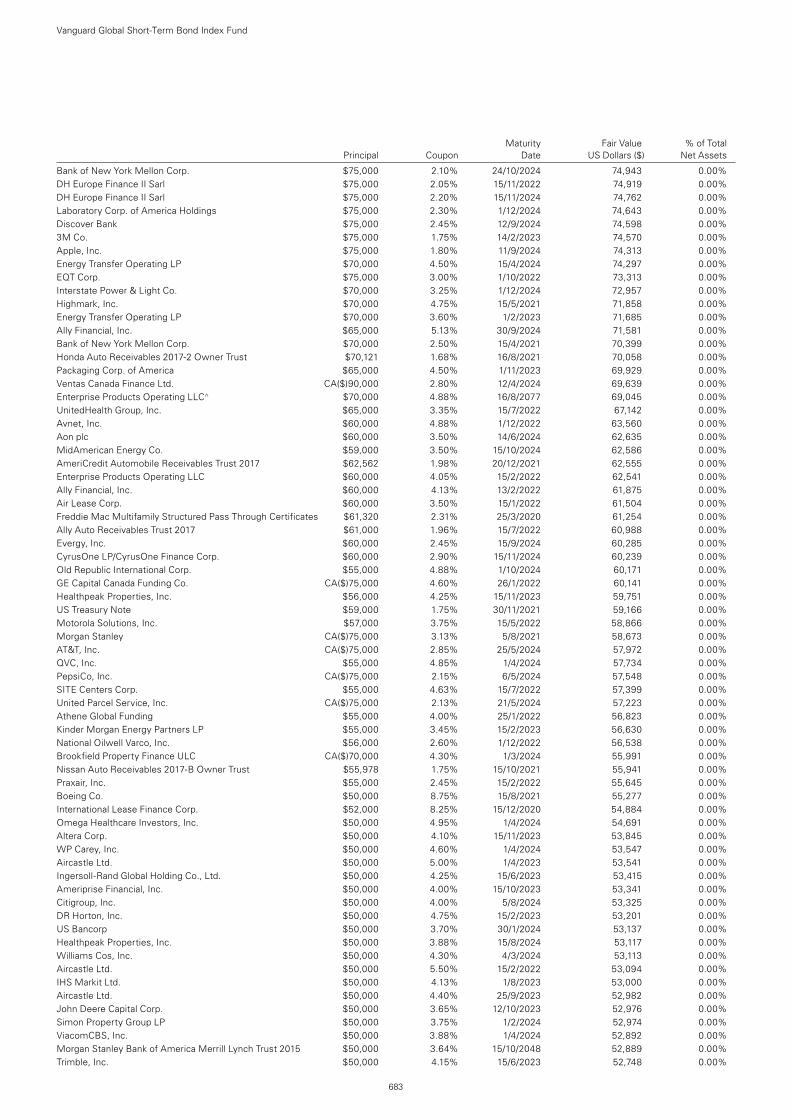
Bank of New York Mellon Corp. $75,000 2.10% 24/10/2024 74,943 0.00%DH Europe Finance II Sarl $75,000 2.05% 15/11/2022 74,919 0.00%DH Europe Finance II Sarl $75,000 2.20% 15/11/2024 74,762 0.00%Laboratory Corp. of America Holdings $75,000 2.30% 1/12/2024 74,643 0.00%Discover Bank $75,000 2.45% 12/9/2024 74,598 0.00%3M Co. $75,000 1.75% 14/2/2023 74,570 0.00%Apple, Inc. $75,000 1.80% 11/9/2024 74,313 0.00%Energy Transfer Operating LP $70,000 4.50% 15/4/2024 74,297 0.00%EQT Corp. $75,000 3.00% 1/10/2022 73,313 0.00%Interstate Power & Light Co. $70,000 3.25% 1/12/2024 72,957 0.00%Highmark, Inc. $70,000 4.75% 15/5/2021 71,858 0.00%Energy Transfer Operating LP $70,000 3.60% 1/2/2023 71,685 0.00%Ally Financial, Inc. $65,000 5.13% 30/9/2024 71,581 0.00%Bank of New York Mellon Corp. $70,000 2.50% 15/4/2021 70,399 0.00%Honda Auto Receivables 2017-2 Owner Trust $70,121 1.68% 16/8/2021 70,058 0.00%Packaging Corp. of America $65,000 4.50% 1/11/2023 69,929 0.00%Ventas Canada Finance Ltd. CA($)90,000 2.80% 12/4/2024 69,639 0.00%Enterprise Products Operating LLC^ $70,000 4.88% 16/8/2077 69,045 0.00%UnitedHealth Group, Inc. $65,000 3.35% 15/7/2022 67,142 0.00%Avnet, Inc. $60,000 4.88% 1/12/2022 63,560 0.00%Aon plc $60,000 3.50% 14/6/2024 62,635 0.00%MidAmerican Energy Co. $59,000 3.50% 15/10/2024 62,586 0.00%AmeriCredit Automobile Receivables Trust 2017 $62,562 1.98% 20/12/2021 62,555 0.00%Enterprise Products Operating LLC $60,000 4.05% 15/2/2022 62,541 0.00%Ally Financial, Inc. $60,000 4.13% 13/2/2022 61,875 0.00%Air Lease Corp. $60,000 3.50% 15/1/2022 61,504 0.00%Freddie Mac Multifamily Structured Pass Through Certificates $61,320 2.31% 25/3/2020 61,254 0.00%Ally Auto Receivables Trust 2017 $61,000 1.96% 15/7/2022 60,988 0.00%Evergy, Inc. $60,000 2.45% 15/9/2024 60,285 0.00%CyrusOne LP/CyrusOne Finance Corp. $60,000 2.90% 15/11/2024 60,239 0.00%Old Republic International Corp. $55,000 4.88% 1/10/2024 60,171 0.00%GE Capital Canada Funding Co. CA($)75,000 4.60% 26/1/2022 60,141 0.00%Healthpeak Properties, Inc. $56,000 4.25% 15/11/2023 59,751 0.00%US Treasury Note $59,000 1.75% 30/11/2021 59,166 0.00%Motorola Solutions, Inc. $57,000 3.75% 15/5/2022 58,866 0.00%Morgan Stanley CA($)75,000 3.13% 5/8/2021 58,673 0.00%AT&T, Inc. CA($)75,000 2.85% 25/5/2024 57,972 0.00%QVC, Inc. $55,000 4.85% 1/4/2024 57,734 0.00%PepsiCo, Inc. CA($)75,000 2.15% 6/5/2024 57,548 0.00%SITE Centers Corp. $55,000 4.63% 15/7/2022 57,399 0.00%United Parcel Service, Inc. CA($)75,000 2.13% 21/5/2024 57,223 0.00%Athene Global Funding $55,000 4.00% 25/1/2022 56,823 0.00%Kinder Morgan Energy Partners LP $55,000 3.45% 15/2/2023 56,630 0.00%National Oilwell Varco, Inc. $56,000 2.60% 1/12/2022 56,538 0.00%Brookfield Property Finance ULC CA($)70,000 4.30% 1/3/2024 55,991 0.00%Nissan Auto Receivables 2017-B Owner Trust $55,978 1.75% 15/10/2021 55,941 0.00%Praxair, Inc. $55,000 2.45% 15/2/2022 55,645 0.00%Boeing Co. $50,000 8.75% 15/8/2021 55,277 0.00%International Lease Finance Corp. $52,000 8.25% 15/12/2020 54,884 0.00%Omega Healthcare Investors, Inc. $50,000 4.95% 1/4/2024 54,691 0.00%Altera Corp. $50,000 4.10% 15/11/2023 53,845 0.00%WP Carey, Inc. $50,000 4.60% 1/4/2024 53,547 0.00%Aircastle Ltd. $50,000 5.00% 1/4/2023 53,541 0.00%Ingersoll-Rand Global Holding Co., Ltd. $50,000 4.25% 15/6/2023 53,415 0.00%Ameriprise Financial, Inc. $50,000 4.00% 15/10/2023 53,341 0.00%Citigroup, Inc. $50,000 4.00% 5/8/2024 53,325 0.00%DR Horton, Inc. $50,000 4.75% 15/2/2023 53,201 0.00%US Bancorp $50,000 3.70% 30/1/2024 53,137 0.00%Healthpeak Properties, Inc. $50,000 3.88% 15/8/2024 53,117 0.00%Williams Cos, Inc. $50,000 4.30% 4/3/2024 53,113 0.00%Aircastle Ltd. $50,000 5.50% 15/2/2022 53,094 0.00%IHS Markit Ltd. $50,000 4.13% 1/8/2023 53,000 0.00%Aircastle Ltd. $50,000 4.40% 25/9/2023 52,982 0.00%John Deere Capital Corp. $50,000 3.65% 12/10/2023 52,976 0.00%Simon Property Group LP $50,000 3.75% 1/2/2024 52,974 0.00%ViacomCBS, Inc. $50,000 3.88% 1/4/2024 52,892 0.00%Morgan Stanley Bank of America Merrill Lynch Trust 2015 $50,000 3.64% 15/10/2048 52,889 0.00%Trimble, Inc. $50,000 4.15% 15/6/2023 52,748 0.00%
Vanguard Global Short-Term Bond Index Fund
683
Maturity Fair Value % of Total Principal Coupon Date US Dollars ($) Net Assets
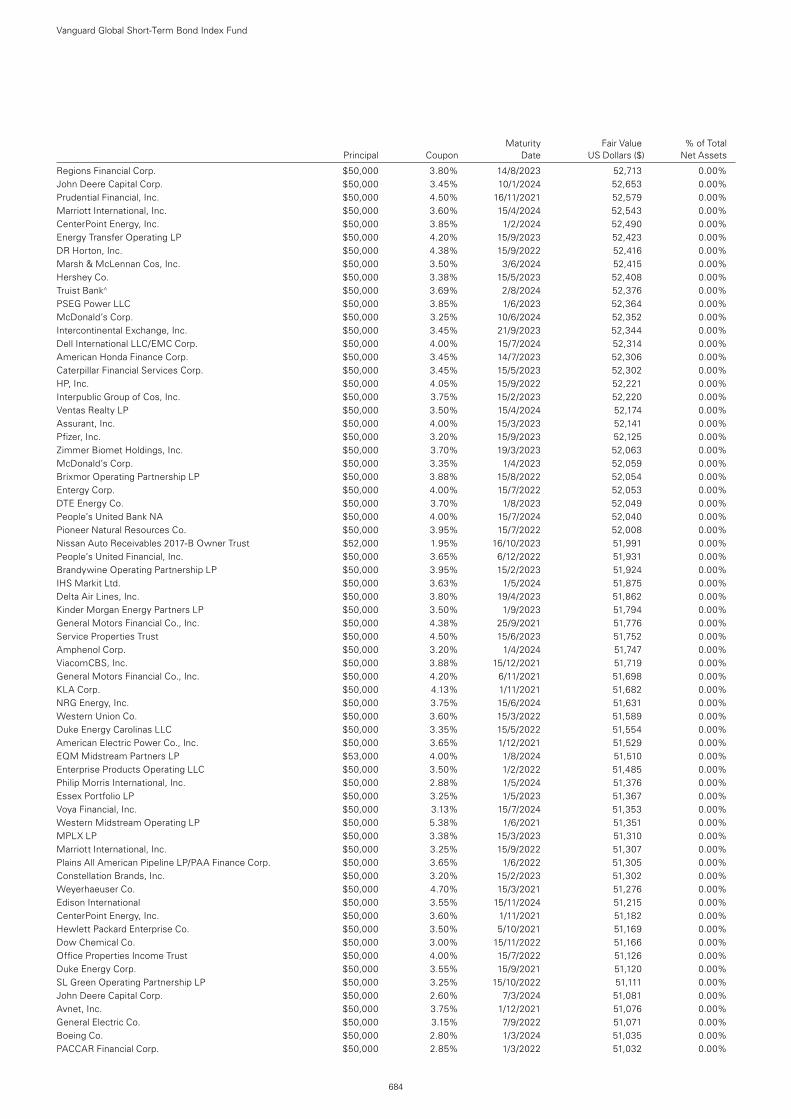
Maturity Fair Value % of Total Principal Coupon Date US Dollars ($) Net Assets
Regions Financial Corp. $50,000 3.80% 14/8/2023 52,713 0.00%John Deere Capital Corp. $50,000 3.45% 10/1/2024 52,653 0.00%Prudential Financial, Inc. $50,000 4.50% 16/11/2021 52,579 0.00%Marriott International, Inc. $50,000 3.60% 15/4/2024 52,543 0.00%CenterPoint Energy, Inc. $50,000 3.85% 1/2/2024 52,490 0.00%Energy Transfer Operating LP $50,000 4.20% 15/9/2023 52,423 0.00%DR Horton, Inc. $50,000 4.38% 15/9/2022 52,416 0.00%Marsh & McLennan Cos, Inc. $50,000 3.50% 3/6/2024 52,415 0.00%Hershey Co. $50,000 3.38% 15/5/2023 52,408 0.00%Truist Bank^ $50,000 3.69% 2/8/2024 52,376 0.00%PSEG Power LLC $50,000 3.85% 1/6/2023 52,364 0.00%McDonald’s Corp. $50,000 3.25% 10/6/2024 52,352 0.00%Intercontinental Exchange, Inc. $50,000 3.45% 21/9/2023 52,344 0.00%Dell International LLC/EMC Corp. $50,000 4.00% 15/7/2024 52,314 0.00%American Honda Finance Corp. $50,000 3.45% 14/7/2023 52,306 0.00%Caterpillar Financial Services Corp. $50,000 3.45% 15/5/2023 52,302 0.00%HP, Inc. $50,000 4.05% 15/9/2022 52,221 0.00%Interpublic Group of Cos, Inc. $50,000 3.75% 15/2/2023 52,220 0.00%Ventas Realty LP $50,000 3.50% 15/4/2024 52,174 0.00%Assurant, Inc. $50,000 4.00% 15/3/2023 52,141 0.00%Pfizer, Inc. $50,000 3.20% 15/9/2023 52,125 0.00%Zimmer Biomet Holdings, Inc. $50,000 3.70% 19/3/2023 52,063 0.00%McDonald’s Corp. $50,000 3.35% 1/4/2023 52,059 0.00%Brixmor Operating Partnership LP $50,000 3.88% 15/8/2022 52,054 0.00%Entergy Corp. $50,000 4.00% 15/7/2022 52,053 0.00%DTE Energy Co. $50,000 3.70% 1/8/2023 52,049 0.00%People’s United Bank NA $50,000 4.00% 15/7/2024 52,040 0.00%Pioneer Natural Resources Co. $50,000 3.95% 15/7/2022 52,008 0.00%Nissan Auto Receivables 2017-B Owner Trust $52,000 1.95% 16/10/2023 51,991 0.00%People’s United Financial, Inc. $50,000 3.65% 6/12/2022 51,931 0.00%Brandywine Operating Partnership LP $50,000 3.95% 15/2/2023 51,924 0.00%IHS Markit Ltd. $50,000 3.63% 1/5/2024 51,875 0.00%Delta Air Lines, Inc. $50,000 3.80% 19/4/2023 51,862 0.00%Kinder Morgan Energy Partners LP $50,000 3.50% 1/9/2023 51,794 0.00%General Motors Financial Co., Inc. $50,000 4.38% 25/9/2021 51,776 0.00%Service Properties Trust $50,000 4.50% 15/6/2023 51,752 0.00%Amphenol Corp. $50,000 3.20% 1/4/2024 51,747 0.00%ViacomCBS, Inc. $50,000 3.88% 15/12/2021 51,719 0.00%General Motors Financial Co., Inc. $50,000 4.20% 6/11/2021 51,698 0.00%KLA Corp. $50,000 4.13% 1/11/2021 51,682 0.00%NRG Energy, Inc. $50,000 3.75% 15/6/2024 51,631 0.00%Western Union Co. $50,000 3.60% 15/3/2022 51,589 0.00%Duke Energy Carolinas LLC $50,000 3.35% 15/5/2022 51,554 0.00%American Electric Power Co., Inc. $50,000 3.65% 1/12/2021 51,529 0.00%EQM Midstream Partners LP $53,000 4.00% 1/8/2024 51,510 0.00%Enterprise Products Operating LLC $50,000 3.50% 1/2/2022 51,485 0.00%Philip Morris International, Inc. $50,000 2.88% 1/5/2024 51,376 0.00%Essex Portfolio LP $50,000 3.25% 1/5/2023 51,367 0.00%Voya Financial, Inc. $50,000 3.13% 15/7/2024 51,353 0.00%Western Midstream Operating LP $50,000 5.38% 1/6/2021 51,351 0.00%MPLX LP $50,000 3.38% 15/3/2023 51,310 0.00%Marriott International, Inc. $50,000 3.25% 15/9/2022 51,307 0.00%Plains All American Pipeline LP/PAA Finance Corp. $50,000 3.65% 1/6/2022 51,305 0.00%Constellation Brands, Inc. $50,000 3.20% 15/2/2023 51,302 0.00%Weyerhaeuser Co. $50,000 4.70% 15/3/2021 51,276 0.00%Edison International $50,000 3.55% 15/11/2024 51,215 0.00%CenterPoint Energy, Inc. $50,000 3.60% 1/11/2021 51,182 0.00%Hewlett Packard Enterprise Co. $50,000 3.50% 5/10/2021 51,169 0.00%Dow Chemical Co. $50,000 3.00% 15/11/2022 51,166 0.00%Office Properties Income Trust $50,000 4.00% 15/7/2022 51,126 0.00%Duke Energy Corp. $50,000 3.55% 15/9/2021 51,120 0.00%SL Green Operating Partnership LP $50,000 3.25% 15/10/2022 51,111 0.00%John Deere Capital Corp. $50,000 2.60% 7/3/2024 51,081 0.00%Avnet, Inc. $50,000 3.75% 1/12/2021 51,076 0.00%General Electric Co. $50,000 3.15% 7/9/2022 51,071 0.00%Boeing Co. $50,000 2.80% 1/3/2024 51,035 0.00%PACCAR Financial Corp. $50,000 2.85% 1/3/2022 51,032 0.00%
Vanguard Global Short-Term Bond Index Fund
684
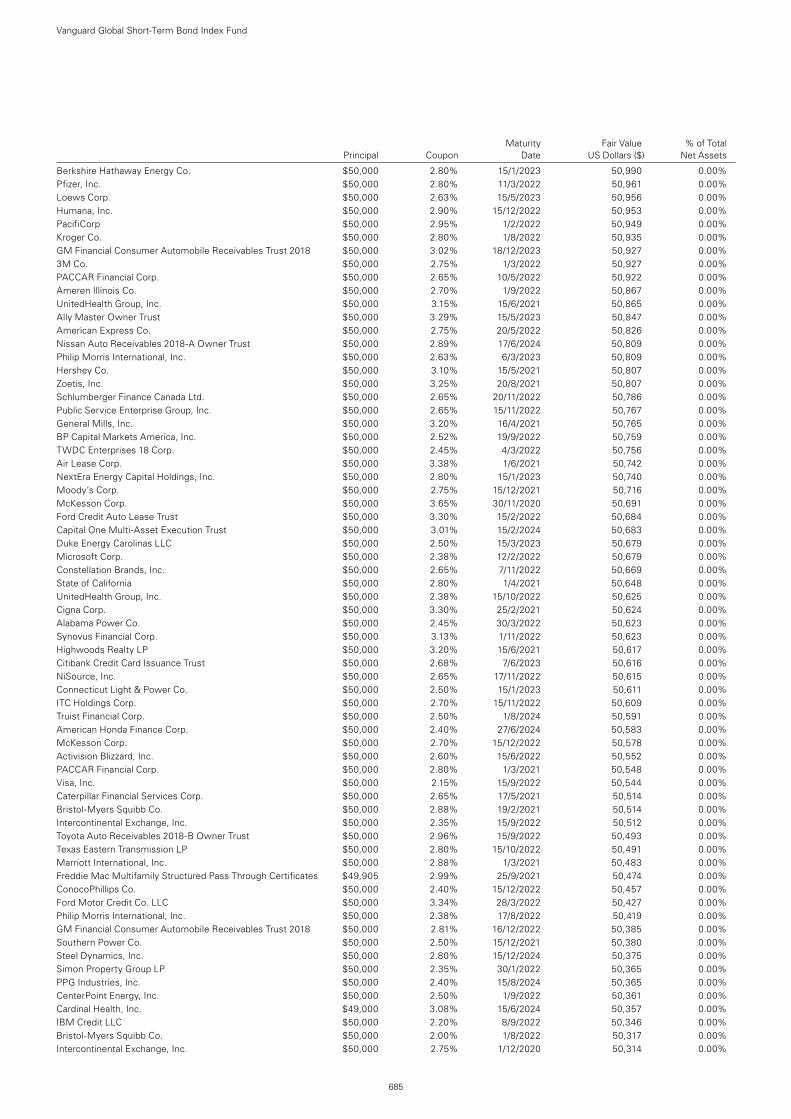
Maturity Fair Value % of Total Principal Coupon Date US Dollars ($) Net Assets
Berkshire Hathaway Energy Co. $50,000 2.80% 15/1/2023 50,990 0.00%Pfizer, Inc. $50,000 2.80% 11/3/2022 50,961 0.00%Loews Corp. $50,000 2.63% 15/5/2023 50,956 0.00%Humana, Inc. $50,000 2.90% 15/12/2022 50,953 0.00%PacifiCorp $50,000 2.95% 1/2/2022 50,949 0.00%Kroger Co. $50,000 2.80% 1/8/2022 50,935 0.00%GM Financial Consumer Automobile Receivables Trust 2018 $50,000 3.02% 18/12/2023 50,927 0.00%3M Co. $50,000 2.75% 1/3/2022 50,927 0.00%PACCAR Financial Corp. $50,000 2.65% 10/5/2022 50,922 0.00%Ameren Illinois Co. $50,000 2.70% 1/9/2022 50,867 0.00%UnitedHealth Group, Inc. $50,000 3.15% 15/6/2021 50,865 0.00%Ally Master Owner Trust $50,000 3.29% 15/5/2023 50,847 0.00%American Express Co. $50,000 2.75% 20/5/2022 50,826 0.00%Nissan Auto Receivables 2018-A Owner Trust $50,000 2.89% 17/6/2024 50,809 0.00%Philip Morris International, Inc. $50,000 2.63% 6/3/2023 50,809 0.00%Hershey Co. $50,000 3.10% 15/5/2021 50,807 0.00%Zoetis, Inc. $50,000 3.25% 20/8/2021 50,807 0.00%Schlumberger Finance Canada Ltd. $50,000 2.65% 20/11/2022 50,786 0.00%Public Service Enterprise Group, Inc. $50,000 2.65% 15/11/2022 50,767 0.00%General Mills, Inc. $50,000 3.20% 16/4/2021 50,765 0.00%BP Capital Markets America, Inc. $50,000 2.52% 19/9/2022 50,759 0.00%TWDC Enterprises 18 Corp. $50,000 2.45% 4/3/2022 50,756 0.00%Air Lease Corp. $50,000 3.38% 1/6/2021 50,742 0.00%NextEra Energy Capital Holdings, Inc. $50,000 2.80% 15/1/2023 50,740 0.00%Moody’s Corp. $50,000 2.75% 15/12/2021 50,716 0.00%McKesson Corp. $50,000 3.65% 30/11/2020 50,691 0.00%Ford Credit Auto Lease Trust $50,000 3.30% 15/2/2022 50,684 0.00%Capital One Multi-Asset Execution Trust $50,000 3.01% 15/2/2024 50,683 0.00%Duke Energy Carolinas LLC $50,000 2.50% 15/3/2023 50,679 0.00%Microsoft Corp. $50,000 2.38% 12/2/2022 50,679 0.00%Constellation Brands, Inc. $50,000 2.65% 7/11/2022 50,669 0.00%State of California $50,000 2.80% 1/4/2021 50,648 0.00%UnitedHealth Group, Inc. $50,000 2.38% 15/10/2022 50,625 0.00%Cigna Corp. $50,000 3.30% 25/2/2021 50,624 0.00%Alabama Power Co. $50,000 2.45% 30/3/2022 50,623 0.00%Synovus Financial Corp. $50,000 3.13% 1/11/2022 50,623 0.00%Highwoods Realty LP $50,000 3.20% 15/6/2021 50,617 0.00%Citibank Credit Card Issuance Trust $50,000 2.68% 7/6/2023 50,616 0.00%NiSource, Inc. $50,000 2.65% 17/11/2022 50,615 0.00%Connecticut Light & Power Co. $50,000 2.50% 15/1/2023 50,611 0.00%ITC Holdings Corp. $50,000 2.70% 15/11/2022 50,609 0.00%Truist Financial Corp. $50,000 2.50% 1/8/2024 50,591 0.00%American Honda Finance Corp. $50,000 2.40% 27/6/2024 50,583 0.00%McKesson Corp. $50,000 2.70% 15/12/2022 50,578 0.00%Activision Blizzard, Inc. $50,000 2.60% 15/6/2022 50,552 0.00%PACCAR Financial Corp. $50,000 2.80% 1/3/2021 50,548 0.00%Visa, Inc. $50,000 2.15% 15/9/2022 50,544 0.00%Caterpillar Financial Services Corp. $50,000 2.65% 17/5/2021 50,514 0.00%Bristol-Myers Squibb Co. $50,000 2.88% 19/2/2021 50,514 0.00%Intercontinental Exchange, Inc. $50,000 2.35% 15/9/2022 50,512 0.00%Toyota Auto Receivables 2018-B Owner Trust $50,000 2.96% 15/9/2022 50,493 0.00%Texas Eastern Transmission LP $50,000 2.80% 15/10/2022 50,491 0.00%Marriott International, Inc. $50,000 2.88% 1/3/2021 50,483 0.00%Freddie Mac Multifamily Structured Pass Through Certificates $49,905 2.99% 25/9/2021 50,474 0.00%ConocoPhillips Co. $50,000 2.40% 15/12/2022 50,457 0.00%Ford Motor Credit Co. LLC $50,000 3.34% 28/3/2022 50,427 0.00%Philip Morris International, Inc. $50,000 2.38% 17/8/2022 50,419 0.00%GM Financial Consumer Automobile Receivables Trust 2018 $50,000 2.81% 16/12/2022 50,385 0.00%Southern Power Co. $50,000 2.50% 15/12/2021 50,380 0.00%Steel Dynamics, Inc. $50,000 2.80% 15/12/2024 50,375 0.00%Simon Property Group LP $50,000 2.35% 30/1/2022 50,365 0.00%PPG Industries, Inc. $50,000 2.40% 15/8/2024 50,365 0.00%CenterPoint Energy, Inc. $50,000 2.50% 1/9/2022 50,361 0.00%Cardinal Health, Inc. $49,000 3.08% 15/6/2024 50,357 0.00%IBM Credit LLC $50,000 2.20% 8/9/2022 50,346 0.00%Bristol-Myers Squibb Co. $50,000 2.00% 1/8/2022 50,317 0.00%Intercontinental Exchange, Inc. $50,000 2.75% 1/12/2020 50,314 0.00%
Vanguard Global Short-Term Bond Index Fund
685
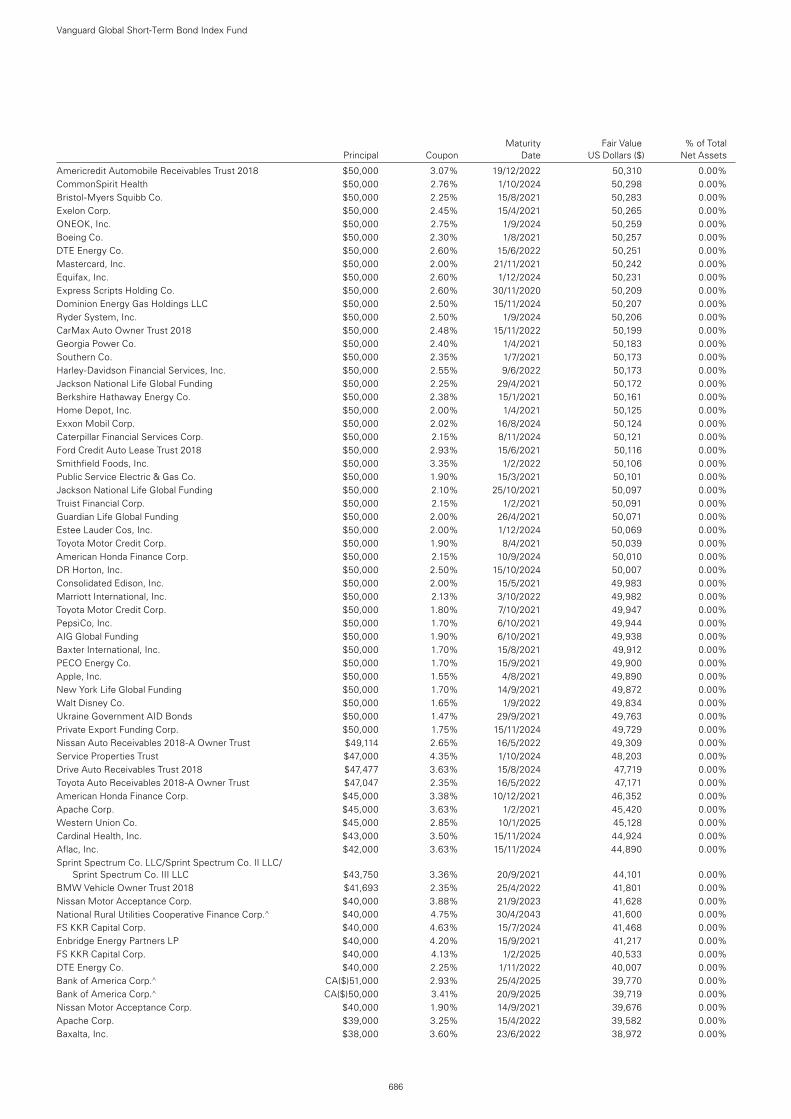
Maturity Fair Value % of Total Principal Coupon Date US Dollars ($) Net Assets
Americredit Automobile Receivables Trust 2018 $50,000 3.07% 19/12/2022 50,310 0.00%CommonSpirit Health $50,000 2.76% 1/10/2024 50,298 0.00%Bristol-Myers Squibb Co. $50,000 2.25% 15/8/2021 50,283 0.00%Exelon Corp. $50,000 2.45% 15/4/2021 50,265 0.00%ONEOK, Inc. $50,000 2.75% 1/9/2024 50,259 0.00%Boeing Co. $50,000 2.30% 1/8/2021 50,257 0.00%DTE Energy Co. $50,000 2.60% 15/6/2022 50,251 0.00%Mastercard, Inc. $50,000 2.00% 21/11/2021 50,242 0.00%Equifax, Inc. $50,000 2.60% 1/12/2024 50,231 0.00%Express Scripts Holding Co. $50,000 2.60% 30/11/2020 50,209 0.00%Dominion Energy Gas Holdings LLC $50,000 2.50% 15/11/2024 50,207 0.00%Ryder System, Inc. $50,000 2.50% 1/9/2024 50,206 0.00%CarMax Auto Owner Trust 2018 $50,000 2.48% 15/11/2022 50,199 0.00%Georgia Power Co. $50,000 2.40% 1/4/2021 50,183 0.00%Southern Co. $50,000 2.35% 1/7/2021 50,173 0.00%Harley-Davidson Financial Services, Inc. $50,000 2.55% 9/6/2022 50,173 0.00%Jackson National Life Global Funding $50,000 2.25% 29/4/2021 50,172 0.00%Berkshire Hathaway Energy Co. $50,000 2.38% 15/1/2021 50,161 0.00%Home Depot, Inc. $50,000 2.00% 1/4/2021 50,125 0.00%Exxon Mobil Corp. $50,000 2.02% 16/8/2024 50,124 0.00%Caterpillar Financial Services Corp. $50,000 2.15% 8/11/2024 50,121 0.00%Ford Credit Auto Lease Trust 2018 $50,000 2.93% 15/6/2021 50,116 0.00%Smithfield Foods, Inc. $50,000 3.35% 1/2/2022 50,106 0.00%Public Service Electric & Gas Co. $50,000 1.90% 15/3/2021 50,101 0.00%Jackson National Life Global Funding $50,000 2.10% 25/10/2021 50,097 0.00%Truist Financial Corp. $50,000 2.15% 1/2/2021 50,091 0.00%Guardian Life Global Funding $50,000 2.00% 26/4/2021 50,071 0.00%Estee Lauder Cos, Inc. $50,000 2.00% 1/12/2024 50,069 0.00%Toyota Motor Credit Corp. $50,000 1.90% 8/4/2021 50,039 0.00%American Honda Finance Corp. $50,000 2.15% 10/9/2024 50,010 0.00%DR Horton, Inc. $50,000 2.50% 15/10/2024 50,007 0.00%Consolidated Edison, Inc. $50,000 2.00% 15/5/2021 49,983 0.00%Marriott International, Inc. $50,000 2.13% 3/10/2022 49,982 0.00%Toyota Motor Credit Corp. $50,000 1.80% 7/10/2021 49,947 0.00%PepsiCo, Inc. $50,000 1.70% 6/10/2021 49,944 0.00%AIG Global Funding $50,000 1.90% 6/10/2021 49,938 0.00%Baxter International, Inc. $50,000 1.70% 15/8/2021 49,912 0.00%PECO Energy Co. $50,000 1.70% 15/9/2021 49,900 0.00%Apple, Inc. $50,000 1.55% 4/8/2021 49,890 0.00%New York Life Global Funding $50,000 1.70% 14/9/2021 49,872 0.00%Walt Disney Co. $50,000 1.65% 1/9/2022 49,834 0.00%Ukraine Government AID Bonds $50,000 1.47% 29/9/2021 49,763 0.00%Private Export Funding Corp. $50,000 1.75% 15/11/2024 49,729 0.00%Nissan Auto Receivables 2018-A Owner Trust $49,114 2.65% 16/5/2022 49,309 0.00%Service Properties Trust $47,000 4.35% 1/10/2024 48,203 0.00%Drive Auto Receivables Trust 2018 $47,477 3.63% 15/8/2024 47,719 0.00%Toyota Auto Receivables 2018-A Owner Trust $47,047 2.35% 16/5/2022 47,171 0.00%American Honda Finance Corp. $45,000 3.38% 10/12/2021 46,352 0.00%Apache Corp. $45,000 3.63% 1/2/2021 45,420 0.00%Western Union Co. $45,000 2.85% 10/1/2025 45,128 0.00%Cardinal Health, Inc. $43,000 3.50% 15/11/2024 44,924 0.00%Aflac, Inc. $42,000 3.63% 15/11/2024 44,890 0.00%Sprint Spectrum Co. LLC/Sprint Spectrum Co. II LLC/
Sprint Spectrum Co. III LLC $43,750 3.36% 20/9/2021 44,101 0.00%BMW Vehicle Owner Trust 2018 $41,693 2.35% 25/4/2022 41,801 0.00%Nissan Motor Acceptance Corp. $40,000 3.88% 21/9/2023 41,628 0.00%National Rural Utilities Cooperative Finance Corp.^ $40,000 4.75% 30/4/2043 41,600 0.00%FS KKR Capital Corp. $40,000 4.63% 15/7/2024 41,468 0.00%Enbridge Energy Partners LP $40,000 4.20% 15/9/2021 41,217 0.00%FS KKR Capital Corp. $40,000 4.13% 1/2/2025 40,533 0.00%DTE Energy Co. $40,000 2.25% 1/11/2022 40,007 0.00%Bank of America Corp.^ CA($)51,000 2.93% 25/4/2025 39,770 0.00%Bank of America Corp.^ CA($)50,000 3.41% 20/9/2025 39,719 0.00%Nissan Motor Acceptance Corp. $40,000 1.90% 14/9/2021 39,676 0.00%Apache Corp. $39,000 3.25% 15/4/2022 39,582 0.00%Baxalta, Inc. $38,000 3.60% 23/6/2022 38,972 0.00%
Vanguard Global Short-Term Bond Index Fund
686

Maturity Fair Value % of Total Principal Coupon Date US Dollars ($) Net Assets
General Motors Financial of Canada Ltd. CA($)50,000 3.00% 26/2/2021 38,779 0.00%Molson Coors International LP CA($)50,000 2.84% 15/7/2023 38,635 0.00%Honda Auto Receivables 2017-2 Owner Trust $38,000 1.87% 15/9/2023 37,975 0.00%Sherwin-Williams Co. $37,000 2.75% 1/6/2022 37,626 0.00%Cadence Design Systems, Inc. $35,000 4.38% 15/10/2024 37,518 0.00%Caterpillar Financial Services Corp. $35,000 3.65% 7/12/2023 37,091 0.00%US Treasury Note $37,000 1.50% 31/1/2022 36,936 0.00%Host Hotels & Resorts LP $35,000 3.88% 1/4/2024 36,902 0.00%TD Ameritrade Holding Corp. $35,000 3.75% 1/4/2024 36,826 0.00%General Motors Financial Co., Inc. AU($)50,000 3.85% 21/2/2023 36,599 0.00%WestRock RKT LLC $35,000 4.00% 1/3/2023 36,472 0.00%Ally Auto Receivables Trust 2018 $36,389 2.35% 15/6/2022 36,447 0.00%Kinder Morgan Energy Partners LP $35,000 4.15% 1/3/2022 36,405 0.00%Carlisle Cos, Inc. $35,000 3.50% 1/12/2024 36,322 0.00%John Deere Capital Corp. $35,000 2.80% 4/3/2021 35,371 0.00%Dominion Energy, Inc. $35,000 2.72% 15/8/2021 35,263 0.00%3M Co. $35,000 1.63% 19/9/2021 34,901 0.00%Freddie Mac Multifamily Structured Pass Through Certificates $32,971 2.87% 25/2/2023 33,403 0.00%Commercial Mortgage Pass Through Certificates $32,657 3.15% 10/2/2047 32,672 0.00%Union Electric Co. $30,000 3.50% 15/4/2024 31,517 0.00%Cabot Corp. $30,000 3.70% 15/7/2022 30,880 0.00%Ventas Canada Finance Ltd. CA($)40,000 2.55% 15/3/2023 30,880 0.00%Guardian Life Global Funding $30,000 2.90% 6/5/2024 30,833 0.00%Discovery Communications LLC $30,000 3.50% 15/6/2022 30,775 0.00%Sunoco Logistics Partners Operations LP $30,000 3.45% 15/1/2023 30,605 0.00%American Express Credit Corp. $30,000 2.70% 3/3/2022 30,475 0.00%Edison International $30,000 3.13% 15/11/2022 30,383 0.00%TPG Specialty Lending, Inc. $30,000 3.88% 1/11/2024 30,177 0.00%BGC Partners, Inc. $30,000 3.75% 1/10/2024 29,938 0.00%Principal Life Global Funding II $30,000 2.25% 21/11/2024 29,913 0.00%Mutual of Omaha Insurance Co.^ $30,000 4.30% 15/7/2054 29,721 0.00%ONEOK, Inc. $25,000 7.50% 1/9/2023 29,081 0.00%Brookfield Property Finance ULC CA($)35,000 4.35% 3/7/2023 28,095 0.00%Seagate HDD Cayman $27,000 4.25% 1/3/2022 27,878 0.00%Honda Auto Receivables 2017-4 Owner Trust $27,822 2.05% 22/11/2021 27,836 0.00%Brookfield Property Finance ULC CA($)35,000 4.12% 19/10/2021 27,724 0.00%Micron Technology, Inc. $25,000 4.64% 6/2/2024 27,031 0.00%Quest Diagnostics, Inc. $25,000 4.25% 1/4/2024 26,807 0.00%US Treasury Note $25,000 3.00% 30/9/2025 26,688 0.00%GATX Corp. $25,000 4.35% 15/2/2024 26,652 0.00%Marsh & McLennan Cos, Inc. $25,000 3.88% 15/3/2024 26,596 0.00%Owl Rock Capital Corp. $25,000 5.25% 15/4/2024 26,440 0.00%Fortune Brands Home & Security, Inc. $25,000 4.00% 21/9/2023 26,404 0.00%American Honda Finance Corp. $25,000 3.63% 10/10/2023 26,372 0.00%CMS Energy Corp. $25,000 5.05% 15/3/2022 26,367 0.00%General Mills, Inc. $25,000 3.70% 17/10/2023 26,329 0.00%Air Products & Chemicals, Inc. $25,000 3.35% 31/7/2024 26,310 0.00%Equifax, Inc. $25,000 3.95% 15/6/2023 26,283 0.00%Ford Credit Auto Owner Trust 2017 $26,300 1.69% 15/11/2021 26,277 0.00%Celanese US Holdings LLC $25,000 5.88% 15/6/2021 26,225 0.00%Bank of New York Mellon Corp. $25,000 3.50% 28/4/2023 26,203 0.00%Eaton Vance Corp. $25,000 3.63% 15/6/2023 26,152 0.00%Mercedes-Benz Auto Lease Trust 2018 $26,116 2.41% 16/2/2021 26,132 0.00%Duke Energy Progress LLC $25,000 3.38% 1/9/2023 26,110 0.00%PACCAR Financial Corp. $25,000 3.40% 9/8/2023 26,090 0.00%NiSource, Inc. $25,000 3.65% 15/6/2023 26,063 0.00%Alliant Energy Finance LLC $25,000 3.75% 15/6/2023 26,057 0.00%Halliburton Co. $25,000 3.50% 1/8/2023 25,976 0.00%Amgen, Inc. $25,000 3.63% 15/5/2022 25,854 0.00%Virginia Electric & Power Co. $25,000 3.45% 1/9/2022 25,845 0.00%Enstar Group Ltd. $25,000 4.50% 10/3/2022 25,844 0.00%eBay, Inc. $25,000 3.80% 9/3/2022 25,835 0.00%CenterPoint Energy Resources Corp. $25,000 3.55% 1/4/2023 25,835 0.00%Domtar Corp. $25,000 4.40% 1/4/2022 25,809 0.00%PPL Capital Funding, Inc. $25,000 3.50% 1/12/2022 25,806 0.00%Costco Wholesale Corp. $25,000 2.75% 18/5/2024 25,793 0.00%Southern California Edison Co. $25,000 3.40% 1/6/2023 25,774 0.00%
Vanguard Global Short-Term Bond Index Fund
687
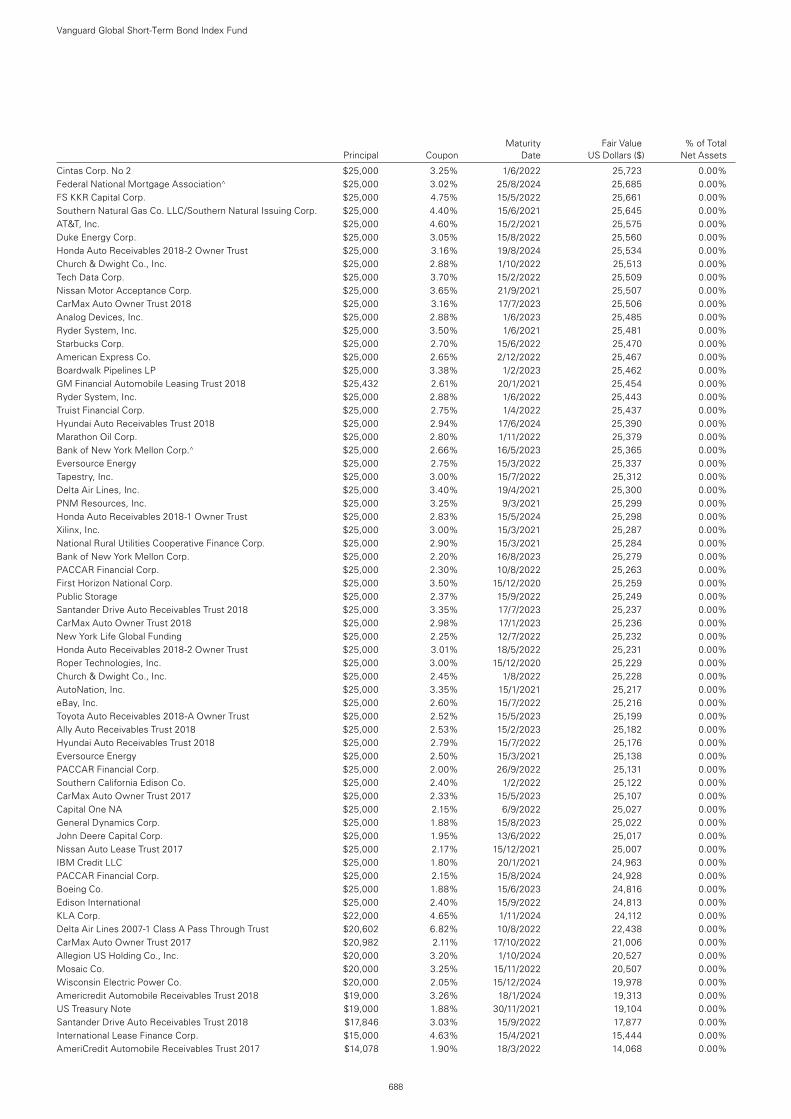
Cintas Corp. No 2 $25,000 3.25% 1/6/2022 25,723 0.00%Federal National Mortgage Association^ $25,000 3.02% 25/8/2024 25,685 0.00%FS KKR Capital Corp. $25,000 4.75% 15/5/2022 25,661 0.00%Southern Natural Gas Co. LLC/Southern Natural Issuing Corp. $25,000 4.40% 15/6/2021 25,645 0.00%AT&T, Inc. $25,000 4.60% 15/2/2021 25,575 0.00%Duke Energy Corp. $25,000 3.05% 15/8/2022 25,560 0.00%Honda Auto Receivables 2018-2 Owner Trust $25,000 3.16% 19/8/2024 25,534 0.00%Church & Dwight Co., Inc. $25,000 2.88% 1/10/2022 25,513 0.00%Tech Data Corp. $25,000 3.70% 15/2/2022 25,509 0.00%Nissan Motor Acceptance Corp. $25,000 3.65% 21/9/2021 25,507 0.00%CarMax Auto Owner Trust 2018 $25,000 3.16% 17/7/2023 25,506 0.00%Analog Devices, Inc. $25,000 2.88% 1/6/2023 25,485 0.00%Ryder System, Inc. $25,000 3.50% 1/6/2021 25,481 0.00%Starbucks Corp. $25,000 2.70% 15/6/2022 25,470 0.00%American Express Co. $25,000 2.65% 2/12/2022 25,467 0.00%Boardwalk Pipelines LP $25,000 3.38% 1/2/2023 25,462 0.00%GM Financial Automobile Leasing Trust 2018 $25,432 2.61% 20/1/2021 25,454 0.00%Ryder System, Inc. $25,000 2.88% 1/6/2022 25,443 0.00%Truist Financial Corp. $25,000 2.75% 1/4/2022 25,437 0.00%Hyundai Auto Receivables Trust 2018 $25,000 2.94% 17/6/2024 25,390 0.00%Marathon Oil Corp. $25,000 2.80% 1/11/2022 25,379 0.00%Bank of New York Mellon Corp.^ $25,000 2.66% 16/5/2023 25,365 0.00%Eversource Energy $25,000 2.75% 15/3/2022 25,337 0.00%Tapestry, Inc. $25,000 3.00% 15/7/2022 25,312 0.00%Delta Air Lines, Inc. $25,000 3.40% 19/4/2021 25,300 0.00%PNM Resources, Inc. $25,000 3.25% 9/3/2021 25,299 0.00%Honda Auto Receivables 2018-1 Owner Trust $25,000 2.83% 15/5/2024 25,298 0.00%Xilinx, Inc. $25,000 3.00% 15/3/2021 25,287 0.00%National Rural Utilities Cooperative Finance Corp. $25,000 2.90% 15/3/2021 25,284 0.00%Bank of New York Mellon Corp. $25,000 2.20% 16/8/2023 25,279 0.00%PACCAR Financial Corp. $25,000 2.30% 10/8/2022 25,263 0.00%First Horizon National Corp. $25,000 3.50% 15/12/2020 25,259 0.00%Public Storage $25,000 2.37% 15/9/2022 25,249 0.00%Santander Drive Auto Receivables Trust 2018 $25,000 3.35% 17/7/2023 25,237 0.00%CarMax Auto Owner Trust 2018 $25,000 2.98% 17/1/2023 25,236 0.00%New York Life Global Funding $25,000 2.25% 12/7/2022 25,232 0.00%Honda Auto Receivables 2018-2 Owner Trust $25,000 3.01% 18/5/2022 25,231 0.00%Roper Technologies, Inc. $25,000 3.00% 15/12/2020 25,229 0.00%Church & Dwight Co., Inc. $25,000 2.45% 1/8/2022 25,228 0.00%AutoNation, Inc. $25,000 3.35% 15/1/2021 25,217 0.00%eBay, Inc. $25,000 2.60% 15/7/2022 25,216 0.00%Toyota Auto Receivables 2018-A Owner Trust $25,000 2.52% 15/5/2023 25,199 0.00%Ally Auto Receivables Trust 2018 $25,000 2.53% 15/2/2023 25,182 0.00%Hyundai Auto Receivables Trust 2018 $25,000 2.79% 15/7/2022 25,176 0.00%Eversource Energy $25,000 2.50% 15/3/2021 25,138 0.00%PACCAR Financial Corp. $25,000 2.00% 26/9/2022 25,131 0.00%Southern California Edison Co. $25,000 2.40% 1/2/2022 25,122 0.00%CarMax Auto Owner Trust 2017 $25,000 2.33% 15/5/2023 25,107 0.00%Capital One NA $25,000 2.15% 6/9/2022 25,027 0.00%General Dynamics Corp. $25,000 1.88% 15/8/2023 25,022 0.00%John Deere Capital Corp. $25,000 1.95% 13/6/2022 25,017 0.00%Nissan Auto Lease Trust 2017 $25,000 2.17% 15/12/2021 25,007 0.00%IBM Credit LLC $25,000 1.80% 20/1/2021 24,963 0.00%PACCAR Financial Corp. $25,000 2.15% 15/8/2024 24,928 0.00%Boeing Co. $25,000 1.88% 15/6/2023 24,816 0.00%Edison International $25,000 2.40% 15/9/2022 24,813 0.00%KLA Corp. $22,000 4.65% 1/11/2024 24,112 0.00%Delta Air Lines 2007-1 Class A Pass Through Trust $20,602 6.82% 10/8/2022 22,438 0.00%CarMax Auto Owner Trust 2017 $20,982 2.11% 17/10/2022 21,006 0.00%Allegion US Holding Co., Inc. $20,000 3.20% 1/10/2024 20,527 0.00%Mosaic Co. $20,000 3.25% 15/11/2022 20,507 0.00%Wisconsin Electric Power Co. $20,000 2.05% 15/12/2024 19,978 0.00%Americredit Automobile Receivables Trust 2018 $19,000 3.26% 18/1/2024 19,313 0.00%US Treasury Note $19,000 1.88% 30/11/2021 19,104 0.00%Santander Drive Auto Receivables Trust 2018 $17,846 3.03% 15/9/2022 17,877 0.00%International Lease Finance Corp. $15,000 4.63% 15/4/2021 15,444 0.00%AmeriCredit Automobile Receivables Trust 2017 $14,078 1.90% 18/3/2022 14,068 0.00%
Vanguard Global Short-Term Bond Index Fund
688
Maturity Fair Value % of Total Principal Coupon Date US Dollars ($) Net Assets
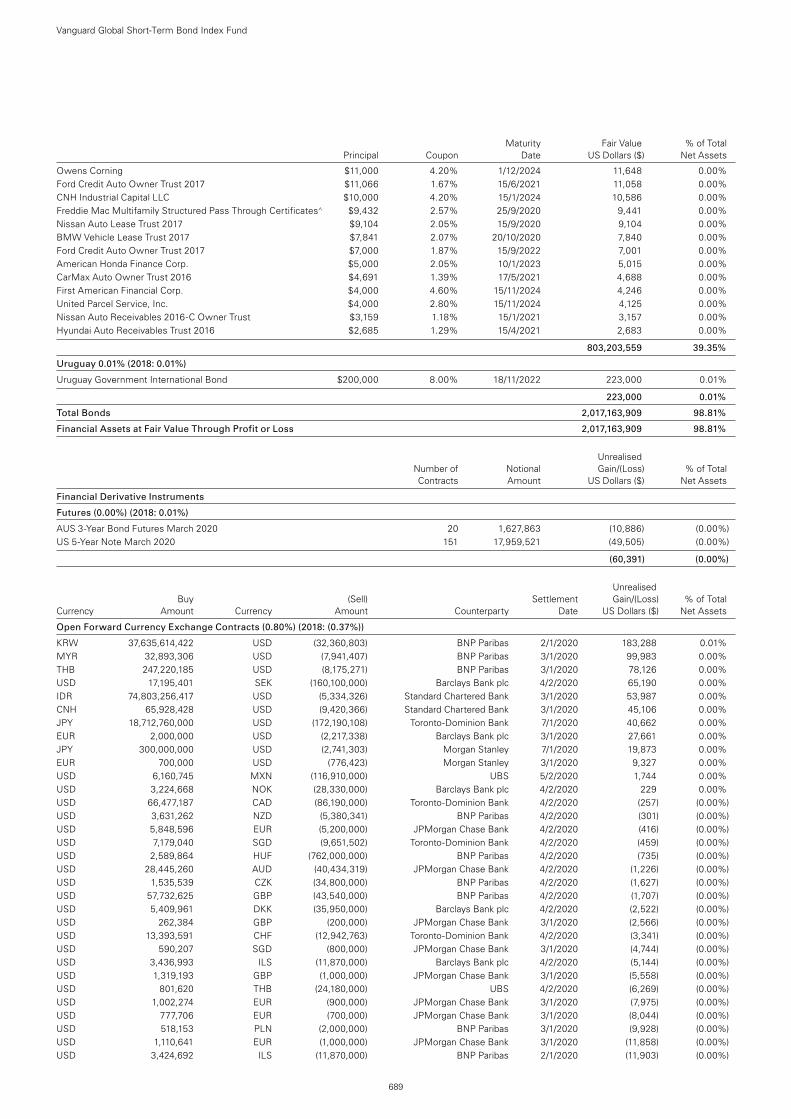
Maturity Fair Value % of Total Principal Coupon Date US Dollars ($) Net Assets
Owens Corning $11,000 4.20% 1/12/2024 11,648 0.00%Ford Credit Auto Owner Trust 2017 $11,066 1.67% 15/6/2021 11,058 0.00%CNH Industrial Capital LLC $10,000 4.20% 15/1/2024 10,586 0.00%Freddie Mac Multifamily Structured Pass Through Certificates^ $9,432 2.57% 25/9/2020 9,441 0.00%Nissan Auto Lease Trust 2017 $9,104 2.05% 15/9/2020 9,104 0.00%BMW Vehicle Lease Trust 2017 $7,841 2.07% 20/10/2020 7,840 0.00%Ford Credit Auto Owner Trust 2017 $7,000 1.87% 15/9/2022 7,001 0.00%American Honda Finance Corp. $5,000 2.05% 10/1/2023 5,015 0.00%CarMax Auto Owner Trust 2016 $4,691 1.39% 17/5/2021 4,688 0.00%First American Financial Corp. $4,000 4.60% 15/11/2024 4,246 0.00%United Parcel Service, Inc. $4,000 2.80% 15/11/2024 4,125 0.00%Nissan Auto Receivables 2016-C Owner Trust $3,159 1.18% 15/1/2021 3,157 0.00%Hyundai Auto Receivables Trust 2016 $2,685 1.29% 15/4/2021 2,683 0.00%
803,203,559 39.35%
Uruguay 0.01% (2018: 0.01%)
Uruguay Government International Bond $200,000 8.00% 18/11/2022 223,000 0.01%
223,000 0.01%
Total Bonds 2,017,163,909 98.81%
Financial Assets at Fair Value Through Profit or Loss 2,017,163,909 98.81%
Unrealised Number of Notional Gain/(Loss) % of Total Contracts Amount US Dollars ($) Net Assets
Financial Derivative Instruments
Futures (0.00%) (2018: 0.01%)
AUS 3-Year Bond Futures March 2020 20 1,627,863 (10,886) (0.00%)US 5-Year Note March 2020 151 17,959,521 (49,505) (0.00%)
(60,391) (0.00%)
Unrealised Buy (Sell) Settlement Gain/(Loss) % of Total Currency Amount Currency Amount Counterparty Date US Dollars ($) Net Assets
Open Forward Currency Exchange Contracts (0.80%) (2018: (0.37%))
KRW 37,635,614,422 USD (32,360,803) BNP Paribas 2/1/2020 183,288 0.01%MYR 32,893,306 USD (7,941,407) BNP Paribas 3/1/2020 99,983 0.00%THB 247,220,185 USD (8,175,271) BNP Paribas 3/1/2020 78,126 0.00%USD 17,195,401 SEK (160,100,000) Barclays Bank plc 4/2/2020 65,190 0.00%IDR 74,803,256,417 USD (5,334,326) Standard Chartered Bank 3/1/2020 53,987 0.00%CNH 65,928,428 USD (9,420,366) Standard Chartered Bank 3/1/2020 45,106 0.00%JPY 18,712,760,000 USD (172,190,108) Toronto-Dominion Bank 7/1/2020 40,662 0.00%EUR 2,000,000 USD (2,217,338) Barclays Bank plc 3/1/2020 27,661 0.00%JPY 300,000,000 USD (2,741,303) Morgan Stanley 7/1/2020 19,873 0.00%EUR 700,000 USD (776,423) Morgan Stanley 3/1/2020 9,327 0.00%USD 6,160,745 MXN (116,910,000) UBS 5/2/2020 1,744 0.00%USD 3,224,668 NOK (28,330,000) Barclays Bank plc 4/2/2020 229 0.00%USD 66,477,187 CAD (86,190,000) Toronto-Dominion Bank 4/2/2020 (257) (0.00%)USD 3,631,262 NZD (5,380,341) BNP Paribas 4/2/2020 (301) (0.00%)USD 5,848,596 EUR (5,200,000) JPMorgan Chase Bank 4/2/2020 (416) (0.00%)USD 7,179,040 SGD (9,651,502) Toronto-Dominion Bank 4/2/2020 (459) (0.00%)USD 2,589,864 HUF (762,000,000) BNP Paribas 4/2/2020 (735) (0.00%)USD 28,445,260 AUD (40,434,319) JPMorgan Chase Bank 4/2/2020 (1,226) (0.00%)USD 1,535,539 CZK (34,800,000) BNP Paribas 4/2/2020 (1,627) (0.00%)USD 57,732,625 GBP (43,540,000) BNP Paribas 4/2/2020 (1,707) (0.00%)USD 5,409,961 DKK (35,950,000) Barclays Bank plc 4/2/2020 (2,522) (0.00%)USD 262,384 GBP (200,000) JPMorgan Chase Bank 3/1/2020 (2,566) (0.00%)USD 13,393,591 CHF (12,942,763) Toronto-Dominion Bank 4/2/2020 (3,341) (0.00%)USD 590,207 SGD (800,000) JPMorgan Chase Bank 3/1/2020 (4,744) (0.00%)USD 3,436,993 ILS (11,870,000) Barclays Bank plc 4/2/2020 (5,144) (0.00%)USD 1,319,193 GBP (1,000,000) JPMorgan Chase Bank 3/1/2020 (5,558) (0.00%)USD 801,620 THB (24,180,000) UBS 4/2/2020 (6,269) (0.00%)USD 1,002,274 EUR (900,000) JPMorgan Chase Bank 3/1/2020 (7,975) (0.00%)USD 777,706 EUR (700,000) JPMorgan Chase Bank 3/1/2020 (8,044) (0.00%)USD 518,153 PLN (2,000,000) BNP Paribas 3/1/2020 (9,928) (0.00%)USD 1,110,641 EUR (1,000,000) JPMorgan Chase Bank 3/1/2020 (11,858) (0.00%)USD 3,424,692 ILS (11,870,000) BNP Paribas 2/1/2020 (11,903) (0.00%)
Vanguard Global Short-Term Bond Index Fund
689
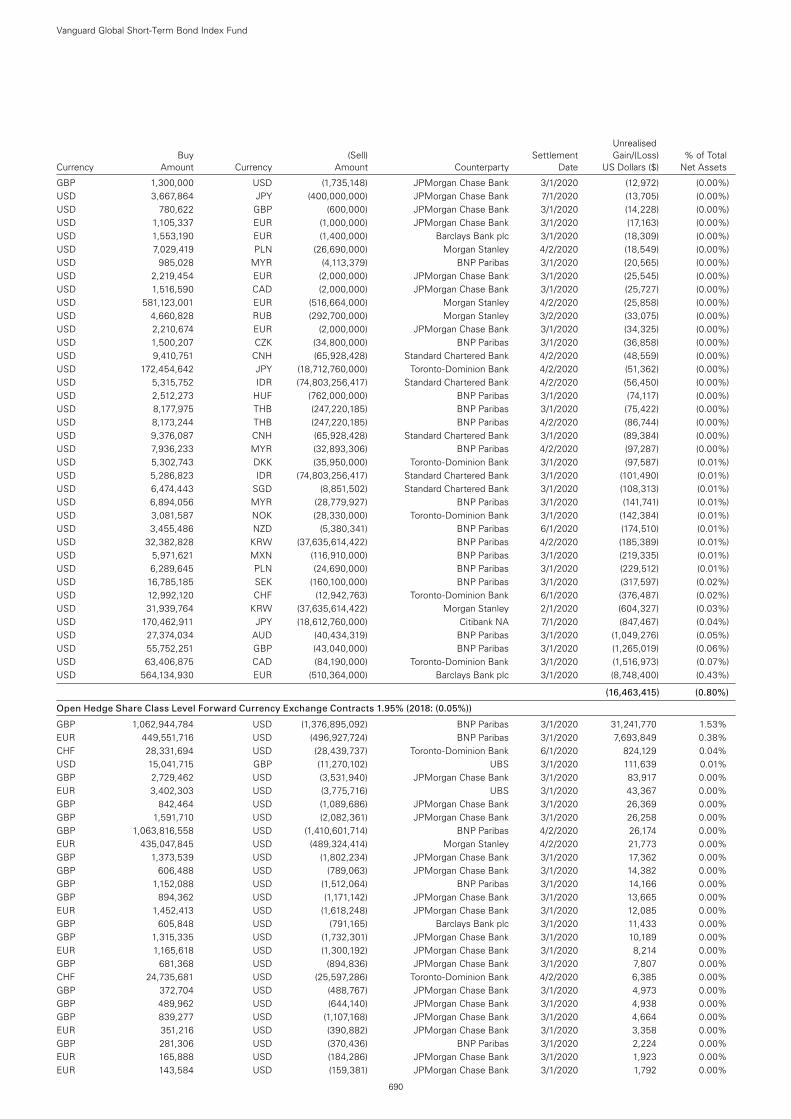
Unrealised Buy (Sell) Settlement Gain/(Loss) % of Total Currency Amount Currency Amount Counterparty Date US Dollars ($) Net Assets
GBP 1,300,000 USD (1,735,148) JPMorgan Chase Bank 3/1/2020 (12,972) (0.00%)USD 3,667,864 JPY (400,000,000) JPMorgan Chase Bank 7/1/2020 (13,705) (0.00%)USD 780,622 GBP (600,000) JPMorgan Chase Bank 3/1/2020 (14,228) (0.00%)USD 1,105,337 EUR (1,000,000) JPMorgan Chase Bank 3/1/2020 (17,163) (0.00%)USD 1,553,190 EUR (1,400,000) Barclays Bank plc 3/1/2020 (18,309) (0.00%)USD 7,029,419 PLN (26,690,000) Morgan Stanley 4/2/2020 (18,549) (0.00%)USD 985,028 MYR (4,113,379) BNP Paribas 3/1/2020 (20,565) (0.00%)USD 2,219,454 EUR (2,000,000) JPMorgan Chase Bank 3/1/2020 (25,545) (0.00%)USD 1,516,590 CAD (2,000,000) JPMorgan Chase Bank 3/1/2020 (25,727) (0.00%)USD 581,123,001 EUR (516,664,000) Morgan Stanley 4/2/2020 (25,858) (0.00%)USD 4,660,828 RUB (292,700,000) Morgan Stanley 3/2/2020 (33,075) (0.00%)USD 2,210,674 EUR (2,000,000) JPMorgan Chase Bank 3/1/2020 (34,325) (0.00%)USD 1,500,207 CZK (34,800,000) BNP Paribas 3/1/2020 (36,858) (0.00%)USD 9,410,751 CNH (65,928,428) Standard Chartered Bank 4/2/2020 (48,559) (0.00%)USD 172,454,642 JPY (18,712,760,000) Toronto-Dominion Bank 4/2/2020 (51,362) (0.00%)USD 5,315,752 IDR (74,803,256,417) Standard Chartered Bank 4/2/2020 (56,450) (0.00%)USD 2,512,273 HUF (762,000,000) BNP Paribas 3/1/2020 (74,117) (0.00%)USD 8,177,975 THB (247,220,185) BNP Paribas 3/1/2020 (75,422) (0.00%)USD 8,173,244 THB (247,220,185) BNP Paribas 4/2/2020 (86,744) (0.00%)USD 9,376,087 CNH (65,928,428) Standard Chartered Bank 3/1/2020 (89,384) (0.00%)USD 7,936,233 MYR (32,893,306) BNP Paribas 4/2/2020 (97,287) (0.00%)USD 5,302,743 DKK (35,950,000) Toronto-Dominion Bank 3/1/2020 (97,587) (0.01%)USD 5,286,823 IDR (74,803,256,417) Standard Chartered Bank 3/1/2020 (101,490) (0.01%)USD 6,474,443 SGD (8,851,502) Standard Chartered Bank 3/1/2020 (108,313) (0.01%)USD 6,894,056 MYR (28,779,927) BNP Paribas 3/1/2020 (141,741) (0.01%)USD 3,081,587 NOK (28,330,000) Toronto-Dominion Bank 3/1/2020 (142,384) (0.01%)USD 3,455,486 NZD (5,380,341) BNP Paribas 6/1/2020 (174,510) (0.01%)USD 32,382,828 KRW (37,635,614,422) BNP Paribas 4/2/2020 (185,389) (0.01%)USD 5,971,621 MXN (116,910,000) BNP Paribas 3/1/2020 (219,335) (0.01%)USD 6,289,645 PLN (24,690,000) BNP Paribas 3/1/2020 (229,512) (0.01%)USD 16,785,185 SEK (160,100,000) BNP Paribas 3/1/2020 (317,597) (0.02%)USD 12,992,120 CHF (12,942,763) Toronto-Dominion Bank 6/1/2020 (376,487) (0.02%)USD 31,939,764 KRW (37,635,614,422) Morgan Stanley 2/1/2020 (604,327) (0.03%)USD 170,462,911 JPY (18,612,760,000) Citibank NA 7/1/2020 (847,467) (0.04%)USD 27,374,034 AUD (40,434,319) BNP Paribas 3/1/2020 (1,049,276) (0.05%)USD 55,752,251 GBP (43,040,000) BNP Paribas 3/1/2020 (1,265,019) (0.06%)USD 63,406,875 CAD (84,190,000) Toronto-Dominion Bank 3/1/2020 (1,516,973) (0.07%)USD 564,134,930 EUR (510,364,000) Barclays Bank plc 3/1/2020 (8,748,400) (0.43%)
(16,463,415) (0.80%)
Open Hedge Share Class Level Forward Currency Exchange Contracts 1.95% (2018: (0.05%))
GBP 1,062,944,784 USD (1,376,895,092) BNP Paribas 3/1/2020 31,241,770 1.53%EUR 449,551,716 USD (496,927,724) BNP Paribas 3/1/2020 7,693,849 0.38%CHF 28,331,694 USD (28,439,737) Toronto-Dominion Bank 6/1/2020 824,129 0.04%USD 15,041,715 GBP (11,270,102) UBS 3/1/2020 111,639 0.01%GBP 2,729,462 USD (3,531,940) JPMorgan Chase Bank 3/1/2020 83,917 0.00%EUR 3,402,303 USD (3,775,716) UBS 3/1/2020 43,367 0.00%GBP 842,464 USD (1,089,686) JPMorgan Chase Bank 3/1/2020 26,369 0.00%GBP 1,591,710 USD (2,082,361) JPMorgan Chase Bank 3/1/2020 26,258 0.00%GBP 1,063,816,558 USD (1,410,601,714) BNP Paribas 4/2/2020 26,174 0.00%EUR 435,047,845 USD (489,324,414) Morgan Stanley 4/2/2020 21,773 0.00%GBP 1,373,539 USD (1,802,234) JPMorgan Chase Bank 3/1/2020 17,362 0.00%GBP 606,488 USD (789,063) JPMorgan Chase Bank 3/1/2020 14,382 0.00%GBP 1,152,088 USD (1,512,064) BNP Paribas 3/1/2020 14,166 0.00%GBP 894,362 USD (1,171,142) JPMorgan Chase Bank 3/1/2020 13,665 0.00%EUR 1,452,413 USD (1,618,248) JPMorgan Chase Bank 3/1/2020 12,085 0.00%GBP 605,848 USD (791,165) Barclays Bank plc 3/1/2020 11,433 0.00%GBP 1,315,335 USD (1,732,301) JPMorgan Chase Bank 3/1/2020 10,189 0.00%EUR 1,165,618 USD (1,300,192) JPMorgan Chase Bank 3/1/2020 8,214 0.00%GBP 681,368 USD (894,836) JPMorgan Chase Bank 3/1/2020 7,807 0.00%CHF 24,735,681 USD (25,597,286) Toronto-Dominion Bank 4/2/2020 6,385 0.00%GBP 372,704 USD (488,767) JPMorgan Chase Bank 3/1/2020 4,973 0.00%GBP 489,962 USD (644,140) JPMorgan Chase Bank 3/1/2020 4,938 0.00%GBP 839,277 USD (1,107,168) JPMorgan Chase Bank 3/1/2020 4,664 0.00%EUR 351,216 USD (390,882) JPMorgan Chase Bank 3/1/2020 3,358 0.00%GBP 281,306 USD (370,436) BNP Paribas 3/1/2020 2,224 0.00%EUR 165,888 USD (184,286) JPMorgan Chase Bank 3/1/2020 1,923 0.00%EUR 143,584 USD (159,381) JPMorgan Chase Bank 3/1/2020 1,792 0.00%
Vanguard Global Short-Term Bond Index Fund
690
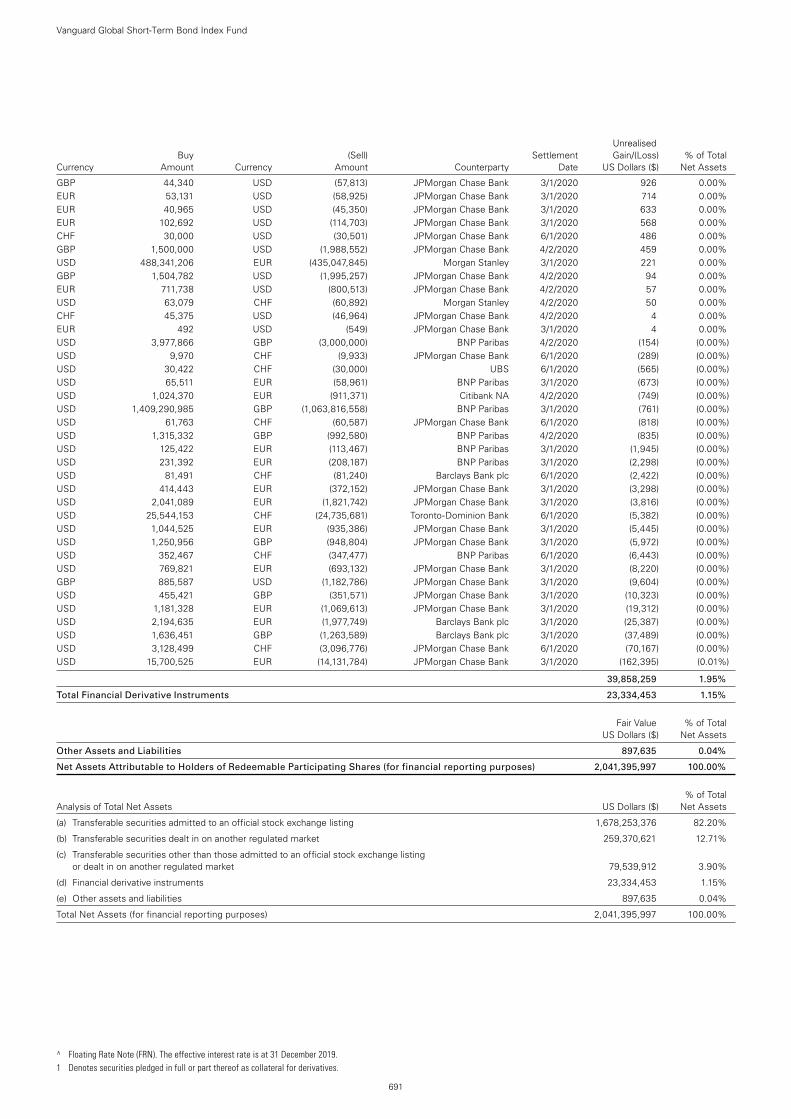
Unrealised Buy (Sell) Settlement Gain/(Loss) % of Total Currency Amount Currency Amount Counterparty Date US Dollars ($) Net Assets
GBP 44,340 USD (57,813) JPMorgan Chase Bank 3/1/2020 926 0.00%EUR 53,131 USD (58,925) JPMorgan Chase Bank 3/1/2020 714 0.00%EUR 40,965 USD (45,350) JPMorgan Chase Bank 3/1/2020 633 0.00%EUR 102,692 USD (114,703) JPMorgan Chase Bank 3/1/2020 568 0.00%CHF 30,000 USD (30,501) JPMorgan Chase Bank 6/1/2020 486 0.00%GBP 1,500,000 USD (1,988,552) JPMorgan Chase Bank 4/2/2020 459 0.00%USD 488,341,206 EUR (435,047,845) Morgan Stanley 3/1/2020 221 0.00%GBP 1,504,782 USD (1,995,257) JPMorgan Chase Bank 4/2/2020 94 0.00%EUR 711,738 USD (800,513) JPMorgan Chase Bank 4/2/2020 57 0.00%USD 63,079 CHF (60,892) Morgan Stanley 4/2/2020 50 0.00%CHF 45,375 USD (46,964) JPMorgan Chase Bank 4/2/2020 4 0.00%EUR 492 USD (549) JPMorgan Chase Bank 3/1/2020 4 0.00%USD 3,977,866 GBP (3,000,000) BNP Paribas 4/2/2020 (154) (0.00%)USD 9,970 CHF (9,933) JPMorgan Chase Bank 6/1/2020 (289) (0.00%)USD 30,422 CHF (30,000) UBS 6/1/2020 (565) (0.00%)USD 65,511 EUR (58,961) BNP Paribas 3/1/2020 (673) (0.00%)USD 1,024,370 EUR (911,371) Citibank NA 4/2/2020 (749) (0.00%)USD 1,409,290,985 GBP (1,063,816,558) BNP Paribas 3/1/2020 (761) (0.00%)USD 61,763 CHF (60,587) JPMorgan Chase Bank 6/1/2020 (818) (0.00%)USD 1,315,332 GBP (992,580) BNP Paribas 4/2/2020 (835) (0.00%)USD 125,422 EUR (113,467) BNP Paribas 3/1/2020 (1,945) (0.00%)USD 231,392 EUR (208,187) BNP Paribas 3/1/2020 (2,298) (0.00%)USD 81,491 CHF (81,240) Barclays Bank plc 6/1/2020 (2,422) (0.00%)USD 414,443 EUR (372,152) JPMorgan Chase Bank 3/1/2020 (3,298) (0.00%)USD 2,041,089 EUR (1,821,742) JPMorgan Chase Bank 3/1/2020 (3,816) (0.00%)USD 25,544,153 CHF (24,735,681) Toronto-Dominion Bank 6/1/2020 (5,382) (0.00%)USD 1,044,525 EUR (935,386) JPMorgan Chase Bank 3/1/2020 (5,445) (0.00%)USD 1,250,956 GBP (948,804) JPMorgan Chase Bank 3/1/2020 (5,972) (0.00%)USD 352,467 CHF (347,477) BNP Paribas 6/1/2020 (6,443) (0.00%)USD 769,821 EUR (693,132) JPMorgan Chase Bank 3/1/2020 (8,220) (0.00%)GBP 885,587 USD (1,182,786) JPMorgan Chase Bank 3/1/2020 (9,604) (0.00%)USD 455,421 GBP (351,571) JPMorgan Chase Bank 3/1/2020 (10,323) (0.00%)USD 1,181,328 EUR (1,069,613) JPMorgan Chase Bank 3/1/2020 (19,312) (0.00%)USD 2,194,635 EUR (1,977,749) Barclays Bank plc 3/1/2020 (25,387) (0.00%)USD 1,636,451 GBP (1,263,589) Barclays Bank plc 3/1/2020 (37,489) (0.00%)USD 3,128,499 CHF (3,096,776) JPMorgan Chase Bank 6/1/2020 (70,167) (0.00%)USD 15,700,525 EUR (14,131,784) JPMorgan Chase Bank 3/1/2020 (162,395) (0.01%)
39,858,259 1.95%
Total Financial Derivative Instruments 23,334,453 1.15%
Fair Value % of Total US Dollars ($) Net Assets
Other Assets and Liabilities 897,635 0.04%
Net Assets Attributable to Holders of Redeemable Participating Shares (for financial reporting purposes) 2,041,395,997 100.00%
% of Total Analysis of Total Net Assets US Dollars ($) Net Assets
(a) Transferable securities admitted to an official stock exchange listing 1,678,253,376 82.20%
(b) Transferable securities dealt in on another regulated market 259,370,621 12.71%
(c) Transferable securities other than those admitted to an official stock exchange listing or dealt in on another regulated market 79,539,912 3.90%
(d) Financial derivative instruments 23,334,453 1.15%
(e) Other assets and liabilities 897,635 0.04%
Total Net Assets (for financial reporting purposes) 2,041,395,997 100.00%
Vanguard Global Short-Term Bond Index Fund
691
^ Floating Rate Note (FRN). The effective interest rate is at 31 December 2019. 1 Denotes securities pledged in full or part thereof as collateral for derivatives.
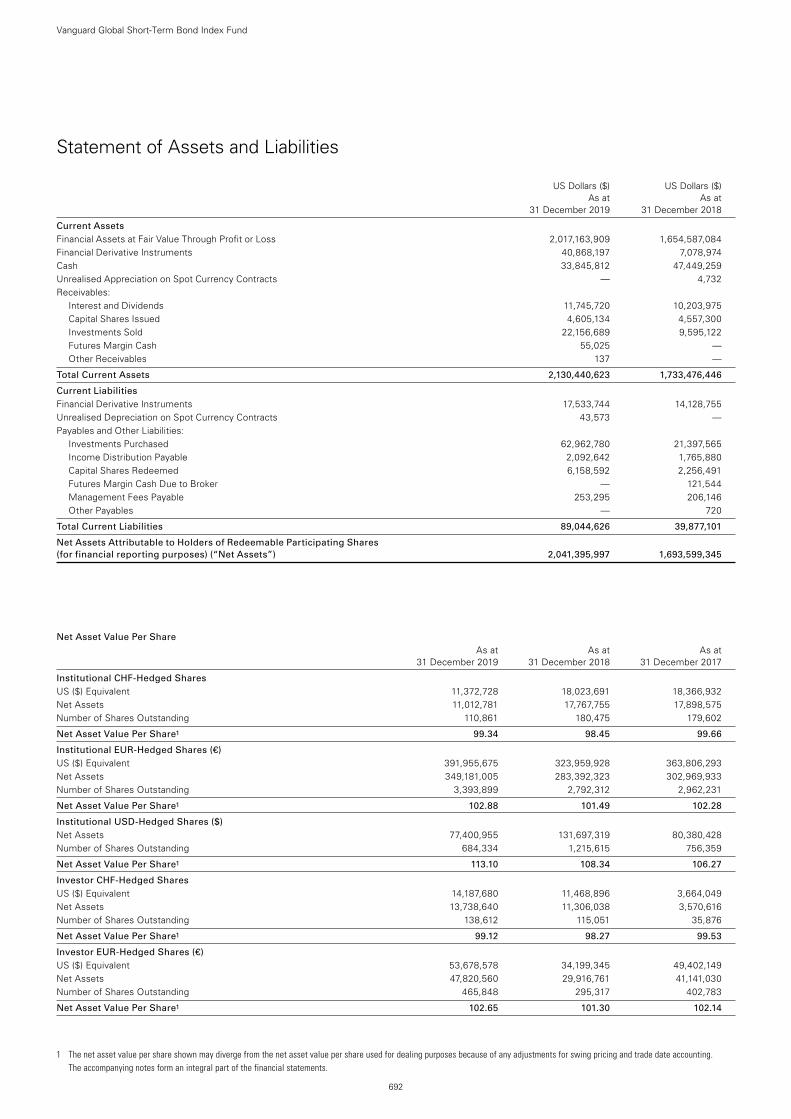
1 The net asset value per share shown may diverge from the net asset value per share used for dealing purposes because of any adjustments for swing pricing and trade date accounting. The accompanying notes form an integral part of the financial statements.
692
Vanguard Global Short-Term Bond Index Fund
Statement of Assets and Liabilities
US Dollars ($) US Dollars ($) As at As at 31 December 2019 31 December 2018
Current Assets Financial Assets at Fair Value Through Profit or Loss 2,017,163,909 1,654,587,084Financial Derivative Instruments 40,868,197 7,078,974Cash 33,845,812 47,449,259Unrealised Appreciation on Spot Currency Contracts — 4,732Receivables:
Interest and Dividends 11,745,720 10,203,975Capital Shares Issued 4,605,134 4,557,300Investments Sold 22,156,689 9,595,122Futures Margin Cash 55,025 —Other Receivables 137 —
Total Current Assets 2,130,440,623 1,733,476,446
Current Liabilities Financial Derivative Instruments 17,533,744 14,128,755Unrealised Depreciation on Spot Currency Contracts 43,573 —Payables and Other Liabilities:
Investments Purchased 62,962,780 21,397,565Income Distribution Payable 2,092,642 1,765,880Capital Shares Redeemed 6,158,592 2,256,491Futures Margin Cash Due to Broker — 121,544Management Fees Payable 253,295 206,146Other Payables — 720
Total Current Liabilities 89,044,626 39,877,101
Net Assets Attributable to Holders of Redeemable Participating Shares (for financial reporting purposes) (“Net Assets”) 2,041,395,997 1,693,599,345
Net Asset Value Per Share As at As at As at 31 December 2019 31 December 2018 31 December 2017
Institutional CHF-Hedged Shares US ($) Equivalent 11,372,728 18,023,691 18,366,932Net Assets 11,012,781 17,767,755 17,898,575Number of Shares Outstanding 110,861 180,475 179,602
Net Asset Value Per Share1 99.34 98.45 99.66
Institutional EUR-Hedged Shares (€) US ($) Equivalent 391,955,675 323,959,928 363,806,293Net Assets 349,181,005 283,392,323 302,969,933Number of Shares Outstanding 3,393,899 2,792,312 2,962,231
Net Asset Value Per Share1 102.88 101.49 102.28
Institutional USD-Hedged Shares ($) Net Assets 77,400,955 131,697,319 80,380,428Number of Shares Outstanding 684,334 1,215,615 756,359
Net Asset Value Per Share1 113.10 108.34 106.27
Investor CHF-Hedged Shares US ($) Equivalent 14,187,680 11,468,896 3,664,049Net Assets 13,738,640 11,306,038 3,570,616Number of Shares Outstanding 138,612 115,051 35,876
Net Asset Value Per Share1 99.12 98.27 99.53
Investor EUR-Hedged Shares (€) US ($) Equivalent 53,678,578 34,199,345 49,402,149Net Assets 47,820,560 29,916,761 41,141,030Number of Shares Outstanding 465,848 295,317 402,783
Net Asset Value Per Share1 102.65 101.30 102.14
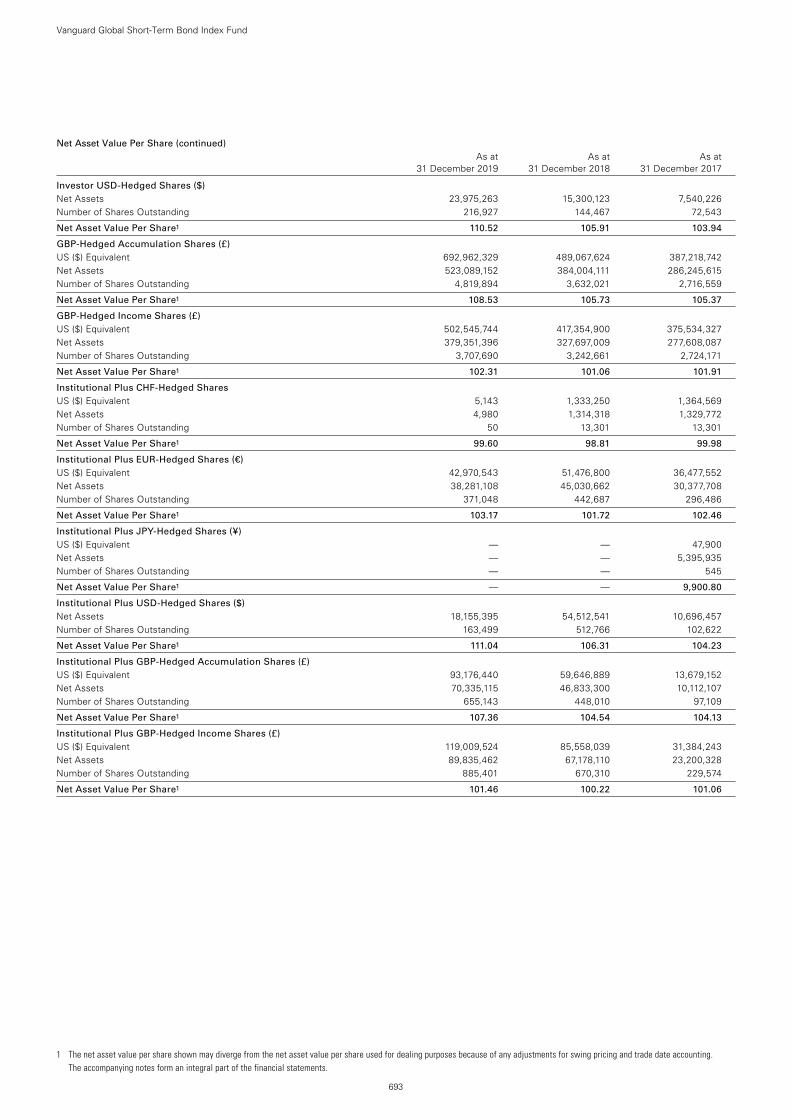
1 The net asset value per share shown may diverge from the net asset value per share used for dealing purposes because of any adjustments for swing pricing and trade date accounting. The accompanying notes form an integral part of the financial statements.
693
Net Asset Value Per Share (continued) As at As at As at 31 December 2019 31 December 2018 31 December 2017
Investor USD-Hedged Shares ($) Net Assets 23,975,263 15,300,123 7,540,226Number of Shares Outstanding 216,927 144,467 72,543
Net Asset Value Per Share1 110.52 105.91 103.94
GBP-Hedged Accumulation Shares (£) US ($) Equivalent 692,962,329 489,067,624 387,218,742Net Assets 523,089,152 384,004,111 286,245,615Number of Shares Outstanding 4,819,894 3,632,021 2,716,559
Net Asset Value Per Share1 108.53 105.73 105.37
GBP-Hedged Income Shares (£) US ($) Equivalent 502,545,744 417,354,900 375,534,327Net Assets 379,351,396 327,697,009 277,608,087Number of Shares Outstanding 3,707,690 3,242,661 2,724,171
Net Asset Value Per Share1 102.31 101.06 101.91
Institutional Plus CHF-Hedged Shares US ($) Equivalent 5,143 1,333,250 1,364,569Net Assets 4,980 1,314,318 1,329,772Number of Shares Outstanding 50 13,301 13,301
Net Asset Value Per Share1 99.60 98.81 99.98
Institutional Plus EUR-Hedged Shares (€) US ($) Equivalent 42,970,543 51,476,800 36,477,552Net Assets 38,281,108 45,030,662 30,377,708Number of Shares Outstanding 371,048 442,687 296,486
Net Asset Value Per Share1 103.17 101.72 102.46
Institutional Plus JPY-Hedged Shares (¥) US ($) Equivalent — — 47,900Net Assets — — 5,395,935Number of Shares Outstanding — — 545
Net Asset Value Per Share1 — — 9,900.80
Institutional Plus USD-Hedged Shares ($) Net Assets 18,155,395 54,512,541 10,696,457Number of Shares Outstanding 163,499 512,766 102,622
Net Asset Value Per Share1 111.04 106.31 104.23
Institutional Plus GBP-Hedged Accumulation Shares (£) US ($) Equivalent 93,176,440 59,646,889 13,679,152Net Assets 70,335,115 46,833,300 10,112,107Number of Shares Outstanding 655,143 448,010 97,109
Net Asset Value Per Share1 107.36 104.54 104.13
Institutional Plus GBP-Hedged Income Shares (£) US ($) Equivalent 119,009,524 85,558,039 31,384,243Net Assets 89,835,462 67,178,110 23,200,328Number of Shares Outstanding 885,401 670,310 229,574
Net Asset Value Per Share1 101.46 100.22 101.06
Vanguard Global Short-Term Bond Index Fund

694
Vanguard Global Short-Term Bond Index Fund
Statement of Operations
US Dollars ($) US Dollars ($) Year Ended Year Ended 31 December 2019 31 December 2018
Investment Income/(Loss) Interest Income 28,750,938 20,056,707Miscellaneous Income 90,661 140,574Net Gain/(Loss) on Financial Instruments 61,901,408 (96,676,734)
Total Investment Income/(Loss) 90,743,007 (76,479,453)
Expenses Management Fees 2,706,055 2,235,914Transaction Fees and Commissions 2,884 2,248
Total Expenses 2,708,939 2,238,162
Finance Costs Interest Expense 67,460 90,612Distribution Paid 8,016,742 5,441,175Income Equalisation (145,940) (130,567)
Total Finance Costs 7,938,262 5,401,220
Net Investment Income/(Loss) 80,095,806 (84,118,835)
Foreign Withholding Tax (167,188) (145,924)
Net Increase/(Decrease) in Net Assets Attributable to Holders of Redeemable Participating Shares (for financial reporting purposes) 79,928,618 (84,264,759)
Statement of Changes in Net Assets Attributable to Holders of Redeemable Participating Shares US Dollars ($) US Dollars ($) Year Ended Year Ended 31 December 2019 31 December 2018
Increase/(Decrease) in Net Assets
Net Increase/(Decrease) in Net Assets Attributable to Holders of Redeemable Participating Shares From Operations 79,928,618 (84,264,759)
Capital Transactions Subscriptions 980,516,379 818,724,960Redemptions (712,667,099) (420,428,935)Reinvestments 18,754 5,060
Total Capital Transactions1 267,868,034 398,301,085
Total Increase/(Decrease) for the Year 347,796,652 314,036,326
Net Assets Attributable to Holders of Redeemable Participating Shares (for financial reporting purposes) Beginning of Year 1,693,599,345 1,379,563,019
End of Year 2,041,395,997 1,693,599,345
1 Capital Transactions include income equalisation adjustments as shown in the Statement of Operations. The accompanying notes form an integral part of the financial statements.
695
Vanguard Global Short-Term Corporate Bond Index FundManaged by Vanguard Global Advisers, LLC
All of the returns in this report represent past performance, which is not a guarantee of future results that may be achieved by the fund. (For performance data current to the most recent month-end, which may be higher or lower than that cited, visit our website at http://global.vanguard.com.) Note, too, that both investment returns and principal value can fluctuate widely, so an investor’s shares, when sold, could be worth more or less than their original cost.* The tracking difference between the fund return and the index return over a stated period of time can be attributed to a number of factors, including, without limitation, small differences in
weightings, trading activity, swing pricing, transaction costs and differences in the valuation and withholding tax treatment between the fund and the index vendor. Tracking difference in the table above is in percentage points.
1 Since-inception returns: EUR-Hedged Institutional Accumulation Shares, 11 September 2019; EUR-Hedged Institutional Plus Accumulation Shares, 7 February 2018; GBP-Hedged Institutional Plus Accumulation Shares, GBP-Hedged Investor Accumulation Shares and USD-Hedged Institutional Accumulation Shares, 2 November 2017.
Investment ObjectiveThe fund seeks to provide returns consistent with the performance of the Bloomberg Barclays Global Aggregate Corporate 1–5 Year Float Adjusted Index, a market-weighted index of global corporate fixed income investments with maturities of between 1 and 5 years.
Performance Summary (unaudited)The Performance Summary does not form part of the Financial Statements.
• Investorscontendedearlyin2019withsignsofdeceleratingglobalgrowth,flare-upsintradedisputes,heightenedinternationaltensionswithIran,andalackof agreement in the United Kingdom on how to exit the European Union. Even as those concerns eased later in the year, many major central banks adopted more accommodative monetary policy by the end of the period in an effort to buoy economic growth and lift inflation expectations.
• TheEuropeanCentralBank(ECB)pusheditsdepositratefurtherbelowzeroand,inSeptember,announcedanewroundofopen-endedbondpurchases. The US Federal Reserve cut interest rates three times in 2019 after raising them four times in 2018. The Bank of Japan remained accommodative as well, pledging to maintain policy rates at very low levels.
• WithTreasuryyieldsfallingandcorporatebondspreadstightening,thefund’sbenchmarkreturned6.60%forthe12monthsended31December2019.Global bonds as a whole, as measured by the Bloomberg Barclays Global Aggregate Float-Adjusted and Scaled Index Hedged, returned 8.60%.
• Inthefund’sindex,bondsissuedbyfinancialinstitutionsperformedalittlebetterthanthoseissuedbyindustrialandutilitycompanies.
• Bycountry,theUnitedStates,whichaccountedformorethan40%oftheindex’smarketvalue,performedalittlebetterthantheindexasawhole. Among other large constituents in the index, China, Italy and the United Kingdom outperformed, while Canada, Australia and Japan were among the laggards.
• Fromacredit-qualityperspective,bondsatthelowestrungoftheinvestment-gradeladderreturnedthemost.
All returns in the commentary above are in US dollars.
Benchmark: Bloomberg Barclays Global Aggregate Corporate 1–5 Year Float Adjusted Index Hedged
Total Returns Periods Ended 31 December 2019 (Annualised for periods over one year)
Ten Years or One Year Since Inception1
EUR-Hedged Institutional Accumulation Shares — 0.13%
Benchmark — 0.25
Tracking Difference* -0.12
EUR-Hedged Institutional Plus Accumulation Shares 3.30% 1.13%
Benchmark 3.47 1.37
Tracking Difference* -0.17
GBP-Hedged Institutional Plus Accumulation Shares 4.56% 1.81%
Benchmark 4.74 1.96
Tracking Difference* -0.18
GBP-Hedged Investor Accumulation Shares 4.43% 1.68%
Benchmark 4.74 1.96
Tracking Difference* -0.31
USD-Hedged Institutional Accumulation Shares 6.29% 3.37%
Benchmark 6.60 3.68
Tracking Difference* -0.31
Each benchmark is in its respective currency.
The Central Bank of Ireland requires a schedule of material changes in the composition of the portfolio during the year. These are defined as aggregate purchases of a security exceeding 1% of the total value of purchases for the year and aggregate disposals greater than 1% of the total value of sales. At a minimum, the largest 20 purchases and 20 sales must be shown; all purchases and sales must be shown if there are fewer than 20. A full listing of the portfolio changes for the year is available, upon request, at no extra cost from the Administrator.
696
Vanguard Global Short-Term Corporate Bond Index Fund
Significant Portfolio Changes (unaudited) For the Year Ended 31 December 2019
Cost Principal US Dollars ($)
Purchases
US Treasury Note 1.63% 15/11/2022 $7,570,000 7,574,042
US Treasury Note 1.63% 15/12/2022 $7,300,000 7,305,629
US Treasury Note 2.38% 29/2/2024 $6,380,000 6,416,941
US Treasury Note 1.25% 31/8/2024 $6,400,000 6,343,088
US Treasury Note 1.50% 31/8/2021 $6,220,000 6,201,550
US Treasury Note 2.00% 31/5/2024 $5,651,000 5,694,435
US Treasury Note 1.38% 15/10/2022 $5,135,000 5,107,266
US Treasury Note 1.50% 30/9/2024 $5,080,000 5,064,828
US Treasury Note 1.50% 15/9/2022 $3,975,000 3,963,534
US Treasury Note 2.25% 31/3/2021 $3,110,000 3,112,336
US Treasury Note 1.50% 31/10/2024 $2,482,000 2,465,325
US Treasury Note 2.50% 31/1/2021 $2,372,000 2,369,195
US Treasury Note 2.50% 28/2/2021 $2,035,000 2,035,838
US Treasury Note 1.75% 30/6/2024 $1,789,000 1,781,196
US Treasury Note 1.75% 31/7/2021 $1,570,000 1,568,588
US Treasury Note 1.50% 30/11/2024 $1,248,000 1,237,064
US Treasury Note 2.25% 30/4/2024 $1,150,000 1,148,685
US Treasury Note 2.50% 31/12/2020 $1,005,000 1,004,061
Resona Bank Ltd. 1.78% 15/3/2022 ¥100,000,000 979,257
Mizuho Financial Group, Inc. 0.95% 16/7/2024 ¥100,000,000 961,351
Proceeds Principal US Dollars ($)
Sales
US Treasury Note 1.63% 15/11/2022 $7,570,000 7,574,554
US Treasury Note 2.38% 29/2/2024 $6,380,000 6,398,434
US Treasury Note 1.25% 31/8/2024 $6,400,000 6,330,744
US Treasury Note 1.50% 31/8/2021 $6,220,000 6,206,201
US Treasury Note 2.00% 31/5/2024 $5,651,000 5,697,852
US Treasury Note 1.38% 15/10/2022 $5,135,000 5,106,320
US Treasury Note 1.50% 30/9/2024 $5,080,000 5,075,160
US Treasury Note 1.50% 15/9/2022 $3,975,000 3,971,708
US Treasury Note 2.25% 31/3/2021 $3,110,000 3,108,664
US Treasury Note 2.50% 31/1/2021 $2,372,000 2,372,084
US Treasury Note 1.50% 31/10/2024 $2,373,000 2,357,610
US Treasury Note 2.50% 28/2/2021 $2,035,000 2,035,508
US Treasury Note 1.75% 30/6/2024 $1,789,000 1,780,811
US Treasury Note 1.75% 31/7/2021 $1,570,000 1,575,405
US Treasury Note 1.50% 30/11/2024 $1,238,000 1,229,798
US Treasury Note 2.25% 30/4/2024 $1,150,000 1,149,821
US Treasury Note 2.50% 31/12/2020 $1,005,000 1,004,368
Japan Government Bond 0.10% 20/9/2023 ¥108,000,000 996,370
Norinchukin Bank 0.26% 27/8/2020 ¥100,000,000 941,876
US Treasury Note 1.50% 15/8/2022 $930,000 931,106
Financial Statements Statement of Investments31 December 2019
Maturity Fair Value % of Total Principal Coupon Date US Dollars ($) Net Assets
Bonds 94.53% (2018: 98.47%)
Australia 2.41% (2018: 3.12%)
National Australia Bank Ltd. ¥100,000,000 0.33% 19/7/2023 919,745 0.14%Scentre Group Trust 1/Scentre Group Trust 2 €500,000 1.38% 22/3/2023 580,445 0.09%Commonwealth Bank of Australia €400,000 0.50% 11/7/2022 455,263 0.07%Qantas Airways Ltd. AU($)500,000 7.75% 19/5/2022 397,934 0.06%Commonwealth Bank of Australia AU($)500,000 3.25% 25/4/2023 370,092 0.06%Westpac Banking Corp. $350,000 2.10% 13/5/2021 350,345 0.06%Commonwealth Bank of Australia^ €300,000 1.94% 3/10/2029 349,890 0.05%Westpac Securities NZ Ltd. €300,000 0.30% 25/6/2024 337,470 0.05%Westpac Banking Corp. $300,000 3.65% 15/5/2023 314,474 0.05%Commonwealth Bank of Australia $275,000 2.50% 18/9/2022 279,779 0.04%Commonwealth Bank of Australia $275,000 2.55% 15/3/2021 276,660 0.04%BHP Billiton Finance Ltd.^ €200,000 5.63% 22/10/2079 273,951 0.04%Macquarie Bank Ltd. $250,000 6.63% 7/4/2021 262,945 0.04%National Australia Bank Ltd. $250,000 3.70% 4/11/2021 257,937 0.04%National Australia Bank Ltd. $250,000 3.00% 20/1/2023 255,991 0.04%Australia & New Zealand Banking Group Ltd. $250,000 2.63% 9/11/2022 254,476 0.04%National Australia Bank Ltd. $250,000 2.80% 10/1/2022 253,938 0.04%Australia & New Zealand Banking Group Ltd. $250,000 2.55% 23/11/2021 252,626 0.04%Commonwealth Bank of Australia^ $250,000 3.38% 20/10/2026 251,875 0.04%National Australia Bank Ltd. $250,000 2.63% 14/1/2021 251,436 0.04%National Australia Bank Ltd. $250,000 2.50% 12/1/2021 251,113 0.04%Australia Pacific Airports Melbourne Pty Ltd. €200,000 3.13% 26/9/2023 249,335 0.04%Origin Energy Finance Ltd. €200,000 3.50% 4/10/2021 237,615 0.04%Westpac Banking Corp. €200,000 0.25% 17/1/2022 225,743 0.04%Toyota Finance Australia Ltd. €200,000 0.00% 9/4/2021 224,906 0.04%Australia & New Zealand Banking Group Ltd. AU($)300,000 3.35% 9/5/2023 222,784 0.03%Australia & New Zealand Banking Group Ltd. $200,000 4.50% 19/3/2024 212,009 0.03%ANZ Bank New Zealand Ltd. NZ($)300,000 3.03% 20/3/2024 209,120 0.03%Australia & New Zealand Banking Group Ltd. $200,000 4.88% 12/1/2021 205,600 0.03%Macquarie Group Ltd.^ $200,000 3.19% 28/11/2023 204,168 0.03%Westpac Banking Corp. $200,000 2.65% 25/1/2021 201,297 0.03%Macquarie Bank Ltd. AU($)280,000 1.75% 7/8/2024 194,909 0.03%Westpac Banking Corp. $175,000 3.30% 26/2/2024 182,031 0.03%Telstra Corp., Ltd. AU($)250,000 2.90% 19/4/2021 178,774 0.03%Westpac Banking Corp. $150,000 2.80% 11/1/2022 152,485 0.02%Australia & New Zealand Banking Group Ltd. €133,000 0.63% 21/2/2023 151,925 0.02%Suncorp-Metway Ltd. $150,000 2.80% 4/5/2022 151,500 0.02%Australia & New Zealand Banking Group Ltd. $150,000 2.30% 1/6/2021 150,528 0.02%National Australia Bank Ltd. AU($)200,000 3.00% 10/2/2023 146,603 0.02%Westpac Banking Corp.^ AU($)200,000 4.50% 11/3/2027 146,008 0.02%Newcrest Finance Pty Ltd. $140,000 4.20% 1/10/2022 145,762 0.02%Macquarie Group Ltd.^ AU($)200,000 3.25% 15/12/2022 143,913 0.02%National Australia Bank Ltd. £100,000 5.13% 9/12/2021 142,749 0.02%Westpac Banking Corp. £100,000 2.63% 14/12/2022 138,073 0.02%Scentre Group Trust 1/Scentre Group Trust 2 £100,000 2.38% 8/4/2022 135,571 0.02%BHP Billiton Finance Ltd. €100,000 3.00% 29/5/2024 126,852 0.02%Westpac Banking Corp. $125,000 2.35% 19/2/2025 125,231 0.02%Telstra Corp., Ltd. €100,000 3.50% 21/9/2022 123,091 0.02%Telstra Corp., Ltd. €100,000 2.50% 15/9/2023 122,148 0.02%Transurban Finance Co. Pty Ltd. €100,000 1.88% 16/9/2024 119,596 0.02%Telstra Corp., Ltd. €100,000 3.63% 15/3/2021 117,421 0.02%Commonwealth Bank of Australia^ €100,000 2.00% 22/4/2027 116,361 0.02%APT Pipelines Ltd. €100,000 1.38% 22/3/2022 115,524 0.02%Macquarie Bank Ltd. €100,000 1.13% 20/1/2022 114,917 0.02%Wesfarmers Ltd. €100,000 1.25% 7/10/2021 114,876 0.02%Westpac Banking Corp. €100,000 0.75% 17/10/2023 114,794 0.02%Stockland Trust €100,000 1.50% 3/11/2021 114,716 0.02%National Australia Bank Ltd. €100,000 0.63% 30/8/2023 114,478 0.02%
Vanguard Global Short-Term Corporate Bond Index Fund
697
National Australia Bank Ltd. €100,000 0.88% 20/1/2022 114,476 0.02%Westpac Banking Corp. €100,000 0.38% 5/3/2023 113,197 0.02%National Australia Bank Ltd. €100,000 0.25% 20/5/2024 112,744 0.02%BHP Billiton Finance USA Ltd. $105,000 3.85% 30/9/2023 111,725 0.02%AGL Energy Ltd. AU($)150,000 5.00% 5/11/2021 109,930 0.02%National Australia Bank Ltd. CHF100,000 0.25% 19/1/2023 104,931 0.02%Macquarie Group Ltd.^ $100,000 4.15% 27/3/2024 104,779 0.02%Telstra Corp., Ltd. $100,000 4.80% 12/10/2021 104,715 0.02%APT Pipelines Ltd. $100,000 3.88% 11/10/2022 103,907 0.02%BHP Billiton Finance USA Ltd.^ $100,000 6.25% 19/10/2075 102,875 0.02%BHP Billiton Finance USA Ltd. $100,000 3.25% 21/11/2021 102,279 0.02%BHP Billiton Finance USA Ltd. $100,000 2.88% 24/2/2022 101,792 0.02%Westpac Banking Corp. $100,000 2.75% 11/1/2023 101,654 0.02%Macquarie Bank Ltd. $100,000 2.85% 15/1/2021 100,713 0.02%Commonwealth Bank of Australia $100,000 2.00% 6/9/2021 100,093 0.02%BHP Billiton Finance Ltd. CA($)110,000 3.23% 15/5/2023 86,869 0.01%Woodside Finance Ltd. $75,000 4.60% 10/5/2021 76,057 0.01%Newcrest Finance Pty Ltd. $65,000 4.45% 15/11/2021 67,189 0.01%Ausgrid Finance Pty Ltd. $60,000 3.85% 1/5/2023 62,288 0.01%Sydney Airport Finance Co. Pty Ltd. $55,000 3.90% 22/3/2023 57,567 0.01%Commonwealth Bank of Australia $50,000 3.35% 4/6/2024 52,258 0.01%Toyota Finance Australia Ltd. AU($)70,000 3.30% 22/11/2023 51,913 0.01%Adani Abbot Point Terminal Pty Ltd. $50,000 4.45% 15/12/2022 50,886 0.01%Westpac Banking Corp. $50,000 2.50% 28/6/2022 50,530 0.01%Aurizon Network Pty Ltd. AU($)40,000 4.00% 21/6/2024 29,850 0.00%Commonwealth Bank of Australia $25,000 3.45% 16/3/2023 26,024 0.00%Australian Gas Networks Vic 3 Pty Ltd. AU($)30,000 4.50% 17/12/2021 22,200 0.00%United Energy Distribution Pty Ltd. AU($)30,000 3.50% 12/9/2023 22,150 0.00%Volkswagen Financial Services Australia Pty Ltd. AU($)30,000 3.25% 13/4/2021 21,416 0.00%Macquarie Group Ltd. $15,000 6.25% 14/1/2021 15,603 0.00%
15,374,408 2.41%
Austria 0.22% (2018: 0.31%)
OMV AG €300,000 0.75% 4/12/2023 345,793 0.05%UNIQA Insurance Group AG^ €200,000 6.88% 31/7/2043 268,558 0.04%Erste Group Bank AG €200,000 0.38% 16/4/2024 226,965 0.04%Raiffeisen Bank International AG €200,000 0.25% 5/7/2021 225,615 0.03%Telekom Finanzmanagement GmbH €100,000 4.00% 4/4/2022 122,273 0.02%JAB Holdings BV €100,000 1.25% 22/5/2024 116,571 0.02%Raiffeisen Bank International AG €100,000 1.00% 4/12/2023 116,137 0.02%
1,421,912 0.22%
Belgium 0.87% (2018: 0.71%)
Anheuser-Busch InBev SA €700,000 0.88% 17/3/2022 802,692 0.12%Anheuser-Busch InBev Finance, Inc. $513,000 3.30% 1/2/2023 530,723 0.08%Anheuser-Busch InBev Worldwide, Inc. AU($)600,000 3.75% 6/9/2024 454,632 0.07%Anheuser-Busch InBev SA £200,000 9.75% 30/7/2024 362,438 0.06%Argenta Spaarbank NV^ €200,000 3.88% 24/5/2026 234,142 0.04%Anheuser-Busch InBev SA €200,000 1.95% 30/9/2021 233,042 0.04%KBC Group NV €200,000 1.13% 25/1/2024 232,471 0.04%Anheuser-Busch InBev SA €200,000 0.80% 20/4/2023 230,466 0.03%Belfius Bank SA €200,000 0.63% 30/8/2023 228,717 0.03%Belfius Bank SA €200,000 0.75% 12/9/2022 228,565 0.03%Anheuser-Busch InBev Worldwide, Inc. $186,000 2.50% 15/7/2022 189,171 0.03%Anheuser-Busch InBev Worldwide, Inc. AU($)250,000 3.25% 6/9/2022 182,462 0.03%Anheuser-Busch InBev Finance, Inc. $166,000 3.70% 1/2/2024 175,913 0.03%Anheuser-Busch InBev Worldwide, Inc. $150,000 3.50% 12/1/2024 157,995 0.02%Anheuser-Busch InBev Finance, Inc. CA($)175,000 2.60% 15/5/2024 134,943 0.02%Euroclear Bank SA £100,000 1.25% 30/9/2024 132,581 0.02%Elia System Operator SA^ €100,000 2.75% Perpetual 118,144 0.02%Solvay SA €100,000 1.63% 2/12/2022 116,783 0.02%KBC Group NV^ €100,000 1.88% 11/3/2027 116,093 0.02%Argenta Spaarbank NV €100,000 1.00% 6/2/2024 115,476 0.02%KBC Group NV €100,000 0.75% 1/3/2022 114,134 0.02%Euroclear Bank SA €100,000 0.50% 10/7/2023 114,031 0.02%Euroclear Bank SA €100,000 0.25% 7/9/2022 112,930 0.02%KBC Group NV^ €100,000 0.50% 3/12/2029 110,439 0.02%Anheuser-Busch InBev Finance, Inc. $87,000 2.63% 17/1/2023 88,450 0.01%
Vanguard Global Short-Term Corporate Bond Index Fund
698
Maturity Fair Value % of Total Principal Coupon Date US Dollars ($) Net Assets
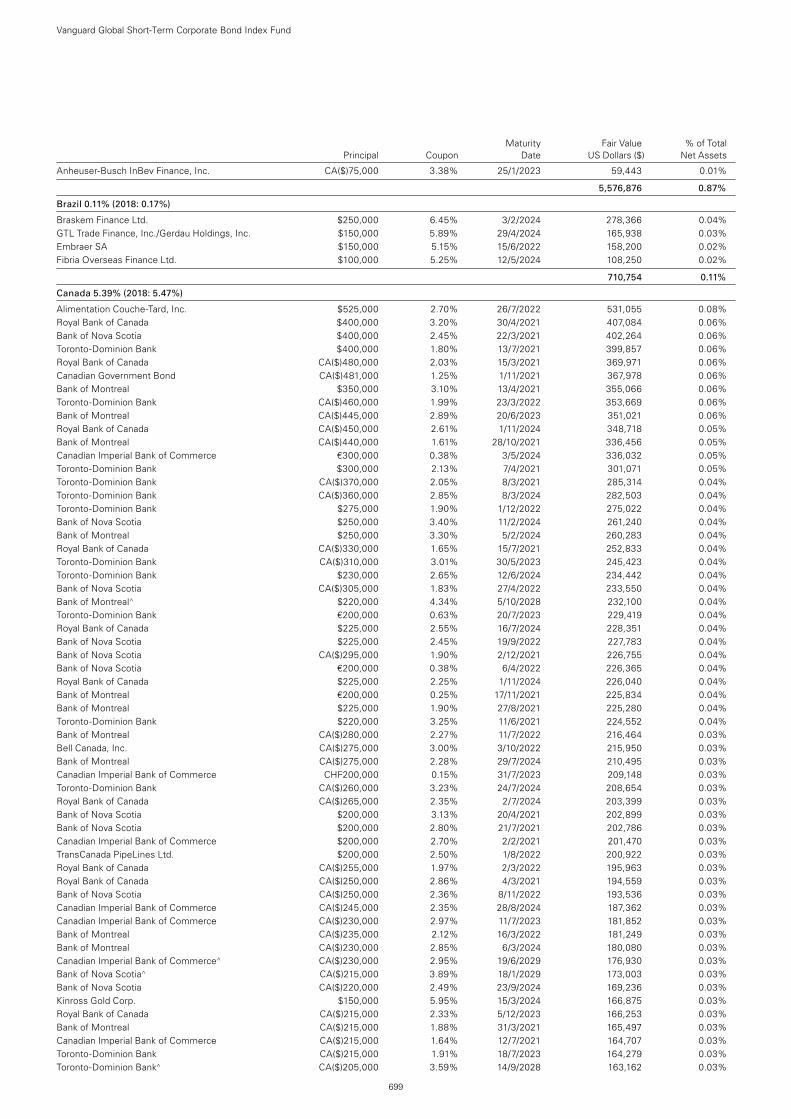
Anheuser-Busch InBev Finance, Inc. CA($)75,000 3.38% 25/1/2023 59,443 0.01%
5,576,876 0.87%
Brazil 0.11% (2018: 0.17%)
Braskem Finance Ltd. $250,000 6.45% 3/2/2024 278,366 0.04%GTL Trade Finance, Inc./Gerdau Holdings, Inc. $150,000 5.89% 29/4/2024 165,938 0.03%Embraer SA $150,000 5.15% 15/6/2022 158,200 0.02%Fibria Overseas Finance Ltd. $100,000 5.25% 12/5/2024 108,250 0.02%
710,754 0.11%
Canada 5.39% (2018: 5.47%)
Alimentation Couche-Tard, Inc. $525,000 2.70% 26/7/2022 531,055 0.08%Royal Bank of Canada $400,000 3.20% 30/4/2021 407,084 0.06%Bank of Nova Scotia $400,000 2.45% 22/3/2021 402,264 0.06%Toronto-Dominion Bank $400,000 1.80% 13/7/2021 399,857 0.06%Royal Bank of Canada CA($)480,000 2.03% 15/3/2021 369,971 0.06%Canadian Government Bond CA($)481,000 1.25% 1/11/2021 367,978 0.06%Bank of Montreal $350,000 3.10% 13/4/2021 355,066 0.06%Toronto-Dominion Bank CA($)460,000 1.99% 23/3/2022 353,669 0.06%Bank of Montreal CA($)445,000 2.89% 20/6/2023 351,021 0.06%Royal Bank of Canada CA($)450,000 2.61% 1/11/2024 348,718 0.05%Bank of Montreal CA($)440,000 1.61% 28/10/2021 336,456 0.05%Canadian Imperial Bank of Commerce €300,000 0.38% 3/5/2024 336,032 0.05%Toronto-Dominion Bank $300,000 2.13% 7/4/2021 301,071 0.05%Toronto-Dominion Bank CA($)370,000 2.05% 8/3/2021 285,314 0.04%Toronto-Dominion Bank CA($)360,000 2.85% 8/3/2024 282,503 0.04%Toronto-Dominion Bank $275,000 1.90% 1/12/2022 275,022 0.04%Bank of Nova Scotia $250,000 3.40% 11/2/2024 261,240 0.04%Bank of Montreal $250,000 3.30% 5/2/2024 260,283 0.04%Royal Bank of Canada CA($)330,000 1.65% 15/7/2021 252,833 0.04%Toronto-Dominion Bank CA($)310,000 3.01% 30/5/2023 245,423 0.04%Toronto-Dominion Bank $230,000 2.65% 12/6/2024 234,442 0.04%Bank of Nova Scotia CA($)305,000 1.83% 27/4/2022 233,550 0.04%Bank of Montreal^ $220,000 4.34% 5/10/2028 232,100 0.04%Toronto-Dominion Bank €200,000 0.63% 20/7/2023 229,419 0.04%Royal Bank of Canada $225,000 2.55% 16/7/2024 228,351 0.04%Bank of Nova Scotia $225,000 2.45% 19/9/2022 227,783 0.04%Bank of Nova Scotia CA($)295,000 1.90% 2/12/2021 226,755 0.04%Bank of Nova Scotia €200,000 0.38% 6/4/2022 226,365 0.04%Royal Bank of Canada $225,000 2.25% 1/11/2024 226,040 0.04%Bank of Montreal €200,000 0.25% 17/11/2021 225,834 0.04%Bank of Montreal $225,000 1.90% 27/8/2021 225,280 0.04%Toronto-Dominion Bank $220,000 3.25% 11/6/2021 224,552 0.04%Bank of Montreal CA($)280,000 2.27% 11/7/2022 216,464 0.03%Bell Canada, Inc. CA($)275,000 3.00% 3/10/2022 215,950 0.03%Bank of Montreal CA($)275,000 2.28% 29/7/2024 210,495 0.03%Canadian Imperial Bank of Commerce CHF200,000 0.15% 31/7/2023 209,148 0.03%Toronto-Dominion Bank CA($)260,000 3.23% 24/7/2024 208,654 0.03%Royal Bank of Canada CA($)265,000 2.35% 2/7/2024 203,399 0.03%Bank of Nova Scotia $200,000 3.13% 20/4/2021 202,899 0.03%Bank of Nova Scotia $200,000 2.80% 21/7/2021 202,786 0.03%Canadian Imperial Bank of Commerce $200,000 2.70% 2/2/2021 201,470 0.03%TransCanada PipeLines Ltd. $200,000 2.50% 1/8/2022 200,922 0.03%Royal Bank of Canada CA($)255,000 1.97% 2/3/2022 195,963 0.03%Royal Bank of Canada CA($)250,000 2.86% 4/3/2021 194,559 0.03%Bank of Nova Scotia CA($)250,000 2.36% 8/11/2022 193,536 0.03%Canadian Imperial Bank of Commerce CA($)245,000 2.35% 28/8/2024 187,362 0.03%Canadian Imperial Bank of Commerce CA($)230,000 2.97% 11/7/2023 181,852 0.03%Bank of Montreal CA($)235,000 2.12% 16/3/2022 181,249 0.03%Bank of Montreal CA($)230,000 2.85% 6/3/2024 180,080 0.03%Canadian Imperial Bank of Commerce^ CA($)230,000 2.95% 19/6/2029 176,930 0.03%Bank of Nova Scotia^ CA($)215,000 3.89% 18/1/2029 173,003 0.03%Bank of Nova Scotia CA($)220,000 2.49% 23/9/2024 169,236 0.03%Kinross Gold Corp. $150,000 5.95% 15/3/2024 166,875 0.03%Royal Bank of Canada CA($)215,000 2.33% 5/12/2023 166,253 0.03%Bank of Montreal CA($)215,000 1.88% 31/3/2021 165,497 0.03%Canadian Imperial Bank of Commerce CA($)215,000 1.64% 12/7/2021 164,707 0.03%Toronto-Dominion Bank CA($)215,000 1.91% 18/7/2023 164,279 0.03%Toronto-Dominion Bank^ CA($)205,000 3.59% 14/9/2028 163,162 0.03%
Vanguard Global Short-Term Corporate Bond Index Fund
699
Maturity Fair Value % of Total Principal Coupon Date US Dollars ($) Net Assets
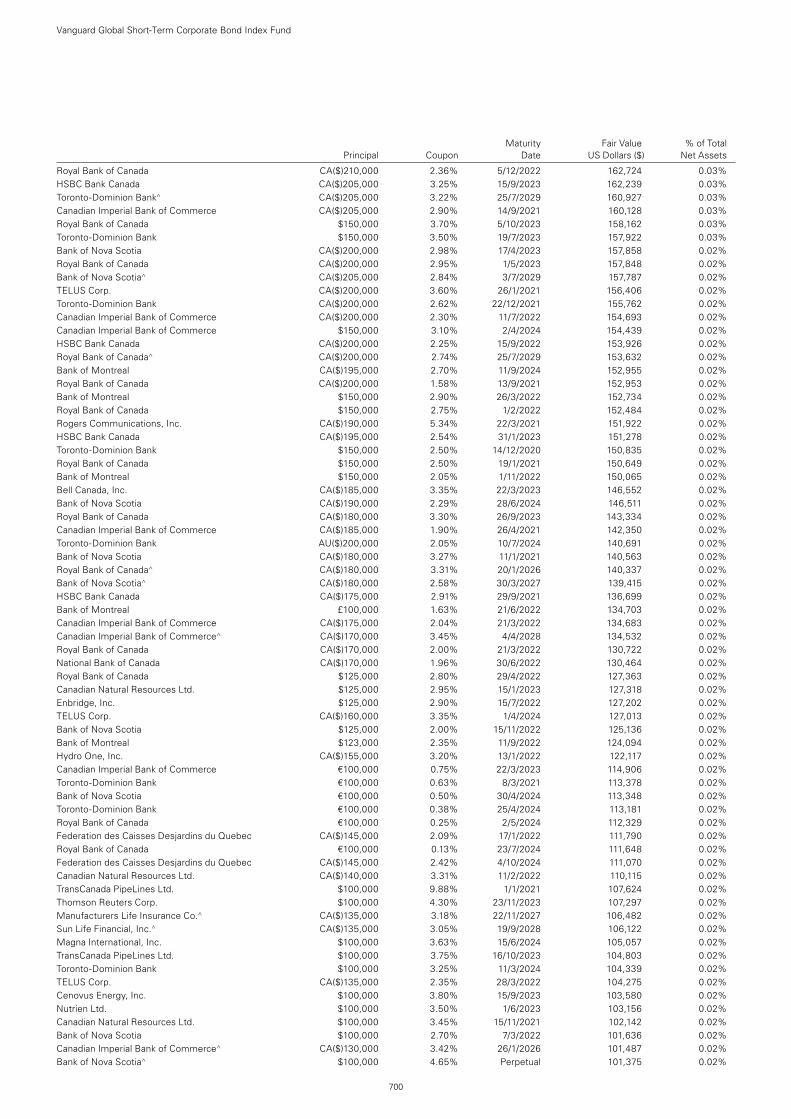
Royal Bank of Canada CA($)210,000 2.36% 5/12/2022 162,724 0.03%HSBC Bank Canada CA($)205,000 3.25% 15/9/2023 162,239 0.03%Toronto-Dominion Bank^ CA($)205,000 3.22% 25/7/2029 160,927 0.03%Canadian Imperial Bank of Commerce CA($)205,000 2.90% 14/9/2021 160,128 0.03%Royal Bank of Canada $150,000 3.70% 5/10/2023 158,162 0.03%Toronto-Dominion Bank $150,000 3.50% 19/7/2023 157,922 0.03%Bank of Nova Scotia CA($)200,000 2.98% 17/4/2023 157,858 0.02%Royal Bank of Canada CA($)200,000 2.95% 1/5/2023 157,848 0.02%Bank of Nova Scotia^ CA($)205,000 2.84% 3/7/2029 157,787 0.02%TELUS Corp. CA($)200,000 3.60% 26/1/2021 156,406 0.02%Toronto-Dominion Bank CA($)200,000 2.62% 22/12/2021 155,762 0.02%Canadian Imperial Bank of Commerce CA($)200,000 2.30% 11/7/2022 154,693 0.02%Canadian Imperial Bank of Commerce $150,000 3.10% 2/4/2024 154,439 0.02%HSBC Bank Canada CA($)200,000 2.25% 15/9/2022 153,926 0.02%Royal Bank of Canada^ CA($)200,000 2.74% 25/7/2029 153,632 0.02%Bank of Montreal CA($)195,000 2.70% 11/9/2024 152,955 0.02%Royal Bank of Canada CA($)200,000 1.58% 13/9/2021 152,953 0.02%Bank of Montreal $150,000 2.90% 26/3/2022 152,734 0.02%Royal Bank of Canada $150,000 2.75% 1/2/2022 152,484 0.02%Rogers Communications, Inc. CA($)190,000 5.34% 22/3/2021 151,922 0.02%HSBC Bank Canada CA($)195,000 2.54% 31/1/2023 151,278 0.02%Toronto-Dominion Bank $150,000 2.50% 14/12/2020 150,835 0.02%Royal Bank of Canada $150,000 2.50% 19/1/2021 150,649 0.02%Bank of Montreal $150,000 2.05% 1/11/2022 150,065 0.02%Bell Canada, Inc. CA($)185,000 3.35% 22/3/2023 146,552 0.02%Bank of Nova Scotia CA($)190,000 2.29% 28/6/2024 146,511 0.02%Royal Bank of Canada CA($)180,000 3.30% 26/9/2023 143,334 0.02%Canadian Imperial Bank of Commerce CA($)185,000 1.90% 26/4/2021 142,350 0.02%Toronto-Dominion Bank AU($)200,000 2.05% 10/7/2024 140,691 0.02%Bank of Nova Scotia CA($)180,000 3.27% 11/1/2021 140,563 0.02%Royal Bank of Canada^ CA($)180,000 3.31% 20/1/2026 140,337 0.02%Bank of Nova Scotia^ CA($)180,000 2.58% 30/3/2027 139,415 0.02%HSBC Bank Canada CA($)175,000 2.91% 29/9/2021 136,699 0.02%Bank of Montreal £100,000 1.63% 21/6/2022 134,703 0.02%Canadian Imperial Bank of Commerce CA($)175,000 2.04% 21/3/2022 134,683 0.02%Canadian Imperial Bank of Commerce^ CA($)170,000 3.45% 4/4/2028 134,532 0.02%Royal Bank of Canada CA($)170,000 2.00% 21/3/2022 130,722 0.02%National Bank of Canada CA($)170,000 1.96% 30/6/2022 130,464 0.02%Royal Bank of Canada $125,000 2.80% 29/4/2022 127,363 0.02%Canadian Natural Resources Ltd. $125,000 2.95% 15/1/2023 127,318 0.02%Enbridge, Inc. $125,000 2.90% 15/7/2022 127,202 0.02%TELUS Corp. CA($)160,000 3.35% 1/4/2024 127,013 0.02%Bank of Nova Scotia $125,000 2.00% 15/11/2022 125,136 0.02%Bank of Montreal $123,000 2.35% 11/9/2022 124,094 0.02%Hydro One, Inc. CA($)155,000 3.20% 13/1/2022 122,117 0.02%Canadian Imperial Bank of Commerce €100,000 0.75% 22/3/2023 114,906 0.02%Toronto-Dominion Bank €100,000 0.63% 8/3/2021 113,378 0.02%Bank of Nova Scotia €100,000 0.50% 30/4/2024 113,348 0.02%Toronto-Dominion Bank €100,000 0.38% 25/4/2024 113,181 0.02%Royal Bank of Canada €100,000 0.25% 2/5/2024 112,329 0.02%Federation des Caisses Desjardins du Quebec CA($)145,000 2.09% 17/1/2022 111,790 0.02%Royal Bank of Canada €100,000 0.13% 23/7/2024 111,648 0.02%Federation des Caisses Desjardins du Quebec CA($)145,000 2.42% 4/10/2024 111,070 0.02%Canadian Natural Resources Ltd. CA($)140,000 3.31% 11/2/2022 110,115 0.02%TransCanada PipeLines Ltd. $100,000 9.88% 1/1/2021 107,624 0.02%Thomson Reuters Corp. $100,000 4.30% 23/11/2023 107,297 0.02%Manufacturers Life Insurance Co.^ CA($)135,000 3.18% 22/11/2027 106,482 0.02%Sun Life Financial, Inc.^ CA($)135,000 3.05% 19/9/2028 106,122 0.02%Magna International, Inc. $100,000 3.63% 15/6/2024 105,057 0.02%TransCanada PipeLines Ltd. $100,000 3.75% 16/10/2023 104,803 0.02%Toronto-Dominion Bank $100,000 3.25% 11/3/2024 104,339 0.02%TELUS Corp. CA($)135,000 2.35% 28/3/2022 104,275 0.02%Cenovus Energy, Inc. $100,000 3.80% 15/9/2023 103,580 0.02%Nutrien Ltd. $100,000 3.50% 1/6/2023 103,156 0.02%Canadian Natural Resources Ltd. $100,000 3.45% 15/11/2021 102,142 0.02%Bank of Nova Scotia $100,000 2.70% 7/3/2022 101,636 0.02%Canadian Imperial Bank of Commerce^ CA($)130,000 3.42% 26/1/2026 101,487 0.02%Bank of Nova Scotia^ $100,000 4.65% Perpetual 101,375 0.02%
Vanguard Global Short-Term Corporate Bond Index Fund
700
Maturity Fair Value % of Total Principal Coupon Date US Dollars ($) Net Assets
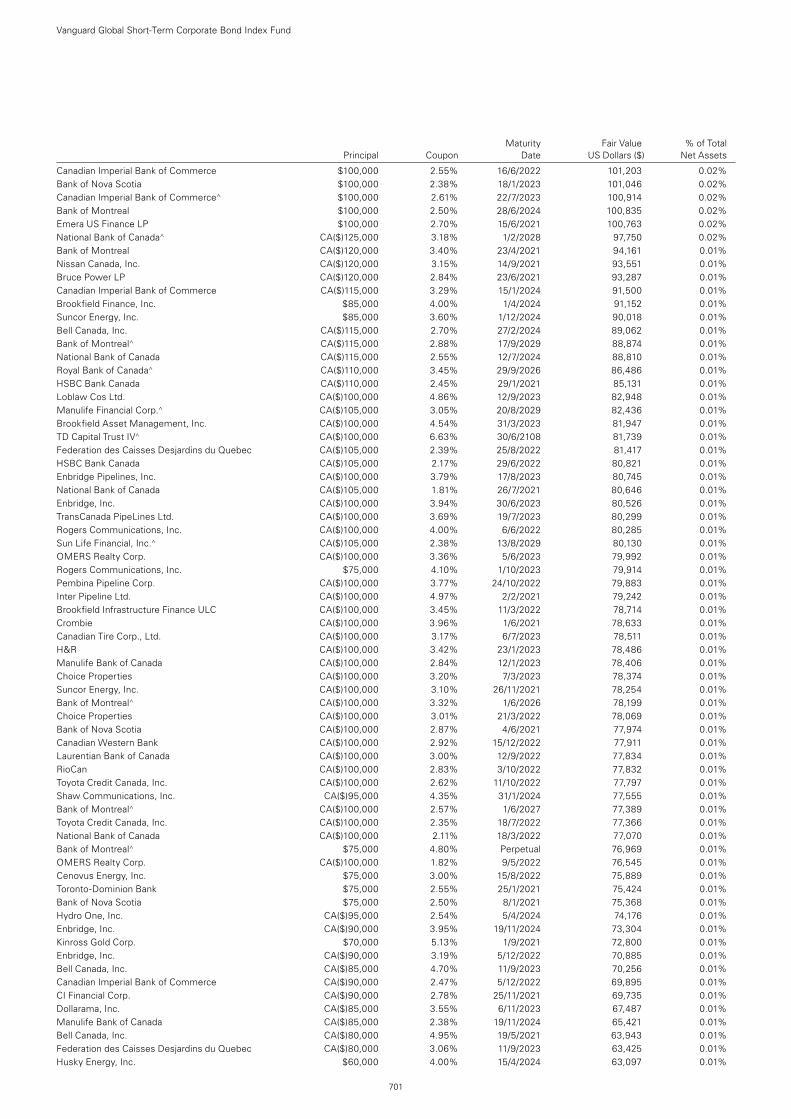
Canadian Imperial Bank of Commerce $100,000 2.55% 16/6/2022 101,203 0.02%Bank of Nova Scotia $100,000 2.38% 18/1/2023 101,046 0.02%Canadian Imperial Bank of Commerce^ $100,000 2.61% 22/7/2023 100,914 0.02%Bank of Montreal $100,000 2.50% 28/6/2024 100,835 0.02%Emera US Finance LP $100,000 2.70% 15/6/2021 100,763 0.02%National Bank of Canada^ CA($)125,000 3.18% 1/2/2028 97,750 0.02%Bank of Montreal CA($)120,000 3.40% 23/4/2021 94,161 0.01%Nissan Canada, Inc. CA($)120,000 3.15% 14/9/2021 93,551 0.01%Bruce Power LP CA($)120,000 2.84% 23/6/2021 93,287 0.01%Canadian Imperial Bank of Commerce CA($)115,000 3.29% 15/1/2024 91,500 0.01%Brookfield Finance, Inc. $85,000 4.00% 1/4/2024 91,152 0.01%Suncor Energy, Inc. $85,000 3.60% 1/12/2024 90,018 0.01%Bell Canada, Inc. CA($)115,000 2.70% 27/2/2024 89,062 0.01%Bank of Montreal^ CA($)115,000 2.88% 17/9/2029 88,874 0.01%National Bank of Canada CA($)115,000 2.55% 12/7/2024 88,810 0.01%Royal Bank of Canada^ CA($)110,000 3.45% 29/9/2026 86,486 0.01%HSBC Bank Canada CA($)110,000 2.45% 29/1/2021 85,131 0.01%Loblaw Cos Ltd. CA($)100,000 4.86% 12/9/2023 82,948 0.01%Manulife Financial Corp.^ CA($)105,000 3.05% 20/8/2029 82,436 0.01%Brookfield Asset Management, Inc. CA($)100,000 4.54% 31/3/2023 81,947 0.01%TD Capital Trust IV^ CA($)100,000 6.63% 30/6/2108 81,739 0.01%Federation des Caisses Desjardins du Quebec CA($)105,000 2.39% 25/8/2022 81,417 0.01%HSBC Bank Canada CA($)105,000 2.17% 29/6/2022 80,821 0.01%Enbridge Pipelines, Inc. CA($)100,000 3.79% 17/8/2023 80,745 0.01%National Bank of Canada CA($)105,000 1.81% 26/7/2021 80,646 0.01%Enbridge, Inc. CA($)100,000 3.94% 30/6/2023 80,526 0.01%TransCanada PipeLines Ltd. CA($)100,000 3.69% 19/7/2023 80,299 0.01%Rogers Communications, Inc. CA($)100,000 4.00% 6/6/2022 80,285 0.01%Sun Life Financial, Inc.^ CA($)105,000 2.38% 13/8/2029 80,130 0.01%OMERS Realty Corp. CA($)100,000 3.36% 5/6/2023 79,992 0.01%Rogers Communications, Inc. $75,000 4.10% 1/10/2023 79,914 0.01%Pembina Pipeline Corp. CA($)100,000 3.77% 24/10/2022 79,883 0.01%Inter Pipeline Ltd. CA($)100,000 4.97% 2/2/2021 79,242 0.01%Brookfield Infrastructure Finance ULC CA($)100,000 3.45% 11/3/2022 78,714 0.01%Crombie CA($)100,000 3.96% 1/6/2021 78,633 0.01%Canadian Tire Corp., Ltd. CA($)100,000 3.17% 6/7/2023 78,511 0.01%H&R CA($)100,000 3.42% 23/1/2023 78,486 0.01%Manulife Bank of Canada CA($)100,000 2.84% 12/1/2023 78,406 0.01%Choice Properties CA($)100,000 3.20% 7/3/2023 78,374 0.01%Suncor Energy, Inc. CA($)100,000 3.10% 26/11/2021 78,254 0.01%Bank of Montreal^ CA($)100,000 3.32% 1/6/2026 78,199 0.01%Choice Properties CA($)100,000 3.01% 21/3/2022 78,069 0.01%Bank of Nova Scotia CA($)100,000 2.87% 4/6/2021 77,974 0.01%Canadian Western Bank CA($)100,000 2.92% 15/12/2022 77,911 0.01%Laurentian Bank of Canada CA($)100,000 3.00% 12/9/2022 77,834 0.01%RioCan CA($)100,000 2.83% 3/10/2022 77,832 0.01%Toyota Credit Canada, Inc. CA($)100,000 2.62% 11/10/2022 77,797 0.01%Shaw Communications, Inc. CA($)95,000 4.35% 31/1/2024 77,555 0.01%Bank of Montreal^ CA($)100,000 2.57% 1/6/2027 77,389 0.01%Toyota Credit Canada, Inc. CA($)100,000 2.35% 18/7/2022 77,366 0.01%National Bank of Canada CA($)100,000 2.11% 18/3/2022 77,070 0.01%Bank of Montreal^ $75,000 4.80% Perpetual 76,969 0.01%OMERS Realty Corp. CA($)100,000 1.82% 9/5/2022 76,545 0.01%Cenovus Energy, Inc. $75,000 3.00% 15/8/2022 75,889 0.01%Toronto-Dominion Bank $75,000 2.55% 25/1/2021 75,424 0.01%Bank of Nova Scotia $75,000 2.50% 8/1/2021 75,368 0.01%Hydro One, Inc. CA($)95,000 2.54% 5/4/2024 74,176 0.01%Enbridge, Inc. CA($)90,000 3.95% 19/11/2024 73,304 0.01%Kinross Gold Corp. $70,000 5.13% 1/9/2021 72,800 0.01%Enbridge, Inc. CA($)90,000 3.19% 5/12/2022 70,885 0.01%Bell Canada, Inc. CA($)85,000 4.70% 11/9/2023 70,256 0.01%Canadian Imperial Bank of Commerce CA($)90,000 2.47% 5/12/2022 69,895 0.01%CI Financial Corp. CA($)90,000 2.78% 25/11/2021 69,735 0.01%Dollarama, Inc. CA($)85,000 3.55% 6/11/2023 67,487 0.01%Manulife Bank of Canada CA($)85,000 2.38% 19/11/2024 65,421 0.01%Bell Canada, Inc. CA($)80,000 4.95% 19/5/2021 63,943 0.01%Federation des Caisses Desjardins du Quebec CA($)80,000 3.06% 11/9/2023 63,425 0.01%Husky Energy, Inc. $60,000 4.00% 15/4/2024 63,097 0.01%
Vanguard Global Short-Term Corporate Bond Index Fund
701
Maturity Fair Value % of Total Principal Coupon Date US Dollars ($) Net Assets
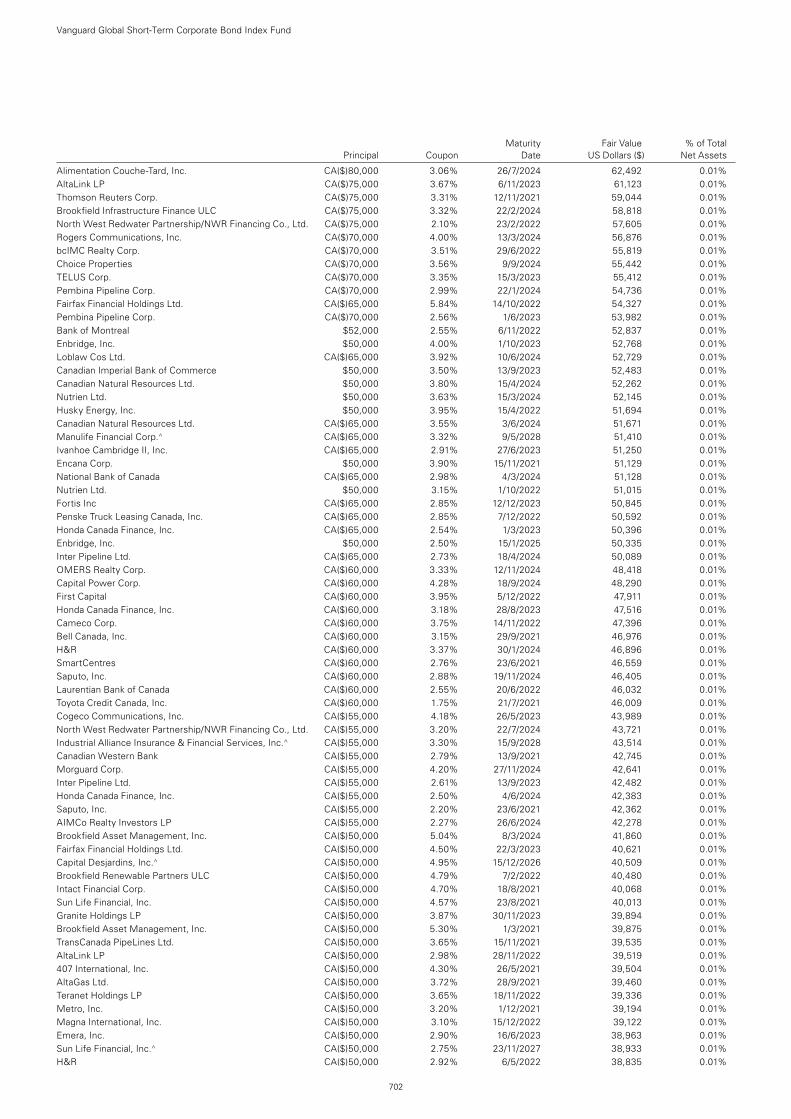
Alimentation Couche-Tard, Inc. CA($)80,000 3.06% 26/7/2024 62,492 0.01%AltaLink LP CA($)75,000 3.67% 6/11/2023 61,123 0.01%Thomson Reuters Corp. CA($)75,000 3.31% 12/11/2021 59,044 0.01%Brookfield Infrastructure Finance ULC CA($)75,000 3.32% 22/2/2024 58,818 0.01%North West Redwater Partnership/NWR Financing Co., Ltd. CA($)75,000 2.10% 23/2/2022 57,605 0.01%Rogers Communications, Inc. CA($)70,000 4.00% 13/3/2024 56,876 0.01%bcIMC Realty Corp. CA($)70,000 3.51% 29/6/2022 55,819 0.01%Choice Properties CA($)70,000 3.56% 9/9/2024 55,442 0.01%TELUS Corp. CA($)70,000 3.35% 15/3/2023 55,412 0.01%Pembina Pipeline Corp. CA($)70,000 2.99% 22/1/2024 54,736 0.01%Fairfax Financial Holdings Ltd. CA($)65,000 5.84% 14/10/2022 54,327 0.01%Pembina Pipeline Corp. CA($)70,000 2.56% 1/6/2023 53,982 0.01%Bank of Montreal $52,000 2.55% 6/11/2022 52,837 0.01%Enbridge, Inc. $50,000 4.00% 1/10/2023 52,768 0.01%Loblaw Cos Ltd. CA($)65,000 3.92% 10/6/2024 52,729 0.01%Canadian Imperial Bank of Commerce $50,000 3.50% 13/9/2023 52,483 0.01%Canadian Natural Resources Ltd. $50,000 3.80% 15/4/2024 52,262 0.01%Nutrien Ltd. $50,000 3.63% 15/3/2024 52,145 0.01%Husky Energy, Inc. $50,000 3.95% 15/4/2022 51,694 0.01%Canadian Natural Resources Ltd. CA($)65,000 3.55% 3/6/2024 51,671 0.01%Manulife Financial Corp.^ CA($)65,000 3.32% 9/5/2028 51,410 0.01%Ivanhoe Cambridge II, Inc. CA($)65,000 2.91% 27/6/2023 51,250 0.01%Encana Corp. $50,000 3.90% 15/11/2021 51,129 0.01%National Bank of Canada CA($)65,000 2.98% 4/3/2024 51,128 0.01%Nutrien Ltd. $50,000 3.15% 1/10/2022 51,015 0.01%Fortis Inc CA($)65,000 2.85% 12/12/2023 50,845 0.01%Penske Truck Leasing Canada, Inc. CA($)65,000 2.85% 7/12/2022 50,592 0.01%Honda Canada Finance, Inc. CA($)65,000 2.54% 1/3/2023 50,396 0.01%Enbridge, Inc. $50,000 2.50% 15/1/2025 50,335 0.01%Inter Pipeline Ltd. CA($)65,000 2.73% 18/4/2024 50,089 0.01%OMERS Realty Corp. CA($)60,000 3.33% 12/11/2024 48,418 0.01%Capital Power Corp. CA($)60,000 4.28% 18/9/2024 48,290 0.01%First Capital CA($)60,000 3.95% 5/12/2022 47,911 0.01%Honda Canada Finance, Inc. CA($)60,000 3.18% 28/8/2023 47,516 0.01%Cameco Corp. CA($)60,000 3.75% 14/11/2022 47,396 0.01%Bell Canada, Inc. CA($)60,000 3.15% 29/9/2021 46,976 0.01%H&R CA($)60,000 3.37% 30/1/2024 46,896 0.01%SmartCentres CA($)60,000 2.76% 23/6/2021 46,559 0.01%Saputo, Inc. CA($)60,000 2.88% 19/11/2024 46,405 0.01%Laurentian Bank of Canada CA($)60,000 2.55% 20/6/2022 46,032 0.01%Toyota Credit Canada, Inc. CA($)60,000 1.75% 21/7/2021 46,009 0.01%Cogeco Communications, Inc. CA($)55,000 4.18% 26/5/2023 43,989 0.01%North West Redwater Partnership/NWR Financing Co., Ltd. CA($)55,000 3.20% 22/7/2024 43,721 0.01%Industrial Alliance Insurance & Financial Services, Inc.^ CA($)55,000 3.30% 15/9/2028 43,514 0.01%Canadian Western Bank CA($)55,000 2.79% 13/9/2021 42,745 0.01%Morguard Corp. CA($)55,000 4.20% 27/11/2024 42,641 0.01%Inter Pipeline Ltd. CA($)55,000 2.61% 13/9/2023 42,482 0.01%Honda Canada Finance, Inc. CA($)55,000 2.50% 4/6/2024 42,383 0.01%Saputo, Inc. CA($)55,000 2.20% 23/6/2021 42,362 0.01%AIMCo Realty Investors LP CA($)55,000 2.27% 26/6/2024 42,278 0.01%Brookfield Asset Management, Inc. CA($)50,000 5.04% 8/3/2024 41,860 0.01%Fairfax Financial Holdings Ltd. CA($)50,000 4.50% 22/3/2023 40,621 0.01%Capital Desjardins, Inc.^ CA($)50,000 4.95% 15/12/2026 40,509 0.01%Brookfield Renewable Partners ULC CA($)50,000 4.79% 7/2/2022 40,480 0.01%Intact Financial Corp. CA($)50,000 4.70% 18/8/2021 40,068 0.01%Sun Life Financial, Inc. CA($)50,000 4.57% 23/8/2021 40,013 0.01%Granite Holdings LP CA($)50,000 3.87% 30/11/2023 39,894 0.01%Brookfield Asset Management, Inc. CA($)50,000 5.30% 1/3/2021 39,875 0.01%TransCanada PipeLines Ltd. CA($)50,000 3.65% 15/11/2021 39,535 0.01%AltaLink LP CA($)50,000 2.98% 28/11/2022 39,519 0.01%407 International, Inc. CA($)50,000 4.30% 26/5/2021 39,504 0.01%AltaGas Ltd. CA($)50,000 3.72% 28/9/2021 39,460 0.01%Teranet Holdings LP CA($)50,000 3.65% 18/11/2022 39,336 0.01%Metro, Inc. CA($)50,000 3.20% 1/12/2021 39,194 0.01%Magna International, Inc. CA($)50,000 3.10% 15/12/2022 39,122 0.01%Emera, Inc. CA($)50,000 2.90% 16/6/2023 38,963 0.01%Sun Life Financial, Inc.^ CA($)50,000 2.75% 23/11/2027 38,933 0.01%H&R CA($)50,000 2.92% 6/5/2022 38,835 0.01%
Vanguard Global Short-Term Corporate Bond Index Fund
702
Maturity Fair Value % of Total Principal Coupon Date US Dollars ($) Net Assets
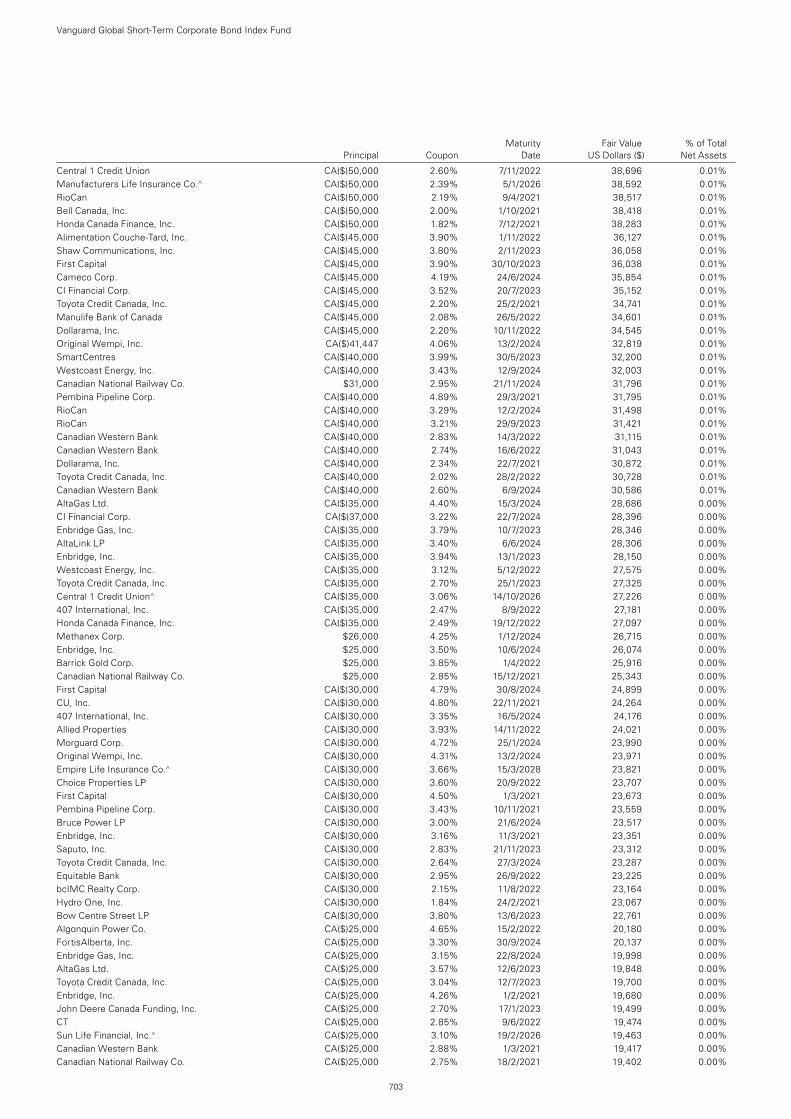
Central 1 Credit Union CA($)50,000 2.60% 7/11/2022 38,696 0.01%Manufacturers Life Insurance Co.^ CA($)50,000 2.39% 5/1/2026 38,592 0.01%RioCan CA($)50,000 2.19% 9/4/2021 38,517 0.01%Bell Canada, Inc. CA($)50,000 2.00% 1/10/2021 38,418 0.01%Honda Canada Finance, Inc. CA($)50,000 1.82% 7/12/2021 38,283 0.01%Alimentation Couche-Tard, Inc. CA($)45,000 3.90% 1/11/2022 36,127 0.01%Shaw Communications, Inc. CA($)45,000 3.80% 2/11/2023 36,058 0.01%First Capital CA($)45,000 3.90% 30/10/2023 36,038 0.01%Cameco Corp. CA($)45,000 4.19% 24/6/2024 35,854 0.01%CI Financial Corp. CA($)45,000 3.52% 20/7/2023 35,152 0.01%Toyota Credit Canada, Inc. CA($)45,000 2.20% 25/2/2021 34,741 0.01%Manulife Bank of Canada CA($)45,000 2.08% 26/5/2022 34,601 0.01%Dollarama, Inc. CA($)45,000 2.20% 10/11/2022 34,545 0.01%Original Wempi, Inc. CA($)41,447 4.06% 13/2/2024 32,819 0.01%SmartCentres CA($)40,000 3.99% 30/5/2023 32,200 0.01%Westcoast Energy, Inc. CA($)40,000 3.43% 12/9/2024 32,003 0.01%Canadian National Railway Co. $31,000 2.95% 21/11/2024 31,796 0.01%Pembina Pipeline Corp. CA($)40,000 4.89% 29/3/2021 31,795 0.01%RioCan CA($)40,000 3.29% 12/2/2024 31,498 0.01%RioCan CA($)40,000 3.21% 29/9/2023 31,421 0.01%Canadian Western Bank CA($)40,000 2.83% 14/3/2022 31,115 0.01%Canadian Western Bank CA($)40,000 2.74% 16/6/2022 31,043 0.01%Dollarama, Inc. CA($)40,000 2.34% 22/7/2021 30,872 0.01%Toyota Credit Canada, Inc. CA($)40,000 2.02% 28/2/2022 30,728 0.01%Canadian Western Bank CA($)40,000 2.60% 6/9/2024 30,586 0.01%AltaGas Ltd. CA($)35,000 4.40% 15/3/2024 28,686 0.00%CI Financial Corp. CA($)37,000 3.22% 22/7/2024 28,396 0.00%Enbridge Gas, Inc. CA($)35,000 3.79% 10/7/2023 28,346 0.00%AltaLink LP CA($)35,000 3.40% 6/6/2024 28,306 0.00%Enbridge, Inc. CA($)35,000 3.94% 13/1/2023 28,150 0.00%Westcoast Energy, Inc. CA($)35,000 3.12% 5/12/2022 27,575 0.00%Toyota Credit Canada, Inc. CA($)35,000 2.70% 25/1/2023 27,325 0.00%Central 1 Credit Union^ CA($)35,000 3.06% 14/10/2026 27,226 0.00%407 International, Inc. CA($)35,000 2.47% 8/9/2022 27,181 0.00%Honda Canada Finance, Inc. CA($)35,000 2.49% 19/12/2022 27,097 0.00%Methanex Corp. $26,000 4.25% 1/12/2024 26,715 0.00%Enbridge, Inc. $25,000 3.50% 10/6/2024 26,074 0.00%Barrick Gold Corp. $25,000 3.85% 1/4/2022 25,916 0.00%Canadian National Railway Co. $25,000 2.85% 15/12/2021 25,343 0.00%First Capital CA($)30,000 4.79% 30/8/2024 24,899 0.00%CU, Inc. CA($)30,000 4.80% 22/11/2021 24,264 0.00%407 International, Inc. CA($)30,000 3.35% 16/5/2024 24,176 0.00%Allied Properties CA($)30,000 3.93% 14/11/2022 24,021 0.00%Morguard Corp. CA($)30,000 4.72% 25/1/2024 23,990 0.00%Original Wempi, Inc. CA($)30,000 4.31% 13/2/2024 23,971 0.00%Empire Life Insurance Co.^ CA($)30,000 3.66% 15/3/2028 23,821 0.00%Choice Properties LP CA($)30,000 3.60% 20/9/2022 23,707 0.00%First Capital CA($)30,000 4.50% 1/3/2021 23,673 0.00%Pembina Pipeline Corp. CA($)30,000 3.43% 10/11/2021 23,559 0.00%Bruce Power LP CA($)30,000 3.00% 21/6/2024 23,517 0.00%Enbridge, Inc. CA($)30,000 3.16% 11/3/2021 23,351 0.00%Saputo, Inc. CA($)30,000 2.83% 21/11/2023 23,312 0.00%Toyota Credit Canada, Inc. CA($)30,000 2.64% 27/3/2024 23,287 0.00%Equitable Bank CA($)30,000 2.95% 26/9/2022 23,225 0.00%bcIMC Realty Corp. CA($)30,000 2.15% 11/8/2022 23,164 0.00%Hydro One, Inc. CA($)30,000 1.84% 24/2/2021 23,067 0.00%Bow Centre Street LP CA($)30,000 3.80% 13/6/2023 22,761 0.00%Algonquin Power Co. CA($)25,000 4.65% 15/2/2022 20,180 0.00%FortisAlberta, Inc. CA($)25,000 3.30% 30/9/2024 20,137 0.00%Enbridge Gas, Inc. CA($)25,000 3.15% 22/8/2024 19,998 0.00%AltaGas Ltd. CA($)25,000 3.57% 12/6/2023 19,848 0.00%Toyota Credit Canada, Inc. CA($)25,000 3.04% 12/7/2023 19,700 0.00%Enbridge, Inc. CA($)25,000 4.26% 1/2/2021 19,680 0.00%John Deere Canada Funding, Inc. CA($)25,000 2.70% 17/1/2023 19,499 0.00%CT CA($)25,000 2.85% 9/6/2022 19,474 0.00%Sun Life Financial, Inc.^ CA($)25,000 3.10% 19/2/2026 19,463 0.00%Canadian Western Bank CA($)25,000 2.88% 1/3/2021 19,417 0.00%Canadian National Railway Co. CA($)25,000 2.75% 18/2/2021 19,402 0.00%
Vanguard Global Short-Term Corporate Bond Index Fund
703
Maturity Fair Value % of Total Principal Coupon Date US Dollars ($) Net Assets
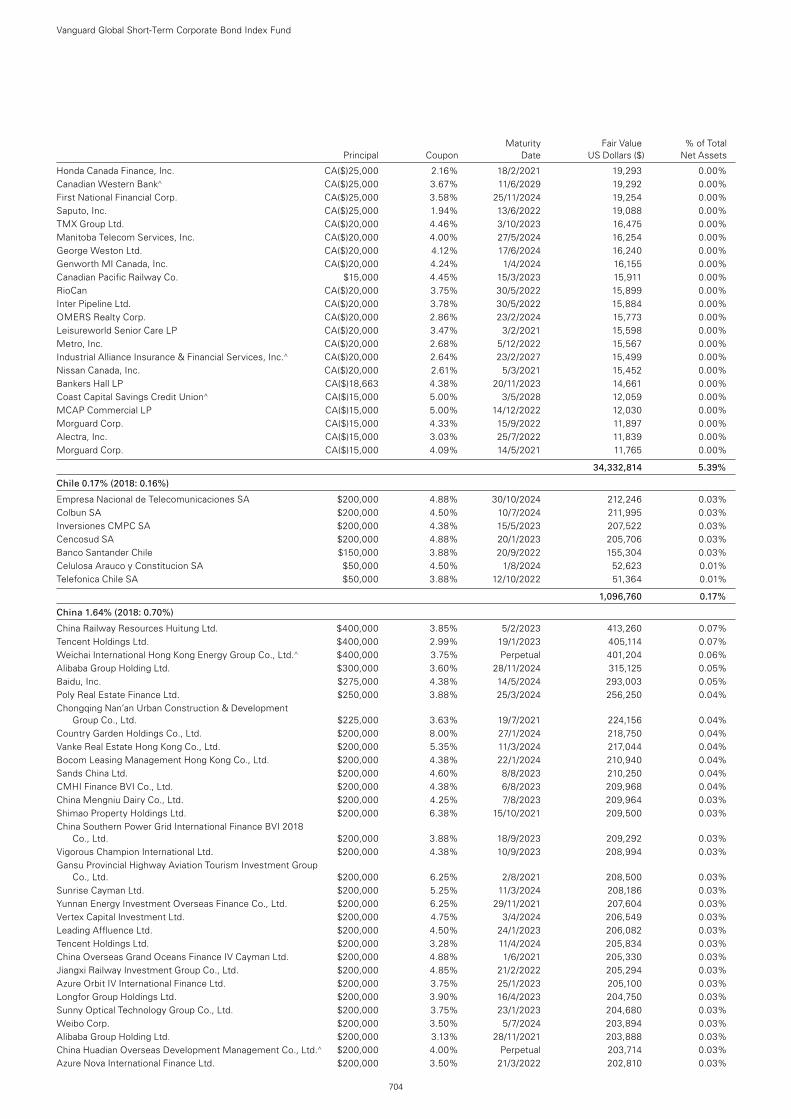
Honda Canada Finance, Inc. CA($)25,000 2.16% 18/2/2021 19,293 0.00%Canadian Western Bank^ CA($)25,000 3.67% 11/6/2029 19,292 0.00%First National Financial Corp. CA($)25,000 3.58% 25/11/2024 19,254 0.00%Saputo, Inc. CA($)25,000 1.94% 13/6/2022 19,088 0.00%TMX Group Ltd. CA($)20,000 4.46% 3/10/2023 16,475 0.00%Manitoba Telecom Services, Inc. CA($)20,000 4.00% 27/5/2024 16,254 0.00%George Weston Ltd. CA($)20,000 4.12% 17/6/2024 16,240 0.00%Genworth MI Canada, Inc. CA($)20,000 4.24% 1/4/2024 16,155 0.00%Canadian Pacific Railway Co. $15,000 4.45% 15/3/2023 15,911 0.00%RioCan CA($)20,000 3.75% 30/5/2022 15,899 0.00%Inter Pipeline Ltd. CA($)20,000 3.78% 30/5/2022 15,884 0.00%OMERS Realty Corp. CA($)20,000 2.86% 23/2/2024 15,773 0.00%Leisureworld Senior Care LP CA($)20,000 3.47% 3/2/2021 15,598 0.00%Metro, Inc. CA($)20,000 2.68% 5/12/2022 15,567 0.00%Industrial Alliance Insurance & Financial Services, Inc.^ CA($)20,000 2.64% 23/2/2027 15,499 0.00%Nissan Canada, Inc. CA($)20,000 2.61% 5/3/2021 15,452 0.00%Bankers Hall LP CA($)18,663 4.38% 20/11/2023 14,661 0.00%Coast Capital Savings Credit Union^ CA($)15,000 5.00% 3/5/2028 12,059 0.00%MCAP Commercial LP CA($)15,000 5.00% 14/12/2022 12,030 0.00%Morguard Corp. CA($)15,000 4.33% 15/9/2022 11,897 0.00%Alectra, Inc. CA($)15,000 3.03% 25/7/2022 11,839 0.00%Morguard Corp. CA($)15,000 4.09% 14/5/2021 11,765 0.00%
34,332,814 5.39%
Chile 0.17% (2018: 0.16%)
Empresa Nacional de Telecomunicaciones SA $200,000 4.88% 30/10/2024 212,246 0.03%Colbun SA $200,000 4.50% 10/7/2024 211,995 0.03%Inversiones CMPC SA $200,000 4.38% 15/5/2023 207,522 0.03%Cencosud SA $200,000 4.88% 20/1/2023 205,706 0.03%Banco Santander Chile $150,000 3.88% 20/9/2022 155,304 0.03%Celulosa Arauco y Constitucion SA $50,000 4.50% 1/8/2024 52,623 0.01%Telefonica Chile SA $50,000 3.88% 12/10/2022 51,364 0.01%
1,096,760 0.17%
China 1.64% (2018: 0.70%)
China Railway Resources Huitung Ltd. $400,000 3.85% 5/2/2023 413,260 0.07%Tencent Holdings Ltd. $400,000 2.99% 19/1/2023 405,114 0.07%Weichai International Hong Kong Energy Group Co., Ltd.^ $400,000 3.75% Perpetual 401,204 0.06%Alibaba Group Holding Ltd. $300,000 3.60% 28/11/2024 315,125 0.05%Baidu, Inc. $275,000 4.38% 14/5/2024 293,003 0.05%Poly Real Estate Finance Ltd. $250,000 3.88% 25/3/2024 256,250 0.04%Chongqing Nan’an Urban Construction & Development
Group Co., Ltd. $225,000 3.63% 19/7/2021 224,156 0.04%Country Garden Holdings Co., Ltd. $200,000 8.00% 27/1/2024 218,750 0.04%Vanke Real Estate Hong Kong Co., Ltd. $200,000 5.35% 11/3/2024 217,044 0.04%Bocom Leasing Management Hong Kong Co., Ltd. $200,000 4.38% 22/1/2024 210,940 0.04%Sands China Ltd. $200,000 4.60% 8/8/2023 210,250 0.04%CMHI Finance BVI Co., Ltd. $200,000 4.38% 6/8/2023 209,968 0.04%China Mengniu Dairy Co., Ltd. $200,000 4.25% 7/8/2023 209,964 0.03%Shimao Property Holdings Ltd. $200,000 6.38% 15/10/2021 209,500 0.03%China Southern Power Grid International Finance BVI 2018
Co., Ltd. $200,000 3.88% 18/9/2023 209,292 0.03%Vigorous Champion International Ltd. $200,000 4.38% 10/9/2023 208,994 0.03%Gansu Provincial Highway Aviation Tourism Investment Group
Co., Ltd. $200,000 6.25% 2/8/2021 208,500 0.03%Sunrise Cayman Ltd. $200,000 5.25% 11/3/2024 208,186 0.03%Yunnan Energy Investment Overseas Finance Co., Ltd. $200,000 6.25% 29/11/2021 207,604 0.03%Vertex Capital Investment Ltd. $200,000 4.75% 3/4/2024 206,549 0.03%Leading Affluence Ltd. $200,000 4.50% 24/1/2023 206,082 0.03%Tencent Holdings Ltd. $200,000 3.28% 11/4/2024 205,834 0.03%China Overseas Grand Oceans Finance IV Cayman Ltd. $200,000 4.88% 1/6/2021 205,330 0.03%Jiangxi Railway Investment Group Co., Ltd. $200,000 4.85% 21/2/2022 205,294 0.03%Azure Orbit IV International Finance Ltd. $200,000 3.75% 25/1/2023 205,100 0.03%Longfor Group Holdings Ltd. $200,000 3.90% 16/4/2023 204,750 0.03%Sunny Optical Technology Group Co., Ltd. $200,000 3.75% 23/1/2023 204,680 0.03%Weibo Corp. $200,000 3.50% 5/7/2024 203,894 0.03%Alibaba Group Holding Ltd. $200,000 3.13% 28/11/2021 203,888 0.03%China Huadian Overseas Development Management Co., Ltd.^ $200,000 4.00% Perpetual 203,714 0.03%Azure Nova International Finance Ltd. $200,000 3.50% 21/3/2022 202,810 0.03%
Vanguard Global Short-Term Corporate Bond Index Fund
704
Maturity Fair Value % of Total Principal Coupon Date US Dollars ($) Net Assets
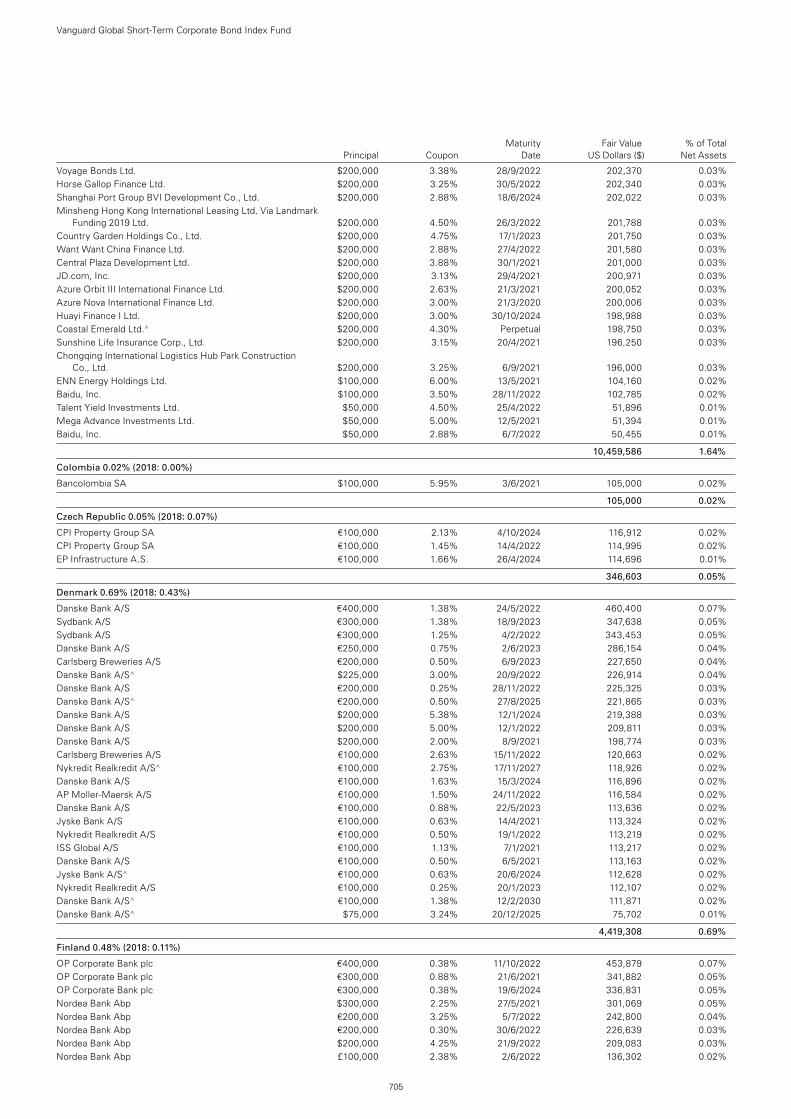
Voyage Bonds Ltd. $200,000 3.38% 28/9/2022 202,370 0.03%Horse Gallop Finance Ltd. $200,000 3.25% 30/5/2022 202,340 0.03%Shanghai Port Group BVI Development Co., Ltd. $200,000 2.88% 18/6/2024 202,022 0.03%Minsheng Hong Kong International Leasing Ltd. Via Landmark
Funding 2019 Ltd. $200,000 4.50% 26/3/2022 201,788 0.03%Country Garden Holdings Co., Ltd. $200,000 4.75% 17/1/2023 201,750 0.03%Want Want China Finance Ltd. $200,000 2.88% 27/4/2022 201,580 0.03%Central Plaza Development Ltd. $200,000 3.88% 30/1/2021 201,000 0.03%JD.com, Inc. $200,000 3.13% 29/4/2021 200,971 0.03%Azure Orbit III International Finance Ltd. $200,000 2.63% 21/3/2021 200,052 0.03%Azure Nova International Finance Ltd. $200,000 3.00% 21/3/2020 200,006 0.03%Huayi Finance I Ltd. $200,000 3.00% 30/10/2024 198,988 0.03%Coastal Emerald Ltd.^ $200,000 4.30% Perpetual 198,750 0.03%Sunshine Life Insurance Corp., Ltd. $200,000 3.15% 20/4/2021 196,250 0.03%Chongqing International Logistics Hub Park Construction
Co., Ltd. $200,000 3.25% 6/9/2021 196,000 0.03%ENN Energy Holdings Ltd. $100,000 6.00% 13/5/2021 104,160 0.02%Baidu, Inc. $100,000 3.50% 28/11/2022 102,785 0.02%Talent Yield Investments Ltd. $50,000 4.50% 25/4/2022 51,896 0.01%Mega Advance Investments Ltd. $50,000 5.00% 12/5/2021 51,394 0.01%Baidu, Inc. $50,000 2.88% 6/7/2022 50,455 0.01%
10,459,586 1.64%
Colombia 0.02% (2018: 0.00%)
Bancolombia SA $100,000 5.95% 3/6/2021 105,000 0.02%
105,000 0.02%
Czech Republic 0.05% (2018: 0.07%)
CPI Property Group SA €100,000 2.13% 4/10/2024 116,912 0.02%CPI Property Group SA €100,000 1.45% 14/4/2022 114,995 0.02%EP Infrastructure A.S. €100,000 1.66% 26/4/2024 114,696 0.01%
346,603 0.05%
Denmark 0.69% (2018: 0.43%)
Danske Bank A/S €400,000 1.38% 24/5/2022 460,400 0.07%Sydbank A/S €300,000 1.38% 18/9/2023 347,638 0.05%Sydbank A/S €300,000 1.25% 4/2/2022 343,453 0.05%Danske Bank A/S €250,000 0.75% 2/6/2023 286,154 0.04%Carlsberg Breweries A/S €200,000 0.50% 6/9/2023 227,650 0.04%Danske Bank A/S^ $225,000 3.00% 20/9/2022 226,914 0.04%Danske Bank A/S €200,000 0.25% 28/11/2022 225,325 0.03%Danske Bank A/S^ €200,000 0.50% 27/8/2025 221,865 0.03%Danske Bank A/S $200,000 5.38% 12/1/2024 219,388 0.03%Danske Bank A/S $200,000 5.00% 12/1/2022 209,811 0.03%Danske Bank A/S $200,000 2.00% 8/9/2021 198,774 0.03%Carlsberg Breweries A/S €100,000 2.63% 15/11/2022 120,663 0.02%Nykredit Realkredit A/S^ €100,000 2.75% 17/11/2027 118,926 0.02%Danske Bank A/S €100,000 1.63% 15/3/2024 116,896 0.02%AP Moller-Maersk A/S €100,000 1.50% 24/11/2022 116,584 0.02%Danske Bank A/S €100,000 0.88% 22/5/2023 113,636 0.02%Jyske Bank A/S €100,000 0.63% 14/4/2021 113,324 0.02%Nykredit Realkredit A/S €100,000 0.50% 19/1/2022 113,219 0.02%ISS Global A/S €100,000 1.13% 7/1/2021 113,217 0.02%Danske Bank A/S €100,000 0.50% 6/5/2021 113,163 0.02%Jyske Bank A/S^ €100,000 0.63% 20/6/2024 112,628 0.02%Nykredit Realkredit A/S €100,000 0.25% 20/1/2023 112,107 0.02%Danske Bank A/S^ €100,000 1.38% 12/2/2030 111,871 0.02%Danske Bank A/S^ $75,000 3.24% 20/12/2025 75,702 0.01%
4,419,308 0.69%
Finland 0.48% (2018: 0.11%)
OP Corporate Bank plc €400,000 0.38% 11/10/2022 453,879 0.07%OP Corporate Bank plc €300,000 0.88% 21/6/2021 341,882 0.05%OP Corporate Bank plc €300,000 0.38% 19/6/2024 336,831 0.05%Nordea Bank Abp $300,000 2.25% 27/5/2021 301,069 0.05%Nordea Bank Abp €200,000 3.25% 5/7/2022 242,800 0.04%Nordea Bank Abp €200,000 0.30% 30/6/2022 226,639 0.03%Nordea Bank Abp $200,000 4.25% 21/9/2022 209,083 0.03%Nordea Bank Abp £100,000 2.38% 2/6/2022 136,302 0.02%
Vanguard Global Short-Term Corporate Bond Index Fund
705
Maturity Fair Value % of Total Principal Coupon Date US Dollars ($) Net Assets
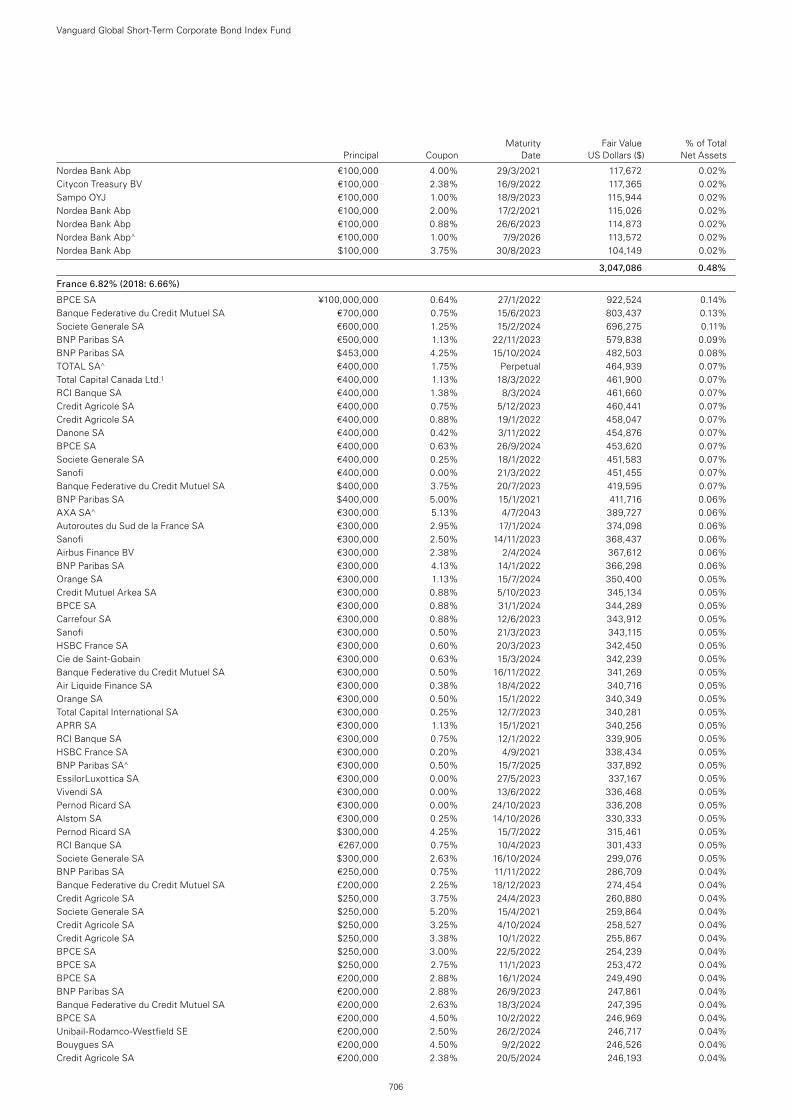
Nordea Bank Abp €100,000 4.00% 29/3/2021 117,672 0.02%Citycon Treasury BV €100,000 2.38% 16/9/2022 117,365 0.02%Sampo OYJ €100,000 1.00% 18/9/2023 115,944 0.02%Nordea Bank Abp €100,000 2.00% 17/2/2021 115,026 0.02%Nordea Bank Abp €100,000 0.88% 26/6/2023 114,873 0.02%Nordea Bank Abp^ €100,000 1.00% 7/9/2026 113,572 0.02%Nordea Bank Abp $100,000 3.75% 30/8/2023 104,149 0.02%
3,047,086 0.48%
France 6.82% (2018: 6.66%)
BPCE SA ¥100,000,000 0.64% 27/1/2022 922,524 0.14%Banque Federative du Credit Mutuel SA €700,000 0.75% 15/6/2023 803,437 0.13%Societe Generale SA €600,000 1.25% 15/2/2024 696,275 0.11%BNP Paribas SA €500,000 1.13% 22/11/2023 579,838 0.09%BNP Paribas SA $453,000 4.25% 15/10/2024 482,503 0.08%TOTAL SA^ €400,000 1.75% Perpetual 464,939 0.07%Total Capital Canada Ltd.1 €400,000 1.13% 18/3/2022 461,900 0.07%RCI Banque SA €400,000 1.38% 8/3/2024 461,660 0.07%Credit Agricole SA €400,000 0.75% 5/12/2023 460,441 0.07%Credit Agricole SA €400,000 0.88% 19/1/2022 458,047 0.07%Danone SA €400,000 0.42% 3/11/2022 454,876 0.07%BPCE SA €400,000 0.63% 26/9/2024 453,620 0.07%Societe Generale SA €400,000 0.25% 18/1/2022 451,583 0.07%Sanofi €400,000 0.00% 21/3/2022 451,455 0.07%Banque Federative du Credit Mutuel SA $400,000 3.75% 20/7/2023 419,595 0.07%BNP Paribas SA $400,000 5.00% 15/1/2021 411,716 0.06%AXA SA^ €300,000 5.13% 4/7/2043 389,727 0.06%Autoroutes du Sud de la France SA €300,000 2.95% 17/1/2024 374,098 0.06%Sanofi €300,000 2.50% 14/11/2023 368,437 0.06%Airbus Finance BV €300,000 2.38% 2/4/2024 367,612 0.06%BNP Paribas SA €300,000 4.13% 14/1/2022 366,298 0.06%Orange SA €300,000 1.13% 15/7/2024 350,400 0.05%Credit Mutuel Arkea SA €300,000 0.88% 5/10/2023 345,134 0.05%BPCE SA €300,000 0.88% 31/1/2024 344,289 0.05%Carrefour SA €300,000 0.88% 12/6/2023 343,912 0.05%Sanofi €300,000 0.50% 21/3/2023 343,115 0.05%HSBC France SA €300,000 0.60% 20/3/2023 342,450 0.05%Cie de Saint-Gobain €300,000 0.63% 15/3/2024 342,239 0.05%Banque Federative du Credit Mutuel SA €300,000 0.50% 16/11/2022 341,269 0.05%Air Liquide Finance SA €300,000 0.38% 18/4/2022 340,716 0.05%Orange SA €300,000 0.50% 15/1/2022 340,349 0.05%Total Capital International SA €300,000 0.25% 12/7/2023 340,281 0.05%APRR SA €300,000 1.13% 15/1/2021 340,256 0.05%RCI Banque SA €300,000 0.75% 12/1/2022 339,905 0.05%HSBC France SA €300,000 0.20% 4/9/2021 338,434 0.05%BNP Paribas SA^ €300,000 0.50% 15/7/2025 337,892 0.05%EssilorLuxottica SA €300,000 0.00% 27/5/2023 337,167 0.05%Vivendi SA €300,000 0.00% 13/6/2022 336,468 0.05%Pernod Ricard SA €300,000 0.00% 24/10/2023 336,208 0.05%Alstom SA €300,000 0.25% 14/10/2026 330,333 0.05%Pernod Ricard SA $300,000 4.25% 15/7/2022 315,461 0.05%RCI Banque SA €267,000 0.75% 10/4/2023 301,433 0.05%Societe Generale SA $300,000 2.63% 16/10/2024 299,076 0.05%BNP Paribas SA €250,000 0.75% 11/11/2022 286,709 0.04%Banque Federative du Credit Mutuel SA £200,000 2.25% 18/12/2023 274,454 0.04%Credit Agricole SA $250,000 3.75% 24/4/2023 260,880 0.04%Societe Generale SA $250,000 5.20% 15/4/2021 259,864 0.04%Credit Agricole SA $250,000 3.25% 4/10/2024 258,527 0.04%Credit Agricole SA $250,000 3.38% 10/1/2022 255,867 0.04%BPCE SA $250,000 3.00% 22/5/2022 254,239 0.04%BPCE SA $250,000 2.75% 11/1/2023 253,472 0.04%BPCE SA €200,000 2.88% 16/1/2024 249,490 0.04%BNP Paribas SA €200,000 2.88% 26/9/2023 247,861 0.04%Banque Federative du Credit Mutuel SA €200,000 2.63% 18/3/2024 247,395 0.04%BPCE SA €200,000 4.50% 10/2/2022 246,969 0.04%Unibail-Rodamco-Westfield SE €200,000 2.50% 26/2/2024 246,717 0.04%Bouygues SA €200,000 4.50% 9/2/2022 246,526 0.04%Credit Agricole SA €200,000 2.38% 20/5/2024 246,193 0.04%
Vanguard Global Short-Term Corporate Bond Index Fund
706
Maturity Fair Value % of Total Principal Coupon Date US Dollars ($) Net Assets
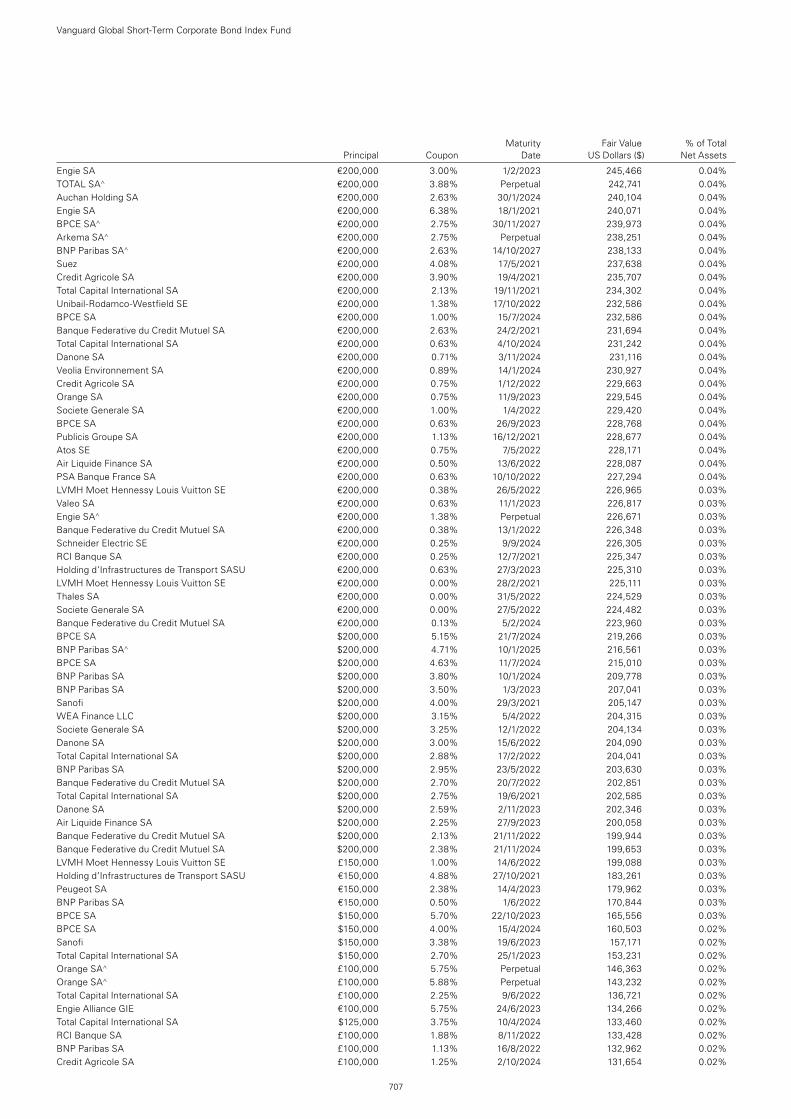
Engie SA €200,000 3.00% 1/2/2023 245,466 0.04%TOTAL SA^ €200,000 3.88% Perpetual 242,741 0.04%Auchan Holding SA €200,000 2.63% 30/1/2024 240,104 0.04%Engie SA €200,000 6.38% 18/1/2021 240,071 0.04%BPCE SA^ €200,000 2.75% 30/11/2027 239,973 0.04%Arkema SA^ €200,000 2.75% Perpetual 238,251 0.04%BNP Paribas SA^ €200,000 2.63% 14/10/2027 238,133 0.04%Suez €200,000 4.08% 17/5/2021 237,638 0.04%Credit Agricole SA €200,000 3.90% 19/4/2021 235,707 0.04%Total Capital International SA €200,000 2.13% 19/11/2021 234,302 0.04%Unibail-Rodamco-Westfield SE €200,000 1.38% 17/10/2022 232,586 0.04%BPCE SA €200,000 1.00% 15/7/2024 232,586 0.04%Banque Federative du Credit Mutuel SA €200,000 2.63% 24/2/2021 231,694 0.04%Total Capital International SA €200,000 0.63% 4/10/2024 231,242 0.04%Danone SA €200,000 0.71% 3/11/2024 231,116 0.04%Veolia Environnement SA €200,000 0.89% 14/1/2024 230,927 0.04%Credit Agricole SA €200,000 0.75% 1/12/2022 229,663 0.04%Orange SA €200,000 0.75% 11/9/2023 229,545 0.04%Societe Generale SA €200,000 1.00% 1/4/2022 229,420 0.04%BPCE SA €200,000 0.63% 26/9/2023 228,768 0.04%Publicis Groupe SA €200,000 1.13% 16/12/2021 228,677 0.04%Atos SE €200,000 0.75% 7/5/2022 228,171 0.04%Air Liquide Finance SA €200,000 0.50% 13/6/2022 228,087 0.04%PSA Banque France SA €200,000 0.63% 10/10/2022 227,294 0.04%LVMH Moet Hennessy Louis Vuitton SE €200,000 0.38% 26/5/2022 226,965 0.03%Valeo SA €200,000 0.63% 11/1/2023 226,817 0.03%Engie SA^ €200,000 1.38% Perpetual 226,671 0.03%Banque Federative du Credit Mutuel SA €200,000 0.38% 13/1/2022 226,348 0.03%Schneider Electric SE €200,000 0.25% 9/9/2024 226,305 0.03%RCI Banque SA €200,000 0.25% 12/7/2021 225,347 0.03%Holding d’Infrastructures de Transport SASU €200,000 0.63% 27/3/2023 225,310 0.03%LVMH Moet Hennessy Louis Vuitton SE €200,000 0.00% 28/2/2021 225,111 0.03%Thales SA €200,000 0.00% 31/5/2022 224,529 0.03%Societe Generale SA €200,000 0.00% 27/5/2022 224,482 0.03%Banque Federative du Credit Mutuel SA €200,000 0.13% 5/2/2024 223,960 0.03%BPCE SA $200,000 5.15% 21/7/2024 219,266 0.03%BNP Paribas SA^ $200,000 4.71% 10/1/2025 216,561 0.03%BPCE SA $200,000 4.63% 11/7/2024 215,010 0.03%BNP Paribas SA $200,000 3.80% 10/1/2024 209,778 0.03%BNP Paribas SA $200,000 3.50% 1/3/2023 207,041 0.03%Sanofi $200,000 4.00% 29/3/2021 205,147 0.03%WEA Finance LLC $200,000 3.15% 5/4/2022 204,315 0.03%Societe Generale SA $200,000 3.25% 12/1/2022 204,134 0.03%Danone SA $200,000 3.00% 15/6/2022 204,090 0.03%Total Capital International SA $200,000 2.88% 17/2/2022 204,041 0.03%BNP Paribas SA $200,000 2.95% 23/5/2022 203,630 0.03%Banque Federative du Credit Mutuel SA $200,000 2.70% 20/7/2022 202,851 0.03%Total Capital International SA $200,000 2.75% 19/6/2021 202,585 0.03%Danone SA $200,000 2.59% 2/11/2023 202,346 0.03%Air Liquide Finance SA $200,000 2.25% 27/9/2023 200,058 0.03%Banque Federative du Credit Mutuel SA $200,000 2.13% 21/11/2022 199,944 0.03%Banque Federative du Credit Mutuel SA $200,000 2.38% 21/11/2024 199,653 0.03%LVMH Moet Hennessy Louis Vuitton SE £150,000 1.00% 14/6/2022 199,088 0.03%Holding d’Infrastructures de Transport SASU €150,000 4.88% 27/10/2021 183,261 0.03%Peugeot SA €150,000 2.38% 14/4/2023 179,962 0.03%BNP Paribas SA €150,000 0.50% 1/6/2022 170,844 0.03%BPCE SA $150,000 5.70% 22/10/2023 165,556 0.03%BPCE SA $150,000 4.00% 15/4/2024 160,503 0.02%Sanofi $150,000 3.38% 19/6/2023 157,171 0.02%Total Capital International SA $150,000 2.70% 25/1/2023 153,231 0.02%Orange SA^ £100,000 5.75% Perpetual 146,363 0.02%Orange SA^ £100,000 5.88% Perpetual 143,232 0.02%Total Capital International SA £100,000 2.25% 9/6/2022 136,721 0.02%Engie Alliance GIE €100,000 5.75% 24/6/2023 134,266 0.02%Total Capital International SA $125,000 3.75% 10/4/2024 133,460 0.02%RCI Banque SA £100,000 1.88% 8/11/2022 133,428 0.02%BNP Paribas SA £100,000 1.13% 16/8/2022 132,962 0.02%Credit Agricole SA £100,000 1.25% 2/10/2024 131,654 0.02%
Vanguard Global Short-Term Corporate Bond Index Fund
707
Maturity Fair Value % of Total Principal Coupon Date US Dollars ($) Net Assets
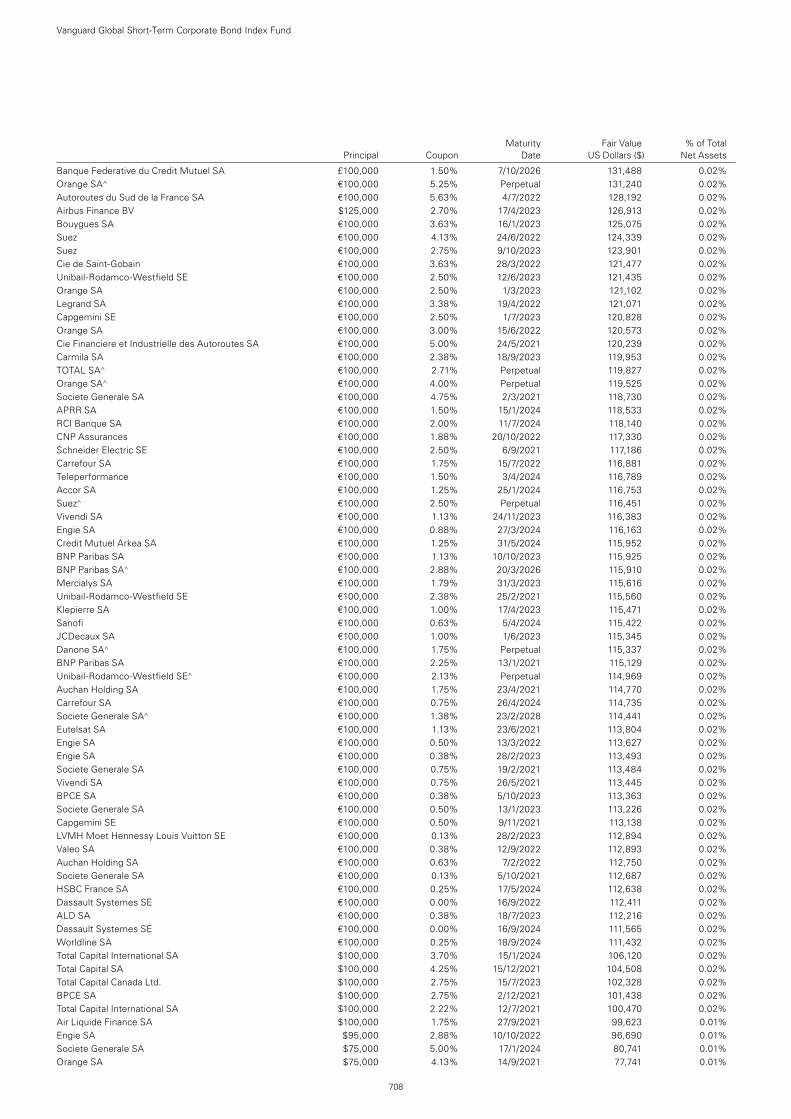
Banque Federative du Credit Mutuel SA £100,000 1.50% 7/10/2026 131,488 0.02%Orange SA^ €100,000 5.25% Perpetual 131,240 0.02%Autoroutes du Sud de la France SA €100,000 5.63% 4/7/2022 128,192 0.02%Airbus Finance BV $125,000 2.70% 17/4/2023 126,913 0.02%Bouygues SA €100,000 3.63% 16/1/2023 125,075 0.02%Suez €100,000 4.13% 24/6/2022 124,339 0.02%Suez €100,000 2.75% 9/10/2023 123,901 0.02%Cie de Saint-Gobain €100,000 3.63% 28/3/2022 121,477 0.02%Unibail-Rodamco-Westfield SE €100,000 2.50% 12/6/2023 121,435 0.02%Orange SA €100,000 2.50% 1/3/2023 121,102 0.02%Legrand SA €100,000 3.38% 19/4/2022 121,071 0.02%Capgemini SE €100,000 2.50% 1/7/2023 120,828 0.02%Orange SA €100,000 3.00% 15/6/2022 120,573 0.02%Cie Financiere et Industrielle des Autoroutes SA €100,000 5.00% 24/5/2021 120,239 0.02%Carmila SA €100,000 2.38% 18/9/2023 119,953 0.02%TOTAL SA^ €100,000 2.71% Perpetual 119,827 0.02%Orange SA^ €100,000 4.00% Perpetual 119,525 0.02%Societe Generale SA €100,000 4.75% 2/3/2021 118,730 0.02%APRR SA €100,000 1.50% 15/1/2024 118,533 0.02%RCI Banque SA €100,000 2.00% 11/7/2024 118,140 0.02%CNP Assurances €100,000 1.88% 20/10/2022 117,330 0.02%Schneider Electric SE €100,000 2.50% 6/9/2021 117,186 0.02%Carrefour SA €100,000 1.75% 15/7/2022 116,881 0.02%Teleperformance €100,000 1.50% 3/4/2024 116,789 0.02%Accor SA €100,000 1.25% 25/1/2024 116,753 0.02%Suez^ €100,000 2.50% Perpetual 116,451 0.02%Vivendi SA €100,000 1.13% 24/11/2023 116,383 0.02%Engie SA €100,000 0.88% 27/3/2024 116,163 0.02%Credit Mutuel Arkea SA €100,000 1.25% 31/5/2024 115,952 0.02%BNP Paribas SA €100,000 1.13% 10/10/2023 115,925 0.02%BNP Paribas SA^ €100,000 2.88% 20/3/2026 115,910 0.02%Mercialys SA €100,000 1.79% 31/3/2023 115,616 0.02%Unibail-Rodamco-Westfield SE €100,000 2.38% 25/2/2021 115,560 0.02%Klepierre SA €100,000 1.00% 17/4/2023 115,471 0.02%Sanofi €100,000 0.63% 5/4/2024 115,422 0.02%JCDecaux SA €100,000 1.00% 1/6/2023 115,345 0.02%Danone SA^ €100,000 1.75% Perpetual 115,337 0.02%BNP Paribas SA €100,000 2.25% 13/1/2021 115,129 0.02%Unibail-Rodamco-Westfield SE^ €100,000 2.13% Perpetual 114,969 0.02%Auchan Holding SA €100,000 1.75% 23/4/2021 114,770 0.02%Carrefour SA €100,000 0.75% 26/4/2024 114,735 0.02%Societe Generale SA^ €100,000 1.38% 23/2/2028 114,441 0.02%Eutelsat SA €100,000 1.13% 23/6/2021 113,804 0.02%Engie SA €100,000 0.50% 13/3/2022 113,627 0.02%Engie SA €100,000 0.38% 28/2/2023 113,493 0.02%Societe Generale SA €100,000 0.75% 19/2/2021 113,484 0.02%Vivendi SA €100,000 0.75% 26/5/2021 113,445 0.02%BPCE SA €100,000 0.38% 5/10/2023 113,363 0.02%Societe Generale SA €100,000 0.50% 13/1/2023 113,226 0.02%Capgemini SE €100,000 0.50% 9/11/2021 113,138 0.02%LVMH Moet Hennessy Louis Vuitton SE €100,000 0.13% 28/2/2023 112,894 0.02%Valeo SA €100,000 0.38% 12/9/2022 112,893 0.02%Auchan Holding SA €100,000 0.63% 7/2/2022 112,750 0.02%Societe Generale SA €100,000 0.13% 5/10/2021 112,687 0.02%HSBC France SA €100,000 0.25% 17/5/2024 112,638 0.02%Dassault Systemes SE €100,000 0.00% 16/9/2022 112,411 0.02%ALD SA €100,000 0.38% 18/7/2023 112,216 0.02%Dassault Systemes SE €100,000 0.00% 16/9/2024 111,565 0.02%Worldline SA €100,000 0.25% 18/9/2024 111,432 0.02%Total Capital International SA $100,000 3.70% 15/1/2024 106,120 0.02%Total Capital SA $100,000 4.25% 15/12/2021 104,508 0.02%Total Capital Canada Ltd. $100,000 2.75% 15/7/2023 102,328 0.02%BPCE SA $100,000 2.75% 2/12/2021 101,438 0.02%Total Capital International SA $100,000 2.22% 12/7/2021 100,470 0.02%Air Liquide Finance SA $100,000 1.75% 27/9/2021 99,623 0.01%Engie SA $95,000 2.88% 10/10/2022 96,690 0.01%Societe Generale SA $75,000 5.00% 17/1/2024 80,741 0.01%Orange SA $75,000 4.13% 14/9/2021 77,741 0.01%
Vanguard Global Short-Term Corporate Bond Index Fund
708
Maturity Fair Value % of Total Principal Coupon Date US Dollars ($) Net Assets
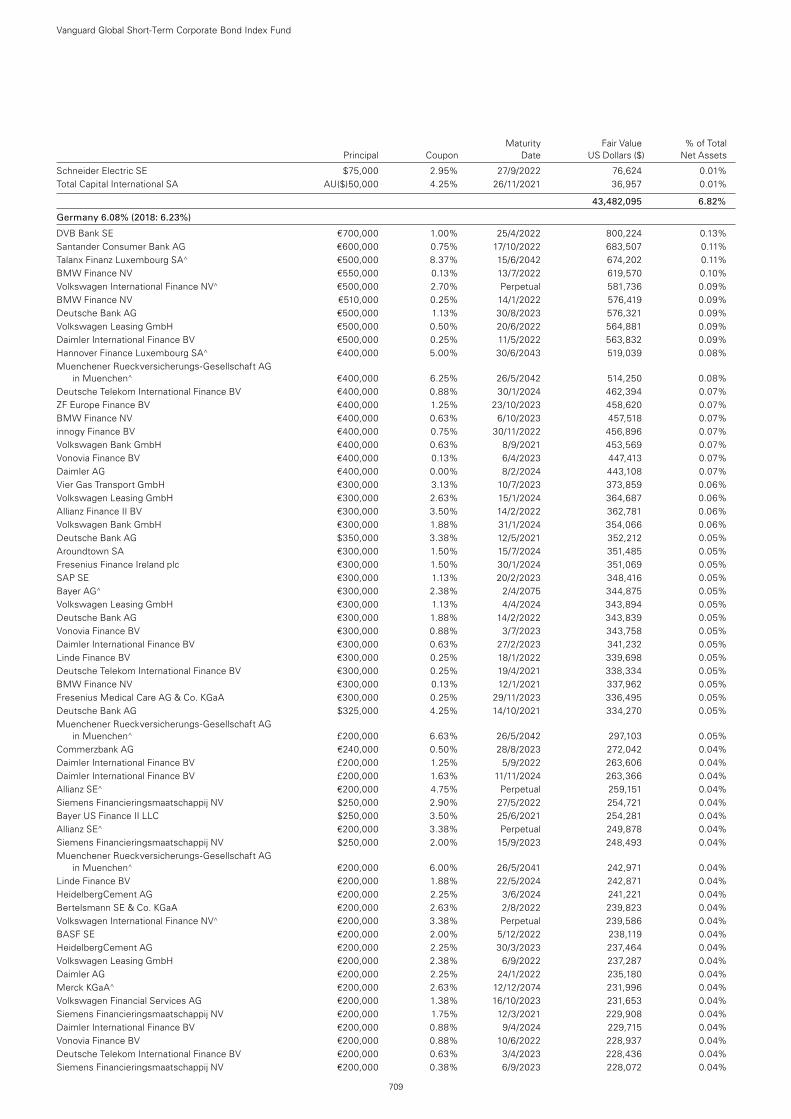
Schneider Electric SE $75,000 2.95% 27/9/2022 76,624 0.01%Total Capital International SA AU($)50,000 4.25% 26/11/2021 36,957 0.01%
43,482,095 6.82%
Germany 6.08% (2018: 6.23%)
DVB Bank SE €700,000 1.00% 25/4/2022 800,224 0.13%Santander Consumer Bank AG €600,000 0.75% 17/10/2022 683,507 0.11%Talanx Finanz Luxembourg SA^ €500,000 8.37% 15/6/2042 674,202 0.11%BMW Finance NV €550,000 0.13% 13/7/2022 619,570 0.10%Volkswagen International Finance NV^ €500,000 2.70% Perpetual 581,736 0.09%BMW Finance NV €510,000 0.25% 14/1/2022 576,419 0.09%Deutsche Bank AG €500,000 1.13% 30/8/2023 576,321 0.09%Volkswagen Leasing GmbH €500,000 0.50% 20/6/2022 564,881 0.09%Daimler International Finance BV €500,000 0.25% 11/5/2022 563,832 0.09%Hannover Finance Luxembourg SA^ €400,000 5.00% 30/6/2043 519,039 0.08%Muenchener Rueckversicherungs-Gesellschaft AG
in Muenchen^ €400,000 6.25% 26/5/2042 514,250 0.08%Deutsche Telekom International Finance BV €400,000 0.88% 30/1/2024 462,394 0.07%ZF Europe Finance BV €400,000 1.25% 23/10/2023 458,620 0.07%BMW Finance NV €400,000 0.63% 6/10/2023 457,518 0.07%innogy Finance BV €400,000 0.75% 30/11/2022 456,896 0.07%Volkswagen Bank GmbH €400,000 0.63% 8/9/2021 453,569 0.07%Vonovia Finance BV €400,000 0.13% 6/4/2023 447,413 0.07%Daimler AG €400,000 0.00% 8/2/2024 443,108 0.07%Vier Gas Transport GmbH €300,000 3.13% 10/7/2023 373,859 0.06%Volkswagen Leasing GmbH €300,000 2.63% 15/1/2024 364,687 0.06%Allianz Finance II BV €300,000 3.50% 14/2/2022 362,781 0.06%Volkswagen Bank GmbH €300,000 1.88% 31/1/2024 354,066 0.06%Deutsche Bank AG $350,000 3.38% 12/5/2021 352,212 0.05%Aroundtown SA €300,000 1.50% 15/7/2024 351,485 0.05%Fresenius Finance Ireland plc €300,000 1.50% 30/1/2024 351,069 0.05%SAP SE €300,000 1.13% 20/2/2023 348,416 0.05%Bayer AG^ €300,000 2.38% 2/4/2075 344,875 0.05%Volkswagen Leasing GmbH €300,000 1.13% 4/4/2024 343,894 0.05%Deutsche Bank AG €300,000 1.88% 14/2/2022 343,839 0.05%Vonovia Finance BV €300,000 0.88% 3/7/2023 343,758 0.05%Daimler International Finance BV €300,000 0.63% 27/2/2023 341,232 0.05%Linde Finance BV €300,000 0.25% 18/1/2022 339,698 0.05%Deutsche Telekom International Finance BV €300,000 0.25% 19/4/2021 338,334 0.05%BMW Finance NV €300,000 0.13% 12/1/2021 337,962 0.05%Fresenius Medical Care AG & Co. KGaA €300,000 0.25% 29/11/2023 336,495 0.05%Deutsche Bank AG $325,000 4.25% 14/10/2021 334,270 0.05%Muenchener Rueckversicherungs-Gesellschaft AG
in Muenchen^ £200,000 6.63% 26/5/2042 297,103 0.05%Commerzbank AG €240,000 0.50% 28/8/2023 272,042 0.04%Daimler International Finance BV £200,000 1.25% 5/9/2022 263,606 0.04%Daimler International Finance BV £200,000 1.63% 11/11/2024 263,366 0.04%Allianz SE^ €200,000 4.75% Perpetual 259,151 0.04%Siemens Financieringsmaatschappij NV $250,000 2.90% 27/5/2022 254,721 0.04%Bayer US Finance II LLC $250,000 3.50% 25/6/2021 254,281 0.04%Allianz SE^ €200,000 3.38% Perpetual 249,878 0.04%Siemens Financieringsmaatschappij NV $250,000 2.00% 15/9/2023 248,493 0.04%Muenchener Rueckversicherungs-Gesellschaft AG
in Muenchen^ €200,000 6.00% 26/5/2041 242,971 0.04%Linde Finance BV €200,000 1.88% 22/5/2024 242,871 0.04%HeidelbergCement AG €200,000 2.25% 3/6/2024 241,221 0.04%Bertelsmann SE & Co. KGaA €200,000 2.63% 2/8/2022 239,823 0.04%Volkswagen International Finance NV^ €200,000 3.38% Perpetual 239,586 0.04%BASF SE €200,000 2.00% 5/12/2022 238,119 0.04%HeidelbergCement AG €200,000 2.25% 30/3/2023 237,464 0.04%Volkswagen Leasing GmbH €200,000 2.38% 6/9/2022 237,287 0.04%Daimler AG €200,000 2.25% 24/1/2022 235,180 0.04%Merck KGaA^ €200,000 2.63% 12/12/2074 231,996 0.04%Volkswagen Financial Services AG €200,000 1.38% 16/10/2023 231,653 0.04%Siemens Financieringsmaatschappij NV €200,000 1.75% 12/3/2021 229,908 0.04%Daimler International Finance BV €200,000 0.88% 9/4/2024 229,715 0.04%Vonovia Finance BV €200,000 0.88% 10/6/2022 228,937 0.04%Deutsche Telekom International Finance BV €200,000 0.63% 3/4/2023 228,436 0.04%Siemens Financieringsmaatschappij NV €200,000 0.38% 6/9/2023 228,072 0.04%
Vanguard Global Short-Term Corporate Bond Index Fund
709
Maturity Fair Value % of Total Principal Coupon Date US Dollars ($) Net Assets
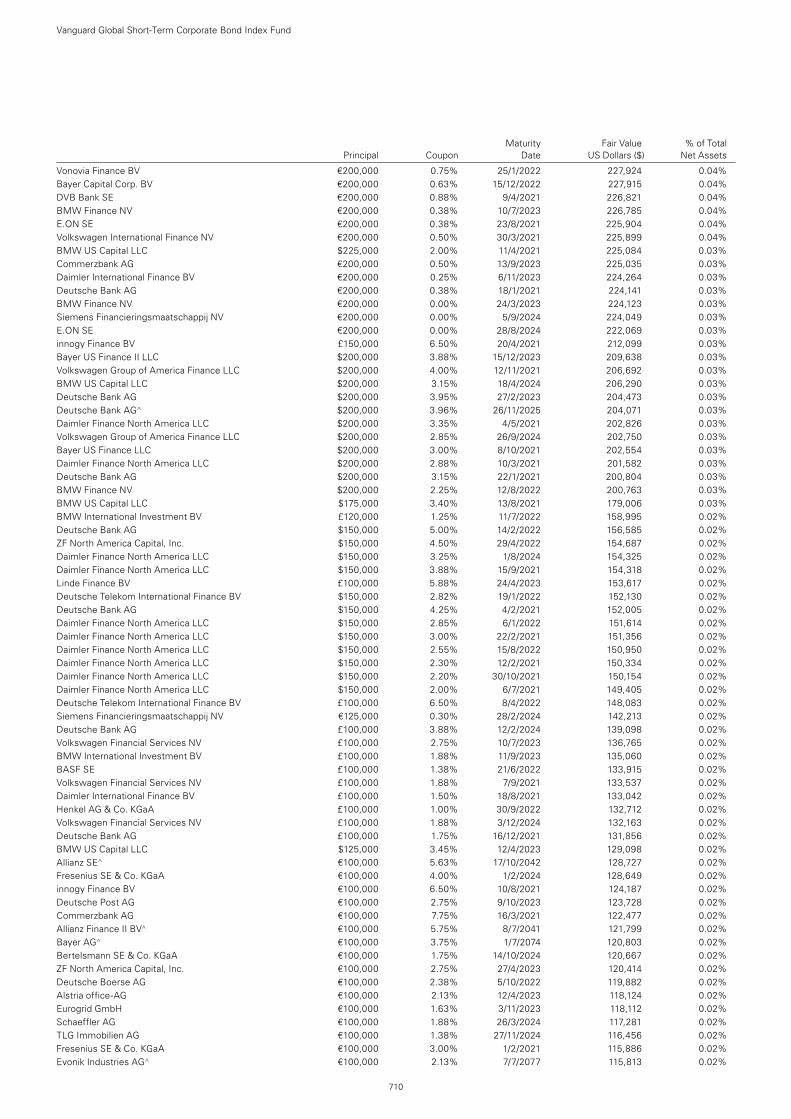
Vonovia Finance BV €200,000 0.75% 25/1/2022 227,924 0.04%Bayer Capital Corp. BV €200,000 0.63% 15/12/2022 227,915 0.04%DVB Bank SE €200,000 0.88% 9/4/2021 226,821 0.04%BMW Finance NV €200,000 0.38% 10/7/2023 226,785 0.04%E.ON SE €200,000 0.38% 23/8/2021 225,904 0.04%Volkswagen International Finance NV €200,000 0.50% 30/3/2021 225,899 0.04%BMW US Capital LLC $225,000 2.00% 11/4/2021 225,084 0.03%Commerzbank AG €200,000 0.50% 13/9/2023 225,035 0.03%Daimler International Finance BV €200,000 0.25% 6/11/2023 224,264 0.03%Deutsche Bank AG €200,000 0.38% 18/1/2021 224,141 0.03%BMW Finance NV €200,000 0.00% 24/3/2023 224,123 0.03%Siemens Financieringsmaatschappij NV €200,000 0.00% 5/9/2024 224,049 0.03%E.ON SE €200,000 0.00% 28/8/2024 222,069 0.03%innogy Finance BV £150,000 6.50% 20/4/2021 212,099 0.03%Bayer US Finance II LLC $200,000 3.88% 15/12/2023 209,638 0.03%Volkswagen Group of America Finance LLC $200,000 4.00% 12/11/2021 206,692 0.03%BMW US Capital LLC $200,000 3.15% 18/4/2024 206,290 0.03%Deutsche Bank AG $200,000 3.95% 27/2/2023 204,473 0.03%Deutsche Bank AG^ $200,000 3.96% 26/11/2025 204,071 0.03%Daimler Finance North America LLC $200,000 3.35% 4/5/2021 202,826 0.03%Volkswagen Group of America Finance LLC $200,000 2.85% 26/9/2024 202,750 0.03%Bayer US Finance LLC $200,000 3.00% 8/10/2021 202,554 0.03%Daimler Finance North America LLC $200,000 2.88% 10/3/2021 201,582 0.03%Deutsche Bank AG $200,000 3.15% 22/1/2021 200,804 0.03%BMW Finance NV $200,000 2.25% 12/8/2022 200,763 0.03%BMW US Capital LLC $175,000 3.40% 13/8/2021 179,006 0.03%BMW International Investment BV £120,000 1.25% 11/7/2022 158,995 0.02%Deutsche Bank AG $150,000 5.00% 14/2/2022 156,585 0.02%ZF North America Capital, Inc. $150,000 4.50% 29/4/2022 154,687 0.02%Daimler Finance North America LLC $150,000 3.25% 1/8/2024 154,325 0.02%Daimler Finance North America LLC $150,000 3.88% 15/9/2021 154,318 0.02%Linde Finance BV £100,000 5.88% 24/4/2023 153,617 0.02%Deutsche Telekom International Finance BV $150,000 2.82% 19/1/2022 152,130 0.02%Deutsche Bank AG $150,000 4.25% 4/2/2021 152,005 0.02%Daimler Finance North America LLC $150,000 2.85% 6/1/2022 151,614 0.02%Daimler Finance North America LLC $150,000 3.00% 22/2/2021 151,356 0.02%Daimler Finance North America LLC $150,000 2.55% 15/8/2022 150,950 0.02%Daimler Finance North America LLC $150,000 2.30% 12/2/2021 150,334 0.02%Daimler Finance North America LLC $150,000 2.20% 30/10/2021 150,154 0.02%Daimler Finance North America LLC $150,000 2.00% 6/7/2021 149,405 0.02%Deutsche Telekom International Finance BV £100,000 6.50% 8/4/2022 148,083 0.02%Siemens Financieringsmaatschappij NV €125,000 0.30% 28/2/2024 142,213 0.02%Deutsche Bank AG £100,000 3.88% 12/2/2024 139,098 0.02%Volkswagen Financial Services NV £100,000 2.75% 10/7/2023 136,765 0.02%BMW International Investment BV £100,000 1.88% 11/9/2023 135,060 0.02%BASF SE £100,000 1.38% 21/6/2022 133,915 0.02%Volkswagen Financial Services NV £100,000 1.88% 7/9/2021 133,537 0.02%Daimler International Finance BV £100,000 1.50% 18/8/2021 133,042 0.02%Henkel AG & Co. KGaA £100,000 1.00% 30/9/2022 132,712 0.02%Volkswagen Financial Services NV £100,000 1.88% 3/12/2024 132,163 0.02%Deutsche Bank AG £100,000 1.75% 16/12/2021 131,856 0.02%BMW US Capital LLC $125,000 3.45% 12/4/2023 129,098 0.02%Allianz SE^ €100,000 5.63% 17/10/2042 128,727 0.02%Fresenius SE & Co. KGaA €100,000 4.00% 1/2/2024 128,649 0.02%innogy Finance BV €100,000 6.50% 10/8/2021 124,187 0.02%Deutsche Post AG €100,000 2.75% 9/10/2023 123,728 0.02%Commerzbank AG €100,000 7.75% 16/3/2021 122,477 0.02%Allianz Finance II BV^ €100,000 5.75% 8/7/2041 121,799 0.02%Bayer AG^ €100,000 3.75% 1/7/2074 120,803 0.02%Bertelsmann SE & Co. KGaA €100,000 1.75% 14/10/2024 120,667 0.02%ZF North America Capital, Inc. €100,000 2.75% 27/4/2023 120,414 0.02%Deutsche Boerse AG €100,000 2.38% 5/10/2022 119,882 0.02%Alstria office-AG €100,000 2.13% 12/4/2023 118,124 0.02%Eurogrid GmbH €100,000 1.63% 3/11/2023 118,112 0.02%Schaeffler AG €100,000 1.88% 26/3/2024 117,281 0.02%TLG Immobilien AG €100,000 1.38% 27/11/2024 116,456 0.02%Fresenius SE & Co. KGaA €100,000 3.00% 1/2/2021 115,886 0.02%Evonik Industries AG^ €100,000 2.13% 7/7/2077 115,813 0.02%
Vanguard Global Short-Term Corporate Bond Index Fund
710
Maturity Fair Value % of Total Principal Coupon Date US Dollars ($) Net Assets
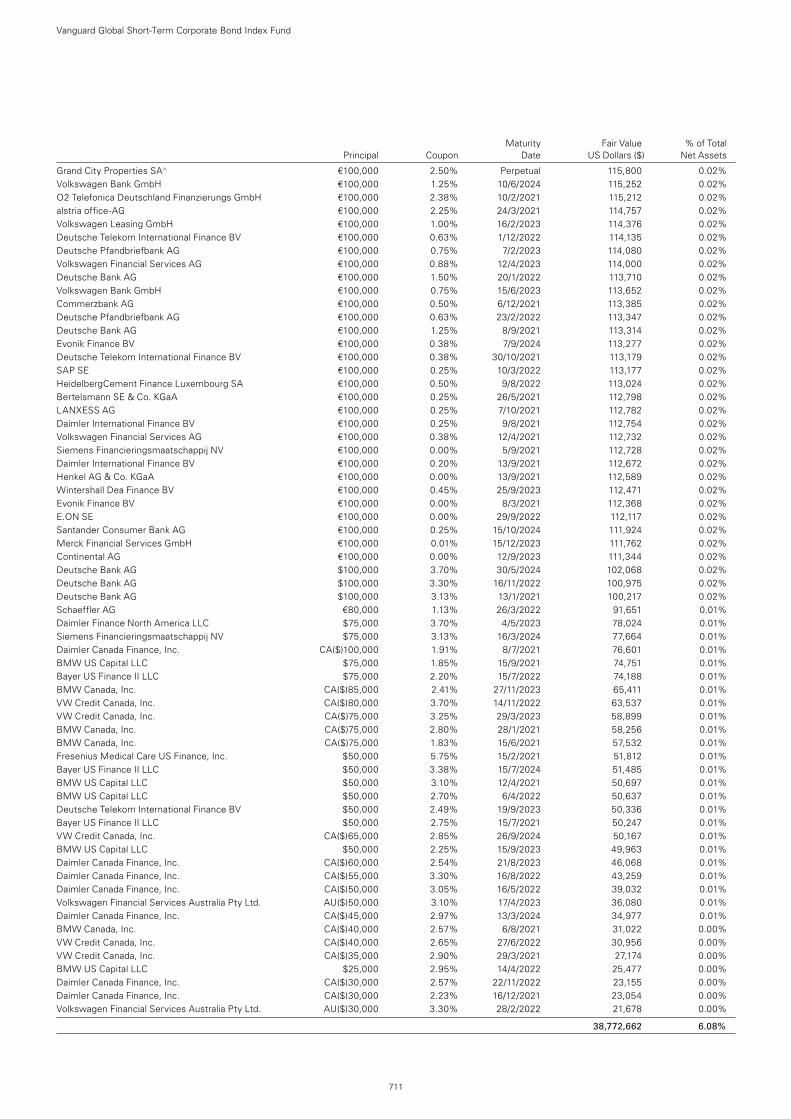
Grand City Properties SA^ €100,000 2.50% Perpetual 115,800 0.02%Volkswagen Bank GmbH €100,000 1.25% 10/6/2024 115,252 0.02%O2 Telefonica Deutschland Finanzierungs GmbH €100,000 2.38% 10/2/2021 115,212 0.02%alstria office-AG €100,000 2.25% 24/3/2021 114,757 0.02%Volkswagen Leasing GmbH €100,000 1.00% 16/2/2023 114,376 0.02%Deutsche Telekom International Finance BV €100,000 0.63% 1/12/2022 114,135 0.02%Deutsche Pfandbriefbank AG €100,000 0.75% 7/2/2023 114,080 0.02%Volkswagen Financial Services AG €100,000 0.88% 12/4/2023 114,000 0.02%Deutsche Bank AG €100,000 1.50% 20/1/2022 113,710 0.02%Volkswagen Bank GmbH €100,000 0.75% 15/6/2023 113,652 0.02%Commerzbank AG €100,000 0.50% 6/12/2021 113,385 0.02%Deutsche Pfandbriefbank AG €100,000 0.63% 23/2/2022 113,347 0.02%Deutsche Bank AG €100,000 1.25% 8/9/2021 113,314 0.02%Evonik Finance BV €100,000 0.38% 7/9/2024 113,277 0.02%Deutsche Telekom International Finance BV €100,000 0.38% 30/10/2021 113,179 0.02%SAP SE €100,000 0.25% 10/3/2022 113,177 0.02%HeidelbergCement Finance Luxembourg SA €100,000 0.50% 9/8/2022 113,024 0.02%Bertelsmann SE & Co. KGaA €100,000 0.25% 26/5/2021 112,798 0.02%LANXESS AG €100,000 0.25% 7/10/2021 112,782 0.02%Daimler International Finance BV €100,000 0.25% 9/8/2021 112,754 0.02%Volkswagen Financial Services AG €100,000 0.38% 12/4/2021 112,732 0.02%Siemens Financieringsmaatschappij NV €100,000 0.00% 5/9/2021 112,728 0.02%Daimler International Finance BV €100,000 0.20% 13/9/2021 112,672 0.02%Henkel AG & Co. KGaA €100,000 0.00% 13/9/2021 112,589 0.02%Wintershall Dea Finance BV €100,000 0.45% 25/9/2023 112,471 0.02%Evonik Finance BV €100,000 0.00% 8/3/2021 112,368 0.02%E.ON SE €100,000 0.00% 29/9/2022 112,117 0.02%Santander Consumer Bank AG €100,000 0.25% 15/10/2024 111,924 0.02%Merck Financial Services GmbH €100,000 0.01% 15/12/2023 111,762 0.02%Continental AG €100,000 0.00% 12/9/2023 111,344 0.02%Deutsche Bank AG $100,000 3.70% 30/5/2024 102,068 0.02%Deutsche Bank AG $100,000 3.30% 16/11/2022 100,975 0.02%Deutsche Bank AG $100,000 3.13% 13/1/2021 100,217 0.02%Schaeffler AG €80,000 1.13% 26/3/2022 91,651 0.01%Daimler Finance North America LLC $75,000 3.70% 4/5/2023 78,024 0.01%Siemens Financieringsmaatschappij NV $75,000 3.13% 16/3/2024 77,664 0.01%Daimler Canada Finance, Inc. CA($)100,000 1.91% 8/7/2021 76,601 0.01%BMW US Capital LLC $75,000 1.85% 15/9/2021 74,751 0.01%Bayer US Finance II LLC $75,000 2.20% 15/7/2022 74,188 0.01%BMW Canada, Inc. CA($)85,000 2.41% 27/11/2023 65,411 0.01%VW Credit Canada, Inc. CA($)80,000 3.70% 14/11/2022 63,537 0.01%VW Credit Canada, Inc. CA($)75,000 3.25% 29/3/2023 58,899 0.01%BMW Canada, Inc. CA($)75,000 2.80% 28/1/2021 58,256 0.01%BMW Canada, Inc. CA($)75,000 1.83% 15/6/2021 57,532 0.01%Fresenius Medical Care US Finance, Inc. $50,000 5.75% 15/2/2021 51,812 0.01%Bayer US Finance II LLC $50,000 3.38% 15/7/2024 51,485 0.01%BMW US Capital LLC $50,000 3.10% 12/4/2021 50,697 0.01%BMW US Capital LLC $50,000 2.70% 6/4/2022 50,637 0.01%Deutsche Telekom International Finance BV $50,000 2.49% 19/9/2023 50,336 0.01%Bayer US Finance II LLC $50,000 2.75% 15/7/2021 50,247 0.01%VW Credit Canada, Inc. CA($)65,000 2.85% 26/9/2024 50,167 0.01%BMW US Capital LLC $50,000 2.25% 15/9/2023 49,963 0.01%Daimler Canada Finance, Inc. CA($)60,000 2.54% 21/8/2023 46,068 0.01%Daimler Canada Finance, Inc. CA($)55,000 3.30% 16/8/2022 43,259 0.01%Daimler Canada Finance, Inc. CA($)50,000 3.05% 16/5/2022 39,032 0.01%Volkswagen Financial Services Australia Pty Ltd. AU($)50,000 3.10% 17/4/2023 36,080 0.01%Daimler Canada Finance, Inc. CA($)45,000 2.97% 13/3/2024 34,977 0.01%BMW Canada, Inc. CA($)40,000 2.57% 6/8/2021 31,022 0.00%VW Credit Canada, Inc. CA($)40,000 2.65% 27/6/2022 30,956 0.00%VW Credit Canada, Inc. CA($)35,000 2.90% 29/3/2021 27,174 0.00%BMW US Capital LLC $25,000 2.95% 14/4/2022 25,477 0.00%Daimler Canada Finance, Inc. CA($)30,000 2.57% 22/11/2022 23,155 0.00%Daimler Canada Finance, Inc. CA($)30,000 2.23% 16/12/2021 23,054 0.00%Volkswagen Financial Services Australia Pty Ltd. AU($)30,000 3.30% 28/2/2022 21,678 0.00%
38,772,662 6.08%
Vanguard Global Short-Term Corporate Bond Index Fund
711
Maturity Fair Value % of Total Principal Coupon Date US Dollars ($) Net Assets
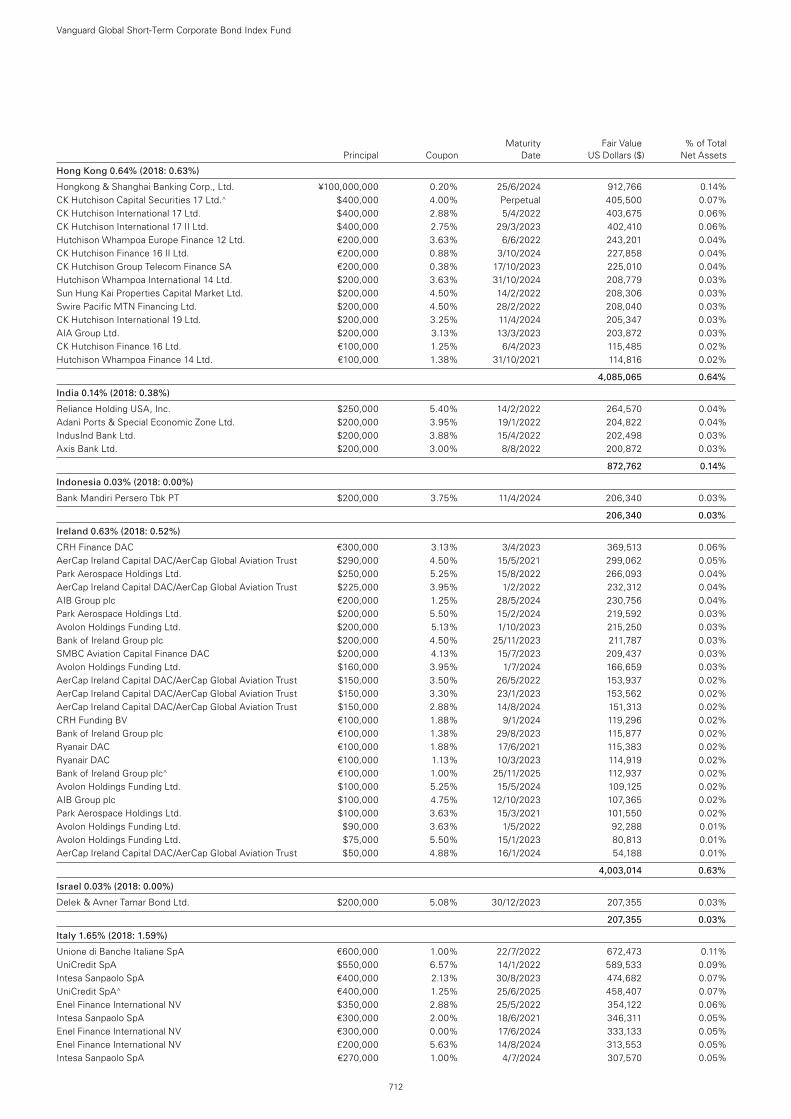
Hong Kong 0.64% (2018: 0.63%)
Hongkong & Shanghai Banking Corp., Ltd. ¥100,000,000 0.20% 25/6/2024 912,766 0.14%CK Hutchison Capital Securities 17 Ltd.^ $400,000 4.00% Perpetual 405,500 0.07%CK Hutchison International 17 Ltd. $400,000 2.88% 5/4/2022 403,675 0.06%CK Hutchison International 17 II Ltd. $400,000 2.75% 29/3/2023 402,410 0.06%Hutchison Whampoa Europe Finance 12 Ltd. €200,000 3.63% 6/6/2022 243,201 0.04%CK Hutchison Finance 16 II Ltd. €200,000 0.88% 3/10/2024 227,858 0.04%CK Hutchison Group Telecom Finance SA €200,000 0.38% 17/10/2023 225,010 0.04%Hutchison Whampoa International 14 Ltd. $200,000 3.63% 31/10/2024 208,779 0.03%Sun Hung Kai Properties Capital Market Ltd. $200,000 4.50% 14/2/2022 208,306 0.03%Swire Pacific MTN Financing Ltd. $200,000 4.50% 28/2/2022 208,040 0.03%CK Hutchison International 19 Ltd. $200,000 3.25% 11/4/2024 205,347 0.03%AIA Group Ltd. $200,000 3.13% 13/3/2023 203,872 0.03%CK Hutchison Finance 16 Ltd. €100,000 1.25% 6/4/2023 115,485 0.02%Hutchison Whampoa Finance 14 Ltd. €100,000 1.38% 31/10/2021 114,816 0.02%
4,085,065 0.64%
India 0.14% (2018: 0.38%)
Reliance Holding USA, Inc. $250,000 5.40% 14/2/2022 264,570 0.04%Adani Ports & Special Economic Zone Ltd. $200,000 3.95% 19/1/2022 204,822 0.04%IndusInd Bank Ltd. $200,000 3.88% 15/4/2022 202,498 0.03%Axis Bank Ltd. $200,000 3.00% 8/8/2022 200,872 0.03%
872,762 0.14%
Indonesia 0.03% (2018: 0.00%)
Bank Mandiri Persero Tbk PT $200,000 3.75% 11/4/2024 206,340 0.03%
206,340 0.03%
Ireland 0.63% (2018: 0.52%)
CRH Finance DAC €300,000 3.13% 3/4/2023 369,513 0.06%AerCap Ireland Capital DAC/AerCap Global Aviation Trust $290,000 4.50% 15/5/2021 299,062 0.05%Park Aerospace Holdings Ltd. $250,000 5.25% 15/8/2022 266,093 0.04%AerCap Ireland Capital DAC/AerCap Global Aviation Trust $225,000 3.95% 1/2/2022 232,312 0.04%AIB Group plc €200,000 1.25% 28/5/2024 230,756 0.04%Park Aerospace Holdings Ltd. $200,000 5.50% 15/2/2024 219,592 0.03%Avolon Holdings Funding Ltd. $200,000 5.13% 1/10/2023 215,250 0.03%Bank of Ireland Group plc $200,000 4.50% 25/11/2023 211,787 0.03%SMBC Aviation Capital Finance DAC $200,000 4.13% 15/7/2023 209,437 0.03%Avolon Holdings Funding Ltd. $160,000 3.95% 1/7/2024 166,659 0.03%AerCap Ireland Capital DAC/AerCap Global Aviation Trust $150,000 3.50% 26/5/2022 153,937 0.02%AerCap Ireland Capital DAC/AerCap Global Aviation Trust $150,000 3.30% 23/1/2023 153,562 0.02%AerCap Ireland Capital DAC/AerCap Global Aviation Trust $150,000 2.88% 14/8/2024 151,313 0.02%CRH Funding BV €100,000 1.88% 9/1/2024 119,296 0.02%Bank of Ireland Group plc €100,000 1.38% 29/8/2023 115,877 0.02%Ryanair DAC €100,000 1.88% 17/6/2021 115,383 0.02%Ryanair DAC €100,000 1.13% 10/3/2023 114,919 0.02%Bank of Ireland Group plc^ €100,000 1.00% 25/11/2025 112,937 0.02%Avolon Holdings Funding Ltd. $100,000 5.25% 15/5/2024 109,125 0.02%AIB Group plc $100,000 4.75% 12/10/2023 107,365 0.02%Park Aerospace Holdings Ltd. $100,000 3.63% 15/3/2021 101,550 0.02%Avolon Holdings Funding Ltd. $90,000 3.63% 1/5/2022 92,288 0.01%Avolon Holdings Funding Ltd. $75,000 5.50% 15/1/2023 80,813 0.01%AerCap Ireland Capital DAC/AerCap Global Aviation Trust $50,000 4.88% 16/1/2024 54,188 0.01%
4,003,014 0.63%
Israel 0.03% (2018: 0.00%)
Delek & Avner Tamar Bond Ltd. $200,000 5.08% 30/12/2023 207,355 0.03%
207,355 0.03%
Italy 1.65% (2018: 1.59%)
Unione di Banche Italiane SpA €600,000 1.00% 22/7/2022 672,473 0.11%UniCredit SpA $550,000 6.57% 14/1/2022 589,533 0.09%Intesa Sanpaolo SpA €400,000 2.13% 30/8/2023 474,682 0.07%UniCredit SpA^ €400,000 1.25% 25/6/2025 458,407 0.07%Enel Finance International NV $350,000 2.88% 25/5/2022 354,122 0.06%Intesa Sanpaolo SpA €300,000 2.00% 18/6/2021 346,311 0.05%Enel Finance International NV €300,000 0.00% 17/6/2024 333,133 0.05%Enel Finance International NV £200,000 5.63% 14/8/2024 313,553 0.05%Intesa Sanpaolo SpA €270,000 1.00% 4/7/2024 307,570 0.05%
Vanguard Global Short-Term Corporate Bond Index Fund
712
Maturity Fair Value % of Total Principal Coupon Date US Dollars ($) Net Assets
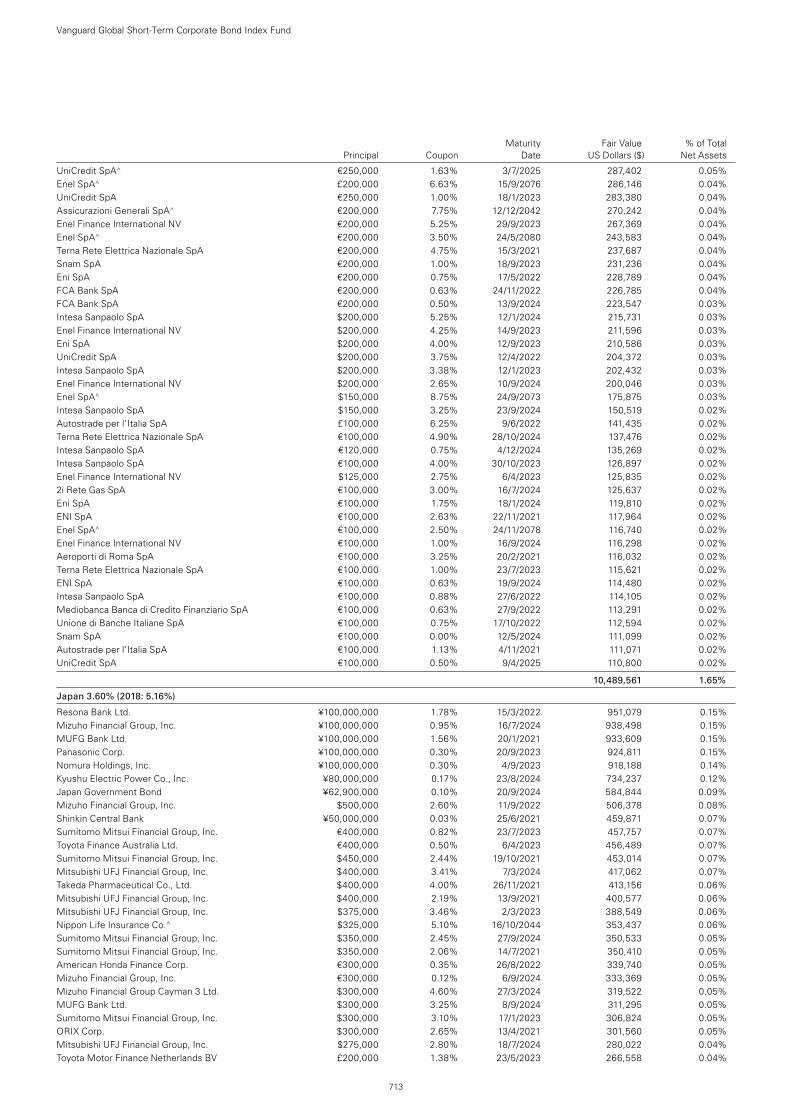
UniCredit SpA^ €250,000 1.63% 3/7/2025 287,402 0.05%Enel SpA^ £200,000 6.63% 15/9/2076 286,146 0.04%UniCredit SpA €250,000 1.00% 18/1/2023 283,380 0.04%Assicurazioni Generali SpA^ €200,000 7.75% 12/12/2042 270,242 0.04%Enel Finance International NV €200,000 5.25% 29/9/2023 267,369 0.04%Enel SpA^ €200,000 3.50% 24/5/2080 243,583 0.04%Terna Rete Elettrica Nazionale SpA €200,000 4.75% 15/3/2021 237,687 0.04%Snam SpA €200,000 1.00% 18/9/2023 231,236 0.04%Eni SpA €200,000 0.75% 17/5/2022 228,789 0.04%FCA Bank SpA €200,000 0.63% 24/11/2022 226,785 0.04%FCA Bank SpA €200,000 0.50% 13/9/2024 223,547 0.03%Intesa Sanpaolo SpA $200,000 5.25% 12/1/2024 215,731 0.03%Enel Finance International NV $200,000 4.25% 14/9/2023 211,596 0.03%Eni SpA $200,000 4.00% 12/9/2023 210,586 0.03%UniCredit SpA $200,000 3.75% 12/4/2022 204,372 0.03%Intesa Sanpaolo SpA $200,000 3.38% 12/1/2023 202,432 0.03%Enel Finance International NV $200,000 2.65% 10/9/2024 200,046 0.03%Enel SpA^ $150,000 8.75% 24/9/2073 175,875 0.03%Intesa Sanpaolo SpA $150,000 3.25% 23/9/2024 150,519 0.02%Autostrade per l’Italia SpA £100,000 6.25% 9/6/2022 141,435 0.02%Terna Rete Elettrica Nazionale SpA €100,000 4.90% 28/10/2024 137,476 0.02%Intesa Sanpaolo SpA €120,000 0.75% 4/12/2024 135,269 0.02%Intesa Sanpaolo SpA €100,000 4.00% 30/10/2023 126,897 0.02%Enel Finance International NV $125,000 2.75% 6/4/2023 125,835 0.02%2i Rete Gas SpA €100,000 3.00% 16/7/2024 125,637 0.02%Eni SpA €100,000 1.75% 18/1/2024 119,810 0.02%ENI SpA €100,000 2.63% 22/11/2021 117,964 0.02%Enel SpA^ €100,000 2.50% 24/11/2078 116,740 0.02%Enel Finance International NV €100,000 1.00% 16/9/2024 116,298 0.02%Aeroporti di Roma SpA €100,000 3.25% 20/2/2021 116,032 0.02%Terna Rete Elettrica Nazionale SpA €100,000 1.00% 23/7/2023 115,621 0.02%ENI SpA €100,000 0.63% 19/9/2024 114,480 0.02%Intesa Sanpaolo SpA €100,000 0.88% 27/6/2022 114,105 0.02%Mediobanca Banca di Credito Finanziario SpA €100,000 0.63% 27/9/2022 113,291 0.02%Unione di Banche Italiane SpA €100,000 0.75% 17/10/2022 112,594 0.02%Snam SpA €100,000 0.00% 12/5/2024 111,099 0.02%Autostrade per l’Italia SpA €100,000 1.13% 4/11/2021 111,071 0.02%UniCredit SpA €100,000 0.50% 9/4/2025 110,800 0.02%
10,489,561 1.65%
Japan 3.60% (2018: 5.16%)
Resona Bank Ltd. ¥100,000,000 1.78% 15/3/2022 951,079 0.15%Mizuho Financial Group, Inc. ¥100,000,000 0.95% 16/7/2024 938,498 0.15%MUFG Bank Ltd. ¥100,000,000 1.56% 20/1/2021 933,609 0.15%Panasonic Corp. ¥100,000,000 0.30% 20/9/2023 924,811 0.15%Nomura Holdings, Inc. ¥100,000,000 0.30% 4/9/2023 918,188 0.14%Kyushu Electric Power Co., Inc. ¥80,000,000 0.17% 23/8/2024 734,237 0.12%Japan Government Bond ¥62,900,000 0.10% 20/9/2024 584,844 0.09%Mizuho Financial Group, Inc. $500,000 2.60% 11/9/2022 506,378 0.08%Shinkin Central Bank ¥50,000,000 0.03% 25/6/2021 459,871 0.07%Sumitomo Mitsui Financial Group, Inc. €400,000 0.82% 23/7/2023 457,757 0.07%Toyota Finance Australia Ltd. €400,000 0.50% 6/4/2023 456,489 0.07%Sumitomo Mitsui Financial Group, Inc. $450,000 2.44% 19/10/2021 453,014 0.07%Mitsubishi UFJ Financial Group, Inc. $400,000 3.41% 7/3/2024 417,062 0.07%Takeda Pharmaceutical Co., Ltd. $400,000 4.00% 26/11/2021 413,156 0.06%Mitsubishi UFJ Financial Group, Inc. $400,000 2.19% 13/9/2021 400,577 0.06%Mitsubishi UFJ Financial Group, Inc. $375,000 3.46% 2/3/2023 388,549 0.06%Nippon Life Insurance Co.^ $325,000 5.10% 16/10/2044 353,437 0.06%Sumitomo Mitsui Financial Group, Inc. $350,000 2.45% 27/9/2024 350,533 0.05%Sumitomo Mitsui Financial Group, Inc. $350,000 2.06% 14/7/2021 350,410 0.05%American Honda Finance Corp. €300,000 0.35% 26/8/2022 339,740 0.05%Mizuho Financial Group, Inc. €300,000 0.12% 6/9/2024 333,369 0.05%Mizuho Financial Group Cayman 3 Ltd. $300,000 4.60% 27/3/2024 319,522 0.05%MUFG Bank Ltd. $300,000 3.25% 8/9/2024 311,295 0.05%Sumitomo Mitsui Financial Group, Inc. $300,000 3.10% 17/1/2023 306,824 0.05%ORIX Corp. $300,000 2.65% 13/4/2021 301,560 0.05%Mitsubishi UFJ Financial Group, Inc. $275,000 2.80% 18/7/2024 280,022 0.04%Toyota Motor Finance Netherlands BV £200,000 1.38% 23/5/2023 266,558 0.04%
Vanguard Global Short-Term Corporate Bond Index Fund
713
Maturity Fair Value % of Total Principal Coupon Date US Dollars ($) Net Assets
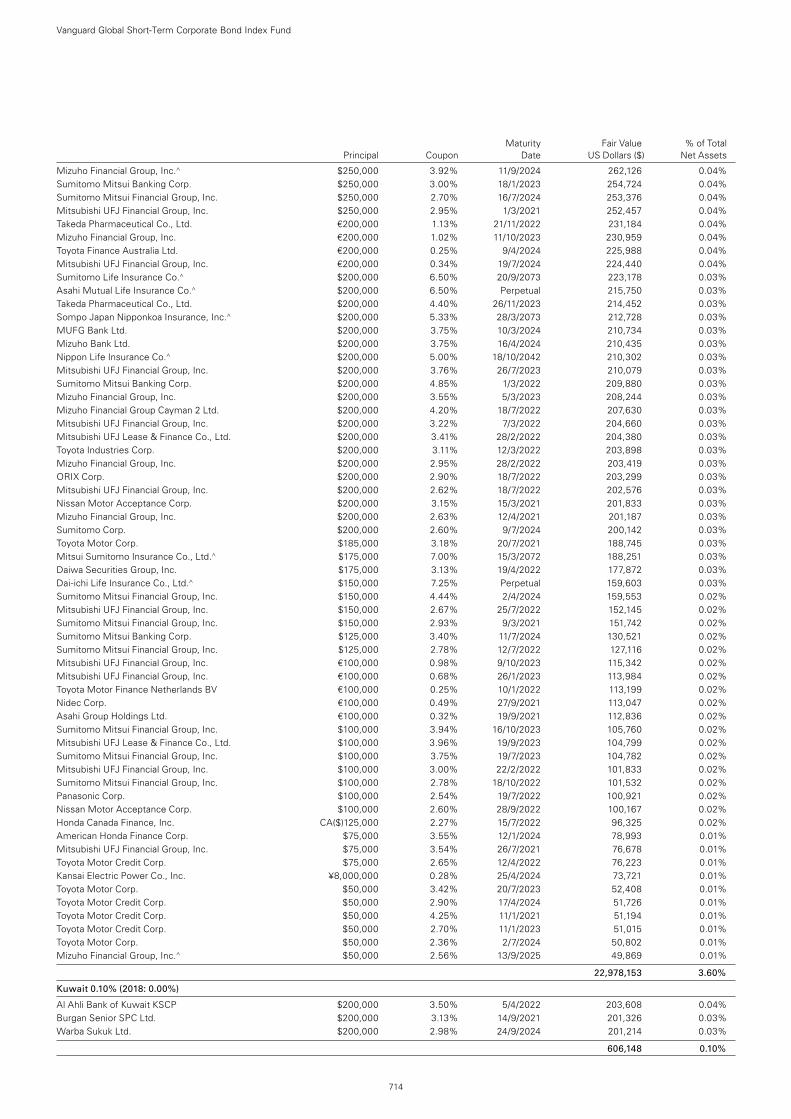
Mizuho Financial Group, Inc.^ $250,000 3.92% 11/9/2024 262,126 0.04%Sumitomo Mitsui Banking Corp. $250,000 3.00% 18/1/2023 254,724 0.04%Sumitomo Mitsui Financial Group, Inc. $250,000 2.70% 16/7/2024 253,376 0.04%Mitsubishi UFJ Financial Group, Inc. $250,000 2.95% 1/3/2021 252,457 0.04%Takeda Pharmaceutical Co., Ltd. €200,000 1.13% 21/11/2022 231,184 0.04%Mizuho Financial Group, Inc. €200,000 1.02% 11/10/2023 230,959 0.04%Toyota Finance Australia Ltd. €200,000 0.25% 9/4/2024 225,988 0.04%Mitsubishi UFJ Financial Group, Inc. €200,000 0.34% 19/7/2024 224,440 0.04%Sumitomo Life Insurance Co.^ $200,000 6.50% 20/9/2073 223,178 0.03%Asahi Mutual Life Insurance Co.^ $200,000 6.50% Perpetual 215,750 0.03%Takeda Pharmaceutical Co., Ltd. $200,000 4.40% 26/11/2023 214,452 0.03%Sompo Japan Nipponkoa Insurance, Inc.^ $200,000 5.33% 28/3/2073 212,728 0.03%MUFG Bank Ltd. $200,000 3.75% 10/3/2024 210,734 0.03%Mizuho Bank Ltd. $200,000 3.75% 16/4/2024 210,435 0.03%Nippon Life Insurance Co.^ $200,000 5.00% 18/10/2042 210,302 0.03%Mitsubishi UFJ Financial Group, Inc. $200,000 3.76% 26/7/2023 210,079 0.03%Sumitomo Mitsui Banking Corp. $200,000 4.85% 1/3/2022 209,880 0.03%Mizuho Financial Group, Inc. $200,000 3.55% 5/3/2023 208,244 0.03%Mizuho Financial Group Cayman 2 Ltd. $200,000 4.20% 18/7/2022 207,630 0.03%Mitsubishi UFJ Financial Group, Inc. $200,000 3.22% 7/3/2022 204,660 0.03%Mitsubishi UFJ Lease & Finance Co., Ltd. $200,000 3.41% 28/2/2022 204,380 0.03%Toyota Industries Corp. $200,000 3.11% 12/3/2022 203,898 0.03%Mizuho Financial Group, Inc. $200,000 2.95% 28/2/2022 203,419 0.03%ORIX Corp. $200,000 2.90% 18/7/2022 203,299 0.03%Mitsubishi UFJ Financial Group, Inc. $200,000 2.62% 18/7/2022 202,576 0.03%Nissan Motor Acceptance Corp. $200,000 3.15% 15/3/2021 201,833 0.03%Mizuho Financial Group, Inc. $200,000 2.63% 12/4/2021 201,187 0.03%Sumitomo Corp. $200,000 2.60% 9/7/2024 200,142 0.03%Toyota Motor Corp. $185,000 3.18% 20/7/2021 188,745 0.03%Mitsui Sumitomo Insurance Co., Ltd.^ $175,000 7.00% 15/3/2072 188,251 0.03%Daiwa Securities Group, Inc. $175,000 3.13% 19/4/2022 177,872 0.03%Dai-ichi Life Insurance Co., Ltd.^ $150,000 7.25% Perpetual 159,603 0.03%Sumitomo Mitsui Financial Group, Inc. $150,000 4.44% 2/4/2024 159,553 0.02%Mitsubishi UFJ Financial Group, Inc. $150,000 2.67% 25/7/2022 152,145 0.02%Sumitomo Mitsui Financial Group, Inc. $150,000 2.93% 9/3/2021 151,742 0.02%Sumitomo Mitsui Banking Corp. $125,000 3.40% 11/7/2024 130,521 0.02%Sumitomo Mitsui Financial Group, Inc. $125,000 2.78% 12/7/2022 127,116 0.02%Mitsubishi UFJ Financial Group, Inc. €100,000 0.98% 9/10/2023 115,342 0.02%Mitsubishi UFJ Financial Group, Inc. €100,000 0.68% 26/1/2023 113,984 0.02%Toyota Motor Finance Netherlands BV €100,000 0.25% 10/1/2022 113,199 0.02%Nidec Corp. €100,000 0.49% 27/9/2021 113,047 0.02%Asahi Group Holdings Ltd. €100,000 0.32% 19/9/2021 112,836 0.02%Sumitomo Mitsui Financial Group, Inc. $100,000 3.94% 16/10/2023 105,760 0.02%Mitsubishi UFJ Lease & Finance Co., Ltd. $100,000 3.96% 19/9/2023 104,799 0.02%Sumitomo Mitsui Financial Group, Inc. $100,000 3.75% 19/7/2023 104,782 0.02%Mitsubishi UFJ Financial Group, Inc. $100,000 3.00% 22/2/2022 101,833 0.02%Sumitomo Mitsui Financial Group, Inc. $100,000 2.78% 18/10/2022 101,532 0.02%Panasonic Corp. $100,000 2.54% 19/7/2022 100,921 0.02%Nissan Motor Acceptance Corp. $100,000 2.60% 28/9/2022 100,167 0.02%Honda Canada Finance, Inc. CA($)125,000 2.27% 15/7/2022 96,325 0.02%American Honda Finance Corp. $75,000 3.55% 12/1/2024 78,993 0.01%Mitsubishi UFJ Financial Group, Inc. $75,000 3.54% 26/7/2021 76,678 0.01%Toyota Motor Credit Corp. $75,000 2.65% 12/4/2022 76,223 0.01%Kansai Electric Power Co., Inc. ¥8,000,000 0.28% 25/4/2024 73,721 0.01%Toyota Motor Corp. $50,000 3.42% 20/7/2023 52,408 0.01%Toyota Motor Credit Corp. $50,000 2.90% 17/4/2024 51,726 0.01%Toyota Motor Credit Corp. $50,000 4.25% 11/1/2021 51,194 0.01%Toyota Motor Credit Corp. $50,000 2.70% 11/1/2023 51,015 0.01%Toyota Motor Corp. $50,000 2.36% 2/7/2024 50,802 0.01%Mizuho Financial Group, Inc.^ $50,000 2.56% 13/9/2025 49,869 0.01%
22,978,153 3.60%
Kuwait 0.10% (2018: 0.00%)
Al Ahli Bank of Kuwait KSCP $200,000 3.50% 5/4/2022 203,608 0.04%Burgan Senior SPC Ltd. $200,000 3.13% 14/9/2021 201,326 0.03%Warba Sukuk Ltd. $200,000 2.98% 24/9/2024 201,214 0.03%
606,148 0.10%
Vanguard Global Short-Term Corporate Bond Index Fund
714
Maturity Fair Value % of Total Principal Coupon Date US Dollars ($) Net Assets
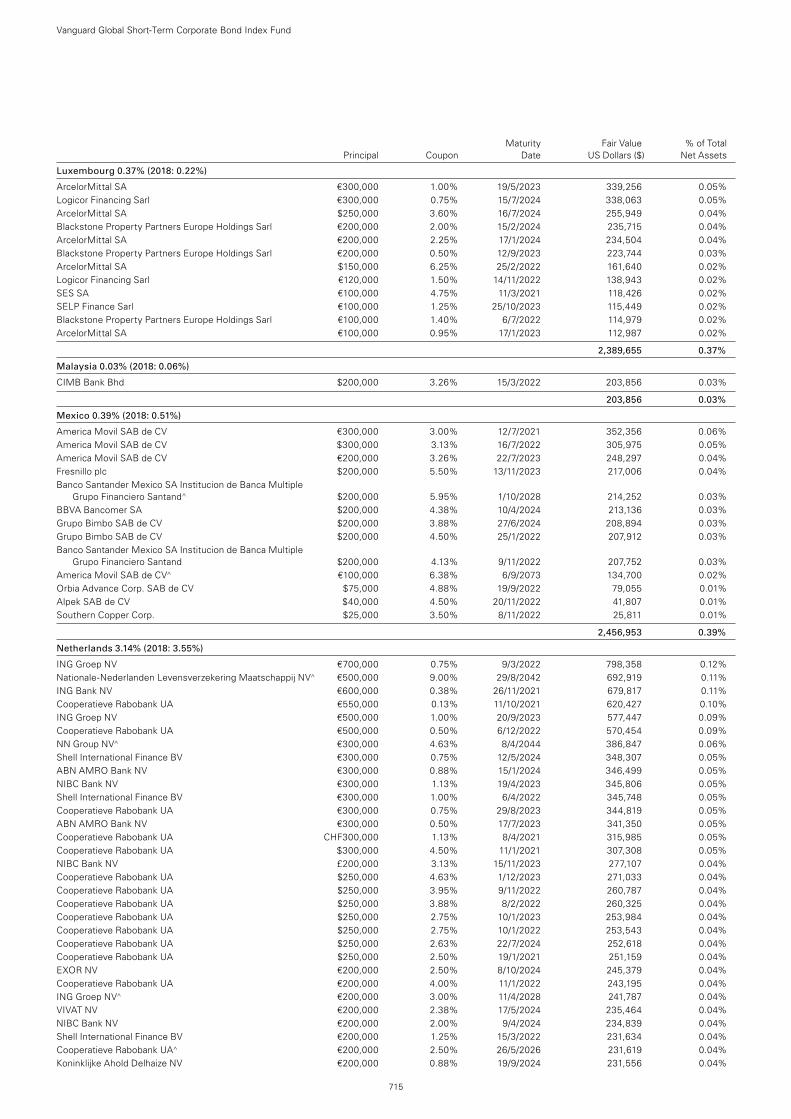
Luxembourg 0.37% (2018: 0.22%)
ArcelorMittal SA €300,000 1.00% 19/5/2023 339,256 0.05%Logicor Financing Sarl €300,000 0.75% 15/7/2024 338,063 0.05%ArcelorMittal SA $250,000 3.60% 16/7/2024 255,949 0.04%Blackstone Property Partners Europe Holdings Sarl €200,000 2.00% 15/2/2024 235,715 0.04%ArcelorMittal SA €200,000 2.25% 17/1/2024 234,504 0.04%Blackstone Property Partners Europe Holdings Sarl €200,000 0.50% 12/9/2023 223,744 0.03%ArcelorMittal SA $150,000 6.25% 25/2/2022 161,640 0.02%Logicor Financing Sarl €120,000 1.50% 14/11/2022 138,943 0.02%SES SA €100,000 4.75% 11/3/2021 118,426 0.02%SELP Finance Sarl €100,000 1.25% 25/10/2023 115,449 0.02%Blackstone Property Partners Europe Holdings Sarl €100,000 1.40% 6/7/2022 114,979 0.02%ArcelorMittal SA €100,000 0.95% 17/1/2023 112,987 0.02%
2,389,655 0.37%
Malaysia 0.03% (2018: 0.06%)
CIMB Bank Bhd $200,000 3.26% 15/3/2022 203,856 0.03%
203,856 0.03%
Mexico 0.39% (2018: 0.51%)
America Movil SAB de CV €300,000 3.00% 12/7/2021 352,356 0.06%America Movil SAB de CV $300,000 3.13% 16/7/2022 305,975 0.05%America Movil SAB de CV €200,000 3.26% 22/7/2023 248,297 0.04%Fresnillo plc $200,000 5.50% 13/11/2023 217,006 0.04%Banco Santander Mexico SA Institucion de Banca Multiple
Grupo Financiero Santand^ $200,000 5.95% 1/10/2028 214,252 0.03%BBVA Bancomer SA $200,000 4.38% 10/4/2024 213,136 0.03%Grupo Bimbo SAB de CV $200,000 3.88% 27/6/2024 208,894 0.03%Grupo Bimbo SAB de CV $200,000 4.50% 25/1/2022 207,912 0.03%Banco Santander Mexico SA Institucion de Banca Multiple
Grupo Financiero Santand $200,000 4.13% 9/11/2022 207,752 0.03%America Movil SAB de CV^ €100,000 6.38% 6/9/2073 134,700 0.02%Orbia Advance Corp. SAB de CV $75,000 4.88% 19/9/2022 79,055 0.01%Alpek SAB de CV $40,000 4.50% 20/11/2022 41,807 0.01%Southern Copper Corp. $25,000 3.50% 8/11/2022 25,811 0.01%
2,456,953 0.39%
Netherlands 3.14% (2018: 3.55%)
ING Groep NV €700,000 0.75% 9/3/2022 798,358 0.12%Nationale-Nederlanden Levensverzekering Maatschappij NV^ €500,000 9.00% 29/8/2042 692,919 0.11%ING Bank NV €600,000 0.38% 26/11/2021 679,817 0.11%Cooperatieve Rabobank UA €550,000 0.13% 11/10/2021 620,427 0.10%ING Groep NV €500,000 1.00% 20/9/2023 577,447 0.09%Cooperatieve Rabobank UA €500,000 0.50% 6/12/2022 570,454 0.09%NN Group NV^ €300,000 4.63% 8/4/2044 386,847 0.06%Shell International Finance BV €300,000 0.75% 12/5/2024 348,307 0.05%ABN AMRO Bank NV €300,000 0.88% 15/1/2024 346,499 0.05%NIBC Bank NV €300,000 1.13% 19/4/2023 345,806 0.05%Shell International Finance BV €300,000 1.00% 6/4/2022 345,748 0.05%Cooperatieve Rabobank UA €300,000 0.75% 29/8/2023 344,819 0.05%ABN AMRO Bank NV €300,000 0.50% 17/7/2023 341,350 0.05%Cooperatieve Rabobank UA CHF300,000 1.13% 8/4/2021 315,985 0.05%Cooperatieve Rabobank UA $300,000 4.50% 11/1/2021 307,308 0.05%NIBC Bank NV £200,000 3.13% 15/11/2023 277,107 0.04%Cooperatieve Rabobank UA $250,000 4.63% 1/12/2023 271,033 0.04%Cooperatieve Rabobank UA $250,000 3.95% 9/11/2022 260,787 0.04%Cooperatieve Rabobank UA $250,000 3.88% 8/2/2022 260,325 0.04%Cooperatieve Rabobank UA $250,000 2.75% 10/1/2023 253,984 0.04%Cooperatieve Rabobank UA $250,000 2.75% 10/1/2022 253,543 0.04%Cooperatieve Rabobank UA $250,000 2.63% 22/7/2024 252,618 0.04%Cooperatieve Rabobank UA $250,000 2.50% 19/1/2021 251,159 0.04%EXOR NV €200,000 2.50% 8/10/2024 245,379 0.04%Cooperatieve Rabobank UA €200,000 4.00% 11/1/2022 243,195 0.04%ING Groep NV^ €200,000 3.00% 11/4/2028 241,787 0.04%VIVAT NV €200,000 2.38% 17/5/2024 235,464 0.04%NIBC Bank NV €200,000 2.00% 9/4/2024 234,839 0.04%Shell International Finance BV €200,000 1.25% 15/3/2022 231,634 0.04%Cooperatieve Rabobank UA^ €200,000 2.50% 26/5/2026 231,619 0.04%Koninklijke Ahold Delhaize NV €200,000 0.88% 19/9/2024 231,556 0.04%
Vanguard Global Short-Term Corporate Bond Index Fund
715
Maturity Fair Value % of Total Principal Coupon Date US Dollars ($) Net Assets
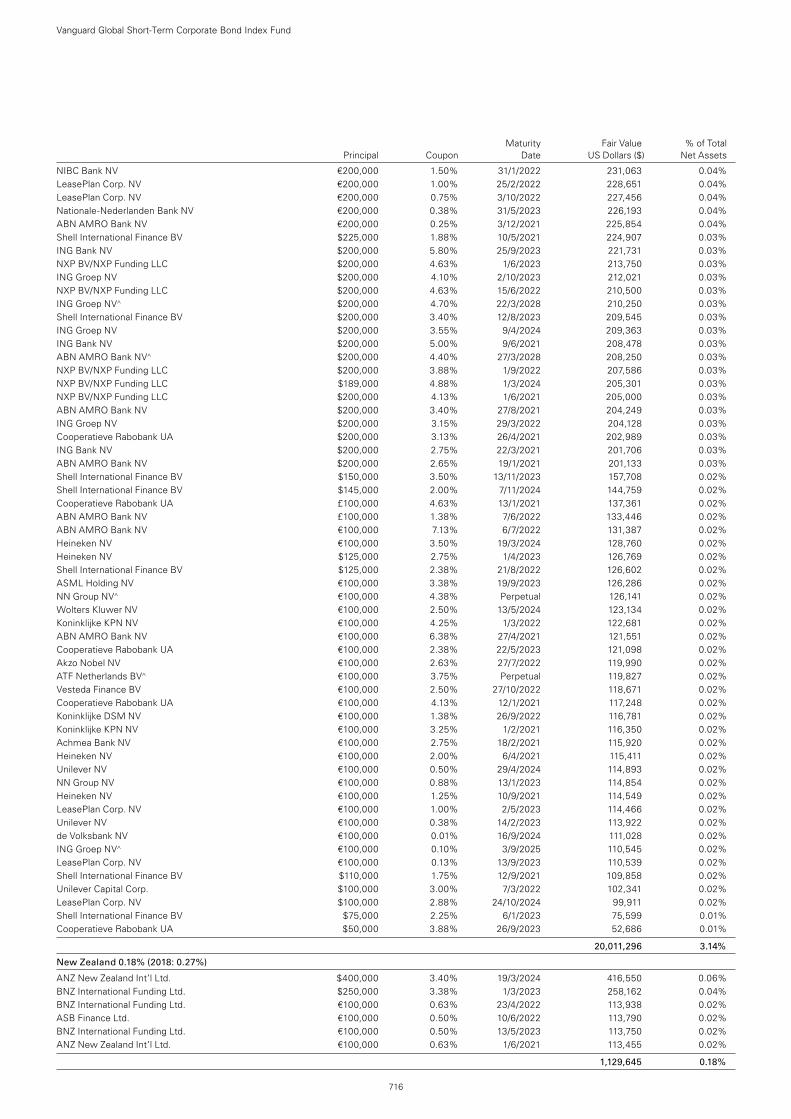
NIBC Bank NV €200,000 1.50% 31/1/2022 231,063 0.04%LeasePlan Corp. NV €200,000 1.00% 25/2/2022 228,651 0.04%LeasePlan Corp. NV €200,000 0.75% 3/10/2022 227,456 0.04%Nationale-Nederlanden Bank NV €200,000 0.38% 31/5/2023 226,193 0.04%ABN AMRO Bank NV €200,000 0.25% 3/12/2021 225,854 0.04%Shell International Finance BV $225,000 1.88% 10/5/2021 224,907 0.03%ING Bank NV $200,000 5.80% 25/9/2023 221,731 0.03%NXP BV/NXP Funding LLC $200,000 4.63% 1/6/2023 213,750 0.03%ING Groep NV $200,000 4.10% 2/10/2023 212,021 0.03%NXP BV/NXP Funding LLC $200,000 4.63% 15/6/2022 210,500 0.03%ING Groep NV^ $200,000 4.70% 22/3/2028 210,250 0.03%Shell International Finance BV $200,000 3.40% 12/8/2023 209,545 0.03%ING Groep NV $200,000 3.55% 9/4/2024 209,363 0.03%ING Bank NV $200,000 5.00% 9/6/2021 208,478 0.03%ABN AMRO Bank NV^ $200,000 4.40% 27/3/2028 208,250 0.03%NXP BV/NXP Funding LLC $200,000 3.88% 1/9/2022 207,586 0.03%NXP BV/NXP Funding LLC $189,000 4.88% 1/3/2024 205,301 0.03%NXP BV/NXP Funding LLC $200,000 4.13% 1/6/2021 205,000 0.03%ABN AMRO Bank NV $200,000 3.40% 27/8/2021 204,249 0.03%ING Groep NV $200,000 3.15% 29/3/2022 204,128 0.03%Cooperatieve Rabobank UA $200,000 3.13% 26/4/2021 202,989 0.03%ING Bank NV $200,000 2.75% 22/3/2021 201,706 0.03%ABN AMRO Bank NV $200,000 2.65% 19/1/2021 201,133 0.03%Shell International Finance BV $150,000 3.50% 13/11/2023 157,708 0.02%Shell International Finance BV $145,000 2.00% 7/11/2024 144,759 0.02%Cooperatieve Rabobank UA £100,000 4.63% 13/1/2021 137,361 0.02%ABN AMRO Bank NV £100,000 1.38% 7/6/2022 133,446 0.02%ABN AMRO Bank NV €100,000 7.13% 6/7/2022 131,387 0.02%Heineken NV €100,000 3.50% 19/3/2024 128,760 0.02%Heineken NV $125,000 2.75% 1/4/2023 126,769 0.02%Shell International Finance BV $125,000 2.38% 21/8/2022 126,602 0.02%ASML Holding NV €100,000 3.38% 19/9/2023 126,286 0.02%NN Group NV^ €100,000 4.38% Perpetual 126,141 0.02%Wolters Kluwer NV €100,000 2.50% 13/5/2024 123,134 0.02%Koninklijke KPN NV €100,000 4.25% 1/3/2022 122,681 0.02%ABN AMRO Bank NV €100,000 6.38% 27/4/2021 121,551 0.02%Cooperatieve Rabobank UA €100,000 2.38% 22/5/2023 121,098 0.02%Akzo Nobel NV €100,000 2.63% 27/7/2022 119,990 0.02%ATF Netherlands BV^ €100,000 3.75% Perpetual 119,827 0.02%Vesteda Finance BV €100,000 2.50% 27/10/2022 118,671 0.02%Cooperatieve Rabobank UA €100,000 4.13% 12/1/2021 117,248 0.02%Koninklijke DSM NV €100,000 1.38% 26/9/2022 116,781 0.02%Koninklijke KPN NV €100,000 3.25% 1/2/2021 116,350 0.02%Achmea Bank NV €100,000 2.75% 18/2/2021 115,920 0.02%Heineken NV €100,000 2.00% 6/4/2021 115,411 0.02%Unilever NV €100,000 0.50% 29/4/2024 114,893 0.02%NN Group NV €100,000 0.88% 13/1/2023 114,854 0.02%Heineken NV €100,000 1.25% 10/9/2021 114,549 0.02%LeasePlan Corp. NV €100,000 1.00% 2/5/2023 114,466 0.02%Unilever NV €100,000 0.38% 14/2/2023 113,922 0.02%de Volksbank NV €100,000 0.01% 16/9/2024 111,028 0.02%ING Groep NV^ €100,000 0.10% 3/9/2025 110,545 0.02%LeasePlan Corp. NV €100,000 0.13% 13/9/2023 110,539 0.02%Shell International Finance BV $110,000 1.75% 12/9/2021 109,858 0.02%Unilever Capital Corp. $100,000 3.00% 7/3/2022 102,341 0.02%LeasePlan Corp. NV $100,000 2.88% 24/10/2024 99,911 0.02%Shell International Finance BV $75,000 2.25% 6/1/2023 75,599 0.01%Cooperatieve Rabobank UA $50,000 3.88% 26/9/2023 52,686 0.01%
20,011,296 3.14%
New Zealand 0.18% (2018: 0.27%)
ANZ New Zealand Int’l Ltd. $400,000 3.40% 19/3/2024 416,550 0.06%BNZ International Funding Ltd. $250,000 3.38% 1/3/2023 258,162 0.04%BNZ International Funding Ltd. €100,000 0.63% 23/4/2022 113,938 0.02%ASB Finance Ltd. €100,000 0.50% 10/6/2022 113,790 0.02%BNZ International Funding Ltd. €100,000 0.50% 13/5/2023 113,750 0.02%ANZ New Zealand Int’l Ltd. €100,000 0.63% 1/6/2021 113,455 0.02%
1,129,645 0.18%
Vanguard Global Short-Term Corporate Bond Index Fund
716
Maturity Fair Value % of Total Principal Coupon Date US Dollars ($) Net Assets
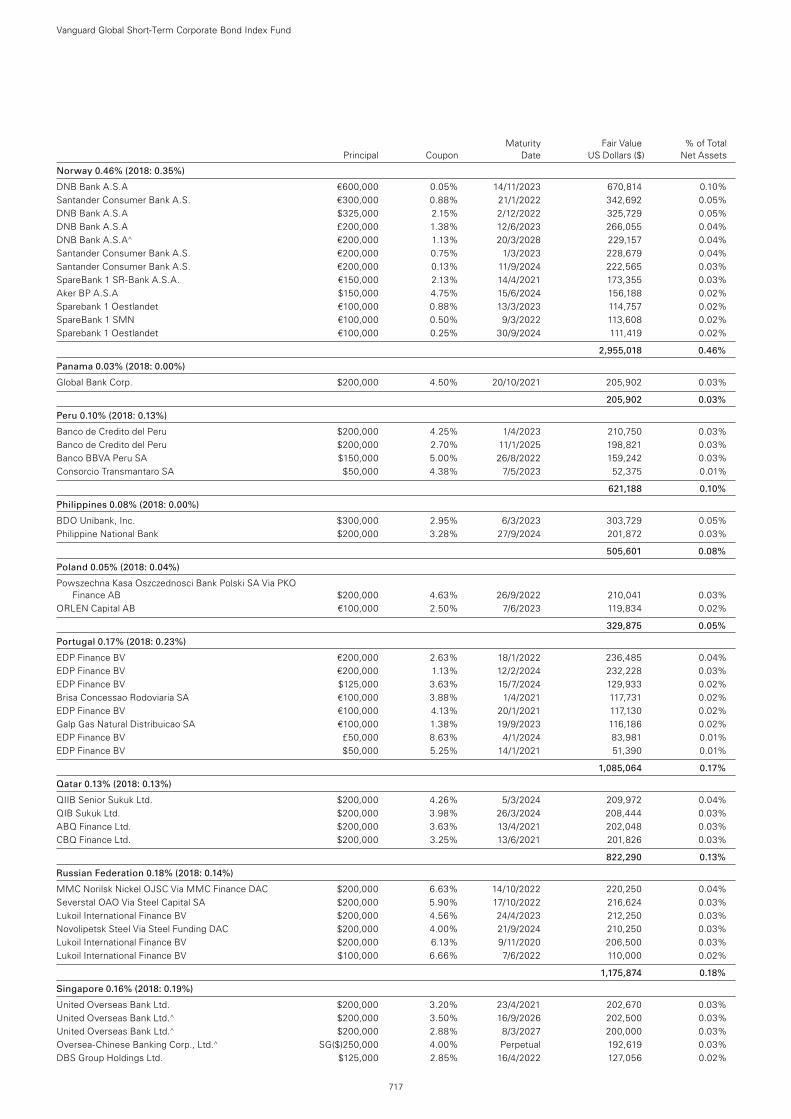
Norway 0.46% (2018: 0.35%)
DNB Bank A.S.A €600,000 0.05% 14/11/2023 670,814 0.10%Santander Consumer Bank A.S. €300,000 0.88% 21/1/2022 342,692 0.05%DNB Bank A.S.A $325,000 2.15% 2/12/2022 325,729 0.05%DNB Bank A.S.A £200,000 1.38% 12/6/2023 266,055 0.04%DNB Bank A.S.A^ €200,000 1.13% 20/3/2028 229,157 0.04%Santander Consumer Bank A.S. €200,000 0.75% 1/3/2023 228,679 0.04%Santander Consumer Bank A.S. €200,000 0.13% 11/9/2024 222,565 0.03%SpareBank 1 SR-Bank A.S.A. €150,000 2.13% 14/4/2021 173,355 0.03%Aker BP A.S.A $150,000 4.75% 15/6/2024 156,188 0.02%Sparebank 1 Oestlandet €100,000 0.88% 13/3/2023 114,757 0.02%SpareBank 1 SMN €100,000 0.50% 9/3/2022 113,608 0.02%Sparebank 1 Oestlandet €100,000 0.25% 30/9/2024 111,419 0.02%
2,955,018 0.46%
Panama 0.03% (2018: 0.00%)
Global Bank Corp. $200,000 4.50% 20/10/2021 205,902 0.03%
205,902 0.03%
Peru 0.10% (2018: 0.13%)
Banco de Credito del Peru $200,000 4.25% 1/4/2023 210,750 0.03%Banco de Credito del Peru $200,000 2.70% 11/1/2025 198,821 0.03%Banco BBVA Peru SA $150,000 5.00% 26/8/2022 159,242 0.03%Consorcio Transmantaro SA $50,000 4.38% 7/5/2023 52,375 0.01%
621,188 0.10%
Philippines 0.08% (2018: 0.00%)
BDO Unibank, Inc. $300,000 2.95% 6/3/2023 303,729 0.05%Philippine National Bank $200,000 3.28% 27/9/2024 201,872 0.03%
505,601 0.08%
Poland 0.05% (2018: 0.04%)
Powszechna Kasa Oszczednosci Bank Polski SA Via PKO Finance AB $200,000 4.63% 26/9/2022 210,041 0.03%
ORLEN Capital AB €100,000 2.50% 7/6/2023 119,834 0.02%
329,875 0.05%
Portugal 0.17% (2018: 0.23%)
EDP Finance BV €200,000 2.63% 18/1/2022 236,485 0.04%EDP Finance BV €200,000 1.13% 12/2/2024 232,228 0.03%EDP Finance BV $125,000 3.63% 15/7/2024 129,933 0.02%Brisa Concessao Rodoviaria SA €100,000 3.88% 1/4/2021 117,731 0.02%EDP Finance BV €100,000 4.13% 20/1/2021 117,130 0.02%Galp Gas Natural Distribuicao SA €100,000 1.38% 19/9/2023 116,186 0.02%EDP Finance BV £50,000 8.63% 4/1/2024 83,981 0.01%EDP Finance BV $50,000 5.25% 14/1/2021 51,390 0.01%
1,085,064 0.17%
Qatar 0.13% (2018: 0.13%)
QIIB Senior Sukuk Ltd. $200,000 4.26% 5/3/2024 209,972 0.04%QIB Sukuk Ltd. $200,000 3.98% 26/3/2024 208,444 0.03%ABQ Finance Ltd. $200,000 3.63% 13/4/2021 202,048 0.03%CBQ Finance Ltd. $200,000 3.25% 13/6/2021 201,826 0.03%
822,290 0.13%
Russian Federation 0.18% (2018: 0.14%)
MMC Norilsk Nickel OJSC Via MMC Finance DAC $200,000 6.63% 14/10/2022 220,250 0.04%Severstal OAO Via Steel Capital SA $200,000 5.90% 17/10/2022 216,624 0.03%Lukoil International Finance BV $200,000 4.56% 24/4/2023 212,250 0.03%Novolipetsk Steel Via Steel Funding DAC $200,000 4.00% 21/9/2024 210,250 0.03%Lukoil International Finance BV $200,000 6.13% 9/11/2020 206,500 0.03%Lukoil International Finance BV $100,000 6.66% 7/6/2022 110,000 0.02%
1,175,874 0.18%
Singapore 0.16% (2018: 0.19%)
United Overseas Bank Ltd. $200,000 3.20% 23/4/2021 202,670 0.03%United Overseas Bank Ltd.^ $200,000 3.50% 16/9/2026 202,500 0.03%United Overseas Bank Ltd.^ $200,000 2.88% 8/3/2027 200,000 0.03%Oversea-Chinese Banking Corp., Ltd.^ SG($)250,000 4.00% Perpetual 192,619 0.03%DBS Group Holdings Ltd. $125,000 2.85% 16/4/2022 127,056 0.02%
Vanguard Global Short-Term Corporate Bond Index Fund
717
Maturity Fair Value % of Total Principal Coupon Date US Dollars ($) Net Assets
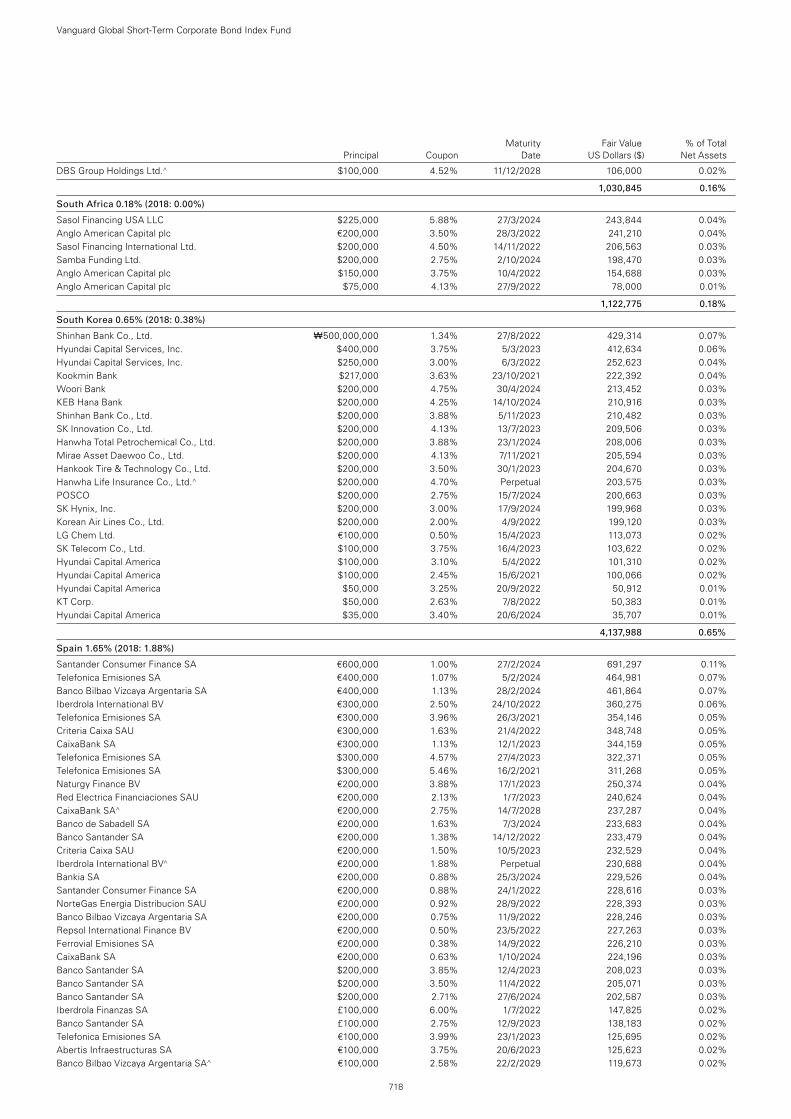
DBS Group Holdings Ltd.^ $100,000 4.52% 11/12/2028 106,000 0.02%
1,030,845 0.16%
South Africa 0.18% (2018: 0.00%)
Sasol Financing USA LLC $225,000 5.88% 27/3/2024 243,844 0.04%Anglo American Capital plc €200,000 3.50% 28/3/2022 241,210 0.04%Sasol Financing International Ltd. $200,000 4.50% 14/11/2022 206,563 0.03%Samba Funding Ltd. $200,000 2.75% 2/10/2024 198,470 0.03%Anglo American Capital plc $150,000 3.75% 10/4/2022 154,688 0.03%Anglo American Capital plc $75,000 4.13% 27/9/2022 78,000 0.01%
1,122,775 0.18%
South Korea 0.65% (2018: 0.38%)
Shinhan Bank Co., Ltd. ₩500,000,000 1.34% 27/8/2022 429,314 0.07%Hyundai Capital Services, Inc. $400,000 3.75% 5/3/2023 412,634 0.06%Hyundai Capital Services, Inc. $250,000 3.00% 6/3/2022 252,623 0.04%Kookmin Bank $217,000 3.63% 23/10/2021 222,392 0.04%Woori Bank $200,000 4.75% 30/4/2024 213,452 0.03%KEB Hana Bank $200,000 4.25% 14/10/2024 210,916 0.03%Shinhan Bank Co., Ltd. $200,000 3.88% 5/11/2023 210,482 0.03%SK Innovation Co., Ltd. $200,000 4.13% 13/7/2023 209,506 0.03%Hanwha Total Petrochemical Co., Ltd. $200,000 3.88% 23/1/2024 208,006 0.03%Mirae Asset Daewoo Co., Ltd. $200,000 4.13% 7/11/2021 205,594 0.03%Hankook Tire & Technology Co., Ltd. $200,000 3.50% 30/1/2023 204,670 0.03%Hanwha Life Insurance Co., Ltd.^ $200,000 4.70% Perpetual 203,575 0.03%POSCO $200,000 2.75% 15/7/2024 200,663 0.03%SK Hynix, Inc. $200,000 3.00% 17/9/2024 199,968 0.03%Korean Air Lines Co., Ltd. $200,000 2.00% 4/9/2022 199,120 0.03%LG Chem Ltd. €100,000 0.50% 15/4/2023 113,073 0.02%SK Telecom Co., Ltd. $100,000 3.75% 16/4/2023 103,622 0.02%Hyundai Capital America $100,000 3.10% 5/4/2022 101,310 0.02%Hyundai Capital America $100,000 2.45% 15/6/2021 100,066 0.02%Hyundai Capital America $50,000 3.25% 20/9/2022 50,912 0.01%KT Corp. $50,000 2.63% 7/8/2022 50,383 0.01%Hyundai Capital America $35,000 3.40% 20/6/2024 35,707 0.01%
4,137,988 0.65%
Spain 1.65% (2018: 1.88%)
Santander Consumer Finance SA €600,000 1.00% 27/2/2024 691,297 0.11%Telefonica Emisiones SA €400,000 1.07% 5/2/2024 464,981 0.07%Banco Bilbao Vizcaya Argentaria SA €400,000 1.13% 28/2/2024 461,864 0.07%Iberdrola International BV €300,000 2.50% 24/10/2022 360,275 0.06%Telefonica Emisiones SA €300,000 3.96% 26/3/2021 354,146 0.05%Criteria Caixa SAU €300,000 1.63% 21/4/2022 348,748 0.05%CaixaBank SA €300,000 1.13% 12/1/2023 344,159 0.05%Telefonica Emisiones SA $300,000 4.57% 27/4/2023 322,371 0.05%Telefonica Emisiones SA $300,000 5.46% 16/2/2021 311,268 0.05%Naturgy Finance BV €200,000 3.88% 17/1/2023 250,374 0.04%Red Electrica Financiaciones SAU €200,000 2.13% 1/7/2023 240,624 0.04%CaixaBank SA^ €200,000 2.75% 14/7/2028 237,287 0.04%Banco de Sabadell SA €200,000 1.63% 7/3/2024 233,683 0.04%Banco Santander SA €200,000 1.38% 14/12/2022 233,479 0.04%Criteria Caixa SAU €200,000 1.50% 10/5/2023 232,529 0.04%Iberdrola International BV^ €200,000 1.88% Perpetual 230,688 0.04%Bankia SA €200,000 0.88% 25/3/2024 229,526 0.04%Santander Consumer Finance SA €200,000 0.88% 24/1/2022 228,616 0.03%NorteGas Energia Distribucion SAU €200,000 0.92% 28/9/2022 228,393 0.03%Banco Bilbao Vizcaya Argentaria SA €200,000 0.75% 11/9/2022 228,246 0.03%Repsol International Finance BV €200,000 0.50% 23/5/2022 227,263 0.03%Ferrovial Emisiones SA €200,000 0.38% 14/9/2022 226,210 0.03%CaixaBank SA €200,000 0.63% 1/10/2024 224,196 0.03%Banco Santander SA $200,000 3.85% 12/4/2023 208,023 0.03%Banco Santander SA $200,000 3.50% 11/4/2022 205,071 0.03%Banco Santander SA $200,000 2.71% 27/6/2024 202,587 0.03%Iberdrola Finanzas SA £100,000 6.00% 1/7/2022 147,825 0.02%Banco Santander SA £100,000 2.75% 12/9/2023 138,183 0.02%Telefonica Emisiones SA €100,000 3.99% 23/1/2023 125,695 0.02%Abertis Infraestructuras SA €100,000 3.75% 20/6/2023 125,623 0.02%Banco Bilbao Vizcaya Argentaria SA^ €100,000 2.58% 22/2/2029 119,673 0.02%
Vanguard Global Short-Term Corporate Bond Index Fund
718
Maturity Fair Value % of Total Principal Coupon Date US Dollars ($) Net Assets
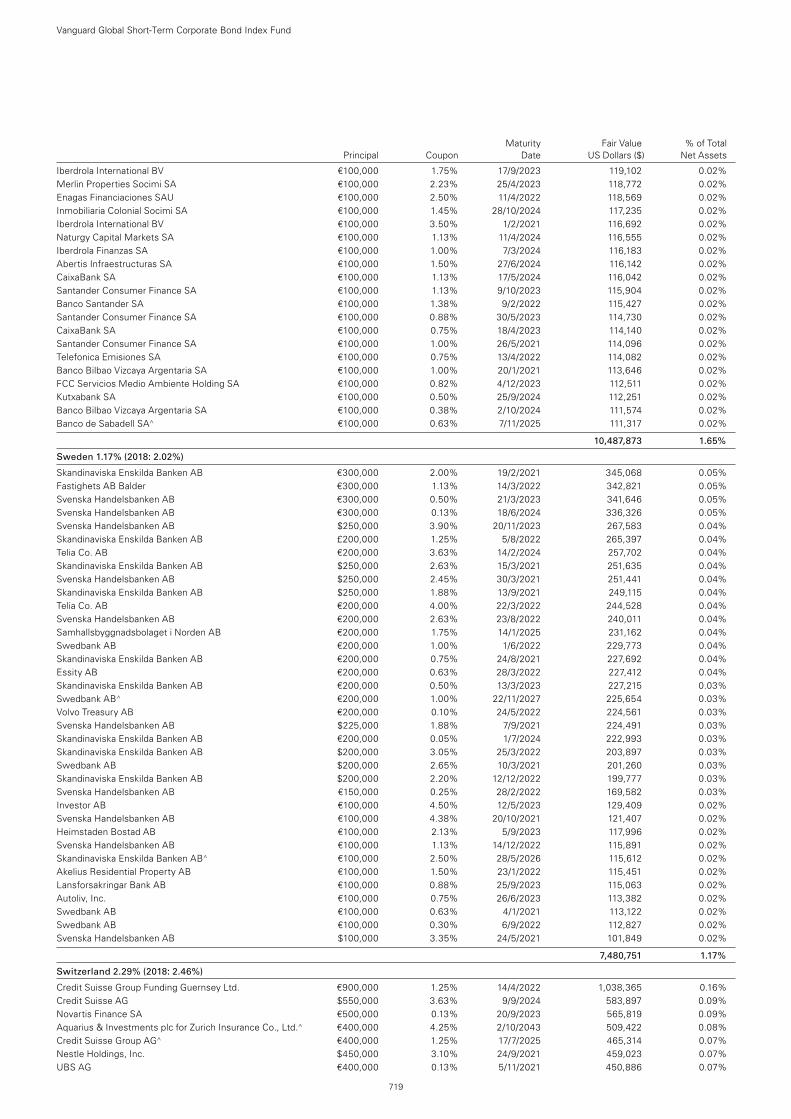
Iberdrola International BV €100,000 1.75% 17/9/2023 119,102 0.02%Merlin Properties Socimi SA €100,000 2.23% 25/4/2023 118,772 0.02%Enagas Financiaciones SAU €100,000 2.50% 11/4/2022 118,569 0.02%Inmobiliaria Colonial Socimi SA €100,000 1.45% 28/10/2024 117,235 0.02%Iberdrola International BV €100,000 3.50% 1/2/2021 116,692 0.02%Naturgy Capital Markets SA €100,000 1.13% 11/4/2024 116,555 0.02%Iberdrola Finanzas SA €100,000 1.00% 7/3/2024 116,183 0.02%Abertis Infraestructuras SA €100,000 1.50% 27/6/2024 116,142 0.02%CaixaBank SA €100,000 1.13% 17/5/2024 116,042 0.02%Santander Consumer Finance SA €100,000 1.13% 9/10/2023 115,904 0.02%Banco Santander SA €100,000 1.38% 9/2/2022 115,427 0.02%Santander Consumer Finance SA €100,000 0.88% 30/5/2023 114,730 0.02%CaixaBank SA €100,000 0.75% 18/4/2023 114,140 0.02%Santander Consumer Finance SA €100,000 1.00% 26/5/2021 114,096 0.02%Telefonica Emisiones SA €100,000 0.75% 13/4/2022 114,082 0.02%Banco Bilbao Vizcaya Argentaria SA €100,000 1.00% 20/1/2021 113,646 0.02%FCC Servicios Medio Ambiente Holding SA €100,000 0.82% 4/12/2023 112,511 0.02%Kutxabank SA €100,000 0.50% 25/9/2024 112,251 0.02%Banco Bilbao Vizcaya Argentaria SA €100,000 0.38% 2/10/2024 111,574 0.02%Banco de Sabadell SA^ €100,000 0.63% 7/11/2025 111,317 0.02%
10,487,873 1.65%
Sweden 1.17% (2018: 2.02%)
Skandinaviska Enskilda Banken AB €300,000 2.00% 19/2/2021 345,068 0.05%Fastighets AB Balder €300,000 1.13% 14/3/2022 342,821 0.05%Svenska Handelsbanken AB €300,000 0.50% 21/3/2023 341,646 0.05%Svenska Handelsbanken AB €300,000 0.13% 18/6/2024 336,326 0.05%Svenska Handelsbanken AB $250,000 3.90% 20/11/2023 267,583 0.04%Skandinaviska Enskilda Banken AB £200,000 1.25% 5/8/2022 265,397 0.04%Telia Co. AB €200,000 3.63% 14/2/2024 257,702 0.04%Skandinaviska Enskilda Banken AB $250,000 2.63% 15/3/2021 251,635 0.04%Svenska Handelsbanken AB $250,000 2.45% 30/3/2021 251,441 0.04%Skandinaviska Enskilda Banken AB $250,000 1.88% 13/9/2021 249,115 0.04%Telia Co. AB €200,000 4.00% 22/3/2022 244,528 0.04%Svenska Handelsbanken AB €200,000 2.63% 23/8/2022 240,011 0.04%Samhallsbyggnadsbolaget i Norden AB €200,000 1.75% 14/1/2025 231,162 0.04%Swedbank AB €200,000 1.00% 1/6/2022 229,773 0.04%Skandinaviska Enskilda Banken AB €200,000 0.75% 24/8/2021 227,692 0.04%Essity AB €200,000 0.63% 28/3/2022 227,412 0.04%Skandinaviska Enskilda Banken AB €200,000 0.50% 13/3/2023 227,215 0.03%Swedbank AB^ €200,000 1.00% 22/11/2027 225,654 0.03%Volvo Treasury AB €200,000 0.10% 24/5/2022 224,561 0.03%Svenska Handelsbanken AB $225,000 1.88% 7/9/2021 224,491 0.03%Skandinaviska Enskilda Banken AB €200,000 0.05% 1/7/2024 222,993 0.03%Skandinaviska Enskilda Banken AB $200,000 3.05% 25/3/2022 203,897 0.03%Swedbank AB $200,000 2.65% 10/3/2021 201,260 0.03%Skandinaviska Enskilda Banken AB $200,000 2.20% 12/12/2022 199,777 0.03%Svenska Handelsbanken AB €150,000 0.25% 28/2/2022 169,582 0.03%Investor AB €100,000 4.50% 12/5/2023 129,409 0.02%Svenska Handelsbanken AB €100,000 4.38% 20/10/2021 121,407 0.02%Heimstaden Bostad AB €100,000 2.13% 5/9/2023 117,996 0.02%Svenska Handelsbanken AB €100,000 1.13% 14/12/2022 115,891 0.02%Skandinaviska Enskilda Banken AB^ €100,000 2.50% 28/5/2026 115,612 0.02%Akelius Residential Property AB €100,000 1.50% 23/1/2022 115,451 0.02%Lansforsakringar Bank AB €100,000 0.88% 25/9/2023 115,063 0.02%Autoliv, Inc. €100,000 0.75% 26/6/2023 113,382 0.02%Swedbank AB €100,000 0.63% 4/1/2021 113,122 0.02%Swedbank AB €100,000 0.30% 6/9/2022 112,827 0.02%Svenska Handelsbanken AB $100,000 3.35% 24/5/2021 101,849 0.02%
7,480,751 1.17%
Switzerland 2.29% (2018: 2.46%)
Credit Suisse Group Funding Guernsey Ltd. €900,000 1.25% 14/4/2022 1,038,365 0.16%Credit Suisse AG $550,000 3.63% 9/9/2024 583,897 0.09%Novartis Finance SA €500,000 0.13% 20/9/2023 565,819 0.09%Aquarius & Investments plc for Zurich Insurance Co., Ltd.^ €400,000 4.25% 2/10/2043 509,422 0.08%Credit Suisse Group AG^ €400,000 1.25% 17/7/2025 465,314 0.07%Nestle Holdings, Inc. $450,000 3.10% 24/9/2021 459,023 0.07%UBS AG €400,000 0.13% 5/11/2021 450,886 0.07%
Vanguard Global Short-Term Corporate Bond Index Fund
719
Maturity Fair Value % of Total Principal Coupon Date US Dollars ($) Net Assets

Roche Holdings, Inc. $400,000 2.88% 29/9/2021 406,436 0.06%UBS Group AG $400,000 2.65% 1/2/2022 404,263 0.06%Nestle Holdings, Inc. $350,000 3.35% 24/9/2023 365,831 0.06%Credit Suisse AG €300,000 1.38% 31/1/2022 347,075 0.05%Novartis Capital Corp. $325,000 2.40% 21/9/2022 329,997 0.05%Credit Suisse Group AG^ $300,000 4.21% 12/6/2024 316,360 0.05%UBS Group AG $300,000 3.49% 23/5/2023 308,249 0.05%Credit Suisse Group Funding Guernsey Ltd. $300,000 3.13% 10/12/2020 302,657 0.05%Credit Suisse Group AG^ £200,000 2.13% 12/9/2025 269,083 0.04%Cloverie plc for Swiss Reinsurance Co., Ltd.^ €200,000 6.63% 1/9/2042 262,090 0.04%Credit Suisse Group Funding Guernsey Ltd. $250,000 3.80% 9/6/2023 261,535 0.04%Credit Suisse Group Funding Guernsey Ltd. $250,000 3.80% 15/9/2022 259,835 0.04%Credit Suisse Group AG $250,000 3.57% 9/1/2023 256,542 0.04%Credit Suisse Group AG^ $250,000 3.00% 14/12/2023 253,971 0.04%Credit Suisse Group Funding Guernsey Ltd. $250,000 3.45% 16/4/2021 253,725 0.04%UBS Group AG €200,000 2.13% 4/3/2024 242,219 0.04%UBS Group AG^ €200,000 1.25% 17/4/2025 233,572 0.04%Nestle Finance International Ltd. €200,000 0.75% 16/5/2023 230,909 0.04%ABB Finance BV €200,000 0.75% 16/5/2024 230,215 0.04%UBS AG €200,000 1.25% 3/9/2021 229,781 0.04%Glencore Finance Europe Ltd. €200,000 1.63% 18/1/2022 229,343 0.04%Roche Finance Europe BV €200,000 0.50% 27/2/2023 228,672 0.04%Nestle Finance International Ltd. €200,000 0.38% 18/1/2024 228,503 0.04%Glencore Finance Europe Ltd. €200,000 1.25% 17/3/2021 226,819 0.04%Roche Holdings, Inc. $200,000 3.35% 30/9/2024 211,764 0.03%UBS Group AG^ $200,000 2.86% 15/8/2023 202,443 0.03%UBS Group AG $200,000 3.00% 15/4/2021 202,408 0.03%UBS AG $200,000 2.45% 1/12/2020 200,642 0.03%Roche Holdings, Inc. $200,000 1.75% 28/1/2022 199,719 0.03%Glencore Funding LLC $175,000 4.13% 30/5/2023 182,034 0.03%Glencore Funding LLC $150,000 4.63% 29/4/2024 159,455 0.02%Glencore Finance Canada Ltd. $150,000 4.25% 25/10/2022 156,188 0.02%Tyco Electronics Group SA $150,000 3.50% 3/2/2022 154,348 0.02%ABB Finance USA, Inc. $150,000 2.88% 8/5/2022 153,052 0.02%Glencore Funding LLC $150,000 3.00% 27/10/2022 150,226 0.02%Zurich Finance Australia Ltd. AU($)200,000 3.48% 31/5/2023 147,942 0.02%Glencore Finance Europe Ltd. £100,000 6.00% 3/4/2022 145,506 0.02%Novartis Capital Corp. $125,000 2.40% 17/5/2022 126,661 0.02%Willow No 2 Ireland plc for Zurich Insurance Co., Ltd. €100,000 3.38% 27/6/2022 121,548 0.02%Roche Holdings, Inc. €100,000 6.50% 4/3/2021 121,257 0.02%Glencore Finance Europe Ltd. €100,000 1.88% 13/9/2023 117,226 0.02%Holcim Finance Luxembourg SA €100,000 1.38% 26/5/2023 117,114 0.02%Swiss Re Finance Jersey Ltd. €100,000 1.38% 27/5/2023 116,849 0.02%Nestle Finance International Ltd. €100,000 0.75% 8/11/2021 114,286 0.02%Novartis Finance SA €100,000 0.00% 31/3/2021 112,653 0.02%Swiss Re Finance Luxembourg SA^ $100,000 5.00% 2/4/2049 111,750 0.02%Novartis Capital Corp. $100,000 3.40% 6/5/2024 105,818 0.02%Glencore Funding LLC $100,000 4.13% 12/3/2024 104,394 0.02%Glencore Finance Canada Ltd. $100,000 4.95% 15/11/2021 104,121 0.02%Credit Suisse AG $100,000 3.00% 29/10/2021 101,850 0.02%ABB Finance USA, Inc. $75,000 3.38% 3/4/2023 77,941 0.01%
14,569,603 2.29%
Taiwan 0.03% (2018: 0.00%)
Competition Team Technologies Ltd. $200,000 3.75% 12/3/2024 206,154 0.03%
206,154 0.03%
Thailand 0.10% (2018: 0.13%)
PTT Global Chemical PCL $200,000 4.25% 19/9/2022 207,657 0.04%Bangkok Bank PCL $200,000 3.88% 27/9/2022 207,574 0.03%Siam Commercial Bank PCL $200,000 2.75% 16/5/2023 201,106 0.03%
616,337 0.10%
United Arab Emirates 0.19% (2018: 0.13%)
EMG SUKUK Ltd. $200,000 4.56% 18/6/2024 209,750 0.04%Mashreqbank PSC $200,000 4.25% 26/2/2024 209,410 0.03%Unity 1 Sukuk Ltd. $200,000 3.86% 30/11/2021 204,234 0.03%DIB Sukuk Ltd. $200,000 3.63% 6/2/2023 204,116 0.03%DIB Sukuk Ltd. $200,000 3.66% 14/2/2022 203,258 0.03%
Vanguard Global Short-Term Corporate Bond Index Fund
720
Maturity Fair Value % of Total Principal Coupon Date US Dollars ($) Net Assets
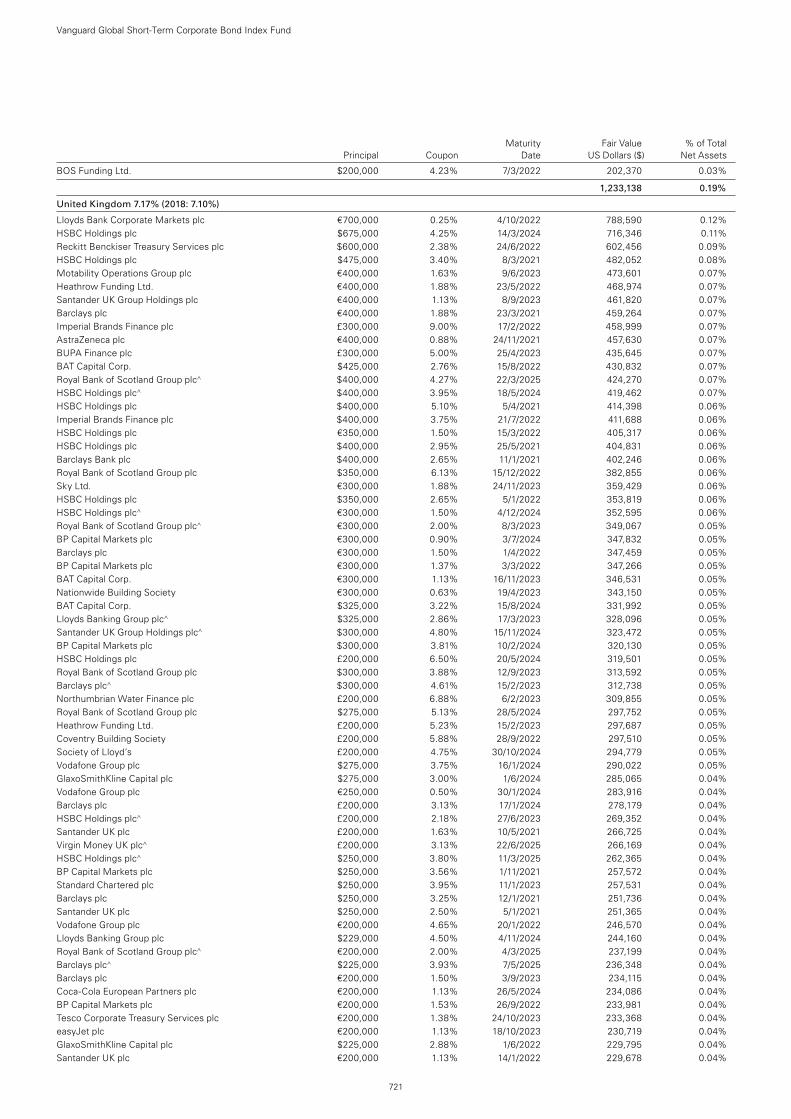
BOS Funding Ltd. $200,000 4.23% 7/3/2022 202,370 0.03%
1,233,138 0.19%
United Kingdom 7.17% (2018: 7.10%)
Lloyds Bank Corporate Markets plc €700,000 0.25% 4/10/2022 788,590 0.12%HSBC Holdings plc $675,000 4.25% 14/3/2024 716,346 0.11%Reckitt Benckiser Treasury Services plc $600,000 2.38% 24/6/2022 602,456 0.09%HSBC Holdings plc $475,000 3.40% 8/3/2021 482,052 0.08%Motability Operations Group plc €400,000 1.63% 9/6/2023 473,601 0.07%Heathrow Funding Ltd. €400,000 1.88% 23/5/2022 468,974 0.07%Santander UK Group Holdings plc €400,000 1.13% 8/9/2023 461,820 0.07%Barclays plc €400,000 1.88% 23/3/2021 459,264 0.07%Imperial Brands Finance plc £300,000 9.00% 17/2/2022 458,999 0.07%AstraZeneca plc €400,000 0.88% 24/11/2021 457,630 0.07%BUPA Finance plc £300,000 5.00% 25/4/2023 435,645 0.07%BAT Capital Corp. $425,000 2.76% 15/8/2022 430,832 0.07%Royal Bank of Scotland Group plc^ $400,000 4.27% 22/3/2025 424,270 0.07%HSBC Holdings plc^ $400,000 3.95% 18/5/2024 419,462 0.07%HSBC Holdings plc $400,000 5.10% 5/4/2021 414,398 0.06%Imperial Brands Finance plc $400,000 3.75% 21/7/2022 411,688 0.06%HSBC Holdings plc €350,000 1.50% 15/3/2022 405,317 0.06%HSBC Holdings plc $400,000 2.95% 25/5/2021 404,831 0.06%Barclays Bank plc $400,000 2.65% 11/1/2021 402,246 0.06%Royal Bank of Scotland Group plc $350,000 6.13% 15/12/2022 382,855 0.06%Sky Ltd. €300,000 1.88% 24/11/2023 359,429 0.06%HSBC Holdings plc $350,000 2.65% 5/1/2022 353,819 0.06%HSBC Holdings plc^ €300,000 1.50% 4/12/2024 352,595 0.06%Royal Bank of Scotland Group plc^ €300,000 2.00% 8/3/2023 349,067 0.05%BP Capital Markets plc €300,000 0.90% 3/7/2024 347,832 0.05%Barclays plc €300,000 1.50% 1/4/2022 347,459 0.05%BP Capital Markets plc €300,000 1.37% 3/3/2022 347,266 0.05%BAT Capital Corp. €300,000 1.13% 16/11/2023 346,531 0.05%Nationwide Building Society €300,000 0.63% 19/4/2023 343,150 0.05%BAT Capital Corp. $325,000 3.22% 15/8/2024 331,992 0.05%Lloyds Banking Group plc^ $325,000 2.86% 17/3/2023 328,096 0.05%Santander UK Group Holdings plc^ $300,000 4.80% 15/11/2024 323,472 0.05%BP Capital Markets plc $300,000 3.81% 10/2/2024 320,130 0.05%HSBC Holdings plc £200,000 6.50% 20/5/2024 319,501 0.05%Royal Bank of Scotland Group plc $300,000 3.88% 12/9/2023 313,592 0.05%Barclays plc^ $300,000 4.61% 15/2/2023 312,738 0.05%Northumbrian Water Finance plc £200,000 6.88% 6/2/2023 309,855 0.05%Royal Bank of Scotland Group plc $275,000 5.13% 28/5/2024 297,752 0.05%Heathrow Funding Ltd. £200,000 5.23% 15/2/2023 297,687 0.05%Coventry Building Society £200,000 5.88% 28/9/2022 297,510 0.05%Society of Lloyd’s £200,000 4.75% 30/10/2024 294,779 0.05%Vodafone Group plc $275,000 3.75% 16/1/2024 290,022 0.05%GlaxoSmithKline Capital plc $275,000 3.00% 1/6/2024 285,065 0.04%Vodafone Group plc €250,000 0.50% 30/1/2024 283,916 0.04%Barclays plc £200,000 3.13% 17/1/2024 278,179 0.04%HSBC Holdings plc^ £200,000 2.18% 27/6/2023 269,352 0.04%Santander UK plc £200,000 1.63% 10/5/2021 266,725 0.04%Virgin Money UK plc^ £200,000 3.13% 22/6/2025 266,169 0.04%HSBC Holdings plc^ $250,000 3.80% 11/3/2025 262,365 0.04%BP Capital Markets plc $250,000 3.56% 1/11/2021 257,572 0.04%Standard Chartered plc $250,000 3.95% 11/1/2023 257,531 0.04%Barclays plc $250,000 3.25% 12/1/2021 251,736 0.04%Santander UK plc $250,000 2.50% 5/1/2021 251,365 0.04%Vodafone Group plc €200,000 4.65% 20/1/2022 246,570 0.04%Lloyds Banking Group plc $229,000 4.50% 4/11/2024 244,160 0.04%Royal Bank of Scotland Group plc^ €200,000 2.00% 4/3/2025 237,199 0.04%Barclays plc^ $225,000 3.93% 7/5/2025 236,348 0.04%Barclays plc €200,000 1.50% 3/9/2023 234,115 0.04%Coca-Cola European Partners plc €200,000 1.13% 26/5/2024 234,086 0.04%BP Capital Markets plc €200,000 1.53% 26/9/2022 233,981 0.04%Tesco Corporate Treasury Services plc €200,000 1.38% 24/10/2023 233,368 0.04%easyJet plc €200,000 1.13% 18/10/2023 230,719 0.04%GlaxoSmithKline Capital plc $225,000 2.88% 1/6/2022 229,795 0.04%Santander UK plc €200,000 1.13% 14/1/2022 229,678 0.04%
Vanguard Global Short-Term Corporate Bond Index Fund
721
Maturity Fair Value % of Total Principal Coupon Date US Dollars ($) Net Assets
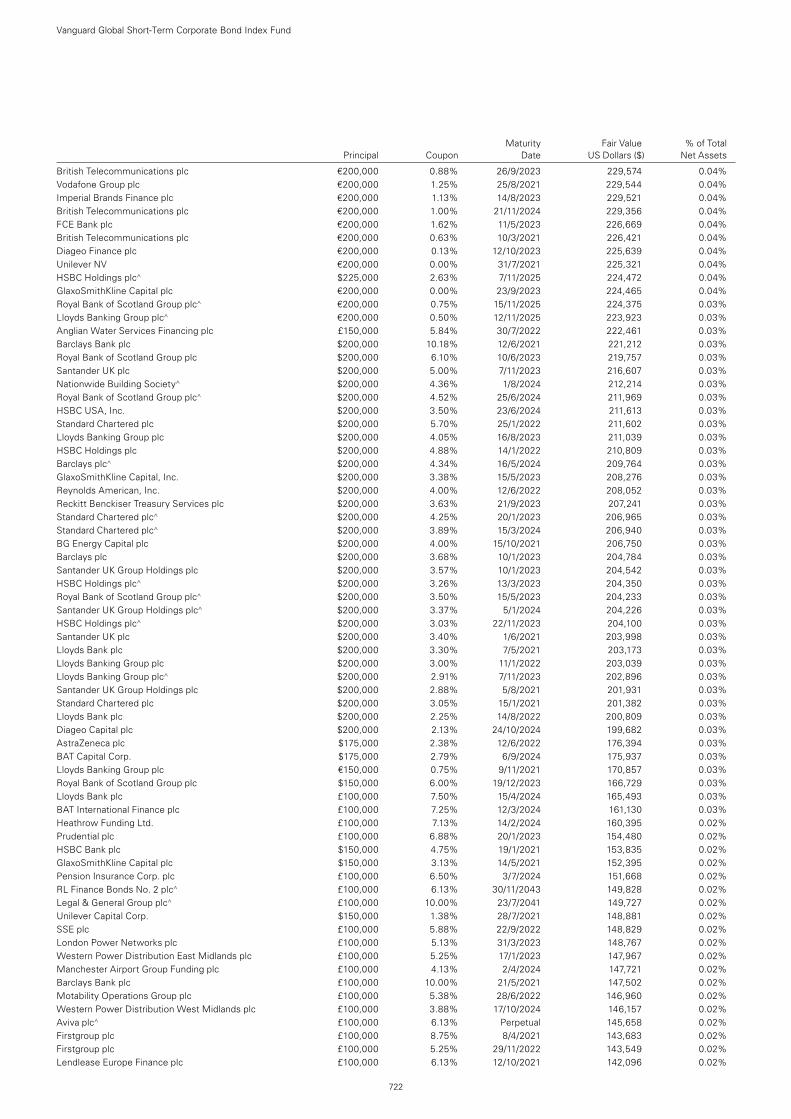
British Telecommunications plc €200,000 0.88% 26/9/2023 229,574 0.04%Vodafone Group plc €200,000 1.25% 25/8/2021 229,544 0.04%Imperial Brands Finance plc €200,000 1.13% 14/8/2023 229,521 0.04%British Telecommunications plc €200,000 1.00% 21/11/2024 229,356 0.04%FCE Bank plc €200,000 1.62% 11/5/2023 226,669 0.04%British Telecommunications plc €200,000 0.63% 10/3/2021 226,421 0.04%Diageo Finance plc €200,000 0.13% 12/10/2023 225,639 0.04%Unilever NV €200,000 0.00% 31/7/2021 225,321 0.04%HSBC Holdings plc^ $225,000 2.63% 7/11/2025 224,472 0.04%GlaxoSmithKline Capital plc €200,000 0.00% 23/9/2023 224,465 0.04%Royal Bank of Scotland Group plc^ €200,000 0.75% 15/11/2025 224,375 0.03%Lloyds Banking Group plc^ €200,000 0.50% 12/11/2025 223,923 0.03%Anglian Water Services Financing plc £150,000 5.84% 30/7/2022 222,461 0.03%Barclays Bank plc $200,000 10.18% 12/6/2021 221,212 0.03%Royal Bank of Scotland Group plc $200,000 6.10% 10/6/2023 219,757 0.03%Santander UK plc $200,000 5.00% 7/11/2023 216,607 0.03%Nationwide Building Society^ $200,000 4.36% 1/8/2024 212,214 0.03%Royal Bank of Scotland Group plc^ $200,000 4.52% 25/6/2024 211,969 0.03%HSBC USA, Inc. $200,000 3.50% 23/6/2024 211,613 0.03%Standard Chartered plc $200,000 5.70% 25/1/2022 211,602 0.03%Lloyds Banking Group plc $200,000 4.05% 16/8/2023 211,039 0.03%HSBC Holdings plc $200,000 4.88% 14/1/2022 210,809 0.03%Barclays plc^ $200,000 4.34% 16/5/2024 209,764 0.03%GlaxoSmithKline Capital, Inc. $200,000 3.38% 15/5/2023 208,276 0.03%Reynolds American, Inc. $200,000 4.00% 12/6/2022 208,052 0.03%Reckitt Benckiser Treasury Services plc $200,000 3.63% 21/9/2023 207,241 0.03%Standard Chartered plc^ $200,000 4.25% 20/1/2023 206,965 0.03%Standard Chartered plc^ $200,000 3.89% 15/3/2024 206,940 0.03%BG Energy Capital plc $200,000 4.00% 15/10/2021 206,750 0.03%Barclays plc $200,000 3.68% 10/1/2023 204,784 0.03%Santander UK Group Holdings plc $200,000 3.57% 10/1/2023 204,542 0.03%HSBC Holdings plc^ $200,000 3.26% 13/3/2023 204,350 0.03%Royal Bank of Scotland Group plc^ $200,000 3.50% 15/5/2023 204,233 0.03%Santander UK Group Holdings plc^ $200,000 3.37% 5/1/2024 204,226 0.03%HSBC Holdings plc^ $200,000 3.03% 22/11/2023 204,100 0.03%Santander UK plc $200,000 3.40% 1/6/2021 203,998 0.03%Lloyds Bank plc $200,000 3.30% 7/5/2021 203,173 0.03%Lloyds Banking Group plc $200,000 3.00% 11/1/2022 203,039 0.03%Lloyds Banking Group plc^ $200,000 2.91% 7/11/2023 202,896 0.03%Santander UK Group Holdings plc $200,000 2.88% 5/8/2021 201,931 0.03%Standard Chartered plc $200,000 3.05% 15/1/2021 201,382 0.03%Lloyds Bank plc $200,000 2.25% 14/8/2022 200,809 0.03%Diageo Capital plc $200,000 2.13% 24/10/2024 199,682 0.03%AstraZeneca plc $175,000 2.38% 12/6/2022 176,394 0.03%BAT Capital Corp. $175,000 2.79% 6/9/2024 175,937 0.03%Lloyds Banking Group plc €150,000 0.75% 9/11/2021 170,857 0.03%Royal Bank of Scotland Group plc $150,000 6.00% 19/12/2023 166,729 0.03%Lloyds Bank plc £100,000 7.50% 15/4/2024 165,493 0.03%BAT International Finance plc £100,000 7.25% 12/3/2024 161,130 0.03%Heathrow Funding Ltd. £100,000 7.13% 14/2/2024 160,395 0.02%Prudential plc £100,000 6.88% 20/1/2023 154,480 0.02%HSBC Bank plc $150,000 4.75% 19/1/2021 153,835 0.02%GlaxoSmithKline Capital plc $150,000 3.13% 14/5/2021 152,395 0.02%Pension Insurance Corp. plc £100,000 6.50% 3/7/2024 151,668 0.02%RL Finance Bonds No. 2 plc^ £100,000 6.13% 30/11/2043 149,828 0.02%Legal & General Group plc^ £100,000 10.00% 23/7/2041 149,727 0.02%Unilever Capital Corp. $150,000 1.38% 28/7/2021 148,881 0.02%SSE plc £100,000 5.88% 22/9/2022 148,829 0.02%London Power Networks plc £100,000 5.13% 31/3/2023 148,767 0.02%Western Power Distribution East Midlands plc £100,000 5.25% 17/1/2023 147,967 0.02%Manchester Airport Group Funding plc £100,000 4.13% 2/4/2024 147,721 0.02%Barclays Bank plc £100,000 10.00% 21/5/2021 147,502 0.02%Motability Operations Group plc £100,000 5.38% 28/6/2022 146,960 0.02%Western Power Distribution West Midlands plc £100,000 3.88% 17/10/2024 146,157 0.02%Aviva plc^ £100,000 6.13% Perpetual 145,658 0.02%Firstgroup plc £100,000 8.75% 8/4/2021 143,683 0.02%Firstgroup plc £100,000 5.25% 29/11/2022 143,549 0.02%Lendlease Europe Finance plc £100,000 6.13% 12/10/2021 142,096 0.02%
Vanguard Global Short-Term Corporate Bond Index Fund
722
Maturity Fair Value % of Total Principal Coupon Date US Dollars ($) Net Assets
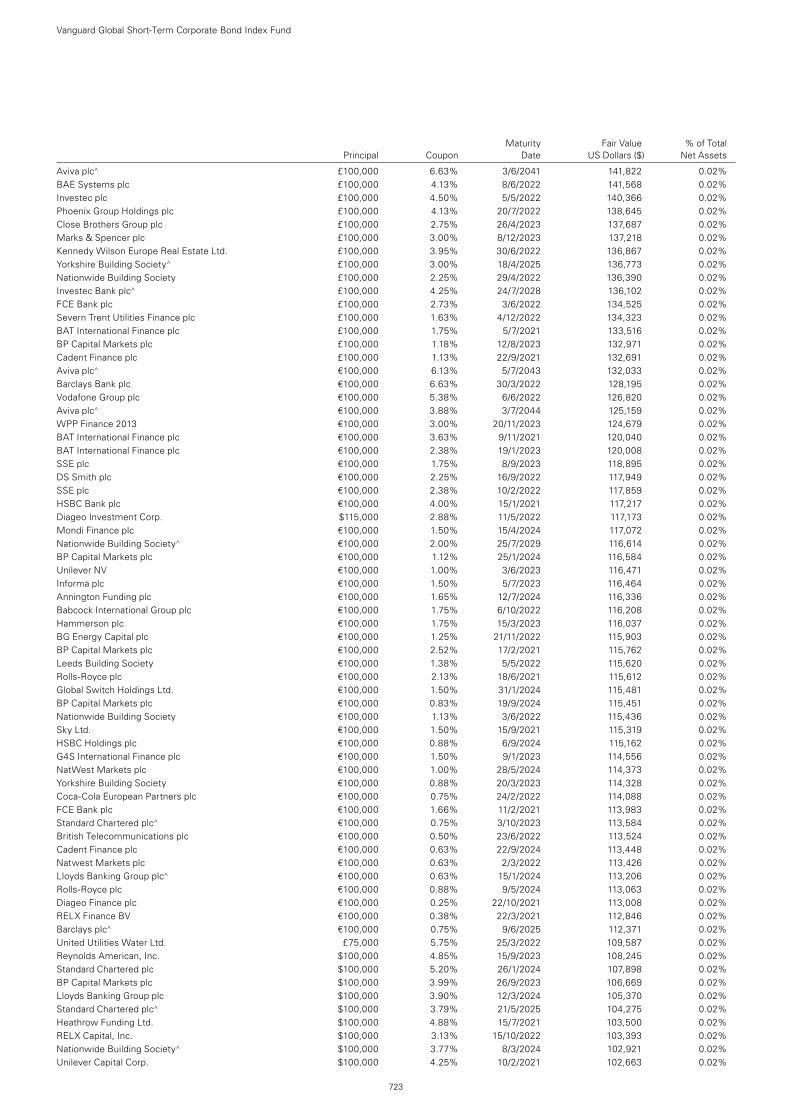
Aviva plc^ £100,000 6.63% 3/6/2041 141,822 0.02%BAE Systems plc £100,000 4.13% 8/6/2022 141,568 0.02%Investec plc £100,000 4.50% 5/5/2022 140,366 0.02%Phoenix Group Holdings plc £100,000 4.13% 20/7/2022 138,645 0.02%Close Brothers Group plc £100,000 2.75% 26/4/2023 137,687 0.02%Marks & Spencer plc £100,000 3.00% 8/12/2023 137,218 0.02%Kennedy Wilson Europe Real Estate Ltd. £100,000 3.95% 30/6/2022 136,867 0.02%Yorkshire Building Society^ £100,000 3.00% 18/4/2025 136,773 0.02%Nationwide Building Society £100,000 2.25% 29/4/2022 136,390 0.02%Investec Bank plc^ £100,000 4.25% 24/7/2028 136,102 0.02%FCE Bank plc £100,000 2.73% 3/6/2022 134,525 0.02%Severn Trent Utilities Finance plc £100,000 1.63% 4/12/2022 134,323 0.02%BAT International Finance plc £100,000 1.75% 5/7/2021 133,516 0.02%BP Capital Markets plc £100,000 1.18% 12/8/2023 132,971 0.02%Cadent Finance plc £100,000 1.13% 22/9/2021 132,691 0.02%Aviva plc^ €100,000 6.13% 5/7/2043 132,033 0.02%Barclays Bank plc €100,000 6.63% 30/3/2022 128,195 0.02%Vodafone Group plc €100,000 5.38% 6/6/2022 126,820 0.02%Aviva plc^ €100,000 3.88% 3/7/2044 125,159 0.02%WPP Finance 2013 €100,000 3.00% 20/11/2023 124,679 0.02%BAT International Finance plc €100,000 3.63% 9/11/2021 120,040 0.02%BAT International Finance plc €100,000 2.38% 19/1/2023 120,008 0.02%SSE plc €100,000 1.75% 8/9/2023 118,895 0.02%DS Smith plc €100,000 2.25% 16/9/2022 117,949 0.02%SSE plc €100,000 2.38% 10/2/2022 117,859 0.02%HSBC Bank plc €100,000 4.00% 15/1/2021 117,217 0.02%Diageo Investment Corp. $115,000 2.88% 11/5/2022 117,173 0.02%Mondi Finance plc €100,000 1.50% 15/4/2024 117,072 0.02%Nationwide Building Society^ €100,000 2.00% 25/7/2029 116,614 0.02%BP Capital Markets plc €100,000 1.12% 25/1/2024 116,584 0.02%Unilever NV €100,000 1.00% 3/6/2023 116,471 0.02%Informa plc €100,000 1.50% 5/7/2023 116,464 0.02%Annington Funding plc €100,000 1.65% 12/7/2024 116,336 0.02%Babcock International Group plc €100,000 1.75% 6/10/2022 116,208 0.02%Hammerson plc €100,000 1.75% 15/3/2023 116,037 0.02%BG Energy Capital plc €100,000 1.25% 21/11/2022 115,903 0.02%BP Capital Markets plc €100,000 2.52% 17/2/2021 115,762 0.02%Leeds Building Society €100,000 1.38% 5/5/2022 115,620 0.02%Rolls-Royce plc €100,000 2.13% 18/6/2021 115,612 0.02%Global Switch Holdings Ltd. €100,000 1.50% 31/1/2024 115,481 0.02%BP Capital Markets plc €100,000 0.83% 19/9/2024 115,451 0.02%Nationwide Building Society €100,000 1.13% 3/6/2022 115,436 0.02%Sky Ltd. €100,000 1.50% 15/9/2021 115,319 0.02%HSBC Holdings plc €100,000 0.88% 6/9/2024 115,162 0.02%G4S International Finance plc €100,000 1.50% 9/1/2023 114,556 0.02%NatWest Markets plc €100,000 1.00% 28/5/2024 114,373 0.02%Yorkshire Building Society €100,000 0.88% 20/3/2023 114,328 0.02%Coca-Cola European Partners plc €100,000 0.75% 24/2/2022 114,088 0.02%FCE Bank plc €100,000 1.66% 11/2/2021 113,983 0.02%Standard Chartered plc^ €100,000 0.75% 3/10/2023 113,584 0.02%British Telecommunications plc €100,000 0.50% 23/6/2022 113,524 0.02%Cadent Finance plc €100,000 0.63% 22/9/2024 113,448 0.02%Natwest Markets plc €100,000 0.63% 2/3/2022 113,426 0.02%Lloyds Banking Group plc^ €100,000 0.63% 15/1/2024 113,206 0.02%Rolls-Royce plc €100,000 0.88% 9/5/2024 113,063 0.02%Diageo Finance plc €100,000 0.25% 22/10/2021 113,008 0.02%RELX Finance BV €100,000 0.38% 22/3/2021 112,846 0.02%Barclays plc^ €100,000 0.75% 9/6/2025 112,371 0.02%United Utilities Water Ltd. £75,000 5.75% 25/3/2022 109,587 0.02%Reynolds American, Inc. $100,000 4.85% 15/9/2023 108,245 0.02%Standard Chartered plc $100,000 5.20% 26/1/2024 107,898 0.02%BP Capital Markets plc $100,000 3.99% 26/9/2023 106,669 0.02%Lloyds Banking Group plc $100,000 3.90% 12/3/2024 105,370 0.02%Standard Chartered plc^ $100,000 3.79% 21/5/2025 104,275 0.02%Heathrow Funding Ltd. $100,000 4.88% 15/7/2021 103,500 0.02%RELX Capital, Inc. $100,000 3.13% 15/10/2022 103,393 0.02%Nationwide Building Society^ $100,000 3.77% 8/3/2024 102,921 0.02%Unilever Capital Corp. $100,000 4.25% 10/2/2021 102,663 0.02%
Vanguard Global Short-Term Corporate Bond Index Fund
723
Maturity Fair Value % of Total Principal Coupon Date US Dollars ($) Net Assets
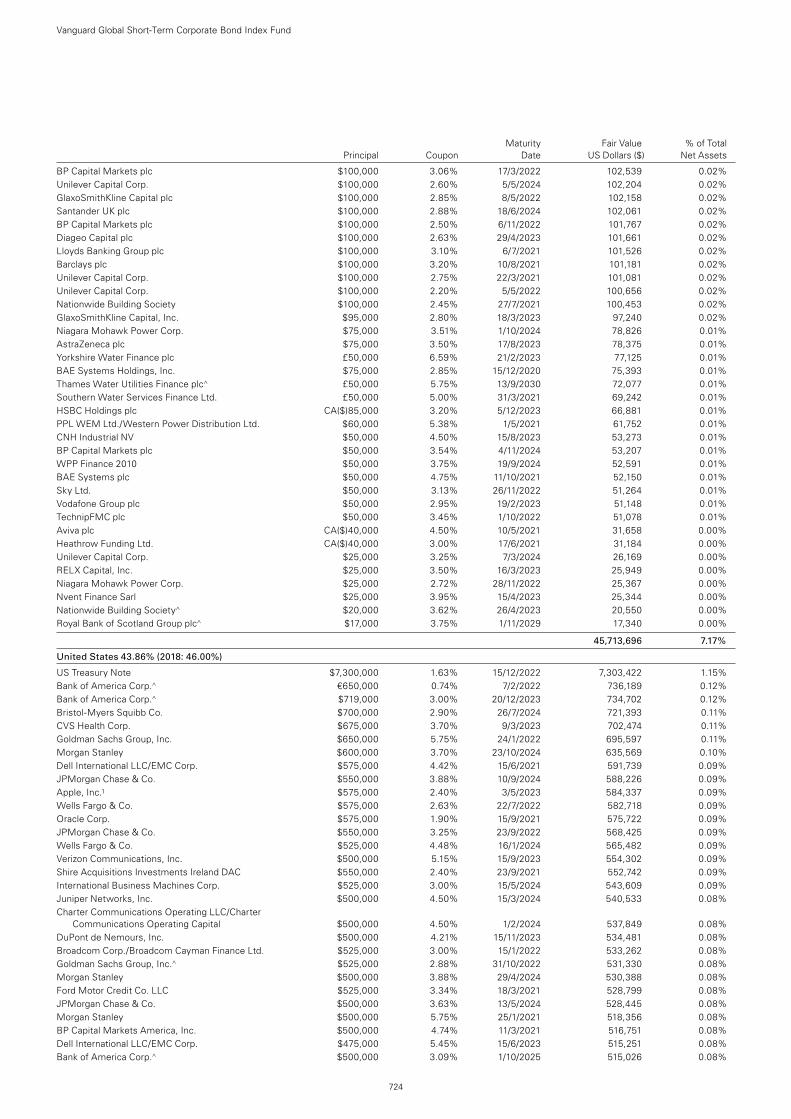
BP Capital Markets plc $100,000 3.06% 17/3/2022 102,539 0.02%Unilever Capital Corp. $100,000 2.60% 5/5/2024 102,204 0.02%GlaxoSmithKline Capital plc $100,000 2.85% 8/5/2022 102,158 0.02%Santander UK plc $100,000 2.88% 18/6/2024 102,061 0.02%BP Capital Markets plc $100,000 2.50% 6/11/2022 101,767 0.02%Diageo Capital plc $100,000 2.63% 29/4/2023 101,661 0.02%Lloyds Banking Group plc $100,000 3.10% 6/7/2021 101,526 0.02%Barclays plc $100,000 3.20% 10/8/2021 101,181 0.02%Unilever Capital Corp. $100,000 2.75% 22/3/2021 101,081 0.02%Unilever Capital Corp. $100,000 2.20% 5/5/2022 100,656 0.02%Nationwide Building Society $100,000 2.45% 27/7/2021 100,453 0.02%GlaxoSmithKline Capital, Inc. $95,000 2.80% 18/3/2023 97,240 0.02%Niagara Mohawk Power Corp. $75,000 3.51% 1/10/2024 78,826 0.01%AstraZeneca plc $75,000 3.50% 17/8/2023 78,375 0.01%Yorkshire Water Finance plc £50,000 6.59% 21/2/2023 77,125 0.01%BAE Systems Holdings, Inc. $75,000 2.85% 15/12/2020 75,393 0.01%Thames Water Utilities Finance plc^ £50,000 5.75% 13/9/2030 72,077 0.01%Southern Water Services Finance Ltd. £50,000 5.00% 31/3/2021 69,242 0.01%HSBC Holdings plc CA($)85,000 3.20% 5/12/2023 66,881 0.01%PPL WEM Ltd./Western Power Distribution Ltd. $60,000 5.38% 1/5/2021 61,752 0.01%CNH Industrial NV $50,000 4.50% 15/8/2023 53,273 0.01%BP Capital Markets plc $50,000 3.54% 4/11/2024 53,207 0.01%WPP Finance 2010 $50,000 3.75% 19/9/2024 52,591 0.01%BAE Systems plc $50,000 4.75% 11/10/2021 52,150 0.01%Sky Ltd. $50,000 3.13% 26/11/2022 51,264 0.01%Vodafone Group plc $50,000 2.95% 19/2/2023 51,148 0.01%TechnipFMC plc $50,000 3.45% 1/10/2022 51,078 0.01%Aviva plc CA($)40,000 4.50% 10/5/2021 31,658 0.00%Heathrow Funding Ltd. CA($)40,000 3.00% 17/6/2021 31,184 0.00%Unilever Capital Corp. $25,000 3.25% 7/3/2024 26,169 0.00%RELX Capital, Inc. $25,000 3.50% 16/3/2023 25,949 0.00%Niagara Mohawk Power Corp. $25,000 2.72% 28/11/2022 25,367 0.00%Nvent Finance Sarl $25,000 3.95% 15/4/2023 25,344 0.00%Nationwide Building Society^ $20,000 3.62% 26/4/2023 20,550 0.00%Royal Bank of Scotland Group plc^ $17,000 3.75% 1/11/2029 17,340 0.00%
45,713,696 7.17%
United States 43.86% (2018: 46.00%)
US Treasury Note $7,300,000 1.63% 15/12/2022 7,303,422 1.15%Bank of America Corp.^ €650,000 0.74% 7/2/2022 736,189 0.12%Bank of America Corp.^ $719,000 3.00% 20/12/2023 734,702 0.12%Bristol-Myers Squibb Co. $700,000 2.90% 26/7/2024 721,393 0.11%CVS Health Corp. $675,000 3.70% 9/3/2023 702,474 0.11%Goldman Sachs Group, Inc. $650,000 5.75% 24/1/2022 695,597 0.11%Morgan Stanley $600,000 3.70% 23/10/2024 635,569 0.10%Dell International LLC/EMC Corp. $575,000 4.42% 15/6/2021 591,739 0.09%JPMorgan Chase & Co. $550,000 3.88% 10/9/2024 588,226 0.09%Apple, Inc.1 $575,000 2.40% 3/5/2023 584,337 0.09%Wells Fargo & Co. $575,000 2.63% 22/7/2022 582,718 0.09%Oracle Corp. $575,000 1.90% 15/9/2021 575,722 0.09%JPMorgan Chase & Co. $550,000 3.25% 23/9/2022 568,425 0.09%Wells Fargo & Co. $525,000 4.48% 16/1/2024 565,482 0.09%Verizon Communications, Inc. $500,000 5.15% 15/9/2023 554,302 0.09%Shire Acquisitions Investments Ireland DAC $550,000 2.40% 23/9/2021 552,742 0.09%International Business Machines Corp. $525,000 3.00% 15/5/2024 543,609 0.09%Juniper Networks, Inc. $500,000 4.50% 15/3/2024 540,533 0.08%Charter Communications Operating LLC/Charter
Communications Operating Capital $500,000 4.50% 1/2/2024 537,849 0.08%DuPont de Nemours, Inc. $500,000 4.21% 15/11/2023 534,481 0.08%Broadcom Corp./Broadcom Cayman Finance Ltd. $525,000 3.00% 15/1/2022 533,262 0.08%Goldman Sachs Group, Inc.^ $525,000 2.88% 31/10/2022 531,330 0.08%Morgan Stanley $500,000 3.88% 29/4/2024 530,388 0.08%Ford Motor Credit Co. LLC $525,000 3.34% 18/3/2021 528,799 0.08%JPMorgan Chase & Co. $500,000 3.63% 13/5/2024 528,445 0.08%Morgan Stanley $500,000 5.75% 25/1/2021 518,356 0.08%BP Capital Markets America, Inc. $500,000 4.74% 11/3/2021 516,751 0.08%Dell International LLC/EMC Corp. $475,000 5.45% 15/6/2023 515,251 0.08%Bank of America Corp.^ $500,000 3.09% 1/10/2025 515,026 0.08%
Vanguard Global Short-Term Corporate Bond Index Fund
724
Maturity Fair Value % of Total Principal Coupon Date US Dollars ($) Net Assets
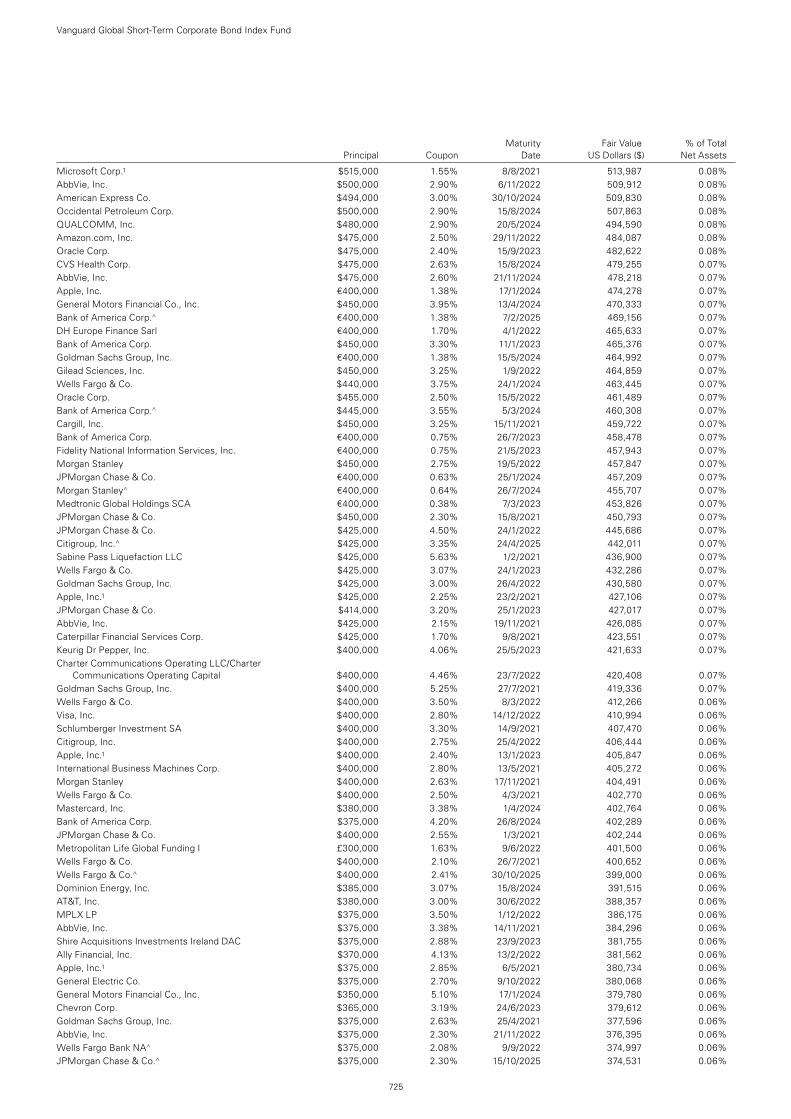
Microsoft Corp.1 $515,000 1.55% 8/8/2021 513,987 0.08%AbbVie, Inc. $500,000 2.90% 6/11/2022 509,912 0.08%American Express Co. $494,000 3.00% 30/10/2024 509,830 0.08%Occidental Petroleum Corp. $500,000 2.90% 15/8/2024 507,863 0.08%QUALCOMM, Inc. $480,000 2.90% 20/5/2024 494,590 0.08%Amazon.com, Inc. $475,000 2.50% 29/11/2022 484,087 0.08%Oracle Corp. $475,000 2.40% 15/9/2023 482,622 0.08%CVS Health Corp. $475,000 2.63% 15/8/2024 479,255 0.07%AbbVie, Inc. $475,000 2.60% 21/11/2024 478,218 0.07%Apple, Inc. €400,000 1.38% 17/1/2024 474,278 0.07%General Motors Financial Co., Inc. $450,000 3.95% 13/4/2024 470,333 0.07%Bank of America Corp.^ €400,000 1.38% 7/2/2025 469,156 0.07%DH Europe Finance Sarl €400,000 1.70% 4/1/2022 465,633 0.07%Bank of America Corp. $450,000 3.30% 11/1/2023 465,376 0.07%Goldman Sachs Group, Inc. €400,000 1.38% 15/5/2024 464,992 0.07%Gilead Sciences, Inc. $450,000 3.25% 1/9/2022 464,859 0.07%Wells Fargo & Co. $440,000 3.75% 24/1/2024 463,445 0.07%Oracle Corp. $455,000 2.50% 15/5/2022 461,489 0.07%Bank of America Corp.^ $445,000 3.55% 5/3/2024 460,308 0.07%Cargill, Inc. $450,000 3.25% 15/11/2021 459,722 0.07%Bank of America Corp. €400,000 0.75% 26/7/2023 458,478 0.07%Fidelity National Information Services, Inc. €400,000 0.75% 21/5/2023 457,943 0.07%Morgan Stanley $450,000 2.75% 19/5/2022 457,847 0.07%JPMorgan Chase & Co. €400,000 0.63% 25/1/2024 457,209 0.07%Morgan Stanley^ €400,000 0.64% 26/7/2024 455,707 0.07%Medtronic Global Holdings SCA €400,000 0.38% 7/3/2023 453,826 0.07%JPMorgan Chase & Co. $450,000 2.30% 15/8/2021 450,793 0.07%JPMorgan Chase & Co. $425,000 4.50% 24/1/2022 445,686 0.07%Citigroup, Inc.^ $425,000 3.35% 24/4/2025 442,011 0.07%Sabine Pass Liquefaction LLC $425,000 5.63% 1/2/2021 436,900 0.07%Wells Fargo & Co. $425,000 3.07% 24/1/2023 432,286 0.07%Goldman Sachs Group, Inc. $425,000 3.00% 26/4/2022 430,580 0.07%Apple, Inc.1 $425,000 2.25% 23/2/2021 427,106 0.07%JPMorgan Chase & Co. $414,000 3.20% 25/1/2023 427,017 0.07%AbbVie, Inc. $425,000 2.15% 19/11/2021 426,085 0.07%Caterpillar Financial Services Corp. $425,000 1.70% 9/8/2021 423,551 0.07%Keurig Dr Pepper, Inc. $400,000 4.06% 25/5/2023 421,633 0.07%Charter Communications Operating LLC/Charter
Communications Operating Capital $400,000 4.46% 23/7/2022 420,408 0.07%Goldman Sachs Group, Inc. $400,000 5.25% 27/7/2021 419,336 0.07%Wells Fargo & Co. $400,000 3.50% 8/3/2022 412,266 0.06%Visa, Inc. $400,000 2.80% 14/12/2022 410,994 0.06%Schlumberger Investment SA $400,000 3.30% 14/9/2021 407,470 0.06%Citigroup, Inc. $400,000 2.75% 25/4/2022 406,444 0.06%Apple, Inc.1 $400,000 2.40% 13/1/2023 405,847 0.06%International Business Machines Corp. $400,000 2.80% 13/5/2021 405,272 0.06%Morgan Stanley $400,000 2.63% 17/11/2021 404,491 0.06%Wells Fargo & Co. $400,000 2.50% 4/3/2021 402,770 0.06%Mastercard, Inc. $380,000 3.38% 1/4/2024 402,764 0.06%Bank of America Corp. $375,000 4.20% 26/8/2024 402,289 0.06%JPMorgan Chase & Co. $400,000 2.55% 1/3/2021 402,244 0.06%Metropolitan Life Global Funding I £300,000 1.63% 9/6/2022 401,500 0.06%Wells Fargo & Co. $400,000 2.10% 26/7/2021 400,652 0.06%Wells Fargo & Co.^ $400,000 2.41% 30/10/2025 399,000 0.06%Dominion Energy, Inc. $385,000 3.07% 15/8/2024 391,515 0.06%AT&T, Inc. $380,000 3.00% 30/6/2022 388,357 0.06%MPLX LP $375,000 3.50% 1/12/2022 386,175 0.06%AbbVie, Inc. $375,000 3.38% 14/11/2021 384,296 0.06%Shire Acquisitions Investments Ireland DAC $375,000 2.88% 23/9/2023 381,755 0.06%Ally Financial, Inc. $370,000 4.13% 13/2/2022 381,562 0.06%Apple, Inc.1 $375,000 2.85% 6/5/2021 380,734 0.06%General Electric Co. $375,000 2.70% 9/10/2022 380,068 0.06%General Motors Financial Co., Inc. $350,000 5.10% 17/1/2024 379,780 0.06%Chevron Corp. $365,000 3.19% 24/6/2023 379,612 0.06%Goldman Sachs Group, Inc. $375,000 2.63% 25/4/2021 377,596 0.06%AbbVie, Inc. $375,000 2.30% 21/11/2022 376,395 0.06%Wells Fargo Bank NA^ $375,000 2.08% 9/9/2022 374,997 0.06%JPMorgan Chase & Co.^ $375,000 2.30% 15/10/2025 374,531 0.06%
Vanguard Global Short-Term Corporate Bond Index Fund
725
Maturity Fair Value % of Total Principal Coupon Date US Dollars ($) Net Assets
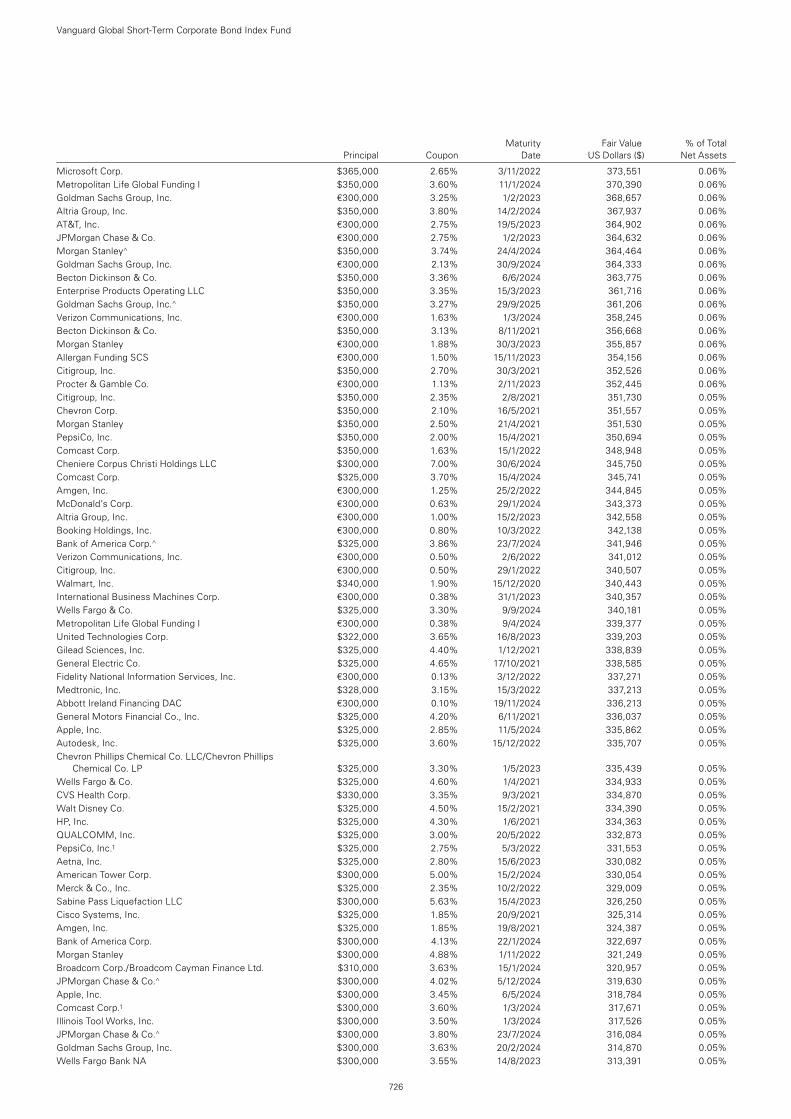
Microsoft Corp. $365,000 2.65% 3/11/2022 373,551 0.06%Metropolitan Life Global Funding I $350,000 3.60% 11/1/2024 370,390 0.06%Goldman Sachs Group, Inc. €300,000 3.25% 1/2/2023 368,657 0.06%Altria Group, Inc. $350,000 3.80% 14/2/2024 367,937 0.06%AT&T, Inc. €300,000 2.75% 19/5/2023 364,902 0.06%JPMorgan Chase & Co. €300,000 2.75% 1/2/2023 364,632 0.06%Morgan Stanley^ $350,000 3.74% 24/4/2024 364,464 0.06%Goldman Sachs Group, Inc. €300,000 2.13% 30/9/2024 364,333 0.06%Becton Dickinson & Co. $350,000 3.36% 6/6/2024 363,775 0.06%Enterprise Products Operating LLC $350,000 3.35% 15/3/2023 361,716 0.06%Goldman Sachs Group, Inc.^ $350,000 3.27% 29/9/2025 361,206 0.06%Verizon Communications, Inc. €300,000 1.63% 1/3/2024 358,245 0.06%Becton Dickinson & Co. $350,000 3.13% 8/11/2021 356,668 0.06%Morgan Stanley €300,000 1.88% 30/3/2023 355,857 0.06%Allergan Funding SCS €300,000 1.50% 15/11/2023 354,156 0.06%Citigroup, Inc. $350,000 2.70% 30/3/2021 352,526 0.06%Procter & Gamble Co. €300,000 1.13% 2/11/2023 352,445 0.06%Citigroup, Inc. $350,000 2.35% 2/8/2021 351,730 0.05%Chevron Corp. $350,000 2.10% 16/5/2021 351,557 0.05%Morgan Stanley $350,000 2.50% 21/4/2021 351,530 0.05%PepsiCo, Inc. $350,000 2.00% 15/4/2021 350,694 0.05%Comcast Corp. $350,000 1.63% 15/1/2022 348,948 0.05%Cheniere Corpus Christi Holdings LLC $300,000 7.00% 30/6/2024 345,750 0.05%Comcast Corp. $325,000 3.70% 15/4/2024 345,741 0.05%Amgen, Inc. €300,000 1.25% 25/2/2022 344,845 0.05%McDonald’s Corp. €300,000 0.63% 29/1/2024 343,373 0.05%Altria Group, Inc. €300,000 1.00% 15/2/2023 342,558 0.05%Booking Holdings, Inc. €300,000 0.80% 10/3/2022 342,138 0.05%Bank of America Corp.^ $325,000 3.86% 23/7/2024 341,946 0.05%Verizon Communications, Inc. €300,000 0.50% 2/6/2022 341,012 0.05%Citigroup, Inc. €300,000 0.50% 29/1/2022 340,507 0.05%Walmart, Inc. $340,000 1.90% 15/12/2020 340,443 0.05%International Business Machines Corp. €300,000 0.38% 31/1/2023 340,357 0.05%Wells Fargo & Co. $325,000 3.30% 9/9/2024 340,181 0.05%Metropolitan Life Global Funding I €300,000 0.38% 9/4/2024 339,377 0.05%United Technologies Corp. $322,000 3.65% 16/8/2023 339,203 0.05%Gilead Sciences, Inc. $325,000 4.40% 1/12/2021 338,839 0.05%General Electric Co. $325,000 4.65% 17/10/2021 338,585 0.05%Fidelity National Information Services, Inc. €300,000 0.13% 3/12/2022 337,271 0.05%Medtronic, Inc. $328,000 3.15% 15/3/2022 337,213 0.05%Abbott Ireland Financing DAC €300,000 0.10% 19/11/2024 336,213 0.05%General Motors Financial Co., Inc. $325,000 4.20% 6/11/2021 336,037 0.05%Apple, Inc. $325,000 2.85% 11/5/2024 335,862 0.05%Autodesk, Inc. $325,000 3.60% 15/12/2022 335,707 0.05%Chevron Phillips Chemical Co. LLC/Chevron Phillips
Chemical Co. LP $325,000 3.30% 1/5/2023 335,439 0.05%Wells Fargo & Co. $325,000 4.60% 1/4/2021 334,933 0.05%CVS Health Corp. $330,000 3.35% 9/3/2021 334,870 0.05%Walt Disney Co. $325,000 4.50% 15/2/2021 334,390 0.05%HP, Inc. $325,000 4.30% 1/6/2021 334,363 0.05%QUALCOMM, Inc. $325,000 3.00% 20/5/2022 332,873 0.05%PepsiCo, Inc.1 $325,000 2.75% 5/3/2022 331,553 0.05%Aetna, Inc. $325,000 2.80% 15/6/2023 330,082 0.05%American Tower Corp. $300,000 5.00% 15/2/2024 330,054 0.05%Merck & Co., Inc. $325,000 2.35% 10/2/2022 329,009 0.05%Sabine Pass Liquefaction LLC $300,000 5.63% 15/4/2023 326,250 0.05%Cisco Systems, Inc. $325,000 1.85% 20/9/2021 325,314 0.05%Amgen, Inc. $325,000 1.85% 19/8/2021 324,387 0.05%Bank of America Corp. $300,000 4.13% 22/1/2024 322,697 0.05%Morgan Stanley $300,000 4.88% 1/11/2022 321,249 0.05%Broadcom Corp./Broadcom Cayman Finance Ltd. $310,000 3.63% 15/1/2024 320,957 0.05%JPMorgan Chase & Co.^ $300,000 4.02% 5/12/2024 319,630 0.05%Apple, Inc. $300,000 3.45% 6/5/2024 318,784 0.05%Comcast Corp.1 $300,000 3.60% 1/3/2024 317,671 0.05%Illinois Tool Works, Inc. $300,000 3.50% 1/3/2024 317,526 0.05%JPMorgan Chase & Co.^ $300,000 3.80% 23/7/2024 316,084 0.05%Goldman Sachs Group, Inc. $300,000 3.63% 20/2/2024 314,870 0.05%Wells Fargo Bank NA $300,000 3.55% 14/8/2023 313,391 0.05%
Vanguard Global Short-Term Corporate Bond Index Fund
726
Maturity Fair Value % of Total Principal Coupon Date US Dollars ($) Net Assets
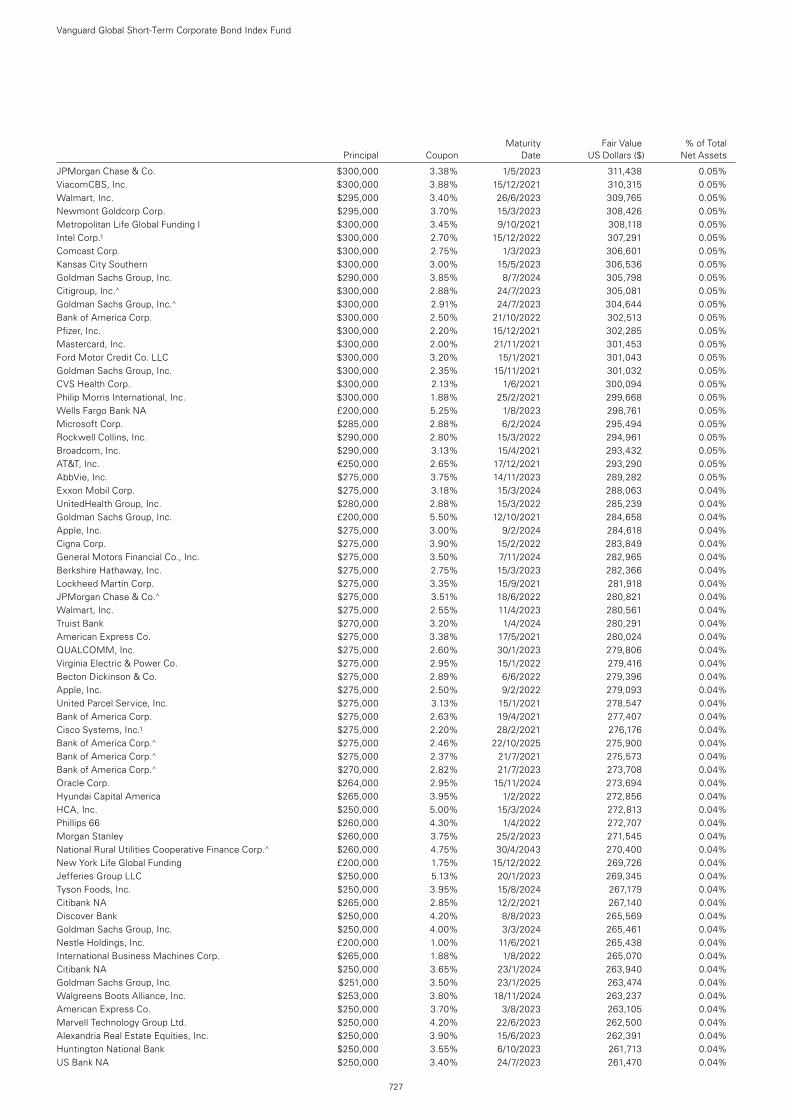
JPMorgan Chase & Co. $300,000 3.38% 1/5/2023 311,438 0.05%ViacomCBS, Inc. $300,000 3.88% 15/12/2021 310,315 0.05%Walmart, Inc. $295,000 3.40% 26/6/2023 309,765 0.05%Newmont Goldcorp Corp. $295,000 3.70% 15/3/2023 308,426 0.05%Metropolitan Life Global Funding I $300,000 3.45% 9/10/2021 308,118 0.05%Intel Corp.1 $300,000 2.70% 15/12/2022 307,291 0.05%Comcast Corp. $300,000 2.75% 1/3/2023 306,601 0.05%Kansas City Southern $300,000 3.00% 15/5/2023 306,536 0.05%Goldman Sachs Group, Inc. $290,000 3.85% 8/7/2024 305,798 0.05%Citigroup, Inc.^ $300,000 2.88% 24/7/2023 305,081 0.05%Goldman Sachs Group, Inc.^ $300,000 2.91% 24/7/2023 304,644 0.05%Bank of America Corp. $300,000 2.50% 21/10/2022 302,513 0.05%Pfizer, Inc. $300,000 2.20% 15/12/2021 302,285 0.05%Mastercard, Inc. $300,000 2.00% 21/11/2021 301,453 0.05%Ford Motor Credit Co. LLC $300,000 3.20% 15/1/2021 301,043 0.05%Goldman Sachs Group, Inc. $300,000 2.35% 15/11/2021 301,032 0.05%CVS Health Corp. $300,000 2.13% 1/6/2021 300,094 0.05%Philip Morris International, Inc. $300,000 1.88% 25/2/2021 299,668 0.05%Wells Fargo Bank NA £200,000 5.25% 1/8/2023 298,761 0.05%Microsoft Corp. $285,000 2.88% 6/2/2024 295,494 0.05%Rockwell Collins, Inc. $290,000 2.80% 15/3/2022 294,961 0.05%Broadcom, Inc. $290,000 3.13% 15/4/2021 293,432 0.05%AT&T, Inc. €250,000 2.65% 17/12/2021 293,290 0.05%AbbVie, Inc. $275,000 3.75% 14/11/2023 289,282 0.05%Exxon Mobil Corp. $275,000 3.18% 15/3/2024 288,063 0.04%UnitedHealth Group, Inc. $280,000 2.88% 15/3/2022 285,239 0.04%Goldman Sachs Group, Inc. £200,000 5.50% 12/10/2021 284,658 0.04%Apple, Inc. $275,000 3.00% 9/2/2024 284,618 0.04%Cigna Corp. $275,000 3.90% 15/2/2022 283,849 0.04%General Motors Financial Co., Inc. $275,000 3.50% 7/11/2024 282,965 0.04%Berkshire Hathaway, Inc. $275,000 2.75% 15/3/2023 282,366 0.04%Lockheed Martin Corp. $275,000 3.35% 15/9/2021 281,918 0.04%JPMorgan Chase & Co.^ $275,000 3.51% 18/6/2022 280,821 0.04%Walmart, Inc. $275,000 2.55% 11/4/2023 280,561 0.04%Truist Bank $270,000 3.20% 1/4/2024 280,291 0.04%American Express Co. $275,000 3.38% 17/5/2021 280,024 0.04%QUALCOMM, Inc. $275,000 2.60% 30/1/2023 279,806 0.04%Virginia Electric & Power Co. $275,000 2.95% 15/1/2022 279,416 0.04%Becton Dickinson & Co. $275,000 2.89% 6/6/2022 279,396 0.04%Apple, Inc. $275,000 2.50% 9/2/2022 279,093 0.04%United Parcel Service, Inc. $275,000 3.13% 15/1/2021 278,547 0.04%Bank of America Corp. $275,000 2.63% 19/4/2021 277,407 0.04%Cisco Systems, Inc.1 $275,000 2.20% 28/2/2021 276,176 0.04%Bank of America Corp.^ $275,000 2.46% 22/10/2025 275,900 0.04%Bank of America Corp.^ $275,000 2.37% 21/7/2021 275,573 0.04%Bank of America Corp.^ $270,000 2.82% 21/7/2023 273,708 0.04%Oracle Corp. $264,000 2.95% 15/11/2024 273,694 0.04%Hyundai Capital America $265,000 3.95% 1/2/2022 272,856 0.04%HCA, Inc. $250,000 5.00% 15/3/2024 272,813 0.04%Phillips 66 $260,000 4.30% 1/4/2022 272,707 0.04%Morgan Stanley $260,000 3.75% 25/2/2023 271,545 0.04%National Rural Utilities Cooperative Finance Corp.^ $260,000 4.75% 30/4/2043 270,400 0.04%New York Life Global Funding £200,000 1.75% 15/12/2022 269,726 0.04%Jefferies Group LLC $250,000 5.13% 20/1/2023 269,345 0.04%Tyson Foods, Inc. $250,000 3.95% 15/8/2024 267,179 0.04%Citibank NA $265,000 2.85% 12/2/2021 267,140 0.04%Discover Bank $250,000 4.20% 8/8/2023 265,569 0.04%Goldman Sachs Group, Inc. $250,000 4.00% 3/3/2024 265,461 0.04%Nestle Holdings, Inc. £200,000 1.00% 11/6/2021 265,438 0.04%International Business Machines Corp. $265,000 1.88% 1/8/2022 265,070 0.04%Citibank NA $250,000 3.65% 23/1/2024 263,940 0.04%Goldman Sachs Group, Inc. $251,000 3.50% 23/1/2025 263,474 0.04%Walgreens Boots Alliance, Inc. $253,000 3.80% 18/11/2024 263,237 0.04%American Express Co. $250,000 3.70% 3/8/2023 263,105 0.04%Marvell Technology Group Ltd. $250,000 4.20% 22/6/2023 262,500 0.04%Alexandria Real Estate Equities, Inc. $250,000 3.90% 15/6/2023 262,391 0.04%Huntington National Bank $250,000 3.55% 6/10/2023 261,713 0.04%US Bank NA $250,000 3.40% 24/7/2023 261,470 0.04%
Vanguard Global Short-Term Corporate Bond Index Fund
727
Maturity Fair Value % of Total Principal Coupon Date US Dollars ($) Net Assets
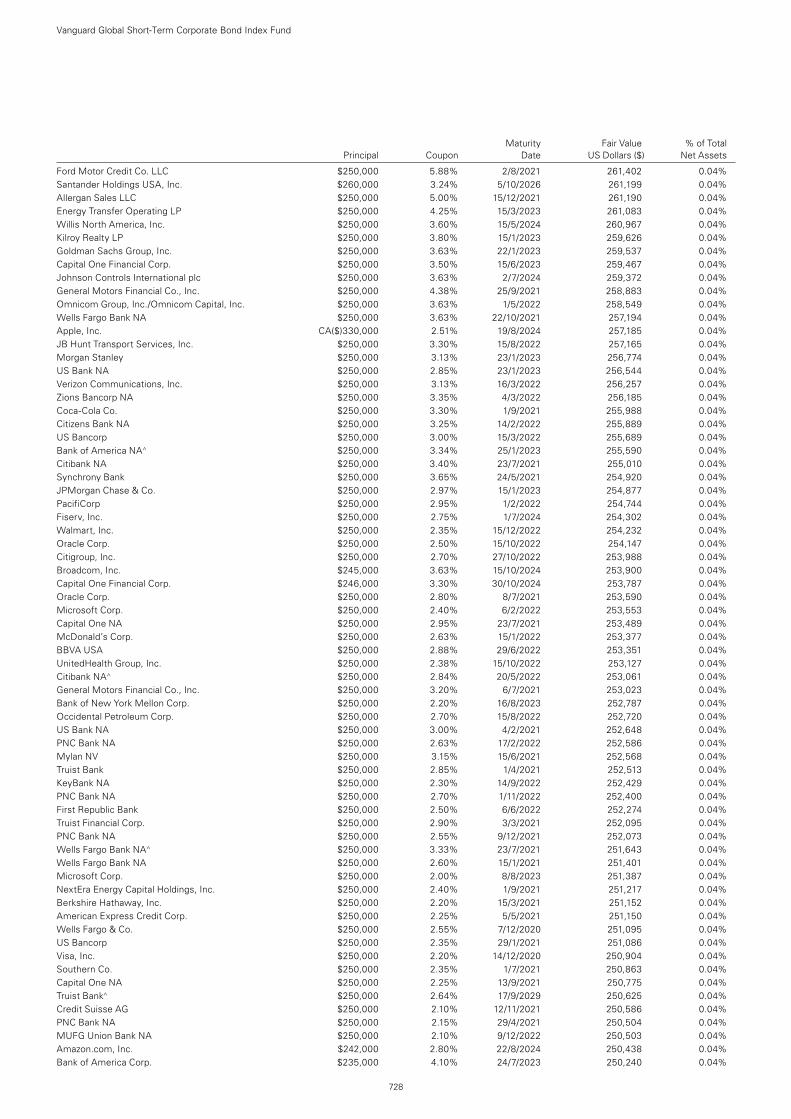
Ford Motor Credit Co. LLC $250,000 5.88% 2/8/2021 261,402 0.04%Santander Holdings USA, Inc. $260,000 3.24% 5/10/2026 261,199 0.04%Allergan Sales LLC $250,000 5.00% 15/12/2021 261,190 0.04%Energy Transfer Operating LP $250,000 4.25% 15/3/2023 261,083 0.04%Willis North America, Inc. $250,000 3.60% 15/5/2024 260,967 0.04%Kilroy Realty LP $250,000 3.80% 15/1/2023 259,626 0.04%Goldman Sachs Group, Inc. $250,000 3.63% 22/1/2023 259,537 0.04%Capital One Financial Corp. $250,000 3.50% 15/6/2023 259,467 0.04%Johnson Controls International plc $250,000 3.63% 2/7/2024 259,372 0.04%General Motors Financial Co., Inc. $250,000 4.38% 25/9/2021 258,883 0.04%Omnicom Group, Inc./Omnicom Capital, Inc. $250,000 3.63% 1/5/2022 258,549 0.04%Wells Fargo Bank NA $250,000 3.63% 22/10/2021 257,194 0.04%Apple, Inc. CA($)330,000 2.51% 19/8/2024 257,185 0.04%JB Hunt Transport Services, Inc. $250,000 3.30% 15/8/2022 257,165 0.04%Morgan Stanley $250,000 3.13% 23/1/2023 256,774 0.04%US Bank NA $250,000 2.85% 23/1/2023 256,544 0.04%Verizon Communications, Inc. $250,000 3.13% 16/3/2022 256,257 0.04%Zions Bancorp NA $250,000 3.35% 4/3/2022 256,185 0.04%Coca-Cola Co. $250,000 3.30% 1/9/2021 255,988 0.04%Citizens Bank NA $250,000 3.25% 14/2/2022 255,889 0.04%US Bancorp $250,000 3.00% 15/3/2022 255,689 0.04%Bank of America NA^ $250,000 3.34% 25/1/2023 255,590 0.04%Citibank NA $250,000 3.40% 23/7/2021 255,010 0.04%Synchrony Bank $250,000 3.65% 24/5/2021 254,920 0.04%JPMorgan Chase & Co. $250,000 2.97% 15/1/2023 254,877 0.04%PacifiCorp $250,000 2.95% 1/2/2022 254,744 0.04%Fiserv, Inc. $250,000 2.75% 1/7/2024 254,302 0.04%Walmart, Inc. $250,000 2.35% 15/12/2022 254,232 0.04%Oracle Corp. $250,000 2.50% 15/10/2022 254,147 0.04%Citigroup, Inc. $250,000 2.70% 27/10/2022 253,988 0.04%Broadcom, Inc. $245,000 3.63% 15/10/2024 253,900 0.04%Capital One Financial Corp. $246,000 3.30% 30/10/2024 253,787 0.04%Oracle Corp. $250,000 2.80% 8/7/2021 253,590 0.04%Microsoft Corp. $250,000 2.40% 6/2/2022 253,553 0.04%Capital One NA $250,000 2.95% 23/7/2021 253,489 0.04%McDonald’s Corp. $250,000 2.63% 15/1/2022 253,377 0.04%BBVA USA $250,000 2.88% 29/6/2022 253,351 0.04%UnitedHealth Group, Inc. $250,000 2.38% 15/10/2022 253,127 0.04%Citibank NA^ $250,000 2.84% 20/5/2022 253,061 0.04%General Motors Financial Co., Inc. $250,000 3.20% 6/7/2021 253,023 0.04%Bank of New York Mellon Corp. $250,000 2.20% 16/8/2023 252,787 0.04%Occidental Petroleum Corp. $250,000 2.70% 15/8/2022 252,720 0.04%US Bank NA $250,000 3.00% 4/2/2021 252,648 0.04%PNC Bank NA $250,000 2.63% 17/2/2022 252,586 0.04%Mylan NV $250,000 3.15% 15/6/2021 252,568 0.04%Truist Bank $250,000 2.85% 1/4/2021 252,513 0.04%KeyBank NA $250,000 2.30% 14/9/2022 252,429 0.04%PNC Bank NA $250,000 2.70% 1/11/2022 252,400 0.04%First Republic Bank $250,000 2.50% 6/6/2022 252,274 0.04%Truist Financial Corp. $250,000 2.90% 3/3/2021 252,095 0.04%PNC Bank NA $250,000 2.55% 9/12/2021 252,073 0.04%Wells Fargo Bank NA^ $250,000 3.33% 23/7/2021 251,643 0.04%Wells Fargo Bank NA $250,000 2.60% 15/1/2021 251,401 0.04%Microsoft Corp. $250,000 2.00% 8/8/2023 251,387 0.04%NextEra Energy Capital Holdings, Inc. $250,000 2.40% 1/9/2021 251,217 0.04%Berkshire Hathaway, Inc. $250,000 2.20% 15/3/2021 251,152 0.04%American Express Credit Corp. $250,000 2.25% 5/5/2021 251,150 0.04%Wells Fargo & Co. $250,000 2.55% 7/12/2020 251,095 0.04%US Bancorp $250,000 2.35% 29/1/2021 251,086 0.04%Visa, Inc. $250,000 2.20% 14/12/2020 250,904 0.04%Southern Co. $250,000 2.35% 1/7/2021 250,863 0.04%Capital One NA $250,000 2.25% 13/9/2021 250,775 0.04%Truist Bank^ $250,000 2.64% 17/9/2029 250,625 0.04%Credit Suisse AG $250,000 2.10% 12/11/2021 250,586 0.04%PNC Bank NA $250,000 2.15% 29/4/2021 250,504 0.04%MUFG Union Bank NA $250,000 2.10% 9/12/2022 250,503 0.04%Amazon.com, Inc. $242,000 2.80% 22/8/2024 250,438 0.04%Bank of America Corp. $235,000 4.10% 24/7/2023 250,240 0.04%
Vanguard Global Short-Term Corporate Bond Index Fund
728
Maturity Fair Value % of Total Principal Coupon Date US Dollars ($) Net Assets
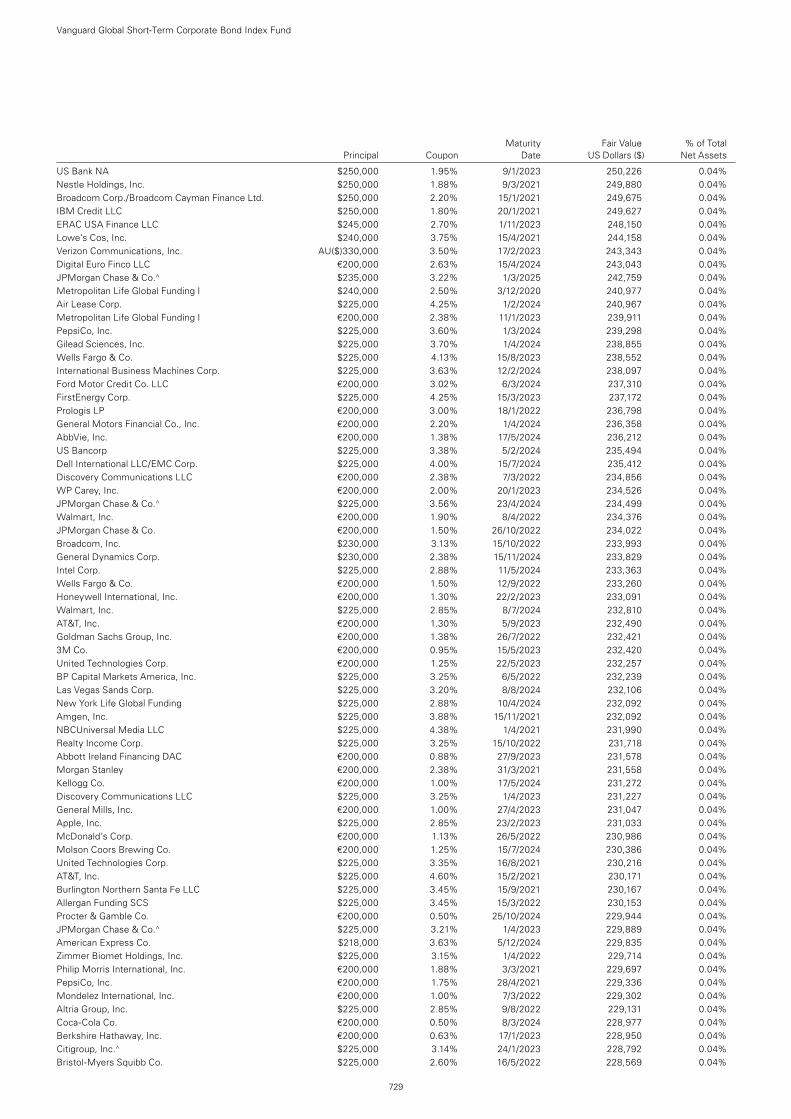
Maturity Fair Value % of Total Principal Coupon Date US Dollars ($) Net Assets
US Bank NA $250,000 1.95% 9/1/2023 250,226 0.04%Nestle Holdings, Inc. $250,000 1.88% 9/3/2021 249,880 0.04%Broadcom Corp./Broadcom Cayman Finance Ltd. $250,000 2.20% 15/1/2021 249,675 0.04%IBM Credit LLC $250,000 1.80% 20/1/2021 249,627 0.04%ERAC USA Finance LLC $245,000 2.70% 1/11/2023 248,150 0.04%Lowe’s Cos, Inc. $240,000 3.75% 15/4/2021 244,158 0.04%Verizon Communications, Inc. AU($)330,000 3.50% 17/2/2023 243,343 0.04%Digital Euro Finco LLC €200,000 2.63% 15/4/2024 243,043 0.04%JPMorgan Chase & Co.^ $235,000 3.22% 1/3/2025 242,759 0.04%Metropolitan Life Global Funding I $240,000 2.50% 3/12/2020 240,977 0.04%Air Lease Corp. $225,000 4.25% 1/2/2024 240,967 0.04%Metropolitan Life Global Funding I €200,000 2.38% 11/1/2023 239,911 0.04%PepsiCo, Inc. $225,000 3.60% 1/3/2024 239,298 0.04%Gilead Sciences, Inc. $225,000 3.70% 1/4/2024 238,855 0.04%Wells Fargo & Co. $225,000 4.13% 15/8/2023 238,552 0.04%International Business Machines Corp. $225,000 3.63% 12/2/2024 238,097 0.04%Ford Motor Credit Co. LLC €200,000 3.02% 6/3/2024 237,310 0.04%FirstEnergy Corp. $225,000 4.25% 15/3/2023 237,172 0.04%Prologis LP €200,000 3.00% 18/1/2022 236,798 0.04%General Motors Financial Co., Inc. €200,000 2.20% 1/4/2024 236,358 0.04%AbbVie, Inc. €200,000 1.38% 17/5/2024 236,212 0.04%US Bancorp $225,000 3.38% 5/2/2024 235,494 0.04%Dell International LLC/EMC Corp. $225,000 4.00% 15/7/2024 235,412 0.04%Discovery Communications LLC €200,000 2.38% 7/3/2022 234,856 0.04%WP Carey, Inc. €200,000 2.00% 20/1/2023 234,526 0.04%JPMorgan Chase & Co.^ $225,000 3.56% 23/4/2024 234,499 0.04%Walmart, Inc. €200,000 1.90% 8/4/2022 234,376 0.04%JPMorgan Chase & Co. €200,000 1.50% 26/10/2022 234,022 0.04%Broadcom, Inc. $230,000 3.13% 15/10/2022 233,993 0.04%General Dynamics Corp. $230,000 2.38% 15/11/2024 233,829 0.04%Intel Corp. $225,000 2.88% 11/5/2024 233,363 0.04%Wells Fargo & Co. €200,000 1.50% 12/9/2022 233,260 0.04%Honeywell International, Inc. €200,000 1.30% 22/2/2023 233,091 0.04%Walmart, Inc. $225,000 2.85% 8/7/2024 232,810 0.04%AT&T, Inc. €200,000 1.30% 5/9/2023 232,490 0.04%Goldman Sachs Group, Inc. €200,000 1.38% 26/7/2022 232,421 0.04%3M Co. €200,000 0.95% 15/5/2023 232,420 0.04%United Technologies Corp. €200,000 1.25% 22/5/2023 232,257 0.04%BP Capital Markets America, Inc. $225,000 3.25% 6/5/2022 232,239 0.04%Las Vegas Sands Corp. $225,000 3.20% 8/8/2024 232,106 0.04%New York Life Global Funding $225,000 2.88% 10/4/2024 232,092 0.04%Amgen, Inc. $225,000 3.88% 15/11/2021 232,092 0.04%NBCUniversal Media LLC $225,000 4.38% 1/4/2021 231,990 0.04%Realty Income Corp. $225,000 3.25% 15/10/2022 231,718 0.04%Abbott Ireland Financing DAC €200,000 0.88% 27/9/2023 231,578 0.04%Morgan Stanley €200,000 2.38% 31/3/2021 231,558 0.04%Kellogg Co. €200,000 1.00% 17/5/2024 231,272 0.04%Discovery Communications LLC $225,000 3.25% 1/4/2023 231,227 0.04%General Mills, Inc. €200,000 1.00% 27/4/2023 231,047 0.04%Apple, Inc. $225,000 2.85% 23/2/2023 231,033 0.04%McDonald’s Corp. €200,000 1.13% 26/5/2022 230,986 0.04%Molson Coors Brewing Co. €200,000 1.25% 15/7/2024 230,386 0.04%United Technologies Corp. $225,000 3.35% 16/8/2021 230,216 0.04%AT&T, Inc. $225,000 4.60% 15/2/2021 230,171 0.04%Burlington Northern Santa Fe LLC $225,000 3.45% 15/9/2021 230,167 0.04%Allergan Funding SCS $225,000 3.45% 15/3/2022 230,153 0.04%Procter & Gamble Co. €200,000 0.50% 25/10/2024 229,944 0.04%JPMorgan Chase & Co.^ $225,000 3.21% 1/4/2023 229,889 0.04%American Express Co. $218,000 3.63% 5/12/2024 229,835 0.04%Zimmer Biomet Holdings, Inc. $225,000 3.15% 1/4/2022 229,714 0.04%Philip Morris International, Inc. €200,000 1.88% 3/3/2021 229,697 0.04%PepsiCo, Inc. €200,000 1.75% 28/4/2021 229,336 0.04%Mondelez International, Inc. €200,000 1.00% 7/3/2022 229,302 0.04%Altria Group, Inc. $225,000 2.85% 9/8/2022 229,131 0.04%Coca-Cola Co. €200,000 0.50% 8/3/2024 228,977 0.04%Berkshire Hathaway, Inc. €200,000 0.63% 17/1/2023 228,950 0.04%Citigroup, Inc.^ $225,000 3.14% 24/1/2023 228,792 0.04%Bristol-Myers Squibb Co. $225,000 2.60% 16/5/2022 228,569 0.04%
Vanguard Global Short-Term Corporate Bond Index Fund
729
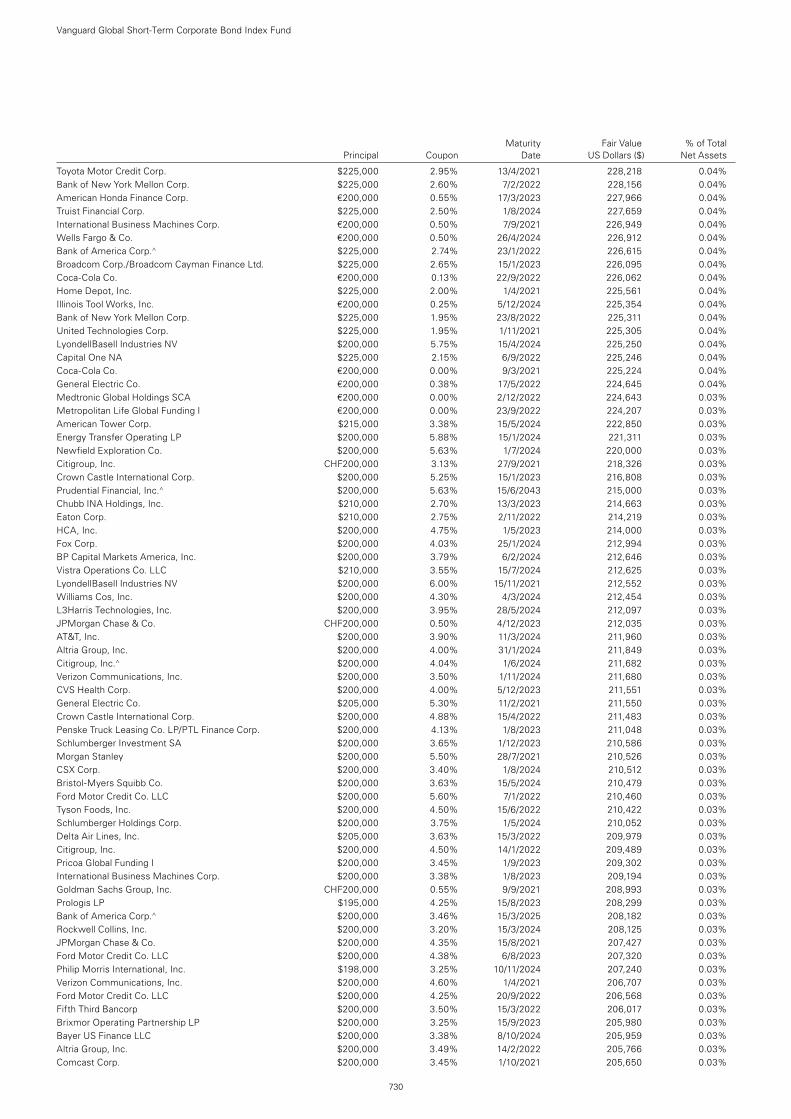
Maturity Fair Value % of Total Principal Coupon Date US Dollars ($) Net Assets
Toyota Motor Credit Corp. $225,000 2.95% 13/4/2021 228,218 0.04%Bank of New York Mellon Corp. $225,000 2.60% 7/2/2022 228,156 0.04%American Honda Finance Corp. €200,000 0.55% 17/3/2023 227,966 0.04%Truist Financial Corp. $225,000 2.50% 1/8/2024 227,659 0.04%International Business Machines Corp. €200,000 0.50% 7/9/2021 226,949 0.04%Wells Fargo & Co. €200,000 0.50% 26/4/2024 226,912 0.04%Bank of America Corp.^ $225,000 2.74% 23/1/2022 226,615 0.04%Broadcom Corp./Broadcom Cayman Finance Ltd. $225,000 2.65% 15/1/2023 226,095 0.04%Coca-Cola Co. €200,000 0.13% 22/9/2022 226,062 0.04%Home Depot, Inc. $225,000 2.00% 1/4/2021 225,561 0.04%Illinois Tool Works, Inc. €200,000 0.25% 5/12/2024 225,354 0.04%Bank of New York Mellon Corp. $225,000 1.95% 23/8/2022 225,311 0.04%United Technologies Corp. $225,000 1.95% 1/11/2021 225,305 0.04%LyondellBasell Industries NV $200,000 5.75% 15/4/2024 225,250 0.04%Capital One NA $225,000 2.15% 6/9/2022 225,246 0.04%Coca-Cola Co. €200,000 0.00% 9/3/2021 225,224 0.04%General Electric Co. €200,000 0.38% 17/5/2022 224,645 0.04%Medtronic Global Holdings SCA €200,000 0.00% 2/12/2022 224,643 0.03%Metropolitan Life Global Funding I €200,000 0.00% 23/9/2022 224,207 0.03%American Tower Corp. $215,000 3.38% 15/5/2024 222,850 0.03%Energy Transfer Operating LP $200,000 5.88% 15/1/2024 221,311 0.03%Newfield Exploration Co. $200,000 5.63% 1/7/2024 220,000 0.03%Citigroup, Inc. CHF200,000 3.13% 27/9/2021 218,326 0.03%Crown Castle International Corp. $200,000 5.25% 15/1/2023 216,808 0.03%Prudential Financial, Inc.^ $200,000 5.63% 15/6/2043 215,000 0.03%Chubb INA Holdings, Inc. $210,000 2.70% 13/3/2023 214,663 0.03%Eaton Corp. $210,000 2.75% 2/11/2022 214,219 0.03%HCA, Inc. $200,000 4.75% 1/5/2023 214,000 0.03%Fox Corp. $200,000 4.03% 25/1/2024 212,994 0.03%BP Capital Markets America, Inc. $200,000 3.79% 6/2/2024 212,646 0.03%Vistra Operations Co. LLC $210,000 3.55% 15/7/2024 212,625 0.03%LyondellBasell Industries NV $200,000 6.00% 15/11/2021 212,552 0.03%Williams Cos, Inc. $200,000 4.30% 4/3/2024 212,454 0.03%L3Harris Technologies, Inc. $200,000 3.95% 28/5/2024 212,097 0.03%JPMorgan Chase & Co. CHF200,000 0.50% 4/12/2023 212,035 0.03%AT&T, Inc. $200,000 3.90% 11/3/2024 211,960 0.03%Altria Group, Inc. $200,000 4.00% 31/1/2024 211,849 0.03%Citigroup, Inc.^ $200,000 4.04% 1/6/2024 211,682 0.03%Verizon Communications, Inc. $200,000 3.50% 1/11/2024 211,680 0.03%CVS Health Corp. $200,000 4.00% 5/12/2023 211,551 0.03%General Electric Co. $205,000 5.30% 11/2/2021 211,550 0.03%Crown Castle International Corp. $200,000 4.88% 15/4/2022 211,483 0.03%Penske Truck Leasing Co. LP/PTL Finance Corp. $200,000 4.13% 1/8/2023 211,048 0.03%Schlumberger Investment SA $200,000 3.65% 1/12/2023 210,586 0.03%Morgan Stanley $200,000 5.50% 28/7/2021 210,526 0.03%CSX Corp. $200,000 3.40% 1/8/2024 210,512 0.03%Bristol-Myers Squibb Co. $200,000 3.63% 15/5/2024 210,479 0.03%Ford Motor Credit Co. LLC $200,000 5.60% 7/1/2022 210,460 0.03%Tyson Foods, Inc. $200,000 4.50% 15/6/2022 210,422 0.03%Schlumberger Holdings Corp. $200,000 3.75% 1/5/2024 210,052 0.03%Delta Air Lines, Inc. $205,000 3.63% 15/3/2022 209,979 0.03%Citigroup, Inc. $200,000 4.50% 14/1/2022 209,489 0.03%Pricoa Global Funding I $200,000 3.45% 1/9/2023 209,302 0.03%International Business Machines Corp. $200,000 3.38% 1/8/2023 209,194 0.03%Goldman Sachs Group, Inc. CHF200,000 0.55% 9/9/2021 208,993 0.03%Prologis LP $195,000 4.25% 15/8/2023 208,299 0.03%Bank of America Corp.^ $200,000 3.46% 15/3/2025 208,182 0.03%Rockwell Collins, Inc. $200,000 3.20% 15/3/2024 208,125 0.03%JPMorgan Chase & Co. $200,000 4.35% 15/8/2021 207,427 0.03%Ford Motor Credit Co. LLC $200,000 4.38% 6/8/2023 207,320 0.03%Philip Morris International, Inc. $198,000 3.25% 10/11/2024 207,240 0.03%Verizon Communications, Inc. $200,000 4.60% 1/4/2021 206,707 0.03%Ford Motor Credit Co. LLC $200,000 4.25% 20/9/2022 206,568 0.03%Fifth Third Bancorp $200,000 3.50% 15/3/2022 206,017 0.03%Brixmor Operating Partnership LP $200,000 3.25% 15/9/2023 205,980 0.03%Bayer US Finance LLC $200,000 3.38% 8/10/2024 205,959 0.03%Altria Group, Inc. $200,000 3.49% 14/2/2022 205,766 0.03%Comcast Corp. $200,000 3.45% 1/10/2021 205,650 0.03%
Vanguard Global Short-Term Corporate Bond Index Fund
730
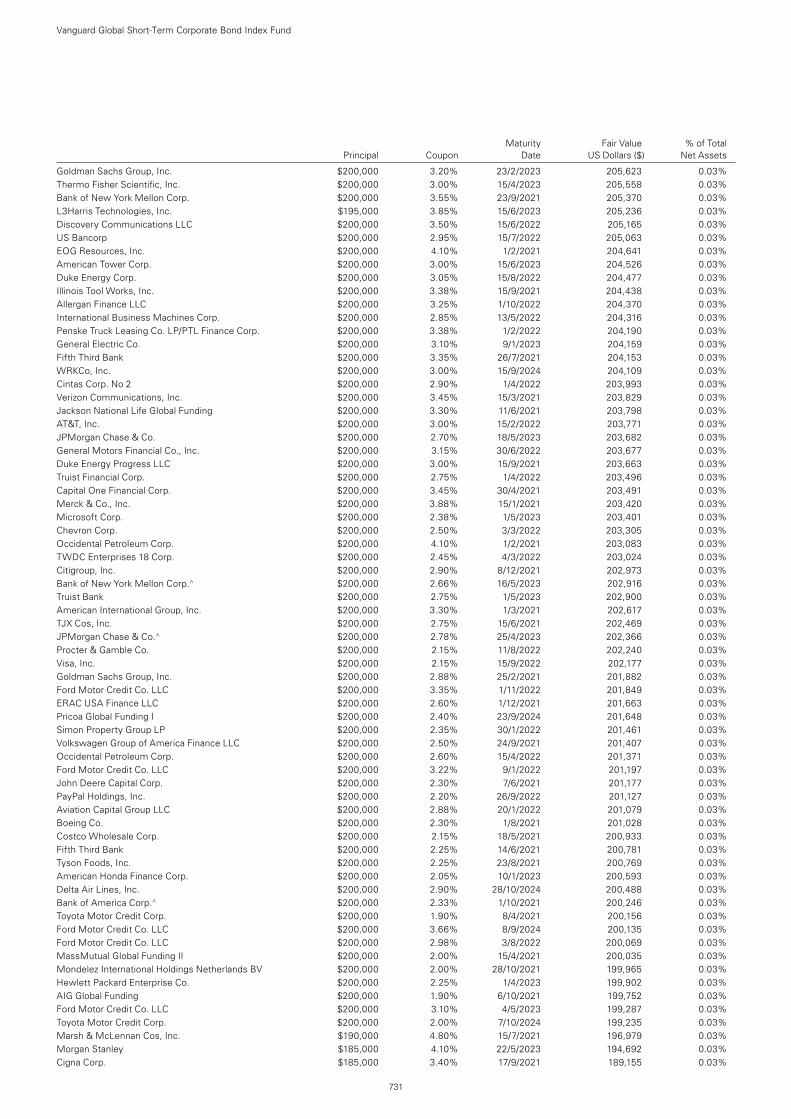
Maturity Fair Value % of Total Principal Coupon Date US Dollars ($) Net Assets
Goldman Sachs Group, Inc. $200,000 3.20% 23/2/2023 205,623 0.03%Thermo Fisher Scientific, Inc. $200,000 3.00% 15/4/2023 205,558 0.03%Bank of New York Mellon Corp. $200,000 3.55% 23/9/2021 205,370 0.03%L3Harris Technologies, Inc. $195,000 3.85% 15/6/2023 205,236 0.03%Discovery Communications LLC $200,000 3.50% 15/6/2022 205,165 0.03%US Bancorp $200,000 2.95% 15/7/2022 205,063 0.03%EOG Resources, Inc. $200,000 4.10% 1/2/2021 204,641 0.03%American Tower Corp. $200,000 3.00% 15/6/2023 204,526 0.03%Duke Energy Corp. $200,000 3.05% 15/8/2022 204,477 0.03%Illinois Tool Works, Inc. $200,000 3.38% 15/9/2021 204,438 0.03%Allergan Finance LLC $200,000 3.25% 1/10/2022 204,370 0.03%International Business Machines Corp. $200,000 2.85% 13/5/2022 204,316 0.03%Penske Truck Leasing Co. LP/PTL Finance Corp. $200,000 3.38% 1/2/2022 204,190 0.03%General Electric Co. $200,000 3.10% 9/1/2023 204,159 0.03%Fifth Third Bank $200,000 3.35% 26/7/2021 204,153 0.03%WRKCo, Inc. $200,000 3.00% 15/9/2024 204,109 0.03%Cintas Corp. No 2 $200,000 2.90% 1/4/2022 203,993 0.03%Verizon Communications, Inc. $200,000 3.45% 15/3/2021 203,829 0.03%Jackson National Life Global Funding $200,000 3.30% 11/6/2021 203,798 0.03%AT&T, Inc. $200,000 3.00% 15/2/2022 203,771 0.03%JPMorgan Chase & Co. $200,000 2.70% 18/5/2023 203,682 0.03%General Motors Financial Co., Inc. $200,000 3.15% 30/6/2022 203,677 0.03%Duke Energy Progress LLC $200,000 3.00% 15/9/2021 203,663 0.03%Truist Financial Corp. $200,000 2.75% 1/4/2022 203,496 0.03%Capital One Financial Corp. $200,000 3.45% 30/4/2021 203,491 0.03%Merck & Co., Inc. $200,000 3.88% 15/1/2021 203,420 0.03%Microsoft Corp. $200,000 2.38% 1/5/2023 203,401 0.03%Chevron Corp. $200,000 2.50% 3/3/2022 203,305 0.03%Occidental Petroleum Corp. $200,000 4.10% 1/2/2021 203,083 0.03%TWDC Enterprises 18 Corp. $200,000 2.45% 4/3/2022 203,024 0.03%Citigroup, Inc. $200,000 2.90% 8/12/2021 202,973 0.03%Bank of New York Mellon Corp.^ $200,000 2.66% 16/5/2023 202,916 0.03%Truist Bank $200,000 2.75% 1/5/2023 202,900 0.03%American International Group, Inc. $200,000 3.30% 1/3/2021 202,617 0.03%TJX Cos, Inc. $200,000 2.75% 15/6/2021 202,469 0.03%JPMorgan Chase & Co.^ $200,000 2.78% 25/4/2023 202,366 0.03%Procter & Gamble Co. $200,000 2.15% 11/8/2022 202,240 0.03%Visa, Inc. $200,000 2.15% 15/9/2022 202,177 0.03%Goldman Sachs Group, Inc. $200,000 2.88% 25/2/2021 201,882 0.03%Ford Motor Credit Co. LLC $200,000 3.35% 1/11/2022 201,849 0.03%ERAC USA Finance LLC $200,000 2.60% 1/12/2021 201,663 0.03%Pricoa Global Funding I $200,000 2.40% 23/9/2024 201,648 0.03%Simon Property Group LP $200,000 2.35% 30/1/2022 201,461 0.03%Volkswagen Group of America Finance LLC $200,000 2.50% 24/9/2021 201,407 0.03%Occidental Petroleum Corp. $200,000 2.60% 15/4/2022 201,371 0.03%Ford Motor Credit Co. LLC $200,000 3.22% 9/1/2022 201,197 0.03%John Deere Capital Corp. $200,000 2.30% 7/6/2021 201,177 0.03%PayPal Holdings, Inc. $200,000 2.20% 26/9/2022 201,127 0.03%Aviation Capital Group LLC $200,000 2.88% 20/1/2022 201,079 0.03%Boeing Co. $200,000 2.30% 1/8/2021 201,028 0.03%Costco Wholesale Corp. $200,000 2.15% 18/5/2021 200,933 0.03%Fifth Third Bank $200,000 2.25% 14/6/2021 200,781 0.03%Tyson Foods, Inc. $200,000 2.25% 23/8/2021 200,769 0.03%American Honda Finance Corp. $200,000 2.05% 10/1/2023 200,593 0.03%Delta Air Lines, Inc. $200,000 2.90% 28/10/2024 200,488 0.03%Bank of America Corp.^ $200,000 2.33% 1/10/2021 200,246 0.03%Toyota Motor Credit Corp. $200,000 1.90% 8/4/2021 200,156 0.03%Ford Motor Credit Co. LLC $200,000 3.66% 8/9/2024 200,135 0.03%Ford Motor Credit Co. LLC $200,000 2.98% 3/8/2022 200,069 0.03%MassMutual Global Funding II $200,000 2.00% 15/4/2021 200,035 0.03%Mondelez International Holdings Netherlands BV $200,000 2.00% 28/10/2021 199,965 0.03%Hewlett Packard Enterprise Co. $200,000 2.25% 1/4/2023 199,902 0.03%AIG Global Funding $200,000 1.90% 6/10/2021 199,752 0.03%Ford Motor Credit Co. LLC $200,000 3.10% 4/5/2023 199,287 0.03%Toyota Motor Credit Corp. $200,000 2.00% 7/10/2024 199,235 0.03%Marsh & McLennan Cos, Inc. $190,000 4.80% 15/7/2021 196,979 0.03%Morgan Stanley $185,000 4.10% 22/5/2023 194,692 0.03%Cigna Corp. $185,000 3.40% 17/9/2021 189,155 0.03%
Vanguard Global Short-Term Corporate Bond Index Fund
731
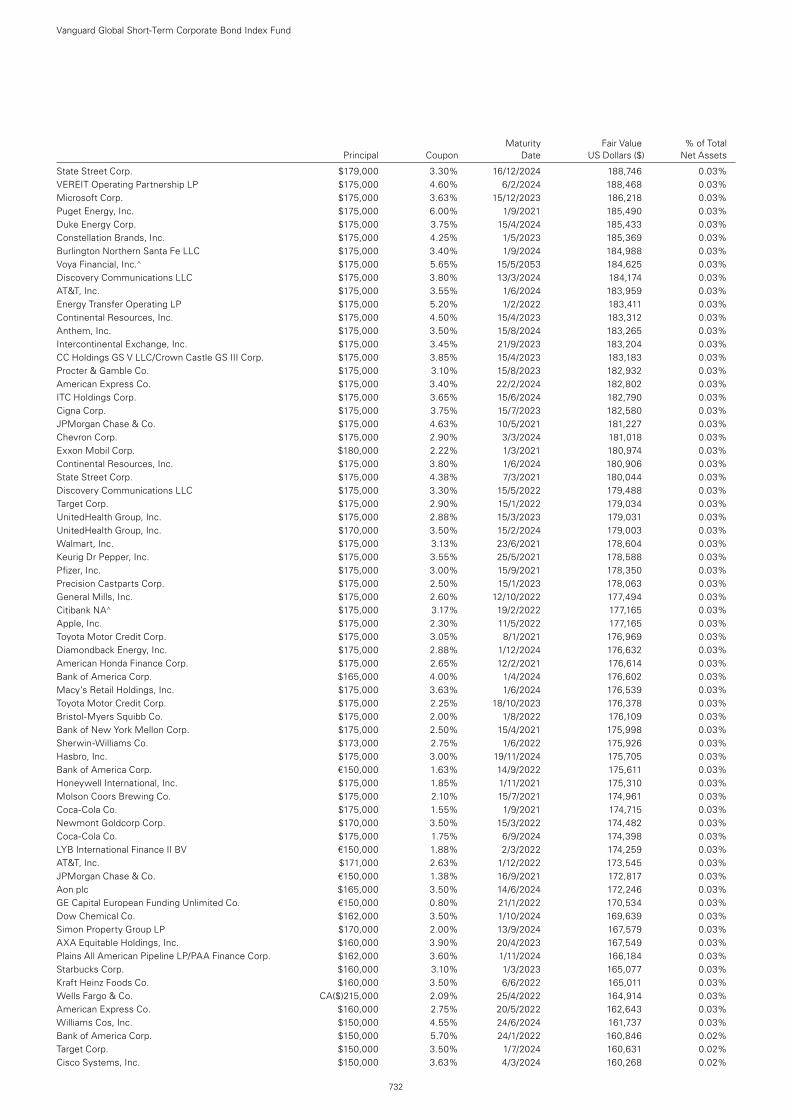
Maturity Fair Value % of Total Principal Coupon Date US Dollars ($) Net Assets
State Street Corp. $179,000 3.30% 16/12/2024 188,746 0.03%VEREIT Operating Partnership LP $175,000 4.60% 6/2/2024 188,468 0.03%Microsoft Corp. $175,000 3.63% 15/12/2023 186,218 0.03%Puget Energy, Inc. $175,000 6.00% 1/9/2021 185,490 0.03%Duke Energy Corp. $175,000 3.75% 15/4/2024 185,433 0.03%Constellation Brands, Inc. $175,000 4.25% 1/5/2023 185,369 0.03%Burlington Northern Santa Fe LLC $175,000 3.40% 1/9/2024 184,988 0.03%Voya Financial, Inc.^ $175,000 5.65% 15/5/2053 184,625 0.03%Discovery Communications LLC $175,000 3.80% 13/3/2024 184,174 0.03%AT&T, Inc. $175,000 3.55% 1/6/2024 183,959 0.03%Energy Transfer Operating LP $175,000 5.20% 1/2/2022 183,411 0.03%Continental Resources, Inc. $175,000 4.50% 15/4/2023 183,312 0.03%Anthem, Inc. $175,000 3.50% 15/8/2024 183,265 0.03%Intercontinental Exchange, Inc. $175,000 3.45% 21/9/2023 183,204 0.03%CC Holdings GS V LLC/Crown Castle GS III Corp. $175,000 3.85% 15/4/2023 183,183 0.03%Procter & Gamble Co. $175,000 3.10% 15/8/2023 182,932 0.03%American Express Co. $175,000 3.40% 22/2/2024 182,802 0.03%ITC Holdings Corp. $175,000 3.65% 15/6/2024 182,790 0.03%Cigna Corp. $175,000 3.75% 15/7/2023 182,580 0.03%JPMorgan Chase & Co. $175,000 4.63% 10/5/2021 181,227 0.03%Chevron Corp. $175,000 2.90% 3/3/2024 181,018 0.03%Exxon Mobil Corp. $180,000 2.22% 1/3/2021 180,974 0.03%Continental Resources, Inc. $175,000 3.80% 1/6/2024 180,906 0.03%State Street Corp. $175,000 4.38% 7/3/2021 180,044 0.03%Discovery Communications LLC $175,000 3.30% 15/5/2022 179,488 0.03%Target Corp. $175,000 2.90% 15/1/2022 179,034 0.03%UnitedHealth Group, Inc. $175,000 2.88% 15/3/2023 179,031 0.03%UnitedHealth Group, Inc. $170,000 3.50% 15/2/2024 179,003 0.03%Walmart, Inc. $175,000 3.13% 23/6/2021 178,604 0.03%Keurig Dr Pepper, Inc. $175,000 3.55% 25/5/2021 178,588 0.03%Pfizer, Inc. $175,000 3.00% 15/9/2021 178,350 0.03%Precision Castparts Corp. $175,000 2.50% 15/1/2023 178,063 0.03%General Mills, Inc. $175,000 2.60% 12/10/2022 177,494 0.03%Citibank NA^ $175,000 3.17% 19/2/2022 177,165 0.03%Apple, Inc. $175,000 2.30% 11/5/2022 177,165 0.03%Toyota Motor Credit Corp. $175,000 3.05% 8/1/2021 176,969 0.03%Diamondback Energy, Inc. $175,000 2.88% 1/12/2024 176,632 0.03%American Honda Finance Corp. $175,000 2.65% 12/2/2021 176,614 0.03%Bank of America Corp. $165,000 4.00% 1/4/2024 176,602 0.03%Macy’s Retail Holdings, Inc. $175,000 3.63% 1/6/2024 176,539 0.03%Toyota Motor Credit Corp. $175,000 2.25% 18/10/2023 176,378 0.03%Bristol-Myers Squibb Co. $175,000 2.00% 1/8/2022 176,109 0.03%Bank of New York Mellon Corp. $175,000 2.50% 15/4/2021 175,998 0.03%Sherwin-Williams Co. $173,000 2.75% 1/6/2022 175,926 0.03%Hasbro, Inc. $175,000 3.00% 19/11/2024 175,705 0.03%Bank of America Corp. €150,000 1.63% 14/9/2022 175,611 0.03%Honeywell International, Inc. $175,000 1.85% 1/11/2021 175,310 0.03%Molson Coors Brewing Co. $175,000 2.10% 15/7/2021 174,961 0.03%Coca-Cola Co. $175,000 1.55% 1/9/2021 174,715 0.03%Newmont Goldcorp Corp. $170,000 3.50% 15/3/2022 174,482 0.03%Coca-Cola Co. $175,000 1.75% 6/9/2024 174,398 0.03%LYB International Finance II BV €150,000 1.88% 2/3/2022 174,259 0.03%AT&T, Inc. $171,000 2.63% 1/12/2022 173,545 0.03%JPMorgan Chase & Co. €150,000 1.38% 16/9/2021 172,817 0.03%Aon plc $165,000 3.50% 14/6/2024 172,246 0.03%GE Capital European Funding Unlimited Co. €150,000 0.80% 21/1/2022 170,534 0.03%Dow Chemical Co. $162,000 3.50% 1/10/2024 169,639 0.03%Simon Property Group LP $170,000 2.00% 13/9/2024 167,579 0.03%AXA Equitable Holdings, Inc. $160,000 3.90% 20/4/2023 167,549 0.03%Plains All American Pipeline LP/PAA Finance Corp. $162,000 3.60% 1/11/2024 166,184 0.03%Starbucks Corp. $160,000 3.10% 1/3/2023 165,077 0.03%Kraft Heinz Foods Co. $160,000 3.50% 6/6/2022 165,011 0.03%Wells Fargo & Co. CA($)215,000 2.09% 25/4/2022 164,914 0.03%American Express Co. $160,000 2.75% 20/5/2022 162,643 0.03%Williams Cos, Inc. $150,000 4.55% 24/6/2024 161,737 0.03%Bank of America Corp. $150,000 5.70% 24/1/2022 160,846 0.02%Target Corp. $150,000 3.50% 1/7/2024 160,631 0.02%Cisco Systems, Inc. $150,000 3.63% 4/3/2024 160,268 0.02%
Vanguard Global Short-Term Corporate Bond Index Fund
732
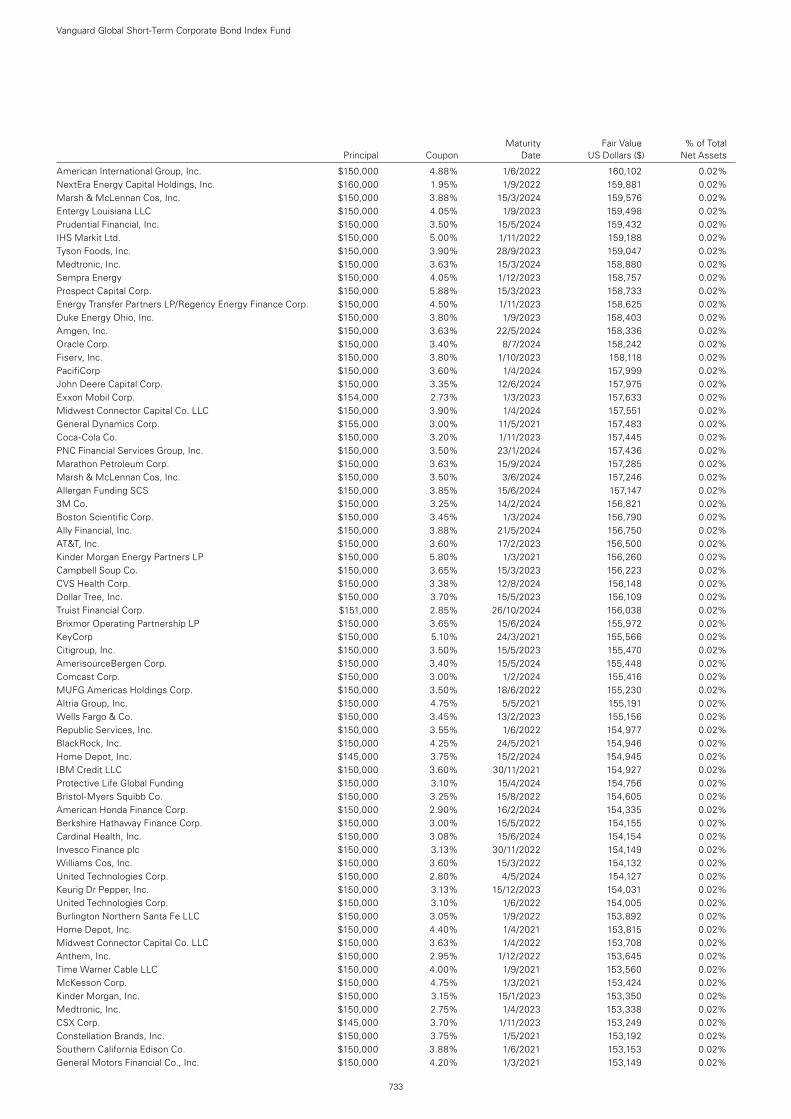
Maturity Fair Value % of Total Principal Coupon Date US Dollars ($) Net Assets
American International Group, Inc. $150,000 4.88% 1/6/2022 160,102 0.02%NextEra Energy Capital Holdings, Inc. $160,000 1.95% 1/9/2022 159,881 0.02%Marsh & McLennan Cos, Inc. $150,000 3.88% 15/3/2024 159,576 0.02%Entergy Louisiana LLC $150,000 4.05% 1/9/2023 159,498 0.02%Prudential Financial, Inc. $150,000 3.50% 15/5/2024 159,432 0.02%IHS Markit Ltd. $150,000 5.00% 1/11/2022 159,188 0.02%Tyson Foods, Inc. $150,000 3.90% 28/9/2023 159,047 0.02%Medtronic, Inc. $150,000 3.63% 15/3/2024 158,880 0.02%Sempra Energy $150,000 4.05% 1/12/2023 158,757 0.02%Prospect Capital Corp. $150,000 5.88% 15/3/2023 158,733 0.02%Energy Transfer Partners LP/Regency Energy Finance Corp. $150,000 4.50% 1/11/2023 158,625 0.02%Duke Energy Ohio, Inc. $150,000 3.80% 1/9/2023 158,403 0.02%Amgen, Inc. $150,000 3.63% 22/5/2024 158,336 0.02%Oracle Corp. $150,000 3.40% 8/7/2024 158,242 0.02%Fiserv, Inc. $150,000 3.80% 1/10/2023 158,118 0.02%PacifiCorp $150,000 3.60% 1/4/2024 157,999 0.02%John Deere Capital Corp. $150,000 3.35% 12/6/2024 157,975 0.02%Exxon Mobil Corp. $154,000 2.73% 1/3/2023 157,633 0.02%Midwest Connector Capital Co. LLC $150,000 3.90% 1/4/2024 157,551 0.02%General Dynamics Corp. $155,000 3.00% 11/5/2021 157,483 0.02%Coca-Cola Co. $150,000 3.20% 1/11/2023 157,445 0.02%PNC Financial Services Group, Inc. $150,000 3.50% 23/1/2024 157,436 0.02%Marathon Petroleum Corp. $150,000 3.63% 15/9/2024 157,285 0.02%Marsh & McLennan Cos, Inc. $150,000 3.50% 3/6/2024 157,246 0.02%Allergan Funding SCS $150,000 3.85% 15/6/2024 157,147 0.02%3M Co. $150,000 3.25% 14/2/2024 156,821 0.02%Boston Scientific Corp. $150,000 3.45% 1/3/2024 156,790 0.02%Ally Financial, Inc. $150,000 3.88% 21/5/2024 156,750 0.02%AT&T, Inc. $150,000 3.60% 17/2/2023 156,500 0.02%Kinder Morgan Energy Partners LP $150,000 5.80% 1/3/2021 156,260 0.02%Campbell Soup Co. $150,000 3.65% 15/3/2023 156,223 0.02%CVS Health Corp. $150,000 3.38% 12/8/2024 156,148 0.02%Dollar Tree, Inc. $150,000 3.70% 15/5/2023 156,109 0.02%Truist Financial Corp. $151,000 2.85% 26/10/2024 156,038 0.02%Brixmor Operating Partnership LP $150,000 3.65% 15/6/2024 155,972 0.02%KeyCorp $150,000 5.10% 24/3/2021 155,566 0.02%Citigroup, Inc. $150,000 3.50% 15/5/2023 155,470 0.02%AmerisourceBergen Corp. $150,000 3.40% 15/5/2024 155,448 0.02%Comcast Corp. $150,000 3.00% 1/2/2024 155,416 0.02%MUFG Americas Holdings Corp. $150,000 3.50% 18/6/2022 155,230 0.02%Altria Group, Inc. $150,000 4.75% 5/5/2021 155,191 0.02%Wells Fargo & Co. $150,000 3.45% 13/2/2023 155,156 0.02%Republic Services, Inc. $150,000 3.55% 1/6/2022 154,977 0.02%BlackRock, Inc. $150,000 4.25% 24/5/2021 154,946 0.02%Home Depot, Inc. $145,000 3.75% 15/2/2024 154,945 0.02%IBM Credit LLC $150,000 3.60% 30/11/2021 154,927 0.02%Protective Life Global Funding $150,000 3.10% 15/4/2024 154,756 0.02%Bristol-Myers Squibb Co. $150,000 3.25% 15/8/2022 154,605 0.02%American Honda Finance Corp. $150,000 2.90% 16/2/2024 154,335 0.02%Berkshire Hathaway Finance Corp. $150,000 3.00% 15/5/2022 154,155 0.02%Cardinal Health, Inc. $150,000 3.08% 15/6/2024 154,154 0.02%Invesco Finance plc $150,000 3.13% 30/11/2022 154,149 0.02%Williams Cos, Inc. $150,000 3.60% 15/3/2022 154,132 0.02%United Technologies Corp. $150,000 2.80% 4/5/2024 154,127 0.02%Keurig Dr Pepper, Inc. $150,000 3.13% 15/12/2023 154,031 0.02%United Technologies Corp. $150,000 3.10% 1/6/2022 154,005 0.02%Burlington Northern Santa Fe LLC $150,000 3.05% 1/9/2022 153,892 0.02%Home Depot, Inc. $150,000 4.40% 1/4/2021 153,815 0.02%Midwest Connector Capital Co. LLC $150,000 3.63% 1/4/2022 153,708 0.02%Anthem, Inc. $150,000 2.95% 1/12/2022 153,645 0.02%Time Warner Cable LLC $150,000 4.00% 1/9/2021 153,560 0.02%McKesson Corp. $150,000 4.75% 1/3/2021 153,424 0.02%Kinder Morgan, Inc. $150,000 3.15% 15/1/2023 153,350 0.02%Medtronic, Inc. $150,000 2.75% 1/4/2023 153,338 0.02%CSX Corp. $145,000 3.70% 1/11/2023 153,249 0.02%Constellation Brands, Inc. $150,000 3.75% 1/5/2021 153,192 0.02%Southern California Edison Co. $150,000 3.88% 1/6/2021 153,153 0.02%General Motors Financial Co., Inc. $150,000 4.20% 1/3/2021 153,149 0.02%
Vanguard Global Short-Term Corporate Bond Index Fund
733
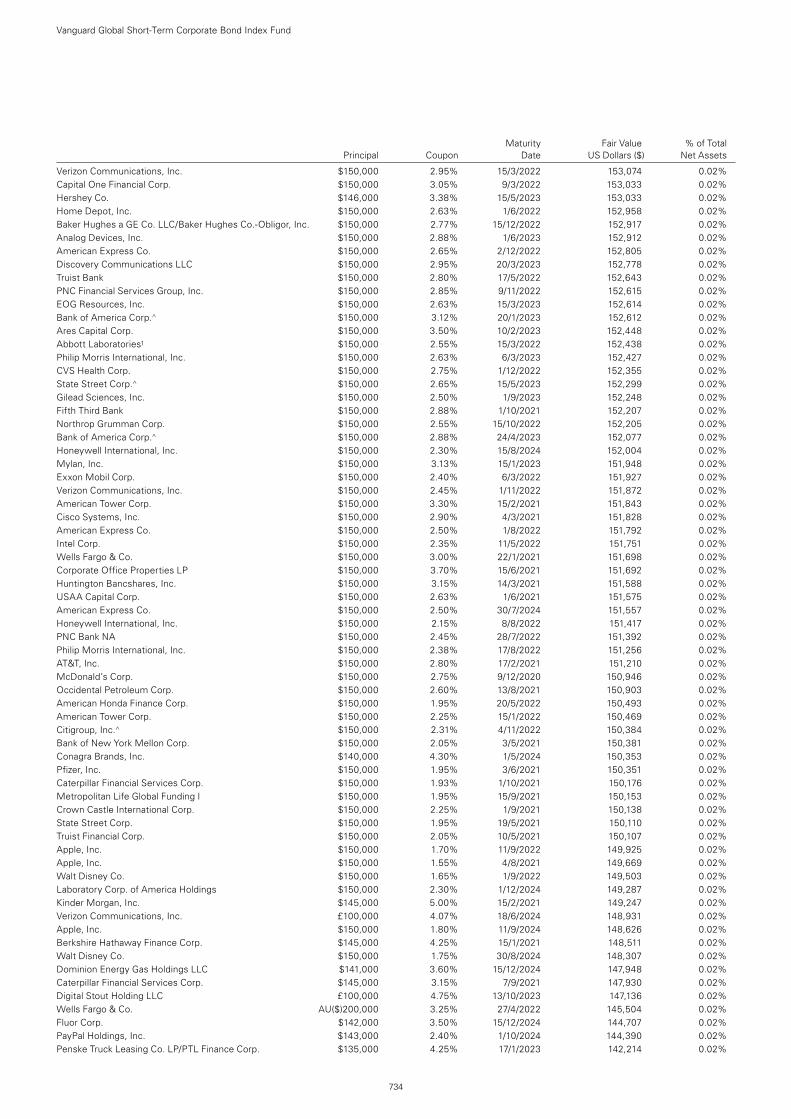
Maturity Fair Value % of Total Principal Coupon Date US Dollars ($) Net Assets
Verizon Communications, Inc. $150,000 2.95% 15/3/2022 153,074 0.02%Capital One Financial Corp. $150,000 3.05% 9/3/2022 153,033 0.02%Hershey Co. $146,000 3.38% 15/5/2023 153,033 0.02%Home Depot, Inc. $150,000 2.63% 1/6/2022 152,958 0.02%Baker Hughes a GE Co. LLC/Baker Hughes Co.-Obligor, Inc. $150,000 2.77% 15/12/2022 152,917 0.02%Analog Devices, Inc. $150,000 2.88% 1/6/2023 152,912 0.02%American Express Co. $150,000 2.65% 2/12/2022 152,805 0.02%Discovery Communications LLC $150,000 2.95% 20/3/2023 152,778 0.02%Truist Bank $150,000 2.80% 17/5/2022 152,643 0.02%PNC Financial Services Group, Inc. $150,000 2.85% 9/11/2022 152,615 0.02%EOG Resources, Inc. $150,000 2.63% 15/3/2023 152,614 0.02%Bank of America Corp.^ $150,000 3.12% 20/1/2023 152,612 0.02%Ares Capital Corp. $150,000 3.50% 10/2/2023 152,448 0.02%Abbott Laboratories1 $150,000 2.55% 15/3/2022 152,438 0.02%Philip Morris International, Inc. $150,000 2.63% 6/3/2023 152,427 0.02%CVS Health Corp. $150,000 2.75% 1/12/2022 152,355 0.02%State Street Corp.^ $150,000 2.65% 15/5/2023 152,299 0.02%Gilead Sciences, Inc. $150,000 2.50% 1/9/2023 152,248 0.02%Fifth Third Bank $150,000 2.88% 1/10/2021 152,207 0.02%Northrop Grumman Corp. $150,000 2.55% 15/10/2022 152,205 0.02%Bank of America Corp.^ $150,000 2.88% 24/4/2023 152,077 0.02%Honeywell International, Inc. $150,000 2.30% 15/8/2024 152,004 0.02%Mylan, Inc. $150,000 3.13% 15/1/2023 151,948 0.02%Exxon Mobil Corp. $150,000 2.40% 6/3/2022 151,927 0.02%Verizon Communications, Inc. $150,000 2.45% 1/11/2022 151,872 0.02%American Tower Corp. $150,000 3.30% 15/2/2021 151,843 0.02%Cisco Systems, Inc. $150,000 2.90% 4/3/2021 151,828 0.02%American Express Co. $150,000 2.50% 1/8/2022 151,792 0.02%Intel Corp. $150,000 2.35% 11/5/2022 151,751 0.02%Wells Fargo & Co. $150,000 3.00% 22/1/2021 151,698 0.02%Corporate Office Properties LP $150,000 3.70% 15/6/2021 151,692 0.02%Huntington Bancshares, Inc. $150,000 3.15% 14/3/2021 151,588 0.02%USAA Capital Corp. $150,000 2.63% 1/6/2021 151,575 0.02%American Express Co. $150,000 2.50% 30/7/2024 151,557 0.02%Honeywell International, Inc. $150,000 2.15% 8/8/2022 151,417 0.02%PNC Bank NA $150,000 2.45% 28/7/2022 151,392 0.02%Philip Morris International, Inc. $150,000 2.38% 17/8/2022 151,256 0.02%AT&T, Inc. $150,000 2.80% 17/2/2021 151,210 0.02%McDonald’s Corp. $150,000 2.75% 9/12/2020 150,946 0.02%Occidental Petroleum Corp. $150,000 2.60% 13/8/2021 150,903 0.02%American Honda Finance Corp. $150,000 1.95% 20/5/2022 150,493 0.02%American Tower Corp. $150,000 2.25% 15/1/2022 150,469 0.02%Citigroup, Inc.^ $150,000 2.31% 4/11/2022 150,384 0.02%Bank of New York Mellon Corp. $150,000 2.05% 3/5/2021 150,381 0.02%Conagra Brands, Inc. $140,000 4.30% 1/5/2024 150,353 0.02%Pfizer, Inc. $150,000 1.95% 3/6/2021 150,351 0.02%Caterpillar Financial Services Corp. $150,000 1.93% 1/10/2021 150,176 0.02%Metropolitan Life Global Funding I $150,000 1.95% 15/9/2021 150,153 0.02%Crown Castle International Corp. $150,000 2.25% 1/9/2021 150,138 0.02%State Street Corp. $150,000 1.95% 19/5/2021 150,110 0.02%Truist Financial Corp. $150,000 2.05% 10/5/2021 150,107 0.02%Apple, Inc. $150,000 1.70% 11/9/2022 149,925 0.02%Apple, Inc. $150,000 1.55% 4/8/2021 149,669 0.02%Walt Disney Co. $150,000 1.65% 1/9/2022 149,503 0.02%Laboratory Corp. of America Holdings $150,000 2.30% 1/12/2024 149,287 0.02%Kinder Morgan, Inc. $145,000 5.00% 15/2/2021 149,247 0.02%Verizon Communications, Inc. £100,000 4.07% 18/6/2024 148,931 0.02%Apple, Inc. $150,000 1.80% 11/9/2024 148,626 0.02%Berkshire Hathaway Finance Corp. $145,000 4.25% 15/1/2021 148,511 0.02%Walt Disney Co. $150,000 1.75% 30/8/2024 148,307 0.02%Dominion Energy Gas Holdings LLC $141,000 3.60% 15/12/2024 147,948 0.02%Caterpillar Financial Services Corp. $145,000 3.15% 7/9/2021 147,930 0.02%Digital Stout Holding LLC £100,000 4.75% 13/10/2023 147,136 0.02%Wells Fargo & Co. AU($)200,000 3.25% 27/4/2022 145,504 0.02%Fluor Corp. $142,000 3.50% 15/12/2024 144,707 0.02%PayPal Holdings, Inc. $143,000 2.40% 1/10/2024 144,390 0.02%Penske Truck Leasing Co. LP/PTL Finance Corp. $135,000 4.25% 17/1/2023 142,214 0.02%
Vanguard Global Short-Term Corporate Bond Index Fund
734
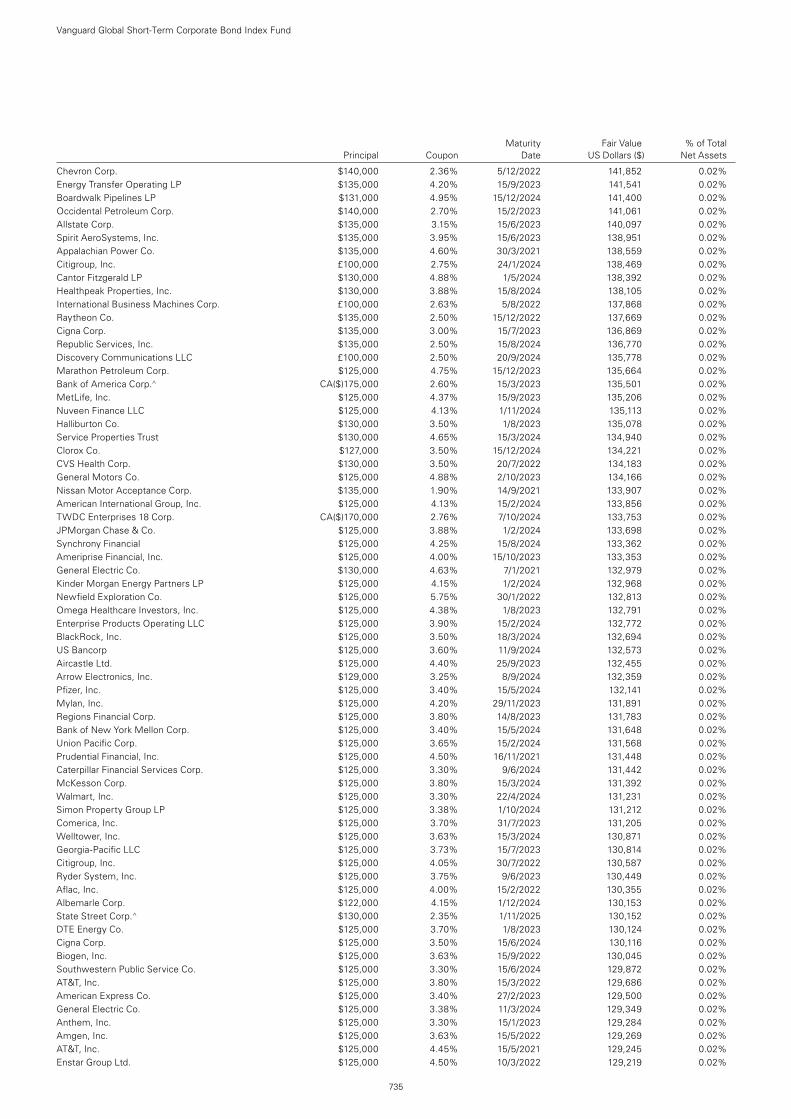
Maturity Fair Value % of Total Principal Coupon Date US Dollars ($) Net Assets
Chevron Corp. $140,000 2.36% 5/12/2022 141,852 0.02%Energy Transfer Operating LP $135,000 4.20% 15/9/2023 141,541 0.02%Boardwalk Pipelines LP $131,000 4.95% 15/12/2024 141,400 0.02%Occidental Petroleum Corp. $140,000 2.70% 15/2/2023 141,061 0.02%Allstate Corp. $135,000 3.15% 15/6/2023 140,097 0.02%Spirit AeroSystems, Inc. $135,000 3.95% 15/6/2023 138,951 0.02%Appalachian Power Co. $135,000 4.60% 30/3/2021 138,559 0.02%Citigroup, Inc. £100,000 2.75% 24/1/2024 138,469 0.02%Cantor Fitzgerald LP $130,000 4.88% 1/5/2024 138,392 0.02%Healthpeak Properties, Inc. $130,000 3.88% 15/8/2024 138,105 0.02%International Business Machines Corp. £100,000 2.63% 5/8/2022 137,868 0.02%Raytheon Co. $135,000 2.50% 15/12/2022 137,669 0.02%Cigna Corp. $135,000 3.00% 15/7/2023 136,869 0.02%Republic Services, Inc. $135,000 2.50% 15/8/2024 136,770 0.02%Discovery Communications LLC £100,000 2.50% 20/9/2024 135,778 0.02%Marathon Petroleum Corp. $125,000 4.75% 15/12/2023 135,664 0.02%Bank of America Corp.^ CA($)175,000 2.60% 15/3/2023 135,501 0.02%MetLife, Inc. $125,000 4.37% 15/9/2023 135,206 0.02%Nuveen Finance LLC $125,000 4.13% 1/11/2024 135,113 0.02%Halliburton Co. $130,000 3.50% 1/8/2023 135,078 0.02%Service Properties Trust $130,000 4.65% 15/3/2024 134,940 0.02%Clorox Co. $127,000 3.50% 15/12/2024 134,221 0.02%CVS Health Corp. $130,000 3.50% 20/7/2022 134,183 0.02%General Motors Co. $125,000 4.88% 2/10/2023 134,166 0.02%Nissan Motor Acceptance Corp. $135,000 1.90% 14/9/2021 133,907 0.02%American International Group, Inc. $125,000 4.13% 15/2/2024 133,856 0.02%TWDC Enterprises 18 Corp. CA($)170,000 2.76% 7/10/2024 133,753 0.02%JPMorgan Chase & Co. $125,000 3.88% 1/2/2024 133,698 0.02%Synchrony Financial $125,000 4.25% 15/8/2024 133,362 0.02%Ameriprise Financial, Inc. $125,000 4.00% 15/10/2023 133,353 0.02%General Electric Co. $130,000 4.63% 7/1/2021 132,979 0.02%Kinder Morgan Energy Partners LP $125,000 4.15% 1/2/2024 132,968 0.02%Newfield Exploration Co. $125,000 5.75% 30/1/2022 132,813 0.02%Omega Healthcare Investors, Inc. $125,000 4.38% 1/8/2023 132,791 0.02%Enterprise Products Operating LLC $125,000 3.90% 15/2/2024 132,772 0.02%BlackRock, Inc. $125,000 3.50% 18/3/2024 132,694 0.02%US Bancorp $125,000 3.60% 11/9/2024 132,573 0.02%Aircastle Ltd. $125,000 4.40% 25/9/2023 132,455 0.02%Arrow Electronics, Inc. $129,000 3.25% 8/9/2024 132,359 0.02%Pfizer, Inc. $125,000 3.40% 15/5/2024 132,141 0.02%Mylan, Inc. $125,000 4.20% 29/11/2023 131,891 0.02%Regions Financial Corp. $125,000 3.80% 14/8/2023 131,783 0.02%Bank of New York Mellon Corp. $125,000 3.40% 15/5/2024 131,648 0.02%Union Pacific Corp. $125,000 3.65% 15/2/2024 131,568 0.02%Prudential Financial, Inc. $125,000 4.50% 16/11/2021 131,448 0.02%Caterpillar Financial Services Corp. $125,000 3.30% 9/6/2024 131,442 0.02%McKesson Corp. $125,000 3.80% 15/3/2024 131,392 0.02%Walmart, Inc. $125,000 3.30% 22/4/2024 131,231 0.02%Simon Property Group LP $125,000 3.38% 1/10/2024 131,212 0.02%Comerica, Inc. $125,000 3.70% 31/7/2023 131,205 0.02%Welltower, Inc. $125,000 3.63% 15/3/2024 130,871 0.02%Georgia-Pacific LLC $125,000 3.73% 15/7/2023 130,814 0.02%Citigroup, Inc. $125,000 4.05% 30/7/2022 130,587 0.02%Ryder System, Inc. $125,000 3.75% 9/6/2023 130,449 0.02%Aflac, Inc. $125,000 4.00% 15/2/2022 130,355 0.02%Albemarle Corp. $122,000 4.15% 1/12/2024 130,153 0.02%State Street Corp.^ $130,000 2.35% 1/11/2025 130,152 0.02%DTE Energy Co. $125,000 3.70% 1/8/2023 130,124 0.02%Cigna Corp. $125,000 3.50% 15/6/2024 130,116 0.02%Biogen, Inc. $125,000 3.63% 15/9/2022 130,045 0.02%Southwestern Public Service Co. $125,000 3.30% 15/6/2024 129,872 0.02%AT&T, Inc. $125,000 3.80% 15/3/2022 129,686 0.02%American Express Co. $125,000 3.40% 27/2/2023 129,500 0.02%General Electric Co. $125,000 3.38% 11/3/2024 129,349 0.02%Anthem, Inc. $125,000 3.30% 15/1/2023 129,284 0.02%Amgen, Inc. $125,000 3.63% 15/5/2022 129,269 0.02%AT&T, Inc. $125,000 4.45% 15/5/2021 129,245 0.02%Enstar Group Ltd. $125,000 4.50% 10/3/2022 129,219 0.02%
Vanguard Global Short-Term Corporate Bond Index Fund
735
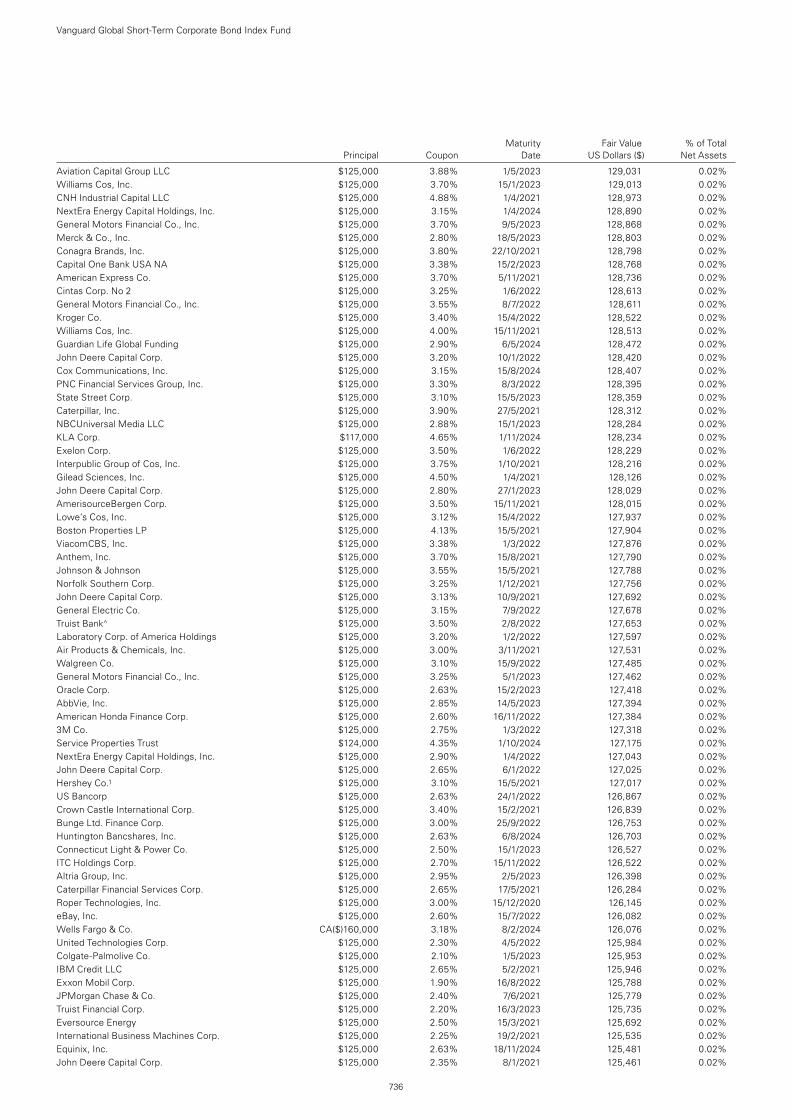
Maturity Fair Value % of Total Principal Coupon Date US Dollars ($) Net Assets
Aviation Capital Group LLC $125,000 3.88% 1/5/2023 129,031 0.02%Williams Cos, Inc. $125,000 3.70% 15/1/2023 129,013 0.02%CNH Industrial Capital LLC $125,000 4.88% 1/4/2021 128,973 0.02%NextEra Energy Capital Holdings, Inc. $125,000 3.15% 1/4/2024 128,890 0.02%General Motors Financial Co., Inc. $125,000 3.70% 9/5/2023 128,868 0.02%Merck & Co., Inc. $125,000 2.80% 18/5/2023 128,803 0.02%Conagra Brands, Inc. $125,000 3.80% 22/10/2021 128,798 0.02%Capital One Bank USA NA $125,000 3.38% 15/2/2023 128,768 0.02%American Express Co. $125,000 3.70% 5/11/2021 128,736 0.02%Cintas Corp. No 2 $125,000 3.25% 1/6/2022 128,613 0.02%General Motors Financial Co., Inc. $125,000 3.55% 8/7/2022 128,611 0.02%Kroger Co. $125,000 3.40% 15/4/2022 128,522 0.02%Williams Cos, Inc. $125,000 4.00% 15/11/2021 128,513 0.02%Guardian Life Global Funding $125,000 2.90% 6/5/2024 128,472 0.02%John Deere Capital Corp. $125,000 3.20% 10/1/2022 128,420 0.02%Cox Communications, Inc. $125,000 3.15% 15/8/2024 128,407 0.02%PNC Financial Services Group, Inc. $125,000 3.30% 8/3/2022 128,395 0.02%State Street Corp. $125,000 3.10% 15/5/2023 128,359 0.02%Caterpillar, Inc. $125,000 3.90% 27/5/2021 128,312 0.02%NBCUniversal Media LLC $125,000 2.88% 15/1/2023 128,284 0.02%KLA Corp. $117,000 4.65% 1/11/2024 128,234 0.02%Exelon Corp. $125,000 3.50% 1/6/2022 128,229 0.02%Interpublic Group of Cos, Inc. $125,000 3.75% 1/10/2021 128,216 0.02%Gilead Sciences, Inc. $125,000 4.50% 1/4/2021 128,126 0.02%John Deere Capital Corp. $125,000 2.80% 27/1/2023 128,029 0.02%AmerisourceBergen Corp. $125,000 3.50% 15/11/2021 128,015 0.02%Lowe’s Cos, Inc. $125,000 3.12% 15/4/2022 127,937 0.02%Boston Properties LP $125,000 4.13% 15/5/2021 127,904 0.02%ViacomCBS, Inc. $125,000 3.38% 1/3/2022 127,876 0.02%Anthem, Inc. $125,000 3.70% 15/8/2021 127,790 0.02%Johnson & Johnson $125,000 3.55% 15/5/2021 127,788 0.02%Norfolk Southern Corp. $125,000 3.25% 1/12/2021 127,756 0.02%John Deere Capital Corp. $125,000 3.13% 10/9/2021 127,692 0.02%General Electric Co. $125,000 3.15% 7/9/2022 127,678 0.02%Truist Bank^ $125,000 3.50% 2/8/2022 127,653 0.02%Laboratory Corp. of America Holdings $125,000 3.20% 1/2/2022 127,597 0.02%Air Products & Chemicals, Inc. $125,000 3.00% 3/11/2021 127,531 0.02%Walgreen Co. $125,000 3.10% 15/9/2022 127,485 0.02%General Motors Financial Co., Inc. $125,000 3.25% 5/1/2023 127,462 0.02%Oracle Corp. $125,000 2.63% 15/2/2023 127,418 0.02%AbbVie, Inc. $125,000 2.85% 14/5/2023 127,394 0.02%American Honda Finance Corp. $125,000 2.60% 16/11/2022 127,384 0.02%3M Co. $125,000 2.75% 1/3/2022 127,318 0.02%Service Properties Trust $124,000 4.35% 1/10/2024 127,175 0.02%NextEra Energy Capital Holdings, Inc. $125,000 2.90% 1/4/2022 127,043 0.02%John Deere Capital Corp. $125,000 2.65% 6/1/2022 127,025 0.02%Hershey Co.1 $125,000 3.10% 15/5/2021 127,017 0.02%US Bancorp $125,000 2.63% 24/1/2022 126,867 0.02%Crown Castle International Corp. $125,000 3.40% 15/2/2021 126,839 0.02%Bunge Ltd. Finance Corp. $125,000 3.00% 25/9/2022 126,753 0.02%Huntington Bancshares, Inc. $125,000 2.63% 6/8/2024 126,703 0.02%Connecticut Light & Power Co. $125,000 2.50% 15/1/2023 126,527 0.02%ITC Holdings Corp. $125,000 2.70% 15/11/2022 126,522 0.02%Altria Group, Inc. $125,000 2.95% 2/5/2023 126,398 0.02%Caterpillar Financial Services Corp. $125,000 2.65% 17/5/2021 126,284 0.02%Roper Technologies, Inc. $125,000 3.00% 15/12/2020 126,145 0.02%eBay, Inc. $125,000 2.60% 15/7/2022 126,082 0.02%Wells Fargo & Co. CA($)160,000 3.18% 8/2/2024 126,076 0.02%United Technologies Corp. $125,000 2.30% 4/5/2022 125,984 0.02%Colgate-Palmolive Co. $125,000 2.10% 1/5/2023 125,953 0.02%IBM Credit LLC $125,000 2.65% 5/2/2021 125,946 0.02%Exxon Mobil Corp. $125,000 1.90% 16/8/2022 125,788 0.02%JPMorgan Chase & Co. $125,000 2.40% 7/6/2021 125,779 0.02%Truist Financial Corp. $125,000 2.20% 16/3/2023 125,735 0.02%Eversource Energy $125,000 2.50% 15/3/2021 125,692 0.02%International Business Machines Corp. $125,000 2.25% 19/2/2021 125,535 0.02%Equinix, Inc. $125,000 2.63% 18/11/2024 125,481 0.02%John Deere Capital Corp. $125,000 2.35% 8/1/2021 125,461 0.02%
Vanguard Global Short-Term Corporate Bond Index Fund
736
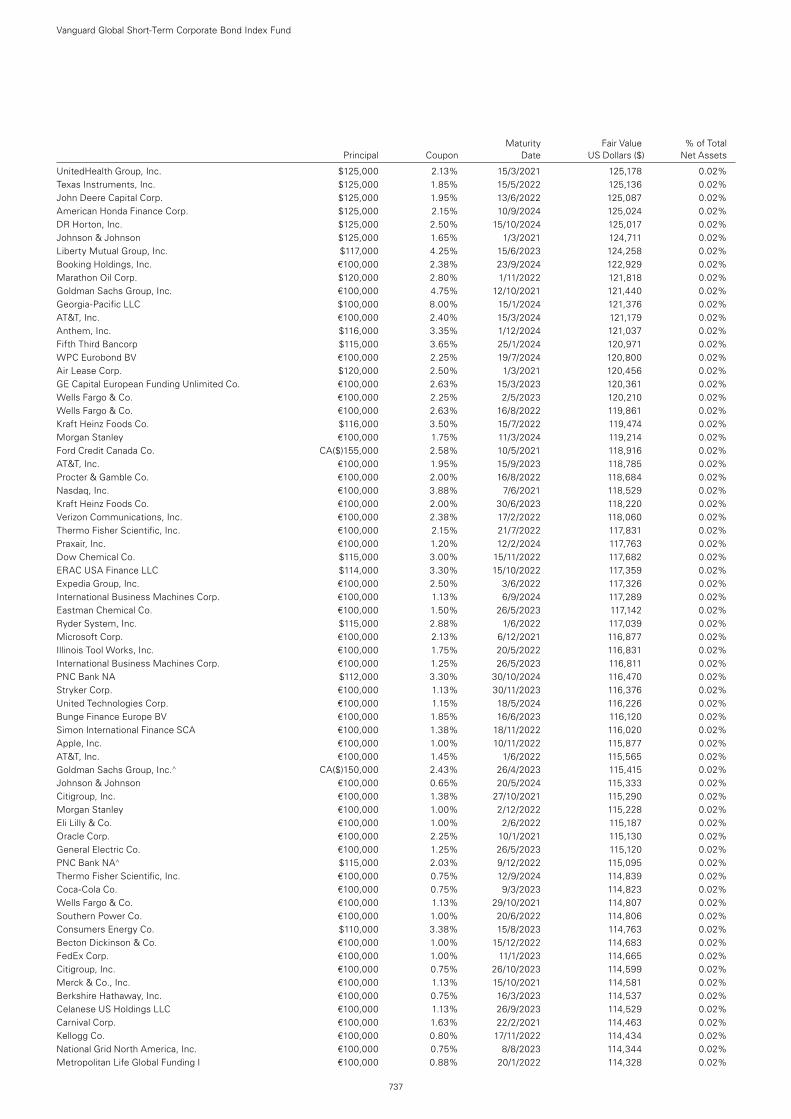
Maturity Fair Value % of Total Principal Coupon Date US Dollars ($) Net Assets
UnitedHealth Group, Inc. $125,000 2.13% 15/3/2021 125,178 0.02%Texas Instruments, Inc. $125,000 1.85% 15/5/2022 125,136 0.02%John Deere Capital Corp. $125,000 1.95% 13/6/2022 125,087 0.02%American Honda Finance Corp. $125,000 2.15% 10/9/2024 125,024 0.02%DR Horton, Inc. $125,000 2.50% 15/10/2024 125,017 0.02%Johnson & Johnson $125,000 1.65% 1/3/2021 124,711 0.02%Liberty Mutual Group, Inc. $117,000 4.25% 15/6/2023 124,258 0.02%Booking Holdings, Inc. €100,000 2.38% 23/9/2024 122,929 0.02%Marathon Oil Corp. $120,000 2.80% 1/11/2022 121,818 0.02%Goldman Sachs Group, Inc. €100,000 4.75% 12/10/2021 121,440 0.02%Georgia-Pacific LLC $100,000 8.00% 15/1/2024 121,376 0.02%AT&T, Inc. €100,000 2.40% 15/3/2024 121,179 0.02%Anthem, Inc. $116,000 3.35% 1/12/2024 121,037 0.02%Fifth Third Bancorp $115,000 3.65% 25/1/2024 120,971 0.02%WPC Eurobond BV €100,000 2.25% 19/7/2024 120,800 0.02%Air Lease Corp. $120,000 2.50% 1/3/2021 120,456 0.02%GE Capital European Funding Unlimited Co. €100,000 2.63% 15/3/2023 120,361 0.02%Wells Fargo & Co. €100,000 2.25% 2/5/2023 120,210 0.02%Wells Fargo & Co. €100,000 2.63% 16/8/2022 119,861 0.02%Kraft Heinz Foods Co. $116,000 3.50% 15/7/2022 119,474 0.02%Morgan Stanley €100,000 1.75% 11/3/2024 119,214 0.02%Ford Credit Canada Co. CA($)155,000 2.58% 10/5/2021 118,916 0.02%AT&T, Inc. €100,000 1.95% 15/9/2023 118,785 0.02%Procter & Gamble Co. €100,000 2.00% 16/8/2022 118,684 0.02%Nasdaq, Inc. €100,000 3.88% 7/6/2021 118,529 0.02%Kraft Heinz Foods Co. €100,000 2.00% 30/6/2023 118,220 0.02%Verizon Communications, Inc. €100,000 2.38% 17/2/2022 118,060 0.02%Thermo Fisher Scientific, Inc. €100,000 2.15% 21/7/2022 117,831 0.02%Praxair, Inc. €100,000 1.20% 12/2/2024 117,763 0.02%Dow Chemical Co. $115,000 3.00% 15/11/2022 117,682 0.02%ERAC USA Finance LLC $114,000 3.30% 15/10/2022 117,359 0.02%Expedia Group, Inc. €100,000 2.50% 3/6/2022 117,326 0.02%International Business Machines Corp. €100,000 1.13% 6/9/2024 117,289 0.02%Eastman Chemical Co. €100,000 1.50% 26/5/2023 117,142 0.02%Ryder System, Inc. $115,000 2.88% 1/6/2022 117,039 0.02%Microsoft Corp. €100,000 2.13% 6/12/2021 116,877 0.02%Illinois Tool Works, Inc. €100,000 1.75% 20/5/2022 116,831 0.02%International Business Machines Corp. €100,000 1.25% 26/5/2023 116,811 0.02%PNC Bank NA $112,000 3.30% 30/10/2024 116,470 0.02%Stryker Corp. €100,000 1.13% 30/11/2023 116,376 0.02%United Technologies Corp. €100,000 1.15% 18/5/2024 116,226 0.02%Bunge Finance Europe BV €100,000 1.85% 16/6/2023 116,120 0.02%Simon International Finance SCA €100,000 1.38% 18/11/2022 116,020 0.02%Apple, Inc. €100,000 1.00% 10/11/2022 115,877 0.02%AT&T, Inc. €100,000 1.45% 1/6/2022 115,565 0.02%Goldman Sachs Group, Inc.^ CA($)150,000 2.43% 26/4/2023 115,415 0.02%Johnson & Johnson €100,000 0.65% 20/5/2024 115,333 0.02%Citigroup, Inc. €100,000 1.38% 27/10/2021 115,290 0.02%Morgan Stanley €100,000 1.00% 2/12/2022 115,228 0.02%Eli Lilly & Co. €100,000 1.00% 2/6/2022 115,187 0.02%Oracle Corp. €100,000 2.25% 10/1/2021 115,130 0.02%General Electric Co. €100,000 1.25% 26/5/2023 115,120 0.02%PNC Bank NA^ $115,000 2.03% 9/12/2022 115,095 0.02%Thermo Fisher Scientific, Inc. €100,000 0.75% 12/9/2024 114,839 0.02%Coca-Cola Co. €100,000 0.75% 9/3/2023 114,823 0.02%Wells Fargo & Co. €100,000 1.13% 29/10/2021 114,807 0.02%Southern Power Co. €100,000 1.00% 20/6/2022 114,806 0.02%Consumers Energy Co. $110,000 3.38% 15/8/2023 114,763 0.02%Becton Dickinson & Co. €100,000 1.00% 15/12/2022 114,683 0.02%FedEx Corp. €100,000 1.00% 11/1/2023 114,665 0.02%Citigroup, Inc. €100,000 0.75% 26/10/2023 114,599 0.02%Merck & Co., Inc. €100,000 1.13% 15/10/2021 114,581 0.02%Berkshire Hathaway, Inc. €100,000 0.75% 16/3/2023 114,537 0.02%Celanese US Holdings LLC €100,000 1.13% 26/9/2023 114,529 0.02%Carnival Corp. €100,000 1.63% 22/2/2021 114,463 0.02%Kellogg Co. €100,000 0.80% 17/11/2022 114,434 0.02%National Grid North America, Inc. €100,000 0.75% 8/8/2023 114,344 0.02%Metropolitan Life Global Funding I €100,000 0.88% 20/1/2022 114,328 0.02%
Vanguard Global Short-Term Corporate Bond Index Fund
737
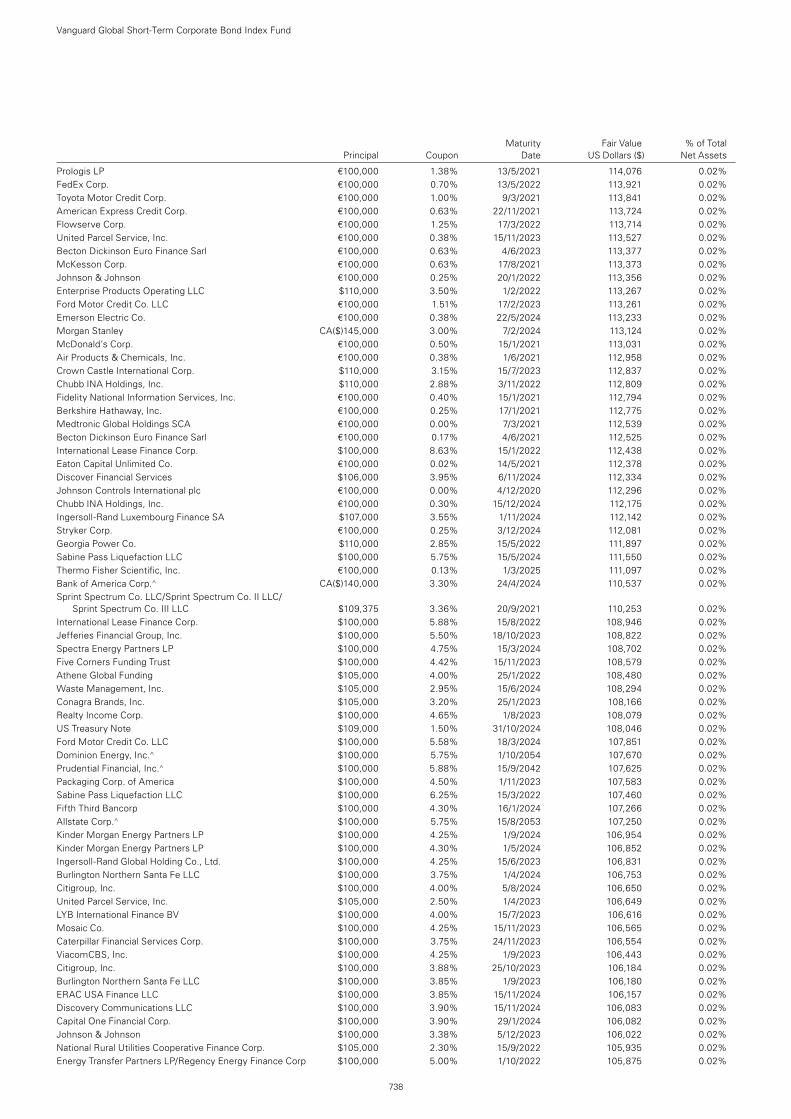
Maturity Fair Value % of Total Principal Coupon Date US Dollars ($) Net Assets
Prologis LP €100,000 1.38% 13/5/2021 114,076 0.02%FedEx Corp. €100,000 0.70% 13/5/2022 113,921 0.02%Toyota Motor Credit Corp. €100,000 1.00% 9/3/2021 113,841 0.02%American Express Credit Corp. €100,000 0.63% 22/11/2021 113,724 0.02%Flowserve Corp. €100,000 1.25% 17/3/2022 113,714 0.02%United Parcel Service, Inc. €100,000 0.38% 15/11/2023 113,527 0.02%Becton Dickinson Euro Finance Sarl €100,000 0.63% 4/6/2023 113,377 0.02%McKesson Corp. €100,000 0.63% 17/8/2021 113,373 0.02%Johnson & Johnson €100,000 0.25% 20/1/2022 113,356 0.02%Enterprise Products Operating LLC $110,000 3.50% 1/2/2022 113,267 0.02%Ford Motor Credit Co. LLC €100,000 1.51% 17/2/2023 113,261 0.02%Emerson Electric Co. €100,000 0.38% 22/5/2024 113,233 0.02%Morgan Stanley CA($)145,000 3.00% 7/2/2024 113,124 0.02%McDonald’s Corp. €100,000 0.50% 15/1/2021 113,031 0.02%Air Products & Chemicals, Inc. €100,000 0.38% 1/6/2021 112,958 0.02%Crown Castle International Corp. $110,000 3.15% 15/7/2023 112,837 0.02%Chubb INA Holdings, Inc. $110,000 2.88% 3/11/2022 112,809 0.02%Fidelity National Information Services, Inc. €100,000 0.40% 15/1/2021 112,794 0.02%Berkshire Hathaway, Inc. €100,000 0.25% 17/1/2021 112,775 0.02%Medtronic Global Holdings SCA €100,000 0.00% 7/3/2021 112,539 0.02%Becton Dickinson Euro Finance Sarl €100,000 0.17% 4/6/2021 112,525 0.02%International Lease Finance Corp. $100,000 8.63% 15/1/2022 112,438 0.02%Eaton Capital Unlimited Co. €100,000 0.02% 14/5/2021 112,378 0.02%Discover Financial Services $106,000 3.95% 6/11/2024 112,334 0.02%Johnson Controls International plc €100,000 0.00% 4/12/2020 112,296 0.02%Chubb INA Holdings, Inc. €100,000 0.30% 15/12/2024 112,175 0.02%Ingersoll-Rand Luxembourg Finance SA $107,000 3.55% 1/11/2024 112,142 0.02%Stryker Corp. €100,000 0.25% 3/12/2024 112,081 0.02%Georgia Power Co. $110,000 2.85% 15/5/2022 111,897 0.02%Sabine Pass Liquefaction LLC $100,000 5.75% 15/5/2024 111,550 0.02%Thermo Fisher Scientific, Inc. €100,000 0.13% 1/3/2025 111,097 0.02%Bank of America Corp.^ CA($)140,000 3.30% 24/4/2024 110,537 0.02%Sprint Spectrum Co. LLC/Sprint Spectrum Co. II LLC/
Sprint Spectrum Co. III LLC $109,375 3.36% 20/9/2021 110,253 0.02%International Lease Finance Corp. $100,000 5.88% 15/8/2022 108,946 0.02%Jefferies Financial Group, Inc. $100,000 5.50% 18/10/2023 108,822 0.02%Spectra Energy Partners LP $100,000 4.75% 15/3/2024 108,702 0.02%Five Corners Funding Trust $100,000 4.42% 15/11/2023 108,579 0.02%Athene Global Funding $105,000 4.00% 25/1/2022 108,480 0.02%Waste Management, Inc. $105,000 2.95% 15/6/2024 108,294 0.02%Conagra Brands, Inc. $105,000 3.20% 25/1/2023 108,166 0.02%Realty Income Corp. $100,000 4.65% 1/8/2023 108,079 0.02%US Treasury Note $109,000 1.50% 31/10/2024 108,046 0.02%Ford Motor Credit Co. LLC $100,000 5.58% 18/3/2024 107,851 0.02%Dominion Energy, Inc.^ $100,000 5.75% 1/10/2054 107,670 0.02%Prudential Financial, Inc.^ $100,000 5.88% 15/9/2042 107,625 0.02%Packaging Corp. of America $100,000 4.50% 1/11/2023 107,583 0.02%Sabine Pass Liquefaction LLC $100,000 6.25% 15/3/2022 107,460 0.02%Fifth Third Bancorp $100,000 4.30% 16/1/2024 107,266 0.02%Allstate Corp.^ $100,000 5.75% 15/8/2053 107,250 0.02%Kinder Morgan Energy Partners LP $100,000 4.25% 1/9/2024 106,954 0.02%Kinder Morgan Energy Partners LP $100,000 4.30% 1/5/2024 106,852 0.02%Ingersoll-Rand Global Holding Co., Ltd. $100,000 4.25% 15/6/2023 106,831 0.02%Burlington Northern Santa Fe LLC $100,000 3.75% 1/4/2024 106,753 0.02%Citigroup, Inc. $100,000 4.00% 5/8/2024 106,650 0.02%United Parcel Service, Inc. $105,000 2.50% 1/4/2023 106,649 0.02%LYB International Finance BV $100,000 4.00% 15/7/2023 106,616 0.02%Mosaic Co. $100,000 4.25% 15/11/2023 106,565 0.02%Caterpillar Financial Services Corp. $100,000 3.75% 24/11/2023 106,554 0.02%ViacomCBS, Inc. $100,000 4.25% 1/9/2023 106,443 0.02%Citigroup, Inc. $100,000 3.88% 25/10/2023 106,184 0.02%Burlington Northern Santa Fe LLC $100,000 3.85% 1/9/2023 106,180 0.02%ERAC USA Finance LLC $100,000 3.85% 15/11/2024 106,157 0.02%Discovery Communications LLC $100,000 3.90% 15/11/2024 106,083 0.02%Capital One Financial Corp. $100,000 3.90% 29/1/2024 106,082 0.02%Johnson & Johnson $100,000 3.38% 5/12/2023 106,022 0.02%National Rural Utilities Cooperative Finance Corp. $105,000 2.30% 15/9/2022 105,935 0.02%Energy Transfer Partners LP/Regency Energy Finance Corp $100,000 5.00% 1/10/2022 105,875 0.02%
Vanguard Global Short-Term Corporate Bond Index Fund
738
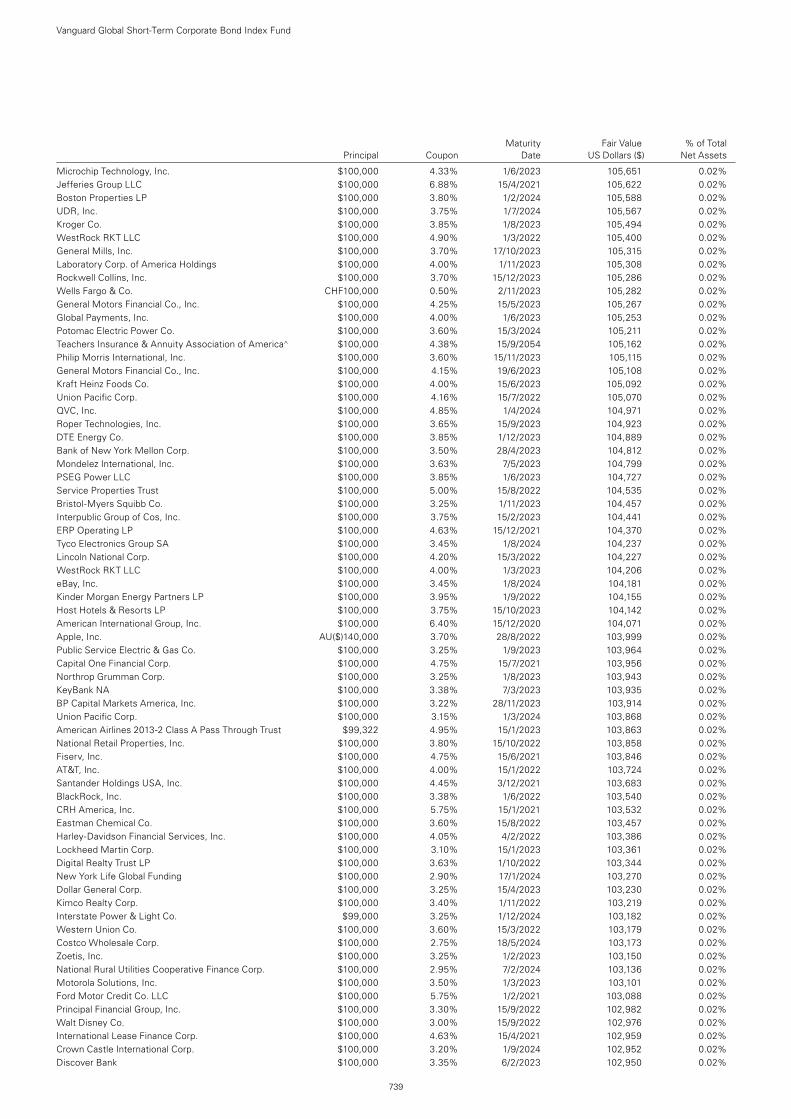
Maturity Fair Value % of Total Principal Coupon Date US Dollars ($) Net Assets
Microchip Technology, Inc. $100,000 4.33% 1/6/2023 105,651 0.02%Jefferies Group LLC $100,000 6.88% 15/4/2021 105,622 0.02%Boston Properties LP $100,000 3.80% 1/2/2024 105,588 0.02%UDR, Inc. $100,000 3.75% 1/7/2024 105,567 0.02%Kroger Co. $100,000 3.85% 1/8/2023 105,494 0.02%WestRock RKT LLC $100,000 4.90% 1/3/2022 105,400 0.02%General Mills, Inc. $100,000 3.70% 17/10/2023 105,315 0.02%Laboratory Corp. of America Holdings $100,000 4.00% 1/11/2023 105,308 0.02%Rockwell Collins, Inc. $100,000 3.70% 15/12/2023 105,286 0.02%Wells Fargo & Co. CHF100,000 0.50% 2/11/2023 105,282 0.02%General Motors Financial Co., Inc. $100,000 4.25% 15/5/2023 105,267 0.02%Global Payments, Inc. $100,000 4.00% 1/6/2023 105,253 0.02%Potomac Electric Power Co. $100,000 3.60% 15/3/2024 105,211 0.02%Teachers Insurance & Annuity Association of America^ $100,000 4.38% 15/9/2054 105,162 0.02%Philip Morris International, Inc. $100,000 3.60% 15/11/2023 105,115 0.02%General Motors Financial Co., Inc. $100,000 4.15% 19/6/2023 105,108 0.02%Kraft Heinz Foods Co. $100,000 4.00% 15/6/2023 105,092 0.02%Union Pacific Corp. $100,000 4.16% 15/7/2022 105,070 0.02%QVC, Inc. $100,000 4.85% 1/4/2024 104,971 0.02%Roper Technologies, Inc. $100,000 3.65% 15/9/2023 104,923 0.02%DTE Energy Co. $100,000 3.85% 1/12/2023 104,889 0.02%Bank of New York Mellon Corp. $100,000 3.50% 28/4/2023 104,812 0.02%Mondelez International, Inc. $100,000 3.63% 7/5/2023 104,799 0.02%PSEG Power LLC $100,000 3.85% 1/6/2023 104,727 0.02%Service Properties Trust $100,000 5.00% 15/8/2022 104,535 0.02%Bristol-Myers Squibb Co. $100,000 3.25% 1/11/2023 104,457 0.02%Interpublic Group of Cos, Inc. $100,000 3.75% 15/2/2023 104,441 0.02%ERP Operating LP $100,000 4.63% 15/12/2021 104,370 0.02%Tyco Electronics Group SA $100,000 3.45% 1/8/2024 104,237 0.02%Lincoln National Corp. $100,000 4.20% 15/3/2022 104,227 0.02%WestRock RKT LLC $100,000 4.00% 1/3/2023 104,206 0.02%eBay, Inc. $100,000 3.45% 1/8/2024 104,181 0.02%Kinder Morgan Energy Partners LP $100,000 3.95% 1/9/2022 104,155 0.02%Host Hotels & Resorts LP $100,000 3.75% 15/10/2023 104,142 0.02%American International Group, Inc. $100,000 6.40% 15/12/2020 104,071 0.02%Apple, Inc. AU($)140,000 3.70% 28/8/2022 103,999 0.02%Public Service Electric & Gas Co. $100,000 3.25% 1/9/2023 103,964 0.02%Capital One Financial Corp. $100,000 4.75% 15/7/2021 103,956 0.02%Northrop Grumman Corp. $100,000 3.25% 1/8/2023 103,943 0.02%KeyBank NA $100,000 3.38% 7/3/2023 103,935 0.02%BP Capital Markets America, Inc. $100,000 3.22% 28/11/2023 103,914 0.02%Union Pacific Corp. $100,000 3.15% 1/3/2024 103,868 0.02%American Airlines 2013-2 Class A Pass Through Trust $99,322 4.95% 15/1/2023 103,863 0.02%National Retail Properties, Inc. $100,000 3.80% 15/10/2022 103,858 0.02%Fiserv, Inc. $100,000 4.75% 15/6/2021 103,846 0.02%AT&T, Inc. $100,000 4.00% 15/1/2022 103,724 0.02%Santander Holdings USA, Inc. $100,000 4.45% 3/12/2021 103,683 0.02%BlackRock, Inc. $100,000 3.38% 1/6/2022 103,540 0.02%CRH America, Inc. $100,000 5.75% 15/1/2021 103,532 0.02%Eastman Chemical Co. $100,000 3.60% 15/8/2022 103,457 0.02%Harley-Davidson Financial Services, Inc. $100,000 4.05% 4/2/2022 103,386 0.02%Lockheed Martin Corp. $100,000 3.10% 15/1/2023 103,361 0.02%Digital Realty Trust LP $100,000 3.63% 1/10/2022 103,344 0.02%New York Life Global Funding $100,000 2.90% 17/1/2024 103,270 0.02%Dollar General Corp. $100,000 3.25% 15/4/2023 103,230 0.02%Kimco Realty Corp. $100,000 3.40% 1/11/2022 103,219 0.02%Interstate Power & Light Co. $99,000 3.25% 1/12/2024 103,182 0.02%Western Union Co. $100,000 3.60% 15/3/2022 103,179 0.02%Costco Wholesale Corp. $100,000 2.75% 18/5/2024 103,173 0.02%Zoetis, Inc. $100,000 3.25% 1/2/2023 103,150 0.02%National Rural Utilities Cooperative Finance Corp. $100,000 2.95% 7/2/2024 103,136 0.02%Motorola Solutions, Inc. $100,000 3.50% 1/3/2023 103,101 0.02%Ford Motor Credit Co. LLC $100,000 5.75% 1/2/2021 103,088 0.02%Principal Financial Group, Inc. $100,000 3.30% 15/9/2022 102,982 0.02%Walt Disney Co. $100,000 3.00% 15/9/2022 102,976 0.02%International Lease Finance Corp. $100,000 4.63% 15/4/2021 102,959 0.02%Crown Castle International Corp. $100,000 3.20% 1/9/2024 102,952 0.02%Discover Bank $100,000 3.35% 6/2/2023 102,950 0.02%
Vanguard Global Short-Term Corporate Bond Index Fund
739
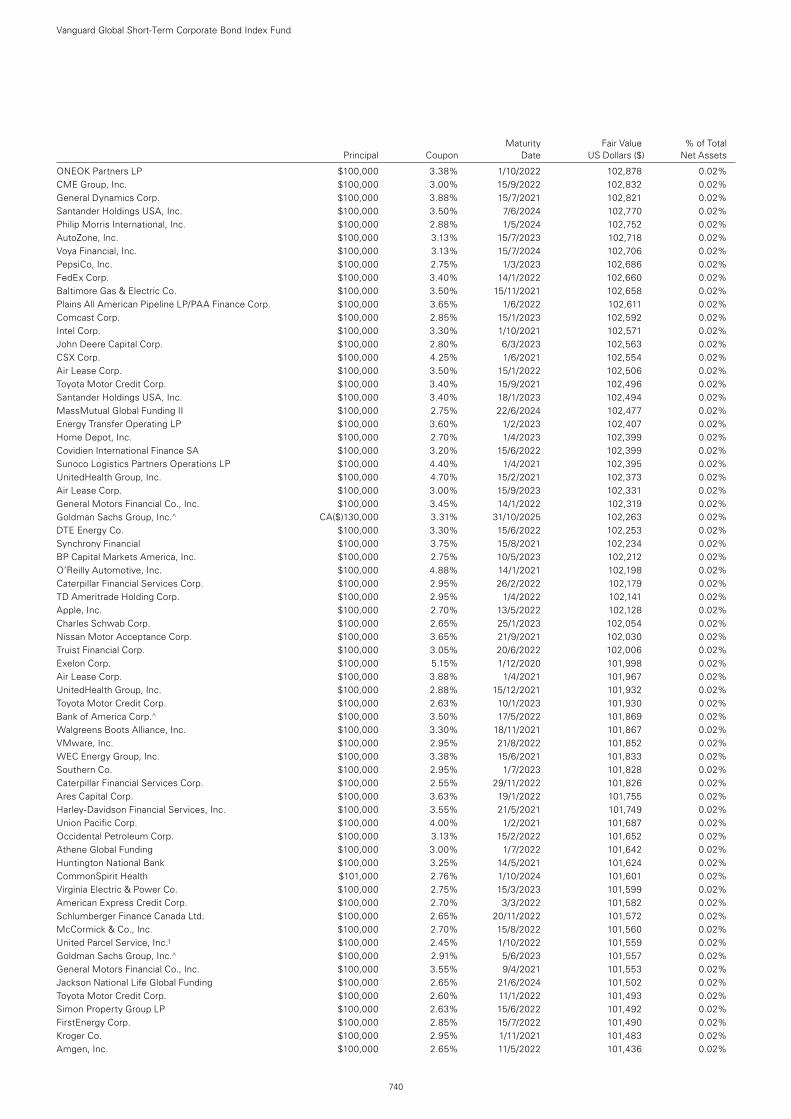
Maturity Fair Value % of Total Principal Coupon Date US Dollars ($) Net Assets
ONEOK Partners LP $100,000 3.38% 1/10/2022 102,878 0.02%CME Group, Inc. $100,000 3.00% 15/9/2022 102,832 0.02%General Dynamics Corp. $100,000 3.88% 15/7/2021 102,821 0.02%Santander Holdings USA, Inc. $100,000 3.50% 7/6/2024 102,770 0.02%Philip Morris International, Inc. $100,000 2.88% 1/5/2024 102,752 0.02%AutoZone, Inc. $100,000 3.13% 15/7/2023 102,718 0.02%Voya Financial, Inc. $100,000 3.13% 15/7/2024 102,706 0.02%PepsiCo, Inc. $100,000 2.75% 1/3/2023 102,686 0.02%FedEx Corp. $100,000 3.40% 14/1/2022 102,660 0.02%Baltimore Gas & Electric Co. $100,000 3.50% 15/11/2021 102,658 0.02%Plains All American Pipeline LP/PAA Finance Corp. $100,000 3.65% 1/6/2022 102,611 0.02%Comcast Corp. $100,000 2.85% 15/1/2023 102,592 0.02%Intel Corp. $100,000 3.30% 1/10/2021 102,571 0.02%John Deere Capital Corp. $100,000 2.80% 6/3/2023 102,563 0.02%CSX Corp. $100,000 4.25% 1/6/2021 102,554 0.02%Air Lease Corp. $100,000 3.50% 15/1/2022 102,506 0.02%Toyota Motor Credit Corp. $100,000 3.40% 15/9/2021 102,496 0.02%Santander Holdings USA, Inc. $100,000 3.40% 18/1/2023 102,494 0.02%MassMutual Global Funding II $100,000 2.75% 22/6/2024 102,477 0.02%Energy Transfer Operating LP $100,000 3.60% 1/2/2023 102,407 0.02%Home Depot, Inc. $100,000 2.70% 1/4/2023 102,399 0.02%Covidien International Finance SA $100,000 3.20% 15/6/2022 102,399 0.02%Sunoco Logistics Partners Operations LP $100,000 4.40% 1/4/2021 102,395 0.02%UnitedHealth Group, Inc. $100,000 4.70% 15/2/2021 102,373 0.02%Air Lease Corp. $100,000 3.00% 15/9/2023 102,331 0.02%General Motors Financial Co., Inc. $100,000 3.45% 14/1/2022 102,319 0.02%Goldman Sachs Group, Inc.^ CA($)130,000 3.31% 31/10/2025 102,263 0.02%DTE Energy Co. $100,000 3.30% 15/6/2022 102,253 0.02%Synchrony Financial $100,000 3.75% 15/8/2021 102,234 0.02%BP Capital Markets America, Inc. $100,000 2.75% 10/5/2023 102,212 0.02%O’Reilly Automotive, Inc. $100,000 4.88% 14/1/2021 102,198 0.02%Caterpillar Financial Services Corp. $100,000 2.95% 26/2/2022 102,179 0.02%TD Ameritrade Holding Corp. $100,000 2.95% 1/4/2022 102,141 0.02%Apple, Inc. $100,000 2.70% 13/5/2022 102,128 0.02%Charles Schwab Corp. $100,000 2.65% 25/1/2023 102,054 0.02%Nissan Motor Acceptance Corp. $100,000 3.65% 21/9/2021 102,030 0.02%Truist Financial Corp. $100,000 3.05% 20/6/2022 102,006 0.02%Exelon Corp. $100,000 5.15% 1/12/2020 101,998 0.02%Air Lease Corp. $100,000 3.88% 1/4/2021 101,967 0.02%UnitedHealth Group, Inc. $100,000 2.88% 15/12/2021 101,932 0.02%Toyota Motor Credit Corp. $100,000 2.63% 10/1/2023 101,930 0.02%Bank of America Corp.^ $100,000 3.50% 17/5/2022 101,869 0.02%Walgreens Boots Alliance, Inc. $100,000 3.30% 18/11/2021 101,867 0.02%VMware, Inc. $100,000 2.95% 21/8/2022 101,852 0.02%WEC Energy Group, Inc. $100,000 3.38% 15/6/2021 101,833 0.02%Southern Co. $100,000 2.95% 1/7/2023 101,828 0.02%Caterpillar Financial Services Corp. $100,000 2.55% 29/11/2022 101,826 0.02%Ares Capital Corp. $100,000 3.63% 19/1/2022 101,755 0.02%Harley-Davidson Financial Services, Inc. $100,000 3.55% 21/5/2021 101,749 0.02%Union Pacific Corp. $100,000 4.00% 1/2/2021 101,687 0.02%Occidental Petroleum Corp. $100,000 3.13% 15/2/2022 101,652 0.02%Athene Global Funding $100,000 3.00% 1/7/2022 101,642 0.02%Huntington National Bank $100,000 3.25% 14/5/2021 101,624 0.02%CommonSpirit Health $101,000 2.76% 1/10/2024 101,601 0.02%Virginia Electric & Power Co. $100,000 2.75% 15/3/2023 101,599 0.02%American Express Credit Corp. $100,000 2.70% 3/3/2022 101,582 0.02%Schlumberger Finance Canada Ltd. $100,000 2.65% 20/11/2022 101,572 0.02%McCormick & Co., Inc. $100,000 2.70% 15/8/2022 101,560 0.02%United Parcel Service, Inc.1 $100,000 2.45% 1/10/2022 101,559 0.02%Goldman Sachs Group, Inc.^ $100,000 2.91% 5/6/2023 101,557 0.02%General Motors Financial Co., Inc. $100,000 3.55% 9/4/2021 101,553 0.02%Jackson National Life Global Funding $100,000 2.65% 21/6/2024 101,502 0.02%Toyota Motor Credit Corp. $100,000 2.60% 11/1/2022 101,493 0.02%Simon Property Group LP $100,000 2.63% 15/6/2022 101,492 0.02%FirstEnergy Corp. $100,000 2.85% 15/7/2022 101,490 0.02%Kroger Co. $100,000 2.95% 1/11/2021 101,483 0.02%Amgen, Inc. $100,000 2.65% 11/5/2022 101,436 0.02%
Vanguard Global Short-Term Corporate Bond Index Fund
740
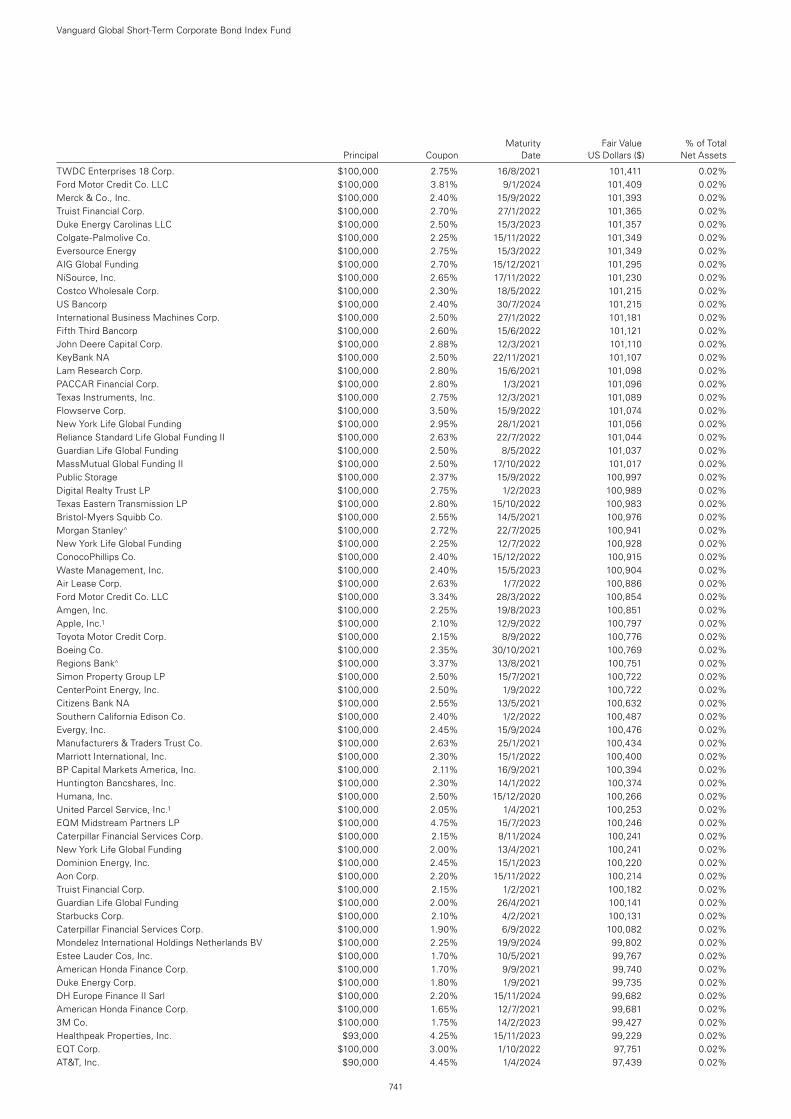
TWDC Enterprises 18 Corp. $100,000 2.75% 16/8/2021 101,411 0.02%Ford Motor Credit Co. LLC $100,000 3.81% 9/1/2024 101,409 0.02%Merck & Co., Inc. $100,000 2.40% 15/9/2022 101,393 0.02%Truist Financial Corp. $100,000 2.70% 27/1/2022 101,365 0.02%Duke Energy Carolinas LLC $100,000 2.50% 15/3/2023 101,357 0.02%Colgate-Palmolive Co. $100,000 2.25% 15/11/2022 101,349 0.02%Eversource Energy $100,000 2.75% 15/3/2022 101,349 0.02%AIG Global Funding $100,000 2.70% 15/12/2021 101,295 0.02%NiSource, Inc. $100,000 2.65% 17/11/2022 101,230 0.02%Costco Wholesale Corp. $100,000 2.30% 18/5/2022 101,215 0.02%US Bancorp $100,000 2.40% 30/7/2024 101,215 0.02%International Business Machines Corp. $100,000 2.50% 27/1/2022 101,181 0.02%Fifth Third Bancorp $100,000 2.60% 15/6/2022 101,121 0.02%John Deere Capital Corp. $100,000 2.88% 12/3/2021 101,110 0.02%KeyBank NA $100,000 2.50% 22/11/2021 101,107 0.02%Lam Research Corp. $100,000 2.80% 15/6/2021 101,098 0.02%PACCAR Financial Corp. $100,000 2.80% 1/3/2021 101,096 0.02%Texas Instruments, Inc. $100,000 2.75% 12/3/2021 101,089 0.02%Flowserve Corp. $100,000 3.50% 15/9/2022 101,074 0.02%New York Life Global Funding $100,000 2.95% 28/1/2021 101,056 0.02%Reliance Standard Life Global Funding II $100,000 2.63% 22/7/2022 101,044 0.02%Guardian Life Global Funding $100,000 2.50% 8/5/2022 101,037 0.02%MassMutual Global Funding II $100,000 2.50% 17/10/2022 101,017 0.02%Public Storage $100,000 2.37% 15/9/2022 100,997 0.02%Digital Realty Trust LP $100,000 2.75% 1/2/2023 100,989 0.02%Texas Eastern Transmission LP $100,000 2.80% 15/10/2022 100,983 0.02%Bristol-Myers Squibb Co. $100,000 2.55% 14/5/2021 100,976 0.02%Morgan Stanley^ $100,000 2.72% 22/7/2025 100,941 0.02%New York Life Global Funding $100,000 2.25% 12/7/2022 100,928 0.02%ConocoPhillips Co. $100,000 2.40% 15/12/2022 100,915 0.02%Waste Management, Inc. $100,000 2.40% 15/5/2023 100,904 0.02%Air Lease Corp. $100,000 2.63% 1/7/2022 100,886 0.02%Ford Motor Credit Co. LLC $100,000 3.34% 28/3/2022 100,854 0.02%Amgen, Inc. $100,000 2.25% 19/8/2023 100,851 0.02%Apple, Inc.1 $100,000 2.10% 12/9/2022 100,797 0.02%Toyota Motor Credit Corp. $100,000 2.15% 8/9/2022 100,776 0.02%Boeing Co. $100,000 2.35% 30/10/2021 100,769 0.02%Regions Bank^ $100,000 3.37% 13/8/2021 100,751 0.02%Simon Property Group LP $100,000 2.50% 15/7/2021 100,722 0.02%CenterPoint Energy, Inc. $100,000 2.50% 1/9/2022 100,722 0.02%Citizens Bank NA $100,000 2.55% 13/5/2021 100,632 0.02%Southern California Edison Co. $100,000 2.40% 1/2/2022 100,487 0.02%Evergy, Inc. $100,000 2.45% 15/9/2024 100,476 0.02%Manufacturers & Traders Trust Co. $100,000 2.63% 25/1/2021 100,434 0.02%Marriott International, Inc. $100,000 2.30% 15/1/2022 100,400 0.02%BP Capital Markets America, Inc. $100,000 2.11% 16/9/2021 100,394 0.02%Huntington Bancshares, Inc. $100,000 2.30% 14/1/2022 100,374 0.02%Humana, Inc. $100,000 2.50% 15/12/2020 100,266 0.02%United Parcel Service, Inc.1 $100,000 2.05% 1/4/2021 100,253 0.02%EQM Midstream Partners LP $100,000 4.75% 15/7/2023 100,246 0.02%Caterpillar Financial Services Corp. $100,000 2.15% 8/11/2024 100,241 0.02%New York Life Global Funding $100,000 2.00% 13/4/2021 100,241 0.02%Dominion Energy, Inc. $100,000 2.45% 15/1/2023 100,220 0.02%Aon Corp. $100,000 2.20% 15/11/2022 100,214 0.02%Truist Financial Corp. $100,000 2.15% 1/2/2021 100,182 0.02%Guardian Life Global Funding $100,000 2.00% 26/4/2021 100,141 0.02%Starbucks Corp. $100,000 2.10% 4/2/2021 100,131 0.02%Caterpillar Financial Services Corp. $100,000 1.90% 6/9/2022 100,082 0.02%Mondelez International Holdings Netherlands BV $100,000 2.25% 19/9/2024 99,802 0.02%Estee Lauder Cos, Inc. $100,000 1.70% 10/5/2021 99,767 0.02%American Honda Finance Corp. $100,000 1.70% 9/9/2021 99,740 0.02%Duke Energy Corp. $100,000 1.80% 1/9/2021 99,735 0.02%DH Europe Finance II Sarl $100,000 2.20% 15/11/2024 99,682 0.02%American Honda Finance Corp. $100,000 1.65% 12/7/2021 99,681 0.02%3M Co. $100,000 1.75% 14/2/2023 99,427 0.02%Healthpeak Properties, Inc. $93,000 4.25% 15/11/2023 99,229 0.02%EQT Corp. $100,000 3.00% 1/10/2022 97,751 0.02%AT&T, Inc. $90,000 4.45% 1/4/2024 97,439 0.02%
Vanguard Global Short-Term Corporate Bond Index Fund
741
Maturity Fair Value % of Total Principal Coupon Date US Dollars ($) Net Assets
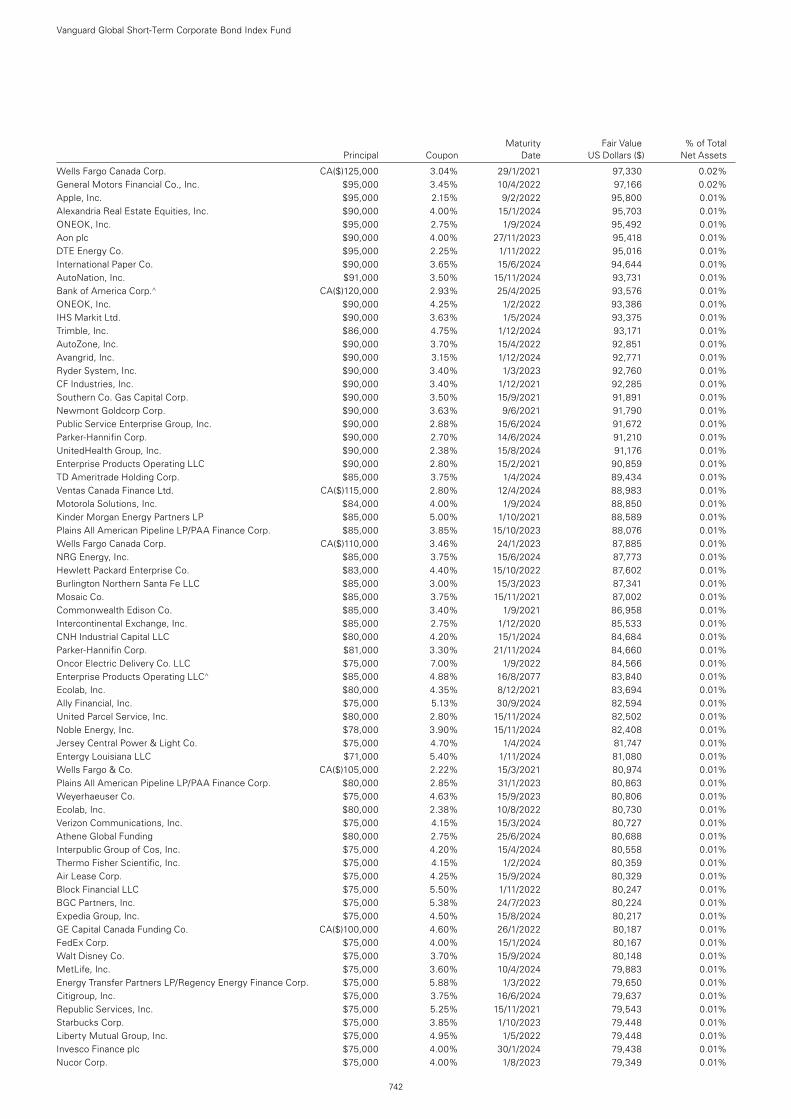
Wells Fargo Canada Corp. CA($)125,000 3.04% 29/1/2021 97,330 0.02% General Motors Financial Co., Inc. $95,000 3.45% 10/4/2022 97,166 0.02%Apple, Inc. $95,000 2.15% 9/2/2022 95,800 0.01%Alexandria Real Estate Equities, Inc. $90,000 4.00% 15/1/2024 95,703 0.01%ONEOK, Inc. $95,000 2.75% 1/9/2024 95,492 0.01%Aon plc $90,000 4.00% 27/11/2023 95,418 0.01%DTE Energy Co. $95,000 2.25% 1/11/2022 95,016 0.01%International Paper Co. $90,000 3.65% 15/6/2024 94,644 0.01%AutoNation, Inc. $91,000 3.50% 15/11/2024 93,731 0.01%Bank of America Corp.^ CA($)120,000 2.93% 25/4/2025 93,576 0.01%ONEOK, Inc. $90,000 4.25% 1/2/2022 93,386 0.01%IHS Markit Ltd. $90,000 3.63% 1/5/2024 93,375 0.01%Trimble, Inc. $86,000 4.75% 1/12/2024 93,171 0.01%AutoZone, Inc. $90,000 3.70% 15/4/2022 92,851 0.01%Avangrid, Inc. $90,000 3.15% 1/12/2024 92,771 0.01%Ryder System, Inc. $90,000 3.40% 1/3/2023 92,760 0.01%CF Industries, Inc. $90,000 3.40% 1/12/2021 92,285 0.01%Southern Co. Gas Capital Corp. $90,000 3.50% 15/9/2021 91,891 0.01%Newmont Goldcorp Corp. $90,000 3.63% 9/6/2021 91,790 0.01%Public Service Enterprise Group, Inc. $90,000 2.88% 15/6/2024 91,672 0.01%Parker-Hannifin Corp. $90,000 2.70% 14/6/2024 91,210 0.01%UnitedHealth Group, Inc. $90,000 2.38% 15/8/2024 91,176 0.01%Enterprise Products Operating LLC $90,000 2.80% 15/2/2021 90,859 0.01%TD Ameritrade Holding Corp. $85,000 3.75% 1/4/2024 89,434 0.01%Ventas Canada Finance Ltd. CA($)115,000 2.80% 12/4/2024 88,983 0.01%Motorola Solutions, Inc. $84,000 4.00% 1/9/2024 88,850 0.01%Kinder Morgan Energy Partners LP $85,000 5.00% 1/10/2021 88,589 0.01%Plains All American Pipeline LP/PAA Finance Corp. $85,000 3.85% 15/10/2023 88,076 0.01%Wells Fargo Canada Corp. CA($)110,000 3.46% 24/1/2023 87,885 0.01%NRG Energy, Inc. $85,000 3.75% 15/6/2024 87,773 0.01%Hewlett Packard Enterprise Co. $83,000 4.40% 15/10/2022 87,602 0.01%Burlington Northern Santa Fe LLC $85,000 3.00% 15/3/2023 87,341 0.01%Mosaic Co. $85,000 3.75% 15/11/2021 87,002 0.01%Commonwealth Edison Co. $85,000 3.40% 1/9/2021 86,958 0.01%Intercontinental Exchange, Inc. $85,000 2.75% 1/12/2020 85,533 0.01%CNH Industrial Capital LLC $80,000 4.20% 15/1/2024 84,684 0.01%Parker-Hannifin Corp. $81,000 3.30% 21/11/2024 84,660 0.01%Oncor Electric Delivery Co. LLC $75,000 7.00% 1/9/2022 84,566 0.01%Enterprise Products Operating LLC^ $85,000 4.88% 16/8/2077 83,840 0.01%Ecolab, Inc. $80,000 4.35% 8/12/2021 83,694 0.01%Ally Financial, Inc. $75,000 5.13% 30/9/2024 82,594 0.01%United Parcel Service, Inc. $80,000 2.80% 15/11/2024 82,502 0.01%Noble Energy, Inc. $78,000 3.90% 15/11/2024 82,408 0.01%Jersey Central Power & Light Co. $75,000 4.70% 1/4/2024 81,747 0.01%Entergy Louisiana LLC $71,000 5.40% 1/11/2024 81,080 0.01%Wells Fargo & Co. CA($)105,000 2.22% 15/3/2021 80,974 0.01%Plains All American Pipeline LP/PAA Finance Corp. $80,000 2.85% 31/1/2023 80,863 0.01%Weyerhaeuser Co. $75,000 4.63% 15/9/2023 80,806 0.01%Ecolab, Inc. $80,000 2.38% 10/8/2022 80,730 0.01%Verizon Communications, Inc. $75,000 4.15% 15/3/2024 80,727 0.01%Athene Global Funding $80,000 2.75% 25/6/2024 80,688 0.01%Interpublic Group of Cos, Inc. $75,000 4.20% 15/4/2024 80,558 0.01%Thermo Fisher Scientific, Inc. $75,000 4.15% 1/2/2024 80,359 0.01%Air Lease Corp. $75,000 4.25% 15/9/2024 80,329 0.01%Block Financial LLC $75,000 5.50% 1/11/2022 80,247 0.01%BGC Partners, Inc. $75,000 5.38% 24/7/2023 80,224 0.01%Expedia Group, Inc. $75,000 4.50% 15/8/2024 80,217 0.01%GE Capital Canada Funding Co. CA($)100,000 4.60% 26/1/2022 80,187 0.01%FedEx Corp. $75,000 4.00% 15/1/2024 80,167 0.01%Walt Disney Co. $75,000 3.70% 15/9/2024 80,148 0.01%MetLife, Inc. $75,000 3.60% 10/4/2024 79,883 0.01%Energy Transfer Partners LP/Regency Energy Finance Corp. $75,000 5.88% 1/3/2022 79,650 0.01%Citigroup, Inc. $75,000 3.75% 16/6/2024 79,637 0.01%Republic Services, Inc. $75,000 5.25% 15/11/2021 79,543 0.01%Starbucks Corp. $75,000 3.85% 1/10/2023 79,448 0.01%Liberty Mutual Group, Inc. $75,000 4.95% 1/5/2022 79,448 0.01%Invesco Finance plc $75,000 4.00% 30/1/2024 79,438 0.01%Nucor Corp. $75,000 4.00% 1/8/2023 79,349 0.01%
Maturity Fair Value % of Total Principal Coupon Date US Dollars ($) Net Assets
Vanguard Global Short-Term Corporate Bond Index Fund
742
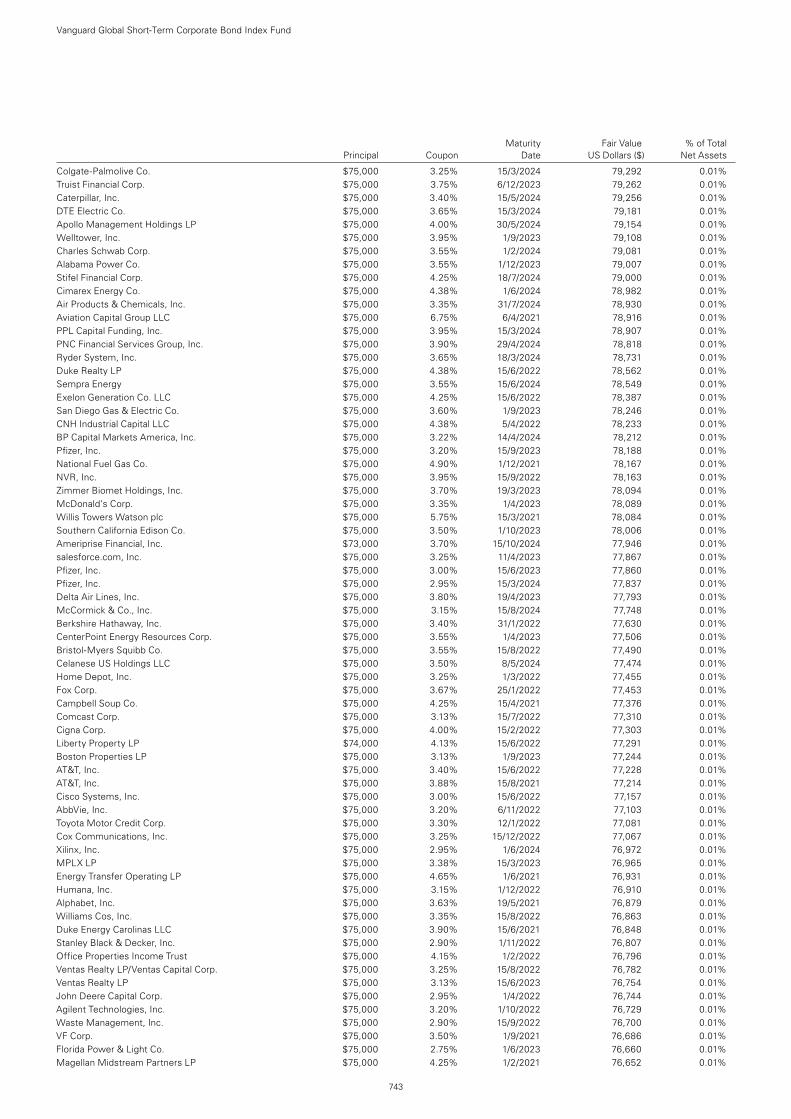
Colgate-Palmolive Co. $75,000 3.25% 15/3/2024 79,292 0.01%Truist Financial Corp. $75,000 3.75% 6/12/2023 79,262 0.01%Caterpillar, Inc. $75,000 3.40% 15/5/2024 79,256 0.01%DTE Electric Co. $75,000 3.65% 15/3/2024 79,181 0.01%Apollo Management Holdings LP $75,000 4.00% 30/5/2024 79,154 0.01%Welltower, Inc. $75,000 3.95% 1/9/2023 79,108 0.01%Charles Schwab Corp. $75,000 3.55% 1/2/2024 79,081 0.01%Alabama Power Co. $75,000 3.55% 1/12/2023 79,007 0.01%Stifel Financial Corp. $75,000 4.25% 18/7/2024 79,000 0.01%Cimarex Energy Co. $75,000 4.38% 1/6/2024 78,982 0.01%Air Products & Chemicals, Inc. $75,000 3.35% 31/7/2024 78,930 0.01%Aviation Capital Group LLC $75,000 6.75% 6/4/2021 78,916 0.01%PPL Capital Funding, Inc. $75,000 3.95% 15/3/2024 78,907 0.01%PNC Financial Services Group, Inc. $75,000 3.90% 29/4/2024 78,818 0.01%Ryder System, Inc. $75,000 3.65% 18/3/2024 78,731 0.01%Duke Realty LP $75,000 4.38% 15/6/2022 78,562 0.01%Sempra Energy $75,000 3.55% 15/6/2024 78,549 0.01%Exelon Generation Co. LLC $75,000 4.25% 15/6/2022 78,387 0.01%San Diego Gas & Electric Co. $75,000 3.60% 1/9/2023 78,246 0.01%CNH Industrial Capital LLC $75,000 4.38% 5/4/2022 78,233 0.01%BP Capital Markets America, Inc. $75,000 3.22% 14/4/2024 78,212 0.01%Pfizer, Inc. $75,000 3.20% 15/9/2023 78,188 0.01%National Fuel Gas Co. $75,000 4.90% 1/12/2021 78,167 0.01%NVR, Inc. $75,000 3.95% 15/9/2022 78,163 0.01%Zimmer Biomet Holdings, Inc. $75,000 3.70% 19/3/2023 78,094 0.01%McDonald’s Corp. $75,000 3.35% 1/4/2023 78,089 0.01%Willis Towers Watson plc $75,000 5.75% 15/3/2021 78,084 0.01%Southern California Edison Co. $75,000 3.50% 1/10/2023 78,006 0.01%Ameriprise Financial, Inc. $73,000 3.70% 15/10/2024 77,946 0.01%salesforce.com, Inc. $75,000 3.25% 11/4/2023 77,867 0.01%Pfizer, Inc. $75,000 3.00% 15/6/2023 77,860 0.01%Pfizer, Inc. $75,000 2.95% 15/3/2024 77,837 0.01%Delta Air Lines, Inc. $75,000 3.80% 19/4/2023 77,793 0.01%McCormick & Co., Inc. $75,000 3.15% 15/8/2024 77,748 0.01%Berkshire Hathaway, Inc. $75,000 3.40% 31/1/2022 77,630 0.01%CenterPoint Energy Resources Corp. $75,000 3.55% 1/4/2023 77,506 0.01%Bristol-Myers Squibb Co. $75,000 3.55% 15/8/2022 77,490 0.01%Celanese US Holdings LLC $75,000 3.50% 8/5/2024 77,474 0.01%Home Depot, Inc. $75,000 3.25% 1/3/2022 77,455 0.01%Fox Corp. $75,000 3.67% 25/1/2022 77,453 0.01%Campbell Soup Co. $75,000 4.25% 15/4/2021 77,376 0.01%Comcast Corp. $75,000 3.13% 15/7/2022 77,310 0.01%Cigna Corp. $75,000 4.00% 15/2/2022 77,303 0.01%Liberty Property LP $74,000 4.13% 15/6/2022 77,291 0.01%Boston Properties LP $75,000 3.13% 1/9/2023 77,244 0.01%AT&T, Inc. $75,000 3.40% 15/6/2022 77,228 0.01%AT&T, Inc. $75,000 3.88% 15/8/2021 77,214 0.01%Cisco Systems, Inc. $75,000 3.00% 15/6/2022 77,157 0.01%AbbVie, Inc. $75,000 3.20% 6/11/2022 77,103 0.01%Toyota Motor Credit Corp. $75,000 3.30% 12/1/2022 77,081 0.01%Cox Communications, Inc. $75,000 3.25% 15/12/2022 77,067 0.01%Xilinx, Inc. $75,000 2.95% 1/6/2024 76,972 0.01%MPLX LP $75,000 3.38% 15/3/2023 76,965 0.01%Energy Transfer Operating LP $75,000 4.65% 1/6/2021 76,931 0.01%Humana, Inc. $75,000 3.15% 1/12/2022 76,910 0.01%Alphabet, Inc. $75,000 3.63% 19/5/2021 76,879 0.01%Williams Cos, Inc. $75,000 3.35% 15/8/2022 76,863 0.01%Duke Energy Carolinas LLC $75,000 3.90% 15/6/2021 76,848 0.01%Stanley Black & Decker, Inc. $75,000 2.90% 1/11/2022 76,807 0.01%Office Properties Income Trust $75,000 4.15% 1/2/2022 76,796 0.01%Ventas Realty LP/Ventas Capital Corp. $75,000 3.25% 15/8/2022 76,782 0.01%Ventas Realty LP $75,000 3.13% 15/6/2023 76,754 0.01%John Deere Capital Corp. $75,000 2.95% 1/4/2022 76,744 0.01%Agilent Technologies, Inc. $75,000 3.20% 1/10/2022 76,729 0.01%Waste Management, Inc. $75,000 2.90% 15/9/2022 76,700 0.01%VF Corp. $75,000 3.50% 1/9/2021 76,686 0.01%Florida Power & Light Co. $75,000 2.75% 1/6/2023 76,660 0.01%Magellan Midstream Partners LP $75,000 4.25% 1/2/2021 76,652 0.01%
Maturity Fair Value % of Total Principal Coupon Date US Dollars ($) Net Assets
Vanguard Global Short-Term Corporate Bond Index Fund
743
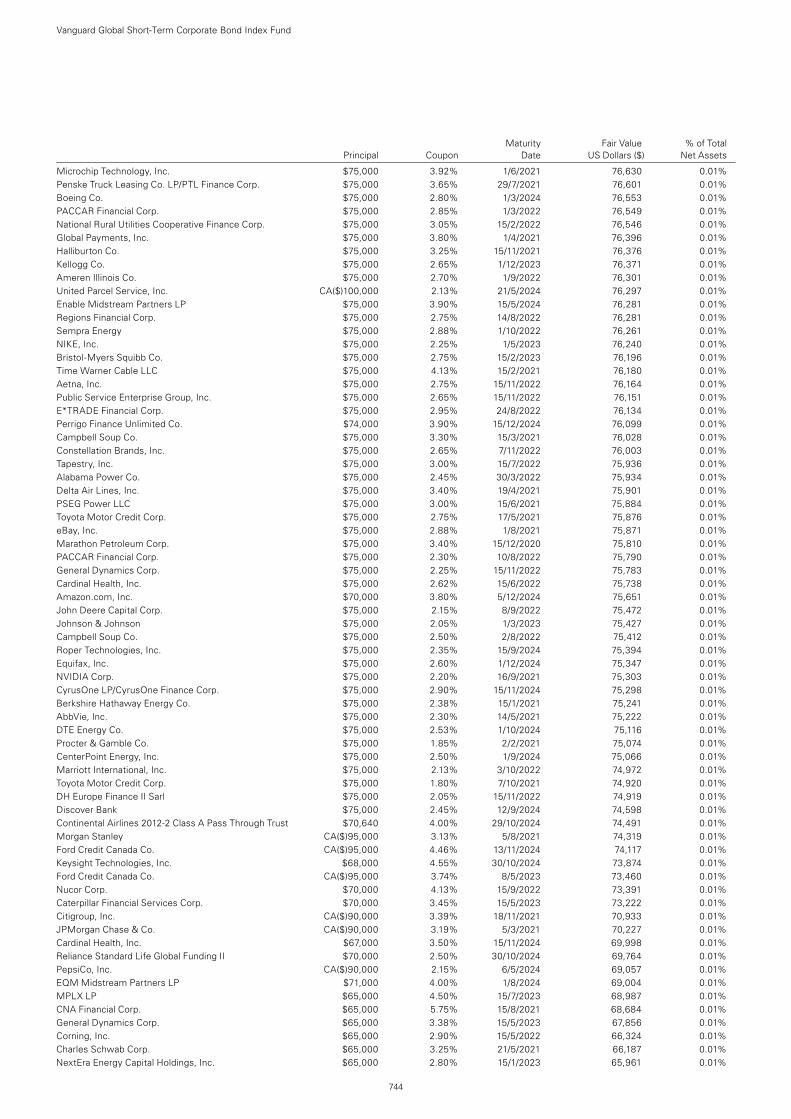
Microchip Technology, Inc. $75,000 3.92% 1/6/2021 76,630 0.01%Penske Truck Leasing Co. LP/PTL Finance Corp. $75,000 3.65% 29/7/2021 76,601 0.01%Boeing Co. $75,000 2.80% 1/3/2024 76,553 0.01%PACCAR Financial Corp. $75,000 2.85% 1/3/2022 76,549 0.01%National Rural Utilities Cooperative Finance Corp. $75,000 3.05% 15/2/2022 76,546 0.01%Global Payments, Inc. $75,000 3.80% 1/4/2021 76,396 0.01%Halliburton Co. $75,000 3.25% 15/11/2021 76,376 0.01%Kellogg Co. $75,000 2.65% 1/12/2023 76,371 0.01%Ameren Illinois Co. $75,000 2.70% 1/9/2022 76,301 0.01%United Parcel Service, Inc. CA($)100,000 2.13% 21/5/2024 76,297 0.01%Enable Midstream Partners LP $75,000 3.90% 15/5/2024 76,281 0.01%Regions Financial Corp. $75,000 2.75% 14/8/2022 76,281 0.01%Sempra Energy $75,000 2.88% 1/10/2022 76,261 0.01%NIKE, Inc. $75,000 2.25% 1/5/2023 76,240 0.01%Bristol-Myers Squibb Co. $75,000 2.75% 15/2/2023 76,196 0.01%Time Warner Cable LLC $75,000 4.13% 15/2/2021 76,180 0.01%Aetna, Inc. $75,000 2.75% 15/11/2022 76,164 0.01%Public Service Enterprise Group, Inc. $75,000 2.65% 15/11/2022 76,151 0.01%E*TRADE Financial Corp. $75,000 2.95% 24/8/2022 76,134 0.01%Perrigo Finance Unlimited Co. $74,000 3.90% 15/12/2024 76,099 0.01%Campbell Soup Co. $75,000 3.30% 15/3/2021 76,028 0.01%Constellation Brands, Inc. $75,000 2.65% 7/11/2022 76,003 0.01%Tapestry, Inc. $75,000 3.00% 15/7/2022 75,936 0.01%Alabama Power Co. $75,000 2.45% 30/3/2022 75,934 0.01%Delta Air Lines, Inc. $75,000 3.40% 19/4/2021 75,901 0.01%PSEG Power LLC $75,000 3.00% 15/6/2021 75,884 0.01%Toyota Motor Credit Corp. $75,000 2.75% 17/5/2021 75,876 0.01%eBay, Inc. $75,000 2.88% 1/8/2021 75,871 0.01%Marathon Petroleum Corp. $75,000 3.40% 15/12/2020 75,810 0.01%PACCAR Financial Corp. $75,000 2.30% 10/8/2022 75,790 0.01%General Dynamics Corp. $75,000 2.25% 15/11/2022 75,783 0.01%Cardinal Health, Inc. $75,000 2.62% 15/6/2022 75,738 0.01%Amazon.com, Inc. $70,000 3.80% 5/12/2024 75,651 0.01%John Deere Capital Corp. $75,000 2.15% 8/9/2022 75,472 0.01%Johnson & Johnson $75,000 2.05% 1/3/2023 75,427 0.01%Campbell Soup Co. $75,000 2.50% 2/8/2022 75,412 0.01%Roper Technologies, Inc. $75,000 2.35% 15/9/2024 75,394 0.01%Equifax, Inc. $75,000 2.60% 1/12/2024 75,347 0.01%NVIDIA Corp. $75,000 2.20% 16/9/2021 75,303 0.01%CyrusOne LP/CyrusOne Finance Corp. $75,000 2.90% 15/11/2024 75,298 0.01%Berkshire Hathaway Energy Co. $75,000 2.38% 15/1/2021 75,241 0.01%AbbVie, Inc. $75,000 2.30% 14/5/2021 75,222 0.01%DTE Energy Co. $75,000 2.53% 1/10/2024 75,116 0.01%Procter & Gamble Co. $75,000 1.85% 2/2/2021 75,074 0.01%CenterPoint Energy, Inc. $75,000 2.50% 1/9/2024 75,066 0.01%Marriott International, Inc. $75,000 2.13% 3/10/2022 74,972 0.01%Toyota Motor Credit Corp. $75,000 1.80% 7/10/2021 74,920 0.01%DH Europe Finance II Sarl $75,000 2.05% 15/11/2022 74,919 0.01%Discover Bank $75,000 2.45% 12/9/2024 74,598 0.01%Continental Airlines 2012-2 Class A Pass Through Trust $70,640 4.00% 29/10/2024 74,491 0.01%Morgan Stanley CA($)95,000 3.13% 5/8/2021 74,319 0.01%Ford Credit Canada Co. CA($)95,000 4.46% 13/11/2024 74,117 0.01%Keysight Technologies, Inc. $68,000 4.55% 30/10/2024 73,874 0.01%Ford Credit Canada Co. CA($)95,000 3.74% 8/5/2023 73,460 0.01%Nucor Corp. $70,000 4.13% 15/9/2022 73,391 0.01%Caterpillar Financial Services Corp. $70,000 3.45% 15/5/2023 73,222 0.01%Citigroup, Inc. CA($)90,000 3.39% 18/11/2021 70,933 0.01%JPMorgan Chase & Co. CA($)90,000 3.19% 5/3/2021 70,227 0.01%Cardinal Health, Inc. $67,000 3.50% 15/11/2024 69,998 0.01%Reliance Standard Life Global Funding II $70,000 2.50% 30/10/2024 69,764 0.01%PepsiCo, Inc. CA($)90,000 2.15% 6/5/2024 69,057 0.01%EQM Midstream Partners LP $71,000 4.00% 1/8/2024 69,004 0.01%MPLX LP $65,000 4.50% 15/7/2023 68,987 0.01%CNA Financial Corp. $65,000 5.75% 15/8/2021 68,684 0.01%General Dynamics Corp. $65,000 3.38% 15/5/2023 67,856 0.01%Corning, Inc. $65,000 2.90% 15/5/2022 66,324 0.01%Charles Schwab Corp. $65,000 3.25% 21/5/2021 66,187 0.01%NextEra Energy Capital Holdings, Inc. $65,000 2.80% 15/1/2023 65,961 0.01%
Maturity Fair Value % of Total Principal Coupon Date US Dollars ($) Net Assets
Vanguard Global Short-Term Corporate Bond Index Fund
744
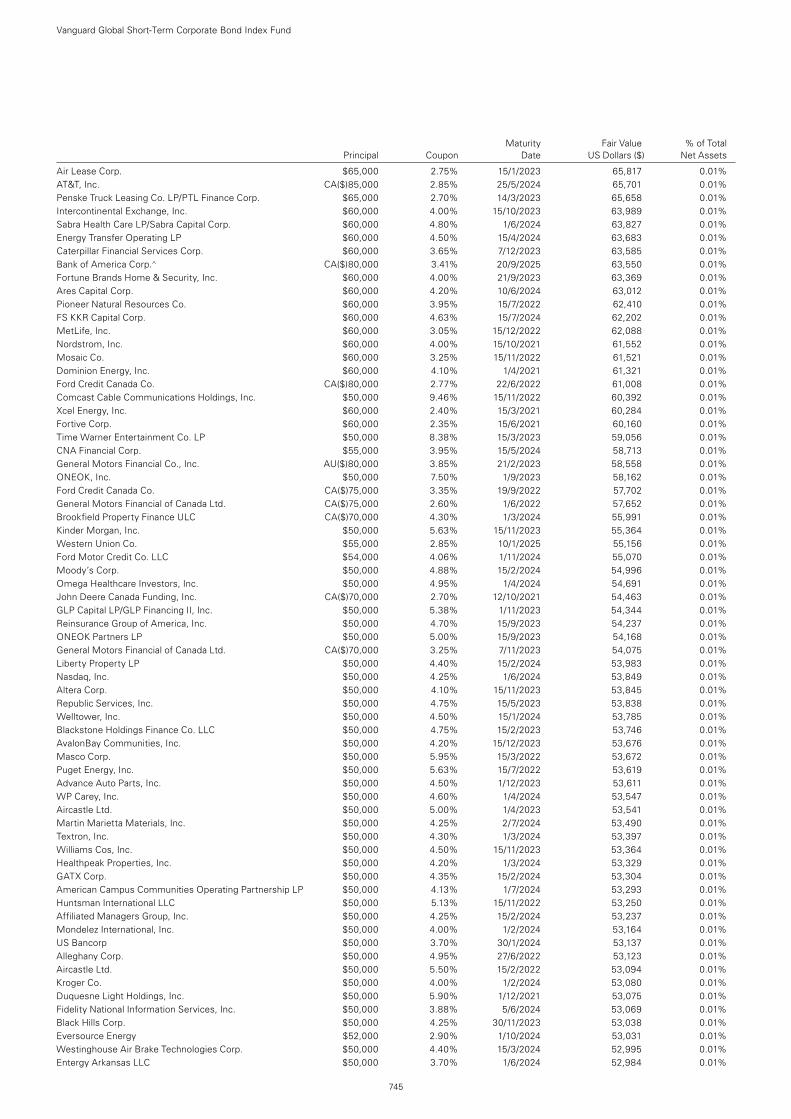
Air Lease Corp. $65,000 2.75% 15/1/2023 65,817 0.01%AT&T, Inc. CA($)85,000 2.85% 25/5/2024 65,701 0.01%Penske Truck Leasing Co. LP/PTL Finance Corp. $65,000 2.70% 14/3/2023 65,658 0.01%Intercontinental Exchange, Inc. $60,000 4.00% 15/10/2023 63,989 0.01%Sabra Health Care LP/Sabra Capital Corp. $60,000 4.80% 1/6/2024 63,827 0.01%Energy Transfer Operating LP $60,000 4.50% 15/4/2024 63,683 0.01%Caterpillar Financial Services Corp. $60,000 3.65% 7/12/2023 63,585 0.01%Bank of America Corp.^ CA($)80,000 3.41% 20/9/2025 63,550 0.01%Fortune Brands Home & Security, Inc. $60,000 4.00% 21/9/2023 63,369 0.01%Ares Capital Corp. $60,000 4.20% 10/6/2024 63,012 0.01%Pioneer Natural Resources Co. $60,000 3.95% 15/7/2022 62,410 0.01%FS KKR Capital Corp. $60,000 4.63% 15/7/2024 62,202 0.01%MetLife, Inc. $60,000 3.05% 15/12/2022 62,088 0.01%Nordstrom, Inc. $60,000 4.00% 15/10/2021 61,552 0.01%Mosaic Co. $60,000 3.25% 15/11/2022 61,521 0.01%Dominion Energy, Inc. $60,000 4.10% 1/4/2021 61,321 0.01%Ford Credit Canada Co. CA($)80,000 2.77% 22/6/2022 61,008 0.01%Comcast Cable Communications Holdings, Inc. $50,000 9.46% 15/11/2022 60,392 0.01%Xcel Energy, Inc. $60,000 2.40% 15/3/2021 60,284 0.01%Fortive Corp. $60,000 2.35% 15/6/2021 60,160 0.01%Time Warner Entertainment Co. LP $50,000 8.38% 15/3/2023 59,056 0.01%CNA Financial Corp. $55,000 3.95% 15/5/2024 58,713 0.01%General Motors Financial Co., Inc. AU($)80,000 3.85% 21/2/2023 58,558 0.01%ONEOK, Inc. $50,000 7.50% 1/9/2023 58,162 0.01%Ford Credit Canada Co. CA($)75,000 3.35% 19/9/2022 57,702 0.01%General Motors Financial of Canada Ltd. CA($)75,000 2.60% 1/6/2022 57,652 0.01%Brookfield Property Finance ULC CA($)70,000 4.30% 1/3/2024 55,991 0.01%Kinder Morgan, Inc. $50,000 5.63% 15/11/2023 55,364 0.01%Western Union Co. $55,000 2.85% 10/1/2025 55,156 0.01%Ford Motor Credit Co. LLC $54,000 4.06% 1/11/2024 55,070 0.01%Moody’s Corp. $50,000 4.88% 15/2/2024 54,996 0.01%Omega Healthcare Investors, Inc. $50,000 4.95% 1/4/2024 54,691 0.01%John Deere Canada Funding, Inc. CA($)70,000 2.70% 12/10/2021 54,463 0.01%GLP Capital LP/GLP Financing II, Inc. $50,000 5.38% 1/11/2023 54,344 0.01%Reinsurance Group of America, Inc. $50,000 4.70% 15/9/2023 54,237 0.01%ONEOK Partners LP $50,000 5.00% 15/9/2023 54,168 0.01%General Motors Financial of Canada Ltd. CA($)70,000 3.25% 7/11/2023 54,075 0.01%Liberty Property LP $50,000 4.40% 15/2/2024 53,983 0.01%Nasdaq, Inc. $50,000 4.25% 1/6/2024 53,849 0.01%Altera Corp. $50,000 4.10% 15/11/2023 53,845 0.01%Republic Services, Inc. $50,000 4.75% 15/5/2023 53,838 0.01%Welltower, Inc. $50,000 4.50% 15/1/2024 53,785 0.01%Blackstone Holdings Finance Co. LLC $50,000 4.75% 15/2/2023 53,746 0.01%AvalonBay Communities, Inc. $50,000 4.20% 15/12/2023 53,676 0.01%Masco Corp. $50,000 5.95% 15/3/2022 53,672 0.01%Puget Energy, Inc. $50,000 5.63% 15/7/2022 53,619 0.01%Advance Auto Parts, Inc. $50,000 4.50% 1/12/2023 53,611 0.01%WP Carey, Inc. $50,000 4.60% 1/4/2024 53,547 0.01%Aircastle Ltd. $50,000 5.00% 1/4/2023 53,541 0.01%Martin Marietta Materials, Inc. $50,000 4.25% 2/7/2024 53,490 0.01%Textron, Inc. $50,000 4.30% 1/3/2024 53,397 0.01%Williams Cos, Inc. $50,000 4.50% 15/11/2023 53,364 0.01%Healthpeak Properties, Inc. $50,000 4.20% 1/3/2024 53,329 0.01%GATX Corp. $50,000 4.35% 15/2/2024 53,304 0.01%American Campus Communities Operating Partnership LP $50,000 4.13% 1/7/2024 53,293 0.01%Huntsman International LLC $50,000 5.13% 15/11/2022 53,250 0.01%Affiliated Managers Group, Inc. $50,000 4.25% 15/2/2024 53,237 0.01%Mondelez International, Inc. $50,000 4.00% 1/2/2024 53,164 0.01%US Bancorp $50,000 3.70% 30/1/2024 53,137 0.01%Alleghany Corp. $50,000 4.95% 27/6/2022 53,123 0.01%Aircastle Ltd. $50,000 5.50% 15/2/2022 53,094 0.01%Kroger Co. $50,000 4.00% 1/2/2024 53,080 0.01%Duquesne Light Holdings, Inc. $50,000 5.90% 1/12/2021 53,075 0.01%Fidelity National Information Services, Inc. $50,000 3.88% 5/6/2024 53,069 0.01%Black Hills Corp. $50,000 4.25% 30/11/2023 53,038 0.01%Eversource Energy $52,000 2.90% 1/10/2024 53,031 0.01%Westinghouse Air Brake Technologies Corp. $50,000 4.40% 15/3/2024 52,995 0.01%Entergy Arkansas LLC $50,000 3.70% 1/6/2024 52,984 0.01%
Maturity Fair Value % of Total Principal Coupon Date US Dollars ($) Net Assets
Vanguard Global Short-Term Corporate Bond Index Fund
745
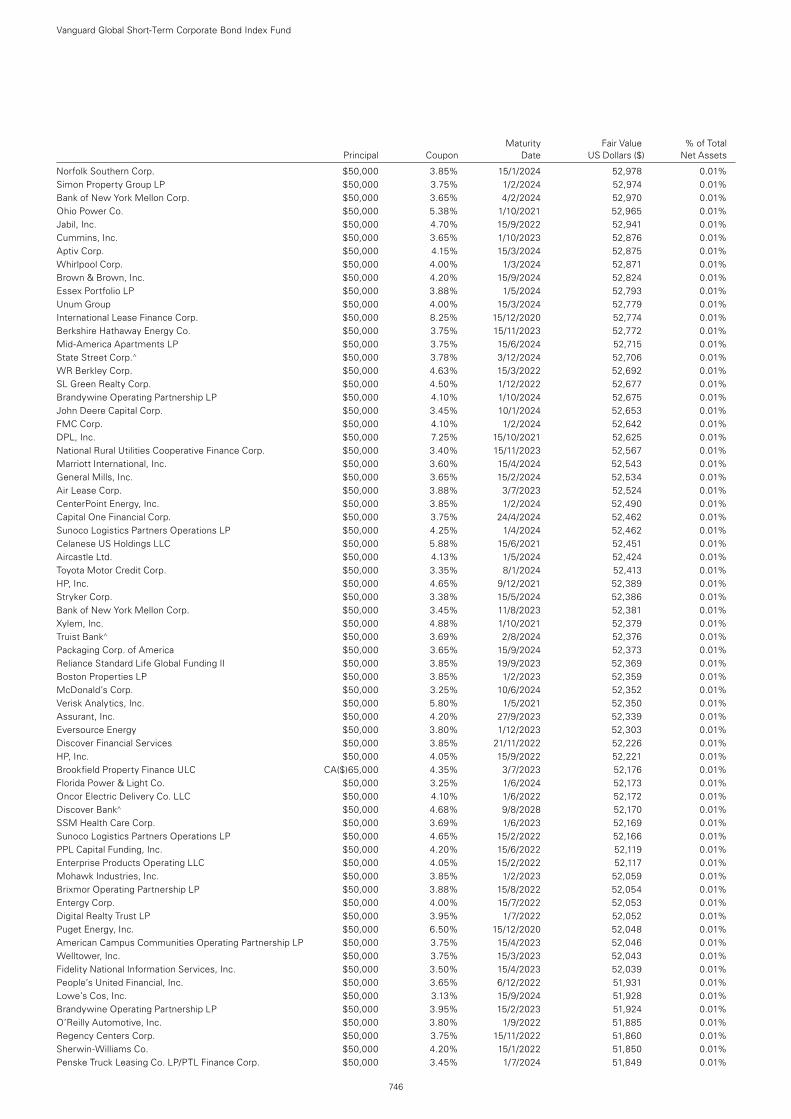
Norfolk Southern Corp. $50,000 3.85% 15/1/2024 52,978 0.01%Simon Property Group LP $50,000 3.75% 1/2/2024 52,974 0.01%Bank of New York Mellon Corp. $50,000 3.65% 4/2/2024 52,970 0.01%Ohio Power Co. $50,000 5.38% 1/10/2021 52,965 0.01%Jabil, Inc. $50,000 4.70% 15/9/2022 52,941 0.01%Cummins, Inc. $50,000 3.65% 1/10/2023 52,876 0.01%Aptiv Corp. $50,000 4.15% 15/3/2024 52,875 0.01%Whirlpool Corp. $50,000 4.00% 1/3/2024 52,871 0.01%Brown & Brown, Inc. $50,000 4.20% 15/9/2024 52,824 0.01%Essex Portfolio LP $50,000 3.88% 1/5/2024 52,793 0.01%Unum Group $50,000 4.00% 15/3/2024 52,779 0.01%International Lease Finance Corp. $50,000 8.25% 15/12/2020 52,774 0.01%Berkshire Hathaway Energy Co. $50,000 3.75% 15/11/2023 52,772 0.01%Mid-America Apartments LP $50,000 3.75% 15/6/2024 52,715 0.01%State Street Corp.^ $50,000 3.78% 3/12/2024 52,706 0.01%WR Berkley Corp. $50,000 4.63% 15/3/2022 52,692 0.01%SL Green Realty Corp. $50,000 4.50% 1/12/2022 52,677 0.01%Brandywine Operating Partnership LP $50,000 4.10% 1/10/2024 52,675 0.01%John Deere Capital Corp. $50,000 3.45% 10/1/2024 52,653 0.01%FMC Corp. $50,000 4.10% 1/2/2024 52,642 0.01%DPL, Inc. $50,000 7.25% 15/10/2021 52,625 0.01%National Rural Utilities Cooperative Finance Corp. $50,000 3.40% 15/11/2023 52,567 0.01%Marriott International, Inc. $50,000 3.60% 15/4/2024 52,543 0.01%General Mills, Inc. $50,000 3.65% 15/2/2024 52,534 0.01%Air Lease Corp. $50,000 3.88% 3/7/2023 52,524 0.01%CenterPoint Energy, Inc. $50,000 3.85% 1/2/2024 52,490 0.01%Capital One Financial Corp. $50,000 3.75% 24/4/2024 52,462 0.01%Sunoco Logistics Partners Operations LP $50,000 4.25% 1/4/2024 52,462 0.01%Celanese US Holdings LLC $50,000 5.88% 15/6/2021 52,451 0.01%Aircastle Ltd. $50,000 4.13% 1/5/2024 52,424 0.01%Toyota Motor Credit Corp. $50,000 3.35% 8/1/2024 52,413 0.01%HP, Inc. $50,000 4.65% 9/12/2021 52,389 0.01%Stryker Corp. $50,000 3.38% 15/5/2024 52,386 0.01%Bank of New York Mellon Corp. $50,000 3.45% 11/8/2023 52,381 0.01%Xylem, Inc. $50,000 4.88% 1/10/2021 52,379 0.01%Truist Bank^ $50,000 3.69% 2/8/2024 52,376 0.01%Packaging Corp. of America $50,000 3.65% 15/9/2024 52,373 0.01%Reliance Standard Life Global Funding II $50,000 3.85% 19/9/2023 52,369 0.01%Boston Properties LP $50,000 3.85% 1/2/2023 52,359 0.01%McDonald’s Corp. $50,000 3.25% 10/6/2024 52,352 0.01%Verisk Analytics, Inc. $50,000 5.80% 1/5/2021 52,350 0.01%Assurant, Inc. $50,000 4.20% 27/9/2023 52,339 0.01%Eversource Energy $50,000 3.80% 1/12/2023 52,303 0.01%Discover Financial Services $50,000 3.85% 21/11/2022 52,226 0.01%HP, Inc. $50,000 4.05% 15/9/2022 52,221 0.01%Brookfield Property Finance ULC CA($)65,000 4.35% 3/7/2023 52,176 0.01%Florida Power & Light Co. $50,000 3.25% 1/6/2024 52,173 0.01%Oncor Electric Delivery Co. LLC $50,000 4.10% 1/6/2022 52,172 0.01%Discover Bank^ $50,000 4.68% 9/8/2028 52,170 0.01%SSM Health Care Corp. $50,000 3.69% 1/6/2023 52,169 0.01%Sunoco Logistics Partners Operations LP $50,000 4.65% 15/2/2022 52,166 0.01%PPL Capital Funding, Inc. $50,000 4.20% 15/6/2022 52,119 0.01%Enterprise Products Operating LLC $50,000 4.05% 15/2/2022 52,117 0.01%Mohawk Industries, Inc. $50,000 3.85% 1/2/2023 52,059 0.01%Brixmor Operating Partnership LP $50,000 3.88% 15/8/2022 52,054 0.01%Entergy Corp. $50,000 4.00% 15/7/2022 52,053 0.01%Digital Realty Trust LP $50,000 3.95% 1/7/2022 52,052 0.01%Puget Energy, Inc. $50,000 6.50% 15/12/2020 52,048 0.01%American Campus Communities Operating Partnership LP $50,000 3.75% 15/4/2023 52,046 0.01%Welltower, Inc. $50,000 3.75% 15/3/2023 52,043 0.01%Fidelity National Information Services, Inc. $50,000 3.50% 15/4/2023 52,039 0.01%People’s United Financial, Inc. $50,000 3.65% 6/12/2022 51,931 0.01%Lowe’s Cos, Inc. $50,000 3.13% 15/9/2024 51,928 0.01%Brandywine Operating Partnership LP $50,000 3.95% 15/2/2023 51,924 0.01%O’Reilly Automotive, Inc. $50,000 3.80% 1/9/2022 51,885 0.01%Regency Centers Corp. $50,000 3.75% 15/11/2022 51,860 0.01%Sherwin-Williams Co. $50,000 4.20% 15/1/2022 51,850 0.01%Penske Truck Leasing Co. LP/PTL Finance Corp. $50,000 3.45% 1/7/2024 51,849 0.01%
Maturity Fair Value % of Total Principal Coupon Date US Dollars ($) Net Assets
Vanguard Global Short-Term Corporate Bond Index Fund
746
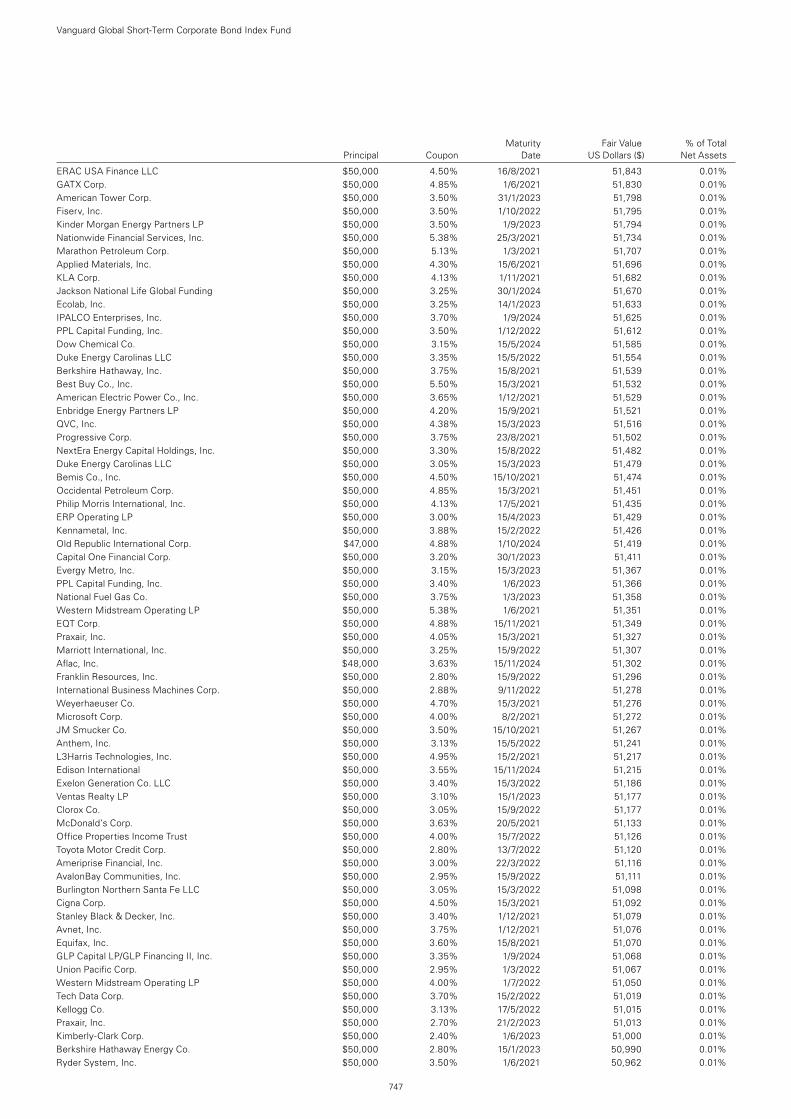
ERAC USA Finance LLC $50,000 4.50% 16/8/2021 51,843 0.01%GATX Corp. $50,000 4.85% 1/6/2021 51,830 0.01%American Tower Corp. $50,000 3.50% 31/1/2023 51,798 0.01%Fiserv, Inc. $50,000 3.50% 1/10/2022 51,795 0.01%Kinder Morgan Energy Partners LP $50,000 3.50% 1/9/2023 51,794 0.01%Nationwide Financial Services, Inc. $50,000 5.38% 25/3/2021 51,734 0.01%Marathon Petroleum Corp. $50,000 5.13% 1/3/2021 51,707 0.01%Applied Materials, Inc. $50,000 4.30% 15/6/2021 51,696 0.01%KLA Corp. $50,000 4.13% 1/11/2021 51,682 0.01%Jackson National Life Global Funding $50,000 3.25% 30/1/2024 51,670 0.01%Ecolab, Inc. $50,000 3.25% 14/1/2023 51,633 0.01%IPALCO Enterprises, Inc. $50,000 3.70% 1/9/2024 51,625 0.01%PPL Capital Funding, Inc. $50,000 3.50% 1/12/2022 51,612 0.01%Dow Chemical Co. $50,000 3.15% 15/5/2024 51,585 0.01%Duke Energy Carolinas LLC $50,000 3.35% 15/5/2022 51,554 0.01%Berkshire Hathaway, Inc. $50,000 3.75% 15/8/2021 51,539 0.01%Best Buy Co., Inc. $50,000 5.50% 15/3/2021 51,532 0.01%American Electric Power Co., Inc. $50,000 3.65% 1/12/2021 51,529 0.01%Enbridge Energy Partners LP $50,000 4.20% 15/9/2021 51,521 0.01%QVC, Inc. $50,000 4.38% 15/3/2023 51,516 0.01%Progressive Corp. $50,000 3.75% 23/8/2021 51,502 0.01%NextEra Energy Capital Holdings, Inc. $50,000 3.30% 15/8/2022 51,482 0.01%Duke Energy Carolinas LLC $50,000 3.05% 15/3/2023 51,479 0.01%Bemis Co., Inc. $50,000 4.50% 15/10/2021 51,474 0.01%Occidental Petroleum Corp. $50,000 4.85% 15/3/2021 51,451 0.01%Philip Morris International, Inc. $50,000 4.13% 17/5/2021 51,435 0.01%ERP Operating LP $50,000 3.00% 15/4/2023 51,429 0.01%Kennametal, Inc. $50,000 3.88% 15/2/2022 51,426 0.01%Old Republic International Corp. $47,000 4.88% 1/10/2024 51,419 0.01%Capital One Financial Corp. $50,000 3.20% 30/1/2023 51,411 0.01%Evergy Metro, Inc. $50,000 3.15% 15/3/2023 51,367 0.01%PPL Capital Funding, Inc. $50,000 3.40% 1/6/2023 51,366 0.01%National Fuel Gas Co. $50,000 3.75% 1/3/2023 51,358 0.01%Western Midstream Operating LP $50,000 5.38% 1/6/2021 51,351 0.01%EQT Corp. $50,000 4.88% 15/11/2021 51,349 0.01%Praxair, Inc. $50,000 4.05% 15/3/2021 51,327 0.01%Marriott International, Inc. $50,000 3.25% 15/9/2022 51,307 0.01%Aflac, Inc. $48,000 3.63% 15/11/2024 51,302 0.01%Franklin Resources, Inc. $50,000 2.80% 15/9/2022 51,296 0.01%International Business Machines Corp. $50,000 2.88% 9/11/2022 51,278 0.01%Weyerhaeuser Co. $50,000 4.70% 15/3/2021 51,276 0.01%Microsoft Corp. $50,000 4.00% 8/2/2021 51,272 0.01%JM Smucker Co. $50,000 3.50% 15/10/2021 51,267 0.01%Anthem, Inc. $50,000 3.13% 15/5/2022 51,241 0.01%L3Harris Technologies, Inc. $50,000 4.95% 15/2/2021 51,217 0.01%Edison International $50,000 3.55% 15/11/2024 51,215 0.01%Exelon Generation Co. LLC $50,000 3.40% 15/3/2022 51,186 0.01%Ventas Realty LP $50,000 3.10% 15/1/2023 51,177 0.01%Clorox Co. $50,000 3.05% 15/9/2022 51,177 0.01%McDonald’s Corp. $50,000 3.63% 20/5/2021 51,133 0.01%Office Properties Income Trust $50,000 4.00% 15/7/2022 51,126 0.01%Toyota Motor Credit Corp. $50,000 2.80% 13/7/2022 51,120 0.01%Ameriprise Financial, Inc. $50,000 3.00% 22/3/2022 51,116 0.01%AvalonBay Communities, Inc. $50,000 2.95% 15/9/2022 51,111 0.01%Burlington Northern Santa Fe LLC $50,000 3.05% 15/3/2022 51,098 0.01%Cigna Corp. $50,000 4.50% 15/3/2021 51,092 0.01%Stanley Black & Decker, Inc. $50,000 3.40% 1/12/2021 51,079 0.01%Avnet, Inc. $50,000 3.75% 1/12/2021 51,076 0.01%Equifax, Inc. $50,000 3.60% 15/8/2021 51,070 0.01%GLP Capital LP/GLP Financing II, Inc. $50,000 3.35% 1/9/2024 51,068 0.01%Union Pacific Corp. $50,000 2.95% 1/3/2022 51,067 0.01%Western Midstream Operating LP $50,000 4.00% 1/7/2022 51,050 0.01%Tech Data Corp. $50,000 3.70% 15/2/2022 51,019 0.01%Kellogg Co. $50,000 3.13% 17/5/2022 51,015 0.01%Praxair, Inc. $50,000 2.70% 21/2/2023 51,013 0.01%Kimberly-Clark Corp. $50,000 2.40% 1/6/2023 51,000 0.01%Berkshire Hathaway Energy Co. $50,000 2.80% 15/1/2023 50,990 0.01%Ryder System, Inc. $50,000 3.50% 1/6/2021 50,962 0.01%
Maturity Fair Value % of Total Principal Coupon Date US Dollars ($) Net Assets
Vanguard Global Short-Term Corporate Bond Index Fund
747
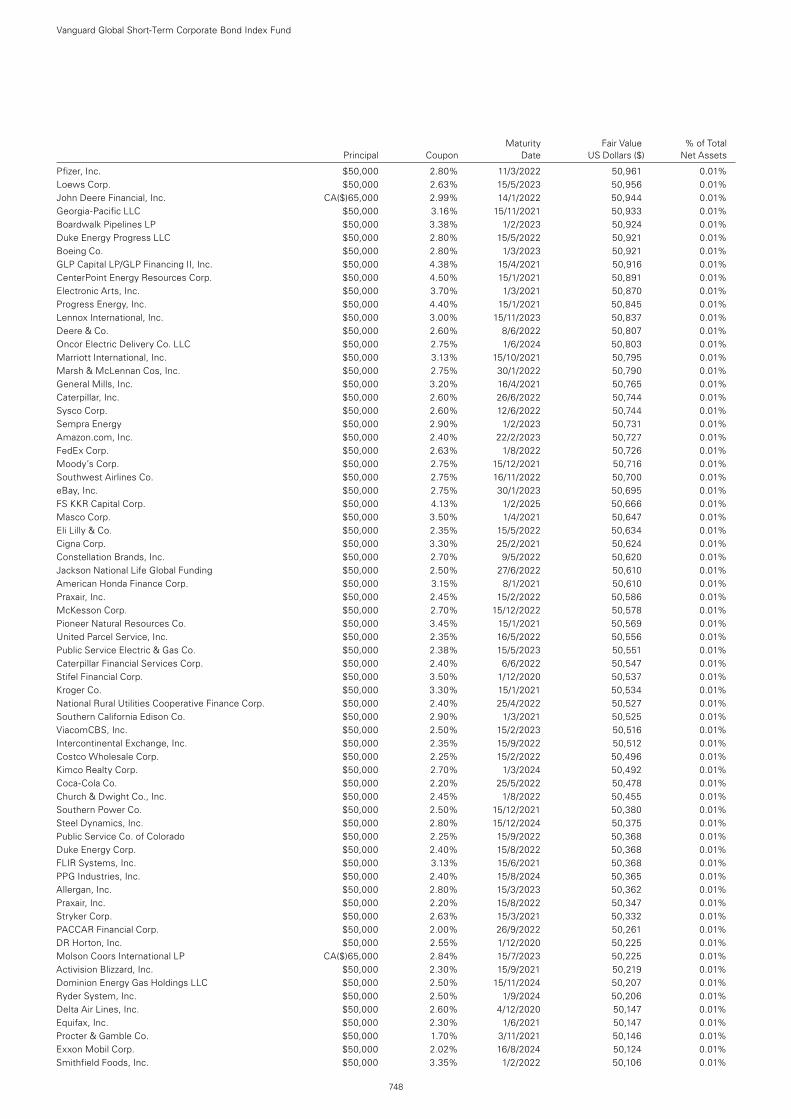
Pfizer, Inc. $50,000 2.80% 11/3/2022 50,961 0.01%Loews Corp. $50,000 2.63% 15/5/2023 50,956 0.01%John Deere Financial, Inc. CA($)65,000 2.99% 14/1/2022 50,944 0.01%Georgia-Pacific LLC $50,000 3.16% 15/11/2021 50,933 0.01%Boardwalk Pipelines LP $50,000 3.38% 1/2/2023 50,924 0.01%Duke Energy Progress LLC $50,000 2.80% 15/5/2022 50,921 0.01%Boeing Co. $50,000 2.80% 1/3/2023 50,921 0.01%GLP Capital LP/GLP Financing II, Inc. $50,000 4.38% 15/4/2021 50,916 0.01%CenterPoint Energy Resources Corp. $50,000 4.50% 15/1/2021 50,891 0.01%Electronic Arts, Inc. $50,000 3.70% 1/3/2021 50,870 0.01%Progress Energy, Inc. $50,000 4.40% 15/1/2021 50,845 0.01%Lennox International, Inc. $50,000 3.00% 15/11/2023 50,837 0.01%Deere & Co. $50,000 2.60% 8/6/2022 50,807 0.01%Oncor Electric Delivery Co. LLC $50,000 2.75% 1/6/2024 50,803 0.01%Marriott International, Inc. $50,000 3.13% 15/10/2021 50,795 0.01%Marsh & McLennan Cos, Inc. $50,000 2.75% 30/1/2022 50,790 0.01%General Mills, Inc. $50,000 3.20% 16/4/2021 50,765 0.01%Caterpillar, Inc. $50,000 2.60% 26/6/2022 50,744 0.01%Sysco Corp. $50,000 2.60% 12/6/2022 50,744 0.01%Sempra Energy $50,000 2.90% 1/2/2023 50,731 0.01%Amazon.com, Inc. $50,000 2.40% 22/2/2023 50,727 0.01%FedEx Corp. $50,000 2.63% 1/8/2022 50,726 0.01%Moody’s Corp. $50,000 2.75% 15/12/2021 50,716 0.01%Southwest Airlines Co. $50,000 2.75% 16/11/2022 50,700 0.01%eBay, Inc. $50,000 2.75% 30/1/2023 50,695 0.01%FS KKR Capital Corp. $50,000 4.13% 1/2/2025 50,666 0.01%Masco Corp. $50,000 3.50% 1/4/2021 50,647 0.01%Eli Lilly & Co. $50,000 2.35% 15/5/2022 50,634 0.01%Cigna Corp. $50,000 3.30% 25/2/2021 50,624 0.01%Constellation Brands, Inc. $50,000 2.70% 9/5/2022 50,620 0.01%Jackson National Life Global Funding $50,000 2.50% 27/6/2022 50,610 0.01%American Honda Finance Corp. $50,000 3.15% 8/1/2021 50,610 0.01%Praxair, Inc. $50,000 2.45% 15/2/2022 50,586 0.01%McKesson Corp. $50,000 2.70% 15/12/2022 50,578 0.01%Pioneer Natural Resources Co. $50,000 3.45% 15/1/2021 50,569 0.01%United Parcel Service, Inc. $50,000 2.35% 16/5/2022 50,556 0.01%Public Service Electric & Gas Co. $50,000 2.38% 15/5/2023 50,551 0.01%Caterpillar Financial Services Corp. $50,000 2.40% 6/6/2022 50,547 0.01%Stifel Financial Corp. $50,000 3.50% 1/12/2020 50,537 0.01%Kroger Co. $50,000 3.30% 15/1/2021 50,534 0.01%National Rural Utilities Cooperative Finance Corp. $50,000 2.40% 25/4/2022 50,527 0.01%Southern California Edison Co. $50,000 2.90% 1/3/2021 50,525 0.01%ViacomCBS, Inc. $50,000 2.50% 15/2/2023 50,516 0.01%Intercontinental Exchange, Inc. $50,000 2.35% 15/9/2022 50,512 0.01%Costco Wholesale Corp. $50,000 2.25% 15/2/2022 50,496 0.01%Kimco Realty Corp. $50,000 2.70% 1/3/2024 50,492 0.01%Coca-Cola Co. $50,000 2.20% 25/5/2022 50,478 0.01%Church & Dwight Co., Inc. $50,000 2.45% 1/8/2022 50,455 0.01%Southern Power Co. $50,000 2.50% 15/12/2021 50,380 0.01%Steel Dynamics, Inc. $50,000 2.80% 15/12/2024 50,375 0.01%Public Service Co. of Colorado $50,000 2.25% 15/9/2022 50,368 0.01%Duke Energy Corp. $50,000 2.40% 15/8/2022 50,368 0.01%FLIR Systems, Inc. $50,000 3.13% 15/6/2021 50,368 0.01%PPG Industries, Inc. $50,000 2.40% 15/8/2024 50,365 0.01%Allergan, Inc. $50,000 2.80% 15/3/2023 50,362 0.01%Praxair, Inc. $50,000 2.20% 15/8/2022 50,347 0.01%Stryker Corp. $50,000 2.63% 15/3/2021 50,332 0.01%PACCAR Financial Corp. $50,000 2.00% 26/9/2022 50,261 0.01%DR Horton, Inc. $50,000 2.55% 1/12/2020 50,225 0.01%Molson Coors International LP CA($)65,000 2.84% 15/7/2023 50,225 0.01%Activision Blizzard, Inc. $50,000 2.30% 15/9/2021 50,219 0.01%Dominion Energy Gas Holdings LLC $50,000 2.50% 15/11/2024 50,207 0.01%Ryder System, Inc. $50,000 2.50% 1/9/2024 50,206 0.01%Delta Air Lines, Inc. $50,000 2.60% 4/12/2020 50,147 0.01%Equifax, Inc. $50,000 2.30% 1/6/2021 50,147 0.01%Procter & Gamble Co. $50,000 1.70% 3/11/2021 50,146 0.01%Exxon Mobil Corp. $50,000 2.02% 16/8/2024 50,124 0.01%Smithfield Foods, Inc. $50,000 3.35% 1/2/2022 50,106 0.01%
Maturity Fair Value % of Total Principal Coupon Date US Dollars ($) Net Assets
Vanguard Global Short-Term Corporate Bond Index Fund
748
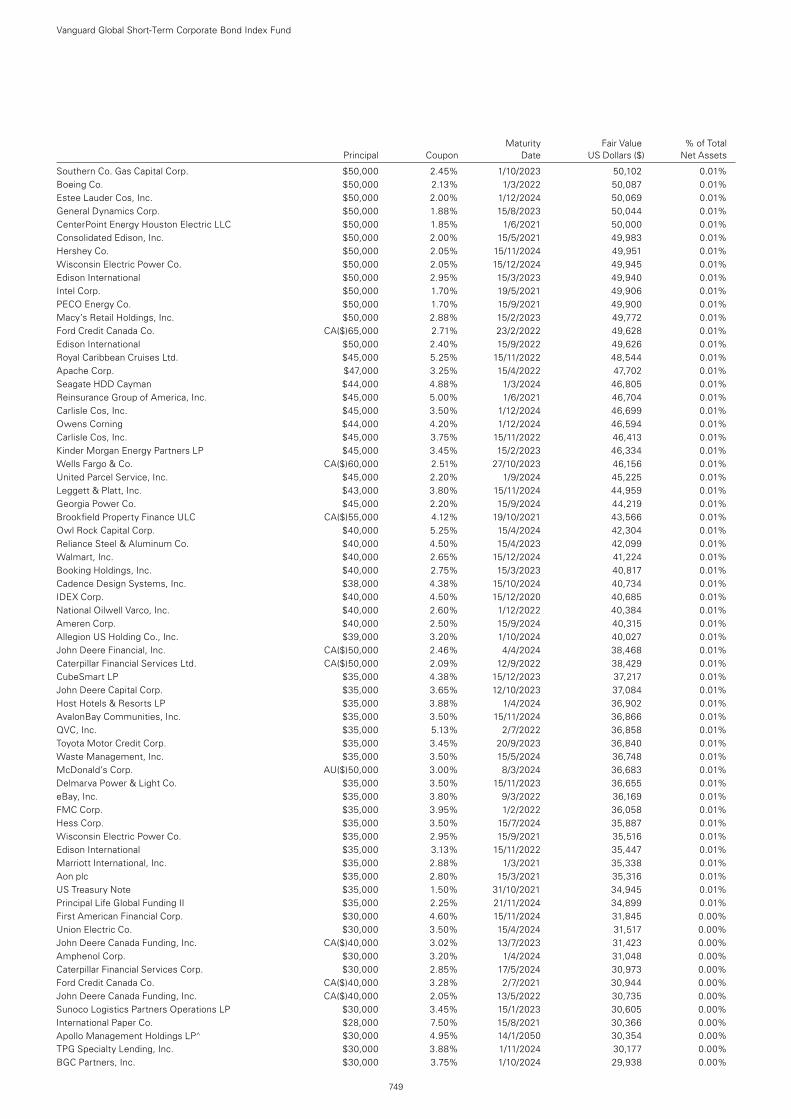
Vanguard Global Short-Term Corporate Bond Index Fund
749
Southern Co. Gas Capital Corp. $50,000 2.45% 1/10/2023 50,102 0.01%Boeing Co. $50,000 2.13% 1/3/2022 50,087 0.01%Estee Lauder Cos, Inc. $50,000 2.00% 1/12/2024 50,069 0.01%General Dynamics Corp. $50,000 1.88% 15/8/2023 50,044 0.01%CenterPoint Energy Houston Electric LLC $50,000 1.85% 1/6/2021 50,000 0.01%Consolidated Edison, Inc. $50,000 2.00% 15/5/2021 49,983 0.01%Hershey Co. $50,000 2.05% 15/11/2024 49,951 0.01%Wisconsin Electric Power Co. $50,000 2.05% 15/12/2024 49,945 0.01%Edison International $50,000 2.95% 15/3/2023 49,940 0.01%Intel Corp. $50,000 1.70% 19/5/2021 49,906 0.01%PECO Energy Co. $50,000 1.70% 15/9/2021 49,900 0.01%Macy’s Retail Holdings, Inc. $50,000 2.88% 15/2/2023 49,772 0.01%Ford Credit Canada Co. CA($)65,000 2.71% 23/2/2022 49,628 0.01%Edison International $50,000 2.40% 15/9/2022 49,626 0.01%Royal Caribbean Cruises Ltd. $45,000 5.25% 15/11/2022 48,544 0.01%Apache Corp. $47,000 3.25% 15/4/2022 47,702 0.01%Seagate HDD Cayman $44,000 4.88% 1/3/2024 46,805 0.01%Reinsurance Group of America, Inc. $45,000 5.00% 1/6/2021 46,704 0.01%Carlisle Cos, Inc. $45,000 3.50% 1/12/2024 46,699 0.01%Owens Corning $44,000 4.20% 1/12/2024 46,594 0.01%Carlisle Cos, Inc. $45,000 3.75% 15/11/2022 46,413 0.01%Kinder Morgan Energy Partners LP $45,000 3.45% 15/2/2023 46,334 0.01%Wells Fargo & Co. CA($)60,000 2.51% 27/10/2023 46,156 0.01%United Parcel Service, Inc. $45,000 2.20% 1/9/2024 45,225 0.01%Leggett & Platt, Inc. $43,000 3.80% 15/11/2024 44,959 0.01%Georgia Power Co. $45,000 2.20% 15/9/2024 44,219 0.01%Brookfield Property Finance ULC CA($)55,000 4.12% 19/10/2021 43,566 0.01%Owl Rock Capital Corp. $40,000 5.25% 15/4/2024 42,304 0.01%Reliance Steel & Aluminum Co. $40,000 4.50% 15/4/2023 42,099 0.01%Walmart, Inc. $40,000 2.65% 15/12/2024 41,224 0.01%Booking Holdings, Inc. $40,000 2.75% 15/3/2023 40,817 0.01%Cadence Design Systems, Inc. $38,000 4.38% 15/10/2024 40,734 0.01%IDEX Corp. $40,000 4.50% 15/12/2020 40,685 0.01%National Oilwell Varco, Inc. $40,000 2.60% 1/12/2022 40,384 0.01%Ameren Corp. $40,000 2.50% 15/9/2024 40,315 0.01%Allegion US Holding Co., Inc. $39,000 3.20% 1/10/2024 40,027 0.01%John Deere Financial, Inc. CA($)50,000 2.46% 4/4/2024 38,468 0.01%Caterpillar Financial Services Ltd. CA($)50,000 2.09% 12/9/2022 38,429 0.01%CubeSmart LP $35,000 4.38% 15/12/2023 37,217 0.01%John Deere Capital Corp. $35,000 3.65% 12/10/2023 37,084 0.01%Host Hotels & Resorts LP $35,000 3.88% 1/4/2024 36,902 0.01%AvalonBay Communities, Inc. $35,000 3.50% 15/11/2024 36,866 0.01%QVC, Inc. $35,000 5.13% 2/7/2022 36,858 0.01%Toyota Motor Credit Corp. $35,000 3.45% 20/9/2023 36,840 0.01%Waste Management, Inc. $35,000 3.50% 15/5/2024 36,748 0.01%McDonald’s Corp. AU($)50,000 3.00% 8/3/2024 36,683 0.01%Delmarva Power & Light Co. $35,000 3.50% 15/11/2023 36,655 0.01%eBay, Inc. $35,000 3.80% 9/3/2022 36,169 0.01%FMC Corp. $35,000 3.95% 1/2/2022 36,058 0.01%Hess Corp. $35,000 3.50% 15/7/2024 35,887 0.01%Wisconsin Electric Power Co. $35,000 2.95% 15/9/2021 35,516 0.01%Edison International $35,000 3.13% 15/11/2022 35,447 0.01%Marriott International, Inc. $35,000 2.88% 1/3/2021 35,338 0.01%Aon plc $35,000 2.80% 15/3/2021 35,316 0.01%US Treasury Note $35,000 1.50% 31/10/2021 34,945 0.01%Principal Life Global Funding II $35,000 2.25% 21/11/2024 34,899 0.01%First American Financial Corp. $30,000 4.60% 15/11/2024 31,845 0.00%Union Electric Co. $30,000 3.50% 15/4/2024 31,517 0.00%John Deere Canada Funding, Inc. CA($)40,000 3.02% 13/7/2023 31,423 0.00%Amphenol Corp. $30,000 3.20% 1/4/2024 31,048 0.00%Caterpillar Financial Services Corp. $30,000 2.85% 17/5/2024 30,973 0.00%Ford Credit Canada Co. CA($)40,000 3.28% 2/7/2021 30,944 0.00%John Deere Canada Funding, Inc. CA($)40,000 2.05% 13/5/2022 30,735 0.00%Sunoco Logistics Partners Operations LP $30,000 3.45% 15/1/2023 30,605 0.00%International Paper Co. $28,000 7.50% 15/8/2021 30,366 0.00%Apollo Management Holdings LP^ $30,000 4.95% 14/1/2050 30,354 0.00%TPG Specialty Lending, Inc. $30,000 3.88% 1/11/2024 30,177 0.00%BGC Partners, Inc. $30,000 3.75% 1/10/2024 29,938 0.00%
Maturity Fair Value % of Total Principal Coupon Date US Dollars ($) Net Assets
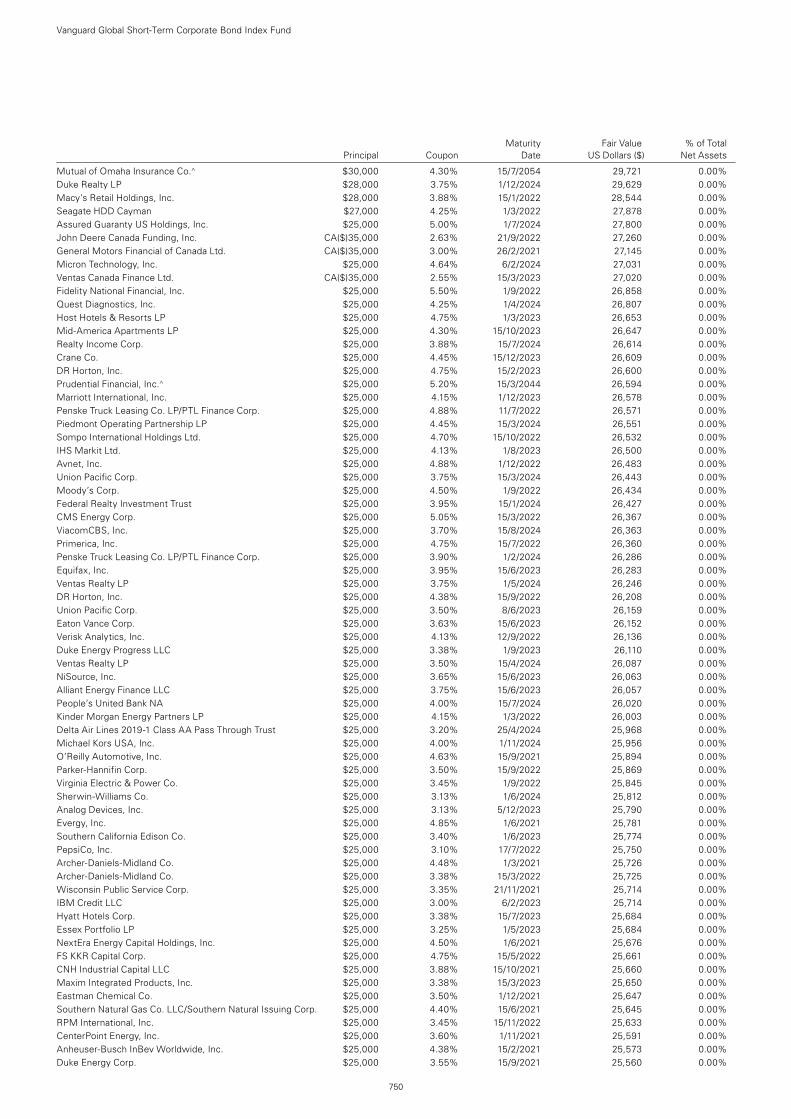
Vanguard Global Short-Term Corporate Bond Index Fund
750
Mutual of Omaha Insurance Co.^ $30,000 4.30% 15/7/2054 29,721 0.00%Duke Realty LP $28,000 3.75% 1/12/2024 29,629 0.00%Macy’s Retail Holdings, Inc. $28,000 3.88% 15/1/2022 28,544 0.00%Seagate HDD Cayman $27,000 4.25% 1/3/2022 27,878 0.00%Assured Guaranty US Holdings, Inc. $25,000 5.00% 1/7/2024 27,800 0.00%John Deere Canada Funding, Inc. CA($)35,000 2.63% 21/9/2022 27,260 0.00%General Motors Financial of Canada Ltd. CA($)35,000 3.00% 26/2/2021 27,145 0.00%Micron Technology, Inc. $25,000 4.64% 6/2/2024 27,031 0.00%Ventas Canada Finance Ltd. CA($)35,000 2.55% 15/3/2023 27,020 0.00%Fidelity National Financial, Inc. $25,000 5.50% 1/9/2022 26,858 0.00%Quest Diagnostics, Inc. $25,000 4.25% 1/4/2024 26,807 0.00%Host Hotels & Resorts LP $25,000 4.75% 1/3/2023 26,653 0.00%Mid-America Apartments LP $25,000 4.30% 15/10/2023 26,647 0.00%Realty Income Corp. $25,000 3.88% 15/7/2024 26,614 0.00%Crane Co. $25,000 4.45% 15/12/2023 26,609 0.00%DR Horton, Inc. $25,000 4.75% 15/2/2023 26,600 0.00%Prudential Financial, Inc.^ $25,000 5.20% 15/3/2044 26,594 0.00%Marriott International, Inc. $25,000 4.15% 1/12/2023 26,578 0.00%Penske Truck Leasing Co. LP/PTL Finance Corp. $25,000 4.88% 11/7/2022 26,571 0.00%Piedmont Operating Partnership LP $25,000 4.45% 15/3/2024 26,551 0.00%Sompo International Holdings Ltd. $25,000 4.70% 15/10/2022 26,532 0.00%IHS Markit Ltd. $25,000 4.13% 1/8/2023 26,500 0.00%Avnet, Inc. $25,000 4.88% 1/12/2022 26,483 0.00%Union Pacific Corp. $25,000 3.75% 15/3/2024 26,443 0.00%Moody’s Corp. $25,000 4.50% 1/9/2022 26,434 0.00%Federal Realty Investment Trust $25,000 3.95% 15/1/2024 26,427 0.00%CMS Energy Corp. $25,000 5.05% 15/3/2022 26,367 0.00%ViacomCBS, Inc. $25,000 3.70% 15/8/2024 26,363 0.00%Primerica, Inc. $25,000 4.75% 15/7/2022 26,360 0.00%Penske Truck Leasing Co. LP/PTL Finance Corp. $25,000 3.90% 1/2/2024 26,286 0.00%Equifax, Inc. $25,000 3.95% 15/6/2023 26,283 0.00%Ventas Realty LP $25,000 3.75% 1/5/2024 26,246 0.00%DR Horton, Inc. $25,000 4.38% 15/9/2022 26,208 0.00%Union Pacific Corp. $25,000 3.50% 8/6/2023 26,159 0.00%Eaton Vance Corp. $25,000 3.63% 15/6/2023 26,152 0.00%Verisk Analytics, Inc. $25,000 4.13% 12/9/2022 26,136 0.00%Duke Energy Progress LLC $25,000 3.38% 1/9/2023 26,110 0.00%Ventas Realty LP $25,000 3.50% 15/4/2024 26,087 0.00%NiSource, Inc. $25,000 3.65% 15/6/2023 26,063 0.00%Alliant Energy Finance LLC $25,000 3.75% 15/6/2023 26,057 0.00%People’s United Bank NA $25,000 4.00% 15/7/2024 26,020 0.00%Kinder Morgan Energy Partners LP $25,000 4.15% 1/3/2022 26,003 0.00%Delta Air Lines 2019-1 Class AA Pass Through Trust $25,000 3.20% 25/4/2024 25,968 0.00%Michael Kors USA, Inc. $25,000 4.00% 1/11/2024 25,956 0.00%O’Reilly Automotive, Inc. $25,000 4.63% 15/9/2021 25,894 0.00%Parker-Hannifin Corp. $25,000 3.50% 15/9/2022 25,869 0.00%Virginia Electric & Power Co. $25,000 3.45% 1/9/2022 25,845 0.00%Sherwin-Williams Co. $25,000 3.13% 1/6/2024 25,812 0.00%Analog Devices, Inc. $25,000 3.13% 5/12/2023 25,790 0.00%Evergy, Inc. $25,000 4.85% 1/6/2021 25,781 0.00%Southern California Edison Co. $25,000 3.40% 1/6/2023 25,774 0.00%PepsiCo, Inc. $25,000 3.10% 17/7/2022 25,750 0.00%Archer-Daniels-Midland Co. $25,000 4.48% 1/3/2021 25,726 0.00%Archer-Daniels-Midland Co. $25,000 3.38% 15/3/2022 25,725 0.00%Wisconsin Public Service Corp. $25,000 3.35% 21/11/2021 25,714 0.00%IBM Credit LLC $25,000 3.00% 6/2/2023 25,714 0.00%Hyatt Hotels Corp. $25,000 3.38% 15/7/2023 25,684 0.00%Essex Portfolio LP $25,000 3.25% 1/5/2023 25,684 0.00%NextEra Energy Capital Holdings, Inc. $25,000 4.50% 1/6/2021 25,676 0.00%FS KKR Capital Corp. $25,000 4.75% 15/5/2022 25,661 0.00%CNH Industrial Capital LLC $25,000 3.88% 15/10/2021 25,660 0.00%Maxim Integrated Products, Inc. $25,000 3.38% 15/3/2023 25,650 0.00%Eastman Chemical Co. $25,000 3.50% 1/12/2021 25,647 0.00%Southern Natural Gas Co. LLC/Southern Natural Issuing Corp. $25,000 4.40% 15/6/2021 25,645 0.00%RPM International, Inc. $25,000 3.45% 15/11/2022 25,633 0.00%CenterPoint Energy, Inc. $25,000 3.60% 1/11/2021 25,591 0.00%Anheuser-Busch InBev Worldwide, Inc. $25,000 4.38% 15/2/2021 25,573 0.00%Duke Energy Corp. $25,000 3.55% 15/9/2021 25,560 0.00%
Maturity Fair Value % of Total Principal Coupon Date US Dollars ($) Net Assets
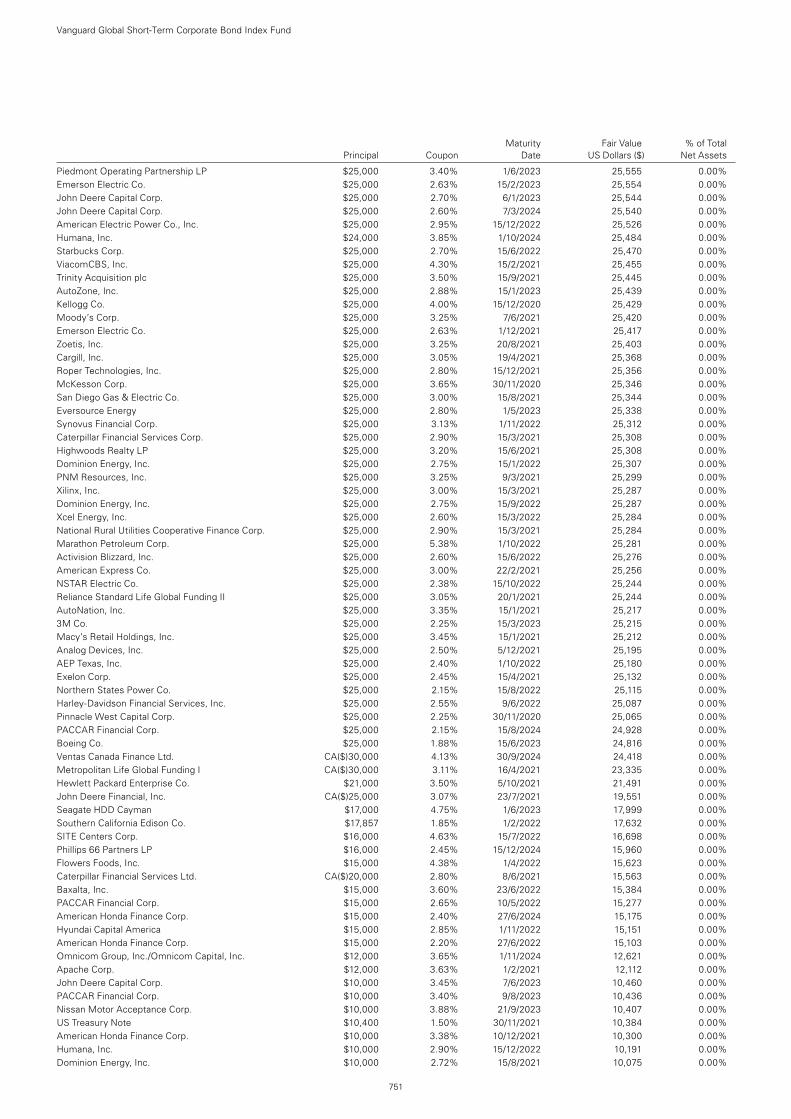
Vanguard Global Short-Term Corporate Bond Index Fund
751
Piedmont Operating Partnership LP $25,000 3.40% 1/6/2023 25,555 0.00%Emerson Electric Co. $25,000 2.63% 15/2/2023 25,554 0.00%John Deere Capital Corp. $25,000 2.70% 6/1/2023 25,544 0.00%John Deere Capital Corp. $25,000 2.60% 7/3/2024 25,540 0.00%American Electric Power Co., Inc. $25,000 2.95% 15/12/2022 25,526 0.00%Humana, Inc. $24,000 3.85% 1/10/2024 25,484 0.00%Starbucks Corp. $25,000 2.70% 15/6/2022 25,470 0.00%ViacomCBS, Inc. $25,000 4.30% 15/2/2021 25,455 0.00%Trinity Acquisition plc $25,000 3.50% 15/9/2021 25,445 0.00%AutoZone, Inc. $25,000 2.88% 15/1/2023 25,439 0.00%Kellogg Co. $25,000 4.00% 15/12/2020 25,429 0.00%Moody’s Corp. $25,000 3.25% 7/6/2021 25,420 0.00%Emerson Electric Co. $25,000 2.63% 1/12/2021 25,417 0.00%Zoetis, Inc. $25,000 3.25% 20/8/2021 25,403 0.00%Cargill, Inc. $25,000 3.05% 19/4/2021 25,368 0.00%Roper Technologies, Inc. $25,000 2.80% 15/12/2021 25,356 0.00%McKesson Corp. $25,000 3.65% 30/11/2020 25,346 0.00%San Diego Gas & Electric Co. $25,000 3.00% 15/8/2021 25,344 0.00%Eversource Energy $25,000 2.80% 1/5/2023 25,338 0.00%Synovus Financial Corp. $25,000 3.13% 1/11/2022 25,312 0.00%Caterpillar Financial Services Corp. $25,000 2.90% 15/3/2021 25,308 0.00%Highwoods Realty LP $25,000 3.20% 15/6/2021 25,308 0.00%Dominion Energy, Inc. $25,000 2.75% 15/1/2022 25,307 0.00%PNM Resources, Inc. $25,000 3.25% 9/3/2021 25,299 0.00%Xilinx, Inc. $25,000 3.00% 15/3/2021 25,287 0.00%Dominion Energy, Inc. $25,000 2.75% 15/9/2022 25,287 0.00%Xcel Energy, Inc. $25,000 2.60% 15/3/2022 25,284 0.00%National Rural Utilities Cooperative Finance Corp. $25,000 2.90% 15/3/2021 25,284 0.00%Marathon Petroleum Corp. $25,000 5.38% 1/10/2022 25,281 0.00%Activision Blizzard, Inc. $25,000 2.60% 15/6/2022 25,276 0.00%American Express Co. $25,000 3.00% 22/2/2021 25,256 0.00%NSTAR Electric Co. $25,000 2.38% 15/10/2022 25,244 0.00%Reliance Standard Life Global Funding II $25,000 3.05% 20/1/2021 25,244 0.00%AutoNation, Inc. $25,000 3.35% 15/1/2021 25,217 0.00%3M Co. $25,000 2.25% 15/3/2023 25,215 0.00%Macy’s Retail Holdings, Inc. $25,000 3.45% 15/1/2021 25,212 0.00%Analog Devices, Inc. $25,000 2.50% 5/12/2021 25,195 0.00%AEP Texas, Inc. $25,000 2.40% 1/10/2022 25,180 0.00%Exelon Corp. $25,000 2.45% 15/4/2021 25,132 0.00%Northern States Power Co. $25,000 2.15% 15/8/2022 25,115 0.00%Harley-Davidson Financial Services, Inc. $25,000 2.55% 9/6/2022 25,087 0.00%Pinnacle West Capital Corp. $25,000 2.25% 30/11/2020 25,065 0.00%PACCAR Financial Corp. $25,000 2.15% 15/8/2024 24,928 0.00%Boeing Co. $25,000 1.88% 15/6/2023 24,816 0.00%Ventas Canada Finance Ltd. CA($)30,000 4.13% 30/9/2024 24,418 0.00%Metropolitan Life Global Funding I CA($)30,000 3.11% 16/4/2021 23,335 0.00%Hewlett Packard Enterprise Co. $21,000 3.50% 5/10/2021 21,491 0.00%John Deere Financial, Inc. CA($)25,000 3.07% 23/7/2021 19,551 0.00%Seagate HDD Cayman $17,000 4.75% 1/6/2023 17,999 0.00%Southern California Edison Co. $17,857 1.85% 1/2/2022 17,632 0.00%SITE Centers Corp. $16,000 4.63% 15/7/2022 16,698 0.00%Phillips 66 Partners LP $16,000 2.45% 15/12/2024 15,960 0.00%Flowers Foods, Inc. $15,000 4.38% 1/4/2022 15,623 0.00%Caterpillar Financial Services Ltd. CA($)20,000 2.80% 8/6/2021 15,563 0.00%Baxalta, Inc. $15,000 3.60% 23/6/2022 15,384 0.00%PACCAR Financial Corp. $15,000 2.65% 10/5/2022 15,277 0.00%American Honda Finance Corp. $15,000 2.40% 27/6/2024 15,175 0.00%Hyundai Capital America $15,000 2.85% 1/11/2022 15,151 0.00%American Honda Finance Corp. $15,000 2.20% 27/6/2022 15,103 0.00%Omnicom Group, Inc./Omnicom Capital, Inc. $12,000 3.65% 1/11/2024 12,621 0.00%Apache Corp. $12,000 3.63% 1/2/2021 12,112 0.00%John Deere Capital Corp. $10,000 3.45% 7/6/2023 10,460 0.00%PACCAR Financial Corp. $10,000 3.40% 9/8/2023 10,436 0.00%Nissan Motor Acceptance Corp. $10,000 3.88% 21/9/2023 10,407 0.00%US Treasury Note $10,400 1.50% 30/11/2021 10,384 0.00%American Honda Finance Corp. $10,000 3.38% 10/12/2021 10,300 0.00%Humana, Inc. $10,000 2.90% 15/12/2022 10,191 0.00%Dominion Energy, Inc. $10,000 2.72% 15/8/2021 10,075 0.00%
Maturity Fair Value % of Total Principal Coupon Date US Dollars ($) Net Assets
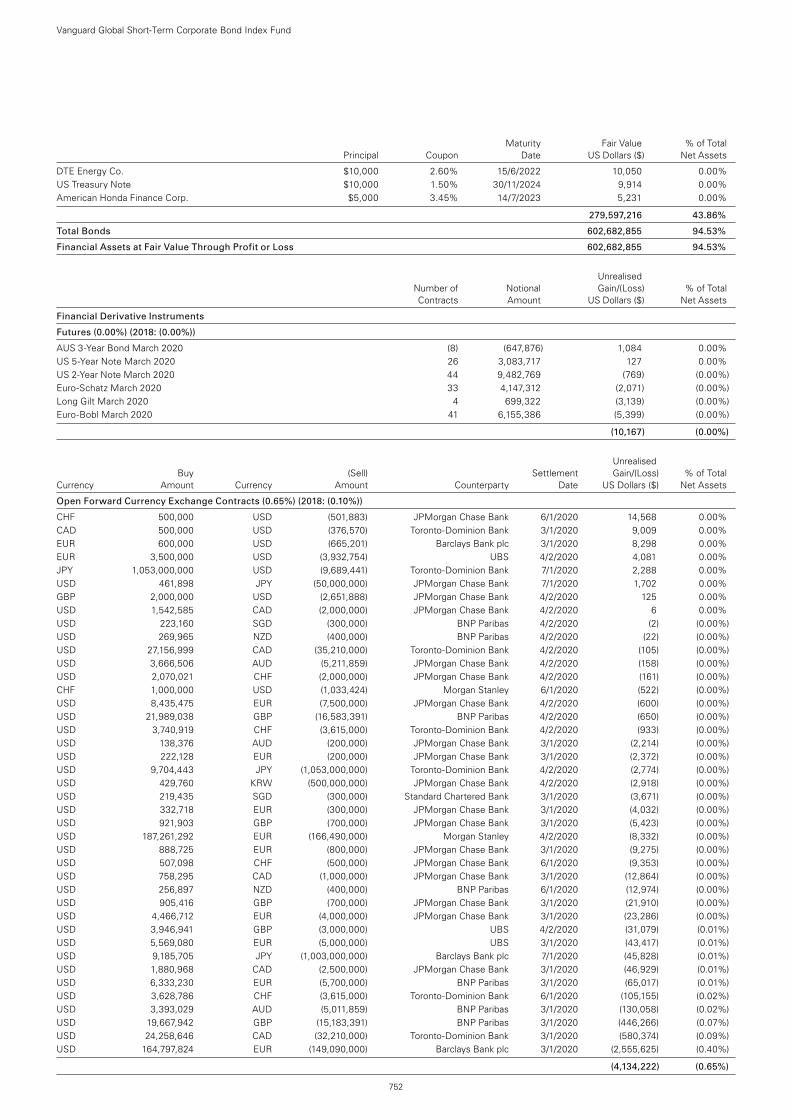
DTE Energy Co. $10,000 2.60% 15/6/2022 10,050 0.00%US Treasury Note $10,000 1.50% 30/11/2024 9,914 0.00%American Honda Finance Corp. $5,000 3.45% 14/7/2023 5,231 0.00%
279,597,216 43.86%
Total Bonds 602,682,855 94.53%
Financial Assets at Fair Value Through Profit or Loss 602,682,855 94.53%
Unrealised Number of Notional Gain/(Loss) % of Total Contracts Amount US Dollars ($) Net Assets
Financial Derivative Instruments
Futures (0.00%) (2018: (0.00%))
AUS 3-Year Bond March 2020 (8) (647,876) 1,084 0.00%US 5-Year Note March 2020 26 3,083,717 127 0.00%US 2-Year Note March 2020 44 9,482,769 (769) (0.00%)Euro-Schatz March 2020 33 4,147,312 (2,071) (0.00%)Long Gilt March 2020 4 699,322 (3,139) (0.00%)Euro-Bobl March 2020 41 6,155,386 (5,399) (0.00%)
(10,167) (0.00%)
Unrealised Buy (Sell) Settlement Gain/(Loss) % of Total Currency Amount Currency Amount Counterparty Date US Dollars ($) Net Assets
Open Forward Currency Exchange Contracts (0.65%) (2018: (0.10%))
CHF 500,000 USD (501,883) JPMorgan Chase Bank 6/1/2020 14,568 0.00%CAD 500,000 USD (376,570) Toronto-Dominion Bank 3/1/2020 9,009 0.00%EUR 600,000 USD (665,201) Barclays Bank plc 3/1/2020 8,298 0.00%EUR 3,500,000 USD (3,932,754) UBS 4/2/2020 4,081 0.00%JPY 1,053,000,000 USD (9,689,441) Toronto-Dominion Bank 7/1/2020 2,288 0.00%USD 461,898 JPY (50,000,000) JPMorgan Chase Bank 7/1/2020 1,702 0.00%GBP 2,000,000 USD (2,651,888) JPMorgan Chase Bank 4/2/2020 125 0.00%USD 1,542,585 CAD (2,000,000) JPMorgan Chase Bank 4/2/2020 6 0.00%USD 223,160 SGD (300,000) BNP Paribas 4/2/2020 (2) (0.00%)USD 269,965 NZD (400,000) BNP Paribas 4/2/2020 (22) (0.00%)USD 27,156,999 CAD (35,210,000) Toronto-Dominion Bank 4/2/2020 (105) (0.00%)USD 3,666,506 AUD (5,211,859) JPMorgan Chase Bank 4/2/2020 (158) (0.00%)USD 2,070,021 CHF (2,000,000) JPMorgan Chase Bank 4/2/2020 (161) (0.00%)CHF 1,000,000 USD (1,033,424) Morgan Stanley 6/1/2020 (522) (0.00%)USD 8,435,475 EUR (7,500,000) JPMorgan Chase Bank 4/2/2020 (600) (0.00%)USD 21,989,038 GBP (16,583,391) BNP Paribas 4/2/2020 (650) (0.00%)USD 3,740,919 CHF (3,615,000) Toronto-Dominion Bank 4/2/2020 (933) (0.00%)USD 138,376 AUD (200,000) JPMorgan Chase Bank 3/1/2020 (2,214) (0.00%)USD 222,128 EUR (200,000) JPMorgan Chase Bank 3/1/2020 (2,372) (0.00%)USD 9,704,443 JPY (1,053,000,000) Toronto-Dominion Bank 4/2/2020 (2,774) (0.00%)USD 429,760 KRW (500,000,000) JPMorgan Chase Bank 4/2/2020 (2,918) (0.00%)USD 219,435 SGD (300,000) Standard Chartered Bank 3/1/2020 (3,671) (0.00%)USD 332,718 EUR (300,000) JPMorgan Chase Bank 3/1/2020 (4,032) (0.00%)USD 921,903 GBP (700,000) JPMorgan Chase Bank 3/1/2020 (5,423) (0.00%)USD 187,261,292 EUR (166,490,000) Morgan Stanley 4/2/2020 (8,332) (0.00%)USD 888,725 EUR (800,000) JPMorgan Chase Bank 3/1/2020 (9,275) (0.00%)USD 507,098 CHF (500,000) JPMorgan Chase Bank 6/1/2020 (9,353) (0.00%)USD 758,295 CAD (1,000,000) JPMorgan Chase Bank 3/1/2020 (12,864) (0.00%)USD 256,897 NZD (400,000) BNP Paribas 6/1/2020 (12,974) (0.00%)USD 905,416 GBP (700,000) JPMorgan Chase Bank 3/1/2020 (21,910) (0.00%)USD 4,466,712 EUR (4,000,000) JPMorgan Chase Bank 3/1/2020 (23,286) (0.00%)USD 3,946,941 GBP (3,000,000) UBS 4/2/2020 (31,079) (0.01%)USD 5,569,080 EUR (5,000,000) UBS 3/1/2020 (43,417) (0.01%)USD 9,185,705 JPY (1,003,000,000) Barclays Bank plc 7/1/2020 (45,828) (0.01%)USD 1,880,968 CAD (2,500,000) JPMorgan Chase Bank 3/1/2020 (46,929) (0.01%)USD 6,333,230 EUR (5,700,000) BNP Paribas 3/1/2020 (65,017) (0.01%)USD 3,628,786 CHF (3,615,000) Toronto-Dominion Bank 6/1/2020 (105,155) (0.02%)USD 3,393,029 AUD (5,011,859) BNP Paribas 3/1/2020 (130,058) (0.02%)USD 19,667,942 GBP (15,183,391) BNP Paribas 3/1/2020 (446,266) (0.07%)USD 24,258,646 CAD (32,210,000) Toronto-Dominion Bank 3/1/2020 (580,374) (0.09%)USD 164,797,824 EUR (149,090,000) Barclays Bank plc 3/1/2020 (2,555,625) (0.40%)
(4,134,222) (0.65%)
Maturity Fair Value % of Total Principal Coupon Date US Dollars ($) Net Assets
Vanguard Global Short-Term Corporate Bond Index Fund
752
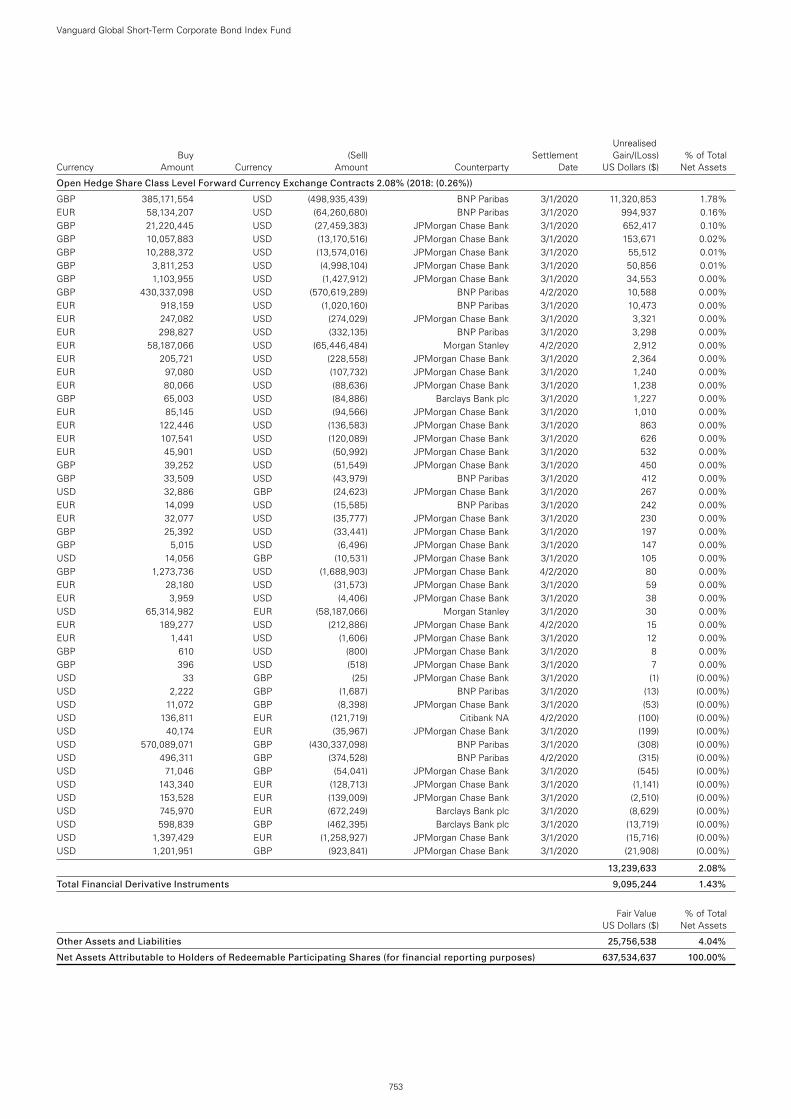
Open Hedge Share Class Level Forward Currency Exchange Contracts 2.08% (2018: (0.26%))
GBP 385,171,554 USD (498,935,439) BNP Paribas 3/1/2020 11,320,853 1.78%EUR 58,134,207 USD (64,260,680) BNP Paribas 3/1/2020 994,937 0.16%GBP 21,220,445 USD (27,459,383) JPMorgan Chase Bank 3/1/2020 652,417 0.10%GBP 10,057,883 USD (13,170,516) JPMorgan Chase Bank 3/1/2020 153,671 0.02%GBP 10,288,372 USD (13,574,016) JPMorgan Chase Bank 3/1/2020 55,512 0.01%GBP 3,811,253 USD (4,998,104) JPMorgan Chase Bank 3/1/2020 50,856 0.01%GBP 1,103,955 USD (1,427,912) JPMorgan Chase Bank 3/1/2020 34,553 0.00%GBP 430,337,098 USD (570,619,289) BNP Paribas 4/2/2020 10,588 0.00%EUR 918,159 USD (1,020,160) BNP Paribas 3/1/2020 10,473 0.00%EUR 247,082 USD (274,029) JPMorgan Chase Bank 3/1/2020 3,321 0.00%EUR 298,827 USD (332,135) BNP Paribas 3/1/2020 3,298 0.00%EUR 58,187,066 USD (65,446,484) Morgan Stanley 4/2/2020 2,912 0.00%EUR 205,721 USD (228,558) JPMorgan Chase Bank 3/1/2020 2,364 0.00%EUR 97,080 USD (107,732) JPMorgan Chase Bank 3/1/2020 1,240 0.00%EUR 80,066 USD (88,636) JPMorgan Chase Bank 3/1/2020 1,238 0.00%GBP 65,003 USD (84,886) Barclays Bank plc 3/1/2020 1,227 0.00%EUR 85,145 USD (94,566) JPMorgan Chase Bank 3/1/2020 1,010 0.00%EUR 122,446 USD (136,583) JPMorgan Chase Bank 3/1/2020 863 0.00%EUR 107,541 USD (120,089) JPMorgan Chase Bank 3/1/2020 626 0.00%EUR 45,901 USD (50,992) JPMorgan Chase Bank 3/1/2020 532 0.00%GBP 39,252 USD (51,549) JPMorgan Chase Bank 3/1/2020 450 0.00%GBP 33,509 USD (43,979) BNP Paribas 3/1/2020 412 0.00%USD 32,886 GBP (24,623) JPMorgan Chase Bank 3/1/2020 267 0.00%EUR 14,099 USD (15,585) BNP Paribas 3/1/2020 242 0.00%EUR 32,077 USD (35,777) JPMorgan Chase Bank 3/1/2020 230 0.00%GBP 25,392 USD (33,441) JPMorgan Chase Bank 3/1/2020 197 0.00%GBP 5,015 USD (6,496) JPMorgan Chase Bank 3/1/2020 147 0.00%USD 14,056 GBP (10,531) JPMorgan Chase Bank 3/1/2020 105 0.00%GBP 1,273,736 USD (1,688,903) JPMorgan Chase Bank 4/2/2020 80 0.00%EUR 28,180 USD (31,573) JPMorgan Chase Bank 3/1/2020 59 0.00%EUR 3,959 USD (4,406) JPMorgan Chase Bank 3/1/2020 38 0.00%USD 65,314,982 EUR (58,187,066) Morgan Stanley 3/1/2020 30 0.00%EUR 189,277 USD (212,886) JPMorgan Chase Bank 4/2/2020 15 0.00%EUR 1,441 USD (1,606) JPMorgan Chase Bank 3/1/2020 12 0.00%GBP 610 USD (800) JPMorgan Chase Bank 3/1/2020 8 0.00%GBP 396 USD (518) JPMorgan Chase Bank 3/1/2020 7 0.00%USD 33 GBP (25) JPMorgan Chase Bank 3/1/2020 (1) (0.00%)USD 2,222 GBP (1,687) BNP Paribas 3/1/2020 (13) (0.00%)USD 11,072 GBP (8,398) JPMorgan Chase Bank 3/1/2020 (53) (0.00%)USD 136,811 EUR (121,719) Citibank NA 4/2/2020 (100) (0.00%)USD 40,174 EUR (35,967) JPMorgan Chase Bank 3/1/2020 (199) (0.00%)USD 570,089,071 GBP (430,337,098) BNP Paribas 3/1/2020 (308) (0.00%)USD 496,311 GBP (374,528) BNP Paribas 4/2/2020 (315) (0.00%)USD 71,046 GBP (54,041) JPMorgan Chase Bank 3/1/2020 (545) (0.00%)USD 143,340 EUR (128,713) JPMorgan Chase Bank 3/1/2020 (1,141) (0.00%)USD 153,528 EUR (139,009) JPMorgan Chase Bank 3/1/2020 (2,510) (0.00%)USD 745,970 EUR (672,249) Barclays Bank plc 3/1/2020 (8,629) (0.00%)USD 598,839 GBP (462,395) Barclays Bank plc 3/1/2020 (13,719) (0.00%)USD 1,397,429 EUR (1,258,927) JPMorgan Chase Bank 3/1/2020 (15,716) (0.00%)USD 1,201,951 GBP (923,841) JPMorgan Chase Bank 3/1/2020 (21,908) (0.00%)
13,239,633 2.08%
Total Financial Derivative Instruments 9,095,244 1.43%
Fair Value % of Total US Dollars ($) Net Assets
Other Assets and Liabilities 25,756,538 4.04%
Net Assets Attributable to Holders of Redeemable Participating Shares (for financial reporting purposes) 637,534,637 100.00%
Unrealised Buy (Sell) Settlement Gain/(Loss) % of Total Currency Amount Currency Amount Counterparty Date US Dollars ($) Net Assets
Vanguard Global Short-Term Corporate Bond Index Fund
753
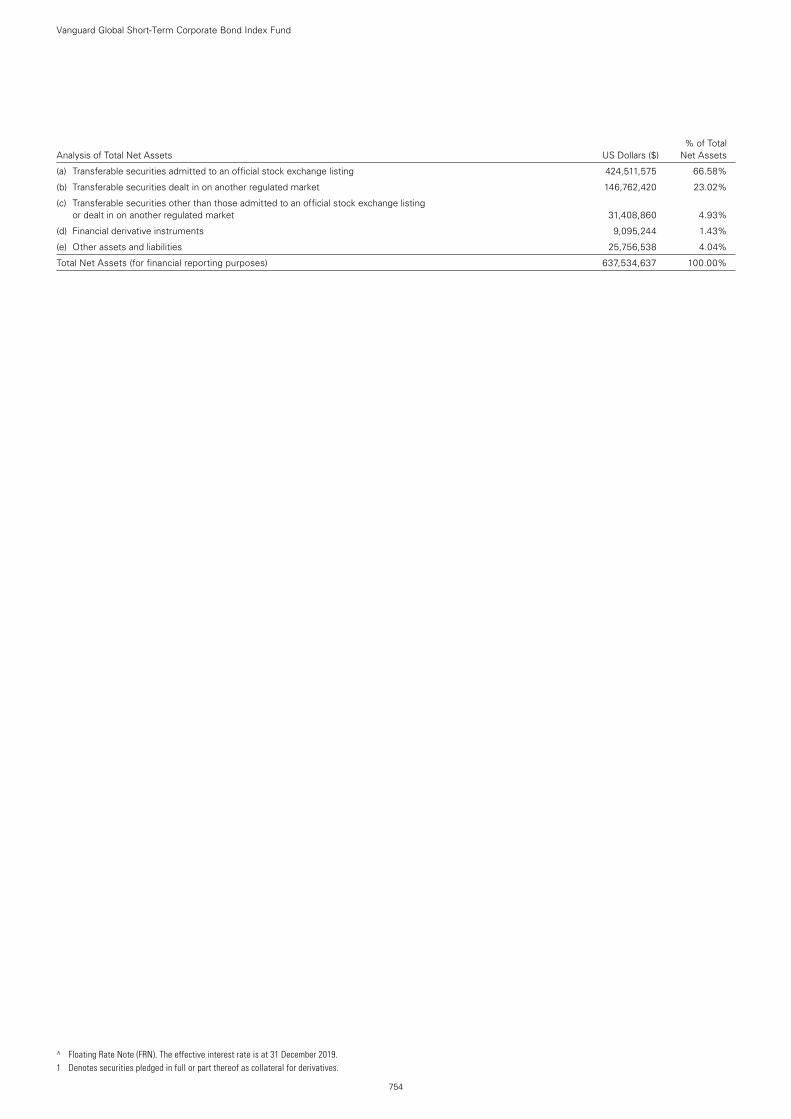
% of Total Analysis of Total Net Assets US Dollars ($) Net Assets
(a) Transferable securities admitted to an official stock exchange listing 424,511,575 66.58%
(b) Transferable securities dealt in on another regulated market 146,762,420 23.02%
(c) Transferable securities other than those admitted to an official stock exchange listing or dealt in on another regulated market 31,408,860 4.93%
(d) Financial derivative instruments 9,095,244 1.43%
(e) Other assets and liabilities 25,756,538 4.04%
Total Net Assets (for financial reporting purposes) 637,534,637 100.00%
Vanguard Global Short-Term Corporate Bond Index Fund
754
^ Floating Rate Note (FRN). The effective interest rate is at 31 December 2019. 1 Denotes securities pledged in full or part thereof as collateral for derivatives.
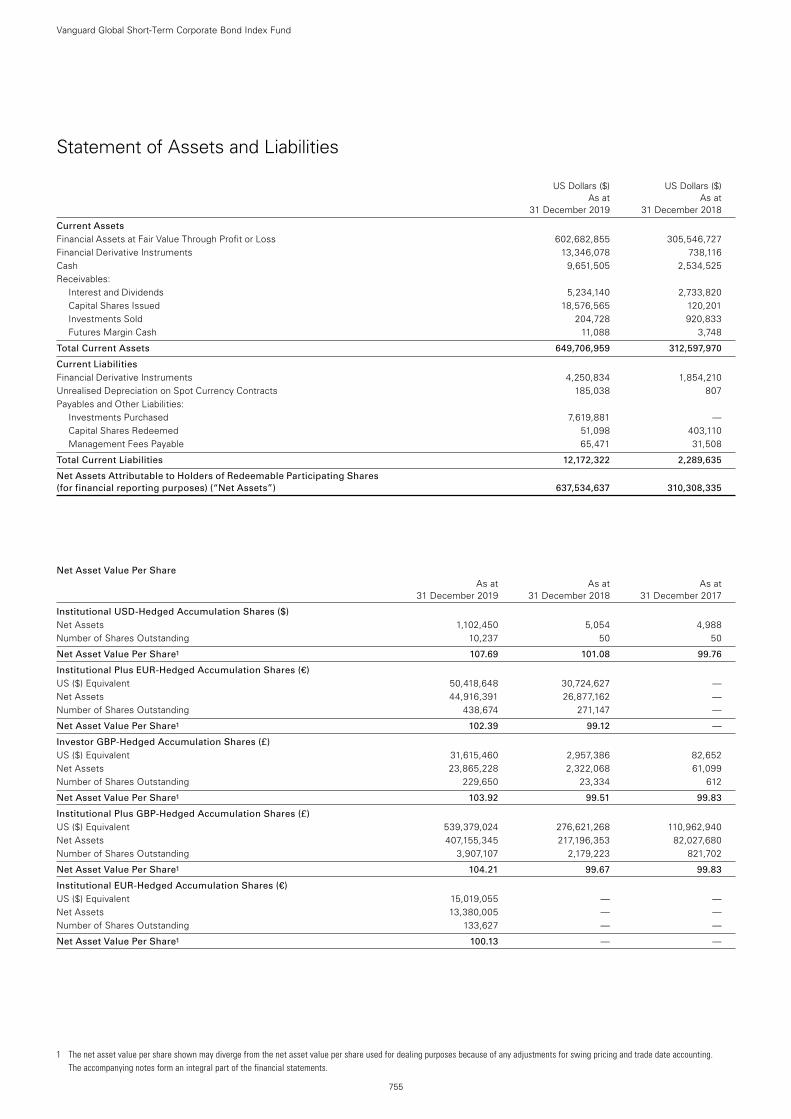
1 The net asset value per share shown may diverge from the net asset value per share used for dealing purposes because of any adjustments for swing pricing and trade date accounting. The accompanying notes form an integral part of the financial statements.
755
Vanguard Global Short-Term Corporate Bond Index Fund
Statement of Assets and Liabilities
US Dollars ($) US Dollars ($) As at As at 31 December 2019 31 December 2018
Current Assets Financial Assets at Fair Value Through Profit or Loss 602,682,855 305,546,727Financial Derivative Instruments 13,346,078 738,116Cash 9,651,505 2,534,525Receivables:
Interest and Dividends 5,234,140 2,733,820Capital Shares Issued 18,576,565 120,201Investments Sold 204,728 920,833Futures Margin Cash 11,088 3,748
Total Current Assets 649,706,959 312,597,970
Current Liabilities Financial Derivative Instruments 4,250,834 1,854,210Unrealised Depreciation on Spot Currency Contracts 185,038 807Payables and Other Liabilities:
Investments Purchased 7,619,881 —Capital Shares Redeemed 51,098 403,110Management Fees Payable 65,471 31,508
Total Current Liabilities 12,172,322 2,289,635
Net Assets Attributable to Holders of Redeemable Participating Shares (for financial reporting purposes) (“Net Assets”) 637,534,637 310,308,335
Net Asset Value Per Share As at As at As at 31 December 2019 31 December 2018 31 December 2017
Institutional USD-Hedged Accumulation Shares ($) Net Assets 1,102,450 5,054 4,988Number of Shares Outstanding 10,237 50 50
Net Asset Value Per Share1 107.69 101.08 99.76
Institutional Plus EUR-Hedged Accumulation Shares (€) US ($) Equivalent 50,418,648 30,724,627 —Net Assets 44,916,391 26,877,162 —Number of Shares Outstanding 438,674 271,147 —
Net Asset Value Per Share1 102.39 99.12 —
Investor GBP-Hedged Accumulation Shares (£) US ($) Equivalent 31,615,460 2,957,386 82,652Net Assets 23,865,228 2,322,068 61,099Number of Shares Outstanding 229,650 23,334 612
Net Asset Value Per Share1 103.92 99.51 99.83
Institutional Plus GBP-Hedged Accumulation Shares (£) US ($) Equivalent 539,379,024 276,621,268 110,962,940Net Assets 407,155,345 217,196,353 82,027,680Number of Shares Outstanding 3,907,107 2,179,223 821,702
Net Asset Value Per Share1 104.21 99.67 99.83
Institutional EUR-Hedged Accumulation Shares (€) US ($) Equivalent 15,019,055 — —Net Assets 13,380,005 — —Number of Shares Outstanding 133,627 — —
Net Asset Value Per Share1 100.13 — —
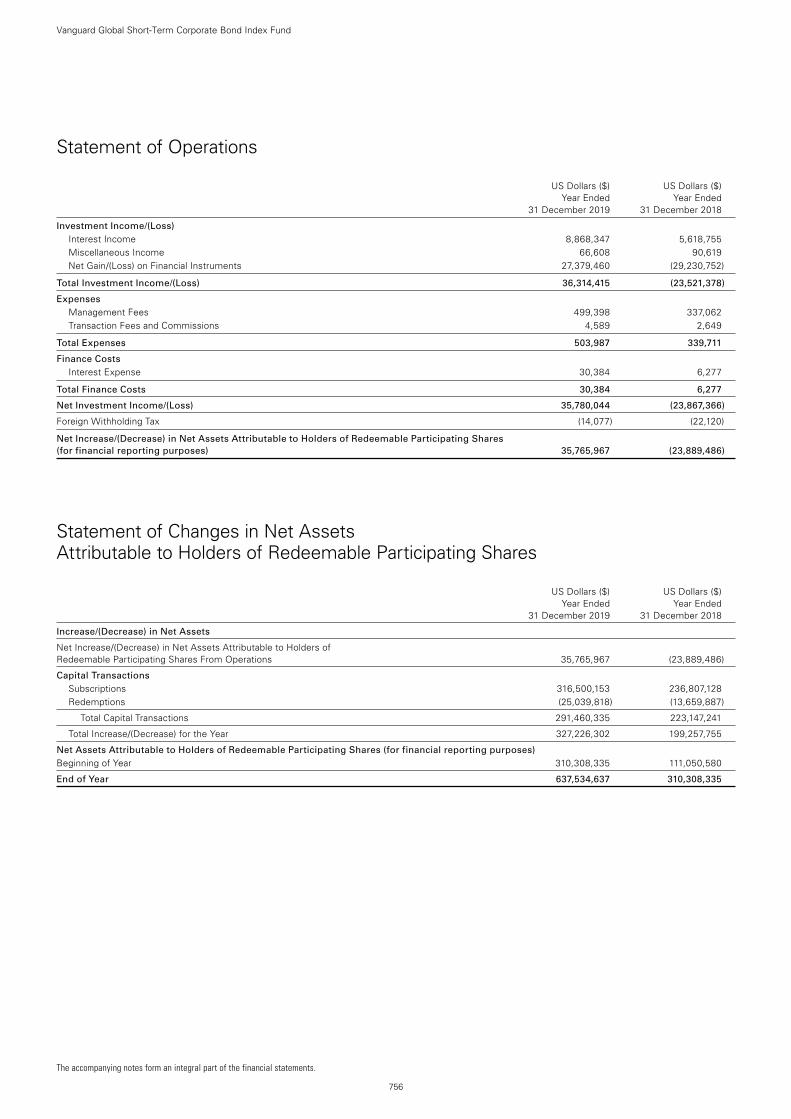
756
Vanguard Global Short-Term Corporate Bond Index Fund
Statement of Operations
US Dollars ($) US Dollars ($) Year Ended Year Ended 31 December 2019 31 December 2018
Investment Income/(Loss) Interest Income 8,868,347 5,618,755Miscellaneous Income 66,608 90,619Net Gain/(Loss) on Financial Instruments 27,379,460 (29,230,752)
Total Investment Income/(Loss) 36,314,415 (23,521,378)
Expenses Management Fees 499,398 337,062Transaction Fees and Commissions 4,589 2,649
Total Expenses 503,987 339,711
Finance Costs Interest Expense 30,384 6,277
Total Finance Costs 30,384 6,277
Net Investment Income/(Loss) 35,780,044 (23,867,366)
Foreign Withholding Tax (14,077) (22,120)
Net Increase/(Decrease) in Net Assets Attributable to Holders of Redeemable Participating Shares (for financial reporting purposes) 35,765,967 (23,889,486)
Statement of Changes in Net Assets Attributable to Holders of Redeemable Participating Shares
US Dollars ($) US Dollars ($) Year Ended Year Ended 31 December 2019 31 December 2018
Increase/(Decrease) in Net Assets
Net Increase/(Decrease) in Net Assets Attributable to Holders of Redeemable Participating Shares From Operations 35,765,967 (23,889,486)
Capital Transactions Subscriptions 316,500,153 236,807,128Redemptions (25,039,818) (13,659,887)
Total Capital Transactions 291,460,335 223,147,241
Total Increase/(Decrease) for the Year 327,226,302 199,257,755
Net Assets Attributable to Holders of Redeemable Participating Shares (for financial reporting purposes) Beginning of Year 310,308,335 111,050,580
End of Year 637,534,637 310,308,335
The accompanying notes form an integral part of the financial statements.
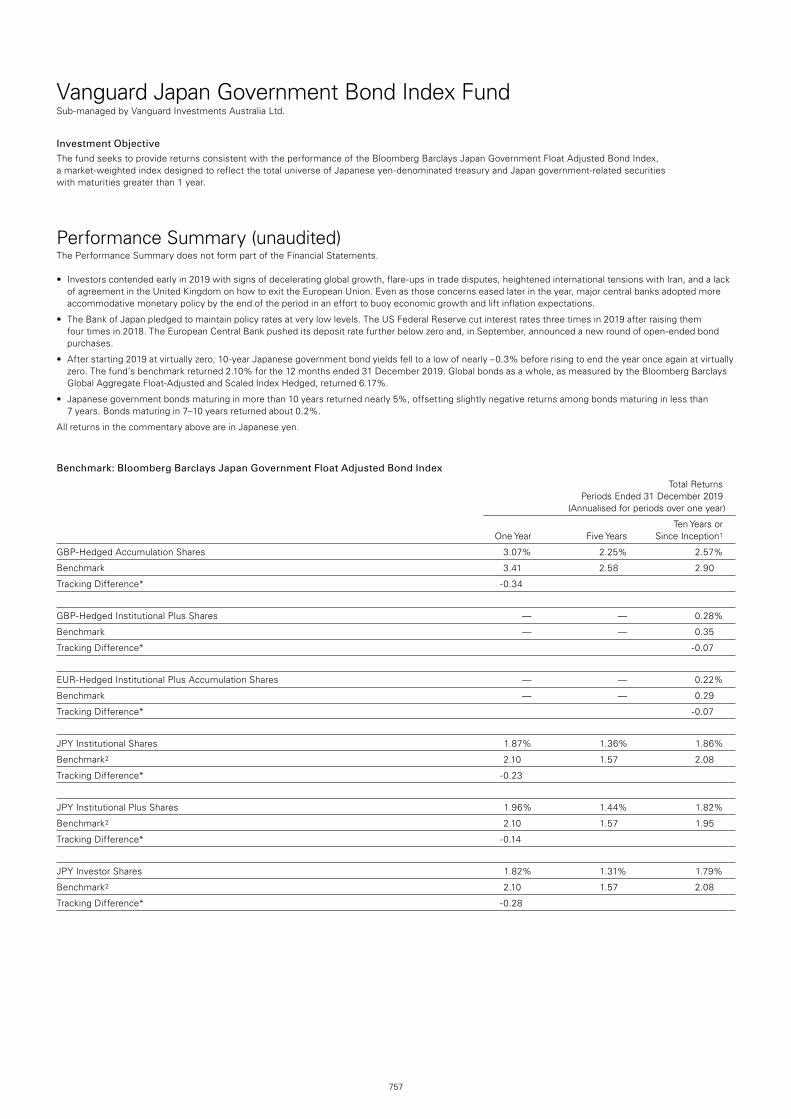
757
Vanguard Japan Government Bond Index FundSub-managed by Vanguard Investments Australia Ltd.
Investment ObjectiveThe fund seeks to provide returns consistent with the performance of the Bloomberg Barclays Japan Government Float Adjusted Bond Index, a market-weighted index designed to reflect the total universe of Japanese yen-denominated treasury and Japan government-related securities with maturities greater than 1 year.
Performance Summary (unaudited)The Performance Summary does not form part of the Financial Statements.
• Investorscontendedearlyin2019withsignsofdeceleratingglobalgrowth,flare-upsintradedisputes,heightenedinternationaltensionswithIran,andalackof agreement in the United Kingdom on how to exit the European Union. Even as those concerns eased later in the year, major central banks adopted more accommodative monetary policy by the end of the period in an effort to buoy economic growth and lift inflation expectations.
• TheBankofJapanpledgedtomaintainpolicyratesatverylowlevels.TheUSFederalReservecutinterestratesthreetimesin2019afterraisingthemfour times in 2018. The European Central Bank pushed its deposit rate further below zero and, in September, announced a new round of open-ended bond purchases.
• Afterstarting2019atvirtuallyzero,10-yearJapanesegovernmentbondyieldsfelltoalowofnearly–0.3%beforerisingtoendtheyearonceagainatvirtuallyzero. The fund’s benchmark returned 2.10% for the 12 months ended 31 December 2019. Global bonds as a whole, as measured by the Bloomberg Barclays Global Aggregate Float-Adjusted and Scaled Index Hedged, returned 6.17%.
• Japanesegovernmentbondsmaturinginmorethan10yearsreturnednearly5%,offsettingslightlynegativereturnsamongbondsmaturinginlessthan 7 years. Bonds maturing in 7–10 years returned about 0.2%.
All returns in the commentary above are in Japanese yen.
Benchmark: Bloomberg Barclays Japan Government Float Adjusted Bond Index
Total Returns Periods Ended 31 December 2019 (Annualised for periods over one year)
Ten Years or One Year Five Years Since Inception1
GBP-Hedged Accumulation Shares 3.07% 2.25% 2.57%
Benchmark 3.41 2.58 2.90
Tracking Difference* -0.34
GBP-Hedged Institutional Plus Shares — — 0.28%
Benchmark — — 0.35
Tracking Difference* -0.07
EUR-Hedged Institutional Plus Accumulation Shares — — 0.22%
Benchmark — — 0.29
Tracking Difference* -0.07
JPY Institutional Shares 1.87% 1.36% 1.86%
Benchmark2 2.10 1.57 2.08
Tracking Difference* -0.23
JPY Institutional Plus Shares 1.96% 1.44% 1.82%
Benchmark2 2.10 1.57 1.95
Tracking Difference* -0.14
JPY Investor Shares 1.82% 1.31% 1.79%
Benchmark2 2.10 1.57 2.08
Tracking Difference* -0.28
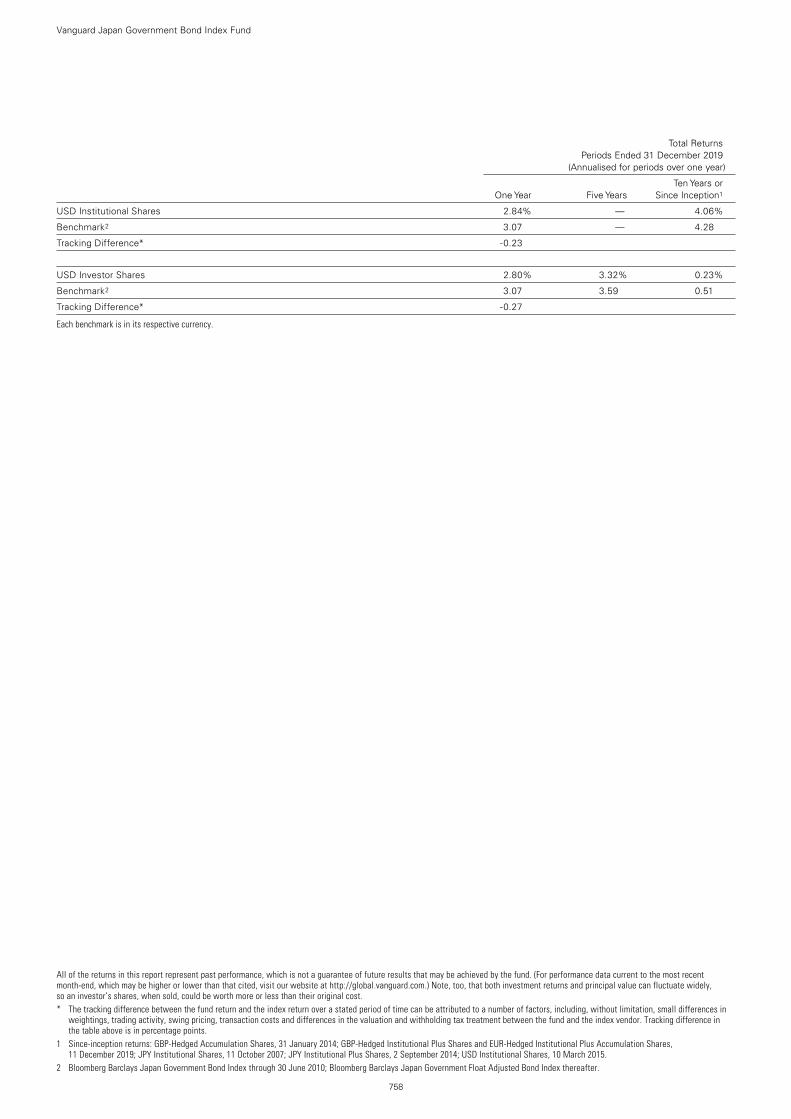
758
All of the returns in this report represent past performance, which is not a guarantee of future results that may be achieved by the fund. (For performance data current to the most recent month-end, which may be higher or lower than that cited, visit our website at http://global.vanguard.com.) Note, too, that both investment returns and principal value can fluctuate widely, so an investor’s shares, when sold, could be worth more or less than their original cost.* The tracking difference between the fund return and the index return over a stated period of time can be attributed to a number of factors, including, without limitation, small differences in
weightings, trading activity, swing pricing, transaction costs and differences in the valuation and withholding tax treatment between the fund and the index vendor. Tracking difference in the table above is in percentage points.
1 Since-inception returns: GBP-Hedged Accumulation Shares, 31 January 2014; GBP-Hedged Institutional Plus Shares and EUR-Hedged Institutional Plus Accumulation Shares, 11 December 2019; JPY Institutional Shares, 11 October 2007; JPY Institutional Plus Shares, 2 September 2014; USD Institutional Shares, 10 March 2015.
2 Bloomberg Barclays Japan Government Bond Index through 30 June 2010; Bloomberg Barclays Japan Government Float Adjusted Bond Index thereafter.
Total Returns Periods Ended 31 December 2019 (Annualised for periods over one year)
Ten Years or One Year Five Years Since Inception1
USD Institutional Shares 2.84% — 4.06%
Benchmark2 3.07 — 4.28
Tracking Difference* -0.23
USD Investor Shares 2.80% 3.32% 0.23%
Benchmark2 3.07 3.59 0.51
Tracking Difference* -0.27
Each benchmark is in its respective currency.
Vanguard Japan Government Bond Index Fund
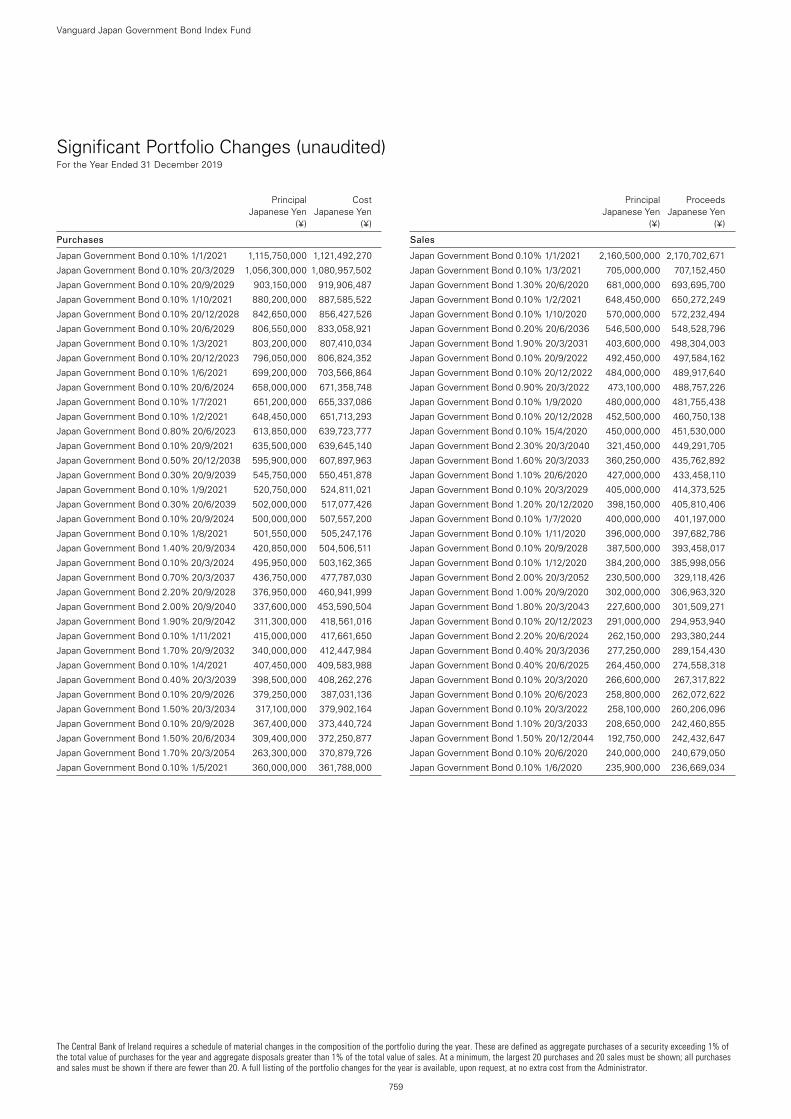
The Central Bank of Ireland requires a schedule of material changes in the composition of the portfolio during the year. These are defined as aggregate purchases of a security exceeding 1% of the total value of purchases for the year and aggregate disposals greater than 1% of the total value of sales. At a minimum, the largest 20 purchases and 20 sales must be shown; all purchases and sales must be shown if there are fewer than 20. A full listing of the portfolio changes for the year is available, upon request, at no extra cost from the Administrator.
759
Vanguard Japan Government Bond Index Fund
Significant Portfolio Changes (unaudited) For the Year Ended 31 December 2019
Principal Cost Japanese Yen Japanese Yen (¥) (¥)
Purchases
Japan Government Bond 0.10% 1/1/2021 1,115,750,000 1,121,492,270
Japan Government Bond 0.10% 20/3/2029 1,056,300,000 1,080,957,502
Japan Government Bond 0.10% 20/9/2029 903,150,000 919,906,487
Japan Government Bond 0.10% 1/10/2021 880,200,000 887,585,522
Japan Government Bond 0.10% 20/12/2028 842,650,000 856,427,526
Japan Government Bond 0.10% 20/6/2029 806,550,000 833,058,921
Japan Government Bond 0.10% 1/3/2021 803,200,000 807,410,034
Japan Government Bond 0.10% 20/12/2023 796,050,000 806,824,352
Japan Government Bond 0.10% 1/6/2021 699,200,000 703,566,864
Japan Government Bond 0.10% 20/6/2024 658,000,000 671,358,748
Japan Government Bond 0.10% 1/7/2021 651,200,000 655,337,086
Japan Government Bond 0.10% 1/2/2021 648,450,000 651,713,293
Japan Government Bond 0.80% 20/6/2023 613,850,000 639,723,777
Japan Government Bond 0.10% 20/9/2021 635,500,000 639,645,140
Japan Government Bond 0.50% 20/12/2038 595,900,000 607,897,963
Japan Government Bond 0.30% 20/9/2039 545,750,000 550,451,878
Japan Government Bond 0.10% 1/9/2021 520,750,000 524,811,021
Japan Government Bond 0.30% 20/6/2039 502,000,000 517,077,426
Japan Government Bond 0.10% 20/9/2024 500,000,000 507,557,200
Japan Government Bond 0.10% 1/8/2021 501,550,000 505,247,176
Japan Government Bond 1.40% 20/9/2034 420,850,000 504,506,511
Japan Government Bond 0.10% 20/3/2024 495,950,000 503,162,365
Japan Government Bond 0.70% 20/3/2037 436,750,000 477,787,030
Japan Government Bond 2.20% 20/9/2028 376,950,000 460,941,999
Japan Government Bond 2.00% 20/9/2040 337,600,000 453,590,504
Japan Government Bond 1.90% 20/9/2042 311,300,000 418,561,016
Japan Government Bond 0.10% 1/11/2021 415,000,000 417,661,650
Japan Government Bond 1.70% 20/9/2032 340,000,000 412,447,984
Japan Government Bond 0.10% 1/4/2021 407,450,000 409,583,988
Japan Government Bond 0.40% 20/3/2039 398,500,000 408,262,276
Japan Government Bond 0.10% 20/9/2026 379,250,000 387,031,136
Japan Government Bond 1.50% 20/3/2034 317,100,000 379,902,164
Japan Government Bond 0.10% 20/9/2028 367,400,000 373,440,724
Japan Government Bond 1.50% 20/6/2034 309,400,000 372,250,877
Japan Government Bond 1.70% 20/3/2054 263,300,000 370,879,726
Japan Government Bond 0.10% 1/5/2021 360,000,000 361,788,000
Principal Proceeds Japanese Yen Japanese Yen (¥) (¥)
Sales
Japan Government Bond 0.10% 1/1/2021 2,160,500,000 2,170,702,671
Japan Government Bond 0.10% 1/3/2021 705,000,000 707,152,450
Japan Government Bond 1.30% 20/6/2020 681,000,000 693,695,700
Japan Government Bond 0.10% 1/2/2021 648,450,000 650,272,249
Japan Government Bond 0.10% 1/10/2020 570,000,000 572,232,494
Japan Government Bond 0.20% 20/6/2036 546,500,000 548,528,796
Japan Government Bond 1.90% 20/3/2031 403,600,000 498,304,003
Japan Government Bond 0.10% 20/9/2022 492,450,000 497,584,162
Japan Government Bond 0.10% 20/12/2022 484,000,000 489,917,640
Japan Government Bond 0.90% 20/3/2022 473,100,000 488,757,226
Japan Government Bond 0.10% 1/9/2020 480,000,000 481,755,438
Japan Government Bond 0.10% 20/12/2028 452,500,000 460,750,138
Japan Government Bond 0.10% 15/4/2020 450,000,000 451,530,000
Japan Government Bond 2.30% 20/3/2040 321,450,000 449,291,705
Japan Government Bond 1.60% 20/3/2033 360,250,000 435,762,892
Japan Government Bond 1.10% 20/6/2020 427,000,000 433,458,110
Japan Government Bond 0.10% 20/3/2029 405,000,000 414,373,525
Japan Government Bond 1.20% 20/12/2020 398,150,000 405,810,406
Japan Government Bond 0.10% 1/7/2020 400,000,000 401,197,000
Japan Government Bond 0.10% 1/11/2020 396,000,000 397,682,786
Japan Government Bond 0.10% 20/9/2028 387,500,000 393,458,017
Japan Government Bond 0.10% 1/12/2020 384,200,000 385,998,056
Japan Government Bond 2.00% 20/3/2052 230,500,000 329,118,426
Japan Government Bond 1.00% 20/9/2020 302,000,000 306,963,320
Japan Government Bond 1.80% 20/3/2043 227,600,000 301,509,271
Japan Government Bond 0.10% 20/12/2023 291,000,000 294,953,940
Japan Government Bond 2.20% 20/6/2024 262,150,000 293,380,244
Japan Government Bond 0.40% 20/3/2036 277,250,000 289,154,430
Japan Government Bond 0.40% 20/6/2025 264,450,000 274,558,318
Japan Government Bond 0.10% 20/3/2020 266,600,000 267,317,822
Japan Government Bond 0.10% 20/6/2023 258,800,000 262,072,622
Japan Government Bond 0.10% 20/3/2022 258,100,000 260,206,096
Japan Government Bond 1.10% 20/3/2033 208,650,000 242,460,855
Japan Government Bond 1.50% 20/12/2044 192,750,000 242,432,647
Japan Government Bond 0.10% 20/6/2020 240,000,000 240,679,050
Japan Government Bond 0.10% 1/6/2020 235,900,000 236,669,034
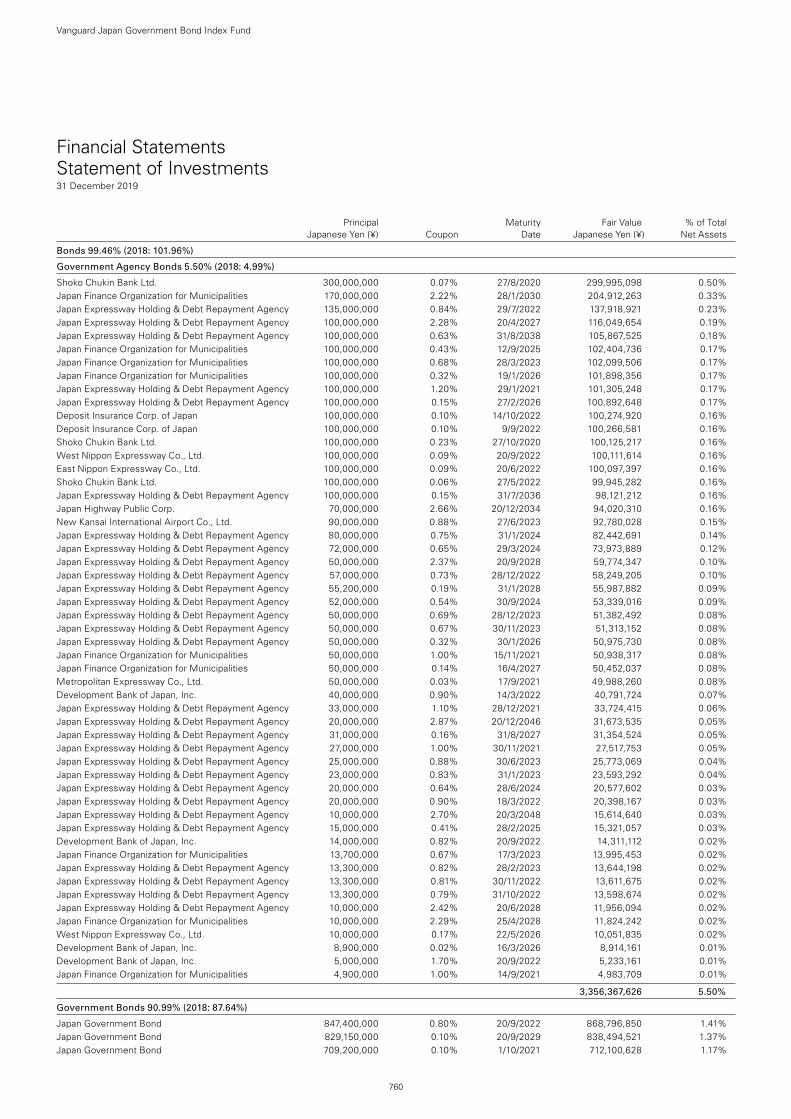
Financial Statements Statement of Investments31 December 2019
Principal Maturity Fair Value % of Total Japanese Yen (¥) Coupon Date Japanese Yen (¥) Net Assets
Bonds 99.46% (2018: 101.96%)
Government Agency Bonds 5.50% (2018: 4.99%)
Shoko Chukin Bank Ltd. 300,000,000 0.07% 27/8/2020 299,995,098 0.50%Japan Finance Organization for Municipalities 170,000,000 2.22% 28/1/2030 204,912,263 0.33%Japan Expressway Holding & Debt Repayment Agency 135,000,000 0.84% 29/7/2022 137,918,921 0.23%Japan Expressway Holding & Debt Repayment Agency 100,000,000 2.28% 20/4/2027 116,049,654 0.19%Japan Expressway Holding & Debt Repayment Agency 100,000,000 0.63% 31/8/2038 105,867,525 0.18%Japan Finance Organization for Municipalities 100,000,000 0.43% 12/9/2025 102,404,736 0.17%Japan Finance Organization for Municipalities 100,000,000 0.68% 28/3/2023 102,099,506 0.17%Japan Finance Organization for Municipalities 100,000,000 0.32% 19/1/2026 101,898,356 0.17%Japan Expressway Holding & Debt Repayment Agency 100,000,000 1.20% 29/1/2021 101,305,248 0.17%Japan Expressway Holding & Debt Repayment Agency 100,000,000 0.15% 27/2/2026 100,892,648 0.17%Deposit Insurance Corp. of Japan 100,000,000 0.10% 14/10/2022 100,274,920 0.16%Deposit Insurance Corp. of Japan 100,000,000 0.10% 9/9/2022 100,266,581 0.16%Shoko Chukin Bank Ltd. 100,000,000 0.23% 27/10/2020 100,125,217 0.16%West Nippon Expressway Co., Ltd. 100,000,000 0.09% 20/9/2022 100,111,614 0.16%East Nippon Expressway Co., Ltd. 100,000,000 0.09% 20/6/2022 100,097,397 0.16%Shoko Chukin Bank Ltd. 100,000,000 0.06% 27/5/2022 99,945,282 0.16%Japan Expressway Holding & Debt Repayment Agency 100,000,000 0.15% 31/7/2036 98,121,212 0.16%Japan Highway Public Corp. 70,000,000 2.66% 20/12/2034 94,020,310 0.16%New Kansai International Airport Co., Ltd. 90,000,000 0.88% 27/6/2023 92,780,028 0.15%Japan Expressway Holding & Debt Repayment Agency 80,000,000 0.75% 31/1/2024 82,442,691 0.14%Japan Expressway Holding & Debt Repayment Agency 72,000,000 0.65% 29/3/2024 73,973,889 0.12%Japan Expressway Holding & Debt Repayment Agency 50,000,000 2.37% 20/9/2028 59,774,347 0.10%Japan Expressway Holding & Debt Repayment Agency 57,000,000 0.73% 28/12/2022 58,249,205 0.10%Japan Expressway Holding & Debt Repayment Agency 55,200,000 0.19% 31/1/2028 55,987,882 0.09%Japan Expressway Holding & Debt Repayment Agency 52,000,000 0.54% 30/9/2024 53,339,016 0.09%Japan Expressway Holding & Debt Repayment Agency 50,000,000 0.69% 28/12/2023 51,382,492 0.08%Japan Expressway Holding & Debt Repayment Agency 50,000,000 0.67% 30/11/2023 51,313,152 0.08%Japan Expressway Holding & Debt Repayment Agency 50,000,000 0.32% 30/1/2026 50,975,730 0.08%Japan Finance Organization for Municipalities 50,000,000 1.00% 15/11/2021 50,938,317 0.08%Japan Finance Organization for Municipalities 50,000,000 0.14% 16/4/2027 50,452,037 0.08%Metropolitan Expressway Co., Ltd. 50,000,000 0.03% 17/9/2021 49,988,260 0.08%Development Bank of Japan, Inc. 40,000,000 0.90% 14/3/2022 40,791,724 0.07%Japan Expressway Holding & Debt Repayment Agency 33,000,000 1.10% 28/12/2021 33,724,415 0.06%Japan Expressway Holding & Debt Repayment Agency 20,000,000 2.87% 20/12/2046 31,673,535 0.05%Japan Expressway Holding & Debt Repayment Agency 31,000,000 0.16% 31/8/2027 31,354,524 0.05%Japan Expressway Holding & Debt Repayment Agency 27,000,000 1.00% 30/11/2021 27,517,753 0.05%Japan Expressway Holding & Debt Repayment Agency 25,000,000 0.88% 30/6/2023 25,773,069 0.04%Japan Expressway Holding & Debt Repayment Agency 23,000,000 0.83% 31/1/2023 23,593,292 0.04%Japan Expressway Holding & Debt Repayment Agency 20,000,000 0.64% 28/6/2024 20,577,602 0.03%Japan Expressway Holding & Debt Repayment Agency 20,000,000 0.90% 18/3/2022 20,398,167 0.03%Japan Expressway Holding & Debt Repayment Agency 10,000,000 2.70% 20/3/2048 15,614,640 0.03%Japan Expressway Holding & Debt Repayment Agency 15,000,000 0.41% 28/2/2025 15,321,057 0.03%Development Bank of Japan, Inc. 14,000,000 0.82% 20/9/2022 14,311,112 0.02%Japan Finance Organization for Municipalities 13,700,000 0.67% 17/3/2023 13,995,453 0.02%Japan Expressway Holding & Debt Repayment Agency 13,300,000 0.82% 28/2/2023 13,644,198 0.02%Japan Expressway Holding & Debt Repayment Agency 13,300,000 0.81% 30/11/2022 13,611,675 0.02%Japan Expressway Holding & Debt Repayment Agency 13,300,000 0.79% 31/10/2022 13,598,674 0.02%Japan Expressway Holding & Debt Repayment Agency 10,000,000 2.42% 20/6/2028 11,956,094 0.02%Japan Finance Organization for Municipalities 10,000,000 2.29% 25/4/2028 11,824,242 0.02%West Nippon Expressway Co., Ltd. 10,000,000 0.17% 22/5/2026 10,051,835 0.02%Development Bank of Japan, Inc. 8,900,000 0.02% 16/3/2026 8,914,161 0.01%Development Bank of Japan, Inc. 5,000,000 1.70% 20/9/2022 5,233,161 0.01%Japan Finance Organization for Municipalities 4,900,000 1.00% 14/9/2021 4,983,709 0.01%
3,356,367,626 5.50%
Government Bonds 90.99% (2018: 87.64%)
Japan Government Bond 847,400,000 0.80% 20/9/2022 868,796,850 1.41%Japan Government Bond 829,150,000 0.10% 20/9/2029 838,494,521 1.37%Japan Government Bond 709,200,000 0.10% 1/10/2021 712,100,628 1.17%
Vanguard Japan Government Bond Index Fund
760

Principal Maturity Fair Value % of Total Japanese Yen (¥) Coupon Date Japanese Yen (¥) Net Assets
Japan Government Bond 658,000,000 0.10% 20/6/2024 664,612,900 1.09%Japan Government Bond 651,300,000 0.10% 20/3/2029 659,317,503 1.08%Japan Government Bond 651,350,000 0.10% 20/9/2021 654,000,995 1.07%Japan Government Bond 630,850,000 0.80% 20/6/2023 651,327,391 1.07%Japan Government Bond 617,550,000 0.10% 20/6/2029 624,824,739 1.02%Japan Government Bond 599,200,000 0.10% 1/6/2021 601,165,376 0.99%Japan Government Bond 487,650,000 2.10% 20/12/2030 598,448,957 0.98%Japan Government Bond 439,900,000 1.90% 20/9/2042 591,643,505 0.97%Japan Government Bond 577,550,000 0.10% 20/9/2022 581,309,851 0.95%Japan Government Bond 551,200,000 0.10% 1/7/2021 553,107,152 0.91%Japan Government Bond 537,600,000 0.10% 1/5/2021 539,218,176 0.88%Japan Government Bond 520,750,000 0.10% 1/9/2021 522,754,888 0.86%Japan Government Bond 377,700,000 2.00% 20/9/2041 511,356,699 0.84%Japan Government Bond 505,050,000 0.10% 20/12/2023 509,656,056 0.84%Japan Government Bond 500,000,000 0.10% 20/9/2024 505,230,000 0.83%Japan Government Bond 501,550,000 0.10% 1/8/2021 503,380,658 0.82%Japan Government Bond 495,950,000 0.10% 20/3/2024 500,755,756 0.82%Japan Government Bond 420,850,000 1.40% 20/9/2034 498,122,269 0.82%Japan Government Bond 488,850,000 0.10% 20/6/2023 492,883,013 0.81%Japan Government Bond 487,900,000 0.10% 20/9/2023 492,178,883 0.81%Japan Government Bond 465,000,000 0.50% 20/9/2036 487,673,400 0.80%Japan Government Bond 452,900,000 0.90% 20/3/2022 463,221,591 0.76%Japan Government Bond 327,550,000 2.30% 20/3/2040 456,683,312 0.75%Japan Government Bond 337,600,000 2.00% 20/9/2040 453,022,064 0.74%Japan Government Bond 410,750,000 0.70% 20/3/2037 444,357,565 0.73%Japan Government Bond 441,550,000 0.30% 20/9/2039 442,909,974 0.73%Japan Government Bond 323,850,000 2.00% 20/3/2042 440,455,431 0.72%Japan Government Bond 364,500,000 1.70% 20/12/2031 435,894,615 0.71%Japan Government Bond 426,750,000 0.10% 20/6/2026 432,792,780 0.71%Japan Government Bond 407,000,000 0.40% 20/9/2025 419,275,120 0.69%Japan Government Bond 415,000,000 0.10% 20/3/2023 418,183,050 0.69%Japan Government Bond 415,000,000 0.10% 1/11/2021 416,780,350 0.68%Japan Government Bond 395,450,000 0.50% 20/12/2038 412,335,715 0.68%Japan Government Bond 340,000,000 1.70% 20/9/2032 409,608,200 0.67%Japan Government Bond 407,450,000 0.10% 1/4/2021 408,603,084 0.67%Japan Government Bond 271,900,000 2.00% 20/3/2052 400,772,443 0.66%Japan Government Bond 292,000,000 2.40% 20/3/2037 399,642,880 0.65%Japan Government Bond 380,350,000 0.50% 20/6/2038 397,237,540 0.65%Japan Government Bond 327,050,000 1.70% 20/6/2033 397,005,995 0.65%Japan Government Bond 387,600,000 0.80% 20/6/2022 396,495,420 0.65%Japan Government Bond 390,150,000 0.10% 20/12/2028 395,179,034 0.65%Japan Government Bond 324,000,000 1.80% 20/3/2032 392,406,120 0.64%Japan Government Bond 278,600,000 2.20% 20/3/2041 386,978,186 0.63%Japan Government Bond 369,850,000 0.40% 20/3/2039 378,382,440 0.62%Japan Government Bond 309,000,000 2.00% 20/3/2031 376,905,840 0.62%Japan Government Bond 267,700,000 1.70% 20/3/2054 375,409,095 0.62%Japan Government Bond 323,000,000 1.20% 20/9/2035 374,576,640 0.61%Japan Government Bond 342,700,000 0.70% 20/9/2038 370,040,606 0.61%Japan Government Bond 309,400,000 1.50% 20/6/2034 369,961,956 0.61%Japan Government Bond 361,700,000 0.10% 20/9/2028 366,713,162 0.60%Japan Government Bond 358,900,000 0.10% 20/3/2027 364,068,160 0.60%Japan Government Bond 361,750,000 0.30% 20/6/2039 363,186,148 0.60%Japan Government Bond 300,000,000 1.80% 20/12/2031 362,328,000 0.59%Japan Government Bond 357,300,000 0.10% 20/6/2022 359,358,048 0.59%Japan Government Bond 333,150,000 0.60% 20/12/2037 354,255,053 0.58%Japan Government Bond 349,600,000 0.10% 20/12/2022 352,033,216 0.58%Japan Government Bond 342,850,000 0.10% 20/3/2028 347,900,181 0.57%Japan Government Bond 337,000,000 0.90% 20/6/2022 345,566,540 0.57%Japan Government Bond 334,850,000 0.40% 20/6/2025 344,500,377 0.56%Japan Government Bond 280,550,000 1.50% 20/3/2034 334,993,533 0.55%Japan Government Bond 243,000,000 2.30% 20/3/2039 334,584,270 0.55%Japan Government Bond 277,000,000 1.70% 20/3/2032 332,128,540 0.54%Japan Government Bond 317,000,000 2.00% 21/3/2022 331,981,420 0.54%Japan Government Bond 324,200,000 0.10% 20/6/2028 328,871,722 0.54%Japan Government Bond 236,350,000 2.40% 20/9/2038 328,694,309 0.54%Japan Government Bond 272,000,000 1.80% 20/6/2031 326,677,440 0.54%Japan Government Bond 308,050,000 0.50% 20/3/2038 321,878,365 0.53%Japan Government Bond 311,200,000 0.60% 20/6/2024 321,310,888 0.53%
Vanguard Japan Government Bond Index Fund
761
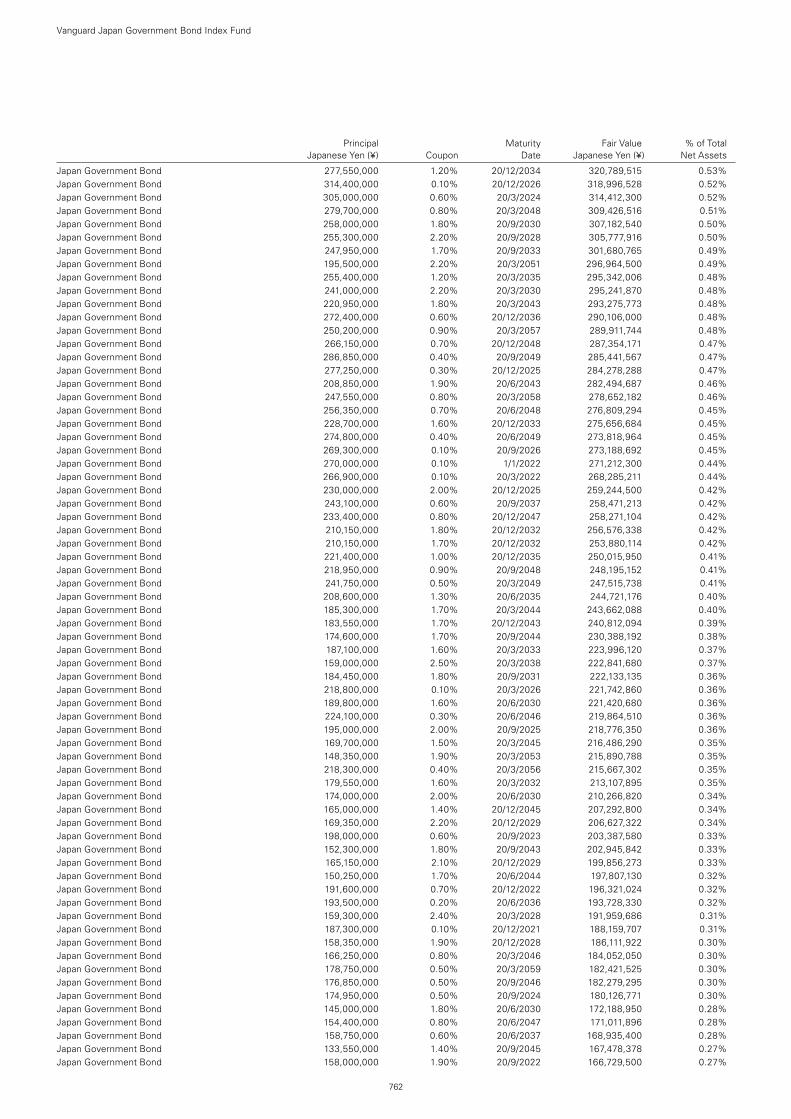
Principal Maturity Fair Value % of Total Japanese Yen (¥) Coupon Date Japanese Yen (¥) Net Assets
Japan Government Bond 277,550,000 1.20% 20/12/2034 320,789,515 0.53%Japan Government Bond 314,400,000 0.10% 20/12/2026 318,996,528 0.52%Japan Government Bond 305,000,000 0.60% 20/3/2024 314,412,300 0.52%Japan Government Bond 279,700,000 0.80% 20/3/2048 309,426,516 0.51%Japan Government Bond 258,000,000 1.80% 20/9/2030 307,182,540 0.50%Japan Government Bond 255,300,000 2.20% 20/9/2028 305,777,916 0.50%Japan Government Bond 247,950,000 1.70% 20/9/2033 301,680,765 0.49%Japan Government Bond 195,500,000 2.20% 20/3/2051 296,964,500 0.49%Japan Government Bond 255,400,000 1.20% 20/3/2035 295,342,006 0.48%Japan Government Bond 241,000,000 2.20% 20/3/2030 295,241,870 0.48%Japan Government Bond 220,950,000 1.80% 20/3/2043 293,275,773 0.48%Japan Government Bond 272,400,000 0.60% 20/12/2036 290,106,000 0.48%Japan Government Bond 250,200,000 0.90% 20/3/2057 289,911,744 0.48%Japan Government Bond 266,150,000 0.70% 20/12/2048 287,354,171 0.47%Japan Government Bond 286,850,000 0.40% 20/9/2049 285,441,567 0.47%Japan Government Bond 277,250,000 0.30% 20/12/2025 284,278,288 0.47%Japan Government Bond 208,850,000 1.90% 20/6/2043 282,494,687 0.46%Japan Government Bond 247,550,000 0.80% 20/3/2058 278,652,182 0.46%Japan Government Bond 256,350,000 0.70% 20/6/2048 276,809,294 0.45%Japan Government Bond 228,700,000 1.60% 20/12/2033 275,656,684 0.45%Japan Government Bond 274,800,000 0.40% 20/6/2049 273,818,964 0.45%Japan Government Bond 269,300,000 0.10% 20/9/2026 273,188,692 0.45%Japan Government Bond 270,000,000 0.10% 1/1/2022 271,212,300 0.44%Japan Government Bond 266,900,000 0.10% 20/3/2022 268,285,211 0.44%Japan Government Bond 230,000,000 2.00% 20/12/2025 259,244,500 0.42%Japan Government Bond 243,100,000 0.60% 20/9/2037 258,471,213 0.42%Japan Government Bond 233,400,000 0.80% 20/12/2047 258,271,104 0.42%Japan Government Bond 210,150,000 1.80% 20/12/2032 256,576,338 0.42%Japan Government Bond 210,150,000 1.70% 20/12/2032 253,880,114 0.42%Japan Government Bond 221,400,000 1.00% 20/12/2035 250,015,950 0.41%Japan Government Bond 218,950,000 0.90% 20/9/2048 248,195,152 0.41%Japan Government Bond 241,750,000 0.50% 20/3/2049 247,515,738 0.41%Japan Government Bond 208,600,000 1.30% 20/6/2035 244,721,176 0.40%Japan Government Bond 185,300,000 1.70% 20/3/2044 243,662,088 0.40%Japan Government Bond 183,550,000 1.70% 20/12/2043 240,812,094 0.39%Japan Government Bond 174,600,000 1.70% 20/9/2044 230,388,192 0.38%Japan Government Bond 187,100,000 1.60% 20/3/2033 223,996,120 0.37%Japan Government Bond 159,000,000 2.50% 20/3/2038 222,841,680 0.37%Japan Government Bond 184,450,000 1.80% 20/9/2031 222,133,135 0.36%Japan Government Bond 218,800,000 0.10% 20/3/2026 221,742,860 0.36%Japan Government Bond 189,800,000 1.60% 20/6/2030 221,420,680 0.36%Japan Government Bond 224,100,000 0.30% 20/6/2046 219,864,510 0.36%Japan Government Bond 195,000,000 2.00% 20/9/2025 218,776,350 0.36%Japan Government Bond 169,700,000 1.50% 20/3/2045 216,486,290 0.35%Japan Government Bond 148,350,000 1.90% 20/3/2053 215,890,788 0.35%Japan Government Bond 218,300,000 0.40% 20/3/2056 215,667,302 0.35%Japan Government Bond 179,550,000 1.60% 20/3/2032 213,107,895 0.35%Japan Government Bond 174,000,000 2.00% 20/6/2030 210,266,820 0.34%Japan Government Bond 165,000,000 1.40% 20/12/2045 207,292,800 0.34%Japan Government Bond 169,350,000 2.20% 20/12/2029 206,627,322 0.34%Japan Government Bond 198,000,000 0.60% 20/9/2023 203,387,580 0.33%Japan Government Bond 152,300,000 1.80% 20/9/2043 202,945,842 0.33%Japan Government Bond 165,150,000 2.10% 20/12/2029 199,856,273 0.33%Japan Government Bond 150,250,000 1.70% 20/6/2044 197,807,130 0.32%Japan Government Bond 191,600,000 0.70% 20/12/2022 196,321,024 0.32%Japan Government Bond 193,500,000 0.20% 20/6/2036 193,728,330 0.32%Japan Government Bond 159,300,000 2.40% 20/3/2028 191,959,686 0.31%Japan Government Bond 187,300,000 0.10% 20/12/2021 188,159,707 0.31%Japan Government Bond 158,350,000 1.90% 20/12/2028 186,111,922 0.30%Japan Government Bond 166,250,000 0.80% 20/3/2046 184,052,050 0.30%Japan Government Bond 178,750,000 0.50% 20/3/2059 182,421,525 0.30%Japan Government Bond 176,850,000 0.50% 20/9/2046 182,279,295 0.30%Japan Government Bond 174,950,000 0.50% 20/9/2024 180,126,771 0.30%Japan Government Bond 145,000,000 1.80% 20/6/2030 172,188,950 0.28%Japan Government Bond 154,400,000 0.80% 20/6/2047 171,011,896 0.28%Japan Government Bond 158,750,000 0.60% 20/6/2037 168,935,400 0.28%Japan Government Bond 133,550,000 1.40% 20/9/2045 167,478,378 0.27%Japan Government Bond 158,000,000 1.90% 20/9/2022 166,729,500 0.27%
Vanguard Japan Government Bond Index Fund
762
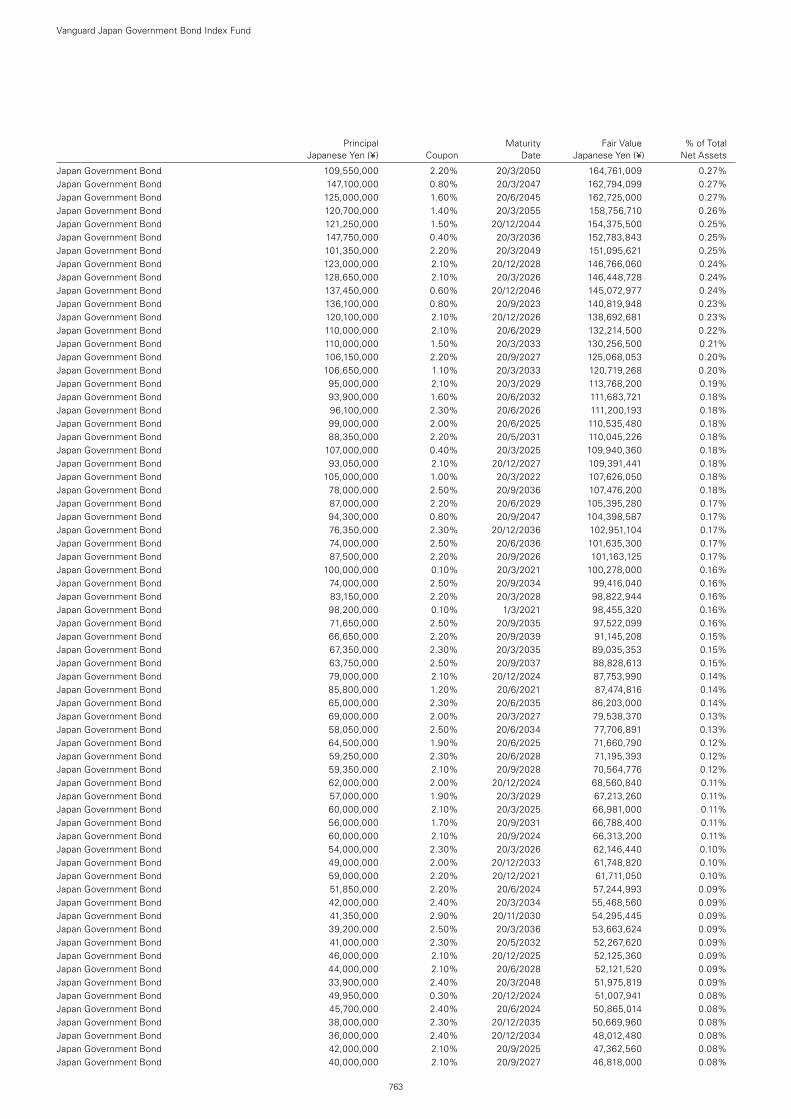
Principal Maturity Fair Value % of Total Japanese Yen (¥) Coupon Date Japanese Yen (¥) Net Assets
Japan Government Bond 109,550,000 2.20% 20/3/2050 164,761,009 0.27%Japan Government Bond 147,100,000 0.80% 20/3/2047 162,794,099 0.27%Japan Government Bond 125,000,000 1.60% 20/6/2045 162,725,000 0.27%Japan Government Bond 120,700,000 1.40% 20/3/2055 158,756,710 0.26%Japan Government Bond 121,250,000 1.50% 20/12/2044 154,375,500 0.25%Japan Government Bond 147,750,000 0.40% 20/3/2036 152,783,843 0.25%Japan Government Bond 101,350,000 2.20% 20/3/2049 151,095,621 0.25%Japan Government Bond 123,000,000 2.10% 20/12/2028 146,766,060 0.24%Japan Government Bond 128,650,000 2.10% 20/3/2026 146,448,728 0.24%Japan Government Bond 137,450,000 0.60% 20/12/2046 145,072,977 0.24%Japan Government Bond 136,100,000 0.80% 20/9/2023 140,819,948 0.23%Japan Government Bond 120,100,000 2.10% 20/12/2026 138,692,681 0.23%Japan Government Bond 110,000,000 2.10% 20/6/2029 132,214,500 0.22%Japan Government Bond 110,000,000 1.50% 20/3/2033 130,256,500 0.21%Japan Government Bond 106,150,000 2.20% 20/9/2027 125,068,053 0.20%Japan Government Bond 106,650,000 1.10% 20/3/2033 120,719,268 0.20%Japan Government Bond 95,000,000 2.10% 20/3/2029 113,768,200 0.19%Japan Government Bond 93,900,000 1.60% 20/6/2032 111,683,721 0.18%Japan Government Bond 96,100,000 2.30% 20/6/2026 111,200,193 0.18%Japan Government Bond 99,000,000 2.00% 20/6/2025 110,535,480 0.18%Japan Government Bond 88,350,000 2.20% 20/5/2031 110,045,226 0.18%Japan Government Bond 107,000,000 0.40% 20/3/2025 109,940,360 0.18%Japan Government Bond 93,050,000 2.10% 20/12/2027 109,391,441 0.18%Japan Government Bond 105,000,000 1.00% 20/3/2022 107,626,050 0.18%Japan Government Bond 78,000,000 2.50% 20/9/2036 107,476,200 0.18%Japan Government Bond 87,000,000 2.20% 20/6/2029 105,395,280 0.17%Japan Government Bond 94,300,000 0.80% 20/9/2047 104,398,587 0.17%Japan Government Bond 76,350,000 2.30% 20/12/2036 102,951,104 0.17%Japan Government Bond 74,000,000 2.50% 20/6/2036 101,635,300 0.17%Japan Government Bond 87,500,000 2.20% 20/9/2026 101,163,125 0.17%Japan Government Bond 100,000,000 0.10% 20/3/2021 100,278,000 0.16%Japan Government Bond 74,000,000 2.50% 20/9/2034 99,416,040 0.16%Japan Government Bond 83,150,000 2.20% 20/3/2028 98,822,944 0.16%Japan Government Bond 98,200,000 0.10% 1/3/2021 98,455,320 0.16%Japan Government Bond 71,650,000 2.50% 20/9/2035 97,522,099 0.16%Japan Government Bond 66,650,000 2.20% 20/9/2039 91,145,208 0.15%Japan Government Bond 67,350,000 2.30% 20/3/2035 89,035,353 0.15%Japan Government Bond 63,750,000 2.50% 20/9/2037 88,828,613 0.15%Japan Government Bond 79,000,000 2.10% 20/12/2024 87,753,990 0.14%Japan Government Bond 85,800,000 1.20% 20/6/2021 87,474,816 0.14%Japan Government Bond 65,000,000 2.30% 20/6/2035 86,203,000 0.14%Japan Government Bond 69,000,000 2.00% 20/3/2027 79,538,370 0.13%Japan Government Bond 58,050,000 2.50% 20/6/2034 77,706,891 0.13%Japan Government Bond 64,500,000 1.90% 20/6/2025 71,660,790 0.12%Japan Government Bond 59,250,000 2.30% 20/6/2028 71,195,393 0.12%Japan Government Bond 59,350,000 2.10% 20/9/2028 70,564,776 0.12%Japan Government Bond 62,000,000 2.00% 20/12/2024 68,560,840 0.11%Japan Government Bond 57,000,000 1.90% 20/3/2029 67,213,260 0.11%Japan Government Bond 60,000,000 2.10% 20/3/2025 66,981,000 0.11%Japan Government Bond 56,000,000 1.70% 20/9/2031 66,788,400 0.11%Japan Government Bond 60,000,000 2.10% 20/9/2024 66,313,200 0.11%Japan Government Bond 54,000,000 2.30% 20/3/2026 62,146,440 0.10%Japan Government Bond 49,000,000 2.00% 20/12/2033 61,748,820 0.10%Japan Government Bond 59,000,000 2.20% 20/12/2021 61,711,050 0.10%Japan Government Bond 51,850,000 2.20% 20/6/2024 57,244,993 0.09%Japan Government Bond 42,000,000 2.40% 20/3/2034 55,468,560 0.09%Japan Government Bond 41,350,000 2.90% 20/11/2030 54,295,445 0.09%Japan Government Bond 39,200,000 2.50% 20/3/2036 53,663,624 0.09%Japan Government Bond 41,000,000 2.30% 20/5/2032 52,267,620 0.09%Japan Government Bond 46,000,000 2.10% 20/12/2025 52,125,360 0.09%Japan Government Bond 44,000,000 2.10% 20/6/2028 52,121,520 0.09%Japan Government Bond 33,900,000 2.40% 20/3/2048 51,975,819 0.09%Japan Government Bond 49,950,000 0.30% 20/12/2024 51,007,941 0.08%Japan Government Bond 45,700,000 2.40% 20/6/2024 50,865,014 0.08%Japan Government Bond 38,000,000 2.30% 20/12/2035 50,669,960 0.08%Japan Government Bond 36,000,000 2.40% 20/12/2034 48,012,480 0.08%Japan Government Bond 42,000,000 2.10% 20/9/2025 47,362,560 0.08%Japan Government Bond 40,000,000 2.10% 20/9/2027 46,818,000 0.08%
Vanguard Japan Government Bond Index Fund
763
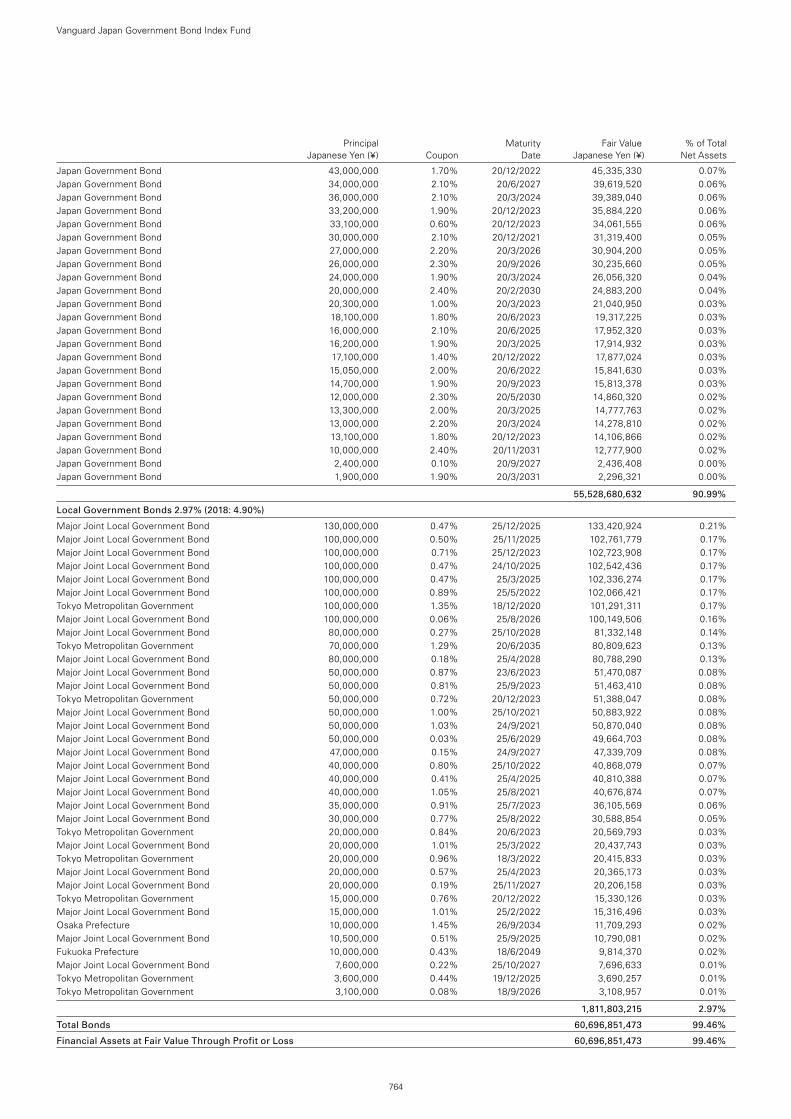
Principal Maturity Fair Value % of Total Japanese Yen (¥) Coupon Date Japanese Yen (¥) Net Assets
Japan Government Bond 43,000,000 1.70% 20/12/2022 45,335,330 0.07%Japan Government Bond 34,000,000 2.10% 20/6/2027 39,619,520 0.06%Japan Government Bond 36,000,000 2.10% 20/3/2024 39,389,040 0.06%Japan Government Bond 33,200,000 1.90% 20/12/2023 35,884,220 0.06%Japan Government Bond 33,100,000 0.60% 20/12/2023 34,061,555 0.06%Japan Government Bond 30,000,000 2.10% 20/12/2021 31,319,400 0.05%Japan Government Bond 27,000,000 2.20% 20/3/2026 30,904,200 0.05%Japan Government Bond 26,000,000 2.30% 20/9/2026 30,235,660 0.05%Japan Government Bond 24,000,000 1.90% 20/3/2024 26,056,320 0.04%Japan Government Bond 20,000,000 2.40% 20/2/2030 24,883,200 0.04%Japan Government Bond 20,300,000 1.00% 20/3/2023 21,040,950 0.03%Japan Government Bond 18,100,000 1.80% 20/6/2023 19,317,225 0.03%Japan Government Bond 16,000,000 2.10% 20/6/2025 17,952,320 0.03%Japan Government Bond 16,200,000 1.90% 20/3/2025 17,914,932 0.03%Japan Government Bond 17,100,000 1.40% 20/12/2022 17,877,024 0.03%Japan Government Bond 15,050,000 2.00% 20/6/2022 15,841,630 0.03%Japan Government Bond 14,700,000 1.90% 20/9/2023 15,813,378 0.03%Japan Government Bond 12,000,000 2.30% 20/5/2030 14,860,320 0.02%Japan Government Bond 13,300,000 2.00% 20/3/2025 14,777,763 0.02%Japan Government Bond 13,000,000 2.20% 20/3/2024 14,278,810 0.02%Japan Government Bond 13,100,000 1.80% 20/12/2023 14,106,866 0.02%Japan Government Bond 10,000,000 2.40% 20/11/2031 12,777,900 0.02%Japan Government Bond 2,400,000 0.10% 20/9/2027 2,436,408 0.00%Japan Government Bond 1,900,000 1.90% 20/3/2031 2,296,321 0.00%
55,528,680,632 90.99%
Local Government Bonds 2.97% (2018: 4.90%)
Major Joint Local Government Bond 130,000,000 0.47% 25/12/2025 133,420,924 0.21%Major Joint Local Government Bond 100,000,000 0.50% 25/11/2025 102,761,779 0.17%Major Joint Local Government Bond 100,000,000 0.71% 25/12/2023 102,723,908 0.17%Major Joint Local Government Bond 100,000,000 0.47% 24/10/2025 102,542,436 0.17%Major Joint Local Government Bond 100,000,000 0.47% 25/3/2025 102,336,274 0.17%Major Joint Local Government Bond 100,000,000 0.89% 25/5/2022 102,066,421 0.17%Tokyo Metropolitan Government 100,000,000 1.35% 18/12/2020 101,291,311 0.17%Major Joint Local Government Bond 100,000,000 0.06% 25/8/2026 100,149,506 0.16%Major Joint Local Government Bond 80,000,000 0.27% 25/10/2028 81,332,148 0.14%Tokyo Metropolitan Government 70,000,000 1.29% 20/6/2035 80,809,623 0.13%Major Joint Local Government Bond 80,000,000 0.18% 25/4/2028 80,788,290 0.13%Major Joint Local Government Bond 50,000,000 0.87% 23/6/2023 51,470,087 0.08%Major Joint Local Government Bond 50,000,000 0.81% 25/9/2023 51,463,410 0.08%Tokyo Metropolitan Government 50,000,000 0.72% 20/12/2023 51,388,047 0.08%Major Joint Local Government Bond 50,000,000 1.00% 25/10/2021 50,883,922 0.08%Major Joint Local Government Bond 50,000,000 1.03% 24/9/2021 50,870,040 0.08%Major Joint Local Government Bond 50,000,000 0.03% 25/6/2029 49,664,703 0.08%Major Joint Local Government Bond 47,000,000 0.15% 24/9/2027 47,339,709 0.08%Major Joint Local Government Bond 40,000,000 0.80% 25/10/2022 40,868,079 0.07%Major Joint Local Government Bond 40,000,000 0.41% 25/4/2025 40,810,388 0.07%Major Joint Local Government Bond 40,000,000 1.05% 25/8/2021 40,676,874 0.07%Major Joint Local Government Bond 35,000,000 0.91% 25/7/2023 36,105,569 0.06%Major Joint Local Government Bond 30,000,000 0.77% 25/8/2022 30,588,854 0.05%Tokyo Metropolitan Government 20,000,000 0.84% 20/6/2023 20,569,793 0.03%Major Joint Local Government Bond 20,000,000 1.01% 25/3/2022 20,437,743 0.03%Tokyo Metropolitan Government 20,000,000 0.96% 18/3/2022 20,415,833 0.03%Major Joint Local Government Bond 20,000,000 0.57% 25/4/2023 20,365,173 0.03%Major Joint Local Government Bond 20,000,000 0.19% 25/11/2027 20,206,158 0.03%Tokyo Metropolitan Government 15,000,000 0.76% 20/12/2022 15,330,126 0.03%Major Joint Local Government Bond 15,000,000 1.01% 25/2/2022 15,316,496 0.03%Osaka Prefecture 10,000,000 1.45% 26/9/2034 11,709,293 0.02%Major Joint Local Government Bond 10,500,000 0.51% 25/9/2025 10,790,081 0.02%Fukuoka Prefecture 10,000,000 0.43% 18/6/2049 9,814,370 0.02%Major Joint Local Government Bond 7,600,000 0.22% 25/10/2027 7,696,633 0.01%Tokyo Metropolitan Government 3,600,000 0.44% 19/12/2025 3,690,257 0.01%Tokyo Metropolitan Government 3,100,000 0.08% 18/9/2026 3,108,957 0.01%
1,811,803,215 2.97%
Total Bonds 60,696,851,473 99.46%
Financial Assets at Fair Value Through Profit or Loss 60,696,851,473 99.46%
Vanguard Japan Government Bond Index Fund
764
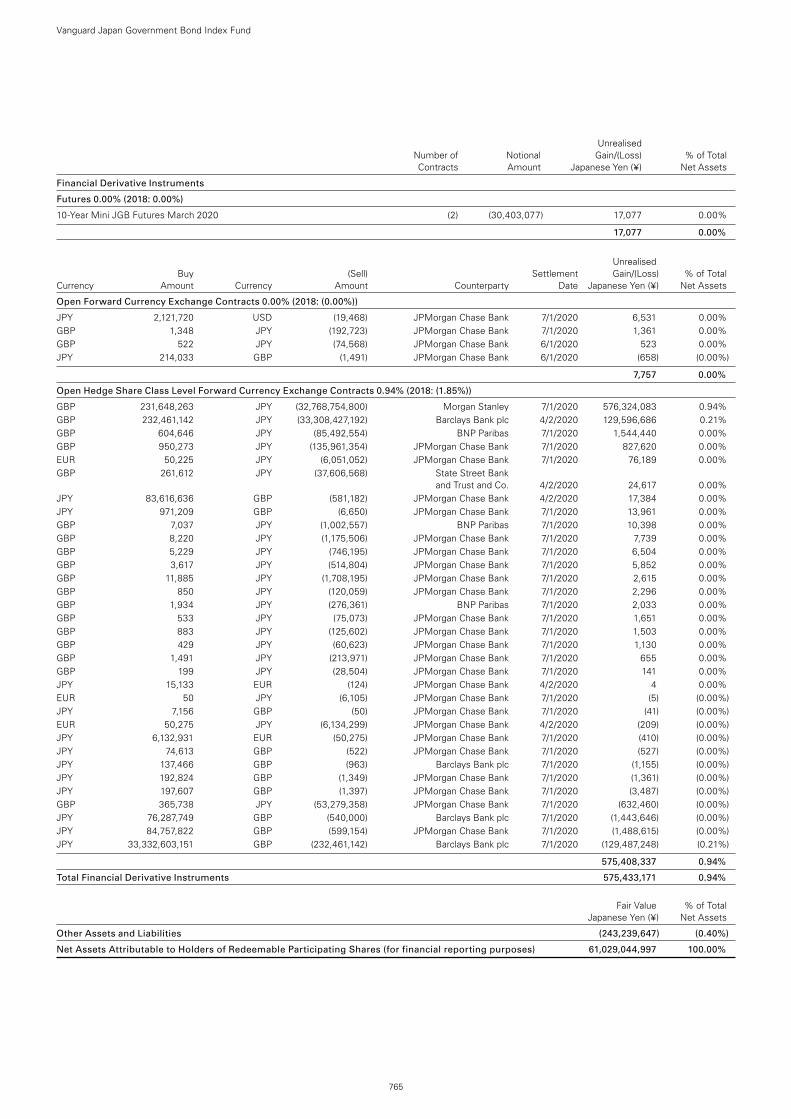
Unrealised Number of Notional Gain/(Loss) % of Total Contracts Amount Japanese Yen (¥) Net Assets
Financial Derivative Instruments
Futures 0.00% (2018: 0.00%)
10-Year Mini JGB Futures March 2020 (2) (30,403,077) 17,077 0.00%
17,077 0.00%
Unrealised Buy (Sell) Settlement Gain/(Loss) % of Total Currency Amount Currency Amount Counterparty Date Japanese Yen (¥) Net Assets
Open Forward Currency Exchange Contracts 0.00% (2018: (0.00%))
JPY 2,121,720 USD (19,468) JPMorgan Chase Bank 7/1/2020 6,531 0.00%GBP 1,348 JPY (192,723) JPMorgan Chase Bank 7/1/2020 1,361 0.00%GBP 522 JPY (74,568) JPMorgan Chase Bank 6/1/2020 523 0.00%JPY 214,033 GBP (1,491) JPMorgan Chase Bank 6/1/2020 (658) (0.00%)
7,757 0.00%
Open Hedge Share Class Level Forward Currency Exchange Contracts 0.94% (2018: (1.85%))
GBP 231,648,263 JPY (32,768,754,800) Morgan Stanley 7/1/2020 576,324,083 0.94%GBP 232,461,142 JPY (33,308,427,192) Barclays Bank plc 4/2/2020 129,596,686 0.21%GBP 604,646 JPY (85,492,554) BNP Paribas 7/1/2020 1,544,440 0.00%GBP 950,273 JPY (135,961,354) JPMorgan Chase Bank 7/1/2020 827,620 0.00%EUR 50,225 JPY (6,051,052) JPMorgan Chase Bank 7/1/2020 76,189 0.00%GBP 261,612 JPY (37,606,568) State Street Bank
and Trust and Co. 4/2/2020 24,617 0.00%JPY 83,616,636 GBP (581,182) JPMorgan Chase Bank 4/2/2020 17,384 0.00%JPY 971,209 GBP (6,650) JPMorgan Chase Bank 7/1/2020 13,961 0.00%GBP 7,037 JPY (1,002,557) BNP Paribas 7/1/2020 10,398 0.00%GBP 8,220 JPY (1,175,506) JPMorgan Chase Bank 7/1/2020 7,739 0.00%GBP 5,229 JPY (746,195) JPMorgan Chase Bank 7/1/2020 6,504 0.00%GBP 3,617 JPY (514,804) JPMorgan Chase Bank 7/1/2020 5,852 0.00%GBP 11,885 JPY (1,708,195) JPMorgan Chase Bank 7/1/2020 2,615 0.00%GBP 850 JPY (120,059) JPMorgan Chase Bank 7/1/2020 2,296 0.00%GBP 1,934 JPY (276,361) BNP Paribas 7/1/2020 2,033 0.00%GBP 533 JPY (75,073) JPMorgan Chase Bank 7/1/2020 1,651 0.00%GBP 883 JPY (125,602) JPMorgan Chase Bank 7/1/2020 1,503 0.00%GBP 429 JPY (60,623) JPMorgan Chase Bank 7/1/2020 1,130 0.00%GBP 1,491 JPY (213,971) JPMorgan Chase Bank 7/1/2020 655 0.00%GBP 199 JPY (28,504) JPMorgan Chase Bank 7/1/2020 141 0.00%JPY 15,133 EUR (124) JPMorgan Chase Bank 4/2/2020 4 0.00%EUR 50 JPY (6,105) JPMorgan Chase Bank 7/1/2020 (5) (0.00%)JPY 7,156 GBP (50) JPMorgan Chase Bank 7/1/2020 (41) (0.00%)EUR 50,275 JPY (6,134,299) JPMorgan Chase Bank 4/2/2020 (209) (0.00%)JPY 6,132,931 EUR (50,275) JPMorgan Chase Bank 7/1/2020 (410) (0.00%)JPY 74,613 GBP (522) JPMorgan Chase Bank 7/1/2020 (527) (0.00%)JPY 137,466 GBP (963) Barclays Bank plc 7/1/2020 (1,155) (0.00%)JPY 192,824 GBP (1,349) JPMorgan Chase Bank 7/1/2020 (1,361) (0.00%)JPY 197,607 GBP (1,397) JPMorgan Chase Bank 7/1/2020 (3,487) (0.00%)GBP 365,738 JPY (53,279,358) JPMorgan Chase Bank 7/1/2020 (632,460) (0.00%)JPY 76,287,749 GBP (540,000) Barclays Bank plc 7/1/2020 (1,443,646) (0.00%)JPY 84,757,822 GBP (599,154) JPMorgan Chase Bank 7/1/2020 (1,488,615) (0.00%)JPY 33,332,603,151 GBP (232,461,142) Barclays Bank plc 7/1/2020 (129,487,248) (0.21%)
575,408,337 0.94%
Total Financial Derivative Instruments 575,433,171 0.94%
Fair Value % of Total Japanese Yen (¥) Net Assets
Other Assets and Liabilities (243,239,647) (0.40%)
Net Assets Attributable to Holders of Redeemable Participating Shares (for financial reporting purposes) 61,029,044,997 100.00%
Vanguard Japan Government Bond Index Fund
765
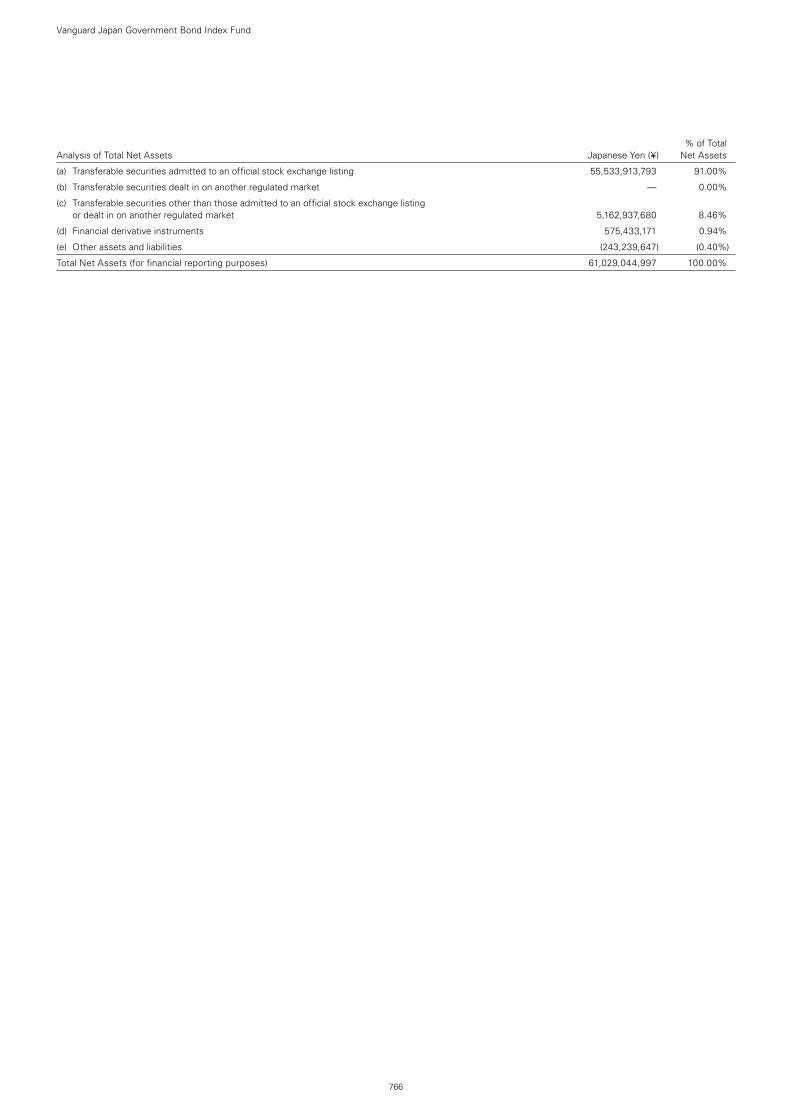
% of Total Analysis of Total Net Assets Japanese Yen (¥) Net Assets
(a) Transferable securities admitted to an official stock exchange listing 55,533,913,793 91.00%
(b) Transferable securities dealt in on another regulated market — 0.00%
(c) Transferable securities other than those admitted to an official stock exchange listing or dealt in on another regulated market 5,162,937,680 8.46%
(d) Financial derivative instruments 575,433,171 0.94%
(e) Other assets and liabilities (243,239,647) (0.40%)
Total Net Assets (for financial reporting purposes) 61,029,044,997 100.00%
Vanguard Japan Government Bond Index Fund
766
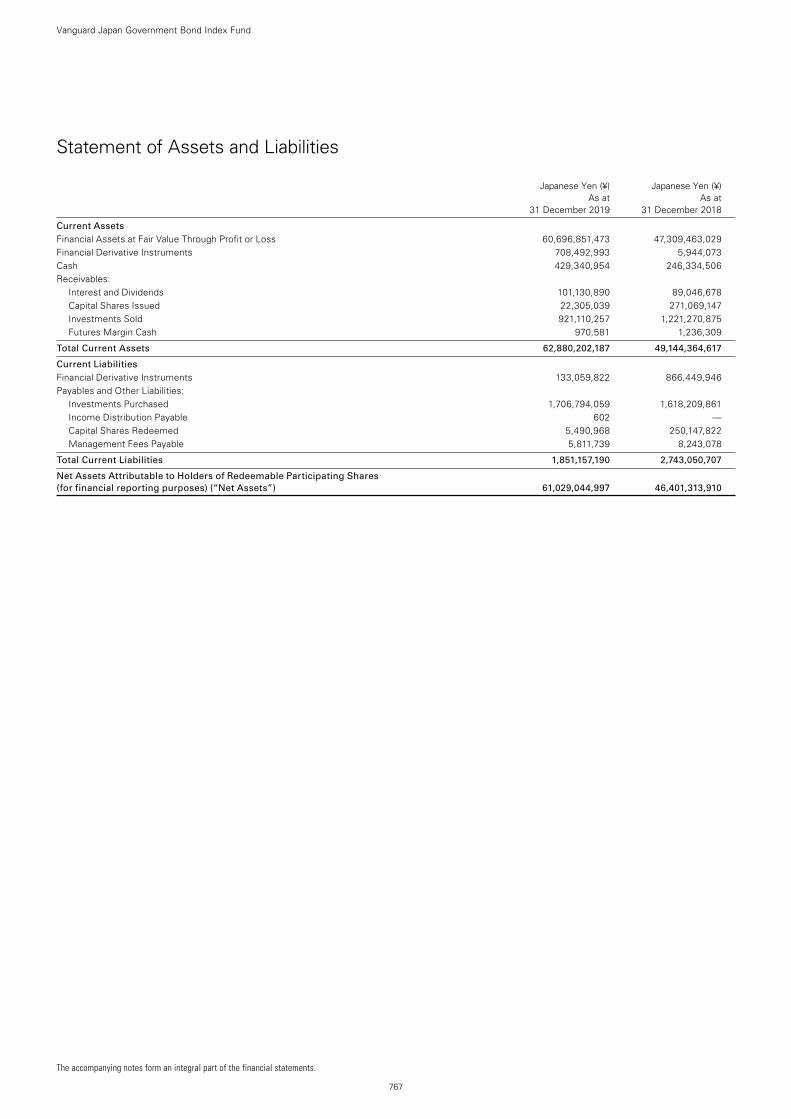
The accompanying notes form an integral part of the financial statements.
767
Vanguard Japan Government Bond Index Fund
Statement of Assets and Liabilities
Japanese Yen (¥) Japanese Yen (¥) As at As at 31 December 2019 31 December 2018
Current Assets Financial Assets at Fair Value Through Profit or Loss 60,696,851,473 47,309,463,029Financial Derivative Instruments 708,492,993 5,944,073Cash 429,340,954 246,334,506Receivables:
Interest and Dividends 101,130,890 89,046,678Capital Shares Issued 22,305,039 271,069,147Investments Sold 921,110,257 1,221,270,875Futures Margin Cash 970,581 1,236,309
Total Current Assets 62,880,202,187 49,144,364,617
Current Liabilities Financial Derivative Instruments 133,059,822 866,449,946Payables and Other Liabilities:
Investments Purchased 1,706,794,059 1,618,209,861Income Distribution Payable 602 —Capital Shares Redeemed 5,490,968 250,147,822Management Fees Payable 5,811,739 8,243,078
Total Current Liabilities 1,851,157,190 2,743,050,707
Net Assets Attributable to Holders of Redeemable Participating Shares (for financial reporting purposes) (“Net Assets”) 61,029,044,997 46,401,313,910
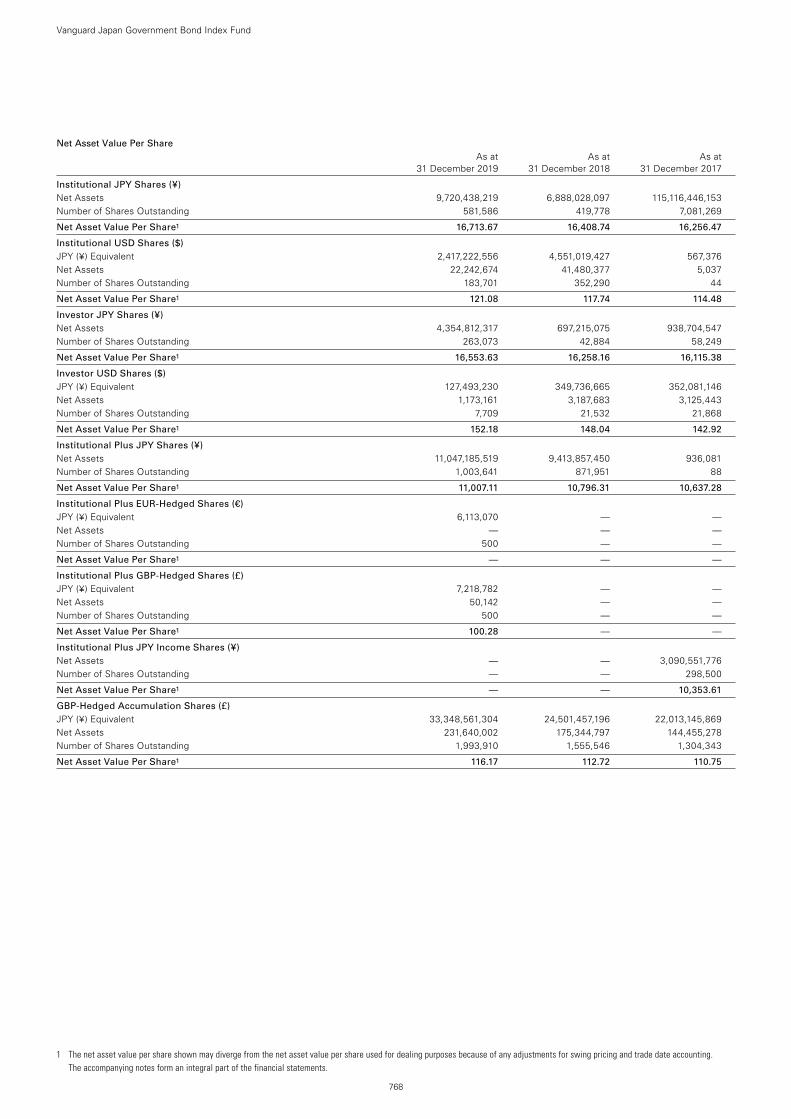
1 The net asset value per share shown may diverge from the net asset value per share used for dealing purposes because of any adjustments for swing pricing and trade date accounting. The accompanying notes form an integral part of the financial statements.
768
Net Asset Value Per Share As at As at As at 31 December 2019 31 December 2018 31 December 2017
Institutional JPY Shares (¥) Net Assets 9,720,438,219 6,888,028,097 115,116,446,153Number of Shares Outstanding 581,586 419,778 7,081,269
Net Asset Value Per Share1 16,713.67 16,408.74 16,256.47
Institutional USD Shares ($) JPY (¥) Equivalent 2,417,222,556 4,551,019,427 567,376Net Assets 22,242,674 41,480,377 5,037Number of Shares Outstanding 183,701 352,290 44
Net Asset Value Per Share1 121.08 117.74 114.48
Investor JPY Shares (¥) Net Assets 4,354,812,317 697,215,075 938,704,547Number of Shares Outstanding 263,073 42,884 58,249
Net Asset Value Per Share1 16,553.63 16,258.16 16,115.38
Investor USD Shares ($) JPY (¥) Equivalent 127,493,230 349,736,665 352,081,146Net Assets 1,173,161 3,187,683 3,125,443Number of Shares Outstanding 7,709 21,532 21,868
Net Asset Value Per Share1 152.18 148.04 142.92
Institutional Plus JPY Shares (¥) Net Assets 11,047,185,519 9,413,857,450 936,081Number of Shares Outstanding 1,003,641 871,951 88
Net Asset Value Per Share1 11,007.11 10,796.31 10,637.28
Institutional Plus EUR-Hedged Shares (€) JPY (¥) Equivalent 6,113,070 — —Net Assets — — —Number of Shares Outstanding 500 — —
Net Asset Value Per Share1 — — —
Institutional Plus GBP-Hedged Shares (£) JPY (¥) Equivalent 7,218,782 — —Net Assets 50,142 — —Number of Shares Outstanding 500 — —
Net Asset Value Per Share1 100.28 — —
Institutional Plus JPY Income Shares (¥) Net Assets — — 3,090,551,776Number of Shares Outstanding — — 298,500
Net Asset Value Per Share1 — — 10,353.61
GBP-Hedged Accumulation Shares (£) JPY (¥) Equivalent 33,348,561,304 24,501,457,196 22,013,145,869Net Assets 231,640,002 175,344,797 144,455,278Number of Shares Outstanding 1,993,910 1,555,546 1,304,343
Net Asset Value Per Share1 116.17 112.72 110.75
Vanguard Japan Government Bond Index Fund

769
Vanguard Japan Government Bond Index Fund
Statement of Operations
Japanese Yen (¥) Japanese Yen (¥) Year Ended Year Ended 31 December 2019 31 December 2018
Investment Income/(Loss) Interest Income 173,995,601 267,557,377Net Gain/(Loss) on Financial Instruments 2,109,442,599 (1,331,442,874)
Total Investment Income/(Loss) 2,283,438,200 (1,063,885,497)
Expenses Management Fees 97,768,753 194,102,810Transaction Fees and Commissions 92,390 39,999
Total Expenses 97,861,143 194,142,809
Finance Costs Interest Expense 696,083 796,840Distribution Paid 602 —
Total Finance Costs 696,685 796,840
Net Investment Income/(Loss) 2,184,880,372 (1,258,825,146)
Net Increase/(Decrease) in Net Assets Attributable to Holders of Redeemable Participating Shares (for financial reporting purposes) 2,184,880,372 (1,258,825,146)
Statement of Changes in Net Assets Attributable to Holders of Redeemable Participating Shares
Japanese Yen (¥) Japanese Yen (¥) Year Ended Year Ended 31 December 2019 31 December 2018
Increase/(Decrease) in Net Assets
Net Increase/(Decrease) in Net Assets Attributable to Holders of Redeemable Participating Shares From Operations 2,184,880,372 (1,258,825,146)
Capital Transactions Subscriptions 25,018,771,408 32,665,733,130Redemptions (12,575,920,693) (126,518,027,022)
Total Capital Transactions 12,442,850,715 (93,852,293,892)
Total Increase/(Decrease) for the Year 14,627,731,087 (95,111,119,038)
Net Assets Attributable to Holders of Redeemable Participating Shares (for financial reporting purposes) Beginning of Year 46,401,313,910 141,512,432,948
End of Year 61,029,044,997 46,401,313,910
The accompanying notes form an integral part of the financial statements.
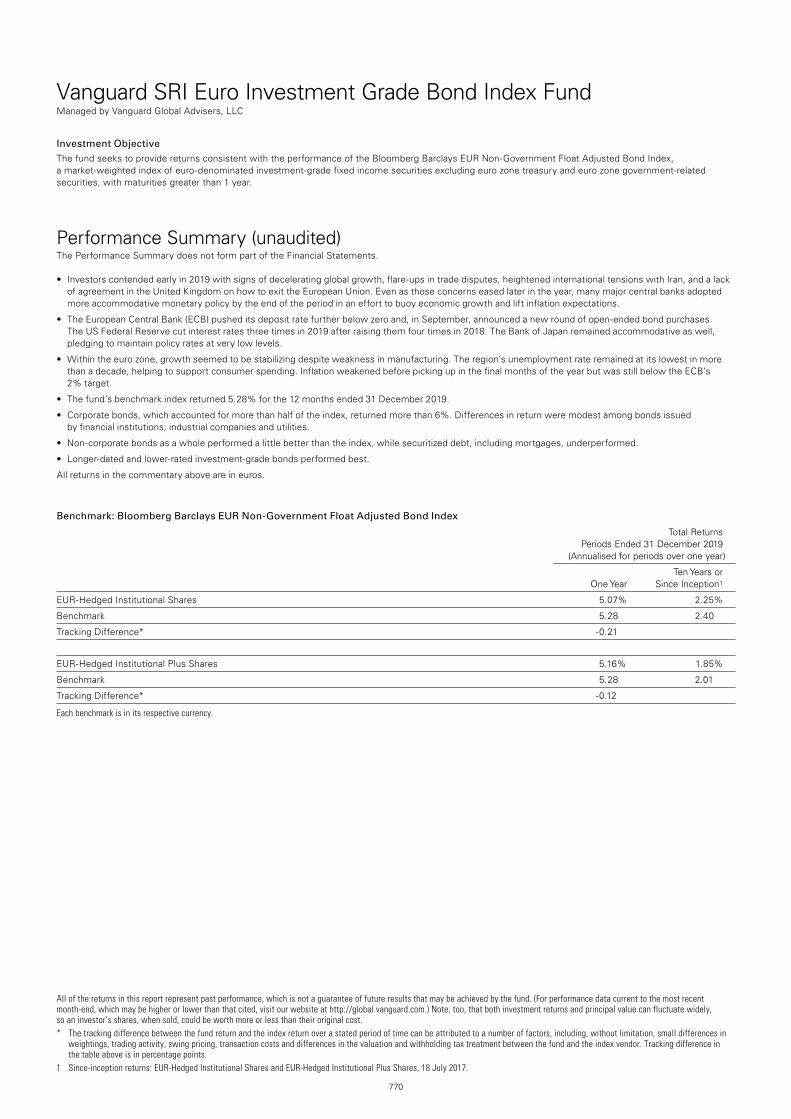
770
Vanguard SRI Euro Investment Grade Bond Index FundManaged by Vanguard Global Advisers, LLC
All of the returns in this report represent past performance, which is not a guarantee of future results that may be achieved by the fund. (For performance data current to the most recent month-end, which may be higher or lower than that cited, visit our website at http://global.vanguard.com.) Note, too, that both investment returns and principal value can fluctuate widely, so an investor’s shares, when sold, could be worth more or less than their original cost.* The tracking difference between the fund return and the index return over a stated period of time can be attributed to a number of factors, including, without limitation, small differences in
weightings, trading activity, swing pricing, transaction costs and differences in the valuation and withholding tax treatment between the fund and the index vendor. Tracking difference in the table above is in percentage points.
1 Since-inception returns: EUR-Hedged Institutional Shares and EUR-Hedged Institutional Plus Shares, 18 July 2017.
Investment ObjectiveThe fund seeks to provide returns consistent with the performance of the Bloomberg Barclays EUR Non-Government Float Adjusted Bond Index, a market-weighted index of euro-denominated investment-grade fixed income securities excluding euro zone treasury and euro zone government-related securities, with maturities greater than 1 year.
Performance Summary (unaudited)The Performance Summary does not form part of the Financial Statements.
• Investorscontendedearlyin2019withsignsofdeceleratingglobalgrowth,flare-upsintradedisputes,heightenedinternationaltensionswithIran,andalackof agreement in the United Kingdom on how to exit the European Union. Even as those concerns eased later in the year, many major central banks adopted more accommodative monetary policy by the end of the period in an effort to buoy economic growth and lift inflation expectations.
• TheEuropeanCentralBank(ECB)pusheditsdepositratefurtherbelowzeroand,inSeptember,announcedanewroundofopen-endedbondpurchases. The US Federal Reserve cut interest rates three times in 2019 after raising them four times in 2018. The Bank of Japan remained accommodative as well, pledging to maintain policy rates at very low levels.
• Withintheeurozone,growthseemedtobestabilizingdespiteweaknessinmanufacturing.Theregion’sunemploymentrateremainedatitslowestinmorethan a decade, helping to support consumer spending. Inflation weakened before picking up in the final months of the year but was still below the ECB’s 2% target.
• Thefund’sbenchmarkindexreturned5.28%forthe12monthsended31December2019.
• Corporatebonds,whichaccountedformorethanhalfoftheindex,returnedmorethan6%.Differencesinreturnweremodestamongbondsissued by financial institutions, industrial companies and utilities.
• Non-corporatebondsasawholeperformedalittlebetterthantheindex,whilesecuritizeddebt,includingmortgages,underperformed.
• Longer-datedandlower-ratedinvestment-gradebondsperformedbest.
All returns in the commentary above are in euros.
Benchmark: Bloomberg Barclays EUR Non-Government Float Adjusted Bond Index
Total Returns Periods Ended 31 December 2019 (Annualised for periods over one year)
Ten Years or One Year Since Inception1
EUR-Hedged Institutional Shares 5.07% 2.25%
Benchmark 5.28 2.40
Tracking Difference* -0.21
EUR-Hedged Institutional Plus Shares 5.16% 1.85%
Benchmark 5.28 2.01
Tracking Difference* -0.12
Each benchmark is in its respective currency.
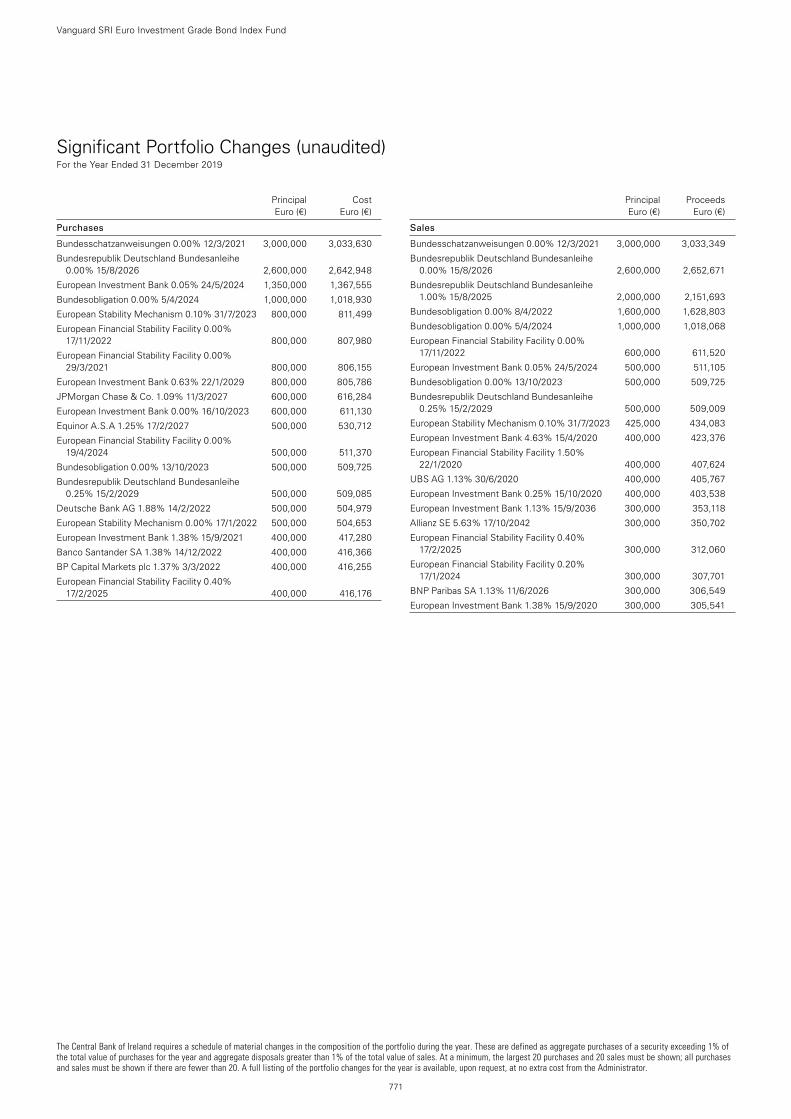
The Central Bank of Ireland requires a schedule of material changes in the composition of the portfolio during the year. These are defined as aggregate purchases of a security exceeding 1% of the total value of purchases for the year and aggregate disposals greater than 1% of the total value of sales. At a minimum, the largest 20 purchases and 20 sales must be shown; all purchases and sales must be shown if there are fewer than 20. A full listing of the portfolio changes for the year is available, upon request, at no extra cost from the Administrator.
771
Vanguard SRI Euro Investment Grade Bond Index Fund
Significant Portfolio Changes (unaudited) For the Year Ended 31 December 2019
Principal Cost Euro (€) Euro (€)
Purchases
Bundesschatzanweisungen 0.00% 12/3/2021 3,000,000 3,033,630
Bundesrepublik Deutschland Bundesanleihe 0.00% 15/8/2026 2,600,000 2,642,948
European Investment Bank 0.05% 24/5/2024 1,350,000 1,367,555
Bundesobligation 0.00% 5/4/2024 1,000,000 1,018,930
European Stability Mechanism 0.10% 31/7/2023 800,000 811,499
European Financial Stability Facility 0.00% 17/11/2022 800,000 807,980
European Financial Stability Facility 0.00% 29/3/2021 800,000 806,155
European Investment Bank 0.63% 22/1/2029 800,000 805,786
JPMorgan Chase & Co. 1.09% 11/3/2027 600,000 616,284
European Investment Bank 0.00% 16/10/2023 600,000 611,130
Equinor A.S.A 1.25% 17/2/2027 500,000 530,712
European Financial Stability Facility 0.00% 19/4/2024 500,000 511,370
Bundesobligation 0.00% 13/10/2023 500,000 509,725
Bundesrepublik Deutschland Bundesanleihe 0.25% 15/2/2029 500,000 509,085
Deutsche Bank AG 1.88% 14/2/2022 500,000 504,979
European Stability Mechanism 0.00% 17/1/2022 500,000 504,653
European Investment Bank 1.38% 15/9/2021 400,000 417,280
Banco Santander SA 1.38% 14/12/2022 400,000 416,366
BP Capital Markets plc 1.37% 3/3/2022 400,000 416,255
European Financial Stability Facility 0.40% 17/2/2025 400,000 416,176
Principal Proceeds Euro (€) Euro (€)
Sales
Bundesschatzanweisungen 0.00% 12/3/2021 3,000,000 3,033,349
Bundesrepublik Deutschland Bundesanleihe 0.00% 15/8/2026 2,600,000 2,652,671
Bundesrepublik Deutschland Bundesanleihe 1.00% 15/8/2025 2,000,000 2,151,693
Bundesobligation 0.00% 8/4/2022 1,600,000 1,628,803
Bundesobligation 0.00% 5/4/2024 1,000,000 1,018,068
European Financial Stability Facility 0.00% 17/11/2022 600,000 611,520
European Investment Bank 0.05% 24/5/2024 500,000 511,105
Bundesobligation 0.00% 13/10/2023 500,000 509,725
Bundesrepublik Deutschland Bundesanleihe 0.25% 15/2/2029 500,000 509,009
European Stability Mechanism 0.10% 31/7/2023 425,000 434,083
European Investment Bank 4.63% 15/4/2020 400,000 423,376
European Financial Stability Facility 1.50% 22/1/2020 400,000 407,624
UBS AG 1.13% 30/6/2020 400,000 405,767
European Investment Bank 0.25% 15/10/2020 400,000 403,538
European Investment Bank 1.13% 15/9/2036 300,000 353,118
Allianz SE 5.63% 17/10/2042 300,000 350,702
European Financial Stability Facility 0.40% 17/2/2025 300,000 312,060
European Financial Stability Facility 0.20% 17/1/2024 300,000 307,701
BNP Paribas SA 1.13% 11/6/2026 300,000 306,549
European Investment Bank 1.38% 15/9/2020 300,000 305,541
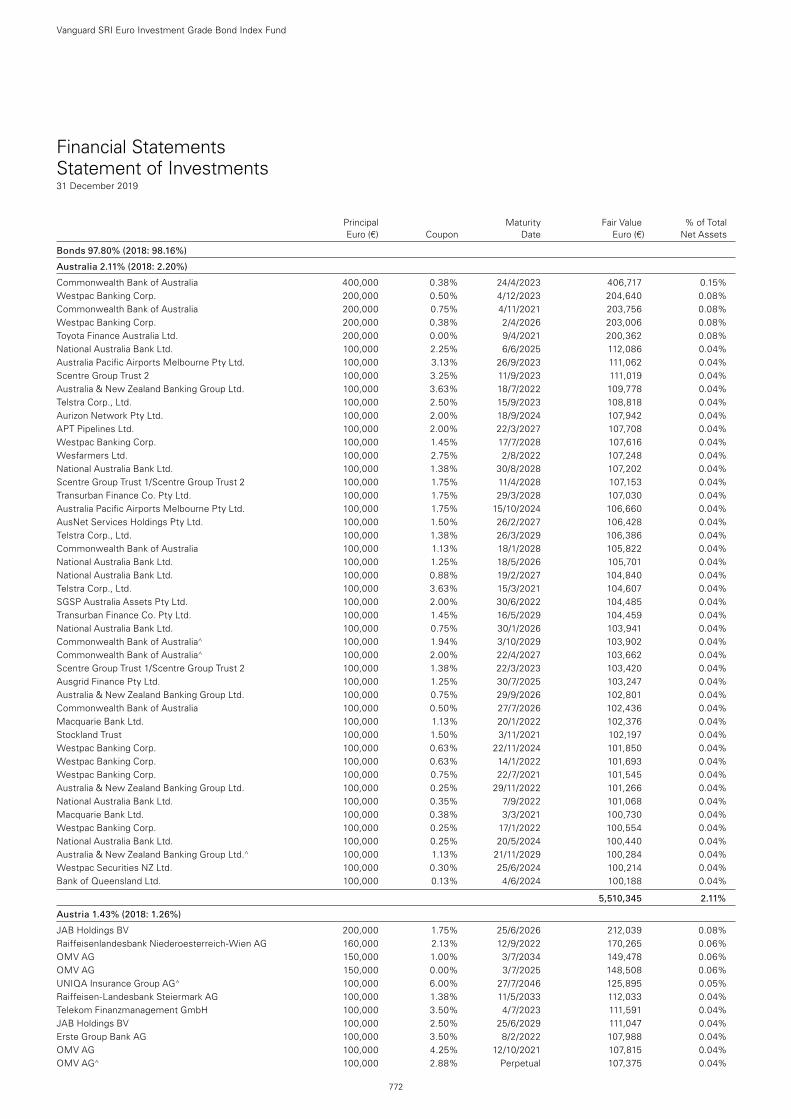
Financial Statements Statement of Investments31 December 2019
Principal Maturity Fair Value % of Total Euro (€) Coupon Date Euro (€) Net Assets
Bonds 97.80% (2018: 98.16%)
Australia 2.11% (2018: 2.20%)
Commonwealth Bank of Australia 400,000 0.38% 24/4/2023 406,717 0.15%Westpac Banking Corp. 200,000 0.50% 4/12/2023 204,640 0.08%Commonwealth Bank of Australia 200,000 0.75% 4/11/2021 203,756 0.08%Westpac Banking Corp. 200,000 0.38% 2/4/2026 203,006 0.08%Toyota Finance Australia Ltd. 200,000 0.00% 9/4/2021 200,362 0.08%National Australia Bank Ltd. 100,000 2.25% 6/6/2025 112,086 0.04%Australia Pacific Airports Melbourne Pty Ltd. 100,000 3.13% 26/9/2023 111,062 0.04%Scentre Group Trust 2 100,000 3.25% 11/9/2023 111,019 0.04%Australia & New Zealand Banking Group Ltd. 100,000 3.63% 18/7/2022 109,778 0.04%Telstra Corp., Ltd. 100,000 2.50% 15/9/2023 108,818 0.04%Aurizon Network Pty Ltd. 100,000 2.00% 18/9/2024 107,942 0.04%APT Pipelines Ltd. 100,000 2.00% 22/3/2027 107,708 0.04%Westpac Banking Corp. 100,000 1.45% 17/7/2028 107,616 0.04%Wesfarmers Ltd. 100,000 2.75% 2/8/2022 107,248 0.04%National Australia Bank Ltd. 100,000 1.38% 30/8/2028 107,202 0.04%Scentre Group Trust 1/Scentre Group Trust 2 100,000 1.75% 11/4/2028 107,153 0.04%Transurban Finance Co. Pty Ltd. 100,000 1.75% 29/3/2028 107,030 0.04%Australia Pacific Airports Melbourne Pty Ltd. 100,000 1.75% 15/10/2024 106,660 0.04%AusNet Services Holdings Pty Ltd. 100,000 1.50% 26/2/2027 106,428 0.04%Telstra Corp., Ltd. 100,000 1.38% 26/3/2029 106,386 0.04%Commonwealth Bank of Australia 100,000 1.13% 18/1/2028 105,822 0.04%National Australia Bank Ltd. 100,000 1.25% 18/5/2026 105,701 0.04%National Australia Bank Ltd. 100,000 0.88% 19/2/2027 104,840 0.04%Telstra Corp., Ltd. 100,000 3.63% 15/3/2021 104,607 0.04%SGSP Australia Assets Pty Ltd. 100,000 2.00% 30/6/2022 104,485 0.04%Transurban Finance Co. Pty Ltd. 100,000 1.45% 16/5/2029 104,459 0.04%National Australia Bank Ltd. 100,000 0.75% 30/1/2026 103,941 0.04%Commonwealth Bank of Australia^ 100,000 1.94% 3/10/2029 103,902 0.04%Commonwealth Bank of Australia^ 100,000 2.00% 22/4/2027 103,662 0.04%Scentre Group Trust 1/Scentre Group Trust 2 100,000 1.38% 22/3/2023 103,420 0.04%Ausgrid Finance Pty Ltd. 100,000 1.25% 30/7/2025 103,247 0.04%Australia & New Zealand Banking Group Ltd. 100,000 0.75% 29/9/2026 102,801 0.04%Commonwealth Bank of Australia 100,000 0.50% 27/7/2026 102,436 0.04%Macquarie Bank Ltd. 100,000 1.13% 20/1/2022 102,376 0.04%Stockland Trust 100,000 1.50% 3/11/2021 102,197 0.04%Westpac Banking Corp. 100,000 0.63% 22/11/2024 101,850 0.04%Westpac Banking Corp. 100,000 0.63% 14/1/2022 101,693 0.04%Westpac Banking Corp. 100,000 0.75% 22/7/2021 101,545 0.04%Australia & New Zealand Banking Group Ltd. 100,000 0.25% 29/11/2022 101,266 0.04%National Australia Bank Ltd. 100,000 0.35% 7/9/2022 101,068 0.04%Macquarie Bank Ltd. 100,000 0.38% 3/3/2021 100,730 0.04%Westpac Banking Corp. 100,000 0.25% 17/1/2022 100,554 0.04%National Australia Bank Ltd. 100,000 0.25% 20/5/2024 100,440 0.04%Australia & New Zealand Banking Group Ltd.^ 100,000 1.13% 21/11/2029 100,284 0.04%Westpac Securities NZ Ltd. 100,000 0.30% 25/6/2024 100,214 0.04%Bank of Queensland Ltd. 100,000 0.13% 4/6/2024 100,188 0.04%
5,510,345 2.11%
Austria 1.43% (2018: 1.26%)
JAB Holdings BV 200,000 1.75% 25/6/2026 212,039 0.08%Raiffeisenlandesbank Niederoesterreich-Wien AG 160,000 2.13% 12/9/2022 170,265 0.06%OMV AG 150,000 1.00% 3/7/2034 149,478 0.06%OMV AG 150,000 0.00% 3/7/2025 148,508 0.06%UNIQA Insurance Group AG^ 100,000 6.00% 27/7/2046 125,895 0.05%Raiffeisen-Landesbank Steiermark AG 100,000 1.38% 11/5/2033 112,033 0.04%Telekom Finanzmanagement GmbH 100,000 3.50% 4/7/2023 111,591 0.04%JAB Holdings BV 100,000 2.50% 25/6/2029 111,047 0.04%Erste Group Bank AG 100,000 3.50% 8/2/2022 107,988 0.04%OMV AG 100,000 4.25% 12/10/2021 107,815 0.04%OMV AG^ 100,000 2.88% Perpetual 107,375 0.04%
Vanguard SRI Euro Investment Grade Bond Index Fund
772
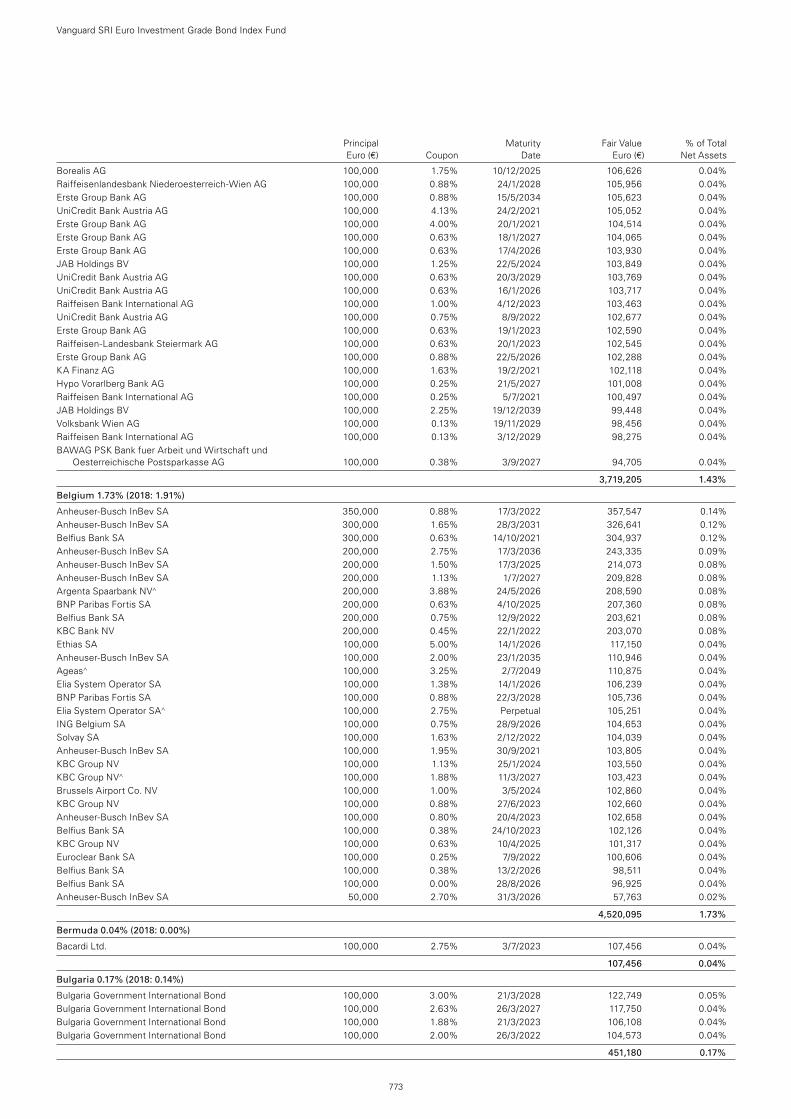
Borealis AG 100,000 1.75% 10/12/2025 106,626 0.04%Raiffeisenlandesbank Niederoesterreich-Wien AG 100,000 0.88% 24/1/2028 105,956 0.04%Erste Group Bank AG 100,000 0.88% 15/5/2034 105,623 0.04%UniCredit Bank Austria AG 100,000 4.13% 24/2/2021 105,052 0.04%Erste Group Bank AG 100,000 4.00% 20/1/2021 104,514 0.04%Erste Group Bank AG 100,000 0.63% 18/1/2027 104,065 0.04%Erste Group Bank AG 100,000 0.63% 17/4/2026 103,930 0.04%JAB Holdings BV 100,000 1.25% 22/5/2024 103,849 0.04%UniCredit Bank Austria AG 100,000 0.63% 20/3/2029 103,769 0.04%UniCredit Bank Austria AG 100,000 0.63% 16/1/2026 103,717 0.04%Raiffeisen Bank International AG 100,000 1.00% 4/12/2023 103,463 0.04%UniCredit Bank Austria AG 100,000 0.75% 8/9/2022 102,677 0.04%Erste Group Bank AG 100,000 0.63% 19/1/2023 102,590 0.04%Raiffeisen-Landesbank Steiermark AG 100,000 0.63% 20/1/2023 102,545 0.04%Erste Group Bank AG 100,000 0.88% 22/5/2026 102,288 0.04%KA Finanz AG 100,000 1.63% 19/2/2021 102,118 0.04%Hypo Vorarlberg Bank AG 100,000 0.25% 21/5/2027 101,008 0.04%Raiffeisen Bank International AG 100,000 0.25% 5/7/2021 100,497 0.04%JAB Holdings BV 100,000 2.25% 19/12/2039 99,448 0.04%Volksbank Wien AG 100,000 0.13% 19/11/2029 98,456 0.04%Raiffeisen Bank International AG 100,000 0.13% 3/12/2029 98,275 0.04%BAWAG PSK Bank fuer Arbeit und Wirtschaft und
Oesterreichische Postsparkasse AG 100,000 0.38% 3/9/2027 94,705 0.04%
3,719,205 1.43%
Belgium 1.73% (2018: 1.91%)
Anheuser-Busch InBev SA 350,000 0.88% 17/3/2022 357,547 0.14%Anheuser-Busch InBev SA 300,000 1.65% 28/3/2031 326,641 0.12%Belfius Bank SA 300,000 0.63% 14/10/2021 304,937 0.12%Anheuser-Busch InBev SA 200,000 2.75% 17/3/2036 243,335 0.09%Anheuser-Busch InBev SA 200,000 1.50% 17/3/2025 214,073 0.08%Anheuser-Busch InBev SA 200,000 1.13% 1/7/2027 209,828 0.08%Argenta Spaarbank NV^ 200,000 3.88% 24/5/2026 208,590 0.08%BNP Paribas Fortis SA 200,000 0.63% 4/10/2025 207,360 0.08%Belfius Bank SA 200,000 0.75% 12/9/2022 203,621 0.08%KBC Bank NV 200,000 0.45% 22/1/2022 203,070 0.08%Ethias SA 100,000 5.00% 14/1/2026 117,150 0.04%Anheuser-Busch InBev SA 100,000 2.00% 23/1/2035 110,946 0.04%Ageas^ 100,000 3.25% 2/7/2049 110,875 0.04%Elia System Operator SA 100,000 1.38% 14/1/2026 106,239 0.04%BNP Paribas Fortis SA 100,000 0.88% 22/3/2028 105,736 0.04%Elia System Operator SA^ 100,000 2.75% Perpetual 105,251 0.04%ING Belgium SA 100,000 0.75% 28/9/2026 104,653 0.04%Solvay SA 100,000 1.63% 2/12/2022 104,039 0.04%Anheuser-Busch InBev SA 100,000 1.95% 30/9/2021 103,805 0.04%KBC Group NV 100,000 1.13% 25/1/2024 103,550 0.04%KBC Group NV^ 100,000 1.88% 11/3/2027 103,423 0.04%Brussels Airport Co. NV 100,000 1.00% 3/5/2024 102,860 0.04%KBC Group NV 100,000 0.88% 27/6/2023 102,660 0.04%Anheuser-Busch InBev SA 100,000 0.80% 20/4/2023 102,658 0.04%Belfius Bank SA 100,000 0.38% 24/10/2023 102,126 0.04%KBC Group NV 100,000 0.63% 10/4/2025 101,317 0.04%Euroclear Bank SA 100,000 0.25% 7/9/2022 100,606 0.04%Belfius Bank SA 100,000 0.38% 13/2/2026 98,511 0.04%Belfius Bank SA 100,000 0.00% 28/8/2026 96,925 0.04%Anheuser-Busch InBev SA 50,000 2.70% 31/3/2026 57,763 0.02%
4,520,095 1.73%
Bermuda 0.04% (2018: 0.00%)
Bacardi Ltd. 100,000 2.75% 3/7/2023 107,456 0.04%
107,456 0.04%
Bulgaria 0.17% (2018: 0.14%)
Bulgaria Government International Bond 100,000 3.00% 21/3/2028 122,749 0.05%Bulgaria Government International Bond 100,000 2.63% 26/3/2027 117,750 0.04%Bulgaria Government International Bond 100,000 1.88% 21/3/2023 106,108 0.04%Bulgaria Government International Bond 100,000 2.00% 26/3/2022 104,573 0.04%
451,180 0.17%
Vanguard SRI Euro Investment Grade Bond Index Fund
773
Principal Maturity Fair Value % of Total Euro (€) Coupon Date Euro (€) Net Assets
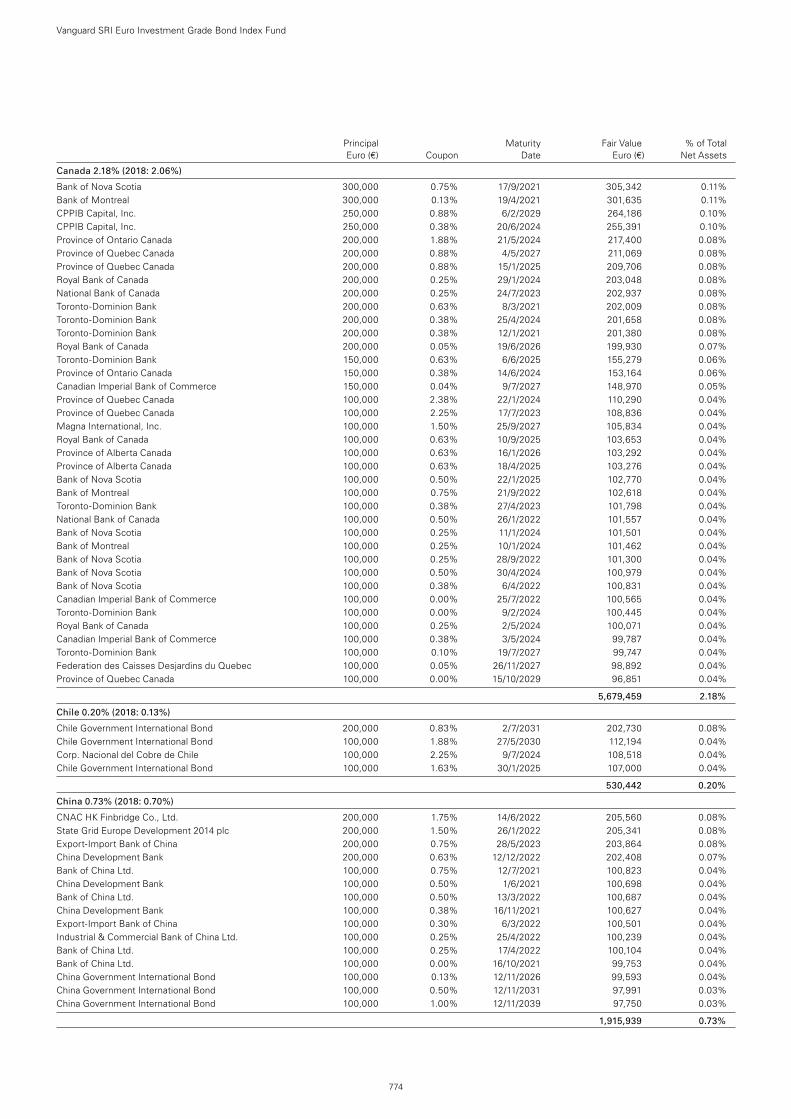
Canada 2.18% (2018: 2.06%)
Bank of Nova Scotia 300,000 0.75% 17/9/2021 305,342 0.11%Bank of Montreal 300,000 0.13% 19/4/2021 301,635 0.11%CPPIB Capital, Inc. 250,000 0.88% 6/2/2029 264,186 0.10%CPPIB Capital, Inc. 250,000 0.38% 20/6/2024 255,391 0.10%Province of Ontario Canada 200,000 1.88% 21/5/2024 217,400 0.08%Province of Quebec Canada 200,000 0.88% 4/5/2027 211,069 0.08%Province of Quebec Canada 200,000 0.88% 15/1/2025 209,706 0.08%Royal Bank of Canada 200,000 0.25% 29/1/2024 203,048 0.08%National Bank of Canada 200,000 0.25% 24/7/2023 202,937 0.08%Toronto-Dominion Bank 200,000 0.63% 8/3/2021 202,009 0.08%Toronto-Dominion Bank 200,000 0.38% 25/4/2024 201,658 0.08%Toronto-Dominion Bank 200,000 0.38% 12/1/2021 201,380 0.08%Royal Bank of Canada 200,000 0.05% 19/6/2026 199,930 0.07%Toronto-Dominion Bank 150,000 0.63% 6/6/2025 155,279 0.06%Province of Ontario Canada 150,000 0.38% 14/6/2024 153,164 0.06%Canadian Imperial Bank of Commerce 150,000 0.04% 9/7/2027 148,970 0.05%Province of Quebec Canada 100,000 2.38% 22/1/2024 110,290 0.04%Province of Quebec Canada 100,000 2.25% 17/7/2023 108,836 0.04%Magna International, Inc. 100,000 1.50% 25/9/2027 105,834 0.04%Royal Bank of Canada 100,000 0.63% 10/9/2025 103,653 0.04%Province of Alberta Canada 100,000 0.63% 16/1/2026 103,292 0.04%Province of Alberta Canada 100,000 0.63% 18/4/2025 103,276 0.04%Bank of Nova Scotia 100,000 0.50% 22/1/2025 102,770 0.04%Bank of Montreal 100,000 0.75% 21/9/2022 102,618 0.04%Toronto-Dominion Bank 100,000 0.38% 27/4/2023 101,798 0.04%National Bank of Canada 100,000 0.50% 26/1/2022 101,557 0.04%Bank of Nova Scotia 100,000 0.25% 11/1/2024 101,501 0.04%Bank of Montreal 100,000 0.25% 10/1/2024 101,462 0.04%Bank of Nova Scotia 100,000 0.25% 28/9/2022 101,300 0.04%Bank of Nova Scotia 100,000 0.50% 30/4/2024 100,979 0.04%Bank of Nova Scotia 100,000 0.38% 6/4/2022 100,831 0.04%Canadian Imperial Bank of Commerce 100,000 0.00% 25/7/2022 100,565 0.04%Toronto-Dominion Bank 100,000 0.00% 9/2/2024 100,445 0.04%Royal Bank of Canada 100,000 0.25% 2/5/2024 100,071 0.04%Canadian Imperial Bank of Commerce 100,000 0.38% 3/5/2024 99,787 0.04%Toronto-Dominion Bank 100,000 0.10% 19/7/2027 99,747 0.04%Federation des Caisses Desjardins du Quebec 100,000 0.05% 26/11/2027 98,892 0.04%Province of Quebec Canada 100,000 0.00% 15/10/2029 96,851 0.04%
5,679,459 2.18%
Chile 0.20% (2018: 0.13%)
Chile Government International Bond 200,000 0.83% 2/7/2031 202,730 0.08%Chile Government International Bond 100,000 1.88% 27/5/2030 112,194 0.04%Corp. Nacional del Cobre de Chile 100,000 2.25% 9/7/2024 108,518 0.04%Chile Government International Bond 100,000 1.63% 30/1/2025 107,000 0.04%
530,442 0.20%
China 0.73% (2018: 0.70%)
CNAC HK Finbridge Co., Ltd. 200,000 1.75% 14/6/2022 205,560 0.08%State Grid Europe Development 2014 plc 200,000 1.50% 26/1/2022 205,341 0.08%Export-Import Bank of China 200,000 0.75% 28/5/2023 203,864 0.08%China Development Bank 200,000 0.63% 12/12/2022 202,408 0.07%Bank of China Ltd. 100,000 0.75% 12/7/2021 100,823 0.04%China Development Bank 100,000 0.50% 1/6/2021 100,698 0.04%Bank of China Ltd. 100,000 0.50% 13/3/2022 100,687 0.04%China Development Bank 100,000 0.38% 16/11/2021 100,627 0.04%Export-Import Bank of China 100,000 0.30% 6/3/2022 100,501 0.04%Industrial & Commercial Bank of China Ltd. 100,000 0.25% 25/4/2022 100,239 0.04%Bank of China Ltd. 100,000 0.25% 17/4/2022 100,104 0.04%Bank of China Ltd. 100,000 0.00% 16/10/2021 99,753 0.04%China Government International Bond 100,000 0.13% 12/11/2026 99,593 0.04%China Government International Bond 100,000 0.50% 12/11/2031 97,991 0.03%China Government International Bond 100,000 1.00% 12/11/2039 97,750 0.03%
1,915,939 0.73%
Vanguard SRI Euro Investment Grade Bond Index Fund
774
Principal Maturity Fair Value % of Total Euro (€) Coupon Date Euro (€) Net Assets
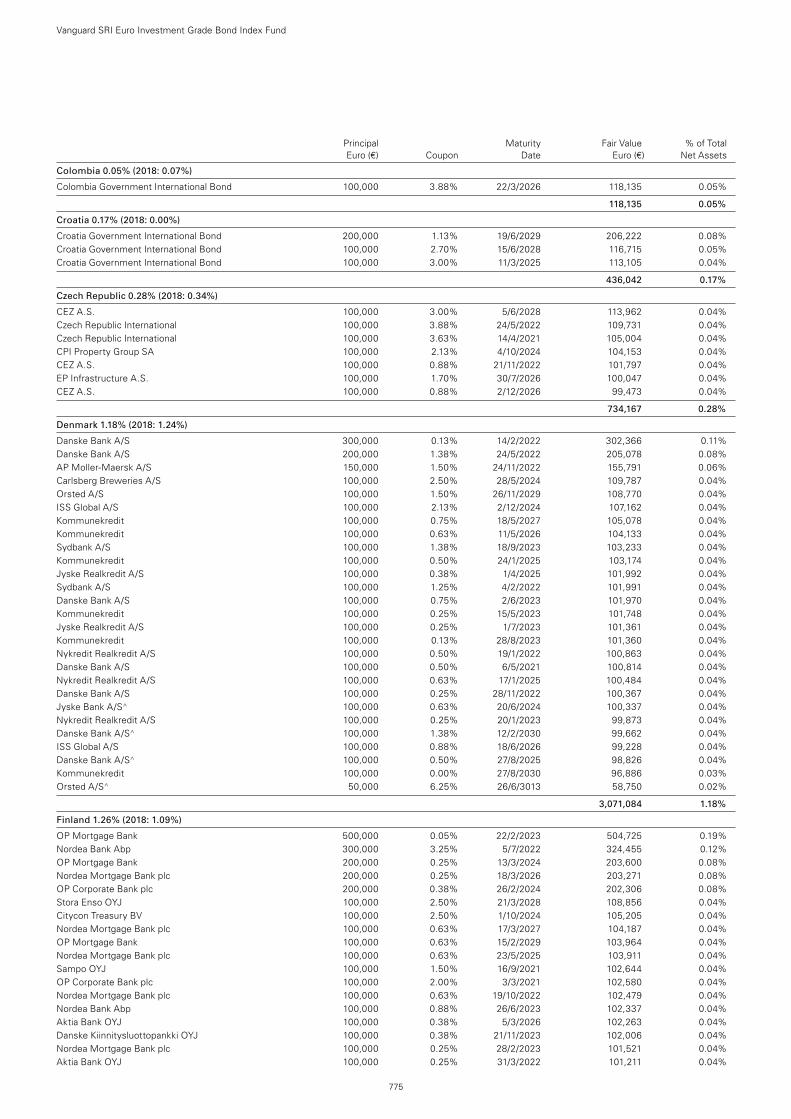
Colombia 0.05% (2018: 0.07%)
Colombia Government International Bond 100,000 3.88% 22/3/2026 118,135 0.05%
118,135 0.05%
Croatia 0.17% (2018: 0.00%)
Croatia Government International Bond 200,000 1.13% 19/6/2029 206,222 0.08%Croatia Government International Bond 100,000 2.70% 15/6/2028 116,715 0.05%Croatia Government International Bond 100,000 3.00% 11/3/2025 113,105 0.04%
436,042 0.17%
Czech Republic 0.28% (2018: 0.34%)
CEZ A.S. 100,000 3.00% 5/6/2028 113,962 0.04%Czech Republic International 100,000 3.88% 24/5/2022 109,731 0.04%Czech Republic International 100,000 3.63% 14/4/2021 105,004 0.04%CPI Property Group SA 100,000 2.13% 4/10/2024 104,153 0.04%CEZ A.S. 100,000 0.88% 21/11/2022 101,797 0.04%EP Infrastructure A.S. 100,000 1.70% 30/7/2026 100,047 0.04%CEZ A.S. 100,000 0.88% 2/12/2026 99,473 0.04%
734,167 0.28%
Denmark 1.18% (2018: 1.24%)
Danske Bank A/S 300,000 0.13% 14/2/2022 302,366 0.11%Danske Bank A/S 200,000 1.38% 24/5/2022 205,078 0.08%AP Moller-Maersk A/S 150,000 1.50% 24/11/2022 155,791 0.06%Carlsberg Breweries A/S 100,000 2.50% 28/5/2024 109,787 0.04%Orsted A/S 100,000 1.50% 26/11/2029 108,770 0.04%ISS Global A/S 100,000 2.13% 2/12/2024 107,162 0.04%Kommunekredit 100,000 0.75% 18/5/2027 105,078 0.04%Kommunekredit 100,000 0.63% 11/5/2026 104,133 0.04%Sydbank A/S 100,000 1.38% 18/9/2023 103,233 0.04%Kommunekredit 100,000 0.50% 24/1/2025 103,174 0.04%Jyske Realkredit A/S 100,000 0.38% 1/4/2025 101,992 0.04%Sydbank A/S 100,000 1.25% 4/2/2022 101,991 0.04%Danske Bank A/S 100,000 0.75% 2/6/2023 101,970 0.04%Kommunekredit 100,000 0.25% 15/5/2023 101,748 0.04%Jyske Realkredit A/S 100,000 0.25% 1/7/2023 101,361 0.04%Kommunekredit 100,000 0.13% 28/8/2023 101,360 0.04%Nykredit Realkredit A/S 100,000 0.50% 19/1/2022 100,863 0.04%Danske Bank A/S 100,000 0.50% 6/5/2021 100,814 0.04%Nykredit Realkredit A/S 100,000 0.63% 17/1/2025 100,484 0.04%Danske Bank A/S 100,000 0.25% 28/11/2022 100,367 0.04%Jyske Bank A/S^ 100,000 0.63% 20/6/2024 100,337 0.04%Nykredit Realkredit A/S 100,000 0.25% 20/1/2023 99,873 0.04%Danske Bank A/S^ 100,000 1.38% 12/2/2030 99,662 0.04%ISS Global A/S 100,000 0.88% 18/6/2026 99,228 0.04%Danske Bank A/S^ 100,000 0.50% 27/8/2025 98,826 0.04%Kommunekredit 100,000 0.00% 27/8/2030 96,886 0.03%Orsted A/S^ 50,000 6.25% 26/6/3013 58,750 0.02%
3,071,084 1.18%
Finland 1.26% (2018: 1.09%)
OP Mortgage Bank 500,000 0.05% 22/2/2023 504,725 0.19%Nordea Bank Abp 300,000 3.25% 5/7/2022 324,455 0.12%OP Mortgage Bank 200,000 0.25% 13/3/2024 203,600 0.08%Nordea Mortgage Bank plc 200,000 0.25% 18/3/2026 203,271 0.08%OP Corporate Bank plc 200,000 0.38% 26/2/2024 202,306 0.08%Stora Enso OYJ 100,000 2.50% 21/3/2028 108,856 0.04%Citycon Treasury BV 100,000 2.50% 1/10/2024 105,205 0.04%Nordea Mortgage Bank plc 100,000 0.63% 17/3/2027 104,187 0.04%OP Mortgage Bank 100,000 0.63% 15/2/2029 103,964 0.04%Nordea Mortgage Bank plc 100,000 0.63% 23/5/2025 103,911 0.04%Sampo OYJ 100,000 1.50% 16/9/2021 102,644 0.04%OP Corporate Bank plc 100,000 2.00% 3/3/2021 102,580 0.04%Nordea Mortgage Bank plc 100,000 0.63% 19/10/2022 102,479 0.04%Nordea Bank Abp 100,000 0.88% 26/6/2023 102,337 0.04%Aktia Bank OYJ 100,000 0.38% 5/3/2026 102,263 0.04%Danske Kiinnitysluottopankki OYJ 100,000 0.38% 21/11/2023 102,006 0.04%Nordea Mortgage Bank plc 100,000 0.25% 28/2/2023 101,521 0.04%Aktia Bank OYJ 100,000 0.25% 31/3/2022 101,211 0.04%
Vanguard SRI Euro Investment Grade Bond Index Fund
775
Principal Maturity Fair Value % of Total Euro (€) Coupon Date Euro (€) Net Assets
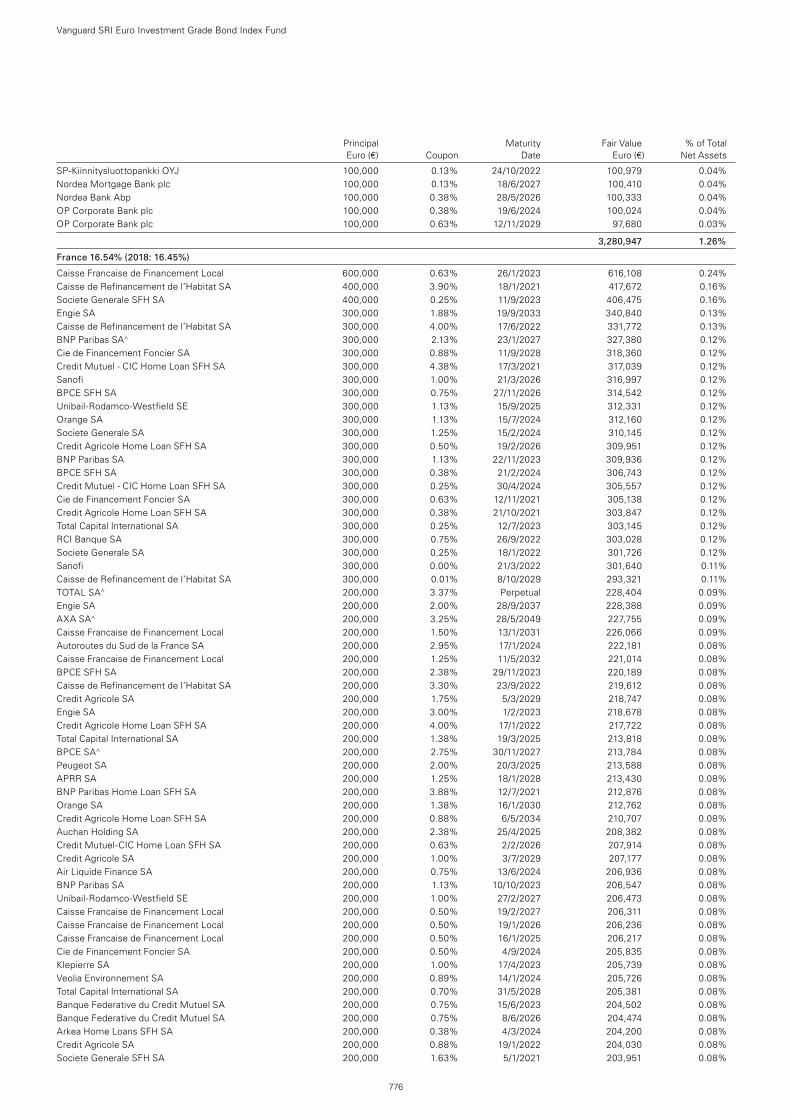
SP-Kiinnitysluottopankki OYJ 100,000 0.13% 24/10/2022 100,979 0.04%Nordea Mortgage Bank plc 100,000 0.13% 18/6/2027 100,410 0.04%Nordea Bank Abp 100,000 0.38% 28/5/2026 100,333 0.04%OP Corporate Bank plc 100,000 0.38% 19/6/2024 100,024 0.04%OP Corporate Bank plc 100,000 0.63% 12/11/2029 97,680 0.03%
3,280,947 1.26%
France 16.54% (2018: 16.45%)
Caisse Francaise de Financement Local 600,000 0.63% 26/1/2023 616,108 0.24%Caisse de Refinancement de l’Habitat SA 400,000 3.90% 18/1/2021 417,672 0.16%Societe Generale SFH SA 400,000 0.25% 11/9/2023 406,475 0.16%Engie SA 300,000 1.88% 19/9/2033 340,840 0.13%Caisse de Refinancement de l’Habitat SA 300,000 4.00% 17/6/2022 331,772 0.13%BNP Paribas SA^ 300,000 2.13% 23/1/2027 327,380 0.12%Cie de Financement Foncier SA 300,000 0.88% 11/9/2028 318,360 0.12%Credit Mutuel - CIC Home Loan SFH SA 300,000 4.38% 17/3/2021 317,039 0.12%Sanofi 300,000 1.00% 21/3/2026 316,997 0.12%BPCE SFH SA 300,000 0.75% 27/11/2026 314,542 0.12%Unibail-Rodamco-Westfield SE 300,000 1.13% 15/9/2025 312,331 0.12%Orange SA 300,000 1.13% 15/7/2024 312,160 0.12%Societe Generale SA 300,000 1.25% 15/2/2024 310,145 0.12%Credit Agricole Home Loan SFH SA 300,000 0.50% 19/2/2026 309,951 0.12%BNP Paribas SA 300,000 1.13% 22/11/2023 309,936 0.12%BPCE SFH SA 300,000 0.38% 21/2/2024 306,743 0.12%Credit Mutuel - CIC Home Loan SFH SA 300,000 0.25% 30/4/2024 305,557 0.12%Cie de Financement Foncier SA 300,000 0.63% 12/11/2021 305,138 0.12%Credit Agricole Home Loan SFH SA 300,000 0.38% 21/10/2021 303,847 0.12%Total Capital International SA 300,000 0.25% 12/7/2023 303,145 0.12%RCI Banque SA 300,000 0.75% 26/9/2022 303,028 0.12%Societe Generale SA 300,000 0.25% 18/1/2022 301,726 0.12%Sanofi 300,000 0.00% 21/3/2022 301,640 0.11%Caisse de Refinancement de l’Habitat SA 300,000 0.01% 8/10/2029 293,321 0.11%TOTAL SA^ 200,000 3.37% Perpetual 228,404 0.09%Engie SA 200,000 2.00% 28/9/2037 228,388 0.09%AXA SA^ 200,000 3.25% 28/5/2049 227,755 0.09%Caisse Francaise de Financement Local 200,000 1.50% 13/1/2031 226,066 0.09%Autoroutes du Sud de la France SA 200,000 2.95% 17/1/2024 222,181 0.08%Caisse Francaise de Financement Local 200,000 1.25% 11/5/2032 221,014 0.08%BPCE SFH SA 200,000 2.38% 29/11/2023 220,189 0.08%Caisse de Refinancement de l’Habitat SA 200,000 3.30% 23/9/2022 219,612 0.08%Credit Agricole SA 200,000 1.75% 5/3/2029 218,747 0.08%Engie SA 200,000 3.00% 1/2/2023 218,678 0.08%Credit Agricole Home Loan SFH SA 200,000 4.00% 17/1/2022 217,722 0.08%Total Capital International SA 200,000 1.38% 19/3/2025 213,818 0.08%BPCE SA^ 200,000 2.75% 30/11/2027 213,784 0.08%Peugeot SA 200,000 2.00% 20/3/2025 213,588 0.08%APRR SA 200,000 1.25% 18/1/2028 213,430 0.08%BNP Paribas Home Loan SFH SA 200,000 3.88% 12/7/2021 212,876 0.08%Orange SA 200,000 1.38% 16/1/2030 212,762 0.08%Credit Agricole Home Loan SFH SA 200,000 0.88% 6/5/2034 210,707 0.08%Auchan Holding SA 200,000 2.38% 25/4/2025 208,382 0.08%Credit Mutuel-CIC Home Loan SFH SA 200,000 0.63% 2/2/2026 207,914 0.08%Credit Agricole SA 200,000 1.00% 3/7/2029 207,177 0.08%Air Liquide Finance SA 200,000 0.75% 13/6/2024 206,936 0.08%BNP Paribas SA 200,000 1.13% 10/10/2023 206,547 0.08%Unibail-Rodamco-Westfield SE 200,000 1.00% 27/2/2027 206,473 0.08%Caisse Francaise de Financement Local 200,000 0.50% 19/2/2027 206,311 0.08%Caisse Francaise de Financement Local 200,000 0.50% 19/1/2026 206,236 0.08%Caisse Francaise de Financement Local 200,000 0.50% 16/1/2025 206,217 0.08%Cie de Financement Foncier SA 200,000 0.50% 4/9/2024 205,835 0.08%Klepierre SA 200,000 1.00% 17/4/2023 205,739 0.08%Veolia Environnement SA 200,000 0.89% 14/1/2024 205,726 0.08%Total Capital International SA 200,000 0.70% 31/5/2028 205,381 0.08%Banque Federative du Credit Mutuel SA 200,000 0.75% 15/6/2023 204,502 0.08%Banque Federative du Credit Mutuel SA 200,000 0.75% 8/6/2026 204,474 0.08%Arkea Home Loans SFH SA 200,000 0.38% 4/3/2024 204,200 0.08%Credit Agricole SA 200,000 0.88% 19/1/2022 204,030 0.08%Societe Generale SFH SA 200,000 1.63% 5/1/2021 203,951 0.08%
Vanguard SRI Euro Investment Grade Bond Index Fund
776
Principal Maturity Fair Value % of Total Euro (€) Coupon Date Euro (€) Net Assets
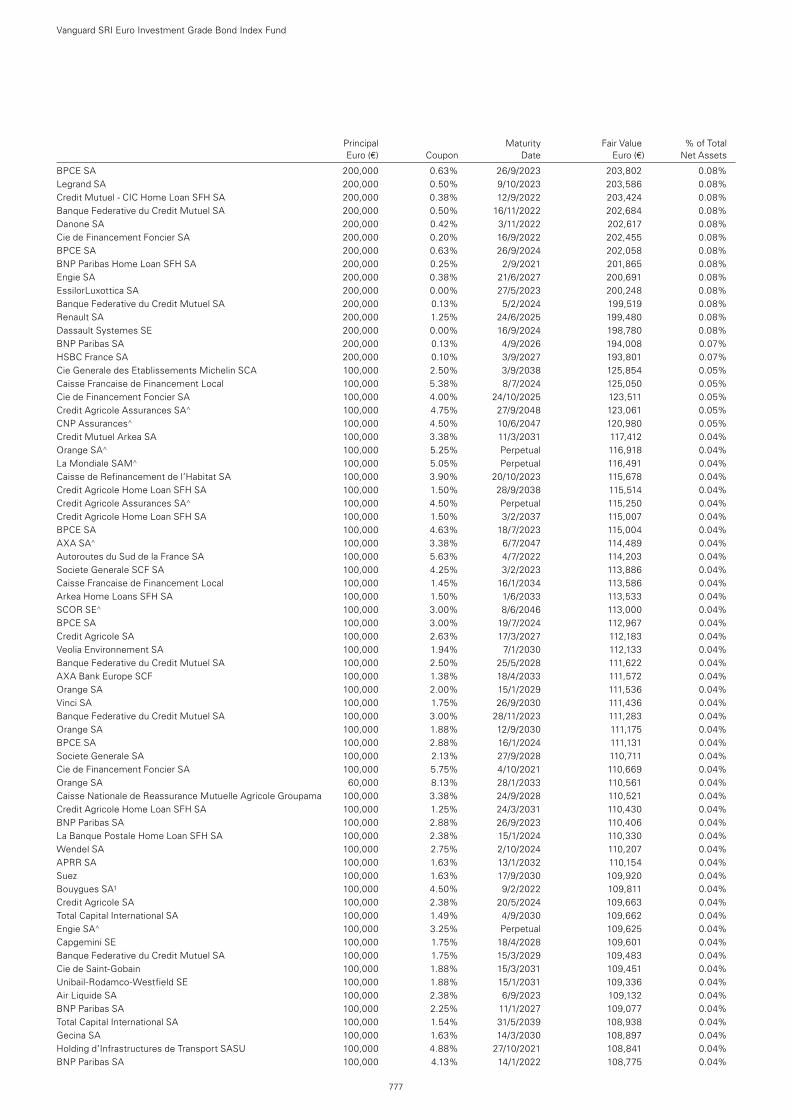
BPCE SA 200,000 0.63% 26/9/2023 203,802 0.08%Legrand SA 200,000 0.50% 9/10/2023 203,586 0.08%Credit Mutuel - CIC Home Loan SFH SA 200,000 0.38% 12/9/2022 203,424 0.08%Banque Federative du Credit Mutuel SA 200,000 0.50% 16/11/2022 202,684 0.08%Danone SA 200,000 0.42% 3/11/2022 202,617 0.08%Cie de Financement Foncier SA 200,000 0.20% 16/9/2022 202,455 0.08%BPCE SA 200,000 0.63% 26/9/2024 202,058 0.08%BNP Paribas Home Loan SFH SA 200,000 0.25% 2/9/2021 201,865 0.08%Engie SA 200,000 0.38% 21/6/2027 200,691 0.08%EssilorLuxottica SA 200,000 0.00% 27/5/2023 200,248 0.08%Banque Federative du Credit Mutuel SA 200,000 0.13% 5/2/2024 199,519 0.08%Renault SA 200,000 1.25% 24/6/2025 199,480 0.08%Dassault Systemes SE 200,000 0.00% 16/9/2024 198,780 0.08%BNP Paribas SA 200,000 0.13% 4/9/2026 194,008 0.07%HSBC France SA 200,000 0.10% 3/9/2027 193,801 0.07%Cie Generale des Etablissements Michelin SCA 100,000 2.50% 3/9/2038 125,854 0.05%Caisse Francaise de Financement Local 100,000 5.38% 8/7/2024 125,050 0.05%Cie de Financement Foncier SA 100,000 4.00% 24/10/2025 123,511 0.05%Credit Agricole Assurances SA^ 100,000 4.75% 27/9/2048 123,061 0.05%CNP Assurances^ 100,000 4.50% 10/6/2047 120,980 0.05%Credit Mutuel Arkea SA 100,000 3.38% 11/3/2031 117,412 0.04%Orange SA^ 100,000 5.25% Perpetual 116,918 0.04%La Mondiale SAM^ 100,000 5.05% Perpetual 116,491 0.04%Caisse de Refinancement de l’Habitat SA 100,000 3.90% 20/10/2023 115,678 0.04%Credit Agricole Home Loan SFH SA 100,000 1.50% 28/9/2038 115,514 0.04%Credit Agricole Assurances SA^ 100,000 4.50% Perpetual 115,250 0.04%Credit Agricole Home Loan SFH SA 100,000 1.50% 3/2/2037 115,007 0.04%BPCE SA 100,000 4.63% 18/7/2023 115,004 0.04%AXA SA^ 100,000 3.38% 6/7/2047 114,489 0.04%Autoroutes du Sud de la France SA 100,000 5.63% 4/7/2022 114,203 0.04%Societe Generale SCF SA 100,000 4.25% 3/2/2023 113,886 0.04%Caisse Francaise de Financement Local 100,000 1.45% 16/1/2034 113,586 0.04%Arkea Home Loans SFH SA 100,000 1.50% 1/6/2033 113,533 0.04%SCOR SE^ 100,000 3.00% 8/6/2046 113,000 0.04%BPCE SA 100,000 3.00% 19/7/2024 112,967 0.04%Credit Agricole SA 100,000 2.63% 17/3/2027 112,183 0.04%Veolia Environnement SA 100,000 1.94% 7/1/2030 112,133 0.04%Banque Federative du Credit Mutuel SA 100,000 2.50% 25/5/2028 111,622 0.04%AXA Bank Europe SCF 100,000 1.38% 18/4/2033 111,572 0.04%Orange SA 100,000 2.00% 15/1/2029 111,536 0.04%Vinci SA 100,000 1.75% 26/9/2030 111,436 0.04%Banque Federative du Credit Mutuel SA 100,000 3.00% 28/11/2023 111,283 0.04%Orange SA 100,000 1.88% 12/9/2030 111,175 0.04%BPCE SA 100,000 2.88% 16/1/2024 111,131 0.04%Societe Generale SA 100,000 2.13% 27/9/2028 110,711 0.04%Cie de Financement Foncier SA 100,000 5.75% 4/10/2021 110,669 0.04%Orange SA 60,000 8.13% 28/1/2033 110,561 0.04%Caisse Nationale de Reassurance Mutuelle Agricole Groupama 100,000 3.38% 24/9/2028 110,521 0.04%Credit Agricole Home Loan SFH SA 100,000 1.25% 24/3/2031 110,430 0.04%BNP Paribas SA 100,000 2.88% 26/9/2023 110,406 0.04%La Banque Postale Home Loan SFH SA 100,000 2.38% 15/1/2024 110,330 0.04%Wendel SA 100,000 2.75% 2/10/2024 110,207 0.04%APRR SA 100,000 1.63% 13/1/2032 110,154 0.04%Suez 100,000 1.63% 17/9/2030 109,920 0.04%Bouygues SA1 100,000 4.50% 9/2/2022 109,811 0.04%Credit Agricole SA 100,000 2.38% 20/5/2024 109,663 0.04%Total Capital International SA 100,000 1.49% 4/9/2030 109,662 0.04%Engie SA^ 100,000 3.25% Perpetual 109,625 0.04%Capgemini SE 100,000 1.75% 18/4/2028 109,601 0.04%Banque Federative du Credit Mutuel SA 100,000 1.75% 15/3/2029 109,483 0.04%Cie de Saint-Gobain 100,000 1.88% 15/3/2031 109,451 0.04%Unibail-Rodamco-Westfield SE 100,000 1.88% 15/1/2031 109,336 0.04%Air Liquide SA 100,000 2.38% 6/9/2023 109,132 0.04%BNP Paribas SA 100,000 2.25% 11/1/2027 109,077 0.04%Total Capital International SA 100,000 1.54% 31/5/2039 108,938 0.04%Gecina SA 100,000 1.63% 14/3/2030 108,897 0.04%Holding d’Infrastructures de Transport SASU 100,000 4.88% 27/10/2021 108,841 0.04%BNP Paribas SA 100,000 4.13% 14/1/2022 108,775 0.04%
Vanguard SRI Euro Investment Grade Bond Index Fund
777
Principal Maturity Fair Value % of Total Euro (€) Coupon Date Euro (€) Net Assets
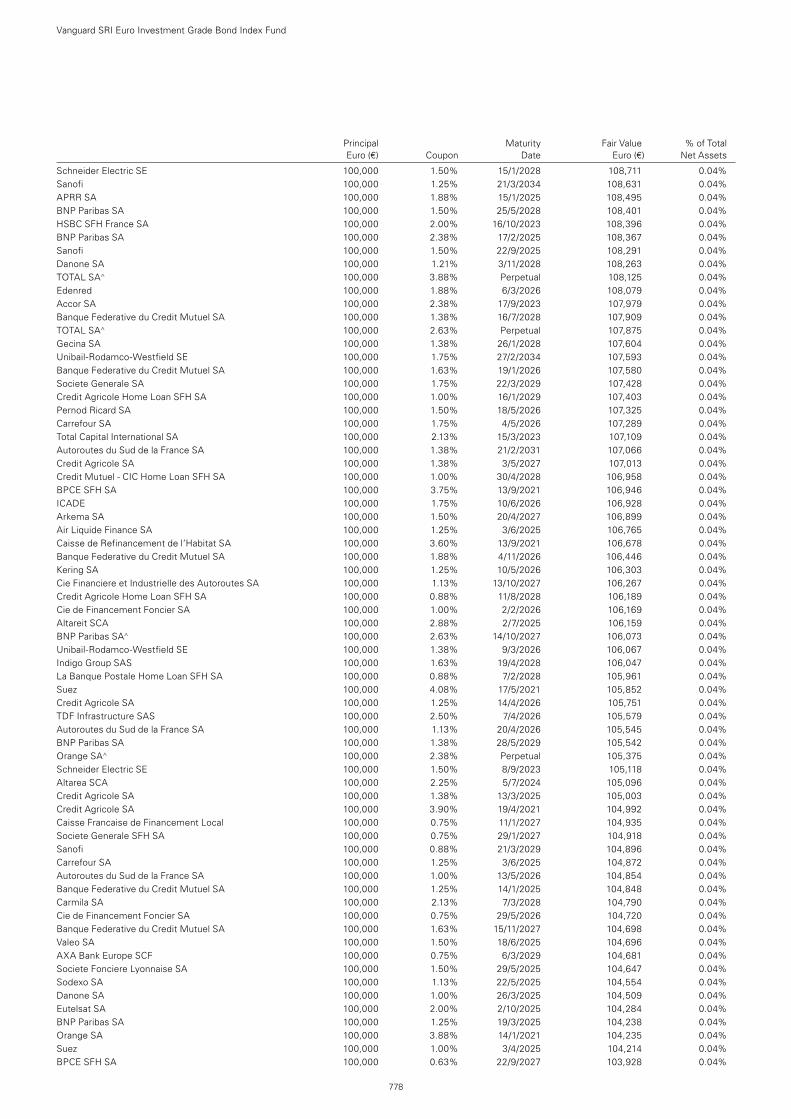
Schneider Electric SE 100,000 1.50% 15/1/2028 108,711 0.04%Sanofi 100,000 1.25% 21/3/2034 108,631 0.04%APRR SA 100,000 1.88% 15/1/2025 108,495 0.04%BNP Paribas SA 100,000 1.50% 25/5/2028 108,401 0.04%HSBC SFH France SA 100,000 2.00% 16/10/2023 108,396 0.04%BNP Paribas SA 100,000 2.38% 17/2/2025 108,367 0.04%Sanofi 100,000 1.50% 22/9/2025 108,291 0.04%Danone SA 100,000 1.21% 3/11/2028 108,263 0.04%TOTAL SA^ 100,000 3.88% Perpetual 108,125 0.04%Edenred 100,000 1.88% 6/3/2026 108,079 0.04%Accor SA 100,000 2.38% 17/9/2023 107,979 0.04%Banque Federative du Credit Mutuel SA 100,000 1.38% 16/7/2028 107,909 0.04%TOTAL SA^ 100,000 2.63% Perpetual 107,875 0.04%Gecina SA 100,000 1.38% 26/1/2028 107,604 0.04%Unibail-Rodamco-Westfield SE 100,000 1.75% 27/2/2034 107,593 0.04%Banque Federative du Credit Mutuel SA 100,000 1.63% 19/1/2026 107,580 0.04%Societe Generale SA 100,000 1.75% 22/3/2029 107,428 0.04%Credit Agricole Home Loan SFH SA 100,000 1.00% 16/1/2029 107,403 0.04%Pernod Ricard SA 100,000 1.50% 18/5/2026 107,325 0.04%Carrefour SA 100,000 1.75% 4/5/2026 107,289 0.04%Total Capital International SA 100,000 2.13% 15/3/2023 107,109 0.04%Autoroutes du Sud de la France SA 100,000 1.38% 21/2/2031 107,066 0.04%Credit Agricole SA 100,000 1.38% 3/5/2027 107,013 0.04%Credit Mutuel - CIC Home Loan SFH SA 100,000 1.00% 30/4/2028 106,958 0.04%BPCE SFH SA 100,000 3.75% 13/9/2021 106,946 0.04%ICADE 100,000 1.75% 10/6/2026 106,928 0.04%Arkema SA 100,000 1.50% 20/4/2027 106,899 0.04%Air Liquide Finance SA 100,000 1.25% 3/6/2025 106,765 0.04%Caisse de Refinancement de l’Habitat SA 100,000 3.60% 13/9/2021 106,678 0.04%Banque Federative du Credit Mutuel SA 100,000 1.88% 4/11/2026 106,446 0.04%Kering SA 100,000 1.25% 10/5/2026 106,303 0.04%Cie Financiere et Industrielle des Autoroutes SA 100,000 1.13% 13/10/2027 106,267 0.04%Credit Agricole Home Loan SFH SA 100,000 0.88% 11/8/2028 106,189 0.04%Cie de Financement Foncier SA 100,000 1.00% 2/2/2026 106,169 0.04%Altareit SCA 100,000 2.88% 2/7/2025 106,159 0.04%BNP Paribas SA^ 100,000 2.63% 14/10/2027 106,073 0.04%Unibail-Rodamco-Westfield SE 100,000 1.38% 9/3/2026 106,067 0.04%Indigo Group SAS 100,000 1.63% 19/4/2028 106,047 0.04%La Banque Postale Home Loan SFH SA 100,000 0.88% 7/2/2028 105,961 0.04%Suez 100,000 4.08% 17/5/2021 105,852 0.04%Credit Agricole SA 100,000 1.25% 14/4/2026 105,751 0.04%TDF Infrastructure SAS 100,000 2.50% 7/4/2026 105,579 0.04%Autoroutes du Sud de la France SA 100,000 1.13% 20/4/2026 105,545 0.04%BNP Paribas SA 100,000 1.38% 28/5/2029 105,542 0.04%Orange SA^ 100,000 2.38% Perpetual 105,375 0.04%Schneider Electric SE 100,000 1.50% 8/9/2023 105,118 0.04%Altarea SCA 100,000 2.25% 5/7/2024 105,096 0.04%Credit Agricole SA 100,000 1.38% 13/3/2025 105,003 0.04%Credit Agricole SA 100,000 3.90% 19/4/2021 104,992 0.04%Caisse Francaise de Financement Local 100,000 0.75% 11/1/2027 104,935 0.04%Societe Generale SFH SA 100,000 0.75% 29/1/2027 104,918 0.04%Sanofi 100,000 0.88% 21/3/2029 104,896 0.04%Carrefour SA 100,000 1.25% 3/6/2025 104,872 0.04%Autoroutes du Sud de la France SA 100,000 1.00% 13/5/2026 104,854 0.04%Banque Federative du Credit Mutuel SA 100,000 1.25% 14/1/2025 104,848 0.04%Carmila SA 100,000 2.13% 7/3/2028 104,790 0.04%Cie de Financement Foncier SA 100,000 0.75% 29/5/2026 104,720 0.04%Banque Federative du Credit Mutuel SA 100,000 1.63% 15/11/2027 104,698 0.04%Valeo SA 100,000 1.50% 18/6/2025 104,696 0.04%AXA Bank Europe SCF 100,000 0.75% 6/3/2029 104,681 0.04%Societe Fonciere Lyonnaise SA 100,000 1.50% 29/5/2025 104,647 0.04%Sodexo SA 100,000 1.13% 22/5/2025 104,554 0.04%Danone SA 100,000 1.00% 26/3/2025 104,509 0.04%Eutelsat SA 100,000 2.00% 2/10/2025 104,284 0.04%BNP Paribas SA 100,000 1.25% 19/3/2025 104,238 0.04%Orange SA 100,000 3.88% 14/1/2021 104,235 0.04%Suez 100,000 1.00% 3/4/2025 104,214 0.04%BPCE SFH SA 100,000 0.63% 22/9/2027 103,928 0.04%
Vanguard SRI Euro Investment Grade Bond Index Fund
778
Principal Maturity Fair Value % of Total Euro (€) Coupon Date Euro (€) Net Assets
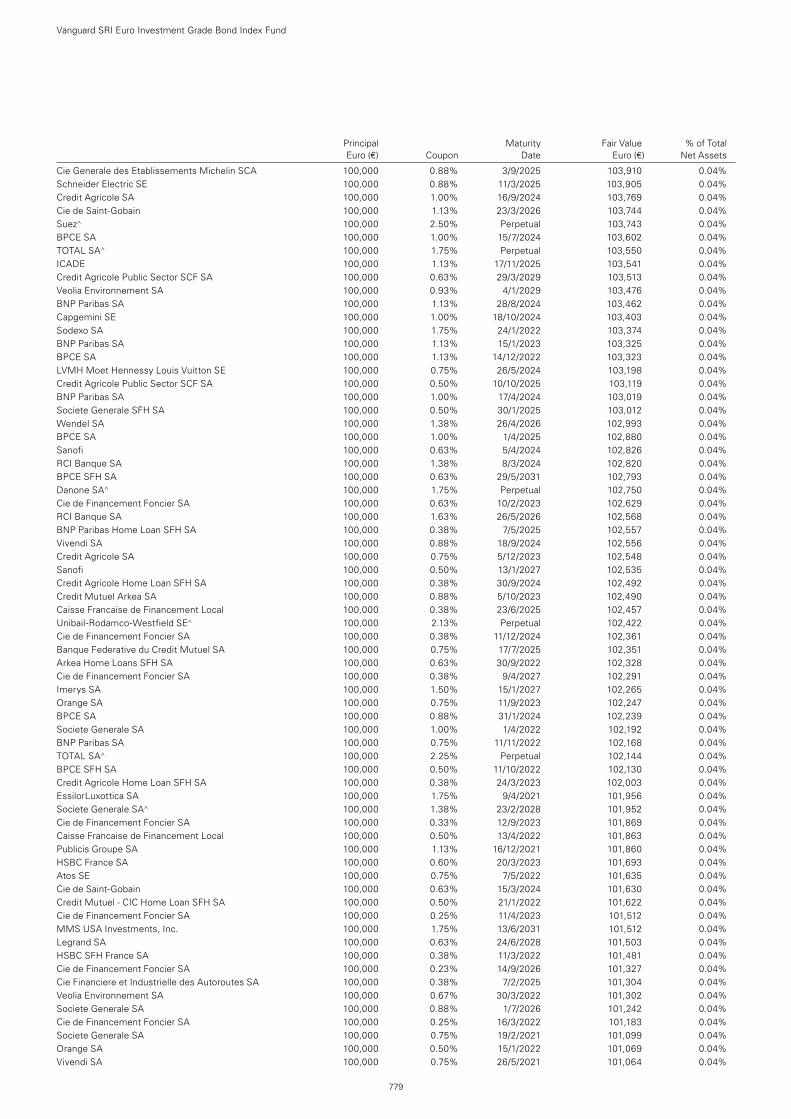
Cie Generale des Etablissements Michelin SCA 100,000 0.88% 3/9/2025 103,910 0.04%Schneider Electric SE 100,000 0.88% 11/3/2025 103,905 0.04%Credit Agricole SA 100,000 1.00% 16/9/2024 103,769 0.04%Cie de Saint-Gobain 100,000 1.13% 23/3/2026 103,744 0.04%Suez^ 100,000 2.50% Perpetual 103,743 0.04%BPCE SA 100,000 1.00% 15/7/2024 103,602 0.04%TOTAL SA^ 100,000 1.75% Perpetual 103,550 0.04%ICADE 100,000 1.13% 17/11/2025 103,541 0.04%Credit Agricole Public Sector SCF SA 100,000 0.63% 29/3/2029 103,513 0.04%Veolia Environnement SA 100,000 0.93% 4/1/2029 103,476 0.04%BNP Paribas SA 100,000 1.13% 28/8/2024 103,462 0.04%Capgemini SE 100,000 1.00% 18/10/2024 103,403 0.04%Sodexo SA 100,000 1.75% 24/1/2022 103,374 0.04%BNP Paribas SA 100,000 1.13% 15/1/2023 103,325 0.04%BPCE SA 100,000 1.13% 14/12/2022 103,323 0.04%LVMH Moet Hennessy Louis Vuitton SE 100,000 0.75% 26/5/2024 103,198 0.04%Credit Agricole Public Sector SCF SA 100,000 0.50% 10/10/2025 103,119 0.04%BNP Paribas SA 100,000 1.00% 17/4/2024 103,019 0.04%Societe Generale SFH SA 100,000 0.50% 30/1/2025 103,012 0.04%Wendel SA 100,000 1.38% 26/4/2026 102,993 0.04%BPCE SA 100,000 1.00% 1/4/2025 102,880 0.04%Sanofi 100,000 0.63% 5/4/2024 102,826 0.04%RCI Banque SA 100,000 1.38% 8/3/2024 102,820 0.04%BPCE SFH SA 100,000 0.63% 29/5/2031 102,793 0.04%Danone SA^ 100,000 1.75% Perpetual 102,750 0.04%Cie de Financement Foncier SA 100,000 0.63% 10/2/2023 102,629 0.04%RCI Banque SA 100,000 1.63% 26/5/2026 102,568 0.04%BNP Paribas Home Loan SFH SA 100,000 0.38% 7/5/2025 102,557 0.04%Vivendi SA 100,000 0.88% 18/9/2024 102,556 0.04%Credit Agricole SA 100,000 0.75% 5/12/2023 102,548 0.04%Sanofi 100,000 0.50% 13/1/2027 102,535 0.04%Credit Agricole Home Loan SFH SA 100,000 0.38% 30/9/2024 102,492 0.04%Credit Mutuel Arkea SA 100,000 0.88% 5/10/2023 102,490 0.04%Caisse Francaise de Financement Local 100,000 0.38% 23/6/2025 102,457 0.04%Unibail-Rodamco-Westfield SE^ 100,000 2.13% Perpetual 102,422 0.04%Cie de Financement Foncier SA 100,000 0.38% 11/12/2024 102,361 0.04%Banque Federative du Credit Mutuel SA 100,000 0.75% 17/7/2025 102,351 0.04%Arkea Home Loans SFH SA 100,000 0.63% 30/9/2022 102,328 0.04%Cie de Financement Foncier SA 100,000 0.38% 9/4/2027 102,291 0.04%Imerys SA 100,000 1.50% 15/1/2027 102,265 0.04%Orange SA 100,000 0.75% 11/9/2023 102,247 0.04%BPCE SA 100,000 0.88% 31/1/2024 102,239 0.04%Societe Generale SA 100,000 1.00% 1/4/2022 102,192 0.04%BNP Paribas SA 100,000 0.75% 11/11/2022 102,168 0.04%TOTAL SA^ 100,000 2.25% Perpetual 102,144 0.04%BPCE SFH SA 100,000 0.50% 11/10/2022 102,130 0.04%Credit Agricole Home Loan SFH SA 100,000 0.38% 24/3/2023 102,003 0.04%EssilorLuxottica SA 100,000 1.75% 9/4/2021 101,956 0.04%Societe Generale SA^ 100,000 1.38% 23/2/2028 101,952 0.04%Cie de Financement Foncier SA 100,000 0.33% 12/9/2023 101,869 0.04%Caisse Francaise de Financement Local 100,000 0.50% 13/4/2022 101,863 0.04%Publicis Groupe SA 100,000 1.13% 16/12/2021 101,860 0.04%HSBC France SA 100,000 0.60% 20/3/2023 101,693 0.04%Atos SE 100,000 0.75% 7/5/2022 101,635 0.04%Cie de Saint-Gobain 100,000 0.63% 15/3/2024 101,630 0.04%Credit Mutuel - CIC Home Loan SFH SA 100,000 0.50% 21/1/2022 101,622 0.04%Cie de Financement Foncier SA 100,000 0.25% 11/4/2023 101,512 0.04%MMS USA Investments, Inc. 100,000 1.75% 13/6/2031 101,512 0.04%Legrand SA 100,000 0.63% 24/6/2028 101,503 0.04%HSBC SFH France SA 100,000 0.38% 11/3/2022 101,481 0.04%Cie de Financement Foncier SA 100,000 0.23% 14/9/2026 101,327 0.04%Cie Financiere et Industrielle des Autoroutes SA 100,000 0.38% 7/2/2025 101,304 0.04%Veolia Environnement SA 100,000 0.67% 30/3/2022 101,302 0.04%Societe Generale SA 100,000 0.88% 1/7/2026 101,242 0.04%Cie de Financement Foncier SA 100,000 0.25% 16/3/2022 101,183 0.04%Societe Generale SA 100,000 0.75% 19/2/2021 101,099 0.04%Orange SA 100,000 0.50% 15/1/2022 101,069 0.04%Vivendi SA 100,000 0.75% 26/5/2021 101,064 0.04%
Vanguard SRI Euro Investment Grade Bond Index Fund
779
Principal Maturity Fair Value % of Total Euro (€) Coupon Date Euro (€) Net Assets
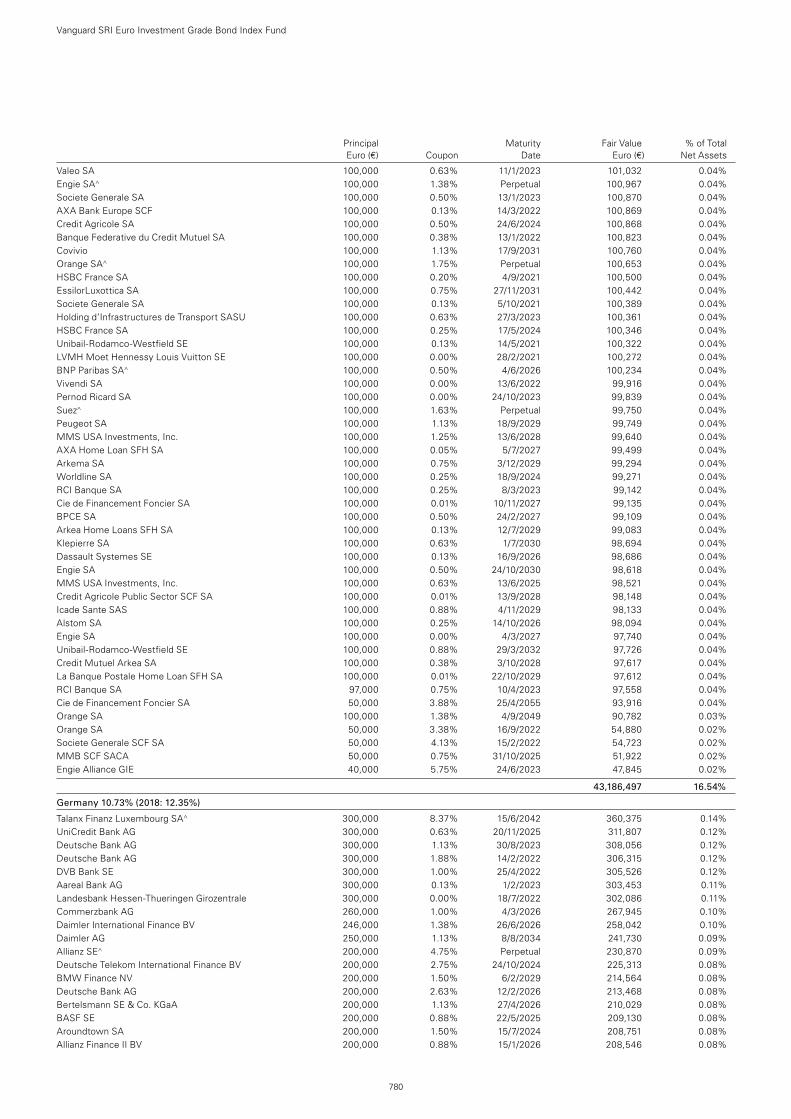
Valeo SA 100,000 0.63% 11/1/2023 101,032 0.04%Engie SA^ 100,000 1.38% Perpetual 100,967 0.04%Societe Generale SA 100,000 0.50% 13/1/2023 100,870 0.04%AXA Bank Europe SCF 100,000 0.13% 14/3/2022 100,869 0.04%Credit Agricole SA 100,000 0.50% 24/6/2024 100,868 0.04%Banque Federative du Credit Mutuel SA 100,000 0.38% 13/1/2022 100,823 0.04%Covivio 100,000 1.13% 17/9/2031 100,760 0.04%Orange SA^ 100,000 1.75% Perpetual 100,653 0.04%HSBC France SA 100,000 0.20% 4/9/2021 100,500 0.04%EssilorLuxottica SA 100,000 0.75% 27/11/2031 100,442 0.04%Societe Generale SA 100,000 0.13% 5/10/2021 100,389 0.04%Holding d’Infrastructures de Transport SASU 100,000 0.63% 27/3/2023 100,361 0.04%HSBC France SA 100,000 0.25% 17/5/2024 100,346 0.04%Unibail-Rodamco-Westfield SE 100,000 0.13% 14/5/2021 100,322 0.04%LVMH Moet Hennessy Louis Vuitton SE 100,000 0.00% 28/2/2021 100,272 0.04%BNP Paribas SA^ 100,000 0.50% 4/6/2026 100,234 0.04%Vivendi SA 100,000 0.00% 13/6/2022 99,916 0.04%Pernod Ricard SA 100,000 0.00% 24/10/2023 99,839 0.04%Suez^ 100,000 1.63% Perpetual 99,750 0.04%Peugeot SA 100,000 1.13% 18/9/2029 99,749 0.04%MMS USA Investments, Inc. 100,000 1.25% 13/6/2028 99,640 0.04%AXA Home Loan SFH SA 100,000 0.05% 5/7/2027 99,499 0.04%Arkema SA 100,000 0.75% 3/12/2029 99,294 0.04%Worldline SA 100,000 0.25% 18/9/2024 99,271 0.04%RCI Banque SA 100,000 0.25% 8/3/2023 99,142 0.04%Cie de Financement Foncier SA 100,000 0.01% 10/11/2027 99,135 0.04%BPCE SA 100,000 0.50% 24/2/2027 99,109 0.04%Arkea Home Loans SFH SA 100,000 0.13% 12/7/2029 99,083 0.04%Klepierre SA 100,000 0.63% 1/7/2030 98,694 0.04%Dassault Systemes SE 100,000 0.13% 16/9/2026 98,686 0.04%Engie SA 100,000 0.50% 24/10/2030 98,618 0.04%MMS USA Investments, Inc. 100,000 0.63% 13/6/2025 98,521 0.04%Credit Agricole Public Sector SCF SA 100,000 0.01% 13/9/2028 98,148 0.04%Icade Sante SAS 100,000 0.88% 4/11/2029 98,133 0.04%Alstom SA 100,000 0.25% 14/10/2026 98,094 0.04%Engie SA 100,000 0.00% 4/3/2027 97,740 0.04%Unibail-Rodamco-Westfield SE 100,000 0.88% 29/3/2032 97,726 0.04%Credit Mutuel Arkea SA 100,000 0.38% 3/10/2028 97,617 0.04%La Banque Postale Home Loan SFH SA 100,000 0.01% 22/10/2029 97,612 0.04%RCI Banque SA 97,000 0.75% 10/4/2023 97,558 0.04%Cie de Financement Foncier SA 50,000 3.88% 25/4/2055 93,916 0.04%Orange SA 100,000 1.38% 4/9/2049 90,782 0.03%Orange SA 50,000 3.38% 16/9/2022 54,880 0.02%Societe Generale SCF SA 50,000 4.13% 15/2/2022 54,723 0.02%MMB SCF SACA 50,000 0.75% 31/10/2025 51,922 0.02%Engie Alliance GIE 40,000 5.75% 24/6/2023 47,845 0.02%
43,186,497 16.54%
Germany 10.73% (2018: 12.35%)
Talanx Finanz Luxembourg SA^ 300,000 8.37% 15/6/2042 360,375 0.14%UniCredit Bank AG 300,000 0.63% 20/11/2025 311,807 0.12%Deutsche Bank AG 300,000 1.13% 30/8/2023 308,056 0.12%Deutsche Bank AG 300,000 1.88% 14/2/2022 306,315 0.12%DVB Bank SE 300,000 1.00% 25/4/2022 305,526 0.12%Aareal Bank AG 300,000 0.13% 1/2/2023 303,453 0.11%Landesbank Hessen-Thueringen Girozentrale 300,000 0.00% 18/7/2022 302,086 0.11%Commerzbank AG 260,000 1.00% 4/3/2026 267,945 0.10%Daimler International Finance BV 246,000 1.38% 26/6/2026 258,042 0.10%Daimler AG 250,000 1.13% 8/8/2034 241,730 0.09%Allianz SE^ 200,000 4.75% Perpetual 230,870 0.09%Deutsche Telekom International Finance BV 200,000 2.75% 24/10/2024 225,313 0.08%BMW Finance NV 200,000 1.50% 6/2/2029 214,564 0.08%Deutsche Bank AG 200,000 2.63% 12/2/2026 213,468 0.08%Bertelsmann SE & Co. KGaA 200,000 1.13% 27/4/2026 210,029 0.08%BASF SE 200,000 0.88% 22/5/2025 209,130 0.08%Aroundtown SA 200,000 1.50% 15/7/2024 208,751 0.08%Allianz Finance II BV 200,000 0.88% 15/1/2026 208,546 0.08%
Vanguard SRI Euro Investment Grade Bond Index Fund
780
Principal Maturity Fair Value % of Total Euro (€) Coupon Date Euro (€) Net Assets
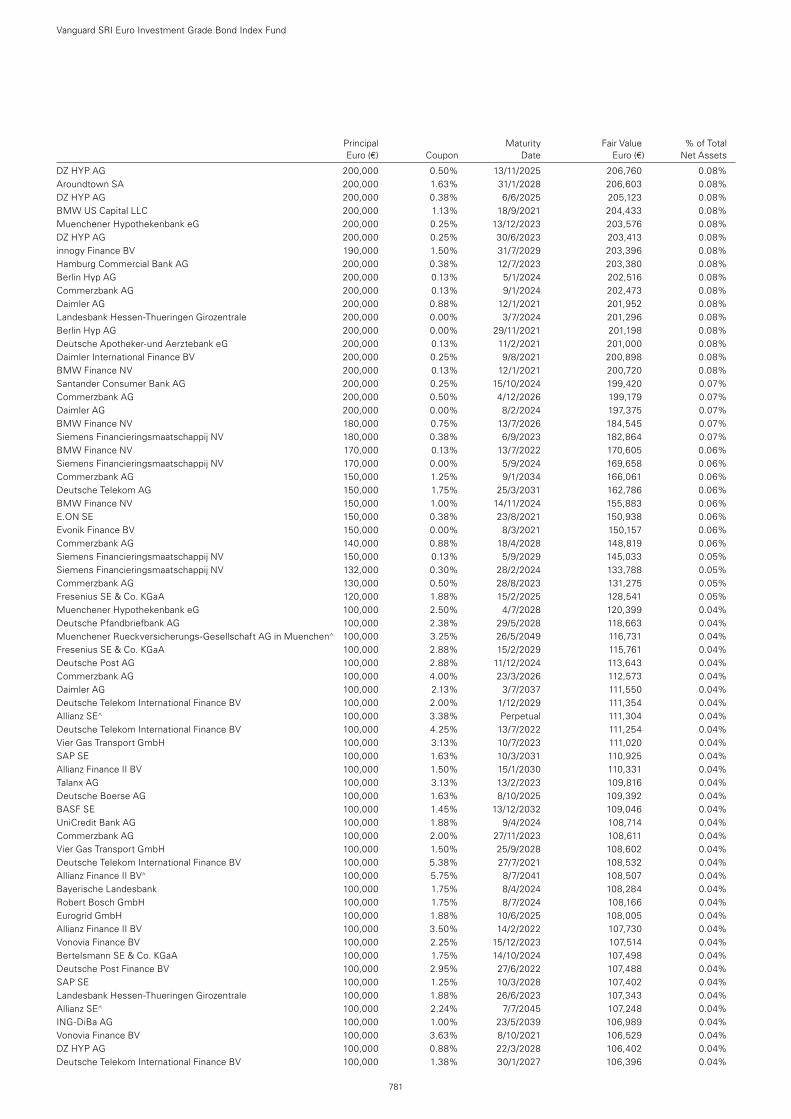
DZ HYP AG 200,000 0.50% 13/11/2025 206,760 0.08%Aroundtown SA 200,000 1.63% 31/1/2028 206,603 0.08%DZ HYP AG 200,000 0.38% 6/6/2025 205,123 0.08%BMW US Capital LLC 200,000 1.13% 18/9/2021 204,433 0.08%Muenchener Hypothekenbank eG 200,000 0.25% 13/12/2023 203,576 0.08%DZ HYP AG 200,000 0.25% 30/6/2023 203,413 0.08%innogy Finance BV 190,000 1.50% 31/7/2029 203,396 0.08%Hamburg Commercial Bank AG 200,000 0.38% 12/7/2023 203,380 0.08%Berlin Hyp AG 200,000 0.13% 5/1/2024 202,516 0.08%Commerzbank AG 200,000 0.13% 9/1/2024 202,473 0.08%Daimler AG 200,000 0.88% 12/1/2021 201,952 0.08%Landesbank Hessen-Thueringen Girozentrale 200,000 0.00% 3/7/2024 201,296 0.08%Berlin Hyp AG 200,000 0.00% 29/11/2021 201,198 0.08%Deutsche Apotheker-und Aerztebank eG 200,000 0.13% 11/2/2021 201,000 0.08%Daimler International Finance BV 200,000 0.25% 9/8/2021 200,898 0.08%BMW Finance NV 200,000 0.13% 12/1/2021 200,720 0.08%Santander Consumer Bank AG 200,000 0.25% 15/10/2024 199,420 0.07%Commerzbank AG 200,000 0.50% 4/12/2026 199,179 0.07%Daimler AG 200,000 0.00% 8/2/2024 197,375 0.07%BMW Finance NV 180,000 0.75% 13/7/2026 184,545 0.07%Siemens Financieringsmaatschappij NV 180,000 0.38% 6/9/2023 182,864 0.07%BMW Finance NV 170,000 0.13% 13/7/2022 170,605 0.06%Siemens Financieringsmaatschappij NV 170,000 0.00% 5/9/2024 169,658 0.06%Commerzbank AG 150,000 1.25% 9/1/2034 166,061 0.06%Deutsche Telekom AG 150,000 1.75% 25/3/2031 162,786 0.06%BMW Finance NV 150,000 1.00% 14/11/2024 155,883 0.06%E.ON SE 150,000 0.38% 23/8/2021 150,938 0.06%Evonik Finance BV 150,000 0.00% 8/3/2021 150,157 0.06%Commerzbank AG 140,000 0.88% 18/4/2028 148,819 0.06%Siemens Financieringsmaatschappij NV 150,000 0.13% 5/9/2029 145,033 0.05%Siemens Financieringsmaatschappij NV 132,000 0.30% 28/2/2024 133,788 0.05%Commerzbank AG 130,000 0.50% 28/8/2023 131,275 0.05%Fresenius SE & Co. KGaA 120,000 1.88% 15/2/2025 128,541 0.05%Muenchener Hypothekenbank eG 100,000 2.50% 4/7/2028 120,399 0.04%Deutsche Pfandbriefbank AG 100,000 2.38% 29/5/2028 118,663 0.04%Muenchener Rueckversicherungs-Gesellschaft AG in Muenchen^ 100,000 3.25% 26/5/2049 116,731 0.04%Fresenius SE & Co. KGaA 100,000 2.88% 15/2/2029 115,761 0.04%Deutsche Post AG 100,000 2.88% 11/12/2024 113,643 0.04%Commerzbank AG 100,000 4.00% 23/3/2026 112,573 0.04%Daimler AG 100,000 2.13% 3/7/2037 111,550 0.04%Deutsche Telekom International Finance BV 100,000 2.00% 1/12/2029 111,354 0.04%Allianz SE^ 100,000 3.38% Perpetual 111,304 0.04%Deutsche Telekom International Finance BV 100,000 4.25% 13/7/2022 111,254 0.04%Vier Gas Transport GmbH 100,000 3.13% 10/7/2023 111,020 0.04%SAP SE 100,000 1.63% 10/3/2031 110,925 0.04%Allianz Finance II BV 100,000 1.50% 15/1/2030 110,331 0.04%Talanx AG 100,000 3.13% 13/2/2023 109,816 0.04%Deutsche Boerse AG 100,000 1.63% 8/10/2025 109,392 0.04%BASF SE 100,000 1.45% 13/12/2032 109,046 0.04%UniCredit Bank AG 100,000 1.88% 9/4/2024 108,714 0.04%Commerzbank AG 100,000 2.00% 27/11/2023 108,611 0.04%Vier Gas Transport GmbH 100,000 1.50% 25/9/2028 108,602 0.04%Deutsche Telekom International Finance BV 100,000 5.38% 27/7/2021 108,532 0.04%Allianz Finance II BV^ 100,000 5.75% 8/7/2041 108,507 0.04%Bayerische Landesbank 100,000 1.75% 8/4/2024 108,284 0.04%Robert Bosch GmbH 100,000 1.75% 8/7/2024 108,166 0.04%Eurogrid GmbH 100,000 1.88% 10/6/2025 108,005 0.04%Allianz Finance II BV 100,000 3.50% 14/2/2022 107,730 0.04%Vonovia Finance BV 100,000 2.25% 15/12/2023 107,514 0.04%Bertelsmann SE & Co. KGaA 100,000 1.75% 14/10/2024 107,498 0.04%Deutsche Post Finance BV 100,000 2.95% 27/6/2022 107,488 0.04%SAP SE 100,000 1.25% 10/3/2028 107,402 0.04%Landesbank Hessen-Thueringen Girozentrale 100,000 1.88% 26/6/2023 107,343 0.04%Allianz SE^ 100,000 2.24% 7/7/2045 107,248 0.04%ING-DiBa AG 100,000 1.00% 23/5/2039 106,989 0.04%Vonovia Finance BV 100,000 3.63% 8/10/2021 106,529 0.04%DZ HYP AG 100,000 0.88% 22/3/2028 106,402 0.04%Deutsche Telekom International Finance BV 100,000 1.38% 30/1/2027 106,396 0.04%
Vanguard SRI Euro Investment Grade Bond Index Fund
781
Principal Maturity Fair Value % of Total Euro (€) Coupon Date Euro (€) Net Assets
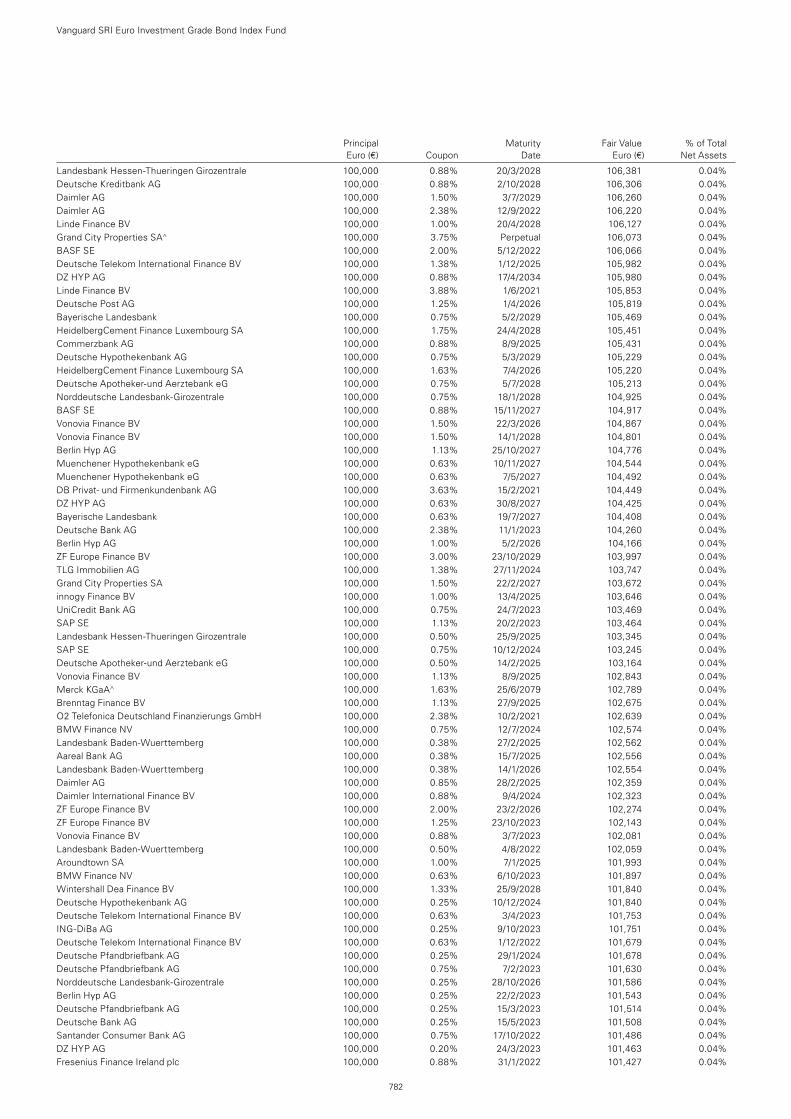
Landesbank Hessen-Thueringen Girozentrale 100,000 0.88% 20/3/2028 106,381 0.04%Deutsche Kreditbank AG 100,000 0.88% 2/10/2028 106,306 0.04%Daimler AG 100,000 1.50% 3/7/2029 106,260 0.04%Daimler AG 100,000 2.38% 12/9/2022 106,220 0.04%Linde Finance BV 100,000 1.00% 20/4/2028 106,127 0.04%Grand City Properties SA^ 100,000 3.75% Perpetual 106,073 0.04%BASF SE 100,000 2.00% 5/12/2022 106,066 0.04%Deutsche Telekom International Finance BV 100,000 1.38% 1/12/2025 105,982 0.04%DZ HYP AG 100,000 0.88% 17/4/2034 105,980 0.04%Linde Finance BV 100,000 3.88% 1/6/2021 105,853 0.04%Deutsche Post AG 100,000 1.25% 1/4/2026 105,819 0.04%Bayerische Landesbank 100,000 0.75% 5/2/2029 105,469 0.04%HeidelbergCement Finance Luxembourg SA 100,000 1.75% 24/4/2028 105,451 0.04%Commerzbank AG 100,000 0.88% 8/9/2025 105,431 0.04%Deutsche Hypothekenbank AG 100,000 0.75% 5/3/2029 105,229 0.04%HeidelbergCement Finance Luxembourg SA 100,000 1.63% 7/4/2026 105,220 0.04%Deutsche Apotheker-und Aerztebank eG 100,000 0.75% 5/7/2028 105,213 0.04%Norddeutsche Landesbank-Girozentrale 100,000 0.75% 18/1/2028 104,925 0.04%BASF SE 100,000 0.88% 15/11/2027 104,917 0.04%Vonovia Finance BV 100,000 1.50% 22/3/2026 104,867 0.04%Vonovia Finance BV 100,000 1.50% 14/1/2028 104,801 0.04%Berlin Hyp AG 100,000 1.13% 25/10/2027 104,776 0.04%Muenchener Hypothekenbank eG 100,000 0.63% 10/11/2027 104,544 0.04%Muenchener Hypothekenbank eG 100,000 0.63% 7/5/2027 104,492 0.04%DB Privat- und Firmenkundenbank AG 100,000 3.63% 15/2/2021 104,449 0.04%DZ HYP AG 100,000 0.63% 30/8/2027 104,425 0.04%Bayerische Landesbank 100,000 0.63% 19/7/2027 104,408 0.04%Deutsche Bank AG 100,000 2.38% 11/1/2023 104,260 0.04%Berlin Hyp AG 100,000 1.00% 5/2/2026 104,166 0.04%ZF Europe Finance BV 100,000 3.00% 23/10/2029 103,997 0.04%TLG Immobilien AG 100,000 1.38% 27/11/2024 103,747 0.04%Grand City Properties SA 100,000 1.50% 22/2/2027 103,672 0.04%innogy Finance BV 100,000 1.00% 13/4/2025 103,646 0.04%UniCredit Bank AG 100,000 0.75% 24/7/2023 103,469 0.04%SAP SE 100,000 1.13% 20/2/2023 103,464 0.04%Landesbank Hessen-Thueringen Girozentrale 100,000 0.50% 25/9/2025 103,345 0.04%SAP SE 100,000 0.75% 10/12/2024 103,245 0.04%Deutsche Apotheker-und Aerztebank eG 100,000 0.50% 14/2/2025 103,164 0.04%Vonovia Finance BV 100,000 1.13% 8/9/2025 102,843 0.04%Merck KGaA^ 100,000 1.63% 25/6/2079 102,789 0.04%Brenntag Finance BV 100,000 1.13% 27/9/2025 102,675 0.04%O2 Telefonica Deutschland Finanzierungs GmbH 100,000 2.38% 10/2/2021 102,639 0.04%BMW Finance NV 100,000 0.75% 12/7/2024 102,574 0.04%Landesbank Baden-Wuerttemberg 100,000 0.38% 27/2/2025 102,562 0.04%Aareal Bank AG 100,000 0.38% 15/7/2025 102,556 0.04%Landesbank Baden-Wuerttemberg 100,000 0.38% 14/1/2026 102,554 0.04%Daimler AG 100,000 0.85% 28/2/2025 102,359 0.04%Daimler International Finance BV 100,000 0.88% 9/4/2024 102,323 0.04%ZF Europe Finance BV 100,000 2.00% 23/2/2026 102,274 0.04%ZF Europe Finance BV 100,000 1.25% 23/10/2023 102,143 0.04%Vonovia Finance BV 100,000 0.88% 3/7/2023 102,081 0.04%Landesbank Baden-Wuerttemberg 100,000 0.50% 4/8/2022 102,059 0.04%Aroundtown SA 100,000 1.00% 7/1/2025 101,993 0.04%BMW Finance NV 100,000 0.63% 6/10/2023 101,897 0.04%Wintershall Dea Finance BV 100,000 1.33% 25/9/2028 101,840 0.04%Deutsche Hypothekenbank AG 100,000 0.25% 10/12/2024 101,840 0.04%Deutsche Telekom International Finance BV 100,000 0.63% 3/4/2023 101,753 0.04%ING-DiBa AG 100,000 0.25% 9/10/2023 101,751 0.04%Deutsche Telekom International Finance BV 100,000 0.63% 1/12/2022 101,679 0.04%Deutsche Pfandbriefbank AG 100,000 0.25% 29/1/2024 101,678 0.04%Deutsche Pfandbriefbank AG 100,000 0.75% 7/2/2023 101,630 0.04%Norddeutsche Landesbank-Girozentrale 100,000 0.25% 28/10/2026 101,586 0.04%Berlin Hyp AG 100,000 0.25% 22/2/2023 101,543 0.04%Deutsche Pfandbriefbank AG 100,000 0.25% 15/3/2023 101,514 0.04%Deutsche Bank AG 100,000 0.25% 15/5/2023 101,508 0.04%Santander Consumer Bank AG 100,000 0.75% 17/10/2022 101,486 0.04%DZ HYP AG 100,000 0.20% 24/3/2023 101,463 0.04%Fresenius Finance Ireland plc 100,000 0.88% 31/1/2022 101,427 0.04%
Vanguard SRI Euro Investment Grade Bond Index Fund
782
Principal Maturity Fair Value % of Total Euro (€) Coupon Date Euro (€) Net Assets
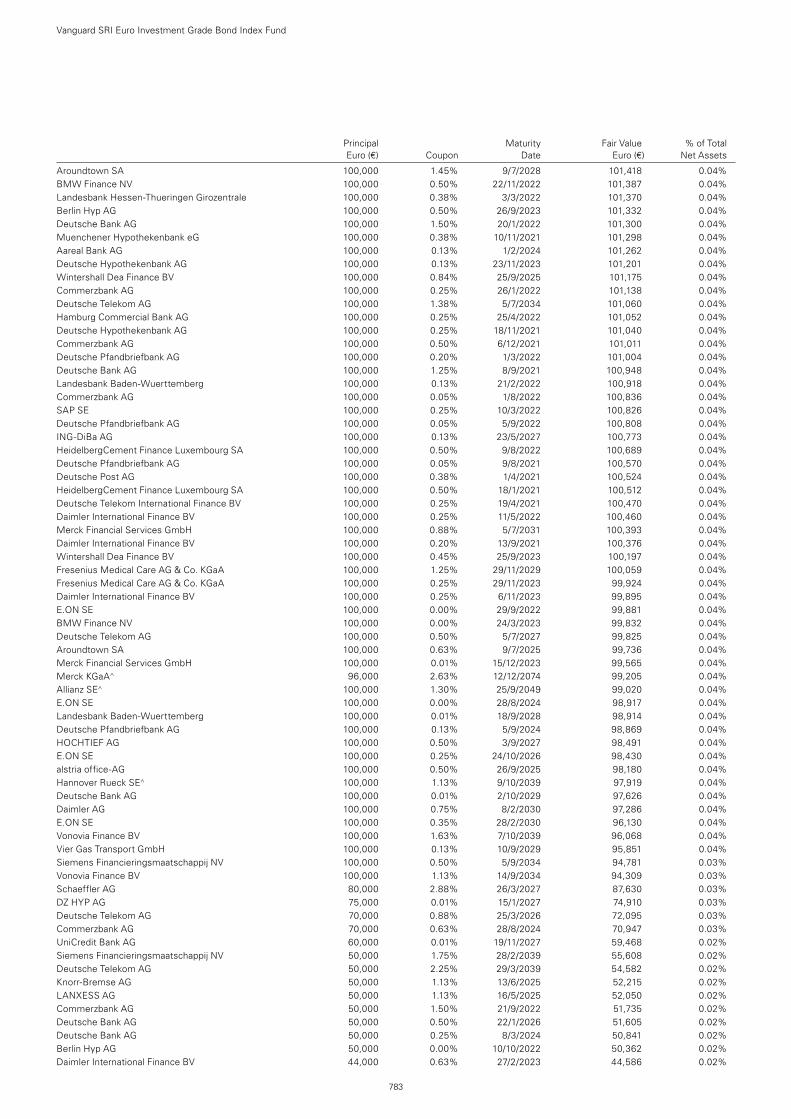
Aroundtown SA 100,000 1.45% 9/7/2028 101,418 0.04%BMW Finance NV 100,000 0.50% 22/11/2022 101,387 0.04%Landesbank Hessen-Thueringen Girozentrale 100,000 0.38% 3/3/2022 101,370 0.04%Berlin Hyp AG 100,000 0.50% 26/9/2023 101,332 0.04%Deutsche Bank AG 100,000 1.50% 20/1/2022 101,300 0.04%Muenchener Hypothekenbank eG 100,000 0.38% 10/11/2021 101,298 0.04%Aareal Bank AG 100,000 0.13% 1/2/2024 101,262 0.04%Deutsche Hypothekenbank AG 100,000 0.13% 23/11/2023 101,201 0.04%Wintershall Dea Finance BV 100,000 0.84% 25/9/2025 101,175 0.04%Commerzbank AG 100,000 0.25% 26/1/2022 101,138 0.04%Deutsche Telekom AG 100,000 1.38% 5/7/2034 101,060 0.04%Hamburg Commercial Bank AG 100,000 0.25% 25/4/2022 101,052 0.04%Deutsche Hypothekenbank AG 100,000 0.25% 18/11/2021 101,040 0.04%Commerzbank AG 100,000 0.50% 6/12/2021 101,011 0.04%Deutsche Pfandbriefbank AG 100,000 0.20% 1/3/2022 101,004 0.04%Deutsche Bank AG 100,000 1.25% 8/9/2021 100,948 0.04%Landesbank Baden-Wuerttemberg 100,000 0.13% 21/2/2022 100,918 0.04%Commerzbank AG 100,000 0.05% 1/8/2022 100,836 0.04%SAP SE 100,000 0.25% 10/3/2022 100,826 0.04%Deutsche Pfandbriefbank AG 100,000 0.05% 5/9/2022 100,808 0.04%ING-DiBa AG 100,000 0.13% 23/5/2027 100,773 0.04%HeidelbergCement Finance Luxembourg SA 100,000 0.50% 9/8/2022 100,689 0.04%Deutsche Pfandbriefbank AG 100,000 0.05% 9/8/2021 100,570 0.04%Deutsche Post AG 100,000 0.38% 1/4/2021 100,524 0.04%HeidelbergCement Finance Luxembourg SA 100,000 0.50% 18/1/2021 100,512 0.04%Deutsche Telekom International Finance BV 100,000 0.25% 19/4/2021 100,470 0.04%Daimler International Finance BV 100,000 0.25% 11/5/2022 100,460 0.04%Merck Financial Services GmbH 100,000 0.88% 5/7/2031 100,393 0.04%Daimler International Finance BV 100,000 0.20% 13/9/2021 100,376 0.04%Wintershall Dea Finance BV 100,000 0.45% 25/9/2023 100,197 0.04%Fresenius Medical Care AG & Co. KGaA 100,000 1.25% 29/11/2029 100,059 0.04%Fresenius Medical Care AG & Co. KGaA 100,000 0.25% 29/11/2023 99,924 0.04%Daimler International Finance BV 100,000 0.25% 6/11/2023 99,895 0.04%E.ON SE 100,000 0.00% 29/9/2022 99,881 0.04%BMW Finance NV 100,000 0.00% 24/3/2023 99,832 0.04%Deutsche Telekom AG 100,000 0.50% 5/7/2027 99,825 0.04%Aroundtown SA 100,000 0.63% 9/7/2025 99,736 0.04%Merck Financial Services GmbH 100,000 0.01% 15/12/2023 99,565 0.04%Merck KGaA^ 96,000 2.63% 12/12/2074 99,205 0.04%Allianz SE^ 100,000 1.30% 25/9/2049 99,020 0.04%E.ON SE 100,000 0.00% 28/8/2024 98,917 0.04%Landesbank Baden-Wuerttemberg 100,000 0.01% 18/9/2028 98,914 0.04%Deutsche Pfandbriefbank AG 100,000 0.13% 5/9/2024 98,869 0.04%HOCHTIEF AG 100,000 0.50% 3/9/2027 98,491 0.04%E.ON SE 100,000 0.25% 24/10/2026 98,430 0.04%alstria office-AG 100,000 0.50% 26/9/2025 98,180 0.04%Hannover Rueck SE^ 100,000 1.13% 9/10/2039 97,919 0.04%Deutsche Bank AG 100,000 0.01% 2/10/2029 97,626 0.04%Daimler AG 100,000 0.75% 8/2/2030 97,286 0.04%E.ON SE 100,000 0.35% 28/2/2030 96,130 0.04%Vonovia Finance BV 100,000 1.63% 7/10/2039 96,068 0.04%Vier Gas Transport GmbH 100,000 0.13% 10/9/2029 95,851 0.04%Siemens Financieringsmaatschappij NV 100,000 0.50% 5/9/2034 94,781 0.03%Vonovia Finance BV 100,000 1.13% 14/9/2034 94,309 0.03%Schaeffler AG 80,000 2.88% 26/3/2027 87,630 0.03%DZ HYP AG 75,000 0.01% 15/1/2027 74,910 0.03%Deutsche Telekom AG 70,000 0.88% 25/3/2026 72,095 0.03%Commerzbank AG 70,000 0.63% 28/8/2024 70,947 0.03%UniCredit Bank AG 60,000 0.01% 19/11/2027 59,468 0.02%Siemens Financieringsmaatschappij NV 50,000 1.75% 28/2/2039 55,608 0.02%Deutsche Telekom AG 50,000 2.25% 29/3/2039 54,582 0.02%Knorr-Bremse AG 50,000 1.13% 13/6/2025 52,215 0.02%LANXESS AG 50,000 1.13% 16/5/2025 52,050 0.02%Commerzbank AG 50,000 1.50% 21/9/2022 51,735 0.02%Deutsche Bank AG 50,000 0.50% 22/1/2026 51,605 0.02%Deutsche Bank AG 50,000 0.25% 8/3/2024 50,841 0.02%Berlin Hyp AG 50,000 0.00% 10/10/2022 50,362 0.02%Daimler International Finance BV 44,000 0.63% 27/2/2023 44,586 0.02%
Vanguard SRI Euro Investment Grade Bond Index Fund
783
Principal Maturity Fair Value % of Total Euro (€) Coupon Date Euro (€) Net Assets
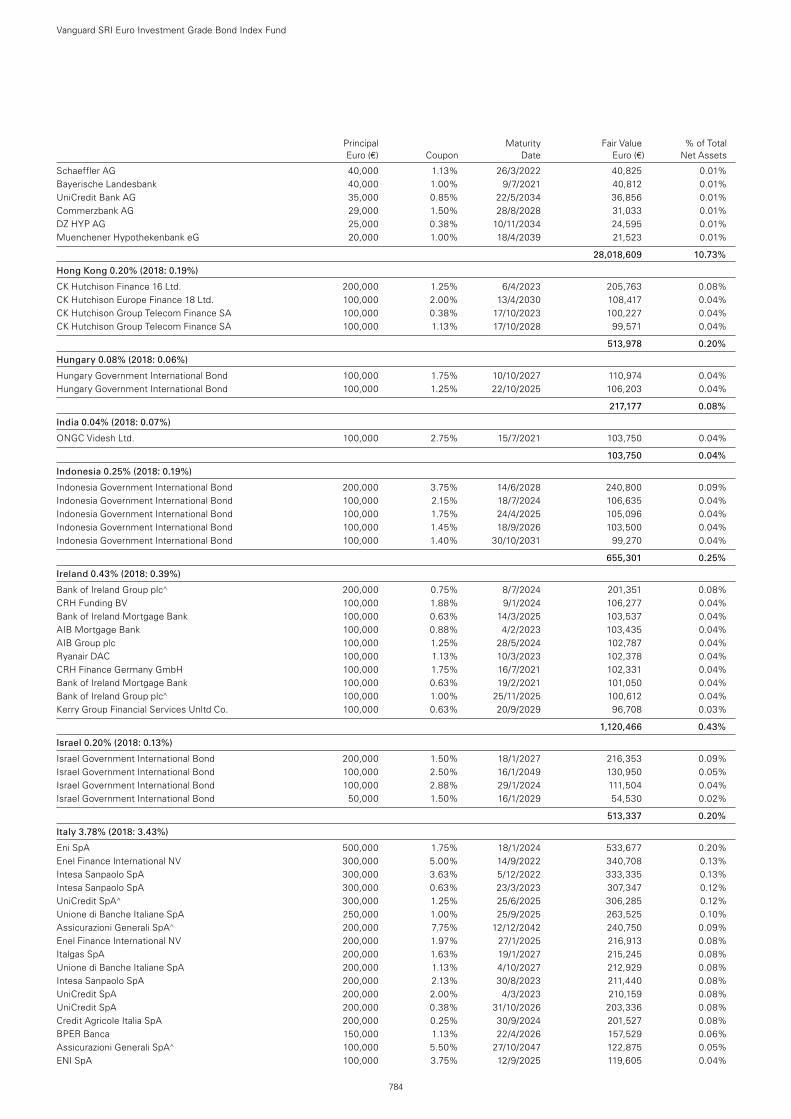
Schaeffler AG 40,000 1.13% 26/3/2022 40,825 0.01%Bayerische Landesbank 40,000 1.00% 9/7/2021 40,812 0.01%UniCredit Bank AG 35,000 0.85% 22/5/2034 36,856 0.01%Commerzbank AG 29,000 1.50% 28/8/2028 31,033 0.01%DZ HYP AG 25,000 0.38% 10/11/2034 24,595 0.01%Muenchener Hypothekenbank eG 20,000 1.00% 18/4/2039 21,523 0.01%
28,018,609 10.73%
Hong Kong 0.20% (2018: 0.19%)
CK Hutchison Finance 16 Ltd. 200,000 1.25% 6/4/2023 205,763 0.08%CK Hutchison Europe Finance 18 Ltd. 100,000 2.00% 13/4/2030 108,417 0.04%CK Hutchison Group Telecom Finance SA 100,000 0.38% 17/10/2023 100,227 0.04%CK Hutchison Group Telecom Finance SA 100,000 1.13% 17/10/2028 99,571 0.04%
513,978 0.20%
Hungary 0.08% (2018: 0.06%)
Hungary Government International Bond 100,000 1.75% 10/10/2027 110,974 0.04%Hungary Government International Bond 100,000 1.25% 22/10/2025 106,203 0.04%
217,177 0.08%
India 0.04% (2018: 0.07%)
ONGC Videsh Ltd. 100,000 2.75% 15/7/2021 103,750 0.04%
103,750 0.04%
Indonesia 0.25% (2018: 0.19%)
Indonesia Government International Bond 200,000 3.75% 14/6/2028 240,800 0.09%Indonesia Government International Bond 100,000 2.15% 18/7/2024 106,635 0.04%Indonesia Government International Bond 100,000 1.75% 24/4/2025 105,096 0.04%Indonesia Government International Bond 100,000 1.45% 18/9/2026 103,500 0.04%Indonesia Government International Bond 100,000 1.40% 30/10/2031 99,270 0.04%
655,301 0.25%
Ireland 0.43% (2018: 0.39%)
Bank of Ireland Group plc^ 200,000 0.75% 8/7/2024 201,351 0.08%CRH Funding BV 100,000 1.88% 9/1/2024 106,277 0.04%Bank of Ireland Mortgage Bank 100,000 0.63% 14/3/2025 103,537 0.04%AIB Mortgage Bank 100,000 0.88% 4/2/2023 103,435 0.04%AIB Group plc 100,000 1.25% 28/5/2024 102,787 0.04%Ryanair DAC 100,000 1.13% 10/3/2023 102,378 0.04%CRH Finance Germany GmbH 100,000 1.75% 16/7/2021 102,331 0.04%Bank of Ireland Mortgage Bank 100,000 0.63% 19/2/2021 101,050 0.04%Bank of Ireland Group plc^ 100,000 1.00% 25/11/2025 100,612 0.04%Kerry Group Financial Services Unltd Co. 100,000 0.63% 20/9/2029 96,708 0.03%
1,120,466 0.43%
Israel 0.20% (2018: 0.13%)
Israel Government International Bond 200,000 1.50% 18/1/2027 216,353 0.09%Israel Government International Bond 100,000 2.50% 16/1/2049 130,950 0.05%Israel Government International Bond 100,000 2.88% 29/1/2024 111,504 0.04%Israel Government International Bond 50,000 1.50% 16/1/2029 54,530 0.02%
513,337 0.20%
Italy 3.78% (2018: 3.43%)
Eni SpA 500,000 1.75% 18/1/2024 533,677 0.20%Enel Finance International NV 300,000 5.00% 14/9/2022 340,708 0.13%Intesa Sanpaolo SpA 300,000 3.63% 5/12/2022 333,335 0.13%Intesa Sanpaolo SpA 300,000 0.63% 23/3/2023 307,347 0.12%UniCredit SpA^ 300,000 1.25% 25/6/2025 306,285 0.12%Unione di Banche Italiane SpA 250,000 1.00% 25/9/2025 263,525 0.10%Assicurazioni Generali SpA^ 200,000 7.75% 12/12/2042 240,750 0.09%Enel Finance International NV 200,000 1.97% 27/1/2025 216,913 0.08%Italgas SpA 200,000 1.63% 19/1/2027 215,245 0.08%Unione di Banche Italiane SpA 200,000 1.13% 4/10/2027 212,929 0.08%Intesa Sanpaolo SpA 200,000 2.13% 30/8/2023 211,440 0.08%UniCredit SpA 200,000 2.00% 4/3/2023 210,159 0.08%UniCredit SpA 200,000 0.38% 31/10/2026 203,336 0.08%Credit Agricole Italia SpA 200,000 0.25% 30/9/2024 201,527 0.08%BPER Banca 150,000 1.13% 22/4/2026 157,529 0.06%Assicurazioni Generali SpA^ 100,000 5.50% 27/10/2047 122,875 0.05%ENI SpA 100,000 3.75% 12/9/2025 119,605 0.04%
Vanguard SRI Euro Investment Grade Bond Index Fund
784
Principal Maturity Fair Value % of Total Euro (€) Coupon Date Euro (€) Net Assets
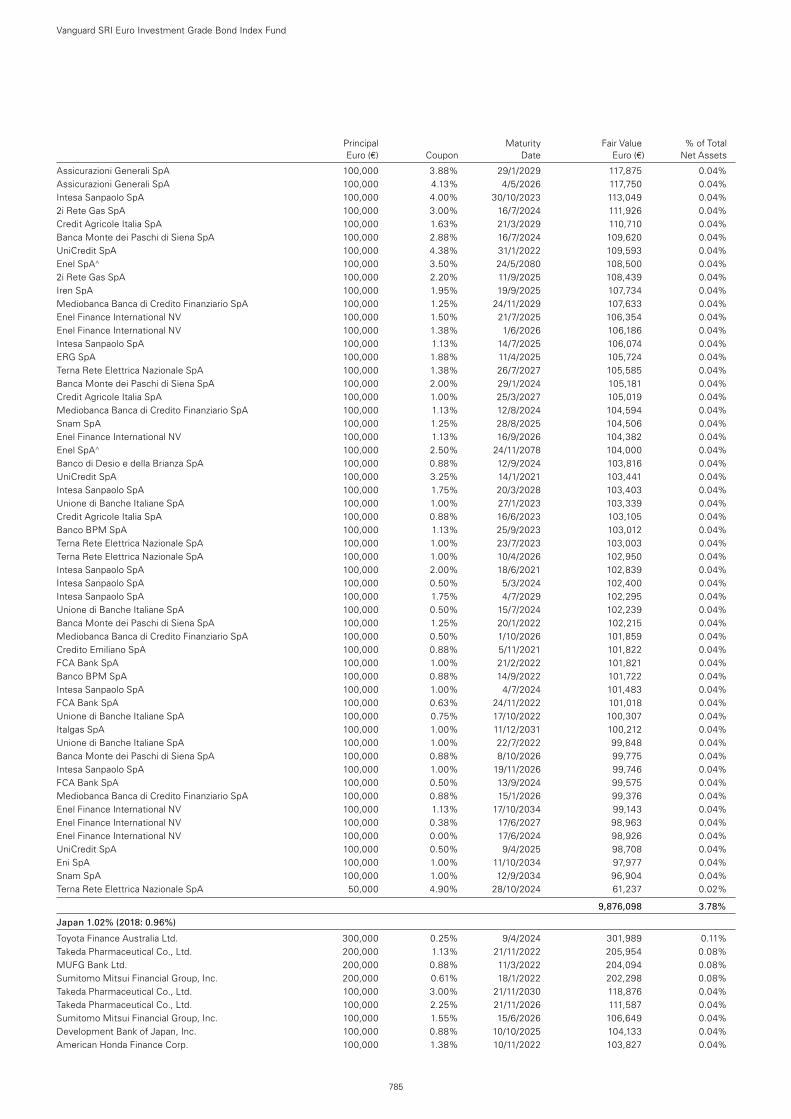
Assicurazioni Generali SpA 100,000 3.88% 29/1/2029 117,875 0.04%Assicurazioni Generali SpA 100,000 4.13% 4/5/2026 117,750 0.04%Intesa Sanpaolo SpA 100,000 4.00% 30/10/2023 113,049 0.04%2i Rete Gas SpA 100,000 3.00% 16/7/2024 111,926 0.04%Credit Agricole Italia SpA 100,000 1.63% 21/3/2029 110,710 0.04%Banca Monte dei Paschi di Siena SpA 100,000 2.88% 16/7/2024 109,620 0.04%UniCredit SpA 100,000 4.38% 31/1/2022 109,593 0.04%Enel SpA^ 100,000 3.50% 24/5/2080 108,500 0.04%2i Rete Gas SpA 100,000 2.20% 11/9/2025 108,439 0.04%Iren SpA 100,000 1.95% 19/9/2025 107,734 0.04%Mediobanca Banca di Credito Finanziario SpA 100,000 1.25% 24/11/2029 107,633 0.04%Enel Finance International NV 100,000 1.50% 21/7/2025 106,354 0.04%Enel Finance International NV 100,000 1.38% 1/6/2026 106,186 0.04%Intesa Sanpaolo SpA 100,000 1.13% 14/7/2025 106,074 0.04%ERG SpA 100,000 1.88% 11/4/2025 105,724 0.04%Terna Rete Elettrica Nazionale SpA 100,000 1.38% 26/7/2027 105,585 0.04%Banca Monte dei Paschi di Siena SpA 100,000 2.00% 29/1/2024 105,181 0.04%Credit Agricole Italia SpA 100,000 1.00% 25/3/2027 105,019 0.04%Mediobanca Banca di Credito Finanziario SpA 100,000 1.13% 12/8/2024 104,594 0.04%Snam SpA 100,000 1.25% 28/8/2025 104,506 0.04%Enel Finance International NV 100,000 1.13% 16/9/2026 104,382 0.04%Enel SpA^ 100,000 2.50% 24/11/2078 104,000 0.04%Banco di Desio e della Brianza SpA 100,000 0.88% 12/9/2024 103,816 0.04%UniCredit SpA 100,000 3.25% 14/1/2021 103,441 0.04%Intesa Sanpaolo SpA 100,000 1.75% 20/3/2028 103,403 0.04%Unione di Banche Italiane SpA 100,000 1.00% 27/1/2023 103,339 0.04%Credit Agricole Italia SpA 100,000 0.88% 16/6/2023 103,105 0.04%Banco BPM SpA 100,000 1.13% 25/9/2023 103,012 0.04%Terna Rete Elettrica Nazionale SpA 100,000 1.00% 23/7/2023 103,003 0.04%Terna Rete Elettrica Nazionale SpA 100,000 1.00% 10/4/2026 102,950 0.04%Intesa Sanpaolo SpA 100,000 2.00% 18/6/2021 102,839 0.04%Intesa Sanpaolo SpA 100,000 0.50% 5/3/2024 102,400 0.04%Intesa Sanpaolo SpA 100,000 1.75% 4/7/2029 102,295 0.04%Unione di Banche Italiane SpA 100,000 0.50% 15/7/2024 102,239 0.04%Banca Monte dei Paschi di Siena SpA 100,000 1.25% 20/1/2022 102,215 0.04%Mediobanca Banca di Credito Finanziario SpA 100,000 0.50% 1/10/2026 101,859 0.04%Credito Emiliano SpA 100,000 0.88% 5/11/2021 101,822 0.04%FCA Bank SpA 100,000 1.00% 21/2/2022 101,821 0.04%Banco BPM SpA 100,000 0.88% 14/9/2022 101,722 0.04%Intesa Sanpaolo SpA 100,000 1.00% 4/7/2024 101,483 0.04%FCA Bank SpA 100,000 0.63% 24/11/2022 101,018 0.04%Unione di Banche Italiane SpA 100,000 0.75% 17/10/2022 100,307 0.04%Italgas SpA 100,000 1.00% 11/12/2031 100,212 0.04%Unione di Banche Italiane SpA 100,000 1.00% 22/7/2022 99,848 0.04%Banca Monte dei Paschi di Siena SpA 100,000 0.88% 8/10/2026 99,775 0.04%Intesa Sanpaolo SpA 100,000 1.00% 19/11/2026 99,746 0.04%FCA Bank SpA 100,000 0.50% 13/9/2024 99,575 0.04%Mediobanca Banca di Credito Finanziario SpA 100,000 0.88% 15/1/2026 99,376 0.04%Enel Finance International NV 100,000 1.13% 17/10/2034 99,143 0.04%Enel Finance International NV 100,000 0.38% 17/6/2027 98,963 0.04%Enel Finance International NV 100,000 0.00% 17/6/2024 98,926 0.04%UniCredit SpA 100,000 0.50% 9/4/2025 98,708 0.04%Eni SpA 100,000 1.00% 11/10/2034 97,977 0.04%Snam SpA 100,000 1.00% 12/9/2034 96,904 0.04%Terna Rete Elettrica Nazionale SpA 50,000 4.90% 28/10/2024 61,237 0.02%
9,876,098 3.78%
Japan 1.02% (2018: 0.96%)
Toyota Finance Australia Ltd. 300,000 0.25% 9/4/2024 301,989 0.11%Takeda Pharmaceutical Co., Ltd. 200,000 1.13% 21/11/2022 205,954 0.08%MUFG Bank Ltd. 200,000 0.88% 11/3/2022 204,094 0.08%Sumitomo Mitsui Financial Group, Inc. 200,000 0.61% 18/1/2022 202,298 0.08%Takeda Pharmaceutical Co., Ltd. 100,000 3.00% 21/11/2030 118,876 0.04%Takeda Pharmaceutical Co., Ltd. 100,000 2.25% 21/11/2026 111,587 0.04%Sumitomo Mitsui Financial Group, Inc. 100,000 1.55% 15/6/2026 106,649 0.04%Development Bank of Japan, Inc. 100,000 0.88% 10/10/2025 104,133 0.04%American Honda Finance Corp. 100,000 1.38% 10/11/2022 103,827 0.04%
Vanguard SRI Euro Investment Grade Bond Index Fund
785
Principal Maturity Fair Value % of Total Euro (€) Coupon Date Euro (€) Net Assets
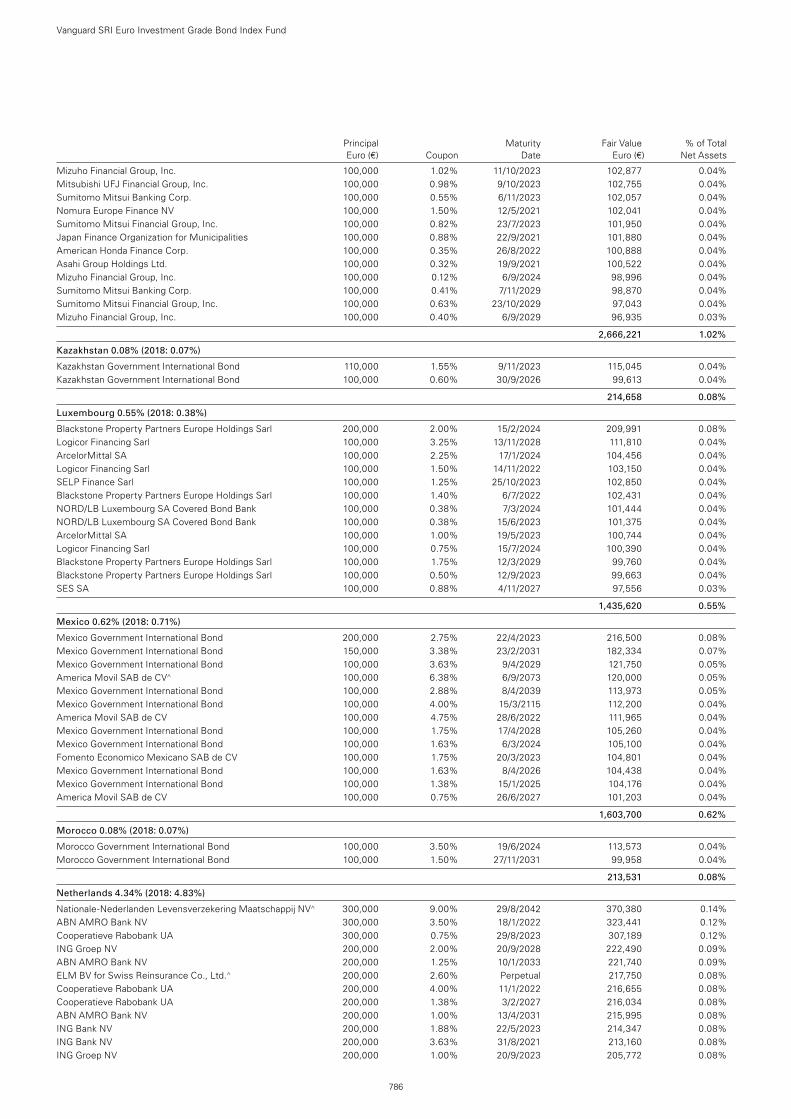
Mizuho Financial Group, Inc. 100,000 1.02% 11/10/2023 102,877 0.04%Mitsubishi UFJ Financial Group, Inc. 100,000 0.98% 9/10/2023 102,755 0.04%Sumitomo Mitsui Banking Corp. 100,000 0.55% 6/11/2023 102,057 0.04%Nomura Europe Finance NV 100,000 1.50% 12/5/2021 102,041 0.04%Sumitomo Mitsui Financial Group, Inc. 100,000 0.82% 23/7/2023 101,950 0.04%Japan Finance Organization for Municipalities 100,000 0.88% 22/9/2021 101,880 0.04%American Honda Finance Corp. 100,000 0.35% 26/8/2022 100,888 0.04%Asahi Group Holdings Ltd. 100,000 0.32% 19/9/2021 100,522 0.04%Mizuho Financial Group, Inc. 100,000 0.12% 6/9/2024 98,996 0.04%Sumitomo Mitsui Banking Corp. 100,000 0.41% 7/11/2029 98,870 0.04%Sumitomo Mitsui Financial Group, Inc. 100,000 0.63% 23/10/2029 97,043 0.04%Mizuho Financial Group, Inc. 100,000 0.40% 6/9/2029 96,935 0.03%
2,666,221 1.02%
Kazakhstan 0.08% (2018: 0.07%)
Kazakhstan Government International Bond 110,000 1.55% 9/11/2023 115,045 0.04%Kazakhstan Government International Bond 100,000 0.60% 30/9/2026 99,613 0.04%
214,658 0.08%
Luxembourg 0.55% (2018: 0.38%)
Blackstone Property Partners Europe Holdings Sarl 200,000 2.00% 15/2/2024 209,991 0.08%Logicor Financing Sarl 100,000 3.25% 13/11/2028 111,810 0.04%ArcelorMittal SA 100,000 2.25% 17/1/2024 104,456 0.04%Logicor Financing Sarl 100,000 1.50% 14/11/2022 103,150 0.04%SELP Finance Sarl 100,000 1.25% 25/10/2023 102,850 0.04%Blackstone Property Partners Europe Holdings Sarl 100,000 1.40% 6/7/2022 102,431 0.04%NORD/LB Luxembourg SA Covered Bond Bank 100,000 0.38% 7/3/2024 101,444 0.04%NORD/LB Luxembourg SA Covered Bond Bank 100,000 0.38% 15/6/2023 101,375 0.04%ArcelorMittal SA 100,000 1.00% 19/5/2023 100,744 0.04%Logicor Financing Sarl 100,000 0.75% 15/7/2024 100,390 0.04%Blackstone Property Partners Europe Holdings Sarl 100,000 1.75% 12/3/2029 99,760 0.04%Blackstone Property Partners Europe Holdings Sarl 100,000 0.50% 12/9/2023 99,663 0.04%SES SA 100,000 0.88% 4/11/2027 97,556 0.03%
1,435,620 0.55%
Mexico 0.62% (2018: 0.71%)
Mexico Government International Bond 200,000 2.75% 22/4/2023 216,500 0.08%Mexico Government International Bond 150,000 3.38% 23/2/2031 182,334 0.07%Mexico Government International Bond 100,000 3.63% 9/4/2029 121,750 0.05%America Movil SAB de CV^ 100,000 6.38% 6/9/2073 120,000 0.05%Mexico Government International Bond 100,000 2.88% 8/4/2039 113,973 0.05%Mexico Government International Bond 100,000 4.00% 15/3/2115 112,200 0.04%America Movil SAB de CV 100,000 4.75% 28/6/2022 111,965 0.04%Mexico Government International Bond 100,000 1.75% 17/4/2028 105,260 0.04%Mexico Government International Bond 100,000 1.63% 6/3/2024 105,100 0.04%Fomento Economico Mexicano SAB de CV 100,000 1.75% 20/3/2023 104,801 0.04%Mexico Government International Bond 100,000 1.63% 8/4/2026 104,438 0.04%Mexico Government International Bond 100,000 1.38% 15/1/2025 104,176 0.04%America Movil SAB de CV 100,000 0.75% 26/6/2027 101,203 0.04%
1,603,700 0.62%
Morocco 0.08% (2018: 0.07%)
Morocco Government International Bond 100,000 3.50% 19/6/2024 113,573 0.04%Morocco Government International Bond 100,000 1.50% 27/11/2031 99,958 0.04%
213,531 0.08%
Netherlands 4.34% (2018: 4.83%)
Nationale-Nederlanden Levensverzekering Maatschappij NV^ 300,000 9.00% 29/8/2042 370,380 0.14%ABN AMRO Bank NV 300,000 3.50% 18/1/2022 323,441 0.12%Cooperatieve Rabobank UA 300,000 0.75% 29/8/2023 307,189 0.12%ING Groep NV 200,000 2.00% 20/9/2028 222,490 0.09%ABN AMRO Bank NV 200,000 1.25% 10/1/2033 221,740 0.09%ELM BV for Swiss Reinsurance Co., Ltd.^ 200,000 2.60% Perpetual 217,750 0.08%Cooperatieve Rabobank UA 200,000 4.00% 11/1/2022 216,655 0.08%Cooperatieve Rabobank UA 200,000 1.38% 3/2/2027 216,034 0.08%ABN AMRO Bank NV 200,000 1.00% 13/4/2031 215,995 0.08%ING Bank NV 200,000 1.88% 22/5/2023 214,347 0.08%ING Bank NV 200,000 3.63% 31/8/2021 213,160 0.08%ING Groep NV 200,000 1.00% 20/9/2023 205,772 0.08%
Vanguard SRI Euro Investment Grade Bond Index Fund
786
Principal Maturity Fair Value % of Total Euro (€) Coupon Date Euro (€) Net Assets
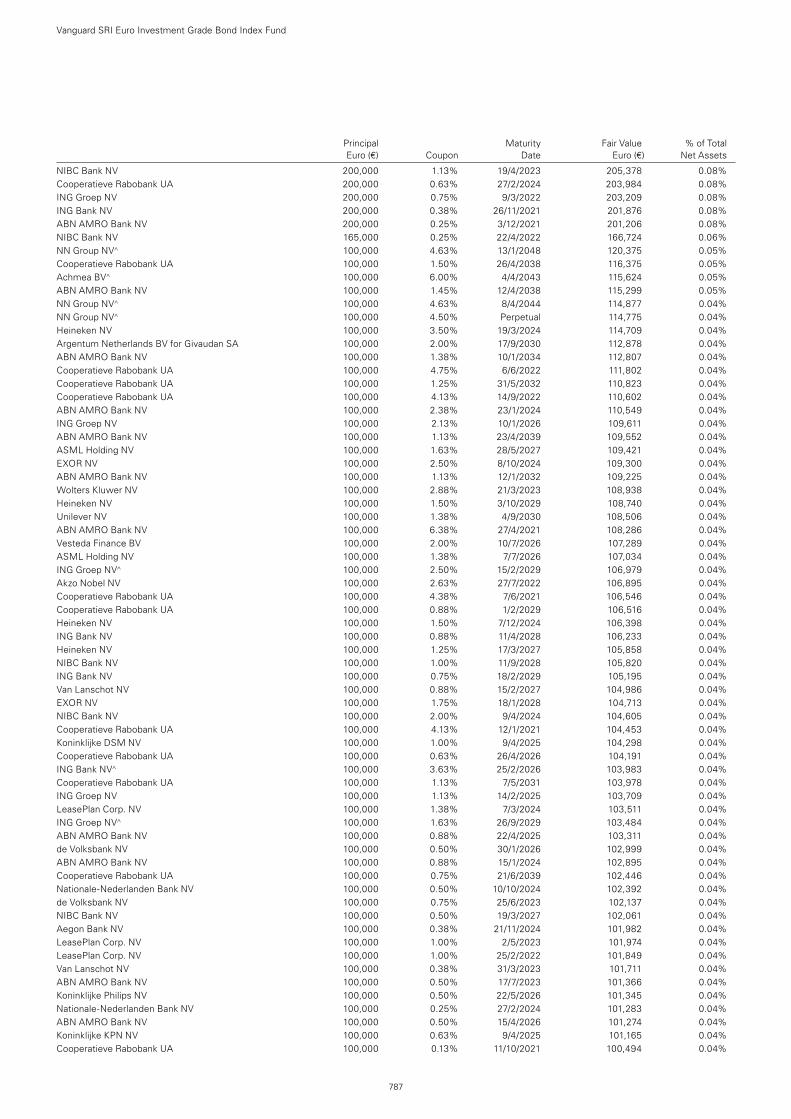
NIBC Bank NV 200,000 1.13% 19/4/2023 205,378 0.08%Cooperatieve Rabobank UA 200,000 0.63% 27/2/2024 203,984 0.08%ING Groep NV 200,000 0.75% 9/3/2022 203,209 0.08%ING Bank NV 200,000 0.38% 26/11/2021 201,876 0.08%ABN AMRO Bank NV 200,000 0.25% 3/12/2021 201,206 0.08%NIBC Bank NV 165,000 0.25% 22/4/2022 166,724 0.06%NN Group NV^ 100,000 4.63% 13/1/2048 120,375 0.05%Cooperatieve Rabobank UA 100,000 1.50% 26/4/2038 116,375 0.05%Achmea BV^ 100,000 6.00% 4/4/2043 115,624 0.05%ABN AMRO Bank NV 100,000 1.45% 12/4/2038 115,299 0.05%NN Group NV^ 100,000 4.63% 8/4/2044 114,877 0.04%NN Group NV^ 100,000 4.50% Perpetual 114,775 0.04%Heineken NV 100,000 3.50% 19/3/2024 114,709 0.04%Argentum Netherlands BV for Givaudan SA 100,000 2.00% 17/9/2030 112,878 0.04%ABN AMRO Bank NV 100,000 1.38% 10/1/2034 112,807 0.04%Cooperatieve Rabobank UA 100,000 4.75% 6/6/2022 111,802 0.04%Cooperatieve Rabobank UA 100,000 1.25% 31/5/2032 110,823 0.04%Cooperatieve Rabobank UA 100,000 4.13% 14/9/2022 110,602 0.04%ABN AMRO Bank NV 100,000 2.38% 23/1/2024 110,549 0.04%ING Groep NV 100,000 2.13% 10/1/2026 109,611 0.04%ABN AMRO Bank NV 100,000 1.13% 23/4/2039 109,552 0.04%ASML Holding NV 100,000 1.63% 28/5/2027 109,421 0.04%EXOR NV 100,000 2.50% 8/10/2024 109,300 0.04%ABN AMRO Bank NV 100,000 1.13% 12/1/2032 109,225 0.04%Wolters Kluwer NV 100,000 2.88% 21/3/2023 108,938 0.04%Heineken NV 100,000 1.50% 3/10/2029 108,740 0.04%Unilever NV 100,000 1.38% 4/9/2030 108,506 0.04%ABN AMRO Bank NV 100,000 6.38% 27/4/2021 108,286 0.04%Vesteda Finance BV 100,000 2.00% 10/7/2026 107,289 0.04%ASML Holding NV 100,000 1.38% 7/7/2026 107,034 0.04%ING Groep NV^ 100,000 2.50% 15/2/2029 106,979 0.04%Akzo Nobel NV 100,000 2.63% 27/7/2022 106,895 0.04%Cooperatieve Rabobank UA 100,000 4.38% 7/6/2021 106,546 0.04%Cooperatieve Rabobank UA 100,000 0.88% 1/2/2029 106,516 0.04%Heineken NV 100,000 1.50% 7/12/2024 106,398 0.04%ING Bank NV 100,000 0.88% 11/4/2028 106,233 0.04%Heineken NV 100,000 1.25% 17/3/2027 105,858 0.04%NIBC Bank NV 100,000 1.00% 11/9/2028 105,820 0.04%ING Bank NV 100,000 0.75% 18/2/2029 105,195 0.04%Van Lanschot NV 100,000 0.88% 15/2/2027 104,986 0.04%EXOR NV 100,000 1.75% 18/1/2028 104,713 0.04%NIBC Bank NV 100,000 2.00% 9/4/2024 104,605 0.04%Cooperatieve Rabobank UA 100,000 4.13% 12/1/2021 104,453 0.04%Koninklijke DSM NV 100,000 1.00% 9/4/2025 104,298 0.04%Cooperatieve Rabobank UA 100,000 0.63% 26/4/2026 104,191 0.04%ING Bank NV^ 100,000 3.63% 25/2/2026 103,983 0.04%Cooperatieve Rabobank UA 100,000 1.13% 7/5/2031 103,978 0.04%ING Groep NV 100,000 1.13% 14/2/2025 103,709 0.04%LeasePlan Corp. NV 100,000 1.38% 7/3/2024 103,511 0.04%ING Groep NV^ 100,000 1.63% 26/9/2029 103,484 0.04%ABN AMRO Bank NV 100,000 0.88% 22/4/2025 103,311 0.04%de Volksbank NV 100,000 0.50% 30/1/2026 102,999 0.04%ABN AMRO Bank NV 100,000 0.88% 15/1/2024 102,895 0.04%Cooperatieve Rabobank UA 100,000 0.75% 21/6/2039 102,446 0.04%Nationale-Nederlanden Bank NV 100,000 0.50% 10/10/2024 102,392 0.04%de Volksbank NV 100,000 0.75% 25/6/2023 102,137 0.04%NIBC Bank NV 100,000 0.50% 19/3/2027 102,061 0.04%Aegon Bank NV 100,000 0.38% 21/11/2024 101,982 0.04%LeasePlan Corp. NV 100,000 1.00% 2/5/2023 101,974 0.04%LeasePlan Corp. NV 100,000 1.00% 25/2/2022 101,849 0.04%Van Lanschot NV 100,000 0.38% 31/3/2023 101,711 0.04%ABN AMRO Bank NV 100,000 0.50% 17/7/2023 101,366 0.04%Koninklijke Philips NV 100,000 0.50% 22/5/2026 101,345 0.04%Nationale-Nederlanden Bank NV 100,000 0.25% 27/2/2024 101,283 0.04%ABN AMRO Bank NV 100,000 0.50% 15/4/2026 101,274 0.04%Koninklijke KPN NV 100,000 0.63% 9/4/2025 101,165 0.04%Cooperatieve Rabobank UA 100,000 0.13% 11/10/2021 100,494 0.04%
Vanguard SRI Euro Investment Grade Bond Index Fund
787
Principal Maturity Fair Value % of Total Euro (€) Coupon Date Euro (€) Net Assets

ING Bank NV 100,000 0.00% 8/4/2022 100,126 0.04%Koninklijke Ahold Delhaize NV 100,000 0.25% 26/6/2025 99,841 0.04%Cooperatieve Rabobank UA 100,000 0.00% 21/6/2027 99,642 0.04%Cooperatieve Rabobank UA 100,000 0.25% 30/10/2026 98,965 0.04%de Volksbank NV 100,000 0.01% 16/9/2024 98,911 0.04%LeasePlan Corp. NV 100,000 0.13% 13/9/2023 98,476 0.04%NIBC Bank NV 100,000 0.01% 15/10/2029 96,290 0.04%
11,332,013 4.34%
New Zealand 0.42% (2018: 0.32%)
BNZ International Funding Ltd. 300,000 0.13% 17/6/2021 301,631 0.11%Auckland Council 200,000 0.13% 26/9/2029 193,972 0.07%ANZ New Zealand Int’l Ltd. 100,000 0.50% 17/1/2024 102,143 0.04%ANZ New Zealand Int’l Ltd. 100,000 0.63% 1/6/2021 101,074 0.04%Westpac Securities NZ Ltd. 100,000 0.25% 6/4/2022 100,955 0.04%ANZ New Zealand Int’l Ltd. 100,000 0.13% 22/9/2023 100,778 0.04%ASB Finance Ltd. 100,000 0.13% 18/10/2023 100,719 0.04%Westpac Securities NZ Ltd. 100,000 0.13% 16/6/2021 100,527 0.04%
1,101,799 0.42%
Norway 2.28% (2018: 2.01%)
Equinor A.S.A 400,000 1.25% 17/2/2027 427,060 0.16%SpareBank 1 Boligkreditt A.S. 400,000 0.05% 25/1/2022 402,590 0.15%DNB Boligkreditt A.S. 300,000 2.75% 21/3/2022 320,113 0.12%DNB Boligkreditt A.S. 300,000 0.05% 11/1/2022 301,945 0.11%DNB Boligkreditt A.S. 200,000 0.63% 14/1/2026 207,542 0.08%SpareBank 1 Boligkreditt A.S. 200,000 0.38% 26/6/2024 204,286 0.08%DNB Bank A.S.A^ 200,000 1.25% 1/3/2027 204,053 0.08%Santander Consumer Bank A.S. 200,000 0.88% 21/1/2022 203,529 0.08%DNB Boligkreditt A.S. 200,000 0.25% 23/1/2023 202,800 0.08%DNB Boligkreditt A.S. 200,000 0.38% 14/1/2021 201,404 0.07%Kommunalbanken A.S. 200,000 0.05% 24/10/2029 195,941 0.07%SpareBank 1 Boligkreditt A.S. 150,000 0.13% 14/5/2026 150,889 0.06%DNB Bank A.S.A 150,000 0.05% 14/11/2023 149,402 0.06%Telenor A.S.A 100,000 2.50% 22/5/2025 112,080 0.04%Telenor A.S.A 100,000 1.75% 31/5/2034 109,686 0.04%Eika Boligkreditt A.S. 100,000 2.13% 30/1/2023 107,222 0.04%Statkraft A.S. 100,000 1.50% 26/3/2030 107,221 0.04%DNB Bank A.S.A 100,000 4.38% 24/2/2021 105,219 0.04%SR-Boligkreditt A.S. 100,000 0.75% 17/10/2025 104,360 0.04%Avinor A.S. 100,000 1.00% 29/4/2025 104,306 0.04%Norsk Hydro A.S.A 100,000 2.00% 11/4/2029 104,195 0.04%Kommunalbanken A.S. 100,000 0.63% 20/4/2026 103,962 0.04%Equinor A.S.A 100,000 0.75% 9/11/2026 103,542 0.04%Statnett SF 100,000 0.88% 8/3/2025 103,019 0.04%SpareBank 1 SR-Bank A.S.A. 100,000 2.13% 14/4/2021 102,958 0.04%Sparebanken Vest Boligkreditt A.S. 100,000 0.50% 12/2/2026 102,835 0.04%Eika Boligkreditt A.S. 100,000 0.50% 28/8/2025 102,805 0.04%Sparebanken Soer Boligkreditt A.S. 100,000 0.50% 6/2/2026 102,664 0.04%Telenor A.S.A 100,000 0.75% 31/5/2026 102,380 0.04%Sparebank 1 Oestlandet 100,000 0.88% 13/3/2023 102,233 0.04%DNB Bank A.S.A^ 100,000 1.13% 20/3/2028 102,074 0.04%DNB Boligkreditt A.S. 100,000 0.38% 14/11/2023 102,039 0.04%Santander Consumer Bank A.S. 100,000 0.75% 1/3/2023 101,861 0.04%Sparebanken Soer Boligkreditt A.S. 100,000 0.38% 20/2/2023 101,666 0.04%DNB Boligkreditt A.S. 100,000 0.25% 18/4/2023 101,447 0.04%SpareBank 1 SR-Bank A.S.A 100,000 0.63% 25/3/2024 101,436 0.04%SpareBank 1 SMN 100,000 0.75% 8/6/2021 101,236 0.04%Sparebanken Soer Boligkreditt A.S. 100,000 0.13% 15/3/2023 100,989 0.04%SR-Boligkreditt A.S. 100,000 0.01% 8/10/2026 99,414 0.04%SpareBank 1 Boligkreditt A.S. 100,000 0.13% 5/11/2029 98,212 0.04%
5,962,615 2.28%
Peru 0.05% (2018: 0.07%)
Peruvian Government International Bond 100,000 3.75% 1/3/2030 128,600 0.05%
128,600 0.05%
Vanguard SRI Euro Investment Grade Bond Index Fund
788
Principal Maturity Fair Value % of Total Euro (€) Coupon Date Euro (€) Net Assets
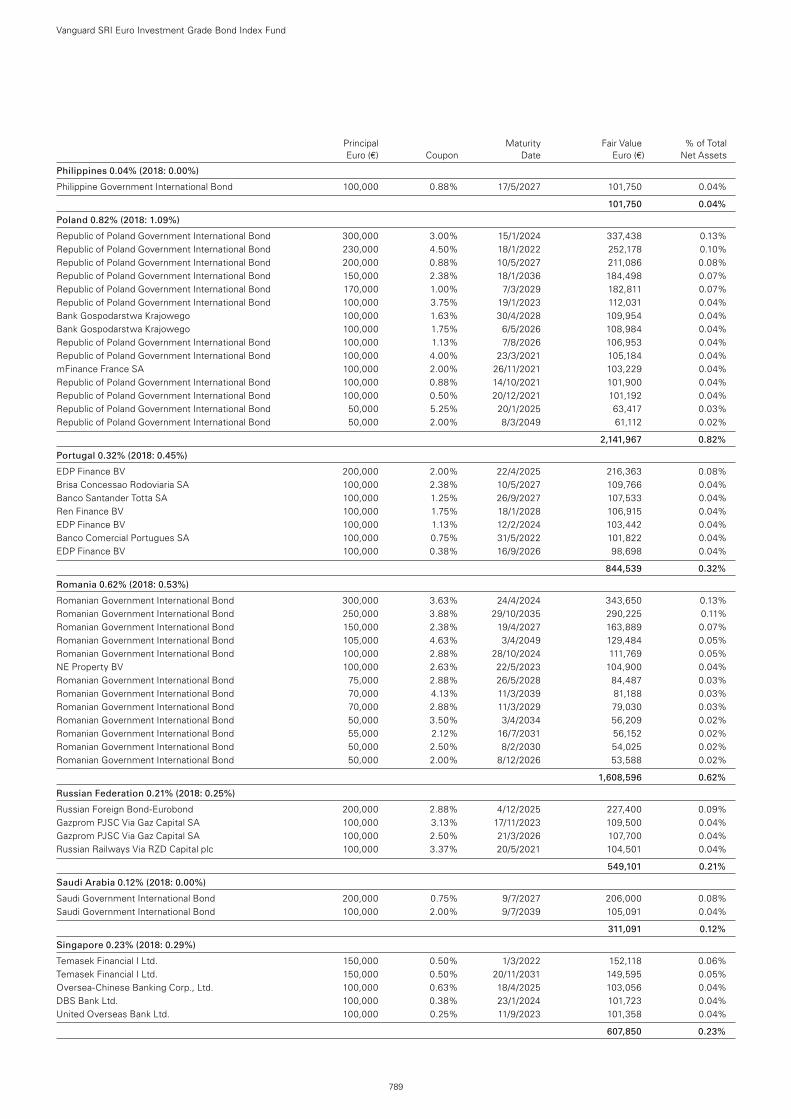
Philippines 0.04% (2018: 0.00%)
Philippine Government International Bond 100,000 0.88% 17/5/2027 101,750 0.04%
101,750 0.04%
Poland 0.82% (2018: 1.09%)
Republic of Poland Government International Bond 300,000 3.00% 15/1/2024 337,438 0.13%Republic of Poland Government International Bond 230,000 4.50% 18/1/2022 252,178 0.10%Republic of Poland Government International Bond 200,000 0.88% 10/5/2027 211,086 0.08%Republic of Poland Government International Bond 150,000 2.38% 18/1/2036 184,498 0.07%Republic of Poland Government International Bond 170,000 1.00% 7/3/2029 182,811 0.07%Republic of Poland Government International Bond 100,000 3.75% 19/1/2023 112,031 0.04%Bank Gospodarstwa Krajowego 100,000 1.63% 30/4/2028 109,954 0.04%Bank Gospodarstwa Krajowego 100,000 1.75% 6/5/2026 108,984 0.04%Republic of Poland Government International Bond 100,000 1.13% 7/8/2026 106,953 0.04%Republic of Poland Government International Bond 100,000 4.00% 23/3/2021 105,184 0.04%mFinance France SA 100,000 2.00% 26/11/2021 103,229 0.04%Republic of Poland Government International Bond 100,000 0.88% 14/10/2021 101,900 0.04%Republic of Poland Government International Bond 100,000 0.50% 20/12/2021 101,192 0.04%Republic of Poland Government International Bond 50,000 5.25% 20/1/2025 63,417 0.03%Republic of Poland Government International Bond 50,000 2.00% 8/3/2049 61,112 0.02%
2,141,967 0.82%
Portugal 0.32% (2018: 0.45%)
EDP Finance BV 200,000 2.00% 22/4/2025 216,363 0.08%Brisa Concessao Rodoviaria SA 100,000 2.38% 10/5/2027 109,766 0.04%Banco Santander Totta SA 100,000 1.25% 26/9/2027 107,533 0.04%Ren Finance BV 100,000 1.75% 18/1/2028 106,915 0.04%EDP Finance BV 100,000 1.13% 12/2/2024 103,442 0.04%Banco Comercial Portugues SA 100,000 0.75% 31/5/2022 101,822 0.04%EDP Finance BV 100,000 0.38% 16/9/2026 98,698 0.04%
844,539 0.32%
Romania 0.62% (2018: 0.53%)
Romanian Government International Bond 300,000 3.63% 24/4/2024 343,650 0.13%Romanian Government International Bond 250,000 3.88% 29/10/2035 290,225 0.11%Romanian Government International Bond 150,000 2.38% 19/4/2027 163,889 0.07%Romanian Government International Bond 105,000 4.63% 3/4/2049 129,484 0.05%Romanian Government International Bond 100,000 2.88% 28/10/2024 111,769 0.05%NE Property BV 100,000 2.63% 22/5/2023 104,900 0.04%Romanian Government International Bond 75,000 2.88% 26/5/2028 84,487 0.03%Romanian Government International Bond 70,000 4.13% 11/3/2039 81,188 0.03%Romanian Government International Bond 70,000 2.88% 11/3/2029 79,030 0.03%Romanian Government International Bond 50,000 3.50% 3/4/2034 56,209 0.02%Romanian Government International Bond 55,000 2.12% 16/7/2031 56,152 0.02%Romanian Government International Bond 50,000 2.50% 8/2/2030 54,025 0.02%Romanian Government International Bond 50,000 2.00% 8/12/2026 53,588 0.02%
1,608,596 0.62%
Russian Federation 0.21% (2018: 0.25%)
Russian Foreign Bond-Eurobond 200,000 2.88% 4/12/2025 227,400 0.09%Gazprom PJSC Via Gaz Capital SA 100,000 3.13% 17/11/2023 109,500 0.04%Gazprom PJSC Via Gaz Capital SA 100,000 2.50% 21/3/2026 107,700 0.04%Russian Railways Via RZD Capital plc 100,000 3.37% 20/5/2021 104,501 0.04%
549,101 0.21%
Saudi Arabia 0.12% (2018: 0.00%)
Saudi Government International Bond 200,000 0.75% 9/7/2027 206,000 0.08%Saudi Government International Bond 100,000 2.00% 9/7/2039 105,091 0.04%
311,091 0.12%
Singapore 0.23% (2018: 0.29%)
Temasek Financial I Ltd. 150,000 0.50% 1/3/2022 152,118 0.06%Temasek Financial I Ltd. 150,000 0.50% 20/11/2031 149,595 0.05%Oversea-Chinese Banking Corp., Ltd. 100,000 0.63% 18/4/2025 103,056 0.04%DBS Bank Ltd. 100,000 0.38% 23/1/2024 101,723 0.04%United Overseas Bank Ltd. 100,000 0.25% 11/9/2023 101,358 0.04%
607,850 0.23%
Vanguard SRI Euro Investment Grade Bond Index Fund
789
Principal Maturity Fair Value % of Total Euro (€) Coupon Date Euro (€) Net Assets
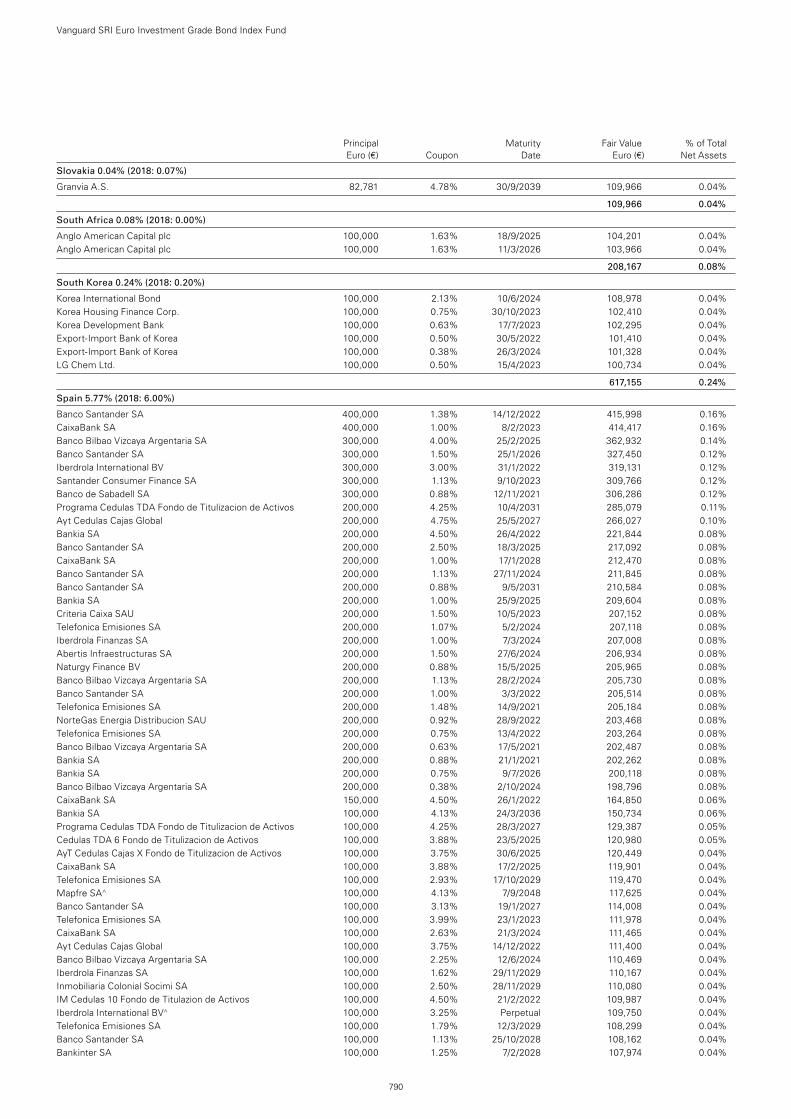
Slovakia 0.04% (2018: 0.07%)
Granvia A.S. 82,781 4.78% 30/9/2039 109,966 0.04%
109,966 0.04%
South Africa 0.08% (2018: 0.00%)
Anglo American Capital plc 100,000 1.63% 18/9/2025 104,201 0.04%Anglo American Capital plc 100,000 1.63% 11/3/2026 103,966 0.04%
208,167 0.08%
South Korea 0.24% (2018: 0.20%)
Korea International Bond 100,000 2.13% 10/6/2024 108,978 0.04%Korea Housing Finance Corp. 100,000 0.75% 30/10/2023 102,410 0.04%Korea Development Bank 100,000 0.63% 17/7/2023 102,295 0.04%Export-Import Bank of Korea 100,000 0.50% 30/5/2022 101,410 0.04%Export-Import Bank of Korea 100,000 0.38% 26/3/2024 101,328 0.04%LG Chem Ltd. 100,000 0.50% 15/4/2023 100,734 0.04%
617,155 0.24%
Spain 5.77% (2018: 6.00%)
Banco Santander SA 400,000 1.38% 14/12/2022 415,998 0.16%CaixaBank SA 400,000 1.00% 8/2/2023 414,417 0.16%Banco Bilbao Vizcaya Argentaria SA 300,000 4.00% 25/2/2025 362,932 0.14%Banco Santander SA 300,000 1.50% 25/1/2026 327,450 0.12%Iberdrola International BV 300,000 3.00% 31/1/2022 319,131 0.12%Santander Consumer Finance SA 300,000 1.13% 9/10/2023 309,766 0.12%Banco de Sabadell SA 300,000 0.88% 12/11/2021 306,286 0.12%Programa Cedulas TDA Fondo de Titulizacion de Activos 200,000 4.25% 10/4/2031 285,079 0.11%Ayt Cedulas Cajas Global 200,000 4.75% 25/5/2027 266,027 0.10%Bankia SA 200,000 4.50% 26/4/2022 221,844 0.08%Banco Santander SA 200,000 2.50% 18/3/2025 217,092 0.08%CaixaBank SA 200,000 1.00% 17/1/2028 212,470 0.08%Banco Santander SA 200,000 1.13% 27/11/2024 211,845 0.08%Banco Santander SA 200,000 0.88% 9/5/2031 210,584 0.08%Bankia SA 200,000 1.00% 25/9/2025 209,604 0.08%Criteria Caixa SAU 200,000 1.50% 10/5/2023 207,152 0.08%Telefonica Emisiones SA 200,000 1.07% 5/2/2024 207,118 0.08%Iberdrola Finanzas SA 200,000 1.00% 7/3/2024 207,008 0.08%Abertis Infraestructuras SA 200,000 1.50% 27/6/2024 206,934 0.08%Naturgy Finance BV 200,000 0.88% 15/5/2025 205,965 0.08%Banco Bilbao Vizcaya Argentaria SA 200,000 1.13% 28/2/2024 205,730 0.08%Banco Santander SA 200,000 1.00% 3/3/2022 205,514 0.08%Telefonica Emisiones SA 200,000 1.48% 14/9/2021 205,184 0.08%NorteGas Energia Distribucion SAU 200,000 0.92% 28/9/2022 203,468 0.08%Telefonica Emisiones SA 200,000 0.75% 13/4/2022 203,264 0.08%Banco Bilbao Vizcaya Argentaria SA 200,000 0.63% 17/5/2021 202,487 0.08%Bankia SA 200,000 0.88% 21/1/2021 202,262 0.08%Bankia SA 200,000 0.75% 9/7/2026 200,118 0.08%Banco Bilbao Vizcaya Argentaria SA 200,000 0.38% 2/10/2024 198,796 0.08%CaixaBank SA 150,000 4.50% 26/1/2022 164,850 0.06%Bankia SA 100,000 4.13% 24/3/2036 150,734 0.06%Programa Cedulas TDA Fondo de Titulizacion de Activos 100,000 4.25% 28/3/2027 129,387 0.05%Cedulas TDA 6 Fondo de Titulizacion de Activos 100,000 3.88% 23/5/2025 120,980 0.05%AyT Cedulas Cajas X Fondo de Titulizacion de Activos 100,000 3.75% 30/6/2025 120,449 0.04%CaixaBank SA 100,000 3.88% 17/2/2025 119,901 0.04%Telefonica Emisiones SA 100,000 2.93% 17/10/2029 119,470 0.04%Mapfre SA^ 100,000 4.13% 7/9/2048 117,625 0.04%Banco Santander SA 100,000 3.13% 19/1/2027 114,008 0.04%Telefonica Emisiones SA 100,000 3.99% 23/1/2023 111,978 0.04%CaixaBank SA 100,000 2.63% 21/3/2024 111,465 0.04%Ayt Cedulas Cajas Global 100,000 3.75% 14/12/2022 111,400 0.04%Banco Bilbao Vizcaya Argentaria SA 100,000 2.25% 12/6/2024 110,469 0.04%Iberdrola Finanzas SA 100,000 1.62% 29/11/2029 110,167 0.04%Inmobiliaria Colonial Socimi SA 100,000 2.50% 28/11/2029 110,080 0.04%IM Cedulas 10 Fondo de Titulazion de Activos 100,000 4.50% 21/2/2022 109,987 0.04%Iberdrola International BV^ 100,000 3.25% Perpetual 109,750 0.04%Telefonica Emisiones SA 100,000 1.79% 12/3/2029 108,299 0.04%Banco Santander SA 100,000 1.13% 25/10/2028 108,162 0.04%Bankinter SA 100,000 1.25% 7/2/2028 107,974 0.04%
Vanguard SRI Euro Investment Grade Bond Index Fund
790
Principal Maturity Fair Value % of Total Euro (€) Coupon Date Euro (€) Net Assets
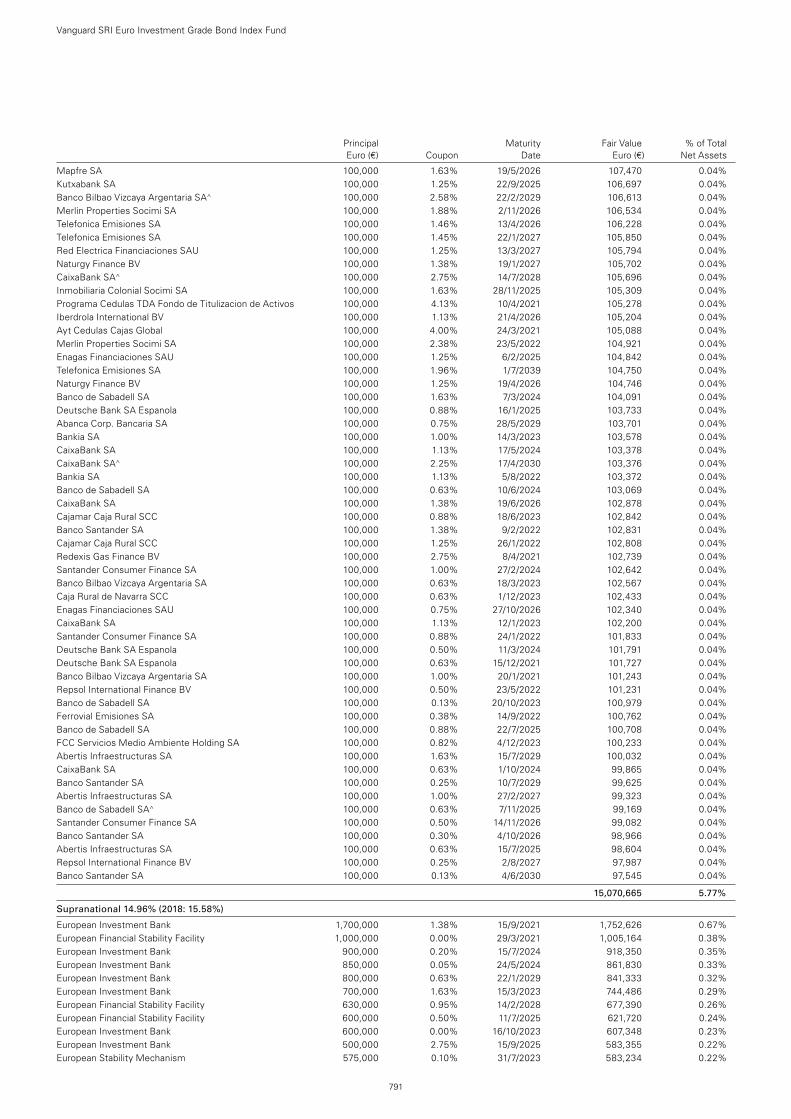
Mapfre SA 100,000 1.63% 19/5/2026 107,470 0.04%Kutxabank SA 100,000 1.25% 22/9/2025 106,697 0.04%Banco Bilbao Vizcaya Argentaria SA^ 100,000 2.58% 22/2/2029 106,613 0.04%Merlin Properties Socimi SA 100,000 1.88% 2/11/2026 106,534 0.04%Telefonica Emisiones SA 100,000 1.46% 13/4/2026 106,228 0.04%Telefonica Emisiones SA 100,000 1.45% 22/1/2027 105,850 0.04%Red Electrica Financiaciones SAU 100,000 1.25% 13/3/2027 105,794 0.04%Naturgy Finance BV 100,000 1.38% 19/1/2027 105,702 0.04%CaixaBank SA^ 100,000 2.75% 14/7/2028 105,696 0.04%Inmobiliaria Colonial Socimi SA 100,000 1.63% 28/11/2025 105,309 0.04%Programa Cedulas TDA Fondo de Titulizacion de Activos 100,000 4.13% 10/4/2021 105,278 0.04%Iberdrola International BV 100,000 1.13% 21/4/2026 105,204 0.04%Ayt Cedulas Cajas Global 100,000 4.00% 24/3/2021 105,088 0.04%Merlin Properties Socimi SA 100,000 2.38% 23/5/2022 104,921 0.04%Enagas Financiaciones SAU 100,000 1.25% 6/2/2025 104,842 0.04%Telefonica Emisiones SA 100,000 1.96% 1/7/2039 104,750 0.04%Naturgy Finance BV 100,000 1.25% 19/4/2026 104,746 0.04%Banco de Sabadell SA 100,000 1.63% 7/3/2024 104,091 0.04%Deutsche Bank SA Espanola 100,000 0.88% 16/1/2025 103,733 0.04%Abanca Corp. Bancaria SA 100,000 0.75% 28/5/2029 103,701 0.04%Bankia SA 100,000 1.00% 14/3/2023 103,578 0.04%CaixaBank SA 100,000 1.13% 17/5/2024 103,378 0.04%CaixaBank SA^ 100,000 2.25% 17/4/2030 103,376 0.04%Bankia SA 100,000 1.13% 5/8/2022 103,372 0.04%Banco de Sabadell SA 100,000 0.63% 10/6/2024 103,069 0.04%CaixaBank SA 100,000 1.38% 19/6/2026 102,878 0.04%Cajamar Caja Rural SCC 100,000 0.88% 18/6/2023 102,842 0.04%Banco Santander SA 100,000 1.38% 9/2/2022 102,831 0.04%Cajamar Caja Rural SCC 100,000 1.25% 26/1/2022 102,808 0.04%Redexis Gas Finance BV 100,000 2.75% 8/4/2021 102,739 0.04%Santander Consumer Finance SA 100,000 1.00% 27/2/2024 102,642 0.04%Banco Bilbao Vizcaya Argentaria SA 100,000 0.63% 18/3/2023 102,567 0.04%Caja Rural de Navarra SCC 100,000 0.63% 1/12/2023 102,433 0.04%Enagas Financiaciones SAU 100,000 0.75% 27/10/2026 102,340 0.04%CaixaBank SA 100,000 1.13% 12/1/2023 102,200 0.04%Santander Consumer Finance SA 100,000 0.88% 24/1/2022 101,833 0.04%Deutsche Bank SA Espanola 100,000 0.50% 11/3/2024 101,791 0.04%Deutsche Bank SA Espanola 100,000 0.63% 15/12/2021 101,727 0.04%Banco Bilbao Vizcaya Argentaria SA 100,000 1.00% 20/1/2021 101,243 0.04%Repsol International Finance BV 100,000 0.50% 23/5/2022 101,231 0.04%Banco de Sabadell SA 100,000 0.13% 20/10/2023 100,979 0.04%Ferrovial Emisiones SA 100,000 0.38% 14/9/2022 100,762 0.04%Banco de Sabadell SA 100,000 0.88% 22/7/2025 100,708 0.04%FCC Servicios Medio Ambiente Holding SA 100,000 0.82% 4/12/2023 100,233 0.04%Abertis Infraestructuras SA 100,000 1.63% 15/7/2029 100,032 0.04%CaixaBank SA 100,000 0.63% 1/10/2024 99,865 0.04%Banco Santander SA 100,000 0.25% 10/7/2029 99,625 0.04%Abertis Infraestructuras SA 100,000 1.00% 27/2/2027 99,323 0.04%Banco de Sabadell SA^ 100,000 0.63% 7/11/2025 99,169 0.04%Santander Consumer Finance SA 100,000 0.50% 14/11/2026 99,082 0.04%Banco Santander SA 100,000 0.30% 4/10/2026 98,966 0.04%Abertis Infraestructuras SA 100,000 0.63% 15/7/2025 98,604 0.04%Repsol International Finance BV 100,000 0.25% 2/8/2027 97,987 0.04%Banco Santander SA 100,000 0.13% 4/6/2030 97,545 0.04%
15,070,665 5.77%
Supranational 14.96% (2018: 15.58%)
European Investment Bank 1,700,000 1.38% 15/9/2021 1,752,626 0.67%European Financial Stability Facility 1,000,000 0.00% 29/3/2021 1,005,164 0.38%European Investment Bank 900,000 0.20% 15/7/2024 918,350 0.35%European Investment Bank 850,000 0.05% 24/5/2024 861,830 0.33%European Investment Bank 800,000 0.63% 22/1/2029 841,333 0.32%European Investment Bank 700,000 1.63% 15/3/2023 744,486 0.29%European Financial Stability Facility 630,000 0.95% 14/2/2028 677,390 0.26%European Financial Stability Facility 600,000 0.50% 11/7/2025 621,720 0.24%European Investment Bank 600,000 0.00% 16/10/2023 607,348 0.23%European Investment Bank 500,000 2.75% 15/9/2025 583,355 0.22%European Stability Mechanism 575,000 0.10% 31/7/2023 583,234 0.22%
Vanguard SRI Euro Investment Grade Bond Index Fund
791
Principal Maturity Fair Value % of Total Euro (€) Coupon Date Euro (€) Net Assets
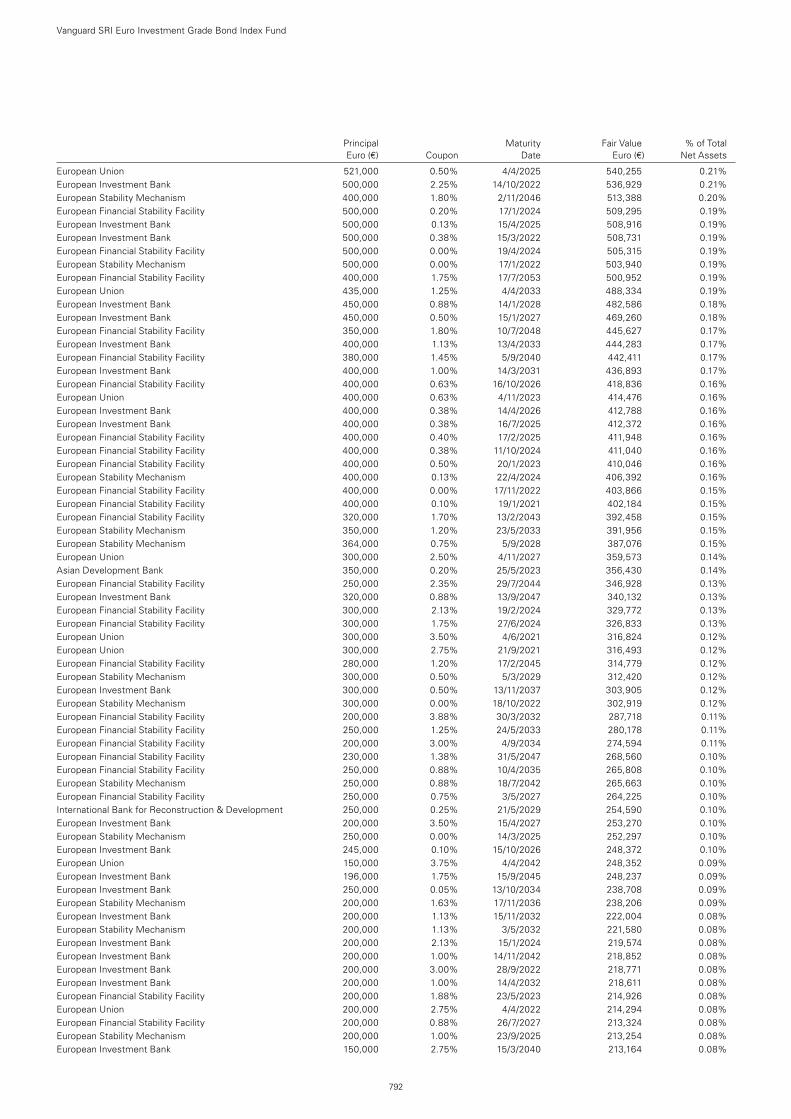
Principal Maturity Fair Value % of Total Euro (€) Coupon Date Euro (€) Net Assets
European Union 521,000 0.50% 4/4/2025 540,255 0.21%European Investment Bank 500,000 2.25% 14/10/2022 536,929 0.21%European Stability Mechanism 400,000 1.80% 2/11/2046 513,388 0.20%European Financial Stability Facility 500,000 0.20% 17/1/2024 509,295 0.19%European Investment Bank 500,000 0.13% 15/4/2025 508,916 0.19%European Investment Bank 500,000 0.38% 15/3/2022 508,731 0.19%European Financial Stability Facility 500,000 0.00% 19/4/2024 505,315 0.19%European Stability Mechanism 500,000 0.00% 17/1/2022 503,940 0.19%European Financial Stability Facility 400,000 1.75% 17/7/2053 500,952 0.19%European Union 435,000 1.25% 4/4/2033 488,334 0.19%European Investment Bank 450,000 0.88% 14/1/2028 482,586 0.18%European Investment Bank 450,000 0.50% 15/1/2027 469,260 0.18%European Financial Stability Facility 350,000 1.80% 10/7/2048 445,627 0.17%European Investment Bank 400,000 1.13% 13/4/2033 444,283 0.17%European Financial Stability Facility 380,000 1.45% 5/9/2040 442,411 0.17%European Investment Bank 400,000 1.00% 14/3/2031 436,893 0.17%European Financial Stability Facility 400,000 0.63% 16/10/2026 418,836 0.16%European Union 400,000 0.63% 4/11/2023 414,476 0.16%European Investment Bank 400,000 0.38% 14/4/2026 412,788 0.16%European Investment Bank 400,000 0.38% 16/7/2025 412,372 0.16%European Financial Stability Facility 400,000 0.40% 17/2/2025 411,948 0.16%European Financial Stability Facility 400,000 0.38% 11/10/2024 411,040 0.16%European Financial Stability Facility 400,000 0.50% 20/1/2023 410,046 0.16%European Stability Mechanism 400,000 0.13% 22/4/2024 406,392 0.16%European Financial Stability Facility 400,000 0.00% 17/11/2022 403,866 0.15%European Financial Stability Facility 400,000 0.10% 19/1/2021 402,184 0.15%European Financial Stability Facility 320,000 1.70% 13/2/2043 392,458 0.15%European Stability Mechanism 350,000 1.20% 23/5/2033 391,956 0.15%European Stability Mechanism 364,000 0.75% 5/9/2028 387,076 0.15%European Union 300,000 2.50% 4/11/2027 359,573 0.14%Asian Development Bank 350,000 0.20% 25/5/2023 356,430 0.14%European Financial Stability Facility 250,000 2.35% 29/7/2044 346,928 0.13%European Investment Bank 320,000 0.88% 13/9/2047 340,132 0.13%European Financial Stability Facility 300,000 2.13% 19/2/2024 329,772 0.13%European Financial Stability Facility 300,000 1.75% 27/6/2024 326,833 0.13%European Union 300,000 3.50% 4/6/2021 316,824 0.12%European Union 300,000 2.75% 21/9/2021 316,493 0.12%European Financial Stability Facility 280,000 1.20% 17/2/2045 314,779 0.12%European Stability Mechanism 300,000 0.50% 5/3/2029 312,420 0.12%European Investment Bank 300,000 0.50% 13/11/2037 303,905 0.12%European Stability Mechanism 300,000 0.00% 18/10/2022 302,919 0.12%European Financial Stability Facility 200,000 3.88% 30/3/2032 287,718 0.11%European Financial Stability Facility 250,000 1.25% 24/5/2033 280,178 0.11%European Financial Stability Facility 200,000 3.00% 4/9/2034 274,594 0.11%European Financial Stability Facility 230,000 1.38% 31/5/2047 268,560 0.10%European Financial Stability Facility 250,000 0.88% 10/4/2035 265,808 0.10%European Stability Mechanism 250,000 0.88% 18/7/2042 265,663 0.10%European Financial Stability Facility 250,000 0.75% 3/5/2027 264,225 0.10%International Bank for Reconstruction & Development 250,000 0.25% 21/5/2029 254,590 0.10%European Investment Bank 200,000 3.50% 15/4/2027 253,270 0.10%European Stability Mechanism 250,000 0.00% 14/3/2025 252,297 0.10%European Investment Bank 245,000 0.10% 15/10/2026 248,372 0.10%European Union 150,000 3.75% 4/4/2042 248,352 0.09%European Investment Bank 196,000 1.75% 15/9/2045 248,237 0.09%European Investment Bank 250,000 0.05% 13/10/2034 238,708 0.09%European Stability Mechanism 200,000 1.63% 17/11/2036 238,206 0.09%European Investment Bank 200,000 1.13% 15/11/2032 222,004 0.08%European Stability Mechanism 200,000 1.13% 3/5/2032 221,580 0.08%European Investment Bank 200,000 2.13% 15/1/2024 219,574 0.08%European Investment Bank 200,000 1.00% 14/11/2042 218,852 0.08%European Investment Bank 200,000 3.00% 28/9/2022 218,771 0.08%European Investment Bank 200,000 1.00% 14/4/2032 218,611 0.08%European Financial Stability Facility 200,000 1.88% 23/5/2023 214,926 0.08%European Union 200,000 2.75% 4/4/2022 214,294 0.08%European Financial Stability Facility 200,000 0.88% 26/7/2027 213,324 0.08%European Stability Mechanism 200,000 1.00% 23/9/2025 213,254 0.08%European Investment Bank 150,000 2.75% 15/3/2040 213,164 0.08%
Vanguard SRI Euro Investment Grade Bond Index Fund
792
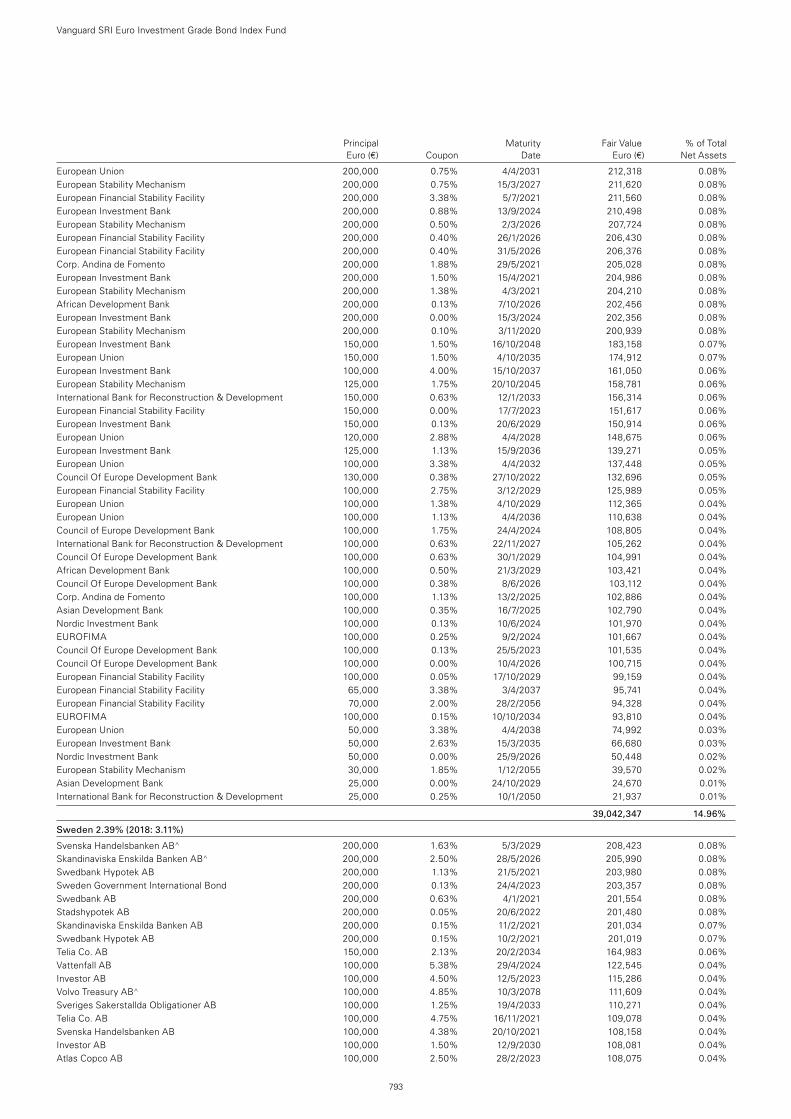
Principal Maturity Fair Value % of Total Euro (€) Coupon Date Euro (€) Net Assets
European Union 200,000 0.75% 4/4/2031 212,318 0.08%European Stability Mechanism 200,000 0.75% 15/3/2027 211,620 0.08%European Financial Stability Facility 200,000 3.38% 5/7/2021 211,560 0.08%European Investment Bank 200,000 0.88% 13/9/2024 210,498 0.08%European Stability Mechanism 200,000 0.50% 2/3/2026 207,724 0.08%European Financial Stability Facility 200,000 0.40% 26/1/2026 206,430 0.08%European Financial Stability Facility 200,000 0.40% 31/5/2026 206,376 0.08%Corp. Andina de Fomento 200,000 1.88% 29/5/2021 205,028 0.08%European Investment Bank 200,000 1.50% 15/4/2021 204,986 0.08%European Stability Mechanism 200,000 1.38% 4/3/2021 204,210 0.08%African Development Bank 200,000 0.13% 7/10/2026 202,456 0.08%European Investment Bank 200,000 0.00% 15/3/2024 202,356 0.08%European Stability Mechanism 200,000 0.10% 3/11/2020 200,939 0.08%European Investment Bank 150,000 1.50% 16/10/2048 183,158 0.07%European Union 150,000 1.50% 4/10/2035 174,912 0.07%European Investment Bank 100,000 4.00% 15/10/2037 161,050 0.06%European Stability Mechanism 125,000 1.75% 20/10/2045 158,781 0.06%International Bank for Reconstruction & Development 150,000 0.63% 12/1/2033 156,314 0.06%European Financial Stability Facility 150,000 0.00% 17/7/2023 151,617 0.06%European Investment Bank 150,000 0.13% 20/6/2029 150,914 0.06%European Union 120,000 2.88% 4/4/2028 148,675 0.06%European Investment Bank 125,000 1.13% 15/9/2036 139,271 0.05%European Union 100,000 3.38% 4/4/2032 137,448 0.05%Council Of Europe Development Bank 130,000 0.38% 27/10/2022 132,696 0.05%European Financial Stability Facility 100,000 2.75% 3/12/2029 125,989 0.05%European Union 100,000 1.38% 4/10/2029 112,365 0.04%European Union 100,000 1.13% 4/4/2036 110,638 0.04%Council of Europe Development Bank 100,000 1.75% 24/4/2024 108,805 0.04%International Bank for Reconstruction & Development 100,000 0.63% 22/11/2027 105,262 0.04%Council Of Europe Development Bank 100,000 0.63% 30/1/2029 104,991 0.04%African Development Bank 100,000 0.50% 21/3/2029 103,421 0.04%Council Of Europe Development Bank 100,000 0.38% 8/6/2026 103,112 0.04%Corp. Andina de Fomento 100,000 1.13% 13/2/2025 102,886 0.04%Asian Development Bank 100,000 0.35% 16/7/2025 102,790 0.04%Nordic Investment Bank 100,000 0.13% 10/6/2024 101,970 0.04%EUROFIMA 100,000 0.25% 9/2/2024 101,667 0.04%Council Of Europe Development Bank 100,000 0.13% 25/5/2023 101,535 0.04%Council Of Europe Development Bank 100,000 0.00% 10/4/2026 100,715 0.04%European Financial Stability Facility 100,000 0.05% 17/10/2029 99,159 0.04%European Financial Stability Facility 65,000 3.38% 3/4/2037 95,741 0.04%European Financial Stability Facility 70,000 2.00% 28/2/2056 94,328 0.04%EUROFIMA 100,000 0.15% 10/10/2034 93,810 0.04%European Union 50,000 3.38% 4/4/2038 74,992 0.03%European Investment Bank 50,000 2.63% 15/3/2035 66,680 0.03%Nordic Investment Bank 50,000 0.00% 25/9/2026 50,448 0.02%European Stability Mechanism 30,000 1.85% 1/12/2055 39,570 0.02%Asian Development Bank 25,000 0.00% 24/10/2029 24,670 0.01%International Bank for Reconstruction & Development 25,000 0.25% 10/1/2050 21,937 0.01%
39,042,347 14.96%
Sweden 2.39% (2018: 3.11%)
Svenska Handelsbanken AB^ 200,000 1.63% 5/3/2029 208,423 0.08%Skandinaviska Enskilda Banken AB^ 200,000 2.50% 28/5/2026 205,990 0.08%Swedbank Hypotek AB 200,000 1.13% 21/5/2021 203,980 0.08%Sweden Government International Bond 200,000 0.13% 24/4/2023 203,357 0.08%Swedbank AB 200,000 0.63% 4/1/2021 201,554 0.08%Stadshypotek AB 200,000 0.05% 20/6/2022 201,480 0.08%Skandinaviska Enskilda Banken AB 200,000 0.15% 11/2/2021 201,034 0.07%Swedbank Hypotek AB 200,000 0.15% 10/2/2021 201,019 0.07%Telia Co. AB 150,000 2.13% 20/2/2034 164,983 0.06%Vattenfall AB 100,000 5.38% 29/4/2024 122,545 0.04%Investor AB 100,000 4.50% 12/5/2023 115,286 0.04%Volvo Treasury AB^ 100,000 4.85% 10/3/2078 111,609 0.04%Sveriges Sakerstallda Obligationer AB 100,000 1.25% 19/4/2033 110,271 0.04%Telia Co. AB 100,000 4.75% 16/11/2021 109,078 0.04%Svenska Handelsbanken AB 100,000 4.38% 20/10/2021 108,158 0.04%Investor AB 100,000 1.50% 12/9/2030 108,081 0.04%Atlas Copco AB 100,000 2.50% 28/2/2023 108,075 0.04%
Vanguard SRI Euro Investment Grade Bond Index Fund
793
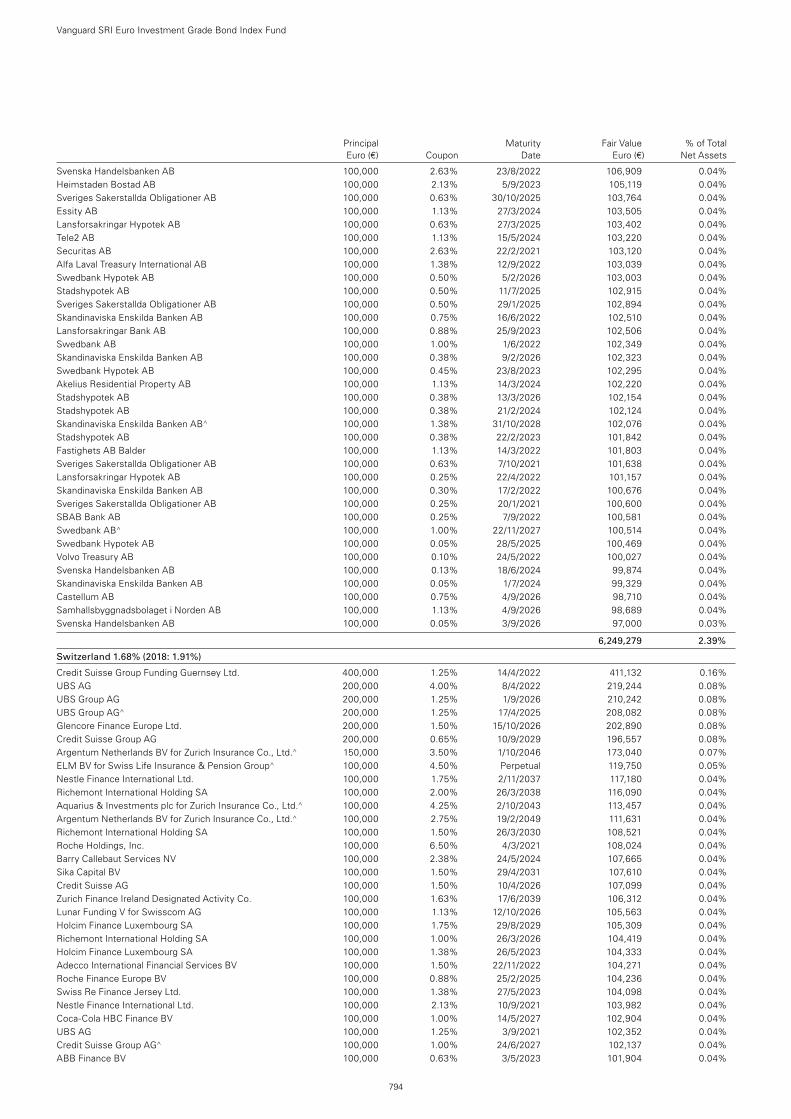
Principal Maturity Fair Value % of Total Euro (€) Coupon Date Euro (€) Net Assets
Svenska Handelsbanken AB 100,000 2.63% 23/8/2022 106,909 0.04%Heimstaden Bostad AB 100,000 2.13% 5/9/2023 105,119 0.04%Sveriges Sakerstallda Obligationer AB 100,000 0.63% 30/10/2025 103,764 0.04%Essity AB 100,000 1.13% 27/3/2024 103,505 0.04%Lansforsakringar Hypotek AB 100,000 0.63% 27/3/2025 103,402 0.04%Tele2 AB 100,000 1.13% 15/5/2024 103,220 0.04%Securitas AB 100,000 2.63% 22/2/2021 103,120 0.04%Alfa Laval Treasury International AB 100,000 1.38% 12/9/2022 103,039 0.04%Swedbank Hypotek AB 100,000 0.50% 5/2/2026 103,003 0.04%Stadshypotek AB 100,000 0.50% 11/7/2025 102,915 0.04%Sveriges Sakerstallda Obligationer AB 100,000 0.50% 29/1/2025 102,894 0.04%Skandinaviska Enskilda Banken AB 100,000 0.75% 16/6/2022 102,510 0.04%Lansforsakringar Bank AB 100,000 0.88% 25/9/2023 102,506 0.04%Swedbank AB 100,000 1.00% 1/6/2022 102,349 0.04%Skandinaviska Enskilda Banken AB 100,000 0.38% 9/2/2026 102,323 0.04%Swedbank Hypotek AB 100,000 0.45% 23/8/2023 102,295 0.04%Akelius Residential Property AB 100,000 1.13% 14/3/2024 102,220 0.04%Stadshypotek AB 100,000 0.38% 13/3/2026 102,154 0.04%Stadshypotek AB 100,000 0.38% 21/2/2024 102,124 0.04%Skandinaviska Enskilda Banken AB^ 100,000 1.38% 31/10/2028 102,076 0.04%Stadshypotek AB 100,000 0.38% 22/2/2023 101,842 0.04%Fastighets AB Balder 100,000 1.13% 14/3/2022 101,803 0.04%Sveriges Sakerstallda Obligationer AB 100,000 0.63% 7/10/2021 101,638 0.04%Lansforsakringar Hypotek AB 100,000 0.25% 22/4/2022 101,157 0.04%Skandinaviska Enskilda Banken AB 100,000 0.30% 17/2/2022 100,676 0.04%Sveriges Sakerstallda Obligationer AB 100,000 0.25% 20/1/2021 100,600 0.04%SBAB Bank AB 100,000 0.25% 7/9/2022 100,581 0.04%Swedbank AB^ 100,000 1.00% 22/11/2027 100,514 0.04%Swedbank Hypotek AB 100,000 0.05% 28/5/2025 100,469 0.04%Volvo Treasury AB 100,000 0.10% 24/5/2022 100,027 0.04%Svenska Handelsbanken AB 100,000 0.13% 18/6/2024 99,874 0.04%Skandinaviska Enskilda Banken AB 100,000 0.05% 1/7/2024 99,329 0.04%Castellum AB 100,000 0.75% 4/9/2026 98,710 0.04%Samhallsbyggnadsbolaget i Norden AB 100,000 1.13% 4/9/2026 98,689 0.04%Svenska Handelsbanken AB 100,000 0.05% 3/9/2026 97,000 0.03%
6,249,279 2.39%
Switzerland 1.68% (2018: 1.91%)
Credit Suisse Group Funding Guernsey Ltd. 400,000 1.25% 14/4/2022 411,132 0.16%UBS AG 200,000 4.00% 8/4/2022 219,244 0.08%UBS Group AG 200,000 1.25% 1/9/2026 210,242 0.08%UBS Group AG^ 200,000 1.25% 17/4/2025 208,082 0.08%Glencore Finance Europe Ltd. 200,000 1.50% 15/10/2026 202,890 0.08%Credit Suisse Group AG 200,000 0.65% 10/9/2029 196,557 0.08%Argentum Netherlands BV for Zurich Insurance Co., Ltd.^ 150,000 3.50% 1/10/2046 173,040 0.07%ELM BV for Swiss Life Insurance & Pension Group^ 100,000 4.50% Perpetual 119,750 0.05%Nestle Finance International Ltd. 100,000 1.75% 2/11/2037 117,180 0.04%Richemont International Holding SA 100,000 2.00% 26/3/2038 116,090 0.04%Aquarius & Investments plc for Zurich Insurance Co., Ltd.^ 100,000 4.25% 2/10/2043 113,457 0.04%Argentum Netherlands BV for Zurich Insurance Co., Ltd.^ 100,000 2.75% 19/2/2049 111,631 0.04%Richemont International Holding SA 100,000 1.50% 26/3/2030 108,521 0.04%Roche Holdings, Inc. 100,000 6.50% 4/3/2021 108,024 0.04%Barry Callebaut Services NV 100,000 2.38% 24/5/2024 107,665 0.04%Sika Capital BV 100,000 1.50% 29/4/2031 107,610 0.04%Credit Suisse AG 100,000 1.50% 10/4/2026 107,099 0.04%Zurich Finance Ireland Designated Activity Co. 100,000 1.63% 17/6/2039 106,312 0.04%Lunar Funding V for Swisscom AG 100,000 1.13% 12/10/2026 105,563 0.04%Holcim Finance Luxembourg SA 100,000 1.75% 29/8/2029 105,309 0.04%Richemont International Holding SA 100,000 1.00% 26/3/2026 104,419 0.04%Holcim Finance Luxembourg SA 100,000 1.38% 26/5/2023 104,333 0.04%Adecco International Financial Services BV 100,000 1.50% 22/11/2022 104,271 0.04%Roche Finance Europe BV 100,000 0.88% 25/2/2025 104,236 0.04%Swiss Re Finance Jersey Ltd. 100,000 1.38% 27/5/2023 104,098 0.04%Nestle Finance International Ltd. 100,000 2.13% 10/9/2021 103,982 0.04%Coca-Cola HBC Finance BV 100,000 1.00% 14/5/2027 102,904 0.04%UBS AG 100,000 1.25% 3/9/2021 102,352 0.04%Credit Suisse Group AG^ 100,000 1.00% 24/6/2027 102,137 0.04%ABB Finance BV 100,000 0.63% 3/5/2023 101,904 0.04%
Vanguard SRI Euro Investment Grade Bond Index Fund
794
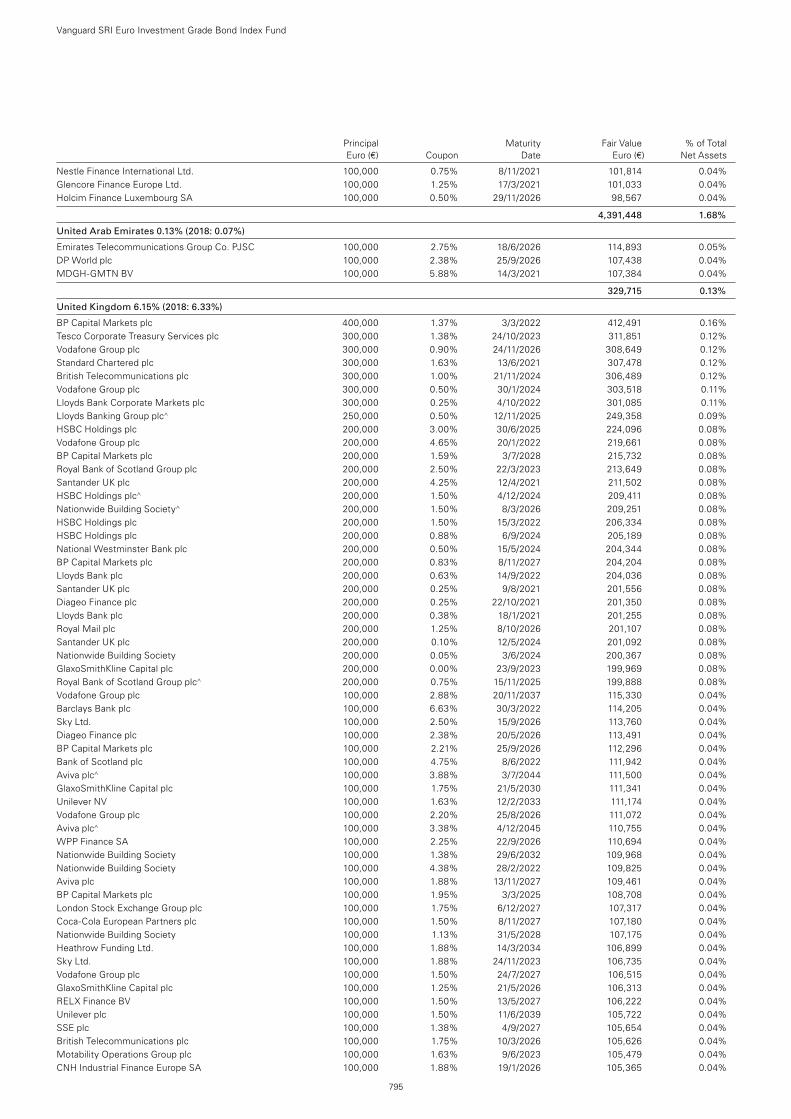
Principal Maturity Fair Value % of Total Euro (€) Coupon Date Euro (€) Net Assets
Nestle Finance International Ltd. 100,000 0.75% 8/11/2021 101,814 0.04%Glencore Finance Europe Ltd. 100,000 1.25% 17/3/2021 101,033 0.04%Holcim Finance Luxembourg SA 100,000 0.50% 29/11/2026 98,567 0.04%
4,391,448 1.68%
United Arab Emirates 0.13% (2018: 0.07%)
Emirates Telecommunications Group Co. PJSC 100,000 2.75% 18/6/2026 114,893 0.05%DP World plc 100,000 2.38% 25/9/2026 107,438 0.04%MDGH-GMTN BV 100,000 5.88% 14/3/2021 107,384 0.04%
329,715 0.13%
United Kingdom 6.15% (2018: 6.33%)
BP Capital Markets plc 400,000 1.37% 3/3/2022 412,491 0.16%Tesco Corporate Treasury Services plc 300,000 1.38% 24/10/2023 311,851 0.12%Vodafone Group plc 300,000 0.90% 24/11/2026 308,649 0.12%Standard Chartered plc 300,000 1.63% 13/6/2021 307,478 0.12%British Telecommunications plc 300,000 1.00% 21/11/2024 306,489 0.12%Vodafone Group plc 300,000 0.50% 30/1/2024 303,518 0.11%Lloyds Bank Corporate Markets plc 300,000 0.25% 4/10/2022 301,085 0.11%Lloyds Banking Group plc^ 250,000 0.50% 12/11/2025 249,358 0.09%HSBC Holdings plc 200,000 3.00% 30/6/2025 224,096 0.08%Vodafone Group plc 200,000 4.65% 20/1/2022 219,661 0.08%BP Capital Markets plc 200,000 1.59% 3/7/2028 215,732 0.08%Royal Bank of Scotland Group plc 200,000 2.50% 22/3/2023 213,649 0.08%Santander UK plc 200,000 4.25% 12/4/2021 211,502 0.08%HSBC Holdings plc^ 200,000 1.50% 4/12/2024 209,411 0.08%Nationwide Building Society^ 200,000 1.50% 8/3/2026 209,251 0.08%HSBC Holdings plc 200,000 1.50% 15/3/2022 206,334 0.08%HSBC Holdings plc 200,000 0.88% 6/9/2024 205,189 0.08%National Westminster Bank plc 200,000 0.50% 15/5/2024 204,344 0.08%BP Capital Markets plc 200,000 0.83% 8/11/2027 204,204 0.08%Lloyds Bank plc 200,000 0.63% 14/9/2022 204,036 0.08%Santander UK plc 200,000 0.25% 9/8/2021 201,556 0.08%Diageo Finance plc 200,000 0.25% 22/10/2021 201,350 0.08%Lloyds Bank plc 200,000 0.38% 18/1/2021 201,255 0.08%Royal Mail plc 200,000 1.25% 8/10/2026 201,107 0.08%Santander UK plc 200,000 0.10% 12/5/2024 201,092 0.08%Nationwide Building Society 200,000 0.05% 3/6/2024 200,367 0.08%GlaxoSmithKline Capital plc 200,000 0.00% 23/9/2023 199,969 0.08%Royal Bank of Scotland Group plc^ 200,000 0.75% 15/11/2025 199,888 0.08%Vodafone Group plc 100,000 2.88% 20/11/2037 115,330 0.04%Barclays Bank plc 100,000 6.63% 30/3/2022 114,205 0.04%Sky Ltd. 100,000 2.50% 15/9/2026 113,760 0.04%Diageo Finance plc 100,000 2.38% 20/5/2026 113,491 0.04%BP Capital Markets plc 100,000 2.21% 25/9/2026 112,296 0.04%Bank of Scotland plc 100,000 4.75% 8/6/2022 111,942 0.04%Aviva plc^ 100,000 3.88% 3/7/2044 111,500 0.04%GlaxoSmithKline Capital plc 100,000 1.75% 21/5/2030 111,341 0.04%Unilever NV 100,000 1.63% 12/2/2033 111,174 0.04%Vodafone Group plc 100,000 2.20% 25/8/2026 111,072 0.04%Aviva plc^ 100,000 3.38% 4/12/2045 110,755 0.04%WPP Finance SA 100,000 2.25% 22/9/2026 110,694 0.04%Nationwide Building Society 100,000 1.38% 29/6/2032 109,968 0.04%Nationwide Building Society 100,000 4.38% 28/2/2022 109,825 0.04%Aviva plc 100,000 1.88% 13/11/2027 109,461 0.04%BP Capital Markets plc 100,000 1.95% 3/3/2025 108,708 0.04%London Stock Exchange Group plc 100,000 1.75% 6/12/2027 107,317 0.04%Coca-Cola European Partners plc 100,000 1.50% 8/11/2027 107,180 0.04%Nationwide Building Society 100,000 1.13% 31/5/2028 107,175 0.04%Heathrow Funding Ltd. 100,000 1.88% 14/3/2034 106,899 0.04%Sky Ltd. 100,000 1.88% 24/11/2023 106,735 0.04%Vodafone Group plc 100,000 1.50% 24/7/2027 106,515 0.04%GlaxoSmithKline Capital plc 100,000 1.25% 21/5/2026 106,313 0.04%RELX Finance BV 100,000 1.50% 13/5/2027 106,222 0.04%Unilever plc 100,000 1.50% 11/6/2039 105,722 0.04%SSE plc 100,000 1.38% 4/9/2027 105,654 0.04%British Telecommunications plc 100,000 1.75% 10/3/2026 105,626 0.04%Motability Operations Group plc 100,000 1.63% 9/6/2023 105,479 0.04%CNH Industrial Finance Europe SA 100,000 1.88% 19/1/2026 105,365 0.04%
Vanguard SRI Euro Investment Grade Bond Index Fund
795
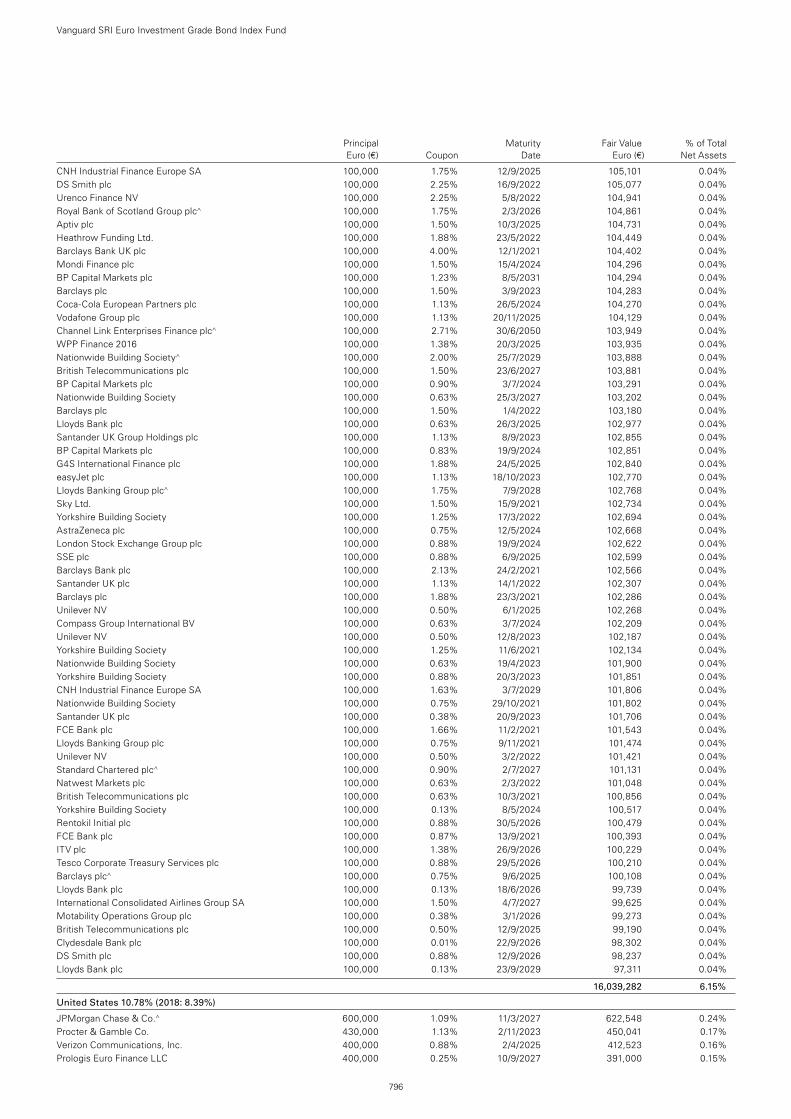
Principal Maturity Fair Value % of Total Euro (€) Coupon Date Euro (€) Net Assets
CNH Industrial Finance Europe SA 100,000 1.75% 12/9/2025 105,101 0.04%DS Smith plc 100,000 2.25% 16/9/2022 105,077 0.04%Urenco Finance NV 100,000 2.25% 5/8/2022 104,941 0.04%Royal Bank of Scotland Group plc^ 100,000 1.75% 2/3/2026 104,861 0.04%Aptiv plc 100,000 1.50% 10/3/2025 104,731 0.04%Heathrow Funding Ltd. 100,000 1.88% 23/5/2022 104,449 0.04%Barclays Bank UK plc 100,000 4.00% 12/1/2021 104,402 0.04%Mondi Finance plc 100,000 1.50% 15/4/2024 104,296 0.04%BP Capital Markets plc 100,000 1.23% 8/5/2031 104,294 0.04%Barclays plc 100,000 1.50% 3/9/2023 104,283 0.04%Coca-Cola European Partners plc 100,000 1.13% 26/5/2024 104,270 0.04%Vodafone Group plc 100,000 1.13% 20/11/2025 104,129 0.04%Channel Link Enterprises Finance plc^ 100,000 2.71% 30/6/2050 103,949 0.04%WPP Finance 2016 100,000 1.38% 20/3/2025 103,935 0.04%Nationwide Building Society^ 100,000 2.00% 25/7/2029 103,888 0.04%British Telecommunications plc 100,000 1.50% 23/6/2027 103,881 0.04%BP Capital Markets plc 100,000 0.90% 3/7/2024 103,291 0.04%Nationwide Building Society 100,000 0.63% 25/3/2027 103,202 0.04%Barclays plc 100,000 1.50% 1/4/2022 103,180 0.04%Lloyds Bank plc 100,000 0.63% 26/3/2025 102,977 0.04%Santander UK Group Holdings plc 100,000 1.13% 8/9/2023 102,855 0.04%BP Capital Markets plc 100,000 0.83% 19/9/2024 102,851 0.04%G4S International Finance plc 100,000 1.88% 24/5/2025 102,840 0.04%easyJet plc 100,000 1.13% 18/10/2023 102,770 0.04%Lloyds Banking Group plc^ 100,000 1.75% 7/9/2028 102,768 0.04%Sky Ltd. 100,000 1.50% 15/9/2021 102,734 0.04%Yorkshire Building Society 100,000 1.25% 17/3/2022 102,694 0.04%AstraZeneca plc 100,000 0.75% 12/5/2024 102,668 0.04%London Stock Exchange Group plc 100,000 0.88% 19/9/2024 102,622 0.04%SSE plc 100,000 0.88% 6/9/2025 102,599 0.04%Barclays Bank plc 100,000 2.13% 24/2/2021 102,566 0.04%Santander UK plc 100,000 1.13% 14/1/2022 102,307 0.04%Barclays plc 100,000 1.88% 23/3/2021 102,286 0.04%Unilever NV 100,000 0.50% 6/1/2025 102,268 0.04%Compass Group International BV 100,000 0.63% 3/7/2024 102,209 0.04%Unilever NV 100,000 0.50% 12/8/2023 102,187 0.04%Yorkshire Building Society 100,000 1.25% 11/6/2021 102,134 0.04%Nationwide Building Society 100,000 0.63% 19/4/2023 101,900 0.04%Yorkshire Building Society 100,000 0.88% 20/3/2023 101,851 0.04%CNH Industrial Finance Europe SA 100,000 1.63% 3/7/2029 101,806 0.04%Nationwide Building Society 100,000 0.75% 29/10/2021 101,802 0.04%Santander UK plc 100,000 0.38% 20/9/2023 101,706 0.04%FCE Bank plc 100,000 1.66% 11/2/2021 101,543 0.04%Lloyds Banking Group plc 100,000 0.75% 9/11/2021 101,474 0.04%Unilever NV 100,000 0.50% 3/2/2022 101,421 0.04%Standard Chartered plc^ 100,000 0.90% 2/7/2027 101,131 0.04%Natwest Markets plc 100,000 0.63% 2/3/2022 101,048 0.04%British Telecommunications plc 100,000 0.63% 10/3/2021 100,856 0.04%Yorkshire Building Society 100,000 0.13% 8/5/2024 100,517 0.04%Rentokil Initial plc 100,000 0.88% 30/5/2026 100,479 0.04%FCE Bank plc 100,000 0.87% 13/9/2021 100,393 0.04%ITV plc 100,000 1.38% 26/9/2026 100,229 0.04%Tesco Corporate Treasury Services plc 100,000 0.88% 29/5/2026 100,210 0.04%Barclays plc^ 100,000 0.75% 9/6/2025 100,108 0.04%Lloyds Bank plc 100,000 0.13% 18/6/2026 99,739 0.04%International Consolidated Airlines Group SA 100,000 1.50% 4/7/2027 99,625 0.04%Motability Operations Group plc 100,000 0.38% 3/1/2026 99,273 0.04%British Telecommunications plc 100,000 0.50% 12/9/2025 99,190 0.04%Clydesdale Bank plc 100,000 0.01% 22/9/2026 98,302 0.04%DS Smith plc 100,000 0.88% 12/9/2026 98,237 0.04%Lloyds Bank plc 100,000 0.13% 23/9/2029 97,311 0.04%
16,039,282 6.15%
United States 10.78% (2018: 8.39%)
JPMorgan Chase & Co.^ 600,000 1.09% 11/3/2027 622,548 0.24%Procter & Gamble Co. 430,000 1.13% 2/11/2023 450,041 0.17%Verizon Communications, Inc. 400,000 0.88% 2/4/2025 412,523 0.16%Prologis Euro Finance LLC 400,000 0.25% 10/9/2027 391,000 0.15%
Vanguard SRI Euro Investment Grade Bond Index Fund
796
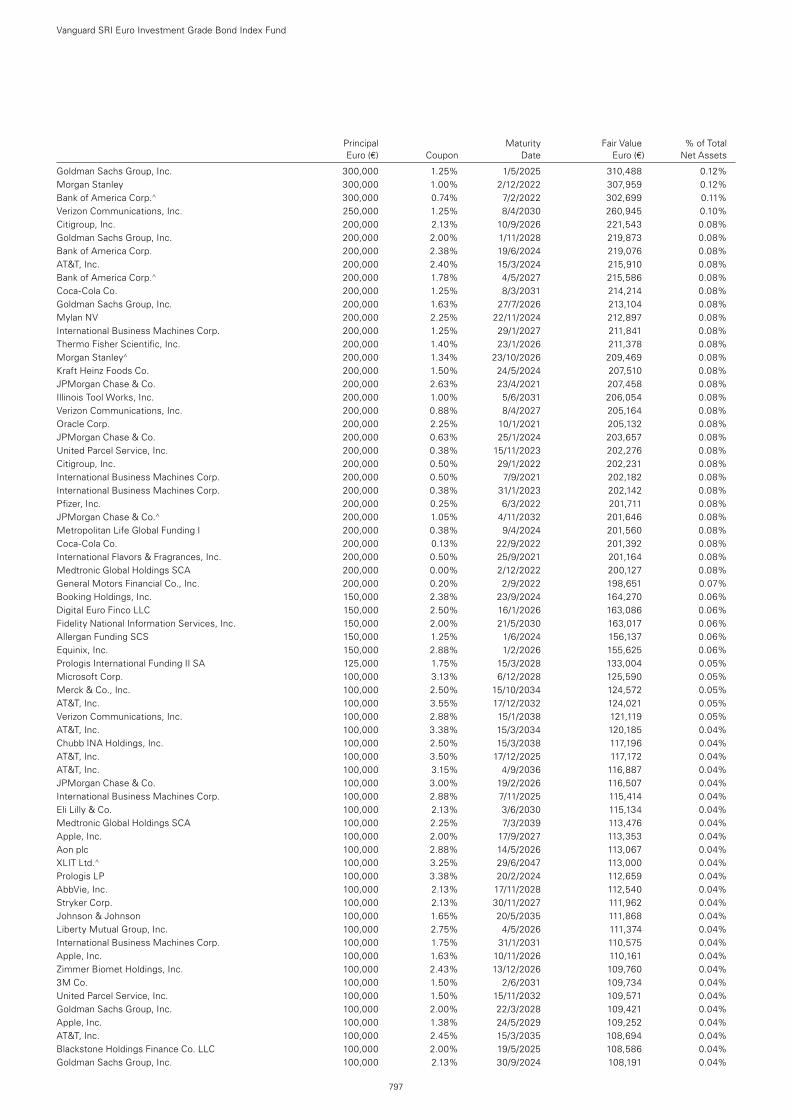
Principal Maturity Fair Value % of Total Euro (€) Coupon Date Euro (€) Net Assets
Goldman Sachs Group, Inc. 300,000 1.25% 1/5/2025 310,488 0.12%Morgan Stanley 300,000 1.00% 2/12/2022 307,959 0.12%Bank of America Corp.^ 300,000 0.74% 7/2/2022 302,699 0.11%Verizon Communications, Inc. 250,000 1.25% 8/4/2030 260,945 0.10%Citigroup, Inc. 200,000 2.13% 10/9/2026 221,543 0.08%Goldman Sachs Group, Inc. 200,000 2.00% 1/11/2028 219,873 0.08%Bank of America Corp. 200,000 2.38% 19/6/2024 219,076 0.08%AT&T, Inc. 200,000 2.40% 15/3/2024 215,910 0.08%Bank of America Corp.^ 200,000 1.78% 4/5/2027 215,586 0.08%Coca-Cola Co. 200,000 1.25% 8/3/2031 214,214 0.08%Goldman Sachs Group, Inc. 200,000 1.63% 27/7/2026 213,104 0.08%Mylan NV 200,000 2.25% 22/11/2024 212,897 0.08%International Business Machines Corp. 200,000 1.25% 29/1/2027 211,841 0.08%Thermo Fisher Scientific, Inc. 200,000 1.40% 23/1/2026 211,378 0.08%Morgan Stanley^ 200,000 1.34% 23/10/2026 209,469 0.08%Kraft Heinz Foods Co. 200,000 1.50% 24/5/2024 207,510 0.08%JPMorgan Chase & Co. 200,000 2.63% 23/4/2021 207,458 0.08%Illinois Tool Works, Inc. 200,000 1.00% 5/6/2031 206,054 0.08%Verizon Communications, Inc. 200,000 0.88% 8/4/2027 205,164 0.08%Oracle Corp. 200,000 2.25% 10/1/2021 205,132 0.08%JPMorgan Chase & Co. 200,000 0.63% 25/1/2024 203,657 0.08%United Parcel Service, Inc. 200,000 0.38% 15/11/2023 202,276 0.08%Citigroup, Inc. 200,000 0.50% 29/1/2022 202,231 0.08%International Business Machines Corp. 200,000 0.50% 7/9/2021 202,182 0.08%International Business Machines Corp. 200,000 0.38% 31/1/2023 202,142 0.08%Pfizer, Inc. 200,000 0.25% 6/3/2022 201,711 0.08%JPMorgan Chase & Co.^ 200,000 1.05% 4/11/2032 201,646 0.08%Metropolitan Life Global Funding I 200,000 0.38% 9/4/2024 201,560 0.08%Coca-Cola Co. 200,000 0.13% 22/9/2022 201,392 0.08%International Flavors & Fragrances, Inc. 200,000 0.50% 25/9/2021 201,164 0.08%Medtronic Global Holdings SCA 200,000 0.00% 2/12/2022 200,127 0.08%General Motors Financial Co., Inc. 200,000 0.20% 2/9/2022 198,651 0.07%Booking Holdings, Inc. 150,000 2.38% 23/9/2024 164,270 0.06%Digital Euro Finco LLC 150,000 2.50% 16/1/2026 163,086 0.06%Fidelity National Information Services, Inc. 150,000 2.00% 21/5/2030 163,017 0.06%Allergan Funding SCS 150,000 1.25% 1/6/2024 156,137 0.06%Equinix, Inc. 150,000 2.88% 1/2/2026 155,625 0.06%Prologis International Funding II SA 125,000 1.75% 15/3/2028 133,004 0.05%Microsoft Corp. 100,000 3.13% 6/12/2028 125,590 0.05%Merck & Co., Inc. 100,000 2.50% 15/10/2034 124,572 0.05%AT&T, Inc. 100,000 3.55% 17/12/2032 124,021 0.05%Verizon Communications, Inc. 100,000 2.88% 15/1/2038 121,119 0.05%AT&T, Inc. 100,000 3.38% 15/3/2034 120,185 0.04%Chubb INA Holdings, Inc. 100,000 2.50% 15/3/2038 117,196 0.04%AT&T, Inc. 100,000 3.50% 17/12/2025 117,172 0.04%AT&T, Inc. 100,000 3.15% 4/9/2036 116,887 0.04%JPMorgan Chase & Co. 100,000 3.00% 19/2/2026 116,507 0.04%International Business Machines Corp. 100,000 2.88% 7/11/2025 115,414 0.04%Eli Lilly & Co. 100,000 2.13% 3/6/2030 115,134 0.04%Medtronic Global Holdings SCA 100,000 2.25% 7/3/2039 113,476 0.04%Apple, Inc. 100,000 2.00% 17/9/2027 113,353 0.04%Aon plc 100,000 2.88% 14/5/2026 113,067 0.04%XLIT Ltd.^ 100,000 3.25% 29/6/2047 113,000 0.04%Prologis LP 100,000 3.38% 20/2/2024 112,659 0.04%AbbVie, Inc. 100,000 2.13% 17/11/2028 112,540 0.04%Stryker Corp. 100,000 2.13% 30/11/2027 111,962 0.04%Johnson & Johnson 100,000 1.65% 20/5/2035 111,868 0.04%Liberty Mutual Group, Inc. 100,000 2.75% 4/5/2026 111,374 0.04%International Business Machines Corp. 100,000 1.75% 31/1/2031 110,575 0.04%Apple, Inc. 100,000 1.63% 10/11/2026 110,161 0.04%Zimmer Biomet Holdings, Inc. 100,000 2.43% 13/12/2026 109,760 0.04%3M Co. 100,000 1.50% 2/6/2031 109,734 0.04%United Parcel Service, Inc. 100,000 1.50% 15/11/2032 109,571 0.04%Goldman Sachs Group, Inc. 100,000 2.00% 22/3/2028 109,421 0.04%Apple, Inc. 100,000 1.38% 24/5/2029 109,252 0.04%AT&T, Inc. 100,000 2.45% 15/3/2035 108,694 0.04%Blackstone Holdings Finance Co. LLC 100,000 2.00% 19/5/2025 108,586 0.04%Goldman Sachs Group, Inc. 100,000 2.13% 30/9/2024 108,191 0.04%
Vanguard SRI Euro Investment Grade Bond Index Fund
797
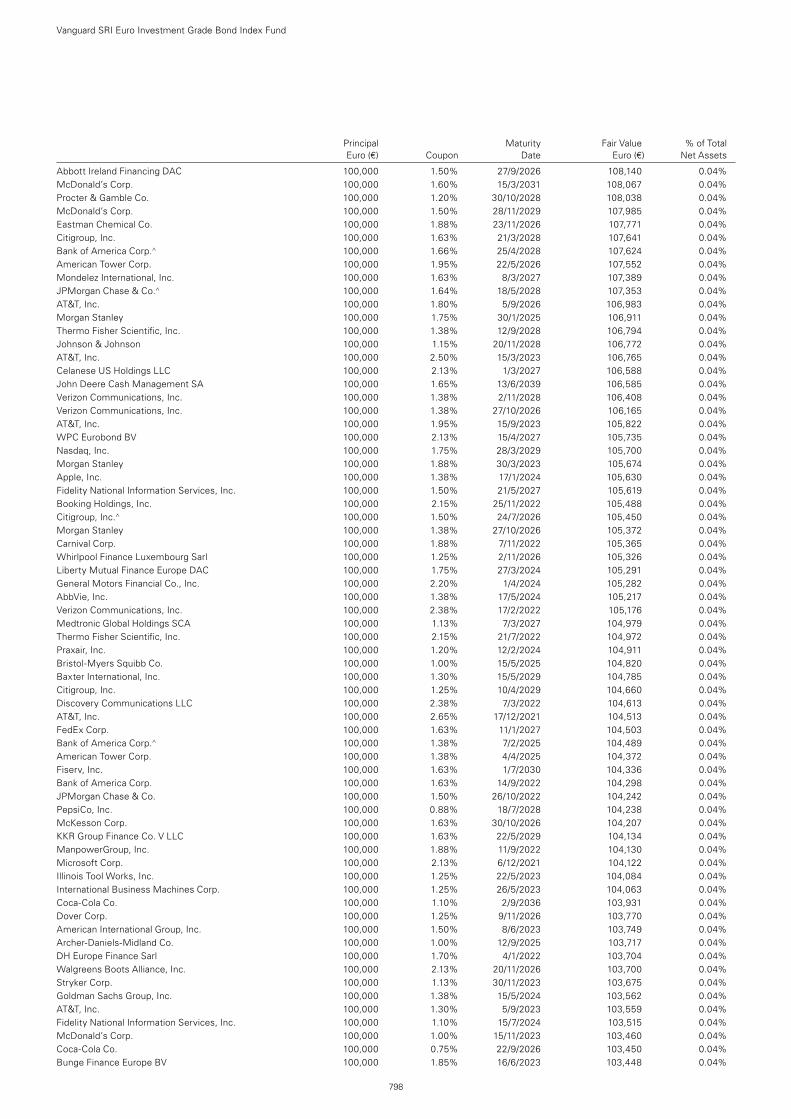
Principal Maturity Fair Value % of Total Euro (€) Coupon Date Euro (€) Net Assets
Abbott Ireland Financing DAC 100,000 1.50% 27/9/2026 108,140 0.04%McDonald’s Corp. 100,000 1.60% 15/3/2031 108,067 0.04%Procter & Gamble Co. 100,000 1.20% 30/10/2028 108,038 0.04%McDonald’s Corp. 100,000 1.50% 28/11/2029 107,985 0.04%Eastman Chemical Co. 100,000 1.88% 23/11/2026 107,771 0.04%Citigroup, Inc. 100,000 1.63% 21/3/2028 107,641 0.04%Bank of America Corp.^ 100,000 1.66% 25/4/2028 107,624 0.04%American Tower Corp. 100,000 1.95% 22/5/2026 107,552 0.04%Mondelez International, Inc. 100,000 1.63% 8/3/2027 107,389 0.04%JPMorgan Chase & Co.^ 100,000 1.64% 18/5/2028 107,353 0.04%AT&T, Inc. 100,000 1.80% 5/9/2026 106,983 0.04%Morgan Stanley 100,000 1.75% 30/1/2025 106,911 0.04%Thermo Fisher Scientific, Inc. 100,000 1.38% 12/9/2028 106,794 0.04%Johnson & Johnson 100,000 1.15% 20/11/2028 106,772 0.04%AT&T, Inc. 100,000 2.50% 15/3/2023 106,765 0.04%Celanese US Holdings LLC 100,000 2.13% 1/3/2027 106,588 0.04%John Deere Cash Management SA 100,000 1.65% 13/6/2039 106,585 0.04%Verizon Communications, Inc. 100,000 1.38% 2/11/2028 106,408 0.04%Verizon Communications, Inc. 100,000 1.38% 27/10/2026 106,165 0.04%AT&T, Inc. 100,000 1.95% 15/9/2023 105,822 0.04%WPC Eurobond BV 100,000 2.13% 15/4/2027 105,735 0.04%Nasdaq, Inc. 100,000 1.75% 28/3/2029 105,700 0.04%Morgan Stanley 100,000 1.88% 30/3/2023 105,674 0.04%Apple, Inc. 100,000 1.38% 17/1/2024 105,630 0.04%Fidelity National Information Services, Inc. 100,000 1.50% 21/5/2027 105,619 0.04%Booking Holdings, Inc. 100,000 2.15% 25/11/2022 105,488 0.04%Citigroup, Inc.^ 100,000 1.50% 24/7/2026 105,450 0.04%Morgan Stanley 100,000 1.38% 27/10/2026 105,372 0.04%Carnival Corp. 100,000 1.88% 7/11/2022 105,365 0.04%Whirlpool Finance Luxembourg Sarl 100,000 1.25% 2/11/2026 105,326 0.04%Liberty Mutual Finance Europe DAC 100,000 1.75% 27/3/2024 105,291 0.04%General Motors Financial Co., Inc. 100,000 2.20% 1/4/2024 105,282 0.04%AbbVie, Inc. 100,000 1.38% 17/5/2024 105,217 0.04%Verizon Communications, Inc. 100,000 2.38% 17/2/2022 105,176 0.04%Medtronic Global Holdings SCA 100,000 1.13% 7/3/2027 104,979 0.04%Thermo Fisher Scientific, Inc. 100,000 2.15% 21/7/2022 104,972 0.04%Praxair, Inc. 100,000 1.20% 12/2/2024 104,911 0.04%Bristol-Myers Squibb Co. 100,000 1.00% 15/5/2025 104,820 0.04%Baxter International, Inc. 100,000 1.30% 15/5/2029 104,785 0.04%Citigroup, Inc. 100,000 1.25% 10/4/2029 104,660 0.04%Discovery Communications LLC 100,000 2.38% 7/3/2022 104,613 0.04%AT&T, Inc. 100,000 2.65% 17/12/2021 104,513 0.04%FedEx Corp. 100,000 1.63% 11/1/2027 104,503 0.04%Bank of America Corp.^ 100,000 1.38% 7/2/2025 104,489 0.04%American Tower Corp. 100,000 1.38% 4/4/2025 104,372 0.04%Fiserv, Inc. 100,000 1.63% 1/7/2030 104,336 0.04%Bank of America Corp. 100,000 1.63% 14/9/2022 104,298 0.04%JPMorgan Chase & Co. 100,000 1.50% 26/10/2022 104,242 0.04%PepsiCo, Inc. 100,000 0.88% 18/7/2028 104,238 0.04%McKesson Corp. 100,000 1.63% 30/10/2026 104,207 0.04%KKR Group Finance Co. V LLC 100,000 1.63% 22/5/2029 104,134 0.04%ManpowerGroup, Inc. 100,000 1.88% 11/9/2022 104,130 0.04%Microsoft Corp. 100,000 2.13% 6/12/2021 104,122 0.04%Illinois Tool Works, Inc. 100,000 1.25% 22/5/2023 104,084 0.04%International Business Machines Corp. 100,000 1.25% 26/5/2023 104,063 0.04%Coca-Cola Co. 100,000 1.10% 2/9/2036 103,931 0.04%Dover Corp. 100,000 1.25% 9/11/2026 103,770 0.04%American International Group, Inc. 100,000 1.50% 8/6/2023 103,749 0.04%Archer-Daniels-Midland Co. 100,000 1.00% 12/9/2025 103,717 0.04%DH Europe Finance Sarl 100,000 1.70% 4/1/2022 103,704 0.04%Walgreens Boots Alliance, Inc. 100,000 2.13% 20/11/2026 103,700 0.04%Stryker Corp. 100,000 1.13% 30/11/2023 103,675 0.04%Goldman Sachs Group, Inc. 100,000 1.38% 15/5/2024 103,562 0.04%AT&T, Inc. 100,000 1.30% 5/9/2023 103,559 0.04%Fidelity National Information Services, Inc. 100,000 1.10% 15/7/2024 103,515 0.04%McDonald’s Corp. 100,000 1.00% 15/11/2023 103,460 0.04%Coca-Cola Co. 100,000 0.75% 22/9/2026 103,450 0.04%Bunge Finance Europe BV 100,000 1.85% 16/6/2023 103,448 0.04%
Vanguard SRI Euro Investment Grade Bond Index Fund
798
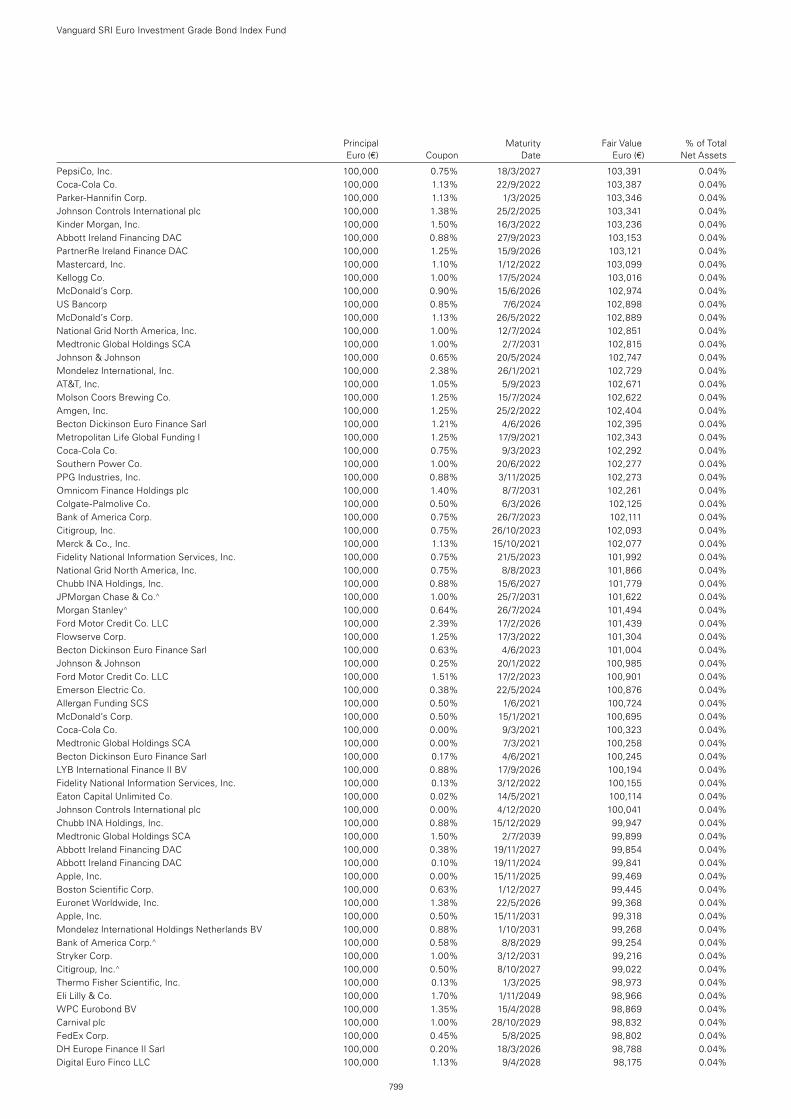
Principal Maturity Fair Value % of Total Euro (€) Coupon Date Euro (€) Net Assets
PepsiCo, Inc. 100,000 0.75% 18/3/2027 103,391 0.04%Coca-Cola Co. 100,000 1.13% 22/9/2022 103,387 0.04%Parker-Hannifin Corp. 100,000 1.13% 1/3/2025 103,346 0.04%Johnson Controls International plc 100,000 1.38% 25/2/2025 103,341 0.04%Kinder Morgan, Inc. 100,000 1.50% 16/3/2022 103,236 0.04%Abbott Ireland Financing DAC 100,000 0.88% 27/9/2023 103,153 0.04%PartnerRe Ireland Finance DAC 100,000 1.25% 15/9/2026 103,121 0.04%Mastercard, Inc. 100,000 1.10% 1/12/2022 103,099 0.04%Kellogg Co. 100,000 1.00% 17/5/2024 103,016 0.04%McDonald’s Corp. 100,000 0.90% 15/6/2026 102,974 0.04%US Bancorp 100,000 0.85% 7/6/2024 102,898 0.04%McDonald’s Corp. 100,000 1.13% 26/5/2022 102,889 0.04%National Grid North America, Inc. 100,000 1.00% 12/7/2024 102,851 0.04%Medtronic Global Holdings SCA 100,000 1.00% 2/7/2031 102,815 0.04%Johnson & Johnson 100,000 0.65% 20/5/2024 102,747 0.04%Mondelez International, Inc. 100,000 2.38% 26/1/2021 102,729 0.04%AT&T, Inc. 100,000 1.05% 5/9/2023 102,671 0.04%Molson Coors Brewing Co. 100,000 1.25% 15/7/2024 102,622 0.04%Amgen, Inc. 100,000 1.25% 25/2/2022 102,404 0.04%Becton Dickinson Euro Finance Sarl 100,000 1.21% 4/6/2026 102,395 0.04%Metropolitan Life Global Funding I 100,000 1.25% 17/9/2021 102,343 0.04%Coca-Cola Co. 100,000 0.75% 9/3/2023 102,292 0.04%Southern Power Co. 100,000 1.00% 20/6/2022 102,277 0.04%PPG Industries, Inc. 100,000 0.88% 3/11/2025 102,273 0.04%Omnicom Finance Holdings plc 100,000 1.40% 8/7/2031 102,261 0.04%Colgate-Palmolive Co. 100,000 0.50% 6/3/2026 102,125 0.04%Bank of America Corp. 100,000 0.75% 26/7/2023 102,111 0.04%Citigroup, Inc. 100,000 0.75% 26/10/2023 102,093 0.04%Merck & Co., Inc. 100,000 1.13% 15/10/2021 102,077 0.04%Fidelity National Information Services, Inc. 100,000 0.75% 21/5/2023 101,992 0.04%National Grid North America, Inc. 100,000 0.75% 8/8/2023 101,866 0.04%Chubb INA Holdings, Inc. 100,000 0.88% 15/6/2027 101,779 0.04%JPMorgan Chase & Co.^ 100,000 1.00% 25/7/2031 101,622 0.04%Morgan Stanley^ 100,000 0.64% 26/7/2024 101,494 0.04%Ford Motor Credit Co. LLC 100,000 2.39% 17/2/2026 101,439 0.04%Flowserve Corp. 100,000 1.25% 17/3/2022 101,304 0.04%Becton Dickinson Euro Finance Sarl 100,000 0.63% 4/6/2023 101,004 0.04%Johnson & Johnson 100,000 0.25% 20/1/2022 100,985 0.04%Ford Motor Credit Co. LLC 100,000 1.51% 17/2/2023 100,901 0.04%Emerson Electric Co. 100,000 0.38% 22/5/2024 100,876 0.04%Allergan Funding SCS 100,000 0.50% 1/6/2021 100,724 0.04%McDonald’s Corp. 100,000 0.50% 15/1/2021 100,695 0.04%Coca-Cola Co. 100,000 0.00% 9/3/2021 100,323 0.04%Medtronic Global Holdings SCA 100,000 0.00% 7/3/2021 100,258 0.04%Becton Dickinson Euro Finance Sarl 100,000 0.17% 4/6/2021 100,245 0.04%LYB International Finance II BV 100,000 0.88% 17/9/2026 100,194 0.04%Fidelity National Information Services, Inc. 100,000 0.13% 3/12/2022 100,155 0.04%Eaton Capital Unlimited Co. 100,000 0.02% 14/5/2021 100,114 0.04%Johnson Controls International plc 100,000 0.00% 4/12/2020 100,041 0.04%Chubb INA Holdings, Inc. 100,000 0.88% 15/12/2029 99,947 0.04%Medtronic Global Holdings SCA 100,000 1.50% 2/7/2039 99,899 0.04%Abbott Ireland Financing DAC 100,000 0.38% 19/11/2027 99,854 0.04%Abbott Ireland Financing DAC 100,000 0.10% 19/11/2024 99,841 0.04%Apple, Inc. 100,000 0.00% 15/11/2025 99,469 0.04%Boston Scientific Corp. 100,000 0.63% 1/12/2027 99,445 0.04%Euronet Worldwide, Inc. 100,000 1.38% 22/5/2026 99,368 0.04%Apple, Inc. 100,000 0.50% 15/11/2031 99,318 0.04%Mondelez International Holdings Netherlands BV 100,000 0.88% 1/10/2031 99,268 0.04%Bank of America Corp.^ 100,000 0.58% 8/8/2029 99,254 0.04%Stryker Corp. 100,000 1.00% 3/12/2031 99,216 0.04%Citigroup, Inc.^ 100,000 0.50% 8/10/2027 99,022 0.04%Thermo Fisher Scientific, Inc. 100,000 0.13% 1/3/2025 98,973 0.04%Eli Lilly & Co. 100,000 1.70% 1/11/2049 98,966 0.04%WPC Eurobond BV 100,000 1.35% 15/4/2028 98,869 0.04%Carnival plc 100,000 1.00% 28/10/2029 98,832 0.04%FedEx Corp. 100,000 0.45% 5/8/2025 98,802 0.04%DH Europe Finance II Sarl 100,000 0.20% 18/3/2026 98,788 0.04%Digital Euro Finco LLC 100,000 1.13% 9/4/2028 98,175 0.04%
Vanguard SRI Euro Investment Grade Bond Index Fund
799
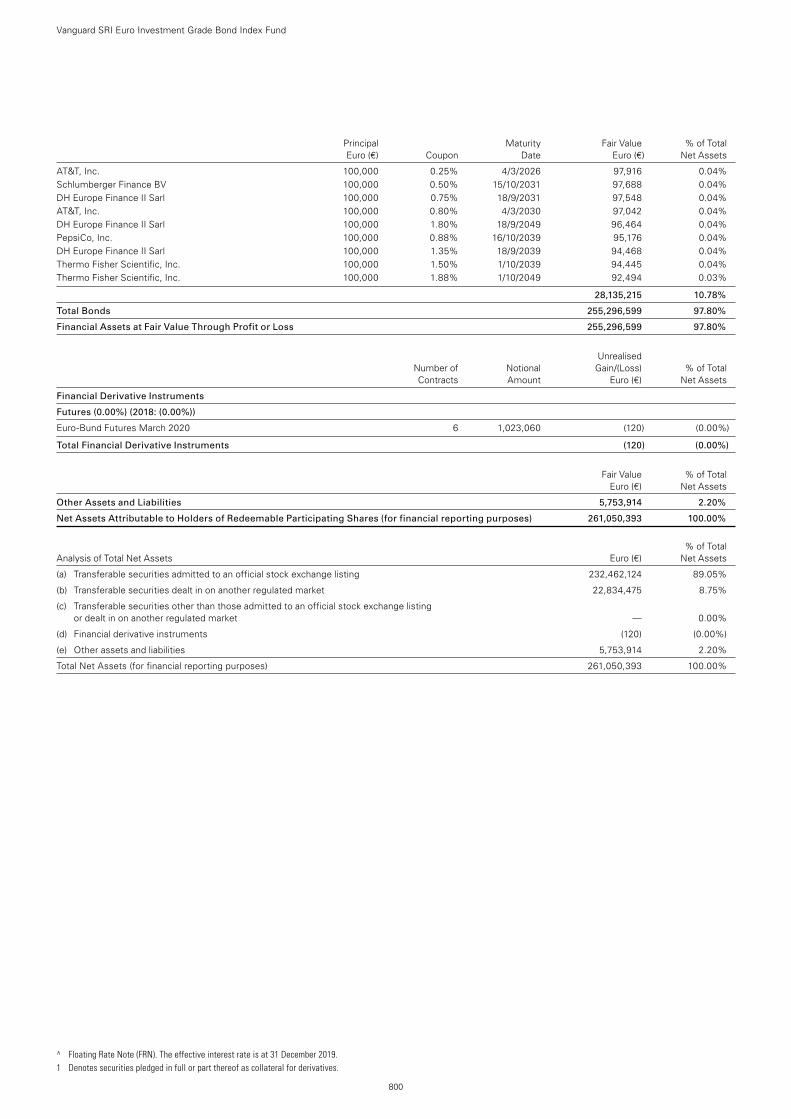
AT&T, Inc. 100,000 0.25% 4/3/2026 97,916 0.04%Schlumberger Finance BV 100,000 0.50% 15/10/2031 97,688 0.04%DH Europe Finance II Sarl 100,000 0.75% 18/9/2031 97,548 0.04%AT&T, Inc. 100,000 0.80% 4/3/2030 97,042 0.04%DH Europe Finance II Sarl 100,000 1.80% 18/9/2049 96,464 0.04%PepsiCo, Inc. 100,000 0.88% 16/10/2039 95,176 0.04%DH Europe Finance II Sarl 100,000 1.35% 18/9/2039 94,468 0.04%Thermo Fisher Scientific, Inc. 100,000 1.50% 1/10/2039 94,445 0.04%Thermo Fisher Scientific, Inc. 100,000 1.88% 1/10/2049 92,494 0.03%
28,135,215 10.78%
Total Bonds 255,296,599 97.80%
Financial Assets at Fair Value Through Profit or Loss 255,296,599 97.80%
Unrealised Number of Notional Gain/(Loss) % of Total Contracts Amount Euro (€) Net Assets
Financial Derivative Instruments
Futures (0.00%) (2018: (0.00%))
Euro-Bund Futures March 2020 6 1,023,060 (120) (0.00%)
Total Financial Derivative Instruments (120) (0.00%)
Fair Value % of Total Euro (€) Net Assets
Other Assets and Liabilities 5,753,914 2.20%
Net Assets Attributable to Holders of Redeemable Participating Shares (for financial reporting purposes) 261,050,393 100.00%
% of Total Analysis of Total Net Assets Euro (€) Net Assets
(a) Transferable securities admitted to an official stock exchange listing 232,462,124 89.05%
(b) Transferable securities dealt in on another regulated market 22,834,475 8.75%
(c) Transferable securities other than those admitted to an official stock exchange listing or dealt in on another regulated market — 0.00%
(d) Financial derivative instruments (120) (0.00%)
(e) Other assets and liabilities 5,753,914 2.20%
Total Net Assets (for financial reporting purposes) 261,050,393 100.00%
Vanguard SRI Euro Investment Grade Bond Index Fund
800
^ Floating Rate Note (FRN). The effective interest rate is at 31 December 2019. 1 Denotes securities pledged in full or part thereof as collateral for derivatives.
Principal Maturity Fair Value % of Total Euro (€) Coupon Date Euro (€) Net Assets
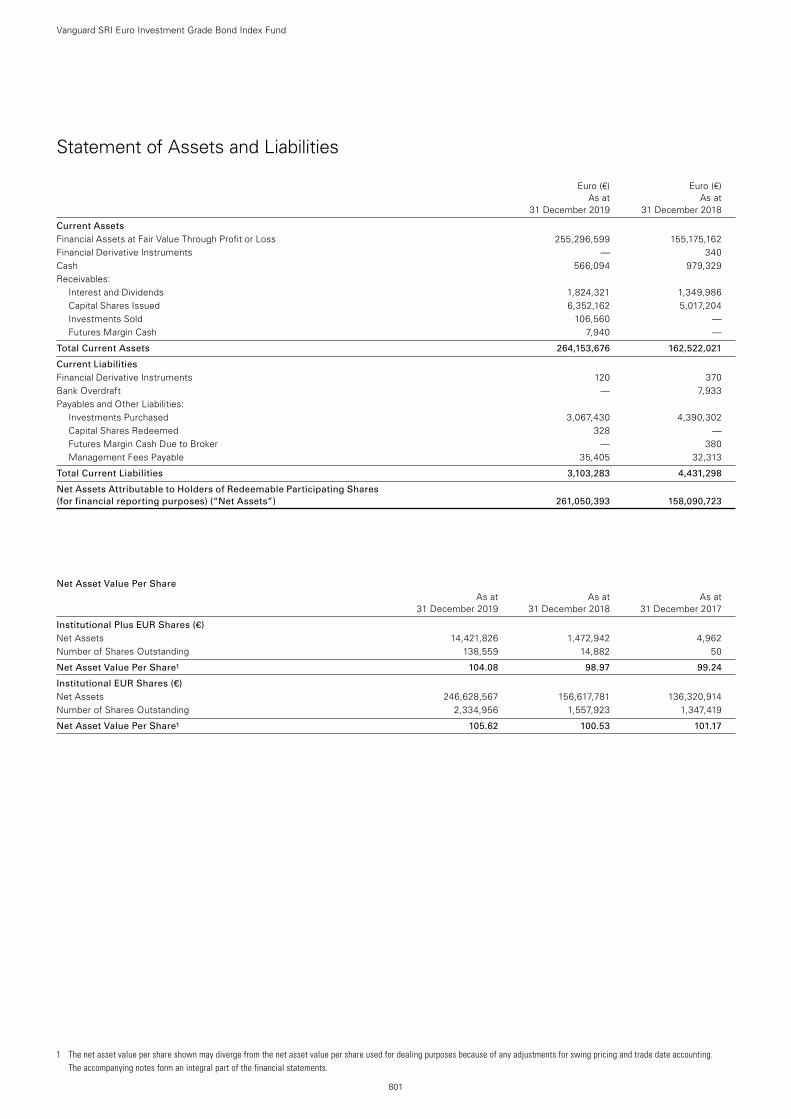
1 The net asset value per share shown may diverge from the net asset value per share used for dealing purposes because of any adjustments for swing pricing and trade date accounting. The accompanying notes form an integral part of the financial statements.
801
Vanguard SRI Euro Investment Grade Bond Index Fund
Statement of Assets and Liabilities
Euro (€) Euro (€) As at As at 31 December 2019 31 December 2018
Current Assets Financial Assets at Fair Value Through Profit or Loss 255,296,599 155,175,162Financial Derivative Instruments — 340Cash 566,094 979,329Receivables:
Interest and Dividends 1,824,321 1,349,986Capital Shares Issued 6,352,162 5,017,204Investments Sold 106,560 —Futures Margin Cash 7,940 —
Total Current Assets 264,153,676 162,522,021
Current Liabilities Financial Derivative Instruments 120 370Bank Overdraft — 7,933Payables and Other Liabilities:
Investments Purchased 3,067,430 4,390,302Capital Shares Redeemed 328 —Futures Margin Cash Due to Broker — 380Management Fees Payable 35,405 32,313
Total Current Liabilities 3,103,283 4,431,298
Net Assets Attributable to Holders of Redeemable Participating Shares (for financial reporting purposes) (“Net Assets”) 261,050,393 158,090,723
Net Asset Value Per Share As at As at As at 31 December 2019 31 December 2018 31 December 2017
Institutional Plus EUR Shares (€) Net Assets 14,421,826 1,472,942 4,962Number of Shares Outstanding 138,559 14,882 50
Net Asset Value Per Share1 104.08 98.97 99.24
Institutional EUR Shares (€) Net Assets 246,628,567 156,617,781 136,320,914Number of Shares Outstanding 2,334,956 1,557,923 1,347,419
Net Asset Value Per Share1 105.62 100.53 101.17
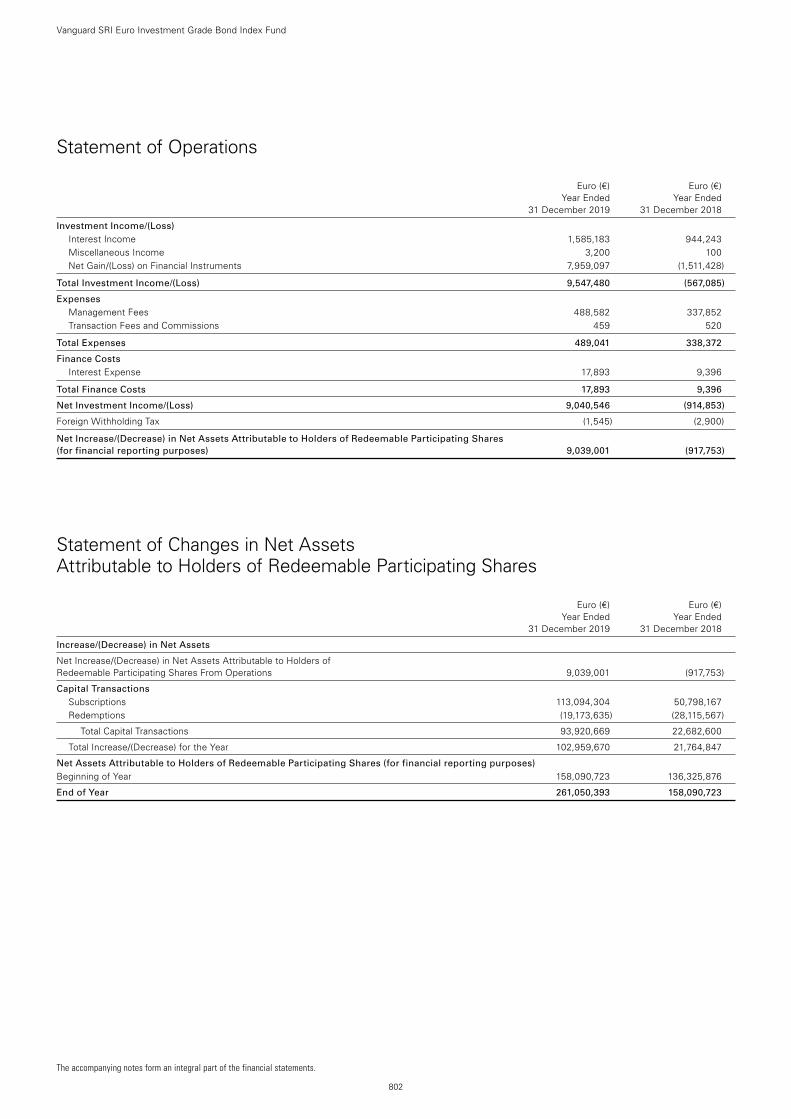
802
Vanguard SRI Euro Investment Grade Bond Index Fund
Statement of Operations
Euro (€) Euro (€) Year Ended Year Ended 31 December 2019 31 December 2018
Investment Income/(Loss) Interest Income 1,585,183 944,243Miscellaneous Income 3,200 100Net Gain/(Loss) on Financial Instruments 7,959,097 (1,511,428)
Total Investment Income/(Loss) 9,547,480 (567,085)
Expenses Management Fees 488,582 337,852Transaction Fees and Commissions 459 520
Total Expenses 489,041 338,372
Finance Costs Interest Expense 17,893 9,396
Total Finance Costs 17,893 9,396
Net Investment Income/(Loss) 9,040,546 (914,853)
Foreign Withholding Tax (1,545) (2,900)
Net Increase/(Decrease) in Net Assets Attributable to Holders of Redeemable Participating Shares (for financial reporting purposes) 9,039,001 (917,753)
Statement of Changes in Net Assets Attributable to Holders of Redeemable Participating Shares
Euro (€) Euro (€) Year Ended Year Ended 31 December 2019 31 December 2018
Increase/(Decrease) in Net Assets
Net Increase/(Decrease) in Net Assets Attributable to Holders of Redeemable Participating Shares From Operations 9,039,001 (917,753)
Capital Transactions Subscriptions 113,094,304 50,798,167Redemptions (19,173,635) (28,115,567)
Total Capital Transactions 93,920,669 22,682,600
Total Increase/(Decrease) for the Year 102,959,670 21,764,847
Net Assets Attributable to Holders of Redeemable Participating Shares (for financial reporting purposes) Beginning of Year 158,090,723 136,325,876
End of Year 261,050,393 158,090,723
The accompanying notes form an integral part of the financial statements.
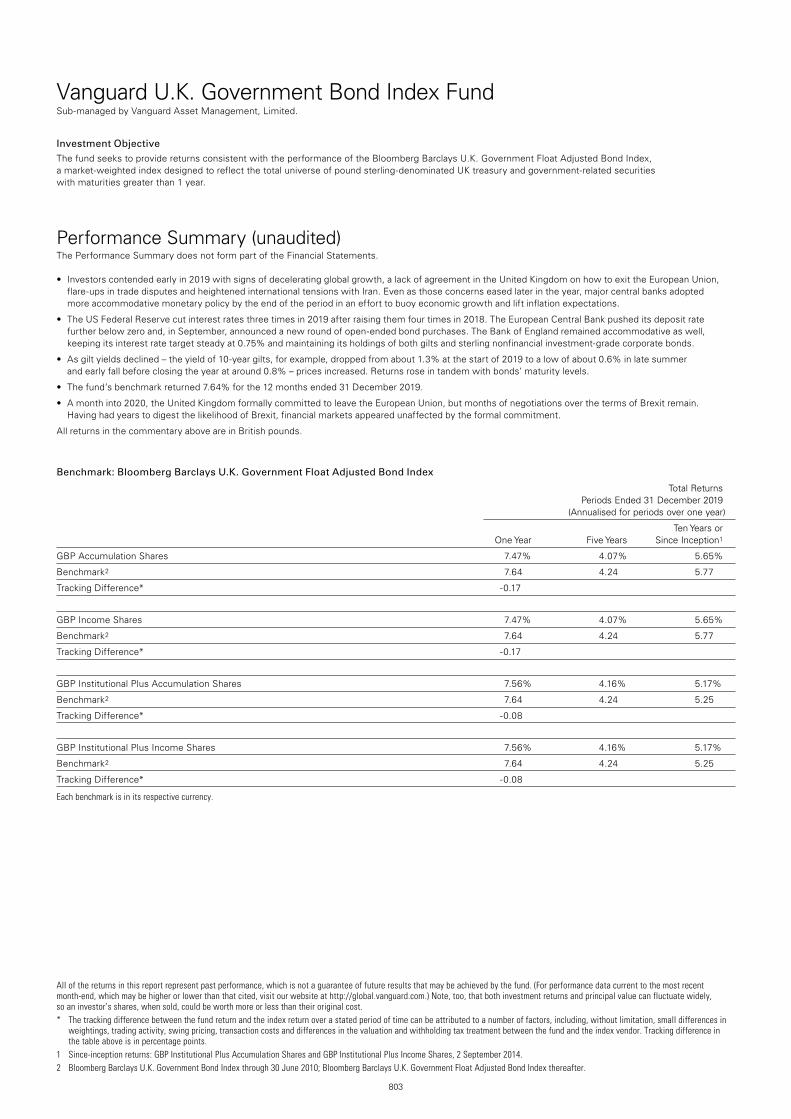
803
Vanguard U.K. Government Bond Index FundSub-managed by Vanguard Asset Management, Limited.
All of the returns in this report represent past performance, which is not a guarantee of future results that may be achieved by the fund. (For performance data current to the most recent month-end, which may be higher or lower than that cited, visit our website at http://global.vanguard.com.) Note, too, that both investment returns and principal value can fluctuate widely, so an investor’s shares, when sold, could be worth more or less than their original cost.* The tracking difference between the fund return and the index return over a stated period of time can be attributed to a number of factors, including, without limitation, small differences in
weightings, trading activity, swing pricing, transaction costs and differences in the valuation and withholding tax treatment between the fund and the index vendor. Tracking difference in the table above is in percentage points.
1 Since-inception returns: GBP Institutional Plus Accumulation Shares and GBP Institutional Plus Income Shares, 2 September 2014.2 Bloomberg Barclays U.K. Government Bond Index through 30 June 2010; Bloomberg Barclays U.K. Government Float Adjusted Bond Index thereafter.
Investment ObjectiveThe fund seeks to provide returns consistent with the performance of the Bloomberg Barclays U.K. Government Float Adjusted Bond Index, a market-weighted index designed to reflect the total universe of pound sterling-denominated UK treasury and government-related securities with maturities greater than 1 year.
Performance Summary (unaudited)The Performance Summary does not form part of the Financial Statements.
• Investorscontendedearlyin2019withsignsofdeceleratingglobalgrowth,alackofagreementintheUnitedKingdomonhowtoexittheEuropeanUnion,flare-ups in trade disputes and heightened international tensions with Iran. Even as those concerns eased later in the year, major central banks adopted more accommodative monetary policy by the end of the period in an effort to buoy economic growth and lift inflation expectations.
• TheUSFederalReservecutinterestratesthreetimesin2019afterraisingthemfourtimesin2018.TheEuropeanCentralBankpusheditsdepositratefurther below zero and, in September, announced a new round of open-ended bond purchases. The Bank of England remained accommodative as well, keeping its interest rate target steady at 0.75% and maintaining its holdings of both gilts and sterling nonfinancial investment-grade corporate bonds.
• Asgiltyieldsdeclined–theyieldof10-yeargilts,forexample,droppedfromabout1.3%atthestartof2019toalowofabout0.6%inlatesummer and early fall before closing the year at around 0.8% – prices increased. Returns rose in tandem with bonds’ maturity levels.
• Thefund’sbenchmarkreturned7.64%forthe12monthsended31December2019.
• Amonthinto2020,theUnitedKingdomformallycommittedtoleavetheEuropeanUnion,butmonthsofnegotiationsoverthetermsofBrexitremain. Having had years to digest the likelihood of Brexit, financial markets appeared unaffected by the formal commitment.
All returns in the commentary above are in British pounds.
Benchmark: Bloomberg Barclays U.K. Government Float Adjusted Bond Index
Total Returns Periods Ended 31 December 2019 (Annualised for periods over one year)
Ten Years or One Year Five Years Since Inception1
GBP Accumulation Shares 7.47% 4.07% 5.65%
Benchmark2 7.64 4.24 5.77
Tracking Difference* -0.17
GBP Income Shares 7.47% 4.07% 5.65%
Benchmark2 7.64 4.24 5.77
Tracking Difference* -0.17
GBP Institutional Plus Accumulation Shares 7.56% 4.16% 5.17%
Benchmark2 7.64 4.24 5.25
Tracking Difference* -0.08
GBP Institutional Plus Income Shares 7.56% 4.16% 5.17%
Benchmark2 7.64 4.24 5.25
Tracking Difference* -0.08
Each benchmark is in its respective currency.
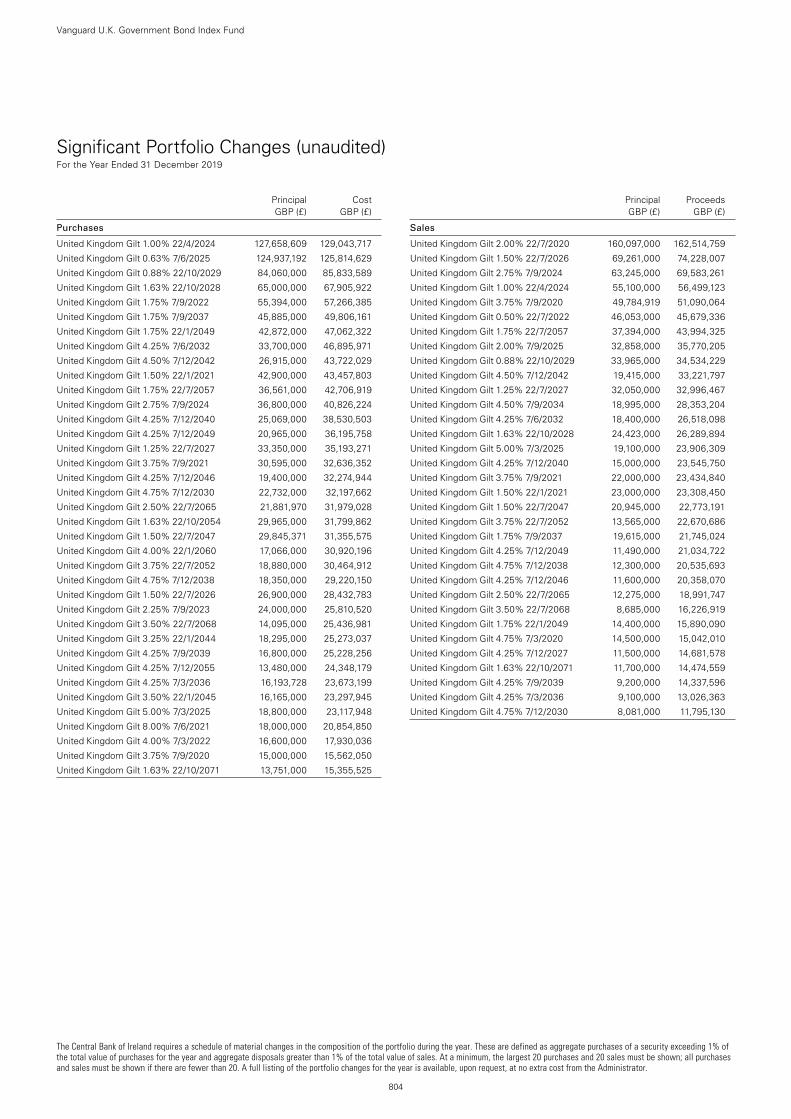
The Central Bank of Ireland requires a schedule of material changes in the composition of the portfolio during the year. These are defined as aggregate purchases of a security exceeding 1% of the total value of purchases for the year and aggregate disposals greater than 1% of the total value of sales. At a minimum, the largest 20 purchases and 20 sales must be shown; all purchases and sales must be shown if there are fewer than 20. A full listing of the portfolio changes for the year is available, upon request, at no extra cost from the Administrator.
804
Vanguard U.K. Government Bond Index Fund
Significant Portfolio Changes (unaudited) For the Year Ended 31 December 2019
Principal Cost GBP (£) GBP (£)
Purchases
United Kingdom Gilt 1.00% 22/4/2024 127,658,609 129,043,717
United Kingdom Gilt 0.63% 7/6/2025 124,937,192 125,814,629
United Kingdom Gilt 0.88% 22/10/2029 84,060,000 85,833,589
United Kingdom Gilt 1.63% 22/10/2028 65,000,000 67,905,922
United Kingdom Gilt 1.75% 7/9/2022 55,394,000 57,266,385
United Kingdom Gilt 1.75% 7/9/2037 45,885,000 49,806,161
United Kingdom Gilt 1.75% 22/1/2049 42,872,000 47,062,322
United Kingdom Gilt 4.25% 7/6/2032 33,700,000 46,895,971
United Kingdom Gilt 4.50% 7/12/2042 26,915,000 43,722,029
United Kingdom Gilt 1.50% 22/1/2021 42,900,000 43,457,803
United Kingdom Gilt 1.75% 22/7/2057 36,561,000 42,706,919
United Kingdom Gilt 2.75% 7/9/2024 36,800,000 40,826,224
United Kingdom Gilt 4.25% 7/12/2040 25,069,000 38,530,503
United Kingdom Gilt 4.25% 7/12/2049 20,965,000 36,195,758
United Kingdom Gilt 1.25% 22/7/2027 33,350,000 35,193,271
United Kingdom Gilt 3.75% 7/9/2021 30,595,000 32,636,352
United Kingdom Gilt 4.25% 7/12/2046 19,400,000 32,274,944
United Kingdom Gilt 4.75% 7/12/2030 22,732,000 32,197,662
United Kingdom Gilt 2.50% 22/7/2065 21,881,970 31,979,028
United Kingdom Gilt 1.63% 22/10/2054 29,965,000 31,799,862
United Kingdom Gilt 1.50% 22/7/2047 29,845,371 31,355,575
United Kingdom Gilt 4.00% 22/1/2060 17,066,000 30,920,196
United Kingdom Gilt 3.75% 22/7/2052 18,880,000 30,464,912
United Kingdom Gilt 4.75% 7/12/2038 18,350,000 29,220,150
United Kingdom Gilt 1.50% 22/7/2026 26,900,000 28,432,783
United Kingdom Gilt 2.25% 7/9/2023 24,000,000 25,810,520
United Kingdom Gilt 3.50% 22/7/2068 14,095,000 25,436,981
United Kingdom Gilt 3.25% 22/1/2044 18,295,000 25,273,037
United Kingdom Gilt 4.25% 7/9/2039 16,800,000 25,228,256
United Kingdom Gilt 4.25% 7/12/2055 13,480,000 24,348,179
United Kingdom Gilt 4.25% 7/3/2036 16,193,728 23,673,199
United Kingdom Gilt 3.50% 22/1/2045 16,165,000 23,297,945
United Kingdom Gilt 5.00% 7/3/2025 18,800,000 23,117,948
United Kingdom Gilt 8.00% 7/6/2021 18,000,000 20,854,850
United Kingdom Gilt 4.00% 7/3/2022 16,600,000 17,930,036
United Kingdom Gilt 3.75% 7/9/2020 15,000,000 15,562,050
United Kingdom Gilt 1.63% 22/10/2071 13,751,000 15,355,525
Principal Proceeds GBP (£) GBP (£)
Sales
United Kingdom Gilt 2.00% 22/7/2020 160,097,000 162,514,759
United Kingdom Gilt 1.50% 22/7/2026 69,261,000 74,228,007
United Kingdom Gilt 2.75% 7/9/2024 63,245,000 69,583,261
United Kingdom Gilt 1.00% 22/4/2024 55,100,000 56,499,123
United Kingdom Gilt 3.75% 7/9/2020 49,784,919 51,090,064
United Kingdom Gilt 0.50% 22/7/2022 46,053,000 45,679,336
United Kingdom Gilt 1.75% 22/7/2057 37,394,000 43,994,325
United Kingdom Gilt 2.00% 7/9/2025 32,858,000 35,770,205
United Kingdom Gilt 0.88% 22/10/2029 33,965,000 34,534,229
United Kingdom Gilt 4.50% 7/12/2042 19,415,000 33,221,797
United Kingdom Gilt 1.25% 22/7/2027 32,050,000 32,996,467
United Kingdom Gilt 4.50% 7/9/2034 18,995,000 28,353,204
United Kingdom Gilt 4.25% 7/6/2032 18,400,000 26,518,098
United Kingdom Gilt 1.63% 22/10/2028 24,423,000 26,289,894
United Kingdom Gilt 5.00% 7/3/2025 19,100,000 23,906,309
United Kingdom Gilt 4.25% 7/12/2040 15,000,000 23,545,750
United Kingdom Gilt 3.75% 7/9/2021 22,000,000 23,434,840
United Kingdom Gilt 1.50% 22/1/2021 23,000,000 23,308,450
United Kingdom Gilt 1.50% 22/7/2047 20,945,000 22,773,191
United Kingdom Gilt 3.75% 22/7/2052 13,565,000 22,670,686
United Kingdom Gilt 1.75% 7/9/2037 19,615,000 21,745,024
United Kingdom Gilt 4.25% 7/12/2049 11,490,000 21,034,722
United Kingdom Gilt 4.75% 7/12/2038 12,300,000 20,535,693
United Kingdom Gilt 4.25% 7/12/2046 11,600,000 20,358,070
United Kingdom Gilt 2.50% 22/7/2065 12,275,000 18,991,747
United Kingdom Gilt 3.50% 22/7/2068 8,685,000 16,226,919
United Kingdom Gilt 1.75% 22/1/2049 14,400,000 15,890,090
United Kingdom Gilt 4.75% 7/3/2020 14,500,000 15,042,010
United Kingdom Gilt 4.25% 7/12/2027 11,500,000 14,681,578
United Kingdom Gilt 1.63% 22/10/2071 11,700,000 14,474,559
United Kingdom Gilt 4.25% 7/9/2039 9,200,000 14,337,596
United Kingdom Gilt 4.25% 7/3/2036 9,100,000 13,026,363
United Kingdom Gilt 4.75% 7/12/2030 8,081,000 11,795,130
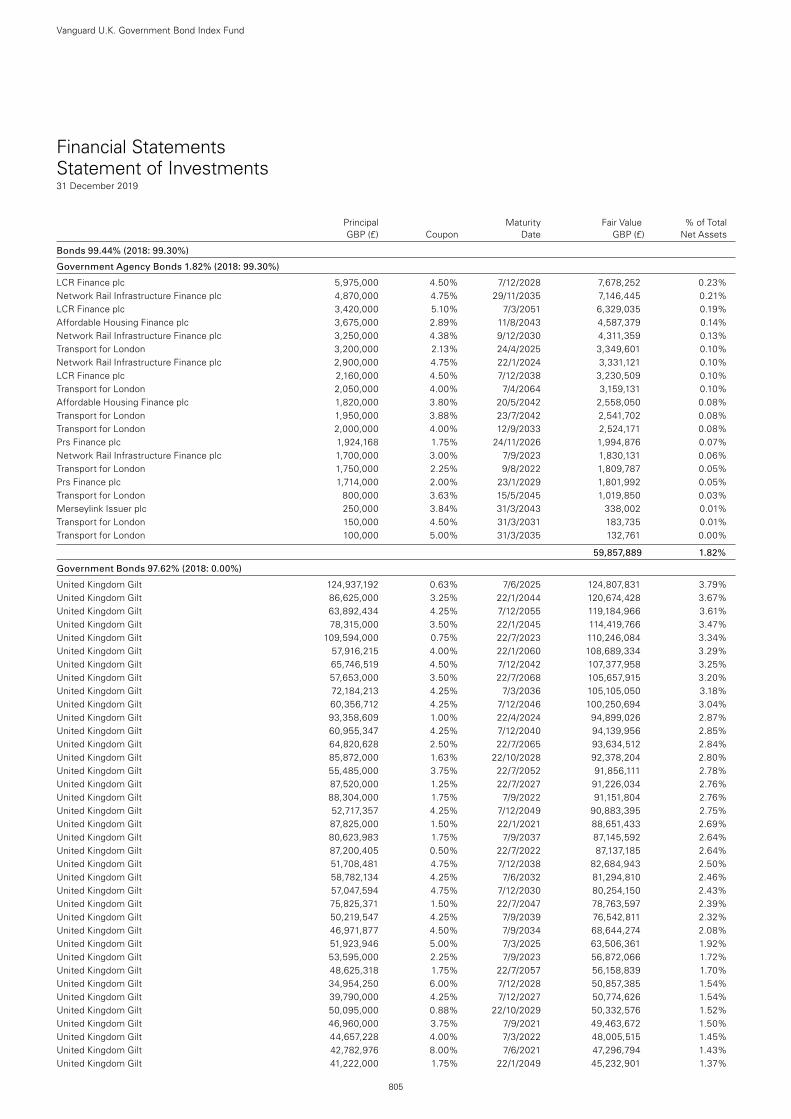
Financial Statements Statement of Investments31 December 2019
Principal Maturity Fair Value % of Total GBP (£) Coupon Date GBP (£) Net Assets
Bonds 99.44% (2018: 99.30%)
Government Agency Bonds 1.82% (2018: 99.30%)
LCR Finance plc 5,975,000 4.50% 7/12/2028 7,678,252 0.23%Network Rail Infrastructure Finance plc 4,870,000 4.75% 29/11/2035 7,146,445 0.21%LCR Finance plc 3,420,000 5.10% 7/3/2051 6,329,035 0.19%Affordable Housing Finance plc 3,675,000 2.89% 11/8/2043 4,587,379 0.14%Network Rail Infrastructure Finance plc 3,250,000 4.38% 9/12/2030 4,311,359 0.13%Transport for London 3,200,000 2.13% 24/4/2025 3,349,601 0.10%Network Rail Infrastructure Finance plc 2,900,000 4.75% 22/1/2024 3,331,121 0.10%LCR Finance plc 2,160,000 4.50% 7/12/2038 3,230,509 0.10%Transport for London 2,050,000 4.00% 7/4/2064 3,159,131 0.10%Affordable Housing Finance plc 1,820,000 3.80% 20/5/2042 2,558,050 0.08%Transport for London 1,950,000 3.88% 23/7/2042 2,541,702 0.08%Transport for London 2,000,000 4.00% 12/9/2033 2,524,171 0.08%Prs Finance plc 1,924,168 1.75% 24/11/2026 1,994,876 0.07%Network Rail Infrastructure Finance plc 1,700,000 3.00% 7/9/2023 1,830,131 0.06%Transport for London 1,750,000 2.25% 9/8/2022 1,809,787 0.05%Prs Finance plc 1,714,000 2.00% 23/1/2029 1,801,992 0.05%Transport for London 800,000 3.63% 15/5/2045 1,019,850 0.03%Merseylink Issuer plc 250,000 3.84% 31/3/2043 338,002 0.01%Transport for London 150,000 4.50% 31/3/2031 183,735 0.01%Transport for London 100,000 5.00% 31/3/2035 132,761 0.00%
59,857,889 1.82%
Government Bonds 97.62% (2018: 0.00%)
United Kingdom Gilt 124,937,192 0.63% 7/6/2025 124,807,831 3.79%United Kingdom Gilt 86,625,000 3.25% 22/1/2044 120,674,428 3.67%United Kingdom Gilt 63,892,434 4.25% 7/12/2055 119,184,966 3.61%United Kingdom Gilt 78,315,000 3.50% 22/1/2045 114,419,766 3.47%United Kingdom Gilt 109,594,000 0.75% 22/7/2023 110,246,084 3.34%United Kingdom Gilt 57,916,215 4.00% 22/1/2060 108,689,334 3.29%United Kingdom Gilt 65,746,519 4.50% 7/12/2042 107,377,958 3.25%United Kingdom Gilt 57,653,000 3.50% 22/7/2068 105,657,915 3.20%United Kingdom Gilt 72,184,213 4.25% 7/3/2036 105,105,050 3.18%United Kingdom Gilt 60,356,712 4.25% 7/12/2046 100,250,694 3.04%United Kingdom Gilt 93,358,609 1.00% 22/4/2024 94,899,026 2.87%United Kingdom Gilt 60,955,347 4.25% 7/12/2040 94,139,956 2.85%United Kingdom Gilt 64,820,628 2.50% 22/7/2065 93,634,512 2.84%United Kingdom Gilt 85,872,000 1.63% 22/10/2028 92,378,204 2.80%United Kingdom Gilt 55,485,000 3.75% 22/7/2052 91,856,111 2.78%United Kingdom Gilt 87,520,000 1.25% 22/7/2027 91,226,034 2.76%United Kingdom Gilt 88,304,000 1.75% 7/9/2022 91,151,804 2.76%United Kingdom Gilt 52,717,357 4.25% 7/12/2049 90,883,395 2.75%United Kingdom Gilt 87,825,000 1.50% 22/1/2021 88,651,433 2.69%United Kingdom Gilt 80,623,983 1.75% 7/9/2037 87,145,592 2.64%United Kingdom Gilt 87,200,405 0.50% 22/7/2022 87,137,185 2.64%United Kingdom Gilt 51,708,481 4.75% 7/12/2038 82,684,943 2.50%United Kingdom Gilt 58,782,134 4.25% 7/6/2032 81,294,810 2.46%United Kingdom Gilt 57,047,594 4.75% 7/12/2030 80,254,150 2.43%United Kingdom Gilt 75,825,371 1.50% 22/7/2047 78,763,597 2.39%United Kingdom Gilt 50,219,547 4.25% 7/9/2039 76,542,811 2.32%United Kingdom Gilt 46,971,877 4.50% 7/9/2034 68,644,274 2.08%United Kingdom Gilt 51,923,946 5.00% 7/3/2025 63,506,361 1.92%United Kingdom Gilt 53,595,000 2.25% 7/9/2023 56,872,066 1.72%United Kingdom Gilt 48,625,318 1.75% 22/7/2057 56,158,839 1.70%United Kingdom Gilt 34,954,250 6.00% 7/12/2028 50,857,385 1.54%United Kingdom Gilt 39,790,000 4.25% 7/12/2027 50,774,626 1.54%United Kingdom Gilt 50,095,000 0.88% 22/10/2029 50,332,576 1.52%United Kingdom Gilt 46,960,000 3.75% 7/9/2021 49,463,672 1.50%United Kingdom Gilt 44,657,228 4.00% 7/3/2022 48,005,515 1.45%United Kingdom Gilt 42,782,976 8.00% 7/6/2021 47,296,794 1.43%United Kingdom Gilt 41,222,000 1.75% 22/1/2049 45,232,901 1.37%
Vanguard U.K. Government Bond Index Fund
805
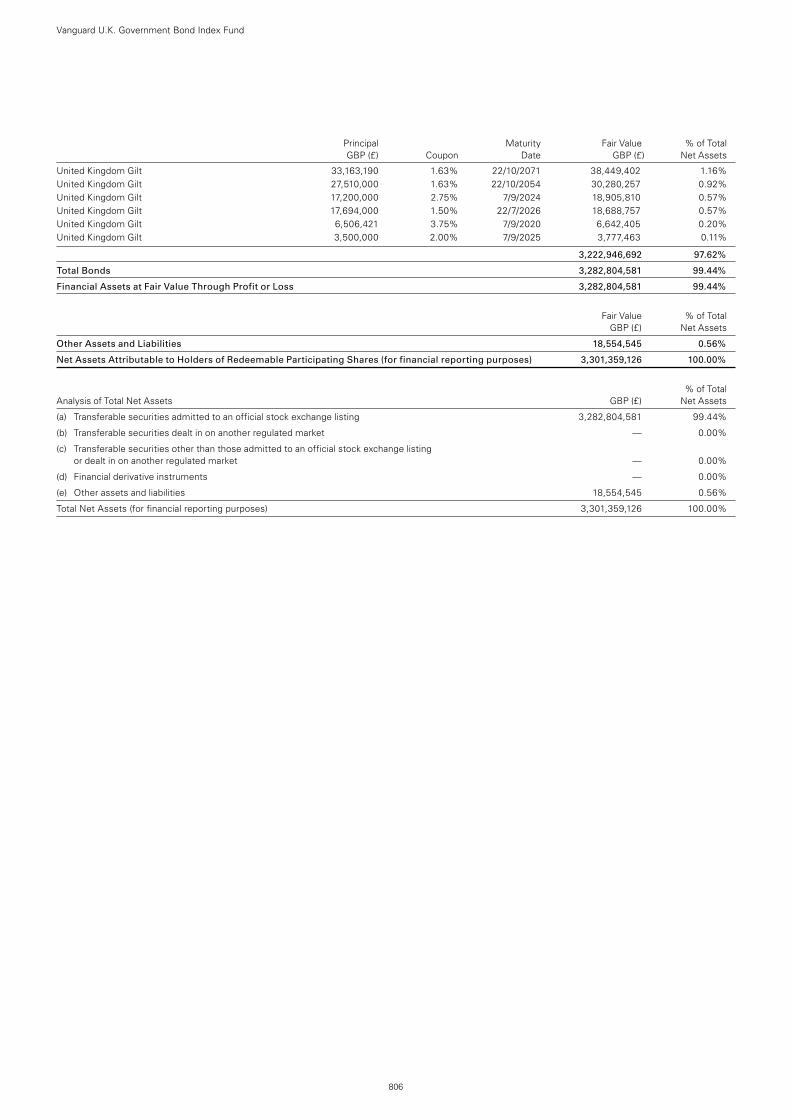
Principal Maturity Fair Value % of Total GBP (£) Coupon Date GBP (£) Net Assets
United Kingdom Gilt 33,163,190 1.63% 22/10/2071 38,449,402 1.16%United Kingdom Gilt 27,510,000 1.63% 22/10/2054 30,280,257 0.92%United Kingdom Gilt 17,200,000 2.75% 7/9/2024 18,905,810 0.57%United Kingdom Gilt 17,694,000 1.50% 22/7/2026 18,688,757 0.57%United Kingdom Gilt 6,506,421 3.75% 7/9/2020 6,642,405 0.20%United Kingdom Gilt 3,500,000 2.00% 7/9/2025 3,777,463 0.11%
3,222,946,692 97.62%
Total Bonds 3,282,804,581 99.44%
Financial Assets at Fair Value Through Profit or Loss 3,282,804,581 99.44%
Fair Value % of Total GBP (£) Net Assets
Other Assets and Liabilities 18,554,545 0.56%
Net Assets Attributable to Holders of Redeemable Participating Shares (for financial reporting purposes) 3,301,359,126 100.00%
% of Total Analysis of Total Net Assets GBP (£) Net Assets
(a) Transferable securities admitted to an official stock exchange listing 3,282,804,581 99.44%
(b) Transferable securities dealt in on another regulated market — 0.00%
(c) Transferable securities other than those admitted to an official stock exchange listing or dealt in on another regulated market — 0.00%
(d) Financial derivative instruments — 0.00%
(e) Other assets and liabilities 18,554,545 0.56%
Total Net Assets (for financial reporting purposes) 3,301,359,126 100.00%
Vanguard U.K. Government Bond Index Fund
806
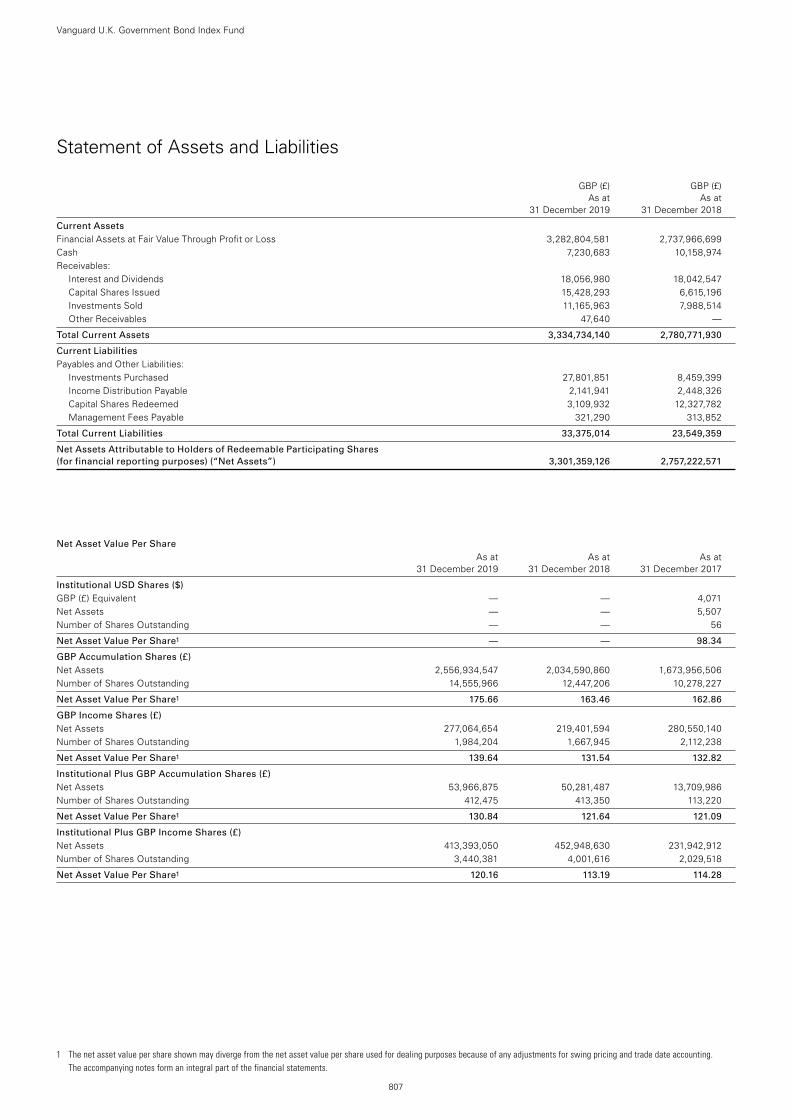
1 The net asset value per share shown may diverge from the net asset value per share used for dealing purposes because of any adjustments for swing pricing and trade date accounting. The accompanying notes form an integral part of the financial statements.
807
Vanguard U.K. Government Bond Index Fund
Statement of Assets and Liabilities
GBP (£) GBP (£) As at As at 31 December 2019 31 December 2018
Current Assets Financial Assets at Fair Value Through Profit or Loss 3,282,804,581 2,737,966,699Cash 7,230,683 10,158,974Receivables:
Interest and Dividends 18,056,980 18,042,547Capital Shares Issued 15,428,293 6,615,196Investments Sold 11,165,963 7,988,514Other Receivables 47,640 —
Total Current Assets 3,334,734,140 2,780,771,930
Current Liabilities Payables and Other Liabilities:
Investments Purchased 27,801,851 8,459,399Income Distribution Payable 2,141,941 2,448,326Capital Shares Redeemed 3,109,932 12,327,782Management Fees Payable 321,290 313,852
Total Current Liabilities 33,375,014 23,549,359
Net Assets Attributable to Holders of Redeemable Participating Shares (for financial reporting purposes) (“Net Assets”) 3,301,359,126 2,757,222,571
Net Asset Value Per Share As at As at As at 31 December 2019 31 December 2018 31 December 2017
Institutional USD Shares ($) GBP (£) Equivalent — — 4,071Net Assets — — 5,507Number of Shares Outstanding — — 56
Net Asset Value Per Share1 — — 98.34
GBP Accumulation Shares (£) Net Assets 2,556,934,547 2,034,590,860 1,673,956,506Number of Shares Outstanding 14,555,966 12,447,206 10,278,227
Net Asset Value Per Share1 175.66 163.46 162.86
GBP Income Shares (£) Net Assets 277,064,654 219,401,594 280,550,140Number of Shares Outstanding 1,984,204 1,667,945 2,112,238
Net Asset Value Per Share1 139.64 131.54 132.82
Institutional Plus GBP Accumulation Shares (£) Net Assets 53,966,875 50,281,487 13,709,986Number of Shares Outstanding 412,475 413,350 113,220
Net Asset Value Per Share1 130.84 121.64 121.09
Institutional Plus GBP Income Shares (£) Net Assets 413,393,050 452,948,630 231,942,912Number of Shares Outstanding 3,440,381 4,001,616 2,029,518
Net Asset Value Per Share1 120.16 113.19 114.28
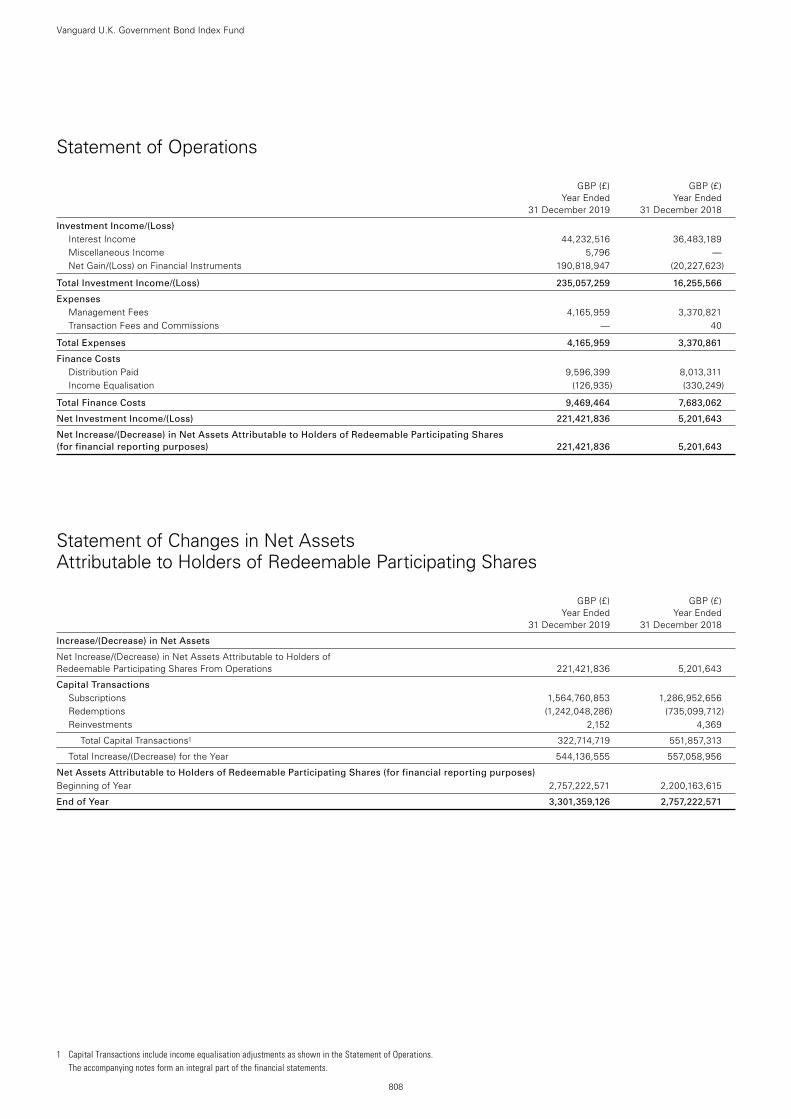
808
Vanguard U.K. Government Bond Index Fund
Statement of Operations
GBP (£) GBP (£) Year Ended Year Ended 31 December 2019 31 December 2018
Investment Income/(Loss) Interest Income 44,232,516 36,483,189Miscellaneous Income 5,796 —Net Gain/(Loss) on Financial Instruments 190,818,947 (20,227,623)
Total Investment Income/(Loss) 235,057,259 16,255,566
Expenses Management Fees 4,165,959 3,370,821Transaction Fees and Commissions — 40
Total Expenses 4,165,959 3,370,861
Finance Costs Distribution Paid 9,596,399 8,013,311Income Equalisation (126,935) (330,249)
Total Finance Costs 9,469,464 7,683,062
Net Investment Income/(Loss) 221,421,836 5,201,643
Net Increase/(Decrease) in Net Assets Attributable to Holders of Redeemable Participating Shares (for financial reporting purposes) 221,421,836 5,201,643
Statement of Changes in Net Assets Attributable to Holders of Redeemable Participating Shares
GBP (£) GBP (£) Year Ended Year Ended 31 December 2019 31 December 2018
Increase/(Decrease) in Net Assets
Net Increase/(Decrease) in Net Assets Attributable to Holders of Redeemable Participating Shares From Operations 221,421,836 5,201,643
Capital Transactions Subscriptions 1,564,760,853 1,286,952,656Redemptions (1,242,048,286) (735,099,712)Reinvestments 2,152 4,369
Total Capital Transactions1 322,714,719 551,857,313
Total Increase/(Decrease) for the Year 544,136,555 557,058,956
Net Assets Attributable to Holders of Redeemable Participating Shares (for financial reporting purposes) Beginning of Year 2,757,222,571 2,200,163,615
End of Year 3,301,359,126 2,757,222,571
1 Capital Transactions include income equalisation adjustments as shown in the Statement of Operations. The accompanying notes form an integral part of the financial statements.

809
Vanguard U.K. Investment Grade Bond Index FundSub-managed by Vanguard Asset Management, Limited.
All of the returns in this report represent past performance, which is not a guarantee of future results that may be achieved by the fund. (For performance data current to the most recent month-end, which may be higher or lower than that cited, visit our website at http://global.vanguard.com.) Note, too, that both investment returns and principal value can fluctuate widely, so an investor’s shares, when sold, could be worth more or less than their original cost.* The tracking difference between the fund return and the index return over a stated period of time can be attributed to a number of factors, including, without limitation, small differences in
weightings, trading activity, swing pricing, transaction costs and differences in the valuation and withholding tax treatment between the fund and the index vendor. Tracking difference in the table above is in percentage points.
1 Since-inception returns: GBP Institutional Plus Accumulation Shares and GBP Institutional Plus Income Shares, 2 September 2014. 2 Bloomberg Barclays GBP Non-Government Bond Index through 30 June 2010; Bloomberg Barclays GBP Non-Government Float Adjusted Bond Index thereafter.
Investment ObjectiveThe fund seeks to provide returns consistent with the performance of the Bloomberg Barclays GBP Non-Government Float Adjusted Bond Index, a market-weighted index designed to reflect the total universe of pound sterling-denominated, investment-grade fixed income securities, excluding government and government-related securities, with maturities greater than 1 year.
Performance Summary (unaudited)The Performance Summary does not form part of the Financial Statements.
• Investorscontendedearlyin2019withsignsofdeceleratingglobalgrowth,alackofagreementintheUnitedKingdomonhowtoexittheEuropeanUnion,flare-ups in trade disputes and heightened international tensions with Iran. Even as those concerns eased later in the year, major central banks adopted more accommodative monetary policy by the end of the period in an effort to buoy economic growth and lift inflation expectations.
• TheEuropeanCentralBankpusheditsdepositratefurtherbelowzeroand,inSeptember,announcedanewroundofopen-endedbondpurchases. The Bank of England remained accommodative as well, keeping its interest rate target steady at 0.75% and maintaining its holdings of both gilts and sterling nonfinancial investment-grade corporate bonds.
• Asyieldsdeclined–theyieldof10-yeargilts,forexample,droppedfromabout1.3%atthestartof2019toalowofabout0.6%inlatesummerandearly fall before closing the year at around 0.8% – bond prices increased. Returns rose in tandem with bonds’ maturity levels.
• Corporatebonds,whichaccountforabouttwo-thirdsofthefund’sbenchmark,returnednearly11%fortheyear.
• Thefund’sbenchmarkreturned9.34%forthe12monthsended31December2019.
• Amonthinto2020,theUnitedKingdomformallycommittedtoleavetheEuropeanUnion,butmonthsofnegotiationsoverthetermsofBrexitremain. Having had years to digest the likelihood of Brexit, financial markets appeared unaffected by the formal commitment.
All returns in the commentary above are in British pounds.
Benchmark: Bloomberg Barclays GBP Non-Government Float Adjusted Bond Index
Total Returns Periods Ended 31 December 2019 (Annualised for periods over one year)
Ten Years or One Year Five Years Since Inception1
GBP Accumulation Shares 9.32% 4.47% 6.42%
Benchmark2 9.34 4.58 6.42
Tracking Difference* -0.02
GBP Income Shares 9.32% 4.47% 6.42%
Benchmark2 9.34 4.58 6.42
Tracking Difference* -0.02
GBP Institutional Plus Accumulation Shares 9.41% 4.55% 5.08%
Benchmark2 9.34 4.58 5.10
Tracking Difference* 0.07
GBP Institutional Plus Income Shares 9.41% 4.55% 5.08%
Benchmark2 9.34 4.58 5.10
Tracking Difference* 0.07
Each benchmark is in its respective currency.
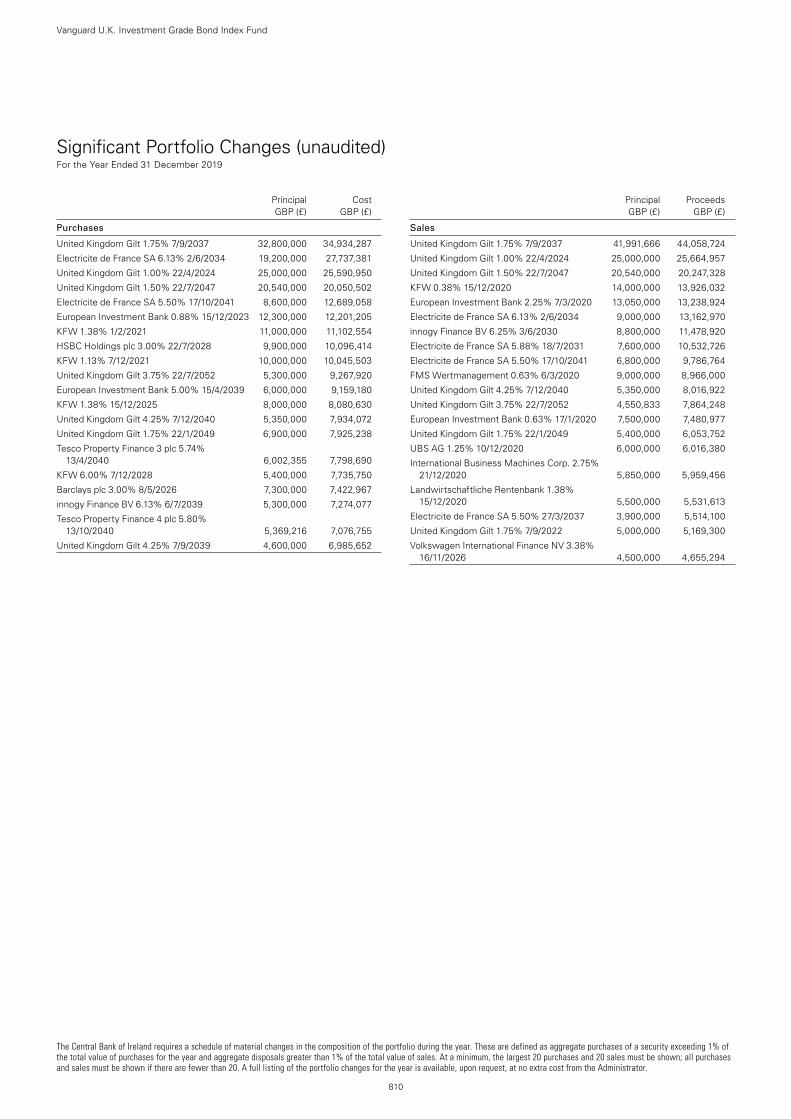
The Central Bank of Ireland requires a schedule of material changes in the composition of the portfolio during the year. These are defined as aggregate purchases of a security exceeding 1% of the total value of purchases for the year and aggregate disposals greater than 1% of the total value of sales. At a minimum, the largest 20 purchases and 20 sales must be shown; all purchases and sales must be shown if there are fewer than 20. A full listing of the portfolio changes for the year is available, upon request, at no extra cost from the Administrator.
810
Vanguard U.K. Investment Grade Bond Index Fund
Significant Portfolio Changes (unaudited) For the Year Ended 31 December 2019
Principal Cost GBP (£) GBP (£)
Purchases
United Kingdom Gilt 1.75% 7/9/2037 32,800,000 34,934,287
Electricite de France SA 6.13% 2/6/2034 19,200,000 27,737,381
United Kingdom Gilt 1.00% 22/4/2024 25,000,000 25,590,950
United Kingdom Gilt 1.50% 22/7/2047 20,540,000 20,050,502
Electricite de France SA 5.50% 17/10/2041 8,600,000 12,689,058
European Investment Bank 0.88% 15/12/2023 12,300,000 12,201,205
KFW 1.38% 1/2/2021 11,000,000 11,102,554
HSBC Holdings plc 3.00% 22/7/2028 9,900,000 10,096,414
KFW 1.13% 7/12/2021 10,000,000 10,045,503
United Kingdom Gilt 3.75% 22/7/2052 5,300,000 9,267,920
European Investment Bank 5.00% 15/4/2039 6,000,000 9,159,180
KFW 1.38% 15/12/2025 8,000,000 8,080,630
United Kingdom Gilt 4.25% 7/12/2040 5,350,000 7,934,072
United Kingdom Gilt 1.75% 22/1/2049 6,900,000 7,925,238
Tesco Property Finance 3 plc 5.74% 13/4/2040 6,002,355 7,798,690
KFW 6.00% 7/12/2028 5,400,000 7,735,750
Barclays plc 3.00% 8/5/2026 7,300,000 7,422,967
innogy Finance BV 6.13% 6/7/2039 5,300,000 7,274,077
Tesco Property Finance 4 plc 5.80% 13/10/2040 5,369,216 7,076,755
United Kingdom Gilt 4.25% 7/9/2039 4,600,000 6,985,652
Principal Proceeds GBP (£) GBP (£)
Sales
United Kingdom Gilt 1.75% 7/9/2037 41,991,666 44,058,724
United Kingdom Gilt 1.00% 22/4/2024 25,000,000 25,664,957
United Kingdom Gilt 1.50% 22/7/2047 20,540,000 20,247,328
KFW 0.38% 15/12/2020 14,000,000 13,926,032
European Investment Bank 2.25% 7/3/2020 13,050,000 13,238,924
Electricite de France SA 6.13% 2/6/2034 9,000,000 13,162,970
innogy Finance BV 6.25% 3/6/2030 8,800,000 11,478,920
Electricite de France SA 5.88% 18/7/2031 7,600,000 10,532,726
Electricite de France SA 5.50% 17/10/2041 6,800,000 9,786,764
FMS Wertmanagement 0.63% 6/3/2020 9,000,000 8,966,000
United Kingdom Gilt 4.25% 7/12/2040 5,350,000 8,016,922
United Kingdom Gilt 3.75% 22/7/2052 4,550,833 7,864,248
European Investment Bank 0.63% 17/1/2020 7,500,000 7,480,977
United Kingdom Gilt 1.75% 22/1/2049 5,400,000 6,053,752
UBS AG 1.25% 10/12/2020 6,000,000 6,016,380
International Business Machines Corp. 2.75% 21/12/2020 5,850,000 5,959,456
Landwirtschaftliche Rentenbank 1.38% 15/12/2020 5,500,000 5,531,613
Electricite de France SA 5.50% 27/3/2037 3,900,000 5,514,100
United Kingdom Gilt 1.75% 7/9/2022 5,000,000 5,169,300
Volkswagen International Finance NV 3.38% 16/11/2026 4,500,000 4,655,294
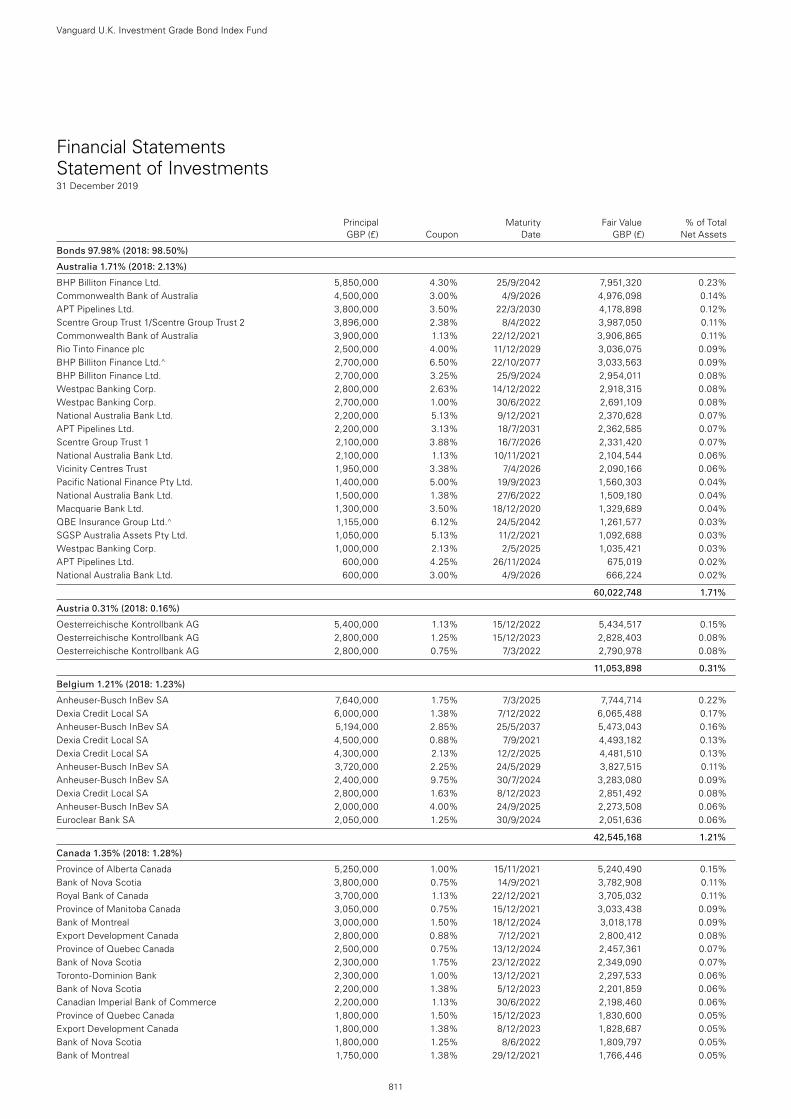
Financial Statements Statement of Investments31 December 2019
Principal Maturity Fair Value % of Total GBP (£) Coupon Date GBP (£) Net Assets
Bonds 97.98% (2018: 98.50%)
Australia 1.71% (2018: 2.13%)
BHP Billiton Finance Ltd. 5,850,000 4.30% 25/9/2042 7,951,320 0.23%Commonwealth Bank of Australia 4,500,000 3.00% 4/9/2026 4,976,098 0.14%APT Pipelines Ltd. 3,800,000 3.50% 22/3/2030 4,178,898 0.12%Scentre Group Trust 1/Scentre Group Trust 2 3,896,000 2.38% 8/4/2022 3,987,050 0.11%Commonwealth Bank of Australia 3,900,000 1.13% 22/12/2021 3,906,865 0.11%Rio Tinto Finance plc 2,500,000 4.00% 11/12/2029 3,036,075 0.09%BHP Billiton Finance Ltd.^ 2,700,000 6.50% 22/10/2077 3,033,563 0.09%BHP Billiton Finance Ltd. 2,700,000 3.25% 25/9/2024 2,954,011 0.08%Westpac Banking Corp. 2,800,000 2.63% 14/12/2022 2,918,315 0.08%Westpac Banking Corp. 2,700,000 1.00% 30/6/2022 2,691,109 0.08%National Australia Bank Ltd. 2,200,000 5.13% 9/12/2021 2,370,628 0.07%APT Pipelines Ltd. 2,200,000 3.13% 18/7/2031 2,362,585 0.07%Scentre Group Trust 1 2,100,000 3.88% 16/7/2026 2,331,420 0.07%National Australia Bank Ltd. 2,100,000 1.13% 10/11/2021 2,104,544 0.06%Vicinity Centres Trust 1,950,000 3.38% 7/4/2026 2,090,166 0.06%Pacific National Finance Pty Ltd. 1,400,000 5.00% 19/9/2023 1,560,303 0.04%National Australia Bank Ltd. 1,500,000 1.38% 27/6/2022 1,509,180 0.04%Macquarie Bank Ltd. 1,300,000 3.50% 18/12/2020 1,329,689 0.04%QBE Insurance Group Ltd.^ 1,155,000 6.12% 24/5/2042 1,261,577 0.03%SGSP Australia Assets Pty Ltd. 1,050,000 5.13% 11/2/2021 1,092,688 0.03%Westpac Banking Corp. 1,000,000 2.13% 2/5/2025 1,035,421 0.03%APT Pipelines Ltd. 600,000 4.25% 26/11/2024 675,019 0.02%National Australia Bank Ltd. 600,000 3.00% 4/9/2026 666,224 0.02%
60,022,748 1.71%
Austria 0.31% (2018: 0.16%)
Oesterreichische Kontrollbank AG 5,400,000 1.13% 15/12/2022 5,434,517 0.15%Oesterreichische Kontrollbank AG 2,800,000 1.25% 15/12/2023 2,828,403 0.08%Oesterreichische Kontrollbank AG 2,800,000 0.75% 7/3/2022 2,790,978 0.08%
11,053,898 0.31%
Belgium 1.21% (2018: 1.23%)
Anheuser-Busch InBev SA 7,640,000 1.75% 7/3/2025 7,744,714 0.22%Dexia Credit Local SA 6,000,000 1.38% 7/12/2022 6,065,488 0.17%Anheuser-Busch InBev SA 5,194,000 2.85% 25/5/2037 5,473,043 0.16%Dexia Credit Local SA 4,500,000 0.88% 7/9/2021 4,493,182 0.13%Dexia Credit Local SA 4,300,000 2.13% 12/2/2025 4,481,510 0.13%Anheuser-Busch InBev SA 3,720,000 2.25% 24/5/2029 3,827,515 0.11%Anheuser-Busch InBev SA 2,400,000 9.75% 30/7/2024 3,283,080 0.09%Dexia Credit Local SA 2,800,000 1.63% 8/12/2023 2,851,492 0.08%Anheuser-Busch InBev SA 2,000,000 4.00% 24/9/2025 2,273,508 0.06%Euroclear Bank SA 2,050,000 1.25% 30/9/2024 2,051,636 0.06%
42,545,168 1.21%
Canada 1.35% (2018: 1.28%)
Province of Alberta Canada 5,250,000 1.00% 15/11/2021 5,240,490 0.15%Bank of Nova Scotia 3,800,000 0.75% 14/9/2021 3,782,908 0.11%Royal Bank of Canada 3,700,000 1.13% 22/12/2021 3,705,032 0.11%Province of Manitoba Canada 3,050,000 0.75% 15/12/2021 3,033,438 0.09%Bank of Montreal 3,000,000 1.50% 18/12/2024 3,018,178 0.09%Export Development Canada 2,800,000 0.88% 7/12/2021 2,800,412 0.08%Province of Quebec Canada 2,500,000 0.75% 13/12/2024 2,457,361 0.07%Bank of Nova Scotia 2,300,000 1.75% 23/12/2022 2,349,090 0.07%Toronto-Dominion Bank 2,300,000 1.00% 13/12/2021 2,297,533 0.06%Bank of Nova Scotia 2,200,000 1.38% 5/12/2023 2,201,859 0.06%Canadian Imperial Bank of Commerce 2,200,000 1.13% 30/6/2022 2,198,460 0.06%Province of Quebec Canada 1,800,000 1.50% 15/12/2023 1,830,600 0.05%Export Development Canada 1,800,000 1.38% 8/12/2023 1,828,687 0.05%Bank of Nova Scotia 1,800,000 1.25% 8/6/2022 1,809,797 0.05%Bank of Montreal 1,750,000 1.38% 29/12/2021 1,766,446 0.05%
Vanguard U.K. Investment Grade Bond Index Fund
811
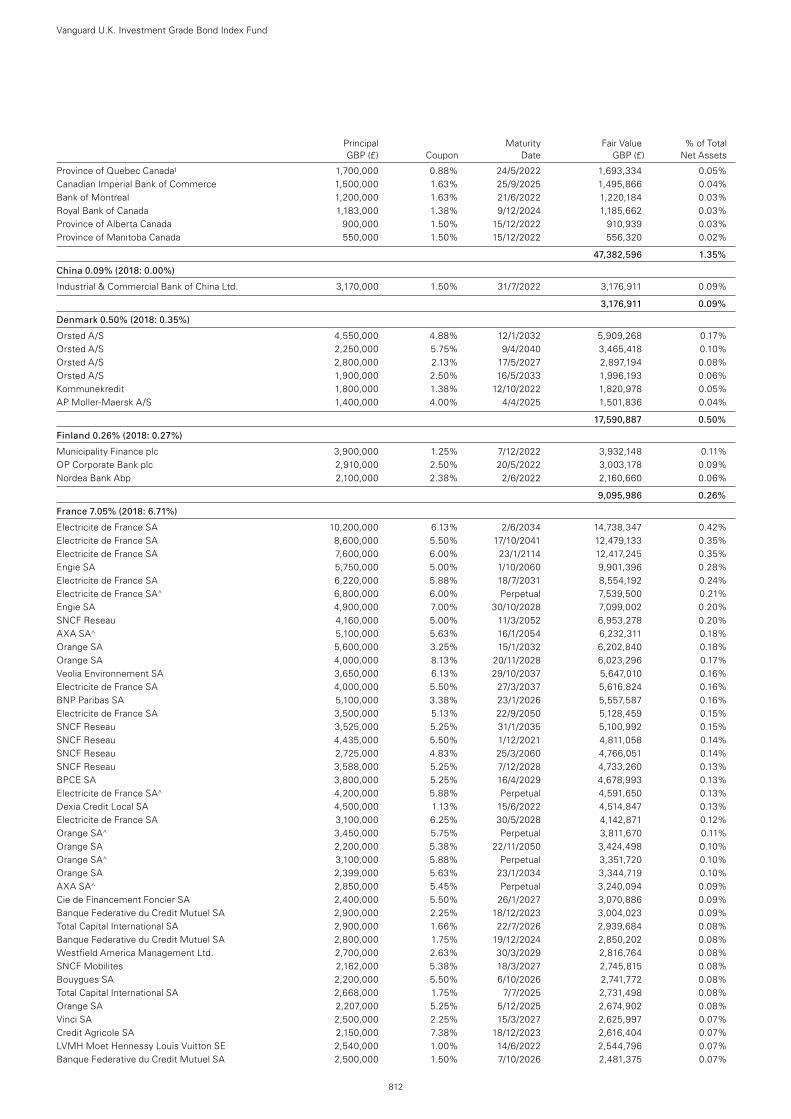
Principal Maturity Fair Value % of Total GBP (£) Coupon Date GBP (£) Net Assets
Province of Quebec Canada1 1,700,000 0.88% 24/5/2022 1,693,334 0.05%Canadian Imperial Bank of Commerce 1,500,000 1.63% 25/9/2025 1,495,866 0.04%Bank of Montreal 1,200,000 1.63% 21/6/2022 1,220,184 0.03%Royal Bank of Canada 1,183,000 1.38% 9/12/2024 1,185,662 0.03%Province of Alberta Canada 900,000 1.50% 15/12/2022 910,939 0.03%Province of Manitoba Canada 550,000 1.50% 15/12/2022 556,320 0.02%
47,382,596 1.35%
China 0.09% (2018: 0.00%)
Industrial & Commercial Bank of China Ltd. 3,170,000 1.50% 31/7/2022 3,176,911 0.09%
3,176,911 0.09%
Denmark 0.50% (2018: 0.35%)
Orsted A/S 4,550,000 4.88% 12/1/2032 5,909,268 0.17%Orsted A/S 2,250,000 5.75% 9/4/2040 3,465,418 0.10%Orsted A/S 2,800,000 2.13% 17/5/2027 2,897,194 0.08%Orsted A/S 1,900,000 2.50% 16/5/2033 1,996,193 0.06%Kommunekredit 1,800,000 1.38% 12/10/2022 1,820,978 0.05%AP Moller-Maersk A/S 1,400,000 4.00% 4/4/2025 1,501,836 0.04%
17,590,887 0.50%
Finland 0.26% (2018: 0.27%)
Municipality Finance plc 3,900,000 1.25% 7/12/2022 3,932,148 0.11%OP Corporate Bank plc 2,910,000 2.50% 20/5/2022 3,003,178 0.09%Nordea Bank Abp 2,100,000 2.38% 2/6/2022 2,160,660 0.06%
9,095,986 0.26%
France 7.05% (2018: 6.71%)
Electricite de France SA 10,200,000 6.13% 2/6/2034 14,738,347 0.42%Electricite de France SA 8,600,000 5.50% 17/10/2041 12,479,133 0.35%Electricite de France SA 7,600,000 6.00% 23/1/2114 12,417,245 0.35%Engie SA 5,750,000 5.00% 1/10/2060 9,901,396 0.28%Electricite de France SA 6,220,000 5.88% 18/7/2031 8,554,192 0.24%Electricite de France SA^ 6,800,000 6.00% Perpetual 7,539,500 0.21%Engie SA 4,900,000 7.00% 30/10/2028 7,099,002 0.20%SNCF Reseau 4,160,000 5.00% 11/3/2052 6,953,278 0.20%AXA SA^ 5,100,000 5.63% 16/1/2054 6,232,311 0.18%Orange SA 5,600,000 3.25% 15/1/2032 6,202,840 0.18%Orange SA 4,000,000 8.13% 20/11/2028 6,023,296 0.17%Veolia Environnement SA 3,650,000 6.13% 29/10/2037 5,647,010 0.16%Electricite de France SA 4,000,000 5.50% 27/3/2037 5,616,824 0.16%BNP Paribas SA 5,100,000 3.38% 23/1/2026 5,557,587 0.16%Electricite de France SA 3,500,000 5.13% 22/9/2050 5,128,459 0.15%SNCF Reseau 3,525,000 5.25% 31/1/2035 5,100,992 0.15%SNCF Reseau 4,435,000 5.50% 1/12/2021 4,811,058 0.14%SNCF Reseau 2,725,000 4.83% 25/3/2060 4,766,051 0.14%SNCF Reseau 3,588,000 5.25% 7/12/2028 4,733,260 0.13%BPCE SA 3,800,000 5.25% 16/4/2029 4,678,993 0.13%Electricite de France SA^ 4,200,000 5.88% Perpetual 4,591,650 0.13%Dexia Credit Local SA 4,500,000 1.13% 15/6/2022 4,514,847 0.13%Electricite de France SA 3,100,000 6.25% 30/5/2028 4,142,871 0.12%Orange SA^ 3,450,000 5.75% Perpetual 3,811,670 0.11%Orange SA 2,200,000 5.38% 22/11/2050 3,424,498 0.10%Orange SA^ 3,100,000 5.88% Perpetual 3,351,720 0.10%Orange SA 2,399,000 5.63% 23/1/2034 3,344,719 0.10%AXA SA^ 2,850,000 5.45% Perpetual 3,240,094 0.09%Cie de Financement Foncier SA 2,400,000 5.50% 26/1/2027 3,070,886 0.09%Banque Federative du Credit Mutuel SA 2,900,000 2.25% 18/12/2023 3,004,023 0.09%Total Capital International SA 2,900,000 1.66% 22/7/2026 2,939,684 0.08%Banque Federative du Credit Mutuel SA 2,800,000 1.75% 19/12/2024 2,850,202 0.08%Westfield America Management Ltd. 2,700,000 2.63% 30/3/2029 2,816,764 0.08%SNCF Mobilites 2,162,000 5.38% 18/3/2027 2,745,815 0.08%Bouygues SA 2,200,000 5.50% 6/10/2026 2,741,772 0.08%Total Capital International SA 2,668,000 1.75% 7/7/2025 2,731,498 0.08%Orange SA 2,207,000 5.25% 5/12/2025 2,674,902 0.08%Vinci SA 2,500,000 2.25% 15/3/2027 2,625,997 0.07%Credit Agricole SA 2,150,000 7.38% 18/12/2023 2,616,404 0.07%LVMH Moet Hennessy Louis Vuitton SE 2,540,000 1.00% 14/6/2022 2,544,796 0.07%Banque Federative du Credit Mutuel SA 2,500,000 1.50% 7/10/2026 2,481,375 0.07%
Vanguard U.K. Investment Grade Bond Index Fund
812
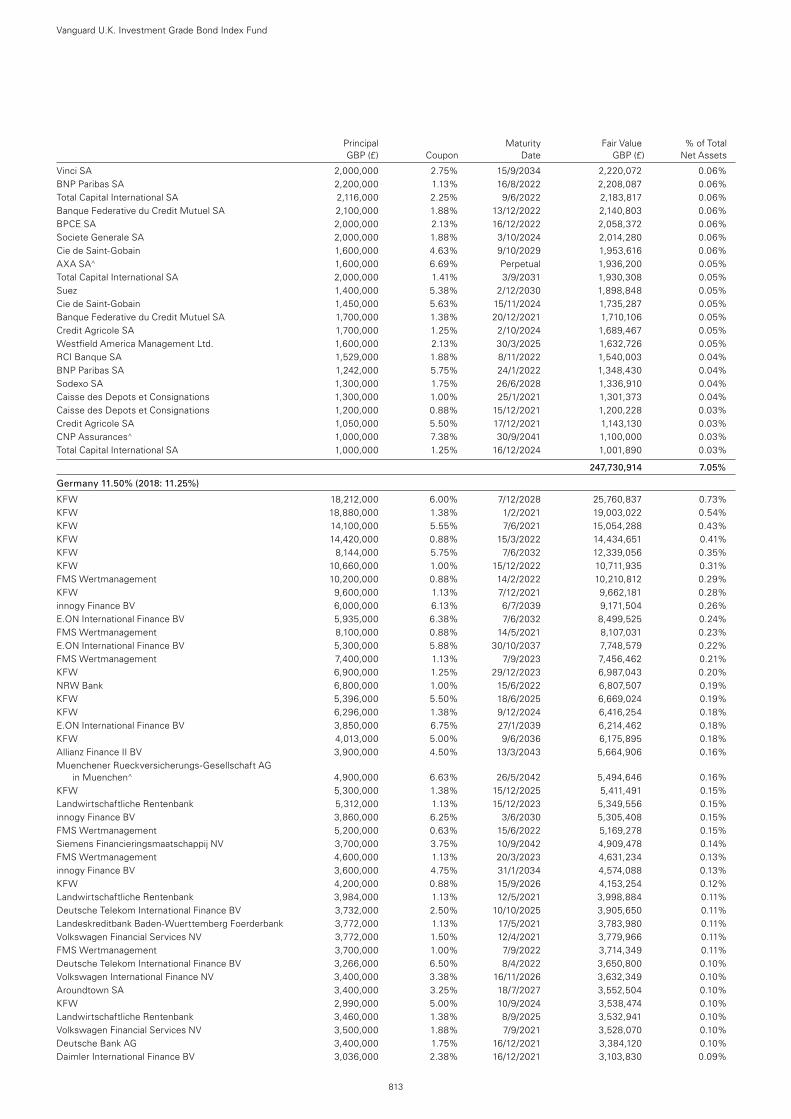
Principal Maturity Fair Value % of Total GBP (£) Coupon Date GBP (£) Net Assets
Vinci SA 2,000,000 2.75% 15/9/2034 2,220,072 0.06%BNP Paribas SA 2,200,000 1.13% 16/8/2022 2,208,087 0.06%Total Capital International SA 2,116,000 2.25% 9/6/2022 2,183,817 0.06%Banque Federative du Credit Mutuel SA 2,100,000 1.88% 13/12/2022 2,140,803 0.06%BPCE SA 2,000,000 2.13% 16/12/2022 2,058,372 0.06%Societe Generale SA 2,000,000 1.88% 3/10/2024 2,014,280 0.06%Cie de Saint-Gobain 1,600,000 4.63% 9/10/2029 1,953,616 0.06%AXA SA^ 1,600,000 6.69% Perpetual 1,936,200 0.05%Total Capital International SA 2,000,000 1.41% 3/9/2031 1,930,308 0.05%Suez 1,400,000 5.38% 2/12/2030 1,898,848 0.05%Cie de Saint-Gobain 1,450,000 5.63% 15/11/2024 1,735,287 0.05%Banque Federative du Credit Mutuel SA 1,700,000 1.38% 20/12/2021 1,710,106 0.05%Credit Agricole SA 1,700,000 1.25% 2/10/2024 1,689,467 0.05%Westfield America Management Ltd. 1,600,000 2.13% 30/3/2025 1,632,726 0.05%RCI Banque SA 1,529,000 1.88% 8/11/2022 1,540,003 0.04%BNP Paribas SA 1,242,000 5.75% 24/1/2022 1,348,430 0.04%Sodexo SA 1,300,000 1.75% 26/6/2028 1,336,910 0.04%Caisse des Depots et Consignations 1,300,000 1.00% 25/1/2021 1,301,373 0.04%Caisse des Depots et Consignations 1,200,000 0.88% 15/12/2021 1,200,228 0.03%Credit Agricole SA 1,050,000 5.50% 17/12/2021 1,143,130 0.03%CNP Assurances^ 1,000,000 7.38% 30/9/2041 1,100,000 0.03%Total Capital International SA 1,000,000 1.25% 16/12/2024 1,001,890 0.03%
247,730,914 7.05%
Germany 11.50% (2018: 11.25%)
KFW 18,212,000 6.00% 7/12/2028 25,760,837 0.73%KFW 18,880,000 1.38% 1/2/2021 19,003,022 0.54%KFW 14,100,000 5.55% 7/6/2021 15,054,288 0.43%KFW 14,420,000 0.88% 15/3/2022 14,434,651 0.41%KFW 8,144,000 5.75% 7/6/2032 12,339,056 0.35%KFW 10,660,000 1.00% 15/12/2022 10,711,935 0.31%FMS Wertmanagement 10,200,000 0.88% 14/2/2022 10,210,812 0.29%KFW 9,600,000 1.13% 7/12/2021 9,662,181 0.28%innogy Finance BV 6,000,000 6.13% 6/7/2039 9,171,504 0.26%E.ON International Finance BV 5,935,000 6.38% 7/6/2032 8,499,525 0.24%FMS Wertmanagement 8,100,000 0.88% 14/5/2021 8,107,031 0.23%E.ON International Finance BV 5,300,000 5.88% 30/10/2037 7,748,579 0.22%FMS Wertmanagement 7,400,000 1.13% 7/9/2023 7,456,462 0.21%KFW 6,900,000 1.25% 29/12/2023 6,987,043 0.20%NRW Bank 6,800,000 1.00% 15/6/2022 6,807,507 0.19%KFW 5,396,000 5.50% 18/6/2025 6,669,024 0.19%KFW 6,296,000 1.38% 9/12/2024 6,416,254 0.18%E.ON International Finance BV 3,850,000 6.75% 27/1/2039 6,214,462 0.18%KFW 4,013,000 5.00% 9/6/2036 6,175,895 0.18%Allianz Finance II BV 3,900,000 4.50% 13/3/2043 5,664,906 0.16%Muenchener Rueckversicherungs-Gesellschaft AG
in Muenchen^ 4,900,000 6.63% 26/5/2042 5,494,646 0.16%KFW 5,300,000 1.38% 15/12/2025 5,411,491 0.15%Landwirtschaftliche Rentenbank 5,312,000 1.13% 15/12/2023 5,349,556 0.15%innogy Finance BV 3,860,000 6.25% 3/6/2030 5,305,408 0.15%FMS Wertmanagement 5,200,000 0.63% 15/6/2022 5,169,278 0.15%Siemens Financieringsmaatschappij NV 3,700,000 3.75% 10/9/2042 4,909,478 0.14%FMS Wertmanagement 4,600,000 1.13% 20/3/2023 4,631,234 0.13%innogy Finance BV 3,600,000 4.75% 31/1/2034 4,574,088 0.13%KFW 4,200,000 0.88% 15/9/2026 4,153,254 0.12%Landwirtschaftliche Rentenbank 3,984,000 1.13% 12/5/2021 3,998,884 0.11%Deutsche Telekom International Finance BV 3,732,000 2.50% 10/10/2025 3,905,650 0.11%Landeskreditbank Baden-Wuerttemberg Foerderbank 3,772,000 1.13% 17/5/2021 3,783,980 0.11%Volkswagen Financial Services NV 3,772,000 1.50% 12/4/2021 3,779,966 0.11%FMS Wertmanagement 3,700,000 1.00% 7/9/2022 3,714,349 0.11%Deutsche Telekom International Finance BV 3,266,000 6.50% 8/4/2022 3,650,800 0.10%Volkswagen International Finance NV 3,400,000 3.38% 16/11/2026 3,632,349 0.10%Aroundtown SA 3,400,000 3.25% 18/7/2027 3,552,504 0.10%KFW 2,990,000 5.00% 10/9/2024 3,538,474 0.10%Landwirtschaftliche Rentenbank 3,460,000 1.38% 8/9/2025 3,532,941 0.10%Volkswagen Financial Services NV 3,500,000 1.88% 7/9/2021 3,528,070 0.10%Deutsche Bank AG 3,400,000 1.75% 16/12/2021 3,384,120 0.10%Daimler International Finance BV 3,036,000 2.38% 16/12/2021 3,103,830 0.09%
Vanguard U.K. Investment Grade Bond Index Fund
813
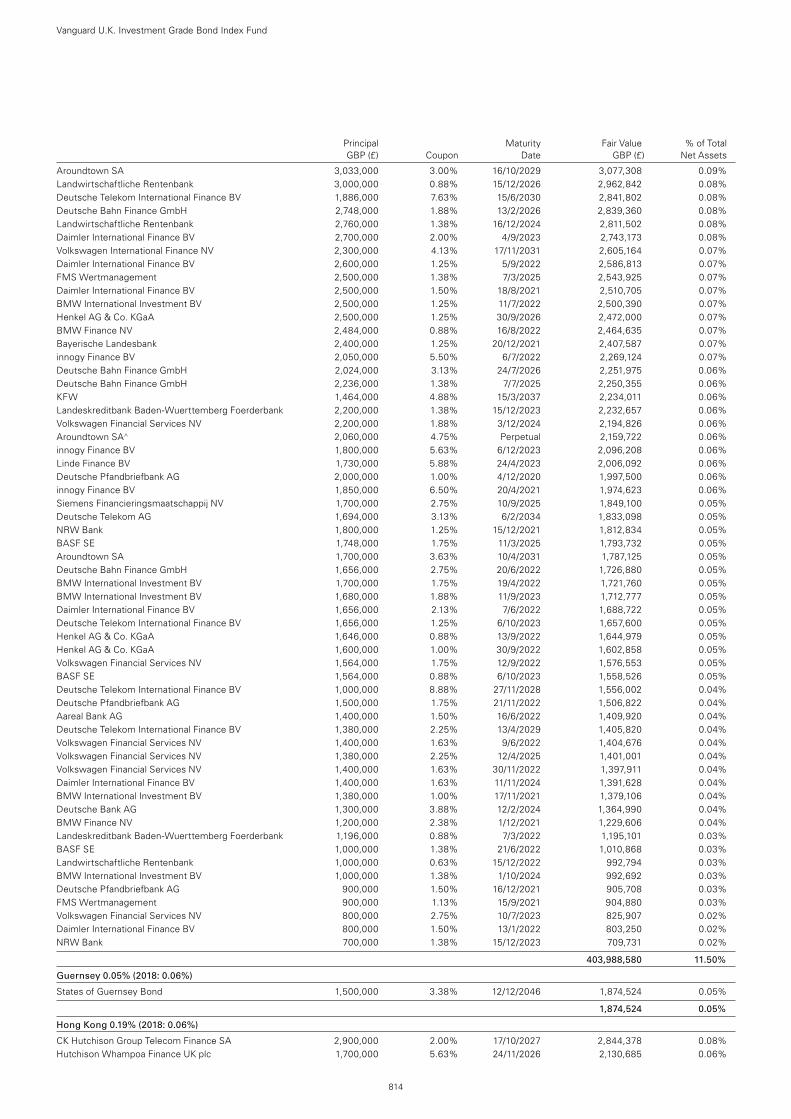
Principal Maturity Fair Value % of Total GBP (£) Coupon Date GBP (£) Net Assets
Aroundtown SA 3,033,000 3.00% 16/10/2029 3,077,308 0.09%Landwirtschaftliche Rentenbank 3,000,000 0.88% 15/12/2026 2,962,842 0.08%Deutsche Telekom International Finance BV 1,886,000 7.63% 15/6/2030 2,841,802 0.08%Deutsche Bahn Finance GmbH 2,748,000 1.88% 13/2/2026 2,839,360 0.08%Landwirtschaftliche Rentenbank 2,760,000 1.38% 16/12/2024 2,811,502 0.08%Daimler International Finance BV 2,700,000 2.00% 4/9/2023 2,743,173 0.08%Volkswagen International Finance NV 2,300,000 4.13% 17/11/2031 2,605,164 0.07%Daimler International Finance BV 2,600,000 1.25% 5/9/2022 2,586,813 0.07%FMS Wertmanagement 2,500,000 1.38% 7/3/2025 2,543,925 0.07%Daimler International Finance BV 2,500,000 1.50% 18/8/2021 2,510,705 0.07%BMW International Investment BV 2,500,000 1.25% 11/7/2022 2,500,390 0.07%Henkel AG & Co. KGaA 2,500,000 1.25% 30/9/2026 2,472,000 0.07%BMW Finance NV 2,484,000 0.88% 16/8/2022 2,464,635 0.07%Bayerische Landesbank 2,400,000 1.25% 20/12/2021 2,407,587 0.07%innogy Finance BV 2,050,000 5.50% 6/7/2022 2,269,124 0.07%Deutsche Bahn Finance GmbH 2,024,000 3.13% 24/7/2026 2,251,975 0.06%Deutsche Bahn Finance GmbH 2,236,000 1.38% 7/7/2025 2,250,355 0.06%KFW 1,464,000 4.88% 15/3/2037 2,234,011 0.06%Landeskreditbank Baden-Wuerttemberg Foerderbank 2,200,000 1.38% 15/12/2023 2,232,657 0.06%Volkswagen Financial Services NV 2,200,000 1.88% 3/12/2024 2,194,826 0.06%Aroundtown SA^ 2,060,000 4.75% Perpetual 2,159,722 0.06%innogy Finance BV 1,800,000 5.63% 6/12/2023 2,096,208 0.06%Linde Finance BV 1,730,000 5.88% 24/4/2023 2,006,092 0.06%Deutsche Pfandbriefbank AG 2,000,000 1.00% 4/12/2020 1,997,500 0.06%innogy Finance BV 1,850,000 6.50% 20/4/2021 1,974,623 0.06%Siemens Financieringsmaatschappij NV 1,700,000 2.75% 10/9/2025 1,849,100 0.05%Deutsche Telekom AG 1,694,000 3.13% 6/2/2034 1,833,098 0.05%NRW Bank 1,800,000 1.25% 15/12/2021 1,812,834 0.05%BASF SE 1,748,000 1.75% 11/3/2025 1,793,732 0.05%Aroundtown SA 1,700,000 3.63% 10/4/2031 1,787,125 0.05%Deutsche Bahn Finance GmbH 1,656,000 2.75% 20/6/2022 1,726,880 0.05%BMW International Investment BV 1,700,000 1.75% 19/4/2022 1,721,760 0.05%BMW International Investment BV 1,680,000 1.88% 11/9/2023 1,712,777 0.05%Daimler International Finance BV 1,656,000 2.13% 7/6/2022 1,688,722 0.05%Deutsche Telekom International Finance BV 1,656,000 1.25% 6/10/2023 1,657,600 0.05%Henkel AG & Co. KGaA 1,646,000 0.88% 13/9/2022 1,644,979 0.05%Henkel AG & Co. KGaA 1,600,000 1.00% 30/9/2022 1,602,858 0.05%Volkswagen Financial Services NV 1,564,000 1.75% 12/9/2022 1,576,553 0.05%BASF SE 1,564,000 0.88% 6/10/2023 1,558,526 0.05%Deutsche Telekom International Finance BV 1,000,000 8.88% 27/11/2028 1,556,002 0.04%Deutsche Pfandbriefbank AG 1,500,000 1.75% 21/11/2022 1,506,822 0.04%Aareal Bank AG 1,400,000 1.50% 16/6/2022 1,409,920 0.04%Deutsche Telekom International Finance BV 1,380,000 2.25% 13/4/2029 1,405,820 0.04%Volkswagen Financial Services NV 1,400,000 1.63% 9/6/2022 1,404,676 0.04%Volkswagen Financial Services NV 1,380,000 2.25% 12/4/2025 1,401,001 0.04%Volkswagen Financial Services NV 1,400,000 1.63% 30/11/2022 1,397,911 0.04%Daimler International Finance BV 1,400,000 1.63% 11/11/2024 1,391,628 0.04%BMW International Investment BV 1,380,000 1.00% 17/11/2021 1,379,106 0.04%Deutsche Bank AG 1,300,000 3.88% 12/2/2024 1,364,990 0.04%BMW Finance NV 1,200,000 2.38% 1/12/2021 1,229,606 0.04%Landeskreditbank Baden-Wuerttemberg Foerderbank 1,196,000 0.88% 7/3/2022 1,195,101 0.03%BASF SE 1,000,000 1.38% 21/6/2022 1,010,868 0.03%Landwirtschaftliche Rentenbank 1,000,000 0.63% 15/12/2022 992,794 0.03%BMW International Investment BV 1,000,000 1.38% 1/10/2024 992,692 0.03%Deutsche Pfandbriefbank AG 900,000 1.50% 16/12/2021 905,708 0.03%FMS Wertmanagement 900,000 1.13% 15/9/2021 904,880 0.03%Volkswagen Financial Services NV 800,000 2.75% 10/7/2023 825,907 0.02%Daimler International Finance BV 800,000 1.50% 13/1/2022 803,250 0.02%NRW Bank 700,000 1.38% 15/12/2023 709,731 0.02%
403,988,580 11.50%
Guernsey 0.05% (2018: 0.06%)
States of Guernsey Bond 1,500,000 3.38% 12/12/2046 1,874,524 0.05%
1,874,524 0.05%
Hong Kong 0.19% (2018: 0.06%)
CK Hutchison Group Telecom Finance SA 2,900,000 2.00% 17/10/2027 2,844,378 0.08%Hutchison Whampoa Finance UK plc 1,700,000 5.63% 24/11/2026 2,130,685 0.06%
Vanguard U.K. Investment Grade Bond Index Fund
814
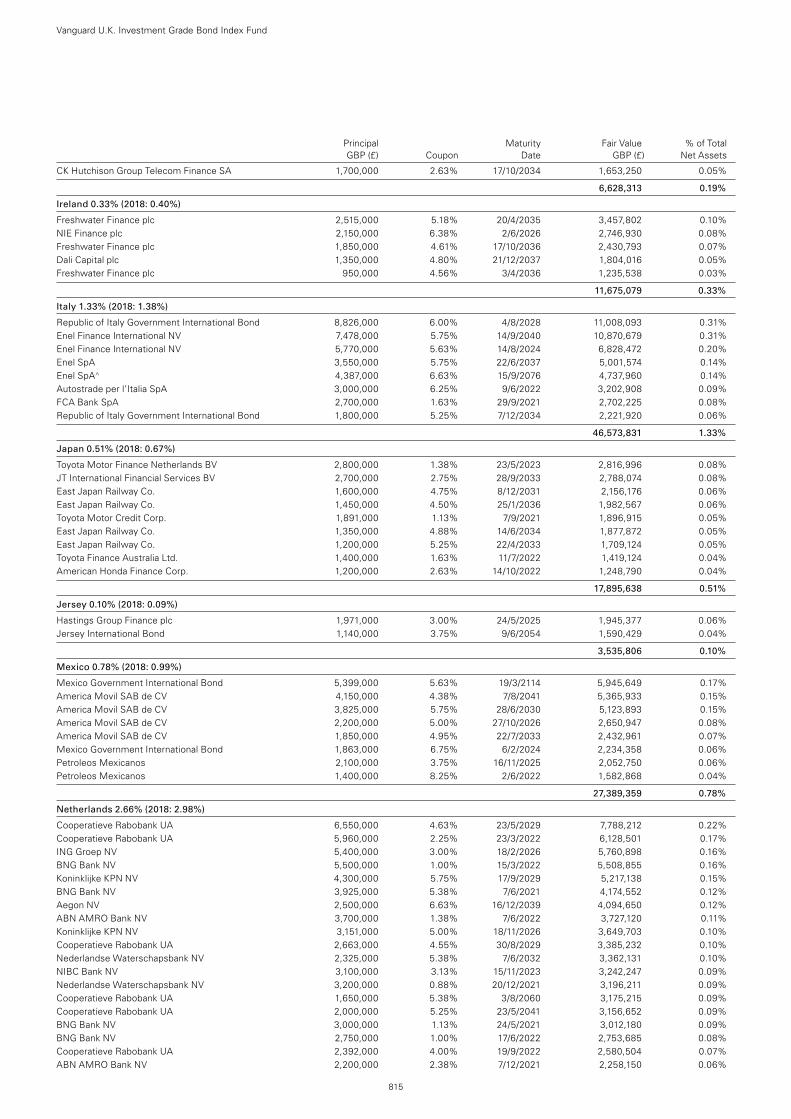
Principal Maturity Fair Value % of Total GBP (£) Coupon Date GBP (£) Net Assets
CK Hutchison Group Telecom Finance SA 1,700,000 2.63% 17/10/2034 1,653,250 0.05%
6,628,313 0.19%
Ireland 0.33% (2018: 0.40%)
Freshwater Finance plc 2,515,000 5.18% 20/4/2035 3,457,802 0.10%NIE Finance plc 2,150,000 6.38% 2/6/2026 2,746,930 0.08%Freshwater Finance plc 1,850,000 4.61% 17/10/2036 2,430,793 0.07%Dali Capital plc 1,350,000 4.80% 21/12/2037 1,804,016 0.05%Freshwater Finance plc 950,000 4.56% 3/4/2036 1,235,538 0.03%
11,675,079 0.33%
Italy 1.33% (2018: 1.38%)
Republic of Italy Government International Bond 8,826,000 6.00% 4/8/2028 11,008,093 0.31%Enel Finance International NV 7,478,000 5.75% 14/9/2040 10,870,679 0.31%Enel Finance International NV 5,770,000 5.63% 14/8/2024 6,828,472 0.20%Enel SpA 3,550,000 5.75% 22/6/2037 5,001,574 0.14%Enel SpA^ 4,387,000 6.63% 15/9/2076 4,737,960 0.14%Autostrade per l’Italia SpA 3,000,000 6.25% 9/6/2022 3,202,908 0.09%FCA Bank SpA 2,700,000 1.63% 29/9/2021 2,702,225 0.08%Republic of Italy Government International Bond 1,800,000 5.25% 7/12/2034 2,221,920 0.06%
46,573,831 1.33%
Japan 0.51% (2018: 0.67%)
Toyota Motor Finance Netherlands BV 2,800,000 1.38% 23/5/2023 2,816,996 0.08%JT International Financial Services BV 2,700,000 2.75% 28/9/2033 2,788,074 0.08%East Japan Railway Co. 1,600,000 4.75% 8/12/2031 2,156,176 0.06%East Japan Railway Co. 1,450,000 4.50% 25/1/2036 1,982,567 0.06%Toyota Motor Credit Corp. 1,891,000 1.13% 7/9/2021 1,896,915 0.05%East Japan Railway Co. 1,350,000 4.88% 14/6/2034 1,877,872 0.05%East Japan Railway Co. 1,200,000 5.25% 22/4/2033 1,709,124 0.05%Toyota Finance Australia Ltd. 1,400,000 1.63% 11/7/2022 1,419,124 0.04%American Honda Finance Corp. 1,200,000 2.63% 14/10/2022 1,248,790 0.04%
17,895,638 0.51%
Jersey 0.10% (2018: 0.09%)
Hastings Group Finance plc 1,971,000 3.00% 24/5/2025 1,945,377 0.06%Jersey International Bond 1,140,000 3.75% 9/6/2054 1,590,429 0.04%
3,535,806 0.10%
Mexico 0.78% (2018: 0.99%)
Mexico Government International Bond 5,399,000 5.63% 19/3/2114 5,945,649 0.17%America Movil SAB de CV 4,150,000 4.38% 7/8/2041 5,365,933 0.15%America Movil SAB de CV 3,825,000 5.75% 28/6/2030 5,123,893 0.15%America Movil SAB de CV 2,200,000 5.00% 27/10/2026 2,650,947 0.08%America Movil SAB de CV 1,850,000 4.95% 22/7/2033 2,432,961 0.07%Mexico Government International Bond 1,863,000 6.75% 6/2/2024 2,234,358 0.06%Petroleos Mexicanos 2,100,000 3.75% 16/11/2025 2,052,750 0.06%Petroleos Mexicanos 1,400,000 8.25% 2/6/2022 1,582,868 0.04%
27,389,359 0.78%
Netherlands 2.66% (2018: 2.98%)
Cooperatieve Rabobank UA 6,550,000 4.63% 23/5/2029 7,788,212 0.22%Cooperatieve Rabobank UA 5,960,000 2.25% 23/3/2022 6,128,501 0.17%ING Groep NV 5,400,000 3.00% 18/2/2026 5,760,898 0.16%BNG Bank NV 5,500,000 1.00% 15/3/2022 5,508,855 0.16%Koninklijke KPN NV 4,300,000 5.75% 17/9/2029 5,217,138 0.15%BNG Bank NV 3,925,000 5.38% 7/6/2021 4,174,552 0.12%Aegon NV 2,500,000 6.63% 16/12/2039 4,094,650 0.12%ABN AMRO Bank NV 3,700,000 1.38% 7/6/2022 3,727,120 0.11%Koninklijke KPN NV 3,151,000 5.00% 18/11/2026 3,649,703 0.10%Cooperatieve Rabobank UA 2,663,000 4.55% 30/8/2029 3,385,232 0.10%Nederlandse Waterschapsbank NV 2,325,000 5.38% 7/6/2032 3,362,131 0.10%NIBC Bank NV 3,100,000 3.13% 15/11/2023 3,242,247 0.09%Nederlandse Waterschapsbank NV 3,200,000 0.88% 20/12/2021 3,196,211 0.09%Cooperatieve Rabobank UA 1,650,000 5.38% 3/8/2060 3,175,215 0.09%Cooperatieve Rabobank UA 2,000,000 5.25% 23/5/2041 3,156,652 0.09%BNG Bank NV 3,000,000 1.13% 24/5/2021 3,012,180 0.09%BNG Bank NV 2,750,000 1.00% 17/6/2022 2,753,685 0.08%Cooperatieve Rabobank UA 2,392,000 4.00% 19/9/2022 2,580,504 0.07%ABN AMRO Bank NV 2,200,000 2.38% 7/12/2021 2,258,150 0.06%
Vanguard U.K. Investment Grade Bond Index Fund
815
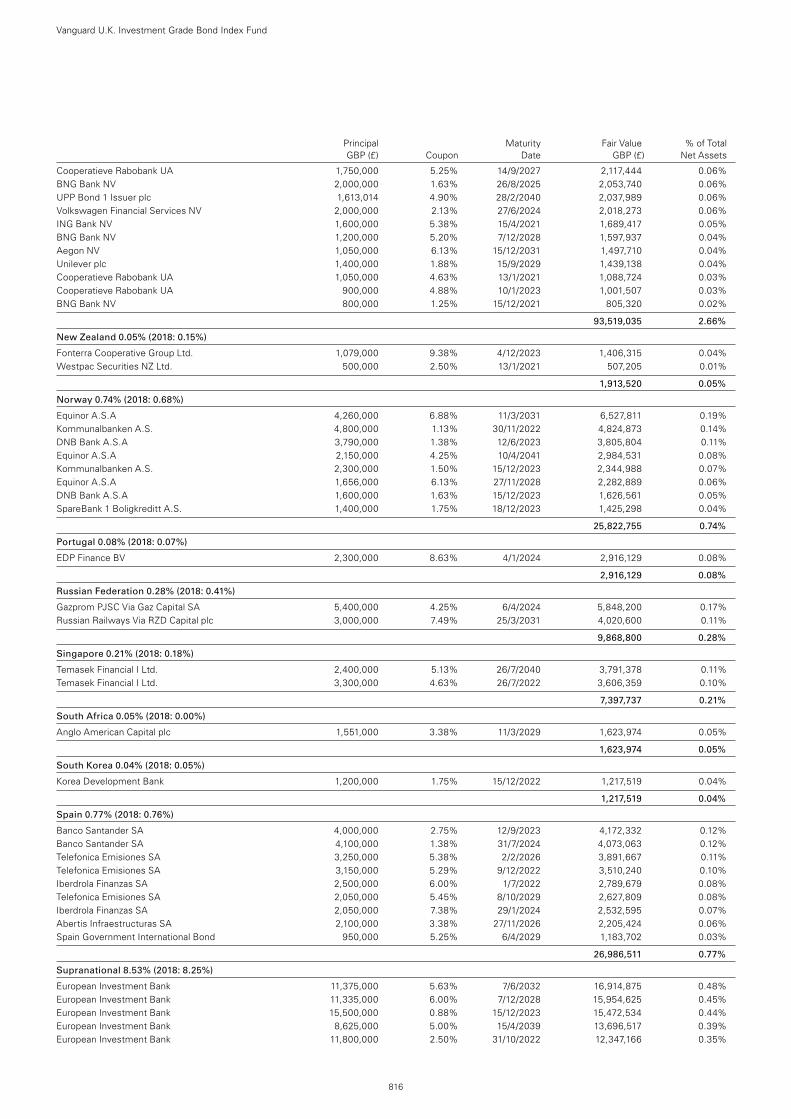
Principal Maturity Fair Value % of Total GBP (£) Coupon Date GBP (£) Net Assets
Cooperatieve Rabobank UA 1,750,000 5.25% 14/9/2027 2,117,444 0.06%BNG Bank NV 2,000,000 1.63% 26/8/2025 2,053,740 0.06%UPP Bond 1 Issuer plc 1,613,014 4.90% 28/2/2040 2,037,989 0.06%Volkswagen Financial Services NV 2,000,000 2.13% 27/6/2024 2,018,273 0.06%ING Bank NV 1,600,000 5.38% 15/4/2021 1,689,417 0.05%BNG Bank NV 1,200,000 5.20% 7/12/2028 1,597,937 0.04%Aegon NV 1,050,000 6.13% 15/12/2031 1,497,710 0.04%Unilever plc 1,400,000 1.88% 15/9/2029 1,439,138 0.04%Cooperatieve Rabobank UA 1,050,000 4.63% 13/1/2021 1,088,724 0.03%Cooperatieve Rabobank UA 900,000 4.88% 10/1/2023 1,001,507 0.03%BNG Bank NV 800,000 1.25% 15/12/2021 805,320 0.02%
93,519,035 2.66%
New Zealand 0.05% (2018: 0.15%)
Fonterra Cooperative Group Ltd. 1,079,000 9.38% 4/12/2023 1,406,315 0.04%Westpac Securities NZ Ltd. 500,000 2.50% 13/1/2021 507,205 0.01%
1,913,520 0.05%
Norway 0.74% (2018: 0.68%)
Equinor A.S.A 4,260,000 6.88% 11/3/2031 6,527,811 0.19%Kommunalbanken A.S. 4,800,000 1.13% 30/11/2022 4,824,873 0.14%DNB Bank A.S.A 3,790,000 1.38% 12/6/2023 3,805,804 0.11%Equinor A.S.A 2,150,000 4.25% 10/4/2041 2,984,531 0.08%Kommunalbanken A.S. 2,300,000 1.50% 15/12/2023 2,344,988 0.07%Equinor A.S.A 1,656,000 6.13% 27/11/2028 2,282,889 0.06%DNB Bank A.S.A 1,600,000 1.63% 15/12/2023 1,626,561 0.05%SpareBank 1 Boligkreditt A.S. 1,400,000 1.75% 18/12/2023 1,425,298 0.04%
25,822,755 0.74%
Portugal 0.08% (2018: 0.07%)
EDP Finance BV 2,300,000 8.63% 4/1/2024 2,916,129 0.08%
2,916,129 0.08%
Russian Federation 0.28% (2018: 0.41%)
Gazprom PJSC Via Gaz Capital SA 5,400,000 4.25% 6/4/2024 5,848,200 0.17%Russian Railways Via RZD Capital plc 3,000,000 7.49% 25/3/2031 4,020,600 0.11%
9,868,800 0.28%
Singapore 0.21% (2018: 0.18%)
Temasek Financial I Ltd. 2,400,000 5.13% 26/7/2040 3,791,378 0.11%Temasek Financial I Ltd. 3,300,000 4.63% 26/7/2022 3,606,359 0.10%
7,397,737 0.21%
South Africa 0.05% (2018: 0.00%)
Anglo American Capital plc 1,551,000 3.38% 11/3/2029 1,623,974 0.05%
1,623,974 0.05%
South Korea 0.04% (2018: 0.05%)
Korea Development Bank 1,200,000 1.75% 15/12/2022 1,217,519 0.04%
1,217,519 0.04%
Spain 0.77% (2018: 0.76%)
Banco Santander SA 4,000,000 2.75% 12/9/2023 4,172,332 0.12%Banco Santander SA 4,100,000 1.38% 31/7/2024 4,073,063 0.12%Telefonica Emisiones SA 3,250,000 5.38% 2/2/2026 3,891,667 0.11%Telefonica Emisiones SA 3,150,000 5.29% 9/12/2022 3,510,240 0.10%Iberdrola Finanzas SA 2,500,000 6.00% 1/7/2022 2,789,679 0.08%Telefonica Emisiones SA 2,050,000 5.45% 8/10/2029 2,627,809 0.08%Iberdrola Finanzas SA 2,050,000 7.38% 29/1/2024 2,532,595 0.07%Abertis Infraestructuras SA 2,100,000 3.38% 27/11/2026 2,205,424 0.06%Spain Government International Bond 950,000 5.25% 6/4/2029 1,183,702 0.03%
26,986,511 0.77%
Supranational 8.53% (2018: 8.25%)
European Investment Bank 11,375,000 5.63% 7/6/2032 16,914,875 0.48%European Investment Bank 11,335,000 6.00% 7/12/2028 15,954,625 0.45%European Investment Bank 15,500,000 0.88% 15/12/2023 15,472,534 0.44%European Investment Bank 8,625,000 5.00% 15/4/2039 13,696,517 0.39%European Investment Bank 11,800,000 2.50% 31/10/2022 12,347,166 0.35%
Vanguard U.K. Investment Grade Bond Index Fund
816
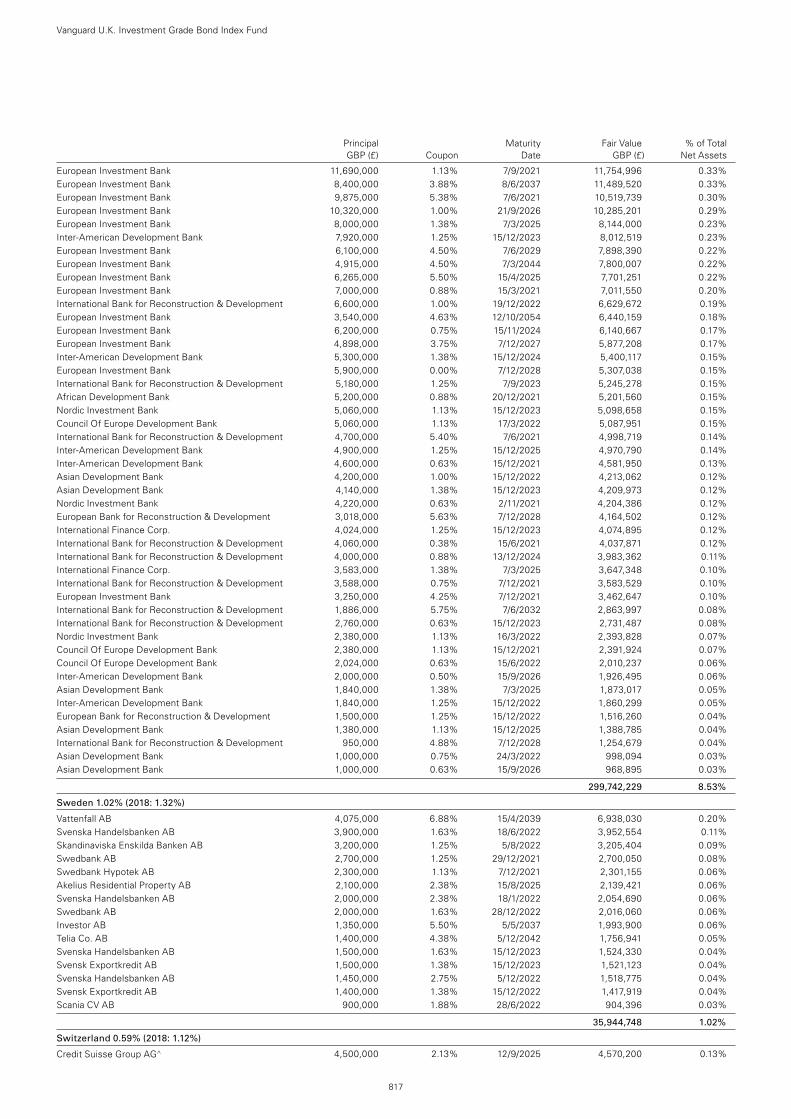
Principal Maturity Fair Value % of Total GBP (£) Coupon Date GBP (£) Net Assets
European Investment Bank 11,690,000 1.13% 7/9/2021 11,754,996 0.33%European Investment Bank 8,400,000 3.88% 8/6/2037 11,489,520 0.33%European Investment Bank 9,875,000 5.38% 7/6/2021 10,519,739 0.30%European Investment Bank 10,320,000 1.00% 21/9/2026 10,285,201 0.29%European Investment Bank 8,000,000 1.38% 7/3/2025 8,144,000 0.23%Inter-American Development Bank 7,920,000 1.25% 15/12/2023 8,012,519 0.23%European Investment Bank 6,100,000 4.50% 7/6/2029 7,898,390 0.22%European Investment Bank 4,915,000 4.50% 7/3/2044 7,800,007 0.22%European Investment Bank 6,265,000 5.50% 15/4/2025 7,701,251 0.22%European Investment Bank 7,000,000 0.88% 15/3/2021 7,011,550 0.20%International Bank for Reconstruction & Development 6,600,000 1.00% 19/12/2022 6,629,672 0.19%European Investment Bank 3,540,000 4.63% 12/10/2054 6,440,159 0.18%European Investment Bank 6,200,000 0.75% 15/11/2024 6,140,667 0.17%European Investment Bank 4,898,000 3.75% 7/12/2027 5,877,208 0.17%Inter-American Development Bank 5,300,000 1.38% 15/12/2024 5,400,117 0.15%European Investment Bank 5,900,000 0.00% 7/12/2028 5,307,038 0.15%International Bank for Reconstruction & Development 5,180,000 1.25% 7/9/2023 5,245,278 0.15%African Development Bank 5,200,000 0.88% 20/12/2021 5,201,560 0.15%Nordic Investment Bank 5,060,000 1.13% 15/12/2023 5,098,658 0.15%Council Of Europe Development Bank 5,060,000 1.13% 17/3/2022 5,087,951 0.15%International Bank for Reconstruction & Development 4,700,000 5.40% 7/6/2021 4,998,719 0.14%Inter-American Development Bank 4,900,000 1.25% 15/12/2025 4,970,790 0.14%Inter-American Development Bank 4,600,000 0.63% 15/12/2021 4,581,950 0.13%Asian Development Bank 4,200,000 1.00% 15/12/2022 4,213,062 0.12%Asian Development Bank 4,140,000 1.38% 15/12/2023 4,209,973 0.12%Nordic Investment Bank 4,220,000 0.63% 2/11/2021 4,204,386 0.12%European Bank for Reconstruction & Development 3,018,000 5.63% 7/12/2028 4,164,502 0.12%International Finance Corp. 4,024,000 1.25% 15/12/2023 4,074,895 0.12%International Bank for Reconstruction & Development 4,060,000 0.38% 15/6/2021 4,037,871 0.12%International Bank for Reconstruction & Development 4,000,000 0.88% 13/12/2024 3,983,362 0.11%International Finance Corp. 3,583,000 1.38% 7/3/2025 3,647,348 0.10%International Bank for Reconstruction & Development 3,588,000 0.75% 7/12/2021 3,583,529 0.10%European Investment Bank 3,250,000 4.25% 7/12/2021 3,462,647 0.10%International Bank for Reconstruction & Development 1,886,000 5.75% 7/6/2032 2,863,997 0.08%International Bank for Reconstruction & Development 2,760,000 0.63% 15/12/2023 2,731,487 0.08%Nordic Investment Bank 2,380,000 1.13% 16/3/2022 2,393,828 0.07%Council Of Europe Development Bank 2,380,000 1.13% 15/12/2021 2,391,924 0.07%Council Of Europe Development Bank 2,024,000 0.63% 15/6/2022 2,010,237 0.06%Inter-American Development Bank 2,000,000 0.50% 15/9/2026 1,926,495 0.06%Asian Development Bank 1,840,000 1.38% 7/3/2025 1,873,017 0.05%Inter-American Development Bank 1,840,000 1.25% 15/12/2022 1,860,299 0.05%European Bank for Reconstruction & Development 1,500,000 1.25% 15/12/2022 1,516,260 0.04%Asian Development Bank 1,380,000 1.13% 15/12/2025 1,388,785 0.04%International Bank for Reconstruction & Development 950,000 4.88% 7/12/2028 1,254,679 0.04%Asian Development Bank 1,000,000 0.75% 24/3/2022 998,094 0.03%Asian Development Bank 1,000,000 0.63% 15/9/2026 968,895 0.03%
299,742,229 8.53%
Sweden 1.02% (2018: 1.32%)
Vattenfall AB 4,075,000 6.88% 15/4/2039 6,938,030 0.20%Svenska Handelsbanken AB 3,900,000 1.63% 18/6/2022 3,952,554 0.11%Skandinaviska Enskilda Banken AB 3,200,000 1.25% 5/8/2022 3,205,404 0.09%Swedbank AB 2,700,000 1.25% 29/12/2021 2,700,050 0.08%Swedbank Hypotek AB 2,300,000 1.13% 7/12/2021 2,301,155 0.06%Akelius Residential Property AB 2,100,000 2.38% 15/8/2025 2,139,421 0.06%Svenska Handelsbanken AB 2,000,000 2.38% 18/1/2022 2,054,690 0.06%Swedbank AB 2,000,000 1.63% 28/12/2022 2,016,060 0.06%Investor AB 1,350,000 5.50% 5/5/2037 1,993,900 0.06%Telia Co. AB 1,400,000 4.38% 5/12/2042 1,756,941 0.05%Svenska Handelsbanken AB 1,500,000 1.63% 15/12/2023 1,524,330 0.04%Svensk Exportkredit AB 1,500,000 1.38% 15/12/2023 1,521,123 0.04%Svenska Handelsbanken AB 1,450,000 2.75% 5/12/2022 1,518,775 0.04%Svensk Exportkredit AB 1,400,000 1.38% 15/12/2022 1,417,919 0.04%Scania CV AB 900,000 1.88% 28/6/2022 904,396 0.03%
35,944,748 1.02%
Switzerland 0.59% (2018: 1.12%)
Credit Suisse Group AG^ 4,500,000 2.13% 12/9/2025 4,570,200 0.13%
Vanguard U.K. Investment Grade Bond Index Fund
817
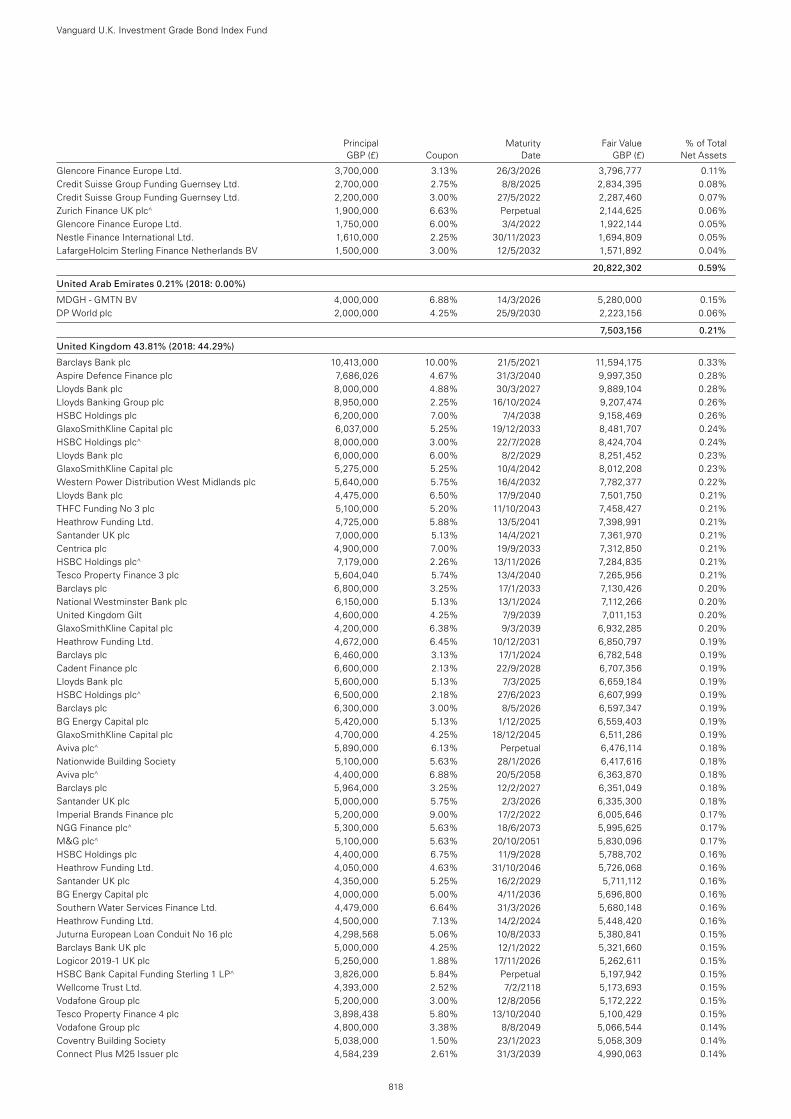
Principal Maturity Fair Value % of Total GBP (£) Coupon Date GBP (£) Net Assets
Glencore Finance Europe Ltd. 3,700,000 3.13% 26/3/2026 3,796,777 0.11%Credit Suisse Group Funding Guernsey Ltd. 2,700,000 2.75% 8/8/2025 2,834,395 0.08%Credit Suisse Group Funding Guernsey Ltd. 2,200,000 3.00% 27/5/2022 2,287,460 0.07%Zurich Finance UK plc^ 1,900,000 6.63% Perpetual 2,144,625 0.06%Glencore Finance Europe Ltd. 1,750,000 6.00% 3/4/2022 1,922,144 0.05%Nestle Finance International Ltd. 1,610,000 2.25% 30/11/2023 1,694,809 0.05%LafargeHolcim Sterling Finance Netherlands BV 1,500,000 3.00% 12/5/2032 1,571,892 0.04%
20,822,302 0.59%
United Arab Emirates 0.21% (2018: 0.00%)
MDGH - GMTN BV 4,000,000 6.88% 14/3/2026 5,280,000 0.15%DP World plc 2,000,000 4.25% 25/9/2030 2,223,156 0.06%
7,503,156 0.21%
United Kingdom 43.81% (2018: 44.29%)
Barclays Bank plc 10,413,000 10.00% 21/5/2021 11,594,175 0.33%Aspire Defence Finance plc 7,686,026 4.67% 31/3/2040 9,997,350 0.28%Lloyds Bank plc 8,000,000 4.88% 30/3/2027 9,889,104 0.28%Lloyds Banking Group plc 8,950,000 2.25% 16/10/2024 9,207,474 0.26%HSBC Holdings plc 6,200,000 7.00% 7/4/2038 9,158,469 0.26%GlaxoSmithKline Capital plc 6,037,000 5.25% 19/12/2033 8,481,707 0.24%HSBC Holdings plc^ 8,000,000 3.00% 22/7/2028 8,424,704 0.24%Lloyds Bank plc 6,000,000 6.00% 8/2/2029 8,251,452 0.23%GlaxoSmithKline Capital plc 5,275,000 5.25% 10/4/2042 8,012,208 0.23%Western Power Distribution West Midlands plc 5,640,000 5.75% 16/4/2032 7,782,377 0.22%Lloyds Bank plc 4,475,000 6.50% 17/9/2040 7,501,750 0.21%THFC Funding No 3 plc 5,100,000 5.20% 11/10/2043 7,458,427 0.21%Heathrow Funding Ltd. 4,725,000 5.88% 13/5/2041 7,398,991 0.21%Santander UK plc 7,000,000 5.13% 14/4/2021 7,361,970 0.21%Centrica plc 4,900,000 7.00% 19/9/2033 7,312,850 0.21%HSBC Holdings plc^ 7,179,000 2.26% 13/11/2026 7,284,835 0.21%Tesco Property Finance 3 plc 5,604,040 5.74% 13/4/2040 7,265,956 0.21%Barclays plc 6,800,000 3.25% 17/1/2033 7,130,426 0.20%National Westminster Bank plc 6,150,000 5.13% 13/1/2024 7,112,266 0.20%United Kingdom Gilt 4,600,000 4.25% 7/9/2039 7,011,153 0.20%GlaxoSmithKline Capital plc 4,200,000 6.38% 9/3/2039 6,932,285 0.20%Heathrow Funding Ltd. 4,672,000 6.45% 10/12/2031 6,850,797 0.19%Barclays plc 6,460,000 3.13% 17/1/2024 6,782,548 0.19%Cadent Finance plc 6,600,000 2.13% 22/9/2028 6,707,356 0.19%Lloyds Bank plc 5,600,000 5.13% 7/3/2025 6,659,184 0.19%HSBC Holdings plc^ 6,500,000 2.18% 27/6/2023 6,607,999 0.19%Barclays plc 6,300,000 3.00% 8/5/2026 6,597,347 0.19%BG Energy Capital plc 5,420,000 5.13% 1/12/2025 6,559,403 0.19%GlaxoSmithKline Capital plc 4,700,000 4.25% 18/12/2045 6,511,286 0.19%Aviva plc^ 5,890,000 6.13% Perpetual 6,476,114 0.18%Nationwide Building Society 5,100,000 5.63% 28/1/2026 6,417,616 0.18%Aviva plc^ 4,400,000 6.88% 20/5/2058 6,363,870 0.18%Barclays plc 5,964,000 3.25% 12/2/2027 6,351,049 0.18%Santander UK plc 5,000,000 5.75% 2/3/2026 6,335,300 0.18%Imperial Brands Finance plc 5,200,000 9.00% 17/2/2022 6,005,646 0.17%NGG Finance plc^ 5,300,000 5.63% 18/6/2073 5,995,625 0.17%M&G plc^ 5,100,000 5.63% 20/10/2051 5,830,096 0.17%HSBC Holdings plc 4,400,000 6.75% 11/9/2028 5,788,702 0.16%Heathrow Funding Ltd. 4,050,000 4.63% 31/10/2046 5,726,068 0.16%Santander UK plc 4,350,000 5.25% 16/2/2029 5,711,112 0.16%BG Energy Capital plc 4,000,000 5.00% 4/11/2036 5,696,800 0.16%Southern Water Services Finance Ltd. 4,479,000 6.64% 31/3/2026 5,680,148 0.16%Heathrow Funding Ltd. 4,500,000 7.13% 14/2/2024 5,448,420 0.16%Juturna European Loan Conduit No 16 plc 4,298,568 5.06% 10/8/2033 5,380,841 0.15%Barclays Bank UK plc 5,000,000 4.25% 12/1/2022 5,321,660 0.15%Logicor 2019-1 UK plc 5,250,000 1.88% 17/11/2026 5,262,611 0.15%HSBC Bank Capital Funding Sterling 1 LP^ 3,826,000 5.84% Perpetual 5,197,942 0.15%Wellcome Trust Ltd. 4,393,000 2.52% 7/2/2118 5,173,693 0.15%Vodafone Group plc 5,200,000 3.00% 12/8/2056 5,172,222 0.15%Tesco Property Finance 4 plc 3,898,438 5.80% 13/10/2040 5,100,429 0.15%Vodafone Group plc 4,800,000 3.38% 8/8/2049 5,066,544 0.14%Coventry Building Society 5,038,000 1.50% 23/1/2023 5,058,309 0.14%Connect Plus M25 Issuer plc 4,584,239 2.61% 31/3/2039 4,990,063 0.14%
Vanguard U.K. Investment Grade Bond Index Fund
818
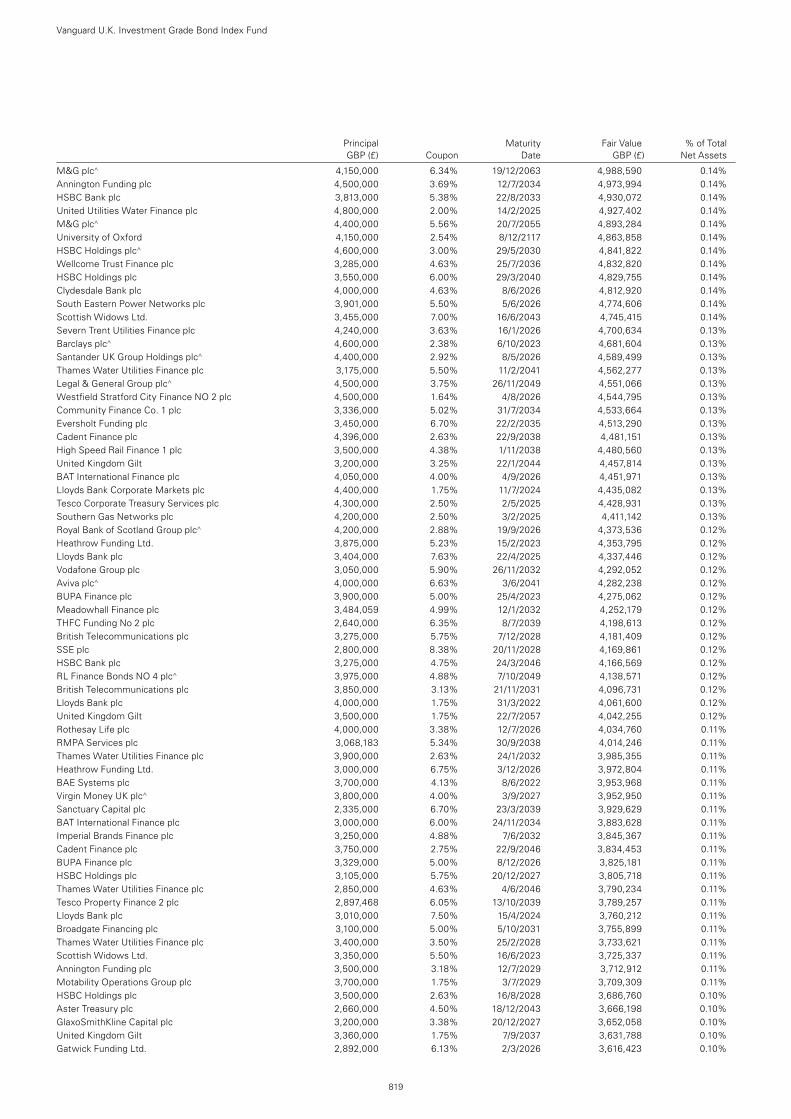
Principal Maturity Fair Value % of Total GBP (£) Coupon Date GBP (£) Net Assets
M&G plc^ 4,150,000 6.34% 19/12/2063 4,988,590 0.14%Annington Funding plc 4,500,000 3.69% 12/7/2034 4,973,994 0.14%HSBC Bank plc 3,813,000 5.38% 22/8/2033 4,930,072 0.14%United Utilities Water Finance plc 4,800,000 2.00% 14/2/2025 4,927,402 0.14%M&G plc^ 4,400,000 5.56% 20/7/2055 4,893,284 0.14%University of Oxford 4,150,000 2.54% 8/12/2117 4,863,858 0.14%HSBC Holdings plc^ 4,600,000 3.00% 29/5/2030 4,841,822 0.14%Wellcome Trust Finance plc 3,285,000 4.63% 25/7/2036 4,832,820 0.14%HSBC Holdings plc 3,550,000 6.00% 29/3/2040 4,829,755 0.14%Clydesdale Bank plc 4,000,000 4.63% 8/6/2026 4,812,920 0.14%South Eastern Power Networks plc 3,901,000 5.50% 5/6/2026 4,774,606 0.14%Scottish Widows Ltd. 3,455,000 7.00% 16/6/2043 4,745,415 0.14%Severn Trent Utilities Finance plc 4,240,000 3.63% 16/1/2026 4,700,634 0.13%Barclays plc^ 4,600,000 2.38% 6/10/2023 4,681,604 0.13%Santander UK Group Holdings plc^ 4,400,000 2.92% 8/5/2026 4,589,499 0.13%Thames Water Utilities Finance plc 3,175,000 5.50% 11/2/2041 4,562,277 0.13%Legal & General Group plc^ 4,500,000 3.75% 26/11/2049 4,551,066 0.13%Westfield Stratford City Finance NO 2 plc 4,500,000 1.64% 4/8/2026 4,544,795 0.13%Community Finance Co. 1 plc 3,336,000 5.02% 31/7/2034 4,533,664 0.13%Eversholt Funding plc 3,450,000 6.70% 22/2/2035 4,513,290 0.13%Cadent Finance plc 4,396,000 2.63% 22/9/2038 4,481,151 0.13%High Speed Rail Finance 1 plc 3,500,000 4.38% 1/11/2038 4,480,560 0.13%United Kingdom Gilt 3,200,000 3.25% 22/1/2044 4,457,814 0.13%BAT International Finance plc 4,050,000 4.00% 4/9/2026 4,451,971 0.13%Lloyds Bank Corporate Markets plc 4,400,000 1.75% 11/7/2024 4,435,082 0.13%Tesco Corporate Treasury Services plc 4,300,000 2.50% 2/5/2025 4,428,931 0.13%Southern Gas Networks plc 4,200,000 2.50% 3/2/2025 4,411,142 0.13%Royal Bank of Scotland Group plc^ 4,200,000 2.88% 19/9/2026 4,373,536 0.12%Heathrow Funding Ltd. 3,875,000 5.23% 15/2/2023 4,353,795 0.12%Lloyds Bank plc 3,404,000 7.63% 22/4/2025 4,337,446 0.12%Vodafone Group plc 3,050,000 5.90% 26/11/2032 4,292,052 0.12%Aviva plc^ 4,000,000 6.63% 3/6/2041 4,282,238 0.12%BUPA Finance plc 3,900,000 5.00% 25/4/2023 4,275,062 0.12%Meadowhall Finance plc 3,484,059 4.99% 12/1/2032 4,252,179 0.12%THFC Funding No 2 plc 2,640,000 6.35% 8/7/2039 4,198,613 0.12%British Telecommunications plc 3,275,000 5.75% 7/12/2028 4,181,409 0.12%SSE plc 2,800,000 8.38% 20/11/2028 4,169,861 0.12%HSBC Bank plc 3,275,000 4.75% 24/3/2046 4,166,569 0.12%RL Finance Bonds NO 4 plc^ 3,975,000 4.88% 7/10/2049 4,138,571 0.12%British Telecommunications plc 3,850,000 3.13% 21/11/2031 4,096,731 0.12%Lloyds Bank plc 4,000,000 1.75% 31/3/2022 4,061,600 0.12%United Kingdom Gilt 3,500,000 1.75% 22/7/2057 4,042,255 0.12%Rothesay Life plc 4,000,000 3.38% 12/7/2026 4,034,760 0.11%RMPA Services plc 3,068,183 5.34% 30/9/2038 4,014,246 0.11%Thames Water Utilities Finance plc 3,900,000 2.63% 24/1/2032 3,985,355 0.11%Heathrow Funding Ltd. 3,000,000 6.75% 3/12/2026 3,972,804 0.11%BAE Systems plc 3,700,000 4.13% 8/6/2022 3,953,968 0.11%Virgin Money UK plc^ 3,800,000 4.00% 3/9/2027 3,952,950 0.11%Sanctuary Capital plc 2,335,000 6.70% 23/3/2039 3,929,629 0.11%BAT International Finance plc 3,000,000 6.00% 24/11/2034 3,883,628 0.11%Imperial Brands Finance plc 3,250,000 4.88% 7/6/2032 3,845,367 0.11%Cadent Finance plc 3,750,000 2.75% 22/9/2046 3,834,453 0.11%BUPA Finance plc 3,329,000 5.00% 8/12/2026 3,825,181 0.11%HSBC Holdings plc 3,105,000 5.75% 20/12/2027 3,805,718 0.11%Thames Water Utilities Finance plc 2,850,000 4.63% 4/6/2046 3,790,234 0.11%Tesco Property Finance 2 plc 2,897,468 6.05% 13/10/2039 3,789,257 0.11%Lloyds Bank plc 3,010,000 7.50% 15/4/2024 3,760,212 0.11%Broadgate Financing plc 3,100,000 5.00% 5/10/2031 3,755,899 0.11%Thames Water Utilities Finance plc 3,400,000 3.50% 25/2/2028 3,733,621 0.11%Scottish Widows Ltd. 3,350,000 5.50% 16/6/2023 3,725,337 0.11%Annington Funding plc 3,500,000 3.18% 12/7/2029 3,712,912 0.11%Motability Operations Group plc 3,700,000 1.75% 3/7/2029 3,709,309 0.11%HSBC Holdings plc 3,500,000 2.63% 16/8/2028 3,686,760 0.10%Aster Treasury plc 2,660,000 4.50% 18/12/2043 3,666,198 0.10%GlaxoSmithKline Capital plc 3,200,000 3.38% 20/12/2027 3,652,058 0.10%United Kingdom Gilt 3,360,000 1.75% 7/9/2037 3,631,788 0.10%Gatwick Funding Ltd. 2,892,000 6.13% 2/3/2026 3,616,423 0.10%
Vanguard U.K. Investment Grade Bond Index Fund
819
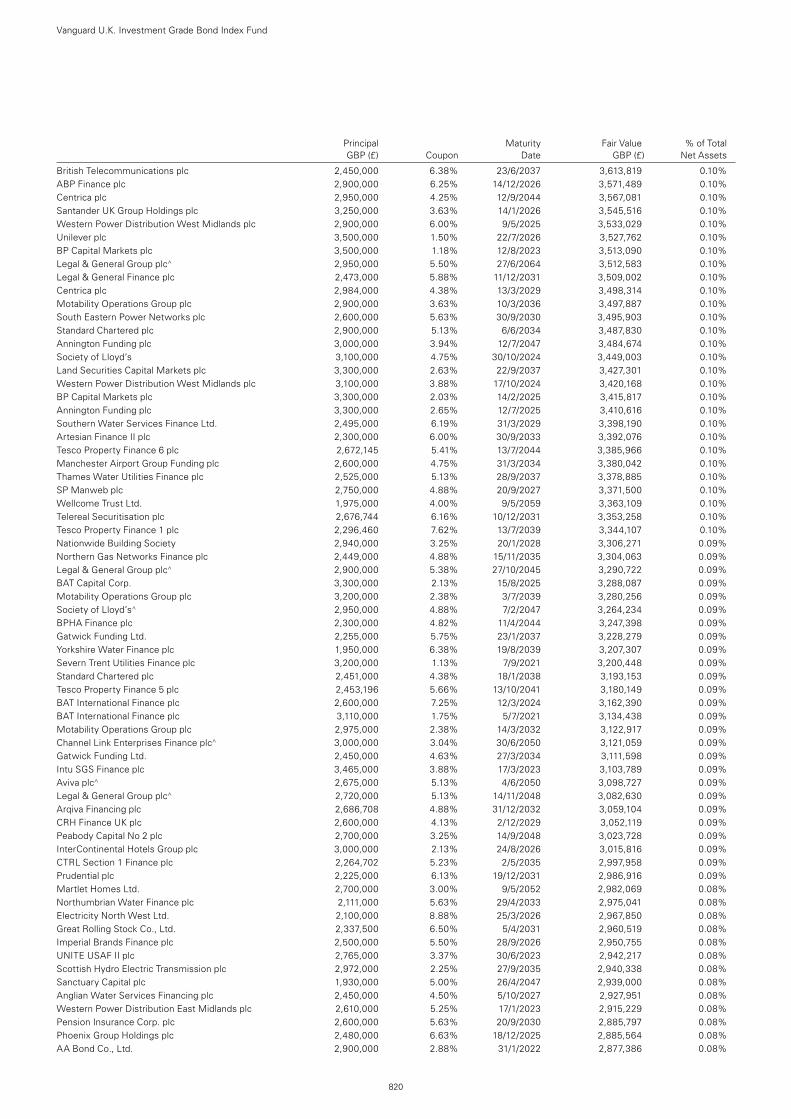
Principal Maturity Fair Value % of Total GBP (£) Coupon Date GBP (£) Net Assets
British Telecommunications plc 2,450,000 6.38% 23/6/2037 3,613,819 0.10%ABP Finance plc 2,900,000 6.25% 14/12/2026 3,571,489 0.10%Centrica plc 2,950,000 4.25% 12/9/2044 3,567,081 0.10%Santander UK Group Holdings plc 3,250,000 3.63% 14/1/2026 3,545,516 0.10%Western Power Distribution West Midlands plc 2,900,000 6.00% 9/5/2025 3,533,029 0.10%Unilever plc 3,500,000 1.50% 22/7/2026 3,527,762 0.10%BP Capital Markets plc 3,500,000 1.18% 12/8/2023 3,513,090 0.10%Legal & General Group plc^ 2,950,000 5.50% 27/6/2064 3,512,583 0.10%Legal & General Finance plc 2,473,000 5.88% 11/12/2031 3,509,002 0.10%Centrica plc 2,984,000 4.38% 13/3/2029 3,498,314 0.10%Motability Operations Group plc 2,900,000 3.63% 10/3/2036 3,497,887 0.10%South Eastern Power Networks plc 2,600,000 5.63% 30/9/2030 3,495,903 0.10%Standard Chartered plc 2,900,000 5.13% 6/6/2034 3,487,830 0.10%Annington Funding plc 3,000,000 3.94% 12/7/2047 3,484,674 0.10%Society of Lloyd’s 3,100,000 4.75% 30/10/2024 3,449,003 0.10%Land Securities Capital Markets plc 3,300,000 2.63% 22/9/2037 3,427,301 0.10%Western Power Distribution West Midlands plc 3,100,000 3.88% 17/10/2024 3,420,168 0.10%BP Capital Markets plc 3,300,000 2.03% 14/2/2025 3,415,817 0.10%Annington Funding plc 3,300,000 2.65% 12/7/2025 3,410,616 0.10%Southern Water Services Finance Ltd. 2,495,000 6.19% 31/3/2029 3,398,190 0.10%Artesian Finance II plc 2,300,000 6.00% 30/9/2033 3,392,076 0.10%Tesco Property Finance 6 plc 2,672,145 5.41% 13/7/2044 3,385,966 0.10%Manchester Airport Group Funding plc 2,600,000 4.75% 31/3/2034 3,380,042 0.10%Thames Water Utilities Finance plc 2,525,000 5.13% 28/9/2037 3,378,885 0.10%SP Manweb plc 2,750,000 4.88% 20/9/2027 3,371,500 0.10%Wellcome Trust Ltd. 1,975,000 4.00% 9/5/2059 3,363,109 0.10%Telereal Securitisation plc 2,676,744 6.16% 10/12/2031 3,353,258 0.10%Tesco Property Finance 1 plc 2,296,460 7.62% 13/7/2039 3,344,107 0.10%Nationwide Building Society 2,940,000 3.25% 20/1/2028 3,306,271 0.09%Northern Gas Networks Finance plc 2,449,000 4.88% 15/11/2035 3,304,063 0.09%Legal & General Group plc^ 2,900,000 5.38% 27/10/2045 3,290,722 0.09%BAT Capital Corp. 3,300,000 2.13% 15/8/2025 3,288,087 0.09%Motability Operations Group plc 3,200,000 2.38% 3/7/2039 3,280,256 0.09%Society of Lloyd’s^ 2,950,000 4.88% 7/2/2047 3,264,234 0.09%BPHA Finance plc 2,300,000 4.82% 11/4/2044 3,247,398 0.09%Gatwick Funding Ltd. 2,255,000 5.75% 23/1/2037 3,228,279 0.09%Yorkshire Water Finance plc 1,950,000 6.38% 19/8/2039 3,207,307 0.09%Severn Trent Utilities Finance plc 3,200,000 1.13% 7/9/2021 3,200,448 0.09%Standard Chartered plc 2,451,000 4.38% 18/1/2038 3,193,153 0.09%Tesco Property Finance 5 plc 2,453,196 5.66% 13/10/2041 3,180,149 0.09%BAT International Finance plc 2,600,000 7.25% 12/3/2024 3,162,390 0.09%BAT International Finance plc 3,110,000 1.75% 5/7/2021 3,134,438 0.09%Motability Operations Group plc 2,975,000 2.38% 14/3/2032 3,122,917 0.09%Channel Link Enterprises Finance plc^ 3,000,000 3.04% 30/6/2050 3,121,059 0.09%Gatwick Funding Ltd. 2,450,000 4.63% 27/3/2034 3,111,598 0.09%Intu SGS Finance plc 3,465,000 3.88% 17/3/2023 3,103,789 0.09%Aviva plc^ 2,675,000 5.13% 4/6/2050 3,098,727 0.09%Legal & General Group plc^ 2,720,000 5.13% 14/11/2048 3,082,630 0.09%Arqiva Financing plc 2,686,708 4.88% 31/12/2032 3,059,104 0.09%CRH Finance UK plc 2,600,000 4.13% 2/12/2029 3,052,119 0.09%Peabody Capital No 2 plc 2,700,000 3.25% 14/9/2048 3,023,728 0.09%InterContinental Hotels Group plc 3,000,000 2.13% 24/8/2026 3,015,816 0.09%CTRL Section 1 Finance plc 2,264,702 5.23% 2/5/2035 2,997,958 0.09%Prudential plc 2,225,000 6.13% 19/12/2031 2,986,916 0.09%Martlet Homes Ltd. 2,700,000 3.00% 9/5/2052 2,982,069 0.08%Northumbrian Water Finance plc 2,111,000 5.63% 29/4/2033 2,975,041 0.08%Electricity North West Ltd. 2,100,000 8.88% 25/3/2026 2,967,850 0.08%Great Rolling Stock Co., Ltd. 2,337,500 6.50% 5/4/2031 2,960,519 0.08%Imperial Brands Finance plc 2,500,000 5.50% 28/9/2026 2,950,755 0.08%UNITE USAF II plc 2,765,000 3.37% 30/6/2023 2,942,217 0.08%Scottish Hydro Electric Transmission plc 2,972,000 2.25% 27/9/2035 2,940,338 0.08%Sanctuary Capital plc 1,930,000 5.00% 26/4/2047 2,939,000 0.08%Anglian Water Services Financing plc 2,450,000 4.50% 5/10/2027 2,927,951 0.08%Western Power Distribution East Midlands plc 2,610,000 5.25% 17/1/2023 2,915,229 0.08%Pension Insurance Corp. plc 2,600,000 5.63% 20/9/2030 2,885,797 0.08%Phoenix Group Holdings plc 2,480,000 6.63% 18/12/2025 2,885,564 0.08%AA Bond Co., Ltd. 2,900,000 2.88% 31/1/2022 2,877,386 0.08%
Vanguard U.K. Investment Grade Bond Index Fund
820
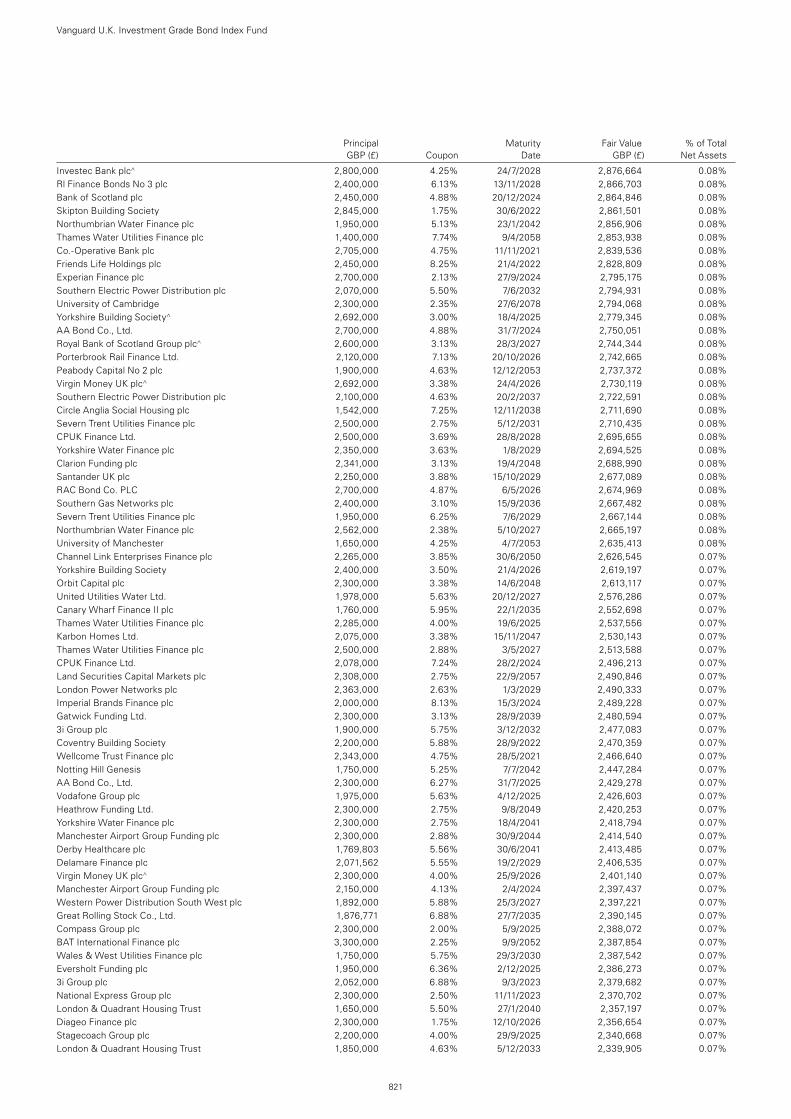
Principal Maturity Fair Value % of Total GBP (£) Coupon Date GBP (£) Net Assets
Investec Bank plc^ 2,800,000 4.25% 24/7/2028 2,876,664 0.08%Rl Finance Bonds No 3 plc 2,400,000 6.13% 13/11/2028 2,866,703 0.08%Bank of Scotland plc 2,450,000 4.88% 20/12/2024 2,864,846 0.08%Skipton Building Society 2,845,000 1.75% 30/6/2022 2,861,501 0.08%Northumbrian Water Finance plc 1,950,000 5.13% 23/1/2042 2,856,906 0.08%Thames Water Utilities Finance plc 1,400,000 7.74% 9/4/2058 2,853,938 0.08%Co.-Operative Bank plc 2,705,000 4.75% 11/11/2021 2,839,536 0.08%Friends Life Holdings plc 2,450,000 8.25% 21/4/2022 2,828,809 0.08%Experian Finance plc 2,700,000 2.13% 27/9/2024 2,795,175 0.08%Southern Electric Power Distribution plc 2,070,000 5.50% 7/6/2032 2,794,931 0.08%University of Cambridge 2,300,000 2.35% 27/6/2078 2,794,068 0.08%Yorkshire Building Society^ 2,692,000 3.00% 18/4/2025 2,779,345 0.08%AA Bond Co., Ltd. 2,700,000 4.88% 31/7/2024 2,750,051 0.08%Royal Bank of Scotland Group plc^ 2,600,000 3.13% 28/3/2027 2,744,344 0.08%Porterbrook Rail Finance Ltd. 2,120,000 7.13% 20/10/2026 2,742,665 0.08%Peabody Capital No 2 plc 1,900,000 4.63% 12/12/2053 2,737,372 0.08%Virgin Money UK plc^ 2,692,000 3.38% 24/4/2026 2,730,119 0.08%Southern Electric Power Distribution plc 2,100,000 4.63% 20/2/2037 2,722,591 0.08%Circle Anglia Social Housing plc 1,542,000 7.25% 12/11/2038 2,711,690 0.08%Severn Trent Utilities Finance plc 2,500,000 2.75% 5/12/2031 2,710,435 0.08%CPUK Finance Ltd. 2,500,000 3.69% 28/8/2028 2,695,655 0.08%Yorkshire Water Finance plc 2,350,000 3.63% 1/8/2029 2,694,525 0.08%Clarion Funding plc 2,341,000 3.13% 19/4/2048 2,688,990 0.08%Santander UK plc 2,250,000 3.88% 15/10/2029 2,677,089 0.08%RAC Bond Co. PLC 2,700,000 4.87% 6/5/2026 2,674,969 0.08%Southern Gas Networks plc 2,400,000 3.10% 15/9/2036 2,667,482 0.08%Severn Trent Utilities Finance plc 1,950,000 6.25% 7/6/2029 2,667,144 0.08%Northumbrian Water Finance plc 2,562,000 2.38% 5/10/2027 2,665,197 0.08%University of Manchester 1,650,000 4.25% 4/7/2053 2,635,413 0.08%Channel Link Enterprises Finance plc 2,265,000 3.85% 30/6/2050 2,626,545 0.07%Yorkshire Building Society 2,400,000 3.50% 21/4/2026 2,619,197 0.07%Orbit Capital plc 2,300,000 3.38% 14/6/2048 2,613,117 0.07%United Utilities Water Ltd. 1,978,000 5.63% 20/12/2027 2,576,286 0.07%Canary Wharf Finance II plc 1,760,000 5.95% 22/1/2035 2,552,698 0.07%Thames Water Utilities Finance plc 2,285,000 4.00% 19/6/2025 2,537,556 0.07%Karbon Homes Ltd. 2,075,000 3.38% 15/11/2047 2,530,143 0.07%Thames Water Utilities Finance plc 2,500,000 2.88% 3/5/2027 2,513,588 0.07%CPUK Finance Ltd. 2,078,000 7.24% 28/2/2024 2,496,213 0.07%Land Securities Capital Markets plc 2,308,000 2.75% 22/9/2057 2,490,846 0.07%London Power Networks plc 2,363,000 2.63% 1/3/2029 2,490,333 0.07%Imperial Brands Finance plc 2,000,000 8.13% 15/3/2024 2,489,228 0.07%Gatwick Funding Ltd. 2,300,000 3.13% 28/9/2039 2,480,594 0.07%3i Group plc 1,900,000 5.75% 3/12/2032 2,477,083 0.07%Coventry Building Society 2,200,000 5.88% 28/9/2022 2,470,359 0.07%Wellcome Trust Finance plc 2,343,000 4.75% 28/5/2021 2,466,640 0.07%Notting Hill Genesis 1,750,000 5.25% 7/7/2042 2,447,284 0.07%AA Bond Co., Ltd. 2,300,000 6.27% 31/7/2025 2,429,278 0.07%Vodafone Group plc 1,975,000 5.63% 4/12/2025 2,426,603 0.07%Heathrow Funding Ltd. 2,300,000 2.75% 9/8/2049 2,420,253 0.07%Yorkshire Water Finance plc 2,300,000 2.75% 18/4/2041 2,418,794 0.07%Manchester Airport Group Funding plc 2,300,000 2.88% 30/9/2044 2,414,540 0.07%Derby Healthcare plc 1,769,803 5.56% 30/6/2041 2,413,485 0.07%Delamare Finance plc 2,071,562 5.55% 19/2/2029 2,406,535 0.07%Virgin Money UK plc^ 2,300,000 4.00% 25/9/2026 2,401,140 0.07%Manchester Airport Group Funding plc 2,150,000 4.13% 2/4/2024 2,397,437 0.07%Western Power Distribution South West plc 1,892,000 5.88% 25/3/2027 2,397,221 0.07%Great Rolling Stock Co., Ltd. 1,876,771 6.88% 27/7/2035 2,390,145 0.07%Compass Group plc 2,300,000 2.00% 5/9/2025 2,388,072 0.07%BAT International Finance plc 3,300,000 2.25% 9/9/2052 2,387,854 0.07%Wales & West Utilities Finance plc 1,750,000 5.75% 29/3/2030 2,387,542 0.07%Eversholt Funding plc 1,950,000 6.36% 2/12/2025 2,386,273 0.07%3i Group plc 2,052,000 6.88% 9/3/2023 2,379,682 0.07%National Express Group plc 2,300,000 2.50% 11/11/2023 2,370,702 0.07%London & Quadrant Housing Trust 1,650,000 5.50% 27/1/2040 2,357,197 0.07%Diageo Finance plc 2,300,000 1.75% 12/10/2026 2,356,654 0.07%Stagecoach Group plc 2,200,000 4.00% 29/9/2025 2,340,668 0.07%London & Quadrant Housing Trust 1,850,000 4.63% 5/12/2033 2,339,905 0.07%
Vanguard U.K. Investment Grade Bond Index Fund
821
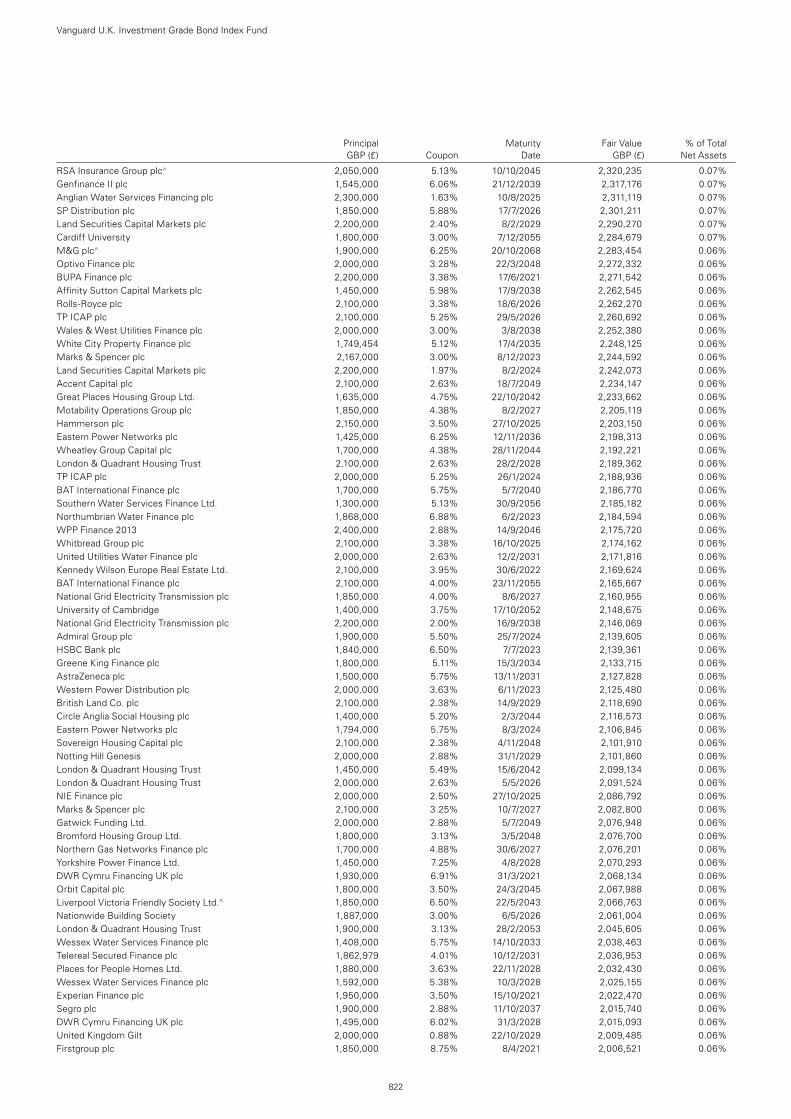
Principal Maturity Fair Value % of Total GBP (£) Coupon Date GBP (£) Net Assets
RSA Insurance Group plc^ 2,050,000 5.13% 10/10/2045 2,320,235 0.07%Genfinance II plc 1,545,000 6.06% 21/12/2039 2,317,176 0.07%Anglian Water Services Financing plc 2,300,000 1.63% 10/8/2025 2,311,119 0.07%SP Distribution plc 1,850,000 5.88% 17/7/2026 2,301,211 0.07%Land Securities Capital Markets plc 2,200,000 2.40% 8/2/2029 2,290,270 0.07%Cardiff University 1,800,000 3.00% 7/12/2055 2,284,679 0.07%M&G plc^ 1,900,000 6.25% 20/10/2068 2,283,454 0.06%Optivo Finance plc 2,000,000 3.28% 22/3/2048 2,272,332 0.06%BUPA Finance plc 2,200,000 3.38% 17/6/2021 2,271,542 0.06%Affinity Sutton Capital Markets plc 1,450,000 5.98% 17/9/2038 2,262,545 0.06%Rolls-Royce plc 2,100,000 3.38% 18/6/2026 2,262,270 0.06%TP ICAP plc 2,100,000 5.25% 29/5/2026 2,260,692 0.06%Wales & West Utilities Finance plc 2,000,000 3.00% 3/8/2038 2,252,380 0.06%White City Property Finance plc 1,749,454 5.12% 17/4/2035 2,248,125 0.06%Marks & Spencer plc 2,167,000 3.00% 8/12/2023 2,244,592 0.06%Land Securities Capital Markets plc 2,200,000 1.97% 8/2/2024 2,242,073 0.06%Accent Capital plc 2,100,000 2.63% 18/7/2049 2,234,147 0.06%Great Places Housing Group Ltd. 1,635,000 4.75% 22/10/2042 2,233,662 0.06%Motability Operations Group plc 1,850,000 4.38% 8/2/2027 2,205,119 0.06%Hammerson plc 2,150,000 3.50% 27/10/2025 2,203,150 0.06%Eastern Power Networks plc 1,425,000 6.25% 12/11/2036 2,198,313 0.06%Wheatley Group Capital plc 1,700,000 4.38% 28/11/2044 2,192,221 0.06%London & Quadrant Housing Trust 2,100,000 2.63% 28/2/2028 2,189,362 0.06%TP ICAP plc 2,000,000 5.25% 26/1/2024 2,188,936 0.06%BAT International Finance plc 1,700,000 5.75% 5/7/2040 2,186,770 0.06%Southern Water Services Finance Ltd. 1,300,000 5.13% 30/9/2056 2,185,182 0.06%Northumbrian Water Finance plc 1,868,000 6.88% 6/2/2023 2,184,594 0.06%WPP Finance 2013 2,400,000 2.88% 14/9/2046 2,175,720 0.06%Whitbread Group plc 2,100,000 3.38% 16/10/2025 2,174,162 0.06%United Utilities Water Finance plc 2,000,000 2.63% 12/2/2031 2,171,816 0.06%Kennedy Wilson Europe Real Estate Ltd. 2,100,000 3.95% 30/6/2022 2,169,624 0.06%BAT International Finance plc 2,100,000 4.00% 23/11/2055 2,165,667 0.06%National Grid Electricity Transmission plc 1,850,000 4.00% 8/6/2027 2,160,955 0.06%University of Cambridge 1,400,000 3.75% 17/10/2052 2,148,675 0.06%National Grid Electricity Transmission plc 2,200,000 2.00% 16/9/2038 2,146,069 0.06%Admiral Group plc 1,900,000 5.50% 25/7/2024 2,139,605 0.06%HSBC Bank plc 1,840,000 6.50% 7/7/2023 2,139,361 0.06%Greene King Finance plc 1,800,000 5.11% 15/3/2034 2,133,715 0.06%AstraZeneca plc 1,500,000 5.75% 13/11/2031 2,127,828 0.06%Western Power Distribution plc 2,000,000 3.63% 6/11/2023 2,125,480 0.06%British Land Co. plc 2,100,000 2.38% 14/9/2029 2,118,690 0.06%Circle Anglia Social Housing plc 1,400,000 5.20% 2/3/2044 2,116,573 0.06%Eastern Power Networks plc 1,794,000 5.75% 8/3/2024 2,106,845 0.06%Sovereign Housing Capital plc 2,100,000 2.38% 4/11/2048 2,101,910 0.06%Notting Hill Genesis 2,000,000 2.88% 31/1/2029 2,101,860 0.06%London & Quadrant Housing Trust 1,450,000 5.49% 15/6/2042 2,099,134 0.06%London & Quadrant Housing Trust 2,000,000 2.63% 5/5/2026 2,091,524 0.06%NIE Finance plc 2,000,000 2.50% 27/10/2025 2,086,792 0.06%Marks & Spencer plc 2,100,000 3.25% 10/7/2027 2,082,800 0.06%Gatwick Funding Ltd. 2,000,000 2.88% 5/7/2049 2,076,948 0.06%Bromford Housing Group Ltd. 1,800,000 3.13% 3/5/2048 2,076,700 0.06%Northern Gas Networks Finance plc 1,700,000 4.88% 30/6/2027 2,076,201 0.06%Yorkshire Power Finance Ltd. 1,450,000 7.25% 4/8/2028 2,070,293 0.06%DWR Cymru Financing UK plc 1,930,000 6.91% 31/3/2021 2,068,134 0.06%Orbit Capital plc 1,800,000 3.50% 24/3/2045 2,067,988 0.06%Liverpool Victoria Friendly Society Ltd.^ 1,850,000 6.50% 22/5/2043 2,066,763 0.06%Nationwide Building Society 1,887,000 3.00% 6/5/2026 2,061,004 0.06%London & Quadrant Housing Trust 1,900,000 3.13% 28/2/2053 2,045,605 0.06%Wessex Water Services Finance plc 1,408,000 5.75% 14/10/2033 2,038,463 0.06%Telereal Secured Finance plc 1,862,979 4.01% 10/12/2031 2,036,953 0.06%Places for People Homes Ltd. 1,880,000 3.63% 22/11/2028 2,032,430 0.06%Wessex Water Services Finance plc 1,592,000 5.38% 10/3/2028 2,025,155 0.06%Experian Finance plc 1,950,000 3.50% 15/10/2021 2,022,470 0.06%Segro plc 1,900,000 2.88% 11/10/2037 2,015,740 0.06%DWR Cymru Financing UK plc 1,495,000 6.02% 31/3/2028 2,015,093 0.06%United Kingdom Gilt 2,000,000 0.88% 22/10/2029 2,009,485 0.06%Firstgroup plc 1,850,000 8.75% 8/4/2021 2,006,521 0.06%
Vanguard U.K. Investment Grade Bond Index Fund
822
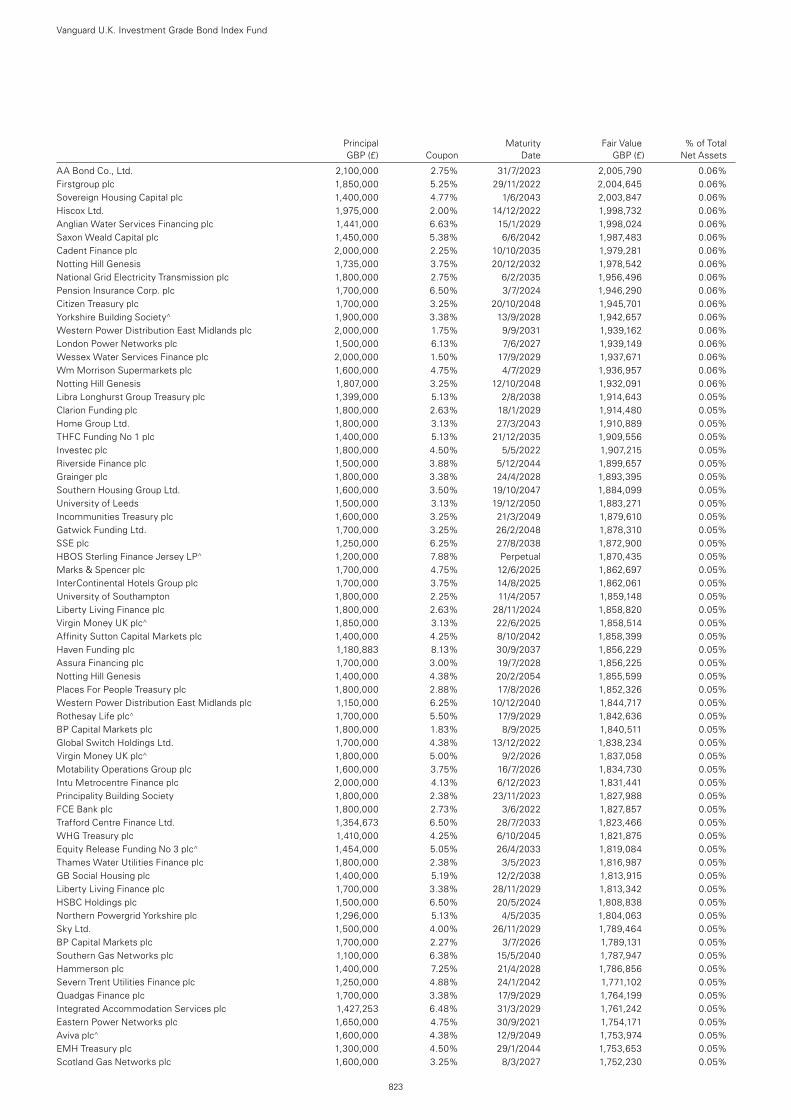
Principal Maturity Fair Value % of Total GBP (£) Coupon Date GBP (£) Net Assets
AA Bond Co., Ltd. 2,100,000 2.75% 31/7/2023 2,005,790 0.06%Firstgroup plc 1,850,000 5.25% 29/11/2022 2,004,645 0.06%Sovereign Housing Capital plc 1,400,000 4.77% 1/6/2043 2,003,847 0.06%Hiscox Ltd. 1,975,000 2.00% 14/12/2022 1,998,732 0.06%Anglian Water Services Financing plc 1,441,000 6.63% 15/1/2029 1,998,024 0.06%Saxon Weald Capital plc 1,450,000 5.38% 6/6/2042 1,987,483 0.06%Cadent Finance plc 2,000,000 2.25% 10/10/2035 1,979,281 0.06%Notting Hill Genesis 1,735,000 3.75% 20/12/2032 1,978,542 0.06%National Grid Electricity Transmission plc 1,800,000 2.75% 6/2/2035 1,956,496 0.06%Pension Insurance Corp. plc 1,700,000 6.50% 3/7/2024 1,946,290 0.06%Citizen Treasury plc 1,700,000 3.25% 20/10/2048 1,945,701 0.06%Yorkshire Building Society^ 1,900,000 3.38% 13/9/2028 1,942,657 0.06%Western Power Distribution East Midlands plc 2,000,000 1.75% 9/9/2031 1,939,162 0.06%London Power Networks plc 1,500,000 6.13% 7/6/2027 1,939,149 0.06%Wessex Water Services Finance plc 2,000,000 1.50% 17/9/2029 1,937,671 0.06%Wm Morrison Supermarkets plc 1,600,000 4.75% 4/7/2029 1,936,957 0.06%Notting Hill Genesis 1,807,000 3.25% 12/10/2048 1,932,091 0.06%Libra Longhurst Group Treasury plc 1,399,000 5.13% 2/8/2038 1,914,643 0.05%Clarion Funding plc 1,800,000 2.63% 18/1/2029 1,914,480 0.05%Home Group Ltd. 1,800,000 3.13% 27/3/2043 1,910,889 0.05%THFC Funding No 1 plc 1,400,000 5.13% 21/12/2035 1,909,556 0.05%Investec plc 1,800,000 4.50% 5/5/2022 1,907,215 0.05%Riverside Finance plc 1,500,000 3.88% 5/12/2044 1,899,657 0.05%Grainger plc 1,800,000 3.38% 24/4/2028 1,893,395 0.05%Southern Housing Group Ltd. 1,600,000 3.50% 19/10/2047 1,884,099 0.05%University of Leeds 1,500,000 3.13% 19/12/2050 1,883,271 0.05%Incommunities Treasury plc 1,600,000 3.25% 21/3/2049 1,879,610 0.05%Gatwick Funding Ltd. 1,700,000 3.25% 26/2/2048 1,878,310 0.05%SSE plc 1,250,000 6.25% 27/8/2038 1,872,900 0.05%HBOS Sterling Finance Jersey LP^ 1,200,000 7.88% Perpetual 1,870,435 0.05%Marks & Spencer plc 1,700,000 4.75% 12/6/2025 1,862,697 0.05%InterContinental Hotels Group plc 1,700,000 3.75% 14/8/2025 1,862,061 0.05%University of Southampton 1,800,000 2.25% 11/4/2057 1,859,148 0.05%Liberty Living Finance plc 1,800,000 2.63% 28/11/2024 1,858,820 0.05%Virgin Money UK plc^ 1,850,000 3.13% 22/6/2025 1,858,514 0.05%Affinity Sutton Capital Markets plc 1,400,000 4.25% 8/10/2042 1,858,399 0.05%Haven Funding plc 1,180,883 8.13% 30/9/2037 1,856,229 0.05%Assura Financing plc 1,700,000 3.00% 19/7/2028 1,856,225 0.05%Notting Hill Genesis 1,400,000 4.38% 20/2/2054 1,855,599 0.05%Places For People Treasury plc 1,800,000 2.88% 17/8/2026 1,852,326 0.05%Western Power Distribution East Midlands plc 1,150,000 6.25% 10/12/2040 1,844,717 0.05%Rothesay Life plc^ 1,700,000 5.50% 17/9/2029 1,842,636 0.05%BP Capital Markets plc 1,800,000 1.83% 8/9/2025 1,840,511 0.05%Global Switch Holdings Ltd. 1,700,000 4.38% 13/12/2022 1,838,234 0.05%Virgin Money UK plc^ 1,800,000 5.00% 9/2/2026 1,837,058 0.05%Motability Operations Group plc 1,600,000 3.75% 16/7/2026 1,834,730 0.05%Intu Metrocentre Finance plc 2,000,000 4.13% 6/12/2023 1,831,441 0.05%Principality Building Society 1,800,000 2.38% 23/11/2023 1,827,988 0.05%FCE Bank plc 1,800,000 2.73% 3/6/2022 1,827,857 0.05%Trafford Centre Finance Ltd. 1,354,673 6.50% 28/7/2033 1,823,466 0.05%WHG Treasury plc 1,410,000 4.25% 6/10/2045 1,821,875 0.05%Equity Release Funding No 3 plc^ 1,454,000 5.05% 26/4/2033 1,819,084 0.05%Thames Water Utilities Finance plc 1,800,000 2.38% 3/5/2023 1,816,987 0.05%GB Social Housing plc 1,400,000 5.19% 12/2/2038 1,813,915 0.05%Liberty Living Finance plc 1,700,000 3.38% 28/11/2029 1,813,342 0.05%HSBC Holdings plc 1,500,000 6.50% 20/5/2024 1,808,838 0.05%Northern Powergrid Yorkshire plc 1,296,000 5.13% 4/5/2035 1,804,063 0.05%Sky Ltd. 1,500,000 4.00% 26/11/2029 1,789,464 0.05%BP Capital Markets plc 1,700,000 2.27% 3/7/2026 1,789,131 0.05%Southern Gas Networks plc 1,100,000 6.38% 15/5/2040 1,787,947 0.05%Hammerson plc 1,400,000 7.25% 21/4/2028 1,786,856 0.05%Severn Trent Utilities Finance plc 1,250,000 4.88% 24/1/2042 1,771,102 0.05%Quadgas Finance plc 1,700,000 3.38% 17/9/2029 1,764,199 0.05%Integrated Accommodation Services plc 1,427,253 6.48% 31/3/2029 1,761,242 0.05%Eastern Power Networks plc 1,650,000 4.75% 30/9/2021 1,754,171 0.05%Aviva plc^ 1,600,000 4.38% 12/9/2049 1,753,974 0.05%EMH Treasury plc 1,300,000 4.50% 29/1/2044 1,753,653 0.05%Scotland Gas Networks plc 1,600,000 3.25% 8/3/2027 1,752,230 0.05%
Vanguard U.K. Investment Grade Bond Index Fund
823
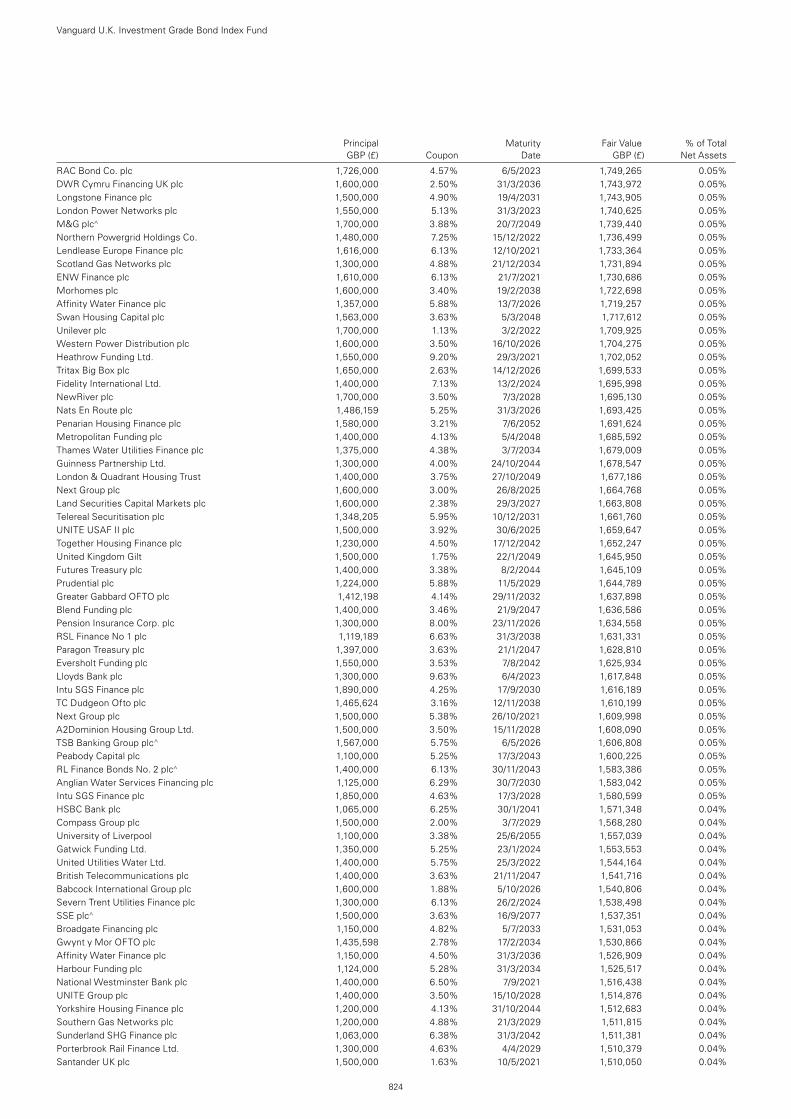
Principal Maturity Fair Value % of Total GBP (£) Coupon Date GBP (£) Net Assets
RAC Bond Co. plc 1,726,000 4.57% 6/5/2023 1,749,265 0.05%DWR Cymru Financing UK plc 1,600,000 2.50% 31/3/2036 1,743,972 0.05%Longstone Finance plc 1,500,000 4.90% 19/4/2031 1,743,905 0.05%London Power Networks plc 1,550,000 5.13% 31/3/2023 1,740,625 0.05%M&G plc^ 1,700,000 3.88% 20/7/2049 1,739,440 0.05%Northern Powergrid Holdings Co. 1,480,000 7.25% 15/12/2022 1,736,499 0.05%Lendlease Europe Finance plc 1,616,000 6.13% 12/10/2021 1,733,364 0.05%Scotland Gas Networks plc 1,300,000 4.88% 21/12/2034 1,731,894 0.05%ENW Finance plc 1,610,000 6.13% 21/7/2021 1,730,686 0.05%Morhomes plc 1,600,000 3.40% 19/2/2038 1,722,698 0.05%Affinity Water Finance plc 1,357,000 5.88% 13/7/2026 1,719,257 0.05%Swan Housing Capital plc 1,563,000 3.63% 5/3/2048 1,717,612 0.05%Unilever plc 1,700,000 1.13% 3/2/2022 1,709,925 0.05%Western Power Distribution plc 1,600,000 3.50% 16/10/2026 1,704,275 0.05%Heathrow Funding Ltd. 1,550,000 9.20% 29/3/2021 1,702,052 0.05%Tritax Big Box plc 1,650,000 2.63% 14/12/2026 1,699,533 0.05%Fidelity International Ltd. 1,400,000 7.13% 13/2/2024 1,695,998 0.05%NewRiver plc 1,700,000 3.50% 7/3/2028 1,695,130 0.05%Nats En Route plc 1,486,159 5.25% 31/3/2026 1,693,425 0.05%Penarian Housing Finance plc 1,580,000 3.21% 7/6/2052 1,691,624 0.05%Metropolitan Funding plc 1,400,000 4.13% 5/4/2048 1,685,592 0.05%Thames Water Utilities Finance plc 1,375,000 4.38% 3/7/2034 1,679,009 0.05%Guinness Partnership Ltd. 1,300,000 4.00% 24/10/2044 1,678,547 0.05%London & Quadrant Housing Trust 1,400,000 3.75% 27/10/2049 1,677,186 0.05%Next Group plc 1,600,000 3.00% 26/8/2025 1,664,768 0.05%Land Securities Capital Markets plc 1,600,000 2.38% 29/3/2027 1,663,808 0.05%Telereal Securitisation plc 1,348,205 5.95% 10/12/2031 1,661,760 0.05%UNITE USAF II plc 1,500,000 3.92% 30/6/2025 1,659,647 0.05%Together Housing Finance plc 1,230,000 4.50% 17/12/2042 1,652,247 0.05%United Kingdom Gilt 1,500,000 1.75% 22/1/2049 1,645,950 0.05%Futures Treasury plc 1,400,000 3.38% 8/2/2044 1,645,109 0.05%Prudential plc 1,224,000 5.88% 11/5/2029 1,644,789 0.05%Greater Gabbard OFTO plc 1,412,198 4.14% 29/11/2032 1,637,898 0.05%Blend Funding plc 1,400,000 3.46% 21/9/2047 1,636,586 0.05%Pension Insurance Corp. plc 1,300,000 8.00% 23/11/2026 1,634,558 0.05%RSL Finance No 1 plc 1,119,189 6.63% 31/3/2038 1,631,331 0.05%Paragon Treasury plc 1,397,000 3.63% 21/1/2047 1,628,810 0.05%Eversholt Funding plc 1,550,000 3.53% 7/8/2042 1,625,934 0.05%Lloyds Bank plc 1,300,000 9.63% 6/4/2023 1,617,848 0.05%Intu SGS Finance plc 1,890,000 4.25% 17/9/2030 1,616,189 0.05%TC Dudgeon Ofto plc 1,465,624 3.16% 12/11/2038 1,610,199 0.05%Next Group plc 1,500,000 5.38% 26/10/2021 1,609,998 0.05%A2Dominion Housing Group Ltd. 1,500,000 3.50% 15/11/2028 1,608,090 0.05%TSB Banking Group plc^ 1,567,000 5.75% 6/5/2026 1,606,808 0.05%Peabody Capital plc 1,100,000 5.25% 17/3/2043 1,600,225 0.05%RL Finance Bonds No. 2 plc^ 1,400,000 6.13% 30/11/2043 1,583,386 0.05%Anglian Water Services Financing plc 1,125,000 6.29% 30/7/2030 1,583,042 0.05%Intu SGS Finance plc 1,850,000 4.63% 17/3/2028 1,580,599 0.05%HSBC Bank plc 1,065,000 6.25% 30/1/2041 1,571,348 0.04%Compass Group plc 1,500,000 2.00% 3/7/2029 1,568,280 0.04%University of Liverpool 1,100,000 3.38% 25/6/2055 1,557,039 0.04%Gatwick Funding Ltd. 1,350,000 5.25% 23/1/2024 1,553,553 0.04%United Utilities Water Ltd. 1,400,000 5.75% 25/3/2022 1,544,164 0.04%British Telecommunications plc 1,400,000 3.63% 21/11/2047 1,541,716 0.04%Babcock International Group plc 1,600,000 1.88% 5/10/2026 1,540,806 0.04%Severn Trent Utilities Finance plc 1,300,000 6.13% 26/2/2024 1,538,498 0.04%SSE plc^ 1,500,000 3.63% 16/9/2077 1,537,351 0.04%Broadgate Financing plc 1,150,000 4.82% 5/7/2033 1,531,053 0.04%Gwynt y Mor OFTO plc 1,435,598 2.78% 17/2/2034 1,530,866 0.04%Affinity Water Finance plc 1,150,000 4.50% 31/3/2036 1,526,909 0.04%Harbour Funding plc 1,124,000 5.28% 31/3/2034 1,525,517 0.04%National Westminster Bank plc 1,400,000 6.50% 7/9/2021 1,516,438 0.04%UNITE Group plc 1,400,000 3.50% 15/10/2028 1,514,876 0.04%Yorkshire Housing Finance plc 1,200,000 4.13% 31/10/2044 1,512,683 0.04%Southern Gas Networks plc 1,200,000 4.88% 21/3/2029 1,511,815 0.04%Sunderland SHG Finance plc 1,063,000 6.38% 31/3/2042 1,511,381 0.04%Porterbrook Rail Finance Ltd. 1,300,000 4.63% 4/4/2029 1,510,379 0.04%Santander UK plc 1,500,000 1.63% 10/5/2021 1,510,050 0.04%
Vanguard U.K. Investment Grade Bond Index Fund
824
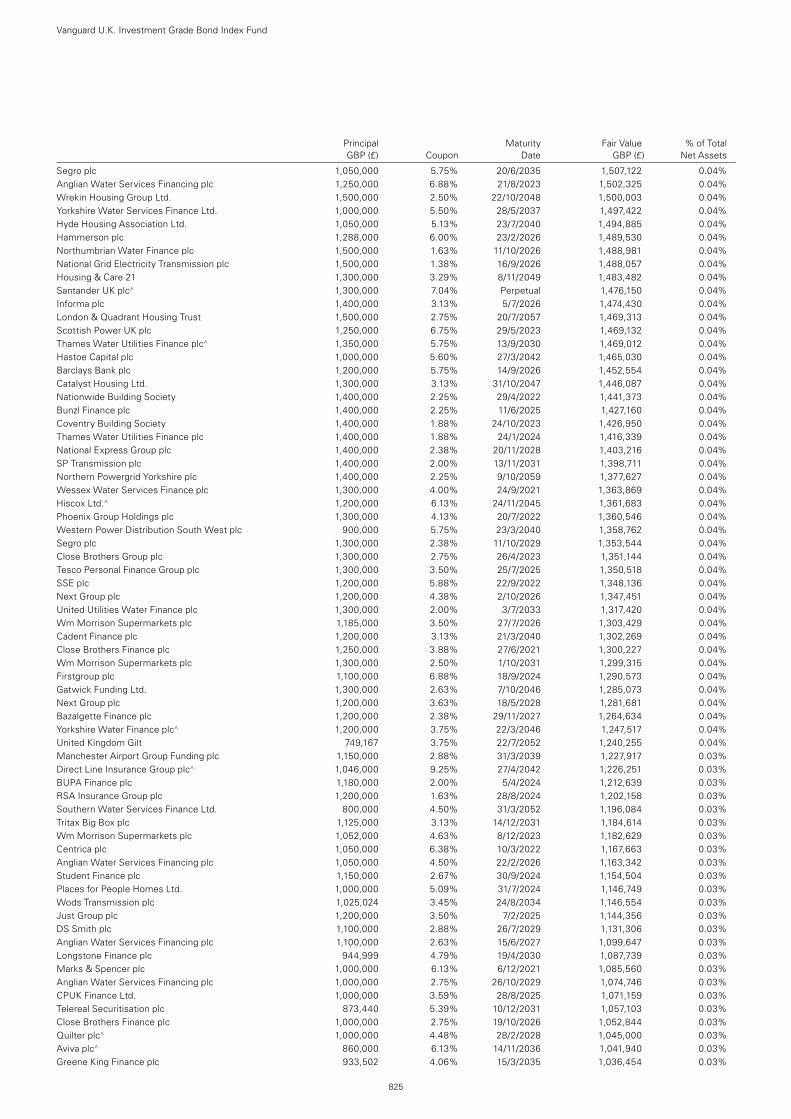
Principal Maturity Fair Value % of Total GBP (£) Coupon Date GBP (£) Net Assets
Segro plc 1,050,000 5.75% 20/6/2035 1,507,122 0.04%Anglian Water Services Financing plc 1,250,000 6.88% 21/8/2023 1,502,325 0.04%Wrekin Housing Group Ltd. 1,500,000 2.50% 22/10/2048 1,500,003 0.04%Yorkshire Water Services Finance Ltd. 1,000,000 5.50% 28/5/2037 1,497,422 0.04%Hyde Housing Association Ltd. 1,050,000 5.13% 23/7/2040 1,494,885 0.04%Hammerson plc 1,288,000 6.00% 23/2/2026 1,489,530 0.04%Northumbrian Water Finance plc 1,500,000 1.63% 11/10/2026 1,488,981 0.04%National Grid Electricity Transmission plc 1,500,000 1.38% 16/9/2026 1,488,057 0.04%Housing & Care 21 1,300,000 3.29% 8/11/2049 1,483,482 0.04%Santander UK plc^ 1,300,000 7.04% Perpetual 1,476,150 0.04%Informa plc 1,400,000 3.13% 5/7/2026 1,474,430 0.04%London & Quadrant Housing Trust 1,500,000 2.75% 20/7/2057 1,469,313 0.04%Scottish Power UK plc 1,250,000 6.75% 29/5/2023 1,469,132 0.04%Thames Water Utilities Finance plc^ 1,350,000 5.75% 13/9/2030 1,469,012 0.04%Hastoe Capital plc 1,000,000 5.60% 27/3/2042 1,465,030 0.04%Barclays Bank plc 1,200,000 5.75% 14/9/2026 1,452,554 0.04%Catalyst Housing Ltd. 1,300,000 3.13% 31/10/2047 1,446,087 0.04%Nationwide Building Society 1,400,000 2.25% 29/4/2022 1,441,373 0.04%Bunzl Finance plc 1,400,000 2.25% 11/6/2025 1,427,160 0.04%Coventry Building Society 1,400,000 1.88% 24/10/2023 1,426,950 0.04%Thames Water Utilities Finance plc 1,400,000 1.88% 24/1/2024 1,416,339 0.04%National Express Group plc 1,400,000 2.38% 20/11/2028 1,403,216 0.04%SP Transmission plc 1,400,000 2.00% 13/11/2031 1,398,711 0.04%Northern Powergrid Yorkshire plc 1,400,000 2.25% 9/10/2059 1,377,627 0.04%Wessex Water Services Finance plc 1,300,000 4.00% 24/9/2021 1,363,869 0.04%Hiscox Ltd.^ 1,200,000 6.13% 24/11/2045 1,361,683 0.04%Phoenix Group Holdings plc 1,300,000 4.13% 20/7/2022 1,360,546 0.04%Western Power Distribution South West plc 900,000 5.75% 23/3/2040 1,358,762 0.04%Segro plc 1,300,000 2.38% 11/10/2029 1,353,544 0.04%Close Brothers Group plc 1,300,000 2.75% 26/4/2023 1,351,144 0.04%Tesco Personal Finance Group plc 1,300,000 3.50% 25/7/2025 1,350,518 0.04%SSE plc 1,200,000 5.88% 22/9/2022 1,348,136 0.04%Next Group plc 1,200,000 4.38% 2/10/2026 1,347,451 0.04%United Utilities Water Finance plc 1,300,000 2.00% 3/7/2033 1,317,420 0.04%Wm Morrison Supermarkets plc 1,185,000 3.50% 27/7/2026 1,303,429 0.04%Cadent Finance plc 1,200,000 3.13% 21/3/2040 1,302,269 0.04%Close Brothers Finance plc 1,250,000 3.88% 27/6/2021 1,300,227 0.04%Wm Morrison Supermarkets plc 1,300,000 2.50% 1/10/2031 1,299,315 0.04%Firstgroup plc 1,100,000 6.88% 18/9/2024 1,290,573 0.04%Gatwick Funding Ltd. 1,300,000 2.63% 7/10/2046 1,285,073 0.04%Next Group plc 1,200,000 3.63% 18/5/2028 1,281,681 0.04%Bazalgette Finance plc 1,200,000 2.38% 29/11/2027 1,264,634 0.04%Yorkshire Water Finance plc^ 1,200,000 3.75% 22/3/2046 1,247,517 0.04%United Kingdom Gilt 749,167 3.75% 22/7/2052 1,240,255 0.04%Manchester Airport Group Funding plc 1,150,000 2.88% 31/3/2039 1,227,917 0.03%Direct Line Insurance Group plc^ 1,046,000 9.25% 27/4/2042 1,226,251 0.03%BUPA Finance plc 1,180,000 2.00% 5/4/2024 1,212,639 0.03%RSA Insurance Group plc 1,200,000 1.63% 28/8/2024 1,202,158 0.03%Southern Water Services Finance Ltd. 800,000 4.50% 31/3/2052 1,196,084 0.03%Tritax Big Box plc 1,125,000 3.13% 14/12/2031 1,184,614 0.03%Wm Morrison Supermarkets plc 1,052,000 4.63% 8/12/2023 1,182,629 0.03%Centrica plc 1,050,000 6.38% 10/3/2022 1,167,663 0.03%Anglian Water Services Financing plc 1,050,000 4.50% 22/2/2026 1,163,342 0.03%Student Finance plc 1,150,000 2.67% 30/9/2024 1,154,504 0.03%Places for People Homes Ltd. 1,000,000 5.09% 31/7/2024 1,146,749 0.03%Wods Transmission plc 1,025,024 3.45% 24/8/2034 1,146,554 0.03%Just Group plc 1,200,000 3.50% 7/2/2025 1,144,356 0.03%DS Smith plc 1,100,000 2.88% 26/7/2029 1,131,306 0.03%Anglian Water Services Financing plc 1,100,000 2.63% 15/6/2027 1,099,647 0.03%Longstone Finance plc 944,999 4.79% 19/4/2030 1,087,739 0.03%Marks & Spencer plc 1,000,000 6.13% 6/12/2021 1,085,560 0.03%Anglian Water Services Financing plc 1,000,000 2.75% 26/10/2029 1,074,746 0.03%CPUK Finance Ltd. 1,000,000 3.59% 28/8/2025 1,071,159 0.03%Telereal Securitisation plc 873,440 5.39% 10/12/2031 1,057,103 0.03%Close Brothers Finance plc 1,000,000 2.75% 19/10/2026 1,052,844 0.03%Quilter plc^ 1,000,000 4.48% 28/2/2028 1,045,000 0.03%Aviva plc^ 860,000 6.13% 14/11/2036 1,041,940 0.03%Greene King Finance plc 933,502 4.06% 15/3/2035 1,036,454 0.03%
Vanguard U.K. Investment Grade Bond Index Fund
825
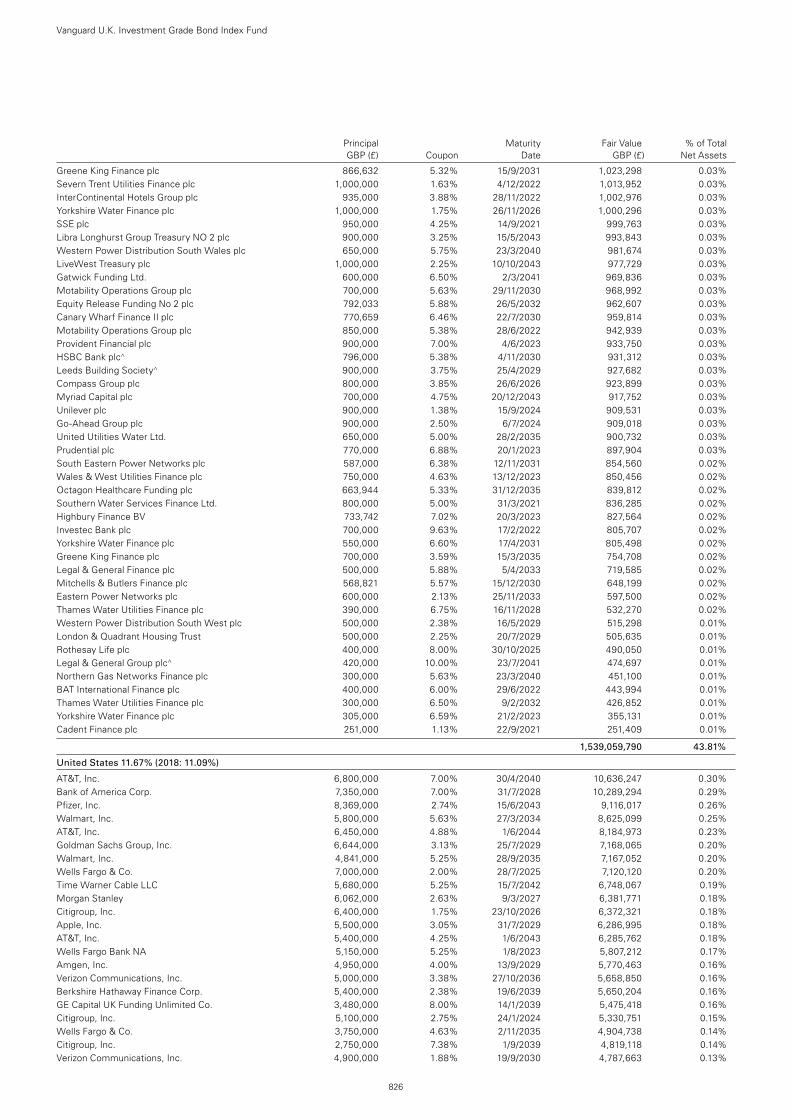
Principal Maturity Fair Value % of Total GBP (£) Coupon Date GBP (£) Net Assets
Greene King Finance plc 866,632 5.32% 15/9/2031 1,023,298 0.03%Severn Trent Utilities Finance plc 1,000,000 1.63% 4/12/2022 1,013,952 0.03%InterContinental Hotels Group plc 935,000 3.88% 28/11/2022 1,002,976 0.03%Yorkshire Water Finance plc 1,000,000 1.75% 26/11/2026 1,000,296 0.03%SSE plc 950,000 4.25% 14/9/2021 999,763 0.03%Libra Longhurst Group Treasury NO 2 plc 900,000 3.25% 15/5/2043 993,843 0.03%Western Power Distribution South Wales plc 650,000 5.75% 23/3/2040 981,674 0.03%LiveWest Treasury plc 1,000,000 2.25% 10/10/2043 977,729 0.03%Gatwick Funding Ltd. 600,000 6.50% 2/3/2041 969,836 0.03%Motability Operations Group plc 700,000 5.63% 29/11/2030 968,992 0.03%Equity Release Funding No 2 plc 792,033 5.88% 26/5/2032 962,607 0.03%Canary Wharf Finance II plc 770,659 6.46% 22/7/2030 959,814 0.03%Motability Operations Group plc 850,000 5.38% 28/6/2022 942,939 0.03%Provident Financial plc 900,000 7.00% 4/6/2023 933,750 0.03%HSBC Bank plc^ 796,000 5.38% 4/11/2030 931,312 0.03%Leeds Building Society^ 900,000 3.75% 25/4/2029 927,682 0.03%Compass Group plc 800,000 3.85% 26/6/2026 923,899 0.03%Myriad Capital plc 700,000 4.75% 20/12/2043 917,752 0.03%Unilever plc 900,000 1.38% 15/9/2024 909,531 0.03%Go-Ahead Group plc 900,000 2.50% 6/7/2024 909,018 0.03%United Utilities Water Ltd. 650,000 5.00% 28/2/2035 900,732 0.03%Prudential plc 770,000 6.88% 20/1/2023 897,904 0.03%South Eastern Power Networks plc 587,000 6.38% 12/11/2031 854,560 0.02%Wales & West Utilities Finance plc 750,000 4.63% 13/12/2023 850,456 0.02%Octagon Healthcare Funding plc 663,944 5.33% 31/12/2035 839,812 0.02%Southern Water Services Finance Ltd. 800,000 5.00% 31/3/2021 836,285 0.02%Highbury Finance BV 733,742 7.02% 20/3/2023 827,564 0.02%Investec Bank plc 700,000 9.63% 17/2/2022 805,707 0.02%Yorkshire Water Finance plc 550,000 6.60% 17/4/2031 805,498 0.02%Greene King Finance plc 700,000 3.59% 15/3/2035 754,708 0.02%Legal & General Finance plc 500,000 5.88% 5/4/2033 719,585 0.02%Mitchells & Butlers Finance plc 568,821 5.57% 15/12/2030 648,199 0.02%Eastern Power Networks plc 600,000 2.13% 25/11/2033 597,500 0.02%Thames Water Utilities Finance plc 390,000 6.75% 16/11/2028 532,270 0.02%Western Power Distribution South West plc 500,000 2.38% 16/5/2029 515,298 0.01%London & Quadrant Housing Trust 500,000 2.25% 20/7/2029 505,635 0.01%Rothesay Life plc 400,000 8.00% 30/10/2025 490,050 0.01%Legal & General Group plc^ 420,000 10.00% 23/7/2041 474,697 0.01%Northern Gas Networks Finance plc 300,000 5.63% 23/3/2040 451,100 0.01%BAT International Finance plc 400,000 6.00% 29/6/2022 443,994 0.01%Thames Water Utilities Finance plc 300,000 6.50% 9/2/2032 426,852 0.01%Yorkshire Water Finance plc 305,000 6.59% 21/2/2023 355,131 0.01%Cadent Finance plc 251,000 1.13% 22/9/2021 251,409 0.01%
1,539,059,790 43.81%
United States 11.67% (2018: 11.09%)
AT&T, Inc. 6,800,000 7.00% 30/4/2040 10,636,247 0.30%Bank of America Corp. 7,350,000 7.00% 31/7/2028 10,289,294 0.29%Pfizer, Inc. 8,369,000 2.74% 15/6/2043 9,116,017 0.26%Walmart, Inc. 5,800,000 5.63% 27/3/2034 8,625,099 0.25%AT&T, Inc. 6,450,000 4.88% 1/6/2044 8,184,973 0.23%Goldman Sachs Group, Inc. 6,644,000 3.13% 25/7/2029 7,168,065 0.20%Walmart, Inc. 4,841,000 5.25% 28/9/2035 7,167,052 0.20%Wells Fargo & Co. 7,000,000 2.00% 28/7/2025 7,120,120 0.20%Time Warner Cable LLC 5,680,000 5.25% 15/7/2042 6,748,067 0.19%Morgan Stanley 6,062,000 2.63% 9/3/2027 6,381,771 0.18%Citigroup, Inc. 6,400,000 1.75% 23/10/2026 6,372,321 0.18%Apple, Inc. 5,500,000 3.05% 31/7/2029 6,286,995 0.18%AT&T, Inc. 5,400,000 4.25% 1/6/2043 6,285,762 0.18%Wells Fargo Bank NA 5,150,000 5.25% 1/8/2023 5,807,212 0.17%Amgen, Inc. 4,950,000 4.00% 13/9/2029 5,770,463 0.16%Verizon Communications, Inc. 5,000,000 3.38% 27/10/2036 5,658,850 0.16%Berkshire Hathaway Finance Corp. 5,400,000 2.38% 19/6/2039 5,650,204 0.16%GE Capital UK Funding Unlimited Co. 3,480,000 8.00% 14/1/2039 5,475,418 0.16%Citigroup, Inc. 5,100,000 2.75% 24/1/2024 5,330,751 0.15%Wells Fargo & Co. 3,750,000 4.63% 2/11/2035 4,904,738 0.14%Citigroup, Inc. 2,750,000 7.38% 1/9/2039 4,819,118 0.14%Verizon Communications, Inc. 4,900,000 1.88% 19/9/2030 4,787,663 0.13%
Vanguard U.K. Investment Grade Bond Index Fund
826
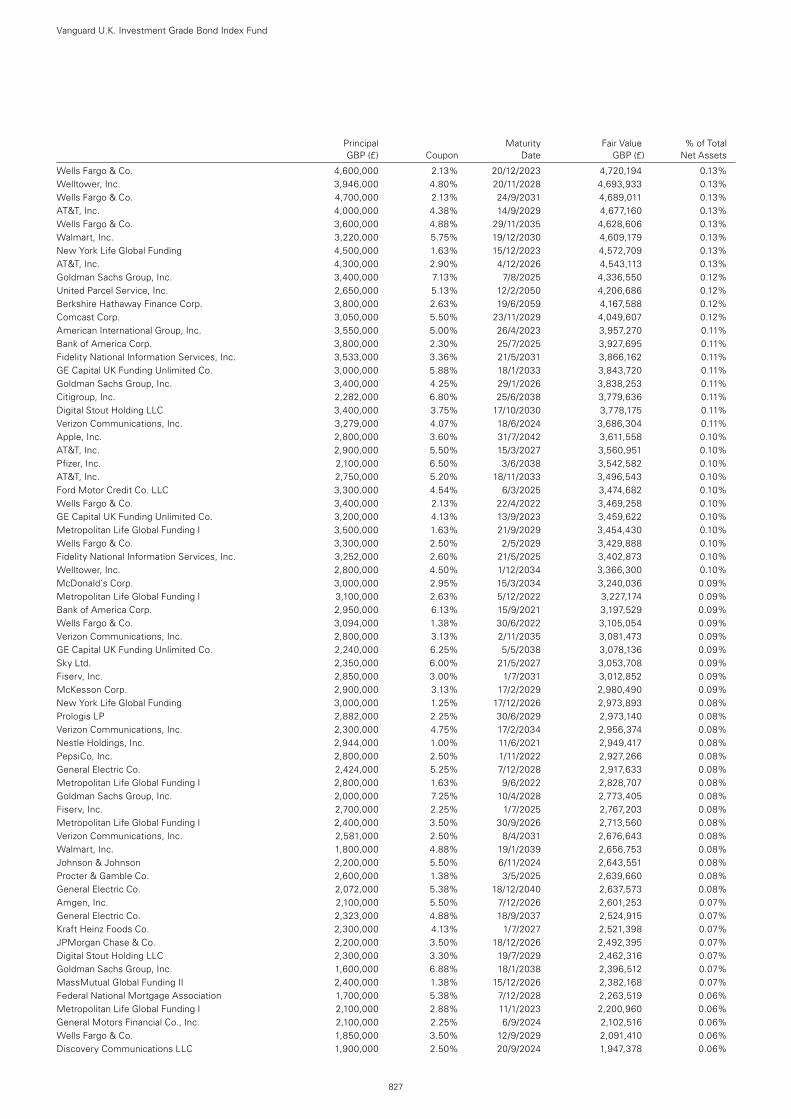
Principal Maturity Fair Value % of Total GBP (£) Coupon Date GBP (£) Net Assets
Wells Fargo & Co. 4,600,000 2.13% 20/12/2023 4,720,194 0.13%Welltower, Inc. 3,946,000 4.80% 20/11/2028 4,693,933 0.13%Wells Fargo & Co. 4,700,000 2.13% 24/9/2031 4,689,011 0.13%AT&T, Inc. 4,000,000 4.38% 14/9/2029 4,677,160 0.13%Wells Fargo & Co. 3,600,000 4.88% 29/11/2035 4,628,606 0.13%Walmart, Inc. 3,220,000 5.75% 19/12/2030 4,609,179 0.13%New York Life Global Funding 4,500,000 1.63% 15/12/2023 4,572,709 0.13%AT&T, Inc. 4,300,000 2.90% 4/12/2026 4,543,113 0.13%Goldman Sachs Group, Inc. 3,400,000 7.13% 7/8/2025 4,336,550 0.12%United Parcel Service, Inc. 2,650,000 5.13% 12/2/2050 4,206,686 0.12%Berkshire Hathaway Finance Corp. 3,800,000 2.63% 19/6/2059 4,167,588 0.12%Comcast Corp. 3,050,000 5.50% 23/11/2029 4,049,607 0.12%American International Group, Inc. 3,550,000 5.00% 26/4/2023 3,957,270 0.11%Bank of America Corp. 3,800,000 2.30% 25/7/2025 3,927,695 0.11%Fidelity National Information Services, Inc. 3,533,000 3.36% 21/5/2031 3,866,162 0.11%GE Capital UK Funding Unlimited Co. 3,000,000 5.88% 18/1/2033 3,843,720 0.11%Goldman Sachs Group, Inc. 3,400,000 4.25% 29/1/2026 3,838,253 0.11%Citigroup, Inc. 2,282,000 6.80% 25/6/2038 3,779,636 0.11%Digital Stout Holding LLC 3,400,000 3.75% 17/10/2030 3,778,175 0.11%Verizon Communications, Inc. 3,279,000 4.07% 18/6/2024 3,686,304 0.11%Apple, Inc. 2,800,000 3.60% 31/7/2042 3,611,558 0.10%AT&T, Inc. 2,900,000 5.50% 15/3/2027 3,560,951 0.10%Pfizer, Inc. 2,100,000 6.50% 3/6/2038 3,542,582 0.10%AT&T, Inc. 2,750,000 5.20% 18/11/2033 3,496,543 0.10%Ford Motor Credit Co. LLC 3,300,000 4.54% 6/3/2025 3,474,682 0.10%Wells Fargo & Co. 3,400,000 2.13% 22/4/2022 3,469,258 0.10%GE Capital UK Funding Unlimited Co. 3,200,000 4.13% 13/9/2023 3,459,622 0.10%Metropolitan Life Global Funding I 3,500,000 1.63% 21/9/2029 3,454,430 0.10%Wells Fargo & Co. 3,300,000 2.50% 2/5/2029 3,429,888 0.10%Fidelity National Information Services, Inc. 3,252,000 2.60% 21/5/2025 3,402,873 0.10%Welltower, Inc. 2,800,000 4.50% 1/12/2034 3,366,300 0.10%McDonald’s Corp. 3,000,000 2.95% 15/3/2034 3,240,036 0.09%Metropolitan Life Global Funding I 3,100,000 2.63% 5/12/2022 3,227,174 0.09%Bank of America Corp. 2,950,000 6.13% 15/9/2021 3,197,529 0.09%Wells Fargo & Co. 3,094,000 1.38% 30/6/2022 3,105,054 0.09%Verizon Communications, Inc. 2,800,000 3.13% 2/11/2035 3,081,473 0.09%GE Capital UK Funding Unlimited Co. 2,240,000 6.25% 5/5/2038 3,078,136 0.09%Sky Ltd. 2,350,000 6.00% 21/5/2027 3,053,708 0.09%Fiserv, Inc. 2,850,000 3.00% 1/7/2031 3,012,852 0.09%McKesson Corp. 2,900,000 3.13% 17/2/2029 2,980,490 0.09%New York Life Global Funding 3,000,000 1.25% 17/12/2026 2,973,893 0.08%Prologis LP 2,882,000 2.25% 30/6/2029 2,973,140 0.08%Verizon Communications, Inc. 2,300,000 4.75% 17/2/2034 2,956,374 0.08%Nestle Holdings, Inc. 2,944,000 1.00% 11/6/2021 2,949,417 0.08%PepsiCo, Inc. 2,800,000 2.50% 1/11/2022 2,927,266 0.08%General Electric Co. 2,424,000 5.25% 7/12/2028 2,917,633 0.08%Metropolitan Life Global Funding I 2,800,000 1.63% 9/6/2022 2,828,707 0.08%Goldman Sachs Group, Inc. 2,000,000 7.25% 10/4/2028 2,773,405 0.08%Fiserv, Inc. 2,700,000 2.25% 1/7/2025 2,767,203 0.08%Metropolitan Life Global Funding I 2,400,000 3.50% 30/9/2026 2,713,560 0.08%Verizon Communications, Inc. 2,581,000 2.50% 8/4/2031 2,676,643 0.08%Walmart, Inc. 1,800,000 4.88% 19/1/2039 2,656,753 0.08%Johnson & Johnson 2,200,000 5.50% 6/11/2024 2,643,551 0.08%Procter & Gamble Co. 2,600,000 1.38% 3/5/2025 2,639,660 0.08%General Electric Co. 2,072,000 5.38% 18/12/2040 2,637,573 0.08%Amgen, Inc. 2,100,000 5.50% 7/12/2026 2,601,253 0.07%General Electric Co. 2,323,000 4.88% 18/9/2037 2,524,915 0.07%Kraft Heinz Foods Co. 2,300,000 4.13% 1/7/2027 2,521,398 0.07%JPMorgan Chase & Co. 2,200,000 3.50% 18/12/2026 2,492,395 0.07%Digital Stout Holding LLC 2,300,000 3.30% 19/7/2029 2,462,316 0.07%Goldman Sachs Group, Inc. 1,600,000 6.88% 18/1/2038 2,396,512 0.07%MassMutual Global Funding II 2,400,000 1.38% 15/12/2026 2,382,168 0.07%Federal National Mortgage Association 1,700,000 5.38% 7/12/2028 2,263,519 0.06%Metropolitan Life Global Funding I 2,100,000 2.88% 11/1/2023 2,200,960 0.06%General Motors Financial Co., Inc. 2,100,000 2.25% 6/9/2024 2,102,516 0.06%Wells Fargo & Co. 1,850,000 3.50% 12/9/2029 2,091,410 0.06%Discovery Communications LLC 1,900,000 2.50% 20/9/2024 1,947,378 0.06%
Vanguard U.K. Investment Grade Bond Index Fund
827
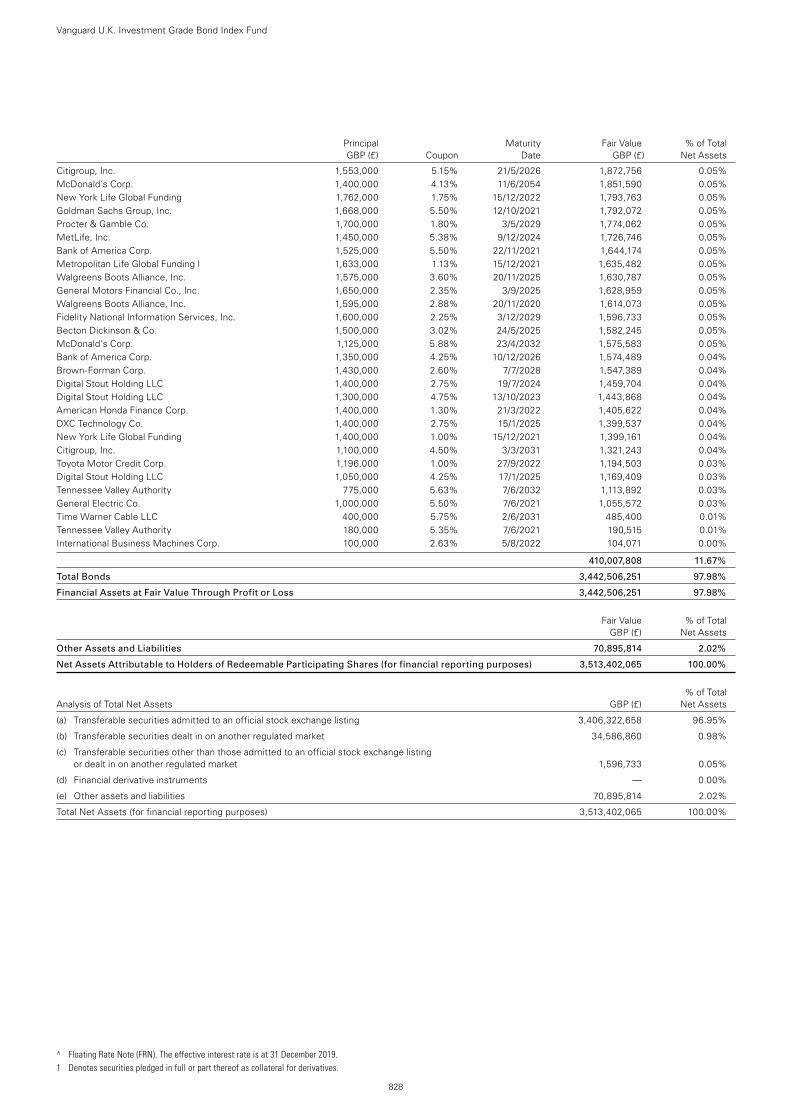
^ Floating Rate Note (FRN). The effective interest rate is at 31 December 2019. 1 Denotes securities pledged in full or part thereof as collateral for derivatives.
Principal Maturity Fair Value % of Total GBP (£) Coupon Date GBP (£) Net Assets
Citigroup, Inc. 1,553,000 5.15% 21/5/2026 1,872,756 0.05%McDonald’s Corp. 1,400,000 4.13% 11/6/2054 1,851,590 0.05%New York Life Global Funding 1,762,000 1.75% 15/12/2022 1,793,763 0.05%Goldman Sachs Group, Inc. 1,668,000 5.50% 12/10/2021 1,792,072 0.05%Procter & Gamble Co. 1,700,000 1.80% 3/5/2029 1,774,062 0.05%MetLife, Inc. 1,450,000 5.38% 9/12/2024 1,726,746 0.05%Bank of America Corp. 1,525,000 5.50% 22/11/2021 1,644,174 0.05%Metropolitan Life Global Funding I 1,633,000 1.13% 15/12/2021 1,635,482 0.05%Walgreens Boots Alliance, Inc. 1,575,000 3.60% 20/11/2025 1,630,787 0.05%General Motors Financial Co., Inc. 1,650,000 2.35% 3/9/2025 1,628,959 0.05%Walgreens Boots Alliance, Inc. 1,595,000 2.88% 20/11/2020 1,614,073 0.05%Fidelity National Information Services, Inc. 1,600,000 2.25% 3/12/2029 1,596,733 0.05%Becton Dickinson & Co. 1,500,000 3.02% 24/5/2025 1,582,245 0.05%McDonald’s Corp. 1,125,000 5.88% 23/4/2032 1,575,583 0.05%Bank of America Corp. 1,350,000 4.25% 10/12/2026 1,574,489 0.04%Brown-Forman Corp. 1,430,000 2.60% 7/7/2028 1,547,389 0.04%Digital Stout Holding LLC 1,400,000 2.75% 19/7/2024 1,459,704 0.04%Digital Stout Holding LLC 1,300,000 4.75% 13/10/2023 1,443,868 0.04%American Honda Finance Corp. 1,400,000 1.30% 21/3/2022 1,405,622 0.04%DXC Technology Co. 1,400,000 2.75% 15/1/2025 1,399,537 0.04%New York Life Global Funding 1,400,000 1.00% 15/12/2021 1,399,161 0.04%Citigroup, Inc. 1,100,000 4.50% 3/3/2031 1,321,243 0.04%Toyota Motor Credit Corp. 1,196,000 1.00% 27/9/2022 1,194,503 0.03%Digital Stout Holding LLC 1,050,000 4.25% 17/1/2025 1,169,409 0.03%Tennessee Valley Authority 775,000 5.63% 7/6/2032 1,113,892 0.03%General Electric Co. 1,000,000 5.50% 7/6/2021 1,055,572 0.03%Time Warner Cable LLC 400,000 5.75% 2/6/2031 485,400 0.01%Tennessee Valley Authority 180,000 5.35% 7/6/2021 190,515 0.01%International Business Machines Corp. 100,000 2.63% 5/8/2022 104,071 0.00%
410,007,808 11.67%
Total Bonds 3,442,506,251 97.98%
Financial Assets at Fair Value Through Profit or Loss 3,442,506,251 97.98%
Fair Value % of Total GBP (£) Net Assets
Other Assets and Liabilities 70,895,814 2.02%
Net Assets Attributable to Holders of Redeemable Participating Shares (for financial reporting purposes) 3,513,402,065 100.00%
% of Total Analysis of Total Net Assets GBP (£) Net Assets
(a) Transferable securities admitted to an official stock exchange listing 3,406,322,658 96.95%
(b) Transferable securities dealt in on another regulated market 34,586,860 0.98%
(c) Transferable securities other than those admitted to an official stock exchange listing or dealt in on another regulated market 1,596,733 0.05%
(d) Financial derivative instruments — 0.00%
(e) Other assets and liabilities 70,895,814 2.02%
Total Net Assets (for financial reporting purposes) 3,513,402,065 100.00%
Vanguard U.K. Investment Grade Bond Index Fund
828
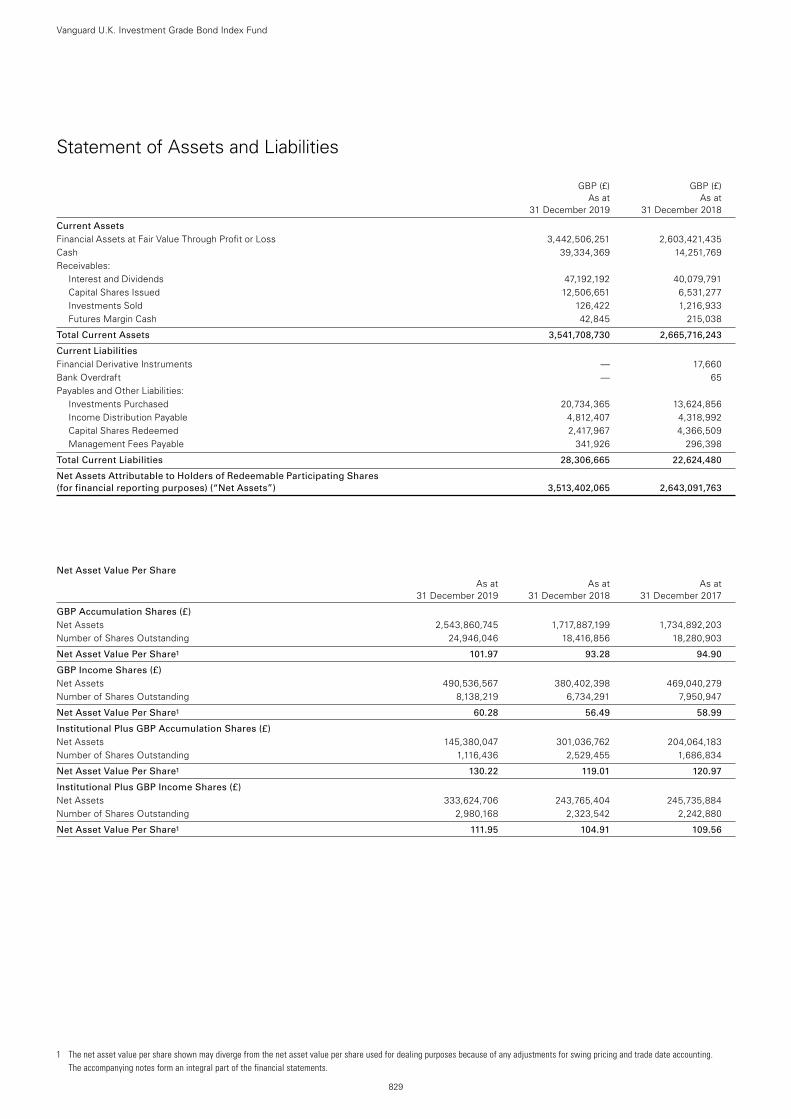
1 The net asset value per share shown may diverge from the net asset value per share used for dealing purposes because of any adjustments for swing pricing and trade date accounting. The accompanying notes form an integral part of the financial statements.
829
Vanguard U.K. Investment Grade Bond Index Fund
Statement of Assets and Liabilities
GBP (£) GBP (£) As at As at 31 December 2019 31 December 2018
Current Assets Financial Assets at Fair Value Through Profit or Loss 3,442,506,251 2,603,421,435Cash 39,334,369 14,251,769Receivables:
Interest and Dividends 47,192,192 40,079,791Capital Shares Issued 12,506,651 6,531,277Investments Sold 126,422 1,216,933Futures Margin Cash 42,845 215,038
Total Current Assets 3,541,708,730 2,665,716,243
Current Liabilities Financial Derivative Instruments — 17,660Bank Overdraft — 65Payables and Other Liabilities:
Investments Purchased 20,734,365 13,624,856Income Distribution Payable 4,812,407 4,318,992Capital Shares Redeemed 2,417,967 4,366,509Management Fees Payable 341,926 296,398
Total Current Liabilities 28,306,665 22,624,480
Net Assets Attributable to Holders of Redeemable Participating Shares (for financial reporting purposes) (“Net Assets”) 3,513,402,065 2,643,091,763
Net Asset Value Per Share As at As at As at 31 December 2019 31 December 2018 31 December 2017
GBP Accumulation Shares (£) Net Assets 2,543,860,745 1,717,887,199 1,734,892,203Number of Shares Outstanding 24,946,046 18,416,856 18,280,903
Net Asset Value Per Share1 101.97 93.28 94.90
GBP Income Shares (£) Net Assets 490,536,567 380,402,398 469,040,279Number of Shares Outstanding 8,138,219 6,734,291 7,950,947
Net Asset Value Per Share1 60.28 56.49 58.99
Institutional Plus GBP Accumulation Shares (£) Net Assets 145,380,047 301,036,762 204,064,183Number of Shares Outstanding 1,116,436 2,529,455 1,686,834
Net Asset Value Per Share1 130.22 119.01 120.97
Institutional Plus GBP Income Shares (£) Net Assets 333,624,706 243,765,404 245,735,884Number of Shares Outstanding 2,980,168 2,323,542 2,242,880
Net Asset Value Per Share1 111.95 104.91 109.56
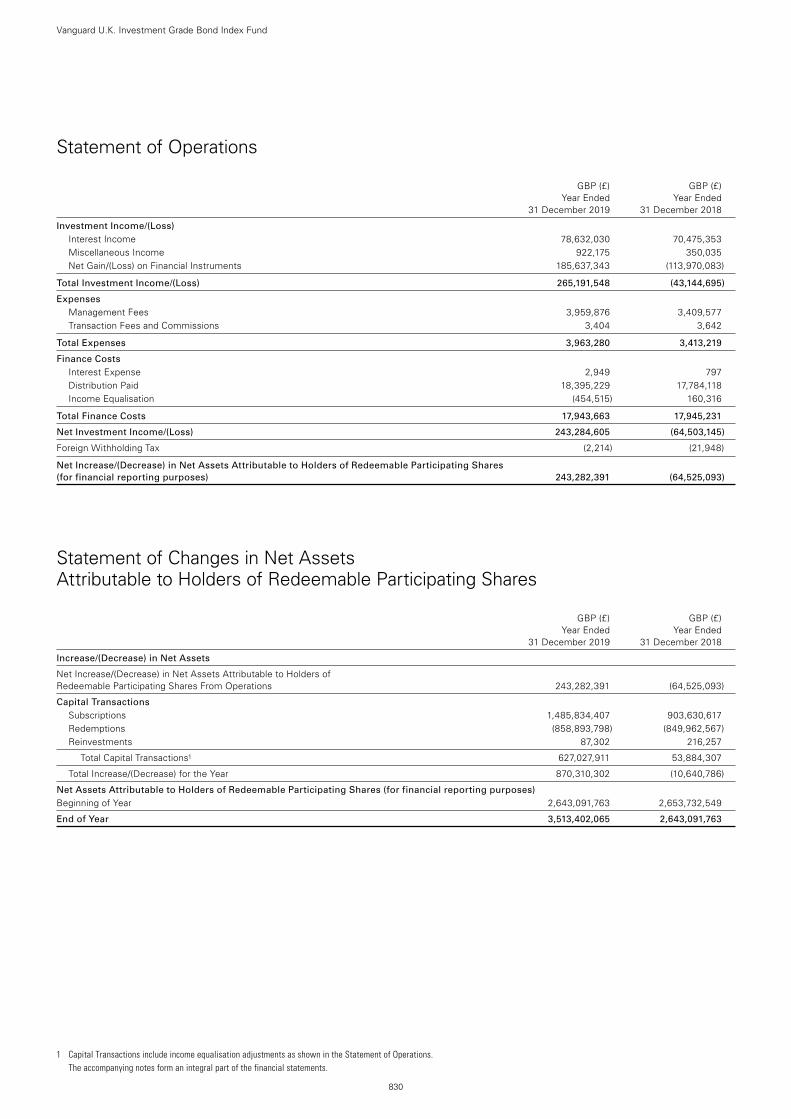
830
Vanguard U.K. Investment Grade Bond Index Fund
Statement of Operations
GBP (£) GBP (£) Year Ended Year Ended 31 December 2019 31 December 2018
Investment Income/(Loss) Interest Income 78,632,030 70,475,353Miscellaneous Income 922,175 350,035Net Gain/(Loss) on Financial Instruments 185,637,343 (113,970,083)
Total Investment Income/(Loss) 265,191,548 (43,144,695)
Expenses Management Fees 3,959,876 3,409,577Transaction Fees and Commissions 3,404 3,642
Total Expenses 3,963,280 3,413,219
Finance Costs Interest Expense 2,949 797Distribution Paid 18,395,229 17,784,118Income Equalisation (454,515) 160,316
Total Finance Costs 17,943,663 17,945,231
Net Investment Income/(Loss) 243,284,605 (64,503,145)
Foreign Withholding Tax (2,214) (21,948)
Net Increase/(Decrease) in Net Assets Attributable to Holders of Redeemable Participating Shares (for financial reporting purposes) 243,282,391 (64,525,093)
Statement of Changes in Net Assets Attributable to Holders of Redeemable Participating Shares
GBP (£) GBP (£) Year Ended Year Ended 31 December 2019 31 December 2018
Increase/(Decrease) in Net Assets
Net Increase/(Decrease) in Net Assets Attributable to Holders of Redeemable Participating Shares From Operations 243,282,391 (64,525,093)
Capital Transactions Subscriptions 1,485,834,407 903,630,617Redemptions (858,893,798) (849,962,567)Reinvestments 87,302 216,257
Total Capital Transactions1 627,027,911 53,884,307
Total Increase/(Decrease) for the Year 870,310,302 (10,640,786)
Net Assets Attributable to Holders of Redeemable Participating Shares (for financial reporting purposes) Beginning of Year 2,643,091,763 2,653,732,549
End of Year 3,513,402,065 2,643,091,763
1 Capital Transactions include income equalisation adjustments as shown in the Statement of Operations. The accompanying notes form an integral part of the financial statements.
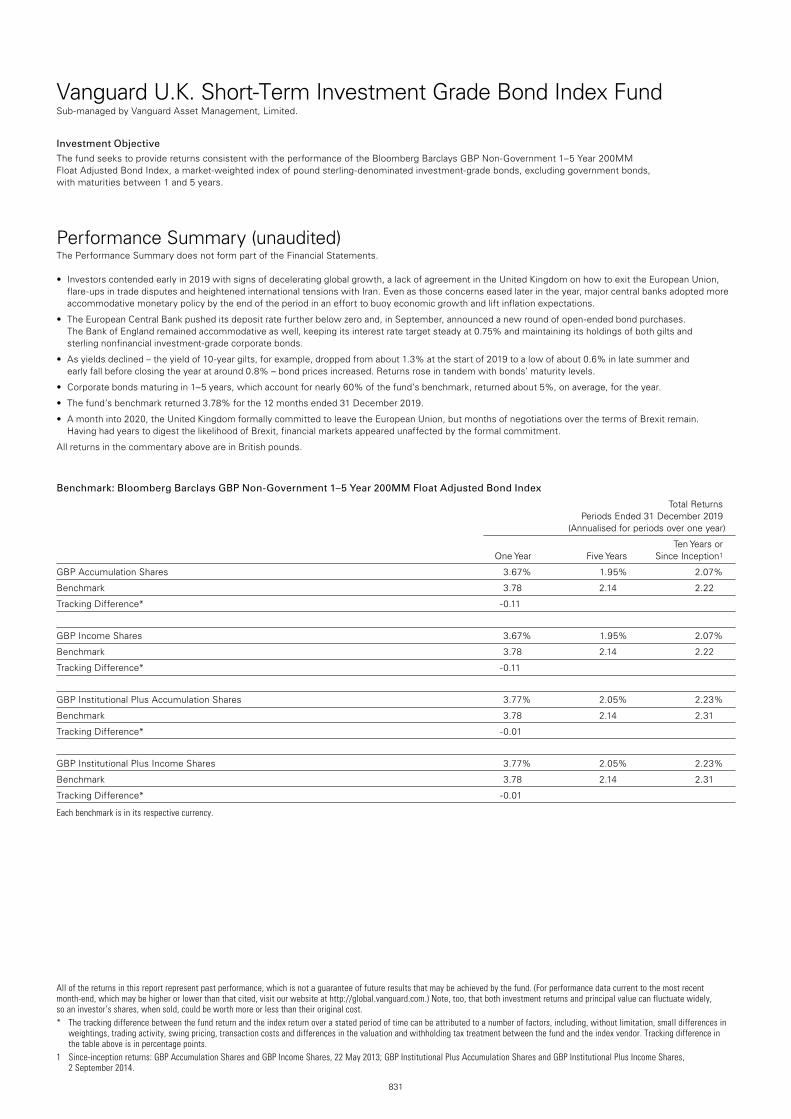
831
Vanguard U.K. Short-Term Investment Grade Bond Index FundSub-managed by Vanguard Asset Management, Limited.
All of the returns in this report represent past performance, which is not a guarantee of future results that may be achieved by the fund. (For performance data current to the most recent month-end, which may be higher or lower than that cited, visit our website at http://global.vanguard.com.) Note, too, that both investment returns and principal value can fluctuate widely, so an investor’s shares, when sold, could be worth more or less than their original cost.* The tracking difference between the fund return and the index return over a stated period of time can be attributed to a number of factors, including, without limitation, small differences in
weightings, trading activity, swing pricing, transaction costs and differences in the valuation and withholding tax treatment between the fund and the index vendor. Tracking difference in the table above is in percentage points.
1 Since-inception returns: GBP Accumulation Shares and GBP Income Shares, 22 May 2013; GBP Institutional Plus Accumulation Shares and GBP Institutional Plus Income Shares, 2 September 2014.
Investment ObjectiveThe fund seeks to provide returns consistent with the performance of the Bloomberg Barclays GBP Non-Government 1–5 Year 200MM Float Adjusted Bond Index, a market-weighted index of pound sterling-denominated investment-grade bonds, excluding government bonds, with maturities between 1 and 5 years.
Performance Summary (unaudited)The Performance Summary does not form part of the Financial Statements.
• Investorscontendedearlyin2019withsignsofdeceleratingglobalgrowth,alackofagreementintheUnitedKingdomonhowtoexittheEuropeanUnion,flare-ups in trade disputes and heightened international tensions with Iran. Even as those concerns eased later in the year, major central banks adopted more accommodative monetary policy by the end of the period in an effort to buoy economic growth and lift inflation expectations.
• TheEuropeanCentralBankpusheditsdepositratefurtherbelowzeroand,inSeptember,announcedanewroundofopen-endedbondpurchases. The Bank of England remained accommodative as well, keeping its interest rate target steady at 0.75% and maintaining its holdings of both gilts and sterling nonfinancial investment-grade corporate bonds.
• Asyieldsdeclined–theyieldof10-yeargilts,forexample,droppedfromabout1.3%atthestartof2019toalowofabout0.6%inlatesummerand early fall before closing the year at around 0.8% – bond prices increased. Returns rose in tandem with bonds’ maturity levels.
• Corporatebondsmaturingin1–5years,whichaccountfornearly60%ofthefund’sbenchmark,returnedabout5%,onaverage,fortheyear.
• Thefund’sbenchmarkreturned3.78%forthe12monthsended31December2019.
• Amonthinto2020,theUnitedKingdomformallycommittedtoleavetheEuropeanUnion,butmonthsofnegotiationsoverthetermsofBrexitremain. Having had years to digest the likelihood of Brexit, financial markets appeared unaffected by the formal commitment.
All returns in the commentary above are in British pounds.
Benchmark: Bloomberg Barclays GBP Non-Government 1–5 Year 200MM Float Adjusted Bond Index
Total Returns Periods Ended 31 December 2019 (Annualised for periods over one year)
Ten Years or One Year Five Years Since Inception1
GBP Accumulation Shares 3.67% 1.95% 2.07%
Benchmark 3.78 2.14 2.22
Tracking Difference* -0.11
GBP Income Shares 3.67% 1.95% 2.07%
Benchmark 3.78 2.14 2.22
Tracking Difference* -0.11
GBP Institutional Plus Accumulation Shares 3.77% 2.05% 2.23%
Benchmark 3.78 2.14 2.31
Tracking Difference* -0.01
GBP Institutional Plus Income Shares 3.77% 2.05% 2.23%
Benchmark 3.78 2.14 2.31
Tracking Difference* -0.01
Each benchmark is in its respective currency.
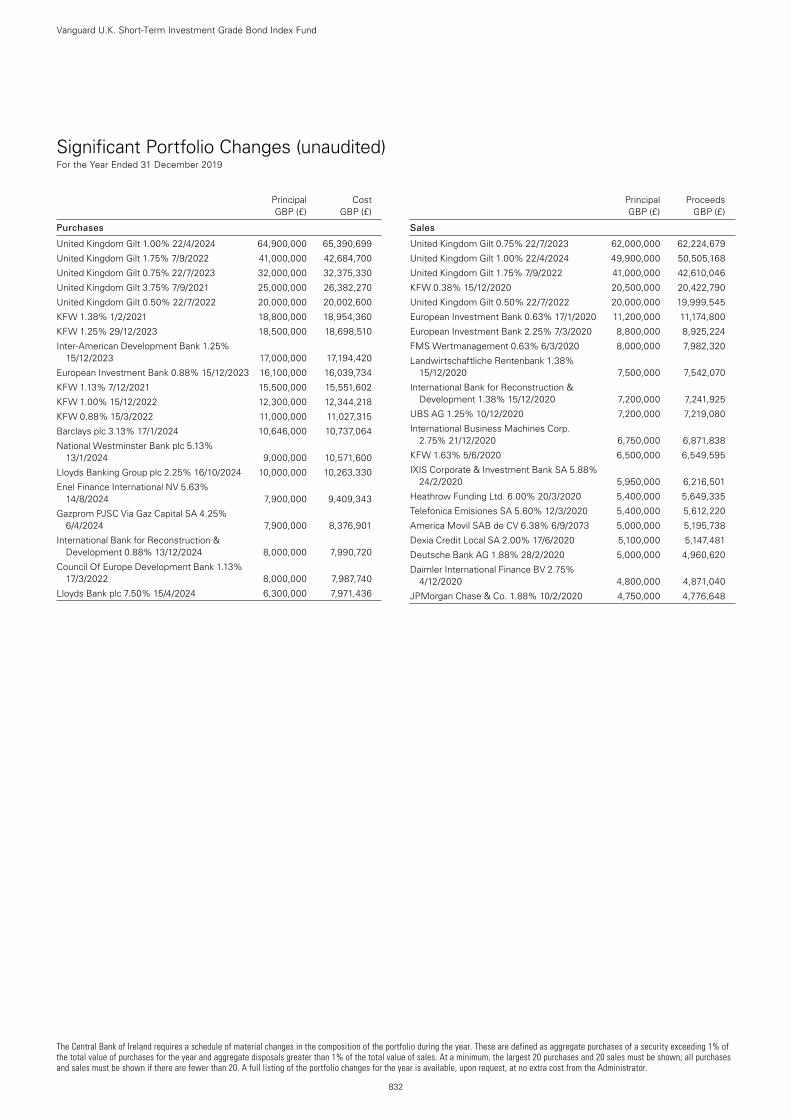
The Central Bank of Ireland requires a schedule of material changes in the composition of the portfolio during the year. These are defined as aggregate purchases of a security exceeding 1% of the total value of purchases for the year and aggregate disposals greater than 1% of the total value of sales. At a minimum, the largest 20 purchases and 20 sales must be shown; all purchases and sales must be shown if there are fewer than 20. A full listing of the portfolio changes for the year is available, upon request, at no extra cost from the Administrator.
832
Vanguard U.K. Short-Term Investment Grade Bond Index Fund
Significant Portfolio Changes (unaudited) For the Year Ended 31 December 2019
Principal Cost GBP (£) GBP (£)
Purchases
United Kingdom Gilt 1.00% 22/4/2024 64,900,000 65,390,699
United Kingdom Gilt 1.75% 7/9/2022 41,000,000 42,684,700
United Kingdom Gilt 0.75% 22/7/2023 32,000,000 32,375,330
United Kingdom Gilt 3.75% 7/9/2021 25,000,000 26,382,270
United Kingdom Gilt 0.50% 22/7/2022 20,000,000 20,002,600
KFW 1.38% 1/2/2021 18,800,000 18,954,360
KFW 1.25% 29/12/2023 18,500,000 18,698,510
Inter-American Development Bank 1.25% 15/12/2023 17,000,000 17,194,420
European Investment Bank 0.88% 15/12/2023 16,100,000 16,039,734
KFW 1.13% 7/12/2021 15,500,000 15,551,602
KFW 1.00% 15/12/2022 12,300,000 12,344,218
KFW 0.88% 15/3/2022 11,000,000 11,027,315
Barclays plc 3.13% 17/1/2024 10,646,000 10,737,064
National Westminster Bank plc 5.13% 13/1/2024 9,000,000 10,571,600
Lloyds Banking Group plc 2.25% 16/10/2024 10,000,000 10,263,330
Enel Finance International NV 5.63% 14/8/2024 7,900,000 9,409,343
Gazprom PJSC Via Gaz Capital SA 4.25% 6/4/2024 7,900,000 8,376,901
International Bank for Reconstruction & Development 0.88% 13/12/2024 8,000,000 7,990,720
Council Of Europe Development Bank 1.13% 17/3/2022 8,000,000 7,987,740
Lloyds Bank plc 7.50% 15/4/2024 6,300,000 7,971,436
Principal Proceeds GBP (£) GBP (£)
Sales
United Kingdom Gilt 0.75% 22/7/2023 62,000,000 62,224,679
United Kingdom Gilt 1.00% 22/4/2024 49,900,000 50,505,168
United Kingdom Gilt 1.75% 7/9/2022 41,000,000 42,610,046
KFW 0.38% 15/12/2020 20,500,000 20,422,790
United Kingdom Gilt 0.50% 22/7/2022 20,000,000 19,999,545
European Investment Bank 0.63% 17/1/2020 11,200,000 11,174,800
European Investment Bank 2.25% 7/3/2020 8,800,000 8,925,224
FMS Wertmanagement 0.63% 6/3/2020 8,000,000 7,982,320
Landwirtschaftliche Rentenbank 1.38% 15/12/2020 7,500,000 7,542,070
International Bank for Reconstruction & Development 1.38% 15/12/2020 7,200,000 7,241,925
UBS AG 1.25% 10/12/2020 7,200,000 7,219,080
International Business Machines Corp. 2.75% 21/12/2020 6,750,000 6,871,838
KFW 1.63% 5/6/2020 6,500,000 6,549,595
IXIS Corporate & Investment Bank SA 5.88% 24/2/2020 5,950,000 6,216,501
Heathrow Funding Ltd. 6.00% 20/3/2020 5,400,000 5,649,335
Telefonica Emisiones SA 5.60% 12/3/2020 5,400,000 5,612,220
America Movil SAB de CV 6.38% 6/9/2073 5,000,000 5,195,738
Dexia Credit Local SA 2.00% 17/6/2020 5,100,000 5,147,481
Deutsche Bank AG 1.88% 28/2/2020 5,000,000 4,960,620
Daimler International Finance BV 2.75% 4/12/2020 4,800,000 4,871,040
JPMorgan Chase & Co. 1.88% 10/2/2020 4,750,000 4,776,648
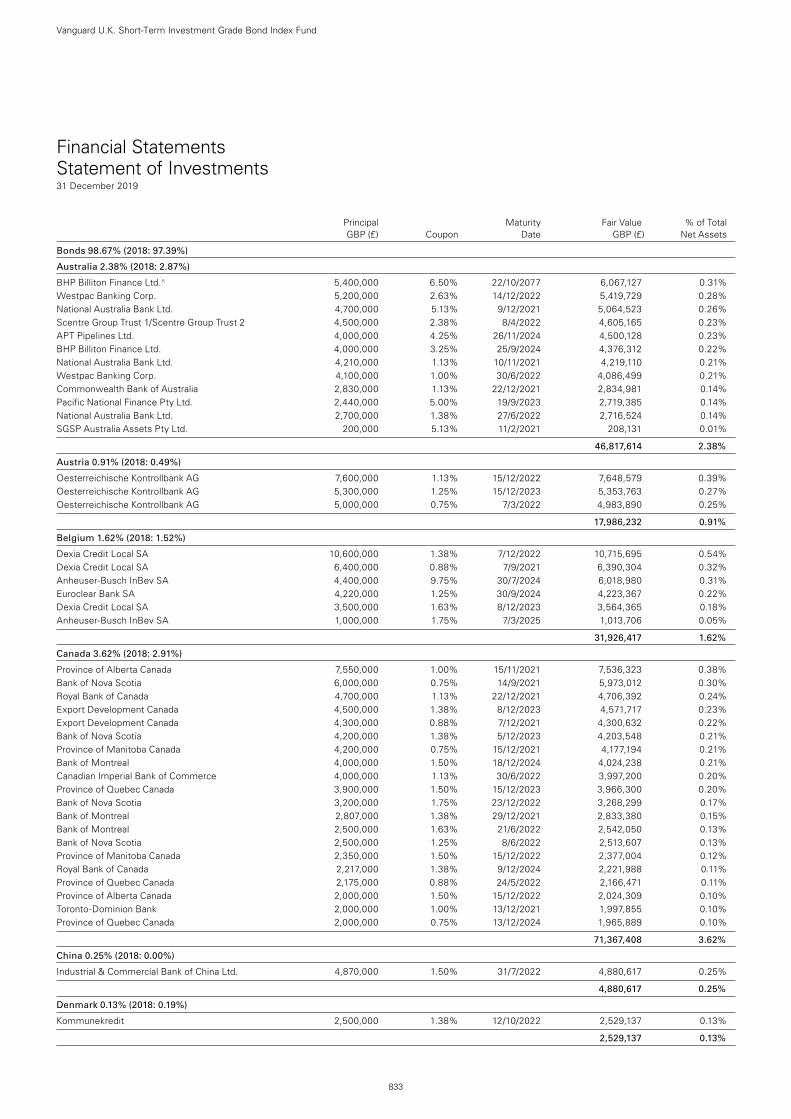
Financial Statements Statement of Investments31 December 2019
Principal Maturity Fair Value % of Total GBP (£) Coupon Date GBP (£) Net Assets
Bonds 98.67% (2018: 97.39%)
Australia 2.38% (2018: 2.87%)
BHP Billiton Finance Ltd.^ 5,400,000 6.50% 22/10/2077 6,067,127 0.31%Westpac Banking Corp. 5,200,000 2.63% 14/12/2022 5,419,729 0.28%National Australia Bank Ltd. 4,700,000 5.13% 9/12/2021 5,064,523 0.26%Scentre Group Trust 1/Scentre Group Trust 2 4,500,000 2.38% 8/4/2022 4,605,165 0.23%APT Pipelines Ltd. 4,000,000 4.25% 26/11/2024 4,500,128 0.23%BHP Billiton Finance Ltd. 4,000,000 3.25% 25/9/2024 4,376,312 0.22%National Australia Bank Ltd. 4,210,000 1.13% 10/11/2021 4,219,110 0.21%Westpac Banking Corp. 4,100,000 1.00% 30/6/2022 4,086,499 0.21%Commonwealth Bank of Australia 2,830,000 1.13% 22/12/2021 2,834,981 0.14%Pacific National Finance Pty Ltd. 2,440,000 5.00% 19/9/2023 2,719,385 0.14%National Australia Bank Ltd. 2,700,000 1.38% 27/6/2022 2,716,524 0.14%SGSP Australia Assets Pty Ltd. 200,000 5.13% 11/2/2021 208,131 0.01%
46,817,614 2.38%
Austria 0.91% (2018: 0.49%)
Oesterreichische Kontrollbank AG 7,600,000 1.13% 15/12/2022 7,648,579 0.39%Oesterreichische Kontrollbank AG 5,300,000 1.25% 15/12/2023 5,353,763 0.27%Oesterreichische Kontrollbank AG 5,000,000 0.75% 7/3/2022 4,983,890 0.25%
17,986,232 0.91%
Belgium 1.62% (2018: 1.52%)
Dexia Credit Local SA 10,600,000 1.38% 7/12/2022 10,715,695 0.54%Dexia Credit Local SA 6,400,000 0.88% 7/9/2021 6,390,304 0.32%Anheuser-Busch InBev SA 4,400,000 9.75% 30/7/2024 6,018,980 0.31%Euroclear Bank SA 4,220,000 1.25% 30/9/2024 4,223,367 0.22%Dexia Credit Local SA 3,500,000 1.63% 8/12/2023 3,564,365 0.18%Anheuser-Busch InBev SA 1,000,000 1.75% 7/3/2025 1,013,706 0.05%
31,926,417 1.62%
Canada 3.62% (2018: 2.91%)
Province of Alberta Canada 7,550,000 1.00% 15/11/2021 7,536,323 0.38%Bank of Nova Scotia 6,000,000 0.75% 14/9/2021 5,973,012 0.30%Royal Bank of Canada 4,700,000 1.13% 22/12/2021 4,706,392 0.24%Export Development Canada 4,500,000 1.38% 8/12/2023 4,571,717 0.23%Export Development Canada 4,300,000 0.88% 7/12/2021 4,300,632 0.22%Bank of Nova Scotia 4,200,000 1.38% 5/12/2023 4,203,548 0.21%Province of Manitoba Canada 4,200,000 0.75% 15/12/2021 4,177,194 0.21%Bank of Montreal 4,000,000 1.50% 18/12/2024 4,024,238 0.21%Canadian Imperial Bank of Commerce 4,000,000 1.13% 30/6/2022 3,997,200 0.20%Province of Quebec Canada 3,900,000 1.50% 15/12/2023 3,966,300 0.20%Bank of Nova Scotia 3,200,000 1.75% 23/12/2022 3,268,299 0.17%Bank of Montreal 2,807,000 1.38% 29/12/2021 2,833,380 0.15%Bank of Montreal 2,500,000 1.63% 21/6/2022 2,542,050 0.13%Bank of Nova Scotia 2,500,000 1.25% 8/6/2022 2,513,607 0.13%Province of Manitoba Canada 2,350,000 1.50% 15/12/2022 2,377,004 0.12%Royal Bank of Canada 2,217,000 1.38% 9/12/2024 2,221,988 0.11%Province of Quebec Canada 2,175,000 0.88% 24/5/2022 2,166,471 0.11%Province of Alberta Canada 2,000,000 1.50% 15/12/2022 2,024,309 0.10%Toronto-Dominion Bank 2,000,000 1.00% 13/12/2021 1,997,855 0.10%Province of Quebec Canada 2,000,000 0.75% 13/12/2024 1,965,889 0.10%
71,367,408 3.62%
China 0.25% (2018: 0.00%)
Industrial & Commercial Bank of China Ltd. 4,870,000 1.50% 31/7/2022 4,880,617 0.25%
4,880,617 0.25%
Denmark 0.13% (2018: 0.19%)
Kommunekredit 2,500,000 1.38% 12/10/2022 2,529,137 0.13%
2,529,137 0.13%
Vanguard U.K. Short-Term Investment Grade Bond Index Fund
833
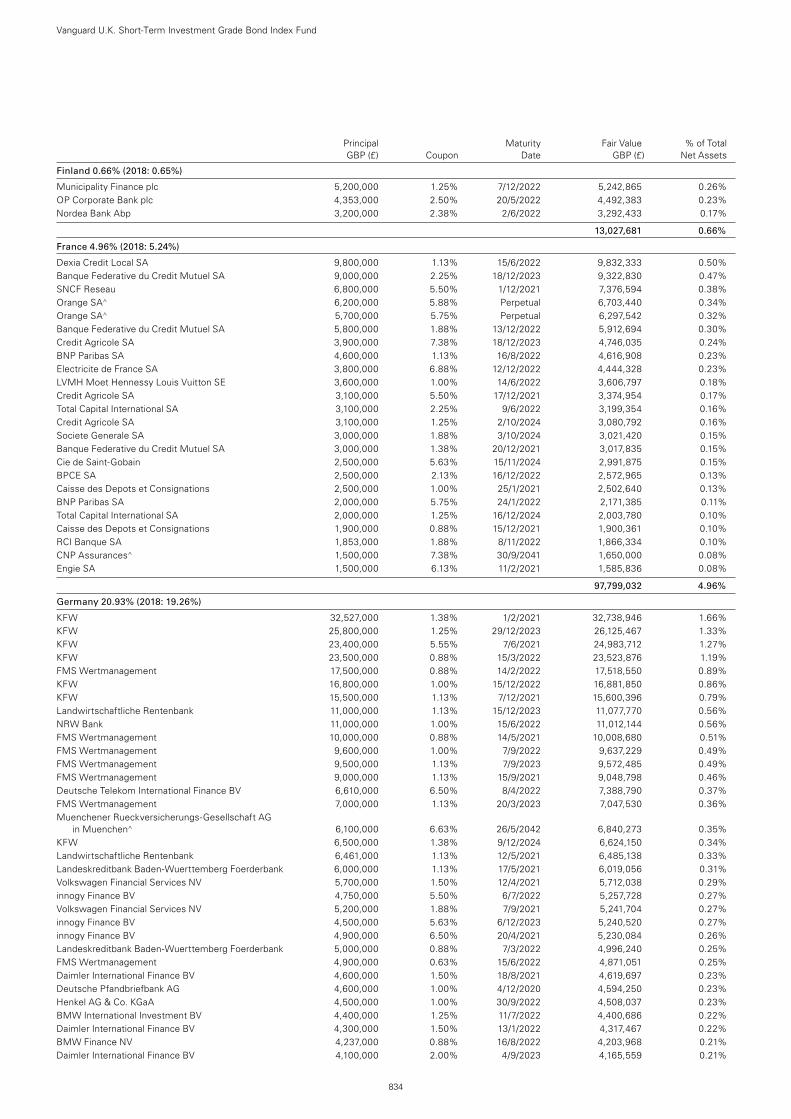
Principal Maturity Fair Value % of Total GBP (£) Coupon Date GBP (£) Net Assets
Finland 0.66% (2018: 0.65%)
Municipality Finance plc 5,200,000 1.25% 7/12/2022 5,242,865 0.26%OP Corporate Bank plc 4,353,000 2.50% 20/5/2022 4,492,383 0.23%Nordea Bank Abp 3,200,000 2.38% 2/6/2022 3,292,433 0.17%
13,027,681 0.66%
France 4.96% (2018: 5.24%)
Dexia Credit Local SA 9,800,000 1.13% 15/6/2022 9,832,333 0.50%Banque Federative du Credit Mutuel SA 9,000,000 2.25% 18/12/2023 9,322,830 0.47%SNCF Reseau 6,800,000 5.50% 1/12/2021 7,376,594 0.38%Orange SA^ 6,200,000 5.88% Perpetual 6,703,440 0.34%Orange SA^ 5,700,000 5.75% Perpetual 6,297,542 0.32%Banque Federative du Credit Mutuel SA 5,800,000 1.88% 13/12/2022 5,912,694 0.30%Credit Agricole SA 3,900,000 7.38% 18/12/2023 4,746,035 0.24%BNP Paribas SA 4,600,000 1.13% 16/8/2022 4,616,908 0.23%Electricite de France SA 3,800,000 6.88% 12/12/2022 4,444,328 0.23%LVMH Moet Hennessy Louis Vuitton SE 3,600,000 1.00% 14/6/2022 3,606,797 0.18%Credit Agricole SA 3,100,000 5.50% 17/12/2021 3,374,954 0.17%Total Capital International SA 3,100,000 2.25% 9/6/2022 3,199,354 0.16%Credit Agricole SA 3,100,000 1.25% 2/10/2024 3,080,792 0.16%Societe Generale SA 3,000,000 1.88% 3/10/2024 3,021,420 0.15%Banque Federative du Credit Mutuel SA 3,000,000 1.38% 20/12/2021 3,017,835 0.15%Cie de Saint-Gobain 2,500,000 5.63% 15/11/2024 2,991,875 0.15%BPCE SA 2,500,000 2.13% 16/12/2022 2,572,965 0.13%Caisse des Depots et Consignations 2,500,000 1.00% 25/1/2021 2,502,640 0.13%BNP Paribas SA 2,000,000 5.75% 24/1/2022 2,171,385 0.11%Total Capital International SA 2,000,000 1.25% 16/12/2024 2,003,780 0.10%Caisse des Depots et Consignations 1,900,000 0.88% 15/12/2021 1,900,361 0.10%RCI Banque SA 1,853,000 1.88% 8/11/2022 1,866,334 0.10%CNP Assurances^ 1,500,000 7.38% 30/9/2041 1,650,000 0.08%Engie SA 1,500,000 6.13% 11/2/2021 1,585,836 0.08%
97,799,032 4.96%
Germany 20.93% (2018: 19.26%)
KFW 32,527,000 1.38% 1/2/2021 32,738,946 1.66%KFW 25,800,000 1.25% 29/12/2023 26,125,467 1.33%KFW 23,400,000 5.55% 7/6/2021 24,983,712 1.27%KFW 23,500,000 0.88% 15/3/2022 23,523,876 1.19%FMS Wertmanagement 17,500,000 0.88% 14/2/2022 17,518,550 0.89%KFW 16,800,000 1.00% 15/12/2022 16,881,850 0.86%KFW 15,500,000 1.13% 7/12/2021 15,600,396 0.79%Landwirtschaftliche Rentenbank 11,000,000 1.13% 15/12/2023 11,077,770 0.56%NRW Bank 11,000,000 1.00% 15/6/2022 11,012,144 0.56%FMS Wertmanagement 10,000,000 0.88% 14/5/2021 10,008,680 0.51%FMS Wertmanagement 9,600,000 1.00% 7/9/2022 9,637,229 0.49%FMS Wertmanagement 9,500,000 1.13% 7/9/2023 9,572,485 0.49%FMS Wertmanagement 9,000,000 1.13% 15/9/2021 9,048,798 0.46%Deutsche Telekom International Finance BV 6,610,000 6.50% 8/4/2022 7,388,790 0.37%FMS Wertmanagement 7,000,000 1.13% 20/3/2023 7,047,530 0.36%Muenchener Rueckversicherungs-Gesellschaft AG
in Muenchen^ 6,100,000 6.63% 26/5/2042 6,840,273 0.35%KFW 6,500,000 1.38% 9/12/2024 6,624,150 0.34%Landwirtschaftliche Rentenbank 6,461,000 1.13% 12/5/2021 6,485,138 0.33%Landeskreditbank Baden-Wuerttemberg Foerderbank 6,000,000 1.13% 17/5/2021 6,019,056 0.31%Volkswagen Financial Services NV 5,700,000 1.50% 12/4/2021 5,712,038 0.29%innogy Finance BV 4,750,000 5.50% 6/7/2022 5,257,728 0.27%Volkswagen Financial Services NV 5,200,000 1.88% 7/9/2021 5,241,704 0.27%innogy Finance BV 4,500,000 5.63% 6/12/2023 5,240,520 0.27%innogy Finance BV 4,900,000 6.50% 20/4/2021 5,230,084 0.26%Landeskreditbank Baden-Wuerttemberg Foerderbank 5,000,000 0.88% 7/3/2022 4,996,240 0.25%FMS Wertmanagement 4,900,000 0.63% 15/6/2022 4,871,051 0.25%Daimler International Finance BV 4,600,000 1.50% 18/8/2021 4,619,697 0.23%Deutsche Pfandbriefbank AG 4,600,000 1.00% 4/12/2020 4,594,250 0.23%Henkel AG & Co. KGaA 4,500,000 1.00% 30/9/2022 4,508,037 0.23%BMW International Investment BV 4,400,000 1.25% 11/7/2022 4,400,686 0.22%Daimler International Finance BV 4,300,000 1.50% 13/1/2022 4,317,467 0.22%BMW Finance NV 4,237,000 0.88% 16/8/2022 4,203,968 0.21%Daimler International Finance BV 4,100,000 2.00% 4/9/2023 4,165,559 0.21%
Vanguard U.K. Short-Term Investment Grade Bond Index Fund
834
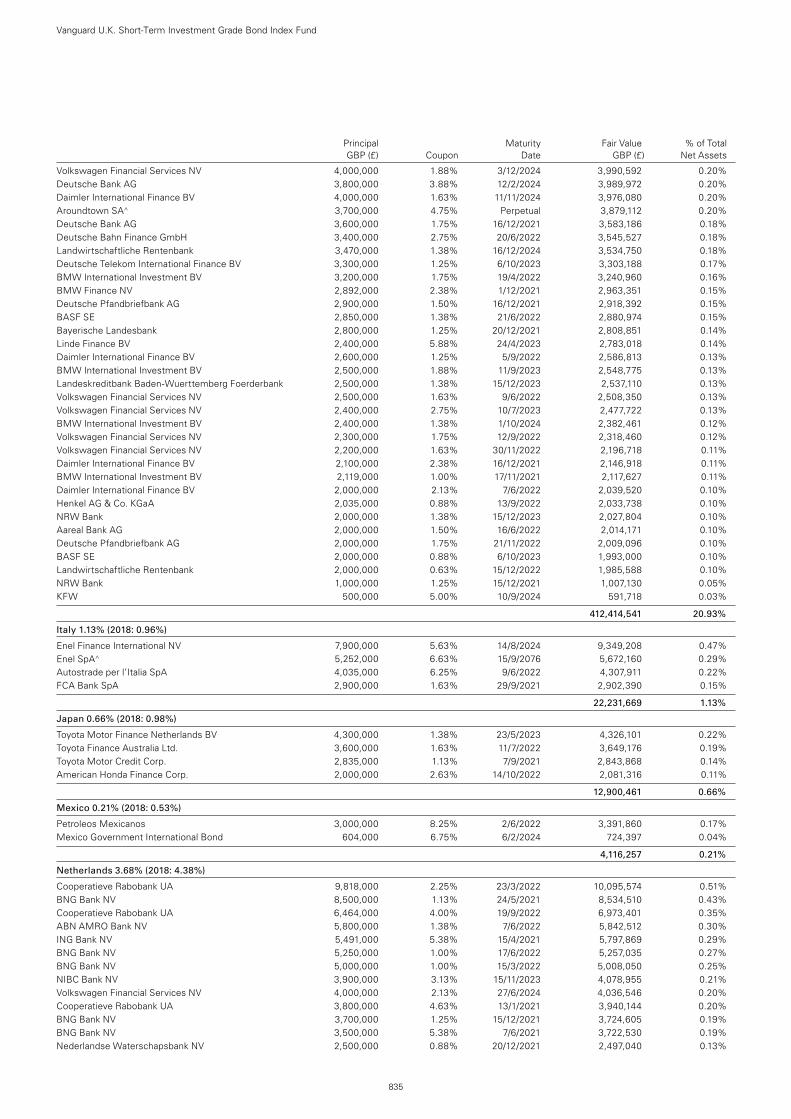
Principal Maturity Fair Value % of Total GBP (£) Coupon Date GBP (£) Net Assets
Volkswagen Financial Services NV 4,000,000 1.88% 3/12/2024 3,990,592 0.20%Deutsche Bank AG 3,800,000 3.88% 12/2/2024 3,989,972 0.20%Daimler International Finance BV 4,000,000 1.63% 11/11/2024 3,976,080 0.20%Aroundtown SA^ 3,700,000 4.75% Perpetual 3,879,112 0.20%Deutsche Bank AG 3,600,000 1.75% 16/12/2021 3,583,186 0.18%Deutsche Bahn Finance GmbH 3,400,000 2.75% 20/6/2022 3,545,527 0.18%Landwirtschaftliche Rentenbank 3,470,000 1.38% 16/12/2024 3,534,750 0.18%Deutsche Telekom International Finance BV 3,300,000 1.25% 6/10/2023 3,303,188 0.17%BMW International Investment BV 3,200,000 1.75% 19/4/2022 3,240,960 0.16%BMW Finance NV 2,892,000 2.38% 1/12/2021 2,963,351 0.15%Deutsche Pfandbriefbank AG 2,900,000 1.50% 16/12/2021 2,918,392 0.15%BASF SE 2,850,000 1.38% 21/6/2022 2,880,974 0.15%Bayerische Landesbank 2,800,000 1.25% 20/12/2021 2,808,851 0.14%Linde Finance BV 2,400,000 5.88% 24/4/2023 2,783,018 0.14%Daimler International Finance BV 2,600,000 1.25% 5/9/2022 2,586,813 0.13%BMW International Investment BV 2,500,000 1.88% 11/9/2023 2,548,775 0.13%Landeskreditbank Baden-Wuerttemberg Foerderbank 2,500,000 1.38% 15/12/2023 2,537,110 0.13%Volkswagen Financial Services NV 2,500,000 1.63% 9/6/2022 2,508,350 0.13%Volkswagen Financial Services NV 2,400,000 2.75% 10/7/2023 2,477,722 0.13%BMW International Investment BV 2,400,000 1.38% 1/10/2024 2,382,461 0.12%Volkswagen Financial Services NV 2,300,000 1.75% 12/9/2022 2,318,460 0.12%Volkswagen Financial Services NV 2,200,000 1.63% 30/11/2022 2,196,718 0.11%Daimler International Finance BV 2,100,000 2.38% 16/12/2021 2,146,918 0.11%BMW International Investment BV 2,119,000 1.00% 17/11/2021 2,117,627 0.11%Daimler International Finance BV 2,000,000 2.13% 7/6/2022 2,039,520 0.10%Henkel AG & Co. KGaA 2,035,000 0.88% 13/9/2022 2,033,738 0.10%NRW Bank 2,000,000 1.38% 15/12/2023 2,027,804 0.10%Aareal Bank AG 2,000,000 1.50% 16/6/2022 2,014,171 0.10%Deutsche Pfandbriefbank AG 2,000,000 1.75% 21/11/2022 2,009,096 0.10%BASF SE 2,000,000 0.88% 6/10/2023 1,993,000 0.10%Landwirtschaftliche Rentenbank 2,000,000 0.63% 15/12/2022 1,985,588 0.10%NRW Bank 1,000,000 1.25% 15/12/2021 1,007,130 0.05%KFW 500,000 5.00% 10/9/2024 591,718 0.03%
412,414,541 20.93%
Italy 1.13% (2018: 0.96%)
Enel Finance International NV 7,900,000 5.63% 14/8/2024 9,349,208 0.47%Enel SpA^ 5,252,000 6.63% 15/9/2076 5,672,160 0.29%Autostrade per l’Italia SpA 4,035,000 6.25% 9/6/2022 4,307,911 0.22%FCA Bank SpA 2,900,000 1.63% 29/9/2021 2,902,390 0.15%
22,231,669 1.13%
Japan 0.66% (2018: 0.98%)
Toyota Motor Finance Netherlands BV 4,300,000 1.38% 23/5/2023 4,326,101 0.22%Toyota Finance Australia Ltd. 3,600,000 1.63% 11/7/2022 3,649,176 0.19%Toyota Motor Credit Corp. 2,835,000 1.13% 7/9/2021 2,843,868 0.14%American Honda Finance Corp. 2,000,000 2.63% 14/10/2022 2,081,316 0.11%
12,900,461 0.66%
Mexico 0.21% (2018: 0.53%)
Petroleos Mexicanos 3,000,000 8.25% 2/6/2022 3,391,860 0.17%Mexico Government International Bond 604,000 6.75% 6/2/2024 724,397 0.04%
4,116,257 0.21%
Netherlands 3.68% (2018: 4.38%)
Cooperatieve Rabobank UA 9,818,000 2.25% 23/3/2022 10,095,574 0.51%BNG Bank NV 8,500,000 1.13% 24/5/2021 8,534,510 0.43%Cooperatieve Rabobank UA 6,464,000 4.00% 19/9/2022 6,973,401 0.35%ABN AMRO Bank NV 5,800,000 1.38% 7/6/2022 5,842,512 0.30%ING Bank NV 5,491,000 5.38% 15/4/2021 5,797,869 0.29%BNG Bank NV 5,250,000 1.00% 17/6/2022 5,257,035 0.27%BNG Bank NV 5,000,000 1.00% 15/3/2022 5,008,050 0.25%NIBC Bank NV 3,900,000 3.13% 15/11/2023 4,078,955 0.21%Volkswagen Financial Services NV 4,000,000 2.13% 27/6/2024 4,036,546 0.20%Cooperatieve Rabobank UA 3,800,000 4.63% 13/1/2021 3,940,144 0.20%BNG Bank NV 3,700,000 1.25% 15/12/2021 3,724,605 0.19%BNG Bank NV 3,500,000 5.38% 7/6/2021 3,722,530 0.19%Nederlandse Waterschapsbank NV 2,500,000 0.88% 20/12/2021 2,497,040 0.13%
Vanguard U.K. Short-Term Investment Grade Bond Index Fund
835
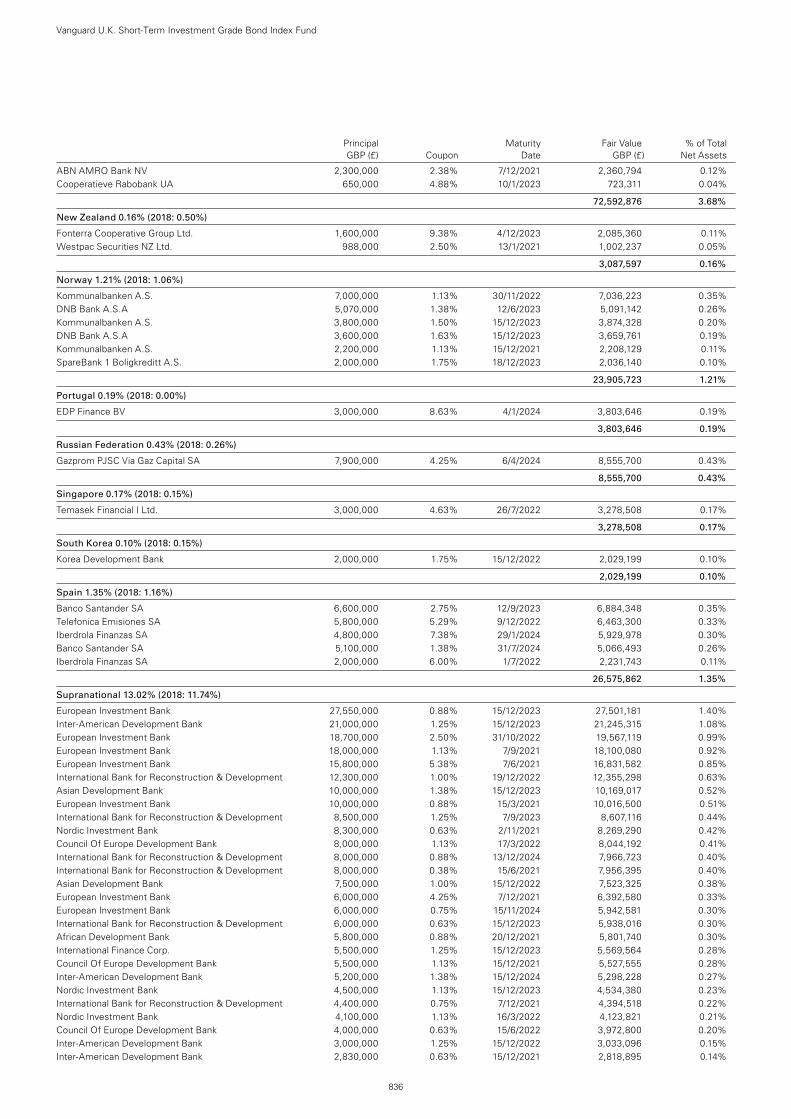
Principal Maturity Fair Value % of Total GBP (£) Coupon Date GBP (£) Net Assets
ABN AMRO Bank NV 2,300,000 2.38% 7/12/2021 2,360,794 0.12%Cooperatieve Rabobank UA 650,000 4.88% 10/1/2023 723,311 0.04%
72,592,876 3.68%
New Zealand 0.16% (2018: 0.50%)
Fonterra Cooperative Group Ltd. 1,600,000 9.38% 4/12/2023 2,085,360 0.11%Westpac Securities NZ Ltd. 988,000 2.50% 13/1/2021 1,002,237 0.05%
3,087,597 0.16%
Norway 1.21% (2018: 1.06%)
Kommunalbanken A.S. 7,000,000 1.13% 30/11/2022 7,036,223 0.35%DNB Bank A.S.A 5,070,000 1.38% 12/6/2023 5,091,142 0.26%Kommunalbanken A.S. 3,800,000 1.50% 15/12/2023 3,874,328 0.20%DNB Bank A.S.A 3,600,000 1.63% 15/12/2023 3,659,761 0.19%Kommunalbanken A.S. 2,200,000 1.13% 15/12/2021 2,208,129 0.11%SpareBank 1 Boligkreditt A.S. 2,000,000 1.75% 18/12/2023 2,036,140 0.10%
23,905,723 1.21%
Portugal 0.19% (2018: 0.00%)
EDP Finance BV 3,000,000 8.63% 4/1/2024 3,803,646 0.19%
3,803,646 0.19%
Russian Federation 0.43% (2018: 0.26%)
Gazprom PJSC Via Gaz Capital SA 7,900,000 4.25% 6/4/2024 8,555,700 0.43%
8,555,700 0.43%
Singapore 0.17% (2018: 0.15%)
Temasek Financial I Ltd. 3,000,000 4.63% 26/7/2022 3,278,508 0.17%
3,278,508 0.17%
South Korea 0.10% (2018: 0.15%)
Korea Development Bank 2,000,000 1.75% 15/12/2022 2,029,199 0.10%
2,029,199 0.10%
Spain 1.35% (2018: 1.16%)
Banco Santander SA 6,600,000 2.75% 12/9/2023 6,884,348 0.35%Telefonica Emisiones SA 5,800,000 5.29% 9/12/2022 6,463,300 0.33%Iberdrola Finanzas SA 4,800,000 7.38% 29/1/2024 5,929,978 0.30%Banco Santander SA 5,100,000 1.38% 31/7/2024 5,066,493 0.26%Iberdrola Finanzas SA 2,000,000 6.00% 1/7/2022 2,231,743 0.11%
26,575,862 1.35%
Supranational 13.02% (2018: 11.74%)
European Investment Bank 27,550,000 0.88% 15/12/2023 27,501,181 1.40%Inter-American Development Bank 21,000,000 1.25% 15/12/2023 21,245,315 1.08%European Investment Bank 18,700,000 2.50% 31/10/2022 19,567,119 0.99%European Investment Bank 18,000,000 1.13% 7/9/2021 18,100,080 0.92%European Investment Bank 15,800,000 5.38% 7/6/2021 16,831,582 0.85%International Bank for Reconstruction & Development 12,300,000 1.00% 19/12/2022 12,355,298 0.63%Asian Development Bank 10,000,000 1.38% 15/12/2023 10,169,017 0.52%European Investment Bank 10,000,000 0.88% 15/3/2021 10,016,500 0.51%International Bank for Reconstruction & Development 8,500,000 1.25% 7/9/2023 8,607,116 0.44%Nordic Investment Bank 8,300,000 0.63% 2/11/2021 8,269,290 0.42%Council Of Europe Development Bank 8,000,000 1.13% 17/3/2022 8,044,192 0.41%International Bank for Reconstruction & Development 8,000,000 0.88% 13/12/2024 7,966,723 0.40%International Bank for Reconstruction & Development 8,000,000 0.38% 15/6/2021 7,956,395 0.40%Asian Development Bank 7,500,000 1.00% 15/12/2022 7,523,325 0.38%European Investment Bank 6,000,000 4.25% 7/12/2021 6,392,580 0.33%European Investment Bank 6,000,000 0.75% 15/11/2024 5,942,581 0.30%International Bank for Reconstruction & Development 6,000,000 0.63% 15/12/2023 5,938,016 0.30%African Development Bank 5,800,000 0.88% 20/12/2021 5,801,740 0.30%International Finance Corp. 5,500,000 1.25% 15/12/2023 5,569,564 0.28%Council Of Europe Development Bank 5,500,000 1.13% 15/12/2021 5,527,555 0.28%Inter-American Development Bank 5,200,000 1.38% 15/12/2024 5,298,228 0.27%Nordic Investment Bank 4,500,000 1.13% 15/12/2023 4,534,380 0.23%International Bank for Reconstruction & Development 4,400,000 0.75% 7/12/2021 4,394,518 0.22%Nordic Investment Bank 4,100,000 1.13% 16/3/2022 4,123,821 0.21%Council Of Europe Development Bank 4,000,000 0.63% 15/6/2022 3,972,800 0.20%Inter-American Development Bank 3,000,000 1.25% 15/12/2022 3,033,096 0.15%Inter-American Development Bank 2,830,000 0.63% 15/12/2021 2,818,895 0.14%
Vanguard U.K. Short-Term Investment Grade Bond Index Fund
836
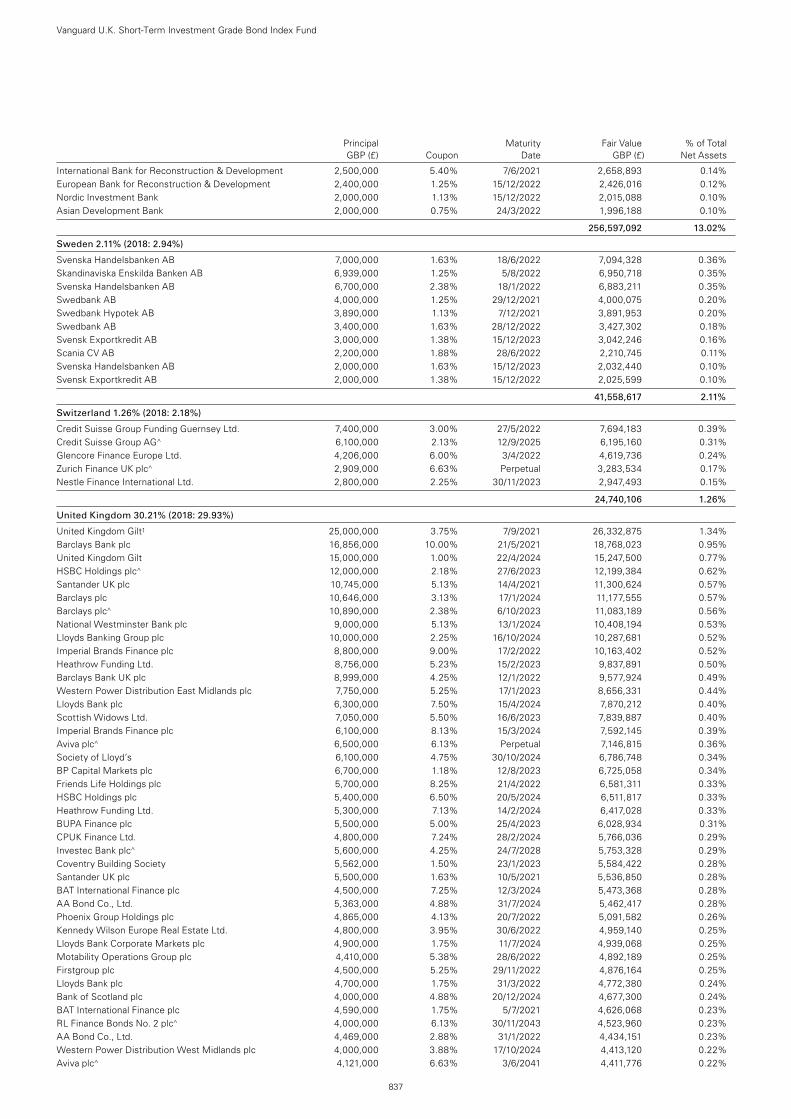
Principal Maturity Fair Value % of Total GBP (£) Coupon Date GBP (£) Net Assets
International Bank for Reconstruction & Development 2,500,000 5.40% 7/6/2021 2,658,893 0.14%European Bank for Reconstruction & Development 2,400,000 1.25% 15/12/2022 2,426,016 0.12%Nordic Investment Bank 2,000,000 1.13% 15/12/2022 2,015,088 0.10%Asian Development Bank 2,000,000 0.75% 24/3/2022 1,996,188 0.10%
256,597,092 13.02%
Sweden 2.11% (2018: 2.94%)
Svenska Handelsbanken AB 7,000,000 1.63% 18/6/2022 7,094,328 0.36%Skandinaviska Enskilda Banken AB 6,939,000 1.25% 5/8/2022 6,950,718 0.35%Svenska Handelsbanken AB 6,700,000 2.38% 18/1/2022 6,883,211 0.35%Swedbank AB 4,000,000 1.25% 29/12/2021 4,000,075 0.20%Swedbank Hypotek AB 3,890,000 1.13% 7/12/2021 3,891,953 0.20%Swedbank AB 3,400,000 1.63% 28/12/2022 3,427,302 0.18%Svensk Exportkredit AB 3,000,000 1.38% 15/12/2023 3,042,246 0.16%Scania CV AB 2,200,000 1.88% 28/6/2022 2,210,745 0.11%Svenska Handelsbanken AB 2,000,000 1.63% 15/12/2023 2,032,440 0.10%Svensk Exportkredit AB 2,000,000 1.38% 15/12/2022 2,025,599 0.10%
41,558,617 2.11%
Switzerland 1.26% (2018: 2.18%)
Credit Suisse Group Funding Guernsey Ltd. 7,400,000 3.00% 27/5/2022 7,694,183 0.39%Credit Suisse Group AG^ 6,100,000 2.13% 12/9/2025 6,195,160 0.31%Glencore Finance Europe Ltd. 4,206,000 6.00% 3/4/2022 4,619,736 0.24%Zurich Finance UK plc^ 2,909,000 6.63% Perpetual 3,283,534 0.17%Nestle Finance International Ltd. 2,800,000 2.25% 30/11/2023 2,947,493 0.15%
24,740,106 1.26%
United Kingdom 30.21% (2018: 29.93%)
United Kingdom Gilt1 25,000,000 3.75% 7/9/2021 26,332,875 1.34%Barclays Bank plc 16,856,000 10.00% 21/5/2021 18,768,023 0.95%United Kingdom Gilt 15,000,000 1.00% 22/4/2024 15,247,500 0.77%HSBC Holdings plc^ 12,000,000 2.18% 27/6/2023 12,199,384 0.62%Santander UK plc 10,745,000 5.13% 14/4/2021 11,300,624 0.57%Barclays plc 10,646,000 3.13% 17/1/2024 11,177,555 0.57%Barclays plc^ 10,890,000 2.38% 6/10/2023 11,083,189 0.56%National Westminster Bank plc 9,000,000 5.13% 13/1/2024 10,408,194 0.53%Lloyds Banking Group plc 10,000,000 2.25% 16/10/2024 10,287,681 0.52%Imperial Brands Finance plc 8,800,000 9.00% 17/2/2022 10,163,402 0.52%Heathrow Funding Ltd. 8,756,000 5.23% 15/2/2023 9,837,891 0.50%Barclays Bank UK plc 8,999,000 4.25% 12/1/2022 9,577,924 0.49%Western Power Distribution East Midlands plc 7,750,000 5.25% 17/1/2023 8,656,331 0.44%Lloyds Bank plc 6,300,000 7.50% 15/4/2024 7,870,212 0.40%Scottish Widows Ltd. 7,050,000 5.50% 16/6/2023 7,839,887 0.40%Imperial Brands Finance plc 6,100,000 8.13% 15/3/2024 7,592,145 0.39%Aviva plc^ 6,500,000 6.13% Perpetual 7,146,815 0.36%Society of Lloyd’s 6,100,000 4.75% 30/10/2024 6,786,748 0.34%BP Capital Markets plc 6,700,000 1.18% 12/8/2023 6,725,058 0.34%Friends Life Holdings plc 5,700,000 8.25% 21/4/2022 6,581,311 0.33%HSBC Holdings plc 5,400,000 6.50% 20/5/2024 6,511,817 0.33%Heathrow Funding Ltd. 5,300,000 7.13% 14/2/2024 6,417,028 0.33%BUPA Finance plc 5,500,000 5.00% 25/4/2023 6,028,934 0.31%CPUK Finance Ltd. 4,800,000 7.24% 28/2/2024 5,766,036 0.29%Investec Bank plc^ 5,600,000 4.25% 24/7/2028 5,753,328 0.29%Coventry Building Society 5,562,000 1.50% 23/1/2023 5,584,422 0.28%Santander UK plc 5,500,000 1.63% 10/5/2021 5,536,850 0.28%BAT International Finance plc 4,500,000 7.25% 12/3/2024 5,473,368 0.28%AA Bond Co., Ltd. 5,363,000 4.88% 31/7/2024 5,462,417 0.28%Phoenix Group Holdings plc 4,865,000 4.13% 20/7/2022 5,091,582 0.26%Kennedy Wilson Europe Real Estate Ltd. 4,800,000 3.95% 30/6/2022 4,959,140 0.25%Lloyds Bank Corporate Markets plc 4,900,000 1.75% 11/7/2024 4,939,068 0.25%Motability Operations Group plc 4,410,000 5.38% 28/6/2022 4,892,189 0.25%Firstgroup plc 4,500,000 5.25% 29/11/2022 4,876,164 0.25%Lloyds Bank plc 4,700,000 1.75% 31/3/2022 4,772,380 0.24%Bank of Scotland plc 4,000,000 4.88% 20/12/2024 4,677,300 0.24%BAT International Finance plc 4,590,000 1.75% 5/7/2021 4,626,068 0.23%RL Finance Bonds No. 2 plc^ 4,000,000 6.13% 30/11/2043 4,523,960 0.23%AA Bond Co., Ltd. 4,469,000 2.88% 31/1/2022 4,434,151 0.23%Western Power Distribution West Midlands plc 4,000,000 3.88% 17/10/2024 4,413,120 0.22%Aviva plc^ 4,121,000 6.63% 3/6/2041 4,411,776 0.22%
Vanguard U.K. Short-Term Investment Grade Bond Index Fund
837
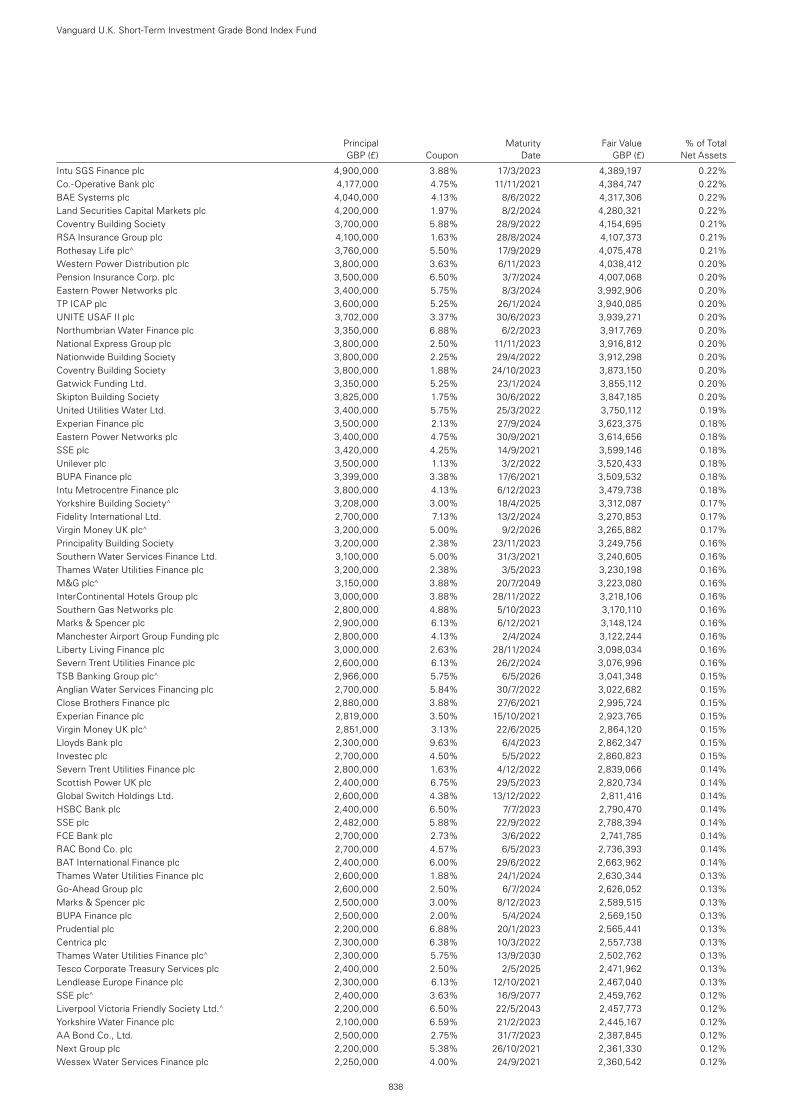
Intu SGS Finance plc 4,900,000 3.88% 17/3/2023 4,389,197 0.22%Co.-Operative Bank plc 4,177,000 4.75% 11/11/2021 4,384,747 0.22%BAE Systems plc 4,040,000 4.13% 8/6/2022 4,317,306 0.22%Land Securities Capital Markets plc 4,200,000 1.97% 8/2/2024 4,280,321 0.22%Coventry Building Society 3,700,000 5.88% 28/9/2022 4,154,695 0.21%RSA Insurance Group plc 4,100,000 1.63% 28/8/2024 4,107,373 0.21%Rothesay Life plc^ 3,760,000 5.50% 17/9/2029 4,075,478 0.21%Western Power Distribution plc 3,800,000 3.63% 6/11/2023 4,038,412 0.20%Pension Insurance Corp. plc 3,500,000 6.50% 3/7/2024 4,007,068 0.20%Eastern Power Networks plc 3,400,000 5.75% 8/3/2024 3,992,906 0.20%TP ICAP plc 3,600,000 5.25% 26/1/2024 3,940,085 0.20%UNITE USAF II plc 3,702,000 3.37% 30/6/2023 3,939,271 0.20%Northumbrian Water Finance plc 3,350,000 6.88% 6/2/2023 3,917,769 0.20%National Express Group plc 3,800,000 2.50% 11/11/2023 3,916,812 0.20%Nationwide Building Society 3,800,000 2.25% 29/4/2022 3,912,298 0.20%Coventry Building Society 3,800,000 1.88% 24/10/2023 3,873,150 0.20%Gatwick Funding Ltd. 3,350,000 5.25% 23/1/2024 3,855,112 0.20%Skipton Building Society 3,825,000 1.75% 30/6/2022 3,847,185 0.20%United Utilities Water Ltd. 3,400,000 5.75% 25/3/2022 3,750,112 0.19%Experian Finance plc 3,500,000 2.13% 27/9/2024 3,623,375 0.18%Eastern Power Networks plc 3,400,000 4.75% 30/9/2021 3,614,656 0.18%SSE plc 3,420,000 4.25% 14/9/2021 3,599,146 0.18%Unilever plc 3,500,000 1.13% 3/2/2022 3,520,433 0.18%BUPA Finance plc 3,399,000 3.38% 17/6/2021 3,509,532 0.18%Intu Metrocentre Finance plc 3,800,000 4.13% 6/12/2023 3,479,738 0.18%Yorkshire Building Society^ 3,208,000 3.00% 18/4/2025 3,312,087 0.17%Fidelity International Ltd. 2,700,000 7.13% 13/2/2024 3,270,853 0.17%Virgin Money UK plc^ 3,200,000 5.00% 9/2/2026 3,265,882 0.17%Principality Building Society 3,200,000 2.38% 23/11/2023 3,249,756 0.16%Southern Water Services Finance Ltd. 3,100,000 5.00% 31/3/2021 3,240,605 0.16%Thames Water Utilities Finance plc 3,200,000 2.38% 3/5/2023 3,230,198 0.16%M&G plc^ 3,150,000 3.88% 20/7/2049 3,223,080 0.16%InterContinental Hotels Group plc 3,000,000 3.88% 28/11/2022 3,218,106 0.16%Southern Gas Networks plc 2,800,000 4.88% 5/10/2023 3,170,110 0.16%Marks & Spencer plc 2,900,000 6.13% 6/12/2021 3,148,124 0.16%Manchester Airport Group Funding plc 2,800,000 4.13% 2/4/2024 3,122,244 0.16%Liberty Living Finance plc 3,000,000 2.63% 28/11/2024 3,098,034 0.16%Severn Trent Utilities Finance plc 2,600,000 6.13% 26/2/2024 3,076,996 0.16%TSB Banking Group plc^ 2,966,000 5.75% 6/5/2026 3,041,348 0.15%Anglian Water Services Financing plc 2,700,000 5.84% 30/7/2022 3,022,682 0.15%Close Brothers Finance plc 2,880,000 3.88% 27/6/2021 2,995,724 0.15%Experian Finance plc 2,819,000 3.50% 15/10/2021 2,923,765 0.15%Virgin Money UK plc^ 2,851,000 3.13% 22/6/2025 2,864,120 0.15%Lloyds Bank plc 2,300,000 9.63% 6/4/2023 2,862,347 0.15%Investec plc 2,700,000 4.50% 5/5/2022 2,860,823 0.15%Severn Trent Utilities Finance plc 2,800,000 1.63% 4/12/2022 2,839,066 0.14%Scottish Power UK plc 2,400,000 6.75% 29/5/2023 2,820,734 0.14%Global Switch Holdings Ltd. 2,600,000 4.38% 13/12/2022 2,811,416 0.14%HSBC Bank plc 2,400,000 6.50% 7/7/2023 2,790,470 0.14%SSE plc 2,482,000 5.88% 22/9/2022 2,788,394 0.14%FCE Bank plc 2,700,000 2.73% 3/6/2022 2,741,785 0.14%RAC Bond Co. plc 2,700,000 4.57% 6/5/2023 2,736,393 0.14%BAT International Finance plc 2,400,000 6.00% 29/6/2022 2,663,962 0.14%Thames Water Utilities Finance plc 2,600,000 1.88% 24/1/2024 2,630,344 0.13%Go-Ahead Group plc 2,600,000 2.50% 6/7/2024 2,626,052 0.13%Marks & Spencer plc 2,500,000 3.00% 8/12/2023 2,589,515 0.13%BUPA Finance plc 2,500,000 2.00% 5/4/2024 2,569,150 0.13%Prudential plc 2,200,000 6.88% 20/1/2023 2,565,441 0.13%Centrica plc 2,300,000 6.38% 10/3/2022 2,557,738 0.13%Thames Water Utilities Finance plc^ 2,300,000 5.75% 13/9/2030 2,502,762 0.13%Tesco Corporate Treasury Services plc 2,400,000 2.50% 2/5/2025 2,471,962 0.13%Lendlease Europe Finance plc 2,300,000 6.13% 12/10/2021 2,467,040 0.13%SSE plc^ 2,400,000 3.63% 16/9/2077 2,459,762 0.12%Liverpool Victoria Friendly Society Ltd.^ 2,200,000 6.50% 22/5/2043 2,457,773 0.12%Yorkshire Water Finance plc 2,100,000 6.59% 21/2/2023 2,445,167 0.12%AA Bond Co., Ltd. 2,500,000 2.75% 31/7/2023 2,387,845 0.12%Next Group plc 2,200,000 5.38% 26/10/2021 2,361,330 0.12%Wessex Water Services Finance plc 2,250,000 4.00% 24/9/2021 2,360,542 0.12%
Vanguard U.K. Short-Term Investment Grade Bond Index Fund
838
Principal Maturity Fair Value % of Total GBP (£) Coupon Date GBP (£) Net Assets
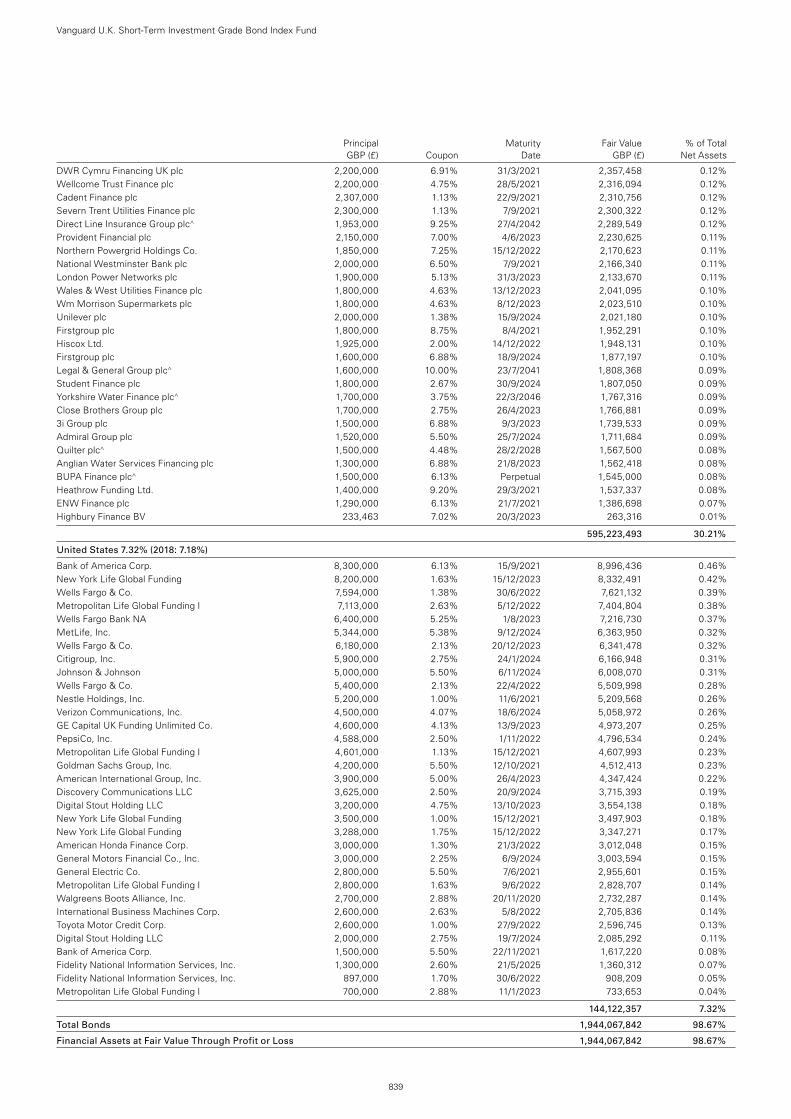
DWR Cymru Financing UK plc 2,200,000 6.91% 31/3/2021 2,357,458 0.12%Wellcome Trust Finance plc 2,200,000 4.75% 28/5/2021 2,316,094 0.12%Cadent Finance plc 2,307,000 1.13% 22/9/2021 2,310,756 0.12%Severn Trent Utilities Finance plc 2,300,000 1.13% 7/9/2021 2,300,322 0.12%Direct Line Insurance Group plc^ 1,953,000 9.25% 27/4/2042 2,289,549 0.12%Provident Financial plc 2,150,000 7.00% 4/6/2023 2,230,625 0.11%Northern Powergrid Holdings Co. 1,850,000 7.25% 15/12/2022 2,170,623 0.11%National Westminster Bank plc 2,000,000 6.50% 7/9/2021 2,166,340 0.11%London Power Networks plc 1,900,000 5.13% 31/3/2023 2,133,670 0.11%Wales & West Utilities Finance plc 1,800,000 4.63% 13/12/2023 2,041,095 0.10%Wm Morrison Supermarkets plc 1,800,000 4.63% 8/12/2023 2,023,510 0.10%Unilever plc 2,000,000 1.38% 15/9/2024 2,021,180 0.10%Firstgroup plc 1,800,000 8.75% 8/4/2021 1,952,291 0.10%Hiscox Ltd. 1,925,000 2.00% 14/12/2022 1,948,131 0.10%Firstgroup plc 1,600,000 6.88% 18/9/2024 1,877,197 0.10%Legal & General Group plc^ 1,600,000 10.00% 23/7/2041 1,808,368 0.09%Student Finance plc 1,800,000 2.67% 30/9/2024 1,807,050 0.09%Yorkshire Water Finance plc^ 1,700,000 3.75% 22/3/2046 1,767,316 0.09%Close Brothers Group plc 1,700,000 2.75% 26/4/2023 1,766,881 0.09%3i Group plc 1,500,000 6.88% 9/3/2023 1,739,533 0.09%Admiral Group plc 1,520,000 5.50% 25/7/2024 1,711,684 0.09%Quilter plc^ 1,500,000 4.48% 28/2/2028 1,567,500 0.08%Anglian Water Services Financing plc 1,300,000 6.88% 21/8/2023 1,562,418 0.08%BUPA Finance plc^ 1,500,000 6.13% Perpetual 1,545,000 0.08%Heathrow Funding Ltd. 1,400,000 9.20% 29/3/2021 1,537,337 0.08%ENW Finance plc 1,290,000 6.13% 21/7/2021 1,386,698 0.07%Highbury Finance BV 233,463 7.02% 20/3/2023 263,316 0.01%
595,223,493 30.21%
United States 7.32% (2018: 7.18%)
Bank of America Corp. 8,300,000 6.13% 15/9/2021 8,996,436 0.46%New York Life Global Funding 8,200,000 1.63% 15/12/2023 8,332,491 0.42%Wells Fargo & Co. 7,594,000 1.38% 30/6/2022 7,621,132 0.39%Metropolitan Life Global Funding I 7,113,000 2.63% 5/12/2022 7,404,804 0.38%Wells Fargo Bank NA 6,400,000 5.25% 1/8/2023 7,216,730 0.37%MetLife, Inc. 5,344,000 5.38% 9/12/2024 6,363,950 0.32%Wells Fargo & Co. 6,180,000 2.13% 20/12/2023 6,341,478 0.32%Citigroup, Inc. 5,900,000 2.75% 24/1/2024 6,166,948 0.31%Johnson & Johnson 5,000,000 5.50% 6/11/2024 6,008,070 0.31%Wells Fargo & Co. 5,400,000 2.13% 22/4/2022 5,509,998 0.28%Nestle Holdings, Inc. 5,200,000 1.00% 11/6/2021 5,209,568 0.26%Verizon Communications, Inc. 4,500,000 4.07% 18/6/2024 5,058,972 0.26%GE Capital UK Funding Unlimited Co. 4,600,000 4.13% 13/9/2023 4,973,207 0.25%PepsiCo, Inc. 4,588,000 2.50% 1/11/2022 4,796,534 0.24%Metropolitan Life Global Funding I 4,601,000 1.13% 15/12/2021 4,607,993 0.23%Goldman Sachs Group, Inc. 4,200,000 5.50% 12/10/2021 4,512,413 0.23%American International Group, Inc. 3,900,000 5.00% 26/4/2023 4,347,424 0.22%Discovery Communications LLC 3,625,000 2.50% 20/9/2024 3,715,393 0.19%Digital Stout Holding LLC 3,200,000 4.75% 13/10/2023 3,554,138 0.18%New York Life Global Funding 3,500,000 1.00% 15/12/2021 3,497,903 0.18%New York Life Global Funding 3,288,000 1.75% 15/12/2022 3,347,271 0.17%American Honda Finance Corp. 3,000,000 1.30% 21/3/2022 3,012,048 0.15%General Motors Financial Co., Inc. 3,000,000 2.25% 6/9/2024 3,003,594 0.15%General Electric Co. 2,800,000 5.50% 7/6/2021 2,955,601 0.15%Metropolitan Life Global Funding I 2,800,000 1.63% 9/6/2022 2,828,707 0.14%Walgreens Boots Alliance, Inc. 2,700,000 2.88% 20/11/2020 2,732,287 0.14%International Business Machines Corp. 2,600,000 2.63% 5/8/2022 2,705,836 0.14%Toyota Motor Credit Corp. 2,600,000 1.00% 27/9/2022 2,596,745 0.13%Digital Stout Holding LLC 2,000,000 2.75% 19/7/2024 2,085,292 0.11%Bank of America Corp. 1,500,000 5.50% 22/11/2021 1,617,220 0.08%Fidelity National Information Services, Inc. 1,300,000 2.60% 21/5/2025 1,360,312 0.07%Fidelity National Information Services, Inc. 897,000 1.70% 30/6/2022 908,209 0.05%Metropolitan Life Global Funding I 700,000 2.88% 11/1/2023 733,653 0.04%
144,122,357 7.32%
Total Bonds 1,944,067,842 98.67%
Financial Assets at Fair Value Through Profit or Loss 1,944,067,842 98.67%
Vanguard U.K. Short-Term Investment Grade Bond Index Fund
839
Principal Maturity Fair Value % of Total GBP (£) Coupon Date GBP (£) Net Assets
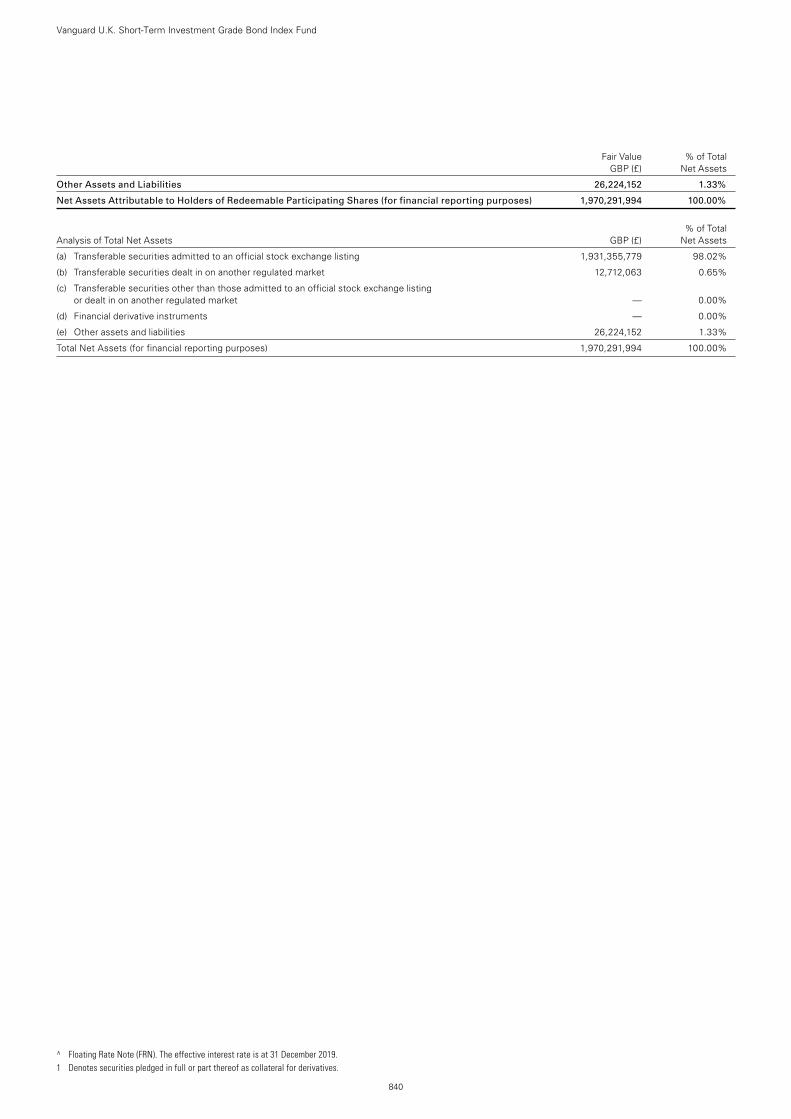
^ Floating Rate Note (FRN). The effective interest rate is at 31 December 2019. 1 Denotes securities pledged in full or part thereof as collateral for derivatives.
Fair Value % of Total GBP (£) Net Assets
Other Assets and Liabilities 26,224,152 1.33%
Net Assets Attributable to Holders of Redeemable Participating Shares (for financial reporting purposes) 1,970,291,994 100.00%
% of Total Analysis of Total Net Assets GBP (£) Net Assets
(a) Transferable securities admitted to an official stock exchange listing 1,931,355,779 98.02%
(b) Transferable securities dealt in on another regulated market 12,712,063 0.65%
(c) Transferable securities other than those admitted to an official stock exchange listing or dealt in on another regulated market — 0.00%
(d) Financial derivative instruments — 0.00%
(e) Other assets and liabilities 26,224,152 1.33%
Total Net Assets (for financial reporting purposes) 1,970,291,994 100.00%
Vanguard U.K. Short-Term Investment Grade Bond Index Fund
840
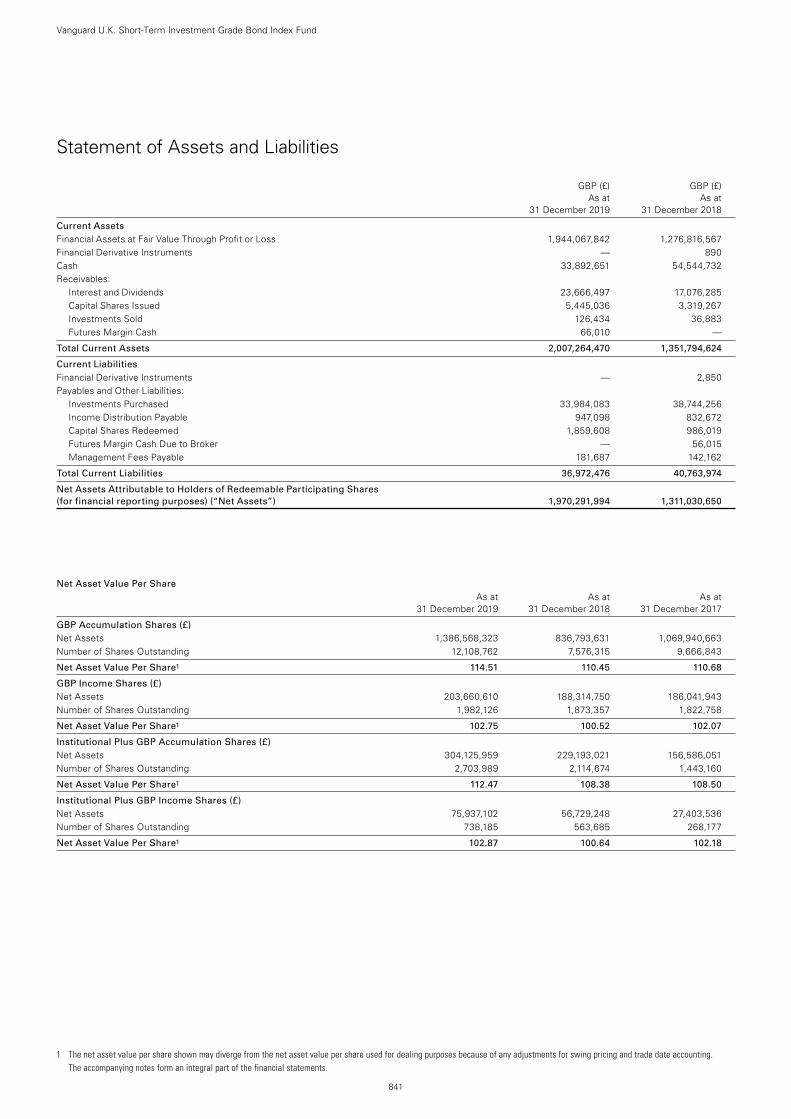
1 The net asset value per share shown may diverge from the net asset value per share used for dealing purposes because of any adjustments for swing pricing and trade date accounting. The accompanying notes form an integral part of the financial statements.
841
Vanguard U.K. Short-Term Investment Grade Bond Index Fund
Statement of Assets and Liabilities
GBP (£) GBP (£) As at As at 31 December 2019 31 December 2018
Current Assets Financial Assets at Fair Value Through Profit or Loss 1,944,067,842 1,276,816,567Financial Derivative Instruments — 890Cash 33,892,651 54,544,732Receivables:
Interest and Dividends 23,666,497 17,076,285Capital Shares Issued 5,445,036 3,319,267Investments Sold 126,434 36,883Futures Margin Cash 66,010 —
Total Current Assets 2,007,264,470 1,351,794,624
Current Liabilities Financial Derivative Instruments — 2,850Payables and Other Liabilities:
Investments Purchased 33,984,083 38,744,256Income Distribution Payable 947,098 832,672Capital Shares Redeemed 1,859,608 986,019Futures Margin Cash Due to Broker — 56,015Management Fees Payable 181,687 142,162
Total Current Liabilities 36,972,476 40,763,974
Net Assets Attributable to Holders of Redeemable Participating Shares (for financial reporting purposes) (“Net Assets”) 1,970,291,994 1,311,030,650
Net Asset Value Per Share As at As at As at 31 December 2019 31 December 2018 31 December 2017
GBP Accumulation Shares (£) Net Assets 1,386,568,323 836,793,631 1,069,940,663Number of Shares Outstanding 12,108,762 7,576,315 9,666,843
Net Asset Value Per Share1 114.51 110.45 110.68
GBP Income Shares (£) Net Assets 203,660,610 188,314,750 186,041,943Number of Shares Outstanding 1,982,126 1,873,357 1,822,758
Net Asset Value Per Share1 102.75 100.52 102.07
Institutional Plus GBP Accumulation Shares (£) Net Assets 304,125,959 229,193,021 156,586,051Number of Shares Outstanding 2,703,989 2,114,674 1,443,160
Net Asset Value Per Share1 112.47 108.38 108.50
Institutional Plus GBP Income Shares (£) Net Assets 75,937,102 56,729,248 27,403,536Number of Shares Outstanding 738,185 563,685 268,177
Net Asset Value Per Share1 102.87 100.64 102.18
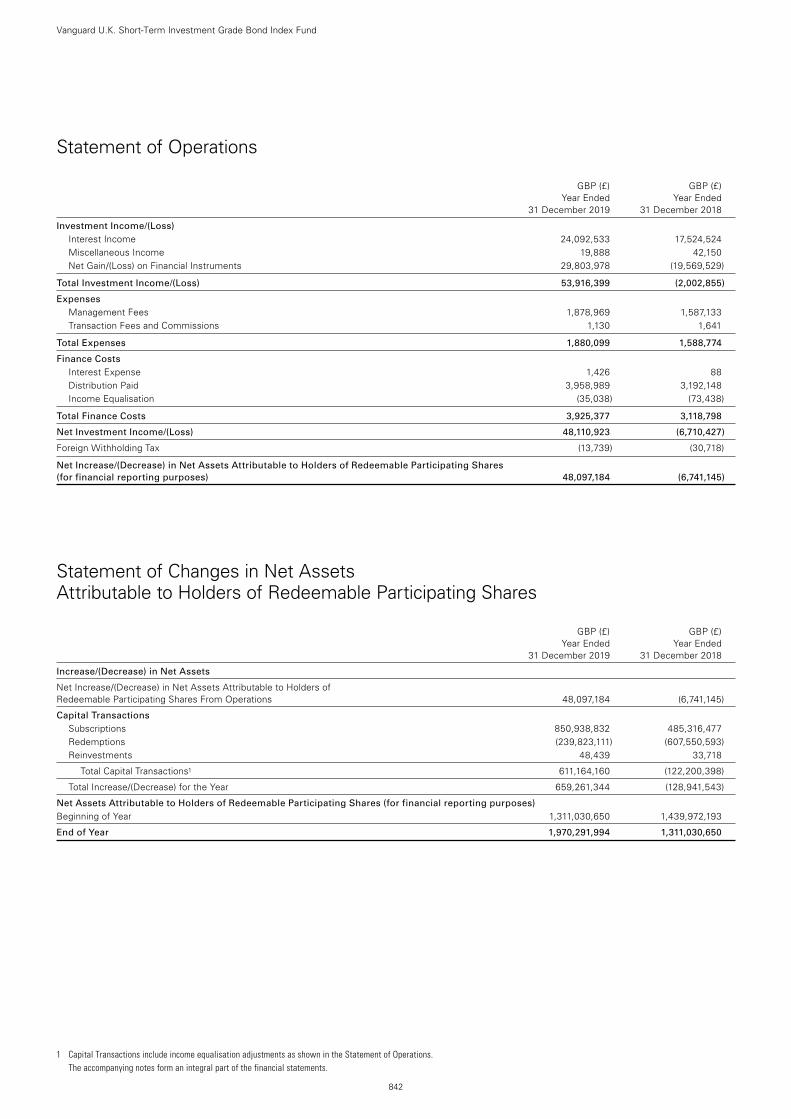
842
Vanguard U.K. Short-Term Investment Grade Bond Index Fund
Statement of Operations
GBP (£) GBP (£) Year Ended Year Ended 31 December 2019 31 December 2018
Investment Income/(Loss) Interest Income 24,092,533 17,524,524Miscellaneous Income 19,888 42,150Net Gain/(Loss) on Financial Instruments 29,803,978 (19,569,529)
Total Investment Income/(Loss) 53,916,399 (2,002,855)
Expenses Management Fees 1,878,969 1,587,133Transaction Fees and Commissions 1,130 1,641
Total Expenses 1,880,099 1,588,774
Finance Costs Interest Expense 1,426 88Distribution Paid 3,958,989 3,192,148Income Equalisation (35,038) (73,438)
Total Finance Costs 3,925,377 3,118,798
Net Investment Income/(Loss) 48,110,923 (6,710,427)
Foreign Withholding Tax (13,739) (30,718)
Net Increase/(Decrease) in Net Assets Attributable to Holders of Redeemable Participating Shares (for financial reporting purposes) 48,097,184 (6,741,145)
Statement of Changes in Net Assets Attributable to Holders of Redeemable Participating Shares
GBP (£) GBP (£) Year Ended Year Ended 31 December 2019 31 December 2018
Increase/(Decrease) in Net Assets
Net Increase/(Decrease) in Net Assets Attributable to Holders of Redeemable Participating Shares From Operations 48,097,184 (6,741,145)
Capital Transactions Subscriptions 850,938,832 485,316,477Redemptions (239,823,111) (607,550,593)Reinvestments 48,439 33,718
Total Capital Transactions1 611,164,160 (122,200,398)
Total Increase/(Decrease) for the Year 659,261,344 (128,941,543)
Net Assets Attributable to Holders of Redeemable Participating Shares (for financial reporting purposes) Beginning of Year 1,311,030,650 1,439,972,193
End of Year 1,970,291,994 1,311,030,650
1 Capital Transactions include income equalisation adjustments as shown in the Statement of Operations. The accompanying notes form an integral part of the financial statements.
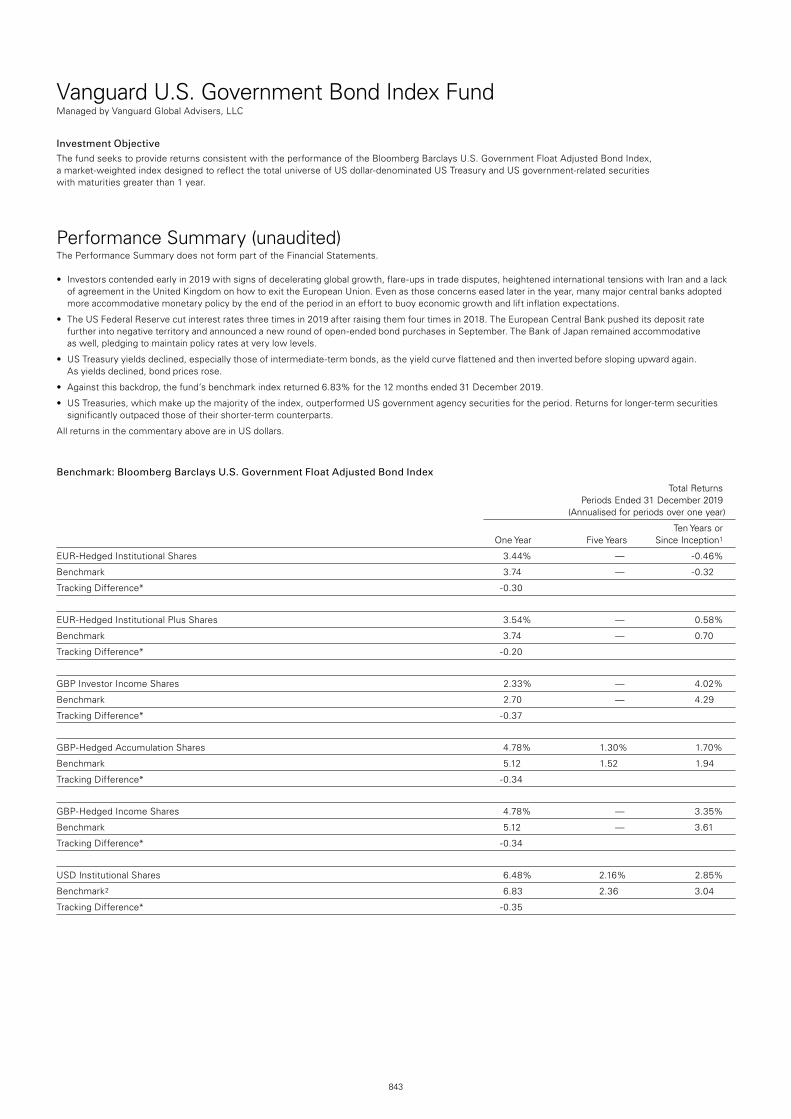
843
Vanguard U.S. Government Bond Index FundManaged by Vanguard Global Advisers, LLC
Investment ObjectiveThe fund seeks to provide returns consistent with the performance of the Bloomberg Barclays U.S. Government Float Adjusted Bond Index, a market-weighted index designed to reflect the total universe of US dollar-denominated US Treasury and US government-related securities with maturities greater than 1 year.
Performance Summary (unaudited)The Performance Summary does not form part of the Financial Statements.
• Investorscontendedearlyin2019withsignsofdeceleratingglobalgrowth,flare-upsintradedisputes,heightenedinternationaltensionswithIranandalackof agreement in the United Kingdom on how to exit the European Union. Even as those concerns eased later in the year, many major central banks adopted more accommodative monetary policy by the end of the period in an effort to buoy economic growth and lift inflation expectations.
• TheUSFederalReservecutinterestratesthreetimesin2019afterraisingthemfourtimesin2018.TheEuropeanCentralBankpusheditsdepositratefurther into negative territory and announced a new round of open-ended bond purchases in September. The Bank of Japan remained accommodative as well, pledging to maintain policy rates at very low levels.
• USTreasuryyieldsdeclined,especiallythoseofintermediate-termbonds,astheyieldcurveflattenedandtheninvertedbeforeslopingupwardagain. As yields declined, bond prices rose.
• Againstthisbackdrop,thefund’sbenchmarkindexreturned6.83%forthe12monthsended31December2019.
• USTreasuries,whichmakeupthemajorityoftheindex,outperformedUSgovernmentagencysecuritiesfortheperiod.Returnsforlonger-termsecuritiessignificantly outpaced those of their shorter-term counterparts.
All returns in the commentary above are in US dollars.
Benchmark: Bloomberg Barclays U.S. Government Float Adjusted Bond Index
Total Returns Periods Ended 31 December 2019 (Annualised for periods over one year)
Ten Years or One Year Five Years Since Inception1
EUR-Hedged Institutional Shares 3.44% — -0.46%
Benchmark 3.74 — -0.32
Tracking Difference* -0.30
EUR-Hedged Institutional Plus Shares 3.54% — 0.58%
Benchmark 3.74 — 0.70
Tracking Difference* -0.20
GBP Investor Income Shares 2.33% — 4.02%
Benchmark 2.70 — 4.29
Tracking Difference* -0.37
GBP-Hedged Accumulation Shares 4.78% 1.30% 1.70%
Benchmark 5.12 1.52 1.94
Tracking Difference* -0.34
GBP-Hedged Income Shares 4.78% — 3.35%
Benchmark 5.12 — 3.61
Tracking Difference* -0.34
USD Institutional Shares 6.48% 2.16% 2.85%
Benchmark2 6.83 2.36 3.04
Tracking Difference* -0.35
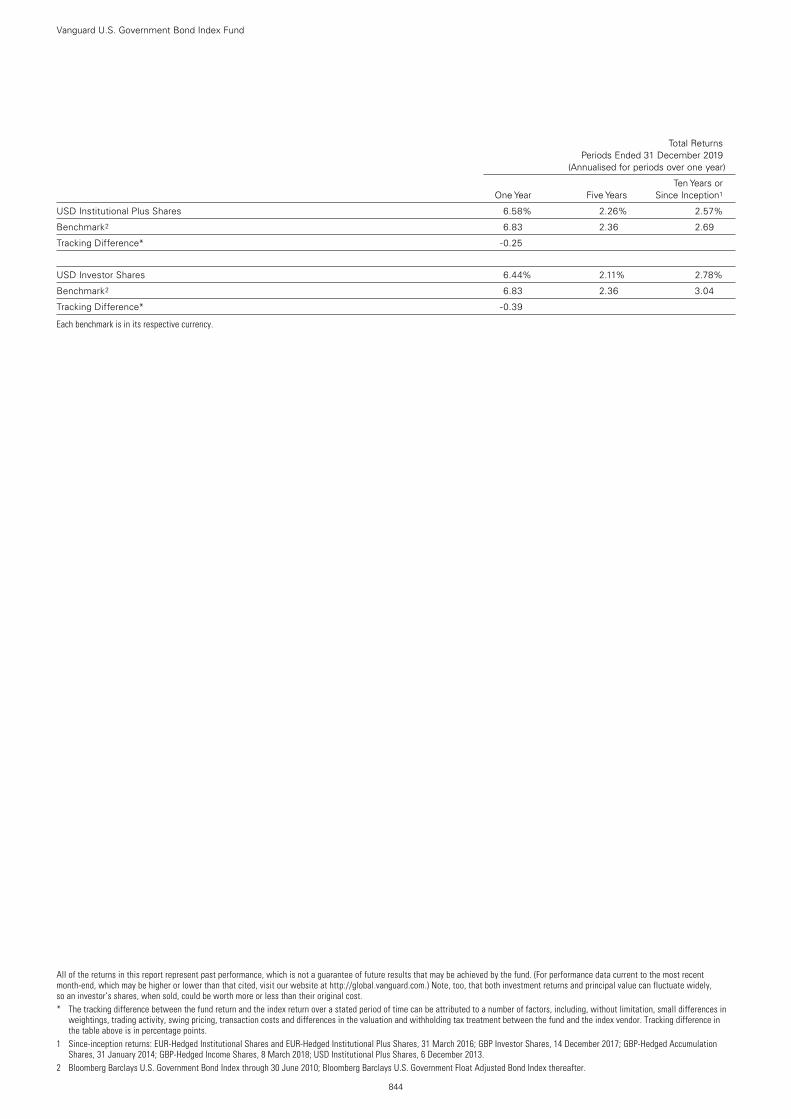
Vanguard U.S. Government Bond Index Fund
844
All of the returns in this report represent past performance, which is not a guarantee of future results that may be achieved by the fund. (For performance data current to the most recent month-end, which may be higher or lower than that cited, visit our website at http://global.vanguard.com.) Note, too, that both investment returns and principal value can fluctuate widely, so an investor’s shares, when sold, could be worth more or less than their original cost.* The tracking difference between the fund return and the index return over a stated period of time can be attributed to a number of factors, including, without limitation, small differences in
weightings, trading activity, swing pricing, transaction costs and differences in the valuation and withholding tax treatment between the fund and the index vendor. Tracking difference in the table above is in percentage points.
1 Since-inception returns: EUR-Hedged Institutional Shares and EUR-Hedged Institutional Plus Shares, 31 March 2016; GBP Investor Shares, 14 December 2017; GBP-Hedged Accumulation Shares, 31 January 2014; GBP-Hedged Income Shares, 8 March 2018; USD Institutional Plus Shares, 6 December 2013.
2 Bloomberg Barclays U.S. Government Bond Index through 30 June 2010; Bloomberg Barclays U.S. Government Float Adjusted Bond Index thereafter.
Total Returns Periods Ended 31 December 2019 (Annualised for periods over one year)
Ten Years or One Year Five Years Since Inception1
USD Institutional Plus Shares 6.58% 2.26% 2.57%
Benchmark2 6.83 2.36 2.69
Tracking Difference* -0.25
USD Investor Shares 6.44% 2.11% 2.78%
Benchmark2 6.83 2.36 3.04
Tracking Difference* -0.39
Each benchmark is in its respective currency.
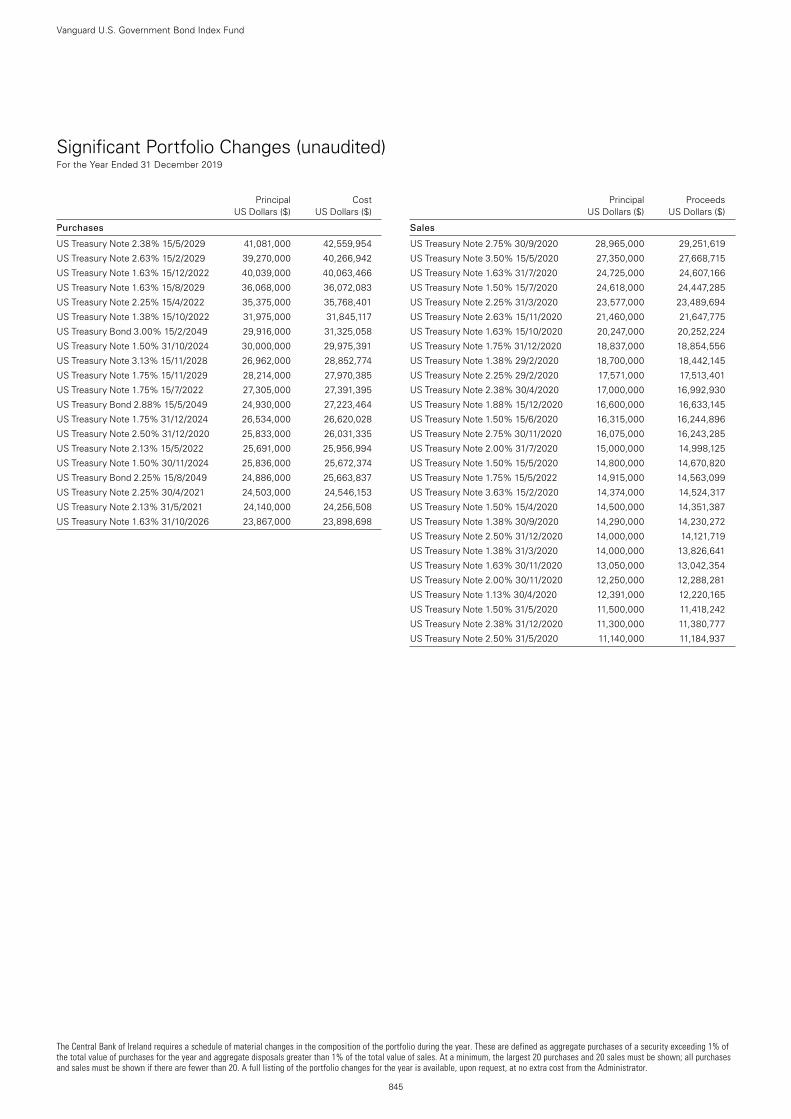
The Central Bank of Ireland requires a schedule of material changes in the composition of the portfolio during the year. These are defined as aggregate purchases of a security exceeding 1% of the total value of purchases for the year and aggregate disposals greater than 1% of the total value of sales. At a minimum, the largest 20 purchases and 20 sales must be shown; all purchases and sales must be shown if there are fewer than 20. A full listing of the portfolio changes for the year is available, upon request, at no extra cost from the Administrator.
845
Vanguard U.S. Government Bond Index Fund
Significant Portfolio Changes (unaudited) For the Year Ended 31 December 2019
Principal Cost US Dollars ($) US Dollars ($)
Purchases
US Treasury Note 2.38% 15/5/2029 41,081,000 42,559,954
US Treasury Note 2.63% 15/2/2029 39,270,000 40,266,942
US Treasury Note 1.63% 15/12/2022 40,039,000 40,063,466
US Treasury Note 1.63% 15/8/2029 36,068,000 36,072,083
US Treasury Note 2.25% 15/4/2022 35,375,000 35,768,401
US Treasury Note 1.38% 15/10/2022 31,975,000 31,845,117
US Treasury Bond 3.00% 15/2/2049 29,916,000 31,325,058
US Treasury Note 1.50% 31/10/2024 30,000,000 29,975,391
US Treasury Note 3.13% 15/11/2028 26,962,000 28,852,774
US Treasury Note 1.75% 15/11/2029 28,214,000 27,970,385
US Treasury Note 1.75% 15/7/2022 27,305,000 27,391,395
US Treasury Bond 2.88% 15/5/2049 24,930,000 27,223,464
US Treasury Note 1.75% 31/12/2024 26,534,000 26,620,028
US Treasury Note 2.50% 31/12/2020 25,833,000 26,031,335
US Treasury Note 2.13% 15/5/2022 25,691,000 25,956,994
US Treasury Note 1.50% 30/11/2024 25,836,000 25,672,374
US Treasury Bond 2.25% 15/8/2049 24,886,000 25,663,837
US Treasury Note 2.25% 30/4/2021 24,503,000 24,546,153
US Treasury Note 2.13% 31/5/2021 24,140,000 24,256,508
US Treasury Note 1.63% 31/10/2026 23,867,000 23,898,698
Principal Proceeds US Dollars ($) US Dollars ($)
Sales
US Treasury Note 2.75% 30/9/2020 28,965,000 29,251,619
US Treasury Note 3.50% 15/5/2020 27,350,000 27,668,715
US Treasury Note 1.63% 31/7/2020 24,725,000 24,607,166
US Treasury Note 1.50% 15/7/2020 24,618,000 24,447,285
US Treasury Note 2.25% 31/3/2020 23,577,000 23,489,694
US Treasury Note 2.63% 15/11/2020 21,460,000 21,647,775
US Treasury Note 1.63% 15/10/2020 20,247,000 20,252,224
US Treasury Note 1.75% 31/12/2020 18,837,000 18,854,556
US Treasury Note 1.38% 29/2/2020 18,700,000 18,442,145
US Treasury Note 2.25% 29/2/2020 17,571,000 17,513,401
US Treasury Note 2.38% 30/4/2020 17,000,000 16,992,930
US Treasury Note 1.88% 15/12/2020 16,600,000 16,633,145
US Treasury Note 1.50% 15/6/2020 16,315,000 16,244,896
US Treasury Note 2.75% 30/11/2020 16,075,000 16,243,285
US Treasury Note 2.00% 31/7/2020 15,000,000 14,998,125
US Treasury Note 1.50% 15/5/2020 14,800,000 14,670,820
US Treasury Note 1.75% 15/5/2022 14,915,000 14,563,099
US Treasury Note 3.63% 15/2/2020 14,374,000 14,524,317
US Treasury Note 1.50% 15/4/2020 14,500,000 14,351,387
US Treasury Note 1.38% 30/9/2020 14,290,000 14,230,272
US Treasury Note 2.50% 31/12/2020 14,000,000 14,121,719
US Treasury Note 1.38% 31/3/2020 14,000,000 13,826,641
US Treasury Note 1.63% 30/11/2020 13,050,000 13,042,354
US Treasury Note 2.00% 30/11/2020 12,250,000 12,288,281
US Treasury Note 1.13% 30/4/2020 12,391,000 12,220,165
US Treasury Note 1.50% 31/5/2020 11,500,000 11,418,242
US Treasury Note 2.38% 31/12/2020 11,300,000 11,380,777
US Treasury Note 2.50% 31/5/2020 11,140,000 11,184,937
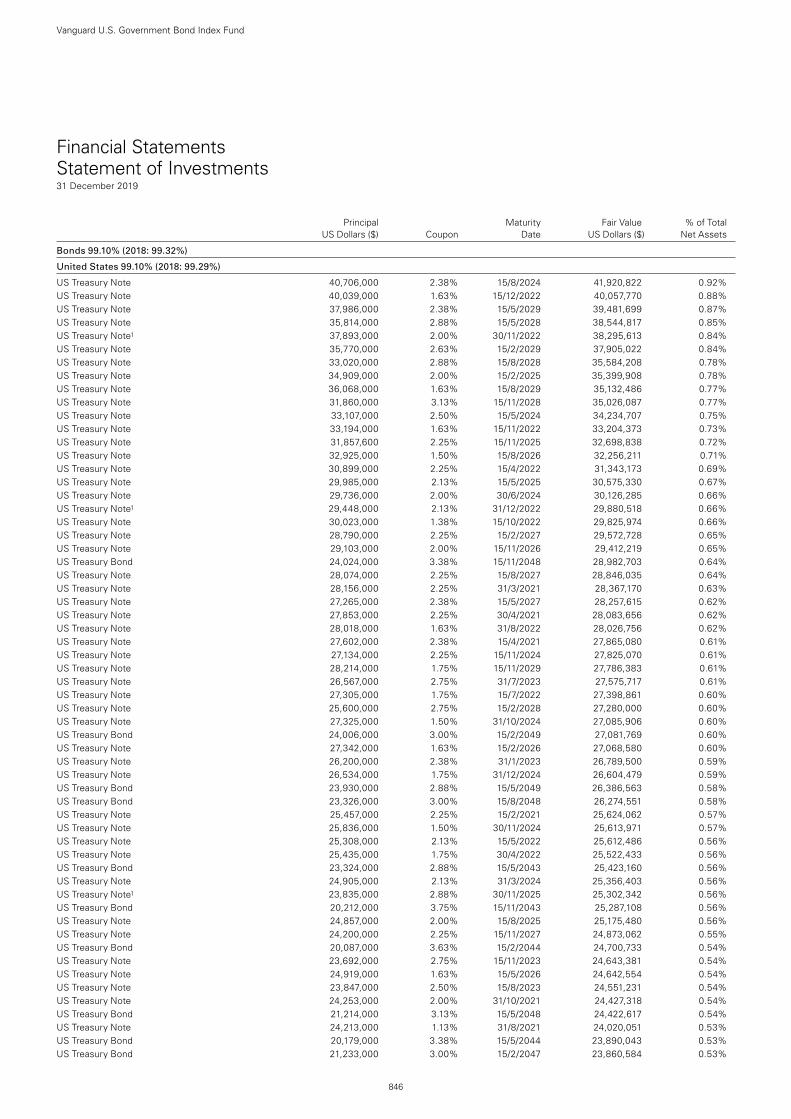
Financial Statements Statement of Investments31 December 2019
Principal Maturity Fair Value % of Total US Dollars ($) Coupon Date US Dollars ($) Net Assets
Bonds 99.10% (2018: 99.32%)
United States 99.10% (2018: 99.29%)
US Treasury Note 40,706,000 2.38% 15/8/2024 41,920,822 0.92%US Treasury Note 40,039,000 1.63% 15/12/2022 40,057,770 0.88%US Treasury Note 37,986,000 2.38% 15/5/2029 39,481,699 0.87%US Treasury Note 35,814,000 2.88% 15/5/2028 38,544,817 0.85%US Treasury Note1 37,893,000 2.00% 30/11/2022 38,295,613 0.84%US Treasury Note 35,770,000 2.63% 15/2/2029 37,905,022 0.84%US Treasury Note 33,020,000 2.88% 15/8/2028 35,584,208 0.78%US Treasury Note 34,909,000 2.00% 15/2/2025 35,399,908 0.78%US Treasury Note 36,068,000 1.63% 15/8/2029 35,132,486 0.77%US Treasury Note 31,860,000 3.13% 15/11/2028 35,026,087 0.77%US Treasury Note 33,107,000 2.50% 15/5/2024 34,234,707 0.75%US Treasury Note 33,194,000 1.63% 15/11/2022 33,204,373 0.73%US Treasury Note 31,857,600 2.25% 15/11/2025 32,698,838 0.72%US Treasury Note 32,925,000 1.50% 15/8/2026 32,256,211 0.71%US Treasury Note 30,899,000 2.25% 15/4/2022 31,343,173 0.69%US Treasury Note 29,985,000 2.13% 15/5/2025 30,575,330 0.67%US Treasury Note 29,736,000 2.00% 30/6/2024 30,126,285 0.66%US Treasury Note1 29,448,000 2.13% 31/12/2022 29,880,518 0.66%US Treasury Note 30,023,000 1.38% 15/10/2022 29,825,974 0.66%US Treasury Note 28,790,000 2.25% 15/2/2027 29,572,728 0.65%US Treasury Note 29,103,000 2.00% 15/11/2026 29,412,219 0.65%US Treasury Bond 24,024,000 3.38% 15/11/2048 28,982,703 0.64%US Treasury Note 28,074,000 2.25% 15/8/2027 28,846,035 0.64%US Treasury Note 28,156,000 2.25% 31/3/2021 28,367,170 0.63%US Treasury Note 27,265,000 2.38% 15/5/2027 28,257,615 0.62%US Treasury Note 27,853,000 2.25% 30/4/2021 28,083,656 0.62%US Treasury Note 28,018,000 1.63% 31/8/2022 28,026,756 0.62%US Treasury Note 27,602,000 2.38% 15/4/2021 27,865,080 0.61%US Treasury Note 27,134,000 2.25% 15/11/2024 27,825,070 0.61%US Treasury Note 28,214,000 1.75% 15/11/2029 27,786,383 0.61%US Treasury Note 26,567,000 2.75% 31/7/2023 27,575,717 0.61%US Treasury Note 27,305,000 1.75% 15/7/2022 27,398,861 0.60%US Treasury Note 25,600,000 2.75% 15/2/2028 27,280,000 0.60%US Treasury Note 27,325,000 1.50% 31/10/2024 27,085,906 0.60%US Treasury Bond 24,006,000 3.00% 15/2/2049 27,081,769 0.60%US Treasury Note 27,342,000 1.63% 15/2/2026 27,068,580 0.60%US Treasury Note 26,200,000 2.38% 31/1/2023 26,789,500 0.59%US Treasury Note 26,534,000 1.75% 31/12/2024 26,604,479 0.59%US Treasury Bond 23,930,000 2.88% 15/5/2049 26,386,563 0.58%US Treasury Bond 23,326,000 3.00% 15/8/2048 26,274,551 0.58%US Treasury Note 25,457,000 2.25% 15/2/2021 25,624,062 0.57%US Treasury Note 25,836,000 1.50% 30/11/2024 25,613,971 0.57%US Treasury Note 25,308,000 2.13% 15/5/2022 25,612,486 0.56%US Treasury Note 25,435,000 1.75% 30/4/2022 25,522,433 0.56%US Treasury Bond 23,324,000 2.88% 15/5/2043 25,423,160 0.56%US Treasury Note 24,905,000 2.13% 31/3/2024 25,356,403 0.56%US Treasury Note1 23,835,000 2.88% 30/11/2025 25,302,342 0.56%US Treasury Bond 20,212,000 3.75% 15/11/2043 25,287,108 0.56%US Treasury Note 24,857,000 2.00% 15/8/2025 25,175,480 0.56%US Treasury Note 24,200,000 2.25% 15/11/2027 24,873,062 0.55%US Treasury Bond 20,087,000 3.63% 15/2/2044 24,700,733 0.54%US Treasury Note 23,692,000 2.75% 15/11/2023 24,643,381 0.54%US Treasury Note 24,919,000 1.63% 15/5/2026 24,642,554 0.54%US Treasury Note 23,847,000 2.50% 15/8/2023 24,551,231 0.54%US Treasury Note 24,253,000 2.00% 31/10/2021 24,427,318 0.54%US Treasury Bond 21,214,000 3.13% 15/5/2048 24,422,617 0.54%US Treasury Note 24,213,000 1.13% 31/8/2021 24,020,051 0.53%US Treasury Bond 20,179,000 3.38% 15/5/2044 23,890,043 0.53%US Treasury Bond 21,233,000 3.00% 15/2/2047 23,860,584 0.53%
Vanguard U.S. Government Bond Index Fund
846

Principal Maturity Fair Value % of Total US Dollars ($) Coupon Date US Dollars ($) Net Assets
US Treasury Note 23,393,000 1.75% 31/5/2022 23,477,070 0.52%US Treasury Note 21,841,000 3.00% 31/10/2025 23,325,507 0.51%US Treasury Bond 23,967,000 2.25% 15/8/2049 23,259,226 0.51%US Treasury Note 22,750,000 2.00% 15/2/2023 23,002,384 0.51%US Treasury Bond 20,110,000 3.13% 15/8/2044 22,887,694 0.50%US Treasury Note 22,735,000 1.75% 31/1/2023 22,820,256 0.50%US Treasury Bond 20,125,000 3.00% 15/5/2045 22,483,398 0.50%US Treasury Bond 18,211,000 3.63% 15/8/2043 22,339,776 0.49%US Treasury Note 22,000,000 1.88% 31/5/2022 22,144,375 0.49%US Treasury Note 22,192,000 1.50% 15/8/2022 22,133,054 0.49%US Treasury Bond 19,637,000 3.00% 15/11/2044 21,901,392 0.48%US Treasury Note 21,695,000 2.13% 31/5/2021 21,847,542 0.48%US Treasury Bond 19,754,000 2.88% 15/8/2045 21,599,764 0.48%US Treasury Bond 19,065,000 3.00% 15/2/2048 21,430,252 0.47%US Treasury Note 21,216,000 1.88% 31/7/2026 21,288,930 0.47%US Treasury Bond 18,976,000 3.00% 15/11/2045 21,229,400 0.47%US Treasury Note 20,000,000 2.88% 30/9/2023 20,878,124 0.46%US Treasury Note 20,600,000 2.13% 30/6/2022 20,863,938 0.46%US Treasury Bond 20,738,000 2.38% 15/11/2049 20,676,433 0.46%US Treasury Note 20,280,000 2.50% 15/1/2022 20,638,068 0.46%US Treasury Note 20,482,000 1.50% 30/11/2021 20,449,997 0.45%US Treasury Bond 18,366,000 2.88% 15/11/2046 20,148,075 0.44%US Treasury Bond 19,729,000 2.50% 15/2/2045 20,145,160 0.44%US Treasury Note 19,685,000 3.63% 15/2/2021 20,112,535 0.44%US Treasury Note 19,945,000 1.88% 31/8/2024 20,103,938 0.44%US Treasury Bond 17,889,000 3.00% 15/5/2047 20,097,173 0.44%US Treasury Note 20,000,000 1.75% 30/6/2022 20,075,000 0.44%US Treasury Note 19,949,500 1.75% 15/5/2023 20,014,958 0.44%US Treasury Note 18,693,000 3.00% 30/9/2025 19,954,777 0.44%US Treasury Note 19,435,000 2.25% 31/10/2024 19,933,022 0.44%US Treasury Note 19,500,000 2.63% 15/7/2021 19,798,594 0.44%US Treasury Note 19,895,000 1.63% 31/10/2026 19,627,661 0.43%US Treasury Note 18,597,000 2.75% 31/8/2025 19,590,777 0.43%US Treasury Bond 19,141,800 2.50% 15/5/2046 19,545,573 0.43%US Treasury Note 19,306,000 1.88% 30/4/2022 19,426,663 0.43%US Treasury Note 19,010,000 2.13% 30/9/2024 19,378,319 0.43%US Treasury Bond 18,935,400 2.50% 15/2/2046 19,337,777 0.43%US Treasury Bond 17,915,000 2.75% 15/11/2047 19,211,039 0.42%US Treasury Note 19,152,000 1.63% 31/12/2021 19,172,948 0.42%US Treasury Note 18,858,000 2.00% 31/10/2022 19,055,421 0.42%US Treasury Note1 18,845,000 1.88% 31/8/2022 18,974,559 0.42%US Treasury Note 18,799,000 2.00% 31/5/2021 18,898,870 0.42%US Treasury Note 18,500,000 2.13% 31/7/2024 18,846,875 0.42%US Treasury Note 18,772,000 1.75% 31/7/2021 18,813,064 0.42%US Treasury Note 18,195,000 2.50% 31/1/2024 18,786,338 0.41%US Treasury Note 18,311,000 2.25% 30/4/2024 18,740,164 0.41%US Treasury Note 18,550,000 2.13% 30/9/2021 18,712,313 0.41%US Treasury Bond 17,388,000 2.75% 15/8/2047 18,648,630 0.41%US Treasury Note 18,743,000 1.75% 31/12/2026 18,637,571 0.41%US Treasury Note 18,484,000 1.88% 31/7/2022 18,605,301 0.41%US Treasury Note1 18,000,000 2.75% 15/9/2021 18,343,125 0.40%US Treasury Note 17,288,000 2.63% 31/12/2025 18,117,285 0.40%US Treasury Note 18,104,000 1.50% 15/9/2022 18,053,083 0.40%US Treasury Note 17,645,000 2.00% 31/5/2024 17,876,591 0.39%US Treasury Note 17,878,000 1.13% 28/2/2021 17,771,849 0.39%US Treasury Note 17,654,000 1.50% 31/10/2021 17,626,416 0.39%US Treasury Note 16,878,000 2.38% 30/4/2026 17,458,181 0.39%US Treasury Note 17,650,000 1.63% 30/11/2026 17,412,828 0.38%US Treasury Note1 17,447,000 1.38% 31/1/2021 17,395,203 0.38%US Treasury Note 16,750,000 2.25% 31/12/2024 17,187,071 0.38%US Treasury Note 17,000,000 1.88% 28/2/2022 17,100,938 0.38%US Treasury Note 17,171,100 1.50% 30/9/2024 17,020,853 0.38%US Treasury Note 16,800,000 2.38% 15/3/2021 16,941,750 0.37%US Treasury Note 16,700,000 2.50% 31/1/2021 16,851,344 0.37%US Treasury Bond 17,234,000 2.25% 15/8/2046 16,751,986 0.37%US Treasury Note1 16,355,000 2.88% 15/11/2021 16,738,320 0.37%US Treasury Note 16,115,000 2.63% 31/12/2023 16,706,723 0.37%
Vanguard U.S. Government Bond Index Fund
847
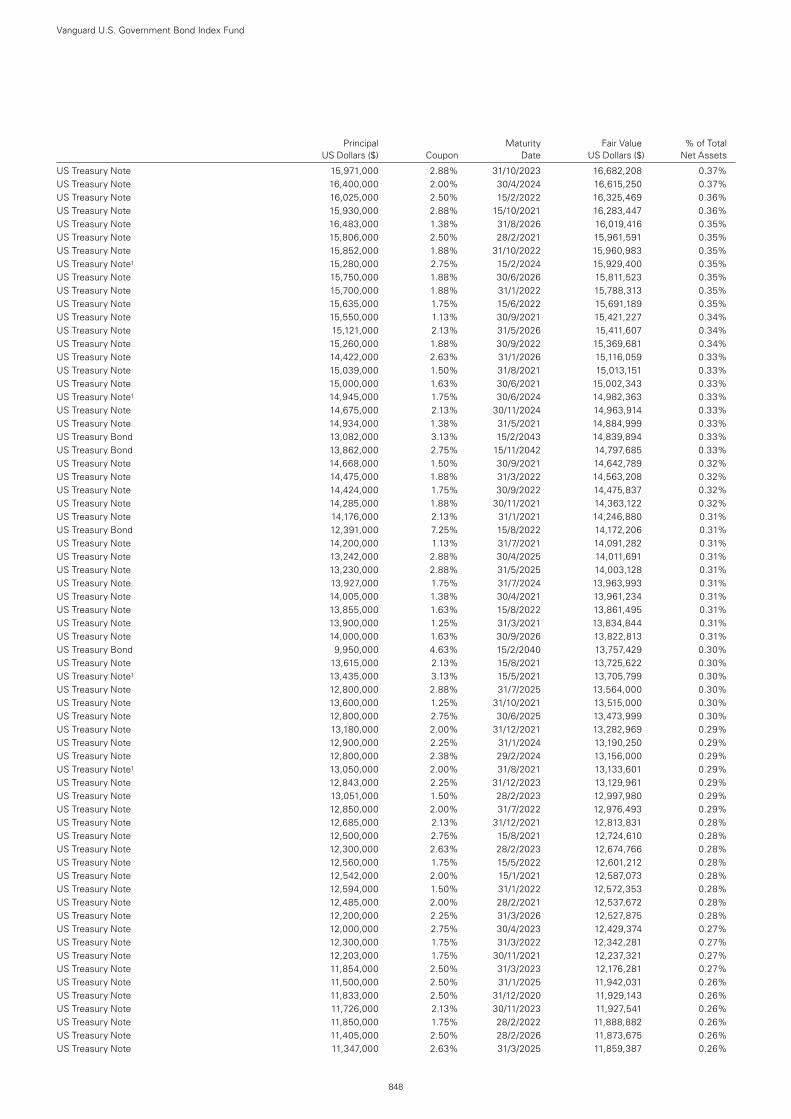
Principal Maturity Fair Value % of Total US Dollars ($) Coupon Date US Dollars ($) Net Assets
US Treasury Note 15,971,000 2.88% 31/10/2023 16,682,208 0.37%US Treasury Note 16,400,000 2.00% 30/4/2024 16,615,250 0.37%US Treasury Note 16,025,000 2.50% 15/2/2022 16,325,469 0.36%US Treasury Note 15,930,000 2.88% 15/10/2021 16,283,447 0.36%US Treasury Note 16,483,000 1.38% 31/8/2026 16,019,416 0.35%US Treasury Note 15,806,000 2.50% 28/2/2021 15,961,591 0.35%US Treasury Note 15,852,000 1.88% 31/10/2022 15,960,983 0.35%US Treasury Note1 15,280,000 2.75% 15/2/2024 15,929,400 0.35%US Treasury Note 15,750,000 1.88% 30/6/2026 15,811,523 0.35%US Treasury Note 15,700,000 1.88% 31/1/2022 15,788,313 0.35%US Treasury Note 15,635,000 1.75% 15/6/2022 15,691,189 0.35%US Treasury Note 15,550,000 1.13% 30/9/2021 15,421,227 0.34%US Treasury Note 15,121,000 2.13% 31/5/2026 15,411,607 0.34%US Treasury Note 15,260,000 1.88% 30/9/2022 15,369,681 0.34%US Treasury Note 14,422,000 2.63% 31/1/2026 15,116,059 0.33%US Treasury Note 15,039,000 1.50% 31/8/2021 15,013,151 0.33%US Treasury Note 15,000,000 1.63% 30/6/2021 15,002,343 0.33%US Treasury Note1 14,945,000 1.75% 30/6/2024 14,982,363 0.33%US Treasury Note 14,675,000 2.13% 30/11/2024 14,963,914 0.33%US Treasury Note 14,934,000 1.38% 31/5/2021 14,884,999 0.33%US Treasury Bond 13,082,000 3.13% 15/2/2043 14,839,894 0.33%US Treasury Bond 13,862,000 2.75% 15/11/2042 14,797,685 0.33%US Treasury Note 14,668,000 1.50% 30/9/2021 14,642,789 0.32%US Treasury Note 14,475,000 1.88% 31/3/2022 14,563,208 0.32%US Treasury Note 14,424,000 1.75% 30/9/2022 14,475,837 0.32%US Treasury Note 14,285,000 1.88% 30/11/2021 14,363,122 0.32%US Treasury Note 14,176,000 2.13% 31/1/2021 14,246,880 0.31%US Treasury Bond 12,391,000 7.25% 15/8/2022 14,172,206 0.31%US Treasury Note 14,200,000 1.13% 31/7/2021 14,091,282 0.31%US Treasury Note 13,242,000 2.88% 30/4/2025 14,011,691 0.31%US Treasury Note 13,230,000 2.88% 31/5/2025 14,003,128 0.31%US Treasury Note 13,927,000 1.75% 31/7/2024 13,963,993 0.31%US Treasury Note 14,005,000 1.38% 30/4/2021 13,961,234 0.31%US Treasury Note 13,855,000 1.63% 15/8/2022 13,861,495 0.31%US Treasury Note 13,900,000 1.25% 31/3/2021 13,834,844 0.31%US Treasury Note 14,000,000 1.63% 30/9/2026 13,822,813 0.31%US Treasury Bond 9,950,000 4.63% 15/2/2040 13,757,429 0.30%US Treasury Note 13,615,000 2.13% 15/8/2021 13,725,622 0.30%US Treasury Note1 13,435,000 3.13% 15/5/2021 13,705,799 0.30%US Treasury Note 12,800,000 2.88% 31/7/2025 13,564,000 0.30%US Treasury Note 13,600,000 1.25% 31/10/2021 13,515,000 0.30%US Treasury Note 12,800,000 2.75% 30/6/2025 13,473,999 0.30%US Treasury Note 13,180,000 2.00% 31/12/2021 13,282,969 0.29%US Treasury Note 12,900,000 2.25% 31/1/2024 13,190,250 0.29%US Treasury Note 12,800,000 2.38% 29/2/2024 13,156,000 0.29%US Treasury Note1 13,050,000 2.00% 31/8/2021 13,133,601 0.29%US Treasury Note 12,843,000 2.25% 31/12/2023 13,129,961 0.29%US Treasury Note 13,051,000 1.50% 28/2/2023 12,997,980 0.29%US Treasury Note 12,850,000 2.00% 31/7/2022 12,976,493 0.29%US Treasury Note 12,685,000 2.13% 31/12/2021 12,813,831 0.28%US Treasury Note 12,500,000 2.75% 15/8/2021 12,724,610 0.28%US Treasury Note 12,300,000 2.63% 28/2/2023 12,674,766 0.28%US Treasury Note 12,560,000 1.75% 15/5/2022 12,601,212 0.28%US Treasury Note 12,542,000 2.00% 15/1/2021 12,587,073 0.28%US Treasury Note 12,594,000 1.50% 31/1/2022 12,572,353 0.28%US Treasury Note 12,485,000 2.00% 28/2/2021 12,537,672 0.28%US Treasury Note 12,200,000 2.25% 31/3/2026 12,527,875 0.28%US Treasury Note 12,000,000 2.75% 30/4/2023 12,429,374 0.27%US Treasury Note 12,300,000 1.75% 31/3/2022 12,342,281 0.27%US Treasury Note 12,203,000 1.75% 30/11/2021 12,237,321 0.27%US Treasury Note 11,854,000 2.50% 31/3/2023 12,176,281 0.27%US Treasury Note 11,500,000 2.50% 31/1/2025 11,942,031 0.26%US Treasury Note 11,833,000 2.50% 31/12/2020 11,929,143 0.26%US Treasury Note 11,726,000 2.13% 30/11/2023 11,927,541 0.26%US Treasury Note 11,850,000 1.75% 28/2/2022 11,888,882 0.26%US Treasury Note 11,405,000 2.50% 28/2/2026 11,873,675 0.26%US Treasury Note 11,347,000 2.63% 31/3/2025 11,859,387 0.26%
Vanguard U.S. Government Bond Index Fund
848
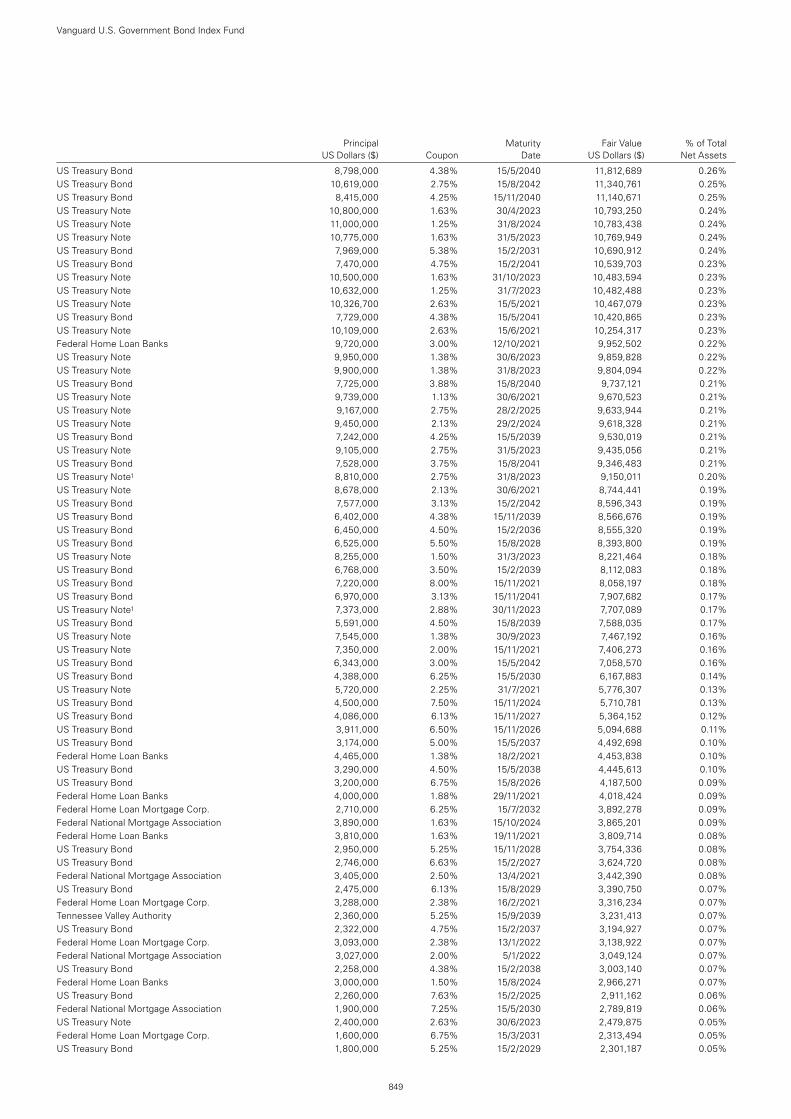
Principal Maturity Fair Value % of Total US Dollars ($) Coupon Date US Dollars ($) Net Assets
US Treasury Bond 8,798,000 4.38% 15/5/2040 11,812,689 0.26%US Treasury Bond 10,619,000 2.75% 15/8/2042 11,340,761 0.25%US Treasury Bond 8,415,000 4.25% 15/11/2040 11,140,671 0.25%US Treasury Note 10,800,000 1.63% 30/4/2023 10,793,250 0.24%US Treasury Note 11,000,000 1.25% 31/8/2024 10,783,438 0.24%US Treasury Note 10,775,000 1.63% 31/5/2023 10,769,949 0.24%US Treasury Bond 7,969,000 5.38% 15/2/2031 10,690,912 0.24%US Treasury Bond 7,470,000 4.75% 15/2/2041 10,539,703 0.23%US Treasury Note 10,500,000 1.63% 31/10/2023 10,483,594 0.23%US Treasury Note 10,632,000 1.25% 31/7/2023 10,482,488 0.23%US Treasury Note 10,326,700 2.63% 15/5/2021 10,467,079 0.23%US Treasury Bond 7,729,000 4.38% 15/5/2041 10,420,865 0.23%US Treasury Note 10,109,000 2.63% 15/6/2021 10,254,317 0.23%Federal Home Loan Banks 9,720,000 3.00% 12/10/2021 9,952,502 0.22%US Treasury Note 9,950,000 1.38% 30/6/2023 9,859,828 0.22%US Treasury Note 9,900,000 1.38% 31/8/2023 9,804,094 0.22%US Treasury Bond 7,725,000 3.88% 15/8/2040 9,737,121 0.21%US Treasury Note 9,739,000 1.13% 30/6/2021 9,670,523 0.21%US Treasury Note 9,167,000 2.75% 28/2/2025 9,633,944 0.21%US Treasury Note 9,450,000 2.13% 29/2/2024 9,618,328 0.21%US Treasury Bond 7,242,000 4.25% 15/5/2039 9,530,019 0.21%US Treasury Note 9,105,000 2.75% 31/5/2023 9,435,056 0.21%US Treasury Bond 7,528,000 3.75% 15/8/2041 9,346,483 0.21%US Treasury Note1 8,810,000 2.75% 31/8/2023 9,150,011 0.20%US Treasury Note 8,678,000 2.13% 30/6/2021 8,744,441 0.19%US Treasury Bond 7,577,000 3.13% 15/2/2042 8,596,343 0.19%US Treasury Bond 6,402,000 4.38% 15/11/2039 8,566,676 0.19%US Treasury Bond 6,450,000 4.50% 15/2/2036 8,555,320 0.19%US Treasury Bond 6,525,000 5.50% 15/8/2028 8,393,800 0.19%US Treasury Note 8,255,000 1.50% 31/3/2023 8,221,464 0.18%US Treasury Bond 6,768,000 3.50% 15/2/2039 8,112,083 0.18%US Treasury Bond 7,220,000 8.00% 15/11/2021 8,058,197 0.18%US Treasury Bond 6,970,000 3.13% 15/11/2041 7,907,682 0.17%US Treasury Note1 7,373,000 2.88% 30/11/2023 7,707,089 0.17%US Treasury Bond 5,591,000 4.50% 15/8/2039 7,588,035 0.17%US Treasury Note 7,545,000 1.38% 30/9/2023 7,467,192 0.16%US Treasury Note 7,350,000 2.00% 15/11/2021 7,406,273 0.16%US Treasury Bond 6,343,000 3.00% 15/5/2042 7,058,570 0.16%US Treasury Bond 4,388,000 6.25% 15/5/2030 6,167,883 0.14%US Treasury Note 5,720,000 2.25% 31/7/2021 5,776,307 0.13%US Treasury Bond 4,500,000 7.50% 15/11/2024 5,710,781 0.13%US Treasury Bond 4,086,000 6.13% 15/11/2027 5,364,152 0.12%US Treasury Bond 3,911,000 6.50% 15/11/2026 5,094,688 0.11%US Treasury Bond 3,174,000 5.00% 15/5/2037 4,492,698 0.10%Federal Home Loan Banks 4,465,000 1.38% 18/2/2021 4,453,838 0.10%US Treasury Bond 3,290,000 4.50% 15/5/2038 4,445,613 0.10%US Treasury Bond 3,200,000 6.75% 15/8/2026 4,187,500 0.09%Federal Home Loan Banks 4,000,000 1.88% 29/11/2021 4,018,424 0.09%Federal Home Loan Mortgage Corp. 2,710,000 6.25% 15/7/2032 3,892,278 0.09%Federal National Mortgage Association 3,890,000 1.63% 15/10/2024 3,865,201 0.09%Federal Home Loan Banks 3,810,000 1.63% 19/11/2021 3,809,714 0.08%US Treasury Bond 2,950,000 5.25% 15/11/2028 3,754,336 0.08%US Treasury Bond 2,746,000 6.63% 15/2/2027 3,624,720 0.08%Federal National Mortgage Association 3,405,000 2.50% 13/4/2021 3,442,390 0.08%US Treasury Bond 2,475,000 6.13% 15/8/2029 3,390,750 0.07%Federal Home Loan Mortgage Corp. 3,288,000 2.38% 16/2/2021 3,316,234 0.07%Tennessee Valley Authority 2,360,000 5.25% 15/9/2039 3,231,413 0.07%US Treasury Bond 2,322,000 4.75% 15/2/2037 3,194,927 0.07%Federal Home Loan Mortgage Corp. 3,093,000 2.38% 13/1/2022 3,138,922 0.07%Federal National Mortgage Association 3,027,000 2.00% 5/1/2022 3,049,124 0.07%US Treasury Bond 2,258,000 4.38% 15/2/2038 3,003,140 0.07%Federal Home Loan Banks 3,000,000 1.50% 15/8/2024 2,966,271 0.07%US Treasury Bond 2,260,000 7.63% 15/2/2025 2,911,162 0.06%Federal National Mortgage Association 1,900,000 7.25% 15/5/2030 2,789,819 0.06%US Treasury Note 2,400,000 2.63% 30/6/2023 2,479,875 0.05%Federal Home Loan Mortgage Corp. 1,600,000 6.75% 15/3/2031 2,313,494 0.05%US Treasury Bond 1,800,000 5.25% 15/2/2029 2,301,187 0.05%
Vanguard U.S. Government Bond Index Fund
849
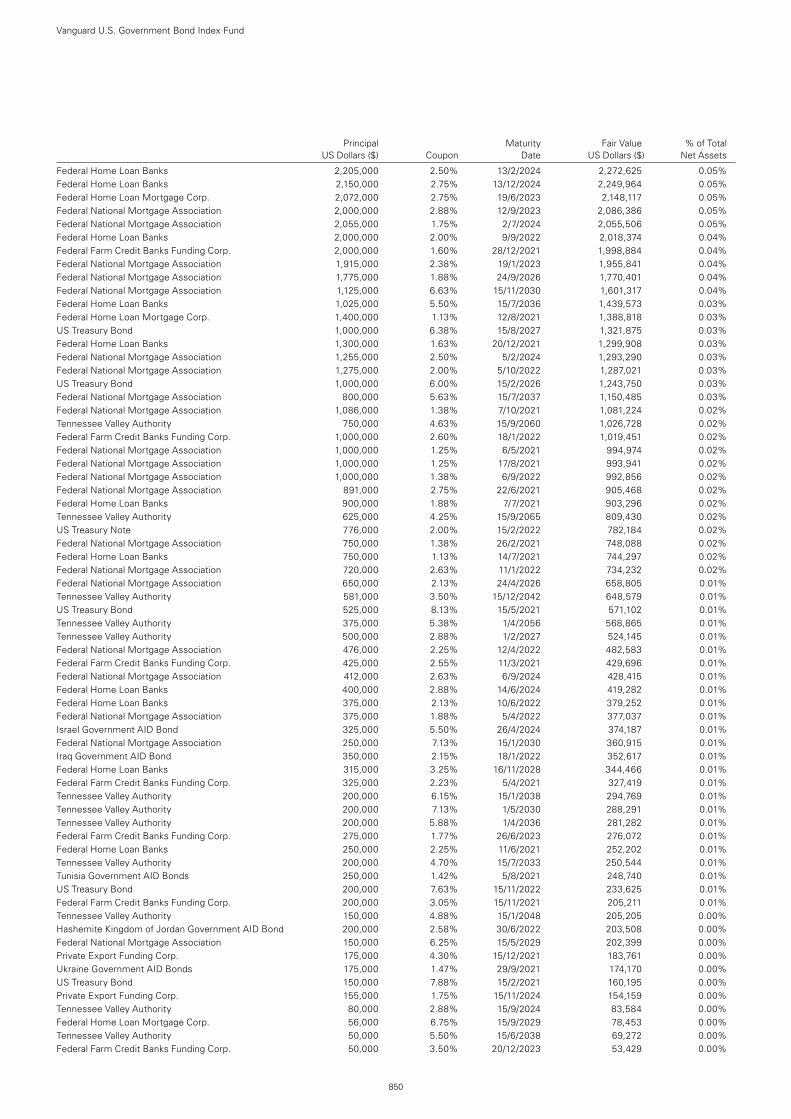
Principal Maturity Fair Value % of Total US Dollars ($) Coupon Date US Dollars ($) Net Assets
Federal Home Loan Banks 2,205,000 2.50% 13/2/2024 2,272,625 0.05%Federal Home Loan Banks 2,150,000 2.75% 13/12/2024 2,249,964 0.05%Federal Home Loan Mortgage Corp. 2,072,000 2.75% 19/6/2023 2,148,117 0.05%Federal National Mortgage Association 2,000,000 2.88% 12/9/2023 2,086,386 0.05%Federal National Mortgage Association 2,055,000 1.75% 2/7/2024 2,055,506 0.05%Federal Home Loan Banks 2,000,000 2.00% 9/9/2022 2,018,374 0.04%Federal Farm Credit Banks Funding Corp. 2,000,000 1.60% 28/12/2021 1,998,884 0.04%Federal National Mortgage Association 1,915,000 2.38% 19/1/2023 1,955,841 0.04%Federal National Mortgage Association 1,775,000 1.88% 24/9/2026 1,770,401 0.04%Federal National Mortgage Association 1,125,000 6.63% 15/11/2030 1,601,317 0.04%Federal Home Loan Banks 1,025,000 5.50% 15/7/2036 1,439,573 0.03%Federal Home Loan Mortgage Corp. 1,400,000 1.13% 12/8/2021 1,388,818 0.03%US Treasury Bond 1,000,000 6.38% 15/8/2027 1,321,875 0.03%Federal Home Loan Banks 1,300,000 1.63% 20/12/2021 1,299,908 0.03%Federal National Mortgage Association 1,255,000 2.50% 5/2/2024 1,293,290 0.03%Federal National Mortgage Association 1,275,000 2.00% 5/10/2022 1,287,021 0.03%US Treasury Bond 1,000,000 6.00% 15/2/2026 1,243,750 0.03%Federal National Mortgage Association 800,000 5.63% 15/7/2037 1,150,485 0.03%Federal National Mortgage Association 1,086,000 1.38% 7/10/2021 1,081,224 0.02%Tennessee Valley Authority 750,000 4.63% 15/9/2060 1,026,728 0.02%Federal Farm Credit Banks Funding Corp. 1,000,000 2.60% 18/1/2022 1,019,451 0.02%Federal National Mortgage Association 1,000,000 1.25% 6/5/2021 994,974 0.02%Federal National Mortgage Association 1,000,000 1.25% 17/8/2021 993,941 0.02%Federal National Mortgage Association 1,000,000 1.38% 6/9/2022 992,856 0.02%Federal National Mortgage Association 891,000 2.75% 22/6/2021 905,468 0.02%Federal Home Loan Banks 900,000 1.88% 7/7/2021 903,296 0.02%Tennessee Valley Authority 625,000 4.25% 15/9/2065 809,430 0.02%US Treasury Note 776,000 2.00% 15/2/2022 782,184 0.02%Federal National Mortgage Association 750,000 1.38% 26/2/2021 748,088 0.02%Federal Home Loan Banks 750,000 1.13% 14/7/2021 744,297 0.02%Federal National Mortgage Association 720,000 2.63% 11/1/2022 734,232 0.02%Federal National Mortgage Association 650,000 2.13% 24/4/2026 658,805 0.01%Tennessee Valley Authority 581,000 3.50% 15/12/2042 648,579 0.01%US Treasury Bond 525,000 8.13% 15/5/2021 571,102 0.01%Tennessee Valley Authority 375,000 5.38% 1/4/2056 568,865 0.01%Tennessee Valley Authority 500,000 2.88% 1/2/2027 524,145 0.01%Federal National Mortgage Association 476,000 2.25% 12/4/2022 482,583 0.01%Federal Farm Credit Banks Funding Corp. 425,000 2.55% 11/3/2021 429,696 0.01%Federal National Mortgage Association 412,000 2.63% 6/9/2024 428,415 0.01%Federal Home Loan Banks 400,000 2.88% 14/6/2024 419,282 0.01%Federal Home Loan Banks 375,000 2.13% 10/6/2022 379,252 0.01%Federal National Mortgage Association 375,000 1.88% 5/4/2022 377,037 0.01%Israel Government AID Bond 325,000 5.50% 26/4/2024 374,187 0.01%Federal National Mortgage Association 250,000 7.13% 15/1/2030 360,915 0.01%Iraq Government AID Bond 350,000 2.15% 18/1/2022 352,617 0.01%Federal Home Loan Banks 315,000 3.25% 16/11/2028 344,466 0.01%Federal Farm Credit Banks Funding Corp. 325,000 2.23% 5/4/2021 327,419 0.01%Tennessee Valley Authority 200,000 6.15% 15/1/2038 294,769 0.01%Tennessee Valley Authority 200,000 7.13% 1/5/2030 288,291 0.01%Tennessee Valley Authority 200,000 5.88% 1/4/2036 281,282 0.01%Federal Farm Credit Banks Funding Corp. 275,000 1.77% 26/6/2023 276,072 0.01%Federal Home Loan Banks 250,000 2.25% 11/6/2021 252,202 0.01%Tennessee Valley Authority 200,000 4.70% 15/7/2033 250,544 0.01%Tunisia Government AID Bonds 250,000 1.42% 5/8/2021 248,740 0.01%US Treasury Bond 200,000 7.63% 15/11/2022 233,625 0.01%Federal Farm Credit Banks Funding Corp. 200,000 3.05% 15/11/2021 205,211 0.01%Tennessee Valley Authority 150,000 4.88% 15/1/2048 205,205 0.00%Hashemite Kingdom of Jordan Government AID Bond 200,000 2.58% 30/6/2022 203,508 0.00%Federal National Mortgage Association 150,000 6.25% 15/5/2029 202,399 0.00%Private Export Funding Corp. 175,000 4.30% 15/12/2021 183,761 0.00%Ukraine Government AID Bonds 175,000 1.47% 29/9/2021 174,170 0.00%US Treasury Bond 150,000 7.88% 15/2/2021 160,195 0.00%Private Export Funding Corp. 155,000 1.75% 15/11/2024 154,159 0.00%Tennessee Valley Authority 80,000 2.88% 15/9/2024 83,584 0.00%Federal Home Loan Mortgage Corp. 56,000 6.75% 15/9/2029 78,453 0.00%Tennessee Valley Authority 50,000 5.50% 15/6/2038 69,272 0.00%Federal Farm Credit Banks Funding Corp. 50,000 3.50% 20/12/2023 53,429 0.00%
Vanguard U.S. Government Bond Index Fund
850
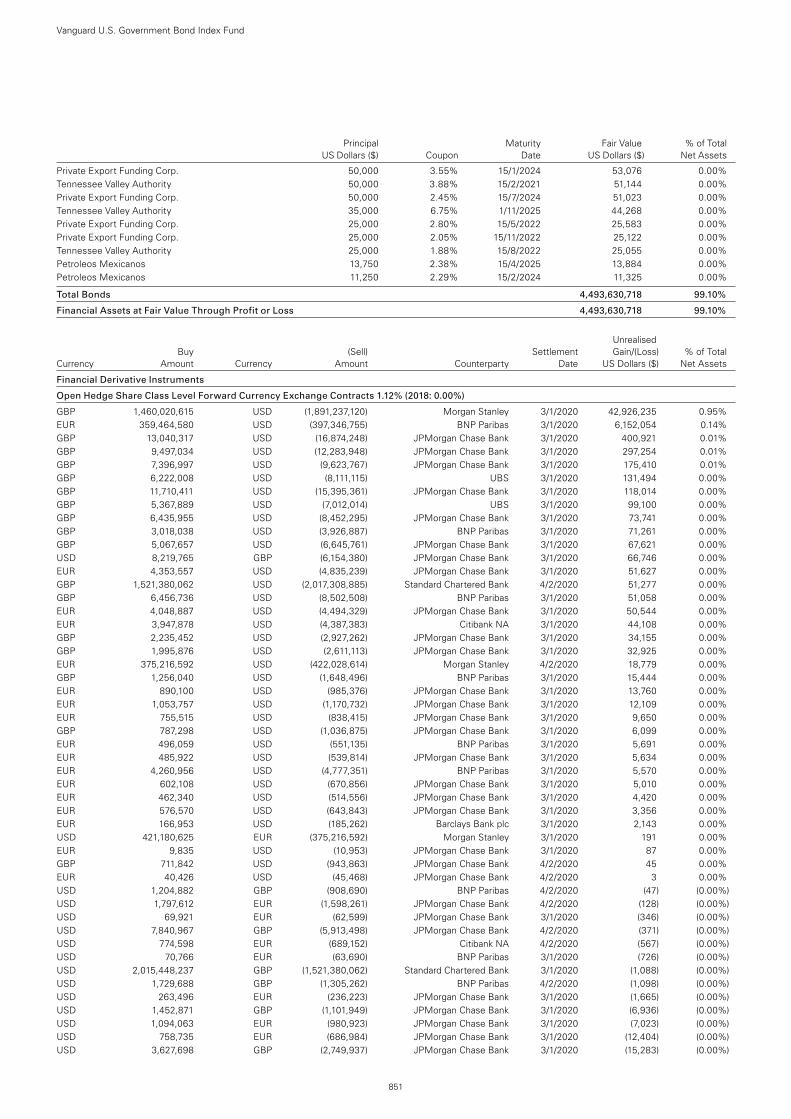
Principal Maturity Fair Value % of Total US Dollars ($) Coupon Date US Dollars ($) Net Assets
Private Export Funding Corp. 50,000 3.55% 15/1/2024 53,076 0.00%Tennessee Valley Authority 50,000 3.88% 15/2/2021 51,144 0.00%Private Export Funding Corp. 50,000 2.45% 15/7/2024 51,023 0.00%Tennessee Valley Authority 35,000 6.75% 1/11/2025 44,268 0.00%Private Export Funding Corp. 25,000 2.80% 15/5/2022 25,583 0.00%Private Export Funding Corp. 25,000 2.05% 15/11/2022 25,122 0.00%Tennessee Valley Authority 25,000 1.88% 15/8/2022 25,055 0.00%Petroleos Mexicanos 13,750 2.38% 15/4/2025 13,884 0.00%Petroleos Mexicanos 11,250 2.29% 15/2/2024 11,325 0.00%
Total Bonds 4,493,630,718 99.10%
Financial Assets at Fair Value Through Profit or Loss 4,493,630,718 99.10%
Unrealised Buy (Sell) Settlement Gain/(Loss) % of Total Currency Amount Currency Amount Counterparty Date US Dollars ($) Net Assets
Financial Derivative Instruments
Open Hedge Share Class Level Forward Currency Exchange Contracts 1.12% (2018: 0.00%)
GBP 1,460,020,615 USD (1,891,237,120) Morgan Stanley 3/1/2020 42,926,235 0.95%EUR 359,464,580 USD (397,346,755) BNP Paribas 3/1/2020 6,152,054 0.14%GBP 13,040,317 USD (16,874,248) JPMorgan Chase Bank 3/1/2020 400,921 0.01%GBP 9,497,034 USD (12,283,948) JPMorgan Chase Bank 3/1/2020 297,254 0.01%GBP 7,396,997 USD (9,623,767) JPMorgan Chase Bank 3/1/2020 175,410 0.01%GBP 6,222,008 USD (8,111,115) UBS 3/1/2020 131,494 0.00%GBP 11,710,411 USD (15,395,361) JPMorgan Chase Bank 3/1/2020 118,014 0.00%GBP 5,367,889 USD (7,012,014) UBS 3/1/2020 99,100 0.00%GBP 6,435,955 USD (8,452,295) JPMorgan Chase Bank 3/1/2020 73,741 0.00%GBP 3,018,038 USD (3,926,887) BNP Paribas 3/1/2020 71,261 0.00%GBP 5,067,657 USD (6,645,761) JPMorgan Chase Bank 3/1/2020 67,621 0.00%USD 8,219,765 GBP (6,154,380) JPMorgan Chase Bank 3/1/2020 66,746 0.00%EUR 4,353,557 USD (4,835,239) JPMorgan Chase Bank 3/1/2020 51,627 0.00%GBP 1,521,380,062 USD (2,017,308,885) Standard Chartered Bank 4/2/2020 51,277 0.00%GBP 6,456,736 USD (8,502,508) BNP Paribas 3/1/2020 51,058 0.00%EUR 4,048,887 USD (4,494,329) JPMorgan Chase Bank 3/1/2020 50,544 0.00%EUR 3,947,878 USD (4,387,383) Citibank NA 3/1/2020 44,108 0.00%GBP 2,235,452 USD (2,927,262) JPMorgan Chase Bank 3/1/2020 34,155 0.00%GBP 1,995,876 USD (2,611,113) JPMorgan Chase Bank 3/1/2020 32,925 0.00%EUR 375,216,592 USD (422,028,614) Morgan Stanley 4/2/2020 18,779 0.00%GBP 1,256,040 USD (1,648,496) BNP Paribas 3/1/2020 15,444 0.00%EUR 890,100 USD (985,376) JPMorgan Chase Bank 3/1/2020 13,760 0.00%EUR 1,053,757 USD (1,170,732) JPMorgan Chase Bank 3/1/2020 12,109 0.00%EUR 755,515 USD (838,415) JPMorgan Chase Bank 3/1/2020 9,650 0.00%GBP 787,298 USD (1,036,875) JPMorgan Chase Bank 3/1/2020 6,099 0.00%EUR 496,059 USD (551,135) BNP Paribas 3/1/2020 5,691 0.00%EUR 485,922 USD (539,814) JPMorgan Chase Bank 3/1/2020 5,634 0.00%EUR 4,260,956 USD (4,777,351) BNP Paribas 3/1/2020 5,570 0.00%EUR 602,108 USD (670,856) JPMorgan Chase Bank 3/1/2020 5,010 0.00%EUR 462,340 USD (514,556) JPMorgan Chase Bank 3/1/2020 4,420 0.00%EUR 576,570 USD (643,843) JPMorgan Chase Bank 3/1/2020 3,356 0.00%EUR 166,953 USD (185,262) Barclays Bank plc 3/1/2020 2,143 0.00%USD 421,180,625 EUR (375,216,592) Morgan Stanley 3/1/2020 191 0.00%EUR 9,835 USD (10,953) JPMorgan Chase Bank 3/1/2020 87 0.00%GBP 711,842 USD (943,863) JPMorgan Chase Bank 4/2/2020 45 0.00%EUR 40,426 USD (45,468) JPMorgan Chase Bank 4/2/2020 3 0.00%USD 1,204,882 GBP (908,690) BNP Paribas 4/2/2020 (47) (0.00%)USD 1,797,612 EUR (1,598,261) JPMorgan Chase Bank 4/2/2020 (128) (0.00%)USD 69,921 EUR (62,599) JPMorgan Chase Bank 3/1/2020 (346) (0.00%)USD 7,840,967 GBP (5,913,498) JPMorgan Chase Bank 4/2/2020 (371) (0.00%)USD 774,598 EUR (689,152) Citibank NA 4/2/2020 (567) (0.00%)USD 70,766 EUR (63,690) BNP Paribas 3/1/2020 (726) (0.00%)USD 2,015,448,237 GBP (1,521,380,062) Standard Chartered Bank 3/1/2020 (1,088) (0.00%)USD 1,729,688 GBP (1,305,262) BNP Paribas 4/2/2020 (1,098) (0.00%)USD 263,496 EUR (236,223) JPMorgan Chase Bank 3/1/2020 (1,665) (0.00%)USD 1,452,871 GBP (1,101,949) JPMorgan Chase Bank 3/1/2020 (6,936) (0.00%)USD 1,094,063 EUR (980,923) JPMorgan Chase Bank 3/1/2020 (7,023) (0.00%)USD 758,735 EUR (686,984) JPMorgan Chase Bank 3/1/2020 (12,404) (0.00%)USD 3,627,698 GBP (2,749,937) JPMorgan Chase Bank 3/1/2020 (15,283) (0.00%)
Vanguard U.S. Government Bond Index Fund
851
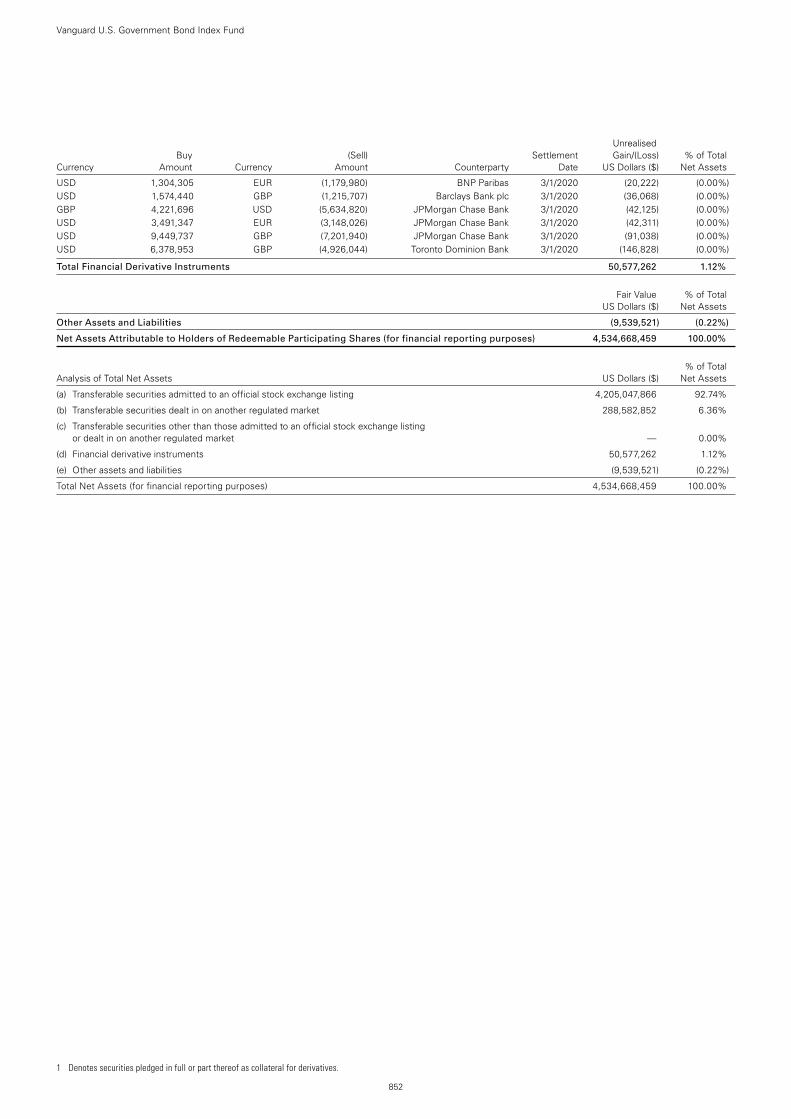
1 Denotes securities pledged in full or part thereof as collateral for derivatives.
USD 1,304,305 EUR (1,179,980) BNP Paribas 3/1/2020 (20,222) (0.00%)USD 1,574,440 GBP (1,215,707) Barclays Bank plc 3/1/2020 (36,068) (0.00%)GBP 4,221,696 USD (5,634,820) JPMorgan Chase Bank 3/1/2020 (42,125) (0.00%)USD 3,491,347 EUR (3,148,026) JPMorgan Chase Bank 3/1/2020 (42,311) (0.00%)USD 9,449,737 GBP (7,201,940) JPMorgan Chase Bank 3/1/2020 (91,038) (0.00%)USD 6,378,953 GBP (4,926,044) Toronto Dominion Bank 3/1/2020 (146,828) (0.00%)
Total Financial Derivative Instruments 50,577,262 1.12%
Fair Value % of Total US Dollars ($) Net Assets
Other Assets and Liabilities (9,539,521) (0.22%)
Net Assets Attributable to Holders of Redeemable Participating Shares (for financial reporting purposes) 4,534,668,459 100.00%
% of Total Analysis of Total Net Assets US Dollars ($) Net Assets
(a) Transferable securities admitted to an official stock exchange listing 4,205,047,866 92.74%
(b) Transferable securities dealt in on another regulated market 288,582,852 6.36%
(c) Transferable securities other than those admitted to an official stock exchange listing or dealt in on another regulated market — 0.00%
(d) Financial derivative instruments 50,577,262 1.12%
(e) Other assets and liabilities (9,539,521) (0.22%)
Total Net Assets (for financial reporting purposes) 4,534,668,459 100.00%
Vanguard U.S. Government Bond Index Fund
852
Unrealised Buy (Sell) Settlement Gain/(Loss) % of Total Currency Amount Currency Amount Counterparty Date US Dollars ($) Net Assets
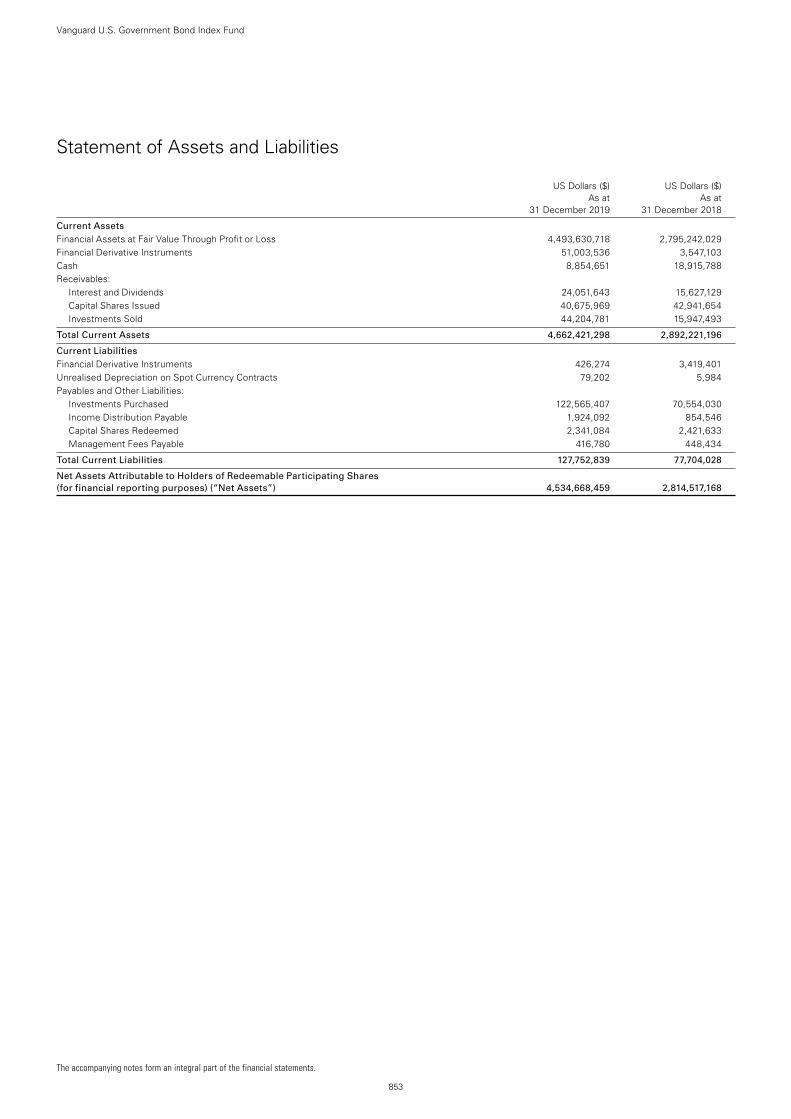
The accompanying notes form an integral part of the financial statements.
853
Vanguard U.S. Government Bond Index Fund
Statement of Assets and Liabilities
US Dollars ($) US Dollars ($) As at As at 31 December 2019 31 December 2018
Current Assets Financial Assets at Fair Value Through Profit or Loss 4,493,630,718 2,795,242,029Financial Derivative Instruments 51,003,536 3,547,103Cash 8,854,651 18,915,788Receivables:
Interest and Dividends 24,051,643 15,627,129Capital Shares Issued 40,675,969 42,941,654Investments Sold 44,204,781 15,947,493
Total Current Assets 4,662,421,298 2,892,221,196
Current Liabilities Financial Derivative Instruments 426,274 3,419,401Unrealised Depreciation on Spot Currency Contracts 79,202 5,984Payables and Other Liabilities:
Investments Purchased 122,565,407 70,554,030Income Distribution Payable 1,924,092 854,546Capital Shares Redeemed 2,341,084 2,421,633Management Fees Payable 416,780 448,434
Total Current Liabilities 127,752,839 77,704,028
Net Assets Attributable to Holders of Redeemable Participating Shares (for financial reporting purposes) (“Net Assets”) 4,534,668,459 2,814,517,168
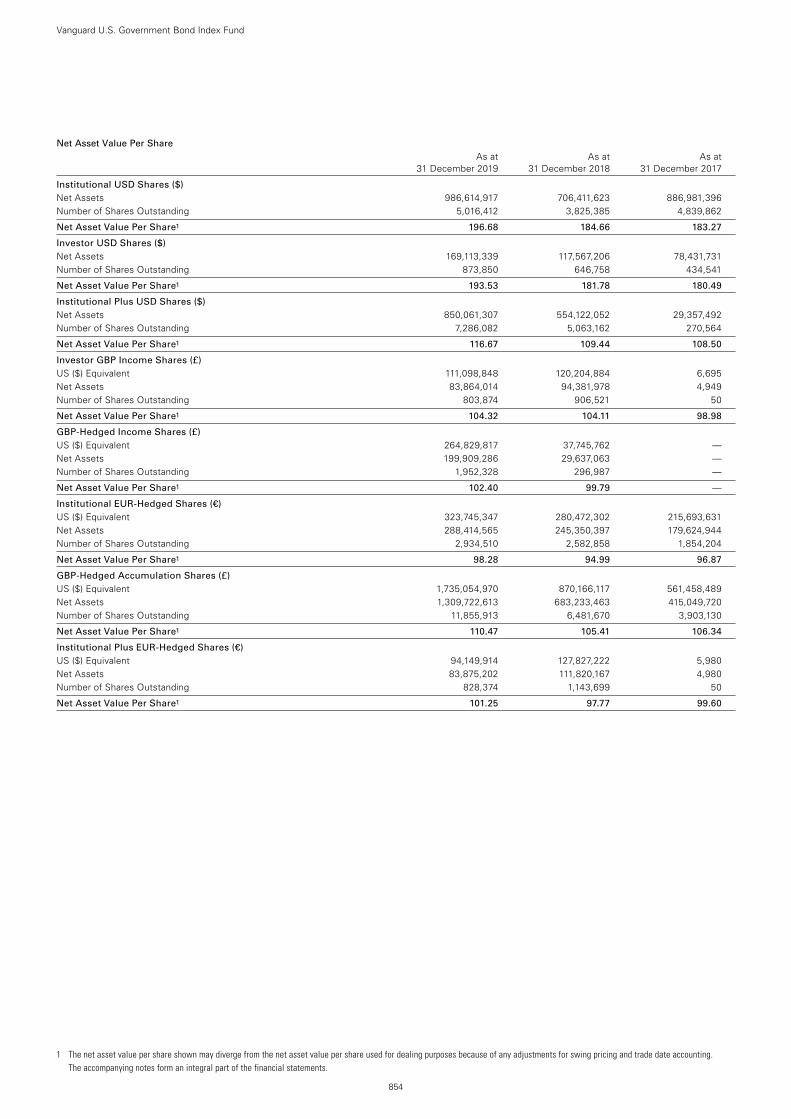
1 The net asset value per share shown may diverge from the net asset value per share used for dealing purposes because of any adjustments for swing pricing and trade date accounting. The accompanying notes form an integral part of the financial statements.
854
Vanguard U.S. Government Bond Index Fund
Net Asset Value Per Share As at As at As at 31 December 2019 31 December 2018 31 December 2017
Institutional USD Shares ($) Net Assets 986,614,917 706,411,623 886,981,396Number of Shares Outstanding 5,016,412 3,825,385 4,839,862
Net Asset Value Per Share1 196.68 184.66 183.27
Investor USD Shares ($) Net Assets 169,113,339 117,567,206 78,431,731Number of Shares Outstanding 873,850 646,758 434,541
Net Asset Value Per Share1 193.53 181.78 180.49
Institutional Plus USD Shares ($) Net Assets 850,061,307 554,122,052 29,357,492Number of Shares Outstanding 7,286,082 5,063,162 270,564
Net Asset Value Per Share1 116.67 109.44 108.50
Investor GBP Income Shares (£) US ($) Equivalent 111,098,848 120,204,884 6,695Net Assets 83,864,014 94,381,978 4,949Number of Shares Outstanding 803,874 906,521 50
Net Asset Value Per Share1 104.32 104.11 98.98
GBP-Hedged Income Shares (£) US ($) Equivalent 264,829,817 37,745,762 —Net Assets 199,909,286 29,637,063 —Number of Shares Outstanding 1,952,328 296,987 —
Net Asset Value Per Share1 102.40 99.79 —
Institutional EUR-Hedged Shares (€) US ($) Equivalent 323,745,347 280,472,302 215,693,631Net Assets 288,414,565 245,350,397 179,624,944Number of Shares Outstanding 2,934,510 2,582,858 1,854,204
Net Asset Value Per Share1 98.28 94.99 96.87
GBP-Hedged Accumulation Shares (£) US ($) Equivalent 1,735,054,970 870,166,117 561,458,489Net Assets 1,309,722,613 683,233,463 415,049,720Number of Shares Outstanding 11,855,913 6,481,670 3,903,130
Net Asset Value Per Share1 110.47 105.41 106.34
Institutional Plus EUR-Hedged Shares (€) US ($) Equivalent 94,149,914 127,827,222 5,980Net Assets 83,875,202 111,820,167 4,980Number of Shares Outstanding 828,374 1,143,699 50
Net Asset Value Per Share1 101.25 97.77 99.60
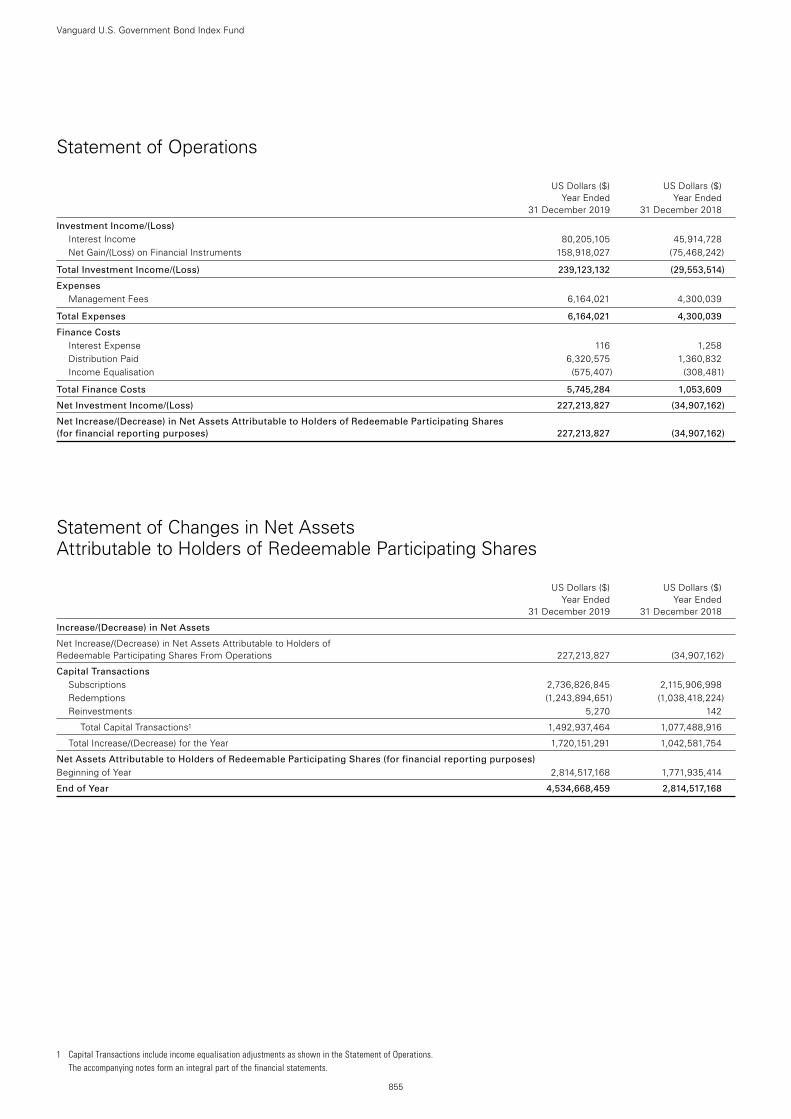
855
Vanguard U.S. Government Bond Index Fund
Statement of Operations
US Dollars ($) US Dollars ($) Year Ended Year Ended 31 December 2019 31 December 2018
Investment Income/(Loss) Interest Income 80,205,105 45,914,728Net Gain/(Loss) on Financial Instruments 158,918,027 (75,468,242)
Total Investment Income/(Loss) 239,123,132 (29,553,514)
Expenses Management Fees 6,164,021 4,300,039
Total Expenses 6,164,021 4,300,039
Finance Costs Interest Expense 116 1,258Distribution Paid 6,320,575 1,360,832Income Equalisation (575,407) (308,481)
Total Finance Costs 5,745,284 1,053,609
Net Investment Income/(Loss) 227,213,827 (34,907,162)
Net Increase/(Decrease) in Net Assets Attributable to Holders of Redeemable Participating Shares (for financial reporting purposes) 227,213,827 (34,907,162)
Statement of Changes in Net Assets Attributable to Holders of Redeemable Participating Shares
US Dollars ($) US Dollars ($) Year Ended Year Ended 31 December 2019 31 December 2018
Increase/(Decrease) in Net Assets
Net Increase/(Decrease) in Net Assets Attributable to Holders of Redeemable Participating Shares From Operations 227,213,827 (34,907,162)
Capital Transactions Subscriptions 2,736,826,845 2,115,906,998Redemptions (1,243,894,651) (1,038,418,224)Reinvestments 5,270 142
Total Capital Transactions1 1,492,937,464 1,077,488,916
Total Increase/(Decrease) for the Year 1,720,151,291 1,042,581,754
Net Assets Attributable to Holders of Redeemable Participating Shares (for financial reporting purposes) Beginning of Year 2,814,517,168 1,771,935,414
End of Year 4,534,668,459 2,814,517,168
1 Capital Transactions include income equalisation adjustments as shown in the Statement of Operations. The accompanying notes form an integral part of the financial statements.
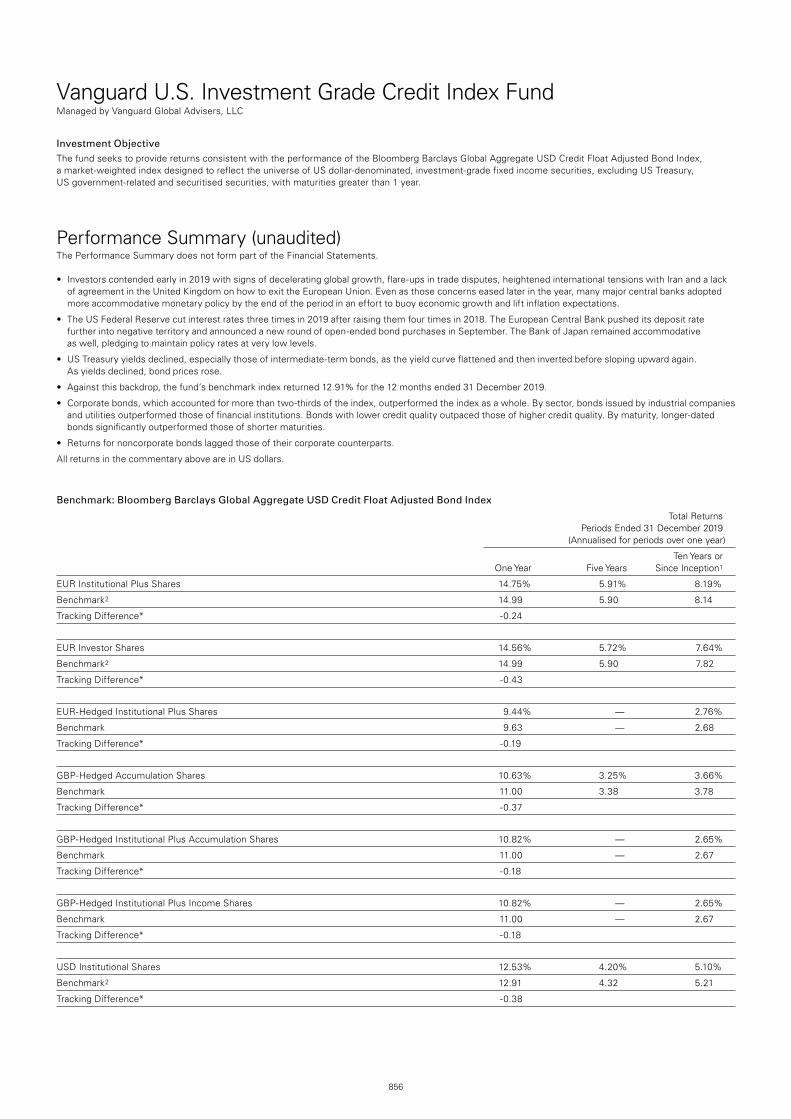
856
Vanguard U.S. Investment Grade Credit Index FundManaged by Vanguard Global Advisers, LLC
Investment ObjectiveThe fund seeks to provide returns consistent with the performance of the Bloomberg Barclays Global Aggregate USD Credit Float Adjusted Bond Index, a market-weighted index designed to reflect the universe of US dollar-denominated, investment-grade fixed income securities, excluding US Treasury, US government-related and securitised securities, with maturities greater than 1 year.
Performance Summary (unaudited)The Performance Summary does not form part of the Financial Statements.
• Investorscontendedearlyin2019withsignsofdeceleratingglobalgrowth,flare-upsintradedisputes,heightenedinternationaltensionswithIranandalackof agreement in the United Kingdom on how to exit the European Union. Even as those concerns eased later in the year, many major central banks adopted more accommodative monetary policy by the end of the period in an effort to buoy economic growth and lift inflation expectations.
• TheUSFederalReservecutinterestratesthreetimesin2019afterraisingthemfourtimesin2018.TheEuropeanCentralBankpusheditsdepositratefurther into negative territory and announced a new round of open-ended bond purchases in September. The Bank of Japan remained accommodative as well, pledging to maintain policy rates at very low levels.
• USTreasuryyieldsdeclined,especiallythoseofintermediate-termbonds,astheyieldcurveflattenedandtheninvertedbeforeslopingupwardagain. As yields declined, bond prices rose.
• Againstthisbackdrop,thefund’sbenchmarkindexreturned12.91%forthe12monthsended31December2019.
• Corporatebonds,whichaccountedformorethantwo-thirdsoftheindex,outperformedtheindexasawhole.Bysector,bondsissuedbyindustrialcompaniesand utilities outperformed those of financial institutions. Bonds with lower credit quality outpaced those of higher credit quality. By maturity, longer-dated bonds significantly outperformed those of shorter maturities.
• Returnsfornoncorporatebondslaggedthoseoftheircorporatecounterparts.
All returns in the commentary above are in US dollars.
Benchmark: Bloomberg Barclays Global Aggregate USD Credit Float Adjusted Bond Index
Total Returns Periods Ended 31 December 2019 (Annualised for periods over one year)
Ten Years or One Year Five Years Since Inception1
EUR Institutional Plus Shares 14.75% 5.91% 8.19%
Benchmark2 14.99 5.90 8.14
Tracking Difference* -0.24
EUR Investor Shares 14.56% 5.72% 7.64%
Benchmark2 14.99 5.90 7.82
Tracking Difference* -0.43
EUR-Hedged Institutional Plus Shares 9.44% — 2.76%
Benchmark 9.63 — 2.68
Tracking Difference* -0.19
GBP-Hedged Accumulation Shares 10.63% 3.25% 3.66%
Benchmark 11.00 3.38 3.78
Tracking Difference* -0.37
GBP-Hedged Institutional Plus Accumulation Shares 10.82% — 2.65%
Benchmark 11.00 — 2.67
Tracking Difference* -0.18
GBP-Hedged Institutional Plus Income Shares 10.82% — 2.65%
Benchmark 11.00 — 2.67
Tracking Difference* -0.18
USD Institutional Shares 12.53% 4.20% 5.10%
Benchmark2 12.91 4.32 5.21
Tracking Difference* -0.38
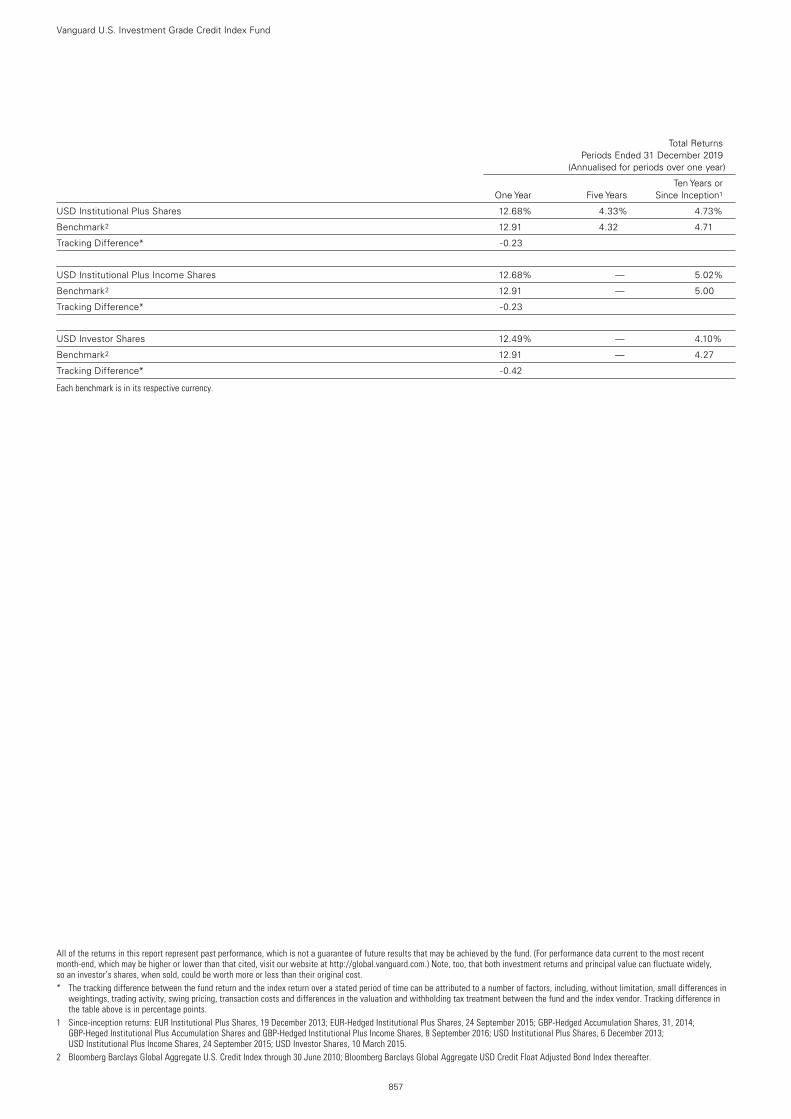
Vanguard U.S. Investment Grade Credit Index Fund
857
All of the returns in this report represent past performance, which is not a guarantee of future results that may be achieved by the fund. (For performance data current to the most recent month-end, which may be higher or lower than that cited, visit our website at http://global.vanguard.com.) Note, too, that both investment returns and principal value can fluctuate widely, so an investor’s shares, when sold, could be worth more or less than their original cost.* The tracking difference between the fund return and the index return over a stated period of time can be attributed to a number of factors, including, without limitation, small differences in
weightings, trading activity, swing pricing, transaction costs and differences in the valuation and withholding tax treatment between the fund and the index vendor. Tracking difference in the table above is in percentage points.
1 Since-inception returns: EUR Institutional Plus Shares, 19 December 2013; EUR-Hedged Institutional Plus Shares, 24 September 2015; GBP-Hedged Accumulation Shares, 31, 2014; GBP-Heged Institutional Plus Accumulation Shares and GBP-Hedged Institutional Plus Income Shares, 8 September 2016; USD Institutional Plus Shares, 6 December 2013; USD Institutional Plus Income Shares, 24 September 2015; USD Investor Shares, 10 March 2015.
2 Bloomberg Barclays Global Aggregate U.S. Credit Index through 30 June 2010; Bloomberg Barclays Global Aggregate USD Credit Float Adjusted Bond Index thereafter.
Total Returns Periods Ended 31 December 2019 (Annualised for periods over one year)
Ten Years or One Year Five Years Since Inception1
USD Institutional Plus Shares 12.68% 4.33% 4.73%
Benchmark2 12.91 4.32 4.71
Tracking Difference* -0.23
USD Institutional Plus Income Shares 12.68% — 5.02%
Benchmark2 12.91 — 5.00
Tracking Difference* -0.23
USD Investor Shares 12.49% — 4.10%
Benchmark2 12.91 — 4.27
Tracking Difference* -0.42
Each benchmark is in its respective currency.
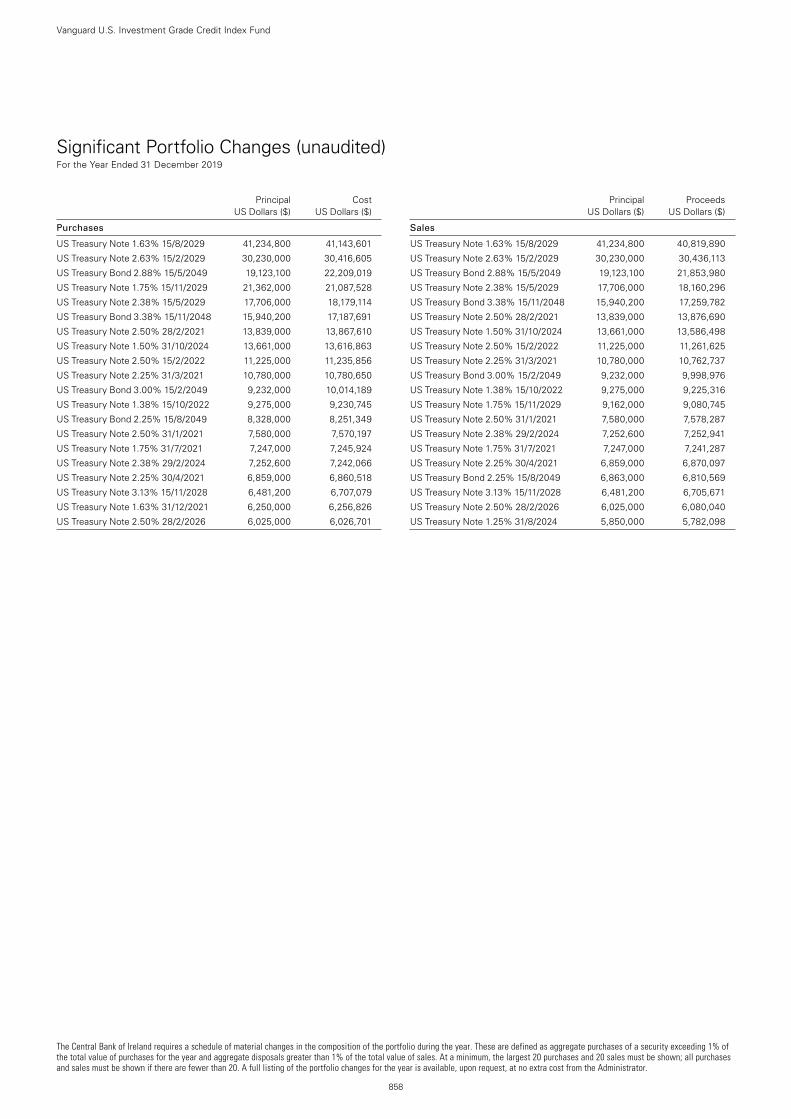
The Central Bank of Ireland requires a schedule of material changes in the composition of the portfolio during the year. These are defined as aggregate purchases of a security exceeding 1% of the total value of purchases for the year and aggregate disposals greater than 1% of the total value of sales. At a minimum, the largest 20 purchases and 20 sales must be shown; all purchases and sales must be shown if there are fewer than 20. A full listing of the portfolio changes for the year is available, upon request, at no extra cost from the Administrator.
858
Vanguard U.S. Investment Grade Credit Index Fund
Significant Portfolio Changes (unaudited) For the Year Ended 31 December 2019
Principal Cost US Dollars ($) US Dollars ($)
Purchases
US Treasury Note 1.63% 15/8/2029 41,234,800 41,143,601
US Treasury Note 2.63% 15/2/2029 30,230,000 30,416,605
US Treasury Bond 2.88% 15/5/2049 19,123,100 22,209,019
US Treasury Note 1.75% 15/11/2029 21,362,000 21,087,528
US Treasury Note 2.38% 15/5/2029 17,706,000 18,179,114
US Treasury Bond 3.38% 15/11/2048 15,940,200 17,187,691
US Treasury Note 2.50% 28/2/2021 13,839,000 13,867,610
US Treasury Note 1.50% 31/10/2024 13,661,000 13,616,863
US Treasury Note 2.50% 15/2/2022 11,225,000 11,235,856
US Treasury Note 2.25% 31/3/2021 10,780,000 10,780,650
US Treasury Bond 3.00% 15/2/2049 9,232,000 10,014,189
US Treasury Note 1.38% 15/10/2022 9,275,000 9,230,745
US Treasury Bond 2.25% 15/8/2049 8,328,000 8,251,349
US Treasury Note 2.50% 31/1/2021 7,580,000 7,570,197
US Treasury Note 1.75% 31/7/2021 7,247,000 7,245,924
US Treasury Note 2.38% 29/2/2024 7,252,600 7,242,066
US Treasury Note 2.25% 30/4/2021 6,859,000 6,860,518
US Treasury Note 3.13% 15/11/2028 6,481,200 6,707,079
US Treasury Note 1.63% 31/12/2021 6,250,000 6,256,826
US Treasury Note 2.50% 28/2/2026 6,025,000 6,026,701
Principal Proceeds US Dollars ($) US Dollars ($)
Sales
US Treasury Note 1.63% 15/8/2029 41,234,800 40,819,890
US Treasury Note 2.63% 15/2/2029 30,230,000 30,436,113
US Treasury Bond 2.88% 15/5/2049 19,123,100 21,853,980
US Treasury Note 2.38% 15/5/2029 17,706,000 18,160,296
US Treasury Bond 3.38% 15/11/2048 15,940,200 17,259,782
US Treasury Note 2.50% 28/2/2021 13,839,000 13,876,690
US Treasury Note 1.50% 31/10/2024 13,661,000 13,586,498
US Treasury Note 2.50% 15/2/2022 11,225,000 11,261,625
US Treasury Note 2.25% 31/3/2021 10,780,000 10,762,737
US Treasury Bond 3.00% 15/2/2049 9,232,000 9,998,976
US Treasury Note 1.38% 15/10/2022 9,275,000 9,225,316
US Treasury Note 1.75% 15/11/2029 9,162,000 9,080,745
US Treasury Note 2.50% 31/1/2021 7,580,000 7,578,287
US Treasury Note 2.38% 29/2/2024 7,252,600 7,252,941
US Treasury Note 1.75% 31/7/2021 7,247,000 7,241,287
US Treasury Note 2.25% 30/4/2021 6,859,000 6,870,097
US Treasury Bond 2.25% 15/8/2049 6,863,000 6,810,569
US Treasury Note 3.13% 15/11/2028 6,481,200 6,705,671
US Treasury Note 2.50% 28/2/2026 6,025,000 6,080,040
US Treasury Note 1.25% 31/8/2024 5,850,000 5,782,098
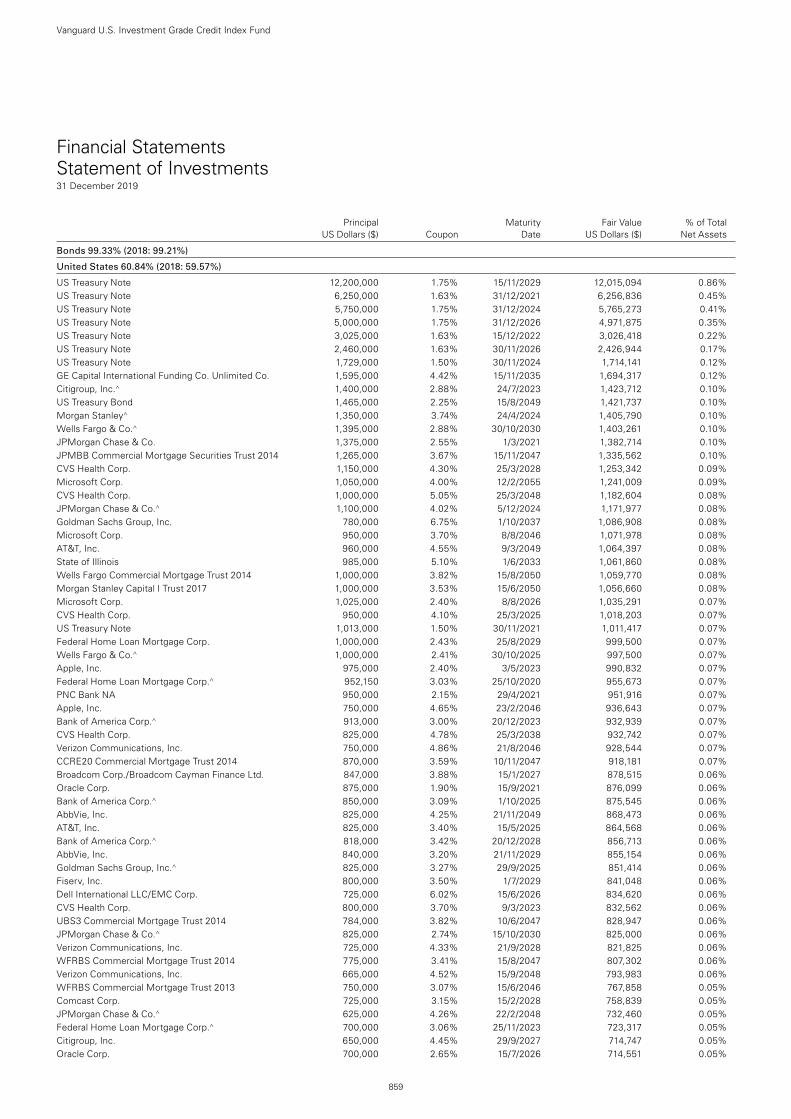
Vanguard U.S. Investment Grade Credit Index Fund
Bonds 99.33% (2018: 99.21%)
United States 60.84% (2018: 59.57%)
US Treasury Note 12,200,000 1.75% 15/11/2029 12,015,094 0.86%US Treasury Note 6,250,000 1.63% 31/12/2021 6,256,836 0.45%US Treasury Note 5,750,000 1.75% 31/12/2024 5,765,273 0.41%US Treasury Note 5,000,000 1.75% 31/12/2026 4,971,875 0.35%US Treasury Note 3,025,000 1.63% 15/12/2022 3,026,418 0.22%US Treasury Note 2,460,000 1.63% 30/11/2026 2,426,944 0.17%US Treasury Note 1,729,000 1.50% 30/11/2024 1,714,141 0.12%GE Capital International Funding Co. Unlimited Co. 1,595,000 4.42% 15/11/2035 1,694,317 0.12%Citigroup, Inc.^ 1,400,000 2.88% 24/7/2023 1,423,712 0.10%US Treasury Bond 1,465,000 2.25% 15/8/2049 1,421,737 0.10%Morgan Stanley^ 1,350,000 3.74% 24/4/2024 1,405,790 0.10%Wells Fargo & Co.^ 1,395,000 2.88% 30/10/2030 1,403,261 0.10%JPMorgan Chase & Co. 1,375,000 2.55% 1/3/2021 1,382,714 0.10%JPMBB Commercial Mortgage Securities Trust 2014 1,265,000 3.67% 15/11/2047 1,335,562 0.10%CVS Health Corp. 1,150,000 4.30% 25/3/2028 1,253,342 0.09%Microsoft Corp. 1,050,000 4.00% 12/2/2055 1,241,009 0.09%CVS Health Corp. 1,000,000 5.05% 25/3/2048 1,182,604 0.08%JPMorgan Chase & Co.^ 1,100,000 4.02% 5/12/2024 1,171,977 0.08%Goldman Sachs Group, Inc. 780,000 6.75% 1/10/2037 1,086,908 0.08%Microsoft Corp. 950,000 3.70% 8/8/2046 1,071,978 0.08%AT&T, Inc. 960,000 4.55% 9/3/2049 1,064,397 0.08%State of Illinois 985,000 5.10% 1/6/2033 1,061,860 0.08%Wells Fargo Commercial Mortgage Trust 2014 1,000,000 3.82% 15/8/2050 1,059,770 0.08%Morgan Stanley Capital I Trust 2017 1,000,000 3.53% 15/6/2050 1,056,660 0.08%Microsoft Corp. 1,025,000 2.40% 8/8/2026 1,035,291 0.07%CVS Health Corp. 950,000 4.10% 25/3/2025 1,018,203 0.07%US Treasury Note 1,013,000 1.50% 30/11/2021 1,011,417 0.07%Federal Home Loan Mortgage Corp. 1,000,000 2.43% 25/8/2029 999,500 0.07%Wells Fargo & Co.^ 1,000,000 2.41% 30/10/2025 997,500 0.07%Apple, Inc. 975,000 2.40% 3/5/2023 990,832 0.07%Federal Home Loan Mortgage Corp.^ 952,150 3.03% 25/10/2020 955,673 0.07%PNC Bank NA 950,000 2.15% 29/4/2021 951,916 0.07%Apple, Inc. 750,000 4.65% 23/2/2046 936,643 0.07%Bank of America Corp.^ 913,000 3.00% 20/12/2023 932,939 0.07%CVS Health Corp. 825,000 4.78% 25/3/2038 932,742 0.07%Verizon Communications, Inc. 750,000 4.86% 21/8/2046 928,544 0.07%CCRE20 Commercial Mortgage Trust 2014 870,000 3.59% 10/11/2047 918,181 0.07%Broadcom Corp./Broadcom Cayman Finance Ltd. 847,000 3.88% 15/1/2027 878,515 0.06%Oracle Corp. 875,000 1.90% 15/9/2021 876,099 0.06%Bank of America Corp.^ 850,000 3.09% 1/10/2025 875,545 0.06%AbbVie, Inc. 825,000 4.25% 21/11/2049 868,473 0.06%AT&T, Inc. 825,000 3.40% 15/5/2025 864,568 0.06%Bank of America Corp.^ 818,000 3.42% 20/12/2028 856,713 0.06%AbbVie, Inc. 840,000 3.20% 21/11/2029 855,154 0.06%Goldman Sachs Group, Inc.^ 825,000 3.27% 29/9/2025 851,414 0.06%Fiserv, Inc. 800,000 3.50% 1/7/2029 841,048 0.06%Dell International LLC/EMC Corp. 725,000 6.02% 15/6/2026 834,620 0.06%CVS Health Corp. 800,000 3.70% 9/3/2023 832,562 0.06%UBS3 Commercial Mortgage Trust 2014 784,000 3.82% 10/6/2047 828,947 0.06%JPMorgan Chase & Co.^ 825,000 2.74% 15/10/2030 825,000 0.06%Verizon Communications, Inc. 725,000 4.33% 21/9/2028 821,825 0.06%WFRBS Commercial Mortgage Trust 2014 775,000 3.41% 15/8/2047 807,302 0.06%Verizon Communications, Inc. 665,000 4.52% 15/9/2048 793,983 0.06%WFRBS Commercial Mortgage Trust 2013 750,000 3.07% 15/6/2046 767,858 0.05%Comcast Corp. 725,000 3.15% 15/2/2028 758,839 0.05%JPMorgan Chase & Co.^ 625,000 4.26% 22/2/2048 732,460 0.05%Federal Home Loan Mortgage Corp.^ 700,000 3.06% 25/11/2023 723,317 0.05%Citigroup, Inc. 650,000 4.45% 29/9/2027 714,747 0.05%Oracle Corp. 700,000 2.65% 15/7/2026 714,551 0.05%
859
Financial Statements Statement of Investments31 December 2019
Principal Maturity Fair Value % of Total US Dollars ($) Coupon Date US Dollars ($) Net Assets
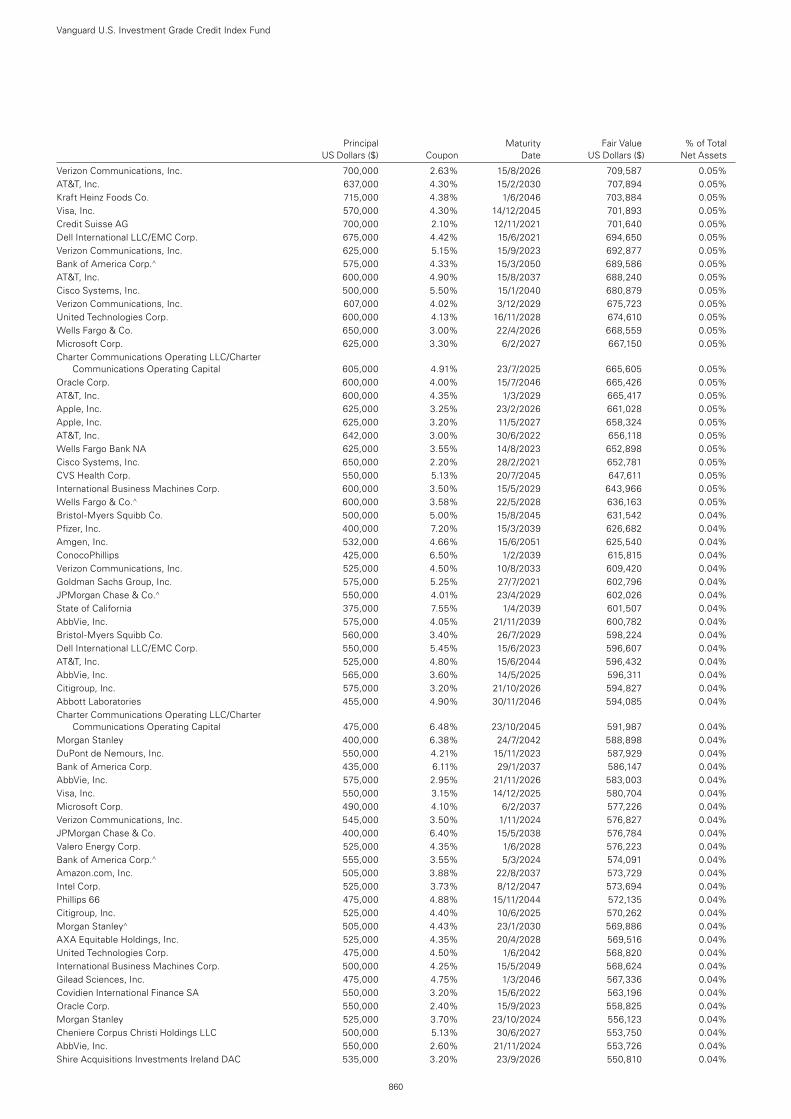
Principal Maturity Fair Value % of Total US Dollars ($) Coupon Date US Dollars ($) Net Assets
Verizon Communications, Inc. 700,000 2.63% 15/8/2026 709,587 0.05%AT&T, Inc. 637,000 4.30% 15/2/2030 707,894 0.05%Kraft Heinz Foods Co. 715,000 4.38% 1/6/2046 703,884 0.05%Visa, Inc. 570,000 4.30% 14/12/2045 701,893 0.05%Credit Suisse AG 700,000 2.10% 12/11/2021 701,640 0.05%Dell International LLC/EMC Corp. 675,000 4.42% 15/6/2021 694,650 0.05%Verizon Communications, Inc. 625,000 5.15% 15/9/2023 692,877 0.05%Bank of America Corp.^ 575,000 4.33% 15/3/2050 689,586 0.05%AT&T, Inc. 600,000 4.90% 15/8/2037 688,240 0.05%Cisco Systems, Inc. 500,000 5.50% 15/1/2040 680,879 0.05%Verizon Communications, Inc. 607,000 4.02% 3/12/2029 675,723 0.05%United Technologies Corp. 600,000 4.13% 16/11/2028 674,610 0.05%Wells Fargo & Co. 650,000 3.00% 22/4/2026 668,559 0.05%Microsoft Corp. 625,000 3.30% 6/2/2027 667,150 0.05%Charter Communications Operating LLC/Charter
Communications Operating Capital 605,000 4.91% 23/7/2025 665,605 0.05%Oracle Corp. 600,000 4.00% 15/7/2046 665,426 0.05%AT&T, Inc. 600,000 4.35% 1/3/2029 665,417 0.05%Apple, Inc. 625,000 3.25% 23/2/2026 661,028 0.05%Apple, Inc. 625,000 3.20% 11/5/2027 658,324 0.05%AT&T, Inc. 642,000 3.00% 30/6/2022 656,118 0.05%Wells Fargo Bank NA 625,000 3.55% 14/8/2023 652,898 0.05%Cisco Systems, Inc. 650,000 2.20% 28/2/2021 652,781 0.05%CVS Health Corp. 550,000 5.13% 20/7/2045 647,611 0.05%International Business Machines Corp. 600,000 3.50% 15/5/2029 643,966 0.05%Wells Fargo & Co.^ 600,000 3.58% 22/5/2028 636,163 0.05%Bristol-Myers Squibb Co. 500,000 5.00% 15/8/2045 631,542 0.04%Pfizer, Inc. 400,000 7.20% 15/3/2039 626,682 0.04%Amgen, Inc. 532,000 4.66% 15/6/2051 625,540 0.04%ConocoPhillips 425,000 6.50% 1/2/2039 615,815 0.04%Verizon Communications, Inc. 525,000 4.50% 10/8/2033 609,420 0.04%Goldman Sachs Group, Inc. 575,000 5.25% 27/7/2021 602,796 0.04%JPMorgan Chase & Co.^ 550,000 4.01% 23/4/2029 602,026 0.04%State of California 375,000 7.55% 1/4/2039 601,507 0.04%AbbVie, Inc. 575,000 4.05% 21/11/2039 600,782 0.04%Bristol-Myers Squibb Co. 560,000 3.40% 26/7/2029 598,224 0.04%Dell International LLC/EMC Corp. 550,000 5.45% 15/6/2023 596,607 0.04%AT&T, Inc. 525,000 4.80% 15/6/2044 596,432 0.04%AbbVie, Inc. 565,000 3.60% 14/5/2025 596,311 0.04%Citigroup, Inc. 575,000 3.20% 21/10/2026 594,827 0.04%Abbott Laboratories 455,000 4.90% 30/11/2046 594,085 0.04%Charter Communications Operating LLC/Charter
Communications Operating Capital 475,000 6.48% 23/10/2045 591,987 0.04%Morgan Stanley 400,000 6.38% 24/7/2042 588,898 0.04%DuPont de Nemours, Inc. 550,000 4.21% 15/11/2023 587,929 0.04%Bank of America Corp. 435,000 6.11% 29/1/2037 586,147 0.04%AbbVie, Inc. 575,000 2.95% 21/11/2026 583,003 0.04%Visa, Inc. 550,000 3.15% 14/12/2025 580,704 0.04%Microsoft Corp. 490,000 4.10% 6/2/2037 577,226 0.04%Verizon Communications, Inc. 545,000 3.50% 1/11/2024 576,827 0.04%JPMorgan Chase & Co. 400,000 6.40% 15/5/2038 576,784 0.04%Valero Energy Corp. 525,000 4.35% 1/6/2028 576,223 0.04%Bank of America Corp.^ 555,000 3.55% 5/3/2024 574,091 0.04%Amazon.com, Inc. 505,000 3.88% 22/8/2037 573,729 0.04%Intel Corp. 525,000 3.73% 8/12/2047 573,694 0.04%Phillips 66 475,000 4.88% 15/11/2044 572,135 0.04%Citigroup, Inc. 525,000 4.40% 10/6/2025 570,262 0.04%Morgan Stanley^ 505,000 4.43% 23/1/2030 569,886 0.04%AXA Equitable Holdings, Inc. 525,000 4.35% 20/4/2028 569,516 0.04%United Technologies Corp. 475,000 4.50% 1/6/2042 568,820 0.04%International Business Machines Corp. 500,000 4.25% 15/5/2049 568,624 0.04%Gilead Sciences, Inc. 475,000 4.75% 1/3/2046 567,336 0.04%Covidien International Finance SA 550,000 3.20% 15/6/2022 563,196 0.04%Oracle Corp. 550,000 2.40% 15/9/2023 558,825 0.04%Morgan Stanley 525,000 3.70% 23/10/2024 556,123 0.04%Cheniere Corpus Christi Holdings LLC 500,000 5.13% 30/6/2027 553,750 0.04%AbbVie, Inc. 550,000 2.60% 21/11/2024 553,726 0.04%Shire Acquisitions Investments Ireland DAC 535,000 3.20% 23/9/2026 550,810 0.04%
Vanguard U.S. Investment Grade Credit Index Fund
860
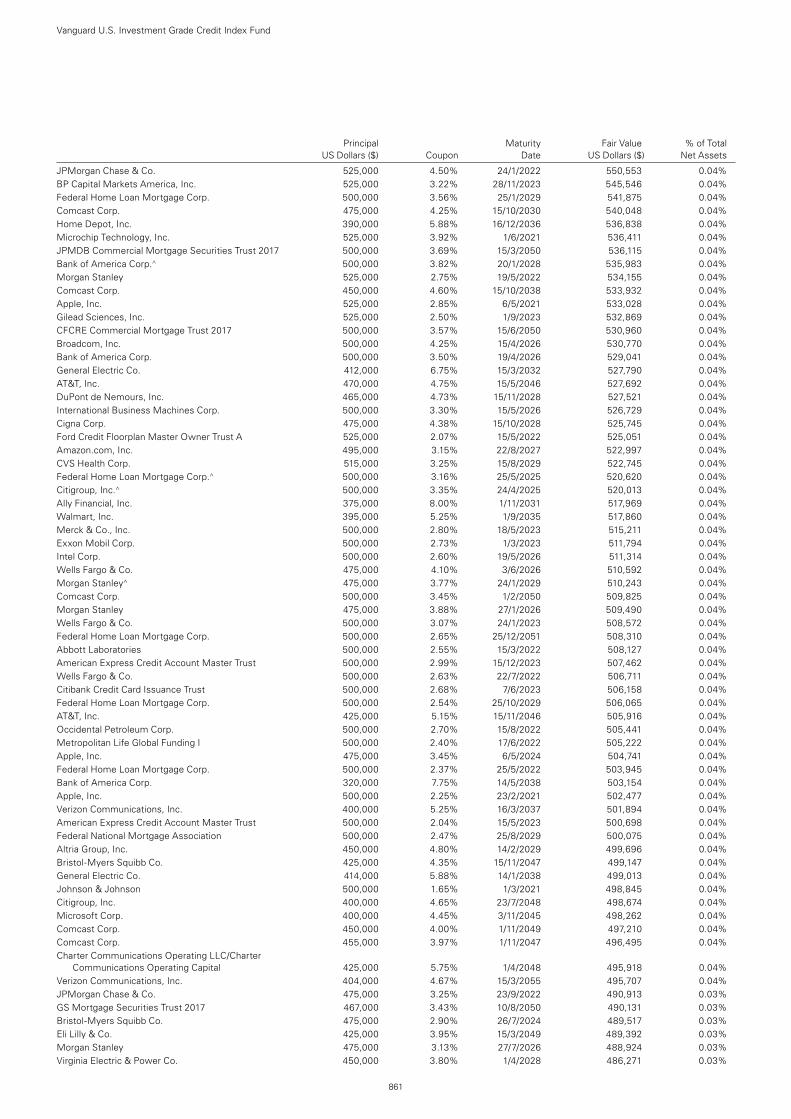
Principal Maturity Fair Value % of Total US Dollars ($) Coupon Date US Dollars ($) Net Assets
JPMorgan Chase & Co. 525,000 4.50% 24/1/2022 550,553 0.04%BP Capital Markets America, Inc. 525,000 3.22% 28/11/2023 545,546 0.04%Federal Home Loan Mortgage Corp. 500,000 3.56% 25/1/2029 541,875 0.04%Comcast Corp. 475,000 4.25% 15/10/2030 540,048 0.04%Home Depot, Inc. 390,000 5.88% 16/12/2036 536,838 0.04%Microchip Technology, Inc. 525,000 3.92% 1/6/2021 536,411 0.04%JPMDB Commercial Mortgage Securities Trust 2017 500,000 3.69% 15/3/2050 536,115 0.04%Bank of America Corp.^ 500,000 3.82% 20/1/2028 535,983 0.04%Morgan Stanley 525,000 2.75% 19/5/2022 534,155 0.04%Comcast Corp. 450,000 4.60% 15/10/2038 533,932 0.04%Apple, Inc. 525,000 2.85% 6/5/2021 533,028 0.04%Gilead Sciences, Inc. 525,000 2.50% 1/9/2023 532,869 0.04%CFCRE Commercial Mortgage Trust 2017 500,000 3.57% 15/6/2050 530,960 0.04%Broadcom, Inc. 500,000 4.25% 15/4/2026 530,770 0.04%Bank of America Corp. 500,000 3.50% 19/4/2026 529,041 0.04%General Electric Co. 412,000 6.75% 15/3/2032 527,790 0.04%AT&T, Inc. 470,000 4.75% 15/5/2046 527,692 0.04%DuPont de Nemours, Inc. 465,000 4.73% 15/11/2028 527,521 0.04%International Business Machines Corp. 500,000 3.30% 15/5/2026 526,729 0.04%Cigna Corp. 475,000 4.38% 15/10/2028 525,745 0.04%Ford Credit Floorplan Master Owner Trust A 525,000 2.07% 15/5/2022 525,051 0.04%Amazon.com, Inc. 495,000 3.15% 22/8/2027 522,997 0.04%CVS Health Corp. 515,000 3.25% 15/8/2029 522,745 0.04%Federal Home Loan Mortgage Corp.^ 500,000 3.16% 25/5/2025 520,620 0.04%Citigroup, Inc.^ 500,000 3.35% 24/4/2025 520,013 0.04%Ally Financial, Inc. 375,000 8.00% 1/11/2031 517,969 0.04%Walmart, Inc. 395,000 5.25% 1/9/2035 517,860 0.04%Merck & Co., Inc. 500,000 2.80% 18/5/2023 515,211 0.04%Exxon Mobil Corp. 500,000 2.73% 1/3/2023 511,794 0.04%Intel Corp. 500,000 2.60% 19/5/2026 511,314 0.04%Wells Fargo & Co. 475,000 4.10% 3/6/2026 510,592 0.04%Morgan Stanley^ 475,000 3.77% 24/1/2029 510,243 0.04%Comcast Corp. 500,000 3.45% 1/2/2050 509,825 0.04%Morgan Stanley 475,000 3.88% 27/1/2026 509,490 0.04%Wells Fargo & Co. 500,000 3.07% 24/1/2023 508,572 0.04%Federal Home Loan Mortgage Corp. 500,000 2.65% 25/12/2051 508,310 0.04%Abbott Laboratories 500,000 2.55% 15/3/2022 508,127 0.04%American Express Credit Account Master Trust 500,000 2.99% 15/12/2023 507,462 0.04%Wells Fargo & Co. 500,000 2.63% 22/7/2022 506,711 0.04%Citibank Credit Card Issuance Trust 500,000 2.68% 7/6/2023 506,158 0.04%Federal Home Loan Mortgage Corp. 500,000 2.54% 25/10/2029 506,065 0.04%AT&T, Inc. 425,000 5.15% 15/11/2046 505,916 0.04%Occidental Petroleum Corp. 500,000 2.70% 15/8/2022 505,441 0.04%Metropolitan Life Global Funding I 500,000 2.40% 17/6/2022 505,222 0.04%Apple, Inc. 475,000 3.45% 6/5/2024 504,741 0.04%Federal Home Loan Mortgage Corp. 500,000 2.37% 25/5/2022 503,945 0.04%Bank of America Corp. 320,000 7.75% 14/5/2038 503,154 0.04%Apple, Inc. 500,000 2.25% 23/2/2021 502,477 0.04%Verizon Communications, Inc. 400,000 5.25% 16/3/2037 501,894 0.04%American Express Credit Account Master Trust 500,000 2.04% 15/5/2023 500,698 0.04%Federal National Mortgage Association 500,000 2.47% 25/8/2029 500,075 0.04%Altria Group, Inc. 450,000 4.80% 14/2/2029 499,696 0.04%Bristol-Myers Squibb Co. 425,000 4.35% 15/11/2047 499,147 0.04%General Electric Co. 414,000 5.88% 14/1/2038 499,013 0.04%Johnson & Johnson 500,000 1.65% 1/3/2021 498,845 0.04%Citigroup, Inc. 400,000 4.65% 23/7/2048 498,674 0.04%Microsoft Corp. 400,000 4.45% 3/11/2045 498,262 0.04%Comcast Corp. 450,000 4.00% 1/11/2049 497,210 0.04%Comcast Corp. 455,000 3.97% 1/11/2047 496,495 0.04%Charter Communications Operating LLC/Charter
Communications Operating Capital 425,000 5.75% 1/4/2048 495,918 0.04%Verizon Communications, Inc. 404,000 4.67% 15/3/2055 495,707 0.04%JPMorgan Chase & Co. 475,000 3.25% 23/9/2022 490,913 0.03%GS Mortgage Securities Trust 2017 467,000 3.43% 10/8/2050 490,131 0.03%Bristol-Myers Squibb Co. 475,000 2.90% 26/7/2024 489,517 0.03%Eli Lilly & Co. 425,000 3.95% 15/3/2049 489,392 0.03%Morgan Stanley 475,000 3.13% 27/7/2026 488,924 0.03%Virginia Electric & Power Co. 450,000 3.80% 1/4/2028 486,271 0.03%
Vanguard U.S. Investment Grade Credit Index Fund
861
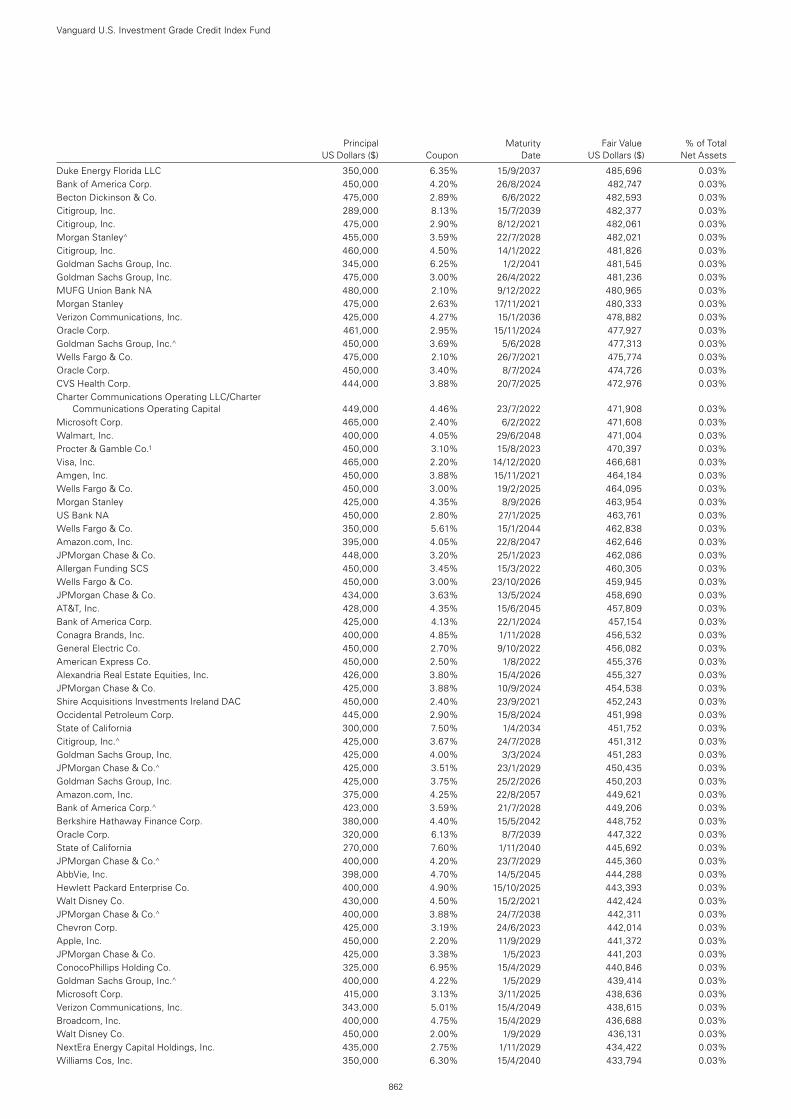
Principal Maturity Fair Value % of Total US Dollars ($) Coupon Date US Dollars ($) Net Assets
Duke Energy Florida LLC 350,000 6.35% 15/9/2037 485,696 0.03%Bank of America Corp. 450,000 4.20% 26/8/2024 482,747 0.03%Becton Dickinson & Co. 475,000 2.89% 6/6/2022 482,593 0.03%Citigroup, Inc. 289,000 8.13% 15/7/2039 482,377 0.03%Citigroup, Inc. 475,000 2.90% 8/12/2021 482,061 0.03%Morgan Stanley^ 455,000 3.59% 22/7/2028 482,021 0.03%Citigroup, Inc. 460,000 4.50% 14/1/2022 481,826 0.03%Goldman Sachs Group, Inc. 345,000 6.25% 1/2/2041 481,545 0.03%Goldman Sachs Group, Inc. 475,000 3.00% 26/4/2022 481,236 0.03%MUFG Union Bank NA 480,000 2.10% 9/12/2022 480,965 0.03%Morgan Stanley 475,000 2.63% 17/11/2021 480,333 0.03%Verizon Communications, Inc. 425,000 4.27% 15/1/2036 478,882 0.03%Oracle Corp. 461,000 2.95% 15/11/2024 477,927 0.03%Goldman Sachs Group, Inc.^ 450,000 3.69% 5/6/2028 477,313 0.03%Wells Fargo & Co. 475,000 2.10% 26/7/2021 475,774 0.03%Oracle Corp. 450,000 3.40% 8/7/2024 474,726 0.03%CVS Health Corp. 444,000 3.88% 20/7/2025 472,976 0.03%Charter Communications Operating LLC/Charter
Communications Operating Capital 449,000 4.46% 23/7/2022 471,908 0.03%Microsoft Corp. 465,000 2.40% 6/2/2022 471,608 0.03%Walmart, Inc. 400,000 4.05% 29/6/2048 471,004 0.03%Procter & Gamble Co.1 450,000 3.10% 15/8/2023 470,397 0.03%Visa, Inc. 465,000 2.20% 14/12/2020 466,681 0.03%Amgen, Inc. 450,000 3.88% 15/11/2021 464,184 0.03%Wells Fargo & Co. 450,000 3.00% 19/2/2025 464,095 0.03%Morgan Stanley 425,000 4.35% 8/9/2026 463,954 0.03%US Bank NA 450,000 2.80% 27/1/2025 463,761 0.03%Wells Fargo & Co. 350,000 5.61% 15/1/2044 462,838 0.03%Amazon.com, Inc. 395,000 4.05% 22/8/2047 462,646 0.03%JPMorgan Chase & Co. 448,000 3.20% 25/1/2023 462,086 0.03%Allergan Funding SCS 450,000 3.45% 15/3/2022 460,305 0.03%Wells Fargo & Co. 450,000 3.00% 23/10/2026 459,945 0.03%JPMorgan Chase & Co. 434,000 3.63% 13/5/2024 458,690 0.03%AT&T, Inc. 428,000 4.35% 15/6/2045 457,809 0.03%Bank of America Corp. 425,000 4.13% 22/1/2024 457,154 0.03%Conagra Brands, Inc. 400,000 4.85% 1/11/2028 456,532 0.03%General Electric Co. 450,000 2.70% 9/10/2022 456,082 0.03%American Express Co. 450,000 2.50% 1/8/2022 455,376 0.03%Alexandria Real Estate Equities, Inc. 426,000 3.80% 15/4/2026 455,327 0.03%JPMorgan Chase & Co. 425,000 3.88% 10/9/2024 454,538 0.03%Shire Acquisitions Investments Ireland DAC 450,000 2.40% 23/9/2021 452,243 0.03%Occidental Petroleum Corp. 445,000 2.90% 15/8/2024 451,998 0.03%State of California 300,000 7.50% 1/4/2034 451,752 0.03%Citigroup, Inc.^ 425,000 3.67% 24/7/2028 451,312 0.03%Goldman Sachs Group, Inc. 425,000 4.00% 3/3/2024 451,283 0.03%JPMorgan Chase & Co.^ 425,000 3.51% 23/1/2029 450,435 0.03%Goldman Sachs Group, Inc. 425,000 3.75% 25/2/2026 450,203 0.03%Amazon.com, Inc. 375,000 4.25% 22/8/2057 449,621 0.03%Bank of America Corp.^ 423,000 3.59% 21/7/2028 449,206 0.03%Berkshire Hathaway Finance Corp. 380,000 4.40% 15/5/2042 448,752 0.03%Oracle Corp. 320,000 6.13% 8/7/2039 447,322 0.03%State of California 270,000 7.60% 1/11/2040 445,692 0.03%JPMorgan Chase & Co.^ 400,000 4.20% 23/7/2029 445,360 0.03%AbbVie, Inc. 398,000 4.70% 14/5/2045 444,288 0.03%Hewlett Packard Enterprise Co. 400,000 4.90% 15/10/2025 443,393 0.03%Walt Disney Co. 430,000 4.50% 15/2/2021 442,424 0.03%JPMorgan Chase & Co.^ 400,000 3.88% 24/7/2038 442,311 0.03%Chevron Corp. 425,000 3.19% 24/6/2023 442,014 0.03%Apple, Inc. 450,000 2.20% 11/9/2029 441,372 0.03%JPMorgan Chase & Co. 425,000 3.38% 1/5/2023 441,203 0.03%ConocoPhillips Holding Co. 325,000 6.95% 15/4/2029 440,846 0.03%Goldman Sachs Group, Inc.^ 400,000 4.22% 1/5/2029 439,414 0.03%Microsoft Corp. 415,000 3.13% 3/11/2025 438,636 0.03%Verizon Communications, Inc. 343,000 5.01% 15/4/2049 438,615 0.03%Broadcom, Inc. 400,000 4.75% 15/4/2029 436,688 0.03%Walt Disney Co. 450,000 2.00% 1/9/2029 436,131 0.03%NextEra Energy Capital Holdings, Inc. 435,000 2.75% 1/11/2029 434,422 0.03%Williams Cos, Inc. 350,000 6.30% 15/4/2040 433,794 0.03%
Vanguard U.S. Investment Grade Credit Index Fund
862
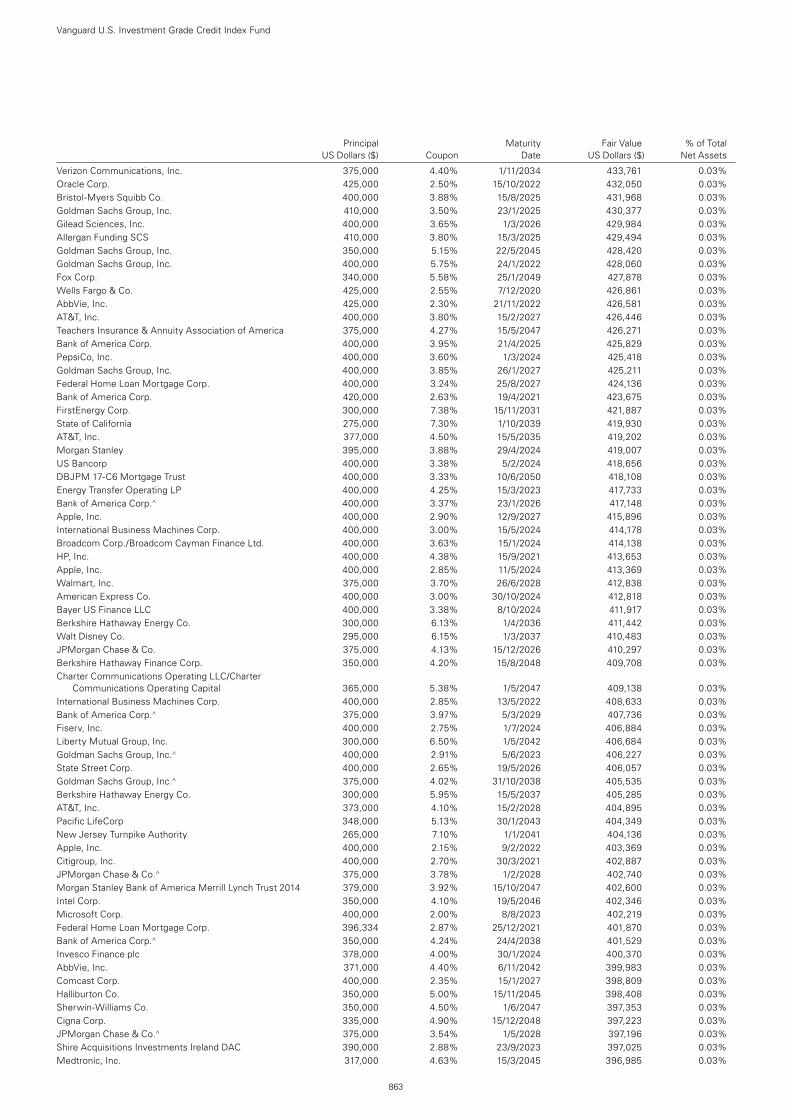
Principal Maturity Fair Value % of Total US Dollars ($) Coupon Date US Dollars ($) Net Assets
Verizon Communications, Inc. 375,000 4.40% 1/11/2034 433,761 0.03%Oracle Corp. 425,000 2.50% 15/10/2022 432,050 0.03%Bristol-Myers Squibb Co. 400,000 3.88% 15/8/2025 431,968 0.03%Goldman Sachs Group, Inc. 410,000 3.50% 23/1/2025 430,377 0.03%Gilead Sciences, Inc. 400,000 3.65% 1/3/2026 429,984 0.03%Allergan Funding SCS 410,000 3.80% 15/3/2025 429,494 0.03%Goldman Sachs Group, Inc. 350,000 5.15% 22/5/2045 428,420 0.03%Goldman Sachs Group, Inc. 400,000 5.75% 24/1/2022 428,060 0.03%Fox Corp. 340,000 5.58% 25/1/2049 427,878 0.03%Wells Fargo & Co. 425,000 2.55% 7/12/2020 426,861 0.03%AbbVie, Inc. 425,000 2.30% 21/11/2022 426,581 0.03%AT&T, Inc. 400,000 3.80% 15/2/2027 426,446 0.03%Teachers Insurance & Annuity Association of America 375,000 4.27% 15/5/2047 426,271 0.03%Bank of America Corp. 400,000 3.95% 21/4/2025 425,829 0.03%PepsiCo, Inc. 400,000 3.60% 1/3/2024 425,418 0.03%Goldman Sachs Group, Inc. 400,000 3.85% 26/1/2027 425,211 0.03%Federal Home Loan Mortgage Corp. 400,000 3.24% 25/8/2027 424,136 0.03%Bank of America Corp. 420,000 2.63% 19/4/2021 423,675 0.03%FirstEnergy Corp. 300,000 7.38% 15/11/2031 421,887 0.03%State of California 275,000 7.30% 1/10/2039 419,930 0.03%AT&T, Inc. 377,000 4.50% 15/5/2035 419,202 0.03%Morgan Stanley 395,000 3.88% 29/4/2024 419,007 0.03%US Bancorp 400,000 3.38% 5/2/2024 418,656 0.03%DBJPM 17-C6 Mortgage Trust 400,000 3.33% 10/6/2050 418,108 0.03%Energy Transfer Operating LP 400,000 4.25% 15/3/2023 417,733 0.03%Bank of America Corp.^ 400,000 3.37% 23/1/2026 417,148 0.03%Apple, Inc. 400,000 2.90% 12/9/2027 415,896 0.03%International Business Machines Corp. 400,000 3.00% 15/5/2024 414,178 0.03%Broadcom Corp./Broadcom Cayman Finance Ltd. 400,000 3.63% 15/1/2024 414,138 0.03%HP, Inc. 400,000 4.38% 15/9/2021 413,653 0.03%Apple, Inc. 400,000 2.85% 11/5/2024 413,369 0.03%Walmart, Inc. 375,000 3.70% 26/6/2028 412,838 0.03%American Express Co. 400,000 3.00% 30/10/2024 412,818 0.03%Bayer US Finance LLC 400,000 3.38% 8/10/2024 411,917 0.03%Berkshire Hathaway Energy Co. 300,000 6.13% 1/4/2036 411,442 0.03%Walt Disney Co. 295,000 6.15% 1/3/2037 410,483 0.03%JPMorgan Chase & Co. 375,000 4.13% 15/12/2026 410,297 0.03%Berkshire Hathaway Finance Corp. 350,000 4.20% 15/8/2048 409,708 0.03%Charter Communications Operating LLC/Charter
Communications Operating Capital 365,000 5.38% 1/5/2047 409,138 0.03%International Business Machines Corp. 400,000 2.85% 13/5/2022 408,633 0.03%Bank of America Corp.^ 375,000 3.97% 5/3/2029 407,736 0.03%Fiserv, Inc. 400,000 2.75% 1/7/2024 406,884 0.03%Liberty Mutual Group, Inc. 300,000 6.50% 1/5/2042 406,684 0.03%Goldman Sachs Group, Inc.^ 400,000 2.91% 5/6/2023 406,227 0.03%State Street Corp. 400,000 2.65% 19/5/2026 406,057 0.03%Goldman Sachs Group, Inc.^ 375,000 4.02% 31/10/2038 405,535 0.03%Berkshire Hathaway Energy Co. 300,000 5.95% 15/5/2037 405,285 0.03%AT&T, Inc. 373,000 4.10% 15/2/2028 404,895 0.03%Pacific LifeCorp 348,000 5.13% 30/1/2043 404,349 0.03%New Jersey Turnpike Authority 265,000 7.10% 1/1/2041 404,136 0.03%Apple, Inc. 400,000 2.15% 9/2/2022 403,369 0.03%Citigroup, Inc. 400,000 2.70% 30/3/2021 402,887 0.03%JPMorgan Chase & Co.^ 375,000 3.78% 1/2/2028 402,740 0.03%Morgan Stanley Bank of America Merrill Lynch Trust 2014 379,000 3.92% 15/10/2047 402,600 0.03%Intel Corp. 350,000 4.10% 19/5/2046 402,346 0.03%Microsoft Corp. 400,000 2.00% 8/8/2023 402,219 0.03%Federal Home Loan Mortgage Corp. 396,334 2.87% 25/12/2021 401,870 0.03%Bank of America Corp.^ 350,000 4.24% 24/4/2038 401,529 0.03%Invesco Finance plc 378,000 4.00% 30/1/2024 400,370 0.03%AbbVie, Inc. 371,000 4.40% 6/11/2042 399,983 0.03%Comcast Corp. 400,000 2.35% 15/1/2027 398,809 0.03%Halliburton Co. 350,000 5.00% 15/11/2045 398,408 0.03%Sherwin-Williams Co. 350,000 4.50% 1/6/2047 397,353 0.03%Cigna Corp. 335,000 4.90% 15/12/2048 397,223 0.03%JPMorgan Chase & Co.^ 375,000 3.54% 1/5/2028 397,196 0.03%Shire Acquisitions Investments Ireland DAC 390,000 2.88% 23/9/2023 397,025 0.03%Medtronic, Inc. 317,000 4.63% 15/3/2045 396,985 0.03%
Vanguard U.S. Investment Grade Credit Index Fund
863
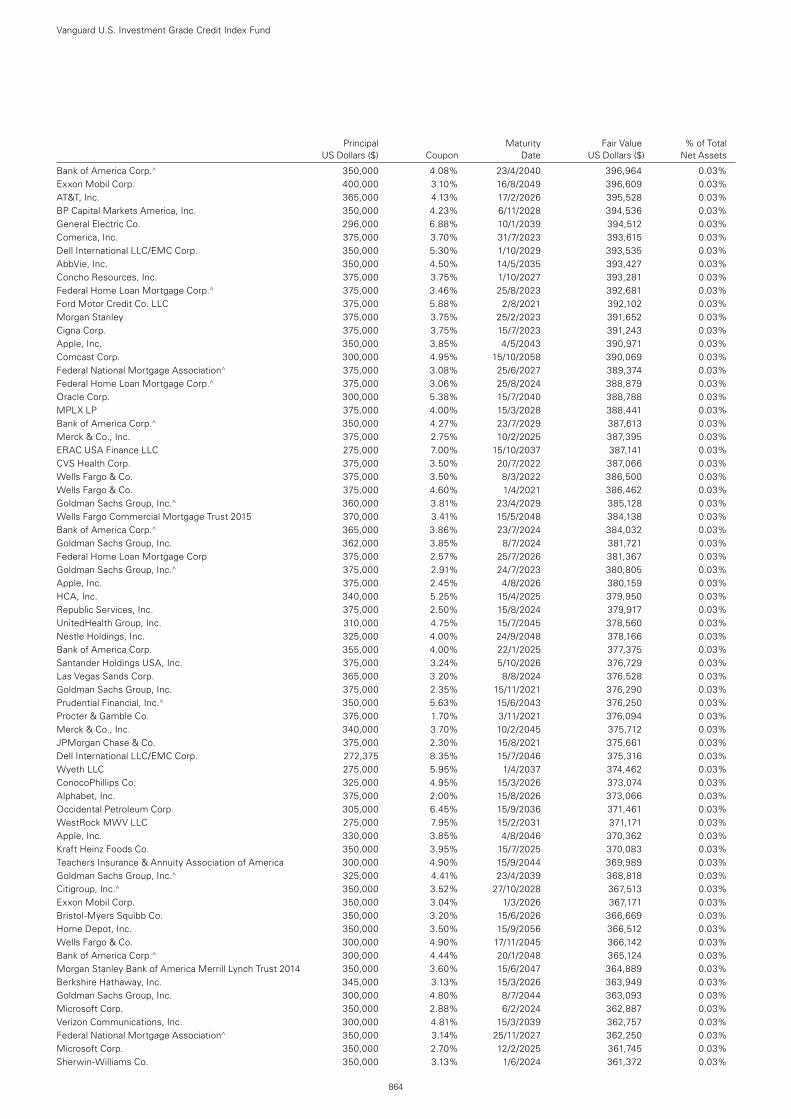
Principal Maturity Fair Value % of Total US Dollars ($) Coupon Date US Dollars ($) Net Assets
Bank of America Corp.^ 350,000 4.08% 23/4/2040 396,964 0.03%Exxon Mobil Corp. 400,000 3.10% 16/8/2049 396,609 0.03%AT&T, Inc. 365,000 4.13% 17/2/2026 395,528 0.03%BP Capital Markets America, Inc. 350,000 4.23% 6/11/2028 394,536 0.03%General Electric Co. 296,000 6.88% 10/1/2039 394,512 0.03%Comerica, Inc. 375,000 3.70% 31/7/2023 393,615 0.03%Dell International LLC/EMC Corp. 350,000 5.30% 1/10/2029 393,535 0.03%AbbVie, Inc. 350,000 4.50% 14/5/2035 393,427 0.03%Concho Resources, Inc. 375,000 3.75% 1/10/2027 393,281 0.03%Federal Home Loan Mortgage Corp.^ 375,000 3.46% 25/8/2023 392,681 0.03%Ford Motor Credit Co. LLC 375,000 5.88% 2/8/2021 392,102 0.03%Morgan Stanley 375,000 3.75% 25/2/2023 391,652 0.03%Cigna Corp. 375,000 3.75% 15/7/2023 391,243 0.03%Apple, Inc. 350,000 3.85% 4/5/2043 390,971 0.03%Comcast Corp. 300,000 4.95% 15/10/2058 390,069 0.03%Federal National Mortgage Association^ 375,000 3.08% 25/6/2027 389,374 0.03%Federal Home Loan Mortgage Corp.^ 375,000 3.06% 25/8/2024 388,879 0.03%Oracle Corp. 300,000 5.38% 15/7/2040 388,788 0.03%MPLX LP 375,000 4.00% 15/3/2028 388,441 0.03%Bank of America Corp.^ 350,000 4.27% 23/7/2029 387,613 0.03%Merck & Co., Inc. 375,000 2.75% 10/2/2025 387,395 0.03%ERAC USA Finance LLC 275,000 7.00% 15/10/2037 387,141 0.03%CVS Health Corp. 375,000 3.50% 20/7/2022 387,066 0.03%Wells Fargo & Co. 375,000 3.50% 8/3/2022 386,500 0.03%Wells Fargo & Co. 375,000 4.60% 1/4/2021 386,462 0.03%Goldman Sachs Group, Inc.^ 360,000 3.81% 23/4/2029 385,128 0.03%Wells Fargo Commercial Mortgage Trust 2015 370,000 3.41% 15/5/2048 384,138 0.03%Bank of America Corp.^ 365,000 3.86% 23/7/2024 384,032 0.03%Goldman Sachs Group, Inc. 362,000 3.85% 8/7/2024 381,721 0.03%Federal Home Loan Mortgage Corp 375,000 2.57% 25/7/2026 381,367 0.03%Goldman Sachs Group, Inc.^ 375,000 2.91% 24/7/2023 380,805 0.03%Apple, Inc. 375,000 2.45% 4/8/2026 380,159 0.03%HCA, Inc. 340,000 5.25% 15/4/2025 379,950 0.03%Republic Services, Inc. 375,000 2.50% 15/8/2024 379,917 0.03%UnitedHealth Group, Inc. 310,000 4.75% 15/7/2045 378,560 0.03%Nestle Holdings, Inc. 325,000 4.00% 24/9/2048 378,166 0.03%Bank of America Corp. 355,000 4.00% 22/1/2025 377,375 0.03%Santander Holdings USA, Inc. 375,000 3.24% 5/10/2026 376,729 0.03%Las Vegas Sands Corp. 365,000 3.20% 8/8/2024 376,528 0.03%Goldman Sachs Group, Inc. 375,000 2.35% 15/11/2021 376,290 0.03%Prudential Financial, Inc.^ 350,000 5.63% 15/6/2043 376,250 0.03%Procter & Gamble Co. 375,000 1.70% 3/11/2021 376,094 0.03%Merck & Co., Inc. 340,000 3.70% 10/2/2045 375,712 0.03%JPMorgan Chase & Co. 375,000 2.30% 15/8/2021 375,661 0.03%Dell International LLC/EMC Corp. 272,375 8.35% 15/7/2046 375,316 0.03%Wyeth LLC 275,000 5.95% 1/4/2037 374,462 0.03%ConocoPhillips Co. 325,000 4.95% 15/3/2026 373,074 0.03%Alphabet, Inc. 375,000 2.00% 15/8/2026 373,066 0.03%Occidental Petroleum Corp. 305,000 6.45% 15/9/2036 371,461 0.03%WestRock MWV LLC 275,000 7.95% 15/2/2031 371,171 0.03%Apple, Inc. 330,000 3.85% 4/8/2046 370,362 0.03%Kraft Heinz Foods Co. 350,000 3.95% 15/7/2025 370,083 0.03%Teachers Insurance & Annuity Association of America 300,000 4.90% 15/9/2044 369,989 0.03%Goldman Sachs Group, Inc.^ 325,000 4.41% 23/4/2039 368,818 0.03%Citigroup, Inc.^ 350,000 3.52% 27/10/2028 367,513 0.03%Exxon Mobil Corp. 350,000 3.04% 1/3/2026 367,171 0.03%Bristol-Myers Squibb Co. 350,000 3.20% 15/6/2026 366,669 0.03%Home Depot, Inc. 350,000 3.50% 15/9/2056 366,512 0.03%Wells Fargo & Co. 300,000 4.90% 17/11/2045 366,142 0.03%Bank of America Corp.^ 300,000 4.44% 20/1/2048 365,124 0.03%Morgan Stanley Bank of America Merrill Lynch Trust 2014 350,000 3.60% 15/6/2047 364,889 0.03%Berkshire Hathaway, Inc. 345,000 3.13% 15/3/2026 363,949 0.03%Goldman Sachs Group, Inc. 300,000 4.80% 8/7/2044 363,093 0.03%Microsoft Corp. 350,000 2.88% 6/2/2024 362,887 0.03%Verizon Communications, Inc. 300,000 4.81% 15/3/2039 362,757 0.03%Federal National Mortgage Association^ 350,000 3.14% 25/11/2027 362,250 0.03%Microsoft Corp. 350,000 2.70% 12/2/2025 361,745 0.03%Sherwin-Williams Co. 350,000 3.13% 1/6/2024 361,372 0.03%
Vanguard U.S. Investment Grade Credit Index Fund
864
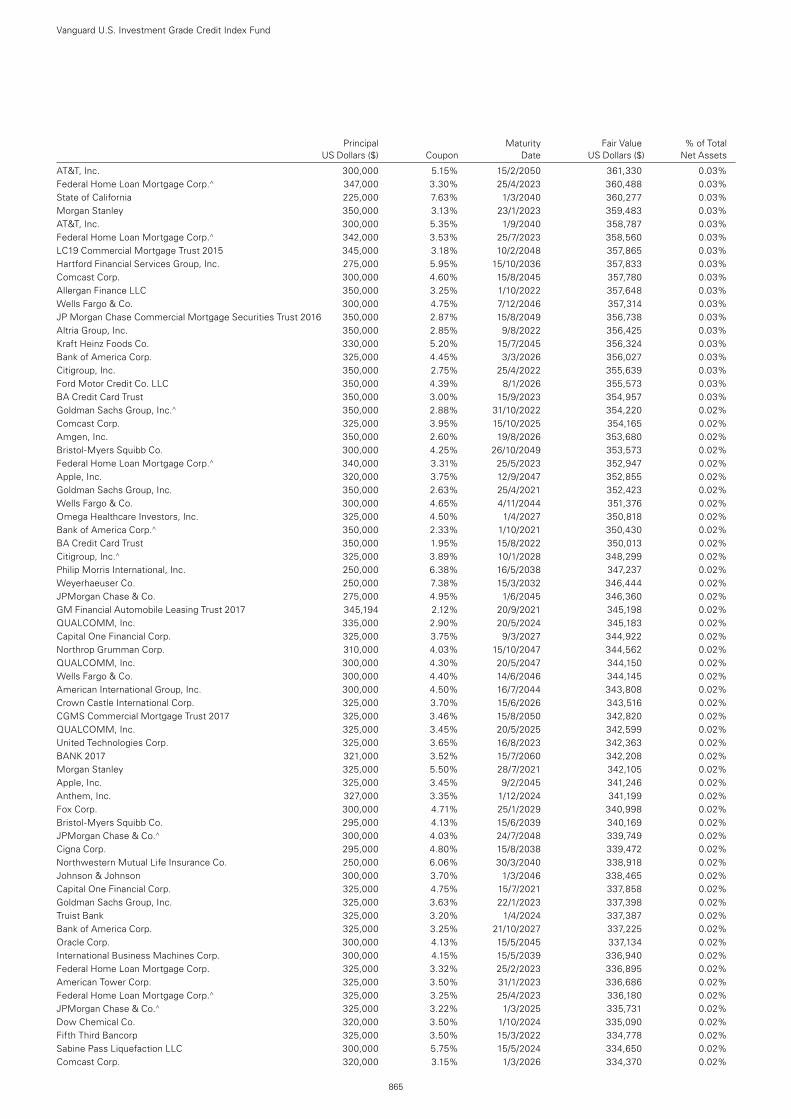
Principal Maturity Fair Value % of Total US Dollars ($) Coupon Date US Dollars ($) Net Assets
AT&T, Inc. 300,000 5.15% 15/2/2050 361,330 0.03%Federal Home Loan Mortgage Corp.^ 347,000 3.30% 25/4/2023 360,488 0.03%State of California 225,000 7.63% 1/3/2040 360,277 0.03%Morgan Stanley 350,000 3.13% 23/1/2023 359,483 0.03%AT&T, Inc. 300,000 5.35% 1/9/2040 358,787 0.03%Federal Home Loan Mortgage Corp.^ 342,000 3.53% 25/7/2023 358,560 0.03%LC19 Commercial Mortgage Trust 2015 345,000 3.18% 10/2/2048 357,865 0.03%Hartford Financial Services Group, Inc. 275,000 5.95% 15/10/2036 357,833 0.03%Comcast Corp. 300,000 4.60% 15/8/2045 357,780 0.03%Allergan Finance LLC 350,000 3.25% 1/10/2022 357,648 0.03%Wells Fargo & Co. 300,000 4.75% 7/12/2046 357,314 0.03%JP Morgan Chase Commercial Mortgage Securities Trust 2016 350,000 2.87% 15/8/2049 356,738 0.03%Altria Group, Inc. 350,000 2.85% 9/8/2022 356,425 0.03%Kraft Heinz Foods Co. 330,000 5.20% 15/7/2045 356,324 0.03%Bank of America Corp. 325,000 4.45% 3/3/2026 356,027 0.03%Citigroup, Inc. 350,000 2.75% 25/4/2022 355,639 0.03%Ford Motor Credit Co. LLC 350,000 4.39% 8/1/2026 355,573 0.03%BA Credit Card Trust 350,000 3.00% 15/9/2023 354,957 0.03%Goldman Sachs Group, Inc.^ 350,000 2.88% 31/10/2022 354,220 0.02%Comcast Corp. 325,000 3.95% 15/10/2025 354,165 0.02%Amgen, Inc. 350,000 2.60% 19/8/2026 353,680 0.02%Bristol-Myers Squibb Co. 300,000 4.25% 26/10/2049 353,573 0.02%Federal Home Loan Mortgage Corp.^ 340,000 3.31% 25/5/2023 352,947 0.02%Apple, Inc. 320,000 3.75% 12/9/2047 352,855 0.02%Goldman Sachs Group, Inc. 350,000 2.63% 25/4/2021 352,423 0.02%Wells Fargo & Co. 300,000 4.65% 4/11/2044 351,376 0.02%Omega Healthcare Investors, Inc. 325,000 4.50% 1/4/2027 350,818 0.02%Bank of America Corp.^ 350,000 2.33% 1/10/2021 350,430 0.02%BA Credit Card Trust 350,000 1.95% 15/8/2022 350,013 0.02%Citigroup, Inc.^ 325,000 3.89% 10/1/2028 348,299 0.02%Philip Morris International, Inc. 250,000 6.38% 16/5/2038 347,237 0.02%Weyerhaeuser Co. 250,000 7.38% 15/3/2032 346,444 0.02%JPMorgan Chase & Co. 275,000 4.95% 1/6/2045 346,360 0.02%GM Financial Automobile Leasing Trust 2017 345,194 2.12% 20/9/2021 345,198 0.02%QUALCOMM, Inc. 335,000 2.90% 20/5/2024 345,183 0.02%Capital One Financial Corp. 325,000 3.75% 9/3/2027 344,922 0.02%Northrop Grumman Corp. 310,000 4.03% 15/10/2047 344,562 0.02%QUALCOMM, Inc. 300,000 4.30% 20/5/2047 344,150 0.02%Wells Fargo & Co. 300,000 4.40% 14/6/2046 344,145 0.02%American International Group, Inc. 300,000 4.50% 16/7/2044 343,808 0.02%Crown Castle International Corp. 325,000 3.70% 15/6/2026 343,516 0.02%CGMS Commercial Mortgage Trust 2017 325,000 3.46% 15/8/2050 342,820 0.02%QUALCOMM, Inc. 325,000 3.45% 20/5/2025 342,599 0.02%United Technologies Corp. 325,000 3.65% 16/8/2023 342,363 0.02%BANK 2017 321,000 3.52% 15/7/2060 342,208 0.02%Morgan Stanley 325,000 5.50% 28/7/2021 342,105 0.02%Apple, Inc. 325,000 3.45% 9/2/2045 341,246 0.02%Anthem, Inc. 327,000 3.35% 1/12/2024 341,199 0.02%Fox Corp. 300,000 4.71% 25/1/2029 340,998 0.02%Bristol-Myers Squibb Co. 295,000 4.13% 15/6/2039 340,169 0.02%JPMorgan Chase & Co.^ 300,000 4.03% 24/7/2048 339,749 0.02%Cigna Corp. 295,000 4.80% 15/8/2038 339,472 0.02%Northwestern Mutual Life Insurance Co. 250,000 6.06% 30/3/2040 338,918 0.02%Johnson & Johnson 300,000 3.70% 1/3/2046 338,465 0.02%Capital One Financial Corp. 325,000 4.75% 15/7/2021 337,858 0.02%Goldman Sachs Group, Inc. 325,000 3.63% 22/1/2023 337,398 0.02%Truist Bank 325,000 3.20% 1/4/2024 337,387 0.02%Bank of America Corp. 325,000 3.25% 21/10/2027 337,225 0.02%Oracle Corp. 300,000 4.13% 15/5/2045 337,134 0.02%International Business Machines Corp. 300,000 4.15% 15/5/2039 336,940 0.02%Federal Home Loan Mortgage Corp. 325,000 3.32% 25/2/2023 336,895 0.02%American Tower Corp. 325,000 3.50% 31/1/2023 336,686 0.02%Federal Home Loan Mortgage Corp.^ 325,000 3.25% 25/4/2023 336,180 0.02%JPMorgan Chase & Co.^ 325,000 3.22% 1/3/2025 335,731 0.02%Dow Chemical Co. 320,000 3.50% 1/10/2024 335,090 0.02%Fifth Third Bancorp 325,000 3.50% 15/3/2022 334,778 0.02%Sabine Pass Liquefaction LLC 300,000 5.75% 15/5/2024 334,650 0.02%Comcast Corp. 320,000 3.15% 1/3/2026 334,370 0.02%
Vanguard U.S. Investment Grade Credit Index Fund
865
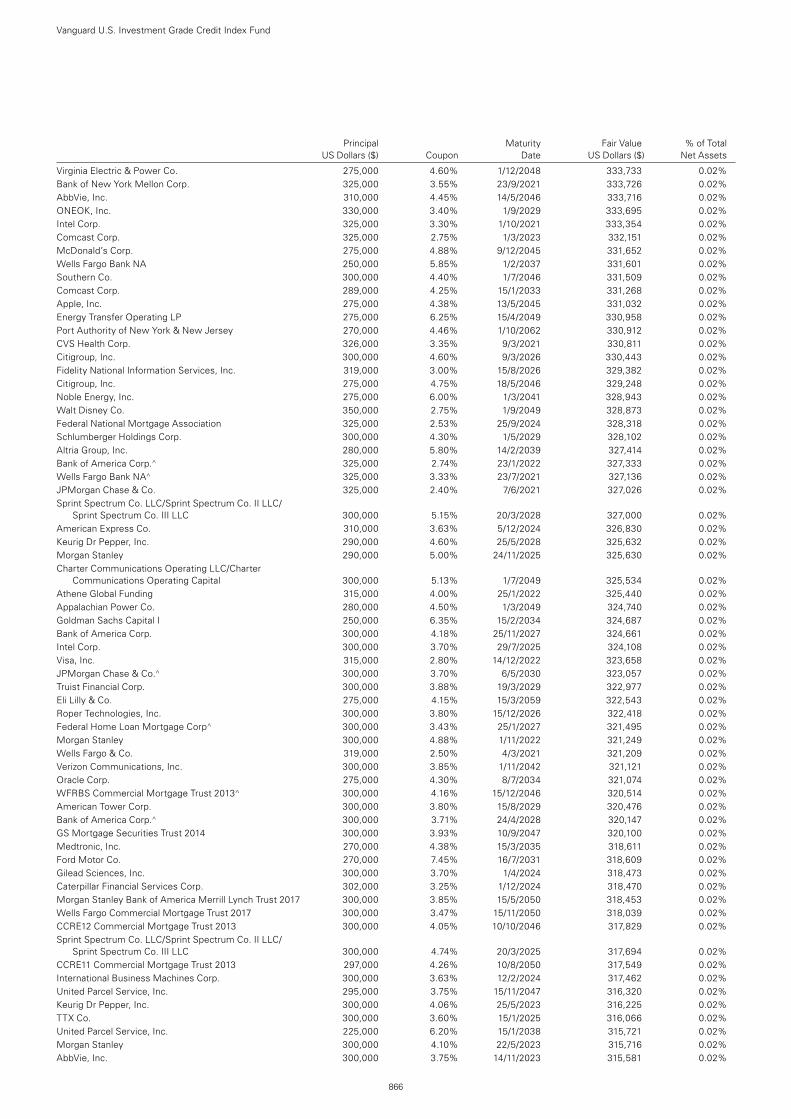
Principal Maturity Fair Value % of Total US Dollars ($) Coupon Date US Dollars ($) Net Assets
Virginia Electric & Power Co. 275,000 4.60% 1/12/2048 333,733 0.02%Bank of New York Mellon Corp. 325,000 3.55% 23/9/2021 333,726 0.02%AbbVie, Inc. 310,000 4.45% 14/5/2046 333,716 0.02%ONEOK, Inc. 330,000 3.40% 1/9/2029 333,695 0.02%Intel Corp. 325,000 3.30% 1/10/2021 333,354 0.02%Comcast Corp. 325,000 2.75% 1/3/2023 332,151 0.02%McDonald’s Corp. 275,000 4.88% 9/12/2045 331,652 0.02%Wells Fargo Bank NA 250,000 5.85% 1/2/2037 331,601 0.02%Southern Co. 300,000 4.40% 1/7/2046 331,509 0.02%Comcast Corp. 289,000 4.25% 15/1/2033 331,268 0.02%Apple, Inc. 275,000 4.38% 13/5/2045 331,032 0.02%Energy Transfer Operating LP 275,000 6.25% 15/4/2049 330,958 0.02%Port Authority of New York & New Jersey 270,000 4.46% 1/10/2062 330,912 0.02%CVS Health Corp. 326,000 3.35% 9/3/2021 330,811 0.02%Citigroup, Inc. 300,000 4.60% 9/3/2026 330,443 0.02%Fidelity National Information Services, Inc. 319,000 3.00% 15/8/2026 329,382 0.02%Citigroup, Inc. 275,000 4.75% 18/5/2046 329,248 0.02%Noble Energy, Inc. 275,000 6.00% 1/3/2041 328,943 0.02%Walt Disney Co. 350,000 2.75% 1/9/2049 328,873 0.02%Federal National Mortgage Association 325,000 2.53% 25/9/2024 328,318 0.02%Schlumberger Holdings Corp. 300,000 4.30% 1/5/2029 328,102 0.02%Altria Group, Inc. 280,000 5.80% 14/2/2039 327,414 0.02%Bank of America Corp.^ 325,000 2.74% 23/1/2022 327,333 0.02%Wells Fargo Bank NA^ 325,000 3.33% 23/7/2021 327,136 0.02%JPMorgan Chase & Co. 325,000 2.40% 7/6/2021 327,026 0.02%Sprint Spectrum Co. LLC/Sprint Spectrum Co. II LLC/
Sprint Spectrum Co. III LLC 300,000 5.15% 20/3/2028 327,000 0.02%American Express Co. 310,000 3.63% 5/12/2024 326,830 0.02%Keurig Dr Pepper, Inc. 290,000 4.60% 25/5/2028 325,632 0.02%Morgan Stanley 290,000 5.00% 24/11/2025 325,630 0.02%Charter Communications Operating LLC/Charter
Communications Operating Capital 300,000 5.13% 1/7/2049 325,534 0.02%Athene Global Funding 315,000 4.00% 25/1/2022 325,440 0.02%Appalachian Power Co. 280,000 4.50% 1/3/2049 324,740 0.02%Goldman Sachs Capital I 250,000 6.35% 15/2/2034 324,687 0.02%Bank of America Corp. 300,000 4.18% 25/11/2027 324,661 0.02%Intel Corp. 300,000 3.70% 29/7/2025 324,108 0.02%Visa, Inc. 315,000 2.80% 14/12/2022 323,658 0.02%JPMorgan Chase & Co.^ 300,000 3.70% 6/5/2030 323,057 0.02%Truist Financial Corp. 300,000 3.88% 19/3/2029 322,977 0.02%Eli Lilly & Co. 275,000 4.15% 15/3/2059 322,543 0.02%Roper Technologies, Inc. 300,000 3.80% 15/12/2026 322,418 0.02%Federal Home Loan Mortgage Corp^ 300,000 3.43% 25/1/2027 321,495 0.02%Morgan Stanley 300,000 4.88% 1/11/2022 321,249 0.02%Wells Fargo & Co. 319,000 2.50% 4/3/2021 321,209 0.02%Verizon Communications, Inc. 300,000 3.85% 1/11/2042 321,121 0.02%Oracle Corp. 275,000 4.30% 8/7/2034 321,074 0.02%WFRBS Commercial Mortgage Trust 2013^ 300,000 4.16% 15/12/2046 320,514 0.02%American Tower Corp. 300,000 3.80% 15/8/2029 320,476 0.02%Bank of America Corp.^ 300,000 3.71% 24/4/2028 320,147 0.02%GS Mortgage Securities Trust 2014 300,000 3.93% 10/9/2047 320,100 0.02%Medtronic, Inc. 270,000 4.38% 15/3/2035 318,611 0.02%Ford Motor Co. 270,000 7.45% 16/7/2031 318,609 0.02%Gilead Sciences, Inc. 300,000 3.70% 1/4/2024 318,473 0.02%Caterpillar Financial Services Corp. 302,000 3.25% 1/12/2024 318,470 0.02%Morgan Stanley Bank of America Merrill Lynch Trust 2017 300,000 3.85% 15/5/2050 318,453 0.02%Wells Fargo Commercial Mortgage Trust 2017 300,000 3.47% 15/11/2050 318,039 0.02%CCRE12 Commercial Mortgage Trust 2013 300,000 4.05% 10/10/2046 317,829 0.02%Sprint Spectrum Co. LLC/Sprint Spectrum Co. II LLC/
Sprint Spectrum Co. III LLC 300,000 4.74% 20/3/2025 317,694 0.02%CCRE11 Commercial Mortgage Trust 2013 297,000 4.26% 10/8/2050 317,549 0.02%International Business Machines Corp. 300,000 3.63% 12/2/2024 317,462 0.02%United Parcel Service, Inc. 295,000 3.75% 15/11/2047 316,320 0.02%Keurig Dr Pepper, Inc. 300,000 4.06% 25/5/2023 316,225 0.02%TTX Co. 300,000 3.60% 15/1/2025 316,066 0.02%United Parcel Service, Inc. 225,000 6.20% 15/1/2038 315,721 0.02%Morgan Stanley 300,000 4.10% 22/5/2023 315,716 0.02%AbbVie, Inc. 300,000 3.75% 14/11/2023 315,581 0.02%
Vanguard U.S. Investment Grade Credit Index Fund
866
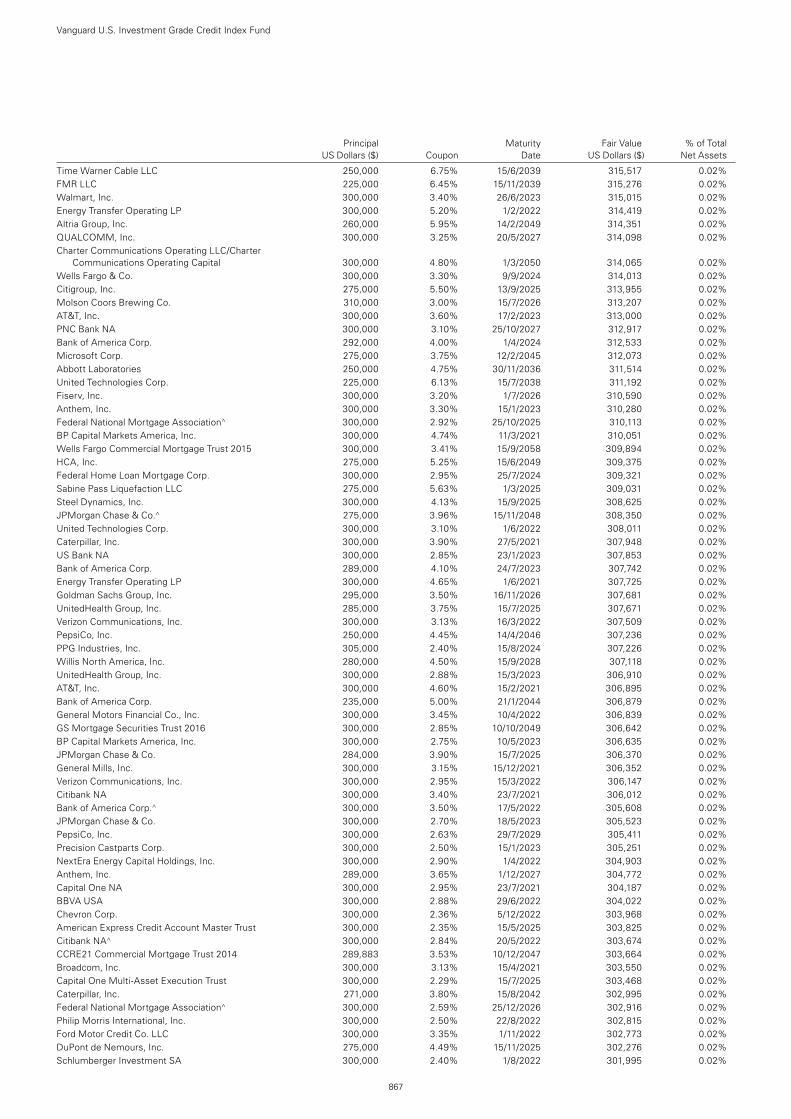
Principal Maturity Fair Value % of Total US Dollars ($) Coupon Date US Dollars ($) Net Assets
Time Warner Cable LLC 250,000 6.75% 15/6/2039 315,517 0.02%FMR LLC 225,000 6.45% 15/11/2039 315,276 0.02%Walmart, Inc. 300,000 3.40% 26/6/2023 315,015 0.02%Energy Transfer Operating LP 300,000 5.20% 1/2/2022 314,419 0.02%Altria Group, Inc. 260,000 5.95% 14/2/2049 314,351 0.02%QUALCOMM, Inc. 300,000 3.25% 20/5/2027 314,098 0.02%Charter Communications Operating LLC/Charter
Communications Operating Capital 300,000 4.80% 1/3/2050 314,065 0.02%Wells Fargo & Co. 300,000 3.30% 9/9/2024 314,013 0.02%Citigroup, Inc. 275,000 5.50% 13/9/2025 313,955 0.02%Molson Coors Brewing Co. 310,000 3.00% 15/7/2026 313,207 0.02%AT&T, Inc. 300,000 3.60% 17/2/2023 313,000 0.02%PNC Bank NA 300,000 3.10% 25/10/2027 312,917 0.02%Bank of America Corp. 292,000 4.00% 1/4/2024 312,533 0.02%Microsoft Corp. 275,000 3.75% 12/2/2045 312,073 0.02%Abbott Laboratories 250,000 4.75% 30/11/2036 311,514 0.02%United Technologies Corp. 225,000 6.13% 15/7/2038 311,192 0.02%Fiserv, Inc. 300,000 3.20% 1/7/2026 310,590 0.02%Anthem, Inc. 300,000 3.30% 15/1/2023 310,280 0.02%Federal National Mortgage Association^ 300,000 2.92% 25/10/2025 310,113 0.02%BP Capital Markets America, Inc. 300,000 4.74% 11/3/2021 310,051 0.02%Wells Fargo Commercial Mortgage Trust 2015 300,000 3.41% 15/9/2058 309,894 0.02%HCA, Inc. 275,000 5.25% 15/6/2049 309,375 0.02%Federal Home Loan Mortgage Corp. 300,000 2.95% 25/7/2024 309,321 0.02%Sabine Pass Liquefaction LLC 275,000 5.63% 1/3/2025 309,031 0.02%Steel Dynamics, Inc. 300,000 4.13% 15/9/2025 308,625 0.02%JPMorgan Chase & Co.^ 275,000 3.96% 15/11/2048 308,350 0.02%United Technologies Corp. 300,000 3.10% 1/6/2022 308,011 0.02%Caterpillar, Inc. 300,000 3.90% 27/5/2021 307,948 0.02%US Bank NA 300,000 2.85% 23/1/2023 307,853 0.02%Bank of America Corp. 289,000 4.10% 24/7/2023 307,742 0.02%Energy Transfer Operating LP 300,000 4.65% 1/6/2021 307,725 0.02%Goldman Sachs Group, Inc. 295,000 3.50% 16/11/2026 307,681 0.02%UnitedHealth Group, Inc. 285,000 3.75% 15/7/2025 307,671 0.02%Verizon Communications, Inc. 300,000 3.13% 16/3/2022 307,509 0.02%PepsiCo, Inc. 250,000 4.45% 14/4/2046 307,236 0.02%PPG Industries, Inc. 305,000 2.40% 15/8/2024 307,226 0.02%Willis North America, Inc. 280,000 4.50% 15/9/2028 307,118 0.02%UnitedHealth Group, Inc. 300,000 2.88% 15/3/2023 306,910 0.02%AT&T, Inc. 300,000 4.60% 15/2/2021 306,895 0.02%Bank of America Corp. 235,000 5.00% 21/1/2044 306,879 0.02%General Motors Financial Co., Inc. 300,000 3.45% 10/4/2022 306,839 0.02%GS Mortgage Securities Trust 2016 300,000 2.85% 10/10/2049 306,642 0.02%BP Capital Markets America, Inc. 300,000 2.75% 10/5/2023 306,635 0.02%JPMorgan Chase & Co. 284,000 3.90% 15/7/2025 306,370 0.02%General Mills, Inc. 300,000 3.15% 15/12/2021 306,352 0.02%Verizon Communications, Inc. 300,000 2.95% 15/3/2022 306,147 0.02%Citibank NA 300,000 3.40% 23/7/2021 306,012 0.02%Bank of America Corp.^ 300,000 3.50% 17/5/2022 305,608 0.02%JPMorgan Chase & Co. 300,000 2.70% 18/5/2023 305,523 0.02%PepsiCo, Inc. 300,000 2.63% 29/7/2029 305,411 0.02%Precision Castparts Corp. 300,000 2.50% 15/1/2023 305,251 0.02%NextEra Energy Capital Holdings, Inc. 300,000 2.90% 1/4/2022 304,903 0.02%Anthem, Inc. 289,000 3.65% 1/12/2027 304,772 0.02%Capital One NA 300,000 2.95% 23/7/2021 304,187 0.02%BBVA USA 300,000 2.88% 29/6/2022 304,022 0.02%Chevron Corp. 300,000 2.36% 5/12/2022 303,968 0.02%American Express Credit Account Master Trust 300,000 2.35% 15/5/2025 303,825 0.02%Citibank NA^ 300,000 2.84% 20/5/2022 303,674 0.02%CCRE21 Commercial Mortgage Trust 2014 289,883 3.53% 10/12/2047 303,664 0.02%Broadcom, Inc. 300,000 3.13% 15/4/2021 303,550 0.02%Capital One Multi-Asset Execution Trust 300,000 2.29% 15/7/2025 303,468 0.02%Caterpillar, Inc. 271,000 3.80% 15/8/2042 302,995 0.02%Federal National Mortgage Association^ 300,000 2.59% 25/12/2026 302,916 0.02%Philip Morris International, Inc. 300,000 2.50% 22/8/2022 302,815 0.02%Ford Motor Credit Co. LLC 300,000 3.35% 1/11/2022 302,773 0.02%DuPont de Nemours, Inc. 275,000 4.49% 15/11/2025 302,276 0.02%Schlumberger Investment SA 300,000 2.40% 1/8/2022 301,995 0.02%
Vanguard U.S. Investment Grade Credit Index Fund
867
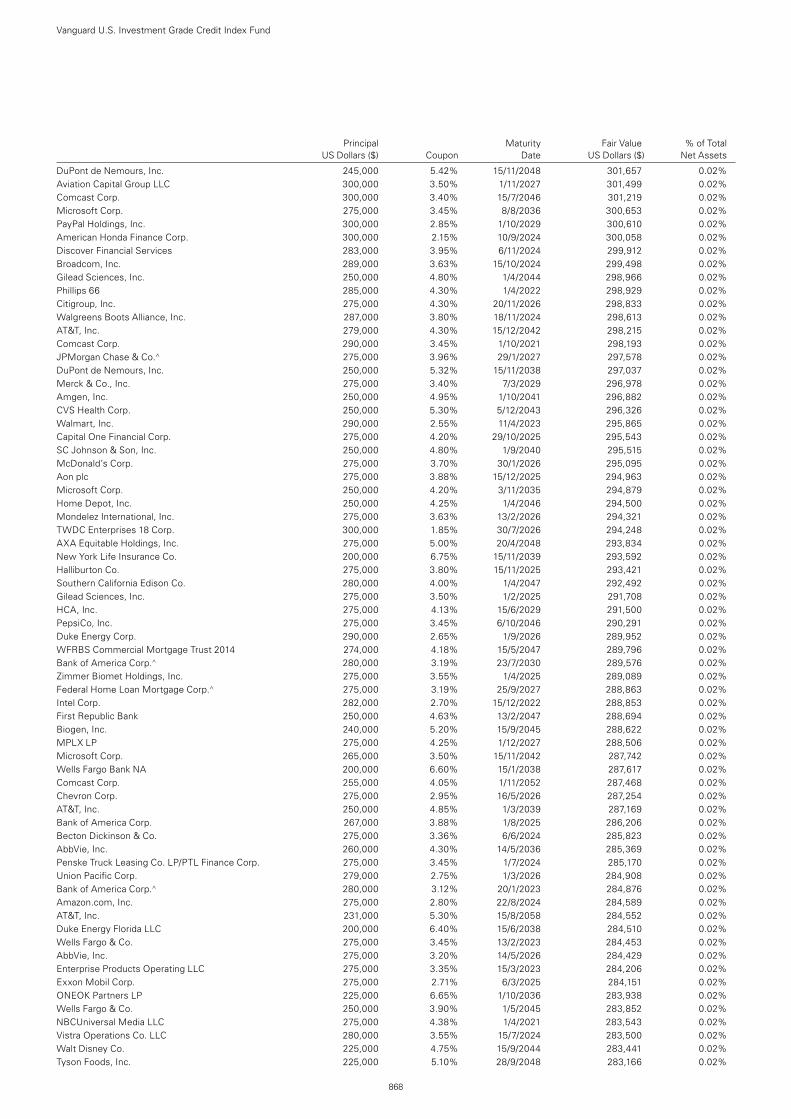
Principal Maturity Fair Value % of Total US Dollars ($) Coupon Date US Dollars ($) Net Assets
DuPont de Nemours, Inc. 245,000 5.42% 15/11/2048 301,657 0.02%Aviation Capital Group LLC 300,000 3.50% 1/11/2027 301,499 0.02%Comcast Corp. 300,000 3.40% 15/7/2046 301,219 0.02%Microsoft Corp. 275,000 3.45% 8/8/2036 300,653 0.02%PayPal Holdings, Inc. 300,000 2.85% 1/10/2029 300,610 0.02%American Honda Finance Corp. 300,000 2.15% 10/9/2024 300,058 0.02%Discover Financial Services 283,000 3.95% 6/11/2024 299,912 0.02%Broadcom, Inc. 289,000 3.63% 15/10/2024 299,498 0.02%Gilead Sciences, Inc. 250,000 4.80% 1/4/2044 298,966 0.02%Phillips 66 285,000 4.30% 1/4/2022 298,929 0.02%Citigroup, Inc. 275,000 4.30% 20/11/2026 298,833 0.02%Walgreens Boots Alliance, Inc. 287,000 3.80% 18/11/2024 298,613 0.02%AT&T, Inc. 279,000 4.30% 15/12/2042 298,215 0.02%Comcast Corp. 290,000 3.45% 1/10/2021 298,193 0.02%JPMorgan Chase & Co.^ 275,000 3.96% 29/1/2027 297,578 0.02%DuPont de Nemours, Inc. 250,000 5.32% 15/11/2038 297,037 0.02%Merck & Co., Inc. 275,000 3.40% 7/3/2029 296,978 0.02%Amgen, Inc. 250,000 4.95% 1/10/2041 296,882 0.02%CVS Health Corp. 250,000 5.30% 5/12/2043 296,326 0.02%Walmart, Inc. 290,000 2.55% 11/4/2023 295,865 0.02%Capital One Financial Corp. 275,000 4.20% 29/10/2025 295,543 0.02%SC Johnson & Son, Inc. 250,000 4.80% 1/9/2040 295,515 0.02%McDonald’s Corp. 275,000 3.70% 30/1/2026 295,095 0.02%Aon plc 275,000 3.88% 15/12/2025 294,963 0.02%Microsoft Corp. 250,000 4.20% 3/11/2035 294,879 0.02%Home Depot, Inc. 250,000 4.25% 1/4/2046 294,500 0.02%Mondelez International, Inc. 275,000 3.63% 13/2/2026 294,321 0.02%TWDC Enterprises 18 Corp. 300,000 1.85% 30/7/2026 294,248 0.02%AXA Equitable Holdings, Inc. 275,000 5.00% 20/4/2048 293,834 0.02%New York Life Insurance Co. 200,000 6.75% 15/11/2039 293,592 0.02%Halliburton Co. 275,000 3.80% 15/11/2025 293,421 0.02%Southern California Edison Co. 280,000 4.00% 1/4/2047 292,492 0.02%Gilead Sciences, Inc. 275,000 3.50% 1/2/2025 291,708 0.02%HCA, Inc. 275,000 4.13% 15/6/2029 291,500 0.02%PepsiCo, Inc. 275,000 3.45% 6/10/2046 290,291 0.02%Duke Energy Corp. 290,000 2.65% 1/9/2026 289,952 0.02%WFRBS Commercial Mortgage Trust 2014 274,000 4.18% 15/5/2047 289,796 0.02%Bank of America Corp.^ 280,000 3.19% 23/7/2030 289,576 0.02%Zimmer Biomet Holdings, Inc. 275,000 3.55% 1/4/2025 289,089 0.02%Federal Home Loan Mortgage Corp.^ 275,000 3.19% 25/9/2027 288,863 0.02%Intel Corp. 282,000 2.70% 15/12/2022 288,853 0.02%First Republic Bank 250,000 4.63% 13/2/2047 288,694 0.02%Biogen, Inc. 240,000 5.20% 15/9/2045 288,622 0.02%MPLX LP 275,000 4.25% 1/12/2027 288,506 0.02%Microsoft Corp. 265,000 3.50% 15/11/2042 287,742 0.02%Wells Fargo Bank NA 200,000 6.60% 15/1/2038 287,617 0.02%Comcast Corp. 255,000 4.05% 1/11/2052 287,468 0.02%Chevron Corp. 275,000 2.95% 16/5/2026 287,254 0.02%AT&T, Inc. 250,000 4.85% 1/3/2039 287,169 0.02%Bank of America Corp. 267,000 3.88% 1/8/2025 286,206 0.02%Becton Dickinson & Co. 275,000 3.36% 6/6/2024 285,823 0.02%AbbVie, Inc. 260,000 4.30% 14/5/2036 285,369 0.02%Penske Truck Leasing Co. LP/PTL Finance Corp. 275,000 3.45% 1/7/2024 285,170 0.02%Union Pacific Corp. 279,000 2.75% 1/3/2026 284,908 0.02%Bank of America Corp.^ 280,000 3.12% 20/1/2023 284,876 0.02%Amazon.com, Inc. 275,000 2.80% 22/8/2024 284,589 0.02%AT&T, Inc. 231,000 5.30% 15/8/2058 284,552 0.02%Duke Energy Florida LLC 200,000 6.40% 15/6/2038 284,510 0.02%Wells Fargo & Co. 275,000 3.45% 13/2/2023 284,453 0.02%AbbVie, Inc. 275,000 3.20% 14/5/2026 284,429 0.02%Enterprise Products Operating LLC 275,000 3.35% 15/3/2023 284,206 0.02%Exxon Mobil Corp. 275,000 2.71% 6/3/2025 284,151 0.02%ONEOK Partners LP 225,000 6.65% 1/10/2036 283,938 0.02%Wells Fargo & Co. 250,000 3.90% 1/5/2045 283,852 0.02%NBCUniversal Media LLC 275,000 4.38% 1/4/2021 283,543 0.02%Vistra Operations Co. LLC 280,000 3.55% 15/7/2024 283,500 0.02%Walt Disney Co. 225,000 4.75% 15/9/2044 283,441 0.02%Tyson Foods, Inc. 225,000 5.10% 28/9/2048 283,166 0.02%
Vanguard U.S. Investment Grade Credit Index Fund
868
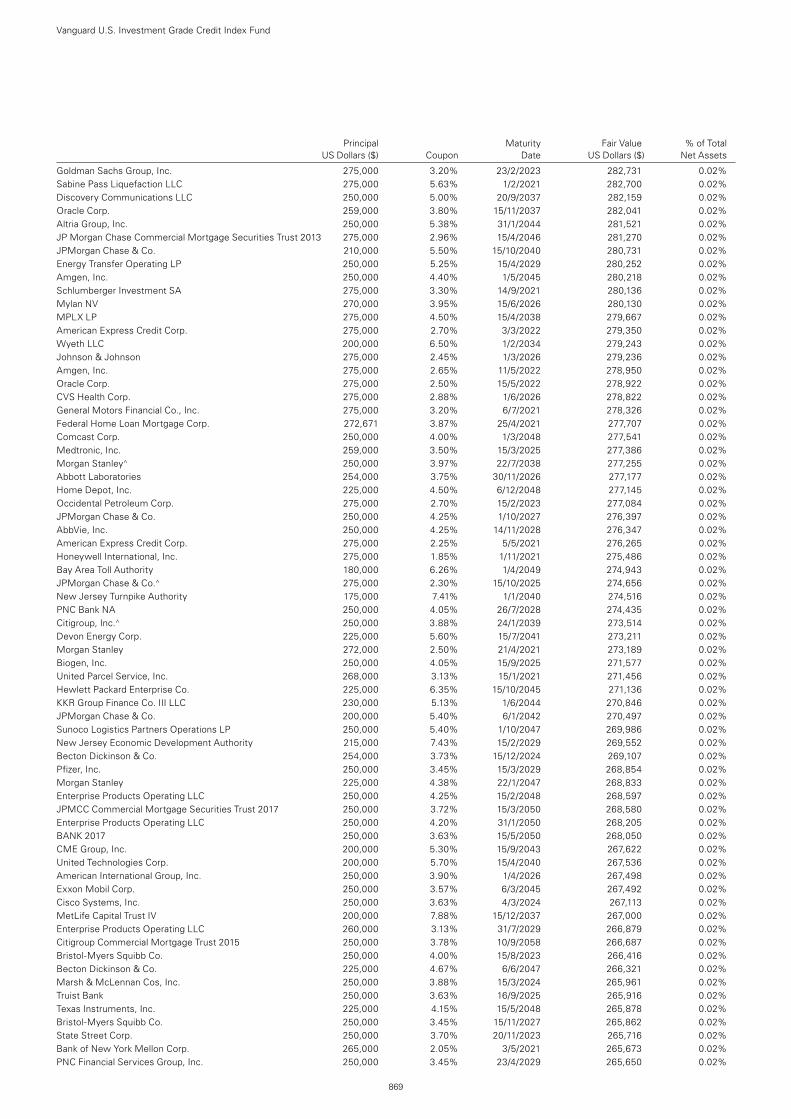
Principal Maturity Fair Value % of Total US Dollars ($) Coupon Date US Dollars ($) Net Assets
Goldman Sachs Group, Inc. 275,000 3.20% 23/2/2023 282,731 0.02%Sabine Pass Liquefaction LLC 275,000 5.63% 1/2/2021 282,700 0.02%Discovery Communications LLC 250,000 5.00% 20/9/2037 282,159 0.02%Oracle Corp. 259,000 3.80% 15/11/2037 282,041 0.02%Altria Group, Inc. 250,000 5.38% 31/1/2044 281,521 0.02%JP Morgan Chase Commercial Mortgage Securities Trust 2013 275,000 2.96% 15/4/2046 281,270 0.02%JPMorgan Chase & Co. 210,000 5.50% 15/10/2040 280,731 0.02%Energy Transfer Operating LP 250,000 5.25% 15/4/2029 280,252 0.02%Amgen, Inc. 250,000 4.40% 1/5/2045 280,218 0.02%Schlumberger Investment SA 275,000 3.30% 14/9/2021 280,136 0.02%Mylan NV 270,000 3.95% 15/6/2026 280,130 0.02%MPLX LP 275,000 4.50% 15/4/2038 279,667 0.02%American Express Credit Corp. 275,000 2.70% 3/3/2022 279,350 0.02%Wyeth LLC 200,000 6.50% 1/2/2034 279,243 0.02%Johnson & Johnson 275,000 2.45% 1/3/2026 279,236 0.02%Amgen, Inc. 275,000 2.65% 11/5/2022 278,950 0.02%Oracle Corp. 275,000 2.50% 15/5/2022 278,922 0.02%CVS Health Corp. 275,000 2.88% 1/6/2026 278,822 0.02%General Motors Financial Co., Inc. 275,000 3.20% 6/7/2021 278,326 0.02%Federal Home Loan Mortgage Corp. 272,671 3.87% 25/4/2021 277,707 0.02%Comcast Corp. 250,000 4.00% 1/3/2048 277,541 0.02%Medtronic, Inc. 259,000 3.50% 15/3/2025 277,386 0.02%Morgan Stanley^ 250,000 3.97% 22/7/2038 277,255 0.02%Abbott Laboratories 254,000 3.75% 30/11/2026 277,177 0.02%Home Depot, Inc. 225,000 4.50% 6/12/2048 277,145 0.02%Occidental Petroleum Corp. 275,000 2.70% 15/2/2023 277,084 0.02%JPMorgan Chase & Co. 250,000 4.25% 1/10/2027 276,397 0.02%AbbVie, Inc. 250,000 4.25% 14/11/2028 276,347 0.02%American Express Credit Corp. 275,000 2.25% 5/5/2021 276,265 0.02%Honeywell International, Inc. 275,000 1.85% 1/11/2021 275,486 0.02%Bay Area Toll Authority 180,000 6.26% 1/4/2049 274,943 0.02%JPMorgan Chase & Co.^ 275,000 2.30% 15/10/2025 274,656 0.02%New Jersey Turnpike Authority 175,000 7.41% 1/1/2040 274,516 0.02%PNC Bank NA 250,000 4.05% 26/7/2028 274,435 0.02%Citigroup, Inc.^ 250,000 3.88% 24/1/2039 273,514 0.02%Devon Energy Corp. 225,000 5.60% 15/7/2041 273,211 0.02%Morgan Stanley 272,000 2.50% 21/4/2021 273,189 0.02%Biogen, Inc. 250,000 4.05% 15/9/2025 271,577 0.02%United Parcel Service, Inc. 268,000 3.13% 15/1/2021 271,456 0.02%Hewlett Packard Enterprise Co. 225,000 6.35% 15/10/2045 271,136 0.02%KKR Group Finance Co. III LLC 230,000 5.13% 1/6/2044 270,846 0.02%JPMorgan Chase & Co. 200,000 5.40% 6/1/2042 270,497 0.02%Sunoco Logistics Partners Operations LP 250,000 5.40% 1/10/2047 269,986 0.02%New Jersey Economic Development Authority 215,000 7.43% 15/2/2029 269,552 0.02%Becton Dickinson & Co. 254,000 3.73% 15/12/2024 269,107 0.02%Pfizer, Inc. 250,000 3.45% 15/3/2029 268,854 0.02%Morgan Stanley 225,000 4.38% 22/1/2047 268,833 0.02%Enterprise Products Operating LLC 250,000 4.25% 15/2/2048 268,597 0.02%JPMCC Commercial Mortgage Securities Trust 2017 250,000 3.72% 15/3/2050 268,580 0.02%Enterprise Products Operating LLC 250,000 4.20% 31/1/2050 268,205 0.02%BANK 2017 250,000 3.63% 15/5/2050 268,050 0.02%CME Group, Inc. 200,000 5.30% 15/9/2043 267,622 0.02%United Technologies Corp. 200,000 5.70% 15/4/2040 267,536 0.02%American International Group, Inc. 250,000 3.90% 1/4/2026 267,498 0.02%Exxon Mobil Corp. 250,000 3.57% 6/3/2045 267,492 0.02%Cisco Systems, Inc. 250,000 3.63% 4/3/2024 267,113 0.02%MetLife Capital Trust IV 200,000 7.88% 15/12/2037 267,000 0.02%Enterprise Products Operating LLC 260,000 3.13% 31/7/2029 266,879 0.02%Citigroup Commercial Mortgage Trust 2015 250,000 3.78% 10/9/2058 266,687 0.02%Bristol-Myers Squibb Co. 250,000 4.00% 15/8/2023 266,416 0.02%Becton Dickinson & Co. 225,000 4.67% 6/6/2047 266,321 0.02%Marsh & McLennan Cos, Inc. 250,000 3.88% 15/3/2024 265,961 0.02%Truist Bank 250,000 3.63% 16/9/2025 265,916 0.02%Texas Instruments, Inc. 225,000 4.15% 15/5/2048 265,878 0.02%Bristol-Myers Squibb Co. 250,000 3.45% 15/11/2027 265,862 0.02%State Street Corp. 250,000 3.70% 20/11/2023 265,716 0.02%Bank of New York Mellon Corp. 265,000 2.05% 3/5/2021 265,673 0.02%PNC Financial Services Group, Inc. 250,000 3.45% 23/4/2029 265,650 0.02%
Vanguard U.S. Investment Grade Credit Index Fund
869
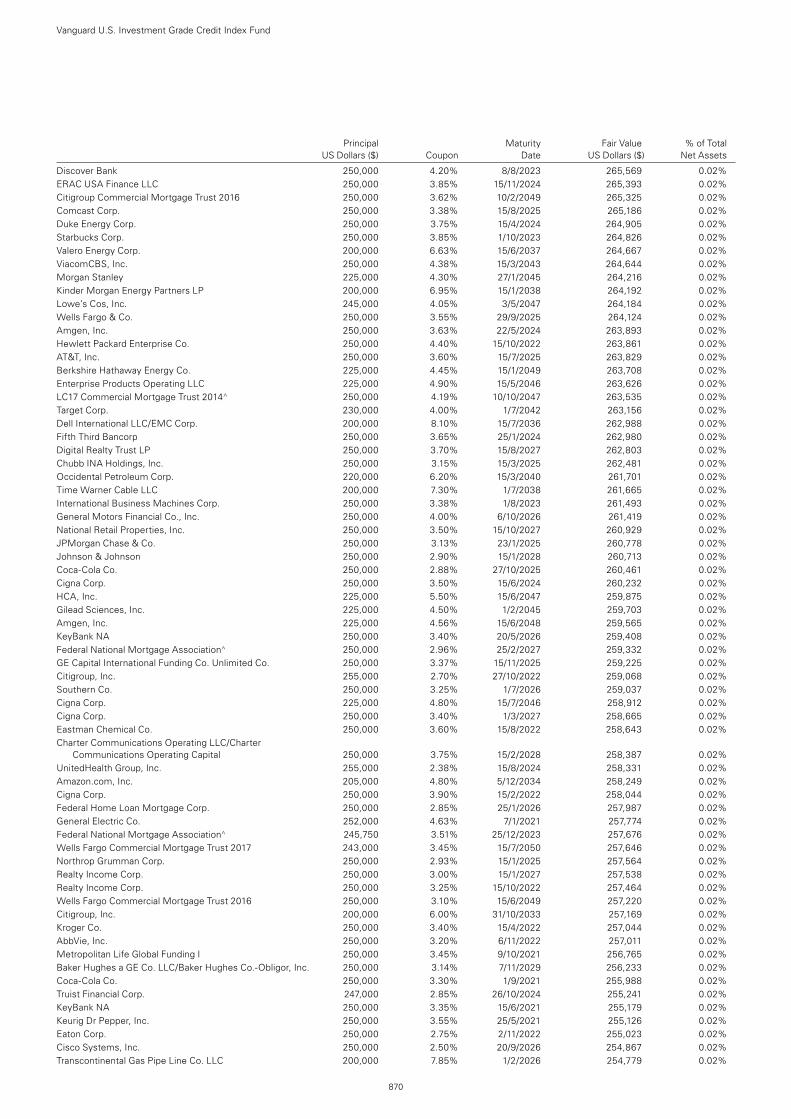
Principal Maturity Fair Value % of Total US Dollars ($) Coupon Date US Dollars ($) Net Assets
Discover Bank 250,000 4.20% 8/8/2023 265,569 0.02%ERAC USA Finance LLC 250,000 3.85% 15/11/2024 265,393 0.02%Citigroup Commercial Mortgage Trust 2016 250,000 3.62% 10/2/2049 265,325 0.02%Comcast Corp. 250,000 3.38% 15/8/2025 265,186 0.02%Duke Energy Corp. 250,000 3.75% 15/4/2024 264,905 0.02%Starbucks Corp. 250,000 3.85% 1/10/2023 264,826 0.02%Valero Energy Corp. 200,000 6.63% 15/6/2037 264,667 0.02%ViacomCBS, Inc. 250,000 4.38% 15/3/2043 264,644 0.02%Morgan Stanley 225,000 4.30% 27/1/2045 264,216 0.02%Kinder Morgan Energy Partners LP 200,000 6.95% 15/1/2038 264,192 0.02%Lowe’s Cos, Inc. 245,000 4.05% 3/5/2047 264,184 0.02%Wells Fargo & Co. 250,000 3.55% 29/9/2025 264,124 0.02%Amgen, Inc. 250,000 3.63% 22/5/2024 263,893 0.02%Hewlett Packard Enterprise Co. 250,000 4.40% 15/10/2022 263,861 0.02%AT&T, Inc. 250,000 3.60% 15/7/2025 263,829 0.02%Berkshire Hathaway Energy Co. 225,000 4.45% 15/1/2049 263,708 0.02%Enterprise Products Operating LLC 225,000 4.90% 15/5/2046 263,626 0.02%LC17 Commercial Mortgage Trust 2014^ 250,000 4.19% 10/10/2047 263,535 0.02%Target Corp. 230,000 4.00% 1/7/2042 263,156 0.02%Dell International LLC/EMC Corp. 200,000 8.10% 15/7/2036 262,988 0.02%Fifth Third Bancorp 250,000 3.65% 25/1/2024 262,980 0.02%Digital Realty Trust LP 250,000 3.70% 15/8/2027 262,803 0.02%Chubb INA Holdings, Inc. 250,000 3.15% 15/3/2025 262,481 0.02%Occidental Petroleum Corp. 220,000 6.20% 15/3/2040 261,701 0.02%Time Warner Cable LLC 200,000 7.30% 1/7/2038 261,665 0.02%International Business Machines Corp. 250,000 3.38% 1/8/2023 261,493 0.02%General Motors Financial Co., Inc. 250,000 4.00% 6/10/2026 261,419 0.02%National Retail Properties, Inc. 250,000 3.50% 15/10/2027 260,929 0.02%JPMorgan Chase & Co. 250,000 3.13% 23/1/2025 260,778 0.02%Johnson & Johnson 250,000 2.90% 15/1/2028 260,713 0.02%Coca-Cola Co. 250,000 2.88% 27/10/2025 260,461 0.02%Cigna Corp. 250,000 3.50% 15/6/2024 260,232 0.02%HCA, Inc. 225,000 5.50% 15/6/2047 259,875 0.02%Gilead Sciences, Inc. 225,000 4.50% 1/2/2045 259,703 0.02%Amgen, Inc. 225,000 4.56% 15/6/2048 259,565 0.02%KeyBank NA 250,000 3.40% 20/5/2026 259,408 0.02%Federal National Mortgage Association^ 250,000 2.96% 25/2/2027 259,332 0.02%GE Capital International Funding Co. Unlimited Co. 250,000 3.37% 15/11/2025 259,225 0.02%Citigroup, Inc. 255,000 2.70% 27/10/2022 259,068 0.02%Southern Co. 250,000 3.25% 1/7/2026 259,037 0.02%Cigna Corp. 225,000 4.80% 15/7/2046 258,912 0.02%Cigna Corp. 250,000 3.40% 1/3/2027 258,665 0.02%Eastman Chemical Co. 250,000 3.60% 15/8/2022 258,643 0.02%Charter Communications Operating LLC/Charter
Communications Operating Capital 250,000 3.75% 15/2/2028 258,387 0.02%UnitedHealth Group, Inc. 255,000 2.38% 15/8/2024 258,331 0.02%Amazon.com, Inc. 205,000 4.80% 5/12/2034 258,249 0.02%Cigna Corp. 250,000 3.90% 15/2/2022 258,044 0.02%Federal Home Loan Mortgage Corp. 250,000 2.85% 25/1/2026 257,987 0.02%General Electric Co. 252,000 4.63% 7/1/2021 257,774 0.02%Federal National Mortgage Association^ 245,750 3.51% 25/12/2023 257,676 0.02%Wells Fargo Commercial Mortgage Trust 2017 243,000 3.45% 15/7/2050 257,646 0.02%Northrop Grumman Corp. 250,000 2.93% 15/1/2025 257,564 0.02%Realty Income Corp. 250,000 3.00% 15/1/2027 257,538 0.02%Realty Income Corp. 250,000 3.25% 15/10/2022 257,464 0.02%Wells Fargo Commercial Mortgage Trust 2016 250,000 3.10% 15/6/2049 257,220 0.02%Citigroup, Inc. 200,000 6.00% 31/10/2033 257,169 0.02%Kroger Co. 250,000 3.40% 15/4/2022 257,044 0.02%AbbVie, Inc. 250,000 3.20% 6/11/2022 257,011 0.02%Metropolitan Life Global Funding I 250,000 3.45% 9/10/2021 256,765 0.02%Baker Hughes a GE Co. LLC/Baker Hughes Co.-Obligor, Inc. 250,000 3.14% 7/11/2029 256,233 0.02%Coca-Cola Co. 250,000 3.30% 1/9/2021 255,988 0.02%Truist Financial Corp. 247,000 2.85% 26/10/2024 255,241 0.02%KeyBank NA 250,000 3.35% 15/6/2021 255,179 0.02%Keurig Dr Pepper, Inc. 250,000 3.55% 25/5/2021 255,126 0.02%Eaton Corp. 250,000 2.75% 2/11/2022 255,023 0.02%Cisco Systems, Inc. 250,000 2.50% 20/9/2026 254,867 0.02%Transcontinental Gas Pipe Line Co. LLC 200,000 7.85% 1/2/2026 254,779 0.02%
Vanguard U.S. Investment Grade Credit Index Fund
870
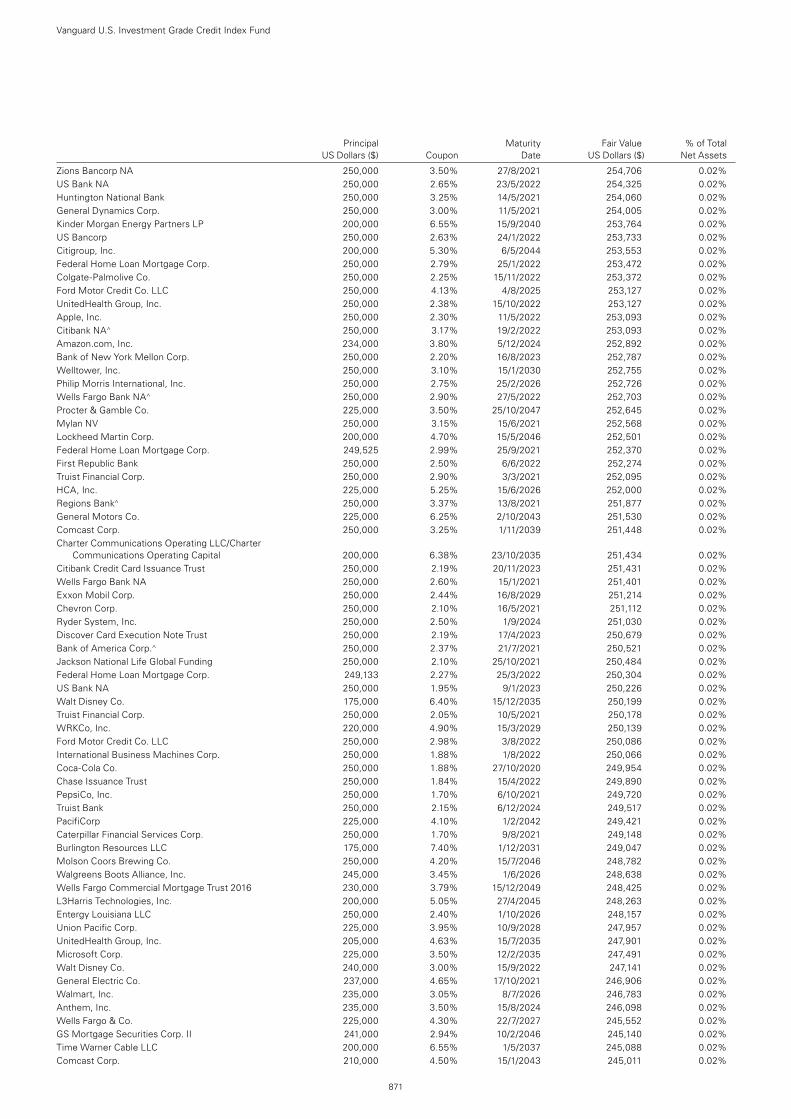
Principal Maturity Fair Value % of Total US Dollars ($) Coupon Date US Dollars ($) Net Assets
Zions Bancorp NA 250,000 3.50% 27/8/2021 254,706 0.02%US Bank NA 250,000 2.65% 23/5/2022 254,325 0.02%Huntington National Bank 250,000 3.25% 14/5/2021 254,060 0.02%General Dynamics Corp. 250,000 3.00% 11/5/2021 254,005 0.02%Kinder Morgan Energy Partners LP 200,000 6.55% 15/9/2040 253,764 0.02%US Bancorp 250,000 2.63% 24/1/2022 253,733 0.02%Citigroup, Inc. 200,000 5.30% 6/5/2044 253,553 0.02%Federal Home Loan Mortgage Corp. 250,000 2.79% 25/1/2022 253,472 0.02%Colgate-Palmolive Co. 250,000 2.25% 15/11/2022 253,372 0.02%Ford Motor Credit Co. LLC 250,000 4.13% 4/8/2025 253,127 0.02%UnitedHealth Group, Inc. 250,000 2.38% 15/10/2022 253,127 0.02%Apple, Inc. 250,000 2.30% 11/5/2022 253,093 0.02%Citibank NA^ 250,000 3.17% 19/2/2022 253,093 0.02%Amazon.com, Inc. 234,000 3.80% 5/12/2024 252,892 0.02%Bank of New York Mellon Corp. 250,000 2.20% 16/8/2023 252,787 0.02%Welltower, Inc. 250,000 3.10% 15/1/2030 252,755 0.02%Philip Morris International, Inc. 250,000 2.75% 25/2/2026 252,726 0.02%Wells Fargo Bank NA^ 250,000 2.90% 27/5/2022 252,703 0.02%Procter & Gamble Co. 225,000 3.50% 25/10/2047 252,645 0.02%Mylan NV 250,000 3.15% 15/6/2021 252,568 0.02%Lockheed Martin Corp. 200,000 4.70% 15/5/2046 252,501 0.02%Federal Home Loan Mortgage Corp. 249,525 2.99% 25/9/2021 252,370 0.02%First Republic Bank 250,000 2.50% 6/6/2022 252,274 0.02%Truist Financial Corp. 250,000 2.90% 3/3/2021 252,095 0.02%HCA, Inc. 225,000 5.25% 15/6/2026 252,000 0.02%Regions Bank^ 250,000 3.37% 13/8/2021 251,877 0.02%General Motors Co. 225,000 6.25% 2/10/2043 251,530 0.02%Comcast Corp. 250,000 3.25% 1/11/2039 251,448 0.02%Charter Communications Operating LLC/Charter
Communications Operating Capital 200,000 6.38% 23/10/2035 251,434 0.02%Citibank Credit Card Issuance Trust 250,000 2.19% 20/11/2023 251,431 0.02%Wells Fargo Bank NA 250,000 2.60% 15/1/2021 251,401 0.02%Exxon Mobil Corp. 250,000 2.44% 16/8/2029 251,214 0.02%Chevron Corp. 250,000 2.10% 16/5/2021 251,112 0.02%Ryder System, Inc. 250,000 2.50% 1/9/2024 251,030 0.02%Discover Card Execution Note Trust 250,000 2.19% 17/4/2023 250,679 0.02%Bank of America Corp.^ 250,000 2.37% 21/7/2021 250,521 0.02%Jackson National Life Global Funding 250,000 2.10% 25/10/2021 250,484 0.02%Federal Home Loan Mortgage Corp. 249,133 2.27% 25/3/2022 250,304 0.02%US Bank NA 250,000 1.95% 9/1/2023 250,226 0.02%Walt Disney Co. 175,000 6.40% 15/12/2035 250,199 0.02%Truist Financial Corp. 250,000 2.05% 10/5/2021 250,178 0.02%WRKCo, Inc. 220,000 4.90% 15/3/2029 250,139 0.02%Ford Motor Credit Co. LLC 250,000 2.98% 3/8/2022 250,086 0.02%International Business Machines Corp. 250,000 1.88% 1/8/2022 250,066 0.02%Coca-Cola Co. 250,000 1.88% 27/10/2020 249,954 0.02%Chase Issuance Trust 250,000 1.84% 15/4/2022 249,890 0.02%PepsiCo, Inc. 250,000 1.70% 6/10/2021 249,720 0.02%Truist Bank 250,000 2.15% 6/12/2024 249,517 0.02%PacifiCorp 225,000 4.10% 1/2/2042 249,421 0.02%Caterpillar Financial Services Corp. 250,000 1.70% 9/8/2021 249,148 0.02%Burlington Resources LLC 175,000 7.40% 1/12/2031 249,047 0.02%Molson Coors Brewing Co. 250,000 4.20% 15/7/2046 248,782 0.02%Walgreens Boots Alliance, Inc. 245,000 3.45% 1/6/2026 248,638 0.02%Wells Fargo Commercial Mortgage Trust 2016 230,000 3.79% 15/12/2049 248,425 0.02%L3Harris Technologies, Inc. 200,000 5.05% 27/4/2045 248,263 0.02%Entergy Louisiana LLC 250,000 2.40% 1/10/2026 248,157 0.02%Union Pacific Corp. 225,000 3.95% 10/9/2028 247,957 0.02%UnitedHealth Group, Inc. 205,000 4.63% 15/7/2035 247,901 0.02%Microsoft Corp. 225,000 3.50% 12/2/2035 247,491 0.02%Walt Disney Co. 240,000 3.00% 15/9/2022 247,141 0.02%General Electric Co. 237,000 4.65% 17/10/2021 246,906 0.02%Walmart, Inc. 235,000 3.05% 8/7/2026 246,783 0.02%Anthem, Inc. 235,000 3.50% 15/8/2024 246,098 0.02%Wells Fargo & Co. 225,000 4.30% 22/7/2027 245,552 0.02%GS Mortgage Securities Corp. II 241,000 2.94% 10/2/2046 245,140 0.02%Time Warner Cable LLC 200,000 6.55% 1/5/2037 245,088 0.02%Comcast Corp. 210,000 4.50% 15/1/2043 245,011 0.02%
Vanguard U.S. Investment Grade Credit Index Fund
871
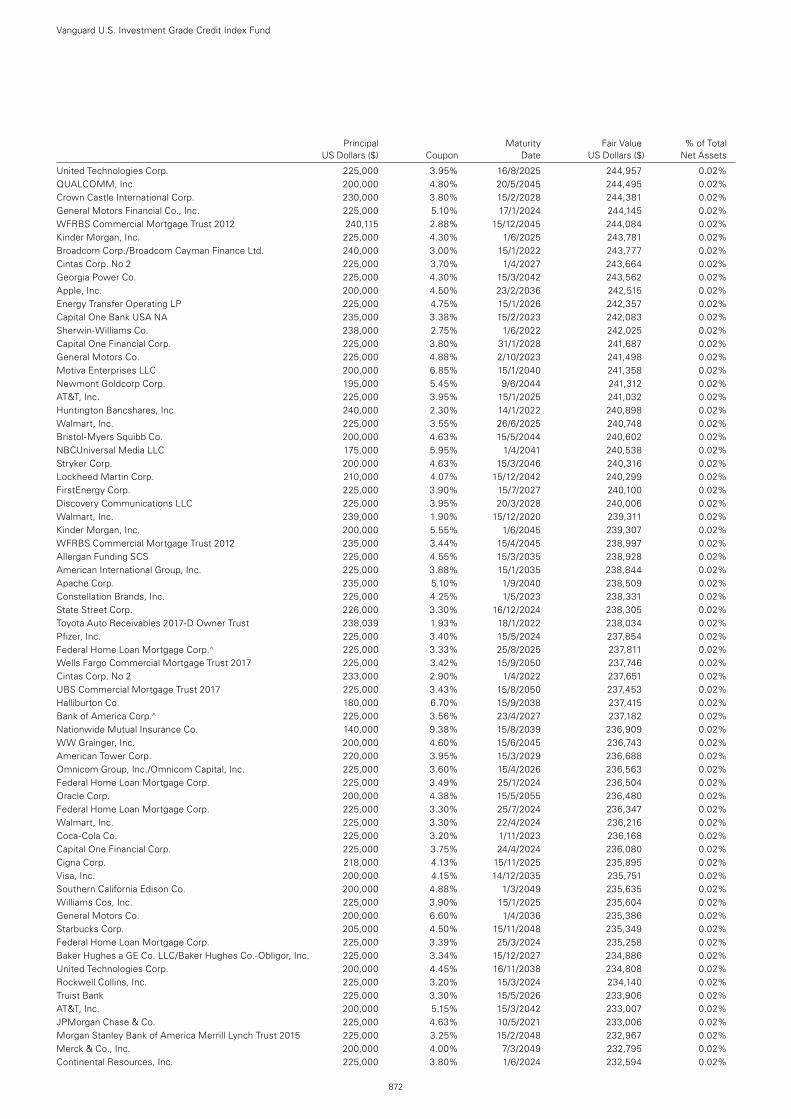
Principal Maturity Fair Value % of Total US Dollars ($) Coupon Date US Dollars ($) Net Assets
United Technologies Corp. 225,000 3.95% 16/8/2025 244,957 0.02%QUALCOMM, Inc. 200,000 4.80% 20/5/2045 244,495 0.02%Crown Castle International Corp. 230,000 3.80% 15/2/2028 244,381 0.02%General Motors Financial Co., Inc. 225,000 5.10% 17/1/2024 244,145 0.02%WFRBS Commercial Mortgage Trust 2012 240,115 2.88% 15/12/2045 244,084 0.02%Kinder Morgan, Inc. 225,000 4.30% 1/6/2025 243,781 0.02%Broadcom Corp./Broadcom Cayman Finance Ltd. 240,000 3.00% 15/1/2022 243,777 0.02%Cintas Corp. No 2 225,000 3.70% 1/4/2027 243,664 0.02%Georgia Power Co. 225,000 4.30% 15/3/2042 243,562 0.02%Apple, Inc. 200,000 4.50% 23/2/2036 242,515 0.02%Energy Transfer Operating LP 225,000 4.75% 15/1/2026 242,357 0.02%Capital One Bank USA NA 235,000 3.38% 15/2/2023 242,083 0.02%Sherwin-Williams Co. 238,000 2.75% 1/6/2022 242,025 0.02%Capital One Financial Corp. 225,000 3.80% 31/1/2028 241,687 0.02%General Motors Co. 225,000 4.88% 2/10/2023 241,498 0.02%Motiva Enterprises LLC 200,000 6.85% 15/1/2040 241,358 0.02%Newmont Goldcorp Corp. 195,000 5.45% 9/6/2044 241,312 0.02%AT&T, Inc. 225,000 3.95% 15/1/2025 241,032 0.02%Huntington Bancshares, Inc. 240,000 2.30% 14/1/2022 240,898 0.02%Walmart, Inc. 225,000 3.55% 26/6/2025 240,748 0.02%Bristol-Myers Squibb Co. 200,000 4.63% 15/5/2044 240,602 0.02%NBCUniversal Media LLC 175,000 5.95% 1/4/2041 240,538 0.02%Stryker Corp. 200,000 4.63% 15/3/2046 240,316 0.02%Lockheed Martin Corp. 210,000 4.07% 15/12/2042 240,299 0.02%FirstEnergy Corp. 225,000 3.90% 15/7/2027 240,100 0.02%Discovery Communications LLC 225,000 3.95% 20/3/2028 240,006 0.02%Walmart, Inc. 239,000 1.90% 15/12/2020 239,311 0.02%Kinder Morgan, Inc. 200,000 5.55% 1/6/2045 239,307 0.02%WFRBS Commercial Mortgage Trust 2012 235,000 3.44% 15/4/2045 238,997 0.02%Allergan Funding SCS 225,000 4.55% 15/3/2035 238,928 0.02%American International Group, Inc. 225,000 3.88% 15/1/2035 238,844 0.02%Apache Corp. 235,000 5.10% 1/9/2040 238,509 0.02%Constellation Brands, Inc. 225,000 4.25% 1/5/2023 238,331 0.02%State Street Corp. 226,000 3.30% 16/12/2024 238,305 0.02%Toyota Auto Receivables 2017-D Owner Trust 238,039 1.93% 18/1/2022 238,034 0.02%Pfizer, Inc. 225,000 3.40% 15/5/2024 237,854 0.02%Federal Home Loan Mortgage Corp.^ 225,000 3.33% 25/8/2025 237,811 0.02%Wells Fargo Commercial Mortgage Trust 2017 225,000 3.42% 15/9/2050 237,746 0.02%Cintas Corp. No 2 233,000 2.90% 1/4/2022 237,651 0.02%UBS Commercial Mortgage Trust 2017 225,000 3.43% 15/8/2050 237,453 0.02%Halliburton Co. 180,000 6.70% 15/9/2038 237,415 0.02%Bank of America Corp.^ 225,000 3.56% 23/4/2027 237,182 0.02%Nationwide Mutual Insurance Co. 140,000 9.38% 15/8/2039 236,909 0.02%WW Grainger, Inc. 200,000 4.60% 15/6/2045 236,743 0.02%American Tower Corp. 220,000 3.95% 15/3/2029 236,688 0.02%Omnicom Group, Inc./Omnicom Capital, Inc. 225,000 3.60% 15/4/2026 236,563 0.02%Federal Home Loan Mortgage Corp. 225,000 3.49% 25/1/2024 236,504 0.02%Oracle Corp. 200,000 4.38% 15/5/2055 236,480 0.02%Federal Home Loan Mortgage Corp. 225,000 3.30% 25/7/2024 236,347 0.02%Walmart, Inc. 225,000 3.30% 22/4/2024 236,216 0.02%Coca-Cola Co. 225,000 3.20% 1/11/2023 236,168 0.02%Capital One Financial Corp. 225,000 3.75% 24/4/2024 236,080 0.02%Cigna Corp. 218,000 4.13% 15/11/2025 235,895 0.02%Visa, Inc. 200,000 4.15% 14/12/2035 235,751 0.02%Southern California Edison Co. 200,000 4.88% 1/3/2049 235,635 0.02%Williams Cos, Inc. 225,000 3.90% 15/1/2025 235,604 0.02%General Motors Co. 200,000 6.60% 1/4/2036 235,386 0.02%Starbucks Corp. 205,000 4.50% 15/11/2048 235,349 0.02%Federal Home Loan Mortgage Corp. 225,000 3.39% 25/3/2024 235,258 0.02%Baker Hughes a GE Co. LLC/Baker Hughes Co.-Obligor, Inc. 225,000 3.34% 15/12/2027 234,886 0.02%United Technologies Corp. 200,000 4.45% 16/11/2038 234,808 0.02%Rockwell Collins, Inc. 225,000 3.20% 15/3/2024 234,140 0.02%Truist Bank 225,000 3.30% 15/5/2026 233,906 0.02%AT&T, Inc. 200,000 5.15% 15/3/2042 233,007 0.02%JPMorgan Chase & Co. 225,000 4.63% 10/5/2021 233,006 0.02%Morgan Stanley Bank of America Merrill Lynch Trust 2015 225,000 3.25% 15/2/2048 232,967 0.02%Merck & Co., Inc. 200,000 4.00% 7/3/2049 232,795 0.02%Continental Resources, Inc. 225,000 3.80% 1/6/2024 232,594 0.02%
Vanguard U.S. Investment Grade Credit Index Fund
872

Principal Maturity Fair Value % of Total US Dollars ($) Coupon Date US Dollars ($) Net Assets
Republic Services, Inc. 225,000 3.55% 1/6/2022 232,466 0.02%UnitedHealth Group, Inc. 225,000 3.35% 15/7/2022 232,413 0.02%Walmart, Inc. 200,000 3.95% 28/6/2038 232,239 0.02%Apple, Inc. 225,000 2.75% 13/1/2025 232,229 0.02%Altria Group, Inc. 250,000 3.88% 16/9/2046 232,175 0.02%Zoetis, Inc. 225,000 3.25% 1/2/2023 232,087 0.02%UnitedHealth Group, Inc. 200,000 4.25% 15/6/2048 232,016 0.02%Union Pacific Corp. 225,000 4.10% 15/9/2067 231,773 0.02%CSX Corp. 175,000 6.15% 1/5/2037 231,761 0.02%Discovery Communications LLC 200,000 5.20% 20/9/2047 231,606 0.02%Federal Home Loan Mortgage Corp. 225,000 2.75% 25/1/2026 231,460 0.02%CD 2017-CD3 Mortgage Trust 216,000 3.63% 10/2/2050 231,338 0.02%Thermo Fisher Scientific, Inc. 225,000 3.00% 15/4/2023 231,253 0.02%Federal National Mortgage Association^ 225,000 2.90% 25/1/2025 231,129 0.02%PepsiCo, Inc. 225,000 2.75% 1/3/2023 231,044 0.02%Apple, Inc. 225,000 2.85% 23/2/2023 231,033 0.02%Pfizer, Inc. 200,000 4.13% 15/12/2046 230,688 0.02%Fifth Third Bancorp 150,000 8.25% 1/3/2038 230,596 0.02%Cheniere Corpus Christi Holdings LLC 200,000 7.00% 30/6/2024 230,500 0.02%American Tower Corp. 225,000 2.95% 15/1/2025 230,499 0.02%Illinois Tool Works, Inc. 200,000 3.90% 1/9/2042 230,486 0.02%Federal Home Loan Mortgage Corp. 225,000 2.67% 25/12/2024 230,303 0.02%Prudential Financial, Inc. 200,000 4.35% 25/2/2050 230,154 0.02%Synchrony Card Issuance Trust 225,000 3.38% 15/9/2024 230,134 0.02%Cardinal Health, Inc. 225,000 3.41% 15/6/2027 229,963 0.02%JPMorgan Chase & Co. 215,000 3.88% 1/2/2024 229,960 0.02%Burlington Northern Santa Fe LLC 200,000 4.15% 1/4/2045 229,839 0.02%Ventas Realty LP 225,000 3.25% 15/10/2026 229,796 0.02%Sabine Pass Liquefaction LLC 200,000 5.88% 30/6/2026 229,750 0.02%General Motors Financial Co., Inc. 225,000 4.20% 1/3/2021 229,723 0.02%Walmart, Inc. 225,000 3.13% 23/6/2021 229,634 0.02%AbbVie, Inc. 200,000 4.88% 14/11/2048 229,626 0.02%Capital One Financial Corp. 225,000 3.05% 9/3/2022 229,549 0.02%American International Group, Inc. 215,000 4.88% 1/6/2022 229,479 0.02%AbbVie, Inc. 225,000 2.90% 6/11/2022 229,460 0.02%Occidental Petroleum Corp. 225,000 3.50% 15/8/2029 229,422 0.02%JPMorgan Chase & Co. 225,000 2.97% 15/1/2023 229,390 0.02%Zimmer Biomet Holdings, Inc. 225,000 3.38% 30/11/2021 229,348 0.02%Sysco Corp. 200,000 4.50% 1/4/2046 229,134 0.02%Truist Financial Corp. 225,000 2.75% 1/4/2022 228,933 0.02%QUALCOMM, Inc. 225,000 2.60% 30/1/2023 228,932 0.02%Bristol-Myers Squibb Co. 210,000 3.90% 20/2/2028 228,895 0.02%Texas Transportation Commission State Highway Fund 190,000 5.18% 1/4/2030 228,728 0.02%Citizens Financial Group, Inc. 225,000 2.85% 27/7/2026 228,568 0.02%CVS Health Corp. 225,000 2.75% 1/12/2022 228,533 0.02%Pfizer, Inc. 200,000 4.10% 15/9/2038 228,440 0.02%Bank of New York Mellon Corp. 225,000 2.60% 7/2/2022 228,156 0.02%Bank of America Corp.^ 225,000 2.82% 21/7/2023 228,090 0.02%Microsoft Corp. 225,000 2.38% 12/2/2022 228,056 0.02%Anheuser-Busch InBev Worldwide, Inc. 225,000 3.75% 15/7/2042 227,753 0.02%JPMorgan Chase & Co.^ 200,000 4.45% 5/12/2029 227,524 0.02%Marathon Petroleum Corp. 220,000 5.13% 1/3/2021 227,510 0.02%PNC Bank NA 225,000 2.63% 17/2/2022 227,327 0.02%Occidental Petroleum Corp. 225,000 4.40% 15/4/2046 227,240 0.02%Costco Wholesale Corp. 225,000 2.25% 15/2/2022 227,232 0.02%Metropolitan Transportation Authority 160,000 6.81% 15/11/2040 227,214 0.02%Florida Power & Light Co. 200,000 4.13% 1/2/2042 227,023 0.02%Fluor Corp. 225,000 4.25% 15/9/2028 227,020 0.02%United Technologies Corp. 200,000 4.05% 4/5/2047 226,964 0.02%Port Authority of New York & New Jersey 170,000 5.65% 1/11/2040 226,925 0.02%Fiserv, Inc. 200,000 4.40% 1/7/2049 226,754 0.02%Berkshire Hathaway, Inc. 220,000 2.75% 15/3/2023 225,893 0.02%Caterpillar, Inc. 175,000 5.20% 27/5/2041 225,830 0.02%Chubb INA Holdings, Inc. 188,000 4.35% 3/11/2045 225,760 0.02%Walmart, Inc. 155,000 6.20% 15/4/2038 225,679 0.02%AbbVie, Inc. 225,000 2.30% 14/5/2021 225,665 0.02%Wells Fargo & Co. 175,000 5.38% 7/2/2035 225,622 0.02%Corning, Inc. 200,000 4.75% 15/3/2042 225,600 0.02%
Vanguard U.S. Investment Grade Credit Index Fund
873
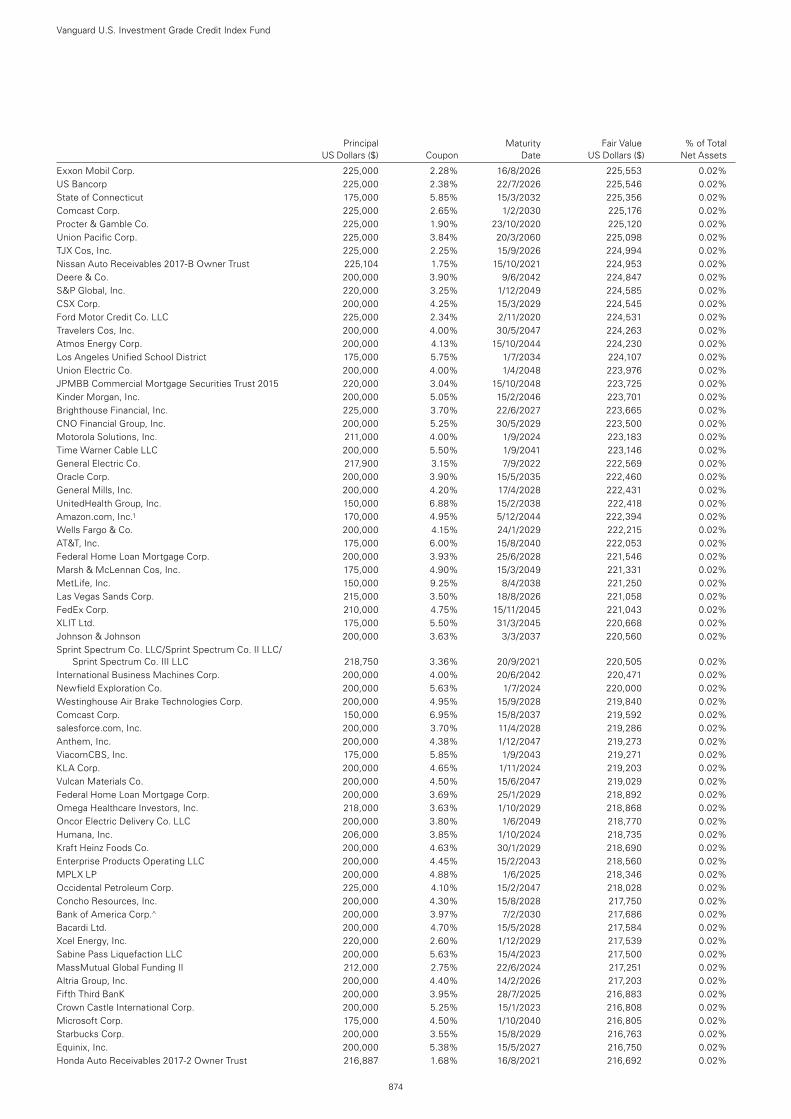
Principal Maturity Fair Value % of Total US Dollars ($) Coupon Date US Dollars ($) Net Assets
Exxon Mobil Corp. 225,000 2.28% 16/8/2026 225,553 0.02%US Bancorp 225,000 2.38% 22/7/2026 225,546 0.02%State of Connecticut 175,000 5.85% 15/3/2032 225,356 0.02%Comcast Corp. 225,000 2.65% 1/2/2030 225,176 0.02%Procter & Gamble Co. 225,000 1.90% 23/10/2020 225,120 0.02%Union Pacific Corp. 225,000 3.84% 20/3/2060 225,098 0.02%TJX Cos, Inc. 225,000 2.25% 15/9/2026 224,994 0.02%Nissan Auto Receivables 2017-B Owner Trust 225,104 1.75% 15/10/2021 224,953 0.02%Deere & Co. 200,000 3.90% 9/6/2042 224,847 0.02%S&P Global, Inc. 220,000 3.25% 1/12/2049 224,585 0.02%CSX Corp. 200,000 4.25% 15/3/2029 224,545 0.02%Ford Motor Credit Co. LLC 225,000 2.34% 2/11/2020 224,531 0.02%Travelers Cos, Inc. 200,000 4.00% 30/5/2047 224,263 0.02%Atmos Energy Corp. 200,000 4.13% 15/10/2044 224,230 0.02%Los Angeles Unified School District 175,000 5.75% 1/7/2034 224,107 0.02%Union Electric Co. 200,000 4.00% 1/4/2048 223,976 0.02%JPMBB Commercial Mortgage Securities Trust 2015 220,000 3.04% 15/10/2048 223,725 0.02%Kinder Morgan, Inc. 200,000 5.05% 15/2/2046 223,701 0.02%Brighthouse Financial, Inc. 225,000 3.70% 22/6/2027 223,665 0.02%CNO Financial Group, Inc. 200,000 5.25% 30/5/2029 223,500 0.02%Motorola Solutions, Inc. 211,000 4.00% 1/9/2024 223,183 0.02%Time Warner Cable LLC 200,000 5.50% 1/9/2041 223,146 0.02%General Electric Co. 217,900 3.15% 7/9/2022 222,569 0.02%Oracle Corp. 200,000 3.90% 15/5/2035 222,460 0.02%General Mills, Inc. 200,000 4.20% 17/4/2028 222,431 0.02%UnitedHealth Group, Inc. 150,000 6.88% 15/2/2038 222,418 0.02%Amazon.com, Inc.1 170,000 4.95% 5/12/2044 222,394 0.02%Wells Fargo & Co. 200,000 4.15% 24/1/2029 222,215 0.02%AT&T, Inc. 175,000 6.00% 15/8/2040 222,053 0.02%Federal Home Loan Mortgage Corp. 200,000 3.93% 25/6/2028 221,546 0.02%Marsh & McLennan Cos, Inc. 175,000 4.90% 15/3/2049 221,331 0.02%MetLife, Inc. 150,000 9.25% 8/4/2038 221,250 0.02%Las Vegas Sands Corp. 215,000 3.50% 18/8/2026 221,058 0.02%FedEx Corp. 210,000 4.75% 15/11/2045 221,043 0.02%XLIT Ltd. 175,000 5.50% 31/3/2045 220,668 0.02%Johnson & Johnson 200,000 3.63% 3/3/2037 220,560 0.02%Sprint Spectrum Co. LLC/Sprint Spectrum Co. II LLC/
Sprint Spectrum Co. III LLC 218,750 3.36% 20/9/2021 220,505 0.02%International Business Machines Corp. 200,000 4.00% 20/6/2042 220,471 0.02%Newfield Exploration Co. 200,000 5.63% 1/7/2024 220,000 0.02%Westinghouse Air Brake Technologies Corp. 200,000 4.95% 15/9/2028 219,840 0.02%Comcast Corp. 150,000 6.95% 15/8/2037 219,592 0.02%salesforce.com, Inc. 200,000 3.70% 11/4/2028 219,286 0.02%Anthem, Inc. 200,000 4.38% 1/12/2047 219,273 0.02%ViacomCBS, Inc. 175,000 5.85% 1/9/2043 219,271 0.02%KLA Corp. 200,000 4.65% 1/11/2024 219,203 0.02%Vulcan Materials Co. 200,000 4.50% 15/6/2047 219,029 0.02%Federal Home Loan Mortgage Corp. 200,000 3.69% 25/1/2029 218,892 0.02%Omega Healthcare Investors, Inc. 218,000 3.63% 1/10/2029 218,868 0.02%Oncor Electric Delivery Co. LLC 200,000 3.80% 1/6/2049 218,770 0.02%Humana, Inc. 206,000 3.85% 1/10/2024 218,735 0.02%Kraft Heinz Foods Co. 200,000 4.63% 30/1/2029 218,690 0.02%Enterprise Products Operating LLC 200,000 4.45% 15/2/2043 218,560 0.02%MPLX LP 200,000 4.88% 1/6/2025 218,346 0.02%Occidental Petroleum Corp. 225,000 4.10% 15/2/2047 218,028 0.02%Concho Resources, Inc. 200,000 4.30% 15/8/2028 217,750 0.02%Bank of America Corp.^ 200,000 3.97% 7/2/2030 217,686 0.02%Bacardi Ltd. 200,000 4.70% 15/5/2028 217,584 0.02%Xcel Energy, Inc. 220,000 2.60% 1/12/2029 217,539 0.02%Sabine Pass Liquefaction LLC 200,000 5.63% 15/4/2023 217,500 0.02%MassMutual Global Funding II 212,000 2.75% 22/6/2024 217,251 0.02%Altria Group, Inc. 200,000 4.40% 14/2/2026 217,203 0.02%Fifth Third BanK 200,000 3.95% 28/7/2025 216,883 0.02%Crown Castle International Corp. 200,000 5.25% 15/1/2023 216,808 0.02%Microsoft Corp. 175,000 4.50% 1/10/2040 216,805 0.02%Starbucks Corp. 200,000 3.55% 15/8/2029 216,763 0.02%Equinix, Inc. 200,000 5.38% 15/5/2027 216,750 0.02%Honda Auto Receivables 2017-2 Owner Trust 216,887 1.68% 16/8/2021 216,692 0.02%
Vanguard U.S. Investment Grade Credit Index Fund
874
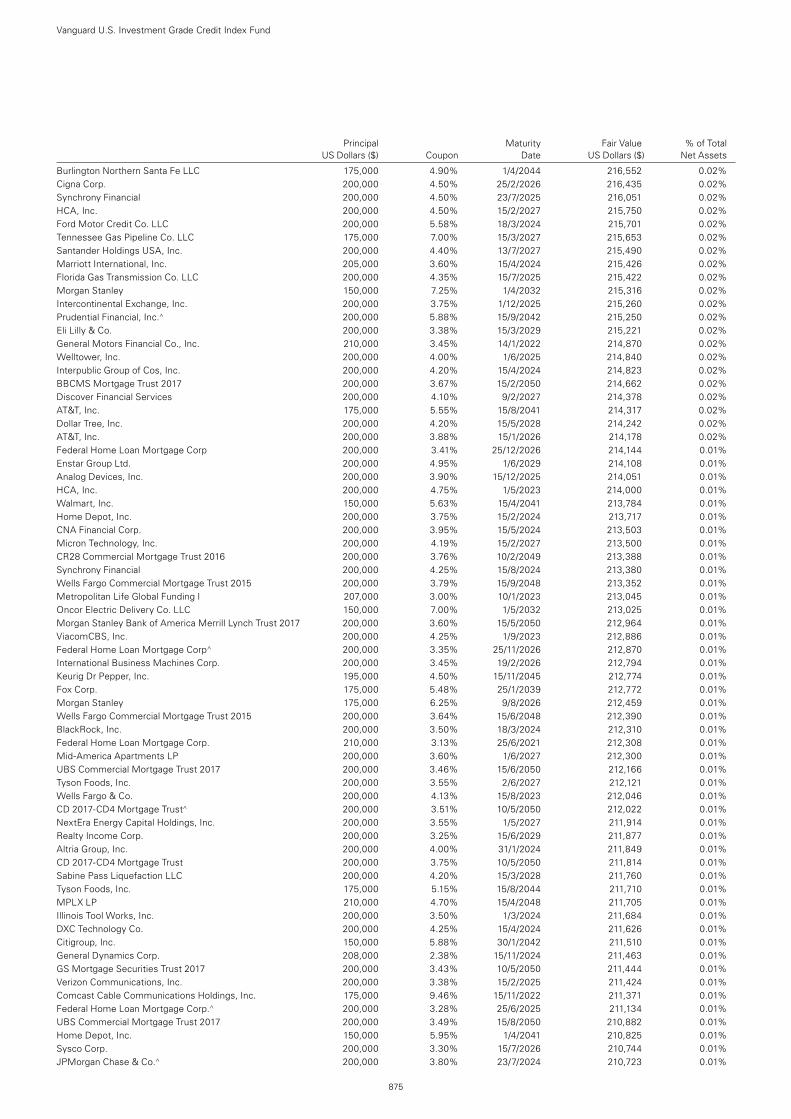
Principal Maturity Fair Value % of Total US Dollars ($) Coupon Date US Dollars ($) Net Assets
Burlington Northern Santa Fe LLC 175,000 4.90% 1/4/2044 216,552 0.02%Cigna Corp. 200,000 4.50% 25/2/2026 216,435 0.02%Synchrony Financial 200,000 4.50% 23/7/2025 216,051 0.02%HCA, Inc. 200,000 4.50% 15/2/2027 215,750 0.02%Ford Motor Credit Co. LLC 200,000 5.58% 18/3/2024 215,701 0.02%Tennessee Gas Pipeline Co. LLC 175,000 7.00% 15/3/2027 215,653 0.02%Santander Holdings USA, Inc. 200,000 4.40% 13/7/2027 215,490 0.02%Marriott International, Inc. 205,000 3.60% 15/4/2024 215,426 0.02%Florida Gas Transmission Co. LLC 200,000 4.35% 15/7/2025 215,422 0.02%Morgan Stanley 150,000 7.25% 1/4/2032 215,316 0.02%Intercontinental Exchange, Inc. 200,000 3.75% 1/12/2025 215,260 0.02%Prudential Financial, Inc.^ 200,000 5.88% 15/9/2042 215,250 0.02%Eli Lilly & Co. 200,000 3.38% 15/3/2029 215,221 0.02%General Motors Financial Co., Inc. 210,000 3.45% 14/1/2022 214,870 0.02%Welltower, Inc. 200,000 4.00% 1/6/2025 214,840 0.02%Interpublic Group of Cos, Inc. 200,000 4.20% 15/4/2024 214,823 0.02%BBCMS Mortgage Trust 2017 200,000 3.67% 15/2/2050 214,662 0.02%Discover Financial Services 200,000 4.10% 9/2/2027 214,378 0.02%AT&T, Inc. 175,000 5.55% 15/8/2041 214,317 0.02%Dollar Tree, Inc. 200,000 4.20% 15/5/2028 214,242 0.02%AT&T, Inc. 200,000 3.88% 15/1/2026 214,178 0.02%Federal Home Loan Mortgage Corp 200,000 3.41% 25/12/2026 214,144 0.01%Enstar Group Ltd. 200,000 4.95% 1/6/2029 214,108 0.01%Analog Devices, Inc. 200,000 3.90% 15/12/2025 214,051 0.01%HCA, Inc. 200,000 4.75% 1/5/2023 214,000 0.01%Walmart, Inc. 150,000 5.63% 15/4/2041 213,784 0.01%Home Depot, Inc. 200,000 3.75% 15/2/2024 213,717 0.01%CNA Financial Corp. 200,000 3.95% 15/5/2024 213,503 0.01%Micron Technology, Inc. 200,000 4.19% 15/2/2027 213,500 0.01%CR28 Commercial Mortgage Trust 2016 200,000 3.76% 10/2/2049 213,388 0.01%Synchrony Financial 200,000 4.25% 15/8/2024 213,380 0.01%Wells Fargo Commercial Mortgage Trust 2015 200,000 3.79% 15/9/2048 213,352 0.01%Metropolitan Life Global Funding I 207,000 3.00% 10/1/2023 213,045 0.01%Oncor Electric Delivery Co. LLC 150,000 7.00% 1/5/2032 213,025 0.01%Morgan Stanley Bank of America Merrill Lynch Trust 2017 200,000 3.60% 15/5/2050 212,964 0.01%ViacomCBS, Inc. 200,000 4.25% 1/9/2023 212,886 0.01%Federal Home Loan Mortgage Corp^ 200,000 3.35% 25/11/2026 212,870 0.01%International Business Machines Corp. 200,000 3.45% 19/2/2026 212,794 0.01%Keurig Dr Pepper, Inc. 195,000 4.50% 15/11/2045 212,774 0.01%Fox Corp. 175,000 5.48% 25/1/2039 212,772 0.01%Morgan Stanley 175,000 6.25% 9/8/2026 212,459 0.01%Wells Fargo Commercial Mortgage Trust 2015 200,000 3.64% 15/6/2048 212,390 0.01%BlackRock, Inc. 200,000 3.50% 18/3/2024 212,310 0.01%Federal Home Loan Mortgage Corp. 210,000 3.13% 25/6/2021 212,308 0.01%Mid-America Apartments LP 200,000 3.60% 1/6/2027 212,300 0.01%UBS Commercial Mortgage Trust 2017 200,000 3.46% 15/6/2050 212,166 0.01%Tyson Foods, Inc. 200,000 3.55% 2/6/2027 212,121 0.01%Wells Fargo & Co. 200,000 4.13% 15/8/2023 212,046 0.01%CD 2017-CD4 Mortgage Trust^ 200,000 3.51% 10/5/2050 212,022 0.01%NextEra Energy Capital Holdings, Inc. 200,000 3.55% 1/5/2027 211,914 0.01%Realty Income Corp. 200,000 3.25% 15/6/2029 211,877 0.01%Altria Group, Inc. 200,000 4.00% 31/1/2024 211,849 0.01%CD 2017-CD4 Mortgage Trust 200,000 3.75% 10/5/2050 211,814 0.01%Sabine Pass Liquefaction LLC 200,000 4.20% 15/3/2028 211,760 0.01%Tyson Foods, Inc. 175,000 5.15% 15/8/2044 211,710 0.01%MPLX LP 210,000 4.70% 15/4/2048 211,705 0.01%Illinois Tool Works, Inc. 200,000 3.50% 1/3/2024 211,684 0.01%DXC Technology Co. 200,000 4.25% 15/4/2024 211,626 0.01%Citigroup, Inc. 150,000 5.88% 30/1/2042 211,510 0.01%General Dynamics Corp. 208,000 2.38% 15/11/2024 211,463 0.01%GS Mortgage Securities Trust 2017 200,000 3.43% 10/5/2050 211,444 0.01%Verizon Communications, Inc. 200,000 3.38% 15/2/2025 211,424 0.01%Comcast Cable Communications Holdings, Inc. 175,000 9.46% 15/11/2022 211,371 0.01%Federal Home Loan Mortgage Corp.^ 200,000 3.28% 25/6/2025 211,134 0.01%UBS Commercial Mortgage Trust 2017 200,000 3.49% 15/8/2050 210,882 0.01%Home Depot, Inc. 150,000 5.95% 1/4/2041 210,825 0.01%Sysco Corp. 200,000 3.30% 15/7/2026 210,744 0.01%JPMorgan Chase & Co.^ 200,000 3.80% 23/7/2024 210,723 0.01%
Vanguard U.S. Investment Grade Credit Index Fund
875
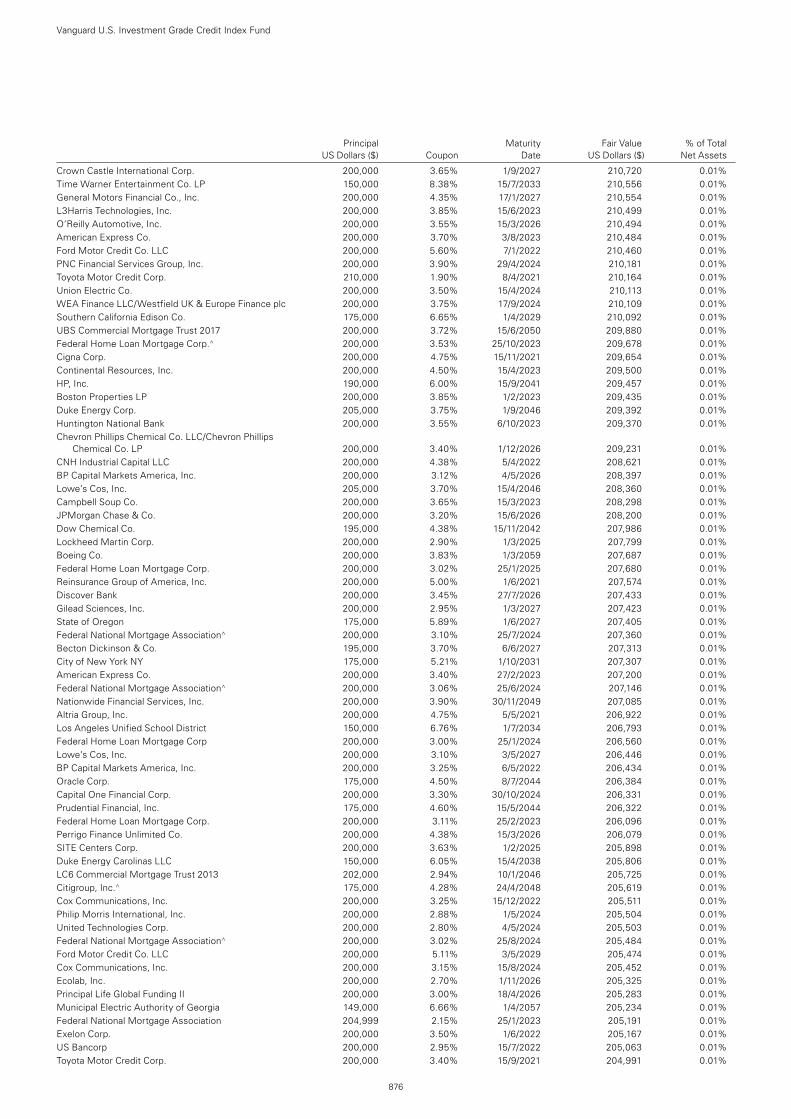
Principal Maturity Fair Value % of Total US Dollars ($) Coupon Date US Dollars ($) Net Assets
Crown Castle International Corp. 200,000 3.65% 1/9/2027 210,720 0.01%Time Warner Entertainment Co. LP 150,000 8.38% 15/7/2033 210,556 0.01%General Motors Financial Co., Inc. 200,000 4.35% 17/1/2027 210,554 0.01%L3Harris Technologies, Inc. 200,000 3.85% 15/6/2023 210,499 0.01%O’Reilly Automotive, Inc. 200,000 3.55% 15/3/2026 210,494 0.01%American Express Co. 200,000 3.70% 3/8/2023 210,484 0.01%Ford Motor Credit Co. LLC 200,000 5.60% 7/1/2022 210,460 0.01%PNC Financial Services Group, Inc. 200,000 3.90% 29/4/2024 210,181 0.01%Toyota Motor Credit Corp. 210,000 1.90% 8/4/2021 210,164 0.01%Union Electric Co. 200,000 3.50% 15/4/2024 210,113 0.01%WEA Finance LLC/Westfield UK & Europe Finance plc 200,000 3.75% 17/9/2024 210,109 0.01%Southern California Edison Co. 175,000 6.65% 1/4/2029 210,092 0.01%UBS Commercial Mortgage Trust 2017 200,000 3.72% 15/6/2050 209,880 0.01%Federal Home Loan Mortgage Corp.^ 200,000 3.53% 25/10/2023 209,678 0.01%Cigna Corp. 200,000 4.75% 15/11/2021 209,654 0.01%Continental Resources, Inc. 200,000 4.50% 15/4/2023 209,500 0.01%HP, Inc. 190,000 6.00% 15/9/2041 209,457 0.01%Boston Properties LP 200,000 3.85% 1/2/2023 209,435 0.01%Duke Energy Corp. 205,000 3.75% 1/9/2046 209,392 0.01%Huntington National Bank 200,000 3.55% 6/10/2023 209,370 0.01%Chevron Phillips Chemical Co. LLC/Chevron Phillips
Chemical Co. LP 200,000 3.40% 1/12/2026 209,231 0.01%CNH Industrial Capital LLC 200,000 4.38% 5/4/2022 208,621 0.01%BP Capital Markets America, Inc. 200,000 3.12% 4/5/2026 208,397 0.01%Lowe’s Cos, Inc. 205,000 3.70% 15/4/2046 208,360 0.01%Campbell Soup Co. 200,000 3.65% 15/3/2023 208,298 0.01%JPMorgan Chase & Co. 200,000 3.20% 15/6/2026 208,200 0.01%Dow Chemical Co. 195,000 4.38% 15/11/2042 207,986 0.01%Lockheed Martin Corp. 200,000 2.90% 1/3/2025 207,799 0.01%Boeing Co. 200,000 3.83% 1/3/2059 207,687 0.01%Federal Home Loan Mortgage Corp. 200,000 3.02% 25/1/2025 207,680 0.01%Reinsurance Group of America, Inc. 200,000 5.00% 1/6/2021 207,574 0.01%Discover Bank 200,000 3.45% 27/7/2026 207,433 0.01%Gilead Sciences, Inc. 200,000 2.95% 1/3/2027 207,423 0.01%State of Oregon 175,000 5.89% 1/6/2027 207,405 0.01%Federal National Mortgage Association^ 200,000 3.10% 25/7/2024 207,360 0.01%Becton Dickinson & Co. 195,000 3.70% 6/6/2027 207,313 0.01%City of New York NY 175,000 5.21% 1/10/2031 207,307 0.01%American Express Co. 200,000 3.40% 27/2/2023 207,200 0.01%Federal National Mortgage Association^ 200,000 3.06% 25/6/2024 207,146 0.01%Nationwide Financial Services, Inc. 200,000 3.90% 30/11/2049 207,085 0.01%Altria Group, Inc. 200,000 4.75% 5/5/2021 206,922 0.01%Los Angeles Unified School District 150,000 6.76% 1/7/2034 206,793 0.01%Federal Home Loan Mortgage Corp 200,000 3.00% 25/1/2024 206,560 0.01%Lowe’s Cos, Inc. 200,000 3.10% 3/5/2027 206,446 0.01%BP Capital Markets America, Inc. 200,000 3.25% 6/5/2022 206,434 0.01%Oracle Corp. 175,000 4.50% 8/7/2044 206,384 0.01%Capital One Financial Corp. 200,000 3.30% 30/10/2024 206,331 0.01%Prudential Financial, Inc. 175,000 4.60% 15/5/2044 206,322 0.01%Federal Home Loan Mortgage Corp. 200,000 3.11% 25/2/2023 206,096 0.01%Perrigo Finance Unlimited Co. 200,000 4.38% 15/3/2026 206,079 0.01%SITE Centers Corp. 200,000 3.63% 1/2/2025 205,898 0.01%Duke Energy Carolinas LLC 150,000 6.05% 15/4/2038 205,806 0.01%LC6 Commercial Mortgage Trust 2013 202,000 2.94% 10/1/2046 205,725 0.01%Citigroup, Inc.^ 175,000 4.28% 24/4/2048 205,619 0.01%Cox Communications, Inc. 200,000 3.25% 15/12/2022 205,511 0.01%Philip Morris International, Inc. 200,000 2.88% 1/5/2024 205,504 0.01%United Technologies Corp. 200,000 2.80% 4/5/2024 205,503 0.01%Federal National Mortgage Association^ 200,000 3.02% 25/8/2024 205,484 0.01%Ford Motor Credit Co. LLC 200,000 5.11% 3/5/2029 205,474 0.01%Cox Communications, Inc. 200,000 3.15% 15/8/2024 205,452 0.01%Ecolab, Inc. 200,000 2.70% 1/11/2026 205,325 0.01%Principal Life Global Funding II 200,000 3.00% 18/4/2026 205,283 0.01%Municipal Electric Authority of Georgia 149,000 6.66% 1/4/2057 205,234 0.01%Federal National Mortgage Association 204,999 2.15% 25/1/2023 205,191 0.01%Exelon Corp. 200,000 3.50% 1/6/2022 205,167 0.01%US Bancorp 200,000 2.95% 15/7/2022 205,063 0.01%Toyota Motor Credit Corp. 200,000 3.40% 15/9/2021 204,991 0.01%
Vanguard U.S. Investment Grade Credit Index Fund
876
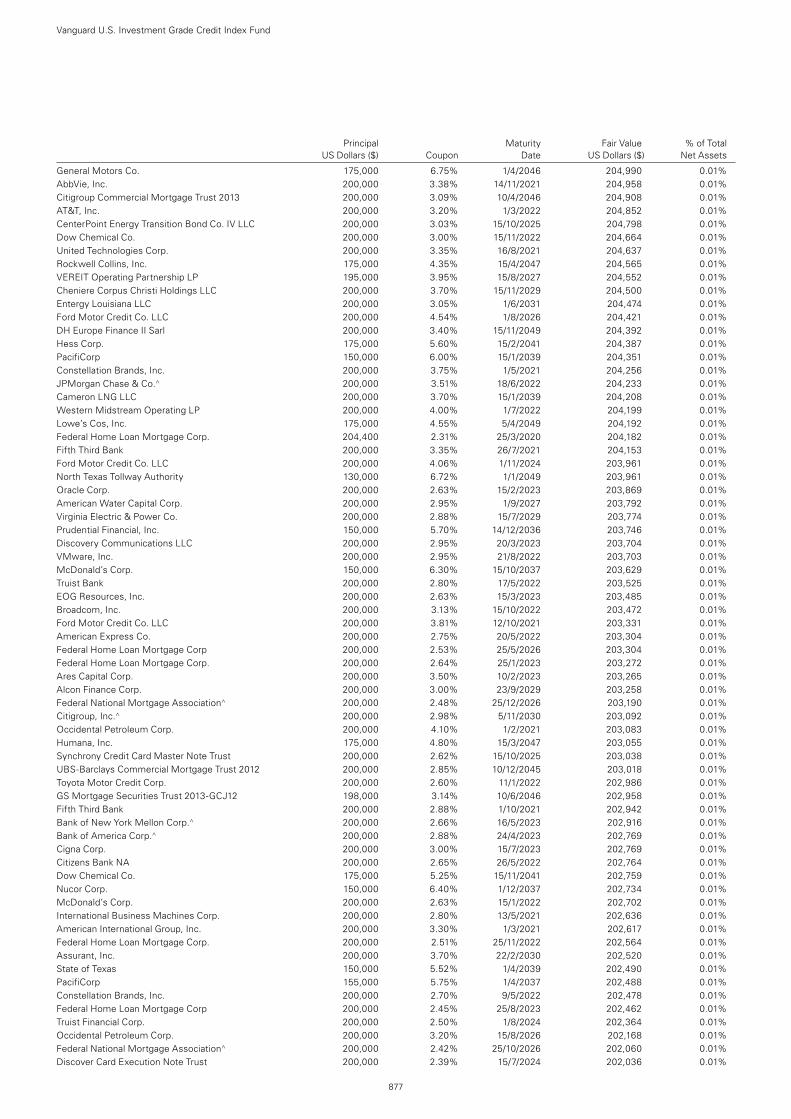
Principal Maturity Fair Value % of Total US Dollars ($) Coupon Date US Dollars ($) Net Assets
General Motors Co. 175,000 6.75% 1/4/2046 204,990 0.01%AbbVie, Inc. 200,000 3.38% 14/11/2021 204,958 0.01%Citigroup Commercial Mortgage Trust 2013 200,000 3.09% 10/4/2046 204,908 0.01%AT&T, Inc. 200,000 3.20% 1/3/2022 204,852 0.01%CenterPoint Energy Transition Bond Co. IV LLC 200,000 3.03% 15/10/2025 204,798 0.01%Dow Chemical Co. 200,000 3.00% 15/11/2022 204,664 0.01%United Technologies Corp. 200,000 3.35% 16/8/2021 204,637 0.01%Rockwell Collins, Inc. 175,000 4.35% 15/4/2047 204,565 0.01%VEREIT Operating Partnership LP 195,000 3.95% 15/8/2027 204,552 0.01%Cheniere Corpus Christi Holdings LLC 200,000 3.70% 15/11/2029 204,500 0.01%Entergy Louisiana LLC 200,000 3.05% 1/6/2031 204,474 0.01%Ford Motor Credit Co. LLC 200,000 4.54% 1/8/2026 204,421 0.01%DH Europe Finance II Sarl 200,000 3.40% 15/11/2049 204,392 0.01%Hess Corp. 175,000 5.60% 15/2/2041 204,387 0.01%PacifiCorp 150,000 6.00% 15/1/2039 204,351 0.01%Constellation Brands, Inc. 200,000 3.75% 1/5/2021 204,256 0.01%JPMorgan Chase & Co.^ 200,000 3.51% 18/6/2022 204,233 0.01%Cameron LNG LLC 200,000 3.70% 15/1/2039 204,208 0.01%Western Midstream Operating LP 200,000 4.00% 1/7/2022 204,199 0.01%Lowe’s Cos, Inc. 175,000 4.55% 5/4/2049 204,192 0.01%Federal Home Loan Mortgage Corp. 204,400 2.31% 25/3/2020 204,182 0.01%Fifth Third Bank 200,000 3.35% 26/7/2021 204,153 0.01%Ford Motor Credit Co. LLC 200,000 4.06% 1/11/2024 203,961 0.01%North Texas Tollway Authority 130,000 6.72% 1/1/2049 203,961 0.01%Oracle Corp. 200,000 2.63% 15/2/2023 203,869 0.01%American Water Capital Corp. 200,000 2.95% 1/9/2027 203,792 0.01%Virginia Electric & Power Co. 200,000 2.88% 15/7/2029 203,774 0.01%Prudential Financial, Inc. 150,000 5.70% 14/12/2036 203,746 0.01%Discovery Communications LLC 200,000 2.95% 20/3/2023 203,704 0.01%VMware, Inc. 200,000 2.95% 21/8/2022 203,703 0.01%McDonald’s Corp. 150,000 6.30% 15/10/2037 203,629 0.01%Truist Bank 200,000 2.80% 17/5/2022 203,525 0.01%EOG Resources, Inc. 200,000 2.63% 15/3/2023 203,485 0.01%Broadcom, Inc. 200,000 3.13% 15/10/2022 203,472 0.01%Ford Motor Credit Co. LLC 200,000 3.81% 12/10/2021 203,331 0.01%American Express Co. 200,000 2.75% 20/5/2022 203,304 0.01%Federal Home Loan Mortgage Corp 200,000 2.53% 25/5/2026 203,304 0.01%Federal Home Loan Mortgage Corp. 200,000 2.64% 25/1/2023 203,272 0.01%Ares Capital Corp. 200,000 3.50% 10/2/2023 203,265 0.01%Alcon Finance Corp. 200,000 3.00% 23/9/2029 203,258 0.01%Federal National Mortgage Association^ 200,000 2.48% 25/12/2026 203,190 0.01%Citigroup, Inc.^ 200,000 2.98% 5/11/2030 203,092 0.01%Occidental Petroleum Corp. 200,000 4.10% 1/2/2021 203,083 0.01%Humana, Inc. 175,000 4.80% 15/3/2047 203,055 0.01%Synchrony Credit Card Master Note Trust 200,000 2.62% 15/10/2025 203,038 0.01%UBS-Barclays Commercial Mortgage Trust 2012 200,000 2.85% 10/12/2045 203,018 0.01%Toyota Motor Credit Corp. 200,000 2.60% 11/1/2022 202,986 0.01%GS Mortgage Securities Trust 2013-GCJ12 198,000 3.14% 10/6/2046 202,958 0.01%Fifth Third Bank 200,000 2.88% 1/10/2021 202,942 0.01%Bank of New York Mellon Corp.^ 200,000 2.66% 16/5/2023 202,916 0.01%Bank of America Corp.^ 200,000 2.88% 24/4/2023 202,769 0.01%Cigna Corp. 200,000 3.00% 15/7/2023 202,769 0.01%Citizens Bank NA 200,000 2.65% 26/5/2022 202,764 0.01%Dow Chemical Co. 175,000 5.25% 15/11/2041 202,759 0.01%Nucor Corp. 150,000 6.40% 1/12/2037 202,734 0.01%McDonald’s Corp. 200,000 2.63% 15/1/2022 202,702 0.01%International Business Machines Corp. 200,000 2.80% 13/5/2021 202,636 0.01%American International Group, Inc. 200,000 3.30% 1/3/2021 202,617 0.01%Federal Home Loan Mortgage Corp. 200,000 2.51% 25/11/2022 202,564 0.01%Assurant, Inc. 200,000 3.70% 22/2/2030 202,520 0.01%State of Texas 150,000 5.52% 1/4/2039 202,490 0.01%PacifiCorp 155,000 5.75% 1/4/2037 202,488 0.01%Constellation Brands, Inc. 200,000 2.70% 9/5/2022 202,478 0.01%Federal Home Loan Mortgage Corp 200,000 2.45% 25/8/2023 202,462 0.01%Truist Financial Corp. 200,000 2.50% 1/8/2024 202,364 0.01%Occidental Petroleum Corp. 200,000 3.20% 15/8/2026 202,168 0.01%Federal National Mortgage Association^ 200,000 2.42% 25/10/2026 202,060 0.01%Discover Card Execution Note Trust 200,000 2.39% 15/7/2024 202,036 0.01%
Vanguard U.S. Investment Grade Credit Index Fund
877
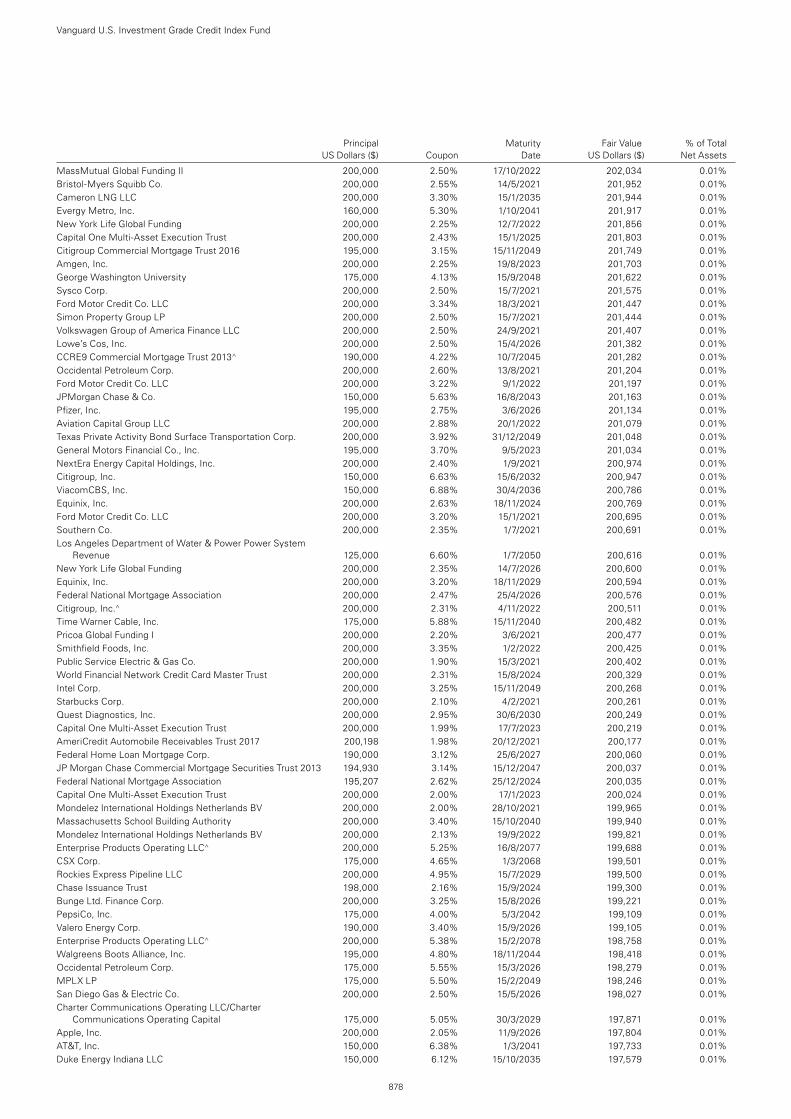
Principal Maturity Fair Value % of Total US Dollars ($) Coupon Date US Dollars ($) Net Assets
MassMutual Global Funding II 200,000 2.50% 17/10/2022 202,034 0.01%Bristol-Myers Squibb Co. 200,000 2.55% 14/5/2021 201,952 0.01%Cameron LNG LLC 200,000 3.30% 15/1/2035 201,944 0.01%Evergy Metro, Inc. 160,000 5.30% 1/10/2041 201,917 0.01%New York Life Global Funding 200,000 2.25% 12/7/2022 201,856 0.01%Capital One Multi-Asset Execution Trust 200,000 2.43% 15/1/2025 201,803 0.01%Citigroup Commercial Mortgage Trust 2016 195,000 3.15% 15/11/2049 201,749 0.01%Amgen, Inc. 200,000 2.25% 19/8/2023 201,703 0.01%George Washington University 175,000 4.13% 15/9/2048 201,622 0.01%Sysco Corp. 200,000 2.50% 15/7/2021 201,575 0.01%Ford Motor Credit Co. LLC 200,000 3.34% 18/3/2021 201,447 0.01%Simon Property Group LP 200,000 2.50% 15/7/2021 201,444 0.01%Volkswagen Group of America Finance LLC 200,000 2.50% 24/9/2021 201,407 0.01%Lowe’s Cos, Inc. 200,000 2.50% 15/4/2026 201,382 0.01%CCRE9 Commercial Mortgage Trust 2013^ 190,000 4.22% 10/7/2045 201,282 0.01%Occidental Petroleum Corp. 200,000 2.60% 13/8/2021 201,204 0.01%Ford Motor Credit Co. LLC 200,000 3.22% 9/1/2022 201,197 0.01%JPMorgan Chase & Co. 150,000 5.63% 16/8/2043 201,163 0.01%Pfizer, Inc. 195,000 2.75% 3/6/2026 201,134 0.01%Aviation Capital Group LLC 200,000 2.88% 20/1/2022 201,079 0.01%Texas Private Activity Bond Surface Transportation Corp. 200,000 3.92% 31/12/2049 201,048 0.01%General Motors Financial Co., Inc. 195,000 3.70% 9/5/2023 201,034 0.01%NextEra Energy Capital Holdings, Inc. 200,000 2.40% 1/9/2021 200,974 0.01%Citigroup, Inc. 150,000 6.63% 15/6/2032 200,947 0.01%ViacomCBS, Inc. 150,000 6.88% 30/4/2036 200,786 0.01%Equinix, Inc. 200,000 2.63% 18/11/2024 200,769 0.01%Ford Motor Credit Co. LLC 200,000 3.20% 15/1/2021 200,695 0.01%Southern Co. 200,000 2.35% 1/7/2021 200,691 0.01%Los Angeles Department of Water & Power Power System
Revenue 125,000 6.60% 1/7/2050 200,616 0.01%New York Life Global Funding 200,000 2.35% 14/7/2026 200,600 0.01%Equinix, Inc. 200,000 3.20% 18/11/2029 200,594 0.01%Federal National Mortgage Association 200,000 2.47% 25/4/2026 200,576 0.01%Citigroup, Inc.^ 200,000 2.31% 4/11/2022 200,511 0.01%Time Warner Cable, Inc. 175,000 5.88% 15/11/2040 200,482 0.01%Pricoa Global Funding I 200,000 2.20% 3/6/2021 200,477 0.01%Smithfield Foods, Inc. 200,000 3.35% 1/2/2022 200,425 0.01%Public Service Electric & Gas Co. 200,000 1.90% 15/3/2021 200,402 0.01%World Financial Network Credit Card Master Trust 200,000 2.31% 15/8/2024 200,329 0.01%Intel Corp. 200,000 3.25% 15/11/2049 200,268 0.01%Starbucks Corp. 200,000 2.10% 4/2/2021 200,261 0.01%Quest Diagnostics, Inc. 200,000 2.95% 30/6/2030 200,249 0.01%Capital One Multi-Asset Execution Trust 200,000 1.99% 17/7/2023 200,219 0.01%AmeriCredit Automobile Receivables Trust 2017 200,198 1.98% 20/12/2021 200,177 0.01%Federal Home Loan Mortgage Corp. 190,000 3.12% 25/6/2027 200,060 0.01%JP Morgan Chase Commercial Mortgage Securities Trust 2013 194,930 3.14% 15/12/2047 200,037 0.01%Federal National Mortgage Association 195,207 2.62% 25/12/2024 200,035 0.01%Capital One Multi-Asset Execution Trust 200,000 2.00% 17/1/2023 200,024 0.01%Mondelez International Holdings Netherlands BV 200,000 2.00% 28/10/2021 199,965 0.01%Massachusetts School Building Authority 200,000 3.40% 15/10/2040 199,940 0.01%Mondelez International Holdings Netherlands BV 200,000 2.13% 19/9/2022 199,821 0.01%Enterprise Products Operating LLC^ 200,000 5.25% 16/8/2077 199,688 0.01%CSX Corp. 175,000 4.65% 1/3/2068 199,501 0.01%Rockies Express Pipeline LLC 200,000 4.95% 15/7/2029 199,500 0.01%Chase Issuance Trust 198,000 2.16% 15/9/2024 199,300 0.01%Bunge Ltd. Finance Corp. 200,000 3.25% 15/8/2026 199,221 0.01%PepsiCo, Inc. 175,000 4.00% 5/3/2042 199,109 0.01%Valero Energy Corp. 190,000 3.40% 15/9/2026 199,105 0.01%Enterprise Products Operating LLC^ 200,000 5.38% 15/2/2078 198,758 0.01%Walgreens Boots Alliance, Inc. 195,000 4.80% 18/11/2044 198,418 0.01%Occidental Petroleum Corp. 175,000 5.55% 15/3/2026 198,279 0.01%MPLX LP 175,000 5.50% 15/2/2049 198,246 0.01%San Diego Gas & Electric Co. 200,000 2.50% 15/5/2026 198,027 0.01%Charter Communications Operating LLC/Charter
Communications Operating Capital 175,000 5.05% 30/3/2029 197,871 0.01%Apple, Inc. 200,000 2.05% 11/9/2026 197,804 0.01%AT&T, Inc. 150,000 6.38% 1/3/2041 197,733 0.01%Duke Energy Indiana LLC 150,000 6.12% 15/10/2035 197,579 0.01%
Vanguard U.S. Investment Grade Credit Index Fund
878
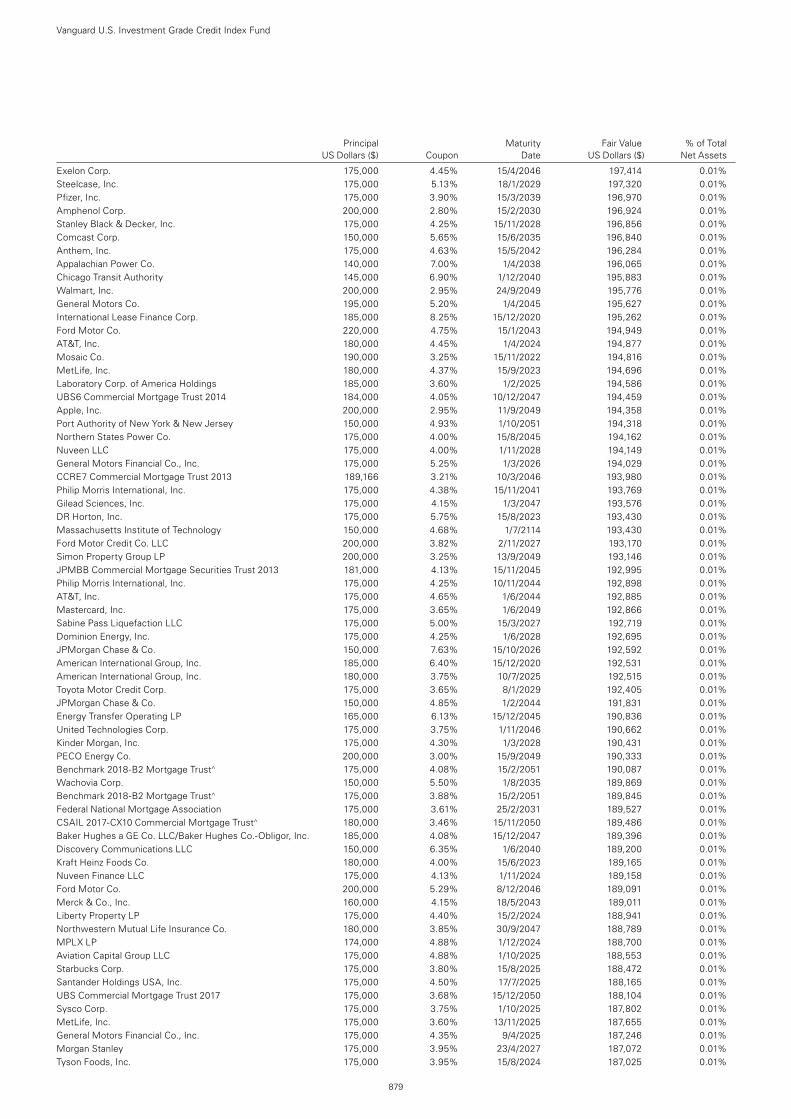
Principal Maturity Fair Value % of Total US Dollars ($) Coupon Date US Dollars ($) Net Assets
Exelon Corp. 175,000 4.45% 15/4/2046 197,414 0.01%Steelcase, Inc. 175,000 5.13% 18/1/2029 197,320 0.01%Pfizer, Inc. 175,000 3.90% 15/3/2039 196,970 0.01%Amphenol Corp. 200,000 2.80% 15/2/2030 196,924 0.01%Stanley Black & Decker, Inc. 175,000 4.25% 15/11/2028 196,856 0.01%Comcast Corp. 150,000 5.65% 15/6/2035 196,840 0.01%Anthem, Inc. 175,000 4.63% 15/5/2042 196,284 0.01%Appalachian Power Co. 140,000 7.00% 1/4/2038 196,065 0.01%Chicago Transit Authority 145,000 6.90% 1/12/2040 195,883 0.01%Walmart, Inc. 200,000 2.95% 24/9/2049 195,776 0.01%General Motors Co. 195,000 5.20% 1/4/2045 195,627 0.01%International Lease Finance Corp. 185,000 8.25% 15/12/2020 195,262 0.01%Ford Motor Co. 220,000 4.75% 15/1/2043 194,949 0.01%AT&T, Inc. 180,000 4.45% 1/4/2024 194,877 0.01%Mosaic Co. 190,000 3.25% 15/11/2022 194,816 0.01%MetLife, Inc. 180,000 4.37% 15/9/2023 194,696 0.01%Laboratory Corp. of America Holdings 185,000 3.60% 1/2/2025 194,586 0.01%UBS6 Commercial Mortgage Trust 2014 184,000 4.05% 10/12/2047 194,459 0.01%Apple, Inc. 200,000 2.95% 11/9/2049 194,358 0.01%Port Authority of New York & New Jersey 150,000 4.93% 1/10/2051 194,318 0.01%Northern States Power Co. 175,000 4.00% 15/8/2045 194,162 0.01%Nuveen LLC 175,000 4.00% 1/11/2028 194,149 0.01%General Motors Financial Co., Inc. 175,000 5.25% 1/3/2026 194,029 0.01%CCRE7 Commercial Mortgage Trust 2013 189,166 3.21% 10/3/2046 193,980 0.01%Philip Morris International, Inc. 175,000 4.38% 15/11/2041 193,769 0.01%Gilead Sciences, Inc. 175,000 4.15% 1/3/2047 193,576 0.01%DR Horton, Inc. 175,000 5.75% 15/8/2023 193,430 0.01%Massachusetts Institute of Technology 150,000 4.68% 1/7/2114 193,430 0.01%Ford Motor Credit Co. LLC 200,000 3.82% 2/11/2027 193,170 0.01%Simon Property Group LP 200,000 3.25% 13/9/2049 193,146 0.01%JPMBB Commercial Mortgage Securities Trust 2013 181,000 4.13% 15/11/2045 192,995 0.01%Philip Morris International, Inc. 175,000 4.25% 10/11/2044 192,898 0.01%AT&T, Inc. 175,000 4.65% 1/6/2044 192,885 0.01%Mastercard, Inc. 175,000 3.65% 1/6/2049 192,866 0.01%Sabine Pass Liquefaction LLC 175,000 5.00% 15/3/2027 192,719 0.01%Dominion Energy, Inc. 175,000 4.25% 1/6/2028 192,695 0.01%JPMorgan Chase & Co. 150,000 7.63% 15/10/2026 192,592 0.01%American International Group, Inc. 185,000 6.40% 15/12/2020 192,531 0.01%American International Group, Inc. 180,000 3.75% 10/7/2025 192,515 0.01%Toyota Motor Credit Corp. 175,000 3.65% 8/1/2029 192,405 0.01%JPMorgan Chase & Co. 150,000 4.85% 1/2/2044 191,831 0.01%Energy Transfer Operating LP 165,000 6.13% 15/12/2045 190,836 0.01%United Technologies Corp. 175,000 3.75% 1/11/2046 190,662 0.01%Kinder Morgan, Inc. 175,000 4.30% 1/3/2028 190,431 0.01%PECO Energy Co. 200,000 3.00% 15/9/2049 190,333 0.01%Benchmark 2018-B2 Mortgage Trust^ 175,000 4.08% 15/2/2051 190,087 0.01%Wachovia Corp. 150,000 5.50% 1/8/2035 189,869 0.01%Benchmark 2018-B2 Mortgage Trust^ 175,000 3.88% 15/2/2051 189,845 0.01%Federal National Mortgage Association 175,000 3.61% 25/2/2031 189,527 0.01%CSAIL 2017-CX10 Commercial Mortgage Trust^ 180,000 3.46% 15/11/2050 189,486 0.01%Baker Hughes a GE Co. LLC/Baker Hughes Co.-Obligor, Inc. 185,000 4.08% 15/12/2047 189,396 0.01%Discovery Communications LLC 150,000 6.35% 1/6/2040 189,200 0.01%Kraft Heinz Foods Co. 180,000 4.00% 15/6/2023 189,165 0.01%Nuveen Finance LLC 175,000 4.13% 1/11/2024 189,158 0.01%Ford Motor Co. 200,000 5.29% 8/12/2046 189,091 0.01%Merck & Co., Inc. 160,000 4.15% 18/5/2043 189,011 0.01%Liberty Property LP 175,000 4.40% 15/2/2024 188,941 0.01%Northwestern Mutual Life Insurance Co. 180,000 3.85% 30/9/2047 188,789 0.01%MPLX LP 174,000 4.88% 1/12/2024 188,700 0.01%Aviation Capital Group LLC 175,000 4.88% 1/10/2025 188,553 0.01%Starbucks Corp. 175,000 3.80% 15/8/2025 188,472 0.01%Santander Holdings USA, Inc. 175,000 4.50% 17/7/2025 188,165 0.01%UBS Commercial Mortgage Trust 2017 175,000 3.68% 15/12/2050 188,104 0.01%Sysco Corp. 175,000 3.75% 1/10/2025 187,802 0.01%MetLife, Inc. 175,000 3.60% 13/11/2025 187,655 0.01%General Motors Financial Co., Inc. 175,000 4.35% 9/4/2025 187,246 0.01%Morgan Stanley 175,000 3.95% 23/4/2027 187,072 0.01%Tyson Foods, Inc. 175,000 3.95% 15/8/2024 187,025 0.01%
Vanguard U.S. Investment Grade Credit Index Fund
879
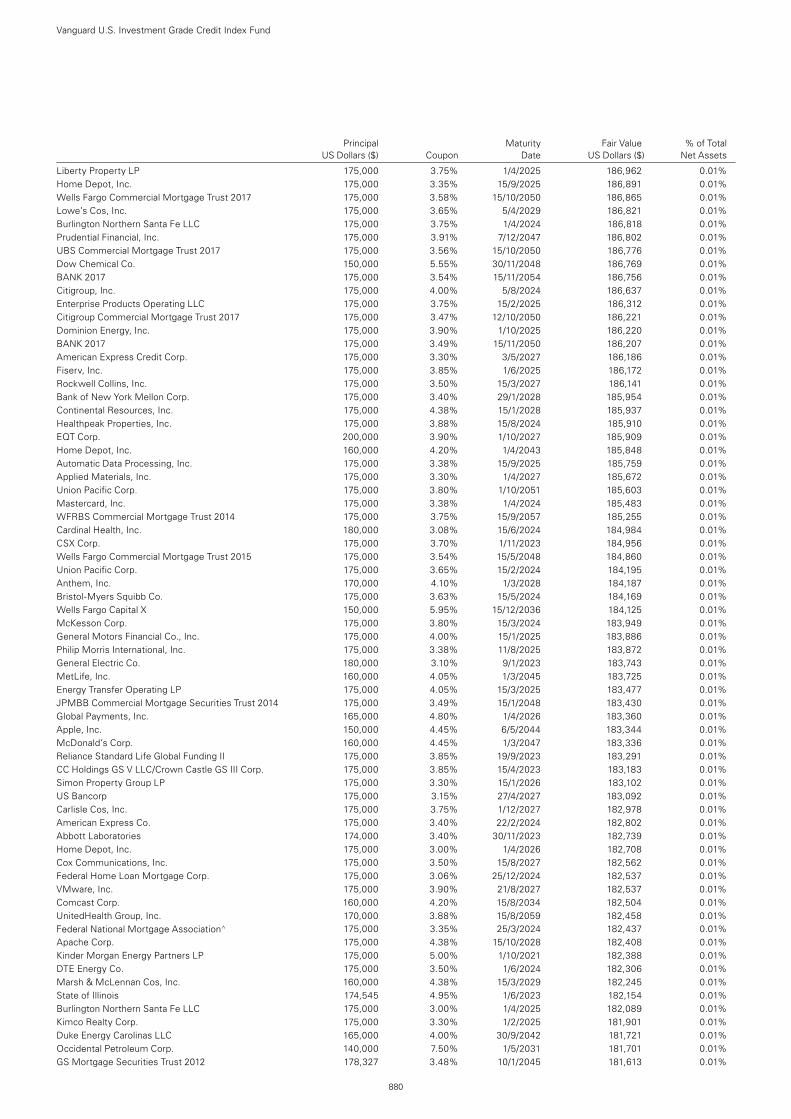
Principal Maturity Fair Value % of Total US Dollars ($) Coupon Date US Dollars ($) Net Assets
Liberty Property LP 175,000 3.75% 1/4/2025 186,962 0.01%Home Depot, Inc. 175,000 3.35% 15/9/2025 186,891 0.01%Wells Fargo Commercial Mortgage Trust 2017 175,000 3.58% 15/10/2050 186,865 0.01%Lowe’s Cos, Inc. 175,000 3.65% 5/4/2029 186,821 0.01%Burlington Northern Santa Fe LLC 175,000 3.75% 1/4/2024 186,818 0.01%Prudential Financial, Inc. 175,000 3.91% 7/12/2047 186,802 0.01%UBS Commercial Mortgage Trust 2017 175,000 3.56% 15/10/2050 186,776 0.01%Dow Chemical Co. 150,000 5.55% 30/11/2048 186,769 0.01%BANK 2017 175,000 3.54% 15/11/2054 186,756 0.01%Citigroup, Inc. 175,000 4.00% 5/8/2024 186,637 0.01%Enterprise Products Operating LLC 175,000 3.75% 15/2/2025 186,312 0.01%Citigroup Commercial Mortgage Trust 2017 175,000 3.47% 12/10/2050 186,221 0.01%Dominion Energy, Inc. 175,000 3.90% 1/10/2025 186,220 0.01%BANK 2017 175,000 3.49% 15/11/2050 186,207 0.01%American Express Credit Corp. 175,000 3.30% 3/5/2027 186,186 0.01%Fiserv, Inc. 175,000 3.85% 1/6/2025 186,172 0.01%Rockwell Collins, Inc. 175,000 3.50% 15/3/2027 186,141 0.01%Bank of New York Mellon Corp. 175,000 3.40% 29/1/2028 185,954 0.01%Continental Resources, Inc. 175,000 4.38% 15/1/2028 185,937 0.01%Healthpeak Properties, Inc. 175,000 3.88% 15/8/2024 185,910 0.01%EQT Corp. 200,000 3.90% 1/10/2027 185,909 0.01%Home Depot, Inc. 160,000 4.20% 1/4/2043 185,848 0.01%Automatic Data Processing, Inc. 175,000 3.38% 15/9/2025 185,759 0.01%Applied Materials, Inc. 175,000 3.30% 1/4/2027 185,672 0.01%Union Pacific Corp. 175,000 3.80% 1/10/2051 185,603 0.01%Mastercard, Inc. 175,000 3.38% 1/4/2024 185,483 0.01%WFRBS Commercial Mortgage Trust 2014 175,000 3.75% 15/9/2057 185,255 0.01%Cardinal Health, Inc. 180,000 3.08% 15/6/2024 184,984 0.01%CSX Corp. 175,000 3.70% 1/11/2023 184,956 0.01%Wells Fargo Commercial Mortgage Trust 2015 175,000 3.54% 15/5/2048 184,860 0.01%Union Pacific Corp. 175,000 3.65% 15/2/2024 184,195 0.01%Anthem, Inc. 170,000 4.10% 1/3/2028 184,187 0.01%Bristol-Myers Squibb Co. 175,000 3.63% 15/5/2024 184,169 0.01%Wells Fargo Capital X 150,000 5.95% 15/12/2036 184,125 0.01%McKesson Corp. 175,000 3.80% 15/3/2024 183,949 0.01%General Motors Financial Co., Inc. 175,000 4.00% 15/1/2025 183,886 0.01%Philip Morris International, Inc. 175,000 3.38% 11/8/2025 183,872 0.01%General Electric Co. 180,000 3.10% 9/1/2023 183,743 0.01%MetLife, Inc. 160,000 4.05% 1/3/2045 183,725 0.01%Energy Transfer Operating LP 175,000 4.05% 15/3/2025 183,477 0.01%JPMBB Commercial Mortgage Securities Trust 2014 175,000 3.49% 15/1/2048 183,430 0.01%Global Payments, Inc. 165,000 4.80% 1/4/2026 183,360 0.01%Apple, Inc. 150,000 4.45% 6/5/2044 183,344 0.01%McDonald’s Corp. 160,000 4.45% 1/3/2047 183,336 0.01%Reliance Standard Life Global Funding II 175,000 3.85% 19/9/2023 183,291 0.01%CC Holdings GS V LLC/Crown Castle GS III Corp. 175,000 3.85% 15/4/2023 183,183 0.01%Simon Property Group LP 175,000 3.30% 15/1/2026 183,102 0.01%US Bancorp 175,000 3.15% 27/4/2027 183,092 0.01%Carlisle Cos, Inc. 175,000 3.75% 1/12/2027 182,978 0.01%American Express Co. 175,000 3.40% 22/2/2024 182,802 0.01%Abbott Laboratories 174,000 3.40% 30/11/2023 182,739 0.01%Home Depot, Inc. 175,000 3.00% 1/4/2026 182,708 0.01%Cox Communications, Inc. 175,000 3.50% 15/8/2027 182,562 0.01%Federal Home Loan Mortgage Corp. 175,000 3.06% 25/12/2024 182,537 0.01%VMware, Inc. 175,000 3.90% 21/8/2027 182,537 0.01%Comcast Corp. 160,000 4.20% 15/8/2034 182,504 0.01%UnitedHealth Group, Inc. 170,000 3.88% 15/8/2059 182,458 0.01%Federal National Mortgage Association^ 175,000 3.35% 25/3/2024 182,437 0.01%Apache Corp. 175,000 4.38% 15/10/2028 182,408 0.01%Kinder Morgan Energy Partners LP 175,000 5.00% 1/10/2021 182,388 0.01%DTE Energy Co. 175,000 3.50% 1/6/2024 182,306 0.01%Marsh & McLennan Cos, Inc. 160,000 4.38% 15/3/2029 182,245 0.01%State of Illinois 174,545 4.95% 1/6/2023 182,154 0.01%Burlington Northern Santa Fe LLC 175,000 3.00% 1/4/2025 182,089 0.01%Kimco Realty Corp. 175,000 3.30% 1/2/2025 181,901 0.01%Duke Energy Carolinas LLC 165,000 4.00% 30/9/2042 181,721 0.01%Occidental Petroleum Corp. 140,000 7.50% 1/5/2031 181,701 0.01%GS Mortgage Securities Trust 2012 178,327 3.48% 10/1/2045 181,613 0.01%
Vanguard U.S. Investment Grade Credit Index Fund
880
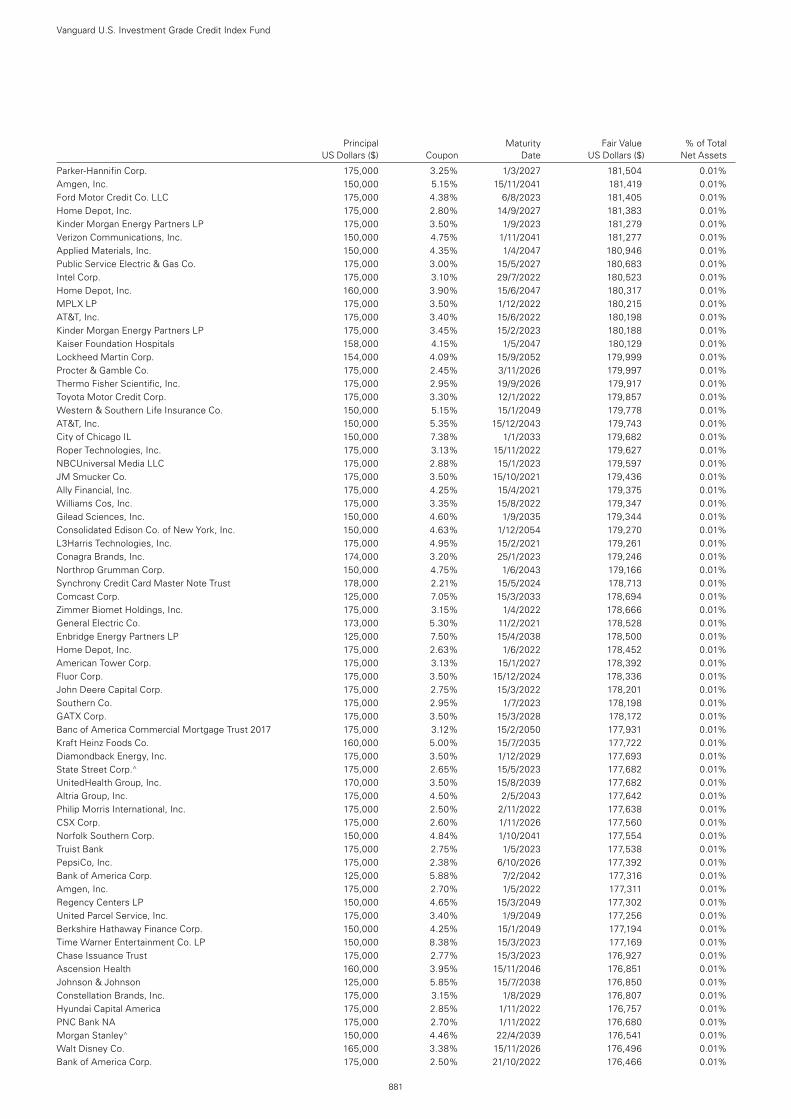
Principal Maturity Fair Value % of Total US Dollars ($) Coupon Date US Dollars ($) Net Assets
Parker-Hannifin Corp. 175,000 3.25% 1/3/2027 181,504 0.01%Amgen, Inc. 150,000 5.15% 15/11/2041 181,419 0.01%Ford Motor Credit Co. LLC 175,000 4.38% 6/8/2023 181,405 0.01%Home Depot, Inc. 175,000 2.80% 14/9/2027 181,383 0.01%Kinder Morgan Energy Partners LP 175,000 3.50% 1/9/2023 181,279 0.01%Verizon Communications, Inc. 150,000 4.75% 1/11/2041 181,277 0.01%Applied Materials, Inc. 150,000 4.35% 1/4/2047 180,946 0.01%Public Service Electric & Gas Co. 175,000 3.00% 15/5/2027 180,683 0.01%Intel Corp. 175,000 3.10% 29/7/2022 180,523 0.01%Home Depot, Inc. 160,000 3.90% 15/6/2047 180,317 0.01%MPLX LP 175,000 3.50% 1/12/2022 180,215 0.01%AT&T, Inc. 175,000 3.40% 15/6/2022 180,198 0.01%Kinder Morgan Energy Partners LP 175,000 3.45% 15/2/2023 180,188 0.01%Kaiser Foundation Hospitals 158,000 4.15% 1/5/2047 180,129 0.01%Lockheed Martin Corp. 154,000 4.09% 15/9/2052 179,999 0.01%Procter & Gamble Co. 175,000 2.45% 3/11/2026 179,997 0.01%Thermo Fisher Scientific, Inc. 175,000 2.95% 19/9/2026 179,917 0.01%Toyota Motor Credit Corp. 175,000 3.30% 12/1/2022 179,857 0.01%Western & Southern Life Insurance Co. 150,000 5.15% 15/1/2049 179,778 0.01%AT&T, Inc. 150,000 5.35% 15/12/2043 179,743 0.01%City of Chicago IL 150,000 7.38% 1/1/2033 179,682 0.01%Roper Technologies, Inc. 175,000 3.13% 15/11/2022 179,627 0.01%NBCUniversal Media LLC 175,000 2.88% 15/1/2023 179,597 0.01%JM Smucker Co. 175,000 3.50% 15/10/2021 179,436 0.01%Ally Financial, Inc. 175,000 4.25% 15/4/2021 179,375 0.01%Williams Cos, Inc. 175,000 3.35% 15/8/2022 179,347 0.01%Gilead Sciences, Inc. 150,000 4.60% 1/9/2035 179,344 0.01%Consolidated Edison Co. of New York, Inc. 150,000 4.63% 1/12/2054 179,270 0.01%L3Harris Technologies, Inc. 175,000 4.95% 15/2/2021 179,261 0.01%Conagra Brands, Inc. 174,000 3.20% 25/1/2023 179,246 0.01%Northrop Grumman Corp. 150,000 4.75% 1/6/2043 179,166 0.01%Synchrony Credit Card Master Note Trust 178,000 2.21% 15/5/2024 178,713 0.01%Comcast Corp. 125,000 7.05% 15/3/2033 178,694 0.01%Zimmer Biomet Holdings, Inc. 175,000 3.15% 1/4/2022 178,666 0.01%General Electric Co. 173,000 5.30% 11/2/2021 178,528 0.01%Enbridge Energy Partners LP 125,000 7.50% 15/4/2038 178,500 0.01%Home Depot, Inc. 175,000 2.63% 1/6/2022 178,452 0.01%American Tower Corp. 175,000 3.13% 15/1/2027 178,392 0.01%Fluor Corp. 175,000 3.50% 15/12/2024 178,336 0.01%John Deere Capital Corp. 175,000 2.75% 15/3/2022 178,201 0.01%Southern Co. 175,000 2.95% 1/7/2023 178,198 0.01%GATX Corp. 175,000 3.50% 15/3/2028 178,172 0.01%Banc of America Commercial Mortgage Trust 2017 175,000 3.12% 15/2/2050 177,931 0.01%Kraft Heinz Foods Co. 160,000 5.00% 15/7/2035 177,722 0.01%Diamondback Energy, Inc. 175,000 3.50% 1/12/2029 177,693 0.01%State Street Corp.^ 175,000 2.65% 15/5/2023 177,682 0.01%UnitedHealth Group, Inc. 170,000 3.50% 15/8/2039 177,682 0.01%Altria Group, Inc. 175,000 4.50% 2/5/2043 177,642 0.01%Philip Morris International, Inc. 175,000 2.50% 2/11/2022 177,638 0.01%CSX Corp. 175,000 2.60% 1/11/2026 177,560 0.01%Norfolk Southern Corp. 150,000 4.84% 1/10/2041 177,554 0.01%Truist Bank 175,000 2.75% 1/5/2023 177,538 0.01%PepsiCo, Inc. 175,000 2.38% 6/10/2026 177,392 0.01%Bank of America Corp. 125,000 5.88% 7/2/2042 177,316 0.01%Amgen, Inc. 175,000 2.70% 1/5/2022 177,311 0.01%Regency Centers LP 150,000 4.65% 15/3/2049 177,302 0.01%United Parcel Service, Inc. 175,000 3.40% 1/9/2049 177,256 0.01%Berkshire Hathaway Finance Corp. 150,000 4.25% 15/1/2049 177,194 0.01%Time Warner Entertainment Co. LP 150,000 8.38% 15/3/2023 177,169 0.01%Chase Issuance Trust 175,000 2.77% 15/3/2023 176,927 0.01%Ascension Health 160,000 3.95% 15/11/2046 176,851 0.01%Johnson & Johnson 125,000 5.85% 15/7/2038 176,850 0.01%Constellation Brands, Inc. 175,000 3.15% 1/8/2029 176,807 0.01%Hyundai Capital America 175,000 2.85% 1/11/2022 176,757 0.01%PNC Bank NA 175,000 2.70% 1/11/2022 176,680 0.01%Morgan Stanley^ 150,000 4.46% 22/4/2039 176,541 0.01%Walt Disney Co. 165,000 3.38% 15/11/2026 176,496 0.01%Bank of America Corp. 175,000 2.50% 21/10/2022 176,466 0.01%
Vanguard U.S. Investment Grade Credit Index Fund
881
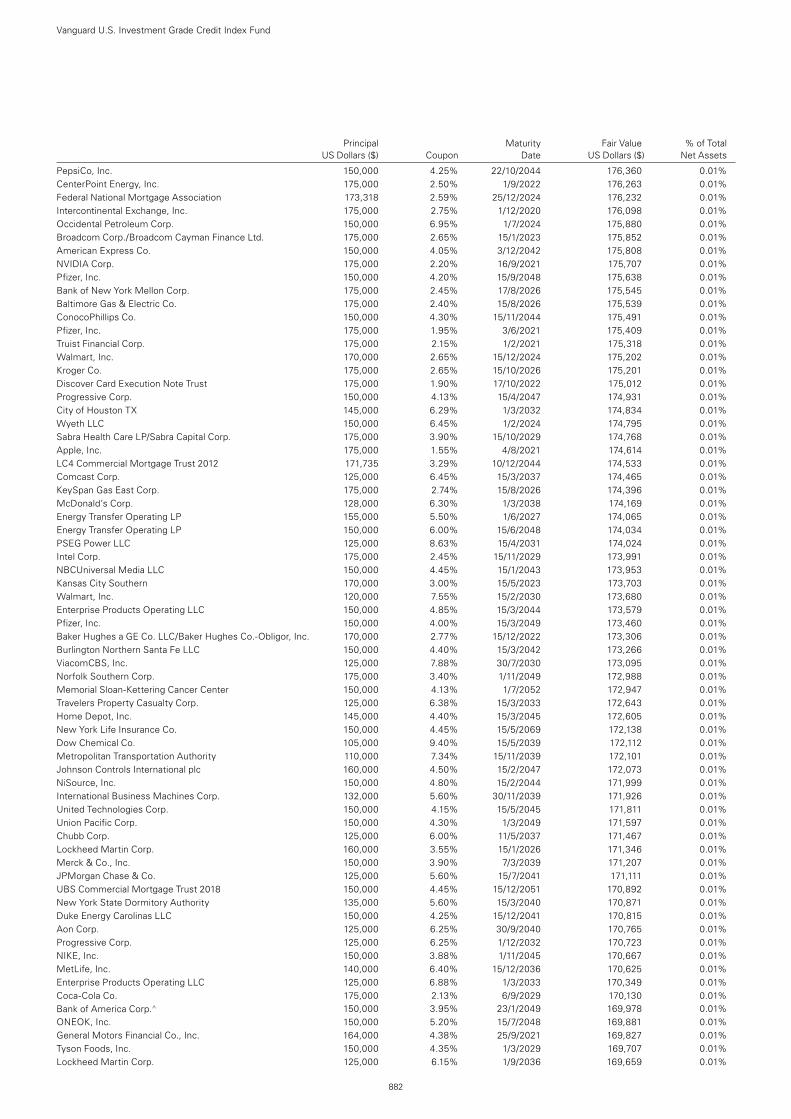
Principal Maturity Fair Value % of Total US Dollars ($) Coupon Date US Dollars ($) Net Assets
PepsiCo, Inc. 150,000 4.25% 22/10/2044 176,360 0.01%CenterPoint Energy, Inc. 175,000 2.50% 1/9/2022 176,263 0.01%Federal National Mortgage Association 173,318 2.59% 25/12/2024 176,232 0.01%Intercontinental Exchange, Inc. 175,000 2.75% 1/12/2020 176,098 0.01%Occidental Petroleum Corp. 150,000 6.95% 1/7/2024 175,880 0.01%Broadcom Corp./Broadcom Cayman Finance Ltd. 175,000 2.65% 15/1/2023 175,852 0.01%American Express Co. 150,000 4.05% 3/12/2042 175,808 0.01%NVIDIA Corp. 175,000 2.20% 16/9/2021 175,707 0.01%Pfizer, Inc. 150,000 4.20% 15/9/2048 175,638 0.01%Bank of New York Mellon Corp. 175,000 2.45% 17/8/2026 175,545 0.01%Baltimore Gas & Electric Co. 175,000 2.40% 15/8/2026 175,539 0.01%ConocoPhillips Co. 150,000 4.30% 15/11/2044 175,491 0.01%Pfizer, Inc. 175,000 1.95% 3/6/2021 175,409 0.01%Truist Financial Corp. 175,000 2.15% 1/2/2021 175,318 0.01%Walmart, Inc. 170,000 2.65% 15/12/2024 175,202 0.01%Kroger Co. 175,000 2.65% 15/10/2026 175,201 0.01%Discover Card Execution Note Trust 175,000 1.90% 17/10/2022 175,012 0.01%Progressive Corp. 150,000 4.13% 15/4/2047 174,931 0.01%City of Houston TX 145,000 6.29% 1/3/2032 174,834 0.01%Wyeth LLC 150,000 6.45% 1/2/2024 174,795 0.01%Sabra Health Care LP/Sabra Capital Corp. 175,000 3.90% 15/10/2029 174,768 0.01%Apple, Inc. 175,000 1.55% 4/8/2021 174,614 0.01%LC4 Commercial Mortgage Trust 2012 171,735 3.29% 10/12/2044 174,533 0.01%Comcast Corp. 125,000 6.45% 15/3/2037 174,465 0.01%KeySpan Gas East Corp. 175,000 2.74% 15/8/2026 174,396 0.01%McDonald’s Corp. 128,000 6.30% 1/3/2038 174,169 0.01%Energy Transfer Operating LP 155,000 5.50% 1/6/2027 174,065 0.01%Energy Transfer Operating LP 150,000 6.00% 15/6/2048 174,034 0.01%PSEG Power LLC 125,000 8.63% 15/4/2031 174,024 0.01%Intel Corp. 175,000 2.45% 15/11/2029 173,991 0.01%NBCUniversal Media LLC 150,000 4.45% 15/1/2043 173,953 0.01%Kansas City Southern 170,000 3.00% 15/5/2023 173,703 0.01%Walmart, Inc. 120,000 7.55% 15/2/2030 173,680 0.01%Enterprise Products Operating LLC 150,000 4.85% 15/3/2044 173,579 0.01%Pfizer, Inc. 150,000 4.00% 15/3/2049 173,460 0.01%Baker Hughes a GE Co. LLC/Baker Hughes Co.-Obligor, Inc. 170,000 2.77% 15/12/2022 173,306 0.01%Burlington Northern Santa Fe LLC 150,000 4.40% 15/3/2042 173,266 0.01%ViacomCBS, Inc. 125,000 7.88% 30/7/2030 173,095 0.01%Norfolk Southern Corp. 175,000 3.40% 1/11/2049 172,988 0.01%Memorial Sloan-Kettering Cancer Center 150,000 4.13% 1/7/2052 172,947 0.01%Travelers Property Casualty Corp. 125,000 6.38% 15/3/2033 172,643 0.01%Home Depot, Inc. 145,000 4.40% 15/3/2045 172,605 0.01%New York Life Insurance Co. 150,000 4.45% 15/5/2069 172,138 0.01%Dow Chemical Co. 105,000 9.40% 15/5/2039 172,112 0.01%Metropolitan Transportation Authority 110,000 7.34% 15/11/2039 172,101 0.01%Johnson Controls International plc 160,000 4.50% 15/2/2047 172,073 0.01%NiSource, Inc. 150,000 4.80% 15/2/2044 171,999 0.01%International Business Machines Corp. 132,000 5.60% 30/11/2039 171,926 0.01%United Technologies Corp. 150,000 4.15% 15/5/2045 171,811 0.01%Union Pacific Corp. 150,000 4.30% 1/3/2049 171,597 0.01%Chubb Corp. 125,000 6.00% 11/5/2037 171,467 0.01%Lockheed Martin Corp. 160,000 3.55% 15/1/2026 171,346 0.01%Merck & Co., Inc. 150,000 3.90% 7/3/2039 171,207 0.01%JPMorgan Chase & Co. 125,000 5.60% 15/7/2041 171,111 0.01%UBS Commercial Mortgage Trust 2018 150,000 4.45% 15/12/2051 170,892 0.01%New York State Dormitory Authority 135,000 5.60% 15/3/2040 170,871 0.01%Duke Energy Carolinas LLC 150,000 4.25% 15/12/2041 170,815 0.01%Aon Corp. 125,000 6.25% 30/9/2040 170,765 0.01%Progressive Corp. 125,000 6.25% 1/12/2032 170,723 0.01%NIKE, Inc. 150,000 3.88% 1/11/2045 170,667 0.01%MetLife, Inc. 140,000 6.40% 15/12/2036 170,625 0.01%Enterprise Products Operating LLC 125,000 6.88% 1/3/2033 170,349 0.01%Coca-Cola Co. 175,000 2.13% 6/9/2029 170,130 0.01%Bank of America Corp.^ 150,000 3.95% 23/1/2049 169,978 0.01%ONEOK, Inc. 150,000 5.20% 15/7/2048 169,881 0.01%General Motors Financial Co., Inc. 164,000 4.38% 25/9/2021 169,827 0.01%Tyson Foods, Inc. 150,000 4.35% 1/3/2029 169,707 0.01%Lockheed Martin Corp. 125,000 6.15% 1/9/2036 169,659 0.01%
Vanguard U.S. Investment Grade Credit Index Fund
882
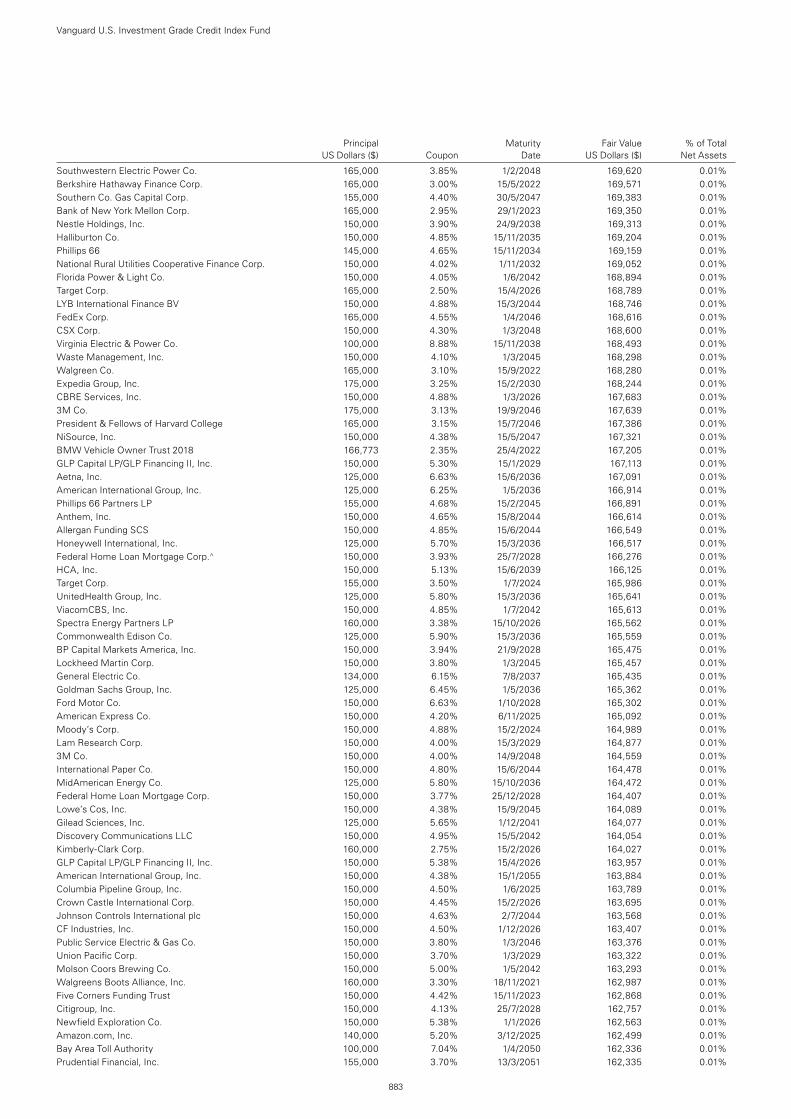
Principal Maturity Fair Value % of Total US Dollars ($) Coupon Date US Dollars ($) Net Assets
Southwestern Electric Power Co. 165,000 3.85% 1/2/2048 169,620 0.01%Berkshire Hathaway Finance Corp. 165,000 3.00% 15/5/2022 169,571 0.01%Southern Co. Gas Capital Corp. 155,000 4.40% 30/5/2047 169,383 0.01%Bank of New York Mellon Corp. 165,000 2.95% 29/1/2023 169,350 0.01%Nestle Holdings, Inc. 150,000 3.90% 24/9/2038 169,313 0.01%Halliburton Co. 150,000 4.85% 15/11/2035 169,204 0.01%Phillips 66 145,000 4.65% 15/11/2034 169,159 0.01%National Rural Utilities Cooperative Finance Corp. 150,000 4.02% 1/11/2032 169,052 0.01%Florida Power & Light Co. 150,000 4.05% 1/6/2042 168,894 0.01%Target Corp. 165,000 2.50% 15/4/2026 168,789 0.01%LYB International Finance BV 150,000 4.88% 15/3/2044 168,746 0.01%FedEx Corp. 165,000 4.55% 1/4/2046 168,616 0.01%CSX Corp. 150,000 4.30% 1/3/2048 168,600 0.01%Virginia Electric & Power Co. 100,000 8.88% 15/11/2038 168,493 0.01%Waste Management, Inc. 150,000 4.10% 1/3/2045 168,298 0.01%Walgreen Co. 165,000 3.10% 15/9/2022 168,280 0.01%Expedia Group, Inc. 175,000 3.25% 15/2/2030 168,244 0.01%CBRE Services, Inc. 150,000 4.88% 1/3/2026 167,683 0.01%3M Co. 175,000 3.13% 19/9/2046 167,639 0.01%President & Fellows of Harvard College 165,000 3.15% 15/7/2046 167,386 0.01%NiSource, Inc. 150,000 4.38% 15/5/2047 167,321 0.01%BMW Vehicle Owner Trust 2018 166,773 2.35% 25/4/2022 167,205 0.01%GLP Capital LP/GLP Financing II, Inc. 150,000 5.30% 15/1/2029 167,113 0.01%Aetna, Inc. 125,000 6.63% 15/6/2036 167,091 0.01%American International Group, Inc. 125,000 6.25% 1/5/2036 166,914 0.01%Phillips 66 Partners LP 155,000 4.68% 15/2/2045 166,891 0.01%Anthem, Inc. 150,000 4.65% 15/8/2044 166,614 0.01%Allergan Funding SCS 150,000 4.85% 15/6/2044 166,549 0.01%Honeywell International, Inc. 125,000 5.70% 15/3/2036 166,517 0.01%Federal Home Loan Mortgage Corp.^ 150,000 3.93% 25/7/2028 166,276 0.01%HCA, Inc. 150,000 5.13% 15/6/2039 166,125 0.01%Target Corp. 155,000 3.50% 1/7/2024 165,986 0.01%UnitedHealth Group, Inc. 125,000 5.80% 15/3/2036 165,641 0.01%ViacomCBS, Inc. 150,000 4.85% 1/7/2042 165,613 0.01%Spectra Energy Partners LP 160,000 3.38% 15/10/2026 165,562 0.01%Commonwealth Edison Co. 125,000 5.90% 15/3/2036 165,559 0.01%BP Capital Markets America, Inc. 150,000 3.94% 21/9/2028 165,475 0.01%Lockheed Martin Corp. 150,000 3.80% 1/3/2045 165,457 0.01%General Electric Co. 134,000 6.15% 7/8/2037 165,435 0.01%Goldman Sachs Group, Inc. 125,000 6.45% 1/5/2036 165,362 0.01%Ford Motor Co. 150,000 6.63% 1/10/2028 165,302 0.01%American Express Co. 150,000 4.20% 6/11/2025 165,092 0.01%Moody’s Corp. 150,000 4.88% 15/2/2024 164,989 0.01%Lam Research Corp. 150,000 4.00% 15/3/2029 164,877 0.01%3M Co. 150,000 4.00% 14/9/2048 164,559 0.01%International Paper Co. 150,000 4.80% 15/6/2044 164,478 0.01%MidAmerican Energy Co. 125,000 5.80% 15/10/2036 164,472 0.01%Federal Home Loan Mortgage Corp. 150,000 3.77% 25/12/2028 164,407 0.01%Lowe’s Cos, Inc. 150,000 4.38% 15/9/2045 164,089 0.01%Gilead Sciences, Inc. 125,000 5.65% 1/12/2041 164,077 0.01%Discovery Communications LLC 150,000 4.95% 15/5/2042 164,054 0.01%Kimberly-Clark Corp. 160,000 2.75% 15/2/2026 164,027 0.01%GLP Capital LP/GLP Financing II, Inc. 150,000 5.38% 15/4/2026 163,957 0.01%American International Group, Inc. 150,000 4.38% 15/1/2055 163,884 0.01%Columbia Pipeline Group, Inc. 150,000 4.50% 1/6/2025 163,789 0.01%Crown Castle International Corp. 150,000 4.45% 15/2/2026 163,695 0.01%Johnson Controls International plc 150,000 4.63% 2/7/2044 163,568 0.01%CF Industries, Inc. 150,000 4.50% 1/12/2026 163,407 0.01%Public Service Electric & Gas Co. 150,000 3.80% 1/3/2046 163,376 0.01%Union Pacific Corp. 150,000 3.70% 1/3/2029 163,322 0.01%Molson Coors Brewing Co. 150,000 5.00% 1/5/2042 163,293 0.01%Walgreens Boots Alliance, Inc. 160,000 3.30% 18/11/2021 162,987 0.01%Five Corners Funding Trust 150,000 4.42% 15/11/2023 162,868 0.01%Citigroup, Inc. 150,000 4.13% 25/7/2028 162,757 0.01%Newfield Exploration Co. 150,000 5.38% 1/1/2026 162,563 0.01%Amazon.com, Inc. 140,000 5.20% 3/12/2025 162,499 0.01%Bay Area Toll Authority 100,000 7.04% 1/4/2050 162,336 0.01%Prudential Financial, Inc. 155,000 3.70% 13/3/2051 162,335 0.01%
Vanguard U.S. Investment Grade Credit Index Fund
883
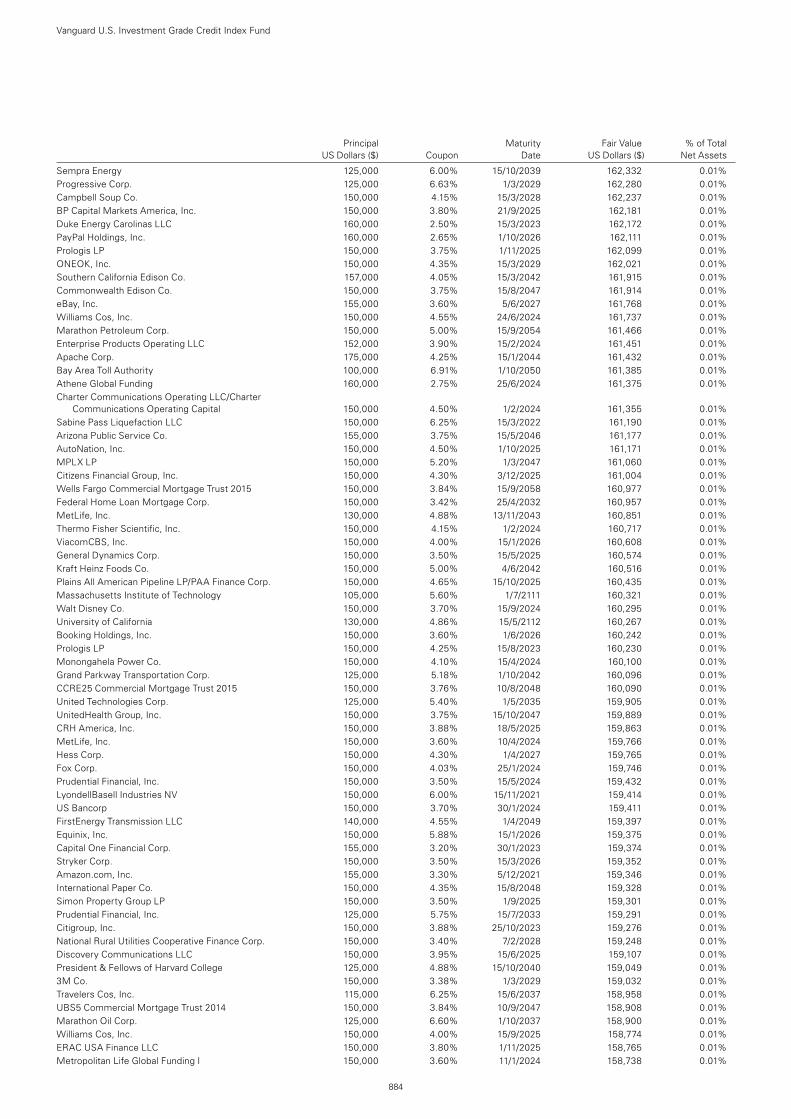
Principal Maturity Fair Value % of Total US Dollars ($) Coupon Date US Dollars ($) Net Assets
Sempra Energy 125,000 6.00% 15/10/2039 162,332 0.01%Progressive Corp. 125,000 6.63% 1/3/2029 162,280 0.01%Campbell Soup Co. 150,000 4.15% 15/3/2028 162,237 0.01%BP Capital Markets America, Inc. 150,000 3.80% 21/9/2025 162,181 0.01%Duke Energy Carolinas LLC 160,000 2.50% 15/3/2023 162,172 0.01%PayPal Holdings, Inc. 160,000 2.65% 1/10/2026 162,111 0.01%Prologis LP 150,000 3.75% 1/11/2025 162,099 0.01%ONEOK, Inc. 150,000 4.35% 15/3/2029 162,021 0.01%Southern California Edison Co. 157,000 4.05% 15/3/2042 161,915 0.01%Commonwealth Edison Co. 150,000 3.75% 15/8/2047 161,914 0.01%eBay, Inc. 155,000 3.60% 5/6/2027 161,768 0.01%Williams Cos, Inc. 150,000 4.55% 24/6/2024 161,737 0.01%Marathon Petroleum Corp. 150,000 5.00% 15/9/2054 161,466 0.01%Enterprise Products Operating LLC 152,000 3.90% 15/2/2024 161,451 0.01%Apache Corp. 175,000 4.25% 15/1/2044 161,432 0.01%Bay Area Toll Authority 100,000 6.91% 1/10/2050 161,385 0.01%Athene Global Funding 160,000 2.75% 25/6/2024 161,375 0.01%Charter Communications Operating LLC/Charter
Communications Operating Capital 150,000 4.50% 1/2/2024 161,355 0.01%Sabine Pass Liquefaction LLC 150,000 6.25% 15/3/2022 161,190 0.01%Arizona Public Service Co. 155,000 3.75% 15/5/2046 161,177 0.01%AutoNation, Inc. 150,000 4.50% 1/10/2025 161,171 0.01%MPLX LP 150,000 5.20% 1/3/2047 161,060 0.01%Citizens Financial Group, Inc. 150,000 4.30% 3/12/2025 161,004 0.01%Wells Fargo Commercial Mortgage Trust 2015 150,000 3.84% 15/9/2058 160,977 0.01%Federal Home Loan Mortgage Corp. 150,000 3.42% 25/4/2032 160,957 0.01%MetLife, Inc. 130,000 4.88% 13/11/2043 160,851 0.01%Thermo Fisher Scientific, Inc. 150,000 4.15% 1/2/2024 160,717 0.01%ViacomCBS, Inc. 150,000 4.00% 15/1/2026 160,608 0.01%General Dynamics Corp. 150,000 3.50% 15/5/2025 160,574 0.01%Kraft Heinz Foods Co. 150,000 5.00% 4/6/2042 160,516 0.01%Plains All American Pipeline LP/PAA Finance Corp. 150,000 4.65% 15/10/2025 160,435 0.01%Massachusetts Institute of Technology 105,000 5.60% 1/7/2111 160,321 0.01%Walt Disney Co. 150,000 3.70% 15/9/2024 160,295 0.01%University of California 130,000 4.86% 15/5/2112 160,267 0.01%Booking Holdings, Inc. 150,000 3.60% 1/6/2026 160,242 0.01%Prologis LP 150,000 4.25% 15/8/2023 160,230 0.01%Monongahela Power Co. 150,000 4.10% 15/4/2024 160,100 0.01%Grand Parkway Transportation Corp. 125,000 5.18% 1/10/2042 160,096 0.01%CCRE25 Commercial Mortgage Trust 2015 150,000 3.76% 10/8/2048 160,090 0.01%United Technologies Corp. 125,000 5.40% 1/5/2035 159,905 0.01%UnitedHealth Group, Inc. 150,000 3.75% 15/10/2047 159,889 0.01%CRH America, Inc. 150,000 3.88% 18/5/2025 159,863 0.01%MetLife, Inc. 150,000 3.60% 10/4/2024 159,766 0.01%Hess Corp. 150,000 4.30% 1/4/2027 159,765 0.01%Fox Corp. 150,000 4.03% 25/1/2024 159,746 0.01%Prudential Financial, Inc. 150,000 3.50% 15/5/2024 159,432 0.01%LyondellBasell Industries NV 150,000 6.00% 15/11/2021 159,414 0.01%US Bancorp 150,000 3.70% 30/1/2024 159,411 0.01%FirstEnergy Transmission LLC 140,000 4.55% 1/4/2049 159,397 0.01%Equinix, Inc. 150,000 5.88% 15/1/2026 159,375 0.01%Capital One Financial Corp. 155,000 3.20% 30/1/2023 159,374 0.01%Stryker Corp. 150,000 3.50% 15/3/2026 159,352 0.01%Amazon.com, Inc. 155,000 3.30% 5/12/2021 159,346 0.01%International Paper Co. 150,000 4.35% 15/8/2048 159,328 0.01%Simon Property Group LP 150,000 3.50% 1/9/2025 159,301 0.01%Prudential Financial, Inc. 125,000 5.75% 15/7/2033 159,291 0.01%Citigroup, Inc. 150,000 3.88% 25/10/2023 159,276 0.01%National Rural Utilities Cooperative Finance Corp. 150,000 3.40% 7/2/2028 159,248 0.01%Discovery Communications LLC 150,000 3.95% 15/6/2025 159,107 0.01%President & Fellows of Harvard College 125,000 4.88% 15/10/2040 159,049 0.01%3M Co. 150,000 3.38% 1/3/2029 159,032 0.01%Travelers Cos, Inc. 115,000 6.25% 15/6/2037 158,958 0.01%UBS5 Commercial Mortgage Trust 2014 150,000 3.84% 10/9/2047 158,908 0.01%Marathon Oil Corp. 125,000 6.60% 1/10/2037 158,900 0.01%Williams Cos, Inc. 150,000 4.00% 15/9/2025 158,774 0.01%ERAC USA Finance LLC 150,000 3.80% 1/11/2025 158,765 0.01%Metropolitan Life Global Funding I 150,000 3.60% 11/1/2024 158,738 0.01%
Vanguard U.S. Investment Grade Credit Index Fund
884
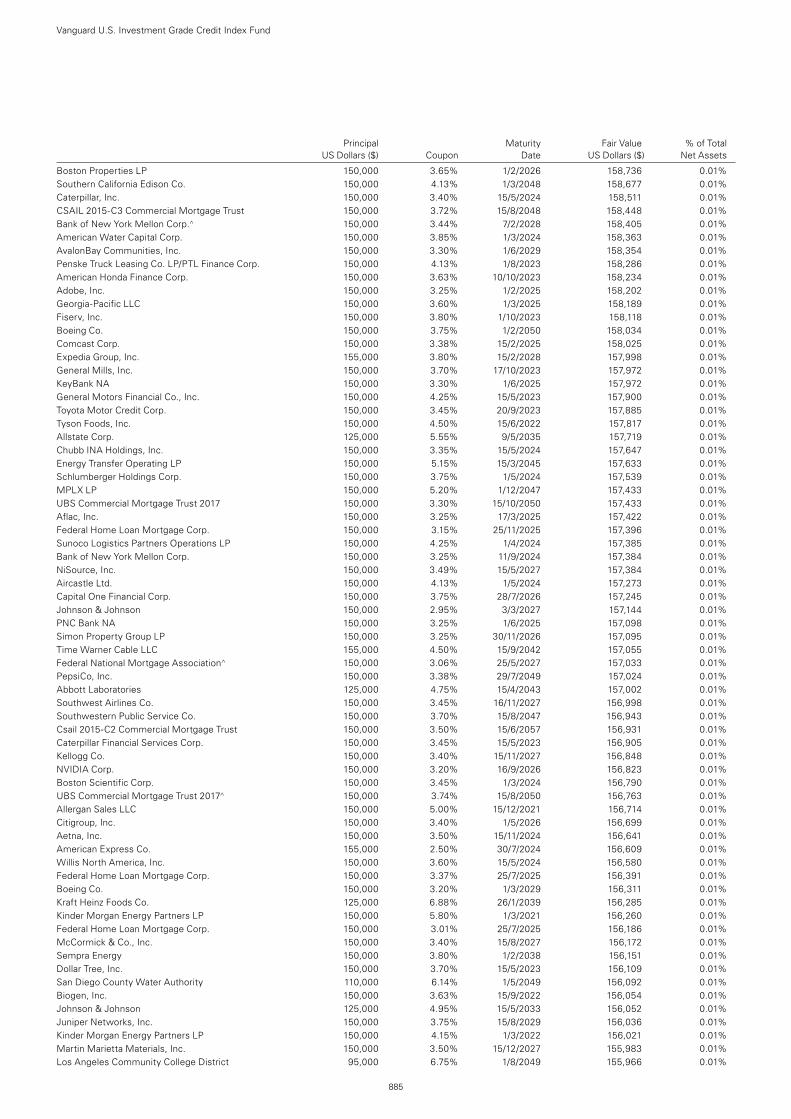
Principal Maturity Fair Value % of Total US Dollars ($) Coupon Date US Dollars ($) Net Assets
Boston Properties LP 150,000 3.65% 1/2/2026 158,736 0.01%Southern California Edison Co. 150,000 4.13% 1/3/2048 158,677 0.01%Caterpillar, Inc. 150,000 3.40% 15/5/2024 158,511 0.01%CSAIL 2015-C3 Commercial Mortgage Trust 150,000 3.72% 15/8/2048 158,448 0.01%Bank of New York Mellon Corp.^ 150,000 3.44% 7/2/2028 158,405 0.01%American Water Capital Corp. 150,000 3.85% 1/3/2024 158,363 0.01%AvalonBay Communities, Inc. 150,000 3.30% 1/6/2029 158,354 0.01%Penske Truck Leasing Co. LP/PTL Finance Corp. 150,000 4.13% 1/8/2023 158,286 0.01%American Honda Finance Corp. 150,000 3.63% 10/10/2023 158,234 0.01%Adobe, Inc. 150,000 3.25% 1/2/2025 158,202 0.01%Georgia-Pacific LLC 150,000 3.60% 1/3/2025 158,189 0.01%Fiserv, Inc. 150,000 3.80% 1/10/2023 158,118 0.01%Boeing Co. 150,000 3.75% 1/2/2050 158,034 0.01%Comcast Corp. 150,000 3.38% 15/2/2025 158,025 0.01%Expedia Group, Inc. 155,000 3.80% 15/2/2028 157,998 0.01%General Mills, Inc. 150,000 3.70% 17/10/2023 157,972 0.01%KeyBank NA 150,000 3.30% 1/6/2025 157,972 0.01%General Motors Financial Co., Inc. 150,000 4.25% 15/5/2023 157,900 0.01%Toyota Motor Credit Corp. 150,000 3.45% 20/9/2023 157,885 0.01%Tyson Foods, Inc. 150,000 4.50% 15/6/2022 157,817 0.01%Allstate Corp. 125,000 5.55% 9/5/2035 157,719 0.01%Chubb INA Holdings, Inc. 150,000 3.35% 15/5/2024 157,647 0.01%Energy Transfer Operating LP 150,000 5.15% 15/3/2045 157,633 0.01%Schlumberger Holdings Corp. 150,000 3.75% 1/5/2024 157,539 0.01%MPLX LP 150,000 5.20% 1/12/2047 157,433 0.01%UBS Commercial Mortgage Trust 2017 150,000 3.30% 15/10/2050 157,433 0.01%Aflac, Inc. 150,000 3.25% 17/3/2025 157,422 0.01%Federal Home Loan Mortgage Corp. 150,000 3.15% 25/11/2025 157,396 0.01%Sunoco Logistics Partners Operations LP 150,000 4.25% 1/4/2024 157,385 0.01%Bank of New York Mellon Corp. 150,000 3.25% 11/9/2024 157,384 0.01%NiSource, Inc. 150,000 3.49% 15/5/2027 157,384 0.01%Aircastle Ltd. 150,000 4.13% 1/5/2024 157,273 0.01%Capital One Financial Corp. 150,000 3.75% 28/7/2026 157,245 0.01%Johnson & Johnson 150,000 2.95% 3/3/2027 157,144 0.01%PNC Bank NA 150,000 3.25% 1/6/2025 157,098 0.01%Simon Property Group LP 150,000 3.25% 30/11/2026 157,095 0.01%Time Warner Cable LLC 155,000 4.50% 15/9/2042 157,055 0.01%Federal National Mortgage Association^ 150,000 3.06% 25/5/2027 157,033 0.01%PepsiCo, Inc. 150,000 3.38% 29/7/2049 157,024 0.01%Abbott Laboratories 125,000 4.75% 15/4/2043 157,002 0.01%Southwest Airlines Co. 150,000 3.45% 16/11/2027 156,998 0.01%Southwestern Public Service Co. 150,000 3.70% 15/8/2047 156,943 0.01%Csail 2015-C2 Commercial Mortgage Trust 150,000 3.50% 15/6/2057 156,931 0.01%Caterpillar Financial Services Corp. 150,000 3.45% 15/5/2023 156,905 0.01%Kellogg Co. 150,000 3.40% 15/11/2027 156,848 0.01%NVIDIA Corp. 150,000 3.20% 16/9/2026 156,823 0.01%Boston Scientific Corp. 150,000 3.45% 1/3/2024 156,790 0.01%UBS Commercial Mortgage Trust 2017^ 150,000 3.74% 15/8/2050 156,763 0.01%Allergan Sales LLC 150,000 5.00% 15/12/2021 156,714 0.01%Citigroup, Inc. 150,000 3.40% 1/5/2026 156,699 0.01%Aetna, Inc. 150,000 3.50% 15/11/2024 156,641 0.01%American Express Co. 155,000 2.50% 30/7/2024 156,609 0.01%Willis North America, Inc. 150,000 3.60% 15/5/2024 156,580 0.01%Federal Home Loan Mortgage Corp. 150,000 3.37% 25/7/2025 156,391 0.01%Boeing Co. 150,000 3.20% 1/3/2029 156,311 0.01%Kraft Heinz Foods Co. 125,000 6.88% 26/1/2039 156,285 0.01%Kinder Morgan Energy Partners LP 150,000 5.80% 1/3/2021 156,260 0.01%Federal Home Loan Mortgage Corp. 150,000 3.01% 25/7/2025 156,186 0.01%McCormick & Co., Inc. 150,000 3.40% 15/8/2027 156,172 0.01%Sempra Energy 150,000 3.80% 1/2/2038 156,151 0.01%Dollar Tree, Inc. 150,000 3.70% 15/5/2023 156,109 0.01%San Diego County Water Authority 110,000 6.14% 1/5/2049 156,092 0.01%Biogen, Inc. 150,000 3.63% 15/9/2022 156,054 0.01%Johnson & Johnson 125,000 4.95% 15/5/2033 156,052 0.01%Juniper Networks, Inc. 150,000 3.75% 15/8/2029 156,036 0.01%Kinder Morgan Energy Partners LP 150,000 4.15% 1/3/2022 156,021 0.01%Martin Marietta Materials, Inc. 150,000 3.50% 15/12/2027 155,983 0.01%Los Angeles Community College District 95,000 6.75% 1/8/2049 155,966 0.01%
Vanguard U.S. Investment Grade Credit Index Fund
885
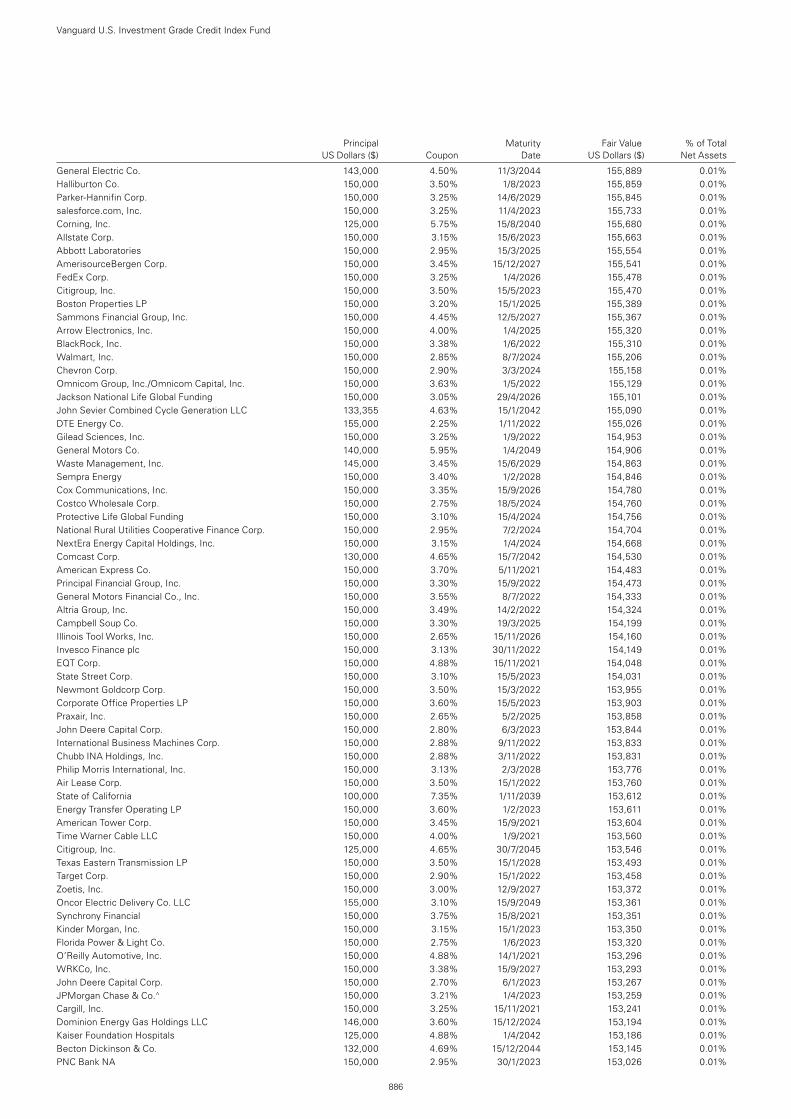
Principal Maturity Fair Value % of Total US Dollars ($) Coupon Date US Dollars ($) Net Assets
General Electric Co. 143,000 4.50% 11/3/2044 155,889 0.01%Halliburton Co. 150,000 3.50% 1/8/2023 155,859 0.01%Parker-Hannifin Corp. 150,000 3.25% 14/6/2029 155,845 0.01%salesforce.com, Inc. 150,000 3.25% 11/4/2023 155,733 0.01%Corning, Inc. 125,000 5.75% 15/8/2040 155,680 0.01%Allstate Corp. 150,000 3.15% 15/6/2023 155,663 0.01%Abbott Laboratories 150,000 2.95% 15/3/2025 155,554 0.01%AmerisourceBergen Corp. 150,000 3.45% 15/12/2027 155,541 0.01%FedEx Corp. 150,000 3.25% 1/4/2026 155,478 0.01%Citigroup, Inc. 150,000 3.50% 15/5/2023 155,470 0.01%Boston Properties LP 150,000 3.20% 15/1/2025 155,389 0.01%Sammons Financial Group, Inc. 150,000 4.45% 12/5/2027 155,367 0.01%Arrow Electronics, Inc. 150,000 4.00% 1/4/2025 155,320 0.01%BlackRock, Inc. 150,000 3.38% 1/6/2022 155,310 0.01%Walmart, Inc. 150,000 2.85% 8/7/2024 155,206 0.01%Chevron Corp. 150,000 2.90% 3/3/2024 155,158 0.01%Omnicom Group, Inc./Omnicom Capital, Inc. 150,000 3.63% 1/5/2022 155,129 0.01%Jackson National Life Global Funding 150,000 3.05% 29/4/2026 155,101 0.01%John Sevier Combined Cycle Generation LLC 133,355 4.63% 15/1/2042 155,090 0.01%DTE Energy Co. 155,000 2.25% 1/11/2022 155,026 0.01%Gilead Sciences, Inc. 150,000 3.25% 1/9/2022 154,953 0.01%General Motors Co. 140,000 5.95% 1/4/2049 154,906 0.01%Waste Management, Inc. 145,000 3.45% 15/6/2029 154,863 0.01%Sempra Energy 150,000 3.40% 1/2/2028 154,846 0.01%Cox Communications, Inc. 150,000 3.35% 15/9/2026 154,780 0.01%Costco Wholesale Corp. 150,000 2.75% 18/5/2024 154,760 0.01%Protective Life Global Funding 150,000 3.10% 15/4/2024 154,756 0.01%National Rural Utilities Cooperative Finance Corp. 150,000 2.95% 7/2/2024 154,704 0.01%NextEra Energy Capital Holdings, Inc. 150,000 3.15% 1/4/2024 154,668 0.01%Comcast Corp. 130,000 4.65% 15/7/2042 154,530 0.01%American Express Co. 150,000 3.70% 5/11/2021 154,483 0.01%Principal Financial Group, Inc. 150,000 3.30% 15/9/2022 154,473 0.01%General Motors Financial Co., Inc. 150,000 3.55% 8/7/2022 154,333 0.01%Altria Group, Inc. 150,000 3.49% 14/2/2022 154,324 0.01%Campbell Soup Co. 150,000 3.30% 19/3/2025 154,199 0.01%Illinois Tool Works, Inc. 150,000 2.65% 15/11/2026 154,160 0.01%Invesco Finance plc 150,000 3.13% 30/11/2022 154,149 0.01%EQT Corp. 150,000 4.88% 15/11/2021 154,048 0.01%State Street Corp. 150,000 3.10% 15/5/2023 154,031 0.01%Newmont Goldcorp Corp. 150,000 3.50% 15/3/2022 153,955 0.01%Corporate Office Properties LP 150,000 3.60% 15/5/2023 153,903 0.01%Praxair, Inc. 150,000 2.65% 5/2/2025 153,858 0.01%John Deere Capital Corp. 150,000 2.80% 6/3/2023 153,844 0.01%International Business Machines Corp. 150,000 2.88% 9/11/2022 153,833 0.01%Chubb INA Holdings, Inc. 150,000 2.88% 3/11/2022 153,831 0.01%Philip Morris International, Inc. 150,000 3.13% 2/3/2028 153,776 0.01%Air Lease Corp. 150,000 3.50% 15/1/2022 153,760 0.01%State of California 100,000 7.35% 1/11/2039 153,612 0.01%Energy Transfer Operating LP 150,000 3.60% 1/2/2023 153,611 0.01%American Tower Corp. 150,000 3.45% 15/9/2021 153,604 0.01%Time Warner Cable LLC 150,000 4.00% 1/9/2021 153,560 0.01%Citigroup, Inc. 125,000 4.65% 30/7/2045 153,546 0.01%Texas Eastern Transmission LP 150,000 3.50% 15/1/2028 153,493 0.01%Target Corp. 150,000 2.90% 15/1/2022 153,458 0.01%Zoetis, Inc. 150,000 3.00% 12/9/2027 153,372 0.01%Oncor Electric Delivery Co. LLC 155,000 3.10% 15/9/2049 153,361 0.01%Synchrony Financial 150,000 3.75% 15/8/2021 153,351 0.01%Kinder Morgan, Inc. 150,000 3.15% 15/1/2023 153,350 0.01%Florida Power & Light Co. 150,000 2.75% 1/6/2023 153,320 0.01%O’Reilly Automotive, Inc. 150,000 4.88% 14/1/2021 153,296 0.01%WRKCo, Inc. 150,000 3.38% 15/9/2027 153,293 0.01%John Deere Capital Corp. 150,000 2.70% 6/1/2023 153,267 0.01%JPMorgan Chase & Co.^ 150,000 3.21% 1/4/2023 153,259 0.01%Cargill, Inc. 150,000 3.25% 15/11/2021 153,241 0.01%Dominion Energy Gas Holdings LLC 146,000 3.60% 15/12/2024 153,194 0.01%Kaiser Foundation Hospitals 125,000 4.88% 1/4/2042 153,186 0.01%Becton Dickinson & Co. 132,000 4.69% 15/12/2044 153,145 0.01%PNC Bank NA 150,000 2.95% 30/1/2023 153,026 0.01%
Vanguard U.S. Investment Grade Credit Index Fund
886
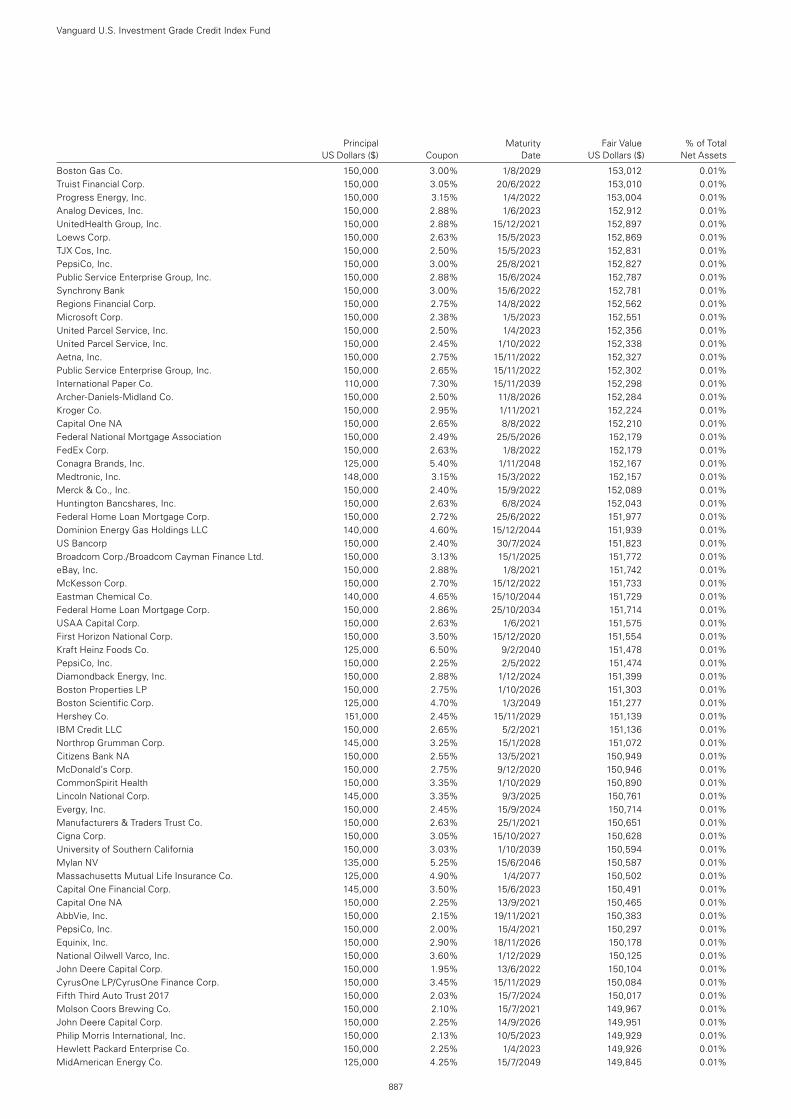
Principal Maturity Fair Value % of Total US Dollars ($) Coupon Date US Dollars ($) Net Assets
Boston Gas Co. 150,000 3.00% 1/8/2029 153,012 0.01%Truist Financial Corp. 150,000 3.05% 20/6/2022 153,010 0.01%Progress Energy, Inc. 150,000 3.15% 1/4/2022 153,004 0.01%Analog Devices, Inc. 150,000 2.88% 1/6/2023 152,912 0.01%UnitedHealth Group, Inc. 150,000 2.88% 15/12/2021 152,897 0.01%Loews Corp. 150,000 2.63% 15/5/2023 152,869 0.01%TJX Cos, Inc. 150,000 2.50% 15/5/2023 152,831 0.01%PepsiCo, Inc. 150,000 3.00% 25/8/2021 152,827 0.01%Public Service Enterprise Group, Inc. 150,000 2.88% 15/6/2024 152,787 0.01%Synchrony Bank 150,000 3.00% 15/6/2022 152,781 0.01%Regions Financial Corp. 150,000 2.75% 14/8/2022 152,562 0.01%Microsoft Corp. 150,000 2.38% 1/5/2023 152,551 0.01%United Parcel Service, Inc. 150,000 2.50% 1/4/2023 152,356 0.01%United Parcel Service, Inc. 150,000 2.45% 1/10/2022 152,338 0.01%Aetna, Inc. 150,000 2.75% 15/11/2022 152,327 0.01%Public Service Enterprise Group, Inc. 150,000 2.65% 15/11/2022 152,302 0.01%International Paper Co. 110,000 7.30% 15/11/2039 152,298 0.01%Archer-Daniels-Midland Co. 150,000 2.50% 11/8/2026 152,284 0.01%Kroger Co. 150,000 2.95% 1/11/2021 152,224 0.01%Capital One NA 150,000 2.65% 8/8/2022 152,210 0.01%Federal National Mortgage Association 150,000 2.49% 25/5/2026 152,179 0.01%FedEx Corp. 150,000 2.63% 1/8/2022 152,179 0.01%Conagra Brands, Inc. 125,000 5.40% 1/11/2048 152,167 0.01%Medtronic, Inc. 148,000 3.15% 15/3/2022 152,157 0.01%Merck & Co., Inc. 150,000 2.40% 15/9/2022 152,089 0.01%Huntington Bancshares, Inc. 150,000 2.63% 6/8/2024 152,043 0.01%Federal Home Loan Mortgage Corp. 150,000 2.72% 25/6/2022 151,977 0.01%Dominion Energy Gas Holdings LLC 140,000 4.60% 15/12/2044 151,939 0.01%US Bancorp 150,000 2.40% 30/7/2024 151,823 0.01%Broadcom Corp./Broadcom Cayman Finance Ltd. 150,000 3.13% 15/1/2025 151,772 0.01%eBay, Inc. 150,000 2.88% 1/8/2021 151,742 0.01%McKesson Corp. 150,000 2.70% 15/12/2022 151,733 0.01%Eastman Chemical Co. 140,000 4.65% 15/10/2044 151,729 0.01%Federal Home Loan Mortgage Corp. 150,000 2.86% 25/10/2034 151,714 0.01%USAA Capital Corp. 150,000 2.63% 1/6/2021 151,575 0.01%First Horizon National Corp. 150,000 3.50% 15/12/2020 151,554 0.01%Kraft Heinz Foods Co. 125,000 6.50% 9/2/2040 151,478 0.01%PepsiCo, Inc. 150,000 2.25% 2/5/2022 151,474 0.01%Diamondback Energy, Inc. 150,000 2.88% 1/12/2024 151,399 0.01%Boston Properties LP 150,000 2.75% 1/10/2026 151,303 0.01%Boston Scientific Corp. 125,000 4.70% 1/3/2049 151,277 0.01%Hershey Co. 151,000 2.45% 15/11/2029 151,139 0.01%IBM Credit LLC 150,000 2.65% 5/2/2021 151,136 0.01%Northrop Grumman Corp. 145,000 3.25% 15/1/2028 151,072 0.01%Citizens Bank NA 150,000 2.55% 13/5/2021 150,949 0.01%McDonald’s Corp. 150,000 2.75% 9/12/2020 150,946 0.01%CommonSpirit Health 150,000 3.35% 1/10/2029 150,890 0.01%Lincoln National Corp. 145,000 3.35% 9/3/2025 150,761 0.01%Evergy, Inc. 150,000 2.45% 15/9/2024 150,714 0.01%Manufacturers & Traders Trust Co. 150,000 2.63% 25/1/2021 150,651 0.01%Cigna Corp. 150,000 3.05% 15/10/2027 150,628 0.01%University of Southern California 150,000 3.03% 1/10/2039 150,594 0.01%Mylan NV 135,000 5.25% 15/6/2046 150,587 0.01%Massachusetts Mutual Life Insurance Co. 125,000 4.90% 1/4/2077 150,502 0.01%Capital One Financial Corp. 145,000 3.50% 15/6/2023 150,491 0.01%Capital One NA 150,000 2.25% 13/9/2021 150,465 0.01%AbbVie, Inc. 150,000 2.15% 19/11/2021 150,383 0.01%PepsiCo, Inc. 150,000 2.00% 15/4/2021 150,297 0.01%Equinix, Inc. 150,000 2.90% 18/11/2026 150,178 0.01%National Oilwell Varco, Inc. 150,000 3.60% 1/12/2029 150,125 0.01%John Deere Capital Corp. 150,000 1.95% 13/6/2022 150,104 0.01%CyrusOne LP/CyrusOne Finance Corp. 150,000 3.45% 15/11/2029 150,084 0.01%Fifth Third Auto Trust 2017 150,000 2.03% 15/7/2024 150,017 0.01%Molson Coors Brewing Co. 150,000 2.10% 15/7/2021 149,967 0.01%John Deere Capital Corp. 150,000 2.25% 14/9/2026 149,951 0.01%Philip Morris International, Inc. 150,000 2.13% 10/5/2023 149,929 0.01%Hewlett Packard Enterprise Co. 150,000 2.25% 1/4/2023 149,926 0.01%MidAmerican Energy Co. 125,000 4.25% 15/7/2049 149,845 0.01%
Vanguard U.S. Investment Grade Credit Index Fund
887
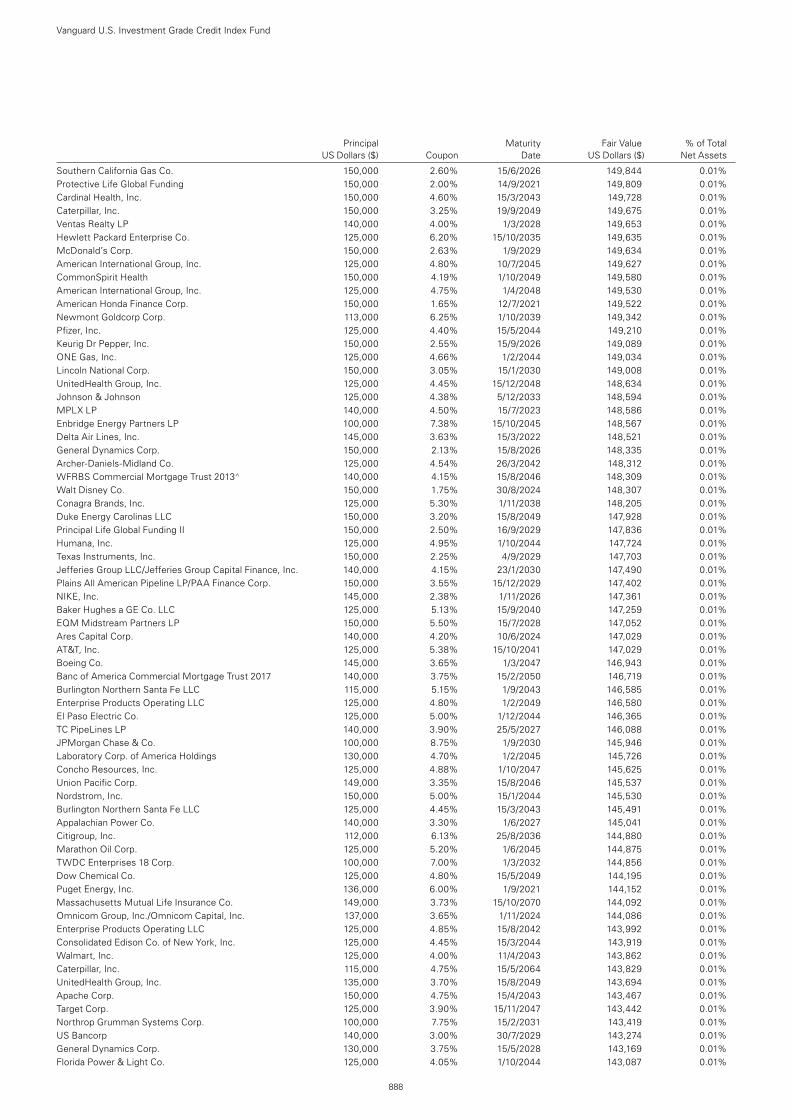
Principal Maturity Fair Value % of Total US Dollars ($) Coupon Date US Dollars ($) Net Assets
Southern California Gas Co. 150,000 2.60% 15/6/2026 149,844 0.01%Protective Life Global Funding 150,000 2.00% 14/9/2021 149,809 0.01%Cardinal Health, Inc. 150,000 4.60% 15/3/2043 149,728 0.01%Caterpillar, Inc. 150,000 3.25% 19/9/2049 149,675 0.01%Ventas Realty LP 140,000 4.00% 1/3/2028 149,653 0.01%Hewlett Packard Enterprise Co. 125,000 6.20% 15/10/2035 149,635 0.01%McDonald’s Corp. 150,000 2.63% 1/9/2029 149,634 0.01%American International Group, Inc. 125,000 4.80% 10/7/2045 149,627 0.01%CommonSpirit Health 150,000 4.19% 1/10/2049 149,580 0.01%American International Group, Inc. 125,000 4.75% 1/4/2048 149,530 0.01%American Honda Finance Corp. 150,000 1.65% 12/7/2021 149,522 0.01%Newmont Goldcorp Corp. 113,000 6.25% 1/10/2039 149,342 0.01%Pfizer, Inc. 125,000 4.40% 15/5/2044 149,210 0.01%Keurig Dr Pepper, Inc. 150,000 2.55% 15/9/2026 149,089 0.01%ONE Gas, Inc. 125,000 4.66% 1/2/2044 149,034 0.01%Lincoln National Corp. 150,000 3.05% 15/1/2030 149,008 0.01%UnitedHealth Group, Inc. 125,000 4.45% 15/12/2048 148,634 0.01%Johnson & Johnson 125,000 4.38% 5/12/2033 148,594 0.01%MPLX LP 140,000 4.50% 15/7/2023 148,586 0.01%Enbridge Energy Partners LP 100,000 7.38% 15/10/2045 148,567 0.01%Delta Air Lines, Inc. 145,000 3.63% 15/3/2022 148,521 0.01%General Dynamics Corp. 150,000 2.13% 15/8/2026 148,335 0.01%Archer-Daniels-Midland Co. 125,000 4.54% 26/3/2042 148,312 0.01%WFRBS Commercial Mortgage Trust 2013^ 140,000 4.15% 15/8/2046 148,309 0.01%Walt Disney Co. 150,000 1.75% 30/8/2024 148,307 0.01%Conagra Brands, Inc. 125,000 5.30% 1/11/2038 148,205 0.01%Duke Energy Carolinas LLC 150,000 3.20% 15/8/2049 147,928 0.01%Principal Life Global Funding II 150,000 2.50% 16/9/2029 147,836 0.01%Humana, Inc. 125,000 4.95% 1/10/2044 147,724 0.01%Texas Instruments, Inc. 150,000 2.25% 4/9/2029 147,703 0.01%Jefferies Group LLC/Jefferies Group Capital Finance, Inc. 140,000 4.15% 23/1/2030 147,490 0.01%Plains All American Pipeline LP/PAA Finance Corp. 150,000 3.55% 15/12/2029 147,402 0.01%NIKE, Inc. 145,000 2.38% 1/11/2026 147,361 0.01%Baker Hughes a GE Co. LLC 125,000 5.13% 15/9/2040 147,259 0.01%EQM Midstream Partners LP 150,000 5.50% 15/7/2028 147,052 0.01%Ares Capital Corp. 140,000 4.20% 10/6/2024 147,029 0.01%AT&T, Inc. 125,000 5.38% 15/10/2041 147,029 0.01%Boeing Co. 145,000 3.65% 1/3/2047 146,943 0.01%Banc of America Commercial Mortgage Trust 2017 140,000 3.75% 15/2/2050 146,719 0.01%Burlington Northern Santa Fe LLC 115,000 5.15% 1/9/2043 146,585 0.01%Enterprise Products Operating LLC 125,000 4.80% 1/2/2049 146,580 0.01%El Paso Electric Co. 125,000 5.00% 1/12/2044 146,365 0.01%TC PipeLines LP 140,000 3.90% 25/5/2027 146,088 0.01%JPMorgan Chase & Co. 100,000 8.75% 1/9/2030 145,946 0.01%Laboratory Corp. of America Holdings 130,000 4.70% 1/2/2045 145,726 0.01%Concho Resources, Inc. 125,000 4.88% 1/10/2047 145,625 0.01%Union Pacific Corp. 149,000 3.35% 15/8/2046 145,537 0.01%Nordstrom, Inc. 150,000 5.00% 15/1/2044 145,530 0.01%Burlington Northern Santa Fe LLC 125,000 4.45% 15/3/2043 145,491 0.01%Appalachian Power Co. 140,000 3.30% 1/6/2027 145,041 0.01%Citigroup, Inc. 112,000 6.13% 25/8/2036 144,880 0.01%Marathon Oil Corp. 125,000 5.20% 1/6/2045 144,875 0.01%TWDC Enterprises 18 Corp. 100,000 7.00% 1/3/2032 144,856 0.01%Dow Chemical Co. 125,000 4.80% 15/5/2049 144,195 0.01%Puget Energy, Inc. 136,000 6.00% 1/9/2021 144,152 0.01%Massachusetts Mutual Life Insurance Co. 149,000 3.73% 15/10/2070 144,092 0.01%Omnicom Group, Inc./Omnicom Capital, Inc. 137,000 3.65% 1/11/2024 144,086 0.01%Enterprise Products Operating LLC 125,000 4.85% 15/8/2042 143,992 0.01%Consolidated Edison Co. of New York, Inc. 125,000 4.45% 15/3/2044 143,919 0.01%Walmart, Inc. 125,000 4.00% 11/4/2043 143,862 0.01%Caterpillar, Inc. 115,000 4.75% 15/5/2064 143,829 0.01%UnitedHealth Group, Inc. 135,000 3.70% 15/8/2049 143,694 0.01%Apache Corp. 150,000 4.75% 15/4/2043 143,467 0.01%Target Corp. 125,000 3.90% 15/11/2047 143,442 0.01%Northrop Grumman Systems Corp. 100,000 7.75% 15/2/2031 143,419 0.01%US Bancorp 140,000 3.00% 30/7/2029 143,274 0.01%General Dynamics Corp. 130,000 3.75% 15/5/2028 143,169 0.01%Florida Power & Light Co. 125,000 4.05% 1/10/2044 143,087 0.01%
Vanguard U.S. Investment Grade Credit Index Fund
888
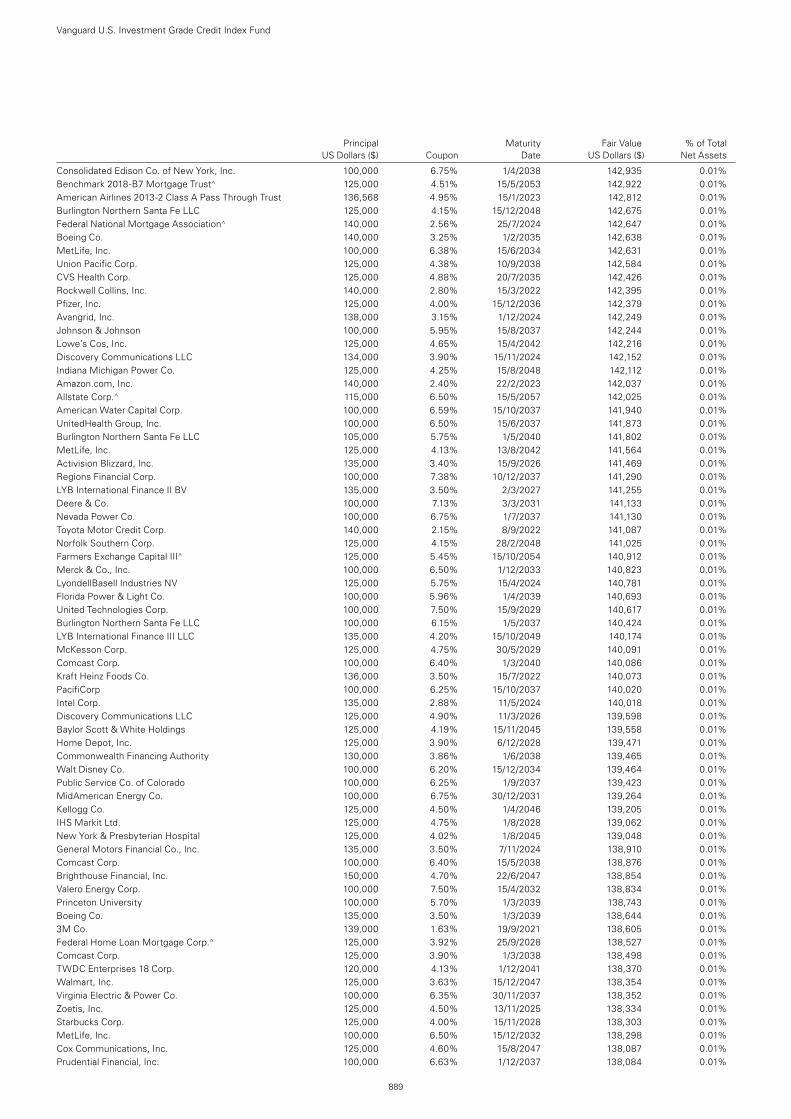
Principal Maturity Fair Value % of Total US Dollars ($) Coupon Date US Dollars ($) Net Assets
Consolidated Edison Co. of New York, Inc. 100,000 6.75% 1/4/2038 142,935 0.01%Benchmark 2018-B7 Mortgage Trust^ 125,000 4.51% 15/5/2053 142,922 0.01%American Airlines 2013-2 Class A Pass Through Trust 136,568 4.95% 15/1/2023 142,812 0.01%Burlington Northern Santa Fe LLC 125,000 4.15% 15/12/2048 142,675 0.01%Federal National Mortgage Association^ 140,000 2.56% 25/7/2024 142,647 0.01%Boeing Co. 140,000 3.25% 1/2/2035 142,638 0.01%MetLife, Inc. 100,000 6.38% 15/6/2034 142,631 0.01%Union Pacific Corp. 125,000 4.38% 10/9/2038 142,584 0.01%CVS Health Corp. 125,000 4.88% 20/7/2035 142,426 0.01%Rockwell Collins, Inc. 140,000 2.80% 15/3/2022 142,395 0.01%Pfizer, Inc. 125,000 4.00% 15/12/2036 142,379 0.01%Avangrid, Inc. 138,000 3.15% 1/12/2024 142,249 0.01%Johnson & Johnson 100,000 5.95% 15/8/2037 142,244 0.01%Lowe’s Cos, Inc. 125,000 4.65% 15/4/2042 142,216 0.01%Discovery Communications LLC 134,000 3.90% 15/11/2024 142,152 0.01%Indiana Michigan Power Co. 125,000 4.25% 15/8/2048 142,112 0.01%Amazon.com, Inc. 140,000 2.40% 22/2/2023 142,037 0.01%Allstate Corp.^ 115,000 6.50% 15/5/2057 142,025 0.01%American Water Capital Corp. 100,000 6.59% 15/10/2037 141,940 0.01%UnitedHealth Group, Inc. 100,000 6.50% 15/6/2037 141,873 0.01%Burlington Northern Santa Fe LLC 105,000 5.75% 1/5/2040 141,802 0.01%MetLife, Inc. 125,000 4.13% 13/8/2042 141,564 0.01%Activision Blizzard, Inc. 135,000 3.40% 15/9/2026 141,469 0.01%Regions Financial Corp. 100,000 7.38% 10/12/2037 141,290 0.01%LYB International Finance II BV 135,000 3.50% 2/3/2027 141,255 0.01%Deere & Co. 100,000 7.13% 3/3/2031 141,133 0.01%Nevada Power Co. 100,000 6.75% 1/7/2037 141,130 0.01%Toyota Motor Credit Corp. 140,000 2.15% 8/9/2022 141,087 0.01%Norfolk Southern Corp. 125,000 4.15% 28/2/2048 141,025 0.01%Farmers Exchange Capital III^ 125,000 5.45% 15/10/2054 140,912 0.01%Merck & Co., Inc. 100,000 6.50% 1/12/2033 140,823 0.01%LyondellBasell Industries NV 125,000 5.75% 15/4/2024 140,781 0.01%Florida Power & Light Co. 100,000 5.96% 1/4/2039 140,693 0.01%United Technologies Corp. 100,000 7.50% 15/9/2029 140,617 0.01%Burlington Northern Santa Fe LLC 100,000 6.15% 1/5/2037 140,424 0.01%LYB International Finance III LLC 135,000 4.20% 15/10/2049 140,174 0.01%McKesson Corp. 125,000 4.75% 30/5/2029 140,091 0.01%Comcast Corp. 100,000 6.40% 1/3/2040 140,086 0.01%Kraft Heinz Foods Co. 136,000 3.50% 15/7/2022 140,073 0.01%PacifiCorp 100,000 6.25% 15/10/2037 140,020 0.01%Intel Corp. 135,000 2.88% 11/5/2024 140,018 0.01%Discovery Communications LLC 125,000 4.90% 11/3/2026 139,598 0.01%Baylor Scott & White Holdings 125,000 4.19% 15/11/2045 139,558 0.01%Home Depot, Inc. 125,000 3.90% 6/12/2028 139,471 0.01%Commonwealth Financing Authority 130,000 3.86% 1/6/2038 139,465 0.01%Walt Disney Co. 100,000 6.20% 15/12/2034 139,464 0.01%Public Service Co. of Colorado 100,000 6.25% 1/9/2037 139,423 0.01%MidAmerican Energy Co. 100,000 6.75% 30/12/2031 139,264 0.01%Kellogg Co. 125,000 4.50% 1/4/2046 139,205 0.01%IHS Markit Ltd. 125,000 4.75% 1/8/2028 139,062 0.01%New York & Presbyterian Hospital 125,000 4.02% 1/8/2045 139,048 0.01%General Motors Financial Co., Inc. 135,000 3.50% 7/11/2024 138,910 0.01%Comcast Corp. 100,000 6.40% 15/5/2038 138,876 0.01%Brighthouse Financial, Inc. 150,000 4.70% 22/6/2047 138,854 0.01%Valero Energy Corp. 100,000 7.50% 15/4/2032 138,834 0.01%Princeton University 100,000 5.70% 1/3/2039 138,743 0.01%Boeing Co. 135,000 3.50% 1/3/2039 138,644 0.01%3M Co. 139,000 1.63% 19/9/2021 138,605 0.01%Federal Home Loan Mortgage Corp.^ 125,000 3.92% 25/9/2028 138,527 0.01%Comcast Corp. 125,000 3.90% 1/3/2038 138,498 0.01%TWDC Enterprises 18 Corp. 120,000 4.13% 1/12/2041 138,370 0.01%Walmart, Inc. 125,000 3.63% 15/12/2047 138,354 0.01%Virginia Electric & Power Co. 100,000 6.35% 30/11/2037 138,352 0.01%Zoetis, Inc. 125,000 4.50% 13/11/2025 138,334 0.01%Starbucks Corp. 125,000 4.00% 15/11/2028 138,303 0.01%MetLife, Inc. 100,000 6.50% 15/12/2032 138,298 0.01%Cox Communications, Inc. 125,000 4.60% 15/8/2047 138,087 0.01%Prudential Financial, Inc. 100,000 6.63% 1/12/2037 138,084 0.01%
Vanguard U.S. Investment Grade Credit Index Fund
889
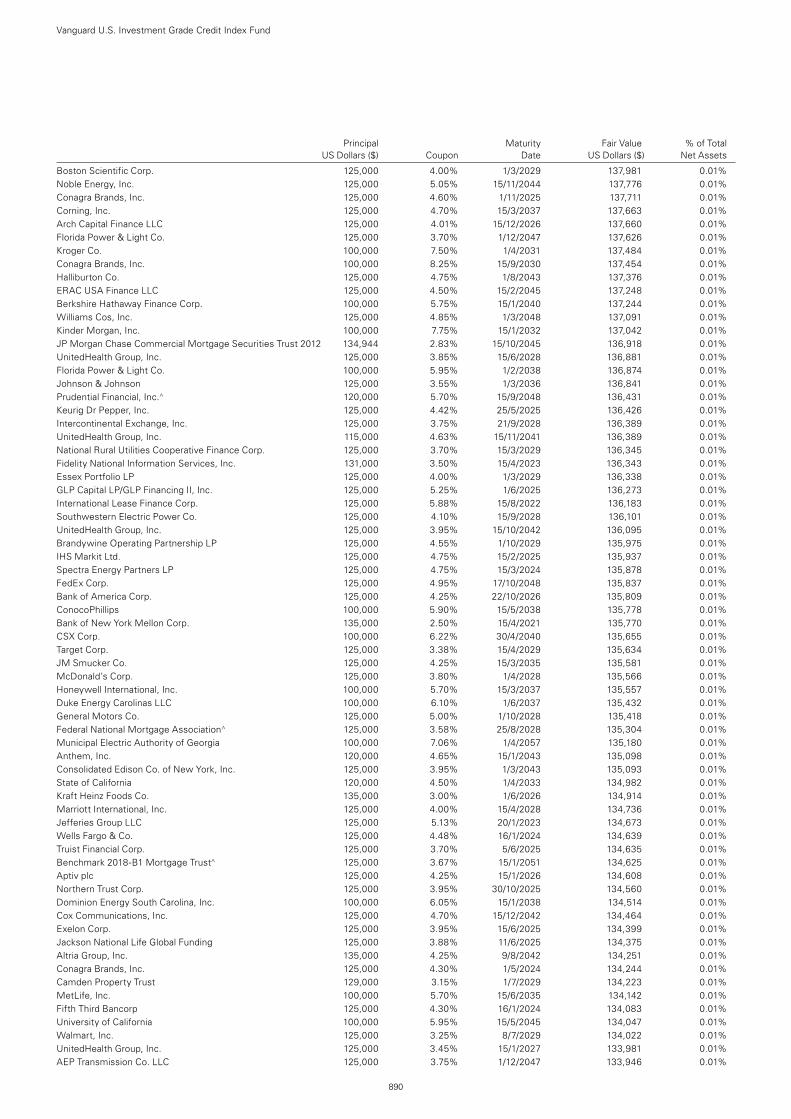
Principal Maturity Fair Value % of Total US Dollars ($) Coupon Date US Dollars ($) Net Assets
Boston Scientific Corp. 125,000 4.00% 1/3/2029 137,981 0.01%Noble Energy, Inc. 125,000 5.05% 15/11/2044 137,776 0.01%Conagra Brands, Inc. 125,000 4.60% 1/11/2025 137,711 0.01%Corning, Inc. 125,000 4.70% 15/3/2037 137,663 0.01%Arch Capital Finance LLC 125,000 4.01% 15/12/2026 137,660 0.01%Florida Power & Light Co. 125,000 3.70% 1/12/2047 137,626 0.01%Kroger Co. 100,000 7.50% 1/4/2031 137,484 0.01%Conagra Brands, Inc. 100,000 8.25% 15/9/2030 137,454 0.01%Halliburton Co. 125,000 4.75% 1/8/2043 137,376 0.01%ERAC USA Finance LLC 125,000 4.50% 15/2/2045 137,248 0.01%Berkshire Hathaway Finance Corp. 100,000 5.75% 15/1/2040 137,244 0.01%Williams Cos, Inc. 125,000 4.85% 1/3/2048 137,091 0.01%Kinder Morgan, Inc. 100,000 7.75% 15/1/2032 137,042 0.01%JP Morgan Chase Commercial Mortgage Securities Trust 2012 134,944 2.83% 15/10/2045 136,918 0.01%UnitedHealth Group, Inc. 125,000 3.85% 15/6/2028 136,881 0.01%Florida Power & Light Co. 100,000 5.95% 1/2/2038 136,874 0.01%Johnson & Johnson 125,000 3.55% 1/3/2036 136,841 0.01%Prudential Financial, Inc.^ 120,000 5.70% 15/9/2048 136,431 0.01%Keurig Dr Pepper, Inc. 125,000 4.42% 25/5/2025 136,426 0.01%Intercontinental Exchange, Inc. 125,000 3.75% 21/9/2028 136,389 0.01%UnitedHealth Group, Inc. 115,000 4.63% 15/11/2041 136,389 0.01%National Rural Utilities Cooperative Finance Corp. 125,000 3.70% 15/3/2029 136,345 0.01%Fidelity National Information Services, Inc. 131,000 3.50% 15/4/2023 136,343 0.01%Essex Portfolio LP 125,000 4.00% 1/3/2029 136,338 0.01%GLP Capital LP/GLP Financing II, Inc. 125,000 5.25% 1/6/2025 136,273 0.01%International Lease Finance Corp. 125,000 5.88% 15/8/2022 136,183 0.01%Southwestern Electric Power Co. 125,000 4.10% 15/9/2028 136,101 0.01%UnitedHealth Group, Inc. 125,000 3.95% 15/10/2042 136,095 0.01%Brandywine Operating Partnership LP 125,000 4.55% 1/10/2029 135,975 0.01%IHS Markit Ltd. 125,000 4.75% 15/2/2025 135,937 0.01%Spectra Energy Partners LP 125,000 4.75% 15/3/2024 135,878 0.01%FedEx Corp. 125,000 4.95% 17/10/2048 135,837 0.01%Bank of America Corp. 125,000 4.25% 22/10/2026 135,809 0.01%ConocoPhillips 100,000 5.90% 15/5/2038 135,778 0.01%Bank of New York Mellon Corp. 135,000 2.50% 15/4/2021 135,770 0.01%CSX Corp. 100,000 6.22% 30/4/2040 135,655 0.01%Target Corp. 125,000 3.38% 15/4/2029 135,634 0.01%JM Smucker Co. 125,000 4.25% 15/3/2035 135,581 0.01%McDonald’s Corp. 125,000 3.80% 1/4/2028 135,566 0.01%Honeywell International, Inc. 100,000 5.70% 15/3/2037 135,557 0.01%Duke Energy Carolinas LLC 100,000 6.10% 1/6/2037 135,432 0.01%General Motors Co. 125,000 5.00% 1/10/2028 135,418 0.01%Federal National Mortgage Association^ 125,000 3.58% 25/8/2028 135,304 0.01%Municipal Electric Authority of Georgia 100,000 7.06% 1/4/2057 135,180 0.01%Anthem, Inc. 120,000 4.65% 15/1/2043 135,098 0.01%Consolidated Edison Co. of New York, Inc. 125,000 3.95% 1/3/2043 135,093 0.01%State of California 120,000 4.50% 1/4/2033 134,982 0.01%Kraft Heinz Foods Co. 135,000 3.00% 1/6/2026 134,914 0.01%Marriott International, Inc. 125,000 4.00% 15/4/2028 134,736 0.01%Jefferies Group LLC 125,000 5.13% 20/1/2023 134,673 0.01%Wells Fargo & Co. 125,000 4.48% 16/1/2024 134,639 0.01%Truist Financial Corp. 125,000 3.70% 5/6/2025 134,635 0.01%Benchmark 2018-B1 Mortgage Trust^ 125,000 3.67% 15/1/2051 134,625 0.01%Aptiv plc 125,000 4.25% 15/1/2026 134,608 0.01%Northern Trust Corp. 125,000 3.95% 30/10/2025 134,560 0.01%Dominion Energy South Carolina, Inc. 100,000 6.05% 15/1/2038 134,514 0.01%Cox Communications, Inc. 125,000 4.70% 15/12/2042 134,464 0.01%Exelon Corp. 125,000 3.95% 15/6/2025 134,399 0.01%Jackson National Life Global Funding 125,000 3.88% 11/6/2025 134,375 0.01%Altria Group, Inc. 135,000 4.25% 9/8/2042 134,251 0.01%Conagra Brands, Inc. 125,000 4.30% 1/5/2024 134,244 0.01%Camden Property Trust 129,000 3.15% 1/7/2029 134,223 0.01%MetLife, Inc. 100,000 5.70% 15/6/2035 134,142 0.01%Fifth Third Bancorp 125,000 4.30% 16/1/2024 134,083 0.01%University of California 100,000 5.95% 15/5/2045 134,047 0.01%Walmart, Inc. 125,000 3.25% 8/7/2029 134,022 0.01%UnitedHealth Group, Inc. 125,000 3.45% 15/1/2027 133,981 0.01%AEP Transmission Co. LLC 125,000 3.75% 1/12/2047 133,946 0.01%
Vanguard U.S. Investment Grade Credit Index Fund
890
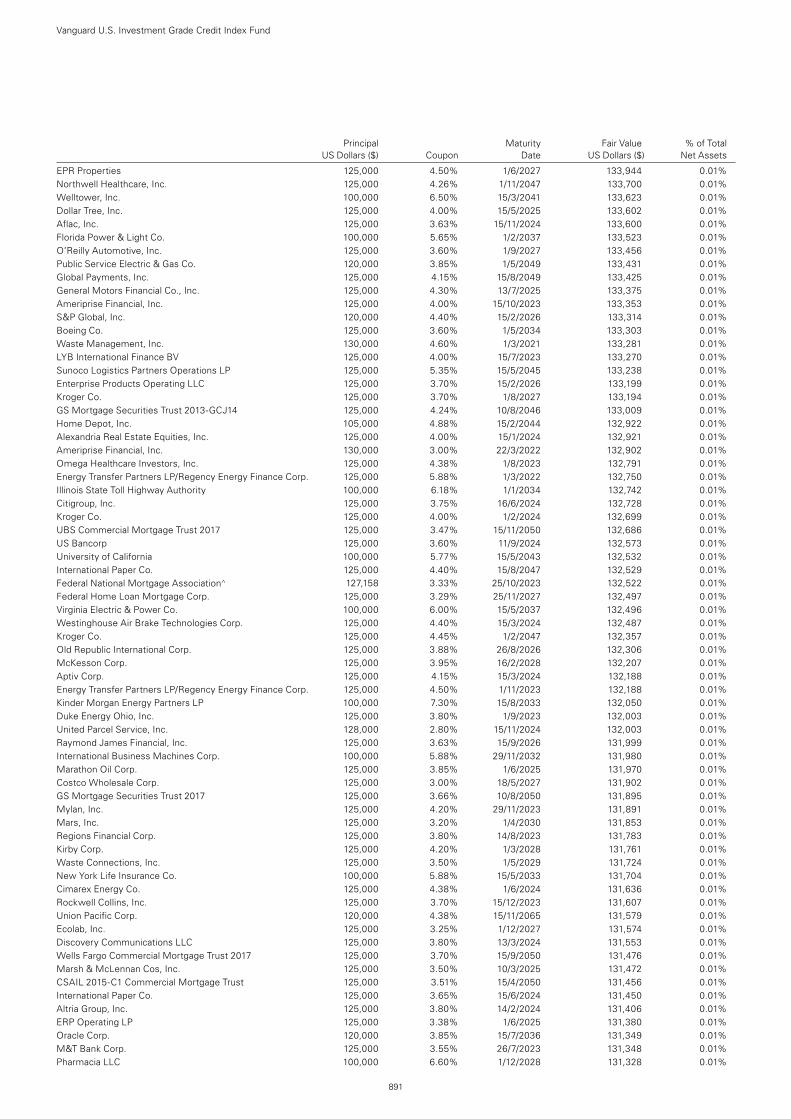
Principal Maturity Fair Value % of Total US Dollars ($) Coupon Date US Dollars ($) Net Assets
EPR Properties 125,000 4.50% 1/6/2027 133,944 0.01%Northwell Healthcare, Inc. 125,000 4.26% 1/11/2047 133,700 0.01%Welltower, Inc. 100,000 6.50% 15/3/2041 133,623 0.01%Dollar Tree, Inc. 125,000 4.00% 15/5/2025 133,602 0.01%Aflac, Inc. 125,000 3.63% 15/11/2024 133,600 0.01%Florida Power & Light Co. 100,000 5.65% 1/2/2037 133,523 0.01%O’Reilly Automotive, Inc. 125,000 3.60% 1/9/2027 133,456 0.01%Public Service Electric & Gas Co. 120,000 3.85% 1/5/2049 133,431 0.01%Global Payments, Inc. 125,000 4.15% 15/8/2049 133,425 0.01%General Motors Financial Co., Inc. 125,000 4.30% 13/7/2025 133,375 0.01%Ameriprise Financial, Inc. 125,000 4.00% 15/10/2023 133,353 0.01%S&P Global, Inc. 120,000 4.40% 15/2/2026 133,314 0.01%Boeing Co. 125,000 3.60% 1/5/2034 133,303 0.01%Waste Management, Inc. 130,000 4.60% 1/3/2021 133,281 0.01%LYB International Finance BV 125,000 4.00% 15/7/2023 133,270 0.01%Sunoco Logistics Partners Operations LP 125,000 5.35% 15/5/2045 133,238 0.01%Enterprise Products Operating LLC 125,000 3.70% 15/2/2026 133,199 0.01%Kroger Co. 125,000 3.70% 1/8/2027 133,194 0.01%GS Mortgage Securities Trust 2013-GCJ14 125,000 4.24% 10/8/2046 133,009 0.01%Home Depot, Inc. 105,000 4.88% 15/2/2044 132,922 0.01%Alexandria Real Estate Equities, Inc. 125,000 4.00% 15/1/2024 132,921 0.01%Ameriprise Financial, Inc. 130,000 3.00% 22/3/2022 132,902 0.01%Omega Healthcare Investors, Inc. 125,000 4.38% 1/8/2023 132,791 0.01%Energy Transfer Partners LP/Regency Energy Finance Corp. 125,000 5.88% 1/3/2022 132,750 0.01%Illinois State Toll Highway Authority 100,000 6.18% 1/1/2034 132,742 0.01%Citigroup, Inc. 125,000 3.75% 16/6/2024 132,728 0.01%Kroger Co. 125,000 4.00% 1/2/2024 132,699 0.01%UBS Commercial Mortgage Trust 2017 125,000 3.47% 15/11/2050 132,686 0.01%US Bancorp 125,000 3.60% 11/9/2024 132,573 0.01%University of California 100,000 5.77% 15/5/2043 132,532 0.01%International Paper Co. 125,000 4.40% 15/8/2047 132,529 0.01%Federal National Mortgage Association^ 127,158 3.33% 25/10/2023 132,522 0.01%Federal Home Loan Mortgage Corp. 125,000 3.29% 25/11/2027 132,497 0.01%Virginia Electric & Power Co. 100,000 6.00% 15/5/2037 132,496 0.01%Westinghouse Air Brake Technologies Corp. 125,000 4.40% 15/3/2024 132,487 0.01%Kroger Co. 125,000 4.45% 1/2/2047 132,357 0.01%Old Republic International Corp. 125,000 3.88% 26/8/2026 132,306 0.01%McKesson Corp. 125,000 3.95% 16/2/2028 132,207 0.01%Aptiv Corp. 125,000 4.15% 15/3/2024 132,188 0.01%Energy Transfer Partners LP/Regency Energy Finance Corp. 125,000 4.50% 1/11/2023 132,188 0.01%Kinder Morgan Energy Partners LP 100,000 7.30% 15/8/2033 132,050 0.01%Duke Energy Ohio, Inc. 125,000 3.80% 1/9/2023 132,003 0.01%United Parcel Service, Inc. 128,000 2.80% 15/11/2024 132,003 0.01%Raymond James Financial, Inc. 125,000 3.63% 15/9/2026 131,999 0.01%International Business Machines Corp. 100,000 5.88% 29/11/2032 131,980 0.01%Marathon Oil Corp. 125,000 3.85% 1/6/2025 131,970 0.01%Costco Wholesale Corp. 125,000 3.00% 18/5/2027 131,902 0.01%GS Mortgage Securities Trust 2017 125,000 3.66% 10/8/2050 131,895 0.01%Mylan, Inc. 125,000 4.20% 29/11/2023 131,891 0.01%Mars, Inc. 125,000 3.20% 1/4/2030 131,853 0.01%Regions Financial Corp. 125,000 3.80% 14/8/2023 131,783 0.01%Kirby Corp. 125,000 4.20% 1/3/2028 131,761 0.01%Waste Connections, Inc. 125,000 3.50% 1/5/2029 131,724 0.01%New York Life Insurance Co. 100,000 5.88% 15/5/2033 131,704 0.01%Cimarex Energy Co. 125,000 4.38% 1/6/2024 131,636 0.01%Rockwell Collins, Inc. 125,000 3.70% 15/12/2023 131,607 0.01%Union Pacific Corp. 120,000 4.38% 15/11/2065 131,579 0.01%Ecolab, Inc. 125,000 3.25% 1/12/2027 131,574 0.01%Discovery Communications LLC 125,000 3.80% 13/3/2024 131,553 0.01%Wells Fargo Commercial Mortgage Trust 2017 125,000 3.70% 15/9/2050 131,476 0.01%Marsh & McLennan Cos, Inc. 125,000 3.50% 10/3/2025 131,472 0.01%CSAIL 2015-C1 Commercial Mortgage Trust 125,000 3.51% 15/4/2050 131,456 0.01%International Paper Co. 125,000 3.65% 15/6/2024 131,450 0.01%Altria Group, Inc. 125,000 3.80% 14/2/2024 131,406 0.01%ERP Operating LP 125,000 3.38% 1/6/2025 131,380 0.01%Oracle Corp. 120,000 3.85% 15/7/2036 131,349 0.01%M&T Bank Corp. 125,000 3.55% 26/7/2023 131,348 0.01%Pharmacia LLC 100,000 6.60% 1/12/2028 131,328 0.01%
Vanguard U.S. Investment Grade Credit Index Fund
891
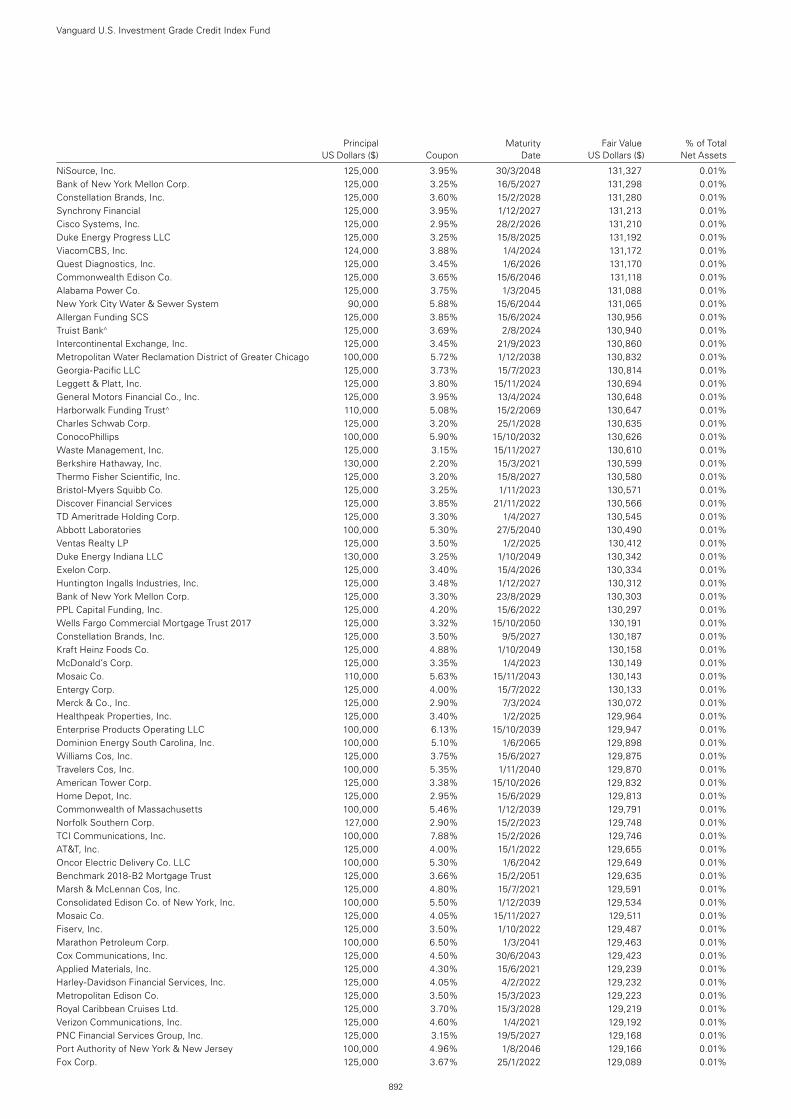
Principal Maturity Fair Value % of Total US Dollars ($) Coupon Date US Dollars ($) Net Assets
NiSource, Inc. 125,000 3.95% 30/3/2048 131,327 0.01%Bank of New York Mellon Corp. 125,000 3.25% 16/5/2027 131,298 0.01%Constellation Brands, Inc. 125,000 3.60% 15/2/2028 131,280 0.01%Synchrony Financial 125,000 3.95% 1/12/2027 131,213 0.01%Cisco Systems, Inc. 125,000 2.95% 28/2/2026 131,210 0.01%Duke Energy Progress LLC 125,000 3.25% 15/8/2025 131,192 0.01%ViacomCBS, Inc. 124,000 3.88% 1/4/2024 131,172 0.01%Quest Diagnostics, Inc. 125,000 3.45% 1/6/2026 131,170 0.01%Commonwealth Edison Co. 125,000 3.65% 15/6/2046 131,118 0.01%Alabama Power Co. 125,000 3.75% 1/3/2045 131,088 0.01%New York City Water & Sewer System 90,000 5.88% 15/6/2044 131,065 0.01%Allergan Funding SCS 125,000 3.85% 15/6/2024 130,956 0.01%Truist Bank^ 125,000 3.69% 2/8/2024 130,940 0.01%Intercontinental Exchange, Inc. 125,000 3.45% 21/9/2023 130,860 0.01%Metropolitan Water Reclamation District of Greater Chicago 100,000 5.72% 1/12/2038 130,832 0.01%Georgia-Pacific LLC 125,000 3.73% 15/7/2023 130,814 0.01%Leggett & Platt, Inc. 125,000 3.80% 15/11/2024 130,694 0.01%General Motors Financial Co., Inc. 125,000 3.95% 13/4/2024 130,648 0.01%Harborwalk Funding Trust^ 110,000 5.08% 15/2/2069 130,647 0.01%Charles Schwab Corp. 125,000 3.20% 25/1/2028 130,635 0.01%ConocoPhillips 100,000 5.90% 15/10/2032 130,626 0.01%Waste Management, Inc. 125,000 3.15% 15/11/2027 130,610 0.01%Berkshire Hathaway, Inc. 130,000 2.20% 15/3/2021 130,599 0.01%Thermo Fisher Scientific, Inc. 125,000 3.20% 15/8/2027 130,580 0.01%Bristol-Myers Squibb Co. 125,000 3.25% 1/11/2023 130,571 0.01%Discover Financial Services 125,000 3.85% 21/11/2022 130,566 0.01%TD Ameritrade Holding Corp. 125,000 3.30% 1/4/2027 130,545 0.01%Abbott Laboratories 100,000 5.30% 27/5/2040 130,490 0.01%Ventas Realty LP 125,000 3.50% 1/2/2025 130,412 0.01%Duke Energy Indiana LLC 130,000 3.25% 1/10/2049 130,342 0.01%Exelon Corp. 125,000 3.40% 15/4/2026 130,334 0.01%Huntington Ingalls Industries, Inc. 125,000 3.48% 1/12/2027 130,312 0.01%Bank of New York Mellon Corp. 125,000 3.30% 23/8/2029 130,303 0.01%PPL Capital Funding, Inc. 125,000 4.20% 15/6/2022 130,297 0.01%Wells Fargo Commercial Mortgage Trust 2017 125,000 3.32% 15/10/2050 130,191 0.01%Constellation Brands, Inc. 125,000 3.50% 9/5/2027 130,187 0.01%Kraft Heinz Foods Co. 125,000 4.88% 1/10/2049 130,158 0.01%McDonald’s Corp. 125,000 3.35% 1/4/2023 130,149 0.01%Mosaic Co. 110,000 5.63% 15/11/2043 130,143 0.01%Entergy Corp. 125,000 4.00% 15/7/2022 130,133 0.01%Merck & Co., Inc. 125,000 2.90% 7/3/2024 130,072 0.01%Healthpeak Properties, Inc. 125,000 3.40% 1/2/2025 129,964 0.01%Enterprise Products Operating LLC 100,000 6.13% 15/10/2039 129,947 0.01%Dominion Energy South Carolina, Inc. 100,000 5.10% 1/6/2065 129,898 0.01%Williams Cos, Inc. 125,000 3.75% 15/6/2027 129,875 0.01%Travelers Cos, Inc. 100,000 5.35% 1/11/2040 129,870 0.01%American Tower Corp. 125,000 3.38% 15/10/2026 129,832 0.01%Home Depot, Inc. 125,000 2.95% 15/6/2029 129,813 0.01%Commonwealth of Massachusetts 100,000 5.46% 1/12/2039 129,791 0.01%Norfolk Southern Corp. 127,000 2.90% 15/2/2023 129,748 0.01%TCI Communications, Inc. 100,000 7.88% 15/2/2026 129,746 0.01%AT&T, Inc. 125,000 4.00% 15/1/2022 129,655 0.01%Oncor Electric Delivery Co. LLC 100,000 5.30% 1/6/2042 129,649 0.01%Benchmark 2018-B2 Mortgage Trust 125,000 3.66% 15/2/2051 129,635 0.01%Marsh & McLennan Cos, Inc. 125,000 4.80% 15/7/2021 129,591 0.01%Consolidated Edison Co. of New York, Inc. 100,000 5.50% 1/12/2039 129,534 0.01%Mosaic Co. 125,000 4.05% 15/11/2027 129,511 0.01%Fiserv, Inc. 125,000 3.50% 1/10/2022 129,487 0.01%Marathon Petroleum Corp. 100,000 6.50% 1/3/2041 129,463 0.01%Cox Communications, Inc. 125,000 4.50% 30/6/2043 129,423 0.01%Applied Materials, Inc. 125,000 4.30% 15/6/2021 129,239 0.01%Harley-Davidson Financial Services, Inc. 125,000 4.05% 4/2/2022 129,232 0.01%Metropolitan Edison Co. 125,000 3.50% 15/3/2023 129,223 0.01%Royal Caribbean Cruises Ltd. 125,000 3.70% 15/3/2028 129,219 0.01%Verizon Communications, Inc. 125,000 4.60% 1/4/2021 129,192 0.01%PNC Financial Services Group, Inc. 125,000 3.15% 19/5/2027 129,168 0.01%Port Authority of New York & New Jersey 100,000 4.96% 1/8/2046 129,166 0.01%Fox Corp. 125,000 3.67% 25/1/2022 129,089 0.01%
Vanguard U.S. Investment Grade Credit Index Fund
892
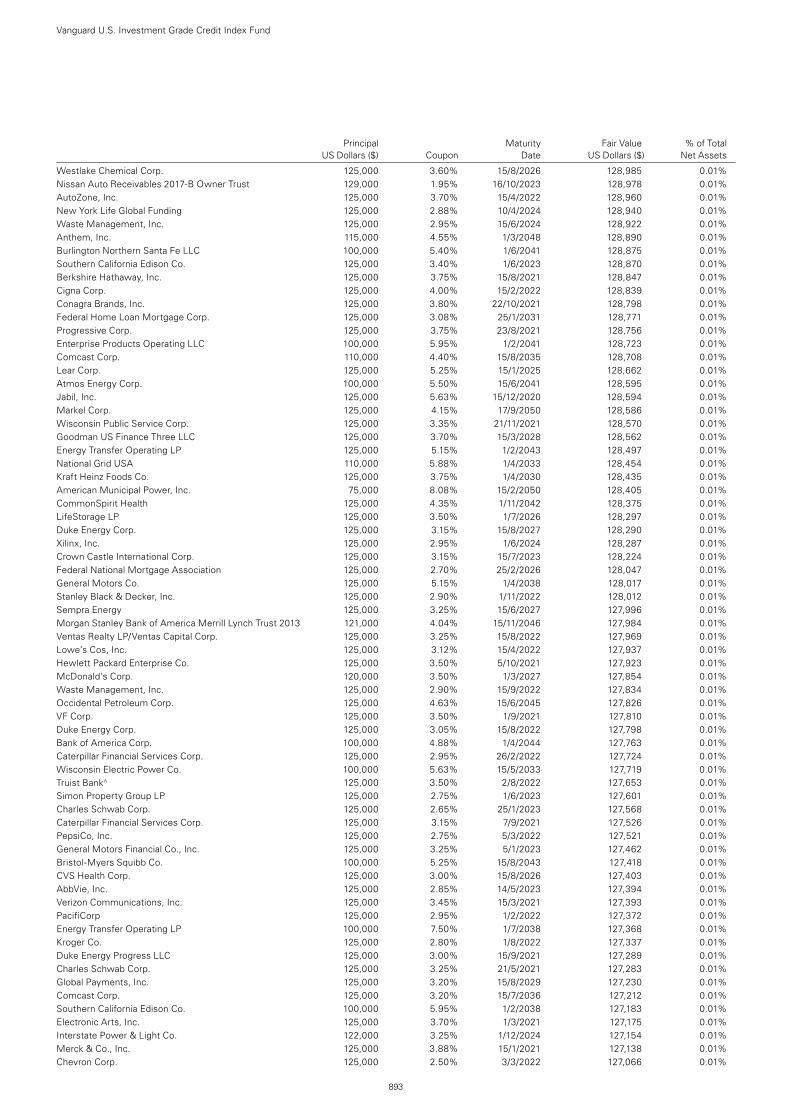
Principal Maturity Fair Value % of Total US Dollars ($) Coupon Date US Dollars ($) Net Assets
Westlake Chemical Corp. 125,000 3.60% 15/8/2026 128,985 0.01%Nissan Auto Receivables 2017-B Owner Trust 129,000 1.95% 16/10/2023 128,978 0.01%AutoZone, Inc. 125,000 3.70% 15/4/2022 128,960 0.01%New York Life Global Funding 125,000 2.88% 10/4/2024 128,940 0.01%Waste Management, Inc. 125,000 2.95% 15/6/2024 128,922 0.01%Anthem, Inc. 115,000 4.55% 1/3/2048 128,890 0.01%Burlington Northern Santa Fe LLC 100,000 5.40% 1/6/2041 128,875 0.01%Southern California Edison Co. 125,000 3.40% 1/6/2023 128,870 0.01%Berkshire Hathaway, Inc. 125,000 3.75% 15/8/2021 128,847 0.01%Cigna Corp. 125,000 4.00% 15/2/2022 128,839 0.01%Conagra Brands, Inc. 125,000 3.80% 22/10/2021 128,798 0.01%Federal Home Loan Mortgage Corp. 125,000 3.08% 25/1/2031 128,771 0.01%Progressive Corp. 125,000 3.75% 23/8/2021 128,756 0.01%Enterprise Products Operating LLC 100,000 5.95% 1/2/2041 128,723 0.01%Comcast Corp. 110,000 4.40% 15/8/2035 128,708 0.01%Lear Corp. 125,000 5.25% 15/1/2025 128,662 0.01%Atmos Energy Corp. 100,000 5.50% 15/6/2041 128,595 0.01%Jabil, Inc. 125,000 5.63% 15/12/2020 128,594 0.01%Markel Corp. 125,000 4.15% 17/9/2050 128,586 0.01%Wisconsin Public Service Corp. 125,000 3.35% 21/11/2021 128,570 0.01%Goodman US Finance Three LLC 125,000 3.70% 15/3/2028 128,562 0.01%Energy Transfer Operating LP 125,000 5.15% 1/2/2043 128,497 0.01%National Grid USA 110,000 5.88% 1/4/2033 128,454 0.01%Kraft Heinz Foods Co. 125,000 3.75% 1/4/2030 128,435 0.01%American Municipal Power, Inc. 75,000 8.08% 15/2/2050 128,405 0.01%CommonSpirit Health 125,000 4.35% 1/11/2042 128,375 0.01%LifeStorage LP 125,000 3.50% 1/7/2026 128,297 0.01%Duke Energy Corp. 125,000 3.15% 15/8/2027 128,290 0.01%Xilinx, Inc. 125,000 2.95% 1/6/2024 128,287 0.01%Crown Castle International Corp. 125,000 3.15% 15/7/2023 128,224 0.01%Federal National Mortgage Association 125,000 2.70% 25/2/2026 128,047 0.01%General Motors Co. 125,000 5.15% 1/4/2038 128,017 0.01%Stanley Black & Decker, Inc. 125,000 2.90% 1/11/2022 128,012 0.01%Sempra Energy 125,000 3.25% 15/6/2027 127,996 0.01%Morgan Stanley Bank of America Merrill Lynch Trust 2013 121,000 4.04% 15/11/2046 127,984 0.01%Ventas Realty LP/Ventas Capital Corp. 125,000 3.25% 15/8/2022 127,969 0.01%Lowe’s Cos, Inc. 125,000 3.12% 15/4/2022 127,937 0.01%Hewlett Packard Enterprise Co. 125,000 3.50% 5/10/2021 127,923 0.01%McDonald’s Corp. 120,000 3.50% 1/3/2027 127,854 0.01%Waste Management, Inc. 125,000 2.90% 15/9/2022 127,834 0.01%Occidental Petroleum Corp. 125,000 4.63% 15/6/2045 127,826 0.01%VF Corp. 125,000 3.50% 1/9/2021 127,810 0.01%Duke Energy Corp. 125,000 3.05% 15/8/2022 127,798 0.01%Bank of America Corp. 100,000 4.88% 1/4/2044 127,763 0.01%Caterpillar Financial Services Corp. 125,000 2.95% 26/2/2022 127,724 0.01%Wisconsin Electric Power Co. 100,000 5.63% 15/5/2033 127,719 0.01%Truist Bank^ 125,000 3.50% 2/8/2022 127,653 0.01%Simon Property Group LP 125,000 2.75% 1/6/2023 127,601 0.01%Charles Schwab Corp. 125,000 2.65% 25/1/2023 127,568 0.01%Caterpillar Financial Services Corp. 125,000 3.15% 7/9/2021 127,526 0.01%PepsiCo, Inc. 125,000 2.75% 5/3/2022 127,521 0.01%General Motors Financial Co., Inc. 125,000 3.25% 5/1/2023 127,462 0.01%Bristol-Myers Squibb Co. 100,000 5.25% 15/8/2043 127,418 0.01%CVS Health Corp. 125,000 3.00% 15/8/2026 127,403 0.01%AbbVie, Inc. 125,000 2.85% 14/5/2023 127,394 0.01%Verizon Communications, Inc. 125,000 3.45% 15/3/2021 127,393 0.01%PacifiCorp 125,000 2.95% 1/2/2022 127,372 0.01%Energy Transfer Operating LP 100,000 7.50% 1/7/2038 127,368 0.01%Kroger Co. 125,000 2.80% 1/8/2022 127,337 0.01%Duke Energy Progress LLC 125,000 3.00% 15/9/2021 127,289 0.01%Charles Schwab Corp. 125,000 3.25% 21/5/2021 127,283 0.01%Global Payments, Inc. 125,000 3.20% 15/8/2029 127,230 0.01%Comcast Corp. 125,000 3.20% 15/7/2036 127,212 0.01%Southern California Edison Co. 100,000 5.95% 1/2/2038 127,183 0.01%Electronic Arts, Inc. 125,000 3.70% 1/3/2021 127,175 0.01%Interstate Power & Light Co. 122,000 3.25% 1/12/2024 127,154 0.01%Merck & Co., Inc. 125,000 3.88% 15/1/2021 127,138 0.01%Chevron Corp. 125,000 2.50% 3/3/2022 127,066 0.01%
Vanguard U.S. Investment Grade Credit Index Fund
893
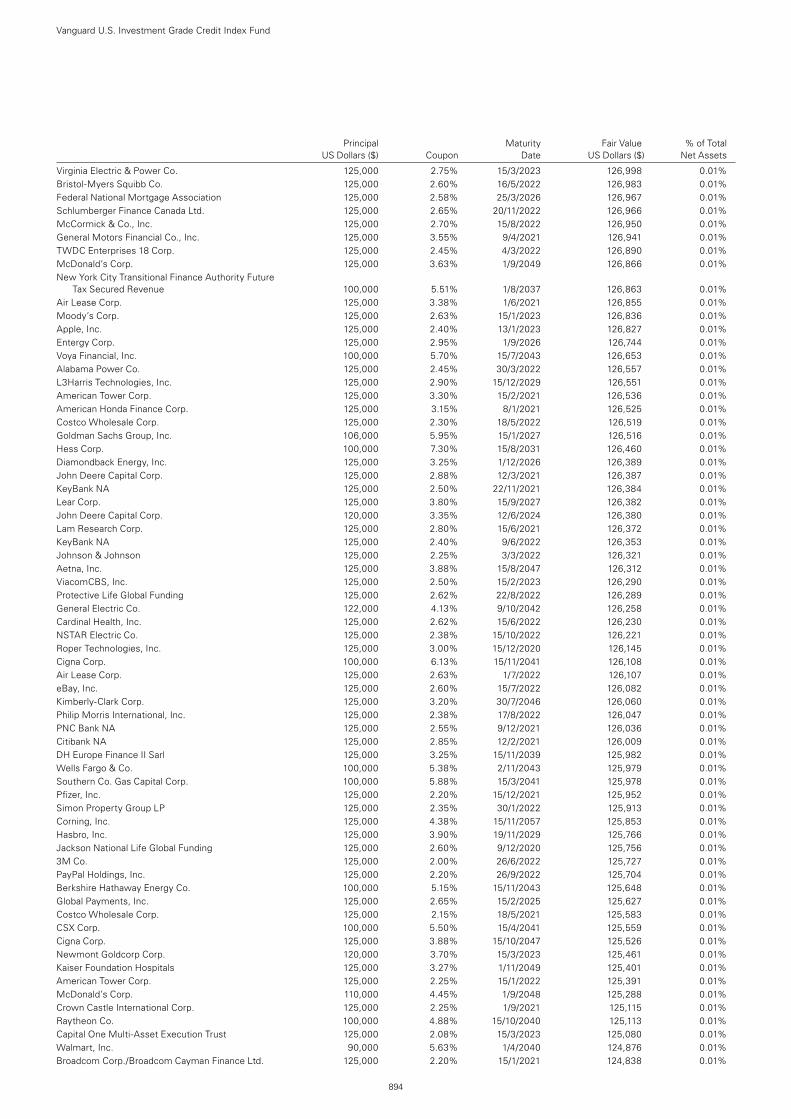
Principal Maturity Fair Value % of Total US Dollars ($) Coupon Date US Dollars ($) Net Assets
Virginia Electric & Power Co. 125,000 2.75% 15/3/2023 126,998 0.01%Bristol-Myers Squibb Co. 125,000 2.60% 16/5/2022 126,983 0.01%Federal National Mortgage Association 125,000 2.58% 25/3/2026 126,967 0.01%Schlumberger Finance Canada Ltd. 125,000 2.65% 20/11/2022 126,966 0.01%McCormick & Co., Inc. 125,000 2.70% 15/8/2022 126,950 0.01%General Motors Financial Co., Inc. 125,000 3.55% 9/4/2021 126,941 0.01%TWDC Enterprises 18 Corp. 125,000 2.45% 4/3/2022 126,890 0.01%McDonald’s Corp. 125,000 3.63% 1/9/2049 126,866 0.01%New York City Transitional Finance Authority Future
Tax Secured Revenue 100,000 5.51% 1/8/2037 126,863 0.01%Air Lease Corp. 125,000 3.38% 1/6/2021 126,855 0.01%Moody’s Corp. 125,000 2.63% 15/1/2023 126,836 0.01%Apple, Inc. 125,000 2.40% 13/1/2023 126,827 0.01%Entergy Corp. 125,000 2.95% 1/9/2026 126,744 0.01%Voya Financial, Inc. 100,000 5.70% 15/7/2043 126,653 0.01%Alabama Power Co. 125,000 2.45% 30/3/2022 126,557 0.01%L3Harris Technologies, Inc. 125,000 2.90% 15/12/2029 126,551 0.01%American Tower Corp. 125,000 3.30% 15/2/2021 126,536 0.01%American Honda Finance Corp. 125,000 3.15% 8/1/2021 126,525 0.01%Costco Wholesale Corp. 125,000 2.30% 18/5/2022 126,519 0.01%Goldman Sachs Group, Inc. 106,000 5.95% 15/1/2027 126,516 0.01%Hess Corp. 100,000 7.30% 15/8/2031 126,460 0.01%Diamondback Energy, Inc. 125,000 3.25% 1/12/2026 126,389 0.01%John Deere Capital Corp. 125,000 2.88% 12/3/2021 126,387 0.01%KeyBank NA 125,000 2.50% 22/11/2021 126,384 0.01%Lear Corp. 125,000 3.80% 15/9/2027 126,382 0.01%John Deere Capital Corp. 120,000 3.35% 12/6/2024 126,380 0.01%Lam Research Corp. 125,000 2.80% 15/6/2021 126,372 0.01%KeyBank NA 125,000 2.40% 9/6/2022 126,353 0.01%Johnson & Johnson 125,000 2.25% 3/3/2022 126,321 0.01%Aetna, Inc. 125,000 3.88% 15/8/2047 126,312 0.01%ViacomCBS, Inc. 125,000 2.50% 15/2/2023 126,290 0.01%Protective Life Global Funding 125,000 2.62% 22/8/2022 126,289 0.01%General Electric Co. 122,000 4.13% 9/10/2042 126,258 0.01%Cardinal Health, Inc. 125,000 2.62% 15/6/2022 126,230 0.01%NSTAR Electric Co. 125,000 2.38% 15/10/2022 126,221 0.01%Roper Technologies, Inc. 125,000 3.00% 15/12/2020 126,145 0.01%Cigna Corp. 100,000 6.13% 15/11/2041 126,108 0.01%Air Lease Corp. 125,000 2.63% 1/7/2022 126,107 0.01%eBay, Inc. 125,000 2.60% 15/7/2022 126,082 0.01%Kimberly-Clark Corp. 125,000 3.20% 30/7/2046 126,060 0.01%Philip Morris International, Inc. 125,000 2.38% 17/8/2022 126,047 0.01%PNC Bank NA 125,000 2.55% 9/12/2021 126,036 0.01%Citibank NA 125,000 2.85% 12/2/2021 126,009 0.01%DH Europe Finance II Sarl 125,000 3.25% 15/11/2039 125,982 0.01%Wells Fargo & Co. 100,000 5.38% 2/11/2043 125,979 0.01%Southern Co. Gas Capital Corp. 100,000 5.88% 15/3/2041 125,978 0.01%Pfizer, Inc. 125,000 2.20% 15/12/2021 125,952 0.01%Simon Property Group LP 125,000 2.35% 30/1/2022 125,913 0.01%Corning, Inc. 125,000 4.38% 15/11/2057 125,853 0.01%Hasbro, Inc. 125,000 3.90% 19/11/2029 125,766 0.01%Jackson National Life Global Funding 125,000 2.60% 9/12/2020 125,756 0.01%3M Co. 125,000 2.00% 26/6/2022 125,727 0.01%PayPal Holdings, Inc. 125,000 2.20% 26/9/2022 125,704 0.01%Berkshire Hathaway Energy Co. 100,000 5.15% 15/11/2043 125,648 0.01%Global Payments, Inc. 125,000 2.65% 15/2/2025 125,627 0.01%Costco Wholesale Corp. 125,000 2.15% 18/5/2021 125,583 0.01%CSX Corp. 100,000 5.50% 15/4/2041 125,559 0.01%Cigna Corp. 125,000 3.88% 15/10/2047 125,526 0.01%Newmont Goldcorp Corp. 120,000 3.70% 15/3/2023 125,461 0.01%Kaiser Foundation Hospitals 125,000 3.27% 1/11/2049 125,401 0.01%American Tower Corp. 125,000 2.25% 15/1/2022 125,391 0.01%McDonald’s Corp. 110,000 4.45% 1/9/2048 125,288 0.01%Crown Castle International Corp. 125,000 2.25% 1/9/2021 125,115 0.01%Raytheon Co. 100,000 4.88% 15/10/2040 125,113 0.01%Capital One Multi-Asset Execution Trust 125,000 2.08% 15/3/2023 125,080 0.01%Walmart, Inc. 90,000 5.63% 1/4/2040 124,876 0.01%Broadcom Corp./Broadcom Cayman Finance Ltd. 125,000 2.20% 15/1/2021 124,838 0.01%
Vanguard U.S. Investment Grade Credit Index Fund
894
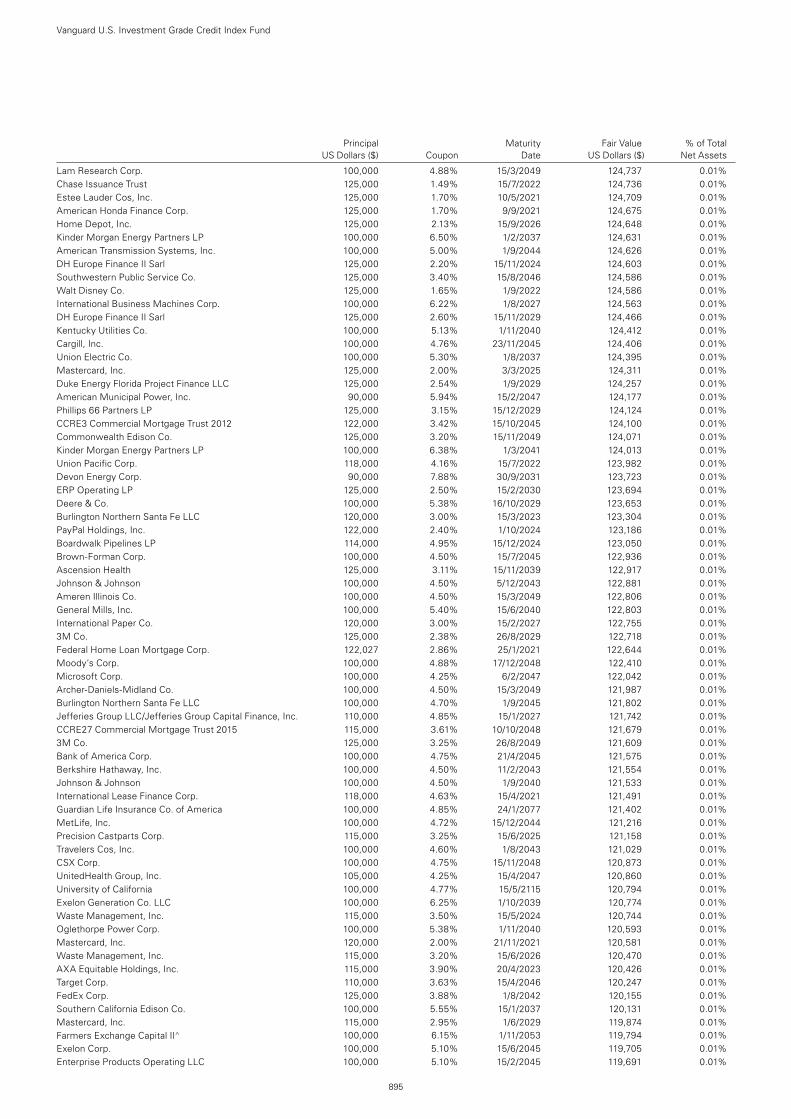
Principal Maturity Fair Value % of Total US Dollars ($) Coupon Date US Dollars ($) Net Assets
Lam Research Corp. 100,000 4.88% 15/3/2049 124,737 0.01%Chase Issuance Trust 125,000 1.49% 15/7/2022 124,736 0.01%Estee Lauder Cos, Inc. 125,000 1.70% 10/5/2021 124,709 0.01%American Honda Finance Corp. 125,000 1.70% 9/9/2021 124,675 0.01%Home Depot, Inc. 125,000 2.13% 15/9/2026 124,648 0.01%Kinder Morgan Energy Partners LP 100,000 6.50% 1/2/2037 124,631 0.01%American Transmission Systems, Inc. 100,000 5.00% 1/9/2044 124,626 0.01%DH Europe Finance II Sarl 125,000 2.20% 15/11/2024 124,603 0.01%Southwestern Public Service Co. 125,000 3.40% 15/8/2046 124,586 0.01%Walt Disney Co. 125,000 1.65% 1/9/2022 124,586 0.01%International Business Machines Corp. 100,000 6.22% 1/8/2027 124,563 0.01%DH Europe Finance II Sarl 125,000 2.60% 15/11/2029 124,466 0.01%Kentucky Utilities Co. 100,000 5.13% 1/11/2040 124,412 0.01%Cargill, Inc. 100,000 4.76% 23/11/2045 124,406 0.01%Union Electric Co. 100,000 5.30% 1/8/2037 124,395 0.01%Mastercard, Inc. 125,000 2.00% 3/3/2025 124,311 0.01%Duke Energy Florida Project Finance LLC 125,000 2.54% 1/9/2029 124,257 0.01%American Municipal Power, Inc. 90,000 5.94% 15/2/2047 124,177 0.01%Phillips 66 Partners LP 125,000 3.15% 15/12/2029 124,124 0.01%CCRE3 Commercial Mortgage Trust 2012 122,000 3.42% 15/10/2045 124,100 0.01%Commonwealth Edison Co. 125,000 3.20% 15/11/2049 124,071 0.01%Kinder Morgan Energy Partners LP 100,000 6.38% 1/3/2041 124,013 0.01%Union Pacific Corp. 118,000 4.16% 15/7/2022 123,982 0.01%Devon Energy Corp. 90,000 7.88% 30/9/2031 123,723 0.01%ERP Operating LP 125,000 2.50% 15/2/2030 123,694 0.01%Deere & Co. 100,000 5.38% 16/10/2029 123,653 0.01%Burlington Northern Santa Fe LLC 120,000 3.00% 15/3/2023 123,304 0.01%PayPal Holdings, Inc. 122,000 2.40% 1/10/2024 123,186 0.01%Boardwalk Pipelines LP 114,000 4.95% 15/12/2024 123,050 0.01%Brown-Forman Corp. 100,000 4.50% 15/7/2045 122,936 0.01%Ascension Health 125,000 3.11% 15/11/2039 122,917 0.01%Johnson & Johnson 100,000 4.50% 5/12/2043 122,881 0.01%Ameren Illinois Co. 100,000 4.50% 15/3/2049 122,806 0.01%General Mills, Inc. 100,000 5.40% 15/6/2040 122,803 0.01%International Paper Co. 120,000 3.00% 15/2/2027 122,755 0.01%3M Co. 125,000 2.38% 26/8/2029 122,718 0.01%Federal Home Loan Mortgage Corp. 122,027 2.86% 25/1/2021 122,644 0.01%Moody’s Corp. 100,000 4.88% 17/12/2048 122,410 0.01%Microsoft Corp. 100,000 4.25% 6/2/2047 122,042 0.01%Archer-Daniels-Midland Co. 100,000 4.50% 15/3/2049 121,987 0.01%Burlington Northern Santa Fe LLC 100,000 4.70% 1/9/2045 121,802 0.01%Jefferies Group LLC/Jefferies Group Capital Finance, Inc. 110,000 4.85% 15/1/2027 121,742 0.01%CCRE27 Commercial Mortgage Trust 2015 115,000 3.61% 10/10/2048 121,679 0.01%3M Co. 125,000 3.25% 26/8/2049 121,609 0.01%Bank of America Corp. 100,000 4.75% 21/4/2045 121,575 0.01%Berkshire Hathaway, Inc. 100,000 4.50% 11/2/2043 121,554 0.01%Johnson & Johnson 100,000 4.50% 1/9/2040 121,533 0.01%International Lease Finance Corp. 118,000 4.63% 15/4/2021 121,491 0.01%Guardian Life Insurance Co. of America 100,000 4.85% 24/1/2077 121,402 0.01%MetLife, Inc. 100,000 4.72% 15/12/2044 121,216 0.01%Precision Castparts Corp. 115,000 3.25% 15/6/2025 121,158 0.01%Travelers Cos, Inc. 100,000 4.60% 1/8/2043 121,029 0.01%CSX Corp. 100,000 4.75% 15/11/2048 120,873 0.01%UnitedHealth Group, Inc. 105,000 4.25% 15/4/2047 120,860 0.01%University of California 100,000 4.77% 15/5/2115 120,794 0.01%Exelon Generation Co. LLC 100,000 6.25% 1/10/2039 120,774 0.01%Waste Management, Inc. 115,000 3.50% 15/5/2024 120,744 0.01%Oglethorpe Power Corp. 100,000 5.38% 1/11/2040 120,593 0.01%Mastercard, Inc. 120,000 2.00% 21/11/2021 120,581 0.01%Waste Management, Inc. 115,000 3.20% 15/6/2026 120,470 0.01%AXA Equitable Holdings, Inc. 115,000 3.90% 20/4/2023 120,426 0.01%Target Corp. 110,000 3.63% 15/4/2046 120,247 0.01%FedEx Corp. 125,000 3.88% 1/8/2042 120,155 0.01%Southern California Edison Co. 100,000 5.55% 15/1/2037 120,131 0.01%Mastercard, Inc. 115,000 2.95% 1/6/2029 119,874 0.01%Farmers Exchange Capital II^ 100,000 6.15% 1/11/2053 119,794 0.01%Exelon Corp. 100,000 5.10% 15/6/2045 119,705 0.01%Enterprise Products Operating LLC 100,000 5.10% 15/2/2045 119,691 0.01%
Vanguard U.S. Investment Grade Credit Index Fund
895
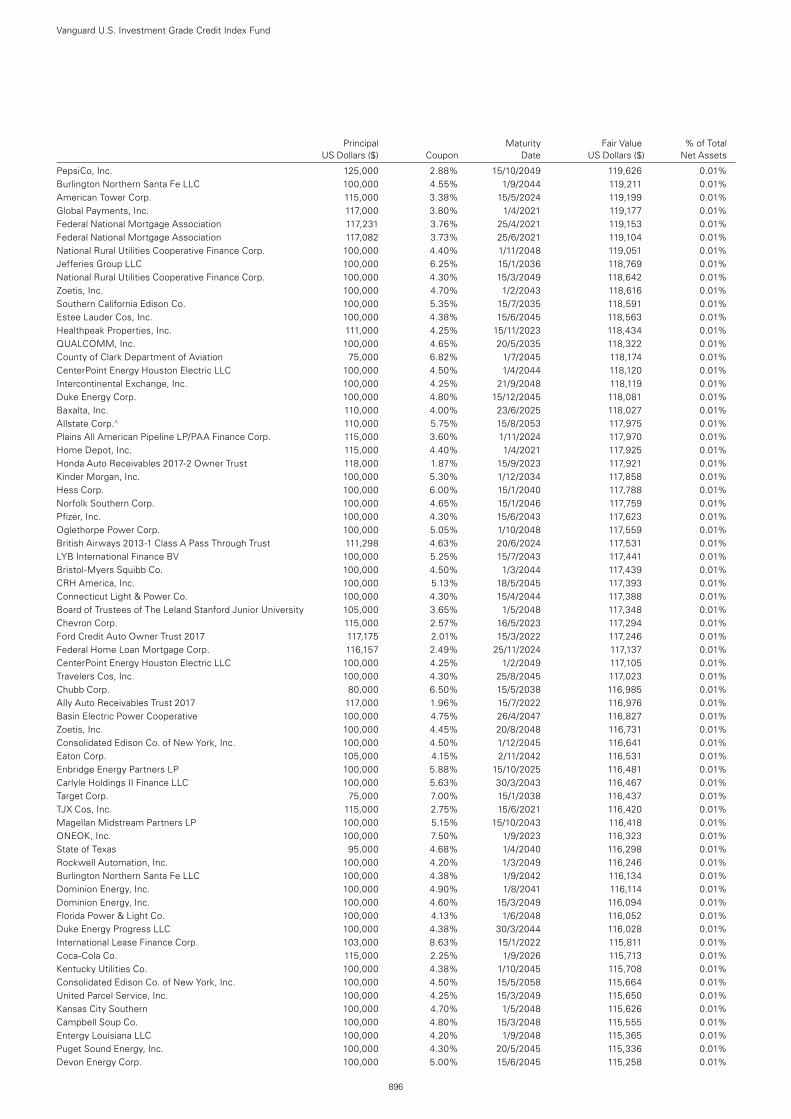
Principal Maturity Fair Value % of Total US Dollars ($) Coupon Date US Dollars ($) Net Assets
PepsiCo, Inc. 125,000 2.88% 15/10/2049 119,626 0.01%Burlington Northern Santa Fe LLC 100,000 4.55% 1/9/2044 119,211 0.01%American Tower Corp. 115,000 3.38% 15/5/2024 119,199 0.01%Global Payments, Inc. 117,000 3.80% 1/4/2021 119,177 0.01%Federal National Mortgage Association 117,231 3.76% 25/4/2021 119,153 0.01%Federal National Mortgage Association 117,082 3.73% 25/6/2021 119,104 0.01%National Rural Utilities Cooperative Finance Corp. 100,000 4.40% 1/11/2048 119,051 0.01%Jefferies Group LLC 100,000 6.25% 15/1/2036 118,769 0.01%National Rural Utilities Cooperative Finance Corp. 100,000 4.30% 15/3/2049 118,642 0.01%Zoetis, Inc. 100,000 4.70% 1/2/2043 118,616 0.01%Southern California Edison Co. 100,000 5.35% 15/7/2035 118,591 0.01%Estee Lauder Cos, Inc. 100,000 4.38% 15/6/2045 118,563 0.01%Healthpeak Properties, Inc. 111,000 4.25% 15/11/2023 118,434 0.01%QUALCOMM, Inc. 100,000 4.65% 20/5/2035 118,322 0.01%County of Clark Department of Aviation 75,000 6.82% 1/7/2045 118,174 0.01%CenterPoint Energy Houston Electric LLC 100,000 4.50% 1/4/2044 118,120 0.01%Intercontinental Exchange, Inc. 100,000 4.25% 21/9/2048 118,119 0.01%Duke Energy Corp. 100,000 4.80% 15/12/2045 118,081 0.01%Baxalta, Inc. 110,000 4.00% 23/6/2025 118,027 0.01%Allstate Corp.^ 110,000 5.75% 15/8/2053 117,975 0.01%Plains All American Pipeline LP/PAA Finance Corp. 115,000 3.60% 1/11/2024 117,970 0.01%Home Depot, Inc. 115,000 4.40% 1/4/2021 117,925 0.01%Honda Auto Receivables 2017-2 Owner Trust 118,000 1.87% 15/9/2023 117,921 0.01%Kinder Morgan, Inc. 100,000 5.30% 1/12/2034 117,858 0.01%Hess Corp. 100,000 6.00% 15/1/2040 117,788 0.01%Norfolk Southern Corp. 100,000 4.65% 15/1/2046 117,759 0.01%Pfizer, Inc. 100,000 4.30% 15/6/2043 117,623 0.01%Oglethorpe Power Corp. 100,000 5.05% 1/10/2048 117,559 0.01%British Airways 2013-1 Class A Pass Through Trust 111,298 4.63% 20/6/2024 117,531 0.01%LYB International Finance BV 100,000 5.25% 15/7/2043 117,441 0.01%Bristol-Myers Squibb Co. 100,000 4.50% 1/3/2044 117,439 0.01%CRH America, Inc. 100,000 5.13% 18/5/2045 117,393 0.01%Connecticut Light & Power Co. 100,000 4.30% 15/4/2044 117,388 0.01%Board of Trustees of The Leland Stanford Junior University 105,000 3.65% 1/5/2048 117,348 0.01%Chevron Corp. 115,000 2.57% 16/5/2023 117,294 0.01%Ford Credit Auto Owner Trust 2017 117,175 2.01% 15/3/2022 117,246 0.01%Federal Home Loan Mortgage Corp. 116,157 2.49% 25/11/2024 117,137 0.01%CenterPoint Energy Houston Electric LLC 100,000 4.25% 1/2/2049 117,105 0.01%Travelers Cos, Inc. 100,000 4.30% 25/8/2045 117,023 0.01%Chubb Corp. 80,000 6.50% 15/5/2038 116,985 0.01%Ally Auto Receivables Trust 2017 117,000 1.96% 15/7/2022 116,976 0.01%Basin Electric Power Cooperative 100,000 4.75% 26/4/2047 116,827 0.01%Zoetis, Inc. 100,000 4.45% 20/8/2048 116,731 0.01%Consolidated Edison Co. of New York, Inc. 100,000 4.50% 1/12/2045 116,641 0.01%Eaton Corp. 105,000 4.15% 2/11/2042 116,531 0.01%Enbridge Energy Partners LP 100,000 5.88% 15/10/2025 116,481 0.01%Carlyle Holdings II Finance LLC 100,000 5.63% 30/3/2043 116,467 0.01%Target Corp. 75,000 7.00% 15/1/2038 116,437 0.01%TJX Cos, Inc. 115,000 2.75% 15/6/2021 116,420 0.01%Magellan Midstream Partners LP 100,000 5.15% 15/10/2043 116,418 0.01%ONEOK, Inc. 100,000 7.50% 1/9/2023 116,323 0.01%State of Texas 95,000 4.68% 1/4/2040 116,298 0.01%Rockwell Automation, Inc. 100,000 4.20% 1/3/2049 116,246 0.01%Burlington Northern Santa Fe LLC 100,000 4.38% 1/9/2042 116,134 0.01%Dominion Energy, Inc. 100,000 4.90% 1/8/2041 116,114 0.01%Dominion Energy, Inc. 100,000 4.60% 15/3/2049 116,094 0.01%Florida Power & Light Co. 100,000 4.13% 1/6/2048 116,052 0.01%Duke Energy Progress LLC 100,000 4.38% 30/3/2044 116,028 0.01%International Lease Finance Corp. 103,000 8.63% 15/1/2022 115,811 0.01%Coca-Cola Co. 115,000 2.25% 1/9/2026 115,713 0.01%Kentucky Utilities Co. 100,000 4.38% 1/10/2045 115,708 0.01%Consolidated Edison Co. of New York, Inc. 100,000 4.50% 15/5/2058 115,664 0.01%United Parcel Service, Inc. 100,000 4.25% 15/3/2049 115,650 0.01%Kansas City Southern 100,000 4.70% 1/5/2048 115,626 0.01%Campbell Soup Co. 100,000 4.80% 15/3/2048 115,555 0.01%Entergy Louisiana LLC 100,000 4.20% 1/9/2048 115,365 0.01%Puget Sound Energy, Inc. 100,000 4.30% 20/5/2045 115,336 0.01%Devon Energy Corp. 100,000 5.00% 15/6/2045 115,258 0.01%
Vanguard U.S. Investment Grade Credit Index Fund
896
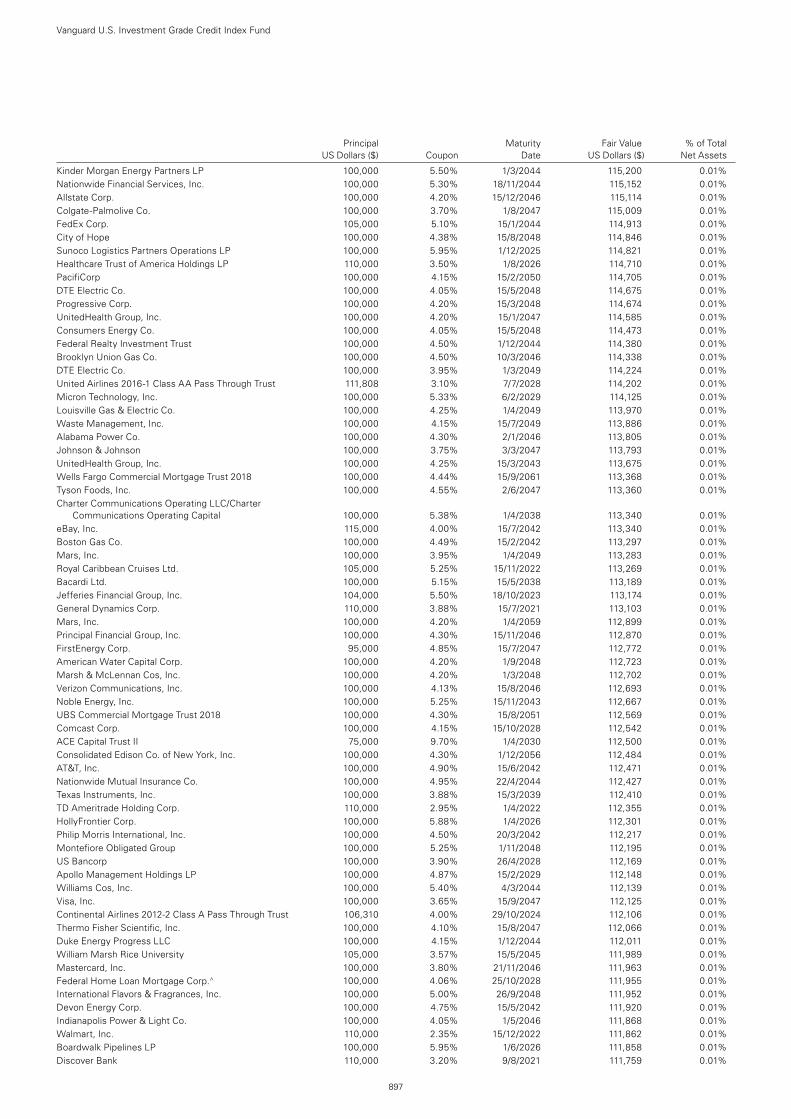
Principal Maturity Fair Value % of Total US Dollars ($) Coupon Date US Dollars ($) Net Assets
Kinder Morgan Energy Partners LP 100,000 5.50% 1/3/2044 115,200 0.01%Nationwide Financial Services, Inc. 100,000 5.30% 18/11/2044 115,152 0.01%Allstate Corp. 100,000 4.20% 15/12/2046 115,114 0.01%Colgate-Palmolive Co. 100,000 3.70% 1/8/2047 115,009 0.01%FedEx Corp. 105,000 5.10% 15/1/2044 114,913 0.01%City of Hope 100,000 4.38% 15/8/2048 114,846 0.01%Sunoco Logistics Partners Operations LP 100,000 5.95% 1/12/2025 114,821 0.01%Healthcare Trust of America Holdings LP 110,000 3.50% 1/8/2026 114,710 0.01%PacifiCorp 100,000 4.15% 15/2/2050 114,705 0.01%DTE Electric Co. 100,000 4.05% 15/5/2048 114,675 0.01%Progressive Corp. 100,000 4.20% 15/3/2048 114,674 0.01%UnitedHealth Group, Inc. 100,000 4.20% 15/1/2047 114,585 0.01%Consumers Energy Co. 100,000 4.05% 15/5/2048 114,473 0.01%Federal Realty Investment Trust 100,000 4.50% 1/12/2044 114,380 0.01%Brooklyn Union Gas Co. 100,000 4.50% 10/3/2046 114,338 0.01%DTE Electric Co. 100,000 3.95% 1/3/2049 114,224 0.01%United Airlines 2016-1 Class AA Pass Through Trust 111,808 3.10% 7/7/2028 114,202 0.01%Micron Technology, Inc. 100,000 5.33% 6/2/2029 114,125 0.01%Louisville Gas & Electric Co. 100,000 4.25% 1/4/2049 113,970 0.01%Waste Management, Inc. 100,000 4.15% 15/7/2049 113,886 0.01%Alabama Power Co. 100,000 4.30% 2/1/2046 113,805 0.01%Johnson & Johnson 100,000 3.75% 3/3/2047 113,793 0.01%UnitedHealth Group, Inc. 100,000 4.25% 15/3/2043 113,675 0.01%Wells Fargo Commercial Mortgage Trust 2018 100,000 4.44% 15/9/2061 113,368 0.01%Tyson Foods, Inc. 100,000 4.55% 2/6/2047 113,360 0.01%Charter Communications Operating LLC/Charter
Communications Operating Capital 100,000 5.38% 1/4/2038 113,340 0.01%eBay, Inc. 115,000 4.00% 15/7/2042 113,340 0.01%Boston Gas Co. 100,000 4.49% 15/2/2042 113,297 0.01%Mars, Inc. 100,000 3.95% 1/4/2049 113,283 0.01%Royal Caribbean Cruises Ltd. 105,000 5.25% 15/11/2022 113,269 0.01%Bacardi Ltd. 100,000 5.15% 15/5/2038 113,189 0.01%Jefferies Financial Group, Inc. 104,000 5.50% 18/10/2023 113,174 0.01%General Dynamics Corp. 110,000 3.88% 15/7/2021 113,103 0.01%Mars, Inc. 100,000 4.20% 1/4/2059 112,899 0.01%Principal Financial Group, Inc. 100,000 4.30% 15/11/2046 112,870 0.01%FirstEnergy Corp. 95,000 4.85% 15/7/2047 112,772 0.01%American Water Capital Corp. 100,000 4.20% 1/9/2048 112,723 0.01%Marsh & McLennan Cos, Inc. 100,000 4.20% 1/3/2048 112,702 0.01%Verizon Communications, Inc. 100,000 4.13% 15/8/2046 112,693 0.01%Noble Energy, Inc. 100,000 5.25% 15/11/2043 112,667 0.01%UBS Commercial Mortgage Trust 2018 100,000 4.30% 15/8/2051 112,569 0.01%Comcast Corp. 100,000 4.15% 15/10/2028 112,542 0.01%ACE Capital Trust II 75,000 9.70% 1/4/2030 112,500 0.01%Consolidated Edison Co. of New York, Inc. 100,000 4.30% 1/12/2056 112,484 0.01%AT&T, Inc. 100,000 4.90% 15/6/2042 112,471 0.01%Nationwide Mutual Insurance Co. 100,000 4.95% 22/4/2044 112,427 0.01%Texas Instruments, Inc. 100,000 3.88% 15/3/2039 112,410 0.01%TD Ameritrade Holding Corp. 110,000 2.95% 1/4/2022 112,355 0.01%HollyFrontier Corp. 100,000 5.88% 1/4/2026 112,301 0.01%Philip Morris International, Inc. 100,000 4.50% 20/3/2042 112,217 0.01%Montefiore Obligated Group 100,000 5.25% 1/11/2048 112,195 0.01%US Bancorp 100,000 3.90% 26/4/2028 112,169 0.01%Apollo Management Holdings LP 100,000 4.87% 15/2/2029 112,148 0.01%Williams Cos, Inc. 100,000 5.40% 4/3/2044 112,139 0.01%Visa, Inc. 100,000 3.65% 15/9/2047 112,125 0.01%Continental Airlines 2012-2 Class A Pass Through Trust 106,310 4.00% 29/10/2024 112,106 0.01%Thermo Fisher Scientific, Inc. 100,000 4.10% 15/8/2047 112,066 0.01%Duke Energy Progress LLC 100,000 4.15% 1/12/2044 112,011 0.01%William Marsh Rice University 105,000 3.57% 15/5/2045 111,989 0.01%Mastercard, Inc. 100,000 3.80% 21/11/2046 111,963 0.01%Federal Home Loan Mortgage Corp.^ 100,000 4.06% 25/10/2028 111,955 0.01%International Flavors & Fragrances, Inc. 100,000 5.00% 26/9/2048 111,952 0.01%Devon Energy Corp. 100,000 4.75% 15/5/2042 111,920 0.01%Indianapolis Power & Light Co. 100,000 4.05% 1/5/2046 111,868 0.01%Walmart, Inc. 110,000 2.35% 15/12/2022 111,862 0.01%Boardwalk Pipelines LP 100,000 5.95% 1/6/2026 111,858 0.01%Discover Bank 110,000 3.20% 9/8/2021 111,759 0.01%
Vanguard U.S. Investment Grade Credit Index Fund
897
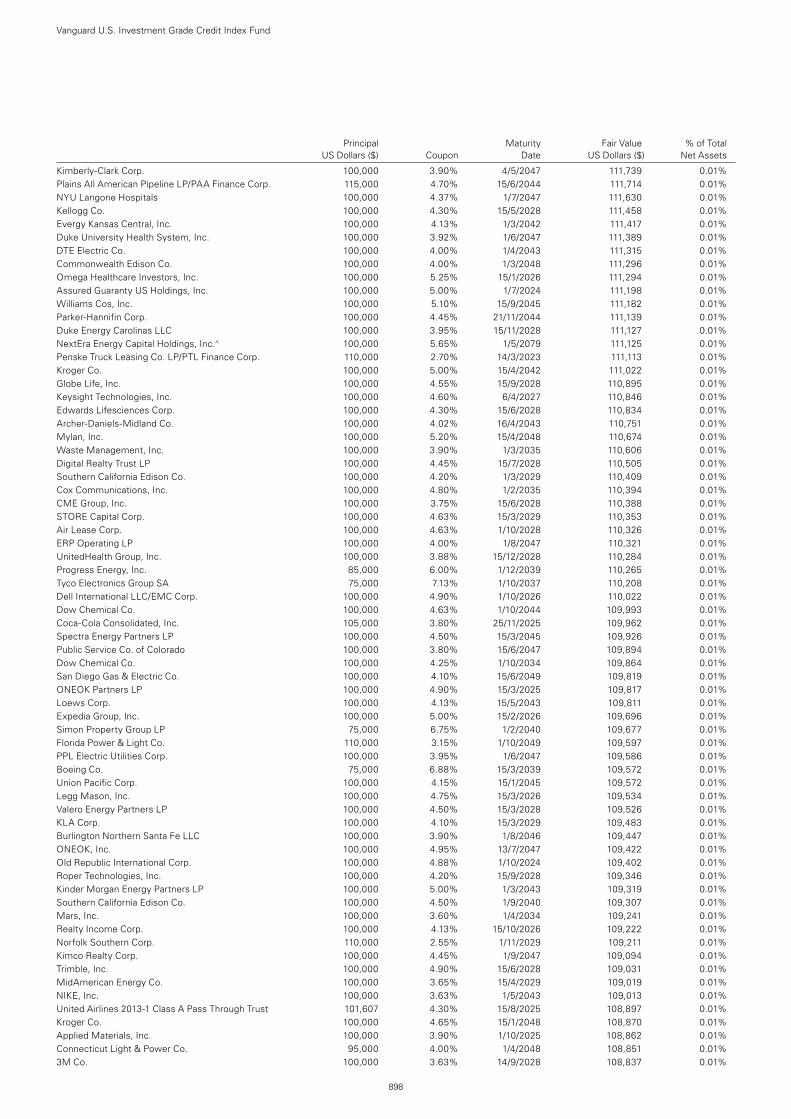
Principal Maturity Fair Value % of Total US Dollars ($) Coupon Date US Dollars ($) Net Assets
Kimberly-Clark Corp. 100,000 3.90% 4/5/2047 111,739 0.01%Plains All American Pipeline LP/PAA Finance Corp. 115,000 4.70% 15/6/2044 111,714 0.01%NYU Langone Hospitals 100,000 4.37% 1/7/2047 111,630 0.01%Kellogg Co. 100,000 4.30% 15/5/2028 111,458 0.01%Evergy Kansas Central, Inc. 100,000 4.13% 1/3/2042 111,417 0.01%Duke University Health System, Inc. 100,000 3.92% 1/6/2047 111,389 0.01%DTE Electric Co. 100,000 4.00% 1/4/2043 111,315 0.01%Commonwealth Edison Co. 100,000 4.00% 1/3/2048 111,296 0.01%Omega Healthcare Investors, Inc. 100,000 5.25% 15/1/2026 111,294 0.01%Assured Guaranty US Holdings, Inc. 100,000 5.00% 1/7/2024 111,198 0.01%Williams Cos, Inc. 100,000 5.10% 15/9/2045 111,182 0.01%Parker-Hannifin Corp. 100,000 4.45% 21/11/2044 111,139 0.01%Duke Energy Carolinas LLC 100,000 3.95% 15/11/2028 111,127 0.01%NextEra Energy Capital Holdings, Inc.^ 100,000 5.65% 1/5/2079 111,125 0.01%Penske Truck Leasing Co. LP/PTL Finance Corp. 110,000 2.70% 14/3/2023 111,113 0.01%Kroger Co. 100,000 5.00% 15/4/2042 111,022 0.01%Globe Life, Inc. 100,000 4.55% 15/9/2028 110,895 0.01%Keysight Technologies, Inc. 100,000 4.60% 6/4/2027 110,846 0.01%Edwards Lifesciences Corp. 100,000 4.30% 15/6/2028 110,834 0.01%Archer-Daniels-Midland Co. 100,000 4.02% 16/4/2043 110,751 0.01%Mylan, Inc. 100,000 5.20% 15/4/2048 110,674 0.01%Waste Management, Inc. 100,000 3.90% 1/3/2035 110,606 0.01%Digital Realty Trust LP 100,000 4.45% 15/7/2028 110,505 0.01%Southern California Edison Co. 100,000 4.20% 1/3/2029 110,409 0.01%Cox Communications, Inc. 100,000 4.80% 1/2/2035 110,394 0.01%CME Group, Inc. 100,000 3.75% 15/6/2028 110,388 0.01%STORE Capital Corp. 100,000 4.63% 15/3/2029 110,353 0.01%Air Lease Corp. 100,000 4.63% 1/10/2028 110,326 0.01%ERP Operating LP 100,000 4.00% 1/8/2047 110,321 0.01%UnitedHealth Group, Inc. 100,000 3.88% 15/12/2028 110,284 0.01%Progress Energy, Inc. 85,000 6.00% 1/12/2039 110,265 0.01%Tyco Electronics Group SA 75,000 7.13% 1/10/2037 110,208 0.01%Dell International LLC/EMC Corp. 100,000 4.90% 1/10/2026 110,022 0.01%Dow Chemical Co. 100,000 4.63% 1/10/2044 109,993 0.01%Coca-Cola Consolidated, Inc. 105,000 3.80% 25/11/2025 109,962 0.01%Spectra Energy Partners LP 100,000 4.50% 15/3/2045 109,926 0.01%Public Service Co. of Colorado 100,000 3.80% 15/6/2047 109,894 0.01%Dow Chemical Co. 100,000 4.25% 1/10/2034 109,864 0.01%San Diego Gas & Electric Co. 100,000 4.10% 15/6/2049 109,819 0.01%ONEOK Partners LP 100,000 4.90% 15/3/2025 109,817 0.01%Loews Corp. 100,000 4.13% 15/5/2043 109,811 0.01%Expedia Group, Inc. 100,000 5.00% 15/2/2026 109,696 0.01%Simon Property Group LP 75,000 6.75% 1/2/2040 109,677 0.01%Florida Power & Light Co. 110,000 3.15% 1/10/2049 109,597 0.01%PPL Electric Utilities Corp. 100,000 3.95% 1/6/2047 109,586 0.01%Boeing Co. 75,000 6.88% 15/3/2039 109,572 0.01%Union Pacific Corp. 100,000 4.15% 15/1/2045 109,572 0.01%Legg Mason, Inc. 100,000 4.75% 15/3/2026 109,534 0.01%Valero Energy Partners LP 100,000 4.50% 15/3/2028 109,526 0.01%KLA Corp. 100,000 4.10% 15/3/2029 109,483 0.01%Burlington Northern Santa Fe LLC 100,000 3.90% 1/8/2046 109,447 0.01%ONEOK, Inc. 100,000 4.95% 13/7/2047 109,422 0.01%Old Republic International Corp. 100,000 4.88% 1/10/2024 109,402 0.01%Roper Technologies, Inc. 100,000 4.20% 15/9/2028 109,346 0.01%Kinder Morgan Energy Partners LP 100,000 5.00% 1/3/2043 109,319 0.01%Southern California Edison Co. 100,000 4.50% 1/9/2040 109,307 0.01%Mars, Inc. 100,000 3.60% 1/4/2034 109,241 0.01%Realty Income Corp. 100,000 4.13% 15/10/2026 109,222 0.01%Norfolk Southern Corp. 110,000 2.55% 1/11/2029 109,211 0.01%Kimco Realty Corp. 100,000 4.45% 1/9/2047 109,094 0.01%Trimble, Inc. 100,000 4.90% 15/6/2028 109,031 0.01%MidAmerican Energy Co. 100,000 3.65% 15/4/2029 109,019 0.01%NIKE, Inc. 100,000 3.63% 1/5/2043 109,013 0.01%United Airlines 2013-1 Class A Pass Through Trust 101,607 4.30% 15/8/2025 108,897 0.01%Kroger Co. 100,000 4.65% 15/1/2048 108,870 0.01%Applied Materials, Inc. 100,000 3.90% 1/10/2025 108,862 0.01%Connecticut Light & Power Co. 95,000 4.00% 1/4/2048 108,851 0.01%3M Co. 100,000 3.63% 14/9/2028 108,837 0.01%
Vanguard U.S. Investment Grade Credit Index Fund
898
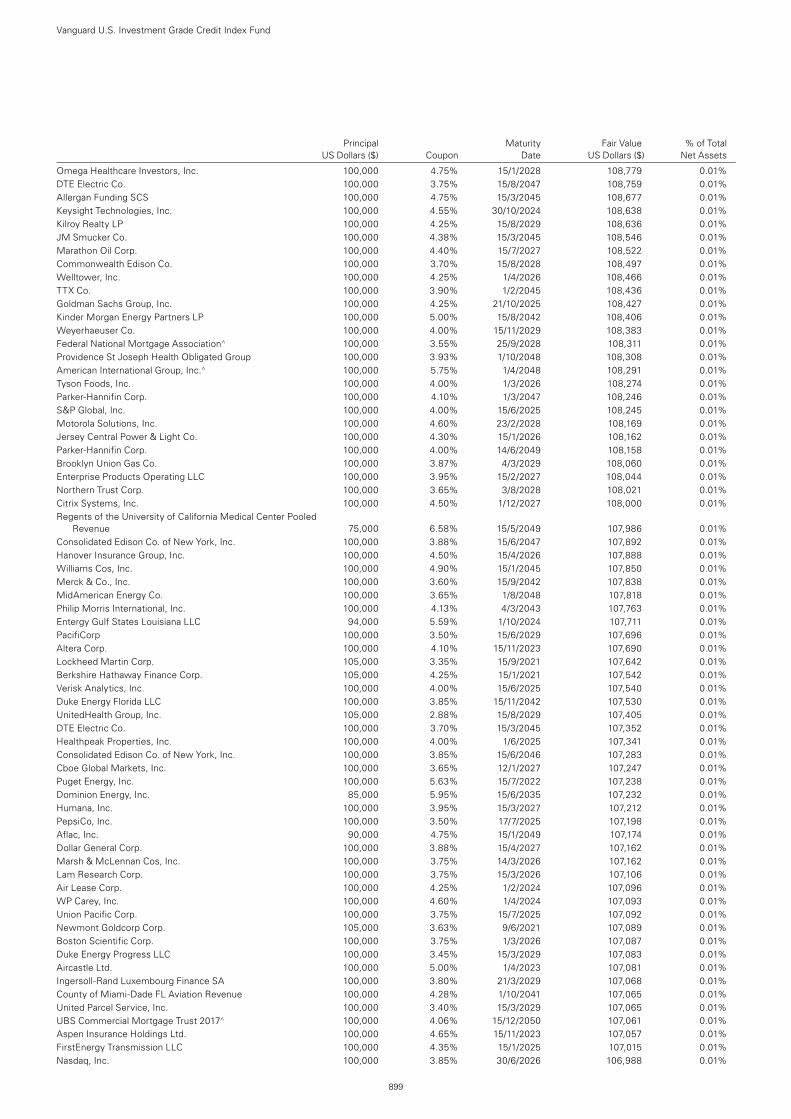
Principal Maturity Fair Value % of Total US Dollars ($) Coupon Date US Dollars ($) Net Assets
Omega Healthcare Investors, Inc. 100,000 4.75% 15/1/2028 108,779 0.01%DTE Electric Co. 100,000 3.75% 15/8/2047 108,759 0.01%Allergan Funding SCS 100,000 4.75% 15/3/2045 108,677 0.01%Keysight Technologies, Inc. 100,000 4.55% 30/10/2024 108,638 0.01%Kilroy Realty LP 100,000 4.25% 15/8/2029 108,636 0.01%JM Smucker Co. 100,000 4.38% 15/3/2045 108,546 0.01%Marathon Oil Corp. 100,000 4.40% 15/7/2027 108,522 0.01%Commonwealth Edison Co. 100,000 3.70% 15/8/2028 108,497 0.01%Welltower, Inc. 100,000 4.25% 1/4/2026 108,466 0.01%TTX Co. 100,000 3.90% 1/2/2045 108,436 0.01%Goldman Sachs Group, Inc. 100,000 4.25% 21/10/2025 108,427 0.01%Kinder Morgan Energy Partners LP 100,000 5.00% 15/8/2042 108,406 0.01%Weyerhaeuser Co. 100,000 4.00% 15/11/2029 108,383 0.01%Federal National Mortgage Association^ 100,000 3.55% 25/9/2028 108,311 0.01%Providence St Joseph Health Obligated Group 100,000 3.93% 1/10/2048 108,308 0.01%American International Group, Inc.^ 100,000 5.75% 1/4/2048 108,291 0.01%Tyson Foods, Inc. 100,000 4.00% 1/3/2026 108,274 0.01%Parker-Hannifin Corp. 100,000 4.10% 1/3/2047 108,246 0.01%S&P Global, Inc. 100,000 4.00% 15/6/2025 108,245 0.01%Motorola Solutions, Inc. 100,000 4.60% 23/2/2028 108,169 0.01%Jersey Central Power & Light Co. 100,000 4.30% 15/1/2026 108,162 0.01%Parker-Hannifin Corp. 100,000 4.00% 14/6/2049 108,158 0.01%Brooklyn Union Gas Co. 100,000 3.87% 4/3/2029 108,060 0.01%Enterprise Products Operating LLC 100,000 3.95% 15/2/2027 108,044 0.01%Northern Trust Corp. 100,000 3.65% 3/8/2028 108,021 0.01%Citrix Systems, Inc. 100,000 4.50% 1/12/2027 108,000 0.01%Regents of the University of California Medical Center Pooled
Revenue 75,000 6.58% 15/5/2049 107,986 0.01%Consolidated Edison Co. of New York, Inc. 100,000 3.88% 15/6/2047 107,892 0.01%Hanover Insurance Group, Inc. 100,000 4.50% 15/4/2026 107,888 0.01%Williams Cos, Inc. 100,000 4.90% 15/1/2045 107,850 0.01%Merck & Co., Inc. 100,000 3.60% 15/9/2042 107,838 0.01%MidAmerican Energy Co. 100,000 3.65% 1/8/2048 107,818 0.01%Philip Morris International, Inc. 100,000 4.13% 4/3/2043 107,763 0.01%Entergy Gulf States Louisiana LLC 94,000 5.59% 1/10/2024 107,711 0.01%PacifiCorp 100,000 3.50% 15/6/2029 107,696 0.01%Altera Corp. 100,000 4.10% 15/11/2023 107,690 0.01%Lockheed Martin Corp. 105,000 3.35% 15/9/2021 107,642 0.01%Berkshire Hathaway Finance Corp. 105,000 4.25% 15/1/2021 107,542 0.01%Verisk Analytics, Inc. 100,000 4.00% 15/6/2025 107,540 0.01%Duke Energy Florida LLC 100,000 3.85% 15/11/2042 107,530 0.01%UnitedHealth Group, Inc. 105,000 2.88% 15/8/2029 107,405 0.01%DTE Electric Co. 100,000 3.70% 15/3/2045 107,352 0.01%Healthpeak Properties, Inc. 100,000 4.00% 1/6/2025 107,341 0.01%Consolidated Edison Co. of New York, Inc. 100,000 3.85% 15/6/2046 107,283 0.01%Cboe Global Markets, Inc. 100,000 3.65% 12/1/2027 107,247 0.01%Puget Energy, Inc. 100,000 5.63% 15/7/2022 107,238 0.01%Dominion Energy, Inc. 85,000 5.95% 15/6/2035 107,232 0.01%Humana, Inc. 100,000 3.95% 15/3/2027 107,212 0.01%PepsiCo, Inc. 100,000 3.50% 17/7/2025 107,198 0.01%Aflac, Inc. 90,000 4.75% 15/1/2049 107,174 0.01%Dollar General Corp. 100,000 3.88% 15/4/2027 107,162 0.01%Marsh & McLennan Cos, Inc. 100,000 3.75% 14/3/2026 107,162 0.01%Lam Research Corp. 100,000 3.75% 15/3/2026 107,106 0.01%Air Lease Corp. 100,000 4.25% 1/2/2024 107,096 0.01%WP Carey, Inc. 100,000 4.60% 1/4/2024 107,093 0.01%Union Pacific Corp. 100,000 3.75% 15/7/2025 107,092 0.01%Newmont Goldcorp Corp. 105,000 3.63% 9/6/2021 107,089 0.01%Boston Scientific Corp. 100,000 3.75% 1/3/2026 107,087 0.01%Duke Energy Progress LLC 100,000 3.45% 15/3/2029 107,083 0.01%Aircastle Ltd. 100,000 5.00% 1/4/2023 107,081 0.01%Ingersoll-Rand Luxembourg Finance SA 100,000 3.80% 21/3/2029 107,068 0.01%County of Miami-Dade FL Aviation Revenue 100,000 4.28% 1/10/2041 107,065 0.01%United Parcel Service, Inc. 100,000 3.40% 15/3/2029 107,065 0.01%UBS Commercial Mortgage Trust 2017^ 100,000 4.06% 15/12/2050 107,061 0.01%Aspen Insurance Holdings Ltd. 100,000 4.65% 15/11/2023 107,057 0.01%FirstEnergy Transmission LLC 100,000 4.35% 15/1/2025 107,015 0.01%Nasdaq, Inc. 100,000 3.85% 30/6/2026 106,988 0.01%
Vanguard U.S. Investment Grade Credit Index Fund
899
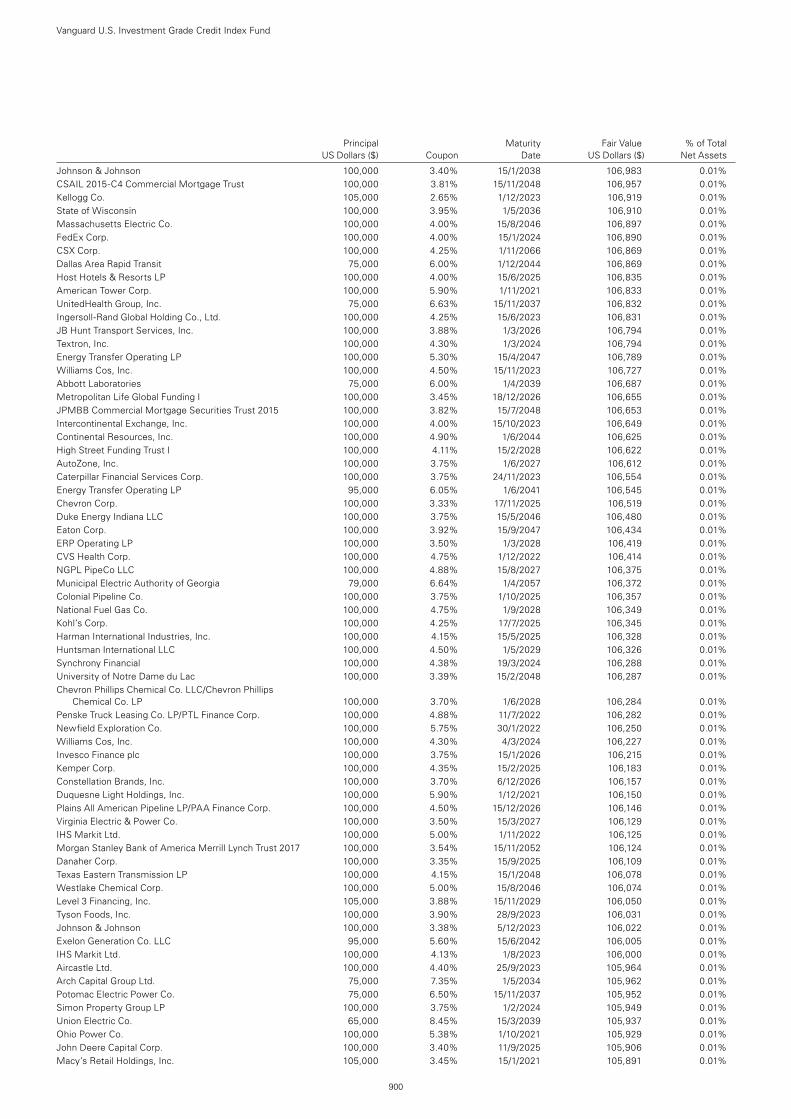
Principal Maturity Fair Value % of Total US Dollars ($) Coupon Date US Dollars ($) Net Assets
Johnson & Johnson 100,000 3.40% 15/1/2038 106,983 0.01%CSAIL 2015-C4 Commercial Mortgage Trust 100,000 3.81% 15/11/2048 106,957 0.01%Kellogg Co. 105,000 2.65% 1/12/2023 106,919 0.01%State of Wisconsin 100,000 3.95% 1/5/2036 106,910 0.01%Massachusetts Electric Co. 100,000 4.00% 15/8/2046 106,897 0.01%FedEx Corp. 100,000 4.00% 15/1/2024 106,890 0.01%CSX Corp. 100,000 4.25% 1/11/2066 106,869 0.01%Dallas Area Rapid Transit 75,000 6.00% 1/12/2044 106,869 0.01%Host Hotels & Resorts LP 100,000 4.00% 15/6/2025 106,835 0.01%American Tower Corp. 100,000 5.90% 1/11/2021 106,833 0.01%UnitedHealth Group, Inc. 75,000 6.63% 15/11/2037 106,832 0.01%Ingersoll-Rand Global Holding Co., Ltd. 100,000 4.25% 15/6/2023 106,831 0.01%JB Hunt Transport Services, Inc. 100,000 3.88% 1/3/2026 106,794 0.01%Textron, Inc. 100,000 4.30% 1/3/2024 106,794 0.01%Energy Transfer Operating LP 100,000 5.30% 15/4/2047 106,789 0.01%Williams Cos, Inc. 100,000 4.50% 15/11/2023 106,727 0.01%Abbott Laboratories 75,000 6.00% 1/4/2039 106,687 0.01%Metropolitan Life Global Funding I 100,000 3.45% 18/12/2026 106,655 0.01%JPMBB Commercial Mortgage Securities Trust 2015 100,000 3.82% 15/7/2048 106,653 0.01%Intercontinental Exchange, Inc. 100,000 4.00% 15/10/2023 106,649 0.01%Continental Resources, Inc. 100,000 4.90% 1/6/2044 106,625 0.01%High Street Funding Trust I 100,000 4.11% 15/2/2028 106,622 0.01%AutoZone, Inc. 100,000 3.75% 1/6/2027 106,612 0.01%Caterpillar Financial Services Corp. 100,000 3.75% 24/11/2023 106,554 0.01%Energy Transfer Operating LP 95,000 6.05% 1/6/2041 106,545 0.01%Chevron Corp. 100,000 3.33% 17/11/2025 106,519 0.01%Duke Energy Indiana LLC 100,000 3.75% 15/5/2046 106,480 0.01%Eaton Corp. 100,000 3.92% 15/9/2047 106,434 0.01%ERP Operating LP 100,000 3.50% 1/3/2028 106,419 0.01%CVS Health Corp. 100,000 4.75% 1/12/2022 106,414 0.01%NGPL PipeCo LLC 100,000 4.88% 15/8/2027 106,375 0.01%Municipal Electric Authority of Georgia 79,000 6.64% 1/4/2057 106,372 0.01%Colonial Pipeline Co. 100,000 3.75% 1/10/2025 106,357 0.01%National Fuel Gas Co. 100,000 4.75% 1/9/2028 106,349 0.01%Kohl’s Corp. 100,000 4.25% 17/7/2025 106,345 0.01%Harman International Industries, Inc. 100,000 4.15% 15/5/2025 106,328 0.01%Huntsman International LLC 100,000 4.50% 1/5/2029 106,326 0.01%Synchrony Financial 100,000 4.38% 19/3/2024 106,288 0.01%University of Notre Dame du Lac 100,000 3.39% 15/2/2048 106,287 0.01%Chevron Phillips Chemical Co. LLC/Chevron Phillips
Chemical Co. LP 100,000 3.70% 1/6/2028 106,284 0.01%Penske Truck Leasing Co. LP/PTL Finance Corp. 100,000 4.88% 11/7/2022 106,282 0.01%Newfield Exploration Co. 100,000 5.75% 30/1/2022 106,250 0.01%Williams Cos, Inc. 100,000 4.30% 4/3/2024 106,227 0.01%Invesco Finance plc 100,000 3.75% 15/1/2026 106,215 0.01%Kemper Corp. 100,000 4.35% 15/2/2025 106,183 0.01%Constellation Brands, Inc. 100,000 3.70% 6/12/2026 106,157 0.01%Duquesne Light Holdings, Inc. 100,000 5.90% 1/12/2021 106,150 0.01%Plains All American Pipeline LP/PAA Finance Corp. 100,000 4.50% 15/12/2026 106,146 0.01%Virginia Electric & Power Co. 100,000 3.50% 15/3/2027 106,129 0.01%IHS Markit Ltd. 100,000 5.00% 1/11/2022 106,125 0.01%Morgan Stanley Bank of America Merrill Lynch Trust 2017 100,000 3.54% 15/11/2052 106,124 0.01%Danaher Corp. 100,000 3.35% 15/9/2025 106,109 0.01%Texas Eastern Transmission LP 100,000 4.15% 15/1/2048 106,078 0.01%Westlake Chemical Corp. 100,000 5.00% 15/8/2046 106,074 0.01%Level 3 Financing, Inc. 105,000 3.88% 15/11/2029 106,050 0.01%Tyson Foods, Inc. 100,000 3.90% 28/9/2023 106,031 0.01%Johnson & Johnson 100,000 3.38% 5/12/2023 106,022 0.01%Exelon Generation Co. LLC 95,000 5.60% 15/6/2042 106,005 0.01%IHS Markit Ltd. 100,000 4.13% 1/8/2023 106,000 0.01%Aircastle Ltd. 100,000 4.40% 25/9/2023 105,964 0.01%Arch Capital Group Ltd. 75,000 7.35% 1/5/2034 105,962 0.01%Potomac Electric Power Co. 75,000 6.50% 15/11/2037 105,952 0.01%Simon Property Group LP 100,000 3.75% 1/2/2024 105,949 0.01%Union Electric Co. 65,000 8.45% 15/3/2039 105,937 0.01%Ohio Power Co. 100,000 5.38% 1/10/2021 105,929 0.01%John Deere Capital Corp. 100,000 3.40% 11/9/2025 105,906 0.01%Macy’s Retail Holdings, Inc. 105,000 3.45% 15/1/2021 105,891 0.01%
Vanguard U.S. Investment Grade Credit Index Fund
900
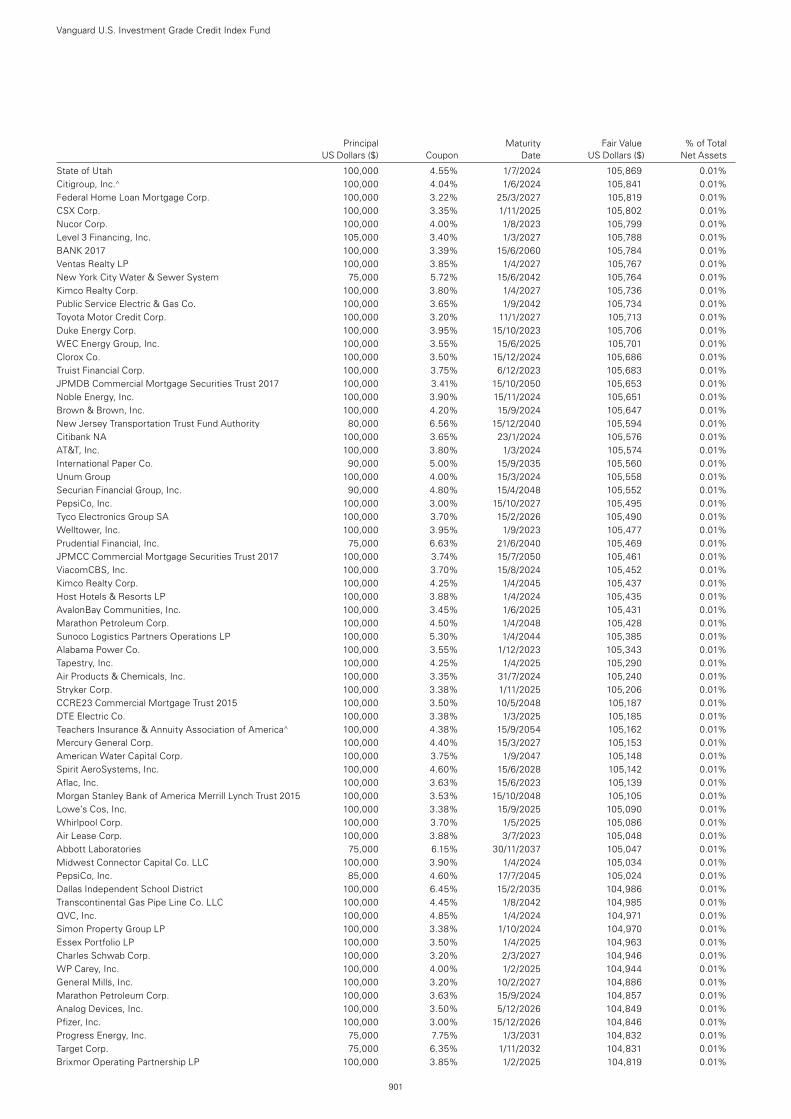
Principal Maturity Fair Value % of Total US Dollars ($) Coupon Date US Dollars ($) Net Assets
State of Utah 100,000 4.55% 1/7/2024 105,869 0.01%Citigroup, Inc.^ 100,000 4.04% 1/6/2024 105,841 0.01%Federal Home Loan Mortgage Corp. 100,000 3.22% 25/3/2027 105,819 0.01%CSX Corp. 100,000 3.35% 1/11/2025 105,802 0.01%Nucor Corp. 100,000 4.00% 1/8/2023 105,799 0.01%Level 3 Financing, Inc. 105,000 3.40% 1/3/2027 105,788 0.01%BANK 2017 100,000 3.39% 15/6/2060 105,784 0.01%Ventas Realty LP 100,000 3.85% 1/4/2027 105,767 0.01%New York City Water & Sewer System 75,000 5.72% 15/6/2042 105,764 0.01%Kimco Realty Corp. 100,000 3.80% 1/4/2027 105,736 0.01%Public Service Electric & Gas Co. 100,000 3.65% 1/9/2042 105,734 0.01%Toyota Motor Credit Corp. 100,000 3.20% 11/1/2027 105,713 0.01%Duke Energy Corp. 100,000 3.95% 15/10/2023 105,706 0.01%WEC Energy Group, Inc. 100,000 3.55% 15/6/2025 105,701 0.01%Clorox Co. 100,000 3.50% 15/12/2024 105,686 0.01%Truist Financial Corp. 100,000 3.75% 6/12/2023 105,683 0.01%JPMDB Commercial Mortgage Securities Trust 2017 100,000 3.41% 15/10/2050 105,653 0.01%Noble Energy, Inc. 100,000 3.90% 15/11/2024 105,651 0.01%Brown & Brown, Inc. 100,000 4.20% 15/9/2024 105,647 0.01%New Jersey Transportation Trust Fund Authority 80,000 6.56% 15/12/2040 105,594 0.01%Citibank NA 100,000 3.65% 23/1/2024 105,576 0.01%AT&T, Inc. 100,000 3.80% 1/3/2024 105,574 0.01%International Paper Co. 90,000 5.00% 15/9/2035 105,560 0.01%Unum Group 100,000 4.00% 15/3/2024 105,558 0.01%Securian Financial Group, Inc. 90,000 4.80% 15/4/2048 105,552 0.01%PepsiCo, Inc. 100,000 3.00% 15/10/2027 105,495 0.01%Tyco Electronics Group SA 100,000 3.70% 15/2/2026 105,490 0.01%Welltower, Inc. 100,000 3.95% 1/9/2023 105,477 0.01%Prudential Financial, Inc. 75,000 6.63% 21/6/2040 105,469 0.01%JPMCC Commercial Mortgage Securities Trust 2017 100,000 3.74% 15/7/2050 105,461 0.01%ViacomCBS, Inc. 100,000 3.70% 15/8/2024 105,452 0.01%Kimco Realty Corp. 100,000 4.25% 1/4/2045 105,437 0.01%Host Hotels & Resorts LP 100,000 3.88% 1/4/2024 105,435 0.01%AvalonBay Communities, Inc. 100,000 3.45% 1/6/2025 105,431 0.01%Marathon Petroleum Corp. 100,000 4.50% 1/4/2048 105,428 0.01%Sunoco Logistics Partners Operations LP 100,000 5.30% 1/4/2044 105,385 0.01%Alabama Power Co. 100,000 3.55% 1/12/2023 105,343 0.01%Tapestry, Inc. 100,000 4.25% 1/4/2025 105,290 0.01%Air Products & Chemicals, Inc. 100,000 3.35% 31/7/2024 105,240 0.01%Stryker Corp. 100,000 3.38% 1/11/2025 105,206 0.01%CCRE23 Commercial Mortgage Trust 2015 100,000 3.50% 10/5/2048 105,187 0.01%DTE Electric Co. 100,000 3.38% 1/3/2025 105,185 0.01%Teachers Insurance & Annuity Association of America^ 100,000 4.38% 15/9/2054 105,162 0.01%Mercury General Corp. 100,000 4.40% 15/3/2027 105,153 0.01%American Water Capital Corp. 100,000 3.75% 1/9/2047 105,148 0.01%Spirit AeroSystems, Inc. 100,000 4.60% 15/6/2028 105,142 0.01%Aflac, Inc. 100,000 3.63% 15/6/2023 105,139 0.01%Morgan Stanley Bank of America Merrill Lynch Trust 2015 100,000 3.53% 15/10/2048 105,105 0.01%Lowe’s Cos, Inc. 100,000 3.38% 15/9/2025 105,090 0.01%Whirlpool Corp. 100,000 3.70% 1/5/2025 105,086 0.01%Air Lease Corp. 100,000 3.88% 3/7/2023 105,048 0.01%Abbott Laboratories 75,000 6.15% 30/11/2037 105,047 0.01%Midwest Connector Capital Co. LLC 100,000 3.90% 1/4/2024 105,034 0.01%PepsiCo, Inc. 85,000 4.60% 17/7/2045 105,024 0.01%Dallas Independent School District 100,000 6.45% 15/2/2035 104,986 0.01%Transcontinental Gas Pipe Line Co. LLC 100,000 4.45% 1/8/2042 104,985 0.01%QVC, Inc. 100,000 4.85% 1/4/2024 104,971 0.01%Simon Property Group LP 100,000 3.38% 1/10/2024 104,970 0.01%Essex Portfolio LP 100,000 3.50% 1/4/2025 104,963 0.01%Charles Schwab Corp. 100,000 3.20% 2/3/2027 104,946 0.01%WP Carey, Inc. 100,000 4.00% 1/2/2025 104,944 0.01%General Mills, Inc. 100,000 3.20% 10/2/2027 104,886 0.01%Marathon Petroleum Corp. 100,000 3.63% 15/9/2024 104,857 0.01%Analog Devices, Inc. 100,000 3.50% 5/12/2026 104,849 0.01%Pfizer, Inc. 100,000 3.00% 15/12/2026 104,846 0.01%Progress Energy, Inc. 75,000 7.75% 1/3/2031 104,832 0.01%Target Corp. 75,000 6.35% 1/11/2032 104,831 0.01%Brixmor Operating Partnership LP 100,000 3.85% 1/2/2025 104,819 0.01%
Vanguard U.S. Investment Grade Credit Index Fund
901
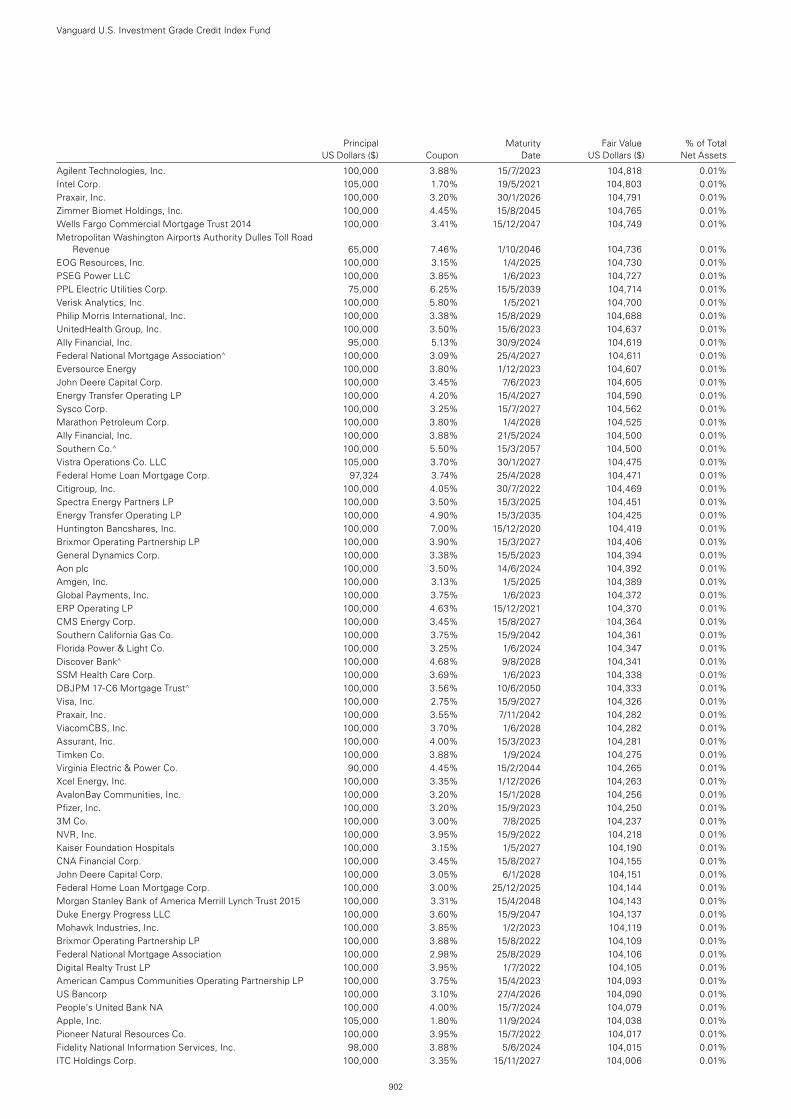
Principal Maturity Fair Value % of Total US Dollars ($) Coupon Date US Dollars ($) Net Assets
Agilent Technologies, Inc. 100,000 3.88% 15/7/2023 104,818 0.01%Intel Corp. 105,000 1.70% 19/5/2021 104,803 0.01%Praxair, Inc. 100,000 3.20% 30/1/2026 104,791 0.01%Zimmer Biomet Holdings, Inc. 100,000 4.45% 15/8/2045 104,765 0.01%Wells Fargo Commercial Mortgage Trust 2014 100,000 3.41% 15/12/2047 104,749 0.01%Metropolitan Washington Airports Authority Dulles Toll Road
Revenue 65,000 7.46% 1/10/2046 104,736 0.01%EOG Resources, Inc. 100,000 3.15% 1/4/2025 104,730 0.01%PSEG Power LLC 100,000 3.85% 1/6/2023 104,727 0.01%PPL Electric Utilities Corp. 75,000 6.25% 15/5/2039 104,714 0.01%Verisk Analytics, Inc. 100,000 5.80% 1/5/2021 104,700 0.01%Philip Morris International, Inc. 100,000 3.38% 15/8/2029 104,688 0.01%UnitedHealth Group, Inc. 100,000 3.50% 15/6/2023 104,637 0.01%Ally Financial, Inc. 95,000 5.13% 30/9/2024 104,619 0.01%Federal National Mortgage Association^ 100,000 3.09% 25/4/2027 104,611 0.01%Eversource Energy 100,000 3.80% 1/12/2023 104,607 0.01%John Deere Capital Corp. 100,000 3.45% 7/6/2023 104,605 0.01%Energy Transfer Operating LP 100,000 4.20% 15/4/2027 104,590 0.01%Sysco Corp. 100,000 3.25% 15/7/2027 104,562 0.01%Marathon Petroleum Corp. 100,000 3.80% 1/4/2028 104,525 0.01%Ally Financial, Inc. 100,000 3.88% 21/5/2024 104,500 0.01%Southern Co.^ 100,000 5.50% 15/3/2057 104,500 0.01%Vistra Operations Co. LLC 105,000 3.70% 30/1/2027 104,475 0.01%Federal Home Loan Mortgage Corp. 97,324 3.74% 25/4/2028 104,471 0.01%Citigroup, Inc. 100,000 4.05% 30/7/2022 104,469 0.01%Spectra Energy Partners LP 100,000 3.50% 15/3/2025 104,451 0.01%Energy Transfer Operating LP 100,000 4.90% 15/3/2035 104,425 0.01%Huntington Bancshares, Inc. 100,000 7.00% 15/12/2020 104,419 0.01%Brixmor Operating Partnership LP 100,000 3.90% 15/3/2027 104,406 0.01%General Dynamics Corp. 100,000 3.38% 15/5/2023 104,394 0.01%Aon plc 100,000 3.50% 14/6/2024 104,392 0.01%Amgen, Inc. 100,000 3.13% 1/5/2025 104,389 0.01%Global Payments, Inc. 100,000 3.75% 1/6/2023 104,372 0.01%ERP Operating LP 100,000 4.63% 15/12/2021 104,370 0.01%CMS Energy Corp. 100,000 3.45% 15/8/2027 104,364 0.01%Southern California Gas Co. 100,000 3.75% 15/9/2042 104,361 0.01%Florida Power & Light Co. 100,000 3.25% 1/6/2024 104,347 0.01%Discover Bank^ 100,000 4.68% 9/8/2028 104,341 0.01%SSM Health Care Corp. 100,000 3.69% 1/6/2023 104,338 0.01%DBJPM 17-C6 Mortgage Trust^ 100,000 3.56% 10/6/2050 104,333 0.01%Visa, Inc. 100,000 2.75% 15/9/2027 104,326 0.01%Praxair, Inc. 100,000 3.55% 7/11/2042 104,282 0.01%ViacomCBS, Inc. 100,000 3.70% 1/6/2028 104,282 0.01%Assurant, Inc. 100,000 4.00% 15/3/2023 104,281 0.01%Timken Co. 100,000 3.88% 1/9/2024 104,275 0.01%Virginia Electric & Power Co. 90,000 4.45% 15/2/2044 104,265 0.01%Xcel Energy, Inc. 100,000 3.35% 1/12/2026 104,263 0.01%AvalonBay Communities, Inc. 100,000 3.20% 15/1/2028 104,256 0.01%Pfizer, Inc. 100,000 3.20% 15/9/2023 104,250 0.01%3M Co. 100,000 3.00% 7/8/2025 104,237 0.01%NVR, Inc. 100,000 3.95% 15/9/2022 104,218 0.01%Kaiser Foundation Hospitals 100,000 3.15% 1/5/2027 104,190 0.01%CNA Financial Corp. 100,000 3.45% 15/8/2027 104,155 0.01%John Deere Capital Corp. 100,000 3.05% 6/1/2028 104,151 0.01%Federal Home Loan Mortgage Corp. 100,000 3.00% 25/12/2025 104,144 0.01%Morgan Stanley Bank of America Merrill Lynch Trust 2015 100,000 3.31% 15/4/2048 104,143 0.01%Duke Energy Progress LLC 100,000 3.60% 15/9/2047 104,137 0.01%Mohawk Industries, Inc. 100,000 3.85% 1/2/2023 104,119 0.01%Brixmor Operating Partnership LP 100,000 3.88% 15/8/2022 104,109 0.01%Federal National Mortgage Association 100,000 2.98% 25/8/2029 104,106 0.01%Digital Realty Trust LP 100,000 3.95% 1/7/2022 104,105 0.01%American Campus Communities Operating Partnership LP 100,000 3.75% 15/4/2023 104,093 0.01%US Bancorp 100,000 3.10% 27/4/2026 104,090 0.01%People’s United Bank NA 100,000 4.00% 15/7/2024 104,079 0.01%Apple, Inc. 105,000 1.80% 11/9/2024 104,038 0.01%Pioneer Natural Resources Co. 100,000 3.95% 15/7/2022 104,017 0.01%Fidelity National Information Services, Inc. 98,000 3.88% 5/6/2024 104,015 0.01%ITC Holdings Corp. 100,000 3.35% 15/11/2027 104,006 0.01%
Vanguard U.S. Investment Grade Credit Index Fund
902
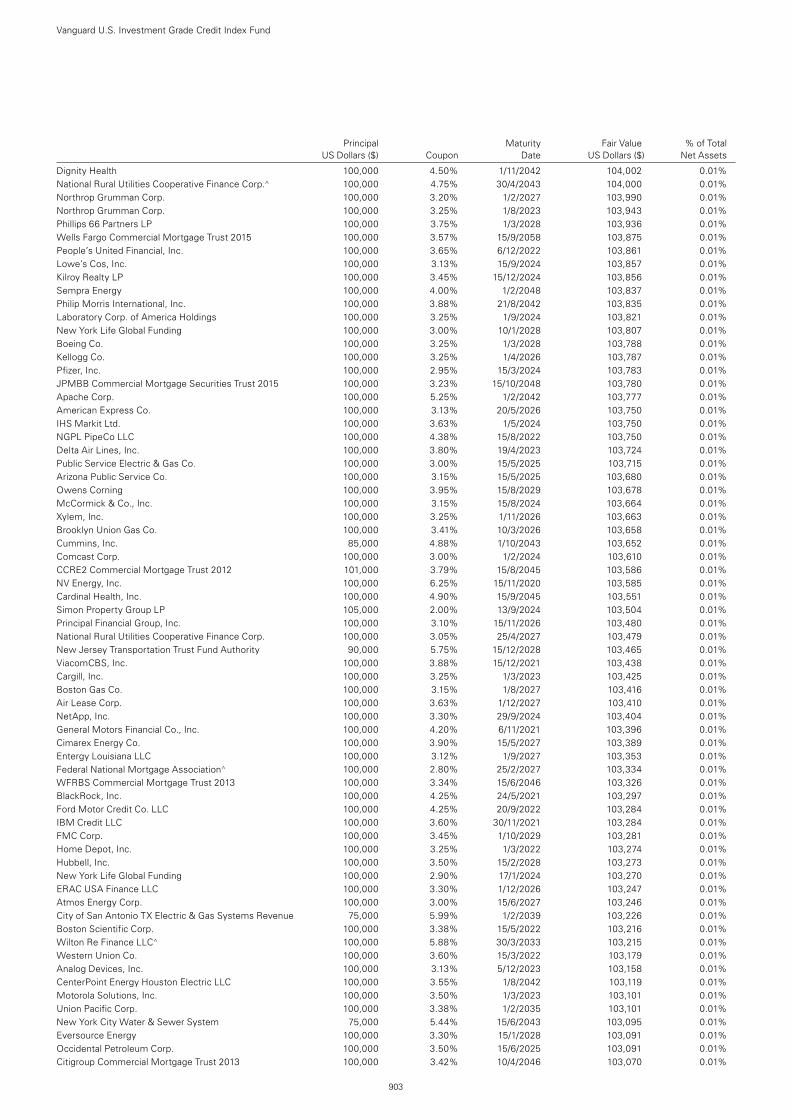
Principal Maturity Fair Value % of Total US Dollars ($) Coupon Date US Dollars ($) Net Assets
Dignity Health 100,000 4.50% 1/11/2042 104,002 0.01%National Rural Utilities Cooperative Finance Corp.^ 100,000 4.75% 30/4/2043 104,000 0.01%Northrop Grumman Corp. 100,000 3.20% 1/2/2027 103,990 0.01%Northrop Grumman Corp. 100,000 3.25% 1/8/2023 103,943 0.01%Phillips 66 Partners LP 100,000 3.75% 1/3/2028 103,936 0.01%Wells Fargo Commercial Mortgage Trust 2015 100,000 3.57% 15/9/2058 103,875 0.01%People’s United Financial, Inc. 100,000 3.65% 6/12/2022 103,861 0.01%Lowe’s Cos, Inc. 100,000 3.13% 15/9/2024 103,857 0.01%Kilroy Realty LP 100,000 3.45% 15/12/2024 103,856 0.01%Sempra Energy 100,000 4.00% 1/2/2048 103,837 0.01%Philip Morris International, Inc. 100,000 3.88% 21/8/2042 103,835 0.01%Laboratory Corp. of America Holdings 100,000 3.25% 1/9/2024 103,821 0.01%New York Life Global Funding 100,000 3.00% 10/1/2028 103,807 0.01%Boeing Co. 100,000 3.25% 1/3/2028 103,788 0.01%Kellogg Co. 100,000 3.25% 1/4/2026 103,787 0.01%Pfizer, Inc. 100,000 2.95% 15/3/2024 103,783 0.01%JPMBB Commercial Mortgage Securities Trust 2015 100,000 3.23% 15/10/2048 103,780 0.01%Apache Corp. 100,000 5.25% 1/2/2042 103,777 0.01%American Express Co. 100,000 3.13% 20/5/2026 103,750 0.01%IHS Markit Ltd. 100,000 3.63% 1/5/2024 103,750 0.01%NGPL PipeCo LLC 100,000 4.38% 15/8/2022 103,750 0.01%Delta Air Lines, Inc. 100,000 3.80% 19/4/2023 103,724 0.01%Public Service Electric & Gas Co. 100,000 3.00% 15/5/2025 103,715 0.01%Arizona Public Service Co. 100,000 3.15% 15/5/2025 103,680 0.01%Owens Corning 100,000 3.95% 15/8/2029 103,678 0.01%McCormick & Co., Inc. 100,000 3.15% 15/8/2024 103,664 0.01%Xylem, Inc. 100,000 3.25% 1/11/2026 103,663 0.01%Brooklyn Union Gas Co. 100,000 3.41% 10/3/2026 103,658 0.01%Cummins, Inc. 85,000 4.88% 1/10/2043 103,652 0.01%Comcast Corp. 100,000 3.00% 1/2/2024 103,610 0.01%CCRE2 Commercial Mortgage Trust 2012 101,000 3.79% 15/8/2045 103,586 0.01%NV Energy, Inc. 100,000 6.25% 15/11/2020 103,585 0.01%Cardinal Health, Inc. 100,000 4.90% 15/9/2045 103,551 0.01%Simon Property Group LP 105,000 2.00% 13/9/2024 103,504 0.01%Principal Financial Group, Inc. 100,000 3.10% 15/11/2026 103,480 0.01%National Rural Utilities Cooperative Finance Corp. 100,000 3.05% 25/4/2027 103,479 0.01%New Jersey Transportation Trust Fund Authority 90,000 5.75% 15/12/2028 103,465 0.01%ViacomCBS, Inc. 100,000 3.88% 15/12/2021 103,438 0.01%Cargill, Inc. 100,000 3.25% 1/3/2023 103,425 0.01%Boston Gas Co. 100,000 3.15% 1/8/2027 103,416 0.01%Air Lease Corp. 100,000 3.63% 1/12/2027 103,410 0.01%NetApp, Inc. 100,000 3.30% 29/9/2024 103,404 0.01%General Motors Financial Co., Inc. 100,000 4.20% 6/11/2021 103,396 0.01%Cimarex Energy Co. 100,000 3.90% 15/5/2027 103,389 0.01%Entergy Louisiana LLC 100,000 3.12% 1/9/2027 103,353 0.01%Federal National Mortgage Association^ 100,000 2.80% 25/2/2027 103,334 0.01%WFRBS Commercial Mortgage Trust 2013 100,000 3.34% 15/6/2046 103,326 0.01%BlackRock, Inc. 100,000 4.25% 24/5/2021 103,297 0.01%Ford Motor Credit Co. LLC 100,000 4.25% 20/9/2022 103,284 0.01%IBM Credit LLC 100,000 3.60% 30/11/2021 103,284 0.01%FMC Corp. 100,000 3.45% 1/10/2029 103,281 0.01%Home Depot, Inc. 100,000 3.25% 1/3/2022 103,274 0.01%Hubbell, Inc. 100,000 3.50% 15/2/2028 103,273 0.01%New York Life Global Funding 100,000 2.90% 17/1/2024 103,270 0.01%ERAC USA Finance LLC 100,000 3.30% 1/12/2026 103,247 0.01%Atmos Energy Corp. 100,000 3.00% 15/6/2027 103,246 0.01%City of San Antonio TX Electric & Gas Systems Revenue 75,000 5.99% 1/2/2039 103,226 0.01%Boston Scientific Corp. 100,000 3.38% 15/5/2022 103,216 0.01%Wilton Re Finance LLC^ 100,000 5.88% 30/3/2033 103,215 0.01%Western Union Co. 100,000 3.60% 15/3/2022 103,179 0.01%Analog Devices, Inc. 100,000 3.13% 5/12/2023 103,158 0.01%CenterPoint Energy Houston Electric LLC 100,000 3.55% 1/8/2042 103,119 0.01%Motorola Solutions, Inc. 100,000 3.50% 1/3/2023 103,101 0.01%Union Pacific Corp. 100,000 3.38% 1/2/2035 103,101 0.01%New York City Water & Sewer System 75,000 5.44% 15/6/2043 103,095 0.01%Eversource Energy 100,000 3.30% 15/1/2028 103,091 0.01%Occidental Petroleum Corp. 100,000 3.50% 15/6/2025 103,091 0.01%Citigroup Commercial Mortgage Trust 2013 100,000 3.42% 10/4/2046 103,070 0.01%
Vanguard U.S. Investment Grade Credit Index Fund
903
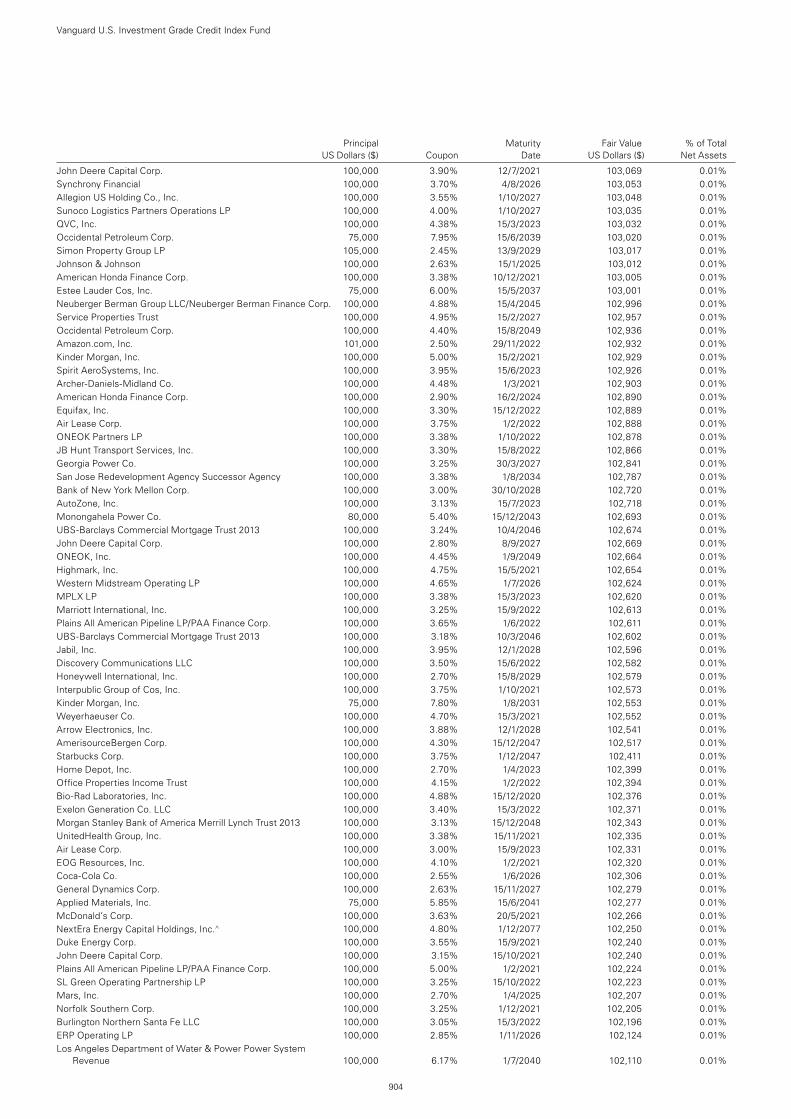
Principal Maturity Fair Value % of Total US Dollars ($) Coupon Date US Dollars ($) Net Assets
John Deere Capital Corp. 100,000 3.90% 12/7/2021 103,069 0.01%Synchrony Financial 100,000 3.70% 4/8/2026 103,053 0.01%Allegion US Holding Co., Inc. 100,000 3.55% 1/10/2027 103,048 0.01%Sunoco Logistics Partners Operations LP 100,000 4.00% 1/10/2027 103,035 0.01%QVC, Inc. 100,000 4.38% 15/3/2023 103,032 0.01%Occidental Petroleum Corp. 75,000 7.95% 15/6/2039 103,020 0.01%Simon Property Group LP 105,000 2.45% 13/9/2029 103,017 0.01%Johnson & Johnson 100,000 2.63% 15/1/2025 103,012 0.01%American Honda Finance Corp. 100,000 3.38% 10/12/2021 103,005 0.01%Estee Lauder Cos, Inc. 75,000 6.00% 15/5/2037 103,001 0.01%Neuberger Berman Group LLC/Neuberger Berman Finance Corp. 100,000 4.88% 15/4/2045 102,996 0.01%Service Properties Trust 100,000 4.95% 15/2/2027 102,957 0.01%Occidental Petroleum Corp. 100,000 4.40% 15/8/2049 102,936 0.01%Amazon.com, Inc. 101,000 2.50% 29/11/2022 102,932 0.01%Kinder Morgan, Inc. 100,000 5.00% 15/2/2021 102,929 0.01%Spirit AeroSystems, Inc. 100,000 3.95% 15/6/2023 102,926 0.01%Archer-Daniels-Midland Co. 100,000 4.48% 1/3/2021 102,903 0.01%American Honda Finance Corp. 100,000 2.90% 16/2/2024 102,890 0.01%Equifax, Inc. 100,000 3.30% 15/12/2022 102,889 0.01%Air Lease Corp. 100,000 3.75% 1/2/2022 102,888 0.01%ONEOK Partners LP 100,000 3.38% 1/10/2022 102,878 0.01%JB Hunt Transport Services, Inc. 100,000 3.30% 15/8/2022 102,866 0.01%Georgia Power Co. 100,000 3.25% 30/3/2027 102,841 0.01%San Jose Redevelopment Agency Successor Agency 100,000 3.38% 1/8/2034 102,787 0.01%Bank of New York Mellon Corp. 100,000 3.00% 30/10/2028 102,720 0.01%AutoZone, Inc. 100,000 3.13% 15/7/2023 102,718 0.01%Monongahela Power Co. 80,000 5.40% 15/12/2043 102,693 0.01%UBS-Barclays Commercial Mortgage Trust 2013 100,000 3.24% 10/4/2046 102,674 0.01%John Deere Capital Corp. 100,000 2.80% 8/9/2027 102,669 0.01%ONEOK, Inc. 100,000 4.45% 1/9/2049 102,664 0.01%Highmark, Inc. 100,000 4.75% 15/5/2021 102,654 0.01%Western Midstream Operating LP 100,000 4.65% 1/7/2026 102,624 0.01%MPLX LP 100,000 3.38% 15/3/2023 102,620 0.01%Marriott International, Inc. 100,000 3.25% 15/9/2022 102,613 0.01%Plains All American Pipeline LP/PAA Finance Corp. 100,000 3.65% 1/6/2022 102,611 0.01%UBS-Barclays Commercial Mortgage Trust 2013 100,000 3.18% 10/3/2046 102,602 0.01%Jabil, Inc. 100,000 3.95% 12/1/2028 102,596 0.01%Discovery Communications LLC 100,000 3.50% 15/6/2022 102,582 0.01%Honeywell International, Inc. 100,000 2.70% 15/8/2029 102,579 0.01%Interpublic Group of Cos, Inc. 100,000 3.75% 1/10/2021 102,573 0.01%Kinder Morgan, Inc. 75,000 7.80% 1/8/2031 102,553 0.01%Weyerhaeuser Co. 100,000 4.70% 15/3/2021 102,552 0.01%Arrow Electronics, Inc. 100,000 3.88% 12/1/2028 102,541 0.01%AmerisourceBergen Corp. 100,000 4.30% 15/12/2047 102,517 0.01%Starbucks Corp. 100,000 3.75% 1/12/2047 102,411 0.01%Home Depot, Inc. 100,000 2.70% 1/4/2023 102,399 0.01%Office Properties Income Trust 100,000 4.15% 1/2/2022 102,394 0.01%Bio-Rad Laboratories, Inc. 100,000 4.88% 15/12/2020 102,376 0.01%Exelon Generation Co. LLC 100,000 3.40% 15/3/2022 102,371 0.01%Morgan Stanley Bank of America Merrill Lynch Trust 2013 100,000 3.13% 15/12/2048 102,343 0.01%UnitedHealth Group, Inc. 100,000 3.38% 15/11/2021 102,335 0.01%Air Lease Corp. 100,000 3.00% 15/9/2023 102,331 0.01%EOG Resources, Inc. 100,000 4.10% 1/2/2021 102,320 0.01%Coca-Cola Co. 100,000 2.55% 1/6/2026 102,306 0.01%General Dynamics Corp. 100,000 2.63% 15/11/2027 102,279 0.01%Applied Materials, Inc. 75,000 5.85% 15/6/2041 102,277 0.01%McDonald’s Corp. 100,000 3.63% 20/5/2021 102,266 0.01%NextEra Energy Capital Holdings, Inc.^ 100,000 4.80% 1/12/2077 102,250 0.01%Duke Energy Corp. 100,000 3.55% 15/9/2021 102,240 0.01%John Deere Capital Corp. 100,000 3.15% 15/10/2021 102,240 0.01%Plains All American Pipeline LP/PAA Finance Corp. 100,000 5.00% 1/2/2021 102,224 0.01%SL Green Operating Partnership LP 100,000 3.25% 15/10/2022 102,223 0.01%Mars, Inc. 100,000 2.70% 1/4/2025 102,207 0.01%Norfolk Southern Corp. 100,000 3.25% 1/12/2021 102,205 0.01%Burlington Northern Santa Fe LLC 100,000 3.05% 15/3/2022 102,196 0.01%ERP Operating LP 100,000 2.85% 1/11/2026 102,124 0.01%Los Angeles Department of Water & Power Power System
Revenue 100,000 6.17% 1/7/2040 102,110 0.01%
Vanguard U.S. Investment Grade Credit Index Fund
904
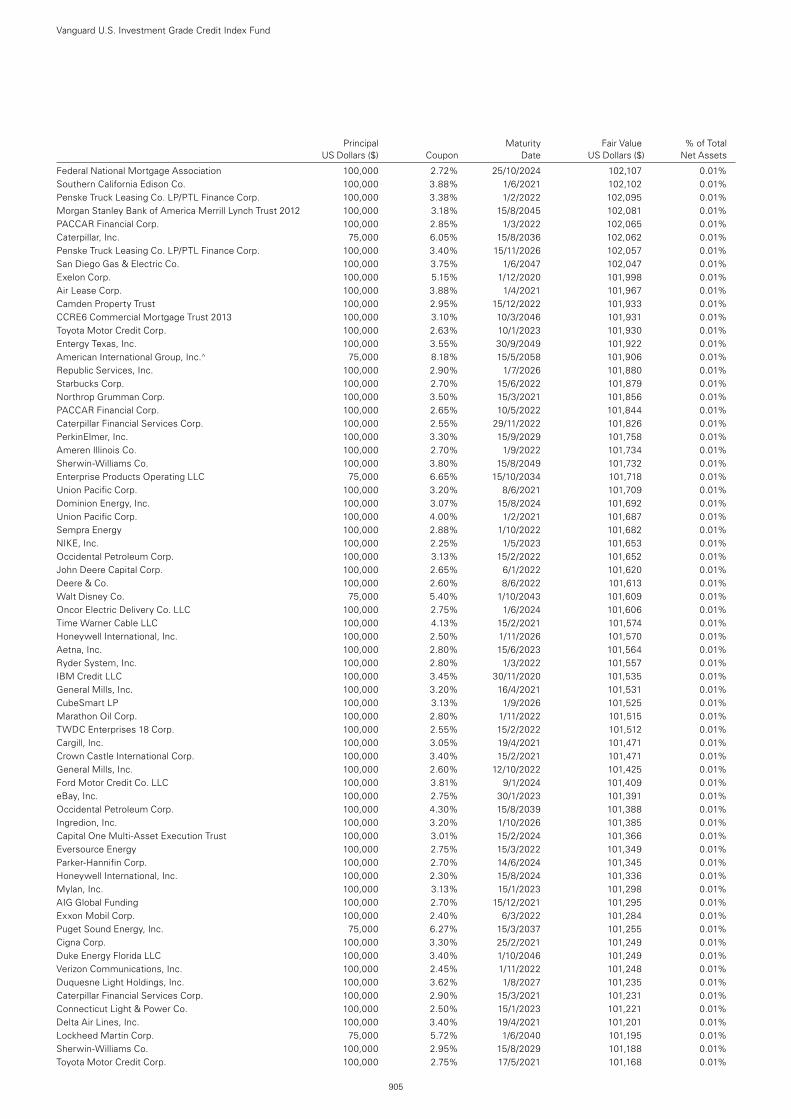
Principal Maturity Fair Value % of Total US Dollars ($) Coupon Date US Dollars ($) Net Assets
Federal National Mortgage Association 100,000 2.72% 25/10/2024 102,107 0.01%Southern California Edison Co. 100,000 3.88% 1/6/2021 102,102 0.01%Penske Truck Leasing Co. LP/PTL Finance Corp. 100,000 3.38% 1/2/2022 102,095 0.01%Morgan Stanley Bank of America Merrill Lynch Trust 2012 100,000 3.18% 15/8/2045 102,081 0.01%PACCAR Financial Corp. 100,000 2.85% 1/3/2022 102,065 0.01%Caterpillar, Inc. 75,000 6.05% 15/8/2036 102,062 0.01%Penske Truck Leasing Co. LP/PTL Finance Corp. 100,000 3.40% 15/11/2026 102,057 0.01%San Diego Gas & Electric Co. 100,000 3.75% 1/6/2047 102,047 0.01%Exelon Corp. 100,000 5.15% 1/12/2020 101,998 0.01%Air Lease Corp. 100,000 3.88% 1/4/2021 101,967 0.01%Camden Property Trust 100,000 2.95% 15/12/2022 101,933 0.01%CCRE6 Commercial Mortgage Trust 2013 100,000 3.10% 10/3/2046 101,931 0.01%Toyota Motor Credit Corp. 100,000 2.63% 10/1/2023 101,930 0.01%Entergy Texas, Inc. 100,000 3.55% 30/9/2049 101,922 0.01%American International Group, Inc.^ 75,000 8.18% 15/5/2058 101,906 0.01%Republic Services, Inc. 100,000 2.90% 1/7/2026 101,880 0.01%Starbucks Corp. 100,000 2.70% 15/6/2022 101,879 0.01%Northrop Grumman Corp. 100,000 3.50% 15/3/2021 101,856 0.01%PACCAR Financial Corp. 100,000 2.65% 10/5/2022 101,844 0.01%Caterpillar Financial Services Corp. 100,000 2.55% 29/11/2022 101,826 0.01%PerkinElmer, Inc. 100,000 3.30% 15/9/2029 101,758 0.01%Ameren Illinois Co. 100,000 2.70% 1/9/2022 101,734 0.01%Sherwin-Williams Co. 100,000 3.80% 15/8/2049 101,732 0.01%Enterprise Products Operating LLC 75,000 6.65% 15/10/2034 101,718 0.01%Union Pacific Corp. 100,000 3.20% 8/6/2021 101,709 0.01%Dominion Energy, Inc. 100,000 3.07% 15/8/2024 101,692 0.01%Union Pacific Corp. 100,000 4.00% 1/2/2021 101,687 0.01%Sempra Energy 100,000 2.88% 1/10/2022 101,682 0.01%NIKE, Inc. 100,000 2.25% 1/5/2023 101,653 0.01%Occidental Petroleum Corp. 100,000 3.13% 15/2/2022 101,652 0.01%John Deere Capital Corp. 100,000 2.65% 6/1/2022 101,620 0.01%Deere & Co. 100,000 2.60% 8/6/2022 101,613 0.01%Walt Disney Co. 75,000 5.40% 1/10/2043 101,609 0.01%Oncor Electric Delivery Co. LLC 100,000 2.75% 1/6/2024 101,606 0.01%Time Warner Cable LLC 100,000 4.13% 15/2/2021 101,574 0.01%Honeywell International, Inc. 100,000 2.50% 1/11/2026 101,570 0.01%Aetna, Inc. 100,000 2.80% 15/6/2023 101,564 0.01%Ryder System, Inc. 100,000 2.80% 1/3/2022 101,557 0.01%IBM Credit LLC 100,000 3.45% 30/11/2020 101,535 0.01%General Mills, Inc. 100,000 3.20% 16/4/2021 101,531 0.01%CubeSmart LP 100,000 3.13% 1/9/2026 101,525 0.01%Marathon Oil Corp. 100,000 2.80% 1/11/2022 101,515 0.01%TWDC Enterprises 18 Corp. 100,000 2.55% 15/2/2022 101,512 0.01%Cargill, Inc. 100,000 3.05% 19/4/2021 101,471 0.01%Crown Castle International Corp. 100,000 3.40% 15/2/2021 101,471 0.01%General Mills, Inc. 100,000 2.60% 12/10/2022 101,425 0.01%Ford Motor Credit Co. LLC 100,000 3.81% 9/1/2024 101,409 0.01%eBay, Inc. 100,000 2.75% 30/1/2023 101,391 0.01%Occidental Petroleum Corp. 100,000 4.30% 15/8/2039 101,388 0.01%Ingredion, Inc. 100,000 3.20% 1/10/2026 101,385 0.01%Capital One Multi-Asset Execution Trust 100,000 3.01% 15/2/2024 101,366 0.01%Eversource Energy 100,000 2.75% 15/3/2022 101,349 0.01%Parker-Hannifin Corp. 100,000 2.70% 14/6/2024 101,345 0.01%Honeywell International, Inc. 100,000 2.30% 15/8/2024 101,336 0.01%Mylan, Inc. 100,000 3.13% 15/1/2023 101,298 0.01%AIG Global Funding 100,000 2.70% 15/12/2021 101,295 0.01%Exxon Mobil Corp. 100,000 2.40% 6/3/2022 101,284 0.01%Puget Sound Energy, Inc. 75,000 6.27% 15/3/2037 101,255 0.01%Cigna Corp. 100,000 3.30% 25/2/2021 101,249 0.01%Duke Energy Florida LLC 100,000 3.40% 1/10/2046 101,249 0.01%Verizon Communications, Inc. 100,000 2.45% 1/11/2022 101,248 0.01%Duquesne Light Holdings, Inc. 100,000 3.62% 1/8/2027 101,235 0.01%Caterpillar Financial Services Corp. 100,000 2.90% 15/3/2021 101,231 0.01%Connecticut Light & Power Co. 100,000 2.50% 15/1/2023 101,221 0.01%Delta Air Lines, Inc. 100,000 3.40% 19/4/2021 101,201 0.01%Lockheed Martin Corp. 75,000 5.72% 1/6/2040 101,195 0.01%Sherwin-Williams Co. 100,000 2.95% 15/8/2029 101,188 0.01%Toyota Motor Credit Corp. 100,000 2.75% 17/5/2021 101,168 0.01%
Vanguard U.S. Investment Grade Credit Index Fund
905
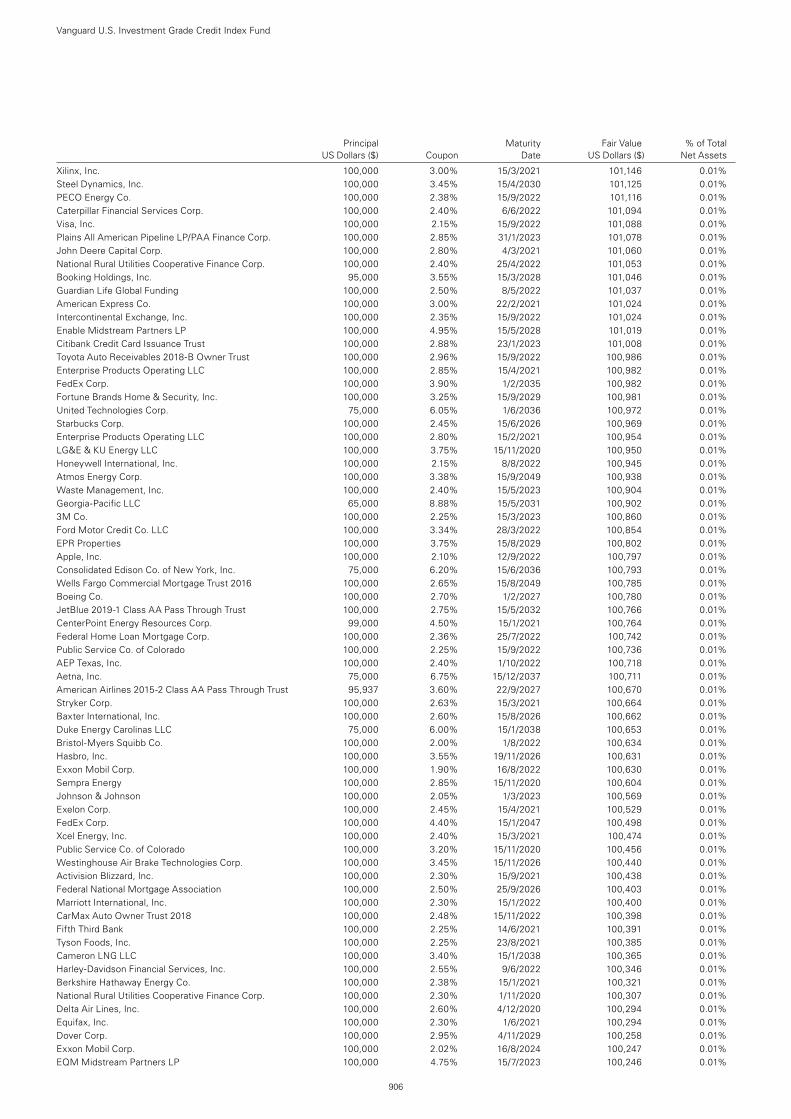
Principal Maturity Fair Value % of Total US Dollars ($) Coupon Date US Dollars ($) Net Assets
Xilinx, Inc. 100,000 3.00% 15/3/2021 101,146 0.01%Steel Dynamics, Inc. 100,000 3.45% 15/4/2030 101,125 0.01%PECO Energy Co. 100,000 2.38% 15/9/2022 101,116 0.01%Caterpillar Financial Services Corp. 100,000 2.40% 6/6/2022 101,094 0.01%Visa, Inc. 100,000 2.15% 15/9/2022 101,088 0.01%Plains All American Pipeline LP/PAA Finance Corp. 100,000 2.85% 31/1/2023 101,078 0.01%John Deere Capital Corp. 100,000 2.80% 4/3/2021 101,060 0.01%National Rural Utilities Cooperative Finance Corp. 100,000 2.40% 25/4/2022 101,053 0.01%Booking Holdings, Inc. 95,000 3.55% 15/3/2028 101,046 0.01%Guardian Life Global Funding 100,000 2.50% 8/5/2022 101,037 0.01%American Express Co. 100,000 3.00% 22/2/2021 101,024 0.01%Intercontinental Exchange, Inc. 100,000 2.35% 15/9/2022 101,024 0.01%Enable Midstream Partners LP 100,000 4.95% 15/5/2028 101,019 0.01%Citibank Credit Card Issuance Trust 100,000 2.88% 23/1/2023 101,008 0.01%Toyota Auto Receivables 2018-B Owner Trust 100,000 2.96% 15/9/2022 100,986 0.01%Enterprise Products Operating LLC 100,000 2.85% 15/4/2021 100,982 0.01%FedEx Corp. 100,000 3.90% 1/2/2035 100,982 0.01%Fortune Brands Home & Security, Inc. 100,000 3.25% 15/9/2029 100,981 0.01%United Technologies Corp. 75,000 6.05% 1/6/2036 100,972 0.01%Starbucks Corp. 100,000 2.45% 15/6/2026 100,969 0.01%Enterprise Products Operating LLC 100,000 2.80% 15/2/2021 100,954 0.01%LG&E & KU Energy LLC 100,000 3.75% 15/11/2020 100,950 0.01%Honeywell International, Inc. 100,000 2.15% 8/8/2022 100,945 0.01%Atmos Energy Corp. 100,000 3.38% 15/9/2049 100,938 0.01%Waste Management, Inc. 100,000 2.40% 15/5/2023 100,904 0.01%Georgia-Pacific LLC 65,000 8.88% 15/5/2031 100,902 0.01%3M Co. 100,000 2.25% 15/3/2023 100,860 0.01%Ford Motor Credit Co. LLC 100,000 3.34% 28/3/2022 100,854 0.01%EPR Properties 100,000 3.75% 15/8/2029 100,802 0.01%Apple, Inc. 100,000 2.10% 12/9/2022 100,797 0.01%Consolidated Edison Co. of New York, Inc. 75,000 6.20% 15/6/2036 100,793 0.01%Wells Fargo Commercial Mortgage Trust 2016 100,000 2.65% 15/8/2049 100,785 0.01%Boeing Co. 100,000 2.70% 1/2/2027 100,780 0.01%JetBlue 2019-1 Class AA Pass Through Trust 100,000 2.75% 15/5/2032 100,766 0.01%CenterPoint Energy Resources Corp. 99,000 4.50% 15/1/2021 100,764 0.01%Federal Home Loan Mortgage Corp. 100,000 2.36% 25/7/2022 100,742 0.01%Public Service Co. of Colorado 100,000 2.25% 15/9/2022 100,736 0.01%AEP Texas, Inc. 100,000 2.40% 1/10/2022 100,718 0.01%Aetna, Inc. 75,000 6.75% 15/12/2037 100,711 0.01%American Airlines 2015-2 Class AA Pass Through Trust 95,937 3.60% 22/9/2027 100,670 0.01%Stryker Corp. 100,000 2.63% 15/3/2021 100,664 0.01%Baxter International, Inc. 100,000 2.60% 15/8/2026 100,662 0.01%Duke Energy Carolinas LLC 75,000 6.00% 15/1/2038 100,653 0.01%Bristol-Myers Squibb Co. 100,000 2.00% 1/8/2022 100,634 0.01%Hasbro, Inc. 100,000 3.55% 19/11/2026 100,631 0.01%Exxon Mobil Corp. 100,000 1.90% 16/8/2022 100,630 0.01%Sempra Energy 100,000 2.85% 15/11/2020 100,604 0.01%Johnson & Johnson 100,000 2.05% 1/3/2023 100,569 0.01%Exelon Corp. 100,000 2.45% 15/4/2021 100,529 0.01%FedEx Corp. 100,000 4.40% 15/1/2047 100,498 0.01%Xcel Energy, Inc. 100,000 2.40% 15/3/2021 100,474 0.01%Public Service Co. of Colorado 100,000 3.20% 15/11/2020 100,456 0.01%Westinghouse Air Brake Technologies Corp. 100,000 3.45% 15/11/2026 100,440 0.01%Activision Blizzard, Inc. 100,000 2.30% 15/9/2021 100,438 0.01%Federal National Mortgage Association 100,000 2.50% 25/9/2026 100,403 0.01%Marriott International, Inc. 100,000 2.30% 15/1/2022 100,400 0.01%CarMax Auto Owner Trust 2018 100,000 2.48% 15/11/2022 100,398 0.01%Fifth Third Bank 100,000 2.25% 14/6/2021 100,391 0.01%Tyson Foods, Inc. 100,000 2.25% 23/8/2021 100,385 0.01%Cameron LNG LLC 100,000 3.40% 15/1/2038 100,365 0.01%Harley-Davidson Financial Services, Inc. 100,000 2.55% 9/6/2022 100,346 0.01%Berkshire Hathaway Energy Co. 100,000 2.38% 15/1/2021 100,321 0.01%National Rural Utilities Cooperative Finance Corp. 100,000 2.30% 1/11/2020 100,307 0.01%Delta Air Lines, Inc. 100,000 2.60% 4/12/2020 100,294 0.01%Equifax, Inc. 100,000 2.30% 1/6/2021 100,294 0.01%Dover Corp. 100,000 2.95% 4/11/2029 100,258 0.01%Exxon Mobil Corp. 100,000 2.02% 16/8/2024 100,247 0.01%EQM Midstream Partners LP 100,000 4.75% 15/7/2023 100,246 0.01%
Vanguard U.S. Investment Grade Credit Index Fund
906
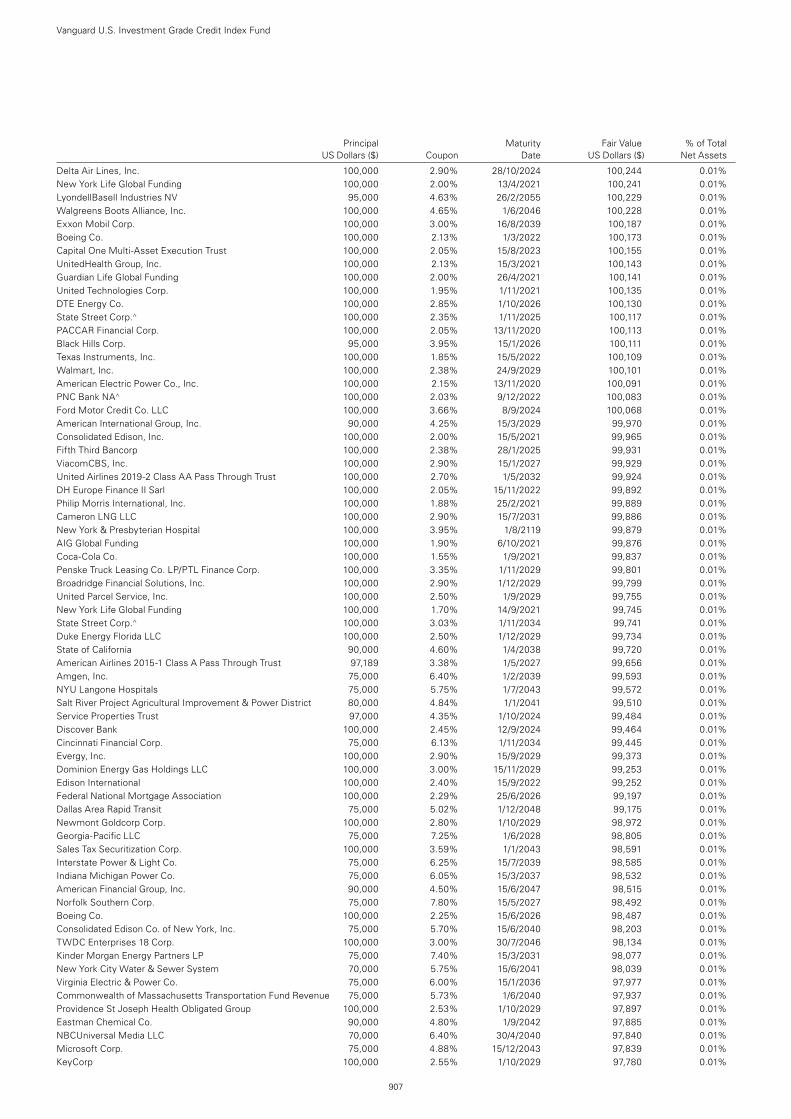
Principal Maturity Fair Value % of Total US Dollars ($) Coupon Date US Dollars ($) Net Assets
Delta Air Lines, Inc. 100,000 2.90% 28/10/2024 100,244 0.01%New York Life Global Funding 100,000 2.00% 13/4/2021 100,241 0.01%LyondellBasell Industries NV 95,000 4.63% 26/2/2055 100,229 0.01%Walgreens Boots Alliance, Inc. 100,000 4.65% 1/6/2046 100,228 0.01%Exxon Mobil Corp. 100,000 3.00% 16/8/2039 100,187 0.01%Boeing Co. 100,000 2.13% 1/3/2022 100,173 0.01%Capital One Multi-Asset Execution Trust 100,000 2.05% 15/8/2023 100,155 0.01%UnitedHealth Group, Inc. 100,000 2.13% 15/3/2021 100,143 0.01%Guardian Life Global Funding 100,000 2.00% 26/4/2021 100,141 0.01%United Technologies Corp. 100,000 1.95% 1/11/2021 100,135 0.01%DTE Energy Co. 100,000 2.85% 1/10/2026 100,130 0.01%State Street Corp.^ 100,000 2.35% 1/11/2025 100,117 0.01%PACCAR Financial Corp. 100,000 2.05% 13/11/2020 100,113 0.01%Black Hills Corp. 95,000 3.95% 15/1/2026 100,111 0.01%Texas Instruments, Inc. 100,000 1.85% 15/5/2022 100,109 0.01%Walmart, Inc. 100,000 2.38% 24/9/2029 100,101 0.01%American Electric Power Co., Inc. 100,000 2.15% 13/11/2020 100,091 0.01%PNC Bank NA^ 100,000 2.03% 9/12/2022 100,083 0.01%Ford Motor Credit Co. LLC 100,000 3.66% 8/9/2024 100,068 0.01%American International Group, Inc. 90,000 4.25% 15/3/2029 99,970 0.01%Consolidated Edison, Inc. 100,000 2.00% 15/5/2021 99,965 0.01%Fifth Third Bancorp 100,000 2.38% 28/1/2025 99,931 0.01%ViacomCBS, Inc. 100,000 2.90% 15/1/2027 99,929 0.01%United Airlines 2019-2 Class AA Pass Through Trust 100,000 2.70% 1/5/2032 99,924 0.01%DH Europe Finance II Sarl 100,000 2.05% 15/11/2022 99,892 0.01%Philip Morris International, Inc. 100,000 1.88% 25/2/2021 99,889 0.01%Cameron LNG LLC 100,000 2.90% 15/7/2031 99,886 0.01%New York & Presbyterian Hospital 100,000 3.95% 1/8/2119 99,879 0.01%AIG Global Funding 100,000 1.90% 6/10/2021 99,876 0.01%Coca-Cola Co. 100,000 1.55% 1/9/2021 99,837 0.01%Penske Truck Leasing Co. LP/PTL Finance Corp. 100,000 3.35% 1/11/2029 99,801 0.01%Broadridge Financial Solutions, Inc. 100,000 2.90% 1/12/2029 99,799 0.01%United Parcel Service, Inc. 100,000 2.50% 1/9/2029 99,755 0.01%New York Life Global Funding 100,000 1.70% 14/9/2021 99,745 0.01%State Street Corp.^ 100,000 3.03% 1/11/2034 99,741 0.01%Duke Energy Florida LLC 100,000 2.50% 1/12/2029 99,734 0.01%State of California 90,000 4.60% 1/4/2038 99,720 0.01%American Airlines 2015-1 Class A Pass Through Trust 97,189 3.38% 1/5/2027 99,656 0.01%Amgen, Inc. 75,000 6.40% 1/2/2039 99,593 0.01%NYU Langone Hospitals 75,000 5.75% 1/7/2043 99,572 0.01%Salt River Project Agricultural Improvement & Power District 80,000 4.84% 1/1/2041 99,510 0.01%Service Properties Trust 97,000 4.35% 1/10/2024 99,484 0.01%Discover Bank 100,000 2.45% 12/9/2024 99,464 0.01%Cincinnati Financial Corp. 75,000 6.13% 1/11/2034 99,445 0.01%Evergy, Inc. 100,000 2.90% 15/9/2029 99,373 0.01%Dominion Energy Gas Holdings LLC 100,000 3.00% 15/11/2029 99,253 0.01%Edison International 100,000 2.40% 15/9/2022 99,252 0.01%Federal National Mortgage Association 100,000 2.29% 25/6/2026 99,197 0.01%Dallas Area Rapid Transit 75,000 5.02% 1/12/2048 99,175 0.01%Newmont Goldcorp Corp. 100,000 2.80% 1/10/2029 98,972 0.01%Georgia-Pacific LLC 75,000 7.25% 1/6/2028 98,805 0.01%Sales Tax Securitization Corp. 100,000 3.59% 1/1/2043 98,591 0.01%Interstate Power & Light Co. 75,000 6.25% 15/7/2039 98,585 0.01%Indiana Michigan Power Co. 75,000 6.05% 15/3/2037 98,532 0.01%American Financial Group, Inc. 90,000 4.50% 15/6/2047 98,515 0.01%Norfolk Southern Corp. 75,000 7.80% 15/5/2027 98,492 0.01%Boeing Co. 100,000 2.25% 15/6/2026 98,487 0.01%Consolidated Edison Co. of New York, Inc. 75,000 5.70% 15/6/2040 98,203 0.01%TWDC Enterprises 18 Corp. 100,000 3.00% 30/7/2046 98,134 0.01%Kinder Morgan Energy Partners LP 75,000 7.40% 15/3/2031 98,077 0.01%New York City Water & Sewer System 70,000 5.75% 15/6/2041 98,039 0.01%Virginia Electric & Power Co. 75,000 6.00% 15/1/2036 97,977 0.01%Commonwealth of Massachusetts Transportation Fund Revenue 75,000 5.73% 1/6/2040 97,937 0.01%Providence St Joseph Health Obligated Group 100,000 2.53% 1/10/2029 97,897 0.01%Eastman Chemical Co. 90,000 4.80% 1/9/2042 97,885 0.01%NBCUniversal Media LLC 70,000 6.40% 30/4/2040 97,840 0.01%Microsoft Corp. 75,000 4.88% 15/12/2043 97,839 0.01%KeyCorp 100,000 2.55% 1/10/2029 97,780 0.01%
Vanguard U.S. Investment Grade Credit Index Fund
907
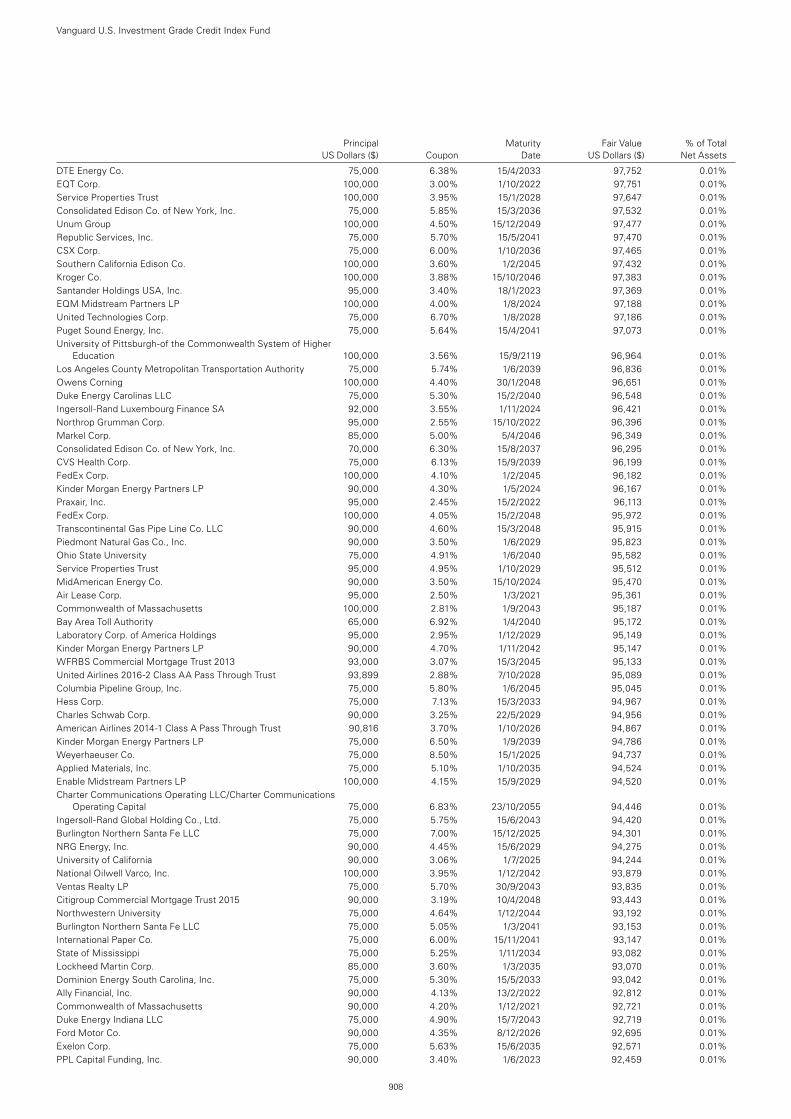
Principal Maturity Fair Value % of Total US Dollars ($) Coupon Date US Dollars ($) Net Assets
DTE Energy Co. 75,000 6.38% 15/4/2033 97,752 0.01%EQT Corp. 100,000 3.00% 1/10/2022 97,751 0.01%Service Properties Trust 100,000 3.95% 15/1/2028 97,647 0.01%Consolidated Edison Co. of New York, Inc. 75,000 5.85% 15/3/2036 97,532 0.01%Unum Group 100,000 4.50% 15/12/2049 97,477 0.01%Republic Services, Inc. 75,000 5.70% 15/5/2041 97,470 0.01%CSX Corp. 75,000 6.00% 1/10/2036 97,465 0.01%Southern California Edison Co. 100,000 3.60% 1/2/2045 97,432 0.01%Kroger Co. 100,000 3.88% 15/10/2046 97,383 0.01%Santander Holdings USA, Inc. 95,000 3.40% 18/1/2023 97,369 0.01%EQM Midstream Partners LP 100,000 4.00% 1/8/2024 97,188 0.01%United Technologies Corp. 75,000 6.70% 1/8/2028 97,186 0.01%Puget Sound Energy, Inc. 75,000 5.64% 15/4/2041 97,073 0.01%University of Pittsburgh-of the Commonwealth System of Higher
Education 100,000 3.56% 15/9/2119 96,964 0.01%Los Angeles County Metropolitan Transportation Authority 75,000 5.74% 1/6/2039 96,836 0.01%Owens Corning 100,000 4.40% 30/1/2048 96,651 0.01%Duke Energy Carolinas LLC 75,000 5.30% 15/2/2040 96,548 0.01%Ingersoll-Rand Luxembourg Finance SA 92,000 3.55% 1/11/2024 96,421 0.01%Northrop Grumman Corp. 95,000 2.55% 15/10/2022 96,396 0.01%Markel Corp. 85,000 5.00% 5/4/2046 96,349 0.01%Consolidated Edison Co. of New York, Inc. 70,000 6.30% 15/8/2037 96,295 0.01%CVS Health Corp. 75,000 6.13% 15/9/2039 96,199 0.01%FedEx Corp. 100,000 4.10% 1/2/2045 96,182 0.01%Kinder Morgan Energy Partners LP 90,000 4.30% 1/5/2024 96,167 0.01%Praxair, Inc. 95,000 2.45% 15/2/2022 96,113 0.01%FedEx Corp. 100,000 4.05% 15/2/2048 95,972 0.01%Transcontinental Gas Pipe Line Co. LLC 90,000 4.60% 15/3/2048 95,915 0.01%Piedmont Natural Gas Co., Inc. 90,000 3.50% 1/6/2029 95,823 0.01%Ohio State University 75,000 4.91% 1/6/2040 95,582 0.01%Service Properties Trust 95,000 4.95% 1/10/2029 95,512 0.01%MidAmerican Energy Co. 90,000 3.50% 15/10/2024 95,470 0.01%Air Lease Corp. 95,000 2.50% 1/3/2021 95,361 0.01%Commonwealth of Massachusetts 100,000 2.81% 1/9/2043 95,187 0.01%Bay Area Toll Authority 65,000 6.92% 1/4/2040 95,172 0.01%Laboratory Corp. of America Holdings 95,000 2.95% 1/12/2029 95,149 0.01%Kinder Morgan Energy Partners LP 90,000 4.70% 1/11/2042 95,147 0.01%WFRBS Commercial Mortgage Trust 2013 93,000 3.07% 15/3/2045 95,133 0.01%United Airlines 2016-2 Class AA Pass Through Trust 93,899 2.88% 7/10/2028 95,089 0.01%Columbia Pipeline Group, Inc. 75,000 5.80% 1/6/2045 95,045 0.01%Hess Corp. 75,000 7.13% 15/3/2033 94,967 0.01%Charles Schwab Corp. 90,000 3.25% 22/5/2029 94,956 0.01%American Airlines 2014-1 Class A Pass Through Trust 90,816 3.70% 1/10/2026 94,867 0.01%Kinder Morgan Energy Partners LP 75,000 6.50% 1/9/2039 94,786 0.01%Weyerhaeuser Co. 75,000 8.50% 15/1/2025 94,737 0.01%Applied Materials, Inc. 75,000 5.10% 1/10/2035 94,524 0.01%Enable Midstream Partners LP 100,000 4.15% 15/9/2029 94,520 0.01%Charter Communications Operating LLC/Charter Communications
Operating Capital 75,000 6.83% 23/10/2055 94,446 0.01%Ingersoll-Rand Global Holding Co., Ltd. 75,000 5.75% 15/6/2043 94,420 0.01%Burlington Northern Santa Fe LLC 75,000 7.00% 15/12/2025 94,301 0.01%NRG Energy, Inc. 90,000 4.45% 15/6/2029 94,275 0.01%University of California 90,000 3.06% 1/7/2025 94,244 0.01%National Oilwell Varco, Inc. 100,000 3.95% 1/12/2042 93,879 0.01%Ventas Realty LP 75,000 5.70% 30/9/2043 93,835 0.01%Citigroup Commercial Mortgage Trust 2015 90,000 3.19% 10/4/2048 93,443 0.01%Northwestern University 75,000 4.64% 1/12/2044 93,192 0.01%Burlington Northern Santa Fe LLC 75,000 5.05% 1/3/2041 93,153 0.01%International Paper Co. 75,000 6.00% 15/11/2041 93,147 0.01%State of Mississippi 75,000 5.25% 1/11/2034 93,082 0.01%Lockheed Martin Corp. 85,000 3.60% 1/3/2035 93,070 0.01%Dominion Energy South Carolina, Inc. 75,000 5.30% 15/5/2033 93,042 0.01%Ally Financial, Inc. 90,000 4.13% 13/2/2022 92,812 0.01%Commonwealth of Massachusetts 90,000 4.20% 1/12/2021 92,721 0.01%Duke Energy Indiana LLC 75,000 4.90% 15/7/2043 92,719 0.01%Ford Motor Co. 90,000 4.35% 8/12/2026 92,695 0.01%Exelon Corp. 75,000 5.63% 15/6/2035 92,571 0.01%PPL Capital Funding, Inc. 90,000 3.40% 1/6/2023 92,459 0.01%
Vanguard U.S. Investment Grade Credit Index Fund
908
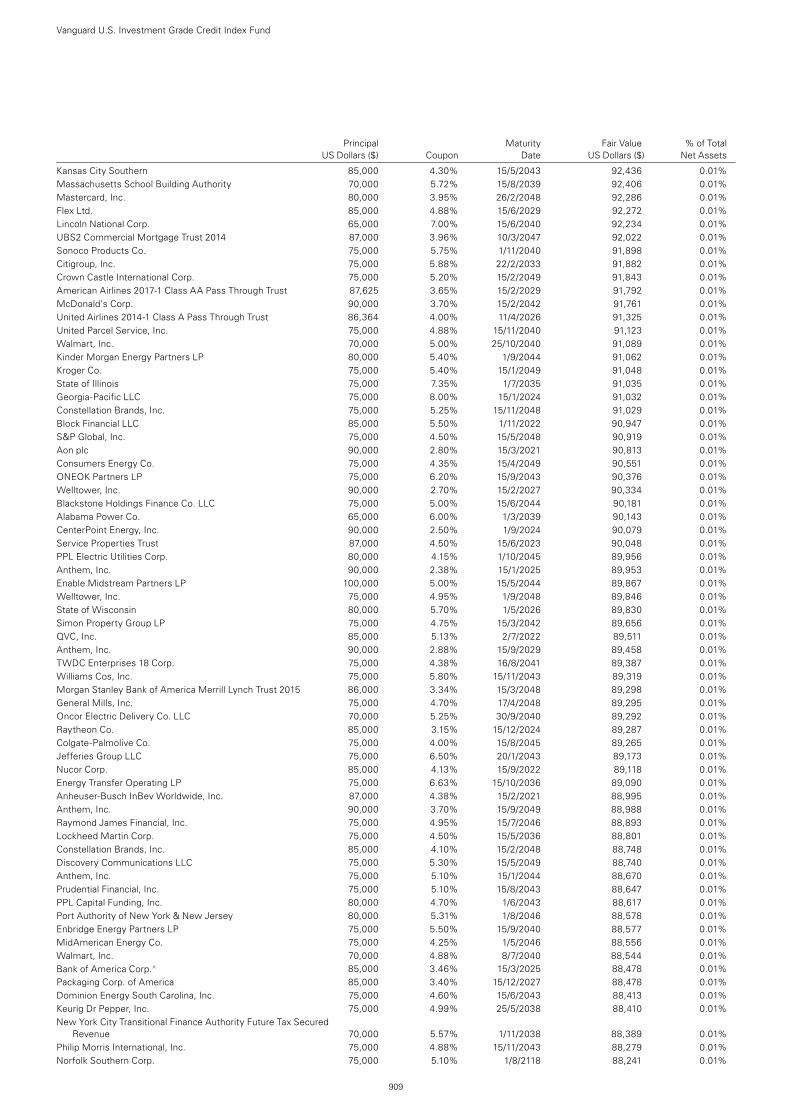
Principal Maturity Fair Value % of Total US Dollars ($) Coupon Date US Dollars ($) Net Assets
Kansas City Southern 85,000 4.30% 15/5/2043 92,436 0.01%Massachusetts School Building Authority 70,000 5.72% 15/8/2039 92,406 0.01%Mastercard, Inc. 80,000 3.95% 26/2/2048 92,286 0.01%Flex Ltd. 85,000 4.88% 15/6/2029 92,272 0.01%Lincoln National Corp. 65,000 7.00% 15/6/2040 92,234 0.01%UBS2 Commercial Mortgage Trust 2014 87,000 3.96% 10/3/2047 92,022 0.01%Sonoco Products Co. 75,000 5.75% 1/11/2040 91,898 0.01%Citigroup, Inc. 75,000 5.88% 22/2/2033 91,882 0.01%Crown Castle International Corp. 75,000 5.20% 15/2/2049 91,843 0.01%American Airlines 2017-1 Class AA Pass Through Trust 87,625 3.65% 15/2/2029 91,792 0.01%McDonald’s Corp. 90,000 3.70% 15/2/2042 91,761 0.01%United Airlines 2014-1 Class A Pass Through Trust 86,364 4.00% 11/4/2026 91,325 0.01%United Parcel Service, Inc. 75,000 4.88% 15/11/2040 91,123 0.01%Walmart, Inc. 70,000 5.00% 25/10/2040 91,089 0.01%Kinder Morgan Energy Partners LP 80,000 5.40% 1/9/2044 91,062 0.01%Kroger Co. 75,000 5.40% 15/1/2049 91,048 0.01%State of Illinois 75,000 7.35% 1/7/2035 91,035 0.01%Georgia-Pacific LLC 75,000 8.00% 15/1/2024 91,032 0.01%Constellation Brands, Inc. 75,000 5.25% 15/11/2048 91,029 0.01%Block Financial LLC 85,000 5.50% 1/11/2022 90,947 0.01%S&P Global, Inc. 75,000 4.50% 15/5/2048 90,919 0.01%Aon plc 90,000 2.80% 15/3/2021 90,813 0.01%Consumers Energy Co. 75,000 4.35% 15/4/2049 90,551 0.01%ONEOK Partners LP 75,000 6.20% 15/9/2043 90,376 0.01%Welltower, Inc. 90,000 2.70% 15/2/2027 90,334 0.01%Blackstone Holdings Finance Co. LLC 75,000 5.00% 15/6/2044 90,181 0.01%Alabama Power Co. 65,000 6.00% 1/3/2039 90,143 0.01%CenterPoint Energy, Inc. 90,000 2.50% 1/9/2024 90,079 0.01%Service Properties Trust 87,000 4.50% 15/6/2023 90,048 0.01%PPL Electric Utilities Corp. 80,000 4.15% 1/10/2045 89,956 0.01%Anthem, Inc. 90,000 2.38% 15/1/2025 89,953 0.01%Enable Midstream Partners LP 100,000 5.00% 15/5/2044 89,867 0.01%Welltower, Inc. 75,000 4.95% 1/9/2048 89,846 0.01%State of Wisconsin 80,000 5.70% 1/5/2026 89,830 0.01%Simon Property Group LP 75,000 4.75% 15/3/2042 89,656 0.01%QVC, Inc. 85,000 5.13% 2/7/2022 89,511 0.01%Anthem, Inc. 90,000 2.88% 15/9/2029 89,458 0.01%TWDC Enterprises 18 Corp. 75,000 4.38% 16/8/2041 89,387 0.01%Williams Cos, Inc. 75,000 5.80% 15/11/2043 89,319 0.01%Morgan Stanley Bank of America Merrill Lynch Trust 2015 86,000 3.34% 15/3/2048 89,298 0.01%General Mills, Inc. 75,000 4.70% 17/4/2048 89,295 0.01%Oncor Electric Delivery Co. LLC 70,000 5.25% 30/9/2040 89,292 0.01%Raytheon Co. 85,000 3.15% 15/12/2024 89,287 0.01%Colgate-Palmolive Co. 75,000 4.00% 15/8/2045 89,265 0.01%Jefferies Group LLC 75,000 6.50% 20/1/2043 89,173 0.01%Nucor Corp. 85,000 4.13% 15/9/2022 89,118 0.01%Energy Transfer Operating LP 75,000 6.63% 15/10/2036 89,090 0.01%Anheuser-Busch InBev Worldwide, Inc. 87,000 4.38% 15/2/2021 88,995 0.01%Anthem, Inc. 90,000 3.70% 15/9/2049 88,988 0.01%Raymond James Financial, Inc. 75,000 4.95% 15/7/2046 88,893 0.01%Lockheed Martin Corp. 75,000 4.50% 15/5/2036 88,801 0.01%Constellation Brands, Inc. 85,000 4.10% 15/2/2048 88,748 0.01%Discovery Communications LLC 75,000 5.30% 15/5/2049 88,740 0.01%Anthem, Inc. 75,000 5.10% 15/1/2044 88,670 0.01%Prudential Financial, Inc. 75,000 5.10% 15/8/2043 88,647 0.01%PPL Capital Funding, Inc. 80,000 4.70% 1/6/2043 88,617 0.01%Port Authority of New York & New Jersey 80,000 5.31% 1/8/2046 88,578 0.01%Enbridge Energy Partners LP 75,000 5.50% 15/9/2040 88,577 0.01%MidAmerican Energy Co. 75,000 4.25% 1/5/2046 88,556 0.01%Walmart, Inc. 70,000 4.88% 8/7/2040 88,544 0.01%Bank of America Corp.^ 85,000 3.46% 15/3/2025 88,478 0.01%Packaging Corp. of America 85,000 3.40% 15/12/2027 88,478 0.01%Dominion Energy South Carolina, Inc. 75,000 4.60% 15/6/2043 88,413 0.01%Keurig Dr Pepper, Inc. 75,000 4.99% 25/5/2038 88,410 0.01%New York City Transitional Finance Authority Future Tax Secured
Revenue 70,000 5.57% 1/11/2038 88,389 0.01%Philip Morris International, Inc. 75,000 4.88% 15/11/2043 88,279 0.01%Norfolk Southern Corp. 75,000 5.10% 1/8/2118 88,241 0.01%
Vanguard U.S. Investment Grade Credit Index Fund
909
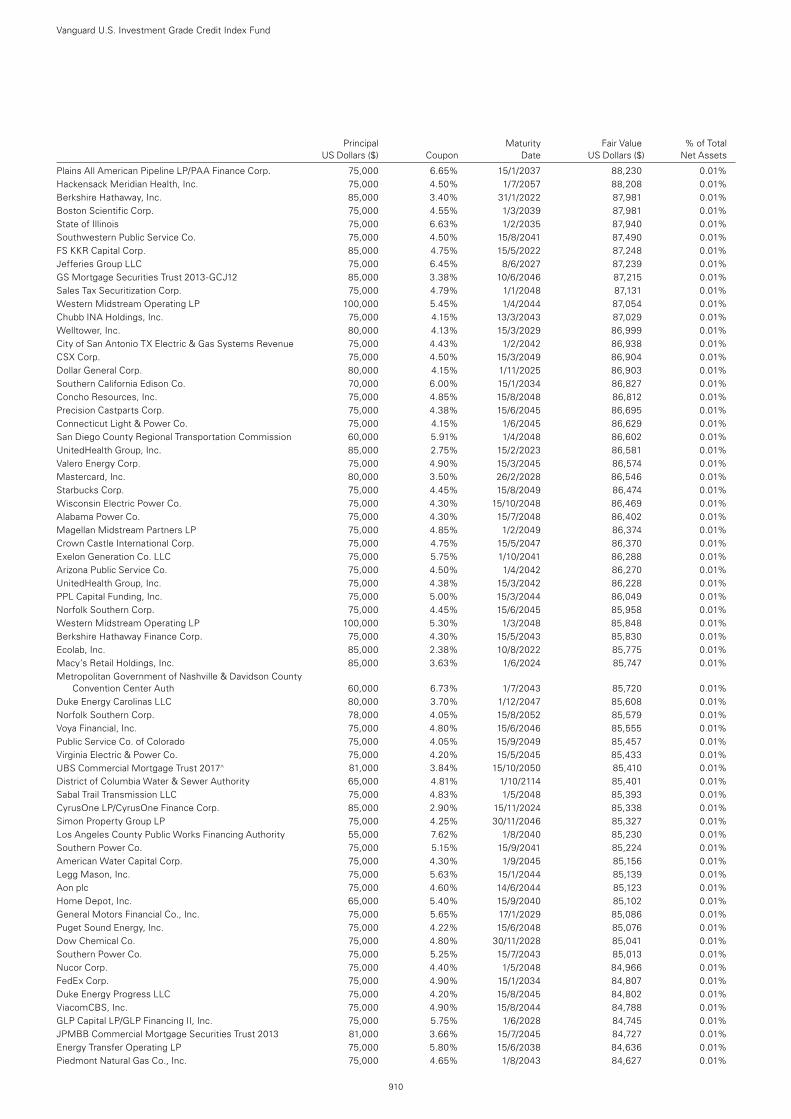
Principal Maturity Fair Value % of Total US Dollars ($) Coupon Date US Dollars ($) Net Assets
Plains All American Pipeline LP/PAA Finance Corp. 75,000 6.65% 15/1/2037 88,230 0.01%Hackensack Meridian Health, Inc. 75,000 4.50% 1/7/2057 88,208 0.01%Berkshire Hathaway, Inc. 85,000 3.40% 31/1/2022 87,981 0.01%Boston Scientific Corp. 75,000 4.55% 1/3/2039 87,981 0.01%State of Illinois 75,000 6.63% 1/2/2035 87,940 0.01%Southwestern Public Service Co. 75,000 4.50% 15/8/2041 87,490 0.01%FS KKR Capital Corp. 85,000 4.75% 15/5/2022 87,248 0.01%Jefferies Group LLC 75,000 6.45% 8/6/2027 87,239 0.01%GS Mortgage Securities Trust 2013-GCJ12 85,000 3.38% 10/6/2046 87,215 0.01%Sales Tax Securitization Corp. 75,000 4.79% 1/1/2048 87,131 0.01%Western Midstream Operating LP 100,000 5.45% 1/4/2044 87,054 0.01%Chubb INA Holdings, Inc. 75,000 4.15% 13/3/2043 87,029 0.01%Welltower, Inc. 80,000 4.13% 15/3/2029 86,999 0.01%City of San Antonio TX Electric & Gas Systems Revenue 75,000 4.43% 1/2/2042 86,938 0.01%CSX Corp. 75,000 4.50% 15/3/2049 86,904 0.01%Dollar General Corp. 80,000 4.15% 1/11/2025 86,903 0.01%Southern California Edison Co. 70,000 6.00% 15/1/2034 86,827 0.01%Concho Resources, Inc. 75,000 4.85% 15/8/2048 86,812 0.01%Precision Castparts Corp. 75,000 4.38% 15/6/2045 86,695 0.01%Connecticut Light & Power Co. 75,000 4.15% 1/6/2045 86,629 0.01%San Diego County Regional Transportation Commission 60,000 5.91% 1/4/2048 86,602 0.01%UnitedHealth Group, Inc. 85,000 2.75% 15/2/2023 86,581 0.01%Valero Energy Corp. 75,000 4.90% 15/3/2045 86,574 0.01%Mastercard, Inc. 80,000 3.50% 26/2/2028 86,546 0.01%Starbucks Corp. 75,000 4.45% 15/8/2049 86,474 0.01%Wisconsin Electric Power Co. 75,000 4.30% 15/10/2048 86,469 0.01%Alabama Power Co. 75,000 4.30% 15/7/2048 86,402 0.01%Magellan Midstream Partners LP 75,000 4.85% 1/2/2049 86,374 0.01%Crown Castle International Corp. 75,000 4.75% 15/5/2047 86,370 0.01%Exelon Generation Co. LLC 75,000 5.75% 1/10/2041 86,288 0.01%Arizona Public Service Co. 75,000 4.50% 1/4/2042 86,270 0.01%UnitedHealth Group, Inc. 75,000 4.38% 15/3/2042 86,228 0.01%PPL Capital Funding, Inc. 75,000 5.00% 15/3/2044 86,049 0.01%Norfolk Southern Corp. 75,000 4.45% 15/6/2045 85,958 0.01%Western Midstream Operating LP 100,000 5.30% 1/3/2048 85,848 0.01%Berkshire Hathaway Finance Corp. 75,000 4.30% 15/5/2043 85,830 0.01%Ecolab, Inc. 85,000 2.38% 10/8/2022 85,775 0.01%Macy’s Retail Holdings, Inc. 85,000 3.63% 1/6/2024 85,747 0.01%Metropolitan Government of Nashville & Davidson County
Convention Center Auth 60,000 6.73% 1/7/2043 85,720 0.01%Duke Energy Carolinas LLC 80,000 3.70% 1/12/2047 85,608 0.01%Norfolk Southern Corp. 78,000 4.05% 15/8/2052 85,579 0.01%Voya Financial, Inc. 75,000 4.80% 15/6/2046 85,555 0.01%Public Service Co. of Colorado 75,000 4.05% 15/9/2049 85,457 0.01%Virginia Electric & Power Co. 75,000 4.20% 15/5/2045 85,433 0.01%UBS Commercial Mortgage Trust 2017^ 81,000 3.84% 15/10/2050 85,410 0.01%District of Columbia Water & Sewer Authority 65,000 4.81% 1/10/2114 85,401 0.01%Sabal Trail Transmission LLC 75,000 4.83% 1/5/2048 85,393 0.01%CyrusOne LP/CyrusOne Finance Corp. 85,000 2.90% 15/11/2024 85,338 0.01%Simon Property Group LP 75,000 4.25% 30/11/2046 85,327 0.01%Los Angeles County Public Works Financing Authority 55,000 7.62% 1/8/2040 85,230 0.01%Southern Power Co. 75,000 5.15% 15/9/2041 85,224 0.01%American Water Capital Corp. 75,000 4.30% 1/9/2045 85,156 0.01%Legg Mason, Inc. 75,000 5.63% 15/1/2044 85,139 0.01%Aon plc 75,000 4.60% 14/6/2044 85,123 0.01%Home Depot, Inc. 65,000 5.40% 15/9/2040 85,102 0.01%General Motors Financial Co., Inc. 75,000 5.65% 17/1/2029 85,086 0.01%Puget Sound Energy, Inc. 75,000 4.22% 15/6/2048 85,076 0.01%Dow Chemical Co. 75,000 4.80% 30/11/2028 85,041 0.01%Southern Power Co. 75,000 5.25% 15/7/2043 85,013 0.01%Nucor Corp. 75,000 4.40% 1/5/2048 84,966 0.01%FedEx Corp. 75,000 4.90% 15/1/2034 84,807 0.01%Duke Energy Progress LLC 75,000 4.20% 15/8/2045 84,802 0.01%ViacomCBS, Inc. 75,000 4.90% 15/8/2044 84,788 0.01%GLP Capital LP/GLP Financing II, Inc. 75,000 5.75% 1/6/2028 84,745 0.01%JPMBB Commercial Mortgage Securities Trust 2013 81,000 3.66% 15/7/2045 84,727 0.01%Energy Transfer Operating LP 75,000 5.80% 15/6/2038 84,636 0.01%Piedmont Natural Gas Co., Inc. 75,000 4.65% 1/8/2043 84,627 0.01%
Vanguard U.S. Investment Grade Credit Index Fund
910
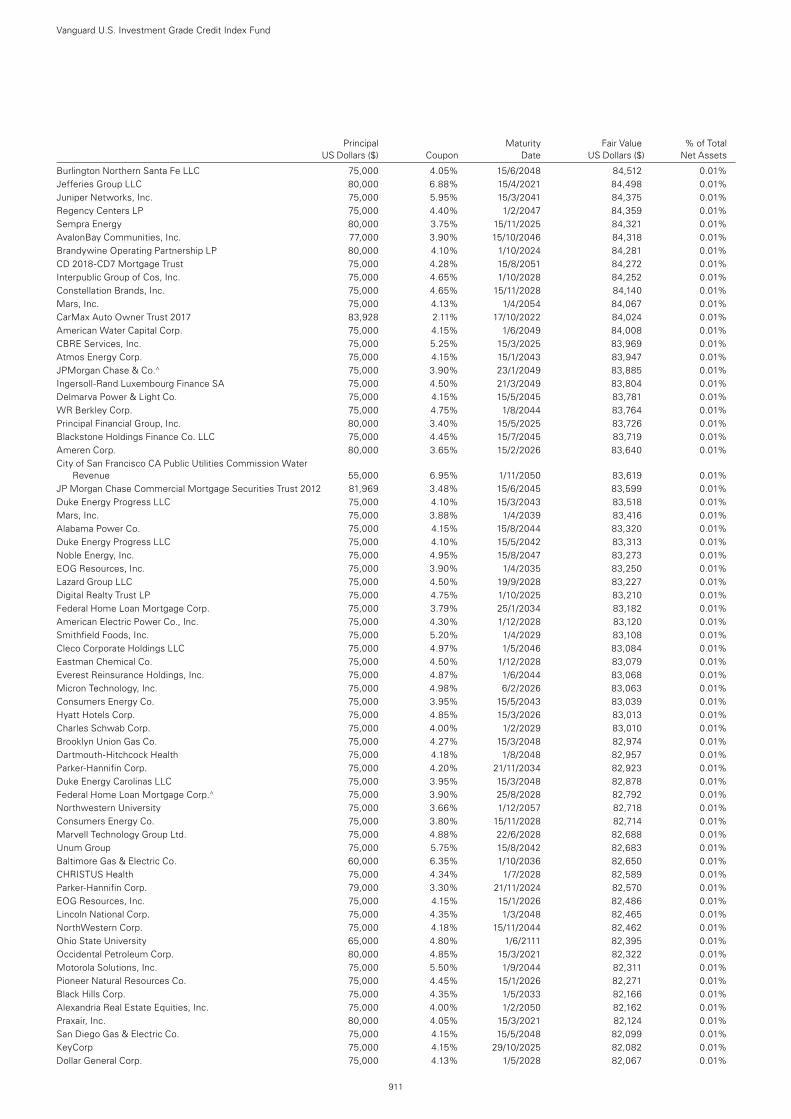
Principal Maturity Fair Value % of Total US Dollars ($) Coupon Date US Dollars ($) Net Assets
Burlington Northern Santa Fe LLC 75,000 4.05% 15/6/2048 84,512 0.01%Jefferies Group LLC 80,000 6.88% 15/4/2021 84,498 0.01%Juniper Networks, Inc. 75,000 5.95% 15/3/2041 84,375 0.01%Regency Centers LP 75,000 4.40% 1/2/2047 84,359 0.01%Sempra Energy 80,000 3.75% 15/11/2025 84,321 0.01%AvalonBay Communities, Inc. 77,000 3.90% 15/10/2046 84,318 0.01%Brandywine Operating Partnership LP 80,000 4.10% 1/10/2024 84,281 0.01%CD 2018-CD7 Mortgage Trust 75,000 4.28% 15/8/2051 84,272 0.01%Interpublic Group of Cos, Inc. 75,000 4.65% 1/10/2028 84,252 0.01%Constellation Brands, Inc. 75,000 4.65% 15/11/2028 84,140 0.01%Mars, Inc. 75,000 4.13% 1/4/2054 84,067 0.01%CarMax Auto Owner Trust 2017 83,928 2.11% 17/10/2022 84,024 0.01%American Water Capital Corp. 75,000 4.15% 1/6/2049 84,008 0.01%CBRE Services, Inc. 75,000 5.25% 15/3/2025 83,969 0.01%Atmos Energy Corp. 75,000 4.15% 15/1/2043 83,947 0.01%JPMorgan Chase & Co.^ 75,000 3.90% 23/1/2049 83,885 0.01%Ingersoll-Rand Luxembourg Finance SA 75,000 4.50% 21/3/2049 83,804 0.01%Delmarva Power & Light Co. 75,000 4.15% 15/5/2045 83,781 0.01%WR Berkley Corp. 75,000 4.75% 1/8/2044 83,764 0.01%Principal Financial Group, Inc. 80,000 3.40% 15/5/2025 83,726 0.01%Blackstone Holdings Finance Co. LLC 75,000 4.45% 15/7/2045 83,719 0.01%Ameren Corp. 80,000 3.65% 15/2/2026 83,640 0.01%City of San Francisco CA Public Utilities Commission Water
Revenue 55,000 6.95% 1/11/2050 83,619 0.01%JP Morgan Chase Commercial Mortgage Securities Trust 2012 81,969 3.48% 15/6/2045 83,599 0.01%Duke Energy Progress LLC 75,000 4.10% 15/3/2043 83,518 0.01%Mars, Inc. 75,000 3.88% 1/4/2039 83,416 0.01%Alabama Power Co. 75,000 4.15% 15/8/2044 83,320 0.01%Duke Energy Progress LLC 75,000 4.10% 15/5/2042 83,313 0.01%Noble Energy, Inc. 75,000 4.95% 15/8/2047 83,273 0.01%EOG Resources, Inc. 75,000 3.90% 1/4/2035 83,250 0.01%Lazard Group LLC 75,000 4.50% 19/9/2028 83,227 0.01%Digital Realty Trust LP 75,000 4.75% 1/10/2025 83,210 0.01%Federal Home Loan Mortgage Corp. 75,000 3.79% 25/1/2034 83,182 0.01%American Electric Power Co., Inc. 75,000 4.30% 1/12/2028 83,120 0.01%Smithfield Foods, Inc. 75,000 5.20% 1/4/2029 83,108 0.01%Cleco Corporate Holdings LLC 75,000 4.97% 1/5/2046 83,084 0.01%Eastman Chemical Co. 75,000 4.50% 1/12/2028 83,079 0.01%Everest Reinsurance Holdings, Inc. 75,000 4.87% 1/6/2044 83,068 0.01%Micron Technology, Inc. 75,000 4.98% 6/2/2026 83,063 0.01%Consumers Energy Co. 75,000 3.95% 15/5/2043 83,039 0.01%Hyatt Hotels Corp. 75,000 4.85% 15/3/2026 83,013 0.01%Charles Schwab Corp. 75,000 4.00% 1/2/2029 83,010 0.01%Brooklyn Union Gas Co. 75,000 4.27% 15/3/2048 82,974 0.01%Dartmouth-Hitchcock Health 75,000 4.18% 1/8/2048 82,957 0.01%Parker-Hannifin Corp. 75,000 4.20% 21/11/2034 82,923 0.01%Duke Energy Carolinas LLC 75,000 3.95% 15/3/2048 82,878 0.01%Federal Home Loan Mortgage Corp.^ 75,000 3.90% 25/8/2028 82,792 0.01%Northwestern University 75,000 3.66% 1/12/2057 82,718 0.01%Consumers Energy Co. 75,000 3.80% 15/11/2028 82,714 0.01%Marvell Technology Group Ltd. 75,000 4.88% 22/6/2028 82,688 0.01%Unum Group 75,000 5.75% 15/8/2042 82,683 0.01%Baltimore Gas & Electric Co. 60,000 6.35% 1/10/2036 82,650 0.01%CHRISTUS Health 75,000 4.34% 1/7/2028 82,589 0.01%Parker-Hannifin Corp. 79,000 3.30% 21/11/2024 82,570 0.01%EOG Resources, Inc. 75,000 4.15% 15/1/2026 82,486 0.01%Lincoln National Corp. 75,000 4.35% 1/3/2048 82,465 0.01%NorthWestern Corp. 75,000 4.18% 15/11/2044 82,462 0.01%Ohio State University 65,000 4.80% 1/6/2111 82,395 0.01%Occidental Petroleum Corp. 80,000 4.85% 15/3/2021 82,322 0.01%Motorola Solutions, Inc. 75,000 5.50% 1/9/2044 82,311 0.01%Pioneer Natural Resources Co. 75,000 4.45% 15/1/2026 82,271 0.01%Black Hills Corp. 75,000 4.35% 1/5/2033 82,166 0.01%Alexandria Real Estate Equities, Inc. 75,000 4.00% 1/2/2050 82,162 0.01%Praxair, Inc. 80,000 4.05% 15/3/2021 82,124 0.01%San Diego Gas & Electric Co. 75,000 4.15% 15/5/2048 82,099 0.01%KeyCorp 75,000 4.15% 29/10/2025 82,082 0.01%Dollar General Corp. 75,000 4.13% 1/5/2028 82,067 0.01%
Vanguard U.S. Investment Grade Credit Index Fund
911
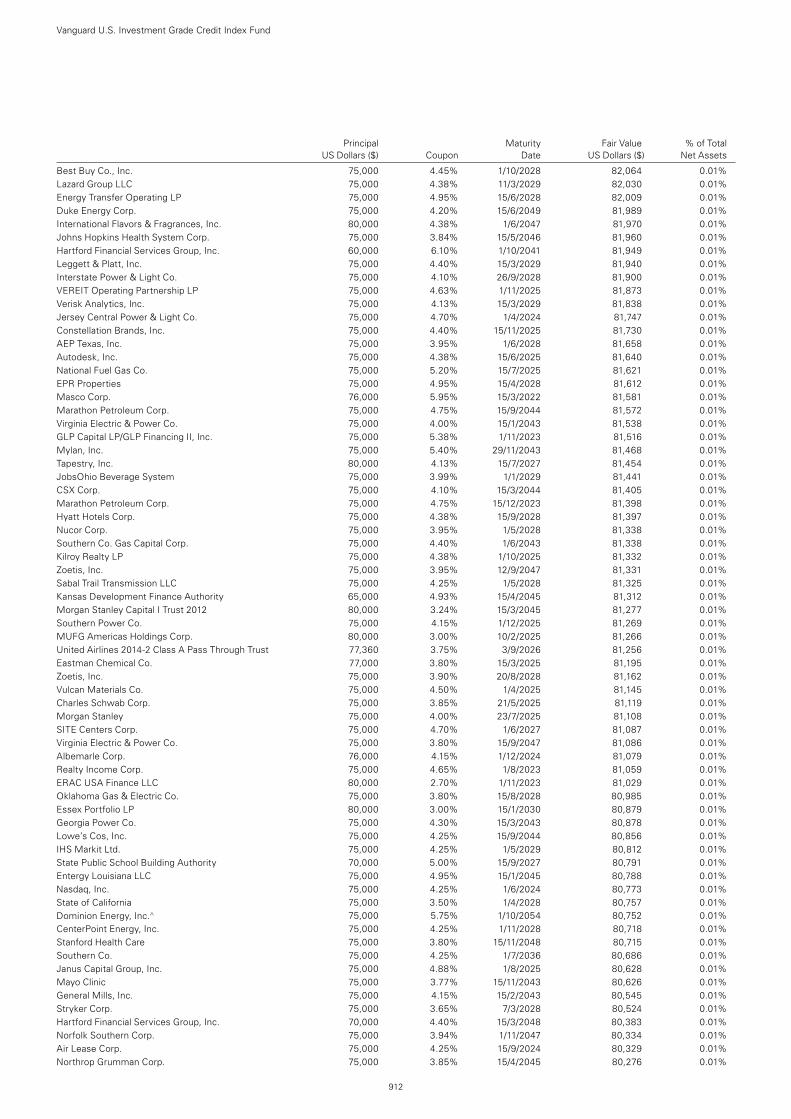
Principal Maturity Fair Value % of Total US Dollars ($) Coupon Date US Dollars ($) Net Assets
Best Buy Co., Inc. 75,000 4.45% 1/10/2028 82,064 0.01%Lazard Group LLC 75,000 4.38% 11/3/2029 82,030 0.01%Energy Transfer Operating LP 75,000 4.95% 15/6/2028 82,009 0.01%Duke Energy Corp. 75,000 4.20% 15/6/2049 81,989 0.01%International Flavors & Fragrances, Inc. 80,000 4.38% 1/6/2047 81,970 0.01%Johns Hopkins Health System Corp. 75,000 3.84% 15/5/2046 81,960 0.01%Hartford Financial Services Group, Inc. 60,000 6.10% 1/10/2041 81,949 0.01%Leggett & Platt, Inc. 75,000 4.40% 15/3/2029 81,940 0.01%Interstate Power & Light Co. 75,000 4.10% 26/9/2028 81,900 0.01%VEREIT Operating Partnership LP 75,000 4.63% 1/11/2025 81,873 0.01%Verisk Analytics, Inc. 75,000 4.13% 15/3/2029 81,838 0.01%Jersey Central Power & Light Co. 75,000 4.70% 1/4/2024 81,747 0.01%Constellation Brands, Inc. 75,000 4.40% 15/11/2025 81,730 0.01%AEP Texas, Inc. 75,000 3.95% 1/6/2028 81,658 0.01%Autodesk, Inc. 75,000 4.38% 15/6/2025 81,640 0.01%National Fuel Gas Co. 75,000 5.20% 15/7/2025 81,621 0.01%EPR Properties 75,000 4.95% 15/4/2028 81,612 0.01%Masco Corp. 76,000 5.95% 15/3/2022 81,581 0.01%Marathon Petroleum Corp. 75,000 4.75% 15/9/2044 81,572 0.01%Virginia Electric & Power Co. 75,000 4.00% 15/1/2043 81,538 0.01%GLP Capital LP/GLP Financing II, Inc. 75,000 5.38% 1/11/2023 81,516 0.01%Mylan, Inc. 75,000 5.40% 29/11/2043 81,468 0.01%Tapestry, Inc. 80,000 4.13% 15/7/2027 81,454 0.01%JobsOhio Beverage System 75,000 3.99% 1/1/2029 81,441 0.01%CSX Corp. 75,000 4.10% 15/3/2044 81,405 0.01%Marathon Petroleum Corp. 75,000 4.75% 15/12/2023 81,398 0.01%Hyatt Hotels Corp. 75,000 4.38% 15/9/2028 81,397 0.01%Nucor Corp. 75,000 3.95% 1/5/2028 81,338 0.01%Southern Co. Gas Capital Corp. 75,000 4.40% 1/6/2043 81,338 0.01%Kilroy Realty LP 75,000 4.38% 1/10/2025 81,332 0.01%Zoetis, Inc. 75,000 3.95% 12/9/2047 81,331 0.01%Sabal Trail Transmission LLC 75,000 4.25% 1/5/2028 81,325 0.01%Kansas Development Finance Authority 65,000 4.93% 15/4/2045 81,312 0.01%Morgan Stanley Capital I Trust 2012 80,000 3.24% 15/3/2045 81,277 0.01%Southern Power Co. 75,000 4.15% 1/12/2025 81,269 0.01%MUFG Americas Holdings Corp. 80,000 3.00% 10/2/2025 81,266 0.01%United Airlines 2014-2 Class A Pass Through Trust 77,360 3.75% 3/9/2026 81,256 0.01%Eastman Chemical Co. 77,000 3.80% 15/3/2025 81,195 0.01%Zoetis, Inc. 75,000 3.90% 20/8/2028 81,162 0.01%Vulcan Materials Co. 75,000 4.50% 1/4/2025 81,145 0.01%Charles Schwab Corp. 75,000 3.85% 21/5/2025 81,119 0.01%Morgan Stanley 75,000 4.00% 23/7/2025 81,108 0.01%SITE Centers Corp. 75,000 4.70% 1/6/2027 81,087 0.01%Virginia Electric & Power Co. 75,000 3.80% 15/9/2047 81,086 0.01%Albemarle Corp. 76,000 4.15% 1/12/2024 81,079 0.01%Realty Income Corp. 75,000 4.65% 1/8/2023 81,059 0.01%ERAC USA Finance LLC 80,000 2.70% 1/11/2023 81,029 0.01%Oklahoma Gas & Electric Co. 75,000 3.80% 15/8/2028 80,985 0.01%Essex Portfolio LP 80,000 3.00% 15/1/2030 80,879 0.01%Georgia Power Co. 75,000 4.30% 15/3/2043 80,878 0.01%Lowe’s Cos, Inc. 75,000 4.25% 15/9/2044 80,856 0.01%IHS Markit Ltd. 75,000 4.25% 1/5/2029 80,812 0.01%State Public School Building Authority 70,000 5.00% 15/9/2027 80,791 0.01%Entergy Louisiana LLC 75,000 4.95% 15/1/2045 80,788 0.01%Nasdaq, Inc. 75,000 4.25% 1/6/2024 80,773 0.01%State of California 75,000 3.50% 1/4/2028 80,757 0.01%Dominion Energy, Inc.^ 75,000 5.75% 1/10/2054 80,752 0.01%CenterPoint Energy, Inc. 75,000 4.25% 1/11/2028 80,718 0.01%Stanford Health Care 75,000 3.80% 15/11/2048 80,715 0.01%Southern Co. 75,000 4.25% 1/7/2036 80,686 0.01%Janus Capital Group, Inc. 75,000 4.88% 1/8/2025 80,628 0.01%Mayo Clinic 75,000 3.77% 15/11/2043 80,626 0.01%General Mills, Inc. 75,000 4.15% 15/2/2043 80,545 0.01%Stryker Corp. 75,000 3.65% 7/3/2028 80,524 0.01%Hartford Financial Services Group, Inc. 70,000 4.40% 15/3/2048 80,383 0.01%Norfolk Southern Corp. 75,000 3.94% 1/11/2047 80,334 0.01%Air Lease Corp. 75,000 4.25% 15/9/2024 80,329 0.01%Northrop Grumman Corp. 75,000 3.85% 15/4/2045 80,276 0.01%
Vanguard U.S. Investment Grade Credit Index Fund
912
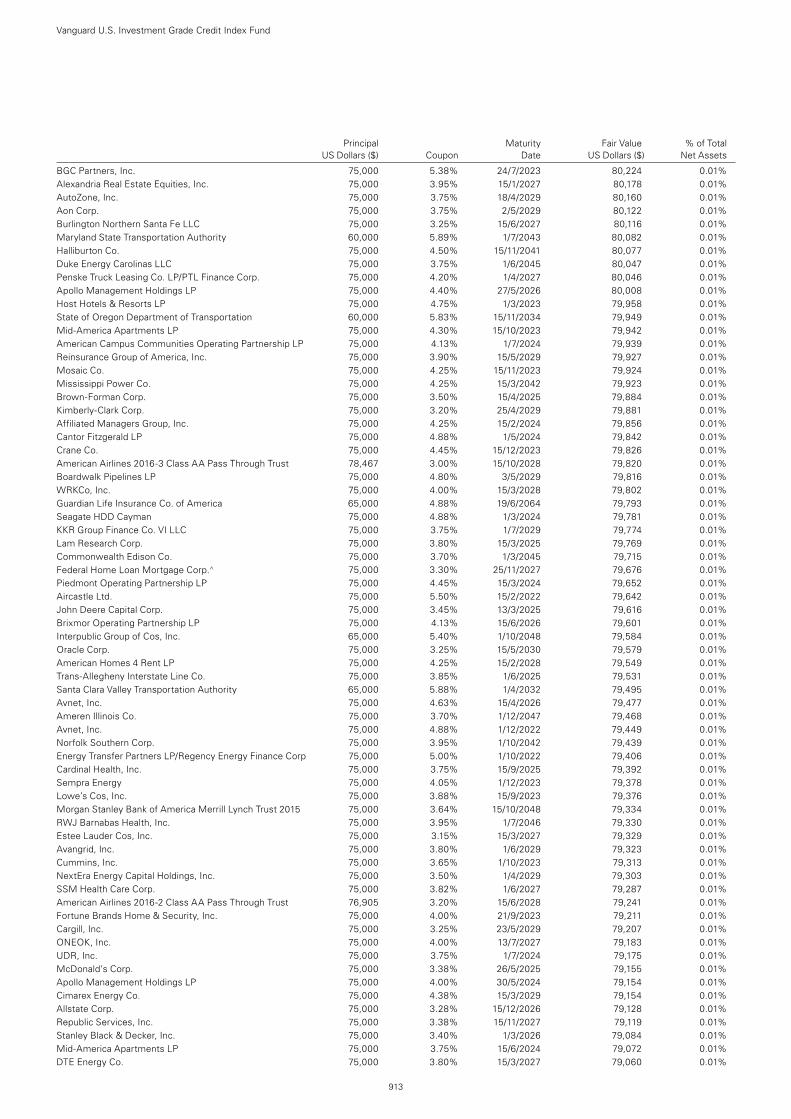
Principal Maturity Fair Value % of Total US Dollars ($) Coupon Date US Dollars ($) Net Assets
BGC Partners, Inc. 75,000 5.38% 24/7/2023 80,224 0.01%Alexandria Real Estate Equities, Inc. 75,000 3.95% 15/1/2027 80,178 0.01%AutoZone, Inc. 75,000 3.75% 18/4/2029 80,160 0.01%Aon Corp. 75,000 3.75% 2/5/2029 80,122 0.01%Burlington Northern Santa Fe LLC 75,000 3.25% 15/6/2027 80,116 0.01%Maryland State Transportation Authority 60,000 5.89% 1/7/2043 80,082 0.01%Halliburton Co. 75,000 4.50% 15/11/2041 80,077 0.01%Duke Energy Carolinas LLC 75,000 3.75% 1/6/2045 80,047 0.01%Penske Truck Leasing Co. LP/PTL Finance Corp. 75,000 4.20% 1/4/2027 80,046 0.01%Apollo Management Holdings LP 75,000 4.40% 27/5/2026 80,008 0.01%Host Hotels & Resorts LP 75,000 4.75% 1/3/2023 79,958 0.01%State of Oregon Department of Transportation 60,000 5.83% 15/11/2034 79,949 0.01%Mid-America Apartments LP 75,000 4.30% 15/10/2023 79,942 0.01%American Campus Communities Operating Partnership LP 75,000 4.13% 1/7/2024 79,939 0.01%Reinsurance Group of America, Inc. 75,000 3.90% 15/5/2029 79,927 0.01%Mosaic Co. 75,000 4.25% 15/11/2023 79,924 0.01%Mississippi Power Co. 75,000 4.25% 15/3/2042 79,923 0.01%Brown-Forman Corp. 75,000 3.50% 15/4/2025 79,884 0.01%Kimberly-Clark Corp. 75,000 3.20% 25/4/2029 79,881 0.01%Affiliated Managers Group, Inc. 75,000 4.25% 15/2/2024 79,856 0.01%Cantor Fitzgerald LP 75,000 4.88% 1/5/2024 79,842 0.01%Crane Co. 75,000 4.45% 15/12/2023 79,826 0.01%American Airlines 2016-3 Class AA Pass Through Trust 78,467 3.00% 15/10/2028 79,820 0.01%Boardwalk Pipelines LP 75,000 4.80% 3/5/2029 79,816 0.01%WRKCo, Inc. 75,000 4.00% 15/3/2028 79,802 0.01%Guardian Life Insurance Co. of America 65,000 4.88% 19/6/2064 79,793 0.01%Seagate HDD Cayman 75,000 4.88% 1/3/2024 79,781 0.01%KKR Group Finance Co. VI LLC 75,000 3.75% 1/7/2029 79,774 0.01%Lam Research Corp. 75,000 3.80% 15/3/2025 79,769 0.01%Commonwealth Edison Co. 75,000 3.70% 1/3/2045 79,715 0.01%Federal Home Loan Mortgage Corp.^ 75,000 3.30% 25/11/2027 79,676 0.01%Piedmont Operating Partnership LP 75,000 4.45% 15/3/2024 79,652 0.01%Aircastle Ltd. 75,000 5.50% 15/2/2022 79,642 0.01%John Deere Capital Corp. 75,000 3.45% 13/3/2025 79,616 0.01%Brixmor Operating Partnership LP 75,000 4.13% 15/6/2026 79,601 0.01%Interpublic Group of Cos, Inc. 65,000 5.40% 1/10/2048 79,584 0.01%Oracle Corp. 75,000 3.25% 15/5/2030 79,579 0.01%American Homes 4 Rent LP 75,000 4.25% 15/2/2028 79,549 0.01%Trans-Allegheny Interstate Line Co. 75,000 3.85% 1/6/2025 79,531 0.01%Santa Clara Valley Transportation Authority 65,000 5.88% 1/4/2032 79,495 0.01%Avnet, Inc. 75,000 4.63% 15/4/2026 79,477 0.01%Ameren Illinois Co. 75,000 3.70% 1/12/2047 79,468 0.01%Avnet, Inc. 75,000 4.88% 1/12/2022 79,449 0.01%Norfolk Southern Corp. 75,000 3.95% 1/10/2042 79,439 0.01%Energy Transfer Partners LP/Regency Energy Finance Corp 75,000 5.00% 1/10/2022 79,406 0.01%Cardinal Health, Inc. 75,000 3.75% 15/9/2025 79,392 0.01%Sempra Energy 75,000 4.05% 1/12/2023 79,378 0.01%Lowe’s Cos, Inc. 75,000 3.88% 15/9/2023 79,376 0.01%Morgan Stanley Bank of America Merrill Lynch Trust 2015 75,000 3.64% 15/10/2048 79,334 0.01%RWJ Barnabas Health, Inc. 75,000 3.95% 1/7/2046 79,330 0.01%Estee Lauder Cos, Inc. 75,000 3.15% 15/3/2027 79,329 0.01%Avangrid, Inc. 75,000 3.80% 1/6/2029 79,323 0.01%Cummins, Inc. 75,000 3.65% 1/10/2023 79,313 0.01%NextEra Energy Capital Holdings, Inc. 75,000 3.50% 1/4/2029 79,303 0.01%SSM Health Care Corp. 75,000 3.82% 1/6/2027 79,287 0.01%American Airlines 2016-2 Class AA Pass Through Trust 76,905 3.20% 15/6/2028 79,241 0.01%Fortune Brands Home & Security, Inc. 75,000 4.00% 21/9/2023 79,211 0.01%Cargill, Inc. 75,000 3.25% 23/5/2029 79,207 0.01%ONEOK, Inc. 75,000 4.00% 13/7/2027 79,183 0.01%UDR, Inc. 75,000 3.75% 1/7/2024 79,175 0.01%McDonald’s Corp. 75,000 3.38% 26/5/2025 79,155 0.01%Apollo Management Holdings LP 75,000 4.00% 30/5/2024 79,154 0.01%Cimarex Energy Co. 75,000 4.38% 15/3/2029 79,154 0.01%Allstate Corp. 75,000 3.28% 15/12/2026 79,128 0.01%Republic Services, Inc. 75,000 3.38% 15/11/2027 79,119 0.01%Stanley Black & Decker, Inc. 75,000 3.40% 1/3/2026 79,084 0.01%Mid-America Apartments LP 75,000 3.75% 15/6/2024 79,072 0.01%DTE Energy Co. 75,000 3.80% 15/3/2027 79,060 0.01%
Vanguard U.S. Investment Grade Credit Index Fund
913
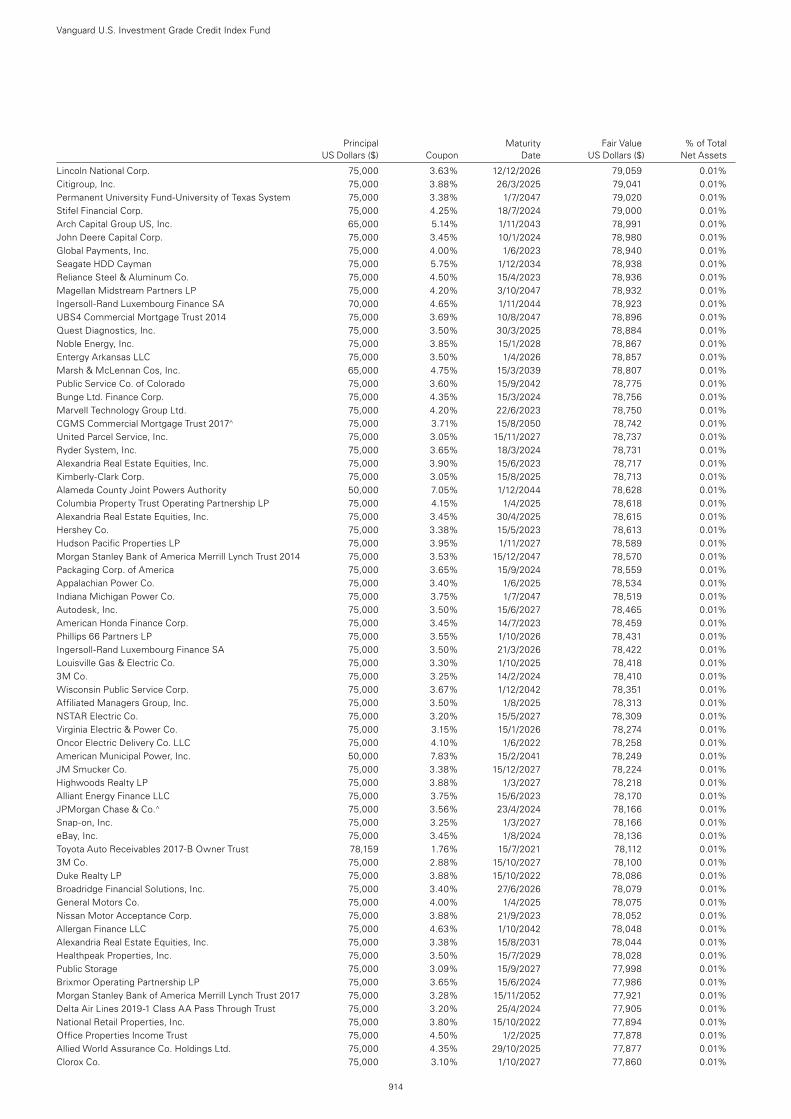
Principal Maturity Fair Value % of Total US Dollars ($) Coupon Date US Dollars ($) Net Assets
Lincoln National Corp. 75,000 3.63% 12/12/2026 79,059 0.01%Citigroup, Inc. 75,000 3.88% 26/3/2025 79,041 0.01%Permanent University Fund-University of Texas System 75,000 3.38% 1/7/2047 79,020 0.01%Stifel Financial Corp. 75,000 4.25% 18/7/2024 79,000 0.01%Arch Capital Group US, Inc. 65,000 5.14% 1/11/2043 78,991 0.01%John Deere Capital Corp. 75,000 3.45% 10/1/2024 78,980 0.01%Global Payments, Inc. 75,000 4.00% 1/6/2023 78,940 0.01%Seagate HDD Cayman 75,000 5.75% 1/12/2034 78,938 0.01%Reliance Steel & Aluminum Co. 75,000 4.50% 15/4/2023 78,936 0.01%Magellan Midstream Partners LP 75,000 4.20% 3/10/2047 78,932 0.01%Ingersoll-Rand Luxembourg Finance SA 70,000 4.65% 1/11/2044 78,923 0.01%UBS4 Commercial Mortgage Trust 2014 75,000 3.69% 10/8/2047 78,896 0.01%Quest Diagnostics, Inc. 75,000 3.50% 30/3/2025 78,884 0.01%Noble Energy, Inc. 75,000 3.85% 15/1/2028 78,867 0.01%Entergy Arkansas LLC 75,000 3.50% 1/4/2026 78,857 0.01%Marsh & McLennan Cos, Inc. 65,000 4.75% 15/3/2039 78,807 0.01%Public Service Co. of Colorado 75,000 3.60% 15/9/2042 78,775 0.01%Bunge Ltd. Finance Corp. 75,000 4.35% 15/3/2024 78,756 0.01%Marvell Technology Group Ltd. 75,000 4.20% 22/6/2023 78,750 0.01%CGMS Commercial Mortgage Trust 2017^ 75,000 3.71% 15/8/2050 78,742 0.01%United Parcel Service, Inc. 75,000 3.05% 15/11/2027 78,737 0.01%Ryder System, Inc. 75,000 3.65% 18/3/2024 78,731 0.01%Alexandria Real Estate Equities, Inc. 75,000 3.90% 15/6/2023 78,717 0.01%Kimberly-Clark Corp. 75,000 3.05% 15/8/2025 78,713 0.01%Alameda County Joint Powers Authority 50,000 7.05% 1/12/2044 78,628 0.01%Columbia Property Trust Operating Partnership LP 75,000 4.15% 1/4/2025 78,618 0.01%Alexandria Real Estate Equities, Inc. 75,000 3.45% 30/4/2025 78,615 0.01%Hershey Co. 75,000 3.38% 15/5/2023 78,613 0.01%Hudson Pacific Properties LP 75,000 3.95% 1/11/2027 78,589 0.01%Morgan Stanley Bank of America Merrill Lynch Trust 2014 75,000 3.53% 15/12/2047 78,570 0.01%Packaging Corp. of America 75,000 3.65% 15/9/2024 78,559 0.01%Appalachian Power Co. 75,000 3.40% 1/6/2025 78,534 0.01%Indiana Michigan Power Co. 75,000 3.75% 1/7/2047 78,519 0.01%Autodesk, Inc. 75,000 3.50% 15/6/2027 78,465 0.01%American Honda Finance Corp. 75,000 3.45% 14/7/2023 78,459 0.01%Phillips 66 Partners LP 75,000 3.55% 1/10/2026 78,431 0.01%Ingersoll-Rand Luxembourg Finance SA 75,000 3.50% 21/3/2026 78,422 0.01%Louisville Gas & Electric Co. 75,000 3.30% 1/10/2025 78,418 0.01%3M Co. 75,000 3.25% 14/2/2024 78,410 0.01%Wisconsin Public Service Corp. 75,000 3.67% 1/12/2042 78,351 0.01%Affiliated Managers Group, Inc. 75,000 3.50% 1/8/2025 78,313 0.01%NSTAR Electric Co. 75,000 3.20% 15/5/2027 78,309 0.01%Virginia Electric & Power Co. 75,000 3.15% 15/1/2026 78,274 0.01%Oncor Electric Delivery Co. LLC 75,000 4.10% 1/6/2022 78,258 0.01%American Municipal Power, Inc. 50,000 7.83% 15/2/2041 78,249 0.01%JM Smucker Co. 75,000 3.38% 15/12/2027 78,224 0.01%Highwoods Realty LP 75,000 3.88% 1/3/2027 78,218 0.01%Alliant Energy Finance LLC 75,000 3.75% 15/6/2023 78,170 0.01%JPMorgan Chase & Co.^ 75,000 3.56% 23/4/2024 78,166 0.01%Snap-on, Inc. 75,000 3.25% 1/3/2027 78,166 0.01%eBay, Inc. 75,000 3.45% 1/8/2024 78,136 0.01%Toyota Auto Receivables 2017-B Owner Trust 78,159 1.76% 15/7/2021 78,112 0.01%3M Co. 75,000 2.88% 15/10/2027 78,100 0.01%Duke Realty LP 75,000 3.88% 15/10/2022 78,086 0.01%Broadridge Financial Solutions, Inc. 75,000 3.40% 27/6/2026 78,079 0.01%General Motors Co. 75,000 4.00% 1/4/2025 78,075 0.01%Nissan Motor Acceptance Corp. 75,000 3.88% 21/9/2023 78,052 0.01%Allergan Finance LLC 75,000 4.63% 1/10/2042 78,048 0.01%Alexandria Real Estate Equities, Inc. 75,000 3.38% 15/8/2031 78,044 0.01%Healthpeak Properties, Inc. 75,000 3.50% 15/7/2029 78,028 0.01%Public Storage 75,000 3.09% 15/9/2027 77,998 0.01%Brixmor Operating Partnership LP 75,000 3.65% 15/6/2024 77,986 0.01%Morgan Stanley Bank of America Merrill Lynch Trust 2017 75,000 3.28% 15/11/2052 77,921 0.01%Delta Air Lines 2019-1 Class AA Pass Through Trust 75,000 3.20% 25/4/2024 77,905 0.01%National Retail Properties, Inc. 75,000 3.80% 15/10/2022 77,894 0.01%Office Properties Income Trust 75,000 4.50% 1/2/2025 77,878 0.01%Allied World Assurance Co. Holdings Ltd. 75,000 4.35% 29/10/2025 77,877 0.01%Clorox Co. 75,000 3.10% 1/10/2027 77,860 0.01%
Vanguard U.S. Investment Grade Credit Index Fund
914
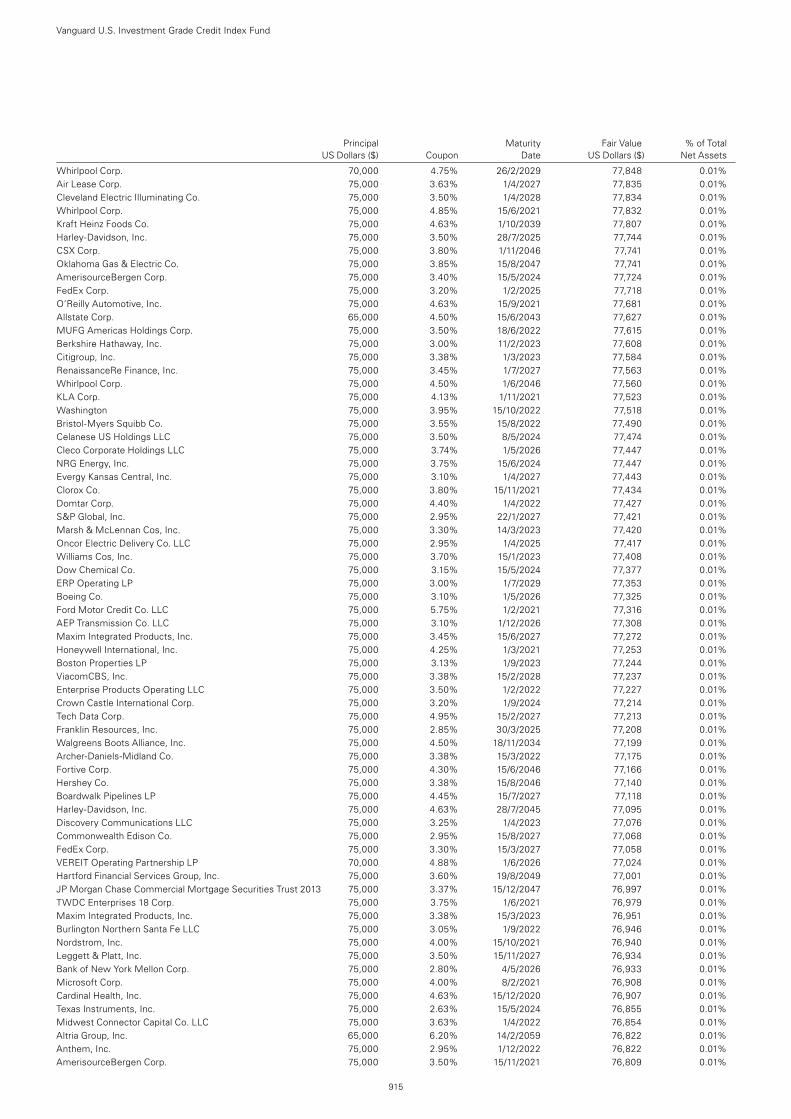
Principal Maturity Fair Value % of Total US Dollars ($) Coupon Date US Dollars ($) Net Assets
Whirlpool Corp. 70,000 4.75% 26/2/2029 77,848 0.01%Air Lease Corp. 75,000 3.63% 1/4/2027 77,835 0.01%Cleveland Electric Illuminating Co. 75,000 3.50% 1/4/2028 77,834 0.01%Whirlpool Corp. 75,000 4.85% 15/6/2021 77,832 0.01%Kraft Heinz Foods Co. 75,000 4.63% 1/10/2039 77,807 0.01%Harley-Davidson, Inc. 75,000 3.50% 28/7/2025 77,744 0.01%CSX Corp. 75,000 3.80% 1/11/2046 77,741 0.01%Oklahoma Gas & Electric Co. 75,000 3.85% 15/8/2047 77,741 0.01%AmerisourceBergen Corp. 75,000 3.40% 15/5/2024 77,724 0.01%FedEx Corp. 75,000 3.20% 1/2/2025 77,718 0.01%O’Reilly Automotive, Inc. 75,000 4.63% 15/9/2021 77,681 0.01%Allstate Corp. 65,000 4.50% 15/6/2043 77,627 0.01%MUFG Americas Holdings Corp. 75,000 3.50% 18/6/2022 77,615 0.01%Berkshire Hathaway, Inc. 75,000 3.00% 11/2/2023 77,608 0.01%Citigroup, Inc. 75,000 3.38% 1/3/2023 77,584 0.01%RenaissanceRe Finance, Inc. 75,000 3.45% 1/7/2027 77,563 0.01%Whirlpool Corp. 75,000 4.50% 1/6/2046 77,560 0.01%KLA Corp. 75,000 4.13% 1/11/2021 77,523 0.01%Washington 75,000 3.95% 15/10/2022 77,518 0.01%Bristol-Myers Squibb Co. 75,000 3.55% 15/8/2022 77,490 0.01%Celanese US Holdings LLC 75,000 3.50% 8/5/2024 77,474 0.01%Cleco Corporate Holdings LLC 75,000 3.74% 1/5/2026 77,447 0.01%NRG Energy, Inc. 75,000 3.75% 15/6/2024 77,447 0.01%Evergy Kansas Central, Inc. 75,000 3.10% 1/4/2027 77,443 0.01%Clorox Co. 75,000 3.80% 15/11/2021 77,434 0.01%Domtar Corp. 75,000 4.40% 1/4/2022 77,427 0.01%S&P Global, Inc. 75,000 2.95% 22/1/2027 77,421 0.01%Marsh & McLennan Cos, Inc. 75,000 3.30% 14/3/2023 77,420 0.01%Oncor Electric Delivery Co. LLC 75,000 2.95% 1/4/2025 77,417 0.01%Williams Cos, Inc. 75,000 3.70% 15/1/2023 77,408 0.01%Dow Chemical Co. 75,000 3.15% 15/5/2024 77,377 0.01%ERP Operating LP 75,000 3.00% 1/7/2029 77,353 0.01%Boeing Co. 75,000 3.10% 1/5/2026 77,325 0.01%Ford Motor Credit Co. LLC 75,000 5.75% 1/2/2021 77,316 0.01%AEP Transmission Co. LLC 75,000 3.10% 1/12/2026 77,308 0.01%Maxim Integrated Products, Inc. 75,000 3.45% 15/6/2027 77,272 0.01%Honeywell International, Inc. 75,000 4.25% 1/3/2021 77,253 0.01%Boston Properties LP 75,000 3.13% 1/9/2023 77,244 0.01%ViacomCBS, Inc. 75,000 3.38% 15/2/2028 77,237 0.01%Enterprise Products Operating LLC 75,000 3.50% 1/2/2022 77,227 0.01%Crown Castle International Corp. 75,000 3.20% 1/9/2024 77,214 0.01%Tech Data Corp. 75,000 4.95% 15/2/2027 77,213 0.01%Franklin Resources, Inc. 75,000 2.85% 30/3/2025 77,208 0.01%Walgreens Boots Alliance, Inc. 75,000 4.50% 18/11/2034 77,199 0.01%Archer-Daniels-Midland Co. 75,000 3.38% 15/3/2022 77,175 0.01%Fortive Corp. 75,000 4.30% 15/6/2046 77,166 0.01%Hershey Co. 75,000 3.38% 15/8/2046 77,140 0.01%Boardwalk Pipelines LP 75,000 4.45% 15/7/2027 77,118 0.01%Harley-Davidson, Inc. 75,000 4.63% 28/7/2045 77,095 0.01%Discovery Communications LLC 75,000 3.25% 1/4/2023 77,076 0.01%Commonwealth Edison Co. 75,000 2.95% 15/8/2027 77,068 0.01%FedEx Corp. 75,000 3.30% 15/3/2027 77,058 0.01%VEREIT Operating Partnership LP 70,000 4.88% 1/6/2026 77,024 0.01%Hartford Financial Services Group, Inc. 75,000 3.60% 19/8/2049 77,001 0.01%JP Morgan Chase Commercial Mortgage Securities Trust 2013 75,000 3.37% 15/12/2047 76,997 0.01%TWDC Enterprises 18 Corp. 75,000 3.75% 1/6/2021 76,979 0.01%Maxim Integrated Products, Inc. 75,000 3.38% 15/3/2023 76,951 0.01%Burlington Northern Santa Fe LLC 75,000 3.05% 1/9/2022 76,946 0.01%Nordstrom, Inc. 75,000 4.00% 15/10/2021 76,940 0.01%Leggett & Platt, Inc. 75,000 3.50% 15/11/2027 76,934 0.01%Bank of New York Mellon Corp. 75,000 2.80% 4/5/2026 76,933 0.01%Microsoft Corp. 75,000 4.00% 8/2/2021 76,908 0.01%Cardinal Health, Inc. 75,000 4.63% 15/12/2020 76,907 0.01%Texas Instruments, Inc. 75,000 2.63% 15/5/2024 76,855 0.01%Midwest Connector Capital Co. LLC 75,000 3.63% 1/4/2022 76,854 0.01%Altria Group, Inc. 65,000 6.20% 14/2/2059 76,822 0.01%Anthem, Inc. 75,000 2.95% 1/12/2022 76,822 0.01%AmerisourceBergen Corp. 75,000 3.50% 15/11/2021 76,809 0.01%
Vanguard U.S. Investment Grade Credit Index Fund
915
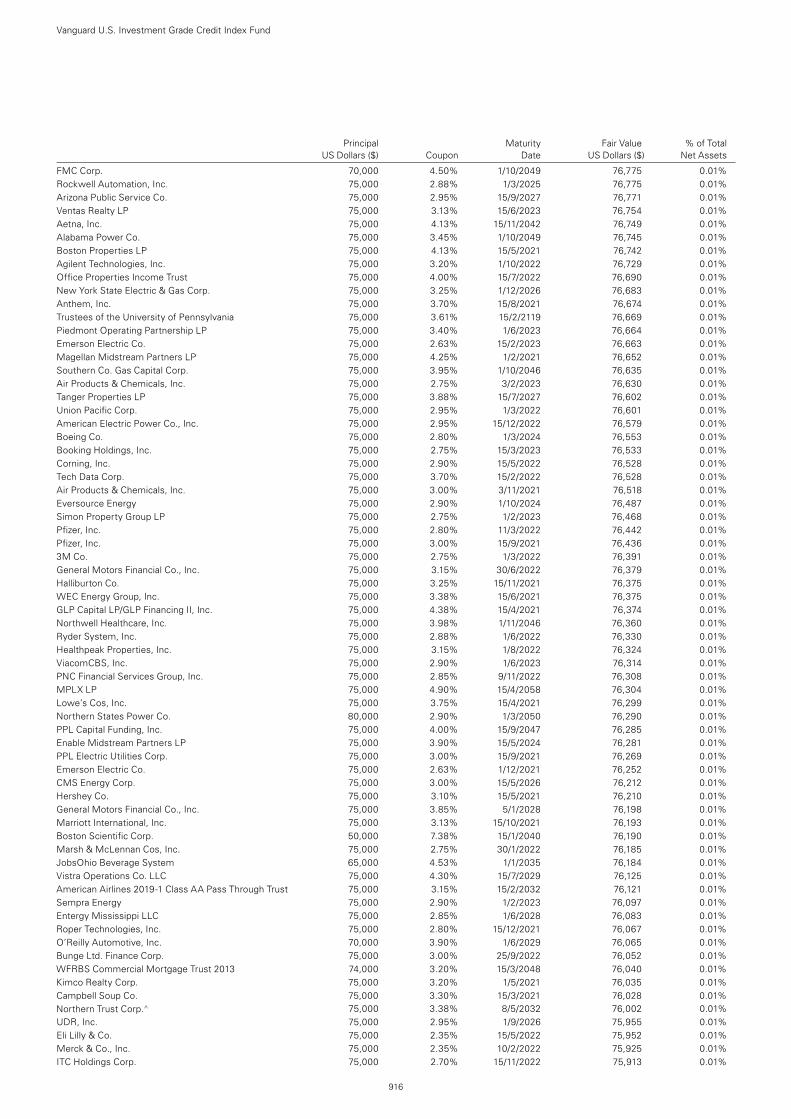
Principal Maturity Fair Value % of Total US Dollars ($) Coupon Date US Dollars ($) Net Assets
FMC Corp. 70,000 4.50% 1/10/2049 76,775 0.01%Rockwell Automation, Inc. 75,000 2.88% 1/3/2025 76,775 0.01%Arizona Public Service Co. 75,000 2.95% 15/9/2027 76,771 0.01%Ventas Realty LP 75,000 3.13% 15/6/2023 76,754 0.01%Aetna, Inc. 75,000 4.13% 15/11/2042 76,749 0.01%Alabama Power Co. 75,000 3.45% 1/10/2049 76,745 0.01%Boston Properties LP 75,000 4.13% 15/5/2021 76,742 0.01%Agilent Technologies, Inc. 75,000 3.20% 1/10/2022 76,729 0.01%Office Properties Income Trust 75,000 4.00% 15/7/2022 76,690 0.01%New York State Electric & Gas Corp. 75,000 3.25% 1/12/2026 76,683 0.01%Anthem, Inc. 75,000 3.70% 15/8/2021 76,674 0.01%Trustees of the University of Pennsylvania 75,000 3.61% 15/2/2119 76,669 0.01%Piedmont Operating Partnership LP 75,000 3.40% 1/6/2023 76,664 0.01%Emerson Electric Co. 75,000 2.63% 15/2/2023 76,663 0.01%Magellan Midstream Partners LP 75,000 4.25% 1/2/2021 76,652 0.01%Southern Co. Gas Capital Corp. 75,000 3.95% 1/10/2046 76,635 0.01%Air Products & Chemicals, Inc. 75,000 2.75% 3/2/2023 76,630 0.01%Tanger Properties LP 75,000 3.88% 15/7/2027 76,602 0.01%Union Pacific Corp. 75,000 2.95% 1/3/2022 76,601 0.01%American Electric Power Co., Inc. 75,000 2.95% 15/12/2022 76,579 0.01%Boeing Co. 75,000 2.80% 1/3/2024 76,553 0.01%Booking Holdings, Inc. 75,000 2.75% 15/3/2023 76,533 0.01%Corning, Inc. 75,000 2.90% 15/5/2022 76,528 0.01%Tech Data Corp. 75,000 3.70% 15/2/2022 76,528 0.01%Air Products & Chemicals, Inc. 75,000 3.00% 3/11/2021 76,518 0.01%Eversource Energy 75,000 2.90% 1/10/2024 76,487 0.01%Simon Property Group LP 75,000 2.75% 1/2/2023 76,468 0.01%Pfizer, Inc. 75,000 2.80% 11/3/2022 76,442 0.01%Pfizer, Inc. 75,000 3.00% 15/9/2021 76,436 0.01%3M Co. 75,000 2.75% 1/3/2022 76,391 0.01%General Motors Financial Co., Inc. 75,000 3.15% 30/6/2022 76,379 0.01%Halliburton Co. 75,000 3.25% 15/11/2021 76,375 0.01%WEC Energy Group, Inc. 75,000 3.38% 15/6/2021 76,375 0.01%GLP Capital LP/GLP Financing II, Inc. 75,000 4.38% 15/4/2021 76,374 0.01%Northwell Healthcare, Inc. 75,000 3.98% 1/11/2046 76,360 0.01%Ryder System, Inc. 75,000 2.88% 1/6/2022 76,330 0.01%Healthpeak Properties, Inc. 75,000 3.15% 1/8/2022 76,324 0.01%ViacomCBS, Inc. 75,000 2.90% 1/6/2023 76,314 0.01%PNC Financial Services Group, Inc. 75,000 2.85% 9/11/2022 76,308 0.01%MPLX LP 75,000 4.90% 15/4/2058 76,304 0.01%Lowe’s Cos, Inc. 75,000 3.75% 15/4/2021 76,299 0.01%Northern States Power Co. 80,000 2.90% 1/3/2050 76,290 0.01%PPL Capital Funding, Inc. 75,000 4.00% 15/9/2047 76,285 0.01%Enable Midstream Partners LP 75,000 3.90% 15/5/2024 76,281 0.01%PPL Electric Utilities Corp. 75,000 3.00% 15/9/2021 76,269 0.01%Emerson Electric Co. 75,000 2.63% 1/12/2021 76,252 0.01%CMS Energy Corp. 75,000 3.00% 15/5/2026 76,212 0.01%Hershey Co. 75,000 3.10% 15/5/2021 76,210 0.01%General Motors Financial Co., Inc. 75,000 3.85% 5/1/2028 76,198 0.01%Marriott International, Inc. 75,000 3.13% 15/10/2021 76,193 0.01%Boston Scientific Corp. 50,000 7.38% 15/1/2040 76,190 0.01%Marsh & McLennan Cos, Inc. 75,000 2.75% 30/1/2022 76,185 0.01%JobsOhio Beverage System 65,000 4.53% 1/1/2035 76,184 0.01%Vistra Operations Co. LLC 75,000 4.30% 15/7/2029 76,125 0.01%American Airlines 2019-1 Class AA Pass Through Trust 75,000 3.15% 15/2/2032 76,121 0.01%Sempra Energy 75,000 2.90% 1/2/2023 76,097 0.01%Entergy Mississippi LLC 75,000 2.85% 1/6/2028 76,083 0.01%Roper Technologies, Inc. 75,000 2.80% 15/12/2021 76,067 0.01%O’Reilly Automotive, Inc. 70,000 3.90% 1/6/2029 76,065 0.01%Bunge Ltd. Finance Corp. 75,000 3.00% 25/9/2022 76,052 0.01%WFRBS Commercial Mortgage Trust 2013 74,000 3.20% 15/3/2048 76,040 0.01%Kimco Realty Corp. 75,000 3.20% 1/5/2021 76,035 0.01%Campbell Soup Co. 75,000 3.30% 15/3/2021 76,028 0.01%Northern Trust Corp.^ 75,000 3.38% 8/5/2032 76,002 0.01%UDR, Inc. 75,000 2.95% 1/9/2026 75,955 0.01%Eli Lilly & Co. 75,000 2.35% 15/5/2022 75,952 0.01%Merck & Co., Inc. 75,000 2.35% 10/2/2022 75,925 0.01%ITC Holdings Corp. 75,000 2.70% 15/11/2022 75,913 0.01%
Vanguard U.S. Investment Grade Credit Index Fund
916
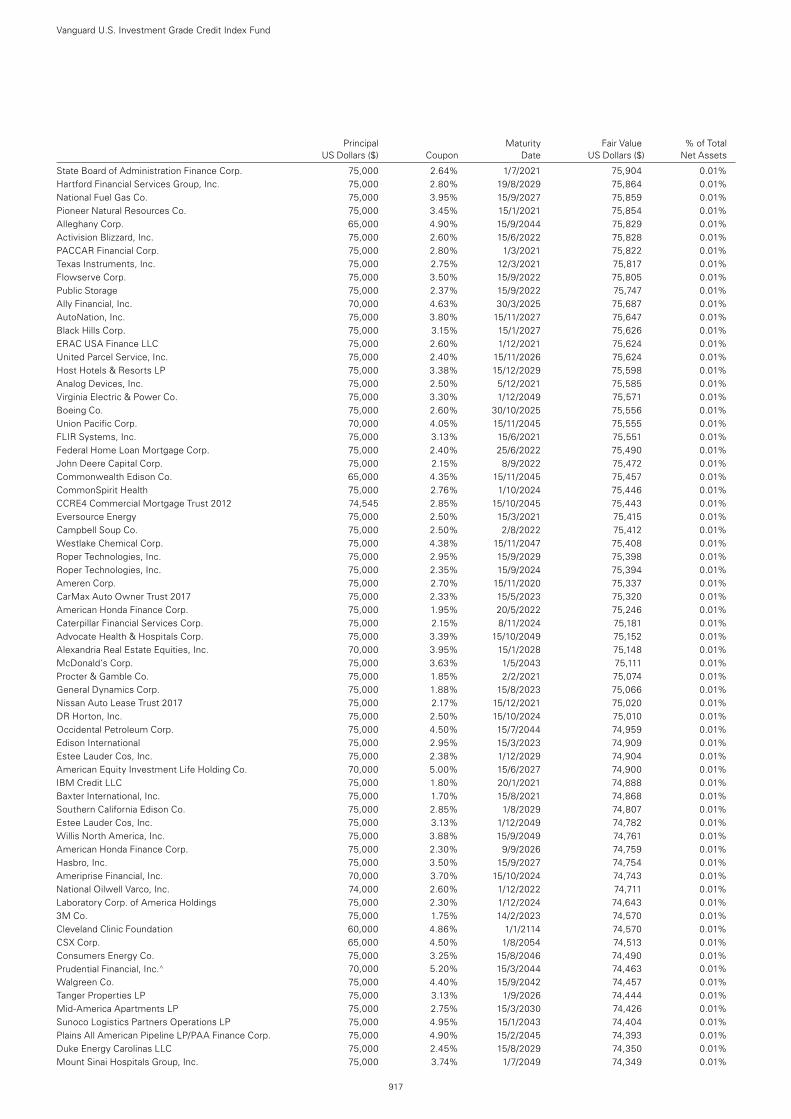
Principal Maturity Fair Value % of Total US Dollars ($) Coupon Date US Dollars ($) Net Assets
State Board of Administration Finance Corp. 75,000 2.64% 1/7/2021 75,904 0.01%Hartford Financial Services Group, Inc. 75,000 2.80% 19/8/2029 75,864 0.01%National Fuel Gas Co. 75,000 3.95% 15/9/2027 75,859 0.01%Pioneer Natural Resources Co. 75,000 3.45% 15/1/2021 75,854 0.01%Alleghany Corp. 65,000 4.90% 15/9/2044 75,829 0.01%Activision Blizzard, Inc. 75,000 2.60% 15/6/2022 75,828 0.01%PACCAR Financial Corp. 75,000 2.80% 1/3/2021 75,822 0.01%Texas Instruments, Inc. 75,000 2.75% 12/3/2021 75,817 0.01%Flowserve Corp. 75,000 3.50% 15/9/2022 75,805 0.01%Public Storage 75,000 2.37% 15/9/2022 75,747 0.01%Ally Financial, Inc. 70,000 4.63% 30/3/2025 75,687 0.01%AutoNation, Inc. 75,000 3.80% 15/11/2027 75,647 0.01%Black Hills Corp. 75,000 3.15% 15/1/2027 75,626 0.01%ERAC USA Finance LLC 75,000 2.60% 1/12/2021 75,624 0.01%United Parcel Service, Inc. 75,000 2.40% 15/11/2026 75,624 0.01%Host Hotels & Resorts LP 75,000 3.38% 15/12/2029 75,598 0.01%Analog Devices, Inc. 75,000 2.50% 5/12/2021 75,585 0.01%Virginia Electric & Power Co. 75,000 3.30% 1/12/2049 75,571 0.01%Boeing Co. 75,000 2.60% 30/10/2025 75,556 0.01%Union Pacific Corp. 70,000 4.05% 15/11/2045 75,555 0.01%FLIR Systems, Inc. 75,000 3.13% 15/6/2021 75,551 0.01%Federal Home Loan Mortgage Corp. 75,000 2.40% 25/6/2022 75,490 0.01%John Deere Capital Corp. 75,000 2.15% 8/9/2022 75,472 0.01%Commonwealth Edison Co. 65,000 4.35% 15/11/2045 75,457 0.01%CommonSpirit Health 75,000 2.76% 1/10/2024 75,446 0.01%CCRE4 Commercial Mortgage Trust 2012 74,545 2.85% 15/10/2045 75,443 0.01%Eversource Energy 75,000 2.50% 15/3/2021 75,415 0.01%Campbell Soup Co. 75,000 2.50% 2/8/2022 75,412 0.01%Westlake Chemical Corp. 75,000 4.38% 15/11/2047 75,408 0.01%Roper Technologies, Inc. 75,000 2.95% 15/9/2029 75,398 0.01%Roper Technologies, Inc. 75,000 2.35% 15/9/2024 75,394 0.01%Ameren Corp. 75,000 2.70% 15/11/2020 75,337 0.01%CarMax Auto Owner Trust 2017 75,000 2.33% 15/5/2023 75,320 0.01%American Honda Finance Corp. 75,000 1.95% 20/5/2022 75,246 0.01%Caterpillar Financial Services Corp. 75,000 2.15% 8/11/2024 75,181 0.01%Advocate Health & Hospitals Corp. 75,000 3.39% 15/10/2049 75,152 0.01%Alexandria Real Estate Equities, Inc. 70,000 3.95% 15/1/2028 75,148 0.01%McDonald’s Corp. 75,000 3.63% 1/5/2043 75,111 0.01%Procter & Gamble Co. 75,000 1.85% 2/2/2021 75,074 0.01%General Dynamics Corp. 75,000 1.88% 15/8/2023 75,066 0.01%Nissan Auto Lease Trust 2017 75,000 2.17% 15/12/2021 75,020 0.01%DR Horton, Inc. 75,000 2.50% 15/10/2024 75,010 0.01%Occidental Petroleum Corp. 75,000 4.50% 15/7/2044 74,959 0.01%Edison International 75,000 2.95% 15/3/2023 74,909 0.01%Estee Lauder Cos, Inc. 75,000 2.38% 1/12/2029 74,904 0.01%American Equity Investment Life Holding Co. 70,000 5.00% 15/6/2027 74,900 0.01%IBM Credit LLC 75,000 1.80% 20/1/2021 74,888 0.01%Baxter International, Inc. 75,000 1.70% 15/8/2021 74,868 0.01%Southern California Edison Co. 75,000 2.85% 1/8/2029 74,807 0.01%Estee Lauder Cos, Inc. 75,000 3.13% 1/12/2049 74,782 0.01%Willis North America, Inc. 75,000 3.88% 15/9/2049 74,761 0.01%American Honda Finance Corp. 75,000 2.30% 9/9/2026 74,759 0.01%Hasbro, Inc. 75,000 3.50% 15/9/2027 74,754 0.01%Ameriprise Financial, Inc. 70,000 3.70% 15/10/2024 74,743 0.01%National Oilwell Varco, Inc. 74,000 2.60% 1/12/2022 74,711 0.01%Laboratory Corp. of America Holdings 75,000 2.30% 1/12/2024 74,643 0.01%3M Co. 75,000 1.75% 14/2/2023 74,570 0.01%Cleveland Clinic Foundation 60,000 4.86% 1/1/2114 74,570 0.01%CSX Corp. 65,000 4.50% 1/8/2054 74,513 0.01%Consumers Energy Co. 75,000 3.25% 15/8/2046 74,490 0.01%Prudential Financial, Inc.^ 70,000 5.20% 15/3/2044 74,463 0.01%Walgreen Co. 75,000 4.40% 15/9/2042 74,457 0.01%Tanger Properties LP 75,000 3.13% 1/9/2026 74,444 0.01%Mid-America Apartments LP 75,000 2.75% 15/3/2030 74,426 0.01%Sunoco Logistics Partners Operations LP 75,000 4.95% 15/1/2043 74,404 0.01%Plains All American Pipeline LP/PAA Finance Corp. 75,000 4.90% 15/2/2045 74,393 0.01%Duke Energy Carolinas LLC 75,000 2.45% 15/8/2029 74,350 0.01%Mount Sinai Hospitals Group, Inc. 75,000 3.74% 1/7/2049 74,349 0.01%
Vanguard U.S. Investment Grade Credit Index Fund
917
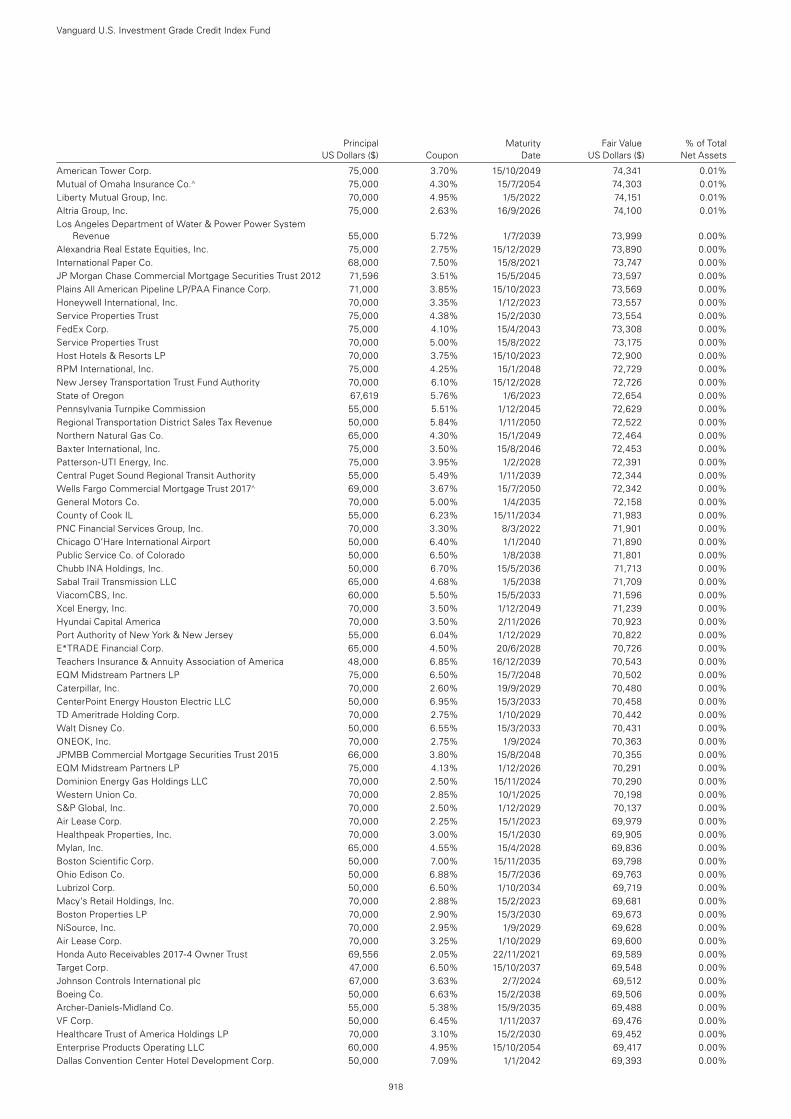
Principal Maturity Fair Value % of Total US Dollars ($) Coupon Date US Dollars ($) Net Assets
American Tower Corp. 75,000 3.70% 15/10/2049 74,341 0.01%Mutual of Omaha Insurance Co.^ 75,000 4.30% 15/7/2054 74,303 0.01%Liberty Mutual Group, Inc. 70,000 4.95% 1/5/2022 74,151 0.01%Altria Group, Inc. 75,000 2.63% 16/9/2026 74,100 0.01%Los Angeles Department of Water & Power Power System
Revenue 55,000 5.72% 1/7/2039 73,999 0.00%Alexandria Real Estate Equities, Inc. 75,000 2.75% 15/12/2029 73,890 0.00%International Paper Co. 68,000 7.50% 15/8/2021 73,747 0.00%JP Morgan Chase Commercial Mortgage Securities Trust 2012 71,596 3.51% 15/5/2045 73,597 0.00%Plains All American Pipeline LP/PAA Finance Corp. 71,000 3.85% 15/10/2023 73,569 0.00%Honeywell International, Inc. 70,000 3.35% 1/12/2023 73,557 0.00%Service Properties Trust 75,000 4.38% 15/2/2030 73,554 0.00%FedEx Corp. 75,000 4.10% 15/4/2043 73,308 0.00%Service Properties Trust 70,000 5.00% 15/8/2022 73,175 0.00%Host Hotels & Resorts LP 70,000 3.75% 15/10/2023 72,900 0.00%RPM International, Inc. 75,000 4.25% 15/1/2048 72,729 0.00%New Jersey Transportation Trust Fund Authority 70,000 6.10% 15/12/2028 72,726 0.00%State of Oregon 67,619 5.76% 1/6/2023 72,654 0.00%Pennsylvania Turnpike Commission 55,000 5.51% 1/12/2045 72,629 0.00%Regional Transportation District Sales Tax Revenue 50,000 5.84% 1/11/2050 72,522 0.00%Northern Natural Gas Co. 65,000 4.30% 15/1/2049 72,464 0.00%Baxter International, Inc. 75,000 3.50% 15/8/2046 72,453 0.00%Patterson-UTI Energy, Inc. 75,000 3.95% 1/2/2028 72,391 0.00%Central Puget Sound Regional Transit Authority 55,000 5.49% 1/11/2039 72,344 0.00%Wells Fargo Commercial Mortgage Trust 2017^ 69,000 3.67% 15/7/2050 72,342 0.00%General Motors Co. 70,000 5.00% 1/4/2035 72,158 0.00%County of Cook IL 55,000 6.23% 15/11/2034 71,983 0.00%PNC Financial Services Group, Inc. 70,000 3.30% 8/3/2022 71,901 0.00%Chicago O’Hare International Airport 50,000 6.40% 1/1/2040 71,890 0.00%Public Service Co. of Colorado 50,000 6.50% 1/8/2038 71,801 0.00%Chubb INA Holdings, Inc. 50,000 6.70% 15/5/2036 71,713 0.00%Sabal Trail Transmission LLC 65,000 4.68% 1/5/2038 71,709 0.00%ViacomCBS, Inc. 60,000 5.50% 15/5/2033 71,596 0.00%Xcel Energy, Inc. 70,000 3.50% 1/12/2049 71,239 0.00%Hyundai Capital America 70,000 3.50% 2/11/2026 70,923 0.00%Port Authority of New York & New Jersey 55,000 6.04% 1/12/2029 70,822 0.00%E*TRADE Financial Corp. 65,000 4.50% 20/6/2028 70,726 0.00%Teachers Insurance & Annuity Association of America 48,000 6.85% 16/12/2039 70,543 0.00%EQM Midstream Partners LP 75,000 6.50% 15/7/2048 70,502 0.00%Caterpillar, Inc. 70,000 2.60% 19/9/2029 70,480 0.00%CenterPoint Energy Houston Electric LLC 50,000 6.95% 15/3/2033 70,458 0.00%TD Ameritrade Holding Corp. 70,000 2.75% 1/10/2029 70,442 0.00%Walt Disney Co. 50,000 6.55% 15/3/2033 70,431 0.00%ONEOK, Inc. 70,000 2.75% 1/9/2024 70,363 0.00%JPMBB Commercial Mortgage Securities Trust 2015 66,000 3.80% 15/8/2048 70,355 0.00%EQM Midstream Partners LP 75,000 4.13% 1/12/2026 70,291 0.00%Dominion Energy Gas Holdings LLC 70,000 2.50% 15/11/2024 70,290 0.00%Western Union Co. 70,000 2.85% 10/1/2025 70,198 0.00%S&P Global, Inc. 70,000 2.50% 1/12/2029 70,137 0.00%Air Lease Corp. 70,000 2.25% 15/1/2023 69,979 0.00%Healthpeak Properties, Inc. 70,000 3.00% 15/1/2030 69,905 0.00%Mylan, Inc. 65,000 4.55% 15/4/2028 69,836 0.00%Boston Scientific Corp. 50,000 7.00% 15/11/2035 69,798 0.00%Ohio Edison Co. 50,000 6.88% 15/7/2036 69,763 0.00%Lubrizol Corp. 50,000 6.50% 1/10/2034 69,719 0.00%Macy’s Retail Holdings, Inc. 70,000 2.88% 15/2/2023 69,681 0.00%Boston Properties LP 70,000 2.90% 15/3/2030 69,673 0.00%NiSource, Inc. 70,000 2.95% 1/9/2029 69,628 0.00%Air Lease Corp. 70,000 3.25% 1/10/2029 69,600 0.00%Honda Auto Receivables 2017-4 Owner Trust 69,556 2.05% 22/11/2021 69,589 0.00%Target Corp. 47,000 6.50% 15/10/2037 69,548 0.00%Johnson Controls International plc 67,000 3.63% 2/7/2024 69,512 0.00%Boeing Co. 50,000 6.63% 15/2/2038 69,506 0.00%Archer-Daniels-Midland Co. 55,000 5.38% 15/9/2035 69,488 0.00%VF Corp. 50,000 6.45% 1/11/2037 69,476 0.00%Healthcare Trust of America Holdings LP 70,000 3.10% 15/2/2030 69,452 0.00%Enterprise Products Operating LLC 60,000 4.95% 15/10/2054 69,417 0.00%Dallas Convention Center Hotel Development Corp. 50,000 7.09% 1/1/2042 69,393 0.00%
Vanguard U.S. Investment Grade Credit Index Fund
918
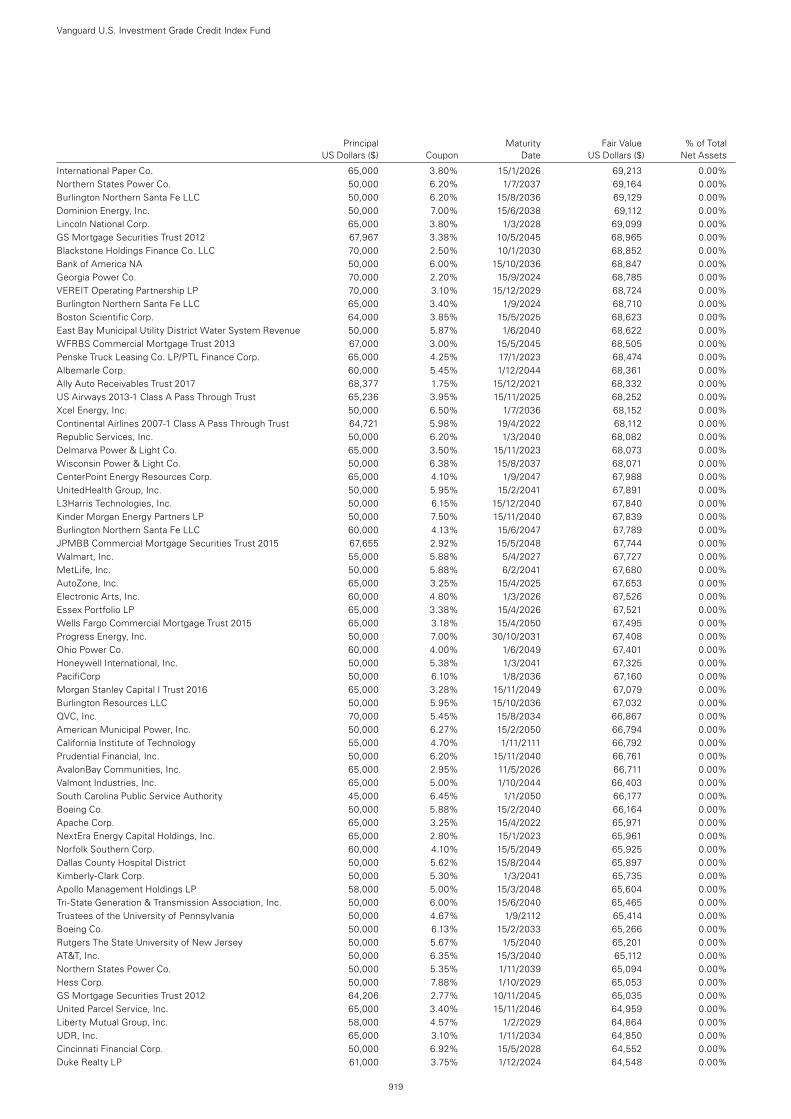
Principal Maturity Fair Value % of Total US Dollars ($) Coupon Date US Dollars ($) Net Assets
International Paper Co. 65,000 3.80% 15/1/2026 69,213 0.00%Northern States Power Co. 50,000 6.20% 1/7/2037 69,164 0.00%Burlington Northern Santa Fe LLC 50,000 6.20% 15/8/2036 69,129 0.00%Dominion Energy, Inc. 50,000 7.00% 15/6/2038 69,112 0.00%Lincoln National Corp. 65,000 3.80% 1/3/2028 69,099 0.00%GS Mortgage Securities Trust 2012 67,967 3.38% 10/5/2045 68,965 0.00%Blackstone Holdings Finance Co. LLC 70,000 2.50% 10/1/2030 68,852 0.00%Bank of America NA 50,000 6.00% 15/10/2036 68,847 0.00%Georgia Power Co. 70,000 2.20% 15/9/2024 68,785 0.00%VEREIT Operating Partnership LP 70,000 3.10% 15/12/2029 68,724 0.00%Burlington Northern Santa Fe LLC 65,000 3.40% 1/9/2024 68,710 0.00%Boston Scientific Corp. 64,000 3.85% 15/5/2025 68,623 0.00%East Bay Municipal Utility District Water System Revenue 50,000 5.87% 1/6/2040 68,622 0.00%WFRBS Commercial Mortgage Trust 2013 67,000 3.00% 15/5/2045 68,505 0.00%Penske Truck Leasing Co. LP/PTL Finance Corp. 65,000 4.25% 17/1/2023 68,474 0.00%Albemarle Corp. 60,000 5.45% 1/12/2044 68,361 0.00%Ally Auto Receivables Trust 2017 68,377 1.75% 15/12/2021 68,332 0.00%US Airways 2013-1 Class A Pass Through Trust 65,236 3.95% 15/11/2025 68,252 0.00%Xcel Energy, Inc. 50,000 6.50% 1/7/2036 68,152 0.00%Continental Airlines 2007-1 Class A Pass Through Trust 64,721 5.98% 19/4/2022 68,112 0.00%Republic Services, Inc. 50,000 6.20% 1/3/2040 68,082 0.00%Delmarva Power & Light Co. 65,000 3.50% 15/11/2023 68,073 0.00%Wisconsin Power & Light Co. 50,000 6.38% 15/8/2037 68,071 0.00%CenterPoint Energy Resources Corp. 65,000 4.10% 1/9/2047 67,988 0.00%UnitedHealth Group, Inc. 50,000 5.95% 15/2/2041 67,891 0.00%L3Harris Technologies, Inc. 50,000 6.15% 15/12/2040 67,840 0.00%Kinder Morgan Energy Partners LP 50,000 7.50% 15/11/2040 67,839 0.00%Burlington Northern Santa Fe LLC 60,000 4.13% 15/6/2047 67,789 0.00%JPMBB Commercial Mortgage Securities Trust 2015 67,655 2.92% 15/5/2048 67,744 0.00%Walmart, Inc. 55,000 5.88% 5/4/2027 67,727 0.00%MetLife, Inc. 50,000 5.88% 6/2/2041 67,680 0.00%AutoZone, Inc. 65,000 3.25% 15/4/2025 67,653 0.00%Electronic Arts, Inc. 60,000 4.80% 1/3/2026 67,526 0.00%Essex Portfolio LP 65,000 3.38% 15/4/2026 67,521 0.00%Wells Fargo Commercial Mortgage Trust 2015 65,000 3.18% 15/4/2050 67,495 0.00%Progress Energy, Inc. 50,000 7.00% 30/10/2031 67,408 0.00%Ohio Power Co. 60,000 4.00% 1/6/2049 67,401 0.00%Honeywell International, Inc. 50,000 5.38% 1/3/2041 67,325 0.00%PacifiCorp 50,000 6.10% 1/8/2036 67,160 0.00%Morgan Stanley Capital I Trust 2016 65,000 3.28% 15/11/2049 67,079 0.00%Burlington Resources LLC 50,000 5.95% 15/10/2036 67,032 0.00%QVC, Inc. 70,000 5.45% 15/8/2034 66,867 0.00%American Municipal Power, Inc. 50,000 6.27% 15/2/2050 66,794 0.00%California Institute of Technology 55,000 4.70% 1/11/2111 66,792 0.00%Prudential Financial, Inc. 50,000 6.20% 15/11/2040 66,761 0.00%AvalonBay Communities, Inc. 65,000 2.95% 11/5/2026 66,711 0.00%Valmont Industries, Inc. 65,000 5.00% 1/10/2044 66,403 0.00%South Carolina Public Service Authority 45,000 6.45% 1/1/2050 66,177 0.00%Boeing Co. 50,000 5.88% 15/2/2040 66,164 0.00%Apache Corp. 65,000 3.25% 15/4/2022 65,971 0.00%NextEra Energy Capital Holdings, Inc. 65,000 2.80% 15/1/2023 65,961 0.00%Norfolk Southern Corp. 60,000 4.10% 15/5/2049 65,925 0.00%Dallas County Hospital District 50,000 5.62% 15/8/2044 65,897 0.00%Kimberly-Clark Corp. 50,000 5.30% 1/3/2041 65,735 0.00%Apollo Management Holdings LP 58,000 5.00% 15/3/2048 65,604 0.00%Tri-State Generation & Transmission Association, Inc. 50,000 6.00% 15/6/2040 65,465 0.00%Trustees of the University of Pennsylvania 50,000 4.67% 1/9/2112 65,414 0.00%Boeing Co. 50,000 6.13% 15/2/2033 65,266 0.00%Rutgers The State University of New Jersey 50,000 5.67% 1/5/2040 65,201 0.00%AT&T, Inc. 50,000 6.35% 15/3/2040 65,112 0.00%Northern States Power Co. 50,000 5.35% 1/11/2039 65,094 0.00%Hess Corp. 50,000 7.88% 1/10/2029 65,053 0.00%GS Mortgage Securities Trust 2012 64,206 2.77% 10/11/2045 65,035 0.00%United Parcel Service, Inc. 65,000 3.40% 15/11/2046 64,959 0.00%Liberty Mutual Group, Inc. 58,000 4.57% 1/2/2029 64,864 0.00%UDR, Inc. 65,000 3.10% 1/11/2034 64,850 0.00%Cincinnati Financial Corp. 50,000 6.92% 15/5/2028 64,552 0.00%Duke Realty LP 61,000 3.75% 1/12/2024 64,548 0.00%
Vanguard U.S. Investment Grade Credit Index Fund
919
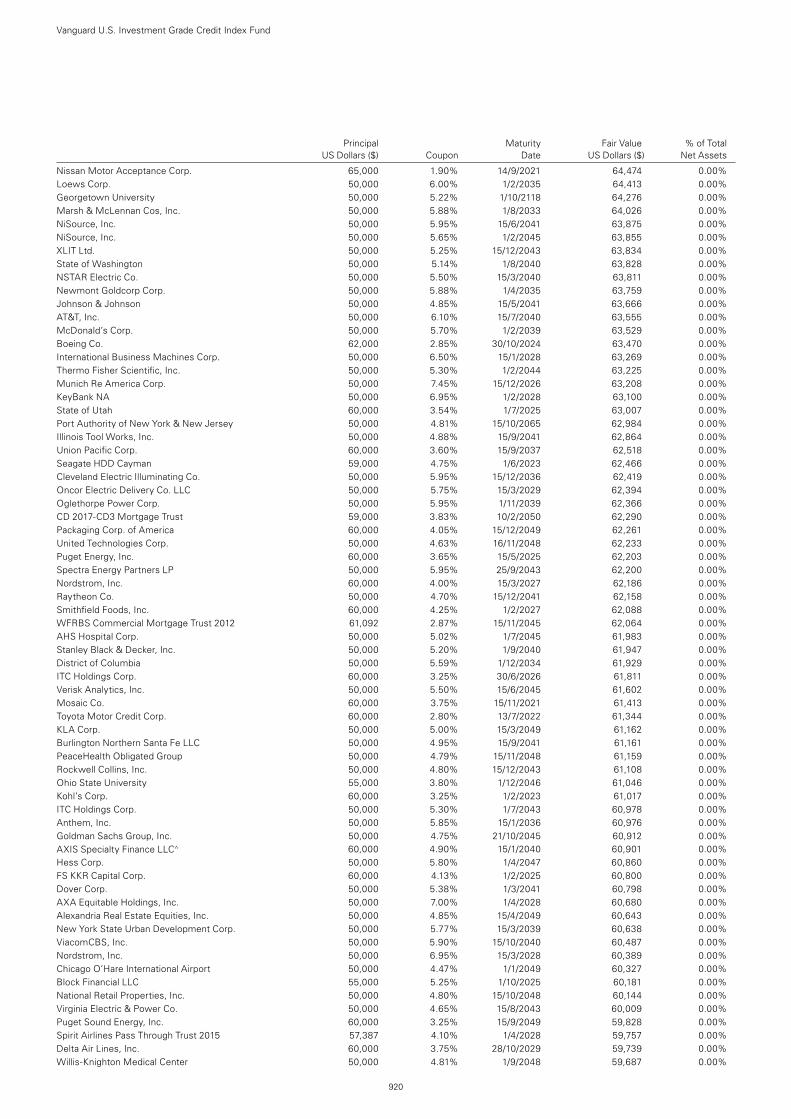
Principal Maturity Fair Value % of Total US Dollars ($) Coupon Date US Dollars ($) Net Assets
Nissan Motor Acceptance Corp. 65,000 1.90% 14/9/2021 64,474 0.00%Loews Corp. 50,000 6.00% 1/2/2035 64,413 0.00%Georgetown University 50,000 5.22% 1/10/2118 64,276 0.00%Marsh & McLennan Cos, Inc. 50,000 5.88% 1/8/2033 64,026 0.00%NiSource, Inc. 50,000 5.95% 15/6/2041 63,875 0.00%NiSource, Inc. 50,000 5.65% 1/2/2045 63,855 0.00%XLIT Ltd. 50,000 5.25% 15/12/2043 63,834 0.00%State of Washington 50,000 5.14% 1/8/2040 63,828 0.00%NSTAR Electric Co. 50,000 5.50% 15/3/2040 63,811 0.00%Newmont Goldcorp Corp. 50,000 5.88% 1/4/2035 63,759 0.00%Johnson & Johnson 50,000 4.85% 15/5/2041 63,666 0.00%AT&T, Inc. 50,000 6.10% 15/7/2040 63,555 0.00%McDonald’s Corp. 50,000 5.70% 1/2/2039 63,529 0.00%Boeing Co. 62,000 2.85% 30/10/2024 63,470 0.00%International Business Machines Corp. 50,000 6.50% 15/1/2028 63,269 0.00%Thermo Fisher Scientific, Inc. 50,000 5.30% 1/2/2044 63,225 0.00%Munich Re America Corp. 50,000 7.45% 15/12/2026 63,208 0.00%KeyBank NA 50,000 6.95% 1/2/2028 63,100 0.00%State of Utah 60,000 3.54% 1/7/2025 63,007 0.00%Port Authority of New York & New Jersey 50,000 4.81% 15/10/2065 62,984 0.00%Illinois Tool Works, Inc. 50,000 4.88% 15/9/2041 62,864 0.00%Union Pacific Corp. 60,000 3.60% 15/9/2037 62,518 0.00%Seagate HDD Cayman 59,000 4.75% 1/6/2023 62,466 0.00%Cleveland Electric Illuminating Co. 50,000 5.95% 15/12/2036 62,419 0.00%Oncor Electric Delivery Co. LLC 50,000 5.75% 15/3/2029 62,394 0.00%Oglethorpe Power Corp. 50,000 5.95% 1/11/2039 62,366 0.00%CD 2017-CD3 Mortgage Trust 59,000 3.83% 10/2/2050 62,290 0.00%Packaging Corp. of America 60,000 4.05% 15/12/2049 62,261 0.00%United Technologies Corp. 50,000 4.63% 16/11/2048 62,233 0.00%Puget Energy, Inc. 60,000 3.65% 15/5/2025 62,203 0.00%Spectra Energy Partners LP 50,000 5.95% 25/9/2043 62,200 0.00%Nordstrom, Inc. 60,000 4.00% 15/3/2027 62,186 0.00%Raytheon Co. 50,000 4.70% 15/12/2041 62,158 0.00%Smithfield Foods, Inc. 60,000 4.25% 1/2/2027 62,088 0.00%WFRBS Commercial Mortgage Trust 2012 61,092 2.87% 15/11/2045 62,064 0.00%AHS Hospital Corp. 50,000 5.02% 1/7/2045 61,983 0.00%Stanley Black & Decker, Inc. 50,000 5.20% 1/9/2040 61,947 0.00%District of Columbia 50,000 5.59% 1/12/2034 61,929 0.00%ITC Holdings Corp. 60,000 3.25% 30/6/2026 61,811 0.00%Verisk Analytics, Inc. 50,000 5.50% 15/6/2045 61,602 0.00%Mosaic Co. 60,000 3.75% 15/11/2021 61,413 0.00%Toyota Motor Credit Corp. 60,000 2.80% 13/7/2022 61,344 0.00%KLA Corp. 50,000 5.00% 15/3/2049 61,162 0.00%Burlington Northern Santa Fe LLC 50,000 4.95% 15/9/2041 61,161 0.00%PeaceHealth Obligated Group 50,000 4.79% 15/11/2048 61,159 0.00%Rockwell Collins, Inc. 50,000 4.80% 15/12/2043 61,108 0.00%Ohio State University 55,000 3.80% 1/12/2046 61,046 0.00%Kohl’s Corp. 60,000 3.25% 1/2/2023 61,017 0.00%ITC Holdings Corp. 50,000 5.30% 1/7/2043 60,978 0.00%Anthem, Inc. 50,000 5.85% 15/1/2036 60,976 0.00%Goldman Sachs Group, Inc. 50,000 4.75% 21/10/2045 60,912 0.00%AXIS Specialty Finance LLC^ 60,000 4.90% 15/1/2040 60,901 0.00%Hess Corp. 50,000 5.80% 1/4/2047 60,860 0.00%FS KKR Capital Corp. 60,000 4.13% 1/2/2025 60,800 0.00%Dover Corp. 50,000 5.38% 1/3/2041 60,798 0.00%AXA Equitable Holdings, Inc. 50,000 7.00% 1/4/2028 60,680 0.00%Alexandria Real Estate Equities, Inc. 50,000 4.85% 15/4/2049 60,643 0.00%New York State Urban Development Corp. 50,000 5.77% 15/3/2039 60,638 0.00%ViacomCBS, Inc. 50,000 5.90% 15/10/2040 60,487 0.00%Nordstrom, Inc. 50,000 6.95% 15/3/2028 60,389 0.00%Chicago O’Hare International Airport 50,000 4.47% 1/1/2049 60,327 0.00%Block Financial LLC 55,000 5.25% 1/10/2025 60,181 0.00%National Retail Properties, Inc. 50,000 4.80% 15/10/2048 60,144 0.00%Virginia Electric & Power Co. 50,000 4.65% 15/8/2043 60,009 0.00%Puget Sound Energy, Inc. 60,000 3.25% 15/9/2049 59,828 0.00%Spirit Airlines Pass Through Trust 2015 57,387 4.10% 1/4/2028 59,757 0.00%Delta Air Lines, Inc. 60,000 3.75% 28/10/2029 59,739 0.00%Willis-Knighton Medical Center 50,000 4.81% 1/9/2048 59,687 0.00%
Vanguard U.S. Investment Grade Credit Index Fund
920
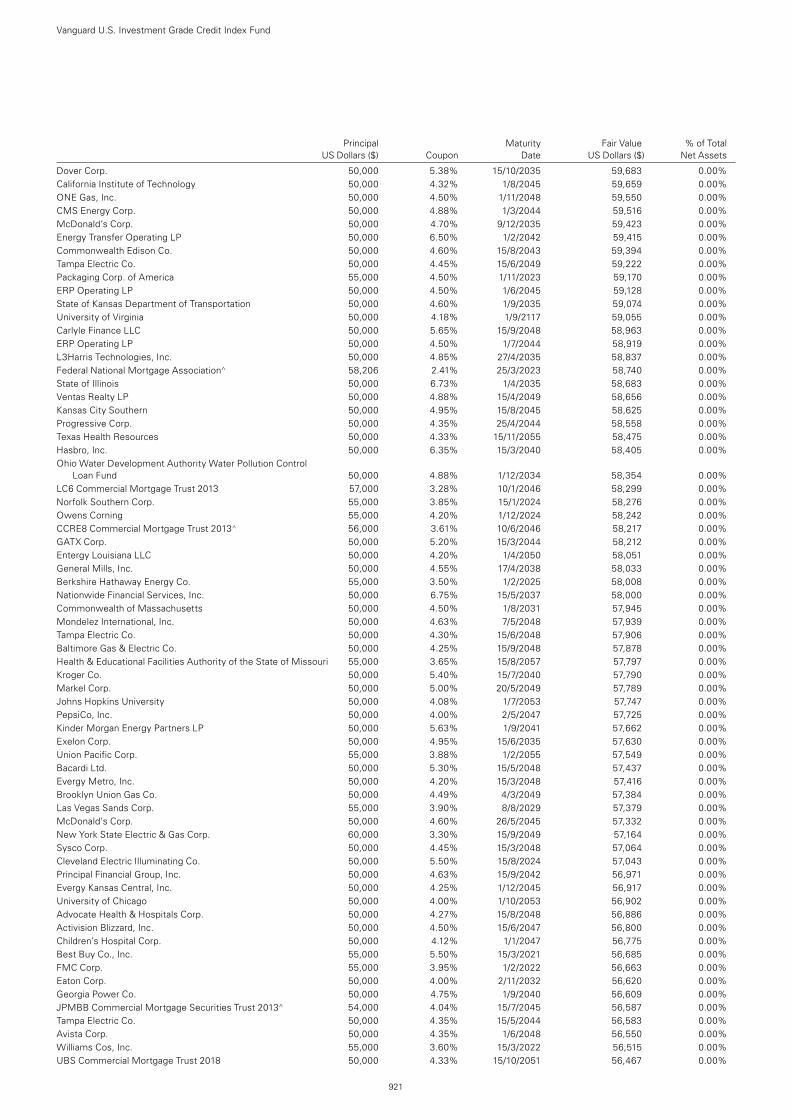
Principal Maturity Fair Value % of Total US Dollars ($) Coupon Date US Dollars ($) Net Assets
Dover Corp. 50,000 5.38% 15/10/2035 59,683 0.00%California Institute of Technology 50,000 4.32% 1/8/2045 59,659 0.00%ONE Gas, Inc. 50,000 4.50% 1/11/2048 59,550 0.00%CMS Energy Corp. 50,000 4.88% 1/3/2044 59,516 0.00%McDonald’s Corp. 50,000 4.70% 9/12/2035 59,423 0.00%Energy Transfer Operating LP 50,000 6.50% 1/2/2042 59,415 0.00%Commonwealth Edison Co. 50,000 4.60% 15/8/2043 59,394 0.00%Tampa Electric Co. 50,000 4.45% 15/6/2049 59,222 0.00%Packaging Corp. of America 55,000 4.50% 1/11/2023 59,170 0.00%ERP Operating LP 50,000 4.50% 1/6/2045 59,128 0.00%State of Kansas Department of Transportation 50,000 4.60% 1/9/2035 59,074 0.00%University of Virginia 50,000 4.18% 1/9/2117 59,055 0.00%Carlyle Finance LLC 50,000 5.65% 15/9/2048 58,963 0.00%ERP Operating LP 50,000 4.50% 1/7/2044 58,919 0.00%L3Harris Technologies, Inc. 50,000 4.85% 27/4/2035 58,837 0.00%Federal National Mortgage Association^ 58,206 2.41% 25/3/2023 58,740 0.00%State of Illinois 50,000 6.73% 1/4/2035 58,683 0.00%Ventas Realty LP 50,000 4.88% 15/4/2049 58,656 0.00%Kansas City Southern 50,000 4.95% 15/8/2045 58,625 0.00%Progressive Corp. 50,000 4.35% 25/4/2044 58,558 0.00%Texas Health Resources 50,000 4.33% 15/11/2055 58,475 0.00%Hasbro, Inc. 50,000 6.35% 15/3/2040 58,405 0.00%Ohio Water Development Authority Water Pollution Control
Loan Fund 50,000 4.88% 1/12/2034 58,354 0.00%LC6 Commercial Mortgage Trust 2013 57,000 3.28% 10/1/2046 58,299 0.00%Norfolk Southern Corp. 55,000 3.85% 15/1/2024 58,276 0.00%Owens Corning 55,000 4.20% 1/12/2024 58,242 0.00%CCRE8 Commercial Mortgage Trust 2013^ 56,000 3.61% 10/6/2046 58,217 0.00%GATX Corp. 50,000 5.20% 15/3/2044 58,212 0.00%Entergy Louisiana LLC 50,000 4.20% 1/4/2050 58,051 0.00%General Mills, Inc. 50,000 4.55% 17/4/2038 58,033 0.00%Berkshire Hathaway Energy Co. 55,000 3.50% 1/2/2025 58,008 0.00%Nationwide Financial Services, Inc. 50,000 6.75% 15/5/2037 58,000 0.00%Commonwealth of Massachusetts 50,000 4.50% 1/8/2031 57,945 0.00%Mondelez International, Inc. 50,000 4.63% 7/5/2048 57,939 0.00%Tampa Electric Co. 50,000 4.30% 15/6/2048 57,906 0.00%Baltimore Gas & Electric Co. 50,000 4.25% 15/9/2048 57,878 0.00%Health & Educational Facilities Authority of the State of Missouri 55,000 3.65% 15/8/2057 57,797 0.00%Kroger Co. 50,000 5.40% 15/7/2040 57,790 0.00%Markel Corp. 50,000 5.00% 20/5/2049 57,789 0.00%Johns Hopkins University 50,000 4.08% 1/7/2053 57,747 0.00%PepsiCo, Inc. 50,000 4.00% 2/5/2047 57,725 0.00%Kinder Morgan Energy Partners LP 50,000 5.63% 1/9/2041 57,662 0.00%Exelon Corp. 50,000 4.95% 15/6/2035 57,630 0.00%Union Pacific Corp. 55,000 3.88% 1/2/2055 57,549 0.00%Bacardi Ltd. 50,000 5.30% 15/5/2048 57,437 0.00%Evergy Metro, Inc. 50,000 4.20% 15/3/2048 57,416 0.00%Brooklyn Union Gas Co. 50,000 4.49% 4/3/2049 57,384 0.00%Las Vegas Sands Corp. 55,000 3.90% 8/8/2029 57,379 0.00%McDonald’s Corp. 50,000 4.60% 26/5/2045 57,332 0.00%New York State Electric & Gas Corp. 60,000 3.30% 15/9/2049 57,164 0.00%Sysco Corp. 50,000 4.45% 15/3/2048 57,064 0.00%Cleveland Electric Illuminating Co. 50,000 5.50% 15/8/2024 57,043 0.00%Principal Financial Group, Inc. 50,000 4.63% 15/9/2042 56,971 0.00%Evergy Kansas Central, Inc. 50,000 4.25% 1/12/2045 56,917 0.00%University of Chicago 50,000 4.00% 1/10/2053 56,902 0.00%Advocate Health & Hospitals Corp. 50,000 4.27% 15/8/2048 56,886 0.00%Activision Blizzard, Inc. 50,000 4.50% 15/6/2047 56,800 0.00%Children’s Hospital Corp. 50,000 4.12% 1/1/2047 56,775 0.00%Best Buy Co., Inc. 55,000 5.50% 15/3/2021 56,685 0.00%FMC Corp. 55,000 3.95% 1/2/2022 56,663 0.00%Eaton Corp. 50,000 4.00% 2/11/2032 56,620 0.00%Georgia Power Co. 50,000 4.75% 1/9/2040 56,609 0.00%JPMBB Commercial Mortgage Securities Trust 2013^ 54,000 4.04% 15/7/2045 56,587 0.00%Tampa Electric Co. 50,000 4.35% 15/5/2044 56,583 0.00%Avista Corp. 50,000 4.35% 1/6/2048 56,550 0.00%Williams Cos, Inc. 55,000 3.60% 15/3/2022 56,515 0.00%UBS Commercial Mortgage Trust 2018 50,000 4.33% 15/10/2051 56,467 0.00%
Vanguard U.S. Investment Grade Credit Index Fund
921
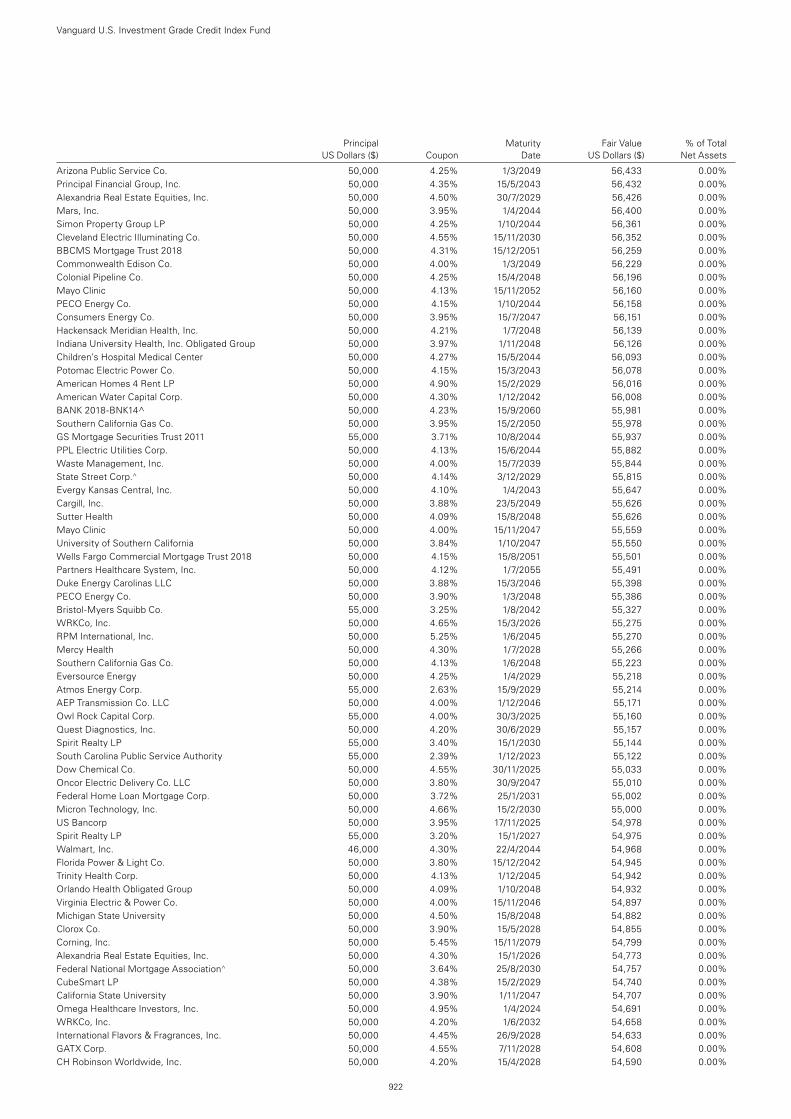
Principal Maturity Fair Value % of Total US Dollars ($) Coupon Date US Dollars ($) Net Assets
Arizona Public Service Co. 50,000 4.25% 1/3/2049 56,433 0.00%Principal Financial Group, Inc. 50,000 4.35% 15/5/2043 56,432 0.00%Alexandria Real Estate Equities, Inc. 50,000 4.50% 30/7/2029 56,426 0.00%Mars, Inc. 50,000 3.95% 1/4/2044 56,400 0.00%Simon Property Group LP 50,000 4.25% 1/10/2044 56,361 0.00%Cleveland Electric Illuminating Co. 50,000 4.55% 15/11/2030 56,352 0.00%BBCMS Mortgage Trust 2018 50,000 4.31% 15/12/2051 56,259 0.00%Commonwealth Edison Co. 50,000 4.00% 1/3/2049 56,229 0.00%Colonial Pipeline Co. 50,000 4.25% 15/4/2048 56,196 0.00%Mayo Clinic 50,000 4.13% 15/11/2052 56,160 0.00%PECO Energy Co. 50,000 4.15% 1/10/2044 56,158 0.00%Consumers Energy Co. 50,000 3.95% 15/7/2047 56,151 0.00%Hackensack Meridian Health, Inc. 50,000 4.21% 1/7/2048 56,139 0.00%Indiana University Health, Inc. Obligated Group 50,000 3.97% 1/11/2048 56,126 0.00%Children’s Hospital Medical Center 50,000 4.27% 15/5/2044 56,093 0.00%Potomac Electric Power Co. 50,000 4.15% 15/3/2043 56,078 0.00%American Homes 4 Rent LP 50,000 4.90% 15/2/2029 56,016 0.00%American Water Capital Corp. 50,000 4.30% 1/12/2042 56,008 0.00%BANK 2018-BNK14^ 50,000 4.23% 15/9/2060 55,981 0.00%Southern California Gas Co. 50,000 3.95% 15/2/2050 55,978 0.00%GS Mortgage Securities Trust 2011 55,000 3.71% 10/8/2044 55,937 0.00%PPL Electric Utilities Corp. 50,000 4.13% 15/6/2044 55,882 0.00%Waste Management, Inc. 50,000 4.00% 15/7/2039 55,844 0.00%State Street Corp.^ 50,000 4.14% 3/12/2029 55,815 0.00%Evergy Kansas Central, Inc. 50,000 4.10% 1/4/2043 55,647 0.00%Cargill, Inc. 50,000 3.88% 23/5/2049 55,626 0.00%Sutter Health 50,000 4.09% 15/8/2048 55,626 0.00%Mayo Clinic 50,000 4.00% 15/11/2047 55,559 0.00%University of Southern California 50,000 3.84% 1/10/2047 55,550 0.00%Wells Fargo Commercial Mortgage Trust 2018 50,000 4.15% 15/8/2051 55,501 0.00%Partners Healthcare System, Inc. 50,000 4.12% 1/7/2055 55,491 0.00%Duke Energy Carolinas LLC 50,000 3.88% 15/3/2046 55,398 0.00%PECO Energy Co. 50,000 3.90% 1/3/2048 55,386 0.00%Bristol-Myers Squibb Co. 55,000 3.25% 1/8/2042 55,327 0.00%WRKCo, Inc. 50,000 4.65% 15/3/2026 55,275 0.00%RPM International, Inc. 50,000 5.25% 1/6/2045 55,270 0.00%Mercy Health 50,000 4.30% 1/7/2028 55,266 0.00%Southern California Gas Co. 50,000 4.13% 1/6/2048 55,223 0.00%Eversource Energy 50,000 4.25% 1/4/2029 55,218 0.00%Atmos Energy Corp. 55,000 2.63% 15/9/2029 55,214 0.00%AEP Transmission Co. LLC 50,000 4.00% 1/12/2046 55,171 0.00%Owl Rock Capital Corp. 55,000 4.00% 30/3/2025 55,160 0.00%Quest Diagnostics, Inc. 50,000 4.20% 30/6/2029 55,157 0.00%Spirit Realty LP 55,000 3.40% 15/1/2030 55,144 0.00%South Carolina Public Service Authority 55,000 2.39% 1/12/2023 55,122 0.00%Dow Chemical Co. 50,000 4.55% 30/11/2025 55,033 0.00%Oncor Electric Delivery Co. LLC 50,000 3.80% 30/9/2047 55,010 0.00%Federal Home Loan Mortgage Corp. 50,000 3.72% 25/1/2031 55,002 0.00%Micron Technology, Inc. 50,000 4.66% 15/2/2030 55,000 0.00%US Bancorp 50,000 3.95% 17/11/2025 54,978 0.00%Spirit Realty LP 55,000 3.20% 15/1/2027 54,975 0.00%Walmart, Inc. 46,000 4.30% 22/4/2044 54,968 0.00%Florida Power & Light Co. 50,000 3.80% 15/12/2042 54,945 0.00%Trinity Health Corp. 50,000 4.13% 1/12/2045 54,942 0.00%Orlando Health Obligated Group 50,000 4.09% 1/10/2048 54,932 0.00%Virginia Electric & Power Co. 50,000 4.00% 15/11/2046 54,897 0.00%Michigan State University 50,000 4.50% 15/8/2048 54,882 0.00%Clorox Co. 50,000 3.90% 15/5/2028 54,855 0.00%Corning, Inc. 50,000 5.45% 15/11/2079 54,799 0.00%Alexandria Real Estate Equities, Inc. 50,000 4.30% 15/1/2026 54,773 0.00%Federal National Mortgage Association^ 50,000 3.64% 25/8/2030 54,757 0.00%CubeSmart LP 50,000 4.38% 15/2/2029 54,740 0.00%California State University 50,000 3.90% 1/11/2047 54,707 0.00%Omega Healthcare Investors, Inc. 50,000 4.95% 1/4/2024 54,691 0.00%WRKCo, Inc. 50,000 4.20% 1/6/2032 54,658 0.00%International Flavors & Fragrances, Inc. 50,000 4.45% 26/9/2028 54,633 0.00%GATX Corp. 50,000 4.55% 7/11/2028 54,608 0.00%CH Robinson Worldwide, Inc. 50,000 4.20% 15/4/2028 54,590 0.00%
Vanguard U.S. Investment Grade Credit Index Fund
922
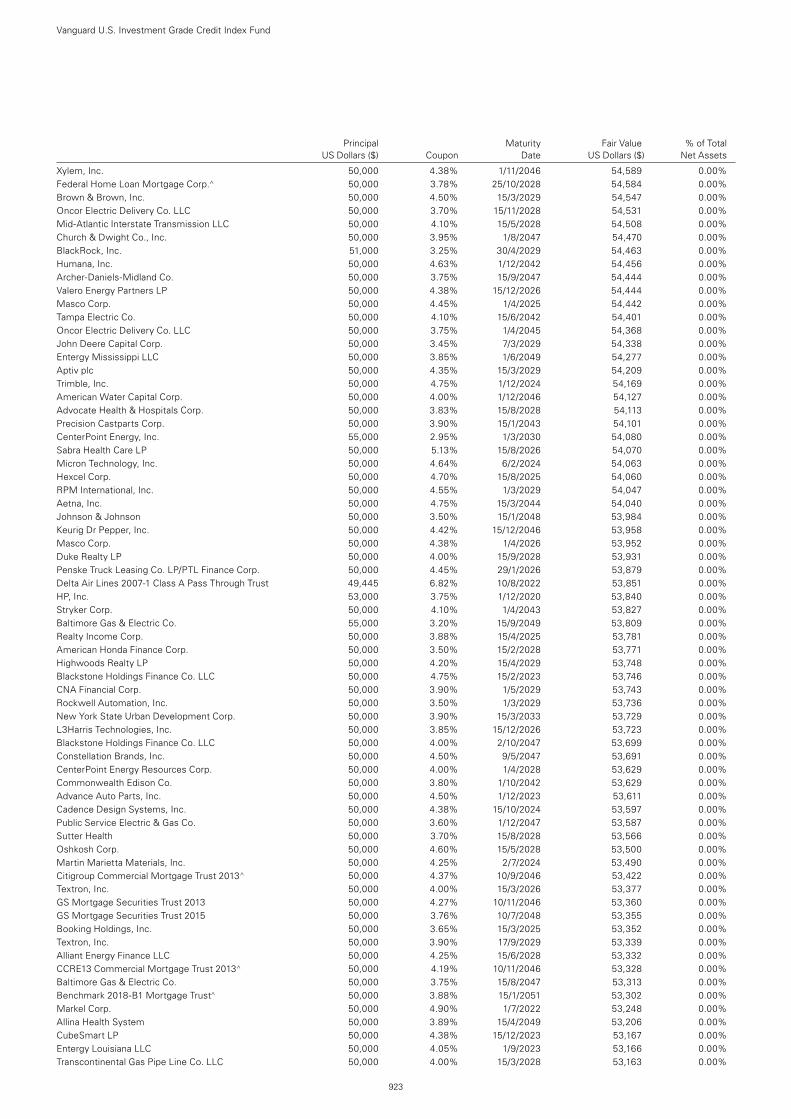
Principal Maturity Fair Value % of Total US Dollars ($) Coupon Date US Dollars ($) Net Assets
Xylem, Inc. 50,000 4.38% 1/11/2046 54,589 0.00%Federal Home Loan Mortgage Corp.^ 50,000 3.78% 25/10/2028 54,584 0.00%Brown & Brown, Inc. 50,000 4.50% 15/3/2029 54,547 0.00%Oncor Electric Delivery Co. LLC 50,000 3.70% 15/11/2028 54,531 0.00%Mid-Atlantic Interstate Transmission LLC 50,000 4.10% 15/5/2028 54,508 0.00%Church & Dwight Co., Inc. 50,000 3.95% 1/8/2047 54,470 0.00%BlackRock, Inc. 51,000 3.25% 30/4/2029 54,463 0.00%Humana, Inc. 50,000 4.63% 1/12/2042 54,456 0.00%Archer-Daniels-Midland Co. 50,000 3.75% 15/9/2047 54,444 0.00%Valero Energy Partners LP 50,000 4.38% 15/12/2026 54,444 0.00%Masco Corp. 50,000 4.45% 1/4/2025 54,442 0.00%Tampa Electric Co. 50,000 4.10% 15/6/2042 54,401 0.00%Oncor Electric Delivery Co. LLC 50,000 3.75% 1/4/2045 54,368 0.00%John Deere Capital Corp. 50,000 3.45% 7/3/2029 54,338 0.00%Entergy Mississippi LLC 50,000 3.85% 1/6/2049 54,277 0.00%Aptiv plc 50,000 4.35% 15/3/2029 54,209 0.00%Trimble, Inc. 50,000 4.75% 1/12/2024 54,169 0.00%American Water Capital Corp. 50,000 4.00% 1/12/2046 54,127 0.00%Advocate Health & Hospitals Corp. 50,000 3.83% 15/8/2028 54,113 0.00%Precision Castparts Corp. 50,000 3.90% 15/1/2043 54,101 0.00%CenterPoint Energy, Inc. 55,000 2.95% 1/3/2030 54,080 0.00%Sabra Health Care LP 50,000 5.13% 15/8/2026 54,070 0.00%Micron Technology, Inc. 50,000 4.64% 6/2/2024 54,063 0.00%Hexcel Corp. 50,000 4.70% 15/8/2025 54,060 0.00%RPM International, Inc. 50,000 4.55% 1/3/2029 54,047 0.00%Aetna, Inc. 50,000 4.75% 15/3/2044 54,040 0.00%Johnson & Johnson 50,000 3.50% 15/1/2048 53,984 0.00%Keurig Dr Pepper, Inc. 50,000 4.42% 15/12/2046 53,958 0.00%Masco Corp. 50,000 4.38% 1/4/2026 53,952 0.00%Duke Realty LP 50,000 4.00% 15/9/2028 53,931 0.00%Penske Truck Leasing Co. LP/PTL Finance Corp. 50,000 4.45% 29/1/2026 53,879 0.00%Delta Air Lines 2007-1 Class A Pass Through Trust 49,445 6.82% 10/8/2022 53,851 0.00%HP, Inc. 53,000 3.75% 1/12/2020 53,840 0.00%Stryker Corp. 50,000 4.10% 1/4/2043 53,827 0.00%Baltimore Gas & Electric Co. 55,000 3.20% 15/9/2049 53,809 0.00%Realty Income Corp. 50,000 3.88% 15/4/2025 53,781 0.00%American Honda Finance Corp. 50,000 3.50% 15/2/2028 53,771 0.00%Highwoods Realty LP 50,000 4.20% 15/4/2029 53,748 0.00%Blackstone Holdings Finance Co. LLC 50,000 4.75% 15/2/2023 53,746 0.00%CNA Financial Corp. 50,000 3.90% 1/5/2029 53,743 0.00%Rockwell Automation, Inc. 50,000 3.50% 1/3/2029 53,736 0.00%New York State Urban Development Corp. 50,000 3.90% 15/3/2033 53,729 0.00%L3Harris Technologies, Inc. 50,000 3.85% 15/12/2026 53,723 0.00%Blackstone Holdings Finance Co. LLC 50,000 4.00% 2/10/2047 53,699 0.00%Constellation Brands, Inc. 50,000 4.50% 9/5/2047 53,691 0.00%CenterPoint Energy Resources Corp. 50,000 4.00% 1/4/2028 53,629 0.00%Commonwealth Edison Co. 50,000 3.80% 1/10/2042 53,629 0.00%Advance Auto Parts, Inc. 50,000 4.50% 1/12/2023 53,611 0.00%Cadence Design Systems, Inc. 50,000 4.38% 15/10/2024 53,597 0.00%Public Service Electric & Gas Co. 50,000 3.60% 1/12/2047 53,587 0.00%Sutter Health 50,000 3.70% 15/8/2028 53,566 0.00%Oshkosh Corp. 50,000 4.60% 15/5/2028 53,500 0.00%Martin Marietta Materials, Inc. 50,000 4.25% 2/7/2024 53,490 0.00%Citigroup Commercial Mortgage Trust 2013^ 50,000 4.37% 10/9/2046 53,422 0.00%Textron, Inc. 50,000 4.00% 15/3/2026 53,377 0.00%GS Mortgage Securities Trust 2013 50,000 4.27% 10/11/2046 53,360 0.00%GS Mortgage Securities Trust 2015 50,000 3.76% 10/7/2048 53,355 0.00%Booking Holdings, Inc. 50,000 3.65% 15/3/2025 53,352 0.00%Textron, Inc. 50,000 3.90% 17/9/2029 53,339 0.00%Alliant Energy Finance LLC 50,000 4.25% 15/6/2028 53,332 0.00%CCRE13 Commercial Mortgage Trust 2013^ 50,000 4.19% 10/11/2046 53,328 0.00%Baltimore Gas & Electric Co. 50,000 3.75% 15/8/2047 53,313 0.00%Benchmark 2018-B1 Mortgage Trust^ 50,000 3.88% 15/1/2051 53,302 0.00%Markel Corp. 50,000 4.90% 1/7/2022 53,248 0.00%Allina Health System 50,000 3.89% 15/4/2049 53,206 0.00%CubeSmart LP 50,000 4.38% 15/12/2023 53,167 0.00%Entergy Louisiana LLC 50,000 4.05% 1/9/2023 53,166 0.00%Transcontinental Gas Pipe Line Co. LLC 50,000 4.00% 15/3/2028 53,163 0.00%
Vanguard U.S. Investment Grade Credit Index Fund
923
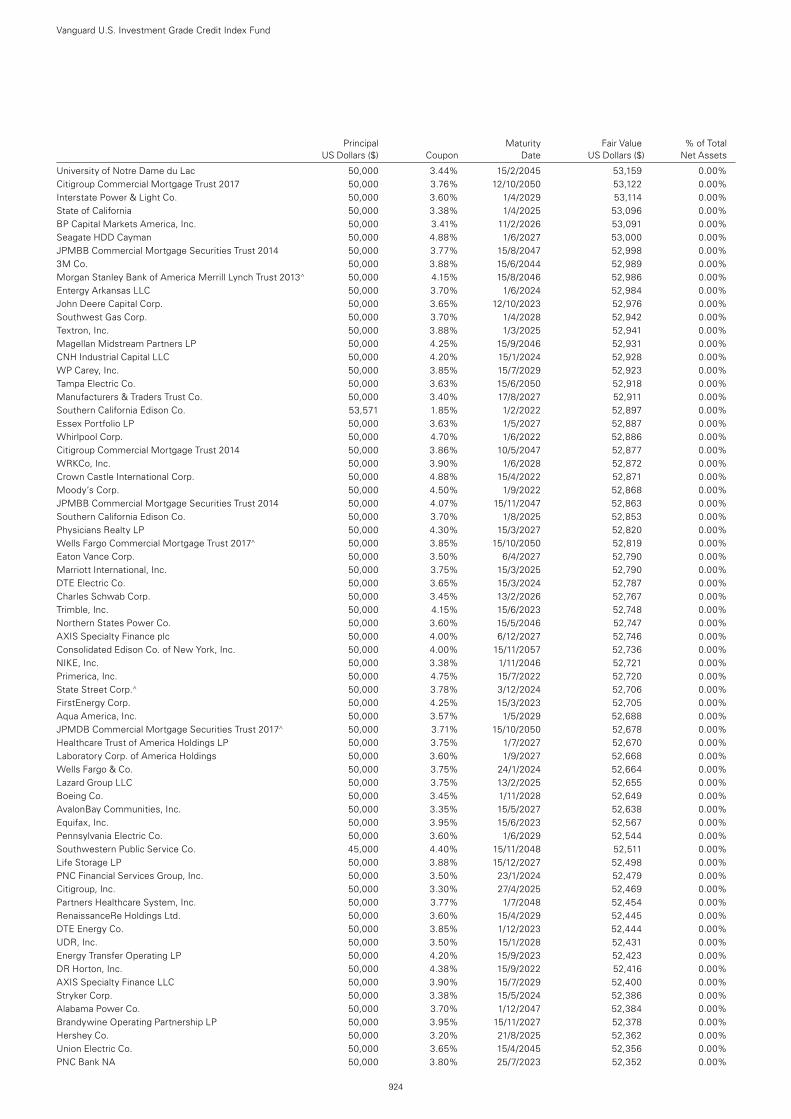
Principal Maturity Fair Value % of Total US Dollars ($) Coupon Date US Dollars ($) Net Assets
University of Notre Dame du Lac 50,000 3.44% 15/2/2045 53,159 0.00%Citigroup Commercial Mortgage Trust 2017 50,000 3.76% 12/10/2050 53,122 0.00%Interstate Power & Light Co. 50,000 3.60% 1/4/2029 53,114 0.00%State of California 50,000 3.38% 1/4/2025 53,096 0.00%BP Capital Markets America, Inc. 50,000 3.41% 11/2/2026 53,091 0.00%Seagate HDD Cayman 50,000 4.88% 1/6/2027 53,000 0.00%JPMBB Commercial Mortgage Securities Trust 2014 50,000 3.77% 15/8/2047 52,998 0.00%3M Co. 50,000 3.88% 15/6/2044 52,989 0.00%Morgan Stanley Bank of America Merrill Lynch Trust 2013^ 50,000 4.15% 15/8/2046 52,986 0.00%Entergy Arkansas LLC 50,000 3.70% 1/6/2024 52,984 0.00%John Deere Capital Corp. 50,000 3.65% 12/10/2023 52,976 0.00%Southwest Gas Corp. 50,000 3.70% 1/4/2028 52,942 0.00%Textron, Inc. 50,000 3.88% 1/3/2025 52,941 0.00%Magellan Midstream Partners LP 50,000 4.25% 15/9/2046 52,931 0.00%CNH Industrial Capital LLC 50,000 4.20% 15/1/2024 52,928 0.00%WP Carey, Inc. 50,000 3.85% 15/7/2029 52,923 0.00%Tampa Electric Co. 50,000 3.63% 15/6/2050 52,918 0.00%Manufacturers & Traders Trust Co. 50,000 3.40% 17/8/2027 52,911 0.00%Southern California Edison Co. 53,571 1.85% 1/2/2022 52,897 0.00%Essex Portfolio LP 50,000 3.63% 1/5/2027 52,887 0.00%Whirlpool Corp. 50,000 4.70% 1/6/2022 52,886 0.00%Citigroup Commercial Mortgage Trust 2014 50,000 3.86% 10/5/2047 52,877 0.00%WRKCo, Inc. 50,000 3.90% 1/6/2028 52,872 0.00%Crown Castle International Corp. 50,000 4.88% 15/4/2022 52,871 0.00%Moody’s Corp. 50,000 4.50% 1/9/2022 52,868 0.00%JPMBB Commercial Mortgage Securities Trust 2014 50,000 4.07% 15/11/2047 52,863 0.00%Southern California Edison Co. 50,000 3.70% 1/8/2025 52,853 0.00%Physicians Realty LP 50,000 4.30% 15/3/2027 52,820 0.00%Wells Fargo Commercial Mortgage Trust 2017^ 50,000 3.85% 15/10/2050 52,819 0.00%Eaton Vance Corp. 50,000 3.50% 6/4/2027 52,790 0.00%Marriott International, Inc. 50,000 3.75% 15/3/2025 52,790 0.00%DTE Electric Co. 50,000 3.65% 15/3/2024 52,787 0.00%Charles Schwab Corp. 50,000 3.45% 13/2/2026 52,767 0.00%Trimble, Inc. 50,000 4.15% 15/6/2023 52,748 0.00%Northern States Power Co. 50,000 3.60% 15/5/2046 52,747 0.00%AXIS Specialty Finance plc 50,000 4.00% 6/12/2027 52,746 0.00%Consolidated Edison Co. of New York, Inc. 50,000 4.00% 15/11/2057 52,736 0.00%NIKE, Inc. 50,000 3.38% 1/11/2046 52,721 0.00%Primerica, Inc. 50,000 4.75% 15/7/2022 52,720 0.00%State Street Corp.^ 50,000 3.78% 3/12/2024 52,706 0.00%FirstEnergy Corp. 50,000 4.25% 15/3/2023 52,705 0.00%Aqua America, Inc. 50,000 3.57% 1/5/2029 52,688 0.00%JPMDB Commercial Mortgage Securities Trust 2017^ 50,000 3.71% 15/10/2050 52,678 0.00%Healthcare Trust of America Holdings LP 50,000 3.75% 1/7/2027 52,670 0.00%Laboratory Corp. of America Holdings 50,000 3.60% 1/9/2027 52,668 0.00%Wells Fargo & Co. 50,000 3.75% 24/1/2024 52,664 0.00%Lazard Group LLC 50,000 3.75% 13/2/2025 52,655 0.00%Boeing Co. 50,000 3.45% 1/11/2028 52,649 0.00%AvalonBay Communities, Inc. 50,000 3.35% 15/5/2027 52,638 0.00%Equifax, Inc. 50,000 3.95% 15/6/2023 52,567 0.00%Pennsylvania Electric Co. 50,000 3.60% 1/6/2029 52,544 0.00%Southwestern Public Service Co. 45,000 4.40% 15/11/2048 52,511 0.00%Life Storage LP 50,000 3.88% 15/12/2027 52,498 0.00%PNC Financial Services Group, Inc. 50,000 3.50% 23/1/2024 52,479 0.00%Citigroup, Inc. 50,000 3.30% 27/4/2025 52,469 0.00%Partners Healthcare System, Inc. 50,000 3.77% 1/7/2048 52,454 0.00%RenaissanceRe Holdings Ltd. 50,000 3.60% 15/4/2029 52,445 0.00%DTE Energy Co. 50,000 3.85% 1/12/2023 52,444 0.00%UDR, Inc. 50,000 3.50% 15/1/2028 52,431 0.00%Energy Transfer Operating LP 50,000 4.20% 15/9/2023 52,423 0.00%DR Horton, Inc. 50,000 4.38% 15/9/2022 52,416 0.00%AXIS Specialty Finance LLC 50,000 3.90% 15/7/2029 52,400 0.00%Stryker Corp. 50,000 3.38% 15/5/2024 52,386 0.00%Alabama Power Co. 50,000 3.70% 1/12/2047 52,384 0.00%Brandywine Operating Partnership LP 50,000 3.95% 15/11/2027 52,378 0.00%Hershey Co. 50,000 3.20% 21/8/2025 52,362 0.00%Union Electric Co. 50,000 3.65% 15/4/2045 52,356 0.00%PNC Bank NA 50,000 3.80% 25/7/2023 52,352 0.00%
Vanguard U.S. Investment Grade Credit Index Fund
924
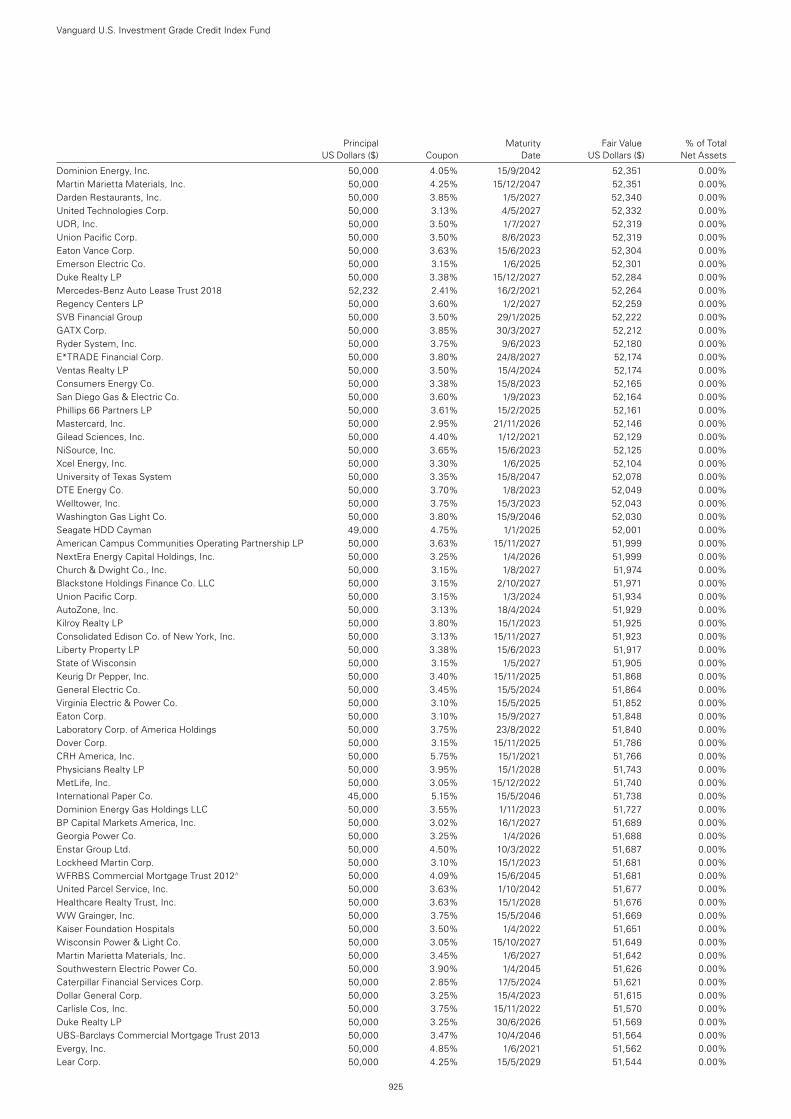
Principal Maturity Fair Value % of Total US Dollars ($) Coupon Date US Dollars ($) Net Assets
Dominion Energy, Inc. 50,000 4.05% 15/9/2042 52,351 0.00%Martin Marietta Materials, Inc. 50,000 4.25% 15/12/2047 52,351 0.00%Darden Restaurants, Inc. 50,000 3.85% 1/5/2027 52,340 0.00%United Technologies Corp. 50,000 3.13% 4/5/2027 52,332 0.00%UDR, Inc. 50,000 3.50% 1/7/2027 52,319 0.00%Union Pacific Corp. 50,000 3.50% 8/6/2023 52,319 0.00%Eaton Vance Corp. 50,000 3.63% 15/6/2023 52,304 0.00%Emerson Electric Co. 50,000 3.15% 1/6/2025 52,301 0.00%Duke Realty LP 50,000 3.38% 15/12/2027 52,284 0.00%Mercedes-Benz Auto Lease Trust 2018 52,232 2.41% 16/2/2021 52,264 0.00%Regency Centers LP 50,000 3.60% 1/2/2027 52,259 0.00%SVB Financial Group 50,000 3.50% 29/1/2025 52,222 0.00%GATX Corp. 50,000 3.85% 30/3/2027 52,212 0.00%Ryder System, Inc. 50,000 3.75% 9/6/2023 52,180 0.00%E*TRADE Financial Corp. 50,000 3.80% 24/8/2027 52,174 0.00%Ventas Realty LP 50,000 3.50% 15/4/2024 52,174 0.00%Consumers Energy Co. 50,000 3.38% 15/8/2023 52,165 0.00%San Diego Gas & Electric Co. 50,000 3.60% 1/9/2023 52,164 0.00%Phillips 66 Partners LP 50,000 3.61% 15/2/2025 52,161 0.00%Mastercard, Inc. 50,000 2.95% 21/11/2026 52,146 0.00%Gilead Sciences, Inc. 50,000 4.40% 1/12/2021 52,129 0.00%NiSource, Inc. 50,000 3.65% 15/6/2023 52,125 0.00%Xcel Energy, Inc. 50,000 3.30% 1/6/2025 52,104 0.00%University of Texas System 50,000 3.35% 15/8/2047 52,078 0.00%DTE Energy Co. 50,000 3.70% 1/8/2023 52,049 0.00%Welltower, Inc. 50,000 3.75% 15/3/2023 52,043 0.00%Washington Gas Light Co. 50,000 3.80% 15/9/2046 52,030 0.00%Seagate HDD Cayman 49,000 4.75% 1/1/2025 52,001 0.00%American Campus Communities Operating Partnership LP 50,000 3.63% 15/11/2027 51,999 0.00%NextEra Energy Capital Holdings, Inc. 50,000 3.25% 1/4/2026 51,999 0.00%Church & Dwight Co., Inc. 50,000 3.15% 1/8/2027 51,974 0.00%Blackstone Holdings Finance Co. LLC 50,000 3.15% 2/10/2027 51,971 0.00%Union Pacific Corp. 50,000 3.15% 1/3/2024 51,934 0.00%AutoZone, Inc. 50,000 3.13% 18/4/2024 51,929 0.00%Kilroy Realty LP 50,000 3.80% 15/1/2023 51,925 0.00%Consolidated Edison Co. of New York, Inc. 50,000 3.13% 15/11/2027 51,923 0.00%Liberty Property LP 50,000 3.38% 15/6/2023 51,917 0.00%State of Wisconsin 50,000 3.15% 1/5/2027 51,905 0.00%Keurig Dr Pepper, Inc. 50,000 3.40% 15/11/2025 51,868 0.00%General Electric Co. 50,000 3.45% 15/5/2024 51,864 0.00%Virginia Electric & Power Co. 50,000 3.10% 15/5/2025 51,852 0.00%Eaton Corp. 50,000 3.10% 15/9/2027 51,848 0.00%Laboratory Corp. of America Holdings 50,000 3.75% 23/8/2022 51,840 0.00%Dover Corp. 50,000 3.15% 15/11/2025 51,786 0.00%CRH America, Inc. 50,000 5.75% 15/1/2021 51,766 0.00%Physicians Realty LP 50,000 3.95% 15/1/2028 51,743 0.00%MetLife, Inc. 50,000 3.05% 15/12/2022 51,740 0.00%International Paper Co. 45,000 5.15% 15/5/2046 51,738 0.00%Dominion Energy Gas Holdings LLC 50,000 3.55% 1/11/2023 51,727 0.00%BP Capital Markets America, Inc. 50,000 3.02% 16/1/2027 51,689 0.00%Georgia Power Co. 50,000 3.25% 1/4/2026 51,688 0.00%Enstar Group Ltd. 50,000 4.50% 10/3/2022 51,687 0.00%Lockheed Martin Corp. 50,000 3.10% 15/1/2023 51,681 0.00%WFRBS Commercial Mortgage Trust 2012^ 50,000 4.09% 15/6/2045 51,681 0.00%United Parcel Service, Inc. 50,000 3.63% 1/10/2042 51,677 0.00%Healthcare Realty Trust, Inc. 50,000 3.63% 15/1/2028 51,676 0.00%WW Grainger, Inc. 50,000 3.75% 15/5/2046 51,669 0.00%Kaiser Foundation Hospitals 50,000 3.50% 1/4/2022 51,651 0.00%Wisconsin Power & Light Co. 50,000 3.05% 15/10/2027 51,649 0.00%Martin Marietta Materials, Inc. 50,000 3.45% 1/6/2027 51,642 0.00%Southwestern Electric Power Co. 50,000 3.90% 1/4/2045 51,626 0.00%Caterpillar Financial Services Corp. 50,000 2.85% 17/5/2024 51,621 0.00%Dollar General Corp. 50,000 3.25% 15/4/2023 51,615 0.00%Carlisle Cos, Inc. 50,000 3.75% 15/11/2022 51,570 0.00%Duke Realty LP 50,000 3.25% 30/6/2026 51,569 0.00%UBS-Barclays Commercial Mortgage Trust 2013 50,000 3.47% 10/4/2046 51,564 0.00%Evergy, Inc. 50,000 4.85% 1/6/2021 51,562 0.00%Lear Corp. 50,000 4.25% 15/5/2029 51,544 0.00%
Vanguard U.S. Investment Grade Credit Index Fund
925
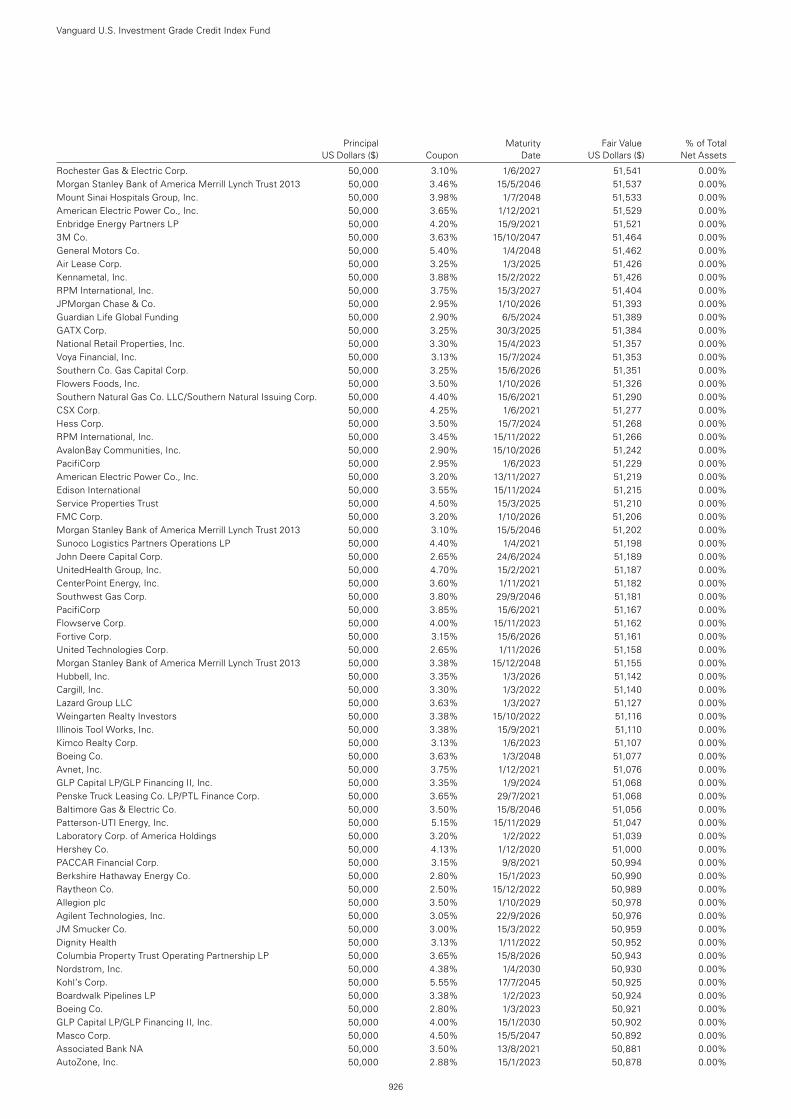
Principal Maturity Fair Value % of Total US Dollars ($) Coupon Date US Dollars ($) Net Assets
Rochester Gas & Electric Corp. 50,000 3.10% 1/6/2027 51,541 0.00%Morgan Stanley Bank of America Merrill Lynch Trust 2013 50,000 3.46% 15/5/2046 51,537 0.00%Mount Sinai Hospitals Group, Inc. 50,000 3.98% 1/7/2048 51,533 0.00%American Electric Power Co., Inc. 50,000 3.65% 1/12/2021 51,529 0.00%Enbridge Energy Partners LP 50,000 4.20% 15/9/2021 51,521 0.00%3M Co. 50,000 3.63% 15/10/2047 51,464 0.00%General Motors Co. 50,000 5.40% 1/4/2048 51,462 0.00%Air Lease Corp. 50,000 3.25% 1/3/2025 51,426 0.00%Kennametal, Inc. 50,000 3.88% 15/2/2022 51,426 0.00%RPM International, Inc. 50,000 3.75% 15/3/2027 51,404 0.00%JPMorgan Chase & Co. 50,000 2.95% 1/10/2026 51,393 0.00%Guardian Life Global Funding 50,000 2.90% 6/5/2024 51,389 0.00%GATX Corp. 50,000 3.25% 30/3/2025 51,384 0.00%National Retail Properties, Inc. 50,000 3.30% 15/4/2023 51,357 0.00%Voya Financial, Inc. 50,000 3.13% 15/7/2024 51,353 0.00%Southern Co. Gas Capital Corp. 50,000 3.25% 15/6/2026 51,351 0.00%Flowers Foods, Inc. 50,000 3.50% 1/10/2026 51,326 0.00%Southern Natural Gas Co. LLC/Southern Natural Issuing Corp. 50,000 4.40% 15/6/2021 51,290 0.00%CSX Corp. 50,000 4.25% 1/6/2021 51,277 0.00%Hess Corp. 50,000 3.50% 15/7/2024 51,268 0.00%RPM International, Inc. 50,000 3.45% 15/11/2022 51,266 0.00%AvalonBay Communities, Inc. 50,000 2.90% 15/10/2026 51,242 0.00%PacifiCorp 50,000 2.95% 1/6/2023 51,229 0.00%American Electric Power Co., Inc. 50,000 3.20% 13/11/2027 51,219 0.00%Edison International 50,000 3.55% 15/11/2024 51,215 0.00%Service Properties Trust 50,000 4.50% 15/3/2025 51,210 0.00%FMC Corp. 50,000 3.20% 1/10/2026 51,206 0.00%Morgan Stanley Bank of America Merrill Lynch Trust 2013 50,000 3.10% 15/5/2046 51,202 0.00%Sunoco Logistics Partners Operations LP 50,000 4.40% 1/4/2021 51,198 0.00%John Deere Capital Corp. 50,000 2.65% 24/6/2024 51,189 0.00%UnitedHealth Group, Inc. 50,000 4.70% 15/2/2021 51,187 0.00%CenterPoint Energy, Inc. 50,000 3.60% 1/11/2021 51,182 0.00%Southwest Gas Corp. 50,000 3.80% 29/9/2046 51,181 0.00%PacifiCorp 50,000 3.85% 15/6/2021 51,167 0.00%Flowserve Corp. 50,000 4.00% 15/11/2023 51,162 0.00%Fortive Corp. 50,000 3.15% 15/6/2026 51,161 0.00%United Technologies Corp. 50,000 2.65% 1/11/2026 51,158 0.00%Morgan Stanley Bank of America Merrill Lynch Trust 2013 50,000 3.38% 15/12/2048 51,155 0.00%Hubbell, Inc. 50,000 3.35% 1/3/2026 51,142 0.00%Cargill, Inc. 50,000 3.30% 1/3/2022 51,140 0.00%Lazard Group LLC 50,000 3.63% 1/3/2027 51,127 0.00%Weingarten Realty Investors 50,000 3.38% 15/10/2022 51,116 0.00%Illinois Tool Works, Inc. 50,000 3.38% 15/9/2021 51,110 0.00%Kimco Realty Corp. 50,000 3.13% 1/6/2023 51,107 0.00%Boeing Co. 50,000 3.63% 1/3/2048 51,077 0.00%Avnet, Inc. 50,000 3.75% 1/12/2021 51,076 0.00%GLP Capital LP/GLP Financing II, Inc. 50,000 3.35% 1/9/2024 51,068 0.00%Penske Truck Leasing Co. LP/PTL Finance Corp. 50,000 3.65% 29/7/2021 51,068 0.00%Baltimore Gas & Electric Co. 50,000 3.50% 15/8/2046 51,056 0.00%Patterson-UTI Energy, Inc. 50,000 5.15% 15/11/2029 51,047 0.00%Laboratory Corp. of America Holdings 50,000 3.20% 1/2/2022 51,039 0.00%Hershey Co. 50,000 4.13% 1/12/2020 51,000 0.00%PACCAR Financial Corp. 50,000 3.15% 9/8/2021 50,994 0.00%Berkshire Hathaway Energy Co. 50,000 2.80% 15/1/2023 50,990 0.00%Raytheon Co. 50,000 2.50% 15/12/2022 50,989 0.00%Allegion plc 50,000 3.50% 1/10/2029 50,978 0.00%Agilent Technologies, Inc. 50,000 3.05% 22/9/2026 50,976 0.00%JM Smucker Co. 50,000 3.00% 15/3/2022 50,959 0.00%Dignity Health 50,000 3.13% 1/11/2022 50,952 0.00%Columbia Property Trust Operating Partnership LP 50,000 3.65% 15/8/2026 50,943 0.00%Nordstrom, Inc. 50,000 4.38% 1/4/2030 50,930 0.00%Kohl’s Corp. 50,000 5.55% 17/7/2045 50,925 0.00%Boardwalk Pipelines LP 50,000 3.38% 1/2/2023 50,924 0.00%Boeing Co. 50,000 2.80% 1/3/2023 50,921 0.00%GLP Capital LP/GLP Financing II, Inc. 50,000 4.00% 15/1/2030 50,902 0.00%Masco Corp. 50,000 4.50% 15/5/2047 50,892 0.00%Associated Bank NA 50,000 3.50% 13/8/2021 50,881 0.00%AutoZone, Inc. 50,000 2.88% 15/1/2023 50,878 0.00%
Vanguard U.S. Investment Grade Credit Index Fund
926
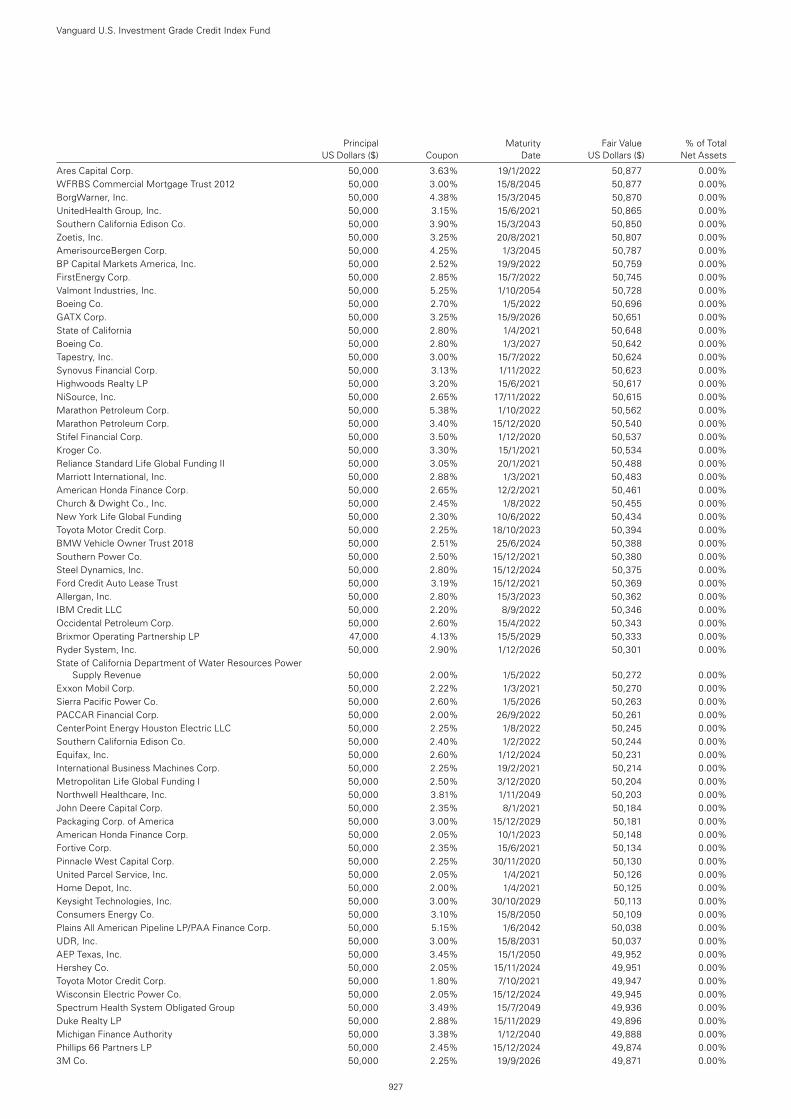
Principal Maturity Fair Value % of Total US Dollars ($) Coupon Date US Dollars ($) Net Assets
Ares Capital Corp. 50,000 3.63% 19/1/2022 50,877 0.00%WFRBS Commercial Mortgage Trust 2012 50,000 3.00% 15/8/2045 50,877 0.00%BorgWarner, Inc. 50,000 4.38% 15/3/2045 50,870 0.00%UnitedHealth Group, Inc. 50,000 3.15% 15/6/2021 50,865 0.00%Southern California Edison Co. 50,000 3.90% 15/3/2043 50,850 0.00%Zoetis, Inc. 50,000 3.25% 20/8/2021 50,807 0.00%AmerisourceBergen Corp. 50,000 4.25% 1/3/2045 50,787 0.00%BP Capital Markets America, Inc. 50,000 2.52% 19/9/2022 50,759 0.00%FirstEnergy Corp. 50,000 2.85% 15/7/2022 50,745 0.00%Valmont Industries, Inc. 50,000 5.25% 1/10/2054 50,728 0.00%Boeing Co. 50,000 2.70% 1/5/2022 50,696 0.00%GATX Corp. 50,000 3.25% 15/9/2026 50,651 0.00%State of California 50,000 2.80% 1/4/2021 50,648 0.00%Boeing Co. 50,000 2.80% 1/3/2027 50,642 0.00%Tapestry, Inc. 50,000 3.00% 15/7/2022 50,624 0.00%Synovus Financial Corp. 50,000 3.13% 1/11/2022 50,623 0.00%Highwoods Realty LP 50,000 3.20% 15/6/2021 50,617 0.00%NiSource, Inc. 50,000 2.65% 17/11/2022 50,615 0.00%Marathon Petroleum Corp. 50,000 5.38% 1/10/2022 50,562 0.00%Marathon Petroleum Corp. 50,000 3.40% 15/12/2020 50,540 0.00%Stifel Financial Corp. 50,000 3.50% 1/12/2020 50,537 0.00%Kroger Co. 50,000 3.30% 15/1/2021 50,534 0.00%Reliance Standard Life Global Funding II 50,000 3.05% 20/1/2021 50,488 0.00%Marriott International, Inc. 50,000 2.88% 1/3/2021 50,483 0.00%American Honda Finance Corp. 50,000 2.65% 12/2/2021 50,461 0.00%Church & Dwight Co., Inc. 50,000 2.45% 1/8/2022 50,455 0.00%New York Life Global Funding 50,000 2.30% 10/6/2022 50,434 0.00%Toyota Motor Credit Corp. 50,000 2.25% 18/10/2023 50,394 0.00%BMW Vehicle Owner Trust 2018 50,000 2.51% 25/6/2024 50,388 0.00%Southern Power Co. 50,000 2.50% 15/12/2021 50,380 0.00%Steel Dynamics, Inc. 50,000 2.80% 15/12/2024 50,375 0.00%Ford Credit Auto Lease Trust 50,000 3.19% 15/12/2021 50,369 0.00%Allergan, Inc. 50,000 2.80% 15/3/2023 50,362 0.00%IBM Credit LLC 50,000 2.20% 8/9/2022 50,346 0.00%Occidental Petroleum Corp. 50,000 2.60% 15/4/2022 50,343 0.00%Brixmor Operating Partnership LP 47,000 4.13% 15/5/2029 50,333 0.00%Ryder System, Inc. 50,000 2.90% 1/12/2026 50,301 0.00%State of California Department of Water Resources Power
Supply Revenue 50,000 2.00% 1/5/2022 50,272 0.00%Exxon Mobil Corp. 50,000 2.22% 1/3/2021 50,270 0.00%Sierra Pacific Power Co. 50,000 2.60% 1/5/2026 50,263 0.00%PACCAR Financial Corp. 50,000 2.00% 26/9/2022 50,261 0.00%CenterPoint Energy Houston Electric LLC 50,000 2.25% 1/8/2022 50,245 0.00%Southern California Edison Co. 50,000 2.40% 1/2/2022 50,244 0.00%Equifax, Inc. 50,000 2.60% 1/12/2024 50,231 0.00%International Business Machines Corp. 50,000 2.25% 19/2/2021 50,214 0.00%Metropolitan Life Global Funding I 50,000 2.50% 3/12/2020 50,204 0.00%Northwell Healthcare, Inc. 50,000 3.81% 1/11/2049 50,203 0.00%John Deere Capital Corp. 50,000 2.35% 8/1/2021 50,184 0.00%Packaging Corp. of America 50,000 3.00% 15/12/2029 50,181 0.00%American Honda Finance Corp. 50,000 2.05% 10/1/2023 50,148 0.00%Fortive Corp. 50,000 2.35% 15/6/2021 50,134 0.00%Pinnacle West Capital Corp. 50,000 2.25% 30/11/2020 50,130 0.00%United Parcel Service, Inc. 50,000 2.05% 1/4/2021 50,126 0.00%Home Depot, Inc. 50,000 2.00% 1/4/2021 50,125 0.00%Keysight Technologies, Inc. 50,000 3.00% 30/10/2029 50,113 0.00%Consumers Energy Co. 50,000 3.10% 15/8/2050 50,109 0.00%Plains All American Pipeline LP/PAA Finance Corp. 50,000 5.15% 1/6/2042 50,038 0.00%UDR, Inc. 50,000 3.00% 15/8/2031 50,037 0.00%AEP Texas, Inc. 50,000 3.45% 15/1/2050 49,952 0.00%Hershey Co. 50,000 2.05% 15/11/2024 49,951 0.00%Toyota Motor Credit Corp. 50,000 1.80% 7/10/2021 49,947 0.00%Wisconsin Electric Power Co. 50,000 2.05% 15/12/2024 49,945 0.00%Spectrum Health System Obligated Group 50,000 3.49% 15/7/2049 49,936 0.00%Duke Realty LP 50,000 2.88% 15/11/2029 49,896 0.00%Michigan Finance Authority 50,000 3.38% 1/12/2040 49,888 0.00%Phillips 66 Partners LP 50,000 2.45% 15/12/2024 49,874 0.00%3M Co. 50,000 2.25% 19/9/2026 49,871 0.00%
Vanguard U.S. Investment Grade Credit Index Fund
927
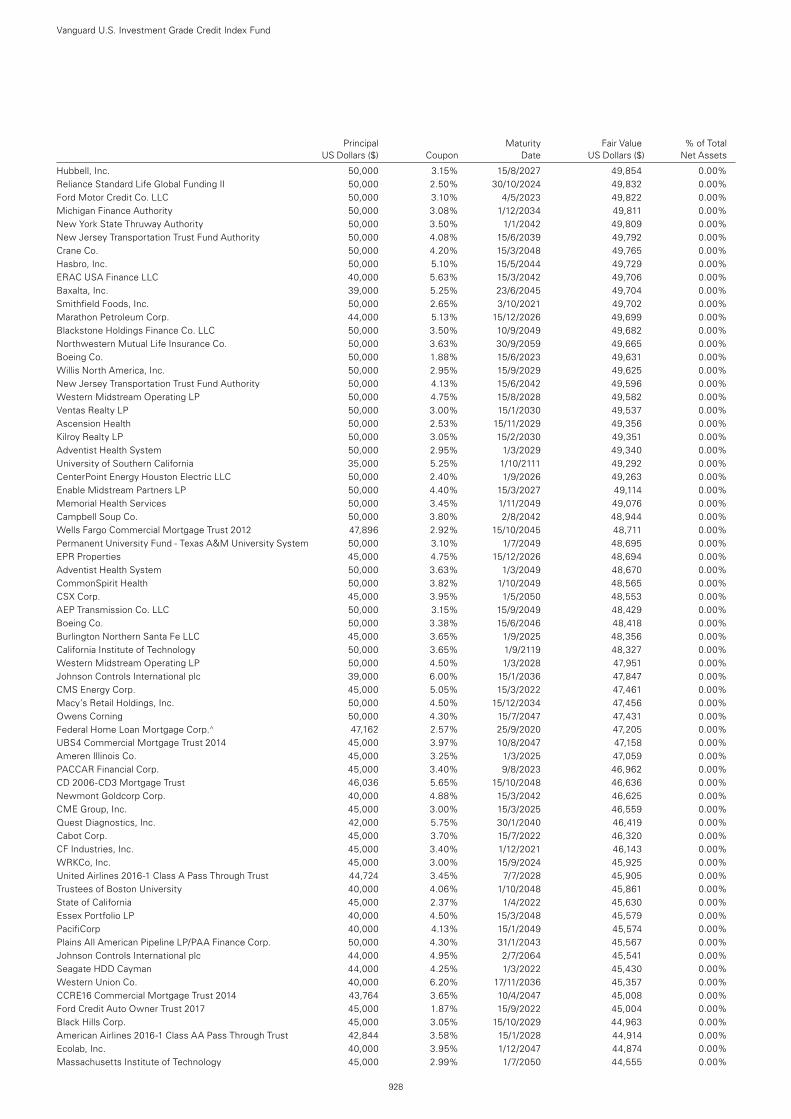
Principal Maturity Fair Value % of Total US Dollars ($) Coupon Date US Dollars ($) Net Assets
Hubbell, Inc. 50,000 3.15% 15/8/2027 49,854 0.00%Reliance Standard Life Global Funding II 50,000 2.50% 30/10/2024 49,832 0.00%Ford Motor Credit Co. LLC 50,000 3.10% 4/5/2023 49,822 0.00%Michigan Finance Authority 50,000 3.08% 1/12/2034 49,811 0.00%New York State Thruway Authority 50,000 3.50% 1/1/2042 49,809 0.00%New Jersey Transportation Trust Fund Authority 50,000 4.08% 15/6/2039 49,792 0.00%Crane Co. 50,000 4.20% 15/3/2048 49,765 0.00%Hasbro, Inc. 50,000 5.10% 15/5/2044 49,729 0.00%ERAC USA Finance LLC 40,000 5.63% 15/3/2042 49,706 0.00%Baxalta, Inc. 39,000 5.25% 23/6/2045 49,704 0.00%Smithfield Foods, Inc. 50,000 2.65% 3/10/2021 49,702 0.00%Marathon Petroleum Corp. 44,000 5.13% 15/12/2026 49,699 0.00%Blackstone Holdings Finance Co. LLC 50,000 3.50% 10/9/2049 49,682 0.00%Northwestern Mutual Life Insurance Co. 50,000 3.63% 30/9/2059 49,665 0.00%Boeing Co. 50,000 1.88% 15/6/2023 49,631 0.00%Willis North America, Inc. 50,000 2.95% 15/9/2029 49,625 0.00%New Jersey Transportation Trust Fund Authority 50,000 4.13% 15/6/2042 49,596 0.00%Western Midstream Operating LP 50,000 4.75% 15/8/2028 49,582 0.00%Ventas Realty LP 50,000 3.00% 15/1/2030 49,537 0.00%Ascension Health 50,000 2.53% 15/11/2029 49,356 0.00%Kilroy Realty LP 50,000 3.05% 15/2/2030 49,351 0.00%Adventist Health System 50,000 2.95% 1/3/2029 49,340 0.00%University of Southern California 35,000 5.25% 1/10/2111 49,292 0.00%CenterPoint Energy Houston Electric LLC 50,000 2.40% 1/9/2026 49,263 0.00%Enable Midstream Partners LP 50,000 4.40% 15/3/2027 49,114 0.00%Memorial Health Services 50,000 3.45% 1/11/2049 49,076 0.00%Campbell Soup Co. 50,000 3.80% 2/8/2042 48,944 0.00%Wells Fargo Commercial Mortgage Trust 2012 47,896 2.92% 15/10/2045 48,711 0.00%Permanent University Fund - Texas A&M University System 50,000 3.10% 1/7/2049 48,695 0.00%EPR Properties 45,000 4.75% 15/12/2026 48,694 0.00%Adventist Health System 50,000 3.63% 1/3/2049 48,670 0.00%CommonSpirit Health 50,000 3.82% 1/10/2049 48,565 0.00%CSX Corp. 45,000 3.95% 1/5/2050 48,553 0.00%AEP Transmission Co. LLC 50,000 3.15% 15/9/2049 48,429 0.00%Boeing Co. 50,000 3.38% 15/6/2046 48,418 0.00%Burlington Northern Santa Fe LLC 45,000 3.65% 1/9/2025 48,356 0.00%California Institute of Technology 50,000 3.65% 1/9/2119 48,327 0.00%Western Midstream Operating LP 50,000 4.50% 1/3/2028 47,951 0.00%Johnson Controls International plc 39,000 6.00% 15/1/2036 47,847 0.00%CMS Energy Corp. 45,000 5.05% 15/3/2022 47,461 0.00%Macy’s Retail Holdings, Inc. 50,000 4.50% 15/12/2034 47,456 0.00%Owens Corning 50,000 4.30% 15/7/2047 47,431 0.00%Federal Home Loan Mortgage Corp.^ 47,162 2.57% 25/9/2020 47,205 0.00%UBS4 Commercial Mortgage Trust 2014 45,000 3.97% 10/8/2047 47,158 0.00%Ameren Illinois Co. 45,000 3.25% 1/3/2025 47,059 0.00%PACCAR Financial Corp. 45,000 3.40% 9/8/2023 46,962 0.00%CD 2006-CD3 Mortgage Trust 46,036 5.65% 15/10/2048 46,636 0.00%Newmont Goldcorp Corp. 40,000 4.88% 15/3/2042 46,625 0.00%CME Group, Inc. 45,000 3.00% 15/3/2025 46,559 0.00%Quest Diagnostics, Inc. 42,000 5.75% 30/1/2040 46,419 0.00%Cabot Corp. 45,000 3.70% 15/7/2022 46,320 0.00%CF Industries, Inc. 45,000 3.40% 1/12/2021 46,143 0.00%WRKCo, Inc. 45,000 3.00% 15/9/2024 45,925 0.00%United Airlines 2016-1 Class A Pass Through Trust 44,724 3.45% 7/7/2028 45,905 0.00%Trustees of Boston University 40,000 4.06% 1/10/2048 45,861 0.00%State of California 45,000 2.37% 1/4/2022 45,630 0.00%Essex Portfolio LP 40,000 4.50% 15/3/2048 45,579 0.00%PacifiCorp 40,000 4.13% 15/1/2049 45,574 0.00%Plains All American Pipeline LP/PAA Finance Corp. 50,000 4.30% 31/1/2043 45,567 0.00%Johnson Controls International plc 44,000 4.95% 2/7/2064 45,541 0.00%Seagate HDD Cayman 44,000 4.25% 1/3/2022 45,430 0.00%Western Union Co. 40,000 6.20% 17/11/2036 45,357 0.00%CCRE16 Commercial Mortgage Trust 2014 43,764 3.65% 10/4/2047 45,008 0.00%Ford Credit Auto Owner Trust 2017 45,000 1.87% 15/9/2022 45,004 0.00%Black Hills Corp. 45,000 3.05% 15/10/2029 44,963 0.00%American Airlines 2016-1 Class AA Pass Through Trust 42,844 3.58% 15/1/2028 44,914 0.00%Ecolab, Inc. 40,000 3.95% 1/12/2047 44,874 0.00%Massachusetts Institute of Technology 45,000 2.99% 1/7/2050 44,555 0.00%
Vanguard U.S. Investment Grade Credit Index Fund
928
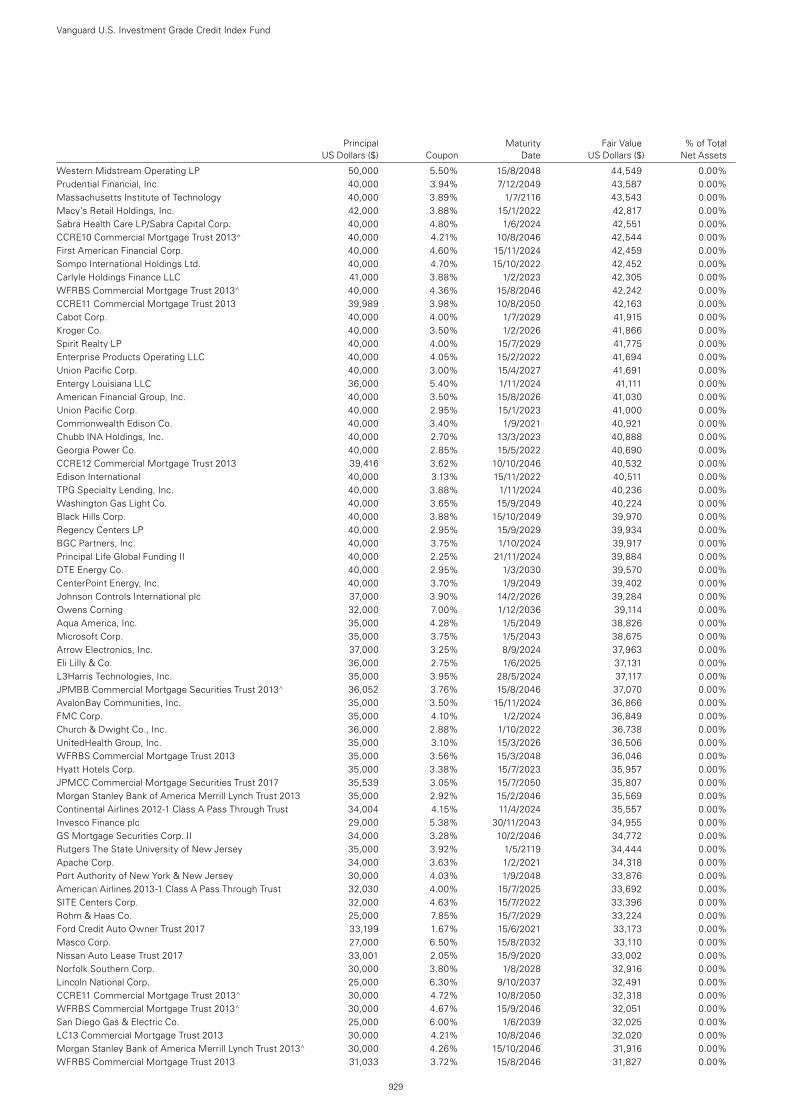
Principal Maturity Fair Value % of Total US Dollars ($) Coupon Date US Dollars ($) Net Assets
Western Midstream Operating LP 50,000 5.50% 15/8/2048 44,549 0.00%Prudential Financial, Inc. 40,000 3.94% 7/12/2049 43,587 0.00%Massachusetts Institute of Technology 40,000 3.89% 1/7/2116 43,543 0.00%Macy’s Retail Holdings, Inc. 42,000 3.88% 15/1/2022 42,817 0.00%Sabra Health Care LP/Sabra Capital Corp. 40,000 4.80% 1/6/2024 42,551 0.00%CCRE10 Commercial Mortgage Trust 2013^ 40,000 4.21% 10/8/2046 42,544 0.00%First American Financial Corp. 40,000 4.60% 15/11/2024 42,459 0.00%Sompo International Holdings Ltd. 40,000 4.70% 15/10/2022 42,452 0.00%Carlyle Holdings Finance LLC 41,000 3.88% 1/2/2023 42,305 0.00%WFRBS Commercial Mortgage Trust 2013^ 40,000 4.36% 15/8/2046 42,242 0.00%CCRE11 Commercial Mortgage Trust 2013 39,989 3.98% 10/8/2050 42,163 0.00%Cabot Corp. 40,000 4.00% 1/7/2029 41,915 0.00%Kroger Co. 40,000 3.50% 1/2/2026 41,866 0.00%Spirit Realty LP 40,000 4.00% 15/7/2029 41,775 0.00%Enterprise Products Operating LLC 40,000 4.05% 15/2/2022 41,694 0.00%Union Pacific Corp. 40,000 3.00% 15/4/2027 41,691 0.00%Entergy Louisiana LLC 36,000 5.40% 1/11/2024 41,111 0.00%American Financial Group, Inc. 40,000 3.50% 15/8/2026 41,030 0.00%Union Pacific Corp. 40,000 2.95% 15/1/2023 41,000 0.00%Commonwealth Edison Co. 40,000 3.40% 1/9/2021 40,921 0.00%Chubb INA Holdings, Inc. 40,000 2.70% 13/3/2023 40,888 0.00%Georgia Power Co. 40,000 2.85% 15/5/2022 40,690 0.00%CCRE12 Commercial Mortgage Trust 2013 39,416 3.62% 10/10/2046 40,532 0.00%Edison International 40,000 3.13% 15/11/2022 40,511 0.00%TPG Specialty Lending, Inc. 40,000 3.88% 1/11/2024 40,236 0.00%Washington Gas Light Co. 40,000 3.65% 15/9/2049 40,224 0.00%Black Hills Corp. 40,000 3.88% 15/10/2049 39,970 0.00%Regency Centers LP 40,000 2.95% 15/9/2029 39,934 0.00%BGC Partners, Inc. 40,000 3.75% 1/10/2024 39,917 0.00%Principal Life Global Funding II 40,000 2.25% 21/11/2024 39,884 0.00%DTE Energy Co. 40,000 2.95% 1/3/2030 39,570 0.00%CenterPoint Energy, Inc. 40,000 3.70% 1/9/2049 39,402 0.00%Johnson Controls International plc 37,000 3.90% 14/2/2026 39,284 0.00%Owens Corning 32,000 7.00% 1/12/2036 39,114 0.00%Aqua America, Inc. 35,000 4.28% 1/5/2049 38,826 0.00%Microsoft Corp. 35,000 3.75% 1/5/2043 38,675 0.00%Arrow Electronics, Inc. 37,000 3.25% 8/9/2024 37,963 0.00%Eli Lilly & Co. 36,000 2.75% 1/6/2025 37,131 0.00%L3Harris Technologies, Inc. 35,000 3.95% 28/5/2024 37,117 0.00%JPMBB Commercial Mortgage Securities Trust 2013^ 36,052 3.76% 15/8/2046 37,070 0.00%AvalonBay Communities, Inc. 35,000 3.50% 15/11/2024 36,866 0.00%FMC Corp. 35,000 4.10% 1/2/2024 36,849 0.00%Church & Dwight Co., Inc. 36,000 2.88% 1/10/2022 36,738 0.00%UnitedHealth Group, Inc. 35,000 3.10% 15/3/2026 36,506 0.00%WFRBS Commercial Mortgage Trust 2013 35,000 3.56% 15/3/2048 36,046 0.00%Hyatt Hotels Corp. 35,000 3.38% 15/7/2023 35,957 0.00%JPMCC Commercial Mortgage Securities Trust 2017 35,539 3.05% 15/7/2050 35,807 0.00%Morgan Stanley Bank of America Merrill Lynch Trust 2013 35,000 2.92% 15/2/2046 35,569 0.00%Continental Airlines 2012-1 Class A Pass Through Trust 34,004 4.15% 11/4/2024 35,557 0.00%Invesco Finance plc 29,000 5.38% 30/11/2043 34,955 0.00%GS Mortgage Securities Corp. II 34,000 3.28% 10/2/2046 34,772 0.00%Rutgers The State University of New Jersey 35,000 3.92% 1/5/2119 34,444 0.00%Apache Corp. 34,000 3.63% 1/2/2021 34,318 0.00%Port Authority of New York & New Jersey 30,000 4.03% 1/9/2048 33,876 0.00%American Airlines 2013-1 Class A Pass Through Trust 32,030 4.00% 15/7/2025 33,692 0.00%SITE Centers Corp. 32,000 4.63% 15/7/2022 33,396 0.00%Rohm & Haas Co. 25,000 7.85% 15/7/2029 33,224 0.00%Ford Credit Auto Owner Trust 2017 33,199 1.67% 15/6/2021 33,173 0.00%Masco Corp. 27,000 6.50% 15/8/2032 33,110 0.00%Nissan Auto Lease Trust 2017 33,001 2.05% 15/9/2020 33,002 0.00%Norfolk Southern Corp. 30,000 3.80% 1/8/2028 32,916 0.00%Lincoln National Corp. 25,000 6.30% 9/10/2037 32,491 0.00%CCRE11 Commercial Mortgage Trust 2013^ 30,000 4.72% 10/8/2050 32,318 0.00%WFRBS Commercial Mortgage Trust 2013^ 30,000 4.67% 15/9/2046 32,051 0.00%San Diego Gas & Electric Co. 25,000 6.00% 1/6/2039 32,025 0.00%LC13 Commercial Mortgage Trust 2013 30,000 4.21% 10/8/2046 32,020 0.00%Morgan Stanley Bank of America Merrill Lynch Trust 2013^ 30,000 4.26% 15/10/2046 31,916 0.00%WFRBS Commercial Mortgage Trust 2013 31,033 3.72% 15/8/2046 31,827 0.00%
Vanguard U.S. Investment Grade Credit Index Fund
929
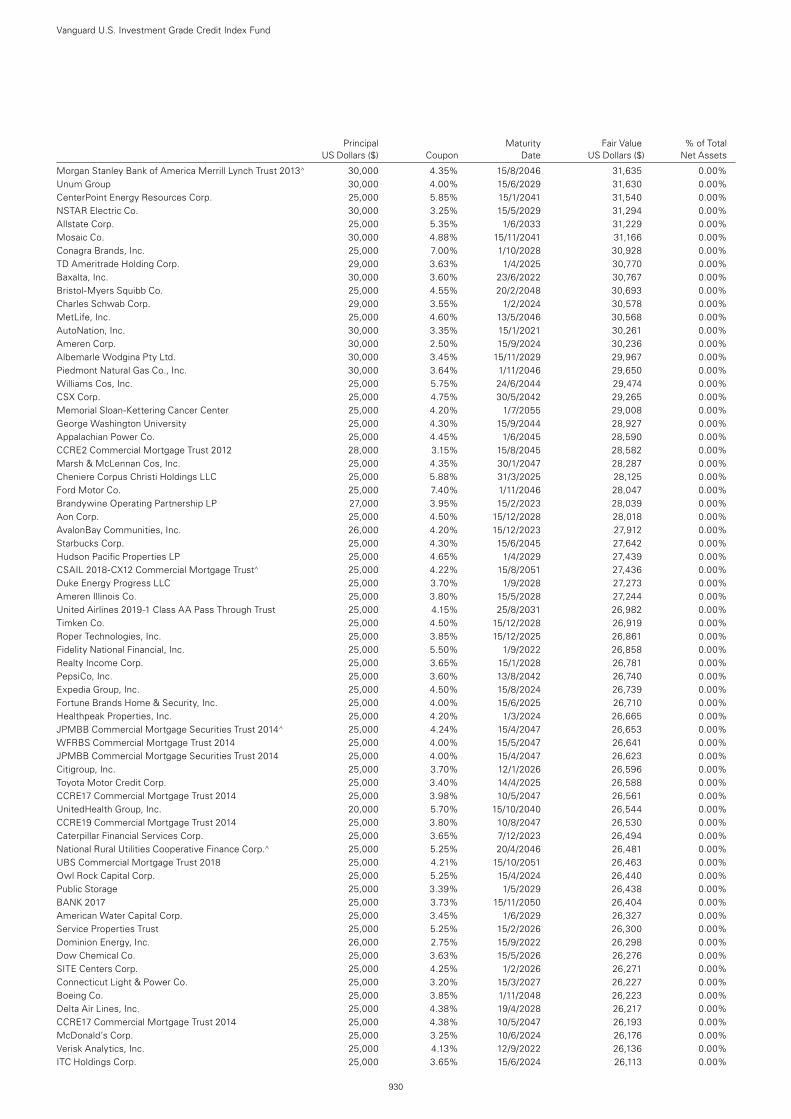
Principal Maturity Fair Value % of Total US Dollars ($) Coupon Date US Dollars ($) Net Assets
Morgan Stanley Bank of America Merrill Lynch Trust 2013^ 30,000 4.35% 15/8/2046 31,635 0.00%Unum Group 30,000 4.00% 15/6/2029 31,630 0.00%CenterPoint Energy Resources Corp. 25,000 5.85% 15/1/2041 31,540 0.00%NSTAR Electric Co. 30,000 3.25% 15/5/2029 31,294 0.00%Allstate Corp. 25,000 5.35% 1/6/2033 31,229 0.00%Mosaic Co. 30,000 4.88% 15/11/2041 31,166 0.00%Conagra Brands, Inc. 25,000 7.00% 1/10/2028 30,928 0.00%TD Ameritrade Holding Corp. 29,000 3.63% 1/4/2025 30,770 0.00%Baxalta, Inc. 30,000 3.60% 23/6/2022 30,767 0.00%Bristol-Myers Squibb Co. 25,000 4.55% 20/2/2048 30,693 0.00%Charles Schwab Corp. 29,000 3.55% 1/2/2024 30,578 0.00%MetLife, Inc. 25,000 4.60% 13/5/2046 30,568 0.00%AutoNation, Inc. 30,000 3.35% 15/1/2021 30,261 0.00%Ameren Corp. 30,000 2.50% 15/9/2024 30,236 0.00%Albemarle Wodgina Pty Ltd. 30,000 3.45% 15/11/2029 29,967 0.00%Piedmont Natural Gas Co., Inc. 30,000 3.64% 1/11/2046 29,650 0.00%Williams Cos, Inc. 25,000 5.75% 24/6/2044 29,474 0.00%CSX Corp. 25,000 4.75% 30/5/2042 29,265 0.00%Memorial Sloan-Kettering Cancer Center 25,000 4.20% 1/7/2055 29,008 0.00%George Washington University 25,000 4.30% 15/9/2044 28,927 0.00%Appalachian Power Co. 25,000 4.45% 1/6/2045 28,590 0.00%CCRE2 Commercial Mortgage Trust 2012 28,000 3.15% 15/8/2045 28,582 0.00%Marsh & McLennan Cos, Inc. 25,000 4.35% 30/1/2047 28,287 0.00%Cheniere Corpus Christi Holdings LLC 25,000 5.88% 31/3/2025 28,125 0.00%Ford Motor Co. 25,000 7.40% 1/11/2046 28,047 0.00%Brandywine Operating Partnership LP 27,000 3.95% 15/2/2023 28,039 0.00%Aon Corp. 25,000 4.50% 15/12/2028 28,018 0.00%AvalonBay Communities, Inc. 26,000 4.20% 15/12/2023 27,912 0.00%Starbucks Corp. 25,000 4.30% 15/6/2045 27,642 0.00%Hudson Pacific Properties LP 25,000 4.65% 1/4/2029 27,439 0.00%CSAIL 2018-CX12 Commercial Mortgage Trust^ 25,000 4.22% 15/8/2051 27,436 0.00%Duke Energy Progress LLC 25,000 3.70% 1/9/2028 27,273 0.00%Ameren Illinois Co. 25,000 3.80% 15/5/2028 27,244 0.00%United Airlines 2019-1 Class AA Pass Through Trust 25,000 4.15% 25/8/2031 26,982 0.00%Timken Co. 25,000 4.50% 15/12/2028 26,919 0.00%Roper Technologies, Inc. 25,000 3.85% 15/12/2025 26,861 0.00%Fidelity National Financial, Inc. 25,000 5.50% 1/9/2022 26,858 0.00%Realty Income Corp. 25,000 3.65% 15/1/2028 26,781 0.00%PepsiCo, Inc. 25,000 3.60% 13/8/2042 26,740 0.00%Expedia Group, Inc. 25,000 4.50% 15/8/2024 26,739 0.00%Fortune Brands Home & Security, Inc. 25,000 4.00% 15/6/2025 26,710 0.00%Healthpeak Properties, Inc. 25,000 4.20% 1/3/2024 26,665 0.00%JPMBB Commercial Mortgage Securities Trust 2014^ 25,000 4.24% 15/4/2047 26,653 0.00%WFRBS Commercial Mortgage Trust 2014 25,000 4.00% 15/5/2047 26,641 0.00%JPMBB Commercial Mortgage Securities Trust 2014 25,000 4.00% 15/4/2047 26,623 0.00%Citigroup, Inc. 25,000 3.70% 12/1/2026 26,596 0.00%Toyota Motor Credit Corp. 25,000 3.40% 14/4/2025 26,588 0.00%CCRE17 Commercial Mortgage Trust 2014 25,000 3.98% 10/5/2047 26,561 0.00%UnitedHealth Group, Inc. 20,000 5.70% 15/10/2040 26,544 0.00%CCRE19 Commercial Mortgage Trust 2014 25,000 3.80% 10/8/2047 26,530 0.00%Caterpillar Financial Services Corp. 25,000 3.65% 7/12/2023 26,494 0.00%National Rural Utilities Cooperative Finance Corp.^ 25,000 5.25% 20/4/2046 26,481 0.00%UBS Commercial Mortgage Trust 2018 25,000 4.21% 15/10/2051 26,463 0.00%Owl Rock Capital Corp. 25,000 5.25% 15/4/2024 26,440 0.00%Public Storage 25,000 3.39% 1/5/2029 26,438 0.00%BANK 2017 25,000 3.73% 15/11/2050 26,404 0.00%American Water Capital Corp. 25,000 3.45% 1/6/2029 26,327 0.00%Service Properties Trust 25,000 5.25% 15/2/2026 26,300 0.00%Dominion Energy, Inc. 26,000 2.75% 15/9/2022 26,298 0.00%Dow Chemical Co. 25,000 3.63% 15/5/2026 26,276 0.00%SITE Centers Corp. 25,000 4.25% 1/2/2026 26,271 0.00%Connecticut Light & Power Co. 25,000 3.20% 15/3/2027 26,227 0.00%Boeing Co. 25,000 3.85% 1/11/2048 26,223 0.00%Delta Air Lines, Inc. 25,000 4.38% 19/4/2028 26,217 0.00%CCRE17 Commercial Mortgage Trust 2014 25,000 4.38% 10/5/2047 26,193 0.00%McDonald’s Corp. 25,000 3.25% 10/6/2024 26,176 0.00%Verisk Analytics, Inc. 25,000 4.13% 12/9/2022 26,136 0.00%ITC Holdings Corp. 25,000 3.65% 15/6/2024 26,113 0.00%
Vanguard U.S. Investment Grade Credit Index Fund
930
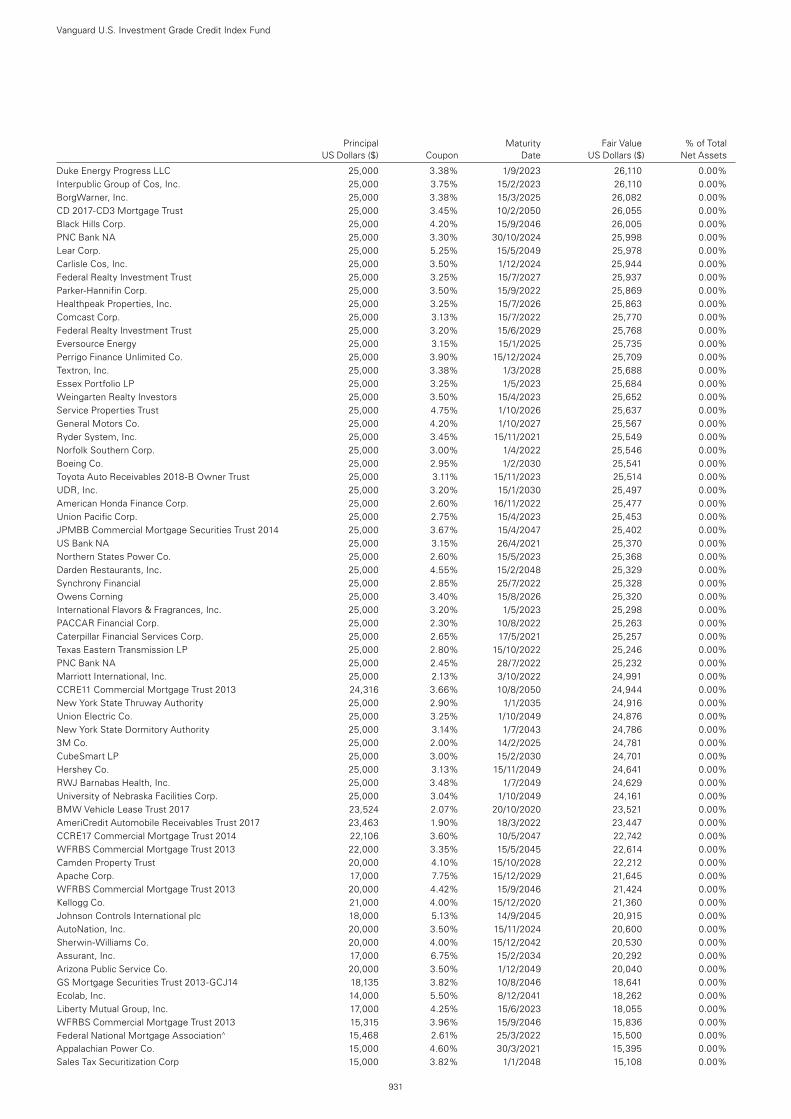
Principal Maturity Fair Value % of Total US Dollars ($) Coupon Date US Dollars ($) Net Assets
Duke Energy Progress LLC 25,000 3.38% 1/9/2023 26,110 0.00%Interpublic Group of Cos, Inc. 25,000 3.75% 15/2/2023 26,110 0.00%BorgWarner, Inc. 25,000 3.38% 15/3/2025 26,082 0.00%CD 2017-CD3 Mortgage Trust 25,000 3.45% 10/2/2050 26,055 0.00%Black Hills Corp. 25,000 4.20% 15/9/2046 26,005 0.00%PNC Bank NA 25,000 3.30% 30/10/2024 25,998 0.00%Lear Corp. 25,000 5.25% 15/5/2049 25,978 0.00%Carlisle Cos, Inc. 25,000 3.50% 1/12/2024 25,944 0.00%Federal Realty Investment Trust 25,000 3.25% 15/7/2027 25,937 0.00%Parker-Hannifin Corp. 25,000 3.50% 15/9/2022 25,869 0.00%Healthpeak Properties, Inc. 25,000 3.25% 15/7/2026 25,863 0.00%Comcast Corp. 25,000 3.13% 15/7/2022 25,770 0.00%Federal Realty Investment Trust 25,000 3.20% 15/6/2029 25,768 0.00%Eversource Energy 25,000 3.15% 15/1/2025 25,735 0.00%Perrigo Finance Unlimited Co. 25,000 3.90% 15/12/2024 25,709 0.00%Textron, Inc. 25,000 3.38% 1/3/2028 25,688 0.00%Essex Portfolio LP 25,000 3.25% 1/5/2023 25,684 0.00%Weingarten Realty Investors 25,000 3.50% 15/4/2023 25,652 0.00%Service Properties Trust 25,000 4.75% 1/10/2026 25,637 0.00%General Motors Co. 25,000 4.20% 1/10/2027 25,567 0.00%Ryder System, Inc. 25,000 3.45% 15/11/2021 25,549 0.00%Norfolk Southern Corp. 25,000 3.00% 1/4/2022 25,546 0.00%Boeing Co. 25,000 2.95% 1/2/2030 25,541 0.00%Toyota Auto Receivables 2018-B Owner Trust 25,000 3.11% 15/11/2023 25,514 0.00%UDR, Inc. 25,000 3.20% 15/1/2030 25,497 0.00%American Honda Finance Corp. 25,000 2.60% 16/11/2022 25,477 0.00%Union Pacific Corp. 25,000 2.75% 15/4/2023 25,453 0.00%JPMBB Commercial Mortgage Securities Trust 2014 25,000 3.67% 15/4/2047 25,402 0.00%US Bank NA 25,000 3.15% 26/4/2021 25,370 0.00%Northern States Power Co. 25,000 2.60% 15/5/2023 25,368 0.00%Darden Restaurants, Inc. 25,000 4.55% 15/2/2048 25,329 0.00%Synchrony Financial 25,000 2.85% 25/7/2022 25,328 0.00%Owens Corning 25,000 3.40% 15/8/2026 25,320 0.00%International Flavors & Fragrances, Inc. 25,000 3.20% 1/5/2023 25,298 0.00%PACCAR Financial Corp. 25,000 2.30% 10/8/2022 25,263 0.00%Caterpillar Financial Services Corp. 25,000 2.65% 17/5/2021 25,257 0.00%Texas Eastern Transmission LP 25,000 2.80% 15/10/2022 25,246 0.00%PNC Bank NA 25,000 2.45% 28/7/2022 25,232 0.00%Marriott International, Inc. 25,000 2.13% 3/10/2022 24,991 0.00%CCRE11 Commercial Mortgage Trust 2013 24,316 3.66% 10/8/2050 24,944 0.00%New York State Thruway Authority 25,000 2.90% 1/1/2035 24,916 0.00%Union Electric Co. 25,000 3.25% 1/10/2049 24,876 0.00%New York State Dormitory Authority 25,000 3.14% 1/7/2043 24,786 0.00%3M Co. 25,000 2.00% 14/2/2025 24,781 0.00%CubeSmart LP 25,000 3.00% 15/2/2030 24,701 0.00%Hershey Co. 25,000 3.13% 15/11/2049 24,641 0.00%RWJ Barnabas Health, Inc. 25,000 3.48% 1/7/2049 24,629 0.00%University of Nebraska Facilities Corp. 25,000 3.04% 1/10/2049 24,161 0.00%BMW Vehicle Lease Trust 2017 23,524 2.07% 20/10/2020 23,521 0.00%AmeriCredit Automobile Receivables Trust 2017 23,463 1.90% 18/3/2022 23,447 0.00%CCRE17 Commercial Mortgage Trust 2014 22,106 3.60% 10/5/2047 22,742 0.00%WFRBS Commercial Mortgage Trust 2013 22,000 3.35% 15/5/2045 22,614 0.00%Camden Property Trust 20,000 4.10% 15/10/2028 22,212 0.00%Apache Corp. 17,000 7.75% 15/12/2029 21,645 0.00%WFRBS Commercial Mortgage Trust 2013 20,000 4.42% 15/9/2046 21,424 0.00%Kellogg Co. 21,000 4.00% 15/12/2020 21,360 0.00%Johnson Controls International plc 18,000 5.13% 14/9/2045 20,915 0.00%AutoNation, Inc. 20,000 3.50% 15/11/2024 20,600 0.00%Sherwin-Williams Co. 20,000 4.00% 15/12/2042 20,530 0.00%Assurant, Inc. 17,000 6.75% 15/2/2034 20,292 0.00%Arizona Public Service Co. 20,000 3.50% 1/12/2049 20,040 0.00%GS Mortgage Securities Trust 2013-GCJ14 18,135 3.82% 10/8/2046 18,641 0.00%Ecolab, Inc. 14,000 5.50% 8/12/2041 18,262 0.00%Liberty Mutual Group, Inc. 17,000 4.25% 15/6/2023 18,055 0.00%WFRBS Commercial Mortgage Trust 2013 15,315 3.96% 15/9/2046 15,836 0.00%Federal National Mortgage Association^ 15,468 2.61% 25/3/2022 15,500 0.00%Appalachian Power Co. 15,000 4.60% 30/3/2021 15,395 0.00%Sales Tax Securitization Corp 15,000 3.82% 1/1/2048 15,108 0.00%
Vanguard U.S. Investment Grade Credit Index Fund
931
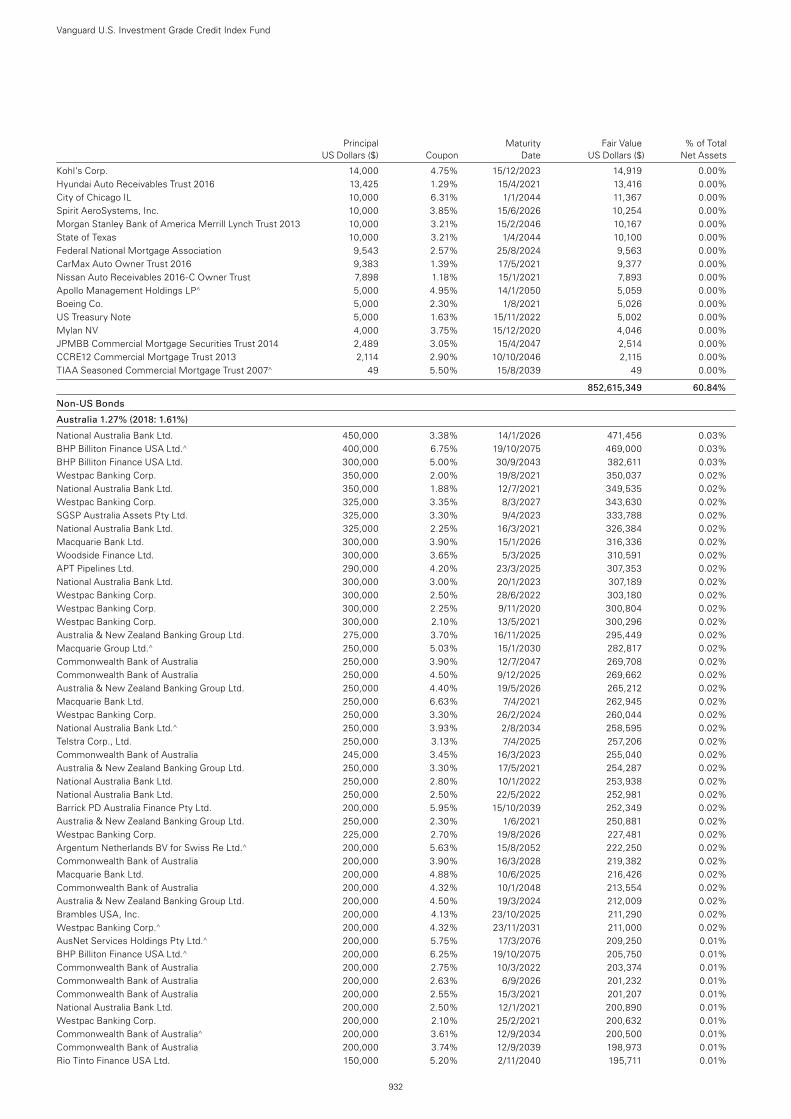
Principal Maturity Fair Value % of Total US Dollars ($) Coupon Date US Dollars ($) Net Assets
Kohl’s Corp. 14,000 4.75% 15/12/2023 14,919 0.00%Hyundai Auto Receivables Trust 2016 13,425 1.29% 15/4/2021 13,416 0.00%City of Chicago IL 10,000 6.31% 1/1/2044 11,367 0.00%Spirit AeroSystems, Inc. 10,000 3.85% 15/6/2026 10,254 0.00%Morgan Stanley Bank of America Merrill Lynch Trust 2013 10,000 3.21% 15/2/2046 10,167 0.00%State of Texas 10,000 3.21% 1/4/2044 10,100 0.00%Federal National Mortgage Association 9,543 2.57% 25/8/2024 9,563 0.00%CarMax Auto Owner Trust 2016 9,383 1.39% 17/5/2021 9,377 0.00%Nissan Auto Receivables 2016-C Owner Trust 7,898 1.18% 15/1/2021 7,893 0.00%Apollo Management Holdings LP^ 5,000 4.95% 14/1/2050 5,059 0.00%Boeing Co. 5,000 2.30% 1/8/2021 5,026 0.00%US Treasury Note 5,000 1.63% 15/11/2022 5,002 0.00%Mylan NV 4,000 3.75% 15/12/2020 4,046 0.00%JPMBB Commercial Mortgage Securities Trust 2014 2,489 3.05% 15/4/2047 2,514 0.00%CCRE12 Commercial Mortgage Trust 2013 2,114 2.90% 10/10/2046 2,115 0.00%TIAA Seasoned Commercial Mortgage Trust 2007^ 49 5.50% 15/8/2039 49 0.00%
852,615,349 60.84%
Non-US Bonds
Australia 1.27% (2018: 1.61%)
National Australia Bank Ltd. 450,000 3.38% 14/1/2026 471,456 0.03%BHP Billiton Finance USA Ltd.^ 400,000 6.75% 19/10/2075 469,000 0.03%BHP Billiton Finance USA Ltd. 300,000 5.00% 30/9/2043 382,611 0.03%Westpac Banking Corp. 350,000 2.00% 19/8/2021 350,037 0.02%National Australia Bank Ltd. 350,000 1.88% 12/7/2021 349,535 0.02%Westpac Banking Corp. 325,000 3.35% 8/3/2027 343,630 0.02%SGSP Australia Assets Pty Ltd. 325,000 3.30% 9/4/2023 333,788 0.02%National Australia Bank Ltd. 325,000 2.25% 16/3/2021 326,384 0.02%Macquarie Bank Ltd. 300,000 3.90% 15/1/2026 316,336 0.02%Woodside Finance Ltd. 300,000 3.65% 5/3/2025 310,591 0.02%APT Pipelines Ltd. 290,000 4.20% 23/3/2025 307,353 0.02%National Australia Bank Ltd. 300,000 3.00% 20/1/2023 307,189 0.02%Westpac Banking Corp. 300,000 2.50% 28/6/2022 303,180 0.02%Westpac Banking Corp. 300,000 2.25% 9/11/2020 300,804 0.02%Westpac Banking Corp. 300,000 2.10% 13/5/2021 300,296 0.02%Australia & New Zealand Banking Group Ltd. 275,000 3.70% 16/11/2025 295,449 0.02%Macquarie Group Ltd.^ 250,000 5.03% 15/1/2030 282,817 0.02%Commonwealth Bank of Australia 250,000 3.90% 12/7/2047 269,708 0.02%Commonwealth Bank of Australia 250,000 4.50% 9/12/2025 269,662 0.02%Australia & New Zealand Banking Group Ltd. 250,000 4.40% 19/5/2026 265,212 0.02%Macquarie Bank Ltd. 250,000 6.63% 7/4/2021 262,945 0.02%Westpac Banking Corp. 250,000 3.30% 26/2/2024 260,044 0.02%National Australia Bank Ltd.^ 250,000 3.93% 2/8/2034 258,595 0.02%Telstra Corp., Ltd. 250,000 3.13% 7/4/2025 257,206 0.02%Commonwealth Bank of Australia 245,000 3.45% 16/3/2023 255,040 0.02%Australia & New Zealand Banking Group Ltd. 250,000 3.30% 17/5/2021 254,287 0.02%National Australia Bank Ltd. 250,000 2.80% 10/1/2022 253,938 0.02%National Australia Bank Ltd. 250,000 2.50% 22/5/2022 252,981 0.02%Barrick PD Australia Finance Pty Ltd. 200,000 5.95% 15/10/2039 252,349 0.02%Australia & New Zealand Banking Group Ltd. 250,000 2.30% 1/6/2021 250,881 0.02%Westpac Banking Corp. 225,000 2.70% 19/8/2026 227,481 0.02%Argentum Netherlands BV for Swiss Re Ltd.^ 200,000 5.63% 15/8/2052 222,250 0.02%Commonwealth Bank of Australia 200,000 3.90% 16/3/2028 219,382 0.02%Macquarie Bank Ltd. 200,000 4.88% 10/6/2025 216,426 0.02%Commonwealth Bank of Australia 200,000 4.32% 10/1/2048 213,554 0.02%Australia & New Zealand Banking Group Ltd. 200,000 4.50% 19/3/2024 212,009 0.02%Brambles USA, Inc. 200,000 4.13% 23/10/2025 211,290 0.02%Westpac Banking Corp.^ 200,000 4.32% 23/11/2031 211,000 0.02%AusNet Services Holdings Pty Ltd.^ 200,000 5.75% 17/3/2076 209,250 0.01%BHP Billiton Finance USA Ltd.^ 200,000 6.25% 19/10/2075 205,750 0.01%Commonwealth Bank of Australia 200,000 2.75% 10/3/2022 203,374 0.01%Commonwealth Bank of Australia 200,000 2.63% 6/9/2026 201,232 0.01%Commonwealth Bank of Australia 200,000 2.55% 15/3/2021 201,207 0.01%National Australia Bank Ltd. 200,000 2.50% 12/1/2021 200,890 0.01%Westpac Banking Corp. 200,000 2.10% 25/2/2021 200,632 0.01%Commonwealth Bank of Australia^ 200,000 3.61% 12/9/2034 200,500 0.01%Commonwealth Bank of Australia 200,000 3.74% 12/9/2039 198,973 0.01%Rio Tinto Finance USA Ltd. 150,000 5.20% 2/11/2040 195,711 0.01%
Vanguard U.S. Investment Grade Credit Index Fund
932
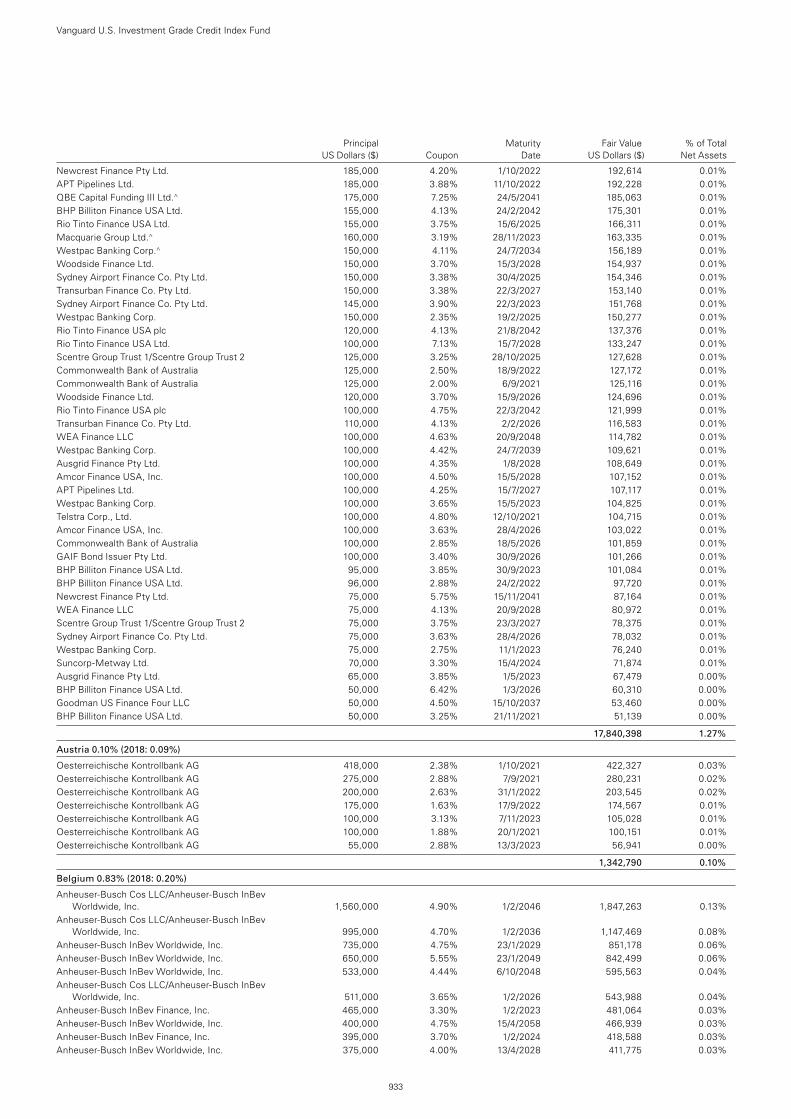
Principal Maturity Fair Value % of Total US Dollars ($) Coupon Date US Dollars ($) Net Assets
Newcrest Finance Pty Ltd. 185,000 4.20% 1/10/2022 192,614 0.01%APT Pipelines Ltd. 185,000 3.88% 11/10/2022 192,228 0.01%QBE Capital Funding III Ltd.^ 175,000 7.25% 24/5/2041 185,063 0.01%BHP Billiton Finance USA Ltd. 155,000 4.13% 24/2/2042 175,301 0.01%Rio Tinto Finance USA Ltd. 155,000 3.75% 15/6/2025 166,311 0.01%Macquarie Group Ltd.^ 160,000 3.19% 28/11/2023 163,335 0.01%Westpac Banking Corp.^ 150,000 4.11% 24/7/2034 156,189 0.01%Woodside Finance Ltd. 150,000 3.70% 15/3/2028 154,937 0.01%Sydney Airport Finance Co. Pty Ltd. 150,000 3.38% 30/4/2025 154,346 0.01%Transurban Finance Co. Pty Ltd. 150,000 3.38% 22/3/2027 153,140 0.01%Sydney Airport Finance Co. Pty Ltd. 145,000 3.90% 22/3/2023 151,768 0.01%Westpac Banking Corp. 150,000 2.35% 19/2/2025 150,277 0.01%Rio Tinto Finance USA plc 120,000 4.13% 21/8/2042 137,376 0.01%Rio Tinto Finance USA Ltd. 100,000 7.13% 15/7/2028 133,247 0.01%Scentre Group Trust 1/Scentre Group Trust 2 125,000 3.25% 28/10/2025 127,628 0.01%Commonwealth Bank of Australia 125,000 2.50% 18/9/2022 127,172 0.01%Commonwealth Bank of Australia 125,000 2.00% 6/9/2021 125,116 0.01%Woodside Finance Ltd. 120,000 3.70% 15/9/2026 124,696 0.01%Rio Tinto Finance USA plc 100,000 4.75% 22/3/2042 121,999 0.01%Transurban Finance Co. Pty Ltd. 110,000 4.13% 2/2/2026 116,583 0.01%WEA Finance LLC 100,000 4.63% 20/9/2048 114,782 0.01%Westpac Banking Corp. 100,000 4.42% 24/7/2039 109,621 0.01%Ausgrid Finance Pty Ltd. 100,000 4.35% 1/8/2028 108,649 0.01%Amcor Finance USA, Inc. 100,000 4.50% 15/5/2028 107,152 0.01%APT Pipelines Ltd. 100,000 4.25% 15/7/2027 107,117 0.01%Westpac Banking Corp. 100,000 3.65% 15/5/2023 104,825 0.01%Telstra Corp., Ltd. 100,000 4.80% 12/10/2021 104,715 0.01%Amcor Finance USA, Inc. 100,000 3.63% 28/4/2026 103,022 0.01%Commonwealth Bank of Australia 100,000 2.85% 18/5/2026 101,859 0.01%GAIF Bond Issuer Pty Ltd. 100,000 3.40% 30/9/2026 101,266 0.01%BHP Billiton Finance USA Ltd. 95,000 3.85% 30/9/2023 101,084 0.01%BHP Billiton Finance USA Ltd. 96,000 2.88% 24/2/2022 97,720 0.01%Newcrest Finance Pty Ltd. 75,000 5.75% 15/11/2041 87,164 0.01%WEA Finance LLC 75,000 4.13% 20/9/2028 80,972 0.01%Scentre Group Trust 1/Scentre Group Trust 2 75,000 3.75% 23/3/2027 78,375 0.01%Sydney Airport Finance Co. Pty Ltd. 75,000 3.63% 28/4/2026 78,032 0.01%Westpac Banking Corp. 75,000 2.75% 11/1/2023 76,240 0.01%Suncorp-Metway Ltd. 70,000 3.30% 15/4/2024 71,874 0.01%Ausgrid Finance Pty Ltd. 65,000 3.85% 1/5/2023 67,479 0.00%BHP Billiton Finance USA Ltd. 50,000 6.42% 1/3/2026 60,310 0.00%Goodman US Finance Four LLC 50,000 4.50% 15/10/2037 53,460 0.00%BHP Billiton Finance USA Ltd. 50,000 3.25% 21/11/2021 51,139 0.00%
17,840,398 1.27%
Austria 0.10% (2018: 0.09%)
Oesterreichische Kontrollbank AG 418,000 2.38% 1/10/2021 422,327 0.03%Oesterreichische Kontrollbank AG 275,000 2.88% 7/9/2021 280,231 0.02%Oesterreichische Kontrollbank AG 200,000 2.63% 31/1/2022 203,545 0.02%Oesterreichische Kontrollbank AG 175,000 1.63% 17/9/2022 174,567 0.01%Oesterreichische Kontrollbank AG 100,000 3.13% 7/11/2023 105,028 0.01%Oesterreichische Kontrollbank AG 100,000 1.88% 20/1/2021 100,151 0.01%Oesterreichische Kontrollbank AG 55,000 2.88% 13/3/2023 56,941 0.00%
1,342,790 0.10%
Belgium 0.83% (2018: 0.20%)
Anheuser-Busch Cos LLC/Anheuser-Busch InBev Worldwide, Inc. 1,560,000 4.90% 1/2/2046 1,847,263 0.13%
Anheuser-Busch Cos LLC/Anheuser-Busch InBev Worldwide, Inc. 995,000 4.70% 1/2/2036 1,147,469 0.08%
Anheuser-Busch InBev Worldwide, Inc. 735,000 4.75% 23/1/2029 851,178 0.06%Anheuser-Busch InBev Worldwide, Inc. 650,000 5.55% 23/1/2049 842,499 0.06%Anheuser-Busch InBev Worldwide, Inc. 533,000 4.44% 6/10/2048 595,563 0.04%Anheuser-Busch Cos LLC/Anheuser-Busch InBev
Worldwide, Inc. 511,000 3.65% 1/2/2026 543,988 0.04%Anheuser-Busch InBev Finance, Inc. 465,000 3.30% 1/2/2023 481,064 0.03%Anheuser-Busch InBev Worldwide, Inc. 400,000 4.75% 15/4/2058 466,939 0.03%Anheuser-Busch InBev Finance, Inc. 395,000 3.70% 1/2/2024 418,588 0.03%Anheuser-Busch InBev Worldwide, Inc. 375,000 4.00% 13/4/2028 411,775 0.03%
Vanguard U.S. Investment Grade Credit Index Fund
933
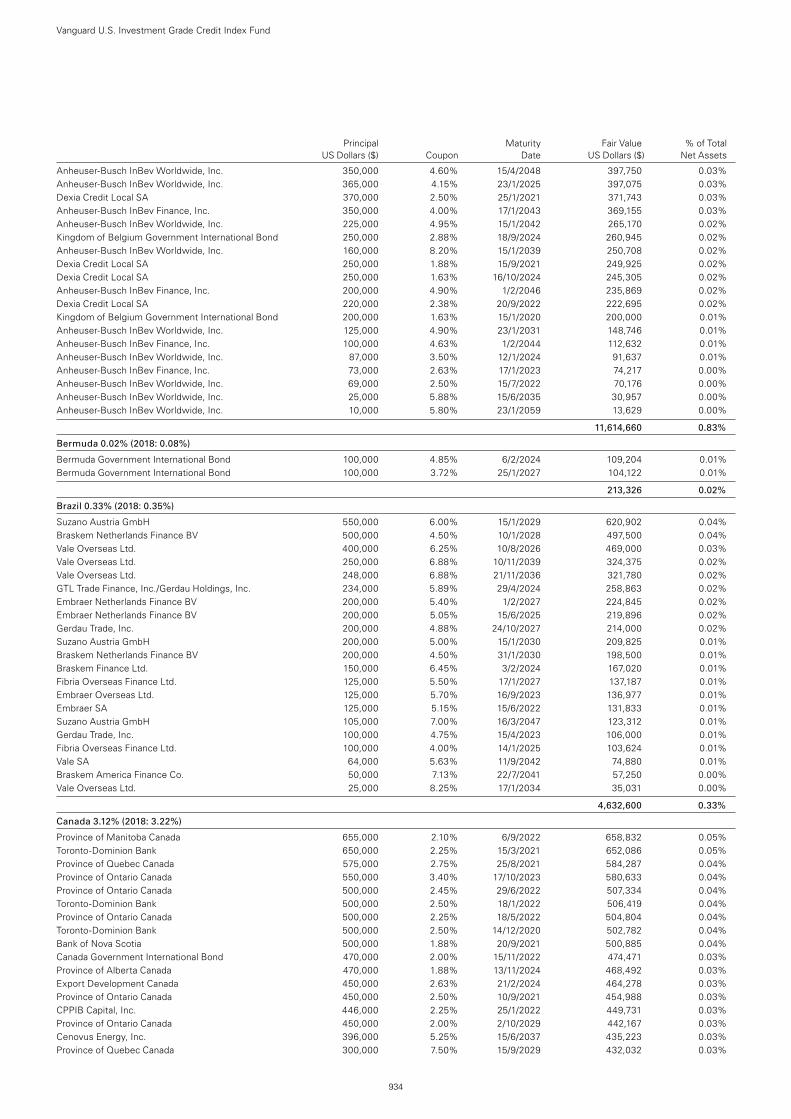
Principal Maturity Fair Value % of Total US Dollars ($) Coupon Date US Dollars ($) Net Assets
Anheuser-Busch InBev Worldwide, Inc. 350,000 4.60% 15/4/2048 397,750 0.03%Anheuser-Busch InBev Worldwide, Inc. 365,000 4.15% 23/1/2025 397,075 0.03%Dexia Credit Local SA 370,000 2.50% 25/1/2021 371,743 0.03%Anheuser-Busch InBev Finance, Inc. 350,000 4.00% 17/1/2043 369,155 0.03%Anheuser-Busch InBev Worldwide, Inc. 225,000 4.95% 15/1/2042 265,170 0.02%Kingdom of Belgium Government International Bond 250,000 2.88% 18/9/2024 260,945 0.02%Anheuser-Busch InBev Worldwide, Inc. 160,000 8.20% 15/1/2039 250,708 0.02%Dexia Credit Local SA 250,000 1.88% 15/9/2021 249,925 0.02%Dexia Credit Local SA 250,000 1.63% 16/10/2024 245,305 0.02%Anheuser-Busch InBev Finance, Inc. 200,000 4.90% 1/2/2046 235,869 0.02%Dexia Credit Local SA 220,000 2.38% 20/9/2022 222,695 0.02%Kingdom of Belgium Government International Bond 200,000 1.63% 15/1/2020 200,000 0.01%Anheuser-Busch InBev Worldwide, Inc. 125,000 4.90% 23/1/2031 148,746 0.01%Anheuser-Busch InBev Finance, Inc. 100,000 4.63% 1/2/2044 112,632 0.01%Anheuser-Busch InBev Worldwide, Inc. 87,000 3.50% 12/1/2024 91,637 0.01%Anheuser-Busch InBev Finance, Inc. 73,000 2.63% 17/1/2023 74,217 0.00%Anheuser-Busch InBev Worldwide, Inc. 69,000 2.50% 15/7/2022 70,176 0.00%Anheuser-Busch InBev Worldwide, Inc. 25,000 5.88% 15/6/2035 30,957 0.00%Anheuser-Busch InBev Worldwide, Inc. 10,000 5.80% 23/1/2059 13,629 0.00%
11,614,660 0.83%
Bermuda 0.02% (2018: 0.08%)
Bermuda Government International Bond 100,000 4.85% 6/2/2024 109,204 0.01%Bermuda Government International Bond 100,000 3.72% 25/1/2027 104,122 0.01%
213,326 0.02%
Brazil 0.33% (2018: 0.35%)
Suzano Austria GmbH 550,000 6.00% 15/1/2029 620,902 0.04%Braskem Netherlands Finance BV 500,000 4.50% 10/1/2028 497,500 0.04%Vale Overseas Ltd. 400,000 6.25% 10/8/2026 469,000 0.03%Vale Overseas Ltd. 250,000 6.88% 10/11/2039 324,375 0.02%Vale Overseas Ltd. 248,000 6.88% 21/11/2036 321,780 0.02%GTL Trade Finance, Inc./Gerdau Holdings, Inc. 234,000 5.89% 29/4/2024 258,863 0.02%Embraer Netherlands Finance BV 200,000 5.40% 1/2/2027 224,845 0.02%Embraer Netherlands Finance BV 200,000 5.05% 15/6/2025 219,896 0.02%Gerdau Trade, Inc. 200,000 4.88% 24/10/2027 214,000 0.02%Suzano Austria GmbH 200,000 5.00% 15/1/2030 209,825 0.01%Braskem Netherlands Finance BV 200,000 4.50% 31/1/2030 198,500 0.01%Braskem Finance Ltd. 150,000 6.45% 3/2/2024 167,020 0.01%Fibria Overseas Finance Ltd. 125,000 5.50% 17/1/2027 137,187 0.01%Embraer Overseas Ltd. 125,000 5.70% 16/9/2023 136,977 0.01%Embraer SA 125,000 5.15% 15/6/2022 131,833 0.01%Suzano Austria GmbH 105,000 7.00% 16/3/2047 123,312 0.01%Gerdau Trade, Inc. 100,000 4.75% 15/4/2023 106,000 0.01%Fibria Overseas Finance Ltd. 100,000 4.00% 14/1/2025 103,624 0.01%Vale SA 64,000 5.63% 11/9/2042 74,880 0.01%Braskem America Finance Co. 50,000 7.13% 22/7/2041 57,250 0.00%Vale Overseas Ltd. 25,000 8.25% 17/1/2034 35,031 0.00%
4,632,600 0.33%
Canada 3.12% (2018: 3.22%)
Province of Manitoba Canada 655,000 2.10% 6/9/2022 658,832 0.05%Toronto-Dominion Bank 650,000 2.25% 15/3/2021 652,086 0.05%Province of Quebec Canada 575,000 2.75% 25/8/2021 584,287 0.04%Province of Ontario Canada 550,000 3.40% 17/10/2023 580,633 0.04%Province of Ontario Canada 500,000 2.45% 29/6/2022 507,334 0.04%Toronto-Dominion Bank 500,000 2.50% 18/1/2022 506,419 0.04%Province of Ontario Canada 500,000 2.25% 18/5/2022 504,804 0.04%Toronto-Dominion Bank 500,000 2.50% 14/12/2020 502,782 0.04%Bank of Nova Scotia 500,000 1.88% 20/9/2021 500,885 0.04%Canada Government International Bond 470,000 2.00% 15/11/2022 474,471 0.03%Province of Alberta Canada 470,000 1.88% 13/11/2024 468,492 0.03%Export Development Canada 450,000 2.63% 21/2/2024 464,278 0.03%Province of Ontario Canada 450,000 2.50% 10/9/2021 454,988 0.03%CPPIB Capital, Inc. 446,000 2.25% 25/1/2022 449,731 0.03%Province of Ontario Canada 450,000 2.00% 2/10/2029 442,167 0.03%Cenovus Energy, Inc. 396,000 5.25% 15/6/2037 435,223 0.03%Province of Quebec Canada 300,000 7.50% 15/9/2029 432,032 0.03%
Vanguard U.S. Investment Grade Credit Index Fund
934
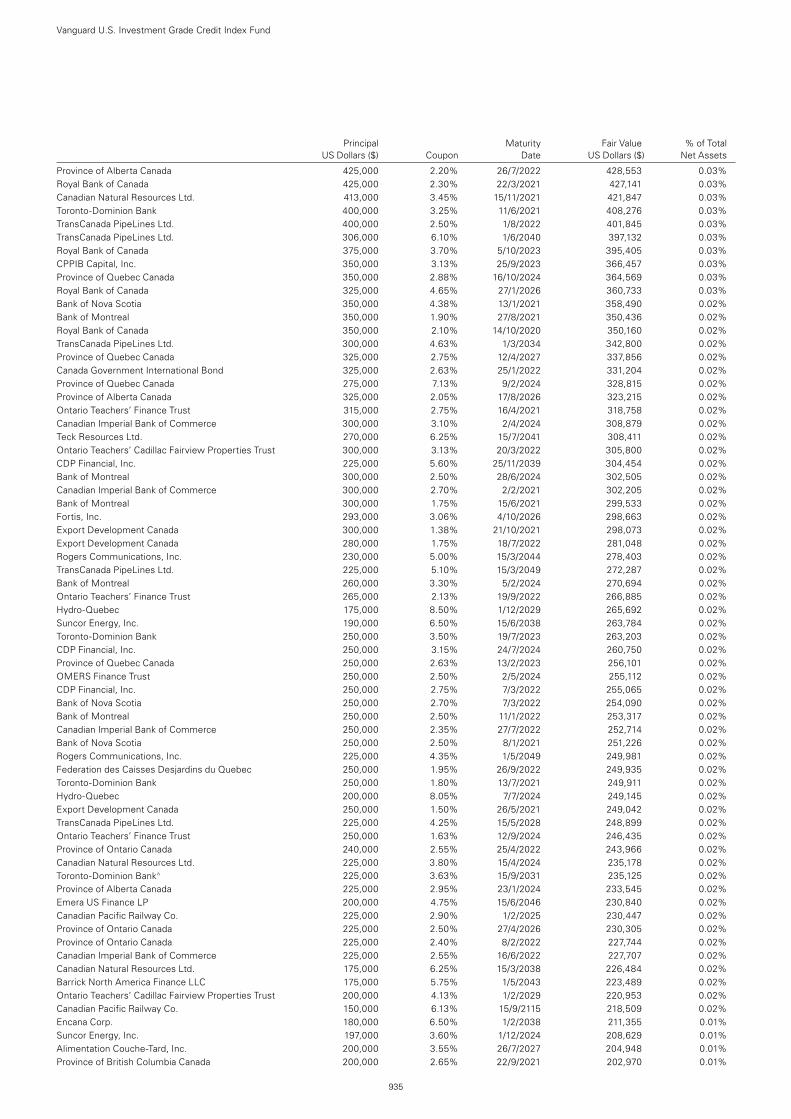
Principal Maturity Fair Value % of Total US Dollars ($) Coupon Date US Dollars ($) Net Assets
Vanguard U.S. Investment Grade Credit Index Fund
935
Province of Alberta Canada 425,000 2.20% 26/7/2022 428,553 0.03%Royal Bank of Canada 425,000 2.30% 22/3/2021 427,141 0.03%Canadian Natural Resources Ltd. 413,000 3.45% 15/11/2021 421,847 0.03%Toronto-Dominion Bank 400,000 3.25% 11/6/2021 408,276 0.03%TransCanada PipeLines Ltd. 400,000 2.50% 1/8/2022 401,845 0.03%TransCanada PipeLines Ltd. 306,000 6.10% 1/6/2040 397,132 0.03%Royal Bank of Canada 375,000 3.70% 5/10/2023 395,405 0.03%CPPIB Capital, Inc. 350,000 3.13% 25/9/2023 366,457 0.03%Province of Quebec Canada 350,000 2.88% 16/10/2024 364,569 0.03%Royal Bank of Canada 325,000 4.65% 27/1/2026 360,733 0.03%Bank of Nova Scotia 350,000 4.38% 13/1/2021 358,490 0.02%Bank of Montreal 350,000 1.90% 27/8/2021 350,436 0.02%Royal Bank of Canada 350,000 2.10% 14/10/2020 350,160 0.02%TransCanada PipeLines Ltd. 300,000 4.63% 1/3/2034 342,800 0.02%Province of Quebec Canada 325,000 2.75% 12/4/2027 337,856 0.02%Canada Government International Bond 325,000 2.63% 25/1/2022 331,204 0.02%Province of Quebec Canada 275,000 7.13% 9/2/2024 328,815 0.02%Province of Alberta Canada 325,000 2.05% 17/8/2026 323,215 0.02%Ontario Teachers’ Finance Trust 315,000 2.75% 16/4/2021 318,758 0.02%Canadian Imperial Bank of Commerce 300,000 3.10% 2/4/2024 308,879 0.02%Teck Resources Ltd. 270,000 6.25% 15/7/2041 308,411 0.02%Ontario Teachers’ Cadillac Fairview Properties Trust 300,000 3.13% 20/3/2022 305,800 0.02%CDP Financial, Inc. 225,000 5.60% 25/11/2039 304,454 0.02%Bank of Montreal 300,000 2.50% 28/6/2024 302,505 0.02%Canadian Imperial Bank of Commerce 300,000 2.70% 2/2/2021 302,205 0.02%Bank of Montreal 300,000 1.75% 15/6/2021 299,533 0.02%Fortis, Inc. 293,000 3.06% 4/10/2026 298,663 0.02%Export Development Canada 300,000 1.38% 21/10/2021 298,073 0.02%Export Development Canada 280,000 1.75% 18/7/2022 281,048 0.02%Rogers Communications, Inc. 230,000 5.00% 15/3/2044 278,403 0.02%TransCanada PipeLines Ltd. 225,000 5.10% 15/3/2049 272,287 0.02%Bank of Montreal 260,000 3.30% 5/2/2024 270,694 0.02%Ontario Teachers’ Finance Trust 265,000 2.13% 19/9/2022 266,885 0.02%Hydro-Quebec 175,000 8.50% 1/12/2029 265,692 0.02%Suncor Energy, Inc. 190,000 6.50% 15/6/2038 263,784 0.02%Toronto-Dominion Bank 250,000 3.50% 19/7/2023 263,203 0.02%CDP Financial, Inc. 250,000 3.15% 24/7/2024 260,750 0.02%Province of Quebec Canada 250,000 2.63% 13/2/2023 256,101 0.02%OMERS Finance Trust 250,000 2.50% 2/5/2024 255,112 0.02%CDP Financial, Inc. 250,000 2.75% 7/3/2022 255,065 0.02%Bank of Nova Scotia 250,000 2.70% 7/3/2022 254,090 0.02%Bank of Montreal 250,000 2.50% 11/1/2022 253,317 0.02%Canadian Imperial Bank of Commerce 250,000 2.35% 27/7/2022 252,714 0.02%Bank of Nova Scotia 250,000 2.50% 8/1/2021 251,226 0.02%Rogers Communications, Inc. 225,000 4.35% 1/5/2049 249,981 0.02%Federation des Caisses Desjardins du Quebec 250,000 1.95% 26/9/2022 249,935 0.02%Toronto-Dominion Bank 250,000 1.80% 13/7/2021 249,911 0.02%Hydro-Quebec 200,000 8.05% 7/7/2024 249,145 0.02%Export Development Canada 250,000 1.50% 26/5/2021 249,042 0.02%TransCanada PipeLines Ltd. 225,000 4.25% 15/5/2028 248,899 0.02%Ontario Teachers’ Finance Trust 250,000 1.63% 12/9/2024 246,435 0.02%Province of Ontario Canada 240,000 2.55% 25/4/2022 243,966 0.02%Canadian Natural Resources Ltd. 225,000 3.80% 15/4/2024 235,178 0.02%Toronto-Dominion Bank^ 225,000 3.63% 15/9/2031 235,125 0.02%Province of Alberta Canada 225,000 2.95% 23/1/2024 233,545 0.02%Emera US Finance LP 200,000 4.75% 15/6/2046 230,840 0.02%Canadian Pacific Railway Co. 225,000 2.90% 1/2/2025 230,447 0.02%Province of Ontario Canada 225,000 2.50% 27/4/2026 230,305 0.02%Province of Ontario Canada 225,000 2.40% 8/2/2022 227,744 0.02%Canadian Imperial Bank of Commerce 225,000 2.55% 16/6/2022 227,707 0.02%Canadian Natural Resources Ltd. 175,000 6.25% 15/3/2038 226,484 0.02%Barrick North America Finance LLC 175,000 5.75% 1/5/2043 223,489 0.02%Ontario Teachers’ Cadillac Fairview Properties Trust 200,000 4.13% 1/2/2029 220,953 0.02%Canadian Pacific Railway Co. 150,000 6.13% 15/9/2115 218,509 0.02%Encana Corp. 180,000 6.50% 1/2/2038 211,355 0.01%Suncor Energy, Inc. 197,000 3.60% 1/12/2024 208,629 0.01%Alimentation Couche-Tard, Inc. 200,000 3.55% 26/7/2027 204,948 0.01%Province of British Columbia Canada 200,000 2.65% 22/9/2021 202,970 0.01%
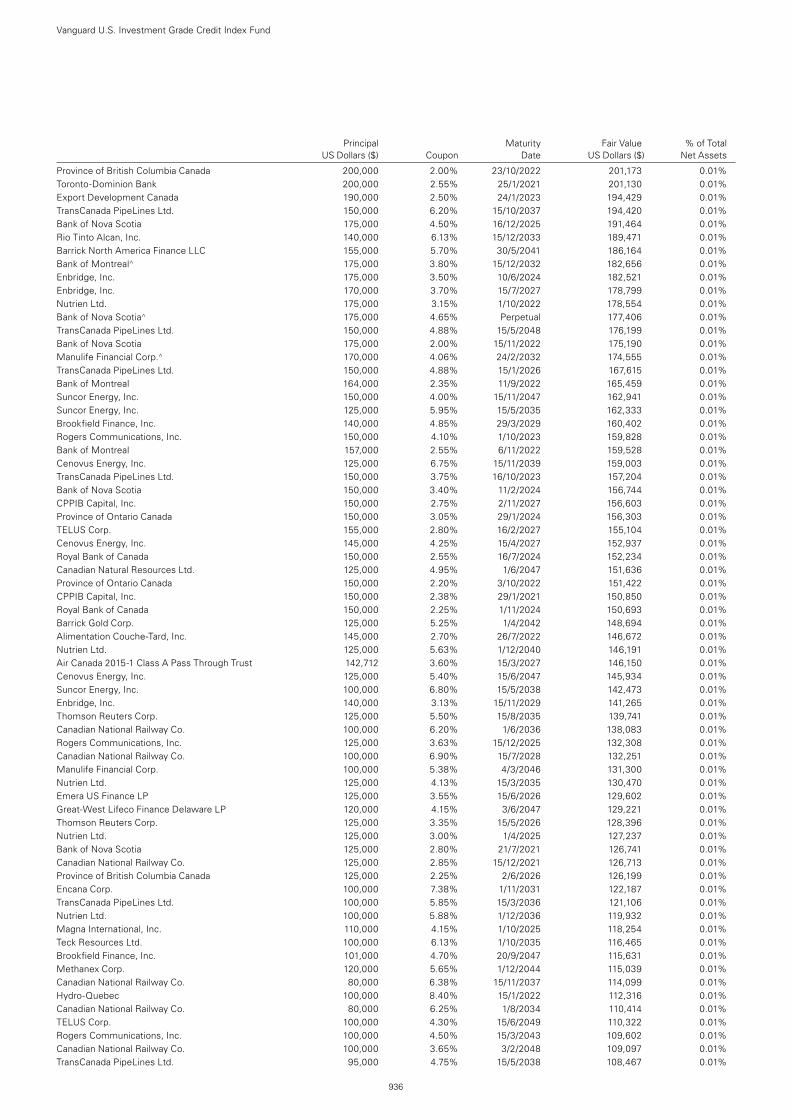
Principal Maturity Fair Value % of Total US Dollars ($) Coupon Date US Dollars ($) Net Assets
Vanguard U.S. Investment Grade Credit Index Fund
936
Province of British Columbia Canada 200,000 2.00% 23/10/2022 201,173 0.01%Toronto-Dominion Bank 200,000 2.55% 25/1/2021 201,130 0.01%Export Development Canada 190,000 2.50% 24/1/2023 194,429 0.01%TransCanada PipeLines Ltd. 150,000 6.20% 15/10/2037 194,420 0.01%Bank of Nova Scotia 175,000 4.50% 16/12/2025 191,464 0.01%Rio Tinto Alcan, Inc. 140,000 6.13% 15/12/2033 189,471 0.01%Barrick North America Finance LLC 155,000 5.70% 30/5/2041 186,164 0.01%Bank of Montreal^ 175,000 3.80% 15/12/2032 182,656 0.01%Enbridge, Inc. 175,000 3.50% 10/6/2024 182,521 0.01%Enbridge, Inc. 170,000 3.70% 15/7/2027 178,799 0.01%Nutrien Ltd. 175,000 3.15% 1/10/2022 178,554 0.01%Bank of Nova Scotia^ 175,000 4.65% Perpetual 177,406 0.01%TransCanada PipeLines Ltd. 150,000 4.88% 15/5/2048 176,199 0.01%Bank of Nova Scotia 175,000 2.00% 15/11/2022 175,190 0.01%Manulife Financial Corp.^ 170,000 4.06% 24/2/2032 174,555 0.01%TransCanada PipeLines Ltd. 150,000 4.88% 15/1/2026 167,615 0.01%Bank of Montreal 164,000 2.35% 11/9/2022 165,459 0.01%Suncor Energy, Inc. 150,000 4.00% 15/11/2047 162,941 0.01%Suncor Energy, Inc. 125,000 5.95% 15/5/2035 162,333 0.01%Brookfield Finance, Inc. 140,000 4.85% 29/3/2029 160,402 0.01%Rogers Communications, Inc. 150,000 4.10% 1/10/2023 159,828 0.01%Bank of Montreal 157,000 2.55% 6/11/2022 159,528 0.01%Cenovus Energy, Inc. 125,000 6.75% 15/11/2039 159,003 0.01%TransCanada PipeLines Ltd. 150,000 3.75% 16/10/2023 157,204 0.01%Bank of Nova Scotia 150,000 3.40% 11/2/2024 156,744 0.01%CPPIB Capital, Inc. 150,000 2.75% 2/11/2027 156,603 0.01%Province of Ontario Canada 150,000 3.05% 29/1/2024 156,303 0.01%TELUS Corp. 155,000 2.80% 16/2/2027 155,104 0.01%Cenovus Energy, Inc. 145,000 4.25% 15/4/2027 152,937 0.01%Royal Bank of Canada 150,000 2.55% 16/7/2024 152,234 0.01%Canadian Natural Resources Ltd. 125,000 4.95% 1/6/2047 151,636 0.01%Province of Ontario Canada 150,000 2.20% 3/10/2022 151,422 0.01%CPPIB Capital, Inc. 150,000 2.38% 29/1/2021 150,850 0.01%Royal Bank of Canada 150,000 2.25% 1/11/2024 150,693 0.01%Barrick Gold Corp. 125,000 5.25% 1/4/2042 148,694 0.01%Alimentation Couche-Tard, Inc. 145,000 2.70% 26/7/2022 146,672 0.01%Nutrien Ltd. 125,000 5.63% 1/12/2040 146,191 0.01%Air Canada 2015-1 Class A Pass Through Trust 142,712 3.60% 15/3/2027 146,150 0.01%Cenovus Energy, Inc. 125,000 5.40% 15/6/2047 145,934 0.01%Suncor Energy, Inc. 100,000 6.80% 15/5/2038 142,473 0.01%Enbridge, Inc. 140,000 3.13% 15/11/2029 141,265 0.01%Thomson Reuters Corp. 125,000 5.50% 15/8/2035 139,741 0.01%Canadian National Railway Co. 100,000 6.20% 1/6/2036 138,083 0.01%Rogers Communications, Inc. 125,000 3.63% 15/12/2025 132,308 0.01%Canadian National Railway Co. 100,000 6.90% 15/7/2028 132,251 0.01%Manulife Financial Corp. 100,000 5.38% 4/3/2046 131,300 0.01%Nutrien Ltd. 125,000 4.13% 15/3/2035 130,470 0.01%Emera US Finance LP 125,000 3.55% 15/6/2026 129,602 0.01%Great-West Lifeco Finance Delaware LP 120,000 4.15% 3/6/2047 129,221 0.01%Thomson Reuters Corp. 125,000 3.35% 15/5/2026 128,396 0.01%Nutrien Ltd. 125,000 3.00% 1/4/2025 127,237 0.01%Bank of Nova Scotia 125,000 2.80% 21/7/2021 126,741 0.01%Canadian National Railway Co. 125,000 2.85% 15/12/2021 126,713 0.01%Province of British Columbia Canada 125,000 2.25% 2/6/2026 126,199 0.01%Encana Corp. 100,000 7.38% 1/11/2031 122,187 0.01%TransCanada PipeLines Ltd. 100,000 5.85% 15/3/2036 121,106 0.01%Nutrien Ltd. 100,000 5.88% 1/12/2036 119,932 0.01%Magna International, Inc. 110,000 4.15% 1/10/2025 118,254 0.01%Teck Resources Ltd. 100,000 6.13% 1/10/2035 116,465 0.01%Brookfield Finance, Inc. 101,000 4.70% 20/9/2047 115,631 0.01%Methanex Corp. 120,000 5.65% 1/12/2044 115,039 0.01%Canadian National Railway Co. 80,000 6.38% 15/11/2037 114,099 0.01%Hydro-Quebec 100,000 8.40% 15/1/2022 112,316 0.01%Canadian National Railway Co. 80,000 6.25% 1/8/2034 110,414 0.01%TELUS Corp. 100,000 4.30% 15/6/2049 110,322 0.01%Rogers Communications, Inc. 100,000 4.50% 15/3/2043 109,602 0.01%Canadian National Railway Co. 100,000 3.65% 3/2/2048 109,097 0.01%TransCanada PipeLines Ltd. 95,000 4.75% 15/5/2038 108,467 0.01%
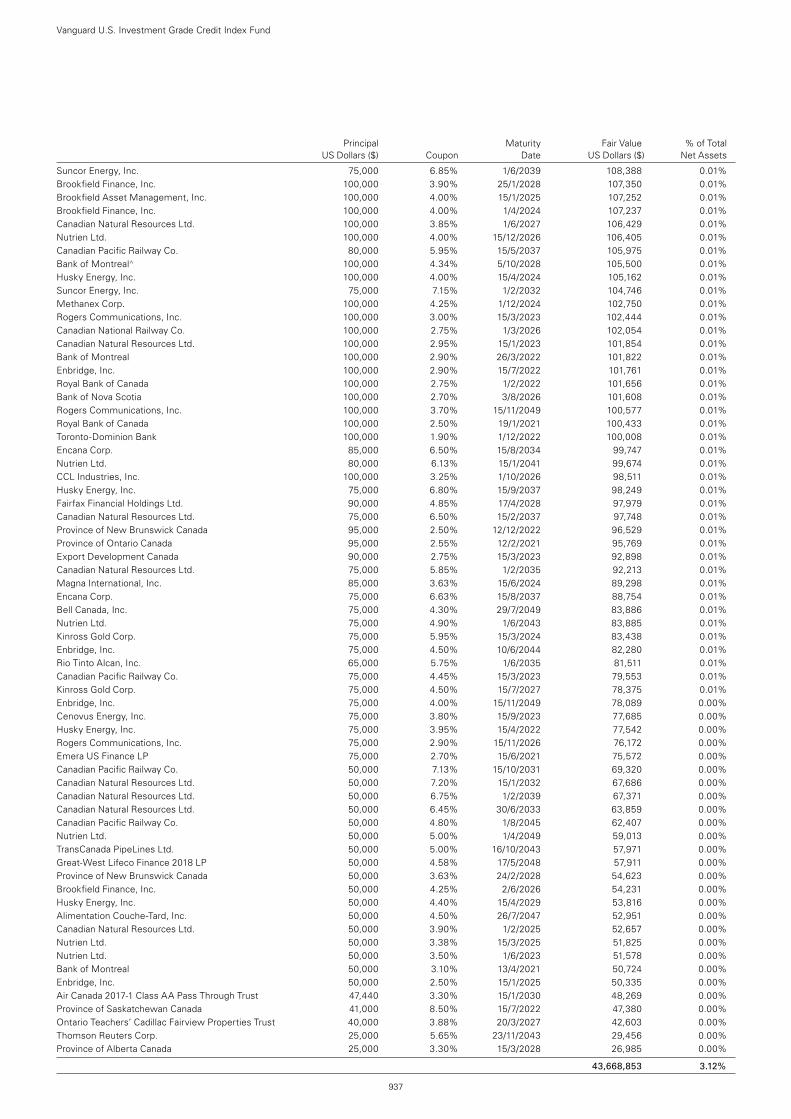
Principal Maturity Fair Value % of Total US Dollars ($) Coupon Date US Dollars ($) Net Assets
Vanguard U.S. Investment Grade Credit Index Fund
937
Suncor Energy, Inc. 75,000 6.85% 1/6/2039 108,388 0.01%Brookfield Finance, Inc. 100,000 3.90% 25/1/2028 107,350 0.01%Brookfield Asset Management, Inc. 100,000 4.00% 15/1/2025 107,252 0.01%Brookfield Finance, Inc. 100,000 4.00% 1/4/2024 107,237 0.01%Canadian Natural Resources Ltd. 100,000 3.85% 1/6/2027 106,429 0.01%Nutrien Ltd. 100,000 4.00% 15/12/2026 106,405 0.01%Canadian Pacific Railway Co. 80,000 5.95% 15/5/2037 105,975 0.01%Bank of Montreal^ 100,000 4.34% 5/10/2028 105,500 0.01%Husky Energy, Inc. 100,000 4.00% 15/4/2024 105,162 0.01%Suncor Energy, Inc. 75,000 7.15% 1/2/2032 104,746 0.01%Methanex Corp. 100,000 4.25% 1/12/2024 102,750 0.01%Rogers Communications, Inc. 100,000 3.00% 15/3/2023 102,444 0.01%Canadian National Railway Co. 100,000 2.75% 1/3/2026 102,054 0.01%Canadian Natural Resources Ltd. 100,000 2.95% 15/1/2023 101,854 0.01%Bank of Montreal 100,000 2.90% 26/3/2022 101,822 0.01%Enbridge, Inc. 100,000 2.90% 15/7/2022 101,761 0.01%Royal Bank of Canada 100,000 2.75% 1/2/2022 101,656 0.01%Bank of Nova Scotia 100,000 2.70% 3/8/2026 101,608 0.01%Rogers Communications, Inc. 100,000 3.70% 15/11/2049 100,577 0.01%Royal Bank of Canada 100,000 2.50% 19/1/2021 100,433 0.01%Toronto-Dominion Bank 100,000 1.90% 1/12/2022 100,008 0.01%Encana Corp. 85,000 6.50% 15/8/2034 99,747 0.01%Nutrien Ltd. 80,000 6.13% 15/1/2041 99,674 0.01%CCL Industries, Inc. 100,000 3.25% 1/10/2026 98,511 0.01%Husky Energy, Inc. 75,000 6.80% 15/9/2037 98,249 0.01%Fairfax Financial Holdings Ltd. 90,000 4.85% 17/4/2028 97,979 0.01%Canadian Natural Resources Ltd. 75,000 6.50% 15/2/2037 97,748 0.01%Province of New Brunswick Canada 95,000 2.50% 12/12/2022 96,529 0.01%Province of Ontario Canada 95,000 2.55% 12/2/2021 95,769 0.01%Export Development Canada 90,000 2.75% 15/3/2023 92,898 0.01%Canadian Natural Resources Ltd. 75,000 5.85% 1/2/2035 92,213 0.01%Magna International, Inc. 85,000 3.63% 15/6/2024 89,298 0.01%Encana Corp. 75,000 6.63% 15/8/2037 88,754 0.01%Bell Canada, Inc. 75,000 4.30% 29/7/2049 83,886 0.01%Nutrien Ltd. 75,000 4.90% 1/6/2043 83,885 0.01%Kinross Gold Corp. 75,000 5.95% 15/3/2024 83,438 0.01%Enbridge, Inc. 75,000 4.50% 10/6/2044 82,280 0.01%Rio Tinto Alcan, Inc. 65,000 5.75% 1/6/2035 81,511 0.01%Canadian Pacific Railway Co. 75,000 4.45% 15/3/2023 79,553 0.01%Kinross Gold Corp. 75,000 4.50% 15/7/2027 78,375 0.01%Enbridge, Inc. 75,000 4.00% 15/11/2049 78,089 0.00%Cenovus Energy, Inc. 75,000 3.80% 15/9/2023 77,685 0.00%Husky Energy, Inc. 75,000 3.95% 15/4/2022 77,542 0.00%Rogers Communications, Inc. 75,000 2.90% 15/11/2026 76,172 0.00%Emera US Finance LP 75,000 2.70% 15/6/2021 75,572 0.00%Canadian Pacific Railway Co. 50,000 7.13% 15/10/2031 69,320 0.00%Canadian Natural Resources Ltd. 50,000 7.20% 15/1/2032 67,686 0.00%Canadian Natural Resources Ltd. 50,000 6.75% 1/2/2039 67,371 0.00%Canadian Natural Resources Ltd. 50,000 6.45% 30/6/2033 63,859 0.00%Canadian Pacific Railway Co. 50,000 4.80% 1/8/2045 62,407 0.00%Nutrien Ltd. 50,000 5.00% 1/4/2049 59,013 0.00%TransCanada PipeLines Ltd. 50,000 5.00% 16/10/2043 57,971 0.00%Great-West Lifeco Finance 2018 LP 50,000 4.58% 17/5/2048 57,911 0.00%Province of New Brunswick Canada 50,000 3.63% 24/2/2028 54,623 0.00%Brookfield Finance, Inc. 50,000 4.25% 2/6/2026 54,231 0.00%Husky Energy, Inc. 50,000 4.40% 15/4/2029 53,816 0.00%Alimentation Couche-Tard, Inc. 50,000 4.50% 26/7/2047 52,951 0.00%Canadian Natural Resources Ltd. 50,000 3.90% 1/2/2025 52,657 0.00%Nutrien Ltd. 50,000 3.38% 15/3/2025 51,825 0.00%Nutrien Ltd. 50,000 3.50% 1/6/2023 51,578 0.00%Bank of Montreal 50,000 3.10% 13/4/2021 50,724 0.00%Enbridge, Inc. 50,000 2.50% 15/1/2025 50,335 0.00%Air Canada 2017-1 Class AA Pass Through Trust 47,440 3.30% 15/1/2030 48,269 0.00%Province of Saskatchewan Canada 41,000 8.50% 15/7/2022 47,380 0.00%Ontario Teachers’ Cadillac Fairview Properties Trust 40,000 3.88% 20/3/2027 42,603 0.00%Thomson Reuters Corp. 25,000 5.65% 23/11/2043 29,456 0.00%Province of Alberta Canada 25,000 3.30% 15/3/2028 26,985 0.00%
43,668,853 3.12%
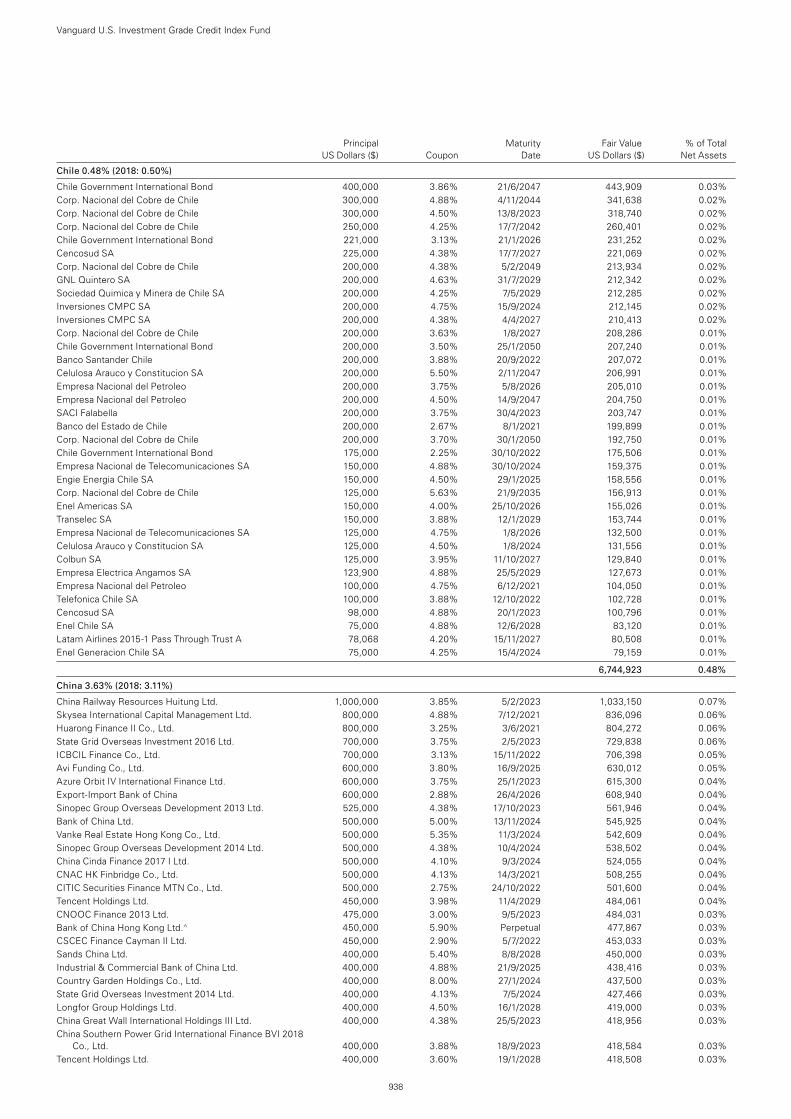
Principal Maturity Fair Value % of Total US Dollars ($) Coupon Date US Dollars ($) Net Assets
Vanguard U.S. Investment Grade Credit Index Fund
938
Chile 0.48% (2018: 0.50%)
Chile Government International Bond 400,000 3.86% 21/6/2047 443,909 0.03%Corp. Nacional del Cobre de Chile 300,000 4.88% 4/11/2044 341,638 0.02%Corp. Nacional del Cobre de Chile 300,000 4.50% 13/8/2023 318,740 0.02%Corp. Nacional del Cobre de Chile 250,000 4.25% 17/7/2042 260,401 0.02%Chile Government International Bond 221,000 3.13% 21/1/2026 231,252 0.02%Cencosud SA 225,000 4.38% 17/7/2027 221,069 0.02%Corp. Nacional del Cobre de Chile 200,000 4.38% 5/2/2049 213,934 0.02%GNL Quintero SA 200,000 4.63% 31/7/2029 212,342 0.02%Sociedad Quimica y Minera de Chile SA 200,000 4.25% 7/5/2029 212,285 0.02%Inversiones CMPC SA 200,000 4.75% 15/9/2024 212,145 0.02%Inversiones CMPC SA 200,000 4.38% 4/4/2027 210,413 0.02%Corp. Nacional del Cobre de Chile 200,000 3.63% 1/8/2027 208,286 0.01%Chile Government International Bond 200,000 3.50% 25/1/2050 207,240 0.01%Banco Santander Chile 200,000 3.88% 20/9/2022 207,072 0.01%Celulosa Arauco y Constitucion SA 200,000 5.50% 2/11/2047 206,991 0.01%Empresa Nacional del Petroleo 200,000 3.75% 5/8/2026 205,010 0.01%Empresa Nacional del Petroleo 200,000 4.50% 14/9/2047 204,750 0.01%SACI Falabella 200,000 3.75% 30/4/2023 203,747 0.01%Banco del Estado de Chile 200,000 2.67% 8/1/2021 199,899 0.01%Corp. Nacional del Cobre de Chile 200,000 3.70% 30/1/2050 192,750 0.01%Chile Government International Bond 175,000 2.25% 30/10/2022 175,506 0.01%Empresa Nacional de Telecomunicaciones SA 150,000 4.88% 30/10/2024 159,375 0.01%Engie Energia Chile SA 150,000 4.50% 29/1/2025 158,556 0.01%Corp. Nacional del Cobre de Chile 125,000 5.63% 21/9/2035 156,913 0.01%Enel Americas SA 150,000 4.00% 25/10/2026 155,026 0.01%Transelec SA 150,000 3.88% 12/1/2029 153,744 0.01%Empresa Nacional de Telecomunicaciones SA 125,000 4.75% 1/8/2026 132,500 0.01%Celulosa Arauco y Constitucion SA 125,000 4.50% 1/8/2024 131,556 0.01%Colbun SA 125,000 3.95% 11/10/2027 129,840 0.01%Empresa Electrica Angamos SA 123,900 4.88% 25/5/2029 127,673 0.01%Empresa Nacional del Petroleo 100,000 4.75% 6/12/2021 104,050 0.01%Telefonica Chile SA 100,000 3.88% 12/10/2022 102,728 0.01%Cencosud SA 98,000 4.88% 20/1/2023 100,796 0.01%Enel Chile SA 75,000 4.88% 12/6/2028 83,120 0.01%Latam Airlines 2015-1 Pass Through Trust A 78,068 4.20% 15/11/2027 80,508 0.01%Enel Generacion Chile SA 75,000 4.25% 15/4/2024 79,159 0.01%
6,744,923 0.48%
China 3.63% (2018: 3.11%)
China Railway Resources Huitung Ltd. 1,000,000 3.85% 5/2/2023 1,033,150 0.07%Skysea International Capital Management Ltd. 800,000 4.88% 7/12/2021 836,096 0.06%Huarong Finance II Co., Ltd. 800,000 3.25% 3/6/2021 804,272 0.06%State Grid Overseas Investment 2016 Ltd. 700,000 3.75% 2/5/2023 729,838 0.06%ICBCIL Finance Co., Ltd. 700,000 3.13% 15/11/2022 706,398 0.05%Avi Funding Co., Ltd. 600,000 3.80% 16/9/2025 630,012 0.05%Azure Orbit IV International Finance Ltd. 600,000 3.75% 25/1/2023 615,300 0.04%Export-Import Bank of China 600,000 2.88% 26/4/2026 608,940 0.04%Sinopec Group Overseas Development 2013 Ltd. 525,000 4.38% 17/10/2023 561,946 0.04%Bank of China Ltd. 500,000 5.00% 13/11/2024 545,925 0.04%Vanke Real Estate Hong Kong Co., Ltd. 500,000 5.35% 11/3/2024 542,609 0.04%Sinopec Group Overseas Development 2014 Ltd. 500,000 4.38% 10/4/2024 538,502 0.04%China Cinda Finance 2017 I Ltd. 500,000 4.10% 9/3/2024 524,055 0.04%CNAC HK Finbridge Co., Ltd. 500,000 4.13% 14/3/2021 508,255 0.04%CITIC Securities Finance MTN Co., Ltd. 500,000 2.75% 24/10/2022 501,600 0.04%Tencent Holdings Ltd. 450,000 3.98% 11/4/2029 484,061 0.04%CNOOC Finance 2013 Ltd. 475,000 3.00% 9/5/2023 484,031 0.03%Bank of China Hong Kong Ltd.^ 450,000 5.90% Perpetual 477,867 0.03%CSCEC Finance Cayman II Ltd. 450,000 2.90% 5/7/2022 453,033 0.03%Sands China Ltd. 400,000 5.40% 8/8/2028 450,000 0.03%Industrial & Commercial Bank of China Ltd. 400,000 4.88% 21/9/2025 438,416 0.03%Country Garden Holdings Co., Ltd. 400,000 8.00% 27/1/2024 437,500 0.03%State Grid Overseas Investment 2014 Ltd. 400,000 4.13% 7/5/2024 427,466 0.03%Longfor Group Holdings Ltd. 400,000 4.50% 16/1/2028 419,000 0.03%China Great Wall International Holdings III Ltd. 400,000 4.38% 25/5/2023 418,956 0.03%China Southern Power Grid International Finance BVI 2018
Co., Ltd. 400,000 3.88% 18/9/2023 418,584 0.03%Tencent Holdings Ltd. 400,000 3.60% 19/1/2028 418,508 0.03%
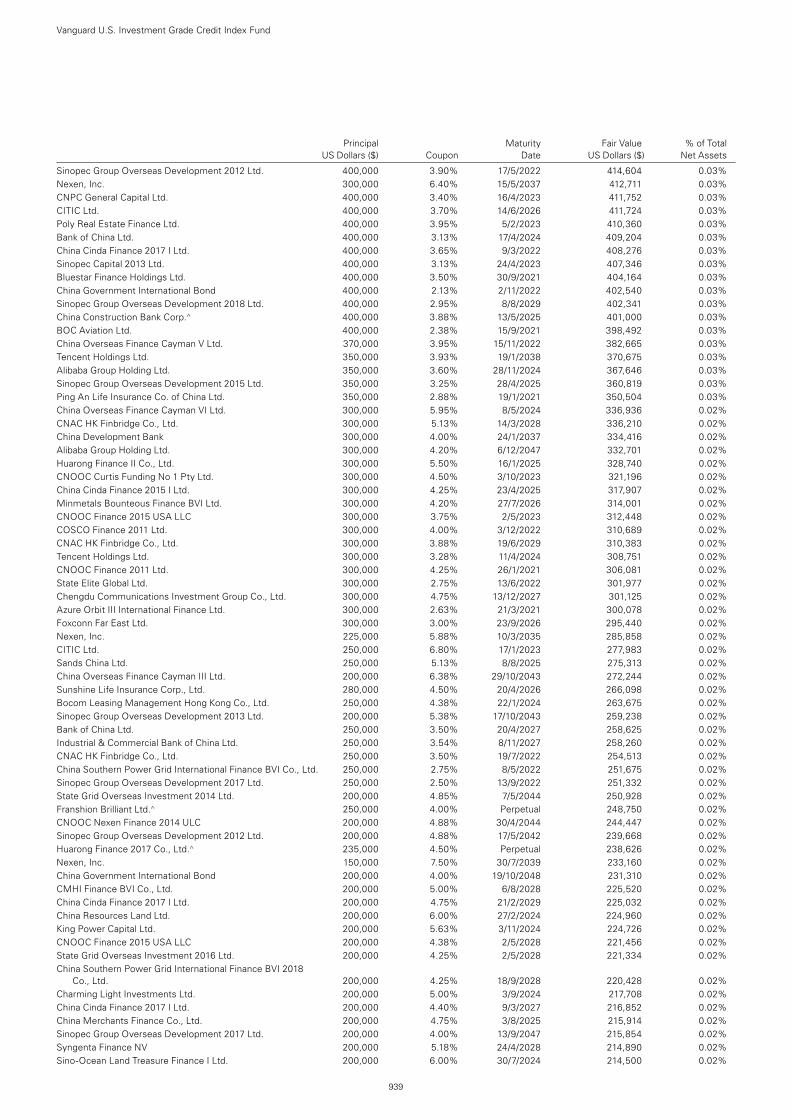
Principal Maturity Fair Value % of Total US Dollars ($) Coupon Date US Dollars ($) Net Assets
Vanguard U.S. Investment Grade Credit Index Fund
939
Sinopec Group Overseas Development 2012 Ltd. 400,000 3.90% 17/5/2022 414,604 0.03%Nexen, Inc. 300,000 6.40% 15/5/2037 412,711 0.03%CNPC General Capital Ltd. 400,000 3.40% 16/4/2023 411,752 0.03%CITIC Ltd. 400,000 3.70% 14/6/2026 411,724 0.03%Poly Real Estate Finance Ltd. 400,000 3.95% 5/2/2023 410,360 0.03%Bank of China Ltd. 400,000 3.13% 17/4/2024 409,204 0.03%China Cinda Finance 2017 I Ltd. 400,000 3.65% 9/3/2022 408,276 0.03%Sinopec Capital 2013 Ltd. 400,000 3.13% 24/4/2023 407,346 0.03%Bluestar Finance Holdings Ltd. 400,000 3.50% 30/9/2021 404,164 0.03%China Government International Bond 400,000 2.13% 2/11/2022 402,540 0.03%Sinopec Group Overseas Development 2018 Ltd. 400,000 2.95% 8/8/2029 402,341 0.03%China Construction Bank Corp.^ 400,000 3.88% 13/5/2025 401,000 0.03%BOC Aviation Ltd. 400,000 2.38% 15/9/2021 398,492 0.03%China Overseas Finance Cayman V Ltd. 370,000 3.95% 15/11/2022 382,665 0.03%Tencent Holdings Ltd. 350,000 3.93% 19/1/2038 370,675 0.03%Alibaba Group Holding Ltd. 350,000 3.60% 28/11/2024 367,646 0.03%Sinopec Group Overseas Development 2015 Ltd. 350,000 3.25% 28/4/2025 360,819 0.03%Ping An Life Insurance Co. of China Ltd. 350,000 2.88% 19/1/2021 350,504 0.03%China Overseas Finance Cayman VI Ltd. 300,000 5.95% 8/5/2024 336,936 0.02%CNAC HK Finbridge Co., Ltd. 300,000 5.13% 14/3/2028 336,210 0.02%China Development Bank 300,000 4.00% 24/1/2037 334,416 0.02%Alibaba Group Holding Ltd. 300,000 4.20% 6/12/2047 332,701 0.02%Huarong Finance II Co., Ltd. 300,000 5.50% 16/1/2025 328,740 0.02%CNOOC Curtis Funding No 1 Pty Ltd. 300,000 4.50% 3/10/2023 321,196 0.02%China Cinda Finance 2015 I Ltd. 300,000 4.25% 23/4/2025 317,907 0.02%Minmetals Bounteous Finance BVI Ltd. 300,000 4.20% 27/7/2026 314,001 0.02%CNOOC Finance 2015 USA LLC 300,000 3.75% 2/5/2023 312,448 0.02%COSCO Finance 2011 Ltd. 300,000 4.00% 3/12/2022 310,689 0.02%CNAC HK Finbridge Co., Ltd. 300,000 3.88% 19/6/2029 310,383 0.02%Tencent Holdings Ltd. 300,000 3.28% 11/4/2024 308,751 0.02%CNOOC Finance 2011 Ltd. 300,000 4.25% 26/1/2021 306,081 0.02%State Elite Global Ltd. 300,000 2.75% 13/6/2022 301,977 0.02%Chengdu Communications Investment Group Co., Ltd. 300,000 4.75% 13/12/2027 301,125 0.02%Azure Orbit III International Finance Ltd. 300,000 2.63% 21/3/2021 300,078 0.02%Foxconn Far East Ltd. 300,000 3.00% 23/9/2026 295,440 0.02%Nexen, Inc. 225,000 5.88% 10/3/2035 285,858 0.02%CITIC Ltd. 250,000 6.80% 17/1/2023 277,983 0.02%Sands China Ltd. 250,000 5.13% 8/8/2025 275,313 0.02%China Overseas Finance Cayman III Ltd. 200,000 6.38% 29/10/2043 272,244 0.02%Sunshine Life Insurance Corp., Ltd. 280,000 4.50% 20/4/2026 266,098 0.02%Bocom Leasing Management Hong Kong Co., Ltd. 250,000 4.38% 22/1/2024 263,675 0.02%Sinopec Group Overseas Development 2013 Ltd. 200,000 5.38% 17/10/2043 259,238 0.02%Bank of China Ltd. 250,000 3.50% 20/4/2027 258,625 0.02%Industrial & Commercial Bank of China Ltd. 250,000 3.54% 8/11/2027 258,260 0.02%CNAC HK Finbridge Co., Ltd. 250,000 3.50% 19/7/2022 254,513 0.02%China Southern Power Grid International Finance BVI Co., Ltd. 250,000 2.75% 8/5/2022 251,675 0.02%Sinopec Group Overseas Development 2017 Ltd. 250,000 2.50% 13/9/2022 251,332 0.02%State Grid Overseas Investment 2014 Ltd. 200,000 4.85% 7/5/2044 250,928 0.02%Franshion Brilliant Ltd.^ 250,000 4.00% Perpetual 248,750 0.02%CNOOC Nexen Finance 2014 ULC 200,000 4.88% 30/4/2044 244,447 0.02%Sinopec Group Overseas Development 2012 Ltd. 200,000 4.88% 17/5/2042 239,668 0.02%Huarong Finance 2017 Co., Ltd.^ 235,000 4.50% Perpetual 238,626 0.02%Nexen, Inc. 150,000 7.50% 30/7/2039 233,160 0.02%China Government International Bond 200,000 4.00% 19/10/2048 231,310 0.02%CMHI Finance BVI Co., Ltd. 200,000 5.00% 6/8/2028 225,520 0.02%China Cinda Finance 2017 I Ltd. 200,000 4.75% 21/2/2029 225,032 0.02%China Resources Land Ltd. 200,000 6.00% 27/2/2024 224,960 0.02%King Power Capital Ltd. 200,000 5.63% 3/11/2024 224,726 0.02%CNOOC Finance 2015 USA LLC 200,000 4.38% 2/5/2028 221,456 0.02%State Grid Overseas Investment 2016 Ltd. 200,000 4.25% 2/5/2028 221,334 0.02%China Southern Power Grid International Finance BVI 2018
Co., Ltd. 200,000 4.25% 18/9/2028 220,428 0.02%Charming Light Investments Ltd. 200,000 5.00% 3/9/2024 217,708 0.02%China Cinda Finance 2017 I Ltd. 200,000 4.40% 9/3/2027 216,852 0.02%China Merchants Finance Co., Ltd. 200,000 4.75% 3/8/2025 215,914 0.02%Sinopec Group Overseas Development 2017 Ltd. 200,000 4.00% 13/9/2047 215,854 0.02%Syngenta Finance NV 200,000 5.18% 24/4/2028 214,890 0.02%Sino-Ocean Land Treasure Finance I Ltd. 200,000 6.00% 30/7/2024 214,500 0.02%
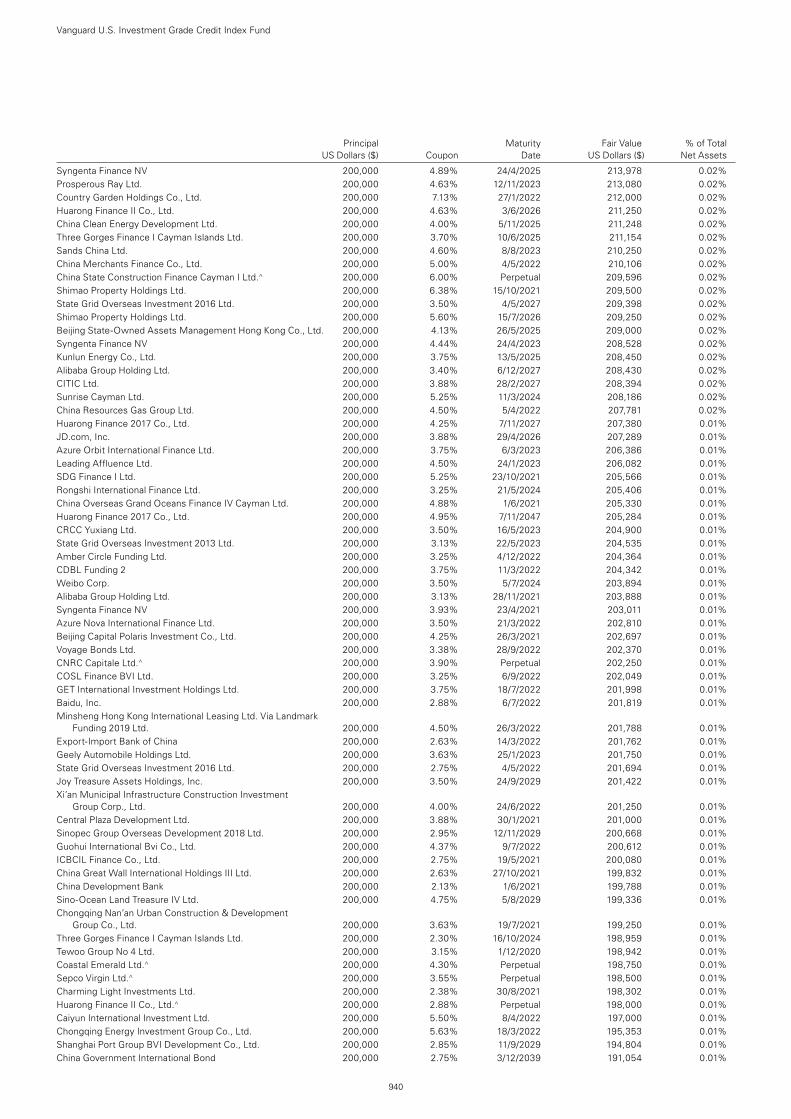
Vanguard U.S. Investment Grade Credit Index Fund
940
Syngenta Finance NV 200,000 4.89% 24/4/2025 213,978 0.02%Prosperous Ray Ltd. 200,000 4.63% 12/11/2023 213,080 0.02%Country Garden Holdings Co., Ltd. 200,000 7.13% 27/1/2022 212,000 0.02%Huarong Finance II Co., Ltd. 200,000 4.63% 3/6/2026 211,250 0.02%China Clean Energy Development Ltd. 200,000 4.00% 5/11/2025 211,248 0.02%Three Gorges Finance I Cayman Islands Ltd. 200,000 3.70% 10/6/2025 211,154 0.02%Sands China Ltd. 200,000 4.60% 8/8/2023 210,250 0.02%China Merchants Finance Co., Ltd. 200,000 5.00% 4/5/2022 210,106 0.02%China State Construction Finance Cayman I Ltd.^ 200,000 6.00% Perpetual 209,596 0.02%Shimao Property Holdings Ltd. 200,000 6.38% 15/10/2021 209,500 0.02%State Grid Overseas Investment 2016 Ltd. 200,000 3.50% 4/5/2027 209,398 0.02%Shimao Property Holdings Ltd. 200,000 5.60% 15/7/2026 209,250 0.02%Beijing State-Owned Assets Management Hong Kong Co., Ltd. 200,000 4.13% 26/5/2025 209,000 0.02%Syngenta Finance NV 200,000 4.44% 24/4/2023 208,528 0.02%Kunlun Energy Co., Ltd. 200,000 3.75% 13/5/2025 208,450 0.02%Alibaba Group Holding Ltd. 200,000 3.40% 6/12/2027 208,430 0.02%CITIC Ltd. 200,000 3.88% 28/2/2027 208,394 0.02%Sunrise Cayman Ltd. 200,000 5.25% 11/3/2024 208,186 0.02%China Resources Gas Group Ltd. 200,000 4.50% 5/4/2022 207,781 0.02%Huarong Finance 2017 Co., Ltd. 200,000 4.25% 7/11/2027 207,380 0.01%JD.com, Inc. 200,000 3.88% 29/4/2026 207,289 0.01%Azure Orbit International Finance Ltd. 200,000 3.75% 6/3/2023 206,386 0.01%Leading Affluence Ltd. 200,000 4.50% 24/1/2023 206,082 0.01%SDG Finance I Ltd. 200,000 5.25% 23/10/2021 205,566 0.01%Rongshi International Finance Ltd. 200,000 3.25% 21/5/2024 205,406 0.01%China Overseas Grand Oceans Finance IV Cayman Ltd. 200,000 4.88% 1/6/2021 205,330 0.01%Huarong Finance 2017 Co., Ltd. 200,000 4.95% 7/11/2047 205,284 0.01%CRCC Yuxiang Ltd. 200,000 3.50% 16/5/2023 204,900 0.01%State Grid Overseas Investment 2013 Ltd. 200,000 3.13% 22/5/2023 204,535 0.01%Amber Circle Funding Ltd. 200,000 3.25% 4/12/2022 204,364 0.01%CDBL Funding 2 200,000 3.75% 11/3/2022 204,342 0.01%Weibo Corp. 200,000 3.50% 5/7/2024 203,894 0.01%Alibaba Group Holding Ltd. 200,000 3.13% 28/11/2021 203,888 0.01%Syngenta Finance NV 200,000 3.93% 23/4/2021 203,011 0.01%Azure Nova International Finance Ltd. 200,000 3.50% 21/3/2022 202,810 0.01%Beijing Capital Polaris Investment Co., Ltd. 200,000 4.25% 26/3/2021 202,697 0.01%Voyage Bonds Ltd. 200,000 3.38% 28/9/2022 202,370 0.01%CNRC Capitale Ltd.^ 200,000 3.90% Perpetual 202,250 0.01%COSL Finance BVI Ltd. 200,000 3.25% 6/9/2022 202,049 0.01%GET International Investment Holdings Ltd. 200,000 3.75% 18/7/2022 201,998 0.01%Baidu, Inc. 200,000 2.88% 6/7/2022 201,819 0.01%Minsheng Hong Kong International Leasing Ltd. Via Landmark
Funding 2019 Ltd. 200,000 4.50% 26/3/2022 201,788 0.01%Export-Import Bank of China 200,000 2.63% 14/3/2022 201,762 0.01%Geely Automobile Holdings Ltd. 200,000 3.63% 25/1/2023 201,750 0.01%State Grid Overseas Investment 2016 Ltd. 200,000 2.75% 4/5/2022 201,694 0.01%Joy Treasure Assets Holdings, Inc. 200,000 3.50% 24/9/2029 201,422 0.01%Xi’an Municipal Infrastructure Construction Investment
Group Corp., Ltd. 200,000 4.00% 24/6/2022 201,250 0.01%Central Plaza Development Ltd. 200,000 3.88% 30/1/2021 201,000 0.01%Sinopec Group Overseas Development 2018 Ltd. 200,000 2.95% 12/11/2029 200,668 0.01%Guohui International Bvi Co., Ltd. 200,000 4.37% 9/7/2022 200,612 0.01%ICBCIL Finance Co., Ltd. 200,000 2.75% 19/5/2021 200,080 0.01%China Great Wall International Holdings III Ltd. 200,000 2.63% 27/10/2021 199,832 0.01%China Development Bank 200,000 2.13% 1/6/2021 199,788 0.01%Sino-Ocean Land Treasure IV Ltd. 200,000 4.75% 5/8/2029 199,336 0.01%Chongqing Nan’an Urban Construction & Development
Group Co., Ltd. 200,000 3.63% 19/7/2021 199,250 0.01%Three Gorges Finance I Cayman Islands Ltd. 200,000 2.30% 16/10/2024 198,959 0.01%Tewoo Group No 4 Ltd. 200,000 3.15% 1/12/2020 198,942 0.01%Coastal Emerald Ltd.^ 200,000 4.30% Perpetual 198,750 0.01%Sepco Virgin Ltd.^ 200,000 3.55% Perpetual 198,500 0.01%Charming Light Investments Ltd. 200,000 2.38% 30/8/2021 198,302 0.01%Huarong Finance II Co., Ltd.^ 200,000 2.88% Perpetual 198,000 0.01%Caiyun International Investment Ltd. 200,000 5.50% 8/4/2022 197,000 0.01%Chongqing Energy Investment Group Co., Ltd. 200,000 5.63% 18/3/2022 195,353 0.01%Shanghai Port Group BVI Development Co., Ltd. 200,000 2.85% 11/9/2029 194,804 0.01%China Government International Bond 200,000 2.75% 3/12/2039 191,054 0.01%
Principal Maturity Fair Value % of Total US Dollars ($) Coupon Date US Dollars ($) Net Assets
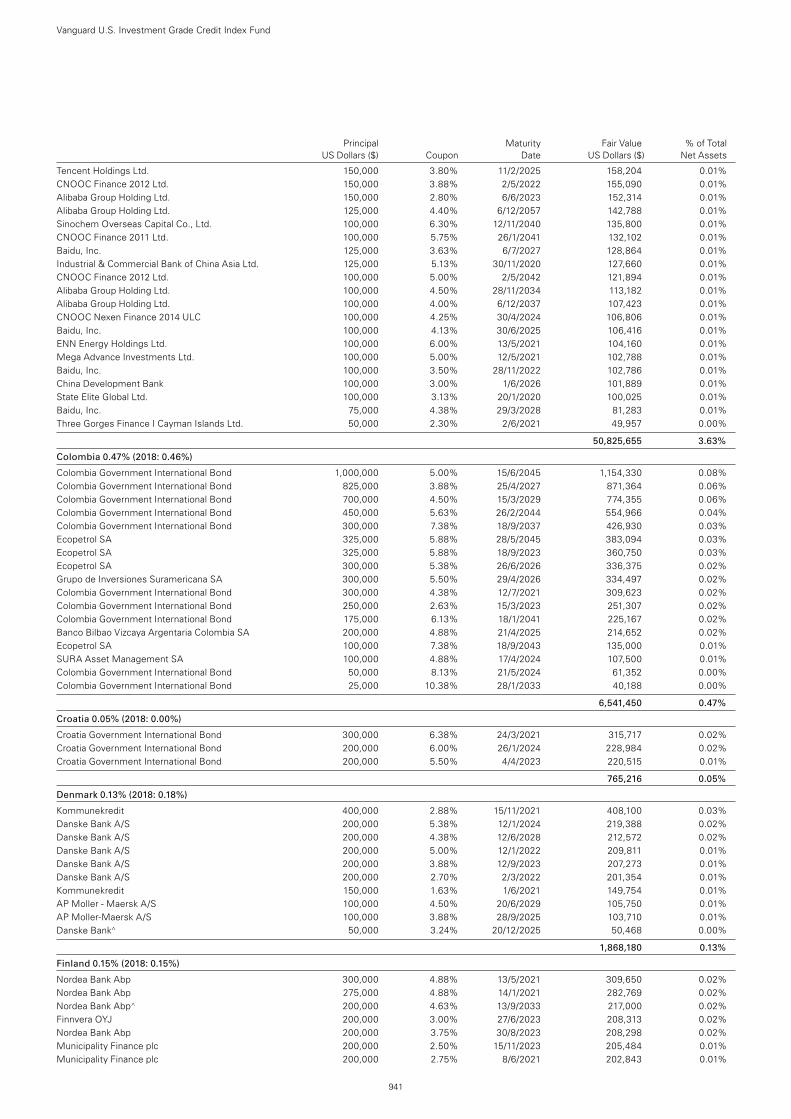
Vanguard U.S. Investment Grade Credit Index Fund
941
Tencent Holdings Ltd. 150,000 3.80% 11/2/2025 158,204 0.01%CNOOC Finance 2012 Ltd. 150,000 3.88% 2/5/2022 155,090 0.01%Alibaba Group Holding Ltd. 150,000 2.80% 6/6/2023 152,314 0.01%Alibaba Group Holding Ltd. 125,000 4.40% 6/12/2057 142,788 0.01%Sinochem Overseas Capital Co., Ltd. 100,000 6.30% 12/11/2040 135,800 0.01%CNOOC Finance 2011 Ltd. 100,000 5.75% 26/1/2041 132,102 0.01%Baidu, Inc. 125,000 3.63% 6/7/2027 128,864 0.01%Industrial & Commercial Bank of China Asia Ltd. 125,000 5.13% 30/11/2020 127,660 0.01%CNOOC Finance 2012 Ltd. 100,000 5.00% 2/5/2042 121,894 0.01%Alibaba Group Holding Ltd. 100,000 4.50% 28/11/2034 113,182 0.01%Alibaba Group Holding Ltd. 100,000 4.00% 6/12/2037 107,423 0.01%CNOOC Nexen Finance 2014 ULC 100,000 4.25% 30/4/2024 106,806 0.01%Baidu, Inc. 100,000 4.13% 30/6/2025 106,416 0.01%ENN Energy Holdings Ltd. 100,000 6.00% 13/5/2021 104,160 0.01%Mega Advance Investments Ltd. 100,000 5.00% 12/5/2021 102,788 0.01%Baidu, Inc. 100,000 3.50% 28/11/2022 102,786 0.01%China Development Bank 100,000 3.00% 1/6/2026 101,889 0.01%State Elite Global Ltd. 100,000 3.13% 20/1/2020 100,025 0.01%Baidu, Inc. 75,000 4.38% 29/3/2028 81,283 0.01%Three Gorges Finance I Cayman Islands Ltd. 50,000 2.30% 2/6/2021 49,957 0.00%
50,825,655 3.63%
Colombia 0.47% (2018: 0.46%)
Colombia Government International Bond 1,000,000 5.00% 15/6/2045 1,154,330 0.08%Colombia Government International Bond 825,000 3.88% 25/4/2027 871,364 0.06%Colombia Government International Bond 700,000 4.50% 15/3/2029 774,355 0.06%Colombia Government International Bond 450,000 5.63% 26/2/2044 554,966 0.04%Colombia Government International Bond 300,000 7.38% 18/9/2037 426,930 0.03%Ecopetrol SA 325,000 5.88% 28/5/2045 383,094 0.03%Ecopetrol SA 325,000 5.88% 18/9/2023 360,750 0.03%Ecopetrol SA 300,000 5.38% 26/6/2026 336,375 0.02%Grupo de Inversiones Suramericana SA 300,000 5.50% 29/4/2026 334,497 0.02%Colombia Government International Bond 300,000 4.38% 12/7/2021 309,623 0.02%Colombia Government International Bond 250,000 2.63% 15/3/2023 251,307 0.02%Colombia Government International Bond 175,000 6.13% 18/1/2041 225,167 0.02%Banco Bilbao Vizcaya Argentaria Colombia SA 200,000 4.88% 21/4/2025 214,652 0.02%Ecopetrol SA 100,000 7.38% 18/9/2043 135,000 0.01%SURA Asset Management SA 100,000 4.88% 17/4/2024 107,500 0.01%Colombia Government International Bond 50,000 8.13% 21/5/2024 61,352 0.00%Colombia Government International Bond 25,000 10.38% 28/1/2033 40,188 0.00%
6,541,450 0.47%
Croatia 0.05% (2018: 0.00%)
Croatia Government International Bond 300,000 6.38% 24/3/2021 315,717 0.02%Croatia Government International Bond 200,000 6.00% 26/1/2024 228,984 0.02%Croatia Government International Bond 200,000 5.50% 4/4/2023 220,515 0.01%
765,216 0.05%
Denmark 0.13% (2018: 0.18%)
Kommunekredit 400,000 2.88% 15/11/2021 408,100 0.03%Danske Bank A/S 200,000 5.38% 12/1/2024 219,388 0.02%Danske Bank A/S 200,000 4.38% 12/6/2028 212,572 0.02%Danske Bank A/S 200,000 5.00% 12/1/2022 209,811 0.01%Danske Bank A/S 200,000 3.88% 12/9/2023 207,273 0.01%Danske Bank A/S 200,000 2.70% 2/3/2022 201,354 0.01%Kommunekredit 150,000 1.63% 1/6/2021 149,754 0.01%AP Moller - Maersk A/S 100,000 4.50% 20/6/2029 105,750 0.01%AP Moller-Maersk A/S 100,000 3.88% 28/9/2025 103,710 0.01%Danske Bank^ 50,000 3.24% 20/12/2025 50,468 0.00%
1,868,180 0.13%
Finland 0.15% (2018: 0.15%)
Nordea Bank Abp 300,000 4.88% 13/5/2021 309,650 0.02%Nordea Bank Abp 275,000 4.88% 14/1/2021 282,769 0.02%Nordea Bank Abp^ 200,000 4.63% 13/9/2033 217,000 0.02%Finnvera OYJ 200,000 3.00% 27/6/2023 208,313 0.02%Nordea Bank Abp 200,000 3.75% 30/8/2023 208,298 0.02%Municipality Finance plc 200,000 2.50% 15/11/2023 205,484 0.01%Municipality Finance plc 200,000 2.75% 8/6/2021 202,843 0.01%
Principal Maturity Fair Value % of Total US Dollars ($) Coupon Date US Dollars ($) Net Assets
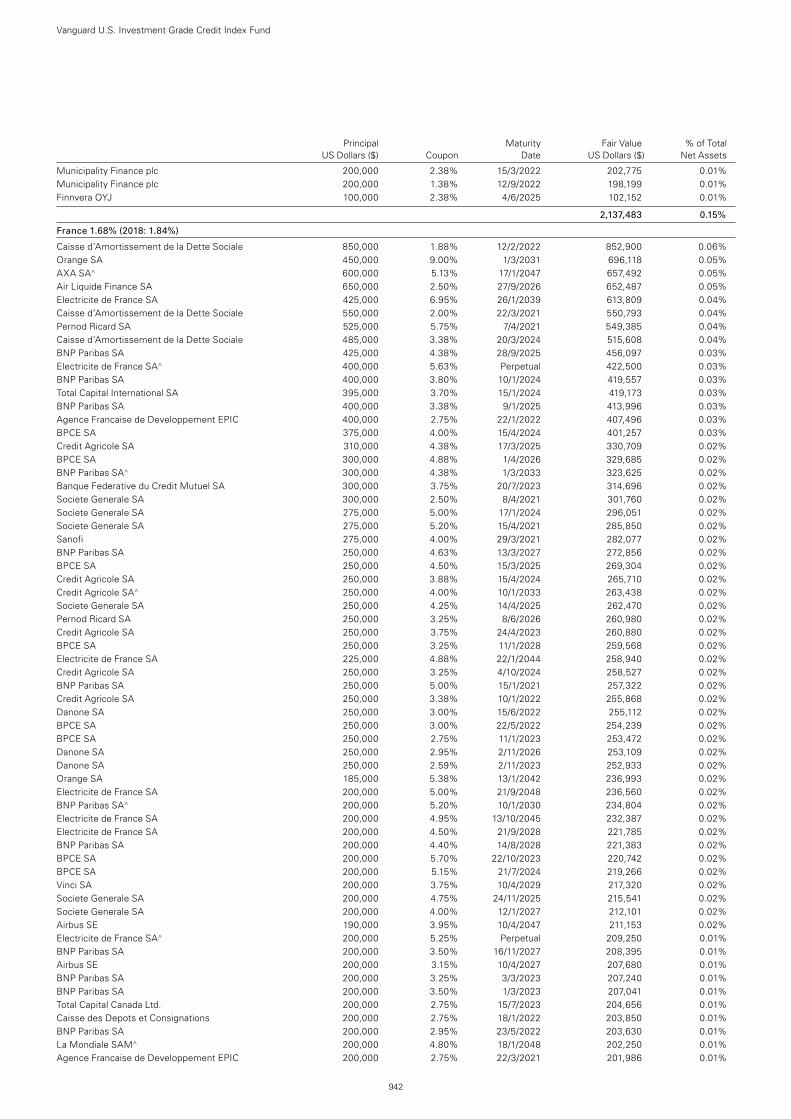
Vanguard U.S. Investment Grade Credit Index Fund
942
Municipality Finance plc 200,000 2.38% 15/3/2022 202,775 0.01%Municipality Finance plc 200,000 1.38% 12/9/2022 198,199 0.01%Finnvera OYJ 100,000 2.38% 4/6/2025 102,152 0.01%
2,137,483 0.15%
France 1.68% (2018: 1.84%)
Caisse d’Amortissement de la Dette Sociale 850,000 1.88% 12/2/2022 852,900 0.06%Orange SA 450,000 9.00% 1/3/2031 696,118 0.05%AXA SA^ 600,000 5.13% 17/1/2047 657,492 0.05%Air Liquide Finance SA 650,000 2.50% 27/9/2026 652,487 0.05%Electricite de France SA 425,000 6.95% 26/1/2039 613,809 0.04%Caisse d’Amortissement de la Dette Sociale 550,000 2.00% 22/3/2021 550,793 0.04%Pernod Ricard SA 525,000 5.75% 7/4/2021 549,385 0.04%Caisse d’Amortissement de la Dette Sociale 485,000 3.38% 20/3/2024 515,608 0.04%BNP Paribas SA 425,000 4.38% 28/9/2025 456,097 0.03%Electricite de France SA^ 400,000 5.63% Perpetual 422,500 0.03%BNP Paribas SA 400,000 3.80% 10/1/2024 419,557 0.03%Total Capital International SA 395,000 3.70% 15/1/2024 419,173 0.03%BNP Paribas SA 400,000 3.38% 9/1/2025 413,996 0.03%Agence Francaise de Developpement EPIC 400,000 2.75% 22/1/2022 407,496 0.03%BPCE SA 375,000 4.00% 15/4/2024 401,257 0.03%Credit Agricole SA 310,000 4.38% 17/3/2025 330,709 0.02%BPCE SA 300,000 4.88% 1/4/2026 329,685 0.02%BNP Paribas SA^ 300,000 4.38% 1/3/2033 323,625 0.02%Banque Federative du Credit Mutuel SA 300,000 3.75% 20/7/2023 314,696 0.02%Societe Generale SA 300,000 2.50% 8/4/2021 301,760 0.02%Societe Generale SA 275,000 5.00% 17/1/2024 296,051 0.02%Societe Generale SA 275,000 5.20% 15/4/2021 285,850 0.02%Sanofi 275,000 4.00% 29/3/2021 282,077 0.02%BNP Paribas SA 250,000 4.63% 13/3/2027 272,856 0.02%BPCE SA 250,000 4.50% 15/3/2025 269,304 0.02%Credit Agricole SA 250,000 3.88% 15/4/2024 265,710 0.02%Credit Agricole SA^ 250,000 4.00% 10/1/2033 263,438 0.02%Societe Generale SA 250,000 4.25% 14/4/2025 262,470 0.02%Pernod Ricard SA 250,000 3.25% 8/6/2026 260,980 0.02%Credit Agricole SA 250,000 3.75% 24/4/2023 260,880 0.02%BPCE SA 250,000 3.25% 11/1/2028 259,568 0.02%Electricite de France SA 225,000 4.88% 22/1/2044 258,940 0.02%Credit Agricole SA 250,000 3.25% 4/10/2024 258,527 0.02%BNP Paribas SA 250,000 5.00% 15/1/2021 257,322 0.02%Credit Agricole SA 250,000 3.38% 10/1/2022 255,868 0.02%Danone SA 250,000 3.00% 15/6/2022 255,112 0.02%BPCE SA 250,000 3.00% 22/5/2022 254,239 0.02%BPCE SA 250,000 2.75% 11/1/2023 253,472 0.02%Danone SA 250,000 2.95% 2/11/2026 253,109 0.02%Danone SA 250,000 2.59% 2/11/2023 252,933 0.02%Orange SA 185,000 5.38% 13/1/2042 236,993 0.02%Electricite de France SA 200,000 5.00% 21/9/2048 236,560 0.02%BNP Paribas SA^ 200,000 5.20% 10/1/2030 234,804 0.02%Electricite de France SA 200,000 4.95% 13/10/2045 232,387 0.02%Electricite de France SA 200,000 4.50% 21/9/2028 221,785 0.02%BNP Paribas SA 200,000 4.40% 14/8/2028 221,383 0.02%BPCE SA 200,000 5.70% 22/10/2023 220,742 0.02%BPCE SA 200,000 5.15% 21/7/2024 219,266 0.02%Vinci SA 200,000 3.75% 10/4/2029 217,320 0.02%Societe Generale SA 200,000 4.75% 24/11/2025 215,541 0.02%Societe Generale SA 200,000 4.00% 12/1/2027 212,101 0.02%Airbus SE 190,000 3.95% 10/4/2047 211,153 0.02%Electricite de France SA^ 200,000 5.25% Perpetual 209,250 0.01%BNP Paribas SA 200,000 3.50% 16/11/2027 208,395 0.01%Airbus SE 200,000 3.15% 10/4/2027 207,680 0.01%BNP Paribas SA 200,000 3.25% 3/3/2023 207,240 0.01%BNP Paribas SA 200,000 3.50% 1/3/2023 207,041 0.01%Total Capital Canada Ltd. 200,000 2.75% 15/7/2023 204,656 0.01%Caisse des Depots et Consignations 200,000 2.75% 18/1/2022 203,850 0.01%BNP Paribas SA 200,000 2.95% 23/5/2022 203,630 0.01%La Mondiale SAM^ 200,000 4.80% 18/1/2048 202,250 0.01%Agence Francaise de Developpement EPIC 200,000 2.75% 22/3/2021 201,986 0.01%
Principal Maturity Fair Value % of Total US Dollars ($) Coupon Date US Dollars ($) Net Assets
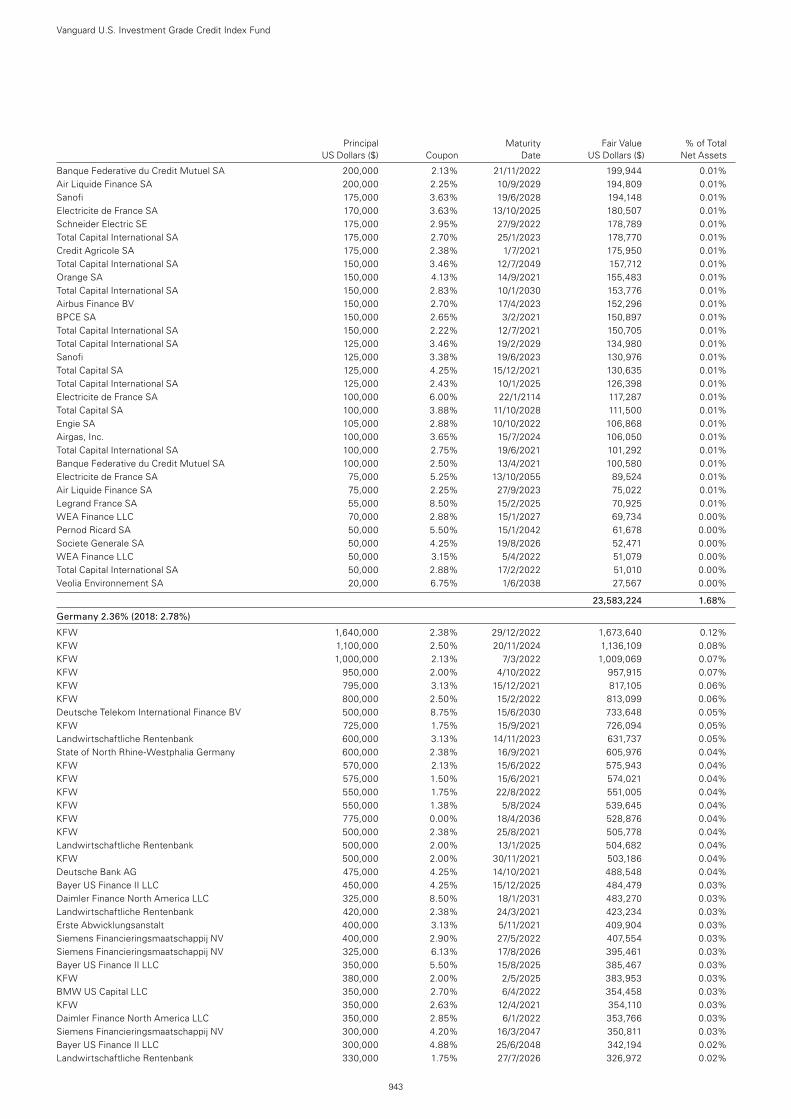
Vanguard U.S. Investment Grade Credit Index Fund
943
Banque Federative du Credit Mutuel SA 200,000 2.13% 21/11/2022 199,944 0.01%Air Liquide Finance SA 200,000 2.25% 10/9/2029 194,809 0.01%Sanofi 175,000 3.63% 19/6/2028 194,148 0.01%Electricite de France SA 170,000 3.63% 13/10/2025 180,507 0.01%Schneider Electric SE 175,000 2.95% 27/9/2022 178,789 0.01%Total Capital International SA 175,000 2.70% 25/1/2023 178,770 0.01%Credit Agricole SA 175,000 2.38% 1/7/2021 175,950 0.01%Total Capital International SA 150,000 3.46% 12/7/2049 157,712 0.01%Orange SA 150,000 4.13% 14/9/2021 155,483 0.01%Total Capital International SA 150,000 2.83% 10/1/2030 153,776 0.01%Airbus Finance BV 150,000 2.70% 17/4/2023 152,296 0.01%BPCE SA 150,000 2.65% 3/2/2021 150,897 0.01%Total Capital International SA 150,000 2.22% 12/7/2021 150,705 0.01%Total Capital International SA 125,000 3.46% 19/2/2029 134,980 0.01%Sanofi 125,000 3.38% 19/6/2023 130,976 0.01%Total Capital SA 125,000 4.25% 15/12/2021 130,635 0.01%Total Capital International SA 125,000 2.43% 10/1/2025 126,398 0.01%Electricite de France SA 100,000 6.00% 22/1/2114 117,287 0.01%Total Capital SA 100,000 3.88% 11/10/2028 111,500 0.01%Engie SA 105,000 2.88% 10/10/2022 106,868 0.01%Airgas, Inc. 100,000 3.65% 15/7/2024 106,050 0.01%Total Capital International SA 100,000 2.75% 19/6/2021 101,292 0.01%Banque Federative du Credit Mutuel SA 100,000 2.50% 13/4/2021 100,580 0.01%Electricite de France SA 75,000 5.25% 13/10/2055 89,524 0.01%Air Liquide Finance SA 75,000 2.25% 27/9/2023 75,022 0.01%Legrand France SA 55,000 8.50% 15/2/2025 70,925 0.01%WEA Finance LLC 70,000 2.88% 15/1/2027 69,734 0.00%Pernod Ricard SA 50,000 5.50% 15/1/2042 61,678 0.00%Societe Generale SA 50,000 4.25% 19/8/2026 52,471 0.00%WEA Finance LLC 50,000 3.15% 5/4/2022 51,079 0.00%Total Capital International SA 50,000 2.88% 17/2/2022 51,010 0.00%Veolia Environnement SA 20,000 6.75% 1/6/2038 27,567 0.00%
23,583,224 1.68%
Germany 2.36% (2018: 2.78%)
KFW 1,640,000 2.38% 29/12/2022 1,673,640 0.12%KFW 1,100,000 2.50% 20/11/2024 1,136,109 0.08%KFW 1,000,000 2.13% 7/3/2022 1,009,069 0.07%KFW 950,000 2.00% 4/10/2022 957,915 0.07%KFW 795,000 3.13% 15/12/2021 817,105 0.06%KFW 800,000 2.50% 15/2/2022 813,099 0.06%Deutsche Telekom International Finance BV 500,000 8.75% 15/6/2030 733,648 0.05%KFW 725,000 1.75% 15/9/2021 726,094 0.05%Landwirtschaftliche Rentenbank 600,000 3.13% 14/11/2023 631,737 0.05%State of North Rhine-Westphalia Germany 600,000 2.38% 16/9/2021 605,976 0.04%KFW 570,000 2.13% 15/6/2022 575,943 0.04%KFW 575,000 1.50% 15/6/2021 574,021 0.04%KFW 550,000 1.75% 22/8/2022 551,005 0.04%KFW 550,000 1.38% 5/8/2024 539,645 0.04%KFW 775,000 0.00% 18/4/2036 528,876 0.04%KFW 500,000 2.38% 25/8/2021 505,778 0.04%Landwirtschaftliche Rentenbank 500,000 2.00% 13/1/2025 504,682 0.04%KFW 500,000 2.00% 30/11/2021 503,186 0.04%Deutsche Bank AG 475,000 4.25% 14/10/2021 488,548 0.04%Bayer US Finance II LLC 450,000 4.25% 15/12/2025 484,479 0.03%Daimler Finance North America LLC 325,000 8.50% 18/1/2031 483,270 0.03%Landwirtschaftliche Rentenbank 420,000 2.38% 24/3/2021 423,234 0.03%Erste Abwicklungsanstalt 400,000 3.13% 5/11/2021 409,904 0.03%Siemens Financieringsmaatschappij NV 400,000 2.90% 27/5/2022 407,554 0.03%Siemens Financieringsmaatschappij NV 325,000 6.13% 17/8/2026 395,461 0.03%Bayer US Finance II LLC 350,000 5.50% 15/8/2025 385,467 0.03%KFW 380,000 2.00% 2/5/2025 383,953 0.03%BMW US Capital LLC 350,000 2.70% 6/4/2022 354,458 0.03%KFW 350,000 2.63% 12/4/2021 354,110 0.03%Daimler Finance North America LLC 350,000 2.85% 6/1/2022 353,766 0.03%Siemens Financieringsmaatschappij NV 300,000 4.20% 16/3/2047 350,811 0.03%Bayer US Finance II LLC 300,000 4.88% 25/6/2048 342,194 0.02%Landwirtschaftliche Rentenbank 330,000 1.75% 27/7/2026 326,972 0.02%
Principal Maturity Fair Value % of Total US Dollars ($) Coupon Date US Dollars ($) Net Assets
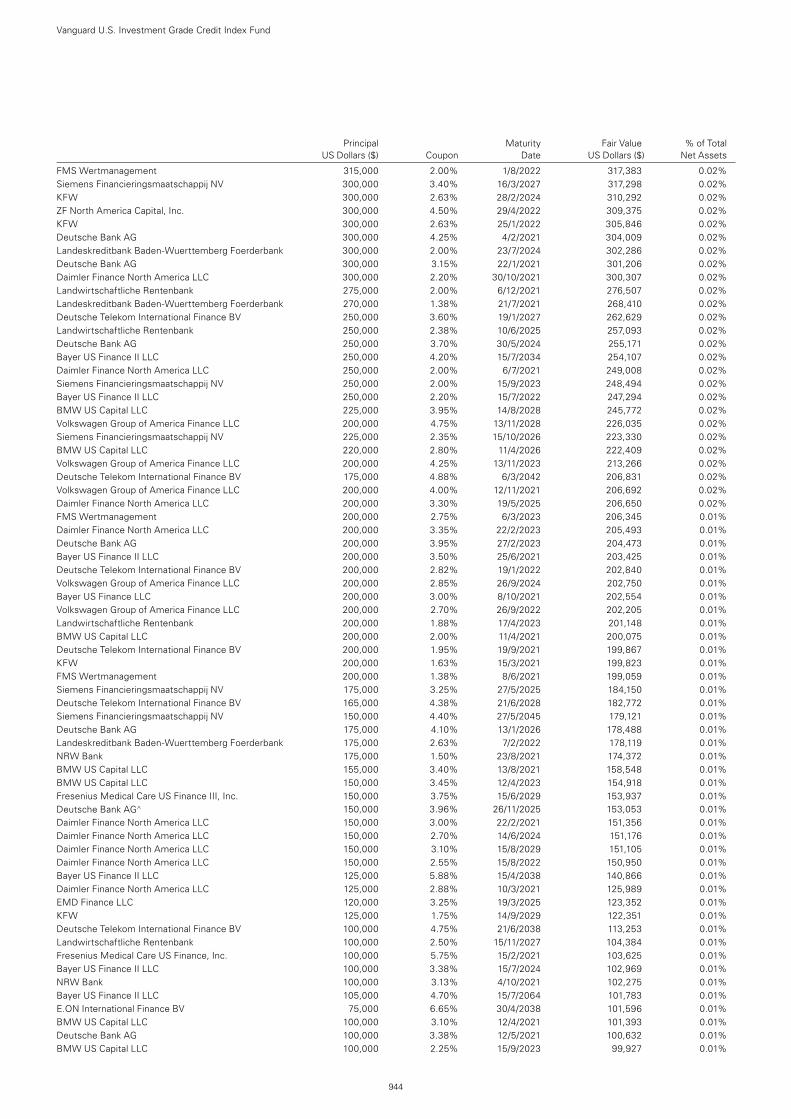
Vanguard U.S. Investment Grade Credit Index Fund
944
FMS Wertmanagement 315,000 2.00% 1/8/2022 317,383 0.02%Siemens Financieringsmaatschappij NV 300,000 3.40% 16/3/2027 317,298 0.02%KFW 300,000 2.63% 28/2/2024 310,292 0.02%ZF North America Capital, Inc. 300,000 4.50% 29/4/2022 309,375 0.02%KFW 300,000 2.63% 25/1/2022 305,846 0.02%Deutsche Bank AG 300,000 4.25% 4/2/2021 304,009 0.02%Landeskreditbank Baden-Wuerttemberg Foerderbank 300,000 2.00% 23/7/2024 302,286 0.02%Deutsche Bank AG 300,000 3.15% 22/1/2021 301,206 0.02%Daimler Finance North America LLC 300,000 2.20% 30/10/2021 300,307 0.02%Landwirtschaftliche Rentenbank 275,000 2.00% 6/12/2021 276,507 0.02%Landeskreditbank Baden-Wuerttemberg Foerderbank 270,000 1.38% 21/7/2021 268,410 0.02%Deutsche Telekom International Finance BV 250,000 3.60% 19/1/2027 262,629 0.02%Landwirtschaftliche Rentenbank 250,000 2.38% 10/6/2025 257,093 0.02%Deutsche Bank AG 250,000 3.70% 30/5/2024 255,171 0.02%Bayer US Finance II LLC 250,000 4.20% 15/7/2034 254,107 0.02%Daimler Finance North America LLC 250,000 2.00% 6/7/2021 249,008 0.02%Siemens Financieringsmaatschappij NV 250,000 2.00% 15/9/2023 248,494 0.02%Bayer US Finance II LLC 250,000 2.20% 15/7/2022 247,294 0.02%BMW US Capital LLC 225,000 3.95% 14/8/2028 245,772 0.02%Volkswagen Group of America Finance LLC 200,000 4.75% 13/11/2028 226,035 0.02%Siemens Financieringsmaatschappij NV 225,000 2.35% 15/10/2026 223,330 0.02%BMW US Capital LLC 220,000 2.80% 11/4/2026 222,409 0.02%Volkswagen Group of America Finance LLC 200,000 4.25% 13/11/2023 213,266 0.02%Deutsche Telekom International Finance BV 175,000 4.88% 6/3/2042 206,831 0.02%Volkswagen Group of America Finance LLC 200,000 4.00% 12/11/2021 206,692 0.02%Daimler Finance North America LLC 200,000 3.30% 19/5/2025 206,650 0.02%FMS Wertmanagement 200,000 2.75% 6/3/2023 206,345 0.01%Daimler Finance North America LLC 200,000 3.35% 22/2/2023 205,493 0.01%Deutsche Bank AG 200,000 3.95% 27/2/2023 204,473 0.01%Bayer US Finance II LLC 200,000 3.50% 25/6/2021 203,425 0.01%Deutsche Telekom International Finance BV 200,000 2.82% 19/1/2022 202,840 0.01%Volkswagen Group of America Finance LLC 200,000 2.85% 26/9/2024 202,750 0.01%Bayer US Finance LLC 200,000 3.00% 8/10/2021 202,554 0.01%Volkswagen Group of America Finance LLC 200,000 2.70% 26/9/2022 202,205 0.01%Landwirtschaftliche Rentenbank 200,000 1.88% 17/4/2023 201,148 0.01%BMW US Capital LLC 200,000 2.00% 11/4/2021 200,075 0.01%Deutsche Telekom International Finance BV 200,000 1.95% 19/9/2021 199,867 0.01%KFW 200,000 1.63% 15/3/2021 199,823 0.01%FMS Wertmanagement 200,000 1.38% 8/6/2021 199,059 0.01%Siemens Financieringsmaatschappij NV 175,000 3.25% 27/5/2025 184,150 0.01%Deutsche Telekom International Finance BV 165,000 4.38% 21/6/2028 182,772 0.01%Siemens Financieringsmaatschappij NV 150,000 4.40% 27/5/2045 179,121 0.01%Deutsche Bank AG 175,000 4.10% 13/1/2026 178,488 0.01%Landeskreditbank Baden-Wuerttemberg Foerderbank 175,000 2.63% 7/2/2022 178,119 0.01%NRW Bank 175,000 1.50% 23/8/2021 174,372 0.01%BMW US Capital LLC 155,000 3.40% 13/8/2021 158,548 0.01%BMW US Capital LLC 150,000 3.45% 12/4/2023 154,918 0.01%Fresenius Medical Care US Finance III, Inc. 150,000 3.75% 15/6/2029 153,937 0.01%Deutsche Bank AG^ 150,000 3.96% 26/11/2025 153,053 0.01%Daimler Finance North America LLC 150,000 3.00% 22/2/2021 151,356 0.01%Daimler Finance North America LLC 150,000 2.70% 14/6/2024 151,176 0.01%Daimler Finance North America LLC 150,000 3.10% 15/8/2029 151,105 0.01%Daimler Finance North America LLC 150,000 2.55% 15/8/2022 150,950 0.01%Bayer US Finance II LLC 125,000 5.88% 15/4/2038 140,866 0.01%Daimler Finance North America LLC 125,000 2.88% 10/3/2021 125,989 0.01%EMD Finance LLC 120,000 3.25% 19/3/2025 123,352 0.01%KFW 125,000 1.75% 14/9/2029 122,351 0.01%Deutsche Telekom International Finance BV 100,000 4.75% 21/6/2038 113,253 0.01%Landwirtschaftliche Rentenbank 100,000 2.50% 15/11/2027 104,384 0.01%Fresenius Medical Care US Finance, Inc. 100,000 5.75% 15/2/2021 103,625 0.01%Bayer US Finance II LLC 100,000 3.38% 15/7/2024 102,969 0.01%NRW Bank 100,000 3.13% 4/10/2021 102,275 0.01%Bayer US Finance II LLC 105,000 4.70% 15/7/2064 101,783 0.01%E.ON International Finance BV 75,000 6.65% 30/4/2038 101,596 0.01%BMW US Capital LLC 100,000 3.10% 12/4/2021 101,393 0.01%Deutsche Bank AG 100,000 3.38% 12/5/2021 100,632 0.01%BMW US Capital LLC 100,000 2.25% 15/9/2023 99,927 0.01%
Principal Maturity Fair Value % of Total US Dollars ($) Coupon Date US Dollars ($) Net Assets
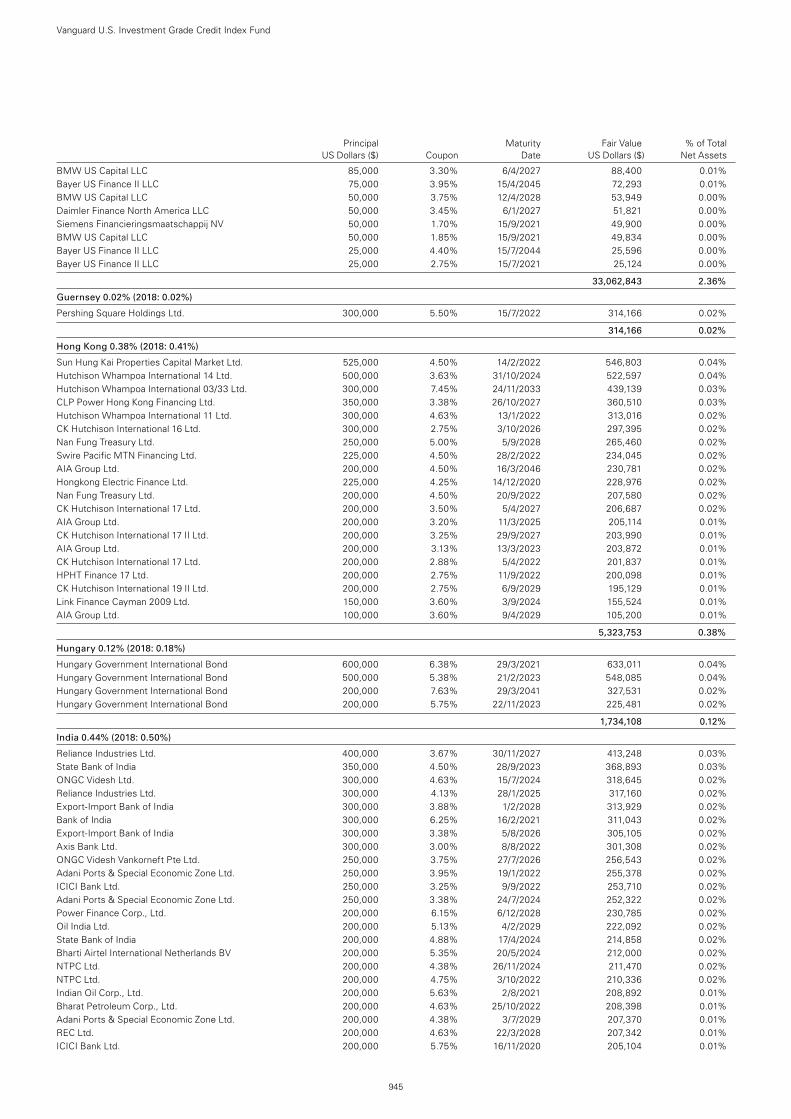
Vanguard U.S. Investment Grade Credit Index Fund
945
BMW US Capital LLC 85,000 3.30% 6/4/2027 88,400 0.01%Bayer US Finance II LLC 75,000 3.95% 15/4/2045 72,293 0.01%BMW US Capital LLC 50,000 3.75% 12/4/2028 53,949 0.00%Daimler Finance North America LLC 50,000 3.45% 6/1/2027 51,821 0.00%Siemens Financieringsmaatschappij NV 50,000 1.70% 15/9/2021 49,900 0.00%BMW US Capital LLC 50,000 1.85% 15/9/2021 49,834 0.00%Bayer US Finance II LLC 25,000 4.40% 15/7/2044 25,596 0.00%Bayer US Finance II LLC 25,000 2.75% 15/7/2021 25,124 0.00%
33,062,843 2.36%
Guernsey 0.02% (2018: 0.02%)
Pershing Square Holdings Ltd. 300,000 5.50% 15/7/2022 314,166 0.02%
314,166 0.02%
Hong Kong 0.38% (2018: 0.41%)
Sun Hung Kai Properties Capital Market Ltd. 525,000 4.50% 14/2/2022 546,803 0.04%Hutchison Whampoa International 14 Ltd. 500,000 3.63% 31/10/2024 522,597 0.04%Hutchison Whampoa International 03/33 Ltd. 300,000 7.45% 24/11/2033 439,139 0.03%CLP Power Hong Kong Financing Ltd. 350,000 3.38% 26/10/2027 360,510 0.03%Hutchison Whampoa International 11 Ltd. 300,000 4.63% 13/1/2022 313,016 0.02%CK Hutchison International 16 Ltd. 300,000 2.75% 3/10/2026 297,395 0.02%Nan Fung Treasury Ltd. 250,000 5.00% 5/9/2028 265,460 0.02%Swire Pacific MTN Financing Ltd. 225,000 4.50% 28/2/2022 234,045 0.02%AIA Group Ltd. 200,000 4.50% 16/3/2046 230,781 0.02%Hongkong Electric Finance Ltd. 225,000 4.25% 14/12/2020 228,976 0.02%Nan Fung Treasury Ltd. 200,000 4.50% 20/9/2022 207,580 0.02%CK Hutchison International 17 Ltd. 200,000 3.50% 5/4/2027 206,687 0.02%AIA Group Ltd. 200,000 3.20% 11/3/2025 205,114 0.01%CK Hutchison International 17 II Ltd. 200,000 3.25% 29/9/2027 203,990 0.01%AIA Group Ltd. 200,000 3.13% 13/3/2023 203,872 0.01%CK Hutchison International 17 Ltd. 200,000 2.88% 5/4/2022 201,837 0.01%HPHT Finance 17 Ltd. 200,000 2.75% 11/9/2022 200,098 0.01%CK Hutchison International 19 II Ltd. 200,000 2.75% 6/9/2029 195,129 0.01%Link Finance Cayman 2009 Ltd. 150,000 3.60% 3/9/2024 155,524 0.01%AIA Group Ltd. 100,000 3.60% 9/4/2029 105,200 0.01%
5,323,753 0.38%
Hungary 0.12% (2018: 0.18%)
Hungary Government International Bond 600,000 6.38% 29/3/2021 633,011 0.04%Hungary Government International Bond 500,000 5.38% 21/2/2023 548,085 0.04%Hungary Government International Bond 200,000 7.63% 29/3/2041 327,531 0.02%Hungary Government International Bond 200,000 5.75% 22/11/2023 225,481 0.02%
1,734,108 0.12%
India 0.44% (2018: 0.50%)
Reliance Industries Ltd. 400,000 3.67% 30/11/2027 413,248 0.03%State Bank of India 350,000 4.50% 28/9/2023 368,893 0.03%ONGC Videsh Ltd. 300,000 4.63% 15/7/2024 318,645 0.02%Reliance Industries Ltd. 300,000 4.13% 28/1/2025 317,160 0.02%Export-Import Bank of India 300,000 3.88% 1/2/2028 313,929 0.02%Bank of India 300,000 6.25% 16/2/2021 311,043 0.02%Export-Import Bank of India 300,000 3.38% 5/8/2026 305,105 0.02%Axis Bank Ltd. 300,000 3.00% 8/8/2022 301,308 0.02%ONGC Videsh Vankorneft Pte Ltd. 250,000 3.75% 27/7/2026 256,543 0.02%Adani Ports & Special Economic Zone Ltd. 250,000 3.95% 19/1/2022 255,378 0.02%ICICI Bank Ltd. 250,000 3.25% 9/9/2022 253,710 0.02%Adani Ports & Special Economic Zone Ltd. 250,000 3.38% 24/7/2024 252,322 0.02%Power Finance Corp., Ltd. 200,000 6.15% 6/12/2028 230,785 0.02%Oil India Ltd. 200,000 5.13% 4/2/2029 222,092 0.02%State Bank of India 200,000 4.88% 17/4/2024 214,858 0.02%Bharti Airtel International Netherlands BV 200,000 5.35% 20/5/2024 212,000 0.02%NTPC Ltd. 200,000 4.38% 26/11/2024 211,470 0.02%NTPC Ltd. 200,000 4.75% 3/10/2022 210,336 0.02%Indian Oil Corp., Ltd. 200,000 5.63% 2/8/2021 208,892 0.01%Bharat Petroleum Corp., Ltd. 200,000 4.63% 25/10/2022 208,398 0.01%Adani Ports & Special Economic Zone Ltd. 200,000 4.38% 3/7/2029 207,370 0.01%REC Ltd. 200,000 4.63% 22/3/2028 207,342 0.01%ICICI Bank Ltd. 200,000 5.75% 16/11/2020 205,104 0.01%
Principal Maturity Fair Value % of Total US Dollars ($) Coupon Date US Dollars ($) Net Assets
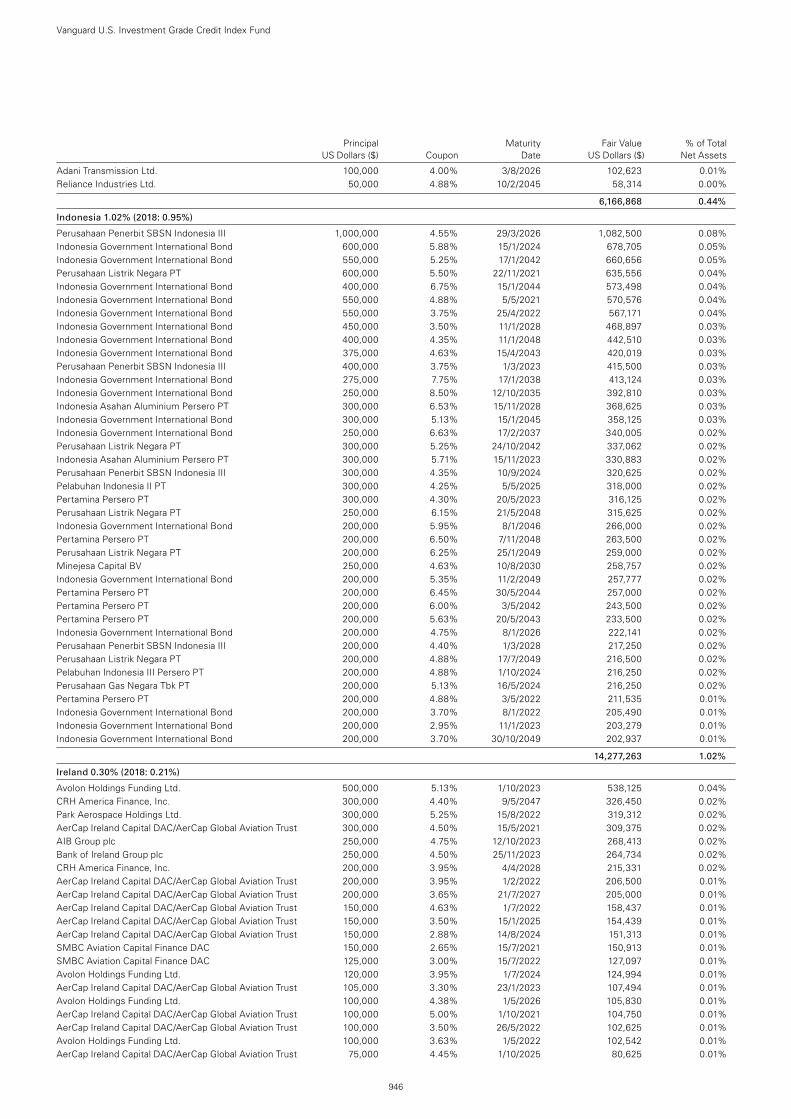
Vanguard U.S. Investment Grade Credit Index Fund
946
Adani Transmission Ltd. 100,000 4.00% 3/8/2026 102,623 0.01%Reliance Industries Ltd. 50,000 4.88% 10/2/2045 58,314 0.00%
6,166,868 0.44%
Indonesia 1.02% (2018: 0.95%)
Perusahaan Penerbit SBSN Indonesia III 1,000,000 4.55% 29/3/2026 1,082,500 0.08%Indonesia Government International Bond 600,000 5.88% 15/1/2024 678,705 0.05%Indonesia Government International Bond 550,000 5.25% 17/1/2042 660,656 0.05%Perusahaan Listrik Negara PT 600,000 5.50% 22/11/2021 635,556 0.04%Indonesia Government International Bond 400,000 6.75% 15/1/2044 573,498 0.04%Indonesia Government International Bond 550,000 4.88% 5/5/2021 570,576 0.04%Indonesia Government International Bond 550,000 3.75% 25/4/2022 567,171 0.04%Indonesia Government International Bond 450,000 3.50% 11/1/2028 468,897 0.03%Indonesia Government International Bond 400,000 4.35% 11/1/2048 442,510 0.03%Indonesia Government International Bond 375,000 4.63% 15/4/2043 420,019 0.03%Perusahaan Penerbit SBSN Indonesia III 400,000 3.75% 1/3/2023 415,500 0.03%Indonesia Government International Bond 275,000 7.75% 17/1/2038 413,124 0.03%Indonesia Government International Bond 250,000 8.50% 12/10/2035 392,810 0.03%Indonesia Asahan Aluminium Persero PT 300,000 6.53% 15/11/2028 368,625 0.03%Indonesia Government International Bond 300,000 5.13% 15/1/2045 358,125 0.03%Indonesia Government International Bond 250,000 6.63% 17/2/2037 340,005 0.02%Perusahaan Listrik Negara PT 300,000 5.25% 24/10/2042 337,062 0.02%Indonesia Asahan Aluminium Persero PT 300,000 5.71% 15/11/2023 330,883 0.02%Perusahaan Penerbit SBSN Indonesia III 300,000 4.35% 10/9/2024 320,625 0.02%Pelabuhan Indonesia II PT 300,000 4.25% 5/5/2025 318,000 0.02%Pertamina Persero PT 300,000 4.30% 20/5/2023 316,125 0.02%Perusahaan Listrik Negara PT 250,000 6.15% 21/5/2048 315,625 0.02%Indonesia Government International Bond 200,000 5.95% 8/1/2046 266,000 0.02%Pertamina Persero PT 200,000 6.50% 7/11/2048 263,500 0.02%Perusahaan Listrik Negara PT 200,000 6.25% 25/1/2049 259,000 0.02%Minejesa Capital BV 250,000 4.63% 10/8/2030 258,757 0.02%Indonesia Government International Bond 200,000 5.35% 11/2/2049 257,777 0.02%Pertamina Persero PT 200,000 6.45% 30/5/2044 257,000 0.02%Pertamina Persero PT 200,000 6.00% 3/5/2042 243,500 0.02%Pertamina Persero PT 200,000 5.63% 20/5/2043 233,500 0.02%Indonesia Government International Bond 200,000 4.75% 8/1/2026 222,141 0.02%Perusahaan Penerbit SBSN Indonesia III 200,000 4.40% 1/3/2028 217,250 0.02%Perusahaan Listrik Negara PT 200,000 4.88% 17/7/2049 216,500 0.02%Pelabuhan Indonesia III Persero PT 200,000 4.88% 1/10/2024 216,250 0.02%Perusahaan Gas Negara Tbk PT 200,000 5.13% 16/5/2024 216,250 0.02%Pertamina Persero PT 200,000 4.88% 3/5/2022 211,535 0.01%Indonesia Government International Bond 200,000 3.70% 8/1/2022 205,490 0.01%Indonesia Government International Bond 200,000 2.95% 11/1/2023 203,279 0.01%Indonesia Government International Bond 200,000 3.70% 30/10/2049 202,937 0.01%
14,277,263 1.02%
Ireland 0.30% (2018: 0.21%)
Avolon Holdings Funding Ltd. 500,000 5.13% 1/10/2023 538,125 0.04%CRH America Finance, Inc. 300,000 4.40% 9/5/2047 326,450 0.02%Park Aerospace Holdings Ltd. 300,000 5.25% 15/8/2022 319,312 0.02%AerCap Ireland Capital DAC/AerCap Global Aviation Trust 300,000 4.50% 15/5/2021 309,375 0.02%AIB Group plc 250,000 4.75% 12/10/2023 268,413 0.02%Bank of Ireland Group plc 250,000 4.50% 25/11/2023 264,734 0.02%CRH America Finance, Inc. 200,000 3.95% 4/4/2028 215,331 0.02%AerCap Ireland Capital DAC/AerCap Global Aviation Trust 200,000 3.95% 1/2/2022 206,500 0.01%AerCap Ireland Capital DAC/AerCap Global Aviation Trust 200,000 3.65% 21/7/2027 205,000 0.01%AerCap Ireland Capital DAC/AerCap Global Aviation Trust 150,000 4.63% 1/7/2022 158,437 0.01%AerCap Ireland Capital DAC/AerCap Global Aviation Trust 150,000 3.50% 15/1/2025 154,439 0.01%AerCap Ireland Capital DAC/AerCap Global Aviation Trust 150,000 2.88% 14/8/2024 151,313 0.01%SMBC Aviation Capital Finance DAC 150,000 2.65% 15/7/2021 150,913 0.01%SMBC Aviation Capital Finance DAC 125,000 3.00% 15/7/2022 127,097 0.01%Avolon Holdings Funding Ltd. 120,000 3.95% 1/7/2024 124,994 0.01%AerCap Ireland Capital DAC/AerCap Global Aviation Trust 105,000 3.30% 23/1/2023 107,494 0.01%Avolon Holdings Funding Ltd. 100,000 4.38% 1/5/2026 105,830 0.01%AerCap Ireland Capital DAC/AerCap Global Aviation Trust 100,000 5.00% 1/10/2021 104,750 0.01%AerCap Ireland Capital DAC/AerCap Global Aviation Trust 100,000 3.50% 26/5/2022 102,625 0.01%Avolon Holdings Funding Ltd. 100,000 3.63% 1/5/2022 102,542 0.01%AerCap Ireland Capital DAC/AerCap Global Aviation Trust 75,000 4.45% 1/10/2025 80,625 0.01%
Principal Maturity Fair Value % of Total US Dollars ($) Coupon Date US Dollars ($) Net Assets
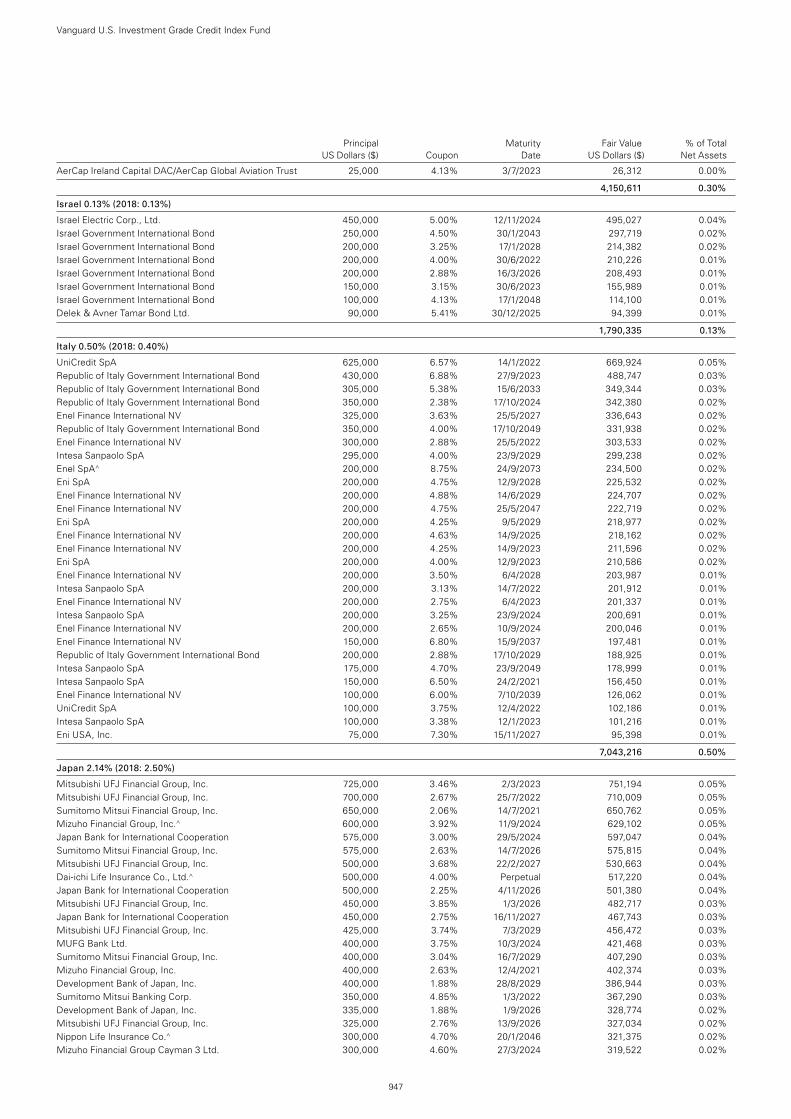
Vanguard U.S. Investment Grade Credit Index Fund
947
AerCap Ireland Capital DAC/AerCap Global Aviation Trust 25,000 4.13% 3/7/2023 26,312 0.00%
4,150,611 0.30%
Israel 0.13% (2018: 0.13%)
Israel Electric Corp., Ltd. 450,000 5.00% 12/11/2024 495,027 0.04%Israel Government International Bond 250,000 4.50% 30/1/2043 297,719 0.02%Israel Government International Bond 200,000 3.25% 17/1/2028 214,382 0.02%Israel Government International Bond 200,000 4.00% 30/6/2022 210,226 0.01%Israel Government International Bond 200,000 2.88% 16/3/2026 208,493 0.01%Israel Government International Bond 150,000 3.15% 30/6/2023 155,989 0.01%Israel Government International Bond 100,000 4.13% 17/1/2048 114,100 0.01%Delek & Avner Tamar Bond Ltd. 90,000 5.41% 30/12/2025 94,399 0.01%
1,790,335 0.13%
Italy 0.50% (2018: 0.40%)
UniCredit SpA 625,000 6.57% 14/1/2022 669,924 0.05%Republic of Italy Government International Bond 430,000 6.88% 27/9/2023 488,747 0.03%Republic of Italy Government International Bond 305,000 5.38% 15/6/2033 349,344 0.03%Republic of Italy Government International Bond 350,000 2.38% 17/10/2024 342,380 0.02%Enel Finance International NV 325,000 3.63% 25/5/2027 336,643 0.02%Republic of Italy Government International Bond 350,000 4.00% 17/10/2049 331,938 0.02%Enel Finance International NV 300,000 2.88% 25/5/2022 303,533 0.02%Intesa Sanpaolo SpA 295,000 4.00% 23/9/2029 299,238 0.02%Enel SpA^ 200,000 8.75% 24/9/2073 234,500 0.02%Eni SpA 200,000 4.75% 12/9/2028 225,532 0.02%Enel Finance International NV 200,000 4.88% 14/6/2029 224,707 0.02%Enel Finance International NV 200,000 4.75% 25/5/2047 222,719 0.02%Eni SpA 200,000 4.25% 9/5/2029 218,977 0.02%Enel Finance International NV 200,000 4.63% 14/9/2025 218,162 0.02%Enel Finance International NV 200,000 4.25% 14/9/2023 211,596 0.02%Eni SpA 200,000 4.00% 12/9/2023 210,586 0.02%Enel Finance International NV 200,000 3.50% 6/4/2028 203,987 0.01%Intesa Sanpaolo SpA 200,000 3.13% 14/7/2022 201,912 0.01%Enel Finance International NV 200,000 2.75% 6/4/2023 201,337 0.01%Intesa Sanpaolo SpA 200,000 3.25% 23/9/2024 200,691 0.01%Enel Finance International NV 200,000 2.65% 10/9/2024 200,046 0.01%Enel Finance International NV 150,000 6.80% 15/9/2037 197,481 0.01%Republic of Italy Government International Bond 200,000 2.88% 17/10/2029 188,925 0.01%Intesa Sanpaolo SpA 175,000 4.70% 23/9/2049 178,999 0.01%Intesa Sanpaolo SpA 150,000 6.50% 24/2/2021 156,450 0.01%Enel Finance International NV 100,000 6.00% 7/10/2039 126,062 0.01%UniCredit SpA 100,000 3.75% 12/4/2022 102,186 0.01%Intesa Sanpaolo SpA 100,000 3.38% 12/1/2023 101,216 0.01%Eni USA, Inc. 75,000 7.30% 15/11/2027 95,398 0.01%
7,043,216 0.50%
Japan 2.14% (2018: 2.50%)
Mitsubishi UFJ Financial Group, Inc. 725,000 3.46% 2/3/2023 751,194 0.05%Mitsubishi UFJ Financial Group, Inc. 700,000 2.67% 25/7/2022 710,009 0.05%Sumitomo Mitsui Financial Group, Inc. 650,000 2.06% 14/7/2021 650,762 0.05%Mizuho Financial Group, Inc.^ 600,000 3.92% 11/9/2024 629,102 0.05%Japan Bank for International Cooperation 575,000 3.00% 29/5/2024 597,047 0.04%Sumitomo Mitsui Financial Group, Inc. 575,000 2.63% 14/7/2026 575,815 0.04%Mitsubishi UFJ Financial Group, Inc. 500,000 3.68% 22/2/2027 530,663 0.04%Dai-ichi Life Insurance Co., Ltd.^ 500,000 4.00% Perpetual 517,220 0.04%Japan Bank for International Cooperation 500,000 2.25% 4/11/2026 501,380 0.04%Mitsubishi UFJ Financial Group, Inc. 450,000 3.85% 1/3/2026 482,717 0.03%Japan Bank for International Cooperation 450,000 2.75% 16/11/2027 467,743 0.03%Mitsubishi UFJ Financial Group, Inc. 425,000 3.74% 7/3/2029 456,472 0.03%MUFG Bank Ltd. 400,000 3.75% 10/3/2024 421,468 0.03%Sumitomo Mitsui Financial Group, Inc. 400,000 3.04% 16/7/2029 407,290 0.03%Mizuho Financial Group, Inc. 400,000 2.63% 12/4/2021 402,374 0.03%Development Bank of Japan, Inc. 400,000 1.88% 28/8/2029 386,944 0.03%Sumitomo Mitsui Banking Corp. 350,000 4.85% 1/3/2022 367,290 0.03%Development Bank of Japan, Inc. 335,000 1.88% 1/9/2026 328,774 0.02%Mitsubishi UFJ Financial Group, Inc. 325,000 2.76% 13/9/2026 327,034 0.02%Nippon Life Insurance Co.^ 300,000 4.70% 20/1/2046 321,375 0.02%Mizuho Financial Group Cayman 3 Ltd. 300,000 4.60% 27/3/2024 319,522 0.02%
Principal Maturity Fair Value % of Total US Dollars ($) Coupon Date US Dollars ($) Net Assets
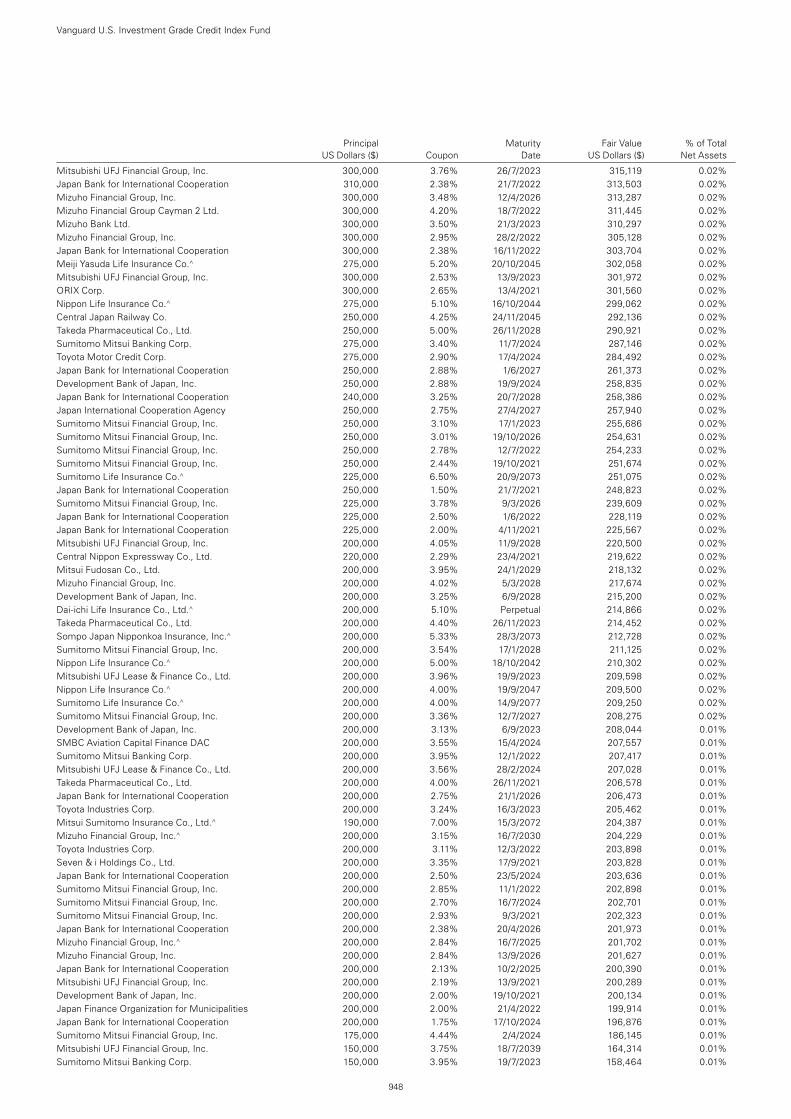
Principal Maturity Fair Value % of Total US Dollars ($) Coupon Date US Dollars ($) Net Assets
Vanguard U.S. Investment Grade Credit Index Fund
948
Mitsubishi UFJ Financial Group, Inc. 300,000 3.76% 26/7/2023 315,119 0.02%Japan Bank for International Cooperation 310,000 2.38% 21/7/2022 313,503 0.02%Mizuho Financial Group, Inc. 300,000 3.48% 12/4/2026 313,287 0.02%Mizuho Financial Group Cayman 2 Ltd. 300,000 4.20% 18/7/2022 311,445 0.02%Mizuho Bank Ltd. 300,000 3.50% 21/3/2023 310,297 0.02%Mizuho Financial Group, Inc. 300,000 2.95% 28/2/2022 305,128 0.02%Japan Bank for International Cooperation 300,000 2.38% 16/11/2022 303,704 0.02%Meiji Yasuda Life Insurance Co.^ 275,000 5.20% 20/10/2045 302,058 0.02%Mitsubishi UFJ Financial Group, Inc. 300,000 2.53% 13/9/2023 301,972 0.02%ORIX Corp. 300,000 2.65% 13/4/2021 301,560 0.02%Nippon Life Insurance Co.^ 275,000 5.10% 16/10/2044 299,062 0.02%Central Japan Railway Co. 250,000 4.25% 24/11/2045 292,136 0.02%Takeda Pharmaceutical Co., Ltd. 250,000 5.00% 26/11/2028 290,921 0.02%Sumitomo Mitsui Banking Corp. 275,000 3.40% 11/7/2024 287,146 0.02%Toyota Motor Credit Corp. 275,000 2.90% 17/4/2024 284,492 0.02%Japan Bank for International Cooperation 250,000 2.88% 1/6/2027 261,373 0.02%Development Bank of Japan, Inc. 250,000 2.88% 19/9/2024 258,835 0.02%Japan Bank for International Cooperation 240,000 3.25% 20/7/2028 258,386 0.02%Japan International Cooperation Agency 250,000 2.75% 27/4/2027 257,940 0.02%Sumitomo Mitsui Financial Group, Inc. 250,000 3.10% 17/1/2023 255,686 0.02%Sumitomo Mitsui Financial Group, Inc. 250,000 3.01% 19/10/2026 254,631 0.02%Sumitomo Mitsui Financial Group, Inc. 250,000 2.78% 12/7/2022 254,233 0.02%Sumitomo Mitsui Financial Group, Inc. 250,000 2.44% 19/10/2021 251,674 0.02%Sumitomo Life Insurance Co.^ 225,000 6.50% 20/9/2073 251,075 0.02%Japan Bank for International Cooperation 250,000 1.50% 21/7/2021 248,823 0.02%Sumitomo Mitsui Financial Group, Inc. 225,000 3.78% 9/3/2026 239,609 0.02%Japan Bank for International Cooperation 225,000 2.50% 1/6/2022 228,119 0.02%Japan Bank for International Cooperation 225,000 2.00% 4/11/2021 225,567 0.02%Mitsubishi UFJ Financial Group, Inc. 200,000 4.05% 11/9/2028 220,500 0.02%Central Nippon Expressway Co., Ltd. 220,000 2.29% 23/4/2021 219,622 0.02%Mitsui Fudosan Co., Ltd. 200,000 3.95% 24/1/2029 218,132 0.02%Mizuho Financial Group, Inc. 200,000 4.02% 5/3/2028 217,674 0.02%Development Bank of Japan, Inc. 200,000 3.25% 6/9/2028 215,200 0.02%Dai-ichi Life Insurance Co., Ltd.^ 200,000 5.10% Perpetual 214,866 0.02%Takeda Pharmaceutical Co., Ltd. 200,000 4.40% 26/11/2023 214,452 0.02%Sompo Japan Nipponkoa Insurance, Inc.^ 200,000 5.33% 28/3/2073 212,728 0.02%Sumitomo Mitsui Financial Group, Inc. 200,000 3.54% 17/1/2028 211,125 0.02%Nippon Life Insurance Co.^ 200,000 5.00% 18/10/2042 210,302 0.02%Mitsubishi UFJ Lease & Finance Co., Ltd. 200,000 3.96% 19/9/2023 209,598 0.02%Nippon Life Insurance Co.^ 200,000 4.00% 19/9/2047 209,500 0.02%Sumitomo Life Insurance Co.^ 200,000 4.00% 14/9/2077 209,250 0.02%Sumitomo Mitsui Financial Group, Inc. 200,000 3.36% 12/7/2027 208,275 0.02%Development Bank of Japan, Inc. 200,000 3.13% 6/9/2023 208,044 0.01%SMBC Aviation Capital Finance DAC 200,000 3.55% 15/4/2024 207,557 0.01%Sumitomo Mitsui Banking Corp. 200,000 3.95% 12/1/2022 207,417 0.01%Mitsubishi UFJ Lease & Finance Co., Ltd. 200,000 3.56% 28/2/2024 207,028 0.01%Takeda Pharmaceutical Co., Ltd. 200,000 4.00% 26/11/2021 206,578 0.01%Japan Bank for International Cooperation 200,000 2.75% 21/1/2026 206,473 0.01%Toyota Industries Corp. 200,000 3.24% 16/3/2023 205,462 0.01%Mitsui Sumitomo Insurance Co., Ltd.^ 190,000 7.00% 15/3/2072 204,387 0.01%Mizuho Financial Group, Inc.^ 200,000 3.15% 16/7/2030 204,229 0.01%Toyota Industries Corp. 200,000 3.11% 12/3/2022 203,898 0.01%Seven & i Holdings Co., Ltd. 200,000 3.35% 17/9/2021 203,828 0.01%Japan Bank for International Cooperation 200,000 2.50% 23/5/2024 203,636 0.01%Sumitomo Mitsui Financial Group, Inc. 200,000 2.85% 11/1/2022 202,898 0.01%Sumitomo Mitsui Financial Group, Inc. 200,000 2.70% 16/7/2024 202,701 0.01%Sumitomo Mitsui Financial Group, Inc. 200,000 2.93% 9/3/2021 202,323 0.01%Japan Bank for International Cooperation 200,000 2.38% 20/4/2026 201,973 0.01%Mizuho Financial Group, Inc.^ 200,000 2.84% 16/7/2025 201,702 0.01%Mizuho Financial Group, Inc. 200,000 2.84% 13/9/2026 201,627 0.01%Japan Bank for International Cooperation 200,000 2.13% 10/2/2025 200,390 0.01%Mitsubishi UFJ Financial Group, Inc. 200,000 2.19% 13/9/2021 200,289 0.01%Development Bank of Japan, Inc. 200,000 2.00% 19/10/2021 200,134 0.01%Japan Finance Organization for Municipalities 200,000 2.00% 21/4/2022 199,914 0.01%Japan Bank for International Cooperation 200,000 1.75% 17/10/2024 196,876 0.01%Sumitomo Mitsui Financial Group, Inc. 175,000 4.44% 2/4/2024 186,145 0.01%Mitsubishi UFJ Financial Group, Inc. 150,000 3.75% 18/7/2039 164,314 0.01%Sumitomo Mitsui Banking Corp. 150,000 3.95% 19/7/2023 158,464 0.01%
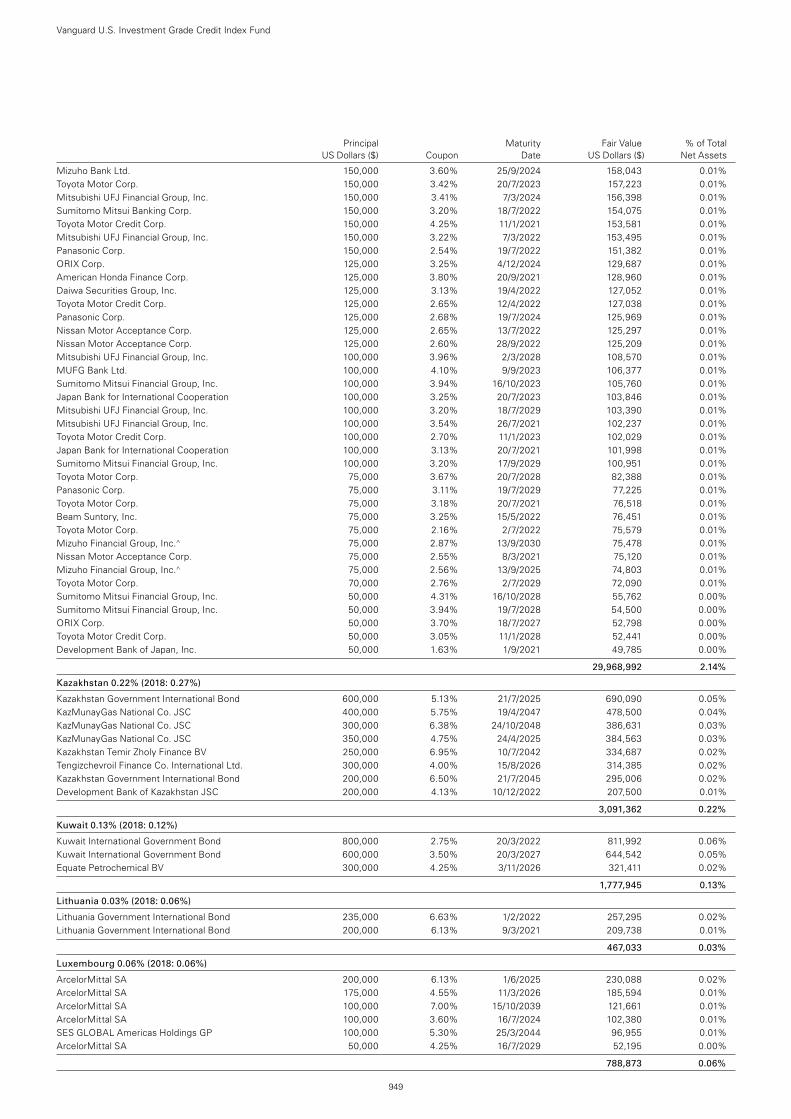
Principal Maturity Fair Value % of Total US Dollars ($) Coupon Date US Dollars ($) Net Assets
Vanguard U.S. Investment Grade Credit Index Fund
949
Mizuho Bank Ltd. 150,000 3.60% 25/9/2024 158,043 0.01%Toyota Motor Corp. 150,000 3.42% 20/7/2023 157,223 0.01%Mitsubishi UFJ Financial Group, Inc. 150,000 3.41% 7/3/2024 156,398 0.01%Sumitomo Mitsui Banking Corp. 150,000 3.20% 18/7/2022 154,075 0.01%Toyota Motor Credit Corp. 150,000 4.25% 11/1/2021 153,581 0.01%Mitsubishi UFJ Financial Group, Inc. 150,000 3.22% 7/3/2022 153,495 0.01%Panasonic Corp. 150,000 2.54% 19/7/2022 151,382 0.01%ORIX Corp. 125,000 3.25% 4/12/2024 129,687 0.01%American Honda Finance Corp. 125,000 3.80% 20/9/2021 128,960 0.01%Daiwa Securities Group, Inc. 125,000 3.13% 19/4/2022 127,052 0.01%Toyota Motor Credit Corp. 125,000 2.65% 12/4/2022 127,038 0.01%Panasonic Corp. 125,000 2.68% 19/7/2024 125,969 0.01%Nissan Motor Acceptance Corp. 125,000 2.65% 13/7/2022 125,297 0.01%Nissan Motor Acceptance Corp. 125,000 2.60% 28/9/2022 125,209 0.01%Mitsubishi UFJ Financial Group, Inc. 100,000 3.96% 2/3/2028 108,570 0.01%MUFG Bank Ltd. 100,000 4.10% 9/9/2023 106,377 0.01%Sumitomo Mitsui Financial Group, Inc. 100,000 3.94% 16/10/2023 105,760 0.01%Japan Bank for International Cooperation 100,000 3.25% 20/7/2023 103,846 0.01%Mitsubishi UFJ Financial Group, Inc. 100,000 3.20% 18/7/2029 103,390 0.01%Mitsubishi UFJ Financial Group, Inc. 100,000 3.54% 26/7/2021 102,237 0.01%Toyota Motor Credit Corp. 100,000 2.70% 11/1/2023 102,029 0.01%Japan Bank for International Cooperation 100,000 3.13% 20/7/2021 101,998 0.01%Sumitomo Mitsui Financial Group, Inc. 100,000 3.20% 17/9/2029 100,951 0.01%Toyota Motor Corp. 75,000 3.67% 20/7/2028 82,388 0.01%Panasonic Corp. 75,000 3.11% 19/7/2029 77,225 0.01%Toyota Motor Corp. 75,000 3.18% 20/7/2021 76,518 0.01%Beam Suntory, Inc. 75,000 3.25% 15/5/2022 76,451 0.01%Toyota Motor Corp. 75,000 2.16% 2/7/2022 75,579 0.01%Mizuho Financial Group, Inc.^ 75,000 2.87% 13/9/2030 75,478 0.01%Nissan Motor Acceptance Corp. 75,000 2.55% 8/3/2021 75,120 0.01%Mizuho Financial Group, Inc.^ 75,000 2.56% 13/9/2025 74,803 0.01%Toyota Motor Corp. 70,000 2.76% 2/7/2029 72,090 0.01%Sumitomo Mitsui Financial Group, Inc. 50,000 4.31% 16/10/2028 55,762 0.00%Sumitomo Mitsui Financial Group, Inc. 50,000 3.94% 19/7/2028 54,500 0.00%ORIX Corp. 50,000 3.70% 18/7/2027 52,798 0.00%Toyota Motor Credit Corp. 50,000 3.05% 11/1/2028 52,441 0.00%Development Bank of Japan, Inc. 50,000 1.63% 1/9/2021 49,785 0.00%
29,968,992 2.14%
Kazakhstan 0.22% (2018: 0.27%)
Kazakhstan Government International Bond 600,000 5.13% 21/7/2025 690,090 0.05%KazMunayGas National Co. JSC 400,000 5.75% 19/4/2047 478,500 0.04%KazMunayGas National Co. JSC 300,000 6.38% 24/10/2048 386,631 0.03%KazMunayGas National Co. JSC 350,000 4.75% 24/4/2025 384,563 0.03%Kazakhstan Temir Zholy Finance BV 250,000 6.95% 10/7/2042 334,687 0.02%Tengizchevroil Finance Co. International Ltd. 300,000 4.00% 15/8/2026 314,385 0.02%Kazakhstan Government International Bond 200,000 6.50% 21/7/2045 295,006 0.02%Development Bank of Kazakhstan JSC 200,000 4.13% 10/12/2022 207,500 0.01%
3,091,362 0.22%
Kuwait 0.13% (2018: 0.12%)
Kuwait International Government Bond 800,000 2.75% 20/3/2022 811,992 0.06%Kuwait International Government Bond 600,000 3.50% 20/3/2027 644,542 0.05%Equate Petrochemical BV 300,000 4.25% 3/11/2026 321,411 0.02%
1,777,945 0.13%
Lithuania 0.03% (2018: 0.06%)
Lithuania Government International Bond 235,000 6.63% 1/2/2022 257,295 0.02%Lithuania Government International Bond 200,000 6.13% 9/3/2021 209,738 0.01%
467,033 0.03%
Luxembourg 0.06% (2018: 0.06%)
ArcelorMittal SA 200,000 6.13% 1/6/2025 230,088 0.02%ArcelorMittal SA 175,000 4.55% 11/3/2026 185,594 0.01%ArcelorMittal SA 100,000 7.00% 15/10/2039 121,661 0.01%ArcelorMittal SA 100,000 3.60% 16/7/2024 102,380 0.01%SES GLOBAL Americas Holdings GP 100,000 5.30% 25/3/2044 96,955 0.01%ArcelorMittal SA 50,000 4.25% 16/7/2029 52,195 0.00%
788,873 0.06%
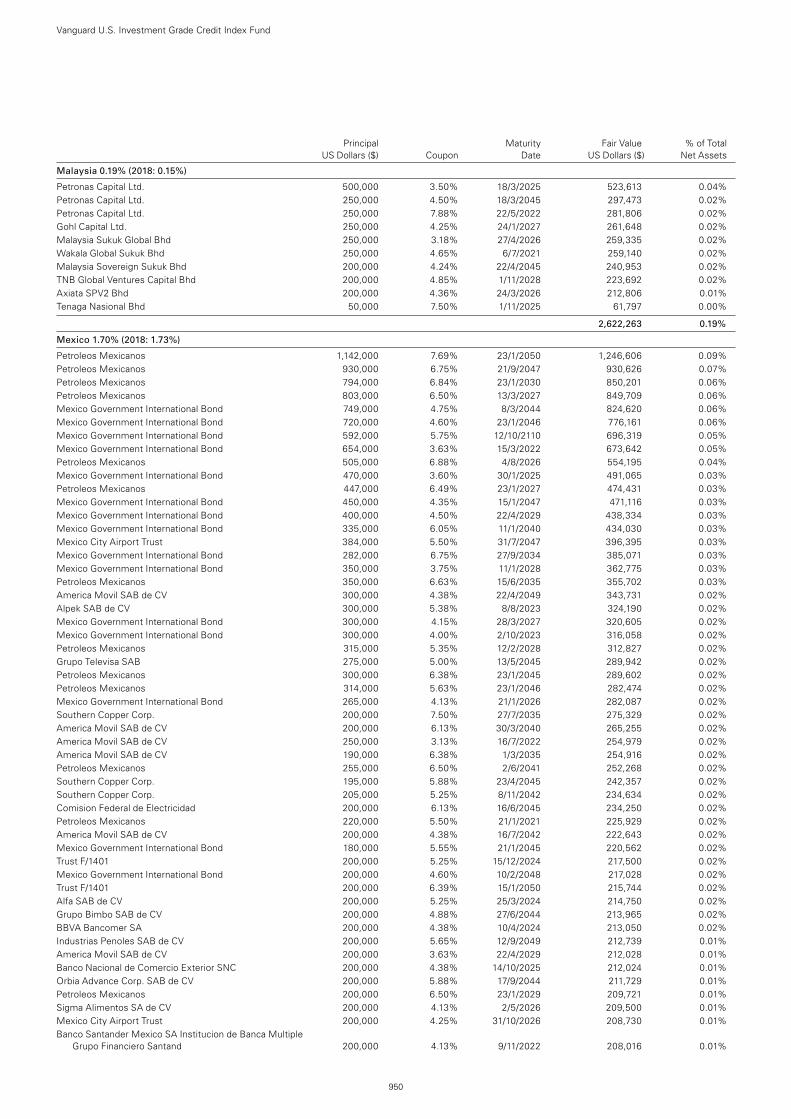
Principal Maturity Fair Value % of Total US Dollars ($) Coupon Date US Dollars ($) Net Assets
Vanguard U.S. Investment Grade Credit Index Fund
950
Malaysia 0.19% (2018: 0.15%)
Petronas Capital Ltd. 500,000 3.50% 18/3/2025 523,613 0.04%Petronas Capital Ltd. 250,000 4.50% 18/3/2045 297,473 0.02%Petronas Capital Ltd. 250,000 7.88% 22/5/2022 281,806 0.02%Gohl Capital Ltd. 250,000 4.25% 24/1/2027 261,648 0.02%Malaysia Sukuk Global Bhd 250,000 3.18% 27/4/2026 259,335 0.02%Wakala Global Sukuk Bhd 250,000 4.65% 6/7/2021 259,140 0.02%Malaysia Sovereign Sukuk Bhd 200,000 4.24% 22/4/2045 240,953 0.02%TNB Global Ventures Capital Bhd 200,000 4.85% 1/11/2028 223,692 0.02%Axiata SPV2 Bhd 200,000 4.36% 24/3/2026 212,806 0.01%Tenaga Nasional Bhd 50,000 7.50% 1/11/2025 61,797 0.00%
2,622,263 0.19%
Mexico 1.70% (2018: 1.73%)
Petroleos Mexicanos 1,142,000 7.69% 23/1/2050 1,246,606 0.09%Petroleos Mexicanos 930,000 6.75% 21/9/2047 930,626 0.07%Petroleos Mexicanos 794,000 6.84% 23/1/2030 850,201 0.06%Petroleos Mexicanos 803,000 6.50% 13/3/2027 849,709 0.06%Mexico Government International Bond 749,000 4.75% 8/3/2044 824,620 0.06%Mexico Government International Bond 720,000 4.60% 23/1/2046 776,161 0.06%Mexico Government International Bond 592,000 5.75% 12/10/2110 696,319 0.05%Mexico Government International Bond 654,000 3.63% 15/3/2022 673,642 0.05%Petroleos Mexicanos 505,000 6.88% 4/8/2026 554,195 0.04%Mexico Government International Bond 470,000 3.60% 30/1/2025 491,065 0.03%Petroleos Mexicanos 447,000 6.49% 23/1/2027 474,431 0.03%Mexico Government International Bond 450,000 4.35% 15/1/2047 471,116 0.03%Mexico Government International Bond 400,000 4.50% 22/4/2029 438,334 0.03%Mexico Government International Bond 335,000 6.05% 11/1/2040 434,030 0.03%Mexico City Airport Trust 384,000 5.50% 31/7/2047 396,395 0.03%Mexico Government International Bond 282,000 6.75% 27/9/2034 385,071 0.03%Mexico Government International Bond 350,000 3.75% 11/1/2028 362,775 0.03%Petroleos Mexicanos 350,000 6.63% 15/6/2035 355,702 0.03%America Movil SAB de CV 300,000 4.38% 22/4/2049 343,731 0.02%Alpek SAB de CV 300,000 5.38% 8/8/2023 324,190 0.02%Mexico Government International Bond 300,000 4.15% 28/3/2027 320,605 0.02%Mexico Government International Bond 300,000 4.00% 2/10/2023 316,058 0.02%Petroleos Mexicanos 315,000 5.35% 12/2/2028 312,827 0.02%Grupo Televisa SAB 275,000 5.00% 13/5/2045 289,942 0.02%Petroleos Mexicanos 300,000 6.38% 23/1/2045 289,602 0.02%Petroleos Mexicanos 314,000 5.63% 23/1/2046 282,474 0.02%Mexico Government International Bond 265,000 4.13% 21/1/2026 282,087 0.02%Southern Copper Corp. 200,000 7.50% 27/7/2035 275,329 0.02%America Movil SAB de CV 200,000 6.13% 30/3/2040 265,255 0.02%America Movil SAB de CV 250,000 3.13% 16/7/2022 254,979 0.02%America Movil SAB de CV 190,000 6.38% 1/3/2035 254,916 0.02%Petroleos Mexicanos 255,000 6.50% 2/6/2041 252,268 0.02%Southern Copper Corp. 195,000 5.88% 23/4/2045 242,357 0.02%Southern Copper Corp. 205,000 5.25% 8/11/2042 234,634 0.02%Comision Federal de Electricidad 200,000 6.13% 16/6/2045 234,250 0.02%Petroleos Mexicanos 220,000 5.50% 21/1/2021 225,929 0.02%America Movil SAB de CV 200,000 4.38% 16/7/2042 222,643 0.02%Mexico Government International Bond 180,000 5.55% 21/1/2045 220,562 0.02%Trust F/1401 200,000 5.25% 15/12/2024 217,500 0.02%Mexico Government International Bond 200,000 4.60% 10/2/2048 217,028 0.02%Trust F/1401 200,000 6.39% 15/1/2050 215,744 0.02%Alfa SAB de CV 200,000 5.25% 25/3/2024 214,750 0.02%Grupo Bimbo SAB de CV 200,000 4.88% 27/6/2044 213,965 0.02%BBVA Bancomer SA 200,000 4.38% 10/4/2024 213,050 0.02%Industrias Penoles SAB de CV 200,000 5.65% 12/9/2049 212,739 0.01%America Movil SAB de CV 200,000 3.63% 22/4/2029 212,028 0.01%Banco Nacional de Comercio Exterior SNC 200,000 4.38% 14/10/2025 212,024 0.01%Orbia Advance Corp. SAB de CV 200,000 5.88% 17/9/2044 211,729 0.01%Petroleos Mexicanos 200,000 6.50% 23/1/2029 209,721 0.01%Sigma Alimentos SA de CV 200,000 4.13% 2/5/2026 209,500 0.01%Mexico City Airport Trust 200,000 4.25% 31/10/2026 208,730 0.01%Banco Santander Mexico SA Institucion de Banca Multiple
Grupo Financiero Santand 200,000 4.13% 9/11/2022 208,016 0.01%
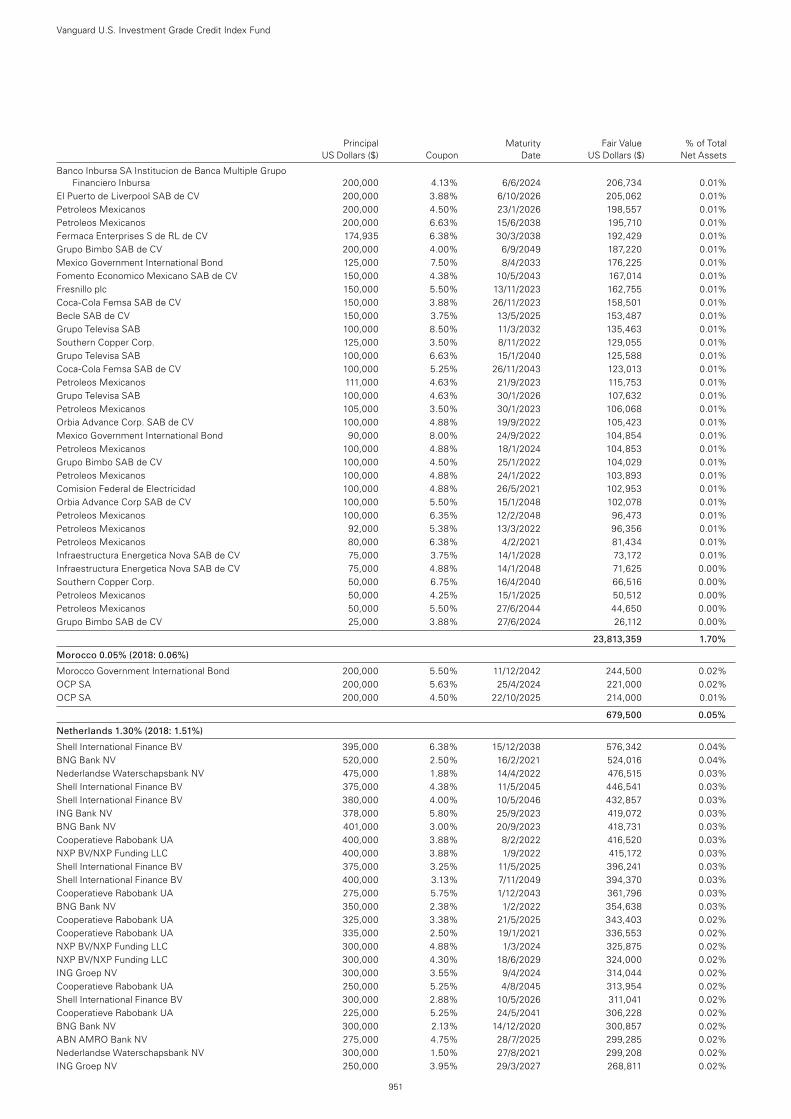
Principal Maturity Fair Value % of Total US Dollars ($) Coupon Date US Dollars ($) Net Assets
Vanguard U.S. Investment Grade Credit Index Fund
951
Banco Inbursa SA Institucion de Banca Multiple Grupo Financiero Inbursa 200,000 4.13% 6/6/2024 206,734 0.01%
El Puerto de Liverpool SAB de CV 200,000 3.88% 6/10/2026 205,062 0.01%Petroleos Mexicanos 200,000 4.50% 23/1/2026 198,557 0.01%Petroleos Mexicanos 200,000 6.63% 15/6/2038 195,710 0.01%Fermaca Enterprises S de RL de CV 174,935 6.38% 30/3/2038 192,429 0.01%Grupo Bimbo SAB de CV 200,000 4.00% 6/9/2049 187,220 0.01%Mexico Government International Bond 125,000 7.50% 8/4/2033 176,225 0.01%Fomento Economico Mexicano SAB de CV 150,000 4.38% 10/5/2043 167,014 0.01%Fresnillo plc 150,000 5.50% 13/11/2023 162,755 0.01%Coca-Cola Femsa SAB de CV 150,000 3.88% 26/11/2023 158,501 0.01%Becle SAB de CV 150,000 3.75% 13/5/2025 153,487 0.01%Grupo Televisa SAB 100,000 8.50% 11/3/2032 135,463 0.01%Southern Copper Corp. 125,000 3.50% 8/11/2022 129,055 0.01%Grupo Televisa SAB 100,000 6.63% 15/1/2040 125,588 0.01%Coca-Cola Femsa SAB de CV 100,000 5.25% 26/11/2043 123,013 0.01%Petroleos Mexicanos 111,000 4.63% 21/9/2023 115,753 0.01%Grupo Televisa SAB 100,000 4.63% 30/1/2026 107,632 0.01%Petroleos Mexicanos 105,000 3.50% 30/1/2023 106,068 0.01%Orbia Advance Corp. SAB de CV 100,000 4.88% 19/9/2022 105,423 0.01%Mexico Government International Bond 90,000 8.00% 24/9/2022 104,854 0.01%Petroleos Mexicanos 100,000 4.88% 18/1/2024 104,853 0.01%Grupo Bimbo SAB de CV 100,000 4.50% 25/1/2022 104,029 0.01%Petroleos Mexicanos 100,000 4.88% 24/1/2022 103,893 0.01%Comision Federal de Electricidad 100,000 4.88% 26/5/2021 102,953 0.01%Orbia Advance Corp SAB de CV 100,000 5.50% 15/1/2048 102,078 0.01%Petroleos Mexicanos 100,000 6.35% 12/2/2048 96,473 0.01%Petroleos Mexicanos 92,000 5.38% 13/3/2022 96,356 0.01%Petroleos Mexicanos 80,000 6.38% 4/2/2021 81,434 0.01%Infraestructura Energetica Nova SAB de CV 75,000 3.75% 14/1/2028 73,172 0.01%Infraestructura Energetica Nova SAB de CV 75,000 4.88% 14/1/2048 71,625 0.00%Southern Copper Corp. 50,000 6.75% 16/4/2040 66,516 0.00%Petroleos Mexicanos 50,000 4.25% 15/1/2025 50,512 0.00%Petroleos Mexicanos 50,000 5.50% 27/6/2044 44,650 0.00%Grupo Bimbo SAB de CV 25,000 3.88% 27/6/2024 26,112 0.00%
23,813,359 1.70%
Morocco 0.05% (2018: 0.06%)
Morocco Government International Bond 200,000 5.50% 11/12/2042 244,500 0.02%OCP SA 200,000 5.63% 25/4/2024 221,000 0.02%OCP SA 200,000 4.50% 22/10/2025 214,000 0.01%
679,500 0.05%
Netherlands 1.30% (2018: 1.51%)
Shell International Finance BV 395,000 6.38% 15/12/2038 576,342 0.04%BNG Bank NV 520,000 2.50% 16/2/2021 524,016 0.04%Nederlandse Waterschapsbank NV 475,000 1.88% 14/4/2022 476,515 0.03%Shell International Finance BV 375,000 4.38% 11/5/2045 446,541 0.03%Shell International Finance BV 380,000 4.00% 10/5/2046 432,857 0.03%ING Bank NV 378,000 5.80% 25/9/2023 419,072 0.03%BNG Bank NV 401,000 3.00% 20/9/2023 418,731 0.03%Cooperatieve Rabobank UA 400,000 3.88% 8/2/2022 416,520 0.03%NXP BV/NXP Funding LLC 400,000 3.88% 1/9/2022 415,172 0.03%Shell International Finance BV 375,000 3.25% 11/5/2025 396,241 0.03%Shell International Finance BV 400,000 3.13% 7/11/2049 394,370 0.03%Cooperatieve Rabobank UA 275,000 5.75% 1/12/2043 361,796 0.03%BNG Bank NV 350,000 2.38% 1/2/2022 354,638 0.03%Cooperatieve Rabobank UA 325,000 3.38% 21/5/2025 343,403 0.02%Cooperatieve Rabobank UA 335,000 2.50% 19/1/2021 336,553 0.02%NXP BV/NXP Funding LLC 300,000 4.88% 1/3/2024 325,875 0.02%NXP BV/NXP Funding LLC 300,000 4.30% 18/6/2029 324,000 0.02%ING Groep NV 300,000 3.55% 9/4/2024 314,044 0.02%Cooperatieve Rabobank UA 250,000 5.25% 4/8/2045 313,954 0.02%Shell International Finance BV 300,000 2.88% 10/5/2026 311,041 0.02%Cooperatieve Rabobank UA 225,000 5.25% 24/5/2041 306,228 0.02%BNG Bank NV 300,000 2.13% 14/12/2020 300,857 0.02%ABN AMRO Bank NV 275,000 4.75% 28/7/2025 299,285 0.02%Nederlandse Waterschapsbank NV 300,000 1.50% 27/8/2021 299,208 0.02%ING Groep NV 250,000 3.95% 29/3/2027 268,811 0.02%
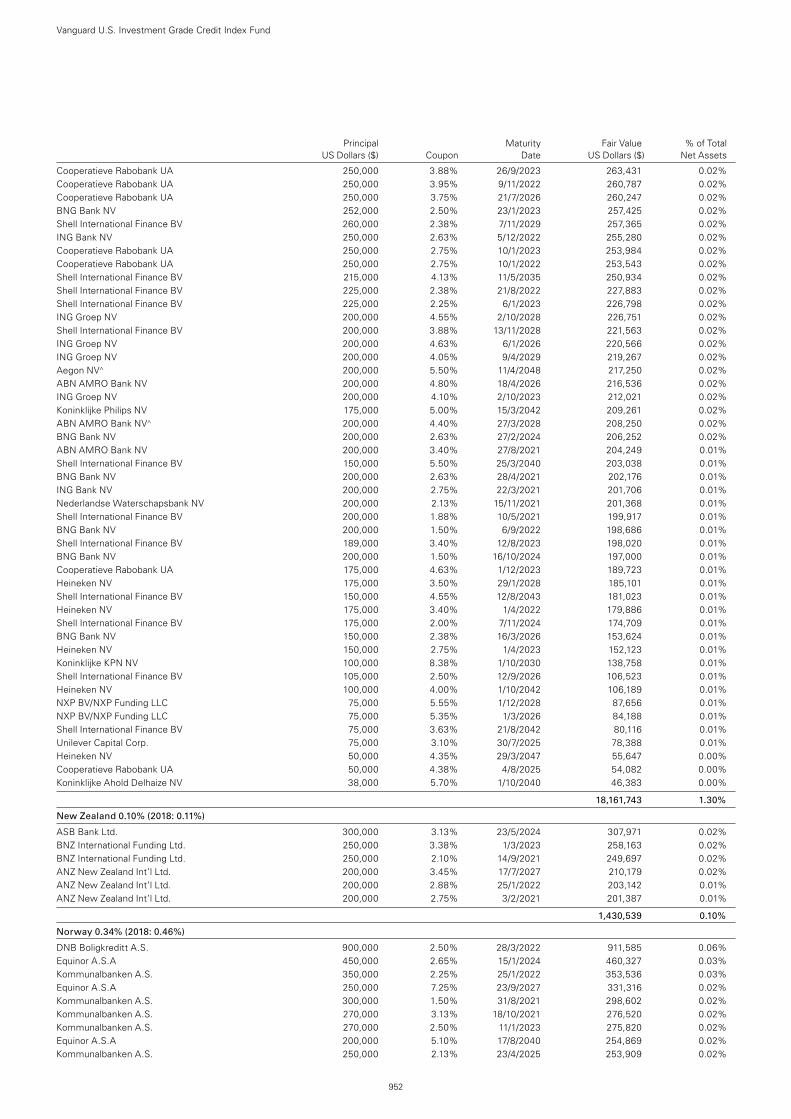
Principal Maturity Fair Value % of Total US Dollars ($) Coupon Date US Dollars ($) Net Assets
Vanguard U.S. Investment Grade Credit Index Fund
952
Cooperatieve Rabobank UA 250,000 3.88% 26/9/2023 263,431 0.02%Cooperatieve Rabobank UA 250,000 3.95% 9/11/2022 260,787 0.02%Cooperatieve Rabobank UA 250,000 3.75% 21/7/2026 260,247 0.02%BNG Bank NV 252,000 2.50% 23/1/2023 257,425 0.02%Shell International Finance BV 260,000 2.38% 7/11/2029 257,365 0.02%ING Bank NV 250,000 2.63% 5/12/2022 255,280 0.02%Cooperatieve Rabobank UA 250,000 2.75% 10/1/2023 253,984 0.02%Cooperatieve Rabobank UA 250,000 2.75% 10/1/2022 253,543 0.02%Shell International Finance BV 215,000 4.13% 11/5/2035 250,934 0.02%Shell International Finance BV 225,000 2.38% 21/8/2022 227,883 0.02%Shell International Finance BV 225,000 2.25% 6/1/2023 226,798 0.02%ING Groep NV 200,000 4.55% 2/10/2028 226,751 0.02%Shell International Finance BV 200,000 3.88% 13/11/2028 221,563 0.02%ING Groep NV 200,000 4.63% 6/1/2026 220,566 0.02%ING Groep NV 200,000 4.05% 9/4/2029 219,267 0.02%Aegon NV^ 200,000 5.50% 11/4/2048 217,250 0.02%ABN AMRO Bank NV 200,000 4.80% 18/4/2026 216,536 0.02%ING Groep NV 200,000 4.10% 2/10/2023 212,021 0.02%Koninklijke Philips NV 175,000 5.00% 15/3/2042 209,261 0.02%ABN AMRO Bank NV^ 200,000 4.40% 27/3/2028 208,250 0.02%BNG Bank NV 200,000 2.63% 27/2/2024 206,252 0.02%ABN AMRO Bank NV 200,000 3.40% 27/8/2021 204,249 0.01%Shell International Finance BV 150,000 5.50% 25/3/2040 203,038 0.01%BNG Bank NV 200,000 2.63% 28/4/2021 202,176 0.01%ING Bank NV 200,000 2.75% 22/3/2021 201,706 0.01%Nederlandse Waterschapsbank NV 200,000 2.13% 15/11/2021 201,368 0.01%Shell International Finance BV 200,000 1.88% 10/5/2021 199,917 0.01%BNG Bank NV 200,000 1.50% 6/9/2022 198,686 0.01%Shell International Finance BV 189,000 3.40% 12/8/2023 198,020 0.01%BNG Bank NV 200,000 1.50% 16/10/2024 197,000 0.01%Cooperatieve Rabobank UA 175,000 4.63% 1/12/2023 189,723 0.01%Heineken NV 175,000 3.50% 29/1/2028 185,101 0.01%Shell International Finance BV 150,000 4.55% 12/8/2043 181,023 0.01%Heineken NV 175,000 3.40% 1/4/2022 179,886 0.01%Shell International Finance BV 175,000 2.00% 7/11/2024 174,709 0.01%BNG Bank NV 150,000 2.38% 16/3/2026 153,624 0.01%Heineken NV 150,000 2.75% 1/4/2023 152,123 0.01%Koninklijke KPN NV 100,000 8.38% 1/10/2030 138,758 0.01%Shell International Finance BV 105,000 2.50% 12/9/2026 106,523 0.01%Heineken NV 100,000 4.00% 1/10/2042 106,189 0.01%NXP BV/NXP Funding LLC 75,000 5.55% 1/12/2028 87,656 0.01%NXP BV/NXP Funding LLC 75,000 5.35% 1/3/2026 84,188 0.01%Shell International Finance BV 75,000 3.63% 21/8/2042 80,116 0.01%Unilever Capital Corp. 75,000 3.10% 30/7/2025 78,388 0.01%Heineken NV 50,000 4.35% 29/3/2047 55,647 0.00%Cooperatieve Rabobank UA 50,000 4.38% 4/8/2025 54,082 0.00%Koninklijke Ahold Delhaize NV 38,000 5.70% 1/10/2040 46,383 0.00%
18,161,743 1.30%
New Zealand 0.10% (2018: 0.11%)
ASB Bank Ltd. 300,000 3.13% 23/5/2024 307,971 0.02%BNZ International Funding Ltd. 250,000 3.38% 1/3/2023 258,163 0.02%BNZ International Funding Ltd. 250,000 2.10% 14/9/2021 249,697 0.02%ANZ New Zealand Int’l Ltd. 200,000 3.45% 17/7/2027 210,179 0.02%ANZ New Zealand Int’l Ltd. 200,000 2.88% 25/1/2022 203,142 0.01%ANZ New Zealand Int’l Ltd. 200,000 2.75% 3/2/2021 201,387 0.01%
1,430,539 0.10%
Norway 0.34% (2018: 0.46%)
DNB Boligkreditt A.S. 900,000 2.50% 28/3/2022 911,585 0.06%Equinor A.S.A 450,000 2.65% 15/1/2024 460,327 0.03%Kommunalbanken A.S. 350,000 2.25% 25/1/2022 353,536 0.03%Equinor A.S.A 250,000 7.25% 23/9/2027 331,316 0.02%Kommunalbanken A.S. 300,000 1.50% 31/8/2021 298,602 0.02%Kommunalbanken A.S. 270,000 3.13% 18/10/2021 276,520 0.02%Kommunalbanken A.S. 270,000 2.50% 11/1/2023 275,820 0.02%Equinor A.S.A 200,000 5.10% 17/8/2040 254,869 0.02%Kommunalbanken A.S. 250,000 2.13% 23/4/2025 253,909 0.02%
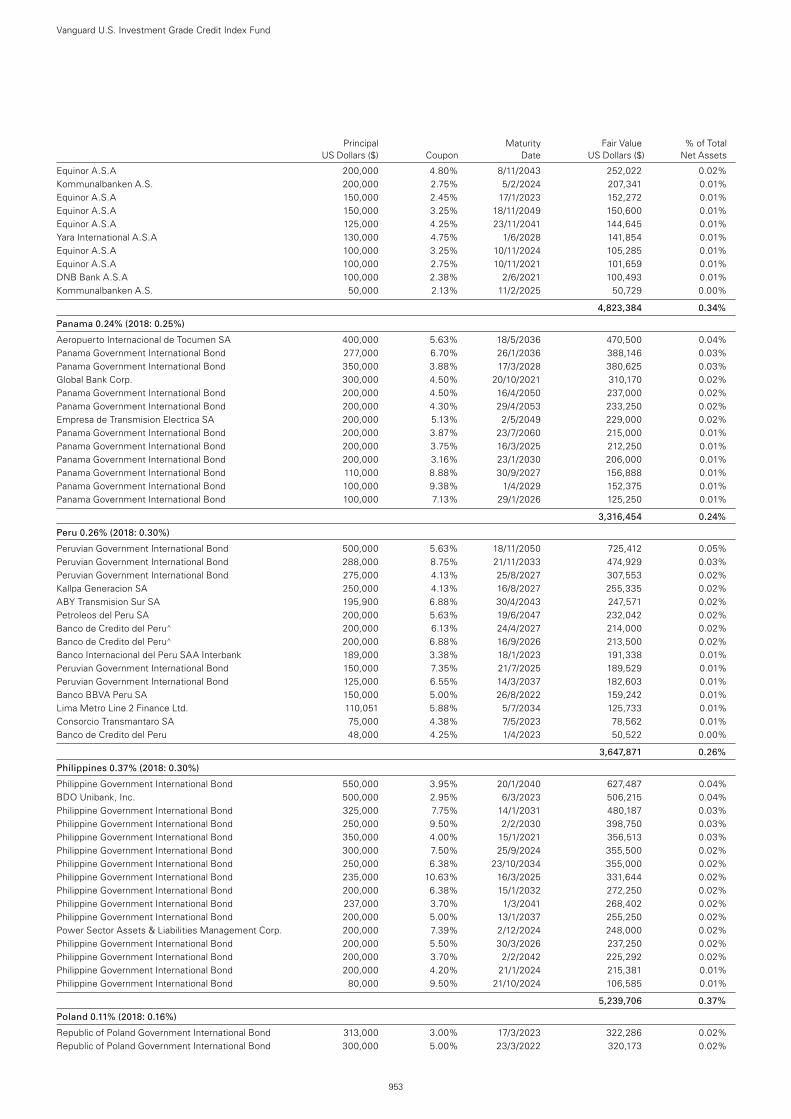
Principal Maturity Fair Value % of Total US Dollars ($) Coupon Date US Dollars ($) Net Assets
Vanguard U.S. Investment Grade Credit Index Fund
953
Equinor A.S.A 200,000 4.80% 8/11/2043 252,022 0.02%Kommunalbanken A.S. 200,000 2.75% 5/2/2024 207,341 0.01%Equinor A.S.A 150,000 2.45% 17/1/2023 152,272 0.01%Equinor A.S.A 150,000 3.25% 18/11/2049 150,600 0.01%Equinor A.S.A 125,000 4.25% 23/11/2041 144,645 0.01%Yara International A.S.A 130,000 4.75% 1/6/2028 141,854 0.01%Equinor A.S.A 100,000 3.25% 10/11/2024 105,285 0.01%Equinor A.S.A 100,000 2.75% 10/11/2021 101,659 0.01%DNB Bank A.S.A 100,000 2.38% 2/6/2021 100,493 0.01%Kommunalbanken A.S. 50,000 2.13% 11/2/2025 50,729 0.00%
4,823,384 0.34%
Panama 0.24% (2018: 0.25%)
Aeropuerto Internacional de Tocumen SA 400,000 5.63% 18/5/2036 470,500 0.04%Panama Government International Bond 277,000 6.70% 26/1/2036 388,146 0.03%Panama Government International Bond 350,000 3.88% 17/3/2028 380,625 0.03%Global Bank Corp. 300,000 4.50% 20/10/2021 310,170 0.02%Panama Government International Bond 200,000 4.50% 16/4/2050 237,000 0.02%Panama Government International Bond 200,000 4.30% 29/4/2053 233,250 0.02%Empresa de Transmision Electrica SA 200,000 5.13% 2/5/2049 229,000 0.02%Panama Government International Bond 200,000 3.87% 23/7/2060 215,000 0.01%Panama Government International Bond 200,000 3.75% 16/3/2025 212,250 0.01%Panama Government International Bond 200,000 3.16% 23/1/2030 206,000 0.01%Panama Government International Bond 110,000 8.88% 30/9/2027 156,888 0.01%Panama Government International Bond 100,000 9.38% 1/4/2029 152,375 0.01%Panama Government International Bond 100,000 7.13% 29/1/2026 125,250 0.01%
3,316,454 0.24%
Peru 0.26% (2018: 0.30%)
Peruvian Government International Bond 500,000 5.63% 18/11/2050 725,412 0.05%Peruvian Government International Bond 288,000 8.75% 21/11/2033 474,929 0.03%Peruvian Government International Bond 275,000 4.13% 25/8/2027 307,553 0.02%Kallpa Generacion SA 250,000 4.13% 16/8/2027 255,335 0.02%ABY Transmision Sur SA 195,900 6.88% 30/4/2043 247,571 0.02%Petroleos del Peru SA 200,000 5.63% 19/6/2047 232,042 0.02%Banco de Credito del Peru^ 200,000 6.13% 24/4/2027 214,000 0.02%Banco de Credito del Peru^ 200,000 6.88% 16/9/2026 213,500 0.02%Banco Internacional del Peru SAA Interbank 189,000 3.38% 18/1/2023 191,338 0.01%Peruvian Government International Bond 150,000 7.35% 21/7/2025 189,529 0.01%Peruvian Government International Bond 125,000 6.55% 14/3/2037 182,603 0.01%Banco BBVA Peru SA 150,000 5.00% 26/8/2022 159,242 0.01%Lima Metro Line 2 Finance Ltd. 110,051 5.88% 5/7/2034 125,733 0.01%Consorcio Transmantaro SA 75,000 4.38% 7/5/2023 78,562 0.01%Banco de Credito del Peru 48,000 4.25% 1/4/2023 50,522 0.00%
3,647,871 0.26%
Philippines 0.37% (2018: 0.30%)
Philippine Government International Bond 550,000 3.95% 20/1/2040 627,487 0.04%BDO Unibank, Inc. 500,000 2.95% 6/3/2023 506,215 0.04%Philippine Government International Bond 325,000 7.75% 14/1/2031 480,187 0.03%Philippine Government International Bond 250,000 9.50% 2/2/2030 398,750 0.03%Philippine Government International Bond 350,000 4.00% 15/1/2021 356,513 0.03%Philippine Government International Bond 300,000 7.50% 25/9/2024 355,500 0.02%Philippine Government International Bond 250,000 6.38% 23/10/2034 355,000 0.02%Philippine Government International Bond 235,000 10.63% 16/3/2025 331,644 0.02%Philippine Government International Bond 200,000 6.38% 15/1/2032 272,250 0.02%Philippine Government International Bond 237,000 3.70% 1/3/2041 268,402 0.02%Philippine Government International Bond 200,000 5.00% 13/1/2037 255,250 0.02%Power Sector Assets & Liabilities Management Corp. 200,000 7.39% 2/12/2024 248,000 0.02%Philippine Government International Bond 200,000 5.50% 30/3/2026 237,250 0.02%Philippine Government International Bond 200,000 3.70% 2/2/2042 225,292 0.02%Philippine Government International Bond 200,000 4.20% 21/1/2024 215,381 0.01%Philippine Government International Bond 80,000 9.50% 21/10/2024 106,585 0.01%
5,239,706 0.37%
Poland 0.11% (2018: 0.16%)
Republic of Poland Government International Bond 313,000 3.00% 17/3/2023 322,286 0.02%Republic of Poland Government International Bond 300,000 5.00% 23/3/2022 320,173 0.02%
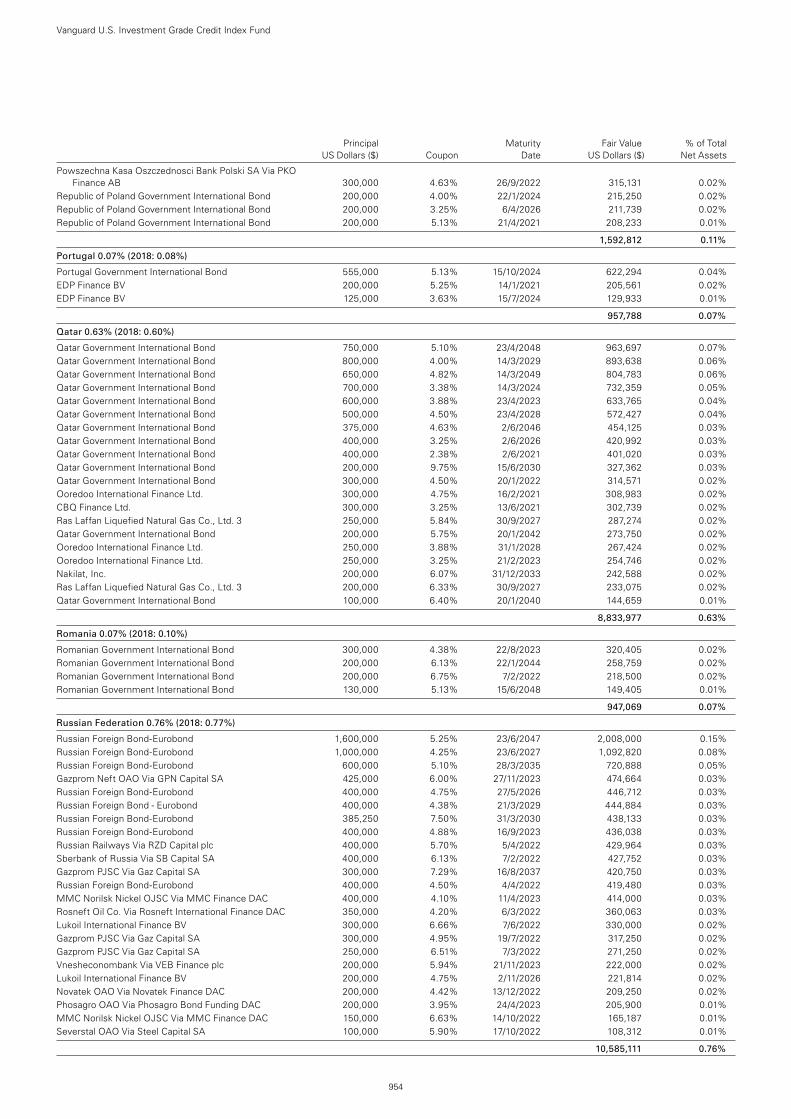
Principal Maturity Fair Value % of Total US Dollars ($) Coupon Date US Dollars ($) Net Assets
Vanguard U.S. Investment Grade Credit Index Fund
954
Powszechna Kasa Oszczednosci Bank Polski SA Via PKO Finance AB 300,000 4.63% 26/9/2022 315,131 0.02%
Republic of Poland Government International Bond 200,000 4.00% 22/1/2024 215,250 0.02%Republic of Poland Government International Bond 200,000 3.25% 6/4/2026 211,739 0.02%Republic of Poland Government International Bond 200,000 5.13% 21/4/2021 208,233 0.01%
1,592,812 0.11%
Portugal 0.07% (2018: 0.08%)
Portugal Government International Bond 555,000 5.13% 15/10/2024 622,294 0.04%EDP Finance BV 200,000 5.25% 14/1/2021 205,561 0.02%EDP Finance BV 125,000 3.63% 15/7/2024 129,933 0.01%
957,788 0.07%
Qatar 0.63% (2018: 0.60%)
Qatar Government International Bond 750,000 5.10% 23/4/2048 963,697 0.07%Qatar Government International Bond 800,000 4.00% 14/3/2029 893,638 0.06%Qatar Government International Bond 650,000 4.82% 14/3/2049 804,783 0.06%Qatar Government International Bond 700,000 3.38% 14/3/2024 732,359 0.05%Qatar Government International Bond 600,000 3.88% 23/4/2023 633,765 0.04%Qatar Government International Bond 500,000 4.50% 23/4/2028 572,427 0.04%Qatar Government International Bond 375,000 4.63% 2/6/2046 454,125 0.03%Qatar Government International Bond 400,000 3.25% 2/6/2026 420,992 0.03%Qatar Government International Bond 400,000 2.38% 2/6/2021 401,020 0.03%Qatar Government International Bond 200,000 9.75% 15/6/2030 327,362 0.03%Qatar Government International Bond 300,000 4.50% 20/1/2022 314,571 0.02%Ooredoo International Finance Ltd. 300,000 4.75% 16/2/2021 308,983 0.02%CBQ Finance Ltd. 300,000 3.25% 13/6/2021 302,739 0.02%Ras Laffan Liquefied Natural Gas Co., Ltd. 3 250,000 5.84% 30/9/2027 287,274 0.02%Qatar Government International Bond 200,000 5.75% 20/1/2042 273,750 0.02%Ooredoo International Finance Ltd. 250,000 3.88% 31/1/2028 267,424 0.02%Ooredoo International Finance Ltd. 250,000 3.25% 21/2/2023 254,746 0.02%Nakilat, Inc. 200,000 6.07% 31/12/2033 242,588 0.02%Ras Laffan Liquefied Natural Gas Co., Ltd. 3 200,000 6.33% 30/9/2027 233,075 0.02%Qatar Government International Bond 100,000 6.40% 20/1/2040 144,659 0.01%
8,833,977 0.63%
Romania 0.07% (2018: 0.10%)
Romanian Government International Bond 300,000 4.38% 22/8/2023 320,405 0.02%Romanian Government International Bond 200,000 6.13% 22/1/2044 258,759 0.02%Romanian Government International Bond 200,000 6.75% 7/2/2022 218,500 0.02%Romanian Government International Bond 130,000 5.13% 15/6/2048 149,405 0.01%
947,069 0.07%
Russian Federation 0.76% (2018: 0.77%)
Russian Foreign Bond-Eurobond 1,600,000 5.25% 23/6/2047 2,008,000 0.15%Russian Foreign Bond-Eurobond 1,000,000 4.25% 23/6/2027 1,092,820 0.08%Russian Foreign Bond-Eurobond 600,000 5.10% 28/3/2035 720,888 0.05%Gazprom Neft OAO Via GPN Capital SA 425,000 6.00% 27/11/2023 474,664 0.03%Russian Foreign Bond-Eurobond 400,000 4.75% 27/5/2026 446,712 0.03%Russian Foreign Bond - Eurobond 400,000 4.38% 21/3/2029 444,884 0.03%Russian Foreign Bond-Eurobond 385,250 7.50% 31/3/2030 438,133 0.03%Russian Foreign Bond-Eurobond 400,000 4.88% 16/9/2023 436,038 0.03%Russian Railways Via RZD Capital plc 400,000 5.70% 5/4/2022 429,964 0.03%Sberbank of Russia Via SB Capital SA 400,000 6.13% 7/2/2022 427,752 0.03%Gazprom PJSC Via Gaz Capital SA 300,000 7.29% 16/8/2037 420,750 0.03%Russian Foreign Bond-Eurobond 400,000 4.50% 4/4/2022 419,480 0.03%MMC Norilsk Nickel OJSC Via MMC Finance DAC 400,000 4.10% 11/4/2023 414,000 0.03%Rosneft Oil Co. Via Rosneft International Finance DAC 350,000 4.20% 6/3/2022 360,063 0.03%Lukoil International Finance BV 300,000 6.66% 7/6/2022 330,000 0.02%Gazprom PJSC Via Gaz Capital SA 300,000 4.95% 19/7/2022 317,250 0.02%Gazprom PJSC Via Gaz Capital SA 250,000 6.51% 7/3/2022 271,250 0.02%Vnesheconombank Via VEB Finance plc 200,000 5.94% 21/11/2023 222,000 0.02%Lukoil International Finance BV 200,000 4.75% 2/11/2026 221,814 0.02%Novatek OAO Via Novatek Finance DAC 200,000 4.42% 13/12/2022 209,250 0.02%Phosagro OAO Via Phosagro Bond Funding DAC 200,000 3.95% 24/4/2023 205,900 0.01%MMC Norilsk Nickel OJSC Via MMC Finance DAC 150,000 6.63% 14/10/2022 165,187 0.01%Severstal OAO Via Steel Capital SA 100,000 5.90% 17/10/2022 108,312 0.01%
10,585,111 0.76%
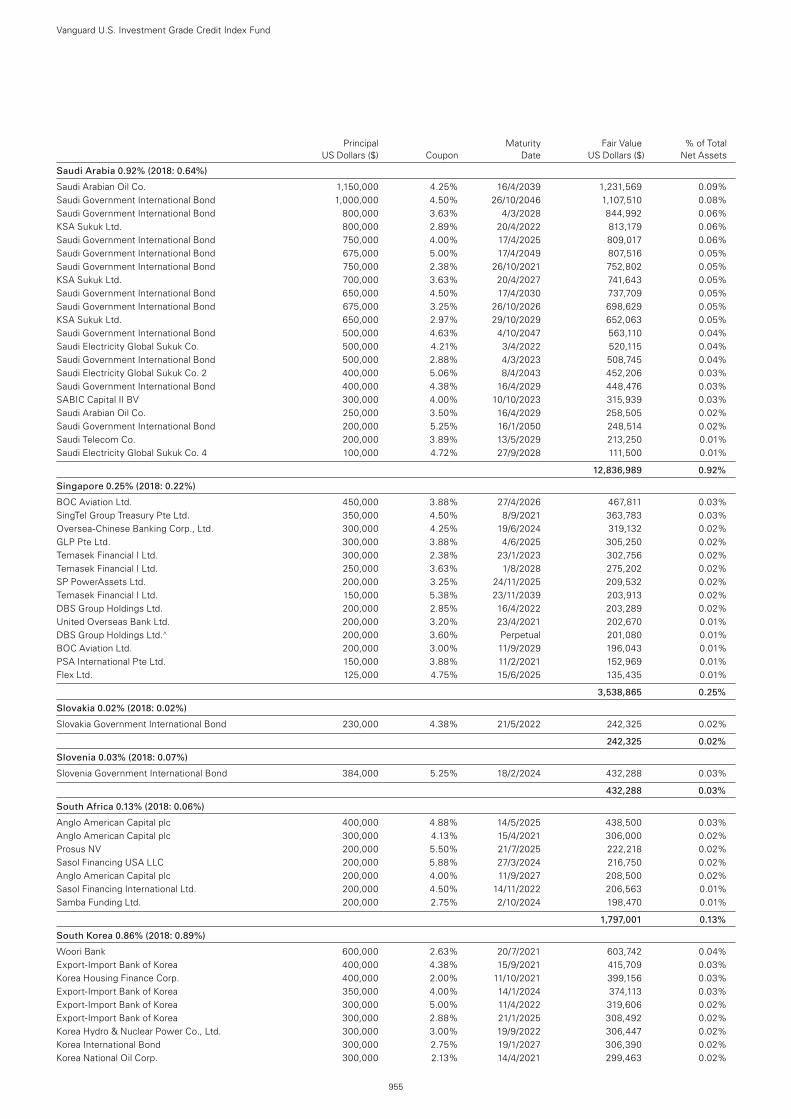
Principal Maturity Fair Value % of Total US Dollars ($) Coupon Date US Dollars ($) Net Assets
Vanguard U.S. Investment Grade Credit Index Fund
955
Saudi Arabia 0.92% (2018: 0.64%)
Saudi Arabian Oil Co. 1,150,000 4.25% 16/4/2039 1,231,569 0.09%Saudi Government International Bond 1,000,000 4.50% 26/10/2046 1,107,510 0.08%Saudi Government International Bond 800,000 3.63% 4/3/2028 844,992 0.06%KSA Sukuk Ltd. 800,000 2.89% 20/4/2022 813,179 0.06%Saudi Government International Bond 750,000 4.00% 17/4/2025 809,017 0.06%Saudi Government International Bond 675,000 5.00% 17/4/2049 807,516 0.05%Saudi Government International Bond 750,000 2.38% 26/10/2021 752,802 0.05%KSA Sukuk Ltd. 700,000 3.63% 20/4/2027 741,643 0.05%Saudi Government International Bond 650,000 4.50% 17/4/2030 737,709 0.05%Saudi Government International Bond 675,000 3.25% 26/10/2026 698,629 0.05%KSA Sukuk Ltd. 650,000 2.97% 29/10/2029 652,063 0.05%Saudi Government International Bond 500,000 4.63% 4/10/2047 563,110 0.04%Saudi Electricity Global Sukuk Co. 500,000 4.21% 3/4/2022 520,115 0.04%Saudi Government International Bond 500,000 2.88% 4/3/2023 508,745 0.04%Saudi Electricity Global Sukuk Co. 2 400,000 5.06% 8/4/2043 452,206 0.03%Saudi Government International Bond 400,000 4.38% 16/4/2029 448,476 0.03%SABIC Capital II BV 300,000 4.00% 10/10/2023 315,939 0.03%Saudi Arabian Oil Co. 250,000 3.50% 16/4/2029 258,505 0.02%Saudi Government International Bond 200,000 5.25% 16/1/2050 248,514 0.02%Saudi Telecom Co. 200,000 3.89% 13/5/2029 213,250 0.01%Saudi Electricity Global Sukuk Co. 4 100,000 4.72% 27/9/2028 111,500 0.01%
12,836,989 0.92%
Singapore 0.25% (2018: 0.22%)
BOC Aviation Ltd. 450,000 3.88% 27/4/2026 467,811 0.03%SingTel Group Treasury Pte Ltd. 350,000 4.50% 8/9/2021 363,783 0.03%Oversea-Chinese Banking Corp., Ltd. 300,000 4.25% 19/6/2024 319,132 0.02%GLP Pte Ltd. 300,000 3.88% 4/6/2025 305,250 0.02%Temasek Financial I Ltd. 300,000 2.38% 23/1/2023 302,756 0.02%Temasek Financial I Ltd. 250,000 3.63% 1/8/2028 275,202 0.02%SP PowerAssets Ltd. 200,000 3.25% 24/11/2025 209,532 0.02%Temasek Financial I Ltd. 150,000 5.38% 23/11/2039 203,913 0.02%DBS Group Holdings Ltd. 200,000 2.85% 16/4/2022 203,289 0.02%United Overseas Bank Ltd. 200,000 3.20% 23/4/2021 202,670 0.01%DBS Group Holdings Ltd.^ 200,000 3.60% Perpetual 201,080 0.01%BOC Aviation Ltd. 200,000 3.00% 11/9/2029 196,043 0.01%PSA International Pte Ltd. 150,000 3.88% 11/2/2021 152,969 0.01%Flex Ltd. 125,000 4.75% 15/6/2025 135,435 0.01%
3,538,865 0.25%
Slovakia 0.02% (2018: 0.02%)
Slovakia Government International Bond 230,000 4.38% 21/5/2022 242,325 0.02%
242,325 0.02%
Slovenia 0.03% (2018: 0.07%)
Slovenia Government International Bond 384,000 5.25% 18/2/2024 432,288 0.03%
432,288 0.03%
South Africa 0.13% (2018: 0.06%)
Anglo American Capital plc 400,000 4.88% 14/5/2025 438,500 0.03%Anglo American Capital plc 300,000 4.13% 15/4/2021 306,000 0.02%Prosus NV 200,000 5.50% 21/7/2025 222,218 0.02%Sasol Financing USA LLC 200,000 5.88% 27/3/2024 216,750 0.02%Anglo American Capital plc 200,000 4.00% 11/9/2027 208,500 0.02%Sasol Financing International Ltd. 200,000 4.50% 14/11/2022 206,563 0.01%Samba Funding Ltd. 200,000 2.75% 2/10/2024 198,470 0.01%
1,797,001 0.13%
South Korea 0.86% (2018: 0.89%)
Woori Bank 600,000 2.63% 20/7/2021 603,742 0.04%Export-Import Bank of Korea 400,000 4.38% 15/9/2021 415,709 0.03%Korea Housing Finance Corp. 400,000 2.00% 11/10/2021 399,156 0.03%Export-Import Bank of Korea 350,000 4.00% 14/1/2024 374,113 0.03%Export-Import Bank of Korea 300,000 5.00% 11/4/2022 319,606 0.02%Export-Import Bank of Korea 300,000 2.88% 21/1/2025 308,492 0.02%Korea Hydro & Nuclear Power Co., Ltd. 300,000 3.00% 19/9/2022 306,447 0.02%Korea International Bond 300,000 2.75% 19/1/2027 306,390 0.02%Korea National Oil Corp. 300,000 2.13% 14/4/2021 299,463 0.02%
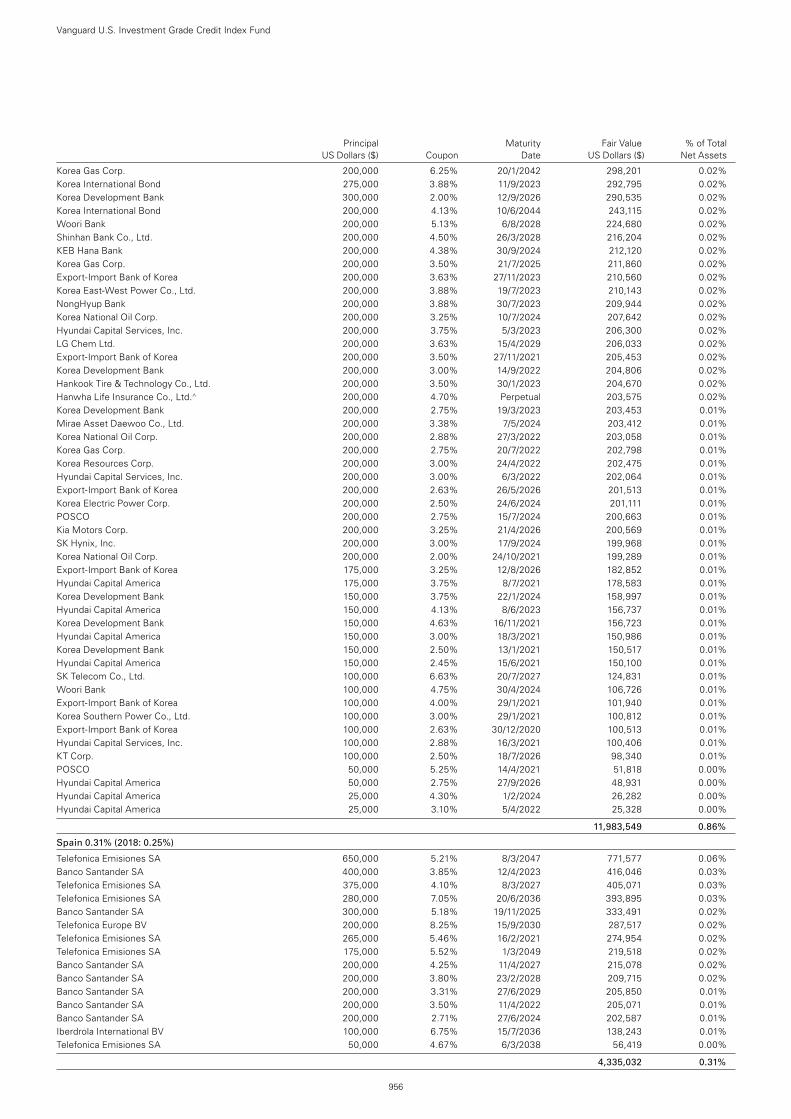
Principal Maturity Fair Value % of Total US Dollars ($) Coupon Date US Dollars ($) Net Assets
Vanguard U.S. Investment Grade Credit Index Fund
956
Korea Gas Corp. 200,000 6.25% 20/1/2042 298,201 0.02%Korea International Bond 275,000 3.88% 11/9/2023 292,795 0.02%Korea Development Bank 300,000 2.00% 12/9/2026 290,535 0.02%Korea International Bond 200,000 4.13% 10/6/2044 243,115 0.02%Woori Bank 200,000 5.13% 6/8/2028 224,680 0.02%Shinhan Bank Co., Ltd. 200,000 4.50% 26/3/2028 216,204 0.02%KEB Hana Bank 200,000 4.38% 30/9/2024 212,120 0.02%Korea Gas Corp. 200,000 3.50% 21/7/2025 211,860 0.02%Export-Import Bank of Korea 200,000 3.63% 27/11/2023 210,560 0.02%Korea East-West Power Co., Ltd. 200,000 3.88% 19/7/2023 210,143 0.02%NongHyup Bank 200,000 3.88% 30/7/2023 209,944 0.02%Korea National Oil Corp. 200,000 3.25% 10/7/2024 207,642 0.02%Hyundai Capital Services, Inc. 200,000 3.75% 5/3/2023 206,300 0.02%LG Chem Ltd. 200,000 3.63% 15/4/2029 206,033 0.02%Export-Import Bank of Korea 200,000 3.50% 27/11/2021 205,453 0.02%Korea Development Bank 200,000 3.00% 14/9/2022 204,806 0.02%Hankook Tire & Technology Co., Ltd. 200,000 3.50% 30/1/2023 204,670 0.02%Hanwha Life Insurance Co., Ltd.^ 200,000 4.70% Perpetual 203,575 0.02%Korea Development Bank 200,000 2.75% 19/3/2023 203,453 0.01%Mirae Asset Daewoo Co., Ltd. 200,000 3.38% 7/5/2024 203,412 0.01%Korea National Oil Corp. 200,000 2.88% 27/3/2022 203,058 0.01%Korea Gas Corp. 200,000 2.75% 20/7/2022 202,798 0.01%Korea Resources Corp. 200,000 3.00% 24/4/2022 202,475 0.01%Hyundai Capital Services, Inc. 200,000 3.00% 6/3/2022 202,064 0.01%Export-Import Bank of Korea 200,000 2.63% 26/5/2026 201,513 0.01%Korea Electric Power Corp. 200,000 2.50% 24/6/2024 201,111 0.01%POSCO 200,000 2.75% 15/7/2024 200,663 0.01%Kia Motors Corp. 200,000 3.25% 21/4/2026 200,569 0.01%SK Hynix, Inc. 200,000 3.00% 17/9/2024 199,968 0.01%Korea National Oil Corp. 200,000 2.00% 24/10/2021 199,289 0.01%Export-Import Bank of Korea 175,000 3.25% 12/8/2026 182,852 0.01%Hyundai Capital America 175,000 3.75% 8/7/2021 178,583 0.01%Korea Development Bank 150,000 3.75% 22/1/2024 158,997 0.01%Hyundai Capital America 150,000 4.13% 8/6/2023 156,737 0.01%Korea Development Bank 150,000 4.63% 16/11/2021 156,723 0.01%Hyundai Capital America 150,000 3.00% 18/3/2021 150,986 0.01%Korea Development Bank 150,000 2.50% 13/1/2021 150,517 0.01%Hyundai Capital America 150,000 2.45% 15/6/2021 150,100 0.01%SK Telecom Co., Ltd. 100,000 6.63% 20/7/2027 124,831 0.01%Woori Bank 100,000 4.75% 30/4/2024 106,726 0.01%Export-Import Bank of Korea 100,000 4.00% 29/1/2021 101,940 0.01%Korea Southern Power Co., Ltd. 100,000 3.00% 29/1/2021 100,812 0.01%Export-Import Bank of Korea 100,000 2.63% 30/12/2020 100,513 0.01%Hyundai Capital Services, Inc. 100,000 2.88% 16/3/2021 100,406 0.01%KT Corp. 100,000 2.50% 18/7/2026 98,340 0.01%POSCO 50,000 5.25% 14/4/2021 51,818 0.00%Hyundai Capital America 50,000 2.75% 27/9/2026 48,931 0.00%Hyundai Capital America 25,000 4.30% 1/2/2024 26,282 0.00%Hyundai Capital America 25,000 3.10% 5/4/2022 25,328 0.00%
11,983,549 0.86%
Spain 0.31% (2018: 0.25%)
Telefonica Emisiones SA 650,000 5.21% 8/3/2047 771,577 0.06%Banco Santander SA 400,000 3.85% 12/4/2023 416,046 0.03%Telefonica Emisiones SA 375,000 4.10% 8/3/2027 405,071 0.03%Telefonica Emisiones SA 280,000 7.05% 20/6/2036 393,895 0.03%Banco Santander SA 300,000 5.18% 19/11/2025 333,491 0.02%Telefonica Europe BV 200,000 8.25% 15/9/2030 287,517 0.02%Telefonica Emisiones SA 265,000 5.46% 16/2/2021 274,954 0.02%Telefonica Emisiones SA 175,000 5.52% 1/3/2049 219,518 0.02%Banco Santander SA 200,000 4.25% 11/4/2027 215,078 0.02%Banco Santander SA 200,000 3.80% 23/2/2028 209,715 0.02%Banco Santander SA 200,000 3.31% 27/6/2029 205,850 0.01%Banco Santander SA 200,000 3.50% 11/4/2022 205,071 0.01%Banco Santander SA 200,000 2.71% 27/6/2024 202,587 0.01%Iberdrola International BV 100,000 6.75% 15/7/2036 138,243 0.01%Telefonica Emisiones SA 50,000 4.67% 6/3/2038 56,419 0.00%
4,335,032 0.31%
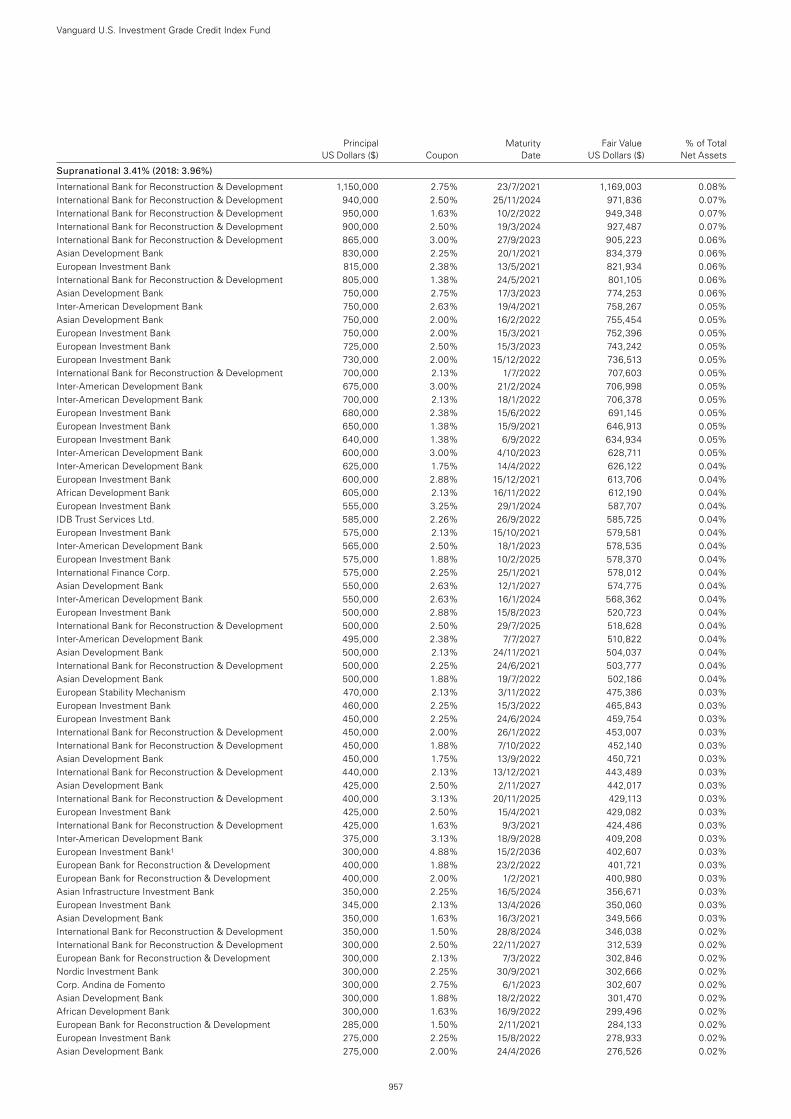
Principal Maturity Fair Value % of Total US Dollars ($) Coupon Date US Dollars ($) Net Assets
Vanguard U.S. Investment Grade Credit Index Fund
957
Supranational 3.41% (2018: 3.96%)
International Bank for Reconstruction & Development 1,150,000 2.75% 23/7/2021 1,169,003 0.08%International Bank for Reconstruction & Development 940,000 2.50% 25/11/2024 971,836 0.07%International Bank for Reconstruction & Development 950,000 1.63% 10/2/2022 949,348 0.07%International Bank for Reconstruction & Development 900,000 2.50% 19/3/2024 927,487 0.07%International Bank for Reconstruction & Development 865,000 3.00% 27/9/2023 905,223 0.06%Asian Development Bank 830,000 2.25% 20/1/2021 834,379 0.06%European Investment Bank 815,000 2.38% 13/5/2021 821,934 0.06%International Bank for Reconstruction & Development 805,000 1.38% 24/5/2021 801,105 0.06%Asian Development Bank 750,000 2.75% 17/3/2023 774,253 0.06%Inter-American Development Bank 750,000 2.63% 19/4/2021 758,267 0.05%Asian Development Bank 750,000 2.00% 16/2/2022 755,454 0.05%European Investment Bank 750,000 2.00% 15/3/2021 752,396 0.05%European Investment Bank 725,000 2.50% 15/3/2023 743,242 0.05%European Investment Bank 730,000 2.00% 15/12/2022 736,513 0.05%International Bank for Reconstruction & Development 700,000 2.13% 1/7/2022 707,603 0.05%Inter-American Development Bank 675,000 3.00% 21/2/2024 706,998 0.05%Inter-American Development Bank 700,000 2.13% 18/1/2022 706,378 0.05%European Investment Bank 680,000 2.38% 15/6/2022 691,145 0.05%European Investment Bank 650,000 1.38% 15/9/2021 646,913 0.05%European Investment Bank 640,000 1.38% 6/9/2022 634,934 0.05%Inter-American Development Bank 600,000 3.00% 4/10/2023 628,711 0.05%Inter-American Development Bank 625,000 1.75% 14/4/2022 626,122 0.04%European Investment Bank 600,000 2.88% 15/12/2021 613,706 0.04%African Development Bank 605,000 2.13% 16/11/2022 612,190 0.04%European Investment Bank 555,000 3.25% 29/1/2024 587,707 0.04%IDB Trust Services Ltd. 585,000 2.26% 26/9/2022 585,725 0.04%European Investment Bank 575,000 2.13% 15/10/2021 579,581 0.04%Inter-American Development Bank 565,000 2.50% 18/1/2023 578,535 0.04%European Investment Bank 575,000 1.88% 10/2/2025 578,370 0.04%International Finance Corp. 575,000 2.25% 25/1/2021 578,012 0.04%Asian Development Bank 550,000 2.63% 12/1/2027 574,775 0.04%Inter-American Development Bank 550,000 2.63% 16/1/2024 568,362 0.04%European Investment Bank 500,000 2.88% 15/8/2023 520,723 0.04%International Bank for Reconstruction & Development 500,000 2.50% 29/7/2025 518,628 0.04%Inter-American Development Bank 495,000 2.38% 7/7/2027 510,822 0.04%Asian Development Bank 500,000 2.13% 24/11/2021 504,037 0.04%International Bank for Reconstruction & Development 500,000 2.25% 24/6/2021 503,777 0.04%Asian Development Bank 500,000 1.88% 19/7/2022 502,186 0.04%European Stability Mechanism 470,000 2.13% 3/11/2022 475,386 0.03%European Investment Bank 460,000 2.25% 15/3/2022 465,843 0.03%European Investment Bank 450,000 2.25% 24/6/2024 459,754 0.03%International Bank for Reconstruction & Development 450,000 2.00% 26/1/2022 453,007 0.03%International Bank for Reconstruction & Development 450,000 1.88% 7/10/2022 452,140 0.03%Asian Development Bank 450,000 1.75% 13/9/2022 450,721 0.03%International Bank for Reconstruction & Development 440,000 2.13% 13/12/2021 443,489 0.03%Asian Development Bank 425,000 2.50% 2/11/2027 442,017 0.03%International Bank for Reconstruction & Development 400,000 3.13% 20/11/2025 429,113 0.03%European Investment Bank 425,000 2.50% 15/4/2021 429,082 0.03%International Bank for Reconstruction & Development 425,000 1.63% 9/3/2021 424,486 0.03%Inter-American Development Bank 375,000 3.13% 18/9/2028 409,208 0.03%European Investment Bank1 300,000 4.88% 15/2/2036 402,607 0.03%European Bank for Reconstruction & Development 400,000 1.88% 23/2/2022 401,721 0.03%European Bank for Reconstruction & Development 400,000 2.00% 1/2/2021 400,980 0.03%Asian Infrastructure Investment Bank 350,000 2.25% 16/5/2024 356,671 0.03%European Investment Bank 345,000 2.13% 13/4/2026 350,060 0.03%Asian Development Bank 350,000 1.63% 16/3/2021 349,566 0.03%International Bank for Reconstruction & Development 350,000 1.50% 28/8/2024 346,038 0.02%International Bank for Reconstruction & Development 300,000 2.50% 22/11/2027 312,539 0.02%European Bank for Reconstruction & Development 300,000 2.13% 7/3/2022 302,846 0.02%Nordic Investment Bank 300,000 2.25% 30/9/2021 302,666 0.02%Corp. Andina de Fomento 300,000 2.75% 6/1/2023 302,607 0.02%Asian Development Bank 300,000 1.88% 18/2/2022 301,470 0.02%African Development Bank 300,000 1.63% 16/9/2022 299,496 0.02%European Bank for Reconstruction & Development 285,000 1.50% 2/11/2021 284,133 0.02%European Investment Bank 275,000 2.25% 15/8/2022 278,933 0.02%Asian Development Bank 275,000 2.00% 24/4/2026 276,526 0.02%
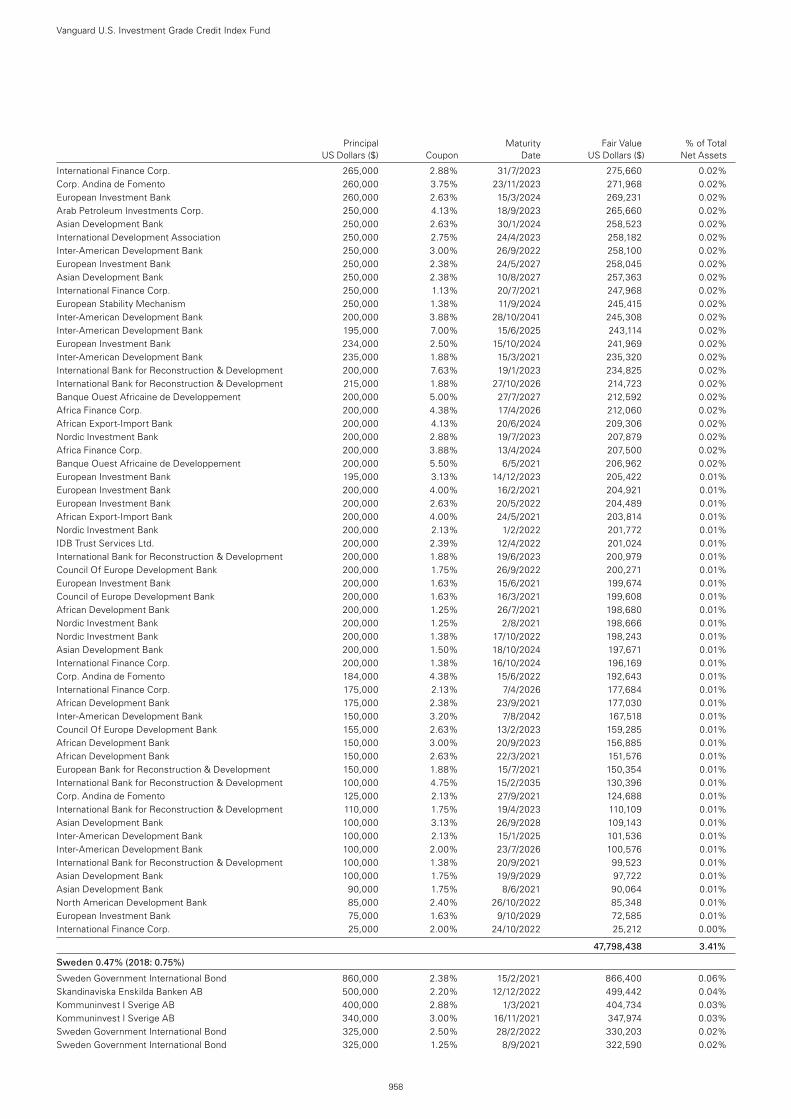
International Finance Corp. 265,000 2.88% 31/7/2023 275,660 0.02%Corp. Andina de Fomento 260,000 3.75% 23/11/2023 271,968 0.02%European Investment Bank 260,000 2.63% 15/3/2024 269,231 0.02%Arab Petroleum Investments Corp. 250,000 4.13% 18/9/2023 265,660 0.02%Asian Development Bank 250,000 2.63% 30/1/2024 258,523 0.02%International Development Association 250,000 2.75% 24/4/2023 258,182 0.02%Inter-American Development Bank 250,000 3.00% 26/9/2022 258,100 0.02%European Investment Bank 250,000 2.38% 24/5/2027 258,045 0.02%Asian Development Bank 250,000 2.38% 10/8/2027 257,363 0.02%International Finance Corp. 250,000 1.13% 20/7/2021 247,968 0.02%European Stability Mechanism 250,000 1.38% 11/9/2024 245,415 0.02%Inter-American Development Bank 200,000 3.88% 28/10/2041 245,308 0.02%Inter-American Development Bank 195,000 7.00% 15/6/2025 243,114 0.02%European Investment Bank 234,000 2.50% 15/10/2024 241,969 0.02%Inter-American Development Bank 235,000 1.88% 15/3/2021 235,320 0.02%International Bank for Reconstruction & Development 200,000 7.63% 19/1/2023 234,825 0.02%International Bank for Reconstruction & Development 215,000 1.88% 27/10/2026 214,723 0.02%Banque Ouest Africaine de Developpement 200,000 5.00% 27/7/2027 212,592 0.02%Africa Finance Corp. 200,000 4.38% 17/4/2026 212,060 0.02%African Export-Import Bank 200,000 4.13% 20/6/2024 209,306 0.02%Nordic Investment Bank 200,000 2.88% 19/7/2023 207,879 0.02%Africa Finance Corp. 200,000 3.88% 13/4/2024 207,500 0.02%Banque Ouest Africaine de Developpement 200,000 5.50% 6/5/2021 206,962 0.02%European Investment Bank 195,000 3.13% 14/12/2023 205,422 0.01%European Investment Bank 200,000 4.00% 16/2/2021 204,921 0.01%European Investment Bank 200,000 2.63% 20/5/2022 204,489 0.01%African Export-Import Bank 200,000 4.00% 24/5/2021 203,814 0.01%Nordic Investment Bank 200,000 2.13% 1/2/2022 201,772 0.01%IDB Trust Services Ltd. 200,000 2.39% 12/4/2022 201,024 0.01%International Bank for Reconstruction & Development 200,000 1.88% 19/6/2023 200,979 0.01%Council Of Europe Development Bank 200,000 1.75% 26/9/2022 200,271 0.01%European Investment Bank 200,000 1.63% 15/6/2021 199,674 0.01%Council of Europe Development Bank 200,000 1.63% 16/3/2021 199,608 0.01%African Development Bank 200,000 1.25% 26/7/2021 198,680 0.01%Nordic Investment Bank 200,000 1.25% 2/8/2021 198,666 0.01%Nordic Investment Bank 200,000 1.38% 17/10/2022 198,243 0.01%Asian Development Bank 200,000 1.50% 18/10/2024 197,671 0.01%International Finance Corp. 200,000 1.38% 16/10/2024 196,169 0.01%Corp. Andina de Fomento 184,000 4.38% 15/6/2022 192,643 0.01%International Finance Corp. 175,000 2.13% 7/4/2026 177,684 0.01%African Development Bank 175,000 2.38% 23/9/2021 177,030 0.01%Inter-American Development Bank 150,000 3.20% 7/8/2042 167,518 0.01%Council Of Europe Development Bank 155,000 2.63% 13/2/2023 159,285 0.01%African Development Bank 150,000 3.00% 20/9/2023 156,885 0.01%African Development Bank 150,000 2.63% 22/3/2021 151,576 0.01%European Bank for Reconstruction & Development 150,000 1.88% 15/7/2021 150,354 0.01%International Bank for Reconstruction & Development 100,000 4.75% 15/2/2035 130,396 0.01%Corp. Andina de Fomento 125,000 2.13% 27/9/2021 124,688 0.01%International Bank for Reconstruction & Development 110,000 1.75% 19/4/2023 110,109 0.01%Asian Development Bank 100,000 3.13% 26/9/2028 109,143 0.01%Inter-American Development Bank 100,000 2.13% 15/1/2025 101,536 0.01%Inter-American Development Bank 100,000 2.00% 23/7/2026 100,576 0.01%International Bank for Reconstruction & Development 100,000 1.38% 20/9/2021 99,523 0.01%Asian Development Bank 100,000 1.75% 19/9/2029 97,722 0.01%Asian Development Bank 90,000 1.75% 8/6/2021 90,064 0.01%North American Development Bank 85,000 2.40% 26/10/2022 85,348 0.01%European Investment Bank 75,000 1.63% 9/10/2029 72,585 0.01%International Finance Corp. 25,000 2.00% 24/10/2022 25,212 0.00%
47,798,438 3.41%
Sweden 0.47% (2018: 0.75%)
Sweden Government International Bond 860,000 2.38% 15/2/2021 866,400 0.06%Skandinaviska Enskilda Banken AB 500,000 2.20% 12/12/2022 499,442 0.04%Kommuninvest I Sverige AB 400,000 2.88% 1/3/2021 404,734 0.03%Kommuninvest I Sverige AB 340,000 3.00% 16/11/2021 347,974 0.03%Sweden Government International Bond 325,000 2.50% 28/2/2022 330,203 0.02%Sweden Government International Bond 325,000 1.25% 8/9/2021 322,590 0.02%
Vanguard U.S. Investment Grade Credit Index Fund
958
Principal Maturity Fair Value % of Total US Dollars ($) Coupon Date US Dollars ($) Net Assets
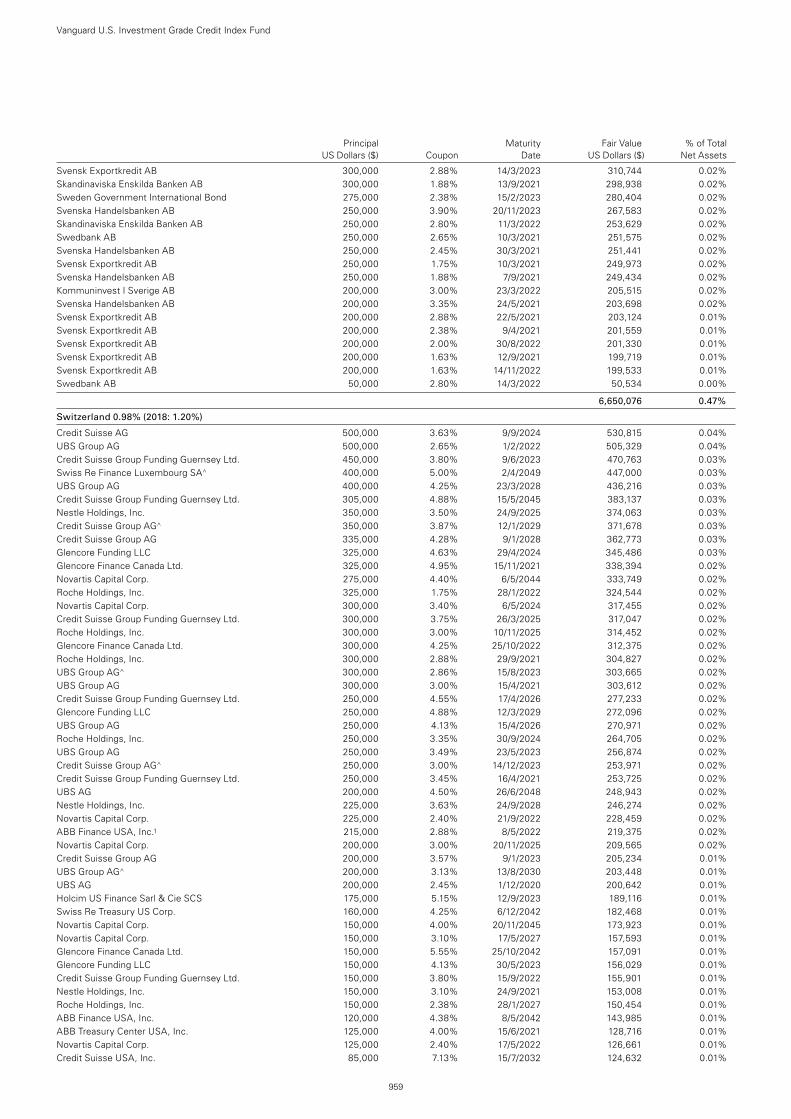
Principal Maturity Fair Value % of Total US Dollars ($) Coupon Date US Dollars ($) Net Assets
Svensk Exportkredit AB 300,000 2.88% 14/3/2023 310,744 0.02%Skandinaviska Enskilda Banken AB 300,000 1.88% 13/9/2021 298,938 0.02%Sweden Government International Bond 275,000 2.38% 15/2/2023 280,404 0.02%Svenska Handelsbanken AB 250,000 3.90% 20/11/2023 267,583 0.02%Skandinaviska Enskilda Banken AB 250,000 2.80% 11/3/2022 253,629 0.02%Swedbank AB 250,000 2.65% 10/3/2021 251,575 0.02%Svenska Handelsbanken AB 250,000 2.45% 30/3/2021 251,441 0.02%Svensk Exportkredit AB 250,000 1.75% 10/3/2021 249,973 0.02%Svenska Handelsbanken AB 250,000 1.88% 7/9/2021 249,434 0.02%Kommuninvest I Sverige AB 200,000 3.00% 23/3/2022 205,515 0.02%Svenska Handelsbanken AB 200,000 3.35% 24/5/2021 203,698 0.02%Svensk Exportkredit AB 200,000 2.88% 22/5/2021 203,124 0.01%Svensk Exportkredit AB 200,000 2.38% 9/4/2021 201,559 0.01%Svensk Exportkredit AB 200,000 2.00% 30/8/2022 201,330 0.01%Svensk Exportkredit AB 200,000 1.63% 12/9/2021 199,719 0.01%Svensk Exportkredit AB 200,000 1.63% 14/11/2022 199,533 0.01%Swedbank AB 50,000 2.80% 14/3/2022 50,534 0.00%
6,650,076 0.47%
Switzerland 0.98% (2018: 1.20%)
Credit Suisse AG 500,000 3.63% 9/9/2024 530,815 0.04%UBS Group AG 500,000 2.65% 1/2/2022 505,329 0.04%Credit Suisse Group Funding Guernsey Ltd. 450,000 3.80% 9/6/2023 470,763 0.03%Swiss Re Finance Luxembourg SA^ 400,000 5.00% 2/4/2049 447,000 0.03%UBS Group AG 400,000 4.25% 23/3/2028 436,216 0.03%Credit Suisse Group Funding Guernsey Ltd. 305,000 4.88% 15/5/2045 383,137 0.03%Nestle Holdings, Inc. 350,000 3.50% 24/9/2025 374,063 0.03%Credit Suisse Group AG^ 350,000 3.87% 12/1/2029 371,678 0.03%Credit Suisse Group AG 335,000 4.28% 9/1/2028 362,773 0.03%Glencore Funding LLC 325,000 4.63% 29/4/2024 345,486 0.03%Glencore Finance Canada Ltd. 325,000 4.95% 15/11/2021 338,394 0.02%Novartis Capital Corp. 275,000 4.40% 6/5/2044 333,749 0.02%Roche Holdings, Inc. 325,000 1.75% 28/1/2022 324,544 0.02%Novartis Capital Corp. 300,000 3.40% 6/5/2024 317,455 0.02%Credit Suisse Group Funding Guernsey Ltd. 300,000 3.75% 26/3/2025 317,047 0.02%Roche Holdings, Inc. 300,000 3.00% 10/11/2025 314,452 0.02%Glencore Finance Canada Ltd. 300,000 4.25% 25/10/2022 312,375 0.02%Roche Holdings, Inc. 300,000 2.88% 29/9/2021 304,827 0.02%UBS Group AG^ 300,000 2.86% 15/8/2023 303,665 0.02%UBS Group AG 300,000 3.00% 15/4/2021 303,612 0.02%Credit Suisse Group Funding Guernsey Ltd. 250,000 4.55% 17/4/2026 277,233 0.02%Glencore Funding LLC 250,000 4.88% 12/3/2029 272,096 0.02%UBS Group AG 250,000 4.13% 15/4/2026 270,971 0.02%Roche Holdings, Inc. 250,000 3.35% 30/9/2024 264,705 0.02%UBS Group AG 250,000 3.49% 23/5/2023 256,874 0.02%Credit Suisse Group AG^ 250,000 3.00% 14/12/2023 253,971 0.02%Credit Suisse Group Funding Guernsey Ltd. 250,000 3.45% 16/4/2021 253,725 0.02%UBS AG 200,000 4.50% 26/6/2048 248,943 0.02%Nestle Holdings, Inc. 225,000 3.63% 24/9/2028 246,274 0.02%Novartis Capital Corp. 225,000 2.40% 21/9/2022 228,459 0.02%ABB Finance USA, Inc.1 215,000 2.88% 8/5/2022 219,375 0.02%Novartis Capital Corp. 200,000 3.00% 20/11/2025 209,565 0.02%Credit Suisse Group AG 200,000 3.57% 9/1/2023 205,234 0.01%UBS Group AG^ 200,000 3.13% 13/8/2030 203,448 0.01%UBS AG 200,000 2.45% 1/12/2020 200,642 0.01%Holcim US Finance Sarl & Cie SCS 175,000 5.15% 12/9/2023 189,116 0.01%Swiss Re Treasury US Corp. 160,000 4.25% 6/12/2042 182,468 0.01%Novartis Capital Corp. 150,000 4.00% 20/11/2045 173,923 0.01%Novartis Capital Corp. 150,000 3.10% 17/5/2027 157,593 0.01%Glencore Finance Canada Ltd. 150,000 5.55% 25/10/2042 157,091 0.01%Glencore Funding LLC 150,000 4.13% 30/5/2023 156,029 0.01%Credit Suisse Group Funding Guernsey Ltd. 150,000 3.80% 15/9/2022 155,901 0.01%Nestle Holdings, Inc. 150,000 3.10% 24/9/2021 153,008 0.01%Roche Holdings, Inc. 150,000 2.38% 28/1/2027 150,454 0.01%ABB Finance USA, Inc. 120,000 4.38% 8/5/2042 143,985 0.01%ABB Treasury Center USA, Inc. 125,000 4.00% 15/6/2021 128,716 0.01%Novartis Capital Corp. 125,000 2.40% 17/5/2022 126,661 0.01%Credit Suisse USA, Inc. 85,000 7.13% 15/7/2032 124,632 0.01%
Vanguard U.S. Investment Grade Credit Index Fund
959
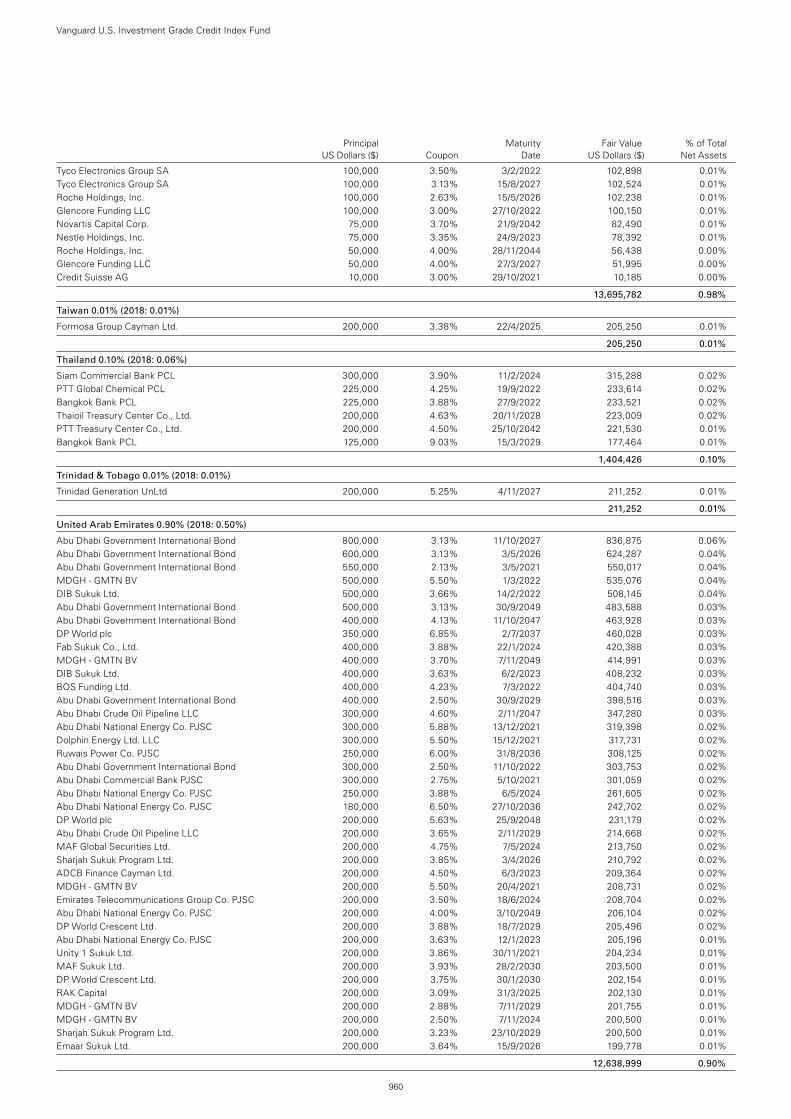
Principal Maturity Fair Value % of Total US Dollars ($) Coupon Date US Dollars ($) Net Assets
Tyco Electronics Group SA 100,000 3.50% 3/2/2022 102,898 0.01%Tyco Electronics Group SA 100,000 3.13% 15/8/2027 102,524 0.01%Roche Holdings, Inc. 100,000 2.63% 15/5/2026 102,238 0.01%Glencore Funding LLC 100,000 3.00% 27/10/2022 100,150 0.01%Novartis Capital Corp. 75,000 3.70% 21/9/2042 82,490 0.01%Nestle Holdings, Inc. 75,000 3.35% 24/9/2023 78,392 0.01%Roche Holdings, Inc. 50,000 4.00% 28/11/2044 56,438 0.00%Glencore Funding LLC 50,000 4.00% 27/3/2027 51,995 0.00%Credit Suisse AG 10,000 3.00% 29/10/2021 10,185 0.00%
13,695,782 0.98%
Taiwan 0.01% (2018: 0.01%)
Formosa Group Cayman Ltd. 200,000 3.38% 22/4/2025 205,250 0.01%
205,250 0.01%
Thailand 0.10% (2018: 0.06%)
Siam Commercial Bank PCL 300,000 3.90% 11/2/2024 315,288 0.02%PTT Global Chemical PCL 225,000 4.25% 19/9/2022 233,614 0.02%Bangkok Bank PCL 225,000 3.88% 27/9/2022 233,521 0.02%Thaioil Treasury Center Co., Ltd. 200,000 4.63% 20/11/2028 223,009 0.02%PTT Treasury Center Co., Ltd. 200,000 4.50% 25/10/2042 221,530 0.01%Bangkok Bank PCL 125,000 9.03% 15/3/2029 177,464 0.01%
1,404,426 0.10%
Trinidad & Tobago 0.01% (2018: 0.01%)
Trinidad Generation UnLtd 200,000 5.25% 4/11/2027 211,252 0.01%
211,252 0.01%
United Arab Emirates 0.90% (2018: 0.50%)
Abu Dhabi Government International Bond 800,000 3.13% 11/10/2027 836,875 0.06%Abu Dhabi Government International Bond 600,000 3.13% 3/5/2026 624,287 0.04%Abu Dhabi Government International Bond 550,000 2.13% 3/5/2021 550,017 0.04%MDGH - GMTN BV 500,000 5.50% 1/3/2022 535,076 0.04%DIB Sukuk Ltd. 500,000 3.66% 14/2/2022 508,145 0.04%Abu Dhabi Government International Bond 500,000 3.13% 30/9/2049 483,588 0.03%Abu Dhabi Government International Bond 400,000 4.13% 11/10/2047 463,928 0.03%DP World plc 350,000 6.85% 2/7/2037 460,028 0.03%Fab Sukuk Co., Ltd. 400,000 3.88% 22/1/2024 420,388 0.03%MDGH - GMTN BV 400,000 3.70% 7/11/2049 414,991 0.03%DIB Sukuk Ltd. 400,000 3.63% 6/2/2023 408,232 0.03%BOS Funding Ltd. 400,000 4.23% 7/3/2022 404,740 0.03%Abu Dhabi Government International Bond 400,000 2.50% 30/9/2029 398,516 0.03%Abu Dhabi Crude Oil Pipeline LLC 300,000 4.60% 2/11/2047 347,280 0.03%Abu Dhabi National Energy Co. PJSC 300,000 5.88% 13/12/2021 319,398 0.02%Dolphin Energy Ltd. LLC 300,000 5.50% 15/12/2021 317,731 0.02%Ruwais Power Co. PJSC 250,000 6.00% 31/8/2036 308,125 0.02%Abu Dhabi Government International Bond 300,000 2.50% 11/10/2022 303,753 0.02%Abu Dhabi Commercial Bank PJSC 300,000 2.75% 5/10/2021 301,059 0.02%Abu Dhabi National Energy Co. PJSC 250,000 3.88% 6/5/2024 261,605 0.02%Abu Dhabi National Energy Co. PJSC 180,000 6.50% 27/10/2036 242,702 0.02%DP World plc 200,000 5.63% 25/9/2048 231,179 0.02%Abu Dhabi Crude Oil Pipeline LLC 200,000 3.65% 2/11/2029 214,668 0.02%MAF Global Securities Ltd. 200,000 4.75% 7/5/2024 213,750 0.02%Sharjah Sukuk Program Ltd. 200,000 3.85% 3/4/2026 210,792 0.02%ADCB Finance Cayman Ltd. 200,000 4.50% 6/3/2023 209,364 0.02%MDGH - GMTN BV 200,000 5.50% 20/4/2021 208,731 0.02%Emirates Telecommunications Group Co. PJSC 200,000 3.50% 18/6/2024 208,704 0.02%Abu Dhabi National Energy Co. PJSC 200,000 4.00% 3/10/2049 206,104 0.02%DP World Crescent Ltd. 200,000 3.88% 18/7/2029 205,496 0.02%Abu Dhabi National Energy Co. PJSC 200,000 3.63% 12/1/2023 205,196 0.01%Unity 1 Sukuk Ltd. 200,000 3.86% 30/11/2021 204,234 0.01%MAF Sukuk Ltd. 200,000 3.93% 28/2/2030 203,500 0.01%DP World Crescent Ltd. 200,000 3.75% 30/1/2030 202,154 0.01%RAK Capital 200,000 3.09% 31/3/2025 202,130 0.01%MDGH - GMTN BV 200,000 2.88% 7/11/2029 201,755 0.01%MDGH - GMTN BV 200,000 2.50% 7/11/2024 200,500 0.01%Sharjah Sukuk Program Ltd. 200,000 3.23% 23/10/2029 200,500 0.01%Emaar Sukuk Ltd. 200,000 3.64% 15/9/2026 199,778 0.01%
12,638,999 0.90%
Vanguard U.S. Investment Grade Credit Index Fund
960
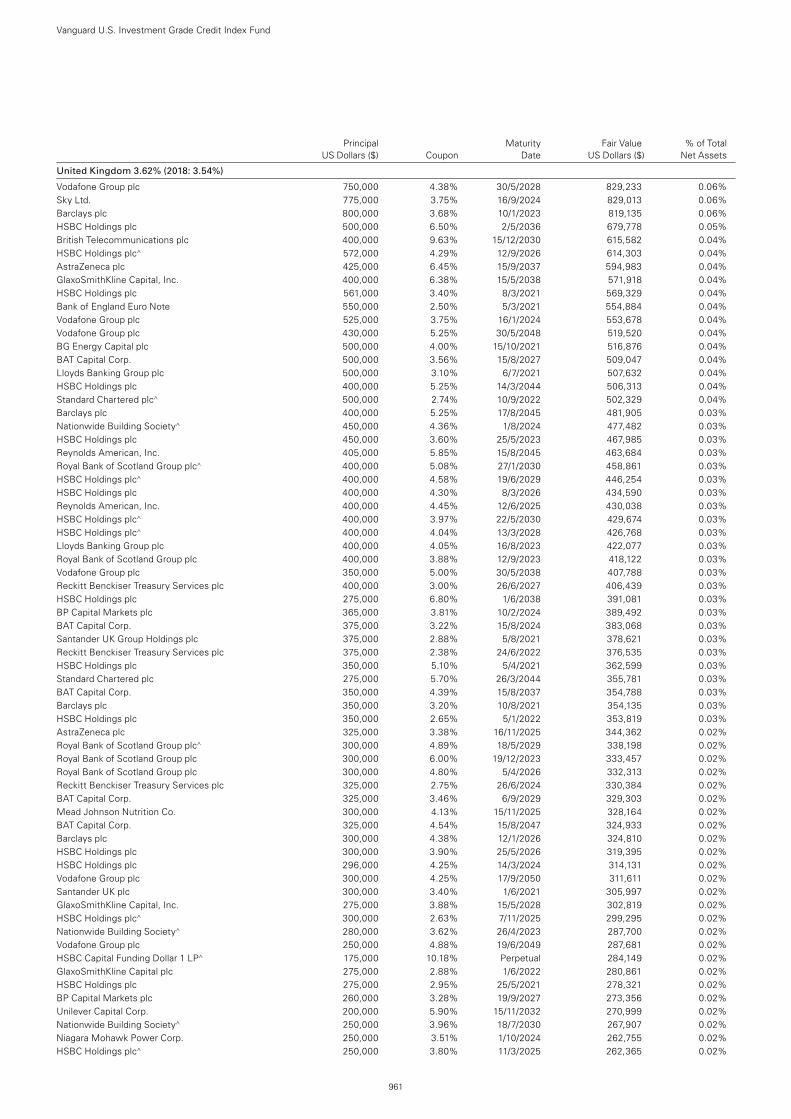
Principal Maturity Fair Value % of Total US Dollars ($) Coupon Date US Dollars ($) Net Assets
United Kingdom 3.62% (2018: 3.54%)
Vodafone Group plc 750,000 4.38% 30/5/2028 829,233 0.06%Sky Ltd. 775,000 3.75% 16/9/2024 829,013 0.06%Barclays plc 800,000 3.68% 10/1/2023 819,135 0.06%HSBC Holdings plc 500,000 6.50% 2/5/2036 679,778 0.05%British Telecommunications plc 400,000 9.63% 15/12/2030 615,582 0.04%HSBC Holdings plc^ 572,000 4.29% 12/9/2026 614,303 0.04%AstraZeneca plc 425,000 6.45% 15/9/2037 594,983 0.04%GlaxoSmithKline Capital, Inc. 400,000 6.38% 15/5/2038 571,918 0.04%HSBC Holdings plc 561,000 3.40% 8/3/2021 569,329 0.04%Bank of England Euro Note 550,000 2.50% 5/3/2021 554,884 0.04%Vodafone Group plc 525,000 3.75% 16/1/2024 553,678 0.04%Vodafone Group plc 430,000 5.25% 30/5/2048 519,520 0.04%BG Energy Capital plc 500,000 4.00% 15/10/2021 516,876 0.04%BAT Capital Corp. 500,000 3.56% 15/8/2027 509,047 0.04%Lloyds Banking Group plc 500,000 3.10% 6/7/2021 507,632 0.04%HSBC Holdings plc 400,000 5.25% 14/3/2044 506,313 0.04%Standard Chartered plc^ 500,000 2.74% 10/9/2022 502,329 0.04%Barclays plc 400,000 5.25% 17/8/2045 481,905 0.03%Nationwide Building Society^ 450,000 4.36% 1/8/2024 477,482 0.03%HSBC Holdings plc 450,000 3.60% 25/5/2023 467,985 0.03%Reynolds American, Inc. 405,000 5.85% 15/8/2045 463,684 0.03%Royal Bank of Scotland Group plc^ 400,000 5.08% 27/1/2030 458,861 0.03%HSBC Holdings plc^ 400,000 4.58% 19/6/2029 446,254 0.03%HSBC Holdings plc 400,000 4.30% 8/3/2026 434,590 0.03%Reynolds American, Inc. 400,000 4.45% 12/6/2025 430,038 0.03%HSBC Holdings plc^ 400,000 3.97% 22/5/2030 429,674 0.03%HSBC Holdings plc^ 400,000 4.04% 13/3/2028 426,768 0.03%Lloyds Banking Group plc 400,000 4.05% 16/8/2023 422,077 0.03%Royal Bank of Scotland Group plc 400,000 3.88% 12/9/2023 418,122 0.03%Vodafone Group plc 350,000 5.00% 30/5/2038 407,788 0.03%Reckitt Benckiser Treasury Services plc 400,000 3.00% 26/6/2027 406,439 0.03%HSBC Holdings plc 275,000 6.80% 1/6/2038 391,081 0.03%BP Capital Markets plc 365,000 3.81% 10/2/2024 389,492 0.03%BAT Capital Corp. 375,000 3.22% 15/8/2024 383,068 0.03%Santander UK Group Holdings plc 375,000 2.88% 5/8/2021 378,621 0.03%Reckitt Benckiser Treasury Services plc 375,000 2.38% 24/6/2022 376,535 0.03%HSBC Holdings plc 350,000 5.10% 5/4/2021 362,599 0.03%Standard Chartered plc 275,000 5.70% 26/3/2044 355,781 0.03%BAT Capital Corp. 350,000 4.39% 15/8/2037 354,788 0.03%Barclays plc 350,000 3.20% 10/8/2021 354,135 0.03%HSBC Holdings plc 350,000 2.65% 5/1/2022 353,819 0.03%AstraZeneca plc 325,000 3.38% 16/11/2025 344,362 0.02%Royal Bank of Scotland Group plc^ 300,000 4.89% 18/5/2029 338,198 0.02%Royal Bank of Scotland Group plc 300,000 6.00% 19/12/2023 333,457 0.02%Royal Bank of Scotland Group plc 300,000 4.80% 5/4/2026 332,313 0.02%Reckitt Benckiser Treasury Services plc 325,000 2.75% 26/6/2024 330,384 0.02%BAT Capital Corp. 325,000 3.46% 6/9/2029 329,303 0.02%Mead Johnson Nutrition Co. 300,000 4.13% 15/11/2025 328,164 0.02%BAT Capital Corp. 325,000 4.54% 15/8/2047 324,933 0.02%Barclays plc 300,000 4.38% 12/1/2026 324,810 0.02%HSBC Holdings plc 300,000 3.90% 25/5/2026 319,395 0.02%HSBC Holdings plc 296,000 4.25% 14/3/2024 314,131 0.02%Vodafone Group plc 300,000 4.25% 17/9/2050 311,611 0.02%Santander UK plc 300,000 3.40% 1/6/2021 305,997 0.02%GlaxoSmithKline Capital, Inc. 275,000 3.88% 15/5/2028 302,819 0.02%HSBC Holdings plc^ 300,000 2.63% 7/11/2025 299,295 0.02%Nationwide Building Society^ 280,000 3.62% 26/4/2023 287,700 0.02%Vodafone Group plc 250,000 4.88% 19/6/2049 287,681 0.02%HSBC Capital Funding Dollar 1 LP^ 175,000 10.18% Perpetual 284,149 0.02%GlaxoSmithKline Capital plc 275,000 2.88% 1/6/2022 280,861 0.02%HSBC Holdings plc 275,000 2.95% 25/5/2021 278,321 0.02%BP Capital Markets plc 260,000 3.28% 19/9/2027 273,356 0.02%Unilever Capital Corp. 200,000 5.90% 15/11/2032 270,999 0.02%Nationwide Building Society^ 250,000 3.96% 18/7/2030 267,907 0.02%Niagara Mohawk Power Corp. 250,000 3.51% 1/10/2024 262,755 0.02%HSBC Holdings plc^ 250,000 3.80% 11/3/2025 262,365 0.02%
Vanguard U.S. Investment Grade Credit Index Fund
961
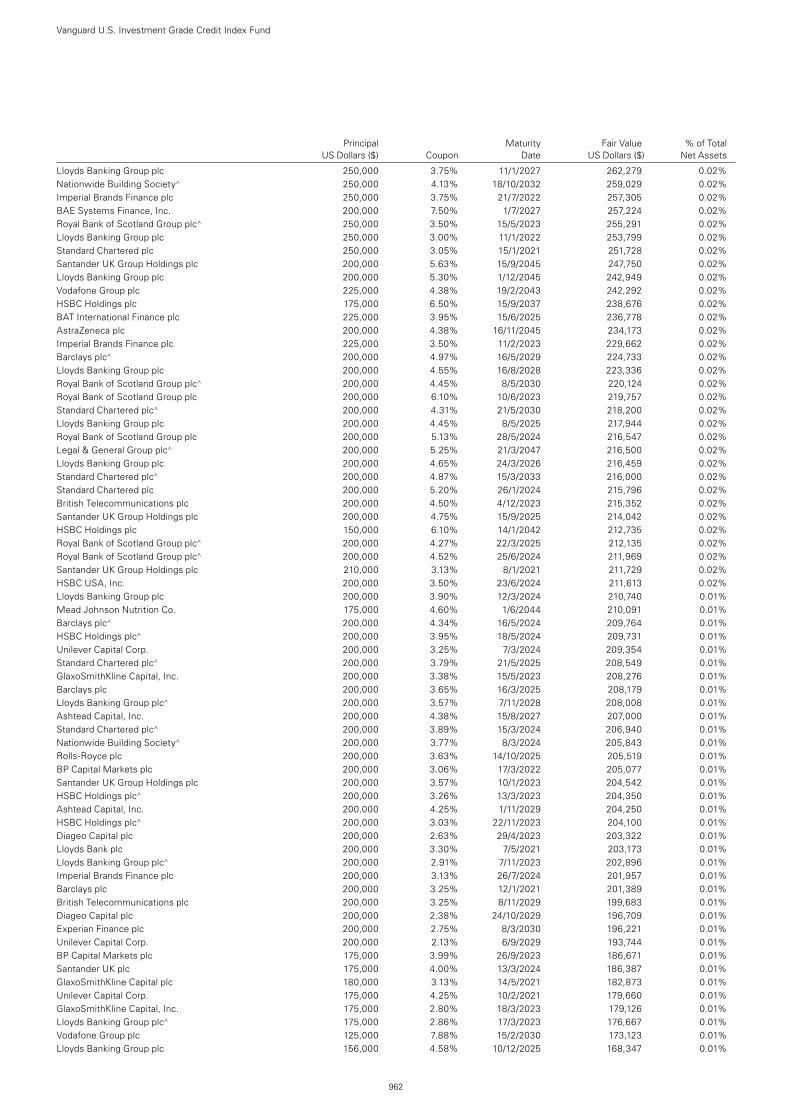
Lloyds Banking Group plc 250,000 3.75% 11/1/2027 262,279 0.02%Nationwide Building Society^ 250,000 4.13% 18/10/2032 259,029 0.02%Imperial Brands Finance plc 250,000 3.75% 21/7/2022 257,305 0.02%BAE Systems Finance, Inc. 200,000 7.50% 1/7/2027 257,224 0.02%Royal Bank of Scotland Group plc^ 250,000 3.50% 15/5/2023 255,291 0.02%Lloyds Banking Group plc 250,000 3.00% 11/1/2022 253,799 0.02%Standard Chartered plc 250,000 3.05% 15/1/2021 251,728 0.02%Santander UK Group Holdings plc 200,000 5.63% 15/9/2045 247,750 0.02%Lloyds Banking Group plc 200,000 5.30% 1/12/2045 242,949 0.02%Vodafone Group plc 225,000 4.38% 19/2/2043 242,292 0.02%HSBC Holdings plc 175,000 6.50% 15/9/2037 238,676 0.02%BAT International Finance plc 225,000 3.95% 15/6/2025 236,778 0.02%AstraZeneca plc 200,000 4.38% 16/11/2045 234,173 0.02%Imperial Brands Finance plc 225,000 3.50% 11/2/2023 229,662 0.02%Barclays plc^ 200,000 4.97% 16/5/2029 224,733 0.02%Lloyds Banking Group plc 200,000 4.55% 16/8/2028 223,336 0.02%Royal Bank of Scotland Group plc^ 200,000 4.45% 8/5/2030 220,124 0.02%Royal Bank of Scotland Group plc 200,000 6.10% 10/6/2023 219,757 0.02%Standard Chartered plc^ 200,000 4.31% 21/5/2030 218,200 0.02%Lloyds Banking Group plc 200,000 4.45% 8/5/2025 217,944 0.02%Royal Bank of Scotland Group plc 200,000 5.13% 28/5/2024 216,547 0.02%Legal & General Group plc^ 200,000 5.25% 21/3/2047 216,500 0.02%Lloyds Banking Group plc 200,000 4.65% 24/3/2026 216,459 0.02%Standard Chartered plc^ 200,000 4.87% 15/3/2033 216,000 0.02%Standard Chartered plc 200,000 5.20% 26/1/2024 215,796 0.02%British Telecommunications plc 200,000 4.50% 4/12/2023 215,352 0.02%Santander UK Group Holdings plc 200,000 4.75% 15/9/2025 214,042 0.02%HSBC Holdings plc 150,000 6.10% 14/1/2042 212,735 0.02%Royal Bank of Scotland Group plc^ 200,000 4.27% 22/3/2025 212,135 0.02%Royal Bank of Scotland Group plc^ 200,000 4.52% 25/6/2024 211,969 0.02%Santander UK Group Holdings plc 210,000 3.13% 8/1/2021 211,729 0.02%HSBC USA, Inc. 200,000 3.50% 23/6/2024 211,613 0.02%Lloyds Banking Group plc 200,000 3.90% 12/3/2024 210,740 0.01%Mead Johnson Nutrition Co. 175,000 4.60% 1/6/2044 210,091 0.01%Barclays plc^ 200,000 4.34% 16/5/2024 209,764 0.01%HSBC Holdings plc^ 200,000 3.95% 18/5/2024 209,731 0.01%Unilever Capital Corp. 200,000 3.25% 7/3/2024 209,354 0.01%Standard Chartered plc^ 200,000 3.79% 21/5/2025 208,549 0.01%GlaxoSmithKline Capital, Inc. 200,000 3.38% 15/5/2023 208,276 0.01%Barclays plc 200,000 3.65% 16/3/2025 208,179 0.01%Lloyds Banking Group plc^ 200,000 3.57% 7/11/2028 208,008 0.01%Ashtead Capital, Inc. 200,000 4.38% 15/8/2027 207,000 0.01%Standard Chartered plc^ 200,000 3.89% 15/3/2024 206,940 0.01%Nationwide Building Society^ 200,000 3.77% 8/3/2024 205,843 0.01%Rolls-Royce plc 200,000 3.63% 14/10/2025 205,519 0.01%BP Capital Markets plc 200,000 3.06% 17/3/2022 205,077 0.01%Santander UK Group Holdings plc 200,000 3.57% 10/1/2023 204,542 0.01%HSBC Holdings plc^ 200,000 3.26% 13/3/2023 204,350 0.01%Ashtead Capital, Inc. 200,000 4.25% 1/11/2029 204,250 0.01%HSBC Holdings plc^ 200,000 3.03% 22/11/2023 204,100 0.01%Diageo Capital plc 200,000 2.63% 29/4/2023 203,322 0.01%Lloyds Bank plc 200,000 3.30% 7/5/2021 203,173 0.01%Lloyds Banking Group plc^ 200,000 2.91% 7/11/2023 202,896 0.01%Imperial Brands Finance plc 200,000 3.13% 26/7/2024 201,957 0.01%Barclays plc 200,000 3.25% 12/1/2021 201,389 0.01%British Telecommunications plc 200,000 3.25% 8/11/2029 199,683 0.01%Diageo Capital plc 200,000 2.38% 24/10/2029 196,709 0.01%Experian Finance plc 200,000 2.75% 8/3/2030 196,221 0.01%Unilever Capital Corp. 200,000 2.13% 6/9/2029 193,744 0.01%BP Capital Markets plc 175,000 3.99% 26/9/2023 186,671 0.01%Santander UK plc 175,000 4.00% 13/3/2024 186,387 0.01%GlaxoSmithKline Capital plc 180,000 3.13% 14/5/2021 182,873 0.01%Unilever Capital Corp. 175,000 4.25% 10/2/2021 179,660 0.01%GlaxoSmithKline Capital, Inc. 175,000 2.80% 18/3/2023 179,126 0.01%Lloyds Banking Group plc^ 175,000 2.86% 17/3/2023 176,667 0.01%Vodafone Group plc 125,000 7.88% 15/2/2030 173,123 0.01%Lloyds Banking Group plc 156,000 4.58% 10/12/2025 168,347 0.01%
Vanguard U.S. Investment Grade Credit Index Fund
962
Principal Maturity Fair Value % of Total US Dollars ($) Coupon Date US Dollars ($) Net Assets
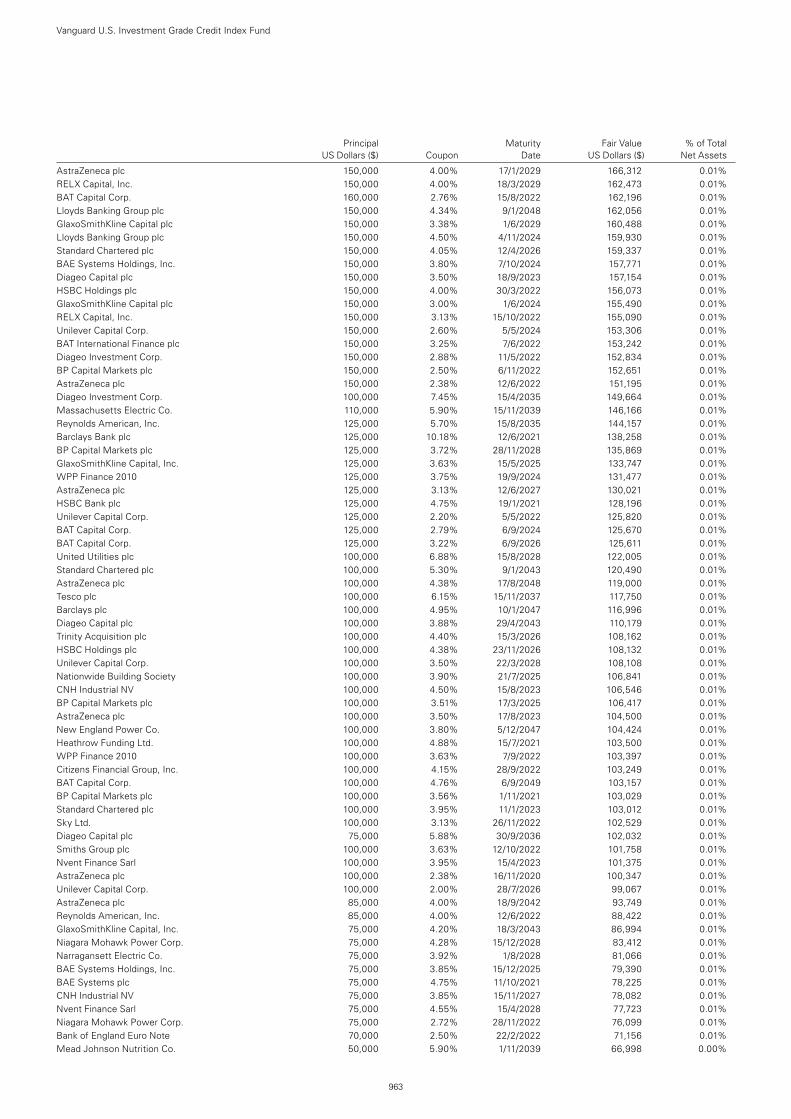
AstraZeneca plc 150,000 4.00% 17/1/2029 166,312 0.01%RELX Capital, Inc. 150,000 4.00% 18/3/2029 162,473 0.01%BAT Capital Corp. 160,000 2.76% 15/8/2022 162,196 0.01%Lloyds Banking Group plc 150,000 4.34% 9/1/2048 162,056 0.01%GlaxoSmithKline Capital plc 150,000 3.38% 1/6/2029 160,488 0.01%Lloyds Banking Group plc 150,000 4.50% 4/11/2024 159,930 0.01%Standard Chartered plc 150,000 4.05% 12/4/2026 159,337 0.01%BAE Systems Holdings, Inc. 150,000 3.80% 7/10/2024 157,771 0.01%Diageo Capital plc 150,000 3.50% 18/9/2023 157,154 0.01%HSBC Holdings plc 150,000 4.00% 30/3/2022 156,073 0.01%GlaxoSmithKline Capital plc 150,000 3.00% 1/6/2024 155,490 0.01%RELX Capital, Inc. 150,000 3.13% 15/10/2022 155,090 0.01%Unilever Capital Corp. 150,000 2.60% 5/5/2024 153,306 0.01%BAT International Finance plc 150,000 3.25% 7/6/2022 153,242 0.01%Diageo Investment Corp. 150,000 2.88% 11/5/2022 152,834 0.01%BP Capital Markets plc 150,000 2.50% 6/11/2022 152,651 0.01%AstraZeneca plc 150,000 2.38% 12/6/2022 151,195 0.01%Diageo Investment Corp. 100,000 7.45% 15/4/2035 149,664 0.01%Massachusetts Electric Co. 110,000 5.90% 15/11/2039 146,166 0.01%Reynolds American, Inc. 125,000 5.70% 15/8/2035 144,157 0.01%Barclays Bank plc 125,000 10.18% 12/6/2021 138,258 0.01%BP Capital Markets plc 125,000 3.72% 28/11/2028 135,869 0.01%GlaxoSmithKline Capital, Inc. 125,000 3.63% 15/5/2025 133,747 0.01%WPP Finance 2010 125,000 3.75% 19/9/2024 131,477 0.01%AstraZeneca plc 125,000 3.13% 12/6/2027 130,021 0.01%HSBC Bank plc 125,000 4.75% 19/1/2021 128,196 0.01%Unilever Capital Corp. 125,000 2.20% 5/5/2022 125,820 0.01%BAT Capital Corp. 125,000 2.79% 6/9/2024 125,670 0.01%BAT Capital Corp. 125,000 3.22% 6/9/2026 125,611 0.01%United Utilities plc 100,000 6.88% 15/8/2028 122,005 0.01%Standard Chartered plc 100,000 5.30% 9/1/2043 120,490 0.01%AstraZeneca plc 100,000 4.38% 17/8/2048 119,000 0.01%Tesco plc 100,000 6.15% 15/11/2037 117,750 0.01%Barclays plc 100,000 4.95% 10/1/2047 116,996 0.01%Diageo Capital plc 100,000 3.88% 29/4/2043 110,179 0.01%Trinity Acquisition plc 100,000 4.40% 15/3/2026 108,162 0.01%HSBC Holdings plc 100,000 4.38% 23/11/2026 108,132 0.01%Unilever Capital Corp. 100,000 3.50% 22/3/2028 108,108 0.01%Nationwide Building Society 100,000 3.90% 21/7/2025 106,841 0.01%CNH Industrial NV 100,000 4.50% 15/8/2023 106,546 0.01%BP Capital Markets plc 100,000 3.51% 17/3/2025 106,417 0.01%AstraZeneca plc 100,000 3.50% 17/8/2023 104,500 0.01%New England Power Co. 100,000 3.80% 5/12/2047 104,424 0.01%Heathrow Funding Ltd. 100,000 4.88% 15/7/2021 103,500 0.01%WPP Finance 2010 100,000 3.63% 7/9/2022 103,397 0.01%Citizens Financial Group, Inc. 100,000 4.15% 28/9/2022 103,249 0.01%BAT Capital Corp. 100,000 4.76% 6/9/2049 103,157 0.01%BP Capital Markets plc 100,000 3.56% 1/11/2021 103,029 0.01%Standard Chartered plc 100,000 3.95% 11/1/2023 103,012 0.01%Sky Ltd. 100,000 3.13% 26/11/2022 102,529 0.01%Diageo Capital plc 75,000 5.88% 30/9/2036 102,032 0.01%Smiths Group plc 100,000 3.63% 12/10/2022 101,758 0.01%Nvent Finance Sarl 100,000 3.95% 15/4/2023 101,375 0.01%AstraZeneca plc 100,000 2.38% 16/11/2020 100,347 0.01%Unilever Capital Corp. 100,000 2.00% 28/7/2026 99,067 0.01%AstraZeneca plc 85,000 4.00% 18/9/2042 93,749 0.01%Reynolds American, Inc. 85,000 4.00% 12/6/2022 88,422 0.01%GlaxoSmithKline Capital, Inc. 75,000 4.20% 18/3/2043 86,994 0.01%Niagara Mohawk Power Corp. 75,000 4.28% 15/12/2028 83,412 0.01%Narragansett Electric Co. 75,000 3.92% 1/8/2028 81,066 0.01%BAE Systems Holdings, Inc. 75,000 3.85% 15/12/2025 79,390 0.01%BAE Systems plc 75,000 4.75% 11/10/2021 78,225 0.01%CNH Industrial NV 75,000 3.85% 15/11/2027 78,082 0.01%Nvent Finance Sarl 75,000 4.55% 15/4/2028 77,723 0.01%Niagara Mohawk Power Corp. 75,000 2.72% 28/11/2022 76,099 0.01%Bank of England Euro Note 70,000 2.50% 22/2/2022 71,156 0.01%Mead Johnson Nutrition Co. 50,000 5.90% 1/11/2039 66,998 0.00%
Vanguard U.S. Investment Grade Credit Index Fund
963
Principal Maturity Fair Value % of Total US Dollars ($) Coupon Date US Dollars ($) Net Assets
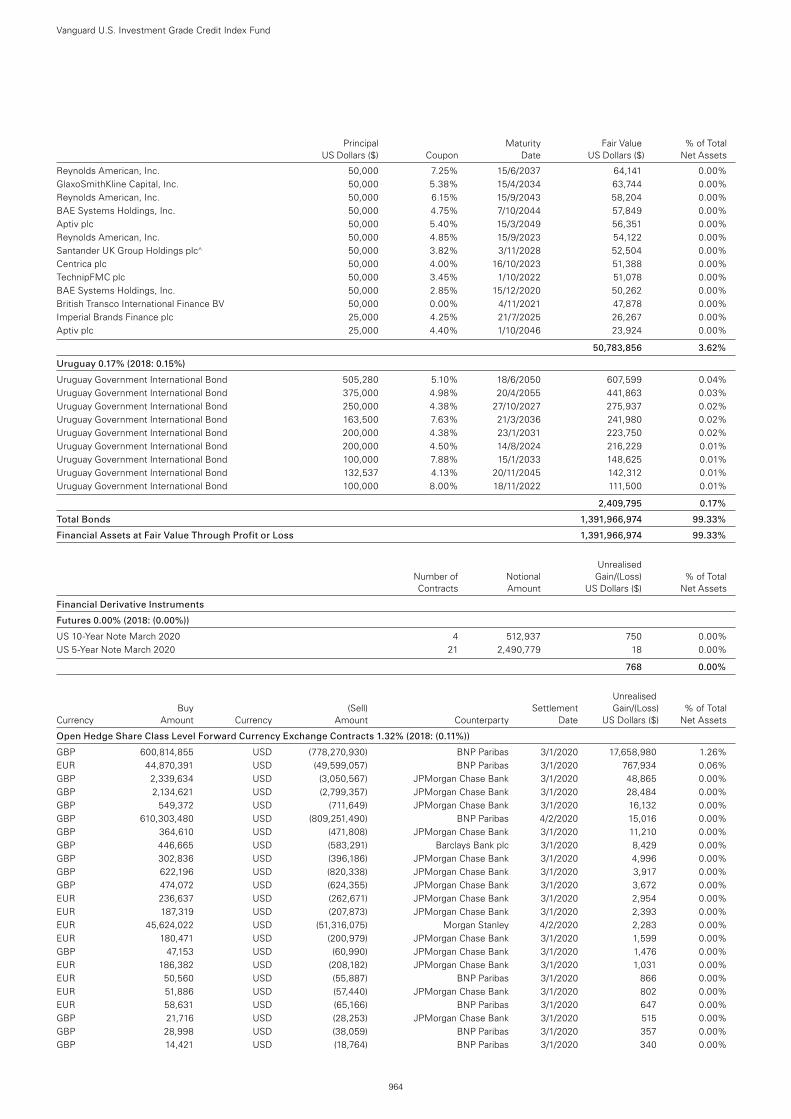
Reynolds American, Inc. 50,000 7.25% 15/6/2037 64,141 0.00%GlaxoSmithKline Capital, Inc. 50,000 5.38% 15/4/2034 63,744 0.00%Reynolds American, Inc. 50,000 6.15% 15/9/2043 58,204 0.00%BAE Systems Holdings, Inc. 50,000 4.75% 7/10/2044 57,849 0.00%Aptiv plc 50,000 5.40% 15/3/2049 56,351 0.00%Reynolds American, Inc. 50,000 4.85% 15/9/2023 54,122 0.00%Santander UK Group Holdings plc^ 50,000 3.82% 3/11/2028 52,504 0.00%Centrica plc 50,000 4.00% 16/10/2023 51,388 0.00%TechnipFMC plc 50,000 3.45% 1/10/2022 51,078 0.00%BAE Systems Holdings, Inc. 50,000 2.85% 15/12/2020 50,262 0.00%British Transco International Finance BV 50,000 0.00% 4/11/2021 47,878 0.00%Imperial Brands Finance plc 25,000 4.25% 21/7/2025 26,267 0.00%Aptiv plc 25,000 4.40% 1/10/2046 23,924 0.00%
50,783,856 3.62%
Uruguay 0.17% (2018: 0.15%)
Uruguay Government International Bond 505,280 5.10% 18/6/2050 607,599 0.04%Uruguay Government International Bond 375,000 4.98% 20/4/2055 441,863 0.03%Uruguay Government International Bond 250,000 4.38% 27/10/2027 275,937 0.02%Uruguay Government International Bond 163,500 7.63% 21/3/2036 241,980 0.02%Uruguay Government International Bond 200,000 4.38% 23/1/2031 223,750 0.02%Uruguay Government International Bond 200,000 4.50% 14/8/2024 216,229 0.01%Uruguay Government International Bond 100,000 7.88% 15/1/2033 148,625 0.01%Uruguay Government International Bond 132,537 4.13% 20/11/2045 142,312 0.01%Uruguay Government International Bond 100,000 8.00% 18/11/2022 111,500 0.01%
2,409,795 0.17%
Total Bonds 1,391,966,974 99.33%
Financial Assets at Fair Value Through Profit or Loss 1,391,966,974 99.33%
Unrealised Number of Notional Gain/(Loss) % of Total Contracts Amount US Dollars ($) Net Assets
Financial Derivative Instruments
Futures 0.00% (2018: (0.00%))
US 10-Year Note March 2020 4 512,937 750 0.00%US 5-Year Note March 2020 21 2,490,779 18 0.00%
768 0.00%
Unrealised Buy (Sell) Settlement Gain/(Loss) % of Total Currency Amount Currency Amount Counterparty Date US Dollars ($) Net Assets
Open Hedge Share Class Level Forward Currency Exchange Contracts 1.32% (2018: (0.11%))
GBP 600,814,855 USD (778,270,930) BNP Paribas 3/1/2020 17,658,980 1.26%EUR 44,870,391 USD (49,599,057) BNP Paribas 3/1/2020 767,934 0.06%GBP 2,339,634 USD (3,050,567) JPMorgan Chase Bank 3/1/2020 48,865 0.00%GBP 2,134,621 USD (2,799,357) JPMorgan Chase Bank 3/1/2020 28,484 0.00%GBP 549,372 USD (711,649) JPMorgan Chase Bank 3/1/2020 16,132 0.00%GBP 610,303,480 USD (809,251,490) BNP Paribas 4/2/2020 15,016 0.00%GBP 364,610 USD (471,808) JPMorgan Chase Bank 3/1/2020 11,210 0.00%GBP 446,665 USD (583,291) Barclays Bank plc 3/1/2020 8,429 0.00%GBP 302,836 USD (396,186) JPMorgan Chase Bank 3/1/2020 4,996 0.00%GBP 622,196 USD (820,338) JPMorgan Chase Bank 3/1/2020 3,917 0.00%GBP 474,072 USD (624,355) JPMorgan Chase Bank 3/1/2020 3,672 0.00%EUR 236,637 USD (262,671) JPMorgan Chase Bank 3/1/2020 2,954 0.00%EUR 187,319 USD (207,873) JPMorgan Chase Bank 3/1/2020 2,393 0.00%EUR 45,624,022 USD (51,316,075) Morgan Stanley 4/2/2020 2,283 0.00%EUR 180,471 USD (200,979) JPMorgan Chase Bank 3/1/2020 1,599 0.00%GBP 47,153 USD (60,990) JPMorgan Chase Bank 3/1/2020 1,476 0.00%EUR 186,382 USD (208,182) JPMorgan Chase Bank 3/1/2020 1,031 0.00%EUR 50,560 USD (55,887) BNP Paribas 3/1/2020 866 0.00%EUR 51,886 USD (57,440) JPMorgan Chase Bank 3/1/2020 802 0.00%EUR 58,631 USD (65,166) BNP Paribas 3/1/2020 647 0.00%GBP 21,716 USD (28,253) JPMorgan Chase Bank 3/1/2020 515 0.00%GBP 28,998 USD (38,059) BNP Paribas 3/1/2020 357 0.00%GBP 14,421 USD (18,764) BNP Paribas 3/1/2020 340 0.00%
Vanguard U.S. Investment Grade Credit Index Fund
964
Principal Maturity Fair Value % of Total US Dollars ($) Coupon Date US Dollars ($) Net Assets
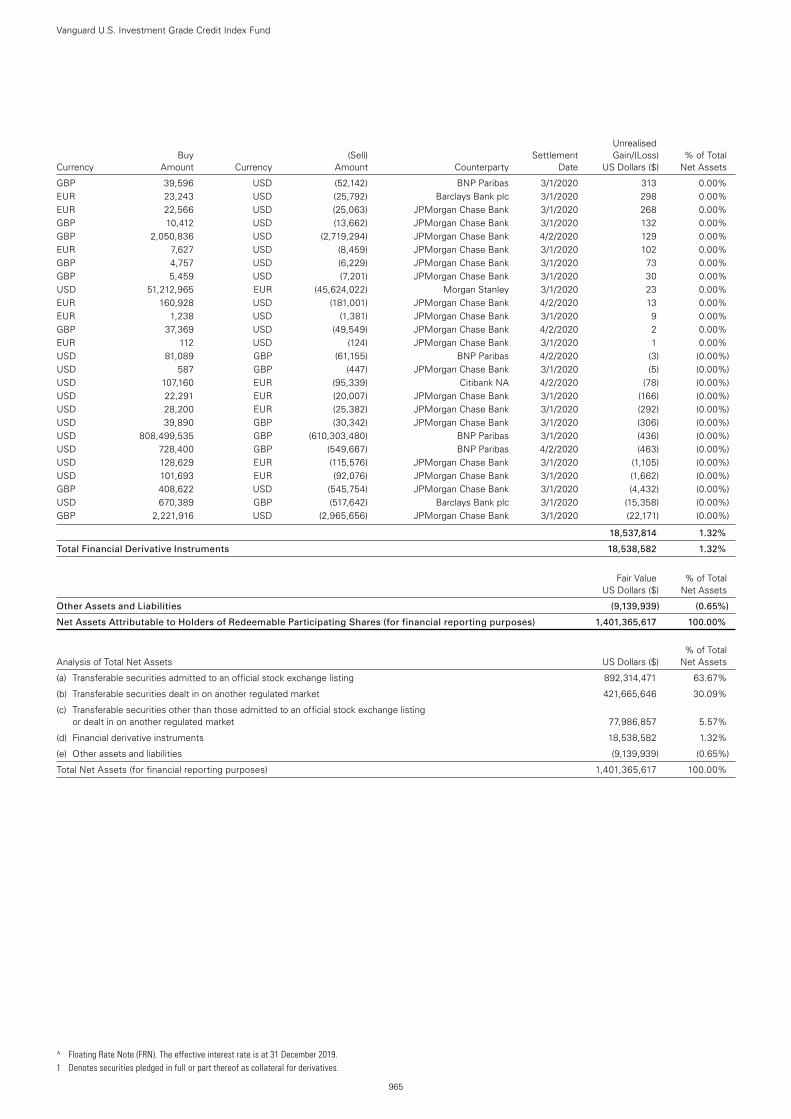
GBP 39,596 USD (52,142) BNP Paribas 3/1/2020 313 0.00%EUR 23,243 USD (25,792) Barclays Bank plc 3/1/2020 298 0.00%EUR 22,566 USD (25,063) JPMorgan Chase Bank 3/1/2020 268 0.00%GBP 10,412 USD (13,662) JPMorgan Chase Bank 3/1/2020 132 0.00%GBP 2,050,836 USD (2,719,294) JPMorgan Chase Bank 4/2/2020 129 0.00%EUR 7,627 USD (8,459) JPMorgan Chase Bank 3/1/2020 102 0.00%GBP 4,757 USD (6,229) JPMorgan Chase Bank 3/1/2020 73 0.00%GBP 5,459 USD (7,201) JPMorgan Chase Bank 3/1/2020 30 0.00%USD 51,212,965 EUR (45,624,022) Morgan Stanley 3/1/2020 23 0.00%EUR 160,928 USD (181,001) JPMorgan Chase Bank 4/2/2020 13 0.00%EUR 1,238 USD (1,381) JPMorgan Chase Bank 3/1/2020 9 0.00%GBP 37,369 USD (49,549) JPMorgan Chase Bank 4/2/2020 2 0.00%EUR 112 USD (124) JPMorgan Chase Bank 3/1/2020 1 0.00%USD 81,089 GBP (61,155) BNP Paribas 4/2/2020 (3) (0.00%)USD 587 GBP (447) JPMorgan Chase Bank 3/1/2020 (5) (0.00%)USD 107,160 EUR (95,339) Citibank NA 4/2/2020 (78) (0.00%)USD 22,291 EUR (20,007) JPMorgan Chase Bank 3/1/2020 (166) (0.00%)USD 28,200 EUR (25,382) JPMorgan Chase Bank 3/1/2020 (292) (0.00%)USD 39,890 GBP (30,342) JPMorgan Chase Bank 3/1/2020 (306) (0.00%)USD 808,499,535 GBP (610,303,480) BNP Paribas 3/1/2020 (436) (0.00%)USD 728,400 GBP (549,667) BNP Paribas 4/2/2020 (463) (0.00%)USD 128,629 EUR (115,576) JPMorgan Chase Bank 3/1/2020 (1,105) (0.00%)USD 101,693 EUR (92,076) JPMorgan Chase Bank 3/1/2020 (1,662) (0.00%)GBP 408,622 USD (545,754) JPMorgan Chase Bank 3/1/2020 (4,432) (0.00%)USD 670,389 GBP (517,642) Barclays Bank plc 3/1/2020 (15,358) (0.00%)GBP 2,221,916 USD (2,965,656) JPMorgan Chase Bank 3/1/2020 (22,171) (0.00%)
18,537,814 1.32%
Total Financial Derivative Instruments 18,538,582 1.32%
Fair Value % of Total US Dollars ($) Net Assets
Other Assets and Liabilities (9,139,939) (0.65%)
Net Assets Attributable to Holders of Redeemable Participating Shares (for financial reporting purposes) 1,401,365,617 100.00%
% of Total Analysis of Total Net Assets US Dollars ($) Net Assets
(a) Transferable securities admitted to an official stock exchange listing 892,314,471 63.67%
(b) Transferable securities dealt in on another regulated market 421,665,646 30.09%
(c) Transferable securities other than those admitted to an official stock exchange listing or dealt in on another regulated market 77,986,857 5.57%
(d) Financial derivative instruments 18,538,582 1.32%
(e) Other assets and liabilities (9,139,939) (0.65%)
Total Net Assets (for financial reporting purposes) 1,401,365,617 100.00%
Vanguard U.S. Investment Grade Credit Index Fund
965
^ Floating Rate Note (FRN). The effective interest rate is at 31 December 2019. 1 Denotes securities pledged in full or part thereof as collateral for derivatives.
Unrealised Buy (Sell) Settlement Gain/(Loss) % of Total Currency Amount Currency Amount Counterparty Date US Dollars ($) Net Assets
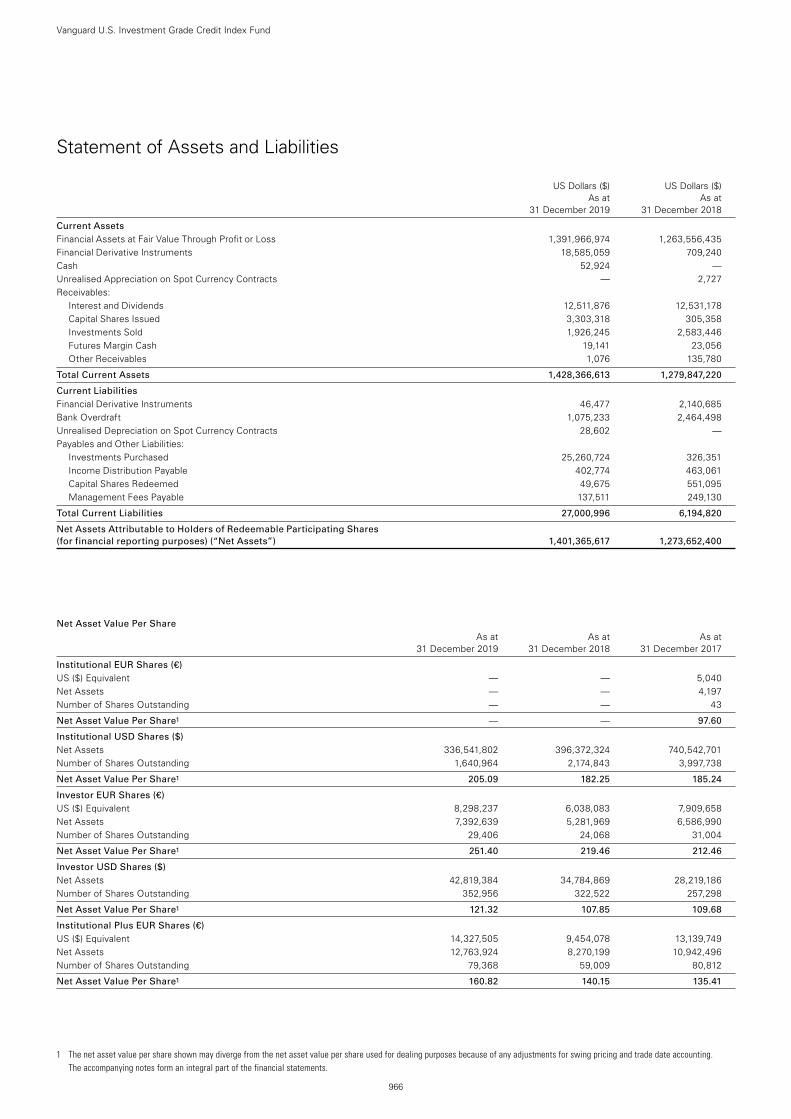
1 The net asset value per share shown may diverge from the net asset value per share used for dealing purposes because of any adjustments for swing pricing and trade date accounting. The accompanying notes form an integral part of the financial statements.
966
Vanguard U.S. Investment Grade Credit Index Fund
Statement of Assets and Liabilities
US Dollars ($) US Dollars ($) As at As at 31 December 2019 31 December 2018
Current Assets Financial Assets at Fair Value Through Profit or Loss 1,391,966,974 1,263,556,435Financial Derivative Instruments 18,585,059 709,240Cash 52,924 —Unrealised Appreciation on Spot Currency Contracts — 2,727Receivables:
Interest and Dividends 12,511,876 12,531,178Capital Shares Issued 3,303,318 305,358Investments Sold 1,926,245 2,583,446Futures Margin Cash 19,141 23,056Other Receivables 1,076 135,780
Total Current Assets 1,428,366,613 1,279,847,220
Current Liabilities Financial Derivative Instruments 46,477 2,140,685Bank Overdraft 1,075,233 2,464,498Unrealised Depreciation on Spot Currency Contracts 28,602 —Payables and Other Liabilities:
Investments Purchased 25,260,724 326,351Income Distribution Payable 402,774 463,061Capital Shares Redeemed 49,675 551,095Management Fees Payable 137,511 249,130
Total Current Liabilities 27,000,996 6,194,820
Net Assets Attributable to Holders of Redeemable Participating Shares (for financial reporting purposes) (“Net Assets”) 1,401,365,617 1,273,652,400
Net Asset Value Per Share As at As at As at 31 December 2019 31 December 2018 31 December 2017
Institutional EUR Shares (€) US ($) Equivalent — — 5,040Net Assets — — 4,197Number of Shares Outstanding — — 43
Net Asset Value Per Share1 — — 97.60
Institutional USD Shares ($) Net Assets 336,541,802 396,372,324 740,542,701Number of Shares Outstanding 1,640,964 2,174,843 3,997,738
Net Asset Value Per Share1 205.09 182.25 185.24
Investor EUR Shares (€) US ($) Equivalent 8,298,237 6,038,083 7,909,658Net Assets 7,392,639 5,281,969 6,586,990Number of Shares Outstanding 29,406 24,068 31,004
Net Asset Value Per Share1 251.40 219.46 212.46
Investor USD Shares ($) Net Assets 42,819,384 34,784,869 28,219,186Number of Shares Outstanding 352,956 322,522 257,298
Net Asset Value Per Share1 121.32 107.85 109.68
Institutional Plus EUR Shares (€) US ($) Equivalent 14,327,505 9,454,078 13,139,749Net Assets 12,763,924 8,270,199 10,942,496Number of Shares Outstanding 79,368 59,009 80,812
Net Asset Value Per Share1 160.82 140.15 135.41
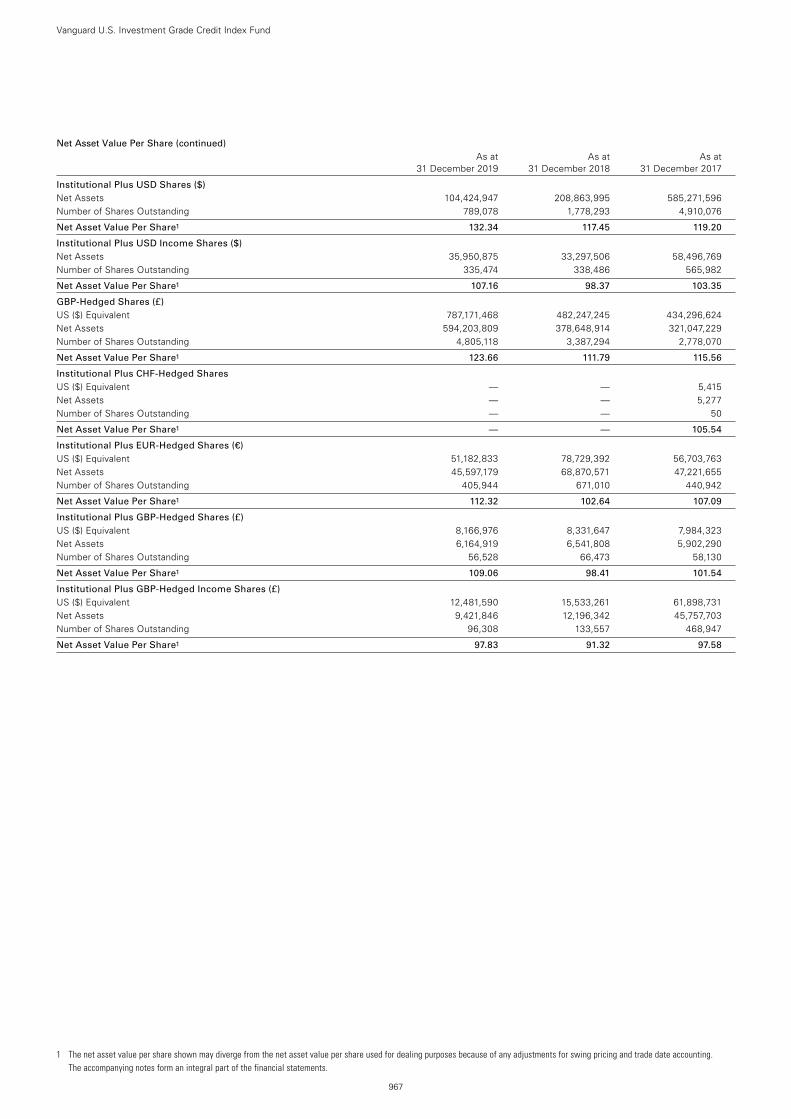
1 The net asset value per share shown may diverge from the net asset value per share used for dealing purposes because of any adjustments for swing pricing and trade date accounting. The accompanying notes form an integral part of the financial statements.
967
Institutional Plus USD Shares ($) Net Assets 104,424,947 208,863,995 585,271,596Number of Shares Outstanding 789,078 1,778,293 4,910,076
Net Asset Value Per Share1 132.34 117.45 119.20
Institutional Plus USD Income Shares ($) Net Assets 35,950,875 33,297,506 58,496,769Number of Shares Outstanding 335,474 338,486 565,982
Net Asset Value Per Share1 107.16 98.37 103.35
GBP-Hedged Shares (£) US ($) Equivalent 787,171,468 482,247,245 434,296,624Net Assets 594,203,809 378,648,914 321,047,229Number of Shares Outstanding 4,805,118 3,387,294 2,778,070
Net Asset Value Per Share1 123.66 111.79 115.56
Institutional Plus CHF-Hedged Shares US ($) Equivalent — — 5,415Net Assets — — 5,277Number of Shares Outstanding — — 50
Net Asset Value Per Share1 — — 105.54
Institutional Plus EUR-Hedged Shares (€) US ($) Equivalent 51,182,833 78,729,392 56,703,763Net Assets 45,597,179 68,870,571 47,221,655Number of Shares Outstanding 405,944 671,010 440,942
Net Asset Value Per Share1 112.32 102.64 107.09
Institutional Plus GBP-Hedged Shares (£) US ($) Equivalent 8,166,976 8,331,647 7,984,323Net Assets 6,164,919 6,541,808 5,902,290Number of Shares Outstanding 56,528 66,473 58,130
Net Asset Value Per Share1 109.06 98.41 101.54
Institutional Plus GBP-Hedged Income Shares (£) US ($) Equivalent 12,481,590 15,533,261 61,898,731Net Assets 9,421,846 12,196,342 45,757,703Number of Shares Outstanding 96,308 133,557 468,947
Net Asset Value Per Share1 97.83 91.32 97.58
Vanguard U.S. Investment Grade Credit Index Fund
Net Asset Value Per Share (continued) As at As at As at 31 December 2019 31 December 2018 31 December 2017
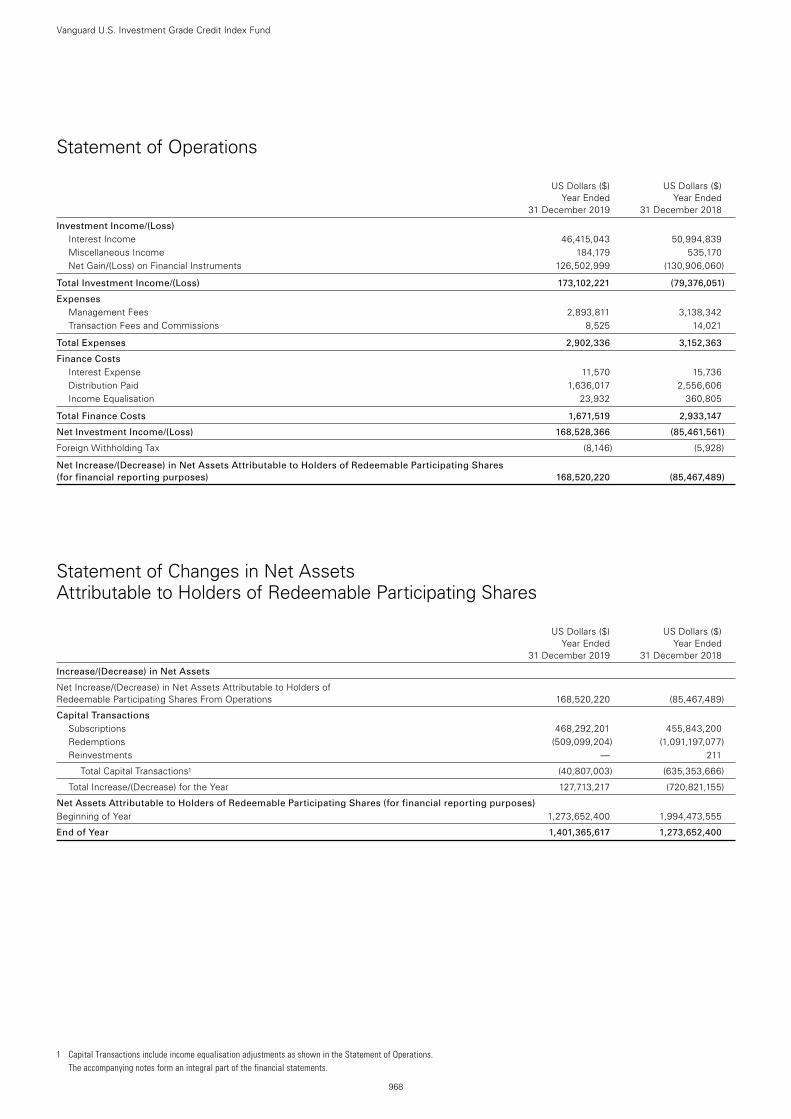
968
Vanguard U.S. Investment Grade Credit Index Fund
Statement of Operations
US Dollars ($) US Dollars ($) Year Ended Year Ended 31 December 2019 31 December 2018
Investment Income/(Loss) Interest Income 46,415,043 50,994,839Miscellaneous Income 184,179 535,170Net Gain/(Loss) on Financial Instruments 126,502,999 (130,906,060)
Total Investment Income/(Loss) 173,102,221 (79,376,051)
Expenses Management Fees 2,893,811 3,138,342Transaction Fees and Commissions 8,525 14,021
Total Expenses 2,902,336 3,152,363
Finance Costs Interest Expense 11,570 15,736Distribution Paid 1,636,017 2,556,606Income Equalisation 23,932 360,805
Total Finance Costs 1,671,519 2,933,147
Net Investment Income/(Loss) 168,528,366 (85,461,561)
Foreign Withholding Tax (8,146) (5,928)
Net Increase/(Decrease) in Net Assets Attributable to Holders of Redeemable Participating Shares (for financial reporting purposes) 168,520,220 (85,467,489)
Statement of Changes in Net Assets Attributable to Holders of Redeemable Participating Shares
US Dollars ($) US Dollars ($) Year Ended Year Ended 31 December 2019 31 December 2018
Increase/(Decrease) in Net Assets
Net Increase/(Decrease) in Net Assets Attributable to Holders of Redeemable Participating Shares From Operations 168,520,220 (85,467,489)
Capital Transactions Subscriptions 468,292,201 455,843,200Redemptions (509,099,204) (1,091,197,077)Reinvestments — 211
Total Capital Transactions1 (40,807,003) (635,353,666)
Total Increase/(Decrease) for the Year 127,713,217 (720,821,155)
Net Assets Attributable to Holders of Redeemable Participating Shares (for financial reporting purposes) Beginning of Year 1,273,652,400 1,994,473,555
End of Year 1,401,365,617 1,273,652,400
1 Capital Transactions include income equalisation adjustments as shown in the Statement of Operations. The accompanying notes form an integral part of the financial statements.
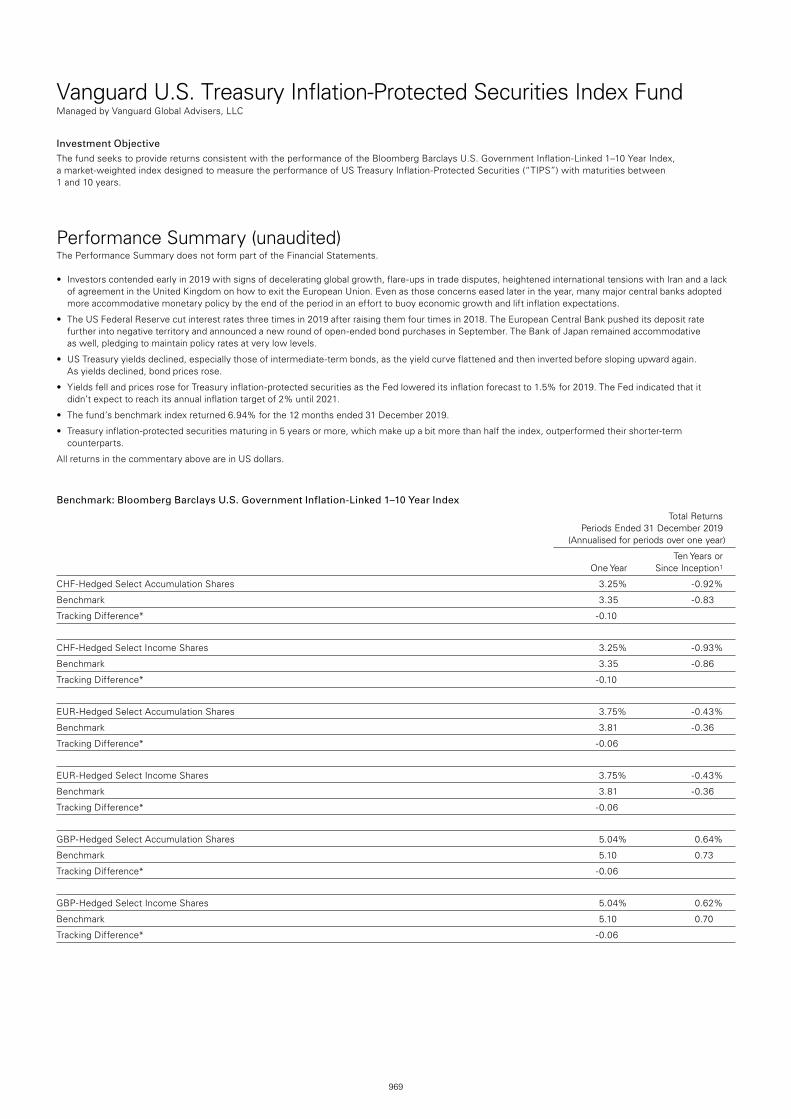
969
Vanguard U.S. Treasury Inflation-Protected Securities Index FundManaged by Vanguard Global Advisers, LLC
Investment ObjectiveThe fund seeks to provide returns consistent with the performance of the Bloomberg Barclays U.S. Government Inflation-Linked 1–10 Year Index, a market-weighted index designed to measure the performance of US Treasury Inflation-Protected Securities (“TIPS”) with maturities between 1 and 10 years.
Performance Summary (unaudited)The Performance Summary does not form part of the Financial Statements.
• Investorscontendedearlyin2019withsignsofdeceleratingglobalgrowth,flare-upsintradedisputes,heightenedinternationaltensionswithIranandalackof agreement in the United Kingdom on how to exit the European Union. Even as those concerns eased later in the year, many major central banks adopted more accommodative monetary policy by the end of the period in an effort to buoy economic growth and lift inflation expectations.
• TheUSFederalReservecutinterestratesthreetimesin2019afterraisingthemfourtimesin2018.TheEuropeanCentralBankpusheditsdepositratefurther into negative territory and announced a new round of open-ended bond purchases in September. The Bank of Japan remained accommodative as well, pledging to maintain policy rates at very low levels.
• USTreasuryyieldsdeclined,especiallythoseofintermediate-termbonds,astheyieldcurveflattenedandtheninvertedbeforeslopingupwardagain. As yields declined, bond prices rose.
• YieldsfellandpricesroseforTreasuryinflation-protectedsecuritiesastheFedlowereditsinflationforecastto1.5%for2019.TheFedindicatedthatit didn’t expect to reach its annual inflation target of 2% until 2021.
• Thefund’sbenchmarkindexreturned6.94%forthe12monthsended31December2019.
• Treasuryinflation-protectedsecuritiesmaturingin5yearsormore,whichmakeupabitmorethanhalftheindex,outperformedtheirshorter-termcounterparts.
All returns in the commentary above are in US dollars.
Benchmark: Bloomberg Barclays U.S. Government Inflation-Linked 1–10 Year Index
Total Returns Periods Ended 31 December 2019 (Annualised for periods over one year)
Ten Years or One Year Since Inception1
CHF-Hedged Select Accumulation Shares 3.25% -0.92%
Benchmark 3.35 -0.83
Tracking Difference* -0.10
CHF-Hedged Select Income Shares 3.25% -0.93%
Benchmark 3.35 -0.86
Tracking Difference* -0.10
EUR-Hedged Select Accumulation Shares 3.75% -0.43%
Benchmark 3.81 -0.36
Tracking Difference* -0.06
EUR-Hedged Select Income Shares 3.75% -0.43%
Benchmark 3.81 -0.36
Tracking Difference* -0.06
GBP-Hedged Select Accumulation Shares 5.04% 0.64%
Benchmark 5.10 0.73
Tracking Difference* -0.06
GBP-Hedged Select Income Shares 5.04% 0.62%
Benchmark 5.10 0.70
Tracking Difference* -0.06
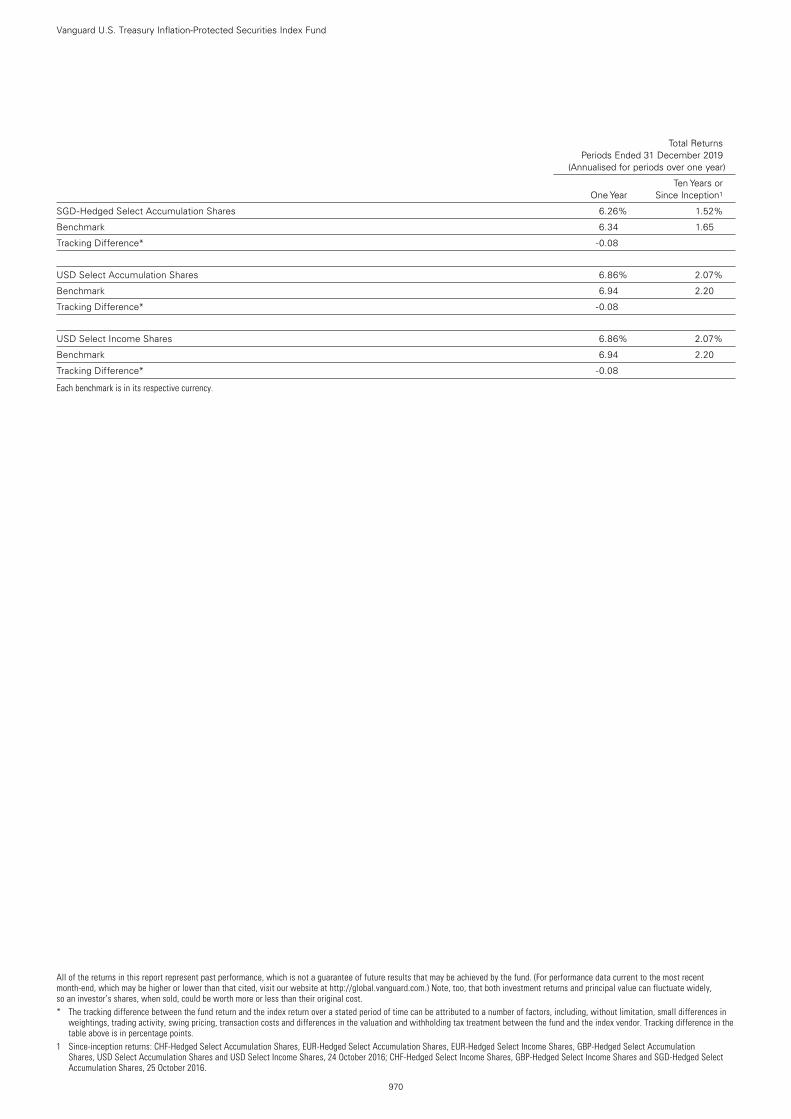
Vanguard U.S. Treasury Inflation-Protected Securities Index Fund
970
All of the returns in this report represent past performance, which is not a guarantee of future results that may be achieved by the fund. (For performance data current to the most recent month-end, which may be higher or lower than that cited, visit our website at http://global.vanguard.com.) Note, too, that both investment returns and principal value can fluctuate widely, so an investor’s shares, when sold, could be worth more or less than their original cost.* The tracking difference between the fund return and the index return over a stated period of time can be attributed to a number of factors, including, without limitation, small differences in
weightings, trading activity, swing pricing, transaction costs and differences in the valuation and withholding tax treatment between the fund and the index vendor. Tracking difference in the table above is in percentage points.
1 Since-inception returns: CHF-Hedged Select Accumulation Shares, EUR-Hedged Select Accumulation Shares, EUR-Hedged Select Income Shares, GBP-Hedged Select Accumulation Shares, USD Select Accumulation Shares and USD Select Income Shares, 24 October 2016; CHF-Hedged Select Income Shares, GBP-Hedged Select Income Shares and SGD-Hedged Select Accumulation Shares, 25 October 2016.
Total Returns Periods Ended 31 December 2019 (Annualised for periods over one year)
Ten Years or One Year Since Inception1
SGD-Hedged Select Accumulation Shares 6.26% 1.52%
Benchmark 6.34 1.65
Tracking Difference* -0.08
USD Select Accumulation Shares 6.86% 2.07%
Benchmark 6.94 2.20
Tracking Difference* -0.08
USD Select Income Shares 6.86% 2.07%
Benchmark 6.94 2.20
Tracking Difference* -0.08
Each benchmark is in its respective currency.
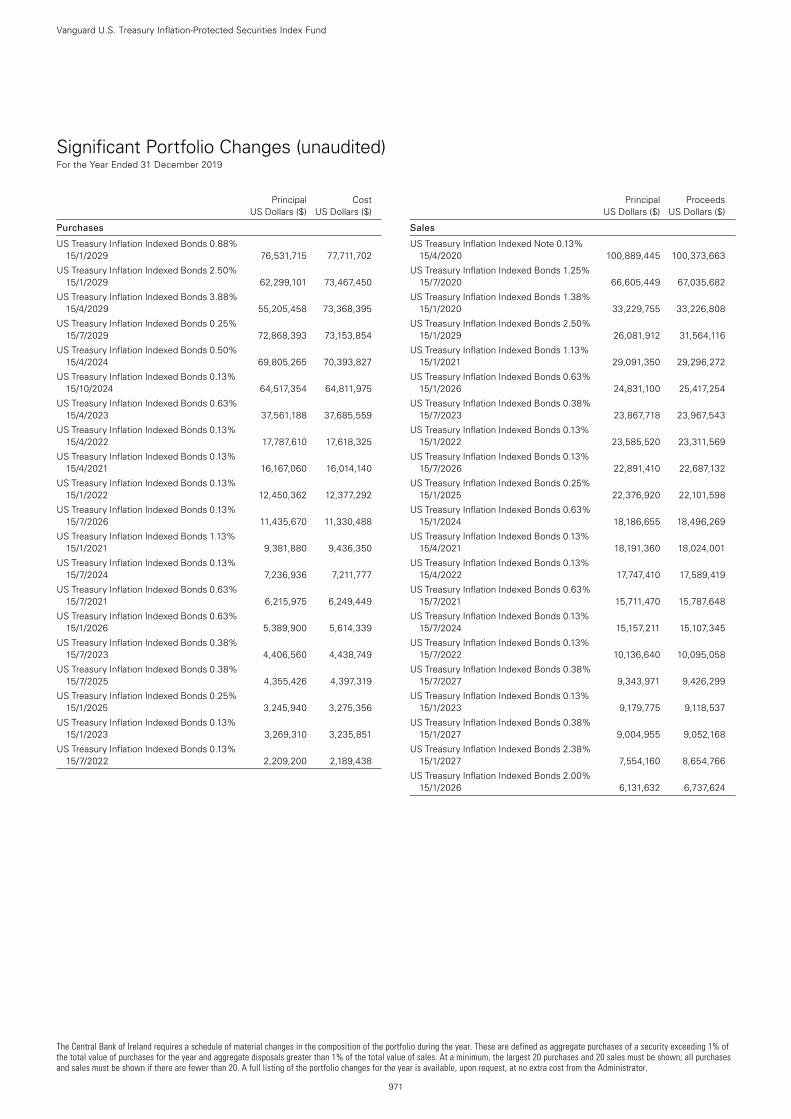
The Central Bank of Ireland requires a schedule of material changes in the composition of the portfolio during the year. These are defined as aggregate purchases of a security exceeding 1% of the total value of purchases for the year and aggregate disposals greater than 1% of the total value of sales. At a minimum, the largest 20 purchases and 20 sales must be shown; all purchases and sales must be shown if there are fewer than 20. A full listing of the portfolio changes for the year is available, upon request, at no extra cost from the Administrator.
971
Vanguard U.S. Treasury Inflation-Protected Securities Index Fund
Significant Portfolio Changes (unaudited) For the Year Ended 31 December 2019
Principal Cost US Dollars ($) US Dollars ($)
Purchases
US Treasury Inflation Indexed Bonds 0.88% 15/1/2029 76,531,715 77,711,702
US Treasury Inflation Indexed Bonds 2.50% 15/1/2029 62,299,101 73,467,450
US Treasury Inflation Indexed Bonds 3.88% 15/4/2029 55,205,458 73,368,395
US Treasury Inflation Indexed Bonds 0.25% 15/7/2029 72,868,393 73,153,854
US Treasury Inflation Indexed Bonds 0.50% 15/4/2024 69,805,265 70,393,827
US Treasury Inflation Indexed Bonds 0.13% 15/10/2024 64,517,354 64,811,975
US Treasury Inflation Indexed Bonds 0.63% 15/4/2023 37,561,188 37,685,559
US Treasury Inflation Indexed Bonds 0.13% 15/4/2022 17,787,610 17,618,325
US Treasury Inflation Indexed Bonds 0.13% 15/4/2021 16,167,060 16,014,140
US Treasury Inflation Indexed Bonds 0.13% 15/1/2022 12,450,362 12,377,292
US Treasury Inflation Indexed Bonds 0.13% 15/7/2026 11,435,670 11,330,488
US Treasury Inflation Indexed Bonds 1.13% 15/1/2021 9,381,880 9,436,350
US Treasury Inflation Indexed Bonds 0.13% 15/7/2024 7,236,936 7,211,777
US Treasury Inflation Indexed Bonds 0.63% 15/7/2021 6,215,975 6,249,449
US Treasury Inflation Indexed Bonds 0.63% 15/1/2026 5,389,900 5,614,339
US Treasury Inflation Indexed Bonds 0.38% 15/7/2023 4,406,560 4,438,749
US Treasury Inflation Indexed Bonds 0.38% 15/7/2025 4,355,426 4,397,319
US Treasury Inflation Indexed Bonds 0.25% 15/1/2025 3,245,940 3,275,356
US Treasury Inflation Indexed Bonds 0.13% 15/1/2023 3,269,310 3,235,851
US Treasury Inflation Indexed Bonds 0.13% 15/7/2022 2,209,200 2,189,438
Principal Proceeds US Dollars ($) US Dollars ($)
Sales
US Treasury Inflation Indexed Note 0.13% 15/4/2020 100,889,445 100,373,663
US Treasury Inflation Indexed Bonds 1.25% 15/7/2020 66,605,449 67,035,682
US Treasury Inflation Indexed Bonds 1.38% 15/1/2020 33,229,755 33,226,808
US Treasury Inflation Indexed Bonds 2.50% 15/1/2029 26,081,912 31,564,116
US Treasury Inflation Indexed Bonds 1.13% 15/1/2021 29,091,350 29,296,272
US Treasury Inflation Indexed Bonds 0.63% 15/1/2026 24,831,100 25,417,254
US Treasury Inflation Indexed Bonds 0.38% 15/7/2023 23,867,718 23,967,543
US Treasury Inflation Indexed Bonds 0.13% 15/1/2022 23,585,520 23,311,569
US Treasury Inflation Indexed Bonds 0.13% 15/7/2026 22,891,410 22,687,132
US Treasury Inflation Indexed Bonds 0.25% 15/1/2025 22,376,920 22,101,598
US Treasury Inflation Indexed Bonds 0.63% 15/1/2024 18,186,655 18,496,269
US Treasury Inflation Indexed Bonds 0.13% 15/4/2021 18,191,360 18,024,001
US Treasury Inflation Indexed Bonds 0.13% 15/4/2022 17,747,410 17,589,419
US Treasury Inflation Indexed Bonds 0.63% 15/7/2021 15,711,470 15,787,648
US Treasury Inflation Indexed Bonds 0.13% 15/7/2024 15,157,211 15,107,345
US Treasury Inflation Indexed Bonds 0.13% 15/7/2022 10,136,640 10,095,058
US Treasury Inflation Indexed Bonds 0.38% 15/7/2027 9,343,971 9,426,299
US Treasury Inflation Indexed Bonds 0.13% 15/1/2023 9,179,775 9,118,537
US Treasury Inflation Indexed Bonds 0.38% 15/1/2027 9,004,955 9,052,168
US Treasury Inflation Indexed Bonds 2.38% 15/1/2027 7,554,160 8,654,766
US Treasury Inflation Indexed Bonds 2.00% 15/1/2026 6,131,632 6,737,624
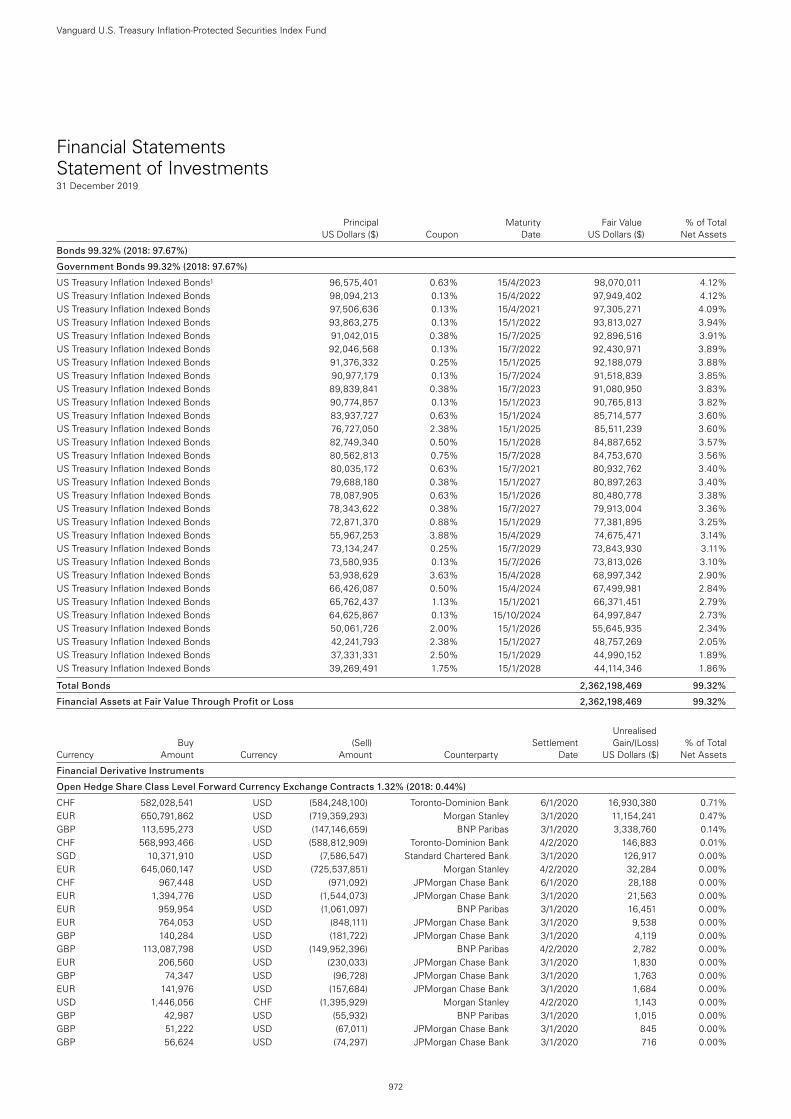
Financial Statements Statement of Investments31 December 2019
Principal Maturity Fair Value % of Total US Dollars ($) Coupon Date US Dollars ($) Net Assets
Bonds 99.32% (2018: 97.67%)
Government Bonds 99.32% (2018: 97.67%)
US Treasury Inflation Indexed Bonds1 96,575,401 0.63% 15/4/2023 98,070,011 4.12%US Treasury Inflation Indexed Bonds 98,094,213 0.13% 15/4/2022 97,949,402 4.12%US Treasury Inflation Indexed Bonds 97,506,636 0.13% 15/4/2021 97,305,271 4.09%US Treasury Inflation Indexed Bonds 93,863,275 0.13% 15/1/2022 93,813,027 3.94%US Treasury Inflation Indexed Bonds 91,042,015 0.38% 15/7/2025 92,896,516 3.91%US Treasury Inflation Indexed Bonds 92,046,568 0.13% 15/7/2022 92,430,971 3.89%US Treasury Inflation Indexed Bonds 91,376,332 0.25% 15/1/2025 92,188,079 3.88%US Treasury Inflation Indexed Bonds 90,977,179 0.13% 15/7/2024 91,518,839 3.85%US Treasury Inflation Indexed Bonds 89,839,841 0.38% 15/7/2023 91,080,950 3.83%US Treasury Inflation Indexed Bonds 90,774,857 0.13% 15/1/2023 90,765,813 3.82%US Treasury Inflation Indexed Bonds 83,937,727 0.63% 15/1/2024 85,714,577 3.60%US Treasury Inflation Indexed Bonds 76,727,050 2.38% 15/1/2025 85,511,239 3.60%US Treasury Inflation Indexed Bonds 82,749,340 0.50% 15/1/2028 84,887,652 3.57%US Treasury Inflation Indexed Bonds 80,562,813 0.75% 15/7/2028 84,753,670 3.56%US Treasury Inflation Indexed Bonds 80,035,172 0.63% 15/7/2021 80,932,762 3.40%US Treasury Inflation Indexed Bonds 79,688,180 0.38% 15/1/2027 80,897,263 3.40%US Treasury Inflation Indexed Bonds 78,087,905 0.63% 15/1/2026 80,480,778 3.38%US Treasury Inflation Indexed Bonds 78,343,622 0.38% 15/7/2027 79,913,004 3.36%US Treasury Inflation Indexed Bonds 72,871,370 0.88% 15/1/2029 77,381,895 3.25%US Treasury Inflation Indexed Bonds 55,967,253 3.88% 15/4/2029 74,675,471 3.14%US Treasury Inflation Indexed Bonds 73,134,247 0.25% 15/7/2029 73,843,930 3.11%US Treasury Inflation Indexed Bonds 73,580,935 0.13% 15/7/2026 73,813,026 3.10%US Treasury Inflation Indexed Bonds 53,938,629 3.63% 15/4/2028 68,997,342 2.90%US Treasury Inflation Indexed Bonds 66,426,087 0.50% 15/4/2024 67,499,981 2.84%US Treasury Inflation Indexed Bonds 65,762,437 1.13% 15/1/2021 66,371,451 2.79%US Treasury Inflation Indexed Bonds 64,625,867 0.13% 15/10/2024 64,997,847 2.73%US Treasury Inflation Indexed Bonds 50,061,726 2.00% 15/1/2026 55,645,935 2.34%US Treasury Inflation Indexed Bonds 42,241,793 2.38% 15/1/2027 48,757,269 2.05%US Treasury Inflation Indexed Bonds 37,331,331 2.50% 15/1/2029 44,990,152 1.89%US Treasury Inflation Indexed Bonds 39,269,491 1.75% 15/1/2028 44,114,346 1.86%
Total Bonds 2,362,198,469 99.32%
Financial Assets at Fair Value Through Profit or Loss 2,362,198,469 99.32%
Unrealised Buy (Sell) Settlement Gain/(Loss) % of Total Currency Amount Currency Amount Counterparty Date US Dollars ($) Net Assets
Financial Derivative Instruments
Open Hedge Share Class Level Forward Currency Exchange Contracts 1.32% (2018: 0.44%)
CHF 582,028,541 USD (584,248,100) Toronto-Dominion Bank 6/1/2020 16,930,380 0.71%EUR 650,791,862 USD (719,359,293) Morgan Stanley 3/1/2020 11,154,241 0.47%GBP 113,595,273 USD (147,146,659) BNP Paribas 3/1/2020 3,338,760 0.14%CHF 568,993,466 USD (588,812,909) Toronto-Dominion Bank 4/2/2020 146,883 0.01%SGD 10,371,910 USD (7,586,547) Standard Chartered Bank 3/1/2020 126,917 0.00%EUR 645,060,147 USD (725,537,851) Morgan Stanley 4/2/2020 32,284 0.00%CHF 967,448 USD (971,092) JPMorgan Chase Bank 6/1/2020 28,188 0.00%EUR 1,394,776 USD (1,544,073) JPMorgan Chase Bank 3/1/2020 21,563 0.00%EUR 959,954 USD (1,061,097) BNP Paribas 3/1/2020 16,451 0.00%EUR 764,053 USD (848,111) JPMorgan Chase Bank 3/1/2020 9,538 0.00%GBP 140,284 USD (181,722) JPMorgan Chase Bank 3/1/2020 4,119 0.00%GBP 113,087,798 USD (149,952,396) BNP Paribas 4/2/2020 2,782 0.00%EUR 206,560 USD (230,033) JPMorgan Chase Bank 3/1/2020 1,830 0.00%GBP 74,347 USD (96,728) JPMorgan Chase Bank 3/1/2020 1,763 0.00%EUR 141,976 USD (157,684) JPMorgan Chase Bank 3/1/2020 1,684 0.00%USD 1,446,056 CHF (1,395,929) Morgan Stanley 4/2/2020 1,143 0.00%GBP 42,987 USD (55,932) BNP Paribas 3/1/2020 1,015 0.00%GBP 51,222 USD (67,011) JPMorgan Chase Bank 3/1/2020 845 0.00%GBP 56,624 USD (74,297) JPMorgan Chase Bank 3/1/2020 716 0.00%
Vanguard U.S. Treasury Inflation-Protected Securities Index Fund
972
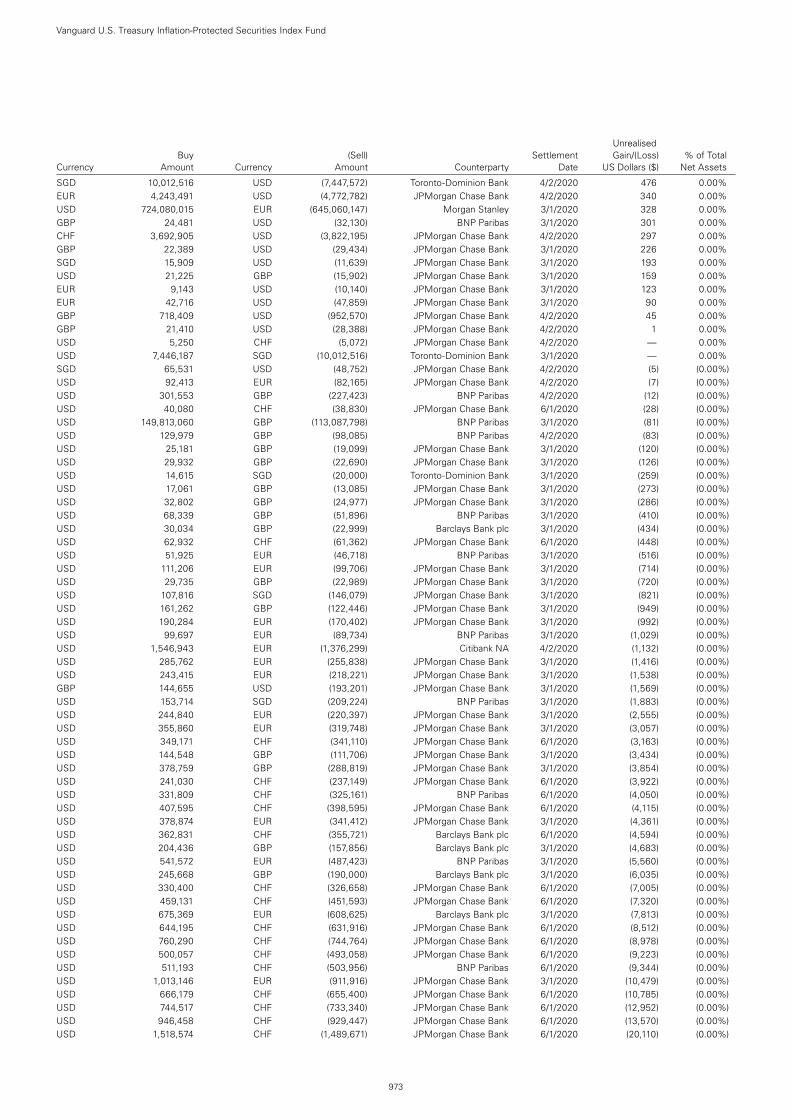
SGD 10,012,516 USD (7,447,572) Toronto-Dominion Bank 4/2/2020 476 0.00%EUR 4,243,491 USD (4,772,782) JPMorgan Chase Bank 4/2/2020 340 0.00%USD 724,080,015 EUR (645,060,147) Morgan Stanley 3/1/2020 328 0.00%GBP 24,481 USD (32,130) BNP Paribas 3/1/2020 301 0.00%CHF 3,692,905 USD (3,822,195) JPMorgan Chase Bank 4/2/2020 297 0.00%GBP 22,389 USD (29,434) JPMorgan Chase Bank 3/1/2020 226 0.00%SGD 15,909 USD (11,639) JPMorgan Chase Bank 3/1/2020 193 0.00%USD 21,225 GBP (15,902) JPMorgan Chase Bank 3/1/2020 159 0.00%EUR 9,143 USD (10,140) JPMorgan Chase Bank 3/1/2020 123 0.00%EUR 42,716 USD (47,859) JPMorgan Chase Bank 3/1/2020 90 0.00%GBP 718,409 USD (952,570) JPMorgan Chase Bank 4/2/2020 45 0.00%GBP 21,410 USD (28,388) JPMorgan Chase Bank 4/2/2020 1 0.00%USD 5,250 CHF (5,072) JPMorgan Chase Bank 4/2/2020 — 0.00%USD 7,446,187 SGD (10,012,516) Toronto-Dominion Bank 3/1/2020 — 0.00%SGD 65,531 USD (48,752) JPMorgan Chase Bank 4/2/2020 (5) (0.00%)USD 92,413 EUR (82,165) JPMorgan Chase Bank 4/2/2020 (7) (0.00%)USD 301,553 GBP (227,423) BNP Paribas 4/2/2020 (12) (0.00%)USD 40,080 CHF (38,830) JPMorgan Chase Bank 6/1/2020 (28) (0.00%)USD 149,813,060 GBP (113,087,798) BNP Paribas 3/1/2020 (81) (0.00%)USD 129,979 GBP (98,085) BNP Paribas 4/2/2020 (83) (0.00%)USD 25,181 GBP (19,099) JPMorgan Chase Bank 3/1/2020 (120) (0.00%)USD 29,932 GBP (22,690) JPMorgan Chase Bank 3/1/2020 (126) (0.00%)USD 14,615 SGD (20,000) Toronto-Dominion Bank 3/1/2020 (259) (0.00%)USD 17,061 GBP (13,085) JPMorgan Chase Bank 3/1/2020 (273) (0.00%)USD 32,802 GBP (24,977) JPMorgan Chase Bank 3/1/2020 (286) (0.00%)USD 68,339 GBP (51,896) BNP Paribas 3/1/2020 (410) (0.00%)USD 30,034 GBP (22,999) Barclays Bank plc 3/1/2020 (434) (0.00%)USD 62,932 CHF (61,362) JPMorgan Chase Bank 6/1/2020 (448) (0.00%)USD 51,925 EUR (46,718) BNP Paribas 3/1/2020 (516) (0.00%)USD 111,206 EUR (99,706) JPMorgan Chase Bank 3/1/2020 (714) (0.00%)USD 29,735 GBP (22,989) JPMorgan Chase Bank 3/1/2020 (720) (0.00%)USD 107,816 SGD (146,079) JPMorgan Chase Bank 3/1/2020 (821) (0.00%)USD 161,262 GBP (122,446) JPMorgan Chase Bank 3/1/2020 (949) (0.00%)USD 190,284 EUR (170,402) JPMorgan Chase Bank 3/1/2020 (992) (0.00%)USD 99,697 EUR (89,734) BNP Paribas 3/1/2020 (1,029) (0.00%)USD 1,546,943 EUR (1,376,299) Citibank NA 4/2/2020 (1,132) (0.00%)USD 285,762 EUR (255,838) JPMorgan Chase Bank 3/1/2020 (1,416) (0.00%)USD 243,415 EUR (218,221) JPMorgan Chase Bank 3/1/2020 (1,538) (0.00%)GBP 144,655 USD (193,201) JPMorgan Chase Bank 3/1/2020 (1,569) (0.00%)USD 153,714 SGD (209,224) BNP Paribas 3/1/2020 (1,883) (0.00%)USD 244,840 EUR (220,397) JPMorgan Chase Bank 3/1/2020 (2,555) (0.00%)USD 355,860 EUR (319,748) JPMorgan Chase Bank 3/1/2020 (3,057) (0.00%)USD 349,171 CHF (341,110) JPMorgan Chase Bank 6/1/2020 (3,163) (0.00%)USD 144,548 GBP (111,706) JPMorgan Chase Bank 3/1/2020 (3,434) (0.00%)USD 378,759 GBP (288,819) JPMorgan Chase Bank 3/1/2020 (3,854) (0.00%)USD 241,030 CHF (237,149) JPMorgan Chase Bank 6/1/2020 (3,922) (0.00%)USD 331,809 CHF (325,161) BNP Paribas 6/1/2020 (4,050) (0.00%)USD 407,595 CHF (398,595) JPMorgan Chase Bank 6/1/2020 (4,115) (0.00%)USD 378,874 EUR (341,412) JPMorgan Chase Bank 3/1/2020 (4,361) (0.00%)USD 362,831 CHF (355,721) Barclays Bank plc 6/1/2020 (4,594) (0.00%)USD 204,436 GBP (157,856) Barclays Bank plc 3/1/2020 (4,683) (0.00%)USD 541,572 EUR (487,423) BNP Paribas 3/1/2020 (5,560) (0.00%)USD 245,668 GBP (190,000) Barclays Bank plc 3/1/2020 (6,035) (0.00%)USD 330,400 CHF (326,658) JPMorgan Chase Bank 6/1/2020 (7,005) (0.00%)USD 459,131 CHF (451,593) JPMorgan Chase Bank 6/1/2020 (7,320) (0.00%)USD 675,369 EUR (608,625) Barclays Bank plc 3/1/2020 (7,813) (0.00%)USD 644,195 CHF (631,916) JPMorgan Chase Bank 6/1/2020 (8,512) (0.00%)USD 760,290 CHF (744,764) JPMorgan Chase Bank 6/1/2020 (8,978) (0.00%)USD 500,057 CHF (493,058) JPMorgan Chase Bank 6/1/2020 (9,223) (0.00%)USD 511,193 CHF (503,956) BNP Paribas 6/1/2020 (9,344) (0.00%)USD 1,013,146 EUR (911,916) JPMorgan Chase Bank 3/1/2020 (10,479) (0.00%)USD 666,179 CHF (655,400) JPMorgan Chase Bank 6/1/2020 (10,785) (0.00%)USD 744,517 CHF (733,340) JPMorgan Chase Bank 6/1/2020 (12,952) (0.00%)USD 946,458 CHF (929,447) JPMorgan Chase Bank 6/1/2020 (13,570) (0.00%)USD 1,518,574 CHF (1,489,671) JPMorgan Chase Bank 6/1/2020 (20,110) (0.00%)
Vanguard U.S. Treasury Inflation-Protected Securities Index Fund
973
Unrealised Buy (Sell) Settlement Gain/(Loss) % of Total Currency Amount Currency Amount Counterparty Date US Dollars ($) Net Assets
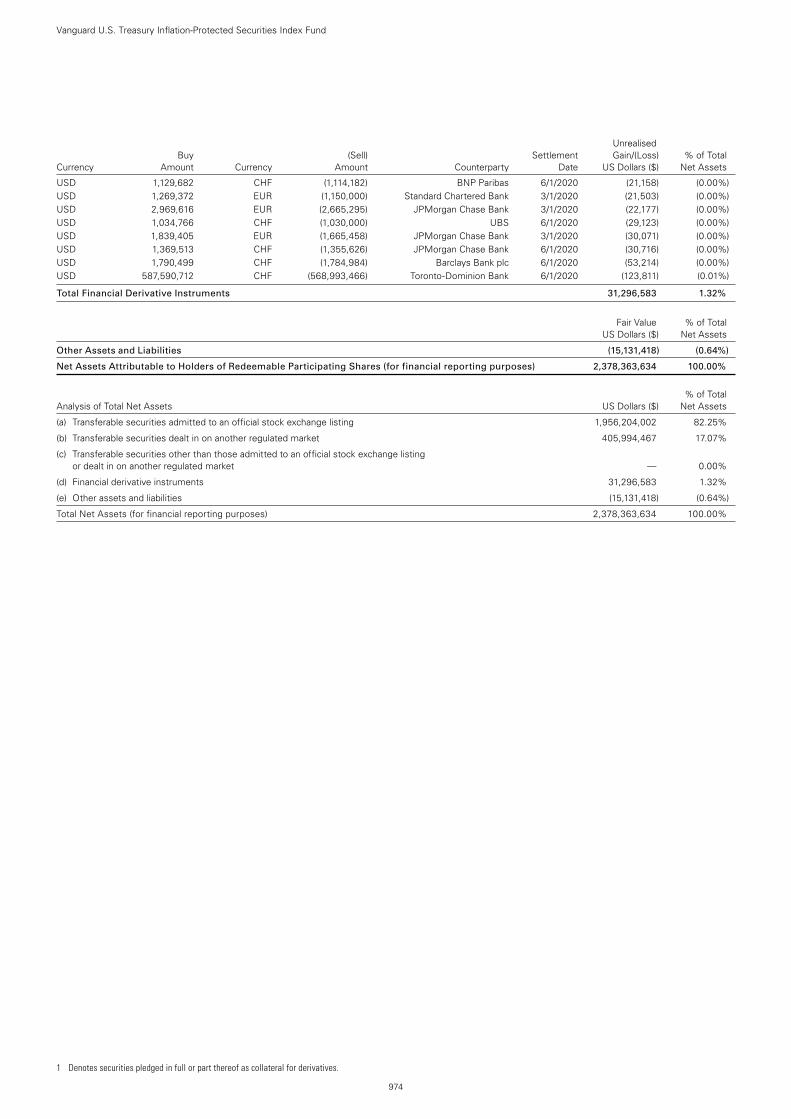
1 Denotes securities pledged in full or part thereof as collateral for derivatives.
USD 1,129,682 CHF (1,114,182) BNP Paribas 6/1/2020 (21,158) (0.00%)USD 1,269,372 EUR (1,150,000) Standard Chartered Bank 3/1/2020 (21,503) (0.00%)USD 2,969,616 EUR (2,665,295) JPMorgan Chase Bank 3/1/2020 (22,177) (0.00%)USD 1,034,766 CHF (1,030,000) UBS 6/1/2020 (29,123) (0.00%)USD 1,839,405 EUR (1,665,458) JPMorgan Chase Bank 3/1/2020 (30,071) (0.00%)USD 1,369,513 CHF (1,355,626) JPMorgan Chase Bank 6/1/2020 (30,716) (0.00%)USD 1,790,499 CHF (1,784,984) Barclays Bank plc 6/1/2020 (53,214) (0.00%)USD 587,590,712 CHF (568,993,466) Toronto-Dominion Bank 6/1/2020 (123,811) (0.01%)
Total Financial Derivative Instruments 31,296,583 1.32%
Fair Value % of Total US Dollars ($) Net Assets
Other Assets and Liabilities (15,131,418) (0.64%)
Net Assets Attributable to Holders of Redeemable Participating Shares (for financial reporting purposes) 2,378,363,634 100.00%
% of Total Analysis of Total Net Assets US Dollars ($) Net Assets
(a) Transferable securities admitted to an official stock exchange listing 1,956,204,002 82.25%
(b) Transferable securities dealt in on another regulated market 405,994,467 17.07%
(c) Transferable securities other than those admitted to an official stock exchange listing or dealt in on another regulated market — 0.00%
(d) Financial derivative instruments 31,296,583 1.32%
(e) Other assets and liabilities (15,131,418) (0.64%)
Total Net Assets (for financial reporting purposes) 2,378,363,634 100.00%
Vanguard U.S. Treasury Inflation-Protected Securities Index Fund
974
Unrealised Buy (Sell) Settlement Gain/(Loss) % of Total Currency Amount Currency Amount Counterparty Date US Dollars ($) Net Assets
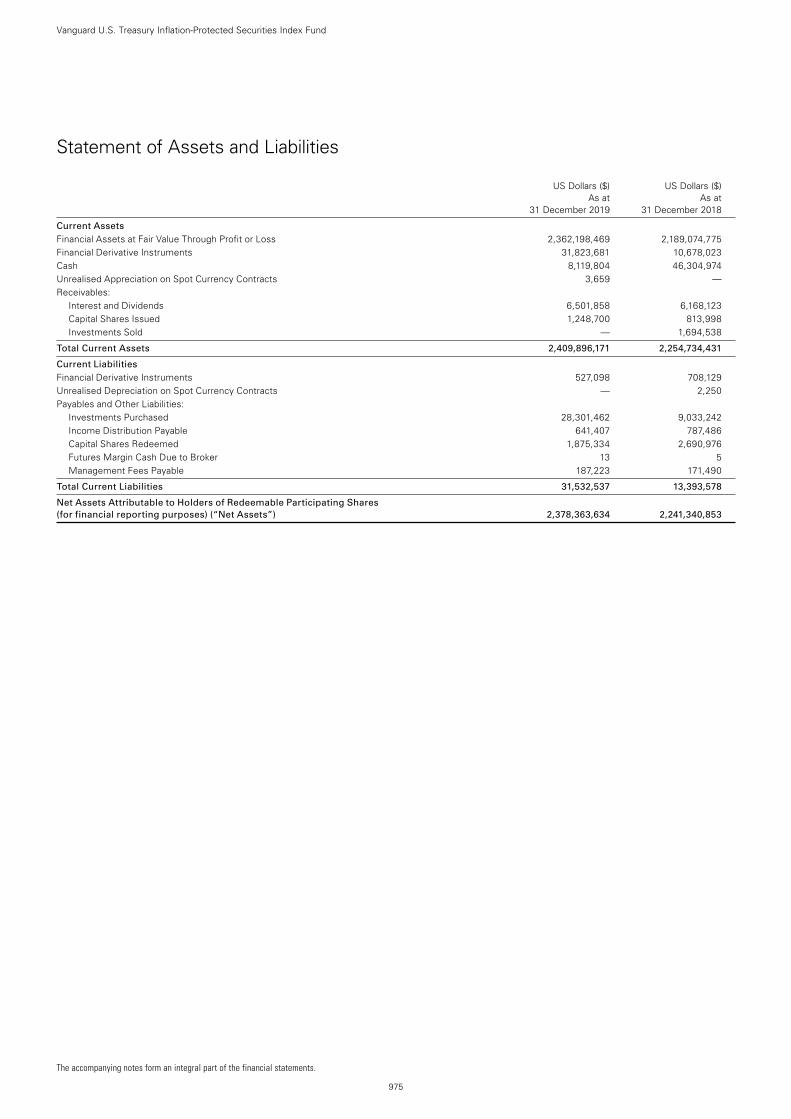
The accompanying notes form an integral part of the financial statements.
975
Vanguard U.S. Treasury Inflation-Protected Securities Index Fund
Statement of Assets and Liabilities
US Dollars ($) US Dollars ($) As at As at 31 December 2019 31 December 2018
Current Assets Financial Assets at Fair Value Through Profit or Loss 2,362,198,469 2,189,074,775Financial Derivative Instruments 31,823,681 10,678,023Cash 8,119,804 46,304,974Unrealised Appreciation on Spot Currency Contracts 3,659 —Receivables:
Interest and Dividends 6,501,858 6,168,123Capital Shares Issued 1,248,700 813,998Investments Sold — 1,694,538
Total Current Assets 2,409,896,171 2,254,734,431
Current Liabilities Financial Derivative Instruments 527,098 708,129Unrealised Depreciation on Spot Currency Contracts — 2,250Payables and Other Liabilities:
Investments Purchased 28,301,462 9,033,242Income Distribution Payable 641,407 787,486Capital Shares Redeemed 1,875,334 2,690,976Futures Margin Cash Due to Broker 13 5Management Fees Payable 187,223 171,490
Total Current Liabilities 31,532,537 13,393,578
Net Assets Attributable to Holders of Redeemable Participating Shares (for financial reporting purposes) (“Net Assets”) 2,378,363,634 2,241,340,853
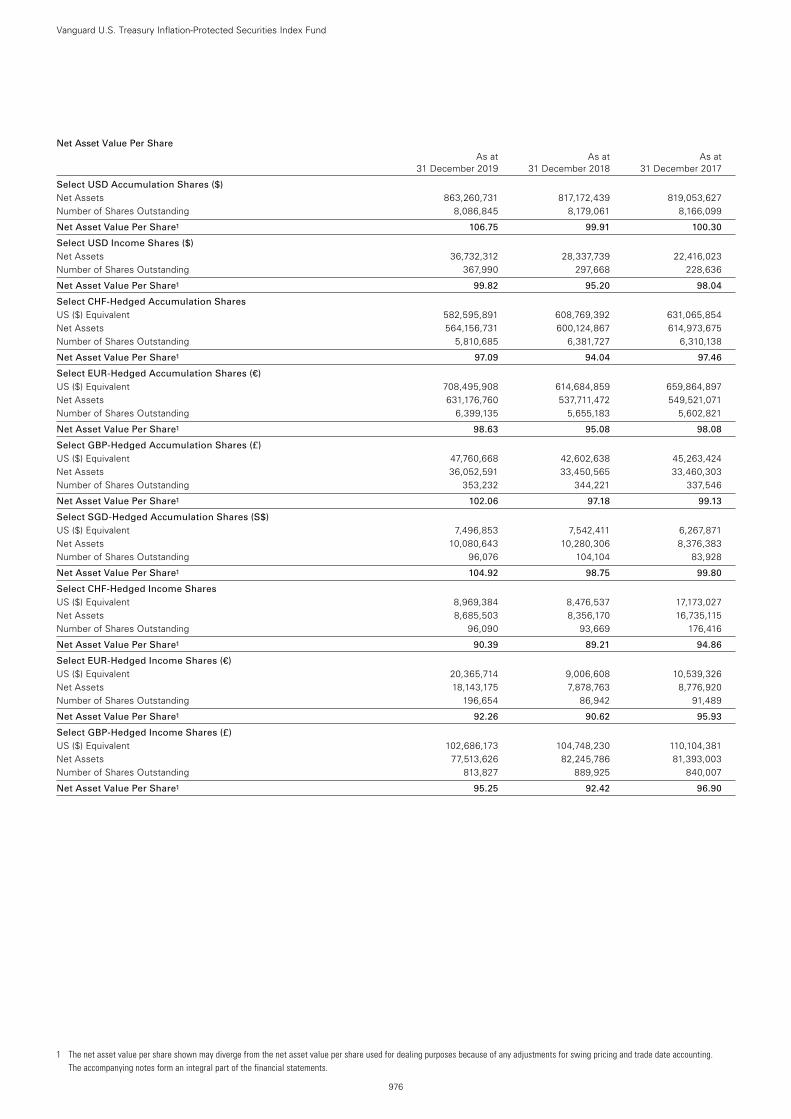
1 The net asset value per share shown may diverge from the net asset value per share used for dealing purposes because of any adjustments for swing pricing and trade date accounting. The accompanying notes form an integral part of the financial statements.
976
Vanguard U.S. Treasury Inflation-Protected Securities Index Fund
Net Asset Value Per Share As at As at As at 31 December 2019 31 December 2018 31 December 2017
Select USD Accumulation Shares ($) Net Assets 863,260,731 817,172,439 819,053,627Number of Shares Outstanding 8,086,845 8,179,061 8,166,099
Net Asset Value Per Share1 106.75 99.91 100.30
Select USD Income Shares ($) Net Assets 36,732,312 28,337,739 22,416,023Number of Shares Outstanding 367,990 297,668 228,636
Net Asset Value Per Share1 99.82 95.20 98.04
Select CHF-Hedged Accumulation Shares US ($) Equivalent 582,595,891 608,769,392 631,065,854Net Assets 564,156,731 600,124,867 614,973,675Number of Shares Outstanding 5,810,685 6,381,727 6,310,138
Net Asset Value Per Share1 97.09 94.04 97.46
Select EUR-Hedged Accumulation Shares (€) US ($) Equivalent 708,495,908 614,684,859 659,864,897Net Assets 631,176,760 537,711,472 549,521,071Number of Shares Outstanding 6,399,135 5,655,183 5,602,821
Net Asset Value Per Share1 98.63 95.08 98.08
Select GBP-Hedged Accumulation Shares (£) US ($) Equivalent 47,760,668 42,602,638 45,263,424Net Assets 36,052,591 33,450,565 33,460,303Number of Shares Outstanding 353,232 344,221 337,546
Net Asset Value Per Share1 102.06 97.18 99.13
Select SGD-Hedged Accumulation Shares (S$) US ($) Equivalent 7,496,853 7,542,411 6,267,871Net Assets 10,080,643 10,280,306 8,376,383Number of Shares Outstanding 96,076 104,104 83,928
Net Asset Value Per Share1 104.92 98.75 99.80
Select CHF-Hedged Income Shares US ($) Equivalent 8,969,384 8,476,537 17,173,027Net Assets 8,685,503 8,356,170 16,735,115Number of Shares Outstanding 96,090 93,669 176,416
Net Asset Value Per Share1 90.39 89.21 94.86
Select EUR-Hedged Income Shares (€) US ($) Equivalent 20,365,714 9,006,608 10,539,326Net Assets 18,143,175 7,878,763 8,776,920Number of Shares Outstanding 196,654 86,942 91,489
Net Asset Value Per Share1 92.26 90.62 95.93
Select GBP-Hedged Income Shares (£) US ($) Equivalent 102,686,173 104,748,230 110,104,381Net Assets 77,513,626 82,245,786 81,393,003Number of Shares Outstanding 813,827 889,925 840,007
Net Asset Value Per Share1 95.25 92.42 96.90
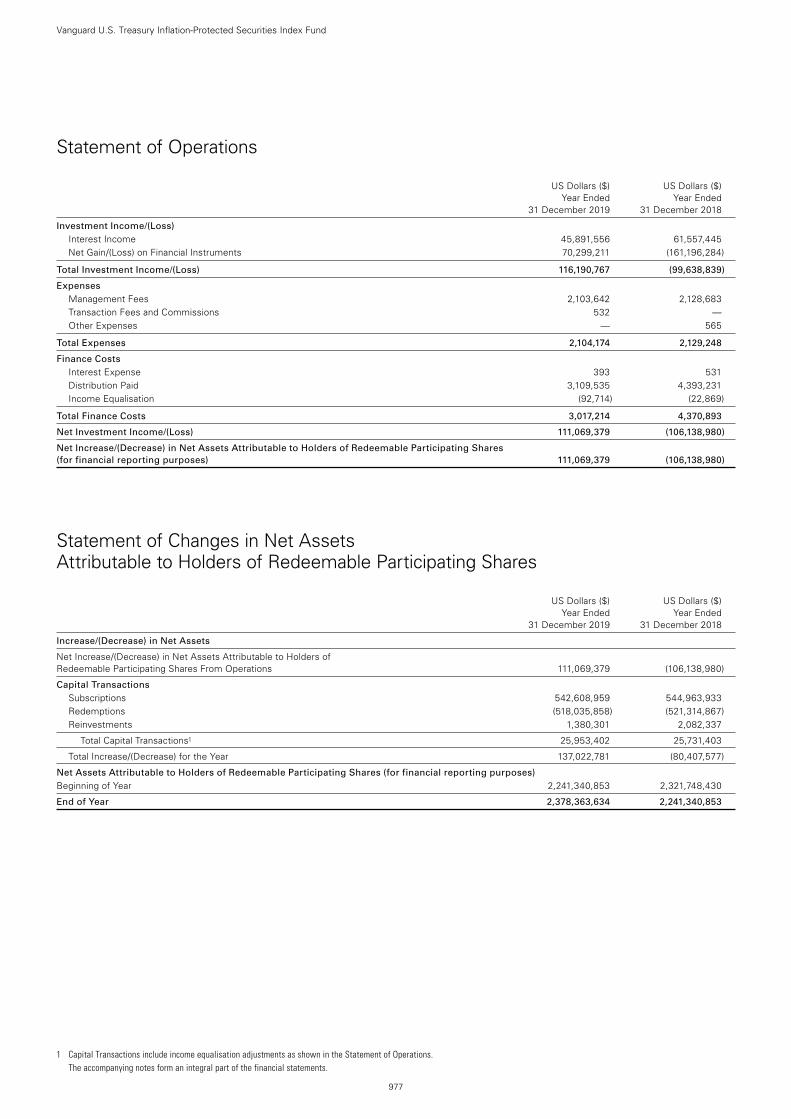
977
Vanguard U.S. Treasury Inflation-Protected Securities Index Fund
Statement of Operations
US Dollars ($) US Dollars ($) Year Ended Year Ended 31 December 2019 31 December 2018
Investment Income/(Loss) Interest Income 45,891,556 61,557,445Net Gain/(Loss) on Financial Instruments 70,299,211 (161,196,284)
Total Investment Income/(Loss) 116,190,767 (99,638,839)
Expenses Management Fees 2,103,642 2,128,683Transaction Fees and Commissions 532 —Other Expenses — 565
Total Expenses 2,104,174 2,129,248
Finance Costs Interest Expense 393 531Distribution Paid 3,109,535 4,393,231Income Equalisation (92,714) (22,869)
Total Finance Costs 3,017,214 4,370,893
Net Investment Income/(Loss) 111,069,379 (106,138,980)
Net Increase/(Decrease) in Net Assets Attributable to Holders of Redeemable Participating Shares (for financial reporting purposes) 111,069,379 (106,138,980)
Statement of Changes in Net Assets Attributable to Holders of Redeemable Participating Shares
US Dollars ($) US Dollars ($) Year Ended Year Ended 31 December 2019 31 December 2018
Increase/(Decrease) in Net Assets
Net Increase/(Decrease) in Net Assets Attributable to Holders of Redeemable Participating Shares From Operations 111,069,379 (106,138,980)
Capital Transactions Subscriptions 542,608,959 544,963,933Redemptions (518,035,858) (521,314,867)Reinvestments 1,380,301 2,082,337
Total Capital Transactions1 25,953,402 25,731,403
Total Increase/(Decrease) for the Year 137,022,781 (80,407,577)
Net Assets Attributable to Holders of Redeemable Participating Shares (for financial reporting purposes) Beginning of Year 2,241,340,853 2,321,748,430
End of Year 2,378,363,634 2,241,340,853
1 Capital Transactions include income equalisation adjustments as shown in the Statement of Operations. The accompanying notes form an integral part of the financial statements.
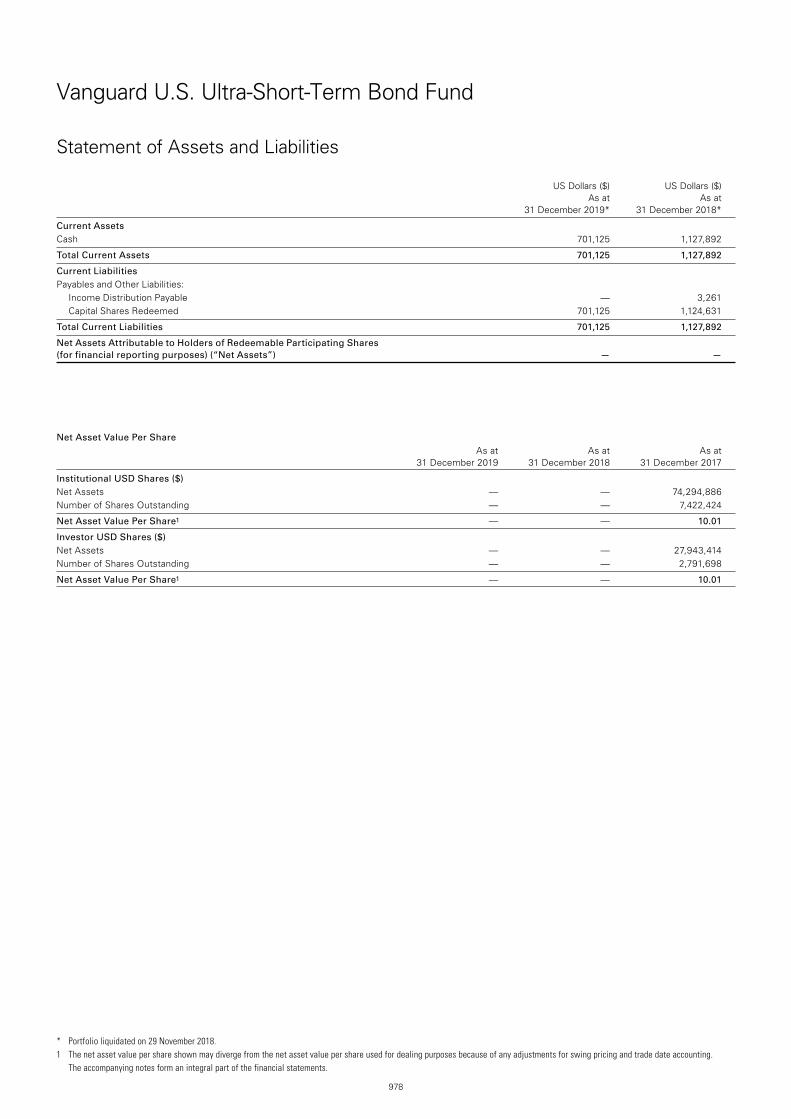
978
Vanguard U.S. Ultra-Short-Term Bond Fund
Statement of Assets and Liabilities
US Dollars ($) US Dollars ($) As at As at 31 December 2019* 31 December 2018*
Current Assets Cash 701,125 1,127,892
Total Current Assets 701,125 1,127,892
Current Liabilities Payables and Other Liabilities:
Income Distribution Payable — 3,261Capital Shares Redeemed 701,125 1,124,631
Total Current Liabilities 701,125 1,127,892
Net Assets Attributable to Holders of Redeemable Participating Shares (for financial reporting purposes) (“Net Assets”) — —
Net Asset Value Per Share As at As at As at 31 December 2019 31 December 2018 31 December 2017
Institutional USD Shares ($) Net Assets — — 74,294,886Number of Shares Outstanding — — 7,422,424
Net Asset Value Per Share1 — — 10.01
Investor USD Shares ($) Net Assets — — 27,943,414Number of Shares Outstanding — — 2,791,698
Net Asset Value Per Share1 — — 10.01
* Portfolio liquidated on 29 November 2018.1 The net asset value per share shown may diverge from the net asset value per share used for dealing purposes because of any adjustments for swing pricing and trade date accounting. The accompanying notes form an integral part of the financial statements.
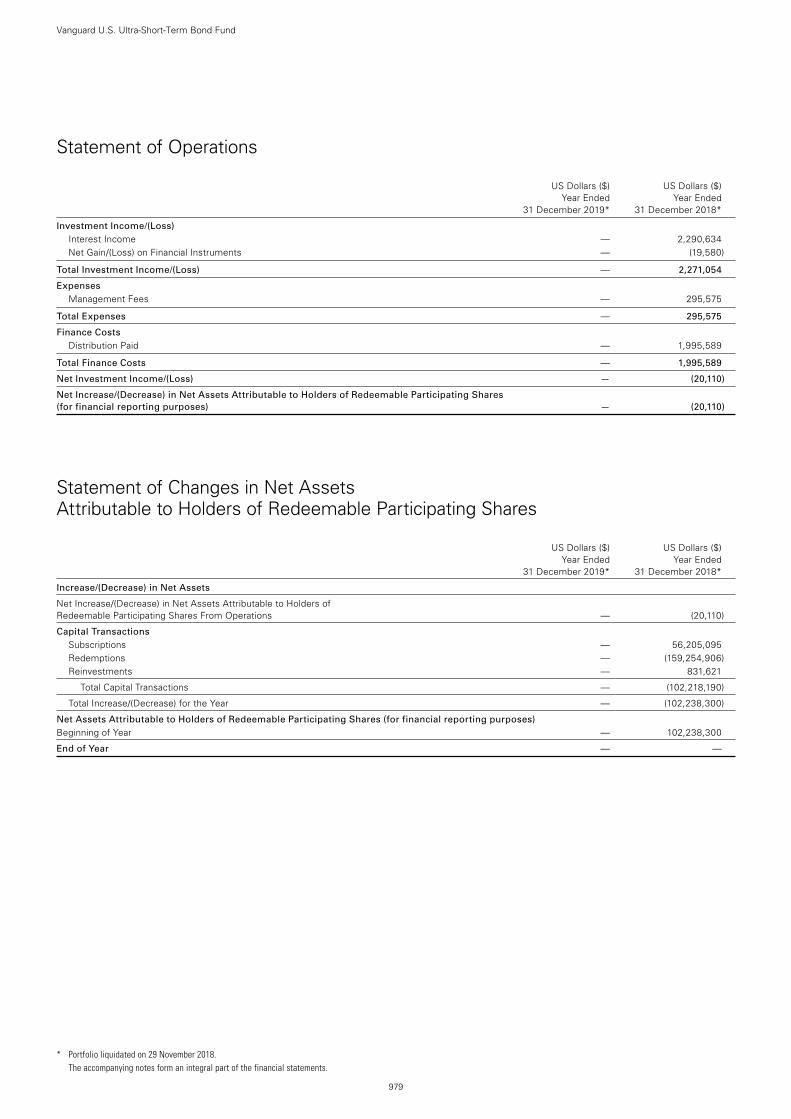
979
Vanguard U.S. Ultra-Short-Term Bond Fund
Statement of Operations
US Dollars ($) US Dollars ($) Year Ended Year Ended 31 December 2019* 31 December 2018*
Investment Income/(Loss) Interest Income — 2,290,634Net Gain/(Loss) on Financial Instruments — (19,580)
Total Investment Income/(Loss) — 2,271,054
Expenses Management Fees — 295,575
Total Expenses — 295,575
Finance Costs Distribution Paid — 1,995,589
Total Finance Costs — 1,995,589
Net Investment Income/(Loss) — (20,110)
Net Increase/(Decrease) in Net Assets Attributable to Holders of Redeemable Participating Shares (for financial reporting purposes) — (20,110)
Statement of Changes in Net Assets Attributable to Holders of Redeemable Participating Shares
US Dollars ($) US Dollars ($) Year Ended Year Ended 31 December 2019* 31 December 2018*
Increase/(Decrease) in Net Assets
Net Increase/(Decrease) in Net Assets Attributable to Holders of Redeemable Participating Shares From Operations — (20,110)
Capital Transactions Subscriptions — 56,205,095Redemptions — (159,254,906)Reinvestments — 831,621
Total Capital Transactions — (102,218,190)
Total Increase/(Decrease) for the Year — (102,238,300)
Net Assets Attributable to Holders of Redeemable Participating Shares (for financial reporting purposes) Beginning of Year — 102,238,300
End of Year — —
* Portfolio liquidated on 29 November 2018. The accompanying notes form an integral part of the financial statements.
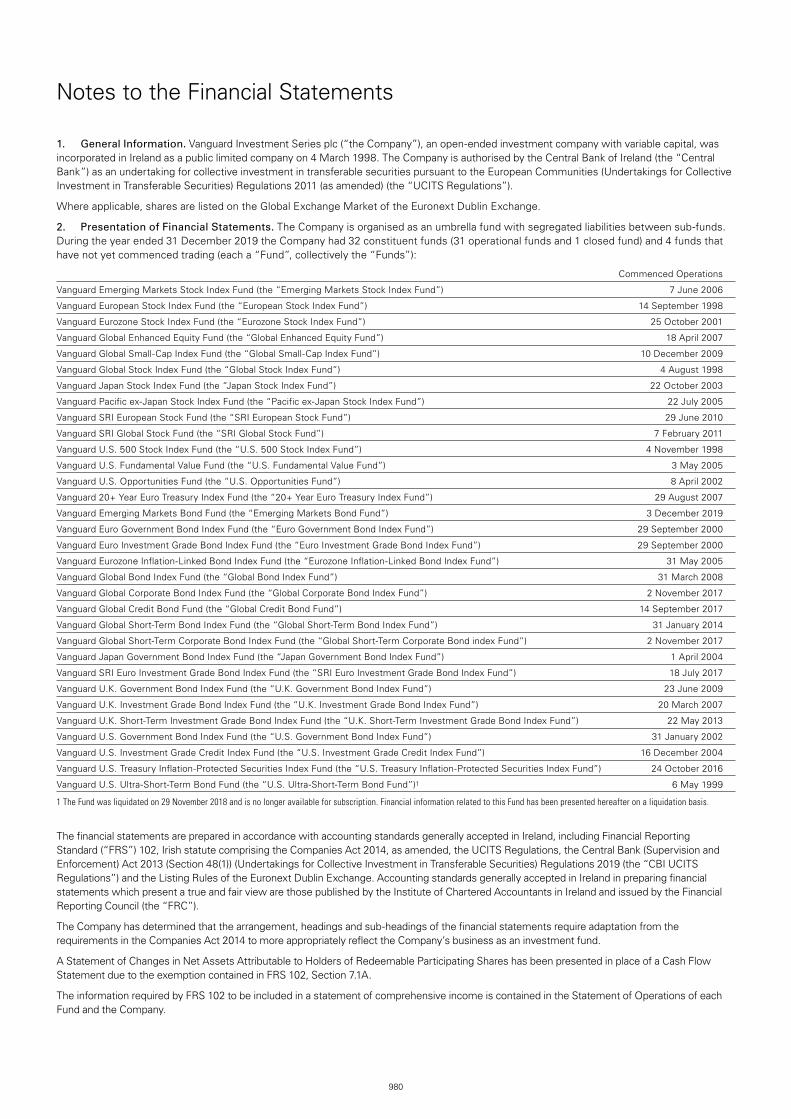
980
1. General Information. Vanguard Investment Series plc (“the Company”), an open-ended investment company with variable capital, was incorporated in Ireland as a public limited company on 4 March 1998. The Company is authorised by the Central Bank of Ireland (the “Central Bank”) as an undertaking for collective investment in transferable securities pursuant to the European Communities (Undertakings for Collective Investment in Transferable Securities) Regulations 2011 (as amended) (the “UCITS Regulations”).
Where applicable, shares are listed on the Global Exchange Market of the Euronext Dublin Exchange.
2. Presentation of Financial Statements. The Company is organised as an umbrella fund with segregated liabilities between sub-funds. During the year ended 31 December 2019 the Company had 32 constituent funds (31 operational funds and 1 closed fund) and 4 funds that have not yet commenced trading (each a “Fund”, collectively the “Funds”):
Commenced Operations
Vanguard Emerging Markets Stock Index Fund (the “Emerging Markets Stock Index Fund”) 7 June 2006
Vanguard European Stock Index Fund (the “European Stock Index Fund”) 14 September 1998
Vanguard Eurozone Stock Index Fund (the “Eurozone Stock Index Fund”) 25 October 2001
Vanguard Global Enhanced Equity Fund (the “Global Enhanced Equity Fund”) 18 April 2007
Vanguard Global Small-Cap Index Fund (the “Global Small-Cap Index Fund”) 10 December 2009
Vanguard Global Stock Index Fund (the “Global Stock Index Fund”) 4 August 1998
Vanguard Japan Stock Index Fund (the “Japan Stock Index Fund”) 22 October 2003
Vanguard Pacific ex-Japan Stock Index Fund (the “Pacific ex-Japan Stock Index Fund”) 22 July 2005
Vanguard SRI European Stock Fund (the “SRI European Stock Fund”) 29 June 2010
Vanguard SRI Global Stock Fund (the “SRI Global Stock Fund”) 7 February 2011
Vanguard U.S. 500 Stock Index Fund (the “U.S. 500 Stock Index Fund”) 4 November 1998
Vanguard U.S. Fundamental Value Fund (the “U.S. Fundamental Value Fund”) 3 May 2005
Vanguard U.S. Opportunities Fund (the “U.S. Opportunities Fund”) 8 April 2002
Vanguard 20+ Year Euro Treasury Index Fund (the “20+ Year Euro Treasury Index Fund”) 29 August 2007
Vanguard Emerging Markets Bond Fund (the “Emerging Markets Bond Fund”) 3 December 2019
Vanguard Euro Government Bond Index Fund (the “Euro Government Bond Index Fund”) 29 September 2000
Vanguard Euro Investment Grade Bond Index Fund (the “Euro Investment Grade Bond Index Fund”) 29 September 2000
Vanguard Eurozone Inflation-Linked Bond Index Fund (the “Eurozone Inflation-Linked Bond Index Fund”) 31 May 2005
Vanguard Global Bond Index Fund (the “Global Bond Index Fund”) 31 March 2008
Vanguard Global Corporate Bond Index Fund (the “Global Corporate Bond Index Fund”) 2 November 2017
Vanguard Global Credit Bond Fund (the “Global Credit Bond Fund”) 14 September 2017
Vanguard Global Short-Term Bond Index Fund (the “Global Short-Term Bond Index Fund”) 31 January 2014
Vanguard Global Short-Term Corporate Bond Index Fund (the “Global Short-Term Corporate Bond index Fund”) 2 November 2017
Vanguard Japan Government Bond Index Fund (the “Japan Government Bond Index Fund”) 1 April 2004
Vanguard SRI Euro Investment Grade Bond Index Fund (the “SRI Euro Investment Grade Bond Index Fund”) 18 July 2017
Vanguard U.K. Government Bond Index Fund (the “U.K. Government Bond Index Fund”) 23 June 2009
Vanguard U.K. Investment Grade Bond Index Fund (the “U.K. Investment Grade Bond Index Fund”) 20 March 2007
Vanguard U.K. Short-Term Investment Grade Bond Index Fund (the “U.K. Short-Term Investment Grade Bond Index Fund”) 22 May 2013
Vanguard U.S. Government Bond Index Fund (the “U.S. Government Bond Index Fund”) 31 January 2002
Vanguard U.S. Investment Grade Credit Index Fund (the “U.S. Investment Grade Credit Index Fund”) 16 December 2004
Vanguard U.S. Treasury Inflation-Protected Securities Index Fund (the “U.S. Treasury Inflation-Protected Securities Index Fund”) 24 October 2016
Vanguard U.S. Ultra-Short-Term Bond Fund (the “U.S. Ultra-Short-Term Bond Fund”)1 6 May 1999
1 The Fund was liquidated on 29 November 2018 and is no longer available for subscription. Financial information related to this Fund has been presented hereafter on a liquidation basis.
The financial statements are prepared in accordance with accounting standards generally accepted in Ireland, including Financial Reporting Standard (“FRS”) 102, Irish statute comprising the Companies Act 2014, as amended, the UCITS Regulations, the Central Bank (Supervision and Enforcement) Act 2013 (Section 48(1)) (Undertakings for Collective Investment in Transferable Securities) Regulations 2019 (the “CBI UCITS Regulations”) and the Listing Rules of the Euronext Dublin Exchange. Accounting standards generally accepted in Ireland in preparing financial statements which present a true and fair view are those published by the Institute of Chartered Accountants in Ireland and issued by the Financial Reporting Council (the “FRC”).
The Company has determined that the arrangement, headings and sub-headings of the financial statements require adaptation from the requirements in the Companies Act 2014 to more appropriately reflect the Company’s business as an investment fund.
A Statement of Changes in Net Assets Attributable to Holders of Redeemable Participating Shares has been presented in place of a Cash Flow Statement due to the exemption contained in FRS 102, Section 7.1A.
The information required by FRS 102 to be included in a statement of comprehensive income is contained in the Statement of Operations of each Fund and the Company.
Notes to the Financial Statements
981
Notes to the Financial Statements
3. Significant Accounting Policies.
(a) Critical Accounting Estimates and Judgements. The preparation of these financial statements requires the use of certain accounting estimates and requires the Company to exercise judgement when applying the Funds’ accounting policies. The estimates and associated judgements are based on historical experience and various other facts that are believed to be reasonable under the circumstances, the results of which form the basis of making judgements concerning the classification of financial assets and liabilities, the carrying values of financial instruments, as well as the fair value of certain financial instruments in instances where information is not readily apparent from other sources.
(b) Revenue Recognition. Dividends, whether cash or stock, are recognised when the securities are quoted ex-dividend. Special dividends are treated as either capital or revenue depending on the facts of each particular case.
In the case of debt securities, any difference between acquisition cost and maturity value is recognised as revenue over the life of the security using the effective yield basis of calculating amortisation. Revenue from debt securities is accounted for on a basis which takes account of the amortisation of any discount or premium between the purchase price and the expected final maturity price over the remaining life of the security.
The treatment of returns from derivatives is dependent upon the nature of the transaction and considers both motives and circumstances to determine whether returns should be treated as capital or revenue. Where positions are undertaken to protect or enhance capital, the returns are considered capital. Similarly, where positions are undertaken for generating or protecting revenue, the returns are considered revenue. Where positions generate total returns, an apportionment of any such return between capital and revenue is made to properly reflect the nature of the transaction.
Revenue is recognised gross of any withholding taxes incurred.
Bank interest is recognised on an accrual basis.
Securities lending revenue is accounted for on an accrual basis.
(c) Taxation. Current tax is recognised as the amount of income tax paid or payable in respect of the taxable overseas net profit. Deferred taxation is provided on all timing differences that have originated but not reversed by the reporting date. Deferred tax is measured at the rates expected to apply for the year in which the timing differences will reverse. Deferred taxes are not discounted to reflect the time value of money and are only recognised to the extent they are expected to crystallise.
Withholding taxes on foreign dividends and capital gains have been provided for in accordance with the Funds’ understanding of the applicable countries’ tax rules and rates. Foreign capital gains tax is accounted for based upon net unrealised gains.
(d) Financial Assets and Financial Liabilities. FRS 102 requires a reporting entity to apply either (a) the full requirements of FRS 102 relating to Basic Financial Instruments and Other Financial Instruments Issues; (b) the recognition and measurement provisions of International Accounting Standards (“IAS”) 39, Financial Instruments: Recognition and Measurement (“IAS 39”), and only the disclosure requirements of FRS 102 relating to Basic Financial Instruments and Other Financial Instruments; or (c) the recognition and measurement provisions of International Financial Reporting Standards (“IFRS”) 9, Financial Instruments, and the disclosure requirements of FRS 102 relating to Basic Financial Instruments and Other Financial Instruments. The Company has elected to apply the recognition and measurement provisions of IAS 39 and the disclosure requirements of FRS 102.
Classification and Measurement. Financial assets and financial liabilities, including derivative investments, are classified and measured at Fair Value Through Profit or Loss (“FVTPL“) from the launch date. Obligations for net assets attributable to holders of redeemable shares are presented at the redemption amount, which approximates their fair value. All other financial assets and liabilities are measured at amortised cost, which approximates fair value.
Recognition and Derecognition. Purchases and sales of financial instruments are recognised on the trade date, being the date on which the Company commits itself to the purchase or sale. Financial instruments at FVTPL are initially recognised when the Funds become party to the contractual provisions of the instrument. Financial instruments are derecognised when the contractual rights to the cash flows from the instruments expire, or when substantially all the risks and rewards of ownership have been transferred. Realised gains and losses are specifically identified when securities are derecognised. Premiums received on expired options are realised as gains, while premiums paid on expired options are realised as losses. Premiums on exercised options will result in gains or losses by either increasing the proceeds received when selling the underlying security or decreasing the cost basis when purchasing the underlying security.
Equities. Equities (including warrants and rights) are valued at the latest available last traded value at year-end. Instruments traded on a recognised market are valued on the basis of valuations provided by a principal market maker or a pricing service. When applicable, unlisted and suspended instruments are based on the Investment Manager’s assessment of their net realisable value or the last traded price from broker-dealers for non-exchange-trade purposes.
982
Notes to the Financial Statements
Fixed Income. Fixed income securities traded in recognised markets are valued using the latest bid prices on the securities exchange in which they are principally traded or using valuations based on a matrix system (which considers such factors as security prices, yields, maturities and ratings), both as furnished by independent pricing services.
Derivatives. Futures contracts are valued in an active market if quoted prices are readily and regularly available; this represents the amount that would be required to close the position. Forward currency contracts are valued at the closing prices of the forward currency contract rates in the London foreign exchange markets on a daily basis as provided by a reliable bank or dealer. Credit default swaps are valued using a pricing service provider; where no pricing service provider is available, contracts are marked-to-market daily based upon quotations received from counterparties or based upon calculations using valuation models. Option contracts are valued at their quoted daily settlement prices.
(e) Fair Value Measurement. The Funds classify financial instruments measured at fair value using a three-level hierarchy. Instruments are categorised in their entirety based on the lowest-level input that is significant to the fair value measurement. Assessing the significance and observability of a particular input requires significant judgement specific to an asset or liability. Inputs are considered to be observable when they are readily available, regularly distributed or updated, reliable and verifiable, not proprietary, and provided by independent sources that are actively involved in the relevant market.
Level 1—Quoted prices in active markets for identical securities.
Level 2—Other significant observable inputs (including quoted prices for similar securities, interest rates, prepayment speeds, credit risk, etc.).
Level 3—Significant unobservable inputs (including the fund’s own assumptions used to determine the fair value of investments).
(f) Transaction Costs. Transaction costs are incremental costs that are directly attributable to the acquisition, issue or disposal of an investment. These costs include fees and commissions paid to agents, advisers, brokers and dealers. Transaction costs incurred in the purchase and sale of securities designated at FVTPL are expensed on an accrual basis.
(g) Foreign Currency. All transactions in foreign currencies are translated into each Fund’s functional currency at the exchange rates prevailing on the date of the transaction. At the reporting date, monetary assets and liabilities denominated in foreign currencies are translated at the prevailing exchange rates. Gains and losses arising on translation are included in total return and are reported on a net basis.
The functional currency of each Fund is:
Fund Currency
Emerging Markets Stock Index Fund US dollar (US$)
European Stock Index Fund US dollar (US$)
Global Enhanced Equity Fund US dollar (US$)
Global Small-Cap Index Fund US dollar (US$)
Global Stock Index Fund US dollar (US$)
SRI Global Stock Fund US dollar (US$)
U.S. 500 Stock Index Fund US dollar (US$)
U.S. Fundamental Value Fund US dollar (US$)
U.S. Opportunities Fund US dollar (US$)
Emerging Markets Bond Fund US dollar (US$)
Global Bond Index Fund US dollar (US$)
Global Corporate Bond Index Fund US dollar (US$)
Global Credit Bond Fund US dollar (US$)
Global Short-Term Bond Index Fund US dollar (US$)
Global Short-Term Corporate Bond Index Fund US dollar (US$)
U.S. Government Bond Index Fund US dollar (US$)
Fund Currency
U.S. Investment Grade Credit Index Fund US dollar (US$)
U.S. Treasury Inflation-Protected Securities Index Fund US dollar (US$)
U.S. Ultra-Short-Term Bond Fund US dollar (US$)
Eurozone Stock Index Fund Euro (€)
Japan Stock Index Fund Euro (€)
Pacific ex-Japan Stock Index Fund Euro (€)
SRI European Stock Fund Euro (€)
20+ Year Euro Treasury Index Fund Euro (€)
Euro Government Bond Index Fund Euro (€)
Euro Investment Grade Bond Index Fund Euro (€)
Eurozone Inflation-Linked Bond Index Fund Euro (€)
SRI Euro Investment Grade Bond Index Fund Euro (€)
U.K. Government Bond Index Fund British pound (£)
U.K. Investment Grade Bond Index Fund British pound (£)
U.K. Short-Term Investment Grade Bond Index Fund British pound (£)
Japan Government Bond Index Fund Japanese yen (¥)
In preparing the aggregate Company financial statements, all transactions have been translated into USD at the prevailing exchange rates in effect.
983
Notes to the Financial Statements
(h) Cash and Bank Overdrafts. Cash is composed of demand deposits with financial institutions or bank overdrafts. Bank overdrafts, when applicable, are presented as current liabilities. Cash held or pledged as collateral against financial transactions or derivative instruments is not included within Cash and Bank Overdrafts but is segregated and presented separately on the Statement of Assets and Liabilities as Cash Collateral.
In respect to share issuances or redemptions, the Company operates an umbrella cash account. Monies received or proceeds due will be held and transmitted through this account and are included in Cash and Bank Overdrafts.
Margin. Upon entering into futures contracts, cash deposits are required (initial margin) in an amount equal to a certain percentage of the contract value. Subsequent payments (variation margin) are made or received by the Funds each day. Margin against these derivative instruments is not included within Cash or Bank Overdrafts but is segregated and presented separately as Futures Margin Cash or Futures Margin Cash Due to Broker, as applicable.
(i) Redeemable Participating Shares. Redeemable participating shares provide Shareholders with the right to redeem their shares for cash and are classified as financial liabilities.
(j) Trade Date Reporting. Investment transactions for financial statement purposes as at 31 December 2019 are accounted for on the trade date. This is different from the basis used for the daily dealing net asset value, which is accounted for using the trade date plus one business day.
(k) Offsetting. Financial assets and liabilities are offset and the net amount reported when there is both a legally enforceable right to set off the recognised amounts and an intention to settle on a net basis, or realise the assets and settle the liability simultaneously. As at 31 December 2019, there were no financial assets or liabilities offset.
(l) Equalisation. Equalisation occurs to reflect the pro rata payment of distributions based on the time period over which shares have been owned by an investor. If shares are purchased when the Funds have accrued income but not yet declared a distribution, the Funds will credit to the equalisation account the portion of the purchase price representing income accrued but directly attributable to those shares. Conversely, if shares are redeemed when the Funds have accrued income but not yet declared a distribution, the Funds will deduct from the equalisation account the portion of the redemption price representing income accrued but directly attributable to those shares. Equalisation is accounted for through the Statement of Operations as a finance cost.
(m) Swing Pricing. The Funds employ swing pricing as a means to prevent dilution. Swing pricing results from the Company’s determination to adjust the Funds’ net asset value, on any dealing day, following a consideration of dealing activity (i.e. level of subscriptions and redemptions) and the level of costs associated with such activity. A dilution adjustment is exercised only for the purpose of reducing the negative effects of transaction charges in the interest of the non-dealing shareholders in the Funds and is applied consistently in respect of the Funds, and in respect of all assets of the Funds. The direction of the swing depends on whether there are net subscriptions or net redemptions in the Funds on the relevant dealing day, while the magnitude of the swing is based on pre-determined estimates of the average execution costs in the relevant asset classes in which the Funds are invested.
The dilution adjustment did not exceed 2% of the original net asset value per share of the Funds during the year (30 December 2018: none).
4. Risk Management Policies.
Price Risk. Price risk is the risk that the value of financial instruments will fluctuate because of changes in the market. The Investment Manager considers the asset allocation of the portfolio in order to minimise the risk associated with particular countries or industry sectors while continuing to follow the stated investment objective.
The investment objective for an index fund is to seek to track as closely as reasonably possible the performance of the benchmark index. In order to achieve this objective, an index fund invests primarily in securities held in the relevant benchmark index. An index fund places limitations on the amount by which a holding may deviate from the proportion in the benchmark to limit the market risk from mismatched positions.
All investments present a risk of loss of capital. The Investment Manager assesses market risk volatility to ensure that the effect of using financial derivative instruments is not significant enough to cause disproportionate losses to overall value. The Investment Manager moderates this risk through careful selection of financial instruments.

984
Notes to the Financial Statements
Currency Risk. Currency risk is the risk that the value of the Funds’ investments will fluctuate as a result of changes in currency exchange rates. Local interest rates and monetary policy, as well as other government fiscal and labour policies, can also adversely impact currency values. The Funds may enter into foreign currency contracts for hedging purposes, which can include the economic hedging of all or a portion of the currency exposure of an investment or group of investments. The Funds may also enter into these contracts for non-hedging purposes, which can include increasing the exposure to a foreign currency, or the shifting of exposure to foreign currency fluctuations from one country to another.
All currency-hedged share classes for the year ended 31 December 2019 are listed in the following table:
Fund Currency
Global Stock Index Fund
Institutional EUR-Hedged Shares EUR
U.S. 500 Stock Index Fund
Institutional EUR-Hedged Shares EUR
Emerging Markets Bond Fund
Investor EUR-Hedged Accumulation Shares EUR
Investor GBP-Hedged Accumulation Shares GBP
Investor USD-Hedged Accumulation Shares USD
Institutional Plus USD-Hedged Accumulation Shares USD
Euro Government Bond Index Fund
GBP-Hedged Accumulation Shares GBP
Euro Investment Grade Bond Index Fund
GBP-Hedged Accumulation Shares GBP
Global Bond Index Fund
Institutional CHF-Hedged Shares CHF
Institutional EUR-Hedged Shares EUR
Institutional JPY-Hedged Shares JPY
Institutional USD-Hedged Shares USD
Investor CHF-Hedged Shares CHF
Investor EUR-Hedged Shares EUR
Investor USD-Hedged Shares USD
GBP-Hedged Accumulation Shares GBP
GBP-Hedged Income Shares GBP
Institutional Plus CHF-Hedged Shares CHF
Institutional Plus EUR-Hedged Shares EUR
Institutional Plus JPY-Hedged Shares JPY
Institutional Plus USD-Hedged Shares USD
Institutional Plus GBP-Hedged Accumulation Shares GBP
Institutional Plus GBP-Hedged Income Shares GBP
Institutional Plus USD-Hedged Income Shares USD
Global Corporate Bond Index Fund
Institutional USD-Hedged Accumulation Shares USD
Institutional Plus EUR-Hedged Shares EUR
Institutional Plus GBP-Hedged Accumulation Shares GBP
Investor GBP-Hedged Accumulation Shares GBP
Global Credit Bond Fund
Investor USD-Hedged Accumulation Shares USD
Institutional USD-Hedged Accumulation Shares USD
Institutional EUR-Hedged Accumulation Shares EUR
Investor GBP-Hedged Income Shares GBP
Investor GBP-Hedged Accumulation Shares GBP
Fund Currency
Global Short-Term Bond Index Fund
Institutional CHF-Hedged Shares CHF
Institutional EUR-Hedged Shares EUR
Institutional USD-Hedged Shares USD
Investor CHF-Hedged Shares CHF
Investor EUR-Hedged Shares EUR
Investor USD-Hedged Shares USD
GBP-Hedged Accumulation Shares GBP
GBP-Hedged Income Shares GBP
Institutional Plus CHF-Hedged Shares CHF
Institutional Plus EUR-Hedged Shares EUR
Institutional Plus JPY-Hedged Shares JPY
Institutional Plus USD-Hedged Shares USD
Institutional Plus GBP-Hedged Accumulation Shares GBP
Institutional Plus GBP-Hedged Income Shares GBP
Global Short-Term Corporate Bond Index Fund
Institutional USD-Hedged Accumulation Shares USD
Institutional Plus EUR-Hedged Shares EUR
Institutional Plus GBP-Hedged Accumulation Shares GBP
Investor GBP-Hedged Accumulation Shares GBP
Japan Government Bond Index Fund
GBP-Hedged Accumulation Shares GBP
U.S. Government Bond Index Fund
Institutional EUR-Hedged Shares EUR
Investor GBP-Hedged Shares GBP
GBP-Hedged Accumulation Shares GBP
Institutional Plus EUR-Hedged Shares EUR
U.S. Investment Grade Credit Index Fund
GBP-Hedged Accumulation Shares GBP
Institutional Plus CHF-Hedged Shares CHF
Institutional Plus EUR-Hedged Shares EUR
Institutional Plus GBP-Hedged Accumulation Shares GBP
Institutional Plus GBP-Hedged Income Shares GBP
U.S. Treasury Inflation-Protected Securities Index Fund
Select CHF-Hedged Accumulation Shares CHF
Select EUR-Hedged Accumulation Shares EUR
Select GBP-Hedged Accumulation Shares GBP
Select SGD-Hedged Accumulation Shares SGD
Select CHF-Hedged Income Shares CHF
Select EUR-Hedged Income Shares EUR
Select GBP-Hedged Income Shares GBP
985
All currency-hedged share classes for the year ended 31 December 2018 are listed in the following table:
Fund Currency
Global Stock Index Fund
Institutional EUR-Hedged Shares EUR
U.S. 500 Stock Index Fund
Institutional EUR-Hedged Shares EUR
Euro Government Bond Index Fund
GBP-Hedged Accumulation Shares GBP
Euro Investment Grade Bond Index Fund
GBP-Hedged Accumulation Shares GBP
Global Bond Index Fund
Institutional CHF-Hedged Shares CHF
Institutional EUR-Hedged Shares EUR
Institutional JPY-Hedged Shares JPY
Institutional USD-Hedged Shares USD
Investor CHF-Hedged Shares CHF
Investor EUR-Hedged Shares EUR
Investor USD-Hedged Shares USD
GBP-Hedged Accumulation Shares GBP
GBP-Hedged Income Shares GBP
Institutional Plus CHF-Hedged Shares CHF
Institutional Plus EUR-Hedged Shares EUR
Institutional Plus JPY-Hedged Shares JPY
Institutional Plus USD-Hedged Shares USD
Institutional Plus GBP-Hedged Accumulation Shares GBP
Institutional Plus GBP-Hedged Income Shares GBP
Institutional Plus USD-Hedged Income Shares USD
Global Corporate Bond Index Fund
Institutional USD-Hedged Accumulation Shares USD
Institutional Plus EUR-Hedged Accumulation Shares EUR
Institutional Plus GBP-Hedged Accumulation Shares GBP
Investor GBP-Hedged Accumulation Shares GBP
Global Credit Bond Fund
Investor USD-Hedged Accumulation Shares USD
Institutional USD-Hedged Accumulation Shares USD
Institutional EUR-Hedged Accumulation Shares EUR
Investor GBP-Hedged Accumulation Shares GBP
Fund Currency
Global Short-Term Bond Index Fund
Institutional CHF-Hedged Shares CHF
Institutional EUR-Hedged Shares EUR
Institutional USD-Hedged Shares USD
Investor CHF-Hedged Shares CHF
Investor EUR-Hedged Shares EUR
Investor USD-Hedged Shares USD
GBP-Hedged Accumulation Shares GBP
GBP-Hedged Income Shares GBP
Institutional Plus CHF-Hedged Shares CHF
Institutional Plus EUR-Hedged Shares EUR
Institutional Plus JPY-Hedged Shares JPY
Institutional Plus USD-Hedged Shares USD
Institutional Plus GBP-Hedged Accumulation Shares GBP
Institutional Plus GBP-Hedged Income Shares GBP
Global Short-Term Corporate Bond Index Fund
Institutional USD-Hedged Accumulation Shares USD
Institutional Plus EUR-Hedged Accumulation Shares EUR
Institutional Plus GBP-Hedged Accumulation Shares GBP
Investor GBP-Hedged Accumulation Shares GBP
Japan Government Bond Index Fund
GBP-Hedged Accumulation Shares GBP
U.S. Government Bond Index Fund
Institutional EUR-Hedged Shares EUR
Investor GBP-Hedged Shares GBP
GBP-Hedged Shares GBP
Institutional Plus EUR-Hedged Shares EUR
U.S. Investment Grade Credit Index Fund
GBP-Hedged Shares GBP
Institutional Plus CHF-Hedged Shares CHF
Institutional Plus EUR-Hedged Shares EUR
Institutional Plus GBP-Hedged Shares GBP
Institutional Plus GBP-Hedged Income Shares GBP
U.S. Treasury Inflation-Protect Securities Index Fund
Select CHF-Hedged Accumulation Shares CHF
Select EUR-Hedged Accumulation Shares EUR
Select GBP-Hedged Accumulation Shares GBP
Select SGD-Hedged Accumulation Shares SGD
Select CHF-Hedged Income Shares CHF
Select EUR-Hedged Income Shares EUR
Select GBP-Hedged Income Shares GBP
Notes to the Financial Statements
986
Notes to the Financial Statements
Each hedged share class incorporates a currency hedge, which acts as a buffer against the impact of currency fluctuations for investors for whom the base currency is hedged-share-class-specific currency.
Interest Rate Risk. Revenue on fixed income securities may be affected by changes in interest rates relevant to particular securities or as a result of the Investment Manager being unable to secure similar returns on the expiry of contracts or sale of securities. The value of fixed rate securities may be affected by interest rate movements or the expectation of such movements in the future. Interest receivable on bank deposits or payable on bank overdraft positions will also be affected by fluctuations in interest rates.
For Funds with exposure to interest rate risk, the tables below summarise the percentage of each Fund’s holdings by maturity:
31 December 2019
Fund Under 1 Year 1-5 Years 5-10 Years 10-15 Years 15-20 Years 20-25 Years Over 25 Years
20+ Year Euro Treasury Index Fund 0.01% — — — — 40.75% 59.24%
Emerging Markets Bond Fund 5.29% 9.22% 49.63% 7.04% — 4.25% 24.57%
Euro Government Bond Index Fund 1.19% 37.46% 32.23% 8.59% 7.30% 6.02% 7.21%
Euro Investment Grade Bond Index Fund 0.98% 46.32% 36.97% 6.92% 3.10% 1.06% 4.65%
Eurozone Inflation-Linked Bond Index Fund 0.10% 37.73% 22.14% 20.55% 5.97% 8.25% 5.26%
Global Bond Index Fund 2.14% 42.86% 30.19% 5.16% 5.32% 5.35% 8.98%
Global Corporate Bond Index Fund 3.88% 38.28% 30.26% 4.44% 5.73% 5.61% 11.80%
Global Credit Bond Fund 6.05% 25.18% 44.07% 6.62% 5.62% 1.59% 10.87%
Global Short-Term Bond Index Fund 2.12% 96.39% 1.49% — — — —
Global Short-Term Corporate Bond Index Fund 5.28% 89.16% 5.56% — — — —
Japan Government Bond Index Fund 1.00% 30.64% 19.38% 15.57% 14.22% 7.73% 11.46%
SRI Euro Investment Grade Bond Index Fund 1.63% 47.64% 35.59% 7.24% 2.60% 1.42% 3.88%
U.K. Government Bond Index Fund 0.23% 21.29% 17.06% 7.21% 11.04% 10.10% 33.07%
U.K. Investment Grade Bond Index Fund 0.83% 30.35% 29.98% 12.29% 8.83% 7.38% 10.34%
U.K. Short-Term Investment Grade Bond Index Fund 0.51% 93.82% 5.67% — — — —
U.S. Government Bond Index Fund 0.65% 57.05% 23.51% 0.63% 1.43% 6.86% 9.87%
U.S. Investment Grade Credit Index Fund 1.10% 40.96% 28.44% 3.33% 6.41% 6.69% 13.07%
U.S. Treasury Inflation-Protected Securities Index Fund 0.41% 47.08% 52.51% — — — —
31 December 2018
Fund Under 1 Year 1-5 Years 5-10 Years 10-15 Years 15-20 Years 20-25 Years Over 25 Years
20+ Year Euro Treasury Index Fund 0.01% — — — — 41.58% 58.41%
Euro Government Bond Index Fund 0.15% 39.61% 34.19% 8.38% 6.43% 4.67% 6.57%
Euro Investment Grade Bond Index Fund 0.05% 49.51% 36.26% 6.30% 2.50% 1.13% 4.25%
Eurozone Inflation-Linked Bond Index Fund 0.03% 36.97% 29.72% 17.01% 4.81% 7.08% 4.38%
Global Bond Index Fund 0.71% 42.01% 34.15% 5.45% 5.01% 4.44% 8.23%
Global Corporate Bond Index Fund 1.75% 40.86% 32.21% 4.01% 4.92% 5.18% 11.07%
Global Credit Bond Fund 1.55% 29.88% 45.95% 9.53% 2.69% 0.76% 9.64%
Global Short-Term Bond Index Fund 2.81% 96.09% 1.10% — — — —
Global Short-Term Corporate Bond Index Fund 0.70% 94.84% 4.46% — — — —
Japan Government Bond Index Fund -1.54% 36.09% 16.57% 19.27% 12.15% 7.34% 10.12%
SRI Euro Investment Grade Bond Index Fund 1.02% 49.97% 36.01% 5.84% 2.26% 1.21% 3.69%
U.K. Government Bond Index Fund 0.05% 25.91% 17.66% 4.41% 10.99% 8.41% 32.57%
U.K. Investment Grade Bond Index Fund — 31.47% 26.70% 14.24% 8.35% 8.04% 11.20%
U.K. Short-Term Investment Grade Bond Index Fund 1.32% 91.55% 7.13% — — — —
U.S. Government Bond Index Fund 0.18% 56.66% 25.96% 1.08% 0.65% 5.76% 9.71%
U.S. Investment Grade Credit Index Fund 0.72% 43.49% 29.50% 2.86% 5.66% 5.85% 11.92%
U.S. Treasury Inflation-Protected Securities Index Fund 2.05% 45.01% 52.94% — — — —
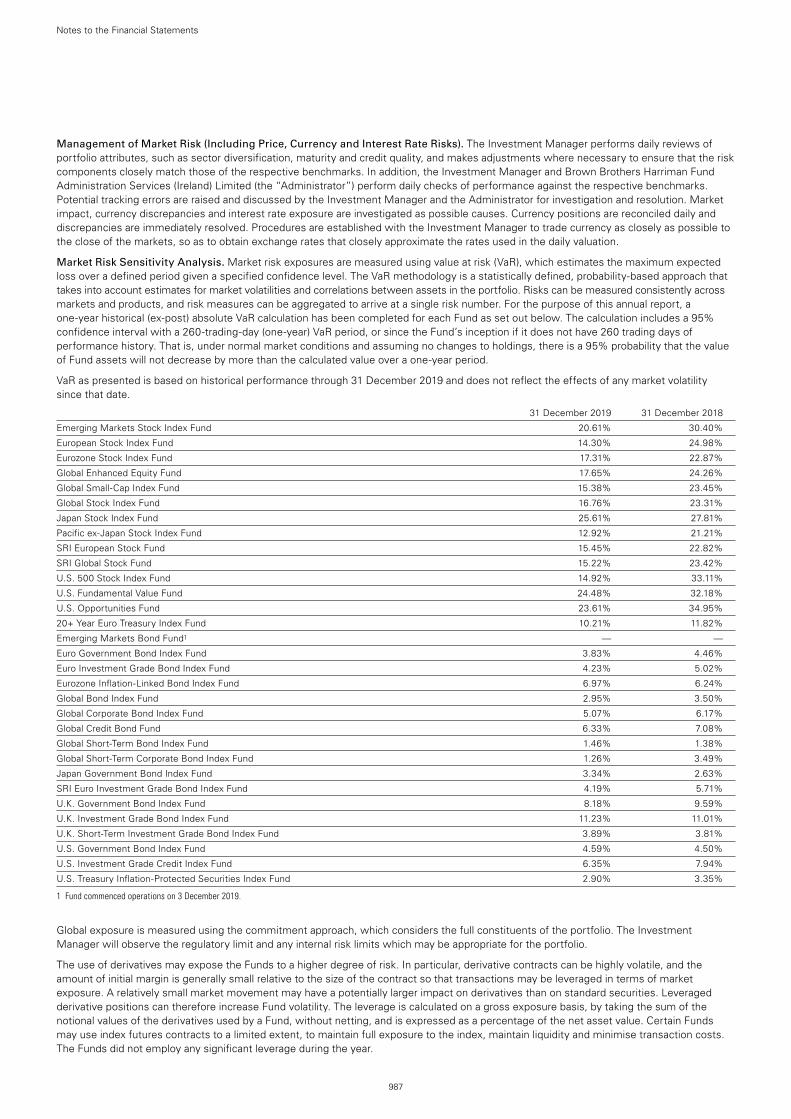
Management of Market Risk (Including Price, Currency and Interest Rate Risks). The Investment Manager performs daily reviews of portfolio attributes, such as sector diversification, maturity and credit quality, and makes adjustments where necessary to ensure that the risk components closely match those of the respective benchmarks. In addition, the Investment Manager and Brown Brothers Harriman Fund Administration Services (Ireland) Limited (the “Administrator”) perform daily checks of performance against the respective benchmarks. Potential tracking errors are raised and discussed by the Investment Manager and the Administrator for investigation and resolution. Market impact, currency discrepancies and interest rate exposure are investigated as possible causes. Currency positions are reconciled daily and discrepancies are immediately resolved. Procedures are established with the Investment Manager to trade currency as closely as possible to the close of the markets, so as to obtain exchange rates that closely approximate the rates used in the daily valuation.
Market Risk Sensitivity Analysis. Market risk exposures are measured using value at risk (VaR), which estimates the maximum expected loss over a defined period given a specified confidence level. The VaR methodology is a statistically defined, probability-based approach that takes into account estimates for market volatilities and correlations between assets in the portfolio. Risks can be measured consistently across markets and products, and risk measures can be aggregated to arrive at a single risk number. For the purpose of this annual report, a one-year historical (ex-post) absolute VaR calculation has been completed for each Fund as set out below. The calculation includes a 95% confidence interval with a 260-trading-day (one-year) VaR period, or since the Fund’s inception if it does not have 260 trading days of performance history. That is, under normal market conditions and assuming no changes to holdings, there is a 95% probability that the value of Fund assets will not decrease by more than the calculated value over a one-year period.
VaR as presented is based on historical performance through 31 December 2019 and does not reflect the effects of any market volatility since that date.
31 December 2019 31 December 2018
Emerging Markets Stock Index Fund 20.61% 30.40%
European Stock Index Fund 14.30% 24.98%
Eurozone Stock Index Fund 17.31% 22.87%
Global Enhanced Equity Fund 17.65% 24.26%
Global Small-Cap Index Fund 15.38% 23.45%
Global Stock Index Fund 16.76% 23.31%
Japan Stock Index Fund 25.61% 27.81%
Pacific ex-Japan Stock Index Fund 12.92% 21.21%
SRI European Stock Fund 15.45% 22.82%
SRI Global Stock Fund 15.22% 23.42%
U.S. 500 Stock Index Fund 14.92% 33.11%
U.S. Fundamental Value Fund 24.48% 32.18%
U.S. Opportunities Fund 23.61% 34.95%
20+ Year Euro Treasury Index Fund 10.21% 11.82%
Emerging Markets Bond Fund1 — —
Euro Government Bond Index Fund 3.83% 4.46%
Euro Investment Grade Bond Index Fund 4.23% 5.02%
Eurozone Inflation-Linked Bond Index Fund 6.97% 6.24%
Global Bond Index Fund 2.95% 3.50%
Global Corporate Bond Index Fund 5.07% 6.17%
Global Credit Bond Fund 6.33% 7.08%
Global Short-Term Bond Index Fund 1.46% 1.38%
Global Short-Term Corporate Bond Index Fund 1.26% 3.49%
Japan Government Bond Index Fund 3.34% 2.63%
SRI Euro Investment Grade Bond Index Fund 4.19% 5.71%
U.K. Government Bond Index Fund 8.18% 9.59%
U.K. Investment Grade Bond Index Fund 11.23% 11.01%
U.K. Short-Term Investment Grade Bond Index Fund 3.89% 3.81%
U.S. Government Bond Index Fund 4.59% 4.50%
U.S. Investment Grade Credit Index Fund 6.35% 7.94%
U.S. Treasury Inflation-Protected Securities Index Fund 2.90% 3.35%
1 Fund commenced operations on 3 December 2019.
Global exposure is measured using the commitment approach, which considers the full constituents of the portfolio. The Investment Manager will observe the regulatory limit and any internal risk limits which may be appropriate for the portfolio.
The use of derivatives may expose the Funds to a higher degree of risk. In particular, derivative contracts can be highly volatile, and the amount of initial margin is generally small relative to the size of the contract so that transactions may be leveraged in terms of market exposure. A relatively small market movement may have a potentially larger impact on derivatives than on standard securities. Leveraged derivative positions can therefore increase Fund volatility. The leverage is calculated on a gross exposure basis, by taking the sum of the notional values of the derivatives used by a Fund, without netting, and is expressed as a percentage of the net asset value. Certain Funds may use index futures contracts to a limited extent, to maintain full exposure to the index, maintain liquidity and minimise transaction costs. The Funds did not employ any significant leverage during the year.
987
Notes to the Financial Statements
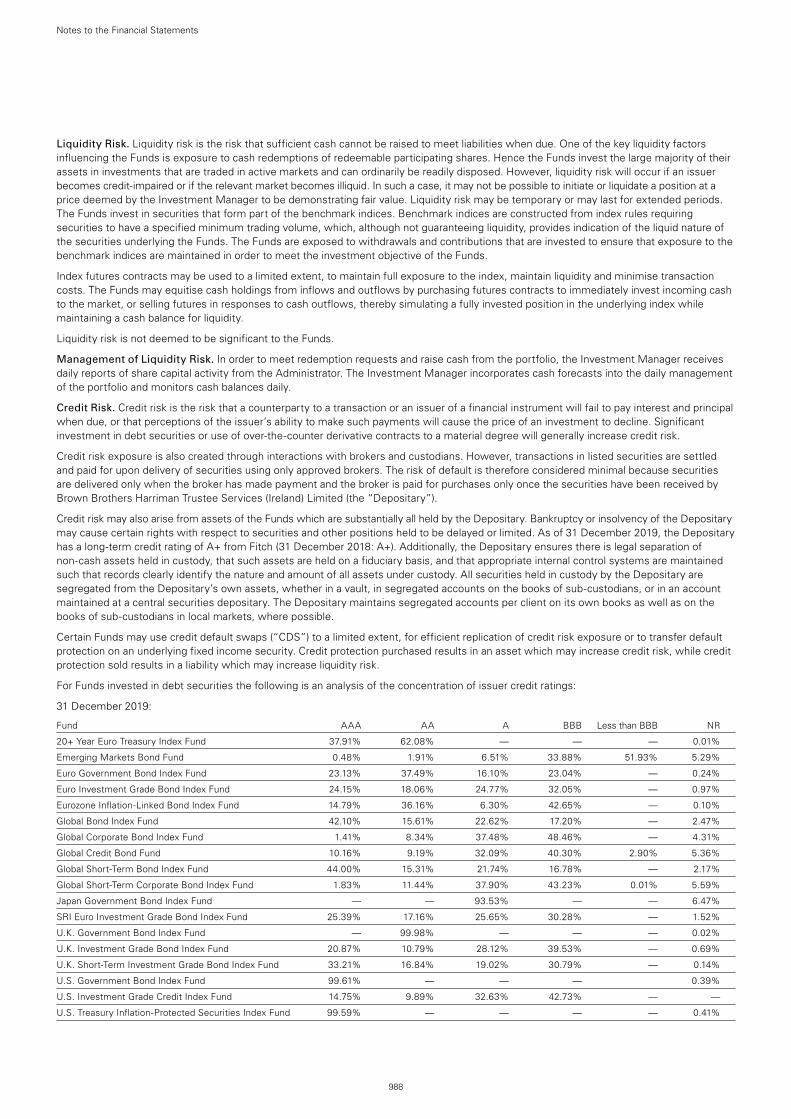
988
Notes to the Financial Statements
Liquidity Risk. Liquidity risk is the risk that sufficient cash cannot be raised to meet liabilities when due. One of the key liquidity factors influencing the Funds is exposure to cash redemptions of redeemable participating shares. Hence the Funds invest the large majority of their assets in investments that are traded in active markets and can ordinarily be readily disposed. However, liquidity risk will occur if an issuer becomes credit-impaired or if the relevant market becomes illiquid. In such a case, it may not be possible to initiate or liquidate a position at a price deemed by the Investment Manager to be demonstrating fair value. Liquidity risk may be temporary or may last for extended periods. The Funds invest in securities that form part of the benchmark indices. Benchmark indices are constructed from index rules requiring securities to have a specified minimum trading volume, which, although not guaranteeing liquidity, provides indication of the liquid nature of the securities underlying the Funds. The Funds are exposed to withdrawals and contributions that are invested to ensure that exposure to the benchmark indices are maintained in order to meet the investment objective of the Funds.
Index futures contracts may be used to a limited extent, to maintain full exposure to the index, maintain liquidity and minimise transaction costs. The Funds may equitise cash holdings from inflows and outflows by purchasing futures contracts to immediately invest incoming cash to the market, or selling futures in responses to cash outflows, thereby simulating a fully invested position in the underlying index while maintaining a cash balance for liquidity.
Liquidity risk is not deemed to be significant to the Funds.
Management of Liquidity Risk. In order to meet redemption requests and raise cash from the portfolio, the Investment Manager receives daily reports of share capital activity from the Administrator. The Investment Manager incorporates cash forecasts into the daily management of the portfolio and monitors cash balances daily.
Credit Risk. Credit risk is the risk that a counterparty to a transaction or an issuer of a financial instrument will fail to pay interest and principal when due, or that perceptions of the issuer’s ability to make such payments will cause the price of an investment to decline. Significant investment in debt securities or use of over-the-counter derivative contracts to a material degree will generally increase credit risk.
Credit risk exposure is also created through interactions with brokers and custodians. However, transactions in listed securities are settled and paid for upon delivery of securities using only approved brokers. The risk of default is therefore considered minimal because securities are delivered only when the broker has made payment and the broker is paid for purchases only once the securities have been received by Brown Brothers Harriman Trustee Services (Ireland) Limited (the “Depositary”).
Credit risk may also arise from assets of the Funds which are substantially all held by the Depositary. Bankruptcy or insolvency of the Depositary may cause certain rights with respect to securities and other positions held to be delayed or limited. As of 31 December 2019, the Depositary has a long-term credit rating of A+ from Fitch (31 December 2018: A+). Additionally, the Depositary ensures there is legal separation of non-cash assets held in custody, that such assets are held on a fiduciary basis, and that appropriate internal control systems are maintained such that records clearly identify the nature and amount of all assets under custody. All securities held in custody by the Depositary are segregated from the Depositary’s own assets, whether in a vault, in segregated accounts on the books of sub-custodians, or in an account maintained at a central securities depositary. The Depositary maintains segregated accounts per client on its own books as well as on the books of sub-custodians in local markets, where possible.
Certain Funds may use credit default swaps (“CDS”) to a limited extent, for efficient replication of credit risk exposure or to transfer default protection on an underlying fixed income security. Credit protection purchased results in an asset which may increase credit risk, while credit protection sold results in a liability which may increase liquidity risk.
For Funds invested in debt securities the following is an analysis of the concentration of issuer credit ratings:
31 December 2019:
Fund AAA AA A BBB Less than BBB NR
20+ Year Euro Treasury Index Fund 37.91% 62.08% — — — 0.01%
Emerging Markets Bond Fund 0.48% 1.91% 6.51% 33.88% 51.93% 5.29%
Euro Government Bond Index Fund 23.13% 37.49% 16.10% 23.04% — 0.24%
Euro Investment Grade Bond Index Fund 24.15% 18.06% 24.77% 32.05% — 0.97%
Eurozone Inflation-Linked Bond Index Fund 14.79% 36.16% 6.30% 42.65% — 0.10%
Global Bond Index Fund 42.10% 15.61% 22.62% 17.20% — 2.47%
Global Corporate Bond Index Fund 1.41% 8.34% 37.48% 48.46% — 4.31%
Global Credit Bond Fund 10.16% 9.19% 32.09% 40.30% 2.90% 5.36%
Global Short-Term Bond Index Fund 44.00% 15.31% 21.74% 16.78% — 2.17%
Global Short-Term Corporate Bond Index Fund 1.83% 11.44% 37.90% 43.23% 0.01% 5.59%
Japan Government Bond Index Fund — — 93.53% — — 6.47%
SRI Euro Investment Grade Bond Index Fund 25.39% 17.16% 25.65% 30.28% — 1.52%
U.K. Government Bond Index Fund — 99.98% — — — 0.02%
U.K. Investment Grade Bond Index Fund 20.87% 10.79% 28.12% 39.53% — 0.69%
U.K. Short-Term Investment Grade Bond Index Fund 33.21% 16.84% 19.02% 30.79% — 0.14%
U.S. Government Bond Index Fund 99.61% — — — 0.39%
U.S. Investment Grade Credit Index Fund 14.75% 9.89% 32.63% 42.73% — —
U.S. Treasury Inflation-Protected Securities Index Fund 99.59% — — — — 0.41%
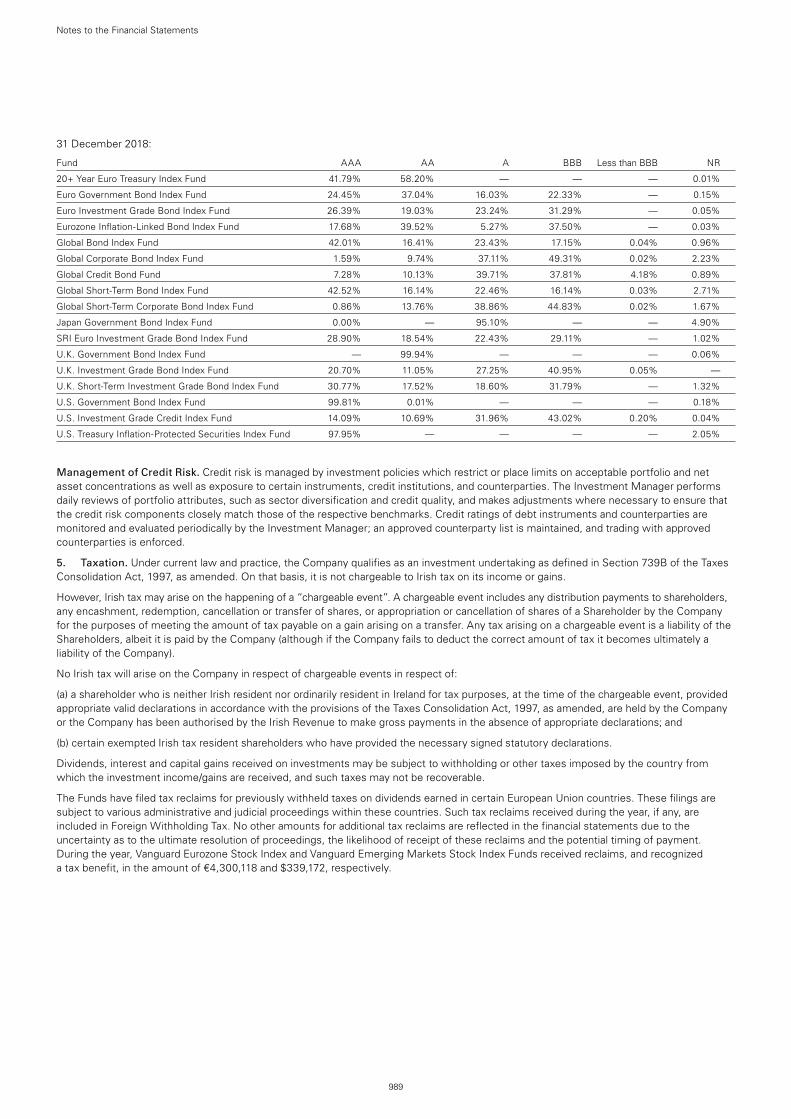
989
Notes to the Financial Statements
31 December 2018:
Fund AAA AA A BBB Less than BBB NR
20+ Year Euro Treasury Index Fund 41.79% 58.20% — — — 0.01%
Euro Government Bond Index Fund 24.45% 37.04% 16.03% 22.33% — 0.15%
Euro Investment Grade Bond Index Fund 26.39% 19.03% 23.24% 31.29% — 0.05%
Eurozone Inflation-Linked Bond Index Fund 17.68% 39.52% 5.27% 37.50% — 0.03%
Global Bond Index Fund 42.01% 16.41% 23.43% 17.15% 0.04% 0.96%
Global Corporate Bond Index Fund 1.59% 9.74% 37.11% 49.31% 0.02% 2.23%
Global Credit Bond Fund 7.28% 10.13% 39.71% 37.81% 4.18% 0.89%
Global Short-Term Bond Index Fund 42.52% 16.14% 22.46% 16.14% 0.03% 2.71%
Global Short-Term Corporate Bond Index Fund 0.86% 13.76% 38.86% 44.83% 0.02% 1.67%
Japan Government Bond Index Fund 0.00% — 95.10% — — 4.90%
SRI Euro Investment Grade Bond Index Fund 28.90% 18.54% 22.43% 29.11% — 1.02%
U.K. Government Bond Index Fund — 99.94% — — — 0.06%
U.K. Investment Grade Bond Index Fund 20.70% 11.05% 27.25% 40.95% 0.05% —
U.K. Short-Term Investment Grade Bond Index Fund 30.77% 17.52% 18.60% 31.79% — 1.32%
U.S. Government Bond Index Fund 99.81% 0.01% — — — 0.18%
U.S. Investment Grade Credit Index Fund 14.09% 10.69% 31.96% 43.02% 0.20% 0.04%
U.S. Treasury Inflation-Protected Securities Index Fund 97.95% — — — — 2.05%
Management of Credit Risk. Credit risk is managed by investment policies which restrict or place limits on acceptable portfolio and net asset concentrations as well as exposure to certain instruments, credit institutions, and counterparties. The Investment Manager performs daily reviews of portfolio attributes, such as sector diversification and credit quality, and makes adjustments where necessary to ensure that the credit risk components closely match those of the respective benchmarks. Credit ratings of debt instruments and counterparties are monitored and evaluated periodically by the Investment Manager; an approved counterparty list is maintained, and trading with approved counterparties is enforced.
5. Taxation. Under current law and practice, the Company qualifies as an investment undertaking as defined in Section 739B of the Taxes Consolidation Act, 1997, as amended. On that basis, it is not chargeable to Irish tax on its income or gains.
However, Irish tax may arise on the happening of a “chargeable event”. A chargeable event includes any distribution payments to shareholders, any encashment, redemption, cancellation or transfer of shares, or appropriation or cancellation of shares of a Shareholder by the Company for the purposes of meeting the amount of tax payable on a gain arising on a transfer. Any tax arising on a chargeable event is a liability of the Shareholders, albeit it is paid by the Company (although if the Company fails to deduct the correct amount of tax it becomes ultimately a liability of the Company).
No Irish tax will arise on the Company in respect of chargeable events in respect of:
(a) a shareholder who is neither Irish resident nor ordinarily resident in Ireland for tax purposes, at the time of the chargeable event, provided appropriate valid declarations in accordance with the provisions of the Taxes Consolidation Act, 1997, as amended, are held by the Company or the Company has been authorised by the Irish Revenue to make gross payments in the absence of appropriate declarations; and
(b) certain exempted Irish tax resident shareholders who have provided the necessary signed statutory declarations.
Dividends, interest and capital gains received on investments may be subject to withholding or other taxes imposed by the country from which the investment income/gains are received, and such taxes may not be recoverable.
The Funds have filed tax reclaims for previously withheld taxes on dividends earned in certain European Union countries. These filings are subject to various administrative and judicial proceedings within these countries. Such tax reclaims received during the year, if any, are included in Foreign Withholding Tax. No other amounts for additional tax reclaims are reflected in the financial statements due to the uncertainty as to the ultimate resolution of proceedings, the likelihood of receipt of these reclaims and the potential timing of payment. During the year, Vanguard Eurozone Stock Index and Vanguard Emerging Markets Stock Index Funds received reclaims, and recognized a tax benefit, in the amount of €4,300,118 and $339,172, respectively.
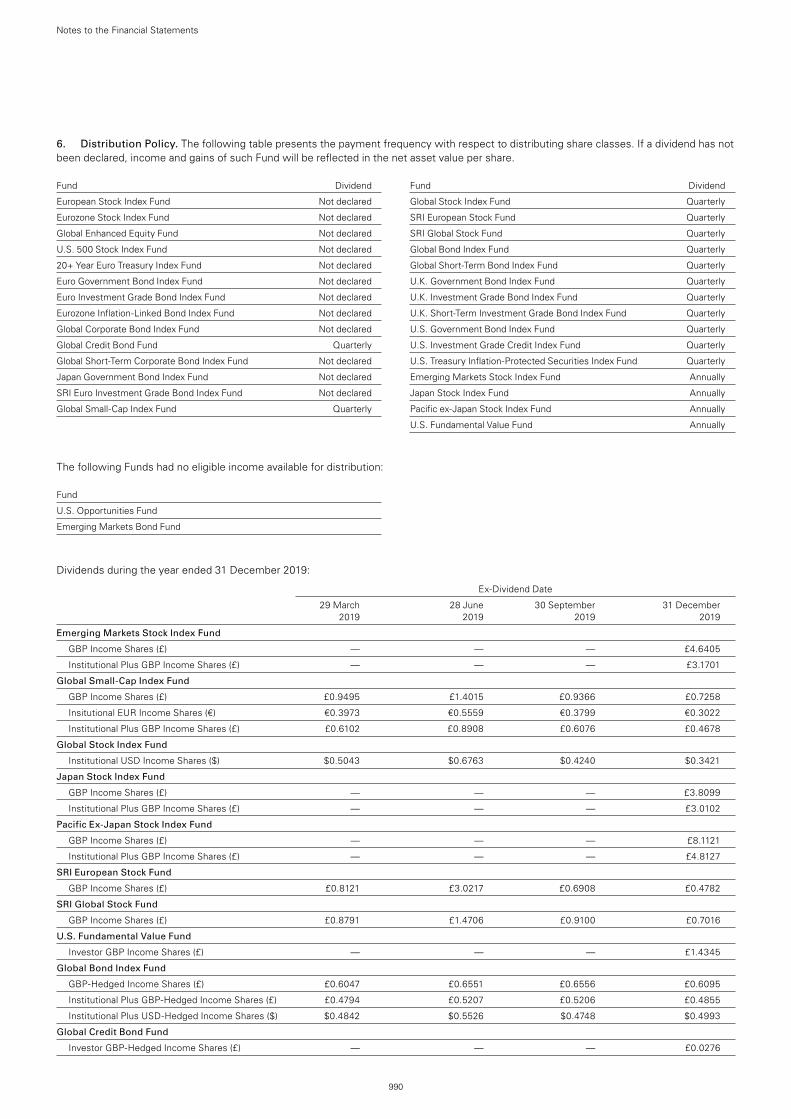
990
Notes to the Financial Statements
6. Distribution Policy. The following table presents the payment frequency with respect to distributing share classes. If a dividend has not been declared, income and gains of such Fund will be reflected in the net asset value per share.
Fund Dividend
European Stock Index Fund Not declared
Eurozone Stock Index Fund Not declared
Global Enhanced Equity Fund Not declared
U.S. 500 Stock Index Fund Not declared
20+ Year Euro Treasury Index Fund Not declared
Euro Government Bond Index Fund Not declared
Euro Investment Grade Bond Index Fund Not declared
Eurozone Inflation-Linked Bond Index Fund Not declared
Global Corporate Bond Index Fund Not declared
Global Credit Bond Fund Quarterly
Global Short-Term Corporate Bond Index Fund Not declared
Japan Government Bond Index Fund Not declared
SRI Euro Investment Grade Bond Index Fund Not declared
Global Small-Cap Index Fund Quarterly
Fund Dividend
Global Stock Index Fund Quarterly
SRI European Stock Fund Quarterly
SRI Global Stock Fund Quarterly
Global Bond Index Fund Quarterly
Global Short-Term Bond Index Fund Quarterly
U.K. Government Bond Index Fund Quarterly
U.K. Investment Grade Bond Index Fund Quarterly
U.K. Short-Term Investment Grade Bond Index Fund Quarterly
U.S. Government Bond Index Fund Quarterly
U.S. Investment Grade Credit Index Fund Quarterly
U.S. Treasury Inflation-Protected Securities Index Fund Quarterly
Emerging Markets Stock Index Fund Annually
Japan Stock Index Fund Annually
Pacific ex-Japan Stock Index Fund Annually
U.S. Fundamental Value Fund Annually
The following Funds had no eligible income available for distribution:
Fund
U.S. Opportunities Fund
Emerging Markets Bond Fund
Dividends during the year ended 31 December 2019:
Ex-Dividend Date
29 March 28 June 30 September 31 December 2019 2019 2019 2019
Emerging Markets Stock Index Fund
GBP Income Shares (£) — — — £4.6405
Institutional Plus GBP Income Shares (£) — — — £3.1701
Global Small-Cap Index Fund
GBP Income Shares (£) £0.9495 £1.4015 £0.9366 £0.7258
Insitutional EUR Income Shares (€) €0.3973 €0.5559 €0.3799 €0.3022
Institutional Plus GBP Income Shares (£) £0.6102 £0.8908 £0.6076 £0.4678
Global Stock Index Fund
Institutional USD Income Shares ($) $0.5043 $0.6763 $0.4240 $0.3421
Japan Stock Index Fund
GBP Income Shares (£) — — — £3.8099
Institutional Plus GBP Income Shares (£) — — — £3.0102
Pacific Ex-Japan Stock Index Fund
GBP Income Shares (£) — — — £8.1121
Institutional Plus GBP Income Shares (£) — — — £4.8127
SRI European Stock Fund
GBP Income Shares (£) £0.8121 £3.0217 £0.6908 £0.4782
SRI Global Stock Fund
GBP Income Shares (£) £0.8791 £1.4706 £0.9100 £0.7016
U.S. Fundamental Value Fund
Investor GBP Income Shares (£) — — — £1.4345
Global Bond Index Fund
GBP-Hedged Income Shares (£) £0.6047 £0.6551 £0.6556 £0.6095
Institutional Plus GBP-Hedged Income Shares (£) £0.4794 £0.5207 £0.5206 £0.4855
Institutional Plus USD-Hedged Income Shares ($) $0.4842 $0.5526 $0.4748 $0.4993
Global Credit Bond Fund
Investor GBP-Hedged Income Shares (£) — — — £0.0276
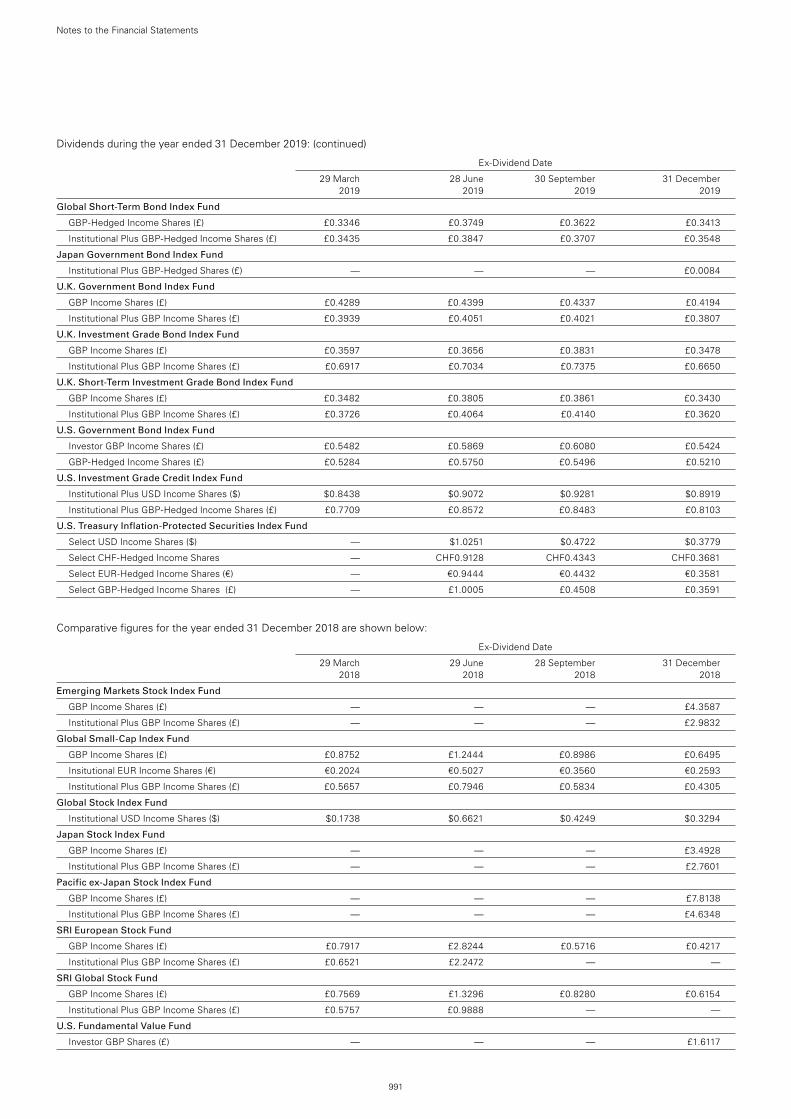
991
Notes to the Financial Statements
Dividends during the year ended 31 December 2019: (continued)
Ex-Dividend Date
29 March 28 June 30 September 31 December 2019 2019 2019 2019
Global Short-Term Bond Index Fund
GBP-Hedged Income Shares (£) £0.3346 £0.3749 £0.3622 £0.3413
Institutional Plus GBP-Hedged Income Shares (£) £0.3435 £0.3847 £0.3707 £0.3548
Japan Government Bond Index Fund
Institutional Plus GBP-Hedged Shares (£) — — — £0.0084
U.K. Government Bond Index Fund
GBP Income Shares (£) £0.4289 £0.4399 £0.4337 £0.4194
Institutional Plus GBP Income Shares (£) £0.3939 £0.4051 £0.4021 £0.3807
U.K. Investment Grade Bond Index Fund
GBP Income Shares (£) £0.3597 £0.3656 £0.3831 £0.3478
Institutional Plus GBP Income Shares (£) £0.6917 £0.7034 £0.7375 £0.6650
U.K. Short-Term Investment Grade Bond Index Fund
GBP Income Shares (£) £0.3482 £0.3805 £0.3861 £0.3430
Institutional Plus GBP Income Shares (£) £0.3726 £0.4064 £0.4140 £0.3620
U.S. Government Bond Index Fund
Investor GBP Income Shares (£) £0.5482 £0.5869 £0.6080 £0.5424
GBP-Hedged Income Shares (£) £0.5284 £0.5750 £0.5496 £0.5210
U.S. Investment Grade Credit Index Fund
Institutional Plus USD Income Shares ($) $0.8438 $0.9072 $0.9281 $0.8919
Institutional Plus GBP-Hedged Income Shares (£) £0.7709 £0.8572 £0.8483 £0.8103
U.S. Treasury Inflation-Protected Securities Index Fund
Select USD Income Shares ($) — $1.0251 $0.4722 $0.3779
Select CHF-Hedged Income Shares — CHF0.9128 CHF0.4343 CHF0.3681
Select EUR-Hedged Income Shares (€) — €0.9444 €0.4432 €0.3581
Select GBP-Hedged Income Shares (£) — £1.0005 £0.4508 £0.3591
Comparative figures for the year ended 31 December 2018 are shown below:
Ex-Dividend Date
29 March 29 June 28 September 31 December 2018 2018 2018 2018
Emerging Markets Stock Index Fund
GBP Income Shares (£) — — — £4.3587
Institutional Plus GBP Income Shares (£) — — — £2.9832
Global Small-Cap Index Fund
GBP Income Shares (£) £0.8752 £1.2444 £0.8986 £0.6495
Insitutional EUR Income Shares (€) €0.2024 €0.5027 €0.3560 €0.2593
Institutional Plus GBP Income Shares (£) £0.5657 £0.7946 £0.5834 £0.4305
Global Stock Index Fund
Institutional USD Income Shares ($) $0.1738 $0.6621 $0.4249 $0.3294
Japan Stock Index Fund
GBP Income Shares (£) — — — £3.4928
Institutional Plus GBP Income Shares (£) — — — £2.7601
Pacific ex-Japan Stock Index Fund
GBP Income Shares (£) — — — £7.8138
Institutional Plus GBP Income Shares (£) — — — £4.6348
SRI European Stock Fund
GBP Income Shares (£) £0.7917 £2.8244 £0.5716 £0.4217
Institutional Plus GBP Income Shares (£) £0.6521 £2.2472 — —
SRI Global Stock Fund
GBP Income Shares (£) £0.7569 £1.3296 £0.8280 £0.6154
Institutional Plus GBP Income Shares (£) £0.5757 £0.9888 — —
U.S. Fundamental Value Fund
Investor GBP Shares (£) — — — £1.6117
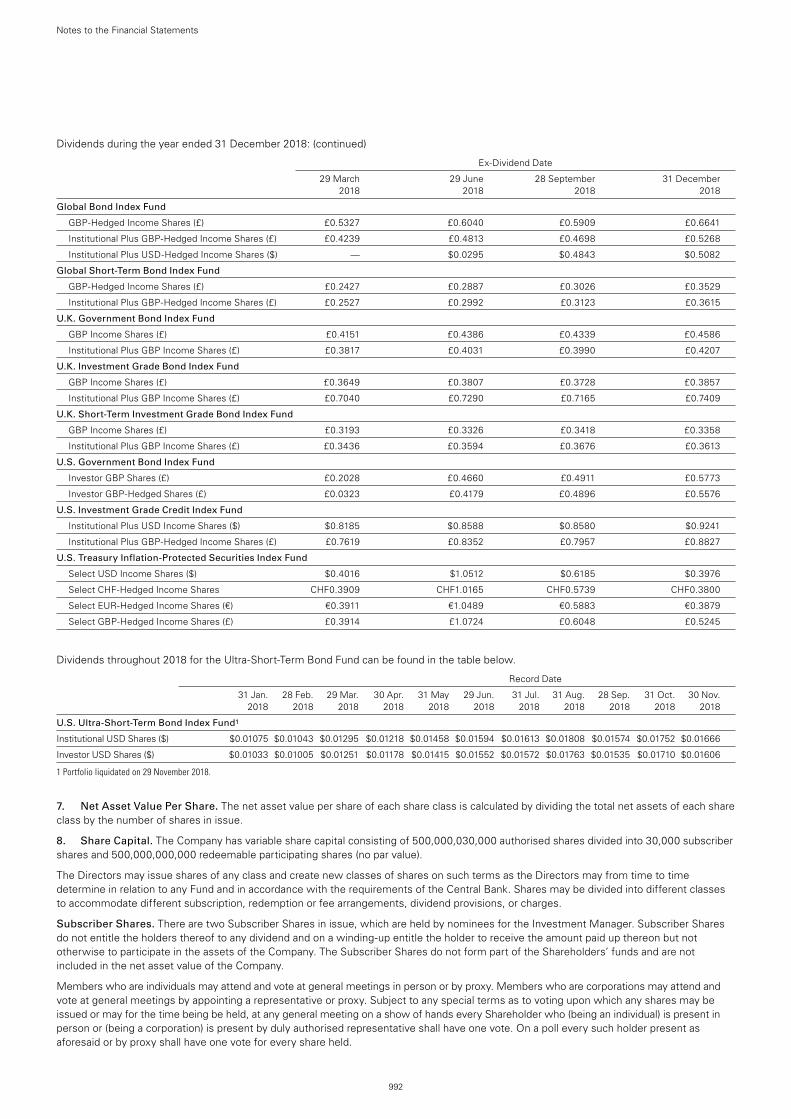
Dividends during the year ended 31 December 2018: (continued)
Ex-Dividend Date
29 March 29 June 28 September 31 December 2018 2018 2018 2018
Global Bond Index Fund
GBP-Hedged Income Shares (£) £0.5327 £0.6040 £0.5909 £0.6641
Institutional Plus GBP-Hedged Income Shares (£) £0.4239 £0.4813 £0.4698 £0.5268
Institutional Plus USD-Hedged Income Shares ($) — $0.0295 $0.4843 $0.5082
Global Short-Term Bond Index Fund
GBP-Hedged Income Shares (£) £0.2427 £0.2887 £0.3026 £0.3529
Institutional Plus GBP-Hedged Income Shares (£) £0.2527 £0.2992 £0.3123 £0.3615
U.K. Government Bond Index Fund
GBP Income Shares (£) £0.4151 £0.4386 £0.4339 £0.4586
Institutional Plus GBP Income Shares (£) £0.3817 £0.4031 £0.3990 £0.4207
U.K. Investment Grade Bond Index Fund
GBP Income Shares (£) £0.3649 £0.3807 £0.3728 £0.3857
Institutional Plus GBP Income Shares (£) £0.7040 £0.7290 £0.7165 £0.7409
U.K. Short-Term Investment Grade Bond Index Fund
GBP Income Shares (£) £0.3193 £0.3326 £0.3418 £0.3358
Institutional Plus GBP Income Shares (£) £0.3436 £0.3594 £0.3676 £0.3613
U.S. Government Bond Index Fund
Investor GBP Shares (£) £0.2028 £0.4660 £0.4911 £0.5773
Investor GBP-Hedged Shares (£) £0.0323 £0.4179 £0.4896 £0.5576
U.S. Investment Grade Credit Index Fund
Institutional Plus USD Income Shares ($) $0.8185 $0.8588 $0.8580 $0.9241
Institutional Plus GBP-Hedged Income Shares (£) £0.7619 £0.8352 £0.7957 £0.8827
U.S. Treasury Inflation-Protected Securities Index Fund
Select USD Income Shares ($) $0.4016 $1.0512 $0.6185 $0.3976
Select CHF-Hedged Income Shares CHF0.3909 CHF1.0165 CHF0.5739 CHF0.3800
Select EUR-Hedged Income Shares (€) €0.3911 €1.0489 €0.5883 €0.3879
Select GBP-Hedged Income Shares (£) £0.3914 £1.0724 £0.6048 £0.5245
Dividends throughout 2018 for the Ultra-Short-Term Bond Fund can be found in the table below.
Record Date
31 Jan. 28 Feb. 29 Mar. 30 Apr. 31 May 29 Jun. 31 Jul. 31 Aug. 28 Sep. 31 Oct. 30 Nov. 2018 2018 2018 2018 2018 2018 2018 2018 2018 2018 2018
U.S. Ultra-Short-Term Bond Index Fund1
Institutional USD Shares ($) $0.01075 $0.01043 $0.01295 $0.01218 $0.01458 $0.01594 $0.01613 $0.01808 $0.01574 $0.01752 $0.01666
Investor USD Shares ($) $0.01033 $0.01005 $0.01251 $0.01178 $0.01415 $0.01552 $0.01572 $0.01763 $0.01535 $0.01710 $0.01606
1 Portfolio liquidated on 29 November 2018.
7. Net Asset Value Per Share. The net asset value per share of each share class is calculated by dividing the total net assets of each share class by the number of shares in issue.
8. Share Capital. The Company has variable share capital consisting of 500,000,030,000 authorised shares divided into 30,000 subscriber shares and 500,000,000,000 redeemable participating shares (no par value).
The Directors may issue shares of any class and create new classes of shares on such terms as the Directors may from time to time determine in relation to any Fund and in accordance with the requirements of the Central Bank. Shares may be divided into different classes to accommodate different subscription, redemption or fee arrangements, dividend provisions, or charges.
Subscriber Shares. There are two Subscriber Shares in issue, which are held by nominees for the Investment Manager. Subscriber Shares do not entitle the holders thereof to any dividend and on a winding-up entitle the holder to receive the amount paid up thereon but not otherwise to participate in the assets of the Company. The Subscriber Shares do not form part of the Shareholders’ funds and are not included in the net asset value of the Company.
Members who are individuals may attend and vote at general meetings in person or by proxy. Members who are corporations may attend and vote at general meetings by appointing a representative or proxy. Subject to any special terms as to voting upon which any shares may be issued or may for the time being be held, at any general meeting on a show of hands every Shareholder who (being an individual) is present in person or (being a corporation) is present by duly authorised representative shall have one vote. On a poll every such holder present as aforesaid or by proxy shall have one vote for every share held.
992
Notes to the Financial Statements
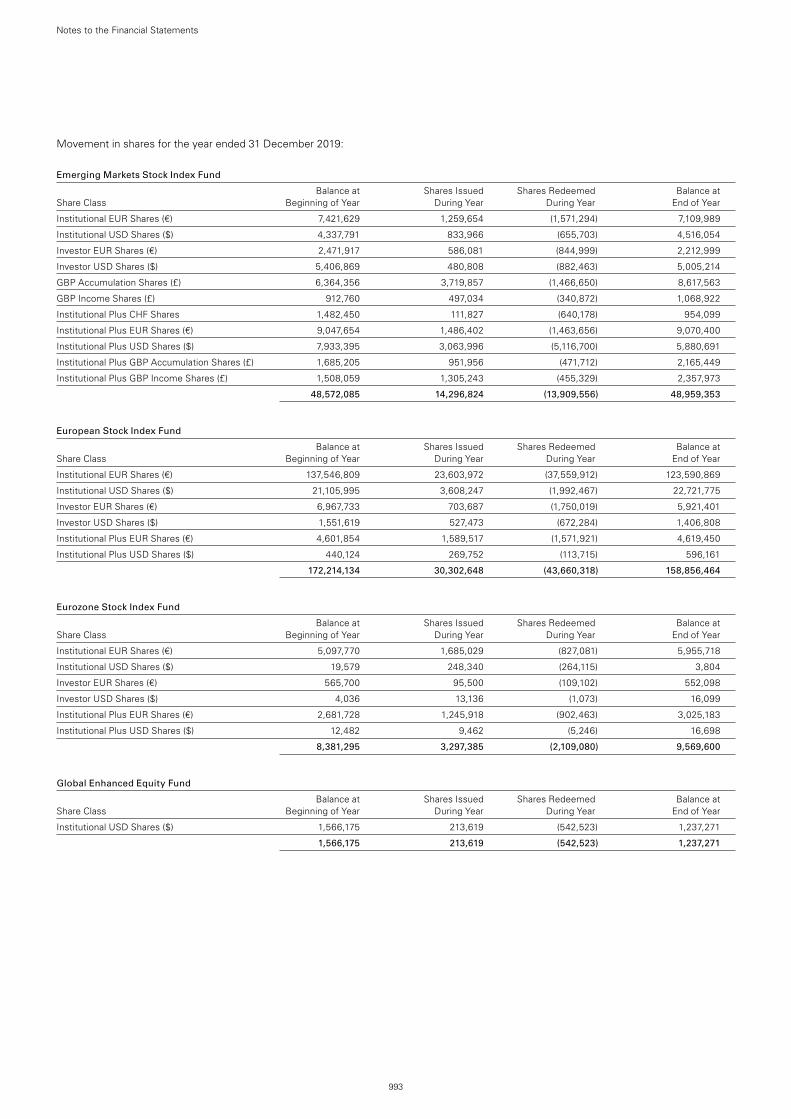
Movement in shares for the year ended 31 December 2019:
Emerging Markets Stock Index Fund
Balance at Shares Issued Shares Redeemed Balance at Share Class Beginning of Year During Year During Year End of Year
Institutional EUR Shares (€) 7,421,629 1,259,654 (1,571,294) 7,109,989
Institutional USD Shares ($) 4,337,791 833,966 (655,703) 4,516,054
Investor EUR Shares (€) 2,471,917 586,081 (844,999) 2,212,999
Investor USD Shares ($) 5,406,869 480,808 (882,463) 5,005,214
GBP Accumulation Shares (£) 6,364,356 3,719,857 (1,466,650) 8,617,563
GBP Income Shares (£) 912,760 497,034 (340,872) 1,068,922
Institutional Plus CHF Shares 1,482,450 111,827 (640,178) 954,099
Institutional Plus EUR Shares (€) 9,047,654 1,486,402 (1,463,656) 9,070,400
Institutional Plus USD Shares ($) 7,933,395 3,063,996 (5,116,700) 5,880,691
Institutional Plus GBP Accumulation Shares (£) 1,685,205 951,956 (471,712) 2,165,449
Institutional Plus GBP Income Shares (£) 1,508,059 1,305,243 (455,329) 2,357,973
48,572,085 14,296,824 (13,909,556) 48,959,353
European Stock Index Fund
Balance at Shares Issued Shares Redeemed Balance at Share Class Beginning of Year During Year During Year End of Year
Institutional EUR Shares (€) 137,546,809 23,603,972 (37,559,912) 123,590,869
Institutional USD Shares ($) 21,105,995 3,608,247 (1,992,467) 22,721,775
Investor EUR Shares (€) 6,967,733 703,687 (1,750,019) 5,921,401
Investor USD Shares ($) 1,551,619 527,473 (672,284) 1,406,808
Institutional Plus EUR Shares (€) 4,601,854 1,589,517 (1,571,921) 4,619,450
Institutional Plus USD Shares ($) 440,124 269,752 (113,715) 596,161
172,214,134 30,302,648 (43,660,318) 158,856,464
Eurozone Stock Index Fund
Balance at Shares Issued Shares Redeemed Balance at Share Class Beginning of Year During Year During Year End of Year
Institutional EUR Shares (€) 5,097,770 1,685,029 (827,081) 5,955,718
Institutional USD Shares ($) 19,579 248,340 (264,115) 3,804
Investor EUR Shares (€) 565,700 95,500 (109,102) 552,098
Investor USD Shares ($) 4,036 13,136 (1,073) 16,099
Institutional Plus EUR Shares (€) 2,681,728 1,245,918 (902,463) 3,025,183
Institutional Plus USD Shares ($) 12,482 9,462 (5,246) 16,698
8,381,295 3,297,385 (2,109,080) 9,569,600
Global Enhanced Equity Fund
Balance at Shares Issued Shares Redeemed Balance at Share Class Beginning of Year During Year During Year End of Year
Institutional USD Shares ($) 1,566,175 213,619 (542,523) 1,237,271
1,566,175 213,619 (542,523) 1,237,271
993
Notes to the Financial Statements
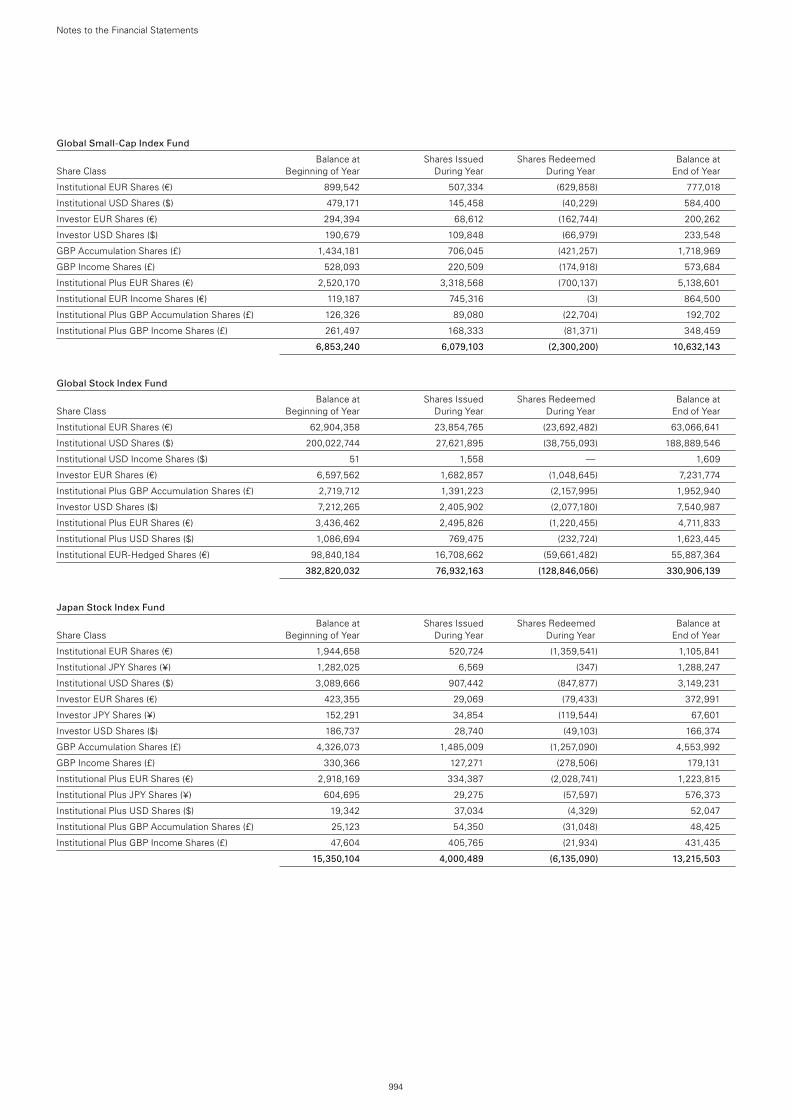
Global Small-Cap Index Fund
Balance at Shares Issued Shares Redeemed Balance at Share Class Beginning of Year During Year During Year End of Year
Institutional EUR Shares (€) 899,542 507,334 (629,858) 777,018
Institutional USD Shares ($) 479,171 145,458 (40,229) 584,400
Investor EUR Shares (€) 294,394 68,612 (162,744) 200,262
Investor USD Shares ($) 190,679 109,848 (66,979) 233,548
GBP Accumulation Shares (£) 1,434,181 706,045 (421,257) 1,718,969
GBP Income Shares (£) 528,093 220,509 (174,918) 573,684
Institutional Plus EUR Shares (€) 2,520,170 3,318,568 (700,137) 5,138,601
Institutional EUR Income Shares (€) 119,187 745,316 (3) 864,500
Institutional Plus GBP Accumulation Shares (£) 126,326 89,080 (22,704) 192,702
Institutional Plus GBP Income Shares (£) 261,497 168,333 (81,371) 348,459
6,853,240 6,079,103 (2,300,200) 10,632,143
Global Stock Index Fund
Balance at Shares Issued Shares Redeemed Balance at Share Class Beginning of Year During Year During Year End of Year
Institutional EUR Shares (€) 62,904,358 23,854,765 (23,692,482) 63,066,641
Institutional USD Shares ($) 200,022,744 27,621,895 (38,755,093) 188,889,546
Institutional USD Income Shares ($) 51 1,558 — 1,609
Investor EUR Shares (€) 6,597,562 1,682,857 (1,048,645) 7,231,774
Institutional Plus GBP Accumulation Shares (£) 2,719,712 1,391,223 (2,157,995) 1,952,940
Investor USD Shares ($) 7,212,265 2,405,902 (2,077,180) 7,540,987
Institutional Plus EUR Shares (€) 3,436,462 2,495,826 (1,220,455) 4,711,833
Institutional Plus USD Shares ($) 1,086,694 769,475 (232,724) 1,623,445
Institutional EUR-Hedged Shares (€) 98,840,184 16,708,662 (59,661,482) 55,887,364
382,820,032 76,932,163 (128,846,056) 330,906,139
Japan Stock Index Fund
Balance at Shares Issued Shares Redeemed Balance at Share Class Beginning of Year During Year During Year End of Year
Institutional EUR Shares (€) 1,944,658 520,724 (1,359,541) 1,105,841
Institutional JPY Shares (¥) 1,282,025 6,569 (347) 1,288,247
Institutional USD Shares ($) 3,089,666 907,442 (847,877) 3,149,231
Investor EUR Shares (€) 423,355 29,069 (79,433) 372,991
Investor JPY Shares (¥) 152,291 34,854 (119,544) 67,601
Investor USD Shares ($) 186,737 28,740 (49,103) 166,374
GBP Accumulation Shares (£) 4,326,073 1,485,009 (1,257,090) 4,553,992
GBP Income Shares (£) 330,366 127,271 (278,506) 179,131
Institutional Plus EUR Shares (€) 2,918,169 334,387 (2,028,741) 1,223,815
Institutional Plus JPY Shares (¥) 604,695 29,275 (57,597) 576,373
Institutional Plus USD Shares ($) 19,342 37,034 (4,329) 52,047
Institutional Plus GBP Accumulation Shares (£) 25,123 54,350 (31,048) 48,425
Institutional Plus GBP Income Shares (£) 47,604 405,765 (21,934) 431,435
15,350,104 4,000,489 (6,135,090) 13,215,503
994
Notes to the Financial Statements
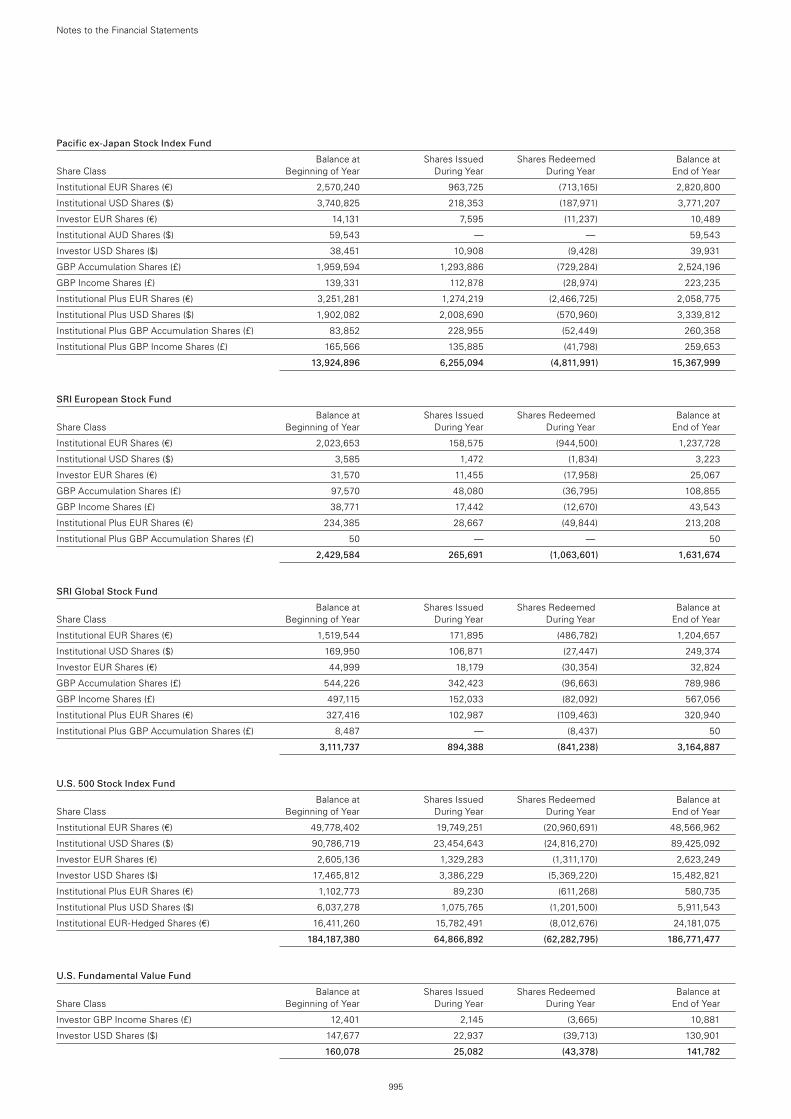
Pacific ex-Japan Stock Index Fund
Balance at Shares Issued Shares Redeemed Balance at Share Class Beginning of Year During Year During Year End of Year
Institutional EUR Shares (€) 2,570,240 963,725 (713,165) 2,820,800
Institutional USD Shares ($) 3,740,825 218,353 (187,971) 3,771,207
Investor EUR Shares (€) 14,131 7,595 (11,237) 10,489
Institutional AUD Shares ($) 59,543 — — 59,543
Investor USD Shares ($) 38,451 10,908 (9,428) 39,931
GBP Accumulation Shares (£) 1,959,594 1,293,886 (729,284) 2,524,196
GBP Income Shares (£) 139,331 112,878 (28,974) 223,235
Institutional Plus EUR Shares (€) 3,251,281 1,274,219 (2,466,725) 2,058,775
Institutional Plus USD Shares ($) 1,902,082 2,008,690 (570,960) 3,339,812
Institutional Plus GBP Accumulation Shares (£) 83,852 228,955 (52,449) 260,358
Institutional Plus GBP Income Shares (£) 165,566 135,885 (41,798) 259,653
13,924,896 6,255,094 (4,811,991) 15,367,999
SRI European Stock Fund
Balance at Shares Issued Shares Redeemed Balance at Share Class Beginning of Year During Year During Year End of Year
Institutional EUR Shares (€) 2,023,653 158,575 (944,500) 1,237,728
Institutional USD Shares ($) 3,585 1,472 (1,834) 3,223
Investor EUR Shares (€) 31,570 11,455 (17,958) 25,067
GBP Accumulation Shares (£) 97,570 48,080 (36,795) 108,855
GBP Income Shares (£) 38,771 17,442 (12,670) 43,543
Institutional Plus EUR Shares (€) 234,385 28,667 (49,844) 213,208
Institutional Plus GBP Accumulation Shares (£) 50 — — 50
2,429,584 265,691 (1,063,601) 1,631,674
SRI Global Stock Fund
Balance at Shares Issued Shares Redeemed Balance at Share Class Beginning of Year During Year During Year End of Year
Institutional EUR Shares (€) 1,519,544 171,895 (486,782) 1,204,657
Institutional USD Shares ($) 169,950 106,871 (27,447) 249,374
Investor EUR Shares (€) 44,999 18,179 (30,354) 32,824
GBP Accumulation Shares (£) 544,226 342,423 (96,663) 789,986
GBP Income Shares (£) 497,115 152,033 (82,092) 567,056
Institutional Plus EUR Shares (€) 327,416 102,987 (109,463) 320,940
Institutional Plus GBP Accumulation Shares (£) 8,487 — (8,437) 50
3,111,737 894,388 (841,238) 3,164,887
U.S. 500 Stock Index Fund
Balance at Shares Issued Shares Redeemed Balance at Share Class Beginning of Year During Year During Year End of Year
Institutional EUR Shares (€) 49,778,402 19,749,251 (20,960,691) 48,566,962
Institutional USD Shares ($) 90,786,719 23,454,643 (24,816,270) 89,425,092
Investor EUR Shares (€) 2,605,136 1,329,283 (1,311,170) 2,623,249
Investor USD Shares ($) 17,465,812 3,386,229 (5,369,220) 15,482,821
Institutional Plus EUR Shares (€) 1,102,773 89,230 (611,268) 580,735
Institutional Plus USD Shares ($) 6,037,278 1,075,765 (1,201,500) 5,911,543
Institutional EUR-Hedged Shares (€) 16,411,260 15,782,491 (8,012,676) 24,181,075
184,187,380 64,866,892 (62,282,795) 186,771,477
U.S. Fundamental Value Fund
Balance at Shares Issued Shares Redeemed Balance at Share Class Beginning of Year During Year During Year End of Year
Investor GBP Income Shares (£) 12,401 2,145 (3,665) 10,881
Investor USD Shares ($) 147,677 22,937 (39,713) 130,901
160,078 25,082 (43,378) 141,782
995
Notes to the Financial Statements
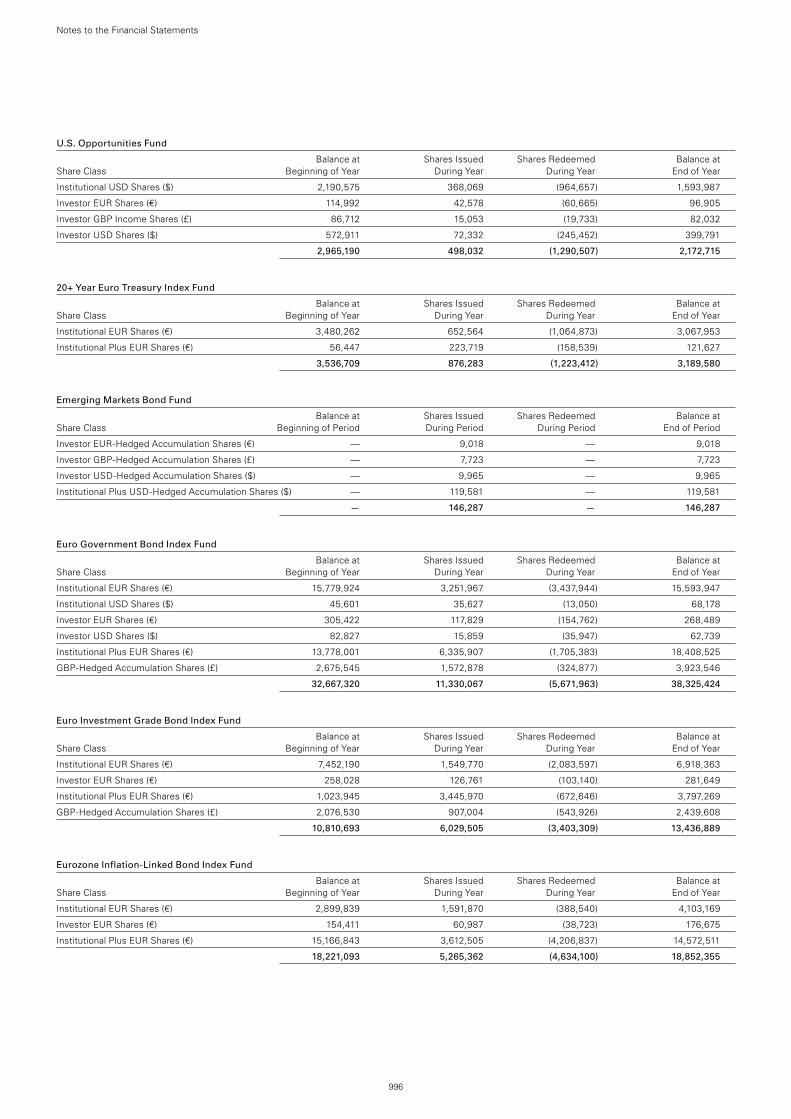
996
Notes to the Financial Statements
U.S. Opportunities Fund
Balance at Shares Issued Shares Redeemed Balance at Share Class Beginning of Year During Year During Year End of Year
Institutional USD Shares ($) 2,190,575 368,069 (964,657) 1,593,987
Investor EUR Shares (€) 114,992 42,578 (60,665) 96,905
Investor GBP Income Shares (£) 86,712 15,053 (19,733) 82,032
Investor USD Shares ($) 572,911 72,332 (245,452) 399,791
2,965,190 498,032 (1,290,507) 2,172,715
20+ Year Euro Treasury Index Fund
Balance at Shares Issued Shares Redeemed Balance at Share Class Beginning of Year During Year During Year End of Year
Institutional EUR Shares (€) 3,480,262 652,564 (1,064,873) 3,067,953
Institutional Plus EUR Shares (€) 56,447 223,719 (158,539) 121,627
3,536,709 876,283 (1,223,412) 3,189,580
Emerging Markets Bond Fund
Balance at Shares Issued Shares Redeemed Balance at Share Class Beginning of Period During Period During Period End of Period
Investor EUR-Hedged Accumulation Shares (€) — 9,018 — 9,018
Investor GBP-Hedged Accumulation Shares (£) — 7,723 — 7,723
Investor USD-Hedged Accumulation Shares ($) — 9,965 — 9,965
Institutional Plus USD-Hedged Accumulation Shares ($) — 119,581 — 119,581
— 146,287 — 146,287
Euro Government Bond Index Fund
Balance at Shares Issued Shares Redeemed Balance at Share Class Beginning of Year During Year During Year End of Year
Institutional EUR Shares (€) 15,779,924 3,251,967 (3,437,944) 15,593,947
Institutional USD Shares ($) 45,601 35,627 (13,050) 68,178
Investor EUR Shares (€) 305,422 117,829 (154,762) 268,489
Investor USD Shares ($) 82,827 15,859 (35,947) 62,739
Institutional Plus EUR Shares (€) 13,778,001 6,335,907 (1,705,383) 18,408,525
GBP-Hedged Accumulation Shares (£) 2,675,545 1,572,878 (324,877) 3,923,546
32,667,320 11,330,067 (5,671,963) 38,325,424
Euro Investment Grade Bond Index Fund
Balance at Shares Issued Shares Redeemed Balance at Share Class Beginning of Year During Year During Year End of Year
Institutional EUR Shares (€) 7,452,190 1,549,770 (2,083,597) 6,918,363
Investor EUR Shares (€) 258,028 126,761 (103,140) 281,649
Institutional Plus EUR Shares (€) 1,023,945 3,445,970 (672,646) 3,797,269
GBP-Hedged Accumulation Shares (£) 2,076,530 907,004 (543,926) 2,439,608
10,810,693 6,029,505 (3,403,309) 13,436,889
Eurozone Inflation-Linked Bond Index Fund
Balance at Shares Issued Shares Redeemed Balance at Share Class Beginning of Year During Year During Year End of Year
Institutional EUR Shares (€) 2,899,839 1,591,870 (388,540) 4,103,169
Investor EUR Shares (€) 154,411 60,987 (38,723) 176,675
Institutional Plus EUR Shares (€) 15,166,843 3,612,505 (4,206,837) 14,572,511
18,221,093 5,265,362 (4,634,100) 18,852,355
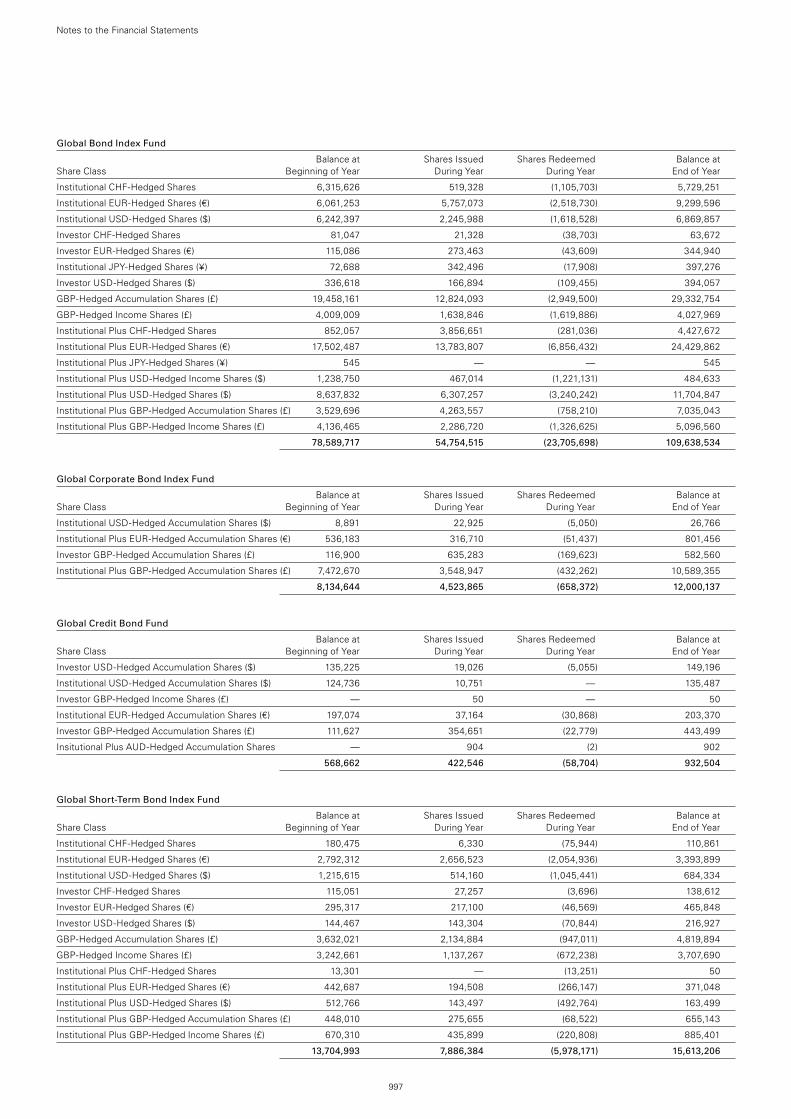
997
Notes to the Financial Statements
Global Bond Index Fund
Balance at Shares Issued Shares Redeemed Balance at Share Class Beginning of Year During Year During Year End of Year
Institutional CHF-Hedged Shares 6,315,626 519,328 (1,105,703) 5,729,251
Institutional EUR-Hedged Shares (€) 6,061,253 5,757,073 (2,518,730) 9,299,596
Institutional USD-Hedged Shares ($) 6,242,397 2,245,988 (1,618,528) 6,869,857
Investor CHF-Hedged Shares 81,047 21,328 (38,703) 63,672
Investor EUR-Hedged Shares (€) 115,086 273,463 (43,609) 344,940
Institutional JPY-Hedged Shares (¥) 72,688 342,496 (17,908) 397,276
Investor USD-Hedged Shares ($) 336,618 166,894 (109,455) 394,057
GBP-Hedged Accumulation Shares (£) 19,458,161 12,824,093 (2,949,500) 29,332,754
GBP-Hedged Income Shares (£) 4,009,009 1,638,846 (1,619,886) 4,027,969
Institutional Plus CHF-Hedged Shares 852,057 3,856,651 (281,036) 4,427,672
Institutional Plus EUR-Hedged Shares (€) 17,502,487 13,783,807 (6,856,432) 24,429,862
Institutional Plus JPY-Hedged Shares (¥) 545 — — 545
Institutional Plus USD-Hedged Income Shares ($) 1,238,750 467,014 (1,221,131) 484,633
Institutional Plus USD-Hedged Shares ($) 8,637,832 6,307,257 (3,240,242) 11,704,847
Institutional Plus GBP-Hedged Accumulation Shares (£) 3,529,696 4,263,557 (758,210) 7,035,043
Institutional Plus GBP-Hedged Income Shares (£) 4,136,465 2,286,720 (1,326,625) 5,096,560
78,589,717 54,754,515 (23,705,698) 109,638,534
Global Corporate Bond Index Fund
Balance at Shares Issued Shares Redeemed Balance at Share Class Beginning of Year During Year During Year End of Year
Institutional USD-Hedged Accumulation Shares ($) 8,891 22,925 (5,050) 26,766
Institutional Plus EUR-Hedged Accumulation Shares (€) 536,183 316,710 (51,437) 801,456
Investor GBP-Hedged Accumulation Shares (£) 116,900 635,283 (169,623) 582,560
Institutional Plus GBP-Hedged Accumulation Shares (£) 7,472,670 3,548,947 (432,262) 10,589,355
8,134,644 4,523,865 (658,372) 12,000,137
Global Credit Bond Fund
Balance at Shares Issued Shares Redeemed Balance at Share Class Beginning of Year During Year During Year End of Year
Investor USD-Hedged Accumulation Shares ($) 135,225 19,026 (5,055) 149,196
Institutional USD-Hedged Accumulation Shares ($) 124,736 10,751 — 135,487
Investor GBP-Hedged Income Shares (£) — 50 — 50
Institutional EUR-Hedged Accumulation Shares (€) 197,074 37,164 (30,868) 203,370
Investor GBP-Hedged Accumulation Shares (£) 111,627 354,651 (22,779) 443,499
Insitutional Plus AUD-Hedged Accumulation Shares — 904 (2) 902
568,662 422,546 (58,704) 932,504
Global Short-Term Bond Index Fund
Balance at Shares Issued Shares Redeemed Balance at Share Class Beginning of Year During Year During Year End of Year
Institutional CHF-Hedged Shares 180,475 6,330 (75,944) 110,861
Institutional EUR-Hedged Shares (€) 2,792,312 2,656,523 (2,054,936) 3,393,899
Institutional USD-Hedged Shares ($) 1,215,615 514,160 (1,045,441) 684,334
Investor CHF-Hedged Shares 115,051 27,257 (3,696) 138,612
Investor EUR-Hedged Shares (€) 295,317 217,100 (46,569) 465,848
Investor USD-Hedged Shares ($) 144,467 143,304 (70,844) 216,927
GBP-Hedged Accumulation Shares (£) 3,632,021 2,134,884 (947,011) 4,819,894
GBP-Hedged Income Shares (£) 3,242,661 1,137,267 (672,238) 3,707,690
Institutional Plus CHF-Hedged Shares 13,301 — (13,251) 50
Institutional Plus EUR-Hedged Shares (€) 442,687 194,508 (266,147) 371,048
Institutional Plus USD-Hedged Shares ($) 512,766 143,497 (492,764) 163,499
Institutional Plus GBP-Hedged Accumulation Shares (£) 448,010 275,655 (68,522) 655,143
Institutional Plus GBP-Hedged Income Shares (£) 670,310 435,899 (220,808) 885,401
13,704,993 7,886,384 (5,978,171) 15,613,206
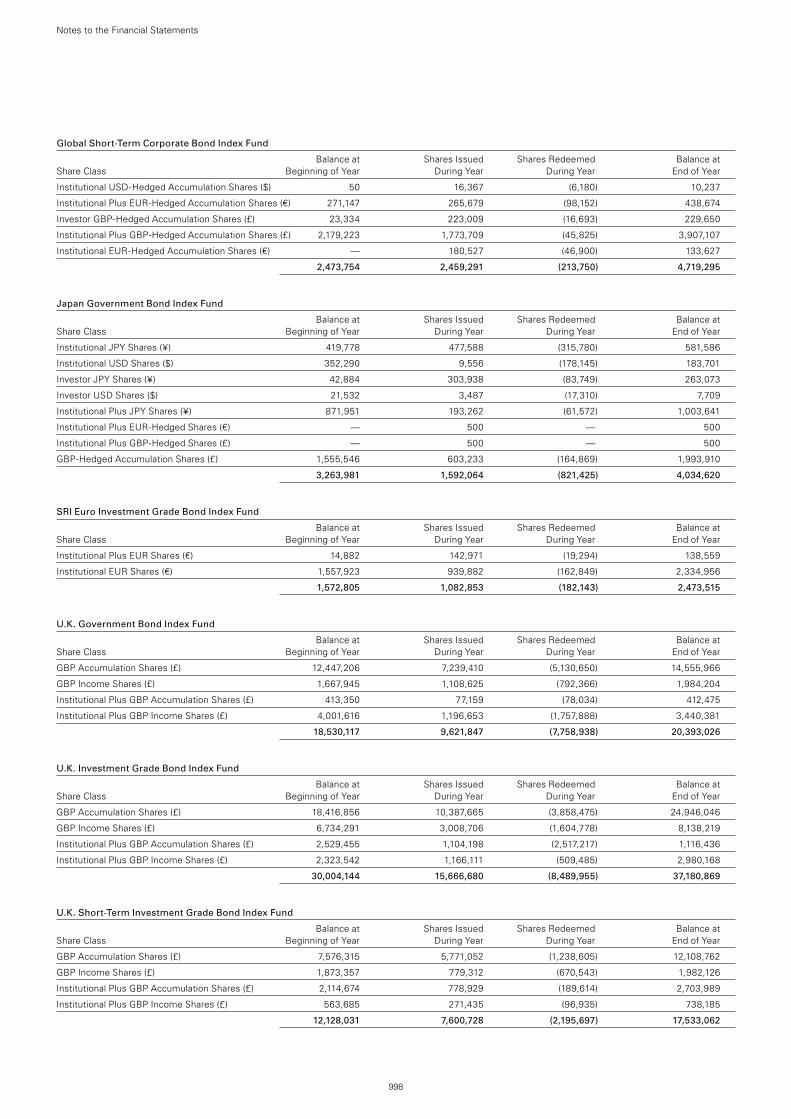
998
Notes to the Financial Statements
Global Short-Term Corporate Bond Index Fund
Balance at Shares Issued Shares Redeemed Balance at Share Class Beginning of Year During Year During Year End of Year
Institutional USD-Hedged Accumulation Shares ($) 50 16,367 (6,180) 10,237
Institutional Plus EUR-Hedged Accumulation Shares (€) 271,147 265,679 (98,152) 438,674
Investor GBP-Hedged Accumulation Shares (£) 23,334 223,009 (16,693) 229,650
Institutional Plus GBP-Hedged Accumulation Shares (£) 2,179,223 1,773,709 (45,825) 3,907,107
Institutional EUR-Hedged Accumulation Shares (€) — 180,527 (46,900) 133,627
2,473,754 2,459,291 (213,750) 4,719,295
Japan Government Bond Index Fund
Balance at Shares Issued Shares Redeemed Balance at Share Class Beginning of Year During Year During Year End of Year
Institutional JPY Shares (¥) 419,778 477,588 (315,780) 581,586
Institutional USD Shares ($) 352,290 9,556 (178,145) 183,701
Investor JPY Shares (¥) 42,884 303,938 (83,749) 263,073
Investor USD Shares ($) 21,532 3,487 (17,310) 7,709
Institutional Plus JPY Shares (¥) 871,951 193,262 (61,572) 1,003,641
Institutional Plus EUR-Hedged Shares (€) — 500 — 500
Institutional Plus GBP-Hedged Shares (£) — 500 — 500
GBP-Hedged Accumulation Shares (£) 1,555,546 603,233 (164,869) 1,993,910
3,263,981 1,592,064 (821,425) 4,034,620
SRI Euro Investment Grade Bond Index Fund
Balance at Shares Issued Shares Redeemed Balance at Share Class Beginning of Year During Year During Year End of Year
Institutional Plus EUR Shares (€) 14,882 142,971 (19,294) 138,559
Institutional EUR Shares (€) 1,557,923 939,882 (162,849) 2,334,956
1,572,805 1,082,853 (182,143) 2,473,515
U.K. Government Bond Index Fund
Balance at Shares Issued Shares Redeemed Balance at Share Class Beginning of Year During Year During Year End of Year
GBP Accumulation Shares (£) 12,447,206 7,239,410 (5,130,650) 14,555,966
GBP Income Shares (£) 1,667,945 1,108,625 (792,366) 1,984,204
Institutional Plus GBP Accumulation Shares (£) 413,350 77,159 (78,034) 412,475
Institutional Plus GBP Income Shares (£) 4,001,616 1,196,653 (1,757,888) 3,440,381
18,530,117 9,621,847 (7,758,938) 20,393,026
U.K. Investment Grade Bond Index Fund
Balance at Shares Issued Shares Redeemed Balance at Share Class Beginning of Year During Year During Year End of Year
GBP Accumulation Shares (£) 18,416,856 10,387,665 (3,858,475) 24,946,046
GBP Income Shares (£) 6,734,291 3,008,706 (1,604,778) 8,138,219
Institutional Plus GBP Accumulation Shares (£) 2,529,455 1,104,198 (2,517,217) 1,116,436
Institutional Plus GBP Income Shares (£) 2,323,542 1,166,111 (509,485) 2,980,168
30,004,144 15,666,680 (8,489,955) 37,180,869
U.K. Short-Term Investment Grade Bond Index Fund
Balance at Shares Issued Shares Redeemed Balance at Share Class Beginning of Year During Year During Year End of Year
GBP Accumulation Shares (£) 7,576,315 5,771,052 (1,238,605) 12,108,762
GBP Income Shares (£) 1,873,357 779,312 (670,543) 1,982,126
Institutional Plus GBP Accumulation Shares (£) 2,114,674 778,929 (189,614) 2,703,989
Institutional Plus GBP Income Shares (£) 563,685 271,435 (96,935) 738,185
12,128,031 7,600,728 (2,195,697) 17,533,062
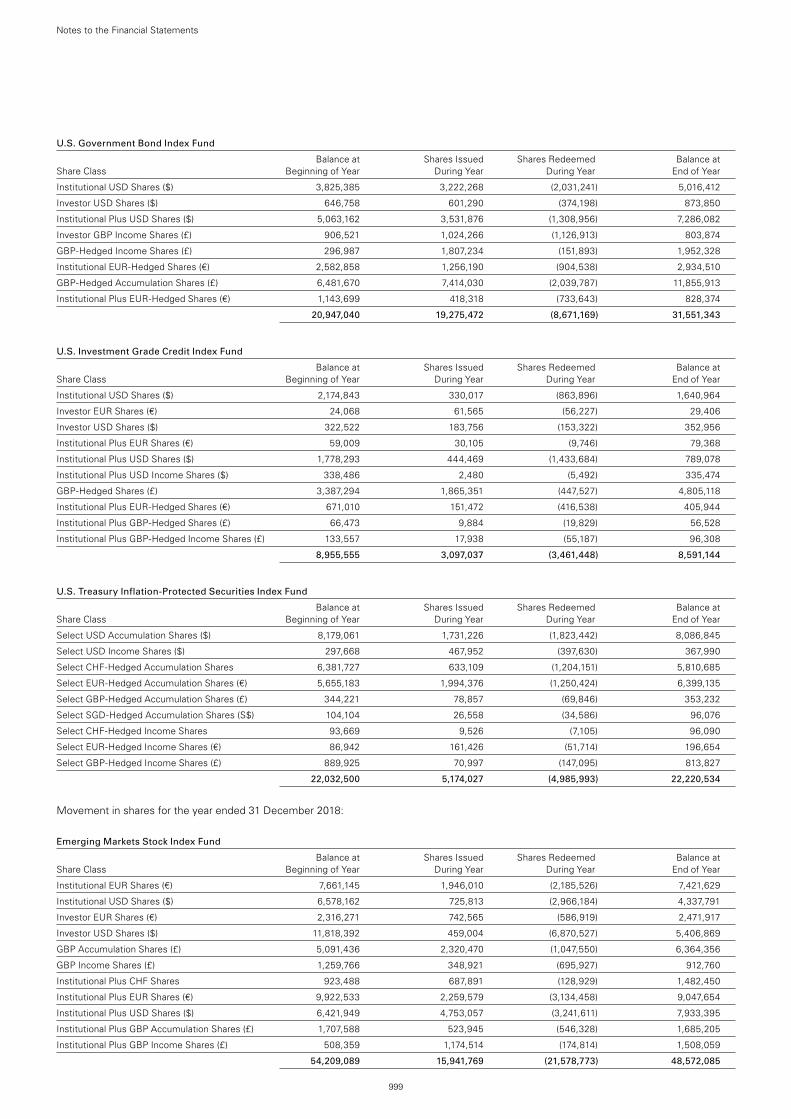
999
Notes to the Financial Statements
U.S. Government Bond Index Fund
Balance at Shares Issued Shares Redeemed Balance at Share Class Beginning of Year During Year During Year End of Year
Institutional USD Shares ($) 3,825,385 3,222,268 (2,031,241) 5,016,412
Investor USD Shares ($) 646,758 601,290 (374,198) 873,850
Institutional Plus USD Shares ($) 5,063,162 3,531,876 (1,308,956) 7,286,082
Investor GBP Income Shares (£) 906,521 1,024,266 (1,126,913) 803,874
GBP-Hedged Income Shares (£) 296,987 1,807,234 (151,893) 1,952,328
Institutional EUR-Hedged Shares (€) 2,582,858 1,256,190 (904,538) 2,934,510
GBP-Hedged Accumulation Shares (£) 6,481,670 7,414,030 (2,039,787) 11,855,913
Institutional Plus EUR-Hedged Shares (€) 1,143,699 418,318 (733,643) 828,374
20,947,040 19,275,472 (8,671,169) 31,551,343
U.S. Investment Grade Credit Index Fund
Balance at Shares Issued Shares Redeemed Balance at Share Class Beginning of Year During Year During Year End of Year
Institutional USD Shares ($) 2,174,843 330,017 (863,896) 1,640,964
Investor EUR Shares (€) 24,068 61,565 (56,227) 29,406
Investor USD Shares ($) 322,522 183,756 (153,322) 352,956
Institutional Plus EUR Shares (€) 59,009 30,105 (9,746) 79,368
Institutional Plus USD Shares ($) 1,778,293 444,469 (1,433,684) 789,078
Institutional Plus USD Income Shares ($) 338,486 2,480 (5,492) 335,474
GBP-Hedged Shares (£) 3,387,294 1,865,351 (447,527) 4,805,118
Institutional Plus EUR-Hedged Shares (€) 671,010 151,472 (416,538) 405,944
Institutional Plus GBP-Hedged Shares (£) 66,473 9,884 (19,829) 56,528
Institutional Plus GBP-Hedged Income Shares (£) 133,557 17,938 (55,187) 96,308
8,955,555 3,097,037 (3,461,448) 8,591,144
U.S. Treasury Inflation-Protected Securities Index Fund
Balance at Shares Issued Shares Redeemed Balance at Share Class Beginning of Year During Year During Year End of Year
Select USD Accumulation Shares ($) 8,179,061 1,731,226 (1,823,442) 8,086,845
Select USD Income Shares ($) 297,668 467,952 (397,630) 367,990
Select CHF-Hedged Accumulation Shares 6,381,727 633,109 (1,204,151) 5,810,685
Select EUR-Hedged Accumulation Shares (€) 5,655,183 1,994,376 (1,250,424) 6,399,135
Select GBP-Hedged Accumulation Shares (£) 344,221 78,857 (69,846) 353,232
Select SGD-Hedged Accumulation Shares (S$) 104,104 26,558 (34,586) 96,076
Select CHF-Hedged Income Shares 93,669 9,526 (7,105) 96,090
Select EUR-Hedged Income Shares (€) 86,942 161,426 (51,714) 196,654
Select GBP-Hedged Income Shares (£) 889,925 70,997 (147,095) 813,827
22,032,500 5,174,027 (4,985,993) 22,220,534
Movement in shares for the year ended 31 December 2018:
Emerging Markets Stock Index Fund
Balance at Shares Issued Shares Redeemed Balance at Share Class Beginning of Year During Year During Year End of Year
Institutional EUR Shares (€) 7,661,145 1,946,010 (2,185,526) 7,421,629
Institutional USD Shares ($) 6,578,162 725,813 (2,966,184) 4,337,791
Investor EUR Shares (€) 2,316,271 742,565 (586,919) 2,471,917
Investor USD Shares ($) 11,818,392 459,004 (6,870,527) 5,406,869
GBP Accumulation Shares (£) 5,091,436 2,320,470 (1,047,550) 6,364,356
GBP Income Shares (£) 1,259,766 348,921 (695,927) 912,760
Institutional Plus CHF Shares 923,488 687,891 (128,929) 1,482,450
Institutional Plus EUR Shares (€) 9,922,533 2,259,579 (3,134,458) 9,047,654
Institutional Plus USD Shares ($) 6,421,949 4,753,057 (3,241,611) 7,933,395
Institutional Plus GBP Accumulation Shares (£) 1,707,588 523,945 (546,328) 1,685,205
Institutional Plus GBP Income Shares (£) 508,359 1,174,514 (174,814) 1,508,059
54,209,089 15,941,769 (21,578,773) 48,572,085
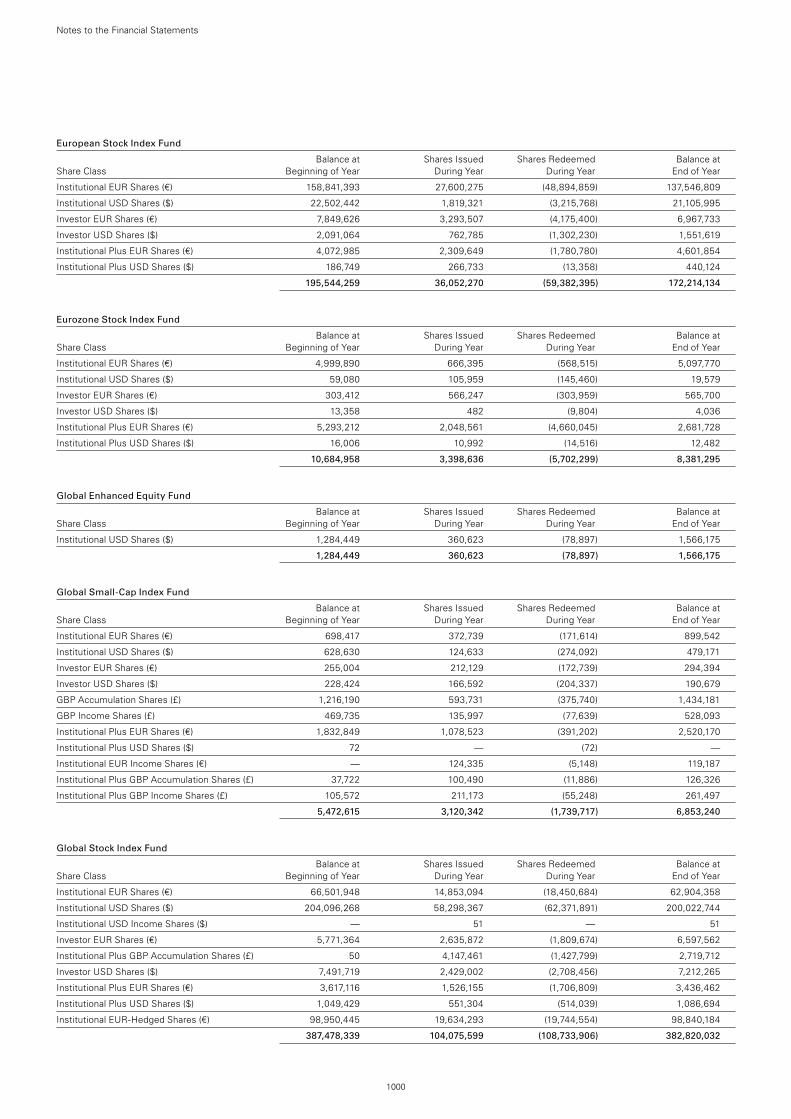
1000
Notes to the Financial Statements
European Stock Index Fund
Balance at Shares Issued Shares Redeemed Balance at Share Class Beginning of Year During Year During Year End of Year
Institutional EUR Shares (€) 158,841,393 27,600,275 (48,894,859) 137,546,809
Institutional USD Shares ($) 22,502,442 1,819,321 (3,215,768) 21,105,995
Investor EUR Shares (€) 7,849,626 3,293,507 (4,175,400) 6,967,733
Investor USD Shares ($) 2,091,064 762,785 (1,302,230) 1,551,619
Institutional Plus EUR Shares (€) 4,072,985 2,309,649 (1,780,780) 4,601,854
Institutional Plus USD Shares ($) 186,749 266,733 (13,358) 440,124
195,544,259 36,052,270 (59,382,395) 172,214,134
Eurozone Stock Index Fund
Balance at Shares Issued Shares Redeemed Balance at Share Class Beginning of Year During Year During Year End of Year
Institutional EUR Shares (€) 4,999,890 666,395 (568,515) 5,097,770
Institutional USD Shares ($) 59,080 105,959 (145,460) 19,579
Investor EUR Shares (€) 303,412 566,247 (303,959) 565,700
Investor USD Shares ($) 13,358 482 (9,804) 4,036
Institutional Plus EUR Shares (€) 5,293,212 2,048,561 (4,660,045) 2,681,728
Institutional Plus USD Shares ($) 16,006 10,992 (14,516) 12,482
10,684,958 3,398,636 (5,702,299) 8,381,295
Global Enhanced Equity Fund
Balance at Shares Issued Shares Redeemed Balance at Share Class Beginning of Year During Year During Year End of Year
Institutional USD Shares ($) 1,284,449 360,623 (78,897) 1,566,175
1,284,449 360,623 (78,897) 1,566,175
Global Small-Cap Index Fund
Balance at Shares Issued Shares Redeemed Balance at Share Class Beginning of Year During Year During Year End of Year
Institutional EUR Shares (€) 698,417 372,739 (171,614) 899,542
Institutional USD Shares ($) 628,630 124,633 (274,092) 479,171
Investor EUR Shares (€) 255,004 212,129 (172,739) 294,394
Investor USD Shares ($) 228,424 166,592 (204,337) 190,679
GBP Accumulation Shares (£) 1,216,190 593,731 (375,740) 1,434,181
GBP Income Shares (£) 469,735 135,997 (77,639) 528,093
Institutional Plus EUR Shares (€) 1,832,849 1,078,523 (391,202) 2,520,170
Institutional Plus USD Shares ($) 72 — (72) —
Institutional EUR Income Shares (€) — 124,335 (5,148) 119,187
Institutional Plus GBP Accumulation Shares (£) 37,722 100,490 (11,886) 126,326
Institutional Plus GBP Income Shares (£) 105,572 211,173 (55,248) 261,497
5,472,615 3,120,342 (1,739,717) 6,853,240
Global Stock Index Fund
Balance at Shares Issued Shares Redeemed Balance at Share Class Beginning of Year During Year During Year End of Year
Institutional EUR Shares (€) 66,501,948 14,853,094 (18,450,684) 62,904,358
Institutional USD Shares ($) 204,096,268 58,298,367 (62,371,891) 200,022,744
Institutional USD Income Shares ($) — 51 — 51
Investor EUR Shares (€) 5,771,364 2,635,872 (1,809,674) 6,597,562
Institutional Plus GBP Accumulation Shares (£) 50 4,147,461 (1,427,799) 2,719,712
Investor USD Shares ($) 7,491,719 2,429,002 (2,708,456) 7,212,265
Institutional Plus EUR Shares (€) 3,617,116 1,526,155 (1,706,809) 3,436,462
Institutional Plus USD Shares ($) 1,049,429 551,304 (514,039) 1,086,694
Institutional EUR-Hedged Shares (€) 98,950,445 19,634,293 (19,744,554) 98,840,184
387,478,339 104,075,599 (108,733,906) 382,820,032
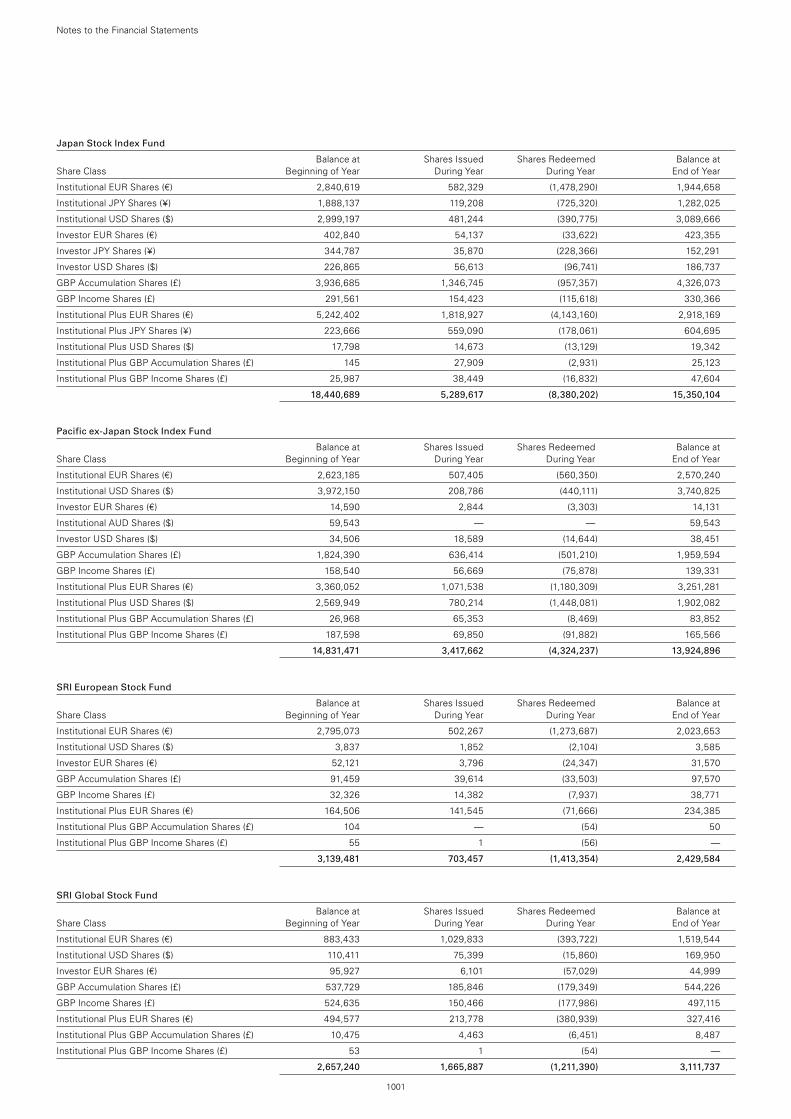
1001
Notes to the Financial Statements
Japan Stock Index Fund
Balance at Shares Issued Shares Redeemed Balance at Share Class Beginning of Year During Year During Year End of Year
Institutional EUR Shares (€) 2,840,619 582,329 (1,478,290) 1,944,658
Institutional JPY Shares (¥) 1,888,137 119,208 (725,320) 1,282,025
Institutional USD Shares ($) 2,999,197 481,244 (390,775) 3,089,666
Investor EUR Shares (€) 402,840 54,137 (33,622) 423,355
Investor JPY Shares (¥) 344,787 35,870 (228,366) 152,291
Investor USD Shares ($) 226,865 56,613 (96,741) 186,737
GBP Accumulation Shares (£) 3,936,685 1,346,745 (957,357) 4,326,073
GBP Income Shares (£) 291,561 154,423 (115,618) 330,366
Institutional Plus EUR Shares (€) 5,242,402 1,818,927 (4,143,160) 2,918,169
Institutional Plus JPY Shares (¥) 223,666 559,090 (178,061) 604,695
Institutional Plus USD Shares ($) 17,798 14,673 (13,129) 19,342
Institutional Plus GBP Accumulation Shares (£) 145 27,909 (2,931) 25,123
Institutional Plus GBP Income Shares (£) 25,987 38,449 (16,832) 47,604
18,440,689 5,289,617 (8,380,202) 15,350,104
Pacific ex-Japan Stock Index Fund
Balance at Shares Issued Shares Redeemed Balance at Share Class Beginning of Year During Year During Year End of Year
Institutional EUR Shares (€) 2,623,185 507,405 (560,350) 2,570,240
Institutional USD Shares ($) 3,972,150 208,786 (440,111) 3,740,825
Investor EUR Shares (€) 14,590 2,844 (3,303) 14,131
Institutional AUD Shares ($) 59,543 — — 59,543
Investor USD Shares ($) 34,506 18,589 (14,644) 38,451
GBP Accumulation Shares (£) 1,824,390 636,414 (501,210) 1,959,594
GBP Income Shares (£) 158,540 56,669 (75,878) 139,331
Institutional Plus EUR Shares (€) 3,360,052 1,071,538 (1,180,309) 3,251,281
Institutional Plus USD Shares ($) 2,569,949 780,214 (1,448,081) 1,902,082
Institutional Plus GBP Accumulation Shares (£) 26,968 65,353 (8,469) 83,852
Institutional Plus GBP Income Shares (£) 187,598 69,850 (91,882) 165,566
14,831,471 3,417,662 (4,324,237) 13,924,896
SRI European Stock Fund
Balance at Shares Issued Shares Redeemed Balance at Share Class Beginning of Year During Year During Year End of Year
Institutional EUR Shares (€) 2,795,073 502,267 (1,273,687) 2,023,653
Institutional USD Shares ($) 3,837 1,852 (2,104) 3,585
Investor EUR Shares (€) 52,121 3,796 (24,347) 31,570
GBP Accumulation Shares (£) 91,459 39,614 (33,503) 97,570
GBP Income Shares (£) 32,326 14,382 (7,937) 38,771
Institutional Plus EUR Shares (€) 164,506 141,545 (71,666) 234,385
Institutional Plus GBP Accumulation Shares (£) 104 — (54) 50
Institutional Plus GBP Income Shares (£) 55 1 (56) —
3,139,481 703,457 (1,413,354) 2,429,584
SRI Global Stock Fund
Balance at Shares Issued Shares Redeemed Balance at Share Class Beginning of Year During Year During Year End of Year
Institutional EUR Shares (€) 883,433 1,029,833 (393,722) 1,519,544
Institutional USD Shares ($) 110,411 75,399 (15,860) 169,950
Investor EUR Shares (€) 95,927 6,101 (57,029) 44,999
GBP Accumulation Shares (£) 537,729 185,846 (179,349) 544,226
GBP Income Shares (£) 524,635 150,466 (177,986) 497,115
Institutional Plus EUR Shares (€) 494,577 213,778 (380,939) 327,416
Institutional Plus GBP Accumulation Shares (£) 10,475 4,463 (6,451) 8,487
Institutional Plus GBP Income Shares (£) 53 1 (54) —
2,657,240 1,665,887 (1,211,390) 3,111,737
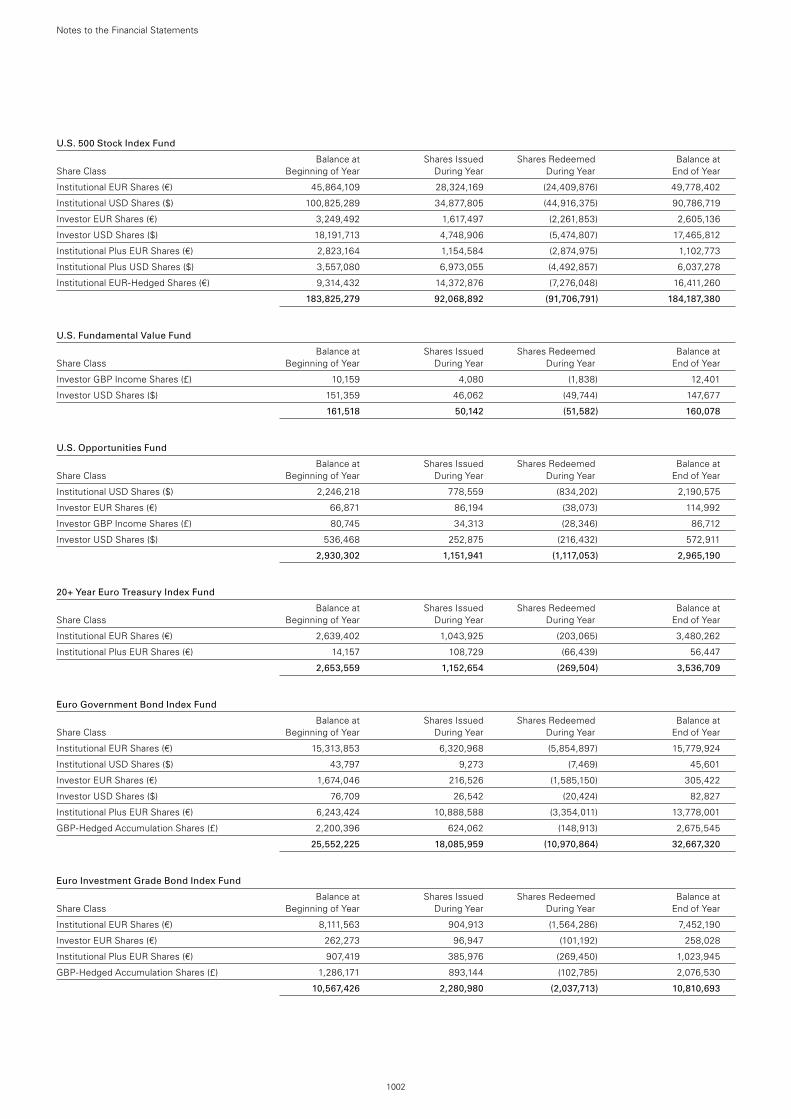
1002
Notes to the Financial Statements
U.S. 500 Stock Index Fund
Balance at Shares Issued Shares Redeemed Balance at Share Class Beginning of Year During Year During Year End of Year
Institutional EUR Shares (€) 45,864,109 28,324,169 (24,409,876) 49,778,402
Institutional USD Shares ($) 100,825,289 34,877,805 (44,916,375) 90,786,719
Investor EUR Shares (€) 3,249,492 1,617,497 (2,261,853) 2,605,136
Investor USD Shares ($) 18,191,713 4,748,906 (5,474,807) 17,465,812
Institutional Plus EUR Shares (€) 2,823,164 1,154,584 (2,874,975) 1,102,773
Institutional Plus USD Shares ($) 3,557,080 6,973,055 (4,492,857) 6,037,278
Institutional EUR-Hedged Shares (€) 9,314,432 14,372,876 (7,276,048) 16,411,260
183,825,279 92,068,892 (91,706,791) 184,187,380
U.S. Fundamental Value Fund
Balance at Shares Issued Shares Redeemed Balance at Share Class Beginning of Year During Year During Year End of Year
Investor GBP Income Shares (£) 10,159 4,080 (1,838) 12,401
Investor USD Shares ($) 151,359 46,062 (49,744) 147,677
161,518 50,142 (51,582) 160,078
U.S. Opportunities Fund
Balance at Shares Issued Shares Redeemed Balance at Share Class Beginning of Year During Year During Year End of Year
Institutional USD Shares ($) 2,246,218 778,559 (834,202) 2,190,575
Investor EUR Shares (€) 66,871 86,194 (38,073) 114,992
Investor GBP Income Shares (£) 80,745 34,313 (28,346) 86,712
Investor USD Shares ($) 536,468 252,875 (216,432) 572,911
2,930,302 1,151,941 (1,117,053) 2,965,190
20+ Year Euro Treasury Index Fund
Balance at Shares Issued Shares Redeemed Balance at Share Class Beginning of Year During Year During Year End of Year
Institutional EUR Shares (€) 2,639,402 1,043,925 (203,065) 3,480,262
Institutional Plus EUR Shares (€) 14,157 108,729 (66,439) 56,447
2,653,559 1,152,654 (269,504) 3,536,709
Euro Government Bond Index Fund
Balance at Shares Issued Shares Redeemed Balance at Share Class Beginning of Year During Year During Year End of Year
Institutional EUR Shares (€) 15,313,853 6,320,968 (5,854,897) 15,779,924
Institutional USD Shares ($) 43,797 9,273 (7,469) 45,601
Investor EUR Shares (€) 1,674,046 216,526 (1,585,150) 305,422
Investor USD Shares ($) 76,709 26,542 (20,424) 82,827
Institutional Plus EUR Shares (€) 6,243,424 10,888,588 (3,354,011) 13,778,001
GBP-Hedged Accumulation Shares (£) 2,200,396 624,062 (148,913) 2,675,545
25,552,225 18,085,959 (10,970,864) 32,667,320
Euro Investment Grade Bond Index Fund
Balance at Shares Issued Shares Redeemed Balance at Share Class Beginning of Year During Year During Year End of Year
Institutional EUR Shares (€) 8,111,563 904,913 (1,564,286) 7,452,190
Investor EUR Shares (€) 262,273 96,947 (101,192) 258,028
Institutional Plus EUR Shares (€) 907,419 385,976 (269,450) 1,023,945
GBP-Hedged Accumulation Shares (£) 1,286,171 893,144 (102,785) 2,076,530
10,567,426 2,280,980 (2,037,713) 10,810,693
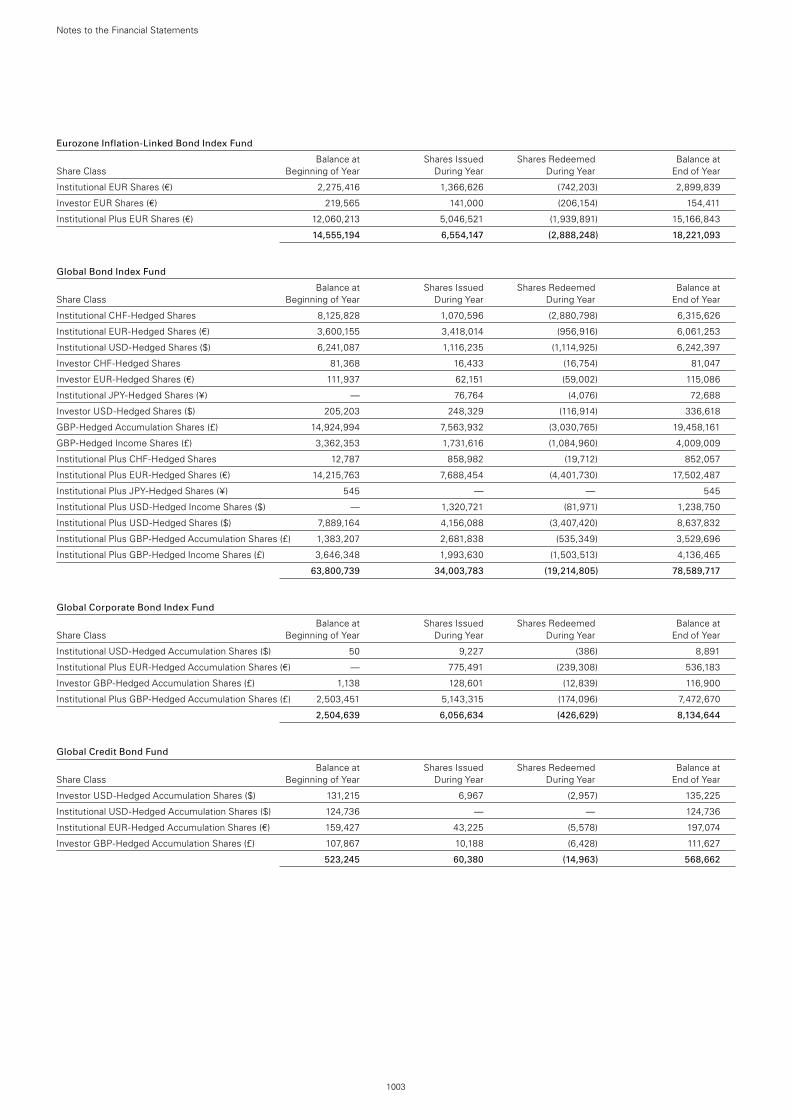
1003
Notes to the Financial Statements
Eurozone Inflation-Linked Bond Index Fund
Balance at Shares Issued Shares Redeemed Balance at Share Class Beginning of Year During Year During Year End of Year
Institutional EUR Shares (€) 2,275,416 1,366,626 (742,203) 2,899,839
Investor EUR Shares (€) 219,565 141,000 (206,154) 154,411
Institutional Plus EUR Shares (€) 12,060,213 5,046,521 (1,939,891) 15,166,843
14,555,194 6,554,147 (2,888,248) 18,221,093
Global Bond Index Fund
Balance at Shares Issued Shares Redeemed Balance at Share Class Beginning of Year During Year During Year End of Year
Institutional CHF-Hedged Shares 8,125,828 1,070,596 (2,880,798) 6,315,626
Institutional EUR-Hedged Shares (€) 3,600,155 3,418,014 (956,916) 6,061,253
Institutional USD-Hedged Shares ($) 6,241,087 1,116,235 (1,114,925) 6,242,397
Investor CHF-Hedged Shares 81,368 16,433 (16,754) 81,047
Investor EUR-Hedged Shares (€) 111,937 62,151 (59,002) 115,086
Institutional JPY-Hedged Shares (¥) — 76,764 (4,076) 72,688
Investor USD-Hedged Shares ($) 205,203 248,329 (116,914) 336,618
GBP-Hedged Accumulation Shares (£) 14,924,994 7,563,932 (3,030,765) 19,458,161
GBP-Hedged Income Shares (£) 3,362,353 1,731,616 (1,084,960) 4,009,009
Institutional Plus CHF-Hedged Shares 12,787 858,982 (19,712) 852,057
Institutional Plus EUR-Hedged Shares (€) 14,215,763 7,688,454 (4,401,730) 17,502,487
Institutional Plus JPY-Hedged Shares (¥) 545 — — 545
Institutional Plus USD-Hedged Income Shares ($) — 1,320,721 (81,971) 1,238,750
Institutional Plus USD-Hedged Shares ($) 7,889,164 4,156,088 (3,407,420) 8,637,832
Institutional Plus GBP-Hedged Accumulation Shares (£) 1,383,207 2,681,838 (535,349) 3,529,696
Institutional Plus GBP-Hedged Income Shares (£) 3,646,348 1,993,630 (1,503,513) 4,136,465
63,800,739 34,003,783 (19,214,805) 78,589,717
Global Corporate Bond Index Fund
Balance at Shares Issued Shares Redeemed Balance at Share Class Beginning of Year During Year During Year End of Year
Institutional USD-Hedged Accumulation Shares ($) 50 9,227 (386) 8,891
Institutional Plus EUR-Hedged Accumulation Shares (€) — 775,491 (239,308) 536,183
Investor GBP-Hedged Accumulation Shares (£) 1,138 128,601 (12,839) 116,900
Institutional Plus GBP-Hedged Accumulation Shares (£) 2,503,451 5,143,315 (174,096) 7,472,670
2,504,639 6,056,634 (426,629) 8,134,644
Global Credit Bond Fund
Balance at Shares Issued Shares Redeemed Balance at Share Class Beginning of Year During Year During Year End of Year
Investor USD-Hedged Accumulation Shares ($) 131,215 6,967 (2,957) 135,225
Institutional USD-Hedged Accumulation Shares ($) 124,736 — — 124,736
Institutional EUR-Hedged Accumulation Shares (€) 159,427 43,225 (5,578) 197,074
Investor GBP-Hedged Accumulation Shares (£) 107,867 10,188 (6,428) 111,627
523,245 60,380 (14,963) 568,662
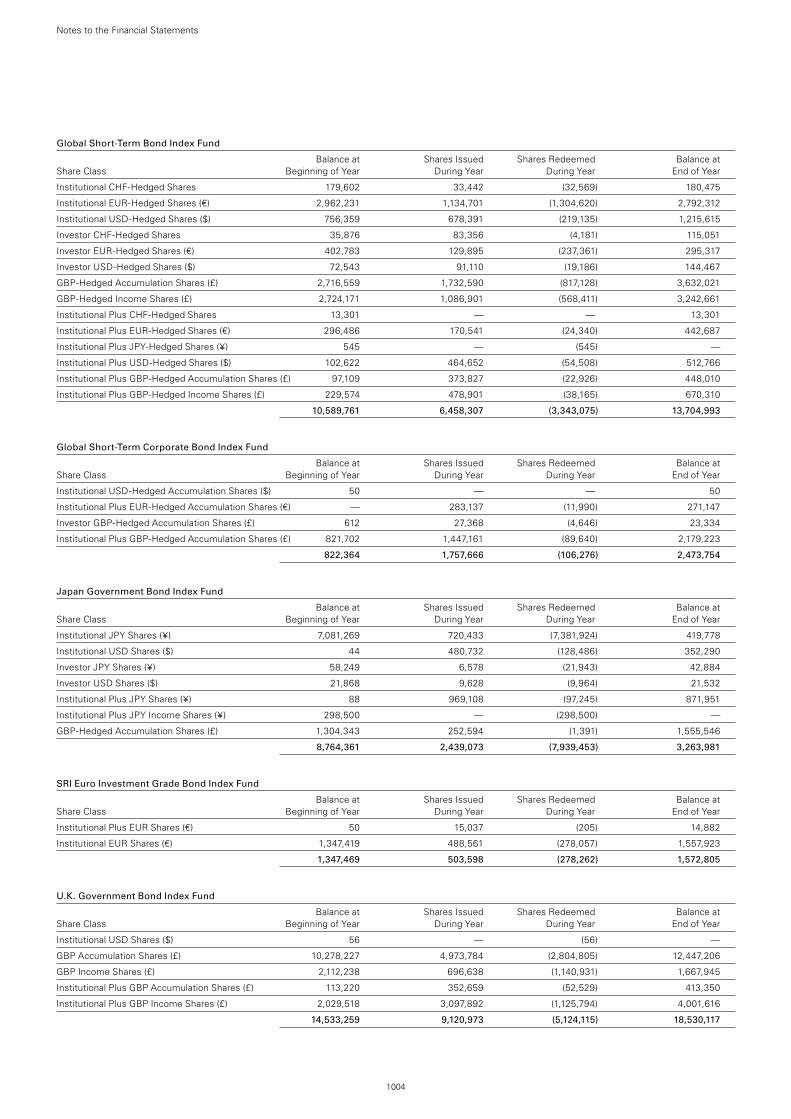
1004
Notes to the Financial Statements
Global Short-Term Bond Index Fund
Balance at Shares Issued Shares Redeemed Balance at Share Class Beginning of Year During Year During Year End of Year
Institutional CHF-Hedged Shares 179,602 33,442 (32,569) 180,475
Institutional EUR-Hedged Shares (€) 2,962,231 1,134,701 (1,304,620) 2,792,312
Institutional USD-Hedged Shares ($) 756,359 678,391 (219,135) 1,215,615
Investor CHF-Hedged Shares 35,876 83,356 (4,181) 115,051
Investor EUR-Hedged Shares (€) 402,783 129,895 (237,361) 295,317
Investor USD-Hedged Shares ($) 72,543 91,110 (19,186) 144,467
GBP-Hedged Accumulation Shares (£) 2,716,559 1,732,590 (817,128) 3,632,021
GBP-Hedged Income Shares (£) 2,724,171 1,086,901 (568,411) 3,242,661
Institutional Plus CHF-Hedged Shares 13,301 — — 13,301
Institutional Plus EUR-Hedged Shares (€) 296,486 170,541 (24,340) 442,687
Institutional Plus JPY-Hedged Shares (¥) 545 — (545) —
Institutional Plus USD-Hedged Shares ($) 102,622 464,652 (54,508) 512,766
Institutional Plus GBP-Hedged Accumulation Shares (£) 97,109 373,827 (22,926) 448,010
Institutional Plus GBP-Hedged Income Shares (£) 229,574 478,901 (38,165) 670,310
10,589,761 6,458,307 (3,343,075) 13,704,993
Global Short-Term Corporate Bond Index Fund
Balance at Shares Issued Shares Redeemed Balance at Share Class Beginning of Year During Year During Year End of Year
Institutional USD-Hedged Accumulation Shares ($) 50 — — 50
Institutional Plus EUR-Hedged Accumulation Shares (€) — 283,137 (11,990) 271,147
Investor GBP-Hedged Accumulation Shares (£) 612 27,368 (4,646) 23,334
Institutional Plus GBP-Hedged Accumulation Shares (£) 821,702 1,447,161 (89,640) 2,179,223
822,364 1,757,666 (106,276) 2,473,754
Japan Government Bond Index Fund
Balance at Shares Issued Shares Redeemed Balance at Share Class Beginning of Year During Year During Year End of Year
Institutional JPY Shares (¥) 7,081,269 720,433 (7,381,924) 419,778
Institutional USD Shares ($) 44 480,732 (128,486) 352,290
Investor JPY Shares (¥) 58,249 6,578 (21,943) 42,884
Investor USD Shares ($) 21,868 9,628 (9,964) 21,532
Institutional Plus JPY Shares (¥) 88 969,108 (97,245) 871,951
Institutional Plus JPY Income Shares (¥) 298,500 — (298,500) —
GBP-Hedged Accumulation Shares (£) 1,304,343 252,594 (1,391) 1,555,546
8,764,361 2,439,073 (7,939,453) 3,263,981
SRI Euro Investment Grade Bond Index Fund
Balance at Shares Issued Shares Redeemed Balance at Share Class Beginning of Year During Year During Year End of Year
Institutional Plus EUR Shares (€) 50 15,037 (205) 14,882
Institutional EUR Shares (€) 1,347,419 488,561 (278,057) 1,557,923
1,347,469 503,598 (278,262) 1,572,805
U.K. Government Bond Index Fund
Balance at Shares Issued Shares Redeemed Balance at Share Class Beginning of Year During Year During Year End of Year
Institutional USD Shares ($) 56 — (56) —
GBP Accumulation Shares (£) 10,278,227 4,973,784 (2,804,805) 12,447,206
GBP Income Shares (£) 2,112,238 696,638 (1,140,931) 1,667,945
Institutional Plus GBP Accumulation Shares (£) 113,220 352,659 (52,529) 413,350
Institutional Plus GBP Income Shares (£) 2,029,518 3,097,892 (1,125,794) 4,001,616
14,533,259 9,120,973 (5,124,115) 18,530,117
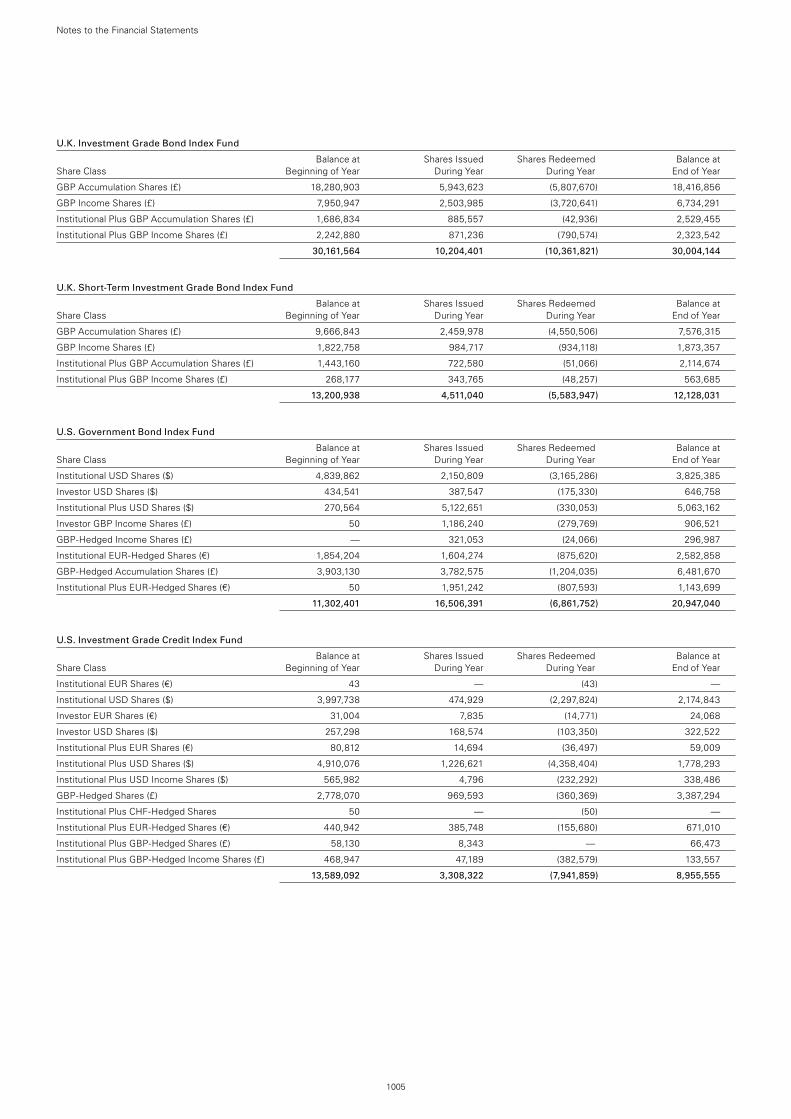
1005
Notes to the Financial Statements
U.K. Investment Grade Bond Index Fund
Balance at Shares Issued Shares Redeemed Balance at Share Class Beginning of Year During Year During Year End of Year
GBP Accumulation Shares (£) 18,280,903 5,943,623 (5,807,670) 18,416,856
GBP Income Shares (£) 7,950,947 2,503,985 (3,720,641) 6,734,291
Institutional Plus GBP Accumulation Shares (£) 1,686,834 885,557 (42,936) 2,529,455
Institutional Plus GBP Income Shares (£) 2,242,880 871,236 (790,574) 2,323,542
30,161,564 10,204,401 (10,361,821) 30,004,144
U.K. Short-Term Investment Grade Bond Index Fund
Balance at Shares Issued Shares Redeemed Balance at Share Class Beginning of Year During Year During Year End of Year
GBP Accumulation Shares (£) 9,666,843 2,459,978 (4,550,506) 7,576,315
GBP Income Shares (£) 1,822,758 984,717 (934,118) 1,873,357
Institutional Plus GBP Accumulation Shares (£) 1,443,160 722,580 (51,066) 2,114,674
Institutional Plus GBP Income Shares (£) 268,177 343,765 (48,257) 563,685
13,200,938 4,511,040 (5,583,947) 12,128,031
U.S. Government Bond Index Fund
Balance at Shares Issued Shares Redeemed Balance at Share Class Beginning of Year During Year During Year End of Year
Institutional USD Shares ($) 4,839,862 2,150,809 (3,165,286) 3,825,385
Investor USD Shares ($) 434,541 387,547 (175,330) 646,758
Institutional Plus USD Shares ($) 270,564 5,122,651 (330,053) 5,063,162
Investor GBP Income Shares (£) 50 1,186,240 (279,769) 906,521
GBP-Hedged Income Shares (£) — 321,053 (24,066) 296,987
Institutional EUR-Hedged Shares (€) 1,854,204 1,604,274 (875,620) 2,582,858
GBP-Hedged Accumulation Shares (£) 3,903,130 3,782,575 (1,204,035) 6,481,670
Institutional Plus EUR-Hedged Shares (€) 50 1,951,242 (807,593) 1,143,699
11,302,401 16,506,391 (6,861,752) 20,947,040
U.S. Investment Grade Credit Index Fund
Balance at Shares Issued Shares Redeemed Balance at Share Class Beginning of Year During Year During Year End of Year
Institutional EUR Shares (€) 43 — (43) —
Institutional USD Shares ($) 3,997,738 474,929 (2,297,824) 2,174,843
Investor EUR Shares (€) 31,004 7,835 (14,771) 24,068
Investor USD Shares ($) 257,298 168,574 (103,350) 322,522
Institutional Plus EUR Shares (€) 80,812 14,694 (36,497) 59,009
Institutional Plus USD Shares ($) 4,910,076 1,226,621 (4,358,404) 1,778,293
Institutional Plus USD Income Shares ($) 565,982 4,796 (232,292) 338,486
GBP-Hedged Shares (£) 2,778,070 969,593 (360,369) 3,387,294
Institutional Plus CHF-Hedged Shares 50 — (50) —
Institutional Plus EUR-Hedged Shares (€) 440,942 385,748 (155,680) 671,010
Institutional Plus GBP-Hedged Shares (£) 58,130 8,343 — 66,473
Institutional Plus GBP-Hedged Income Shares (£) 468,947 47,189 (382,579) 133,557
13,589,092 3,308,322 (7,941,859) 8,955,555
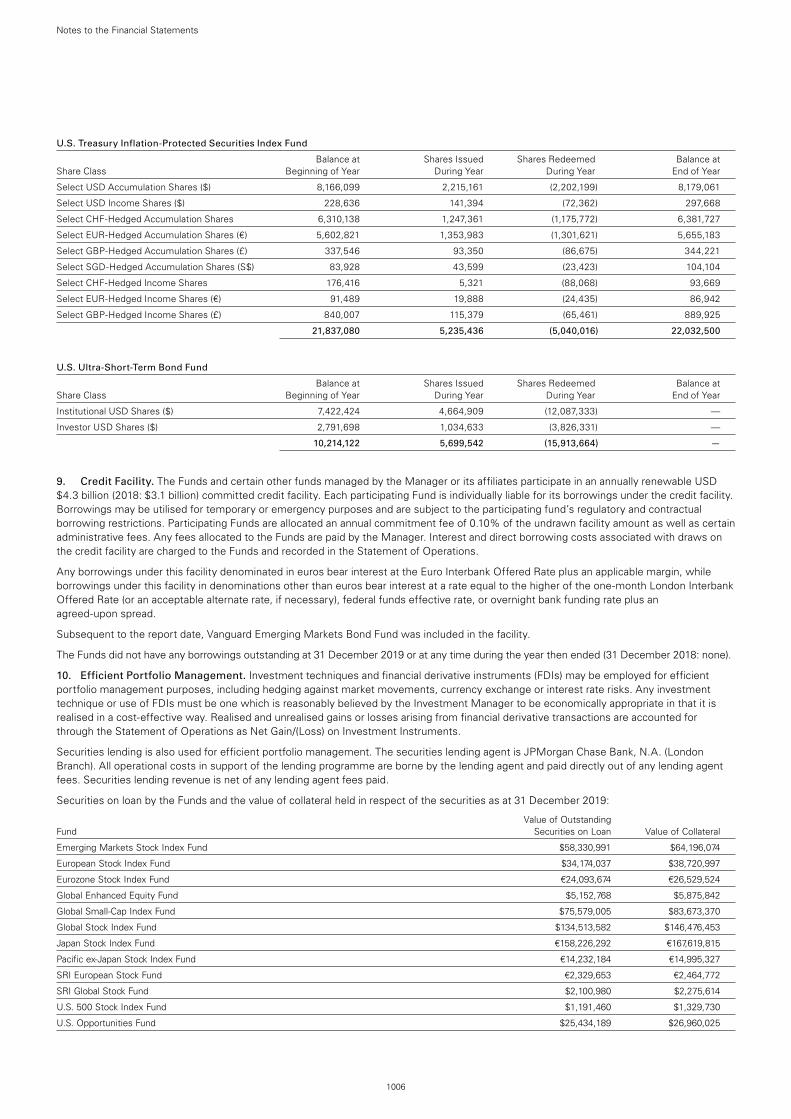
1006
Notes to the Financial Statements
U.S. Treasury Inflation-Protected Securities Index Fund
Balance at Shares Issued Shares Redeemed Balance at Share Class Beginning of Year During Year During Year End of Year
Select USD Accumulation Shares ($) 8,166,099 2,215,161 (2,202,199) 8,179,061
Select USD Income Shares ($) 228,636 141,394 (72,362) 297,668
Select CHF-Hedged Accumulation Shares 6,310,138 1,247,361 (1,175,772) 6,381,727
Select EUR-Hedged Accumulation Shares (€) 5,602,821 1,353,983 (1,301,621) 5,655,183
Select GBP-Hedged Accumulation Shares (£) 337,546 93,350 (86,675) 344,221
Select SGD-Hedged Accumulation Shares (S$) 83,928 43,599 (23,423) 104,104
Select CHF-Hedged Income Shares 176,416 5,321 (88,068) 93,669
Select EUR-Hedged Income Shares (€) 91,489 19,888 (24,435) 86,942
Select GBP-Hedged Income Shares (£) 840,007 115,379 (65,461) 889,925
21,837,080 5,235,436 (5,040,016) 22,032,500
U.S. Ultra-Short-Term Bond Fund
Balance at Shares Issued Shares Redeemed Balance at Share Class Beginning of Year During Year During Year End of Year
Institutional USD Shares ($) 7,422,424 4,664,909 (12,087,333) —
Investor USD Shares ($) 2,791,698 1,034,633 (3,826,331) —
10,214,122 5,699,542 (15,913,664) —
9. Credit Facility. The Funds and certain other funds managed by the Manager or its affiliates participate in an annually renewable USD $4.3 billion (2018: $3.1 billion) committed credit facility. Each participating Fund is individually liable for its borrowings under the credit facility. Borrowings may be utilised for temporary or emergency purposes and are subject to the participating fund’s regulatory and contractual borrowing restrictions. Participating Funds are allocated an annual commitment fee of 0.10% of the undrawn facility amount as well as certain administrative fees. Any fees allocated to the Funds are paid by the Manager. Interest and direct borrowing costs associated with draws on the credit facility are charged to the Funds and recorded in the Statement of Operations.
Any borrowings under this facility denominated in euros bear interest at the Euro Interbank Offered Rate plus an applicable margin, while borrowings under this facility in denominations other than euros bear interest at a rate equal to the higher of the one-month London Interbank Offered Rate (or an acceptable alternate rate, if necessary), federal funds effective rate, or overnight bank funding rate plus an agreed-upon spread.
Subsequent to the report date, Vanguard Emerging Markets Bond Fund was included in the facility.
The Funds did not have any borrowings outstanding at 31 December 2019 or at any time during the year then ended (31 December 2018: none).
10. Efficient Portfolio Management. Investment techniques and financial derivative instruments (FDIs) may be employed for efficient portfolio management purposes, including hedging against market movements, currency exchange or interest rate risks. Any investment technique or use of FDIs must be one which is reasonably believed by the Investment Manager to be economically appropriate in that it is realised in a cost-effective way. Realised and unrealised gains or losses arising from financial derivative transactions are accounted for through the Statement of Operations as Net Gain/(Loss) on Investment Instruments.
Securities lending is also used for efficient portfolio management. The securities lending agent is JPMorgan Chase Bank, N.A. (London Branch). All operational costs in support of the lending programme are borne by the lending agent and paid directly out of any lending agent fees. Securities lending revenue is net of any lending agent fees paid.
Securities on loan by the Funds and the value of collateral held in respect of the securities as at 31 December 2019:
Value of Outstanding Fund Securities on Loan Value of Collateral
Emerging Markets Stock Index Fund $58,330,991 $64,196,074
European Stock Index Fund $34,174,037 $38,720,997
Eurozone Stock Index Fund €24,093,674 €26,529,524
Global Enhanced Equity Fund $5,152,768 $5,875,842
Global Small-Cap Index Fund $75,579,005 $83,673,370
Global Stock Index Fund $134,513,582 $146,476,453
Japan Stock Index Fund €158,226,292 €167,619,815
Pacific ex-Japan Stock Index Fund €14,232,184 €14,995,327
SRI European Stock Fund €2,329,653 €2,464,772
SRI Global Stock Fund $2,100,980 $2,275,614
U.S. 500 Stock Index Fund $1,191,460 $1,329,730
U.S. Opportunities Fund $25,434,189 $26,960,025
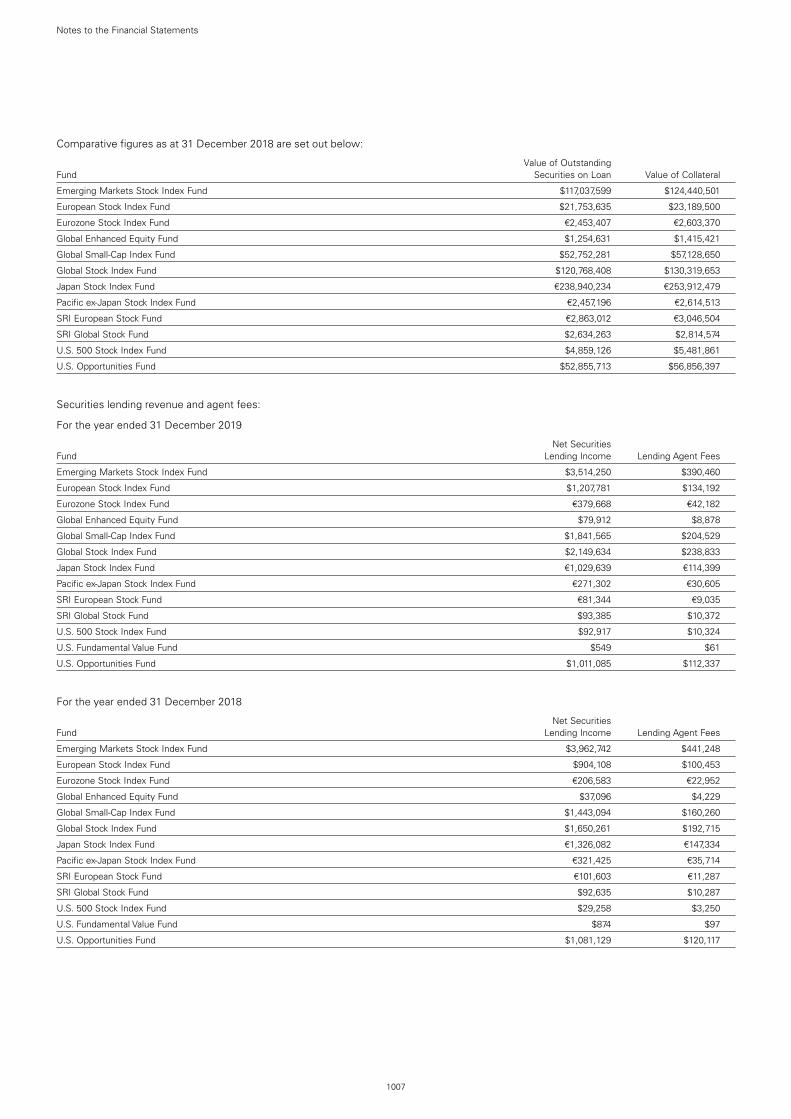
1007
Notes to the Financial Statements
Comparative figures as at 31 December 2018 are set out below:
Value of Outstanding Fund Securities on Loan Value of Collateral
Emerging Markets Stock Index Fund $117,037,599 $124,440,501
European Stock Index Fund $21,753,635 $23,189,500
Eurozone Stock Index Fund €2,453,407 €2,603,370
Global Enhanced Equity Fund $1,254,631 $1,415,421
Global Small-Cap Index Fund $52,752,281 $57,128,650
Global Stock Index Fund $120,768,408 $130,319,653
Japan Stock Index Fund €238,940,234 €253,912,479
Pacific ex-Japan Stock Index Fund €2,457,196 €2,614,513
SRI European Stock Fund €2,863,012 €3,046,504
SRI Global Stock Fund $2,634,263 $2,814,574
U.S. 500 Stock Index Fund $4,859,126 $5,481,861
U.S. Opportunities Fund $52,855,713 $56,856,397
Securities lending revenue and agent fees:
For the year ended 31 December 2019
Net Securities Fund Lending Income Lending Agent Fees
Emerging Markets Stock Index Fund $3,514,250 $390,460
European Stock Index Fund $1,207,781 $134,192
Eurozone Stock Index Fund €379,668 €42,182
Global Enhanced Equity Fund $79,912 $8,878
Global Small-Cap Index Fund $1,841,565 $204,529
Global Stock Index Fund $2,149,634 $238,833
Japan Stock Index Fund €1,029,639 €114,399
Pacific ex-Japan Stock Index Fund €271,302 €30,605
SRI European Stock Fund €81,344 €9,035
SRI Global Stock Fund $93,385 $10,372
U.S. 500 Stock Index Fund $92,917 $10,324
U.S. Fundamental Value Fund $549 $61
U.S. Opportunities Fund $1,011,085 $112,337
For the year ended 31 December 2018
Net Securities Fund Lending Income Lending Agent Fees
Emerging Markets Stock Index Fund $3,962,742 $441,248
European Stock Index Fund $904,108 $100,453
Eurozone Stock Index Fund €206,583 €22,952
Global Enhanced Equity Fund $37,096 $4,229
Global Small-Cap Index Fund $1,443,094 $160,260
Global Stock Index Fund $1,650,261 $192,715
Japan Stock Index Fund €1,326,082 €147,334
Pacific ex-Japan Stock Index Fund €321,425 €35,714
SRI European Stock Fund €101,603 €11,287
SRI Global Stock Fund $92,635 $10,287
U.S. 500 Stock Index Fund $29,258 $3,250
U.S. Fundamental Value Fund $874 $97
U.S. Opportunities Fund $1,081,129 $120,117
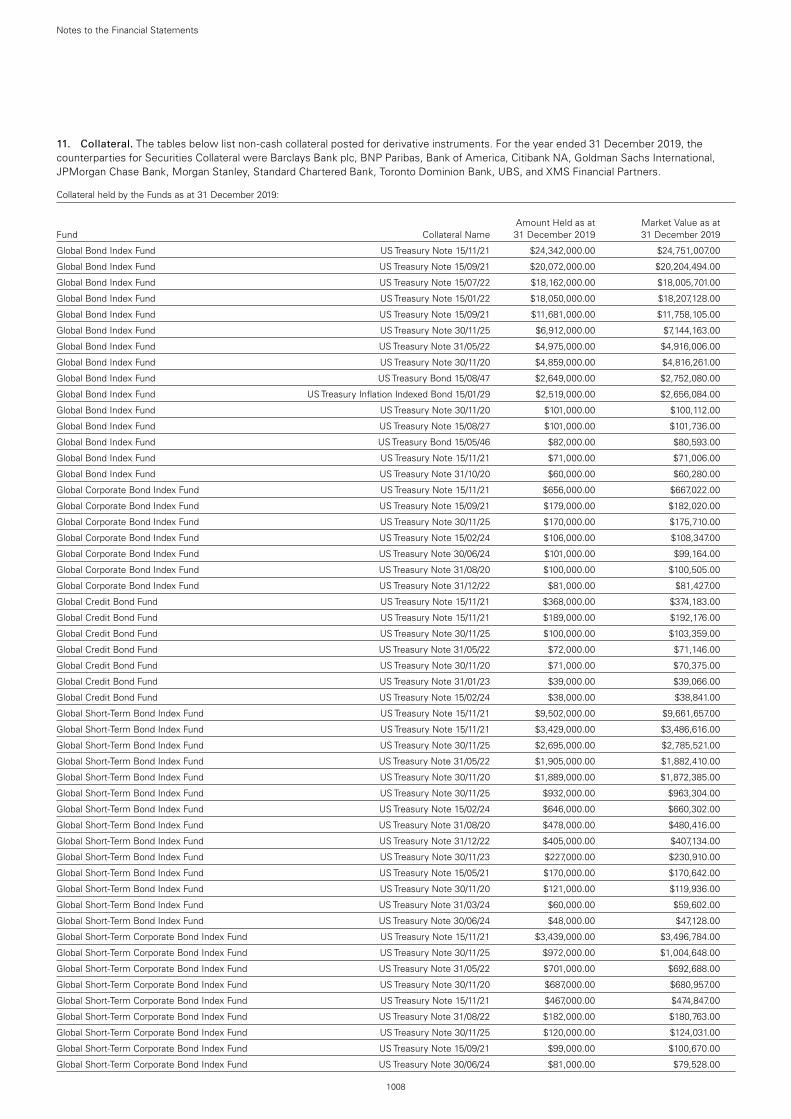
1008
Notes to the Financial Statements
11. Collateral. The tables below list non-cash collateral posted for derivative instruments. For the year ended 31 December 2019, the counterparties for Securities Collateral were Barclays Bank plc, BNP Paribas, Bank of America, Citibank NA, Goldman Sachs International, JPMorgan Chase Bank, Morgan Stanley, Standard Chartered Bank, Toronto Dominion Bank, UBS, and XMS Financial Partners.
Collateral held by the Funds as at 31 December 2019:
Amount Held as at Market Value as at Fund Collateral Name 31 December 2019 31 December 2019
Global Bond Index Fund US Treasury Note 15/11/21 $24,342,000.00 $24,751,007.00
Global Bond Index Fund US Treasury Note 15/09/21 $20,072,000.00 $20,204,494.00
Global Bond Index Fund US Treasury Note 15/07/22 $18,162,000.00 $18,005,701.00
Global Bond Index Fund US Treasury Note 15/01/22 $18,050,000.00 $18,207,128.00
Global Bond Index Fund US Treasury Note 15/09/21 $11,681,000.00 $11,758,105.00
Global Bond Index Fund US Treasury Note 30/11/25 $6,912,000.00 $7,144,163.00
Global Bond Index Fund US Treasury Note 31/05/22 $4,975,000.00 $4,916,006.00
Global Bond Index Fund US Treasury Note 30/11/20 $4,859,000.00 $4,816,261.00
Global Bond Index Fund US Treasury Bond 15/08/47 $2,649,000.00 $2,752,080.00
Global Bond Index Fund US Treasury Inflation Indexed Bond 15/01/29 $2,519,000.00 $2,656,084.00
Global Bond Index Fund US Treasury Note 30/11/20 $101,000.00 $100,112.00
Global Bond Index Fund US Treasury Note 15/08/27 $101,000.00 $101,736.00
Global Bond Index Fund US Treasury Bond 15/05/46 $82,000.00 $80,593.00
Global Bond Index Fund US Treasury Note 15/11/21 $71,000.00 $71,006.00
Global Bond Index Fund US Treasury Note 31/10/20 $60,000.00 $60,280.00
Global Corporate Bond Index Fund US Treasury Note 15/11/21 $656,000.00 $667,022.00
Global Corporate Bond Index Fund US Treasury Note 15/09/21 $179,000.00 $182,020.00
Global Corporate Bond Index Fund US Treasury Note 30/11/25 $170,000.00 $175,710.00
Global Corporate Bond Index Fund US Treasury Note 15/02/24 $106,000.00 $108,347.00
Global Corporate Bond Index Fund US Treasury Note 30/06/24 $101,000.00 $99,164.00
Global Corporate Bond Index Fund US Treasury Note 31/08/20 $100,000.00 $100,505.00
Global Corporate Bond Index Fund US Treasury Note 31/12/22 $81,000.00 $81,427.00
Global Credit Bond Fund US Treasury Note 15/11/21 $368,000.00 $374,183.00
Global Credit Bond Fund US Treasury Note 15/11/21 $189,000.00 $192,176.00
Global Credit Bond Fund US Treasury Note 30/11/25 $100,000.00 $103,359.00
Global Credit Bond Fund US Treasury Note 31/05/22 $72,000.00 $71,146.00
Global Credit Bond Fund US Treasury Note 30/11/20 $71,000.00 $70,375.00
Global Credit Bond Fund US Treasury Note 31/01/23 $39,000.00 $39,066.00
Global Credit Bond Fund US Treasury Note 15/02/24 $38,000.00 $38,841.00
Global Short-Term Bond Index Fund US Treasury Note 15/11/21 $9,502,000.00 $9,661,657.00
Global Short-Term Bond Index Fund US Treasury Note 15/11/21 $3,429,000.00 $3,486,616.00
Global Short-Term Bond Index Fund US Treasury Note 30/11/25 $2,695,000.00 $2,785,521.00
Global Short-Term Bond Index Fund US Treasury Note 31/05/22 $1,905,000.00 $1,882,410.00
Global Short-Term Bond Index Fund US Treasury Note 30/11/20 $1,889,000.00 $1,872,385.00
Global Short-Term Bond Index Fund US Treasury Note 30/11/25 $932,000.00 $963,304.00
Global Short-Term Bond Index Fund US Treasury Note 15/02/24 $646,000.00 $660,302.00
Global Short-Term Bond Index Fund US Treasury Note 31/08/20 $478,000.00 $480,416.00
Global Short-Term Bond Index Fund US Treasury Note 31/12/22 $405,000.00 $407,134.00
Global Short-Term Bond Index Fund US Treasury Note 30/11/23 $227,000.00 $230,910.00
Global Short-Term Bond Index Fund US Treasury Note 15/05/21 $170,000.00 $170,642.00
Global Short-Term Bond Index Fund US Treasury Note 30/11/20 $121,000.00 $119,936.00
Global Short-Term Bond Index Fund US Treasury Note 31/03/24 $60,000.00 $59,602.00
Global Short-Term Bond Index Fund US Treasury Note 30/06/24 $48,000.00 $47,128.00
Global Short-Term Corporate Bond Index Fund US Treasury Note 15/11/21 $3,439,000.00 $3,496,784.00
Global Short-Term Corporate Bond Index Fund US Treasury Note 30/11/25 $972,000.00 $1,004,648.00
Global Short-Term Corporate Bond Index Fund US Treasury Note 31/05/22 $701,000.00 $692,688.00
Global Short-Term Corporate Bond Index Fund US Treasury Note 30/11/20 $687,000.00 $680,957.00
Global Short-Term Corporate Bond Index Fund US Treasury Note 15/11/21 $467,000.00 $474,847.00
Global Short-Term Corporate Bond Index Fund US Treasury Note 31/08/22 $182,000.00 $180,763.00
Global Short-Term Corporate Bond Index Fund US Treasury Note 30/11/25 $120,000.00 $124,031.00
Global Short-Term Corporate Bond Index Fund US Treasury Note 15/09/21 $99,000.00 $100,670.00
Global Short-Term Corporate Bond Index Fund US Treasury Note 30/06/24 $81,000.00 $79,528.00
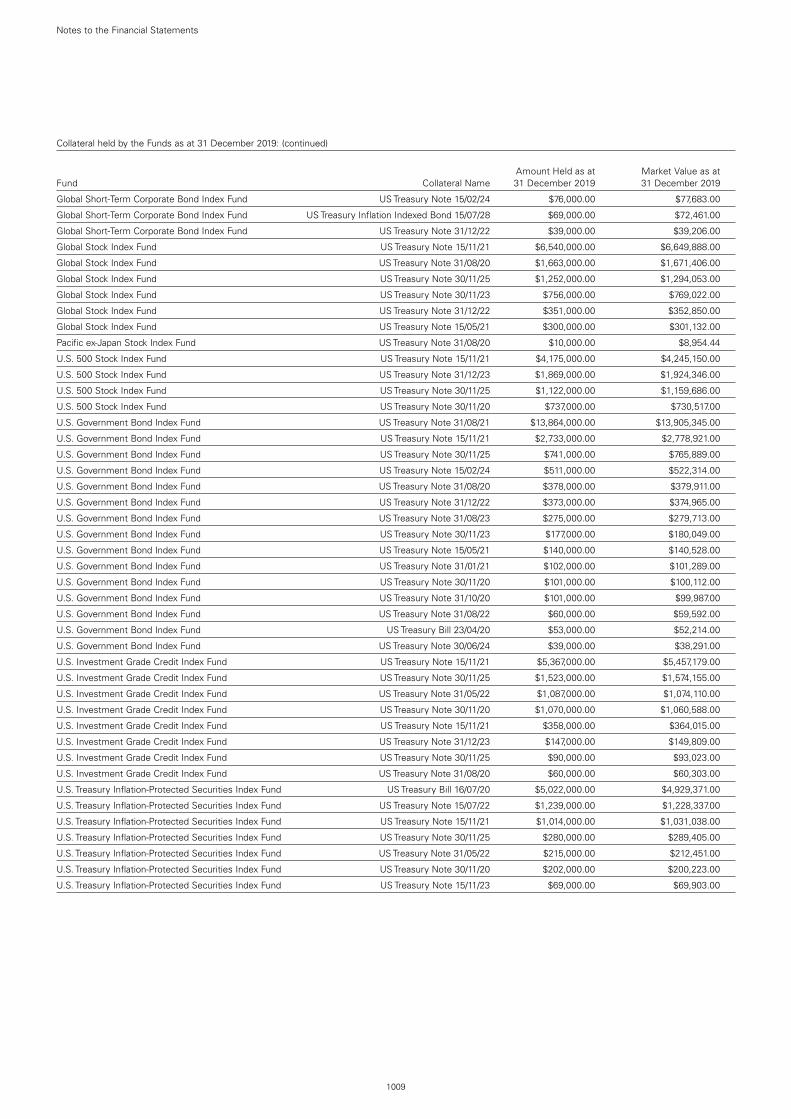
1009
Notes to the Financial Statements
Collateral held by the Funds as at 31 December 2019: (continued)
Amount Held as at Market Value as at Fund Collateral Name 31 December 2019 31 December 2019
Global Short-Term Corporate Bond Index Fund US Treasury Note 15/02/24 $76,000.00 $77,683.00
Global Short-Term Corporate Bond Index Fund US Treasury Inflation Indexed Bond 15/07/28 $69,000.00 $72,461.00
Global Short-Term Corporate Bond Index Fund US Treasury Note 31/12/22 $39,000.00 $39,206.00
Global Stock Index Fund US Treasury Note 15/11/21 $6,540,000.00 $6,649,888.00
Global Stock Index Fund US Treasury Note 31/08/20 $1,663,000.00 $1,671,406.00
Global Stock Index Fund US Treasury Note 30/11/25 $1,252,000.00 $1,294,053.00
Global Stock Index Fund US Treasury Note 30/11/23 $756,000.00 $769,022.00
Global Stock Index Fund US Treasury Note 31/12/22 $351,000.00 $352,850.00
Global Stock Index Fund US Treasury Note 15/05/21 $300,000.00 $301,132.00
Pacific ex-Japan Stock Index Fund US Treasury Note 31/08/20 $10,000.00 $8,954.44
U.S. 500 Stock Index Fund US Treasury Note 15/11/21 $4,175,000.00 $4,245,150.00
U.S. 500 Stock Index Fund US Treasury Note 31/12/23 $1,869,000.00 $1,924,346.00
U.S. 500 Stock Index Fund US Treasury Note 30/11/25 $1,122,000.00 $1,159,686.00
U.S. 500 Stock Index Fund US Treasury Note 30/11/20 $737,000.00 $730,517.00
U.S. Government Bond Index Fund US Treasury Note 31/08/21 $13,864,000.00 $13,905,345.00
U.S. Government Bond Index Fund US Treasury Note 15/11/21 $2,733,000.00 $2,778,921.00
U.S. Government Bond Index Fund US Treasury Note 30/11/25 $741,000.00 $765,889.00
U.S. Government Bond Index Fund US Treasury Note 15/02/24 $511,000.00 $522,314.00
U.S. Government Bond Index Fund US Treasury Note 31/08/20 $378,000.00 $379,911.00
U.S. Government Bond Index Fund US Treasury Note 31/12/22 $373,000.00 $374,965.00
U.S. Government Bond Index Fund US Treasury Note 31/08/23 $275,000.00 $279,713.00
U.S. Government Bond Index Fund US Treasury Note 30/11/23 $177,000.00 $180,049.00
U.S. Government Bond Index Fund US Treasury Note 15/05/21 $140,000.00 $140,528.00
U.S. Government Bond Index Fund US Treasury Note 31/01/21 $102,000.00 $101,289.00
U.S. Government Bond Index Fund US Treasury Note 30/11/20 $101,000.00 $100,112.00
U.S. Government Bond Index Fund US Treasury Note 31/10/20 $101,000.00 $99,987.00
U.S. Government Bond Index Fund US Treasury Note 31/08/22 $60,000.00 $59,592.00
U.S. Government Bond Index Fund US Treasury Bill 23/04/20 $53,000.00 $52,214.00
U.S. Government Bond Index Fund US Treasury Note 30/06/24 $39,000.00 $38,291.00
U.S. Investment Grade Credit Index Fund US Treasury Note 15/11/21 $5,367,000.00 $5,457,179.00
U.S. Investment Grade Credit Index Fund US Treasury Note 30/11/25 $1,523,000.00 $1,574,155.00
U.S. Investment Grade Credit Index Fund US Treasury Note 31/05/22 $1,087,000.00 $1,074,110.00
U.S. Investment Grade Credit Index Fund US Treasury Note 30/11/20 $1,070,000.00 $1,060,588.00
U.S. Investment Grade Credit Index Fund US Treasury Note 15/11/21 $358,000.00 $364,015.00
U.S. Investment Grade Credit Index Fund US Treasury Note 31/12/23 $147,000.00 $149,809.00
U.S. Investment Grade Credit Index Fund US Treasury Note 30/11/25 $90,000.00 $93,023.00
U.S. Investment Grade Credit Index Fund US Treasury Note 31/08/20 $60,000.00 $60,303.00
U.S. Treasury Inflation-Protected Securities Index Fund US Treasury Bill 16/07/20 $5,022,000.00 $4,929,371.00
U.S. Treasury Inflation-Protected Securities Index Fund US Treasury Note 15/07/22 $1,239,000.00 $1,228,337.00
U.S. Treasury Inflation-Protected Securities Index Fund US Treasury Note 15/11/21 $1,014,000.00 $1,031,038.00
U.S. Treasury Inflation-Protected Securities Index Fund US Treasury Note 30/11/25 $280,000.00 $289,405.00
U.S. Treasury Inflation-Protected Securities Index Fund US Treasury Note 31/05/22 $215,000.00 $212,451.00
U.S. Treasury Inflation-Protected Securities Index Fund US Treasury Note 30/11/20 $202,000.00 $200,223.00
U.S. Treasury Inflation-Protected Securities Index Fund US Treasury Note 15/11/23 $69,000.00 $69,903.00
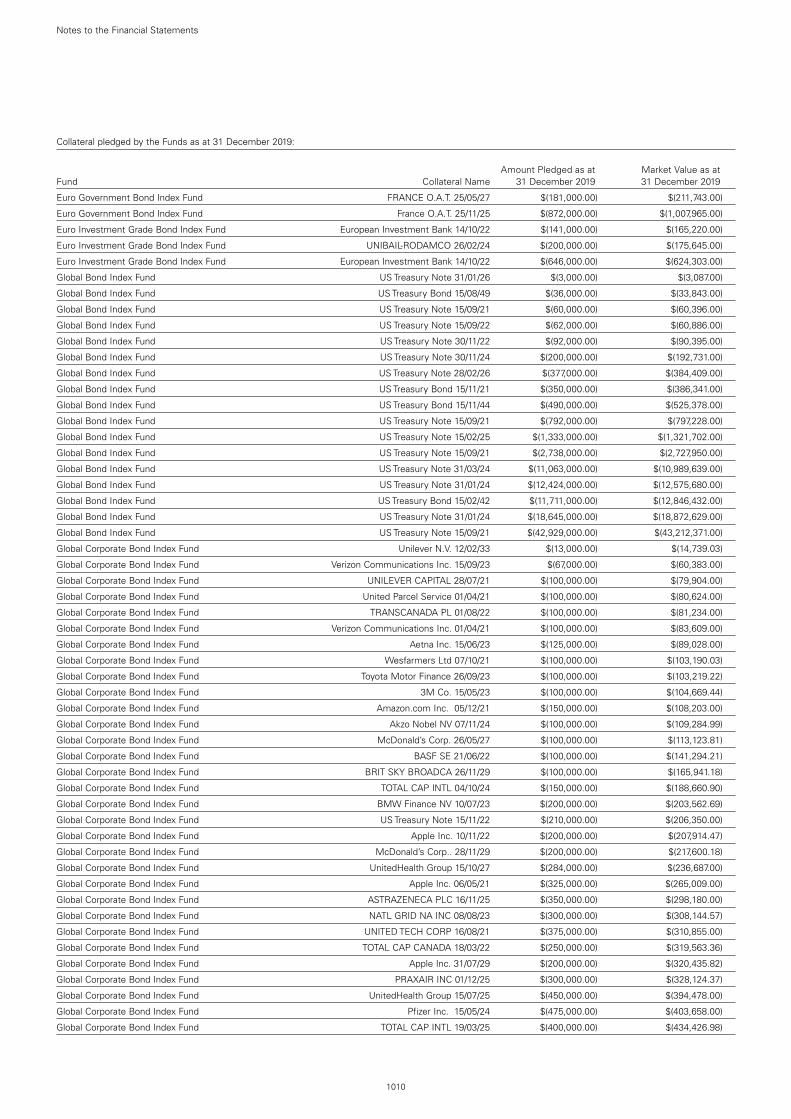
1010
Notes to the Financial Statements
Collateral pledged by the Funds as at 31 December 2019:
Amount Pledged as at Market Value as at Fund Collateral Name 31 December 2019 31 December 2019
Euro Government Bond Index Fund FRANCE O.A.T. 25/05/27 $(181,000.00) $(211,743.00)
Euro Government Bond Index Fund France O.A.T. 25/11/25 $(872,000.00) $(1,007,965.00)
Euro Investment Grade Bond Index Fund European Investment Bank 14/10/22 $(141,000.00) $(165,220.00)
Euro Investment Grade Bond Index Fund UNIBAIL-RODAMCO 26/02/24 $(200,000.00) $(175,645.00)
Euro Investment Grade Bond Index Fund European Investment Bank 14/10/22 $(646,000.00) $(624,303.00)
Global Bond Index Fund US Treasury Note 31/01/26 $(3,000.00) $(3,087.00)
Global Bond Index Fund US Treasury Bond 15/08/49 $(36,000.00) $(33,843.00)
Global Bond Index Fund US Treasury Note 15/09/21 $(60,000.00) $(60,396.00)
Global Bond Index Fund US Treasury Note 15/09/22 $(62,000.00) $(60,886.00)
Global Bond Index Fund US Treasury Note 30/11/22 $(92,000.00) $(90,395.00)
Global Bond Index Fund US Treasury Note 30/11/24 $(200,000.00) $(192,731.00)
Global Bond Index Fund US Treasury Note 28/02/26 $(377,000.00) $(384,409.00)
Global Bond Index Fund US Treasury Bond 15/11/21 $(350,000.00) $(386,341.00)
Global Bond Index Fund US Treasury Bond 15/11/44 $(490,000.00) $(525,378.00)
Global Bond Index Fund US Treasury Note 15/09/21 $(792,000.00) $(797,228.00)
Global Bond Index Fund US Treasury Note 15/02/25 $(1,333,000.00) $(1,321,702.00)
Global Bond Index Fund US Treasury Note 15/09/21 $(2,738,000.00) $(2,727,950.00)
Global Bond Index Fund US Treasury Note 31/03/24 $(11,063,000.00) $(10,989,639.00)
Global Bond Index Fund US Treasury Note 31/01/24 $(12,424,000.00) $(12,575,680.00)
Global Bond Index Fund US Treasury Bond 15/02/42 $(11,711,000.00) $(12,846,432.00)
Global Bond Index Fund US Treasury Note 31/01/24 $(18,645,000.00) $(18,872,629.00)
Global Bond Index Fund US Treasury Note 15/09/21 $(42,929,000.00) $(43,212,371.00)
Global Corporate Bond Index Fund Unilever N.V. 12/02/33 $(13,000.00) $(14,739.03)
Global Corporate Bond Index Fund Verizon Communications Inc. 15/09/23 $(67,000.00) $(60,383.00)
Global Corporate Bond Index Fund UNILEVER CAPITAL 28/07/21 $(100,000.00) $(79,904.00)
Global Corporate Bond Index Fund United Parcel Service 01/04/21 $(100,000.00) $(80,624.00)
Global Corporate Bond Index Fund TRANSCANADA PL 01/08/22 $(100,000.00) $(81,234.00)
Global Corporate Bond Index Fund Verizon Communications Inc. 01/04/21 $(100,000.00) $(83,609.00)
Global Corporate Bond Index Fund Aetna Inc. 15/06/23 $(125,000.00) $(89,028.00)
Global Corporate Bond Index Fund Wesfarmers Ltd 07/10/21 $(100,000.00) $(103,190.03)
Global Corporate Bond Index Fund Toyota Motor Finance 26/09/23 $(100,000.00) $(103,219.22)
Global Corporate Bond Index Fund 3M Co. 15/05/23 $(100,000.00) $(104,669.44)
Global Corporate Bond Index Fund Amazon.com Inc. 05/12/21 $(150,000.00) $(108,203.00)
Global Corporate Bond Index Fund Akzo Nobel NV 07/11/24 $(100,000.00) $(109,284.99)
Global Corporate Bond Index Fund McDonald’s Corp. 26/05/27 $(100,000.00) $(113,123.81)
Global Corporate Bond Index Fund BASF SE 21/06/22 $(100,000.00) $(141,294.21)
Global Corporate Bond Index Fund BRIT SKY BROADCA 26/11/29 $(100,000.00) $(165,941.18)
Global Corporate Bond Index Fund TOTAL CAP INTL 04/10/24 $(150,000.00) $(188,660.90)
Global Corporate Bond Index Fund BMW Finance NV 10/07/23 $(200,000.00) $(203,562.69)
Global Corporate Bond Index Fund US Treasury Note 15/11/22 $(210,000.00) $(206,350.00)
Global Corporate Bond Index Fund Apple Inc. 10/11/22 $(200,000.00) $(207,914.47)
Global Corporate Bond Index Fund McDonald’s Corp.. 28/11/29 $(200,000.00) $(217,600.18)
Global Corporate Bond Index Fund UnitedHealth Group 15/10/27 $(284,000.00) $(236,687.00)
Global Corporate Bond Index Fund Apple Inc. 06/05/21 $(325,000.00) $(265,009.00)
Global Corporate Bond Index Fund ASTRAZENECA PLC 16/11/25 $(350,000.00) $(298,180.00)
Global Corporate Bond Index Fund NATL GRID NA INC 08/08/23 $(300,000.00) $(308,144.57)
Global Corporate Bond Index Fund UNITED TECH CORP 16/08/21 $(375,000.00) $(310,855.00)
Global Corporate Bond Index Fund TOTAL CAP CANADA 18/03/22 $(250,000.00) $(319,563.36)
Global Corporate Bond Index Fund Apple Inc. 31/07/29 $(200,000.00) $(320,435.82)
Global Corporate Bond Index Fund PRAXAIR INC 01/12/25 $(300,000.00) $(328,124.37)
Global Corporate Bond Index Fund UnitedHealth Group 15/07/25 $(450,000.00) $(394,478.00)
Global Corporate Bond Index Fund Pfizer Inc. 15/05/24 $(475,000.00) $(403,658.00)
Global Corporate Bond Index Fund TOTAL CAP INTL 19/03/25 $(400,000.00) $(434,426.98)
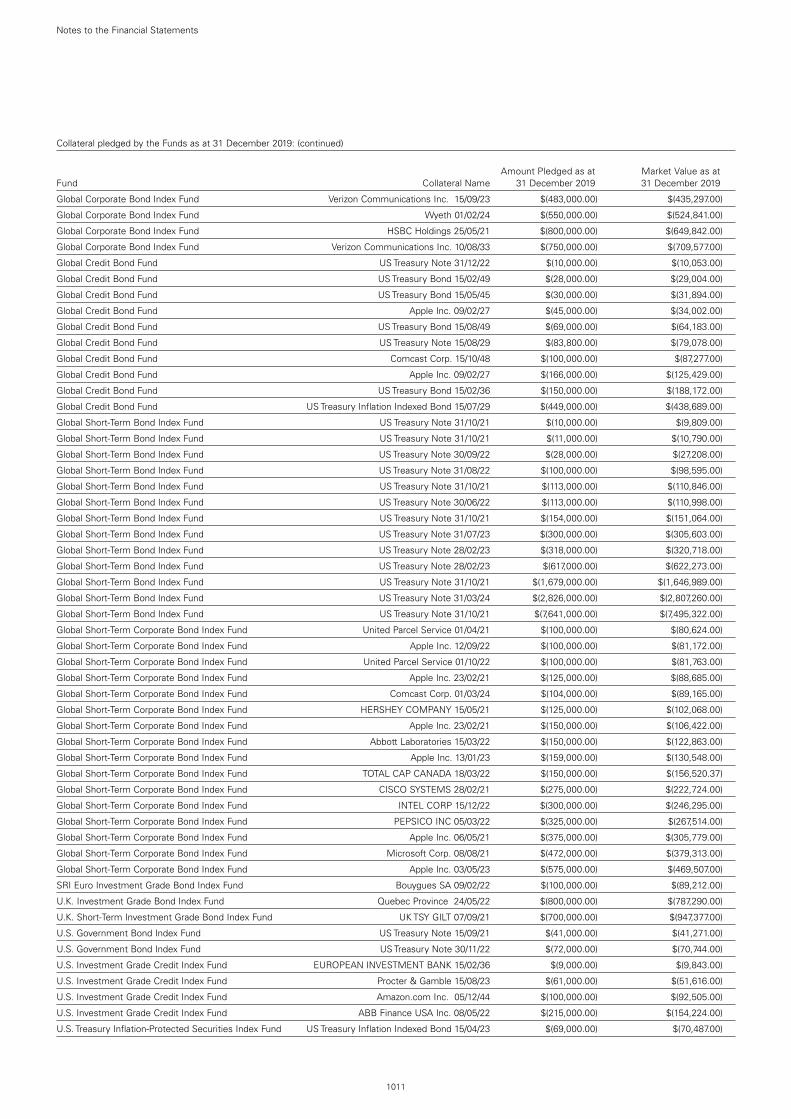
1011
Notes to the Financial Statements
Collateral pledged by the Funds as at 31 December 2019: (continued)
Amount Pledged as at Market Value as at Fund Collateral Name 31 December 2019 31 December 2019
Global Corporate Bond Index Fund Verizon Communications Inc. 15/09/23 $(483,000.00) $(435,297.00)
Global Corporate Bond Index Fund Wyeth 01/02/24 $(550,000.00) $(524,841.00)
Global Corporate Bond Index Fund HSBC Holdings 25/05/21 $(800,000.00) $(649,842.00)
Global Corporate Bond Index Fund Verizon Communications Inc. 10/08/33 $(750,000.00) $(709,577.00)
Global Credit Bond Fund US Treasury Note 31/12/22 $(10,000.00) $(10,053.00)
Global Credit Bond Fund US Treasury Bond 15/02/49 $(28,000.00) $(29,004.00)
Global Credit Bond Fund US Treasury Bond 15/05/45 $(30,000.00) $(31,894.00)
Global Credit Bond Fund Apple Inc. 09/02/27 $(45,000.00) $(34,002.00)
Global Credit Bond Fund US Treasury Bond 15/08/49 $(69,000.00) $(64,183.00)
Global Credit Bond Fund US Treasury Note 15/08/29 $(83,800.00) $(79,078.00)
Global Credit Bond Fund Comcast Corp. 15/10/48 $(100,000.00) $(87,277.00)
Global Credit Bond Fund Apple Inc. 09/02/27 $(166,000.00) $(125,429.00)
Global Credit Bond Fund US Treasury Bond 15/02/36 $(150,000.00) $(188,172.00)
Global Credit Bond Fund US Treasury Inflation Indexed Bond 15/07/29 $(449,000.00) $(438,689.00)
Global Short-Term Bond Index Fund US Treasury Note 31/10/21 $(10,000.00) $(9,809.00)
Global Short-Term Bond Index Fund US Treasury Note 31/10/21 $(11,000.00) $(10,790.00)
Global Short-Term Bond Index Fund US Treasury Note 30/09/22 $(28,000.00) $(27,208.00)
Global Short-Term Bond Index Fund US Treasury Note 31/08/22 $(100,000.00) $(98,595.00)
Global Short-Term Bond Index Fund US Treasury Note 31/10/21 $(113,000.00) $(110,846.00)
Global Short-Term Bond Index Fund US Treasury Note 30/06/22 $(113,000.00) $(110,998.00)
Global Short-Term Bond Index Fund US Treasury Note 31/10/21 $(154,000.00) $(151,064.00)
Global Short-Term Bond Index Fund US Treasury Note 31/07/23 $(300,000.00) $(305,603.00)
Global Short-Term Bond Index Fund US Treasury Note 28/02/23 $(318,000.00) $(320,718.00)
Global Short-Term Bond Index Fund US Treasury Note 28/02/23 $(617,000.00) $(622,273.00)
Global Short-Term Bond Index Fund US Treasury Note 31/10/21 $(1,679,000.00) $(1,646,989.00)
Global Short-Term Bond Index Fund US Treasury Note 31/03/24 $(2,826,000.00) $(2,807,260.00)
Global Short-Term Bond Index Fund US Treasury Note 31/10/21 $(7,641,000.00) $(7,495,322.00)
Global Short-Term Corporate Bond Index Fund United Parcel Service 01/04/21 $(100,000.00) $(80,624.00)
Global Short-Term Corporate Bond Index Fund Apple Inc. 12/09/22 $(100,000.00) $(81,172.00)
Global Short-Term Corporate Bond Index Fund United Parcel Service 01/10/22 $(100,000.00) $(81,763.00)
Global Short-Term Corporate Bond Index Fund Apple Inc. 23/02/21 $(125,000.00) $(88,685.00)
Global Short-Term Corporate Bond Index Fund Comcast Corp. 01/03/24 $(104,000.00) $(89,165.00)
Global Short-Term Corporate Bond Index Fund HERSHEY COMPANY 15/05/21 $(125,000.00) $(102,068.00)
Global Short-Term Corporate Bond Index Fund Apple Inc. 23/02/21 $(150,000.00) $(106,422.00)
Global Short-Term Corporate Bond Index Fund Abbott Laboratories 15/03/22 $(150,000.00) $(122,863.00)
Global Short-Term Corporate Bond Index Fund Apple Inc. 13/01/23 $(159,000.00) $(130,548.00)
Global Short-Term Corporate Bond Index Fund TOTAL CAP CANADA 18/03/22 $(150,000.00) $(156,520.37)
Global Short-Term Corporate Bond Index Fund CISCO SYSTEMS 28/02/21 $(275,000.00) $(222,724.00)
Global Short-Term Corporate Bond Index Fund INTEL CORP 15/12/22 $(300,000.00) $(246,295.00)
Global Short-Term Corporate Bond Index Fund PEPSICO INC 05/03/22 $(325,000.00) $(267,514.00)
Global Short-Term Corporate Bond Index Fund Apple Inc. 06/05/21 $(375,000.00) $(305,779.00)
Global Short-Term Corporate Bond Index Fund Microsoft Corp. 08/08/21 $(472,000.00) $(379,313.00)
Global Short-Term Corporate Bond Index Fund Apple Inc. 03/05/23 $(575,000.00) $(469,507.00)
SRI Euro Investment Grade Bond Index Fund Bouygues SA 09/02/22 $(100,000.00) $(89,212.00)
U.K. Investment Grade Bond Index Fund Quebec Province 24/05/22 $(800,000.00) $(787,290.00)
U.K. Short-Term Investment Grade Bond Index Fund UK TSY GILT 07/09/21 $(700,000.00) $(947,377.00)
U.S. Government Bond Index Fund US Treasury Note 15/09/21 $(41,000.00) $(41,271.00)
U.S. Government Bond Index Fund US Treasury Note 30/11/22 $(72,000.00) $(70,744.00)
U.S. Investment Grade Credit Index Fund EUROPEAN INVESTMENT BANK 15/02/36 $(9,000.00) $(9,843.00)
U.S. Investment Grade Credit Index Fund Procter & Gamble 15/08/23 $(61,000.00) $(51,616.00)
U.S. Investment Grade Credit Index Fund Amazon.com Inc. 05/12/44 $(100,000.00) $(92,505.00)
U.S. Investment Grade Credit Index Fund ABB Finance USA Inc. 08/05/22 $(215,000.00) $(154,224.00)
U.S. Treasury Inflation-Protected Securities Index Fund US Treasury Inflation Indexed Bond 15/04/23 $(69,000.00) $(70,487.00)
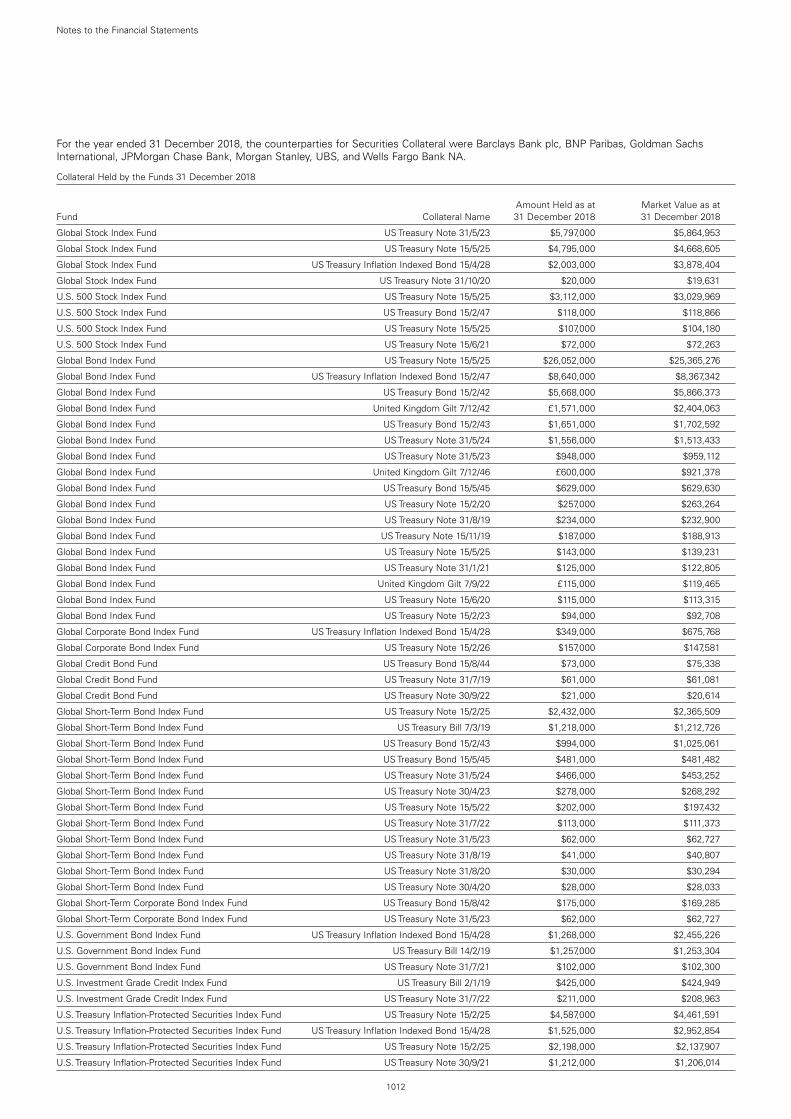
1012
Notes to the Financial Statements
For the year ended 31 December 2018, the counterparties for Securities Collateral were Barclays Bank plc, BNP Paribas, Goldman Sachs International, JPMorgan Chase Bank, Morgan Stanley, UBS, and Wells Fargo Bank NA.
Collateral Held by the Funds 31 December 2018
Amount Held as at Market Value as at Fund Collateral Name 31 December 2018 31 December 2018
Global Stock Index Fund US Treasury Note 31/5/23 $5,797,000 $5,864,953
Global Stock Index Fund US Treasury Note 15/5/25 $4,795,000 $4,668,605
Global Stock Index Fund US Treasury Inflation Indexed Bond 15/4/28 $2,003,000 $3,878,404
Global Stock Index Fund US Treasury Note 31/10/20 $20,000 $19,631
U.S. 500 Stock Index Fund US Treasury Note 15/5/25 $3,112,000 $3,029,969
U.S. 500 Stock Index Fund US Treasury Bond 15/2/47 $118,000 $118,866
U.S. 500 Stock Index Fund US Treasury Note 15/5/25 $107,000 $104,180
U.S. 500 Stock Index Fund US Treasury Note 15/6/21 $72,000 $72,263
Global Bond Index Fund US Treasury Note 15/5/25 $26,052,000 $25,365,276
Global Bond Index Fund US Treasury Inflation Indexed Bond 15/2/47 $8,640,000 $8,367,342
Global Bond Index Fund US Treasury Bond 15/2/42 $5,668,000 $5,866,373
Global Bond Index Fund United Kingdom Gilt 7/12/42 £1,571,000 $2,404,063
Global Bond Index Fund US Treasury Bond 15/2/43 $1,651,000 $1,702,592
Global Bond Index Fund US Treasury Note 31/5/24 $1,556,000 $1,513,433
Global Bond Index Fund US Treasury Note 31/5/23 $948,000 $959,112
Global Bond Index Fund United Kingdom Gilt 7/12/46 £600,000 $921,378
Global Bond Index Fund US Treasury Bond 15/5/45 $629,000 $629,630
Global Bond Index Fund US Treasury Note 15/2/20 $257,000 $263,264
Global Bond Index Fund US Treasury Note 31/8/19 $234,000 $232,900
Global Bond Index Fund US Treasury Note 15/11/19 $187,000 $188,913
Global Bond Index Fund US Treasury Note 15/5/25 $143,000 $139,231
Global Bond Index Fund US Treasury Note 31/1/21 $125,000 $122,805
Global Bond Index Fund United Kingdom Gilt 7/9/22 £115,000 $119,465
Global Bond Index Fund US Treasury Note 15/6/20 $115,000 $113,315
Global Bond Index Fund US Treasury Note 15/2/23 $94,000 $92,708
Global Corporate Bond Index Fund US Treasury Inflation Indexed Bond 15/4/28 $349,000 $675,768
Global Corporate Bond Index Fund US Treasury Note 15/2/26 $157,000 $147,581
Global Credit Bond Fund US Treasury Bond 15/8/44 $73,000 $75,338
Global Credit Bond Fund US Treasury Note 31/7/19 $61,000 $61,081
Global Credit Bond Fund US Treasury Note 30/9/22 $21,000 $20,614
Global Short-Term Bond Index Fund US Treasury Note 15/2/25 $2,432,000 $2,365,509
Global Short-Term Bond Index Fund US Treasury Bill 7/3/19 $1,218,000 $1,212,726
Global Short-Term Bond Index Fund US Treasury Bond 15/2/43 $994,000 $1,025,061
Global Short-Term Bond Index Fund US Treasury Bond 15/5/45 $481,000 $481,482
Global Short-Term Bond Index Fund US Treasury Note 31/5/24 $466,000 $453,252
Global Short-Term Bond Index Fund US Treasury Note 30/4/23 $278,000 $268,292
Global Short-Term Bond Index Fund US Treasury Note 15/5/22 $202,000 $197,432
Global Short-Term Bond Index Fund US Treasury Note 31/7/22 $113,000 $111,373
Global Short-Term Bond Index Fund US Treasury Note 31/5/23 $62,000 $62,727
Global Short-Term Bond Index Fund US Treasury Note 31/8/19 $41,000 $40,807
Global Short-Term Bond Index Fund US Treasury Note 31/8/20 $30,000 $30,294
Global Short-Term Bond Index Fund US Treasury Note 30/4/20 $28,000 $28,033
Global Short-Term Corporate Bond Index Fund US Treasury Bond 15/8/42 $175,000 $169,285
Global Short-Term Corporate Bond Index Fund US Treasury Note 31/5/23 $62,000 $62,727
U.S. Government Bond Index Fund US Treasury Inflation Indexed Bond 15/4/28 $1,268,000 $2,455,226
U.S. Government Bond Index Fund US Treasury Bill 14/2/19 $1,257,000 $1,253,304
U.S. Government Bond Index Fund US Treasury Note 31/7/21 $102,000 $102,300
U.S. Investment Grade Credit Index Fund US Treasury Bill 2/1/19 $425,000 $424,949
U.S. Investment Grade Credit Index Fund US Treasury Note 31/7/22 $211,000 $208,963
U.S. Treasury Inflation-Protected Securities Index Fund US Treasury Note 15/2/25 $4,587,000 $4,461,591
U.S. Treasury Inflation-Protected Securities Index Fund US Treasury Inflation Indexed Bond 15/4/28 $1,525,000 $2,952,854
U.S. Treasury Inflation-Protected Securities Index Fund US Treasury Note 15/2/25 $2,198,000 $2,137,907
U.S. Treasury Inflation-Protected Securities Index Fund US Treasury Note 30/9/21 $1,212,000 $1,206,014

1013
Notes to the Financial Statements
Collateral Held by the Funds 31 December 2018 (continued)
Amount Held as at Market Value as at Fund Collateral Name 31 December 2018 31 December 2018
U.S. Treasury Inflation-Protected Securities Index Fund US Treasury Note 31/5/23 $744,000 $752,721
U.S. Treasury Inflation-Protected Securities Index Fund US Treasury Bond 15/5/43 $140,000 $137,164
Collateral Pledged by the Funds 31 December 2018
Amount Pledged as at Market Value as at Fund Collateral Name 31 December 2018 31 December 2018
Global Corporate Bond Index Fund 3M Co. 7/8/20 ($32,000) ($31,852)
Global Corporate Bond Index Fund NSTAR Electric Co. 15/3/40 ($50,000) ($57,976)
Global Corporate Bond Index Fund John Deere Capital Corp. 4/3/21 ($75,000) ($74,531)
Global Corporate Bond Index Fund Walt Disney Co. 12/2/21 ($150,000) ($147,931)
Global Corporate Bond Index Fund Costco Wholesale Corp. 15/2/20 ($150,000) ($148,003)
Global Corporate Bond Index Fund Total Capital International SA 17/2/22 ($150,000) ($148,358)
Global Corporate Bond Index Fund United Parcel Service, Inc. 15/1/21 ($150,000) ($150,575)
Global Corporate Bond Index Fund Total Capital Canada Ltd. 15/7/23 ($200,000) ($194,694)
Global Corporate Bond Index Fund Walmart, Inc. 15/12/20 ($225,000) ($221,224)
Global Corporate Bond Index Fund Motability Operations Group plc 14/3/25 (€200,000) ($226,497)
Global Corporate Bond Index Fund Verizon Communications, Inc. 2/6/22 (€200,000) ($228,006)
Global Corporate Bond Index Fund Target Corp. 15/7/20 ($225,000) ($228,265)
Global Corporate Bond Index Fund Walt Disney Co. 30/7/26 ($290,000) ($257,039)
Global Corporate Bond Index Fund Target Corp. 1/11/32 ($225,000) ($276,778)
Global Corporate Bond Index Fund Evonik Finance BV 8/3/21 (€300,000) ($340,510)
Global Corporate Bond Index Fund Unilever NV 29/4/20 (€300,000) ($342,916)
Global Corporate Bond Index Fund Orange SA 1/3/31 ($250,000) ($346,251)
Global Corporate Bond Index Fund JAB Holdings BV 25/6/29 (€300,000) ($346,948)
Global Corporate Bond Index Fund Verizon Communications, Inc. 1/11/21 ($350,000) ($353,099)
Global Corporate Bond Index Fund Deutsche Bank AG 20/1/22 (€400,000) ($448,778)
Global Corporate Bond Index Fund Verizon Communications, Inc. 16/3/22 ($500,000) ($496,478)
Global Corporate Bond Index Fund Verizon Communications, Inc. 15/9/23 ($550,000) ($585,849)
Global Corporate Bond Index Fund Verizon Communications, Inc. 10/8/33 ($625,000) ($621,272)
Global Short-Term Corporate Bond Index Fund Boeing Co. 15/2/20 ($125,000) ($127,510)
Global Short-Term Corporate Bond Index Fund 3M Co. 7/8/20 ($135,000) ($133,347)
Global Short-Term Corporate Bond Index Fund Microsoft Corp. 6/2/20 ($150,000) ($148,891)
Global Short-Term Corporate Bond Index Fund Walt Disney Co. 4/3/22 ($200,000) ($195,640)
Global Short-Term Corporate Bond Index Fund Intel Corp. 11/5/20 ($250,000) ($246,958)
Global Short-Term Corporate Bond Index Fund International Business Machines Corp. 1/8/22 ($265,000) ($250,054)
Global Short-Term Corporate Bond Index Fund Verizon Communications, Inc. 15/9/23 ($442,000) ($475,840)
Global Short-Term Corporate Bond Index Fund Verizon Communications, Inc. 2/6/22 (€500,000) ($570,015)
SRI Euro Investment Grade Bond Index Fund Bouygues SA 9/2/22 (€100,000) ($112,643)
U.K. Investment Grade Bond Index Fund Orange SA 10/11/20 £(790,000) ($870,182)
U.K. Short-Term Investment Grade Bond Index Fund Orange SA 10/11/20 £(850,000) ($945,470)
U.S. Government Bond Index Fund US Treasury Note 31/7/22 ($312,000) ($307,509)
U.S. Government Bond Index Fund US Treasury Note 15/2/26 ($538,000) ($505,722)
U.S. Investment Grade Credit Index Fund Province of Quebec Canada 29/7/20 ($50,000) ($50,650)
U.S. Investment Grade Credit Index Fund Province of Quebec Canada 13/2/23 ($250,000) ($247,754)
U.S. Investment Grade Credit Index Fund European Investment Bank 15/6/20 ($875,000) ($859,841)
12. Related Party Transactions.
Manager. Vanguard Group (Ireland) Limited is the Funds’ Manager and acts as a principal in respect of all transactions of shares in the Funds. For its services, the Manager receives a fixed single fee per share class (the “Management Fees”) calculated on a daily basis and expressed as a percentage by dividing the total net assets of each share class by the number of shares in issue and paid monthly. Out of the fees received, the Manager pays for any sub-advisers, as well as the costs of administration including audit, depositary, legal, registration and regulatory fees associated with the Funds. As a result, the Manager anticipates that the ongoing charges figure (“OCF”) of each share class will closely track the
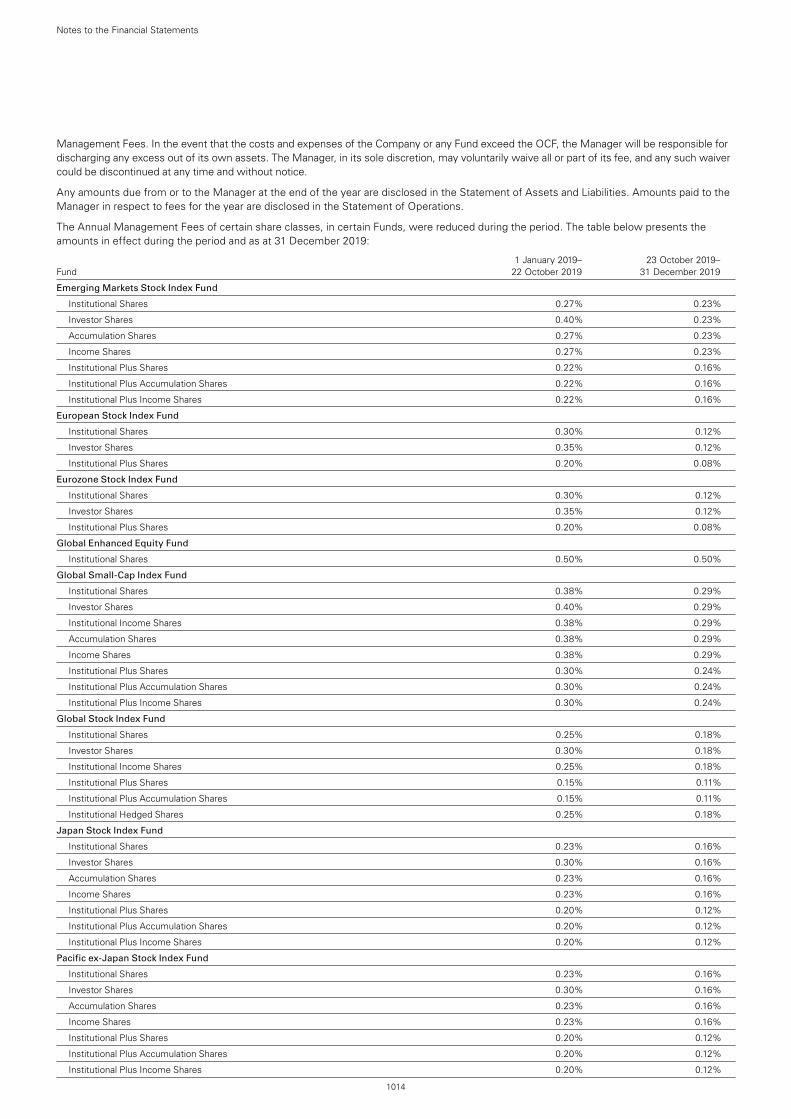
1014
Management Fees. In the event that the costs and expenses of the Company or any Fund exceed the OCF, the Manager will be responsible for discharging any excess out of its own assets. The Manager, in its sole discretion, may voluntarily waive all or part of its fee, and any such waiver could be discontinued at any time and without notice.
Any amounts due from or to the Manager at the end of the year are disclosed in the Statement of Assets and Liabilities. Amounts paid to the Manager in respect to fees for the year are disclosed in the Statement of Operations.
The Annual Management Fees of certain share classes, in certain Funds, were reduced during the period. The table below presents the amounts in effect during the period and as at 31 December 2019:
1 January 2019– 23 October 2019– Fund 22 October 2019 31 December 2019
Emerging Markets Stock Index Fund
Institutional Shares 0.27% 0.23%
Investor Shares 0.40% 0.23%
Accumulation Shares 0.27% 0.23%
Income Shares 0.27% 0.23%
Institutional Plus Shares 0.22% 0.16%
Institutional Plus Accumulation Shares 0.22% 0.16%
Institutional Plus Income Shares 0.22% 0.16%
European Stock Index Fund
Institutional Shares 0.30% 0.12%
Investor Shares 0.35% 0.12%
Institutional Plus Shares 0.20% 0.08%
Eurozone Stock Index Fund
Institutional Shares 0.30% 0.12%
Investor Shares 0.35% 0.12%
Institutional Plus Shares 0.20% 0.08%
Global Enhanced Equity Fund
Institutional Shares 0.50% 0.50%
Global Small-Cap Index Fund
Institutional Shares 0.38% 0.29%
Investor Shares 0.40% 0.29%
Institutional Income Shares 0.38% 0.29%
Accumulation Shares 0.38% 0.29%
Income Shares 0.38% 0.29%
Institutional Plus Shares 0.30% 0.24%
Institutional Plus Accumulation Shares 0.30% 0.24%
Institutional Plus Income Shares 0.30% 0.24%
Global Stock Index Fund
Institutional Shares 0.25% 0.18%
Investor Shares 0.30% 0.18%
Institutional Income Shares 0.25% 0.18%
Institutional Plus Shares 0.15% 0.11%
Institutional Plus Accumulation Shares 0.15% 0.11%
Institutional Hedged Shares 0.25% 0.18%
Japan Stock Index Fund
Institutional Shares 0.23% 0.16%
Investor Shares 0.30% 0.16%
Accumulation Shares 0.23% 0.16%
Income Shares 0.23% 0.16%
Institutional Plus Shares 0.20% 0.12%
Institutional Plus Accumulation Shares 0.20% 0.12%
Institutional Plus Income Shares 0.20% 0.12%
Pacific ex-Japan Stock Index Fund
Institutional Shares 0.23% 0.16%
Investor Shares 0.30% 0.16%
Accumulation Shares 0.23% 0.16%
Income Shares 0.23% 0.16%
Institutional Plus Shares 0.20% 0.12%
Institutional Plus Accumulation Shares 0.20% 0.12%
Institutional Plus Income Shares 0.20% 0.12%
Notes to the Financial Statements
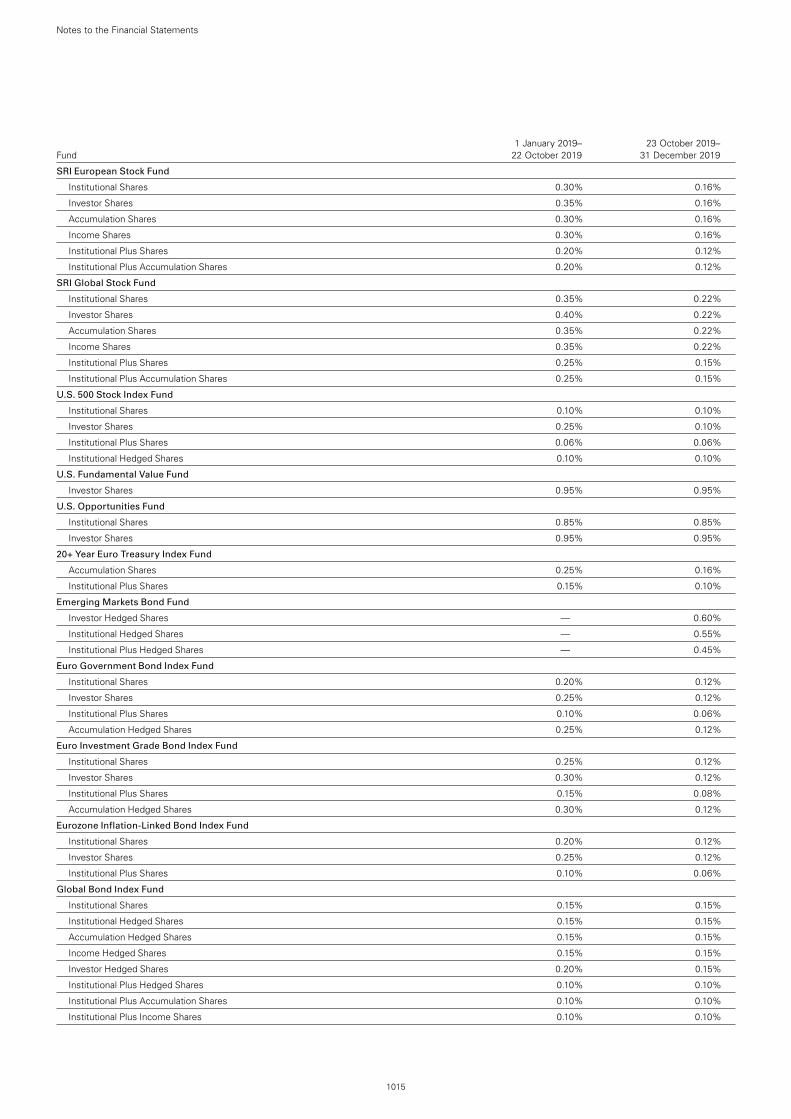
1015
1 January 2019– 23 October 2019– Fund 22 October 2019 31 December 2019
SRI European Stock Fund
Institutional Shares 0.30% 0.16%
Investor Shares 0.35% 0.16%
Accumulation Shares 0.30% 0.16%
Income Shares 0.30% 0.16%
Institutional Plus Shares 0.20% 0.12%
Institutional Plus Accumulation Shares 0.20% 0.12%
SRI Global Stock Fund
Institutional Shares 0.35% 0.22%
Investor Shares 0.40% 0.22%
Accumulation Shares 0.35% 0.22%
Income Shares 0.35% 0.22%
Institutional Plus Shares 0.25% 0.15%
Institutional Plus Accumulation Shares 0.25% 0.15%
U.S. 500 Stock Index Fund
Institutional Shares 0.10% 0.10%
Investor Shares 0.25% 0.10%
Institutional Plus Shares 0.06% 0.06%
Institutional Hedged Shares 0.10% 0.10%
U.S. Fundamental Value Fund
Investor Shares 0.95% 0.95%
U.S. Opportunities Fund
Institutional Shares 0.85% 0.85%
Investor Shares 0.95% 0.95%
20+ Year Euro Treasury Index Fund
Accumulation Shares 0.25% 0.16%
Institutional Plus Shares 0.15% 0.10%
Emerging Markets Bond Fund
Investor Hedged Shares — 0.60%
Institutional Hedged Shares — 0.55%
Institutional Plus Hedged Shares — 0.45%
Euro Government Bond Index Fund
Institutional Shares 0.20% 0.12%
Investor Shares 0.25% 0.12%
Institutional Plus Shares 0.10% 0.06%
Accumulation Hedged Shares 0.25% 0.12%
Euro Investment Grade Bond Index Fund
Institutional Shares 0.25% 0.12%
Investor Shares 0.30% 0.12%
Institutional Plus Shares 0.15% 0.08%
Accumulation Hedged Shares 0.30% 0.12%
Eurozone Inflation-Linked Bond Index Fund
Institutional Shares 0.20% 0.12%
Investor Shares 0.25% 0.12%
Institutional Plus Shares 0.10% 0.06%
Global Bond Index Fund
Institutional Shares 0.15% 0.15%
Institutional Hedged Shares 0.15% 0.15%
Accumulation Hedged Shares 0.15% 0.15%
Income Hedged Shares 0.15% 0.15%
Investor Hedged Shares 0.20% 0.15%
Institutional Plus Hedged Shares 0.10% 0.10%
Institutional Plus Accumulation Shares 0.10% 0.10%
Institutional Plus Income Shares 0.10% 0.10%
Notes to the Financial Statements
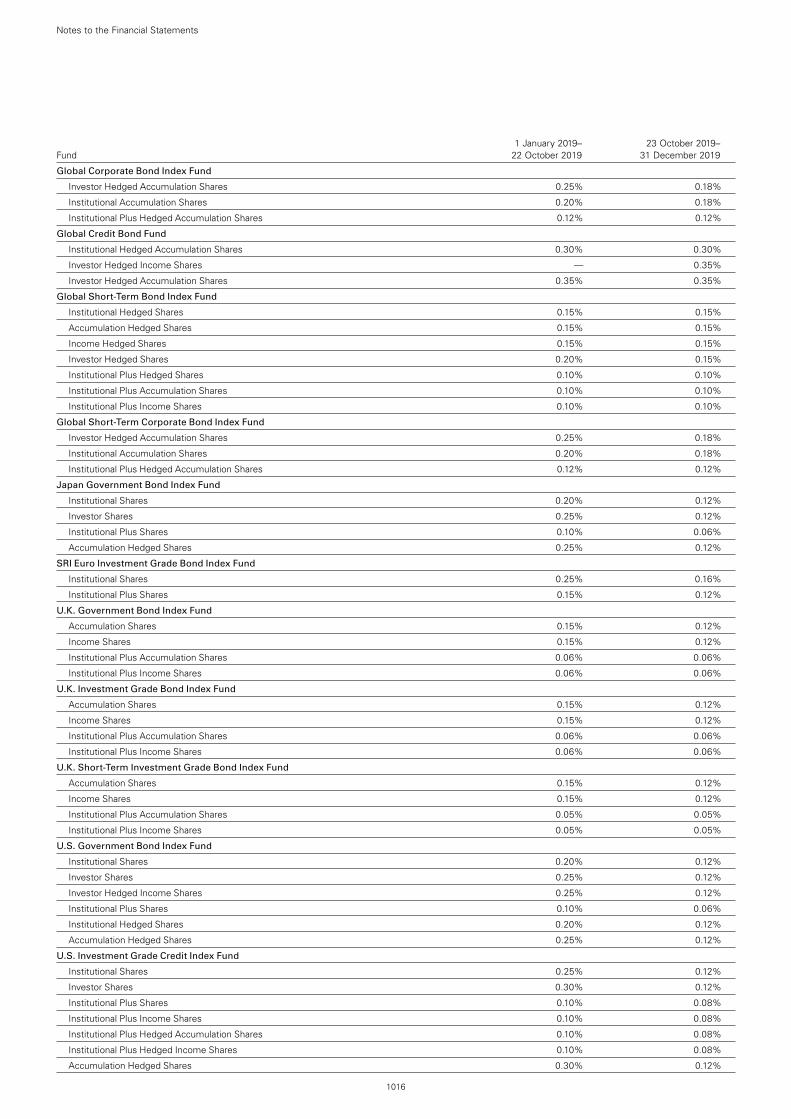
1016
Notes to the Financial Statements
1 January 2019– 23 October 2019– Fund 22 October 2019 31 December 2019
Global Corporate Bond Index Fund
Investor Hedged Accumulation Shares 0.25% 0.18%
Institutional Accumulation Shares 0.20% 0.18%
Institutional Plus Hedged Accumulation Shares 0.12% 0.12%
Global Credit Bond Fund
Institutional Hedged Accumulation Shares 0.30% 0.30%
Investor Hedged Income Shares — 0.35%
Investor Hedged Accumulation Shares 0.35% 0.35%
Global Short-Term Bond Index Fund
Institutional Hedged Shares 0.15% 0.15%
Accumulation Hedged Shares 0.15% 0.15%
Income Hedged Shares 0.15% 0.15%
Investor Hedged Shares 0.20% 0.15%
Institutional Plus Hedged Shares 0.10% 0.10%
Institutional Plus Accumulation Shares 0.10% 0.10%
Institutional Plus Income Shares 0.10% 0.10%
Global Short-Term Corporate Bond Index Fund
Investor Hedged Accumulation Shares 0.25% 0.18%
Institutional Accumulation Shares 0.20% 0.18%
Institutional Plus Hedged Accumulation Shares 0.12% 0.12%
Japan Government Bond Index Fund
Institutional Shares 0.20% 0.12%
Investor Shares 0.25% 0.12%
Institutional Plus Shares 0.10% 0.06%
Accumulation Hedged Shares 0.25% 0.12%
SRI Euro Investment Grade Bond Index Fund
Institutional Shares 0.25% 0.16%
Institutional Plus Shares 0.15% 0.12%
U.K. Government Bond Index Fund
Accumulation Shares 0.15% 0.12%
Income Shares 0.15% 0.12%
Institutional Plus Accumulation Shares 0.06% 0.06%
Institutional Plus Income Shares 0.06% 0.06%
U.K. Investment Grade Bond Index Fund
Accumulation Shares 0.15% 0.12%
Income Shares 0.15% 0.12%
Institutional Plus Accumulation Shares 0.06% 0.06%
Institutional Plus Income Shares 0.06% 0.06%
U.K. Short-Term Investment Grade Bond Index Fund
Accumulation Shares 0.15% 0.12%
Income Shares 0.15% 0.12%
Institutional Plus Accumulation Shares 0.05% 0.05%
Institutional Plus Income Shares 0.05% 0.05%
U.S. Government Bond Index Fund
Institutional Shares 0.20% 0.12%
Investor Shares 0.25% 0.12%
Investor Hedged Income Shares 0.25% 0.12%
Institutional Plus Shares 0.10% 0.06%
Institutional Hedged Shares 0.20% 0.12%
Accumulation Hedged Shares 0.25% 0.12%
U.S. Investment Grade Credit Index Fund
Institutional Shares 0.25% 0.12%
Investor Shares 0.30% 0.12%
Institutional Plus Shares 0.10% 0.08%
Institutional Plus Income Shares 0.10% 0.08%
Institutional Plus Hedged Accumulation Shares 0.10% 0.08%
Institutional Plus Hedged Income Shares 0.10% 0.08%
Accumulation Hedged Shares 0.30% 0.12%
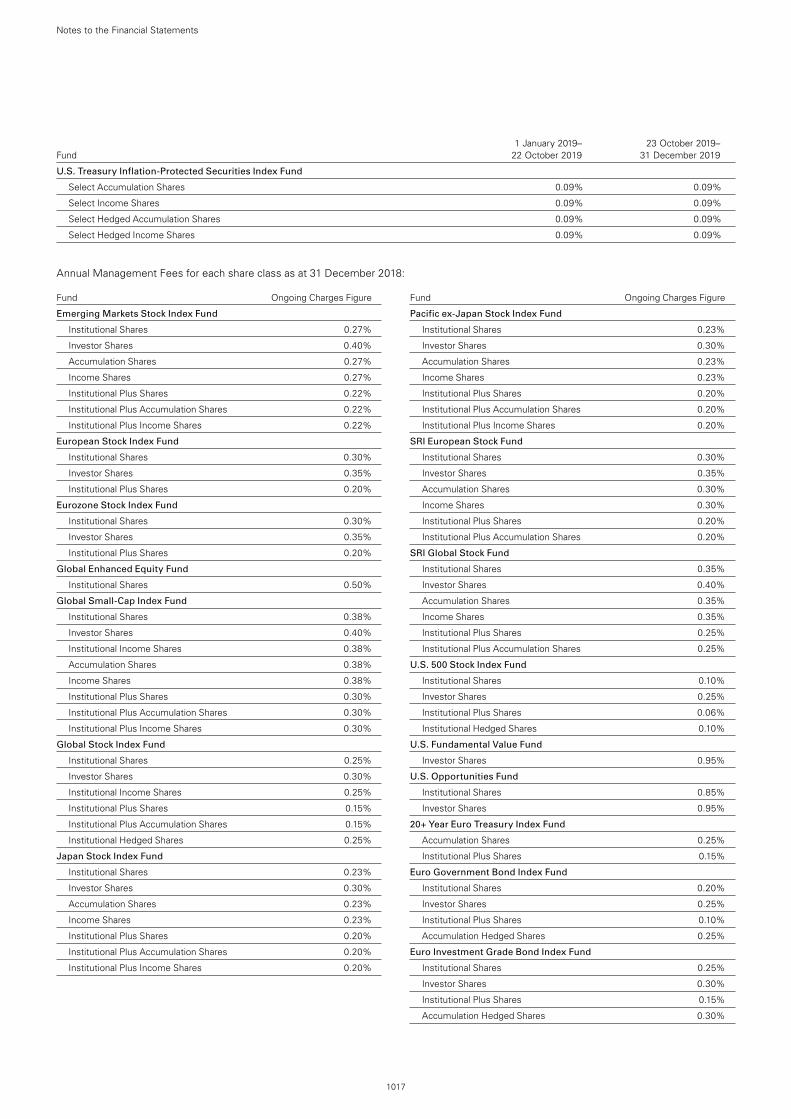
1017
Notes to the Financial Statements
1 January 2019– 23 October 2019– Fund 22 October 2019 31 December 2019
U.S. Treasury Inflation-Protected Securities Index Fund
Select Accumulation Shares 0.09% 0.09%
Select Income Shares 0.09% 0.09%
Select Hedged Accumulation Shares 0.09% 0.09%
Select Hedged Income Shares 0.09% 0.09%
Annual Management Fees for each share class as at 31 December 2018:
Fund Ongoing Charges Figure
Emerging Markets Stock Index Fund
Institutional Shares 0.27%
Investor Shares 0.40%
Accumulation Shares 0.27%
Income Shares 0.27%
Institutional Plus Shares 0.22%
Institutional Plus Accumulation Shares 0.22%
Institutional Plus Income Shares 0.22%
European Stock Index Fund
Institutional Shares 0.30%
Investor Shares 0.35%
Institutional Plus Shares 0.20%
Eurozone Stock Index Fund
Institutional Shares 0.30%
Investor Shares 0.35%
Institutional Plus Shares 0.20%
Global Enhanced Equity Fund
Institutional Shares 0.50%
Global Small-Cap Index Fund
Institutional Shares 0.38%
Investor Shares 0.40%
Institutional Income Shares 0.38%
Accumulation Shares 0.38%
Income Shares 0.38%
Institutional Plus Shares 0.30%
Institutional Plus Accumulation Shares 0.30%
Institutional Plus Income Shares 0.30%
Global Stock Index Fund
Institutional Shares 0.25%
Investor Shares 0.30%
Institutional Income Shares 0.25%
Institutional Plus Shares 0.15%
Institutional Plus Accumulation Shares 0.15%
Institutional Hedged Shares 0.25%
Japan Stock Index Fund
Institutional Shares 0.23%
Investor Shares 0.30%
Accumulation Shares 0.23%
Income Shares 0.23%
Institutional Plus Shares 0.20%
Institutional Plus Accumulation Shares 0.20%
Institutional Plus Income Shares 0.20%
Fund Ongoing Charges Figure
Pacific ex-Japan Stock Index Fund
Institutional Shares 0.23%
Investor Shares 0.30%
Accumulation Shares 0.23%
Income Shares 0.23%
Institutional Plus Shares 0.20%
Institutional Plus Accumulation Shares 0.20%
Institutional Plus Income Shares 0.20%
SRI European Stock Fund
Institutional Shares 0.30%
Investor Shares 0.35%
Accumulation Shares 0.30%
Income Shares 0.30%
Institutional Plus Shares 0.20%
Institutional Plus Accumulation Shares 0.20%
SRI Global Stock Fund
Institutional Shares 0.35%
Investor Shares 0.40%
Accumulation Shares 0.35%
Income Shares 0.35%
Institutional Plus Shares 0.25%
Institutional Plus Accumulation Shares 0.25%
U.S. 500 Stock Index Fund
Institutional Shares 0.10%
Investor Shares 0.25%
Institutional Plus Shares 0.06%
Institutional Hedged Shares 0.10%
U.S. Fundamental Value Fund
Investor Shares 0.95%
U.S. Opportunities Fund
Institutional Shares 0.85%
Investor Shares 0.95%
20+ Year Euro Treasury Index Fund
Accumulation Shares 0.25%
Institutional Plus Shares 0.15%
Euro Government Bond Index Fund
Institutional Shares 0.20%
Investor Shares 0.25%
Institutional Plus Shares 0.10%
Accumulation Hedged Shares 0.25%
Euro Investment Grade Bond Index Fund
Institutional Shares 0.25%
Investor Shares 0.30%
Institutional Plus Shares 0.15%
Accumulation Hedged Shares 0.30%
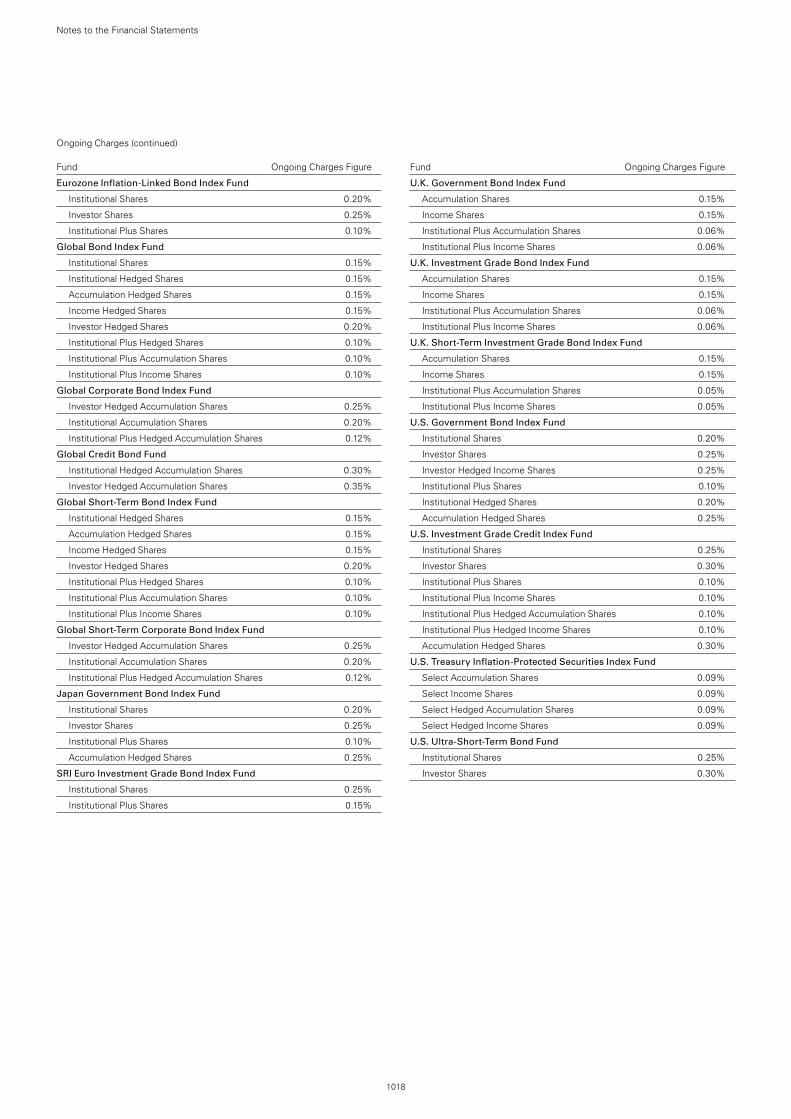
1018
Notes to the Financial Statements
Ongoing Charges (continued) Fund Ongoing Charges Figure
Eurozone Inflation-Linked Bond Index Fund
Institutional Shares 0.20%
Investor Shares 0.25%
Institutional Plus Shares 0.10%
Global Bond Index Fund
Institutional Shares 0.15%
Institutional Hedged Shares 0.15%
Accumulation Hedged Shares 0.15%
Income Hedged Shares 0.15%
Investor Hedged Shares 0.20%
Institutional Plus Hedged Shares 0.10%
Institutional Plus Accumulation Shares 0.10%
Institutional Plus Income Shares 0.10%
Global Corporate Bond Index Fund
Investor Hedged Accumulation Shares 0.25%
Institutional Accumulation Shares 0.20%
Institutional Plus Hedged Accumulation Shares 0.12%
Global Credit Bond Fund
Institutional Hedged Accumulation Shares 0.30%
Investor Hedged Accumulation Shares 0.35%
Global Short-Term Bond Index Fund
Institutional Hedged Shares 0.15%
Accumulation Hedged Shares 0.15%
Income Hedged Shares 0.15%
Investor Hedged Shares 0.20%
Institutional Plus Hedged Shares 0.10%
Institutional Plus Accumulation Shares 0.10%
Institutional Plus Income Shares 0.10%
Global Short-Term Corporate Bond Index Fund
Investor Hedged Accumulation Shares 0.25%
Institutional Accumulation Shares 0.20%
Institutional Plus Hedged Accumulation Shares 0.12%
Japan Government Bond Index Fund
Institutional Shares 0.20%
Investor Shares 0.25%
Institutional Plus Shares 0.10%
Accumulation Hedged Shares 0.25%
SRI Euro Investment Grade Bond Index Fund
Institutional Shares 0.25%
Institutional Plus Shares 0.15%
Fund Ongoing Charges Figure
U.K. Government Bond Index Fund
Accumulation Shares 0.15%
Income Shares 0.15%
Institutional Plus Accumulation Shares 0.06%
Institutional Plus Income Shares 0.06%
U.K. Investment Grade Bond Index Fund
Accumulation Shares 0.15%
Income Shares 0.15%
Institutional Plus Accumulation Shares 0.06%
Institutional Plus Income Shares 0.06%
U.K. Short-Term Investment Grade Bond Index Fund
Accumulation Shares 0.15%
Income Shares 0.15%
Institutional Plus Accumulation Shares 0.05%
Institutional Plus Income Shares 0.05%
U.S. Government Bond Index Fund
Institutional Shares 0.20%
Investor Shares 0.25%
Investor Hedged Income Shares 0.25%
Institutional Plus Shares 0.10%
Institutional Hedged Shares 0.20%
Accumulation Hedged Shares 0.25%
U.S. Investment Grade Credit Index Fund
Institutional Shares 0.25%
Investor Shares 0.30%
Institutional Plus Shares 0.10%
Institutional Plus Income Shares 0.10%
Institutional Plus Hedged Accumulation Shares 0.10%
Institutional Plus Hedged Income Shares 0.10%
Accumulation Hedged Shares 0.30%
U.S. Treasury Inflation-Protected Securities Index Fund
Select Accumulation Shares 0.09%
Select Income Shares 0.09%
Select Hedged Accumulation Shares 0.09%
Select Hedged Income Shares 0.09%
U.S. Ultra-Short-Term Bond Fund
Institutional Shares 0.25%
Investor Shares 0.30%
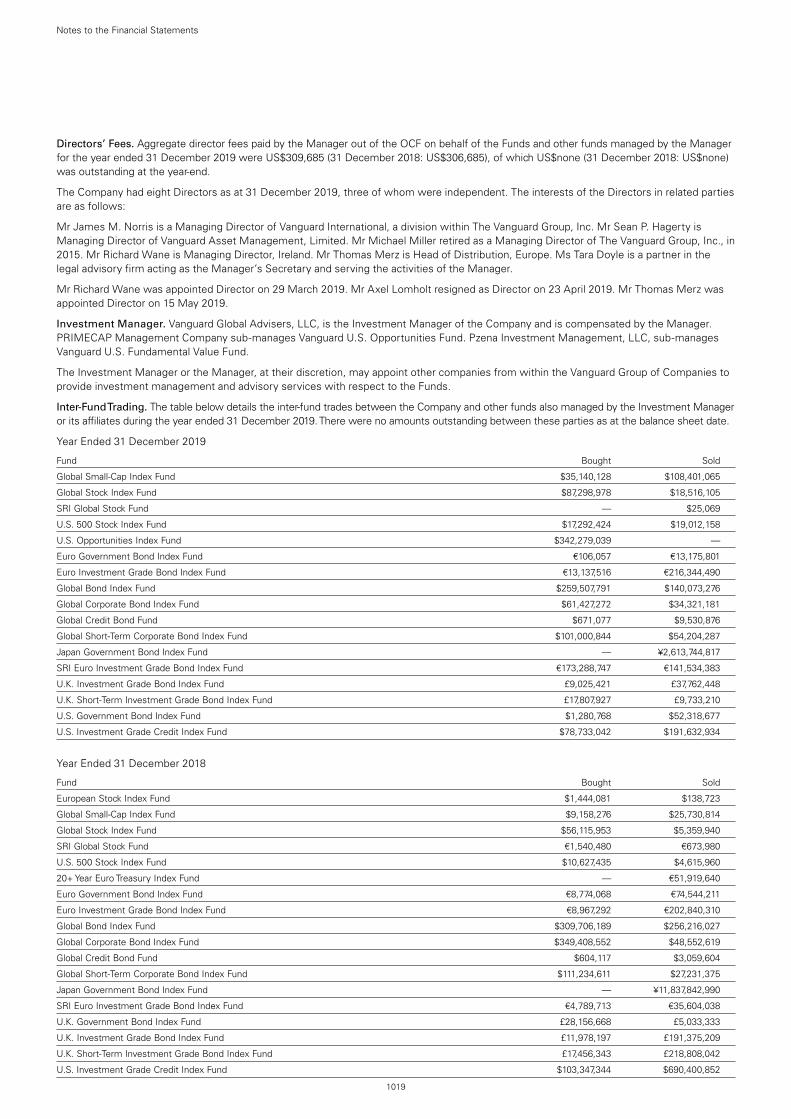
1019
Notes to the Financial Statements
Directors’ Fees. Aggregate director fees paid by the Manager out of the OCF on behalf of the Funds and other funds managed by the Manager for the year ended 31 December 2019 were US$309,685 (31 December 2018: US$306,685), of which US$none (31 December 2018: US$none) was outstanding at the year-end.
The Company had eight Directors as at 31 December 2019, three of whom were independent. The interests of the Directors in related parties are as follows:
Mr James M. Norris is a Managing Director of Vanguard International, a division within The Vanguard Group, Inc. Mr Sean P. Hagerty is Managing Director of Vanguard Asset Management, Limited. Mr Michael Miller retired as a Managing Director of The Vanguard Group, Inc., in 2015. Mr Richard Wane is Managing Director, Ireland. Mr Thomas Merz is Head of Distribution, Europe. Ms Tara Doyle is a partner in the legal advisory firm acting as the Manager’s Secretary and serving the activities of the Manager.
Mr Richard Wane was appointed Director on 29 March 2019. Mr Axel Lomholt resigned as Director on 23 April 2019. Mr Thomas Merz was appointed Director on 15 May 2019.
Investment Manager. Vanguard Global Advisers, LLC, is the Investment Manager of the Company and is compensated by the Manager. PRIMECAP Management Company sub-manages Vanguard U.S. Opportunities Fund. Pzena Investment Management, LLC, sub-manages Vanguard U.S. Fundamental Value Fund.
The Investment Manager or the Manager, at their discretion, may appoint other companies from within the Vanguard Group of Companies to provide investment management and advisory services with respect to the Funds.
Inter-Fund Trading. The table below details the inter-fund trades between the Company and other funds also managed by the Investment Manager or its affiliates during the year ended 31 December 2019. There were no amounts outstanding between these parties as at the balance sheet date.
Year Ended 31 December 2019
Fund Bought Sold
Global Small-Cap Index Fund $35,140,128 $108,401,065
Global Stock Index Fund $87,298,978 $18,516,105
SRI Global Stock Fund — $25,069
U.S. 500 Stock Index Fund $17,292,424 $19,012,158
U.S. Opportunities Index Fund $342,279,039 —
Euro Government Bond Index Fund €106,057 €13,175,801
Euro Investment Grade Bond Index Fund €13,137,516 €216,344,490
Global Bond Index Fund $259,507,791 $140,073,276
Global Corporate Bond Index Fund $61,427,272 $34,321,181
Global Credit Bond Fund $671,077 $9,530,876
Global Short-Term Corporate Bond Index Fund $101,000,844 $54,204,287
Japan Government Bond Index Fund — ¥2,613,744,817
SRI Euro Investment Grade Bond Index Fund €173,288,747 €141,534,383
U.K. Investment Grade Bond Index Fund £9,025,421 £37,762,448
U.K. Short-Term Investment Grade Bond Index Fund £17,807,927 £9,733,210
U.S. Government Bond Index Fund $1,280,768 $52,318,677
U.S. Investment Grade Credit Index Fund $78,733,042 $191,632,934
Year Ended 31 December 2018
Fund Bought Sold
European Stock Index Fund $1,444,081 $138,723
Global Small-Cap Index Fund $9,158,276 $25,730,814
Global Stock Index Fund $56,115,953 $5,359,940
SRI Global Stock Fund €1,540,480 €673,980
U.S. 500 Stock Index Fund $10,627,435 $4,615,960
20+ Year Euro Treasury Index Fund — €51,919,640
Euro Government Bond Index Fund €8,774,068 €74,544,211
Euro Investment Grade Bond Index Fund €8,967,292 €202,840,310
Global Bond Index Fund $309,706,189 $256,216,027
Global Corporate Bond Index Fund $349,408,552 $48,552,619
Global Credit Bond Fund $604,117 $3,059,604
Global Short-Term Corporate Bond Index Fund $111,234,611 $27,231,375
Japan Government Bond Index Fund — ¥11,837,842,990
SRI Euro Investment Grade Bond Index Fund €4,789,713 €35,604,038
U.K. Government Bond Index Fund £28,156,668 £5,033,333
U.K. Investment Grade Bond Index Fund £11,978,197 £191,375,209
U.K. Short-Term Investment Grade Bond Index Fund £17,456,343 £218,808,042
U.S. Investment Grade Credit Index Fund $103,347,344 $690,400,852
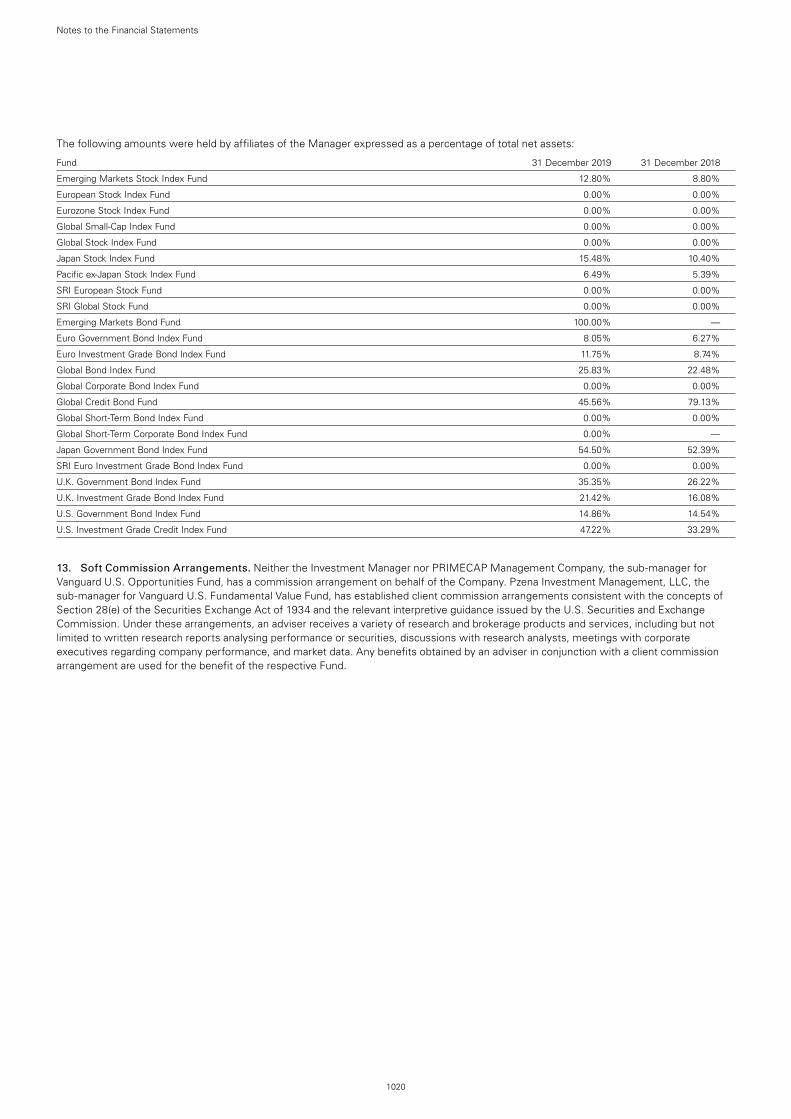
1020
Notes to the Financial Statements
The following amounts were held by affiliates of the Manager expressed as a percentage of total net assets:
Fund 31 December 2019 31 December 2018
Emerging Markets Stock Index Fund 12.80% 8.80%
European Stock Index Fund 0.00% 0.00%
Eurozone Stock Index Fund 0.00% 0.00%
Global Small-Cap Index Fund 0.00% 0.00%
Global Stock Index Fund 0.00% 0.00%
Japan Stock Index Fund 15.48% 10.40%
Pacific ex-Japan Stock Index Fund 6.49% 5.39%
SRI European Stock Fund 0.00% 0.00%
SRI Global Stock Fund 0.00% 0.00%
Emerging Markets Bond Fund 100.00% —
Euro Government Bond Index Fund 8.05% 6.27%
Euro Investment Grade Bond Index Fund 11.75% 8.74%
Global Bond Index Fund 25.83% 22.48%
Global Corporate Bond Index Fund 0.00% 0.00%
Global Credit Bond Fund 45.56% 79.13%
Global Short-Term Bond Index Fund 0.00% 0.00%
Global Short-Term Corporate Bond Index Fund 0.00% —
Japan Government Bond Index Fund 54.50% 52.39%
SRI Euro Investment Grade Bond Index Fund 0.00% 0.00%
U.K. Government Bond Index Fund 35.35% 26.22%
U.K. Investment Grade Bond Index Fund 21.42% 16.08%
U.S. Government Bond Index Fund 14.86% 14.54%
U.S. Investment Grade Credit Index Fund 47.22% 33.29%
13. Soft Commission Arrangements. Neither the Investment Manager nor PRIMECAP Management Company, the sub-manager for Vanguard U.S. Opportunities Fund, has a commission arrangement on behalf of the Company. Pzena Investment Management, LLC, the sub-manager for Vanguard U.S. Fundamental Value Fund, has established client commission arrangements consistent with the concepts of Section 28(e) of the Securities Exchange Act of 1934 and the relevant interpretive guidance issued by the U.S. Securities and Exchange Commission. Under these arrangements, an adviser receives a variety of research and brokerage products and services, including but not limited to written research reports analysing performance or securities, discussions with research analysts, meetings with corporate executives regarding company performance, and market data. Any benefits obtained by an adviser in conjunction with a client commission arrangement are used for the benefit of the respective Fund.
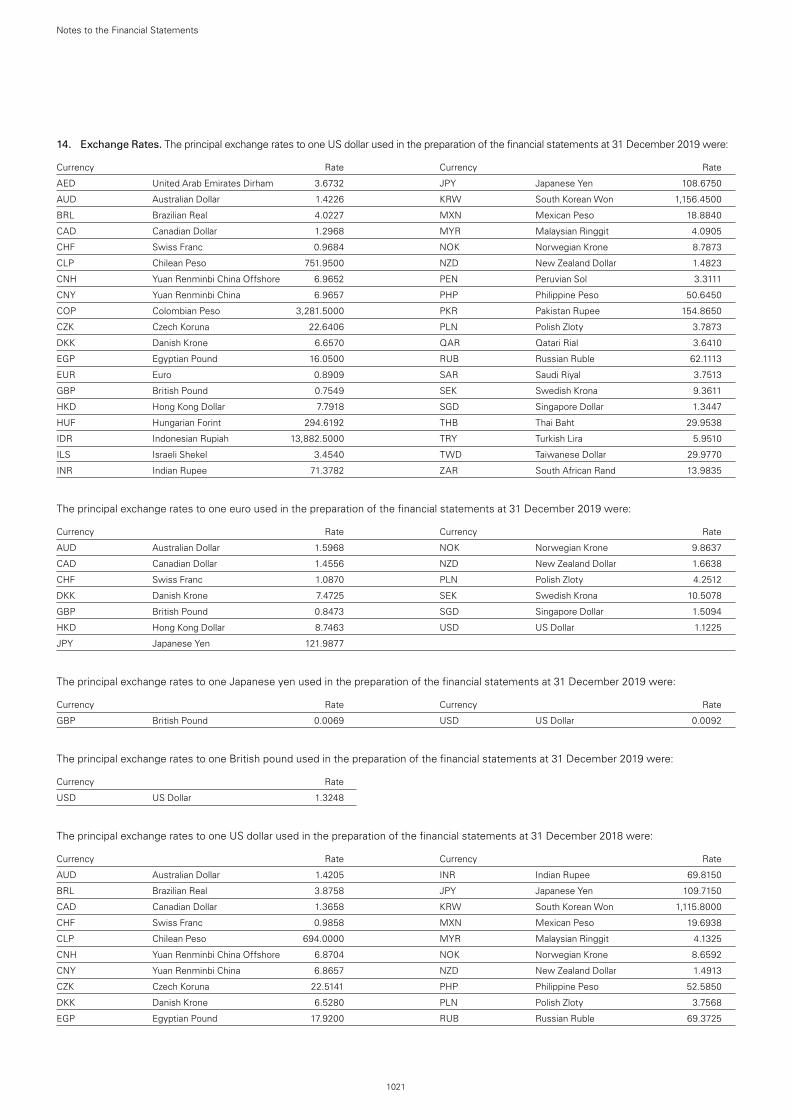
1021
Notes to the Financial Statements
14. Exchange Rates. The principal exchange rates to one US dollar used in the preparation of the financial statements at 31 December 2019 were:
Currency Rate Currency Rate
AED United Arab Emirates Dirham 3.6732 JPY Japanese Yen 108.6750
AUD Australian Dollar 1.4226 KRW South Korean Won 1,156.4500
BRL Brazilian Real 4.0227 MXN Mexican Peso 18.8840
CAD Canadian Dollar 1.2968 MYR Malaysian Ringgit 4.0905
CHF Swiss Franc 0.9684 NOK Norwegian Krone 8.7873
CLP Chilean Peso 751.9500 NZD New Zealand Dollar 1.4823
CNH Yuan Renminbi China Offshore 6.9652 PEN Peruvian Sol 3.3111
CNY Yuan Renminbi China 6.9657 PHP Philippine Peso 50.6450
COP Colombian Peso 3,281.5000 PKR Pakistan Rupee 154.8650
CZK Czech Koruna 22.6406 PLN Polish Zloty 3.7873
DKK Danish Krone 6.6570 QAR Qatari Rial 3.6410
EGP Egyptian Pound 16.0500 RUB Russian Ruble 62.1113
EUR Euro 0.8909 SAR Saudi Riyal 3.7513
GBP British Pound 0.7549 SEK Swedish Krona 9.3611
HKD Hong Kong Dollar 7.7918 SGD Singapore Dollar 1.3447
HUF Hungarian Forint 294.6192 THB Thai Baht 29.9538
IDR Indonesian Rupiah 13,882.5000 TRY Turkish Lira 5.9510
ILS Israeli Shekel 3.4540 TWD Taiwanese Dollar 29.9770
INR Indian Rupee 71.3782 ZAR South African Rand 13.9835
The principal exchange rates to one euro used in the preparation of the financial statements at 31 December 2019 were:
Currency Rate Currency Rate
AUD Australian Dollar 1.5968 NOK Norwegian Krone 9.8637
CAD Canadian Dollar 1.4556 NZD New Zealand Dollar 1.6638
CHF Swiss Franc 1.0870 PLN Polish Zloty 4.2512
DKK Danish Krone 7.4725 SEK Swedish Krona 10.5078
GBP British Pound 0.8473 SGD Singapore Dollar 1.5094
HKD Hong Kong Dollar 8.7463 USD US Dollar 1.1225
JPY Japanese Yen 121.9877
The principal exchange rates to one Japanese yen used in the preparation of the financial statements at 31 December 2019 were:
Currency Rate Currency Rate
GBP British Pound 0.0069 USD US Dollar 0.0092
The principal exchange rates to one British pound used in the preparation of the financial statements at 31 December 2019 were:
Currency Rate
USD US Dollar 1.3248
The principal exchange rates to one US dollar used in the preparation of the financial statements at 31 December 2018 were:
Currency Rate Currency Rate
AUD Australian Dollar 1.4205 INR Indian Rupee 69.8150
BRL Brazilian Real 3.8758 JPY Japanese Yen 109.7150
CAD Canadian Dollar 1.3658 KRW South Korean Won 1,115.8000
CHF Swiss Franc 0.9858 MXN Mexican Peso 19.6938
CLP Chilean Peso 694.0000 MYR Malaysian Ringgit 4.1325
CNH Yuan Renminbi China Offshore 6.8704 NOK Norwegian Krone 8.6592
CNY Yuan Renminbi China 6.8657 NZD New Zealand Dollar 1.4913
CZK Czech Koruna 22.5141 PHP Philippine Peso 52.5850
DKK Danish Krone 6.5280 PLN Polish Zloty 3.7568
EGP Egyptian Pound 17.9200 RUB Russian Ruble 69.3725
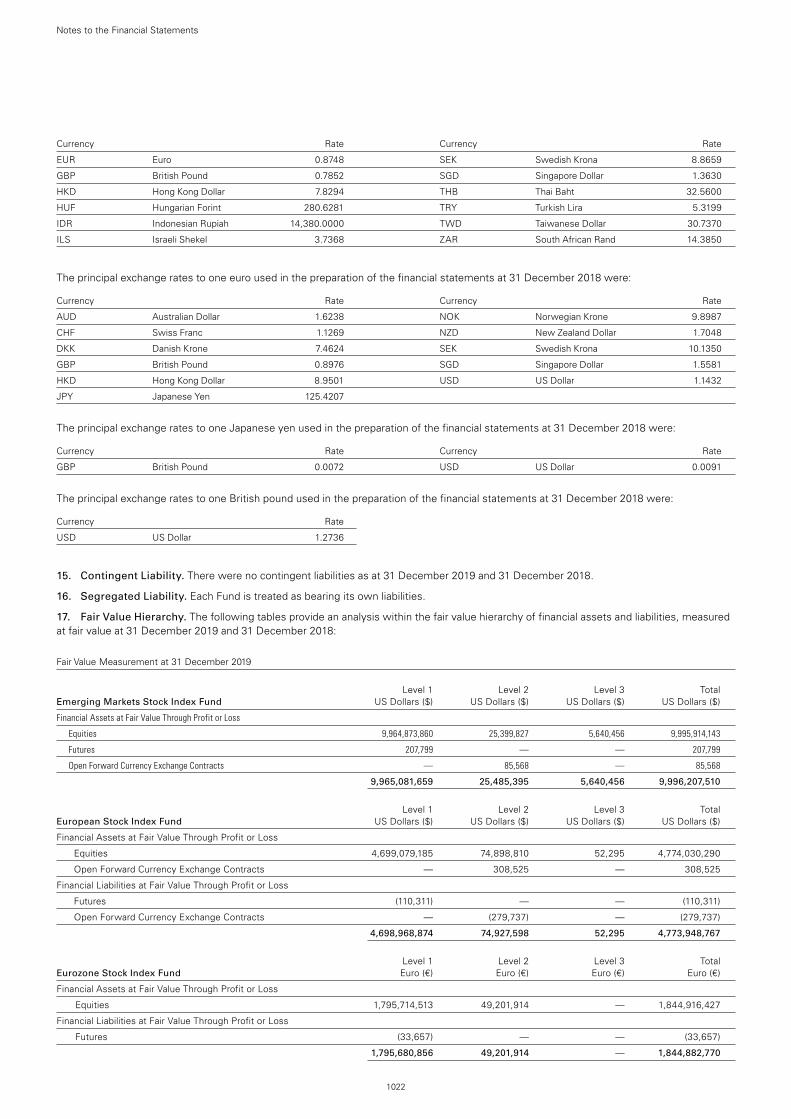
1022
Notes to the Financial Statements
Currency Rate Currency Rate
EUR Euro 0.8748 SEK Swedish Krona 8.8659
GBP British Pound 0.7852 SGD Singapore Dollar 1.3630
HKD Hong Kong Dollar 7.8294 THB Thai Baht 32.5600
HUF Hungarian Forint 280.6281 TRY Turkish Lira 5.3199
IDR Indonesian Rupiah 14,380.0000 TWD Taiwanese Dollar 30.7370
ILS Israeli Shekel 3.7368 ZAR South African Rand 14.3850
The principal exchange rates to one euro used in the preparation of the financial statements at 31 December 2018 were:
Currency Rate Currency Rate
AUD Australian Dollar 1.6238 NOK Norwegian Krone 9.8987
CHF Swiss Franc 1.1269 NZD New Zealand Dollar 1.7048
DKK Danish Krone 7.4624 SEK Swedish Krona 10.1350
GBP British Pound 0.8976 SGD Singapore Dollar 1.5581
HKD Hong Kong Dollar 8.9501 USD US Dollar 1.1432
JPY Japanese Yen 125.4207
The principal exchange rates to one Japanese yen used in the preparation of the financial statements at 31 December 2018 were:
Currency Rate Currency Rate
GBP British Pound 0.0072 USD US Dollar 0.0091
The principal exchange rates to one British pound used in the preparation of the financial statements at 31 December 2018 were:
Currency Rate
USD US Dollar 1.2736
15. Contingent Liability. There were no contingent liabilities as at 31 December 2019 and 31 December 2018.
16. Segregated Liability. Each Fund is treated as bearing its own liabilities.
17. Fair Value Hierarchy. The following tables provide an analysis within the fair value hierarchy of financial assets and liabilities, measured at fair value at 31 December 2019 and 31 December 2018:
Fair Value Measurement at 31 December 2019
Level 1 Level 2 Level 3 Total Emerging Markets Stock Index Fund US Dollars ($) US Dollars ($) US Dollars ($) US Dollars ($)
Financial Assets at Fair Value Through Profit or Loss
Equities 9,964,873,860 25,399,827 5,640,456 9,995,914,143
Futures 207,799 — — 207,799
Open Forward Currency Exchange Contracts — 85,568 — 85,568
9,965,081,659 25,485,395 5,640,456 9,996,207,510
Level 1 Level 2 Level 3 Total European Stock Index Fund US Dollars ($) US Dollars ($) US Dollars ($) US Dollars ($)
Financial Assets at Fair Value Through Profit or Loss
Equities 4,699,079,185 74,898,810 52,295 4,774,030,290
Open Forward Currency Exchange Contracts — 308,525 — 308,525
Financial Liabilities at Fair Value Through Profit or Loss
Futures (110,311) — — (110,311)
Open Forward Currency Exchange Contracts — (279,737) — (279,737)
4,698,968,874 74,927,598 52,295 4,773,948,767
Level 1 Level 2 Level 3 Total Eurozone Stock Index Fund Euro (€) Euro (€) Euro (€) Euro (€)
Financial Assets at Fair Value Through Profit or Loss
Equities 1,795,714,513 49,201,914 — 1,844,916,427
Financial Liabilities at Fair Value Through Profit or Loss
Futures (33,657) — — (33,657)
1,795,680,856 49,201,914 — 1,844,882,770
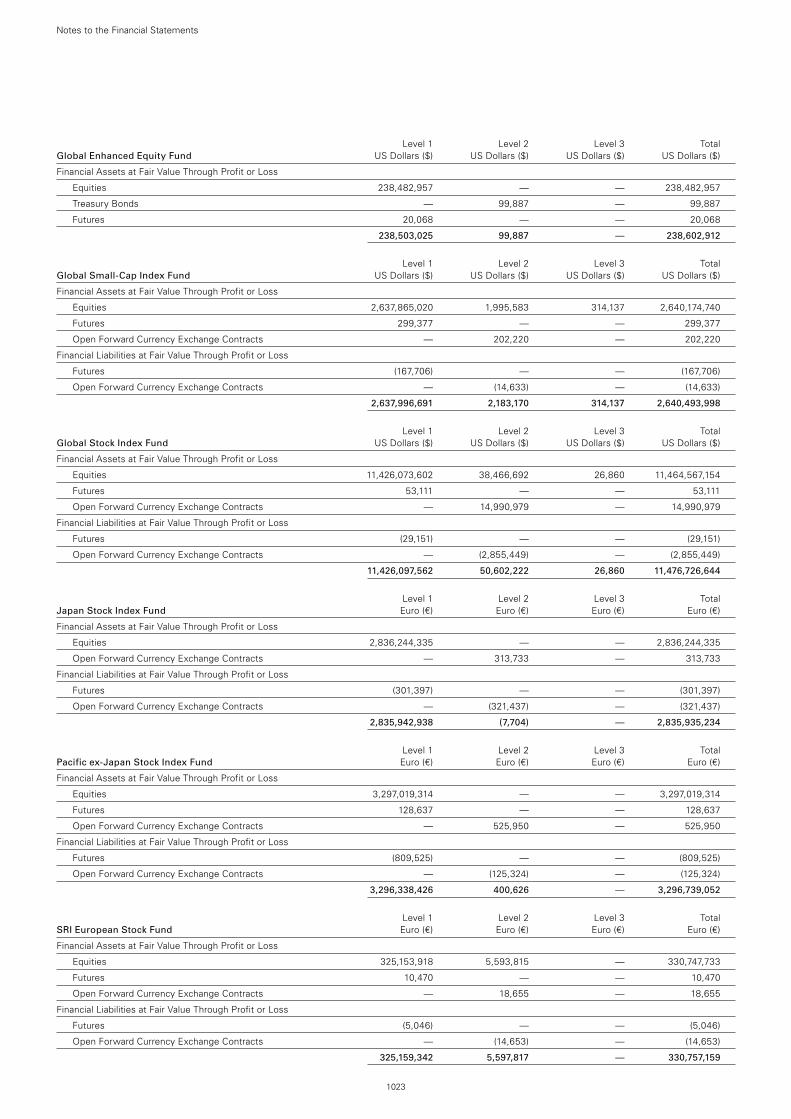
1023
Notes to the Financial Statements
Level 1 Level 2 Level 3 Total Global Enhanced Equity Fund US Dollars ($) US Dollars ($) US Dollars ($) US Dollars ($)
Financial Assets at Fair Value Through Profit or Loss
Equities 238,482,957 — — 238,482,957
Treasury Bonds — 99,887 — 99,887
Futures 20,068 — — 20,068
238,503,025 99,887 — 238,602,912
Level 1 Level 2 Level 3 Total Global Small-Cap Index Fund US Dollars ($) US Dollars ($) US Dollars ($) US Dollars ($)
Financial Assets at Fair Value Through Profit or Loss
Equities 2,637,865,020 1,995,583 314,137 2,640,174,740
Futures 299,377 — — 299,377
Open Forward Currency Exchange Contracts — 202,220 — 202,220
Financial Liabilities at Fair Value Through Profit or Loss
Futures (167,706) — — (167,706)
Open Forward Currency Exchange Contracts — (14,633) — (14,633)
2,637,996,691 2,183,170 314,137 2,640,493,998
Level 1 Level 2 Level 3 Total Global Stock Index Fund US Dollars ($) US Dollars ($) US Dollars ($) US Dollars ($)
Financial Assets at Fair Value Through Profit or Loss
Equities 11,426,073,602 38,466,692 26,860 11,464,567,154
Futures 53,111 — — 53,111
Open Forward Currency Exchange Contracts — 14,990,979 — 14,990,979
Financial Liabilities at Fair Value Through Profit or Loss
Futures (29,151) — — (29,151)
Open Forward Currency Exchange Contracts — (2,855,449) — (2,855,449)
11,426,097,562 50,602,222 26,860 11,476,726,644
Level 1 Level 2 Level 3 Total Japan Stock Index Fund Euro (€) Euro (€) Euro (€) Euro (€)
Financial Assets at Fair Value Through Profit or Loss
Equities 2,836,244,335 — — 2,836,244,335
Open Forward Currency Exchange Contracts — 313,733 — 313,733
Financial Liabilities at Fair Value Through Profit or Loss
Futures (301,397) — — (301,397)
Open Forward Currency Exchange Contracts — (321,437) — (321,437)
2,835,942,938 (7,704) — 2,835,935,234
Level 1 Level 2 Level 3 Total Pacific ex-Japan Stock Index Fund Euro (€) Euro (€) Euro (€) Euro (€)
Financial Assets at Fair Value Through Profit or Loss
Equities 3,297,019,314 — — 3,297,019,314
Futures 128,637 — — 128,637
Open Forward Currency Exchange Contracts — 525,950 — 525,950
Financial Liabilities at Fair Value Through Profit or Loss
Futures (809,525) — — (809,525)
Open Forward Currency Exchange Contracts — (125,324) — (125,324)
3,296,338,426 400,626 — 3,296,739,052
Level 1 Level 2 Level 3 Total SRI European Stock Fund Euro (€) Euro (€) Euro (€) Euro (€)
Financial Assets at Fair Value Through Profit or Loss
Equities 325,153,918 5,593,815 — 330,747,733
Futures 10,470 — — 10,470
Open Forward Currency Exchange Contracts — 18,655 — 18,655
Financial Liabilities at Fair Value Through Profit or Loss
Futures (5,046) — — (5,046)
Open Forward Currency Exchange Contracts — (14,653) — (14,653)
325,159,342 5,597,817 — 330,757,159
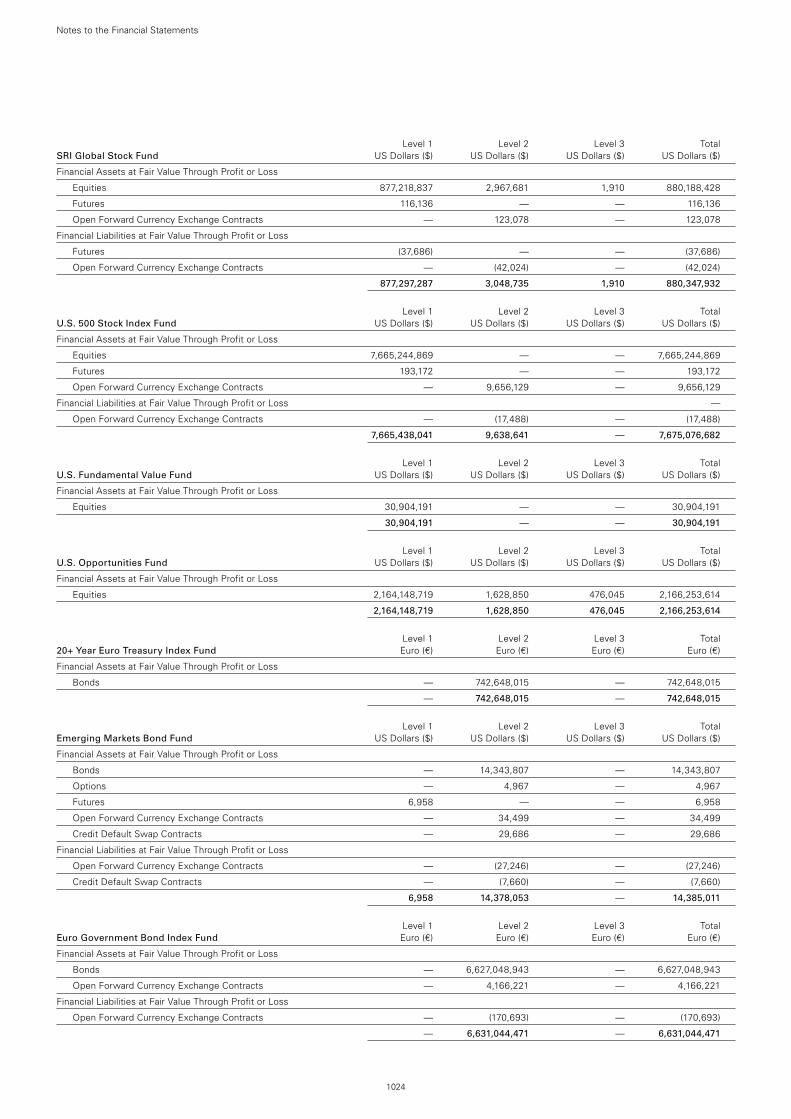
1024
Notes to the Financial Statements
Level 1 Level 2 Level 3 Total SRI Global Stock Fund US Dollars ($) US Dollars ($) US Dollars ($) US Dollars ($)
Financial Assets at Fair Value Through Profit or Loss
Equities 877,218,837 2,967,681 1,910 880,188,428
Futures 116,136 — — 116,136
Open Forward Currency Exchange Contracts — 123,078 — 123,078
Financial Liabilities at Fair Value Through Profit or Loss
Futures (37,686) — — (37,686)
Open Forward Currency Exchange Contracts — (42,024) — (42,024)
877,297,287 3,048,735 1,910 880,347,932
Level 1 Level 2 Level 3 Total U.S. 500 Stock Index Fund US Dollars ($) US Dollars ($) US Dollars ($) US Dollars ($)
Financial Assets at Fair Value Through Profit or Loss
Equities 7,665,244,869 — — 7,665,244,869
Futures 193,172 — — 193,172
Open Forward Currency Exchange Contracts — 9,656,129 — 9,656,129
Financial Liabilities at Fair Value Through Profit or Loss —
Open Forward Currency Exchange Contracts — (17,488) — (17,488)
7,665,438,041 9,638,641 — 7,675,076,682
Level 1 Level 2 Level 3 Total U.S. Fundamental Value Fund US Dollars ($) US Dollars ($) US Dollars ($) US Dollars ($)
Financial Assets at Fair Value Through Profit or Loss
Equities 30,904,191 — — 30,904,191
30,904,191 — — 30,904,191
Level 1 Level 2 Level 3 Total U.S. Opportunities Fund US Dollars ($) US Dollars ($) US Dollars ($) US Dollars ($)
Financial Assets at Fair Value Through Profit or Loss
Equities 2,164,148,719 1,628,850 476,045 2,166,253,614
2,164,148,719 1,628,850 476,045 2,166,253,614
Level 1 Level 2 Level 3 Total 20+ Year Euro Treasury Index Fund Euro (€) Euro (€) Euro (€) Euro (€)
Financial Assets at Fair Value Through Profit or Loss
Bonds — 742,648,015 — 742,648,015
— 742,648,015 — 742,648,015
Level 1 Level 2 Level 3 Total Emerging Markets Bond Fund US Dollars ($) US Dollars ($) US Dollars ($) US Dollars ($)
Financial Assets at Fair Value Through Profit or Loss
Bonds — 14,343,807 — 14,343,807
Options — 4,967 — 4,967
Futures 6,958 — — 6,958
Open Forward Currency Exchange Contracts — 34,499 — 34,499
Credit Default Swap Contracts — 29,686 — 29,686
Financial Liabilities at Fair Value Through Profit or Loss
Open Forward Currency Exchange Contracts — (27,246) — (27,246)
Credit Default Swap Contracts — (7,660) — (7,660)
6,958 14,378,053 — 14,385,011
Level 1 Level 2 Level 3 Total Euro Government Bond Index Fund Euro (€) Euro (€) Euro (€) Euro (€)
Financial Assets at Fair Value Through Profit or Loss
Bonds — 6,627,048,943 — 6,627,048,943
Open Forward Currency Exchange Contracts — 4,166,221 — 4,166,221
Financial Liabilities at Fair Value Through Profit or Loss
Open Forward Currency Exchange Contracts — (170,693) — (170,693)
— 6,631,044,471 — 6,631,044,471
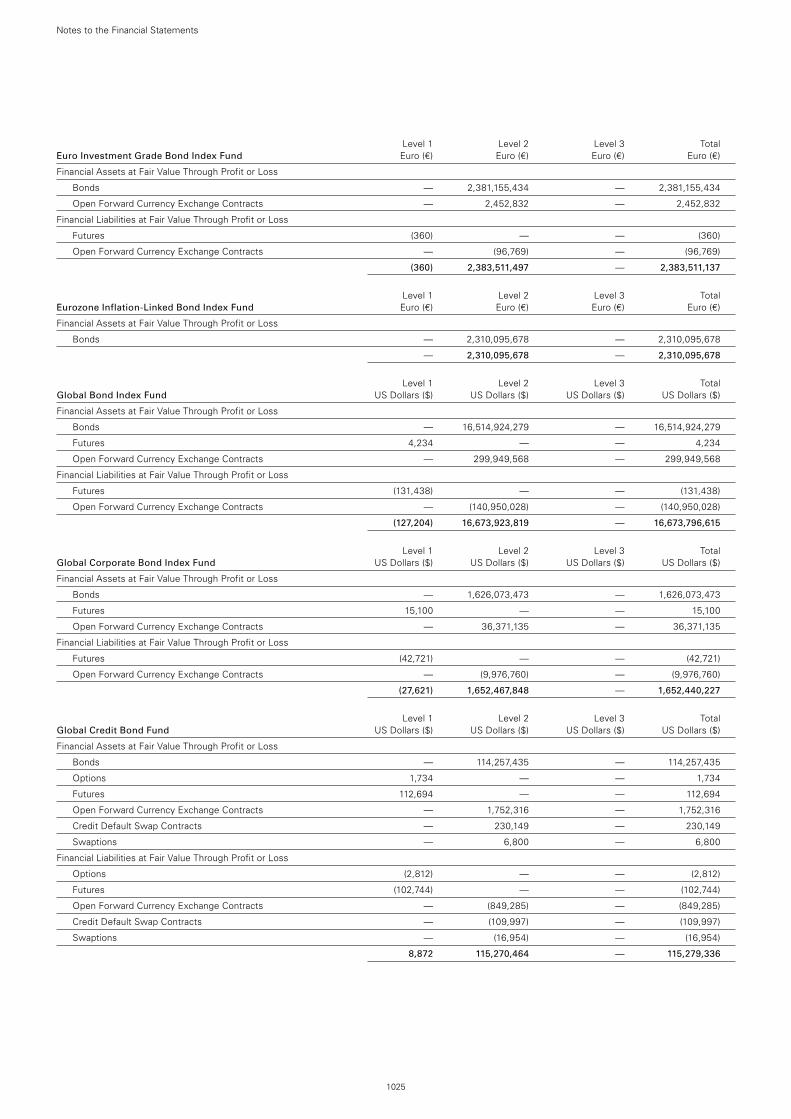
1025
Notes to the Financial Statements
Level 1 Level 2 Level 3 Total Euro Investment Grade Bond Index Fund Euro (€) Euro (€) Euro (€) Euro (€)
Financial Assets at Fair Value Through Profit or Loss
Bonds — 2,381,155,434 — 2,381,155,434
Open Forward Currency Exchange Contracts — 2,452,832 — 2,452,832
Financial Liabilities at Fair Value Through Profit or Loss
Futures (360) — — (360)
Open Forward Currency Exchange Contracts — (96,769) — (96,769)
(360) 2,383,511,497 — 2,383,511,137
Level 1 Level 2 Level 3 Total Eurozone Inflation-Linked Bond Index Fund Euro (€) Euro (€) Euro (€) Euro (€)
Financial Assets at Fair Value Through Profit or Loss
Bonds — 2,310,095,678 — 2,310,095,678
— 2,310,095,678 — 2,310,095,678
Level 1 Level 2 Level 3 Total Global Bond Index Fund US Dollars ($) US Dollars ($) US Dollars ($) US Dollars ($)
Financial Assets at Fair Value Through Profit or Loss
Bonds — 16,514,924,279 — 16,514,924,279
Futures 4,234 — — 4,234
Open Forward Currency Exchange Contracts — 299,949,568 — 299,949,568
Financial Liabilities at Fair Value Through Profit or Loss
Futures (131,438) — — (131,438)
Open Forward Currency Exchange Contracts — (140,950,028) — (140,950,028)
(127,204) 16,673,923,819 — 16,673,796,615
Level 1 Level 2 Level 3 Total Global Corporate Bond Index Fund US Dollars ($) US Dollars ($) US Dollars ($) US Dollars ($)
Financial Assets at Fair Value Through Profit or Loss
Bonds — 1,626,073,473 — 1,626,073,473
Futures 15,100 — — 15,100
Open Forward Currency Exchange Contracts — 36,371,135 — 36,371,135
Financial Liabilities at Fair Value Through Profit or Loss
Futures (42,721) — — (42,721)
Open Forward Currency Exchange Contracts — (9,976,760) — (9,976,760)
(27,621) 1,652,467,848 — 1,652,440,227
Level 1 Level 2 Level 3 Total Global Credit Bond Fund US Dollars ($) US Dollars ($) US Dollars ($) US Dollars ($)
Financial Assets at Fair Value Through Profit or Loss
Bonds — 114,257,435 — 114,257,435
Options 1,734 — — 1,734
Futures 112,694 — — 112,694
Open Forward Currency Exchange Contracts — 1,752,316 — 1,752,316
Credit Default Swap Contracts — 230,149 — 230,149
Swaptions — 6,800 — 6,800
Financial Liabilities at Fair Value Through Profit or Loss
Options (2,812) — — (2,812)
Futures (102,744) — — (102,744)
Open Forward Currency Exchange Contracts — (849,285) — (849,285)
Credit Default Swap Contracts — (109,997) — (109,997)
Swaptions — (16,954) — (16,954)
8,872 115,270,464 — 115,279,336
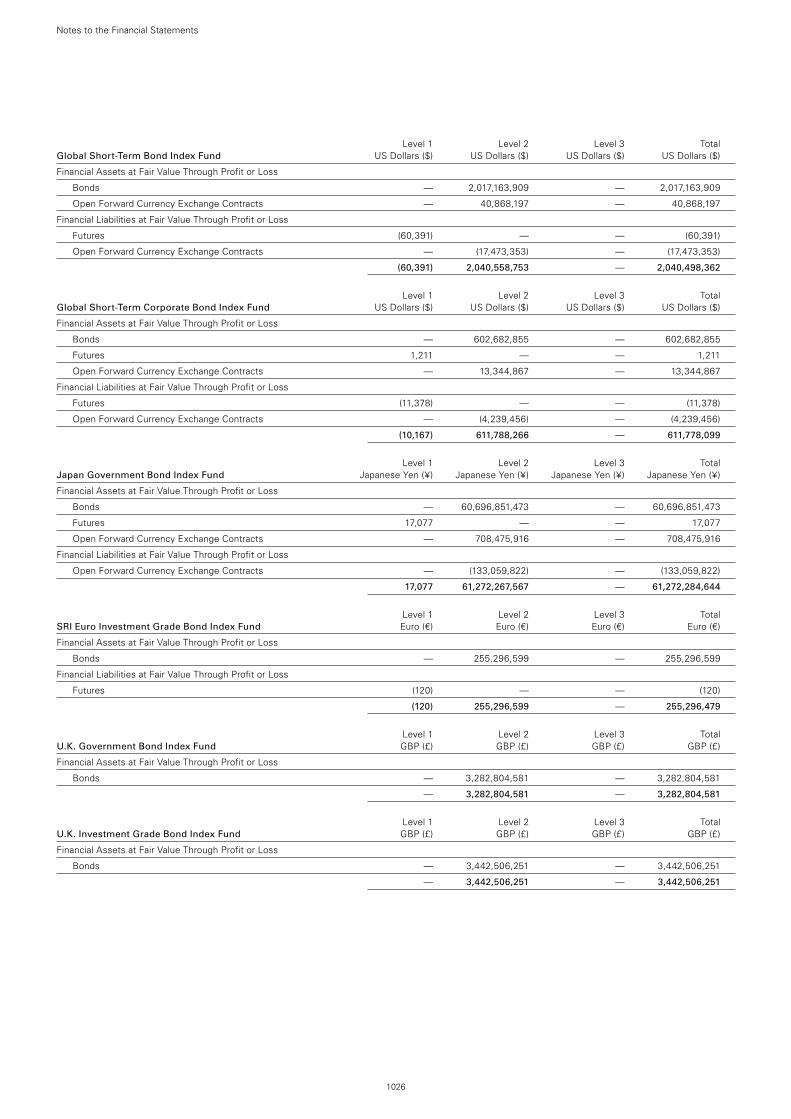
1026
Notes to the Financial Statements
Level 1 Level 2 Level 3 Total Global Short-Term Bond Index Fund US Dollars ($) US Dollars ($) US Dollars ($) US Dollars ($)
Financial Assets at Fair Value Through Profit or Loss
Bonds — 2,017,163,909 — 2,017,163,909
Open Forward Currency Exchange Contracts — 40,868,197 — 40,868,197
Financial Liabilities at Fair Value Through Profit or Loss
Futures (60,391) — — (60,391)
Open Forward Currency Exchange Contracts — (17,473,353) — (17,473,353)
(60,391) 2,040,558,753 — 2,040,498,362
Level 1 Level 2 Level 3 Total Global Short-Term Corporate Bond Index Fund US Dollars ($) US Dollars ($) US Dollars ($) US Dollars ($)
Financial Assets at Fair Value Through Profit or Loss
Bonds — 602,682,855 — 602,682,855
Futures 1,211 — — 1,211
Open Forward Currency Exchange Contracts — 13,344,867 — 13,344,867
Financial Liabilities at Fair Value Through Profit or Loss
Futures (11,378) — — (11,378)
Open Forward Currency Exchange Contracts — (4,239,456) — (4,239,456)
(10,167) 611,788,266 — 611,778,099
Level 1 Level 2 Level 3 Total Japan Government Bond Index Fund Japanese Yen (¥) Japanese Yen (¥) Japanese Yen (¥) Japanese Yen (¥)
Financial Assets at Fair Value Through Profit or Loss
Bonds — 60,696,851,473 — 60,696,851,473
Futures 17,077 — — 17,077
Open Forward Currency Exchange Contracts — 708,475,916 — 708,475,916
Financial Liabilities at Fair Value Through Profit or Loss
Open Forward Currency Exchange Contracts — (133,059,822) — (133,059,822)
17,077 61,272,267,567 — 61,272,284,644
Level 1 Level 2 Level 3 Total SRI Euro Investment Grade Bond Index Fund Euro (€) Euro (€) Euro (€) Euro (€)
Financial Assets at Fair Value Through Profit or Loss
Bonds — 255,296,599 — 255,296,599
Financial Liabilities at Fair Value Through Profit or Loss
Futures (120) — — (120)
(120) 255,296,599 — 255,296,479
Level 1 Level 2 Level 3 Total U.K. Government Bond Index Fund GBP (£) GBP (£) GBP (£) GBP (£)
Financial Assets at Fair Value Through Profit or Loss
Bonds — 3,282,804,581 — 3,282,804,581
— 3,282,804,581 — 3,282,804,581
Level 1 Level 2 Level 3 Total U.K. Investment Grade Bond Index Fund GBP (£) GBP (£) GBP (£) GBP (£)
Financial Assets at Fair Value Through Profit or Loss
Bonds — 3,442,506,251 — 3,442,506,251
— 3,442,506,251 — 3,442,506,251
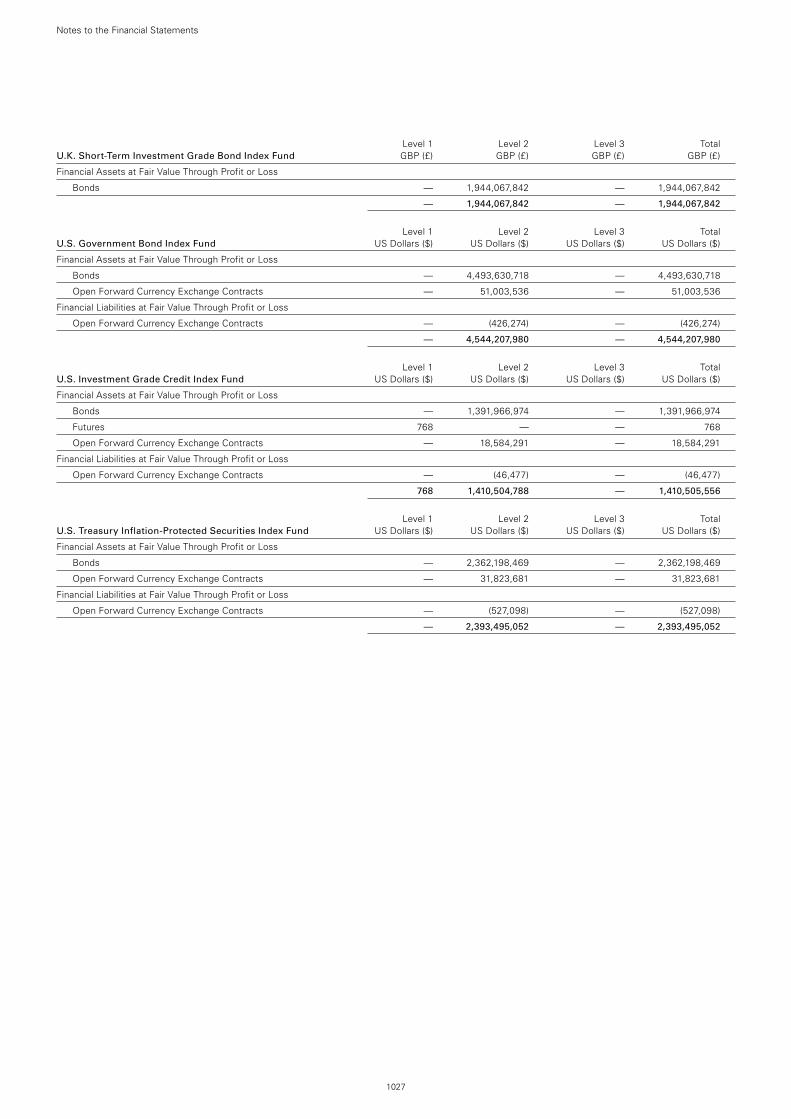
1027
Notes to the Financial Statements
Level 1 Level 2 Level 3 Total U.K. Short-Term Investment Grade Bond Index Fund GBP (£) GBP (£) GBP (£) GBP (£)
Financial Assets at Fair Value Through Profit or Loss
Bonds — 1,944,067,842 — 1,944,067,842
— 1,944,067,842 — 1,944,067,842
Level 1 Level 2 Level 3 Total U.S. Government Bond Index Fund US Dollars ($) US Dollars ($) US Dollars ($) US Dollars ($)
Financial Assets at Fair Value Through Profit or Loss
Bonds — 4,493,630,718 — 4,493,630,718
Open Forward Currency Exchange Contracts — 51,003,536 — 51,003,536
Financial Liabilities at Fair Value Through Profit or Loss
Open Forward Currency Exchange Contracts — (426,274) — (426,274)
— 4,544,207,980 — 4,544,207,980
Level 1 Level 2 Level 3 Total U.S. Investment Grade Credit Index Fund US Dollars ($) US Dollars ($) US Dollars ($) US Dollars ($)
Financial Assets at Fair Value Through Profit or Loss
Bonds — 1,391,966,974 — 1,391,966,974
Futures 768 — — 768
Open Forward Currency Exchange Contracts — 18,584,291 — 18,584,291
Financial Liabilities at Fair Value Through Profit or Loss
Open Forward Currency Exchange Contracts — (46,477) — (46,477)
768 1,410,504,788 — 1,410,505,556
Level 1 Level 2 Level 3 Total U.S. Treasury Inflation-Protected Securities Index Fund US Dollars ($) US Dollars ($) US Dollars ($) US Dollars ($)
Financial Assets at Fair Value Through Profit or Loss
Bonds — 2,362,198,469 — 2,362,198,469
Open Forward Currency Exchange Contracts — 31,823,681 — 31,823,681
Financial Liabilities at Fair Value Through Profit or Loss
Open Forward Currency Exchange Contracts — (527,098) — (527,098)
— 2,393,495,052 — 2,393,495,052
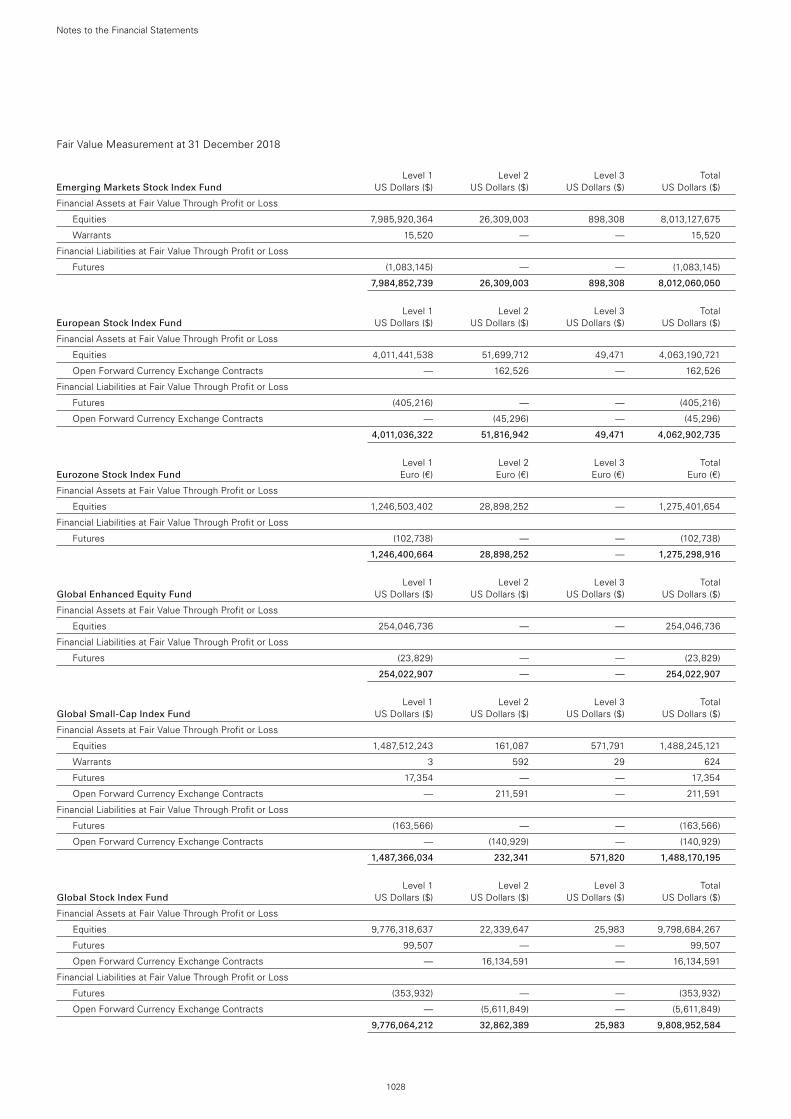
1028
Notes to the Financial Statements
Fair Value Measurement at 31 December 2018
Level 1 Level 2 Level 3 Total Emerging Markets Stock Index Fund US Dollars ($) US Dollars ($) US Dollars ($) US Dollars ($)
Financial Assets at Fair Value Through Profit or Loss
Equities 7,985,920,364 26,309,003 898,308 8,013,127,675
Warrants 15,520 — — 15,520
Financial Liabilities at Fair Value Through Profit or Loss
Futures (1,083,145) — — (1,083,145)
7,984,852,739 26,309,003 898,308 8,012,060,050
Level 1 Level 2 Level 3 Total European Stock Index Fund US Dollars ($) US Dollars ($) US Dollars ($) US Dollars ($)
Financial Assets at Fair Value Through Profit or Loss
Equities 4,011,441,538 51,699,712 49,471 4,063,190,721
Open Forward Currency Exchange Contracts — 162,526 — 162,526
Financial Liabilities at Fair Value Through Profit or Loss
Futures (405,216) — — (405,216)
Open Forward Currency Exchange Contracts — (45,296) — (45,296)
4,011,036,322 51,816,942 49,471 4,062,902,735
Level 1 Level 2 Level 3 Total Eurozone Stock Index Fund Euro (€) Euro (€) Euro (€) Euro (€)
Financial Assets at Fair Value Through Profit or Loss
Equities 1,246,503,402 28,898,252 — 1,275,401,654
Financial Liabilities at Fair Value Through Profit or Loss
Futures (102,738) — — (102,738)
1,246,400,664 28,898,252 — 1,275,298,916
Level 1 Level 2 Level 3 Total Global Enhanced Equity Fund US Dollars ($) US Dollars ($) US Dollars ($) US Dollars ($)
Financial Assets at Fair Value Through Profit or Loss
Equities 254,046,736 — — 254,046,736
Financial Liabilities at Fair Value Through Profit or Loss
Futures (23,829) — — (23,829)
254,022,907 — — 254,022,907
Level 1 Level 2 Level 3 Total Global Small-Cap Index Fund US Dollars ($) US Dollars ($) US Dollars ($) US Dollars ($)
Financial Assets at Fair Value Through Profit or Loss
Equities 1,487,512,243 161,087 571,791 1,488,245,121
Warrants 3 592 29 624
Futures 17,354 — — 17,354
Open Forward Currency Exchange Contracts — 211,591 — 211,591
Financial Liabilities at Fair Value Through Profit or Loss
Futures (163,566) — — (163,566)
Open Forward Currency Exchange Contracts — (140,929) — (140,929)
1,487,366,034 232,341 571,820 1,488,170,195
Level 1 Level 2 Level 3 Total Global Stock Index Fund US Dollars ($) US Dollars ($) US Dollars ($) US Dollars ($)
Financial Assets at Fair Value Through Profit or Loss
Equities 9,776,318,637 22,339,647 25,983 9,798,684,267
Futures 99,507 — — 99,507
Open Forward Currency Exchange Contracts — 16,134,591 — 16,134,591
Financial Liabilities at Fair Value Through Profit or Loss
Futures (353,932) — — (353,932)
Open Forward Currency Exchange Contracts — (5,611,849) — (5,611,849)
9,776,064,212 32,862,389 25,983 9,808,952,584
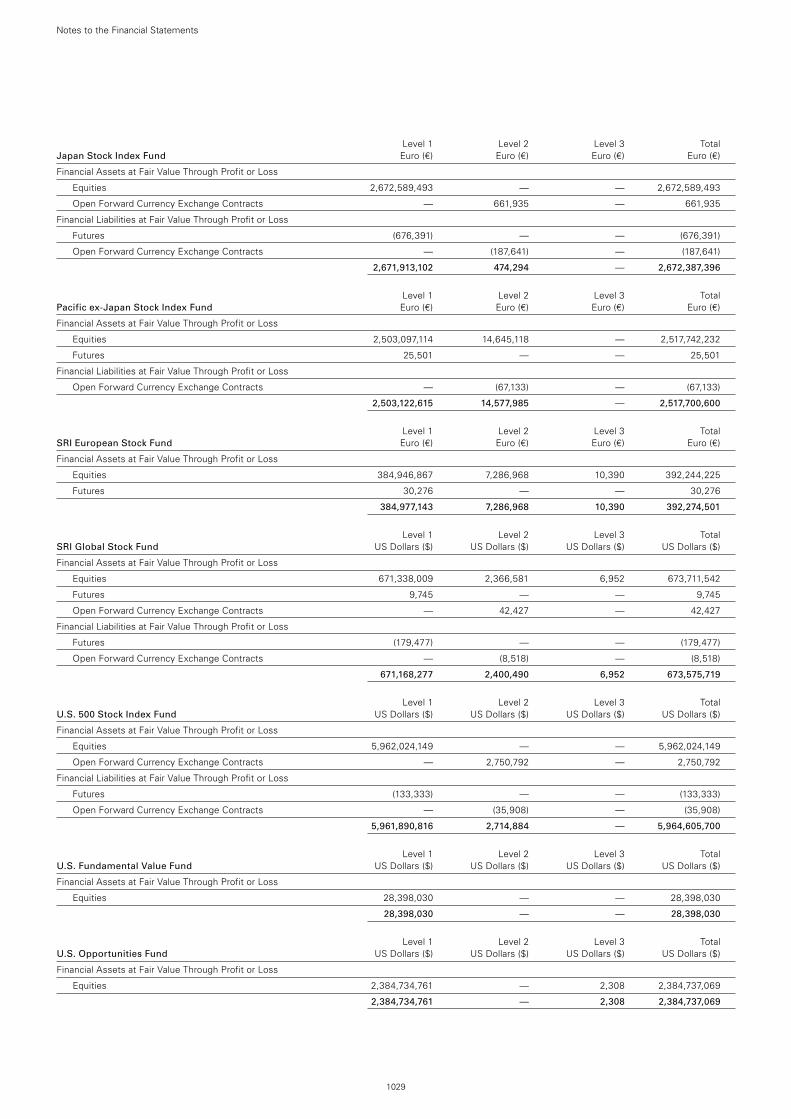
1029
Notes to the Financial Statements
Level 1 Level 2 Level 3 Total Japan Stock Index Fund Euro (€) Euro (€) Euro (€) Euro (€)
Financial Assets at Fair Value Through Profit or Loss
Equities 2,672,589,493 — — 2,672,589,493
Open Forward Currency Exchange Contracts — 661,935 — 661,935
Financial Liabilities at Fair Value Through Profit or Loss
Futures (676,391) — — (676,391)
Open Forward Currency Exchange Contracts — (187,641) — (187,641)
2,671,913,102 474,294 — 2,672,387,396
Level 1 Level 2 Level 3 Total Pacific ex-Japan Stock Index Fund Euro (€) Euro (€) Euro (€) Euro (€)
Financial Assets at Fair Value Through Profit or Loss
Equities 2,503,097,114 14,645,118 — 2,517,742,232
Futures 25,501 — — 25,501
Financial Liabilities at Fair Value Through Profit or Loss
Open Forward Currency Exchange Contracts — (67,133) — (67,133)
2,503,122,615 14,577,985 — 2,517,700,600
Level 1 Level 2 Level 3 Total SRI European Stock Fund Euro (€) Euro (€) Euro (€) Euro (€)
Financial Assets at Fair Value Through Profit or Loss
Equities 384,946,867 7,286,968 10,390 392,244,225
Futures 30,276 — — 30,276
384,977,143 7,286,968 10,390 392,274,501
Level 1 Level 2 Level 3 Total SRI Global Stock Fund US Dollars ($) US Dollars ($) US Dollars ($) US Dollars ($)
Financial Assets at Fair Value Through Profit or Loss
Equities 671,338,009 2,366,581 6,952 673,711,542
Futures 9,745 — — 9,745
Open Forward Currency Exchange Contracts — 42,427 — 42,427
Financial Liabilities at Fair Value Through Profit or Loss
Futures (179,477) — — (179,477)
Open Forward Currency Exchange Contracts — (8,518) — (8,518)
671,168,277 2,400,490 6,952 673,575,719
Level 1 Level 2 Level 3 Total U.S. 500 Stock Index Fund US Dollars ($) US Dollars ($) US Dollars ($) US Dollars ($)
Financial Assets at Fair Value Through Profit or Loss
Equities 5,962,024,149 — — 5,962,024,149
Open Forward Currency Exchange Contracts — 2,750,792 — 2,750,792
Financial Liabilities at Fair Value Through Profit or Loss
Futures (133,333) — — (133,333)
Open Forward Currency Exchange Contracts — (35,908) — (35,908)
5,961,890,816 2,714,884 — 5,964,605,700
Level 1 Level 2 Level 3 Total U.S. Fundamental Value Fund US Dollars ($) US Dollars ($) US Dollars ($) US Dollars ($)
Financial Assets at Fair Value Through Profit or Loss
Equities 28,398,030 — — 28,398,030
28,398,030 — — 28,398,030
Level 1 Level 2 Level 3 Total U.S. Opportunities Fund US Dollars ($) US Dollars ($) US Dollars ($) US Dollars ($)
Financial Assets at Fair Value Through Profit or Loss
Equities 2,384,734,761 — 2,308 2,384,737,069
2,384,734,761 — 2,308 2,384,737,069
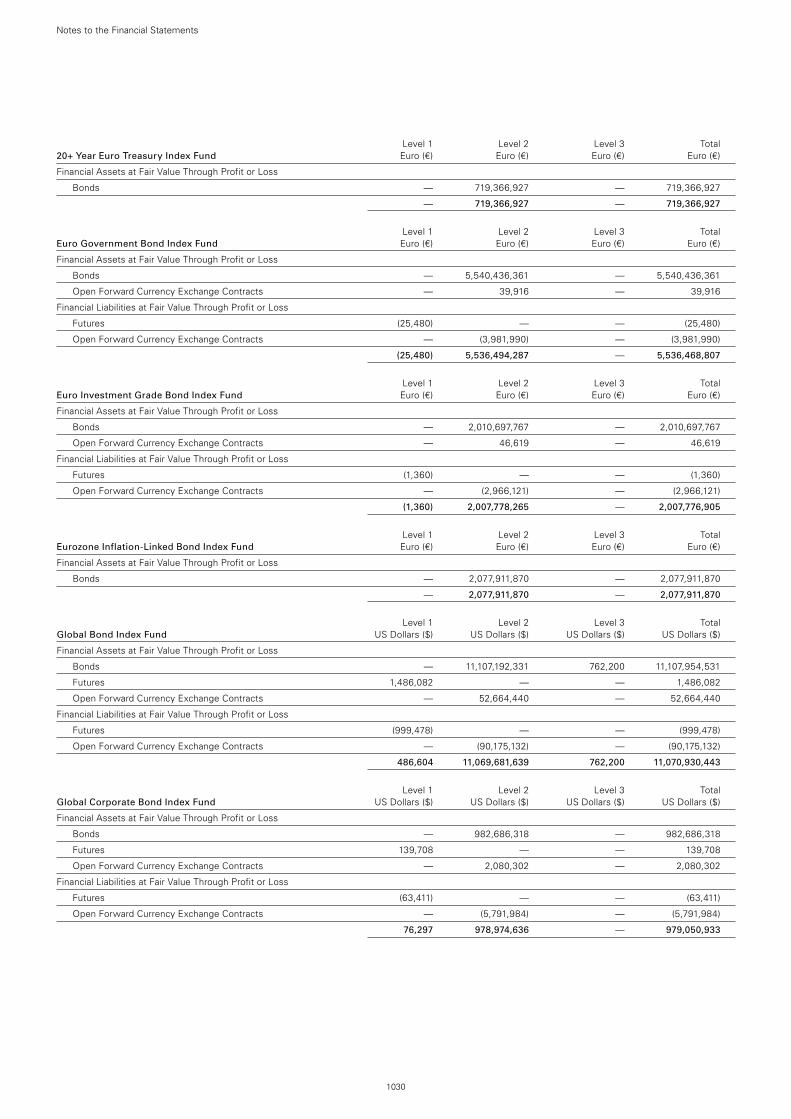
1030
Notes to the Financial Statements
Level 1 Level 2 Level 3 Total 20+ Year Euro Treasury Index Fund Euro (€) Euro (€) Euro (€) Euro (€)
Financial Assets at Fair Value Through Profit or Loss
Bonds — 719,366,927 — 719,366,927
— 719,366,927 — 719,366,927
Level 1 Level 2 Level 3 Total Euro Government Bond Index Fund Euro (€) Euro (€) Euro (€) Euro (€)
Financial Assets at Fair Value Through Profit or Loss
Bonds — 5,540,436,361 — 5,540,436,361
Open Forward Currency Exchange Contracts — 39,916 — 39,916
Financial Liabilities at Fair Value Through Profit or Loss
Futures (25,480) — — (25,480)
Open Forward Currency Exchange Contracts — (3,981,990) — (3,981,990)
(25,480) 5,536,494,287 — 5,536,468,807
Level 1 Level 2 Level 3 Total Euro Investment Grade Bond Index Fund Euro (€) Euro (€) Euro (€) Euro (€)
Financial Assets at Fair Value Through Profit or Loss
Bonds — 2,010,697,767 — 2,010,697,767
Open Forward Currency Exchange Contracts — 46,619 — 46,619
Financial Liabilities at Fair Value Through Profit or Loss
Futures (1,360) — — (1,360)
Open Forward Currency Exchange Contracts — (2,966,121) — (2,966,121)
(1,360) 2,007,778,265 — 2,007,776,905
Level 1 Level 2 Level 3 Total Eurozone Inflation-Linked Bond Index Fund Euro (€) Euro (€) Euro (€) Euro (€)
Financial Assets at Fair Value Through Profit or Loss
Bonds — 2,077,911,870 — 2,077,911,870
— 2,077,911,870 — 2,077,911,870
Level 1 Level 2 Level 3 Total Global Bond Index Fund US Dollars ($) US Dollars ($) US Dollars ($) US Dollars ($)
Financial Assets at Fair Value Through Profit or Loss
Bonds — 11,107,192,331 762,200 11,107,954,531
Futures 1,486,082 — — 1,486,082
Open Forward Currency Exchange Contracts — 52,664,440 — 52,664,440
Financial Liabilities at Fair Value Through Profit or Loss
Futures (999,478) — — (999,478)
Open Forward Currency Exchange Contracts — (90,175,132) — (90,175,132)
486,604 11,069,681,639 762,200 11,070,930,443
Level 1 Level 2 Level 3 Total Global Corporate Bond Index Fund US Dollars ($) US Dollars ($) US Dollars ($) US Dollars ($)
Financial Assets at Fair Value Through Profit or Loss
Bonds — 982,686,318 — 982,686,318
Futures 139,708 — — 139,708
Open Forward Currency Exchange Contracts — 2,080,302 — 2,080,302
Financial Liabilities at Fair Value Through Profit or Loss
Futures (63,411) — — (63,411)
Open Forward Currency Exchange Contracts — (5,791,984) — (5,791,984)
76,297 978,974,636 — 979,050,933
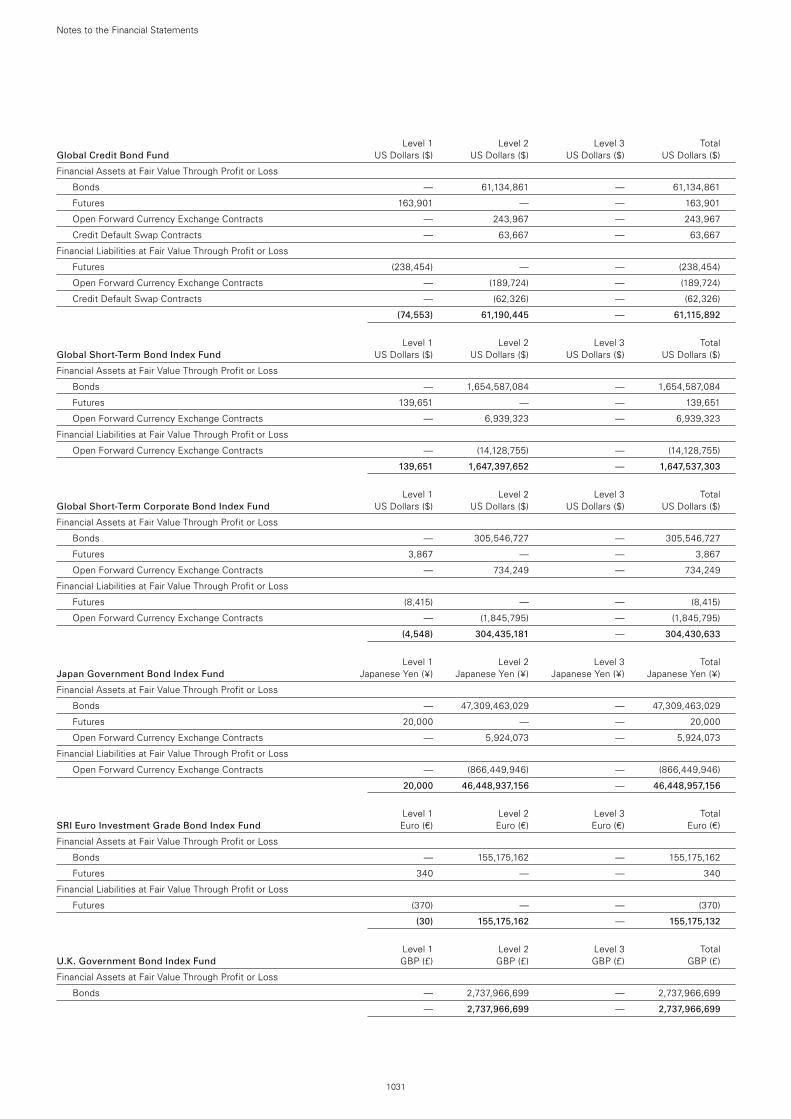
1031
Level 1 Level 2 Level 3 Total Global Credit Bond Fund US Dollars ($) US Dollars ($) US Dollars ($) US Dollars ($)
Financial Assets at Fair Value Through Profit or Loss
Bonds — 61,134,861 — 61,134,861
Futures 163,901 — — 163,901
Open Forward Currency Exchange Contracts — 243,967 — 243,967
Credit Default Swap Contracts — 63,667 — 63,667
Financial Liabilities at Fair Value Through Profit or Loss
Futures (238,454) — — (238,454)
Open Forward Currency Exchange Contracts — (189,724) — (189,724)
Credit Default Swap Contracts — (62,326) — (62,326)
(74,553) 61,190,445 — 61,115,892
Level 1 Level 2 Level 3 Total Global Short-Term Bond Index Fund US Dollars ($) US Dollars ($) US Dollars ($) US Dollars ($)
Financial Assets at Fair Value Through Profit or Loss
Bonds — 1,654,587,084 — 1,654,587,084
Futures 139,651 — — 139,651
Open Forward Currency Exchange Contracts — 6,939,323 — 6,939,323
Financial Liabilities at Fair Value Through Profit or Loss
Open Forward Currency Exchange Contracts — (14,128,755) — (14,128,755)
139,651 1,647,397,652 — 1,647,537,303
Level 1 Level 2 Level 3 Total Global Short-Term Corporate Bond Index Fund US Dollars ($) US Dollars ($) US Dollars ($) US Dollars ($)
Financial Assets at Fair Value Through Profit or Loss
Bonds — 305,546,727 — 305,546,727
Futures 3,867 — — 3,867
Open Forward Currency Exchange Contracts — 734,249 — 734,249
Financial Liabilities at Fair Value Through Profit or Loss
Futures (8,415) — — (8,415)
Open Forward Currency Exchange Contracts — (1,845,795) — (1,845,795)
(4,548) 304,435,181 — 304,430,633
Level 1 Level 2 Level 3 Total Japan Government Bond Index Fund Japanese Yen (¥) Japanese Yen (¥) Japanese Yen (¥) Japanese Yen (¥)
Financial Assets at Fair Value Through Profit or Loss
Bonds — 47,309,463,029 — 47,309,463,029
Futures 20,000 — — 20,000
Open Forward Currency Exchange Contracts — 5,924,073 — 5,924,073
Financial Liabilities at Fair Value Through Profit or Loss
Open Forward Currency Exchange Contracts — (866,449,946) — (866,449,946)
20,000 46,448,937,156 — 46,448,957,156
Level 1 Level 2 Level 3 Total SRI Euro Investment Grade Bond Index Fund Euro (€) Euro (€) Euro (€) Euro (€)
Financial Assets at Fair Value Through Profit or Loss
Bonds — 155,175,162 — 155,175,162
Futures 340 — — 340
Financial Liabilities at Fair Value Through Profit or Loss
Futures (370) — — (370)
(30) 155,175,162 — 155,175,132
Level 1 Level 2 Level 3 Total U.K. Government Bond Index Fund GBP (£) GBP (£) GBP (£) GBP (£)
Financial Assets at Fair Value Through Profit or Loss
Bonds — 2,737,966,699 — 2,737,966,699
— 2,737,966,699 — 2,737,966,699
Notes to the Financial Statements
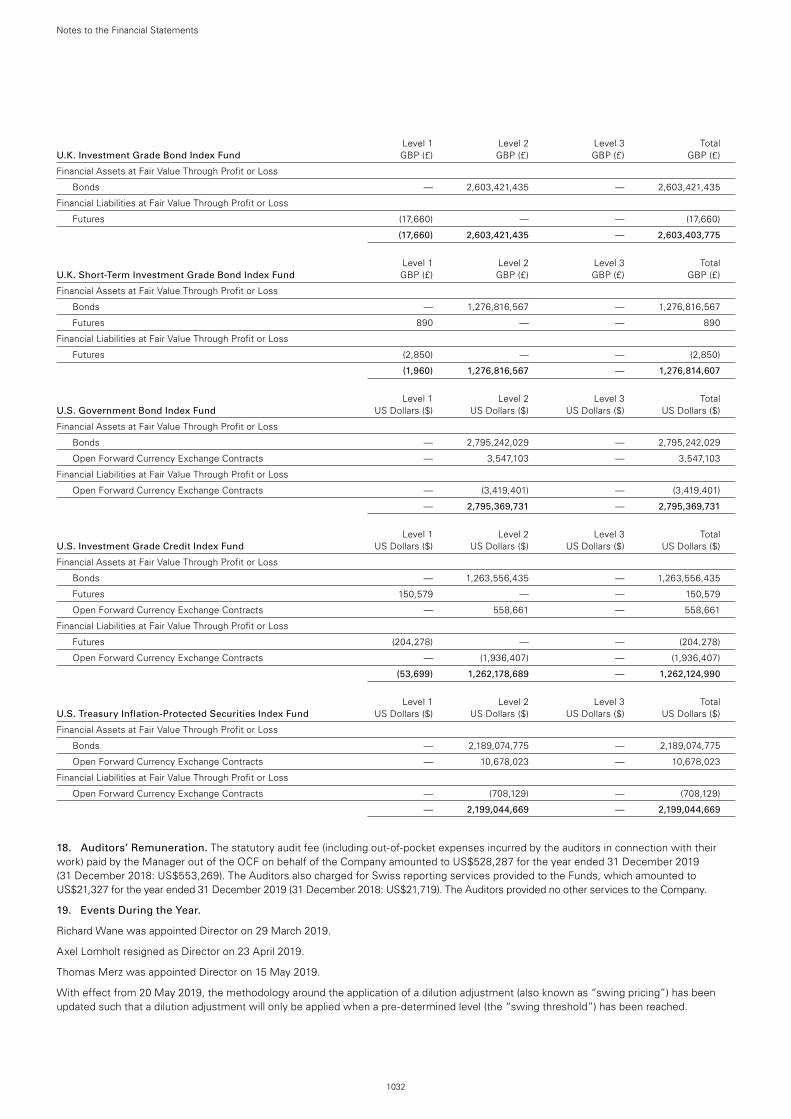
1032
Level 1 Level 2 Level 3 Total U.K. Investment Grade Bond Index Fund GBP (£) GBP (£) GBP (£) GBP (£)
Financial Assets at Fair Value Through Profit or Loss
Bonds — 2,603,421,435 — 2,603,421,435
Financial Liabilities at Fair Value Through Profit or Loss
Futures (17,660) — — (17,660)
(17,660) 2,603,421,435 — 2,603,403,775
Level 1 Level 2 Level 3 Total U.K. Short-Term Investment Grade Bond Index Fund GBP (£) GBP (£) GBP (£) GBP (£)
Financial Assets at Fair Value Through Profit or Loss
Bonds — 1,276,816,567 — 1,276,816,567
Futures 890 — — 890
Financial Liabilities at Fair Value Through Profit or Loss
Futures (2,850) — — (2,850)
(1,960) 1,276,816,567 — 1,276,814,607
Level 1 Level 2 Level 3 Total U.S. Government Bond Index Fund US Dollars ($) US Dollars ($) US Dollars ($) US Dollars ($)
Financial Assets at Fair Value Through Profit or Loss
Bonds — 2,795,242,029 — 2,795,242,029
Open Forward Currency Exchange Contracts — 3,547,103 — 3,547,103
Financial Liabilities at Fair Value Through Profit or Loss
Open Forward Currency Exchange Contracts — (3,419,401) — (3,419,401)
— 2,795,369,731 — 2,795,369,731
Level 1 Level 2 Level 3 Total U.S. Investment Grade Credit Index Fund US Dollars ($) US Dollars ($) US Dollars ($) US Dollars ($)
Financial Assets at Fair Value Through Profit or Loss
Bonds — 1,263,556,435 — 1,263,556,435
Futures 150,579 — — 150,579
Open Forward Currency Exchange Contracts — 558,661 — 558,661
Financial Liabilities at Fair Value Through Profit or Loss
Futures (204,278) — — (204,278)
Open Forward Currency Exchange Contracts — (1,936,407) — (1,936,407)
(53,699) 1,262,178,689 — 1,262,124,990
Level 1 Level 2 Level 3 Total U.S. Treasury Inflation-Protected Securities Index Fund US Dollars ($) US Dollars ($) US Dollars ($) US Dollars ($)
Financial Assets at Fair Value Through Profit or Loss
Bonds — 2,189,074,775 — 2,189,074,775
Open Forward Currency Exchange Contracts — 10,678,023 — 10,678,023
Financial Liabilities at Fair Value Through Profit or Loss
Open Forward Currency Exchange Contracts — (708,129) — (708,129)
— 2,199,044,669 — 2,199,044,669
18. Auditors’ Remuneration. The statutory audit fee (including out-of-pocket expenses incurred by the auditors in connection with theirwork) paid by the Manager out of the OCF on behalf of the Company amounted to US$528,287 for the year ended 31 December 2019 (31 December 2018: US$553,269). The Auditors also charged for Swiss reporting services provided to the Funds, which amounted to US$21,327 for the year ended 31 December 2019 (31 December 2018: US$21,719). The Auditors provided no other services to the Company.
19. Events During the Year.
Richard Wane was appointed Director on 29 March 2019.
Axel Lomholt resigned as Director on 23 April 2019.
Thomas Merz was appointed Director on 15 May 2019.
With effect from 20 May 2019, the methodology around the application of a dilution adjustment (also known as “swing pricing”) has been updated such that a dilution adjustment will only be applied when a pre-determined level (the “swing threshold”) has been reached.
Notes to the Financial Statements

1033
Notes to the Financial Statements
20. Events Since the Statement of Assets and Liabilities Date.
Market disruptions associated with the COVID-19 pandemic have had a global impact, and uncertainty exists as to the long-term implications. Such disruptions can adversely affect assets of the Funds and thus performance of the Funds. Management is continuing to monitor this development and evaluate its impact on the Funds.
On 30 March 2020 shareholders voted to approve: (i) a change to the benchmark of the Vanguard SRI Global Stock Fund from the FTSE Developed Index to the FTSE Developed All Cap ex Controversies/Non-Renewable Energy/Vice Products/Weapons Index; and (ii) following this change in benchmark, a change to the name of the fund from the Vanguard SRI Global Stock Fund to the Vanguard ESG Developed World All Cap Equity Index Fund. These changes will go into effect on 13 May 2020.
Management has determined that no other events or transactions occurred subsequent to 31 December 2019 that would require recognition or disclosure in these financial statements.
21. Approval of Financial Statements. The Financial Statements were approved by the Directors on 24 April 2020.
1034
The Board of Directors (the “Directors”) submits its annual report together with the audited financial statements for Vanguard Investment Series plc (the “Company”) for the year ended 31 December 2019.
Directors’ responsibilities statementThe Directors are responsible for preparing the Annual Report and the financial statements in accordance with Irish law and regulations.
Irish company law requires the Directors to prepare financial statements giving a true and fair view of the state of affairs of the Company and the profit or loss of the Company for each year. Under that law the Directors have elected to prepare the financial statements in accordance with Irish Generally Accepted Accounting Practice (accounting standards issued by the Financial Reporting Council and promulgated by the Institute of Chartered Accountants in Ireland and Irish law).
In preparing those financial statements, the Directors are required to:
• Selectsuitableaccountingpoliciesandthenapplythemconsistently;
• Makejudgementsandaccountingestimatesthatarereasonable and prudent;
• Preparethefinancialstatementsonthegoingconcernbasis unless it is inappropriate to presume that the Company will continue in business; and
• Statewhetherthefinancialstatementshavebeenpreparedin accordance with applicable accounting standards, identify those standards, and note the effect and the reasons for any material departure from those standards.
The Directors are responsible for keeping adequate accounting records that disclose with reasonable accuracy at any time the financial position of the Company and enable them to ensure that the financial statements are prepared in accordance with accounting standards generally accepted in Ireland and comply with the Companies Act 2014 and the European Communities (Undertakings for Collective Investment in Transferable Securities) Regulations, 2011 (as amended) (the “UCITS Regulations”). They are also responsible for safeguarding the assets of the Company and hence for taking reasonable steps for the prevention and detection of fraud and other irregularities.
The Directors have the power, under the Memorandum and Articles of Association of the Company, to determine the time and place at which payment for shares must be made. Accordingly, the Directors in exceptional circumstances have discretion to accept subscription monies after the dealing time specified in the Prospectus. In exercising this discretion, the Directors will take into account legal considerations, timing considerations and other relevant considerations.
The financial statements are published at www.vanguard.co.uk. The Directors together with the Manager and Investment Manager are responsible for the maintenance
and integrity of the website as far as it relates to Vanguard Investment Series plc. The work carried out by the auditors does not involve consideration of the maintenance and integrity of the website and accordingly, the auditors accept no responsibility for any changes that have occurred to the financial statements presented on the website. Legislation in the Republic of Ireland governing the presentation and dissemination of the financial statements may differ from legislation in other jurisdictions.
Statement of Relevant Audit InformationThe Directors in office at the date of this report have each confirmed that:
• Asfarastheyareaware,thereisnorelevantauditinformationof which the Company’s auditor is unaware; and
• Theyhavetakenallthestepsthattheyoughttohavetaken as a director in order to make themselves aware of any relevant audit information and to establish that the Company’s auditor is aware of that information.
Directors’ Compliance StatementIt is the policy of the Company to comply with its relevant obligations (as defined in the Companies Act 2014). As required by Section 225(2) of the Companies Act 2014, the Directors acknowledge that they are responsible for securing the Company’s compliance with the Relevant Obligations. The Directors have drawn up a compliance policy statement as defined in Section 225(3)(a) of the Companies Act 2014 and a compliance policy which refers to the arrangements and structures that are in place and which are, in the Directors’ opinion, designed to secure material compliance with the Company’s Relevant Obligations. In discharging their responsibilities under Section 225, the Directors relied upon, among other things, the services provided, advice and/or representations from third parties whom the Directors believe have the requisite knowledge and experience in order to secure material compliance with the Company’s Relevant Obligations.
Accounting recordsThe measures taken by the Directors to secure compliance with the Company’s obligations to keep adequate accounting records are the use of appropriate systems and procedures, appointment of an administrator and employment of competent persons. The accounting records are kept at the Administrator, 30 Herbert Street, Dublin 2, Ireland.
Review of the business and future developments The Company is organised as an investment company with variable capital under the laws of Ireland as a public limited company pursuant to the Companies Act 2014 and the UCITS Regulations. There was no change in the nature of the Company’s business during the year.
A complete list of Funds can be found in Note 2 of the Notes to the Financial Statements.
Report from the Directors
Report from the Directors
1035
Potential implications of BrexitThe United Kingdom (“UK”) left the European Union (“EU”) on 31 January 2020, with a transition period that will end on 31 December 2020, unless extended (the “Transition Period”). Any decision to extend the Transition Period must be taken before 1 July 2020 and the extension can only be for one or two years. Therefore, the UK has ceased to be a EU Member State but, during the Transition Period, the UK continues to be treated as an EU Member State and EU law continues to apply. The exact nature and extent of the UK’s future relationship with the EU, following the Transition Period, remains uncertain.
Political instability and economic uncertainty may lead to speculation and subsequent market volatility, particularly for assets denominated in British pounds. Vanguard continues to encourage investors to follow its core investing principles, including maintaining long-term discipline. The implications of Brexit extend well beyond the UK economy and financial markets, affecting multinational organisations globally. Vanguard remains committed to safeguarding our investors’ assets and their long-term interests and has devoted significant resources to developing plans to manage the impact of Brexit.
Risk management objectives and policies The Directors draw your attention to the principal risks affecting the Funds, which are outlined in Note 4 of the Notes to Financial Statements.
Results and dividendsThe results and dividends for the year are stated in the Statement of Operations.
Events Since the Statement of Assets and Liabilities DateMarket disruptions associated with the COVID-19 pandemic have had a global impact, and uncertainty exists as to the long-term implications. Such disruptions can adversely affect assets of the Funds and thus performance of the Funds. Management is continuing to monitor this development and evaluate its impact on the Funds. Vanguard continues to encourage investors to follow its core investment principles, including maintaining long-term discipline. Vanguard is committed to safeguarding the assets of investors and their long-term interests.
On 30 March 2020 shareholders voted to approve: (i) a change to the benchmark of the Vanguard SRI Global Stock Fund from the FTSE Developed Index to the FTSE Developed All Cap ex Controversies/Non-Renewable Energy/ Vice Products/Weapons Index; and (ii) following this change in benchmark, a change to the name of the fund from the Vanguard SRI Global Stock Fund to the Vanguard ESG Developed World All Cap Equity Index Fund. These changes will go into effect on 13 May 2020.
Directors The names of the persons who were Directors for all or part of the year ended 31 December 2019 are set out below.
Peter Blessing (Irish) James M. Norris (American) William Slattery (Irish) Michael S. Miller (American) Sean P. Hagerty (American) Tara Doyle (Irish) Richard Wane (British) Thomas Merz (Swiss)
Mr Richard Wane (British) was appointed Director on 29 March 2019. Mr Axel Lomholt resigned as Director on 23 April 2019. Mr Thomas Merz (Swiss) was appointed Director on 15 May 2019.
Directors’ and Secretary’s interests The Directors and Secretary and their families had no interest in the shares of the Company at 31 December 2019. No Directors had at any time during the year a material interest in any contract of significance subsisting during or at the end of the year in relation to the business of the Company.
Independent AuditorsThe auditors, PricewaterhouseCoopers, will be reappointed in accordance with Section 160(2) of the Companies Act 2014.
Directors’ disclosure on corporate governanceCorporate governanceThe Company is authorised in Ireland pursuant to the Companies Act 2014 and the UCITS Regulations. Accordingly, the Directors are obliged to carry out the business of the Company in accordance with the UCITS Regulations and in accordance with all of the relevant provisions of the Companies Act 2014. The Directors have also adopted the Corporate Governance Code issued by the Irish Funds Industry Association (the “IFIA Corporate Governance Code”). A copy of the IFIA Corporate Governance Code is available at http://www.irishfunds.ie/publications/.
Shareholder meetings and voting rightsGeneral meetingsAll general meetings of the Company shall be held in Ireland, and at least one general meeting of the Company shall be held in each year as the Company’s annual general meeting. At least 21 days’ notice (inclusive of the day on which the notice is served or deemed to be served and of the day for which the notice is given) shall be given to shareholders. The notice shall specify the place, day and hour of the meeting and the terms of the resolutions to be proposed. A proxy may attend on behalf of any shareholder.
Report from the Directors
1036
Voting rightsEach shareholder shall be entitled to such number of votes as shall be produced by dividing the aggregate net asset value of that shareholder’s shareholding (expressed or converted into US dollars and calculated as of the “relevant record date”) by one. The subscriber shareholders shall have one vote for each subscriber share held. The relevant record date for these purposes shall be a date being not more than 30 days prior to the date of the relevant general meeting of shareholders or written resolution as determined by the Directors. In relation to a resolution that in the opinion of the Directors gives or may give rise to a conflict of interest between the shareholders of any class, such resolution shall be deemed to have been duly passed only if, in lieu of being passed through a single meeting of the shareholders of such class, such resolution shall have been passed at a separate meeting of the shareholders of such classes. All votes shall be cast by a poll of shareholders present in person or by proxy at the relevant shareholder meeting or by unanimous written resolution of the shareholders.
Class meetings—variation of class rights Under the Articles of Association of the Company (the “Articles”), the rights attached to each class of shares may, whether or not the Company is being wound up, be varied with the consent in writing of the holders of three-fourths of the issued shares of that class or with the sanction of a Special Resolution passed at a separate general meeting of the holders of the shares of that class. The rights attaching to any class of shares shall not be deemed to be varied by the creation or issue of further shares ranking pari passu with shares already in issue, unless otherwise expressly provided by the terms of issue of those shares. The provisions of the Articles relating to general meetings shall apply to every such separate general meeting except that the necessary quorum at such a meeting shall be two persons present in person or by proxy holding shares of the class in question or, at an adjourned meeting, one person holding shares of the class in question or his or her proxy.
Directors of the company Unless otherwise determined by an ordinary resolution of the Company in a general meeting, the number of Directors may not be less than three nor more than nine. Currently there are seven Directors, being those listed in the directory in these financial statements.
The business of the Company is managed by the Directors, who exercise all such powers of the Company which are not required to be exercised by the Company in a general meeting in accordance with the Companies Acts and the Articles. A Director may, and the Company Secretary of the Company on the requisition of a Director will, at any time summon a meeting of the Directors. Questions arising at any meeting of the Directors are determined by a majority of votes. The quorum necessary for the transaction of business at a meeting of the Directors may be fixed by the Directors, and unless so fixed at any other number shall be two.
Internal controls and risk management The Directors are responsible for establishing and maintaining adequate internal control and risk management systems of the Company in relation to the financial reporting process. Such systems are designed to manage rather than eliminate the risk of error or fraud in achieving the Company’s financial reporting objectives and can only provide reasonable and not absolute assurance against material misstatement or loss.
The Directors have entrusted various delegates with responsibility for the oversight of the internal control and risk management systems. Separately, two Directors, Peter Blessing and Michael S. Miller, have been designated with the primary responsibility for evaluating the independent accountants, reviewing audit coverage and use of audit resources, and overseeing financial reporting and audit processes. The Company’s internal audit function is carried out by the Internal Audit Department (“IAD”) of The Vanguard Group, Inc. (“VGI”). The IAD is mandated to assist the Directors in reaching a conclusion about the overall effectiveness of internal controls and provide the Directors with the information necessary to discharge their responsibilities.
The Directors have procedures in place to ensure that all relevant books of account are properly maintained and are readily available, including production of annual and half yearly financial statements. The Directors are responsible for ensuring that the books of account disclose with reasonable accuracy at any time the financial position of the Company and enable them to ensure that financial statements are prepared in accordance with accounting standards generally accepted in Ireland and comply with the Companies Act 2014 and the UCITS Regulations. The annual financial statements of the Company are required to be approved by the Directors. The statutory financial statements are required to be audited by the Company’s independent auditors, PricewaterhouseCoopers, who report annually to the Audit Committee on their findings.
Brown Brothers Harriman Fund Administration Services (Ireland) Limited (the “Administrator”) is appointed as an independent administrator to the Company to maintain the books and records and the Administrator is authorised and regulated by the Central Bank of Ireland and must comply with the rules imposed by the Central Bank of Ireland. In addition, the Administrator will prepare all financial statements and corresponding notes in respect of the Company together with its annual and semiannual reports.
From time to time the board also examines and evaluates the Administrator’s financial accounting and reporting routines and monitors and evaluates the external auditors’ performance, qualifications and independence. The Directors are also responsible for safeguarding the assets of the Company which involves the taking of reasonable steps for the prevention and detection of fraud and other irregularities.
On behalf of the Board, Sean P. Hagerty James M. Norris 24 April 2020
Report from the Directors
1037
Remuneration DisclosureVanguard personnel providing services to the Manager are subject to the Vanguard European Remuneration Policy (the “Remuneration Policy”). The Remuneration Policy includes the remuneration requirements of the UCITS V Directive (2014/91/EU).
The governance of remuneration within Vanguard Europe is undertaken through a tiered structure, including Vanguard’s Global Remuneration Committee and the European Remuneration Committee (“ERC”). The Global Remuneration Committee also operates at The Vanguard Group level and oversees the overall compensation programmes of The Vanguard Group. The ERC is responsible for implementing the remuneration programmes in accordance with our total rewards philosophy and global organisation, including overseeing the Remuneration Policy.
The Remuneration Policy provides for an appropriate balance of fixed salary; benefits, such as pension; and annual bonus and long-term incentive arrangements. Incentives are based on the overall business performance of The Vanguard Group, or individual, team, business unit and fund performance. The incentive plans are reviewed and approved by the ERC (and other applicable groups) in order to ensure that plans appropriately assess financial and non-financial performance and do not encourage conflicts of interest, and to ensure that risk or compliance issues are appropriately reflected.
The ERC also reviews and approves the list of UCITS code staff annually. Identified code staff are notified and understand the code staff responsibilities.
Under the UCITS V Directive, the Manager is required to disclose information relating to the remuneration paid to its staff for the financial year, split into fixed and variable remuneration. The table below presents the aggregate total remuneration paid to staff who provide services to the Funds and the aggregate total remuneration paid to all relevant UCITS code staff.
Total Remuneration Headcount1 (£000)2,3
Funds, of which 33 3,113
Fixed Remuneration 33 2,316
Variable Remuneration 33 797
Performance Fees n/a n/a
Code Staff 2 744
Fixed Remuneration 2 298
Variable Remuneration 2 446
Performance Fees n/a n/a
1 This is the total number of employees who are employed through VGIL. 2 The staff in this table provide services to the Irish Funds. 3 The remuneration disclosed is the total remuneration earned for the 2019 Irish Funds fiscal year.
Remuneration reflects fixed pay (salary) and performance-related pay (annual and long-term incentives). Individual incentive outcomes under the plans are based on performance assessed by reference to an appropriate balance of quantitative and qualitative measures, such as behaviour, including compliance with all applicable policies. The individual incentive outcome is fully discretionary and, if appropriate, outcomes based on financial performance can be overridden based on the qualitative measures.
Connected Persons DisclosureTransactions carried out with the Company by the Investment Manager, Manager, Depositary, Investment Adviser and/or associated or group companies of these (“Connected Persons”) during the year ended 31 December 2019 were carried out as if negotiated at arm’s length and were in the best interests of the Company’s Shareholders. The Directors of the Company are satisfied that there are arrangements (evidenced by written procedures) in place to ensure that all transactions entered into by the Company with Connected Persons are carried out as if negotiated at arm’s length and in the best interests of the Company’s Shareholders.
Securities Financing Transactions Regulation (“SFTR”)Securities Financing Transactions Regulation ("SFTR") introduces reporting requirements for securities financing transactions ("SFTs").
Additional Information From the Directors (unaudited)
1038
A Securities Financing Transaction (SFT) is defined as per Article 3(11) of the SFTR as:
• Arepurchase/reverserepurchaseagreement.
• Securitiesorcommoditieslendingandsecuritiesorcommoditiesborrowing.
• Abuy-sellbacktransactionorsell-buybacktransaction.
• Amarginlendingtransaction.
As at 31 December 2019, Vanguard Investment Series plc had securities lending programme as a type of SFT under the scope of the SFTR.
Global DataThe amounts of securities on loan as at 31 December 2019 are as follows:
Proportion Proportion of Fund Amount of NAV (%) Lendable Assets (%)
Emerging Markets Stock Index Fund $58,330,991 0.58 1.12
European Stock Index Fund $34,174,037 0.71 0.73
Eurozone Stock Index Fund € 24,093,674 1.30 1.34
Global Enhanced Equity Fund $5,152,768 2.15 2.32
Global Small-Cap Index Fund $75,579,005 2.80 3.10
Global Stock Index Fund $134,513,582 1.17 1.25
Japan Stock Index Fund € 158,226,292 5.49 5.62
Pacific ex-Japan Stock Index Fund € 14,232,184 0.43 1.43
SRI European Stock Fund € 2,329,653 0.69 0.72
SRI Global Stock Fund $2,100,980 0.23 0.25
U.S. 500 Stock Index Fund $1,191,460 0.02 0.02
U.S. Opportunities Fund $25,434,189 1.14 1.25
Data on Re-Use of Collateral Vanguard Investment Series Plc did not re-use any collateral received during the year ended 31 December 2019.
Concentration Data The split of issuers of collateral securities received across all SFTs as at 31 December 2019 is as follows:
Fund Collateral Issuer Collateral Amount
Emerging Markets Stock Index Fund UK Government $29,642,430
Emerging Markets Stock Index Fund US Government $16,888,864
Emerging Markets Stock Index Fund FR Government $11,219,588
Emerging Markets Stock Index Fund DE Government $5,286,033
Emerging Markets Stock Index Fund NL Government $1,159,159
European Stock Index Fund US Government $19,962,303
European Stock Index Fund UK Government $6,397,228
European Stock Index Fund DE Government $6,130,308
European Stock Index Fund FR Government $5,779,719
European Stock Index Fund NL Government $451,439
Eurozone Stock Index Fund UK Government €12,379,801
Eurozone Stock Index Fund FR Government €5,554,326
Eurozone Stock Index Fund US Government €5,024,481
Eurozone Stock Index Fund DE Government €3,471,969
Eurozone Stock Index Fund NL Government €98,947
Global Enhanced Equity Fund FR Government $1,893,341
Global Enhanced Equity Fund US Government $1,771,008
Global Enhanced Equity Fund DE Government $1,225,452
Global Enhanced Equity Fund UK Government $896,356
Global Enhanced Equity Fund NL Government $89,685
Global Small-Cap Index Fund UK Government $30,444,872
Global Small-Cap Index Fund US Government $21,857,475
Global Small-Cap Index Fund FR Government $20,326,604
Global Small-Cap Index Fund DE Government $9,556,490
Global Small-Cap Index Fund NL Government $1,487,929
Additional Information From the Directors (unaudited)
1039
Global Stock Index Fund UK Government $56,869,626
Global Stock Index Fund FR Government $44,169,091
Global Stock Index Fund US Government $27,750,114
Global Stock Index Fund DE Government $14,113,402
Global Stock Index Fund NL Government $3,574,220
Japan Stock Index Fund FR Government €75,767,997
Japan Stock Index Fund US Government €32,837,124
Japan Stock Index Fund UK Government €31,168,386
Japan Stock Index Fund DE Government €26,907,988
Japan Stock Index Fund NL Government €938,320
Pacific ex-Japan Stock Index Fund US Government €11,997,486
Pacific ex-Japan Stock Index Fund FR Government €2,030,521
Pacific ex-Japan Stock Index Fund DE Government €612,453
Pacific ex-Japan Stock Index Fund NL Government €354,867
SRI European Stock Fund US Government €1,647,203
SRI European Stock Fund UK Government €433,750
SRI European Stock Fund FR Government €258,794
SRI European Stock Fund DE Government €77,306
SRI European Stock Fund NL Government €47,719
SRI Global Stock Fund UK Government $1,048,791
SRI Global Stock Fund FR Government $676,313
SRI Global Stock Fund DE Government $288,305
SRI Global Stock Fund US Government $251,997
SRI Global Stock Fund NL Government $10,208
U.S. 500 Stock Index Fund UK Government $861,662
U.S. 500 Stock Index Fund FR Government $376,986
U.S. 500 Stock Index Fund NL Government $91,082
U.S. Opportunities Fund UK Government $23,865,944
U.S. Opportunities Fund FR Government $2,308,680
U.S. Opportunities Fund DE Government $712,013
U.S. Opportunities Fund NL Government $73,388
The split of counterparties of the securities lending programme as at 31 December 2019 is as follows:
Securities on Fund Counterparty Loan Amount
Emerging Markets Stock Index Fund UBS $16,752,892
Emerging Markets Stock Index Fund Credit Suisse Group $11,211,425
Emerging Markets Stock Index Fund Morgan Stanley $10,686,131
Emerging Markets Stock Index Fund Merrill Lynch $7,221,447
Emerging Markets Stock Index Fund Citigroup $5,519,866
Emerging Markets Stock Index Fund JP Morgan $3,765,802
Emerging Markets Stock Index Fund HSBC $3,173,428
European Stock Index Fund Morgan Stanley $16,093,653
European Stock Index Fund Merrill Lynch $11,460,377
European Stock Index Fund JP Morgan $5,604,745
European Stock Index Fund Citigroup $602,179
European Stock Index Fund UBS $413,083
Eurozone Stock Index Fund JP Morgan €7,871,658
Eurozone Stock Index Fund Citigroup €4,853,383
Eurozone Stock Index Fund Merrill Lynch €4,165,501
Eurozone Stock Index Fund Morgan Stanley €3,450,506
Eurozone Stock Index Fund HSBC €3,397,085
Eurozone Stock Index Fund UBS €355,541
Global Enhanced Equity Fund Merrill Lynch $1,762,316
Global Enhanced Equity Fund Citigroup $1,186,072
Global Enhanced Equity Fund Morgan Stanley $1,122,743
Global Enhanced Equity Fund Credit Suisse Group $754,375
Additional Information From the Directors (unaudited)
Fund Collateral Issuer Collateral Amount
1040
Global Enhanced Equity Fund JP Morgan $227,305
Global Enhanced Equity Fund HSBC $99,957
Global Small-Cap Index Fund Morgan Stanley $15,548,657
Global Small-Cap Index Fund Citigroup $14,232,292
Global Small-Cap Index Fund Credit Suisse Group $13,611,083
Global Small-Cap Index Fund UBS $11,771,109
Global Small-Cap Index Fund Merrill Lynch $10,584,494
Global Small-Cap Index Fund JP Morgan $5,896,582
Global Small-Cap Index Fund HSBC $3,934,787
Global Stock Index Fund Credit Suisse Group $38,573,876
Global Stock Index Fund Citigroup $35,467,230
Global Stock Index Fund Morgan Stanley $21,731,332
Global Stock Index Fund UBS $16,879,558
Global Stock Index Fund JP Morgan $8,295,719
Global Stock Index Fund Merrill Lynch $8,077,198
Global Stock Index Fund HSBC $5,488,669
Japan Stock Index Fund Citigroup €94,459,143
Japan Stock Index Fund Morgan Stanley €31,932,166
Japan Stock Index Fund JP Morgan €21,592,877
Japan Stock Index Fund UBS €9,329,174
Japan Stock Index Fund Merrill Lynch €912,932
Pacific ex-Japan Stock Index Fund Morgan Stanley €12,632,557
Pacific ex-Japan Stock Index Fund Citigroup €1,599,627
SRI European Stock Fund Morgan Stanley €1,699,012
SRI European Stock Fund JP Morgan €287,756
SRI European Stock Fund Citigroup €196,747
SRI European Stock Fund UBS €146,138
SRI Global Stock Fund UBS $797,413
SRI Global Stock Fund Citigroup $734,362
SRI Global Stock Fund HSBC $268,426
SRI Global Stock Fund Merrill Lynch $171,639
SRI Global Stock Fund Credit Suisse Group $129,140
U.S. 500 Stock Index Fund Credit Suisse Group $1,191,460
U.S. Opportunities Fund HSBC $18,994,177
U.S. Opportunities Fund JP Morgan $2,910,260
U.S. Opportunities Fund Citigroup $2,585,200
U.S. Opportunities Fund Credit Suisse Group $944,552
Safekeeping of Collateral ReceivedAll securities lending collateral received is held by JPM – Securities Collateral Management as at 31 December 2019.
Aggregate Transaction DataThe aggregate transaction data for collateral positions received in respect of the securities lending programme as at 31 December 2019 are as follows:
Country of Type of Collateral Fitch Maturity Tenor of Currency of Counterparty Settlement Fund Collateral Amount Rating Collateral Collateral Establishment and Clearing
Emerging Markets Stock Index Fund Bond $3,515,057 AA 3 months to 1 year EUR United Kingdom Tri Party
Emerging Markets Stock Index Fund Bond $7,704,531 AA > 1 year EUR United Kingdom Tri Party
Emerging Markets Stock Index Fund Bond $66,269 AA 3 months to 1 year GBP United Kingdom Tri Party
Emerging Markets Stock Index Fund Bond $29,576,161 AA > 1 year GBP United Kingdom Tri Party
Emerging Markets Stock Index Fund Bond $6,445,192 AAA > 1 year EUR United Kingdom Tri Party
Emerging Markets Stock Index Fund Bond $1,280,807 AAA 1 week to 1 month USD United Kingdom Tri Party
Emerging Markets Stock Index Fund Bond $377,517 AAA 1 month to 3 months USD United Kingdom Tri Party
Emerging Markets Stock Index Fund Bond $4,899,624 AAA 3 months to 1 year USD United Kingdom Tri Party
Emerging Markets Stock Index Fund Bond $10,330,916 AAA > 1 year USD United Kingdom Tri Party
European Stock Index Fund Bond $5,779,719 AA > 1 year EUR United Kingdom Tri Party
Additional Information From the Directors (unaudited)
Securities on Fund Counterparty Loan Amount
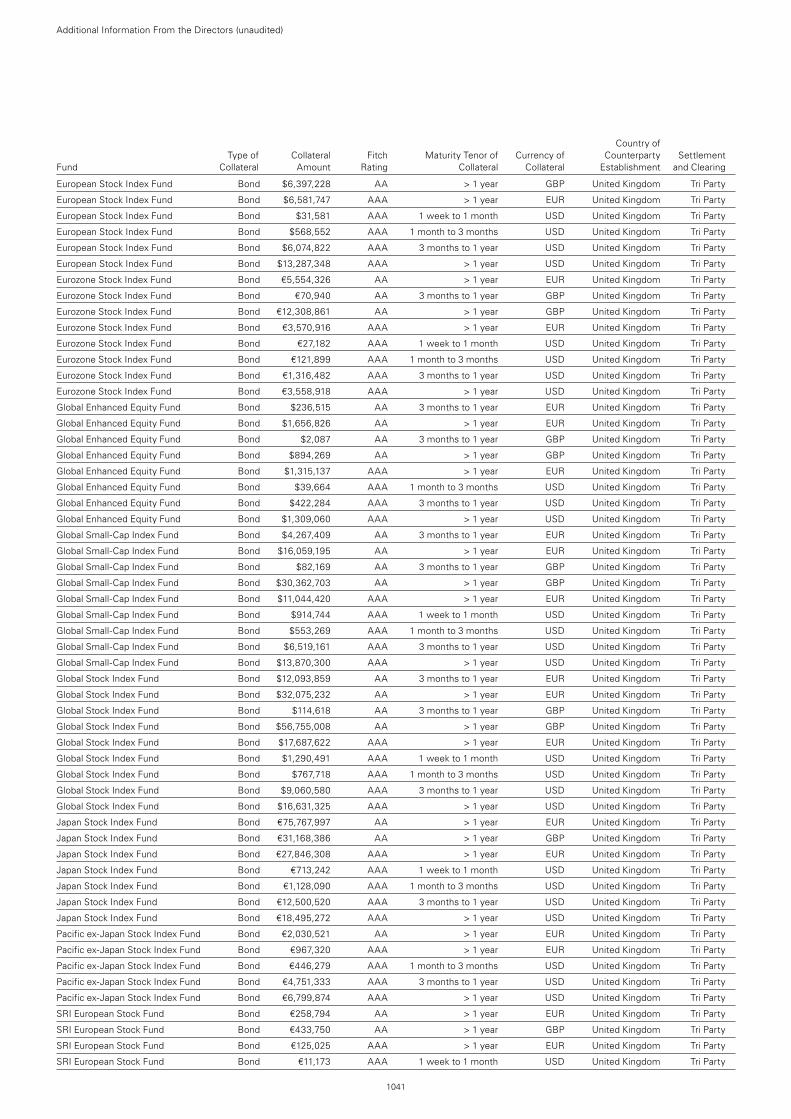
1041
European Stock Index Fund Bond $6,397,228 AA > 1 year GBP United Kingdom Tri Party
European Stock Index Fund Bond $6,581,747 AAA > 1 year EUR United Kingdom Tri Party
European Stock Index Fund Bond $31,581 AAA 1 week to 1 month USD United Kingdom Tri Party
European Stock Index Fund Bond $568,552 AAA 1 month to 3 months USD United Kingdom Tri Party
European Stock Index Fund Bond $6,074,822 AAA 3 months to 1 year USD United Kingdom Tri Party
European Stock Index Fund Bond $13,287,348 AAA > 1 year USD United Kingdom Tri Party
Eurozone Stock Index Fund Bond €5,554,326 AA > 1 year EUR United Kingdom Tri Party
Eurozone Stock Index Fund Bond €70,940 AA 3 months to 1 year GBP United Kingdom Tri Party
Eurozone Stock Index Fund Bond €12,308,861 AA > 1 year GBP United Kingdom Tri Party
Eurozone Stock Index Fund Bond €3,570,916 AAA > 1 year EUR United Kingdom Tri Party
Eurozone Stock Index Fund Bond €27,182 AAA 1 week to 1 month USD United Kingdom Tri Party
Eurozone Stock Index Fund Bond €121,899 AAA 1 month to 3 months USD United Kingdom Tri Party
Eurozone Stock Index Fund Bond €1,316,482 AAA 3 months to 1 year USD United Kingdom Tri Party
Eurozone Stock Index Fund Bond €3,558,918 AAA > 1 year USD United Kingdom Tri Party
Global Enhanced Equity Fund Bond $236,515 AA 3 months to 1 year EUR United Kingdom Tri Party
Global Enhanced Equity Fund Bond $1,656,826 AA > 1 year EUR United Kingdom Tri Party
Global Enhanced Equity Fund Bond $2,087 AA 3 months to 1 year GBP United Kingdom Tri Party
Global Enhanced Equity Fund Bond $894,269 AA > 1 year GBP United Kingdom Tri Party
Global Enhanced Equity Fund Bond $1,315,137 AAA > 1 year EUR United Kingdom Tri Party
Global Enhanced Equity Fund Bond $39,664 AAA 1 month to 3 months USD United Kingdom Tri Party
Global Enhanced Equity Fund Bond $422,284 AAA 3 months to 1 year USD United Kingdom Tri Party
Global Enhanced Equity Fund Bond $1,309,060 AAA > 1 year USD United Kingdom Tri Party
Global Small-Cap Index Fund Bond $4,267,409 AA 3 months to 1 year EUR United Kingdom Tri Party
Global Small-Cap Index Fund Bond $16,059,195 AA > 1 year EUR United Kingdom Tri Party
Global Small-Cap Index Fund Bond $82,169 AA 3 months to 1 year GBP United Kingdom Tri Party
Global Small-Cap Index Fund Bond $30,362,703 AA > 1 year GBP United Kingdom Tri Party
Global Small-Cap Index Fund Bond $11,044,420 AAA > 1 year EUR United Kingdom Tri Party
Global Small-Cap Index Fund Bond $914,744 AAA 1 week to 1 month USD United Kingdom Tri Party
Global Small-Cap Index Fund Bond $553,269 AAA 1 month to 3 months USD United Kingdom Tri Party
Global Small-Cap Index Fund Bond $6,519,161 AAA 3 months to 1 year USD United Kingdom Tri Party
Global Small-Cap Index Fund Bond $13,870,300 AAA > 1 year USD United Kingdom Tri Party
Global Stock Index Fund Bond $12,093,859 AA 3 months to 1 year EUR United Kingdom Tri Party
Global Stock Index Fund Bond $32,075,232 AA > 1 year EUR United Kingdom Tri Party
Global Stock Index Fund Bond $114,618 AA 3 months to 1 year GBP United Kingdom Tri Party
Global Stock Index Fund Bond $56,755,008 AA > 1 year GBP United Kingdom Tri Party
Global Stock Index Fund Bond $17,687,622 AAA > 1 year EUR United Kingdom Tri Party
Global Stock Index Fund Bond $1,290,491 AAA 1 week to 1 month USD United Kingdom Tri Party
Global Stock Index Fund Bond $767,718 AAA 1 month to 3 months USD United Kingdom Tri Party
Global Stock Index Fund Bond $9,060,580 AAA 3 months to 1 year USD United Kingdom Tri Party
Global Stock Index Fund Bond $16,631,325 AAA > 1 year USD United Kingdom Tri Party
Japan Stock Index Fund Bond €75,767,997 AA > 1 year EUR United Kingdom Tri Party
Japan Stock Index Fund Bond €31,168,386 AA > 1 year GBP United Kingdom Tri Party
Japan Stock Index Fund Bond €27,846,308 AAA > 1 year EUR United Kingdom Tri Party
Japan Stock Index Fund Bond €713,242 AAA 1 week to 1 month USD United Kingdom Tri Party
Japan Stock Index Fund Bond €1,128,090 AAA 1 month to 3 months USD United Kingdom Tri Party
Japan Stock Index Fund Bond €12,500,520 AAA 3 months to 1 year USD United Kingdom Tri Party
Japan Stock Index Fund Bond €18,495,272 AAA > 1 year USD United Kingdom Tri Party
Pacific ex-Japan Stock Index Fund Bond €2,030,521 AA > 1 year EUR United Kingdom Tri Party
Pacific ex-Japan Stock Index Fund Bond €967,320 AAA > 1 year EUR United Kingdom Tri Party
Pacific ex-Japan Stock Index Fund Bond €446,279 AAA 1 month to 3 months USD United Kingdom Tri Party
Pacific ex-Japan Stock Index Fund Bond €4,751,333 AAA 3 months to 1 year USD United Kingdom Tri Party
Pacific ex-Japan Stock Index Fund Bond €6,799,874 AAA > 1 year USD United Kingdom Tri Party
SRI European Stock Fund Bond €258,794 AA > 1 year EUR United Kingdom Tri Party
SRI European Stock Fund Bond €433,750 AA > 1 year GBP United Kingdom Tri Party
SRI European Stock Fund Bond €125,025 AAA > 1 year EUR United Kingdom Tri Party
SRI European Stock Fund Bond €11,173 AAA 1 week to 1 month USD United Kingdom Tri Party
Additional Information From the Directors (unaudited)
Country of Type of Collateral Fitch Maturity Tenor of Currency of Counterparty Settlement Fund Collateral Amount Rating Collateral Collateral Establishment and Clearing
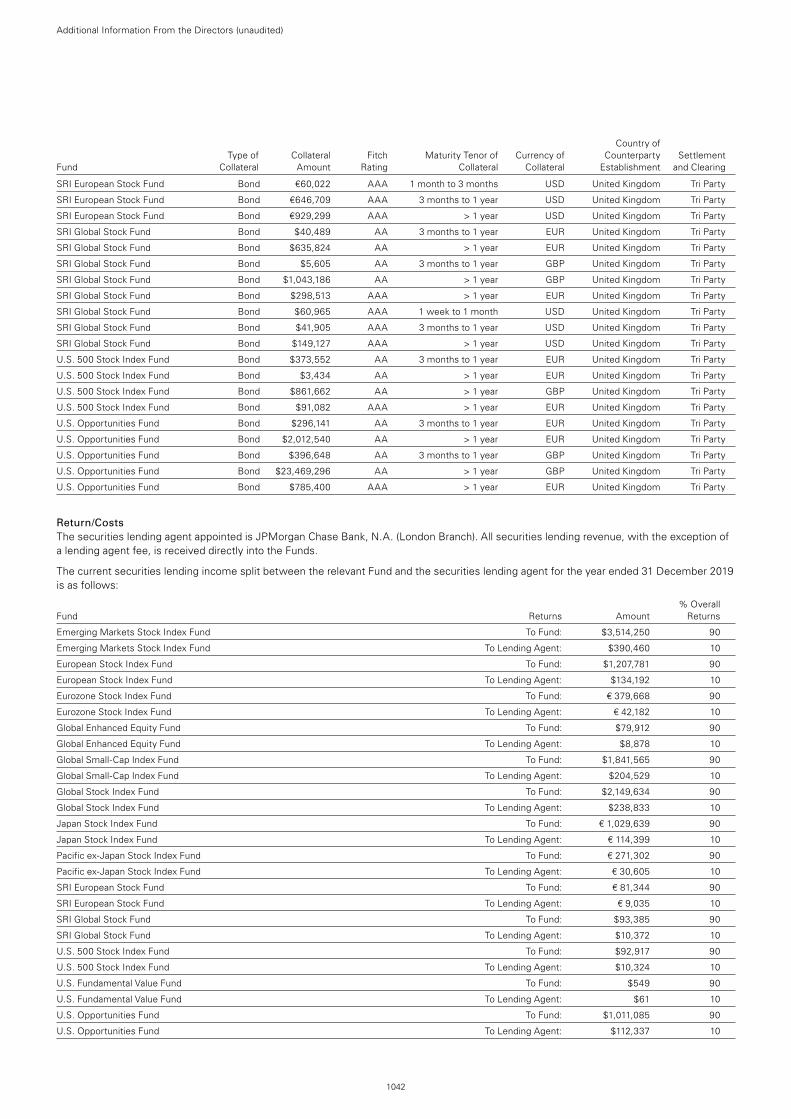
Additional Information From the Directors (unaudited)
1042
SRI European Stock Fund Bond €60,022 AAA 1 month to 3 months USD United Kingdom Tri Party
SRI European Stock Fund Bond €646,709 AAA 3 months to 1 year USD United Kingdom Tri Party
SRI European Stock Fund Bond €929,299 AAA > 1 year USD United Kingdom Tri Party
SRI Global Stock Fund Bond $40,489 AA 3 months to 1 year EUR United Kingdom Tri Party
SRI Global Stock Fund Bond $635,824 AA > 1 year EUR United Kingdom Tri Party
SRI Global Stock Fund Bond $5,605 AA 3 months to 1 year GBP United Kingdom Tri Party
SRI Global Stock Fund Bond $1,043,186 AA > 1 year GBP United Kingdom Tri Party
SRI Global Stock Fund Bond $298,513 AAA > 1 year EUR United Kingdom Tri Party
SRI Global Stock Fund Bond $60,965 AAA 1 week to 1 month USD United Kingdom Tri Party
SRI Global Stock Fund Bond $41,905 AAA 3 months to 1 year USD United Kingdom Tri Party
SRI Global Stock Fund Bond $149,127 AAA > 1 year USD United Kingdom Tri Party
U.S. 500 Stock Index Fund Bond $373,552 AA 3 months to 1 year EUR United Kingdom Tri Party
U.S. 500 Stock Index Fund Bond $3,434 AA > 1 year EUR United Kingdom Tri Party
U.S. 500 Stock Index Fund Bond $861,662 AA > 1 year GBP United Kingdom Tri Party
U.S. 500 Stock Index Fund Bond $91,082 AAA > 1 year EUR United Kingdom Tri Party
U.S. Opportunities Fund Bond $296,141 AA 3 months to 1 year EUR United Kingdom Tri Party
U.S. Opportunities Fund Bond $2,012,540 AA > 1 year EUR United Kingdom Tri Party
U.S. Opportunities Fund Bond $396,648 AA 3 months to 1 year GBP United Kingdom Tri Party
U.S. Opportunities Fund Bond $23,469,296 AA > 1 year GBP United Kingdom Tri Party
U.S. Opportunities Fund Bond $785,400 AAA > 1 year EUR United Kingdom Tri Party
Return/CostsThe securities lending agent appointed is JPMorgan Chase Bank, N.A. (London Branch). All securities lending revenue, with the exception of a lending agent fee, is received directly into the Funds.
The current securities lending income split between the relevant Fund and the securities lending agent for the year ended 31 December 2019 is as follows:
% Overall Fund Returns Amount Returns
Emerging Markets Stock Index Fund To Fund: $3,514,250 90
Emerging Markets Stock Index Fund To Lending Agent: $390,460 10
European Stock Index Fund To Fund: $1,207,781 90
European Stock Index Fund To Lending Agent: $134,192 10
Eurozone Stock Index Fund To Fund: € 379,668 90
Eurozone Stock Index Fund To Lending Agent: € 42,182 10
Global Enhanced Equity Fund To Fund: $79,912 90
Global Enhanced Equity Fund To Lending Agent: $8,878 10
Global Small-Cap Index Fund To Fund: $1,841,565 90
Global Small-Cap Index Fund To Lending Agent: $204,529 10
Global Stock Index Fund To Fund: $2,149,634 90
Global Stock Index Fund To Lending Agent: $238,833 10
Japan Stock Index Fund To Fund: € 1,029,639 90
Japan Stock Index Fund To Lending Agent: € 114,399 10
Pacific ex-Japan Stock Index Fund To Fund: € 271,302 90
Pacific ex-Japan Stock Index Fund To Lending Agent: € 30,605 10
SRI European Stock Fund To Fund: € 81,344 90
SRI European Stock Fund To Lending Agent: € 9,035 10
SRI Global Stock Fund To Fund: $93,385 90
SRI Global Stock Fund To Lending Agent: $10,372 10
U.S. 500 Stock Index Fund To Fund: $92,917 90
U.S. 500 Stock Index Fund To Lending Agent: $10,324 10
U.S. Fundamental Value Fund To Fund: $549 90
U.S. Fundamental Value Fund To Lending Agent: $61 10
U.S. Opportunities Fund To Fund: $1,011,085 90
U.S. Opportunities Fund To Lending Agent: $112,337 10
Country of Type of Collateral Fitch Maturity Tenor of Currency of Counterparty Settlement Fund Collateral Amount Rating Collateral Collateral Establishment and Clearing
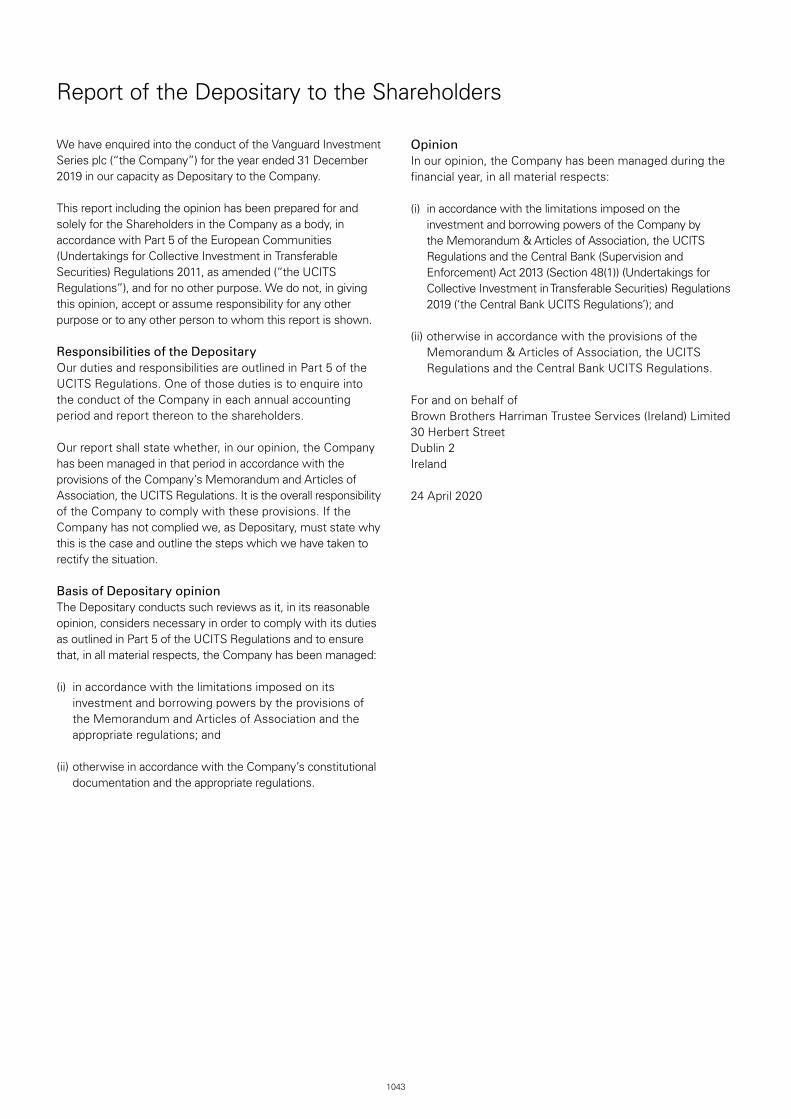
1043
We have enquired into the conduct of the Vanguard Investment Series plc (“the Company”) for the year ended 31 December 2019 in our capacity as Depositary to the Company.
This report including the opinion has been prepared for and solely for the Shareholders in the Company as a body, in accordance with Part 5 of the European Communities (Undertakings for Collective Investment in Transferable Securities) Regulations 2011, as amended (“the UCITS Regulations”), and for no other purpose. We do not, in giving this opinion, accept or assume responsibility for any other purpose or to any other person to whom this report is shown.
Responsibilities of the DepositaryOur duties and responsibilities are outlined in Part 5 of the UCITS Regulations. One of those duties is to enquire into the conduct of the Company in each annual accounting period and report thereon to the shareholders.
Our report shall state whether, in our opinion, the Company has been managed in that period in accordance with the provisions of the Company’s Memorandum and Articles of Association, the UCITS Regulations. It is the overall responsibility of the Company to comply with these provisions. If the Company has not complied we, as Depositary, must state why this is the case and outline the steps which we have taken to rectify the situation.
Basis of Depositary opinionThe Depositary conducts such reviews as it, in its reasonable opinion, considers necessary in order to comply with its duties as outlined in Part 5 of the UCITS Regulations and to ensure that, in all material respects, the Company has been managed:
(i) in accordance with the limitations imposed on its investment and borrowing powers by the provisions of the Memorandum and Articles of Association and the appropriate regulations; and
(ii) otherwise in accordance with the Company’s constitutional documentation and the appropriate regulations.
OpinionIn our opinion, the Company has been managed during the financial year, in all material respects:
(i) in accordance with the limitations imposed on the investment and borrowing powers of the Company by the Memorandum & Articles of Association, the UCITS Regulations and the Central Bank (Supervision and Enforcement) Act 2013 (Section 48(1)) (Undertakings for Collective Investment in Transferable Securities) Regulations 2019 (‘the Central Bank UCITS Regulations’); and
(ii) otherwise in accordance with the provisions of the Memorandum & Articles of Association, the UCITS Regulations and the Central Bank UCITS Regulations.
For and on behalf of Brown Brothers Harriman Trustee Services (Ireland) Limited 30 Herbert Street Dublin 2 Ireland
24 April 2020
Report of the Depositary to the Shareholders
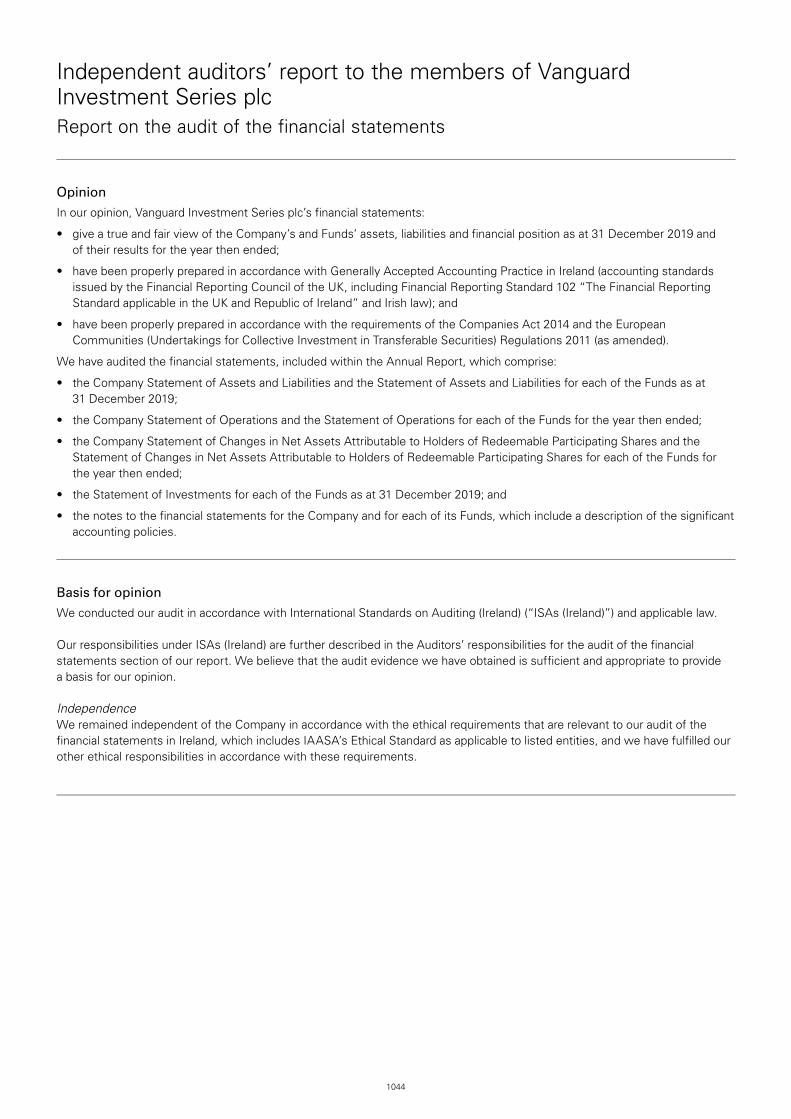
1044
Independent auditors’ report to the members of Vanguard Investment Series plc Report on the audit of the financial statements
Opinion
In our opinion, Vanguard Investment Series plc’s financial statements:
• giveatrueandfairviewoftheCompany’sandFunds’assets,liabilitiesandfinancialpositionasat31December2019and of their results for the year then ended;
• havebeenproperlypreparedinaccordancewithGenerallyAcceptedAccountingPracticeinIreland(accountingstandardsissued by the Financial Reporting Council of the UK, including Financial Reporting Standard 102 “The Financial Reporting Standard applicable in the UK and Republic of Ireland” and Irish law); and
• havebeenproperlypreparedinaccordancewiththerequirementsoftheCompaniesAct2014andtheEuropeanCommunities (Undertakings for Collective Investment in Transferable Securities) Regulations 2011 (as amended).
We have audited the financial statements, included within the Annual Report, which comprise:
• theCompanyStatementofAssetsandLiabilitiesandtheStatementofAssetsandLiabilitiesforeachoftheFundsasat 31 December 2019;
• theCompanyStatementofOperationsandtheStatementofOperationsforeachoftheFundsfortheyearthenended;
• theCompanyStatementofChangesinNetAssetsAttributabletoHoldersofRedeemableParticipatingSharesandtheStatement of Changes in Net Assets Attributable to Holders of Redeemable Participating Shares for each of the Funds for the year then ended;
• theStatementofInvestmentsforeachoftheFundsasat31December2019;and
• thenotestothefinancialstatementsfortheCompanyandforeachofitsFunds,whichincludeadescriptionofthesignificantaccounting policies.
Basis for opinion
We conducted our audit in accordance with International Standards on Auditing (Ireland) (“ISAs (Ireland)”) and applicable law.
Our responsibilities under ISAs (Ireland) are further described in the Auditors’ responsibilities for the audit of the financial statements section of our report. We believe that the audit evidence we have obtained is sufficient and appropriate to provide a basis for our opinion.
IndependenceWe remained independent of the Company in accordance with the ethical requirements that are relevant to our audit of the financial statements in Ireland, which includes IAASA’s Ethical Standard as applicable to listed entities, and we have fulfilled our other ethical responsibilities in accordance with these requirements.
1045
Our audit approach
Overview
Materiality
• Overallmateriality:50basispointsofNetAssetValue("NAV")at31December2019foreachof the Company’s Funds.
Audit scope
• TheCompanyisanopen-endedinvestmentCompanywithvariablecapitalandengagesVanguard Group (Ireland) Limited (the “Manager”) to manage certain duties and responsibilities with regards to the day-to-day management of the Company. We tailored the scope of our audit taking into account the types of investments within the Funds, the involvement of the third parties referred to overleaf, the accounting processes and controls, and the industry in which the Company operates. We look at each of the Funds at an individual level.
Key audit matters
• Existenceandvaluationoffinancialassetsatfairvaluethroughprofitorloss.
The scope of our auditAs part of designing our audit, we determined materiality and assessed the risks of material misstatement in the financial statements. In particular, we looked at where the directors made subjective judgements, for example the selection of pricing sources to value the investment portfolio. As in all of our audits, we also addressed the risk of management override of internal controls, including evaluating whether there was evidence of bias by the directors that represented a risk of material misstatement due to fraud.
Key audit mattersKey audit matters are those matters that, in the auditors’ professional judgement, were of most significance in the audit of the financial statements of the current period and include the most significant assessed risks of material misstatement (whether or not due to fraud) identified by the auditors, including those which had the greatest effect on: the overall audit strategy; the allocation of resources in the audit; and directing the efforts of the engagement team. These matters, and any comments we make on the results of our procedures thereon, were addressed in the context of our audit of the financial statements as a whole, and in forming our opinion thereon, and we do not provide a separate opinion on these matters. This is not a complete list of all risks identified by our audit.
Key audit matter How our audit addressed the key audit matter
Existence and valuation of financial assets at fair value through profit or loss
Refer to the Statement of Investments for each of the Funds and the accounting policies set out in note 3 (a) and (d).
The financial assets at fair value through profit or loss included in the Statement of Assets and Liabilities as at 31 December 2019 are valued at fair value in line with Generally Accepted Accounting Practice in Ireland.
This is considered a key audit matter as it represents the principal element of the financial statements.
We obtained independent confirmation from the Depositary or other counterparties of the investment portfolios held as at 31 December 2019, agreeing the amounts held to the accounting records.
We tested the valuation of the investment portfolios by independently agreeing the valuation of investments to third party vendor sources.
No material misstatements were identified as a result of the procedures we performed.
Materiality
Audit scope
Key audit matters
1046
How we tailored the audit scopeWe tailored the scope of our audit to ensure that we performed enough work to be able to give an opinion on the financial statements as a whole, taking into account the structure of the Company, the accounting processes and controls, and the industry in which it operates.
As at 31 December 2019 there are 31 operational Funds and 1 closed Fund. The Company's Statement of Assets and Liabilities, Statement of Operations and Statement of Changes in Net Assets Attributable to Holders of Redeemable Participating Shares are an aggregation of the positions and results of the 32 Funds.
The directors control the affairs of the Company and are responsible for the overall investment policy which is determined by them. The Company engages the Manager to manage certain duties and responsibilities with regards to the day to day management of the Company. The Manager has delegated certain responsibilities to Vanguard Global Advisers, LLC (the ‘Investment Manager’) and to Brown Brothers Harriman Fund Administration Services (Ireland) Limited (the ‘Administrator’). The financial statements, which remain the responsibility of the directors, are prepared on their behalf by the Administrator. The Company has appointed Brown Brothers Harriman Trustee Services (Ireland) Limited (the “Depositary”) to act as Depositary of the Company’s assets. In establishing the overall approach to our audit we assessed the risk of material misstatement at a fund level, taking into account the nature, likelihood and potential magnitude of any misstatement. As part of our risk assessment, we considered the Company’s interaction with the Administrator, and we assessed the control environment in place at the Administrator.
MaterialityThe scope of our audit was influenced by our application of materiality. We set certain quantitative thresholds for materiality. These, together with qualitative considerations, helped us to determine the scope of our audit and the nature, timing and extent of our audit procedures on the individual financial statement line items and disclosures and in evaluating the effect of misstatements, both individually and in aggregate on the financial statements as a whole.
Based on our professional judgement, we determined materiality for the financial statements of each of the Company’s Funds as follows:
Overall materiality and how we determined it
50 basis points (2018: 50 basis points) of Net Asset Value ("NAV") at 31 December 2019 for each of the Company’s Funds.
Rationale for benchmark applied We have applied this benchmark because the main objective of the Company is to provide investors with a total return at a Fund level, taking account of the capital and income returns.
We agreed with the Audit Committee that we would report to them misstatements identified during our audit above 5 basis points of each Fund’s NAV, for NAV per share impacting differences (2018: 5 basis points of each Fund’s NAV, for NAV per share impacting differences) as well as misstatements below that amount that, in our view, warranted reporting for qualitative reasons.
Conclusions relating to going concern
We have nothing to report in respect of the following matters in relation to which ISAs (Ireland) require us to report to you where::
• thedirectors’useofthegoingconcernbasisofaccountinginthepreparationofthefinancialstatementsisnotappropriate;or
• thedirectorshavenotdisclosedinthefinancialstatementsanyidentifiedmaterialuncertaintiesthatmaycastsignificantdoubt about the Company’s and Funds’ ability to continue to adopt the going concern basis of accounting for a period of at least twelve months from the date when the financial statements are authorised for issue.
However, because not all future events or conditions can be predicted, this statement is not a guarantee as to the Company’s and Funds’ ability to continue as going concerns.
Reporting on other informationThe other information comprises all of the information in the Annual Report other than the financial statements and our auditors’ report thereon. The directors are responsible for the other information. Our opinion on the financial statements does not cover the other information and, accordingly, we do not express an audit opinion or, except to the extent otherwise explicitly stated in this report, any form of assurance thereon. In connection with our audit of the financial statements, our responsibility is to read the other information and, in doing so, consider whether the other information is materially inconsistent with the financial
1047
statements or our knowledge obtained in the audit, or otherwise appears to be materially misstated. If we identify an apparent material inconsistency or material misstatement, we are required to perform procedures to conclude whether there is a material misstatement of the financial statements or a material misstatement of the other information. If, based on the work we have performed, we conclude that there is a material misstatement of this other information, we are required to report that fact. We have nothing to report based on these responsibilities.
With respect to the Report from the Directors, we also considered whether the disclosures required by the Companies Act 2014 have been included.
Based on the responsibilities described above and our work undertaken in the course of the audit, ISAs (Ireland) and the Companies Act 2014 require us to also report certain opinions and matters as described below:
• Inouropinion,basedontheworkundertakeninthecourseoftheaudit,theinformationgivenintheReportfromtheDirectors for the year ended 31 December 2019 is consistent with the financial statements and has been prepared in accordance with applicable legal requirements.
• BasedonourknowledgeandunderstandingoftheCompanyanditsenvironmentobtainedinthecourseoftheaudit, we have not identified any material misstatements in the Report from the Directors.
Responsibilities for the financial statements and the audit
Responsibilities of the directors for the financial statementsAs explained more fully in the Directors’ responsibilities statement set out on page 1034, the directors are responsible for the preparation of the financial statements in accordance with the applicable framework and for being satisfied that they give a true and fair view.
The directors are also responsible for such internal control as they determine is necessary to enable the preparation of financial statements that are free from material misstatement, whether due to fraud or error.
In preparing the financial statements, the directors are responsible for assessing the Company’s and Funds’ ability to continue as going concerns, disclosing as applicable, matters related to going concern and using the going concern basis of accounting unless the directors either intend to liquidate the Company or to cease operations, or have no realistic alternative but to do so.
Auditors’ responsibilities for the audit of the financial statementsOur objectives are to obtain reasonable assurance about whether the financial statements as a whole are free from material misstatement, whether due to fraud or error, and to issue an auditors’ report that includes our opinion. Reasonable assurance is a high level of assurance, but is not a guarantee that an audit conducted in accordance with ISAs (Ireland) will always detect a material misstatement when it exists. Misstatements can arise from fraud or error and are considered material if, individually or in the aggregate, they could reasonably be expected to influence the economic decisions of users taken on the basis of these financial statements.
A further description of our responsibilities for the audit of the financial statements is located on the IAASA website at: https://www.iaasa.ie/getmedia/b2389013-1cf6-458b-9b8f-a98202dc9c3a/Description_of_auditors_responsibilities_for_audit.pdf. This description forms part of our auditors’ report.
Use of this reportThis report, including the opinions, has been prepared for and only for the Company’s members as a body in accordance with section 391 of the Companies Act 2014 and for no other purpose. We do not, in giving these opinions, accept or assume responsibility for any other purpose or to any other person to whom this report is shown or into whose hands it may come save where expressly agreed by our prior consent in writing.
1048
Other required reporting
Companies Act 2014 opinions on other matters
• Wehaveobtainedalltheinformationandexplanationswhichweconsidernecessaryforthepurposesofouraudit.
• InouropiniontheaccountingrecordsoftheCompanyweresufficienttopermitthefinancialstatementstobereadilyand properly audited.
• Thefinancialstatementsareinagreementwiththeaccountingrecords.
Companies Act 2014 exception reporting
Directors’ remuneration and transactionsUnder the Companies Act 2014 we are required to report to you if, in our opinion, the disclosures of directors’ remuneration and transactions specified by sections 305 to 312 of that Act have not been made. We have no exceptions to report arising from this responsibility.
Declan Murphy
for and on behalf of PricewaterhouseCoopers Chartered Accountants and Statutory Audit Firm Dublin 24 April 2020
1049
Additional Information for Investors in the Federal Republic of Germany
J.P. Morgan AG, Junghofstrasse 14, D-60311 Frankfurt am Main has undertaken the function of Paying and Information Agent for the Company in the Federal Republic of Germany (the “German Paying and Information Agent”).
Applications for the redemptions and conversion of Shares may be sent to the German Paying and Information Agent. All payments to investors, including redemption proceeds and potential distributions, may, upon request, be paid through the German Paying and Information Agent.
The Prospectus together with its supplements, the key investor information documents, the Memorandum and Articles of Association of the Company and the annual and semi-annual reports may be obtained, free of charge, in hard-copy form at the office of the German Paying and Information Agent during normal opening hours. The statement of changes in the composition of the investment portfolio is also free of charge upon request at the office of the German Paying and Information Agent.
Issue, redemption and conversion prices of Shares, and any other information to the shareholders, are also available, free of charge, from the German Paying and Information Agent.
The issue, redemption and conversion prices will be published on the following website: www.fundinfo.com.
Any other information to the shareholders will be published in Germany by way of investor letter.
VANGUARD INVESTMENT SERIES PLC
Additional Information for Investors in Switzerland
This additional information for investors in Switzerland forms part of the annual report for the period ended 31 December 2019 and should be read in conjunction with the Prospectus of Vanguard Investment Series Plc (hereinafter the “Company”) and all notes, explanations and additions thereto.
1. SWISS REPRESENTATIVE AND PAYING AGENTBNP Paribas Securities Services, Paris, succursale de Zurich, Selnaustrasse 16, CH-8002 Zurich.
Copies of the prospectus, the Key Investor Information Documents, the articles of association, any later versions of the above documents, the current annual report and financial statements of the Company or, if more recent, the interim report and interim financial statements are available at no charge at the registered office of the Swiss representative.
2. TOTAL EXPENSE RATIO (TER)All the total expense ratios (TER) reported in the Fund Profile section of the report were calculated in accordance with the 16 May 2008 guidelines on the calculation and disclosure of the TER of the Swiss Funds & Asset Management Association (SFAMA). The calculation method corresponds to the method used in Ireland. As the Company is subject to Irish law, the TER was calculated in accordance with the SFAMA guidelines and was provided for information purposes only. As a rule, deviations are limited to rounding differences.
The TER was calculated for each segment (“sub-fund”) or each share class for the period ended 31 December 2019.
Depending on the transaction, transaction costs are stated at the purchase price of the securities or separately in the revenue statement. These costs, which are not included in operating expenses under the guidelines on calculation and disclosure of the TER, are not taken into account in calculating the TER.
3. PERFORMANCE OF THE FUND AND PORTFOLIO TURNOVER RATEFund performance was calculated in accordance with the SFAMA’s 16 May 2008 guidelines for the calculation and disclosure of fund performance. Historical performance data does not provide an indication of current or future performance. These performance data do not include fees and costs incurred on the issue and redemption of shares.
Fund performance for the period ended 31 December 2019 is presented in the Performance Summary section of the report.
The portfolio turnover rate (PTR) was calculated in accordance with the SFAMA’s 16 May 2008 guidelines for the calculation and disclosure of the PTR and is presented separately for each sub-fund.
4. CHANGES IN THE COMPOSITION OF THE SECURITIES PORTFOLIOAn overview of the changes in the composition of the securities portfolio during the period under review (1 January 2019 to 31 December 2019) may be obtained at no charge from the Swiss representative.
5. REFUNDSRefunds to institutional investors are paid in accordance with the provisions of Irish law.

1052
BLOOMBERG is a trademark and service mark of Bloomberg Finance L.P. BARCLAYS is a trademark and service mark of Barclays Bank Plc, used under license. Bloomberg Finance L.P. and its affiliates, including Bloomberg Index Services Limited (BISL) (collectively, Bloomberg), or Bloomberg’s licensors, own all proprietary rights in the Bloomberg Barclays Euro Treasury 20+ Year Bond Index, Bloomberg Barclays Euro Government Float Adjusted Bond Index, Bloomberg Barclays EUR Non-Government Float Adjusted Bond Index, Bloomberg Barclays Global Inflation-Linked: Eurozone — Euro CPI Index, Bloomberg Barclays Global Aggregate Float Adjusted Bond Index, Bloomberg Barclays Global Aggregate Float Adjusted Corporate Index Hedged, Bloomberg Barclays Global Aggregate Credit Index Hedged, Bloomberg Barclays Global Aggregate Ex US MBS 1—5 Year Float Adjusted Bond Index, Bloomberg Barclays Global Aggregate Corporate 1—5 Year Float Adjusted Index, Bloomberg Barclays Japan Government Float Adjusted Bond Index, Bloomberg Barclays U.K. Government Float Adjusted Bond Index, Bloomberg Barclays GBP Non-Government Float Adjusted Bond Index, Bloomberg Barclays GBP Non-Government 1—5 Year 200MM Float Adjusted Bond Index, Bloomberg Barclays U.S. Government Float Adjusted Bond Index, Bloomberg Barclays Global Aggregate USD Credit Float Adjusted Bond Index, and Bloomberg Barclays U.S. Government Inflation-Linked 1—10 Year Index (the Indices or Bloomberg Barclays Indices).
Neither Barclays Bank Plc, Barclays Capital Inc., or any affiliate (collectively Barclays) or Bloomberg is the issuer or producer of the Vanguard Funds and neither Bloomberg nor Barclays has any responsibilities, obligations or duties to investors in the Vanguard Funds. The Indices are licensed for use by The Vanguard Group, Inc. (Vanguard) as the sponsor of the Vanguard Funds. Bloomberg and Barclays’ only relationship with Vanguard in respect of the Indices is the licensing of the Indices, which are determined, composed and calculated by BISL, or any successor thereto, without regard to the Issuer or the Vanguard Funds or the owners of the Vanguard Funds.
Additionally, Vanguard may for itself execute transaction(s) with Barclays in or relating to the Indices in connection with the Vanguard Funds. Investors acquire the Vanguard Funds from Vanguard and investors neither acquire any interest in the Indices nor enter into any relationship of any kind whatsoever with Bloomberg or Barclays upon making an investment in the Vanguard Funds. The Vanguard Funds are not sponsored, endorsed, sold or promoted by Bloomberg or Barclays. Neither Bloomberg nor Barclays makes any representation or warranty, express or implied regarding the advisability of investing in the Vanguard Funds or the advisability of investing in securities generally or the ability of the Indices to track corresponding or relative market performance. Neither Bloomberg nor Barclays has passed on the legality or suitability of the Vanguard Funds with respect to any person or entity. Neither Bloomberg nor Barclays is responsible for and has not participated in the determination of the timing of, prices at, or quantities of the Vanguard Funds to be issued. Neither Bloomberg nor Barclays has any obligation to take the needs of the Issuer or the owners of the Vanguard Funds or any other third party into consideration in determining, composing or calculating the Indices. Neither Bloomberg nor Barclays has any obligation or liability in connection with administration, marketing or trading of the Vanguard Funds.
The licensing agreement between Bloomberg and Barclays is solely for the benefit of Bloomberg and Barclays and not for the benefit of the owners of the Vanguard Funds, investors or other third parties. In addition, the licensing agreement between Vanguard and Bloomberg is solely for the benefit of Vanguard and Bloomberg and not for the benefit of the owners of the Vanguard Funds, investors or other third parties.
NEITHER BLOOMBERG NOR BARCLAYS SHALL HAVE ANY LIABILITY TO THE ISSUER, INVESTORS OR TO OTHER THIRD PARTIES FOR THE QUALITY, ACCURACY AND/OR COMPLETENESS OF THE BLOOMBERG BARCLAYS INDICES OR ANY DATA INCLUDED THEREIN OR FOR INTERRUPTIONS IN THE DELIVERY OF THE BLOOMBERG BARCLAYS INDICES. NEITHER BLOOMBERG NOR BARCLAYS MAKES ANY WARRANTY, EXPRESS OR IMPLIED, AS TO RESULTS TO BE OBTAINED BY THE ISSUER, THE INVESTORS OR ANY OTHER PERSON OR ENTITY FROM THE USE OF THE BLOOMBERG BARCLAYS INDICES OR ANY DATA INCLUDED THEREIN. NEITHER BLOOMBERG NOR BARCLAYS MAKES ANY EXPRESS OR IMPLIED WARRANTIES, AND EACH HEREBY EXPRESSLY DISCLAIMS ALL WARRANTIES OF MERCHANTABILITY OR FITNESS FOR A PARTICULAR PURPOSE OR USE WITH RESPECT TO THE BLOOMBERG BARCLAYS INDICES OR ANY DATA INCLUDED THEREIN. BLOOMBERG RESERVES THE RIGHT TO CHANGE THE METHODS OF CALCULATION OR PUBLICATION, OR TO CEASE THE CALCULATION OR PUBLICATION OF THE BLOOMBERG BARCLAYS INDICES, AND NEITHER BLOOMBERG NOR BARCLAYS SHALL BE LIABLE FOR ANY MISCALCULATION OF OR ANY INCORRECT, DELAYED OR INTERRUPTED PUBLICATION WITH RESPECT TO THE BLOOMBERG BARCLAYS INDICES. NEITHER BLOOMBERG NOR BARCLAYS SHALL BE LIABLE FOR ANY DAMAGES, INCLUDING, WITHOUT LIMITATION, ANY SPECIAL, INDIRECT OR CONSEQUENTIAL DAMAGES, OR ANY LOST PROFITS AND EVEN IF ADVISED OF THE POSSIBILITY OF SUCH, RESULTING FROM THE USE OF THE BLOOMBERG BARCLAYS INDICES OR ANY DATA INCLUDED THEREIN OR WITH RESPECT TO THE VANGUARD FUNDS.
None of the information supplied by Bloomberg or Barclays and used in this publication may be reproduced in any manner without the prior written permission of both Bloomberg and Barclays Capital, the investment banking division of Barclays Bank Plc. Barclays Bank Plc is registered in England No. 1026167. Registered office 1 Churchill Place London E14 5HP.
© 2020 Bloomberg. Used with Permission.
Source: Bloomberg Index Services Limited. Copyright 2020, Bloomberg. All rights reserved.

This page intentionally left blank.

This page intentionally left blank.
Board of Directors1
Peter Blessing2 (Irish) James M. Norris (American) William Slattery2 (Irish) Michael S. Miller (American) Sean P. Hagerty (American) Tara Doyle2 (Irish) Richard Wane3 (British) Thomas Merz4 (Swiss)
ManagerVanguard Group (Ireland) Limited 70 Sir John Rogerson’s Quay Dublin 2 Ireland
Investment Manager Vanguard Global Advisers, LLC 100 Vanguard Boulevard Malvem, PA 19355 USA
Sponsoring Euronext Dublin BrokerJ & E Davy Davy House 49 Dawson Street Dublin 2 Ireland
DepositaryBrown Brothers Harriman Trustee Services (Ireland) Limited 30 Herbert Street Dublin 2 Ireland
Administrator Brown Brothers Harriman Fund Administration Services (Ireland) Limited 30 Herbert Street Dublin 2 Ireland
Company Secretary Matsack Trust Limited 70 Sir John Rogerson’s Quay Dublin 2 Ireland
Legal Advisors as to Matters of Irish LawWilliam Fry 2 Grand Canal Square Dublin 2 Ireland
Independent AuditorsPricewaterhouseCoopers One Spencer Dock North Wall Quay Dublin 1 Ireland
1 Axel Lomholt resigned as a director of the Manager and the Company, effective on 23 April 2019.2 Served in an independent, non-executive capacity during the year.3 Was appointed to the Board of Directors of the Manager and the Company, effective on 29 March 2019.4 Was appointed to the Board of Directors of the Manager and the Company, effective on 15 May 2019.
Brown Brothers Harriman Fund Administration Services (Ireland) Limited 30 Herbert StreetDublin 2 Ireland
Connect with Vanguard® > vanguard.com
© 2020 Vanguard Group (Ireland) Limited. All rights reserved.
QVIL2 042020
This report is intended for the Funds’ shareholders. It may not be distributed to prospective investors unless it is preceded or accompanied by the Company’s current prospectus.
All comparative mutual fund data are from Lipper, a Thomson Reuters Company, or Morningstar, Inc., unless otherwise noted.
London Stock Exchange Group companies include FTSE International Limited (“FTSE”), Frank Russell Company (“Russell”), MTS Next Limited (“MTS”), and FTSE TMX Global Debt Capital Markets Inc. (“FTSE TMX”). All rights reserved. “FTSE®”, “Russell®”, “MTS®”, “FTSE TMX®” and “FTSE Russell” and other service marks and trademarks related to the FTSE or Russell indexes are trademarks of the London Stock Exchange Group companies and are used by FTSE, MTS, FTSE TMX and Russell under licence. All information is provided for information purposes only. No responsibility or liability can be accepted by the London Stock Exchange Group companies nor its licensors for any errors or for any loss from use of this publication. Neither the London Stock Exchange Group companies nor any of its licensors make any claim, prediction, warranty or representation whatsoever, expressly or impliedly, either as to the results to be obtained from the use of the FTSE Developed Index or FTSE Developed Europe Index, or the fitness or suitability of the FTSE Developed Index or FTSE Developed Europe Index for any particular purpose to which they might be put.
The Funds or securities referred to herein are not sponsored, endorsed, or promoted by MSCI, and MSCI bears no liability with respect to any such funds or securities. The prospectus or the Statement of Additional Information contains a more detailed description of the limited relationship MSCI has with Vanguard and any related funds.
The S&P 500 Index is a product of S&P Dow Jones Indices LLC (“SPDJI”), and has been licensed for use by Vanguard. Standard & Poor’s® and S&P® are registered trademarks of Standard & Poor’s Financial Services LLC (“S&P”); Dow Jones® is a registered trademark of Dow Jones Trademark Holdings LLC (“Dow Jones”); S&P® and S&P 500® are trademarks of S&P; and these trademarks have been licensed for use by SPDJI and sublicensed for certain purposes by Vanguard. Vanguard’s product is not sponsored, endorsed, sold or promoted by SPDJI, Dow Jones, S&P, or their respective affiliates and none of such parties make any representation regarding the advisability of investing in such product nor do they have any liability for any errors, omissions, or interruptions of the S&P 500 Index.
Investor Information and Services (Ireland) Fax: 353-1-612-3067 Phone: 353-1-612-3226
World Wide Web http://global.vanguard.com