Van use in Europe and their environmental impact - Transport ...
79
Van use in Europe and their environmental impact
-
Upload
khangminh22 -
Category
Documents
-
view
3 -
download
0
Transcript of Van use in Europe and their environmental impact - Transport ...
Van use in Europe and their environmental impact
1 September 2017 4.L06 – Van use in Europe and their environmental impact
This report is prepared by:
Michiel van Bokhorst
Lisanne van Wijngaarden
Matthijs Otten
Anco Hoen
Delft, CE Delft, September 2017
Publication code: 17.4L06.95
Transport / Environmental Effects / Quantitiy / Technology / Regulations / Market / Electric
vehicles / FT: Vans
Client: Transport & Environment.
CE publications are available from www.cedelft.eu
Further information on this study can be obtained from the contact person, Anco Hoen.
© copyright, CE Delft, Delft
Van use in Europe and their environmental impact
CE Delft
Committed to the Environment
Through its independent research and consultancy work CE Delft is helping build a sustainable
world. In the fields of energy, transport and resources our expertise is leading-edge. With our
wealth of know-how on technologies, policies and economic issues we support government
agencies, NGOs and industries in pursuit of structural change. For 35 years now, the skills and
enthusiasm of CE Delft’s staff have been devoted to achieving this mission.
2 September 2017 4.L06 – Van use in Europe and their environmental impact
Content
Executive summary 4
1 Introduction 7 1.1 Background 7 1.2 Approach used, scope and validity of results 8 1.3 Structure of the report 9
2 Trends and size of vehicle fleet in EU28 10 2.1 Total number of registered vans 10 2.2 Newly registered vans 11 2.3 CO2 emissions of vans in EU28 13
3 Technology 17 3.1 Emission regulation for vans 17 3.2 Differences between real world and test cycle emissions 21 3.3 Vehicle technology for CO2 reduction in conventional vehicles 23 3.4 Alternative fuel technologies 28
4 Regulations 32 4.1 Definitions 32 4.2 Legislation on definition of vehicle types (vans = N1) 32 4.3 Emission legislation on CO2 and air pollution 32 4.4 Legislation concerning vehicle utilisation 33 4.5 Vehicle tax legislation 37 4.6 Analysis of impacts of changes in regulations 38
5 Market structure 41 5.1 Introduction 41 5.2 Fleet composition 41 5.3 Businesses using vans and their characteristics 46 5.4 Vehicle use 48 5.5 Main findings from interviews 51
6 TCO 54 6.1 Benefits and limitations of TCO 54 6.2 TCO parameters used and main inputs 55 6.3 Results 61 6.4 Cost comparison: Vans versus small trucks 67
7 Projection electric vans 69 7.1 Past and current new registrations 69 7.2 Existing studies with EV projections 69 7.3 Van projection made for this study 70
3 September 2017 4.L06 – Van use in Europe and their environmental impact
8 Conclusions 72 8.1 Main conclusions 72 8.2 Recommendations for further research 73
9 References 74
4 September 2017 4.L06 – Van use in Europe and their environmental impact
Executive summary
Vans are responsible for 9% of GHG emissions of transport This study provides an overview of the knowledge on van use in the EU and explores options and opportunities to reduce their environmental impact. In the EU there are approximately 27 million Light Commercial Vehicles (LCVs), more commonly known as ‘vans’, which is about one-tenth of the number of passenger cars. Van numbers and van use are expected to keep growing. They are currently responsible for roughly 9% of GHG emissions of EU transport. The share in air polluting emissions is even higher, as nearly all vans are diesel vehicles. Considering that vans often operate in urban areas, their negative impact on urban air quality is disproportionally high.
Increasing gap between emission regulations and real world To this day, both the CO2 and air pollutant standards in place for vans have not met their full potential. The emission limits for air pollutants (Euro standards) have been tightened over the last decade but real world NOx emissions have not decreased at the same rate. In fact, from Euro2 onwards, real world NOx emissions have remained almost constant. It is unclear whether the newest Euro6 norm will deliver a substantial improvement. The gap between vans test cycle and real world CO2 emissions has also increased over the past years. For vans this gap is around 25 to 30%, which is smaller than for passenger cars (42% in 2015) and therefore might further increase. Also, the 2020 target (147 gCO2/km) for vans is found to be less challenging for manufacturers than the 2021 target (95 gCO2/km) for passenger cars.
Many policies favour vans Compared to heavy-duty vehicles, national regulations for vans are less strict in most Member States. Particularly the tachograph exemption for vans in combination with the European driver times regulation is considered a major benefit for van users. Being able to drive a van with a regular B driver license is also seen as an important benefit. In many Member States vehicle taxes for passenger cars have evolved and are increasingly based on the CO2 emissions of the vehicle. This is not the case for vans. In addition, road charging schemes that are in place in several Member States only apply to HDVs and not to vans. Tolls are generally higher for HDVs as well. Across Europe, the same speed limits generally apply for vans as for passenger cars. The option of driving at higher speeds with a van compared to a larger truck, together with a lack of mandatory rest times and lack of maximum allowable driving hours per day, offers the possibility for significant travel time savings (higher speeds will result in higher CO2 and NOx emissions). Overall, regulations for vans are substantially less strict compared to HDVs. This could offer a competitive advantage for transport companies that predominantly use vans.
Market structure The total number of vans in the EU is growing steadily. Registrations of new vans dropped dramatically during the economic crisis, but have increased since 2013, although they are still below the pre-economic crisis level.
5 September 2017 4.L06 – Van use in Europe and their environmental impact
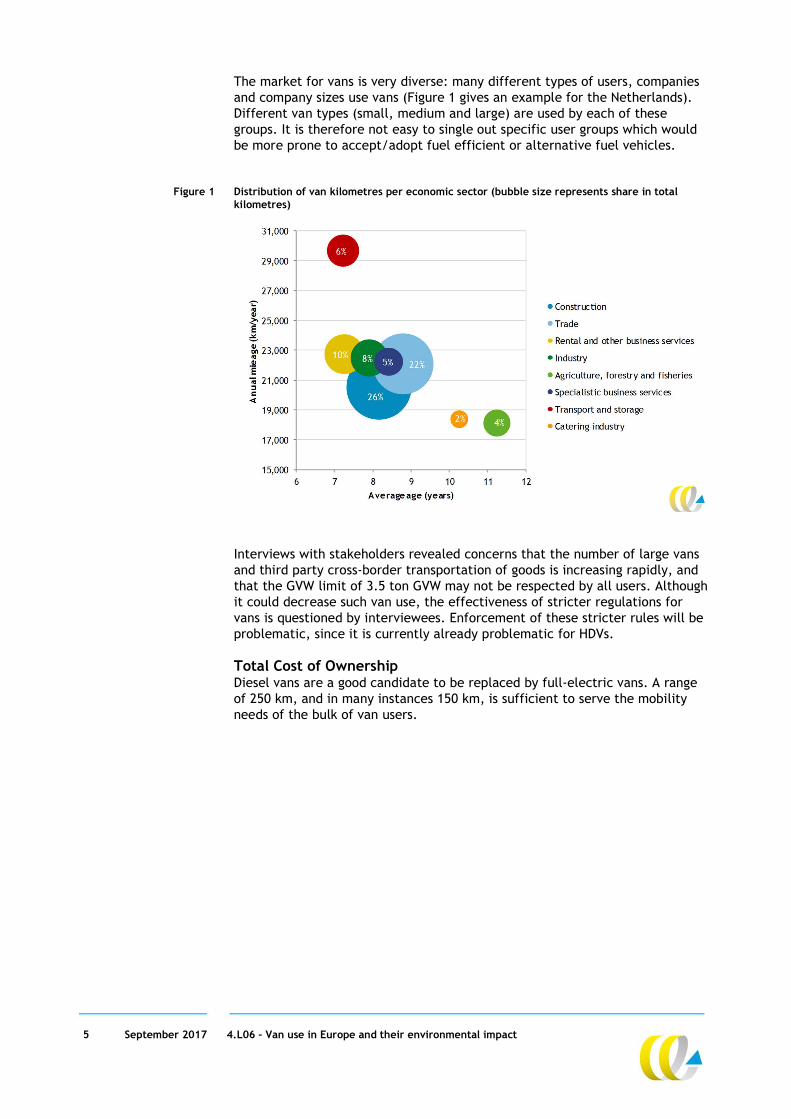
The market for vans is very diverse: many different types of users, companies and company sizes use vans (Figure 1 gives an example for the Netherlands). Different van types (small, medium and large) are used by each of these groups. It is therefore not easy to single out specific user groups which would be more prone to accept/adopt fuel efficient or alternative fuel vehicles.
Figure 1 Distribution of van kilometres per economic sector (bubble size represents share in total kilometres)
Interviews with stakeholders revealed concerns that the number of large vans and third party cross-border transportation of goods is increasing rapidly, and that the GVW limit of 3.5 ton GVW may not be respected by all users. Although it could decrease such van use, the effectiveness of stricter regulations for vans is questioned by interviewees. Enforcement of these stricter rules will be problematic, since it is currently already problematic for HDVs.
Total Cost of Ownership Diesel vans are a good candidate to be replaced by full-electric vans. A range of 250 km, and in many instances 150 km, is sufficient to serve the mobility needs of the bulk of van users.

6 September 2017 4.L06 – Van use in Europe and their environmental impact
Figure 2 Projected TCO for small, medium and large full-electric vans
Although small class electric vans are currently not cost-competitive to the diesel alternative, they would reach parity around the year 2018 (see Figure 2). For medium and in particular for larger vans, the ‘tipping point’ will not occur before the year 2025/2026. This could be sooner if the tax exemptions for diesel vans are abolished. Electric vans must strike the right balance between the weight of the battery packs (correlated with the desired driving range) and the maximum weight that can be carried.
Implications for policy makers The environmental impact of vans is expected to increase due to growing vehicle numbers and use. The absence of strict regulations for vans is likely to stimulate van growth. Long term climate targets, which will be tightened following the Paris Agreement, call for substantial additional policy efforts. It is recommended to continue to strengthen the CO2 regulations of vans over time. In addition, efforts to close the gap between test cycle and real world emissions need to be stepped up since the new WLTP driving cycle will reduce but not eliminate this gap. At the same time, the adoption of alternative fuel vans, in particular full-electric vans, should be promoted, possibly through a mandate for low or zero-emission vehicles. Stricter regulations for vans in general and fiscal incentives for low- and zero-emission vans would be an effective way to reduce the emissions of vans, but need to be accompanied by stricter enforcement to warrant their effectiveness. Finally, to enable the assessment of the effectiveness of different policy options, the EU should strive for better data on van use across Member States. Numbers on new registrations and fleet size should be clearly distinguishable from passenger cars and ideally be available for at least three weight classes. Vehicle use data such as kilometres driven, type and amount of goods carried and which companies or private parties use them should also be made available.
7 September 2017 4.L06 – Van use in Europe and their environmental impact
1 Introduction
1.1 Background
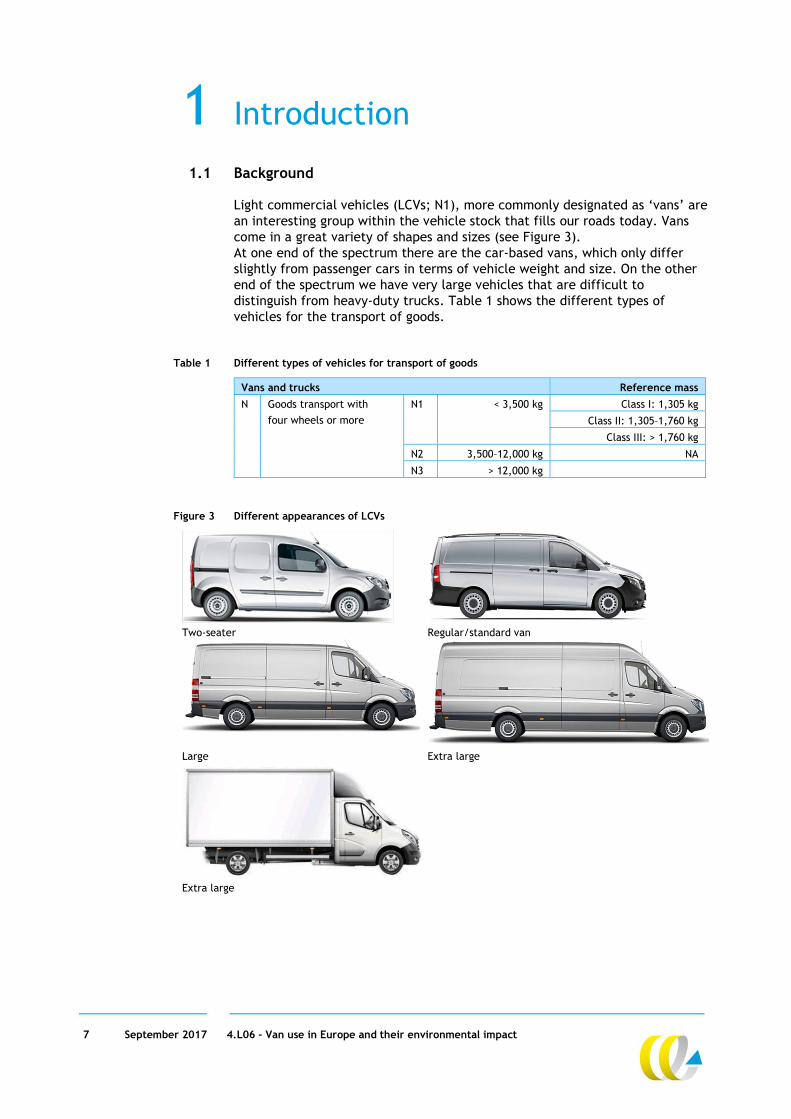
Light commercial vehicles (LCVs; N1), more commonly designated as ‘vans’ are an interesting group within the vehicle stock that fills our roads today. Vans come in a great variety of shapes and sizes (see Figure 3). At one end of the spectrum there are the car-based vans, which only differ slightly from passenger cars in terms of vehicle weight and size. On the other end of the spectrum we have very large vehicles that are difficult to distinguish from heavy-duty trucks. Table 1 shows the different types of vehicles for the transport of goods.
Table 1 Different types of vehicles for transport of goods
Vans and trucks Reference mass
N Goods transport with
four wheels or more
N1 < 3,500 kg Class I: 1,305 kg
Class II: 1,305–1,760 kg
Class III: > 1,760 kg
N2 3,500–12,000 kg NA
N3 > 12,000 kg
Figure 3 Different appearances of LCVs
Two-seater Regular/standard van
Large Extra large
Extra large

8 September 2017 4.L06 – Van use in Europe and their environmental impact
Although most vans are designed to transport goods, not all vans are used for this purpose. Many vans are used by construction workers or grocers who rarely use the full loading capacity of their vehicles. Also, in many EU countries LCVs are (partly) exempt from the vehicle taxes that apply to passenger cars, yet simultaneously are not subject to the regulations applying to heavy-duty vehicles, e.g. tachograph requirements or speed limiters. Vans take up a substantial part of all new vehicle registrations in the EU. In 2015 it was approximately 13% (ICCT, 2016). The share of vans in the total road vehicle fleet was approximately 10% in 2014, although this number is difficult to pinpoint due to incomplete data series and inconsistencies between them (ANFAC, 2014); (EC, 2016); (Eurostat, 2017). Since the average van is relatively large and heavy compared to a passenger car, they contribute substantially to the CO₂ emissions emitted by transport. Approximately 9% of CO2 transport emissions in the EU28 can be attributed to vans (EEA, 2016). Considering the numbers above, it is surprising that very little is known about the use and ownership of vans in Europe, in contrast to what is known about passenger cars. This is particularly striking if we realise that the EU has set a long-term goal of reducing greenhouse gas emissions by 80 to 95% in 2050 compared to 1990 levels. According to the EU White Paper, emissions from transport should be reduced to 60% below 1990 levels by 2050 to reach this target (EC, 2011a). At the same time, it is expected that transport volumes will grow by 150% by 2050 compared to 1990 (EC, 2013). This equates to a long term reduction by approximately a factor 6 in CO2 emissions. Moreover, the 60% target is based on a maximum increase of global warming in this century of 2°C above pre-industrial levels. The recent Paris Agreement is clearly more ambitious and calls for “holding the increase in the global average temperature to well below 2°C above pre-industrial levels and pursuing efforts to limit the temperature increase to 1.5°C above pre-industrial levels…”. To meet this target the transport sector will have to reduce its emissions significantly further than the White Paper dictates. Although there is currently a CO₂ legislation in place for vans, the emission limit values of 147 g CO2/km for new vehicles aim for a reduction of 16% between 2017 and 2020 only (which is less ambitious and demanding than for passenger cars). Moreover, this percentage will be even lower in practice due to increasing difference in test cycle and real world emissions (‘CO₂ gap’). In short, much more effort will be needed to ensure vans will make a fair contribution in meeting long term climate goals. To get a better understanding of van use in Europe and the possibilities for decarbonising this transport ‘sector’, Transport and Environment (T&E) commissioned CE Delft to draw up a report that gives an overview of state-of-the-art knowledge of van use and ownership in the EU.
1.2 Approach used, scope and validity of results
In this report we investigate four key aspects that influence the European van fleet today. First we look at the technological options currently available on the market. Vehicle technology and exhaust control technology are crucial to reduce emissions. The implementation of these options is driven (mainly) by European emission legislation. Besides their impact on emissions, technologies also increase vehicle costs, which in turn influence vehicle choice.
9 September 2017 4.L06 – Van use in Europe and their environmental impact
A second important element that may impact vehicle choice is regulation. Obligatory requirements (or the lack thereof) to use certain types of vehicles such as specific drivers licenses, permits for carrying goods or accessing particular areas, professional requirements etc. are likely to influence vehicle choice. This is particularly the case when the regulations are different for different types of vehicles with similar functionality. We will map the regulations of vans in Europe and differences between Member States. We will also compare them with the regulations in place for small heavy-duty trucks, which are most likely the primary potential substitute for vans. Thirdly, we will examine the market structure. To this end, we will zoom in on the companies and individuals that use vans for their daily operations. Their motives to use this vehicle type instead of alternatives are the key focus point. Interviews with fleet owners (either large companies or leasing companies) are used to gain better understanding of the willingness of van users to adopt fuel efficient and environmentally friendly vans. The fourth element we look into is the Total Costs of Ownership (TCO) of diesel vans and full-electric vans. For businesses, TCO is an important element that determines the types of vans that are acquired. The TCO analysis reveals which cost elements are dominant in the total costs, but it also reveals at which point in time full-electric vans become cost-competitive with conventional (diesel) vans. Information on these four elements is gathered through literature research, data analysis and interviews held with several fleet owners and van users. TCO calculations are carried out with the COSTREAM model which was extended for the purpose of this project to incorporate vans.
Scope and validity of results We would like to note that there is little EU-wide data available on vans and the number of studies that have examined van use is very limited. Within the scope of this project all possible information was gathered. The results of this study should nevertheless be regarded as a first impression of the way the van market in Europe is organised and what the options are to minimize their environmental impact.
1.3 Structure of the report
In Chapter 2 we show some main trends in and size of the vehicle fleet of vans in EU28. In Chapter 3 an oversight is given of the possible technological improvements in vans as well as the use of alternative fuels. Information regarding the current legislation on vans and CO₂ emissions is given in Chapter 4. In Chapter 5 the results of the market consultation are shown. Calculations for the Total Cost of Ownership are presented in Chapter 6. Future projections for the deployment of electric vans are presented in Chapter 7. Chapter 8 gives the conclusions of this report and recommendations for further research.

10 September 2017 4.L06 – Van use in Europe and their environmental impact
2 Trends and size of vehicle fleet in EU28
2.1 Total number of registered vans
Only one complete data set showing the total number of vans in EU28 is available for the period 2005-2010, see Figure 4. There is a slight increase in the total number of vehicles between 2005 and 2010, from 26.8 million to 29.3 million. In the same period, the total number of passenger cars in EU28 grew from 225 million to 240 million (TRACCS, 2013). Other incomplete data sets for the period 2009 to 2014 also show a slow increase in the number of vans for the period 2009 to 2014 (only countries with complete data for each year were analysed).
Figure 4 Number of registered vans per member state for the period 2005–2014
Source: (TRACCS, 2013; ANFAC, 2014 and Eurostat, 2017)1. Figure 5 shows the number of vans per inhabitant per member state for 2010. Cyprus, Portugal, Spain and France have the highest ratio. Germany, Austria and most Central and Eastern European countries have ratios that are significantly below the EU average. The observed differences are large. In Chapter 4 we will delve into regulatory differences between Member States to try and explain the differences in these ratios.
1 For the period 2011 to 2014 the data from ANFAC, 2014 is used. For 2013 and 2014 this is
supplemented with Eurostat data. The data for the period 2011 to 2014 is not fully complete. Particularly scare are data from Middle and Eastern European countries.

11 September 2017 4.L06 – Van use in Europe and their environmental impact
Figure 5 Number of vans per inhabitant per member state for 2010
Source: (TRACCS, 2013 and Eurostat, 2017).
2.2 Newly registered vans
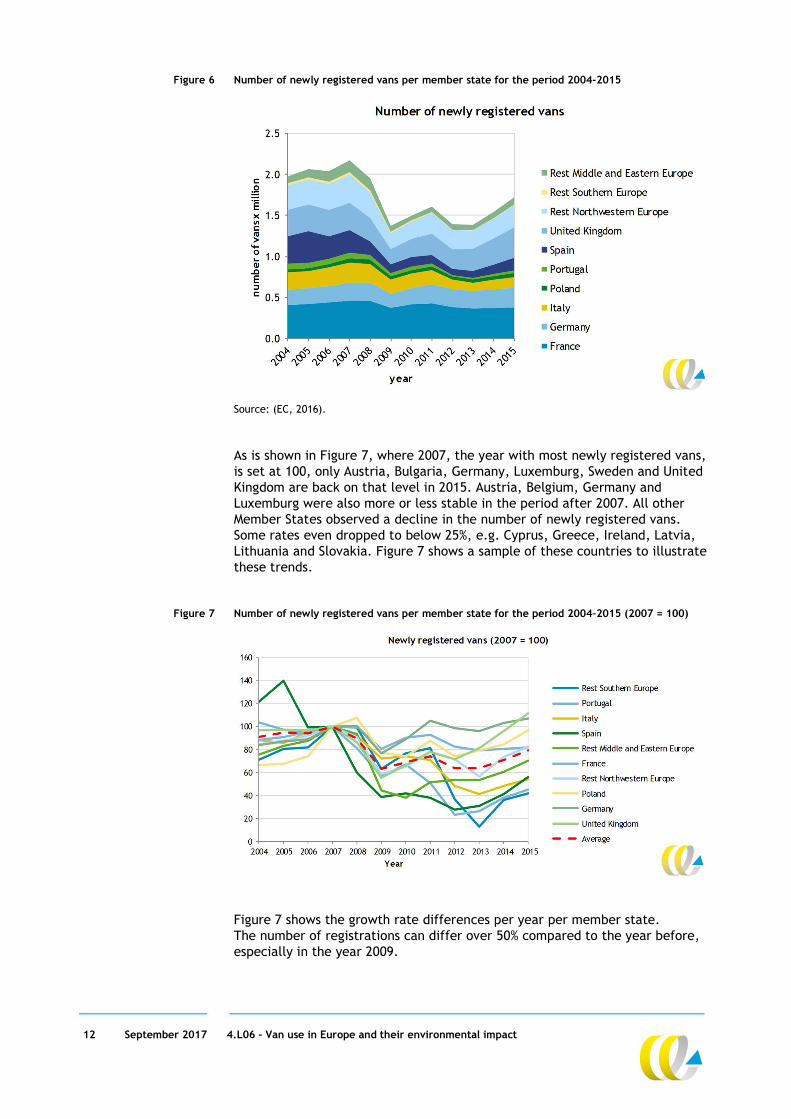
In Figure 6 an overview of newly registered vans in the period 2004-2015 is given per Member State. It clearly shows that in 2009 the number of newly registered vans dropped dramatically from about 2 million in the EU to less than 1.4 million per year. This was likely caused by the economic crisis, which put many small companies out of business and put a hold on new investments such as renewing vehicle fleets. In 2010-2011 a recovery is seen, followed by a subsequent drop in 2012 and 2013 to approximately 1.4 million vans per year. Especially in 2009, but also in 2012 and 2013 a decline in GDP for many Member States was observed (Eurostat). From 2013 onwards the number of newly registered vans has been increasing, but it has not yet reached its pre-economic crisis level. This could suggest that, compared to before the economic crisis, older vehicles are being replaced with newer ones at a later moment in time and are thus used for a longer period. However, no data was found on the average age of the vans in the EU.
12 September 2017 4.L06 – Van use in Europe and their environmental impact
Figure 6 Number of newly registered vans per member state for the period 2004-2015
Source: (EC, 2016). As is shown in Figure 7, where 2007, the year with most newly registered vans, is set at 100, only Austria, Bulgaria, Germany, Luxemburg, Sweden and United Kingdom are back on that level in 2015. Austria, Belgium, Germany and Luxemburg were also more or less stable in the period after 2007. All other Member States observed a decline in the number of newly registered vans. Some rates even dropped to below 25%, e.g. Cyprus, Greece, Ireland, Latvia, Lithuania and Slovakia. Figure 7 shows a sample of these countries to illustrate these trends.
Figure 7 Number of newly registered vans per member state for the period 2004–2015 (2007 = 100)
Figure 7 shows the growth rate differences per year per member state. The number of registrations can differ over 50% compared to the year before, especially in the year 2009.

13 September 2017 4.L06 – Van use in Europe and their environmental impact
Comparison with new registrations of lorries The number of newly registered lorries between 3.5 and 16 tonnes in EU28 has been declining from 2005 to 2014 from about 125,000 to about 62,000 per year, with the exception of a growth burst in 2011 (about 6,000 or about 8% more than in 2010). The year 2015 shows growth of about 3,000 (about 5%) (ICCT, 2016). Figure 8 shows that newly registered lorries between 3.5 and 16 tonnes have been lagging in terms of growth since 2014 compared to vans and lorries over 16 tonnes. In absolute terms the number of vans sold is about 15 to 20 times higher than the number of lorries. The average WTW CO₂ emissions in g/tkm of vans is 1,153 versus 259 g/tkm for small lorries (CE Delft, 2016). A shift from small lorries to vans therefore has a negative environmental impact.
Figure 8 Number of newly registered vans and lorries in EU28 for the period 2004–2015 (2007 = 100)
2.3 CO2 emissions of vans in EU28
The contribution of vans to CO₂ emissions in the EU is about 130,000 Ktonne per year CO2 (TRACCS, 2013). Vans accounted for 8.9% of the CO₂ emissions for transport in 2014 in EU28 (EEA, 2016a).

14 September 2017 4.L06 – Van use in Europe and their environmental impact
Figure 9 Total CO2 emissions (in Ktonne) of vans per member state for the period 2005–2010
Source: (TRACCS, 2013).
The 2017 target for CO₂ emissions from vans is an average of 175 g/km. The 2020 target is an average of 147 g/km (EU, 2011). This implies a reduction of 16% in three years. For more detail about the targets, see Chapter 3. For several Member States and for EU28 the CO₂ emissions per km per van for the period 2009 to 2015 are shown compared to the 2017 average target of 175 g/km in Figure 10. In general CO₂ emissions per van are decreasing. Only in Germany, the UK and EU12-13 (which includes Germany and the UK) CO₂ emissions per km per van were above the 2017 target in 2015. For EU12-13 there is a remarkable increase in 2011. For Belgium an increase is seen in 2014 and 2015. No explanation was found. In 2016 average CO2 emissions of new vans registered in the EU dropped further to 164 g/km, a reduction of 4.5 g per km compared to 2015. This is the highest annual reduction observed since 2013 (EEA, 2017).

15 September 2017 4.L06 – Van use in Europe and their environmental impact
Figure 10 Average CO2 g per vehicle-km (test cycle values) per country 2009-2015
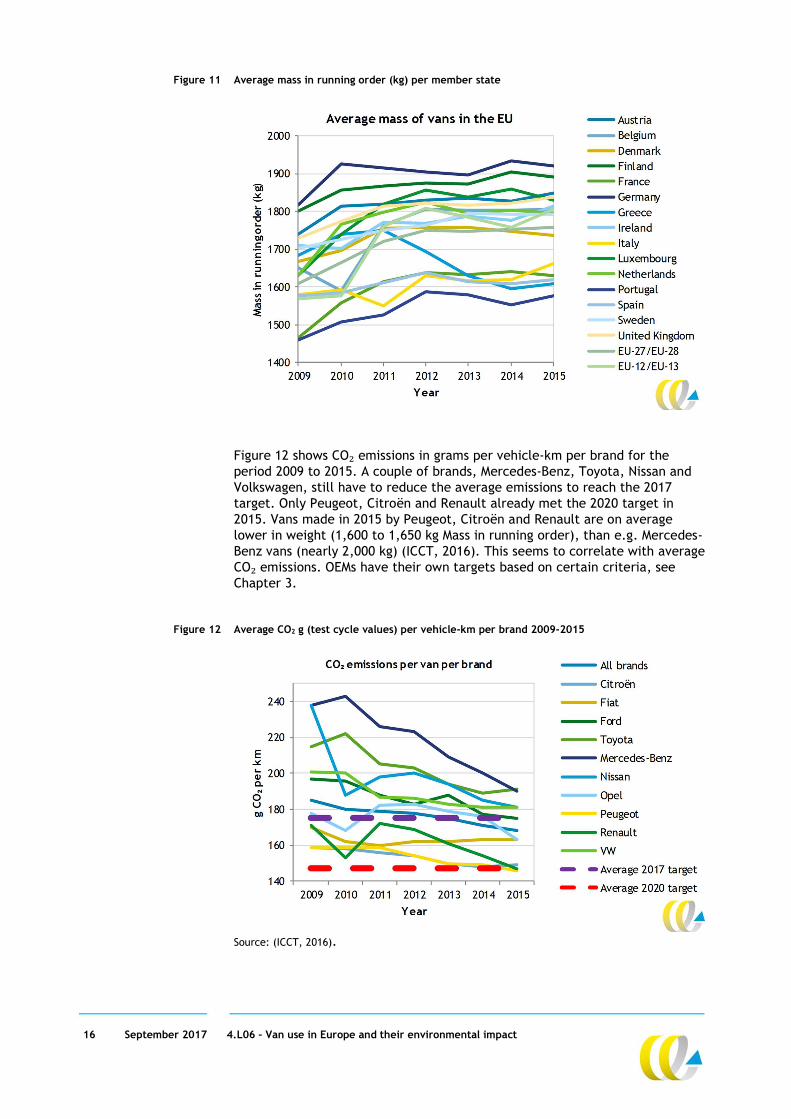
Source: (ICCT, 2016). It must be noted that the CO₂ emissions are based on the New European Driving Cycle (NEDC) test. The real-world performance of new European passenger cars and official CO2 emission test values have been shown to diverge. Although emissions standards are becoming increasingly stringent, the real-world emissions are higher than the test results (see Section 3.2). In addition, it has been noted that the 2013 CO2 monitoring data for vans should be considered incomplete with regard to multi-stage vehicles, i.e. vehicles where the chassis cab is produced by one manufacturer and the bodywork is added by a different manufacturer. In soon to be published work Ricardo estimates that up to 11% of all registrations may be missing from the 2013 monitoring database. Many of these vehicles are assumed to be multi-stage vehicles. Figure 11 shows the average mass of vans in different Member States. The average mass increases in the period 2009 to 2015. Vans registered in 2015 in France, Greece, Portugal and Spain are the lightest (+/- 1,600 kg mass in running order on average). In Austria (1,830 kg), Germany (1,912 kg) and the UK (1,839 kg) vans are the heaviest (ICCT, 2016). Mass seems to correlate with average CO₂ emissions.
16 September 2017 4.L06 – Van use in Europe and their environmental impact
Figure 11 Average mass in running order (kg) per member state
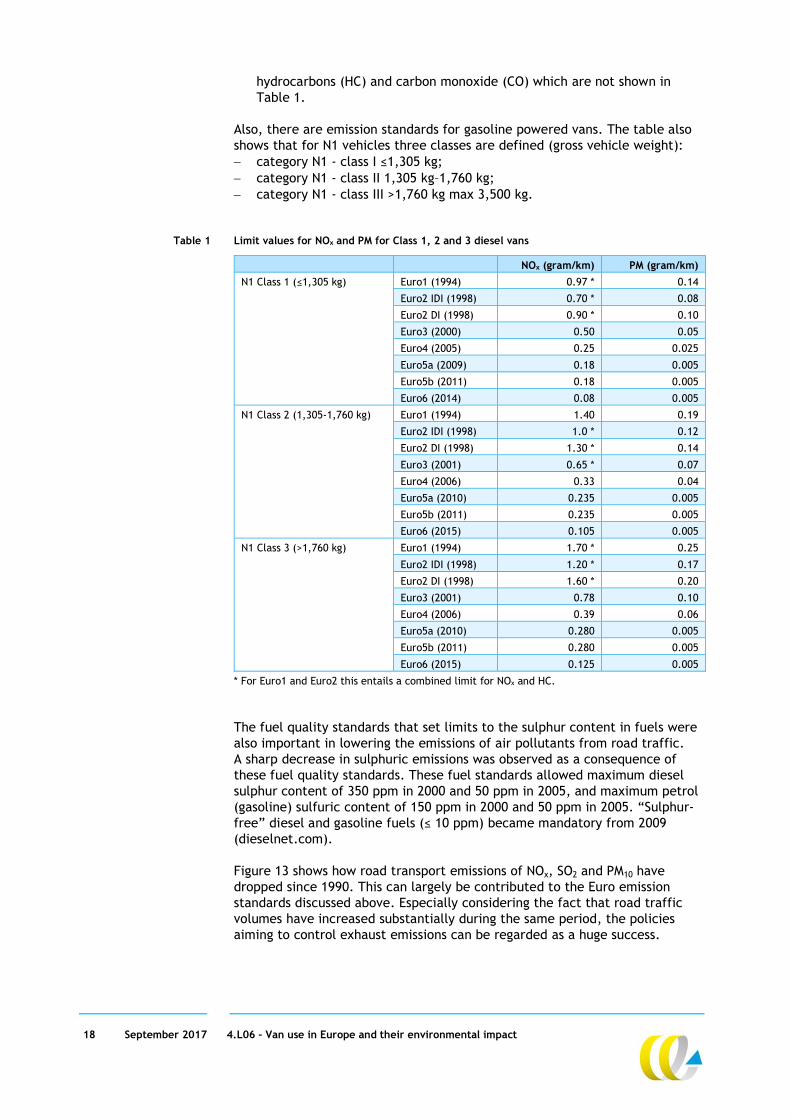
Figure 12 shows CO₂ emissions in grams per vehicle-km per brand for the period 2009 to 2015. A couple of brands, Mercedes-Benz, Toyota, Nissan and Volkswagen, still have to reduce the average emissions to reach the 2017 target. Only Peugeot, Citroën and Renault already met the 2020 target in 2015. Vans made in 2015 by Peugeot, Citroën and Renault are on average lower in weight (1,600 to 1,650 kg Mass in running order), than e.g. Mercedes-Benz vans (nearly 2,000 kg) (ICCT, 2016). This seems to correlate with average CO₂ emissions. OEMs have their own targets based on certain criteria, see Chapter 3.
Figure 12 Average CO2 g (test cycle values) per vehicle-km per brand 2009-2015
Source: (ICCT, 2016).

17 September 2017 4.L06 – Van use in Europe and their environmental impact
3 Technology
In this chapter we examine currently implemented and future technologies aiming to make vans cleaner and more energy efficient. ‘Cleaner’ vehicles emit smaller amounts of exhaust gasses such as nitrous oxides (NOx), particulate matter (PM) and hydrocarbons2 (HC). These emissions cause damage to ecosystems through acidification and pose a significant threat to health worldwide. According to the World Health Organisation (WHO) 436,000 premature deaths in the EU each year can be attributed to the effects of urban outdoor air pollution (EEA, 2016c). ‘Energy efficient’ vehicles use less fuel per kilometre and, as a result, also emit lower amounts of CO2 (carbon dioxide), the main greenhouse gas held responsible for global warming. Technology can be very effective in reducing both air pollutants and greenhouse gas emissions originating from vehicles. In the following sections we first look at current emission legislation in place for vans and show how regulations have been tightened over the years. In Section 3.2 we examine the extent to which emission regulation has resulted in lower emission in the real world (i.e. we go into the difference between test cycle and real world driving emissions). Section 3.3 looks at future options to reduce CO2 emissions from conventional (Internal Combustion Engine - ICE) vehicles. Section 3.4 looks at alternative drive trains and fuels for vans.
3.1 Emission regulation for vans
3.1.1 Air pollutants “Tailpipe” emission standards specify the maximum amount of pollutants allowed in exhaust gases discharged from a diesel engine. The tailpipe emission standards were initiated in California in 1959 to control carbon monoxide (CO) and hydrocarbon (HC) emissions from gasoline engines (dieselnet.com). Today, emissions from internal combustion engines are regulated in many countries throughout the world: In Europe, the first emission standard for passenger cars was introduced in
1970 (EEC, 1970). In the 1990s emissions regulation gained real momentum with the introduction of the Euro1 standard for passenger cars. This prompted the introduction of the catalytic converter which considerably lowered emissions from gasoline cars. In 1994 the Euro1 emission standard was adopted for light commercial vehicles (vans). Since then emission standards for passenger cars and vans have been tightened every three to five years.
In Table 1 the emission limits for NOx (Nitrous oxide) and PM (particulates) for diesel vans are shown. The table clearly shows the emission limits have become more stringent over the years. For NOx the emission limit of Euro6 vans is roughly 12 to 14 times lower than Euro1 (depending on the weight class of the van). The emission limit for PM became much more stringent from Euro5 onwards because of diesel particulate filters for all new vans. Note that apart from NOx and PM there are also limit values for
2 Hydrocarbons (HC) are sometimes also referred to as VOC (Volatile Organic Compounds) or
NMVOC (non-methane Volatile Organic Compounds).
18 September 2017 4.L06 – Van use in Europe and their environmental impact
hydrocarbons (HC) and carbon monoxide (CO) which are not shown in Table 1.
Also, there are emission standards for gasoline powered vans. The table also shows that for N1 vehicles three classes are defined (gross vehicle weight): category N1 - class I ≤1,305 kg; category N1 - class II 1,305 kg–1,760 kg; category N1 - class III >1,760 kg max 3,500 kg.
Table 1 Limit values for NOx and PM for Class 1, 2 and 3 diesel vans
NOx (gram/km) PM (gram/km)
N1 Class 1 (≤1,305 kg) Euro1 (1994) 0.97 * 0.14
Euro2 IDI (1998) 0.70 * 0.08
Euro2 DI (1998) 0.90 * 0.10
Euro3 (2000) 0.50 0.05
Euro4 (2005) 0.25 0.025
Euro5a (2009) 0.18 0.005
Euro5b (2011) 0.18 0.005
Euro6 (2014) 0.08 0.005
N1 Class 2 (1,305-1,760 kg) Euro1 (1994) 1.40 0.19
Euro2 IDI (1998) 1.0 * 0.12
Euro2 DI (1998) 1.30 * 0.14
Euro3 (2001) 0.65 * 0.07
Euro4 (2006) 0.33 0.04
Euro5a (2010) 0.235 0.005
Euro5b (2011) 0.235 0.005
Euro6 (2015) 0.105 0.005
N1 Class 3 (>1,760 kg) Euro1 (1994) 1.70 * 0.25
Euro2 IDI (1998) 1.20 * 0.17
Euro2 DI (1998) 1.60 * 0.20
Euro3 (2001) 0.78 0.10
Euro4 (2006) 0.39 0.06
Euro5a (2010) 0.280 0.005
Euro5b (2011) 0.280 0.005
Euro6 (2015) 0.125 0.005
* For Euro1 and Euro2 this entails a combined limit for NOx and HC.
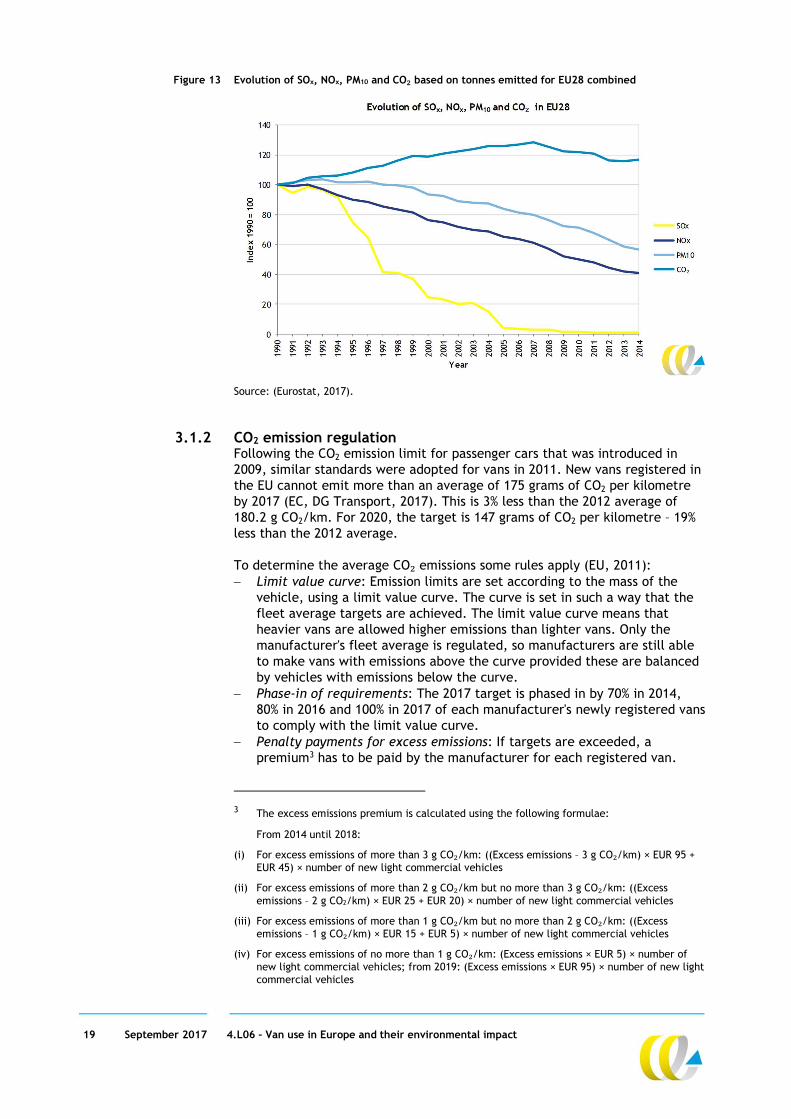
The fuel quality standards that set limits to the sulphur content in fuels were also important in lowering the emissions of air pollutants from road traffic. A sharp decrease in sulphuric emissions was observed as a consequence of these fuel quality standards. These fuel standards allowed maximum diesel sulphur content of 350 ppm in 2000 and 50 ppm in 2005, and maximum petrol (gasoline) sulfuric content of 150 ppm in 2000 and 50 ppm in 2005. “Sulphur-free” diesel and gasoline fuels (≤ 10 ppm) became mandatory from 2009 (dieselnet.com). Figure 13 shows how road transport emissions of NOx, SO2 and PM10 have dropped since 1990. This can largely be contributed to the Euro emission standards discussed above. Especially considering the fact that road traffic volumes have increased substantially during the same period, the policies aiming to control exhaust emissions can be regarded as a huge success.
19 September 2017 4.L06 – Van use in Europe and their environmental impact
Figure 13 Evolution of SOx, NOx, PM10 and CO₂ based on tonnes emitted for EU28 combined
Source: (Eurostat, 2017).
3.1.2 CO2 emission regulation Following the CO2 emission limit for passenger cars that was introduced in 2009, similar standards were adopted for vans in 2011. New vans registered in the EU cannot emit more than an average of 175 grams of CO2 per kilometre by 2017 (EC, DG Transport, 2017). This is 3% less than the 2012 average of 180.2 g CO2/km. For 2020, the target is 147 grams of CO2 per kilometre – 19% less than the 2012 average. To determine the average CO₂ emissions some rules apply (EU, 2011): Limit value curve: Emission limits are set according to the mass of the
vehicle, using a limit value curve. The curve is set in such a way that the fleet average targets are achieved. The limit value curve means that heavier vans are allowed higher emissions than lighter vans. Only the manufacturer's fleet average is regulated, so manufacturers are still able to make vans with emissions above the curve provided these are balanced by vehicles with emissions below the curve.
Phase-in of requirements: The 2017 target is phased in by 70% in 2014, 80% in 2016 and 100% in 2017 of each manufacturer's newly registered vans to comply with the limit value curve.
Penalty payments for excess emissions: If targets are exceeded, a premium3 has to be paid by the manufacturer for each registered van.
3 The excess emissions premium is calculated using the following formulae:
From 2014 until 2018:
(i) For excess emissions of more than 3 g CO₂/km: ((Excess emissions – 3 g CO₂/km) × EUR 95 + EUR 45) × number of new light commercial vehicles
(ii) For excess emissions of more than 2 g CO₂/km but no more than 3 g CO₂/km: ((Excess emissions – 2 g CO2/km) × EUR 25 + EUR 20) × number of new light commercial vehicles
(iii) For excess emissions of more than 1 g CO₂/km but no more than 2 g CO₂/km: ((Excess emissions – 1 g CO₂/km) × EUR 15 + EUR 5) × number of new light commercial vehicles
(iv) For excess emissions of no more than 1 g CO₂/km: (Excess emissions × EUR 5) × number of new light commercial vehicles; from 2019: (Excess emissions × EUR 95) × number of new light commercial vehicles
20 September 2017 4.L06 – Van use in Europe and their environmental impact
For example if 10,000 vehicles exceed with 5 g CO2, the premium is (5 – 3) x (€ 95 + € 45) x 10.000 = € 2.8 million.
Eco-innovations: To encourage eco-innovation, manufacturers can be granted emission credits equivalent to a maximum emissions saving of 7g/km if the CO2 reducing effects of a new technology cannot be demonstrated in the test procedure used for vehicle type approval. An example used with passenger cars is the use of LEDs for headlights (EC, DG Climate Action, 2013a). For this they need to equip vehicles with innovative technologies, of which the effectiveness is based on independently verified data.
Super credits: Manufacturers get super credits until 2017 for producing vehicles with extremely low emissions (below 50 g/km) for a maximum of 25,000 vans over the 2014-17 period. Each low-emitting van will be counted as: 3.5 vehicles in 2014 and 2015; 2.5 in 2016; 1.5 vehicles in 2017; 1 vehicle from 2018 onwards.
Pools acting jointly: Manufacturers are allowed to group together and act jointly to meet the average emission target.
Targets for smaller manufacturers: If a manufacturer produces less than 22,000 newly registered vans, they can propose their own emissions reduction target. Manufacturers that produce less than 1,000 newly registered vans are exempted.
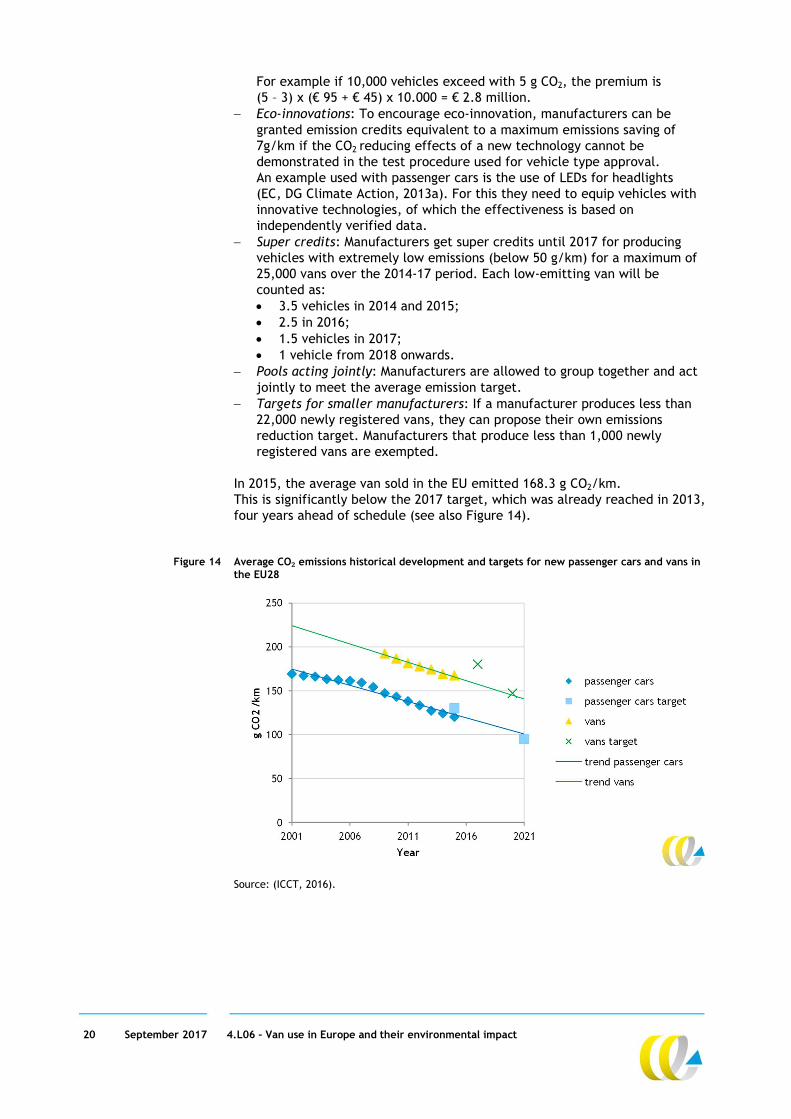
In 2015, the average van sold in the EU emitted 168.3 g CO2/km. This is significantly below the 2017 target, which was already reached in 2013, four years ahead of schedule (see also Figure 14).
Figure 14 Average CO₂ emissions historical development and targets for new passenger cars and vans in the EU28
Source: (ICCT, 2016).
21 September 2017 4.L06 – Van use in Europe and their environmental impact
The downward trend in CO2 emissions from new cars registered in the EU has been the result of the combined effect of technical and non-technical measures. On the technical side, fuel efficiency of new car models is steadily improving as a result of a number of relevant technologies, such as direct fuel injection, variable valve timing and lift, cylinder deactivation, turbocharging and start–stop systems (EEA, 2016a).
3.2 Differences between real world and test cycle emissions
The emission standards described in Section 3.1 need to be enforced to ensure they have the desired effect. Type approval describes the process applied by national authorities to certify that a model of a vehicle meets all EU safety, environmental and conformity of production requirements before authorising it to be placed on the EU market (EC, 2016). To test this, the so-called New European Driving Cycle (NEDC) was developed and implemented in 1990. The NEDC originally was intended for measuring air pollutant emissions (i.e. NOx, PM, CO and HC). From 2009 onwards, when CO2 emission legislation was put in place, the NEDC was also used to determine the CO2 emissions of passenger cars and vans. It has long been recognised that the NEDC does not reflect real world driving conditions. The test offers a stylized driving speed pattern with low accelerations, constant speeds, and many idling events. As a result, the reported emissions that follow from the type approval are very different when tests are used that better represent real world driving conditions. This is true for both air pollutants and CO2 emissions. Below we will review evidence on differences between real world and test cycle emissions both for CO2 and air pollutants.
3.2.1 CO2 real world versus test cycle emissions For passenger cars, data on approximately 1 million vehicles from 13 data sources and seven countries indicate that the divergence, or gap, between official and real-world CO2 emission values of new European passenger cars increased from approximately 9% in 2001 to 42% in 2015 (ICCT, 2016). Since a substantial part of vans are car derived vehicles (TNO et al., 2012) their emission characteristics are very similar to that of passenger cars. For larger vans there is less information on the gap. CBS and TNO have derived fuel specific formulas for vans to calculate CO2 emissions bottom-up. We show the formula for diesel vans below (CBS, 2015):
CO2[g/km] = (0.107*weight[kg] + 40 + 0.325*(Power[kW] – 0.045*weight[kg]))
As we saw in Section 2, the average mass of vans in the EU28 varies between 1,500 and 2,000 kg (empty vehicle weight). Using these values and the formula above we can derive that the real world CO2 emissions of vans roughly varies between 215 and 270 g/km. We also saw in Section 2 that the average CO2 emission according to the NEDC test is roughly 175 g/km in the EU28 and varies between 150 and 190 g/km between Member States. This would mean that the CO2 gap for vans is on average 30%. Bottom-up calculations carried out in the UK also arrive at a difference of 30% between test cycle and real world emissions (ElementEnergy, 2015). The study concludes that the gap for vans in 2014 was likely lower than for passenger
22 September 2017 4.L06 – Van use in Europe and their environmental impact
cars, although not significantly lower. In addition, they argue that with respect to the influence of technologies on the gap the impact for vans is lower than for cars. This is mainly because technologies such as stop-start, hybrid and plug-in hybrid, are (currently) rarely found in the van fleet, but are more frequently used in passenger cars (ElementEnergy, 2015). We look into this more closely in Section 3.3.4. These calculations are largely confirmed by measurements on 10 Euro5 vans in the Netherlands. The average type approval value of the tested vehicles was 194 g CO2/km whereas the real world average amounted to 237 g/km, a discrepancy of 23% (TNO, 2015). (Zacharof et al., 2016) also show that the divergence in CO2 emissions for vans revealed that it increased from 14% in 2006 to 33% in 2014. An explanation for the smaller differences found between test cycle and real word CO2 emissions in vans compared to passenger cars might be that less of the so-called ‘flexibilities’ in the type approval test procedure have been utilized for vans. This explanation is supported by the finding that the 2020 target for vans is less strict in relative terms compared to the 95 g/km target for passenger cars (see Section 3.3.1). As an aside, TNO (2015) also looked at the impact of payloads on real world CO2 emissions in urban driving. They find that average CO2 emissions of the 10 vans increase by 7% if the payload is increased from 28 to 100%. This effect is rather limited. It is not clear however how payloads affect the gap between test cycle and real world emissions.
New test cycle for CO2 under development The increasing discrepancy between real-world and NEDC values has been recognised by policymakers. A new World-harmonised Light-duty vehicle Test Procedure (WLTP) has been developed, which better reflects modern real world driving conditions and behaviour. However, initial tests have suggested that the WLTP will not completely close the gap between test cycle and real world emissions (EEA, 2016b). As a result, the Commission’s Scientific Advice Mechanism was asked to look at further ways of closing this gap. Their report, which was published in 2016, concluded that a framework for monitoring real world CO2 emissions was needed using data from portable emissions measurement systems (PEMS) and that regulatory oversight of the process needed to be improved and made more transparent. The report also recommended the review and further development of the WLTP every five years in order to ensure that the gap between test cycle and real world emissions does not continue to grow (Scientific Advice Mechanism (SAM), 2016).
3.2.2 Air pollutants - real world versus test cycle emissions As a result of the Euro emission standards, the pollutant emissions of light-duty vehicles as observed in type approval tests have been reduced significantly over the past decade (TNO, 2015). The same holds true for vans. Real world emissions however have not decreased at the same rate. Figure 15 shows that the difference between type approval NOx emissions and real-world NOx emissions in urban driving conditions has grown significantly over the years. In fact, from Euro2 onwards real world emissions have remained almost constant.
23 September 2017 4.L06 – Van use in Europe and their environmental impact
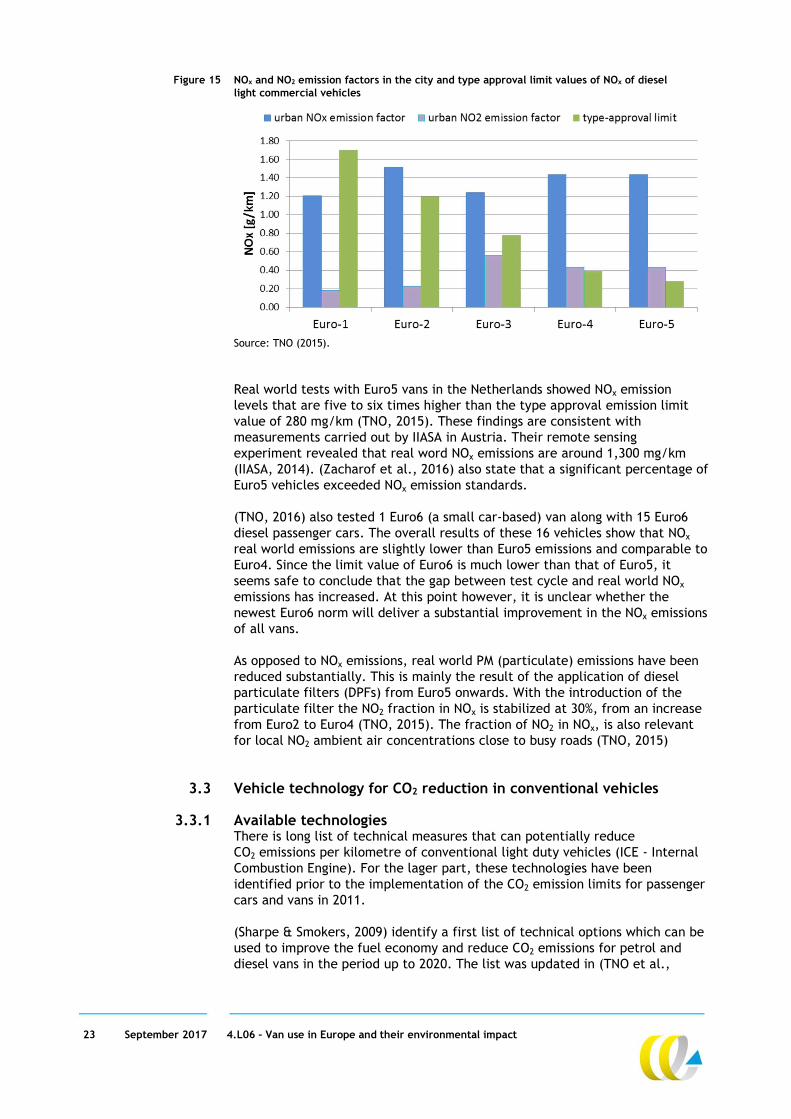
Figure 15 NOx and NO2 emission factors in the city and type approval limit values of NOx of diesel light commercial vehicles
Source: TNO (2015). Real world tests with Euro5 vans in the Netherlands showed NOx emission levels that are five to six times higher than the type approval emission limit value of 280 mg/km (TNO, 2015). These findings are consistent with measurements carried out by IIASA in Austria. Their remote sensing experiment revealed that real word NOx emissions are around 1,300 mg/km (IIASA, 2014). (Zacharof et al., 2016) also state that a significant percentage of Euro5 vehicles exceeded NOx emission standards. (TNO, 2016) also tested 1 Euro6 (a small car-based) van along with 15 Euro6 diesel passenger cars. The overall results of these 16 vehicles show that NOx real world emissions are slightly lower than Euro5 emissions and comparable to Euro4. Since the limit value of Euro6 is much lower than that of Euro5, it seems safe to conclude that the gap between test cycle and real world NOx emissions has increased. At this point however, it is unclear whether the newest Euro6 norm will deliver a substantial improvement in the NOx emissions of all vans. As opposed to NOx emissions, real world PM (particulate) emissions have been reduced substantially. This is mainly the result of the application of diesel particulate filters (DPFs) from Euro5 onwards. With the introduction of the particulate filter the NO2 fraction in NOx is stabilized at 30%, from an increase from Euro2 to Euro4 (TNO, 2015). The fraction of NO2 in NOx, is also relevant for local NO2 ambient air concentrations close to busy roads (TNO, 2015)
3.3 Vehicle technology for CO2 reduction in conventional vehicles
3.3.1 Available technologies There is long list of technical measures that can potentially reduce CO2 emissions per kilometre of conventional light duty vehicles (ICE - Internal Combustion Engine). For the lager part, these technologies have been identified prior to the implementation of the CO2 emission limits for passenger cars and vans in 2011. (Sharpe & Smokers, 2009) identify a first list of technical options which can be used to improve the fuel economy and reduce CO2 emissions for petrol and diesel vans in the period up to 2020. The list was updated in (TNO et al.,

24 September 2017 4.L06 – Van use in Europe and their environmental impact
2012). A further update of available technologies will be presented in Ricardo (2016 forthcoming). (TNO et al., 2012) distinguish following categories in CO2 reduction technologies: engine technologies; lubrication and thermal management technologies; transmission technologies; hybridisation and electrification; light weighting; rolling resistance reduction; aerodynamic improvements; driveline friction reduction. These categories of CO2 reduction technologies are briefly discussed below (see (TNO et al., 2012) for more details), with one exception. Electrification (i.e. vehicles of which the battery can be charged using a cable which is plugged into a wall socket or public charging point) is discussed in Section 3.4.
Engine technologies CO2 reduction technologies that fall into this category are e.g. combustion enhancements, mild and medium downsizing (e.g. engine capacity reduction) and variable valve actuation4.
Lubrication and thermal management technologies Technologies in this category include auxiliary thermal systems improvements, other thermal management technologies, thermo electric generation, secondary heat recovery and electric power steering. Auxiliary systems improvement technology includes variable coolant pumps which enable limiting the mechanical power absorbed by the oil pump during engine warm-up or during thermal steady-state operations as the oil pump is sized mainly for low engine speed operations. Thermal management technologies include for example heat storage system to better control the thermal behaviour of the engine and especially to reduce the fuel consumption during its warm-up, and engine encapsulation used to maintain a nominal engine temperature even after a long vehicle stop. Included in this category also are electric assisted steering, both EPS (Electrical Power Steering) and EPHS (Electrical Power Hydraulic Steering), which can give fuel economy benefits because the pump runs only on demand.
Transmission technologies As low speed torque for LCV engines increases, it is possible to optimise gear ratios to allow the engine to operate at lower engine speeds, thereby allowing a small reduction in CO2 emissions in addition to that provided by the engine. Technologies with names such as ‘Clutch micro-slip control’, ‘Automated Manual Transmissions (AMTs or ASG)’ and ‘Dual clutch transmissions (DCTs or DSG)’ are examples that may be seen in advertisements by OEMs in some instances.
4 Variable valve actuation has benefits that include reducing the pumping loss associated with
the timing while the intake valve is closed as well as achieving better combustion by better gas motion and fuel atomization through lower valve lift.
25 September 2017 4.L06 – Van use in Europe and their environmental impact
Hybridisation The benefits of hybridisation in the LCV segment are most prominent with high levels of stop-start traffic. Since LCVs are frequently used in delivery applications and drive through dense traffic areas all forms of hybridisation can have a very high impact on CO2 reduction. Hybridisation ranges from the inclusion of only stop-start systems, through micro and mild hybrids which include regenerative breaking to full hybrids which have an electric range of up to 30 to 40 kilometres.
Light weighting Reducing vehicle inertia reduces the energy required to propel the vehicle thus providing improvements in fuel economy and CO2. A disadvantage of weight may be that it involves the application of novel materials and processes which can affect vehicle attributes such as crash safety, stiffness and durability. For the small LCVs segment, CO2 reduction by light weighting is less cost-effective than for comparable passenger cars since there are less of the “first choice items” (e.g. seats, noise reducing materials) to remove and/or lightweight. In the (TNO et al., 2012) study light weighting resulting in up to 40% weight reduction is assumed feasible. We should note that light weighting increases the carrying capacity of the van, thus improving cost effectiveness.
Rolling resistance reduction The rolling resistance force produced by a tyre is dependent on the vertical load (i.e. weight), vehicle (wheel) speed, contact patch area and the properties of the rubber compound and tread. Advances in the rubber compound (in particular the introduction of silica), narrower tyres (resulting in a reduced contact area with road surface) and changing the tyre radial velocity by wheel diameters can reduce energy consumption of vehicles.
Aerodynamic Improvements Minor aerodynamic features are considered to be changes that would not affect the overall styling and shape of the vehicles, such as active front grilles, wheel fairings and underbody treatments to improve localised airflow. Major aerodynamic features involve changes to the overall vehicle shape and could only be incorporated as part of a major model update. Such improvements are deemed to be more challenging for large classes of LCVs due to requirements for carrying standard pallet sizes.
Driveline friction reduction Mild reductions in transmission loss can come from lower viscosity lubricant with additional additives, moderately reduced friction in seals and bearings, and optimised gear and casing designs.
3.3.2 Costs of technologies As a general rule, vehicle costs increase with each of the technical measures that is added to the vehicle. Early estimates put the costs of reaching a 125 g/km target for vans are 20 to 30% of the 2007 retail price. According to these older studies a 2020 target of 150 g/km for LCVs can be reached at retail price increases between 10 and 14% compared to 2007 (AEA, 2009). In more recent work TNO et al. (2012), constructed cost curves for small, medium and large diesel LCVs. As Figure 16 shows, a 35% reduction (based on NEDC test cycle) is feasible at around € 2,000 additional manufacturing costs (which is approximately 5 to 10% of the retail price). If further reductions are needed, manufacturing costs are estimated to rise exponentially. The question of

26 September 2017 4.L06 – Van use in Europe and their environmental impact
whether OEMs have adopted any of the ‘low hanging fruit’ and cheap technologies is addressed in Section 3.3.4. The differences in additional costs are fairly small between the three weight classes, with medium and large vans having slightly more cost-effective options at their disposal. To be exact, for CO2 emission reductions up to 31% the additional vehicle costs for reaching a given level of reduction are similar for all three segments (TNO et al., 2012). Above the 31% higher costs are predicted for CO2 emission reductions in small-sized LCVs compared to medium-sized LCVs. From 33% onwards costs for small LCVs are also higher than for large LCVs (TNO et al., 2012). An interesting finding is that the maximum reduction potential is found to increase with vehicle size. This is due to a number of technologies (such as variable valve actuation, thermo-electric generation and secondary heat recovery cycle and electrical assisted steering) that can be applied to the large vans, but not to the small and medium classes. It is also interesting that (TNO et al., 2012) state their cost curves predict lower costs than earlier indicative curves for 2020 by (Sharpe & Smokers, 2009). This begs the question if the forthcoming update by Ricardo et al. (2016, forthcoming) will find even lower cost estimates.
Figure 16 Cost curves for CO2 emission reductions small-sized, medium-sized and large-sized diesel LCVs in 2020, relative to 2010 baseline vehicles
The relatively low additional manufacturer costs that are found in (TNO et al., 2012) for vans compared to passenger cars, lead them to the conclusion that the 147 gCO2/km target for LCVs is less challenging for the manufacturers than the 95 gCO2/km target for passenger cars. For passenger cars an average marginal cost for meeting the 95 gCO2/km passenger car target of € 91/g/km were found (TNO et al. 2012). The LCV study reaches these average marginal costs at an overall average CO2 emission of 113.3 gCO2/km, which is significantly lower than the target of 147 g/km (TNO et al., 2012).
3.3.3 Fuel cost savings, earn back periods Lower fuel consumption results in lower operating costs. The additional vehicle costs shown in Figure 16 will therefore be gradually ‘earned back’ over time. For van users this means that even if the retail price of LCVs increases because of the CO2 target set, the total cost of ownership (TCO) may end up
27 September 2017 4.L06 – Van use in Europe and their environmental impact
lower than without applying the CO2 reducing technologies to meet a certain CO2 target (TNO et al., 2012). Since the additional vehicle costs do not increase linearly with the amount of CO2 reduction, the payback period depends on the CO2 emission limit set. Also, the way in which the vehicle is used (annual mileage, types of goods carried, share of urban kilometres, etc.) and changes in fuel price determine how much fuel costs are saved. (TNO et al., 2012) performed several TCO calculations in which they show that the typical payback period from the van user (or end-user) perspective are between 1.5 and 2 years for a CO2 standard of 147 g/km. For a much stricter norm of around 110 g/km this would be around 3.5 years.
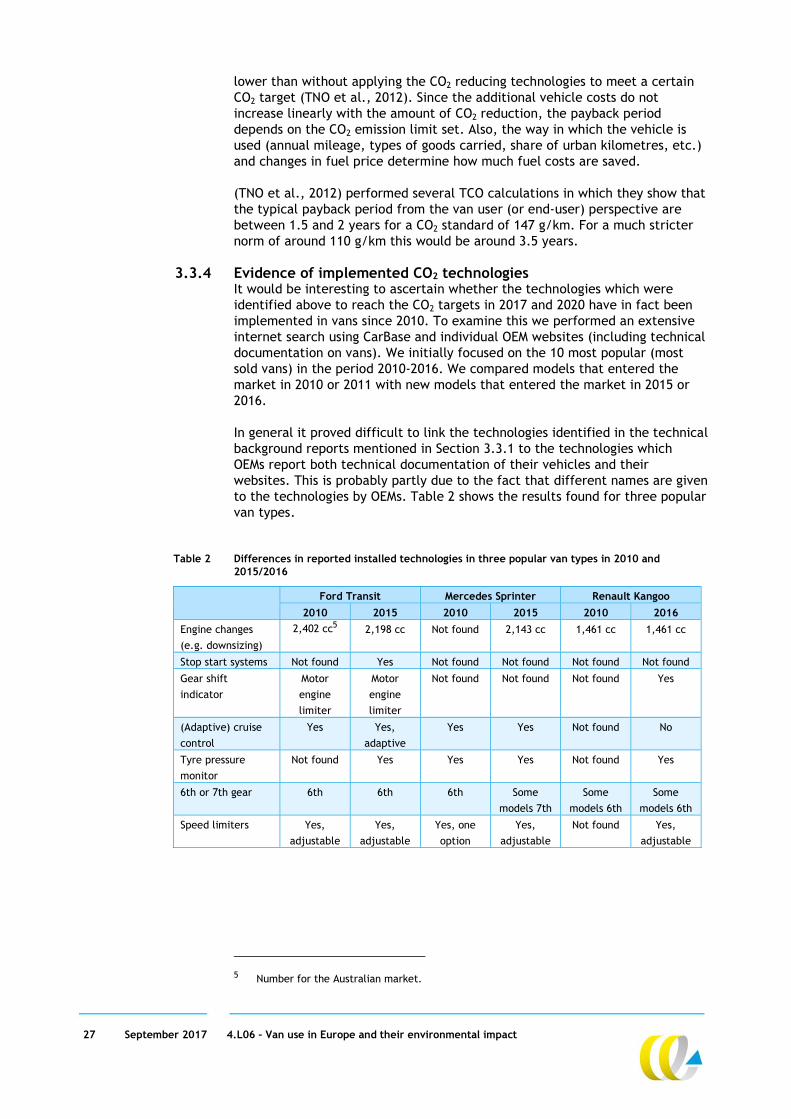
3.3.4 Evidence of implemented CO2 technologies It would be interesting to ascertain whether the technologies which were identified above to reach the CO2 targets in 2017 and 2020 have in fact been implemented in vans since 2010. To examine this we performed an extensive internet search using CarBase and individual OEM websites (including technical documentation on vans). We initially focused on the 10 most popular (most sold vans) in the period 2010-2016. We compared models that entered the market in 2010 or 2011 with new models that entered the market in 2015 or 2016. In general it proved difficult to link the technologies identified in the technical background reports mentioned in Section 3.3.1 to the technologies which OEMs report both technical documentation of their vehicles and their websites. This is probably partly due to the fact that different names are given to the technologies by OEMs. Table 2 shows the results found for three popular van types.
Table 2 Differences in reported installed technologies in three popular van types in 2010 and 2015/2016
Ford Transit Mercedes Sprinter Renault Kangoo
2010 2015 2010 2015 2010 2016
Engine changes
(e.g. downsizing)
2,402 cc5 2,198 cc Not found 2,143 cc 1,461 cc 1,461 cc
Stop start systems Not found Yes Not found Not found Not found Not found
Gear shift
indicator
Motor
engine
limiter
Motor
engine
limiter
Not found Not found Not found Yes
(Adaptive) cruise
control
Yes Yes,
adaptive
Yes Yes Not found No
Tyre pressure
monitor
Not found Yes Yes Yes Not found Yes
6th or 7th gear 6th 6th 6th Some
models 7th
Some
models 6th
Some
models 6th
Speed limiters Yes,
adjustable
Yes,
adjustable
Yes, one
option
Yes,
adjustable
Not found Yes,
adjustable
5 Number for the Australian market.
28 September 2017 4.L06 – Van use in Europe and their environmental impact
In addition several OEMs have specific sections of their websites dedicated to the technological innovations they equip their light commercial vehicles with. Examples are: Volkswagens with EcoFuel (natural gas), Bluemotion (techniques to
increase fuel efficiency) and DSG (Double Shift Gear - a new type of gear box);
Ford’s Eco-boost engine (to increase full efficiency and decrease GHG emissions);
Opel’s BiTurbo engine, ‘Swirl’-technology (energy saving design of cylinder heads), Eco-mode (to optimise fuel consumption), stop-start function;
Mercedes with BlueEFFICIENCY (to increase full efficiency and decrease GHG emissions), Fuel-Efficiency generator, ECO start-stop function.
Although these technologies are claimed to reduce CO2 emissions it is difficult to ascertain the real world reductions they achieve.
3.4 Alternative fuel technologies
In the previous section we looked at technological options to increase the efficiency of conventional vehicles with an internal combustion engine. In this section we examine more advanced technological options for CO2 reduction that involve the implementation of alternative drive trains and/or alternative. fuels. We will briefly discuss the following alternative fuels/drive trains: electric and plug-in electric; fuel cell; compressed natural gas (CNG) and liquefied natural gas (LNG).
3.4.1 Electric and plug-in electric vehicles In the coming years and decades, electric vehicles are likely to enter the light commercial vehicle fleet. These may be either battery electric vehicles, i.e. vehicles solely powered by batteries and an electric motor, or plug-in hybrid models, which typically have a full-electric driving range of several tens of kilometres, but are also powered by an internal combustion engine. Full-electric vehicles have zero tank-to-wheel CO2 emissions. Other exhaust emissions such as NOx and PM are also absent. Tyre and break wear do still produce PM emissions at a level comparable to conventional cars. For passenger cars the number of full-electric vehicles on offer is increasing rapidly. Several brands will introduce new models with better specifications in the coming years. For vans the amount of available models is still very limited. However, the electric light commercial vehicle market can be expected to benefit from efforts currently put into the development of electric passenger cars, and from the incentives provided in the CO2 and vans regulation. There are several barriers which still need to be overcome before the large scale introduction of electric vehicles can be achieved. We will now discuss the three most dominant barriers. A first barrier is the relatively high up-front costs of vehicles (see also Chapter 7). Dominant in the cost mark-up of electric vehicles compared to conventional vehicles are the battery costs. Although these costs are expected to drop considerably in the coming years, it remains to be seen if it will result in a drop in costs that will bring BEVs on par with conventional vehicles. There are three main reasons for this. First is the relatively limited range of electric vehicles compared to conventional vehicles, and diesel vehicles in particular. The typical range of the new generation of
29 September 2017 4.L06 – Van use in Europe and their environmental impact
electric vehicles currently entering the market is around 250 km. As we will see in Chapter 5, the average annual mileage of vans is about 21,000 kilometres which equals about 75 to 100 kilometres per day. An electrical range of 250 (and even 150) kilometres would therefore be more than sufficient for most van users. Nevertheless, due to ‘range anxiety’ electric driving range may still be seen as a barrier for BEV adoption by potential buyers. Additional range, however, requires additional battery capacity which increases costs. It is expected that manufacturers will use drops in battery costs to increase range rather than decrease retail price of vehicles. The second reason is that producer’s indirect costs are currently not incorporated in the current retail prices of EVs. Approximately 60% of the original manufacturing costs is allocated to profits and indirect costs, such as dealer costs, transportation, R&D and corporate overhead (Kolwich, 2013). This is confirmed by interviews with an automotive consultant held to construct the TCO model COSTREAM (see Chapter 6), who claimed there is a multiplier of 1.5-1.7 between direct production costs and the sales price. It stands to reason that once the share of electric vehicles becomes substantial, producers will change this policy and costs of electric vehicles will increase (or remain constant if battery prices continue to decrease at an equal rate). A third barrier for the large uptake of electric vehicles is the availability of charging infrastructure. Searching for a charging point increases travel times. From the Value of Travel Time Savings (VTTS) we can infer that decreased travel times offer considerable benefits particularly for business related activities (VTPI, 2017). Considering the limited range of electric vehicles there is a relatively high density of charge point required. More importantly, charging of a vehicle takes more time than refuelling a conventional vehicle; considerably more time if normal (or slow) charging infrastructure is used (6 to 10 hours depending on the battery capacity of the vehicle). These long charging times however, are not problematic per se as most electric vehicles will be charged overnight. All three barriers mentioned above apply to electric vehicles in general, but to electric vans in particular. Since vans are heavier they require larger battery packs which increase vehicle costs. Since vans are largely used for business related activities they have relatively high annual mileage compared to the average passenger car (see also Chapter 5). This means that limited range will be a bigger problem for the typical van user than for passenger car drivers. The business argument (time is money) also applies to search times for charging points and time needed for charging. In addition, the additional weight of the battery pack will decrease the loading capacity of larger vans, plus the size of the battery pack (especially when higher ranges are required) may limit the available cargo space (volume) in vans. All in all it is likely that the barriers are easier to overcome in the lighter LCV categories (Class I). We can conclude that at the vehicle level, electric vehicles as a technology option is considerably more costly than the ICEV improvements that we discussed in Section 3.3. Currently the price difference between a conventional diesel van and an equivalent battery electric van ranges between 15,000 and 30,000 euro, depending on the van size. Also, the costs for manufacturing electric LCVs are so high that it is not likely that manufacturers will actively market EVs as a strategy to meet the CO2 targets (see Section 3.2). However, as for some end users, the investment of purchasing an EV at a (probably) relatively high price could be compensated by the relatively low
30 September 2017 4.L06 – Van use in Europe and their environmental impact
user costs, as electricity is a relatively low-cost energy carrier. Moreover such EVs can be fiscally attractive, depending on national policy (TNO et al., 2012). In Chapter 6, which deals with the Total Cost of Ownership (TCO) of vans, we look at the cost parameters that are associated with electric-drive trains in more detail.
3.4.2 Fuel cell vehicles Fuel cell vehicles, also referred to fuel cell electric vehicles (FCEVs), use a fuel cell to convert hydrogen into electricity. Similar to battery electric vehicles the electricity is converted into motion by electric motors. Compared to BEVs, FCEVs have a number of advantages. The range of fuel cell vehicles is much less of a problem. Furthermore, the time for refuelling is hardly an issue as it is comparable to conventional vehicles. However there are also significant barriers at this point in time which prevent large scale adoption. Most prominent is the availability of fuel cell vehicles. Currently there are only a few brands that offer fuel cell vehicles and these are not yet available in large numbers. The currently available fuel cell cars on the European market are: the Toyota Mirai, Hyundai Tucson and Honda Clarity. Due to the limited availability and lack of large scale production, purchase costs are still very high (roughly between 50,000 and 70,000 euro). No fuel cell vans are currently available and we found no indications that OEMs plan to bring fuel cell vans to the market any time soon. The retail price of the first hydrogen vans would probably be in the same range as for passenger cars. Although hydrogen fuelling is largely comparable to conventional fuel, it does require a separate infrastructure. The availability of hydrogen fuelling stations is also an important barrier which needs to be overcome. An important aspect for hydrogen is the public perception of safety aspects (ECN, TNO, CE Delft, 2014). In addition, the cost of hydrogen could be a constraint, which is linked to the relatively low well-to-wheel energy efficiency (compared to battery electric vehicles). When hydrogen can be produced by excess capacity of electricity (power-to-gas), the hydrogen production costs may become competitive, but whether this will become reality depends on developments in the power sector such as the electricity mix, and developments of (smart) grids (ECN, TNO, CE Delft, 2014).
3.4.3 CNG and LNG vehicles Natural gas has lower carbon content per energy unit than gasoline and diesel which means that Tank-to-Wheel (TTW) CO2 emissions are slightly lower than those of diesel vehicles. Natural gas as a transport fuel comes in two variants: Compressed natural gas (CNG) and Liquefied Natural Gas (LNG). The difference between CNG and LNG is the energy density which is approximately 3.5 times higher for LNG. This means that the range of an LNG vehicle is much higher than that of a CNG vehicle, making LNG a more suitable option for long haul transport. In fact, for light duty vehicles LNG is not considered to be a viable option due to the small tank size and possible tank evaporation losses (CE Delft, TNO and ECN, 2013). Evaporation considerably limits environmental performance since methane (the chemical name of natural gas) is a potent greenhouse gas, the global warming potential is estimated to be 28 times higher than CO2. The limited viability of LNG for light duty vehicles is strengthened by the fact that there are other effective technologies (i.e. battery electric and fuel cell electric) available to decarbonize them. CNG light duty vehicles are basically conventional cars with a second separate fuel system/tank. These vehicles are often referred to as ‘bi-fuel’ cars.
31 September 2017 4.L06 – Van use in Europe and their environmental impact
There are however also dedicated CNG vehicles which usually have a smaller tank for gasoline to serve as a back-up. The costs of CNG vans are roughly 1,700 euro higher than that of a diesel alternative. A more important barrier is that there is currently little infrastructure for CNG (and LNG).
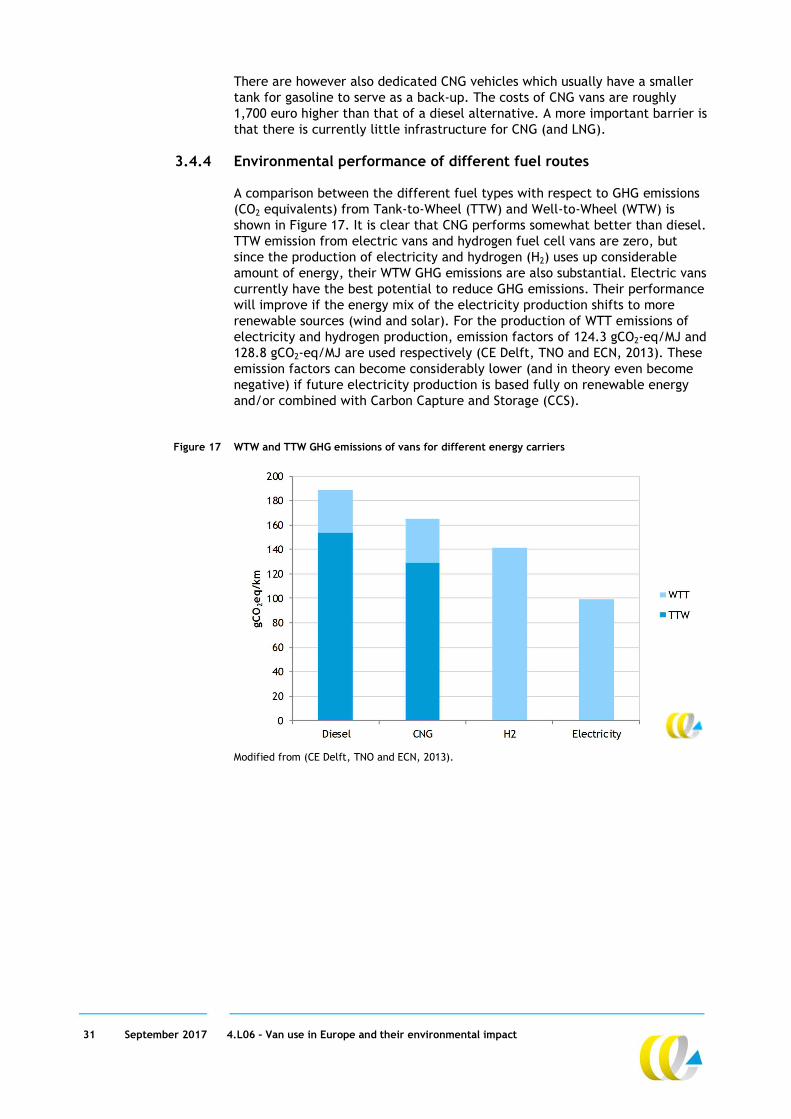
3.4.4 Environmental performance of different fuel routes A comparison between the different fuel types with respect to GHG emissions (CO2 equivalents) from Tank-to-Wheel (TTW) and Well-to-Wheel (WTW) is shown in Figure 17. It is clear that CNG performs somewhat better than diesel. TTW emission from electric vans and hydrogen fuel cell vans are zero, but since the production of electricity and hydrogen (H2) uses up considerable amount of energy, their WTW GHG emissions are also substantial. Electric vans currently have the best potential to reduce GHG emissions. Their performance will improve if the energy mix of the electricity production shifts to more renewable sources (wind and solar). For the production of WTT emissions of electricity and hydrogen production, emission factors of 124.3 gCO2-eq/MJ and 128.8 gCO2-eq/MJ are used respectively (CE Delft, TNO and ECN, 2013). These emission factors can become considerably lower (and in theory even become negative) if future electricity production is based fully on renewable energy and/or combined with Carbon Capture and Storage (CCS).
Figure 17 WTW and TTW GHG emissions of vans for different energy carriers
Modified from (CE Delft, TNO and ECN, 2013).
32 September 2017 4.L06 – Van use in Europe and their environmental impact
4 Regulations
4.1 Definitions
In official EU legislation a van is defined as a category N1 Motor vehicle, designed and constructed primarily for the carriage of goods. Within this category a N1 Vehicle has a gross vehicle weight not exceeding 3.5 tonnes (EC, 2007). A van is additionally defined as “a lorry with the compartment where the driver is located and cargo area within a single unit” (EC, 2007). Other categories for the carriage of goods are N2 (3.5–12 tonnes) and N3 (> 12 tonnes). Those vehicles are generally referred to as Heavy-duty vehicles (HDV) but also as lorries or trucks. Vehicles for transportation of passengers are category M, e.g. passenger cars are classified as M1.
4.2 Legislation on definition of vehicle types (vans = N1)
Vans (N1 vehicles) are subject to specific rules and regulations. There are regulations that apply EU-wide, but also Member State specific regulations. In the remainder of this Section we go into the legislations we came across in both these categories. The following categories are distinguished: emission legislation on CO2 and air pollution; legislation concerning vehicle utilisation:
driving licence requirements; tachograph requirements; access to the profession requirements; speed limitation; weight restrictions; road charges; air pollution requirements.
vehicle tax regulations. It should be noted that in quite a few instances, vehicle legislation can be very specific and detailed, with exceptions for particular vehicle types or users. These nuances have not been examined and mapped closely in this study. The overview of legislations presented here should be regarded as an overview in general.
4.3 Emission legislation on CO2 and air pollution
Emission limit values apply for new vans sold in Europe. There are separate regulations for the emissions of CO2 (an important greenhouse gas) and those of air pollutants (i.e. NOx, PM, CO and HC). The emission regulations for vans are described in Section 3.1.

33 September 2017 4.L06 – Van use in Europe and their environmental impact
4.4 Legislation concerning vehicle utilisation
4.4.1 Driving license requirements The standard type B driving license is sufficient to operate vehicles below 3,500 kg GVW. This entails that there is no difference between driving a passenger car and a van. Pulling a trailer having a gross vehicle weight which does not exceed 750 kg is allowed, but the combination may not exceed 3.5 tonnes. Exceeding this combined mass would require a BE license, which entails passing a test and additional training. Vehicles with a gross vehicle weight exceeding 3.5 tonnes (N2 and N3, i.e. HDVs) require a driving licence type C (or CE for trailer combinations) (EC, 2006a). The additional costs for a C driving license differs per Member State but is roughly between 3,000 and 4,000 euro, giving vans a competitive advantage. Germany, Austria, France and the Netherlands were granted the exemption to drive electric vehicles up to 4,250 kg with a driving license category B instead of a professional driving license category C due to the weight of battery. For the Netherlands this exception has expired but the government is working to renew it. We could not confirm reports that the exception in the other countries has expired as well.
4.4.2 Tachograph requirements For vehicles of goods where the maximum permissible mass of the vehicle, including any trailer, or semi-trailer, exceeds 3.5 tonnes, a tachograph is required (EC, 2006). Tachographs record information about driving time, speed and distance. They are used to make sure drivers and employers follow the rules on drivers’ hours6. As long as no trailer or semi-trailer is used, vans do not require a tachograph. With an attached trailer or semi-trailer a tachograph is needed when the total weight exceeds 3.5 tonnes. There are several EU-wide exceptions for the tachograph requirements for non-commercial carriage of goods which exceed the 3.5 tonnes limit (i.e., categories N2 and N3 vehicles (EC, 2006) are amongst others: vehicles used for the carriage of passengers on regular services on routes
under 50 kilometres; vehicles with a maximum authorised speed under 40 km/h; vehicles for special services, such as armed services, civil defence
services, fire services, transport of humanitarian aid, emergencies or rescue operations, medical purposes, breakdown services;
vehicles undergoing road tests for technical development, repair or maintenance purposes, and new or rebuilt vehicles which have not yet been put into service;
vehicles for the non-commercial carriage of goods in specific cases; a number of other exceptions can be implemented by Member States
(article 13).
6 The main EU rules on driving hours are that you must not drive more than: 9 hours in a day -
this can be extended to 10 hours twice a week; 56 hours in a week; 90 hours in any 2 consecutive weeks. In addition EU driving hour rules prescribe rests and breaks: at least 11 hours rest every day; an unbroken rest period of 45 hours every week; a break or breaks totaling at least 45 minutes after no more than 4 hours 30 minutes driving; weekly rest after 6 consecutive 24-hour periods of working, starting from the end of the last weekly rest period taken.

34 September 2017 4.L06 – Van use in Europe and their environmental impact
In Germany tachographs are mandatory when the total mass exceeds 2.8 tonnes, when available for the vehicle. When a tachograph is not available, a registration form is needed (Bundesministerium der Justiz und für Verbraucherschutz, 2016). Drivers have to obey to the same driving and resting requirements as with vehicles where total weight exceeds 3.5 tonnes. This affects a large share of the vans (N1), about 50% of the new registrations in 2015 (based on (EEA, 2016a)).
4.4.3 Access to the profession requirements European-wide profession requirements are only needed for vehicles exceeding 3.5 tonnes. Operators with vans (N1) (only) are not affected. Operators with lorries (N2 and N3) have extra administrative procedures, extra financial requirements, must train personal (drivers have to have a Certificate of Professional Competence (besides the requirement of a C driving licence) with periodical training and tests) and have to appoint a transport manager (EC, 2009a).
4.4.4 Speed limits and limiters In general, speed limits on EU Member State roads are equal for vans (N1) and passenger cars (M1). Vans towing a trailer have to adhere to a lower speed limit nearly everywhere. Malta and Spain are the only countries to have lower speed limits for vans compared to passenger cars. Estonia and Liechtenstein (no motorways or expressways), have the same speed for vans with or without trailer (EC, DG Transport, 2017). Lorries (N2 and N3) are generally required to drive at lower speeds than vans which is maintained by speed limiters (see below). Speed limiters are obligatory only for goods vehicles exceeding 3.5 tonnes, meaning type N2 and N3 (EC, 2009a), and consequently not for vans. Two systems of speed control devices are most prominently offered for vans: separate speed limiters and cruise control with speed limiters. The separate speed limiter is installed by the OEM and generally cannot be adjusted by the driver. For the cruise control with speed limiter, however, the speed limiter is a functionality of the cruise control system which can always be adjusted by the driver. Intelligent Speed Adaptation (ISA) is currently not yet on the market for LCVs (TML; CE Delft; TNO, 2016). The option to drive at higher speeds with a van compared to a larger truck offers travel time savings. We should be aware however that there is a clear trade-off between the amount of goods that can be carried with a larger truck and the reduced number of trips to transport goods from A to B. Obviously, reducing the number of trips also saves travel time.
4.4.5 Weight restrictions The weight of vans (N1) is restricted to 3.5 tonnes, including load. No other restrictions apply besides the 500 kg requirement for a community license in the Netherlands (see Section 4.4.3). A ‘community licence’ for international transport7 of goods is not needed with a maximum laden mass of up to 3.5 tonnes (EC, 2009b). This means that to drive a van, a community licence is not needed, if no trailer is attached. The only found exception on the weight restriction of 3.5 tonnes is the Netherlands. In practice, the limit of 500 kg means that transport of goods that does not exceed the 500 kg limit are transported without a community licence (Rijksoverheid, 2017). 7 A community license is needed for N2 and N3 vehicles to be allowed to undertaken
international transport of goods. Several requirements have to be fulfilled that depend on national legislation and all other EC legislation mentioned in Sections 4.4.1-4.4.4.
35 September 2017 4.L06 – Van use in Europe and their environmental impact
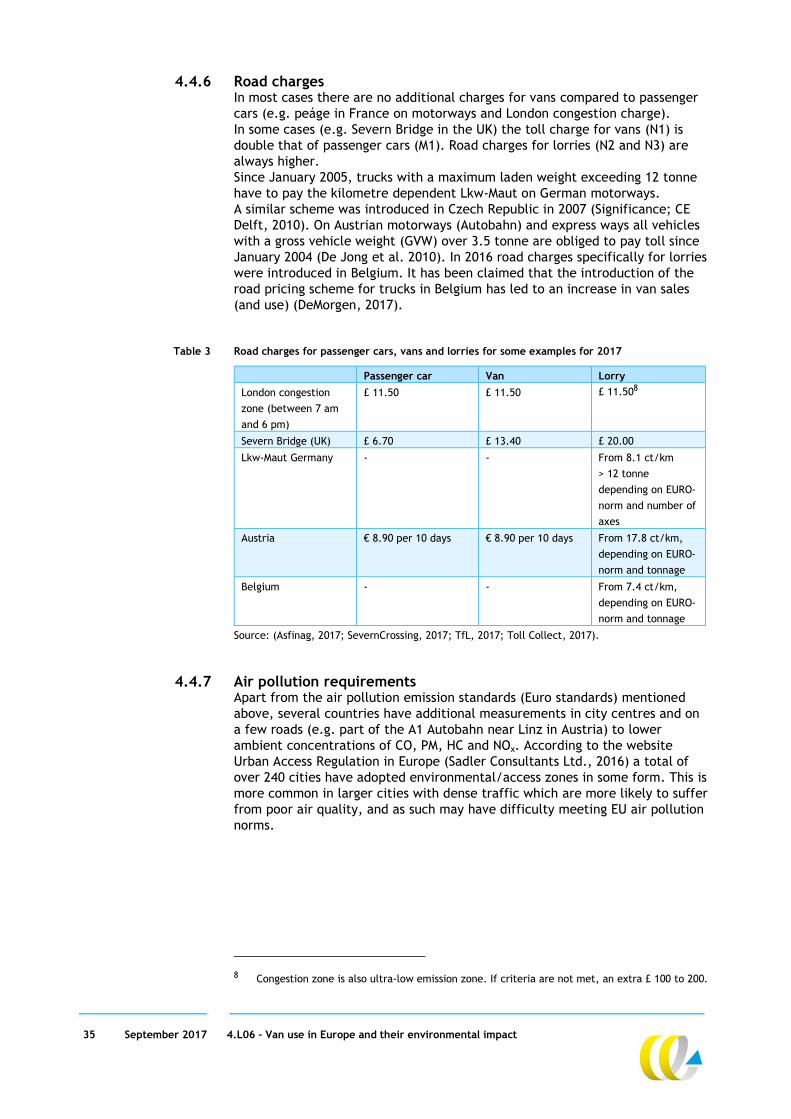
4.4.6 Road charges In most cases there are no additional charges for vans compared to passenger cars (e.g. peáge in France on motorways and London congestion charge). In some cases (e.g. Severn Bridge in the UK) the toll charge for vans (N1) is double that of passenger cars (M1). Road charges for lorries (N2 and N3) are always higher. Since January 2005, trucks with a maximum laden weight exceeding 12 tonne have to pay the kilometre dependent Lkw-Maut on German motorways. A similar scheme was introduced in Czech Republic in 2007 (Significance; CE Delft, 2010). On Austrian motorways (Autobahn) and express ways all vehicles with a gross vehicle weight (GVW) over 3.5 tonne are obliged to pay toll since January 2004 (De Jong et al. 2010). In 2016 road charges specifically for lorries were introduced in Belgium. It has been claimed that the introduction of the road pricing scheme for trucks in Belgium has led to an increase in van sales (and use) (DeMorgen, 2017).
Table 3 Road charges for passenger cars, vans and lorries for some examples for 2017
Passenger car Van Lorry
London congestion
zone (between 7 am
and 6 pm)
£ 11.50 £ 11.50 £ 11.508
Severn Bridge (UK) £ 6.70 £ 13.40 £ 20.00
Lkw-Maut Germany - - From 8.1 ct/km
> 12 tonne
depending on EURO-
norm and number of
axes
Austria € 8.90 per 10 days € 8.90 per 10 days From 17.8 ct/km,
depending on EURO-
norm and tonnage
Belgium - - From 7.4 ct/km,
depending on EURO-
norm and tonnage
Source: (Asfinag, 2017; SevernCrossing, 2017; TfL, 2017; Toll Collect, 2017).
4.4.7 Air pollution requirements Apart from the air pollution emission standards (Euro standards) mentioned above, several countries have additional measurements in city centres and on a few roads (e.g. part of the A1 Autobahn near Linz in Austria) to lower ambient concentrations of CO, PM, HC and NOx. According to the website Urban Access Regulation in Europe (Sadler Consultants Ltd., 2016) a total of over 240 cities have adopted environmental/access zones in some form. This is more common in larger cities with dense traffic which are more likely to suffer from poor air quality, and as such may have difficulty meeting EU air pollution norms.
8 Congestion zone is also ultra-low emission zone. If criteria are not met, an extra £ 100 to 200.
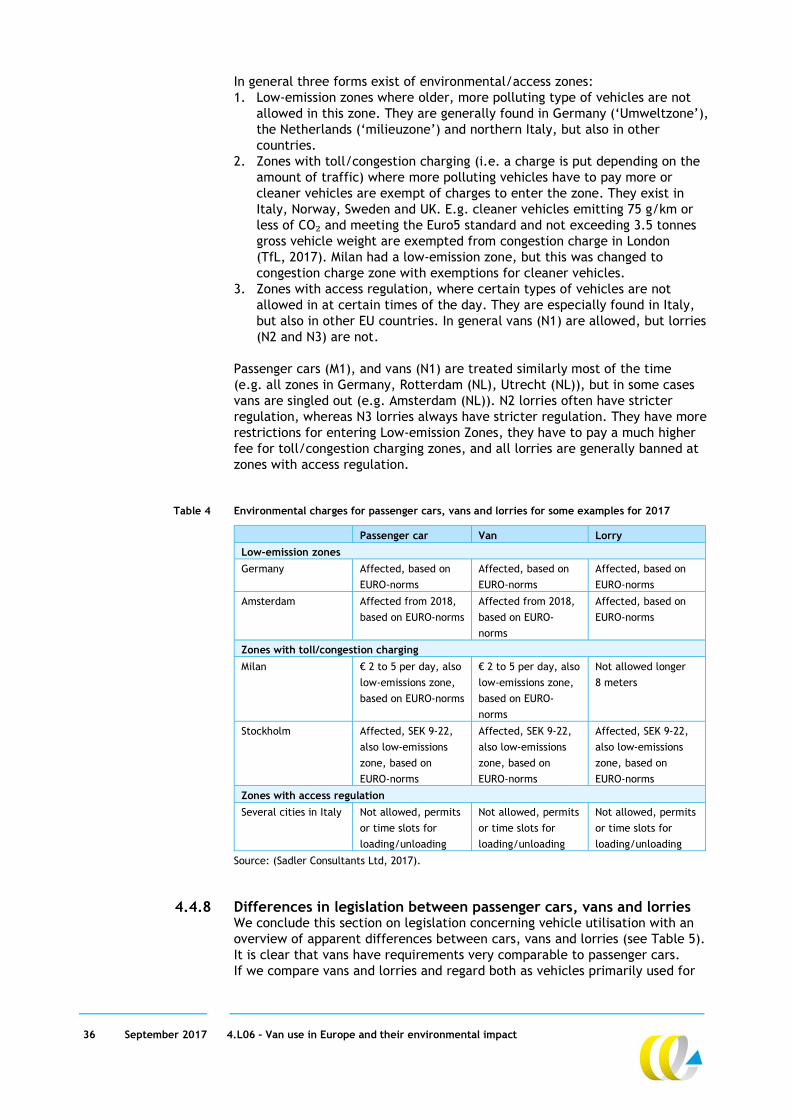
36 September 2017 4.L06 – Van use in Europe and their environmental impact
In general three forms exist of environmental/access zones: 1. Low-emission zones where older, more polluting type of vehicles are not
allowed in this zone. They are generally found in Germany (‘Umweltzone’), the Netherlands (‘milieuzone’) and northern Italy, but also in other countries.
2. Zones with toll/congestion charging (i.e. a charge is put depending on the amount of traffic) where more polluting vehicles have to pay more or cleaner vehicles are exempt of charges to enter the zone. They exist in Italy, Norway, Sweden and UK. E.g. cleaner vehicles emitting 75 g/km or less of CO₂ and meeting the Euro5 standard and not exceeding 3.5 tonnes gross vehicle weight are exempted from congestion charge in London (TfL, 2017). Milan had a low-emission zone, but this was changed to congestion charge zone with exemptions for cleaner vehicles.
3. Zones with access regulation, where certain types of vehicles are not allowed in at certain times of the day. They are especially found in Italy, but also in other EU countries. In general vans (N1) are allowed, but lorries (N2 and N3) are not.
Passenger cars (M1), and vans (N1) are treated similarly most of the time (e.g. all zones in Germany, Rotterdam (NL), Utrecht (NL)), but in some cases vans are singled out (e.g. Amsterdam (NL)). N2 lorries often have stricter regulation, whereas N3 lorries always have stricter regulation. They have more restrictions for entering Low-emission Zones, they have to pay a much higher fee for toll/congestion charging zones, and all lorries are generally banned at zones with access regulation.
Table 4 Environmental charges for passenger cars, vans and lorries for some examples for 2017
Passenger car Van Lorry
Low-emission zones
Germany Affected, based on
EURO-norms
Affected, based on
EURO-norms
Affected, based on
EURO-norms
Amsterdam Affected from 2018,
based on EURO-norms
Affected from 2018,
based on EURO-
norms
Affected, based on
EURO-norms
Zones with toll/congestion charging
Milan € 2 to 5 per day, also
low-emissions zone,
based on EURO-norms
€ 2 to 5 per day, also
low-emissions zone,
based on EURO-
norms
Not allowed longer
8 meters
Stockholm Affected, SEK 9-22,
also low-emissions
zone, based on
EURO-norms
Affected, SEK 9-22,
also low-emissions
zone, based on
EURO-norms
Affected, SEK 9-22,
also low-emissions
zone, based on
EURO-norms
Zones with access regulation
Several cities in Italy Not allowed, permits
or time slots for
loading/unloading
Not allowed, permits
or time slots for
loading/unloading
Not allowed, permits
or time slots for
loading/unloading
Source: (Sadler Consultants Ltd, 2017).
4.4.8 Differences in legislation between passenger cars, vans and lorries We conclude this section on legislation concerning vehicle utilisation with an overview of apparent differences between cars, vans and lorries (see Table 5). It is clear that vans have requirements very comparable to passenger cars. If we compare vans and lorries and regard both as vehicles primarily used for
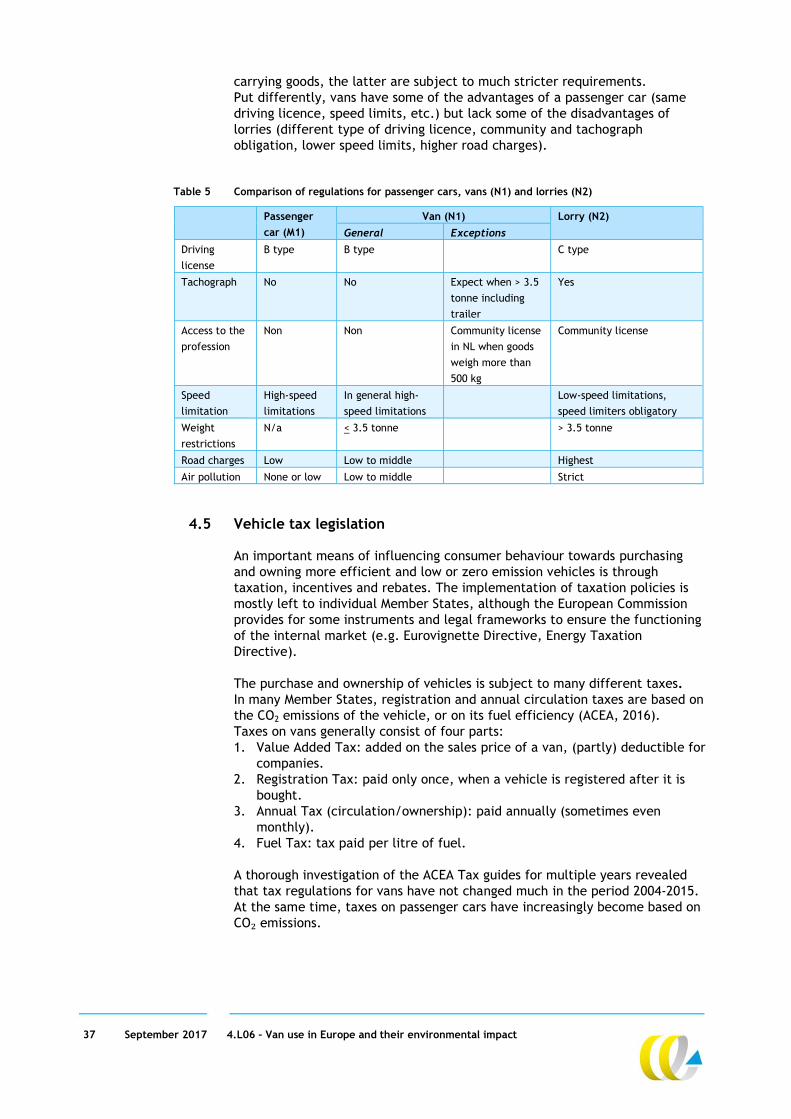
37 September 2017 4.L06 – Van use in Europe and their environmental impact
carrying goods, the latter are subject to much stricter requirements. Put differently, vans have some of the advantages of a passenger car (same driving licence, speed limits, etc.) but lack some of the disadvantages of lorries (different type of driving licence, community and tachograph obligation, lower speed limits, higher road charges).
Table 5 Comparison of regulations for passenger cars, vans (N1) and lorries (N2)
Passenger
car (M1)
Van (N1) Lorry (N2)
General Exceptions
Driving
license
B type B type C type
Tachograph No No Expect when > 3.5
tonne including
trailer
Yes
Access to the
profession
Non Non Community license
in NL when goods
weigh more than
500 kg
Community license
Speed
limitation
High-speed
limitations
In general high-
speed limitations
Low-speed limitations,
speed limiters obligatory
Weight
restrictions
N/a < 3.5 tonne > 3.5 tonne
Road charges Low Low to middle Highest
Air pollution None or low Low to middle Strict
4.5 Vehicle tax legislation
An important means of influencing consumer behaviour towards purchasing and owning more efficient and low or zero emission vehicles is through taxation, incentives and rebates. The implementation of taxation policies is mostly left to individual Member States, although the European Commission provides for some instruments and legal frameworks to ensure the functioning of the internal market (e.g. Eurovignette Directive, Energy Taxation Directive). The purchase and ownership of vehicles is subject to many different taxes. In many Member States, registration and annual circulation taxes are based on the CO2 emissions of the vehicle, or on its fuel efficiency (ACEA, 2016). Taxes on vans generally consist of four parts: 1. Value Added Tax: added on the sales price of a van, (partly) deductible for
companies. 2. Registration Tax: paid only once, when a vehicle is registered after it is
bought. 3. Annual Tax (circulation/ownership): paid annually (sometimes even
monthly). 4. Fuel Tax: tax paid per litre of fuel. A thorough investigation of the ACEA Tax guides for multiple years revealed that tax regulations for vans have not changed much in the period 2004-2015. At the same time, taxes on passenger cars have increasingly become based on CO₂ emissions.
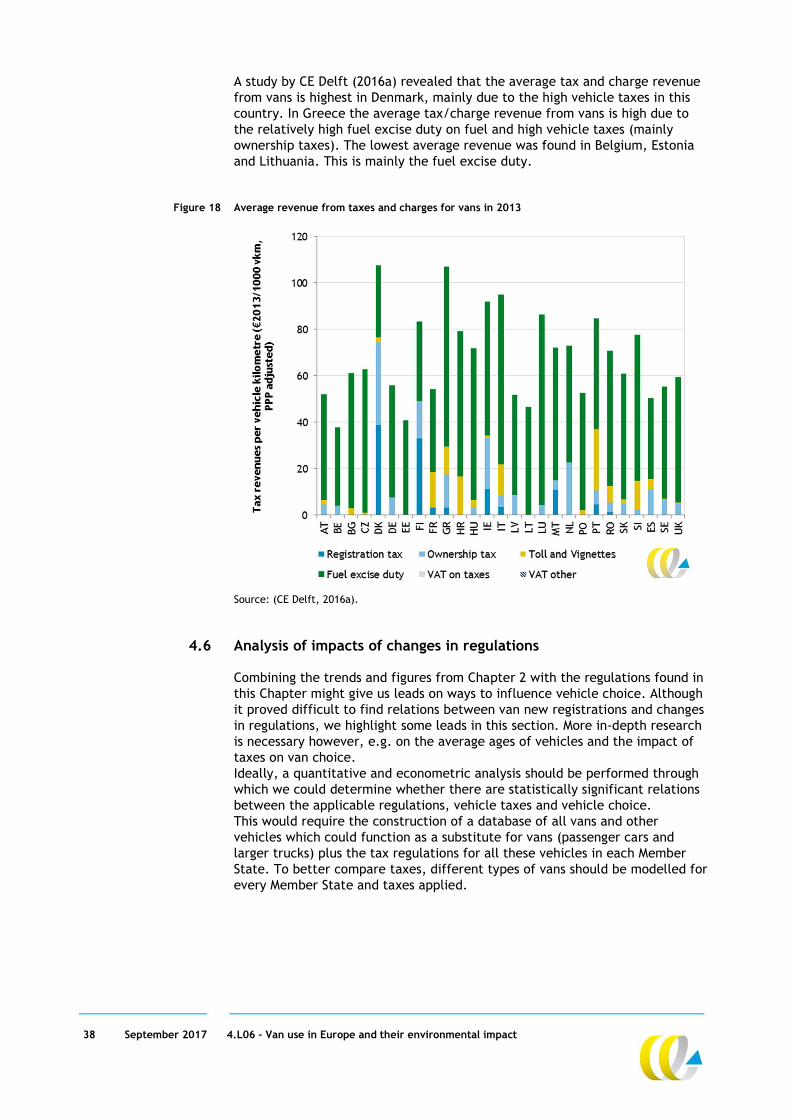
38 September 2017 4.L06 – Van use in Europe and their environmental impact
A study by CE Delft (2016a) revealed that the average tax and charge revenue from vans is highest in Denmark, mainly due to the high vehicle taxes in this country. In Greece the average tax/charge revenue from vans is high due to the relatively high fuel excise duty on fuel and high vehicle taxes (mainly ownership taxes). The lowest average revenue was found in Belgium, Estonia and Lithuania. This is mainly the fuel excise duty.
Figure 18 Average revenue from taxes and charges for vans in 2013
Source: (CE Delft, 2016a).
4.6 Analysis of impacts of changes in regulations
Combining the trends and figures from Chapter 2 with the regulations found in this Chapter might give us leads on ways to influence vehicle choice. Although it proved difficult to find relations between van new registrations and changes in regulations, we highlight some leads in this section. More in-depth research is necessary however, e.g. on the average ages of vehicles and the impact of taxes on van choice. Ideally, a quantitative and econometric analysis should be performed through which we could determine whether there are statistically significant relations between the applicable regulations, vehicle taxes and vehicle choice. This would require the construction of a database of all vans and other vehicles which could function as a substitute for vans (passenger cars and larger trucks) plus the tax regulations for all these vehicles in each Member State. To better compare taxes, different types of vans should be modelled for every Member State and taxes applied.

39 September 2017 4.L06 – Van use in Europe and their environmental impact
4.6.1 Countries with on average heavy vans An interesting outlier in the data is Germany: it has a low number of vans per inhabitant and the vans have a high average weight compared to EU average. In addition Germany has a high number of lorries between 3.5 and 16 tonnes (EC, 2016). One explanation might be that annual taxes in Germany and other Member States alike tend to increase with weight, however in Germany the increase in tax tends to be more gradual (ACEA, 2016). This means that in Germany there is a lower tax penalty on buying large vans. One of the interviewees also mentioned that the share of hired transport (as compared to own transport) is much higher in Germany compared to EU average. This could be an indication that goods transport is, on average, more professionalised which leads to use of more HDVs and fewer LCVs. It would be interesting to examine the German system in more detail. Denmark and the UK have a higher number of vans per inhabitant than Germany but also tend to have heavier vans. Although the UK has relatively low registration taxes which might explain the relatively higher amount of vans, Denmark has a high registration tax compared to other countries (ACEA, 2016). This would lead us to expect lower numbers of vans per inhabitant in Denmark.
4.6.2 Countries with high number of small vans per capita In Chapter 2 we saw that France, Spain and Portugal have a high number of vans per inhabitant and that these vans have a relatively low average weight. We find that French tax levels on passenger cars are much higher than on vans. This is a clear incentive to choose a small van over a passenger car. In Portugal however, the difference between taxes for passenger cars and vans is small (ACEA, 2016).The high share of light vans might also be related to the large share of fairly small businesses (e.g. farms). These small businesses transport limited amounts of goods mainly in rural areas.
4.6.3 Impact of tax changes We found one example where a change in the tax regime had a large impact on van registrations. In the Netherlands the regulation for registration tax and annual circulation tax for vans (‘grijs kenteken’) was altered on 1st July 2005. The change entailed that using a van for personal use became much more expensive. The situation was similar to the current French situation. This resulted in a decline in van sales in 2005 of about 25% compared to 2004 (Buck, et al., 2017). Although no evidence of this was found, it stands to reason that many van users substituted their vans with passenger cars. The environmental benefits of this policy change were therefore estimated to be limited (CE Delft, 2003).
4.6.4 Economic crisis As we saw in Chapter 2, the economic crisis impacted van new registrations dramatically. Between 2009 and 2011 nearly every country showed a decline in new registrations. When there is little money to invest, it is less likely companies will replace older vans. Greece is an extreme example in this respect where in the period 2007 to 2013 GDP (-26.5%) and the number of newly registered vans (-85.7%, from 24,007 to 3,431 per year) shrunk drastically. Another example is Ireland (GDP -6,9%; newly registered vans -74.7%, from nearly 42,727 to 10,325 per year). Poland did better in the same period with GDP (+20.2%), but there was still a decline of newly registered vans (-21.0%, from nearly 52,048 to 41,143 per year). Now that the economic crisis has wavered, new registrations are on the rise: in 2014 and 2015 (nearly) every country shows an increase in new registrations. The effects of the economic crisis on van new registrations show that costs (or available funds) impact vehicle new registrations to a large extent.

40 September 2017 4.L06 – Van use in Europe and their environmental impact
This impact is stronger for vehicles used for business purposes such as vans. Moreover, vans are used often by small companies which are, on average, more heavily affected by economic downfall.
41 September 2017 4.L06 – Van use in Europe and their environmental impact
5 Market structure
5.1 Introduction
In this chapter we zoom in on the companies and individuals that use vans for their daily operations. The focus of this chapter is the underlying motives for choosing this vehicle type instead of alternatives. These motives reveal information on the ‘market structure’ in which vans are commonly used. This chapter kicks off with an overview of data on vehicle use (annual mileage, type of goods carried, purpose and number of trips made as well as time and location of trips), business entity and fleet composition (age and fuel type). This gives a first impression of the characteristics of the market in which vans are used in Europe. We should note however that EU-wide data on these elements is scarce. Much of the information found in this section is based on a recent extensive study into van use and ownership in the Netherlands. At the aggregate level there are likely to be many parallels between the Dutch and EU-wide market structure. When available, country specific or EU-wide data will be used to verify this, and clear deviations from the Dutch case will be discussed. We complement the data and figures with information sourced from interviews with several small and large companies. Some of the interviews (a total of 8) were held specifically for this study. Desk research revealed a substantial number of other interviews which could also be used. Combined, the market structure data and interviews show us whether there are specific user groups that could be more susceptible to adopt vans with fuel efficient or alternative fuel technologies. We will also make clear which barriers van users currently perceive for this transition.
5.2 Fleet composition
5.2.1 Weight classes Vans in Europe come in broad range of weight classes. The upper Gross Vehicle Weight (GVW) limit of 3.5 tonnes determines whether a vehicle is classified as a van or not. However, there are many vans in Europe that remain well below the 2.6 tonne limit. Analysing vehicle registration figures, trends in vehicle weight, and payload capacity, distinguish distinct weight categories (see Figure 19). We find fairly natural breaks at around the 1.8-1.9 tonne and at 2.5 tonne mark that correspond quite well with the current N1 ‘Class’ categories.
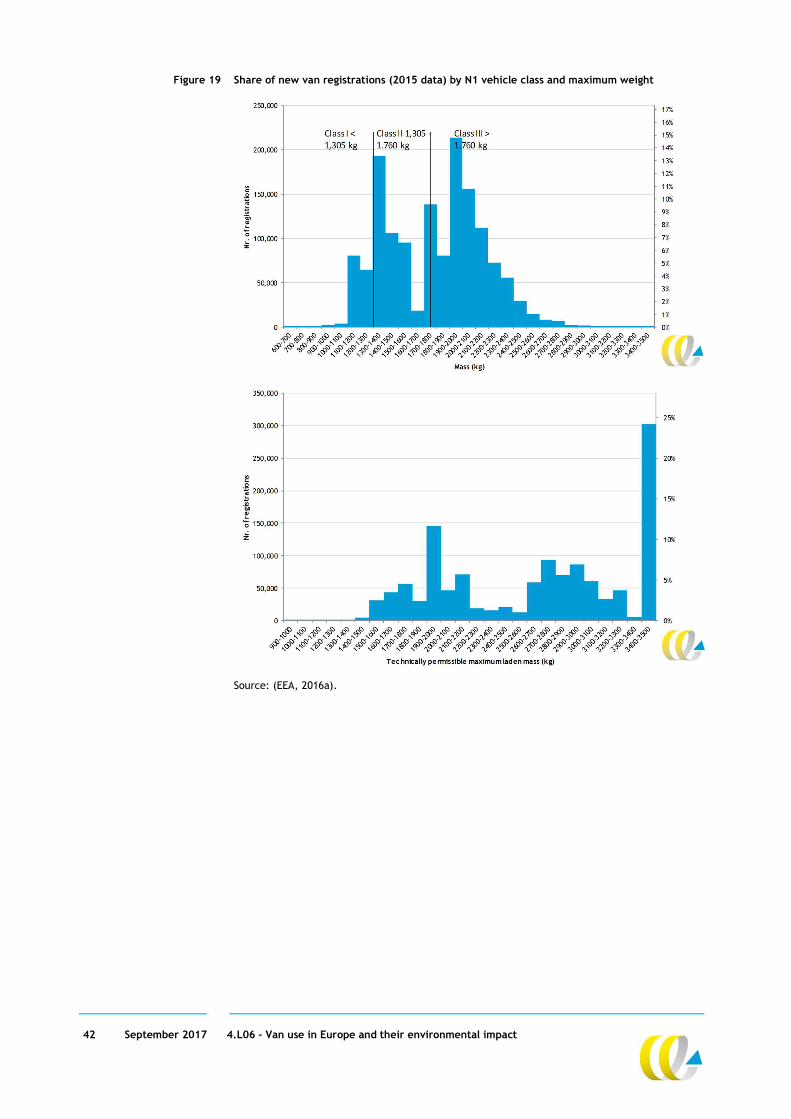
42 September 2017 4.L06 – Van use in Europe and their environmental impact
Figure 19 Share of new van registrations (2015 data) by N1 vehicle class and maximum weight
Source: (EEA, 2016a).
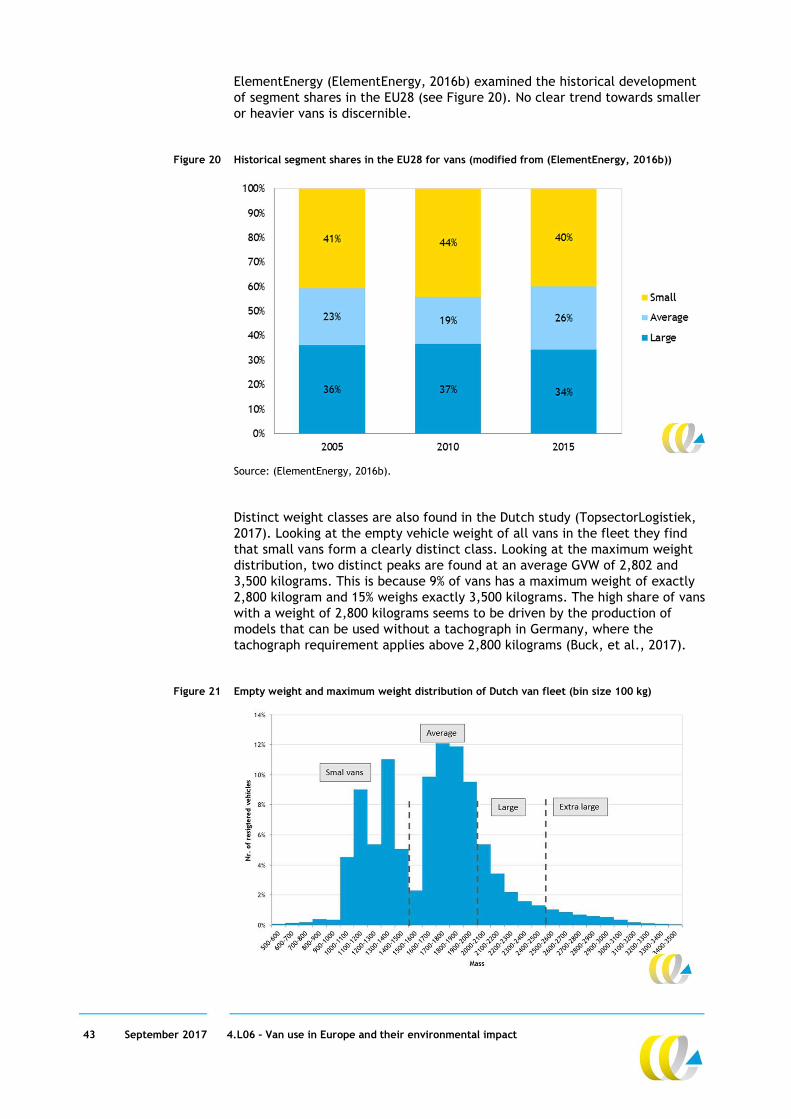
43 September 2017 4.L06 – Van use in Europe and their environmental impact
ElementEnergy (ElementEnergy, 2016b) examined the historical development of segment shares in the EU28 (see Figure 20). No clear trend towards smaller or heavier vans is discernible.
Figure 20 Historical segment shares in the EU28 for vans (modified from (ElementEnergy, 2016b))
Source: (ElementEnergy, 2016b). Distinct weight classes are also found in the Dutch study (TopsectorLogistiek, 2017). Looking at the empty vehicle weight of all vans in the fleet they find that small vans form a clearly distinct class. Looking at the maximum weight distribution, two distinct peaks are found at an average GVW of 2,802 and 3,500 kilograms. This is because 9% of vans has a maximum weight of exactly 2,800 kilogram and 15% weighs exactly 3,500 kilograms. The high share of vans with a weight of 2,800 kilograms seems to be driven by the production of models that can be used without a tachograph in Germany, where the tachograph requirement applies above 2,800 kilograms (Buck, et al., 2017).
Figure 21 Empty weight and maximum weight distribution of Dutch van fleet (bin size 100 kg)

44 September 2017 4.L06 – Van use in Europe and their environmental impact
Source: TopsectorLogistiek (2017). In the Dutch study, four classes of vans are ultimately distinguished: small vans: empty weight 0-1,500 kilogram; medium-sized vans: empty weight 1,500-2,000 kilogram; large vans: empty weight 2,000–2,500 kilogram; extra-large vans: empty weight 2,500–3,500 kilogram. Figure 22 shows a diagram for the Dutch case with the share of each class in the van fleet, with representative pictures for every class. The small (36%) and medium-sized vans (46%) have the highest shares in the fleet in the Netherlands. The share of the large and extra-large vans, however, is growing and has almost doubled in the last 10 years (18% together). The average age of the small and extra-large vans (10 years) is somewhat higher than of the medium-sized vans (9 years) and large vans (8,2 years). On average, the annual mileage of the large and extra-large vans (ca. 24,000 km) is higher than for the medium-sized (21,200 km) and small vans (18,600 km).

45 September 2017 4.L06 – Van use in Europe and their environmental impact
Figure 22 Shares of van-size classes in the Netherlands in 2016
5.2.2 Age distribution of van fleets in Europe EU-wide fleet composition data that reveal differences in the age of vans in Member States are not readily available. We do, however, have detailed fleet composition data for the Netherlands. Since new van sales also give an indication of the age of the vehicle fleet, and the trend in vehicle registrations between MS are not very different (see Section 2.2) we can argue that Dutch fleet composition for the EU12 may be similar to the Dutch case. If we compare the share of vans in the total number of freight vehicles in several countries we also see that differences between MS are fairly small (see Figure 23). Only Germany is an outlier, as their share of Heavy-duty vehicles (HDVs) is fairly high compared to the number of vans.
Figure 23 Share of vans (LCV) in total number of freight vehicles in NL, EU28, UK, France, Germany in 2010
Source: TRACCS.

46 September 2017 4.L06 – Van use in Europe and their environmental impact
In The Netherlands vans have a share of 9% in the registered fleet of road vehicles. The share in kilometres is somewhat higher (13%), due to a higher annual mileage than the average road vehicle (see also Section 5.4). The share in CO2 emissions (14%) reflects the share in kilometres. The share in NOx (22%) and particularly PM10 emissions (39%), however, is disproportionally high (see Figure 24). On the one hand emissions are high compared to passenger cars, due to the high share of diesel and the relatively higher average age of the vans (9.3 years) as compared to diesel passenger cars (7.4 years). On the other hand, compared to trucks, real world NOx emission factors have been hardly reduced during the last fifteen years, whereas NOx emission factors of Euro5 and especially Euro6 trucks have been reduced significantly since 2000 (see also Section 3.1.2). New trucks (Euro6) now have similar NOx emissions per kilometre as new vans (Euro6) do. Furthermore, PM10 emissions originating from trucks have been reduced significantly faster than those of vans. (TfL, 2014) shows that vans in London have a share of 7% in transport CO2 emissions. Interestingly we also see that the share in NOx and PM10 emissions is slightly higher at 8 and 13% respectively. This leads us to conclude that the contribution of vans to local air pollution may be disproportionally high across European cities.
Figure 24 Share in number, kilometres, CO2 and air polluting emissions of vans in road traffic in the Netherlands
Source: (Buck, et al., 2017).
5.3 Businesses using vans and their characteristics
We might gain a better understanding of the van market structure if we know more about the companies that use them. To this end we looked at the share different sectors have in gross added value (GAV) throughout the EU28 and a number of Member States in particular. Figure 25 shows that Industry and Distributive trade (including accommodation and food services) have large share in GAV. More importantly, differences between Member States are fairly small and the Netherlands deviates very little from the EU28 average. It is clear that this needs to be examined in more detail before any hard conclusions can be drawn, but from Figure 25 we could follow the assumption
89%
9%
1% 1%
Registered Vehicles
81%
13%
5% 1%
Vehicle kilometres
Passenger cars
Vans
Trucks
Other
65%14%
18%
3%
CO2 emissions
34%
22%
38%
5%
NOx emissions
42%
39%
15%
3%
PM10 emissions
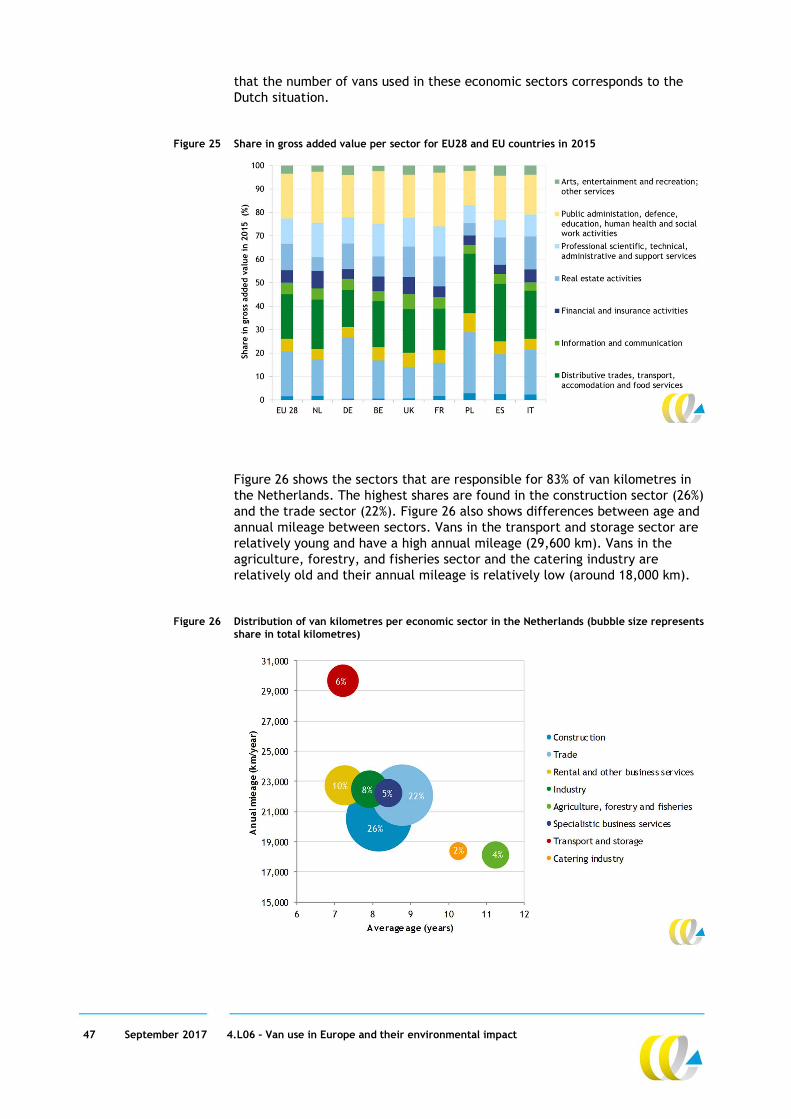
47 September 2017 4.L06 – Van use in Europe and their environmental impact
that the number of vans used in these economic sectors corresponds to the Dutch situation.
Figure 25 Share in gross added value per sector for EU28 and EU countries in 2015
Figure 26 shows the sectors that are responsible for 83% of van kilometres in the Netherlands. The highest shares are found in the construction sector (26%) and the trade sector (22%). Figure 26 also shows differences between age and annual mileage between sectors. Vans in the transport and storage sector are relatively young and have a high annual mileage (29,600 km). Vans in the agriculture, forestry, and fisheries sector and the catering industry are relatively old and their annual mileage is relatively low (around 18,000 km).
Figure 26 Distribution of van kilometres per economic sector in the Netherlands (bubble size represents share in total kilometres)
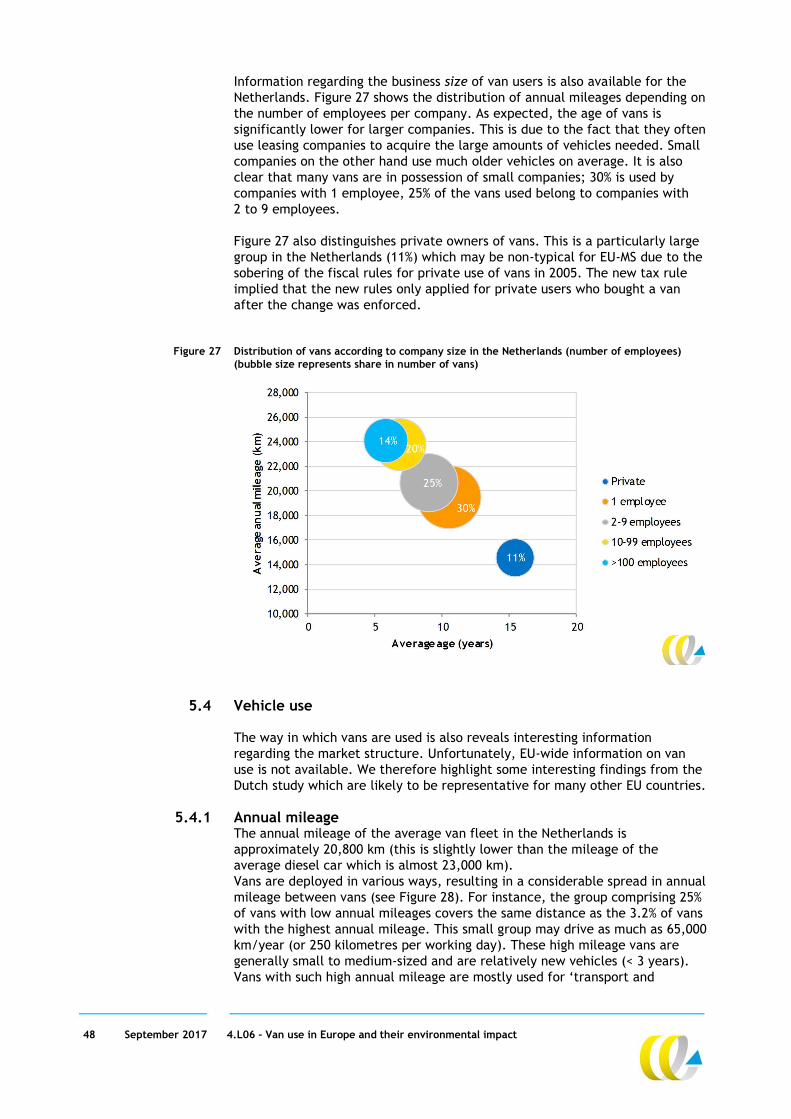
48 September 2017 4.L06 – Van use in Europe and their environmental impact
Information regarding the business size of van users is also available for the Netherlands. Figure 27 shows the distribution of annual mileages depending on the number of employees per company. As expected, the age of vans is significantly lower for larger companies. This is due to the fact that they often use leasing companies to acquire the large amounts of vehicles needed. Small companies on the other hand use much older vehicles on average. It is also clear that many vans are in possession of small companies; 30% is used by companies with 1 employee, 25% of the vans used belong to companies with 2 to 9 employees. Figure 27 also distinguishes private owners of vans. This is a particularly large group in the Netherlands (11%) which may be non-typical for EU-MS due to the sobering of the fiscal rules for private use of vans in 2005. The new tax rule implied that the new rules only applied for private users who bought a van after the change was enforced.
Figure 27 Distribution of vans according to company size in the Netherlands (number of employees) (bubble size represents share in number of vans)
5.4 Vehicle use
The way in which vans are used is also reveals interesting information regarding the market structure. Unfortunately, EU-wide information on van use is not available. We therefore highlight some interesting findings from the Dutch study which are likely to be representative for many other EU countries.
5.4.1 Annual mileage The annual mileage of the average van fleet in the Netherlands is approximately 20,800 km (this is slightly lower than the mileage of the average diesel car which is almost 23,000 km). Vans are deployed in various ways, resulting in a considerable spread in annual mileage between vans (see Figure 28). For instance, the group comprising 25% of vans with low annual mileages covers the same distance as the 3.2% of vans with the highest annual mileage. This small group may drive as much as 65,000 km/year (or 250 kilometres per working day). These high mileage vans are generally small to medium-sized and are relatively new vehicles (< 3 years). Vans with such high annual mileage are mostly used for ‘transport and
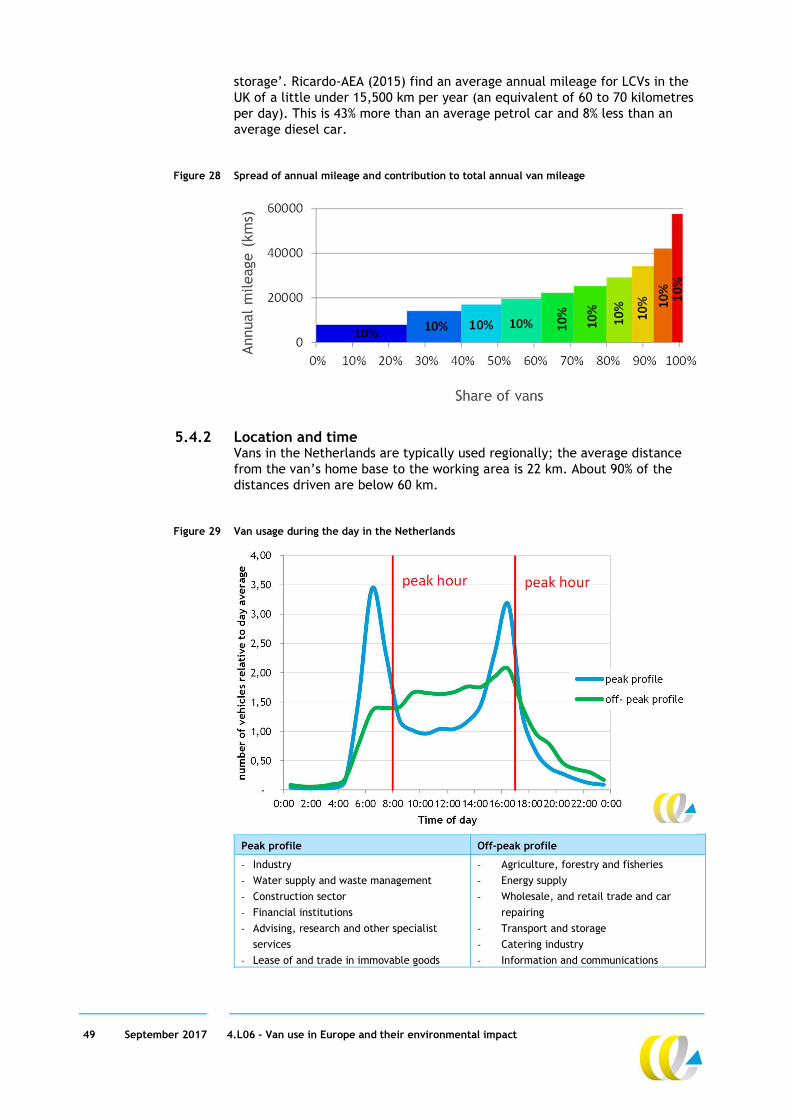
49 September 2017 4.L06 – Van use in Europe and their environmental impact
storage’. Ricardo-AEA (2015) find an average annual mileage for LCVs in the UK of a little under 15,500 km per year (an equivalent of 60 to 70 kilometres per day). This is 43% more than an average petrol car and 8% less than an average diesel car.
Figure 28 Spread of annual mileage and contribution to total annual van mileage
5.4.2 Location and time Vans in the Netherlands are typically used regionally; the average distance from the van’s home base to the working area is 22 km. About 90% of the distances driven are below 60 km.
Figure 29 Van usage during the day in the Netherlands
Peak profile Off-peak profile
- Industry
- Water supply and waste management
- Construction sector
- Financial institutions
- Advising, research and other specialist
services
- Lease of and trade in immovable goods
- Agriculture, forestry and fisheries
- Energy supply
- Wholesale, and retail trade and car
repairing
- Transport and storage
- Catering industry
- Information and communications

50 September 2017 4.L06 – Van use in Europe and their environmental impact
- Lease of movable goods and other business
services
- Public administration and government
services
- Education
- Health and welfare
- Culture, sport and recreation
- Other services
Analysis of license plate scans revealed that most vans can be found between 5.00 am-7.00 pm on the Dutch roads. The highest intensities of vans are observed between 6.00-7.00 am and between 4.00-5.00 pm, just prior to the general peak hours. The results were also analysed per sector which revealed that vans from some sectors show a strong ‘peak hour profile’, while vans in other sector are active during the whole day (‘off-peak profile’) (see Figure 29). A typical sector with a strong peak during rush hours is the construction sector. This is not surprising as many of these vans typically go to the construction site in the morning, and leave at the end of the day. However, vans in the trade and transport sectors, are active over the whole day, showing an off-peak profile.
5.4.3 Activities performed and goods carried by vans A Dutch survey held under approximately 14,000 van users revealed that users identify different purposes for which they use their vehicle. Vans are mainly used for construction and service activities. However, freight and mail transport combined also have a significant share of 22% (see Figure 30). In addition, 24% of the kilometres are reported for private and passenger transport. The fairly high percentage of private use is striking, since private use is demoted through fiscal measures. The Dutch study also zoomed in on the distribution of activities by sector. Vans with construction and service activities mainly transport construction materials (approximately 50% of reported load) and machinery and tools (approximately 50% of reported load). As expected construction and service activities have a high share for vans used in the construction sector. However, the same holds true for vans used in the sectors agriculture, industry, and public administration and government services.
Figure 30 Distribution of activities by vans in the Netherlands (kilometre share)
51 September 2017 4.L06 – Van use in Europe and their environmental impact
The effect of E-commerce The Dutch study also attempted to focus on E-commerce, because of concerns about the growth in the number of vans due to this trend. The study concludes that for the Dutch situation 1.8-3.2% of the vans is active for deliveries at home, having a share of 2.6-4.6% of the kilometres. As the E-commerce is expected to grow with 15-20% per year in the Netherlands, the growth of E-commerce will have a limited influence on the total number of registered vans and kilometres driven. Considering the number of people buying goods online in the Netherlands is considerably higher than the EU average (71% vs 58%) (Twenga Solutions, 2017), this conclusion could very well hold true for the EU28.
5.5 Main findings from interviews
TCO is an important decision criterion for users/fleet owners Larger companies with typically more than 10 vehicles in use are likely to acquire their vehicle stock through leasing companies. In addition, the larger the company is, the more likely it is that their fleet management is professionalised either through internal fleet management section or the outsourcing of these tasks to specialised organisations. For these larger companies, the Total Cost of Ownership (TCO) of their vehicles (or vehicle stock) is an essential decision criterion. This means that all the costs over the entire lifetime of a vehicle (including purchase cost, depreciation, fuel costs related to estimated vehicle use, and insurance, repair and maintenance costs) are estimated simultaneously and with great detail. Once the TCO is known, decisions are commonly based on the lowest cost option.
Fuel costs in itself less important decision criterion Although fuel costs make up a large share of the TCO, they are not regarded as the most important cost by users/fleet owners. This is because companies/ users regard fuel consumption as being ‘unreliable’: they vary greatly with individual driving style. This entails that increased fuel efficiency in vehicles will have a smaller impact on decision process than for example purchase costs and resale value of the vehicle. We did come across initiatives of individual companies, with on average larger vehicle fleets, that encourage drivers to save fuel by giving them the opportunity to compete with colleagues to minimize fuel consumption and, if successful, gain financial rewards. User awareness is also promoted by more and more companies for example to maintain a proper tyre pressure. Although these initiatives are commendable and are likely to reduce CO2 emissions, they do not impact vehicle choice (i.e. do not incentivize companies to purchase vehicles with energy efficient technology).
Downsizing of vehicle fleet There is an increasing trend observed by interviewees of companies that look for ways to downsize the van fleet. Where companies used to purchase all regular (mid-size) vans, they now look which part of the activities can be suited for small, car-based vans. Motives mentioned for this are twofold: cost savings and environmental benefits. Both large construction companies we interviewed mentioned a different approach on fleet downsizing: carpooling for construction workers. Where workers used to drive their individual vans to the work site, they now have an organised in-company travel service which brings workers to the site. The company claims to be able to reduce the number of vans in use.

52 September 2017 4.L06 – Van use in Europe and their environmental impact
Alternative fuel vehicles currently not regarded as a viable option Van users and fleet owners currently don’t regard alternative fuel vehicle, and in particular electric vans (either plug-in nor full-electric) as a viable alternative to diesel vans. Several arguments were heard: too few vehicles available on the market; purchase cost are too high, resale value; limited driving range of vehicles, imposing significant operational changes; payload constraints, imposing significant operational changes; fuelling/charging infrastructure is insufficient, in particular fast charging; electric vehicles not suitable for fast charging; uncertainty around vehicle performance and TCO; vehicle capabilities (are they suitable for different usage patterns); uncertainty on after sales support services; difficulty obtaining permission to install fuelling/charging infrastructure; electric vans are ‘uncool’. The payload constraints mentioned above arise from the concern that the (significant) extra weight of the battery pack will limit the loading capacity since the 3.5 ton GVW limit is reached sooner than with a conventional van. Furthermore, some convey concerns about the volume of the battery pack which could limit cargo space. Interestingly, the Dutch study showed that large vans with largest cargo space are used by larger retail and wholesale companies which are mainly interested in transporting large volumes rather than heavy goods. Despite this, the Dutch Ministry on Infrastructure and the Environment is looking to renew a previously obtained exemption for electric vans which allows a GVW of 4,250 kg without the need to have a C or C1 driver’s license. Germany, Austria and France also have such exemptions (Buck, et al., 2017). One of the interviewees did mention that although the number of companies using electric vans is very limited, user experiences are quite often positive. Leasing contracts that included electric vans are expected to be renewed. One important obstacle of users of electric vans was the fact that some vans were not suitable for fast charging. Despite the generally limited willingness to adopt electric vehicles there are exceptions. Both DHL and UPS have started using electric vehicles mostly for city distribution. Deutsche Post DHL group in fact owns Streetscooter, a full-electric transport vehicle with cargo space of 3.8 M3 and a range of 80 kilometres. Recently they announced that the production of Streetscooters will be increased to 20.000 by the end of 2017 (DHL, 2017).
Fiscal measures seen as very promising tool to promote electric driving Most interviewees state that costs of electric driving are currently not competitive with conventional vehicles. This could change if tax exemptions, which are in place for vans in a number of EU Member States, would be abolished for conventional (diesel) vans. As we will see in Chapter 6, increasing registration tax and road charges has a potentially big impact on vehicle choice and EV adoption. Interestingly, most interviewees wouldn’t strongly oppose such policies even though it would significantly increase costs/TCO of diesel vans.
53 September 2017 4.L06 – Van use in Europe and their environmental impact
Experiences in the Netherlands with fiscal incentives to promote CNG vans were also positive. However, it is important to note that fiscal policies should be consistent over a long period of time. If fiscal policies are changed frequently it is very difficult for companies to assess the costs of acquiring alternative fuel vehicles.
Stricter regulations for vans will likely not increase use of small HDVs Trade organisations have concerns that the number of large vans and third party cross-border transportation of goods is increasing rapidly. These vans are operated by two drivers and are equipped with sleeping area similar to large trucks. There are also concerns that the GVW limit of 3.5 ton GVW may not be respected by all users. According to one of the interviewees, in Poland a relatively higher share of weight violations was found in light commercial vehicles compared to HDVs. Most interviewees acknowledge that the benefits of less stringent regulations for van use likely add to this trend. There are some doubts however whether stricter regulations will affect vehicle choice to a large extent. Vans are regarded as unique vehicles best suited for specific types of operations making it not straightforward to substitute them by HDVs (N2 vehicles). More importantly interviewees question whether enforcement of expansion of tachograph and driver times regulations to vans is feasible, particularly since sufficient enforcement for HDVs is currently already problematic. That being said, a mandatory tachograph requirement combined with driver times regulations would definitely not be welcomed by van users/fleet owners. It would increase operational costs and have a negative impact on business. It may very well be that choice behaviour will be affected in practice if regulations would change.
54 September 2017 4.L06 – Van use in Europe and their environmental impact
6 TCO
6.1 Benefits and limitations of TCO
The Total Cost of Ownership (TCO) is a concept which helps clarify the true costs of buying a particular good or service (Ellram et al., 1998).A TCO analysis covers all costs which occur over the lifetime of the purchased good. For a vehicle, this includes one-time costs like purchase costs, but also incorporates recurring expenses like fuel and maintenance costs (Redelbach, et al., 2012). Since TCO takes into account all the costs over the life cycle, it can be used as an evaluation tool to compare different products (Hurkens et al., 2006). This is of particular importance when comparing conventional and electric vehicles, since the latter have relatively high purchase prices, but might face lower operating expenses (Wu, et al., 2015). A limitation of using TCO is the need to identify the driving characteristics of the owner which are necessary input for the calculations (Redelbach, et al., 2012). For example, the annual mileage will affect fuel expenditures and consequently the TCO results, but may differ largely between users. A proper TCO analysis therefore includes multiple scenarios regarding mileage and other assumptions so as to create a good understanding of the associated uncertainties and bandwidths that result from differences in user characteristics. Not so much a limitation of TCO analysis, but nevertheless important to note, is that TCO analysis typically only includes direct financial cost to the end-user. Indirect costs such as the willingness to pay for reliability of the vehicle, the costs associated with range-anxiety of an electric vehicle or brand loyalty are not expressed in the TCO. These indirect costs may however (significantly) impact vehicle choice behaviour. They are, however, also difficult to quantify. Despite these shortcomings TCO analysis is a valuable tool to compare costs of different vehicle types and technologies, and to establish at which point in time new fuel technologies become cost-competitive with conventional vehicles. This is particularly true for vehicles used for commercial purposes such as vans. As we saw in Chapter 5, companies are more inclined to look at the direct financial costs than private users and are likely to base their vehicle purchase choices largely on the TCO. In the next section we describe the main cost parameters included in the TCO analysis for vans. We also describe expected changes in these parameters based on a review of the literature and present the assumptions used for the TCO calculations. In Section 6.3 we show the results of the TCO calculations based on the COSTREAM model which was developed by CE Delft.
55 September 2017 4.L06 – Van use in Europe and their environmental impact
6.2 TCO parameters used and main inputs
The purpose of the TCO analysis in this chapter is to establish the cost differences between conventional, plug-in electric and full-electric vans. These cost differences may vary depending on the size (and weight) of the vehicle. We therefore distinguish between three van size classes: light vans (car-based LCVs with average empty vehicle weight of
< 1,500 kg); regular vans (average empty vehicle weight of 1,500 to 2,000 kg); large vans (average empty vehicle weight of > 2,000 kg). For each of these van types we gathered information on the cost characteristics (or parameters) that are most important in the TCO. The parameters included are: 1. One-time costs:
a. Depreciation (depending on purchase costs). b. Taxes and subsidies.
2. Recurring costs: a. Fixed recurring costs:
i. Vehicle insurance. ii. Taxes (road charges).
b. Variable recurring costs: i. Energy. ii. Maintenance and repair.
Below we give some more information on the information found in literature on each of these parameters for each of the three fuel types (diesel, plug-in and full-electric). At the end of this section we give an overview of the values of the parameters used for the TCO calculations which can be found in Section 6.3.
6.2.2 Depreciation and purchase costs Battery costs are a large determinant of the purchase price of battery electric vehicles. A typical mid-size car would need a battery pack of 25 to 30 kWh to allow for a range of around 200 to 250 kilometres. For vans, due to the higher vehicle weight additional battery capacity is needed. A large van with an empty vehicle weight of around 2,400 kg would need a battery pack of roughly 40 kWh for a maximum range of 140 km. Determining vehicle costs requires assumptions on battery costs. As vehicle manufacturers are unlikely to reveal the true costs of the components of their vehicles, our battery cost scenario approach was twofold. Firstly, we used a modelled battery cost scenario approach created by Van Velzen (2016). These scenarios were well constructed, based on an extensive literature review and verified by other cost studies as well as an experience curve. Van Velzen (2016) investigated 18 studies (both academic and grey literature) on vehicle batteries and their costs, qualitatively evaluated them on four criteria and subsequently used the 7 best studies to create the three scenarios shown in Figure 31.
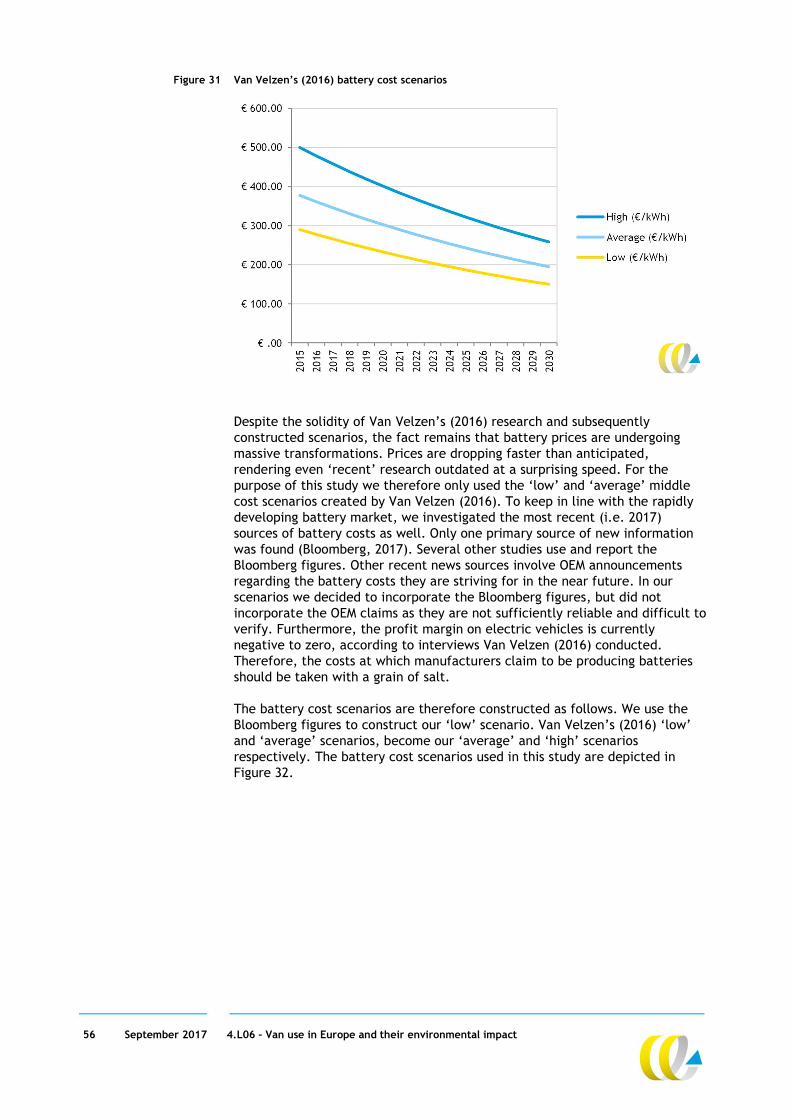
56 September 2017 4.L06 – Van use in Europe and their environmental impact
Figure 31 Van Velzen’s (2016) battery cost scenarios
Despite the solidity of Van Velzen’s (2016) research and subsequently constructed scenarios, the fact remains that battery prices are undergoing massive transformations. Prices are dropping faster than anticipated, rendering even ‘recent’ research outdated at a surprising speed. For the purpose of this study we therefore only used the ‘low’ and ‘average’ middle cost scenarios created by Van Velzen (2016). To keep in line with the rapidly developing battery market, we investigated the most recent (i.e. 2017) sources of battery costs as well. Only one primary source of new information was found (Bloomberg, 2017). Several other studies use and report the Bloomberg figures. Other recent news sources involve OEM announcements regarding the battery costs they are striving for in the near future. In our scenarios we decided to incorporate the Bloomberg figures, but did not incorporate the OEM claims as they are not sufficiently reliable and difficult to verify. Furthermore, the profit margin on electric vehicles is currently negative to zero, according to interviews Van Velzen (2016) conducted. Therefore, the costs at which manufacturers claim to be producing batteries should be taken with a grain of salt. The battery cost scenarios are therefore constructed as follows. We use the Bloomberg figures to construct our ‘low’ scenario. Van Velzen’s (2016) ‘low’ and ‘average’ scenarios, become our ‘average’ and ‘high’ scenarios respectively. The battery cost scenarios used in this study are depicted in Figure 32.
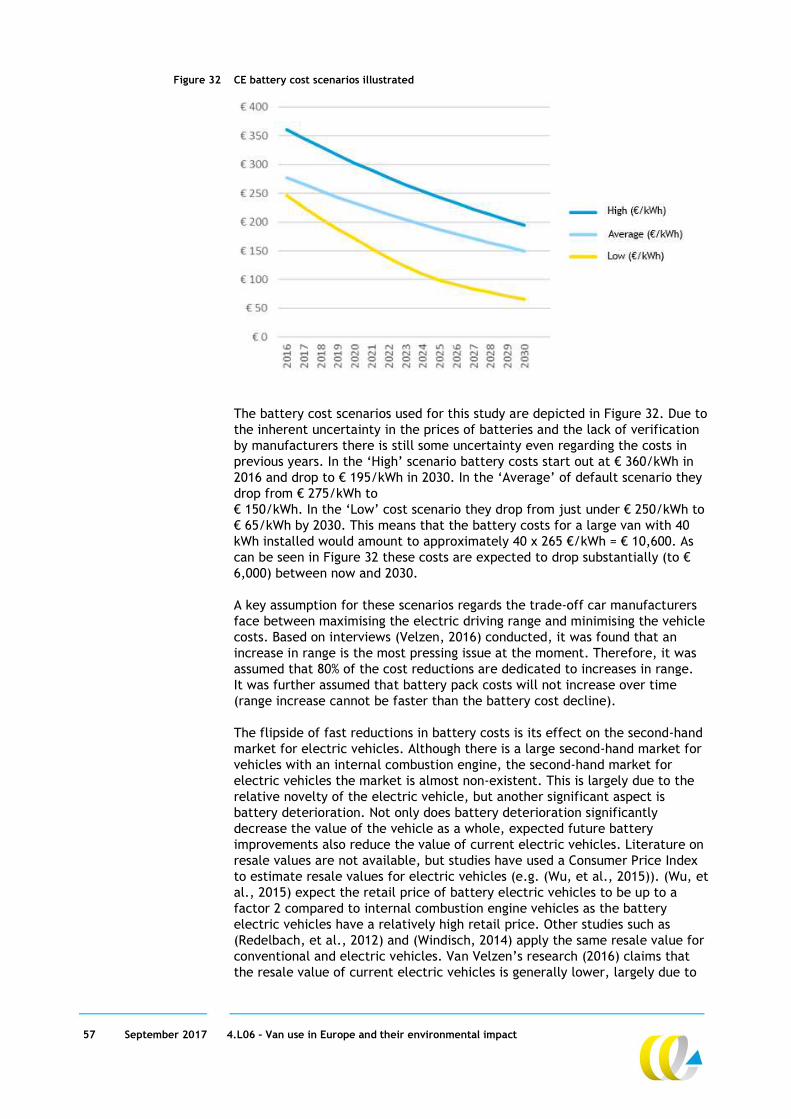
57 September 2017 4.L06 – Van use in Europe and their environmental impact
Figure 32 CE battery cost scenarios illustrated
The battery cost scenarios used for this study are depicted in Figure 32. Due to the inherent uncertainty in the prices of batteries and the lack of verification by manufacturers there is still some uncertainty even regarding the costs in previous years. In the ‘High’ scenario battery costs start out at € 360/kWh in 2016 and drop to € 195/kWh in 2030. In the ‘Average’ of default scenario they drop from € 275/kWh to € 150/kWh. In the ‘Low’ cost scenario they drop from just under € 250/kWh to € 65/kWh by 2030. This means that the battery costs for a large van with 40 kWh installed would amount to approximately 40 x 265 €/kWh = € 10,600. As can be seen in Figure 32 these costs are expected to drop substantially (to € 6,000) between now and 2030. A key assumption for these scenarios regards the trade-off car manufacturers face between maximising the electric driving range and minimising the vehicle costs. Based on interviews (Velzen, 2016) conducted, it was found that an increase in range is the most pressing issue at the moment. Therefore, it was assumed that 80% of the cost reductions are dedicated to increases in range. It was further assumed that battery pack costs will not increase over time (range increase cannot be faster than the battery cost decline). The flipside of fast reductions in battery costs is its effect on the second-hand market for electric vehicles. Although there is a large second-hand market for vehicles with an internal combustion engine, the second-hand market for electric vehicles the market is almost non-existent. This is largely due to the relative novelty of the electric vehicle, but another significant aspect is battery deterioration. Not only does battery deterioration significantly decrease the value of the vehicle as a whole, expected future battery improvements also reduce the value of current electric vehicles. Literature on resale values are not available, but studies have used a Consumer Price Index to estimate resale values for electric vehicles (e.g. (Wu, et al., 2015)). (Wu, et al., 2015) expect the retail price of battery electric vehicles to be up to a factor 2 compared to internal combustion engine vehicles as the battery electric vehicles have a relatively high retail price. Other studies such as (Redelbach, et al., 2012) and (Windisch, 2014) apply the same resale value for conventional and electric vehicles. Van Velzen’s research (2016) claims that the resale value of current electric vehicles is generally lower, largely due to
58 September 2017 4.L06 – Van use in Europe and their environmental impact
uncertainty about the battery quality after longer periods of time (e.g. 10 years). Further factors supporting this hypothesis are the fact that current electric vehicle buyers are not interested in second-hand cars at all, and the large improvements in technology that tend to lead to creative destruction (Velzen, 2016). There are disagreements regarding the future trends in resale values of electric vehicles. Some argue the values of conventional and electric vehicles might stabilise once uncertainty is reduced, whereas others believe that due to lower maintenance costs electric vehicles are likely to have a higher resale value than conventional vehicles (Velzen, 2016). Future purchasing prices are another determinant of TCO whose trend is difficult to predict. Stricter future CO2 regulation may force the industry to scale up electric vehicle production. There are numerous examples of international regulation for emission targets for the transport sector. EU average fleet CO2 emissions could not exceed 130 g/km in 2015, and this value will decline to 95g/km by 2021. In the US the target is set at 89g/km by 2025 (DieselNet, 2015). It can be argued that if producers have a certain emissions target that is below the average emissions from an internal combustion engine vehicle, they are forced to either reduce the price of an electric vehicle or increase the price of conventional vehicles (Velzen, 2016). Changes in the purchase price of conventional vehicles are also relevant for the TCO analysis. As we saw in Chapter 3, CO2 emission reducing technologies increase vehicle prices. The cost curves found in Chapter 3 are used for the TCO calculations in Section 6.3.
6.2.3 Taxes and subsidies (one-time and recurring) Fuel levies form a significant part of fuel costs. The average diesel tax in the EU is approximately 42 eurocents (Energy.eu, 2017) which is approximately 40% of retail price. Although electric vehicles do not use fuel they are not exempt from energy taxes on electricity. The difference in fuel levies and energy taxes per unit of energy used determines the cost difference between the two drive trains. Fiscal incentives are perhaps one of the most effective stimulants for the use of electric vehicles. Certain countries, e.g. the Netherlands, subject you to a registration tax with the purchase of your car, in addition to the general VAT. As the price of an electric vehicle is currently a barrier for vehicle adoption, some countries have introduced an exemption from the vehicle registration tax for electric vehicles, e.g. the Netherlands (ICCT, 2016b). Many other EU countries have tax exemptions, premiums or discounts for electric vehicles (ACEA, 2017). The effect of this policy is to directly lower the retail price of the car and thus the TCO. However, the pricing strategy of OEMs can be adjusted based on countries’ specific fiscal policy, suggesting that the retail price of electric vehicles is higher in countries where the tax credit is increased (Velzen, 2016) Another fiscal incentive that may stimulate the use of electric vehicles is in the form of differing road ownership/circulation taxes per type of fuel driven vehicle. In the Netherlands, battery electric vehicles are exempt from ownership/circulation tax, and plug-in hybrid vehicles are only charged half of the rate for conventional vehicles (ICCT, 2016b).

59 September 2017 4.L06 – Van use in Europe and their environmental impact
6.2.4 Vehicle insurance Vehicle insurance costs are monthly recurring expenses to provide financial protection against vehicle damage and/or physical injuries resulting from accidents. The fees tend to be based on the retail price, weight and expected mileage of the vehicle. Since the acquisition price of electric vehicles tends to be higher than those with an internal combustion engine, one should expect the insurance premiums to be higher as well. Only a few recent studies incorporated insurance costs in their calculations. Their results, however, do not support the hypothesis that electric vehicles have higher insurance premiums. (Windisch, 2014) based his price differentials on insurance offers in France, and applied a 20% reduction for battery electric vehicles compared to vehicles with an internal combustion engine. However, plug-in hybrid electric vehicles were charged 20% more than vehicles with an internal combustion engine (Windisch, 2014). (OECD/ITF, 2012) argued that there is no reason to have a price differential in insurance costs between electric vehicles and vehicles with an internal combustion engine. This was supported by (Velzen, 2016), who interviewed two Dutch insurance companies asking them about this supposed price differential. Both interviewees confirmed that there is no reason to assume insurers use different rates for electric vehicles in comparison to conventional vehicles (Velzen, 2016). Furthermore, they did not expect this would change in the future as more electric vehicles are introduced.
6.2.5 Energy consumption
Conventional fuel consumption It is not unreasonable to assume CO2 emissions regulation will become more stringent for the transport sector in the future. This is likely to lead to more efficient use of fuel, using a lower amount of fuel to drive the same distance. The reduction in use of fuel will correspond to lower fuel costs for vehicles with an internal combustion engine.
Electricity consumption In order to determine future trends in electricity consumption, we need to distinguish between two categories of charging points for electric vehicles: residential/workplace and public charging points. For home charging, a private parking space or garage next to the house is required in order to plug the car in. The charging infrastructure can be seen as a onetime premium. The electricity price at the home charging stations is the regular electricity price for consumers. Some have argued this is likely to decline (Velzen, 2016), whereas others have argued it will increase (ECN; PBL; CBS; RVO, 2015). The price of electricity from public charging points is higher than home charging, as the commercial parties need to recoup the investments. Amongst others the Dutch, Norwegian and UK governments currently subsidise these charging points, making it difficult to predict what direction prices are likely to move in in the future. Economies of scale paired with high utilization rates could cause them to decline, but higher prices could also be expected once the subsidies are cancelled (Velzen, 2016); (ICCT, 2016b).
Energy efficiency of vehicles The amount of energy used also depends on the size and weight of the vehicle. (CE Delft; ICF; Ecologic, 2011) report 36% higher energy consumption for heavy full-electric cars compared to small electric cars. The difference in energy consumption between a small van and a large van is higher due to the larger
60 September 2017 4.L06 – Van use in Europe and their environmental impact
weight difference and larger difference in surface area. More important for the TCO calculation is the difference in energy consumption between diesel vans and electric vans. Size and weight is of less importance here for the difference between diesel and full-electric. (Hill et al., 2015) estimate that a 2013 segment C car ICEV has an energy consumption of 5.25 L/100 km, whereas a BEV is at 1.167 L/100 km. The energy consumption of BEVs will decrease to 1.08 L/100 km in 2030 due to weight reductions and an increase in overall energy efficiency ( (Hill et al., 2015); (Hill N., 2016)).
Annual mileage Obviously the amount of kilometres driven each year affects the TCO as well. The difference in energy consumption between ICEVs and BEVs results in a larger cost benefit for BEVs with increased mileage.
6.2.6 Maintenance and repair Maintenance and repair costs are recurring expenses for both electric and conventional vehicle owners which cover expected maintenance and unexpected repairs. It has been argued that maintenance costs for electric vehicles are likely to be lower than those for conventional vehicles, for reasons such as a less complex construction of the powertrain and fewer moveable parts (ORNL, 2010); (Vliet, et al., 2010); (Windisch, 2014) and (OECD/ITF, 2012). Furthermore, electric vehicles have regenerative braking, resulting in less wearing on the brakes and electric motors have fewer running hours as there is no idle mode. Both these factors are likely to contribute to lower maintenance costs (ORNL, 2010). However, the largest problem in confirming the above hypothesis is the lack of available data due to the relative novelty of electric vehicles. Some studies have therefore chosen to ignore the potentially lower maintenance costs for electric vehicles and used the same maintenance costs for all types of vehicles. In addition, the abovementioned costs are usually considered scheduled maintenance costs. A second issue relating to the novelty of electric vehicle technology is that there is no information about unscheduled maintenance costs. It is possible that the increase in unscheduled maintenance costs due to relative immaturity of the technology cancels out some of the benefits from lower scheduled maintenance costs (ORNL, 2010). Other concerns regard battery deterioration, resulting in potential replacement of the battery pack after a certain amount of years (CE Delft; ICF; Ecologic, 2011). Interviews with industry confirm that many expect maintenance costs for electric vehicles to decline in the future as technology matures, maintenance schedules are optimised and there increased competition in the maintenance of electric vehicles (Velzen, 2016).
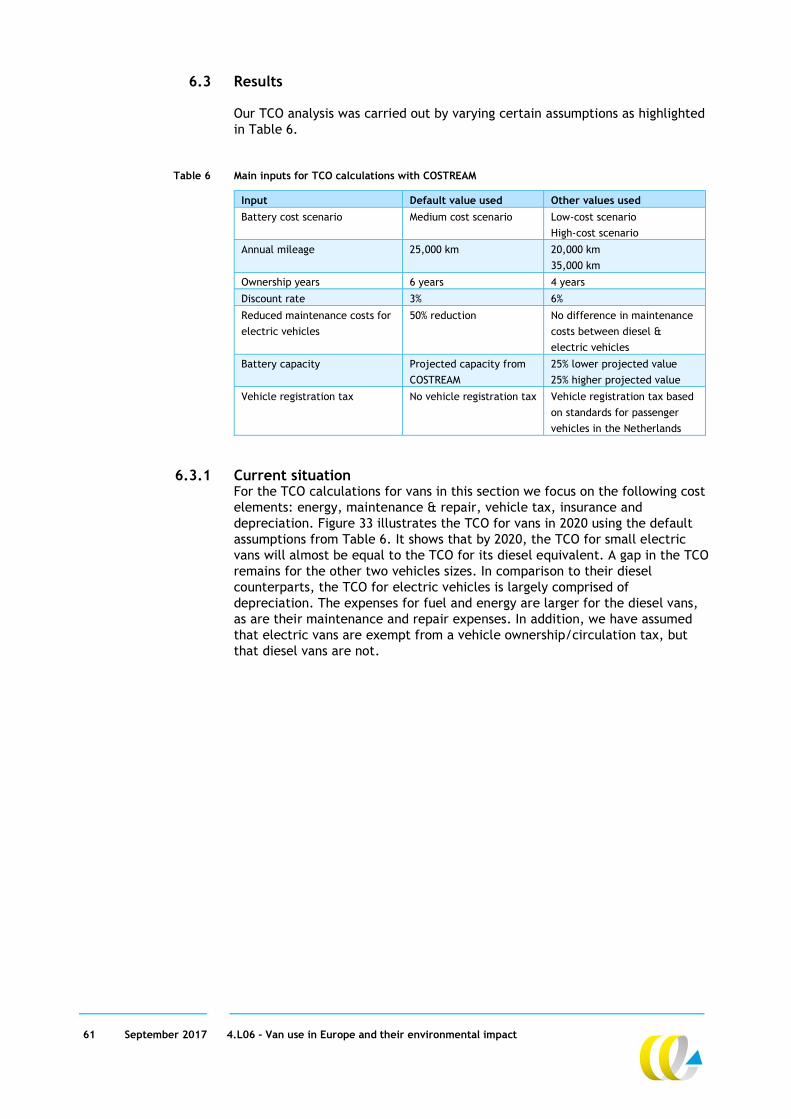
61 September 2017 4.L06 – Van use in Europe and their environmental impact
6.3 Results
Our TCO analysis was carried out by varying certain assumptions as highlighted in Table 6.
Table 6 Main inputs for TCO calculations with COSTREAM
Input Default value used Other values used
Battery cost scenario Medium cost scenario Low-cost scenario
High-cost scenario
Annual mileage 25,000 km 20,000 km
35,000 km
Ownership years 6 years 4 years
Discount rate 3% 6%
Reduced maintenance costs for
electric vehicles
50% reduction No difference in maintenance
costs between diesel &
electric vehicles
Battery capacity Projected capacity from
COSTREAM
25% lower projected value
25% higher projected value
Vehicle registration tax No vehicle registration tax Vehicle registration tax based
on standards for passenger
vehicles in the Netherlands
6.3.1 Current situation For the TCO calculations for vans in this section we focus on the following cost elements: energy, maintenance & repair, vehicle tax, insurance and depreciation. Figure 33 illustrates the TCO for vans in 2020 using the default assumptions from Table 6. It shows that by 2020, the TCO for small electric vans will almost be equal to the TCO for its diesel equivalent. A gap in the TCO remains for the other two vehicles sizes. In comparison to their diesel counterparts, the TCO for electric vehicles is largely comprised of depreciation. The expenses for fuel and energy are larger for the diesel vans, as are their maintenance and repair expenses. In addition, we have assumed that electric vans are exempt from a vehicle ownership/circulation tax, but that diesel vans are not.
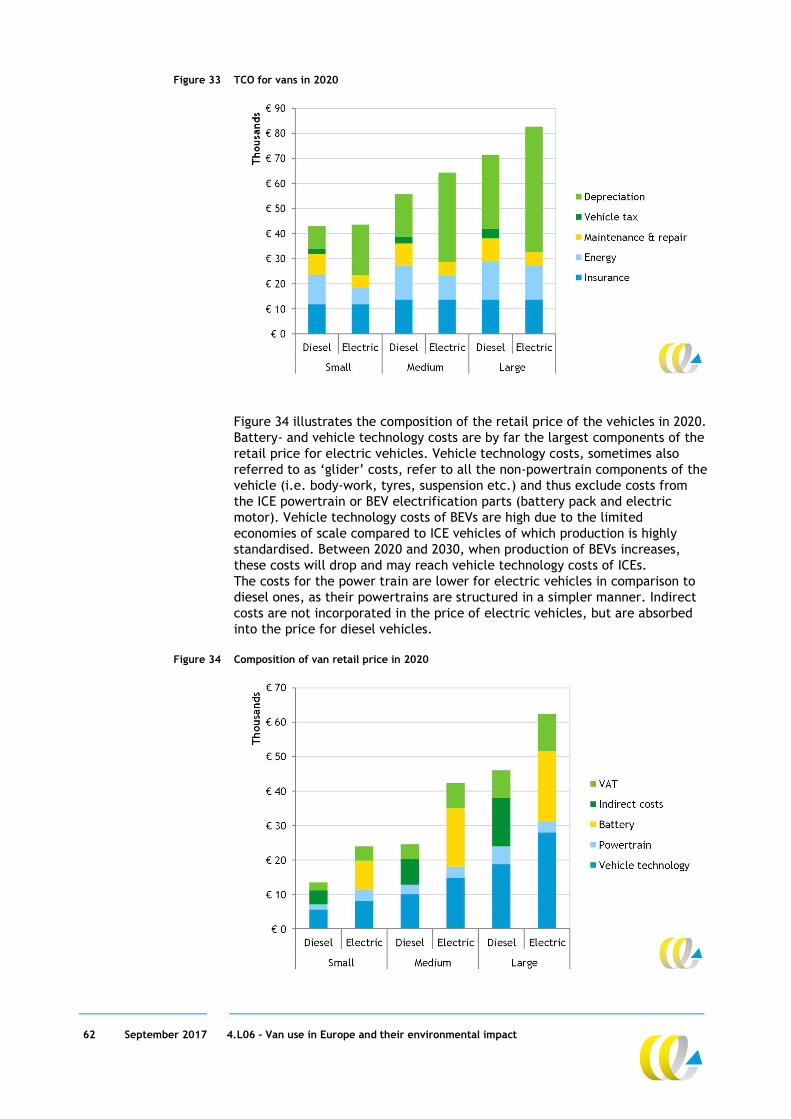
62 September 2017 4.L06 – Van use in Europe and their environmental impact
Figure 33 TCO for vans in 2020
Figure 34 illustrates the composition of the retail price of the vehicles in 2020. Battery- and vehicle technology costs are by far the largest components of the retail price for electric vehicles. Vehicle technology costs, sometimes also referred to as ‘glider’ costs, refer to all the non-powertrain components of the vehicle (i.e. body-work, tyres, suspension etc.) and thus exclude costs from the ICE powertrain or BEV electrification parts (battery pack and electric motor). Vehicle technology costs of BEVs are high due to the limited economies of scale compared to ICE vehicles of which production is highly standardised. Between 2020 and 2030, when production of BEVs increases, these costs will drop and may reach vehicle technology costs of ICEs. The costs for the power train are lower for electric vehicles in comparison to diesel ones, as their powertrains are structured in a simpler manner. Indirect costs are not incorporated in the price of electric vehicles, but are absorbed into the price for diesel vehicles.
Figure 34 Composition of van retail price in 2020

63 September 2017 4.L06 – Van use in Europe and their environmental impact
6.3.2 Projected TCO
Default assumptions Using the default assumptions from Table 7, the COSTREAM model projects TCO for the different types of vans until 2030 (see Figure 34). Small electric vans are expected to be cost-competitive by 2018. Medium and large electric vans are not expected to be cost-competitive with their diesel counterparts by 2025 and 2026 respectively.
Figure 35 Projected TCO with default assumptions
For the remainder of this section, some of the default assumptions from Table 6 will be altered to identify the effect of that particular assumption on the TCO. Two graphs will be presented in one figure. The graph on the left will have default assumptions only, whereas the one on the right will have one or more assumption(s) tweaked to allow for a clear comparison.
Annual mileage Variations in annual mileage were exploited to identify their effects on TCO. With the default mileage (25,000 km per year) the TCO of small electric vans breaks even with TCO of small diesel vans by 2018 (see Figure 35). For medium and large sized vans, electric vans will be cost-competitive by 2025 and 2026 respectively with an annual mileage of 25,000 km. With a higher annual mileage, the break-even points of the TCO are brought forward to 2016, 2022 and 2024 for small, medium and large vans respectively (see Figure 35).
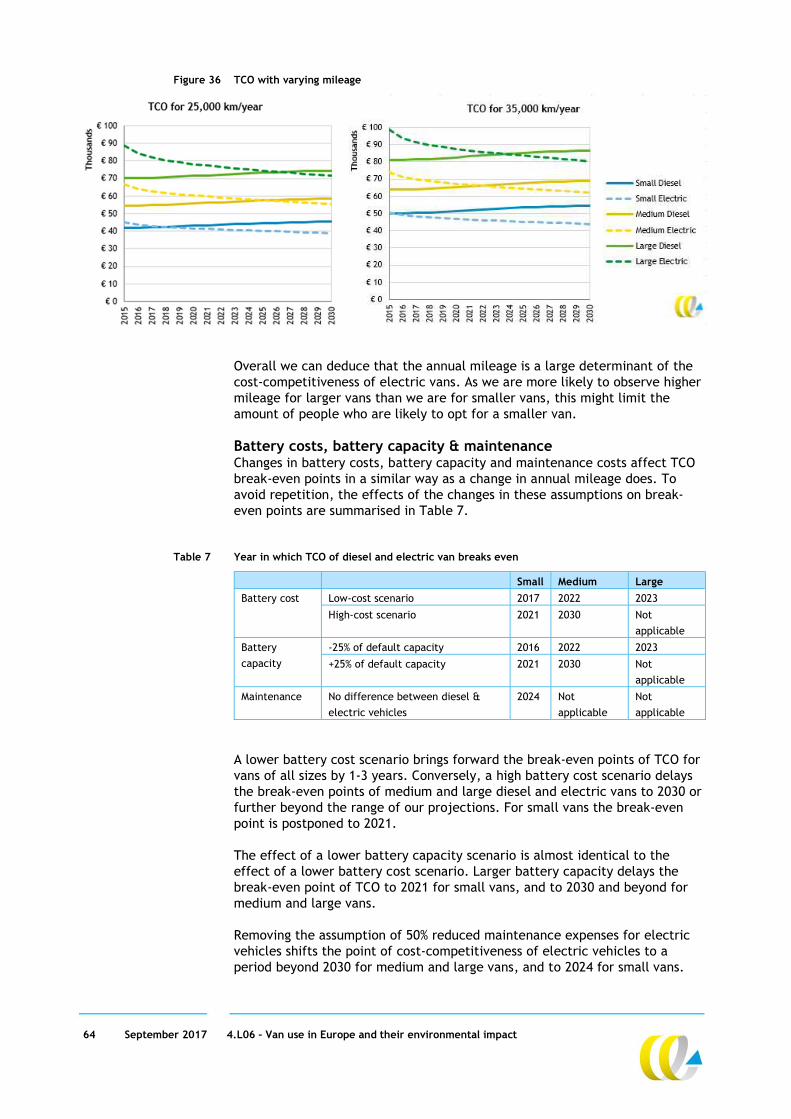
64 September 2017 4.L06 – Van use in Europe and their environmental impact
Figure 36 TCO with varying mileage
Overall we can deduce that the annual mileage is a large determinant of the cost-competitiveness of electric vans. As we are more likely to observe higher mileage for larger vans than we are for smaller vans, this might limit the amount of people who are likely to opt for a smaller van.
Battery costs, battery capacity & maintenance Changes in battery costs, battery capacity and maintenance costs affect TCO break-even points in a similar way as a change in annual mileage does. To avoid repetition, the effects of the changes in these assumptions on break-even points are summarised in Table 7.
Table 7 Year in which TCO of diesel and electric van breaks even
Small Medium Large
Battery cost Low-cost scenario 2017 2022 2023
High-cost scenario 2021 2030 Not
applicable
Battery
capacity
-25% of default capacity 2016 2022 2023
+25% of default capacity 2021 2030 Not
applicable
Maintenance No difference between diesel &
electric vehicles
2024 Not
applicable
Not
applicable
A lower battery cost scenario brings forward the break-even points of TCO for vans of all sizes by 1-3 years. Conversely, a high battery cost scenario delays the break-even points of medium and large diesel and electric vans to 2030 or further beyond the range of our projections. For small vans the break-even point is postponed to 2021. The effect of a lower battery capacity scenario is almost identical to the effect of a lower battery cost scenario. Larger battery capacity delays the break-even point of TCO to 2021 for small vans, and to 2030 and beyond for medium and large vans. Removing the assumption of 50% reduced maintenance expenses for electric vehicles shifts the point of cost-competitiveness of electric vehicles to a period beyond 2030 for medium and large vans, and to 2024 for small vans.
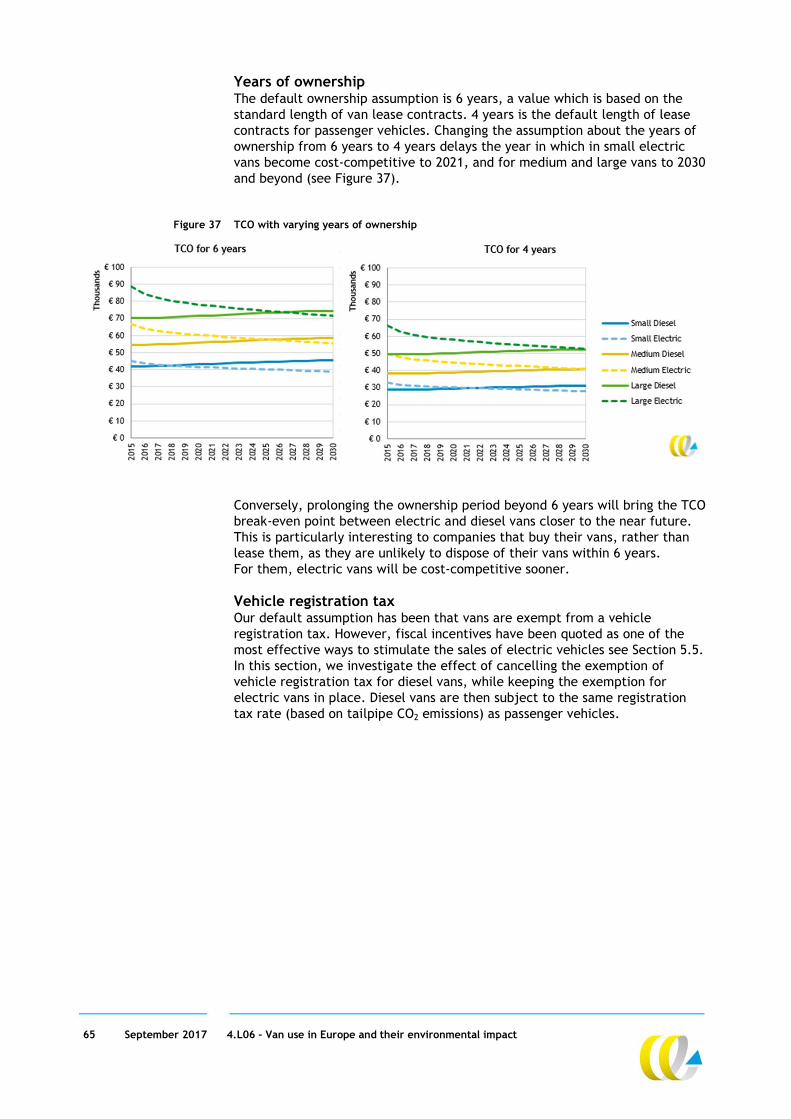
65 September 2017 4.L06 – Van use in Europe and their environmental impact
Years of ownership The default ownership assumption is 6 years, a value which is based on the standard length of van lease contracts. 4 years is the default length of lease contracts for passenger vehicles. Changing the assumption about the years of ownership from 6 years to 4 years delays the year in which in small electric vans become cost-competitive to 2021, and for medium and large vans to 2030 and beyond (see Figure 37).
Figure 37 TCO with varying years of ownership
Conversely, prolonging the ownership period beyond 6 years will bring the TCO break-even point between electric and diesel vans closer to the near future. This is particularly interesting to companies that buy their vans, rather than lease them, as they are unlikely to dispose of their vans within 6 years. For them, electric vans will be cost-competitive sooner.
Vehicle registration tax Our default assumption has been that vans are exempt from a vehicle registration tax. However, fiscal incentives have been quoted as one of the most effective ways to stimulate the sales of electric vehicles see Section 5.5. In this section, we investigate the effect of cancelling the exemption of vehicle registration tax for diesel vans, while keeping the exemption for electric vans in place. Diesel vans are then subject to the same registration tax rate (based on tailpipe CO2 emissions) as passenger vehicles.
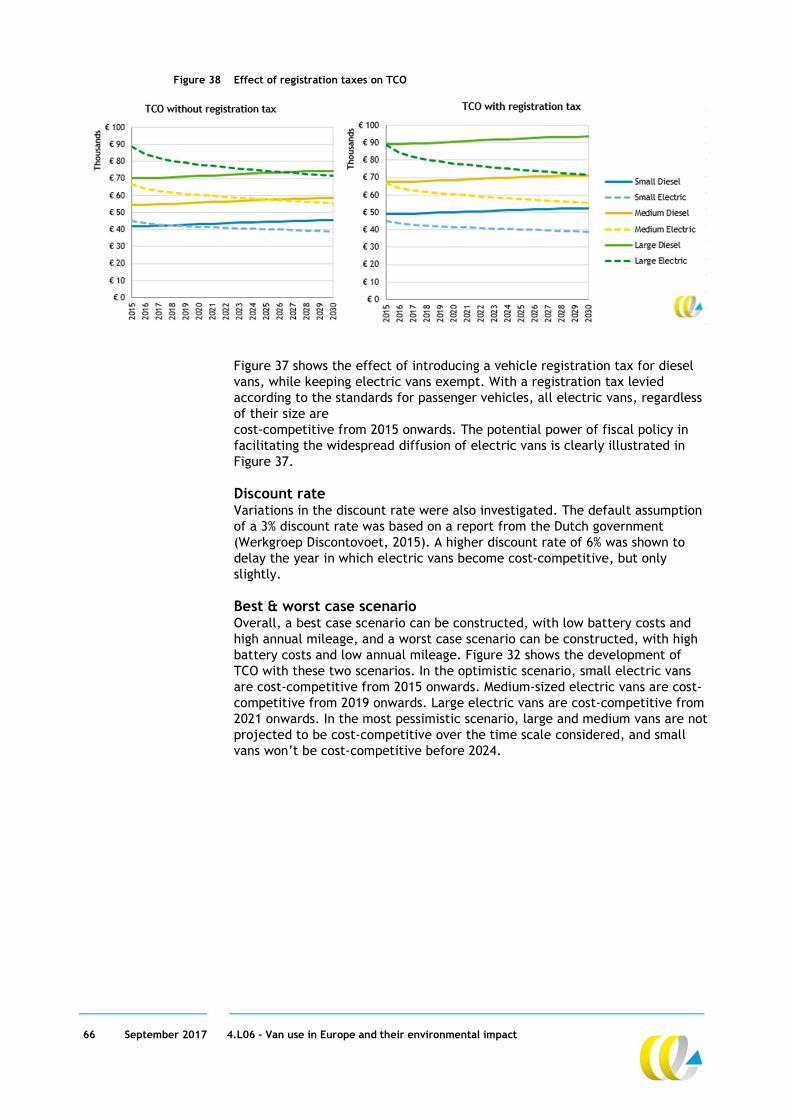
66 September 2017 4.L06 – Van use in Europe and their environmental impact
Figure 38 Effect of registration taxes on TCO
Figure 37 shows the effect of introducing a vehicle registration tax for diesel vans, while keeping electric vans exempt. With a registration tax levied according to the standards for passenger vehicles, all electric vans, regardless of their size are cost-competitive from 2015 onwards. The potential power of fiscal policy in facilitating the widespread diffusion of electric vans is clearly illustrated in Figure 37.
Discount rate Variations in the discount rate were also investigated. The default assumption of a 3% discount rate was based on a report from the Dutch government (Werkgroep Discontovoet, 2015). A higher discount rate of 6% was shown to delay the year in which electric vans become cost-competitive, but only slightly.
Best & worst case scenario Overall, a best case scenario can be constructed, with low battery costs and high annual mileage, and a worst case scenario can be constructed, with high battery costs and low annual mileage. Figure 32 shows the development of TCO with these two scenarios. In the optimistic scenario, small electric vans are cost-competitive from 2015 onwards. Medium-sized electric vans are cost-competitive from 2019 onwards. Large electric vans are cost-competitive from 2021 onwards. In the most pessimistic scenario, large and medium vans are not projected to be cost-competitive over the time scale considered, and small vans won’t be cost-competitive before 2024.

67 September 2017 4.L06 – Van use in Europe and their environmental impact
Figure 39 Best & worst case scenario
6.3.1 Summary on TCO analysis An important conclusion we can draw from the TCO calculations in the previous section is that although currently small class electric vans are not cost-competitive to the diesel alternative, the cost differences will decrease rapidly, resulting in cost competitiveness in the near future. However, for medium and in particular for larger vans, the ‘turning point’ will occur much later. For companies/van users that drive a higher amount of kilometres annually, electric driving will become financially viable sooner than for low-mileage companies. Registration tax differentiation (i.e. exemption for electric vans but not for diesel vans) is very effective in expediting the turning point. To incentivise companies to adopt electric vans policy makers in Member States should look into abolishing current tax exemptions for conventional vans.
6.4 Cost comparison: Vans versus small trucks
The previous section conducted a comparison of TCO between vehicles in the same segment (i.e. vans). However, there is a growing concern that there may be some sense of competition between vans and small trucks. There is a fear of substantial increases in the number of vans in the near future as some of the sectors currently using (small) trucks may switch to using vans. The benefits of vans compared to N2 vehicles have been discussed in Chapter 4. Cost differences may be another incentive to choose a van over a heavy-duty vehicle. Figure 40 shows a cost comparison of the total annual operational expenses between three types of vans and a small truck, taking into account the labour costs of driving such vehicles. It is clear that the labour costs make up the lion’s share of the total annual operational expenses. However, the difference in labour costs between vans and trucks is not as large as one might imagine. It could very well be possible that the main argument for using vans over trucks is not because of their lower costs, but rather because of their flexibility in terms of deployment. Many of the interviews we conducted confirmed this hypothesis. Some of the examples of flexibility include the larger pool of drivers at their disposal for vans (as
Best case scenario Worst case scenario
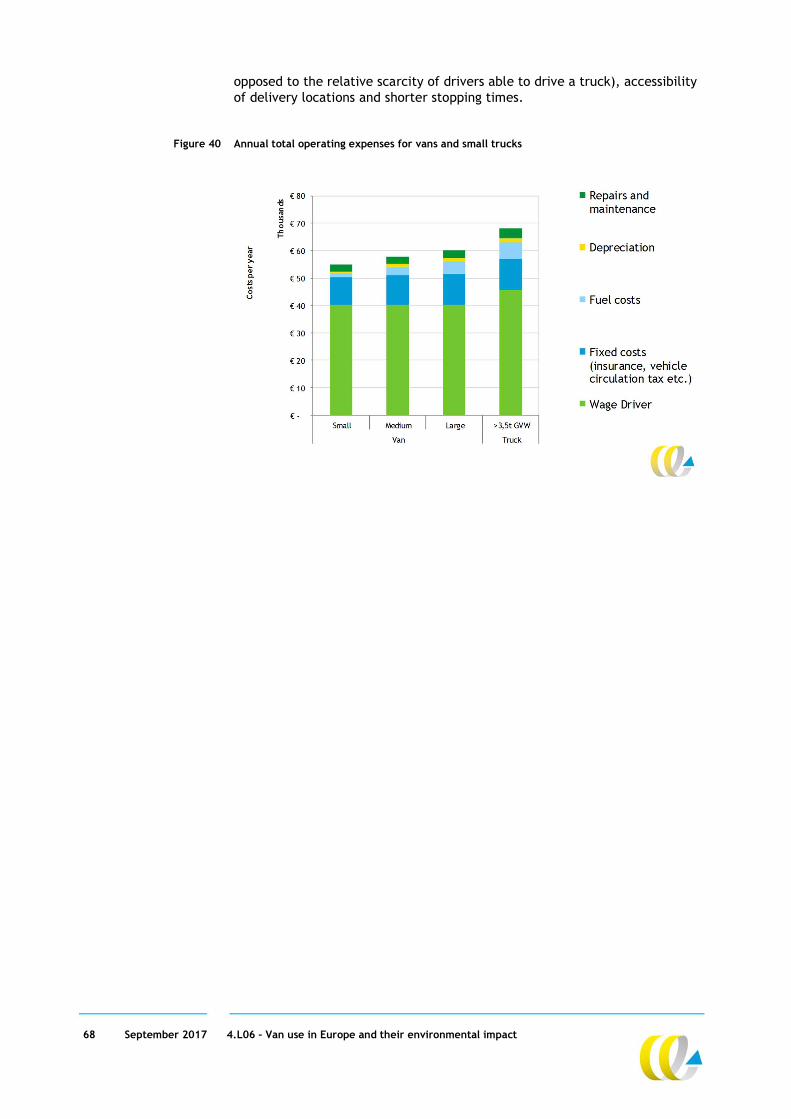
68 September 2017 4.L06 – Van use in Europe and their environmental impact
opposed to the relative scarcity of drivers able to drive a truck), accessibility of delivery locations and shorter stopping times.
Figure 40 Annual total operating expenses for vans and small trucks

69 September 2017 4.L06 – Van use in Europe and their environmental impact
7 Projection electric vans
We have arrived at the point where the four core elements of this study which shed light on motives for van choice have been addressed: technology, regulations, market structure and Total Cost of Ownership. In this final chapter we attempt to assess possible growth of electric van sales in the future. This chapter mainly uses existing literature on such projections for passenger cars. Based on what we have learned so far about vans we make an approximate projection of new van registrations until the year 2030.
7.1 Past and current new registrations
With 0.6% in new registrations in the EU in 2015 the share of electric vans is currently lower than the share of electric passenger cars which is 1.1% (BEV and PHEV, based on (EEA, 2016a); (ICCT, 2016). Electric van new registrations grew from approximately 1,000 in 2012 to 10,000-12,000 in 2015. In the same time the number of available models grew from 2 to 15 (T&E, 2016). The supply of full-electric vans sold at the moment is limited. We found the following (T&E, 2016; complemented with search on several OEM sites): Citroen Berlingo Electric (N1 class 2); Mercedes Benz Vito E-cell (N1 class 3); Nissan e-NV200 (N1 class 2); Peugeot Partner Electric (N1 class 2); Piaggio Porter (N1 class 1); Renault Kangoo ZE (N1 class 1); Renault Twizy Cargo; Spijkstaal StreetScooter Work; Volkswagen e-load up. Hybrid vans available are: Citroen Jumper; Citroen Jumpy; Mercedes V-ision E Concept; XLhybrids converts Chevy Express, GMC Savanna 2500/3500 Vans; and Ford Transit Cargo. VIA VTRUX Van has an Extended Range Electric Vehicle (EREV) van. According to their websites, several OEMs are working on introducing at least one type of electric van and more models per OEM will be released in the future. Examples are the VW Crafter and Ford Transit Custom PHEV.
7.2 Existing studies with EV projections
Van-only projections We found a study from the UK that gives an electric van projection (ElementEnergy, 2015). ElementEnergy used data from the Committee on Climate Change (CCC), who initiated the study, according to which the total van park will increase by 48% between 2014 and 2030. According to the CCC, the share of new BEV and FCEV van registrations will increase from 1.5% in

70 September 2017 4.L06 – Van use in Europe and their environmental impact
2020 to 40% in 2030. This is based on the assumption of a strong growth in zero tailpipe emission powertrains. No distinctions are given between BEV and FCEV and no numbers of EREV and PHEV are given. A more recent EU-wide study, the Green transport roadmap from EA Energy Analyses (2017), used a 40% growth in all LCVs between now and 2030. In the business-as-usual scenario the new registrations in sales of both BEV/FCEV and PHEV are 5%. In the 30% reduction scenario, the new registrations in sales of both BEV/FCEV and PHEV are 20%.
LDV projections Other studies show LDV (light duty vehicle = passenger car and vans combined) or passenger cars only. The EU Reference Scenario 2016 (EC, 2016a) projects a share of 0% of FCEV, 2% of BEV, 5% PHEV and 20% hybrid for the LDV for 2030 measured in vehicle kilometres. Their reference scenario assumes that OEMs comply with the CO2 standards and Member States place strong incentives such as tax exemption or subsidisation. OECD/IAE (IEA, 2016) give an annual required growth rate for new registration of electric cars of 25% until 2025 and, 7 to 10% between 2030 and 2050 to meet the 2030 target of the IEA 2DS scenario (at least a 50% chance of limiting the average global temperature increase to 2°C). This 2 degrees scenario is obviously not a ‘business as usual’ scenario but would require substantial additional (policy) efforts.
Passenger car-only projections In different scenarios by CE Delft in 2011 (CE Delft; ICF; Ecologic, 2011) the share of new registrations of PHEV, EREV and FEV (BEV) for passenger cars in 2030 in the EU ranges from 19% to 84% and 7% to 33% in the fleet. Variables in the scenarios are cost, energy use and oil price, governmental incentives, technological developments, consumer behaviour, production capacity and charging opportunities and energy prices. In the most realistic scenario (1) the share of new registrations of passenger cars for 2030 are 30% for PHEV, 11% for EREV and 11% for FEV (= 52% full-electric driving possible, hybrid is not given).
7.3 Van projection made for this study
Combining the information from previous section we can construct Figure 41. Projections are shown for the 2020, 2025 and 2030 with the following assumptions: 1. For the total van fleet a growth of 5.5% between 2017 and 2022 is
assumed, which is extrapolated to 2030 (Mordor Intelligence, 2017). The percentages for BEV/FCEV and PHEV/EREV are taken from EU Reference Scenario 2016 (EC, 2016a; only 2020 and 2030), and an average annual growth rate of 25% until 2030 is taken from IEA (IEA, 2016).
2. The calculations of Green transport roadmap are with an LCV growth of 40% and a share of BEV/FCEV of 5% (BAU) and 20% (30% scenario) and a share of PHEV/EREV of 5% (BAU) and 20% (30% scenario).
The total number of BEV and FCEV vans in 2020 is expected to be between 17,000 and 54,000 vehicles EU-wide. These amounts may grow to a range of 34,000 to 480,000 vehicles in 2030. The total number of PHEV/EREV will be between 17,000 and 59,000 vehicles EU-wide in 2020 and between 86,000 and 480,000 vehicles in 2030.
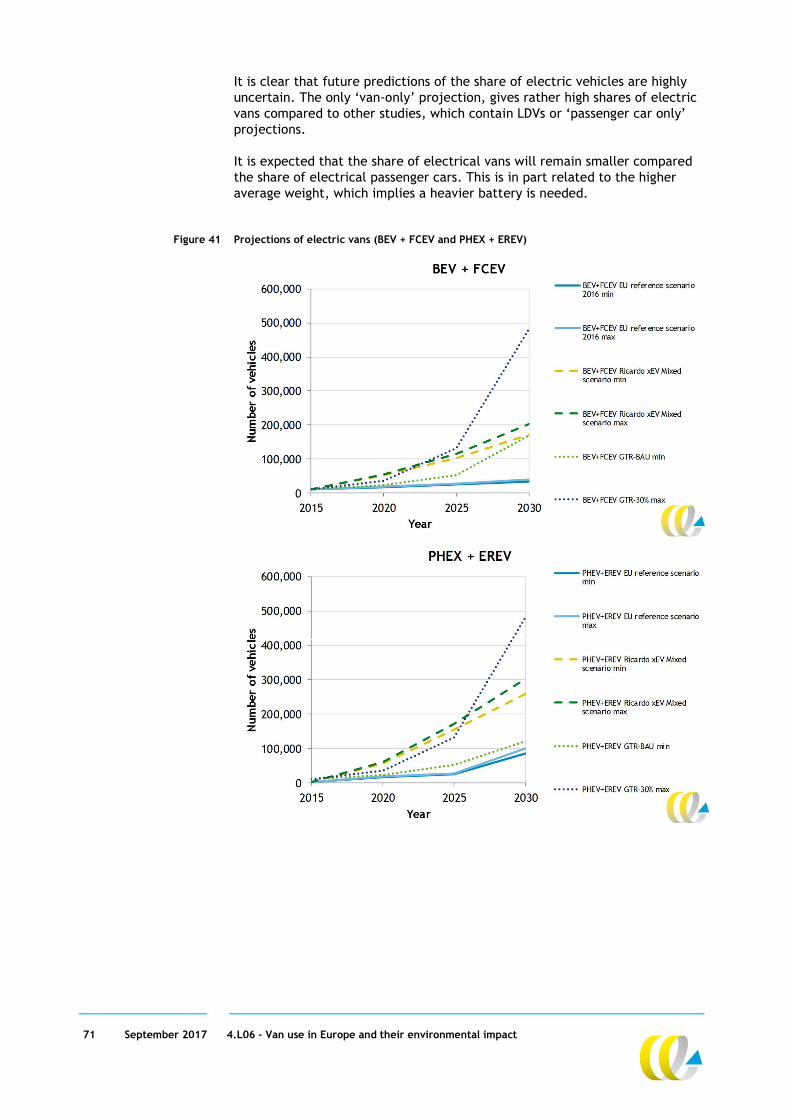
71 September 2017 4.L06 – Van use in Europe and their environmental impact
It is clear that future predictions of the share of electric vehicles are highly uncertain. The only ‘van-only’ projection, gives rather high shares of electric vans compared to other studies, which contain LDVs or ‘passenger car only’ projections. It is expected that the share of electrical vans will remain smaller compared the share of electrical passenger cars. This is in part related to the higher average weight, which implies a heavier battery is needed.
Figure 41 Projections of electric vans (BEV + FCEV and PHEX + EREV)

72 September 2017 4.L06 – Van use in Europe and their environmental impact
8 Conclusions
8.1 Main conclusions
In this study we have shown that Light Commercial Vehicles (LCVs), more commonly known as ‘vans’, take up a significant part of the road vehicle fleet in the EU and the associated environmental impact of road transport. This impact is expected to increase due to growing vehicle numbers and van use. The absence of regulations for vans, in contrast to heavy-duty vehicles, is likely to stimulate growth further. Some convey concerns that heavier vans are increasingly used for cross border deliveries of goods. The environmental impact of vans is counteracted by European emission standards (Euro standards and CO2 standards). Despite the fact that emission limits for air pollutants have been tightened over the last decade, real world emissions have not decreased at the same rate. In fact, from Euro2 onwards real world emissions have remained almost constant. It is unclear whether the newest Euro6 standard will deliver a substantial improvement in terms of real world emissions compared to Euro5. In addition, there are indications that the van fleet is relatively old. This results in high NOx and in particular PM10 emissions. Considering vans operate often in urban areas, the negative impact of vans on urban air quality is also likely to be disproportionally high. The CO2 emissions per kilometre driven by vans have decreased over time due to emission standards. However, there is a large and increasing discrepancy between test cycle and real world CO2 emissions of 25 to 30%. This gap is somewhat smaller than for passenger cars. However, this does not necessarily mean that CO2 legislation for vans has been more successful than the legislation for passenger cars. The lower gap might also be an indication that not all ‘flexibilities’ in the NEDC driving cycle have been utilized by manufacturers. In addition, the 2020 (147 gCO2/km) target for vans is found to be less challenging for manufacturers than the 2020 (95 gCO2/km) target for passenger cars. Technological improvements have great potential to improve the energy efficiency of conventional (diesel) vans. It is recommended to continue to pursue stricter CO2 regulations of vans over time. In addition, efforts to close the gap between test cycle and real world emissions need to be stepped up since the new WLTP driving cycle will reduce but not eliminate this gap. At the same time, the adoption of alternative fuel vans, in particular full-electric vans, should be promoted, possible through a mandate for low or zero-emission vehicles. With respect to advanced technologies such as electric-drive trains, diesel vans are a good candidate to be replaced by full-electric vans. A range of 250 km is sufficient to serve the mobility needs of the bulk of van users. With respect to regulations and legislation, vans have a considerable advantage over Heavy-duty vehicles (HDVs). Particularly the tachograph exemption for vans, in combination with the European driver times regulation, is considered a major benefit amongst van users. The benefits of these less stringent regulations are likely to be an incentive for the increased van use. However, it is considered uncertain whether stricter regulations affect vehicle choice to a large extent. Vans are regarded as unique vehicles best suited for

73 September 2017 4.L06 – Van use in Europe and their environmental impact
specific types of operations making substitution by HDVs not as straightforward. More importantly, questions arise whether enforcement of the expansion of tachograph and driver times regulations to incorporate vans is feasible, particularly since sufficient enforcement for HDVs is currently already problematic. Designing effective policies to reduce the environmental impact of vans at the user level is likely to be difficult. The market structure for vans is very diversified: many different types of users, companies and company sizes use vans. Different van types (small, normal and large) are used by each of these groups. It is therefore not easy to single out specific user groups that would be more prone to accept/adopt fuel-efficient or alternative fuel vehicles. According to users Total Cost of Ownership (TCO) is the most important criterion for vehicle choice. This is particularly true for larger companies that lease vans or use (in house or external) fleet managers. This largely explains why alternative fuel vehicles are currently not regarded as a viable option by van users. Fuel costs are found to be fairly unimportant by users. This is because fuel consumption varies greatly with individual driving style. Some companies encourage drivers to save fuel with specific programs with a competitive element which also offer financial rewards. Although currently small class electric vans are not cost-competitive with the diesel alternative, the cost differences will decrease rapidly in the coming years. For medium and larger vans in particular the ‘turning point’ will occur much later. This can be brought forward if tax exemptions for diesel vans will be abolished. A possible downside of electric vans is the weight of the battery packs which limits the maximum weight that can be carried.
8.2 Recommendations for further research
Despite the fact that ambitious long term, climate targets are in place and many EU Member States continue to struggle with urban air quality standards, very little is known about vans compared to passenger cars and heavy-duty road vehicles. Particularly little is known about van use, i.e. which companies and individuals drive vans, how they are being used and which elements determine vehicle choice. As we have argued, considerable additional policy efforts are required, in particular to meet long term climate targets, which will be tightened following the Paris Agreement. To ensure these policy measures are effective, it is crucial to gain more insight in van use in Europe and their environmental impact. The EU should strive for better data on van use across Member States. Alternatively, it could commission a study following the Dutch example, in which country specific van data for all EU Member States is collected and analysed. A specific point of interest are claims by some that the number of large vans dedicated to third party cross-border transport of goods is increasing rapidly. These claims could be verified by programs that monitor cross-border van activity, the layout/design of these vehicles (i.e. are they equipped with sleeper cabins) and whether users comply to the 3.5 ton GVW weight restriction for vans.

74 September 2017 4.L06 – Van use in Europe and their environmental impact
9 References
ACEA, 2016. ACEA Tax Guide 2016, Brussels: European Automobile Manufacturers' Association (ACEA). ACEA, 2017. Overview on Tax Incentives for Electric Vehicles in the EU, Brussels: European Automobile Manufacturers Association (ACEA). AEA, 2009. Assessment with respect to long term CO2 emission targets for passenger cars and vans. Final report, London: AEA. ANFAC, 2014. European motor vehicle parc 2014, Madrid: Asociación Española de Fabricantes de Automóviles y Camiones (ANFAC). Asfinag, 2017-. Toll. [Online] Available at: https://www.asfinag.at/toll [Accessed 22 May 2017]. Bloomberg, 2017. Electric Vehicle Outlook 2017, sl: sn Buck, et al., 2017. Gebruikers en inzet van bestelauto's in Nederland, Delft: Connekt. Bundesministerium der Justiz und für Verbraucherschutz, 2016. Fahrpersonalverordnung vom 27. Juni 2005 (BGBl. I S. 1882), die zuletzt durch Artikel 4 der Verordnung vom 17. Juni 2016 (BGBl. I S. 1463) geändert worden ist", Berlin: Bundesministerium der Justiz und für Verbraucherschutz. CBS, 2015. Bottom-up berekening CO2 van bestelauto’s, Den Haag: Centraal Bureau voor de Statistiek (CBS). CE Delft, TNO and ECN, 2013. Natural gas in transport : an assessment of different routes, Delft: CE Delft. CE Delft; ICF; Ecologic, 2011. Impact of electric vehicles : Deliverables 1-5 and summery report, Delft: CE Delft. CE Delft, 2001. Hebben autobelastingen en accijnzen effect? : Invloed van auto- en brandstofbelastingen op het autopark en -gebruik in 8 EU lidstaten , Delft: CE Delft. CE Delft, 2003. Bestelauto’s anders belast : Evaluatie van opties voor een andere fiscale belasting van bestelauto’s, Delft: CE Delft. CE Delft, 2016a. Road taxation and spending in the EU, Delft: CE Delft. CE Delft, 2016. STREAM Goederenvervoer 2016 : Emissies van modaliteiten in het goederenvervoer, Delft: CE Delft. DeMorgen, 2017. "Fors meer bestelwagens na invoering kilometerheffing voor vrachtwagens". DeMorgen, 29 03, p. online. DHL, 2017. Persbericht : DHL verdubbelt productie elektrische bestelauto naar 20.000 stuks. [Online] Available at: http://www.dhl.nl/nl/pers/pers_berichten/berichten_2017/local/dhl_verdubbelt_productie_elektrische_bestelauto_naar_20000_stuks.html [Accessed 2017]. DieselNet, 2015. EU Cars : Greenhouse Gas Emissions. [Online] Available at: https://www.dieselnet.com/standards/eu/ghg.php [Accessed 2017]. Ea Energy Analysis, 2017. Green transport roadmap : 30% CO₂ reduction in EU road transport towards 2030, Copenhagen: Ea Energy Analysis. EC, DG Climate Action, 2013a. Commission approves first eco-innovation for passenger cars. [Online] Available at: https://ec.europa.eu/clima/news/articles/news_2013031301_en [Accessed 22 May 2017]. EC, DG Transport, 2017. Going abroad : download the free GoingAbroad app. [Online]
75 September 2017 4.L06 – Van use in Europe and their environmental impact
Available at: http://ec.europa.eu/transport/road_safety/going_abroad/index_en.htm [Accessed 8 March 2017]. EC, 2006a. Directive 2006/126/EC of the European Parliament and of the Council of 20 December 2006 on driving licences (Recast) (Text with EEA relevance). Official Journal of the European Union, L403(30.12.2006), pp. 18-60. EC, 2006. Regulation (EC) No 561/2006 of the EP (...) Council of 15 March 2006 on the harmonisation of certain social legislation relating to road transport (...) Council Regulations (EEC) No 3821/85 and (EC) No 2135/98 and repealing Council Regulation No 3820/85. Official Journal of the European Union, L 102(11.4.2006), pp. 1-13. EC, 2007. Directive 2007/46/EC of the European Parliament and of the Council of 5 September 2007 establishing a framework for the approval of motor vehicles and their trailers, and of systems, components and separate technical units intended for such vehicles. Official Journal of the European Union, L263(9.10.2007), pp. 1-160. EC, 2009a. Regulation (EC) No 1071/2009 of the EP and of the Council of 21 October 2009 establishing common rules concerning the conditions to be complied with to pursue the occupation of road transport operator and repealing Council Directive 96/26/EC. Official Journal of theEuropean Union, L300(14.11.2009), p. 51. EC, 2009b. Regulation (EC) No 1072/2009 of the European Parliament and of the Council of 21 October 2009 on common rules for access to the international road haulage market. Official Journal of theEuropean Union, L300(14.11.2009), pp. 72-87. EC, 2009. Regulation (EC) No 661/2009 of the European Parliament and of the Council of 13 July 2009 concerning type-approval requirements for the general safety of motor vehicles, their trailers and systems, components and separate technical units intended therefor. Official Journal of the European Union, L200(31.7.2009), pp. 1-24. EC, 2011a. White paper, Roadmap to a single European Transport Area : Towards a competitive and resource efficient transport system COM(2011)0144 final, Brussels: European Commission (CE). EC, 2013. EU Energy, transport and GHG emissions trends to 2050 : Reference Scenario 2013, Brussels: European Commission, DG. Energy. EC, 2016c. EU Reference Scenarios 2016 : Energy, transport and GHG emissions Trends to 2050, Luxembourg: Publications Office of the European Union,. EC, 2016. EU Transport in Figures : Statistical Pocketbook 2016, Luxembourg: European Commission. ECN, TNO, CE Delft, 2014. Scenarios for energy carriers in the transport sector, Petten: ECN. ECN; PBL; CBS; RVO, 2015. Nationale Energieverkenning 2015, Petten: ECN. EEA, 2016a. Monitoring CO2 emissions from new passenger cars and vans in 2015. [Online] Available at: February [Accessed 28 February 2017]. EEA, 2016b. Explaining road transport emissions : A non-technical guide, Luxembourg: Publications Office of the European Union. EEA, 2016c. Air quality in Europe — 2016 report, Copenhagen: European Environment Agency (EEA). EEA, 2016. Transitions towards a more sustainable mobility system : TERM 2016: Transport indicators tracking progress towards environmental targets in Europe, Luxembourg: Publications Office of the European Union. EEA, 2017. Carbon dioxide emissions from new vans in Europe continued to fall in 2016. [Online]

76 September 2017 4.L06 – Van use in Europe and their environmental impact
Available at: https://www.eea.europa.eu/highlights/carbon-dioxide-emissions-from-new [Accessed 2017]. EEC, 1970. Council Directive 70/220/EEC of 20 March 1970 on the approximation of the laws of the Member States relating to measures to be taken against air pollution by gases from positive-ignition engines of motor vehicles. Official Journal of the European Communities, L76(6.4.70), pp. 171-191. ElementEnergy, 2012. Cost and Performance of EV Batteries : Report for The Committee on Climate Change, Cambridge: Element Energy Limited. ElementEnergy, 2015. Quantifying the impact or real-world driving on total CO2 emissions from UK cars adn vans, final report for the Committee on Climate Change, Cambridge: Element Energy Limited. ElementEnergy, 2016b. Towards a European Market for Electro-Mobility, Final Report, Cambridge: Element Energy Limited. ElementEnergy, 2016. Low carbon cars in the 2020s : Consumer impacts and EU policy implications, Brussels ; Cambridge ; Lille ; London: ElementEnergy. Ellram et al., 1998. Total cost of ownership: a key concept in strategic cost management decisions.. Journal of Business Logistics, 2017(Issue 1), pp. 55-80. Energy.eu, 2017. Eruope's Energy Portal. [Online] Available at: www.energy.eu/fuelprices ETC/ACM, 2012. Use and effectiveness of economic instruments in the decarbonisation of passenger cars : ETC/ACM Technical paper, Bilthoven: The European Topic Centre on Air Pollution and Climate Change Mitigation (ETC/ACM). EU, 2011. Regulation (EU) No 510/2011 of the EP and of the Council of 11 May 2011 setting emission performance standards for new light commercial vehicles as part of the Union's integrated approach to reduce CO 2 emissions from light-duty vehicles (Text with EEA..). Official Journal of the European Union, L 145(31.5.2011), pp. 1-18. Eurostat, 2017. Eurostat Home page : different datasets. [Online] Available at: http://ec.europa.eu/eurostat/web/main [Accessed 4 May 2017]. Hill et al., 2015. Improving understanding of technology and costs for CO2 reductions from cars and LCVs in the period to 2030 and development of cost curves, s.l.: European Commission. Hill N., 2016. Improving understanding of technology and costs for CO2 reductions from cars and LCVs in the period to 2030 and development of cost curves, s.l.: Ricardo Energy & Environment. Hurkens et al., 2006. Total Cost of Ownership in the Services Sector: A Case Study. Journal of Supply Chain Management, pp. 27-37. ICCT, 2016a. From Laboratory to road : A 2016 update of official and 'real-world' fuel consumption and CO2 values for passenger cars in Europe, Berlin: International Council on Clean Transportation Europe (ICCT). ICCT, 2016b. Comparison of leading electric vehicle policy and deployment in Europe, Berlin: The International Council on Clean Transportation (ICCT). ICCT, 2016. European Vehicle Market Statistics Pocketbook 2015/16, Berlin: The International Council on Clean Transportation. IEA, 2016. Global EV Outlook 2016 : Beyond on million electric cars, Paris: OECD/IEA International Energy Agency. IIASA, 2014. Real World Emissions from Road Vehicles: Results from Remote Sensing, Emission Measurements and Models, Laxenburg: International Institute for Applied Systems Analysis (IIASA). Kolwich, G., 2013. Light-Duty Vehicle Technology Cost Analysis European Vehicle Market Updated Indirect Cost Multiplier (ICM) Methodology, Washington DC: International Council on Clean Transportation (ICCT).
77 September 2017 4.L06 – Van use in Europe and their environmental impact
Mordor Intelligence, 2017. Europe LCV Market - Forecasts, Growth and Trends (2017 - 2022). [Online] Available at: https://www.mordorintelligence.com/industry-reports/europe-lcv-market [Accessed 3 May 2017]. OECD/ITF, 2012. Electric Vehicles Revisited : Costs, Subsidies and Prospects, Paris: OECD, International Transport Forum (ITF). ORNL, 2010. Plug-in Hybrid Electric Vehicle Value Proposition Study, Final Report, Oak Ridge: Oak Ridge National Laboratory (ONRL). PBL, 2016. Verkeer en vervoer in de Nationale Energieverkenning 2015, Den Haag: Planbureau voor de Leefomgeving (PBL). Redelbach, M., Propfe, B. & Friedrich, H. E., 2012. Competitive Cost Analysis of Alternative Powertrain Technologies, paper at the International Advanced Mobility Forum 2012 (IAMF). Geneva, The International Advanced Mobility Forum (IAMF). Ricardo-AEA, 2015. Improvements to the definition of lifetime mileage of light duty vehicles, Didcot: Ricardo-AEA Ltd. Ricardo, et al., (2016 forthcoming). Improving understanding of technology and costs for CO2 reductions from cars and LCVs in the period to 2030 and development of cost curves, Service Request 4 to LDV Emissions Framework Contract, Didcot (UK): Ricardo. Rijksoverheid, 2017. Wet op de motorrijtuigenbelasting 1994: Wet van 16 december 1993, tot vaststelling van de Wet op de motorrijtuigenbelasting 1994, Den Haag: Rijksoverheid , Ministerie van Financiën. Sadler Consultants Ltd., 2016. Urban Access Regulations In Europe. [Online] Available at: http://nl.urbanaccessregulations.eu/ [Accessed 8 May 2017]. Scientific Advice Mechanism (SAM), 2016. Closing the gap between light-duty vehicle real-world CO2 emissions and laboratory testing, Brussels: European Commission, Directorate-General for Research and Innovation. Severn River Crossing, 2017. SevernCrossings : toll prices. [Online] Available at: https://www.severnbridge.co.uk/Home.aspx?.Parent=&FileName=toll-price12 [Accessed 22 May 2017]. Sharpe, R. & Smokers, R., 2009. Assessment with respect to long term CO2 emission targets for passenger cars and vans. Deliverable D2:final report, London: AEA Technology plc. Significance; CE Delft, 2010. Price sensitivity of European road freight transport: towards a better understanding of existing results, s.l.: Significance; CE Delft. T&E, 2016. Electric Vehicles in Europe-2016 : Approaching adolescence, Brussels: Transport and Environment (T&E). TfL, 2014. Transport Emissions Roadmap, Cleaner transport for a cleaner London, London: TfL. TfL, 2017. Discounts & exemptions. [Online] Available at: https://tfl.gov.uk/modes/driving/congestion-charge/discounts-and-exemptions TML; CE Delft; TNO, 2016. Consideration of the role of speed limiters in light commercial vehicle CO2 regulation, report DG Climate Action, Leuven: Transport & Mobilitiy Leuven (TML). TNO et al., 2012. Support for the revision of regulation on CO2 emissions from light commercial vehicles, Delft: TNO, Behavioural and Societal Sciences. TNO, 2015. On-road NOx and CO2 investigations of Euro 5 Light Commercial Vehicles, Delft: TNO, Urbanisation. TNO, 2016. NOx emissions of fifteen Euro 6 diesel cars: Results of the Dutch LD road vehicle emission testing programme 2016, Delft: TNO, Earth, Life & Social Sciences.
78 September 2017 4.L06 – Van use in Europe and their environmental impact
Toll Collect GmbH, 2017. Mauttarife. [Online] Available at: https://www.toll-collect.de/de/toll_collect/rund_um_die_maut/maut_tarife/maut_tarife.html [Accessed 22 May 2017]. TRACCS, 2013. Road data output per menber state. [Online] Available at: http://traccs.emisia.com/server/php/files/Public%20data/TRACCS_ROAD_Final_EXCEL_2013-12-20.zip [Accessed 21 February 2017]. Twenga Solutions, 2017. E-commerce in Europe 2016. [Online] Available at: www.twenga-solutions.com/nl/insights/infographic-ecommerce-europa-2016-feiten-en-cijfers/ Velzen, A. v., 2016. Electric vehicles: a cost competitive game changer or technology’s false hope?: Total Cost of Ownership analysis of Electric Vehicles for the 2015 - 2030 timeframe, Delft: TU Delft, Technology, Policy and Management. ViaPass, 2017. Alle Tarieven : Kilometerheffing voor vrachtwagens van meer dan 3,5 ton. [Online] Available at: http://www.viapass.be/fileadmin/viapass/documents/download/tarievenN.JPG [Accessed 22 May 2017]. Vliet, O. P. v., Kruithof , T., Turkenburg, W. C. & Faaij, A. P., 2010. Techno-economic comparison of series hybrid, plug-in hybrid, fuel cell and regular cars. Journal of Power Sources, 195(19), pp. 6570-6585. VTPI, 2017. Transportation Cost and Benefit Analysis II – Travel Time Costs, Victoria, Canada: VTPI. Werkgroep Discontovoet, 2015. Rapport Werkgroep Discontovoet 2015, Den Haag: Rijksoverheid. Windisch, E., 2014. Driving electric? A financial analysis of electric vehicle policies in France, Paris: Statistical Finance, Ecole des Ponts ParisTech. Wu, G., Inderbitzin, A. & Bening, C., 2015. Total cost of ownership of electric vehicles compared to conventional vehicles: A probabilistic analysis and projection across market segments. Energy Policy, 80(May), pp. 196-214. Zacharof et al., 2016. Type approval and real-world CO2 and NOx emissions from EU light commercial vehicles. Energy Policy, 97(October), pp. 540-548.