Validity of the centrifuge method for determining the water retention properties of tropical soils
22
1 Validity of the centrifuge method for determining the water retention properties of tropical soils Adriana Reatto a,b , Euzebio Medrado da Silva a , Ary Bruand b,* , Eder Souza Martins a , Jorge Enoch Furquim Werneck Lima a a Empresa Brasileira de Pesquisa Agropecuária (Embrapa Cerrados), BR 020, km 18, 73310-970, Planaltina, Distrito Federal, Brazil, b Université d’Orléans, CNRS/INSU, Université de Tours, Institut des Sciences de la Terre d'Orléans (ISTO) UMR6113, 1A rue de la Férollerie 45071 Orléans, France Cedex 2, *Corresponding author: tel.: 33-2-38417024; fax: 33-2-38417308. Email address: [email protected] (A. Bruand) ABSTRACT This study compared the centrifuge and pressure plate methods with appropriate run durations. Samples collected in tropical soils located in Brazil along a 10-km local hydrosequence across the Cerrado–Amazonia transition (Set 1) and along a 350-km regional toposequence across the Cerrado region (Set 2) were selected to compare and discuss statistically the similarity of the soil water retention recorded by using the pressure plate and centrifuge methods. The results showed good agreement (R 2 = 0.99) for the 1:1 comparison of measured pointwise soil water content values (Set 1) as well as for the fitted soil water content curves by the van Genuchten model using data points obtained with the two methods (Set 2). Thus, the centrifuge method should be considered as an appropriate method for determining soil water retention properties not only because of similar results with the pressure plate method but also because it is much less time consuming. insu-00311740, version 1 - 31 Oct 2008 Author manuscript, published in "Soil Science Society of America Journal 72, 6 (2008) 1547-1553" DOI : 10.2136/sssaj2007.0355N
-
Upload
independent -
Category
Documents
-
view
1 -
download
0
Transcript of Validity of the centrifuge method for determining the water retention properties of tropical soils
1
Validity of the centrifuge method for determining the water retention properties of
tropical soils
Adriana Reattoa,b, Euzebio Medrado da Silvaa, Ary Bruandb,*, Eder Souza Martinsa, Jorge
Enoch Furquim Werneck Limaa
aEmpresa Brasileira de Pesquisa Agropecuária (Embrapa Cerrados), BR 020, km 18,
73310-970, Planaltina, Distrito Federal, Brazil,
bUniversité d’Orléans, CNRS/INSU, Université de Tours, Institut des Sciences de la
Terre d'Orléans (ISTO) UMR6113, 1A rue de la Férollerie 45071 Orléans,
France Cedex 2,
*Corresponding author: tel.: 33-2-38417024; fax: 33-2-38417308. Email address:
[email protected] (A. Bruand)
ABSTRACT
This study compared the centrifuge and pressure plate methods with appropriate run
durations. Samples collected in tropical soils located in Brazil along a 10-km local
hydrosequence across the Cerrado–Amazonia transition (Set 1) and along a 350-km
regional toposequence across the Cerrado region (Set 2) were selected to compare and
discuss statistically the similarity of the soil water retention recorded by using the
pressure plate and centrifuge methods. The results showed good agreement (R2 = 0.99)
for the 1:1 comparison of measured pointwise soil water content values (Set 1) as well as
for the fitted soil water content curves by the van Genuchten model using data points
obtained with the two methods (Set 2). Thus, the centrifuge method should be considered
as an appropriate method for determining soil water retention properties not only because
of similar results with the pressure plate method but also because it is much less time
consuming.
insu
-003
1174
0, v
ersi
on 1
- 31
Oct
200
8Author manuscript, published in "Soil Science Society of America Journal 72, 6 (2008) 1547-1553"
DOI : 10.2136/sssaj2007.0355N

2
INTRODUCTION
The relationship between soil-water content and its corresponding water potential is
one of the basic parameters required to model water movement. Among the earliest
works dealing with that relationship, Briggs and McLane (1910) defined the equivalent
moisture as being the soil-water content recorded when a 1-cm long soil sample is
centrifuged for 40 min in a gravitational field equal to 103 times the acceleration of
gravity. Thus, they were the first to use a variation of the gravitational field by
centrifugation to apply a particular value of water potential to a soil sample. The method
was questioned later by Thomas and Harris (1925) who showed that the equivalent
moisture was influenced by the amount of material centrifuged and the physical and
chemical conditions of the centrifugation. Russel and Richards (1938) extended the
method by presenting a rather complete mathematical treatment of the centrifuge theory
for calculating the water potential corresponding to a measured water content of
centrifuged soil samples.
After the development of the pressure plate apparatus (Richards and Fireman,
1943), the centrifuge technique was noticeably set aside, probably due to difficulties in
having centrifuges with capability to develop speed of rotation sufficiently high to obtain
soil water water potentials near the corresponding permanent wilting point. Later on, the
centrifuge technique came back into consideration with the work done by Odén (1975),
who proposed a mathematical formalism to put forth an integral method for the
determination of the soil water retention curve by centrifugation. This method was
experimentally tested using soil samples varying in composition and comparing the
results with those recorded with suction or pressure plates, showing a relatively good
agreement between the two methods.
insu
-003
1174
0, v
ersi
on 1
- 31
Oct
200
8

3
Nowadays, the centrifuge technique has been also applied to determine the
unsaturated hydraulic conductivity (see Nimmo et al., 2002; Singh and Kuriyan, 2002;
Caputo and Nimmo, 2005; Simunek and Nimmo, 2005; Nakajima and Stadler, 2006). In
addition, the centrifuge has been used in geotechnical engineering to carry out scaled
model tests for studies on soil mechanical behavior and contaminant movement in
groundwater (Arulanandan et al., 1988; Taylor, 1995).
Such a limited appeal for the centrifuge method for determining the soil water
retention is frequently related to the fact that many researchers are uncertain about its
accuracy as compared to the results obtained from the pressure plate method. Indeed,
even though Freitas Junior and Silva (1984) derived a mathematical equation to calculate
the average water potential at a given cross-section of a centrifuged soil sample, thus
enabling the determination of different points of the soil-water retention curve from a
previously selected rotation speed, they did not perform any statistical analysis to
determine the quality of their results. Medeiros (1987) applied the method developed by
Freitas Junior and Silva (1984) to an Alfisol and several Oxisols and showed that the
water contents obtained with the centrifuge and pressure plate methods were, in general,
highly linearly correlated but with appreciable differences at each soil water potential.
Centurion et al. (1997) compared the centrifuge method with the pressure plate method
applied to representative Brazilian tropical soils. They showed that the results recorded
with the centrifuge and pressure plate methods were again highly correlated. Balbino et
al. (2002) analyzed data obtained from Brazilian Oxisols and showed that the water
content determined at –10, –33 and –1500 kPa were greater when measured with the
centrifuge method compared to the pressure plate method. Khanzode et al (2000, 2002),
by using a proposed adaptation of a medical centrifuge to measure soil water
characteristic curves on artificially packed disturbed soil samples, compared three soils
insu
-003
1174
0, v
ersi
on 1
- 31
Oct
200
8

4
with clay contents ranging from 7 to 70 g kg-1 and showed also the centrifuge method
overestimated the water retention when compared to the data obtained with tempe cells
for water potentials varying from -1 to -600 kPa. By testing the run duration, they
concluded that 120 minutes of rotation was sufficient to attain equilibrium conditions for
the silty soil used but not good enough to reach equilibrium for the heavier soils studied.
Meanwhile, Silva and Azevedo (2001, 2002), using soils from the Cerrado Biome, which
usually have soil water characteristics typical of sandy soils, showed that the run duration
was critical for the precision of the centrifuge method, finding that from 83 to 130 min
were required to reach equilibrium at each applied rotation speed, depending on the soil
texture, while the centrifugation time had been 5 to 60 min in the study of Odèn (1975)
and 50 to 60 min in the study of Centurion et al. (1997). A possible explanation for the
different water contents recorded with the centrifuge and pressure plate methods at a
given water potential is the run duration adopted. Because the centrifuge method is much
less time consuming than the pressure plate method for determining the soil water
retention curve, it is potentially an attractive alternative method. The aim of this study
was to demonstrate the validity of the centrifugation method using a wide range of
tropical soils.
MATERIAL AND METHODS
The studied soils
Two sets of Brazilian tropical soils were selected for the study: Set 1, 10 soil core
samples located along a 10-km local hydrosequence across a Cerrado-Amazonia
transition; and Set 2, 10 soil core samples located along a 350-km regional toposequence
across the Cerrado (Reatto et al., 2007) (Table 1). The soil water retention properties for
core samples were determined by using the pressure plate apparatus (Richards and
insu
-003
1174
0, v
ersi
on 1
- 31
Oct
200
8

5
Fireman, 1943) and the centrifugation method (Russel and Richards, 1938), following the
laboratory procedures (Freitas Junior and Silva, 1984; Silva and Azevedo, 2002) applied
for the whole centrifuged soil sample. The soils were described according to the field
manual of Lemos and Santos (1996) and the Brazilian Soil Taxonomy (Embrapa, 1999).
Core samples were collected by using stainless steel cylinders of 100 cm3 (5.1-cm diam,
5.0-cm lengh) in the top, transitional and diagnostic horizons of the soils belonging to the
local hydrosequence (Set 1) and in the sole diagnostic horizon of the soils belonging to
the regional toposequence (Set 2). Disturbed soil samples were also collected in order to
determine the particle density, particle size distribution, and organic C content according
to the Brazilian standard procedures (Embrapa, 1997), which in general follow the
international procedures (Klute, 1986; Page et al., 1982). Specifically, the particle size
distribution was determined with the pipette method after dispersion in 1 mol L-1 NaOH.
The particle density was measured by using 95% hydrated alcohol instead of distilled
water, with 20 g of air-dried soil material in a 50-ml pycnometer; and the organic C
content was determined by wet combustion with 0.27 mol L-1 K2Cr2O7 (Table 1).
Soil-water retention properties
The water retention properties were determined by using core soil samples (Silva et
al., 2006). Gravimetric water contents (w in g g-1) at -1, -3, -6, -10, -33, -80, -400, -1000,
and -1500 kPa water potential were determined for the soils belonging to the local
hydrosequence (Set 1), while it was determined only at -1, -6, -10, -33, -300, and -1500
kPa water potential for the soils belonging to the regional toposequence (Set 2). For every
soil, samples were first saturated for 24 h and then weighed to determine the soil water
content at saturation before submitting them to water extraction by applying the pressure
plate and centrifuge methods. For the centrifuge method (Russel and Richards, 1938), we
insu
-003
1174
0, v
ersi
on 1
- 31
Oct
200
8

6
used a Kokusan H-1400pF centrifuge with an outer radii, re, of 8.3 cm, specially designed
to hold four soil samples (Fig. 1). In the centrifuge, each soil cylinder was inserted into a
stainless sample holder provided by the centrifuge manufacturer. A drilled metallic plate
and 205-µm filter paper were placed at the bottom of the sample holder to facilitate
retention of soil particles and drainage during centrifugation (Fig. 1). The Kokusan H-
1400pF centrifuge was equipped with a mechanism to maintain and control the inside
temperature within the range of 16 to 21oC. This method is routinely used in the soil
physics laboratory at Embrapa Cerrados (Silva and Azevedo, 2001).
For the centrifugation method, care was taken to keep the samples under constant
rotation for 120 min to reach the soil water potential equilibrium corresponding to a given
centrifugal force (Silva and Azevedo, 2002). After each centrifugation step, the samples
were weighed and returned to the centrifuge to undergo a higher rotation speed. This
procedure was repeated up to the last established water potential (-1500 kPa). The
samples were then oven-dried at 105°C for 24 hours to obtain the soil dry mass. Each
applied rotation speed, whenever necessary, was adjusted by using an electronic
tachometer. The equation used for calculating the average distribution of matric soil-
water potential, h (kPa), along the soil sample of length, L (cm), subject to an angular
velocity,ω (rad s-1) was
[ ]erLLgk
h 36
12 −= −ω [1]
where g is the acceleration of gravity (981 cm s-2), and k a constant value equal to
0.09807 kPa cm-1. For example, if ω = 77.67 rad s-1 (741.6 rpm), then with re = 8.3 cm
and L = 5.0 cm, we obtain h = -10 kPa. Similarly, the angular velocity for -1 kPa is 24.56
rad s-1 (234.5 rpm), and so on. Equation (1) takes into consideration the nonlinear
behavior of the matric water potential distribution along the soil sample that is established
insu
-003
1174
0, v
ersi
on 1
- 31
Oct
200
8

7
during the centrifugation. Because of this nonlinearity, the average water potential is not
necessarily at the midpoint of the soil sample, as pointed out by Khanzode et al. (2000).
In the case of the pressure plate apparatus (Richards and Fireman, 1943), the water
potentials were established and controlled by an electrical automatic air-pressure pump.
The time for equilibrium for the pressure plate varied depending on the magnitude of the
applied pressure and the type of soil. Each pressure step was maintained until the water
outflow nearly stopped, which took from 3 to 10 d. In any case, the soil sample mass for
both methods was measured at every water potential and the final water content
determined at -1500 kPa after oven-drying the soil at 105°C for 24 hours. The water
content at each potential was then calculated. The bulk density (Db in Mg m-3) was
determined on six replicates by using the oven-dry mass of the soil material contained in
cylinders 100-cm3 in volume. The volumetric water content (θ in m3 m-3) was computed
as
bDwρ
θ 1= [2]
where, ρ, the water density (Mg m-3).
The soil water contents recorded with the two methods were fitted to the van
Genuchten’s model (van Genuchten, 1980) in order to allow a pairwise comparison
between the resulting soil water retention curves and thus additionally validating the
similarity between the methods. This model was expressed by
( ) [ ]( )nnrsr h
/11)(1
+−+−+= δθθθθ [3]
where θ, the volumetric soil water content (m3 m-3), θr, the fitted residual volumetric soil
water content (m3 m-3), θs, the measured saturated volumetric soil water content (m3 m-3),
h, the matric soil water potential (kPa), and δ and n are fitting parameters (kPa-1 and
insu
-003
1174
0, v
ersi
on 1
- 31
Oct
200
8
8
dimensionless, respectively). The fitted parameters (θr, δ and n) were obtained with the
solver routine embedded in the Microsoft Excel program.
Statistical Analysis of the data sets
Water contents recorded at every water potential for the soils belonging to Set 1
were compared in a point-wise manner by plotting each measured soil water content
obtained with the pressure plate and centrifuge methods using appropriate statistical
analysis as proposed by Graybill (1976) (see Appendix).
The water retention properties of the soils belonging to Set 2 were used to establish
the similarity of the overall soil water retention curves as determined with the pressure
plate and centrifuge methods and adjusted by the van Genuchten model. The statistical
analysis of this comparison follows the F test used by Silva and Azevedo (2002), which
somewhat resembles the curve comparison method proposed by Motolusky and
Christopoulos (2003) to select nonlinear models fitted to a given set of data points.
RESULTS AND DISCUSSION
Analysis of the elementary measured water contents
On the basis of the data recorded with the soils belonging to the hydrosequence (Set
1), we gathered a total of 468 average soil water contents obtained with either the
pressure plate (θp) or centrifuge (θc) method. These water contents were compared in a
pointwise manner (Fig. 2), to determine if the outcome follows, in general, a
1:1 relationship. The fitted straight line showed a high correlation (R2 = 0.9891). The
slope was very close to 1 (0.9796) and the intercept to 0 (0.01136) (Fig. 2). The statistical
analysis applied to determine the significance of the deviation between the 1:1 model and
insu
-003
1174
0, v
ersi
on 1
- 31
Oct
200
8
9
the fitted straight line using the Graybill test showed that both models were statistically
identical for a P = 0.0109 (Fig. 2). As a result, the comparison of pointwise soil water
content measured with the pressure plate (θp) and centrifuge (θc) method for soils of the
hydrosequence (Cerrado-Amazonia transition) showed that, for the two methods, the
water contents corresponding to the range from –1 to –1500 kPa are statistically identical
for a large range of soil types (Plinthaquox, Fluvaquent, Hapludox) (Table 1).
Considering the good agreement found between these methods, it could be inferred that
the overestimated water contents recorded by Balbino et al. (2002) and Khanzode et al.
(2000, 2002) with the centrifuge technique would be due to some inappropriate combined
consideration of the centrifugation run duration, geometry of the soil sample, and type of
soil structure and not necessarily to inappropriate equilibrium conditions as suggested by
Khanzode et al. (2000, 2002). Thus, the use of artificially packed soil samples such as in
the study of Khanzode et al. (2000, 2002) might have affected the water retention
process, especially at low soil water potentials. On the other hand, Balbino et al. (2002)
plotted in the same graph water contents measured at a given matric potential with the
centrifuge and pressure plate methods according to the clay content. In doing so, a unique
relationship was assumed between the water content at a given water potential and the
clay content, which is highly questionable because of the contribution of the mineralogy
and assemblage of the fine fractions to the water retention properties (Bruand and
Tessier, 2000).
Analysis of the water retention curves
For every horizon of the regional toposequence studied (Set 2), the van Genuchten
model was fitted to the water contents recorded with the centrifuge method and then to
those recorded with the pressure plate method (Fig. 3). The statistical results based on the
insu
-003
1174
0, v
ersi
on 1
- 31
Oct
200
8

10
F test for curve comparison (Silva and Azevedo, 2002) showed that the smallest
probability of rejecting the null hypothesis of similarity for the water retention curves
measured with the two methods was P = 0.0106 for the soil sample from O9, while the
highest similarity was observed for the soil sample from O3 (P = 0.7388). The variation
of sample height was <2 % for all the samples studied up to –80 kPa, then reaching 20 to
30 % according to the sample at –1500 kPa. Despite this height variation, which resulted
from sample deformation due to centrifugal force and possibly some sample shrinkage
because of water removal, the soil water retention curves obtained with the two methods
did not differ significantly (Fig. 3). Finally, detailed analysis of the curves showed that
the difference in water content between the two methods was the largest at -1 kPa on
replicate samples (except for O10) (Fig. 3). This difference would be related to the large
change in water content with respect to potential at high potential, thus generating errors
whatever the method used.
CONCLUSIONS
Our results showed good agreement between the centrifuge and pressure plate
methods when applied to the large range of tropical soils studied in a routine laboratory
application. Comparison of the water content recorded in a point-wise manner and of the
water retention curve showed clearly that there was no difference when the appropriate
methodology was used for the centrifuge method. These results showed also that the
centrifuge should be considered an appropriate method because it requires a relatively
short time, compared with the pressure plate method, for the determination of the whole
water retention curve. Indeed, a soil water retention curve with nine pressure points
requires from 2 to 3 mo to be determined in a 24-h running time using the pressure plate
insu
-003
1174
0, v
ersi
on 1
- 31
Oct
200
8

11
method, while the centrifuge method requires only 120 min of rotation time for every
pressure point, for a total time of only 4 d including the time required to oven dry the soil.
APPENDIX
Graybill (1976) proposed a mathematical expression to calculate an Fw-statistic
distribution value to test the significance of a null hypothesis of similarity of a set of
linear models. In this study, the test was applied to Set 1 and consisted in verifying the
similarity between the 1:1 model and the straight line fitted to the experimental data. The
hypothesis of equality is rejected if and only if 4,2: −≥ Nw FF α is met. In this inequality,
4,2: −NFα is the F distribution value corresponding to a previously established Type I error
α with 2 and N-4 degrees of freedom; N is the total number of data points of both models.
The statistic Fw (Graybill, 1976) can be expressed as follows for soils from Set 1:
( )( )( )
( )( )
( )
−
−
−−−
−−
−−
=∑∑
∑∑ ∑∑∑∑
∑∑
= =
= = = =
= =
= =
2
4
ˆ
ˆ
2
1 1
2
2
1 1
2
1 1
2
2
1 1
2
22
1 12
NF
m
N
imiCmiC
m
N
i m
N
imiCmiC
m
N
imPmiP
m
N
imPmiPmCmiC
mCmiC
w m
m m
m
m
θθ
θθθθ
θθθθθθ
where m = 1 (model 1:1) and m = 2 (centrifuge versus pressure plate); I is an index for a
given water content value; miCθ is a measured centrifuge water content for a given m
and i; miPθ is the measured pressure plate-water content for a given m and i;
mCθ is the
average centrifuge water content for a given m; mPθ is the average pressure plate water
content for a given m; miCθ̂ is a calculated centrifuge-water content for a given m and i;
insu
-003
1174
0, v
ersi
on 1
- 31
Oct
200
8

12
miPθ̂ is a calculated pressure plate-water for a given m and i; mN is the number of data
points for each model. For m = 1, it was set miCθ =
miPθ ; mCθ =
mPθ ; miCθ̂ =
miPθ̂ .
The statistic Fc was computed as follows in this study for soils from data Set 2:
( )( )
++−
=num
den
2met1met
2met1metcombc DF
DF
RSSRSS
RSSRSSRSSF
where RSSmet1 and RSSmet2 are the residual sum of squares, resulting from fitting a given
soil water retention model to the data obtained from either pressure plate (met1) or
centrifuge methods (met2), respectively; RSScomb represents the residual sum of squares,
obtained from fitting the same soil water retention model to the data altogether obtained
from both pressure plate and centrifuge; DFnum and DFden represent the degrees of
freedom of numerator and denominator, respectively, corresponding to difference
between the number of data points and the parameters from each fitting.
ACKNOWLEDGEMENTS
We thank the Empresa Brasileira de Pesquisa Agropecuária (EMBRAPA) for its financial
support of A. Reatto’s work in France. We also thank Wantuir Caixeta Vieira, technician
assistant in the Embrapa Cerrados physical laboratory, for its contribution to the study.
This research is part of the project Embrapa Cerrados, n°02.02.5.05.5.00 “Development
of pedotransfer functions for estimating soil water retention and saturated hydraulic
conductivity from Latosols of the Biome Cerrado”.
insu
-003
1174
0, v
ersi
on 1
- 31
Oct
200
8

13
REFERENCES
Arulanandan, K., P. Y. Thompson, B. L. Kutter, N. J. Meegoda, K. K. Muraleetharan,
and C. Yogachandran. 1988. Centrifuge modeling of transport processes for
pollutants in soils. J. Geotech. Eng – Ascel. 114 (2): 185-205.
Balbino, L. C., M. Brossard, J-C. Leprun, and A. Bruand. 2002. Mise en valeur des
Ferralsols de la région du Cerrado (Brésil) et évolution de leurs propriétés physiques:
une étude bibliographique. Étude et Gestion des Sols. 9 (2): 83–104.
Briggs, L. J., and J. W. McLane. 1910. Moisture equivalent determinations and their
application. Proc. Am. Soc. Agron. 2: 138–147.
Bruand, A., and D. Tessier. 2000. Water retention properties of the clay in soils
developed on clayed sediments: significance of parent material and soil history. Eur.
J. Soil Sci. 51: 679-688.
Caputo, M. C., and J. R. Nimmo. 2005. Quasi-steady centrifuge method for unsaturated
hydraulic properties. Water Resour. Res. 41 (11): W11504.
Centurion J. F., M. H. Moraes, and C. L. F. Della Libera. 1997. Comparação de métodos
para determinação da curva de retenção de água em solos. Rev. Bras. Cienc. Solo. 21:
173–179.
Embrapa. 1997. Manual de métodos de análise de solo. Empresa Brasileira de Pesquisa
Agropecuária, Rio de Janeiro, RJ.
Embrapa. 1999. Sistema Brasileiro de Classificação de Solos. Empresa Brasileira de
Pesquisa Agropecuária, Rio de Janeiro, RJ.
Freitas Júnior, E., and E.M., Silva. 1984. Uso da centrífuga para determinação da curva
de retenção de água do solo, em uma única operação. Pesq. Agropec. Bras. 19: 1423–
1428.
insu
-003
1174
0, v
ersi
on 1
- 31
Oct
200
8

14
Graybill, F. A. 1976. Theory and application of the linear model. Duxbury press,
Colorado State University.
IUSS Working Group WRB. 2006. World reference base for soil resources 2006. World
Soil Resources Reports N° 103. FAO, Rome.
Lemos, R. C., and R. D. Santos. 1996. Manual de descrição e coleta de solo no campo.
Sociedade Brasileira de Ciência do Solo, Campinas, SP.
Medeiros, S. D. 1987. Determinação da curva de retenção da água no solo através do
fatiamento de amostras centrifugadas. Ph.D. thesis, ESALQ-USP, Piracicaba, SP.
Motolusky H. J., and A. Christopoulos. 2003. Fitting models to biological data using
linear and nonlinear regression. A practical guide to curve fitting. GraphPad Software
Inc., San Diego CA, www.graphpad.com.
Nakajima, H., and A. T. Stadler. 2006. Centrifuge modeling of one-step outflow testes for
unsaturated parameter estimations. Hydrol. Earth Syst. Sci. 10: 715-729.
Nimmo, J. R., K. S. Perkins, and A. M. Lewis. 2002. Steady-state centrifuge. p. 903-916.
In J. H. Dane and G. C. Topp (eds.). Methods of Soil Analysis, Part 4, Physical
Methods. Soil Sci. Soc. Amer., Madison, Wisconsin, USA.
Odén, S. 1975. An integral method for the determination of moisture retention curves by
centrifugation. Grundförbättring. 27 (4): 137–143.
Khanzode, R. M., D. G. Fredlund, and S. K. Vanapalli. 2000. A new test procedure to
measure the soil-water characteristic curves using a small-scale centrifuge. p.335-340.
In Proc. Asian Conference on Unsaturated Soils from Theory to Practice. UNSAT-
ASIA.
insu
-003
1174
0, v
ersi
on 1
- 31
Oct
200
8

15
Khanzode, R. M., S. K. Vanapalli, and D. G. Fredlund. 2002. Measurement of soil-water
characteristics curves for fine-grained soils using a small-scale centrifuge. Can.
Geotech. J. 39: 1209-1217.
Klute, A. 1986. Methods of Soil Analysis, Part 1, Physical and Mineralogical Methods.
Amer. Soc. Agronomy and Soil Sci. Soc. Amer., Madison, Wisconsin, USA.
Page, A. L., R. H. Miller, and D. R. Keeney. 1982. Methods of Soil Analysis, Part 2,
Chemical and Microbiological Properties. Amer. Soc. Agronomy and Soil Sci. Soc.
Amer., Madison, Wisconsin, USA.
Reatto, A., A. Bruand., E. M. Silva, E. S. Martins, and M. Brossard. 2007. Hydraulic
properties of the diagnostic horizon of Latosols of a regional topossequence across
the Brazilian Central Plateau. Geoderma. 139: 51-59.
Richards, L. A., and M. Fireman. 1943. Pressure-plate apparatus for measuring moisture
sorption and transmission by soils. Soil Sci. 56: 395–404.
Russel, M. B., and L. A. Richards. 1938. The determination of soil moisture energy
relations by centrifugation. Soil Sci. Soc. Proc. 3: 65–69.
Silva, E.M., and J.A. Azevedo. 2001. Período de centrifugação adequado para
levantamento da curva de retenção da água em solos do Bioma Cerrado. B.P.
Embrapa Cerrados. 8: 1-40.
Silva, E.M., and J.A. Azevedo. 2002. Influência do período de centrifugação na curva
de retenção de água em solos de Cerrado. Pesq. Agropec. Bras. 37: 1487–1494.
Silva, E. M., J. E. F. W. Lima, J. A. Azevedo, and L. N Rodrigues. 2006. Valores de
tensão na determinação da curva de retenção de água de solos do Cerrado. Pesq.
Agropec. Bras. 41 (2): 323-330.
insu
-003
1174
0, v
ersi
on 1
- 31
Oct
200
8

16
Simunek, J., and J. R. Nimmo. 2005. Estimating soil hydraulic parameters from transient
flow experiments in a centrifuge using parameter optimization technique. Water
Resour. Res. 41 (4): W04015.
Singh, D. N., and S. J. Kuriyan. 2002. Estimation of hydraulic conductivity of
unsaturated soils using a geotechnical centrifuge. Can. Geotech. J. 39: 684-694.
Soil Survey Staff. 2006. Keys to Soil Taxonomy. 10th ed. USDA-Natural Resources
Conservation Service. Washington, DC.
Taylor, R. N. 1995. Geotechnical Centrifuge Technology. Blackie Academic and
Professional, London.
Thomas, M. D., and K. Harris. 1925. The moisture equivalent of soils. Soil Sci. 21 (6):
411-423.
van Genuchten, M. T. 1980. A closed form equation for predicting the hydraulic
conductivity of unsaturated soils. Soil Sci. Soc. Am. J. 44: 892–898.
insu
-003
1174
0, v
ersi
on 1
- 31
Oct
200
8

17
1
List of Tables 2
3
Table 1. General characteristics of the two sets of soil samples from Brazilian Tropical 4
soils studied. 5
6
insu
-003
1174
0, v
ersi
on 1
- 31
Oct
200
8

18
List of Figures 7
Fig. 1. Saturated soil core samples (a), empty sample holders, with and without filter 8
paper (b), and sample holders positioned inside the centrifuge rotor chamber (c). 9
10
Fig. 2. Point-wise comparison of measured volumetric soil-water content values from 11
both pressure plate and centrifuge methods for soils from Embrapa Cerrados database set 12
(1). Fw: F-test statistic value, according to (Graybill, 1976). p: probability of Fw according 13
to F-distribution for 2 and 464 degrees of freedom. 14
15
Fig. 3. Soil-water retention fitting using van Genuchten model using results from both 16
pressure plate and centrifuge methods for soils from data set (2). O: Oxisols, Fc: F-test 17
statistic value, p: probability of Fc according to F-distribution for 3 and 39 degrees of 18
freedom. 19
20
insu
-003
1174
0, v
ersi
on 1
- 31
Oct
200
8
19
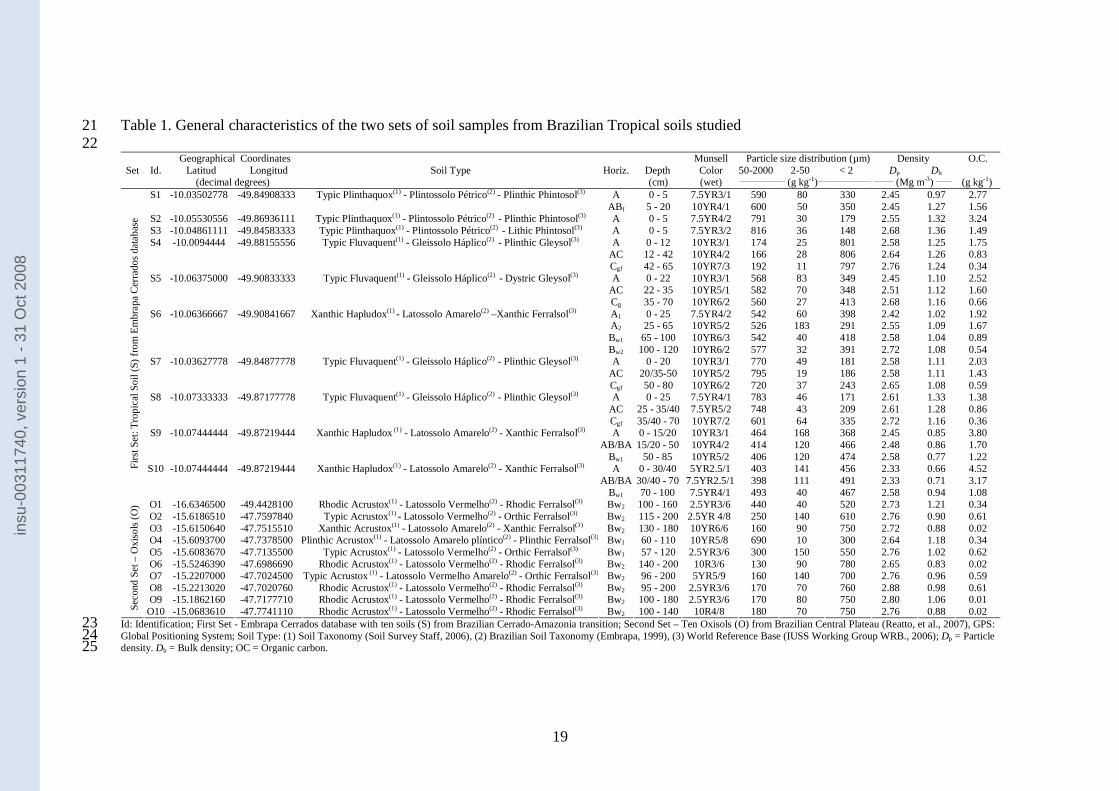
Table 1. General characteristics of the two sets of soil samples from Brazilian Tropical soils studied 21 22
Geographical Coordinates Munsell Particle size distribution (µm) Density O.C. Set Id. Latitud Longitud Soil Type Horiz. Depth Color 50-2000 2-50 < 2 Dp Db
(decimal degrees) (cm) (wet) ______________ (g kg-1)_______________________ (Mg m-3) _____ (g kg-1) S1 -10.03502778 -49.84908333 Typic Plinthaquox(1) - Plintossolo Pétrico(2) - Plinthic Phintosol(3) A 0 - 5 7.5YR3/1 590 80 330 2.45 0.97 2.77 ABf 5 - 20 10YR4/1 600 50 350 2.45 1.27 1.56
S2 -10.05530556 -49.86936111 Typic Plinthaquox(1) - Plintossolo Pétrico(2) - Plinthic Phintosol(3) A 0 - 5 7.5YR4/2 791 30 179 2.55 1.32 3.24 S3 -10.04861111 -49.84583333 Typic Plinthaquox(1) - Plintossolo Pétrico(2) - Lithic Phintosol(3) A 0 - 5 7.5YR3/2 816 36 148 2.68 1.36 1.49 S4 -10.0094444 -49.88155556 Typic Fluvaquent(1) - Gleissolo Háplico(2) - Plinthic Gleysol(3) A 0 - 12 10YR3/1 174 25 801 2.58 1.25 1.75 AC 12 - 42 10YR4/2 166 28 806 2.64 1.26 0.83 Cgf 42 - 65 10YR7/3 192 11 797 2.76 1.24 0.34
S5 -10.06375000 -49.90833333 Typic Fluvaquent(1) - Gleissolo Háplico(2) - Dystric Gleysol(3) A 0 - 22 10YR3/1 568 83 349 2.45 1.10 2.52 AC 22 - 35 10YR5/1 582 70 348 2.51 1.12 1.60 Cg 35 - 70 10YR6/2 560 27 413 2.68 1.16 0.66
S6 -10.06366667 -49.90841667 Xanthic Hapludox(1) - Latossolo Amarelo(2) –Xanthic Ferralsol(3) A1 0 - 25 7.5YR4/2 542 60 398 2.42 1.02 1.92 A2 25 - 65 10YR5/2 526 183 291 2.55 1.09 1.67 Bw1 65 - 100 10YR6/3 542 40 418 2.58 1.04 0.89 Bw2 100 - 120 10YR6/2 577 32 391 2.72 1.08 0.54
S7 -10.03627778 -49.84877778 Typic Fluvaquent(1) - Gleissolo Háplico(2) - Plinthic Gleysol(3) A 0 - 20 10YR3/1 770 49 181 2.58 1.11 2.03 AC 20/35-50 10YR5/2 795 19 186 2.58 1.11 1.43 Cgf 50 - 80 10YR6/2 720 37 243 2.65 1.08 0.59
S8 -10.07333333 -49.87177778 Typic Fluvaquent(1) - Gleissolo Háplico(2) - Plinthic Gleysol(3) A 0 - 25 7.5YR4/1 783 46 171 2.61 1.33 1.38 AC 25 - 35/40 7.5YR5/2 748 43 209 2.61 1.28 0.86 Cgf 35/40 - 70 10YR7/2 601 64 335 2.72 1.16 0.36
S9 -10.07444444 -49.87219444 Xanthic Hapludox (1) - Latossolo Amarelo(2) - Xanthic Ferralsol(3) A 0 - 15/20 10YR3/1 464 168 368 2.45 0.85 3.80 AB/BA 15/20 - 50 10YR4/2 414 120 466 2.48 0.86 1.70 Bw1 50 - 85 10YR5/2 406 120 474 2.58 0.77 1.22
S10 -10.07444444 -49.87219444 Xanthic Hapludox(1) - Latossolo Amarelo(2) - Xanthic Ferralsol(3) A 0 - 30/40 5YR2.5/1 403 141 456 2.33 0.66 4.52 AB/BA 30/40 - 70 7.5YR2.5/1 398 111 491 2.33 0.71 3.17
Firs
t Set
: Tro
pic
al S
oil
(S)
fro
m E
mb
rap
a C
erra
do
s da
tab
ase
Bw1 70 - 100 7.5YR4/1 493 40 467 2.58 0.94 1.08 O1 -16.6346500 -49.4428100 Rhodic Acrustox(1) - Latossolo Vermelho(2) - Rhodic Ferralsol(3) Bw2 100 - 160 2.5YR3/6 440 40 520 2.73 1.21 0.34 O2 -15.6186510 -47.7597840 Typic Acrustox(1) - Latossolo Vermelho(2) - Orthic Ferralsol(3) Bw2 115 - 200 2.5YR 4/8 250 140 610 2.76 0.90 0.61 O3 -15.6150640 -47.7515510 Xanthic Acrustox(1) - Latossolo Amarelo(2) - Xanthic Ferralsol(3) Bw2 130 - 180 10YR6/6 160 90 750 2.72 0.88 0.02 O4 -15.6093700 -47.7378500 Plinthic Acrustox(1) - Latossolo Amarelo plíntico(2) - Plinthic Ferralsol(3) Bw1 60 - 110 10YR5/8 690 10 300 2.64 1.18 0.34 O5 -15.6083670 -47.7135500 Typic Acrustox(1) - Latossolo Vermelho(2) - Orthic Ferralsol(3) Bw1 57 - 120 2.5YR3/6 300 150 550 2.76 1.02 0.62 O6 -15.5246390 -47.6986690 Rhodic Acrustox(1) - Latossolo Vermelho(2) - Rhodic Ferralsol(3) Bw2 140 - 200 10R3/6 130 90 780 2.65 0.83 0.02 O7 -15.2207000 -47.7024500 Typic Acrustox (1) - Latossolo Vermelho Amarelo(2) - Orthic Ferralsol(3) Bw2 96 - 200 5YR5/9 160 140 700 2.76 0.96 0.59 O8 -15.2213020 -47.7020760 Rhodic Acrustox(1) - Latossolo Vermelho(2) - Rhodic Ferralsol(3) Bw2 95 - 200 2.5YR3/6 170 70 760 2.88 0.98 0.61 O9 -15.1862160 -47.7177710 Rhodic Acrustox(1) - Latossolo Vermelho(2) - Rhodic Ferralsol(3) Bw2 100 - 180 2.5YR3/6 170 80 750 2.80 1.06 0.01
Sec
ond
Set
– O
xiso
ls (
O)
O10 -15.0683610 -47.7741110 Rhodic Acrustox(1) - Latossolo Vermelho(2) - Rhodic Ferralsol(3) Bw2 100 - 140 10R4/8 180 70 750 2.76 0.88 0.02 Id: Identification; First Set - Embrapa Cerrados database with ten soils (S) from Brazilian Cerrado-Amazonia transition; Second Set – Ten Oxisols (O) from Brazilian Central Plateau (Reatto, et al., 2007), GPS: 23 Global Positioning System; Soil Type: (1) Soil Taxonomy (Soil Survey Staff, 2006), (2) Brazilian Soil Taxonomy (Embrapa, 1999), (3) World Reference Base (IUSS Working Group WRB., 2006); Dp = Particle 24 density. Db = Bulk density; OC = Organic carbon. 25
insu
-003
1174
0, v
ersi
on 1
- 31
Oct
200
8

20
26
27 28 29
Fig. 1. Saturated soil core samples (a), empty sample holders with and without filter 30
paper (b) and sample holders positioned inside the centrifuge rotor chamber (c). 31
32 33
insu
-003
1174
0, v
ersi
on 1
- 31
Oct
200
8

21
34
0.0
0.1
0.2
0.3
0.4
0.5
0.6
0.7
Wat
er c
onte
nt f
rom
ce n
trif
uge,
θc
(m
m
)
0.0 0.1 0.2 0.3 0.4 0.5 0.6 0.7Water content from pressure plate, θp (m m )
Line 1:1Regression line
θc = 0.9796 θp + 0.01136
Measured data
F = 4.565
p-value = 0.0109
3-3
3 -3
w
(R = 0.9891)2
35
36
Fig. 2. Point-wise comparison of measured volumetric soil-water content values from 37
both pressure plate and centrifuge methods for soils from Embrapa Cerrados database 38
set (1). Fw: F-test statistic value, according to (Graybill, 1976). p: probability of Fw 39
according to F-distribution for 2 and 464 degrees of freedom. 40
41
42
insu
-003
1174
0, v
ersi
on 1
- 31
Oct
200
8

22
43
0.0
0.2
0.4
0.6
0.8
0.0
0.2
0.4
0.6
0.8
0.0
0.2
0.4
0.6
0.8
0.0
0.2
0.4
0.6
0.8
0.0
0.2
0.4
0.6
0.8
-10-1 -100 -101 -102 -103 -104 -10
-1 -100 -101 -102 -103 -104
Fitted centrifuge modelFitted pressure plate model
Soil-Water Potential (kPa)
Vo
lum
etri
c S
oil-
Wa
ter
Co
nte
nt (
m m
)
-3Measured centrifuge data
O1
O3
O5
O7
O9
O2
O4
O6
O8
O10
F = 0.8903p-value = 0.4547c
F = 3.1971
F = 0.4284
F = 1.2301
F = 2.7339
F = 4.2738
p-value = 0.0338
p-value = 0.7388
p-value = 0.3117
p-value = 0.0566
p-value = 0.0106
F = 1.9945
F = 3.9589
F = 0.4284
F = 3.1805
p-value = 0.1307
p-value = 0.0148
p-value = 0.7338
p-value = 0.0345
c
c
c
c
c
c
c
c
c
c
Measured pressure plate data3
44 Fig. 3. Soil-water retention fitting using van Genuchten model using results from both 45
pressure plate and centrifuge methods for soils from data set (2). O: Oxisols, Fc: F-test 46
statistic value, p: probability of Fc according to F-distribution for 3 and 39 degrees of 47
freedom. 48
49 50 51
insu
-003
1174
0, v
ersi
on 1
- 31
Oct
200
8