DETERMINING BANK PERFORMANCE IN EMERGING ...
210
DETERMINING BANK PERFORMANCE IN EMERGING MARKETS: THE CASE OF JORDAN COMPETITION, PORTFOLIO BEHAVIOUR, AND EFFICIENCY By MOHAMMED ABDULLAH KHATAYBEH A Thesis Submitted to The University of Birmingham For the degree of DOCTOR OF PHILOSOPHY University of Birmingham Collage of Social Sciences Birmingham Business School Department of Economics January 2013
-
Upload
khangminh22 -
Category
Documents
-
view
5 -
download
0
Transcript of DETERMINING BANK PERFORMANCE IN EMERGING ...
DETERMINING BANK PERFORMANCE IN EMERGING MARKETS: THE CASE OF
JORDAN COMPETITION, PORTFOLIO BEHAVIOUR, AND EFFICIENCY
By
MOHAMMED ABDULLAH KHATAYBEH
A Thesis Submitted to
The University of Birmingham For the degree of
DOCTOR OF PHILOSOPHY
University of Birmingham Collage of Social Sciences Birmingham Business School Department of Economics January 2013

University of Birmingham Research Archive
e-theses repository This unpublished thesis/dissertation is copyright of the author and/or third parties. The intellectual property rights of the author or third parties in respect of this work are as defined by The Copyright Designs and Patents Act 1988 or as modified by any successor legislation. Any use made of information contained in this thesis/dissertation must be in accordance with that legislation and must be properly acknowledged. Further distribution or reproduction in any format is prohibited without the permission of the copyright holder.

DEDICATION
To;
Professor Jim L. Ford,

ACKNOWLEDEMENT
First and foremost, I would like to thank Allah the Almighty, the Most Beneficent the
most merciful for giving me the courage, support, and guidance to complete this thesis.
Prayers and peace be upon His prophet Muhammad.
I would like to express my sincere gratitude to my supervisor, Professor Nick
Horsewood, whose excellence in supervision and devotion to research has inspired my work
and whose kindness and patience has encouraged my research efforts. I confirm here that his
continuous assistance, supervision, encouragement, comments, suggestions and constructive
criticism throughout this study enabled me to complete this thesis. I would also like to thank
Professor Jim Ford to whom I am eternally grateful for his supervision during the first two
years of my PhD, who has contributed immensely towards this piece of research. I also want
to thank Professor Somnath Sen for his immense support and guidance throughout the
formulation of this thesis. A special thanks also to all staff members at the department of
Economics; Emma, Jackie, and Lisa.
I would like dedicate this Ph.D. thesis to my parents. They have been a pillar of
support throughout my life and without their patience and commitment; none of this would
have been possible.
Finally, I would like to thank my brothers and sisters, Ghada, Ahmad, Reem, Ibrahim,
Heba, Abeer, and my lovely little princess Alia, for their patience, sacrifice and love
throughout my graduate studies.

ABSTRACT
This study attempts to explain the banking performance in Jordan to draw out the
implications of related theories and evidence for policy makers. Accordingly, they can
influence the banking industry, which, in turn, impacts the economy overall. First, we
investigate bank performance and the likely impact of market structures on such performance.
The way in which market structure has an emotional impact on banks’ performance is vital
for the reason that one objective of bank regulation is to ensure market competitiveness.
Chapter three seek to examine two competing hypotheses, the SCP and the Efficient Market,
for the Jordanian banking market using an unbalanced panel data set over the period 1991 to
2009. The results obtained support the SCP hypothesis as an explanation for market
performance in Jordan. In chapter four we investigate the portfolio behaviour of Jordanian
banks during 2002 to 2009 using monthly data. The model used is based on the portfolio
choice theory, originated by Hicks (1935) and developed by Markowitz (1952) and Tobin
(1958). Several nested models are developed to test the theoretical restrictions, including
symmetry and homogeneity of the interest rate matrix. The empirical results, in general,
clearly do not provide any support for interest rates which are important in determining the
general composition of the portfolio holdings of Jordanian banks. The results show, however,
that availability of funds is more important in determining the structure of these portfolios. In
chapter five, the last empirical study, we examine the influence of efficiency estimates, which
are derived from the Data Envelopment Analysis, on stock prices of listed banks in the
Amman Stock Exchange (ASE). We test whether changes in banks’ efficiency scores have
helped to explain the change in banks’ stock prices. The overall findings suggest that the
share prices of Jordanian banks move according to the representative changes under the
technical efficiency variables in the three presented panels.

-I-
CONTENTS
TABLE OF FIGURES ............................................................................................................ V
TABLE OF TABLES ........................................................................................................... VII
CHAPTER 1 : INTRODUCTION ......................................................................................... 1
1.1. INTRODUCTION ................................................................................................................. 1
1.2. BACKGROUND .................................................................................................................. 1
1.3. AIMS AND MOTIVATIONS ................................................................................................. 3
1.4. RESEARCH METHODOLOGY .............................................................................................. 5
1.5. OUTLINE OF THE THESIS ................................................................................................... 5
CHAPTER 2 : JORDAN PROFILE ..................................................................................... 8
2.1. INTRODUCTION ................................................................................................................. 8
2.2. JORDAN ECONOMY ........................................................................................................... 9
2.2. 1. Banking Industry.................................................................................................... 16
2.2.1.1. Trends in Main Indicators of Banking Development ...................................... 20
2.3. SOURCES AND USES OF FUNDS IN BANKING ................................................................... 22
2.3. 1. Sources of Funds ................................................................................................... 24
2.3.1.1. Capital and Reserves ........................................................................................ 24
2.3.1.2. Deposits: .......................................................................................................... 26
2.3. 2. Uses of Fund .......................................................................................................... 29
2.3.2.1. Cash and Balances with Other Banks: ............................................................. 29
2.3.2.2. Security Investments ........................................................................................ 32
2.3.2.3. Loans: ............................................................................................................... 33
2.4. BANKING PROFITABILITY ............................................................................................... 39
2.4. 1. The Need for Adequate Profits .............................................................................. 39
2.4. 2. Measurement of Bank Profits ................................................................................ 40
2.4.2.1. Return on Assets .............................................................................................. 40
2.4.2.2. Return on Equity .............................................................................................. 41
2.4.2.3. Trends in Profitability in the Jordanian Banking market over the period 1991-
2009............................................................................................................................... 41
2.5. CONCLUSION .................................................................................................................. 47

-II-
CHAPTER 3 : THE RELATIONSHIP BETWEEN MARKET CONCENTRATION
AND PROFITABILITY IN BANKING ............................................................................ 49
3.1. INTRODUCTION ............................................................................................................... 49
3.2. THEORETICAL BACKGROUND ......................................................................................... 49
3.2. 1. Market Efficiency Paradigm .................................................................................. 59
3.2. 2. Banking Market Concentration ............................................................................. 60
3.2. 3. Measures of Performance ...................................................................................... 62
3.3. REVIEWS OF EMPIRICAL STUDIES ................................................................................... 62
3.4. EMPIRICAL ESTIMATION ................................................................................................. 71
3.4. 1. Concentration in Jordanian banking ..................................................................... 71
3.4. 2. Data and Methodology .......................................................................................... 72
3.4.2.1. Sample and Variables Selections ..................................................................... 73
3.4.2.2. Methodology .................................................................................................... 75
3.4.2.3. Test for non-spherical residual......................................................................... 80
3.4. 3. Estimation Results ................................................................................................. 82
3.5. CONCLUSION .................................................................................................................. 87
CHAPTER 4 : PORTFOLIO BEHAVIOUR OF COMMERCIAL BANKS IN
JORDAN UNDER RISK AVERSION: THE EXPECTED UTILITY APPROACH 90
4.1. INTRODUCTION ............................................................................................................... 90
4.2. ALTERNATIVE THEORIES OF BANK PORTFOLIO BEHAVIOUR .......................................... 91
4.3. ASSUMPTIONS OF THE MODEL ........................................................................................ 95
4.4. METHODOLOGY AND DATA .......................................................................................... 100
4.4. 1. Choice Non-Choice Items and Estimation Procedures ....................................... 101
4.4. 2. The Nature of Data .............................................................................................. 102
4.4.2.1. Aggregation of Data:...................................................................................... 102
4.4.2.2. Endogeniety and Exogeneity of Bank’s Assets: ............................................ 103
4.4.2.3. Endogeniety and Exogeneity of Bank’s Liabilities: ...................................... 104
4.4. 3. Classification of Assets between Choice and Non-Choice Items ........................ 105
4.4.3.1. Descriptive Statistics for the Endogenous Variables ..................................... 106
4.4.3.2. Descriptive Statistics for the Main Interest Rate (%) .................................... 107
4.4.3.3. Descriptive Statistics for the Exogenous Variables ....................................... 110
4.5. RESULTS OF THE GENERAL FRAMEWORK ..................................................................... 111
4.5. 1. Review of the Empirical Results on the Dynamic Model ..................................... 111

-III-
4.5. 2. Results on the Interest Rate Matrix ..................................................................... 114
4.5. 3. Results on the Own-Rate Effects .......................................................................... 114
4.5. 4. Results on the Cross-Rate Effects ........................................................................ 115
4.5. 5. Results on Non-choice Assets .............................................................................. 115
4.5. 6. Results on the System’s Dynamic Matrix ............................................................ 117
4.5. 7. The Impact, Interim and Total Multipliers .......................................................... 118
4.5.7.1. Impact effects of policy instruments on Jordanian banking portfolios .......... 118
4.5.7.2. Total effects of policy instruments on the Jordanian banks' portfolios ......... 121
4.6. CONCLUSION: ............................................................................................................... 125
CHAPTER 5 : BANK EFFICIENCY AND STOCK PERFORMANCE ................... 127
5.1. INTRODUCTION ............................................................................................................. 127
5.2. BANKING EFFICIENCY: MEANING, THEORY AND MEASUREMENT ................................ 128
5.2. 1. Conventional and Frontier Efficiency Approach ................................................ 129
5.2. 2. The Efficiency Concept ........................................................................................ 130
5.2. 3. The Framework of Efficiency .............................................................................. 131
5.2. 4. The Economic Theory and the Causes of Inefficiency ......................................... 132
5.2. 5. Technical and Allocative Efficiency .................................................................... 134
5.2. 6. Approaches to the Estimation of Efficiency ......................................................... 136
5.2. 7. Parametric versus Non-parametric Approaches to Measure Efficiency ............. 137
5.2.7.1. Data Envelopment Analysis (DEA) Approach .............................................. 138
5.2.7.2. DEA Model .................................................................................................... 139
5.3. LITERATURE REVIEW ................................................................................................... 142
5.4. METHODOLOGY ............................................................................................................ 145
5.4. 1. Stock Performance ............................................................................................... 147
5.4. 2. Efficiency Score Changes .................................................................................... 147
5.4. 3. Specification of Bank Inputs and Outputs ........................................................... 149
5.5. EMPIRICAL RESULTS .................................................................................................... 152
5.5. 1. Intermediation Approach (Panel 1) ..................................................................... 153
5.5. 2. Re-estimated the Intermediation Approach (Panel 2) ......................................... 157
5.5. 3. Profit-Oriented Approach (Panel 3) .................................................................... 160
5.6. CONCLUSIONS .............................................................................................................. 164
CHAPTER 6 : CONCLUSION AND SUGGESTIONS FOR FUTURE RESEARCH
................................................................................................................................................ 166

-IV-
6.1. INTRODUCTION ............................................................................................................. 166
6.2. SUGGESTIONS FOR FUTURE RESEARCH......................................................................... 171
APPENDIX .......................................................................................................................... 172
REFERENCES ..................................................................................................................... 176
-V-
Table of Figures
Figure 2-1: Population and GDP growth, 1976-2010. ............................................................................ 8
Figure 2-2: The Sectoral Distribution in Jordan in terms of GDP, 1964-2009. ...................................... 9
Figure 2-3: GDP and Real GDP levels (Million JD’s) and Growth Rates, 1974-2010. ....................... 10
Figure 2-4: Workers' Remittances and Grants as a Percentage of GDP, 1972-2009. ........................... 11
Figure 2-5: Per Capita Income in USD terms, 1974-2010. ................................................................... 12
Figure 2-6: Total Public Debt (Internal and Foreign) and GDP (Million JDs), 1990-2009.................. 14
Figure 2-7: Total Public Revenue, Expenditure and Grants (Million JDs), 1967-2010. ...................... 14
Figure 2-8: Banking Density Index, 1964-2010. .................................................................................. 18
Figure 2-9: Bank Nonperforming Loans to Total Gross Loans (%), 2000-2010. ................................. 19
Figure 2-10: Capital Adequacy Ratio %, 2000-2010. ........................................................................... 20
Figure 2-11: M2Y, CPY and TDY, 1965-2009. ................................................................................... 21
Figure 2-12: Growth in Capital and Reserve and Deposits, 1964-2010. .............................................. 24
Figure 2-13: Capital and Reserve as a Percentage of Total Deposits, 1994-2010. ............................... 25
Figure 2-14: Deposits According to Maturity, 1975-2010.................................................................... 27
Figure 2-15: Deposits Growth over the Period, 1964-2010 .................................................................. 27
Figure 2-16: Demand Deposits and Time and saving as a Proportion of Total Deposits, 1994-2010. . 28
Figure 2-17: Obligatory and Total Reserves Held by Central Bank (Million’s JD), 1993-2010. ......... 30
Figure 2-18: Cash and Balances as a percentage of Assets over the period, 2002-2010. ..................... 31
Figure 2-19: Loans to Deposits ratio, 1993-2010. ................................................................................ 31
Figure 2-20: Cash and Balances to Total Deposits ratio, 2002-2010.................................................... 32
Figure 2-21: Portfolio to Total Assets Ratio, 2002-2010. ..................................................................... 33
Figure 2-22: Total Credits according to Type (Million’s JD), 1993-2011. ........................................... 34
Figure 2-23: Total Credit Growth, Credit to Assets, and Credit to Deposits, 1993-2010. .................... 35
Figure 2-24: Loans Portfolio of Jordanian Banks according to Borrowers .......................................... 36
Figure 2-25: The Changes of Credit to Assets Ratio, the Change in Total Assets, and the Required
Reserve Ratio’s in Deposits, 1993-2010. .............................................................................................. 37
Figure 2-26: Saving and Time Deposits Growth to Total Deposits Ratio with Growth in Credits to
Total Assets Ratio, 1993-2010. ............................................................................................................. 38
Figure 2-27: Banks ROA, 1991-2009. .................................................................................................. 42
Figure 2-28: Banks ROE, 1991-2009. .................................................................................................. 43
Figure 2-29: ROA and ROE, 1991-2009. ............................................................................................. 44
Figure 2-30: ASE Un-weighted Price Indices (points), 1991-2011. ..................................................... 45
-VI-
Figure 2-31: Monthly Percentage Changes of the Stock Prices Index of the Banking Sector, 1993-
2010. ..................................................................................................................................................... 45
Figure 3-1: The linear SCP model ........................................................................................................ 52
Figure 3-2: The Interaction Relationship between Market Structure, Conduct and Performance. ....... 53
Figure 3-3: Big Three and Five Banks Share in terms of Assets and Deposits, 1991-2009. ................ 71
Figure 3-4: Herfindahl-Hirschman Index (HHI) for Assets and Deposits, 1991-2009. ........................ 72
Figure 4-1: Endogenous Variables Movements (2002-2009) ............................................................. 108
Figure 4-2: Main Interest Rate movements (2002-2009) .................................................................... 109
Figure 4-3: Exogenous Variables movements (2002-2009) ............................................................... 110
Figure 4-4: Actual, Fitted and Residuals Series from each of the Six Estimated Equations .............. 113
Figure 4-5: The Effects of Main Interest Rate (Exogenous) on Endogenous Variables ..................... 122
Figure 5-1: Technical and Allocative Efficiency ................................................................................ 135

-VII-
Table of Tables
Table 2.1: Economic Adjustment Programs Time-table ....................................................................... 15
Table 2.2: The Consolidate Balance Sheet for Jordanian Banks (Million’s JD), 2007-2011. .............. 23
Table 2.3: Loans Portfolio (Million’s JD), 2007-2011. ........................................................................ 34
Table 2.4: Variables Correlation ........................................................................................................... 39
Table 3.1: Types of Markets which describe the Structures of the Practices........................................ 50
Table 3.2:Summary of the Major Finding of SCP Literature during 1960s-1980s ............................... 68
Table 3.3: Summary of the Major Finding of Bank Performance Measures in SCP Literature during
1960s-1980s .......................................................................................................................................... 68
Table 3.4: Summary of the Major Finding of Market Structure Measures in SCP Literature during
1960s-1980s .......................................................................................................................................... 68
Table 3.5: Descriptive Summary Statistics for Variables ..................................................................... 74
Table 3.6: Variables Signs .................................................................................................................... 78
Table 3.7: Correlation Matrix ............................................................................................................... 81
Table 3.8: Regression Results for Testing Efficient Markets and SCP Hypothesis ............................. 83
Table 3.9: Mean Values of the Estimation Variables ........................................................................... 84
Table 3.10: Variables Elasticises .......................................................................................................... 85
Table 4.1: Balance Sheet Items and Rate of Return............................................................................ 104
Table 4.2: Choice and Non-choice Items ............................................................................................ 105
Table 4.3: Unit Root Test (KPSS) ...................................................................................................... 106
Table 4.4: Descriptive Statistics for the Endogenous Variables ......................................................... 106
Table 4.5: Descriptive Statistics for the Main Interest Rate (%) ........................................................ 107
Table 4.6: Correlation among Main Interest Rate (%) ........................................................................ 107
Table 4.7: Descriptive Statistics for the Exogenous Variables ........................................................... 110
Table 4.8: Aggregation of Balance Sheet Items.................................................................................. 111
Table 4.9: Testing Special Cases of the General Model ..................................................................... 112
Table 4.10: The Overall Statistics for Each Equation in the Model ................................................... 112
Table 4.11: System Residual Portmanteau Tests for Autocorrelations ............................................... 112
Table 4.12: Dynamic EU Model ......................................................................................................... 114
Table 4.13: Dynamic EU Model ......................................................................................................... 116
Table 4.14: Elasticises for EU Model ................................................................................................. 116
Table 4.15: Dynamic EU Model (Lagged Endogenous coefficients) ................................................. 117
Table 4.16: Impact Effects of Policy Instruments on Jordanian Banking Portfolios .......................... 119

-VIII-
Table 4.17: Total Effects of Policy Instruments on Jordanian Banking Portfolios ............................. 123
Table 5.1: Panels Outputs and Inputs.................................................................................................. 148
Table 5.2: Summary Statistics Inputs, Outputs and Proxies Variables. .............................................. 152
Table 5.3: DEA Efficiency Scores and Annual Changes for Panel (1)............................................... 153
Table 5.4: Bank Efficiency and Stock Performance Regressions Results for Panel (1) ..................... 154
Table 5.5 : Bank Efficiency and Stock Performance and Proxies for Size, Risk and Profits Regression
Results for Panel (1) ............................................................................................................................ 156
Table 5.6: Correlation between Variables for Panel (1) ..................................................................... 157
Table 5.7: DEA Efficiency Scores and Annual Changes for Panel (2)............................................... 158
Table 5.8: Bank Efficiency and Stock Performance Regressions Results for Panel (2) ..................... 159
Table 5.9: Bank Efficiency and Stock Performance and Proxies for Size, Risk and Profits Regression
Results for Panel (2) ............................................................................................................................ 159
Table 5.10: Correlation between Variables for Panel (2) ................................................................... 160
Table 5.11: DEA Efficiency Scores and Annual Changes for Panel (3)............................................. 161
Table 5.12: Bank Efficiency and Stock Performance Regressions Results for Panel (3) ................... 161
Table 5.13: Bank Efficiency and Stock Performance and Proxies for Size, Risk and Profits Regression
Results for Panel (3) ............................................................................................................................ 162
Table 5.14: Correlation between Variables for Panel (3) ................................................................... 163
Table A. 1: Chapter Three Bank Sample for 18 Banks....................................................................... 174
Table A. 2: Chapter Three Bank Sample for 22 Banks....................................................................... 175
Table A. 3: Chapter Five Bank Sample .............................................................................................. 176

0
Chapter One
Introduction

-1-
CHAPTER 1 : INTRODUCTION
1.1. Introduction
Banks throughout the world have witnessed significant developments over the last
five decades. The change of the banking environment has had substantial implications for the
economic role of banks and their activities. Many factors played a crucial role in reducing the
costs of information processing and transmission and have been major forces impacting on
the performance of the international banking sector. Deregulation, globalisation, financial
innovation and technological are among these factors (Girardone, et al, 2004). Many studies
in the economic literature have tackled the topic of bank performance simply because banks
play a very important role in an economy. Many expressions were introduced to express this
term “performance of Banks” such as competition, concentration, efficiency, productivity,
and profitability (Bikker and Bos, 2008) and, as Athanasoglou et al. (2008) noticed “banks
with better performance are better able to withstand negative shocks and contribute to the
stability of the financial system”.
1.2. Background
The banking sector in Jordan is one of the pillars and foundations of the Jordanian
service industry and the economy in general. The sector has seen remarkable progress over
the last few decades, with the recent round of development, especially the capital increase
being significant and impacting on the sector. The importance of the Jordanian banking sector
exceeds its position as a major contributor to the GDP, a major employer in the private sector

-2-
and the largest capitalization of the Amman Stock Exchange (ASE), constituting 55 percent
in 2008, and extends its role as the main device of economy as one of its long-standing pillars.
However, bank performance in developing countries has been relatively poor because
banking systems in these countries are prone to relatively high levels of government control
and this, in turn, has inhibited competition and the efficient allocation of resources.
Fortunately, a number of influential reforms have been implemented in the banking system
within developing economies, with the intention of promoting competition and efficiency.
One such example is within Jordan, where a number of financial reforms have been
implemented in order to improve the structure and efficiency of the banking system. These
reforms include the transformation of the banking industry, resulting from the gradual lifting
of existing barriers to freedom of entry and exchange controls on capital movements, and will
affect the Jordanian consumers in a positive way. These reforms have substantially affected
the structure of Jordanian banking system and, therefore, a wide selection of banking
characteristics that are supposed to be influenced by market structure. These factors should
result in providing better and cheaper financial products as a result of greater competition
among financial institutions, the exploitation of economies of scale and the elimination of X-
inefficiencies.
In consequence, policy makers need to assess how the bank structure affects their
mission of protecting consumers and ensuring financial stability and competitiveness of local
banks in an international financial market (Molyneux, 1990). Therefore, reassessing the
structure of banking regulation and supervision becomes a necessity as the banking world is
becoming more international. The demand for banking services affects the number of banks
operating in particular areas of the market, which directly affects the size of the bank.
Consequently, it seems unlikely that simply because a bank extends the market areas will be
less sensitive to supply conditions, the terms of the number of competitors, demand

-3-
conditions, and consumer performance for services. A profit maximizing bank would price its
services to reflect the market supply and demand conditions (Tremblay, 2007). Finally, the
objectives of the banks may be dictated by the need to minimize potential conflicts of interest
between its differing interest groups and align its assets and other internal resources
effectively with its external environment to ensure better competitive performance. This can
lead to policy decisions or particular behaviour where public and private planning horizons
and objectives may differ.
In fact, the bank’s internal resources, the perception of opportunities and threats in its
external environment decide or play a crucial role in the bank’s behaviour in setting and
choosing certain competitive strategies. Therefore, the competitive strategies of banks are not
necessarily dependent on the market structure in which they operate. Moreover, based on the
above discussion, conducting a thorough analysis of the specific relationships between
competitive strategy and performance is necessary in order to be able to identify the sources
of banks profitability in Jordan. Concentration in the local market, asset and liability
management and efficiency are the factors that may affect the performance. With this in mind,
we outline the aims, motivations and provide an overview of the thesis:
1.3. Aims and Motivations
Berger et al. (2000) global advantage hypothesis, they donated that in transition and
developing economies foreign banks entrants may additionally benefit from access to
international capital markets and raising funds from their parent enterprises. This resulted in
reduces their cost of funds, which in turn should be translated into customers by lower
lending rates obtained. Consequently, a new foreign bank entrant should enhance the banking
industry market power by the observed decreased for the concentration level; in addition, the

-4-
entry of new banks should effect the composition of the assets' holdings and expected to
change the composition of the Jordanian assets' holdings portfolio. Finally, we would expect
that the entry of new banks should enhancing managerial operation of operating banks by
controlling costs and functioning at the right scale.
This research aims at empirically testing both the Structure-Conduct-Performance
paradigm and the efficiency hypothesis. The theory suggests two possible approaches for the
dependent variable in such models to test the profit-concentration relationship. Therefore, an
empirical analysis of banks' portfolios would thus provide one of the foundations for
formulating and evaluating monetary policy in Jordan. An efficient monetary policy should
be based on an in-depth understanding of the behaviour of the banking sector, a sector which
plays a profound role throughout the broader economy. To provide a solid foundation and to
allow financial policy to be conducted to the best advantage, it is necessary to develop a
satisfactory model for the behaviour of banks since the strength of monetary policy is
mediated in part by the ability and the willingness of these banks to vary their asset holdings.
Finally, this thesis attempts to explain the influence of efficiency estimates on the
stock prices of listed banks on the Amman Stock Exchange (ASE). By shifting the emphasis
from the traditional relationship between stock prices and efficiency measures, we test
whether changes in banks’ efficiency scores have helped to explain the change in banks’
stock prices, rather than traditional accounting measures, using three approaches.
The empirical element to these important studies may reveal interesting relationships
and may help the relevant authorities and the policymakers to better evaluate and understand
the workings of Jordanian banking.

-5-
1.4. Research Methodology
This thesis consists of three main empirical studies, these studies involving solid and reliable
understanding of the literature, by using appropriate models methodologies suggested by
theory. Furthermore, it gives a good following implementation of econometric techniques and
discussion of reasonable finding and conclusion. However, the main contribution of this
thesis and the choosing of this area of research arise from the activities of banking and their
crucial development in an economy, particularly Jordan. This thesis provides pioneer and
new empirical/econometric work never done on Jordan. However, it is acknowledged that the
main limitation of this study is the small sample size, both in terms of time series and of the
cross-section used. The sample size was determined by the availability of data for the key
variables.
1.5. Outline of the Thesis
The thesis is divided into six chapters:
Chapter Two will provide a review of the Jordanian economy, discussed the Jordanian
banking industry development during the last four decades. Economic growth and the
structure of Jordanian economy were illustrated in beginning of this chapter, which draw the
main features of the economy. The main objective of this chapter is to provide the
background about the Jordanian banking industry, which is essential to understand the
Jordanian case when the empirical results and analysis are presented in further chapters. This
discussion will prevent us from duplicating the analysis in each empirical chapter. It will also
give us a clear picture of the country’s economy as a whole. Moreover, it will shed much
light on the banking industry in Jordan, in terms of development, sources and uses of funds,

-6-
and the profitability performance of banks. Chapter Three consists of two parts; the first
section will provide a literature review, especially how the Structure-Conduct-Performance
(SCP) model has been applied to different banking markets over the last decades. The second
part will provide an outline for the theoretical framework; it will describe sources and the
collection of data, analyse all the variables used and reports model estimates of tests of the
SCP paradigm.
Chapter Four investigates the portfolio behaviour of Jordanian banks during the
period 2002 to 2009 using monthly data. The model is based on the portfolio choice theory,
originated by Hicks (1935) and developed by Markowitz (1952) and Tobin (1958). Several
nested models are developed to test theoretical restrictions including symmetry and
homogeneity of the interest rate matrix. An empirical finding of the dynamic modelling of
portfolio behaviour is presented. In addition, using the multiplier methodology the effects,
current, interim and total of the policy determined factors have on the portfolio of these banks
has been captured. Chapter Five employs the DEA approach; the efficiency measures are the
direct result of the implementation of Constant Returns to Scale (CRS), Variable Returns to
Scale (VRS) and Scale efficiency (SE), and uses input-oriented cost minimisation models.
Although we adopt the intermediation approach, the profit-oriented approach also has been
estimated to compare the results obtained from the two approaches. The intention of this
study is not to compare efficiencies, but to relate efficiency and stock prices, particularly
regarding the intermediation and the Profit approach. Finally, Chapter Six provides a
conclusion and discusses the results in general, and contains some recommended suggestions
for future research.

7
Chapter Two
Jordan Profile
8
CHAPTER 2 : JORDAN PROFILE
2.1. Introduction
“The Hashemite Kingdom of Jordan (HKJ) has proved to be one of the world’s most
vulnerable countries to external political, economic and security events” (Knowles, 2005, 1).
In other words, Jordan’s geographical position and the regional conflicts have put the country
under a considerable amount of pressure. It has been rocked by the effects of apparent
inherent regional instability. Nevertheless, despite threats, Jordan has managed to preserve
and even enhance its political and economic position during the last decades. In 1921, Jordan
emerged as a political entity from parts of the Ottoman Empire, under the British mandate
and under the name of Transjordan. The country’s borders and population have been
susceptible to political developments in the region. After the occupation of the coastal parts
of Palestine in 1948, the West Bankers (Palestinians) voted to join Transjordan in 1950, when
the new entity became known as “The Hashemite Kingdom of Jordan”. Consequently, the
population of Jordan showed the highest growth rate in the world, accounting for an average
annual growth rate of 4.3 percent during 1979-1994 due to the natural growth and the waves
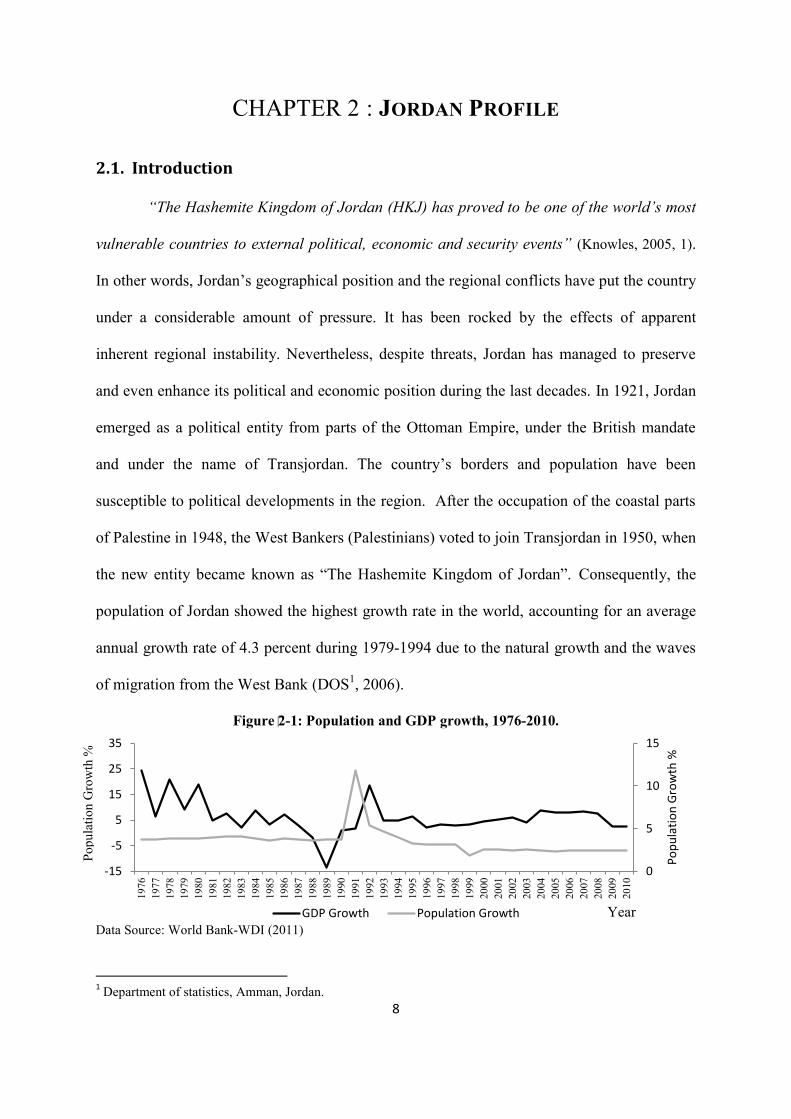
of migration from the West Bank (DOS1, 2006).
Figure 2-1: Population and GDP growth, 1976-2010.
Data Source: World Bank-WDI (2011)
1 Department of statistics, Amman, Jordan.
0
5
10
15
-15
-5
5
15
25
35
1976
1977
1978
1979
1980
1981
1982
1983
1984
1985
1986
1987
1988
1989
1990
1991
1992
1993
1994
1995
1996
1997
1998
1999
2000
2001
2002
2003
2004
2005
2006
2007
2008
2009
2010
Po
pu
lati
on
Gro
wth
%
GDP Growth Population Growth Year
Popu
latio
n G
row
th %

-9-
While the annual population growth rate has decreased in the last few years to 2.8
percent, according to the 2010 census inhabitants of the country were estimated to be 6.113
million (DOS, 2011).
Since the country emerged as a political entity, it has been susceptible to political and
economic events affecting the region and their consequences constituted one of the major
challenges that faced the Jordanian economy. On the other hand, the Jordanian economy is
considered to be unique. It has a large service sector, accounting for up to nearly 70 percent
of GDP. Consequently, it has a narrow productive base and limited natural resources. Less
than 8 percent of the country’s agricultural land is arable, and virtually all oil is imported.
These facts describing the structure of the economy impeded the attainment of higher
levels of self-sufficiency in the production of goods and services. Figure 2-2 shows the
sectoral distribution in Jordan in terms of GDP over the period 1964 to 2009.
Figure 2-2: The Sectoral Distribution in Jordan in terms of GDP, 1964-2009.
Data Source: Central Bank of Jordan (2011)
2.2. Jordan Economy
In turn, the Jordanian economy has benefitted from the boom in oil prices during
1970s. Furthermore, the government has traditionally pursued liberal, outward looking
policies in many respects, for example trade, labour migration, and foreign exchange
0%
20%
40%
60%
80%
100%
1964
1966
1968
1970
1972
1974
1976
1978
1980
1982
1984
1986
1988
1990
1992
1994
1996
1998
2000
2002
2004
2006
2008
Services Constructions Industry Agriculture Others
Perc
enta
ge o
f GD
P
Year
-10-
transactions. These policies enable Jordan to respond to the emerging opportunities in the
region. Therefore, the country enjoyed favourable economic and social conditions that
benefitted it in the forms of grants, loans, and worker’s remittances from the rich
neighbouring countries.
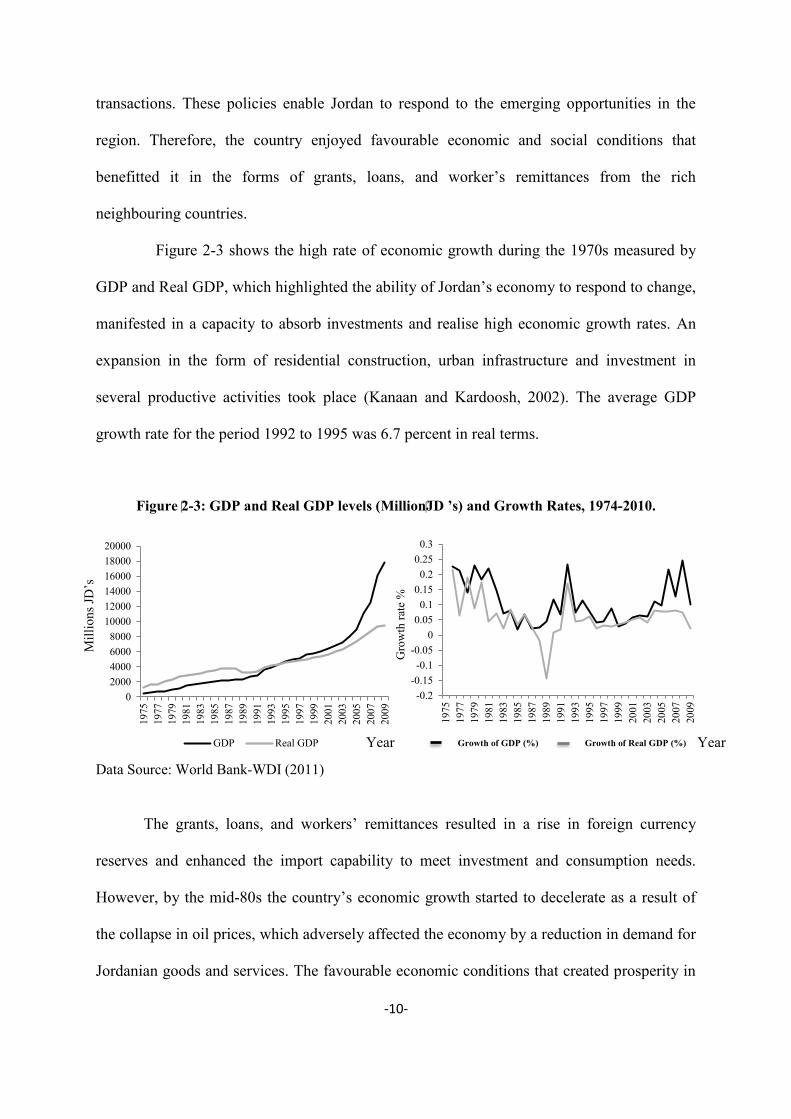
Figure 2-3 shows the high rate of economic growth during the 1970s measured by
GDP and Real GDP, which highlighted the ability of Jordan’s economy to respond to change,
manifested in a capacity to absorb investments and realise high economic growth rates. An
expansion in the form of residential construction, urban infrastructure and investment in
several productive activities took place (Kanaan and Kardoosh, 2002). The average GDP
growth rate for the period 1992 to 1995 was 6.7 percent in real terms.
Figure 2-3: GDP and Real GDP levels (MillionJD ’s) and Growth Rates, 1974-2010.
Growth of GDP (%) Growth of Real GDP (%)
Data Source: World Bank-WDI (2011)
The grants, loans, and workers’ remittances resulted in a rise in foreign currency
reserves and enhanced the import capability to meet investment and consumption needs.
However, by the mid-80s the country’s economic growth started to decelerate as a result of
the collapse in oil prices, which adversely affected the economy by a reduction in demand for
Jordanian goods and services. The favourable economic conditions that created prosperity in
02000400060008000
100001200014000160001800020000
1975
1977
1979
1981
1983
1985
1987
1989
1991
1993
1995
1997
1999
2001
2003
2005
2007
2009
GDP Real GDP
-0.2-0.15-0.1
-0.050
0.050.1
0.150.2
0.250.3
1975
1977
1979
1981
1983
1985
1987
1989
1991
1993
1995
1997
1999
2001
2003
2005
2007
2009
Year Year
Gro
wth
rate
%
Mill
ions
JD’s
-11-
the 1970s began to change. The direct result was an increasingly deep recession accompanied
by rapidly mounting foreign obligations.
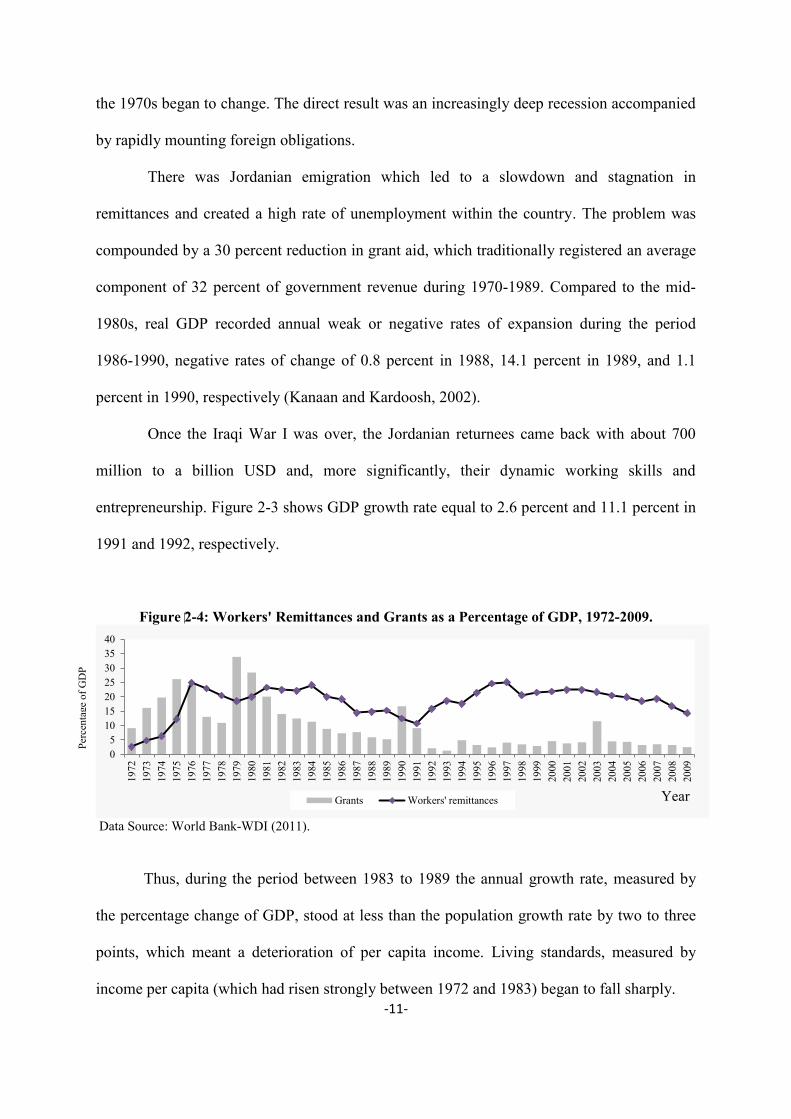
There was Jordanian emigration which led to a slowdown and stagnation in
remittances and created a high rate of unemployment within the country. The problem was
compounded by a 30 percent reduction in grant aid, which traditionally registered an average
component of 32 percent of government revenue during 1970-1989. Compared to the mid-
1980s, real GDP recorded annual weak or negative rates of expansion during the period
1986-1990, negative rates of change of 0.8 percent in 1988, 14.1 percent in 1989, and 1.1
percent in 1990, respectively (Kanaan and Kardoosh, 2002).
Once the Iraqi War I was over, the Jordanian returnees came back with about 700
million to a billion USD and, more significantly, their dynamic working skills and
entrepreneurship. Figure 2-3 shows GDP growth rate equal to 2.6 percent and 11.1 percent in
1991 and 1992, respectively.
Figure 2-4: Workers' Remittances and Grants as a Percentage of GDP, 1972-2009.
Data Source: World Bank-WDI (2011).
Thus, during the period between 1983 to 1989 the annual growth rate, measured by
the percentage change of GDP, stood at less than the population growth rate by two to three
points, which meant a deterioration of per capita income. Living standards, measured by
income per capita (which had risen strongly between 1972 and 1983) began to fall sharply.
05
10152025303540
1972
1973
1974
1975
1976
1977
1978
1979
1980
1981
1982
1983
1984
1985
1986
1987
1988
1989
1990
1991
1992
1993
1994
1995
1996
1997
1998
1999
2000
2001
2002
2003
2004
2005
2006
2007
2008
2009
Grants Workers' remittances
Perc
enta
ge o
f GD
P
Year

-12-
Figure 2-5: Per Capita Income in USD terms, 1974-2010.
Data Source: World Bank-WDI (2011)
Jordan was forced to undertake foreign borrowing as a consequence of a strong
reserves position in the early 1980s, in order to maintain economic growth. Economic planner
in the country found it relatively easy to raise funds on international markets. At the same
time, the ratio of foreign debt to GDP rose sharply.
In March 1989, the crisis came to a head when the government failed to meet its debt
obligations which had recently reached a total of a billion USD for the first time. By
December 1989, the Jordanian dinar depreciated by more than 37 percent, from $2.70/ JD to
$1.7/ JD (Kanaan and Kardoosh, 2002).
“By the end of 1988, the budget deficit was equal to about 25 percent of GDP,
[while the] total external debt stood at more than 210 percent of GDP, and foreign exchange
reserves were literally non-existent” (Omet, 2004: p.15). In fact, this period was the most
difficult in the recent history of the Jordan economy, the huge deficits of the budget and the
trade balance led the country to "the exhaustion of Central Bank foreign currencies and the
devaluation of the Jordanian Dinar in 1989" (Al-Abed, 2003: p.19).
0
1000
2000
3000
4000
5000
1975 1977 1979 1981 1983 1985 1987 1989 1991 1993 1995 1997 1999 2001 2003 2005 2007 2009
US
Dol
lars
Year

-13-
As a result of the Jordanian Dinar devaluation in 1989, inflation jumped to 25 percent
and the Jordanian government was forced to adopt Economic Adjustment Programme in
cooperation with the IMF2.
By spring 1989, IMF assistance was required to reschedule debt repayments. The IMF
titled for an austerity programme which involved deep cuts in public expenditure, combined
with the removal of food (mainly bread) and petrol price subsidies and import duties on
luxury goods.
The programme enabled Jordan to have some of its bilateral debt forgiven and
rescheduled debt repayments. A second, Structural Adjustment Programme (SAP II) was
initiated in October 1991, which continued the reform of macroeconomic policy. This
programme resulted in the remarkable reduction in the fiscal deficit between 1996 and 2000.
The government managed to cut its budgetary deficit (excluding grants) to 8.2 percent over
the period 1996 to 2000, mainly by decreasing investment expenditure and reducing subsidies.
By the end of 2000 the ratio of external debt to GDP had declined to 87 percent, down from
103.1 percent in 1996. Table 2.1 presents the objectives, aims, approaches, and policies for
Economic Adjustment Programmes.
After the initial boom between 1992 and 1995, economic growth began to slow to a
trickle during 1996-1999, see Figure 2-3. Real GDP growth during this period only averaged
2.9 percent with an annual population growth rate of 3 percent, this translated into a decline
in the overall standard of living throughout the late 1990s.
1These Economic Adjustment Programmes were intended to help reschedule external debt and debt services and
re-establish internal and external balances. However, their policies concentrate on market-oriented policies
aiming to improve the efficiency of public institutions, and to enhance the role of the private sector. The
country gain more financing from international institutions such as the IMF, IBRD, and foreign governments.
Moreover, Jordan benefitted from the return of funds after the Gulf War I (1990), concessional loans and
assistances, rescheduling of external debt, and inflow of external funds after structural reform of public
institutions (World Bank, 2003).

-14-
Figure 2-6: Total Public Debt (Internal and Foreign) and GDP (Million JDs), 1990-2009.
Data Source: Central Bank of Jordan (2011)
In 2006, the government gained from the decline in interest rates in global markets,
since they recalled and replaced some of the country debt using new low interest rate debt
instruments. In addition, after 2008, and to maintain the stability and the soundness of the
financial system after the financial crises led to a reduction in the volume of loans (funds)
available to private sector, the government covered the public debt using the domestic market
instead of foreign market. Figure 2-6 shows the amount of domestic and foreign debt since
1990.
Figure 2-7: Total Public Revenue, Expenditure and Grants (Million JDs), 1967-2010.
Data Source: World Bank-WDI (2011)
02000400060008000
100001200014000160001800020000
1990 1991 1992 1993 1994 1995 1996 1997 1998 1999 2000 2001 2002 2003 2004 2005 2006 2007 2008 2009
Domestic Debt External Debt GDP
0
200
400
600
800
1000
1200
1967
1969
1971
1973
1975
1977
1979
1981
1983
1985
1987
1989
Expenditures Grants Revenues
0
1000
2000
3000
4000
5000
6000
1991
1992
1993
1994
1995
1996
1997
1998
1999
2000
2001
2002
2003
2004
2005
2006
2007
2008
2009
2010
Expenditures Grants Revenues
Mill
ions
JD
Mill
ions
JD’s
Year
Year
Mill
ions
JD’s

15
Table 2.1: Economic Adjustment Programs Time-table
Date 1989 1991 1994 1999
Objectives Increase the rate of
economic growth. Maintain price stability. Reduce budget and balance
of payments deficit.
Restore and sustain economic growth.
Generate employment. Achieve budgetary and
balance of payment viability.
Sustain economic growth. Enhance job opportunities. Improve living standards.
Sustain economic growth. Maintain low inflation. Strengthen the international
services position.
Aims Economic growth rate to 4% by 1992.
Reduce inflation from 14% to 7% by 1993.
Eliminate external current account deficit by 1993.
Increase real GDP growth rate to 4%.
Reduce inflation to less than 5% in 1997.
Reduce external current account deficit near balance in 1998.
Real growth of 6% a year until 1998.
Hold inflation at 4-5%. Eliminate exceptional
financing by 1998. Maintain a comfortable
level of foreign exchange rate.
Raise growth to 3.5% by 2001.
Keep inflation in the range of 2-3%.
External current account deficit of GDP to 5.3 by 2001.
Increase foreign exchange reserves to $1.7 billion.
Approaches Boost investment incentive. Eliminate government
dissaving. Seek rescheduling of
external debt-service obligations.
Increase domestic saving and investment.
Improve the efficiency of investment.
Increase domestic savings. Fiscal consolidation. Wide ranging structural
reforms.
Policies Reduce the government budget deficit by: increases in tax rate on luxury products, reduction in subsidies, and increases Gas product prices.
Monetary expansion. Manage exchange rate. Trade liberalization and
tariff reform.
Reduce budget deficit. Pursue a tight credit policy. Maintain flexible exchange
rate policy.
Reduce fiscal deficit to GDP to 2.5%.
Maintain flexible exchange rate policy.
Accept obligations under IMF Article VIII.
Switch to indirect monetary control.
Reduce budget deficit to GDP to 4% by 2001.
The exchange rate peg will continue to serve as a nominal anchor.
Monetary policy to build up foreign reserves and maintain low inflation.
Tax and tariff reforms.
Source: IMF (2005), and Al-Tarwaneh (2012, p.16)

16
Consequently, the changes in the performance of commercial banks, analysed in the
last part of section three in chapter two, appear to reflect the impact of both economic and
regulatory factors prevailing during our period of study.
2.2. 1. Banking Industry3
The banking industry in Jordan has developed considerably over the last four decades
in terms of the number of licensed banks operating, size of assets, deposits and credit
facilities and banking services. During the 1970s and 1980s, the banking sector doubled its
loans, deposits, and number of operating banks in the country, after the government identified
services provided by banking as a key player in its economic development policy (Saleh and
Zeitun, 2006). At that time, Jordan was the only Arab country in which the assets value of
banks exceeded GDP. In fact, the banking establishment in Jordan is relatively recent; the
first licensed bank was the Ottoman bank (British bank) which started its operation in 1925
(Hamiltona et al., 2010). Before 1964, the Jordanian Monetary Council was the monetary
authority in the country and the amount of Jordanian Dinar issued was be backed by Sterling
pounds. However, there were only three foreign banks and four domestic banks operating at
that time.
In 1964, the Central Bank of Jordan (CBJ) was established as the only authority
responsible to undertake both monetary policy and supervise the banking system in the
country. The main objectives were to maintain monetary stability and to insure the
convertibility of the Dinar in an attempt to promote and enhance economic growth in
accordance to the central governments general economic policy.
3 The banking industry in Jordan consisted of two groups according to the CBJ classification; the commercial banks and Islamic banks. It is worth nothing that one Islamic bank is included on our empirical studies in the remaining chapters to be tested individually and jointly.
-17-
According to monetary policy in the country, the development may be divided into
two stages: the first stage (1964 to 1990), the CBJ used traditional and direct monetary tools,
fixing the interest rate and reserve requirement ratio to control the operation of the banking
system (Miani and Daradkah, 2008). During this period, the banking industry served as an
agent for the government, helping to channel investment funds to selected sectors under its
economic development policy 4 , whilst imposing many restrictions and requirements on
banking activities (Maghyereh, 2002). Furthermore, and according to Karasneh et al., (1997),
the Central Bank exercised their control to establish the size, cost and direction of credit
facilities, and to restructure the financial portfolio of banks operating in Jordan.5 The second
stage was from 1991 to present with the government initiating a series of financial sector
reforms to improve the structure and efficiency of the banking sector. In this manner, interest
rates were fully liberalized (set by the market rather than governmental authority) in the early
1990s and, also in 1993, the CBJ changed the way it implemented direct instruments of
monetary control by issuing its own certificates of deposits to mop up excess liquidity from
the system. In 1996, a new investment law was passed which allowed equal treatment for
foreign and local practices. In addition to this, there was further liberalization of financial
markets to foreign participants. In addition, a new securities law was approved which
improved the structure of the stock market in 1997. In the following year, the CBJ introduced
an overnight repurchase agreement with operating banks, and opened an overnight deposit
facility. In August 2000, a banking law was approved by parliament which aimed to protect
deposits, reduce money market risk, guard against loan concentration, and money laundering.
4 For example, banks were required to invest 8 percent of deposits in government bills and bonds and to invest at
least 15 percent of their capital in public and mixed sectors. 5 For example, (1) the CBJ determined lending limits for banks (2) set a ceiling on interest rates for loans and
deposits (3) restricted entry into the Jordanian banking market (4) imposed high reserve requirement ratios
(5)set tight restrictions on foreign exchange transactions (Karasneh et al., 1997).

-18-
Furthermore, in an effort to enhance competition within the Jordanian banking
industry, the CBJ allowed three new branches of a foreign-owned bank to begin operating in
the country. These branches belonged to a large financial institution in the region which had a
wealth of experience in risk management practices and a large financial position in terms of
assets, liabilities and capital. The CBJ hoped that their introduction would help to promote
and enhance competition within the Jordanian banking sector, and encourage existing banks
to operate more efficiently, in order to be able to compete with the new banks operating in the
country (Himiltona et al., 2010).
Figure 2-8: Banking Density Index, 1964-2010.
Data Source: Central Bank of Jordan (2012)
At the end of 2010, the licensed banks operated 663 branches inside the country and
one year later the number was 695 branches. As such, the banking density index (number of
people/ total number of branches) stood at around 9100 persons per branch at the end of 2011
compared to 9220 persons per branch year previously. Figure 2-8 shows that density index
decreased from 47.36 thousands in 1964, to 11 thousands in 1990, and 10.5 thousands in
2000 with a mean average of 18.9 thousands from 1964 to 2011.
The IMF reported in 2003 that the Jordanian banking sector had reached the status of
a highly developed financial system, being the most developed nation in this regard amongst
countries in the MENA region. The report indicates, using a number of financial indicators,
0
10
20
30
40
50
19
64
19
66
19
68
19
70
19
72
19
74
19
76
19
78
19
80
19
82
19
84
19
86
19
88
19
90
19
92
19
94
19
96
19
98
20
00
20
02
20
04
20
06
20
08
20
101
00
0 p
er
Bra
nch
Year
-19-
which the banking sector in Jordan is well developed, profitable, and efficient; see Creane et
al. (2003).
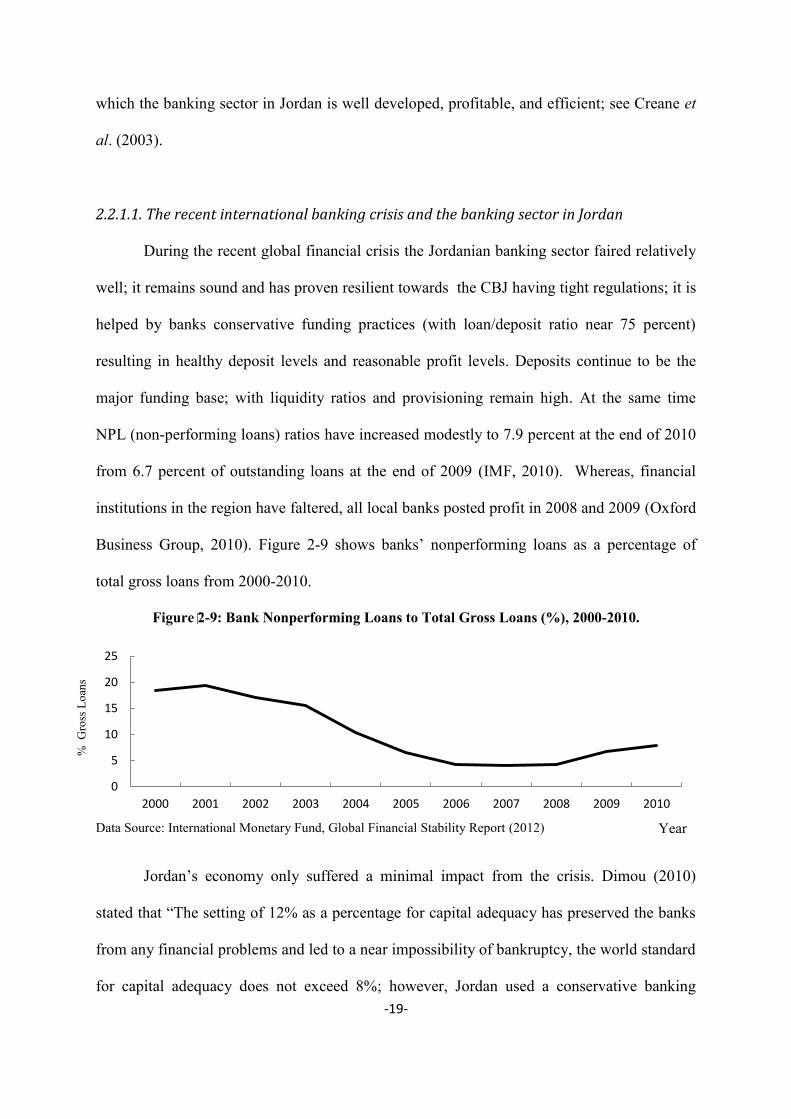
2.2.1.1. The recent international banking crisis and the banking sector in Jordan
During the recent global financial crisis the Jordanian banking sector faired relatively
well; it remains sound and has proven resilient towards the CBJ having tight regulations; it is
helped by banks conservative funding practices (with loan/deposit ratio near 75 percent)
resulting in healthy deposit levels and reasonable profit levels. Deposits continue to be the
major funding base; with liquidity ratios and provisioning remain high. At the same time
NPL (non-performing loans) ratios have increased modestly to 7.9 percent at the end of 2010
from 6.7 percent of outstanding loans at the end of 2009 (IMF, 2010). Whereas, financial
institutions in the region have faltered, all local banks posted profit in 2008 and 2009 (Oxford
Business Group, 2010). Figure 2-9 shows banks’ nonperforming loans as a percentage of
total gross loans from 2000-2010.
Figure 2-9: Bank Nonperforming Loans to Total Gross Loans (%), 2000-2010.
Data Source: International Monetary Fund, Global Financial Stability Report (2012)
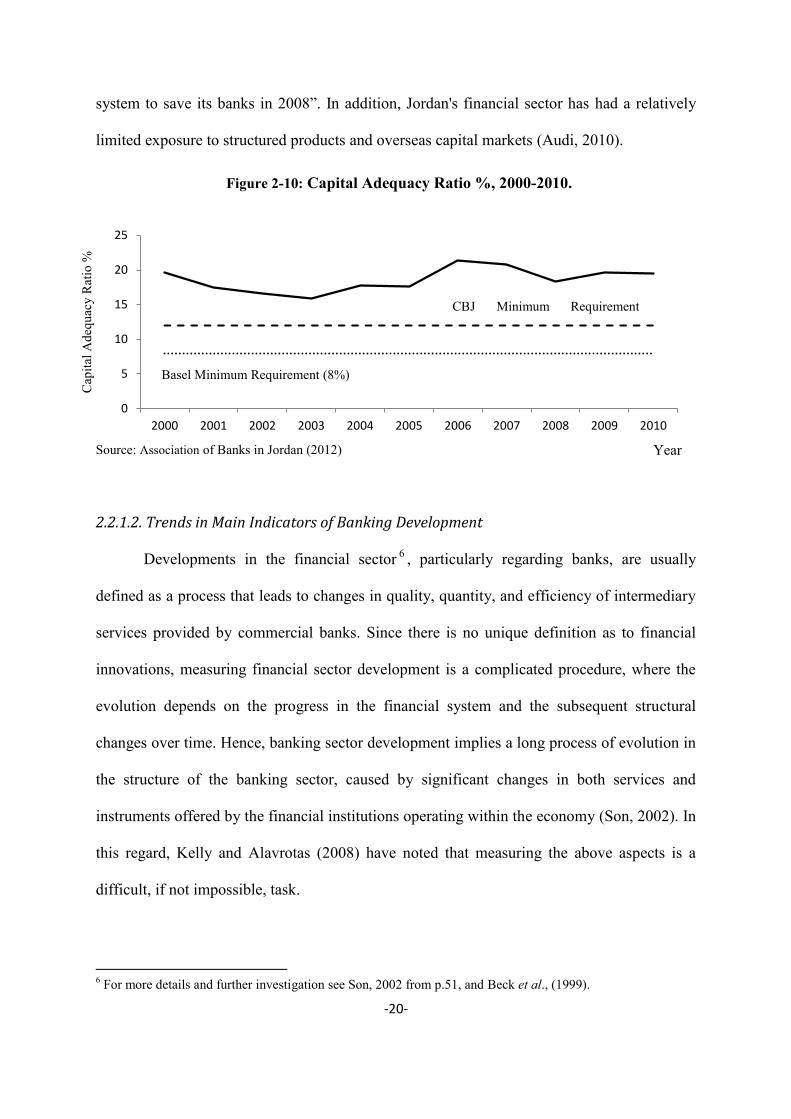
Jordan’s economy only suffered a minimal impact from the crisis. Dimou (2010)
stated that “The setting of 12% as a percentage for capital adequacy has preserved the banks
from any financial problems and led to a near impossibility of bankruptcy, the world standard
for capital adequacy does not exceed 8%; however, Jordan used a conservative banking
0
5
10
15
20
25
2000 2001 2002 2003 2004 2005 2006 2007 2008 2009 2010
% G
ross
Loa
ns
Year
-20-
0
5
10
15
20
25
2000 2001 2002 2003 2004 2005 2006 2007 2008 2009 2010
CBJ Minimum Requirement (12%)
Basel Minimum Requirement (8%)
system to save its banks in 2008”. In addition, Jordan's financial sector has had a relatively
limited exposure to structured products and overseas capital markets (Audi, 2010).
Source: Association of Banks in Jordan (2012)
2.2.1.2. Trends in Main Indicators of Banking Development
Developments in the financial sector 6 , particularly regarding banks, are usually
defined as a process that leads to changes in quality, quantity, and efficiency of intermediary
services provided by commercial banks. Since there is no unique definition as to financial
innovations, measuring financial sector development is a complicated procedure, where the
evolution depends on the progress in the financial system and the subsequent structural
changes over time. Hence, banking sector development implies a long process of evolution in
the structure of the banking sector, caused by significant changes in both services and
instruments offered by the financial institutions operating within the economy (Son, 2002). In
this regard, Kelly and Alavrotas (2008) have noted that measuring the above aspects is a
difficult, if not impossible, task.
6 For more details and further investigation see Son, 2002 from p.51, and Beck et al., (1999).
Figure 2-10: Capital Adequacy Ratio %, 2000-2010.
Cap
ital A
dequ
acy
Rat
io %
Year

-21-
Figure 2-11 shows three banking sector development indicators, which cover several
aspects of the development concept in the financial industry 7 . The first two indicators
represent the simplest measures of banking sector development; the ratio of broad money
(M2) to GDP reflects the level of financial depth (M2Y), and the ratio of credit extended to
the private sector to GDP (CPY). These ratios proxy the extension of the commercial banks’
ability to facilitate credit for alternative beneficial purposes. The total deposits to GDP ratio
(TDY) capture the ability of banks to produce loans through the system, King and Levine
(1993). As shown in Figure 2-11, M2Y, CPY and TDY have experienced a slow increase
over the period 1965-2009.
Figure 2-11: M2Y, CPY and TDY, 1965-2009.
Source: Calculated by the Author’s using data collected from Central Bank of Jordan (2011)
The ratio of broad money to GDP has increased from almost 30 percent in 1965 to
about 130 percent in 1991. During 1992 to 1998 the ratio fell to around 110 percent and it
was largely affected by the Gulf Wars. The CPY indicator delivers more accurate information
about the role of financial intermediaries in funding the private sector and allocating funds
from savers to borrowers, see Khan and Senhadji (2000, p.5). It increased significantly from
8.8 percent in 1965 to around 109 percent in 2009 with an average of 74 percent for the
7 For more investigation about MENA region see, IMF staff paper No.53 (3), Creane et al., (2007).
1965 1970 1975 1980 1985 1990 1995 2000 2005 2010
50
100
150
M2Y CPY TDY
Dev
elop
men
t Rat
io %
Year

-22-
whole period. In contrast, the TDY ratio rose from 20.5 percent in 1965 to 110 percent at the
end of the 1980s. There was a sudden decline in 1990 due to the financial crisis in the
previous year. Nevertheless, the decline in GDP over the first Gulf War, and the large wave
of Jordanian migrants returned home saw the TDY experience a high ratio at about 140
percent. This ratio reflected the role which financial institutions played in the development of
the banking system by encouraging higher savings ratios. The average ratio of total deposits
to GDP is about 87 percent over the period.
2.3. Sources and Uses of Funds in Banking
Financial institutions make pivotal contribution to a country’s economic development
through their deployment of allocation of resources. Financial intermediaries mobilise
savings from a large number of small savers. These funds are allocated to individuals or
practices that require more funds than they have at their disposal. A well-functioning
financial system improves the allocation of resources in multiple ways.8 Financial institutions
create viability for investment projects which may have been impossible otherwise. Therefore,
“the financial system creates economies of scale by pooling the relatively small savings of a
large number of individuals and makes them available to a relatively small number of large
investment projects” (Rose, 1999). Furthermore, the diversification of financial institutions
investments reduces risks. Financial institutions also provide allocational efficiency by
separating the act of saving from investing, reducing information and search costs for savers,
allowing them to generate returns which would have been otherwise unobtainable.
This section discusses the mobilization and allocation of financial resources by the
banking system in Jordan. Therefore, we consider the balance sheet structures of these
8 For more detailes of these discussion points, see (Levine, 1997,p.6), (Levine, 2004), and (Economic
Commission for Africa, 2004)

-23-
institutions to find the sources of their funds. In addition, an analysis of the structure of banks’
balance sheets is an essential ingredient in the performance evaluation process, an issue to be
addressed in subsequent chapters. Table 2.2 shows the consolidated balance sheet for
Jordanian banks from 2007 to 2011.
Table 2.2: The Consolidate Balance Sheet for Jordanian Banks (Million’sJD) , 2007-2011.
2007 2008 2009 2010 2011
Foreign Assets 6285.9 6516.5 5810.3 5309.7 6104.5
Cash in Vaults (In Foreign Currencies) 135.3 96.1 125.7 98.1 114.5 Balances with Foreign Banks 4298.6 5295.7 4531.6 3192.4 3897.5 Portfolio (Non-Resident) 637.5 372.6 333.5 817 816.2 Credit Facilities to Private Sector (Non-Resident) 974 309.7 536.4 945.3 1020.1 Other Foreign Assets 240.5 442.4 283.1 256.9 256.2 Domestic Assets 31400.5 20299.1 23986.3 26647.2 28868.6
Claims on Public Sector 7402.7 3077.4 4353.1 5203.4 5686.3
Claims on Central Government 2451.7 3700.5 4721.4 5169.8 6888.9
Claims on Public Entities 625.7 652.6 482 516.5 513.8
Claims on Private Sector (Resident) 14905.2 10985.5 12514.5 12674.4 13593.7 Claims on Financial Institutions 128.1 176.6 246.1 166.1 146.4 Reserves
3630.7 4013.4 6009 6477.8 5639
Currency 177.8 206.7 206.7 234.8 347.6
Deposits with CBJ in Jordan Dinar 3452.9 3806.7 5802.2 6243 5291.4
Deposits with CBJ in Foreign Currencies 527.4 472.2 573 409.3 411.2 Unclassified Assets 2798.1 1956.7 2286.2 2185 2553.2 Liabilities 37686.4 26815.6 29796.6 31956.9 34973.1
Demand Deposits 5807.1 3372.6 3785.1 4436.7 5053.8
Public Non-Financial Institutions 39.3 69.6 16.4 25.2 29.7
Municipalities and Village Councils 20.7 16.4 35.3 20.2 3.4
Non-Banking Financial Institutions 15.3 51.1 33.5 57.8 88
Social Security Corporation 26.5 48.3 58 45.6 43.5
Private Sector (Resident) 3270.8 3599.7 4293.5 4905 5642.5
Time and Saving Deposits 15272.2 9999.7 11639.3 12816.5 14377.3
Public Non-Financial Institutions 592.5 595.4 445.7 276.7 299
Municipalities and Village Councils 43 3.4 7.2 15.3 13
Non-Banking Financial Institutions 85.7 85.3 115.7 144.9 189
Social Security Corporation 50.3 262.8 284.7 501.5 507.9
Private Sector (Resident) 9228.2 10692.4 11963.2 13438.9 14263.3
Foreign Liabilities 6164 4793.2 5522.2 5674.8 5990.8 Central Government Deposits 637.4 526.7 561.1 780.9 665.8 Credit From CBJ 449 436.3 373.1 371.7 414.6 Capital Accounts & Allowances 5397.2 3523 3803.5 4374.8 4949.7 Unclassified Liabilities 3959.5 4164.1 4112.3 3501.5 3521.1
Source: Central Bank of Jordan (2012)

-24-
2.3. 1. Sources of Funds
Like their counterparts across the worlds, Jordanian commercial banks obtain their
funds from two main sources: capital reserves, and deposits.
2.3.1.1. Capital and Reserves
The greater the bank’s capital, the greater the public confidence in the stability of the
banks and their ability to meet their obligations (Sinkey, 1998). However, one of the most
difficult factors to quantify is the amount of capital which is sufficient to meet the target of
bank capital. Capital could perform the following functions; protect uninsured depositors in
the event of insolvency and liquidation and acquire the physical plant and basic needs
required for banking services, such as building and offices.
“Capital performs such indispensable functions as supplying resources to start a
new financial firm, creating a base of resources for future growth, providing a
cushion of protection against risk, and promoting public confidences in the long-
term viability of a financial firm. Moreover, capital has become the centrepiece of
supervision and regulation today-the lever that regulators can pull whenever the
alarm bell sounds in an effort to prevent the collapse of a financial firm”.
Rose and Hudgins (2008, p. 476)
Figure 2-12: Growth in Capital and Reserve and Deposits, 1964-2010.
Data Source: Central Bank of Jordan (2011)
1965 1970 1975 1980 1985 1990 1995 2000 2005 2010
0.00
0.25
0.50
Growth in Capital and Reserves Growth in Deposits
Gro
wth
Rat
e %
Year

-25-
Figure 2-12 shows the growth in capital and reserves rate and the growth of total
deposits of Jordanian banks rate, where Figure 2-13 illustrates the capital to deposits ratio and
its growth rate. Capital and reserve to account an average growth around 17.2 percent during
the whole period from 1965 to 2010. In addition, the total deposits held by banks operating in
Jordan have also registered an average increase of around 15 percent; starting with 48.7
million in 1965 and increasing to 22504.8 million at the end of 2010.
Figure 2-13: Capital and Reserve as a Percentage of Total Deposits, 1994-2010.
Data Source: Central Bank of Jordan (2011)
Figure 2-12 shows that from 1973 to 1977 a high growth rate in capital and reserve
was recorded, and the years 1992 to 1999 and 2003 to 2007. The main reason was new banks
start operating in the country during these periods, and the consolidated capital and reserves
items in the balance sheet were greater. In addition, capital and reserve as a percentage of
total deposits have fluctuated between 7 percent and 22 percent over the whole period. We
can explain these changes and fluctuations by a number of facts. Firstly, the CBJ requested a
rise in capital; banks’ capital requirements in Jordan was JD .75 million until 1981, after that
the central bank asked them to maintain capital of at least JD 3 million. In 1985 the central
bank requested banks to raise their capital to JD 5 million. After 2003, the minimum required
capital became JD 50 million; in addition, the new capital requirement at the end of 2011 is
100 million JD and 50 million JD for foreign branches. These rises were the reason that the
1965 1970 1975 1980 1985 1990 1995 2000 2005 2010
0.10
0.15
0.20
Capital/Deposits
Perc
enta
ge %
Year

-26-
CBJ is keen on instigating mergers in what is widely considered to be an overcrowded market
(CBJ, 2011). Secondly, the requirements of Basel I meant that the central bank forced the
banks operating in Jordan to maintain a minimum capital of 8 percent of their risk-adjusted
assets to comply with the Basel Accord (1988). The growth in the capital-asset ratio in 1991
and 1992 was a result of this rule. Thirdly the banking law in Jordan obliged banks to transfer
10 percent of their annual profits to a statutory reserve account until it was equal to its
capital9. In contrast, it is worth to mention that capital and reserve declined in 1991 as two
banks were involved in great losses and one of them faced bankruptcy and ended its
operation. The “Petra Bank” collapsed when challenged by a financial scandal.
2.3.1.2. Deposits:
Deposits on the whole are classified into demand, savings and time, which are
dominant liability items in the balance sheet of banks. Deposits are of particular importance
because they are the main source of bank funding and their corresponding structure
determines the volume and nature of the loans made by commercial banks.
The structure of deposits has various implications for asset management. This shows,
for example, the stability or volatility of the bank's funds. Since current account deposits are
theoretically redeemable on demand, a higher ratio of current account deposits to total
deposits indicates potential instability. Savings and time deposits are interest-bearing, while
current accounts are commonly interest-free; their relative proportions are important variables
to monitor as sources of costs and revenues.
9 For further details see Article 62 of the banking Law No 28 of 2000.

-27-
Figure 2-14: Deposits According to Maturity, 1975-2010.
Data Source: Central Bank of Jordan (2011)
The structure of deposits also generally determines the lending profile - the structure
of bank assets generally. What it does, for example, tends to give an indication to the
question of whether and to what extent banks can lend long term. In general, the more the
time deposits, the more appropriate to carry out long-term loans.
Figure 2-15: Deposits Growth over the Period, 1964-2010
Data Source: Central Bank of Jordan (2011)
As can be seen from Figure 2-15, the 1970s period saw a high growth rate in deposits
since the establishment of new banks enhanced and changed the behaviour of the population
toward the banking industry and the more wide distribution of banking as a safe place to
place wealth instead of keeping savings at home. Furthermore, returns can be obtained by
depositing funds at banks. In addition, an increase in deposits took place in 1991 in the wake
of the Gulf crisis as many Jordanian expatriates brought their savings back to the country.
1965 1970 1975 1980 1985 1990 1995 2000 2005 2010
-0.25
0.00
0.25
0.50
0.75
1.00
Demand Saving Time
Gro
wth
Rat
e %
M
illio
ns JD
Year Year
Mill
ions
JD
Year

-28-
Substantial increases were recorded for saving and time deposits. Whereas the
proportion of demand deposits to total deposits steadily declined from 62.4 percent in 1967 to
14.8 percent in 1999, the proportion of saving and time deposits to total deposits held by
banks operating in Jordan increased from 37.6 percent in 1967 to 85.2 percent in 1999.
Figure 2-16: Demand Deposits and Time and saving as a Proportion of Total Deposits, 1994-2010.
Data Source: Central Bank of Jordan (2011)
The justification for this shift (seen in Figure 2-16, above) might be because the other
types of deposit pay interest whereas demand deposits do not. In fact, we can here link
depositors’ behaviour during this period with most political issues affecting the region and
the country. After 1999, when the new King led the country after his father’s death, there was
a decrease in savings and time deposits as people were fearful of the unclear political
situation and withdrew their deposits. In addition, during Iraqi War II, there was another
downward trend which can be put down to the new investment opportunities especially in the
stock markets. There was also a high demand for other alternative investments, such as
building construction, which pays higher returns than saving and time deposits due to the
decline in interest rate on the global market. To end with, the new banks increased the
competition between banks which may have encourage the residents to invest more in time
and saving deposits.
0%10%20%30%40%50%60%70%80%90%
100%
1964
1965
1966
1967
1968
1969
1970
1971
1972
1973
1974
1975
1976
1977
1978
1979
1980
1981
1982
1983
1984
1985
1986
1987
1988
1989
1990
1991
1992
1993
1993
1994
1995
1996
1997
1998
1998
1999
1999
2000
2001
2002
2003
2004
2005
2006
2007
2008
2009
2010
Demand Saving and Time
Perc
enta
ge %
Year

-29-
In this manner, the Jordan Deposit Insurance Corporation (JODIC) was established in
2000, and managed and supervised by a Board of Directors chaired by the Governor of the
CBJ. JODIC is responsible for compensating Jordanian Dinars depositors up to JD 10,000 in
case of bank liquidation. In October 2008 the government would guarantee all deposits in
banks operating in Jordan until the end of 2009: a pledge it later extended until the end of
2010.
2.3. 2. Uses of Fund
A major contribution of the financial system is the role which it plays in the allocation
of an economy’s resources, promoting development. Resources are mobilized by the
commercial banking system, and in Jordan, this has been particularly influential in the
direction and level of economic growth. In addition, each asset has a specific rate of return,
risk, and acquisition cost. Thus, the composition of assets is a key determinant of profitability,
an issue to be addressed later.
2.3.2.1. Cash and Balances with Other Banks:
Cash and balances with other banks represent the most liquid assets among the banks’
balance sheet assets. The IMF guide (2006, p.276) defined liquidity as “In terms of
instruments, liquidity generally refers to those assets that can be converted into cash quickly
without a significant loss in value”.
Capital liquidity is essential for the bank to meet its regulatory obligations at all times.
In general, these duties include meeting deposit withdrawal requests and loan demands - the
basic functions of liquidity. According to Sinkey (1998, p.248) liquidity serves:
1. To demonstrate to the market, in particular risk-averse depositors, that the bank is safe
and therefore capable of repaying its borrowings.

-30-
2. To enable the bank to meet its prior loan commitments (liabilities), whether formal or
informal.
3. To enable the bank to avoid unprofitable sale of assets.
4. To avoid abuse of the privilege of borrowing.
Liquidity is measured by the volume currency and coins (cash), balances within the
Central Bank, and balances with other depository institutions. Banks in Jordan by law are
required to maintain a proportion of their assets in the form of legal reserve.10
Figure 2-17: Obligatory and Total Reserves Heldb yC entral Bank (Million’sJD ), 1993-2010.
Data Source: Central Bank of Jordan (2011)
The compulsory cash reserve with the Central Bank became law in 1971, but the data
are only available from 1987. In 1991, the Central Bank imposed reserves denominated in
foreign currencies; the rate was 35 percent for foreign currencies deposits and 15 percent for
local currency deposits, and 8 percent from 2000 to 2007 for local currency deposits. The
Central Bank increased the requirement to 9 percent in 2008 to control the credit provided by
banks during the global credit crunch. The required figure was reduced to 7 percent in 2009
to encourage the banking sector to expand their investment portfolios, especially public debt
10
“Licensed banks have to deposit a compulsory cash reserve with the Central Bank as a percentage of their
various types of deposits This percentage range from 5-35 percent” Article 42 of the Central Bank Law No. 23
of 1971.
Mill
ions
JD
Year

-31-
instruments. In addition, the Central Bank pays interest on banks’ foreign currency deposits
at a rate which is equivalent to the rate prevailing in the international market since May 1989.
Figure 2-18 shows that cash and balances constituted around 42 percent of the total
assets in 2002 but declined to 31.2 in 2010. This could imply that banks were rather liquid,
particularly in 2002-2003. A Banks’ liquidity is also considered to be an important factor in
determining profitability. As Hemple and Simonson (1999, 158) state: “Long-run
profitability may be hurt if a bank has too many in low-earning sources in relation to its
needs for such liquidity”.
Figure 2-18: Cash and Balances as a percentage of Assets over the period, 2002-2010.
Data Source: Central Bank of Jordan (2011)
Further insights on liquidity, the ratio of loans to deposits will be utilised as far as it
has been proposed in the literature. Figure 2-19 shows the movement of loans to deposit ratio
from 1993-2010.
Figure 2-19: Loans to Deposits ratio, 1993-2010.
Data Source: Central Bank of Jordan (2011)
2002 2003 2004 2005 2006 2007 2008 2009 2010 2011 2012
0.35
0.40
Liquid/Total Assets
1995 2000 2005 2010
0.6
0.7
Loans/Deposits
Perc
enta
ge %
Perc
enta
ge %
Year
Year

-32-
The above figure shows that 2008 was the least liquid, and account for 72 percent,
whereas 2003 was the most liquid accounting for 52.7 percent, it worth mentioning a further
liquidity measure the ratio of liquid assets to total deposits.
Figure 2-20: Cash and Balances to Total Deposits ratio, 2002-2010.
Data Source: Central Bank of Jordan (2011)
The ratio of cash balances to total deposits is a superior tool of analysis in some ways
(compared to the loans/deposit ratio) because it compares liquid and illiquid assets. Liquidity
in this figure may be related mainly to the increase in the size of deposits over the period. As
mentioned before, the required reserve ratio for deposits were relatively unchanged from
2001 to 2007, and as seen in figure 2.26.
2.3.2.2. Security Investments
Security investments11 are generally regarded as secondary reserves. The reserves of a
commercial bank consist of high earning liquid assets that can be converted into cash with
little delay and little risk of loss. Commercial banks purchase securities for various purposes,
such as providing the bank with diversification, income tax benefits and liquidity back up for
the secondary reserve (Sinkey, 1998). It is not surprising that the volume of securities in the 11 For commercial bank operating in Jordan investments are almost wholly in government securities, since the
banking legislation specified prohibits banks from investing in the equities of companies or in real estate. Article
48 of the Banking Law, No.28 of 2000.
2002 2003 2004 2005 2006 2007 2008 2009 2010 2011 2012
0.5
0.6
0.7
Cash assets/Deposits
Perc
enta
ge %
Year

-33-
commercial banks’ portfolio, as appeared in the Consolidated Balance Sheet of commercial
banks operating in Jordan, has been relatively small.
Figure 2-21: Portfolio to Total Assets Ratio, 2002-2010.
Data Source: Central Bank of Jordan (2011)
These investments account for an average of 2.6 percent of total assets from 2002 to
2010. It may be that banks in Jordan prefer to invest in funds in the Central Bank to obtain
the window rate, which gives a good source of income as it fits the CBJ’s need to manage
liquidity and profitability.
2.3.2.3. Loans:
Loans are the least liquid of banking assets and are the major source of risk. Loanable
funds represent the main category of assets for most banking institutions as well as the
primary source of income. The loan portfolio is influenced by several factors, such as capital
position, risk and profitability of various types of loans, stability of deposits, economic
conditions, and the influence of monetary and fiscal policy. Table 2.3 shows the Loans
Portfolio of Jordanian banks from 2007 to 2011.
2002 2003 2004 2005 2006 2007 2008 2009 2010 2011 2012
0.02
0.03
Portfolio/ Total Assets
Perc
enta
ge %
Year

-34-
Table 2.3: Loans Portfolio (Million’s JD), 2007-2011.
2007 2008 2009 2010 2011 Total Credit 11295.6 13044.3 13317.2 14451.4 15851.2
Overdraft
1769.6 1599.6 1782 2025.5 2025.5 Loans and Advances 9199.8 10859 11418 12403.8 13538 Due within
(3) Months 2904.2 2904.2 2048.6 2152.7 2575.4
(3-6) Months 985.2 985.2 1062.7 1095.8 1018
(6-12) Months 1119.3 1119.3 1107 1123.3 1112.1
More than (12) Months 5234.8 5234.8 6468.3 7067.9 7756.9
Receivable 51.5 88.9 99.5 93.1 44.1 Accrued
526.6 526.6 631.9 871 1031.5
Discounted Bills & Bonds 437.2 415.7 299.6 265.6 287.7 Due within
(3) Months 148.4 165.7 114.8 99.8 152.6
(3-6) Months 65.4 64.2 42.7 41.4 34
(6-12) Months 75.6 53.6 33 27.4 21
More than (12) Months 97 74.2 52.9 27.3 30.7
Receivable 5.9 10.2 9.9 9.3 6.7 Accrued
44.9 47.8 46.3 60.4 42.7
Ratio of total credits
Overdraft
14.7 13.6 12.0 12.3 12.8 Loans and Advances 81.4 83.2 85.7 85.8 85.4 Discounted Bills and Bonds 3.9 3.2 2.3 1.9 1.8
Source: Central Bank of Jordan (2012)
Figure 2-22 shows total credits provided by banks operating over the period 1993 to
2010 in terms of loans, overdrafts, and discounted bills and bonds.
Figure 2-22: Total Credits according to Type (Million’sJD ), 1993-2011.
Source: Central Bank of Jordan (2012)
0
500
1000
1500
2000
2500
0
2000
4000
6000
8000
10000
12000
14000
16000
19
93
19
94
19
95
19
96
19
97
19
98
19
98
19
99
19
99
20
00
20
01
20
02
20
03
20
04
20
05
20
06
20
07
20
08
20
09
20
10
20
11
Dis
cou
nt
Bill
s an
d B
on
d &
O
verd
raft
Loan
s an
d A
dva
nce
s
Loans and Advances Overdraft Discounted Bills and Bond
Year
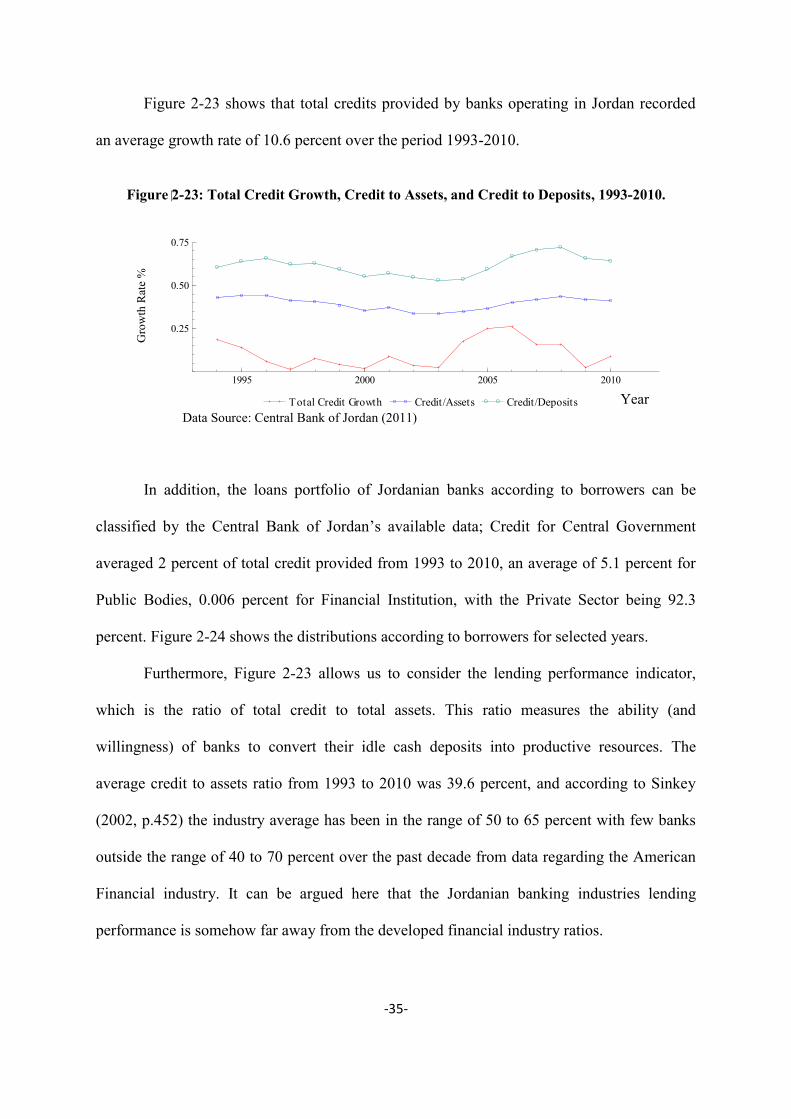
-35-
Figure 2-23 shows that total credits provided by banks operating in Jordan recorded
an average growth rate of 10.6 percent over the period 1993-2010.
Figure 2-23: Total Credit Growth, Credit to Assets, and Credit to Deposits, 1993-2010.
Data Source: Central Bank of Jordan (2011)
In addition, the loans portfolio of Jordanian banks according to borrowers can be
classified by the Central Bank of Jordan’s available data; Credit for Central Government
averaged 2 percent of total credit provided from 1993 to 2010, an average of 5.1 percent for
Public Bodies, 0.006 percent for Financial Institution, with the Private Sector being 92.3
percent. Figure 2-24 shows the distributions according to borrowers for selected years.
Furthermore, Figure 2-23 allows us to consider the lending performance indicator,
which is the ratio of total credit to total assets. This ratio measures the ability (and
willingness) of banks to convert their idle cash deposits into productive resources. The
average credit to assets ratio from 1993 to 2010 was 39.6 percent, and according to Sinkey
(2002, p.452) the industry average has been in the range of 50 to 65 percent with few banks
outside the range of 40 to 70 percent over the past decade from data regarding the American
Financial industry. It can be argued here that the Jordanian banking industries lending
performance is somehow far away from the developed financial industry ratios.
1995 2000 2005 2010
0.25
0.50
0.75
Total Credit Growth Credit/Assets Credit/Deposits
Gro
wth
Rat
e %
Year

-36-
Figure 2-24: Loans Portfolio of Jordanian Banks according to Borrowers
Data Source: Central Bank of Jordan (2012)
In 2000 the minimum reserve requirement, as mentioned before, was changed to 8
percent, which enabled banks to diversify their portfolios more and encourage the banking
industry to make more loans, as can be seen from Figure 2-25. The decrease in 2008 and the
increase in 2009 also can be explained by the increase and the decrease in the required
reserve for deposits from 9 to 7 percent.
2% 7%
3%
88%
1993 4% 3%
0.5%
92.5%
2000
1% 5% 1%
93%
2005 2%
2%
0.5%
95.5%
2011
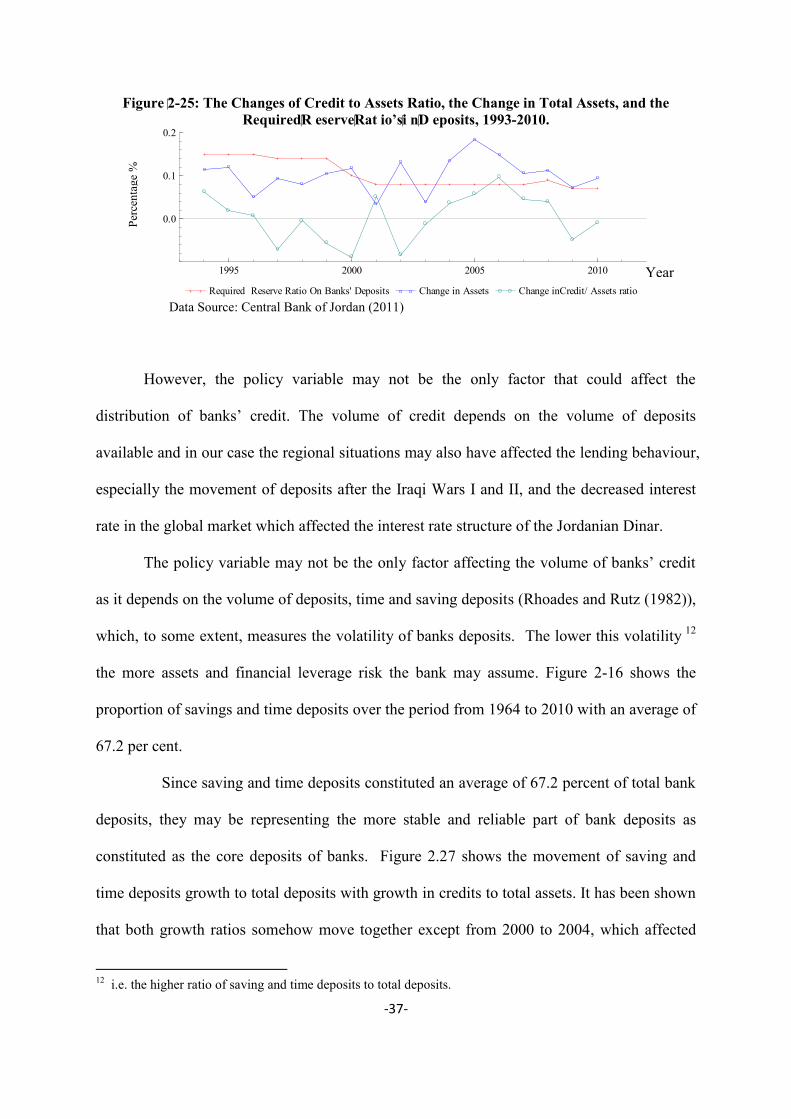
-37-
Figure 2-25: The Changes of Credit to Assets Ratio, the Change in Total Assets, and the RequiredR eserveRat io’si nD eposits, 1993-2010.
Data Source: Central Bank of Jordan (2011)
However, the policy variable may not be the only factor that could affect the
distribution of banks’ credit. The volume of credit depends on the volume of deposits
available and in our case the regional situations may also have affected the lending behaviour,
especially the movement of deposits after the Iraqi Wars I and II, and the decreased interest
rate in the global market which affected the interest rate structure of the Jordanian Dinar.
The policy variable may not be the only factor affecting the volume of banks’ credit
as it depends on the volume of deposits, time and saving deposits (Rhoades and Rutz (1982)),
which, to some extent, measures the volatility of banks deposits. The lower this volatility 12
the more assets and financial leverage risk the bank may assume. Figure 2-16 shows the
proportion of savings and time deposits over the period from 1964 to 2010 with an average of
67.2 per cent.
Since saving and time deposits constituted an average of 67.2 percent of total bank
deposits, they may be representing the more stable and reliable part of bank deposits as
constituted as the core deposits of banks. Figure 2.27 shows the movement of saving and
time deposits growth to total deposits with growth in credits to total assets. It has been shown
that both growth ratios somehow move together except from 2000 to 2004, which affected
12 i.e. the higher ratio of saving and time deposits to total deposits.
1995 2000 2005 2010
0.0
0.1
0.2
Required Reserve Ratio On Banks' Deposits Change in Assets Change inCredit/ Assets ratio
Perc
enta
ge %
Year

-38-
the credits to assets ratio by two factors; the change of required reserve from 10 percent to 8
percent and the second Iraqi War and its effect on the general economy which affected the
lending behaviour since the big share of Jordanian exports were toward the Iraqi market.
Data Source: Central Bank of Jordan (2011)
A positive correlation is therefore expected to appear between the saving and time
deposits to total deposits ratio and loans to total assets ratio. Table 2.4 shows the expected
sign of their statistical association, the correlation coefficient is 0.36. In sequence, the number
of banks’ branches may be also considered as a factor which might affect the amount of
credit provided by banks extended, a positive sign between credits to total assets ratio and
banking branches but less than the time and saving deposits and account for 0.27 correlation
coefficient.
As the supply of funds to the banking sector did not reflect the increase in credit, we
may justify by looking at the other main uses of funds, cash and balances, which has been
termed here as the liquidity of the banks. During 2002 to 2009, when such data are available,
it is obvious that the industry is liquid and illustrates the weak performance of banks in terms
of credit extended.
1995 2000 2005 2010
0.0
0.1
Growth in Time ans Saving deposits/Total deposits Growth inCredit/ Assets ratio
1995 2000 2005 2010
0.0
0.1
Growth in Time ans Saving deposits/Total deposits Growth inCredit/ Assets ratio
Figure 2-26: Saving and Time Deposits Growth to Total Deposits Ratio with Growth in Credits to Total Assets Ratio, 1993-2010.
Gro
wth
Rat
e %
Year

-39-
Table 2.4: Variables Correlation
Variables Time and Saving deposits/ deposits Credit/ Assets Branches
Growth in Time and Saving deposits/ deposits 1.00
Growth in Credit/ Assets 0.36065 1.00
Branches 0.40409 0.27015 1.00 Source: Author’s Calculations 2.4. Banking Profitability
Profits can play a very important role in providing a source of internal capital growth
and a signal upon which may provide facilities for additional borrowing. Profits also provide
a source of dividend payments to shareholders and provide expectations of future dividend
payments, which may encourage future equity investment. Thus far, "profits" are
fundamental to commercial banks. Profits of commercial banks are frequently the only
realistic source of equity capital. The crucial role that profitability plays in the future viability
of banking organisations implies that the relative competitive strength of different-sized
banks may be assessed based on this criterion. This section places great emphasis on the
measurement of banks profitability during the period 1991-2009.
2.4. 1. The Need for Adequate Profits
Bank profits are required to attract new capital to make possible the expansion and
improvement of the banking sector. If the return on existing capital is not comparable to the
returns on other investments, capital will be directed to other more profitable pursuits. Profits
can perform many functions; one of which is to provide reserves for contingencies and losses
that may have occurred incidental to the business of banking. Profits in banking also act as an
incentive to management to expand and improve corporate strategy, to reduce costs, and
improve services. Shareholders are interested in profits as they represent the return on
invested capital. Bank profits are beneficial to depositors as they provide a safer, more liquid

-40-
institution which is more efficient as it increases reserves and expands the ability to offer a
wider range of facilities. Borrowers also have an indirect interest in an adequate level of
profits since the lending ability of a bank depends on the size and structure of the bank’s
capital accounts, and bank profits constitute a major source of equity capital. (Reed and Gill,
1989, p 213).
2.4. 2. Measurement of Bank Profits
Bank profitability can be measured by using different methods. All of these methods
have some pros and cons. One popular method is to compare profitability to total bank assets,
and, as mentioned above, the return on assets is a valuable measure when comparing the
profitability of one bank with anther or with the commercial banking system (Reed and Gill,
1989, p.200). If time and saving accounts comprise an unusually large proportion of total
deposits, interest expenses may be higher than average. The bank could, of course, attempt to
offset this by adopting more aggressive lending and investment policies to generate more
income.
Rates of return on total assets do not show how well the bank is performing for its
owners. Thus, bankers and bank stockholders look closely at earning per share. This is a good
way to see how well a bank has done compared with previous years or to management’s
expectation. Nonetheless, the return on assets (ROA) and the return on equity (ROE) are the
methods that will be used to measure bank profitability in this study13. These measures are
important tools of financial analysis, providing information about bank performance and,
therefore, can be employed to compare performance over time and/or across banks.
2.4.2.1. Return on Assets
The return on assets (ROA) is typically considered the most suitable ratio for
assessing the performance of a bank (Sinkey, 1998). This measure is calculated by dividing a
13 For further details, see Gitman and Zutter (2011, 81), Rose and Hudgins (2008, 167) and (Sinkey, 1998, 84).

-41-
bank’s income before interest payable by its assets. ROAs measure the effectiveness of a
manager at utilising the resources of a bank to generate profit. It also gauges a bank’s
effectiveness in using all of its financial and real investments to earn interest payments and
fees. Thus it reveals the return to both depositors and shareholders. This measure of bank
profitability is particularly relevant when comparing operational efficiencies across banks.
2.4.2.2. Return on Equity
While the ROA ratio illustrates the ability of management to generate profit on its assets,
the ROE measures profitability from the owner’s perspective. The ROE expresses how much the
business is earning on the book value of their investment. This ratio is calculated by dividing a
bank’s net income by its equity, reflecting revenue generation, operational efficiency,
financial leverage and tax planning (Sinkey, 1998).
This ratio has some pitfalls as a profitability measurement. The ROE can, for example,
be high because a bank has inadequate equity capital. In addition to this, ROE is the product
of ROA and the leverage multiplier and the bank can use this relationship between the two
ratios to enhance its ROE. For example, a bank with a low ROA may increase its ROE by
using additional leverage by increasing its ratio of assets to equity (Koch and MacDonald,
2009,p 507):
2.4.2.3. Trends in Profitability in the Jordanian Banking market over the period 1991-2009.
The changes in the performance of commercial banks appear to reflect the impact of
both economic and regulatory factors prevailing during the concerned period. The data were

-42-
collected from the annual financial reports of the banks and from unpublished material in the
Central Bank of Jordan and the Association Banks of Jordan. 14 From 1991 to 1993, the
banking industry’s performance in Jordan, measured by ROA and ROE, appeared to
decreased. The regional context was extremely fluid in the early years of the 1990s.
Figure 2-27: Banks ROA, 1991-2009.
Data Source: Association of Banks in Jordan- Banks in Jordan: Facts and Numbers, various issues.
The closure of the Iraqi market had a negative impact on Jordan’s exports and
industrial production; around 25% of Jordan exports and 70% of the industrial output was
directed to Iraq (Knowles, 2005, p 81).
At the end of this period the economy received a short-term boost from the money
repatriated by the returnees, as mentioned previously, when around 300,000 workers and
their families were forced to leave the Gulf area, which was spent mainly in the construction
sector. According to Knowles (2005, p.81) the estimated expenditure was between US$ 600
to 700 million on housing and US$ 50 to 150 million on industrial and commercial building.
On the other hand, banks’ profitability appears to register a positive upwards trend,
from 1994 to 1998. The last period ended with a short-term economic boom resulting from
the money repatriated by the returnees. Furthermore, Knowles, (2005, p.82) noted that “The
14 Banks in Jordan: Facts and Numbers, Association of banks in Jordan-hard copy of Arabic version from 1991.
1990 1995 2000 2005 2010
0.01
0.02
ROA
Perc
enta
ge %
Year

-43-
injection of returnees’ capital created a mini-boom that lasted until the mid-1990s, with
annual real GDP growth averaging almost 9% between 1992 and 1995”.
Figure 2-28: Banks ROE, 1991-2009.
Data Source: Association of Banks in Jordan- Banks in Jordan: Facts and Numbers, various issues.
In October 1994 came the signing of the peace treaty between Jordan and Israel, as
the conflict was recognised as a major cause of uncertainty to the economic development in
Jordan. However, the regional situation was expected to bring a significant peace dividend to
the economy. The country had gained from agreements while international efforts had been
made to ‘normalise’ the peace by supporting the country by developing and funding many
projects, such as the Jordan Rift Valley. Jordan was allowed to enter into international
agreements, for example the Euro-Med and the World Trade Organisation (WTO), aiming to
move the country toward an open economy and to the acceptance of the global norms of
economic decision-making.
Before continuing with a further explanation of the profitability trends in Jordan, it is
worth noting that, from Figure 2-29, somehow the ROE moves away far from ROA 15 .
However, due to the confidentiality of the data used in this section, we can tell that foreign
banks operating in Jordan possessed very small amount of capital compared to the domestic
15 A foreign bank operating in Jordan has registered a 30% ROE during 1996, while ROA was 1.9%.
1990 1995 2000 2005 2010
0.10
0.15
0.20
0.25
ROE
Perc
enta
ge %
Year
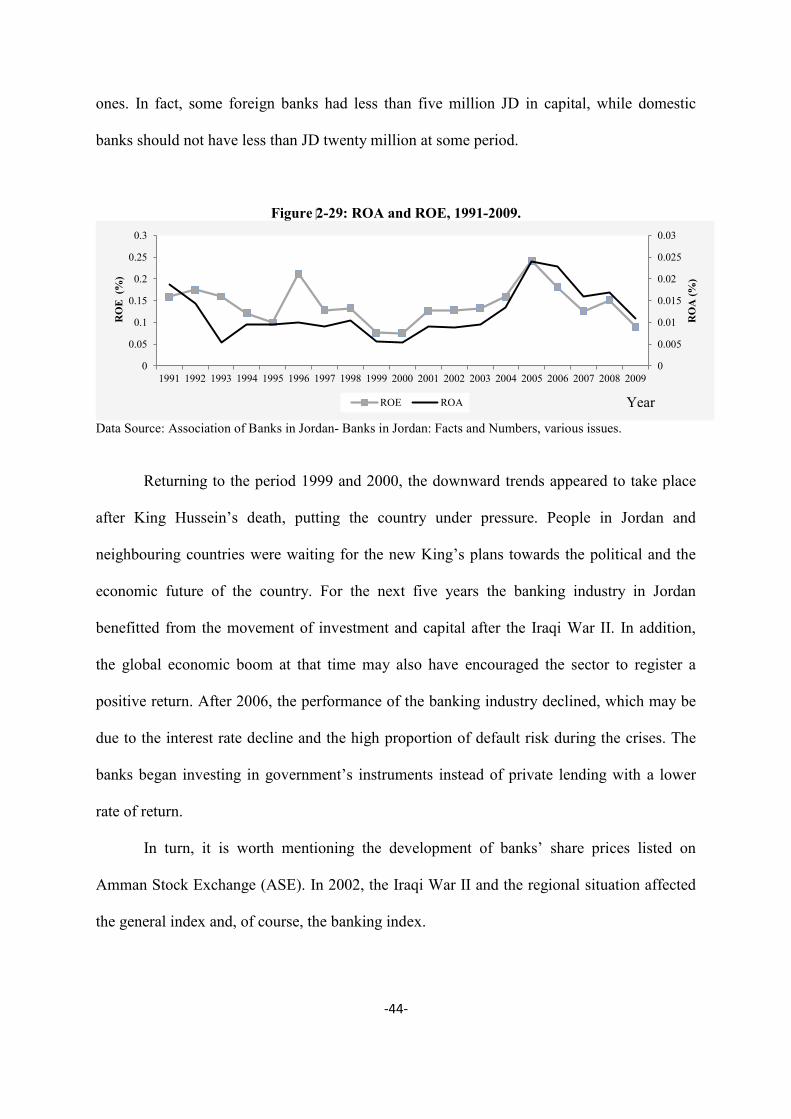
-44-
ones. In fact, some foreign banks had less than five million JD in capital, while domestic
banks should not have less than JD twenty million at some period.
Figure 2-29: ROA and ROE, 1991-2009.
Data Source: Association of Banks in Jordan- Banks in Jordan: Facts and Numbers, various issues.
Returning to the period 1999 and 2000, the downward trends appeared to take place
after King Hussein’s death, putting the country under pressure. People in Jordan and
neighbouring countries were waiting for the new King’s plans towards the political and the
economic future of the country. For the next five years the banking industry in Jordan
benefitted from the movement of investment and capital after the Iraqi War II. In addition,
the global economic boom at that time may also have encouraged the sector to register a
positive return. After 2006, the performance of the banking industry declined, which may be
due to the interest rate decline and the high proportion of default risk during the crises. The
banks began investing in government’s instruments instead of private lending with a lower
rate of return.
In turn, it is worth mentioning the development of banks’ share prices listed on
Amman Stock Exchange (ASE). In 2002, the Iraqi War II and the regional situation affected
the general index and, of course, the banking index.
0
0.005
0.01
0.015
0.02
0.025
0.03
0
0.05
0.1
0.15
0.2
0.25
0.3
1991 1992 1993 1994 1995 1996 1997 1998 1999 2000 2001 2002 2003 2004 2005 2006 2007 2008 2009
RO
A (%
)
RO
E (
%)
ROE ROA Year

-45-
Figure 2-30: ASE Un-weighted Price Indices (points), 1991-2011.
Data Source: Amman Stock Exchange- Historical data (2012).
Figure 2-31 shows the monthly percentage change of banks’ stock prices listed on the
ASE. The monthly data reflect more prices fluctuations which can give a clearer picture of
price indexes of the banking sector from 1993-2010.
Figure 2-31: Monthly Percentage Changes of the Stock Prices Index of the Banking Sector,
1993-2010.
Data Source: Amman Stock Exchange- Historical data (2011).
The highest percentage change was in July 2005, and accounted for a 232.4% increase
in monthly basis calculations. In addition, the banking industry profits originated mainly from
stock market investment portfolios, the non-operational activities. Whereas, there were a
negative growth due to the losses of banks portfolios’ in 2006. From the late 2008 to mid-
2009, many reasons can be explained for such decreased, the heavy-weighted or large listed
0
1000
2000
3000
4000
5000
6000
1991
1992
1993
1994
1995
1996
1997
1998
1999
2000
2001
2002
2003
2004
2005
2006
2007
2008
2009
2010
2011
Banks Insurance Services Industry General
-100%
-50%
0%
50%
100%
150%
200%
250%
Jan
-93
Oct
-93
Jul-
94
Ap
r-9
5
Jan
-96
Oct
-96
Jul-
97
Ap
r-9
8
Jan
-99
Oct
-99
Jul-
00
Ap
r-0
1
Jan
-02
Oct
-02
Jul-
03
Ap
r-0
4
Jan
-05
Oct
-05
Jul-
06
Ap
r-0
7
Jan
-08
Oct
-08
Jul-
09
Ap
r-1
0
Poin
ts
Perc
enta
ge C
hang
e %
Year
Month-Year

-46-
companies listed in ASE, namely the mining and extraction sectors, affect banks portfolio’s
as the 2006 negatively as the lost a huge drop of their values. Also, high domestic inflation
rate that also decrease consumers spending powers which affect banks’ credit policies.
Consequently, the deterioration in number of traded stocks and capital volume in ASE also
affected banks’ by reducing their trading and brokerage fees income, since most banks have
brokerage companies dealing at ASE. From 1993 to December 2010 the average banking
stocks growth rate was 18 percent.

-47-
2.5. Conclusion
Jordan had been susceptible to political and economic events affecting the region. The
closure of Arab Gulf markets to Jordanian goods and products and the transfer of people from
Kuwait and other Gulf countries, around 300 thousands persons, had a huge impact on the
economy and results in most sectors, banking, financial services, housing, education and
health (MOP, 2008). The banking industry in Jordan has developed considerably in the last
four decades in terms of the number of licensed banks operating, size of assets, deposits and
credit facilitating and the banking services. Monetary policy in the country also experienced
considerable development turning from the traditional and direct monetary tools to liberalised
interest rate, and equal treatment for foreign banks. In fact, the country has initiated a
multiple financial reforms in order to improve the efficiency and structure of the banking
industry since early 1990s.
To complete the full picture about the banking industry and the behaviour of banks
operating, we address the analysis of bank performance and the impact of market structure on
performance in the next chapter.
An examination of the source and uses of funds in Jordanian banks have shown
substantial growth. On the other hand, Hemply (1994, p.158) has noted “long-run
profitability may be hurt if a bank has too much in low-earning source in relation to its needs
for such liquidity”. In consequence, Figure 2-18 shows that the overall picture obtained from
looking at the consolidated balance sheet of banks in Jordan is a high status of liquidity, with
an average of 37 percent over the period from 2002 to 2009. This led us to investigate the
bank’s portfolio behaviour in Jordan as portfolio compositions affect the flow of funds into
alternative security forms, which is covered in Chapter Four.

-48-
Chapter Three
The Relationship between Market
Concentration and Profitability in Banking

-49-
CHAPTER 3 : THE RELATIONSHIP BETWEEN MARKET CONCENTRATION AND PROFITABILITY IN BANKING
3.1. Introduction
Competition and concentration may, in various ways, be influenced by the soundness
and stability of the financial sector (Yeyati and Micco, 2003). In addition, global competition
forces governments to deregulate or liberalize various aspects of their financial markets, so
that their financial institutions can compete efficiently globally (Fabozzi and Modigliani,
2003).
Much of the empirical work shows that high profitability comes from high market
concentration, and highly concentrated markets are less competitive than markets in which
many small practices operate. Moreover, a concentrated market enables market practices to
collude and to protect their market position with strategic behaviour.
In the present chapter, we will present an overview of the literature on the links
between market structure and profitability, particularly to the banking sector. Following the
market structure-conduct-performance (SCP) framework from the economics of industrial
organization, a number of studies of banks’ behaviour have considered market structure as a
proxy for market power. Hence, there are two theories put forward to examine market
structure: this chapter focuses on the two most related theories, namely; the structure-
conduct-performance (SCP) hypothesis and the efficient market (EM) hypothesis.
3.2. Theoretical Background
Theoretically, the seminal work on SCP dates from Mason (1939). A student of
Mason’s, Bain (1951, 1956) developed the early classical work in this area which has come

-50-
to be known as the SCP hypothesis. Bain gave the field its modern shape using inter-industry
comparisons. In turn, as the market defined as a mechanism through which buyers and sellers
exchange goods and services with the desired terms of sale, market structure refers to the
underlying characteristics that determine the intensity of competition among practices. In
addition, there are important elements of such characteristics as the number and size
distribution of buyers and sellers in the market, the height of entry or exit barriers, prices,
product differentiation, and the stability of demand and supply functions in the market.
Table 3.1: Types of Markets which describe the Structures of the Practices
MARKET TYPE FREEDOM OF ENTRY
NATURE OF PRODUCT
MAIN CONDITION
FAMILIAR INSTANCE
PERFECT COMPETITION
Unrestricted Homogeneous Over 50 competitors, all with negligible market shares
Wheat, corn, cabbages, carrots
(these approximate to perfect
competition) MONOPOLISTIC COMETITION
Unrestricted Differentiated Many effective competitors, none with more than 10
percent of the market
Builders, restaurants,
retailing , clothing
OLIGOPOLY Restricted Undifferentiated The leading four practices combined,
have 50-100 percent of the
market
Cement, cars, electrical
appliances
MONOPOLY Restricted or completely blocked
Unique One practice has 100 percent of the
market
Many prescription drugs, local water
company, and other utilities
Source: adapted from Baumol and Blinder (2008), Hamilton and Webster (2009).
There are several types of markets which describe the structures of the firm, from
markets with many practices in which there is freedom of entry with competitive rivalry to
markets where there is one supplier with restricted or completely blocked freedom of entry.
The various categories of markets, as presented in Table 3.1 show the differences between the
four categories.

-51-
In the context of banking, Rose (2008) defines structure as the number of banks and
competing non-bank financial services firms serving in a given market, the particular services
they offer in that market, the distributions of banks and bank customers, and the barriers to
market entry. Market structure had had two main internal elements: market share and
concentration. The market share ranges from 100 percent to nearly zero, from pure monopoly
to perfect competition. Secondly, concentration looks at the combined market shares of the
biggest players. This is how concentrated the market is in the pockets of large players (Clarke,
1985). In consequence, the fact that elements of market structure have an autonomous
influence on the performance of firms does not imply that there is only one set of variables
that can do so. Yet it is sometimes suggested that market structure determines the behaviour
or conduct of practices, whose joint conduct then determines the collective performance of
practices in the market place. According to Ferguson (1988), conduct refers to the behaviour
of the practices in a market, the behaviour of price competition, promotional activities,
mergers and innovations, to the decisions these practices make and also to the way in which
these decisions are taken. It, therefore, focuses on how the practices set prices, whether
independently or in collusion with other practices in the market. In sequence, practices
dealing in a perfectly competitive market have no incentive to advertise or to attempt to
discourage entry; practices can sell all that is demanded at the market price.
Different types of market structures will influence the conduct of the business, i.e.,
under pure competition, each practice is a price taker and has no significant influence on
price. Under imperfectly competitive market, each practice believes that it can influence the
price by changing the quantity of goods or services it produces. Then, the market
performance is related to productive and allocative efficiency, and the practices profitability.
Profitability, performance, and efficiency are all interrelated in one way or another.
Profitability measurement assesses the relationships among different components of cost and

-52-
revenue and provides a common origin for evaluating financial performance across
businesses. Performance measurement is the quantitative assessment of efficient progress
towards achieving a particular goal; therefore, performance can be divided into two elements:
profitability and efficiency. Profitability is the main goal of a firm’s economic performance;
efficiency on the other hand, refers to how well a practice can yield a maximum quantity of
outputs or minimum cost of production from a given total of inputs. In the case of banks,
performance may be particularly affected by factors such as concentration in the local market,
asset and liability management and the structure of branching. Like other practices, the
structure and the behaviour of banks will affect their market performance. Therefore, we
describe a conventional version of the SCP framework and then focus on some of the
criticisms. The simplest version in Figure 3.1 below illustrates that market structure
determines the conduct of practices in the market, and the conduct determines the market
performance.
Figure 3-1: The linear SCP model
However, the simple version of SCP model is very simple so that it does not explain
fully the real interactions relationship among structure, conduct, and performance. While
there are feedback effects in real-world markets, such feedback effects exist from
performance to structure i.e. (high profits increase market share and affect structure),
performance to conduct i.e. (high profits may encourage research and development), and
from conduct to structure i.e. (mergers and predation affect structure). In addition, these
interactions in the relationships might be determined within the whole system of structure,
conduct and performance. Figure 3.2 may help to explain these interactive relationships.
Structure Conduct Performance
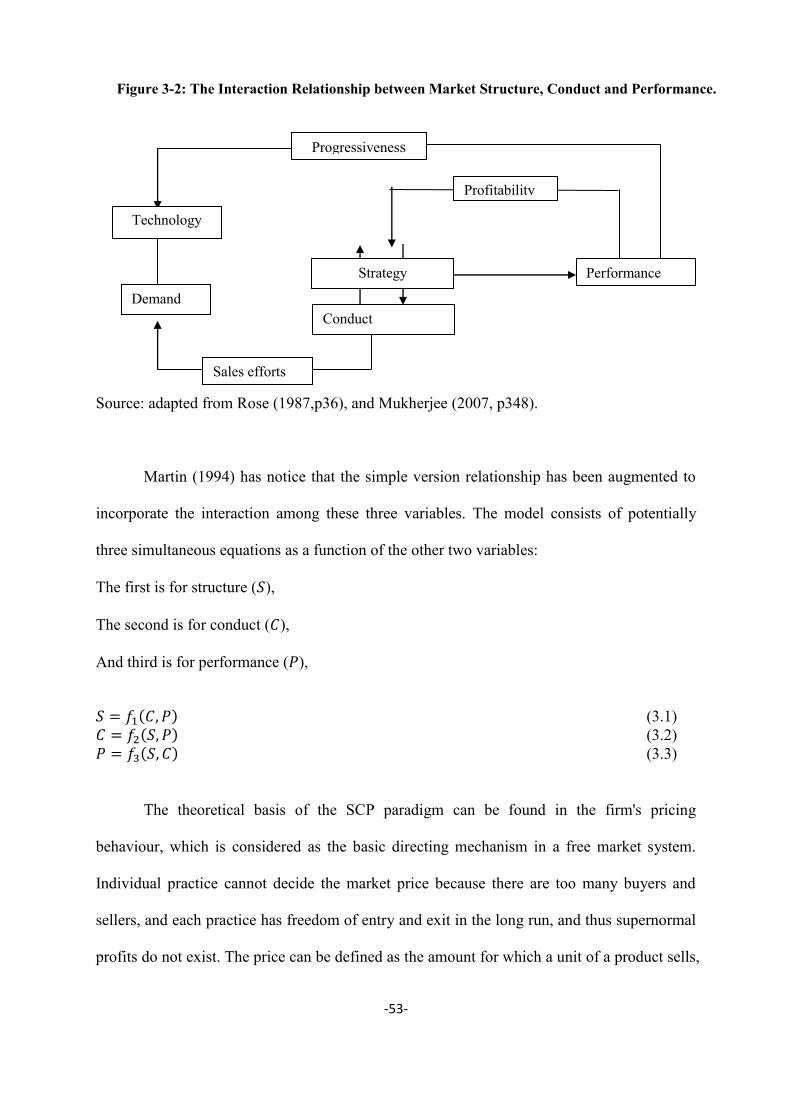
-53-
Performance
Profitability
Conduct
Technology
Progressiveness
Sales efforts
Demand
Strategy
Source: adapted from Rose (1987,p36), and Mukherjee (2007, p348).
Martin (1994) has notice that the simple version relationship has been augmented to
incorporate the interaction among these three variables. The model consists of potentially
three simultaneous equations as a function of the other two variables:
The first is for structure ( ),
The second is for conduct ( ),
And third is for performance ( ),
( ) (3.1) ( ) (3.2) ( ) (3.3)
The theoretical basis of the SCP paradigm can be found in the firm's pricing
behaviour, which is considered as the basic directing mechanism in a free market system.
Individual practice cannot decide the market price because there are too many buyers and
sellers, and each practice has freedom of entry and exit in the long run, and thus supernormal
profits do not exist. The price can be defined as the amount for which a unit of a product sells,
Structure
Figure 3-2: The Interaction Relationship between Market Structure, Conduct and Performance.
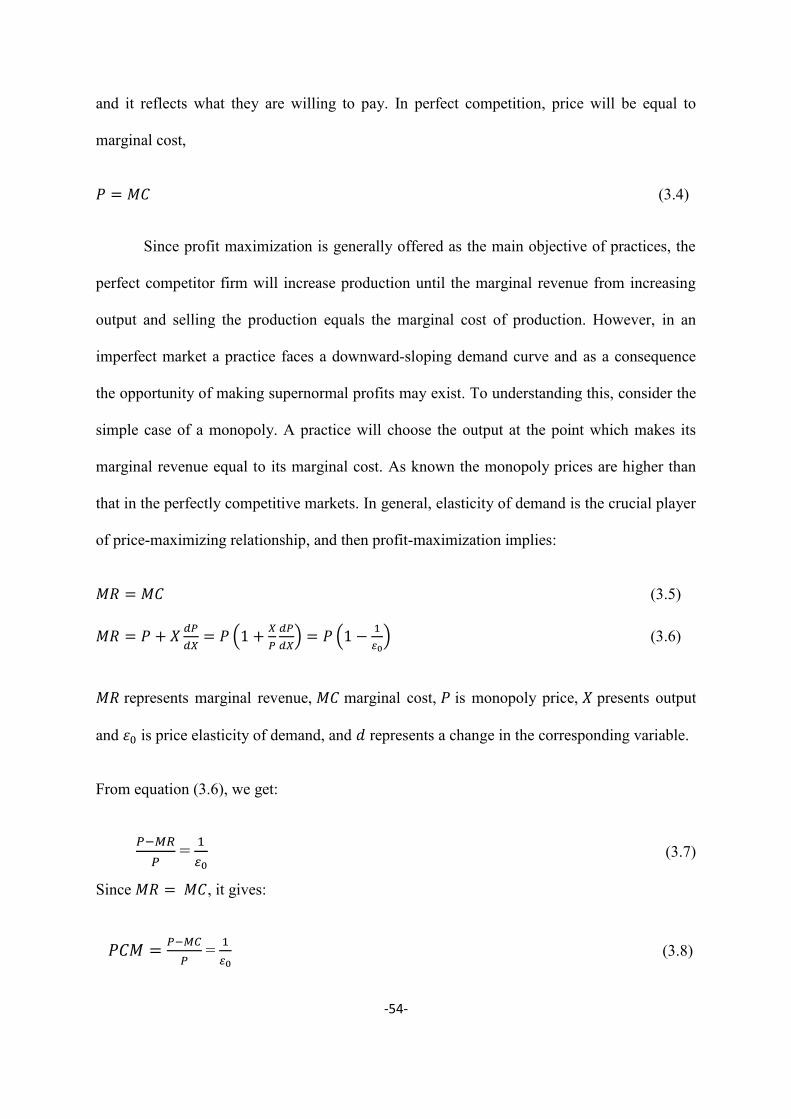
-54-
and it reflects what they are willing to pay. In perfect competition, price will be equal to
marginal cost,
(3.4)
Since profit maximization is generally offered as the main objective of practices, the
perfect competitor firm will increase production until the marginal revenue from increasing
output and selling the production equals the marginal cost of production. However, in an
imperfect market a practice faces a downward-sloping demand curve and as a consequence
the opportunity of making supernormal profits may exist. To understanding this, consider the
simple case of a monopoly. A practice will choose the output at the point which makes its
marginal revenue equal to its marginal cost. As known the monopoly prices are higher than
that in the perfectly competitive markets. In general, elasticity of demand is the crucial player
of price-maximizing relationship, and then profit-maximization implies:
(3.5)
(
) (
) (3.6)
represents marginal revenue, marginal cost, is monopoly price, presents output
and is price elasticity of demand, and represents a change in the corresponding variable.
From equation (3.6), we get:
=
(3.7)
Since , it gives:
=
(3.8)

-55-
Where presents the price-cost margin; from equation (3.8), the equals the inverse
of market elasticity of demand and has the same expression as the Lerner index of the degree
of market power (Lerner, 1934). The Lerner index measures the degree of market power by
the extent to which the monopolist practices can hold price above marginal cost by picking
the output that makes its .
The Lerner index can be extended to an oligopolistic market. Following Cowling and
Waterson (1976), Clarke and Davies (1982), and Clarke et al. (1984) we present a typical
oligopoly model. There are practices, indexed by , producing homogeneous
products. The marginal cost of each practice is assumed to differ across practices. The profit
equation of practice :
( ) (3.9)
is profit of practice ; is the practices output; is price; is output of the
industry, and is marginal cost of the 'th practice.
Inverse demand of the industry is
( ) (3.10) The first-order condition for profit-maximizing:
( )
( )
(3.11)
where
the output of all practices except the ith practice is denoted by
( )
In an oligopolistic market, there is conjectural variation where the practice has to
consider the reaction of competitor to it reactions. We assume Cournot market equilibrium,

-56-
i.e., a practice expects its rivals to hold their output constant. Now we denote a parameter that
shows the elasticity of a rival's output with respect to practice 's output, which is defined as:
⁄
(3.12)
This is the percentage change in all other practices’ output in response to a one
percent change of practice 's output. It is usually called a conjectural variation for practice
(Martin, 1994). Each practice is assumed to have a conjectural variation ( ). From equation
(3.12) above:
(3.13)
Introducing the definition of price elasticity of demand (
) into equation (3.11), the
firm's price-cost margin (PCM) is:
(
) (3.14)
where
represents the market share of practice , and presents the price elasticity of
practice 's demand. Equation (3.14) can be rewritten using equation (3.13) as,
(
)
( ( ) ) (3.15)
Multiplying (3.15) by and summing across practices within each industry, the industry
profit-cost margin can presented as:

-57-
∑(
)
( ( ) ) ∑
( )
Equation (3.16) provides a theoretical explanation for the SCP approach, that industry
PCMs are related directly and positively to the market concentration measurement,
Herfindahl index, and inversely to the industry’s price elasticity of demand. If increases,
then profitability increases. As mentioned, the SCP one-way causation from concentration to
profitability is too simple a causal relationship. The reason is that it ignores the impact that
conduct and performance, in sequence, could have on structure. Studies typically estimate
equations in a simultaneous equation system of the following form:
( ) (3.17) ( ) (3.18) ( ) (3.19)
where presents a measure of profitability, and is a measure of market structure and are
variables selected to measure the structural determinants of entry barriers, and are variables
representing demand conditions. In equation (3.17) profitability is associated with high entry
barriers and collusion. In equation (3.18) the degree of easy collusion is often proxied by
market concentration, which is measured by the concentration ratio. Market structure is
determined by entry barrier ( ) market performance( ), and number and size distribution of
sellers/buyers ( ) Following Bain (1951), entry barriers are postulated to be a function of
economies of scale capital requirement ( ) and product differentiation advantages( ).
This approach has inadequate theoretical foundations. While Bain analysed the SCP
relationship in detail, empirical studies later used this relationship as a base for their work.
Although there are a variety of oligopoly theories, only some of them suggest that price and

-58-
the concentration were positively associated. The first attempt to explicitly include behaviour
was the study of Cowling and Waterson (1976), with an assumption of Cournot behaviour.
The Cournot and dominant firm model suggest that prices increase with market concentration.
However, if we assume the Bertrand model, this prediction might not be applicable. A second
criticism is related to the problem of entry. The SCP hypothesis assumes that existing
practices in concentrated markets have the market power to earn supernormal profits. But
practices may not be able to exercise such power if threatened by potential new participants.
The potential or actual entry might nullify the market power of oligopolists. With regard to
potential competition, we are able to find some important implications from contestable
market theory, which was introduced by Baumol et al. (1982). The theory starts with
assumptions of zero sunk costs and free entry/exit from the market in the short run. They
showed that the possible competition could play the same role in disciplining incumbent
practices that actual competition does. In this case, the concentration will not result in high
yields, as expected, in general. Therefore, even in highly concentrated markets there is no
systematic relationship between structure and performance. The market performance in
contestable markets will be optimal as in competitive markets. Although the underlying
assumptions of the theory of competitive markets may be too strong, Martin (1994) argued
that no real-world industry has as yet been shown to be contestable; however, the contestable
markets hypothesis provides a conceptual tool to point out the limitations of the SCP
approach which deals with only realized competition. A third criticism concerns the
interpretation of the concentration, profitability, positive relationships.

-59-
3.2. 1. Market Efficiency Paradigm
Scholars argued that the links between market concentration and profitability are
likely to be caused by the efficiency of large-scale operations instead of market power. This
traditional theory has been criticized since the work of Demsetz (1973). He argued that the
commonly observed links for this relation are likely to be caused by market power. His work
was followed by Peltzman (1977), Clarke et al., (1984), Porter (1979), Weiss and Pascoe
(1985), and Berger (1995). The larger efficiency differences create more unequal market
shares and greater returns. In this view the superior efficiency causes both high profitability
and high concentration, thus profitability and concentration move together. If some practices
have superior efficiency, they might be large practices and earn high returns. Demsetz (1973)
considered industries in which large practices have a competitive advantage. His argument
can be explained by absolute cost advantages of successful practices. Large practices with
cost advantages will have higher rates of return than small practices because their costs are
lower. As Demsetz (1973) does not actually suggest a specific model, we consider the model
of Clarke et al., (1984) who followed Demsetz's methodology. They suggested a specific
model with which to test whether Demsetz's hypothesis is the sole explanation for the
correlation between concentration and profitability. To see this, we consider equation 3.16
∑(
)
( ( ) ) ∑
( )
This equation is presented as a theoretical justification of the SCP approach. However,
this relationship does not necessarily imply collusion among practices, as interpreted by
Clarke et al. (1984). If , i.e. in the case of no collusive practices as in the basic Cournot
model, then the outcome is
. This indicates that profitability at the industry level
-60-
and concentration are positively related in the case of no collusive practices, which is the
prediction of Demsetz. More generally, in equation (3.20) the is positively correlated
with market share and there are larger returns for the larger practices. Clarke et al., (1984)
found an explanation for these results in the capabilities of large practices to create
efficiencies. Consider practices that have initially identical costs and size. If one of these
practices discovers an innovating method to lower cost, it could increase its market share and
mark-up. Consequently, it raises the Herfindahl index. Since the practice occupies a larger
share of the industry, the also rises, and therefore profitability and concentration move
together without any collusion. The efficiency interpretation of the positive relationship
between market concentration and profitability is that practices with greater efficiency will be
able to take higher profits than other practices, because their costs are lower. However, a
practice may prefer to exercise market power.
3.2. 2. Banking Market Concentration
Concentration ratio ( ) and the Herfindahl-Hirschman Index( ) are the main
measures of market concentration have been proposed in the literature. The concentration
ratio shows the share of the total market, banking in particular, (e.g. measured by
employment, sales, assets, deposits, and credits) that is accounted for by relatively few of the
largest practices in that particular market. The calculation of the concentration ratio is as
follows;
∑
( )

-61-
is the practice concentration ratio, and is the percentage market share of the
practice i.e. assets, deposits, and sales. is the market share of the largest practices
in the market, ignoring the remaining practices in the market. However, using the
concentration ratio has its disadvantages. Firstly, the selection of the number of practices to
be included is highly arbitrary and ignores the structure of the remaining practices in the
market.
Moreover, these limitations mentioned above may be to some extent corrected using
an alternative measure of market concentration, such as the Herfindahl-Hirschman index
( ), which had taken into account the number and market shares of all practices in the
market. It is calculated by summing the squared market shares in percentage terms of all
practices as follows:
∑
( )
where is the number of practices in an industry and is the percentage of i.e. deposits/
assets controlled by the practice. The Herfindahl-Hirschman Indices , which is
grounded on the knowledge that the market behaviour is dominated by a small number of
large practices. However, bank supervisory bodies have traditionally measured ( ) using
deposit market share as a proxy for the level of competition over the cluster of services
offered by banks (Cohen, 2004). According to U.S. guidelines if the is less than 1,000,
the banking industry is regarded to be a competitive one, while if the lies between 1,000
and 1,800 somewhat concentrated (Moderately) concentrated, and concentrated industry if
is more than 1,800, Zaretsky (2004). In addition, the EU commission realizes that more
than 1,000 indicating a level of concentration that may affect competition adversely,
Hamilton and Webster (2009). We use ( ) and ( ) to evaluate the degrees of banking

-62-
markets concentration in Jordan, considering the ratio, in terms of both deposits and
assets, as the big three and the big five banks in Jordan.
3.2. 3. Measures of Performance
Gilbert (1984, p.632) states that “The only measures of bank performance derived
from the report of income and report of condition that do not have major measurement
problem are bank profit rates”. One of the main advantages of using the profitability measure
is the fact that it is simple and readily available. However, we found that the two profitability
measures most commonly used in the literature are return on assets and return on equity. In
fact, profitability measures are regarded as the most appropriate measures of bank
performance.
Market structure can be described with reference to the distribution of banks in the
financial system in terms of the number of providers and their market share. The description
may also include the different characteristics of banking market, including its size and value.
However, market structure is important because of its impact upon the performance of the
banking sector in providing banking service to the end-user.
The studies of bank market structure use the structure-performance hypothesis to
examine the banking industry. According to this hypothesis the structure of the market
determines the degree of competition in the market and the degree of competition affects the
performance of practices.
3.3. Reviews of Empirical Studies
The structure-performance relationship could be better explained by the hypotheses
that can be categorized into two main theoretical approaches; the Structure-Conduct-

-63-
Performance Hypothesis, and the Efficient Structure Hypothesis. The first of which favors a
highly concentrated market to effective collusion. This is justified by looking at the levels of
competition among market practices and what extent they are affected by concentration
among a few large practices. In fact, in high levels of concentration, effective monopoly
exists, and then market applicants are able to reach the monopoly price that maximizes
practices profits. In brief, the SCP hypothesis results from the model of oligopolistic
behaviour of practices which implies that collusive activities are less costly to preserve in
concentrated markets (Stigler, 1964). Prices, therefore, are likely to increase in response to
any additional increases in concentration.
As mentioned earlier a positive relationship between market concentration and
performance is interpreted by the SCP in banking, which advocates as evidence that practices
are able to achieve monopolistic rents through their ability to offer lower deposit rates and to
charge higher loan rates (Mugume, 2010). Shen (2003) re-evaluates the issue of bank
concentration on bank performance, using 52 countries from 1993-2000. His findings support
the view that the higher the market concentration the higher the profit. Also, he finds that the
concentration effect is negatively affected by low risk, corruption, confiscation and
accounting standard.
Several studies have reported a statistically significant negative relationship between
market concentration and performance, such as Geroski (1981), Connolly and Hirschey
(1984), Clarke (1984), Berger and Hannan (1989), Maudos (1998), and Delorme Jr. et al
(2002). However, previous studies finding a positive relationship between concentration and
profitability cannot be interpreted as a causal relationship between structure and performance.
This proposition has been offered by Berger and Humphrey (1991), Molyneux and Forbes
(1995) and Berger (1995).

-64-
The Efficient Structure Hypothesis is a challenge to the SCP paradigm, Demsetz
(1973) and Brozen (1982). Demsetz (1973) argues that a positive relationship between profit
and concentration may reflect the different efficiency of the largest and smallest practices in
numerous markets, rather than reflecting more and effective collusion in the concentrated
markets. The efficient structure hypothesis suggests that an industry’s structure arises as a
consequence of superior efficiency by particular practices, which means any increase in a
practice’s profits are assumed to accrue to these practices as a result of practice-specific
efficiency and not essentially because of collusive behaviour. Therefore, a positive
relationship between firms’ profits and structure can be attributed to the gains made in market
shares by more efficient practices, leading in sequence to increased concentration, Smirlock
(1985). In other words, the performance of an individual practice depends on the practice’s
degree of efficiency. This means if a practice enjoys a higher degree of efficiency than its
competitors, in which the practice has a relatively low cost of production, then that practice
can maximize profits and increase its size and market share, which can be done by keeping
the present market price. Hence, the increase of returns and market share is the result of
efficiency, on the cost side, not of a higher concentration ratio, the demand side. In turn,
Berger (1995) differentiates between market power and efficient structure hypotheses; while
advocating two market power hypotheses: the traditional SCP and the Relative Market Power
(RMP) hypotheses.
The Relative Market Power hypothesis states that only practices with large market
shares and well differentiated products are able to exercise market power in pricing products
and thus earn supernormal returns (Berger, 1995). In addition, Berger declares also that there
are two other explanations of the profit-concentration relationship in banking, linked to the
efficient structure hypothesis. The first is the Relative Efficiency (RE) version, the efficient
structure hypothesis, which asserts that practices may gain higher returns because they have
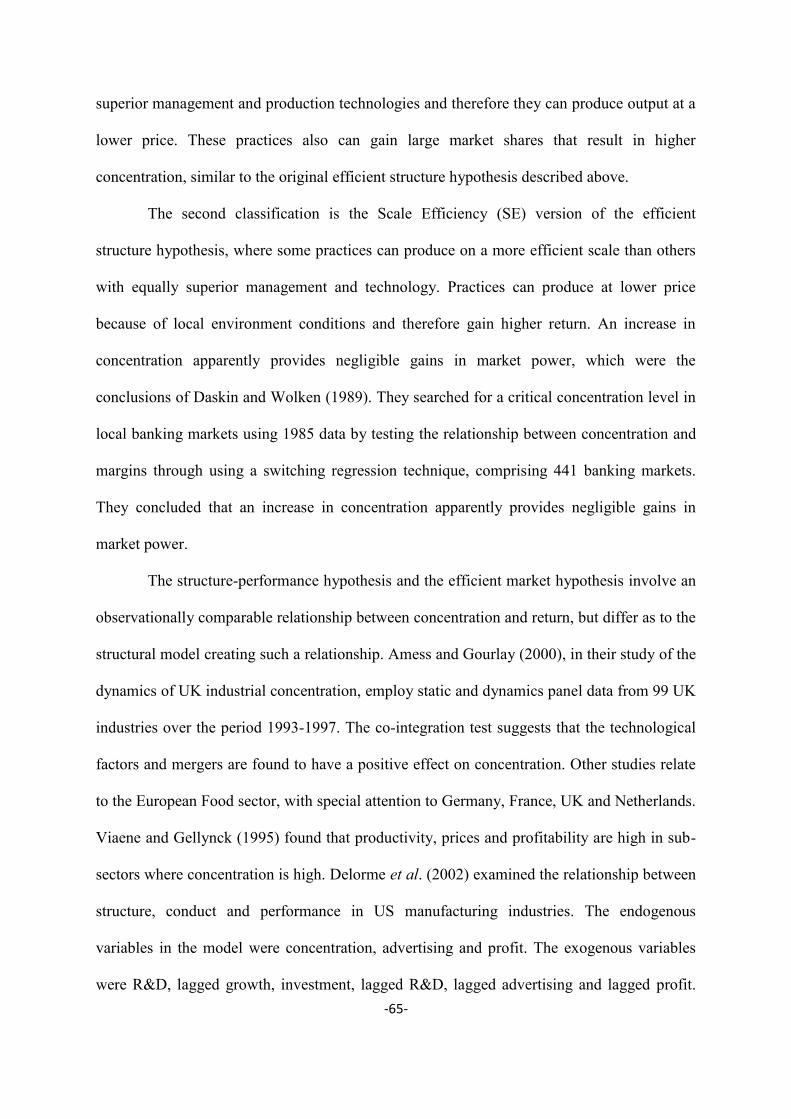
-65-
superior management and production technologies and therefore they can produce output at a
lower price. These practices also can gain large market shares that result in higher
concentration, similar to the original efficient structure hypothesis described above.
The second classification is the Scale Efficiency (SE) version of the efficient
structure hypothesis, where some practices can produce on a more efficient scale than others
with equally superior management and technology. Practices can produce at lower price
because of local environment conditions and therefore gain higher return. An increase in
concentration apparently provides negligible gains in market power, which were the
conclusions of Daskin and Wolken (1989). They searched for a critical concentration level in
local banking markets using 1985 data by testing the relationship between concentration and
margins through using a switching regression technique, comprising 441 banking markets.
They concluded that an increase in concentration apparently provides negligible gains in
market power.
The structure-performance hypothesis and the efficient market hypothesis involve an
observationally comparable relationship between concentration and return, but differ as to the
structural model creating such a relationship. Amess and Gourlay (2000), in their study of the
dynamics of UK industrial concentration, employ static and dynamics panel data from 99 UK
industries over the period 1993-1997. The co-integration test suggests that the technological
factors and mergers are found to have a positive effect on concentration. Other studies relate
to the European Food sector, with special attention to Germany, France, UK and Netherlands.
Viaene and Gellynck (1995) found that productivity, prices and profitability are high in sub-
sectors where concentration is high. Delorme et al. (2002) examined the relationship between
structure, conduct and performance in US manufacturing industries. The endogenous
variables in the model were concentration, advertising and profit. The exogenous variables
were R&D, lagged growth, investment, lagged R&D, lagged advertising and lagged profit.

-66-
Their results showed that the coefficient on profit in the concentration equation were negative
in some years. Edwards et al., (2006) tried to examine efficiency measures as a proxy for
performance to test the SCP hypothesis for U.S. trucking; their result found concentration
significantly affected the efficiency of firms. Other variables such as average haul, average
load and market concentration significantly affected the efficiency of practices. In addition to
the non-financial firms, Aleksandrova and Lubys (2004) tested the SCP paradigm using data
for 293 large non-financial Latvian practices, concluding that the business with higher market
power has lower internal efficiency and profitability than practices with moderate market
power.
Clark (1986a, b) argues that the failure of previous studies to control adequately for
the existence of a systematic interrelationship between market structure, risk, and profitability
may be responsible for the failure of many SCP studies to find “a strong, positive and
significant direct relationship between market concentration and bank profitability”. Both of
his studies use the same data set, consisting of 1,857 banks located in 152 SMSAs (the
Standard Metropolitan Statistical Area) in states permitting either unit or limited branch
banking from 1973 to 1982. In his first study, Clark uses ordinary least squares regression
procedure, with risk measured as the standard deviation of return on equity. His results show
that even when controlling for bank size, there is no significant relationship between
concentration and risk.
In his second paper Clark (1986b) uses a two-stage least square (2SLS) estimation
and compares the results using OLS estimates of structural and reduced-form equations. The
2SLS model allows for simultaneity between the bank's profit, risk, and the structure of the
balance sheet, incorporating other variables to capture the effects of the market, regulatory
and organizational structures. His findings support the traditional structure-performance
hypothesis; a ten percent increase in concentration, measured by the average Herfindahl

-67-
Index, will directly increase the average rate of return on equity by approximately 0.53
percent. On the other hand, the results using OLS to estimate the model's structural equation
for bank profits show quantitatively small and statistically insignificant estimated coefficients
on the market concentration variable.
Other scholars have used the price measurement instead of profit measurement.
Berger and Hannan (1989) test the Structure-Performance hypothesis in a way that excludes
the ES hypothesis as an alternative explanation of the result. This study used price
measurement (deposit interest rate) instead of profit measurement to estimate the SCP
relationship in banking. Their sample of 470 banks was observed quarterly over 2 1/2 years.
The main conclusion suggests that the relationship between the retail deposit interest rate and
local banking market concentration is negative and statistically significant and it varies
substantially over time.
Hannan (1991) also studied SCP using prices. SCP was tested using commercial loan
rates data, taken from the Federal Reserve System surveys of banking institutions. These
commercial loan rates comprised unsecured and secured floating rates as well as unsecured
and secured fixed rates. Hannan focused on the theoretical estimate on the relationship
between market structure and different aspects of bank conduct and performance. The
sample consisted of about 260 banks with a median size of $139 million in assets, located in
SMSAs (the Standard Metropolitan Statistical Area) for the period of 1984, 1985 and 1986,
with eight independent variables being selected in the analysis. The results support the
premise that the deposit market concentration will register a greater effect on the return on
assets than loan market concentration.
The concentration-profit relationship had received major criticisms regarding the
traditional views which have come from the proponents of the efficient structure hypothesis.
Scholars have criticized the traditionalists regarding their finding about SCP. Ajlouni (2010)

-68-
surveyed the empirical research to provide evidence on how the market structure influenced
the performance of banking during the 1960s to1980s. He categorized his study into two
groups. The first investigated, the relationship between bank market structure and its
performance, while the second group concentrated on the efficient structure. According to
Ajlouni (2010), the main features of SCP literature are a positive relationship with regard to
market structure and bank performance, while 14 studies have reported an entirely
insignificant relationship. In fact, return on assets appears to be the most used performance
measures recording 44% of the total studies sampled. On the other hand, the market
concentration ratio as a proxy of market structure appears to be used in more than 80% of
studies in his sample. The most common concentration ratio measure used was CR3; the
share of the big three banks was used in 60% of the whole sample.
Table 3.2:Summary of the Major Finding of SCP Literature during 1960s-1980s
The Relationship between SCP Measures
Entirely Positive
Varied Results According to Entirely
Insignificant Time Period Bank
Performance Market
Structure Summation 21 4 11 6 14
Source: Ajlouni (2010)
Table 3.3: Summary of the Major Finding of Bank Performance Measures in SCP Literature during 1960s-1980s
Interest Rate on Loans
Interest Rate on Deposits
ROA ROE Revenues from Fees
Interest Expenses Paid/Total
Time & Saving
Deposits
Interest and Fees from
Loans/Total Loans
Revenues from Demand
Deposits/Total Demand Deposits
Others
Summation 9 3 22 11 4 15 17 13 10 Source: Ajlouni (2010)
Table 3.4: Summary of the Major Finding of Market Structure Measures in SCP Literature during 1960s-1980s
CR1 CR2 CR3 CR5 N H 1/H G.
Coefficient E G TH
Summation 8 4 30 2 11 12 3 2 1 1 1
Source: Ajlouni (2010)
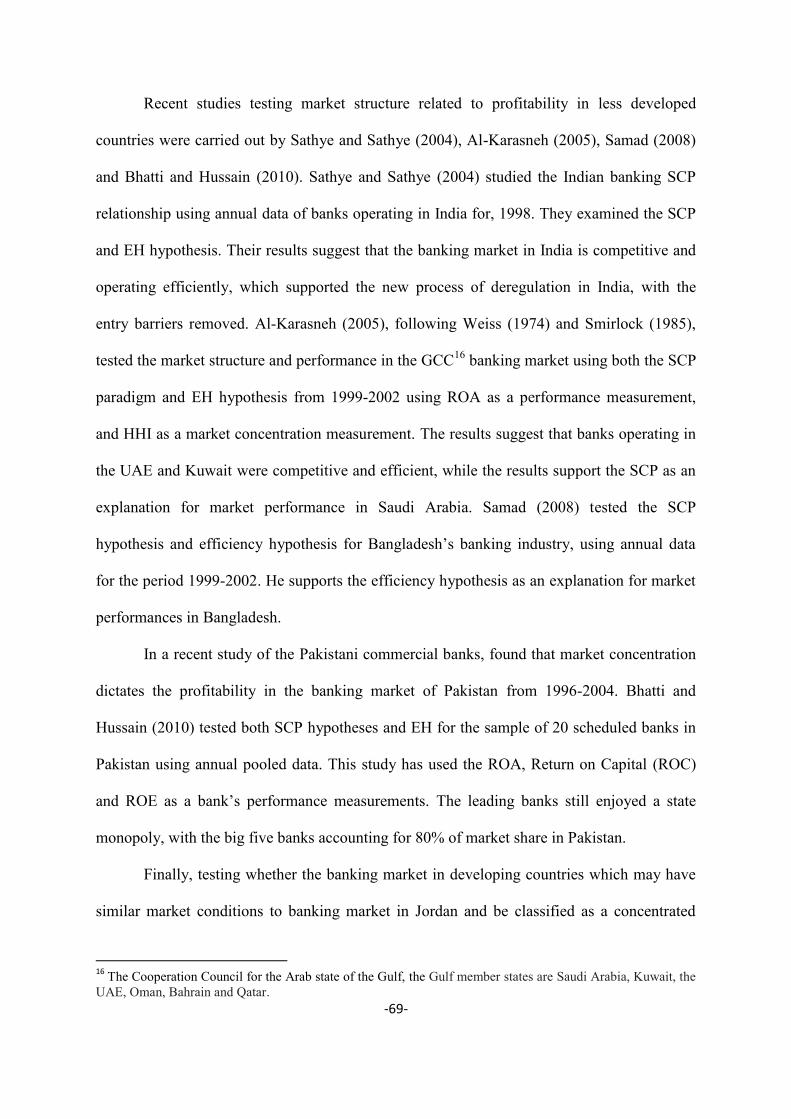
-69-
Recent studies testing market structure related to profitability in less developed
countries were carried out by Sathye and Sathye (2004), Al-Karasneh (2005), Samad (2008)
and Bhatti and Hussain (2010). Sathye and Sathye (2004) studied the Indian banking SCP
relationship using annual data of banks operating in India for, 1998. They examined the SCP
and EH hypothesis. Their results suggest that the banking market in India is competitive and
operating efficiently, which supported the new process of deregulation in India, with the
entry barriers removed. Al-Karasneh (2005), following Weiss (1974) and Smirlock (1985),
tested the market structure and performance in the GCC16 banking market using both the SCP
paradigm and EH hypothesis from 1999-2002 using ROA as a performance measurement,
and HHI as a market concentration measurement. The results suggest that banks operating in
the UAE and Kuwait were competitive and efficient, while the results support the SCP as an
explanation for market performance in Saudi Arabia. Samad (2008) tested the SCP
hypothesis and efficiency hypothesis for Bangladesh’s banking industry, using annual data
for the period 1999-2002. He supports the efficiency hypothesis as an explanation for market
performances in Bangladesh.
In a recent study of the Pakistani commercial banks, found that market concentration
dictates the profitability in the banking market of Pakistan from 1996-2004. Bhatti and
Hussain (2010) tested both SCP hypotheses and EH for the sample of 20 scheduled banks in
Pakistan using annual pooled data. This study has used the ROA, Return on Capital (ROC)
and ROE as a bank’s performance measurements. The leading banks still enjoyed a state
monopoly, with the big five banks accounting for 80% of market share in Pakistan.
Finally, testing whether the banking market in developing countries which may have
similar market conditions to banking market in Jordan and be classified as a concentrated
16
The Cooperation Council for the Arab state of the Gulf, the Gulf member states are Saudi Arabia, Kuwait, the UAE, Oman, Bahrain and Qatar.

-70-
market, two studies, namely Al-Muharrami et al., (2006) and Chio (2005), were presented
testing the market structure in two different developing countries. Al-Muharrami et al, (2006)
used the most frequently applied measured of concentration CRk and HHI, to investigate the
market structure of the Arab GCC banking industry from 1993 to 2002, and evaluate the
monopoly power. They suggest banks in Kuwait, KSA and UAE operate under perfect
competition. In addition, banks in Bahrain, Oman and Qatar operate under monopolistic
conditions. Chio (2005) used the Herfindahl Index to measure market concentration by using
data of deposit and loans for 23 operating banks over the sample 1995 to 2004. The
econometric analysis found banking business to be highly concentrated in Macao.
On the whole, this section has discussed the most important studies of market
structure and bank performance. Basically, structure and performance relationships studies
concentrated at first on the American banking system. However, recent studies on the
banking structure have focussed on European banking. In fact, there has been a little
empirical research focussing on the relationship between structure and performance in the
developing banking markets.

-71-
3.4. Empirical Estimation
Examining the concentration ratios in Jordanian banking industry led us to use three
measures which are proposed in the literature to be employed for this purpose: the big three,
big five bank concentration ratio and the Herfindahl index (HHI) for assets and deposits.
3.4. 1. Concentration in Jordanian banking
For the purpose of our study we will focus on one measure that might be considered
as a proxy for bank output, i.e. the volume of bank deposits. Bourke (1989) suggests deposits
as the essential hallmark of a bank and the one function common to all banks. Figure 3.3
reveals concentration ratios employing deposits, and assets for further explanation of the
Jordanian banking market as the output measure.
Figure 3-3: Big Three and Five Banks Share in terms of Assets and Deposits, 1991-2009.
Source: Association of Banks in Jordan- Banks in Jordan: Facts and Numbers, various issues.
The three leading banks accounted for 54 percent on average of the market deposits
for our period and 51.5 percent for assets. The level of bank concentration decreased over the
period 1991-2009 for both deposits and assets measured by the HHI index.
1990 1995 2000 2005 2010
0.5
0.6
0.7
DBiG3 ABiG3 DBiG5 ABiG5
Perc
enta
ge %
Year

-72-
Figure 3-4: Herfindahl-Hirschman Index (HHI) for Assets and Deposits, 1991-2009.
Source: Association of Banks in Jordan- Banks in Jordan: Facts and Numbers, various issues.
3.4. 2. Data and Methodology
It has been reported earlier that in the Jordanian banking market the current level of
concentration in is low. Figure 3.3 and 3.4 shows the improvements of the banking markets
with regard to the concentration issues during the study period. During the past two decades,
the monetary authority in Jordan has witnessed developments in the banking system. They
have moved from tight regulation to an open market operation in order to realize monetary
stability by applying an indirect management of monetary policy.
Thus the aim of this section is to test empirically both the Structure-Conduct-
Performance paradigm and the efficiency hypothesis to ensure whether the policy authority in
Jordan can be justified on efficiency grounds. The theory suggests two possible approaches
for the dependent variable in such models to test the profit-concentration relationship. Gilbert
(1984, p.632) has claimed that the only measure of bank performance obtained from banks’
financial statements that do not have major problems are profits rates. In fact, two profit
measures have been proposed in the literature, i.e. the return on equity and the return on
assets. Basically, return on equity is considered as the most important performance measure
1990 1995 2000 2005 2010
1250
1500
1750
DHHI AHHI
HH
I Ind
ex
Year

-73-
from the point of view of shareholders. However, return on assets tends to provide a better
view of the margins enjoyed by banks. In this study both the return on equity and assets will
be utilised.
3.4.2.1. Sample and Variables Selections
The sample used in the analysis of this chapter consisted of eighteen banks operating
in Jordan. It is worth noting that the total number of banks operating in Jordan is twenty-five,
but seven of them had to be excluded from our sample for the reason of being newly
established, i.e. less than six years. A data set composing twenty two banks has also been
employed, but due to its relatively inferior statistical merits, results have been reported but
not discussed. In turn, the choice of variables used in our estimation depended on data
available in Bankscope, Central Bank of Jordan published reports (soft copies and hard
copies) and Association of Banks in Jordan Reports. A sample of balance sheet and income
statement data were taken from 1991 to 2009.
In consequence, this study has a small sample size both in terms of time series and of
the cross-section used. In general, the banks sample size for the empirical research was
determined by the availability of data for the key variables. It is worth mention here, that it
would be great if this study included some other variables capturing research and
development and marketing advertisements, but unfortunately even in Bankscope there were
no such data.
As far as the eighteen banks are concerned, Table 3.5 provides summary statistics
describing the characteristics of these banks, i.e. (market share (MS) and the big five banks
(BIG5)), and variables analysed.

-74-
Table 3.5: Descriptive Summary Statistics for Variables
Variables Mean Median Maximum Minimum Std. Dev. ROA 0.011 0.011 0.058 -0.074 0.012 ROE 0.102 0.092 0.471 -0.257 0.101 MS 0.060 0.030 0.368 0.007 0.078 BIG5 0.663 0.660 0.720 0.595 0.040 MSCR5 0.019 0.019 0.022 0.016 0.002 MKTGROW 0.102 0.096 0.522 0.035 0.063 DDOTD 0.216 0.210 0.281 0.148 0.046 INF 0.043 0.034 0.221 -0.007 0.039 DISC 0.060 0.065 0.090 0.038 0.022 ASSETS 952.242 540.380 7468.000 61.252 1240.554 Log. Assets 6.184 6.003 8.918 3.262 1.019 LTTA 0.396 0.400 0.773 0.058 0.116 CRTA 0.150 0.138 0.680 0.014 0.088
is individual banks market share in terms of deposits. is a measure of market
structure, in terms of deposits; denotes the interaction between market share and
concentration ratio; is the growth in the percentage of market deposits;
is the ratio of demand deposits to total market deposits; is the inflation rate; is
Central bank discount rate; individual bank ( ) total assets, is the
natural logarithm of total assets , is ratio of bank ( ) loans to its total assets, is
ratio of bank ( ) capital and reserve to its total assets.
In terms of describing the main characteristics of these banks’ market share, market
concentration and banks size will be explained. Market share in Table 3.5 shows that the
average is 6 percent while the maximum value amounted for 36.8 percent which indicates a
wide range of banks’ market share. The banks market concentration measured by big five
banks also exhibited wide ranges. The average big five banks amounted 66.3 percent, while
the maximum stood at 72 percent. Finally, the banks’ total assets (size measurement) indicate
a wide range too; with the average bank size is 952.24 million JD. The maximum bank assets
accounted 7468 million JD.

-75-
3.4.2.2. Methodology
The traditional SCP and Efficient Structure ES hypotheses can be tested by estimating
the profit equation below as following, Weiss (1974) and Smirlock (1985):
∑ ∑
( )
is a profit measure, a measure of market share, is a measure of market structure
(concentration measure), and is a vector of additional control specific macroeconomic
variables was found to affect bank profitability by prior studies, while X is a vector of
control variable composing specific bank characteristics.
Bank profit is represented by both the rate of return on equity and assets. Bank ( ) market
share is captured by its deposits divided by total banks deposits in the market. The
concentration ratio is measured by the big five banks’ deposits. It is worth to mention here
that we examine assets data in terms of market share and the big five banks, but due to its
relatively inferior statistical merits, results have not been reported. In addition, this study
controls for specific macroeconomic variables that affect bank profitability, i.e. inflation
(INF).
∑ = (3.24)
The variable market growth , represent the percentage growth in the
Jordanian deposits market during the study period. The demand deposits ratio is
measured as the ratio of demand deposits to total market deposits, present as a proxy for cost
variables, denote inflation rate, is the Central bank discount rate. Below are the
specific bank characteristics variables.

-76-
∑ = (3.25)
is bank the logarithm of total assets a bank size proxy, present the ratio of
loans to its total assets for bank ,which is a proxy for bank risk, is the ratio of bank
capital and reserve to its total assets, a measure for bank risk as well.
In such a study of banks, a number of control variables are included to account for
cost, size and risk. We will use the following equation to test the competing hypotheses for
the Jordanian banks.
( )
The following statistical relationships as appeared in the light of the existing studies
are hypothesised to hold between the rate of return variable and each of the independent
variables.
a. There is a positive relationship between the rate of return and market concentration
measurements CR on the basis of the SCP views concerning the structure-
performance relationship.
b. There is a positive relationship between the rate of return and market share variable,
MS, on the grounds that a large bank market share enables the bank to differentiate its
product and ability to set prices without facing the usual market constraints to
generate higher profits.
c. The relationship between the rate of return and the interaction variable between
market share and concentration ratio may be positive or negative.

-77-
d. This study controls for specific macroeconomic variables that affect bank
profitability, , and .
e. There is a positive relationship between the rate of return and market deposits growth,
since rapid market growth should expand profit opportunities for existing banks.
f. There is a positive relationship between rate of return and the ratio of demand
deposits to total deposits. In fact, interest payment on demand deposits were
prohibited and thus provided a cheaper source of funds compared to other sources or
deposits.
g. The relationship between the rate of return and the inflation variable is indeterminate.
h. The relationship between the rate of return and the discount rate variable is
indeterminate, because higher market interest rates restrict economic activity, and on
the other hand they create a more profitable environment for banks.
i. The relationship between the rate of return and banks total assets may be positive or
negative depending upon economies of scale.
Since banks’ profits are not independent of risk, this study uses two variables, LTTA, and
CRTA for measuring bank specific risk,
j. There is a positive relationship between the rate of return and the ratio of bank loans
to total assets, LTTA, since the higher the amount of loans as a percentage of total
assets, the higher the risk for a bank. Thus, the bank is expected to earn a higher rate
of return to compensate for the higher risk.
k. The relationship between the rate of return and the ratio of bank capital and reserve to
total assets may be positive or negative. The bank capital adequacy literature supposes
that banks want to maximise leverage in order to maximise profits. However, for

-78-
increasing bank leverage, they have to pay a higher cost rate for funding and this
could affect the positive impact on profitability.
Table 3.6 provides a summary of anticipated signs the variables employed in the light of
the previously-mentioned hypothesises.
Table 3.6: Variables Signs Variables Anticipated signs
Market share Positive Market Concentration Positive
interaction variable indeterminate Market Growth Positive
Demand deposits/deposits Positive Inflation indeterminate
Discount rate indeterminate Assets indeterminate
Loans/Assets Positive Capital/Assets indeterminate
The efficient hypothesis can explains the market behaviour in Jordan if the sign on
market share is positive, implying that banks with a large market share are more efficient and
therefore gross higher profits than their rivals. Furthermore, concentration does not affect
bank profitability. On the other hand, the SCP hypothesis can be supported by the positive
coefficient on the concentration ratio, suggesting that the market share does not affect a
bank’s profitability and that profitability is the result of indicative of collusion.
In the panel framework common slope coefficients for the whole time period for each
bank, can assumption which may seem too strong given the picture obtained about banks’
characteristics presented in table 3.5. However, due to the small population of the Jordanian
banks it is necessary for our purpose to employ neither solely cross-section nor solely time-
series analysis. This assumption permits us to run a panel regression for Jordanian banks,
since the panel data provide more informative data, more variability, collinearity among
variables should be reduced, more degree of freedom and efficiency. In addition, the

-79-
Hausman test provides a formal way of choosing between a random effect and a fixed effects
model.
Naturally, panel analysis is likely to be more applicable as compared to pooled OLS
as panel allow for control for individual unobserved heterogeneity. In this regard, the
Hausman test, (e.g. random effect vs. fixed effect, and random effect vs. pooled OLS),
provides a way of testing between models for choosing a specific estimation among two
options. The Durbin-Wu-Hausman (DWH) tests for the appropriateness of our model
specification. Adopting this approach, the null hypothesis of “no correlation between the
individual specific effect and the independent variables” cannot be rejected for both
profitability measures for the eighteen banks, suggesting that applying the random effects
model is appropriate.
The random effects model estimation is a consequent strategy, and discriminates between
random and fixed effects by defining the target of inference (Wooldridge, 2002). Sinjders
(2005) and Andre and Mueller (2011) agreed that a random effects model is more appropriate
if the interest of inference relates to a population mean, i.e. banks are viewed as sampled
from an overall population. On the other hand, fixed effects are more suitable if the data are
not sampled but almost cover the full population, which is not the case for our comprehensive
sample the eighteen banks. Furthermore, we control for unobserved bank specific effects, and
the results can confirmed that there was no significant specific bank effects founded, which
can also confirmed that using the random effect model is preferred.
In addition, we apply the Breusch and Pagan (1980) Lagrange multiplier (LM) for
testing random effects models against the pooled OLS model under the null hypothesis that
the cross–sectional variance components are zero. Test results suggests that the banks effect

-80-
is equal to zero and that the estimate coefficients obtained from panel model are reliable in all
cases.
Furthermore, also we use Durbin-Wu-Hausman test for endogeneity, we assume that
vector variables used for measuring bank specific size and risk Assets, CRTA, and LTTA are
endogenous, i.e. they are determined by profits. To examine the existence of endogeneity we
test the three variables jointly.17 Under the null of no endogeneity, a rejection of the null
requires us to use instrumental variables techniques. Results obtained using return on equity
as a profit measure does not support the use of instrument variables, ( = 3.77 with p-value
0.9281).
3.4.2.3. Test for non-spherical residual
We conduct Wooldridge serial correlation test (2002), for identifying serial
correlations. This test has the null of no first-order serial correlation. Results imply that the
residuals are serially correlated in all cases. Table 3.8 presents all the non-spherical results.
Another issue to be addressed is the presence of bank-level heteroskedasticity of
variance of the regression disturbances is likely. However, this study uses the Wald
Heteroskedasticity test and LR Heteroskedasticity test to detect for the heteroskedasticity
problem in both fixed and random effect, respectively. We accept the null hypothesis that
there is no heteroskedasticity. A result for heteroskedasticity implies that the residuals are
heteroskedastic for all cases (estimated models in Table 3.8).
The results of non-spherical test for all models presents in table 3.8 in all cases,
residuals are hetroskedastic and serially-correlated. These results required to use the cluster-
robust standard error estimator18. This option can produce “correct” standard errors even if
17
Further information please see, Berger et al.(2004), Evans et al. (1993), and Bresnahan (1989) 18
For Further information about cluster, please see Rogers (1993), Huber (1967), and any general issues and commands, the STATA 12 User’s Guide.

-81-
the observations are correlated. By using this robust standard error estimator (cluster) we
assumed that observations should be independent across clusters (i.e. Banks) Rogers (1993).
Table 3.7 shows the correlations between the control variables. This correlation
matrix displays that a high level of correlation that can be found between two of the
independent variables, the percentage of capital ratio to total assets CRTA and big five banks
BIG5, with -0.767 correlations. However, the problem here is that there is no agreement
when correlation can be classified as a high. Kennedy (1998) claims that a high correlation
exist if the absolute correlation coefficient were 0.80 or 0.90, while Anderson et al. (2008,
p.644) consider an absolute correlation coefficient with value exceeds 0.70 to be high. Again,
in excess of 0.80 variables may be assumed of exhibiting multicollinearity according to
Brayman and Cramer (2005, p.302). In our case, since both market proxies are away from
that, with a value of 0.142, we can feel more comfortable in dealing with the model.
Table 3.7: Correlation Matrix
ROE MS BIG5 MSCR5 MKTGW DDOTD INF DISC L.Assets CRTA LTTA ROE 1
MS -0.1723 1
(0.003)
BIG5 0.2933 0.1418 1
(0.000) (0.013) MSCR5 -0.1496 -0.0306 -0.5001 1
(0.009) (0.595) (0.000) MKTGW 0.1872 -0.0491 0.142 -0.0896 1
(0.001) (0.393) (0.013) (0.119) DDOTD 0.2606 -0.0167 0.1694 -0.0893 0.391 1
(0.000) (0.771) (0.003) (0.120) (0.000) INF -0.0104 -0.0567 -0.3592 0.2248 0.1977 0.2037 1
(0.857) (0.325) (0.000) (0.000) (0.000) (0.000) DISC 0.1431 0.1067 0.5589 -0.2502 0.0724 -0.1959 -0.0006 1
(0.013) (0.063) (0.000) (0.000) (0.208) (0.000) (0.992) L.Assets -0.0831 0.7057 0.2137 -0.1125 0.0169 0.3621 0.012 -0.023 1
(0.149) (0.000) 0.0002 (0.050) (0.770) (0.000) (0.836) (0.690) CRTA -0.1846 -0.2529 -0.7678 0.334 -0.184 -0.2071 0.2113 -0.4608 -0.2586 1
(0.001) (0.000) (0.000) (0.000) (0.001) (0.000) (0.000) (0.000) (0.000) LTTA 0.0873 -0.483 -0.1201 0.0278 -0.052 -0.0209 0.1029 0.003 -0.1678 0.2982 1
(0.129) (0.000) (0.036) (0.629) (0.366) (0.716) (0.073) (0.959) (0.003) (0.000) Note: p-values are between ( ).

-82-
3.4. 3. Estimation Results
We estimate the model described in equation 3.26, using an unbalanced panel data set.
The model was estimated on data comprising twenty two banks and eighteen banks using
both profitability measures, ROA and ROE.
In fact, comparing the four sets of results, the eighteen banks using ROE as profit
measure appear consistent with the theory, and now we will focus on the conclusion on the
preferred model. As we mentioned early, we carry out a number of tests in order to correct
for heteroskedasticity and autocorrelation. The adjusted R-squared value is 0.346 which is
relatively good and close to that found by other studies. The diagnostic tests show that the
random effect model is the preferred one; Table 3.8 presents the regression results obtained
for testing both hypotheses, the EM and SCP.
The results from the Jordanian banking market support the SCP hypothesis as an
explanation for the market behaviour. We find a significant positive profitability-
concentration relationship. The estimated coefficients of the market-share variable appeared
insignificant; there were no support for larger banks market share is in linked to profitability.
Thus, the findings reject the efficient market hypothesis and support the traditional SCP
hypothesis as an explanation for the market behaviour of Jordanian banks under the big-five
banks concentration measurements. The results can be explained by the fact that the big-five
banks in Jordan in terms of deposits hold more than 60 percent during study period.
In turn, the results for controls for specific macroeconomic variables that effect bank
profitability are mixed. The market deposits growth variable MKTGROW and inflation INF
displays an insignificant relationship with profits. While, the relationship between the ratio of
demand deposits over total deposits variable, DDOTD, and profits is significant with a
positive sign, indicating that banks enjoying prohibited interest payment on demand deposits
by providing a cheaper source of funds compared to other sources of deposits and increase

-83-
banks’ profits. Similarly, there is a positive significant relationship between profits and the
discount rate variable DISC, indicating that banks gain from favourable economic conditions
from the reduction in interest rate during the recent years.
Table 3.8: Regression Results for Testing Efficient Markets and SCP Hypothesis
Dependant Eighteen Banks Twenty two Banks
ROA ROE ROE* ROA ROE
Intercept -0.025* [-3.23]
-0.011 [-0.19]
-0.024 [-0.43]
-.032* [-3.65]
0.027 [0.52]
MS -0.022 [-1.03]
0.047 [0.26]
0.028 [0.16]
-0.021 [-0.47]
0.086 [-0.51]
BIG5 0.011**
[2.02]
0.138*
[3.77]
0.148*
[4.26]
0.0074 [1.41]
-0.005 [-0.15]
MSCR5 0.0002 [0.95]
-0.001 [-0.88]
0.0001 [0.73]
-0.0005 [-0.46]
MKTGROW 0.008 [0.75]
0.094 [1.30]
0.098 [1.35]
0.0078 [0.73]
0.112 [1.57]
DDOTD 0.1069*
[5.71]
0.023*
[6.52]
0.813*
[6.44]
0.095*
[5.20]
0.596*
[5.08]
INF 0.0180 [0.98]
0.111 [0.92]
0.104 [0.86]
0.017 [0.98]
0.073 [0.66]
DISC 0.0797**
[2.09] 0.552** [2.17]
0.558** [2.19]
0.080**
[2.14] 0.591**
[2.40] ASSETS -0.0003
[-0.25] -0.034*
[-3.66] -0.032* [-3.55]
0.0011 [0.77]
-0.022*
[-2.60] CRTA 0.013***
[1.90] -0.014 [-0.30]
0.059 [1.33]
0.009 [1.61]
-0.048 [-1.14]
LTTA 0.004 [0.67]
0.061 [1.35]
-0.011 [-0.25]
0.012***
[1.68] 0.099**
[2.37] R-square 0. 236 0. 346 0.348 0.184 0.145
F-stat. 8.80 (p-value) (0.000) Wald (chi-square) 90.97 173.86 172.98 73.57 (p-value) (0.000) (0.000) (0.000) (0.000) Hausman Test 4.82 1.22 1.36 39.47 9.52 (p-value) (0.9032] (0.999] (0.998) (0.000) (0.483) Breusch-Pagan Lagrange Multiplier 47.61 299.15 298.39 311.44 (p-value) (0.000) (0.000) (0.000) (0.000) Wald Heteroskedasticity test 4176.97 (p-value) (0.000) LR-Heteroskedasticity test 216.55 148.51 184.19 191.91 (p-value) (0.000) (0.000) (0.000) (0.000) Wooldrige-test for autocorrelation 36.147 57.071 56.237 44.798 105.526 (p-value) (0.000) (0.000) (0.000) (0.000) (0.000) No. of Observation 304 304 304 326 326 Note: t-value in [ ], p-values in ( ), and *,**,*** indicates significance at the 1%, 5%, 10% levels. ROE*: presents the regression results obtained excluding the interaction variable.
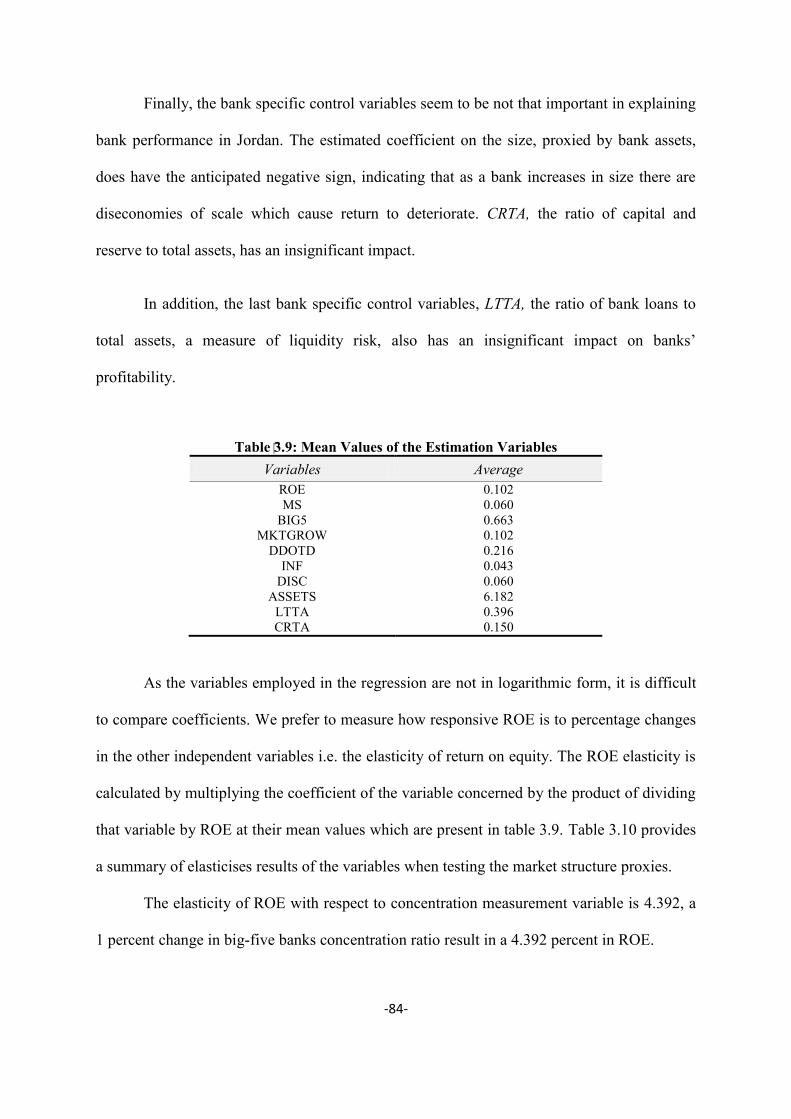
-84-
Finally, the bank specific control variables seem to be not that important in explaining
bank performance in Jordan. The estimated coefficient on the size, proxied by bank assets,
does have the anticipated negative sign, indicating that as a bank increases in size there are
diseconomies of scale which cause return to deteriorate. CRTA, the ratio of capital and
reserve to total assets, has an insignificant impact.
In addition, the last bank specific control variables, LTTA, the ratio of bank loans to
total assets, a measure of liquidity risk, also has an insignificant impact on banks’
profitability.
Table 3.9: Mean Values of the Estimation Variables Variables Average
ROE 0.102 MS 0.060
BIG5 0.663 MKTGROW 0.102
DDOTD 0.216 INF 0.043
DISC 0.060 ASSETS 6.182
LTTA 0.396 CRTA 0.150
As the variables employed in the regression are not in logarithmic form, it is difficult
to compare coefficients. We prefer to measure how responsive ROE is to percentage changes
in the other independent variables i.e. the elasticity of return on equity. The ROE elasticity is
calculated by multiplying the coefficient of the variable concerned by the product of dividing
that variable by ROE at their mean values which are present in table 3.9. Table 3.10 provides
a summary of elasticises results of the variables when testing the market structure proxies.
The elasticity of ROE with respect to concentration measurement variable is 4.392, a
1 percent change in big-five banks concentration ratio result in a 4.392 percent in ROE.

-85-
A ceteris paribus one percent increase in the demand deposits as a percentage of total
deposits would produce an increase in the return on equity by 2.263 percent. Banks enjoying
a cheaper source of funds (demand deposits) interest payment compared to other sources of
deposits such as saving deposits, and affects their profitability positively.
A ceteris paribus one percent increase in the discount rate would produce an increase
in the return on equity by 0.628 percent. It can be that the banks gained from the increase in
the discount rate in the market as they run in a more profitable environment, as this increase
may result by an expansion all over the economy.
A ceteris paribus one percent increase in the size proxied control variable assets
would produce a decrease in the return on equity by -1.895 percent. Results from chapter five
as well can conclude that the banks in Jordan inefficiency were attributed to technical
inefficiency, managerially inefficient in controlling costs.
Table 3.10: Variables Elasticises
Variables Equation 2.26 MS insignificant BIG5 4.392 MKTGROW insignificant DDOTD 2.263 INF insignificant DISC 0.628 ASSETS -1.895 LTTA insignificant CRTA insignificant
Overall, the results that the Jordanian banking market is in line with the SCP
hypothesis as an explanation for market behaviour. The results seem to contradict our
expectation, considering that the big-five banks account for more than 60 percent market
share. Moreover, our findings support the position that despite the significant rise in new
foreign banks operating in Jordan and the decrease in market concentration, banks’ profits

-86-
seem to be explained by greater market power. In contrast, the direct policy implications is
that policies would help to promote and enhance competition within the Jordanian banking
market and encourage existing banks to operate more efficiently should be expected to
benefit without being detrimental to consumers.

-87-
3.5. Conclusion
During the 1990s the Jordanian banking industry could be described as a relatively
concentrated market, especially concentration in deposits, where the top five banks took more
than 60 percent of the total market share. By the end of 2000, the market became less
concentrated. In addition, the Central Bank of Jordan had adopted policies that marked a
striking development in the banking industry, especially encouraging foreign banks to operate
in the country.
This chapter sought to examine the impact of market structure on bank performance.
Two competing hypothesis were tested, the SCP and the ES hypothesis, for Jordanian banks,
using an unbalanced panel data set over the period 1991 to 2009. This chapter employed the
random effect model. However, heteroskedasticity was detected in the random effect model.
So the cluster-robust standard error estimator was used.
Initial results suggested some consistency with the literature and found a positive,
statistically significant market concentration coefficient and a statistically insignificant
market share coefficient. We can conclude that the results support the SCP hypothesis as an
explanation for market performance in Jordan.
Furthermore, the results for controls for specific macroeconomic variables are mixed.
The market deposits growth variable and inflation displayed an insignificant relationship with
profits, indicating that banks have no profit opportunities impact from the rapid market
growth. While, the relationship between the ratio of demand deposits over total deposits and
profits is significant with a positive sign, indicating that banks enjoy a cheaper source of
funds compared to other sources of deposits. A positive and significant coefficient with
discount rate variable as well, indicating that banking gain from the favourable economic
conditions from the reduction in interest rate during the recent years.

-88-
The bank specific control variables seem to be not that important in explaining banks’
performance in Jordan. The estimated coefficient on the size variable does have the
anticipated negative sign, indicating that as a bank increases in size there are diseconomies of
scale which cause returns to deteriorate. Capital and reserve to total assets ratio has an
insignificant impact, in addition, the ratio of bank loans to total assets also has an
insignificant impact on banks’ profitability. Such results obtained led us to investigate the
bank efficiency using alternative approaches regarding the banking sector, which will be
utilised in chapter five, with another profitability measurement, the bank share prices return.

89
Chapter Four
Portfolio Behaviour of Commercial Banks in Jordan
under Risk Aversion: The Expected Utility Approach

-90-
CHAPTER 4 : PORTFOLIO BEHAVIOUR OF COMMERCIAL BANKS IN JORDAN UNDER RISK AVERSION:
THE EXPECTED UTILITY APPROACH
4.1. Introduction
Banks play a crucial role in a country’s economy, generating credit throughout the
economy. Banks take savings from small and large depositors, make loans, operate payments
systems, and provide a mechanism for the transmission of the monetary policy (Garcia, 1997).
At the micro-level, the main objective for individual banks is to maximise the value of wealth.
To do so, banks hold a portfolio of assets and attempt to structure their portfolios to
maximising their return.
With factors such as market interest rate levels, loans and cash demands, discount
rate level and monetary policy actions, banks aim to have the desired distribution of assets in
its portfolio. If the asset distribution is not as desired, then the bank will attempt to adjust its
portfolio composition by increasing some or decreasing other holding assets, depending upon
the cost of doing so (Anderson and Burger, 1969).
This chapter aims to investigate the portfolio behaviour of commercial banks
operating in Jordan. It also aims to determine if the yields or assets rate of return influence
portfolio composition of banks operating in Jordan and analyse the manner in which they
adjust to changes in such variables. Understanding the causal factors of portfolio change is of
utmost importance for the efficient operation of monetary policy, as portfolio changes
ultimately affect the flow of funds into alternative investment forms.
Based on the above exploratory research the rates of return on bank assets are proposed as
being important factors in determining the portfolio allocation of banks in Jordan. This
research tests the hypothesis that the demand for the choice of assets is independent of the

-91-
composition of non-choice assets for the commercial banks in Jordan in monthly data from
2002 to 2009. The sample size was determined by the availability of data form the Central
Bank of Jordan.
This study adopts a narrow view of the portfolio approach, using mean-variance
methods, and uses interest rates and exogenous assets as determinants of the balance sheet
composition. The expected utility model is commonly reduced to the mean-variance model of
portfolio behaviour. When using this approach, portfolio choice decisions are based on the
trade-off between their expected return and risk, where the former is the mean of the
probability distribution of returns and the latter is usually approximated by the variance of
that distribution. A number of static models, as well as dynamic models are tested in this
chapter on the portfolio behaviour of Jordanian banks. In order to determine the underlying
static relationship we opted to use the mean-variance expected utility approach. Moreover,
the researcher applied the Brainard and Tobin (1968) process of the general stock adjustment
to introduce dynamics to the model. Therefore, the models presented in this work are based
on the mean-variance approach of portfolio theory as originated by Hicks (1935) and
developed in works of Markowitz (1952, 1959) and Tobin (1958, 1965), and continued in
several studies by, amongst others, Parkin (1970) Parkin et al. (1970).
4.2. Alternative Theories of Bank Portfolio Behaviour
Studies dealing with portfolio behaviour of banks over the last four decades will be
reviewed. The significance of this study stems from the fact that changes in portfolio
composition ultimately affect the flow of funds into alternative investment forms. Many

-92-
studies have dealt with portfolio behaviour in the banking literature; such as the traditional
approach, the precautionary approach and the portfolio theoretical approach19.
Robinson (1962) started the analysis of the traditional bank behaviour approach. She
conducted a study on the conflicting problem between banks’ profitability and safety. In
addition, she argued that this conflicting problem should be resolved before going through
investment of banks funds, and she listed the legal reserve requirements (imposed by Central
Banks), safe investment, and advances to customers and investment in the open market for
income generation as steps to be taken sequentially.
The Central Bank imposes the so called “reserve requirement” as a legal requirement
for banks to permit customers to withdraw deposits upon demand, so this policy should be
followed by banks. A bank is holding of cash for all possible contingencies and, for
investment protection such dual-use is considered as the second priority. By fulfilling its
obligation, legal requirement of reserve, protective investment, making loans to customers,
then the available funds can be invested on the open market to generate income. Therefore,
the first priority in the above framework is safety and interest rates do not influence the
choice of the bank's portfolio. In addition, this framework does not specify how a bank
optimizes, and hence when portfolio composition is adjusted, due to the absence of marginal
analysis which, in turn, comes from the exclusion of interest rates from influencing the choice
variables.
The models about traditional banking behaviour are descriptive and not analytical.
The applications of a linear programming framework were suggested by Chambers and
Charnes (1961). They view the bank’s problem as one of constrained profit maximization,
where the constraints are the “requirements laid down by the bank examiners which are
19 Please see Hester and Pierce (1975), the research work of Fan (1991), Subeniotis (1991), and Muhammad (2010).

-93-
interpreted as defining limits within which the level of risk associated with the return on
portfolio is an acceptable” and the balance sheet constraint. This model has advantages, for
example marginal analysis is considered as one of them. The reliability of the model is low as
uncertainty is absent from the model due to the assumption that the bank knows “the levels
that will prevail, at various dates in the future, of demand and time deposits, of interest rates
and of the bank’s net worth”.
Orr and Mellor (1961) and Porter (1961) applied a new approach of bank portfolio
behaviour. This theory is based on two basic assumptions: the bank minimizes expected loss
or maximizes expected return, and the bank is subject to random flows of deposits and
estimates the probability distribution of deposits flows. Choosing the optimal beginning-of-
period allocation of the funds to maximize expected profits among reserves and other assets
is one of the bank’s problems. Later on, this approach was adopted by many scholars
including, Morrison (1966), Pool (1968), Frost (1971), Baltensperger (1972, 1980),
Baltensperger et al, (1972), Pringle (1974), Hester and Pierce (1975), Knobel (1977) and
Sprenkle (1987).
The Precautionary Model is based on many factors, one of which is uncertainty which
plays an important factor but banks are nevertheless viewed as risk neutral. Hicks (1935)
propose the theory of bank behaviour under risk aversion upon which most of the empirical
work is based, considered as a popular portfolio theory. He was the first to introduce the idea
of mean- variance (µ, ) in his paper, which was further developed by Markowitz (1952,
1959). This pioneering study of efficient portfolio selection, along with Tobin’s (1958) paper
on liquidity preference, all makes explicit the assumptions of risk aversion. The Portfolio
Theoretical Approach provides some assumptions; it assumes that the bank maximizes
expected utility, whose arguments are commonly the expected value and variance of return
subject to the balance sheet constraint of the portfolio. In general, the maximization of

-94-
expected utility will result in the selection of a diversified portfolio for a risk averse bank.
Most of the empirical work on bank portfolio behaviour is based on this approach. More
studies that dealt with prominent empirical work on commercial bank portfolio behaviour
were undertaken by the following scholars: Kane and Malkiel (1965), Parkin (1970), Parkin
et al.,(1970), Courakis (1974,1975,1980,1989), Klein (1971), Ply (1971), Sharp (1974a),
White (1975), Bewley (1981), Sealey (1980), Fan (1991), Subeniotis (1991), Arjoon (1994),
Kiagigi, Ford and Cadle (1994, 2001) and Muhammad (2010).
Ply (1971) investigated this model by suggesting three assets: a riskless asset,
advances and deposits. The purpose of this model was to determine sufficient conditions for
financial intermediation. Ply concludes that the expected return differential is positive
between assets and liabilities, and the intermediation will hold for the stochastic
independence between assets and liability return. Consequently, intermediation will exist
when there is a positive risk premium on advances and a negative risk premium on deposits
only.
Banks are considered as microeconomic firms that maximize an objective function
operating within the framework of balance sheet constraints, authoritative control and market
constraints. Banks are supposed to achieve certain goals such as satisfying the depositors,
attracting borrowers, maximizing their wealth and fulfilling their commitments to the Central
Bank. Studies on the portfolio behaviour of commercial banks were started by Edgeworth
(1888), who pointed out the importance of random and unsystematic deposit flows that create
uncertainty for shaping a bank’s optimal portfolio.
Both Ply (1971) and Parkin et al., (1970) did not pay attention to the liquidity
problem in their models that could arise due to randomness of cash requirements and default
risks. To incorporate the issue of deposit variation, Kane and Malikiel (1965) have tackled it
by modification of the Tobin and Markowitz portfolio model. They suggest that the variation

-95-
of deposits is based on the customers’ relationship, as when the relationship is good it will
decrease and increase when it is bad. In turn, Sealey (1980) accommodates random deposits
supply as one of the uncertainties for a bank via an implicit supply function included random
deposit supply in his model.
Risk aversion can arise either because the bank’s objective function is concave in
returns, or because influential depositors, whose deposits are the major source of the bank’s
funds, or banking authorities, induce it to act as a risk averter are examples of explicit
allowance the Portfolio-theoretical approach provides. It can support diversification and
handle constraints.
Moreover, the portfolio theoretical approach places great emphasis on the importance
of uncertainty over future rates of return, future deposits withdrawals uncertainty and,
therefore over future liquidation costs. Furthermore, expected profit and its variability is a
bank consideration in portfolio theoretical models and, therefore, they considered to be risk
averse and they maximize expected utility.
4.3. Assumptions of the Model
The model developed upon assets/liability choice, along the lines of the derivatives of
the Parkin-Gray-Barrett model (1970), which is based in the literature on the stochastic nature
of asset return and borrowing cost. This model makes some assumptions; the utility derived
from a bank’s portfolio can be described by a general utility function of profit. Assuming that,
the main objective of banks is to maximize the expected utility of terminal wealth. To do so,
the bank’s decision makers choose their portfolio to maximize the expected utility of their
portfolio. Having made these assumptions, we draw on the traditional mean-variance
approach to bank portfolio modelling, by which a bank’s utility function can be characterized

-96-
in terms of its overall portfolio rate of return. The bank is assumed to be a price taker in the
asset markets and, therefore, the optimal proportionate combination of the portfolio is that
which maximizes the mean-variance utility index subject to the balance sheet constraints and
regulatory requirements. The exponential utility function has proved to be a popular function
since it was first introduced into this type of study by Freund (1956). The optimal
composition of the portfolio is derived from the maximisation of its certainty equivalent (CE).
That is to say, the objective function amounts to one that equals the mean of profit discounted
by the product of its variance and half of the bank's risk-aversion parameter. Following our
discussion thus let:
( ) ( ) (4.1)
Where is the expectation operator; is utility per decision period; are positive
parameters; is the Naperian ; and, is the level of real profit. If profit is normally
distributed then the expected value of the exponential term in equation (4.1) is immediate
since it is effectively, the moment generating function of a normal variable. Hence to
maximise ( ) the bank should maximise:
( ) (4.2)
is the mean of profit, and is its variance. The parameter , is the degree of risk-aversion
and the balance sheet is observed as a portfolio of assets. Liabilities are treated as negative
assets.20
(4.3)
for an dimensional choice set and dimensional set of non-choice (exogenous) variables,
is a column vector of choice assets at time and is an column vector of
exogenous variables; and the transpose of are unit row vectors.
20 : Hence: the plus sign in the following equation 4.3, and this must balance.

-97-
When equation (4.2), taken for the banking system as such, is maximised subject to
equation (4.3) it is straightforward to deduce that the demand equation system in the static
version of the model can be written as variants of those in Parkin et al. (1970), namely as:
(4.4)
is an component vector of expected decision period returns on a choice set of items;
and are respectively and matrices of parameters on the rate of return and
exogenous variables; is an component vector of disturbance terms assumed to possess a
normal distribution with mean of zero and an unknown variance matrix, , that is ( )
and ( ) ∑ ; where ∑ is the covariance matrix of the errors across the equations
for any given point in time, .
A number of restrictions on the coefficient matrices and are implied. The matrix
is symmetric and semi-definite with positive diagonal features, since it is the variance-
covariance matrix of assets return multiplied by the scalar . This matrix also has zero row
column sums; which is the Cournot Aggregation condition. As a consequence of the latter
and the symmetry of , it also has rows that sum to zero. We note in addition that there are
no intercepts in equation (4.4). In respect of we observe that it has column sums of 1. This
is the Engel Aggregation condition.
The conditions and restrictions on the elements (coefficients) of and are:
(4.5a)
(4.5b)
(4.4c)
Equations (4.5a) the Cournot and (4.5b) are symmetric. Equation (4.5c) states the Engel
condition, which has a negative sign on the right hand side because we have entered liabilities
as negative assets. We impose the symmetry constraint and the resultant estimates of the
properties of the system without the symmetry constraint. Imposing symmetry is likely to

-98-
increase estimation efficiency, especially in circumstances where multicollinearity may be
present.
The conditions that the row sums of are zero, which is the system of demand
equations is homogenous of degree zero in the vector of assets returns is:
(4.6)
For the sake of formal completeness (but not sufficient) the condition for bank profit
maximising behaviour to exist is that liabilities’ supply (which we do not model) yield non-
positive elasticises and that assets’ demands have yield elasticises that are non-negative, that
is:
(4.7a)
(4.7b)
Equation (4.4) defines a static model. To transform the system into a dynamic one, we
incorporate an adjustment process proposed by Brainard and Tobin (1968). The dynamic
specification, then, is essentially a system-wide partial stock adjustment mechanism and it
takes the form:
( ) (4.8)
Here, is the desired (optimal) vector of endogenous assets, and (
) represents
a vector of differences between desired and actual holding of choice set items through an
( ) response matrix. In other words, equation (4.8) states that the actual changes in
the holding of any choice set asset denotes an adjustment from its definite to its anticipated
level. Even more, if becomes a long-term target, say, due to transaction cost and market
imperfections, then its differences from the actual levels is reduced in the succeeding decision
period by a constant proportion over time, which obviously depends on the magnitude of the
coefficients in the matrix. When the latter expression is substituted into equation (4.8), we
rearrange to show:

-99-
:
ttttttttt ZAARALILBARLA 1,1,21,1,2,1 )( (4.9)
Here the notation is that used above with respect to the static system, equation (4.1); we note,
additionally, that I is the identity matrix and 1,1 tA is an n component vector of lagged
endogenous items. Additionally, however, we have this condition on the matrix of lagged
responses:
0~Zi (4.10)
below is a Cournot Aggregation condition, implied by the balance sheet equation.
nnnn X
XX
y
yy
..00
...0000
.2
1
2
1
2
1
2
1
(4.11)
The yi are the k observations on endogenous asset i; Xi are the observations on the m
exogenous variables (stacked in order of their appearance on the right-hand side of equation
(4.9) relevant to choice asset i; i is the vector of coefficients on the exogenous variables in
the equation for choice asset i, so that they are the ith row of , B and L combined in that
order; and, the i are the vectors of errors over the sample period for equation i. In this
portfolio framework the Xi are, of course, identical across the choice asset equations.
Accordingly, the generalised least squares estimate of the vector of the stacked i
coefficients, namely, ~ , is:
yXXXI ])([~ 1 (4.12)
and, accordingly, the variance-covariance matrix is:
1)()~var( XX (4.13)
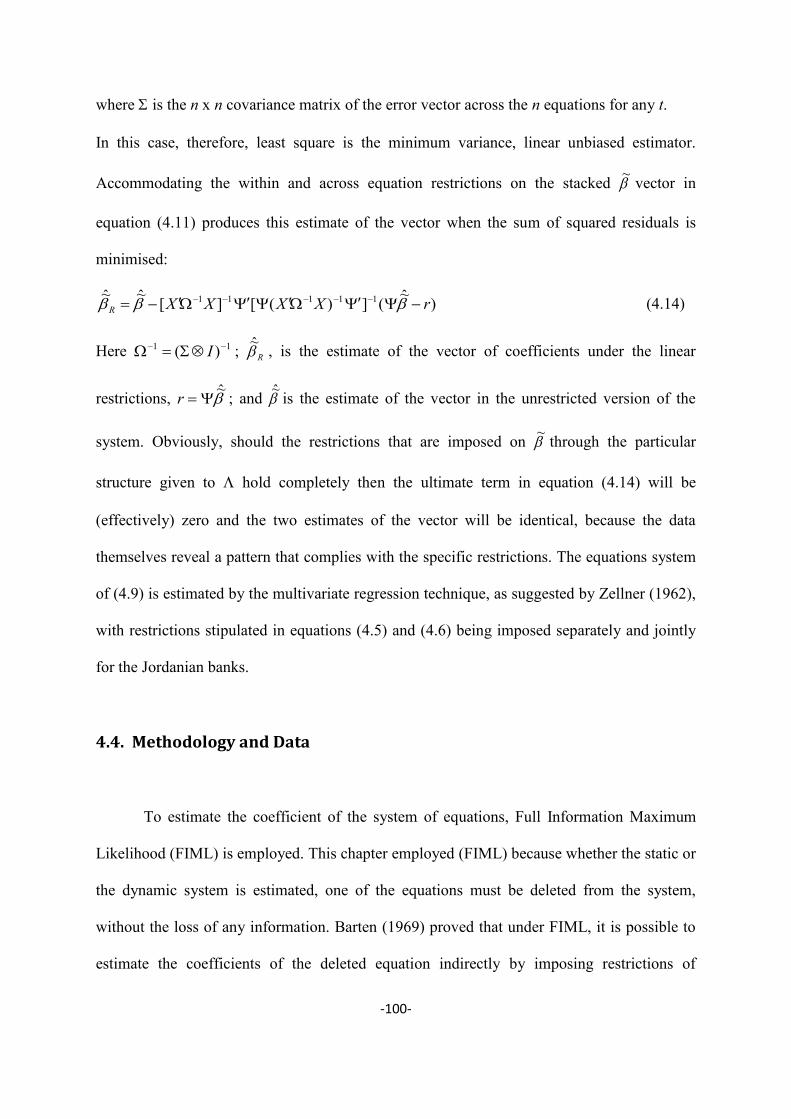
-100-
where is the n x n covariance matrix of the error vector across the n equations for any t.
In this case, therefore, least square is the minimum variance, linear unbiased estimator.
Accommodating the within and across equation restrictions on the stacked ~ vector in
equation (4.11) produces this estimate of the vector when the sum of squared residuals is
minimised:
)~(])([][~~ 11111 rXXXXR (4.14)
Here 11 )( I ; R~ , is the estimate of the vector of coefficients under the linear
restrictions, ~
r ; and ~ is the estimate of the vector in the unrestricted version of the
system. Obviously, should the restrictions that are imposed on ~ through the particular
structure given to hold completely then the ultimate term in equation (4.14) will be
(effectively) zero and the two estimates of the vector will be identical, because the data
themselves reveal a pattern that complies with the specific restrictions. The equations system
of (4.9) is estimated by the multivariate regression technique, as suggested by Zellner (1962),
with restrictions stipulated in equations (4.5) and (4.6) being imposed separately and jointly
for the Jordanian banks.
4.4. Methodology and Data
To estimate the coefficient of the system of equations, Full Information Maximum
Likelihood (FIML) is employed. This chapter employed (FIML) because whether the static or
the dynamic system is estimated, one of the equations must be deleted from the system,
without the loss of any information. Barten (1969) proved that under FIML, it is possible to
estimate the coefficients of the deleted equation indirectly by imposing restrictions of

-101-
Cournot and Engel aggregation respectively, regardless of which equation is omitted. Barton
also explained that even when restrictions are imposed on the matrices of coefficients, FIML
estimates the likelihood function under the assumption that the contemporaneous errors have
a jointly normal distribution. Provided that the likelihood function is correctly specified, on
the whole, FIML estimators are consistent, asymptotically efficient and asymptotically
normally distributed. Another gain of FIML is that tests of parameter restrictions can be seen
as likelihood ratio test.
4.4. 1. Choice Non-Choice Items and Estimation Procedures
Choice and non-choice items in the balance sheet have to be separated in order to
settle the optimal portfolio of banks and, therefore, its asset demand and liabilities supply
equations. In the Jordanian case, the banks have to take whatever deposits they can at the
rates which predetermined. The assets, in general, are outside the control for reasons related
to the behaviour of depositors21 or to the behaviour of the Central Bank in imposing controls
on quantities or on deposits rate of return or on both.
In the context of Jordan, Table 4.1-4.2, shows the definition of each set of assets,
bearing in mind the above considerations. These tables also indicate the status of the
liabilities and provide details of the notation that we have adopted for the scalar variables and
returns. When applied to Jordanian banking data, equation (4.9) will be a seven-equation
system. It is possible to delete one equation from the system without any loss of information,
as we mentioned earlier, due to the balance sheet identity.
21 Perhaps and as consequence operating bank setting rates of return on deposits rather than the Central Bank.

-102-
4.4. 2. The Nature of Data
For the estimation of the Expected Utility (EU) model, we use monthly time series
data from 2002 to 2009. The data were collected from the Central Bank of Jordan and the
Association Banks in Jordan. In turn, the choice of length of data series used in our
estimation depended on data available from Central Bank of Jordan. A sample of balance
sheet statement was determined by the availability of data at the time of our estimation. It is
worth mention here, that it would be great if this study included some other more years, but
unfortunately there were no such data available for longer series. Below we provide the
nature of the key endogenous and exogenous variables that will be used in our econometric
work.
4.4.2.1. Aggregation of Data:
Commercial banks behave identically and have the same expectations, the same
returns, the variance-covariance matrix perceptions and identical utility functions.
Aggregation over choice compositions can easily be accommodated on theoretical grounds
by assuming that all commercial banks operating in Jordan form one representation agent.
The following rules should be considered before taking aggregation over different assets and
over elements of the assets. Firstly, the aggregation items have to be homogeneous (Courakis,
1974, p.187). Consequently, they must have the same return and risk characteristics so as not
to be distinguished by a decision unit as different assets (Bailey, Driscoll and Ford, 1980,
pp.7-8). However, previous research in portfolio behaviour theory shows how different
endogenous and exogenous variables employed in the estimation would themselves be
composed of elements on which the aggregation principles may or may not apply.

-103-
Recognizing inconsistencies caused by such aggregation, but simultaneously being deprived
of alternative options as regarding information and computational facilities, we have to
employ the assumption that all such aggregated elements of banks are homogeneous.22 In
addition, due to the existence of non-stationarity among endogenous/exogenous variables,
one alternative is to estimate the system (static or dynamic) in ratio forms. We adopt this
approach and divide the assets and liabilities of the balance sheet by the total liabilities (total
deposit, credit from Central Bank, capital and allowances, and unclassified liabilities).
4.4.2.2. Endogeniety and Exogeneity of Bank’s Assets:
The endogeniety or exogeniety of assets is not covered in the majority of the literature
regarding the treatment of liability items. The real nature of assets may depend on regulations
of the monetary authority, however, in this study; we treat both private and public sector
loans as endogenous variables, and since the loans ratios do not seem to have constraints on
loans. The “Cash” is treated as an endogenous asset because of the fact that observed
volumes are held irrespective of, and in addition to the reserve ratio regulations. Not far away
from ‘Cash’, we will classify the deposits with Central Banks as endogenous, since the
monetary authority does not seem to have any constraints.
Our next step is to examine the status of Treasury and Corporate bonds, and Treasury
bills. These items are viewed as a separate account within the balance sheet, and in fact,
banks in Jordan showing a high risk averse behaviour to private sector loans may diversify
their portfolio by some form of collateral security. Thus, there is a possibility that banks
prefer investing in governmental bonds and bills, as well as corporate bonds. We treat them
as endogenous variables. Finally, “Other Assets” will be treated as an exogenous variable. 22
See note 1 in Courakis (1974, p.185).

-104-
4.4.2.3. Endogeniety and Exogeneity of Bank’s Liabilities:
We can notice that the literature distinguished whether deposits should be regarded as
endogenous or exogenous variables. As Brainard and Tobin (1968, p.102) have argued,
“banks must be willing to accept demand and time deposits at prevailing interest rate in at
least as large volume as the public wishes to hold”. Based on the above, the status of the
deposits depends on the process of observed interest rate information assimilation.
Commercial banks have to accept the volume of deposits demanded by the depositors.
Therefore, we will take demand deposits, and saving and time deposits as exogenous
variables. The potential borrowing of banks from the Central Bank of Jordan has to be treated
as an endogenous variable since no valid regulation restricts this item. Parkin (1970) noticed
that it is a well-established practice in the literature for treating capital and allowances as
exogenous. Finally, unclassified liabilities will also be treated as exogenous variables.
Before presenting the main results of estimating the model of portfolio behaviour in
Jordan, it is useful to examine some descriptive statistics that would help in shedding more
light on the results.
Table 4.1: Balance Sheet Items and Rate of Return
Assets Rate of Return Corporate Bonds (CORP) Average Interest Rates Corporate Bonds (CBR) Loans to Private (PRIVATE) Average Private Loans Rate (PRI) Loans to Public (PUBLIC) Average Public Loans Rate (PUB) G. Bonds (GBONDS) Average Interest Rate on G. Bonds (GRATE) T. Bills (TBILLS) Average Interest Rate on T. Bills (TRATE) Deposits with Central Banks (DWCB) Overnight Deposit Window Rate (WR) Cash (CASH) Inflation (INF) Other Assets (OTHER) None
Liabilities Rate of Return Demand Deposits Average Demand Deposits Rate Time & saving Deposits Average Time Saving Rate Credit from CBJ Weighted Average Interest Rates on Interbank Capital & allowances None Un classified liabilities None

-105-
4.4. 3. Classification of Assets between Choice and Non-Choice Items
Table 4.2: Choice and Non-choice Items Assets Status
CORP Corporate Bonds Endogenous PRIVATE Loans to Private Sector Endogenous PUBLIC Loans to Public Sector Endogenous GBONDS G. Bonds Endogenous TBILLS T. Bills Endogenous DWCB Deposits with Central Bank of Jordan Endogenous CASH Cash on Hands Endogenous OTHER Other Assets Exogenous
Liabilities Status DD Demand Deposits Exogenous STD Saving & Time deposits Exogenous CFCB Credit (Borrowing) from Central Bank Exogenous CAPITAL Capital & allowances Exogenous UN Un classified liabilities Exogenous
Interest Rate (Rate of return) Status INF Inflation Exogenous TRATE Average Rate Interest on T. Bills Exogenous GRATE Average Interest Rates on G. Bonds Exogenous CBR Average Interest Rates Corporate Bonds Exogenous PUB Average Public Loans Rate Exogenous PRI Average Private Loans Rate Exogenous WR Overnight Deposit Window Rate Exogenous DDR Average Demand Deposits Rate Exogenous STDR Average Time Saving Rate Exogenous INTER Weighted Average Interest Rates on Interbank Exogenous
In order to avoid spurious regressions, we conducted unit root tests, to ensure that the
ratios are I(0). If a variable contains a unit root I(1), then it is non-stationary and regression
involving the series can falsely imply the existence of a meaningful economic relationship
(Philips, 1986). We opted to use the Kwiatkowski–Phillips–Schmidt–Shin (KPSS) test to test
the null hypothesis that a series contains a unit root. This test confirms presented in table 4.3
that all interest rate variables, endogenous and exogenous variables, are I(0) processes.
On the other hand, the portfolio return is normally distributed, since that is one of the
essential assumptions made in the mean-variance model.

-106-
Table 4.3: Unit Root Test (KPSS) Assets Liabilities Interest Rate
CORP
0.140924 DD
0.145821 INF
0.138233 PRIVATE
0.145713 STD
0.14458 TRATE
0.141828
PUBLIC
0.140417 CFCB
0.135138 GRATE
0.145895 GBONDS
0.142463 CAPITAL
0.134826 CBR
0.145802
TBILLS
0.145452 UN
0.144056 PUB
0.142716 DWCB
0.144739
PRI
0.144028
CASH
0.142316
WR
0.137274 OTHER
0.145554
Note: All variables in this table are stationary at 5% as the critical value at this level is 0.146000.
This approach is fulfilled if the returns of all items are normally distributed. The
normality of each return is investigated by using the Jarque-Bera statistics test, and it was
found that all variables are normally distributed. Tables 4.4 to 4.6 indicate the mean; standard
deviation and the relative measures of dispersion (would help in indicating the extent of
volatility of our variables). Also, the graph of the variables suggests that all variables used,
interest rates (rate of return), and the assets and liabilities nominal values are stationary. In
fact, the KPSS test, assumes that under the null hypothesis the variable is stationary or trend
stationary, confirming that they are I(0) processes.
4.4.3.1. Descriptive Statistics for the Endogenous Variables
Table 4.4 shows that no active variable were chapter from the dependant variable, the
highest relative measure of dispersion, the coefficient of variation, stood at (0.49879) which
is the GBONDS.
Table 4.4: Descriptive Statistics for the Endogenous Variables
CORP PRIVATE PUBLIC GBONDS TBILLS DWCB CASH Mean 0.010355 0.389939 0.205124 0.004138 0.094142 0.189121 0.009728
Maximum 0.017014 0.449327 0.292675 0.008459 0.154328 0.253431 0.015711 Minimum 0.005288 0.323725 0.166398 0.000993 0.064227 0.122909 0.007099 Std. Dev. 0.002498 0.030943 0.030881 0.002064 0.026447 0.038690 0.001832 SD/Mean 0.241236 0.079355 0.150547 0.49879 0.28092 0.204578 0.188322

-107-
4.4.3.2. Descriptive Statistics for the Main Interest Rate (%)
The (INF) appears changing over at an incredible rate of relative measure of
dispersion (1.102526); therefore, the main interest rate is stable in general. Also, it is
important to mention that the value of dispersion PRI does not appear to be changing
relatively to the movements on TRATE or WR.
Table 4.5: Descriptive Statistics for the Main Interest Rate (%) CBR PRI PUB GRATE TRATE WR INF
Mean 9.358333 8.808333 7.323958 5.825244 4.692049 3.612500 4.501101 Maximum 11.50000 10.50000 8.400000 7.370076 7.134444 5.200000 19.46228 Minimum 7.600000 7.400000 6.000000 4.565000 2.120000 2.000000 -3.589209 Std. Dev. 0.948091 0.785080 0.839266 0.923810 1.776126 1.135110 4.962584 SD/Mean 0.101309 0.08912 0.11459 0.158587 0.378539 0.314217 1.102526
Table 4.6 shows the correlations among main interest rates. It shows that there are
high correlations among the interest rate variables which cause multicollinearity.
Table 4.6: Correlation among Main Interest Rate (%)
Variables CBR PRI PUB GRATE TRATE WR INF CBR
1.000
PRI 0.862 (0.000)
1.000
PUB 0.156 (0.129)
0.552 (0.000)
1.000
GRATE -0.378 (0.001)
0.056 (0.585)
0.801 (0.000)
1.000
TRATE -0.454 (0.000)
-0.131 (0.203)
0.504 (0.000)
0.737 (0.000)
1.000
WR -0.384 (0.000)
-0.090 (0.386)
0.483 (0.000)
0.651 (0.000)
0.967 (0.000)
1.000
INF -0.263 (0.010)
-0.150 (0.144)
0.211 (0.039)
0.403 (0.000)
0.525 (0.000)
0.520 (0.000)
1.000
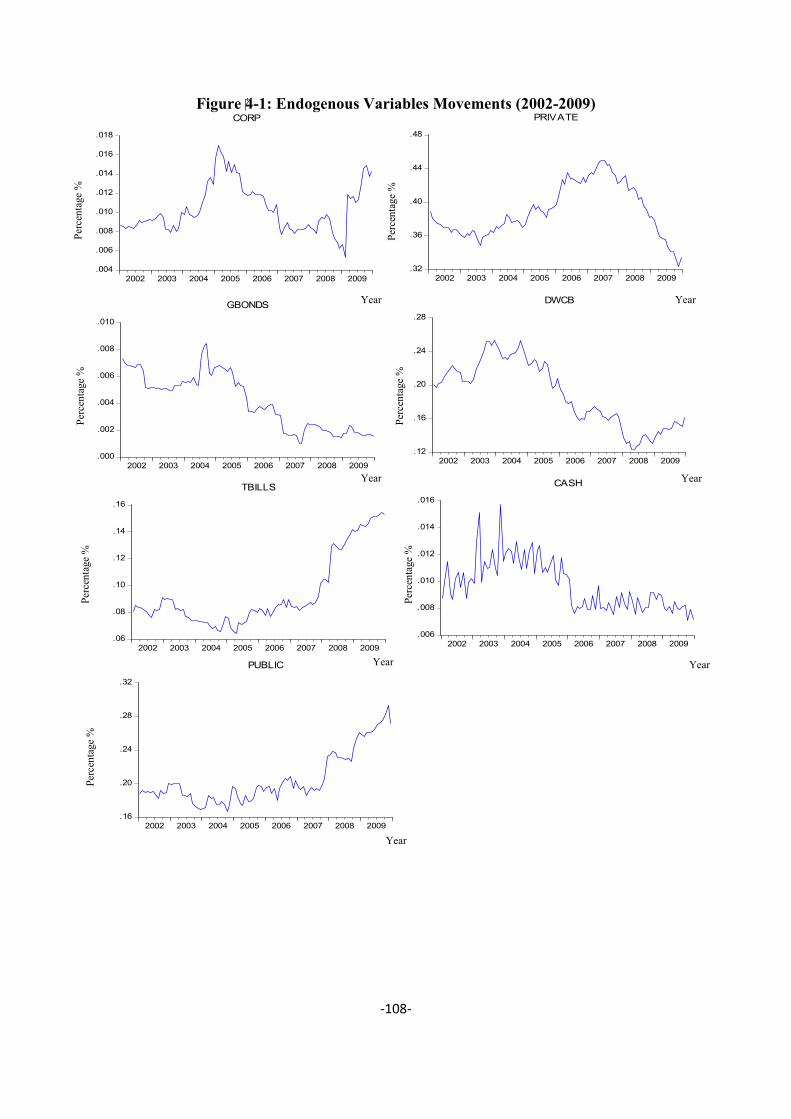
-108-
Figure 4-1: Endogenous Variables Movements (2002-2009)
.004
.006
.008
.010
.012
.014
.016
.018
2002 2003 2004 2005 2006 2007 2008 2009
CORP
.32
.36
.40
.44
.48
2002 2003 2004 2005 2006 2007 2008 2009
PRIVATE
.16
.20
.24
.28
.32
2002 2003 2004 2005 2006 2007 2008 2009
PUBLIC
.000
.002
.004
.006
.008
.010
2002 2003 2004 2005 2006 2007 2008 2009
GBONDS
.06
.08
.10
.12
.14
.16
2002 2003 2004 2005 2006 2007 2008 2009
TBILLS
.12
.16
.20
.24
.28
2002 2003 2004 2005 2006 2007 2008 2009
DWCB
.006
.008
.010
.012
.014
.016
2002 2003 2004 2005 2006 2007 2008 2009
CASH
Year
Year
Year Year
Year
Year
Year
Perc
enta
ge %
Pe
rcen
tage
%
Perc
enta
ge %
Perc
enta
ge %
Pe
rcen
tage
%
Perc
enta
ge %
Perc
enta
ge %

-109-
Figure 4-2: Main Interest Rate movements (2002-2009)
7
8
9
10
11
12
2002 2003 2004 2005 2006 2007 2008 2009
CBR
7
8
9
10
11
2002 2003 2004 2005 2006 2007 2008 2009
PRI
5.5
6.0
6.5
7.0
7.5
8.0
8.5
2002 2003 2004 2005 2006 2007 2008 2009
PUB
4.5
5.0
5.5
6.0
6.5
7.0
7.5
2002 2003 2004 2005 2006 2007 2008 2009
GRATE
2
3
4
5
6
7
8
2002 2003 2004 2005 2006 2007 2008 2009
TRATE
1
2
3
4
5
6
2002 2003 2004 2005 2006 2007 2008 2009
WR
-4
0
4
8
12
16
20
2002 2003 2004 2005 2006 2007 2008 2009
INF
Perc
enta
ge %
Pe
rcen
tage
%
Perc
enta
ge %
Perc
enta
ge %
Pe
rcen
tage
%
Perc
enta
ge %
Perc
enta
ge %
Year
Year Year
Year Year
Year Year
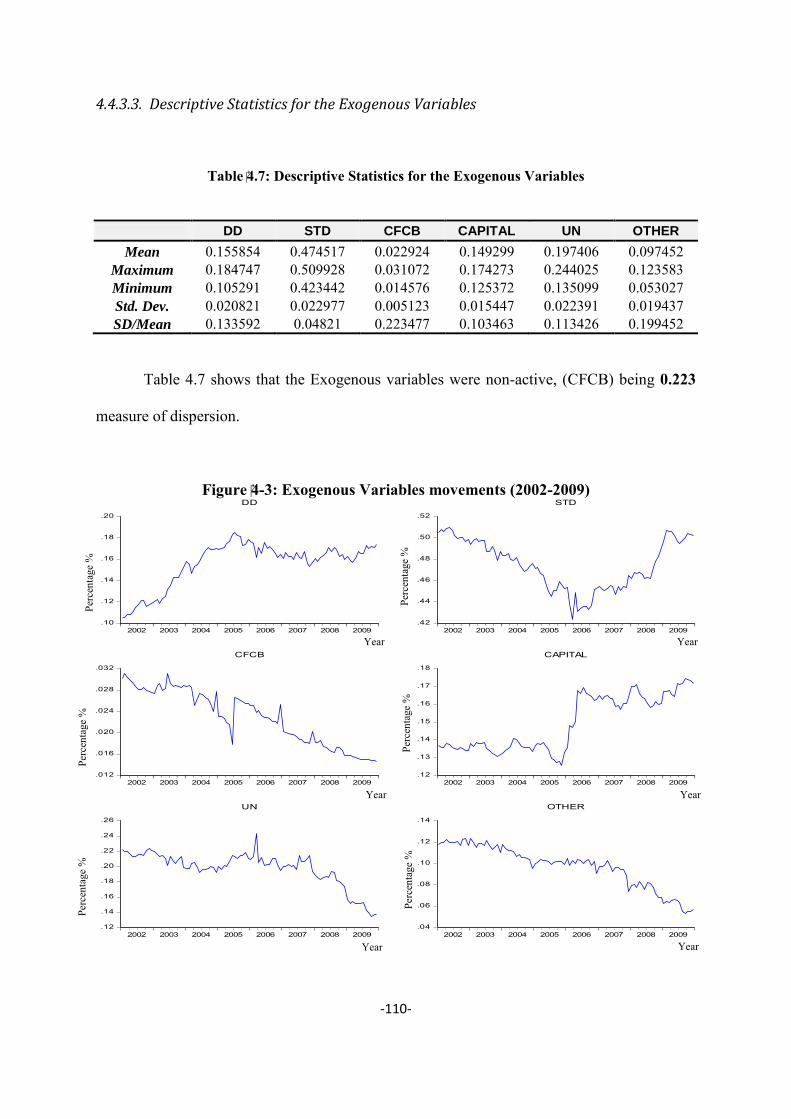
-110-
4.4.3.3. Descriptive Statistics for the Exogenous Variables
Table 4.7: Descriptive Statistics for the Exogenous Variables
DD STD CFCB CAPITAL UN OTHER
Mean 0.155854 0.474517 0.022924 0.149299 0.197406 0.097452 Maximum 0.184747 0.509928 0.031072 0.174273 0.244025 0.123583 Minimum 0.105291 0.423442 0.014576 0.125372 0.135099 0.053027 Std. Dev. 0.020821 0.022977 0.005123 0.015447 0.022391 0.019437 SD/Mean 0.133592 0.04821 0.223477 0.103463 0.113426 0.199452
Table 4.7 shows that the Exogenous variables were non-active, (CFCB) being 0.223
measure of dispersion.
Figure 4-3: Exogenous Variables movements (2002-2009)
.10
.12
.14
.16
.18
.20
2002 2003 2004 2005 2006 2007 2008 2009
DD
.42
.44
.46
.48
.50
.52
2002 2003 2004 2005 2006 2007 2008 2009
STD
.012
.016
.020
.024
.028
.032
2002 2003 2004 2005 2006 2007 2008 2009
CFCB
.12
.13
.14
.15
.16
.17
.18
2002 2003 2004 2005 2006 2007 2008 2009
CAPITAL
.12
.14
.16
.18
.20
.22
.24
.26
2002 2003 2004 2005 2006 2007 2008 2009
UN
.04
.06
.08
.10
.12
.14
2002 2003 2004 2005 2006 2007 2008 2009
OTHER
Perc
enta
ge %
Pe
rcen
tage
%
Perc
enta
ge %
Perc
enta
ge %
Pe
rcen
tage
%
Perc
enta
ge %
Year Year
Year Year
Year Year

-111-
4.5. Results of the General Framework
The dynamic model, equation (4.9), was estimated. However, this model deals with
exogenous variables as independent separate variables.
Table 4.8: Aggregation of Balance Sheet Items
Endogenous CORP Corporate Bonds PRIVATE Loans to Private Sector PUBLIC Loans to Public Sector GBONDS Government Bonds TBILLS Treasury Bills DWCB Deposits with Central Bank of Jordan CASH Cash Exogenous DD Demand Deposits STD Saving & Time deposits CFCB Credit (Borrowing) from Central Bank CAPITAL Capital & allowances UN Un classified liabilities OTHER Other Assets
4.5. 1. Review of the Empirical Results on the Dynamic Model
This section presents and discusses the results from the dynamic model. Seven
equations were constructed, with six equations being estimated and one being a residual
equation derived from the balance sheet identity. The general model is, in effect, equation
(4.9) without any restrictions being imposed upon the matrices of coefficients. To achieve
this, symmetry, homogeneity and joint test for both (homogeneity and symmetry) are tested
against the general unrestricted form. Table 4.9 reports the results of testing these special
cases of the general model. The overall statistics for each equation in the model are presented
in Table 4.10 and graphs of actual, fitted and residuals series from each of the six estimated
equations in figure (4.4);
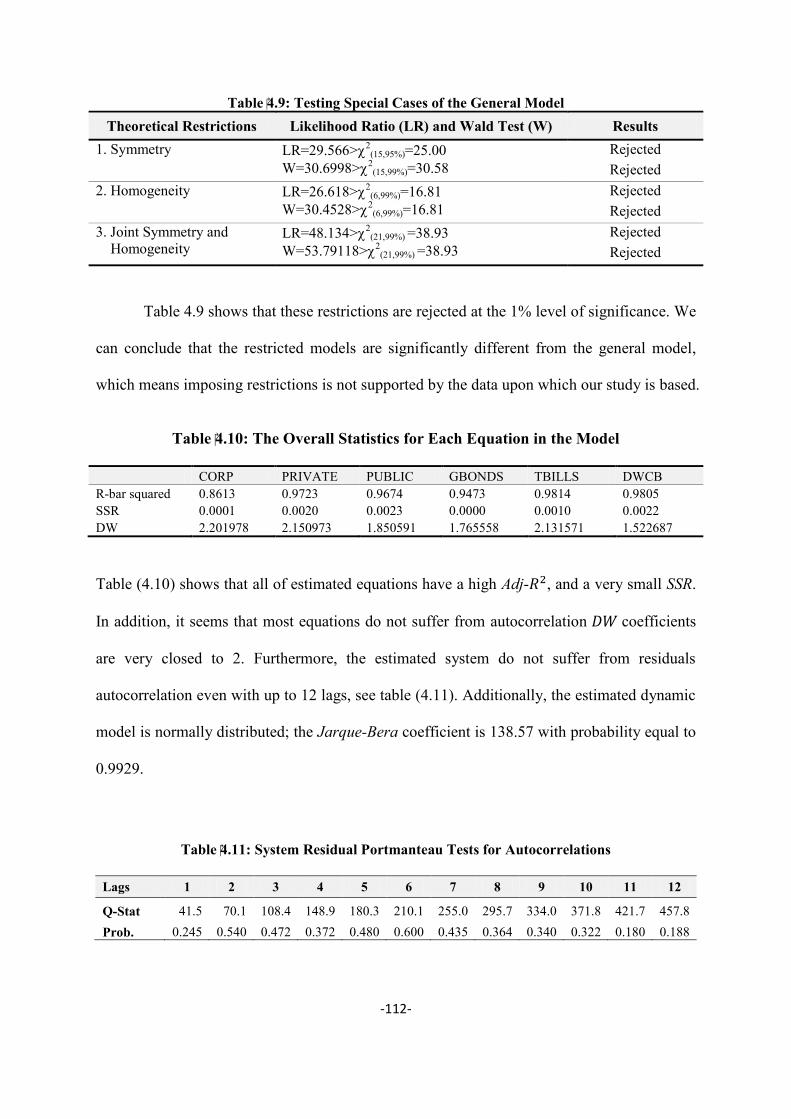
-112-
Table 4.9: Testing Special Cases of the General Model Theoretical Restrictions Likelihood Ratio (LR) and Wald Test (W) Results
1. Symmetry LR=29.566>2(15,95%)=25.00
W=30.6998>2(15,99%)=30.58
Rejected Rejected
2. Homogeneity LR=26.618>2(6,99%)=16.81
W=30.4528>2(6,99%)=16.81
Rejected Rejected
3. Joint Symmetry and Homogeneity
LR=48.134>2(21,99%) =38.93
W=53.79118>2(21,99%) =38.93
Rejected Rejected
Table 4.9 shows that these restrictions are rejected at the 1% level of significance. We
can conclude that the restricted models are significantly different from the general model,
which means imposing restrictions is not supported by the data upon which our study is based.
Table 4.10: The Overall Statistics for Each Equation in the Model
CORP PRIVATE PUBLIC GBONDS TBILLS DWCB R-bar squared 0.8613 0.9723 0.9674 0.9473 0.9814 0.9805 SSR 0.0001 0.0020 0.0023 0.0000 0.0010 0.0022 DW 2.201978 2.150973 1.850591 1.765558 2.131571 1.522687
Table (4.10) shows that all of estimated equations have a high Adj- , and a very small SSR.
In addition, it seems that most equations do not suffer from autocorrelation coefficients
are very closed to 2. Furthermore, the estimated system do not suffer from residuals
autocorrelation even with up to 12 lags, see table (4.11). Additionally, the estimated dynamic
model is normally distributed; the Jarque-Bera coefficient is 138.57 with probability equal to
0.9929.
Table 4.11: System Residual Portmanteau Tests for Autocorrelations
Lags 1 2 3 4 5 6 7 8 9 10 11 12
Q-Stat 41.5 70.1 108.4 148.9 180.3 210.1 255.0 295.7 334.0 371.8 421.7 457.8 Prob. 0.245 0.540 0.472 0.372 0.480 0.600 0.435 0.364 0.340 0.322 0.180 0.188
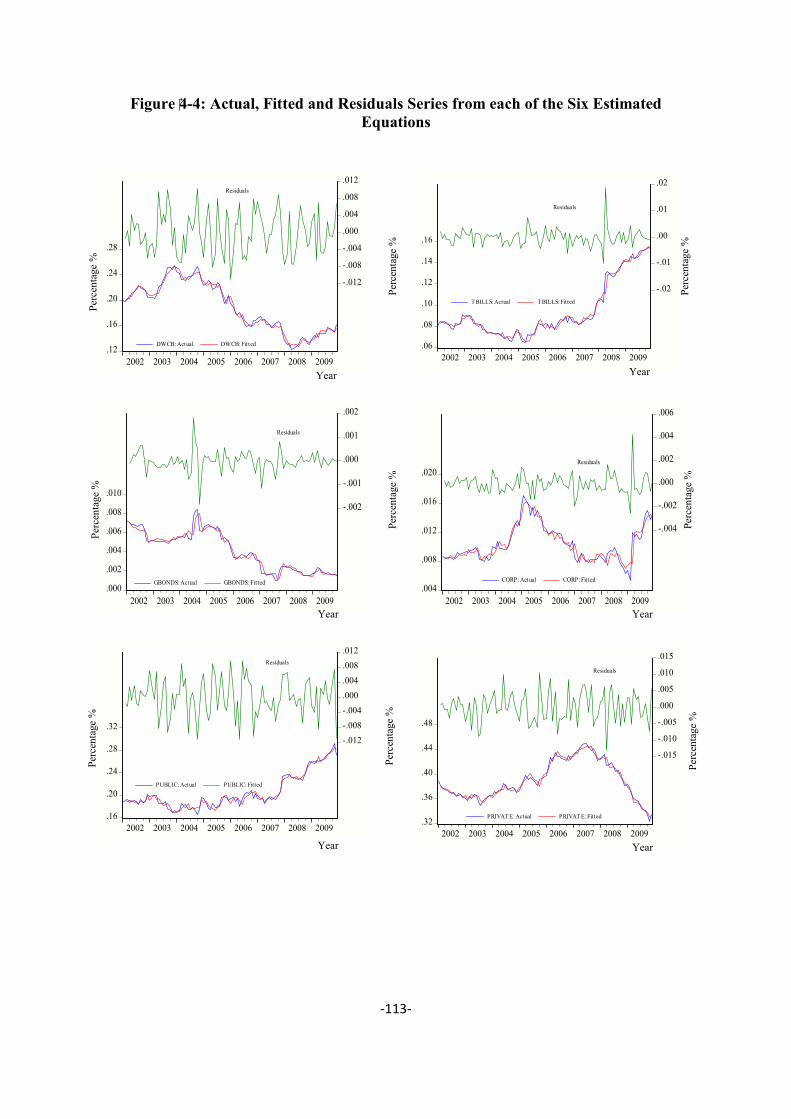
-113-
.06
.08
.10
.12
.14
.16
-.02
-.01
.00
.01
.02
2002 2003 2004 2005 2006 2007 2008 2009
T BILLS: Actual TBILLS: Fitted
Residuals
.004
.008
.012
.016
.020
-.004
-.002
.000
.002
.004
.006
2002 2003 2004 2005 2006 2007 2008 2009
CORP: Actual CORP: Fitted
Residuals
.32
.36
.40
.44
.48
-.015
-.010
-.005
.000
.005
.010
.015
2002 2003 2004 2005 2006 2007 2008 2009
PRIVATE: Actual PRIVATE: Fitted
Residuals
Figure 4-4: Actual, Fitted and Residuals Series from each of the Six Estimated Equations
.12
.16
.20
.24
.28
-.012
-.008
-.004
.000
.004
.008
.012
2002 2003 2004 2005 2006 2007 2008 2009
DWCB: Actual DWCB: Fitted
Residuals
.000
.002
.004
.006
.008
.010-.002
-.001
.000
.001
.002
2002 2003 2004 2005 2006 2007 2008 2009
GBONDS: Actual GBONDS: Fitted
Residuals
.16
.20
.24
.28
.32-.012-.008-.004.000.004.008.012
2002 2003 2004 2005 2006 2007 2008 2009
PUBLIC: Actual PUBLIC: Fitted
Residuals
Year Year
Year Year
Year Year Pe
rcen
tage
%
Perc
enta
ge %
Pe
rcen
tage
%
Perc
enta
ge %
Pe
rcen
tage
%
Perc
enta
ge %
Perc
enta
ge %
Pe
rcen
tage
%
Perc
enta
ge %

-114-
4.5. 2. Results on the Interest Rate Matrix
To start with, seven interest rates were employed in the dynamic analysis, CBR,
which stands for the interest rate on corporate bonds rate; PRI is the interest rate on loans
provided by the commercial banks to private sector; PUB represents the interest rate on loans
provided by the commercial banks to public sector; GRATE is the interest rate on
governments bonds; TRATE is the interest rate on the treasury bills; WR is the interest rate
on commercial banks deposits with Central Bank; INF stands for the inflation rate used as
rate of return on cash holding by the commercial banks.
Table 4.12: Dynamic EU Model
Eqn. Interest Rate Coefficients CBR PRI PUB GRATE TRATE WR INF
CORP -0.000068 -0.00168* 0.001383** -0.000503 0.000066 -0.000226 -0.000060*** [-0.1750] [-2.7324] [2.4781] [-0.5577] [0.2000] [-0.4920] [-1.9183] PRIVATE -0.0037*** -0.00462 0.0088* -0.01514* 0.00344*** 0.00124 0.00041* [-1.7380] [-1.3558] [2.8457] [-3.0221] [1.8880] [0.4874] [2.3324] PUBLIC 0.00282 0.003216 -0.009603* 0.016183* -0.001665 -0.000728 -0.000047 [1.2108] [0.8740] [-2.8692] [2.9903] [-0.8460] [-0.2645] [-0.2498] GBONDS 0.000063 -0.00032 -0.00030 -0.00052 -0.000074 -0.000004 -0.000009 [0.3207] [-1.0284] [-1.0702] [-1.1438] [-0.4491] [-0.0162] [-0.5406] TBILLS 0.0032** 0.0024 -0.00508** 0.01344* -0.00226*** 0.000089 0.000090 [2.1261] [1.2314] [-2.3457] [3.8417] [-1.7739] [0.0498] [0.7367] DWCB -0.00178 0.00132 0.004377 -0.013135** 0.00083 0.000210 -0.000414** [-0.7899] [0.3689] [1.3484] [-2.5021] [0.4319] [0.0788] [-2.2599] Note: the values in [ ] are t-statistics, *,**,*** indicates significance at the 1%, 5%, 10% levels.
4.5. 3. Results on the Own-Rate Effects
Table 4.12 shows that four out of the six interest rates appear insignificant, however,
PUB, which stands for interest rate on public lending, and TBILLS, which presents Treasury
bills rate, were significant with a negative sign. It is noticeable that all of interest rates on our
model indicate insensitivity of the choice assets to the changes on their own-rates.
Statistically, there will be no major changes in the holding of assets as a consequence of

-115-
interest rate movements; as a result, monetary authority interest rate changes will not affect
the assets holding by commercial banks in Jordan. In their study McLaren and Upcher (1986)
have tested further restrictions on portfolio models. They say it is a common feature of such
an unrestricted model to have results that clearly run counter to a prior expectation about the
direction of interest rate effects and the insignificant coefficients, which we also faced in our
results.
4.5. 4. Results on the Cross-Rate Effects
Regarding the off-diagonal interest rate elasticity, eleven out of thirty from table 4.12
has shown values that differ significantly from zero. Therefore, the results show that the
cross-rate somehow effects the decision of allocating the available funds between the choice
set of assets. The most sensitive assets were the lending to private sector (PRIVATE) and
followed by the Treasury bills (TBILLS).
4.5. 5. Results on Non-choice Assets
However, corporate bonds and private lending both were appearing to have a
significant sign with CAPITAL, UN, and the unclassified liabilities. In fact, results show that
a bank’s investment decisions in Jordan to invest in highly risk assets upon banks are being
affected by capital and unclassified liabilities. On the other hand, lending to the public sector
appears significant to time and saving deposits and credit from the Central Bank. Also,
PUBLIC were significant to other assets but with negative sign. Furthermore, government
bonds (GBONDS) are the only assets that none of the endogenous variables come out as
significant. Treasury bills (TBILLS) were significant with the wrong sign to other assets
(OTHER). Finally, deposits with the Central Bank appear to be significant with demand
deposits (DD), which can be explained by banks’ behaviour in investing their short-term

-116-
deposits as deposits with the Central Bank for daily basis rate of return to avoid any
unexpected customer withdrawals.
Table 4.13: Dynamic EU Model
Eqn. Exogenous coefficients DD STD CFCB CAPITAL UN OTHER
CORP 0.048 0.026 0.048 0.082** 0.059** -0.026 [1.502] [0.869] [0.641] [2.392] [2.033] [-0.930] PRIVATE 0.292 0.180 -0.215 0.621* 0.358** 0.037 [1.643] [1.080] [-0.523] [3.260] [2.221] [0.243] PUBLIC -0.086 0.340*** 0.933** 0.124 0.275 -0.960* [-0.446] [1.884] [2.098] [0.600] [1.575] [-5.775] GBONDS -0.002 0.0156 0.014 0.004 0.012 -0.022 [-0.150] [1.028] [0.376] [0.225] [0.832] [-1.569] TBILLS -0.009 0.062 0.137 -0.152 0.005 -0.247** [-0.076] [0.529] [0.478] [-1.143] [0.041] [-2.302] DWCB 0.671* 0.284 -0.069 0.269 0.201 0.254 [3.598] [1.625] [-0.160] [1.345] [1.191] [1.573] Note: the values in [ ] are t-statistics, *,**,*** indicates significance at the 1%, 5%, 10% levels.
Indeed, because of the non-linearity of the demand equations those coefficients cannot be
very informative about the impact of the holding of assets as a result of interest rate
movements.
Table 4.14: Elasticises for EU Model
CORP PRIVATE PUBLIC GBONDS TBILLS DWCB
CBR -0.061 -0.09 0.129 0.142 0.318 -0.088 PRI -1.426 -0.104 0.138 -0.677 0.274 0.061 PUB 0.978 0.166 -0.343 -0.533 -0.395 0.17 GRATE -0.283 -0.226 0.46 -0.732 0.832 -0.405 TRATE 0 0.041 -0.038 -0.084 -0.112 0.02 WR -0.079 0.012 -0.013 -0.003 0.003 0.004 INF -0.026 0.005 -0.001 -0.009 0.004 -0.01 DD 0.725 0.117 -0.065 -0.091 -0.016 0.553 STD 1.197 0.219 0.786 1.785 0.311 0.713 CFCB 0.105 -0.013 0.104 0.078 0.033 -0.008 CAPITAL 1.184 0.238 0.09 0.14 -0.241 0.212 UN 1.126 0.181 0.264 0.581 0.01 0.21 OTHER -0.243 0.009 -0.456 -0.516 -0.256 0.131
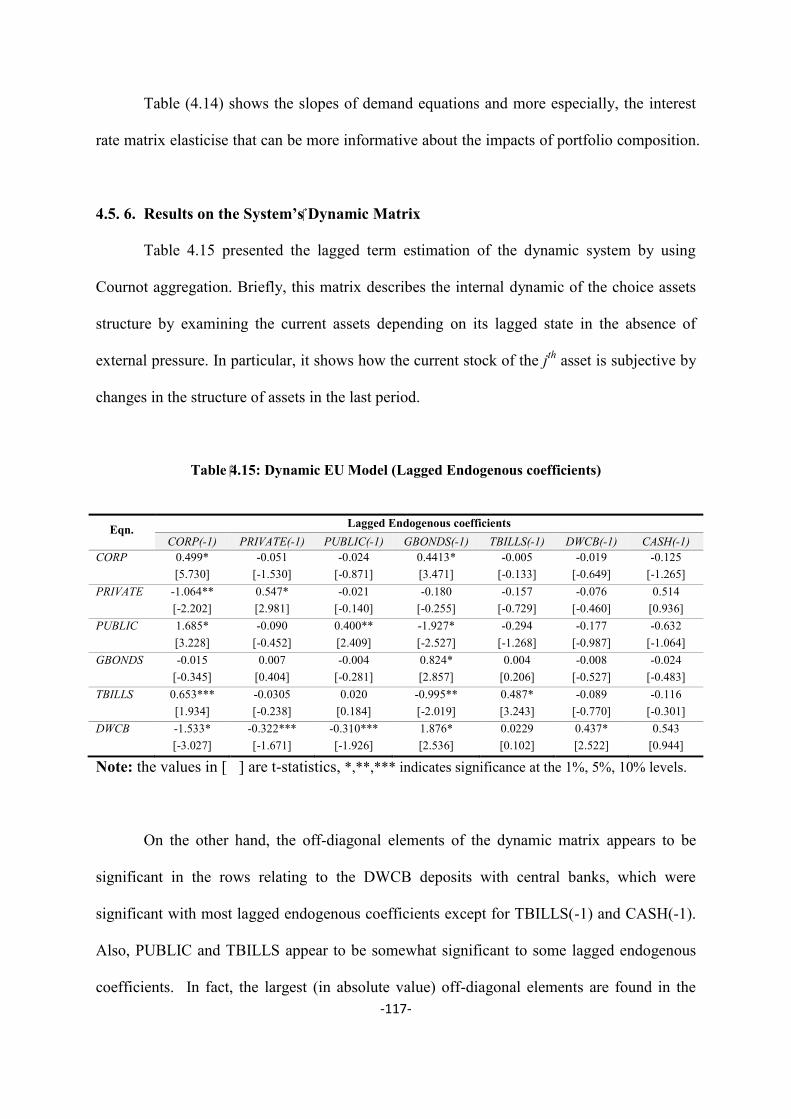
-117-
Table (4.14) shows the slopes of demand equations and more especially, the interest
rate matrix elasticise that can be more informative about the impacts of portfolio composition.
4.5. 6. Results on the System’s Dynamic Matrix
Table 4.15 presented the lagged term estimation of the dynamic system by using
Cournot aggregation. Briefly, this matrix describes the internal dynamic of the choice assets
structure by examining the current assets depending on its lagged state in the absence of
external pressure. In particular, it shows how the current stock of the jth asset is subjective by
changes in the structure of assets in the last period.
Table 4.15: Dynamic EU Model (Lagged Endogenous coefficients)
Eqn.
Lagged Endogenous coefficients CORP(-1) PRIVATE(-1) PUBLIC(-1) GBONDS(-1) TBILLS(-1) DWCB(-1) CASH(-1)
CORP 0.499* -0.051 -0.024 0.4413* -0.005 -0.019 -0.125 [5.730] [-1.530] [-0.871] [3.471] [-0.133] [-0.649] [-1.265] PRIVATE -1.064** 0.547* -0.021 -0.180 -0.157 -0.076 0.514 [-2.202] [2.981] [-0.140] [-0.255] [-0.729] [-0.460] [0.936] PUBLIC 1.685* -0.090 0.400** -1.927* -0.294 -0.177 -0.632 [3.228] [-0.452] [2.409] [-2.527] [-1.268] [-0.987] [-1.064] GBONDS -0.015 0.007 -0.004 0.824* 0.004 -0.008 -0.024 [-0.345] [0.404] [-0.281] [2.857] [0.206] [-0.527] [-0.483] TBILLS 0.653*** -0.0305 0.020 -0.995** 0.487* -0.089 -0.116 [1.934] [-0.238] [0.184] [-2.019] [3.243] [-0.770] [-0.301] DWCB -1.533* -0.322*** -0.310*** 1.876* 0.0229 0.437* 0.543 [-3.027] [-1.671] [-1.926] [2.536] [0.102] [2.522] [0.944]
Note: the values in [ ] are t-statistics, *,**,*** indicates significance at the 1%, 5%, 10% levels.
On the other hand, the off-diagonal elements of the dynamic matrix appears to be
significant in the rows relating to the DWCB deposits with central banks, which were
significant with most lagged endogenous coefficients except for TBILLS(-1) and CASH(-1).
Also, PUBLIC and TBILLS appear to be somewhat significant to some lagged endogenous
coefficients. In fact, the largest (in absolute value) off-diagonal elements are found in the

-118-
rows relating to the PUBLIC and DWCB. The columns relating to lagged quantities for both
instruments are much smaller in absolute value magnitudes. This suggests that changes in the
lagged assets structure affect lending to private sector and deposits with the Central Bank, but
that changes in both instruments have only a small impact on other assets portfolios.
4.5. 7. The Impact, Interim and Total Multipliers
After estimating the dynamic model, in this part will calculate the multiplier effects of
the choice assets to unit changes to the non-choice items. In view of the fact that the Central
Bank of Jordan are controlling, at least officially, nearly all interest rates by setting them or in
some cases by determining the maximum and minimum limits within the economy, some of
these then can be regarded as (possible) direct policy instruments. Consequently, we deem
interest rates on corporate bonds (CBR), lending to private sector (PRI), public lending
(PUB), government bonds (GRATE), treasury bills (TRATE), and deposits with the Central
Bank (WR) to be direct policy instruments. Therefore, the consequences of a one-step change
in these exogenous variables are investigated by the calculation of impact (current), interim
(ensuing periods) and total (cumulative) multipliers. Since the total multiplier effects are
crucial for an overall evaluation of policy implementation, we proceed to derive these effects.
4.5.7.1. Impact effects of policy instruments on Jordanian banking portfolios
Table (4.16), shows the impact effects of the policy variables on the Jordanian
banking portfolio. some of these effects caused by rates of return on, corporate bonds, private
lending, public lending, government bonds, treasury bills, and deposits with central bank.

-119-
Table 4.16: Impact Effects of Policy Instruments on Jordanian Banking Portfolios
CORP PRIVATE PUBLIC GBONDS TBILLS DWCB CBR -0.000068 -0.003742 0.002817 0.000063 0.003198 -0.001783 PRI -0.001676 -0.004617 0.003216 -0.000318 0.002929 0.001317 PUB 0.001383 0.008814 -0.009603 -0.000301 -0.005075 0.004377 GRATE -0.000503 -0.015136 0.016183 -0.000520 0.013439 -0.013135 TRATE 0.000066 0.003440 -0.001665 -0.000074 -0.002257 0.000825 WR -0.000226 0.001242 -0.000728 -0.000004 0.000089 0.000210 INF -0.000060 0.000408 -0.000047 -0.000009 0.000090 -0.000414 DD 0.048149 0.292170 -0.085662 -0.002417 -0.009402 0.670705 STD 0.026133 0.180167 0.339707 0.015571 0.061630 0.284237 CFCB 0.047521 -0.215250 0.932707 0.014048 0.137405 -0.069130 CAPITAL 0.082143 0.621388 0.123664 0.003887 -0.152110 0.268789 UN 0.059066 0.358162 0.274582 0.012176 0.004653 0.201278 OTHER -0.025796 0.037349 -0.960381 -0.021909 -0.247454 0.253670
A one percent change ceteris paribus in the corporate bonds rate seems to cause an
increase in the loans to the public sector and the Treasury bills by a very small fraction
almost (0.003) percent. Surprisingly, the same percent change in corporate bonds rate would
cause no changes in the holding of corporate bonds. On the other hand, such an increase
produces reductions in the loans to the private sector and deposits with the Central Bank.
A one percent increase ceteris paribus in the private lending rate leads to an increase
in the public loans and Treasury bills holding by (0.003) for both instruments, however, the
corporate bonds holding appears to decrease after a one percent increase in the private
lending rate by (-0.002). Surprisingly, this increase leads to a decrease in lending to the
private sector. On the other hand, we can justify the increase on the deposits with the Central
Bank in that the banks found it profitable and much safer to increase its holding of deposits
with the Central Bank. In other words, banks diversified their holding assets to avoid the
probability of private loans defaults.

-120-
A ceteris paribus one percent change in the public lending rate would produce an
increase on corporate bonds, private lending and deposits with the Central Bank. This
increase would lead to an unexpected decrease in the holding of public lending. However, we
can summarise that the public sector have a variety of options to finance their operations
instead of lending from commercial banks.
A one percent increase in the government bonds rate would ceteris paribus produce
an increase in the public lending and Treasury bills. Surprisingly, this increase will lead to a
decrease in the holding of government bonds by -0.001. However, we can also conclude that
the governmental entities have a variety of options to finance their operations. In fact, if
government bonds rates increase they can move toward other financing options, such as loans
from commercial banks or issuing new Treasury bills instead of governments bonds.
A ceteris paribus one percent increase in the treasury bills rate would lead to a small
increase on the private lending and deposits with the Central Bank. Also, this increase will
lead to a decrease on the treasury bills holding by banks.
A ceteris paribus one percent increase in the window rate (the rate of return on
deposits with the Central Bank) has almost no effect except for a small increase in the private
lending 0.001 and decrease on public lending by (-0.001) percent.
Turning to the changes in the exogenous variables, the demand deposits ceteris
paribus change would lead to an increase on the holding of deposits with the Central Bank by
(0.67) percent and (0.292) percent in the holdings of private lending. This change appears
reasonable since the banks holding assets are regarding to their maturity and level of risk.
However, there is no clear explanation why such an increase in demand deposits leads to a
decrease in Treasury bills except that the banks prefer to hold the demand deposits as
deposits with the Central Bank instead of Treasury bills to meet customers’ withdrawals for
their demand deposits. Saving and time deposits ceteris paribus change would lead to an

-121-
increase on the holding of all holding assets, meaning that banks can diversify their holding
assets regarding to the source of available funds. Such long-term deposits give banks more
flexibility to hold different assets.
Finally, the only instrument that seems to produce the most logical changes and,
therefore, can be used as the monetary authorities to control the money supply and credit
expansion in the banking system in Jordan was, the rate of return on deposits with the Central
Bank (WR).
4.5.7.2. Total effects of policy instruments on the Jordanian banks' portfolios
The analysis of the impact effects of the (potential) policy instruments on Jordanian
banks' portfolios presented in Table 4.16 cannot provide a complete picture, since the
estimated reduced form of our model portrays the endogenous variables as being dependent
upon lagged endogenous variables. For the complete picture we need to turn to the total
multiplier effects which are given in Table 4.17.
Before we do so, we should make some remarks about the interim multiplier effects
which when summed with the impact effects, of course, provide us with those total multiplier
effects. They all exhibit cycles around zero of decreasing amplitude with time; and they are
zero or approach zero after around 19 periods: they all attain zero eventually, since as noted,
the model is stable. The interim multiplier effects for exogenous variables (main interest rate)
on the set of choice assets are shown in figure 4.5.

-122-
-.00020
-.00015
-.00010
-.00005
.00000
.00005
.00010
5 10 15 20 25 30
CORP-.0005
.0000
.0005
.0010
.0015
.0020
.0025
.0030
.0035
5 10 15 20 25 30
PRIVATE-.0020
-.0016
-.0012
-.0008
-.0004
.0000
.0004
5 10 15 20 25 30
PUBLIC
-.00008
-.00006
-.00004
-.00002
.00000
.00002
.00004
5 10 15 20 25 30
GBONDS-.0024
-.0020
-.0016
-.0012
-.0008
-.0004
.0000
.0004
5 10 15 20 25 30
TBILLS-.0008
-.0004
.0000
.0004
.0008
.0012
5 10 15 20 25 30
DWCB
Figure 4-5: The Effects of Main Interest Rate (Exogenous) on Endogenous Variables CBR PRI
PUB
GRATE
TRATE
WR
-.04
-.02
.00
.02
.04
.06
.08
.10
5 10 15 20 25 30
CORP-.1
.0
.1
.2
.3
.4
.5
.6
.7
5 10 15 20 25 30
PRIVATE-1.0
-0.8
-0.6
-0.4
-0.2
0.0
0.2
0.4
5 10 15 20 25 30
PUBLIC
-.025
-.020
-.015
-.010
-.005
.000
.005
.010
.015
5 10 15 20 25 30
GBONDS-.25
-.20
-.15
-.10
-.05
.00
.05
5 10 15 20 25 30
TBILLS-.3
-.2
-.1
.0
.1
.2
.3
5 10 15 20 25 30
DWCB
-.0020
-.0016
-.0012
-.0008
-.0004
.0000
.0004
5 10 15 20 25 30
CORP-.005
-.004
-.003
-.002
-.001
.000
.001
5 10 15 20 25 30
PRIVATE-.003
-.002
-.001
.000
.001
.002
.003
.004
5 10 15 20 25 30
PUBLIC
-.00035
-.00030
-.00025
-.00020
-.00015
-.00010
-.00005
.00000
.00005
5 10 15 20 25 30
GBONDS-.0010
-.0005
.0000
.0005
.0010
.0015
.0020
.0025
.0030
5 10 15 20 25 30
TBILLS.0000
.0004
.0008
.0012
.0016
.0020
.0024
.0028
.0032
5 10 15 20 25 30
DWCB
-.0004
.0000
.0004
.0008
.0012
.0016
5 10 15 20 25 30
CORP
-.002
.000
.002
.004
.006
.008
.010
5 10 15 20 25 30
PRIVATE
-.010
-.008
-.006
-.004
-.002
.000
.002
5 10 15 20 25 30
PUBLIC
-.00032
-.00028
-.00024
-.00020
-.00016
-.00012
-.00008
-.00004
.00000
.00004
5 10 15 20 25 30
GBONDS
-.006
-.005
-.004
-.003
-.002
-.001
.000
.001
5 10 15 20 25 30
TBILLS-.003
-.002
-.001
.000
.001
.002
.003
.004
.005
5 10 15 20 25 30
DWCB
-.0006
-.0005
-.0004
-.0003
-.0002
-.0001
.0000
.0001
.0002
.0003
5 10 15 20 25 30
CORP
-.016
-.012
-.008
-.004
.000
.004
5 10 15 20 25 30
PRIVATE-.004
.000
.004
.008
.012
.016
.020
5 10 15 20 25 30
PUBLIC
-.0006
-.0005
-.0004
-.0003
-.0002
-.0001
.0000
.0001
5 10 15 20 25 30
GBONDS-.002
.000
.002
.004
.006
.008
.010
.012
.014
5 10 15 20 25 30
TBILLS-.014
-.012
-.010
-.008
-.006
-.004
-.002
.000
.002
5 10 15 20 25 30
DWCB
-.00024
-.00020
-.00016
-.00012
-.00008
-.00004
.00000
.00004
5 10 15 20 25 30
CORP-.0002
.0000
.0002
.0004
.0006
.0008
.0010
.0012
.0014
5 10 15 20 25 30
PRIVATE
-.0010
-.0008
-.0006
-.0004
-.0002
.0000
.0002
5 10 15 20 25 30
PUBLIC
-.0000050
.0000000
.0000050
.0000100
.0000150
.0000200
5 10 15 20 25 30
GBONDS
-.00030
-.00025
-.00020
-.00015
-.00010
-.00005
.00000
.00005
.00010
5 10 15 20 25 30
TBILLS-.00004
.00000
.00004
.00008
.00012
.00016
.00020
.00024
.00028
.00032
.00036
5 10 15 20 25 30
DWCB
Perc
enta
ge %
Pe
rcen
tage
%
Perc
enta
ge %
Perc
enta
ge %
Pe
rcen
tage
%
Perc
enta
ge %
Periods (Monthly)
Periods (Monthly)
Periods (Monthly)
Periods (Monthly)
Periods (Monthly) Periods (Monthly)

-123-
There are alternations of signs between corresponding impact and total multipliers
appears by comparing Tables (4.16) and (4.17), relating to several variables. These include
only two effects, the effect of the corporate bond own-rate, which has the correct sign under
the total effect; and lending to private sector own-rate.
Table 4.17: Total Effects of Policy Instruments on Jordanian Banking Portfolios
CORP PRIVATE PUBLIC GBONDS TBILLS DWCB CBR 0.00078 -0.01315 0.00521 -0.00011 0.00854 -0.00068 PRI -0.00519 0.00074 -0.00762 -0.00180 -0.00020 0.01424 PUB 0.00060 0.02252 -0.00998 -0.00069 -0.00884 -0.00388 GRATE -0.00054 -0.04200 0.02961 -0.00323 0.03948 -0.02338 TRATE -0.00069 0.01166 -0.00336 0.00009 -0.00603 -0.00142 WR -0.00065 0.00464 -0.00402 0.00016 -0.00178 0.00218 INF -0.00016 0.00143 -0.00068 0.00006 -0.00015 -0.00057 DD -0.00849 0.59681 -0.35181 -0.02957 -0.18773 0.96217 STD 0.06865 0.13490 0.42924 0.06847 0.04250 0.23431 CFCB 0.16748 -1.06900 1.98744 0.03694 0.70787 -0.91290 CAPITAL 0.10272 1.26559 0.36392 0.07023 -0.27612 -0.50334 UN 0.12376 0.47140 0.53844 0.07851 0.05577 -0.28190 OTHER -0.16753 0.69038 -1.75674 -0.11039 -0.77788 1.08236 Unit changes in the interest rate 1%.
A main reason for these results could be that the Central Bank were based primarily
on direct controls (credit ceilings and preferential rates) as a means of influencing the
behavior of the portfolio during most of the period. Therefore, it is not unlikely that the
banks' response to these policies has been negative, particularly with regard to interest rates.
It appears that the commercial banks are more sensitive in applying funds to more
liquid assets than they are to non-liquid. The outcomes also confirm the significance of banks'
capital (Pringle; 1974) regarding the response of banks towards choice assets.
The Overall results may seem disappointing, they are typical of econometric models
reported of banks behaviour (see i.e. Muhammad (2010), Humphery (1981), Spindt and
Tarhan (1980).

-124-
Clearly, the results that appear in this Chapter do not support the view that the entry
of new banks, effecting the composition of the assets' holdings in Jordan, did not explain the
behaviour of the portfolios. That means, during the sample period the new entrance of foreign
bank did not provide any change to the composition of the Jordanian assets' holdings
portfolio. In addition, Brown et al., 2008, and Beer et al., 2010, argue that foreign banks
could supply more credits in foreign currency because they rely less on domestic deposits and
have better and maybe cheaper resources access to the international capital markets. The
observation of a lower lending rate of foreign banks could be easily explained by a different
assets allocation via the “portfolio composition hypothesis”.

-125-
4.6. Conclusion:
This chapter investigates the portfolio behaviour of Jordanian banks during the period
2002 to 2009 using monthly data. The model used is based on the portfolio choice theory
originated by Hicks (1935) and developed by Markowitz (1952) and Tobin (1958). Several
nested models are developed to test theoretical restrictions including symmetry and
homogeneity of the interest rate matrix. Additionally, the multiplier effects (current, interim
and total) of the policy instruments on the behaviour of the Jordanian banks are calculated.
The empirical results in general do not render any support for the argument that interest rates
are an important determinant for the composition of Jordanian bank portfolios, and they do
not fully explain the behaviour of such units. It seems that the availability of funds is more
important in determining the structure of bank portfolios. Such results are reinforced by the
fact that the myopic behaviour hypothesis is also rejected at any reasonable level of
significance, which confirms that non-choice set assets and their composition are major
determinants of the portfolio behaviour of banks in Jordan.
Another suggestion by Spindt and Tarhan (1980, p.203), which can be adjusted to the
results is that banks tend to operate in a highly regulated environment and that these
regulatory restrictions and other institutional considerations (i.e. customer relationships)
dominate relative cost incentives in the short-run determination of the balance sheet structure.
Similarly, if customer loyalty is strong, banks may be able to pass on increases in the cost of
their funds, thus immunising to some degree against variations in liabilities costs in the
portfolio, which seems to be the case in Jordan.

126
Chapter Five
Bank Efficiency and Stock Performance

-127-
CHAPTER 5 : BANK EFFICIENCY AND STOCK PERFORMANCE
5.1. Introduction
During the last decade, competitive pressures have progressively led banks to
strategically focus on generating returns for stockholders (Beccalli et al., 2006). On the other
hand, and according to the efficient market hypotheses, stock prices reflect all public
information (Fama, 1970). Consequently, the investigations of the determinants of the
performance of banks and their relationship with their own stock prices have become
gradually more important. The literature reflecting this investigation is that of market-based
accounting, which examines the relationship between institutions stock prices and financial
annual earnings (Kothari, 2001). Traditionally, institution efficiency has been examined on
the basis of financial ratios. In addition, Patel (1989) emphasises that studies on how
accounting information affect stock prices are only applicable under superior economic
settings and fail to reflect the data of balance sheet. In recent years the emphasis has shifted
to the estimation of operational efficiency, which indicates whether a company aims to
minimize costs (inputs, consume less at the same level of output) or the maximization of
profit (which produces more results for the same amount of inputs). Berger and Humphrey
(1997) agreed that the efficiency frontier approaches seem to be superior compared to the use
of traditional financial ratios. The efficiency concept, represented by an index of the frontier
known as X-efficiency, is a measure of best management practices. Frontier efficiency is
generally estimated using parametric or nonparametric approaches and is used as a tool for
measuring the bank's performance (Berger and Humphrey, 1997).
-128-
This chapter attempts to explain the influence of efficiency, derived from Data
Envelopment Analysis (DEA) approach, on the stock prices of listed banks on the Amman
Stock Exchange (ASE) from 2005 to 2009. Briefly, by shifting emphasis from the traditional
relationship between stock prices and efficiency measures, we test whether changes in banks’
efficiency scores have helped to explain the changes in banks stock prices rather than
traditional accounting measures. In this regard, we would expect efficient banks to be more
profitable and, therefore, greater stockholder returns will exist. Consequently, efficient banks
are more able to supply funds at lower cost, whereas inefficient banks may be more prone to
risk taking, Deelchand and Padgett (2009) considered these arguments by it may reflected the
moral hazard problem that exists in the banking system. In addition, a lower cost of funds,
should be reflected by better stock performance (Beccalli et al, 2006).
5.2. Banking Efficiency: Meaning, Theory and Measurement
The purpose of this section is to introduce the main concept and methods for the
evaluation of performance measurement, however, this survey is selective and focuses on
frontier analysis methods. The Data Envelopment Analysis (DEA) method has a particular
emphasis, which is crucial for the achievement of the research objectives stated for this
chapter.
The efficiency of a productive unit, as the Decision Making Unit (DMU), by
comparing its inputs and outputs to those of the best performing, or the most successful, from
its peers. The resources used are classified as inputs, while the outputs are the products or
services obtained through the production process. The level of the products obtained (outputs)
must be related in some way to the level of inputs used to secure them. This relationship is
known as the technology of production and defines the maximum possible output obtainable
from given inputs.
-129-
For a considerable time economist and management scientists have developed
alternative methods for deriving empirically the technology of production from a set of
similar DMUs under analysis. Despite the differences in the methods available for the
estimation, efficiency is always defined by comparing observed to optimal productive
performance.
5.2. 1. Conventional and Frontier Efficiency Approach
In the last thirty years, academic research has progressively more focused on the
frontier efficiency (or X-efficiency) approach, to measure financial institutions performance.
In fact, there are two main ways to measure the performance of banks. The first is based on
simple profit-cost analysis, the classical approach, which is the simplest and most naive
measure of efficiency. This can be represented by conventional performance ratios such as
return on assets or equity (ROA, ROE), capital asset ratio, and cost/income ratios which
concentrate on examining financial ratios since they are commonly used to evaluate
performance. However, classical performance ratios fail to control for the influences of
input/output prices and other exogenous market factors, which constrain the standard ratios
from reaching the nearest estimations of the actual performance results. In contrast, the
frontier efficiency method measures how well the practice performs relative to the “best-
practice firms” facing the same market conditions. It is the ability of organisation to control
the cost of resources to produce an output.
Frontier efficiency measures summarize the results of the institutions in a single
statistic, efficiency score, which controls the differences between practices in a sophisticated
multidimensional character that is rooted in economic theory (Cummins and Weiss, 2000).
Thus, the frontier efficiency appears to be superior to conventional performance ratios and
better estimates the core business results.

-130-
5.2. 2. The Efficiency Concept
In theory, a firm is completely efficient when it produces the output level and mix that
maximises profits and minimises costs. The concept of economic efficiency flows from the
firms’ microeconomics theory. The decomposed of overall economic efficiency can be into
scale efficiency, scope efficiency, pure technical efficiency, and allocative efficiency. This
was established throughout the ideas of Debreu (1951) and Farrell (1957), who built the
standard framework of productive efficiency.
Before discussing the concept of efficiency which, according to Molyneux et al,
(1996), they notice that it is important to consider the attention for efficiency in the banking
industry. They argue that deregulation induced changes, technology and wider market
developments release new competitive pressures from internal markets and also from outside.
Moreover, globalization and increased competition from the non-bank financial institutions
have also put strong pressure to improve banks operational earnings and to control costs.
Therefore, previous studies have used a number of different definitions of efficiency,
including productive efficiency, cost efficiency and profit efficiency. Productive efficiency or
technical efficiency is defined as the distance, in terms of production of output, between an
institution and best practice institution. This hypothesis of "best practices of the institution" is
defined by reference to all institutions throughout the sample. An "Optimal" institution may
exist in the production function or frontier. A production function assumes that the output
level of businesses depends on the production amount of inputs used, in addition to random
errors and other variables that reflect the environment or the particular environments of each
institution. Productive efficiency is limited in its role of determining the amount of quantity
input that may be diminished to a specified output quantity produced.
Cost efficiency studies estimate how far the production costs of a specific
organisation differ from those of a best practice organisation generating the same outputs and
-131-
functioning under similar environments. On the whole, it defined primarily with reference to
a cost function constructed from observations within the sample set of all institutions. This
cost function assumes that the total production costs of each individual institution is
dependent on the prices of variable inputs, such as labour and capital, the quantity or value of
outputs generated, and any other variables that may account for the particular circumstances
environment of individual practices. Cost efficiency is the dual of productive efficiency,
allowing measurement combination of productive efficiency and the ideal quantity of inputs
in relations of prices or allocative efficiency, also known as price efficiency.
Studies of profit efficiency attempt to quantify the degree to which an institution is
yielding maximum possible profit. Profit efficiency measures are derived from a profit
function or frontier, which assumes that profits are dependent on the level of output prices,
input prices, random error and other variables that account for the particular environment
circumstances of individual organisations. Researchers adopting this efficiency concept
attempt to measure the degree to which output prices may be varied. This variation is
expected to influence revenue, assuming that output prices are determined by factors outside
the boundaries of the model. A profit efficiency measure may therefore be defined as the ratio
of actual earnings achieved to the estimated maximum returns attainable for a `best practice'
institution.
5.2. 3. The Framework of Efficiency
The pillars of measurement of efficiency date back to Debreu (1951) and Koopmans
(1957). Debreu (1951) delivered the first efficiency measure, which was called “the
Coefficient of resource utilisation”, and Koopmans (1957) was the leading to state the
concept of technical efficiency. Farrell (1957) extended their work in a fundamental
document; he changed the focus from absolute to relative efficiency. This development has
-132-
been to show how to bring data to bear on Debreu’s formulation of “the Coefficient of
resource utilisation”. Farrell (1957) laid the foundation for the estimation of frontier
production functions. In most production processes, the conversion of inputs does not follow
a known functional form. Therefore, the traditional economy based on production functions
defined theoretically requiring a priori specification of functional form, is able to identify the
best performance of an unattainable ideal. Farrell (1957) suggested changing the focus from
absolute to relative efficiency by promoting the comparison of a DMU to the best actually
achieved by peers performing a similar function.
5.2. 4. The Economic Theory and the Causes of Inefficiency
The question can be addressed with regard to why practices may not able to utilities
their resources efficiently. Answering this question led us to link the theory of the firm with
the frontier efficiency analysis. As mentioned, the concept of efficiency is derived from the
microeconomic theory of the firm. The conventional neoclassical theory assumes that the
firm is functioning in a perfectly competitive market. Table 3.1 shows the main
characteristics of such a market, and this competitive equilibrium leads all firms to make only
normal profit. In consequence, if any firms are unable to gain such normal profit due to
inefficient operating, then in the long rum these inefficient practices will be either acquired
by efficient practices or withdraw from the market. In turn, previous empirical research
suggest that not all firms operate on an efficient frontier and a number of practices are not
located at the point where long-run average cost are minimised but still survive in the market.
Therefore, alternative theories have been proposed to supplement the neo-classical theory of

-133-
the firm; the managerial theories of the firm and, secondly, the behavioural theories of the
firm.23
The classical theory of the profit-maximising practices has been criticized for being
unrealistic to the modern economy, where a divorce of ownership and control exists in large
practices. Instead, firm managerial theories have been developed. Each of the management
theories argues that the management group controls by pursuing their own interests, rather
than maximizing the practice’s wealth. In fact, managers are most likely to obtain those
interests from which they may obtain prestige, power and greater personal reward. Thus, no
costs can be minimized and a level of organizational slack is built into the system (Brewster,
1997). On the other hand, Baumol (1959) introduced the sales-maximisation model, which
argues that managerial objectives, for example prestige, income, power, etc., are correlated
with income from sales revenue. Consequently, Baumol suggests that the primary
management objective is to maximize revenue after reaching a minimum level of profit
necessary to satisfy stockholders.
The principal-agent model was another development in the managerial theories in the
1970s. This analysis stemmed from Spence and Zeckhauser (1971) and Ross (1973), and the
“agency theory” developed by Jensen and Meckling (1976) and Fama (1980). In general,
however, the principal-agent problem reduces corporate profits and leads to inefficiency of
the practices.
Turning to the behavioural theory of the firm, however, Simon (1959) presented a
theory of the firm that give emphasis to satisficing24 and bounded wisdom in the decision-
making process instead of pursuing a maximisation goal under uncertainty and lack of
complete information in the business world. Hence, restricted rationality exists in the
23
Further information please see (Dong, Y. 2009, 18-22). 24
Satisfice was coined by Simon as a portmanteau of "satisfy" and "suffice".

-134-
procedure of decision-making and decision-makers exhibit ‘satisficing’ behaviour which is
established in terms of some aspiration level, rather than optimising behaviour. Consequently,
firms operating in this way are not going to keep costs to a minimum, which results in
productive inefficiency.
5.2. 5. Technical and Allocative Efficiency
Farrell (1957) analysis of efficiency proposed that the efficiency of a firm consisted of
two components: the technical efficiency, which reflects the firm’s ability to obtain maximal
output from a given amount of inputs, and the allocative efficiency, which reflects their
ability to use the input in best possible proportions, given their respective prices and the
production technology (Coelli et al. 2005, p51). Both combine to provide an overall
economic efficiency measure, the allocative and technical efficiency. A graph can best
illustrated the idea, for the single output (Y) and two inputs ( ) case in the unit isoquant
Figure 5.1, Cooper et al., (2007, p. 258).
In turn, Farrell (1957) initially assumes that the constant return to scale (CRS) depicts
the efficient frontier on the production function. In figure (5.1) the isoquant ( ) fully
describes the technological set that captures the combination of the two inputs ( ) by
which institutions can produce a certain output when perfectly efficiently. In addition, inputs
along the isoquant are assumed as technically efficient while, any point above and to the right
of isoquant, is defined as a technically inefficient producer since the inputs used are enough
to produce a unit of output. Thus, the distance (CD) measures the technical inefficiency of a
producer located at point (D) along the ray (AD). Where (CD) distance denotes the amount
by which inputs can be reduced without decreasing the amount of output. From this diagram,
the technical inefficiency level associated with package (D) can be stated by the ratio
(CD/AD). Technical efficiency (TE) of the producer under analysis would be given by the

-135-
ratio (AC/AD), and this takes a value between zero and one. A value of one implies that the
practice is fully technically efficient (Coelli et al., 2005, p.52).
Allocative efficiency (AE) can also be derived from the unit isoquant plotted in Figure
(5.1). It involves the selection of an input mix that allocates factors to their highest value uses
and introduces the opportunity cost of factor inputs to the measurement of productive
efficiency. However, given information on the market prices of inputs ( ), the isocost
line (JJ) through (D) is associated with ( + = ) and the slope of this line reflects
the input price ratio.
Figure 5-1: Technical and Allocative Efficiency
Adapted from Cooper et al., (2007, 258).
This cost can be further reduced by moving this line in parallel fashion until it is
tangential to the isoquant at (P). The coordinates of (JJ) then give ( +
= )
achieving the minimal cost at the prescribed output level. We can similarly determine the
relative distances of (B) and (C) to obtain the ratio AB/AC, however, and with respect to the
least cost combination of inputs given by the point (P), the above ratio indicates that the
X2
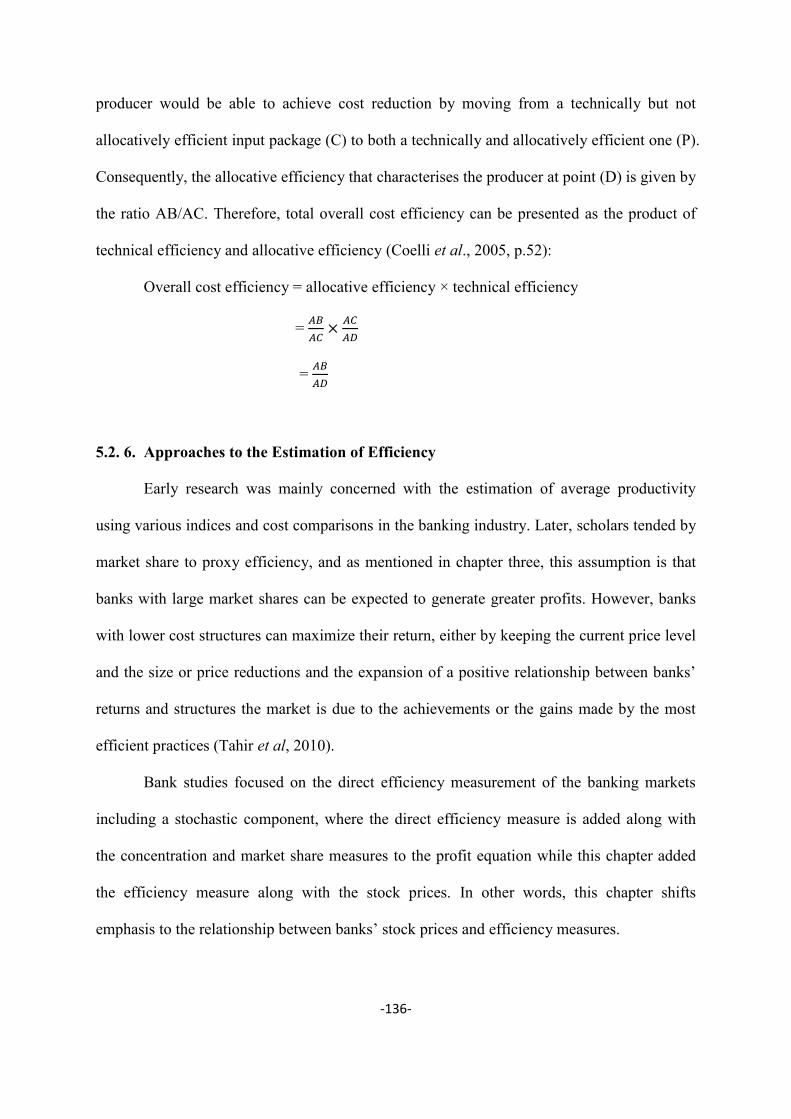
-136-
producer would be able to achieve cost reduction by moving from a technically but not
allocatively efficient input package (C) to both a technically and allocatively efficient one (P).
Consequently, the allocative efficiency that characterises the producer at point (D) is given by
the ratio AB/AC. Therefore, total overall cost efficiency can be presented as the product of
technical efficiency and allocative efficiency (Coelli et al., 2005, p.52):
Overall cost efficiency = allocative efficiency × technical efficiency
=
=
5.2. 6. Approaches to the Estimation of Efficiency
Early research was mainly concerned with the estimation of average productivity
using various indices and cost comparisons in the banking industry. Later, scholars tended by
market share to proxy efficiency, and as mentioned in chapter three, this assumption is that
banks with large market shares can be expected to generate greater profits. However, banks
with lower cost structures can maximize their return, either by keeping the current price level
and the size or price reductions and the expansion of a positive relationship between banks’
returns and structures the market is due to the achievements or the gains made by the most
efficient practices (Tahir et al, 2010).
Bank studies focused on the direct efficiency measurement of the banking markets
including a stochastic component, where the direct efficiency measure is added along with
the concentration and market share measures to the profit equation while this chapter added
the efficiency measure along with the stock prices. In other words, this chapter shifts
emphasis to the relationship between banks’ stock prices and efficiency measures.

-137-
5.2. 7. Parametric versus Non-parametric Approaches to Measure Efficiency
Several approaches have been developed for measuring practice efficiency, from the
simple financial ratios to complex econometric models. On the whole, there have been two
key types of frontier approaches that have been harnessed in most prior efficiency studies:
deterministic and stochastic. The deterministic approach presumes that firms share a
collective technology and hence both face a common production and cost frontier. All
variation in firm performance is then attributed to variation in business efficiencies relative to
these common frontiers. However, the concept of a deterministic frontier shared by all firms
ignores the possibility that a business performance may be affected by factors beyond their
control as well as by factors under its inefficient control. On the other hand, the stochastic
approach assumes that practices may turn from the minimum achievable cost levels for
purely exogenous reasons as well as through inefficiency effects (Al-Jarrah and Molyneux,
2005).
Berger and Humphrey (1997) noted that the efficiency of estimation techniques can
be classified into parametric and non-parametric methods. On the other hand, there is no
consensus on the preferred estimation techniques for determining the best practice frontier
beside which comparative efficiencies is measured. The parametric methods that are
commonly used are the Stochastic Frontier Approach (SFA), Distribution Free Approach
(DFA), and Thick Frontier Approach (TFA). The most commonly used non-parametric
methods are Data Envelopment Analysis (DEA) and Free Disposable Hull (FDH).
Approaches mainly differ in the assumptions imposed on the data in terms of the functional
form frontier of the best practice, Al-Jarrah and Molyneux (2005)25.
25
For further investigation see Al-Jarrah and Molyneux (2005).
-138-
5.2.7.1. Data Envelopment Analysis (DEA) Approach
The Data Envelopment Analysis (DEA) has its roots in the work of Farrell (1957),
this nonparametric approach was first suggested by Charnes, Cooper and Rhoades (1978)
who described the mathematical programming application to observe data in order to locate a
frontier to evaluate the efficiency responsible of each of the practices for the observed
quantities. In other words, they reformulated Farrell's original idea for the calculation of
efficiency scores for each observation in the sample into a mathematical programming
problem permitting that by constructed a nonparametric piece-wise frontier that envelops the
input/output data comparative to which costs are minimised (Al-Jarrah, 2007). The scores
obtained are defined as the percentage reduction in the use of all inputs that can be utilities to
create an observation comparable with the best observations in the sample with no reduction
in output.
The DEA approach is based largely on the concept of efficiency and has been widely
used in order to compute the amount of effort utilities by a machine in relation to the extent
of energy expended in the process, Tahir et al, (2009). The DEA concept is similar to the
microeconomic theory of production in relation to technical efficiency. The key difference is
that the DEA is not determined by some specific equation; as an alternative it is generated
from the actual data for the evaluated practices Casu and Molyneux (2000). The DEA scores
are defined not by an absolute standard but relative to the other best practices under
consideration. The DEA main objective is to determine which firms are operating on their
efficient frontier, as it assumes the same unspecified technology set which describes their
production possibility set that all firms face. Consequently, if the practice's input and output
combination lies on the DEA frontier, the practice is considered efficient, however, if the
practice's input/output combination lies inside the frontier the practice is considered
inefficient.

-139-
This approach can estimate efficiency through the assumption of constant return to
scale (CRS) and, variable returns to scale (VRS). The key assumption is that CRS is only
applicable when all DMUs are functioning at optimal scale Coelli et al. (2005). However,
factors like imperfect competition may cause a DMU not to operate at optimal scale.
Consequently, the specification of CRS used, when some DMUs are not functioning at
optimal scale, confuses measures of technical and scale efficiency, Casu and Molyneux
(2000). Banker et al, (1984) produced a seminal work proposing variable returns to scale
(VRS) and an output oriented model.
5.2.7.2. DEA Model
As mentioned earlier, the DEA model was first developed by Charnes, Copper and
Rhodes (1978), who let it be assumed that a set of data on K inputs and M outputs on each of
N DMUs. Aimed at i-th DMU these are denoted by the vectors and respectively. The
K×N input matrix, Y, and the M×N output matrix, X, and denote the data for all N DMUs. For
every single DMU we would like to ascertain an extent of the ratio of all outputs over all
inputs, for instance , w is an M 1× vector of output weights, where v is a K 1×
vector of input weights. The multiple inputs/outputs are reduced to one single input value and
a one single output value by the allocation of weights to each input/output. These weights are
selected in order to show the efficiency of DMU in the best possible light. In fact, the
succeeding mathematical programming is stated to select optimal:
∑
∑
(5.1)
s.t. ∑
∑
(5.2)
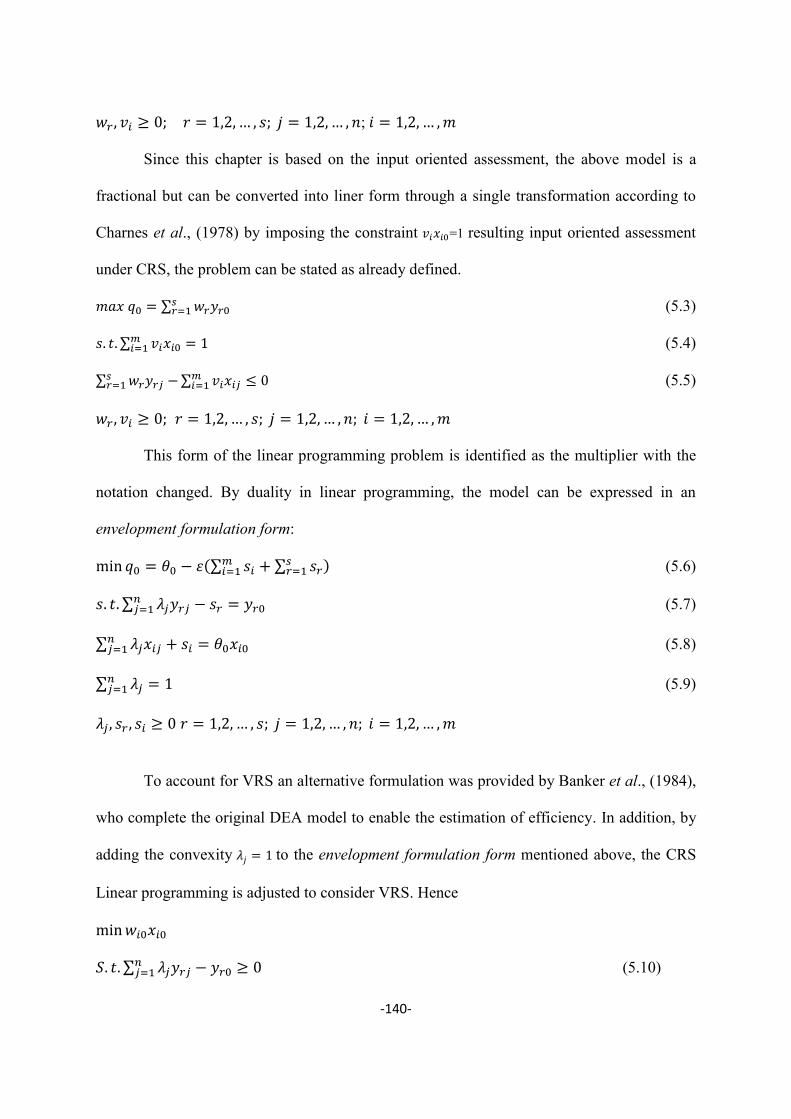
-140-
;
Since this chapter is based on the input oriented assessment, the above model is a
fractional but can be converted into liner form through a single transformation according to
Charnes et al., (1978) by imposing the constraint =1 resulting input oriented assessment
under CRS, the problem can be stated as already defined.
∑ (5.3)
∑ (5.4)
∑ ∑
(5.5)
This form of the linear programming problem is identified as the multiplier with the
notation changed. By duality in linear programming, the model can be expressed in an
envelopment formulation form:
(∑ ∑
) (5.6)
∑ (5.7)
∑ (5.8)
∑ (5.9)
To account for VRS an alternative formulation was provided by Banker et al., (1984),
who complete the original DEA model to enable the estimation of efficiency. In addition, by
adding the convexity to the envelopment formulation form mentioned above, the CRS
Linear programming is adjusted to consider VRS. Hence
∑ (5.10)
-141-
∑ (5.11)
∑ (5.12)
Once pure TE has been achieved, not all production possibilities on the VRS frontier
are equally productive. It is important to make a distinction between efficiency and
productivity. Efficiency, as mentioned earlier, is defined by comparing the outputs and inputs
of a DMU with best practices from its peers. Productivity, on the other hand, is defined as the
amount of outputs produced per unit of inputs use to secure DMU. Consequently, Scale
Efficiency (SE) measures how much the scale of operation of a DMU impacts on its ability to
achieve maximum productivity. On the whole, under VRS, the technical efficiency scores are
higher than or equal to those scores obtained under CRS. Thus, SE can also be generated by
dividing the CRS by VRS; it reflects whether a DMU is functioning at the right scale of
operation or right size.
-142-
5.3. Literature Review
The frontier approach of measuring efficiency received vast attention after the
seminal paper of Farrell (1957). In fact, bank efficiency studies are fast growing, and it is
cleared that the vast majority of studies examine the developed countries. As mentioned
earlier, the frontier approach determines the distance from the bank with the best frontier. In
the literature, the frontier approach can essentially be divided into two main groups, either
programming approach or econometric approach. There are at least five parametric/
nonparametric efficiency measuring techniques, applied to financial institutions in various
countries. The programming approach is nonparametric and deterministic whereas the
econometric approach is parametric and stochastic (Berger et al. 1993; Berger and Humphrey,
1997). This chapter adopts DEA for measuring bank efficiency in line with the economic data.
It has no functional form, functioning efficiently with different banks size and produces
optimal results even for a small sample population.
Bank efficiency studies are on the rise, but the majority of studies cover the U.S.
(Berger et al. 1993; Berger and Humphrey, 1997), while other studies examine several other
countries such the UK (Drake, 2001, Sathye, 2001; Sturm and Williams, 2004) examine
Australia, (Altunbas et al., 2000; Drake and Hall, 2003) examine Japan, and cross-country
studies (Madous et al., 2002; Fries and Taci, 2005; Kasman and Yildirim, 2006). However,
there have been a few studies examining the efficiency of Jordanian banking, such as Bdour
and Al-Khoury (2008), Satya and Jreisat (2009), and Olson and Zoubi (2011).
Bdour and Al-Khoury (2008) employ the data envelopment analysis (DEA) to
measure the efficiency of individual commercial banks in Jordan as a quantitative approach
during 1998 to 2004. The results of the DEA model reveal an increase in bank efficiency
apart from 2003 and 2004 where bank efficiency decreased. Most efficiency scores showed a
consistent increase after the introduction of the Jordanian Government liberalisation
-143-
programme in 1996 with the exclusion of a few banks which showed decreased in efficiency.
It presumed that these banks have responded differently to the liberalisation programme.
Further analysis reveals that had an adverse effect on bank efficiency in both asset utilisation
and the labour factor. They conclude their study by stating that the effect of the liberalisation
programme may require a longer time period before this effect becomes applicable.
Satya and Jreisat (2009) investigated the level of cost efficiency in 17 Jordanian banks
during the period 1996-2007, using the input-oriented DEA model; the cost efficiency scores
for each bank were obtained. Their results concluded that the allocative efficiency is quite
high in the Jordanian banking sector. The cost efficiency score of banks is 0.74 on average,
which implies that banks in Jordan could reduce the cost of production by 26 percent without
affecting the level of output. Their study found that large banks were found to be most
efficient in terms of cost efficiency (86%), allocative efficiency (92.7%) and technical
efficiency (93%).
The study of Olson and Zoubi (2011) examine banks in (MENA) countries, Middle
East and North Africa, accounting-based and economic-based measures of efficiency and
profitability. Ten countries were examined over the period from 2000 to 2008. They noticed
that accounting variables helped explain cost and profit efficiency, while cost efficiency
scores has slight impact on profitability and profit efficiency. Their results suggest that banks
in MENA are slightly less cost efficient as compared to European banks, while comparable to
banks in developing economies. For Jordan the average cost efficiency scores were 70.2, 64.9
for profit efficiency, and scale efficiency scores 95.5, the highest average scores on their
study. On the other hand, MENA banks scored well in terms of profit efficiency comparative
to other banks worldwide.

-144-
Despite the huge amount of literature on banking efficiency, Beccalli et al., 2006
noticed that only a handful of studies have studied banks’ efficiency and bank stock price
performance relationship in the market place.
Chu and Lim (1998) using DEA examined the relative cost and profit efficiency of a
panel of six Singapore listed banks between 1992 and 1996, they initiate that listed banks in
Singapore have showed higher overall efficiency of 95.3% compared to profit efficiency of
82.6%. Their results shows that large banks have reported higher efficiency scores than the
small banks, 99.0% and 92.0% respectively. Their study found that percentage the change of
the price of bank stocks reflected change in profit efficiency rather than cost efficiency.
Sufian and Majid (2006) also examine another study by suggested that the stock prices of
respond more towards the improvements in profit efficiency rather than in cost efficiency
Malaysian banks. They investigated the cost and profit efficiencies by applying the non-
parametric DEA model during 2002 to 2003. Banks were listed on the Kuala Lumpur Stock
Exchange (KLSE). They discovered that cost efficiency of Malaysian banks was on average
significantly greater as compared to profit efficiency.
Beccalli et al. (2006) assessed efficiency measures of the banking cost in 1999 and
2000 to a sample of five European countries’ banks (France, Germany, Italy, Spain, and UK).
Using the DEA and (SFA) method they analysed the intermediation approach using deposits,
loans, and securities as outputs, and labour and capital as inputs. Their outcomes results
suggest that changes in the prices of banks’ stocks reflect changes in cost efficiency,
especially the changes derived from the DEA. As a consequence, Liadaki and Gaganis (2010)
expanded the sample of Beccalli et al. (2006) and examined fifteen EU countries (171
operating banks) and examined whether the stock performance of EU listed bank is related to
their efficiency over the period 2002 to 2006. They used the SFA to examine the cost and
profit efficiency, their results indicating that profit efficiency changes have a positive and

-145-
significant impact on stock prices, while there was not a relationship between cost efficiency
and stock return.
A study of Greek banks and their shock price performance were examined by
Pasiouras et al., (2008). They examined ten commercial Greece banks, listed on the Athens
stock exchange. Their study found that the average technical efficiency under CRS is 93.1%
and 97.7% under VRS. The regression results indicate a significant positive relationship
between technical efficiency scores and stock price returns, while they found that scale
efficiency scores have no impact on stock price returns.
Recent studies examine the relationships between Chinese banks’ efficiency and its
stock prices, Sufian and Abdul Majid (2009) and Gu and Yue (2011). Both studies concluded
that efficiency estimates derived from the DEA contributed significant information for bank
stock holders who wish to explain stock return. In addition, Aftab et al., (2011) examined
evidence from Pakistani banks and also examined the relationship between efficiency and
stock performance over the period from 2003 to 2007 using DEA. Their results also show a
positive significant link between changes in efficiency and stock prices.
5.4. Methodology
This chapter employs the panel fixed effects model since the data cover the twelve
banks listed on ASE. The DEA approach; and using input-oriented cost minimisation models.
Cost efficiency is estimated using the DEA approach, in particular the intermediation
approach. However, the profit-oriented approach has also been estimated to compare the
obtained results between the two methods. Bank stock performance is represented by annual
stock return, calculated from monthly returns for each individual bank. The best practice
frontiers were estimated for the three panels separately. The aim of this study is not to
compare efficiency scores for each individual bank, but to relate efficiency and stock prices

-146-
within approaches, those being the intermediation and the Profit. We follow Beccalli et al,
2006; Pasiouras et al, 2008; Liadaki and Gaganis 2010. The estimated models are:
Model 1: Bank Efficiency and the performance of the bank stock:
(5.13)
This model aims to establish the extent to which changes in the efficiency scores influence
changes in banks’ stocks performance. We employed the following hypothesis:
: The changes in efficiency scores are not reflected in changes in stock prices.
: The changes in efficiency scores are reflected in changes in stock prices.
Model 2: Bank Efficiency, Stock Performance and Proxies for Size, Risk and Profits.
This model is a greater extent for the relationship between banks’ efficiency and stock
performance with controls for other factors that may influence stock performance. We
employed an F-test to test the following hypothesis:
: Complete model is not superior.
: Complete models are better.
The control variables used are: natural logarithm of bank total assets as proxy for size,
the changes in ratio of bank total equity to total loans as proxy for risk, and the changes in
return on assets as a proxy for profitability.
( )

-147-
, present the annual stock return of bank at time t. ,present either bank
annual percentage change in efficiency score ( ) , present the
natural logarithm of total assets of bank , present the annual change in the ratio of
total equity over total loans for bank , present the annual percentage change in return
on assets for bank
5.4. 1. Stock Performance
Bank stock performance is denoted by cumulative annual stock returns ( ), which
were calculated from monthly returns for each bank from the formula given below:
in year (( ) ( ) ( ))
5.4. 2. Efficiency Score Changes
Changes in efficiency score have been calculated as percentage change in efficiency
scores at year-end over the period of our sample as follows:
Efficiency change in year t
Panel (1) and Panel (2) are based on the intermediation approach suggested by most
studies, for example Drake (2001); Drake and Hall, 2003; Drake et al, 2006; and Pasiouras
(2008), with different inputs/outputs combinations to explore on bank efficiency; the credit
risk and off-balance sheet activities in Panel (2).
Panel (1) or the classical model under the intermediation approach appears in the most
studies and uses the following two inputs: the total fixed assets and total deposits and short-
term funding. The two selected outputs are total loans and other earning assets.

-148-
Panel (2) is a re-estimation of panel (1) as suggested by Pasiouras (2008) and by
following the recommendations of Bikker and Bos (2008, p.119) that include off-balance
sheet items in the intermediation approach it is therefore, a first step of bank production
towards an additional balanced view.
“During 1990s, the business of bank with international focus experienced displacement
especially lending, by other activities, larger growth in off balance sheet items relative to
total assets and larger increase in other operating income as compared to traditional deposit
loan spread.” (Machiraju, 2008, p1)
This chapter includes both loss provisions and off-balance sheets items, to account for
off-balance sheet activities and credit risk simultaneously. Consequently, As Loretta (1996,
p1026)) notices:
“Unless quality and risk are controlled for, one might easily miscalculate a bank’s level of
inefficiency; e.g. banks scrimping on credit evaluations or producing excessively risky loans
might be labelled as efficient when compared to banks spending resources to ensure their
loans are of higher quality”
Following Drake et al., (2006); and Pasiouras et al.,(2008), in Panel (3) we examine
the profit-oriented approach, the bank revenue components being defined as outputs and cost
components as inputs. The two inputs are non-interest expenses and loss provisions. The
three outputs are net interest income, net fees and commissions’ income, and other income.
Table 5.1: Panels Outputs and Inputs Panel Inputs Outputs
Panel (1) Total fixed assets Total loans Total deposits and short term funding Other earning assets
Panel (2) Total fixed assets Total loans Total deposits and short term funding Other earning assets Loans loss provisions Off-balance sheets items
Panel (3) Non-interest expenses Net interest income Loans loss provisions Net fees and commissions’ income Other income
-149-
The sample consisted of all listed banks in ASE, which is twelve banks from 2005 to
2009, the data were obtained from Bank Scope, and data related to stock prices are obtained
from ASE official website.
5.4. 3. Specification of Bank Inputs and Outputs
The fact that the banks are a multi-product nature, there is still no clear agreement on
the explicit measurement definition of inputs and banking outputs. The output measures in
the banking sector are particularly difficult since many financial services are jointly produced
and prices rates are usually allocated to a set of financial services (Cowell and Davis, 1992).
It is generally accepted that the efficiency studies choice of variables is significantly affects
the results. In other words, to evaluate the efficiency of banks, the output path is defined and
measured and may influence the results obtained (Berger and Humphrey, 1997). The problem
may influence the results is compounded by the fact that the selection of observation is often
limited by the scarcity of data on relevant variables. Four main approaches are generally used
to measure the flow of services provided by financial institutions in the banking efficiency
literature: the production approach, the intermediation approach, the operating approach, and
more recently, the profit-oriented approach. The first two methods employ traditional
microeconomic theory of the practice to the bank and only differ in the description of
banking activities26. The last two approaches go beyond and incorporate specific activities of
the banking sector in the classical theory and therefore modify it (Sufian, 2011).
In the production approach, initiated by Benston (1965), banks are viewed as firms
which employ capital and labour to produce different types of deposit accounts and loans (see,
for example, Bauer et al (1993) and Berger et al (1997)). Therefore, the output results are
evaluated by the number of deposits and loan accounts, while total costs are the costs of
26 For further details see Cowell and Davis (1992), Das and Ghosh (2006), and Das and Kumbhakar (2012).

-150-
operation used to produce these products excluding interest expense. However, this approach
may be more applicable to branch efficiency studies, as on the whole bank branches
essentially process customer documents and bank financing, while investment decisions are
not generally under the branches control (Berger and Humphrey, 1997).
The intermediation approach views financial business as an intermediary between
savers and borrowers and produces outputs as, total loans and different securities. This
approach was suggested by Sealey and Lindley (1977), and they assume that a bank collect
sources of funds and transforms these sources into loans and other assets. On the other hand,
Deposits along with capital and labour are treated as inputs. Under this approach, costs are
including interest expenses and total costs of production. While, a few scholars advocate the
exclusion of interest expenses from total costs, they reasoning that the interest costs are
purely financial and not relevant in measuring financial institution efficiency.
Additionally, the unit of bank inputs and outputs according to the intermediation
approach are measured in terms of monetary values that can determine the market share of
individual banks. In addition, there are some services that cannot be measured in terms of
number of accounts held by a financial institution, such as investment in securities.
Furthermore, the intermediation approach includes interest expense on deposits and other
purchased funds which comprise the bulk of costs. Finally, the intermediation approach is
the most commonly used in the banking literature on the empirical efficiency of banks
literature. Berger, Leusner and Mingo (1997) indicate that the intermediation approach has
the advantage of being more inclusive and captures the bank's role, and emphasizes the costs
of banking overall and is appropriate for raising a questions related to the cost minimization
of banks (Ferrier and Lovell, 1990).
Although in the banking efficiency literature, the intermediation and production
approach have received the most attention, where are there is no consensus as to the 'best'
-151-
applicable approach. Berger and Humphrey (1997) point out that both approaches are
imperfect, they indicate that because neither fully captures the dual role of financial business,
which contains both the provision of transaction and document processing services, and the
payment from savers to borrowers. They argue that the production approach may be to some
extent better for estimating the efficiencies of branches of such institutions because branches
primarily process the customer’s documents, and branch managers usually have no influence
power over bank investment decisions. In contrast, Casu and Molyneux (2003) argue that the
intermediation approach may be more appropriate for evaluating entire financial business,
since it is inclusive of interest expenses, which total costs often account for around one-half
and two-thirds. On the whole, the intermediation approach is relatively superior for
evaluating the importance of efficiency frontiers as compared for the profitability of financial
business, since the reduction of total costs (and not just production costs) is necessary to
maximise returns (Casu and Molyneux, 2003).
The operating approach and the revenue approach, lately proposed by Drake et al.,
(2006), are driven by the fact that banks have a profit-oriented objective arising from their
financial activities. Leightner and Lovell (1998) specified outputs as total revenue (interest
and non-interest income) and inputs as the total expenses, which are designed to reflect this
objective. They argue that using net interest income and non-interest income as outputs, they
netted the fees generated by deposits without having the problem of including deposits
themselves, which generate expenses, the output. In this approach, the output characteristics
of deposits are limited in non-interest income, and deposit rate of return are capture against
the interest earned on loans to generate “net interest income”.
Table 5.2 summarises the main descriptive statistics of the dependant, inputs, outputs
and proxies variables.

-152-
Table 5.2: Summary Statistics Inputs, Outputs and Proxies Variables.
Mean Median Min Max S.D
Dependant Return (R) -0.090 -0.182 -0.492 0.406 0.343 Inputs Total fixed assets 35.19 34.68 27.61 44.15 6.69 Total deposits and short-term funding 2393.31 2420.35 1968.99 2826.15 355.63 Loan loss provisions 6.73 4.82 1.50 18.42 6.68 Non-interest expenses 61.76 61.20 51.16 80.57 12.10 Outputs Total loans 1308.33 1400.99 946.79 1525.81 249.19 Other earning assets 1210.17 1230.66 1051.42 1304.33 96.94 Total off-balance sheet items 1075.75 1065.29 806.80 1379.32 254.03 Net interest income 83.64 89.37 59.16 97.69 15.97 Net fees and commissions 19.05 18.95 15.60 22.65 3.38 Other income 36.11 34.99 30.28 42.58 4.56 Proxies Annual Changes ASSET 3.172 3.120 4.364 2.560 0.435 EQTL 0.035 -0.007 -0.335 0.978 0.233 ROA 0.114 -0.057 3.603 -0.918 0.720
5.5. Empirical Results
Efficiency scores, derived from the Data Envelopment Analysis window, are reported
in Table 5.3 for Panel (1); Table 5.7 for Panel (2) and Table 5.11 for Panel (3). All computing
was performed using PIM-DEA software for the efficiency of listed banks in Jordan by
applying the DEA approach for all banks. However, for further details in the relationship
between stock return and changes in efficiency scores, tables 5.6, 5.10 and table 5.14 present
the results of correlations analysis for each panel.
Panel fixed effect results, are employed, which are more suitable since the data the
twelve banks listed on ASE 27, derived from estimating equation 5.13 and 5.14 are reported in
tables 5. 4-5 for Panel (1); tables 5.8-9 for Panel (2), and tables 5.12-13 for Panel (3).
27 For further details please see Dougherty (2006, p421).
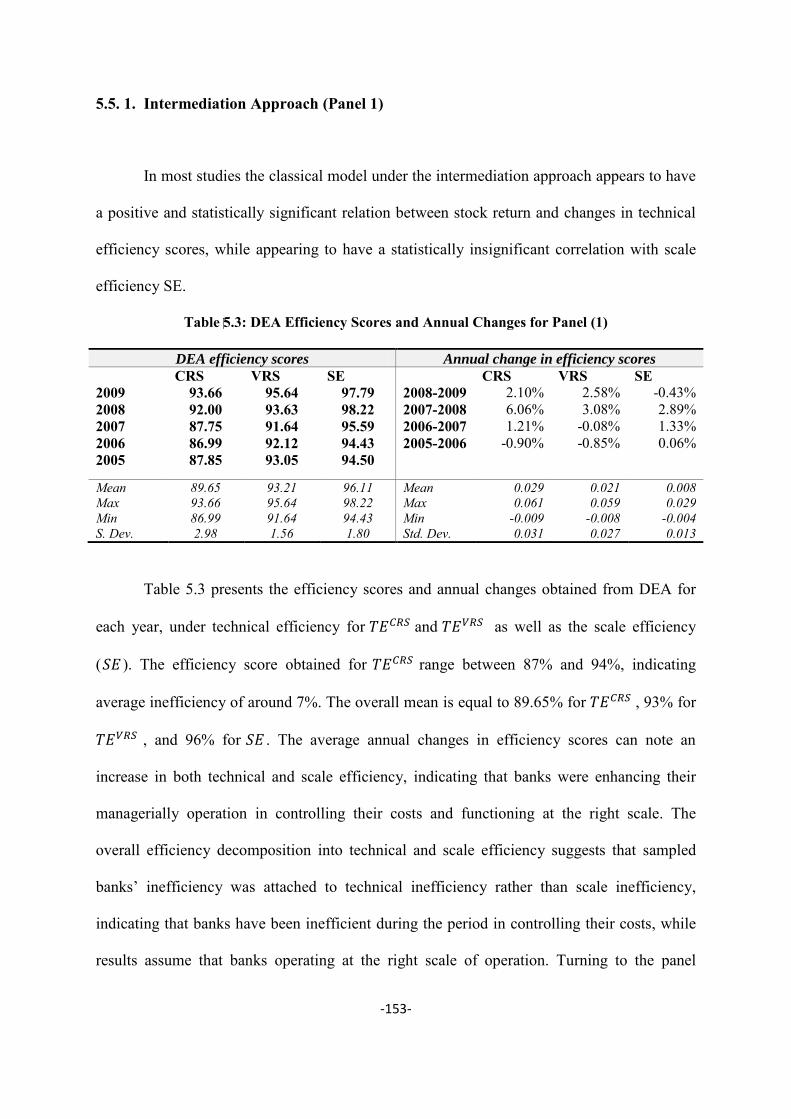
-153-
5.5. 1. Intermediation Approach (Panel 1)
In most studies the classical model under the intermediation approach appears to have
a positive and statistically significant relation between stock return and changes in technical
efficiency scores, while appearing to have a statistically insignificant correlation with scale
efficiency SE.
Table 5.3: DEA Efficiency Scores and Annual Changes for Panel (1)
DEA efficiency scores Annual change in efficiency scores
CRS VRS SE CRS VRS SE 2009 93.66 95.64 97.79 2008-2009 2.10% 2.58% -0.43% 2008 92.00 93.63 98.22 2007-2008 6.06% 3.08% 2.89% 2007 87.75 91.64 95.59 2006-2007 1.21% -0.08% 1.33% 2006 86.99 92.12 94.43 2005-2006 -0.90% -0.85% 0.06% 2005 87.85 93.05 94.50
Mean 89.65 93.21 96.11 Mean 0.029 0.021 0.008 Max 93.66 95.64 98.22 Max 0.061 0.059 0.029 Min 86.99 91.64 94.43 Min -0.009 -0.008 -0.004 S. Dev. 2.98 1.56 1.80 Std. Dev. 0.031 0.027 0.013
Table 5.3 presents the efficiency scores and annual changes obtained from DEA for
each year, under technical efficiency for and as well as the scale efficiency
( ). The efficiency score obtained for range between 87% and 94%, indicating
average inefficiency of around 7%. The overall mean is equal to 89.65% for , 93% for
, and 96% for . The average annual changes in efficiency scores can note an
increase in both technical and scale efficiency, indicating that banks were enhancing their
managerially operation in controlling their costs and functioning at the right scale. The
overall efficiency decomposition into technical and scale efficiency suggests that sampled
banks’ inefficiency was attached to technical inefficiency rather than scale inefficiency,
indicating that banks have been inefficient during the period in controlling their costs, while
results assume that banks operating at the right scale of operation. Turning to the panel

-154-
regression results, the results derived from estimating equation 5.13 and 5.14 are reported in
tables 5.4-5. When both DEA technical and scale efficiency scores are used as explanatory
variables, a statistically significant coefficient of change in efficiency with positive sign
appear under constant and variable return to scale. The slope coefficient is 0.768 for CRS and
1.016 for VRS, implying that the expected increase in banks’ stock prices is more for a point
increase in VRS than CRS.
Table 5.4: Bank Efficiency and Stock Performance Regressions Results for Panel (1)
Parameters Change in CRS Change in VRS Change in SE Constant -0.112*
[-8.94] -0.111* [-17.67]
-0.083* [-7.29]
Constant returns to scale 0.768*** [1.78]
Variable returns to scale 1.016* [3.41]
Scale efficiency
-0.890 [-0.64]
R-square 0.038 0.060 0.011 F-stat. 3.17 11.63 0.41 (p-value) (0.100) (0.005) (0.534) Wald Heteroskedasticity test 191.42 265.20 250.62 (p-value) (0.000) (0.000) (0.000) Wooldrige-test for autocorrelation 0.203 0.162 0.640 (p-value) (0.660) (0.694) (0.439) No. of Observation 65 65 65
Note: t-value in [ ], p-values in ( ), and *,**,*** indicates significance at the 1%, 5%, 10% levels.
Before presenting the results, we conduct Wooldridge serial correlation test (2002), to
investigate the possibility of serial correlations. This test has the null of no first-order serial
correlation. The results imply that the residuals are not serially correlated in all cases. In
addition, heteroskedasticity of variance of the regression disturbances is likely. However, this
study uses the Wald Heteroskedasticity test to detect the heteroskedasticity problem in the
fixed effects model. We accept the null hypothesis that there is no heteroskedasticity. A result
for heteroskedasticity implies that the residuals are heteroskedastic for all cases.

-155-
The results of the non-spherical test for all models presents in table 5.4 indicate that
residuals are heteroskedastic only. Consequently the robust standard errors are estimated. The
variable return to scale is positive and statistically significant at 10 percent level. The model
that includes explains the variability in stock prices with a largest equal to 0.060.
The inclusion in equation 5.14 of further explanatory variables (proxies for banks size,
riskiness and profitability) as expected does increase the model explanatory power, as shown
in table 5.5.
The results from the inclusion of further explanatory variables under the
intermediation approach perform to propose that changes in the prices of bank stocks reflect
the percentage changes in return to scale variables under technical efficiency, while the scale
efficiency appears to be statistically insignificant as obtained from the basic model.
Wooldridge serial correlation test results imply that the residuals are serially
correlated under CRS and VRS. In addition, heteroskedasticity of variance of the regression
disturbances is likely as well. The Wald Heteroskedasticity test rejects the null hypotheses
implying that the residuals are heteroskedastic for all cases. The results of non-spherical test
for all models presented in table 5.5 suggest that the, residuals are heteroskedastic and
serially correlated under technical efficiency, while residuals are only hetroskedastic only
under scale efficiency. As a consequence the cluster robust standard error estimator is
employed for technical efficiency variables and cluster robust standard error estimator for
scale efficiency.

-156-
Table 5.5 : Bank Efficiency and Stock Performance and Proxies for Size, Risk and Profits Regression Results for Panel (1)
Parameters Change in CRS Change in VRS Change in SE
Constant 1.929 [0.93]
2.108 [1.02]
1.462 [0.72]
Constant returns to scale 0.755*** [1.87]
Variable returns to scale 0.888** [2.02]
Scale efficiency 0.057 [0.05]
Banks (i) Total Assets -0.653 [-1.00]
-0.708 [-1.09]
-0.500 [-0.79]
Bank (i) T. Equity/T. Loans -0.289 [-1.49]
-0.325 [-1.65]
-0.202 [-0.58]
Bank (i) Return on Assets 0.355 [4.94]
0.341* [4.72]
0.369* [4.66]
R-square 0.268 0.249 0.290 F-stat. 11.03 11.29 7.52 (p-value) (0.000) (0.000) (0.003) Wald Heteroskedasticity test 82.13 98.59 206.62 (p-value) (0.000) (0.000) (0.000) Wooldrige-test for autocorrelation 4.369 5.094 1.683 (p-value) (0.0585) (0.043) (0.219) No. of Observation 65 65 65 Note: t-value in [ ], p-values in ( ), and *,**,*** indicates significance at the 1%, 5%, 10% levels.
In consequence, changes in both the size and riskiness proxies do not appear to donate
the explanation of changes in stock prices. Profitability proxies, return on assets, appear to be
statistically significant with a positive sign. In table 5.7 we present the results of correlation
analysis to further examine the relationship between stock return and changes in efficiency
scores with proxies for size, riskiness and profitability. On the whole, finding proposes that
stocks of Jordanian banks move gradually towards their inefficient competitors under
technical efficiency variables.

-157-
Table 5.6: Correlation between Variables for Panel (1)
Probability RETURN CRS1 VRS1 SE1 ASSETS EQTL ROA
RETURN 1.000
CRS1 0.196 1.000
(0.118)
VRS1 0.246 0.922 1.000
(0.048) (0.000)
SE1 -0.105 0.317 -0.072 1.000
(0.405) (0.010) (0.567)
ASSETS -0.115 0.039 -0.026 0.164 1.000
(0.363) (0.759) (0.836) (0.191)
EQTL -0.050 0.219 0.274 -0.099 0.089 1.000
(0.695) (0.080) (0.027) (0.432) (0.479)
ROA 0.623 0.089 0.171 -0.191 -0.070 0.084 1.000
(0.000) (0.480) (0.173) (0.127) (0.577) (0.504)
5.5. 2. Re-estimated the Intermediation Approach (Panel 2)
In this panel we re-estimated the classical model under the intermediation approach,
and we included both loss provisions and off-balance sheet items to simultaneously account
for off-balance activities and credit risk. The measured efficiency scores increased very
slightly when we included off-balance sheet and loans loss provisions as an additional
output/input variable compared to figures appearing in Panel (1). This is supported further by
an increase, in the DEA efficiency score from 89.65% in Panel (1) to 93.41% in Panel (2) for
technical efficiency under constant return to scale. The efficiency score obtained for
range between 91% and 98%, indicating average inefficiency of around 7%, which have the
same inefficiency results for Panel (1). The overall mean equal was found to 93.41% for
, 94.86% for , and 98.36% for .
Banks inefficiency was attached to both technical inefficiencies rather than scale
inefficiency, the lower degree of technical efficiency than scale efficiency indicating that
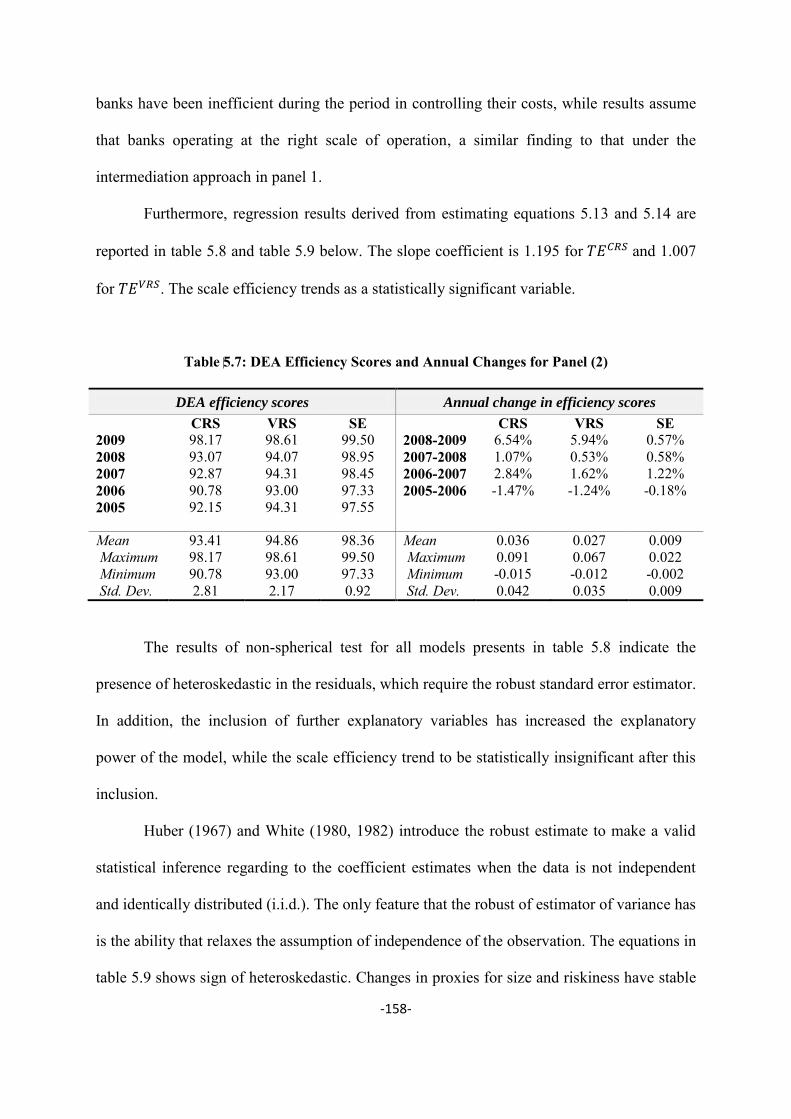
-158-
banks have been inefficient during the period in controlling their costs, while results assume
that banks operating at the right scale of operation, a similar finding to that under the
intermediation approach in panel 1.
Furthermore, regression results derived from estimating equations 5.13 and 5.14 are
reported in table 5.8 and table 5.9 below. The slope coefficient is 1.195 for and 1.007
for . The scale efficiency trends as a statistically significant variable.
Table 5.7: DEA Efficiency Scores and Annual Changes for Panel (2)
DEA efficiency scores Annual change in efficiency scores
CRS VRS SE CRS VRS SE 2009 98.17 98.61 99.50 2008-2009 6.54% 5.94% 0.57% 2008 93.07 94.07 98.95 2007-2008 1.07% 0.53% 0.58% 2007 92.87 94.31 98.45 2006-2007 2.84% 1.62% 1.22% 2006 90.78 93.00 97.33 2005-2006 -1.47% -1.24% -0.18% 2005 92.15 94.31 97.55
Mean 93.41 94.86 98.36 Mean 0.036 0.027 0.009 Maximum 98.17 98.61 99.50 Maximum 0.091 0.067 0.022 Minimum 90.78 93.00 97.33 Minimum -0.015 -0.012 -0.002 Std. Dev. 2.81 2.17 0.92 Std. Dev. 0.042 0.035 0.009
The results of non-spherical test for all models presents in table 5.8 indicate the
presence of heteroskedastic in the residuals, which require the robust standard error estimator.
In addition, the inclusion of further explanatory variables has increased the explanatory
power of the model, while the scale efficiency trend to be statistically insignificant after this
inclusion.
Huber (1967) and White (1980, 1982) introduce the robust estimate to make a valid
statistical inference regarding to the coefficient estimates when the data is not independent
and identically distributed (i.i.d.). The only feature that the robust of estimator of variance has
is the ability that relaxes the assumption of independence of the observation. The equations in
table 5.9 shows sign of heteroskedastic. Changes in proxies for size and riskiness have stable

-159-
statistically appearance of insignificant trends with panels (1), the profitability proxies kept it
is statistically appearance, significant with a positive sign.
Table 5.8: Bank Efficiency and Stock Performance Regressions Results for Panel (2)
Parameters Change in CRS Change in VRS Change in SE Constant -0.133*
[-15.58] -0.117* [-17.65]
-0.111* [-10.57]
Constant returns to scale 1.195* [5.05]
Variable returns to scale 1.007* [4.11]
Scale efficiency
2.507*** [2.07]
R-square 0.093 0.066 0.037 F-stat. 25.48 16.93 4.27 (p-value) (0.000) (0.001) (0.061) Wald Heteroskedasticity test 217.80 231.37 150.42 (p-value) (0.000) (0.000) (0.000) Wooldrige-test for autocorrelation 3.128 1.197 3.073 (p-value) (0.102) (0.296) (0.105) No. of Observation 65 65 65
Note: t-value in [ ], p-values in ( ), and *,**,*** indicates significance at the 1%, 5%, 10% levels.
Table 5.9: Bank Efficiency and Stock Performance and Proxies for Size, Risk and Profits Regression Results for Panel (2)
Parameters Change in CRS Change in VRS Change in SE
Constant 1.894 [0.99]
2.174 [1.02]
1.045 [0.52]
Constant returns to scale 1.060* [4.58]
Variable returns to scale 1.031* [3.70]
Scale efficiency 1.540 [1.77]
Banks (i) Total Assets -0.646 [-1.07]
-0.731 [-1.20]
-0.374 [-0.59]
Bank (i) T. Equity/T. Loans -0.342 [-1.05]
-0.374 [-1.14]
-0.150 [-0.42]
Bank (i) Return on Equity 0.341* [6.72]
0.343* [6.54]
0.368* [4.93]
R-square 0.289 0.252 0.354 F-stat. 37.21 28.08 11.00 (p-value) (0.000) (0.000) (0.001) Wald Heteroskedasticity test 91.96 80.31 3412.84 (p-value) (0.000) (0.000) (0.000) Wooldrige-test for autocorrelation 0.510 (0.823) 2.130 (p-value) (0.489) (0.382) (0.170) Note: t-value in [ ], p-values in ( ), and *,**,*** indicates significance at the 1%, 5%, 10% levels.
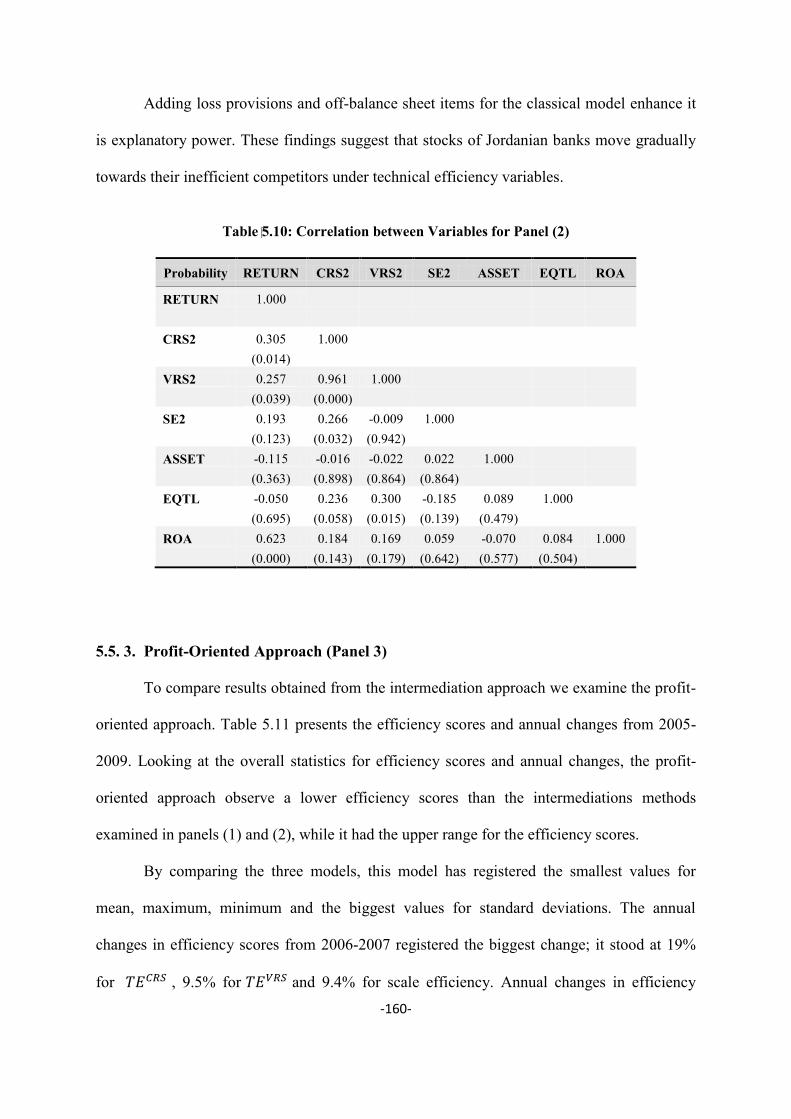
-160-
Adding loss provisions and off-balance sheet items for the classical model enhance it
is explanatory power. These findings suggest that stocks of Jordanian banks move gradually
towards their inefficient competitors under technical efficiency variables.
Table 5.10: Correlation between Variables for Panel (2)
Probability RETURN CRS2 VRS2 SE2 ASSET EQTL ROA
RETURN 1.000
CRS2 0.305 1.000
(0.014)
VRS2 0.257 0.961 1.000
(0.039) (0.000)
SE2 0.193 0.266 -0.009 1.000
(0.123) (0.032) (0.942)
ASSET -0.115 -0.016 -0.022 0.022 1.000
(0.363) (0.898) (0.864) (0.864)
EQTL -0.050 0.236 0.300 -0.185 0.089 1.000
(0.695) (0.058) (0.015) (0.139) (0.479)
ROA 0.623 0.184 0.169 0.059 -0.070 0.084 1.000
(0.000) (0.143) (0.179) (0.642) (0.577) (0.504)
5.5. 3. Profit-Oriented Approach (Panel 3)
To compare results obtained from the intermediation approach we examine the profit-
oriented approach. Table 5.11 presents the efficiency scores and annual changes from 2005-
2009. Looking at the overall statistics for efficiency scores and annual changes, the profit-
oriented approach observe a lower efficiency scores than the intermediations methods
examined in panels (1) and (2), while it had the upper range for the efficiency scores.
By comparing the three models, this model has registered the smallest values for
mean, maximum, minimum and the biggest values for standard deviations. The annual
changes in efficiency scores from 2006-2007 registered the biggest change; it stood at 19%
for , 9.5% for and 9.4% for scale efficiency. Annual changes in efficiency

-161-
scores fluctuated greatly and there were mixed results during the sample period in terms of
positive and negative changes. Banks inefficiency was attached to technical inefficiency
rather than scale inefficiency as resulted in the previous panels, the lower degree of technical
efficiency than scale efficiency indicating that banks have been inefficient during the period
in controlling their costs, while results assume that banks operating at the right scale of
operation compare with previous results.
Table 5.11: DEA Efficiency Scores and Annual Changes for Panel (3)
Table 5.12: Bank Efficiency and Stock Performance Regressions Results for Panel (3)
Parameters Change in CRS Change in VRS Change in SE
Constant -0.133* [-8.95]
-0.114* [-12.74]
-0.107* [-8.64]
Constant returns to scale 0.720** [2.90]
Variable returns to scale 0.648** [2.72]
Scale efficiency
0.721 [1.37]
R-square 0.145 0.071 0.064 F-stat. 8.41 7.40 1.87 (p-value) (0.013) (0.019) (0.197) Wald Heteroskedasticity test 217.46 163.60 311.72 (p-value) (0.000) (0.000) (0.000) Wooldrige-test for autocorrelation 2.780 1.780 1.597 (p-value) (0.121) (0.207) (0.230) No. of Observation 65 65 65
Note: t-value in [ ], p-values in ( ), and *,**,*** indicates significance at the 1%, 5%, 10% levels.
DEA efficiency scores Annual change in efficiency scores
CRS VRS SE CRS VRS SE 2009 86.74 93.16 93.29 2008-2009 -5.10% 1.30% -3.01% 2008 91.59 94.63 96.58 2007-2008 6.22% 2.68% 0.15% 2007 88.51 91.43 96.68 2006-2007 18.88% 9.50% 9.41% 2006 78.18 86.83 90.30 2005-2006 -5.31% -1.98% -2.30% 2005 83.73 88.77 94.04
Mean 85.75 90.97 94.18 Mean 0.060 0.038 0.023 Maximum 91.59 94.63 96.68 Maximum 0.189 0.095 0.094 Minimum 78.18 86.83 90.30 Minimum -0.053 -0.020 -0.030 Std. Dev. 5.10 3.18 2.64 Std. Dev. 0.112 0.046 0.057

-162-
In turn, the profit-oriented approach regression equation are presented in tables 5.12
and 5.13, there is a positive and statistically significant relation between stocks return and
changes in efficiency scores under technical efficiency variables.
From table 5.12, the slope coefficient is 0.72 for and 0.648 for , thus
implying that the expected increase in banks’ stock prices is more for a point increase in
than in . As in previous models the residuals are heteroskedastic only. And so
the robust standard error estimator is used.
Table 5.13: Bank Efficiency and Stock Performance and Proxies for Size, Risk and Profits
Regression Results for Panel (3)
Parameters Change in CRS Change in VRS Change in SE
Constant 1.418 [0.75]
1.720 [0.89]
1.202 [0.62]
Constant returns to scale 0.351*** [2.15]
Variable returns to scale 0.308 [1.69]
Scale efficiency 0.374 [0.90]
Banks (i) Total Assets -0.492 [-0.82]
-0.584 [-0.96]
-0.422 [-0.69]
Bank (i) T. Equity/T. Loans -0.124 [-0.39]
-0.210 [-0.62]
-0.111 [-0.36]
Bank (i) Return on Equity 0.328* [4.41]
0.345* [5.02]
0.354* [4.58]
R-square 0.318 0.267 0.340 F-stat. 8.15 8.09 8.38 (p-value) (0.002) (0.002) (0.002) Wald Heteroskedasticity test 116.83 163.34 186.71 (p-value) (0.000) (0.000) (0.000) Wooldrige-test for autocorrelation 0.097 0.843 0.214 (p-value) (0.761) (0.377) (0.652) No. of Observation 65 65 65 Note: t-value in [ ], p-values in ( ), and *,**,*** indicates significance at the 1%, 5%, 10% levels.
As in all previous panels, the inclusion of additional variables does increase the
explanatory power for this panel (3). Again the residuals are heteroskedastic only. Moreover,
return on assets as proxies for profitability appear to be significant in all presented panels.
Correlation analysis matrix in table 5.14 appears to have an increase in constant return to

-163-
scale with stock return. The overall findings suggest that stocks of Jordanian banks move
gradually towards their inefficient competitors under technical efficiency variables.
Table 5.14: Correlation between Variables for Panel (3)
Probability RETURN CRS3 VRS3 SE3 ASSETS EQTL ROA
RETURN 1.000
CRS3 0.381 1.000
(0.002)
VRS3 0.267 0.739 1.000
(0.031) (0.000)
SE3 0.252 0.549 -0.053 1.000
(0.042) (0.000) (0.672)
ASSETS -0.115 -0.019 -0.078 0.061 1.000
(0.363) (0.881) (0.538) (0.629)
EQTL -0.050 -0.224 0.002 -0.331 0.089 1.000
(0.695) (0.073) (0.986) (0.007) (0.479)
ROA 0.623 0.344 0.303 0.145 -0.070 0.084 1.000
(0.000) (0.005) (0.014) (0.249) (0.577) (0.504)

-164-
5.6. Conclusions
Looking at the overall statistics for efficiency scores and annual changes, the profit-
oriented approach observe a lower efficiency score than the intermediations approach which
is examined in panels (1) and (2), while it has the upper range for the efficiency scores.
Banks inefficiency was attached to technical inefficiency rather than scale inefficiency, the
lower degree of technical efficiency than scale efficiency indicating that Jordanian banks
have been inefficient during the period in controlling their costs, while results assume that
banks operating at the right scale of operation under the three panels used.
The data sampled all the twelve banks on the ASE and so the fixed effect model, was
estimated. The diagnostics tests indicated the presence of heteroskedasticity.
The parameter estimates indicate that the technical efficiency were statistically
significant and positively related to banks stock return. The inclusion of additional variables
increased the explanatory power of the model.
The empirical results shows a statistically significant relationship between banks
stock returns and technical efficiency scores, while changes in scale efficiency scores have no
impact on banks stock return under both intermediation approaches. However, this result does
exist while using profit-oriented approach as efficiency estimated model.
The overall findings suggest that the share prices of Jordanian banks move according to the
representative changes under the technical efficiency variables in the three presented panels.

165
Chapter Six
Conclusion and Suggestions for Future Research

-166-
CHAPTER 6 : CONCLUSION AND SUGGESTIONS FOR FUTURE RESEARCH
6.1. Introduction
Jordan’s geographical position and the surrounding regional conflicts placed the
country under many type of pressure. On the other hand, the Jordanian economy is
considered to be unique, in that a large service sector accounts for up to nearly 70 percent of
the country’s GDP. However, its government has traditionally pursued liberal, outward
looking policies in many respects. These policies enabled Jordan to respond to the emerging
opportunities in the region. Therefore, the country has enjoyed favourable economic and
social conditions that gained in forms of grants, loans, and worker’s remittances from the rich
neighbouring countries.
The banking industry in Jordan has experienced a considerable development in the
last five decades in terms of the number of licensed banks operating in the economy, the size
of banks assets, deposits and credit facilitating and the banking services introduced. Monetary
policy in the country also experienced considerable development turning from the traditional
and direct monetary tools to liberalised interest rate, and equal treatment for foreign banks. In
fact, the country has initiated a multiple financial reforms in order to improve the efficiency
and structure of the banking industry since early 1990s.
An examination of the source and uses of funds in Jordanian banks have shown
substantial growth. Consequently, the overall picture obtained from looking at the
consolidated balance sheet of banks in Jordan shows it has a high status of liquidity, with an
average of 37 percent over the period from 2002 to 2009. This ratio is considered to be high,
and this might have a bearing on the ability of banks to make loans and thus gain profits.
-167-
One core aspect that this thesis addressed was the analysis of bank performance and
the likely impact of banks’ market structure on bank performance. The way in which market
structure has an impact on banks’ performance is vital for the reason that one objective of
bank regulation is to ensure bank market competitiveness. During the 1990s the Jordanian
banking industry could be described as concentrated market, especially in deposits. The top
five banks in the deposit market took more than 60 percent of the total market share. Before
the end of 2000, the market began to liberalise moved towards a moderately concentrated
market. Two competing hypothesis were tested, the SCP and the Efficient Market, for the
Jordanian banks using panel data over the period 1991-2009.
The empirical results obtained suggested some consistency with the literature and
found a positive, statistically significant market concentration coefficient and a statistically
insignificant market share coefficient, a result holding in every case. We can conclude that
the results obtained support the SCP hypothesis as an explanation for market performance in
Jordan. Furthermore, the control variables, size and risk variables appear to indicate either a
negative or insignificant impact on profitability. These results may imply that as banks
increase in size, are diseconomies of scale which cause profit or the return to deteriorate.
Another major research that this thesis addressed was investigating the portfolio
behaviour of commercial banks operating in Jordan. Hemply (1994, p.158) noted: “Long-run
profitability may be hurt if a bank has too much in low-earning source in relation to its needs
for such liquidity”. Hence, the overall picture obtained from looking at the consolidated
balance sheet of banks in Jordan reveals a high status of liquidity. In other words, this study
aims to determine if the yields or assets rate of return influence the portfolio composition of
banks operating in Jordan. Understanding the facts of the casual factors is important for the
efficient operation of monetary authority, since this flow of funds effect eventually banks
portfolio movements’ into alternative investment forms.

-168-
This study has adopted a narrow view of the portfolio approach using the mean-
variance technique, allowing only rates of return and exogenous assets as determination of
balance sheet composition. The expected utility model was commonly reduced to the mean-
variance model of portfolio behaviour. According to this approach, the determinants of
alternative portfolios can be assessed by the trade-off between their expected return and
valuations of risk, where the former is the means of the probability distribution of return. A
number of static as well as dynamic models were tested in the chapter examining the
portfolio behaviour of Jordanian banks. In order to determine the underlying static
relationship we opted to use the mean-variance model. Moreover, Applied the Brainard and
Tobin (1968) process of the general stock adjustment was employed to introduce dynamics
model. The model used is based on the portfolio choice theory originated by Hicks (1935)
and developed by Markowitz (1952) and Tobin (1958).
Additionally, the multiplier effects (current, interim and total) of the policy
instruments on the behaviour of the Jordanian banks are calculated. The empirical results, in
general, clearly do not provide any support for interest rates which are important in
determining the general composition of the portfolio holdings of Jordanian banks. However,
it seems that the capital is more important in determining the structure of these portfolios.
Such results are reinforced by the fact that the myopic behaviour hypothesis is also rejected at
any reasonable level of significance, which confirms that non-choice assets and their
composition are major determinants of the portfolio behaviour of banks in Jordan.
Another suggestion by Spindt and Tarhan (1980, 203), which can be adjusted to the
results is that banks tend to operate in a highly regulated environment and that these
regulatory restrictions and other institutional considerations (i.e. customer relationships)
dominate relative cost incentives in the short-run determination of the balance sheet structure.
Similarly, if customer loyalty is strong, banks may be able to pass on increases in the cost of

-169-
their funds, thus being immunised to some degree against variations in liabilities costs in the
portfolio, which seems to be the case in Jordan.
Therefore, a major goal of this thesis was to examine the performance of banks in
Jordan, and to end with, we examine the influence of efficiency estimates, derived from the
Data Envelopment Analysis (DEA) approach, on the stock prices of listed banks in Amman
Stock Exchange (ASE). By shifting emphasis from the traditional relationship between stock
prices and efficiency measures, we test whether changes in banks’ efficiency scores have
helped to explain the change in banks’ stock prices. In this regard, we would expect efficient
banks to be more profitable and therefore greater stockholder return will exist. Consequently,
efficient banks have a duty to be able to raise capital at lower cost, while inefficient banks
may be more prone to risk taking.
The efficiency measures in this study are the direct result of the implementation of
Constant Returns to Scale (CRS), Variable Returns to Scale (VRS) and Scale efficiency (SE),
and using input-oriented cost minimisation models. Cost efficiency is estimated using the
DEA approach. We adopt the intermediation approach, while the profit-oriented approach
also estimated to enable comparisons to be made between the two approaches. The best
practice frontiers were estimated for the three panels separately.
The average annual changes in efficiency scores under the intermediation approach
can note an increase in both technical and scale efficiency, showing that banks were more
managerially efficient in adjusting costs and have been operating at the right scale. In
addition, we include both loss provisions and off-balance sheet items to simultaneously
account for off-balance activities and credit risk. Efficiency scores increased very slightly
when we include off-balance sheet and loans loss provisions as an additional output/input
compared to the traditional intermediation approach. Finally, looking at the overall statistics

-170-
for efficiency scores and annual changes, we observe that the profit-oriented approach
provides lower efficiency scores than the intermediation approach.
Under the three panels used, banks inefficiency was attached to technical inefficiency
rather than scale inefficiency, the lower degree of technical efficiency than scale efficiency
indicating that Jordanian banks have been inefficient during the period in controlling their
costs, while results assume that banks operating at the right scale of operation.
The empirical results shows a statistically significant relationship between banks
stock returns and technical efficiency scores, while changes in scale efficiency scores have no
impact on banks stock return under both intermediation approaches. However, this result does
exist while using profit-oriented approach as efficiency estimated model.
The findings suggest that the share prices of Jordanian banks move according to the
representative changes under the technical efficiency variables in the three presented panels.
Over all, the new foreign bank entrant does enhance the banking industry market
power by the observed decreased over the study period, in terms of deposits and assets, while
the results that appear in Chapter Four do not support the view that the entry of new banks,
effecting the composition of the assets' holdings in Jordan, did not explain the behaviour of
the portfolios. That means, during the sample period the new entrance of foreign bank did not
provide any change to the composition of the Jordanian assets' holdings portfolio. In turn, in
chapter five, the average annual changes in efficiency scores note an increase in both
technical and scale efficiency, indicating that banks were enhancing their managerially
operation in controlling their costs and functioning at the right scale. In this manner, we can
agree that the entrant of new foreign banks does enhance the banking industry operation.

-171-
6.2. Suggestions for Future Research
In examining the impact of market structure on banks’ performance in chapter three,
the empirical results found that the size variable has a negative impact on a bank’s profits.
We examined such relationships in chapter five but the sample population was twelve banks
over twenty five operating in the country, the size variable having been an insignificant
impact in most cases. Results’ regarding size variables, from chapter three and five makes it
somehow clear. So, further investigation with whole banks population samples on the
association between the size and banks’ average unit costs appears to be a promising option.
Such a task could be valuable in identifying the optimum banks’ size away from which cost
might start to raise.
The second suggestion, an interesting issue raised from chapter four, is that banks can
easily pass any increase in their costs to their customers. The banks’ customer relations, for
instance, could possibly verify this in determining the behaviour of banks in Jordan.
Another interesting issue raised from chapter four also the investigation of bank
portfolio behaviour of Jordan, we recommended researcher to estimate the best safety first
model. It can be that the safety first model may better explain the portfolio behaviour in
Jordan, further investigation in this area is obviously required.

172
Appendix

-173-
Figure A-1: Banks Credit distrbutions by Sectors for selected years
Data Source: Central Bank of Jordan (2012
1% 2% 9%
25% 37%
0%
26%
1970 3% 1%
12%
32%
30%
1%
21%
1980
3% 1% 12%
23%
22% 2%
37%
1990 3% 2%
15%
16%
25% 3%
36%
2000
1% 1% 13% 15%
21%
2%
47%
2005 1% 1%
14%
22%
24% 3%
35%
2011

174
Table A. 1: Chapter Three Bank Sample for 18 Banks
Year 1991 1992 1993 1994 1995 1996 1997 1998 1999 2000 2001 2002 2003 2004 2005 2006 2007 2008 2009 HSBC √ √ √ √ √ √ √ √ √ √ √ √ √ √ √ √ √ √ √
City √ √ √ √ √ √ √ √ √ √ √ √ √ √ √ √ √ √ √
Standard √ √ √ √ √ √ √ √ √ √ √ √ √ √ √ √ √ √ √
Egyption √ √ √ √ √ √ √ √ √ √ √ √ √ √ √ √ √ √ √
Union √ √ √ √ √ √ √ √ √ √ √ √ √ √ √ √ √ √ √
Arab √ √ √ √ √ √ √ √ √ √ √ √ √ √ √ √ √ √ √
Kuwait √ √ √ √ √ √ √ √ √ √ √ √ √ √ √ √ √ √ √
Jor Islamic √ √ √ √ √ √ √ √ √ √ √ √ √ √ √ √ √ √ √
Intr Islamic
√ √ √ √ √ √ √ √ √ √ √ √
Invest Bank √ √ √ √ √ √ √ √ √ √ √ √ √ √ √ √ √ √ √
Commerical √ √ √ √ √ √ √ √ √ √ √ √ √ √ √ √ √ √ √
Housing √ √ √ √ √ √ √ √ √ √ √ √ √ √ √ √ √ √ √
Cairo
√ √ √ √ √ √ √ √ √ √ √ √ √
Capital
√ √ √ √ √ √ √ √ √ √ √ √ √ √
Arb Jor Inv √ √ √ √ √ √ √ √ √ √ √ √ √ √ √ √ √ √ √
Jordan √ √ √ √ √ √ √ √ √ √ √ √ √ √ √ √ √ √ √
Ahli √ √ √ √ √ √ √ √ √ √ √ √ √ √ √ √ √ √ √
ABC √ √ √ √ √ √ √ √ √ √ √ √ √ √ √ √ √ √ √

-175-
Table A. 2: Chapter Three Bank Sample for 22 Banks Year 1991 1992 1993 1994 1995 1996 1997 1998 1999 2000 2001 2002 2003 2004 2005 2006 2007 2008 2009 ABC √ √ √ √ √ √ √ √ √ √ √ √ √ √ √ √ √ √ √
Ahli √ √ √ √ √ √ √ √ √ √ √ √ √ √ √ √ √ √ √
Arab √ √ √ √ √ √ √ √ √ √ √ √ √ √ √ √ √ √ √
Arb Jor Inv √ √ √ √ √ √ √ √ √ √ √ √ √ √ √ √ √ √ √
Audi √ √ √ √ √ √
BLOM √ √ √ √ √ √
Cairo √ √ √ √ √ √ √ √ √ √ √ √ √
Capital √ √ √ √ √ √ √ √ √ √ √ √ √ √
City √ √ √ √ √ √ √ √ √ √ √ √ √ √ √ √ √ √ √
Commerical √ √ √ √ √ √ √ √ √ √ √ √ √ √ √ √ √ √ √
Egyption √ √ √ √ √ √ √ √ √ √ √ √ √ √ √ √ √ √ √
Genral √ √ √ √ √
Housing √ √ √ √ √ √ √ √ √ √ √ √ √ √ √ √ √ √ √
HSBC √ √ √ √ √ √ √ √ √ √ √ √ √ √ √ √ √ √ √
Intr Islamic √ √ √ √ √ √ √ √ √ √ √ √
Invest Bank √ √ √ √ √ √ √ √ √ √ √ √ √ √ √ √ √ √ √
Jor Islamic √ √ √ √ √ √ √ √ √ √ √ √ √ √ √ √ √ √ √
Jordan √ √ √ √ √ √ √ √ √ √ √ √ √ √ √ √ √ √ √
Kuwait √ √ √ √ √ √ √ √ √ √ √ √ √ √ √ √ √ √ √
Kuwait National √ √ √ √ √
Standard √ √ √ √ √ √ √ √ √ √ √ √ √ √ √ √ √ √ √
Union √ √ √ √ √ √ √ √ √ √ √ √ √ √ √ √ √ √ √
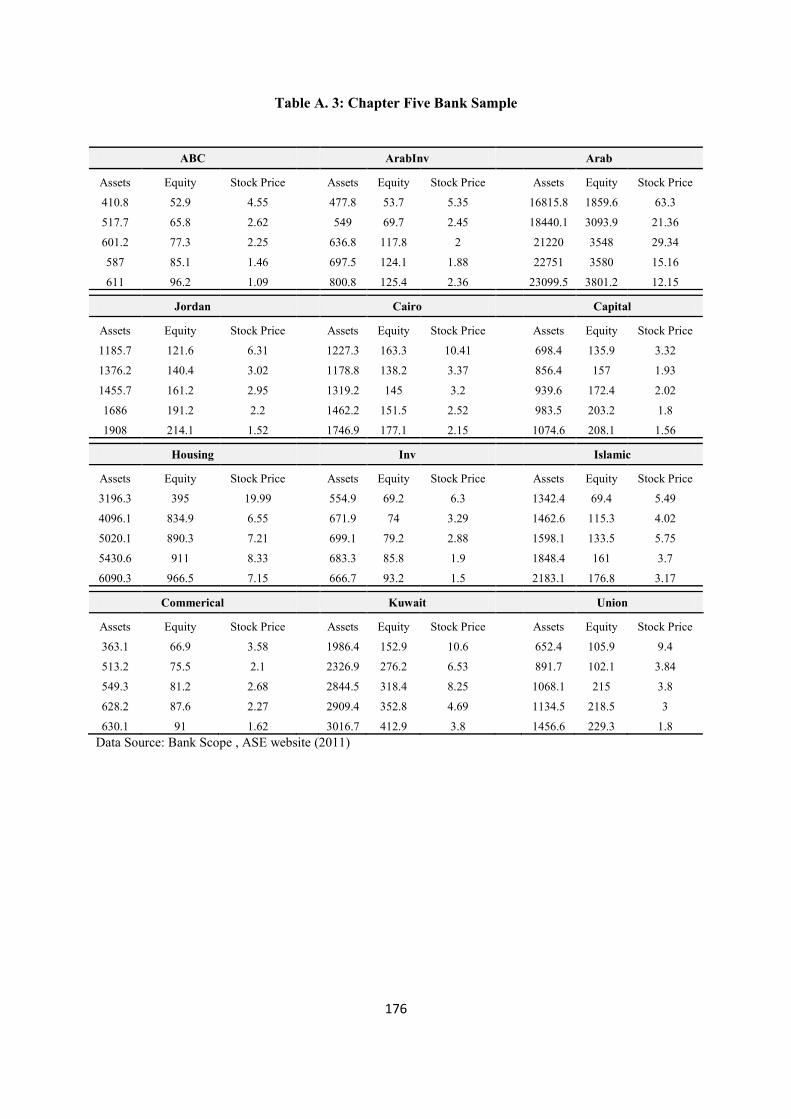
176
Table A. 3: Chapter Five Bank Sample
ABC
ArabInv Arab
Assets Equity Stock Price
Assets Equity Stock Price
Assets Equity Stock Price
410.8 52.9 4.55
477.8 53.7 5.35
16815.8 1859.6 63.3
517.7 65.8 2.62
549 69.7 2.45
18440.1 3093.9 21.36
601.2 77.3 2.25
636.8 117.8 2
21220 3548 29.34
587 85.1 1.46
697.5 124.1 1.88
22751 3580 15.16
611 96.2 1.09
800.8 125.4 2.36
23099.5 3801.2 12.15
Jordan
Cairo
Capital
Assets Equity Stock Price
Assets Equity Stock Price
Assets Equity Stock Price
1185.7 121.6 6.31
1227.3 163.3 10.41
698.4 135.9 3.32
1376.2 140.4 3.02
1178.8 138.2 3.37
856.4 157 1.93
1455.7 161.2 2.95
1319.2 145 3.2
939.6 172.4 2.02
1686 191.2 2.2
1462.2 151.5 2.52
983.5 203.2 1.8
1908 214.1 1.52
1746.9 177.1 2.15
1074.6 208.1 1.56
Housing
Inv
Islamic
Assets Equity Stock Price
Assets Equity Stock Price
Assets Equity Stock Price
3196.3 395 19.99
554.9 69.2 6.3
1342.4 69.4 5.49
4096.1 834.9 6.55
671.9 74 3.29
1462.6 115.3 4.02
5020.1 890.3 7.21
699.1 79.2 2.88
1598.1 133.5 5.75
5430.6 911 8.33
683.3 85.8 1.9
1848.4 161 3.7
6090.3 966.5 7.15
666.7 93.2 1.5
2183.1 176.8 3.17
Commerical
Kuwait
Union
Assets Equity Stock Price
Assets Equity Stock Price
Assets Equity Stock Price
363.1 66.9 3.58
1986.4 152.9 10.6
652.4 105.9 9.4
513.2 75.5 2.1
2326.9 276.2 6.53
891.7 102.1 3.84
549.3 81.2 2.68
2844.5 318.4 8.25
1068.1 215 3.8
628.2 87.6 2.27
2909.4 352.8 4.69
1134.5 218.5 3
630.1 91 1.62
3016.7 412.9 3.8
1456.6 229.3 1.8 Data Source: Bank Scope , ASE website (2011)

177
References
Abcc (2010) Banking in Jordan. Arab-British Business, 33: (6).
Aftab, M., Ahamad, S., Ullah, W., et al. (2011) The impact of bank efficiency on share
performance: Evidence from Pakistan. African Journal of Business Management, 5:
(10): 3975-3980.
Aigner, D.J. (1973) On Estimation of Econometric Model of Short-Run Bank Behaviour.
Journal of Econometrics, 1: (3): 201-228.
Aigner, D.J. and Bryan, W.R. (1971) A Model of Short-Run Bank Behaviour. Quarterly
Journal of Economics, 85: (1): 97-118.
Ajlouni, M. (2010) The Main Features of the Structure-Conduct-Performance (SCP)
Literature in Banking during the Period 1960s -1980s. International Journal of
Economic Perspectives, 4: (3).
AL-ABED, S. (2003) Risk Measurement of Bank Using Accounting and Capital Markets
Measures. PhD Thesis, Manchester Business School.
Al-Jarrah, I. and Molyneux, P. (2005) "Cost Efficiency, Scale Elasticity and Scale Economics
in Arabian Banking". In Khaled, H., and Mohamed, Omran. (Ed.) Jeddah, Saudi Arabia,
Islamic Research and Training Institute, Islamic Development Bank.
Al-Jarrah, I.M. (2007) The use of DEA in measuring efficiency in Arabian banking. Banks
and Bank Systems, 2: (4).
Al-karasneh, I. and Fatheldin, A.M. (2005) "Market Structure and Performance in the GCC
Banking Sector: Evidence from Kuwait, Saudi Arabia, and UAE". AMF Economic
Papers
Al-Muharrami, S., Matthews, K. and Khabani, Y. (2006a) Market structure and competitive
conditions in the Arab GCC banking system. Journal of Banking and Finance, 30:
3487-3501.
Al-Muharrami, S., Matthews, K. and Khabari, Y. (2006b) Market structure and competitive
conditions in the Arab GCC banking system. Journal of Banking & Finance, 30:
(12): 3487-3501.
AL-TARAWNEH, A. (2012) "TOPICS ON FINANCIAL CRISES IN EMERGING
COUNTRIES CASE OF JORDAN". UK, University of Birmingham
-178-
Aleksandrova, A. and Lubys, J. (2004) "Application of the SCP Paradigm in a Transition
Economy: Explaining Reported Profitability of the Largest Latvian Practices".
Stockholm School of Economics in Riga.
Altunbas, Y., Liu, M.-H., Molyneux, P., et al. (2000) Efficiency and risk in Japanese banking.
Journal of Banking & Finance, 24: (10): 1605-1628.
Aly, H.Y., Grabowski, R., Pasurka, C., et al. (1990) Technical, scale and allocative
efficiencies in US banking: An empirical investigation. The Review of Economics and
Statistics, 72: 211-218.
Amess, K. and Gourlay, A. (2000) "The Dynamics of UK Industrial Concentration,1993-
1997". Loughborough University.
Andersen, L.C. and Burger, A.E. (1969) Asset Management and Commercial Bank Portfolio
Behavior: Theory and Practice. The Journal of Finance, 24: (2): 206-221.
Anderson, D.R., Sweeney, D.J. and Williams, T.A. (2008) Statistics for business and
economics. 10.Thomson South-Western.
Arjoon, S. (1994) Portfolio Behaviour of Commercial Banks in the common Wealth
Caribbean. Applied Financial Economics, 4: (6): 413-422.
Ashton, J. (1998) "Cost efficiency, economies of scale and economies of scope in the British
retail banking sector". Working paper. UK, Bournemouth University School of
Finance and Law.
Athanasoglou, P.P., Brissimis, S.N. and Delis, M.D. (2008) Bank-specific, industry-specific
and macroeconomic determinants of bank profitability. Journal of International
Financial Markets, Institutions, & Money, 18: (2): 121-136.
Bain, J.S. (1950) Workable Competition in Oligopoly: Theoretical Considerations and Some
Empirical Evidence. The American Economic Review, 40: (2): 35-47.
Bain, J.S. (1951) Relation of Profit Rate to Industry Concentration: American Manufacturing,
1936-1940. The Quarterly Journal of Economics, 65: (3): 293-324.
Bain, J.S. (1954) Economies of Scale, Concentration, and the Condition of Entry in Twenty
Manufacturing Industries. The American Economic Review, 44: (1): 15-39.
Bain, J.S. (1956) Barriers to New Competition. Cambridge: Harvard University Press.
Cambridge: Harvard University Press.
Baltagi, B.H., Jung, B.C. and Song, S.H. (2010) Testing for heteroskedasticity and serial
correlation in a random effects panel data model. Journal of Econometrics, 154: (2):
122-124.
-179-
Baltensperger, E. (1972) Economies of Scale, Firm Size, and Concentration in Banking.
Journal of Money, Credit and Banking, 4: (3): 467-488.
Baltensperger, E. (1980) Alternative approaches to the theory of the banking firm. Journal of
Monetary Economics, 6: (1): 1-37.
Baltensperger, E., Borts, G. and Murphy, N.B. (1972) Costs of Banking Activities--
Interactions Between Risk and Operating Costs. Journal of Money, Credit and
Banking, 4: (3): 595-615.
Bank, A. (2010) "The Jordanian Economy Report". Amman, Audi Bank.
Banker, R.D., Charnes, A. and Cooper, W.W. (1984) Some Models for Estimating Technical
and Scale Inefficiencies in Data Envelopment Analysis. Management Science, 30:
1078-1092.
Barten, A.P. (1969) Maximum Likelihood Estimation of a Complete System of Demand
Equations. Euorpean Economic Review, 1: (1): 17-73.
Bauer, P.W., Berger, A.N. and Humphrey, D.B. (1993) "Efficiency and productivity growth
in U.S. banking, in: H.O. Fried, C.A.K. Lovell, and S.S. Schmidt, eds". The
Measurement of Productive Efficiency. London, Oxford University Press 386-413.
Baumol, W.J. (1959) Business Behaviour, Value and Growth. New York.: MaCmillan.
Baumol, W.J. and Blinder, A.S. (2008) Microeconomics: Principles and Policy. Cengage
Learning.
Baumol, W.J., Panzar, J.C. and Willig, R.D. (1982) Contestable markets and the theory of
industry structure. Harcourt Brace Jovanovich.
Bdour, J. and Al-Khoury, A. (2008) Predicting change in bank efficiency in Jordan: a data
envelopment analysis. Journal of Accounting & Organizational Change, 4: (2): 162-
181.
Beccalli, E., Casu, B. and Girardone, C. (2006) Efficiency and Stock Performance in
European Banking. Journal of Business Finance and Accounting, 33: (1&2): 245-
262.
Beck, T., Demirguc-Kunt, A. and Levine, R. (1999) "A New Database on the Financial
Development and Structure". Policy Research Pape. World Bank.
Beer, C., Ongena, S. and Peter, M. (2010) Borrowing in foreign currency: Austrian
households as carry traders. Journal of Banking and Finance, 34: (9): 2198-2211.
Benston, G. (1980) The optimal banking structure, theory and practice: current
perspective in banking. AHM Publishing Corporation.
-180-
Benston, G.J. (1965) Branch banking and economies of scale. Journal of Finance, 20: (2):
312-331.
Berger, A., Asli, D.-k., Ross, L., et al. (2004) Bank Concentration and Competition: An
Evolution in the Making. Journal of Money, Credit, and Banking, 36: (3): 1-19.
Berger, A. and Hannan, T. (1989) The Price-Concentration Relationship in Banking. The
Review of Economics and Statistics, 72: (2): 291-299.
Berger, A. and Hannan, T. (1992) The Price-Concentration Relationship in Banking: A reply.
The Review of Economics and Statistics, 74: (2): 376-379.
Berger, A. and Humphrey, B. (1991) Mega-mergers in banking and the use of cost efficiency.
Antitrust Bulletin, 37: 541-600.
Berger, A., Leusner, J.H. and Mingo, J.J. (1997) The Efficiency of Bank Branches. Journal
Monetary Economics, 40: (1): 141-162.
Berger, A.N. (1991) "The Profit-Concentration Relationship in Banking, Tests of Market-
Power and Efficient-Structure Hypotheses and Implications for the Consequences of
Bank Mergers". Finance and Economic Discussion Series. Washington, DC, 176,
Board of Governors of the Federal Reserve System.
Berger, A.N. (1995) The Profit- Structure Relationship in Banking- Tests of Market-Power
and Efficient- Structure Hypotheses. Journal of Money, Credit, and Banking, 27: (2):
404-431.
Berger, A.N., deYoung, R., Genay, H., et al. (2000a) Globalisation of financial institutions:
evidence from cross-border banking performance. Brookings-Wharton Papers on
Financial Services, 3: 23-120.
Berger, A.N., Deyoung, R., Genay, H., et al. (2000b) "Globalization of Financial Institutions:
Evidence from Cross-Border Banking Performance ". Brookings-Wharton Papers on
Financial Services.
Berger, A.N. and Humphrey, D.B. (1997) Efficiency of financial institutions: International
survey and directions for future research. European Journal of Operational Research,
98: 175-212.
Berger, A.N., Nancock, D. and Humphrey, D.B. (1993) Bank efficiency derived from the
profit function. Journal of Banking and Finance, 17: 317-347.
Berndt, E., McCurdy, T.H. and Rose, D.E. (1980) On Testing Theories of Financial
Intermediary Portfolio Selection. Review of Economic Studies, 47: (5): 861-873.
-181-
Bernoulli, D. (1954) Exposition of a New Theory on the Measurement of Risk.
Econometrica, 22: (1): 23-38.
Bewley, R.A. (1981) The Portfolio Behaviour of the London Clearing Banks: 1963-1971.
The Manchester School of Economics and Social studies, 49: 191-210.
Bhatti, G. and Hussain, H. (2010) Evidence on Structure Conduct Performance Hypothesis in
Pakistani Commercial Banks. International Journal of Business and Management, 5:
(9): 174-187.
Bikker, J.A. and Bos, J.W.B. (2008) Bank Performance: A Theoretical and Empirical
Framework for the Analysis of Profitability, Competition and Efficiency. New
York, U.S.A: Routledge.
Bourke, P. (1989) Concentration and other determinants of bank profitability in Europe,
North America and Australia. Journal of Banking & Finance, 13: (1): 65-79.
Brainard, W.C. and Tobin, J. (1968) Econometric Models: Their Problems and Usefulness,
Pitfalls in Financial Model Building. American Economic Review, 58: (2): 99-122.
Bresnahan, T.F. (1989) "Chapter 17 Empirical studies of industries with market power". In
Richard, S. & Robert, W. (Eds.) Handbook of Industrial Organization. Elsevier
1011-1057.
Breusch, T.S. and Pagan, A.R. (1980) The Lagrange Multiplier Test and its Applications to
Model Specification in Econometrics. The Review of Economic Studies, 47: (1): 239-
253.
Brewer, E. and Jackson, W. (2006) A note on “Risk-ajusted” price concentration relationship
in banking. Journal of Banking and Finance, 30: 1041-1054.
Brewster, D. (1997) Business Economics - Decision-making and the Firm. London: The
Dryden Press.
Brown, M., Ongena, S. and Yesin, P. (2008) "Currency Denomination of Bank Loans:
Evidence from Small Firms in Transition Countries". Center for Economic Research
Discussion Paper. Tilburg University.
Brozen, Y. (1982) Concentration, Mergers and Public Policy. New York: MaCmillan.
Bryman, A. and Cramer, D. (2005) Quantitative data analysis with SPSS 12 and 13: a
guide for social scientists. Routledge.
Casu, B. (2002) A Comparative Study of the Cost Efficiency of Italian Bank Conglomerates.
Managerial Finance, 28: (9).

-182-
Casu, B. and Molyneux, P. (2000a) "A Comparative Study of Efficiency in European
Banking". Financial Institutions Center Working Paper Series.
Casu, B. and Molyneux, P. (2000b) "A Comparative Study of Efficiency in European
Banking ". Mimeo, School of Accounting, Banking and Economics, University of
Wales (Bangor).
Casu, B. and Molyneux, P. (2003) A comparative study of efficiency in European banking.
Applied Economics, 35: (17): 1865-1876.
Chamber, D. and Charnes, A. (1961) Inter-temporal Analysis and Optimization of Bank
Portfolio. Management Science, 7: 393-410.
Charnes, A., Cooper, W.W. and Rhodes, E. (1978) Measuring the Efficiency of Decision-
Making Units. European Journal of Operations Research, 2: 429-444.
Chio, K.L. (2005) "Market Structure and Business Development Strategy of the Banking
Sector". Monetary Authority of Macao
Chortareas, G.E., Garza-Garcia, J.G. and Girardone, C. (2011) Banking Sector Performance
in Latin America: Market Power versus Efficiency. Review of Development
Economics, 15: (2): 307-325.
Chu, S.F. and Lim, G.H. (1998) Share performance and profit efficiency of banks in an
oligopolistic market: evidence from Singapore. Journal of Multinational Financial
Management, 8: (2–3): 155-168.
Church, J. and Ware, R. (2000) Industrial Organization: Strategic Approach. 1.The
McGraw-Hill Companies, Inc.
Clarke, J.A. (1986a) Market Structure, Risk and Profitability: The Quiet Life Hypothesis
Revisited. Quarterly Review of Economics and Business, 26: (1): 45-56.
Clarke, J.A. (1986b) Single-Equation, Multiple Regression Methodology Is It an Appropriate
Methodology for the Estimation of the Structure-Performance Relationship in Banking?
Journal of Monetary Economics, 18: 295-312.
Clarke, R. (1984) Profit Margins and Market Concentration in U. K. Manufacturing Industry.
Applied Economics, 16: 57-71.
Clarke, R. (1985) Industrial Economics. 1.Oxford: Basil Blackwell Ltd
Clarke, R., Davies, S. and Waterson, M. (1984) The Profitability-Concentration Relation:
Market Power or Efficiency? The Journal of Industrial Economics, 32: (4): 435-450.
Clarke, R. and Davies, S.W. (1982) Market Structure and Price-Cost Margins. Economica,
49: 277-287.
-183-
Coelli, T.J., Rao, D.S.P., O’Donnell, C.J., et al. (2005) An Introduction to Efficiency and
Productivity Analysis. 2.Springer.
Cohen, A. (2004) Market structure and market definition: the case of small market banks and
thrifts. Economics letters, 85: 77-83.
Colwell, R.J. and Davis, E.P. (1992) Output and Productivity in Banking. The Scandinavian
Journal of Economics, 94: (ArticleType: research-article / Issue Title: Supplement.
Proceedings of a Symposium on Productivity Concepts and Measurement Problems:
Welfare, Quality and Productivity in the Service Industries / Full publication date: 1992
/ Copyright © 1992 The Scandinavian Journal of Economics): S111-S129.
Comanor, S. and Wilson, T. (1967) Advertising Market Structure and Performance. The
Review of Economics and Statistics, 49: (4): 423-440.
Comanor, W.S. (1967) Market Structure, Product Differentiation, and Industrial Research.
The Quarterly Journal of Economics, 81: (4): 639-657.
Conner, K.R. (1991) A Historical Comparison of Resource-Based Theory and Five Schools
of Thought Within Industrial Organization Economics: Do We Have a New Theory of
the Practice? Journal of Management, 17: (1): 121-154.
Connolly, R.A. and Hirschey, M. (1984) Market Structure and Profit: A value-based
Approach. Review of Economics and Statistics, 66: 678-681.
Cooper, W. (1997) New approaches for analyzing and evaluating the performance of
financial institutions. European Journal of Operational Research, 98: 170-174.
Cooper, W.W., Seiford, L.M. and Tone, K. (2007) Data envelopment analysis: a
comprehensive text with models, applications, references and DEA-solver software.
2.Springer.
Courakis, A.S. (1974) Clearing Bank Asset Choice Behaviour: A Mean Variance Treatment.
Oxford Bulletin of Economics and Statistics, 36: (3): 173-201.
Courakis, A.S. (1975) Testing Theories of Discount House Portfolio Selection. Review of
Economics studies, 42: 643-648.
Courakis, A.S. (1980) In Search of an Explanation of Commercial Bank short-run Portfolio
Selection. OxfordBulletin of Economics and Statistics, 42: 305-335.
Courakis, A.S. (1989) Does Constant Relative Risk Aversion Imply Asset Demands That Are
Linear In Expected Returns? Oxford Economic Papers, 41: 553-566.
Cowling, K. and Waterson, M. (1976) Price-Cost Margins and Market Structure. Economica,
43: 267-274.

-184-
Creane, S. and Goyal, R. (2003) "Financial Development in the Middle East and North
Africa". Washington, D.C, International Monetary Fund.
Creane, S., Goyal, R., Mobarak, A.M., et al. (2007) "Measuring Financial Development in
the Middle East and North Africa—A New Database". IMF Staff Papers
Cummins, J.D. and Weiss, M.A. (2000) "The Global Market for Reinsurance: Consolidation,
Capacity, and Efficiency". Brookings-Wharton Papers on Financial Services.
Das, A. and Ghosh, S. (2006) Financial deregulation and efficiency: An empirical analysis of
Indian banks during the post reform period. Review of Financial Economics, 15: (3):
193-221.
Das, A. and Kumbhakar, S.C. (2012) Productivity and efficiency dynamics in Indian banking:
An input distance function approach incorporating quality of inputs and outputs.
Journal of Applied Econometrics, 27: (2): 205-234.
Daskin, A.J. and Wolken, J.D. (1989) An empirical investigation of the critical herfindahl
index in banking. Journal of Economics and Business, 41: (2): 95-105.
Debreu, G. (1951) The Coefficient of Resource Utilization. Econometrica, 19: (3): 273-292.
Degryse, H., Havrylchyk, O., Jurzyk, E., et al. (2012) Foreign bank entry, credit allocation
and lending rates in emerging markets: Empirical evidence from Poland. Journal of
Banking & Finance, 36: (11): 2949-2959.
DEIDDA, L. and FATTOUH, B. (2005) CONCENTRATION IN THE BANKING
INDUSTRY AND ECONOMIC GROWTH. Macroeconomic Dynamics, 9: (02): 198-
219.
Delorme, J., Kamerschen, C.D., Klein, D.R., et al. (2002) Structure, Conduct and
Performance: A Simultaneous Equations Approach. Applied Economics, 34: 2135-
2141
Demsetz, H. (1973) Industry structure, market rivalry, and public policy. Journal of Law
and Economics, 16: (1): 1-10.
Dimou, A. (2010) "Jordan: Success Story of the IMF ". world press.
Dong, Y. (2009) Cost Efficiency in the Chinese Banking Sector: A Comparison of
Parametric and Non-parametric Methodologies. PhD Thesis, Loughborough
University.
DOS (2006) "Social Trends in Jordan". Department of Statsitics
DOS (2011) "Annual Report ". Amman, Jordan, Department of statistics.
Dougherty, C. (2006) Introduction to Econometrics. Oxford University Press, USA.
-185-
Drake, L. (2001) Efficiency and Productivity Change in UK Banking. Applied Financial
Economics, 11: 557–571.
Drake, L. and Hall, M. (2003) Efficiency in Japanese Banking: An Empirical Analysis.
Journal of Banking and Finance, 27: 891–917.
Drake, L., Hall, M.J.B. and Simper, R. (2006) The impact of macroeconomic and regulatory
factors on bank efficiency: A non-parametric analysis of Hong Kong’s banking system.
Journal of Banking and Finance, 30: (5): 1443-1466
EconomicCommissionforAfrica (2004) "Assessing Regional Integration in Africa (ARIA
III)". Ethiopia, Economic Commission for Africa.
Editorial (2008) Dynamics of insurance markets: structure, conduct, and performance in the
21st Century. Journal of Banking and Finance, 32: 1-3.
Edwards, F.R. (1964) Concentration in Banking and Its Effect on Business Loan Rates. The
Review of Economics and Statistics, 4: 294-300.
Edwards, S., Allen, A. and Shaik, S. (2006) "Market Structure Conduct Performance (SCP)
Hypothesis Revisited using Stochastic Frontier Efficiency Analysis". California,
Selected paper prepared for presentation at the American Agricultural Economics
Association.
Evanoff, D. and Fortier, D. (1988) Reevaluation of the structure-conduct-performance
paradigm in banking. Journal of Financial Services Research, 1: (3): 277-294.
Evans, W.N., Froeb, L.M. and Werden, G.J. (1993) Endogeneity in the Concentration--Price
Relationship: Causes, Consequences, and Cures. The Journal of Industrial
Economics, 41: (4): 431-438.
Fabozzi, F.J. and Franco, M. (2003) Capital Markets: Institutions and Instruments.
3.USA: Pearson Education, Inc.
Fabozzi, F.J. and Modigliani, F. (2003) Capital markets: institutions and instruments.
Prentice Hall.
Fama, E.F. (1980) Agency Problems and the Theory of the Firm. Journal of Political
Economy, 88: (2): 288-307.
Fama, F.E. (1985) What’s Different about Banks? Journal of Monetary Economics, 15: 29-
39.
Fan, Q. (1991) Models of Bank Portfolio Behaviour with reference to Commercial Banks
in the United Kingdom. University of Birmingham.
-186-
Farrell, M. (1957) The Measurement of Productive Efficiency. Journal of the Royal
Statistical Society, 120A: (3): 253-281.
Ferguson, P.R. (1988) Industrial Economics: Issues and Perspectives. London: Macmillan
Education Ltd.
Ferrier, G. and Lovell, C.A.K. (1990) Measuring Cost Efficiency in Banking: Econometric
and Linear Programming Evidence. Journal of Econometrics, 46: 229-245.
Ford, J.L. (1983) Choice, Expectation and Uncertainty. New York: Martin Robertson
(Basil Blackwell), Oxford, Barnes and Noble.
Fotios, P. (2008) Estimating the technical and scale efficiency of Greek commercial banks:
The impact of credit risk, off-balance sheet activities, and international operations.
Research in International Business and Finance, 22: (3): 301-318.
Frame, S. and Kamerscher, D. (1997) The profit-structure relationship in legally protected
banking market using efficiency measure. Review of Industrial Organization, 12: 9-
22
Freund, R.J. (1956) The Introduction of Risk into A Programming Model. Econometrica, 24:
(3): 253-263
Fries, S. and Taci, A. (2005) Cost efficiency of banks in transition: Evidence from 289 banks
in 15 post-communist countries. Journal of Banking & Finance, 29: (1): 55-81.
Frost, P.A. (1971) Bank’s Demand for Excess Reserve. Journal of Political Economy, 79:
805-825.
Fu, X. and Heffernan, S. (2008) Economies of scale and scope in China’s banking sector.
Applied Financial Economics, 18: (5): 345-356.
Garcia, G.G. (1997) "Protecting Bank Deposits". ECONOMIC ISSUES. IMF.
Garza-Garcia, J.G. (2011) Does market power influence bank profits in Mexico? A study on
market power and efficiency. Applied Financial Economics, 22: (1): 21-32.
Geroski, P.A. (1981) Specification and testing the profit-concentration relationship: some
experiments for UK. Economica, 48: 279-288.
Gilbert, R.A. (1984) Bank Market Structure and Competition: A Survey. Journal of Money,
Credit and Banking, 16: (4): 617-645.
Girardone, C., Molyneux, P. and Gardener, E.P.M. (2004) Analysing the determinants of
bank efficiency: the case of Italian banks. Applied Economics, 36: (3): 215-227.
Gitman, L.J. and Zutter, C.J. (2011) Principles of Managerial Finance, Student Value
Edition. Prentice Hall PTR.

-187-
Gomis-Porqueras, P. and Benoit, J. (2007) Market Structure and the Banking Sector.
Economics Bulletin, 4: (24): 1-9.
Gorman, J.A. (1969) "Alternative Measures of the Real Output and Productivity of
Commercial Banks.” In Fuchs, Victor R., ed, Production and Productivity in the
Service Industries". Studies in Income and Wealth. New York: Combia University
Press.
Green, C.J. (2008) Financial reform in emerging markets. The European Journal of
Finance, 14: (7): 541-544.
Green, C.J., Kirkpatrick, C.H. and Murinde, V. (2005) Finance and development: surveys
of theory, evidence, and policy. Edward Elgar Pub.
Gu, H. and Yue, J. (2011) The Relationship between Bank Efficiency and Stock Returns:
Evidence from Chinese Listed Banks. World Journal of Social Sciences, 1: (4): 95-
106.
Gujarati, D.N. (2008) Basic Econometrics. 5.New York: Irwin/McGraw-Hill.
Gupta, K.V. (1983) A simultaneous determination of structure, conduct and performance in
Canadian manufacturing. Oxford Economics Paper, 35: 281-301
Hamilton, L. and Webster, P. (2009) The International Business Environment. Oxford
University Press.
Hamiltona, R., Qasrawib, W. and Al-Jarrah, I. (2010) Cost and Profit Efficiency in the
Jordaian Banking Sector 1993-2006: A Parametric Approach. International Research
Journal of Finance and Economics, (56): 96-109.
Hannan, H.T. (1991) Foundation of Structure-Conduct-Performance Paradigm in Banking.
Journal of Money, Credit, and Banking, 23: (1): 68-84
Hempel, G.H. and Simonson, D.G. (1994) Bank management: text and cases. John Wiley.
Hempel, G.H. and Simonson, D.G. (1999) Bank management: text and cases. John Wiley.
Hester, D.D. and Pierce, J.L. (1975) Bank Management and Portfolio Behaviour. Yale
University Press: New Haven.
Hicks, J.R. (1935) A Suggestion for Simplifying the Theory of Money Economica, 2: (5): 1-
19
Hirschman, A. (1964) The Paternity of an Index. American Economic Review, 54: 761-762.
Hoechle, D. (2007) Robust standard errors for panel regressions with cross-sectional
dependence. Stata Journal, 7: (3): 281-312.
-188-
Huber, P.J. (1967) The behavior of maximum likelihood estimates under nonstandard
conditions Berkeley: University of California Press, 1 of Proceedings of the Fifth
Berkeley Symposium on Mathematical Statistics and Probability: 221-233.
Humphrey, D.B. (1981) Intermediation and Cost Determinants of Large Bank Liability
Composition. Journal of Banking and Finance, 5: (2): 167-185.
International Monetary Fund (2010) "Jordan: 2010 Article IV Consultation—Staff Report
and Public Information Notice". IMF Country Report No. 10/297.
International Monetary Fund. (2005) "Evaluation Report - IMF Support to Jordan, 1989–
2004".
Jalilian, H. and Kirkpatrick, C. (2002) Financial development and poverty reduction.
International Journal of Finance and Economics, 7: (2): 97-108.
Jean, D. (1999) "The economics of bank merger in the European Union, a review of the
public policy issues". Working paper. INSEAD.
Jensen, M.C. and Meckling, W.H. (1976) Theory of the Firm: Managerial Behaviour,Agency
Costs and Ownership Structure. Journal of Financial Economics, 3: (4): 305-360.
Jeon, Y. and Miller, S.M. (2006) "Market Definition, Concentration, and Bank Performance".
Social Sciences Network (SSRN).
Johansen, S. (1995) Identifying restrictions of linear equations with applications to
simultaneous equations and cointegration. Journal of Econometrics, 69: (1): 111-132.
Kagigi, Ford and Cadle (1994) "Lesson for Middle East Countries from the Portfolio
Behaviour of Scheduled Banks in Pakistan". University of Birmingham.
Kagigi, Ford, J.L. and Cadle (2001) "Portfolio Behaviour of Islamic Banks: A case study for
Iran, 1984-1994". discussion paper. Department of Economics, University of
Birmingham.
Kanann, T. and Kardoosh, M. (2002) "The History of Economic Growth in Jordan: 1950-
2000". Amman-Jordan
Kane, E.J. and Malkiel, B.G. (1965) Bank Portfolio Allocation, Deposit Variability and the
Availability Doctrine. Quarterly Journal of Economics, LXXXIX: 113-134.
Karasneh, I., Cadle, P. and Ford, J.L. (1997) "Market Structure, Concentration and
Performance: Jordan Banking system, 1980-1993". Discussion Paper. University of
Birmingham
Kasman, A. and Yildirim, C. (2006) Cost and profit efficiencies in transition banking: the
case of new EU members. Applied Economics, 38: (9): 1079-1090.

-189-
Kelly, R. and Alavrotas, J. (2008) Savings and financial sector development: panel
cointegration evidence from Africa. The European Journal of Finance, 14: (7): 563-
581
Kennedy, P. (1998) A Guide to Econometrics. 4.Oxford: Blackwell.
Keuzenkamp, H.A. and Barten, A.P. (1995) Rejection without falsification on the history of
testing the homogeneity condition in the theory of consumer demand. Journal of
Econometrics, 67: (1): 103-127.
Khan, M. and Senhadji, A. (2000) "Financial Development and Economic Growth: An
Overview". IMF Working Paper.
Kilpatrick, W.R. (1967) The choice among alternative measure of industrial concentration.
The Review of Economics and Statistics, 49: (2): 258-260.
King, R.G. and Levine, R. (1993) Finance, entrepreneurship and growth. Journal of
Monetary Economics, 32: (3): 513-542.
Klein, M.A. (1971) A Theory of Banking firm. Journal of Money Credit and Banking, 3.
Knobel, A. (1977) The demand for Reserve by Commercial Banks. Journal of MoneyCredit
and Banking, 9: 32-47.
Knowles, W. (2005) Jordan since 1989: a study in political economy. 1.I.B.Tauris. .
Koch, T.W. and MacDonald, S.S. (2009) Bank Management. Cengage Learning.
Kolari, J.W. and Zardkoohi, A. (1987) Bank costs, structure, and performance. Lexington
Books.
Koopmans, T. (1957) Three Essays on the State of Economic Science. New York.:
McGraw-Hill.
Kothari, S.P. (2001) Capital markets research in accounting. Journal of Accounting and
Economics, 21: 105-231.
Kwiatkowski, D., Phillips, P., Schmidt, P., et al. (1991) Testing the null hypothesis of
stationarity against the alternative of a unit root, how sure are we that economic time
series have a unit root? Journal of Econometrics, 54: 159-178.
Leightner, J.E. and Lovell, C.A.K. (1998) The impact of financial liberalization on the
performance of Thai bank. Journal of Economics and Business, 50: 115-131.
Lerner, A.P. (1934) The Concept of Monopoly and the Measurement of Monopoly Power.
Review of Economic Studies, 1: 157-175.
Levine, R. (1997) Financial Development and Economic Growth: Views and Agenda.
Journal of Economic Literature, 35: 688-726.

-190-
Levine, R. (2004) "Finance and Growth: Theory and Evidence". Carlson School of
Management, University of Minnesota and the NBER.
Lewis, W.A. (1955) The theory of economic growth. 2.R.D. Irwin.
Liadaki, A. and Gaganis, C. (2010) Bank Efficiency and Stock Returns: Evidence from EU
15. Omega: The International Journal of Management Science, 38: 254-259.
Loretta J, M. (1996) A study of bank efficiency taking into account risk-preferences. Journal
of Banking & Finance, 20: (6): 1025-1045.
Machiraju, H.R. and R, H. (2008) Modern Commercial Banking. New Age International (P)
Limited, Publishers.
Maghyereh, A. (2002) "The Effect of Financial Liberalization on the Efficiency of financial
Institutions: The Case of Jordanian Banks". Hashimite University.
Mankiw, N.G. (2011) Principles of Economics. Cengage Learning.
Markowitz, H.M. (1952) Portfolio Selection. Journal of Finance, VII: 77-91.
Markowitz, H.M. (1959) Portfolio Selection, Efficient Diversification of Investment,
(Cowles Foundation for Research in Economics; Monograph No. 16.). John Wiley
and Sons: New York.
Martin, S. (1994) Industrial economics: economic analysis and public policy. 2.Macmillan.
Maudos, J. (1998) Market Structure and Performance in Spanish banking using a direct
measure of efficiency. Applied Financial Economics, 8: 191-200.
Maudos, J.n., Pastor, J.M., Pérez, F., et al. (2002) Cost and profit efficiency in European
banks. Journal of International Financial Markets, Institutions and Money, 12: (1):
33-58.
McKinnon, R.I. (1973) Money and capital in economic development. Brookings Institution.
McLaren, K. and Upcher, M.R. (1986) Testing Further Restrictions on Portfolio Models
Australian Economic Papers, 25: (47): 193-205.
Mertens, A. (2001) Efficiency, scale and scope economies in the Ukrainian banking sector in
1998. Emerging Markets Review, 2: (3): 292-308.
Miani, S. and Daradkah, D. (2008) The Banking Industry in Jordan. Transition Studies
Review, 15: (1): 171-191.
Milind, S. (2001) X-efficiency in Australian banking: An empirical investigation. Journal of
Banking & Finance, 25: (3): 613-630.
Molyneux, P. (1991) Banking: an introductory text. Macmillan.

-191-
Molyneux, P., Altunbaş, A. and Gardener, E.P.M. (1996) Efficiency in European Banking.
Chichester, UK: John Wiley and Sons.
Molyneux, P. and Forbes (1995) Market structure and performance in European banking.
Applied Economics, 27: 155-159.
MOP (2008) "Annual Report". Report. Amman, Jordan, Ministry of Planning.
Morrison, G.R. (1966) Liquidity Preference of Commercial Banks. Chicago: University of
Chicago Press.
Mueller, O. and Uhde, A. (2011) "Cross-border bank lending: Empirical evidence on further
determinants from OECD banking markets". City University London.
Mugume, A. (2010) "Competition and Performance in Uganda's Banking System". African
Economic Research Consortium.
Muhammad, Z. (2010) Portfolio Behaviour of Scheduled Banks of Pakistan. University of
Birmingham.
Mukherjee, S. (2007) Modern Economic Theory. New Age International (P) Ltd.
Neuberger, D. (1997) "Structure, Conduct and Performance in Banking Markets". Thunen-
Series of Applied Economic Theory, Working paper
Newey, W.K. and West, K.D. (1987) A Simple, Positive Semi-Definite, Heteroskedasticity
and Autocorrelation Consistent Covariance Matrix. Econometrica, 55: (3): 703-708.
Olson, D. and Zoubi, T.A. (2011) Efficiency and bank profitability in MENA countries.
Emerging Markets Review, 12: (2): 94-110.
OMET, G. (2001) Does the Private Sector Reciprocate the Good Intentions of Government
Fiscal Policy? The Jordanian Banking Sector Case (1990-2003). International Journal
Of business, 9: (3): 287-299.
Orr, D. and Mellon, W.G. (1961) Stochastic Reserve Losses and Expansion of Bank Credit.
American Economic Review, 51: 614-623.
OxfordBusinessGroup (2010) "Jordan: Growing interest". Oxford Business Group.
Parkin, J.M. (1970) Discount House Portfolio and Debt Selection. Review of Economic
Studies, 37: (4): 469-497.
Parkin, J.M., Gray, M.R. and Barrett, R.J. (eds.) (1970) The Portfolio Behaviour of
Commercial Banks’, in Hilton, K. and Heathfield, D.F. (eds). The Econometric
Study of the United Kingdom: Macmillan: London, 229-51.
Pasiouras, F., Liadaki, A. and Zopounidis, C. (2008) Bank efficiency and share performance:
evidence from Greece. Applied Financial Economics, 18: (14): 1121-1130.

-192-
Patel, J. (1989) Discussion of On the Usefulness of Earnings and Earnings Research: lessons
and directions from to decades of empirical research. Journal of Accounting Research,
27: 193-201.
Peltzman, S. (1977) The Gains and Losses from Industrial Concentration. Journal of Law
and Economics, 20: (2): 229-263.
Ply, D.H. (1971) On the Theory of Financial Intermediation. Journal of Finance, 25: 737-
747.
Poole, W. (1968) Commercial Bank Reserve Management in a Stochastic Model: Implication
for Monetary Policy. Journal of Finance, 23: 769-691.
Porter, M.E. (1979) The Structure within Industries and Companies' Performance. The
Review of Economics and Statistics, 61: (2): 214-227.
Porter, R.C. (1961) A Model of Bank Portfolio Selection. Yale Economics Essays, 1: 323-
359.
Pringle, J. (1974) The Capital Decision in Commercial Banks. Journal of Finance, 29: (3):
779-795.
Reed, E.W. and Gill, E.K. (1989) Commercial banking. Prentice Hall.
Rhoades, S.A. (1986) "The Operating Performance of Acquired Firms in Banking Before and
Afier Acquisition". Staff Economic Studies 149. Washington, DC, Board of
Governors of the Federal Reserve System.
Rhoades, S.A. and Rutz, R.D. (1982) Market power and firm risk: A test of the ‘quiet life’
hypothesis. Journal of Monetary Economics, 9: (1): 73-85.
Robinson, R.I. (1962) The Management of Bank Funds. 2.New York: McGraw-Hill Book
Company.
Rose, P. and Hudgins, S. (2008) Bank Management & Financial Services. 7.McGraw-Hill /
Irwin.
Rose, P.S. (1987) The changing structure of American banking. Columbia University
Press.
Rose, P.S. (1999) Commercial Bank management. 4.McGraw.Hill companies.
Rose, P.S. (2008) Commercial bank management. McGraw-Hill/Irwin.
Rose, P.S. and Fraser, D.R. (1976) The Relationships Between Stability and Change in
Market Structure: An Analysis of Bank Prices. The Journal of Industrial Economics,
24: (4): 251-266.
-193-
Ross, S.A. (1973) The Economic Theory of Agency: The Principal's Problem. American
Economic Review, 63: (2): 134-139.
Saleh, A.S. and Zeitun, R. (2006) "Islamic Banking Performance in the Middle East: A Case
of Jordan". WP 06-21 University of Wollongnon.
Samad, A. (2008) Market structure, conduct and performance: Evidence from the Bangladesh
banking industry. Journal of Asian Economics, 19: (2): 181-193.
Sathye, S. and Sathye, M. (2004) STRUCTURE, CONDUCT AND PERFORMANCE
RELATIONSHIP IN INDIAN BANKING. JOURNAL OF INDIAN SCHOOL OF
POLITICAL ECONOMY.
Satya, P. and Jreisat, A. (2009) "An Analysis of Cost Efficiency in the Jordanian Banking
Sector". School of Economics and Finance, University of Western Sydney
Sealey, C.W. (1980) Deposit Rate-Setting Risk Aversion, and the Theory of Depository
Financial Intermediaries. Journal of Finance, 35: 1139-1154.
Sealey, C.W. and Lindley, J.T. (1977) Inputs, outputs, and a theory of production and cost at
depository financial institutions. Journal of Finance, 32: (4): 1251-1266.
Shams, K. and Molyneux, P. (2005) "Are GCC Banks efficient?". In Khaled, H., and
Mohamed, Omran. (Ed.) Jeddah, Saudi Arabia, Islamic Research and Training Institute,
Islamic Development Bank.
Sharpe, I. (1973) A Quarterly Econometric Model of Portfolio Choice: Part I: Specification
and Estimation Problems. Economic Record, 49: 518-533.
Sharpe, I. (1974a) A Quarterly Econometric Model of Portfolio Choice : Part II: Portfolio
Behaviour of Australian Savings Banks Economic Record, 50: 21-38.
Sharpe, I. (1974b) A Quarterly Econometric Model of Portfolio Choice: A Reply. Economic
Record, 50: 627-628.
Shaw, E.S. (1973) Financial deepening in economic development.
Shen, C.-H. (2003) "Does Bank Concentration Affect Bank Performance". Department of
Money and Banking, National Chengchi University Taiwan.
Short, B.K. (1979) The relation between commercial bank profit rates and banking
concentration in Canada, Western Europe, and Japan. Journal of Banking &
Finance, 3: (3): 209-219.
Simon, H.A. (1959) Theories of Decision-Making in Economics and Behavioural Science.
The American Economic Review, 49: (3): 253-283.
Sinkey, J.F. (1998) Commercial bank financial management. Macmillan.

-194-
Sinkey, J.F. (2002) Commercial bank financial management in the financial-services
industry. Prentice Hall.
Smirlock, M. (1985) Evidence on the (Non) Relationship between Concentration and
Profitability in Banking. Journal of Money, Credit and Banking, 17: (1): 69-83.
Snijders, T.A.B. (2005) Fixed and Random Effects’.In: B.S. Everitt and D.C. Howell (eds.),
Encyclopedia of Statistics in Behavioral Science. 2: 664-665.
Son, S. (2002) Financial Sector Development and Economic Growth: Evidence from
Panel Analysis. PhD, University of Manchester.
Spence, M.A. and Zeckhauser, R. (1971) Insurance, Information, and Individual Action.
American Economic Review, 61: (2): 380-387.
Spindt, D.A. and Tarhan, V. (1980) Liquidity Structure Adjustment Behaviour of Large
Money Centre Banks. Journal of Money, Credit and Banking, 17: (2): 198-208.
Sprinkle, C.M. (1987) Liquidity and Asset Uncertainty for Banks. Journal of Banking and
Finance, 11: 147-159.
Stigler, G.J. (1964) A Theory of Oligopoly. Journal of Political Economy, 72: (1): 44-61.
Sturm, J.-E. and Williams, B. (2004) Foreign bank entry, deregulation and bank efficiency:
Lessons from the Australian experience. Journal of Banking & Finance, 28: (7):
1775-1799.
Subeniotis, D.N. (1991) The Portfolio Behaviour of Greek Commercial Banks. PhD
Thesis, University of Birmingham.
Sufian, F. (2011) Profitability of the Korean Banking Sector: Panel Evidence on Bank-
Specific and Macroeconomic Determinants. Journal of Economics and Management,
College of Business, Feng Chia University, Taiwan, 7: (1): 43-72.
Sufian, F. and Abdul Majid, M. (2009) Bank Efficiency and Share Prices in China: Empirical
Evidence from a Three-Stage Banking Model. International Journal of
Computational Economics and Econometrics, 1: (1).
Sufian, F. and Majid, A. (2006) Banks Efficiency and Stock Prices in Emerging Market:
Evidence from Malaysia. Journal of Asia-Pacific and Business, 7: (4): 35-53.
Sung, N. and Kwon, M.-a. (2006) "An Empirical Analysis of the State of Competition in
OECD Mobile Wireless Markets".
Tahir, I.M., Abu Bakar, N. and Haron, S. (2009) Estimating Technical and Scale Efficiency
of Malaysian Commercial Banks: A Non-Parametric Approach. International Review
of Business Research Papers, 5: (1): 113-123.
-195-
Tahir, I.M., Abu Bakar, N. and Haron, S. (2010) Cost and Profit Efficiency of the Malaysian
Commercial Banks: A Comparison between Domestic and Foreign Bank.
International Journal for Economics and Finance, 2: (1): 186-197.
Thistle, P.D., Mclead, R.W. and Conrad, B.L. (1989) Interest Rates and Bank Portfolio
Adjustments. Journal of Banking and Finance, 13: 151-161.
Tobin, J. (1958) Liquidity Preference as Behaviour Towards Risk. Review of Economic
Studies, 26: 65-86.
Tobin, J. (1963) Commercial Banks as Creators of Money, in Banking and Monetary Studies.
D. Carson (ed.), Homewood, Illinois: Richard D. Irwin, Inc., 408-419.
Tobin, J. (1965) The Theory of Portfolio Selection, in Hahn F. H and Brechling, F. P. R
(eds.), The Theory of Interest Rates. N Y: Macmillan.
Tremblay, H. (2007) Industry and Practices Studies. 4.M.E. Sharp.
Viaene, J. and Gellynck, X. (1995) Structure, Conduct and Performance of the European food
sector. European Review of Agricultural Economics, 22: (3): 282-295.
Weiss, L. (1974) The Concentration-Profit Relationship and Antitrust, in Industrial
Concentration: The New Learning, Goldschmid, H., Mann, H.M. and J.F. Weston
(eds.). Boston, MA: Brown and Company.
Weiss, L.W. and Pascoe, G. (1985) "Adjusted Concentration Ratios in Manufacturing-1972".
Working Paper. Washington: U. S. Federal Trade Commission Line of Business
White, H. (1980) A Heteroskedasticity-Consistent Covariance Matrix Estimator and a Direct
Test for Heteroskedasticity. Econometrica, 48: (4): 817-838.
White, H. (1982) Maximum Likelihood Estimation of Misspecified Models. Econometrica,
50: (1): 1-25.
White, W.R. (1975) Some Econometric Models of Deposits bank Portfolio Behaviour in
the UK: 1963-1970, in Renton, G.A. (ed.), Modelling the Economy. London:
Heinemann.
William, R. (1993) Regression standard errors in clustered samples. Stata Technical
Bulletin, 3: (13).
Wooldridge, J.M. (2002) Econometric Analysis of Cross Section and Panel Data. MIT
Press.
WorldBank (2003) "The Hashemite Kingdom of Jordan: Country assistance evaluation.
Operation Evaluation Department". Report, 26875-Jo. World Bank.

-196-
Yeyati, E.L. and Micco, A. (2003) "Concentration and foreign penetration in Latin American
banking sectors: impact on competition and risk". Inter–American Development Bank,
Research Department.
Yue, P. (1992) "Data Envelopment Analysis and commercial bank performance: A primer
with applications to Missouri banks". Federal Reserve Bank of St. Louis
Zaretsky, A.M. (2004) "Bank Consolidation: Regulators Always Have the Power to Pull the
Plug ". The Regional Economist Federal Reserve Bank of St. Louis
Zellner, A. (1962) An Efficient Method of Estimating Seemingly Unrelated Regressions and
Test for Aggregation Bias. Journal of American Statistical Association, 57: (289):
348-368.