Student Retention In Florida Community Colleges:ccsse's ...
182
University of Central Florida University of Central Florida STARS STARS Electronic Theses and Dissertations, 2004-2019 2006 Student Retention In Florida Community Colleges:ccsse's Student Retention In Florida Community Colleges:ccsse's Retention Index And Florida Accountability Measures Retention Index And Florida Accountability Measures Marcia Roman University of Central Florida Part of the Educational Leadership Commons Find similar works at: https://stars.library.ucf.edu/etd University of Central Florida Libraries http://library.ucf.edu This Doctoral Dissertation (Open Access) is brought to you for free and open access by STARS. It has been accepted for inclusion in Electronic Theses and Dissertations, 2004-2019 by an authorized administrator of STARS. For more information, please contact [email protected]. STARS Citation STARS Citation Roman, Marcia, "Student Retention In Florida Community Colleges:ccsse's Retention Index And Florida Accountability Measures" (2006). Electronic Theses and Dissertations, 2004-2019. 828. https://stars.library.ucf.edu/etd/828
-
Upload
khangminh22 -
Category
Documents
-
view
0 -
download
0
Transcript of Student Retention In Florida Community Colleges:ccsse's ...
University of Central Florida University of Central Florida
STARS STARS
Electronic Theses and Dissertations, 2004-2019
2006
Student Retention In Florida Community Colleges:ccsse's Student Retention In Florida Community Colleges:ccsse's
Retention Index And Florida Accountability Measures Retention Index And Florida Accountability Measures
Marcia Roman University of Central Florida
Part of the Educational Leadership Commons
Find similar works at: https://stars.library.ucf.edu/etd
University of Central Florida Libraries http://library.ucf.edu
This Doctoral Dissertation (Open Access) is brought to you for free and open access by STARS. It has been accepted
for inclusion in Electronic Theses and Dissertations, 2004-2019 by an authorized administrator of STARS. For more
information, please contact [email protected].
STARS Citation STARS Citation Roman, Marcia, "Student Retention In Florida Community Colleges:ccsse's Retention Index And Florida Accountability Measures" (2006). Electronic Theses and Dissertations, 2004-2019. 828. https://stars.library.ucf.edu/etd/828

STUDENT RETENTION IN FLORIDA COMMUNITY COLLEGES:
CCSSE’S RETENTION INDEX AND FLORIDA ACCOUNTABILITY MEASURES
By:
MARCIA A. ROMAN B.A. University of Scranton, 1983
M.A. Fuller Seminary, 1989 M.A. Fuller Seminary, 1990
A dissertation submitted in partial fulfillment of the requirements for the Degree of Doctor of Education
in the Department of Education, Research, Technology, and Leadership in the College of Education
University of Central Florida Orlando, Florida
Fall 2006
Major Professor: Rosemarye Taylor

ii
© Copyright 2006 Marcia A. Roman

iii
ABSTRACT
Student retention has become a serious topic in the past several decades (Wild and
Ebbers, 2002). Problematic, however, is how retention is defined and measured, as well
as a lack of multi-institutional studies that support a theoretical model for improving
student retention, particularly in community colleges (Bailey & Alfonso, 2005). The
Community College Survey of Student Engagement (CCSSE) was launched in 2001.
Based on extensive research that pertains to student learning and persistence, CCSSE
defined five benchmarks of educational practice. Three of the benchmarks comprise the
Retention Index. CCSSE has encouraged additional studies to further validate the
relatively new survey instrument.
Florida’s legislature has a keen interest in the performance of educational
institutions which are mandated by statute to participate in system-wide data collection
from which accountability measures are drawn, including institutional retention rates.
Using institutional level data in simple and multiple linear regressions, this study
examined the relationship between the Florida Community Colleges’ CCSSE Retention
Indices and their retention rate(s) measured by the Florida Accountability Measure.
Student level data was also analyzed using a Nested ANOVA to examine mean
differences in CCSSE Retention Index scores of students from different racial and gender
groups when accounting for the possible influence of institution attended.
iv
ACKNOWLEDGMENTS
Opportunity and accomplishment are rarely accessed and achieved solely through
the efforts of a single individual. While there are many who played a part, either directly
or indirectly, aware or unaware of their role in helping me to achieve this milestone,
several are particularly noteworthy. It is with gratitude and respect that I acknowledge the
contributions of my advisor, Dr. Rosemarye Taylor and committee members, Drs. Debbie
Hahs-Vaughn, Grant Hayes and Kenneth Murray whose encouragement, guidance,
support and confidence in me were inspiring.
I also wish to thank the staff at CCSSE who not only granted permission to use its
data set, but were also responsive to questions, both about this study, and also about how
my current institution is using the CCSSE for assessment and improvement strategies.
Dr. Patricia Windham, Associate Vice Chancellor for Evaluation with the
Division of Community Colleges at the Florida Department of Education, was most
helpful in providing the datasets for the analyses after permission was granted by CCSSE.
My dear Mom and Dad, Frank and Clara Roman, for all they have joyfully given
over the years and the sacrifices made to raise our family. Thank you for cultivating an
interest and enjoyment of learning, instilling a sense of discipline and conscientiousness,
and encouraging me to embrace what life offers with balance and perspective.
My brothers and sisters – John, Francis, Karen, Gregory, David, Kevin and Mary
Jo – their partners and children, whom I admire for being their unique selves, with their
own pursuits and achievements – for also being my teachers.

v
And finally, I wish to thank Dan. My companion, my friend, my husband, Daniel
Dutkofski…now as then, εϋχάρίστω τω θεω περί σου.
vi
TABLE OF CONTENTS
LIST OF TABLES........................................................................................................... viii
LIST OF FIGURES ........................................................................................................... ix
CHAPTER ONE INTRODUCTION................................................................................ 10 Statement of the Problem.............................................................................................. 12 Research Questions....................................................................................................... 14 Definition of Terms ...................................................................................................... 15 Design of the Study....................................................................................................... 17 Delimitations and Limitations ...................................................................................... 19
Delimitations............................................................................................................. 19 Limitations ................................................................................................................ 19
Significance of the Study.............................................................................................. 20 Organization of the Dissertation ................................................................................... 21
CHAPTER TWO REVIEW OF THE LITERATURE ..................................................... 22 Accountability............................................................................................................... 23 Accountability in Florida .............................................................................................. 32 Florida Accountability Measures.................................................................................. 35 Funding ......................................................................................................................... 37 Florida Performance Funding ....................................................................................... 42 Community Colleges .................................................................................................... 46
Types of Students...................................................................................................... 50 Student Retention...................................................................................................... 55 The Evolving Importance of Retention..................................................................... 55 Prominent Models of Student Retention................................................................... 56 Student Retention in Florida ..................................................................................... 59
Caution for Community Colleges ................................................................................. 60 Engagement as a Promising Construct ......................................................................... 65 Community College Survey of Student Engagement ................................................... 67
CHAPTER THREE METHODOLOGY .......................................................................... 72 Introduction................................................................................................................... 72 Statement of the Problem.............................................................................................. 72 Population and Sample ................................................................................................. 74 Florida Accountability Measure of Retention and Success .......................................... 77 Community College Student Report............................................................................. 78 CCSSE’s Retention Index............................................................................................. 80
Active and Collaborative Learning........................................................................... 80 Student-Faculty Interaction....................................................................................... 81

vii
Support for Learners ................................................................................................. 82 Reliability and Validity................................................................................................. 82 Data Collection ............................................................................................................. 86 Analysis Procedures...................................................................................................... 87 Summary....................................................................................................................... 89
CHAPTER 4 RESULTS................................................................................................... 90 Research Question 1 ..................................................................................................... 92
Ancillary Analysis .................................................................................................... 95 Research Question 2 ..................................................................................................... 96 Research Question 3 ................................................................................................... 104
Unbalanced Design ................................................................................................. 106 Balanced Design ..................................................................................................... 113 Summary of Findings from Unbalanced and Balanced Designs ............................ 120
CHAPTER 5 CONCLUSIONS ...................................................................................... 122 Institutional Level Data .............................................................................................. 125 Student Level Data...................................................................................................... 128 Implications and Recommendations........................................................................... 131
APPENDIX A IRB LETTER ......................................................................................... 139
APPENDIX B COMMUNITY COLLEGE STUDENT REPORT ................................ 141
APPENDIX C SURVEY QUESTIONS OF THE RETENTION INDEX .................... 149
APPENDIX D COMMUNITY COLLEGE STUDENT REPORT CODEBOOK........ 151
LIST OF REFERENCES................................................................................................ 164
viii
LIST OF TABLES
Table 1: Percentage Distribution of Students by Risk Factor and Institution Type ........ 52
Table 2: Comparison of Independent and Dependent Variables, Research Question 1 .. 93
Table 3: Comparison of Independent and Dependent Variables, Research Question 2 .. 98
Table 4: Collinearity Diagnostics of Independent Variables......................................... 101
Table 5: Correlation Coefficients: Relationship of Independent Variables.................. 103
Table 6: Results of Unbalanced Nested ANOVA.......................................................... 109
Table 7: Differences in CCSSE Retention Index Scores, Unbalanced Nested ANOVA 112
Table 8: Results of Balanced Nested ANOVA.............................................................. 117
Table 9: Differences in CCSSE Retention Index Scores, Balanced Nested ANOVA... 119
ix
LIST OF FIGURES
Figure 1: Changing Proportion of Community College Budget Sources ........................ 41

10
CHAPTER ONE
INTRODUCTION
Much of what impacts higher education today is better understood in context.
Long esteemed as a vehicle to promote the common good, higher education experienced
a type of fall from grace in the early 1980s when suspect practices were revealed.
Exacerbated by mounting fiscal constraints at the state and federal levels, higher
education has experienced difficulty in staking its claim for public funding. There has
been a corollary push for accountability, productivity, efficiency and effectiveness.
Performance funding models have been adopted in many states to ensure that the
high cultural value of efficiency has been cultivated and put into action (Wirt, Mitchell &
Marshall, 1988). Retention rates, graduation rates and time to degree completion were
among the most frequently reported performance indicators used in community college
funding across the nation (Center for Community College Policy, 2000). Problematic,
however, is how institutional effectiveness, as retention, is defined and measured, as well
as a paucity of empirical multi-institutional studies about institutional policies and
practices that would support a theoretical model for improving student success and
retention, particularly in community colleges (Bailey & Alfonso, 2005; Pascarella &
Terenzini, 2005).
Further amplifying the call for accountability is the widening gap in performance
between minority and majority students. Community colleges enroll almost half of
American undergraduates (Center for Community College Policy, 2000; McClenney,
2004a; Randall, 2004). They attract high proportions of low-income, first-generation

11
college students and students of color, those typically underserved by higher education
(American Association of Community Colleges, 2005; Laden, 1998; Townsend,
Donaldson, & Wilson, 2005). Most community college students have at least one of the
risk factors identified by the National Center for Education Statistics that are associated
with not completing a degree (Hamm, 2004; Jenkins, 2002; Price, 2004). Swelling
enrollments in community colleges will only amplify the complex needs of increasingly
diverse students (Evelyn, 2003). With such varied differences and needs, serving the
diverse populations will likely be difficult (Recruitment & Retention in Higher
Education, April, 2005) and also expensive (Jenkins, 2002; Summers, 2003).
The Community College Survey of Student Engagement (CCSSE) was launched
in 2001 as a project of the Community College Leadership Program based at The
University of Texas at Austin. Grants from The Pew Charitable Trusts, the Lumina
Foundation for Education, the MetLife Foundation and Houston Endowment supported
the effort. The purpose was to raise public awareness about the work of community
colleges, stimulate discussion and dialogue about how quality is defined and measured,
and provide an appropriate assessment tool for their work. Based on extensive research
that pertains to student learning and persistence, the CCSSE has defined five benchmarks
of educational practice. Three of the benchmarks comprise what CCSSE has termed as an
institution’s Retention Index (CCSSE, 2006c). By improving or increasing practices
assessed by CCSSE’s benchmarks, including the Retention Index, it stands to reason that
institutions will foster improvement in student learning, persistence and retention
(CCSSE, 2006a; Marti, 2004). As a relatively new research tool, extensive research has
not yet been conducted to validate the CCSSE survey and its benchmarks as predictors of

12
the outcome of retention, although this has been recommended as a topic of future
research (Marti, 2004).
Florida’s legislature has a keen interest in the performance of its educational
institutions. This has been evidenced, in part, by the number and comprehensiveness of
statutes enacted that govern their operations. Educational entities have been mandated by
statute to participate in system-wide data collection from which accountability measures
and reports are drawn, including the student Retention and Success report.
All 28 of the Florida community colleges participated in the 2004 fielding of the
CCSSE survey. The CCSSE is mentioned several times in the 2005-2006 strategic plan
of the Florida Commission of Community Colleges and Workforce Education. Initiative
1.5.2 states that CCSSE results will be shared, along with best practices identified
through the Lumina Foundation’s ‘Achieving the Dream’ initiative, to improve student
retention, persistence, success. Targeted success indicators include an increase in baseline
scores from the 2004 CCSSE results, and improvement in retention, success and
completion rates system-wide (Florida Commission of Community Colleges and
Workforce Education, 2005) as measured by the accountability measure for Retention
and Success.
Statement of the Problem
There is no clear road map for improving student retention, particularly in
community colleges. Yet from an accountability perspective, community colleges are
increasingly held responsible through accountability measures and even performance-
based funding, to improve retention and completion rates. More profound is how human

13
lives are impacted. From a moral perspective, community colleges are obligated to help
the students they serve and close the yawning gap in performance and retention between
majority and minority students (McClenney, 2004a).
This study proposes to examine the relationship between the Florida community
colleges’ CCSSE Retention Indices from the 2004 fielding of CCSSE’s survey
instrument, the Community College Student Report, and the retention portion of Florida
accountability Measure 1, Part 2 (M1P2) for the cohort tracked from Fall 2000 through
Winter/Spring 2004. While accountability M1P2 measures both student Retention and
Success, this study will focus on the portion of the measure which pertains to retention.
Greene (2005) conducted a study of Florida community college student
engagement levels of African American, Hispanic and White students, as measured by
the CCSSE constructs that comprise the benchmarks, and the empirical relationship to
educational outcomes. However, extensive research has not yet been conducted to
validate the CCSSE benchmarks as a predictor of the outcome of retention, although this
has been recommended as a topic of research (Marti, 2004). The first and second research
questions for this study stem from this problem.
Community colleges nationwide and in Florida are facing increasing pressure to
improve retention rates (Pascarella & Terenzini, 2005). Community college enrollments
have been increasing in recent years both in Florida and across the United States.
Increases are especially noted among minority students (Laden, 1998). While gains have
been made in promoting access for these populations, this does not always translate to
success (Bailey & Alfonso, 2005). African American, Hispanic and Native American
students appear to have higher attrition rates than white or Asian students (Bailey &

14
Alfonso, 2005; Kalsner, 1991). After controlling for enrollment variables and
demographic characteristics, women also persist and graduate at higher rates than men
according to most of the research (Bailey, et al, 2005). In light of the community college
mission to both prepare students for transfer to senior institutions and play a significant
role in workforce preparation and economic development it is important to note what
differences in engagement, as measured by CCSSE benchmarks and the Retention Index
exist in students across specific demographics. Furthermore, it is compelling to explore
whether the institutions attended have a bearing on these student groups’ engagement
levels. CCSSE has recommended that in order to gauge the effectiveness of intervention
strategies used with different populations scores be disaggregated to examine the
benchmarks of different subgroups of students (CCSSE, 2005; Marti, 2004; Marti, 2006).
The third research question stems from the problem of differences in retention rates
between subgroups of students.
Research Questions
1. Can the 2004 CCSSE Retention Index be used to predict Florida’s state retention
rate as measured by the Retention and Success accountability measure?
2. Can the 2004 CCSSE Retention Index be used to predict Florida community
colleges’ state retention rate as measured by the Retention and Success
accountability measure when controlling for the retention rate of different degree
types awarded (Associate of Arts, Associate of Science and Associate of Applied
Science, and Postsecondary Vocational Certificate and Applied Technology
Diplomas)?
15
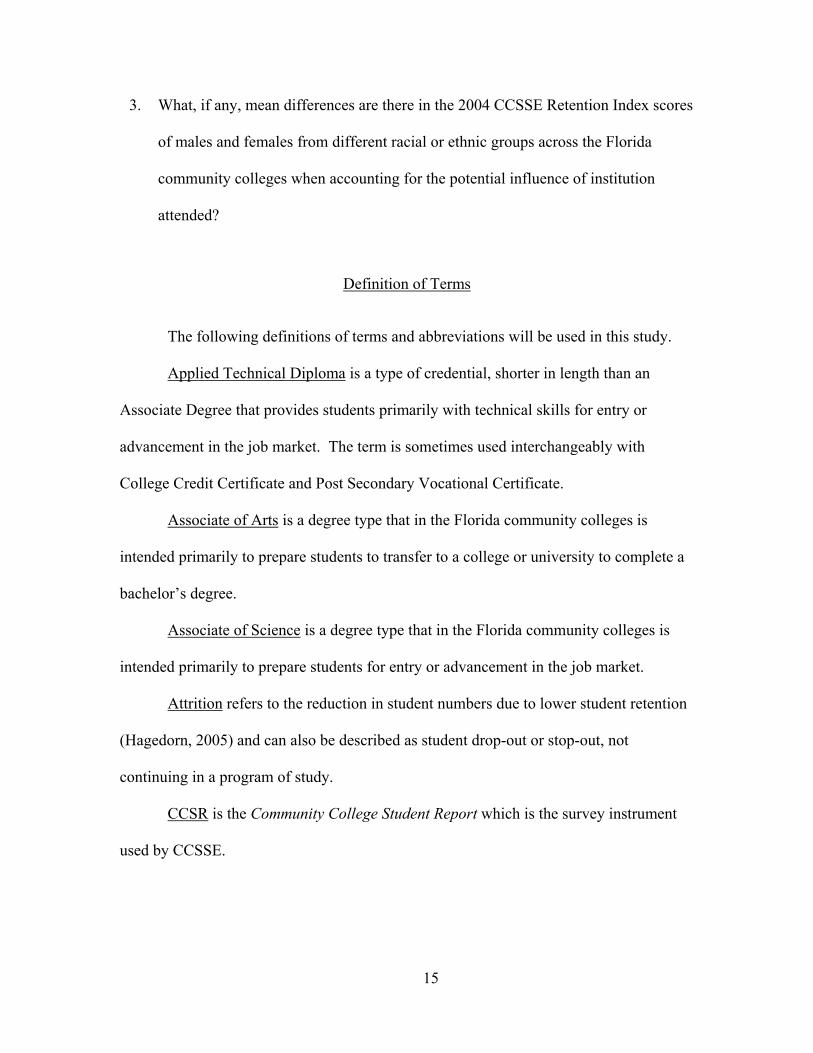
3. What, if any, mean differences are there in the 2004 CCSSE Retention Index scores
of males and females from different racial or ethnic groups across the Florida
community colleges when accounting for the potential influence of institution
attended?
Definition of Terms
The following definitions of terms and abbreviations will be used in this study.
Applied Technical Diploma is a type of credential, shorter in length than an
Associate Degree that provides students primarily with technical skills for entry or
advancement in the job market. The term is sometimes used interchangeably with
College Credit Certificate and Post Secondary Vocational Certificate.
Associate of Arts is a degree type that in the Florida community colleges is
intended primarily to prepare students to transfer to a college or university to complete a
bachelor’s degree.
Associate of Science is a degree type that in the Florida community colleges is
intended primarily to prepare students for entry or advancement in the job market.
Attrition refers to the reduction in student numbers due to lower student retention
(Hagedorn, 2005) and can also be described as student drop-out or stop-out, not
continuing in a program of study.
CCSR is the Community College Student Report which is the survey instrument
used by CCSSE.

16
CCSSE is the Community College Survey of Student Engagement and was
launched in 2001 as a project of the Community College Leadership Program at The
University of Texas at Austin.
CCTCMIS is the abbreviation for the Florida Community College and Technical
Center Management Information System.
Cohort for the Florida accountability measure 1, part 2, (M1P2) Retention and
Success, for 2004 includes first time in college (sic.) students from Fall 2000 who took an
entry level test, achieved 9 (P.S.V.C., A.T.D.) or 18 (A.A., A.S., A.A.S.) credit hours by
Summer 2002 (P.S.V.C., A.T.D.) or Winter/Spring 2004 (A.A., A.S., A.A.S.) and were
seeking an A.A., A.S., A.A.S., P.S.V.C., or A.T.D. award as reported on the Student Data
Base (CCTCMIS, Accountability Report, 2004).
College Credit Certificate is a type of credential, shorter in length than an
Associate Degree that provides students with technical skills for entry or advancement in
the job market. The term is sometimes used interchangeably with Applied Technical
Diploma and Post Secondary Vocational Certificate.
Completer refers to a student who has finished a program of study at a community
college, whether for a certificate or associate degree. This term is virtually synonymous
with “graduate”.
Engagement is the quality of effort students devote to “educationally purposeful
activities that contribute directly to desired outcomes” (CCSSE, 2006d; Hu and Kuh,
2002, p. 555).
M1P2 is the abbreviation for Florida Accountability Measure 1, Part 2, Retention
and Success.

17
OPPAGA is the abbreviation for the Office of Program Policy Analysis and
Government Accountability with the Florida state legislature.
Persistence refers to student re-enrollment. Closely associated with retention,
students must persist in order to graduate, but all those who persist do not necessarily
graduate.
Retention is a complex concept that continues to remain ambiguous across the
literature; generally refers to students staying in school, often synonymous with
persistence, but definitions and measures vary depending on perspective and time period
measured (Hagedorn, 2005).
Retention Rate from Florida Accountability Measure 1, Part 2 is a combination of
other rates (Windham, 2000). It consists of the number of students graduated, plus the
number enrolled in good standing, plus the number enrolled who are not in good standing
as compared to the total cohort.
Retention Index is an additive index comprised of scores from three of the five
CCSSE benchmarks that assess student engagement. These include: active and
collaborative learning, student-faculty interaction, and support for learners (CCSSE,
2006c).
Design of the Study
The first and second research questions examine institution level data of both the
CCSSE Retention Index and the retention portion of the Florida accountability measure
for Retention and Success and include the entire population of the 28 Florida community
colleges. Secondary data sources received from the Florida Department of Education

18
after approval by the director of CCSSE provided the values for these two institution
level measures.
A correlation and simple linear regression analysis will be conducted to answer
the first research question using the CCSSE Retention Index as the independent variable
and the state retention rate provided in the Retention and Success accountability measure
as the dependent variable. The analysis is intended to examine if there is a linear
relationship between these two institutional level variables, measure the strength of the
relationship between the variables, and analyze whether the CCSSE Retention Index can
be used to predict the state retention rate.
To answer the second research question, a multiple linear regression will be
conducted to control for the retention rate of different degree types awarded in exploring
whether the CCSSE Retention Index can be used to predict the state retention rate as
defined in the Retention and Success accountability measure. This question is a deeper
analysis of research question one insofar as it will examine whether the CCSSE Retention
Index can predict the overall retention rates for students when controlling for the
retention rate of Associate of Arts, Associate of Science, Associate of Applied Science,
Post Secondary Vocational Certificate and/or Advanced Technical Diploma programs.
The third research question will examine student level data for the sample of
Florida community college classes that were included in the 2004 fielding of CCSSE’s
survey instrument, the Community College Student Report. Although it is classes that are
sampled, data is provided on the student level.
To answer Research Question 3, a Nested or Hierarchical Analyses of Variance
(ANOVA) will be conducted using the 20,581 students’ CCSSE Retention Index scores

19
computed from their benchmark scores from the three benchmarks that comprise the
Retention Index.. The analysis is to determine if there are mean differences in the
Retention Indices of males and females from different racial or ethnic groups when
accounting for the potential influence of institution attended.
Delimitations and Limitations
Delimitations
1. Analyses will be conducted using data sets received from the Florida Department
of Education.
2. Data will not be associated with the Florida community colleges so as to preserve
anonymity. The data sets themselves do not associate institutional name, but only a
unique identifier so as to distinguish which data is associated with different
institutions.
3. No attempt will be made to generalize results of this study to any population
beyond the Florida community colleges.
Limitations
1. This study will include only public community colleges in Florida.
2. There are 28 public community colleges in Florida. This size of this population
may not provide sufficient power for testing statistical significance in the analyses
for the first and second questions.

20
3. It will be assumed that responses to the CCSSE’s Community College Student
Report survey instrument are accurate and honest.
4. It will be assumed that the institutional retention rates from the Retention and
Success accountability measure for the cohort tracked from Fall 2000 through
Winter/Spring 2004 from the Florida Department of Education are accurate.
5. It will be assumed that the institutional CCSSE benchmark scores and Retention
Indices of the Florida community colleges that were provided by the Florida
Department of Education are accurate.
Significance of the Study
Retention remains a high focus in the accountability movement and strategic
plans of institutions. It seems important not only in the lives of individual students, but
relevant to the Florida community colleges, that institutions as well as government
entities have greater insight into the relationship between what the CCSSE survey
measures and institutional performance in the state Retention and Success accountability
measure..
The performance-based funding formula in Florida includes a factor accounting
for student completion. State accountability measures track student retention and success.
The measure of Retention and Success (M1P2) is not currently part of the funding
formula, although the accountability measures remain at least political leveraging points.
While funds are not always associated with accountability measures (Ewell, 1999), the
aura of their association and potential negative impact on resources can loom large.

21
The intent of this study through the first and second research questions is to
explore the criterion validity of CCSSE’s Retention Index where institution level scores
will be compared to the institution level retention rate from Florida’s accountability
measure of student Retention and Success. CCSSE recommends disaggregating the data,
or breaking it down by different student groups, in order to most effectively analyze the
engagement level of different types of students (CCSSE, 2005). The third research
question aims to provide information about the level of engagement of students as
reflected by student level CCSSE Retention Index scores by demographic variables of
gender and race.
Organization of the Dissertation
After the introduction provided in Chapter one, the second chapter is comprised
of a review of the literature related to the accountability movement on the national level
and in Florida, funding for higher education on both the national level and in Florida, a
history of community colleges and the types of students they serve, student retention
research and a lack of understanding of how it applies to community colleges, and the
genesis of the Community College Survey of Student Engagement. Chapter three is a
presentation of the methodology, including the research questions, population and
sample, data collection, instrumentation, reliability and validity of the instruments and
proposed data analyses to answer the research questions. Chapter four includes the results
from analyses conducted to answer the research questions. Chapter five is a summary of
the results, discussion of conclusions drawn, and recommendations for further study.

22
CHAPTER TWO
REVIEW OF THE LITERATURE
Institutions face increasing pressures to improve retention rates while their
funding is informed and influenced, if not threatened by accountability measures of
performance that include retention rates. This review of the literature is organized to
provide context to the heightened importance of student retention in the accountability
movement and the plight of institutions, particularly community colleges, which are
without a clear road map to improve retention. The literature review is also intended to
provide a context for the research questions examined in this study.
The Community College Survey of Student Engagement (CCSSE) is one of few
nationally benchmarked tools developed specifically for use by community colleges to
assess and improve practices associated with student learning and persistence. Although
both increased retention rates and improved CCSSE benchmarks are cited as success
indicators in the 2005-2006 strategic plan of the Florida Community College System, it is
not yet known whether there is an empirical relationship between CCSSE’s benchmarks
and the state’s accountability measure of student retention.
This literature review first addresses the accountability movement in general and
Florida’s system of accountability in particular. This is followed by an overview of
budgetary constraints at the federal and state levels, Florida’s performance-based funding
system and the impact on funding for higher education. An overview of community
colleges follows and a description of the types of students they serve which are different
from baccalaureate institutions. The topics of student retention, retention theory, and

23
shortcomings of theoretical models are reviewed. In closing, the genesis and an overview
of the Community College Survey of Student Engagement is introduced.
Accountability
Accountability is a high stakes game. Increased demands for accountability from
state and federal governments have pressed institutions of higher education to improve
productivity (Alfred, Ewell, Hudgins & McClenney, 1999; Ewell, 1999). Pressures for
accountability have been paralleled by budget constraints and more recently, by budget
adjustments contingent on how institutions perform according to defined measures.
Long valued as serving the common good, institutions of higher education were
esteemed for years for their role in developing the human person, and providing
opportunity and access to the American dream (McClenney, 2004a). There was a type of
social compact between American society and higher education that decreed a college
education served not only individuals, but society and as such, these institutions were
given both moral and financial support (Burke, 2005b). In recent decades, there was an
erosion of public confidence in higher education that came as a type of landslide in the
1980s and 1990s (Blimling & Whitt, 1999; Cook & McClendon, 1998; Pascarella &
Terenzini, 1991). The litany of transgressions that contributed to higher education’s fall
from grace included problems of earmarked funds for higher education, rising student
loan default rates, criticism that rising tuition costs were due to higher education’s greed,
misuse of research funds, concerns that the curriculum had become politically motivated
and in need of correction, and portrayal of faculty workloads as ridiculously light while
institutions did not care about their undergraduates (Cook & McClendon, 1998).

24
Factions pressing for increased accountability from higher education have expanded from
state and federal governments, to accrediting agencies, employers, parents and students
(Banta, Lund, Black & Oblander, 1996).
A high cultural value placed on efficiency set the stage for policymakers to enact
accountability methods to be used to ensure the value of efficiency is cultivated and put
into action (Wirt, Mitchell & Marshall, 1988). Demands on higher education to justify its
practices and become more accountable are ratcheted up in an environment of reduced
resources and a fall from grace (Burke, 2005). Accountability is not new for higher
education insofar as these institutions have been accountable over the centuries to
religious orders, to students, accrediting agencies, and now to legislators (Callan &
Finney, 2005). But the type of accountability has shifted in recent decades from
consideration of inputs and processes to outcomes (Burke, 2005c; Wolff, 2005). The
tenor and tone of accountability demands have also shifted so that mistrust, if not also
threat and punishment, have become salient characteristics (Burke, 2005).
Demands for increased accountability and quality emanated not only from
external stakeholders, but also from those inside academia over concern for improving
undergraduate education (Chickering & Gamson, 1999). Accountability demands helped
spawn the movement towards increased assessment in higher education (Aper & Hinkle,
1991; Banta, Lund, Black & Oblander, 1996). Regional accrediting bodies became part
of the growing accountability wave in their specificity of the types of information they
began to require (Ewell & Jones, 1996). The Southern Association of Colleges and
Universities (SACS) was the first of the regional accrediting bodies to adopt standards
beyond the traditional evaluation of inputs determined by faculty and student credentials,

25
institutional resources and the physical plant to include evaluation of outputs such as
learning outcomes, retention and graduation rates (Aper & Hinkle, 1991).
The changing landscape for higher education has made accountability
inescapable. Institutions of higher education have been cautioned to respond to increased
criticism not through resistance, avoidance or mere cosmetic efforts, but by raising their
stature using leveraging strategies that include outcomes assessment (Alfred &
Weissman, 1988). Since accountability appears to be here to stay and efforts to resist it
may only be counterproductive (Burke, 2005b; Ewell, 2005), higher education will do
well to meet the challenges and play a role in defining and shaping appropriate and
acceptable measures to be used for accountability purposes (Burke, 2005b; McClenney,
2004a). Otherwise, the approach and measures will likely be imposed by external entities
(Kuh, 2001).
Community colleges have long been focused on providing access to educational
opportunity (Witt, Wattenbarger, Gollattscheck & Suppiger, 1994), but the demand for
greater accountability which increasingly concentrates on outputs, that focus has shifted
to student experiences in general and completion rates in particular (Bailey & Alfonso,
2005; U.S. Department of Education, 2005). Low retention and graduation rates,
especially of community colleges (Summers, 2003; Tinto, 1987; Tinto 1993) have
amplified the call for accountability. After six years, only 36 percent of first-time in
college students who entered a community college in 1995 earned a credential, whether a
certificate, associate or bachelor’s degree (Bailey & Alfonso, 2005). Even eight years
after enrolling in college, only about 33 percent of community college students received a
certificate or degree; 20 percent completed less than ten credits in that time and the rates

26
are even lower for low-income and minority students (Bailey, Calcagno, Jenkins, Kienzel
and Leinbach, January 2005).
Whether corollary or caused by increased competition for scarce resources, higher
education has faced the added difficulty in staking its claim for public funding. It has
become more difficult for colleges and universities to effectively lobby for their causes
(Cook & McClendon, 1998). The Bush administration at the federal level and many
Congressional legislators appear to continue the push for greater accountability for post
secondary institutions (Leinbach, 2005).
As demands for accountability increased with implications of static or reduced
funding, at least in relative terms, institutions of higher education were scrambling, not so
much resisting accountability, according to Kay McClenney, Director of the Community
College Leadership Program housed at The University of Texas at Austin, but being
accountable for the right things (Evelyn, 2003). Research problems associated with this,
however, include the difficulty of finding an adequate way in the work of higher
education to measure efficiency, which is a high priority of the accountability movement
(Aper & Hinkle, 1991). Perhaps because of the paucity of consistently applied reliable
measures of the primary product of higher education which is learning, the dominant
measure of efficiency has been the cost per student or cost per full-time equivalent
(Johnstone, 1998). The measures chosen are problematic in themselves.
Student retention has been identified for decades as an important measure of
institutional effectiveness (Wild and Ebbers, 2002). High attrition rates are costly both to
individual students and to institutional planners (Tinto, 1987). As such, retention is an
important consideration in analyses of cost and efficiency. Students, parents and other

27
stakeholders also view retention as one of the most common indicators of institutional
effectiveness (Hagedorn, 2005). Accordingly, “probably no other issue has been the
object of assessment efforts in the past twenty-five years more than student retention”
(Shibley & Upcraft, 2001, p. 249).
It has been debated whether retention and graduation rates should be used as
accountability measures for community colleges (Burd, 2004; Lederman, 2005).
Performance indicators can be problematic if the same ones, such as completion rates of
degrees, are used to assess institutions with different missions, such as universities and
community colleges (Phelan, 2000; Strauss, 2001; Taylor, 2003). The mission of
community colleges, the tremendous diversity in types of students they serve and the
varied intents of their students have been different from those of baccalaureate
institutions.
Students who attend baccalaureate institutions are largely there with the express
goal of attaining a bachelor’s degree, yet the intentions of students attending two year
colleges are notably different (Tinto, 1987). Community college students have a wider
variety of goals when they enter college - whether to earn a certificate, associate degree,
prepare for entry or re-entry into the workforce, prepare to transfer to a baccalaureate
institution, even to explore whether they really want to pursue postsecondary education –
and thus sometimes are without the goal of continuing enrollment or of ultimate
graduation (Bailey, et al., January 2005; Hagedorn, 2005; Hoachlander, Sikora & Horn,
2003; Summers, 2003; Voorhees, 1987). A recent study by Horn and Nevill (2006)
indicated that when given the chance to report multiple reasons for enrolling, only about
half of community college students expressed intent to earn a degree.
28
The research generally indicates that colleges have higher graduation rates when
they accept students with higher SAT scores who are from higher income families, when
there is a greater proportion of female students and full-time students, and when there are
greater funds expended for instructional and academic support (Bailey, et al., October
2005). Baccalaureate institutions, especially those that are larger, more selective and
residential have higher retention rates (Pascarella & Terenzini, 1991; Shibley & Upcraft,
2001; Titus, 2004 as noted in Bailey, et al., October 2005).
As open admissions institutions, community colleges are not selective and do not
control the types of students they admit, accepting only those who have traits and
characteristics associated with higher retention and graduation rates. Students who
graduate from high school with lower levels of academic preparation more often attend
open admissions institutions; they also earn degrees and certificates at lower rates than
their peers (Hoachlander, Sikora & Horn, 2003; Toolkit Revised, 2006). Tinto (1987)
asserted that “researchers generally agree that what happens following entry is, in most
cases, more important to the process of student departure than what occurs prior to entry”
(Tinto, 1987, p. 47). Yet for as relevant and important as this is for community colleges,
Tinto focused on baccalaureate institutions which tend to be at least residential and enroll
students with a more singular focus on completing a degree.
A majority of the research on institutional effectiveness, as well as retention, has
focused on residential four-year colleges and universities and not on community colleges
or two year institutions (Marti, 2004; Smart, Kuh & Tierney, 1997; Tinto, 1993).
Community colleges were developed well after four-year institutions were established.
With a genesis that emanates from both secondary schools and universities, community

29
colleges – although in existence for more than a century - are not well understood (Witt,
et al., 1994). The four year lenses have been used to study two–year institutions and those
they serve. “It is not surprising that the 2-year institutions are almost always found
lacking because they do not fit 4-year models” (Townsend, Donaldson, & Wilson, 2005,
p 133). Not only researchers, but policy makers also often presume that community
college and four-year college students are alike – aged 18-24 and attending full-time
(Jenkins, 2002). Accountability and performance models lend themselves better to
baccalaureate institutions than to community colleges perhaps because there is an
underdeveloped understanding of institutional factors that support or determine student
success in community colleges (Bailey & Alfonso, 2005; Bailey, et al., January 2005).
Ewell reported in 1999 that many, if not most performance and accountability
systems in the United States are intended primarily or purely to ensure that institutions
are doing what they are expected to do. Performance indicators in some accountability
systems are for this type of pure accountability, as if to keep public institutions honest,
while others inform policy or decision making. Still others are used to leverage
improvement and others to inform consumer choice (Ewell, 1999).
Funds are not always associated with accountability measures, but the aura of
their association and potential negative impact on resource can loom large (Ewell, 1999).
Bailey, et al. noted in 2005 that the Rockefeller Institute of Government at the State
University of New York at Albany stated that the number of states issuing an annual
report card on their colleges increased from 30 in 2000 to 44 by 2003. More than half of
the states used some form of performance budgeting with most of them linking funding to
meeting specified accountability standards (Bailey, et al., January 2005).

30
In this era of accountability, with an increasingly wider span of constituents, there
has been a parallel demand for simpler, almost exclusively quantitative measures such as
report cards issued by state and federal governments and US News and World Reports
(Ewell & Jones, 1996). Statistical indicators are almost universally problematic when
used in isolation as they are more subject to misinterpretation and misuse (Ewell & Jones,
1996). “As a result, colleges are well advised to report such statistics together with
additional information that helps explain why the reported numbers look the way they
do” (Alfred, Ewell, Hudgins, & McClenney, 1999, p. 38.). Yet explanatory information
is often not provided alongside simple, quantitative snapshots of performance.
A report by the Office of Program Policy Analysis and Government
Accountability (OPPAGA) indicated that while the Florida Community College System
accountability process had improved, it criticized the community colleges for inflating
their graduation rates by excluding from its calculations students who did not complete at
least 18 credits (OPPAGA, 2001). Because of the demographics of community college
students who predominantly meet at least one of the high risk factors associated with
attrition, such as first generation college students, low socio-economic status, part-time
enrollment, full-time employment, financial independence and having dependents, these
institutions have been and continue to be at risk of having low retention rates (Walters,
2003). OPPAGA recommended that the Florida Community College System increase
graduation rates of students in Associate Degree programs, despite its acknowledgement
that low graduation rates could be a “natural consequence” of having an open door
admissions policy (OPPAGA, 2001).

31
Despite problems associated with using retention and graduation rates as
accountability measures for community colleges, there is also compelling support and
merit for their use. On a broad scale, community colleges need to respond more directly
to the concerns of a widening sphere of constituents: students, parents, industry and
government (Southern Regional Education Board, 1994). Additionally, many community
college students largely pursue higher education with the expressed intent of earning a
credential (Hoachlander, Sikora & Horn, 2003) and/or more money (Gooden & Matus-
Grossman, 2002; Grubb, 2002). While Hoachlander, Sikora and Horn (2003) indicated
that an estimated nine out of ten of community college students intended to earn a
credential, Horn and Nevill (2006) reported a more modest 49 percent had such an intent.
Completion of credentials, but especially Associate degrees as opposed to certificates,
appear to have a greater economic benefit to students than merely earning credits (Bailey,
et al., January 2005; Gooden & Matus-Grossman, 2002; Grubb, 2002; Hoachlander,
Sikora & Horn, 2003; Ruppert, 2003). Completion of degrees and certificates, and
therefore retention rates, thus appear to be an appropriate measure of community college
effectiveness (Hoachlander, Sikora & Horn, 2003).
The importance of raising students’ aspirations to pursue further education and
complete degrees, especially among low-income and minority students, seems also a
compelling reason to emphasize community college completion (Bailey, et al., January
2005; Dougherty, 1987). Furthermore, retention pertains to the moral commitment
institutions have to their students and as such, it is a topic of central importance to the
future of higher education and society (Braxton, Hirschy & McClendon, 2004).

32
From an accountability perspective, low retention and graduation rates also
represent “wasted time” for students and “wasted money” for the state (OPPAGA, March
1999). Student retention, as a part of enrollment management, will become increasingly
important as institutions also strive to avoid loss of revenues (Braxton, Hirschy &
McClendon, 2004). Yet even those who see a possible benefit, especially to
underrepresented groups of students, in using completion rates as a measure of
accountability advise that use of raw graduation rates could be short-sighted because of
the multitude of student intentions (Hoachlander, Sikora & Horn, 2003) and factors that
impact students and their graduation rates (Leinbach, 2005).
The push for efficiency and suspicions of waste in education are not new to the
latter 20th and early 21st centuries. The Scientific Management movement in the early
part of the 20th century was believed by many to be a panacea for concerns about
efficiency, productivity and waste in education (Calahan, 1962).
Accountability in Florida
Florida officially joined the growing accountability movement in 1991 when it
established through state statute a mandatory process of evaluation (Proctor, 2004).
Florida’s legislature has a keen interest in the performance of its educational institutions.
This is evidenced, in part, by the number and comprehensiveness of statutes enacted that
govern their operations. Educational entities are mandated by statute to participate in
system-wide data collection from which accountability measures and reports are drawn,
including the student Retention and Success report. Florida was among the first states to

33
collect and publish retention and graduation rates of its community colleges (Lederman,
2005).
Florida overhauled its higher education governance system in 1998 when voters
adopted a constitutional amendment – effective January 2003 – to appoint, rather than
elect its Board of Education. In 2001, Senate Bill 1162 authorized the Florida Board of
Education to establish and govern a K-20 seamless educational system (Proctor, 2004).
The former coordinating boards for the community colleges and the state university
system were disbanded. The accountability system also needed revision.
While Florida’s accountability system and its use of accountability measures did
not initially link performance with funding, there were movements that pressed for this
association. The Office of Program Policy Analysis and Government Accountability
(OPPAGA) stated that performance-based program budgeting for its community college
system could improve performance by linking goals declared in the Accountability Plan
to performance indicators used to distribute funds (OPPAGA, March 1999).
Accountability watchdogs lamented that information alone provided through the
accountability measures was not stimulating sufficient improved performance. It was
noted that gains were made when annual reports were issued to provide information and
assisted colleges to focus on issues and populations emphasized in policy, such as
performance of African-American males, speakers of English as a Second Language and
economically disadvantaged students. Other areas did not see significant gains until after
funds were attached through the performance based budgeting approach when
“institutions began reviewing their procedures and processes to ensure student (sic) were
able to graduate without unnecessary roadblocks. This resulted in more degrees without

34
a loss of academic rigor” (Office of Student and Academic Success, (n.d.), p. 3). Support
for linking performance to funding is further evidenced by a proposed resolution from the
chair of Florida’s Board of Governors, which is the statewide governing system of the
State University System, to hold back state money and limit institutions from raising
tuition if they do not meet specified accountability measures (Yeager, 2004).
Florida is the only state to have a K-20 education governance system and with it a
K-20 accountability system “that addresses system wide goals with funding tied to
results” (Task Force Final Report, 2003, p. 7). A task force was created to make
recommendations for a single, unified K-20 education performance accountability
system, as required by F.S. 1008.031 which was amended by the 2003 Legislature. The
task force held its final meeting in October 2003 when members remained unwilling to
recommend certain indicators that would apply to all components of the previous system,
including K-12, community colleges and state universities. The difficulty of establishing
common definitions from which to derive measures came to the forefront as they
struggled over intricacies and differences of such measures as “graduation rate” (Task
Force Final Report, 2003). The task force apparently grappled with problems that Phelan
(2000), Strauss (2001) and Taylor (2003) warned were associated with trying to apply the
same performance indicators, such as completion rates, to assess institutions with
different missions.
As Florida struggled to revise its accountability system to address the K-20
governance system, a representative from its department of education declared that
characteristics of a good system of accountability include incentives for good or
improved performance and consequences for poor performance (Fletcher, 2002).

35
Whether or not, and to what extent, a state’s accountability system actually links funding
to meeting specified standards, the aura of their association and the potential negative
impact on resources can hang like a pall over institutional operations. While fear may
serve as a powerful motivator, it may be misdirected and unfocused motivation when
there is threat of punishment for failure to improve measures that may be ill defined.
While a number of trade-offs “must be made in any information-driven approach to
resource allocation” implementing systems of rewarding high performers and punishing
low performers may only widen inequity gaps between institutions (Ewell, 1999).
Accountability and funding systems that reward achievers and punish low performers
might be viewed as Darwinian where only the fittest survive (Daye, n.d.).
Florida Accountability Measures
The Florida legislature has enacted a number of statutes that govern operations its
educational institutions. Title XLVII is the K-20 Code and includes 14 chapters. Chapter
1008 pertains to assessment and accountability. Florida Statute 1008.31(3) mandates
participation in Systemwide (sic) Data Collection in order to provide both the State Board
of Education and the legislature with information associated with the accountability
system (K-20 Education Code, 2005). This is done through participation in the student
data base (SDB). Extensive data elements are collected from each institution at specified
times throughout the year. Protocols are exacting regarding the generation, verification
and submittal of the data to meet guidelines and criteria established for managing the
database (Community College and Technical Center MIS Staff, 2003). Despite the rigor
for submitting, editing and validating data submitted to the state-wide Student Data Base,

36
problems of consistency in defining and coding data elements remain (CCTCMIS Staff,
2003). Millions of dollars have been invested by the state in creating and managing its
centralized student data base for K-12, community colleges, technical centers and
universities (Office of Student and Academic Success, n.d.). Florida collects more data
about its educational system through its Division of Accountability, Research and
Measurement than any other state (FL DOE, ARM, 2006). The first year the student data
base was in production was 1989-1990 and by 2002 more than 100 data elements were
included that collected information about student demographics, entry level test scores,
acceleration, program of study, financial aid and completion rates (CCTCMIS Staff,
2003). The Student Data Base serves as a resource with few if any parallels in other
states.
Florida Statute 1008.45 addresses the accountability process for community
colleges. Section (1) of the statute mandates development of an accountability plan to
both assess and improve the quality and efficiency of the state’s community colleges.
Elements from the Student Data Base are used to compile the data for the accountability
measures that have been defined to meet statutory requirements (OPPAGA, March 1999).
Reports are generated that show how each community college, and the
community college system as a whole, performed in a specified period according to
information submitted to the Student Data Base. Accountability Measure 1, Part 2
(M1P2) assesses student Retention and Success. Students included in the measure are
rather narrowly defined. This measure is a report of the status of first time in college
(FTIC) degree or certificate seeking students within a three year tracking period with 18
college credit hours, or 9 vocational credit hours earned. The Retention and Success

37
report includes the number and percent of students by ethnicity and full-time/part-time
status for each community college and the system as well as for Associate in Arts (A.A.),
Associate in Science (A.S.), Associate in Applied Science (A.A.S.), Post Secondary
Vocational Certificates (P.S.V.C.) and Applied Technical Diploma (A.T.D.) programs of
study (CCTCMIS, 2005).
Funding
Higher education has traditionally received most of its funding from state
appropriations and federal funding; the federal government and States are now facing
budget deficits deeper than they have ever been and are growing (Andrews, 2006; Lav &
Johnson, 2003; National Association of State Budget Officers, 2004; Rubin, Orszag &
Sinai, 2004; Ruppert, 2003). There are also now more competing and compelling
demands on state and federal budgets (Robles, 1998). Deficits of significant magnitude,
exacerbated by competing demands, jeopardize basic services such as healthcare as well
as education (Lav & Johnson, 2003).
Federal and state funds for higher education have been more constrained and
unpredictable with competition from K-12 education, Medicaid and prisons (Zusman,
1999). Florida’s budget, perhaps not unlike other states, is further constricted by voters’
demands for no new taxes (Sanchez-Penley, Martinez & Nodine, 1997). It is necessary
for institutions of higher education to seek alternative sources of revenue since decreases
in federal and state support are coupled with increased student demand as well as rapid
advances in technology (Faris, 1998). Seeking these alternative funding sources is
cultivating a trend of privatization of public colleges and universities (Zusman, 1999).

38
College presidents now spend an increasing amount of time – one survey indicated nearly
40 percent – in supporting foundation efforts to raise external funds (Milliron & Wilson,
2004). Funding, as well as governance, instead of student learning, now consumes a
disproportionate amount of colleges’ time and energy (Robles, 1998).
As colleges increasingly rely on support from external constituents, they need to
be mindful of effectiveness indicators chosen so as to appeal to stakeholders’ demands
(Alfred, Ewell, Hudgins, & McClenney, 1999; Banta, Lund, Black & Oblander, 1996).
Stakeholders pressing for greater accountability from higher education include state and
federal governments, accrediting agencies, employers, parents and students (Banta, Lund,
Black & Oblander, 1996) many of whom increasingly view retention as one of the most
common indicators of institutional effectiveness (Hagedorn, 2005).
As institutions of higher education play an increasingly significant role in their
economic future (Palomba & Banta, 1999) government views these institutions through
more economic and utilitarian lenses. It has become critical for educational leaders to
justify their existence in terms of quantifiable productivity and performance (Alexander,
2000). Cost effectiveness is unavoidable in the current climate of accountability and
fiscal constraint (Pascarella & Terenzini, 1998). By linking funding to performance,
policymakers hope to provide a clearer sense of how the public’s investment in higher
education is being used. It is a trend unlikely to recede anytime soon (Pascarella &
Terenzini, 1998; Phelan, 2000).
Initially developed more than 50 years ago, the primary objective of funding
formulas has shifted from addressing adequacy in the 1950s, to growth in the 1960s,
equity in the 1970s, stability and quality in the 1980s, and stability, performance and

39
reform in the 1990s (Marks & Caruthers, 1999). Funding formulas, unlike scientific
formulas, are not mathematically exact; there is generally room for the influence of
judgment of those who develop the formula (Marks & Caruthers, 1999).
Interest in performance-based accountability stems from taxpayer backlash
against a perceived lack of productivity coupled by fiscal constraints (Alexander, 2000).
Use of funding formulas and which measures are used in the formulas sends a strong
message about what is and is not important in the systems that adopt them (Hufner, 2003;
Office of Student and Academic Success, n.d.). Retention rates, graduation rates and time
to degree completion were among the most frequently reported performance indicators
used in community college funding across the nation (Center for Community College
Policy, 2000).
Higher education policy and funding generally favors four-year institutions as
evidenced, in part, by the greater proportion of funding they receive (Jenkins, 2002).
Two year colleges receive less federal and state support than do four-year colleges and
universities, yet are the fastest growing sector of higher education (Faris, 1998). Data
regarding size of appropriations and the specific impact of the performance funding
formula in Florida are difficult to secure – a statement concurred by the chief financial
officers of two Florida community colleges. But a report by the statutorily mandated
(F.S. 1008.51) Council for Education Policy Research and Improvement (CEPRI)
indicated that in fiscal year 2002-2003, the state university system (SUS) received 12
percent of the state appropriation for education while community colleges received only
six percent (Proctor, 2002). In the following year, the allocation for the Florida SUS
amounted to over $2.6 billion which included general revenue, student tuition and fees

40
and educational enhancement (USF Fact Book, 2003-2004), while community colleges
received in 2003-2004 just over $1.3 billion from general revenue, student tuition and
fees and lottery funding (FL DOE, 2004).
Local funds provided more than 90 percent of community college funding in
1918, but by the 1960’s, state appropriations became the primary funding stream which
accounted for 34 percent of their income (Strauss, 2001). State support continued to
increase and comprise a significant portion of allocations. By 1992, state support
increased to nearly 46 percent (Center for Community College Policy, 2000). There was
a precipitous drop in state support in the 1980s (Center for Community College Policy,
2000) which signaled a longer standing decline in state support for community colleges
(Inside Higher Education, January 16, 2006). The portion of state funding provided is
increasingly less through direct appropriations and more through funding formulas and
performance indicators (Strauss, 2001). As state funding decreases, the general rule of
thumb is that more money needs to come from students (Ruppert, 2003). Student tuition
and fees now constitute an increasing portion of community college budgets (Center for
Community College Policy, 2000). As shown in Figure 1, results of a dissertation by
Roessler (2006) show the changing proportion of sources of community college budgets
over the past two decades (Fliegler, 2006). Institutions also increasingly rely on
institutional foundations (Milliron & Wilson, 2004).

41
01020304050
State A
pprop
riatio
ns
Local
Approp
riatio
ns
Tution
& Fees
Contra
cts
19812001
Source: Flieger (2006)
Figure 1: Changing Proportion of Community College Budget Sources
Community colleges have a long history of serving as champions of access,
especially for disadvantaged groups. With open admissions, low tuition, flexibility of
schedules and locations near low-income communities, these institutions are a gateway to
higher education for disadvantaged and non-traditional students, including low-income,
low-wage workers, minority, and first generation college students (Dougherty, 1987;
Gooden & Matus-Grossman, 2002; Milliron & Wilson, 2004). Increasing numbers of
students who enroll in community colleges are in need of greater levels of support and
attention in order to be successful (Summers, 2003). Yet such support and attention is
expensive while community colleges continue to be poorly funded (Jenkins, 2002). This
seems an example of what Burke (2005) describes as public demands and taxpayer
support being out of sync. State financial support has declined as need is increasing both

42
quantitatively as evidenced by increasing enrollments and qualitatively as evidenced by
the expanding diversity of students needs (Southern Regional Education Board, 1994).
Enrollments have steadily risen in all sectors of higher education in the past 30
years (Martinez, 2004b). Based on the 2000 census, postsecondary enrollments are
expected to increase up through 2015, not only among traditional age students (age 18-
24), but also among adult students who comprise nearly half of all college enrollments
(Recruitment and Retention, April 2005; Ruppert, 2003). Demographic growth will drive
increases in participation in postsecondary education. Florida is considered a high
growth state for projected increases from 2000 to 2015 in both 18-24 year olds and those
25 and older (Martinez, 2004b). This has implications for postsecondary access and
achievement. Enrollments are projected to increase at the same time state appropriations
for education are projected to decline in relative terms (McClenney, 2004a; Vaughan,
December 2004); similarly “state funding is cut at the very time that students are flooding
into community colleges” (Milliron & Wilson, 2004, p. 56). As a result, some have
called for reconsideration of open access, in terms of how to provide it equitably and in a
fiscally responsible manner (Vaughan, December 2003; Vaughan & MacDonald, October
2005).
Florida Performance Funding
Performance-based budgeting and funding models infer that colleges have control
over their students, yet it appears that less-selective institutions, especially open
admissions community colleges, have less influence than some have traditionally thought
(Alfred, Ewell, Hudgins & McClenney, 1999; Bailey, et al., January 2005; CCSSE, 2004;

43
Ewell, 1999; Taylor, 2003). Based on survey data collected by the Center for
Community College Policy (2000), graduation rates, retention rates and time to degree
completion were among the most frequently reported performance indicators used in
community college funding across the nation. The types of performance indicators used
and to what end becomes a critical concern when institutions are responsible for outputs,
such as retention and graduation rates, when inputs such as the variability of students, are
not taken into account (Ewell, 1999). Community colleges, as open admissions
institutions, cannot control for the qualities that students, as “inputs”, bring to them. Tinto
(2002) asserted that less-selective and open admissions institutions do have control over
institutional factors that may impact student outcomes, including retention (Tinto, 2002)
even if they do not have control over the attributes of admitted students. Yet community
colleges are still hampered by a lack of research and understanding of what institutional
factors need to be shaped to support student achievement (Bailey & Alfonso, 2005;
Bailey, et al., January 2005).
The Division of Community Colleges was established in Florida in 1957.
Initially, these institutions were funded through a full-time equivalent (FTE) formula
approach (FL DOE, 2004). The funding mechanism was modified in the 1980s to one of
incremental increases from the previous year, plus funds for special initiatives (Financial
and Business Services, 2004). The formula has essentially remained a base-plus
approach, despite the shift from FTE to performance (Financial and Business Services,
2004). Although Florida community colleges have a funding formula, by its nature, it is
not mathematically exact (Marks & Caruthers, 1999), and it has not been applied
consistently by the legislature (Proctor, 2002).
44
Galvanized by the federal Government Performance and Accountability Act of
1994 which instigated Florida’s performance-based budgeting reform, the Florida
Community College System was among the first to implement performance-based
funding (PBF) and performance program budgeting (Albertson, 2002; Finance and
Business Services, 2004; FL DOE, 2004). It was fiscal year 1996-97 when the Florida
Legislature began funding its community college system under a performance-based
program budget (Finance and Business Services, 2004; OPPAGA, March 1999).
The performance funding system in Florida has been modified a number of times
since its inception. Incentive funding that was performance-based was initially used to
fund workforce education where a modest amount of funds could be earned, above and
beyond the base budgets (Jenkins, 2002). In 1997, the legislature modified the formula to
one of performance-based funding. A separate allocation was devoted to workforce
development and 15 percent of the funds for workforce development programs in
community colleges and school districts would need to be recovered, or earned, based on
performance by competing with other institutions for more relative points (Finance and
Business Services, 2004; Jenkins, 2002). Points were accrued when students completed
education and training and then were placed in high skill, high demand, and high-wage
jobs (Fletcher, 2002; Jenkins, 2002). While additional points were earned for enrolling,
graduating and placing students from disadvantaged, target populations of low socio
economic status, what emerged was an understanding that disadvantaged students, with
greater needs, were more expensive to support and at higher risk of not completing these
types of programs (Jenkins, 2002).

45
By 2001, Senate Bill 1162 was approved by the Governor and incorporated into
Chapter 2001-170 which required that “…at least 10 percent of the state funds
appropriated for the K-20 education system are conditional upon meeting or exceeding
established performance standards.” In 2003, the budgeting program divided about $7.5
million among the state’s 28 community colleges based on completions (Taylor, 2003).
It is debated how effective accountability systems are that link performance to
funding (Burke, 2005c). The impact of accountability systems on improvement may be
small, in part, because the percent of the overall budget impacted by performance –
including Florida - is relatively small, amounting to approximately 5 percent of the
overall budget (Jenkins, et al., 2006). But even a relatively small financial impact can
impose a significant fiscal and emotional impact, especially in times of tight budgets.
Although 10 percent of the system’s funding was tied to accountability measures,
the legislative requirement for this was “removed by the last (2005) legislative session”
(P. Windham, personal communication, February 27, 2006). It appears that while the
accountability measures are not funded in the performance-based system per se, the data
they contain is “a replication of the results of M4P1 in the performance based Program
Budgeting process which is specifically funded” (P. Windham, personal communication,
February 27, 2006).
Whether or not Florida community colleges are funded directly from defined state
accountability measures, it appears that data from at least some of the measures are in
fact used to determine funding. Since more than half of the states use some form of
performance budgeting where most link funding to meeting specified accountability
standards (Bailey, et al., January 2005), it supports Ewell’s (1999) caution that while

46
funds are not always associated with accountability measures, the aura of their
association and potential negative impact on resource can loom large.
Community Colleges
While there is much confusion about the origins of community colleges (Witt,
Wattenbarger, Gollattscheck, and Suppiger, 1994), William Rainey Harper, who served
as president of the University of Chicago at the turn of the twentieth century, is often
credited with promoting the concept and model of these institutions (Wattenbarger &
Albertson, 2004). American democracy fueled the expansion of community colleges as
un-served, average citizens were the institutions’ target demographic (Witt, et al., 1994).
Community colleges became more comprehensive and far-reaching through the work of
the Truman Commission on Higher Education in 1947, which called for a national system
of low-cost, public community colleges that were to be intimately tied to the life of the
communities they served (McClenney, 2004a; Witt, et al., 1994). They further expanded
with Baby Boom enrollments in the 1960s (Milliron & Wilson, 2004). At the height of
their growth in the United States, a new community college was opened every week
(Center for Community College Policy, 2000).
Community colleges in Florida, not unlike those in other states, began in the
private sector (Wattenbargar & Albertson, 2004). St. Petersburg Junior College was
founded in 1927 as a private two year college (Albertson, 2002). Palm Beach Junior
College, founded in 1947, was the first public junior college in Florida, while Pasco-
Hernando Community College was the last one established in 1972 and “marked the
completion of a state master plan for a system of 28 community colleges that were within

47
commuting distance of 99 percent of the state’s population” (Albertson, 2002, p. 4). The
1960s marked a period when the colleges changed their name from “junior” to
“community” in part, to capture the broader missions of the institutions (Wattenbarger &
Albertson, 2004). Florida went through a period of desegregation of all sectors of
education in the mid-1960s. As part of the state’s plan, 12 black colleges were merged
with local community and junior colleges (Albertson, 2002; FL DOE, 2004).
Community colleges are uniquely American (Wattenbarger & Albertson, 2004) in
their genesis and are founded on democratic traditions that are jeopardized by declining
public investments and concurrent rising enrollment demands (Phelan, 2000). Their
missions are distinct and diverse, evolving far beyond providing the first two years of a
bachelor’s degree, to encompassing educational, economic and social development
(Milliron & Wilson, 2004).
The missions of community colleges, including those in Florida, now include
preparing students for transfer to four-year institutions, vocational education, contract
education for local employers, remediation of basic skills, and even community services
(Wattenbarger & Albertson, 2004; FL DOE, 2004; Gooden & Matus-Grossman, 2002).
Historically open admissions institutions, community colleges in Florida are required by
statute 1004, section 65(5) to be “open access”. Community colleges now serve as a
major component in the higher education system in Florida (FL DOE, 2004) as well as
the United States (Dougherty, 1987; Pascarella & Terenzini, 2005; Phillippe & Sullivan,
2005).
Providing remedial or developmental education is a distinguishing characteristic
and mission of community colleges as opposed to four-year colleges (Townsend,

48
Donaldson, & Wilson, 2005). Increasing numbers of community college students require
remedial education (Milliron &Wilson, 2004; Schemo, 2006). “Developmental/remedial
education exemplifies the social role of community colleges. As more students enter
community colleges, increasing numbers of them lack the academic or social preparation
to succeed in education” (Milliron & Wilson, 2004, p. 54).
Florida Statute 1004.65 (6c) mandates that its community colleges are to provide
remedial and tutorial services to ensure student success. Slightly over one-third of
entering community college students in Florida are college ready, another third requires
remediation in one area, and the final third needs college preparatory instruction in two or
more areas (OPPAGA, 2005). Increasing remedial needs in Florida also represent
increased spending on college preparatory programs (OPPAGA, August 1998).
Community college advocates have argued that these institutions serve larger
societal roles by providing access, social mobility and thus serve a type democratizing
function (Dougherty, 1987; Pascarella & Terenzini, 2005). Critics, however, view
community colleges as diverting rather than democratizing opportunity when viewed as
cooling out aspiration and degree attainment (Pascarella & Terenzini, 2005). Policy
groups also take an interest in the work of community colleges insofar as they play a
potential role in alleviating poverty by expanding access to postsecondary education and
the careers and wages that are associated with advanced education and training (Jenkins,
2002). Higher education was once reserved for only society’s elites, but community
colleges have afforded average citizens with the opportunities that education provides
(Witt, et al, 1994). By providing non-elites with educational opportunities that open doors
to employment and higher paying jobs, community colleges help to build the tax base and

49
develop persons who contribute to the political and local community, are less likely to be
dependent on welfare or in prison and are more likely able to provide for their families
(Carnevale & Desrochers, 2004; Gooden & Matus-Grossman, 2002; McClenney, 2004a).
There has been some debate about whether community colleges, as compared to
four-year institutions, dampen educational aspirations and thus reinforce the social
stratification of students (Dougherty, 1987). A study conducted by Leigh and Gill (2004)
appears to support the premise that access to postsecondary education, including
community colleges, has a substantial impact on expanding students’ educational
aspirations, even those from disadvantaged backgrounds (Leigh & Gill, 2004). Another
study demonstrated that students who attended community college and then earned a
bachelor’s degree appeared similar to bachelor degree graduates who had never attended
community college in their aspirations, work and financial situations (McPhee, 2006).
Because community colleges serve as a major vehicle to prepare people for the
workforce, and employers need increasing numbers of knowledge workers to remain
competitive, these institutions are viewed as a significant player in the economic
development of their local communities (Jenkins, 2002). Although preparing students for
transfer to a senior institution is an important function of community colleges, nearly half
of their enrollments are specifically for career or vocational preparation (Townsend,
Donaldson, & Wilson, 2005). With a headcount of more than 900,000 in 2003-2004,
enrollments in Florida community colleges according to the 2003-2004 Student Data
Base indicate closer to 40 percent for career or vocational preparation as defined by
students enrolled in Associate of Science, Post Secondary Vocational, Post Secondary
Adult Vocational, Continuing Workforce Education and Basic and Secondary Education

50
programs (Florida DOE, 2005). When enrollments in vocational and college preparatory
instruction are factored into the calculation, nearly 60 percent of enrollments in Florida in
2003-2004 were in career and vocational programs. Regardless of these different ways of
analyzing the data, the Florida community colleges are widely seen as the lynchpin of
workforce development (Financial and Business Services, 2004).
Individual and collective well-being depends in part on opportunities for
advanced learning. Access to education beyond high school is fundamental to both
individuals and to society as a whole for social and economic development (Carnevale &
Desrochers, 2004; Education Commission of the States: U.S. profile, October 2003).
“Without universal and lifelong access to the benefits of a college education, the nation
simply will fail to meet the social and economic challenges of the years ahead.” (Ruppert,
2003, p. 7). Some assert that it is because of the important role that higher education
plays in the nation’s economic engine and both business and political leaders’ frustration
with the loss of global stature and competitiveness, that has amplified the push for
accountability, including improving retention rates as a means of holding these
institutions accountable (Lederman, 2005).
Types of Students
Community colleges enroll almost half of American undergraduates (Center for
Community College Policy, 2000; McClenney, 2004a; Randall, 2004). They attract high
proportions low-income, first-generation college students and students of color, those
typically underserved by higher education (American Association of Community
Colleges, 2005; Phillippe & Sullivan, 2005; Townsend, Donaldson, & Wilson, 2005).

51
They also enroll nearly half of minority undergraduates in the United States (Laden,
1998; McClenney, 2004a).
Community colleges have been seen largely as serving students who are older
than those who attend baccalaureate institutions (Riesman, 1981 as noted in Bean &
Metzner, 1985) although almost half of their students are now between 18-24 years of
age (Martinez, 2004a; Wilson, 2004). Community college students are often described as
non-traditional as compared to traditional college students who attend a residential
college full-time immediately after high school graduation, are aged 18-24, and have a
primary focus on school (Bean & Metzner, 1985). More than 25 years ago, Bean and
Metzner (1985) described the difficulty of defining and adequately describing what
constituted a non-traditional student because there were so many possible factors.
McClenney (2004a) draws on the definition from the National Center for Education
Statistics and describes a non-traditional student as “financially independent, attends part-
time, works full-time, delays enrollment after high school, has dependents, is a single
parent, or does not have a high school diploma” (McClenney, 2004a, p. 9). Non-
traditional students, and likewise, community college students, have multiple
commitments, are multi-tasking, often struggle to balance work, family and school, and
are commuters, in part, because community colleges are largely non-residential (Gooden
& Matus-Grossman, 2002; Tinto, 1993; Voorhees, 1987). As shown in Table 1, most
community college students have at least one of the characteristics of non-traditional
students and as such, display risk factors and face barriers associated with those factors at
much higher rates than students who attend four year institutions (Hamm, 2004; Jenkins,
2002; Price, 2004). Non-traditional students not only self-report taking longer to

52
complete their programs of study in order to accommodate demands from work, family,
or to earn additional income (Gooden & Matus-Grossman, 2002), but data suggest they
are also at higher risk of not completing a degree or certificate (Hamm, 2004; Wilson,
2004).
Table 1: Percentage Distribution of Students by Risk Factor and Institution Type
Risk Factor Public Two-Year Institution
Public Four-Year Institution
Delayed Enrollment 45.6 18.0
GED/HS dropout 12.1 1.8
Part-time Attendance 47.4 11.2
Financial Independence 34.5 8.1
One or More Children 20.6 4.2
Single Parent 10.0 2.4
Work Full-time 35.1 10.5 Source: NCES, 2003 as noted in Price (2004)
Increasing diversity of American undergraduates has been noted in both four and
two year institutions (Pascarella & Terenzini, 1998; Ruppert, 2003). Future enrollments
in community colleges are projected to increase between 2000 and 2015 both because of
demographic changes and because increasing percentages of the population will pursue
higher education for the opportunities they offer (Boswell, 2004; Martinez, 2004a).
53
Among traditional-aged college students, those aged 18-22 according to Pascarella and
Terenzini (1991) or aged 18-24, according to Price (2004), most of the increase will be of
students of color and those from low-income households (Price, 2004).
Community colleges serve as a type of portal to higher education for underserved
populations (Phillippe & Sullivan, 2005). Students of color and poor students are
disproportionately represented in community college enrollments (McClenney, 2004a;
McPhee, 2006; Price, 2004). Often referred to as non-traditional, at risk, or disadvantaged
students, nearly “40 percent of first-time community college freshman take at least one
remedial course. In colleges that serve large numbers of minority students, the
proportion is higher” (Jenkins, 2002, p. 2.). It is important to note that these differences
reflect differences in the quality of education usually afforded minority students.
Policymakers will likely look to community colleges to accommodate the
enrollment demands since “expenditures per student at community colleges are less than
at baccalaureate institutions” (Martinez, 2004a, p. 23). Based on survey data collected by
the Center for Community College Policy (2000), four-year state universities in Florida
spent on average nearly twice the amount per full-time equivalent (FTE) in 1998-99 than
did the community colleges. Swelling enrollments in community colleges will only
amplify the complex needs of increasingly diverse students (Evelyn, 2003). With such
varied differences and needs, serving the diverse populations will likely be difficult
(Recruitment & Retention in Higher Education, April 2005). It will also be expensive
(Jenkins, 2002; Summers, 2003).
On the national level, the following emerge as the demographics of community
college students: average age of 29; 64 percent attend part-time; 44 percent work more
54
than 20 hours per week; about half work full-time; 35 percent have dependents; more
than half (51.4 percent) are the first in their families to attend college; 59 percent have a
primary goal of obtaining job-related skills and 47 percent attend with stated intent of
transfer to a 4-year college; nearly half are age 25 and older (Gooden & Matus-
Grossman, 2002; Jenkins, 2002; Randall, 2004). Jenkins (2002) summarizes NCES 2000
data as indicating that nearly half of African-American undergraduates (46.3 percent) are
enrolled in community colleges, while 60 percent of Hispanics who are enrolled in
undergraduate programs in this country attend community colleges.
Students in the Florida Community Colleges are comparably diverse. In Florida,
approximately 34.6 percent of the state’s population is designated as minority (Education
Commission of the States: Florida profile, April 2003) as compared to 30.8 percent of the
population in the United States (Education Commission of the States: U.S. profile,
October 2003). Florida community colleges serve as the major entry point into
postsecondary education for Black and Hispanic students who graduated from public
high schools in the previous year (Windham, 2000). Eighty percent of the minority
students pursuing higher education in a public institution in the state begin their
postsecondary education at the community college (FL DOE, 2003).
The Student Data Base of Florida provides information to generate the profile of a
typical Florida community college student who is a 31-year old, white female freshman
who attends part-time, is not disabled. She is seeking an Associate of Arts degree. Other
sources indicate that she is working and helping to support a family (FL DOE, 2000).

55
Student Retention
Retention or persistence refers to student re-enrollment. Persistence is often a
student measure, while retention is an institutional measure (Hagedorn, 2005). Retention
is often associated with completion of a degree. There is a large amount of literature
about student retention in higher education, but it is rife with single institution studies
with methodological differences, if not problems (Pascarella & Terenzini, 1991) that do
not lend them to being applied to other institutions, and the studies are largely based on
four year residential colleges (Bailey et al. January 2005). The following sections
provide overviews of the growing importance of retention, prominent models of student
retention, caveats on their applicability to community colleges, and student retention in
Florida.
The Evolving Importance of Retention
While retention is a widely discussed if not controversial topic in contemporary
higher education, it seems to have been less of an issue in the early history of American
institutions. Completion of a degree was apparently not emphasized by the colonial
colleges in their earliest years (Thelin, 2004). Enrollments increased in the 19th century
(Potts, 1977), but it is conjecture what was the impact on student retention. It appears that
graduation took on some level of increased importance with time as it became associated
with the social function of launching young men’s entrance into adult life and
corresponding positions of power (Thelin, 2004). Although students who completed two
years at a normal school could, by 1892, complete a baccalaureate at the university in
another two years (Ogren, 1989), it is unclear how prevalent this was.

56
As student enrollment increased more than five fold between the two World
Wars, there was apparently a growing dis-ease among college administrators that they
bore an increasing degree of risk and responsibility for the students admitted. Yet, when
Student Affairs departments were developed, they were not for the purpose of increasing
student retention (Thelin, 2004), but to maintain campus discipline (Ping, 1999). High
numbers of students were admitted with the anticipation that attrition would also be high.
Student retention has become an increasingly critical topic in the past several
decades in American higher education as student retention has been identified as an
important measure of institutional effectiveness (Wild and Ebbers, 2002). High attrition
rates are costly to individual students and to institutional planners alike since loss of
tuition revenue can jeopardize the financial stability of institutions (Tinto, 1987; Tinto,
1993). Because of the demographics of community college students who predominantly
meet at least one of the high risk factors associated with attrition, community colleges
have been and continue to be at risk of having low retention rates (Walters, 2003).
Despite the difficulties community colleges face in improving student retention, there are
mounting fiscal, political, social and moral demands to improve it (Summers, 2003). It is
now generally agreed that higher education must meet the challenge to improve student
learning, retention rates, and credential completion rates in order to meet the needs of the
nation and the world (Kuh, Kinzie, Schuh, and Whitt, 2005).
Prominent Models of Student Retention
While there is a significant amount of literature by many different authors about
student retention in higher education, there is general agreement that most models of

57
retention are based on the work of Tinto which enjoys almost paradigmatic stature
(Braxton, Hirschy & McClendon, 2004; Hagedorn, 2003). Tinto’s hallmark emphasis
was on the importance of academic and social integration (Bailey, et al., October 2005;
Summers, 2003; Wild & Ebbers, 2002). Modified over time, the model was focused on
student attributes, social and academic integration in 1975, addressed the role of student
intentions, the importance of student interaction with faculty and faculty teaching styles
in 1987, and incorporated the acknowledgement in its 1993 version that academic
integration was more important than social integration for commuting students, and that
not all students attended four year residential colleges (Henningsen, 2003).
Retention work conducted by others in addition to Tinto has been cited as highly
influential (Bailey & Alfonso, 2005; Henningsen, 2003; Pascarella & Terenzini, 2005;
Summers, 2003). Selected theorists and a brief explanation of their research follow.
Pascarella (1980) developed a model that drew mostly on the work of Tinto
(1975) and Astin (1975), but the model took into account not only characteristics of
students, but institutional factors, as well as college experiences in examining attrition
and retention. Pascarella noted the influence of socialization on persistence, including
the importance of non-classroom student-faculty contacts. He further noted that
institutions may be able to influence the quality and impact of student-faculty contact “in
ways other than through the kinds of students they enroll” (Pascarella, 1980, p. 65).
Bean and Metzner (1985) drew on the work of Spady (1971), Tinto (1975) and
Pascarella (1980) but focused on nontraditional students and challenged the impact of
social integration on students (Summers, 2003) who were largely part-time with
competing demands of work and family life. Bean and Metzner’s model ascribes attrition

58
decisions to academic performance, intent to leave, background and defining factors, and
environmental factors. Variables pertaining to social integration are excluded from this
model as primary factors in describing departure of non-traditional students since the
students were found to be less influenced by social integration than traditional students,
and more influenced by the external environment (Bean & Metzner, 1985). Bean and
Metzner also reported that non-traditional students have higher drop out rates than other
students. Pascarella and Terenzini (1991) later reported that social integration models are
not as applicable to commuter colleges as residential colleges (As noted in Bailey, et al,
October 2005; Hagedorn, 2006; Summers 2003). More recent studies, one of which was
conducted at a Florida community college, also found results that questioned the
importance of social integration for community college students (Borglum & Kubala,
2000).
Braxton, Hirschy and McClendon (2004) later developed a model that drew on
the work of Tinto, but attempted to address the particular issues associated with
commuter students. In noting the lack of empirical support for Tinto’s theory to explain
student departure, especially in commuter institutions, they modified it to place more
importance on academic integration than social integration. Bailey and Alfonso (2005)
noted that while this model focuses on the importance of building linkages in the
classroom and connecting with students’ significant others, it does not distinguish
between two and four year commuter institutions and does not mention developmental or
remedial education which is central to community college retention.
59
Student Retention in Florida
Not unlike community colleges in other states, Florida’s focus was initially on
providing students with access to higher education. The commitment to access clearly
remains, as the 2005-2006 Strategic Plan for the Florida Community Colleges includes
goals and success indicators for providing and increasing access (Florida Community
Colleges and Workforce Education, 2006). But the shift in focus from one on access to
one of continuing access coupled with success is evident in part through the system’s
strategic plans. The Florida Community Colleges’ Master Plan for 1993 included among
its eight goals, “preserving open access and increase student success in community
college programs.” (FL DOE, 2005). By 1998, the Strategic Plan for all of postsecondary
education required that all of Florida’s higher education sectors ”meet rising student
demand while increasing program and degree completion and maintaining standards of
excellence” (FL DOE, 2005, p. 5).
Florida was among the first states to collect and publish retention and graduation
rates of its community colleges (Lederman, 2005). Florida Accountability Measure 1
tracks student completions of programs of study. Accountability Measure 1, Part 2,
tracks student Retention and Success. According to the Student Data Base, completion
rates, by headcount, steadily rose from 1999-2000 through 2003-2004 for students in
Associate of Arts and Associate of Science programs. Certificate completions, by
headcount, increased overall, but with a slight drop from 2001-2002 to 2002-2003; there
was a gain in certificate completions in 2003-2004, but still not equivalent to that of
2001-2002 (FL DOE, 2005). Minority student completions in these programs also
increased steadily during this time period.

60
Florida’s community colleges ranked among the best in the nation in terms of
degrees awarded to non-traditional and minority students based on 1994-95 graduation
data (Wattenbarger & Albertson, 2004). Yet, U.S. Census Bureau data from 2002
indicates that eighteen and a half percent of Blacks in Florida who are aged 25 and older
have earned an associate degree or higher versus 20 percent at the national level
(Education Commission of the States: Florida Profile, April 2003; Education
Commission of the States: U.S. Profile, October 2003). The majority of awards received
by African American females are associate degrees while the majority awards received
by African American males continue to be certificates (FL DOE, 2003). Twenty-three
point eight percent of Hispanics earn an associate degree or higher versus 14.7 percent at
the national level; 32 percent of whites in Florida earn an associate degree or higher as
compared to 33.6 percent of whites nationally (Education Commission of the States:
Florida profile, April 2003; Education Commission of the States: U.S. profile, October
2003). These data however do not account for enrollment rates or percent of completions
of these populations.
Caution for Community Colleges
Student retention has been identified for decades as an important measure of
institutional effectiveness (Wild and Ebbers, 2002) for which institutions are increasingly
held accountable. Despite seventy years of empirical attention and the prevalence of
articles, journals and books devoted to the topic of student retention, no template or
blueprint exists for successful student retention programs (Braxton, Hirschy &
McClendon, 2004; Tinto, 1993).

61
Most research on student retention has consisted of single institution studies that
pertain to residential baccalaureate institutions (Henningsen, 2003; Pascarella &
Terenzini, 1998) that do not lend themselves to generalizability (Bailey & Alfonso, 2005;
Pascarella & Terenzini, 1991). With a paucity of literature and research about student
retention in community colleges (Bailey & Alfonso, 2005), models of student persistence,
then, are largely informed by research focused on four year institutions and the typical
traditional aged white and affluent demographic (Braxton, Hirschy & McClendon, 2004;
Pascarella & Terenzini, 2005; Voorhees, 1987).
Retention literature for community colleges largely offers suggestions of various
intervention strategies employed to boost retention, such as orientation programming,
formalized mentoring relationships, establishment of women’s centers, but these
represent an alternative to the difficult task of identifying predictive characteristics
(Brawer, 1996) or developing theoretical models. Prior to Spady (1971) and Tinto
(1975), early retention studies were largely descriptive rather than theory based
(Henningsen, 2003). Student and institutional variables that appeared to be related to
student dropout were studied and yielded a wealth of statistically reliable associations,
but without a framework to focus the studies or interpret the results in a conceptual way
(Pascarella & Terenzini, 1980). The development and use of theoretical models is highly
desirable “since theory guides research and brings some degree of order to the chaotic
array of variables available to the researcher of dropout.” (Bean, 1983, p. 129).
Researchers and authors have warned of problems associated with using
theoretical perspectives based primarily on four year college models. Even Tinto’s
model of near paradigmatic stature (Braxton, Hirschy, & McClendon, 2004) has been

62
questioned in its applicability to community colleges. Tinto’s model “was meant to
explain attrition at residential institutions, emphasized social integration, and excluded
variables from the external environment” (Bean & Metzner, 1985, p. 528); “Empirical
tests of these models have not yielded strong support for their application to community
colleges” (Bailey & Alfonso, 2005, p. 2); and the “conceptual basis for applying such
models to community colleges is weak” (Bailey et al, Jan. 2005, p. 14). Tinto himself
acknowledged that the “patterns and roots of departure among commuting colleges are
not identical to those observed among residential institutions” (Tinto, 1987, p. 85).
Community college advocates assert the need for new models to be developed that
effectively address the unique factors of community college settings that impact retention
(Wild and Ebbers, 2002).
Also compounding the difficulty of addressing retention in community colleges is
that there are differences in the definition of retention (Pantages & Creedon, 1978; Wild
and Ebbers, 2002), the closely related term of persistence (Henningsen, 2003) and in the
measures of retention and persistence (Hagedorn, 2005). The lack of common definitions
and common measures for retention and graduation rates seems to have further eroded
the value of much of the retention research (Shibley & Upcraft, 2001). The lack of
common or consistent definitions and measures have also contributed to the lack of
understanding as well as a lack of comprehensive data about community college retention
and graduation rates which are an important tool for institutions dedicated to
improvement (Hayes, 2006; Summers, 2003).
Some institutions and studies have examined re-enrollment from year to year;
others have defined it as re-enrollment from term to term until completion of a degree,

63
certificate or intended objective. It is required that graduation rates be reported to the
U.S. Department of Education since the 1990 Student Right to Know Act (Lederman,
2005). The federal definition of graduation rate provides a widely used definition, but
has inherent problems: it does not account for part-time students who comprise the
majority of community college enrollments, and the rate considers only students who
start and graduate from the same institution, which again skews the rates as an increasing
number of students transfer, or take courses from multiple institutions in order to
continue their education (Bailey, et al., January 2005; Lederman, 2005; Recruitment and
Retention, December 2005b). Transfer rates negatively impact institutional retention and
graduation rates because in many cases, the rates are defined so as to count transfers as
having dropped out (Burd, 2004). Many states thus use their own definitions of retention
and graduation rates. Institutions may also define and track retention rates differently
from the state for their own purposes. In addition, there are also different varieties of
retention: institutional, system-wide, discipline-specific and individual courses
(Hagedorn, 2005).
Community colleges are often noted for poor retention rates, especially compared
to four-year institutions (Bailey, Jenkins & Leinbach, 2005; Hagedorn, 2006; Horn &
Nevill, 2006; Tinto, 1987). It was revealed in a recent study conducted by the
Community College Research Council that only 53 percent of students seeking an
associate’s degree or higher had either earned a degree or transferred to a senior
institution within eight years of beginning their studies (AACC, 2005). Gooden and
Matus-Grossman (2002) refer to a study by Tinto (1993) in which it was reported that
less than half of students who attend public community colleges earn a degree within
64
three years. Minority students show higher drop out rates than their majority classmates
(Lederman, 2005; Szelenyi, 2001; Voorhees, 1987; Zamani, 2000). According to the
Community College Research Center, white students graduate with associate and
bachelor’s degrees within a six-year window at six times the rate of Black students
(Leinbach, 2005). Graduation rates are also lower among students of lower socio-
economic status when compared to students from wealthier backgrounds (Lederman,
2005). Another factor in low retention and graduation rates of community colleges is the
prevalence of remedial need and lack of success of students in these courses. “Research
suggests that more than a quarter of remedial students do not complete their prescribed
remedial coursework. In general, the more remedial courses students are required to take,
the less likely they are to earn a degree.” (Jenkins, 2002, p. 2). Jenkins further explains
that “This is clearly a key cause of the low degree completion rates for which community
colleges are often criticized” (p. 14).
Community colleges have been cautioned to align their definition of retention
with the model of retention theorist Alexander Astin. He stated that success is best
measured by students meeting their intended goals, regardless of whether it is taking a
single class, earning a certificate or a degree (Walters, 2003). Despite this caution by
Astin, retention still appears to be often, if not predominantly defined in terms of re-
enrollment towards completion of certificates or degrees within time frames that are not
consistent, ranging from two years to eight years. Different measures of college
graduation rates have been criticized as “anachronistic formulas that do not track students
through increasingly complex paths to degrees. As a result, we do not really understand
what is going on” (Toolbox Revisited, 2006).
65
Definitional issues, however, are rarely transparent to users of retention statistics,
but may have a significant impact on both their validity and suitable use (Ewell, 1999).
Further complicating the situation is that retention rates can be misleading when “more
than half the variance in institutional retention rates can be attributed directly to
differences in the kinds of students who initially enroll, rather than to any differential
institutional effect” (Astin, 1997, p. 648).
There does appear to be consensus that retention is a complex phenomenon best
understood through examination of both institutional characteristics and student
perceptions and behaviors (Hutto, 2002; Summers, 2003). Yet Hagedorn (2005) notes
that although the problems associated with a lack of a common definition and measure of
retention have been noted for years, a standard formula has not yet been accepted even
after advocated four decades ago by Summerskill (1962).
Engagement as a Promising Construct
Community colleges have broad missions, have open door admissions policies,
have increasing enrollments and serve students of more diverse backgrounds, who have
competing demands and multiple educational needs. As such, these institutions must
define quality in ways different from those often used by four year institutions (CCSSE,
2004a). How quality is defined will inform those things for which they are accountable.
Traditional criteria of rankings usually have little to do with educational outcomes and
include acceptance ratio, reputation, or institutional resources (Aper & Hinkle, 1991;
Manzo, 2001; Pascarella & Terenzini, 1998). Based on their mission, these are not
suitable criteria to evaluate community colleges. Selection of criteria and standards is a

66
critical component in evaluation (Posavac and Carey, 2003) and shapes how institutions
held to those criteria perform and are perceived. Appropriate criteria are needed to both
evaluate and help institutions improve the learning outcomes, educational experiences
and the persistence of the students they serve.
Despite the lack of a substantial amount of research that provides clear direction
on improving student retention in community colleges, there is a “broad body of research
and theoretical perspectives indicating that positive educational outcomes are associated
with student engagement” (Marti, 2006, p. 4). Although the expanse of research on
engagement is not in any way covered here, key authors provide broad brushstrokes of
what engagement encompasses.
Pace (1984) conducted studies on the quality of effort invested by students. The
breadth of student involvement in various aspects of college life was found to be related
to the breadth of student gains in important higher education goals (Pace, 1984). Astin
(1984) posed a theory of student development which associated the proportion of student
learning to both the quality and quantity of student involvement. According to Astin,
“student involvement refers to the amount of physical and psychological energy that the
student devotes to the academic experience” (Astin, 1984, p. 297). Effective educational
practices are those which elicit investment of sufficient student energy (Astin, 1984).
There has been strong support for the argument that heavy involvement had a positive
impact on student academic and personal development (Astin, 1993; Astin, 1999;
Pascarella & Terenzini, 2005). Tinto (1987) emphasized the importance of academic and
social integration to student learning and persistence. He later described integration as
student involvement (Tinto, 1993). Chickering and Gamson (1987) developed what have

67
been termed by Kuh (2003) as engagement indicators in their seminal work of the “Seven
Principles for Good Practice in Undergraduate Education.” Building on the volume of
research conducted in the four year sector of higher education, the National Survey of
Student Engagement (NSSE) was developed and field tested in 1998 (Kuh, 2001) to
assess and benchmark student activities that measure the “time and energy students
devote to educationally purposeful activities” or student engagement (Kuh, 2003). An
instrument appropriate for use by community colleges soon followed.
Community College Survey of Student Engagement
The Community College Survey of Student Engagement (CCSSE) was launched
in 2001 as a project of the Community College Leadership Program based at The
University of Texas at Austin. Grants from The Pew Charitable Trusts, the Lumina
Foundation for Education, the MetLife Foundation and Houston Endowment supported
the effort. The purpose was to raise public awareness about the work of community
colleges, stimulate discussion and dialogue about how quality is defined and measured,
and provide an appropriate assessment tool for their work. Based on extensive research
that pertains to student learning and persistence, the CCSSE has defined five benchmarks
of educational practice (CCSSE, 2006b). Three of the benchmarks comprise an
institution’s Retention Index. CCSSE provides formative measures to benchmark and
improve retention efforts (CCSSE, 2006a; Hayes, 2006).
As community colleges across the country respond to increasing demands for
accountability, including quality and performance, they need assessments that are
appropriate to their mission and population, and that can provide guidance for

68
improvement (CCSSE, 2006a). Community colleges, with open door admissions
policies, must define quality and effectiveness in ways different from traditional criteria
according to CCSSE. Used in the popular media, traditional criteria, which are often
commercially motivated (Ewell, 1999), typically include consideration of an institution’s
financial resources and rankings based on the ratio of those accepted as compared to
those who applied. These popular criteria and associated rankings have little to do with
student learning (Kuh, 2001). Money uses 16 criteria to assess quality and rank
institutions, including four-year graduation rates, retention rates, instructional budget,
percentage of students entering from to the top of their class and faculty, library,
instructional, student services budgets (Money, 1996). Considering a student’s
educational experience as a measure of quality entails focusing on institutional practices
and student behaviors that research has shown to be connected to student learning and
persistence – or retention (McClenney, 2004b). The CCSSE is anchored in extensive
research about effective practices associated with student learning and retention.
Considered the “daughter” of the National Survey of Student Engagement
(NSSE), which is used by four-year institutions to obtain information about learning
practices and student engagement, the CCSSE addresses the unique mission and student
characteristics of community colleges (Ouimet, 2001). The NSSE helps institutions
assess quality by measuring student engagement, which research shows is the best
indicator of student learning and development (Astin, 1993; Pace, 1980 as noted in Kuh,
2003; Pascarella & Terenzini, 1991). There is a significant amount of intentional overlap
between questions used in both the CCSSE and the NSSE instruments although

69
similarities and differences between the respective organizations and their survey
instruments are addressed on the CCSSE website.
Five benchmarks of effective educational practice, one of CCSSE’s most
significant contributions, have been defined through the instrument (McClenney, 2004b).
Each benchmark consists of a group of conceptually related items that pertain to good
educational practice (CCSSE, 2006b). The benchmarks are based upon the work of many
researchers, including Chickering and Gamson’s (1987) landmark publication on good
practices of undergraduate education (Kuh, 2003). The seven principles were developed
by a task force of scholars of policy, organizational and economic issues in higher
education as well as those who had conducted research on the college experience
(Chickering & Gamson, 1999). The CCSSE benchmarks are: active and collaborative
learning, student-faculty interaction, student effort, academic challenge and support for
learners. The benchmark scores are standardized to a mean of 50 for all participating
students and then can be used by institutions to compare themselves to the mean as well
as gauge the impact of efforts intended to improve student learning and persistence
(CCSSE, 2006b). According to McClenney, Director of CCSSE, community colleges are
stepping up to plate through their participation and are “declaring both their commitment
to continuous improvement and their willingness to be accountable for providing the kind
of quality that matters most” (Manzo, 2003).
The CCSSE, used across multiple community colleges over time, stands to offer a
frame of reference to benchmark educational practices and study student characteristics
that can serve as valuable resources to develop strategies to improve student learning and
persistence of different groups of students who may have very different needs.

70
Community college enrollments have been increasing in recent years both in Florida and
across the United States (Proctor, 2002). Increases are especially noted among minority
students. While gains have been made in promoting access for these populations, this
does not always translate to success (Bailey & Alfonso, 2005; McClenney, 2004a;
Ruppert, 2003; Wilson, 2004). Access is critical, but alone is not sufficient (Bailey, et
al., October 2005). African American, Hispanic and Native American students appear to
have higher attrition rates than white or Asian students (Bailey & Alfonso, 2005;
Education Commission of the States, October 2003; Kalsner, 1991; Zamani, 2000). In
Florida, minority students neither participate nor succeed in postsecondary education at
the rates of their majority peers as of those aged 25 and older, nearly 32 percent of whites
in Florida have earned a college degree while only 23.8 percent of Latinos and Hispanics,
and 18.5 percent of African Americans possess a postsecondary degree (Ruppert, 2003).
After controlling for enrollment variables and demographic characteristics, women also
persist and graduate at higher rates than men according to most of the research (Bailey, et
al, January 2005).
Sited in the 2005-2006 strategic plan of the Florida Commission of Community
Colleges and Workforce Education, benchmark scores from the CCSSE survey will be
used as a success indicator. As indictor 1.5.1 the CCSSE survey results and baseline
scores for the system are targeted to steadily increase. Another success indicator, 1.5.2,
is improvement in the system retention, success, and completion rates. (Florida
Community Colleges and Workforce Education, 2006). “The measure for Success
Indicator 1.5.2 of the FCCS Strategic Plan is our current accountability Measure 1, Part
2” (P. Windham, personal communication, February 28, 2006).

71
As one of few benchmarked tools designed specifically for use by community
colleges, the CCSSE instrument is held out as a means to guide improvements in student
learning and persistence. By improving and increasing practices assessed by CCSSE’s
benchmarks, including the Retention Index, it stands to reason that institutions will foster
improvement in student learning, persistence and retention (CCSSE, 2006a; Marti, 2004).
Extensive research has not yet been conducted to validate the CCSSE benchmarks as a
predictor of the outcome of retention, although this has been recommended as a topic of
future research (Marti, 2004) and is a focus of this dissertation study.

72
CHAPTER THREE
METHODOLOGY
Introduction
This chapter includes descriptions of the quantitative approach taken to examine
the empirical relationship between the CCSSE Retention Index and the Florida
accountability measure of student retention as well as the approach taken to examine
mean differences in Retention Index scores of students from different subgroups based on
race and sex while accounting for the possible influence of institution attended.
The statement of the problem and basis for the research questions are reiterated,
followed by a description of the population and sample used in the study. An overview
of instrumentation follows, including the Student Data Base from which the Florida
accountability measures are drawn, and CCSSE’s Community College Student Report.
The reliability and validity of the SDB and CCSR are described. Although this study
entails use of secondary data sets, the data collection procedures used for the SDB and
CCSR are described. Following these are descriptions of the data analyses used to
address the research questions before closing the chapter with a summary.
Statement of the Problem
There is not yet a clear road map for improving student retention, particularly in
community colleges. Yet community colleges are increasingly held responsible through

73
accountability measures and even performance-based funding, to improve retention and
completion rates.
This study proposes to examine the relationship between the institutional CCSSE
Retention Index scores from the 2004 fielding of CCSSE’s survey in the 28 Florida
community colleges, and the retention portion of Florida accountability measure 1, Part 2
(M1P2) for the cohort tracked from Fall 2000 through Winter/Spring 2004. While the
Florida accountability measure of student Retention and Success measures both student
retention and success as operationally defined, this study will focus on the portion of the
measure which pertains to retention.
Targeted success indicators of the 2005-2006 strategic plan for the Florida
Community Colleges and Workforce Education include an increase in baseline scores
from the 2004 CCSSE results, and improvement in retention, success and completion
rates system-wide (Florida Community Colleges and Workforce Education, 2005).
Extensive research has not yet been conducted to validate the CCSSE benchmarks as a
predictor of the outcome of retention, although Greene (2005) examined student level
data in a research study that demonstrated an empirical relationship between engagement
and student outcomes of Florida community college students. Still, examination of
whether the CCSSE benchmarks can predict the outcome of retention per se has been
recommended as a topic of research (Marti, 2004). The first and second research
questions for this study stem from this problem.
Community college students are diverse in age, socio-economic, educational and
cultural backgrounds, ability and aspirations. In light of the community college mission
to both prepare students for transfer to senior institutions and play a significant role in
74
workforce preparation and economic development, as well as rising enrollment rates in
community colleges in Florida, it is compelling to note what differences exist in CCSSE
Retention Index scores of students across specific demographics. African American,
Hispanic and Native American students appear to have higher attrition rates than white or
Asian students (Bailey & Alfonso, 2005; Kalsner, 1991). After controlling for
enrollment variables and demographic characteristics, women also persist and graduate at
higher rates than men according to most of the research (Bailey, et al, 2005). There are a
myriad of academic, social, political and moral reasons to address and close the
persistence and performance gaps (Braxton, Hirschy & McClendon, 2004; McClenney,
2004a; Summers, 2003). Survey questions providing demographic information allow for
comparisons in engagement levels between sub-groups, which is encouraged by CCSSE
(Marti, 2004). The third research question stems from the problem of differences in
retention rates between subgroups and a desire to examine differences in engagement
between these groups as measured by the CCSSE Retention Index while also accounting
for the potential influence of the institution attended.
Population and Sample
The first and second research questions examine institution level data of both the
CCSSE Retention Index and the retention portion of the Florida accountability measure
for Retention and Success for the 28 Florida community colleges. Secondary data
sources provided the values for these two institution level measures. The entire
population of the Florida community colleges is included in the first two research
questions. The institutional CCSSE Retention Index is calculated by averaging a

75
college’s scores in three of the five benchmarks: active and collaborative learning,
student-faculty interaction, and support for learners (CCSSE, 2006c).
The institutional level retention rate from the Retention and Success
accountability measure consists of the number of students graduated, plus the number
enrolled in good standing, plus the number enrolled who are not in good standing as
compared to the total cohort. The Winter/Spring 2004 cohort includes only first time in
college students from Fall 2000 who took an entry level test and achieved nine credits in
a PSVC or ATD program, or 18 credits in an AA, AS or AAS program by Summer 2002
or Winter/Spring 2004 (FL DOE, October 2004).
The third research question examines student level data for a sample of Florida
community college classes. “We sample classes, but data is on the student level” (N.
Marti, personal communication, February 20, 2006). The sample consists of Florida
community college classes included in the 2004 fielding of CCSSE’s survey instrument,
the Community College Student Report.
CCSSE designates a person at each institution to administer the survey according
to protocols. A stratified random cluster sample scheme is used to capture a random,
representative sample of classes from each institution (Marti, 2004; Marti, 2006). Each
class represents a cluster which contains multiple students while a three level
stratification is based on classes beginning between specified times in the morning,
afternoon and evening (Marti, 2004). Based on Integrated Postsecondary Education
Completions Data Files - or what are commonly referred to as IPEDS data - submitted to
CCSSE, participating institutions were instructed to survey a minimum number of college
credit sections of classes. According to the CCSSE web site, the required number of

76
course sections and students to be surveyed is established based on the total sample size
needed to reduce sampling error and to ensure valid results. The sample and population
demographics for the Community College Student Report closely match as indicated by
comparison with data from the Integrated Postsecondary Education Data System, except
in that full-time students were overrepresented (Marti, 2004). The data are weighted to
accommodate for differences in the sampling rates between full and part-time students
(Marti, 2006). A weight “is the inverse of the probability of selection” (Kish as noted in
Hahs-Vaughn, 2005, p. 224). Although the relevance of weights has been debated
(Pfeffermann as noted in Hahs-Vaughn & Lomax, 2006) evidence supports the premise
that they are “required to produce estimates that are representative of the intended
population” (Hahs-Vaughn, 2005, p. 224).
Over sampling is not part of the sampling design used by CCSSE, however
participating colleges can elect to oversample students at their own institutions. "There is
a variable in the master data set that indicates whether a respondent was in the primary or
oversample" (N. Marti, personal communication March 20, 2006). There were 25,040
student responses to the 2004 fielding of the CCSSE survey, 4459 of which were
oversamples. Since oversamples can distort results of statistical analyses and compromise
the generalizability of the results unless they are addressed through statistical means (e.g.,
through weighting the data) (Hahs-Vaughn, 2005), the oversamples were excluded upon
request from the student level data set provided by the Florida Department of Education.
The resulting sample included 20,581 student responses.

77
Florida Accountability Measure of Retention and Success
Florida Statute 1008.45 (1) mandates development of an accountability plan to
both assess and improve the quality and efficiency of the state’s community colleges.
The Student Data Base (SDB) serves as the state repository of student information.
Elements from the SDB are used to compile the data for the accountability measures
(CCTMIS, 2005; OPPAGA, 1999).
Accountability Measure 1, Part 2 (M1P2) is one of eight state accountability
measures and is used to assess student Retention and Success. This measure is a report of
the status of first time in college degree or certificate seeking students within a three year
tracking period with 18 college credit hours, or 9 vocational credit hours earned. Use of
this measure was criticized in a report by OPPAGA (1999) but defended in a response by
the Executive Director of the Florida State Board of Community Colleges who argued
that the measure was chosen to more accurately represent the system’s results (OPPAGA,
1999). The Retention and Success report includes the number and percent of students by
ethnicity and full-time/part-time status for each community college and the system as
well as for Associate in Arts (A.A.), Associate in Science (A.S.), Associate in Applied
Science (A.A.S.), Post Secondary Vocational Certificates (P.S.V.C.) and Applied
Technical Diploma (A.T.D.) programs of study (CCTCMIS, 2005). The retention rate
from the Florida accountability measure of Retention and Success will be used as the
dependent variable in the first two research questions.

78
Community College Student Report
CCSSE’s survey instrument is the Community College Student Report (Marti,
2004). The survey was designed to help community colleges measure student
engagement and focus on both institutional practices and student behaviors that are
positively associated with student learning and retention (CCSSE, 2006c). The
development of benchmarks for use across and within institutions was a primary intent of
the CCSR (Marti, 2004).
The CCSR was adapted with permission from Indiana University (Marti, 2006)
from the National Survey of Student Engagement which is used in four year colleges and
universities (Marti, 2004). There was an intentional high degree of overlap between the
instruments – 71 percent of the questions were common to both instruments in 2003
(Marti, 2004) and 67 percent in 2005 (Marti, 2006). The CCSR, however, is focused on
the two year sector which is distinct from the four year sector in institutional mission and
populations served (Marti, 2004).
Five benchmarks of effective educational practice have been defined through the
Community College Student Report and are seen as one of CCSSE’s most significant
contributions (McClenney, 2004). The five benchmarks are: active and collaborative
learning, student-faculty interaction, student effort, academic challenge, and support for
learners. Three of the five benchmarks comprise an institution’s Retention Index and
include: active and collaborative learning, student-faculty interaction and support for
learners (CCSSE, 2005). Only the three benchmarks comprising the Retention Index are
used in this study.

79
Each benchmark consists of a group of conceptually related items that pertain to
good educational practice (CCSSE, 2006b). Benchmarks were created through
exploratory factor analysis (EFA) and then confirmatory factor analysis (CFA) to
establish a goodness of fit of questions to comprise each benchmark (Marti, 2004).
Because of limitations of CFA, a panel of experts in educational research was used to
further narrow the field of possible benchmarks and the questions that comprise them by
using the factor analysis, reliability tests and expert judgment (Marti, 2004).
“When the CCSSE benchmarks were created we started with a factor analysis to
find the groupings. That was the beginning. Then we worked with a group of experts in
the community college realm. These experts made up of people such as community
college presidents, faculty, researchers in the field etc., then reviewing the groupings and
made suggestions as to where they thought things should fall….. both through factor
analysis and the review of the experts….” (J. Crumpley, Senior Research Associate,
CCSSE - personal communication, February 11, 2005). This summarizes the process of
how the benchmarks were established.
In order to create the benchmark scores, it is explained on the CCSSE website that
the items associated with a benchmark were rescaled so that all items are on the same
scale (0 to 1). The benchmark scores are standardized to a mean of 50 for all participating
students, weighted by full and part-time attendance status, and a standard deviation of
twenty-five. Benchmark scores are then computed by averaging the scores on the
associated items (CCSSE, 2004b). Benchmarks can then be used by institutions to
compare themselves to the mean as well as to compare themselves to themselves and

80
gauge the impact of efforts intended to improve student learning and persistence
(CCSSE, 2006b).
CCSSE’s Retention Index
Three of CCSSE’s five benchmarks of student engagement, active and
collaborative learning, student-faculty interaction and support for learners comprise what
CCSSE has termed the Retention Index (CCSSE, 2006c). Theoretically, institutions can
improve student learning and retention, and their institutional retention rates by
improving and increasing practices measured by this index (CCSSE, 2006a; Marti, 2004).
The CCSSE Retention Index will serve as the independent variable in the first two
analyses and as the dependent variable in the third research question and analysis.
Active and Collaborative Learning
According to the CCSSE website, the basis for the benchmark for active and
collaborative learning (ACL) is described as follows: “Students learn more when they
are actively involved in their education and have opportunities to think about and apply
what they are learning in different settings. Through collaborating with others to solve
problems or master challenging content, students develop valuable skills that prepare
them to deal with the kinds of situations and problems they will encounter in the
workplace, the community, and their personal lives” (CCSSE, 2006). Students absorb
more through collaborative learning and team effort which reinforces skills in
communication and problem-solving (Ewell, & Jones, 1996). More succinctly, “good
learning, like good work, is collaborative and social…” (Chickering & Gamson, 1987, p.

81
4). Insofar as involvement and integration play a role in retention, collaborative
programming, especially in the classroom, is particularly important in commuter
institutions where student attachments may be weak (Tinto, 1993). Activities associated
with active learning include discussion, pair and group work, role playing and
cooperative learning (Braxton, Hirschy & McClendon, 2004). This benchmark consists of
seven questions from the CCSSE survey instrument. (See Appendix C).
Student-Faculty Interaction
Student interaction with faculty, whether inside or outside of class (Chickering &
Gamson, 1987; Lau, 2003; Pascarella & Terenzini, 1991, 2005; Tinto, 1993), and
whether on class projects, committee or community work appears to help students both
learn more effectively and to persist in their academic and career goals (Ewell & Jones,
1996; Kalsner, 1991; Pascarella, 1980; Pascarella & Terenzini, 1980; Pascarella &
Terenzini, 1991). Both the quality and frequency of faculty-student interaction appear to
have an impact on student persistence (Pascarella & Terenzini, 1991). Informal contacts
between students and faculty emerged in Pascarella’s (1980) view to be most influential
when they bridge the intellectual content to the student’s life outside the classroom.
These associations have been found to be statistically significant even when student
characteristics were controlled in the study (Pascarella, 1980). Student-faculty
interaction is critical to student retention (CCSSE, 2005). Low rates of student retention
are generally found in institutions with low rates of interaction between students and
faculty (Tinto, 1987). There are six survey items that comprise the student-faculty
interaction (SFI) benchmark. (See Appendix C).

82
Support for Learners
The support for learners (SFL) benchmark assesses practices associated with
supporting student success through cultivation of positive social and working
relationships on campus, providing services targeted to assist them with the development
of academic skills, as well as academic and career planning (CCSSE, 2006). The support
for learners benchmark accounts for research supporting the premise that students
achieve more when they experience the institution as supportive and having an abiding
concern for their success. Interactions with institutional representatives, be they faculty
or staff, may affect departure insofar as they reflect the level of commitment to individual
student welfare (Tinto, 1987). Focus groups conducted with low-wage working students
from six community colleges further supports this in mention of the importance of
support and services and interest in their well-being by college faculty and staff (Gooden
& Matus-Grossman, 2002). There are seven survey items that comprise this benchmark.
(See Appendix C).
Reliability and Validity
Indicators of the score reliability and validity of the Florida accountability
measures appear to be limited to narratives about promoting the accuracy and consistency
of the Student Data Base (CCTMIS, 2003; CCTMIS, 2005; OPPAGA, 1999). A
commitment to ensuring the reliability and validity of data used to calculate the
accountability measures is evidenced by protocols outlined in workbooks distributed and
facilitated discussions surrounding the topic at the Management Information Systems
(MIS) annual reports workshop for the 28 community college reports coordinators

83
(CCTMIS, 2003; CCTMIS, 2005). Definitions of data elements and procedures for
submitting, validating and verifying the data are prescribed. In an e-mail exchange about
the reliability and validity of the SDB with the Vice Chancellor responsible for much of
its oversight, it was noted that “One underlying principle to remember is that the SDB
was established as a reporting/compliance database not a research database so we have
taken something established for one purpose and are using it for another” (P. Windham,
personal communication, April 8, 2006).
As previously noted, CCSSE’s instrument, the Community College Student
Report, has its genesis in NSSE’s instrument, the College Student Report, and shares a
number of common survey questions. The score reliability and validity of the NSSE have
been extensively explored and demonstrated (Kuh, Hayek, Carini, Ouimet, Gonyea &
Kennedy, 2001, Kuh, 2002 as noted in Marti, 2004). Psychometric analyses were
conducted on the NSSE instrument after five different administrations of the survey to
test the score reliability and validity (Kuh, 2003). Survey responses were normally
distributed and skewness and kurtosis values were acceptable (Kuh, 2003). Furthermore,
focus groups were used to ensure that students understood the NSSE survey questions in
the manner intended and cognitive interviewing was conducted on questions revised for
the 2001 version of the instrument, both of which lend further credibility to the quality of
the questions that comprise the instrument.
The Community College Student Report benchmarks also closely approximate a
normal distribution and acceptable skewness and kurtosis values are reported by Marti
(2004). Normality is important with the CCSSE since benchmarks are presented in a
standardized format.

84
The score reliability of the CCSR and its component benchmarks were measured
through use of Cronbach’s alpha (Marti, 2004). Cronbach’s alpha is a generalized form
of the Kuder-Richarson formulas (Beckman, Ghosh, Cook, Erwin & Mandrekar, 2004)
“which estimates the reliability coefficient from the item inter-correlations” (Nunnally &
Bernstein, 1994, p. 246). It is used to determine if items are related to one another.
Benchmarks that comprise the Retention Index had the following values for alpha: active
and collaborative learning (.67); student-faculty interaction (.72) and support for learners
(.76) (Marti, 2004). Cronbach’s alpha values for the benchmarks are strong, despite not
all exceeding the “gold standard of .70” (Marti, 2006, p. 10).
Test-retest reliability was evaluated by comparing students’ responses to the
survey administered in more than one of their classes although only one survey from each
individual was included in overall analyses (Marti, 2006). Year to year comparisons
between 2003, 2004 and 2005 indicate that the instrument is measuring the same
constructs across time and that differences between subgroups are due to real differences
in means, variances and co-variances as opposed problems associated with the instrument
(Marti, 2006). Test-retest correlation values for the benchmarks that comprise the
Retention Index are: active and collaborative learning (r = .73), student-faculty
interaction (r = .73) and support for learners (r = .73) (Marti, 2006).
The score construct validity of the CCSR has been demonstrated through analyses
associating the benchmarks with the student outcome of grade point average (GPA)
(Marti, 2004). Two of the three benchmarks that comprise the Retention Index showed a
positive relationship between the benchmark and GPA: active and collaborative learning,
t (1, 52,705) = 18.90, p < .001 and student-faculty interaction, t (1, 52,650) = 12.72, p <

85
.001. The support for learners benchmark did not show a positive relationship with GPA:
t (1, 52,685) = .78, p = .44 (Marti, 2004). Although further research is recommended by
CCSSE, an explanation for the weaker relationship offered by CCSSE is that the support
for learners benchmark was intentionally designed to measure student services practices
that have been associated with student retention in previous research (Chaney, et al., 1998
as noted in Marti, 2006) as opposed to the other benchmarks which were designed to
more clearly measure student learning (Marti, 2004). Another explanation is that
students who have particular needs often have lower GPAs and often utilize student
services more frequently (Marti, 2006).
As a relatively new survey instrument, there is still validation work to be done.
There is an ongoing quest, by both NSSE and CCSSE for further evidence of concurrent
validity (Kuh, 2003; Marti, 2004). In an overview of the psychometric properties of the
CCSR, Marti (2004) states “While student engagement is certainly not the only factor
contributing to student success, future work should examine how it relates to direct
assessments of student learning outcomes in community colleges and to other important
outcomes including retention, transfer, graduation, and career successes” (Marti, 2004, p.
25). As previously stated, the first and second research questions of this study are
intended to test the validity of the CCSSE Retention Index as it relates to the student
outcome of retention as measured by the Florida accountability measure of student
Retention and Success.

86
Data Collection
The first and second research questions address institution level data. Data
collection was through secondary data sources consisting of survey results from CCSSE’s
survey instrument, the Community College Student Report, and retention rates for each
institution from the Florida state accountability measure of Retention and Success.
CCSSE institutional Retention Index scores for 2004 of the 28 Florida community
colleges were calculated from a partial data set of CCSR results provided by the Florida
Department of Education. The data set was received after approval of a Data Use
Agreement by the director of CCSSE.
Data used to calculate the Retention and Success accountability measure are
drawn from the statutorily mandated Student Data Base, which serves as the state
repository for student information. The accountability measures are computed and issued
by the Community College and Technical Center MIS (CCTMIS) bureau of the Florida
Department of Education. The measures are sent to the community colleges’ institutional
research officers on a regular basis. The report of the Retention and Success
accountability measure includes the numbers and percentages of students in the cohort by
degree program, ethnicity and part-time or full-time status for each college and for the
whole system (CCTMIS, 2005).
In order to preserve the anonymity of the institutions’ CCSSE data, the Florida
Department of Education provided a cross-walk in the data set that matched each
institution’s CCSSE Retention Index and Florida accountability measure retention rate.
The author did not receive data that linked particular results to named institutions.

87
The third research question addresses student level data. As previously
mentioned, data collection was through a secondary data source consisting of selected
survey results from CCSSE’s survey instrument. The 2004 Community College Student
Report consisted of more than 120 survey questions, all of which were not pertinent to
this study. The data set was received from the Florida Department of Education after
approval of a Data Use Agreement by the director of CCSSE. The CCSSE data set
consists of 20,581 student responses to the survey questions that comprise the Retention
Index as well as to requested demographic questions. Also included are institutional
level variables that distinguish each of the 28 colleges without revealing their identity,
and indicate the size of each institution, as operationally defined by CCSSE. Oversamples
were excluded, as requested, from the partial data set sent by the Florida Department of
Education.
Analysis Procedures
In order to answer Research Question 1, a correlation and simple linear regression
analysis will be conducted, using the CCSSE Retention Index as the independent variable
and the state retention rate provided in the Retention and Success accountability measure
as the dependent variable. Institutional level variables will be used. The accountability
measure retention rate for a cohort of students consists of the number of students
graduated, plus the number enrolled in good standing, plus the number enrolled who are
not in good standing as compared to the total cohort (CCTCMIS, 2005). The first
research question will examine if there is a linear relationship between these two
institutional level variables, measure the strength of the relationship between the

88
variables, and analyze whether the CCSSE Retention Index can be used to predict the
state retention rate.
To answer Research Question 2, a multiple linear regression will be conducted to
control for the retention rate of award type in exploring whether the CCSSE Retention
Index can be used to predict the state retention rate as defined in the Retention and
Success accountability measure. Institutional level variables will be used for this
analysis. The analyses used for the first and second research questions can detect only
one particular type of relationship between the variables, “namely, the linear relationship
between X and Y, or the relationship that can be described by a straight line” (Keppel &
Zedek, 1989, p. 55).
To answer Research Question 3, a Nested or Hierarchical Analysis of Variance
(ANOVA) will be conducted using the 20,581 students’ responses to survey items that
comprise the CCSSE Retention Index. This will entail use of student level variables. The
analysis is to determine if there are mean differences in the Retention Indices of males
and females from different racial or ethnic groups while accounting for the nested or
potential nuisance variable of institution. Assuming a crossed design when neglecting the
potential impact of a nested variable can lead to incorrect interpretation of the results
(Lomax, 2001; Roberts, 2000). As stated previously, institutions are not identified by
name in the dataset. A variable does indicate that the student level data is from one of the
28 Florida community colleges, which allows for the analysis of the nested factor.

89
Summary
Secondary data sources will be used to conduct analyses to answer three different
research questions pertaining to CCSSE’s Retention Index. The first two questions will
be analyzed using institution level data and the third question will be analyzed using
student level data. The purpose of the first two questions is to further examine the
validity of CCSSE’s Retention Index against the student outcome of retention as
measured by the retention rate from Florida’s Retention and Success accountability
measure. Validating CCSSE benchmarks against the student outcome of retention has
been recommended by CCSSE (Marti, 2004; Marti, 2006). The purpose of the third
question is to examine whether there are mean differences in the Retention Index scores
of different sub-groups of students, a practice also recommended by CCSSE in order to
gauge the effectiveness of intervention strategies used with different populations (Marti,
2004; Marti, 2006).
90
CHAPTER 4
RESULTS
This chapter includes the findings from quantitative analyses conducted with data
collected through secondary data sources that included 2004 results of the Community
College Survey of Student Engagement and retention rates of the Florida community
colleges from the Fall 2000 cohort (who were tracked through Spring 2004) from the
Florida accountability measure of Retention and Success. Institution level data was
examined to explore the relationship between CCSSE’s Retention Index and the Florida
retention rate from the state accountability measure of Retention and Success. This was
undertaken, in part, since CCSSE has recommended ongoing validation of its relatively
new survey instrument (Marti, 2004). Student level data was also examined to explore if
there were differences in the CCSSE Retention Index scores of students from different
racial and gender groups when accounting for the potential influence of institution
attended.
Providing further context, the sample for the institutional level data consisted of
the Florida community colleges. The sample for the question that examined student level
data was Florida community college students.
There are 28 public community colleges in Florida that, during the 2003-2004
academic year, enrolled more than 800,000 students. Collectively, the colleges have 52
campuses and 172 sites and are within commuting distance for more than 90 percent of
the state’s population. The smallest college reported a headcount of 1130 in Fall 2004,
and the largest reported a headcount of 57,026 (FL DOE, 2005). CCSSE operationally

91
defines colleges as small (less than 4,500 students), medium (4,500-7,999), large (8,000-
14,999) and extra-large (15,000 plus). According to CCSSE, Florida has six small
community colleges, six medium sized colleges, nine large and seven extra-large
community colleges (CCSSE, 2004b; CCSSE, 2006e).
Most students are classified as seeking Associate of Arts degrees whether
considering only college credit programs, or when considering enrollments in adult
education, career and workforce education, as well as recreation and leisure where they
then comprise 30 percent of enrollments. Associate of Science degree seeking students
comprise nearly 10 percent of the enrollments and College Credit Certificate or Applied
Technical Diploma students comprise less than 2 percent of the enrollments (FL DOE,
2005). The student body is mostly female (61%), attending part-time (62%) with an
average student age of 27 years (FL DOE, 2005). Thirty-nine percent of the headcount
during the 2003-2004 academic year consisted of minority students. Blacks comprised 44
percent of minority enrollments and Hispanics constituted 48 percent of the minority
student population (FL DOE, 2004).
According to the U.S. Department of Education, nearly 55 percent of students
who attended community colleges in 2002 received some type of financial aid, which is
considered an indication that most students came from middle and low socioeconomic
strata (Boulard, 2004). Another source indicated that only 47 percent of community
college students received some form of financial aid, most of which (40 percent) was in
the form of grants (Horn & Nevill, 2006). Relatively few community college students
take out student loans, which is explained in part by the large percentage of these students
who work full time, nearly full-time, and attend part-time (Horn & Nevill, 2006).

92
Research Question 1
Research Question 1 was stated as follows: Can the 2004 CCSSE Retention
Index be used to predict Florida’s state retention rate as measured by the Retention and
Success accountability measure? Data for the first research question were collected
through secondary data sources provided by the Florida Department of Education.
Institutional identities were not provided in the data set. CCSSE institutional benchmark
scores for each of the 28 Florida community colleges were provided by DOE after
approval by CCSSE. The institutional CCSSE Retention Index scores were then
calculated by the author after consultation with CCSSE, by averaging the scores of the
three benchmarks that comprise the Index: active and collaborative learning, student-
faculty interaction and support for learners. The institutional retention rates, as defined
by the Florida accountability measure for Retention and Success, were also provided by
DOE. The retention rate from the accountability measure consists of the number of
students graduated, plus the number enrolled in good standing, plus the number enrolled
who are not in good standing as compared to the total cohort. The cohort of students
tracked to determine the retention rate includes only first time in college students who
took an entry level test, and earned at least18 credit hours if enrolled in an A.A., A.S. or
A.A.S. or earned at least 9 credit hours if enrolled in a P.S.V.C. or A.T.D. program.
Descriptive statistics generated in SPSS yielded measures of variability and central
tendency as reported in Table 2.
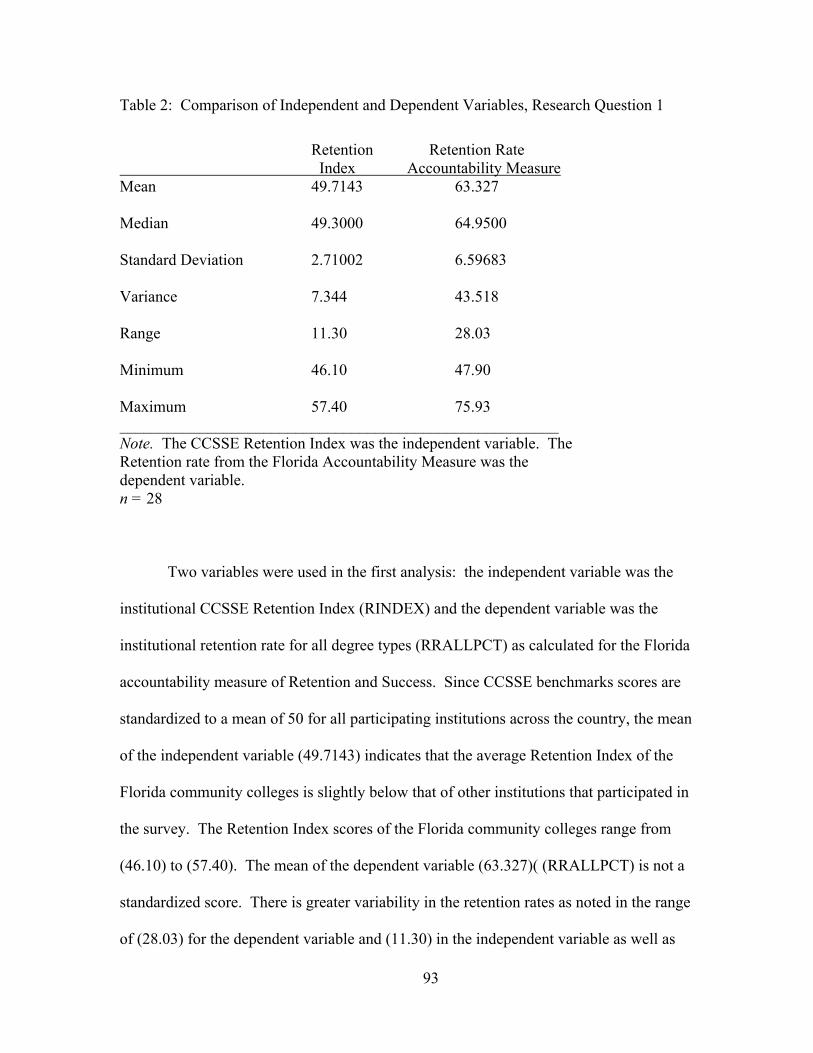
93
Table 2: Comparison of Independent and Dependent Variables, Research Question 1
Retention Retention Rate Index Accountability Measure Mean 49.7143 63.327 Median 49.3000 64.9500 Standard Deviation 2.71002 6.59683 Variance 7.344 43.518 Range 11.30 28.03 Minimum 46.10 47.90 Maximum 57.40 75.93 _______________________________________________________ Note. The CCSSE Retention Index was the independent variable. The Retention rate from the Florida Accountability Measure was the dependent variable. n = 28
Two variables were used in the first analysis: the independent variable was the
institutional CCSSE Retention Index (RINDEX) and the dependent variable was the
institutional retention rate for all degree types (RRALLPCT) as calculated for the Florida
accountability measure of Retention and Success. Since CCSSE benchmarks scores are
standardized to a mean of 50 for all participating institutions across the country, the mean
of the independent variable (49.7143) indicates that the average Retention Index of the
Florida community colleges is slightly below that of other institutions that participated in
the survey. The Retention Index scores of the Florida community colleges range from
(46.10) to (57.40). The mean of the dependent variable (63.327)( (RRALLPCT) is not a
standardized score. There is greater variability in the retention rates as noted in the range
of (28.03) for the dependent variable and (11.30) in the independent variable as well as

94
the variance which was (43.518) for the dependent variable and (7.344) for the
independent variable. The average dispersion or standard deviation of each of the
distributions was (2.71002) for the Retention Index and (6.59683) for the retention rate.
A simple linear regression analysis was conducted to examine the relationship
between institutional CCSSE Retention Index scores and institutional retention rates from
the Florida accountability measure for Retention and Success for the 28 community
colleges in Florida. The intent was to determine if a linear relationship exists between the
two and whether the CCSSE Retention Index can be used to predict the institutional
retention rate from the Florida accountability measure. The null hypothesis was that the
regression coefficient (i.e. the slope) was equal to zero.
Initial review of a scatterplot showed little evidence of a linear relationship. Since
a line of best fit depicted a hint of a slope the regression analysis was conducted to
determine if there was a relationship of statistical significance. Simple linear regression
assumptions were tested yielding mixed results with several causes for concern. Review
of scatterplots for Cook’s distance and the DFBETA for the independent variable
suggested several influential points. The influential points were not removed both
because of the relatively small sample size, but also because the regression was
conducted primarily as an exercise to further validate the observation of little or no linear
relationship evidenced in the scatterplot.
The small value of the correlation coefficient (R = .058) indicated a weak
relationship between the independent and dependent variables. The proportion of
variance explained by the model, or the effect size (R2 = .003) was very small, indicating
that three tenths of a percent of the variation in the state retention rate is accounted for by

95
its linear relationship with the CCSSE Retention Index. Furthermore, Adjusted R2 as a
negative value (-.035) indicated that the model fits the data very poorly. The Regression
sum of squares was small (4.012) compared to the Residual sum of squares (1170.979)
and total sum of squares (1174.991). The Residual sum of squares reflects the regression
error (Garson, 2006). In addition to R2 which is the coefficient of determination, the
large Residual sum of squares value (1170.979), and large regression error it reflects, as
well as the relatively small value of the Regression sum of squares (4.012) indicate that
the model does not explain much of the variability in the dependent variable (Pedhazur,
1997).
The regression equation for predicting the state retention rate as a result of the
CCSSE Retention Index is: State Retention Rate = (56.256) + (.142) (CCSSE Retention
Index). The model predicts that a one unit change in the CCSSE Retention Index results
in an increase of .142 in the state retention rate. The regression model is not statistically
significant (p =.768). Based on institution level data, the CCSSE Retention Index does
not appear to be a good predictor of the Florida retention rate from the state
accountability measure for Retention and Success, F (1, 28) = .089, p = .768.
Ancillary Analysis
Scatterplots were run to determine if there was evidence of a linear relationship
between each of the three benchmarks that comprise the CCSSE Retention Index and the
retention rate from the Florida accountability measure of Retention and Success. This
was done both because of curiosity and upon recommendation by CCSSE in their review
of the author’s proposal for this study. “The more you aggregate the data for analysis the

96
less powerful your analyses are likely to be. For that reason, you may wish to consider at
a minimum looking at retention relationships with the benchmarks one at a time, rather
than (or in addition to) the combined benchmarks in the ‘retention index’” (K.
McClenney, personal communication, January 20, 2006).
Initial review of the scatterplots, including lines of best fit, showed little if any
linear relationship. The slopes of the lines of best fit were almost non-existent and
seemed comparable to that noted in the scatterplot of the CCSSE Retention Index and the
Florida retention rate. With little to no evidence of linear relationships between the three
individual benchmarks that comprise the CCSSE Retention Index and the institutional
retention rate, as well as the intent of this study to examine not only the Florida
accountability measure that calculates institutional retention rates, but the CCSSE
Retention Index per se, no additional regression models were generated to further verify
this observation.
Research Question 2
Research Question 2 was stated as: Can the 2004 CCSSE Retention Index be used
to predict an institution’s state retention rate as measured by the Florida Retention and
Success accountability measure when controlling for the retention rate of different degree
types awarded (Associate of Arts, Associate of Science and Associate of Applied
Science, and Postsecondary Vocational Certificate and Applied Technology Diplomas)?
Data for the second research question were collected in the same manner as that
explained above for data collection for the first research question. There were four
independent variables that consisted of the retention rates of Associate of Arts students
97
(RRAAPCT), Associate of Science and Associate of Applied Science (RRASPCT), and
Post Secondary Vocational Certificate and Advanced Technical Diploma seeking
students (RRATDPCT) as well as the CCSSE Retention Index of the 28 Florida
community colleges (RINDEX). Although each institution’s retention rates were
calculated based on the number of degrees and certificates awarded by each school, the
total number of awards granted in the state were as follows: A.A. degrees (n = 13,484),
A.S. and A.A.S. degrees (n = 2653) and A.T.D. certificates (n = 792). The dependent
variable was the overall institutional retention rate which includes all college credit award
types as calculated for the Florida accountability measure (RRALLPCT). Descriptive
statistics generated in SPSS yielded measures of variability and central tendency as
reported in Table 3.
There were 28 valid scores for each variable. Measures of central tendency and
variability of the CCSSE Retention Index and the dependent variable were reported
above under Research Question One. The mean (82.7571) and median (87.500) of the
institutional retention rates of A.T.D. seeking students were greater than those of either
A.A. seeking students which had a mean of (62.9171) and a median of (64.1250) or A.S.
and A.A.S. seeking students (60.9407) and a median of (62.0700). The institutional
retention rates of A.T.D. seeking students also had the greatest variance of all the
variables (448.398) and the largest standard deviation (21.17541) with a minimum value
of (0.00) and a maximum value of (100.00).

98
Table 3: Comparison of Independent and Dependent Variables, Research Question 2
Retention Rate from FL Accountability Measure Retention AA Degree AS Degree ATD All Awards __________________________Index_________________________________________________________ Mean 49.7143 62.9171 82.7571 82.7571 63.3271
Median 49.3000 64.1250 62.0700 87.5000 64.9500
Standard Deviation 2.71002 7.31631 11.16719 21.17541 6.59683
Variance 7.344 53.528 124.706 448.398 43.518
Range 11.30 32.34 43.33 100.00 28.03
Minimum 46.10 48.98 42.55 .00 47.90
Maximum 57.40 81.32 85.88 100.00 75.93
_________________________________________________________________________________ Note. Independent variables were the CCSSE Retention Index, the Retention Rates for AA Degrees, AS Degrees, and Applied Technical Diplomas. The dependent variable was the Retention rate for all awards from the Florida Accountability Measure. n = 28

99
A multiple linear regression analysis was conducted to determine if the overall
Florida retention rate of community colleges from the state accountability measure can be
predicted by the CCSSE Retention Index as well as the retention rates of Associate of
Arts, Associate of Science and Associate of Applied Science, and Post Secondary
Vocational Certificate and Advanced Technical Diploma seeking students The null
hypothesis was that the regression coefficients or the slopes of the predictor variables
were equal to zero.
Initial review of Cook’s distance, centered leverage values, and scatterplots
suggested that there may be leverage points. An observed Cook’s Distance value of
1.009 is troublesome; a Centered Leverage Value of .663 also causes concern. A
scatterplot of studentized residuals suggests an outlier in the retention rate of Post
Secondary Vocational Certificate and Advanced Technical Diploma seeking students. A
scatterplot of Standardized DFBeta for this same variable revealed a data point that fell
beyond an absolute value of two, which further supports the possibility of a leverage
point.
Regression assumptions were tested and met but with reservations. Scatterplots
for the dependent to independent variables indicated that at least two of the independent
variables – the retention rate for AA degree seeking students, and the retention rate of AS
and AAS degree seeking students - were linearly related, which causes concerns, among
them, redundancy (StatSoft, 2006). The relationship appeared weak at best for the other
two independent variables. Scatterplots of studentized residuals to unstandarized
predicted values and to each independent variable indicated that the assumption of

100
linearity was met as the data points were primarily, although not completely, located
within a band of an absolute value of two.
Unstandardized residuals were reviewed for normality. Skewness (.219) and
kurtosis (-.170) statistics indicated that the assumption of normality was met, as did the
Shapiro Wilks tests (W = .978, df = 28, p = .800). The Q-Q plot indicated normality,
while the histogram and stem and leaf plots indicated some non-normality which could
be due to the relatively small sample size of 28. The boxplot of both unstandardized and
studentized residuals revealed no outliers.
The assumption of independence was supported by scatterplots of studentized
residuals to unstandardized predicted values and by scatterplots of studentized residuals
to each of the independent variables with one exception. Residuals in the scatterplot of
the retention rate for PSVC and ATD students displayed all but one of the data points
clustered above values of 55. Such a pattern suggests that the assumption of
independence may have been violated with this particular variable, although the pattern
may also be due to the small sample size.
A scatterplot of studentized residuals to unstandardized predicted values appeared
to support the assumption of homogeneity as there was no clear pattern to the data points
despite some clustering. This suggests that the variance of one group, the dependent
variable, is not different from the independent variables (Lomax, 2001).
Scatterplots of independent variables did not suggest that multicollinearity was a
problem, nor did Tolerance values which were all greater than .10 (.915, .827, .871,
.825). Variance inflation factor, as shown in Table 4, also did not cause concern as all

101
values were well under 10, ranging from 1.092 to 1.213. However, multiple eigenvalues
that were close to zero, ranging from .001 to .043 were problematic as were at least three
of the condition indices that were close to 15 (14.521), in excess of 15 (24.532) and in
excess of 30 (62.822). Eigenvalues and conditional indices suggest that as many as three
of the independent variables are highly intercorrelated and that there is a problem of
multicollinearity (see Table 4). Since multicollinearity restricts the usefulness of a
model, it has been suggested that one way of dealing with the problem is to remove one
or more of the correlated independent variables (Lomax, 2001). This, however, would
likely render use of a simple linear regression with the same variables used in the first
research question.
Table 4: Collinearity Diagnostics of Independent Variables
Condition Factor Tolerance VIF Eigenvalue Index___ (Constant) 4.925 1.000 Retention Index .916 1.092 .043 10.757 AA Retention Rate .827 1.210 .023 14.521 AS Retention Rate .871 1.149 .008 24.532 ATD Retention Rate .825 1.213 .001 62.822 _____________________________________________________________________ Note. Independent variables were the CCSSE Retention Index, the Retention Rates for AA Degrees, AS Degrees, and Applied Technical Diplomas. n = 28

102
A large value of the multiple correlation coefficient (R = .986) indicated a strong
relationship between the independent and dependent variables. The coefficient of
multiple determination, or effect size (R2 = .973) indicated that 97% of the variation in
the dependent variable (RRALLPCT) is explained by the independent variables (Green &
Salkind, 2005; Keppel & Zedeck, 1989). Since the coefficient of multiple determination
shows greater bias with a small sample size (n =28) and a large number of predictors (m
= 4), it is important to note an Adjusted R2 value (.968) which compensates for a typical
overestimation of the population effect size (Green & Salkind, 2005).
The relatively large Regression Sum of Squares (1143.339) as compared to the
Total Sum of Squares (1174.991) indicated that the model explained much of the
variability. The model is statistically significant (p = .000). Collectively, the independent
variables appear to be a good predictor of the institutions’ state retention rates from the
Florida’s state accountability measure for Retention and Success F (4, 28) = 207.704.
Partial correlation coefficients of the independent variables with the dependent
variable (RRALLPCT) were as follows: CCSSE Retention Index (.041), retention rate
for A.A. degrees (.979), retention rate for A.S. and A.A.S. degrees (.795) and retention
rate for Applied Technical Diplomas (.362) (Table 5).

103
Table 5: Correlation Coefficients: Relationship of Independent Variables
to Dependent Variable
Factor Zero-Order Partial Part___ Retention Index .058 .041 .007 AA Retention Rate - .957 .979 .792 AS Retention Rate .477 .795 .215 ATD Retention Rate .430 .362 .064 ____________________________________________________________ Note. Independent variables were the CCSSE Retention Index, the Retention Rates for AA Degrees, AS Degrees, and Applied Technical Diplomas. n = 28
By squaring the partial correlation coefficients, the model indicates that less than
1 percent (.17%) of the variance in the dependent variable that is not explained by the
other independent variables is explained by the CCSSE Retention Index. Likewise, the
percent of variance in the dependent variable explained by the remaining independent
variables is as follows: retention rate of A.A. degree awards (96%); retention rate of A.S.
and A.A.S degree awards (63%) and retention rate of A.T.D. awards (13%). Beta
coefficients also indicated that two of the independent variables contribute the most to the
model. A strong correlation, however, does not infer causality; it only establishes that
two variables are related in some way (Lomax, 2001)
The retention rates for both A.A. degrees and A.S./A.A.S. degrees thus appear to
be much more influential in the model. This may be explained, at least in part, by the
greater number of these types of awards as compared to the number of A.T.D. awards

104
granted. Again, although each institution’s retention rates are calculated by DOE based
on the number of degrees and certificates awarded by each institution, data available
indicate that, the number of awards granted in the state were as follows: A.A. degrees (n
= 13484), A.S. and A.A.S. degrees (n = 2653) and A.T.D. certificates (n = 792). The
high proportion of A.A. degrees that comprise the overall institutional retention rate, as
compared to the number of A.S./A.A.S. and A.T.D. awards, may be cause for concern
insofar as it acts as a common element in the correlation ratios, thus lending itself to a
potential for bias or spurious correlation (Dunlap, Dietz & Cortina, 1997). There has
been much debate about the prudence of correlating ratio variables that share components
(Dunlap, Dietz & Cortina, 1997; Kritzer, 1990), although studies have demonstrated that
these are valid forms of analysis that do not distort or bias the relationship between ratio
variables with common elements (Kasarda and Nolan (1979) as noted in Macmillan and
Daft, 1980; Macmillan and Daft, 1980).
Research Question 3
Research Question 3 was stated as: What, if any, mean differences are there in
the 2004 CCSSE Retention Index scores of males and females from different racial or
ethnic groups across the Florida community colleges when accounting for the potential
influence of institution attended? Data were collected through secondary data sources as
described at the beginning of this chapter, as well as in Chapter Three. There were
20,581 students in the dataset, some of which had missing data. There were 618 cases
with one or more missing values; some students had multiple missing values.

105
Frequencies and cross-tabs indicated an unbalanced design, which is not unusual with
large datasets (Payne, 2003). The independent variable for race (RERACE) had seven
levels: American Indian or other Native American; Asian, Asian-American or Pacific
Islander; Native Hawaiian; Black, or African American, Non-Hispanic; White, Non-
Hispanic; Hispanic, Latino, Spanish; and Other. The independent variable for gender
(SEX) had two levels: Male and Female. The smallest cell size from a crosstab of race
and sex, was of Native Hawaiian females which contained 17 cases, while the largest cell
size from the crosstab, which was for White females, contained 7874 cases. There are
differing opinions and recommendations for dealing with unbalanced designs (Karpinski,
2004). Although statistical packages such as SPSS can accommodate unbalanced designs,
especially when using Type III Sum of Squares (Green & Salkind, 2005; Lomax, 2001)
there remain concerns about the reasons for the imbalance which compromises the ability
to accurately interpret results (Keppel & Wickens, 2004).
Therefore, only the three most represented levels of race in the dataset were
considered in the analyses. The unweighted cases consisted of the following: Blacks, or
African Americans (n =2574); Whites, Non-Hispanics (n = 13140); and Hispanic, Latinos
(n = 2483). Since this dataset would also generate an unbalanced design, the analysis
was run twice: first with the unbalanced dataset, and a second time with a randomly
selected group of Whites that more closely approximated the size of the other two groups.
This approach responded to differing expert opinions and allowed for comparison of
results between the balanced and unbalanced analysis. Unweighted sample sizes for the
balanced analysis were: Blacks, or African Americans (n =2574); Whites, Non-

106
Hispanics (n = 2498); and Hispanic, Latinos (n = 2483). Results of both analyses are
discussed under separate headings below.
Students are nested within the 28 institutions. Therefore, syntax was applied in
SPSS to indicate that students, by race and sex (RERACE*SEX) were nested within the
institution (ccsse_id). The variable provided by CCSSE to weight cases (iweight) was
applied to accommodate for the disproportionate number of full-time students in the
sample so that the sample more closely reflected the community college student
population which is comprised mostly of part-time students. The dependent variable was
student level CCSSE Retention Index (STRINDEX) scores.
Unbalanced Design
The dataset was generated by excluding cases other than Whites (n =13,140),
Blacks (n = 2574) and Hispanics (n = 2483) so that it was comprised of 18,197 total
cases. The dataset consisted of 14 percent Black, 72 percent White and 14 percent
Hispanic students. There were 23 missing cases of sex. A large number of outliers were
depicted in boxplots of the data examined prior to running the analysis as well as in the
boxplot of residuals that were reviewed after running the analyses. Keppel and Wickens
(2004) recommend particular consideration of outliers that extend three or more standard
deviations from the mean. More than thirty outliers were found upon examination of
standardized residuals of three or greater. Outliers were not removed for three primary
reasons: 1) most datasets, especially large ones, contain some extreme or
“overdispersed” scores which “are a valid part of the distribution and should be included

107
in the analysis” (Keppel & Wickens, p. 146, 2004); 2) results from both a balanced and
unbalanced analysis of the data are presented; and 3) similar results were found from an
exploratory analysis run on the balanced dataset after removing 117 outliers from the
initial boxplot and 2 outliers identified by the boxplot of residuals. The 119 outliers
removed in the exploratory analysis represent approximately one and a half percent of the
sample size of the balanced design.
A two factor fixed-effects nested ANOVA was conducted: 1) to determine mean
differences in the CCSSE Retention Index scores of students based on race; 2) to
determine mean differences in the CCSSE Retention Index scores of students based on
sex; 3) to determine mean differences in the CCSSE Retention Index scores of students
based on the interaction of race and sex; and 4) to determine mean differences in the
CCSSE Retention Index scores of students between institutions who are from the same
race and gender group. Students were nested within institution. This necessitated a
nested or hierarchical ANOVA since this is not a crossed design in which students’
scores could be considered as if they had attended each of the 28 institutions. Institutions
were thus included as a nested factor with 28 levels (28 different community colleges in
Florida). Since these institutions were the only ones available, the institution variable
(ccsse_id) was included as a fixed, rather than random, effect.
The following null hypotheses were tested at an alpha of .05:
H01: The mean CCSSE Retention Index scores for each level of race (RERACE)
are equal
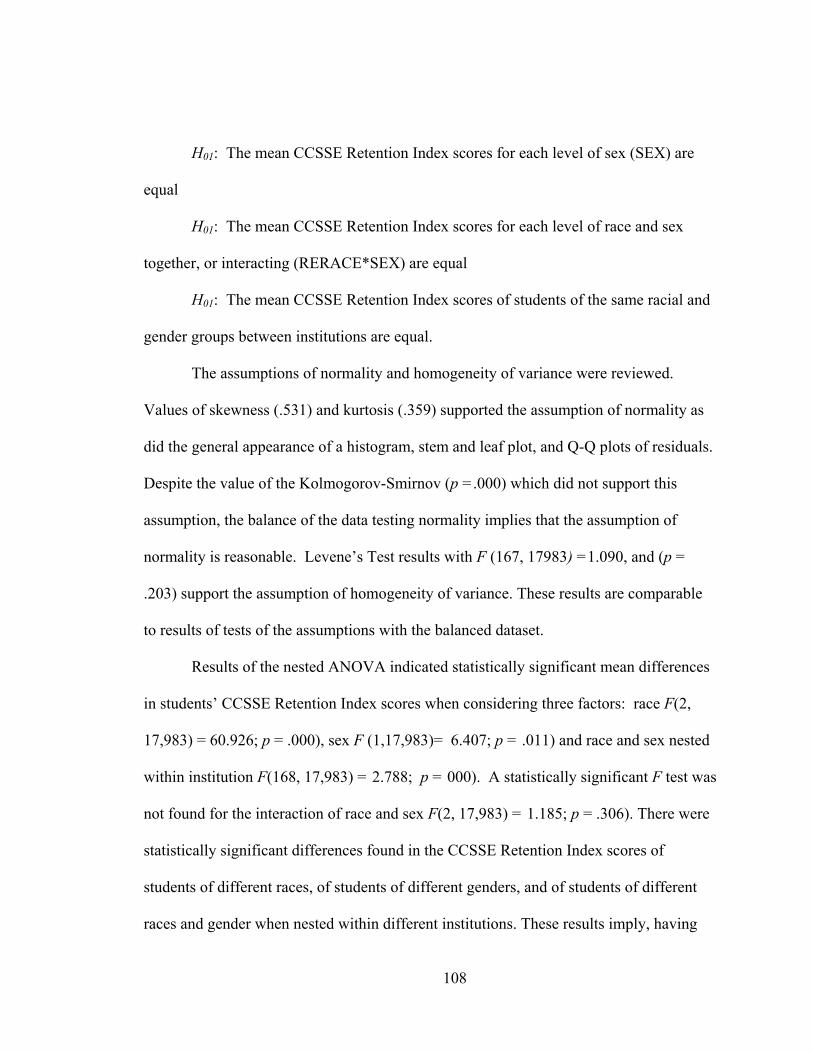
108
H01: The mean CCSSE Retention Index scores for each level of sex (SEX) are
equal
H01: The mean CCSSE Retention Index scores for each level of race and sex
together, or interacting (RERACE*SEX) are equal
H01: The mean CCSSE Retention Index scores of students of the same racial and
gender groups between institutions are equal.
The assumptions of normality and homogeneity of variance were reviewed.
Values of skewness (.531) and kurtosis (.359) supported the assumption of normality as
did the general appearance of a histogram, stem and leaf plot, and Q-Q plots of residuals.
Despite the value of the Kolmogorov-Smirnov (p =.000) which did not support this
assumption, the balance of the data testing normality implies that the assumption of
normality is reasonable. Levene’s Test results with F (167, 17983) =1.090, and (p =
.203) support the assumption of homogeneity of variance. These results are comparable
to results of tests of the assumptions with the balanced dataset.
Results of the nested ANOVA indicated statistically significant mean differences
in students’ CCSSE Retention Index scores when considering three factors: race F(2,
17,983) = 60.926; p = .000), sex F (1,17,983)= 6.407; p = .011) and race and sex nested
within institution F(168, 17,983) = 2.788; p = 000). A statistically significant F test was
not found for the interaction of race and sex F(2, 17,983) = 1.185; p = .306). There were
statistically significant differences found in the CCSSE Retention Index scores of
students of different races, of students of different genders, and of students of different
races and gender when nested within different institutions. These results imply, having

109
tested at a significance level of .05, that there is about a 95 percent chance that
differences in students’ CCSSE Retention Index scores were likely due to real differences
as opposed to mere chance.
Calculation of eta squared, however, which is based on the sum of squares of the
factor divided by total sum of squares, indicated that very little of the variation in CCSSE
Retention Index scores was accounted for by the factors considered. Although partial eta
squared is automatically generated by SPSS, eta squared was calculated and reported due
to its additive nature (Levin & Hullet, 2002). (see Table 6). Values of eta squared
indicate that although the factors were found to be statistically significant, the effect size,
or proportion of the variance in the mean CCSSE Retention Index scores accounted for
by each factor or the nested factor were all less than one percent.
Table 6: Results of Unbalanced Nested ANOVA
Factor df F p ή 2__
Race 2 / 17983 60.926 .000* .0009
Sex 1 / 17983 6.407 .011* .00005
Race and Sex 2 / 17983 1.185 .306 .00002
Students by Race and Sex 162 /17983 2.788 .000* .0032 Nested within Institution ___________________________________________________________________ n = 18,197 *p < .05

110
The observed power was low for testing race and sex (.261) indicating there may
not have been sufficient power in the test to detect a difference in means based on the
interaction of these factors if there really was a difference. There was sufficient power to
test the differences in the dependent variable, or the means of students CCSSE Retention
Index scores, based on race (1.000) and institution nested within race and sex (1.000),
and sufficient or nearly sufficient power to test the variable of sex (.716).
Review of descriptive statistics and estimated marginal means shed some light on
findings from the omnibus F test. Race was found to be a statistically significant factor
in mean differences found in students’ CCSSE Retention Index scores, with Blacks
having the highest mean (54.061) and Whites having the lowest mean (48.315). (see
Table 7). Multiple comparisons using Tukey HSD indicated that there were statistically
significant differences in students’ CCSSE Retention Index scores between all groups for
all group comparisons. The greatest mean difference in students’ CCSSE Retention Index
scores was between Blacks and Whites (5.9443) and the least mean difference was
between Whites and Hispanics (-1.9818), with a mean difference of (3.9625) between
Blacks and Hispanics.
The F test indicated there were statistically significant (p = .011) differences in
scores based on sex; descriptive statistics showed mean scores of males (50.434) and
females (51.894) which are depicted in Table 7. No statistical significance was found in
the mean differences of CCSSE Retention Index scores of students across all institutions
based on both race and sex. (see Table 7).

111
Descriptive statistics showed differences in mean scores of students from the
same racial and gender groups between institutions and ranged from a low score of
38.157 to a high score of 70.071. (see Table 7).
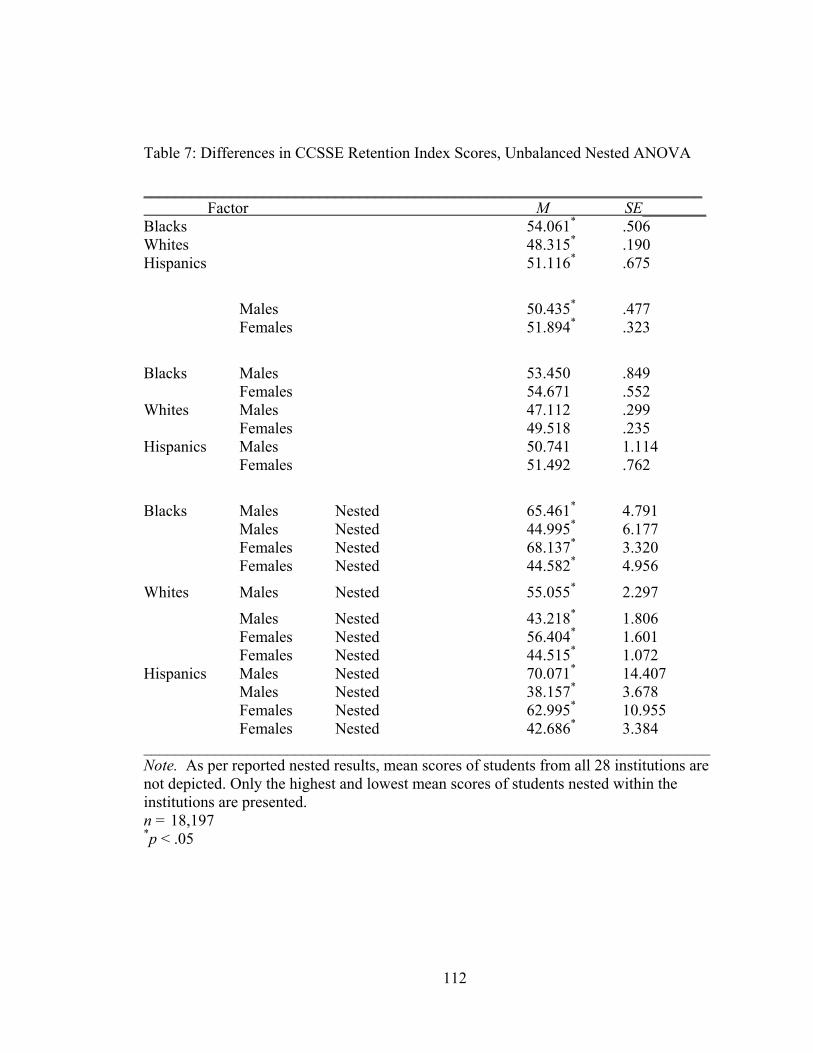
112
Table 7: Differences in CCSSE Retention Index Scores, Unbalanced Nested ANOVA
______________________________________________________________________ Factor M SE________ Blacks 54.061* .506 Whites 48.315* .190 Hispanics 51.116* .675
Males 50.435* .477 Females 51.894* .323
Blacks Males 53.450 .849 Females 54.671 .552 Whites Males 47.112 .299 Females 49.518 .235 Hispanics Males 50.741 1.114 Females 51.492 .762
Blacks Males Nested 65.461* 4.791 Males Nested 44.995* 6.177 Females Nested 68.137* 3.320 Females Nested 44.582* 4.956
Whites Males Nested 55.055* 2.297
Males Nested 43.218* 1.806 Females Nested 56.404* 1.601 Females Nested 44.515* 1.072 Hispanics Males Nested 70.071* 14.407 Males Nested 38.157* 3.678 Females Nested 62.995* 10.955 Females Nested 42.686* 3.384 _______________________________________________________________________ Note. As per reported nested results, mean scores of students from all 28 institutions are not depicted. Only the highest and lowest mean scores of students nested within the institutions are presented. n = 18,197 *p < .05

113
The results infer that there is a difference in students’ CCSSE Retention Index
scores, on average, based on race (RERACE) and based on sex (SEX). The results also
suggest that there is a difference in students’ CCSSE Retention Index scores
(STRINDEX), on average, between institutions (ccsse_id) when examining the scores of
students from the same race and gender groups. Furthermore, the results suggest that
there are no statistically significant differences in students’ CCSSE Retention Index
scores, on average, based on the interaction of race and sex (RERACE*SEX) across
institutions.
Balanced Design
There was a total of 18,197 cases in the dataset comprised of Blacks (n = 2574),
Whites (n = 13,140), and Hispanics (n = 2483). An approximately balanced dataset was
generated by choosing commands in SPSS to randomly select 19 percent of the 13,140
cases of Whites, yielding 2498 cases which is the approximate sample size of the other
races represented in the analysis. These 2498 cases of Whites were merged with all the
cases of Blacks and Hispanics to generate a dataset comprised of 7555 cases. The sample
consisted of 34 percent Black, 33 percent White and 33 percent Hispanic students.
Sample sizes are unweighted. There were 22 cases in the dataset that were missing some
data. Boxplots depicted a large number of outliers. Although more than 100 were
identified through a successive series of boxplots, these outliers comprised approximately
one percent of the sample. They were not removed prior to running the analysis.
Boxplots of standardized residuals also showed a large number of outliers. Thirty-four

114
outliers - less than one half of one percent of the sample - with a standard deviation of
three or greater were counted in the standardized residuals. The outliers were not
removed for three primary reasons: 1) most data sets, especially large ones, contain some
extreme scores, or are “overdispersed” which “are a valid part of the distribution and
should be included in the analysis” (Keppel & Wickens, p. 146, 2004); 2) results from
both a balanced and unbalanced analysis of the data are provided; and 3) similar results
were found from an exploratory analysis run on only the balanced dataset after removing
117 outliers from the boxplots reviewed prior to running the analysis and 2 outliers
identified by the boxplot of residuals. The 119 outliers removed in the exploratory
analysis comprised 1.6 percent of the total sample of 7555.
A two factor fixed-effects nested ANOVA was conducted: 1) to determine mean
differences in the CCSSE Retention Index scores of students based on race; 2) to
determine mean differences in the CCSSE Retention Index scores of students based on
sex; 3) to determine mean differences in the CCSSE Retention Index scores of students
based on the interaction of race and sex; and 4) to determine mean differences in the
CCSSE Retention Index scores of students between institutions who are from the same
race and gender group. Students were nested within institution. This necessitated a
nested or hierarchical ANOVA since this is not a crossed design in which students’
scores could be considered as if they had attended each of the 28 institutions. Institutions
were thus included as a nested factor with 28 levels (28 different community colleges in
Florida). Since these institutions were the only ones available, the institution variable
(ccsse_id) was included as a fixed, rather than random, effect.

115
The following null hypotheses were tested at an alpha of .05:
H01: The mean CCSSE Retention Index scores for each level of race (RERACE)
are equal
H01: The mean CCSSE Retention Index scores for each level of sex (SEX) are
equal
H01: The mean CCSSE Retention Index scores for each level of race and sex
together, or interacting (RERACE*SEX) are equal
H01: The mean CCSSE Retention Index scores of students of the same racial and
gender groups between institutions are equal.
The assumptions of normality and homogeneity of variance were reviewed.
Values of skewness (.462) and kurtosis (.234) supported the assumption of normality as
did the appearance of a histogram, stem and leaf plot, and Q-Q plots of residuals.
However, Kolmogorov-Smirnov (p = .000) did not support this assumption. Violations
of normality are not of great concern since ANOVA can withstand moderate violations
and they are minimal with balanced or nearly balanced designs (Lomax, 2001).
Therefore, the assumption of normality seems reasonable. Levene’s Test results with
F(167, 7365) =1.031, and (p = .377) supports the assumption of homogeneity of variance.
These results are comparable to results of tests of the assumptions with the unbalanced
dataset.
Results of the ANOVA indicated a statistically significant effect on the dependent
variable of students’ CCSSE Retention Index scores from three factors: race F (2, 7365)
= 31.274; p = .000), sex F(1, 7365) = 5.071; p = .024) and race and sex nested within

116
institution F (162, 7365)= 1.792; p = 000). A statistically significant F test was not
found for the interaction of race and sex F = (2, 7365) = .756; p = .469 on the dependent
variable. That is, statistically significant differences in students’ CCSSE Retention Index
scores could be accounted for by the factor of race, the factor of sex, and the interaction
of the factors for race and sex nested within the institution. These results imply, having
tested at a significance level of .05, that there is about a 95 percent chance that
differences detected in students’ CCSSE Retention Index scores were likely due to real
differences as opposed to mere chance.
Calculation of eta squared, however, which is based on the sum of squares of the
factor divided by total sum of squares, indicated that very little of the variation in CCSSE
Retention Index scores was accounted for by the factors considered. Although partial eta
squared is automatically generated by SPSS, eta squared was calculated and reported due
to its additive nature (Levin & Hullett, 2002). (see Table 8). Values of eta squared
indicate that although the factors were found to be statistically significant, the effect size,
or proportion of the variance in the mean CCSSE Retention Index scores accounted for
by each factor or the nested factor were all less than one percent.

117
Table 8: Results of Balanced Nested ANOVA
Factor df F p ή2__
Race 2/7365 31.274 .000* .0011
Sex 1/7365 5.071 .024* .0001
Race and Sex 2/7365 .758 .469 .00003
Students by Race and Sex 162/7365 1.792 .000* .0049 Nested within Institution __________________________________________________________________ n = 7555 *p < .05
The observed power was low for testing the interaction of race and sex (.179)
indicating there may not have been sufficient power in the test to detect a difference in
the dependent variable, or the students’ CCSSE Retention Index scores, based on these
factors if there really was a difference. There was sufficient power to test the differences
in the means of the dependent variable based on race (1.000) and institution nested within
race and sex (1.000), and sufficient, or nearly sufficient power to test the variable of sex
(.615).
Review of descriptive statistics and estimated marginal means shed light on
findings from the omnibus F test. Race was found to be a statistically significant factor
in mean differences found in students’ CCSSE Retention Index scores, with Blacks
having the highest mean (54.096) and Whites having the lowest mean (48.570). (see
Table 9). Multiple comparisons using Tukey HSD indicated that there were statistically
significant differences in students’ CCSSE Retention Index scores between all groups

118
with (p = .000) for comparisons between Blacks and Whites, and Blacks and Hispanics
and with (p = .006) for comparisons between Whites and Hispanics. The greatest mean
difference in students’ CCSSE Retention Index scores was between Blacks and Whites
(5.7156) and the least mean difference was between Whites and Hispanics (-1.7039),
with a mean difference of (4.0117) between Blacks and Hispanics.
As depicted in Table 9, descriptive statistics showed mean scores of males
(50.524) and females (51.997); the F test indicated there were statistically significant (p =
.024) differences in scores based on sex (see Table 8 and 9). Descriptive statistics also
shed light on a lack of statistical significance found in the CCSSE Retention Index scores
of students across all institutions based on the interaction of race and sex. (see Table 9).
Descriptive statistics showed differences in mean scores of students from the
same racial and gender groups between institutions ranged from a low score of 38.157 to
a high score of 70.071. (see Table 9).

119
Table 9: Differences in CCSSE Retention Index Scores, Balanced Nested ANOVA
______________________________________________________________________ Factor M SE________ Blacks 54.096* .517 Whites 48.570* .470 Hispanics 51.116* .689
Males 50.524* .540 Females 51.997* .370
Blacks Males 53.521 .866 Females 54.671 .564 Whites Males 47.311 .759 Females 49.830 .555 Hispanics Males 50.741 1.137 Females 51.492 .778
Blacks Males Nested 65.461* 4.892 Males Nested 44.995* 6.307 Females Nested 68.137* 3.390 Females Nested 44.582* 5.061
Whites Males Nested 66.243* 6.967
Males Nested 38.920* 10.461 Females Nested 54.236* 2.717 Females Nested 43.498* 2.307 Hispanics Males Nested 70.071* 14.711 Males Nested 38.157* 3.756 Females Nested 62.995* 11.186 Females Nested 42.686* 3.455 _______________________________________________________________________ Note. As per reported nested results, mean scores of students from all 28 institutions are not depicted. Only the highest and lowest mean scores of students nested within the institutions are presented. n = 7555 *p < .05

120
The results infer that there is a difference in students’ CCSSE Retention Index
scores, on average, based on race (RERACE) and based on sex (SEX). The results also
suggest that there is a difference in students’ CCSSE Retention Index scores
(STRINDEX), on average, between institutions (ccsse_id) when examining the scores of
students from the same race and gender groups. Furthermore, the results suggest that
there are no statistically significant differences in students’ CCSSE Retention Index
scores based on the interaction of race and sex (RERACE*SEX) across institutions.
Summary of Findings from Unbalanced and Balanced Designs
Two analyses, one unbalanced, and one balanced, were conducted using a nested
or hierarchical ANOVA to determine if there were mean differences in the CCSSE
Retention Index scores of students based on race, sex, the interaction of race and sex, and
also to determine mean differences in students’ Retention Index scores between
institutions when examining the interaction of race and sex of students. Both analyses
were conducted to accommodate for the debate about the ability to accurately interpret
results of unbalanced designs (Keppel & Wickens, 2005).
The findings of both analyses were similar and for practical purposes, the same.
Tests of assumptions of homogeneity of variance and normality yielded the same findings
for interpretation purposes, although the values were not exactly the same. The factors of
race (RERACE), sex (SEX) and the interaction of race and sex (RERACE*SEX) nested
within institution (ccsse_id) were found to be statistically significant in both analyses,
with similar or the same effect size, and observed power. Likewise, the interaction of

121
factors race and sex (RERACE*SEX) were not found to be statistically significant in
either analysis, had comparably small effect sizes in both analyses, and comparable
values of observed power. The same groups between the balanced and unbalanced
designs had the highest means and lowest means for the factors of race and sex. Black
males and females, Hispanic males and females and White males with the highest and
lowest CCSSE Retention Index scores were nested within the same institutions between
designs. White males with the lowest scores were from different institutions between the
balanced and unbalanced design, as were White females with highest and lowest scores.
Although three of the four hypotheses were found to be statistically significant, values of
eta squared for the effect size indicated that the factors analyzed accounted for less than
one percent of the variation or mean differences of students’ CCSSE Retention Index
scores.

122
CHAPTER 5
CONCLUSIONS
The following chapter is a discussion and interpretation of the findings from a
quantitative examination of both the relationship between the institutional level CCSSE
Retention Index and the institutional retention rate from the Florida accountability
measure of Retention and Success, as well as examination of mean differences in student
level CCSSE Retention Index scores of individuals from different gender and
racial/ethnic groups when accounting for the possible influence of the institution in which
the students enrolled. The purpose of the study was to validate whether the CCSSE
Retention Index, which is comprised of three of the five benchmarks from the CCSSE
survey instrument, can be used to predict the Florida community college institutional
retention rate as noted in the state accountability measure for Retention and Success. The
purpose was also to note if and what mean differences exist in the CCSSE Retention
Index scores of students from different gender and racial/ethnic groups while considering
the possible influence of institution attended.
The context which explains the relevance of the research questions and what they
offer to the body of literature was previously noted in the second chapter. Community
colleges, like all sectors of education, have been pressed in recent decades to be more
accountable (Alfred, Ewell, Hudgins & McClenney, 1999; Ewell, 1999; Keeling, 2004),
more performance oriented to justify their existence, at least as recipients of public
money when there are a growing number of competing and compelling demands for

123
those funds (Burke, 2005). The stakes are high in that education is seen as an avenue, if
not a requisite, to opportunity both for individuals aspiring to enter the middle class or
beyond or to escape poverty, as well as to the economic health of the nation. The
accountability movement has also generated increased assessment and greater emphasis
on improvement (Aper & Hinkle, 1991; Banta, Lund, Black & Oblander, 1996).
Accountability measures can be useful tools to gauge how institutions are doing in pre-
determined areas of focus. They can be also be problematic when ill-defined,
inconsistently defined or if applied across institutions with differing missions (Ewell,
1999; Klein, 2006).
Student retention as an accountability measure is compelling as it pertains to the
lives of individual students, to institutional effectiveness, to the future health of the nation
and its inhabitants. Yet problems remain about its application as a measure, in part,
because of the varying definitions and measures of retention, the preponderance of
research that has emanated from and pertains to baccalaureate degree granting, residential
institutions and the relatively nascent research that reflects current enrollment trends
(Toolbox Revisited, 2006) – including attendance at multiple institutions, or “swirling”
(Hamm, 2004) - is more relevant to community colleges and can be generalized beyond
many of the single institutions studied.
Engagement has emerged as a promising construct that provides direction for
ways to improve student retention as well as student learning. Even Tinto (1993) who has
long held near paradigmatic stature in the retention literature asserted that the primary
124
goal should be student learning as opposed to retention, but to improve student learning
would bear the fruit of improved retention rates.
The CCSSE survey, based on engagement theory, provides an appropriate tool
specifically for community colleges to assess its practices. It also provides a practical
tool with a theoretical basis, to inform decisions about how to improve student learning,
student experiences and student retention (CCSSE, 2006a; Marti, 2004).
In general, analyses for the first and second research questions suggest that
institutional CCSSE Retention Index scores are not a good predictor of community
college retention rates as measured by the Florida accountability measure for Retention
and Success. The Florida accountability measures are, by design, institutional measures.
The nature and properties of aggregated data used to calculate institutional CCSSE
Retention Index scores and institutional retention rates for the accountability measure
may have influenced these findings. The way Florida defines the cohorts used to calculate
institutional retention rates may also be a factor that influenced these findings. Mean
differences in student level CCSSE Retention Index scores that were found in the
analysis of the third research question indicate that there are statistically significant mean
differences between the independent variables of race, sex, and the nesting factor of
institution and the dependent variable of students’ Retention Index scores. Statistically
significant mean differences between the interaction of race and sex and students’
CCSSE Retention Index scores were not found. However, the effect size of each of the
statistically significant influences is less than one percent indicating that for practical

125
purposes, these variables do not explain much of the variation in students’ CCSSE
Retention Index scores.
The remainder of this chapter is organized into three subsections. The first is an
examination and discussion of the findings of the first and second research questions
which examined institution level data. The second section is an examination and
discussion of findings from the third research question which examined student level
data. The third section includes implications for practice and recommendations for
further study.
Institutional Level Data
The correlation and simple linear regression conducted to examine the
relationship between the CCSSE Retention Index and institutional retention rates
measured by the Florida state accountability measure of Retention and Success indicated
that there is not a statistically significant relationship. Based upon examination of the
2004 data from the Florida community colleges, an institution’s CCSSE Retention Index
score does not appear to be a good predictor of the institution’s retention rate as measured
by Florida’s state accountability measure. Ancillary analyses were conducted to
determine if there was a linear relationship between any of the three institutional level
CCSSE benchmarks that comprise the Retention Index, namely active and collaborative
learning, student-faculty interaction, and support for learners, and the institutional
retention rate from the Florida accountability measure. None were depicted in scatterplots
as having a linear relationship.

126
The correlation and multiple linear regression conducted to examine the
relationship between the CCSSE Retention Index and institutional retention rate
measured by the Florida state accountability measure of Retention and Success when
controlling for the retention rate of degree types awarded indicated that there is not a
statistically significant relationship. That is, even when controlling for the retention rates
of different degree types awarded, which comprise the institutional retention rate from
the accountability measure, the institutional CCSSE Retention Index does not appear to
be a good predictor of the institutional retention rate.
While many factors surrounding these findings may be relevant, three seem
particularly worthy of mention. First, as previously established as a limitation to this
study, there are only 28 public community colleges in Florida. “It should be noted for
inferential tests of correlations that sample size plays a role in determining statistical
significance….” (Lomax, 2001, p. 181). It was noted that the size of this population may
not provide sufficient power for testing statistical significance in the analyses for the first
and second questions. Statistical power pertains “to the probability of correctly rejecting
the null hypothesis” (Keppel & Zedek, 1989, p. 106); it relates to the probability of a
Type II error in which there is a failure to reject a false null hypothesis. The loss of
statistical power with aggregated data was also noted in CCSSE’s response to this
author’s proposed study and request to use the data. CCSSE recommended
disaggregating the data, at least to examine the relationship between the individual
benchmarks that comprise the Retention Index and their relationship to the state
accountability measure of retention. To this end, ancillary analyses were conducted

127
which also indicated the lack of a linear relationship. In further discussions with CCSSE
after the study was conducted, it was noted that the null effects of the Retention Index
may be due not only to a lack of power, “but a lack of sensitivity. In other words,
relationships that occur on the student level may not be detectable on the institution level
regardless of the statistical power” (Kay McClenney, personal communication, October
6, 2006).
Insofar as institutional level data, which is aggregated, is limited in providing
direction for improvement, institutional level data do help to paint a picture.
Furthermore, despite their limitations, they are also widely used for various purposes,
including accountability which further highlights the caution, concern and debate about
how accountability measures are defined, calculated and used.. It is also noteworthy that
it was the author’s interest in CCSSE’s Retention Index – as an index of retention – that
was of particular interest in undertaking this study.
A second factor is the nature of Florida’s Student Data Base. As noted by
Florida’s Vice Chancellor responsible for much of its oversight, “One underlying
principle to remember is that the SDB was established as a reporting/compliance database
not a research database so we have taken something established for one purpose and are
using it for another” (P. Windham, personal communication, April 8, 2006). As
previously stated, the Florida Student Data Base was established, and institutions are
mandated by statute to participate, in order to provide both the State Board of Education
and the legislature with information associated with the accountability system (K-20
Education Code, 2005).
128
A third factor to consider when examining these results is the definition of the
retention rate and the cohort used to calculate the Florida accountability measure. The
retention rate from the accountability measure consists of the number of students
graduated, plus the number enrolled in good standing, plus the number enrolled who are
not in good standing as compared to the total cohort. The cohort of students tracked to
determine the retention rate includes only first time in college (sic.) students who took an
entry level test, and earned at least18 credit hours if enrolled in an A.A., A.S. or A.A.S.
or earned at least 9 credit hours if enrolled in a P.S.V.C. or A.T.D. program. Some have
taken issue with the exclusion of students who have not earned the minimum number of
credits to be included in the cohort which serves to inflate the retention rates (OPPAGA,
2001). Florida’s definition of its retention rate for accountability purposes has been
defended, but points to the broader problem addressed in the literature review of a lack of
a common definition and measure of retention across and even within the states.
Institutions might do well to broaden the understanding of the accountability
measures at appropriate times within their institutional lives. Information about what
they are, how measures are calculated, what they imply and how they are used may well
be relevant to more than only upper level administrators and institutional researchers who
are likely the ones familiar with them.
Student Level Data
The nested or hierarchical ANOVA conducted with student level CCSSE data
resulted in rejecting three of the four null hypotheses tested. That is, for three of the four

129
factors tested, there were statistically significant mean differences in students’ CCSSE
Retention Index scores. These were for the factor of race (RERACE), the factor of sex
(SEX) and the interaction of race and sex nested within institution (ccsse_id). No
statistically significant mean differences were found in students’ CCSSE Retention Index
scores when examining the interaction of race and sex.
The nested ANOVA was conducted with both a balanced design with comparable
numbers of students in each racial group considered, and with an unbalanced design, in
which all student data from the dataset for Blacks, Whites and Hispanics were used.
Both analyses produced findings which lead to the same conclusions.
The findings of statistical significance with the factor of race and the factor of
sex, as well as the factor of race and sex nested within institution are in keeping with the
literature and research base addressed in Chapter 2 insofar as they indicated that some
groups are more at risk than others, and that institutional factors may play a part in
student retention (Hutto, 2002; Summers, 2003; Bailey, et al, January 2005). It bears
repeating that the factor of race often signals differences in socioeconomic status and the
opportunities associated with higher SES. Two facets of the statistically significant
findings are noteworthy. First, for the factor of race and the factor of sex, the groups
most at risk, racial minorities, and the gender of female which is most likely to face
external pressures that can derail their educational endeavors (Chacon, Cohen and
Strover, 1983 as noted in Tinto, 1987) were the groups with highest levels of engagement
as reflected in the Retention Index. Second, while statistical significance was found with
three of the four factors tested, the effect size of each of them was negligible.

130
Large sample sizes alone can yield statistically significant findings since larger
samples increase statistical power thereby increasing the chances of a Type I error in
which the null hypothesis is incorrectly rejected (Lomax, 2001; Zimmerman, 2004). It is
therefore important, particularly with large sample sizes such as that used with the
student level data in this study, to look beyond statistical significance to other measures
such as effect size when drawing conclusions (Zimmerman, 2004).
The proportion of variance explained by the model, or the effect size was very
small. The factor of race (RERACE) had a value of eta squared of (.0009) in the
unbalanced design and an eta squared value of (.0011) in the balanced design. This
indicates that less than .09 of a percent (unbalanced) and less than .11 of a percent
(balanced) of the variation in the students’ CCSSE Retention Index scores can be
accounted for by race. Eta squared for the factor of sex (SEX) was (.00005) in the
unbalanced design and (.0001) in the balanced design. This indicated that less than .005
of a percent (unbalanced) or less than .01 of a percent (balanced) of the variation in the
students’ Retention Index scores could be explained by the factor of sex. Eta squared for
the third statistically significant factor, the nesting factor of institution (ccsse_id) was
comparably small. With eta squared of .0032 in the unbalanced design and .0049 in the
balanced design, this factor accounts for less than three tenths (unbalanced) or less than
one half of one percent of the variation in the students’ Retention Index scores. In light of
these findings, while there are statistically significant differences in mean Retention
Index scores when examining these factors, in practical terms, these factors do not
explain much of the variation in students’ CCSSE Retention Index scores within the 2004

131
dataset from Florida. The effect size of findings in this study raise the question, and the
need for heightened awareness, of effect sizes found in the body of research. There is
only “a growing recognition of the importance for reporting estimates of effect size” and
they have often been misrepresented or not reported at all (Levin & Hullett, 2003, p. 52).
Implications and Recommendations
Results of this study lend support to advice of exercising caution when reviewing
or distributing quantitative data, especially if only quantitative data is examined, or is
examined without explanation of probable influences and context. While current society
seems to crave quick, succinct, quantitative snapshots or report cards of institutional
performance, such data can be misleading without corresponding explanations of what
the data mean and what contributes to the values (Alfred, Ewell, Hudgins, & McClenney,
1999; Ewell & Jones, 1996). While institutional CCSSE Retention Index scores do not
appear to be a good predictor of institutional retention rates measured by the Florida
accountability measure, the genesis and definitions of these measures are important
considerations when examining their values independently and their relationship, or lack
of one, when examined together.
Accountability and measures of accountability are compelling and warrant serious
consideration by educators and non-educators alike, but the “devil is in the details”
(Klein, 2006). As documented in Chapter 2, many accountability measures, including
retention rates, have been criticized because the measures are inconsistently defined and
the same measures are applied to different types of institutions with different missions.

132
This study examined retention rates from an accountability measure defined specifically
for community colleges in Florida, as well the Retention Index defined by an engagement
assessment instrument also specifically designed for community colleges. Yet it seems to
remain true that there is difficulty in the details or a need to explain how this community
college retention rate is defined, and what it tells us alone or in comparison to the CCSSE
Retention Index.
Although the institutional CCSSE Retention Index scores are not a good predictor
of retention rates as measured by the Florida accountability measure, it is the CCSSE that
provides not only a means to assess, but research-based strategies to benchmark and
improve student learning and retention. The retention rate and other measures from the
state accountability measures are also important considerations for institutions as they are
yardsticks for measuring performance to meet accountability demands. Multiple
measures provide greater breadth and depth to understanding an area of focus. Student
retention is no different.
The CCSSE survey provides a practical tool to help community colleges assess
how well they are engaging their students, while providing a theoretical framework – and
a growing body of research – to guide ways to improve student performance. While this
study provides evidence that the 2004 CCSSE Retention Index is not a good predictor of
an institution’s state retention rate as reflected in Florida’s accountability measure of
Retention and Success, this should not be construed as indicating that engagement levels
measured by the CCSSE benchmarks – including the Retention Index – are not related to
student learning and retention. The correlation and simple linear regression and the

133
correlation and multiple regression analyses used in the first and second research
questions are used only to detect a linear relationship, not every or any kind of
relationship. Engagement levels have been shown to be strongly related to student
learning, student retention and achievement of student goals, at least among students
attending baccalaureate degree granting, residential institutions (Kuh, 2001). Greene
(2005) conducted a study of student level CCSSE results – also from 2004 - of Florida
community college students and their educational outcomes from the same Student Data
Base (SDB) from which the accountability measures are drawn. His purpose was “to
establish empirically the existence of the engagement – outcome relationship and then
identify and describe some of the more compelling educational practices the data
suggested mattered most to enhancing the academic success of African American and
Hispanic community college students” (Greene, 2005, p. 256). Greene’s analysis
demonstrated that a significant relationship exists between student levels of engagement
as assessed by CCSSE and desirable educational outcomes for community college
students as measured by the Florida Student Data Base.
Community college educators do well to consider an array of strategies to
meaningfully and intentionally engage their multi-tasking, largely at-risk students
(Gooden & Matus-Grossman, 2002; McClenney, 2004a) in the moments and activities
where college staff – at all levels – and students meet. The classroom is central to this,
but support services and the quality of student experiences both inside and outside the
classroom – however limited – seem also important. It is advocated in some of the
literature that to improve quality and learning, all college personnel need to collaborate

134
and resources – those in both academic affairs and student affairs – be mobilized and
integrated to improve student learning (ACPA & NASPA, 1998; Blimling & Whitt, 1999;
Bourassa & Kruger, 2001; Keeling, 2004; Srikanthan & Dalrymple, 2002; Tinto, 1993).
CCSSE reported in its 2005 annual report some of the findings from the national
dataset. Highlights included findings that seemed counterintuitive: engagement levels of
different groups of high risk students, including minority students, were higher than
majority students. This is different than what has been found among students attending
baccalaureate degree granting institutions where higher engagement levels are related to
higher achievement levels (Astin, 1993; Kuh, 2001). That is, at-risk students, including
Blacks, Hispanics and Native Americans were found to report higher levels of
engagement in community colleges than White students (CCSSE, 2005; Recruitment and
Retention, December 2005a). Results of the third research question support these
findings. Blacks (54.061) and Hispanics (51.116) were shown to have higher mean
CCSSE Retention Index scores – to be more engaged on average as assessed by the
benchmarks of active and collaborative learning, student-faculty interaction and support
for learners - than Whites (48.315). CCSSE speculates (2005) that less engaged high risk
students may have already dropped out before the survey is administered in the Spring
term, and that those high risk students who are surveyed are working harder, partaking in
more engaging activities, than their peers. Still, these students overall, based on
responses to survey questions, have lower aspirations and based on outcomes data, are
achieving less than their peers. CCSSE also noted in its 2005 national report that there
were only small differences in the engagement levels of students of color as compared to

135
White students on three of the five benchmarks, two of which comprise the Retention
Index, active and collaborative learning and student-faculty interaction. These small
differences may have played a part in the small effect sizes found between groups in the
examination of the Retention Index. In light of the small differences between racial
groups on two of the benchmark scores that comprise the Retention Index as reported by
CCSSE, and the findings of this study which indicated near negligible effect sizes
between groups, it raises the question – not of what the CCSSE survey results tell us –
but what the Retention Index as an Index can tell us, particularly about approaches to
reduce departure rates of minority students, which is a particular concern of CCSSE’s
(Manzo, 2003).
Engagement remains a promising construct for improving student learning and
retention rates in both baccalaureate degree granting and associate degree granting
institutions as noted the second chapter. Yet the general construct of engagement in
community colleges, as well as the Retention Index, needs further study for validation,
deeper understanding and application.
The CCSSE survey collects a number of demographic variables. CCSSE has
already identified the seeming compensatory factor of high risk students as an area for
further study. Institutions would do well to further examine their own data across
multiple variables, even individual survey questions, to detect differences in engagement
levels and thereby unveil strategies that may be more effective with some student groups
than others.

136
There is some debate in the literature about whether to focus retention research on
student characteristics (Lederman, 2005; Toolbox Revisited, 2006) or institutional and
student characteristics (Bailey, et al., January 2005; Hutto, 2002; Summers, 2003; Tinto,
1987). Analyses using nested ANOVA provides one avenue for examining both student
characteristics and institutional influence, albeit in a limited way.
One vein of research that seems related to the construct of engagement is that of
organizational culture. Literature and studies have supported at the basic education level
that there is a relationship between institutional or organizational culture and student
outcomes (Cunningham, 2003; Center for Research and Intervention on Academic
Success, 1994; Wagner & Masden-Copas, 2002). Insofar as engagement is related to
culture, it may be helpful to explore and discuss research findings, including those of
CCSSE, within the context of culture as has been suggested or implied (McClenney and
Greene, 2005).
Additional recommendations for future study are to follow the ongoing
discussions, studies conducted and evolving understanding of student and institutional
factors. There is a need to validate if and how levels of student engagement, as measured
by CCSSE’s survey instrument, relate not only to student learning outcomes, but also to
student retention. CCSSE provides a rich data source to conduct further studies.
Examination of student level data as opposed to institutional level data will likely provide
greater opportunity to detect meaningful differences in survey item responses and
engagement levels of various sub-groups. Demographic variables collected through the
CCSSE survey provide ample research opportunities to examine the connection between
137
demographic factors such as first generation college student, marital status and age and
their relationship to levels of engagement. Although the CCSSE survey and dataset do
not provide information about respondents’ socioeconomic status, it seems a worthy
study to find data sources that used in tandem with CCSSE data would allow for
exploration of the relationship between socioeconomic status and engagement level of
community college students. While race has been found to be associated with
performance outcomes, it is likely the socioeconomic status of persons of different racial
or ethnic groups that has a greater bearing. Likewise, first generation college student may
be viewed as a proxy for socioeconomic status. The socioeconomic status demographic
was the only one found in a major study to be related to degree completion for students
who attended four year institutions, although not in a substantial manner (Toolbox
Revisited, 2006). Examination of CCSSE benchmarks in light of race, first generation
college student and socioeconomic status stands to shed more light on the topic than mere
examination of the factor of race. Furthermore, it is important to continue examination of
benchmark scores and even individual survey questions, and their relationship to
institutional and student outcomes.
Researchers will need to look at other sources of data collected on student
outcomes such as offices of institutional research or departments of education that have
state data warehouses to examine relationships between engagement levels assessed by
CCSSE and targeted outcomes. Such studies are essential in further validating the
engagement-outcome relationship for community college students, but also to better

138
understand the nuances of the relationship and its implications for strategies to improve
student learning and retention.

139
APPENDIX A
IRB LETTER

140

141
APPENDIX B
COMMUNITY COLLEGE STUDENT REPORT

142
Used with permission from The Community College Survey of Student Engagement, 2004. The University of Texas at Austin.
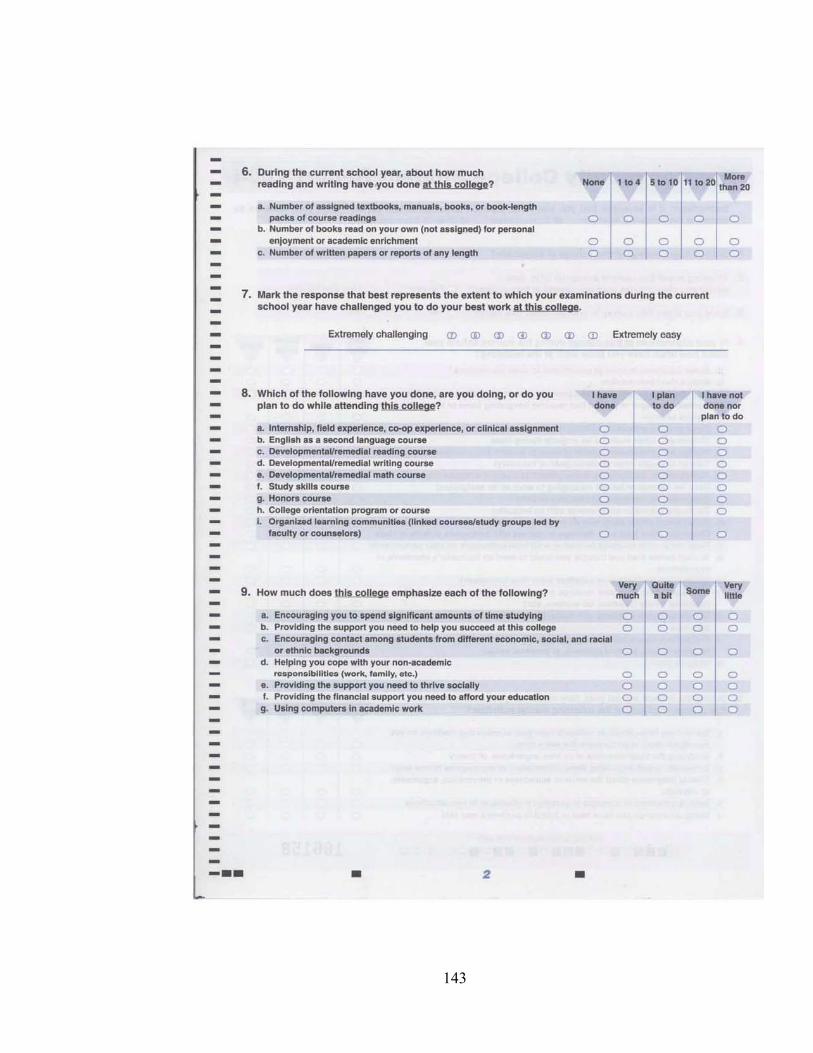
143

144

145

146

147

148

149
APPENDIX C
SURVEY QUESTIONS OF THE RETENTION INDEX
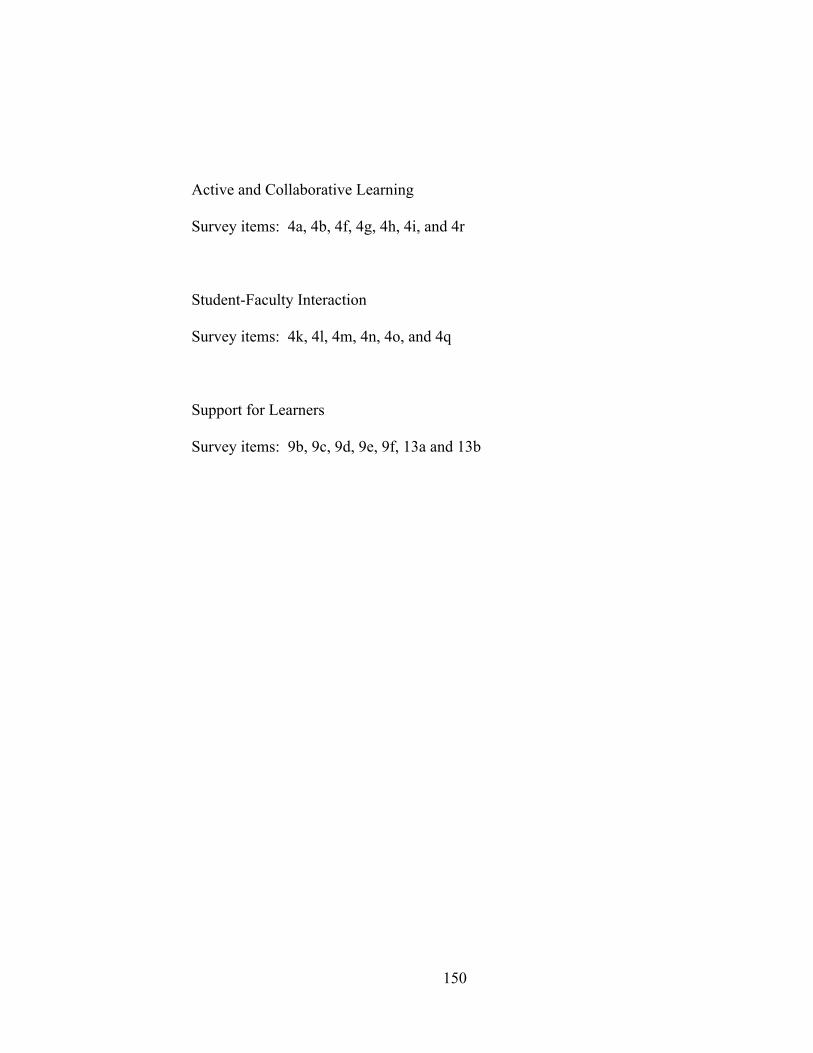
150
Active and Collaborative Learning
Survey items: 4a, 4b, 4f, 4g, 4h, 4i, and 4r
Student-Faculty Interaction
Survey items: 4k, 4l, 4m, 4n, 4o, and 4q
Support for Learners
Survey items: 9b, 9c, 9d, 9e, 9f, 13a and 13b

151
APPENDIX D
COMMUNITY COLLEGE STUDENT REPORT CODEBOOK

152
Used with permission from The Community College Survey of Student Engagement, 2004. The University of Texas at Austin.

153

154

155

156

157

158

159

160

161
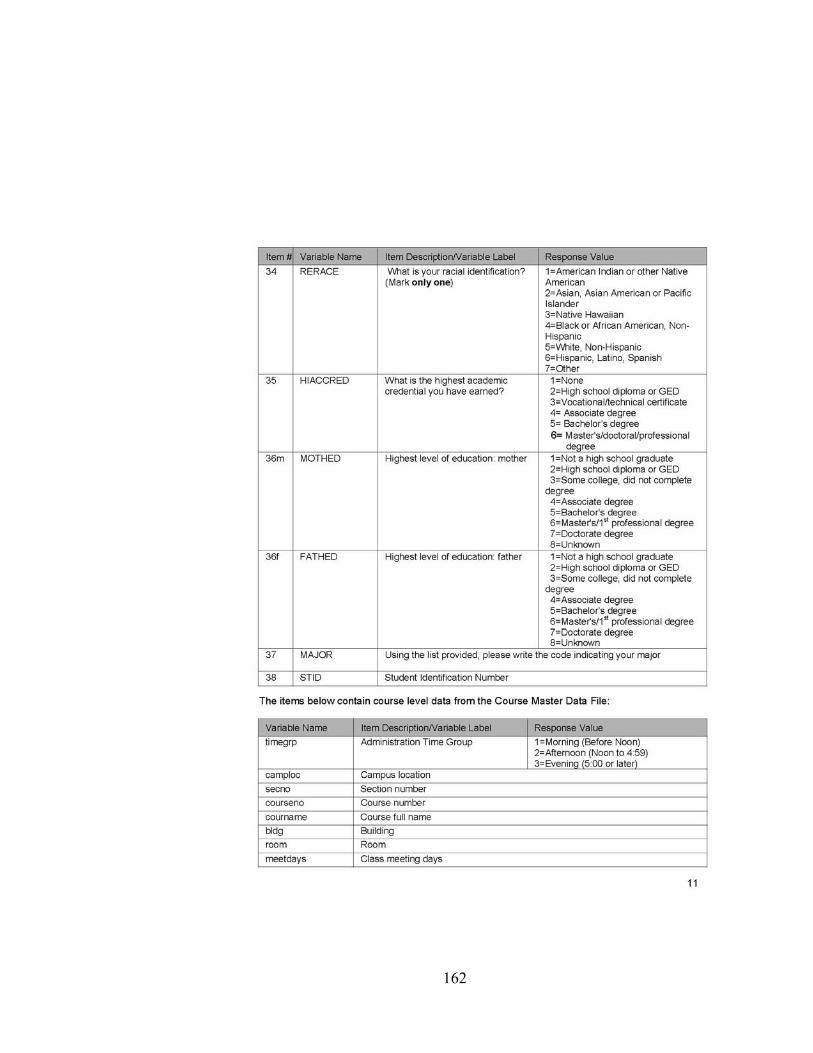
162
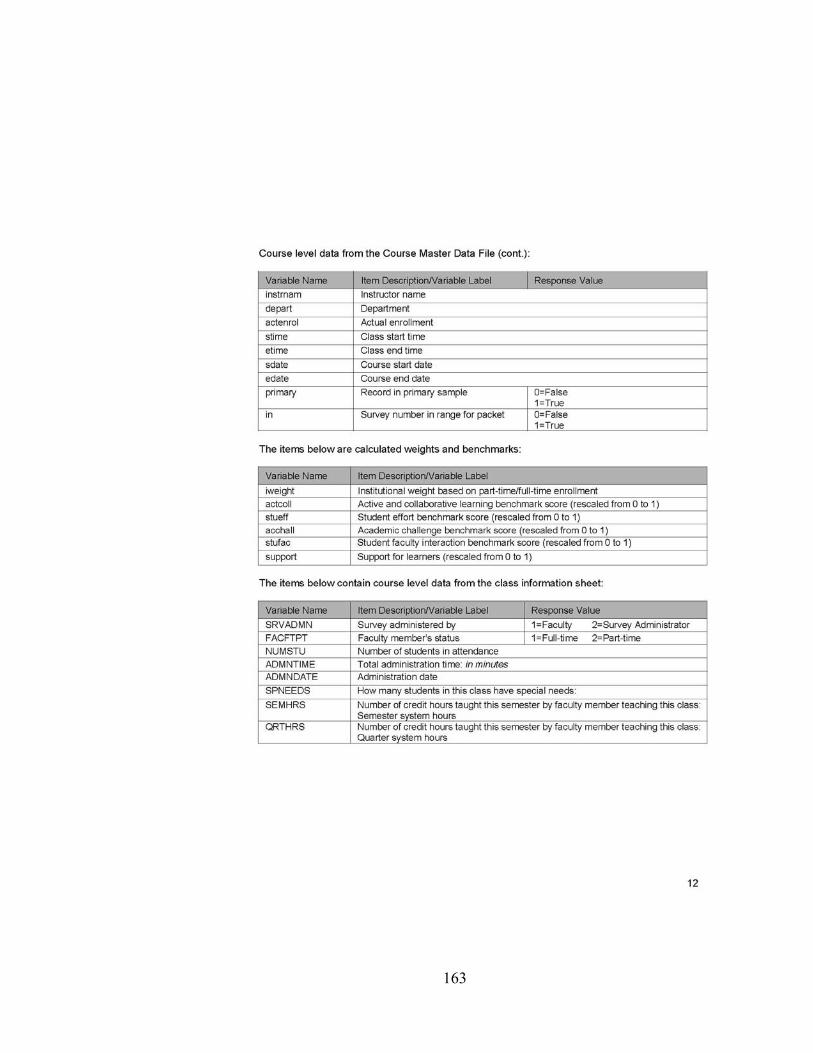
163

164
LIST OF REFERENCES
Alexander, F. K. (2000). The changing face of accountability: Monitoring and assessing institutional performance in higher education. The Journal of Higher Education. 71 (4), 411-431.
Albertson, H.T. (2002). Chronological history of the Florida community college system.
Retrieved 11/14/05 from http://www.facc.org/chronolofccsys.asof9-24-02wpd.pdf Alfred, R., Ewell, P., Hudgins, J., & McClenney, K. (1999). Core indicators of
effectiveness for community colleges. Washington, D.C.: Community College Press. ERIC Number ED426749.
Alfred, R.L. & Weissman, J. (1988). Public image and the university. Report Number
EDO-HE-88-8. ERIC Number ED301145. American Association of Community Colleges (2005). A shared commitment to increase
opportunity. Retrieved 11/15/05 from http://www.aacc.nche.edu/Content/NavigationMenu/ResourceCenter/Projects_Partnerships/Current/Achieving_the_Dream/ATDOnePager.pdf
American Association for Higher Education, American College Personnel Association,
and National Association of Student Personnel Administrators (1998). Powerful partnerships: A shared responsibility for learning. Washington, DC: American Association of Higher Education, American College Personnel Association, and National Association of Student Personnel Administrators.
Andrews, E.L. (January 13, 2006). Budgtet deficit will climb in 2006, White House says.
The New York Times, A13. Aper, J.P. & Hinkle, D.E. (1991). State policies for assessing student outcomes: A case
study with implications for state and institutional authorities. The Journal of Higher Education, 62, 5, 539-555.
Astin, A.W. (1984). Student involvement: A developmental theory for higher education.
Journal of College Student Personnel, 24, 4, 297-308. Astin, A.W. (1993). What matters in college: Four critical years revisited. San
Francisco: Jossey-Bass Publishers.

165
Astin, A.W. (1997). How “good” is your institution’s retention rate? Research in Higher
Education, 38, 6, 647-657. Astin, A.W. (1999). Involvement in learning revisited: Lessons we have learned. Journal
of College Student Development, 40, 5, 587-598. Bailey, T.R. and Alfonso, M (2005). Paths to persistence: An Analysis of research on
program effectiveness at community colleges. Community College Research Center, Teachers College, Columbia University, 6, 1, 1-38.
Bailey, T., Calcagno, J.C., Jenkins, D., Kienzl, G., and Leinbach, T. (January 2005). The
Effects of institutional factors on the success of community college students. Community College Research Center, Teachers College, Columbia University, 1-51. Retrieved 12/5/05 from http://www.tc.columbia.edu/ccrc/
Bailey, T., Calcagno, J.C., Jenkins, D., Kienzl, G. and Leinbach, T. (October 2005).
Community college student success: What institutional characteristics make a difference? Community College Research Center, Teachers College, Columbia University. Retrieved 1/6/06 from http://ccrc.tc.columbia.ed
Bailey, T., Jenkins, D., and Leinbach, T. (2005). Is student success labeled institutional
failure? Community College Research Center, Teachers College, Columbia University. Retrieved 1/6/06 from http://ccrc.tc.columbia.edu
Banta, T.W., Lund, J.P., Black, K.E. and Oblander, F.W. (1996). Assessment in practice:
putting principles to work on college campuses. San Francisco: Jossey-Bass Publishers.
Bean, J.P. (1983). The application of a model of turnover in work organizations to the
student attrition process. The Review of Higher Education, 6, 7, 129-148. Bean, J.P. and Metzner, B.S. (1985). A conceptual model of nontraditional undergraduate
student attrition. Review of Educational Research, 55, 4, 485-540. Beckman, T.J., Ghosh, A.K., Cook, D.A., Erwin, P.J. and Mandrekar, J.N. (2004). How
reliable are assessments of clinical teaching? Journal of General Internal Medicine, 19, 9, 971-977.
Blimling, G.S. and Whitt, E.J. (1999). Good practice in student affairs: principles to
foster student learning. San Francisco: Jossey-Bass.

166
Borglum, K. and Kubala, T. (2000). Academic and social integration of community college students: A case study. Community College Journal of Research & Practice, 24, 7, 567-576.
Boswell, K. (2004). Keeping America's Promise: A discussion guide for state and
community college leaders. In K. Boswell and C.D. Wilson (Eds.) Keeping America's promise: A report on the future of the community college (pp. 47-52). Denver, CO: Education Commission of the States and the League for Innovation in the Community College.
Boulard, G. (May 10, 2004). College access still tied to income. Community College
Week, 16, 20, 10. Bourassa, D.M. and Kruger, K. (2001). The national dialogue on academic and student
affairs collaboration. New Directions for Higher Education, 116, 9-17. Brawer, F.B. (1996). Retention-attrition in the nineties. Los Angeles, CA: ERIC
Clearinghouse for Community Colleges, ERIC Document No. ED393 510. Braxton, J.M., Hirschy, A.S. and McClendon, S.A. (2004). Understanding and reducing
college student departure. ASHE-ERIC Higher Education Report: 30, 3. Burd, S. (April 2, 2004). Graduation rates called a poor measure of colleges. The
Chronicle of Higher Education, 50, 30, A1-A23. Burke, J.C. and Associates (2005a). Achieving accountability in higher education:
Balancing public, academic and market demands. San Francisco: Jossey-Bass. Burke, J.C. (2005b). The many faces of accountability. In J.C. Burke (Ed.) Achieving
accountability in higher education: Balancing public, academic and market demands. (pp. 1-24). San Francisco: Jossey-Bass.
Burke, J.C. (2005c). Reinventing accountability: From bureaucratic rules to performance
results. In J.C. Burke (Ed.) Achieving accountability in higher education: Balancing public, academic and market demands. (pp. 216-246). San Francisco: Jossey-Bass.
Calahan, R. E. (1962). Education and the cult of efficiency. Chicago: University of
Chicago Press. Callan, P.M. and Finney, J.E. (2005). State-by-State report cards: Public purposes and
accountability for a new century. In J.C. Burke (Ed.) Achieving accountability in higher education: Balancing public, academic and market demands. (pp. 198-215). San Francisco: Jossey-Bass.

167
Carnevale, A.P. & Desrochers, D.M. (2004). Why learning? The value of higher
education to society and the individual. In K. Boswell and C.D. Wilson (Eds.) Keeping America's promise: A report on the future of the community college. (pp. 39-45). Denver, CO: Education Commission of the States and the League for Innovation in the Community College.
Center for Community College Policy (2000). State funding for community colleges: A
50 state survey. Denver, CO: Education Commission of the States. ERIC Document No. 449 863.
Center for Research and Intervention on Academic Success (1994). Organizational
culture of secondary schools and students’ academic progress. CRIRES Bulletin, 1, 2, 2-5.
Chickering, A.W. and Gamson, Z.F. (1987). Seven principles for good practice in
undergraduate education. American Association of Higher Education Bulletin, 39, 7, 3-7.
Chickering, A.W. and Gamson, Z.F. (1999). Development and adaptations of the seven
principles for good practice in undergraduate education. New Directions for Teaching & Learning, Winter 99, Issue 80, 75-81.
Community College Survey of Student Engagement (2004a). Communications tools.
Retrieved from the Members Only website 2/12/05, from http://www.ccsse.org/members/release.doc
Community College Survey of Student Engagement (2004b). Institutional Report 2004.
Austin: TX. University of Texas at Austin. Community College Survey of Student Engagement (2005). Engaging students,
challenging the odds: 2005 findings. Retrieved from CCSSE website 12/19/05, from http://www.ccsse.org/publications/CCSSE_reportfinal2005.pdf
Community College Survey of Student Engagement (2006a). An improvement strategy
for community colleges. Retrieved 2/18/06 from http://www.ccsse.org/ Community College Survey of Student Engagement (2006b). Benchmarks: Indicators of
effective educational practice. Retrieved 1/4/06 from http://www.ccsse.org/aboutccsse/aboutccsse.cfm
Community College Survey of Student Engagement (2006c). MetLife foundation
initiative on student success. Retrieved 3/14/06 from http://www.ccsse.org/retention/retention.cfm

168
Community College Survey of Student Engagement (2006d). Why focus on student
engagement? Retrieved 4/9/06 from http://www.ccsse.org/aboutccsse/engage.cfm Community College Survey of Student Engagement (2006e). College profiles. Retrieved
7/7/06 from http://www.ccsse.org/members/profiles/index.cfm?sortby=state Community College and Technical Center MIS Staff (July 13-16, 2003). Florida
community college system annual reports workshop. (Available from the Florida Department of Education, Community College and Technical Center MIS Staff, 325 W. Gaines Street, Tallahassee, FL 32399-0400.)
Community College and Technical Center MIS Staff (September 2004). Florida
Community College System Accountability Outcome Measure 1, Part 2: Retention and Success Report. (Available from the Florida Department of Education, Community College and Technical Center MIS, 325 W. Gaines Street, Suite 1324, Tallahassee, FL, 32399-0400)
Community College and Technical Center MIS Staff (July 10-13, 2005). Florida
community college system annual reports workshop. (Available from the Florida Department of Education, Community College and Technical Center MIS, 325 W. Gaines Street, Suite 1324, Tallahassee, FL, 32399-0400)
Cook, C. E. and McLendon, M. K. (1998). Challenges in the early 1990s. In C.E. Cook
(Ed.) Lobbying for higher education: How colleges and universities influence federal policy. Nashville: Vanderbilt University Press.
Cunningham, B. (2003). A study of the relationship between school culture and student
achievement. An unpublished dissertation completed at the University of Central Florida, FL.
Daye, R. (n.d.). Performance-based funding: An uneasy Darwinian survival of the
fittest? Florida State University. Retrieved 2/12/06 from http://www.collegevalues.org/pdfs/daye%20darwin%20september.pdf
Dougherty, K. (1987). The Effects of community colleges: Aid or hindrance to
socioeconomic attainment? Sociology of Education, 60, 2, 86-103. Dunlap, W.P., Dietz, J., and Cortina, J.M. (1997). The spurious correlation of ratios that
have common variables: A Monte Carlo examination of Pearson’s formula. The Journal of General Psychology, 124, 2, 182-193.

169
Education Commission of the States (April 2003). Closing the college participation gap: Florida profile. Retrieved 1/31/06 from http://www.communitycollegepolicy.org/html/Issues/access/pdf/FL.pdf
Education Commission of the States (October 2003). Closing the college participation
gap: U.S. profile. Retrieved 1/31/06 from http://www.communitycollegepolicy.org/html/Issues/access/pdf/United States.pdf
Evelyn, J. (November 28, 2003) How community colleges measure up. The Chronicle of
Higher Education, 50, 14, pp. A36, C1. Ewell, P.T. (1999). Linking performance measures to resource allocation: Exploring
unmapped terrain. Quality in Higher Education, 5, 3, 191-209. Ewell, P.T. and Jones, D.P. (1996). Indicators of "Good Practice" in undergraduate
education: A handbook for development and implementation. National Center for Higher Education Management Systems. ERIC Document Number ED403828.
Ewell, P.T. (2005). Can assessment serve accountability? It depends on the question. In
J.C. Burke (Ed.) Achieving accountability in higher education: Balancing public, academic and market demands. (pp. 104-124). San Francisco: Jossey-Bass.
Faris, S. K. (1998). Community colleges: Innovators of entrepreneurial Spirit. Digest
Number 98-4. Community Colleges Clearinghouse (JC 990601). ERIC Number ED433886.
Financial and Business Services (June 4, 2004). Resource allocation funding model.
Florida Community Colleges and Workforce Education of the Florida Department of Education.
Fletcher, J. (March 5, 2002). K-20 education accountability. The Florida Legislature
Office of Program Policy Analysis & Government Accountability. Retrieved 11/29/05 from http://flboe.org/K20AccAdvCounc?Mar_5_02/4-PerfAccount.pdf
Fliegler, C.M. (March 2006). A staggering drop for community colleges. University
Business, 9, 3, p. 19. Florida Community Colleges and Workforce Education (2005). Delivering the Dream:
Division of Community Colleges and Workforce Education Strategic Plan 2005. Tallahassee: FL.
Florida Department of Education (February 2000). Florida Fast Fact 32: Who is the
typical FCCS Student? Retrieved 1/23/06 from http://www.fldoe.org/cc/OSAS/FastFacts/ff32.pdf

170
Florida Department of Education (July 2003). Florida Fast Fact 69: African American
student enrollment and awards earned continue to increase. Retrieved 1/23/06 from http://www.fldoe.org/cc/OSAS/FastFacts/ff69.pdf
Florida Department of Education (June 4, 2004). Resource allocation funding model.
Florida Community Colleges & Workforce Education. Tallahassee: FL. Florida Department of Education (2004). The fact book 2004: Report for the Florida
community college system. Retrieved 2/6/06 from http://www.firn.edu/doe/arm/cctcmis/pubs/factbook/fb2004/factbk04.pdf
Florida Department of Education (October 2004). Retention and success report for
tracking period fall 2000 through winter/spring 2004. (Available from the Florida Department of Education, Community College and Technical Center MIS, 325 W. Gaines Street, Suite 1324, Tallahassee, FL, 32399-0400)
Florida Department of Education (2005). The fact book 2005: Report for the Florida
community college system. Retrieved 1/24/06 from http://www.firn.edu/doe/arm/cctcmis/pubs/factbook/fb2005/factbk05.pdf
Florida Department of Education (2006). Accountability, research & measurement.
Retrieved 3/4/06 from http://www.fldoe.org/faq/default.asp?Style=print&Dept=48&ID=67
Garson, G.D. (2006). Statnotes: Topics in Multivariate Analysis. Retrieved 6/23/06 from
http://www2.chass.ncsu.edu/garson/pa765/regress.htm Gooden, S. and Matus-Grossman, L. (2002). Opening doors: Students' perspectives on
juggling work, family and college. New York: Manpower Demonstration Research Corporation.
Green, S.B. and Salkind, N.J. (2005). Using SPSS for Windows and Macintosh:
Analyzing and understanding data. Upper Saddle River: Prentice Hall. Greene, T.G. (2005). Bridging the great divide: Exploring the relationship between
student engagement and educational outcomes for African American and Hispanic community college students in the state of Florida. A dissertation completed at the University of Texas at Austin, TX.
Grubb, W.N. (2002). Learning and earning in the middle, part I: National studies of pre-
baccalaureate education. Economics of Education Review, 21, 299-321.

171
Hagedorn, L.S. (2005). How to define retention: A new look at an old problem. In A. Seidman (Ed.) College student retention: Formula for student success, Westport, CT: Praeger Publishers.
Hagedorn, L.S. (2006). Traveling successfully on the community college pathway: The
research and findings of the Transfer and Retention of Urban Community College Students project. Retrieved 6/29/06 from http://www.coc.ufl.edu/Leadership/ihe/TRUCCS/Files_Booklet_2006.pdf
Hahs-Vaughn, D. (2005). A primer for using and understanding weights with national
datasets. The Journal of Experimental Education, 73, 3, 221-248. Hahs-Vaughn, D. and Lomax, R. (2006). Utilization of sample weights in single-level
structural equation modeling. The Journal of Experimental Education, 74, 2, 163-190.
Hamm, R.E. (2004). Going to college: Not what it used to be. In K. Boswell and C.D.
Wilson (Eds.) Keeping America's promise: A report on the future of the community college (pp. 29-33). Denver, CO: Education Commission of the States and the League for Innovation in the Community College.
Hayes, R. (n.d.). The consortium for student retention data exchange (CSRDE)
Community College Initiative: A concept Paper. Center for Institutional Data Exchange and Analysis, University of Oklahoma. Retrieved1/10/06 from http://www.ou.edu/csrde/Community%20College%20Initiative%20Position%20Paper.pdf.
Henningsen, J.D. (2003). Assessing the fit of Tinto’s longitudinal model of institutional
departure at a community college. An unpublished dissertation completed at the University of Central Florida, Orlando: FL.
Hoachlander, G., Sikora, A.C. and Horn, L. (2003). Community college students: Goals,
academic preparation and outcomes. Washington, DC.: National Center for Education Statistics.
Horn, L. and Nevill, S. (2006). Profile of undergraduates in U.S. postsecondary
education institutions: 2003-2004: With a special analysis of community college students (NCES 2006-184). U.S. Department of Education. Washington, D.C.: National Center for Education Statistics.
Hu, S., and Kuh, G.D. (2002). Being (Dis)engaged in educational purposeful activities:
The influences of student and institutional characteristics. Research in Higher Education, 43, 5, 555-575.
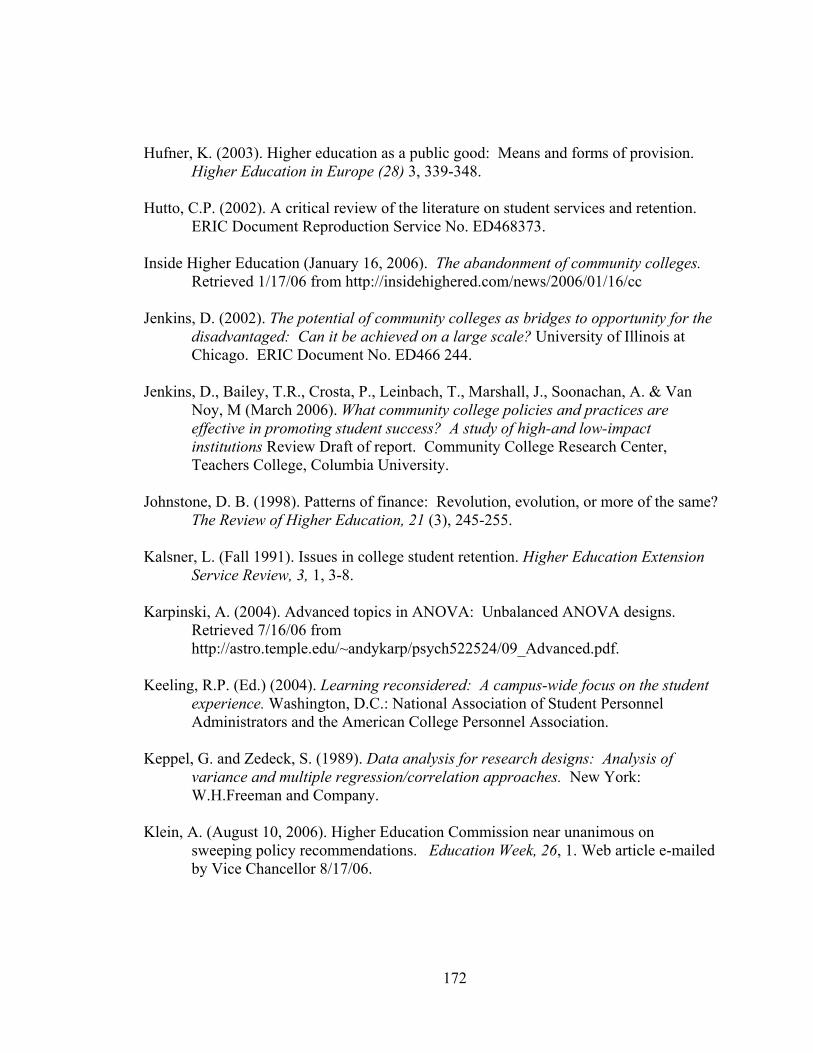
172
Hufner, K. (2003). Higher education as a public good: Means and forms of provision. Higher Education in Europe (28) 3, 339-348.
Hutto, C.P. (2002). A critical review of the literature on student services and retention.
ERIC Document Reproduction Service No. ED468373. Inside Higher Education (January 16, 2006). The abandonment of community colleges.
Retrieved 1/17/06 from http://insidehighered.com/news/2006/01/16/cc Jenkins, D. (2002). The potential of community colleges as bridges to opportunity for the
disadvantaged: Can it be achieved on a large scale? University of Illinois at Chicago. ERIC Document No. ED466 244.
Jenkins, D., Bailey, T.R., Crosta, P., Leinbach, T., Marshall, J., Soonachan, A. & Van
Noy, M (March 2006). What community college policies and practices are effective in promoting student success? A study of high-and low-impact institutions Review Draft of report. Community College Research Center, Teachers College, Columbia University.
Johnstone, D. B. (1998). Patterns of finance: Revolution, evolution, or more of the same?
The Review of Higher Education, 21 (3), 245-255. Kalsner, L. (Fall 1991). Issues in college student retention. Higher Education Extension
Service Review, 3, 1, 3-8. Karpinski, A. (2004). Advanced topics in ANOVA: Unbalanced ANOVA designs.
Retrieved 7/16/06 from http://astro.temple.edu/~andykarp/psych522524/09_Advanced.pdf.
Keeling, R.P. (Ed.) (2004). Learning reconsidered: A campus-wide focus on the student
experience. Washington, D.C.: National Association of Student Personnel Administrators and the American College Personnel Association.
Keppel, G. and Zedeck, S. (1989). Data analysis for research designs: Analysis of
variance and multiple regression/correlation approaches. New York: W.H.Freeman and Company.
Klein, A. (August 10, 2006). Higher Education Commission near unanimous on
sweeping policy recommendations. Education Week, 26, 1. Web article e-mailed by Vice Chancellor 8/17/06.

173
K-20 Education Code, Title XLVIII The 2005 Florida Statutes §1008 (2005). Retrieved 11/12/05 from http://www.flsenate.gov/Statutes/index.cfm?App_mode=Display_Statute&Search_String=&URL=Ch1008/SEC31.HTM&Title=->2005->Ch1008->Section%2031#1008.31
Kritzer, H.M. (1990). Substance and method in the use of ratio variables, or the spurious
nature of spurious correlation? Journal of Politics, 52, 1, 243-254. Kuh, G.D. (2001). Assessing what really matters to student learning: Inside the National
Survey of Student Engagement. Change, 33, 3, 10-19. Kuh, G.D. (2003). The National Survey of Student Engagement: Conceptual framework
and overview of psychometric properties. Indiana University Center for Postsecondary Research and Planning. Retrieved 2/18/06 from http://www.nsse.iub.edu/pdf/conceptual_framework.2003.pdf
Kuh, G.D. Kinzie, J., Schuh, H.H., and Whitt, E.J. (2005). Student success in college:
Creating conditions that matter. San Francisco: Jossey-Bass. Laden, B.V. (1998). An organizational response to welcoming students of color. New
Directions for Community Colleges, 26, 102, 31-41. Lau, L.K. (Fall 2003). Institutional factors affecting student retention. Education, 124, 1,
126-136. Lav, I. J. and Johnson, N. (2003). State budget deficits for fiscal year 2004 are huge and
growing. Center on Budget and Policy Priorities. Washington, D.C. pp. 1-4. Lederman, D. (2005). Improving student retention and persistence. Priorities, 26.
Association of Governing Boards of Colleges and Universities, Washington, DC. Leigh, D.E. and Gill, A.M. (2004). The effect of community colleges on changing
students' educational aspirations. Economics of Education Review, 23, 95-102. Leinbach, T.D. (December 15, 2005). Lost in the shuffle: The Critical role of community
colleges. Diverse Issues in Higher Education, 22, 22, 43. Levin, T.R. and Hullett, C.R. (2002). Eta squared, partial eta squared, and misreporting
of effect size in communication research. Human Communication Research, 28, 4, 612-625.

174
Levin, T. R. and Hullett, C.R. (2003). The overestimation of effect sizes from F values in meta-analysis: The cause and a solution. Communication Monographs, 70, 1, 52-68.
Lomax, R.G. (2001). An introduction to statistical concepts for education and behavioral
sciences. London: Lawrence Erlbaum Associates, Publishers. Macmillan, A. and Daft, R.L. (1980). Relationships among ratio variables with common
components: Fact or artifact. Social Forces, 58, 4, 1109-1128. Manzo, K.K. (September 3, 2001). Are colleges making the grade? Community College
Week 14, 2, 12. Manzo, K.K. (November 24, 2003). New report gives colleges performance yardsticks.
Community College Week, 16, 8, 19. Marks, J.L. and Caruthers, J.K. (August 1999). A primer on funding of public higher
education. Southern Regional Education Board, Atlanta, GA. Retrieved 1/9/06 from http://sreb.org/main/Publications/Finance/PrimeronFundingHigherEd.pdf
Marti, C.N. (2004). Overview of the CCSSE instrument and psychometric properties.
Community College Survey of Student Engagement website. Retrieved 1/29/05 from http://www.ccsse.org/aboutsurvey/psychometrics.pdf
Marti, C.N. (2006). Dimensions of student engagement in American community colleges:
Using the Community College Student Report in research and practice. Retrieved 2/18/06 from http://www.ccsse.org/aboutsurvey/psychometrics.pdf
Martinez, M. (2004a). High and rising: How much higher will college enrollments go?
In K. Boswell and C.D. Wilson (Eds.) Keeping America's promise: A report on the future of the community college (pp. 21-27). Denver, CO: Education Commission of the States and the League for Innovation in the Community College.
Martinez, M.C. (2004b). Meeting the challenges of population growth and the future
demand for postsecondary education: Considerations for state higher education policy. Education Commission on the States. Center for Community College Policy, 1-11.
McClenney, K.M. (2004a). Keeping America's promise. In K. Boswell and C.D. Wilson
(Eds.) Keeping America's promise: A report on the future of the community college. (pp. 7-18). Denver, CO: Education Commission of the States and the League for Innovation in the Community College.

175
McClenney, K.M. (2004b). Redefining quality in community colleges: Focusing on good educational practice. Change, 36, 6, 16-22.
McClenney, K.M. and Greene, T. (2005). A tale of two students: Building a culture of
engagement in the community college. About Campus, 10, 3, 2-7. McPhee, S. (2006). En route to the baccalaureate: Community college student
outcomes. Retrieved 9/12/2006 from http://www.aacc.nche.edu/Content/ContentGroups/Research_Briefs2/B_B_Brief_Final.pdf
Milliron, M.D. and Wilson, C.C. (2004). No need to invent them: Community colleges
and their place in the education landscape. Change, 36, 6, 52-58. Money, Inc. (1996). How we rank the colleges. Money, 25, 9, 118. National Association of State Budget Officers. (2004). Federal budget update:
Administration’s budget lean for states; cracks down on intergovernmental transfers. Washington, DC: Author.
Nunnally, J.C. and Bernstein, I.H. (1994). Psychometric theory. New York: McGraw-
Hill, Inc. Office of Student and Academic Success (n.d.). The impact of accountability on Florida's
community college system. FL DOE, Division of Community Colleges and Workforce Education, Office of Student and Academic Success. Retrieved 11/29/05 from http://www.sheeo.org/account/comm/testim/Florida%20DOE%20CC%20testimony.pdf
Ogren, C.A. (1989). Where coeds were coeducated: Normal schools in Wisconsin, 1870-
1920. In L.F. Goodchild and H.S. Wechsler (Eds.), The history of Higher Education (pp. 149-161). Lexington, MA: Ginn Press.
Oiumet, J.A. (Nov-Dec2001). Assessment measures: The community college survey of
student engagement. Assessment Update, 13, 6, 8-9. OPPAGA (August 1998). Program evaluation and justification review supplemental
analysis: Community college revenues and expenditures. Florida State Legislature, Tallahassee, Office of Program Policy Analysis and Government Accountability. Report No. 98-07. Retrieved 11/23/05 from http://www.oppaga.state.fl.us/reports/pdf/9807rpt.pdf

176
OPPAGA (March 1999). Program evaluation and justification review. Florida State Legislature, Tallahassee, Office of Program Policy Analysis and Government Accountability. Report No. 98-06A Revised. Retrieved 11/23/05 from http://www.oppaga.state.fl.us/reports/pdf/9806Arpt.pdf
OPPAGA Progress Report (June 2001). Florida State Legislature, Tallahassee, Office of
Program Policy Analysis and Government Accountability. Community Colleges Clearinghouse (JC010537)
OPPAGA (September 6, 2005). College preparatory and remediation. Office of Program
Policy Analysis and Government Accountability. Florida Government Accountability Report Number 2065. Retrieved 2/11/06 from http://www.oppaga.state.fl.us/profiles/2065/right.asp?programnum=2065
Pace, C.R. (1984). Measuring the quality of college student experiences. Los Angeles:
University of California, Higher Education Research Institute. Palomba, C.A. and Banta, T.W. (1999). Assessment essentials: Planning, implementing
and improving assessment in higher education. San Francisco: Jossey-Bass Publishers.
Pantages, T.J. and Creedon, C.F. (1978). Studies of college attrition: 1950-1975. Review
of Educational Research, 48, 1, 49-101. Pascarella, E.T. (1980). Student-Faculty informal contact and college outcomes. Review
of Educational Research, 50, 4, 545-595. Pascarella, E.T. and Terenzini, P.T. (1980). Predicting freshman persistence and
voluntary dropout decisions from a theoretical model. The Journal of Higher Education, 51, 1, 60-75.
Pascarella, E.T. and Terenzini, P.T. (1991). How college affects students: Findings and
insights from twenty years of research. San Francisco: Jossey-Bass Publishers. Pascarella, E.T. and Terenzini, P.T. (1998). Studying college students in the 21st century:
Meeting new challenges. The Review of Higher Education, 21, 2, 151-165. Pascarella, E.T. and Terenzini, P.T. (2005). How college affects students: A third decade
of research. San Francisco: Jossey Bass Publications. Payne, R.W. (2003). General balance, large data sets and extensions to unbalanced
treatment structures. Computational Statistics & Data Analysis, 44, 297-304.

177
Pedhazur, E.J. (1997). Multiple regression in behavioral research: Explanation and prediction. Fort Worth: Harcourt Brace College Publishers.
Phelan, D. J. (2000). Enrollment policies and student access at community colleges.
Center for Community College Policy. Report No CC-00-2. Phillippe, K.A. and Sullivan, L.G. (2005). National profile of community colleges:
Trends & statistics. Washington, D.C.: Community College Press. Ping, C.J. (1999). An expanded international role for student affairs. New Directions for
Student Services, 86, 13-21. Posavac, E.J. and Carey, R.G. (2003). Program evaluation: Methods and case studies.
Upper Saddle River, NJ: Prentice Hall. Potts, P.B. (1989). “College enthusiasm!” as public response: 1800-1860. In L.F.
Goodchild & H.S. Wechsler (Eds.), The history of Higher Education (pp. 149-161). Lexington, MA: Ginn Press.
Price, D.V. (2004). Defining the gaps: Access and success at America's community
colleges. In K. Boswell and C.D. Wilson (Eds.) Keeping America's promise: A report on the future of the community college (pp. 35-37). Denver, CO: Education Commission of the States and the League for Innovation in the Community College.
Proctor, W. (2002). Overview of higher education funding in Florida. Tallahassee:
Council for Education Policy Research and Improvement. Retrieved 3/28/06 from http://www.cepri.state.fl.us/ppt/Proctor%20Council%20100%.20presentation.ppt#525,5,Funding for State Universities in Florida
Proctor, W. (April 12, 2004). Statement to the national commission on accountability in
higher education. Presented by Florida Council for Education Policy, Research & Improvement. Retrieved 2/12/06 from http://www.sheeo.org/account/comm/testim/Florida%20CEPRI%20testimony
Randall, L. (January 18, 2004). It takes a community. The New York Times, 153, 44. Recruitment and Retention in Higher Education (April 2005). 2-Years snare larger share
of traditional-age pool. Recruitment and Retention in Higher Education, 19, 4, 8. Recruitment and Retention in Higher Education (December 2005a). Survey finds
unexpected relationship between engagement and retention. Recruitment and Retention in Higher Education, 19, 12, 3.

178
Recruitment and Retention in Higher Education (December 2005b). Students “swirl”
their way to four-year degrees. Recruitment and Retention in Higher Education, 19, 12, 3.
Roberts, J.K. (2000). Nested ANOVA vs. Crossed ANOVA: When and how to use which.
Report number TM 030715. ERIC Number ED440113. Robles, H. J. (1998). Community colleges as learning organizations. Community Colleges
Clearinghouse (JC990074) ERIC Number ED426743. Rubin, R. E., Orszag, P. R., & Sinai, A. (2004, January). Sustained budget deficits:
Longer-run U.S. economic performance and the risk of financial and fiscal disarray. Paper presented at the AEA-NAEFA Joint Session Allied Social Science Associations Annual Meetings, San Diego, CA.
Ruppert, S.S. (2003). Closing the college participation gap: A national summary. Center
for Community College Policy. Denver, CO: Education Commission of the States.
Sanchez-Penley, Y., Martinez, M.C. and Nodine, T. (1997). Florida: Protecting access
and anticipating growth. In P. M. Callan, J. E. Finney, K. R. Bracco, & W. R. Doyle (Eds.) Public and private financing of higher education: Shaping public policy for the future (pp. 106-136). Phoenix, AZ: Oryx Press.
Shemo, D.J. (September 2, 2006). At 2-year colleges, students eager but unready. The
New York Times, A1, A9. Shibley, L.R. and Upcraft, M.L. (2001). Assessing student academic success. In Schuh,
J.H. and Upcraft, M.C. (Eds). Assessment practice in student affairs. (pp. 249-261). San Francisco: Jossey-Bass.
Smart, J.C., Kuh, G.D. and Tierney, W.G. (May/June 1997). The Roles of institutional
cultures and decision approaches in promoting organizational effectiveness in two-year colleges. Journal of Higher Education, 68, 3, 256-281.
Southern Regional Education Board (1994). Changing states: Higher education and the
public good. The Commission for Educational Quality, Atlanta, GA. Srikanthan, G. and Dalrymple, J.F. (2002). Developing a holistic model for quality in
higher education. Quality in Higher Education, Vol. 8, No. 3. 215-224. StatSoft, Inc. (2006). Electronic statistics textbook. Retrieved 9/2/06 from
http://www.statsoft.com/textbook/stmulreg.html#amulticollinearity

179
Strauss, L. (2001) Trends in community college financing: Challenges of the past,
present, and future. Community Colleges Clearinghouse (JC020600) ERIC Number ED467983.
Summers, M.D. (2003). ERIC Review: Attrition research at community colleges.
Community College Review, 30, 4, 64-85. Szelenyi, K. (2001). Minority student retention and academic achievement in community
colleges. New Directions for Community Colleges. ERIC Document No. ED451859.
Task Force Final Report (October 2003). K-20 education performance accountability.
Retrieved 11/29/05 from http://www.k20accountability.org/docs/12.10.FinalReportTaskForceNoApp.pdf
Taylor, S. S. (January 20, 2003). Performance under pressure. Community College Week,
15(12), 6-9. Thelin, J.R. (2004). A history of American higher education. Baltimore: Johns Hopkins
University Press. Tinto, V. (1987). Leaving college: Rethinking the causes and cures of student attrition.
Chicago: University of Chicago Press. Tinto, V. (1993). Leaving college: Rethinking the causes and cures of student attrition.
San Francisco: Jossey-Bass Publishers. Tinto, V. (2002, April). Taking student retention seriously: Rethinking the first year of
college. Speech presented at the annual meeting of the American Association of Collegiate Registrars and Admission Officers, Minneapolis, MN.
Toolbox Revisited (2006). The Tookbox Revisited: Paths to degree completion from high
school through college, Executive Summary. U.S. Department of Education, Washington, D.C. Retrieved 2/28/06 from http://www.ed.gov/rschstat/research/pubs/toolboxrevisit/index.html
Townsend, B.K., Donaldson, J. and Wilson, T. (2005). Marginal or monumental?
Visibility of community colleges in selected higher-education journals. Community College Journal of Research and Practice, 29, 123-135.
U.S. Department of Education (May 17, 2005). Principle indicators of student academic
histories in postsecondary education, 1972-2000. Retrieved 5/17/05 from http://www.ed.gov/rschstat/research/pubs/prinindicat/index.html

180
University of South Florida (2004). University of South Florida Fact Book 2003-2004.
Retrieved 2/12/06 from http://usfweb2.usf.edu/bpa/factbook/fb2004/Section8/default.htm
Vaughan, G.B. (December 5, 2003). Redefining “open access”. Chronicle of Higher
Education, 50, 15, B24. Vaughan, G.B. (December 6, 2004). Is open access but a dream? Community College
Week, 17, 9, 4-5. Vaughan, G.B. and MacDonald, J. (October 28, 2005). Over selling the community
college: What price access? Chronicle of Higher Education, 52, 10, B12-B14. Voorhees, R.A. (1987). Toward building models of community college persistence: A
logit analysis. Research in Higher Education, 26, 2, 115-129. Wagner, C. and Masden-Copas, P. (2002). An audit of the culture starts with two handy
tools. Journal of Staff Development, 23, 42-53. Walters, E. (May 26, 2003). Perking up retention rates. Community College Week, 15, 21. Wattenbarger, J.L. and Albertson, H.T. (2004). A succinct history of the Florida
community college system. Retrieved 11/14/05 from http://www.facc.org/historyfl.ccs.pdf
Wild, L., and Ebbers, L. (2003). Rethinking student retention in community colleges.
Community College Journal of Research and Practice, 26, 503-519. Wilson, C.D. (2004). Coming through the open door: A student profile. In K. Boswell
and C.D. Wilson (Eds.) Keeping America's promise: A report on the future of the community college (pp.25-27). Denver, CO: Education Commission of the States and the League for Innovation in the Community College.
Windham, P. (2000). Accountability in the year 2000. (JC000366) ERIC Number
ED441527. Wirt, F, Mitchell, D. and Marshall, C. (Winter 1988). Culture and education policy:
Analyzing values in state policy systems. Educational Evaluation and Policy Analysis, 10 (4), 271-284.
Witt, A.A., Wattenbarger, J.L., Gollattscheck, J.F. and Suppiger, J.E. (1994). America’s
Community Colleges: The first century. Washington, D.C.: Community College Press.

181
Wolff, R.A. (2005). Accountability and accreditation: Can reforms match increasing
demands? In J.C. Burke (Ed.) Achieving accountability in higher education: Balancing public, academic and market demands. (pp. 78-103). San Francisco: Jossey-Bass.
Yeager, M. (October 21, 2004). Presidents pan board’s plan. Tallahassee Democrat.
Retrieved from http://www.tallahassee.com/mld/tallahassee/news/local/9972407.htm?template=contentM
Zamani, E.M. (2000). Sources and information regarding effective retention strategies for
students of color. New Directions for Community Colleges, 112, 95-104. Zimmerman, D.W. (2004). Inflated statistical significance of Student’s t-test associated
with small intersubject correlation. Journal of Statistical Computation & Simulation, 74, 9, 691-696.
Zusman, A. (1999). Issues facing higher education in the 21st century. In Altbach, P.G.,
Berdahl, R.O., & Gumport, P.J. (Eds.) American Higher Education in the 21st Century (pp. 109-123), Baltimore: The Johns Hopkins University Press.