Measuring the impact of a university first-year experience program on student GPA and retention
20
Measuring the impact of a university first-year experience program on student GPA and retention Eric Jamelske Published online: 13 July 2008 Ó Springer Science+Business Media B.V. 2008 Abstract In 1997 a medium-size Midwestern public university in the U.S. initiated a first year experience program. The program is designed to infuse added curricular and extra- curricular components into core courses in an effort to integrate students into the university community. This article examined the FYE impact on grade point average (GPA) and retention after 1 year for the fall 2006 cohort of entering students. The findings suggest no positive FYE effect on retention, but on average FYE students earned higher GPAs than non-FYE students. Reducing the sample to include only courses identified as goal com- patible FYE courses yielded a positive effect on retention and also accentuated the GPA differential. The estimated positive FYE impact on retention was larger for below average students (especially females) and smaller for above average students. Keywords Higher education First year experience Retention Grade point average Introduction Background As a college degree has become increasingly necessary for young adults to be competitive in the job market, more students are pursuing a higher education. Institutions now enroll many students who would not have attended college in the past. Consequently, many students have needs which require a range of support programs. In addition, most colleges and universities are operating with tightened budgets. Under these circumstances student retention and graduation have become increasingly important. In 2007 the average retention rate among all U.S. institutions of higher education from first year to second year was 68.7%. Within this national average, retention was signifi- cantly lower among 2 year schools compared to 4 year schools. Similarly, retention at E. Jamelske (&) Department of Economics, University of Wisconsin-Eau Claire, 105 Garfield Avenue, P.O. Box 4004, Eau Claire, WI 54702-4004, USA e-mail: [email protected] 123 High Educ (2009) 57:373–391 DOI 10.1007/s10734-008-9161-1
Transcript of Measuring the impact of a university first-year experience program on student GPA and retention
Measuring the impact of a university first-yearexperience program on student GPA and retention
Eric Jamelske
Published online: 13 July 2008� Springer Science+Business Media B.V. 2008
Abstract In 1997 a medium-size Midwestern public university in the U.S. initiated a first
year experience program. The program is designed to infuse added curricular and extra-
curricular components into core courses in an effort to integrate students into the university
community. This article examined the FYE impact on grade point average (GPA) and
retention after 1 year for the fall 2006 cohort of entering students. The findings suggest no
positive FYE effect on retention, but on average FYE students earned higher GPAs than
non-FYE students. Reducing the sample to include only courses identified as goal com-
patible FYE courses yielded a positive effect on retention and also accentuated the GPA
differential. The estimated positive FYE impact on retention was larger for below average
students (especially females) and smaller for above average students.
Keywords Higher education � First year experience � Retention � Grade point average
Introduction
Background
As a college degree has become increasingly necessary for young adults to be competitive
in the job market, more students are pursuing a higher education. Institutions now enroll
many students who would not have attended college in the past. Consequently, many
students have needs which require a range of support programs. In addition, most colleges
and universities are operating with tightened budgets. Under these circumstances student
retention and graduation have become increasingly important.
In 2007 the average retention rate among all U.S. institutions of higher education from
first year to second year was 68.7%. Within this national average, retention was signifi-
cantly lower among 2 year schools compared to 4 year schools. Similarly, retention at
E. Jamelske (&)Department of Economics, University of Wisconsin-Eau Claire,105 Garfield Avenue, P.O. Box 4004, Eau Claire, WI 54702-4004, USAe-mail: [email protected]
123
High Educ (2009) 57:373–391DOI 10.1007/s10734-008-9161-1
4 year private institutions was somewhat higher than at 4 year public institutions. See
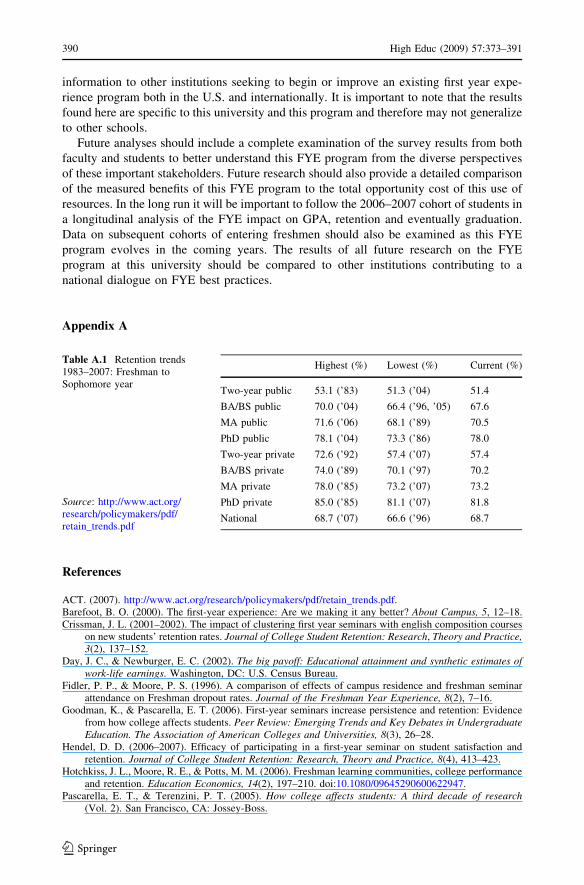
Appendix A for a more detailed look at retention rates across institution types (ACT 2007).
Given that students cannot graduate if they are not retained early on, student retention has
become one of the most analyzed outcomes in higher education.
From the student perspective retention is important for the simple reason that college
pays. In 2003 the median annual salary in the U.S. was $30,800 for a worker with only a
high school diploma. This was significantly lower than the median earnings of $49,900 for
those with a bachelor’s degree (The College Board 2005). Moreover, lifetime earnings for
someone with a bachelor’s degree were estimated to be nearly twice that of someone with
only a high school diploma (Day and Newburger 2002). Retention is also important to
institutions, not surprisingly because it pays. Students are the financial lifeline of colleges
and universities through the tuition and fees as well as government subsidies for public
institutions. A low retention rate means that a college is always working to replace students
that leave which requires resources that could be used elsewhere. In addition, if students
leave before graduating, they are not likely to become donors to their former schools.
Retention and recruitment are closely related as the competition for the best students has
increased recently. Students and parents are becoming reliant on highly publicized national
and regional higher education rankings in choosing institutions. One such publication is the
annual U.S. News and World Report on College Rankings. In this report, an institution’s
retention rate carries a weight between 20 and 25% in the ranking process (U.S. News &
World Report 2008). Therefore, higher retention rates improve national and regional
rankings and are therefore extremely important to recruitment efforts (Porter and Swing
2006). The irony is that the better students a university recruits, the more likely they are to
have a high retention rate. However as pointed out above, the higher an institution’s
retention rate is, the more competitive they will be in recruiting top students.
In response to these challenges many institutions have begun to allocate significant
resources to the first year experience in an effort to improve student outcomes. First year
experience (FYE) programs vary widely across institutions ranging from highly organized
learning communities to basic courses introducing students to college life. Although there
is a growing literature on the evaluation of FYE programs, the results are mixed. This is
because each analysis is specific to the particular institution, student body and program
under study. There are significant differences between public and private colleges, between
large and small colleges, and between those that focus on teaching as opposed to research.
Some campuses are urban while others are suburban or rural and some have significant on
campus housing while others do not. In summary, both the institutional characteristics and
the types of FYE programs being implemented vary greatly.
In 1997 one particular medium-size Midwestern public university in the U.S. initiated a
FYE program. The program was designed to add both curricular and extracurricular
components to existing core courses in an effort to integrate students into the university
community. There has never been an organized and thorough evaluation of this FYE
program. Past assessments were incomplete and consisted mainly of qualitative data from
student surveys. These data show that students generally responded positively about their
FYE course experience, but this is not enough to justify the resources devoted to this
program over the last decade. Specifically, the fall 2006 FYE budget was $237,700. Given
this major expenditure and lack of information on program outcomes, university admin-
istrators called for a detailed program assessment. The research presented in this article is
the first step in developing an on-going assessment of this university’s FYE program.
Although a complete benefit-cost analysis is beyond the scope of this paper, a detailed
investigation of program cost effectiveness is planned for future research.
374 High Educ (2009) 57:373–391
123
This study used both student and faculty survey data and administrative data to measure
the impact of this FYE program on student GPA and retention after 1 year for the fall 2006
cohort of entering students. The FYE impact was also analyzed separately for different
subgroups. The results of this study are integral in developing a successful, cost effective
FYE program at this institution. Moreover, this research adds to the growing literature on
student outcomes associated with first year interventions in higher education. This paper
analyzes the experience of one Midwestern U.S. institution and most of the background
information is also specific to the U.S. However, the first year experience has become a
significant focus of institutions around the world.
The National Resource Center for the First Year Experience (http://www.sc.edu/fye/)
hosts an annual International Conference now in its twenty-first year. The nineteenth
annual conference in Toronto had nearly 500 participants from 17 different countries with
featured speakers from 11 different countries. The attendance at this event represents only
a fraction of the international interest and attention surrounding first year intervention
programs. This suggests that the global demand for research results identifying FYE best-
practices is very high. Because all institutions and programs are different, results from
specific institutional case studies may not generalize to all universities. However, research
results such as presented in this article are still valuable to institutions in a wide variety of
countries that are seeking to either begin a FYE program or improve an existing one.
Literature review
First year interventions have grown dramatically in the last two decades with approxi-
mately 95% of U.S. 4-year institutions having some type of program. Although program
content varies greatly, there are many common elements. Most programs serve, at least in
part, as an extended orientation and are often referred to as an introduction to university
course or a first year seminar. Some institutions go even further by arranging learning
communities for incoming students where small groups of students take a series of linked
courses in their first semester or the first year. In some cases the learning communities are
based on disciplinary themes or linked to residence halls and can encompass the students’
entire class schedule. The more basic FYE courses generally have a regular class meeting
time with a specific instructor or team of instructors and are credit bearing and graded.
They usually include activities and resources designed to introduce new students to uni-
versity life and assist with time management and study skills. Although many courses
include a discipline or specific academic component in addition to the activities above, the
variation in pedagogy and structure is significant across campuses. However, all programs
site the primary goals of increased student performance, persistence and graduation by
integrating students into the university community both academically and socially (Pas-
carella and Terenzini 2005; Tobolowsky et al. 2005; Goodman and Pascarella 2006).
The research examining the success in achieving these stated goals has grown over the
last decade. An exhaustive review of this literature including recommendations for future
research can be found in How College Effects Students (Pascarella and Terenzini 2005).
The most common variables studied have been GPA, retention, graduation and self-
reported student satisfaction. Most research has focused on retention over the first year
because the majority of dropouts occur during the first year (Tinto 1987; Barefoot 2000). In
15 of 23 years studied, University of South Carolina-Columbia researchers found that first
year seminar students were more likely to return for their sophomore year than non-
participants. Several other studies have found similar retention effects, however Pascarella
High Educ (2009) 57:373–391 375
123
and Tarenzini (2005) caution that many of these studies do not use random samples or
control for student pre-college characteristics.
Two studies were identified with highly rigorous analyses. The first study used
matched control groups and found that program students were seven percentage points
more likely to be retained for their second year. The second study used a random
assignment of students and found that participating students were 13 percentage points
more likely to return for their second year (Pascarella and Terenzini 2005; Goodman and
Pascarella 2006). Several other studies are particularly relevant to the analyses presented
in this paper.
In a longitudinal analysis of matched treatment and comparison groups, Schnell and
Doetkott (2002–2003) found significantly higher retention rates for first year seminar
students over a 4 year period at a medium-size Midwestern public university. Hotchkiss
et al. (2006) found first year learning communities had a small positive effect on retention
and GPA at a large Southern public institution, however controlling for selection bias
increased this effect especially among male and female black students. Fidler and Moore
(1996) found significant positive effects on retention for both first year seminar attendance
and residing on-campus over the period 1986–1993. They concluded that the lowest
dropout rates occurred among students who combined both of these experiences.
There are also several examples of FYE programs found to have little or no benefit to
students. Potts et al. (2003–2004) found no consistent positive effects on retention or GPA
for students who participated in an incoming cohort group. They did note that cohort
groups had some positive influence for students entering college at risk. Crissman (2001–
2002) did not find any added positive influence on retention rates from linking the first year
seminar with an English composition class at a small Northeastern liberal arts college.
Hendel (2006–2007) reports no effect of first year seminar participation on overall student
satisfaction or 1-year retention in an analysis at a large urban research institution.
Overall, the evidence suggests that students involved in some type of organized first
year intervention report higher levels of satisfaction and involvement in campus activities,
achieve higher grades and are more likely to be retained and graduate. Given these mixed
research findings, it is clear that a better understanding is needed of how these programs
positively influence students. Pascarella and Terenzini (2005) recommend continued use of
matching controls and random assignment experiments. They also suggest the most
important next step is to incorporate a longitudinal design in order to better understand the
long-term impact of first year program participation. It is important to once again note that
the programs mentioned above vary across institutions in significant ways despite often
being referred to as first year seminars. Moreover, the institutions themselves also vary in
many ways and therefore positive/negative results from one study do not necessarily
generalize to all institutions especially internationally.
FYE program description
This institution is a public comprehensive university located in a small urban setting in the
upper Midwest. The university offers 80 bachelor’s degree programs and 14 master’s
degree programs across a wide range of disciplines. There are 408 full-time faculty
members and the average class size is 28 students, however introductory classes often have
50–75 students. The student body is very traditional in the sense that few students are
returning to college or starting college after an extended absence from educational
activities. Students on this campus are also racially homogeneous with over 92%
376 High Educ (2009) 57:373–391
123
identifying as white. Lastly, the campus houses approximately 4,000 out of just over
10,000 total students in 11 residence halls including over 92% of all first year students.
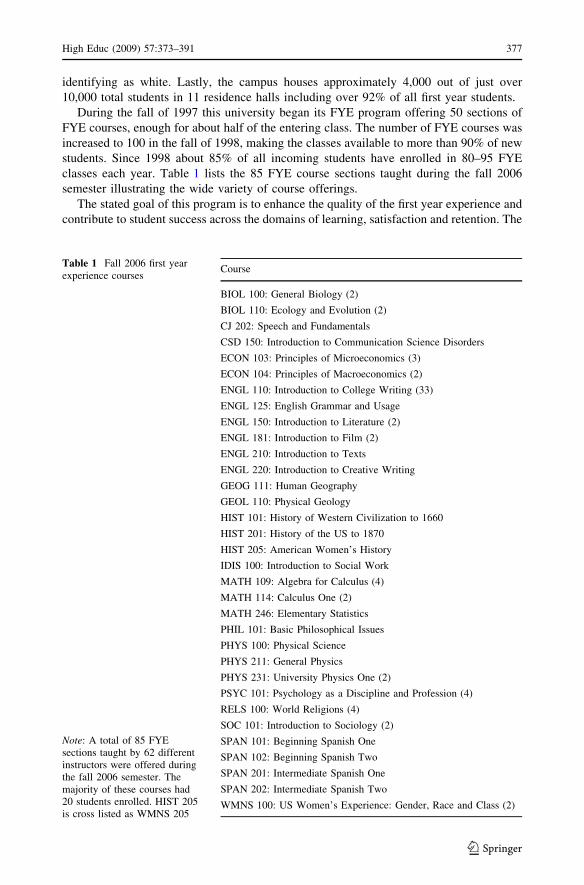
During the fall of 1997 this university began its FYE program offering 50 sections of
FYE courses, enough for about half of the entering class. The number of FYE courses was
increased to 100 in the fall of 1998, making the classes available to more than 90% of new
students. Since 1998 about 85% of all incoming students have enrolled in 80–95 FYE
classes each year. Table 1 lists the 85 FYE course sections taught during the fall 2006
semester illustrating the wide variety of course offerings.
The stated goal of this program is to enhance the quality of the first year experience and
contribute to student success across the domains of learning, satisfaction and retention. The
Table 1 Fall 2006 first yearexperience courses
Note: A total of 85 FYEsections taught by 62 differentinstructors were offered duringthe fall 2006 semester. Themajority of these courses had20 students enrolled. HIST 205is cross listed as WMNS 205
Course
BIOL 100: General Biology (2)
BIOL 110: Ecology and Evolution (2)
CJ 202: Speech and Fundamentals
CSD 150: Introduction to Communication Science Disorders
ECON 103: Principles of Microeconomics (3)
ECON 104: Principles of Macroeconomics (2)
ENGL 110: Introduction to College Writing (33)
ENGL 125: English Grammar and Usage
ENGL 150: Introduction to Literature (2)
ENGL 181: Introduction to Film (2)
ENGL 210: Introduction to Texts
ENGL 220: Introduction to Creative Writing
GEOG 111: Human Geography
GEOL 110: Physical Geology
HIST 101: History of Western Civilization to 1660
HIST 201: History of the US to 1870
HIST 205: American Women’s History
IDIS 100: Introduction to Social Work
MATH 109: Algebra for Calculus (4)
MATH 114: Calculus One (2)
MATH 246: Elementary Statistics
PHIL 101: Basic Philosophical Issues
PHYS 100: Physical Science
PHYS 211: General Physics
PHYS 231: University Physics One (2)
PSYC 101: Psychology as a Discipline and Profession (4)
RELS 100: World Religions (4)
SOC 101: Introduction to Sociology (2)
SPAN 101: Beginning Spanish One
SPAN 102: Beginning Spanish Two
SPAN 201: Intermediate Spanish One
SPAN 202: Intermediate Spanish Two
WMNS 100: US Women’s Experience: Gender, Race and Class (2)
High Educ (2009) 57:373–391 377
123
program was designed to strengthen the connection to the university by providing
opportunities for students to interact with a small group of peers as well as work closely
with an individual faculty member including both in-class and out-of-class activities. The
published program goals have been divided into formal and informal goals.
Formal FYE program goals:
• Introduce students to a liberal education and to awaken intellectual curiosity.
• Enhance skills needed for academic success: reading, writing, speaking, listening,
thinking, inquiry and analysis, use of information technology, library skills, and time
management.
• Strengthen student connections to the University.
• Engage students in meaningful academic and non-academic out-of-class activities.
• Enhance student accountability for their education.
Informal FYE program goals:
• Encourage academic and social ties and connections to a faculty member.
• Provide a setting where connections can be made with peers in an educational learning
community.
The intended design of this program was to infuse core courses with added curricular and
extracurricular activities to integrate students into the university community. Enrollment is
capped at 20 students and each course has an assigned student peer mentor. Curricular
activities that could be added include service learning, field trips, group research or
attending speaker events as well as special lectures and exercises in time management,
study skills or library and technology use. Ideally the student peer mentor would play an
active role in these activities assisting the new students as they adjust to their new aca-
demic environment. As can be imagined some courses would be more adaptable to this
framework given the topical material and course design. Another restriction comes from
the fact that many instructors teach both FYE and non-FYE sections of the same course.
Because all sections earn three credits they must cover the same basic material and grades
must be determined on comparable assignments and exams. From a student incentive
perspective, the additional activities mentioned above should be tied to the student’s course
grade, but should complement the existing course content rather than replace it. Lastly, the
program design suggests that faculty and student mentors engage the students in a variety
of activities outside of class such as visiting career services, attending majors fairs, study
abroad fairs or campus organizations fairs in addition to social events like picnics, playing
or watching sports or just congregating socially.
This design presented a challenge to professors because of the significant work needed
to integrate these curricular additions without compromising the original course. In
addition, the suggested outside time commitment for extracurricular activities was also a
major hurdle for FYE faculty to overcome. Although there were faculty and peer mentor
training workshops to facilitate this process, these sessions have been extremely informal
and because attendance is voluntary many instructors and mentors have chosen not to
attend. Although FYE faculty are given guidelines and encouraged to meet the goals of the
program as defined above, there are no specific rules or procedures to hold instructors
accountable for doing so. These combined factors created a lack of uniformity across
courses and instructors in how FYE classes were organized and taught. Lastly, there was no
formal application process for selecting FYE faculty, and neither the individual depart-
ments nor the university place added value on performance reviews for teaching FYE. This
issue is extremely important and is therefore discussed in greater detail below.
378 High Educ (2009) 57:373–391
123
Method
Participants
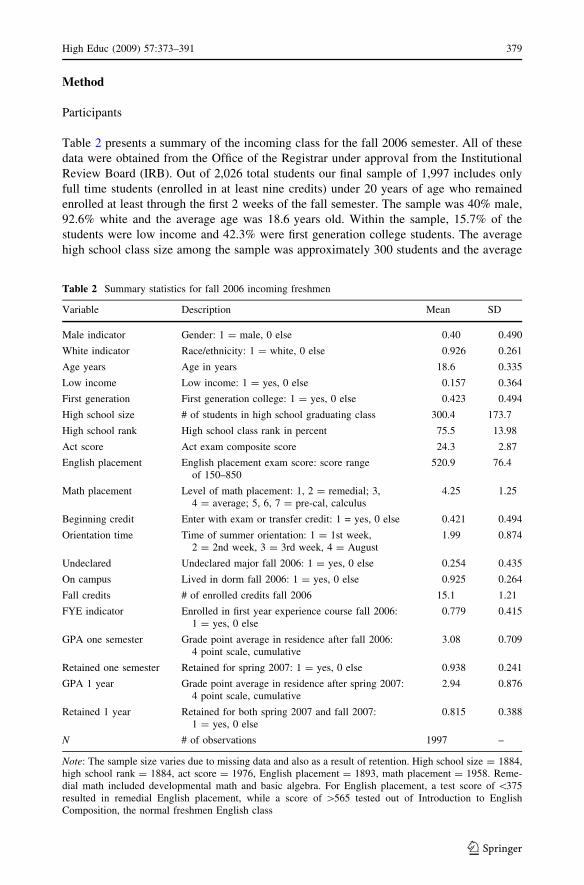
Table 2 presents a summary of the incoming class for the fall 2006 semester. All of these
data were obtained from the Office of the Registrar under approval from the Institutional
Review Board (IRB). Out of 2,026 total students our final sample of 1,997 includes only
full time students (enrolled in at least nine credits) under 20 years of age who remained
enrolled at least through the first 2 weeks of the fall semester. The sample was 40% male,
92.6% white and the average age was 18.6 years old. Within the sample, 15.7% of the
students were low income and 42.3% were first generation college students. The average
high school class size among the sample was approximately 300 students and the average
Table 2 Summary statistics for fall 2006 incoming freshmen
Variable Description Mean SD
Male indicator Gender: 1 = male, 0 else 0.40 0.490
White indicator Race/ethnicity: 1 = white, 0 else 0.926 0.261
Age years Age in years 18.6 0.335
Low income Low income: 1 = yes, 0 else 0.157 0.364
First generation First generation college: 1 = yes, 0 else 0.423 0.494
High school size # of students in high school graduating class 300.4 173.7
High school rank High school class rank in percent 75.5 13.98
Act score Act exam composite score 24.3 2.87
English placement English placement exam score: score rangeof 150–850
520.9 76.4
Math placement Level of math placement: 1, 2 = remedial; 3,4 = average; 5, 6, 7 = pre-cal, calculus
4.25 1.25
Beginning credit Enter with exam or transfer credit: 1 = yes, 0 else 0.421 0.494
Orientation time Time of summer orientation: 1 = 1st week,2 = 2nd week, 3 = 3rd week, 4 = August
1.99 0.874
Undeclared Undeclared major fall 2006: 1 = yes, 0 else 0.254 0.435
On campus Lived in dorm fall 2006: 1 = yes, 0 else 0.925 0.264
Fall credits # of enrolled credits fall 2006 15.1 1.21
FYE indicator Enrolled in first year experience course fall 2006:1 = yes, 0 else
0.779 0.415
GPA one semester Grade point average in residence after fall 2006:4 point scale, cumulative
3.08 0.709
Retained one semester Retained for spring 2007: 1 = yes, 0 else 0.938 0.241
GPA 1 year Grade point average in residence after spring 2007:4 point scale, cumulative
2.94 0.876
Retained 1 year Retained for both spring 2007 and fall 2007:1 = yes, 0 else
0.815 0.388
N # of observations 1997 –
Note: The sample size varies due to missing data and also as a result of retention. High school size = 1884,high school rank = 1884, act score = 1976, English placement = 1893, math placement = 1958. Reme-dial math included developmental math and basic algebra. For English placement, a test score of \375resulted in remedial English placement, while a score of [565 tested out of Introduction to EnglishComposition, the normal freshmen English class
High Educ (2009) 57:373–391 379
123
high school rank was in the 75th percentile. The average ACT composite score for
incoming students was just over 24 and the average English placement test score was
nearly 521. In addition, students were typically placed in average level math courses
(measures for math and English placement are briefly described in Table 2).
Forty-two percent of new students matriculated with existing college credit, while one-
quarter did not have a declared major. More than 92% of first year students lived on
campus in the fall semester and 77.9% were enrolled in an FYE course. The university
requires a summer orientation program for new students to visit the campus and register for
fall classes. The majority of students attended orientation during the first 3 weeks of June
(week 1: 35.5%, week 2: 34.1%, and week 3: 26.9%), while some delayed their visit until
late August (3.5%).1 On average students enrolled in 15.1 credits and earned a GPA of 3.08
during their first semester of college. After 1 year, the average cumulative GPA of students
had declined slightly to 2.94. The retention rate dropped from 93.8% after the fall semester
to 81.6% at the end of the first year.
In comparison to the average 1 year retention rate of about 70% for similar 4-year
public institutions (BA/BS/MA) in the U.S., this university’s retention rate of over 80%
ranks high (ACT 2007). In addition, with 11 residence halls housing approximately 40% of
all students, this university has a higher rate of on campus residence than the average rate
of about 28% for other public institutions (U.S. Department of Education 2006). These
facts are not surprising given the positive correlation between on campus residence and
retention found in other research (Fidler and Moore 1996).
Estimating models
The primary focus of this study was to determine the degree to which this FYE program
positively impacted student retention and GPA after 1 year, while controlling for factors
related to retention and academic performance. For retention, the dependent variable is an
indicator equal to 1 if the student was retained for the fall 2007 semester after being
enrolled for the entire 2006–2007 academic year and 0 otherwise. The maximum likeli-
hood logit estimation is defined as:
PrðRi ¼ 1Þ ¼ expðZiÞ1þ expðZiÞ
ð1Þ
Zi ¼ aþ FYEibþ EDid ð2Þ
R = 1 signals that student i was retained, while FYE indicates participation in a FYE
course in the fall 2006 semester and ED represents both educational and demographic
variables as defined in Table 2. Similarly, the FYE impact on GPA was estimated using
ordinary least squares regression where:
GPAi ¼ aþ FYEibþ EDid ð3Þ
GPA represents the cumulative GPA in residence for student i while all other variables are
as defined in Eq. 2.
1 The timing of orientation is important because FYE course availability may be limited for students whoattended later orientation sessions.
380 High Educ (2009) 57:373–391
123
Goal compatible FYE
As discussed above, FYE instructors faced significant barriers in meeting the program
goals and moreover, there are no specific rules or procedures to hold instructors
accountable for doing so. Given this setup, participating faculty lacked the appropriate
structure, support and incentive to create FYE courses that are compatible with the goals of
the FYE program. Aside from the class size and peer mentor, it is possible that many FYE
classes were little different than regular sections of the same course. To test this
hypothesis, surveys were conducted among FYE instructors and FYE students following
the 2006 fall semester under IRB approval. Survey responses were received from 49 out of
63 FYE instructors for a response rate of nearly 78%. In terms of students there were 559
responses out of 1,556 FYE students for a response rate of almost 36%.
Forty-nine percent of faculty respondents either agreed or strongly agreed that ‘‘it is
difficult both to teach my course effectively and to have it meet all the goals of the FYE
program.’’ Similarly 42% responded strongly disagree, disagree, or neutral when asked if
they ‘‘took a significantly different approach to the teaching of the FYE course compared
with the regular section of the same course.’’ Most striking of all was that only 55% said
that they included the FYE goals in their course syllabus. Among students it was not
uncommon to see comments such as ‘‘my mentor never attended class’’ and ‘‘I was jealous
that my class never did any academic/social activities outside of class like my friend’s FYE
class.’’ Other fairly common student responses were ‘‘my FYE class did not significantly
help me ‘connect’ to the university’’ and ‘‘my mentor was not a valuable resource to me.’’
Taken together these results highlight the barriers and lack of incentive facing instructors
in implementing strategies to meet the FYE goals.
The FYE instructor surveys were anonymous and therefore could not be used to identify
quality FYE courses. Student surveys although confidential, were linked to specific FYE
courses and therefore could be used to identify courses that were likely meeting the FYE
program goals. The first criterion in this process was that at least 25% of enrolled students
responded to the voluntary survey. Next, it was required that at least 25% of enrolled
students either agreed or strongly agreed with the statement ‘‘My course helped me feel
more connected to the university.’’ For the remaining classes, at least 25% of enrolled
students had to either agree or strongly agree with two out of the three of the following
statements: (1) ‘‘My course helped me succeed academically in my first semester.’’ (2)
‘‘My course helped me succeed socially in my first semester.’’ (3) My mentor served as a
valuable resource in my course.’’ This process identified 26 FYE sections taught by 22
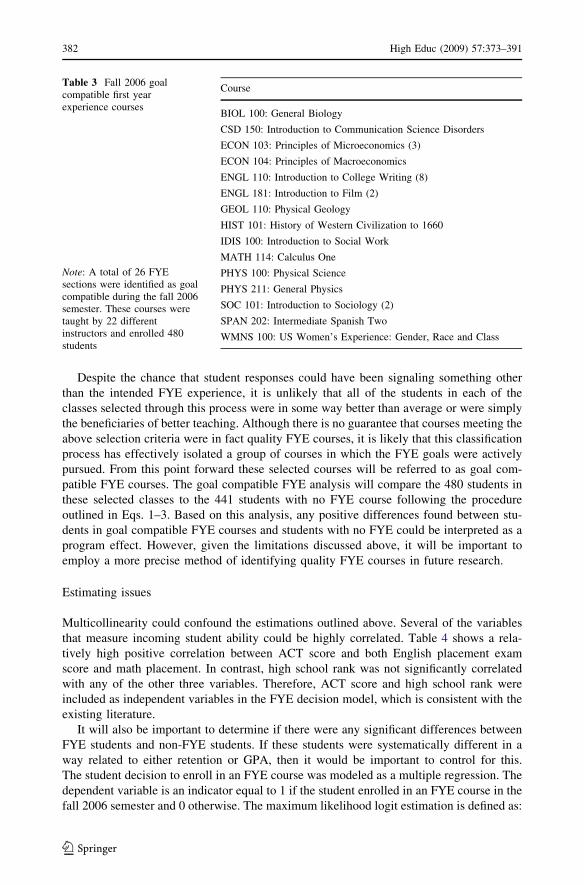
different instructors serving 480 students. These courses are listed in Table 3.
There are some limitations to using self-reported student responses to selected survey
questions to identify successful FYE courses. It is possible that these responses are
reflective of the individual successes of students rather than the result of a quality FYE
course. Similarly, students in these selected FYE courses may just be the beneficiaries of
great teaching in general as opposed to a special first year experience. There are two
features of this FYE classification system that could mitigate these claims. The first
selection requirement was first to have at least 25% of enrolled students respond to the
voluntary survey. None of these courses had all of the students in the class respond to the
survey and in most cases the response rate was between 30 and 50%. Additionally, most
instructors teaching these selected FYE courses also taught non-FYE sections of the same
course. As a result some first year students would have been taking the same courses from
the same professors with some being FYE and some being non-FYE.
High Educ (2009) 57:373–391 381
123
Despite the chance that student responses could have been signaling something other
than the intended FYE experience, it is unlikely that all of the students in each of the
classes selected through this process were in some way better than average or were simply
the beneficiaries of better teaching. Although there is no guarantee that courses meeting the
above selection criteria were in fact quality FYE courses, it is likely that this classification
process has effectively isolated a group of courses in which the FYE goals were actively
pursued. From this point forward these selected courses will be referred to as goal com-
patible FYE courses. The goal compatible FYE analysis will compare the 480 students in
these selected classes to the 441 students with no FYE course following the procedure
outlined in Eqs. 1–3. Based on this analysis, any positive differences found between stu-
dents in goal compatible FYE courses and students with no FYE could be interpreted as a
program effect. However, given the limitations discussed above, it will be important to
employ a more precise method of identifying quality FYE courses in future research.
Estimating issues
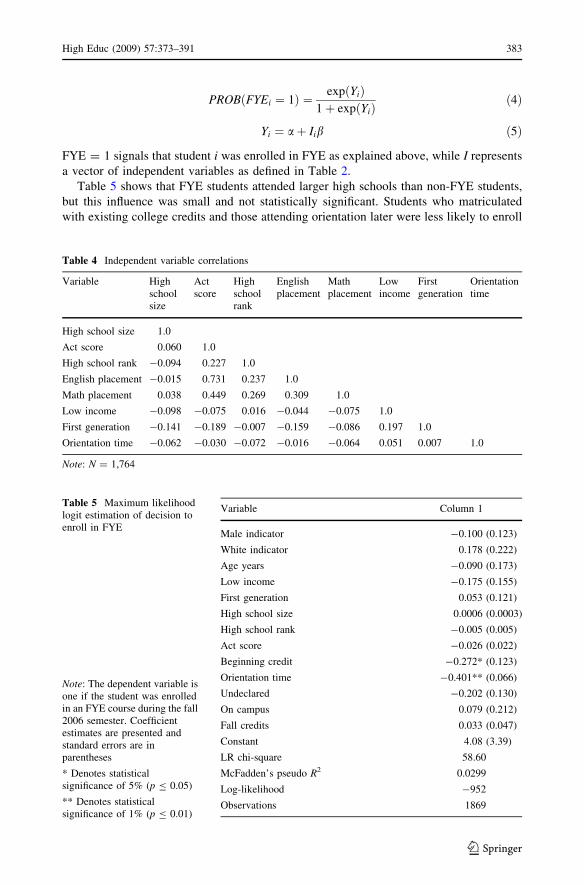
Multicollinearity could confound the estimations outlined above. Several of the variables
that measure incoming student ability could be highly correlated. Table 4 shows a rela-
tively high positive correlation between ACT score and both English placement exam
score and math placement. In contrast, high school rank was not significantly correlated
with any of the other three variables. Therefore, ACT score and high school rank were
included as independent variables in the FYE decision model, which is consistent with the
existing literature.
It will also be important to determine if there were any significant differences between
FYE students and non-FYE students. If these students were systematically different in a
way related to either retention or GPA, then it would be important to control for this.
The student decision to enroll in an FYE course was modeled as a multiple regression. The
dependent variable is an indicator equal to 1 if the student enrolled in an FYE course in the
fall 2006 semester and 0 otherwise. The maximum likelihood logit estimation is defined as:
Table 3 Fall 2006 goalcompatible first yearexperience courses
Note: A total of 26 FYEsections were identified as goalcompatible during the fall 2006semester. These courses weretaught by 22 differentinstructors and enrolled 480students
Course
BIOL 100: General Biology
CSD 150: Introduction to Communication Science Disorders
ECON 103: Principles of Microeconomics (3)
ECON 104: Principles of Macroeconomics
ENGL 110: Introduction to College Writing (8)
ENGL 181: Introduction to Film (2)
GEOL 110: Physical Geology
HIST 101: History of Western Civilization to 1660
IDIS 100: Introduction to Social Work
MATH 114: Calculus One
PHYS 100: Physical Science
PHYS 211: General Physics
SOC 101: Introduction to Sociology (2)
SPAN 202: Intermediate Spanish Two
WMNS 100: US Women’s Experience: Gender, Race and Class
382 High Educ (2009) 57:373–391
123
PROBðFYEi ¼ 1Þ ¼ expðYiÞ1þ expðYiÞ
ð4Þ
Yi ¼ aþ Iib ð5Þ
FYE = 1 signals that student i was enrolled in FYE as explained above, while I represents
a vector of independent variables as defined in Table 2.
Table 5 shows that FYE students attended larger high schools than non-FYE students,
but this influence was small and not statistically significant. Students who matriculated
with existing college credits and those attending orientation later were less likely to enroll
Table 4 Independent variable correlations
Variable Highschoolsize
Actscore
Highschoolrank
Englishplacement
Mathplacement
Lowincome
Firstgeneration
Orientationtime
High school size 1.0
Act score 0.060 1.0
High school rank -0.094 0.227 1.0
English placement -0.015 0.731 0.237 1.0
Math placement 0.038 0.449 0.269 0.309 1.0
Low income -0.098 -0.075 0.016 -0.044 -0.075 1.0
First generation -0.141 -0.189 -0.007 -0.159 -0.086 0.197 1.0
Orientation time -0.062 -0.030 -0.072 -0.016 -0.064 0.051 0.007 1.0
Note: N = 1,764
Table 5 Maximum likelihoodlogit estimation of decision toenroll in FYE
Note: The dependent variable isone if the student was enrolledin an FYE course during the fall2006 semester. Coefficientestimates are presented andstandard errors are inparentheses
* Denotes statisticalsignificance of 5% (p B 0.05)
** Denotes statisticalsignificance of 1% (p B 0.01)
Variable Column 1
Male indicator -0.100 (0.123)
White indicator 0.178 (0.222)
Age years -0.090 (0.173)
Low income -0.175 (0.155)
First generation 0.053 (0.121)
High school size 0.0006 (0.0003)
High school rank -0.005 (0.005)
Act score -0.026 (0.022)
Beginning credit -0.272* (0.123)
Orientation time -0.401** (0.066)
Undeclared -0.202 (0.130)
On campus 0.079 (0.212)
Fall credits 0.033 (0.047)
Constant 4.08 (3.39)
LR chi-square 58.60
McFadden’s pseudo R2 0.0299
Log-likelihood -952
Observations 1869
High Educ (2009) 57:373–391 383
123
in an FYE course. Because having existing college credits could be related to student
performance and college persistence, estimations of the FYE impact on retention and GPA
should control for this. Students who attended orientation late were significantly less likely
to enroll in a FYE course. According to student survey data, FYE course availability was
substantially reduced for these late registrants. However, Table 4 shows that late orien-
tation attendance is not strongly correlated with student ability variables at entry such as
ACT score, high school rank, English placement exam score, or math placement. There-
fore, it is not likely that particularly good or bad students were systematically attending the
late orientation session giving them less access to FYE courses. All other variables are
estimated to have an insignificant effect on the FYE enrollment decision. Based on this
analysis, FYE selection bias should not be a major concern.
Results
FYE retention
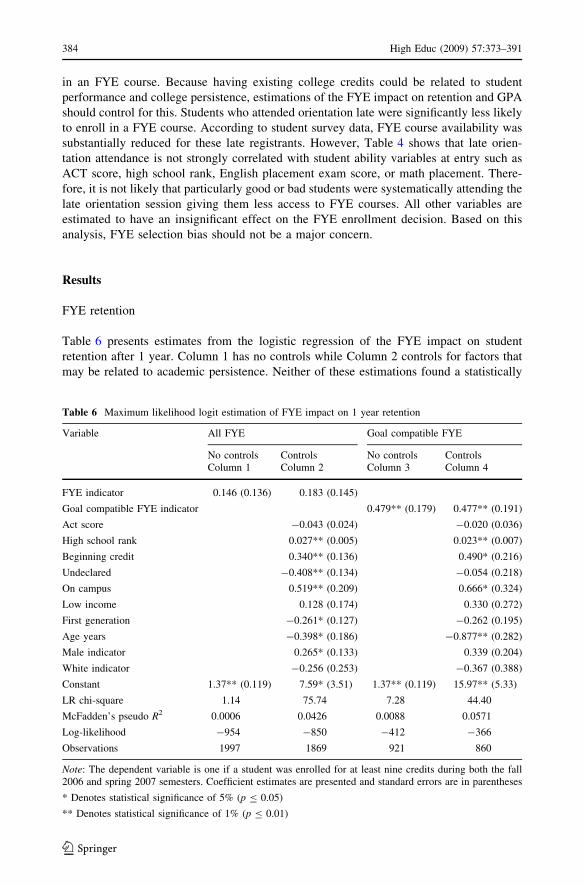
Table 6 presents estimates from the logistic regression of the FYE impact on student
retention after 1 year. Column 1 has no controls while Column 2 controls for factors that
may be related to academic persistence. Neither of these estimations found a statistically
Table 6 Maximum likelihood logit estimation of FYE impact on 1 year retention
Variable All FYE Goal compatible FYE
No controls Controls No controls ControlsColumn 1 Column 2 Column 3 Column 4
FYE indicator 0.146 (0.136) 0.183 (0.145)
Goal compatible FYE indicator 0.479** (0.179) 0.477** (0.191)
Act score -0.043 (0.024) -0.020 (0.036)
High school rank 0.027** (0.005) 0.023** (0.007)
Beginning credit 0.340** (0.136) 0.490* (0.216)
Undeclared -0.408** (0.134) -0.054 (0.218)
On campus 0.519** (0.209) 0.666* (0.324)
Low income 0.128 (0.174) 0.330 (0.272)
First generation -0.261* (0.127) -0.262 (0.195)
Age years -0.398* (0.186) -0.877** (0.282)
Male indicator 0.265* (0.133) 0.339 (0.204)
White indicator -0.256 (0.253) -0.367 (0.388)
Constant 1.37** (0.119) 7.59* (3.51) 1.37** (0.119) 15.97** (5.33)
LR chi-square 1.14 75.74 7.28 44.40
McFadden’s pseudo R2 0.0006 0.0426 0.0088 0.0571
Log-likelihood -954 -850 -412 -366
Observations 1997 1869 921 860
Note: The dependent variable is one if a student was enrolled for at least nine credits during both the fall2006 and spring 2007 semesters. Coefficient estimates are presented and standard errors are in parentheses
* Denotes statistical significance of 5% (p B 0.05)
** Denotes statistical significance of 1% (p B 0.01)
384 High Educ (2009) 57:373–391
123
significant positive effect from being enrolled in a FYE course. Column 2 shows that
having a higher high school rank, entering college with existing credits, living on
campus and being male all increased the probability of retention. In contrast, having an
undeclared major, being a first generation college student and being an older student
were all associated with a lower likelihood of returning after the first year. Each of the
findings above is in line with a priori expectations except for possibly the male versus
female result. All else equal it might have been expected that males would have a lower
retention rate. However, among the FYE research cited in this paper the results regarding
gender and retention are mixed and in many cases the issue of gender is not explicitly
addressed.
The above estimates are not directly interpretable as marginal effects due to the nature
of logistic regression analysis. Although some factors were found to influence retention,
there was no statistically significant relationship between taking an FYE course and student
retention. Because the focus of this paper is to quantify the FYE program effect on student
outcomes, analysis and discussion of the marginal effects are postponed until below.
Goal compatible FYE retention
This initial estimation may have failed to identify a positive FYE effect because many
FYE courses were in practice little different than regular courses. Recall that some FYE
courses were identified as being compatible with the FYE goals based on student survey
responses as outlined above. Column 3 of Table 6 shows that taking a goal compatible
FYE course had a statistically significant positive impact on student retention. Column 4
shows this result to be robust to the inclusion of control variables. The estimated impacts
of the remaining variables were generally consistent to those from the full sample (see
Column 2). High school rank, beginning credits and living on-campus were all positively
correlated with the probability of retention, while older students were again less likely to
return. There were some minor differences in the covariate estimates from the earlier
model. The finding that male students were more likely to be retained was no longer
statistically significant. In addition, the estimated negative impacts of having an unde-
clared major and being a first generation college student were also no longer statistically
significant.
It is now possible to examine the marginal FYE program effects using these estimates.
The predicted probabilities of retention for this model are listed in Table 7. The estimated
retention rate for a student with average characteristics was 84.9%. This is higher than the
actual observed retention rate of 81.6%, but still within a reasonable bound. The next 2
rows show that the average student enrolled in a goal compatible FYE course was 6.4
percentage points more likely to return after 1 year than if they did not have an FYE
course (0.878 - 0.814). It is useful to compare this to the retention impact from living on
campus. The next row shows that an average student without an FYE course and living
off campus was only 70.3% likely to return. If this student had lived on campus the
likelihood of retention would have increased by 11.8 percentage points (0.821 - 0.703).
If this student had also taken a goal compatible FYE course, the likelihood of retention
would have increased by an additional 6.0 percentage points (0.881 - 0.821). This
suggests that if all incoming freshmen lived on campus and enrolled in an FYE course
that met the program goals, the university could expect an approximate 88.1% retention
rate after 1 year.
High Educ (2009) 57:373–391 385
123
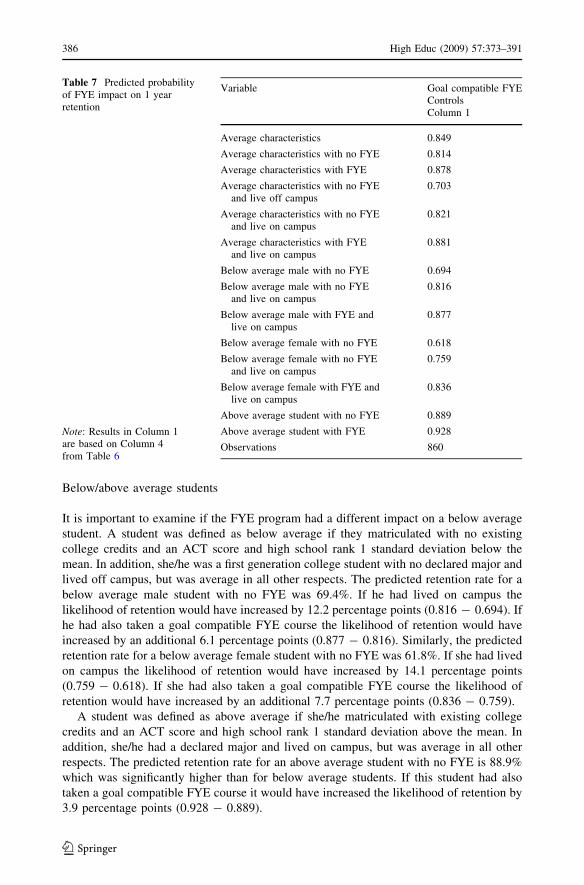
Below/above average students
It is important to examine if the FYE program had a different impact on a below average
student. A student was defined as below average if they matriculated with no existing
college credits and an ACT score and high school rank 1 standard deviation below the
mean. In addition, she/he was a first generation college student with no declared major and
lived off campus, but was average in all other respects. The predicted retention rate for a
below average male student with no FYE was 69.4%. If he had lived on campus the
likelihood of retention would have increased by 12.2 percentage points (0.816 - 0.694). If
he had also taken a goal compatible FYE course the likelihood of retention would have
increased by an additional 6.1 percentage points (0.877 - 0.816). Similarly, the predicted
retention rate for a below average female student with no FYE was 61.8%. If she had lived
on campus the likelihood of retention would have increased by 14.1 percentage points
(0.759 - 0.618). If she had also taken a goal compatible FYE course the likelihood of
retention would have increased by an additional 7.7 percentage points (0.836 - 0.759).
A student was defined as above average if she/he matriculated with existing college
credits and an ACT score and high school rank 1 standard deviation above the mean. In
addition, she/he had a declared major and lived on campus, but was average in all other
respects. The predicted retention rate for an above average student with no FYE is 88.9%
which was significantly higher than for below average students. If this student had also
taken a goal compatible FYE course it would have increased the likelihood of retention by
3.9 percentage points (0.928 - 0.889).
Table 7 Predicted probabilityof FYE impact on 1 yearretention
Note: Results in Column 1are based on Column 4from Table 6
Variable Goal compatible FYEControlsColumn 1
Average characteristics 0.849
Average characteristics with no FYE 0.814
Average characteristics with FYE 0.878
Average characteristics with no FYEand live off campus
0.703
Average characteristics with no FYEand live on campus
0.821
Average characteristics with FYEand live on campus
0.881
Below average male with no FYE 0.694
Below average male with no FYEand live on campus
0.816
Below average male with FYE andlive on campus
0.877
Below average female with no FYE 0.618
Below average female with no FYEand live on campus
0.759
Below average female with FYE andlive on campus
0.836
Above average student with no FYE 0.889
Above average student with FYE 0.928
Observations 860
386 High Educ (2009) 57:373–391
123
In summary, once the analysis was restricted to comparing selected FYE courses in
which the program goals were likely pursued to no FYE course, a positive retention effect
was found. The estimated positive FYE impact was larger for below average female
students and smaller for above average students. Overall, the goal compatible FYE effect
was reasonably large in magnitude. It is worth noting that the retention effect from living
on campus was consistently estimated to be approximately twice that of taking a goal
compatible FYE course. There are certain limitations to the claim that taking an FYE
course significantly improved the probability of student retention. However, these results
suggest that taking a goal compatible FYE course at this university adds value to the
student experience in addition to the strong positive retention effects of living on campus.
FYE grade point average
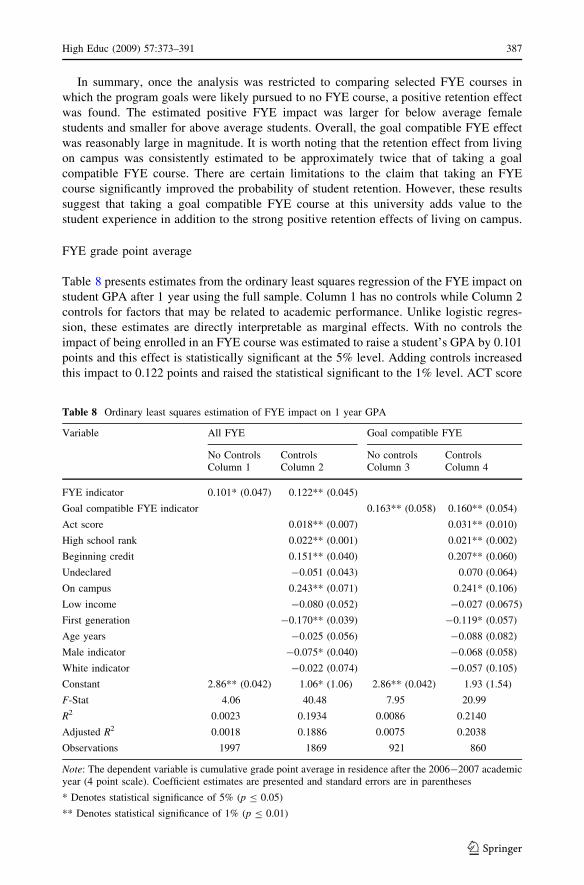
Table 8 presents estimates from the ordinary least squares regression of the FYE impact on
student GPA after 1 year using the full sample. Column 1 has no controls while Column 2
controls for factors that may be related to academic performance. Unlike logistic regres-
sion, these estimates are directly interpretable as marginal effects. With no controls the
impact of being enrolled in an FYE course was estimated to raise a student’s GPA by 0.101
points and this effect is statistically significant at the 5% level. Adding controls increased
this impact to 0.122 points and raised the statistical significant to the 1% level. ACT score
Table 8 Ordinary least squares estimation of FYE impact on 1 year GPA
Variable All FYE Goal compatible FYE
No Controls Controls No controls ControlsColumn 1 Column 2 Column 3 Column 4
FYE indicator 0.101* (0.047) 0.122** (0.045)
Goal compatible FYE indicator 0.163** (0.058) 0.160** (0.054)
Act score 0.018** (0.007) 0.031** (0.010)
High school rank 0.022** (0.001) 0.021** (0.002)
Beginning credit 0.151** (0.040) 0.207** (0.060)
Undeclared -0.051 (0.043) 0.070 (0.064)
On campus 0.243** (0.071) 0.241* (0.106)
Low income -0.080 (0.052) -0.027 (0.0675)
First generation -0.170** (0.039) -0.119* (0.057)
Age years -0.025 (0.056) -0.088 (0.082)
Male indicator -0.075* (0.040) -0.068 (0.058)
White indicator -0.022 (0.074) -0.057 (0.105)
Constant 2.86** (0.042) 1.06* (1.06) 2.86** (0.042) 1.93 (1.54)
F-Stat 4.06 40.48 7.95 20.99
R2 0.0023 0.1934 0.0086 0.2140
Adjusted R2 0.0018 0.1886 0.0075 0.2038
Observations 1997 1869 921 860
Note: The dependent variable is cumulative grade point average in residence after the 2006-2007 academicyear (4 point scale). Coefficient estimates are presented and standard errors are in parentheses
* Denotes statistical significance of 5% (p B 0.05)
** Denotes statistical significance of 1% (p B 0.01)
High Educ (2009) 57:373–391 387
123
and high school rank were both estimated to have a statistically significant positive impact
on student GPA. The ACT impact was particularly small with a 1 point increase in
composite score predicted to raise GPA by just 0.018, while a 10 percentage point increase
in high school rank added an estimated 0.22 points to GPA. Matriculating with existing
college credits and living on campus were also positively correlated with a higher GPA. In
contrast, first generation college students and males were predicted to have lower GPAs.
Entering with exam or transfer credit added 0.151 points to GPA compared to no credit,
while living on-campus added 0.243 points to GPA all else equal. On the other hand, a first
generation student was expected to have a lower GPA by 0.17 points, while males were
predicted to have a lower GPA by 0.075 points.
Goal compatible FYE grade point average
Columns 3 and 4 of Table 8 report results for the estimated effect of a goal compatible
FYE course on GPA. In the model with full controls the estimated impact on GPA of 0.160
points was larger than for all FYE courses. All remaining estimates were nearly identical in
statistical significance and somewhat similar in magnitude compared to Column 2. The
impact of ACT score nearly doubled and existing college credits also had a larger esti-
mated impact. The effect of being a first generation student was reduced and the prediction
of a lower GPA for males was no longer statistically significant.
These results are generally consistent with the existing literature and are similar to the
retention analysis. The FYE program had a positive influence on student academic per-
formance after 1 year as measured by cumulative GPA in residence. This impact was
larger when the analysis is limited to only goal compatible FYE courses. The estimated
boost to GPA attributable to participating in the FYE program was much smaller than the
positive effect of living on campus. However, as was the case with retention, it appears that
taking a goal compatible FYE course at this university improves academic performance in
addition to the positive influence of living on campus.
Discussion
In an effort to improve student outcomes, many institutions have begun to allocate sig-
nificant resources to improving the first year experience. In 1997 one particular medium-
size Midwestern public university in the U.S. initiated a FYE program. The program was
designed to add both curricular and extracurricular components to existing core courses in
an effort to integrate students into the university community. Enrollment was capped at 20
students and each course was assigned a student peer mentor. This design presented a
challenge to instructors because of the significant work needed to infuse the suggested
additional activities into their existing courses. Moreover, despite the defined program
goals, there are no specific rules or procedures to hold instructors accountable for meeting
these goals.
In summary, once the analysis was restricted to comparing selected FYE courses in
which the program goals were likely pursued to no FYE course, a positive retention effect
was found.
Using a combination of student and faculty survey data and university administrative
data this study measured the impact of this FYE program on GPA and retention after
1 year for the cohort of entering students in the fall 2006 semester. The results suggest that
there was no positive effect on retention, but the GPAs for FYE students were higher than
388 High Educ (2009) 57:373–391
123
non-FYE students. Reducing the sample to include only selected FYE courses in which the
program goals were likely pursued yielded a positive effect on retention and also accen-
tuated the GPA differential. The estimated positive impact on retention was larger for
below average students (especially females) and smaller for above average students. In
terms of completely understanding the retention of first year students it is important to note
that all estimates of the positive FYE impact were much smaller than the positive influence
from living on campus.
This FYE program could be improved by instituting a procedure to ensure that the
program goals are being met in all FYE courses and that instructors are held accountable
for doing so. This would require a formal application and screening process for selecting
FYE instructors. In addition, department and university personnel committees need to
recognize the value of quality teaching in the FYE program and reward instructors for
performing at a high level. The administration would also need to allocate sufficient
resources to training and curriculum workshops to encourage faculty to develop quality
FYE courses. These workshops should also include training for the student peer mentors
and methods for faculty to integrate these students into the course.
Another consideration is that the current FYE model does not provide instructors with
sufficient classroom time necessary to achieve the FYE goals. It is hard to imagine that an
existing core college course would come to the FYE program partly empty, containing too
little content to fill up three credits. Perhaps this program asks too much of a three-credit
disciplinary course by taking a perfectly rich, busy, challenging course and adding a
significant amount of new material to its schedule. Therefore, it could prove useful to add
1–2 credits to each FYE course to facilitate this process.
Given the strong positive influence of living on campus, this university should also
consider investing in activities that link the FYE course experience to on campus residence
hall life to explore if such activities further improve student outcomes. Similarly, there may
be significant gains from efforts to more effectively integrate the less than 10% of
incoming freshmen that do not live on campus into the university community. These
recommendations are supported by other research showing that the best retention outcomes
resulted from combining living on campus with participation in a first year seminar (Fidler
and Moore 1996).
If these recommendations are followed, the number of FYE courses that meet the
criteria of goal compatible defined earlier would likely increase. As a result, the positive
impacts of the FYE program on both student retention and GPA should also increase.
However, there are many competing opportunities to use resources to enhance the college
experience and improve student outcomes. Therefore, a careful analysis of all of the
possibilities is needed in order to optimally utilize resources as the university develops a
strategic plan for the future.
This research provides an initial measure of the FYE impact on this cohort of incoming
students. It is the first step in developing an on-going assessment of this university’s efforts
to foster student success through a FYE intervention. Despite some limitations, the results
suggest that a quality program focused on enhancing the first year student experience can
have a meaningful positive effect on both GPA and retention. One key result is that living
on campus had a strong positive influence on both academic performance and persistence
among first year students at this university. However, the overall results suggest there is
additional educational value added to the student experience from taking a FYE course as
long as the course was dedicated to meeting the program goals. There are many issues that
are beyond the scope of this paper and so additional research is necessary to guide sound
decision making by the university administration. This paper also provides valuable
High Educ (2009) 57:373–391 389
123
information to other institutions seeking to begin or improve an existing first year expe-
rience program both in the U.S. and internationally. It is important to note that the results
found here are specific to this university and this program and therefore may not generalize
to other schools.
Future analyses should include a complete examination of the survey results from both
faculty and students to better understand this FYE program from the diverse perspectives
of these important stakeholders. Future research should also provide a detailed comparison
of the measured benefits of this FYE program to the total opportunity cost of this use of
resources. In the long run it will be important to follow the 2006–2007 cohort of students in
a longitudinal analysis of the FYE impact on GPA, retention and eventually graduation.
Data on subsequent cohorts of entering freshmen should also be examined as this FYE
program evolves in the coming years. The results of all future research on the FYE
program at this university should be compared to other institutions contributing to a
national dialogue on FYE best practices.
Appendix A
References
ACT. (2007). http://www.act.org/research/policymakers/pdf/retain_trends.pdf.Barefoot, B. O. (2000). The first-year experience: Are we making it any better? About Campus, 5, 12–18.Crissman, J. L. (2001–2002). The impact of clustering first year seminars with english composition courses
on new students’ retention rates. Journal of College Student Retention: Research, Theory and Practice,3(2), 137–152.
Day, J. C., & Newburger, E. C. (2002). The big payoff: Educational attainment and synthetic estimates ofwork-life earnings. Washington, DC: U.S. Census Bureau.
Fidler, P. P., & Moore, P. S. (1996). A comparison of effects of campus residence and freshman seminarattendance on Freshman dropout rates. Journal of the Freshman Year Experience, 8(2), 7–16.
Goodman, K., & Pascarella, E. T. (2006). First-year seminars increase persistence and retention: Evidencefrom how college affects students. Peer Review: Emerging Trends and Key Debates in UndergraduateEducation. The Association of American Colleges and Universities, 8(3), 26–28.
Hendel, D. D. (2006–2007). Efficacy of participating in a first-year seminar on student satisfaction andretention. Journal of College Student Retention: Research, Theory and Practice, 8(4), 413–423.
Hotchkiss, J. L., Moore, R. E., & Potts, M. M. (2006). Freshman learning communities, college performanceand retention. Education Economics, 14(2), 197–210. doi:10.1080/09645290600622947.
Pascarella, E. T., & Terenzini, P. T. (2005). How college affects students: A third decade of research(Vol. 2). San Francisco, CA: Jossey-Boss.
Table A.1 Retention trends1983–2007: Freshman toSophomore year
Source: http://www.act.org/research/policymakers/pdf/retain_trends.pdf
Highest (%) Lowest (%) Current (%)
Two-year public 53.1 (’83) 51.3 (’04) 51.4
BA/BS public 70.0 (’04) 66.4 (’96, ’05) 67.6
MA public 71.6 (’06) 68.1 (’89) 70.5
PhD public 78.1 (’04) 73.3 (’86) 78.0
Two-year private 72.6 (’92) 57.4 (’07) 57.4
BA/BS private 74.0 (’89) 70.1 (’97) 70.2
MA private 78.0 (’85) 73.2 (’07) 73.2
PhD private 85.0 (’85) 81.1 (’07) 81.8
National 68.7 (’07) 66.6 (’96) 68.7
390 High Educ (2009) 57:373–391
123

Porter, S. R., & Swing, R. (2006). Understanding how first-year seminars affect persistence. Research inHigher Education, 47(1), 89–109.
Potts, G., Schultz, B., & Foust, J. (2003–2004). The effect of freshmen cohort groups on academic per-formance and retention. Journal of College Student Retention: Research, Theory and Practice, 5(4),385–395.
Schnell, C. A., & Doetkott, C. D. (2002–2003). First year seminars produce long-term impact. Journal ofCollege Student Retention: Research, Theory and Practice, 4(4), 377–391.
The College Board. (2005). Education pays. Washington, DC: The College Board.Tinto, V. (1987). Leaving college: Rethinking the causes and cures of student attrition. Chicago, IL:
University of Chicago Press.Tobolowsky, B. F., Mamrick, M., & Cox, B. E. (2005). The 2003 national survey on first-year seminars:
Continuing innovations in the collegiate curriculum. Columbia, SC: University of South Carolina,National Resource Center for the First-Year Experience and Students in Transition.
U.S. Department of Education. (2006). National Center for Education Statistics. http://www.nces.ed.gov/ipeds/.
U.S. News & World Report. (2008). U.S. News and World Report on college rankings. http://colleges.usnews.rankingsandreviews.com/usnews/edu/college/rankings/about/weight_brief.php.
High Educ (2009) 57:373–391 391
123
COPYRIGHT INFORMATION
TITLE: Measuring the impact of a university first-year experienceprogram on student GPA and retention
SOURCE: Higher Educ 57 no3 Mr 2009
The magazine publisher is the copyright holder of this article and itis reproduced with permission. Further reproduction of this article inviolation of the copyright is prohibited. To contact the publisher:http://springerlink.metapress.com/content/1573-174X/