Vacancies, microstructure and the moments of nuclear magnetic resonance: the case of hydrogenated...
15
Microstructure, vacancies and moments of nuclear magnetic resonance of hydrogenated amorphous silicon Parthapratim Biswas‡ and Rajendra Timilsina Department of Physics and Astronomy, The University of Southern Mississippi, Hattiesburg, MS 39406, USA E-mail: [email protected], [email protected] PACS numbers: 71.15.Mb, 71.23.Cq, 71.23. An Abstract. Recent experiments on hydrogenated amorphous silicon using infrared absorption spectroscopy have indicated the presence of mono- and divacancy in samples for concentration of up to 14% hydrogen. Motivated by this observation, we study the microstructure of hydrogen in two model networks of hydrogen-rich amorphous silicon with particular emphasis on the nature of the distribution (of hydrogen), the presence of defects, and the characteristic features of the nuclear magnetic resonance spectra at low and high concentration of hydrogen. Our study reveals the presence of vacancies, which are the built-in features of the model networks. The study also confirms the presence of various hydride configurations in the networks that include from silicon monohydrides and dihydrides to open chain-like structures, which have been observed in the infrared and nuclear magnetic resonance experiments. The broad and the narrow line widths of the nuclear magnetic resonance spectra are calculated from a knowledge of the distribution of spins (hydrogen) in the networks. 1. Introduction Since its first preparation in 1969 using glow discharge deposition technique [1], hydrogenated amorphous silicon is possibly the most extensively studied material of technological importance. The material is widely used in solar cells [2], thin film transistors [3, 4, 5], memory switching circuits [6, 7], photosensors [8], and numerous other electronic devices [9]. A multitude of experimental data are available that address almost every aspect of structural, electronic, optical, and vibrational properties of the material [9, 10]. Fundamental to the understanding of the Staebler- Wronski (SW) [11] effect—the degradation of the material upon prolong exposure to light irradiation—is the distribution and the dynamics of hydrogen atoms in amorphous silicon networks. Since many of the proposed microscopic mechanisms that attempt to explain the SW effect are based on bond-breaking models [12, 13], it is essential to understand the local environment of hydrogen atoms in amorphous silicon networks. While there exist a number of experimental studies that address the distribution of hydrogen in amorphous silicon samples via nuclear magnetic resonance ‡ Author to whom any correspondence should be addressed. arXiv:1008.0386v1 [cond-mat.mtrl-sci] 2 Aug 2010
Transcript of Vacancies, microstructure and the moments of nuclear magnetic resonance: the case of hydrogenated...
Microstructure, vacancies and moments of nuclearmagnetic resonance of hydrogenated amorphoussilicon
Parthapratim Biswas‡ and Rajendra Timilsina
Department of Physics and Astronomy, The University of Southern Mississippi,Hattiesburg, MS 39406, USA
E-mail: [email protected], [email protected]
PACS numbers: 71.15.Mb, 71.23.Cq, 71.23. An
Abstract. Recent experiments on hydrogenated amorphous silicon usinginfrared absorption spectroscopy have indicated the presence of mono- anddivacancy in samples for concentration of up to 14% hydrogen. Motivated bythis observation, we study the microstructure of hydrogen in two model networksof hydrogen-rich amorphous silicon with particular emphasis on the nature ofthe distribution (of hydrogen), the presence of defects, and the characteristicfeatures of the nuclear magnetic resonance spectra at low and high concentrationof hydrogen. Our study reveals the presence of vacancies, which are the built-infeatures of the model networks. The study also confirms the presence of varioushydride configurations in the networks that include from silicon monohydrides anddihydrides to open chain-like structures, which have been observed in the infraredand nuclear magnetic resonance experiments. The broad and the narrow linewidths of the nuclear magnetic resonance spectra are calculated from a knowledgeof the distribution of spins (hydrogen) in the networks.
1. Introduction
Since its first preparation in 1969 using glow discharge deposition technique [1],hydrogenated amorphous silicon is possibly the most extensively studied materialof technological importance. The material is widely used in solar cells [2], thinfilm transistors [3, 4, 5], memory switching circuits [6, 7], photosensors [8], andnumerous other electronic devices [9]. A multitude of experimental data are availablethat address almost every aspect of structural, electronic, optical, and vibrationalproperties of the material [9, 10]. Fundamental to the understanding of the Staebler-Wronski (SW) [11] effect—the degradation of the material upon prolong exposureto light irradiation—is the distribution and the dynamics of hydrogen atoms inamorphous silicon networks. Since many of the proposed microscopic mechanismsthat attempt to explain the SW effect are based on bond-breaking models [12, 13],it is essential to understand the local environment of hydrogen atoms in amorphoussilicon networks. While there exist a number of experimental studies that address thedistribution of hydrogen in amorphous silicon samples via nuclear magnetic resonance
‡ Author to whom any correspondence should be addressed.
arX
iv:1
008.
0386
v1 [
cond
-mat
.mtr
l-sc
i] 2
Aug
201
0

Microstructure of hydrogenated amorphous silicon 2
(NMR) [14, 15, 16, 17, 18, 19] and infrared (IR) spectroscopy [14, 15, 20, 21], there arevery few theoretical studies [22, 23, 24, 25, 26, 27] that address the problem explicitly.
In this paper we study the hydrogen microstructure of realistic models ofhydrogen-rich amorphous silicon at low and high concentration. Since a set of one-dimensional NMR data cannot be uniquely mapped onto a three-dimensional realspace distribution of hydrogen without further information and assumptions, it ismore appropriate and useful to address the problem by employing suitable models ofhydrogenated amorphous silicon. The microstructure of the model networks has beenstudied with particular emphasis on the characteristics of the real space distribution ofhydrogen in the networks, and has been compared directly to the results obtained fromthe NMR and IR experiments. A theoretical estimate of the width of the resonancecurve has been obtained from a knowledge of the position of the spins in the networkusing a suitable approximation to the shape of the NMR line spectra. The approachprovides a direct route to study the distribution of hydrogen, the presence of differenthydride configurations, and the size of the various hydrogen clusters in the networks.The evolution of the microstructure with the concentration of hydrogen in the networkshas been also addressed, and a comparison has been made to the experimental data.
The plan of the paper is as follows. In section 2, we briefly review the resultsfrom the earlier theoretical and experimental studies with particular emphasis on theresults obtained from the NMR and IR spectroscopies of hydrogenated amorphoussilicon. This is followed by a discussion of the microstructure that we have observed inthe model networks at low and high concentration in section 3. Section 4 addresses thepresence of vacancies in the model networks and compares the results to all availableexperimental data. In section 5 we address how to calculate the line widths of theNMR spectra from a knowledge of the distribution of the spins in amorphous networks.This is followed by a conclusion of our work in section 6.
2. Earlier works on hydrogen microstructure: A brief review
Nuclear magnetic resonance (NMR) [14, 15, 16, 17, 18, 19] and infrared (IR)spectroscopy [14, 15, 20, 21] are the two principal experimental techniques thatcan address hydrogen microstructure in amorphous silicon. The former providesuseful information about the nature of the distribution of hydrogen in amorphousnetworks via dipolar interaction between the spins in hydrogen atoms, whereas thelatter identifies the presence of various hydrogen bonding configurations by probingthe bonding environment of hydrogen atoms. Among the early works, the protonmagnetic resonance study by Reimer et al [15] on plasma-deposited samples is the firstto indicate the presence of inhomogeneity in the hydrogen distribution in amorphoussilicon. The study also revealed that hydrogen atoms could reside in amorphousnetworks as small clusters and in a dilute environment. While NMR studies cannotprovide directly a description of the three-dimensional spin distribution in the network,it is possible to infer useful information about the size of hydrogen clusters and thenature of the distribution (either sparse or dense) of hydrogen atoms in the samplesby analyzing the shape and the width of an NMR spectrum. A typical NMR spectrumof a device-quality sample shows the presence of both narrow and broad line widths,which can be approximated as a convolution of a truncated Lorentzian and a Gaussiandistribution. An analysis of the NMR spectra of amorphous silicon samples with 8–32at.% H by Reimer et al [15] indicated that the broad line width of the spectrum liedin the range 22–27 kHz, whereas the narrow line width was of the order of 3–5 kHz.
Microstructure of hydrogenated amorphous silicon 3
Similar observation was also reported in the NMR experiments by Carlos et al [19],who also noted a variation of the line width of up to 20% depending on the nature ofamorphous samples used in the measurements.
A definitive picture about the microstructure emerged with the advent of multiple-quantum nuclear magnetic resonance (MQ-NMR)[16]. The MQ-NMR experiments ofBaum et al [16] confirmed that for device-quality samples a characteristic featureof the microstructure was the presence of small clusters (of size 4–7 H atoms), andwith increasing concentration of hydrogen these clusters merged into large clusters.Thus experimental data appear to suggest that the distribution is inhomogeneousat low concentration, and the microstructure mainly consists of small (hydrogen)clusters and a dilute distribution of hydrogen atoms dispersed in the silicon matrix.However, recent experimental results by Wu et al [17] on hot wire chemically vapordeposited (HW-CVD) samples have revised this view. The authors have observed anew hydrogen distribution with broad line widths of about 34–39 kHz for the glowdischarge (GD) samples of concentration 8–10%, and about 47–53 kHz for the hot wire(HW) samples of concentration 2–3%. In both the samples, the narrow line widthshave been found to be of the order of 3–6 kHz. This implies that even at very lowconcentration it is possible to have large clusters of hydrogen in the samples that canproduce a line width as broad as 50.0 kHz. In other words, the microstructure canvary significantly depending on the preparation conditions, method of deposition andsubstrate temperature, and not just on the concentration of hydrogen in the samples.
While a great deal of information can be obtained from NMR experiments, IRspectroscopy [15, 20, 21] can detect the presence of different hydride configurationsby measuring the vibrational frequencies of hydrogen in various hydrogen bondingenvironments. The results from the IR studies by Ouwens and Schropp et al [21]indicated that for device-quality samples 3–4% of total hydrogen atoms resided in thenetwork as isolated or distributed monohydrides (SiH). This observation is consistentwith the MQ-NMR study of Baum et al [16] on device-quality samples of hydrogenatedamorphous silicon. The IR experiments by Manfredotti et al [20] and Lucovskyet al [28], and the MQ-NMR study by Baum et al [16] provided evidence of thepresence of various hydride configurations such as SiH, SiH2 and SiH3 in device-quality samples, whereas at high concentration it was observed that the networkscould have open chains of (SiH2)n. The microstructure is further enriched by thepresence of vacancies [29, 30], voids [29, 31] and molecular hydrogen [32, 33] in thenetworks. The Mossabauer spectroscopic studies by Hoven et al [30] indicated thepresence of vacancies in hydrogenated amorphous silicon. Recently, Smets et al [29]have studied samples by means of infrared absorption spectroscopy prepared via anexpanding thermal plasma technique and observed that the microstructure is dominantby mono- and divacancy at low concentration of up to 14 at. % H, and microvoids orvoids at high concentration beyond 14 at. % H. The presence of molecular hydrogen inthe amorphous silicon network has been studied extensively by several groups usingNMR [16, 32, 33], infrared-absorption [34] and calorimetry experiments [35]. Theresults of these studies can be summarized by stating that approximately 1% of totalhydrogen can reside in the network in the molecular state.
In contrast to experimental studies, there are only a handful of theoreticalstudies that explicitly focus on the hydrogen microstructure of amorphous silicon [22,23, 24, 25, 26, 27]. Of particular importance is the work by Drabold et al[22, 23] that addresses hydrogen-hydrogen pair separation in various dihydrideconfigurations. The theoretical studies by Kim et al [25, 26] focused on the calculation
Microstructure of hydrogenated amorphous silicon 4
of electronic structure of hydrogenated amorphous silicon and some properties ofvacancy configurations, such as the changes in the volume of a vacancy upon relaxationof the network. Zhang et al [27] studied the creation of higher order vacancies andtheir stability by relaxing the network from first-principles calculations. They foundthat any higher order vacancy had the tendency to evolve into a lower order vacancyincluding a monovacancy and a stable divacancy. An unsatisfactory feature of most ofthe theoretical studies was that the vacancies or defect configurations were createdby hand, which were then relaxed locally or globally in order to obtain a stablevacancy configuration. While such an approach is correct in principle and a prolongedfirst-principles molecular dynamics simulation can indeed find the minimum energy(stable) configuration of the defects, a short local or global relaxation may not besufficient to eliminate the initial bias associated with the defect creation (by hand) inan overconstrained network.
3. Microstructure at low and high concentration of hydrogen
A review of the experimental literature in the preceding section suggests that hydrogencan reside in various bonding environments, which typically consist of SiH, SiH2, SiH3,and the chain structure of mono- and dihydrides that are connected via Si atoms.Furthermore, many of these configurations can realize both in cluster and dilutephases including a completely isolated environment depending on the concentration ofhydrogen in the samples. It is therefore important to study models of hydrogen-richamorphous silicon network both at low and high concentration. In the following wediscuss the microstructure of hydrogenated amorphous silicon for two representativeconcentrations of hydrogen. In particular, we consider two models of hydrogenatedamorphous silicon with 7% and 22% hydrogen that consist of total 540 and 611 atomsrespectively, and compare the results to the available experimental data from theliterature. These models have been constructed using the experimentally constrainedmolecular relaxation (ECMR) [36] technique developed by one of us. The details of theconstruction of the models and their structural, electronic and vibrational propertieshave been studied thoroughly and published elsewhere [37], which we would not repeathere. The 540-atom model with 7% H atoms has very few defects (≤ 2.9 %), whereasthe model with 22% H has only a single defect.
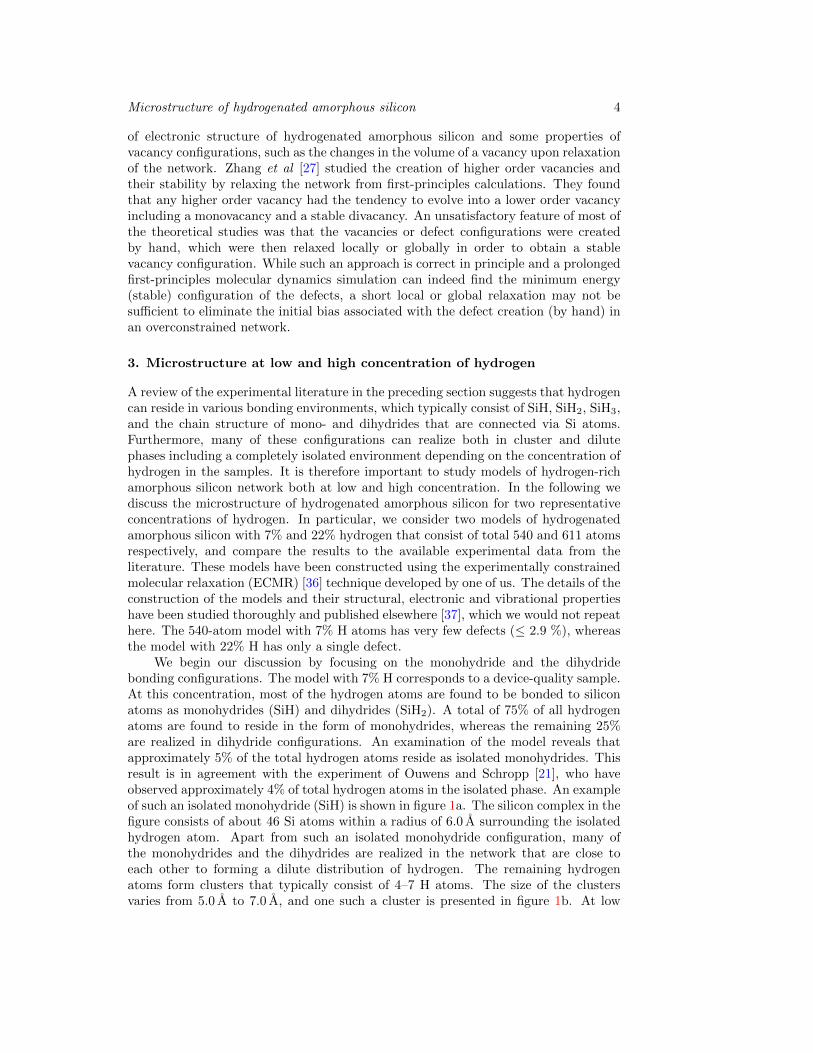
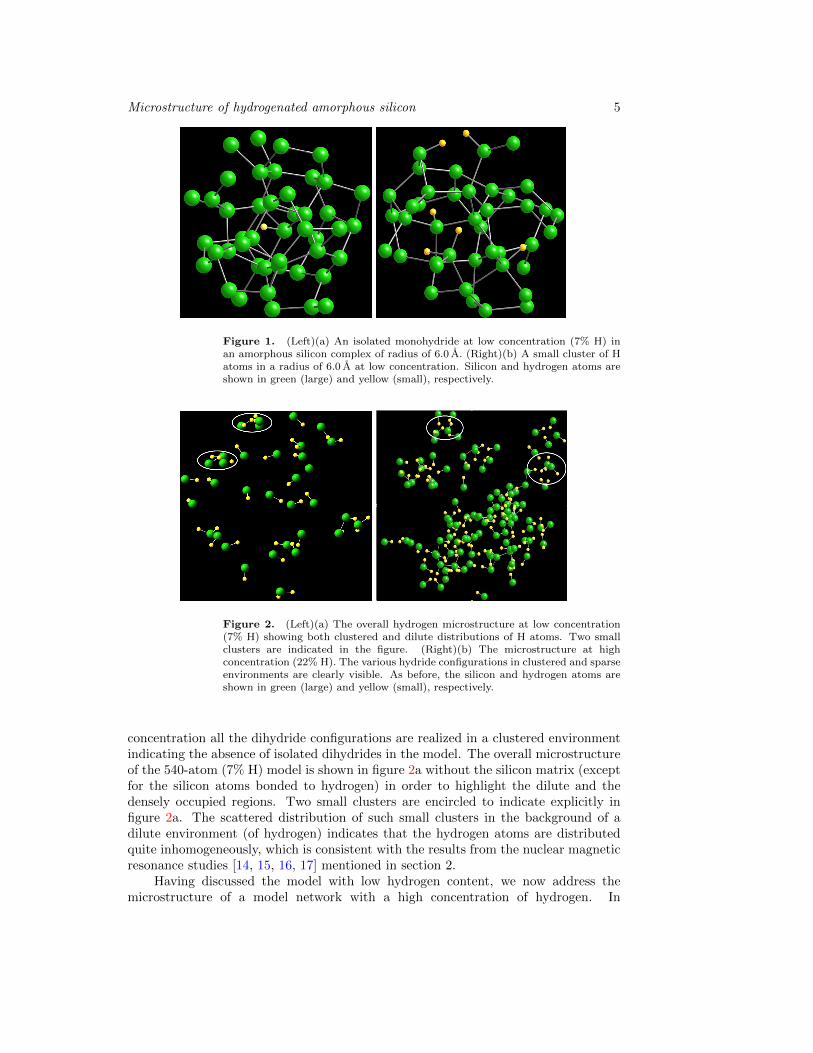
We begin our discussion by focusing on the monohydride and the dihydridebonding configurations. The model with 7% H corresponds to a device-quality sample.At this concentration, most of the hydrogen atoms are found to be bonded to siliconatoms as monohydrides (SiH) and dihydrides (SiH2). A total of 75% of all hydrogenatoms are found to reside in the form of monohydrides, whereas the remaining 25%are realized in dihydride configurations. An examination of the model reveals thatapproximately 5% of the total hydrogen atoms reside as isolated monohydrides. Thisresult is in agreement with the experiment of Ouwens and Schropp [21], who haveobserved approximately 4% of total hydrogen atoms in the isolated phase. An exampleof such an isolated monohydride (SiH) is shown in figure 1a. The silicon complex in thefigure consists of about 46 Si atoms within a radius of 6.0 A surrounding the isolatedhydrogen atom. Apart from such an isolated monohydride configuration, many ofthe monohydrides and the dihydrides are realized in the network that are close toeach other to forming a dilute distribution of hydrogen. The remaining hydrogenatoms form clusters that typically consist of 4–7 H atoms. The size of the clustersvaries from 5.0 A to 7.0 A, and one such a cluster is presented in figure 1b. At low
Microstructure of hydrogenated amorphous silicon 5
Figure 1. (Left)(a) An isolated monohydride at low concentration (7% H) inan amorphous silicon complex of radius of 6.0 A. (Right)(b) A small cluster of Hatoms in a radius of 6.0 A at low concentration. Silicon and hydrogen atoms areshown in green (large) and yellow (small), respectively.
Figure 2. (Left)(a) The overall hydrogen microstructure at low concentration(7% H) showing both clustered and dilute distributions of H atoms. Two smallclusters are indicated in the figure. (Right)(b) The microstructure at highconcentration (22% H). The various hydride configurations in clustered and sparseenvironments are clearly visible. As before, the silicon and hydrogen atoms areshown in green (large) and yellow (small), respectively.
concentration all the dihydride configurations are realized in a clustered environmentindicating the absence of isolated dihydrides in the model. The overall microstructureof the 540-atom (7% H) model is shown in figure 2a without the silicon matrix (exceptfor the silicon atoms bonded to hydrogen) in order to highlight the dilute and thedensely occupied regions. Two small clusters are encircled to indicate explicitly infigure 2a. The scattered distribution of such small clusters in the background of adilute environment (of hydrogen) indicates that the hydrogen atoms are distributedquite inhomogeneously, which is consistent with the results from the nuclear magneticresonance studies [14, 15, 16, 17] mentioned in section 2.
Having discussed the model with low hydrogen content, we now address themicrostructure of a model network with a high concentration of hydrogen. In

Microstructure of hydrogenated amorphous silicon 6
Figure 3. (Left)(a) A pair of lone monohydrides realized in a dilute environmentat high concentration (22% H) in a silicon complex of linear dimension 6.0 A.(Right)(b) A cluster of 16 H atoms in a radius of 6.0 A in high concentrationmodel (22% H). Silicon and hydrogen atoms are shown in green (large) and yellow(small) respectively.
particular, we consider a model with 611 atoms that has total 133 or 22% hydrogenatoms in the network. While the concentration is somewhat higher than a typicaldevice-quality sample (8–20% H) [19], the model provides valuable insights aboutthe changing nature of the microstructure with the addition of hydrogen atoms. Asthe hydrogen concentration increases, more and more hydrogen atoms are availablein the network and small clusters of silicon and hydrogen begin to form until theconcentration is high enough when large clusters appear. The microstructure isdominated by clusters rather than a dilute or sparse distribution of hydrogen atthis stage. The overall distribution of hydrogen for the 611-atom model is shownin figure 2b. The distribution (of hydrogen) is quite inhomogeneous, which consists ofboth small and large clusters. Two such small clusters are indicated in figure 2b thatconsist of 5–8 H atoms. A real space analysis of the model also reveals the presenceof some large clusters consisting of as many as 16 H atoms within a radius of 6.0 A,and is shown in figure 3b. These clusters mostly consist of silicon monohydrides (SiH)and dihydrides (SiH2), but a few SiH4 configurations are also found to realize in ourmodel [24]. While the microstructure at high concentration is mostly dominated bythe presence of clusters, a few monohydrides are also present in a very dilute or analmost isolated environment. In figure 3a we have shown two such lone monohydridesthat are found in a silicon complex of radius 6.0 A.
Finally, we should mention an important aspect of the hydrogen microstructureat high concentration. Some monohydrides can form an open chain-like structure athigh concentration via bond formation between the Si atom in the monohydrides. Thechain structure that we have observed in the model with 22% hydrogen consists of4 to 7 monohydrides (SiH). A few structures are also observed where monohydridesin the chain are replaced by dihydrides. Examples of such chain-like structures areshown in figure 4. The structure in the left (of figure 4) consists of six SiH that areconnected to each other via Si-Si bonding, whereas the structure in the right has fourmonohydrides and a single dihydride. Such chain configurations are not observed inthe model with low concentration (7%) of hydrogen. The presence of such chain-like

Microstructure of hydrogenated amorphous silicon 7
Figure 4. The formation of open chain-like structures via Si-Si bonding at highconcentration (22% H). The structure in the left comprises of seven monohydridesconnected via silicon atoms to form an open chain. The figure in the right showsfour monohydrides and a single dihydride. Silicon and hydrogen atoms are shownin green (large) and yellow (small) respectively.
structures was reported experimentally by Lucovsky et al [28], Manfredotti et al [20],and Baum et al [16].
4. Vacancies in hydrogenated amorphous silicon
Unlike crystalline materials where vacancies can be uniquely defined and identifiedeasily, the presence of disorder makes it difficult to do so in amorphous materials.Nonetheless, for continuous random networks, one can consider missing of one ortwo neighboring atoms in the topologically connected environment as a mono- ordivacancy respectively. On the other hand, the absence of a few or many atoms in thenetwork constitutes a microvoid or a void depending on the number of missing atoms.Infrared absorption spectroscopy on amorphous samples prepared via an expandingthermal plasma technique by Smets et al [29] have indicated that the microstructurein hydrogenated amorphous silicon samples can be characterized by the presenceof vacancies and voids that largely depends on the amount of hydrogen present inthe samples. In particular, these authors have observed that the microstructure isdominated by mono- and divacancy at low concentration of up to 14% H, whereasmicrovoids or voids appear at high concentration. Theoretical study by Zhang etal [27] also indicated the presence of mono- and divacancy as inherent defects inhydrogenated amorphous silicon networks. They noted that any higher order ‘n-vacancy’ had a tendency to split into mono- or divacancy on prolonged relaxationof the network. In most of the theoretical studies [25, 26, 27], the vacancies wereexplicitly introduced by hand, and the stability of the (vacancy) configurations werestudied by relaxing the network using an appropriate ab initio or tight-binding energyfunctional.
Motivated by the experimental results of Smets et al [29], our interest liesin characterizing the microstructure further by searching for mono- and divacancyconfigurations that might be present in our models. A real space analysis indeedconfirms that both mono- and divacancy exist in the models. This observation is very
Microstructure of hydrogenated amorphous silicon 8
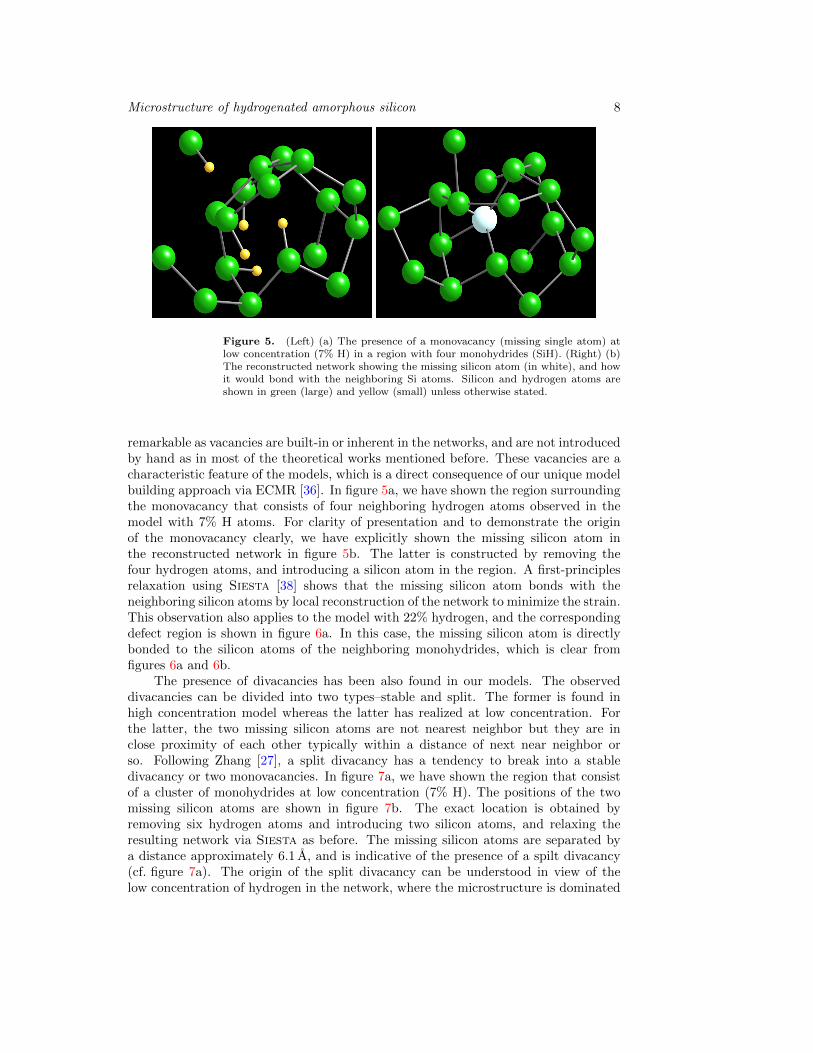
Figure 5. (Left) (a) The presence of a monovacancy (missing single atom) atlow concentration (7% H) in a region with four monohydrides (SiH). (Right) (b)The reconstructed network showing the missing silicon atom (in white), and howit would bond with the neighboring Si atoms. Silicon and hydrogen atoms areshown in green (large) and yellow (small) unless otherwise stated.
remarkable as vacancies are built-in or inherent in the networks, and are not introducedby hand as in most of the theoretical works mentioned before. These vacancies are acharacteristic feature of the models, which is a direct consequence of our unique modelbuilding approach via ECMR [36]. In figure 5a, we have shown the region surroundingthe monovacancy that consists of four neighboring hydrogen atoms observed in themodel with 7% H atoms. For clarity of presentation and to demonstrate the originof the monovacancy clearly, we have explicitly shown the missing silicon atom inthe reconstructed network in figure 5b. The latter is constructed by removing thefour hydrogen atoms, and introducing a silicon atom in the region. A first-principlesrelaxation using Siesta [38] shows that the missing silicon atom bonds with theneighboring silicon atoms by local reconstruction of the network to minimize the strain.This observation also applies to the model with 22% hydrogen, and the correspondingdefect region is shown in figure 6a. In this case, the missing silicon atom is directlybonded to the silicon atoms of the neighboring monohydrides, which is clear fromfigures 6a and 6b.
The presence of divacancies has been also found in our models. The observeddivacancies can be divided into two types–stable and split. The former is found inhigh concentration model whereas the latter has realized at low concentration. Forthe latter, the two missing silicon atoms are not nearest neighbor but they are inclose proximity of each other typically within a distance of next near neighbor orso. Following Zhang [27], a split divacancy has a tendency to break into a stabledivacancy or two monovacancies. In figure 7a, we have shown the region that consistof a cluster of monohydrides at low concentration (7% H). The positions of the twomissing silicon atoms are shown in figure 7b. The exact location is obtained byremoving six hydrogen atoms and introducing two silicon atoms, and relaxing theresulting network via Siesta as before. The missing silicon atoms are separated bya distance approximately 6.1 A, and is indicative of the presence of a spilt divacancy(cf. figure 7a). The origin of the split divacancy can be understood in view of thelow concentration of hydrogen in the network, where the microstructure is dominated

Microstructure of hydrogenated amorphous silicon 9
Figure 6. (Left) (a) The presence of a monovacancy (missing single atom) athigh concentration (22% H) in a region with several monohydrides (SiH). (Right)(b) The reconstructed figure in the right shows the missing silicon atom (white),and its bonding with the neighboring Si atoms. Silicon and the hydrogen atomsare shown in green (large) and yellow (small) except for the missing silicon atom.
Figure 7. (Left) (a) The region showing a split divacancy with six monohydrides(SiH) at low concentration (7% H). (Right) (b) The origin of the divacancy isillustrated by showing the missing two silicon atoms in the network (white).Silicon and the hydrogen atoms are painted in green (large) and yellow (small),respectively.
by a sparse distribution of hydrogen atoms. At high concentration, however, stabledivacancies appear. The presence of more hydrogen atoms at high concentrationreduces the average (hydrogen) cluster-cluster separation, and thereby facilitates theformation of a stable divacancy. One such stable divacancy is shown in figure 8a. Asin the earlier case, we have also indicated the two missing silicon atoms in figure 8b,which are nearest neighbor to each other in this case and are separated by 2.6 A.
In summary, the microstructure of the model networks is characterized by thepresence of mono- and divacancy both at low and high concentration of hydrogen. Aremarkable feature of the models is that the vacancies are built-in, and are inherentdefects that have been experimentally observed in the concentration range studied inthis work.

Microstructure of hydrogenated amorphous silicon 10
Figure 8. (Left) (a) A stable divacancy at high concentration (22% H). (Right)(b) The reconstruction of two missing silicon atoms (white) as described in thetext. Silicon and the hydrogen atoms are shown in green (large) and yellow (small)respectively.
5. NMR widths from Van Vleck moments: An approximate calculation
The direct determination of the width and the shape of the NMR spectra foramorphous solids is a highly nontrivial task, and is difficult to address from first-principles calculations. However, it is possible to calculate the first few moments ofthe resonance spectrum from the position of the spins in the network. The approximateshape and the width of the resonance curve can be estimated from these moments,which can be compared to the values obtained from the experimental NMR data. Itis, however, important to note that an one-dimensional NMR spectrum cannot fullyrepresent every aspect of the three-dimensional spin distribution or the microstructure(of hydrogen) in the network, and further information is needed for a completedescription of the latter. Nonetheless, the moments of an NMR spectrum providevaluable information such as the presence of hydrogen in isolated, sparse and in theclustered environment [15, 16, 17]. A typical NMR line spectrum can be expressed,in the lowest order approximation, as a combination of a Gaussian and a truncatedLorentzian distributions. Since the contribution to the higher moments generallycomes from the wings of the distribution that is rarely observed in experiments, thefirst two or three non-zero moments should suffice to capture the characteristic featuressuch as the shape and the width of the resonance curve [39].
NMR experiments on samples prepared by a variety of methods at differentexperimental conditions and concentrations reveal that at very dilute concentrationrandomly dispersed spins (via dipolar interaction) give rise to a narrow line width,whereas the presence of small clusters produce a broad line width in the spectrum.These narrow and broad widths are generally considered to be associated with atruncated Lorentzian and a Gaussian broadening of the spectrum respectively, andcan be constructed from theoretical arguments based on the moments of the resonancecurve. Following Van Vleck [40], the second and the fourth moments of a system ofN particles (of spin 1/2) can be written as:
M2
γ4~2=
1
2N
N∑j<k
B2jk, (1)
Microstructure of hydrogenated amorphous silicon 11
M4
γ8~4=
3
16N
N∑<jkl>
B2jkB
2jl −
1
36N
N∑<jkl>
B2jk(Bjl −Bkl)
2
+1
72N
N∑<jkl>
BjkBkl(Bjl −Bjk)(Bjl −Bkl)
+1
8N
N∑j<k
B4jk, (2)
where
Bij =3
2
(1− 3 cos2 θij)
r3ij,
and the symbol 〈jkl〉 stands for no two indices being equal in the triple summation.It should be noted that equations (1) and (2) above are independent of the symmetryof the system, and can be applied to both crystalline lattices and amorphousnetworks [41]. The shape of the resonance curve can be interpreted in terms of thesecond and the fourth moments. For an ideal Gaussian, Γ = M4/M
22 = 3, and a low
value of Γ indicates a bi-modal behavior or two separated peaks in the spectrum. Fora Gaussian lineshape, the full width at half maximum (FWHM) is given by [39],
σg =√
8M2 ln 2. (3)
At low concentration and in dilute environment the ratio M4/(M2)2 can be large,which suggests a truncated Lorentzian as a useful approximation to the shape of theresonance curve. In this case, the FWHM can be expressed using the second andfourth moments of the spectrum as:
σL =
√π2
3
M2
Γ. (4)
In practice, the experimental NMR spectra deviate significantly from an idealGaussian or a truncated Lorentzian behavior depending on hydrogen concentration,preparation conditions, and the degree of inhomogeneity present in the microstructure.Equations (3) and (4), therefore, provide only approximate values of the widthsoriginating from the clustered and the dilute environments via dipolar interactionsbetween the spins. For a small deviation (from the ideal Gaussian), one often usesthe Gaussian memory function approximation and expresses the universal line widthas [42]:
σu =
√2πM2
Γ− 2for Γ > 3. (5)
We now proceed to calculate the width of the NMR spectra for the modelconfigurations with 7% and 22% hydrogen atoms. The second and the fourth momentsof the spectrum can be calculated using equations (1) and (2), respectively. TheFWHM is then obtained in the Gaussian approximation from equation (3). In table1, we have listed the values of the Van Vleck moments and the overall line widths ofthe models in the Gaussian approximation. The values of Γ for the model with highconcentration suggest that the NMR spectrum can be well approximated by a Gaussianlineshape, and the FWHM can be obtained from equation (3). The result is consistentwith the hydrogen microstructure observed in section 3. The hydrogen atoms aredensely distributed forming clusters with hydrogen-hydrogen separation varying from
Microstructure of hydrogenated amorphous silicon 12
1.6 A to 2.4 A [24]. This produces a broad resonance via dipolar interaction that canbe approximated by a Gaussian lineshape. For the model with low concentration ofhydrogen Γ is somewhat larger than the ideal Gaussian value 3, which is indicativeof a narrower spectrum than a Gaussian. The contribution from the wings of thespectrum to the higher moments is not negligible in this case, and a direct applicationof the Gaussian approximation may not provide a correct estimate of the width.
Further difficulties can arise in characterizing the microstructure of modelnetworks via width in the presence of strong inhomogeneity. The calculation of thenarrow width of the resonance curve at high concentration via equation (4) can bemisleading in the presence of large hydrogen clusters. If the contribution from a fewlarge clusters dominates the moment summations, the effect of the dilute environmenton the width can be missed out. Similarly, the presence of a single large cluster ina dilute environment (at low concentration) may not be reflected in the calculatedvalue of the narrow width from model networks. It is therefore more appropriate topartition the overall microstructure into regions of clustered and dilute phases, andto use the corresponding moments in equations (1) and (2) for calculation of widthsfor the broad and the narrow part of the spectrum. This partition of the spins intoclustered and dilute regions can be viewed as analogous to the deconvolution of an one-dimensional NMR spectrum into a broad and narrow spectrum. In the following, wediscuss our results for two different concentrations by partitioning the microstructureinto three-dimensional regions of dilute and clustered environments. As mentionedearlier, we can expect to see that the broad line width mainly originates from theclustered environment, whereas the dilute environment accounts for the narrow partof the spectrum.
The results for the broad and narrow line widths from the clustered and diluteenvironment for each of the model configurations are listed in tables 2 and 3. Inaddition to the Gaussian line width (σg) for the broad spectrum, we have also includedthe universal line width (σu) obtained from equation (5) via the Gaussian memoryfunction approximation [42]. The narrow line width of the spectrum is calculatedassuming a truncated Lorentzian shape, and is indicated in the tables as σL. We havealso included the value of the narrow line width estimated from the density of hydrogenatoms (n) in the dilute region using σnarrow = 4πγ2~n/(3
√3) [39]. Since the latter is
often used by experimentalists to get an approximated value of the narrow line width,this provides a simple way to compare our results to the experimental data. In table4, we have summarized the experimental values of the widths obtained by differentauthors with the theoretical results from the models. The experiments of Reimeret al [15] and Gleason et al [14] have indicated that the broad line width typicallyranges from 22 to 30 kHz for samples with 8 to 15% H atoms. This is comparable tothe values of 19.0 to 25.0 kHz obtained from the model with 7% H. The calculatedvalue of the broad line width from the model with 22% H is somewhat larger thanthe experimental value. However, this can be understood by taking into account thepresence of a large cluster (cf. figure 3b) in the model. The presence of such largeclusters is not surprising and have been reported by Wu et al [17], who have observeda broad line width of 50 kHz in hot-filament-assisted CVD deposited films.
In summary, the broad and the narrow line widths for both the models studiedhere lie within the range of experimental values. The large value of the broad linewidth for high concentration model can be understood in terms of the presence ofseveral large clusters with hydrogen-hydrogen separation between 1.6 A to 2.4 A.Our results suggest that the shape and the width of the resonance curve can be

Microstructure of hydrogenated amorphous silicon 13
Table 1. Van Vleck moments and the overall widths for the models from theGaussian approximation
% H Directions µ2(γ4~2) µ4(γ8~4) Γ σg (kHz)
7 100 3.95× 10⁻³ 6.71× 10⁻⁵ 4.30 17.8110 3.15× 10⁻³ 5.30× 10⁻⁵ 5.34 15.9111 4.15× 10⁻³ 9.68× 10⁻⁵ 5.64 18.2
22 100 3.12× 10⁻² 2.98× 10⁻³ 3.07 49.9110 3.19× 10⁻² 3.04× 10⁻³ 2.99 50.5111 3.26× 10⁻² 3.18× 10⁻³ 2.99 51.1
Table 2. Deconvoluted widths for the model with 7% H for the dilute and clusterregions
Distribution Direction σu(kHz) σg (kHz)
Cluster 100 25.1 26.4110 22.6 25.4111 19.2 21.8
σL (kHz) σnarrow (kHz)
Dilute 100 5.3 2.8110 4.9 2.8111 4.9 2.8
Table 3. Deconvoluted widths for the model with 22% H for the dilute andcluster regions
Region Direction σu(kHz) σg (kHz)
Cluster 100 33.8 40.6110 47.3 46.8111 44.3 46.4
σL (kHz) σnarrow (kHz)
Dilute 100 5.9 6.4110 6.9 6.4111 5.9 6.4
Table 4. Summary of experimental and theoretical values of widths
Theory (% H) σu (kHz) σnarrow (kHz)
540-atom model 7.0 19.0–25.0 2.8–5.3611-atom model 22.0 33.8–47.3 5.9–6.4
Experiments (%H) σbroad(kHz) σnarrow (kHz)
Reimer et al (1980) 8.0–32.0 22.0–27.0 3.0–5.0Gleason et al (1987) 8.0–15.0 25.0–30.0 –Wu et al (1996) 8.0–10.0 34.0–39.0 4.0–6.0
” 2.0–3.0 47.0–53.0 3.0–6.0
Microstructure of hydrogenated amorphous silicon 14
approximated by a Gaussian lineshape at high concentration. However, at lowconcentration the shape begins to deviate from an ideal Gaussian toward a narrowshape, which can be approximated by a truncated Lorentzian distribution providedthat the microstructure is dominated by dilute environment. However, in the presenceof a strong inhomogeneous distribution of hydrogen atoms, it is difficult to quantify theshape of the resonance curve via single distribution, and to obtain the line width fromthereof. A more convenient approach in this case is to describe the microstructureseparately by regions of clustered and dilute environment, and to compute the widthoriginating from each of these regions.
6. Conclusion
The distribution of hydrogen atoms in amorphous silicon is studied at low andhigh concentration (of hydrogen) starting from two realistic models of hydrogenatedamorphous silicon. Hydrogen atoms are found to be distributed in a dilute or sparseand a dense or clustered environment in the silicon matrix. At low concentration,the microstructure is characterized by the presence of a few small clusters (4–7 Hatoms) in the background of a sparse distribution of hydrogen. On the other hand,the microstructure is found to be strongly inhomogeneous at high concentration alongwith the presence of a few large and several small clusters. A remarkable featureof the microstructure is the presence of mono- and divacancy both at low and highconcentration. These vacancies are realized in the models as a built-in or an inherentfeature and are not incorporated by hand during model building. The presence ofsuch vacancies has been recently observed in experiments on hydrogenated amorphoussilicon samples obtained via thermal plasma techniques. The widths of the NMRspectra of the model networks are calculated from a knowledge of the distribution ofhydrogen in the network using the Van Vleck moments. The narrow and the broad linewidths of the spectra for the low concentration model are found to be in the range of3–6 kHz and 19–25 kHz, whereas the corresponding values for the high concentrationmodel lie between 5.9–6.4 kHz and 34.0–48.0 kHz, respectively. These results are inexcellent agreement with experimental data obtained from the NMR and the multiple-quantum NMR studies.
Acknowledgments
PB would like to thank the Aubrey Keith Lucas and Ella Ginn Lucas Endowmentfor awarding a fellowship under the faculty excellence in research program at theUniversity of Southern Mississippi.
References
[1] Chittick R C, Alexander J H and Sterling H F 1969 J. Electrochemical Soc. 116 77[2] Carlson D E and Wronski C R 1976 Appl. Phys. Lett. 28 671[3] Snell A J, Mackenzie K D, Spear W E, LeComber P G and Hughes A J 1981 Appl. Phys. 24
357[4] Yaniv Z, Hansell G, Vijan M and Cannella V 1984 Proc. MRS Symp. 33 293[5] Hack M, Shaw J G and Shur M 1988 Proc. MRS Symp. 118 207[6] Ovshinsky S R 1968 Phys. Rev. Lett. 21 1450[7] Owen A E, LeComber P G, Spear W E and Hajto J 1983 J. Non-Cryst. Solids 59-60 1273[8] Takeda T and Sano S 1988 Proc. MRS Symp. 118 399[9] Street R A 1991 Hydrogenated Amorphous Silicon (Cambridge Solid State Science Series)

Microstructure of hydrogenated amorphous silicon 15
[10] Morigai K 1999 Physics of Amorphous Semiconductors (Imperial College Press)[11] Staebler D L and Wronski C R 1977 Appl. Phys. Lett. 31 292[12] Stutzmann M, Jackson W B and Tsai C C 1985 Phys. Rev. B 32 23[13] Pantelides S T 1987 Phys. Rev. B 36 3479[14] Gleason K K, Petrich M A and Reimer J A 1987 Phys. Rev. B 36 3259[15] Reimer J A and Vaughan R W 1980 Phys. Rev. Lett. 44 193[16] Baum J, Gleason K K, Pines A, Garroway A N and Reimer J A 1986 Phys. Rev. Lett. 56 1377[17] Wu Y, Stephen J T, Han D X, Rutland J M, Crandall R S and Mahan A H 1996 Phys. Rev.
Lett. 77 2049[18] Hsu K C and Hwang H L 1992 Appl. Phys. Lett. 61 2075[19] Carlos W E and Taylor P C 1982 Phys. Rev. B 26 3605[20] Manfredotti C, Fizzotti F, Boero M, Pastrino P, Polesllo P and Vittone E 1994 Phys. Rev. B
50 18046[21] Ouwens J D and Schropp R E I 1996 Phys. Rev. B 54 17759[22] Chakraborty S and Drabold D A 2009 Phys. Rev. B 79 115214[23] Drabold D A, Abtew T A, Inam F and Pan Y 2008 J. Non-Cryst. Solids 354 2149[24] Timilsina R and Biswas P 2010 Phys. Status Solidi A 207 609-612[25] Kim E, and Lee Y H 1995 Phys. Rev. B 51 5429[26] Kim E, Lee Y H, Chen C and Pang T 1999 Phys. Rev. B 59 2713[27] Zhang S B and Branz H M 2001 Phys. Rev. Lett. 87 105503[28] Lucovsky G, Nemanich R J and Knights J C 1979 Phys. Rev. B 19 2064[29] Smets A H M, Kessels W M M and Sanden M C M van de 2003 App. Phys. Lett. 82 1547[30] Hoven G N van den, Liang Z N, Niesen L and Custer J S Phys. Rev. Lett. 68 3714[31] Mahan A H, Xu Y, William D L, Beyer W, Perkins J D, Vanacek M, Gedvillas L M and Nelson
B P 2001 J. Appl. Phys. 90 5038[32] Carlos W E and Taylor P C 1982 Phys. Rev. B 25 1435[33] Boyce J B and Stutzmann M 1985 Phys. Rev. Lett. 54 562[34] Lohneysen H v and Schink H J 1984 Phys. Rev. Lett. 52 549[35] Graebner J E, Golding B and Allen L C 1984 Phys. Rev. Lett. 52 553[36] Biswas P, Tafen D N and Drabold D A 2005 Phys. Rev. B 71 054204[37] Biswas P, Atta-Fynn R and Drabold D A 2007 Phys. Rev. B 76 125210[38] Ordejon P, Artacho E and Soler J M 1996 Phys. Rev. B 53 R10441[39] Abragam A 1983 Principles of Nuclear Magnetism (Oxford University Press, London)[40] Vleck J H V 1948 Phys. Rev. 74 1168[41] It may be noted that the analytical expression for the fourth moment given in reference [39]
cannot be employed to calculate the same for an arbitrary distribution of spins in a disorderednetwork. The expression is valid only for crystalline lattices at high concentration of spins.For reasons beyond our understanding, many authors still refer to this in the context ofamorphous networks.
[42] Mehring M 1983 Principles of High Resolution NMR in solid (Springer-Verlag Berlin HeidelbergNew York)