UZAIFA ADAMU KARFI.pdf - of SUA IR
178
PEDOLOGICAL CHARACTERIZATION, CLASSIFICATION AND EVALUATION OF THE POTENTIAL FOR MAIZE PRODUCTION OF SOLOMON MAHLANGU CAMPUS FARM MOROGORO, TANZANIA UZAIFA ADAMU KARFI A THESIS SUBMITTED IN FULFILMENT OF THE REQUIREMENTS FOR THE DEGREE OF DOCTOR OF PHILOSOPHY IN SOIL SCIENCE AND LAND MANAGEMENT OF SOKOINE UNIVERSITY OF AGRICULTURE. MOROGORO, TANZANIA. 2016
-
Upload
khangminh22 -
Category
Documents
-
view
1 -
download
0
Transcript of UZAIFA ADAMU KARFI.pdf - of SUA IR
PEDOLOGICAL CHARACTERIZATION, CLASSIFICATION AND
EVALUATION OF THE POTENTIAL FOR MAIZE PRODUCTION OF
SOLOMON MAHLANGU CAMPUS FARM MOROGORO, TANZANIA
UZAIFA ADAMU KARFI
A THESIS SUBMITTED IN FULFILMENT OF THE REQUIREMENTS FOR THE
DEGREE OF DOCTOR OF PHILOSOPHY IN SOIL SCIENCE AND LAND
MANAGEMENT OF SOKOINE UNIVERSITY OF AGRICULTURE.
MOROGORO, TANZANIA.
2016
ii
EXTENDED ABSTRACT
In Tanzania, limited attention has been channeled towards the assessment of the fertility
status of the soils in areas perceived as suitable for agricultural activities, mainly crop
production. In the absence of reliable soil fertility data and information, agricultural land
use, and in particular crop production has resulted in very low yields of most of the crops,
with subsequent land degradation. The Solomon Mahlangu Campus (SMC) farm –
Sokoine University of Agriculture, which is used mostly for crop production, mainly
maize and pastures, as well as teaching and research, has not been critically assessed with
regard to its soil fertility status, and hence its agricultural potential. This study was carried
out with an overall objective of developing the best management packages for the
improved maize crop production of Solomon Mahlangu Campus farm. Specifically the
study aimed at i) to characterize and classify the soils of the study area using the criteria of
the Soil Taxonomy and World Reference Base for Soil Resources soil legend. ii) to
establish and evaluate the suitability of soils of the SMC farm for maize production and;
iii) to determine the response of maize to different levels of N, P and FYM iv) to identify
the limiting factors in different soil units.
The study was conducted in the 300 ha of the uncultivated portion of the Solomon
Mahlangu Campus farm, Sokoine University of Agriculture. Grid survey at detailed level
(scale, 1:7,500) was carried out to select observation and sampling points. At the
beginning of the survey, an initial reconnaissance survey of the study area was conducted,
followed by transect walks; auguring and selection of representative transect sampling
points. Four mapping units’ were thus delineated and identified in the study area. A total
of four representatives profile pits (1.5 m x 1.5 m long x 2 m deep/limiting layer) were
excavated, studied, described and sampled. Description of the soils and landforms was
iii
done comprehensively following standard procedures as outlined in the FAO (2006)
guidelines for soil description. Surface soil samples were collected from the 0-30 cm for
general soil fertility evaluation. All soil samples collected were mixed properly, air –
dried, grounded, sieved using a 2 mm sieve, bagged and labeled, for general chemical and
physical analysis. The samples were analyzed according to laboratory manual for soil
analysis by Moberg (2000) in the Department of Soil and Geological Sciences at SUA
Morogoro. The data of the physical and chemical characteristics of soils were summarized
using descriptive statistics. The soils were classified to family level according to Keys to
Soil Taxonomy (Soil Survey Staff, 2014) and to WRB soil name- Tier 2 according to the
World Reference Base for Soil Resources [IUSS Working Group WRB (2015)]. The land
suitability evaluation was done using the FAO Guidelines on land evaluation for rain fed
agriculture (FAO, 2006). Screen house studies were also conducted at the Department of
Soil and Geological Sciences screen house to determine the effects of different levels of N,
P and FYM on the growth response, nutrient uptake and dry matter yields of maize. The
experiments were 33
factorial in a completely randomized design (CRD) with three
replications. The treatments used consist of three levels of nitrogen (0, 75 and 150 kg N
ha-1
), three levels of phosphorus (0, 40 and 80 kg P ha-1
) and three levels of farmyard
manure (0, 5 and 10 t FYM ha-1
). Parameters determined included plant height, number of
leaves; stem girth, dry matter yields (DMY) and nutrients uptake (N and P). The data
collected were analyzed using the analysis of variance (ANOVA) technique and means
were separated using the New Duncan’s Multiple Range Test (NDMRT) at 5% level of
probability with the Genstat software package 14th
edition.
The results of this study revealed that: all the soils belong to the soil order Ultisols and
Ustalfs at suborder level in the Soil Taxonomy while Alisols in the Reference Soil Group
(RSG) - Tier 1 for the World Reference Base for Soil Resources soil legend. At great
iv
group and subgroup levels, P1 was classified as Rhodustults and Typic Rhodustults, P1
and P2 as Haplustults and Typic Haplustults, whereas, P4 was classified as Haplustults
and Arenic Haplustults (Soil Taxonomy), which correspond to Haplic RhodicAlisols,
HaplicAlisols, Haplic Chromic and HaplicAlisols (World Reference Base) in the Tier 2 for
RSG soil name for P1, P2, P3 and P4, respectively. Results obtained also indicated that
soils were sandy loam to silt loam in texture with a slightly acidic to mildly alkaline soil
reaction (pHwater = 5.96 - 7.27). The mean values for organic carbon (0.29%), total
nitrogen (0.04%), available phosphorus (9.0 mg kg-1), cation exchange capacity (9.84
cmol.kg-1
), base saturation (21.2%) and exchangeable bases (Ca=0.7, Mg=0.85, K=0.31
and Na=0.21 cmol.kg-1
) were low in all the mapping units.. The mean EC value (0.03
ds/m) was low indicating that the soils were naturally non-saline. The evaluation of the
soils revealed that all the soils of the four mapping units are currently moderately suitable
(S2) for maize production. The major limitations in the study area are low soil fertility
status and soil moisture content. The results for the screen house studies show that
application of different rates of N, P and FYM had significant influence (P < 0.05) on the
growth, nutrients uptake and dry matter yields of maize.
To improve soil productivity and sustain production of the test crop in the area under
investigation, the following recommendations were made: i) an integrated nutrient
management system should be adopted which embraces a holistic approach of integrated
use and management of organic and inorganic nutrient sources in a sustainable way. ii)
Periodic soil tests are very imperative to properly monitor the soil fertility indices and
prevent soil fertility decline and degradation. iii) The low TN & OC contents in the soils
needs to be amended through an integrated nutrients management (INM) iv) Thus, for
enhanced performance of maize in the study area; application of a combination of
nitrogen, phosphorus and farm yard manure fertilizers at reduce rates (75 kg N ha-1
, 40 kg
P ha-1
plus FYM 5 t ha) would be sufficient for maize growth, dry matter yields and
v
nutrients content (N and P) in the test soil.v) Further studies are needed in similar
abandoned farms in other agro-ecological zones for sustainable maize production in
Tanzania.
Key words: Solomon Mahlangu Campus, soil fertility, maize, nitrogen, phosphorus, farm
yard manure, soil characterization, soil suitability evaluation, mapping unit, soil profiles,
soil physico- chemical properties, treatments
vi
DECLARATION
I Uzaifa Adamu Karfi do hereby declare to the Senate of Sokoine University of
Agriculture that this thesis is my own original work done within the period of my
registration and that it has neither been submitted nor being concurrently submitted in any
other institution.
_____________________________ ______________
Uzaifa K. Adamu Date
(PhD Soil Science Candidate)
The above declaration is confirmed by:
_____________________________ ______________
Prof. Jerome P. Mrema Date
(Supervisor)
_____________________________ ______________
Prof. John J. Msaky Date
(Supervisor)

vii
COPYRIGHT
No part of this thesis may be produced, stored in any retrieval system, or transmitted in
any form or by any means without prior permission of the author or Sokoine University of
Agriculture in that behalf.
viii
ACKNOWLEDGEMENTS
All the praises and thanks are to Almighty Allah, the Lord of all that exist. I would like to
express my gratitude to a number of people who encouraged and assisted me in the course
of my study. I am indebted to the late Alhaji Adamu Na’ibi my father who supported me
since from birth to adult stage, I equally deeply indebted to my confident mother Hajiya
Sa’adatu Bayero who first encouraged me at initial stage of my life.
I wish to acknowledge and register my profound gratitude to my supervisors, Prof. Jerome
P. Mrema and Prof. John J. Msaky for the professional and endless efforts they devoted to
this study and patience, well from the proposal stage of the research to the production of
this thesis, their guidance and constructive comments widen my knowledge in shaping this
thesis. I will like to address my sincere thanks to the Government of the Federal Republic
of Nigeria, through Tertiary Education Trust (TET) Funds and Kano University of Science
and Technology, Wudil for sponsoring my PhD study. Thanks are also due to the
Management of Sokoine University of Agriculture Morogoro, Tanzania for the
opportunity, technical and supervisory roles to undertake this study.
I am extremely gratitude to Prof. B. M. Msanya for his input in the area of soil
classification and his willingness to assist me on the work. Thanks are due to the Head of
Soil and Geological Sciences Department SUA, Prof. E. E. Marwa for his concern and
follow-ups on my progress at all the times and for providing the needed facilities in the
Department for this work. I am equally indebted to all academic and non-academic staff of
the Department of Soil and Geological Sciences at SUA, Farm manager Mazimbu campus
(Mr. R. Mangachi) and his staff and Mr. Y. Matembo of GIS Department for their
cooperation, academic and technical assistance rendered to me during the period of the

ix
study. My thanks are extended to my senior colleagues and friends at KUST, Wudil, for
their encouragement and the strength they gave me to go to this level of education. Many
thanks are due to Prof. A. M. Kundiri and the late Prof. S. Mustapha for their
encouragement and academic support.
The company, co-operation and support received from my fellow colleagues (Nigerian
community at SUA), R. N. Martin, B.S. Wudil, A.A. Hussaini, M.A.B. Garko and West
African students union (WASU) who kindly shared ideas, whenever required, are also
very much appreciated.
To my family, I remain grateful for their moral, valuable contributions and
encouragement. You are highly appreciated and you remain blessed. My wives apparently
deserve special and sincere appreciation for their encouragement, care and love. I am
therefore grateful to them and my children for their patience and endurance. Thank you
once again. I say “NA GODE ALLAH YAYI ALBARKA” in Hausa language.
May I seize this opportunity to express my deepest gratitude to all individuals who
contributed directly or indirectly to my study and the production of this thesis. I say
“ASANTE SANA” in Kiswahili language.

x
DEDICATION
This work is dedicated to my beloved parents (Late Alh. Adamu Na’ibi Karfi, May his
soul rest in perfect peace, Amen and Hajiya Sa’adatu Bayero for devoting their resources
in educating me). I also dedicate this work to my wives, our children and Soil Scientists
and to all those who love Soil Science as a profession.
xi
TABLE OF CONTENTS
EXTENDED ABSTRACT ................................................................................................. ii
DECLARATION ............................................................................................................... vi
COPYRIGHT ................................................................................................................... vii
ACKNOWLEDGEMENTS ............................................................................................ viii
DEDICATION ..................................................................................................................... x
TABLE OF CONTENTS .................................................................................................. xi
LIST OF TABLES .......................................................................................................... xvi
LIST OF FIGURES ...................................................................................................... xviii
LIST OF PLATES ........................................................................................................... xix
LIST OF APPENDICES ................................................................................................... xx
LIST OF ABBREVIATIONS, SYMBOLS AND ACRONYMS ................................. xxi
CHAPTER ONE .................................................................................................................. 1
1.0 INTRODUCTION ......................................................................................................... 1
1.1 Agriculture and Land Management in Tanzania ............................................................. 1
1.2 Soil Fertility and Soil Productivity .................................................................................. 5
1.2.1 Processes and factors affecting soil fertility and productivity ............................... 7
1.2.2 Soil fertility evaluation and management ............................................................... 8
1.2.3 Effect of declining soil fertility and soil productivity on crop production ........... 10
1.2.4 Soil fertility maintenance ..................................................................................... 10
1.2.4.1 Application of organic fertilizers ............................................................. 12
1.2.4.2 Application of inorganic fertilizers .......................................................... 14
1.2.4.3 Integrated soil fertility management ........................................................ 16
1.3 Soil Survey and Land Evaluation .................................................................................. 19
1.4 Land Suitability and Capability Classification .............................................................. 20
xii
1.5 Effects of Organic and Inorganic Fertilizers on Plant Growth ...................................... 21
1.6 Major Limitations to Increased Maize Production in Tanzania .................................... 26
1.7 Justification to Undertake the Study ............................................................................. 30
1.8 Objectives of the Study ................................................................................................. 31
1.8.1 Overall objective .................................................................................................. 31
1.8.2 Specific objectives ................................................................................................ 31
1.9 References ..................................................................................................................... 32
CHAPTER TWO ............................................................................................................... 50
2.0 PHYSICO-CHEMICAL PROPERTIES AND CLASSIFICATION OF
SOILS OF SOLOMON MAHLANGU CAMPUS FARM, MOROGORO,
TANZANIA .................................................................................................................. 50
2.1 Abstract ......................................................................................................................... 50
2.2 Introduction ................................................................................................................... 51
2.3 Materials and Methods .................................................................................................. 53
2.3.1 Study location ....................................................................................................... 53
2.3.2 Site survey ............................................................................................................ 54
2.3.4 Analysis of soil physico-chemical properties ....................................................... 56
2.3.5 Data summary and description ............................................................................. 57
2.3.6 Soil classification ................................................................................................. 57
2.3.7 Soil map production and data analysis ................................................................. 57
2.4 Results and Discussion .................................................................................................. 57
2.4.1 Morphology and genesis of the soils .................................................................... 57
2.4.2 Description of the soil mapping units................................................................... 57
2.4.3 Soils physical and chemical characteristics.......................................................... 62
2.4.4 Soil classification ................................................................................................. 71
2.4.5 Soil management strategy .................................................................................... 74
xiii
2.5 Conclusions and Recommendations .............................................................................. 74
2.6 References ..................................................................................................................... 76
CHAPTER THREE .......................................................................................................... 80
3.0 EVALUATION OF THE FERTILITY STATUS AND SUITABILTY FOR
MAIZE PRODUCTION IN SOLOMON MAHLANGU CAMPUS
MOROGORO TANZANIA ....................................................................................... 80
3.1 Abstract ......................................................................................................................... 80
3.2 Introduction ................................................................................................................... 81
3.3 Materials and Methods .................................................................................................. 84
3.3.1 The location of the study area .............................................................................. 84
3.3.2 Field survey and soil sampling ............................................................................. 84
3.3.3 Laboratory analysis of soil physical and chemical properties .............................. 84
3.3.4 Land evaluation .................................................................................................... 85
3.4 Results and Discussion .................................................................................................. 86
3.4.1 Physical and chemical properties of the surface soils .......................................... 87
3.4.2 Relationships between the soil physical and chemical properties of surface
soil ........................................................................................................................ 90
3.4.3 Relationships between soil physical and chemical properties of the soil
profiles .................................................................................................................. 93
3.4.4 Land suitability for maize..................................................................................... 99
3.5 Conclusions and Recommendations ............................................................................ 102
3.6 References ................................................................................................................... 103
CHAPTER FOUR ........................................................................................................... 107
4.0 RESPONSE OF MAIZE TO DIFFERENT RATES OF NITROGEN,
PHOSPHORUS AND FARMYARD MANURE APPLICATION, IN
MOROGORO, TANZANIA. ................................................................................... 107
xiv
4.1 Abstract ....................................................................................................................... 107
4.2 Introduction ................................................................................................................. 108
4.3 Materials and Methods ................................................................................................ 112
4.3.1 Description of the study area .............................................................................. 112
4.3.2 Collection and preparation of soil and farmyard manure samples ..................... 112
4.3.3 Laboratory analysis of soil and farmyard manure .............................................. 113
4.3.4 Experimental design and treatments................................................................... 113
4.3.5 Screen house pot experiments ............................................................................ 114
4.3.6 Planting and agronomic practices....................................................................... 114
4.3.7 Data collection .................................................................................................... 114
4.3.8 Harvesting, processing and plant tissue analysis ............................................... 114
4.3.9 Statistical analyses of data .................................................................................. 118
4.4 Results and Discussion ................................................................................................ 118
4.4.1 Soil physico – chemical properties ..................................................................... 118
4.4.2 Effects of N, P and Fym on plant height ............................................................ 120
4.4.3 Effects of N, P and Fym on number of leaves ................................................... 121
4.4.4 Effects of N, P and Fym on stem girth ............................................................... 123
4.4.5 Effect of nitrogen, phosphorus and farmyard manure on root, shoot and
total dry matter yield of maize ........................................................................... 125
4.4.6 Effects of N, P and Fym on N and P uptakes by the maize plants ..................... 128
4.5 Conclusions and Recommendations ............................................................................ 130
4.5.1 Conclusions ........................................................................................................ 130
4.5.2 Recommendations .............................................................................................. 130
4.6 References ................................................................................................................... 130
CHAPTER FIVE ............................................................................................................. 140
5.0 GENERAL CONCLUSIONS AND RECOMMENDATIONS ............................. 140

xv
5.1 General Conclusions ................................................................................................... 140
5.2 Recommendations ....................................................................................................... 142
APPENDICES ................................................................................................................. 144
xvi
LIST OF TABLES
Table 2.1: Site characteristics of the Solomon Mahlangu Campus farm soils .................... 59
Table 2.2: Some Morphological/Physical Characteristics of SMC Profile soils ................ 61
Table 2.3: Some Physical Properties of Soils of the Study Area ........................................ 65
Table 2.4: Some Chemical Properties of the Solomon Mahlangu Campus Farm Soils ...... 67
Table 2.5: Rating for Soil Fertility Classes ......................................................................... 68
Table 2.6: Critical Limits for Interpreting Levels of Analytical Parameters ...................... 68
Table 2.7: Rating of the status of copper (Cu) Zinc (Zn) manganese (Mn) iro (Fe)
exchangeable acidity (H+ Al3+
) and (CEC) in the savannah zone adopted by
Tisdale et-al. (1995) ............................................................................................ 69
Table 2.8: Profile Distribution of Micro-nutrients .............................................................. 70
Table 2.9: Summary of diagnostic horizons and features of the studied soils (USDA Soil
Taxonomy) .......................................................................................................... 71
Table 2.10: Classification of the studied soils according to Keys to Soil Taxonomy (Soil
Survey Staff, 2014) ............................................................................................. 72
Table 2.11: Diagnostic horizons and other features of the studied soil profiles and their
classification according to the World Reference Base for Soil Resources
[IUSS Working Group WRB (2015)] ................................................................. 72
Table 3.1: Local indicators used for soil fertility evaluation .............................................. 87
Table 3.2: Analytical Data for surface soil.......................................................................... 88
Table 3.3: Critical Limits for Interpreting Levels of Analytical Parameters ...................... 90
Table 3.4: Copper (Cu), Zinc (Zn), manganese (Mn), iron (Fe), exchangeable acidity
(H+ and Al3+
) and (CEC) Ratings in the savannah zone (adopted from
Tisdale et al. 1995) ............................................................................................. 91
Table 3.5: Pearson correlation of some Surface composites Soil parameters ..................... 92
xvii
Table 3.6: Pearson correlation of some soil parameters for profile 1 ................................. 95
Table 3.7: Pearson correlation of some Soil Parameters for Profile 2 ................................ 96
Table 3.8: Pearson correlation of some soil parameters for Profiles 3................................ 97
Table 3.9: Pearson correlation of some soil parameters for Profile-4 ................................. 98
Table 3. 10: Soil Characteristics of site for the suitability classification .......................... 100
Table 3.11: Rating of Land use requirements for maize .................................................. 101
Table 3.12: Maize suitability class of the mapping units in Solomon Mahlangu
Campus farm Soils ............................................................................................ 102
Table 4.1: Physico-chemical Properties of the Experimental Soils used before
Sowing .............................................................................................................. 120
Table 4.2: Effects of Treatments Application Rates on the Plant height of Maize
at 1-4 Weeks after Sowing ................................................................................ 121
Table 4.3: Effects of Combination of Manure and Fertilizer Rates on Leaf number
in Maize at 1-4 Weeks after Sowing ................................................................. 123
Table 4.4: Stem girth of Maize Plants as affected by Organic and Inorganic Fertilizers
in 2014 and 2015............................................................................................... 124
Table 4.5: Effect of Rates of Organic and Inorganic Fertilizers on Dry Matter Yield .... 127
Table 4.6: Treatment Effects on N and P Uptakes in Maize Plants grown in the
2 Screen house Pot Experiments ....................................................................... 129
xviii
LIST OF FIGURES
Figure 2.1: Yearly total rainfall of the study area for the last 12 years ............................... 53
Figure2.2: Mean annual rainfall (Masika and Vuli) of SMC for the past 12 years ............. 54
Figure 2.3: Picture for profile I ........................................................................................... 55
Figure 2.4: Picture for profile II .......................................................................................... 55
Figure 2.5: Picture for profile III ......................................................................................... 55
Figure 2. 6: Picture for profile IV........................................................................................ 55
Figure 2.7: Sketch map of the study area showing the mapping units and pedons
locations ........................................................................................................... 58
Figure 2.8: Sketch map of the study area showing soil’s spatial distribution ..................... 73
xix
LIST OF PLATES
Plate 4.1: Response of maize to treatments at 1 WAS ...................................................... 115
Plate 4.2: Response of maize to treatments at 10 DAS ..................................................... 115
Plate 4.3: Response of maize to treatments at 2 WAS ...................................................... 116
Plate 4.4: Response of maize to treatments at 3 WAS ...................................................... 116
Plate 4.5: Response of maize to treatments at 25 DAS ..................................................... 117
Plate 4.6: Response of maize to treatments at 4 WAS ...................................................... 117
xx
LIST OF APPENDICES
Appendix 2.1: Sketch map of the study area ..................................................................... 144
Appendix 2.2: Morphological and Physico-chemical Descriptions of Profile 1 ............... 145
Appendix 2.3: Morphological and Physico-chemical Descriptions of Profile 2 ............... 146
Appendix 2.4: Morphological and Physico-chemical Descriptions of Profile 3 ............... 147
Appendix 2.5: Morphological and Physico-chemical Descriptions of Profile 4 ............... 148
Appendix4.1: Treatment layout for the pot experiment .................................................... 149
Appendix 4.2: Trend of plant heights of some treatments (2014)..................................... 149
Appendix 4.3: Biomass yield (g/plant) ............................................................................. 150
Appendix 4.4: Shoot Phosphorus uptake and biomass yields ........................................... 150
Appendix 4.5: Shoot N uptake (%) (2014) ....................................................................... 151
Appendix 4.6: Shoot P uptake (%) (2014) ........................................................................ 151
xxi
LIST OF ABBREVIATIONS, SYMBOLS AND ACRONYMS
AAS Atomic Absorption spectrophotometer
ADP Adenosine di- phosphate
AE Agronomic efficiency
AEZ Agro ecological zone
Al Agronomic index
Al3+
Aluminium iron
ANOVA Analysis of variance
ATP Adenosine tri-phosphate
Av Average
BD Bulk density
BLK Block
BS Base saturation
C Carbon
Ca Calcium
CAN Calcium ammonium nitrate
CE Cation exchange
CEC Cation exchange capacity
CL Clay loam
cm Centimeter
cmol Centimol
Co. Company
CRD Completely randomized design
Cu Copper
CV Coeffient of variance
xxii
df degree of fredon
DFID Department for Food and International Development
DM Dry matter
DMY Dry matter yield
DNA Deoxyribonucleic acid
DRG Drainage
DRWT Dry Root Weight
dSm-1
decisimens per meter
DSWT Dry Shoot Weight
e.g. for example
ECe Electrical conductivity
Elev. Elevation
ESP Exchangeable sodium percentage
et al. and others
FAO Food and Agricultural Organization of the United Nations
FAOSTAT Food and Agricultural Organization Statistic
FC Field capacity
Fe-ASS Flame emission Atomic absorption spectrophotometer
FMA & NR Federal ministry of agriculture and natural resources
FMA. WR. RD Federal ministry of agriculture, water resources and rural
development
FRWT Fresh Root Weight
FSWT Fresh Shoot Weight
FYM Farm yard manure
g Gram
xxiii
g/cc Gram per cubic centimeter
GDP Gross domestic product
Geol. Geological
gkg-1
Gram per kilogram
Gnt gently
GPS Global positioning system
H+ Al
3+ Exchangeable acidity
H+
Hydrogen iron
H2O Water
ha Hectare
Hyp Hyperthermic
IFDC International Fertilizer Development Company
IITA International Institute of Tropical Agriculture
INM Integrated Nutrients Management
IPNM Integrated Plant Nutrients Management
ISFM Integrated Soil Fertility Management
IUSS International Union of Soil science
K Potassium
KCl Potassium chloride
kg Kilogram
KUST Kano University of Science and Technology
L Litre
LEIA Low external input agriculture
LISF Local indicators of soil fertility
LN Leaves Number
LR Long rains

xxiv
LS Loamy sand
LSD Least Significant Difference
m Meter
m.a.s.l Meter above sea level
MAAT Monthly average annual temperature
Max. Maximum
mg Milligram
Mid. Medium
Min. Minimum
mm Millimeter
Mn Manganese
mod. Moderate
MPR Minjngu Phosphate Rock
ms Mean of square
MT Metric tonnes
MWD Medium to well drained
MZB Mazimbu
N Nitrogen
n Not suitable
n.s. No significant difference
N1 Conditionally suitable
N2 Permanently not suitable
nd Not determined
NH4AC Ammonium acetate
NH4F Aluminium floride
xxv
NPK Nitrogen Phosphorus and Potassium
NSS National Soil Service
NUE Nutrients Use Efficiency
OC Organic carbon
OM Organic matter
OMF Organo mineral fertilizer
P Phosphorus
P=0.05 Five percent probability level
PD Particle density
PG Plant Girth
pH potential hydrogen ion concentration
ppm Parts per million
PSD Particle size density
r Correlation coefficient
Rep Replication
RNA Ribonucleic acid
RSG Reference Soil Group
S Sand
s. e. Standard error
S:C Silt to clay ratio
S1 Highly suitable
S2 Moderately suitable
S3 Marginally suitable
SAS Statistical Analysis System
SC Sandy clay
SCL Sandy clay loam
xxvi
SMC Solomon Mahlangu Campus
SMR Soil moisture regime
SOM Soil organic matter
spp Species
ss sum of square
SSA Sub-Saharan Africa
SSR Self Sufficiency Ratio
SSS Soil Survey Staff
Stdev/s.d. Standard deviation
STR Soil temperature regime
SUA Sokoine University of Agriculture
t Tonne
T Treatment
TDDMY Total Dried Dry Matter Yield
TEB Total exchangeable bases
TET Funds Tertiary Education Trust Funds
Text. Texture
TFDMY Total Fresh Dry Matter Yield
TISF Technical indicators of soil fertility
TMV Tanzanian maize variety
TN Total nitrogen
Trt. Treatments
TSP Triple super phosphate
UK United Kingdom
Ulg. Uluguru
UNESCO United Nations Educational Scientific and Cultural Organization
xxvii
URT United republic of Tanzania
USA United States of America
USDA United State Department of Agriculture
var. Variety
vol. Volume
WAP Week after planting
WAS Weeks after sowing
WHC Water holding capacity
WRB World Reference Base
wt. weight
www World wide web
yr Year
1
CHAPTER ONE
1.0 INTRODUCTION
1.1 Agriculture and Land Management in Tanzania
Agriculture is the foundation of the Tanzania’s economy, as it accounts for about half of
the national income, three quarters of merchandise exports, the main source of food and
provides employment to about 80% of the Tanzanians (Pascal, 2013). Despite its
importance, the agricultural sector in Tanzania is faced with a multitude of problems
which include but not limited to low investment, low soil fertility, and unsustainable
agricultural practices leading to land degradation. Among the causes of land degradation
include ill-suited land use and inappropriate land and soil management practices, notably
poor cropping and farming systems, shortening or elimination of the fallow period,
insufficient use of manures and fertilizers, removal of crop residues for fodder, and soil
erosion (Pascal, 2013).
Land degradation which is caused by erosion, physical, biological and chemical
degradation from depletion of plant nutrients through the processes of uptake by plants
and leaching are the major setbacks against sustainable agricultural production. Other
setbacks include inadequate use of fertilizers and other soil amendments and inappropriate
tillage practices (Pascal, 2013). Information on the soils inherent nutrient contents,
quantities of the nutrients added to the soils and the nutrient dynamics in most of the soils
under cultivation and their agricultural production potentials is scanty. Lack of soil and
land management packages based on their agricultural production potentials and suitability
for various agricultural practices has led to inappropriate land use.
2
Over the years, food production in Tanzania has failed to meet the demand, consequently
the country has been importing food and receiving food aid to meet the needs of its
populace. For example, in 2007 and 2008 the country imported 48,477 MT and 64,193
MT of maize respectively (FAO 2013). This trend could be attributed to the absence of
concrete and long term focused approaches and principles in crop production. In Tanzania,
in spite of the consistently low yield for most food crops, national food production has
generally exceeded theoretical national requirements (URT, 1997). However with the
prevailing levels of productivity, the country food production would be unable to keep up
with the predicted population growth. The farming sector, which constitutes the backbone
of the economy of the country, is characterized by small scale production, poor returns to
land and labor market (URT, 1997). Furthermore, much of the productive potentials are
not realized due to inappropriate land use systems and practices leading to low and
irregular yields and declining productivity (URT, 1997; Pascal, 2013). This low
productivity on the part of small-scale farmers is a major constraint to the growth of the
agricultural sector. The fundamental challenge is improvement of productivity and
sustainability of food production, which is still dominated by smallholders whose
productivity is low
The average food crop productivity in Tanzania is 1.7 tonnes per hectare, whereas good
management and optimal fertilizer use should result in yields of up to 3.5-4.0 tonnes per
hectare. Furthermore, only 15 per cent of all farmers use fertilizers. In addition, the use of
hand tools and the reliance upon traditional rain-fed cropping methods and animal
husbandry further hamper productivity. AS a result, Tanzania appears not to be fit
currently to take advantage of her agribusiness opportunities and the country is also far
from being a major food exporter. Agricultural imports have been increasing, with food
imports, including wheat, rice and dairy products, taking the largest share (80 per cent) of
3
the total merchandise imports. Since the 1999/2000 season, the Food Self Sufficiency
Ratio (SSR), which compares the volume of domestic food production against the food
requirements of the country’s population, had been fluctuating between as low as 88 per
cent in 2003/04 and as high as 112 per cent in 2006/07. Furthermore, significant variations
in food security between different regions and districts have been experienced.
The United Republic of Tanzania was ranked 152nd out of 187 in the 2011 UN Human
Development Index and 54th out of 79 on the 2012 Global Hunger Index (FAO, 2014). In
Tanzania, the number of chronically hungry people rose from 28.8% in 1992 to 33% in
2013 (FAO, 2014), suggesting that food supply has not matched with the demand.
Moreover, despite 2.6% annual population growth rate between 1988 and 2002 in
Morogoro Region, (United Republic of Tanzania - URT, 2013) maize yields declined from
2.1 tons ha-1 in 1994/95 season to 1.0 tons ha-1 in 2007/08 season (URT, 2012). Thus the
intensification of sustainable agricultural through soil fertility and water management to
increase food productivity per unit area, without degrading the environment, is inevitable
to attain food security (Inter Academy Council, 2004; New Partnership for Africa’s
Development - NEPAD, 2003).
One of the major constraints to crop production in the tropics, Tanzania inclusive, is the
inherently low soil fertility attributed to low activity clays, low soil organic matter,
nitrogen, phosphorus, exchangeable basic cations and low contents of the soil micro-
nutrients (Nottidge et al., 2005; Awodun, 2007). The problem of deficient levels of both
the macro and micro -nutrients and the physical, chemical and biological constraints to
soil productivity in the tropical regions has necessitated increased search for proper soil
fertility management practices, which include the use of organic and/or inorganic

4
fertilizers and other soil amendments to raise soil fertility levels, and thereby increasing
crop yields (Awodun, 2007).
In Tanzania, little attention has been channeled towards the assessment of the fertility
status of the soils in areas perceived as suitable for agricultural activities, mainly crop
production (Pascal, 2013). Absence of reliable data and information on soil fertility have
led to continued agricultural lands use and in particular crop production practices, which
have resulted into very low yields of most of the crops and subsequent land degradation
There is a growing concern over the decline in the productive capacity of Tanzania’s soils
as a result of non-sustainable land use practices (Pascal, 2013). Such practices have led to
soil erosion and adverse changes in hydrological, biological, chemical and physical
properties of the soils. In the country, continual cropping without concurrent use of
manure/inorganic fertilizers has reduced soil fertility, leading to low crop yields (Ndaki,
2001). For example, poor maize yields ranging from 0.5 to 1.5 t ha-1
as opposed to the
potential yield ranging from 5 to 6 t ha-1
,which can be attainable with adequate nutrient
supply, has been recorded (Ikerra and Kalumuma, 1991, Ndaki, 2001).
Whereas nutrient replacement through application of mineral or organic amendments is
possible, small scale farmers are constrained by several socio-economic factors, such as
high prices, timely availability, and low benefit-cost ratios of the amendments (Palm et al.,
1997; 2001). A study to assess the extent of nutrient mining in Tanzania conducted by
Smaling and Janseen (1993) reported negative balances of 27, 4 and 18 kg ha-1
, for N, P
and K, respectively, and this was attributed to nutrients uptake by crops and other losses
such as erosion by surface run-off.
5
In Tanzania, little attention has been channeled towards the assessment of the fertility
status of the soils in areas perceived as suitable for agricultural activities, mainly crop
production (Pascal, 2013). Absence of reliable data and information on soil fertility have
led to continued agricultural lands use and in particular crop production practices, which
have resulted into very low yields of most of the crops and subsequent land degradation
The low soil fertility status of many soils in Morogoro area, as reported in previous studies
(Msanya et al., 2003), and non-use of the appreciable soil amendments by small scale
farmers contribute to the low yields of most annual crops, maize inclusive. The Solomon
Mahlangu Campus farm of Sokoine University of Agriculture (SUA), which is used
mostly for crop production especially maize and pastures, as well as teaching and research,
has not been critically assessed with regard to soil fertility status as well as its agricultural
potential. This study assessed the soil fertility status of the farm at Solomon Mahlangu
Campus (SMC) in Mazimbu Morogoro Tanzania.
1.2 Soil Fertility and Soil Productivity
Soil fertility is the ability of soils to provide the conditions required for plant growth, as a
result of physical, chemical and biological processes that act together to provide nutrients,
water, aeration and stability to the plant as well as freedom from any substances that may
inhibit growth (Stockdale and Shepherd, 2002). The soil’s ability to supply the essential
plant nutrients is determined by the physical, chemical and biological properties and
behavior of the soils (Brady and Weil, 1984).
Soil fertility is thus, the status of a soil with respect to its ability to supply elements
essential for plant growth without a toxic concentration of any element (Stockdale and
Shepherd, 2002). The fertility of a soil can therefore best be described as an evaluation of
6
the status of replenishment system which maintains the soil renewable resource in a
sustainable form for long term productivity (Singh, 1999).
Soil productivity, on the other hand, is the capacity of the soil in its normal environment,
to produce a specified plant or sequence of plants under a specified system of management
(Nandwa, 2003). Soil productivity emphasizes the capacity of the soil to produce crops
and is expressed in terms of yield. Soil productivity has declined in many areas of Sub -
Saharan Africa (SSA), whereby 494 million hectares of land are been affected by soil
degradation and out of these, 25 % is highly degraded with significant losses in their
productive capacities (FAO, 2001). Different definitions of the term soil productivity have
been provided; for instance, FAO (2001) defines soil productivity as the capacity of the
soil to support plant growth and development as influenced by the soil, plant and climatic
factors. Soil productivity is thus the interaction of the soil, climatic and plant factors as
related or linked to plant growth and development.
Farmers used several indicators to assess the soil fertility hence soil productivity on their
farms and these are called local indicators of soil fertility (LISF). These are the visually
observable and identifiable soil properties, features and characteristics which are used for
the qualitative assessment of the fertility status of soil in a given area (Barrios et al., 2000;
Beare et al., 1997; Doran and Safley, 1997). Local indicators of soil fertility include such
soil properties and such characteristics as the colour of the soil, the soil texture (feel), soil
moisture retention capacity, soil structure, soil compaction, presence of soluble salts,
stones, gravel and rocks, presence of ant-hills, soil depth, and depth to the water table, the
presence and appearance of various plant species (dominant vegetation), and the presence
of specific soil fauna. These local indicators of soil fertility have been used by farmers in

7
the development of indigenous (local) soil fertility management strategies in their
localities in sub Saharan Africa (areas).
On the other hand technical indicators of soil fertility (TISF) include the quantified
physical, chemical and biological properties of the soil that influence the growth and
development of plants (Barrios et al., 2000). Physical properties of soil such as texture,
structure, aeration, colour, temperature, density, slope and soil depth, cannot be modified
economically by the farmer. Chemical characteristics that affect soil quality include soil
reaction, organic matter content, cation and anion exchange capacities, buffering of soils,
mineral colloids, and the supply of essential plant nutrients. Biological properties entails
the soil micro organisms (bacteria, yeasts, fungi, algae protozoa, est.) also greatly
influenced the soil fertility. Tugel et al. (2005) referred to properties that change with land
use as dynamic soil properties. The fertility status of the soil is therefore dependent on the
physical, chemical and biological properties of the soil that control the dynamics and
transformations of the nutrient elements in the soil ecosystem.
1.2.1 Processes and factors affecting soil fertility and productivity
Soil fertility is not a static feature; on the contrary, it changes consistently towards
accumulation or depletion which is determined by the interplay between physical,
biological and anthropogenic processes (Smaling el al., 1992). The Physical properties of
soils such as soil texture and soil depth cannot be modified economically by the farmer,
yet they (the properties) determine the suitability of a soil for agricultural production.
Chemical characteristics that affect soil quality are soil reaction, soil organic matter
content, Cation exchange capacity CEC and the supply of the essential and beneficial plant
nutrients (Smaling el al., 1992).
8
Soil physical properties, to a large extent, determine the soil's water and air supplying
capacity to plants, and thereby determining their adaptability to cultivation and the level of
biological activity that can be supported by the soil (Sanchez et al., 1982). On the other
hand, chemical properties also dictate the fertility status of a given land; hence soil
chemical properties are among the most important factors that determine the nutrients
supplying power of the soil to the plants and microbes. The chemical processes and
reactions that occur in the soil also affect processes leading to soil fertility build up
(Smaling el al., 1992). Minerals inherited from the soil parent materials overtime release
nutrient elements that undergo various changes and transformations within the soil.
However, due to continuous cropping and cultivation and the natural nutrient depletion
processes and the natural soil fertility of the farmlands are dramatically declining. The
destruction of soil physical properties together with the depletion of plant nutrients have
caused the imbalance of the natural soil system resulting into a decrease of produce from
the farmlands and favoring the prevalence of pests and diseases (Foth, 1990).
Several factors and processes affect soil fertility; these include soil and climatic factors
such as soil pH, SOM, CEC and nutrients interaction, whereas processes that influence the
fertility of the soil include weathering, leaching, soil erosion, decomposition of organic
matter, acidification-alkalinisation, and nutrient transformations that occur in the soil.
Other factors influencing soil fertility include ion exchange capacity, soil moisture, soil
temperature, soil reaction, mineralogical composition of the inorganic soil constituents,
and soil organic matter (Balagopalm and Jose, 1995).
1.2.2 Soil fertility evaluation and management
Soil fertility evaluation is defined as the process of assessing the nutrient supplying
capacity of the soil, and the identification and selection of the quantities of nutrients to be
9
added to address the deficient levels of the nutrients based on the nutrient requirements of
the crops (Nandwa, 2003). The main diagnostic methods in soil fertility evaluation include
the determination of the local and technical indicators of soil fertility, identification of the
plant nutrient deficiencies symptoms and determination of the crop response to inputs
applied to soils (Beare et al., 1997). The soils have varying properties and can be
classified into soil categories with different productive potentials and constraints and
management (Msanya et al., 2003), hence these properties constitute part of the broader
concept of soil and land suitability classification.
Farmers use several indicators to assess the potentials of soil productivity, which include
the dominant vegetation as an indirect indication of soil fertility, the presence of specific
soil fauna and color as an indicator of organic matter content and soil nutrient – supply
capacity (i.e. fertility) (Doran and Safley, 1997). Other indicators of soil fertility include
the appearance of crops from planting to maturity, crop yields based on the previous
harvest over several seasons and appearance of crop during period of drought (soil’s
capacity to supply water) (Beare et al., 1997). Soil texture and workability (ease or
difficult in cultivation), anti-hills, soil depth and rock outcrops are also taken into
consideration as indicator of soil fertility (Beare et al., 1997). All these are referred to as
local indicators of soil fertility.
Soil fertility management is defined as the management of the soil processes and
properties in a sustainable way, so that the present generation is can be fed and soil
conditions improved to support future generations (Nandwa, 2003). The problems of soil
fertility management in SSA include: land degradation and soil fertility decline, droughts,
land rights and inappropriate cropping and farming technologies, and lack of credit
facilities.

10
1.2.3 Effect of declining soil fertility and soil productivity on crop production
Soil productivity has been on the decline in many areas of SSA (FAO, 2001). The decline
in soil fertility, hence soil productivity has been attributed to abandonment of soil fertility
restoration practices such as fallowing, inadequate and inappropriate nutrient
replenishment practices, and soil and water management strategies and practices. The
challenge of overcoming soil productivity decline is compounded by the fact that, the soil
fertility status is highly dynamic and complex because of the heterogeneous nature of the
soils attributed to the horizontal, vertical, spatial, and temporal variations (Nandwa, 2003).
Continuous cultivation which leads to serious decline in soil productivity has being the
current practice in most SSA countries (FAO, 2001). Soil nutrient depletion and
degradation have been considered as serious threats to agricultural productivity and have
been identified as the major causes of decreased crop yields and per capital food
production in sub – Saharan Africa (Henao and Baananke, 2006). In many parts of Sub –
Saharan Africa, where poor soil conservation method prevails, long term productivity of
soil is projected to decline considerably unless soil management practices are improved
(Omotayo and Chukwuka, 2009).
1.2.4 Soil fertility maintenance
Maintenance of soil fertility involves the return of the nutrients removed from it by
harvests, runoff, erosion, leaching and other loss pathways (Aune, 1993). Failure to return
nutrients removed from the soil culminates into a decline of soil fertility and crop
production. Despite this fact, humankind neglects this resource and soils are exposed to
increasing degree of chemical, physical, and biological stress (Greenland, 1994; Henao
and Baananke, 2006). Therefore, restoration of soil fertility to increase land productivity is
mandatory especially in areas such as semi-arid areas where production per hectare is low.
11
Soil fertility maintenance is a major concern in tropical Africa, especially because of the
rapid increase in population growth, which has been the trend in the past few decades
(Henao and Baananke, 2006). In traditional farming systems, farmers use bush fallow,
plant residues, household refuse, animal manures and other organic nutrient sources to
maintain soil fertility and soil organic matter (Henao and Baananke, 2006). Although this
reliance on biological nutrient sources for soil fertility regeneration is adequate with low
cropping intensity, but with more intensive cropping, it becomes unsustainable unless
inorganic fertilizers is adopted or given due consideration in crop production (Mulongey
and Merck, 1993; Henao and Baananke, 2006).
Maize grain yields vary with the levels of soil fertility and fertilizer use. One of the most
limiting nutrients for crop growth and yield is nitrogen. Yin et al. (2014) indicated that
nitrogen was the main factor for determining maize grain yield followed by water
availability in their study in a semi- arid environment of Northeast China. This is because
N is naturally low in soils with low soil organic matter and is subject to losses through
leaching, immobilization, mobilization and soil erosion (Brady and Weil, 2008). If soil
fertility is well managed, rain fed dependent crop production will turn out to be
productive, and substantial productivity improvement is likely to be realized (Kalhapure et
al., 2013). However, up to 89% of fields under annual crops are reported not to receive
any kind of fertilizer in Morogoro region because of high fertilizer costs (URT, 2012).
Soil fertility and plant nutrition are closely related and emphasize the forms and
availability of nutrients in soils, their movement to and their uptake by roots, and the
utilization of nutrients within plants (Foth and Ellis, 1997). Without maintaining soil
fertility, one cannot talk of improving agricultural production in feeding the alarmingly
increasing population. Therefore, to get optimum, sustained-long lasting and attain self-
12
sufficiency in crop production, soil fertility has to be maintained. The loss of soil nutrients,
which is related to cultural practices such as cultivation, the removal of vegetative cover
(such as straw or stubble) or burning of plant residues as practiced under the traditional
system of crop production or the annual burning of vegetation on grazing lands must be
stopped (Mesfin, 1998). The complementary use of organic and mineral fertilizers has
been proven to be a sound fertility management strategy in many countries of the world
(Bayu et al., 2006; Rosemary, 2007; Schlegel, 2000).
Maintenance of fertility status of soils is an important concept in agricultural production in
order to obtain stable and sustainable agro ecosystem. Many authors (e.g. Usoroh et al.,
1986; Mgbagwu, 1990; Walling Ford et al., 1993; Belay et al., 2001) suggest that in order
to overcome some of the deficiencies inherent in the use of only one fertilizer to boost
crop yield, adequate and effective use of a mixture of organic and inorganic fertilizers will
solve the problems associated with food scarcity in Africa and keep the soil in a much
better condition than when only one fertilizer type is used.
Soil fertility management should not be considered as a simple issue but rather as a
complex one and which has to be approached or addressed holistically. The holistic
approach to soil fertility management embraces integrated soil fertility management
(ISFM) which takes into account responses to a whole range of driving factors and
consequences namely biological, chemical, physical, social, economic and political
aspects of soil fertility decline (Bationo, 2003).
1.2.4.1 Application of organic fertilizers
Organic soil amendments are materials such as green and animal manures, crop residues,
cover crop, compost manure and mulch which when added to the soil will provide one or

13
more of the essential nutrients for plant growth following mineralization during
decomposition (Goh et al., 2001). Organic resources play a dominant role in soil
management in the tropics through their contribution to SOM formation.
Synchronizing nutrient release from organic inputs with crop nutrient needs have also
been reported to increase the nutrients use efficiency (NUE) (Palm et al., 2001). However,
large increases in soil productivity through the use of organic resources as sources of plant
nutrients are constrained by unavailability of sufficient quantities of the resources coupled
with their poor qualities that are low in nutrient contents (Rahman, 2004). It is argued that
organic resources of plant nutrients form the foundation for any sustainable increase in soil
productivity (Rahman, 2004). Strategies for soil fertility enhancement should thus be built
on the existing indigenous technical interventions and by improving the management of
nutrient flows within the farming systems. Such strategies of soil fertility improvements
range from traditional approaches of organic and inorganic fertilizer application to low
external input agriculture (LEIA). In traditional farming systems, farmers use bush fallow,
plant residues, household refuse, animal manures and other organic nutrient sources to
maintain soil fertility and soil organic matter. Other soil fertility enhancement methods
include the use of improved fallow, agroforestry and biomass transfer using nutrients
available in the farmer’s vicinity and adopting agricultural practices geared at soil fertility
improvement.
Tanzania is endowed with a large number of livestock such as cattle, goats, sheep, pigs,
donkeys and poultry. According to Kimbi et al. (1999), animal manure output in mainland
Tanzania is about 14 million tons per year. If the average N content of animal manure is
assumed to be 0.7%, the total N from the manure is 94 500 tons. This is about four times
the amount of nitrogenous fertilizers used in the country in 1980. Efficient use of animal
14
manure could therefore alleviate the problem of declining land productivity in most parts
of Tanzania. Irrespective of the enormous manure production potential, very little amount
of the available animal manure is being utilized for crop production. Kimbi et al. (1992)
observed that in extensive livestock grazing systems only about 1% of the farmers apply
animal manure on land, which implies a serious under utilization of such resources. This
underutilization is largely due to lack of scientific basis for advising farmers on aspects
such as appropriate application rates, storage techniques, and application methods
(Gabriel, 1998).
Due to continual removal of nutrients from the soil by crops, soil erosion, leaching and
other processes, soils generally become deficient in one or more nutrients (Tandon, 1994).
Farmers’ reaction towards declining soil fertility has often been practicing shifting
cultivation (where land is not scarce) or supplying additional nutrients by using fertilizers
and organic manures such as compost, farmyard manure, green manure and use of
leguminous cover crops. Restoring, maintaining, and increasing soil fertility are major
agricultural priorities in many parts of developing world where soils are inherently low in
plant nutrients and the demand for food and raw materials is increasing rapidly (FAO,
1998).
1.2.4.2 Application of inorganic fertilizers
Fertilizer is defined as any organic or inorganic material which is added to the soil to
supply certain elements which are essential to the plants but are lacking or deficient in the
soil for the growth of these plants. Kumpawat and Rauthore (1995) define inorganic
fertilizer as materials usually synthetic which contain elements which are essential for the
plant growth. Fertilizers not only improve crop yields but they also increase the quality of
15
available useful crop residues for livestock feed or organic inputs to the soil (Bationo et
al., 2004).
Judicious application of inorganic fertilizers has been responsible for significant increases
in crop yields on commercial farms in Africa, although this is not the case with small
holder farms (Murwira, 2003). Small crop yields in small holder farms have been
attributed to low rates (less than 60 kg -1
) of fertilizers applied, lack of technical
knowledge on fertilizer use and other socio-economic and structural constraints, such as
low producer prices for crops and lack of credit support (Murwira, 2003). Integrated
approaches incorporating a number of technical interventions are thus needed to improve
soil productivity on small holder farms. An efficient nutrient cycling in a farming system
requires the application of balanced combinations of plant nutrients that are locally
available or generated on the farm and application of moderate amounts or quantities of
externally desired nutrients (i.e. inorganic fertilizers) so as to optimize profitability and
sustainability of the farming system. The appropriate use of organic residues, manures and
inorganic fertilizers in a sustainable way leads to an increase of soil organic matter thereby
leading to an increase of soil fertility levels, which lead to an increase of the availability of
nutrients and efficient use of fertilizers through the synergistic effects of the different
sources of these soil amendments (Murwira, 2003).
In semi-arid southern Zimbabwe, as low as 8.5 kg N ha-1, in combination with 3 t ha-1,
increased maize yield from 1.26 t ha-1 (control) to 2.5 t ha-1 when there was good
seasonal rains (Ncube et al., 2007). According to Tittonell et al. (2008), fertilizer addition
(30 kg P ha-1 + 90 kg N ha-1) under rain fed conditions could increase maize yield yields
and hence bridge the yield gap in Western Kenya.
16
In 2007, Tanzania imported 169,027 metric tons of fertilizer, which increased to 318,060
tons in 2011 - a Compound Annual Growth Rate (CAGR) of 13.5 percent. From 2008 to
2010, there was a sharp increase in total fertilizer use. Notwithstanding this increase, the
average fertilizer application rate of 19.3 kg/ha in Tanzania is still low. The average maize
yield is 1.5 tons per ha, which is far below the potential of 6-7 tons per ha when good
agronomic practices and proper amounts of fertilizer are applied (URT, 2012).
1.2.4.3 Integrated soil fertility management
Integrated Soil Fertility Management (ISFM) may be defined as the application of soil
fertility management practices and the knowledge of adopting these to local conditions,
which maximize fertilizer efficient use of organic resource and crop productivity. These
practices necessarily include appropriate fertilizer and organic input management in
combination with the utilization of improved germ plasma (Nandwa, 2003). Integrated
plant nutrients management (IPNM) therefore entails a combined use of plant nutrients
sources (organic and inorganic) in crop production (Belay et al., 2001). Integrated soil
fertility management is therefore the adoption of a systematic conscious participatory and
broad knowledge intensive holistic approach to research on soil fertility that embraces the
full range of driving factors and consequences such as biological, physical, chemical,
social, economic and political aspects of soil fertility degradation (Bationo et al., 2006,
Nandwa 2003; Kimani et al., 2003).
Integrated soil fertility management is an approach that emphasize on sustainable and
cost-effective management of soil fertility (Sanginga and Woolmer, 2009); and attempts to
make the best use of inherent soil nutrient stocks, locally available soil amendment
resources and mineral fertilizers, and increase land productivity while maintaining or
enhancing soil fertility. ISFM Practices involve i) judicious use of mineral fertilizer and
17
agro minerals in terms of their form, placement and timing of application; ii) management
of crop residues and other locally available organic resources that improve agronomical
efficiency, iii) the use of locally adopted gemplasm that is resistant to local stressful
conditions, both biotic and abiotic and iv) the use of other field practices determined by
local agricultural conditions, particularly pest and descale management, soil erosion,
moisture conservation and the enhancement of beneficial soil biota (Nandwa, 2003).
Huge quantity of organic wastes in relation to inorganic fertilizer required for soil
amendment makes it imperative for a combination of nutrient sources. According to
Uyovbisere and Elemo (2000) integration of organic wastes reduces the quantity required
and enhances nutrient releases. Furthermore, the use of organic wastes to improve soil
productivity as an alternative to mineral fertilizer will help in the disposal of the wastes
whose generation has reached alarming proportions especially in developing countries.
Organic wastes are of immense importance as potential materials in the restoration of soil
productivity (USDA, 2002).
Previous studies (Uyovbisere and Elemo, (2000) showed superior effect of integrated
nutrient supply over the sole use of inorganic source. For instance, there was balanced
nutrient supply, improved soil fertility and crop yield under integrated nutrient
management (Olayinka and Adebayo, 2003; Adeniyan and Ojeniyi, 2006) with the
intensive use of land. Singh and Babasubramanian (1980) and Chand et al. (2006)
corroborated sustainable soil productivity to integrated nutrient management. Sutanto et
al. (2003) noted high crop yield under integrated nutrient management on acid soils.
Integrated nutrient management is effective in the tropics where soil productivity depletion
is rapid as a result of accelerated soil erosion, leaching and non-replaceable crop harvest
18
system. This situation needs to be reversed such that soil nutrient levels would not
continue to decline unabated (Donova et al., 1998).
Based upon research findings across numerous countries and diverse agro ecological zones
of sub–Saharan Africa (SSA), there is a consensus that the highest and most sustainable
gains in crop productivity per unit nutrient are achieved from a mixtures of inorganic and
organic inputs (Vanlauwe et al., 2001). The need to combine essential organic inputs with
fertilizers and farmer – available organic resources are viewed as a major entry point.
Indeed, combining mineral and organic inputs result in greater benefits due to synergistic
interaction effects of inputs than is the case in using either input alone (Sanchez, 1994).
Many farmers in SSA to some extent know how to practice judicious management of their
soils, to use nutrients available in their vicinity and to put agricultural practices geared
towards soil fertility improvements such as improved fallow, agro forestry and biomass
transfer.
ISFM is a set of principles and practices to intensify land use in a sustainable way. The
principles embedded within the definition of ISFM need to be applied within the existing
farming systems. There are two examples illustrating the integration of ISFM principles in
existing cropping systems: (i) dual-purpose grain legume–maize rotations with P fertilizer
targeted at the legume phase and N fertilizer at the rates below those at recommended
targeted at the cereal phase in the moist savannah agro-eco zone (Sanginga et al., 2003);
and (ii) micro-dose fertilizer applications in legume–sorghum or legume–millet rotations
with the retention of crop residues combined with water-harvesting techniques in the semi-
arid agro-eco zone (Bationo et al., 1998; Tabo et al., 2007).
19
ISFM is a holistic approach that not only requires land managers to invest in external farm
inputs, do a better recycling of the available organic resources and foster beneficial and
biological processes but also provides additional incentives and strengthen understanding
for them (managers) to do so (Uphoof, 2002). ISFM is not characterized by unique field
practices but is rather a fresh approach of combining available technology in a manner that
preserves soil quality while promoting its productivity (Uphoof, 2002). ISFM also
embraces a suite of conditions that foster the adoption such as greater access to farm input
supplies, fair commodity markets and conducive regulatory and trade policies (Uphoff,
2002). The overall goal of ISFM is to maximize the interaction that results from the potent
combination of fertilizers, organic inputs, improved germplasm and farmer knowledge
(Nandwa, 2003). ISFM approaches may follow two parallel paths, one for strictly
commercial production that optimizes returns per unit area and another intended for
resource poor farmers that makes the best use of limited affordable fertilizers.
1.3 Soil Survey and Land Evaluation
Soil survey is usually carried out with the emphasis of obtaining information demanded in
land evaluation. Soil survey involves determining the pattern of the soil cover and dividing
this pattern into homogeneous units, and then mapping their distribution and
characterizing them (Kaaya et al., 1994). It (soil survey) enables better predictions about
specific uses of the land, and allows useful statements to be made with respect to land use
potential and behavior towards different management practices (Kaaya et al., 1994).
The FAO (1995) defines land as a delineable area of the earth’s terrestrial surface,
encompassing all attributes of the biosphere immediately above or below this surface,
including those of the near surface climate, the soil and terrain forms, the surface
hydrology (including shallow lakes, rivers, marshes, and swamps), near-surface
20
sedimentary layers and associated ground water reserve, the plant and animal populations,
the human settlement patterns and physical results of past and present human activities
(terracing, water storage of drainage structures, roads, buildings e.t.c).
Land evaluation can be defined as a process of carrying out a preliminary and partial, but
very systematic analysis of the variability of the physical, chemical and biological land
conditions and its influence on the performance of present land use and determine land use
systems, in such a way that the result can be used for optimum land use planning (Fdlar
1982). Land evaluation, therefore serves as a tool for proper, judicious, and more efficient
use of land/soil (Mustapha et al., 2001). In land evaluation, the suitability of the soils is
matched with crop requirements and a suitability index obtained for the various soil
properties like texture, drainage, pH, organic carbon content, base saturation and soil
depth (FAO, 1983). The procedures involved in land evaluation are broadly field work,
interpretation, and presentation of results.
Land (capacity and suitability) evaluation involves the collection and interpretation of
inventories of soil, vegetation, climate and other aspects of land in order to identify and
make a comparison of at least, an optional and sustained used as well as management
alternatives in a known socio-economic setting (Fdlar 1982). The fertility capability
classification system evaluates fertility limitations other than nutrient deficiency (Sanchez
et al., 1982).
1.4 Land Suitability and Capability Classification
Land suitability refers to the ability of a portion of land to tolerate the production of crops
in a sustainable way (FAO, 1976; 1983). Land suitability analysis involves identification
of the main limiting factors on land against agricultural production and enables decision
makers to develop soil and crop management packages to increase land productivity
21
(FAO, 1983). The land suitability classification is one of the principles to the approach
and methods employed in land evaluation (FAO, 1976; 1983). The process of land
suitability classification is the appraisal and grouping of specific areas of land in terms of
their suitability for defined uses (FAO, 1976).
While the term land capability is used in a number of low classification systems (Baja et
al., 2002a), capability is viewed by some as the inherent capacity of land to perform at a
given level of general use, and suitability as a classification of land primarily in relation to
degradation hazards; while some regard the terms “Suitability” and “Capability” as
interchangeable (Baja et al., 2002a). Land capability refers to the potential of land to
sustain a number of predefined land uses in a built – in descending sequences of disability,
arable crops, pasture, woodland, and recreation/wildlife; if the capability of land
decreases, the land becomes suited for fewer major land uses (Baja et al., 2002b). Baja et
al., (2002b) reported two general kinds of land suitability evaluation approaches:
qualitative and quantitative. By qualitative approach, it is possible to assess land potential
in qualitative terms, such as highly suitable, moderately suitable, or not suitable. In the
second approach, quantitative assessment of land suitability is given by numeric
indicators.
1.5 Effects of Organic and Inorganic Fertilizers on Plant Growth
Application of organic manures plays a direct role in plant growth as a source of all the
essential major and minor nutrients in available forms subsequent to mineralization which
improves both the physical and biological properties of the soil (Abou El-Magd et al.,
2006). To meet crop’s nutrient needs, organic manures are however, required in rather
large quantities which call for a strong advocacy for fortifying these manures with
inorganic fertilizers. The combined use of organic sources of nutrients such as farmyard
22
manure not only supply essential nutrients but also offer some positive interaction with
chemical fertilizers to increase their efficiency and thereby to improve the soil structure,
water retention capacity, microbial activities, soil’s buffering capacity, and pH (Elfstrand
et al., 2007).
Animal (cattle, sheep and goats, poultry and pig) manures have been shown to contain
large amounts of organic matter, high nitrogen, and significant concentration of basic
cations such as magnesium, calcium and potassium which are essential nutrients for plant
growth and development (Johnson et al., 2006, Ojeniyi et al., 2009). Manure from
livestock is an important source of nitrogen for crop production in the small holder sector
as it helps farmers to reduce inputs of commercial fertilizers, thereby increasing the profit
margins of the farmer (Ayoola and Makinde, 2008). Nutrients contained in organic
manure are released more slowly and have residual effect of a long time in soil thus
supporting better root development leading to higher crop yields (Sharma and Mittra,
1991; Abou EL-Magd et al., 2005; Davari et al., 2012).
Apart from supplying nutrients, manures suppress diseases by generating ammonia and or
nitrous acid in the soil, and thus reducing Al toxicity (Larzarovita, 2001). It was reported
that when organic manures are used they usually release 30% N to the subsequent crops
(Jamaval, 2006); and according to Shaikh and Patil (2013), this is because the release of
plant available form of nitrogen is slow. Gasket et al. (2006) and George (2011) also
reported that the gradual release of nutrients from organic fertilizers when organic
manures are applied to the soil. The efficiency of manure utilization by a crop is
determined by the method of application, the time of incorporation and the rate of
decomposition in the soil. Characteristically, not all of the nutrients in manure are directly
available after its incorporation in the soil. Organic forms of nutrients must first be
23
mineralized into plant-available forms such as nitrate. The rate of mineralization is
variable and depends on soil type, moisture, temperature, and manure composition. When
cow dung and urine are mixed, a balanced nutrition is made available to the plants
(George, 2011).
The beneficial effects of manure on soil fertility are well documented (Mugwira and
Murwirwa, 1997; Gasket et al., 2006; George, 2011). Crop yield responses to manure can
be seen for several years after the application of the said manures as these reduce soil
acidification and improve the soil buffering capacity and the release of nutrients (Williams
et al., 1995). Hoffman et al. (2001) found that the combined crop-planting patterns and
the application of organic and mineral fertilities in an effective way could maintain
fertility in the soils.
Similarly, many studies demonstrated the response of maize to the application of mineral
fertilizers (Adetunji, 1994). For example maize has been reported to require high amounts
of nutrients particularly nitrogen, phosphorus and potassium which are needed for good
growth and high yields of crops (Onasanya et al., 2009; Mengel and Kirkby, 2001). Thus,
without an adequate nutrient supply, maize would fail to produce high grain yield
(Adediran and Banjoko, 1995). These nutrients could be supplied either from organic or
inorganic source or a combination. Busari et al. (2004) stress the need for improved
management practices through the use of external inputs from organic and inorganic
sources on tropical soil.
Among the inorganic fertilizers, nitrogen is a major yield determining factor in maize
production (Reddy, 2006). It (nitrogen) is a critical component of protein, which controls
the metabolic processes, required for optimum plant growth, and so it must be available in
24
sufficient quantities throughout the growing season of the plant (Lombin, 1983). Law-
Ogbomo and Law-Ogbomo (2009) reported that maize plant height increased with
successive increment of NPK fertilizer application rate of up to 60 kg N ha-1
. The stem
girth increased significantly (P=.05) with the application of N to maximum values of 2.92
cm while leaf area and a number of leaves increased up to 60 kg N ha-1
with values of 692
cm2 and 14.30 respectively. Unfortunately, the capacity of tropical soils to supply N
declines rapidly as a result of agricultural activities such as multiple and continues
cropping systems with low fertilizer application (Wondewosen, 2009; Tenaw et al., 2006).
Phosphorus is also an important nutrient which is required by maize for growth, being an
essential component of nucleic acids (DNA and RNA), phosphorylated sugar,
phospholipids, and protein; and so, Phosphorus plays a vital role in grain production. It
forms high-energy phosphate bonds with adenine, guanine and uridine, which act as
carriers of energy for many biological reactions in plant (Khan et al., 2008). It
(Phosphorus) is important for seed and fruit formation and hastens crop maturation.
Phosphorus hastens the ripening of fruits and can counteract the effects of excess N
applied to the soil. Adequate P supply is critical in the early stages of growth of plant, as it
is needed for growth and development of the root (Ahn, 1993; Adediran and Banjoko,
1995; Mollier and Pellerin, 1999).
An increase in maize plant height with the application of nitrogen and phosphorus at
recommended rates has been reported by Grazia et al. (2003), Ayub et al. (1997), and
Cheema (2000). This observation is also in agreement with the findings of Babatola
(2006) who reported that increasing levels of fertilizer (N and P) application led to an
increase in the growth and yields of crops. Maize varieties are known to vary in P uptake,
utilization efficiencies and adaptability to different soil types (Machado et al., 1999).
25
According to Lode (2004), as the percentage of clay particles and colloids contained in the
soil increases, so is the content of plant nutrients bound by these particles and colloids.
This is due to the very high specific surface area of colloids and their net negative charges
which give soil its great ability to hold more nutrients.
Despite the effectiveness of organic manure in crop production, its availability remains an
important issue due to its bulky nature, while on the other hand inorganic fertilizer which
releases nutrients immediately when applied to the soil is no longer within the reach of
resource poor farmers due to its high costs (Rahman, 2004). The continuous use of
inorganic fertilizers has been associated with an increase in soil acidification, nutrient
imbalances and soil degradation (Ayoola and Makinde, 2008). This shortcoming of
inorganic fertilizer use has motivated agronomists to explore an ecological approach for
soil amendments (Ayoola and Makinde, 2008). However, while inorganic fertilizers
increase the crop yield; its frequent use causes deterioration of the soil structure and
contamination of ground water (Sagardoy, 1993). Therefore, the productivity can be
improved by proper combination of manure with mineral fertilizers at reduced levels
(Bello and Hatom, 2008) because of some positive interaction with chemical fertilizers to
increase their efficiency and thereby to improve soil structure.
There is evidence of positive interaction between the combinations of organic manures
and urea as N source (Bocchi and Tano, 1994; Khaliq et al., 2004). Khaliq et al., (2004)
reported that the combined use of poultry manure and urea gave the best performance for
sweet corn amongst all treatments due to adequate supply of nitrogen which speed up
photo assimilation process. This process, in turn, boosts up growth. Manure application
has also been reported to increase the N and exchangeable cations levels in the soil
(Boateng et al., 2006). This is because N has the ability of improving soil physical

26
condition which determines the health of microbial population that decomposes the
organic nutrients.
Organic inputs are needed to maintain the physical and chemical fertility of the soil while
inorganic inputs are needed to supply quick and sufficient amount of readily available
nutrients to crops (Vanlauwe et al., 2001). Complementary application of organic and
inorganic fertilizers helps in sustaining soil quality and crop yield potentials (Makinde et
al., 2010). A combination of organic and synthetic amendments has been reported to
improve crop yield and soil fertility status (Palm et al., 1997; Vanlauwe et al., 2012).
Inorganic fertilizers supply the needed nutrients, and thus enhance plant luxuriant growth,
development, and yield (Stefano et al., 2004). Integrated use of chemical fertilizers and
organic material may be a good approach for sustainable production of crops. Integrated
use of organic matter and chemical fertilizers is beneficial in improving crop yield, soil
pH, organic carbon and available N, P and K in sandy loam soil (Rautaray et al., 2003).
Organic sources ameliorate the micronutrient deficiencies. Humic acid present in organic
matter was found to increase the permeability of cell membrane, which resulted in
increased uptake of water and nutrient elements (Cheng, 1997). Organic matters not only
increase the water holding capacity of the soil but also the portion of water available for
plant growth and improve physical properties of the soil (Sial et al., 2007).
1.6 Major Limitations to Increased Maize Production in Tanzania
Maize is grown widely in many countries of the world, Tanzania inclusive. According to
Rowhani et al. (2011), annual production of maize in Tanzania has hardly gone beyond
3.0 million tonnes for the past ten years with average yields of 1.4 t ha-1
which is far below
the global potentials of 4.9 t ha-1
. The adverse and erratic weather conditions, low soil

27
fertility and the use of ungraded seeds are usually reported to be the major factors
contributing to the low levels of maize production (Morris et al., 1999; Kisetu et al.,
2014). Low maize production in most African countries has also been attributed to low
soil fertility due to continuous cropping with little or no external inputs (Owusu-Gyimah et
al. (2013).
Studies by Smaling et al. (1997) and Lynan et al. (1998) estimated nutrient depletion at
farm, on national and continental scales for SSA, to be 22 kg N, 2.5 kg P and 15 kg K ha-1
yr-1
, respectively. Symptomatic of the problem is that, per capital food production has
continued to decline over the two decades in SSA. Agricultural production (in terms of
use of land and soil resources) in SSA is threatened by both endogenous and exogenous
factors such as climate, deforestation, soils properties, nutrients depletion and negative
nutrient balance, pest and diseases, population pressure, farming practices, cleaning and
tillage techniques and grazing (Quansah et al., 1997).
Agriculture is closely linked to the management of environmental resources. Tanzania, as
is the case with most Sub-Saharan countries, is believed to face an increasing pressure on
environmental resources, in spite of being a nation with rich resource endowments relative
to population size. The problems gaining most attention are deforestation, soil erosion, and
soil nutrient mining processes, because all of these are believed to be strongly interlinked
with agricultural production. Deforestation is believed to happen because of expanding
agricultural frontiers and fuel wood extraction (Mayawalla, 1996). Reliable figures on
deforestation, however, are scarce and unreliable. An increasing number of studies
identify soil-mining as the most significant environmental problem in southern Africa with
soil nitrogen as the limiting soil nutrient (Stoorvogel and Smaling, 1990). Tanzania, and
some other sub-Saharan countries, are believed to move along the path of declining
28
agricultural productivity, due to losses of soil nutrients, and that these are not being fully
replaced by external sources such as chemical fertilizers (URT, 1997). Such a
development may constitute a hindrance for future increase of agricultural production,
which can lead to food insecurity in these countries.
Smallholder farmers in Tanzania are confronted by a set of difficulty conditions that
threaten their ability to feed themselves and their families (URT, 1997). Over the past two
decades, Tanzania has experienced a series of periodic drought that required food relief
from international agencies (URT, 1997). The problem is even more severe in semi-arid
areas where soils with low organic matter, moisture, N, P, and mineral nutrients are
common (URT, 1997). Sustainable agriculture in these areas therefore requires frequent
addition of soil nutrients by combining the use of inorganic fertilizers and organic
materials (Bekunda et al., 1997). Sakala et al., (2003), Chingonikaya (1999) and
Mgangamundo (2000) found that growing maize after legume residues resulted in
increased maize yields vis-à-vis continuous cropping due residual/carry over effects of
the legume residues on the soil.
Maize production in Tanzania is hampered by a wide range of constraints which include
inadequate use of inputs such as fertilizers, improved maize seeds, and inadequate access
to information and extension services and erratic and inadequate rainfall (Rates, 2003).
Increased productivity is crucial for alleviating poverty and enhancing the livelihoods of
smallholder maize farmers who make up the majority of the rural poor in Tanzania (Rates,
2003).
In Tanzania, as human population is growing, more land is being brought under
cultivation, including marginal lands that are particularly vulnerable to degradation by
29
such processes as erosion, depletion of organic matter and nutrients, pollution, water
logging and salinization (Owino et al., 2006). In effect, degraded lands are cultivated
without full recovery of the soil from previous degradation; this invariably results in low
yields, poverty and malnutrition. The trend is a cause for concerns as a result of its
perceived threat to the earth’s environment and food security. Human activities through
deforestation, logging, farming, urbanization, and construction and population explosions
are some of the factors contributing to climate change (Offiong and Ita, 2012).
Drought is another major threat to maize production in many parts of Tanzania (URT,
1997). Maize production can be a risky and unreliable business because of erratic rainfall
and high susceptibility of maize to drought. The performance of local drought-tolerant
cultivars is low. Maize losses can go as high as 50 percent due to drought related stress.
Erratic rainfall makes maize farmers in Tanzania vulnerable to low yields which translate
to food insecurity (WEMA, 2010).
The agricultural sector, which is predominantly crop based is typically rain fed. The sector
is dominated by smallholder farmers cultivating an average farm size of between 0.9 ha
and 3.0 ha (WEMA, 2010). Of the 44 M ha arable land country wide only 23% is
cultivated. About 70% of Tanzania’s cropped area is cultivated by hand hoe, 20% by ox
plough, and 10% by tractor (URT, 2009; TNBC, 2009).
Furthermore the agriculture sector is risky because of its dependency on highly variable
weather. Future climate change is anticipated to exacerbate production risks in agriculture
by shifting the already volatile long – term weather conditions (Tumbo et al., 2010). The
global climate change judging from the decrease in the rainfall and number of rainy days
indicates an increase in temperature and irregular relative humidity over three decades. On
30
the basis of agricultural potential, it is estimated that more than 50% of the land in
Tanzania is semi – arid or arid (URT, 1997). The semi aridity is caused by low amounts of
rainfall, high evapotranspiration rates and erratic temporal and spatial rainfall distribution
(URT, 1997). The main problems of semi-arid areas are inadequate soil moisture for plant
growth and low availability and imbalances of nutrients (URT, 2012). In semi arid areas,
inadequate soil moisture for plant growth aggravates the problem of soil fertility.
1.7 Justification to Undertake the Study
Despite the importance of maize as the main staple crop, the average yields in farmers’
fields are relatively low averaging 1.2 metric tonnes per hectare as opposed to the
estimated potential yields of 4 to 5 metric tonnes per hectare (FAO, 1998), which could be
used as human food or as a component of animal feeds. The low soil fertility status of
many soils in Morogoro, as reported by Msanya et al. (2003), and non-use of fertilizers by
small scale farmers contribute to the low yields of most annual crops, maize inclusive. In
Morogoro, there has been a substantial number of studies on the collection of basic
information on soil’ in the form of soil surveys and soil fertility studies (Msanya et al.
(1991); Msanya and Mogoggo (1993) and Kilasara et al. (1994), which have centered on a
few selected areas. Moreover, the cited studies have by–passed the SMC farm area, which
has a different parent material from the other soils studied; but it well established that
different soil types have specific properties that affect directly their functions in relation to
supporting crop growth and performance. Moreover, there is no land suitability assessment
that has been done to indicate the suitability of the SMC soils for production of maize;
hence, the need to assess the suitability of the soils occurring in the SMC farm for the
various crops commonly grown in Morogoro.
31
The pedological information provided by the previous studies is very much useful mostly
to the soil scientists, but may not be of immediate interest to the farmers; what farmers
need the most is an interpretation of these findings. This involves identifying the most
limiting land qualities or characteristics and provides a good basis for advising farmers on
appropriate management practices for optimum production in a particular agro-ecological
zone (FAO, 1976; Dent and Young, 1981).
This study therefore addressed the soil fertility status of the SMC farm through, a
comprehensive and critical evaluation of the fertility status and productivity of the soils of
the SMC farm, classification of soils in the farm, establishment of soil and land suitability
maps and maximization of maize yields in the farm through the use of fertilizers. The
study also provides information that will enable land users of the farm to make proper use
of the farm and adopt appropriate alternative management practices.
1.8 Objectives of the Study
1.8.1 Overall objective
In view of the above highlighted knowledge gaps, the overall objective of this study, was
to develop the best management packages for improved maize production in the SMC
Farm.
1.8.2 Specific objectives
The specific objectives were:
i. To characterize and classify the soils of the study area [using the criteria of
the Soil Taxonomy and World Reference Base for Soil Resources soil legend.
ii. To establish and evaluate the suitability classes of soils of SMC farm for
maize production.
iii. To determine response of maize to different levels of N, P and FYM
iv. To identify limiting factors in different soil units.
32
1.9 References
Abou – El-Magd, M.M., Hoda, M.A. and Fawzy, Z.F. (2005). Relationships, growth, yield
of Broccoli with increasing N, P or K ratio in a mixture of N – P – K fertilizers.
Annual Agricultural Science Moshotohor 43 (2): 791 – 805.
Abou El-Magd, M.A, El-Bassiong, M. and Fawzy, Z.F. (2006). Effect of organic manure
with or without chemical fertilizers on growth, yield and quality of some varieties
of broccoli plants. Journal of Applied Science Research 2(10):791-798.
Adediran, J.A, and Banjoko, V.A. (1995). Response of maize to nitrogen, phosphorus and
potassium fertilizers in the savanna zone of Nigeria. Soil Science Plant Analysis
26: 593-606.
Adeniyan, O.N. and Ojeniyi, S.O. (2006). Comparative effectiveness of different levels of
poultry manure with NPK Fertilizer on soil fertility, Nutrient uptake .of maize.
Moor Journal of Agricultural Research, 4:194-197.
Adetunji, M.T. (1994). Phosphorus requirement of maize and cowpeas sequential cropping
on a paleudult. Fertilizer Research 39:161-166.
Ahn, P.M. (1993). Tropical soils and fertilizer use. TAP, Malaysia. 1993:128-130.
Aune, J.B. (1993). Ecological and economic requirements for sustainable land use in Sub
– Saharan Africa. Forum Development Study. 2:211 – 219.
Awodun, M.A. (2007). Effects of integrated application of goat manure and urea on soil
nutrient content and yield of okra. Nigerian Journal of Soil Science 17:126 – 129.
Ayoola, O.T. and Makinde, E.A. (2008). Farming systems research and extension
programme, Institute of Agricultural Research and Training, Obafemi. African
Journal of Plant Science 2: 3-8.
Ayub, M, Tanveer, A, Ahmad, R. and Tariq, M. (1997). Fodder yield and quality of two
maize varieties at different nitrogen levels. Andhra Agriculture Journal 47:7-11.
33
Babatola, I.A. (2006). Effects of NPK 15:15:15 fertilizer on the performance and storage
life of okra (Abelmuschus esculentus). Proceedings of the Horticultural Society of
Nigeria Conference 26:125-128.
Baere, M.H., Cameron, K.C., Williams, P.H. and Doscher, C. (1997). Soil quality
monitoring for sustainable agriculture. Proceeding of 50th
N. Z. Plant Protection
Conference. 1997 New Zealand Plant Protection Society (Inc.) www.nzpps.org
Assessed 23rd
September 2015.
Baja, S., Chapman, D.M., Dragovich, D. (2002a). A conceptual model for defining and
assessing land management units using a fuzzy modeling approach in GIS
environment. Environmental Management 29: 647–661.
Baja, S., Chapman, D.M. and Dragovich, D. (2002b). Using GIS-based continuous
methods for assessing agricultural land use potential in sloping areas. Environment
and planning B: Planning and Design 29: 3–20.
Balagopalm, M. and Jose, A.I. (1995). Soil dominicalytics in a natural forest and adjacent
exotic in plantatius in Kerala, India. Journal of Tropical Forest Science 8: 161 –
166.
Barrios, E., Bekunda, M., Delve, R., Esilaba, A. and Mowo. J. (2000). Identifying local
soil quality indicators, In: Methodologies for Decision Making in National
Resource Management. Eastern African Version, International Center for Tropical
Agriculture, Califonia. 125pp.
Bationo, A. (2003). Introduction of Soil Fertility Management in Africa. A Region
Perspective. ASP_TSBF_CIAT. 306pp.
Bationo, A. Lompo, F. and Koala, S. (1998). Research on nutrient flows and balances in
West Africa: State-of-the art. Agriculture, Ecosystems and Environment 71: 19–35.
34
Bationo, A., Kimetu, J., Iketta, S., Kimani, S., Mugenda, D., Odeudo, M., Silver, M.,
Swift. M.J. and Sanginga, N. (2004). The African Network for Soil Biology and
Fertility (AFNet): New challenges and opportunities. M: Bationo, A. (Ed).
Managing Nutrient Cycles to sustain Soil Fertility in Sub – Saharan Africa.
Academy Science Publishers, Nairobi, Kenya. pp 1 – 23.
Bationo, A., Waswa, B., Kihara, J. and Kimetu, J. (eds). (2006). Advances in Integrated
Soil Fertility Management in Sub – Saharan Africa 76:12 – 3.
Bayu, W., Rethman, N.F.G. and Alemu, G. (2006). Effect of FYM and organic fertilizer
on sorghum growth, yield and nitrogen use in a semi and areas of Ethiopia Journal
of Plant Nutrition 29 (2): 391 – 407.
Bekunda, M.A., Bationo, A. and Ssali, H. (1997). Soil fertility management in Africa: A
review of selected research trials. In ‘‘Replenishing Soil Fertility in Africa’’ (R. J.
Buresh, P. A. Sanchez, and F. Calhoun, Eds.), pp. 63–79. SSSA Special
Publication Number 51, Madison, WI.
Belay, A., Classens, A.S. and Beer, J.M. (2001). Influence of residue manure on selected
nutrient element of soil under long term crop rotation. South Africa Journal of
Plant and Soil 18:1 – 16.
Bello, W.B. and Hatoma, T. (2008). Effect of organo-mineral fertilizer application on
growth and yield of French beans (Phaseolus vulgaris L), Ethiopian Journal of
Environmental Studies and Management 1(3): 8 – 17.
Boaten, S.A, Zickermann, J. and Kornaharens, M. (2006). Effect of poultry manure on
growth and yield of maize. West Africa Journal of Applied Ecology 9:1-11.
Bocchi, S. and Tano, F. (1994). Effect of cattle manure and components of pig slurry on
maize growth and production. European Journal of Agronomy.;3:235-41.
Brady, N.C. and Weil, R.C. (1984). The Nature and Properties of Soils (9th
Ed).
Macmillan Publishing Company, New York. pp 416 – 420.
35
Brady, N.C. and Weil, R.R. (2008). The Nature and Properties of Soils. 14th
edition.
Pearson Education, Inc. pp 975.
Busari, M.A., Adekunle, I.O. and Azeez, J.O. (2004). Effect of poultry manure and
phosphorus application on the productivity and fodder quality of two centrosemo
species in an Alfisol, proceedings of the 24th
Annual Conference of the Soil
Science Society of Nigeria. December, 6 – 10 2004. University of Agriculture,
Abeokuta Nigeria.
Chand, S., Anwar, W. and Potra, D. (2006). Influence of Long-term application of organic
and inorganic fertilizer to build up soil fertility and Nutrient uptake in mint
mustard cropping sequence. Communications in Soil Science and Plant Analysis,
37:63-76.
Cheema, H.N.A. (2000). Yield and quality response of maize (Zea mays L.) fodder grown
on different levels of phosphorus and seedling densities. MSc. Thesis, Department
Agronomy University Agriculture Faisalabad Pakistan.
Cheng, B.T. (1997). Soil organic matter as a plant nutrient. In: soil organic matter studies
Proceedings of 3rd International Symposium on soil organic matter,
Braunschewing, Austria, Vienna: IAEA; 1:1977.
Chingonikaya, E.E. (1999). Effect of improved fallows of selected leguminous shrubs on
soil fertility and maize yield at Gairo, Morogoro, Tanzania. Unpublished
Dissertation for Award of MSc. Degree at Sokoine University of Agriculture,
Morogoro, Tanzania. pp. 41-84.
Davari, M., Sharma, S.N. and Mirzakham, M. (2012). Residual influence of organic
materials crop residues and biofertilizers on performance of succeeding mung
system. International Journal of Recycling of Organic Waste in Agriculture 1:14.
Dent, D. and Young, A. (1981). Soil Survey and Land Evaluation, George Allen and
Unwin. London. 278pp.
36
Donova, G. and Rassey, C. (1998). Soil fertility management in Sub-Sahara Africa.
Agronomy Journal 3: 928-135.
Doran, J.W. and Safley, M. (1997). Defining and assessing Soil health and sustainable
productivity. In: “Biology Indicators of Soil Health”. Pankurst, C. Doube, B.M.
and Gupta, V.V.S.R. (Eds). Dressing on Winter Wheat. Cereal Research
Community 33: 619-626.
Elfstrand, S., Bath, B. and Martensson, A. (2007). Influence of various forms of green
manure amendment on soil microbial community composition, enzyme activity
and nutrient levels in leek. Applied Soil Ecology 36:70–82.
Fdlar, R. (1982). Land evaluation for agricultural level use in Nifera. In: F.O.C. Ezediuma,
E.O.U. Okoye, C.A. Ezendu. T.E.Folina, G.Lekwa, S.M.C. Oparangu. M.C.
fertilization on crop yield. Arch. Acker-Pfl. Boden 52(3): 313-319.
Food and Agricultural Organization (FAO), (2014). Hunger Portal.
[http://www.fao.org/hunger/en/] site visited on 4/06/2016.
Food and Agriculture Organization, (1998). Guide to Efficient Plant Nutrition
Management: Sources of Plant Nutrients, Management of Plant Nutrients,
Environment Issues and Policies. Food and Agriculture Organization of the United
Nations., Rome. 89 pp.
Food and Agriculture Organization, (2013). World maize price.
[http://www.fao.org/foodsecurityportal/Tanzania] site visited on 2/06/2016.
Food and Agriculture Organization of the United Nations (FAO), (1995).United Nations
Education Scientific and Cultural Organization (UNESCO). 1995. The Digital Soil
Map of the World, Version 3.6., FAO, Rome.
Food and Agriculture Organization of the United Nations (FAO), (1983). Guidelines:
Land Evaluation for Rain fed Agriculture FAO. Soils Bulletin, 52. Food and
Agricultural Organization of the United Nations, Rome. pp 237.
37
Food and Agriculture Organization of the United Nations (FAO), (1976). A framework for
land evaluation. Soil Bulletins 32. FAO Rome 1-79.
Food and Agriculture Organization of the United Nations (FAO), (2001). Farming systems
and poverty, Improving farmers’ livelihoods in a changing World, FAO, Rome
formulations for maize in Nigeria.
Food and Agriculture Organization of the United Nations (FAO-IUSS), (2006). Guidelines
for soil description. 4th
edition. Rome.
Foth, H.D. (1990). Fundamental of Soil Science. 8th
ed. John Wiley and Sons, Inc., New
York. 360pp.
Foth, H.D. and Ellis, B.G. (1997). Soil fertility, 2nd
Ed. Lewis CRC Press LLC., USA.
290pp.
Gabriel, B.L.M. (1998). Utilization and management of animal manures for crop
production. The case of Urban Morogoro and Kilosa Districts. BSc. (Agriculture)
Special Project. Sokoine University of Agriculture, Morogoro. Tanzania.
Gasket, M., Smith, R., Mitchell, J., Koike, S.T., Fouche, C., Hortz, T., Hortwath, W. and
Jackson, L. (2006). Soil fertility management for organic crops (University of
California publication). pp 7249.
George, S. (2011). What organic fertilizers mean to plants and soil. Michigan State
University Extension msue.anr.msu.edu/news/what – organic – fertilizers – mean –
to – plants – and – soil.
Goh, K.M., Peason, D.R. and Daily, J.M. (2001). Effects of apple orchard production
system on some important soil physical, chemical and biological quality
parameters. Biological Agriculture and Horticulture Journal 18: 269 – 292.
Grazia, J.D., Tittonell, P.A., Germinara, D. and Chiesa, A. (2003). Short communication:
Phosphorus and nitrogen fertilization in sweet corn (Zea mays L. var. saccharata
Bailey). Span Journal of Agricultural Resources 1(2):103-107.
38
Greenland, D.J. (1994). Longterm cropping experiments in developing countries: The
need, the history and the future. In ‘‘Long Term Experiments in Agricultural and
Ecological Sciences’’ (R. A. Leigh and A. E. Johnston, Eds.), pp. 187–209. CAB
International, Wallingford.
Henao, J. and Baananke, C. (2006). Agricultural production soil nutrient mining in Africa.
Implications for resource conservation and policy development. IFDC Tech. Bull.
International Fertilizer Development Centre. Musele Schools, Alabama. USA.
Hoffman, I., Gerling, D., Kyiogwam, U.B. and Mane – Bielfeldth, A. (2001). Farmers’
management strategies to maintain soil fertility in a remote area in northwest
Nigeria. Agriculture, Ecosystems and Environment 86: 263 – 275.
Ikerra, S.T. and Kalumuna, M.C. (1991). Phosphorus adsorption characteristics of soils
and their influence on maize yield responses to phosphorus application along the
Mlingano Catena, Tanga. Paper presented at the 11th
Annual General Meeting of
the Soil Science Society of East Africa, 1 – 6 December 1991, Kampala, Uganda.
Jamaval, J.S. (2006). Effect of integrated nutrient management in maize (Zea mays) on
succeeding winter crops under rain fed conditions. Indian Journal of Agronomy 51
(1): 14 – 16.
Johnson, G.A., Davis, J.G., Gian, Y.I. and Doesket, K.C. (2006). Top dressing turf with
composted manure improves soil quality and protects water quality. American
Journal of Soil Science Society 70: 2114 – 2121.
Kaaya, A.K., Msanya, B.M. and Mrema, J.P. (1994). Soil and land evaluation of part of
the Sokoine University of Agriculture farm (Tanzania), for some crops under
rained conditions. African Study Monographs 15(2):97-118.
Kalhapure, A.H., Shete, B.T. and Dhonde, M.B. (2013). Integrated Nutrient Management
in Maize (Zea mays L.) for increasing Production with Sustainability. International
Journal of Agriculture and Food Science Technology 4(3): 195-206.

39
Khaliq, T., Mahmmod, T., Kamel, J. and Masood, A. (2004). Effectiveness of farmyard
manure, poultry manure and nitrogen for corn (Zea mays L.) productivity.
International Journal of Agriculture and Biology 6(2): 260- 263.
Khan, H.Z., Malik, M.A. and Saleem, M.F. (2008). Effect of rate and source of organic
materials on the production potential of spring maize (Zeamays L). Pakistan
Journal of Agricultural Science 45(1): 40- 43.
Kilasara, M., Magoggo, J.P. and Msanya, B.M. (1994). Land resource management in
Tanzania. In: Towards Developing a Programme Research for the Faculty of
Agriculture to the Year 2000. Proceedings of the Faculty of Agriculture Research
Workshop held at the Institute of Continuing Education, Sokoine University of
Agriculture, Tanzania 21st - 23
rd March 1993.
Kimani, S.K., Nandwa, S.M., Mugendi, D.N., Obanji, S.N., Ojiem, H.K., Murwira, H.K.
and Bationo, A. (2003). Principles of Integrated Soil Fertility Management in
Africa. A Regional Perspective, ASP – TSBF – CIAT Publication. Gichuru et al,
(Eds). pp 51 – 72.
Kimbi, G.G., V. Rutachokizibwa, N.M. Mollel, T.E.Simalenga, M.S. Ngetti and Biswalo
P.L. (1992). Identification of SUA-TU Linkage Project needs assessment: A
preliminary survey. Report submitted to SUA-TU Linkage Project. Institute of
Continuing Education, Sokoine University of Agriculture.
Kisetu, E. Sileja, L., Witness, J.T. and Anitha, P.R. (2014). Effect of nitrogen and
phosphorus on performance of maize planted at varying soil depths. International
Journal of Agricultural Policy and Research Vol. 2 (3): 90-97.
Kumpawat, B.A. and Ranthore, S.S. (1995). Response of maize (Zea mays), wheat
(Tricum aestivum) cropping sequence of fertilizer application. Indian Journal of
Agronomy 40:26 – 29.
Law-Ogbomo, K.E. and Law-Ogbomo, J.E. (2009). The Performance of Zea mays as
influenced by NPK fertilizer application. Notulae Scientia Biologicae 1(1): 59-62.
40
Lazarotita, G. (2001). Management of soil pathogen with organic soil amendments..
Journal of Plant pathology 23: 1 – 7.
Lode, V. (2004). About the effect of the contents of ratios of soils available Ca, K and Mg
in liming of acid soils. Agricultural Research Center, Teaduse 4/6. Agronomy
Research 2(1): 71 – 82.
Lombin G. (1983). Evaluating the micronutrient fertility of Nigeria’s semiarid savanna
soils. 2. Zinc. Soil Science 136: 42-47.
Lynan, J.K., Drechsel, P. and Gyiele, L.A. (1998). The economic assessment of soil
nutrient depletion. Agriculture, Ecosystem and Environment 71:1.
Machado, C.T., Almeida, D.L. and Machado, A.T. (1999). Variability among maize
varieties to phosphorus use efficiency. Bragantia 958(1): 109-124.
Makinde, E.A., Ayeni, L.S. and Ojeniyi, S.O. (2010). Morphological characteristic of
Amaranthus cruentus as influenced by Kola pod husic, organomineral and NPK
fertilizers in South Western Nigeria. New York Science Journal 3(5): 130-134.
Mayawalla, A.E.J. (1996). Structural adjustment policies and the management of soil and
forest resources in Tanzania. in Christansson, C. and Kikula, I.S. (eds.) Changing
Environments: Research on Man-Land Interrelations in Semi -Arid Tanzania.
Mbagwu, J.S.C. (1990). Effect of field application of organic waste from different source
on chemical rheological and structural properties of some Italian soils. Bioscience
Resources Technology 37:71 – 78.
Mengel, K. and Kirkby, E.A. (2001). Principles of Plant Nutrition. 5th ed. Kluwer
Academic Publishers, Dordrecht, Boston, London. 849pp.
Mesfin, A. (1998). Nature and management of Ethiopian soils. Alemaya University of
Agriculture, Ethiopia. 272pp.
41
Mgangamundo, M.A. (2000). Effects of fallow periods of Cajanus cajan, Sesbania sesban
and Tephrosia vogelii on soil fertility, maize and fire wood production at Gairo,
Morogoro, Tanzania. Unpublished Dissertation for award of MSc. Degree at
Sokoine University of Agriculture, Morogoro, Tanzania. pp 53 – 119.
Moberg, J.R. (2000). Soil and plant analysis Manual. The Royal Veterinary and
Agricultural University, Chemistry Department, Copenhagen, Denmark. 133 pp.
Mollier, A. and Pellerin, S. (1999). Maize root system growth and development as
influenced by phosphorus deficiency. Journal of Experimental Botany 50: 487–
497.
Morris, M.L., Tripp, R. and Dankyi, A.A. (1999). Adoption and impacts of improved
maize production technology. A Case Study of the Ghana Grains Development
Project, Economics Program Paper, 99-01. Mexico, D.F., CIMMYT.
Msanya, B.M. and Magoggo, J.P. (1993). Review of Soil Surveys (Soil Resource
Inventories) in Tanzania. AU, Norway.ISSN 0804-2144,
Msanya, B.M., Kaaya, A.K., Araki, S., Otsuka, H. and Nyadzi, G. (2003). Pedological
characteristics, general fertility and classification of some benchmark soils of
Morogoro district, Tanzania African Journal of Science and Technology (AJST)
Science and Engineering Series 4(2):101-112.
Msanya, B.M., Msaky, J.J., Takamura, Y.T. and Araki, S. (1991). Land use and land
evaluation systems research in Tanzania. A project proposal submitted to the Japan
International Cooperation Agency (JICA), Tokyo Office, Japan.
Mugwira, I.M. and Murwira, H.K. (1997). Use of Cattle Manure to Improve Soil Fertility
in Zimbabwe: Soil Fertility Research in for Maize. Based Farming System in
Malawi and Zimbabwe. pp 195 – 201.
42
Mulongey, K. and Merck, R. (Eds.), (1993). Soil Organic Matter Dynamics and
Sustainability of Tropical Agriculture. John Wiley and Sons, Inc., New York.
392pp.
Murwira, H.K. (2003). Managing Africa’s Soils. Approaches and challenges, In: Gichuru.
M.P., Bationo, A., Bekunda, M.A., Goma, H.C.M., Mafongoya, P.L., Swift, M.J.
(eds). Science Publishers, Nairobi. pp 293 – 306.
Mustapha, S., Babaji, G.A. and Voncir, N. (2001). Suitability assessment of the soils along
two toposequences of two variant parent rocks. Agriculture and Environment
2:139-146.
Nandwa, S.M. (2003). Perspectives on Soil Fertility in Africa In: Soil Fertility
Management in Africa. A Regional Perspective. Gichuru, M.P. et al. (Eds)
ASP._TSBF._CIAT Publication. pp1-50.
Ncube, B., Dimes, J.P., Twomlow, S.J., Mupangwa, W. and Giller, K.E. (2007). Raising
the productivity of smallholder farms under semiarid conditions by use of small
doses of manure and nitrogen: a case of participatory research. Nutrient Cycling in
Agro-ecosystems 77: 53– 67.
Ndaki, S.M.M. (2001). Agronomic evaluation of some industrial wastes as alternative
sources of plant nutrients in Morogoro, District Tanzania. Unpublished dissertation
for award of MSc. Degree of Sokoine University of Agriculture, Morogoro,
Tanzania. 98 pp.
New Partnership for Africa’s Development, (2003). Comprehensive Africa Agriculture
Development Program (CAADP). NEPAD, Midrand, South Africa, pp 102.
Nottidge, D.O., Ojniyi, S.O. and Asawalam, D.O. (2005). Comparative effects of plant
residues and NPK fertilizer on soil properties in a humid ultisol, Nigerian Journal
of Soil Science 15: 9 – 13.
43
Offiong, E.E. and Ita, P.B. (2012). Climate change and agricultural production in the
globe. Journal of Agricultural Sciences 11 (1): 25-31.
Ojeniyi, S.O., Owolabi, O., Aknitola, O.M. and Odedina, S.A. (2009). Field study of effect
of organo – mineral fertilizer on maize growth in South West Nigeria. Nigeria
Journal of Soil Science 19:11 – 16.
Olayinka, A. and Adebayo, A. (1983). The effect of loading rates of saw dust on plant
growth, plant nutrient up take and soil chemical properties. Bio resources 9: 250-
268.
Omotayo, O.E. and Chukwuka, K.S. (2009). Soil fertility restoration techniques in Sub-
Saharan Africa using organic resources African Journal of Agricultural Research 4
(3): 144 – 150.
Onasanya, R.O., Aiyelari, O.P., Onasanya, A., Oikeh, S., Nwilene, F.E. and Oyelakin O.O.
(2009). Growth and yield response of maize (zea mays) to different rates of
nitrogen and phosphorus fertilizers in Southern Nigeria. World Journal of
Agricultural Science 5(4): 400-407.
Owino, J.O., Owido, S.F.O. and Chemelil, M.C. (2006). Nutrients in runoff from a clay
loam soil protected narrow grass strips. Soil and Tillage Research 88: 116 – 122.
Owusu-Gyimah, V., Nyatuame, M. Ampiaw, F. and Ampadu, P.B. (2013). Effect of depth
and placement distance of fertilizer NPK 15-15-15 on the performance and yield of
maize plant. International Journal of Agronomy and Plant Production 4(12): 3197-
3204.
Palm, C.A. Mycis, R.J.K. and Nandwa, S.M. (1997). Organic – inorganic nutrient
interactions in soil fertility replenishment . In: Buresh, R.J. Sanchez. P.A. and
Calhoun, F. (eds). Replenishing soil fertility in Africa. Soil Science Society of
America, Madison Wisconsin. pp 193 – 218.
44
Palm, C.A., Gachengo, C.N., Delive, R.J., Cadisch, G. and Giller, K.E. (2001). Organic
inputs for soil fertility management in tropical agro ecosystems: Agriculture
Ecosystems and Environments 83: 27 – 42.
Pascal, A.P. (2013). Tanzania’s fertilizer assessment. A paper presented at the
International Training Program on Fertilizer Policy and Marketing Strategies in
Africa at Naura Springs Hotel, Arusha, Tanzania May 20_24th
, 2013.
Quansah, C., Kyei-bafour, N. and Safo, E.Y. (1997). Characterization and methodology
for soil loss and run off measurement. In: Proceedings of the workshops on erosion
induced loss in productivity. Kumasi; Ghana, 8 – 11 December 1997. 21 – 35.
Rahman, S.A. (2004). The place of organic manure in sustaining agricultural development
in Nigeria. Paper presented at the 2004th
Annual Conference of Science,
Technology and Society at Lafia, Nassarawa State. 11th
July, 2004.
Rates, R. (2003). Maize market assessment and baseline study for Tanzania. Regional
Agricultural Trade Expansion Support Program, Nairobi, Kenya.
Rautaray, S. K., Ghosh , B.C. and Mittra, B. N. (2003). Effect of ash, organic wastes and
chemical fertilizers on yield, nutrient uptake, heavy metal content and residual
fertility in a rice-mustard cropping sequence in acid lateritic soils. Bioresource
Technol 90: 275-283.
Reddy, K.J. (2006). Nutrient stress. In: Physiology and molecular biology of stress
tolerance in plants. American Journal of Experimental Agriculture 6(1): 22-29.
Rosemary, C.N. (2007). Low External Input and Sustainable Agriculture (LEISA)
Magazine 23(3):102-112.
Rowhani, P., Lobell, D.B., Linderman, M. and Ramankutty, N. (2011). Climate variability
and crop production in Tanzania. Journal of Agriculture Forestry and Meteorology
151: 449–460.
45
Sagardoy, J.A. (1993). An overview of pollution of water by agriculture. In: Prevention of
Water Pollution by Agriculture and Related Activities, Proceedings of the FAO
Expert Consultation, Santiago, Chile, 20-23 Oct. 1992. Water Report 1. FAO,
Rome. pp. 19-26.
Sakala, W.D., Kumwenda, J.D.T. and Saka, A.R. (2003). The potential of green manure
Increase soil fertility and maize yields in Malawi. Biological Agriculture and
Horticulture 21:121 – 130.
Sanchez, P.A., Cauto, I.N. and Boul, S.W. (1982). The fertility capability soil
classification. Geoderma 27: 283 – 309.
Sanchez. P.A. (1994). Tropical Soil Fertility Research Toward the Second Paradigm, 15th
.
World Congress of Soil Science, Acapulco, Mexico. pp 65 – 88.
Sanginga, N. and Woomer, P.L. (eds). (2009). Integrated soil fertility management in
Africa: Principles, practices and development processes. Tropical Soil Biology and
Fertility Institute of the International Center of Tropical Agriculture, Nairobi.
263 pp.
Schlegel, A.I. (2000). Nitrogen and phosphorous fertilizer of irrigated corn and grain
sorghum, Kansar Fertilizer Research. Kansa State University Department of
Agriculture, Extension Station and Cooperative Extension Services, Manhattan.
240 pp.
Shaikh, S. and Patil, M. (2013). Production and utilization strategies of organic fertilizers
for organic farming an eco-friendly approach International Journal of Life Science
and Pharmaceutical Research 3 (2): 1 – 5.
Sharma, A. and Mitra, B.N. (1991). Effect of different rates of application of organic and
nitrogen fertilizer in a rice-based cropping system. Journal of Agricultural Science
117: 313-318.

46
Sial, R.A., Chuadhary, E.H., Hussain, S. and Naveed, M. (2007). Effect of organic
manures and chemical fertilizers on grain yield of maize in rain fed area. Soil
Environment 26: 130-133.
Singh, B.R. (1999). Fertility and salinity /sodicity status of Fodama soil in North –
Western Nigeria I. Kebbi State Nigerian Journals of Basic and Applied Science 8:
1-14.
Singh, K.K. and Babasubramanian, V. (1980). Maintenance of soil fertility in the Hills
with incorporation of legumes cropping sequence. India Journal of Agricultural
Science, 480: 4-40.
Smaling, M.A. and Janssen, B.H. (1993). Calibration of QUEFTS, a model predicting
nutrient uptake and yields from chemical soil fertility indices. Geoderma 59:21 –
44.
Smaling, M.A., Nandwa, S.M. and Janssen, B.H. (1997). Soil fertility is at stake. In
Replenishing Soil Fertility in Africa, ed. Buresh, R.J., Sanchez, P.A. and Calhoun,
F. SSSA Special Publication 51. Madison, Wisc., U.S.A.: Soil Science Society of
America and American Society of Agronomy. Madisou, Wisconsin, U.S.A. pp 67-
73.
Smaling, M.A., Nandwa, S.M., Presteele, H., Roetter, R. and Muchena, F.N. (1992). Yield
response of maize to fertilizers and manure under different agro – ecological
conditions in Kenya Agriculture Ecosystems and Environment 41: 241 – 252.
Stefano, P., Dris, R. and Rapparini, F. (2004). Influence of growing conditions and yield
and quality of cherry Fruit. Journal of Agriculture and Environment 2: 307-309.
Stockdale, E.A. and Shepherd, M.A. (2002). Soil Fertility Management 18 (3): 301 – 308.
Stoorvogel, J.J. and Smaling, E.M.A. (1990). ‘‘Assessment of soil nutrient decline in
Sub‐Saharan Africa, 1983–2000,’’ Report no. 28. Winand Staring Centre‐DLO,
Wageningen.
47
Sutanto, R. Suproyo, A. and Mass, A. (2003). The management of upland acid soils for
sustainable food crops production in Indonesia. Soil Management 5(3): 1576 -
1580.
Tabo, R., Bationo, A., Gerard, B., Ndjeunga, J., Marchal, D., Amadou, B., Annou, G.,
Sogodogo, D., Taonda, J.B.S., Hassane, O., Maimouna, K.D. and Koala, S. (2007).
Improving cereal productivity and farmers’ income using a strategic application of
fertilizers in West Africa. pp 201–208. In: Bationo, A., Waswa, B., Kihara, J. and
Kimetu, J. eds. Advances in Integrated Soil Fertility Management in Sub-Saharan
Africa: Challenges and Opportunities. Kluwer Publishers, Dordrecht, Netherlands.
Tandon, H.L.S. (Ed). (1994). Fertilizers Guide For Extension Workers, Students Sales
Personnel, Trainers, Laboratories and Farmers. 2nd
ed. Fertilizer Development
and Consultation Organization, Newdelhi, India. 156 pp.
Tanzania National Business Council (TNBC), (2009). Ten pillars of Kilimo Kwanza
(Implementation Framework). Dar es Salaam. [http://www.URT] site visited
03/10/2015.
Tenaw, W., Husni, M.H.A., Anuar, A.R. and Rahman. Z.A. (2006). Effect of coffee
residue and intercropping on soil physicochemical properties and yield of
component crops in Southern Ethiopia, Ethiopian Journal of Natural Resources 8
(2): 199-216.
Tittonell, P., Vanlauwe, B., Corbeels, M. and Giller, K.E. (2008). Yield gaps, nutrient use
efficiencies and response to fertilisers by maize across heterogeneous smallholder
farms of western Kenya. Plant and Soil 313:19–37.
Tugel, A.J., Herrick, J.E., Brown, J.R., Mausbach., M.J. and Hipple, K. (2005). Soil
Survey and Natural Resources Decision making: A blue print for action. Soil
Science Society American Journal 69: 738 – 747.

48
Tumbo, S.D., Mbilinyi, B.F., Rwehumbiza, F.B. and Mutabazi, K.D. (2010). Economics
and climate change for agricultural sector in Tanzania. Adaptation options and
their costs, In: Soil Water Management Research Group Sokoine University of
Agriculture Morogoro, Tanzania. pp 63.
United Republic of Tanzania, (2009). Poverty and Human Development Report 2009.
Research and Analysis Working Group, MKUKUTA Monitoring System Ministry
of Finance and Economic Affairs, Dar es Salaam.
United Republic of Tanzania (URT), (1997). Morogoro Region Socio economic Profile,
The planning Commission, Dar-es Salaam Regional Commissioner’s Office.
Morogoro.
United Republic of Tanzania, (2012). National sample census of Agriculture 2007/2008
Vol. 5e: Morogoro regional report. National Bureau of Statistics, Dar es Salaam pp
95.
United Republic of Tanzania, (2013). 2012 Population and Housing census: Population
Distribution by Administrative Areas. National Bureau of Statistics, Dar es
Salaam. pp 105.
United State Development Agency (USDA), (2002). Organic Matter Management and
Soil Conservation into Agriculture Service Information, Bulletin 2003, No. 229.
Uphoof, N. (2002). Changes and Evolution of SRI Methods. In Uphoff et al., (Eds)
Assessment of the System for Rice Intensification (SRI). Proceedings of an
International Conference, Sanya, China. pp. 8-14.
USAID (2008), Tanzania’s Agenda for Action, February 2008, Dar es Salaam.
Uyovbisere, E.O. and Elemo, K.A. (2000). Effect of inorganic fertilizer and foliage
Azadiracta and Parkia specie on the productivity of early maize. Nigeria Journal
of Soil Research 2000 1: 17-22.
49
Vanlauwe, B., Aihou, K., Aman, S., Iwuafor, E.N.O., Tossah, B.K., Diels, F., Sanginga,
N., Merckx, R. and Deckers, S. (2001). Maize yield as affected by organic inputs
and urea in the West Africa mosit Savanna. Agronomy Journal 93: 1191 – 1199.
Vanlauwe, B., Bationo, A., Carsky, R.J., Diels, J. Sanginga, N. and Sehulsz, S. (2012).
Enhancing the contribution of legumes and biological nitrogen fixation in cropping
systems: Experiences from West Africa. Proceedings of Soil Fertility Network
Meeting, Vumba, Zimbabwe. pp 3 – 13.
Walling Ford, G.W., Murphy, S., Powers, W.L. and Manages, H.L. (1993). Disposal of
Beef Feed for Manure: Effect of residual and yearly application on Corn and soil
chemical properties. Applied SC. Publisher Ltd. pp. 102.
WEMA (2010). Policy brief, mitigating the impact of drought in Tanzania.
Williams, T.O., Powell, J.M. and Fernandesz – Rivers, S. (1995). Manure availability in
relation to sustainable food crop production in Semi – arid West Africa evidence
from Niger. Quarantine International Journal of Agriculture 34 (3): 248 – 258.
Wondwosen, T. (2009). Identification of growth limiting nutrient(s) in the major soil
types of Kindo Koye and Delbo Atwaro watersheds, Woliaita zone, Southern
Ethiopia. pp.26.
Yin, G., Gu. J., Zhang, F., Hao, L., Cong, P. and Liu, Z. (2014). Maize Yield Response to
Water Supply and Fertilizer Input in a Semi- Arid Environment of Northeast
China. PLoS ONE 9(1):10.1371.urnal. pone.0086099.
50
CHAPTER TWO
2.0 PHYSICO-CHEMICAL PROPERTIES AND CLASSIFICATION OF SOILS OF
SOLOMON MAHLANGU CAMPUS FARM, MOROGORO, TANZANIA
2.1 Abstract
A study was undertaken with a view of establishing morphological, pedological and
physic-chemical properties and classifying the soils of part of the Solomon Mahlangu
Campus farm, Sokoine University of Agriculture Morogoro Tanzania, for improved
agricultural productivity of the farm. Four soil profiles were excavated to represent the
identified mapping units of the study area, examined and described. Samples were
collected from the four pedons according to the natural pedogenic horizons identified,
analyzed for both physical and chemical properties and characterized. Soil profiles were
described as per FAO (2006) and Soil Survey Staff (2010) soil profile description
guidelines. The study revealed that soil colour varied from brown (7.5YR 4/2) through
dark brown (7.5YR 4/4) to reddish brown (2.5YR 4/6). Soil structure varied from being
weak to moderate sub angular blocky with dominant sand texture. The soil textural class
was predominantly sandy loam/sandy clay loam/sand clay. The bulk density and soil
moisture values were generally low and ranged between 1.4 and 1.78 cm-3
and 1.42 and
12.51%, respectively. Based on the Soil Taxonomy (Soil Survey Staff, 2014) and the
World Reference Base for Soil Resources [IUSS Working Group WRB (2015)] soil
classification systems, all the soils belong to the soil order Ultisols and Ustalfs at suborder
level in the Soil Taxonomy, while Alisols in the Reference Soil Group (RSG) - Tier 1 for
the World Reference Base for Soil Resources soil legend. At great group and subgroup
levels P1 was classified as Rhodustults and Typic Rhodustults, P1 and P2 as Haplustults
and Typic Haplustults, whereas, P4 was classified as Haplustults and Arenic Haplustults
(Soil Taxonomy), which correspond to Haplic RhodicAlisols, HaplicAlisols, Haplic
51
Chromic and HaplicAlisols (World Reference Base) in the Tier 2 for RSG soil name for
the P1, P2, P3 and P4, respectively. To increase the productive capacity of this farm,
recommended management strategies such as crop rotation, planting cover crops, reducing
overgrazing and burning and adoption of integrated nutrient management system which
embraces a holistic approach of integrated use and management of organic and inorganic plant
nutrient sources in a sustainable way are suggested to improved soil condition and crop
production.
Key words: Soil physico-chemical properties; Pedons; Horizons; Soil characterization;
Soil classification; Solomon Mahlangu Campus
2.2 Introduction
Most of the soils in Africa, Tanzania inclusive are characterized by inherent or induced
deficiencies of the major plant nutrient elements, namely N and P and in some cases, low
or excess K and micronutrients (Murwira, 2003). Other soil fertility constraints include
low nutrient retention capacities, strong acidity, alkalinity and low organic matter contents
(Murwira, 2003). Some of the aforementioned constraints lead to land degradation which
has been caused by ill-suited land use and inappropriate management practices, notably
poor crop rotation, shortening or elimination of the fallow, insufficient use of
manures/fertilizers, and removal of crop residues for fodder, inappropriate tillage
practices, just to mention but a few. The low agricultural productivity in Tanzania, and
hence the very high rate and risks of food insecurity is related to the low quality of the soil
resources base.
In Morogoro, there have been a substantial number of studies on the basic information on
soils in the form of soil surveys and soil fertility studies for sound land use planning
52
(Msanya et al., 1991; Msanya and Magoggo, 1993; Kilasara et al., 1994). These studies
have centered on a few selected areas and have not been specific to Solomon Mahlangu
Campus (SMC) and some adjacent lands. Hence there is inadequate information on SMC
farm soils and especially inherent nutrient contents. The parent materials of the soils in
question are different from the soils found at SMC farm, which have been derived from
pyroxene granulites’ containing plagioclase and quartz-rich veins (Moberg et al., 1982).
The nature of parent material is said to profoundly influence development and
characteristics of soils (Brady and Weil, 2005). In small regions of uniform climate, the
nature of parent material is probably more important than any other single factor in
determining the characteristics and productivity of a soil (Olaitan and Lombin, 1984). The
type of soil formed under a particular set of environmental conditions is a function of
parent material and time. The ability of any soil to supply the required quantity of plant
nutrients is mostly affected by the soil genetic composition (parent material), the degree to
which the parent material has been altered by the forces of weathering, and the
management of the soil by man. It is no gainsay, therefore, that the soil productive
potentials and its resiliencies to amendment and management for sustainable agricultural
production depend largely on the soil parent material (Ajiboye, 2010).
The appropriate and profitable use of the SMC farm, calls for the study of the properties,
classification and characterization of the soils. This study provides information that will
enable land users to make proper use of the farm and adopt the appropriate alternative
management practices for improved and sustainable productivity. Specifically, the study’s
objective was to examine and characterize the soils morphological, pedological and
physico-chemical properties.
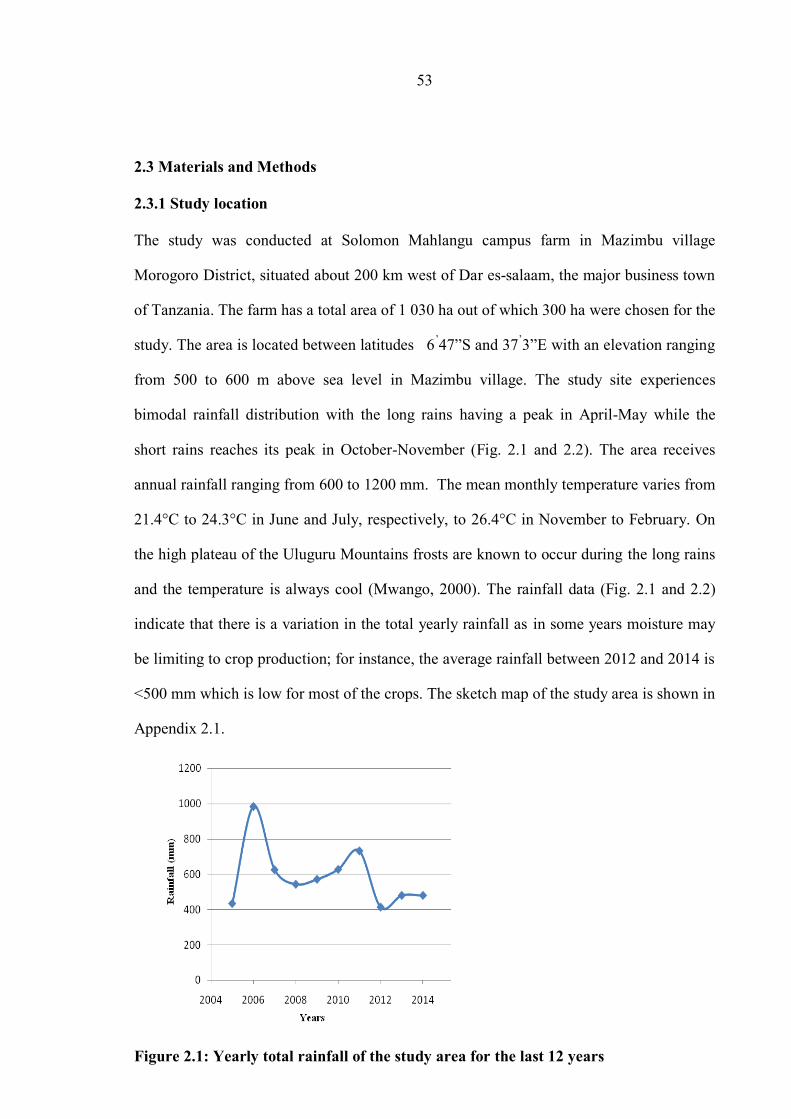
53
2.3 Materials and Methods
2.3.1 Study location
The study was conducted at Solomon Mahlangu campus farm in Mazimbu village
Morogoro District, situated about 200 km west of Dar es-salaam, the major business town
of Tanzania. The farm has a total area of 1 030 ha out of which 300 ha were chosen for the
study. The area is located between latitudes 6’47”S and 37
’3”E with an elevation ranging
from 500 to 600 m above sea level in Mazimbu village. The study site experiences
bimodal rainfall distribution with the long rains having a peak in April-May while the
short rains reaches its peak in October-November (Fig. 2.1 and 2.2). The area receives
annual rainfall ranging from 600 to 1200 mm. The mean monthly temperature varies from
21.4°C to 24.3°C in June and July, respectively, to 26.4°C in November to February. On
the high plateau of the Uluguru Mountains frosts are known to occur during the long rains
and the temperature is always cool (Mwango, 2000). The rainfall data (Fig. 2.1 and 2.2)
indicate that there is a variation in the total yearly rainfall as in some years moisture may
be limiting to crop production; for instance, the average rainfall between 2012 and 2014 is
<500 mm which is low for most of the crops. The sketch map of the study area is shown in
Appendix 2.1.
Figure 2.1: Yearly total rainfall of the study area for the last 12 years
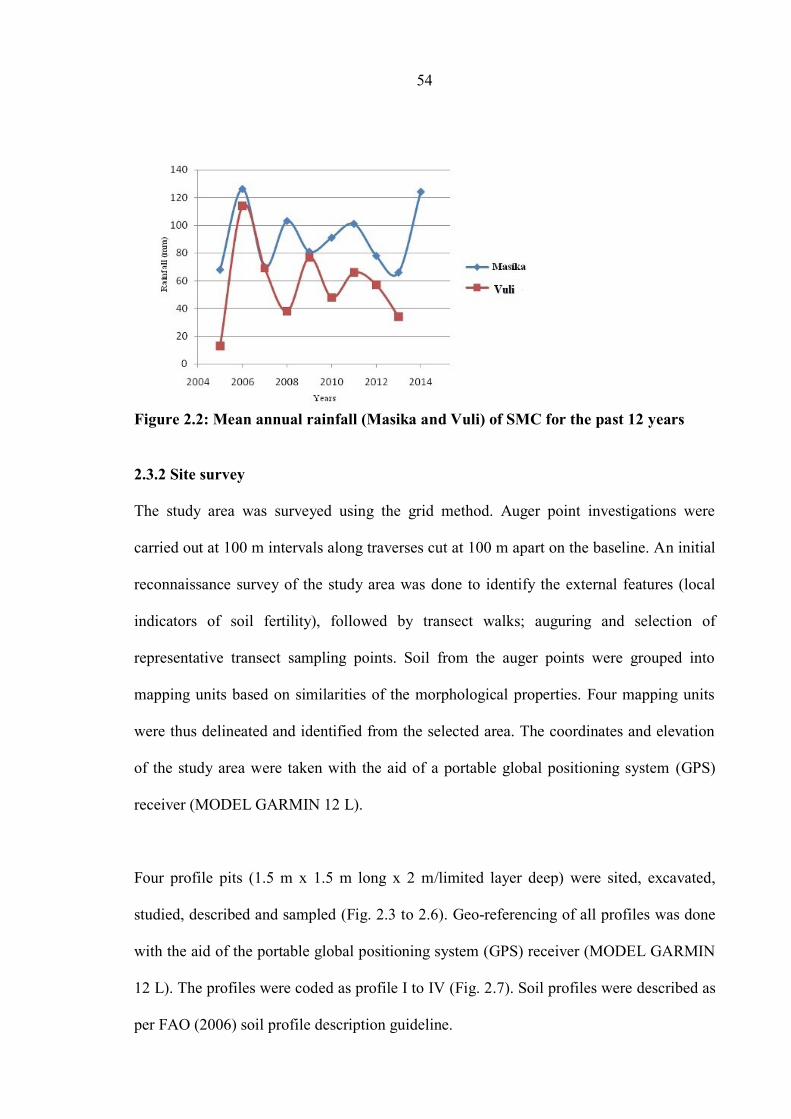
54
Figure 2.2: Mean annual rainfall (Masika and Vuli) of SMC for the past 12 years
2.3.2 Site survey
The study area was surveyed using the grid method. Auger point investigations were
carried out at 100 m intervals along traverses cut at 100 m apart on the baseline. An initial
reconnaissance survey of the study area was done to identify the external features (local
indicators of soil fertility), followed by transect walks; auguring and selection of
representative transect sampling points. Soil from the auger points were grouped into
mapping units based on similarities of the morphological properties. Four mapping units
were thus delineated and identified from the selected area. The coordinates and elevation
of the study area were taken with the aid of a portable global positioning system (GPS)
receiver (MODEL GARMIN 12 L).
Four profile pits (1.5 m x 1.5 m long x 2 m/limited layer deep) were sited, excavated,
studied, described and sampled (Fig. 2.3 to 2.6). Geo-referencing of all profiles was done
with the aid of the portable global positioning system (GPS) receiver (MODEL GARMIN
12 L). The profiles were coded as profile I to IV (Fig. 2.7). Soil profiles were described as
per FAO (2006) soil profile description guideline.
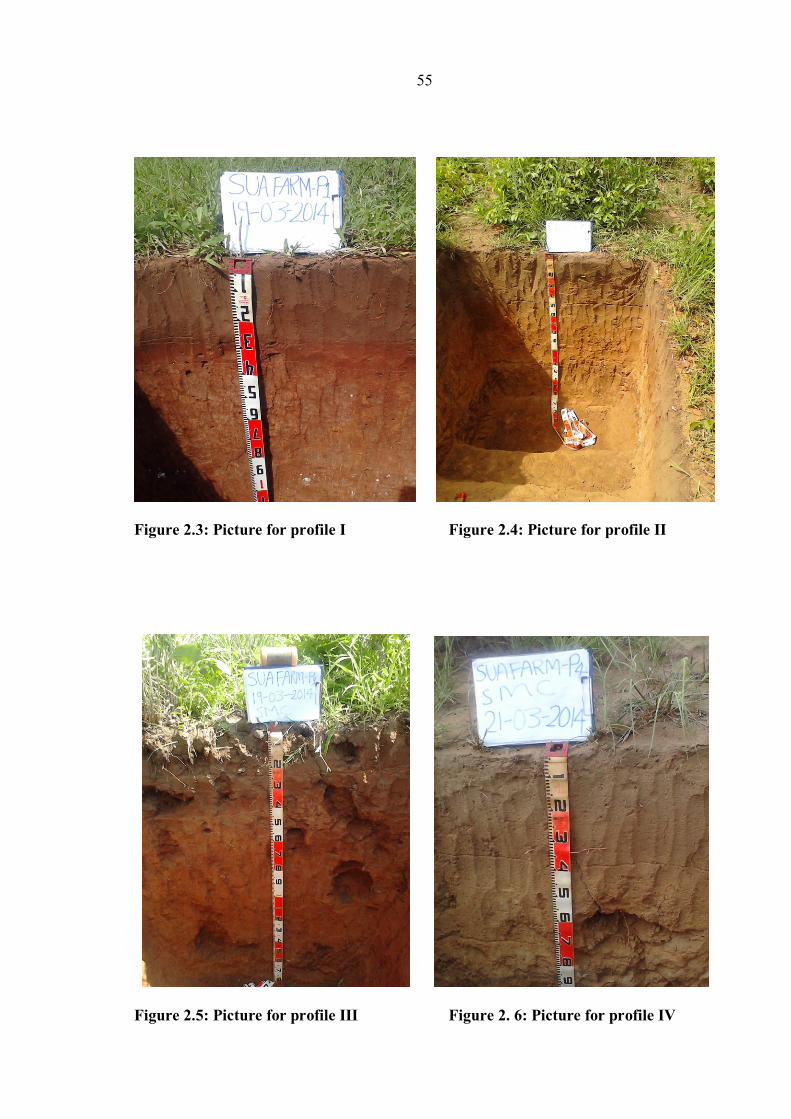
55
Figure 2.3: Picture for profile I
Figure 2.4: Picture for profile II
Figure 2.5: Picture for profile III Figure 2. 6: Picture for profile IV
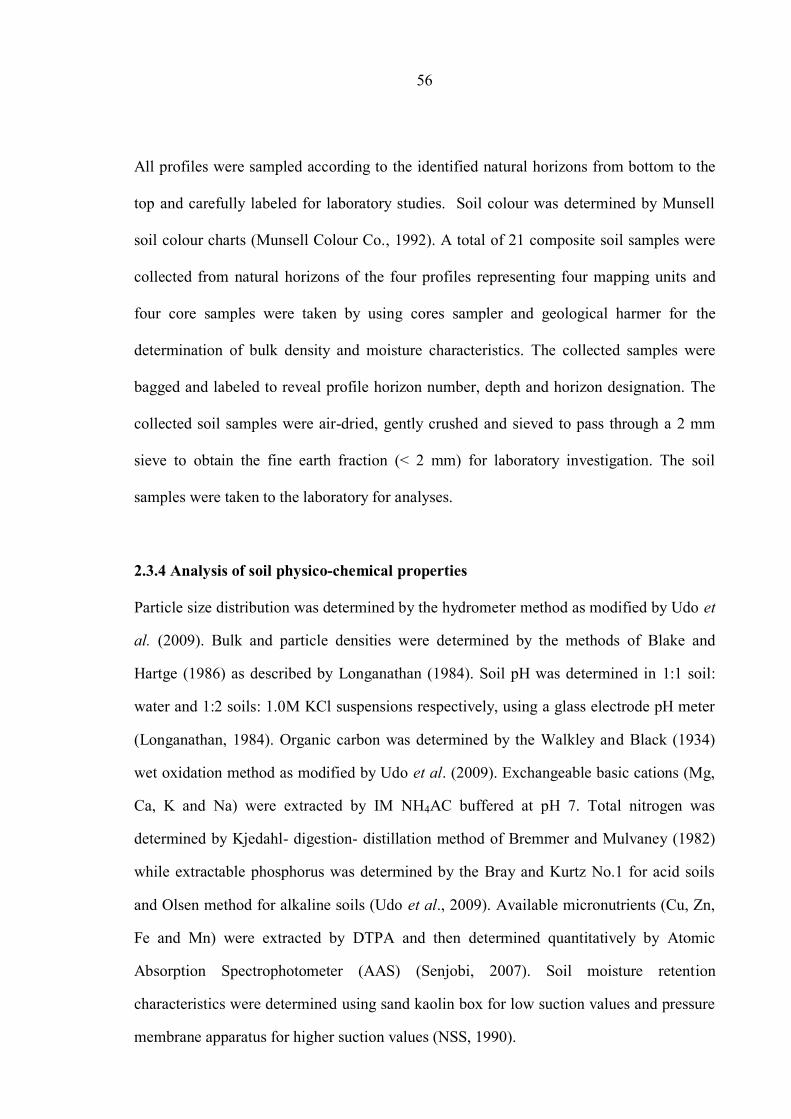
56
All profiles were sampled according to the identified natural horizons from bottom to the
top and carefully labeled for laboratory studies. Soil colour was determined by Munsell
soil colour charts (Munsell Colour Co., 1992). A total of 21 composite soil samples were
collected from natural horizons of the four profiles representing four mapping units and
four core samples were taken by using cores sampler and geological harmer for the
determination of bulk density and moisture characteristics. The collected samples were
bagged and labeled to reveal profile horizon number, depth and horizon designation. The
collected soil samples were air-dried, gently crushed and sieved to pass through a 2 mm
sieve to obtain the fine earth fraction (< 2 mm) for laboratory investigation. The soil
samples were taken to the laboratory for analyses.
2.3.4 Analysis of soil physico-chemical properties
Particle size distribution was determined by the hydrometer method as modified by Udo et
al. (2009). Bulk and particle densities were determined by the methods of Blake and
Hartge (1986) as described by Longanathan (1984). Soil pH was determined in 1:1 soil:
water and 1:2 soils: 1.0M KCl suspensions respectively, using a glass electrode pH meter
(Longanathan, 1984). Organic carbon was determined by the Walkley and Black (1934)
wet oxidation method as modified by Udo et al. (2009). Exchangeable basic cations (Mg,
Ca, K and Na) were extracted by IM NH4AC buffered at pH 7. Total nitrogen was
determined by Kjedahl- digestion- distillation method of Bremmer and Mulvaney (1982)
while extractable phosphorus was determined by the Bray and Kurtz No.1 for acid soils
and Olsen method for alkaline soils (Udo et al., 2009). Available micronutrients (Cu, Zn,
Fe and Mn) were extracted by DTPA and then determined quantitatively by Atomic
Absorption Spectrophotometer (AAS) (Senjobi, 2007). Soil moisture retention
characteristics were determined using sand kaolin box for low suction values and pressure
membrane apparatus for higher suction values (NSS, 1990).
57
2.3.5 Data summary and description
All data obtained were summarized and presented using tables and graphs.
2.3.6 Soil classification
Using field and laboratory data, the soils were classified to family level according to Keys
to Soil Taxonomy (Soil Survey Staff, 2014) and to WRB soil name- Tier 2 according to
the World Reference Base for Soil Resources [IUSS Working Group WRB (2015)] soil
classification system.
2.3.7 Soil map production and data analysis
Using both field and laboratory data a spatial distribution of soils was established and
presented in Fig. 2.8. The data on physical and chemical soil properties were summarized
using descriptive statistics such as minimum, maximum, means and standard deviation.
These were subjected to simple linear correlation analysis using GenStat Discovery
Edition 14 software between measured characters to assess the relationships between
parameters.
2.4 Results and Discussion
2.4.1 Morphology and genesis of the soils
Table 2.1 gives the distinctive characteristic features of the study site soils (Profiles I to
IV). The soils were described and distinguished on the basis of parent materials,
geological formation, slope, drainage class, vegetations, and land use, morphological and
physical characteristics. Soil profiles morphological properties representing the area are
presented with description of each unit (Appendices 2.1 – 2.4).
2.4.2 Description of the soil mapping units
Fig. 2.3 presents topographic information of the soil mapping units using a representative
soil profiles (1-4) in the whole study area. Profile 1 which represent mapping unit 1 is
situated at an average altitude of 500 meter a.s.l, with a slope gradient range of 2 - 3%
(gently sloping).
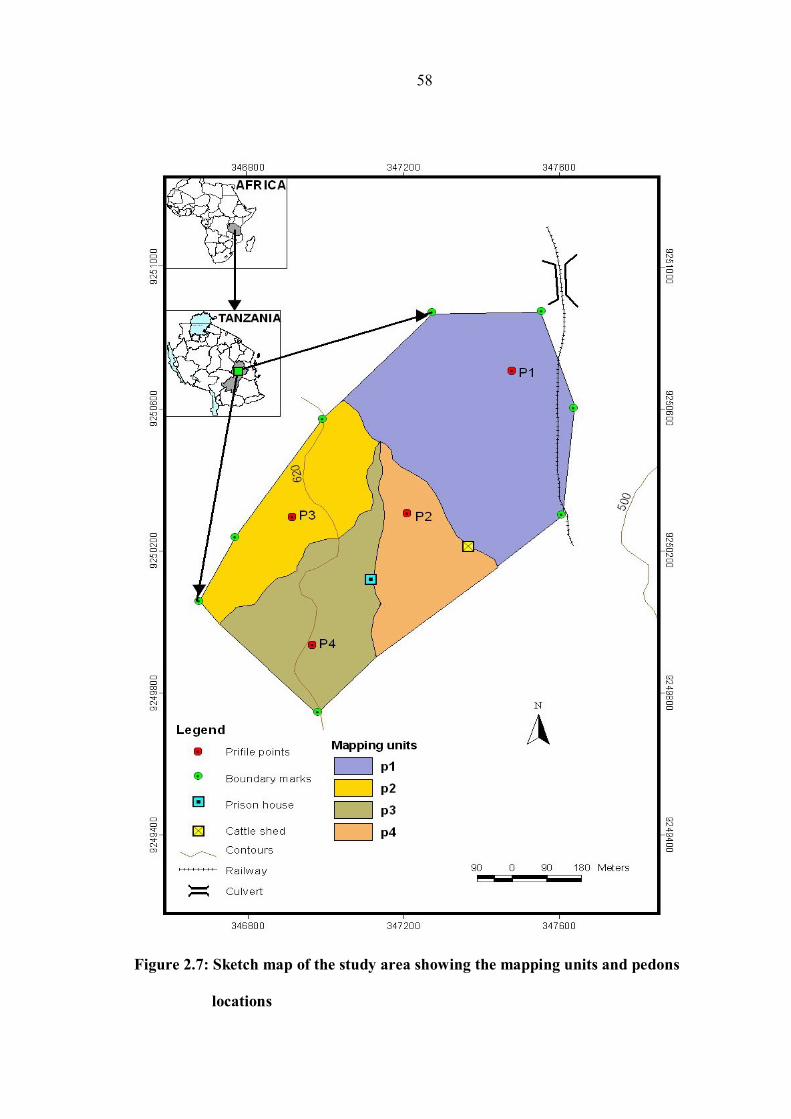
58
Figure 2.7: Sketch map of the study area showing the mapping units and pedons
locations
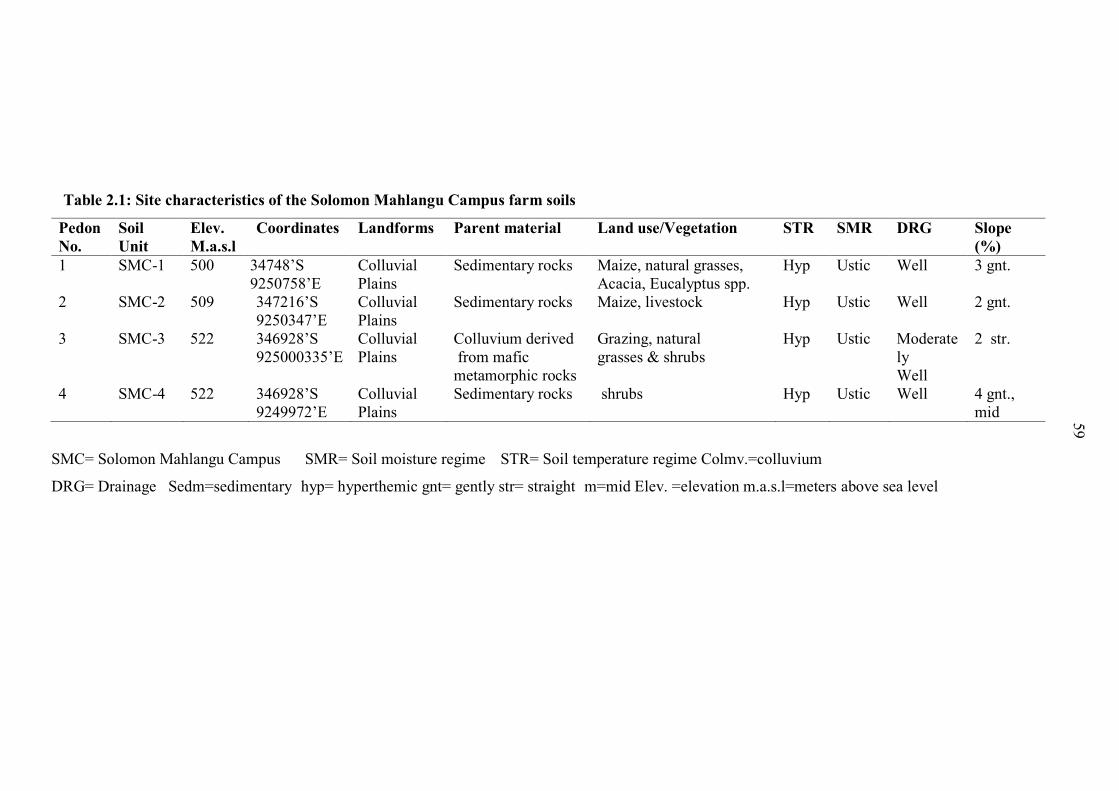
59
Table 2.1: Site characteristics of the Solomon Mahlangu Campus farm soils
Pedon
No.
Soil
Unit
Elev.
M.a.s.l
Coordinates Landforms Parent material Land use/Vegetation STR SMR DRG Slope
(%)
1 SMC-1 500 34748’S
9250758’E
Colluvial
Plains
Sedimentary rocks Maize, natural grasses,
Acacia, Eucalyptus spp.
Hyp Ustic Well 3 gnt.
2 SMC-2 509 347216’S
9250347’E
Colluvial
Plains
Sedimentary rocks
Maize, livestock
Hyp Ustic Well 2 gnt.
3 SMC-3 522 346928’S
925000335’E
Colluvial
Plains
Colluvium derived
from mafic
metamorphic rocks
Grazing, natural
grasses & shrubs
Hyp Ustic Moderate
ly
Well
2 str.
4 SMC-4 522 346928’S
9249972’E
Colluvial
Plains
Sedimentary rocks shrubs Hyp Ustic Well 4 gnt.,
mid
SMC= Solomon Mahlangu Campus SMR= Soil moisture regime STR= Soil temperature regime Colmv.=colluvium
DRG= Drainage Sedm=sedimentary hyp= hyperthemic gnt= gently str= straight m=mid Elev. =elevation m.a.s.l=meters above sea level
59
60
The parent material of all the profiles is colluvium derived from mafic metamorphic rocks
(homblende pyroxene granullites) of the Uluguru Mountains with many macro relief and
geological formation of sedimentary rocks through weathering of rocks (Moberg, et al.,
1982). All the four profiles have surface soils of the moderately to well drained. The
natural vegetation includes natural grasses, Acacia spp, Eucalyptus spp and shrubs with a
land use systems that embraces maize and sunflower production. There were no sealing
deposition and runoff problems with very slight sheet erosion. Hyperthermic soil
temperature and ustic soil moisture regimes in all the soils pedons a condition of limited
water with a mean annual soil temperature equal or greater than 22 0C.
The profiles 2, 3 and 4 that represented mapping units 2, 3 and 4 respectively are situated
at an average altitude of 509, 522 and 521 m.a.s.l., with approximately 200 cm modified
ground water level. The variations in slope forms have had significant influences on
characteristics and distribution of soils such as texture mineral content and drainage
conditions.
Table 2.2 provides a summary of morphological properties of all the four pedons studied
at SMC Farm Soils. The soil pedons have structures that varied from weak-sub-angular-
blocky peds (W-sbk) in the surface horizons to crumby-sub-angular blocky peds (cr-sbk)
in the subsurface soil with abrupt, clear and smooth to diffuse and smooth horizon
boundaries from surface to subsurface horizons, respectively. The weak sub angular
blocky peds of very friable to lose consistence were probably due to the low clay content.
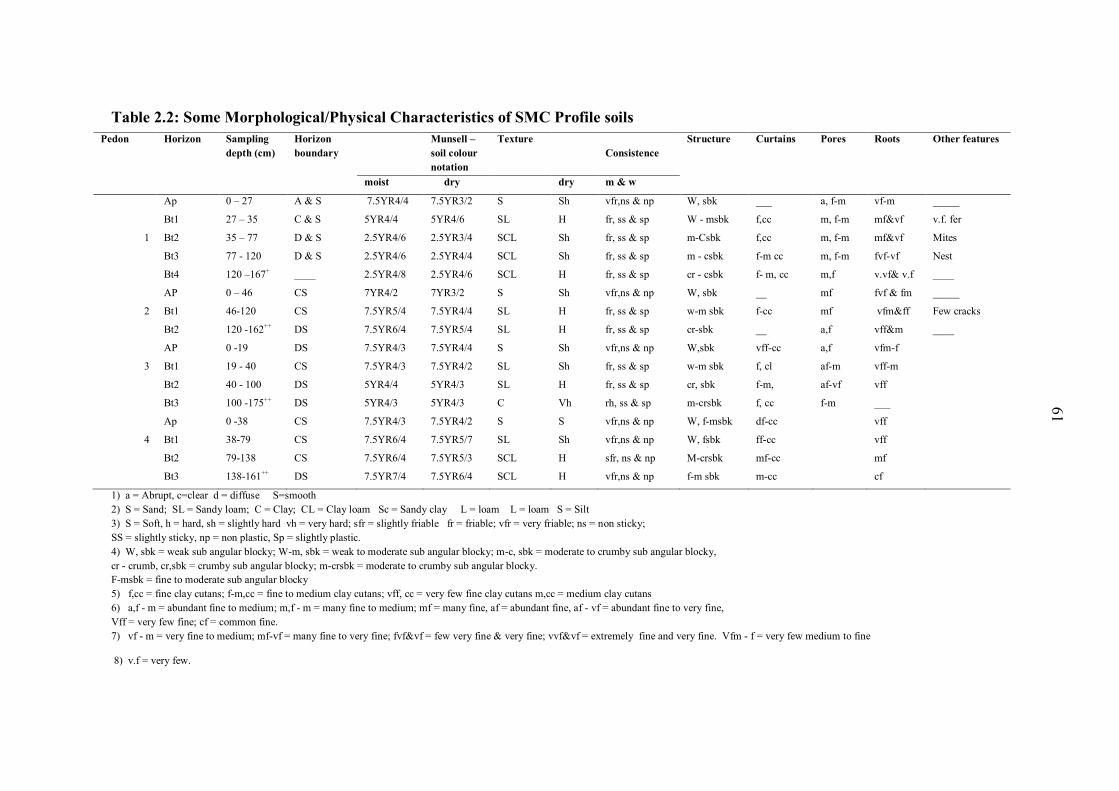
61
Table 2.2: Some Morphological/Physical Characteristics of SMC Profile soils
Pedon Horizon Sampling
depth (cm)
Horizon
boundary
Munsell –
soil colour
notation
Texture
Consistence
Structure Curtains Pores Roots Other features
moist dry dry m & w
Ap 0 – 27 A & S 7.5YR4/4 7.5YR3/2 S Sh vfr,ns & np W, sbk ___ a, f-m vf-m _____
Bt1 27 – 35 C & S 5YR4/4 5YR4/6 SL H fr, ss & sp W - msbk f,cc m, f-m mf&vf v.f. fer
1 Bt2 35 – 77 D & S 2.5YR4/6 2.5YR3/4 SCL Sh fr, ss & sp m-Csbk f,cc m, f-m mf&vf Mites
Bt3 77 - 120 D & S 2.5YR4/6 2.5YR4/4 SCL Sh fr, ss & sp m - csbk f-m cc m, f-m fvf-vf Nest
Bt4 120 –167+ ____ 2.5YR4/8 2.5YR4/6 SCL H fr, ss & sp cr - csbk f- m, cc m,f v.vf& v.f ____
AP 0 – 46 CS 7YR4/2 7YR3/2 S Sh vfr,ns & np W, sbk __ mf fvf & fm _____
2 Bt1 46-120 CS 7.5YR5/4 7.5YR4/4 SL H fr, ss & sp w-m sbk f-cc mf vfm&ff Few cracks
Bt2 120 -162++ DS 7.5YR6/4 7.5YR5/4 SL H fr, ss & sp cr-sbk __ a,f vff&m ____
AP 0 -19 DS 7.5YR4/3 7.5YR4/4 S Sh vfr,ns & np W,sbk vff-cc a,f vfm-f
3 Bt1 19 - 40 CS 7.5YR4/3 7.5YR4/2 SL Sh fr, ss & sp w-m sbk f, cl af-m vff-m
Bt2 40 - 100 DS 5YR4/4 5YR4/3 SL H fr, ss & sp cr, sbk f-m, af-vf vff
Bt3 100 -175++ DS 5YR4/3 5YR4/3 C Vh rh, ss & sp m-crsbk f, cc f-m ___
Ap 0 -38 CS 7.5YR4/3 7.5YR4/2 S S vfr,ns & np W, f-msbk df-cc vff
4 Bt1 38-79 CS 7.5YR6/4 7.5YR5/7 SL Sh vfr,ns & np W, fsbk ff-cc vff
Bt2 79-138 CS 7.5YR6/4 7.5YR5/3 SCL H sfr, ns & np M-crsbk mf-cc mf
Bt3 138-161++ DS 7.5YR7/4 7.5YR6/4 SCL H vfr,ns & np f-m sbk m-cc cf
1) a = Abrupt, c=clear d = diffuse S=smooth
2) S = Sand; SL = Sandy loam; C = Clay; CL = Clay loam Sc = Sandy clay L = loam L = loam S = Silt
3) S = Soft, h = hard, sh = slightly hard vh = very hard; sfr = slightly friable fr = friable; vfr = very friable; ns = non sticky;
SS = slightly sticky, np = non plastic, Sp = slightly plastic.
4) W, sbk = weak sub angular blocky; W-m, sbk = weak to moderate sub angular blocky; m-c, sbk = moderate to crumby sub angular blocky,
cr - crumb, cr,sbk = crumby sub angular blocky; m-crsbk = moderate to crumby sub angular blocky.
F-msbk = fine to moderate sub angular blocky
5) f,cc = fine clay cutans; f-m,cc = fine to medium clay cutans; vff, cc = very few fine clay cutans m,cc = medium clay cutans
6) a,f - m = abundant fine to medium; m,f - m = many fine to medium; mf = many fine, af = abundant fine, af - vf = abundant fine to very fine,
Vff = very few fine; cf = common fine.
7) vf - m = very fine to medium; mf-vf = many fine to very fine; fvf&vf = few very fine & very fine; vvf&vf = extremely fine and very fine. Vfm - f = very few medium to fine
8) v.f = very few.
61

62
The pedons have different matrix colour that ranged from light brown (7.5YR 4/2) to dark
brown (7.5YR 4/4) then to reddish brown (2.5 YR 4/6) in the surface and subsurface
horizons. The variation in colour and the presence of mottles are most likely due to the
high degree of hydration and redox reactions, occasioned by the proximity of fluctuating
underground water table (70-100 cm) within the zone. The parent materials of the soils are
derived from pyroxene granulites containing plagioclase and quartz-rich veins (Moberg et
al., 1982) implying that the rocks arc metasediments covered mostly by red and reddish
brown soils of low nutrient contents.
The soil texture showed that the materials were largely sandy and sandy loam in the
surface horizons to sandy clay and clay loam in the sub-horizons. This explains why the
consistence of the materials was friable to lose when moist due to weak cohesion and
adhesion forces act on the soil materials.
2.4.3 Soils physical and chemical characteristics
Tables 2.3, 2.4 and 2.8 show the physical and chemical properties of soils at Solomon
Mahlangu campus farm. The clay content of the soils from all profiles ranged from 8.12 to
38.12 %. Generally, the clay content was higher in the subsurface horizons and increased
regularly down the profile (Table 2.3). These increases in clay content with depth could
be probably due to illuviation process in the sub surface horizons. Similar results were
obtained by Adamu (2013) and Singh (1999) in their studies of soils in Kano and Kebbi
States, Nigeria.
In the current study, the sand content ranged from 24 to 90.24%. The highest value of sand
was recorded in the surface horizon of profile 1, while the least sand value was recorded in
the subsurface (last) horizon of profile 3. The observed high sand content in the surface
63
soil could probably be due to high precipitation of clay in the surface down to the profile
leaving much of the sand in the surface soil; d also, the sand might have been transported
from high elevated area to lowland. Unlike clay content, the sand values were generally
the highest at the surface horizon of all the profiles and decreased with an increase in the
depth down the profile with the lowest value occurring in the deepest horizons of all the
profiles. The differences between the sand contents of the surface (first) and the last
horizon were greater than 20%. The percentage silt content was similar in all the profiles
(1.64%) except for profile 4 and surface horizon of profile 2. The values of silt were the
lowest compared to those of sand and clay fractions.
The soil textural class was predominantly sandy clay loam/loamy sand/sand clay. The
general characteristics of the soils were of high sand and low silt contents. Most of the
profiles had greater than 60% sand, 20% clay and less than 5% silt (Table 2.3). The sandy
nature of these soils could be attributed to the nature of parent materials. Sand fraction
appeared to be the dominant size (70.12-90.24%) in the surface horizons in all profiles,
while silt and clay contents were low and medium. This is in line with the findings in a
study by Okanny et al. (1999) and Ayolagha and Onuegbu (2002) who reported that the
levee crest and levee slopes are dominantly sandy, while the flood plains and back swamps
are dominantly clay in textures in their study of soils of Rivers State Nigeria. Similar
findings were also reported by Lekwa (1992) in the soils of Kano Nigeria.
In the current study, the bulk density (BD) values were high and ranged from 1.4 to 1.78
cm-3
with values increasing with soil depth gradually from surface to subsurface horizons.
The high BD indicates that, the high sand content and soils were non-compacted; and, its
increase with soil depth could be attributed to a decrease in organic matter content from
surface to subsurface horizons. Soil moisture content generally varied from 1.42 to 5.77%
in the surface horizon and from 3.38 to 12.51% in the subsurface horizons of all the
profiles.
64
Soil pH ranged from strongly acidic (pH in H2O = 5.1; pH in KCl = 4.3) to slightly
alkaline (pH in H2O = 6.9; pH in KCl = 5.5). The soil pH decreased with soil depth in
Profiles 2 and 3, while it increased with an increase in depth in profile 4. The decrease of
soil pH with depth could probably be due to variation of soil moisture content and
drainage condition as pH is normally higher in the well- drained soils in the dry season,
when there are limited root and microbial activity in the soil as CO2 content in the soil is
much lower in the dry season than is the case in the wet season. The soil pH in KCl was
lower than the pH in H2O with almost 1 unit which indicates an increase in the activity of
H+ in the soil that was caused by the K
+. The pH of these soils currently could not pose
any serious problem to crop production, as most crops will thrive well in soils with pH
between 5.5 and 6.5 (Ajiboye, 2012).
The content of organic carbon of the soils was low to moderate. The surface horizons have
higher percentage organic carbon and organic matter than the subsurface horizons. The
surface horizons had organic carbon contents that ranged from 0.29% to 0.51%, while the
subsurface had a value of 0.02% and organic carbon of 0.27%. The organic matter ranged
from 0.23 to 0.84% for the surface horizons and from 0.03 to 0.54% for the subsurface
horizons (Table 2.4). The low levels of organic matter as related to the organic carbon
properties might partly be attributed to the rapid organic matter mineralization and
frequent burning of the area commonly carried out during the dry season. The burning
destroys valuable organic materials that add organic matter to the soil and this indicates
impossibility of having optimum maize yields in the area as maize is a high feeder which
requires adequate nutrients for good performance and optimum yields.
The cation exchange capacity (CEC) for the surface soils ranged from 9:0 to 11.40 cmol
(+) kg - 1
for the surface horizons and from 15.0 to 17.80 cmol (+) kg -1
for the subsurface
horizons. The CEC increased with an increase in depth in all the profiles except in horizon
3 of profile 4 (Table 2.4). The low values of CEC as per the rating scale in Table 2.7 may
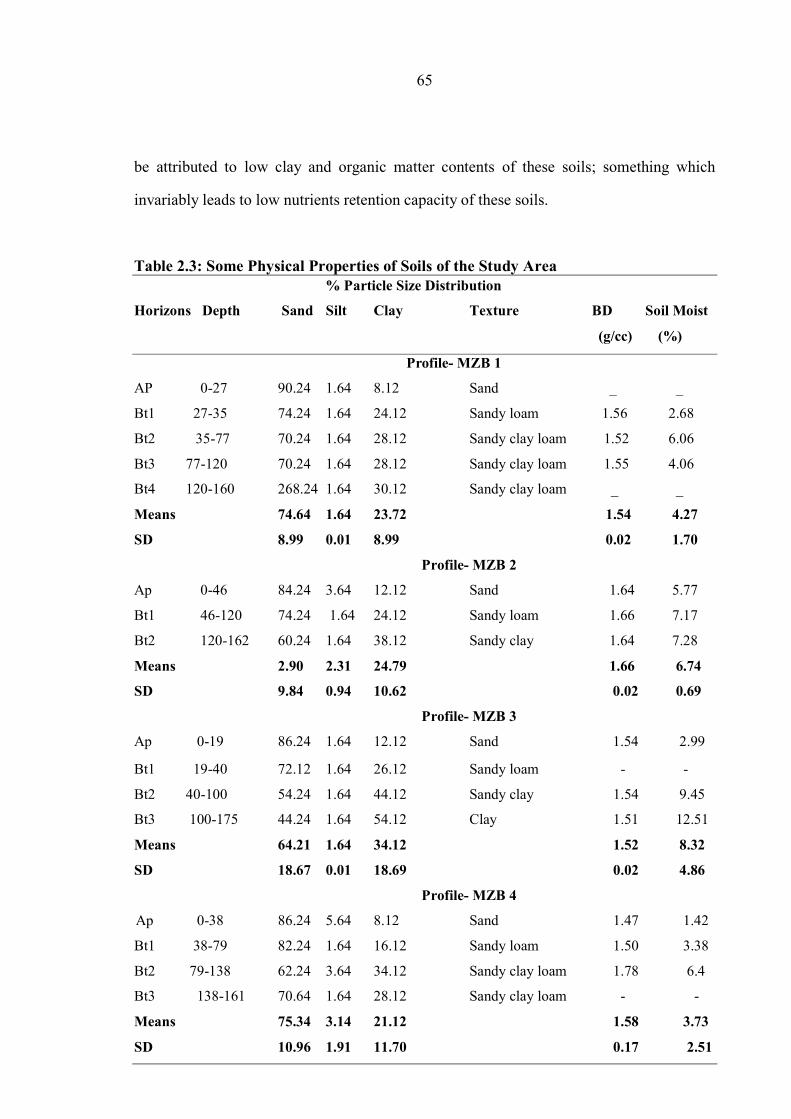
65
be attributed to low clay and organic matter contents of these soils; something which
invariably leads to low nutrients retention capacity of these soils.
Table 2.3: Some Physical Properties of Soils of the Study Area
% Particle Size Distribution
Horizons Depth Sand Silt Clay Texture BD Soil Moist
(g/cc) (%)
Profile- MZB 1
AP 0-27 90.24 1.64 8.12 Sand _ _
Bt1 27-35 74.24 1.64 24.12 Sandy loam 1.56 2.68
Bt2 35-77 70.24 1.64 28.12 Sandy clay loam 1.52 6.06
Bt3 77-120 70.24 1.64 28.12 Sandy clay loam 1.55 4.06
Bt4 120-160 268.24 1.64 30.12 Sandy clay loam _ _
Means 74.64 1.64 23.72 1.54 4.27
SD 8.99 0.01 8.99 0.02 1.70
Profile- MZB 2
Ap 0-46 84.24 3.64 12.12 Sand 1.64 5.77
Bt1 46-120 74.24 1.64 24.12 Sandy loam 1.66 7.17
Bt2 120-162 60.24 1.64 38.12 Sandy clay 1.64 7.28
Means 2.90 2.31 24.79 1.66 6.74
SD 9.84 0.94 10.62 0.02 0.69
Profile- MZB 3
Ap 0-19 86.24 1.64 12.12 Sand 1.54 2.99
Bt1 19-40 72.12 1.64 26.12 Sandy loam - -
Bt2 40-100 54.24 1.64 44.12 Sandy clay 1.54 9.45
Bt3 100-175 44.24 1.64 54.12 Clay 1.51 12.51
Means 64.21 1.64 34.12 1.52 8.32
SD 18.67 0.01 18.69 0.02 4.86
Profile- MZB 4
Ap 0-38 86.24 5.64 8.12 Sand 1.47 1.42
Bt1 38-79 82.24 1.64 16.12 Sandy loam 1.50 3.38
Bt2 79-138 62.24 3.64 34.12 Sandy clay loam 1.78 6.4
Bt3 138-161 70.64 1.64 28.12 Sandy clay loam - -
Means 75.34 3.14 21.12 1.58 3.73
SD 10.96 1.91 11.70 0.17 2.51
66
The available or extractable phosphorus ranged from 4.97 mg kg-1
to 11.52 mg kg-1
for the
surface horizons and from 2.6 to 5.6 mg kg-1
for the sub surface horizons. This is probably
due to a decrease in soil pH from surface to sub surface horizons, hence the low soil pH
which normally favours P immobilization (Brady and Weil, 2008). The production of
maize will therefore be low as P is among the important nutrients element for maize
production.
The exchangeable bases (Ca2+
, Mg2+
, K+ and Na
+) were also low. The exchange sites of
the soils were dominated by exchangeable calcium and magnesium. The values of
exchangeable calcium (Ca2+
) of the surface horizon ranged from 0.37 to 3.16 cmol kg-1
and from 0.37- 5.03 cmol kg-1
for the subsurface horizons. The exchangeable magnesium
content varied from 0.38 to 2.13 cmol kg-1
for the surface horizons and from 2.20 to 3.50
cmol Kg-1
for the subsurface horizons (Table 2.4). The content of Mg2+
increased with an
increase in the depth of the soils, the highest content been observed in the last horizons in
all the profiles. This is attributed to an increase in clay content from surface to sub surface
horizons.
The exchangeable K and Na status of the soils are medium in most of the horizons.
The value of exchangeable K ranged from 0.13 to 0.52 cmolkg-1
and from 0.10 cmolkg-1
to 5.00 cmolkg-1
for the surface and subsurface horizons respectively, while the
exchangeable sodium varied from 0.12 cmolkg-1
to 0.60 cmolkg-1
for the surface horizon
and from 0.30cmolkg-1
to 1.10cmolkg-1
for the subsurface horizons. The exchangeable
bases occur in the order Mg> Ca> K> Na as also reported by many other workers in
alluvial soils (Esu, 1991). The low content for these exchangeable bases especially Ca and
Mg might be due to low content of CEC of the soils.
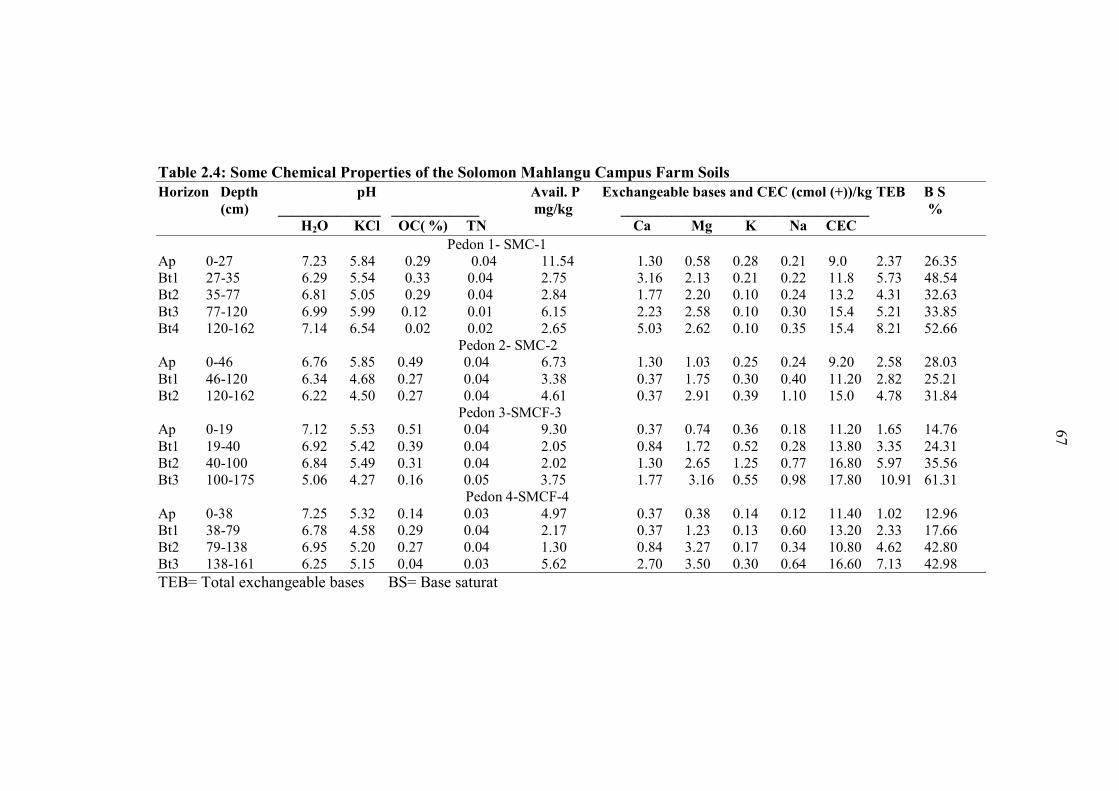
67
Table 2.4: Some Chemical Properties of the Solomon Mahlangu Campus Farm Soils
Horizon Depth pH Avail. P Exchangeable bases and CEC (cmol (+))/kg TEB B S
(cm) ______________ ____________ mg/kg __________________________________ %
H2O KCl OC( %) TN Ca Mg K Na CEC
Pedon 1- SMC-1
Ap 0-27 7.23 5.84 0.29 0.04 11.54 1.30 0.58 0.28 0.21 9.0 2.37 26.35
Bt1 27-35 6.29 5.54 0.33 0.04 2.75 3.16 2.13 0.21 0.22 11.8 5.73 48.54
Bt2 35-77 6.81 5.05 0.29 0.04 2.84 1.77 2.20 0.10 0.24 13.2 4.31 32.63
Bt3 77-120 6.99 5.99 0.12 0.01 6.15 2.23 2.58 0.10 0.30 15.4 5.21 33.85
Bt4 120-162 7.14 6.54 0.02 0.02 2.65 5.03 2.62 0.10 0.35 15.4 8.21 52.66
Pedon 2- SMC-2
Ap 0-46 6.76 5.85 0.49 0.04 6.73 1.30 1.03 0.25 0.24 9.20 2.58 28.03
Bt1 46-120 6.34 4.68 0.27 0.04 3.38 0.37 1.75 0.30 0.40 11.20 2.82 25.21
Bt2 120-162 6.22 4.50 0.27 0.04 4.61 0.37 2.91 0.39 1.10 15.0 4.78 31.84
Pedon 3-SMCF-3
Ap 0-19 7.12 5.53 0.51 0.04 9.30 0.37 0.74 0.36 0.18 11.20 1.65 14.76
Bt1 19-40 6.92 5.42 0.39 0.04 2.05 0.84 1.72 0.52 0.28 13.80 3.35 24.31
Bt2 40-100 6.84 5.49 0.31 0.04 2.02 1.30 2.65 1.25 0.77 16.80 5.97 35.56
Bt3 100-175 5.06 4.27 0.16 0.05 3.75 1.77 3.16 0.55 0.98 17.80 10.91 61.31
Pedon 4-SMCF-4
Ap 0-38 7.25 5.32 0.14 0.03 4.97 0.37 0.38 0.14 0.12 11.40 1.02 12.96
Bt1 38-79 6.78 4.58 0.29 0.04 2.17 0.37 1.23 0.13 0.60 13.20 2.33 17.66
Bt2 79-138 6.95 5.20 0.27 0.04 1.30 0.84 3.27 0.17 0.34 10.80 4.62 42.80
Bt3 138-161 6.25 5.15 0.04 0.03 5.62 2.70 3.50 0.30 0.64 16.60 7.13 42.98
TEB= Total exchangeable bases BS= Base saturat
67
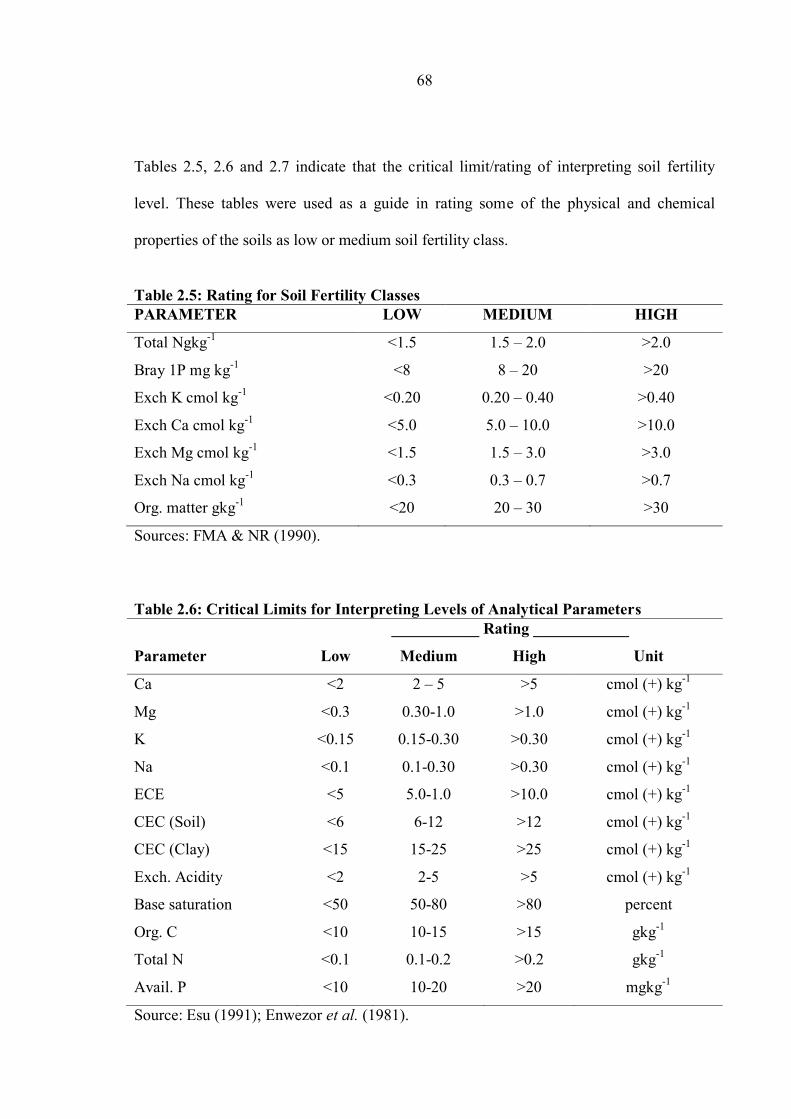
68
Tables 2.5, 2.6 and 2.7 indicate that the critical limit/rating of interpreting soil fertility
level. These tables were used as a guide in rating some of the physical and chemical
properties of the soils as low or medium soil fertility class.
Table 2.5: Rating for Soil Fertility Classes
PARAMETER LOW MEDIUM HIGH
Total Ngkg-1
Bray 1P mg kg-1
Exch K cmol kg-1
Exch Ca cmol kg-1
Exch Mg cmol kg-1
Exch Na cmol kg-1
Org. matter gkg-1
<1.5
<8
<0.20
<5.0
<1.5
<0.3
<20
1.5 – 2.0
8 – 20
0.20 – 0.40
5.0 – 10.0
1.5 – 3.0
0.3 – 0.7
20 – 30
>2.0
>20
>0.40
>10.0
>3.0
>0.7
>30
Sources: FMA & NR (1990).
Table 2.6: Critical Limits for Interpreting Levels of Analytical Parameters
Parameter
___________ Rating ____________
Low Medium High Unit
Ca
Mg
K
Na
ECE
CEC (Soil)
CEC (Clay)
Exch. Acidity
Base saturation
Org. C
Total N
Avail. P
<2
<0.3
<0.15
<0.1
<5
<6
<15
<2
<50
<10
<0.1
<10
2 – 5
0.30-1.0
0.15-0.30
0.1-0.30
5.0-1.0
6-12
15-25
2-5
50-80
10-15
0.1-0.2
10-20
>5
>1.0
>0.30
>0.30
>10.0
>12
>25
>5
>80
>15
>0.2
>20
cmol (+) kg-1
cmol (+) kg-1
cmol (+) kg-1
cmol (+) kg-1
cmol (+) kg-1
cmol (+) kg-1
cmol (+) kg-1
cmol (+) kg-1
percent
gkg-1
gkg-1
mgkg-1
Source: Esu (1991); Enwezor et al. (1981).
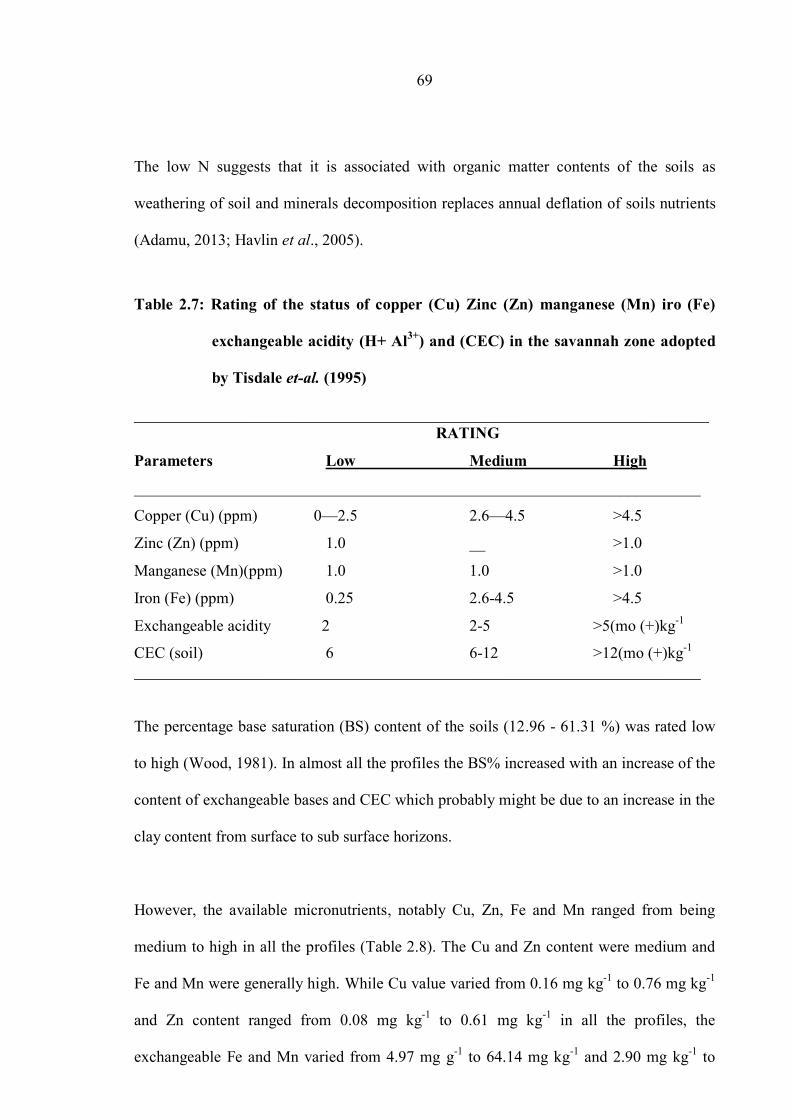
69
The low N suggests that it is associated with organic matter contents of the soils as
weathering of soil and minerals decomposition replaces annual deflation of soils nutrients
(Adamu, 2013; Havlin et al., 2005).
Table 2.7: Rating of the status of copper (Cu) Zinc (Zn) manganese (Mn) iro (Fe)
exchangeable acidity (H+ Al3+
) and (CEC) in the savannah zone adopted
by Tisdale et-al. (1995)
________________________________________________________________________
RATING
Parameters Low Medium High
_______________________________________________________________________
Copper (Cu) (ppm) 0—2.5 2.6—4.5 >4.5
Zinc (Zn) (ppm) 1.0 __ >1.0
Manganese (Mn)(ppm) 1.0 1.0 >1.0
Iron (Fe) (ppm) 0.25 2.6-4.5 >4.5
Exchangeable acidity 2 2-5 >5(mo (+)kg-1
CEC (soil) 6 6-12 >12(mo (+)kg-1
_______________________________________________________________________
The percentage base saturation (BS) content of the soils (12.96 - 61.31 %) was rated low
to high (Wood, 1981). In almost all the profiles the BS% increased with an increase of the
content of exchangeable bases and CEC which probably might be due to an increase in the
clay content from surface to sub surface horizons.
However, the available micronutrients, notably Cu, Zn, Fe and Mn ranged from being
medium to high in all the profiles (Table 2.8). The Cu and Zn content were medium and
Fe and Mn were generally high. While Cu value varied from 0.16 mg kg-1
to 0.76 mg kg-1
and Zn content ranged from 0.08 mg kg-1
to 0.61 mg kg-1
in all the profiles, the
exchangeable Fe and Mn varied from 4.97 mg g-1
to 64.14 mg kg-1
and 2.90 mg kg-1
to
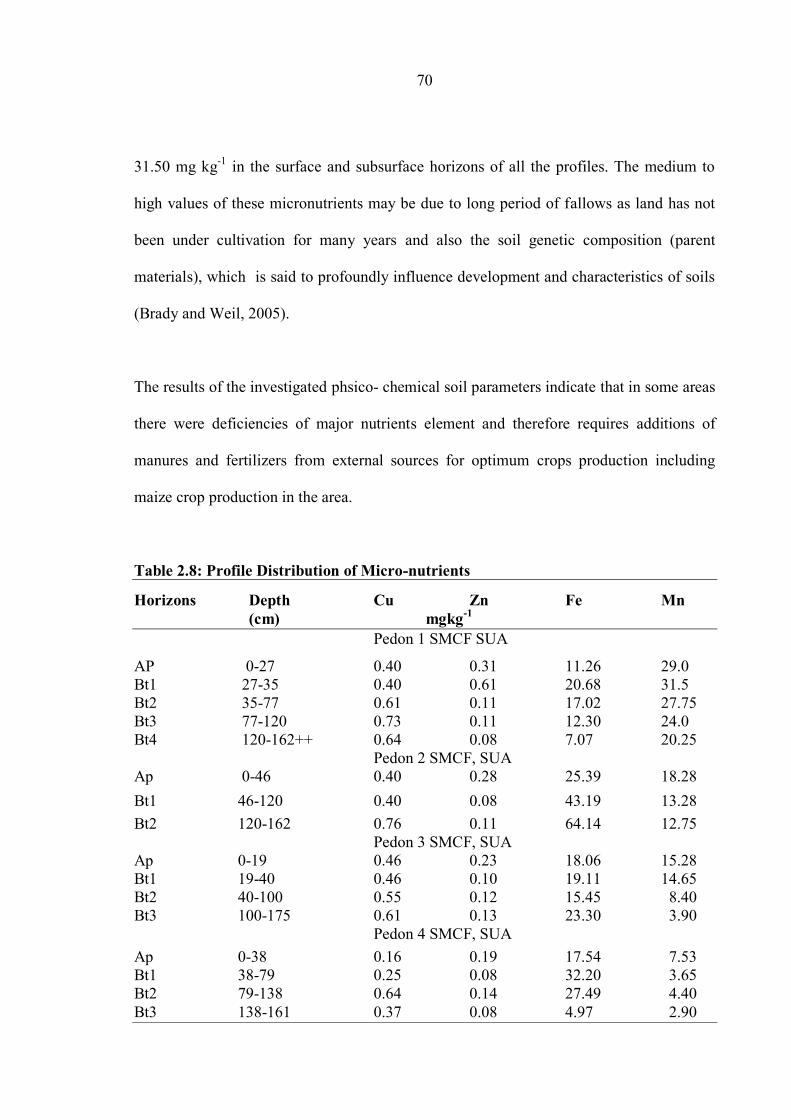
70
31.50 mg kg-1
in the surface and subsurface horizons of all the profiles. The medium to
high values of these micronutrients may be due to long period of fallows as land has not
been under cultivation for many years and also the soil genetic composition (parent
materials), which is said to profoundly influence development and characteristics of soils
(Brady and Weil, 2005).
The results of the investigated phsico- chemical soil parameters indicate that in some areas
there were deficiencies of major nutrients element and therefore requires additions of
manures and fertilizers from external sources for optimum crops production including
maize crop production in the area.
Table 2.8: Profile Distribution of Micro-nutrients
Horizons Depth Cu Zn Fe Mn
(cm) mgkg-1
Pedon 1 SMCF SUA
AP 0-27 0.40 0.31 11.26 29.0
Bt1 27-35 0.40 0.61 20.68 31.5
Bt2 35-77 0.61 0.11 17.02 27.75
Bt3 77-120 0.73 0.11 12.30 24.0
Bt4 120-162++ 0.64 0.08 7.07 20.25
Pedon 2 SMCF, SUA
Ap 0-46 0.40 0.28 25.39 18.28
Bt1 46-120 0.40 0.08 43.19 13.28
Bt2 120-162 0.76 0.11 64.14 12.75
Pedon 3 SMCF, SUA
Ap 0-19 0.46 0.23 18.06 15.28
Bt1 19-40 0.46 0.10 19.11 14.65
Bt2 40-100 0.55 0.12 15.45 8.40
Bt3 100-175 0.61 0.13 23.30 3.90
Pedon 4 SMCF, SUA
Ap 0-38 0.16 0.19 17.54 7.53
Bt1 38-79 0.25 0.08 32.20 3.65
Bt2 79-138 0.64 0.14 27.49 4.40
Bt3 138-161 0.37 0.08 4.97 2.90
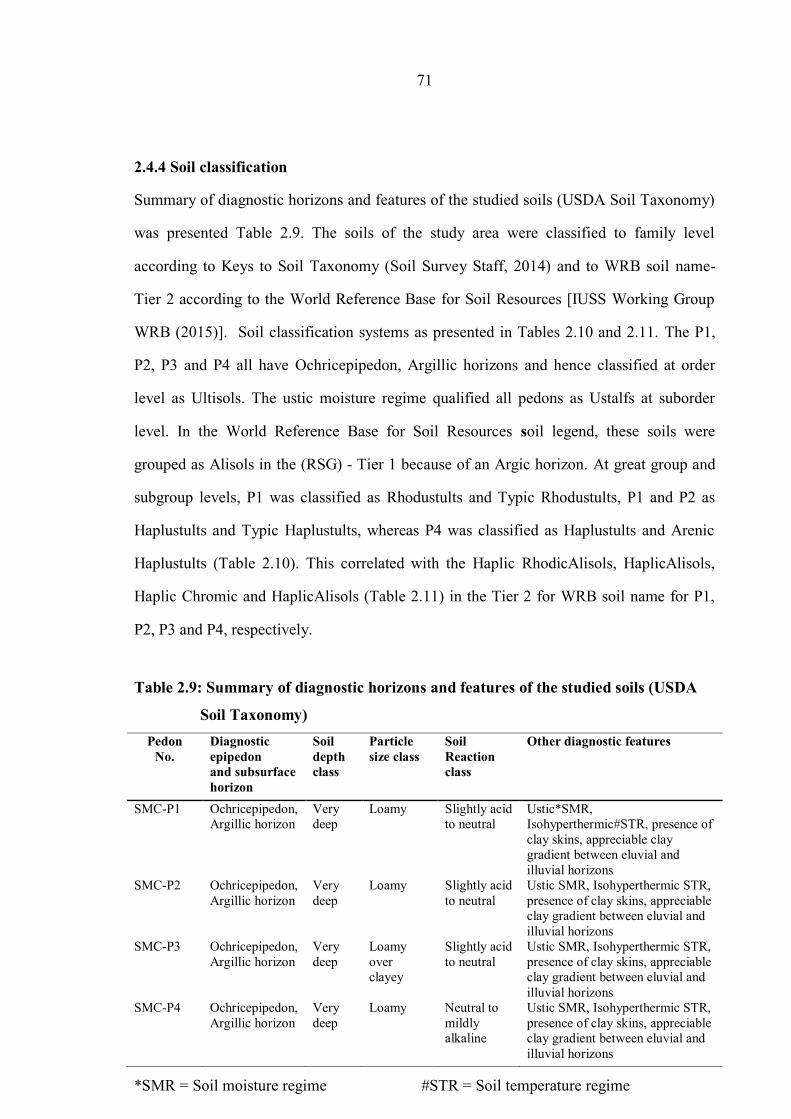
71
2.4.4 Soil classification
Summary of diagnostic horizons and features of the studied soils (USDA Soil Taxonomy)
was presented Table 2.9. The soils of the study area were classified to family level
according to Keys to Soil Taxonomy (Soil Survey Staff, 2014) and to WRB soil name-
Tier 2 according to the World Reference Base for Soil Resources [IUSS Working Group
WRB (2015)]. Soil classification systems as presented in Tables 2.10 and 2.11. The P1,
P2, P3 and P4 all have Ochricepipedon, Argillic horizons and hence classified at order
level as Ultisols. The ustic moisture regime qualified all pedons as Ustalfs at suborder
level. In the World Reference Base for Soil Resources soil legend, these soils were
grouped as Alisols in the (RSG) - Tier 1 because of an Argic horizon. At great group and
subgroup levels, P1 was classified as Rhodustults and Typic Rhodustults, P1 and P2 as
Haplustults and Typic Haplustults, whereas P4 was classified as Haplustults and Arenic
Haplustults (Table 2.10). This correlated with the Haplic RhodicAlisols, HaplicAlisols,
Haplic Chromic and HaplicAlisols (Table 2.11) in the Tier 2 for WRB soil name for P1,
P2, P3 and P4, respectively.
Table 2.9: Summary of diagnostic horizons and features of the studied soils (USDA
Soil Taxonomy)
Pedon
No.
Diagnostic
epipedon
and subsurface
horizon
Soil
depth
class
Particle
size class
Soil
Reaction
class
Other diagnostic features
SMC-P1 Ochricepipedon,
Argillic horizon
Very
deep
Loamy Slightly acid
to neutral
Ustic*SMR,
Isohyperthermic#STR, presence of
clay skins, appreciable clay
gradient between eluvial and
illuvial horizons
SMC-P2 Ochricepipedon,
Argillic horizon
Very
deep
Loamy Slightly acid
to neutral
Ustic SMR, Isohyperthermic STR,
presence of clay skins, appreciable
clay gradient between eluvial and
illuvial horizons
SMC-P3 Ochricepipedon,
Argillic horizon
Very
deep
Loamy
over
clayey
Slightly acid
to neutral
Ustic SMR, Isohyperthermic STR,
presence of clay skins, appreciable
clay gradient between eluvial and
illuvial horizons
SMC-P4 Ochricepipedon,
Argillic horizon
Very
deep
Loamy Neutral to
mildly
alkaline
Ustic SMR, Isohyperthermic STR,
presence of clay skins, appreciable
clay gradient between eluvial and
illuvial horizons
*SMR = Soil moisture regime #STR = Soil temperature regime
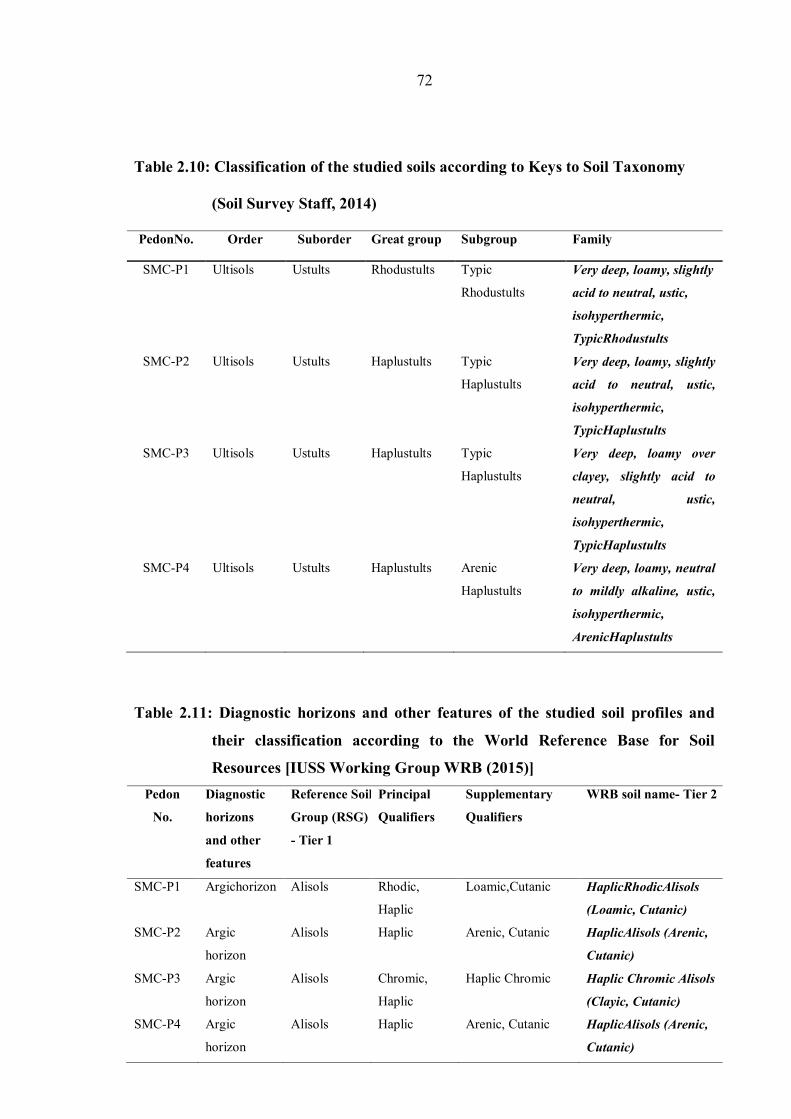
72
Table 2.10: Classification of the studied soils according to Keys to Soil Taxonomy
(Soil Survey Staff, 2014)
PedonNo. Order Suborder Great group Subgroup Family
SMC-P1 Ultisols Ustults Rhodustults Typic
Rhodustults
Very deep, loamy, slightly
acid to neutral, ustic,
isohyperthermic,
TypicRhodustults
SMC-P2 Ultisols Ustults Haplustults Typic
Haplustults
Very deep, loamy, slightly
acid to neutral, ustic,
isohyperthermic,
TypicHaplustults
SMC-P3 Ultisols Ustults Haplustults Typic
Haplustults
Very deep, loamy over
clayey, slightly acid to
neutral, ustic,
isohyperthermic,
TypicHaplustults
SMC-P4 Ultisols Ustults Haplustults Arenic
Haplustults
Very deep, loamy, neutral
to mildly alkaline, ustic,
isohyperthermic,
ArenicHaplustults
Table 2.11: Diagnostic horizons and other features of the studied soil profiles and
their classification according to the World Reference Base for Soil
Resources [IUSS Working Group WRB (2015)]
Pedon
No.
Diagnostic
horizons
and other
features
Reference Soil
Group (RSG)
- Tier 1
Principal
Qualifiers
Supplementary
Qualifiers
WRB soil name- Tier 2
SMC-P1 Argichorizon Alisols Rhodic,
Haplic
Loamic,Cutanic HaplicRhodicAlisols
(Loamic, Cutanic)
SMC-P2 Argic
horizon
Alisols Haplic Arenic, Cutanic HaplicAlisols (Arenic,
Cutanic)
SMC-P3 Argic
horizon
Alisols Chromic,
Haplic
Haplic Chromic Haplic Chromic Alisols
(Clayic, Cutanic)
SMC-P4 Argic
horizon
Alisols Haplic Arenic, Cutanic HaplicAlisols (Arenic,
Cutanic)

73
Figure 2.8: Sketch map of the study area showing soil’s spatial distribution
74
2.4.5 Soil management strategy
Major problems with the soil morphological and physical properties investigated include
weak structure and inadequate moisture retention capacity. Based on these limitations
therefore, it is suggested that the recommended soils management practices and
approaches of reducing nutrients losses caused by overgrazing, burning, erosion, surface
run off and leaching, crop residues management and complementary use of organic and
inorganic manures should be determined on the farm to improved soil productivity.
2.5 Conclusions and Recommendations
The soils were described and distinguished on the basis of parent materials and forms,
macro relief, Geological formation, slope, drainage class, vegetation, land use, and
morphological and physical characteristics. Soil colour varied from brown (7.5YR 4/2)
through dark brown (7.5YR 4/4) to reddish brown (2.5YR 4/6). Soil structure varied from
being weak to moderate sub angular blocky with dominant sand texture. The results of this
study have indicated that, the predominant soil textural classes of the study area were
sand, sandy clay loam, sandy clay, and loamy sand. The general characteristics of the soils
were high sand and low silt contents. Most of the profiles had greater than 60 % sand,
20 % clay and less than five percent (5 %) silt.
Furthermore this study reveals that:
i. All the soils belong to the soil order Ultisols and Ustalfs at suborder level
in the Soil Taxonomy, while Alisols in the Reference Soil Group (RSG) -
Tier 1 for the World Reference Base for Soil Resources soil legend.
ii. At great group and subgroup levels P1 was classified as Rhodustults and
Typic Rhodustults, P1 and P2 as Haplustults and Typic Haplustults,
whereas, P4 was classified as Haplustults and Arenic Haplustults (Soil

75
Taxonomy), which correspond to Haplic RhodicAlisols, HaplicAlisols,
Haplic Chromic and HaplicAlisols (World Reference Base) in the Tier 2 for
RSG soil name for P1, P2, P3 and P4, respectively.
iii. Chemically the soils were slightly acidic to mildly alkaline in reaction and
had low contents of organic carbon and total nitrogen.
iv. Available micronutrient (Fe and Mn) status in these soils was however
found to be adequate in the soils; but the soils were deficient in the major
nutrients such as N, P and exchangeable bases (Ca2+
, Mg2+
, K+ and Na
+).
.
Recommendations
To improve soil productivity and sustain production of crops in the area (SMC farm)
under investigation the following recommendations/measures are suggested:
i. Maintaining high level of organic matter in the soil to improve physical condition
of soil such as soil structure and CEC content to make soil to support good plant
growth.
i. An integrated nutrient management system which embraces a holistic approach of
integrated use and management of organic and inorganic nutrient sources in a
sustainable way should be adopted.
ii. Periodic soil tests of site are very imperative to properly monitor the soil fertility
indices and prevent decline and degradation of soil fertility.
iii. The low TN and OC contents in the soils need to be amended through N-fertilizer
management and the application of integrated nutrients management (INM)
iv. A more detail soil survey of the site is advocated to put the land into best uses,
makes predictions about the behavior of soils and evaluates/predicts the effects of
land use on the environment of the study area.
76
2.6 References
Adamu, U.K. (2013). Profile distribution of some primary macro nutrients and
exchangeable bases in Kano University of Science and Technology, Research
and Commercial farm, Gaya. Techno Science African Journal 8 (2): 14 - 18.
Ajiboye, G.A. and Ogunwale, I.A. (2010). Characteristics and Classification of soils
Developed Over Talc at Ejiba, Kogi State, Nigeria. Nigerian Journal of Soil
Science 20 (1): 1-14.
Ajiboye, G.A. and Olaniyan, J.O. and Bakare, M.O. (2012). Characteristics, classification
and management of Kampe-Omi river basin, Kogi State. Nigerian Journal of
Soil Science 22(2): 211-223.
Ayolagha, G.A. and Onuegbu, B.A. (2002). Soils of Rivers State in land and people of
Rivers State Centrak Niger Delta. (Alagoa E.J ed.), Onyoma publication,
Choba, port Harcour. pp 19 - 42.
Blake, G.R. and Hartge, K.H. (1986). Bulk density: In Klute (eds). Method of Soil
Analysis, Part 1: Physical and Mineralogical Methods. 2nd
Ed. ASA, SSSA.
Madison, WI. pp377-382.
Brady, N.C. and Weil, R.C. (2005). The Nature and Properties of Soils. 13th
Edition.
Pearson Printice-Hall Inc. India. pp 881.
Brady, N.C. and Weil, R.R. (2008). The Nature and Properties of Soils. 14th
edition.
Pearson Education, Inc. pp 975.
Bremner, J.M. and Mulvaney, C.S. (1982). Total nitrogen. In (L.A. Page, R.H. Miller and
Keeney, D.R. eds.) Methods of Soil Analysis, Part 2, 2nd
Edition, Agronomy
Monograph no. 9, pp. 595-624. American Society of Agronomy, Madison,
Wisconsin.
77
Enwezor, W.O., Udo, E.J. and Sabulo, R.A. (1981). Fertility status and productivity of the
Acid Sands of Southern Nigeria. Soil Science Society of Nigeria
Specialpublication. Monograph 1: 56 - 73.
Esu, I.E. (1991). Detailed soil survey of NIHORT farm Bunkure, Kano State, Nigeria.
Institution for Agricultural Research, Ahmadu Bello University Zaria. pp 7.
Federal Ministry of Agriculture and Natural Resources (FMA and), (1990). Literature
Review on soil fertility investigation in Nigeria (in five NR volumes). Federal
Ministry of Agriculture and Natural Resources, Abuja. pp 281.
Food and Agriculture Organization of the United Nations (FAO), (2006). Guidelines for
Soil Description. 4th
edition Rome. pp 66.
Havlin, J.L. James, D.B. Tisdule, S.L. and Nelson W.L. (2005). An Introduction to
Nutrient Management (7th
edition). 237 pp.
IUSS Working Group WRB, (2015). World Reference Base for Soil Resources 2014,
update 2015. International soil classification system for naming soils and
creating legends for soil maps. World Soil Resources Reports No. 106. FAO,
Rome.
Kilasara, M., Magoggo, J.P. and Msanya, B.M. (1994). Land resource management in
Tanzania. In: Tarimo, A.J.P., D.F. Rutatora and A.Z. Mattee (editors). Towards
Developing a Programme Research for the Faculty of Agriculture to the Year
2000. Proceedings of the Faculty of Agriculture Research Workshop held at the
Institute of Continuing Education, Sokoine University of Agriculture, Tanzania
21st - 23rd March 1993, Morogoro, Tanzania.
Lekwa, G. (1992). Characteristics and Classification of Soil Toposequence of Kano State.
Nigeria Soil Science. pp73 - 84.
Longanathan, P. (1984). A laboratory manual on soil plant analysis R/S University of Sci
and Tech. PH Nigeria.
78
Moberg, J.P., Msanya, B.M. and Kilasara, M. (1982). Pedological and edaphological
properties of the soils of two soil associations in the Morogoro Area, Tanzania.
Tropical Agriculture. (Trinidad) 59(2): 139-148.
Msanya, B.M. and Magoggo, J.P. (1993). Review of soil surveys (Soil Resource
Inventories) in Tanzania. Ecology and Development Programmer, the
Agricultural University of Norway, ISSN 0804-2144, Aa, Norway.
Msanya, B.M., Msaky, J.J., Takamura, Y.T. and Araki, S. (1991). Land use and land
evaluation systems research in Tanzania. A project proposal submitted to the
Japan International Cooperation Agency (JICA), Tokyo Office, Japan.
Munsell Color Company, (1992). Munsell Soil Color Charts. Baltimore, Maryland.
Murwira, H.K. (2003). Managing Africa’s Soils. Approaches and challenges, In: Gichuru.
M.P., Bationo, A. Bekunda, M.A. Goma, H.C.M., Mafongoya. P.L., Swift, M.J.
(eds). Soil Fertility Management in Africa. A regional perspective. Academy
Science Publishers, Nairobi. pp293 – 306.
Mwango, S.B. (2000). Automated land evaluation for alternative uses in south western
part of the Uluguru Mountains in Morogoro Rural District, Tanzania
Dissertation for Award of M.Sc. Degree at Sokoine University of A griculture,
Morogoro, Tanzania. pp1 – 4.
NSS (1990). Laboratory Procedures for routine soil analysis, 3rd
ed. Ministry of
Agriculture and Livestock ,Development, National Soil Service (NSS). ARI.
Mlingano.
Okanny, I.P., Ayolagha, G.A. and Dickson, A.A. (1999). Geology and Soils of Bayelsa
State (Central Niger Delta) in land and people of Bayelsa State. Alagoa, E.J.
(Ed). Onyoma publication: Port Hacourt.
Olaitan, S.O. and Lombin, G. (1984). Introduction to Tropical Soil Science. Macmillan
Publishers, London. pp126.
79
Rates, R. (2003). Maize market assessment and baseline study for Tanzania. Regional
Agricultural Trade Expansion Support Program, Nairobi, Kenya.
Senjobi, B.A. (2007). Comparative assessment of the effect of land use and land type on
soil degradation and productivity in Ogun State, Nigeria, Published, PhD
Thesis submitted to the Department of Agronomy, University of Ibadan, Ibadan
pp1-161.
Singh, B.R. (1999). Fertility and salinity/sodicity status of Fadama Soil in North – Western
Nigeria I. Kebbi State Nigerian Journals of Basic and Applied Science 8:1-14.
Soil Survey Staff, (2010). Keys to soil taxonomy, 11th
(Ed). Basic system of soil
classification for making and interpreting soil survey Natural Resource
Conservation Services Agricultural Department Soil Survey Div, Washington
D.C. USA.
Soil Survey Staff, (2014). Keys to Soil Taxonomy. 12th
Edition. United States Department
of Agriculture, Natural Resources Conservation Service.
Tisdale, S.L., Nelson, W.L., Beaton, J.D. and Havlin, J.L. (1995). Soil Fertility and
Fertilizer, 5th
Ed. Prentice-Hall of India, New Delhi. 684p.
Udo, E.J., Ibia, T.O., Ogunwale, J.A., Ano, A.O. and Esu, I.E. (2009). Manual of Soil
Plant and Water Analysis. Sibon Books Ltd flat 15, BK 6 Fourth Avenue
Festac, Lagos.
Walkley, A. and Black, I.A. (1934). Determination of organic matter in soil. Science 37:
549 – 556.
Wood, P.R. (1981). We don’t want soil maps. Just give us capacity. The role of land
capacity survey in Zambia. Soil Survey and Land Evaluation 1(1): 2 - 5.
80
CHAPTER THREE
3.0 EVALUATION OF THE FERTILITY STATUS AND SUITABILTY FOR
MAIZE PRODUCTION IN SOLOMON MAHLANGU CAMPUS
MOROGORO TANZANIA
3.1 Abstract
The low fertility status of most of the soils in Morogoro area and non-use of fertilizers by
small scale farmers contributes to the low yields of most annual crops, including maize.
This study was carried out in 2014/15 cropping season at the Solomon Mahlangu Campus
(SMC) farm, part of Sokoine University of Agriculture (SUA) Morogoro, Tanzania, to
evaluate the current fertility status and suitability classes of the soils for maize production.
A grid survey of the whole study area covering 300 ha was conducted and four mapping
units were delineated. Composite soil samples were collected from each block (mapping
unit) at the depth of 0 – 30 cm and analyzed for different physico-chemical properties
using standard laboratory procedures as advocated by Moberg (2000). Correlation analysis
was also conducted to establish the relationships between measured soil parameters. The
suitability of the soils for maize production was assessed following conventional approach
and matching methods. The results obtained indicated that, soils from all blocks were
sandy loam to silt loam in texture with a slightly acidic to mildly alkaline reaction (pHwater
= 5.9 - 7.2). As per the critical nutrients limit for maize production, the mean values for
organic carbon (0.29 %), total nitrogen (0.04 %), available phosphorus (9.0 mg kg-1)
,
cation exchange capacity (9.84 cmol.kg-1)
, base saturation (21.2%), and exchangeable
bases (Ca=0.7, Mg=0.85, K=0.31 and Na=0.21 cmol.kg-1)
were low in all the mapping
units.. The levels of available Cu, Zn, Fe and Mn were medium to high. The mean EC
value (0.03 ds/m) was below the critical limit indicating that the soils were naturally non-
saline. There was a significant (P < 0.05) positive correlation between the clay% and the
81
soil’s CEC, Zn, Cu, K, Mg, Na and EC and a significant relationship between the OC and
pH in H2O and KCl. Equally, TEB and BS were significantly (P < 0.001) and positively
correlated (r = 0.9993). The evaluation of the soils revealed that, all the soils of the four
mapping units are moderately suitable (S2) for maize production. In conclusion, the soils
of the study area were low in major macronutrients. This suggests low soil fertility that
may require some extenuating measures to improve the soil fertility status.
Key words: Soil suitability evaluation, soil mapping unit, maize, soil fertility and
Solomon Mahlangu Campus farm.
3.2 Introduction
The most prominent constraint to food production in most parts of the world is low soil
fertility (Bationo and Mokwunye, 1991; Henao and Baananke, 2006). Thus, proper soil
fertility management remains a key factor for increased food production. The rate of
nutrient depletion of African soils has been reported to be on the increase (Julio and
Carlos, 1999) due to inappropriate soils management practices. In Tanzania, the low
productivity on the part of small-scale farmers is a major constraint to the agricultural
sector; and is a fundamental challenge to improve the productivity and sustainability of
farm production. The low soil fertility status of many soils in Morogoro area, as reported
in previous studies (Msanya et al., 2003), and non-use of fertilizers by small scale farmers
contributes to the low yields of most annual crops, including maize.
Singh (1999) describes soil fertility management as an evaluation of the status of
replenishment system which maintains the soil renewable resource in a sustainable form
for long term productivity. Soil productivity on the other hand, is the capacity of the soil in
its normal environment, to produce a specified plant or sequence of plants under a
82
specified system of management; soil productivity emphasizes the capacity of the soil to
produce crops and is expressed in terms of yield.
The availability of one nutrient may be affected by the amount of other nutrient elements
in the soil. It has been reported (see Tisdale et al., 1995) that the greater the proportion of
clay mineral high in K, the greater will be the potential K availability in soils. It is possible
to induce or aggravate magnesium deficiency by the liberal use of potash. Application of
phosphorus fertilizers at high rates has been found to reduce zinc availability in soils
because of antagonistic effect, especially when the levels of zinc are only marginally
sufficient (Barow, 1987; Foth, 1990). However, some of the antagonistic effects may be
used effectively in reducing toxicities of certain micronutrients. For example, adding iron
and phosphate fertilizers may reduce copper toxicity in citrus groves caused by residual
copper from fungicidal sprays (Brady and Weil 1996).
Making effective decisions regarding agricultural land suitability is vital to achieve
optimum land productivity and to ensure environmental sustainability. According to FAO
(2006), the term “land suitability evaluation” could be interpreted as the process of
assessing the land performance when the land is used for a specified purpose like for
example crop production. Many workers have used crop yield to confirm the suitability of
soils for crop production. Attempts have been made to predict the yield of crops through
studies on land evaluation at different management levels (Fasina and Ogunkule, 1995).
There is therefore the need to classify and estimate the potential of land for one use or
several alternatives uses in order to develop agriculture efficiently and enhance precision
farming (Osei, 1993).
83
A land utilization type (LUT) is a kind of land use defined in more detail, according to a
set of technical descriptors in a given physical, economic and social setting. Land
utilization types are specified by a set of land use requirement (LUR), which are the
condition of land necessary for the successful and sustainable practice of a given land
utilization type.
Maize (Zea mays L.) is an important cereal crop which ranks third after wheat and rice in
the world (David and Adams, 1985). It is grown widely in many countries of the world,
and it is the major and most preferred staple food and cash crop in Tanzania (Rates, 2003).
The popularity of maize is evidenced by the fact that it is grown in all the agro-ecological
zones of Tanzania. Over two million hectares of land are planted per year with maize and
with the average yield of between 1.4 tons per hectare. Maize accounts for 31% of the
total food production and constitutes more than 75%t of the cereals consumed in the
country. More so, about 85% of Tanzania’s population depends on maize as an income
generating commodity (Sassi, 2004). The annual per capita consumption of maize in
Tanzania is over 115 kg and the national consumption is projected to be three to four
million tonnes per year.
However, there is no land suitability assessment that has been carried out in details to
indicate the suitability of the SMC soils for maize production which could be used for
human consumption and as a component of feeds for livestock in the SMC University
farm. Similarly, each soil type has specific properties and behaviours which affect directly
its functions in relation to supporting crop growth performance and hence the need to
assess the suitability of the soils for the crops that are commonly grown in the farm.
Specifically the study was undertaken with a view to establish and evaluate the fertility
status and suitability of the soils of SMC farm for maize production.
84
3.3 Materials and Methods
3.3.1 The location of the study area
The study was conducted at the SMC farm, one of the Sokoine University of Agriculture
campuses, Morogoro, Tanzania. It is located between latitude 6’47”S and 37
’37”E in
Mazimbu about 200 km west of Dar es-Salaam, Tanzania. The study area covered 300 ha
of uncultivated site of the farm with an elevation ranging from 500 to 600 m above sea
level in agro ecological zone 2 (AEZ 2) of Tanzania. The area receives an annual rainfall
ranging from 600 to 1200 mm. The long rains (Masika) usually fall in February to June,
followed by a dry season between July and September while the short rains (Vuli) last for
4 months (October – January). However, on average small amount of precipitation usually
prevails throughout the year (Mwango, 2000). The mean monthly temperature is about
24.0oC.
3.3.2 Field survey and soil sampling
The area (300 ha) was surveyed using the grid method and auger point investigations were
carried out at 100 m intervals along traverses cut on the baseline. Four soil mapping units
were identified based on soil colour, texture, depth and subsurface characteristics (Chapter
2). Surface soil sample for general soil fertility evaluation was done by collecting twenty
soil samples from each mapping unit at the depth of 0-30 cm in a zig-zag pattern based on
the random sampling plan (FAO, 2006) using a Dutch auger. The collected samples were
air-dried, ground and sieved using a 2 mm sieve for laboratory analysis.
3.3.3 Laboratory analysis of soil physical and chemical properties
Particle size distribution was determined by the hydrometer method as modified by Udo et
al. (2009). Walkley and Black (1934) wet digestion method was used to determine soil
organic carbon content and percent soil organic matter was obtained by multiplying
85
percent soil OC by a factor of 1.724 following an assumptions that on average OM is
composed of 58% carbon. The total N was determined using Kjeldahl digestion,
distillation and titration method as described by Black (1965). The available soil P was
determined by Bray 1 method according to the standard procedure of soil, plant and water
analysis advocated by Udo et al. (2009) extraction method. Cation exchange capacity
(CEC) and exchangeable bases (Ca, Mg, K and Na) were determined after extracting the
soil samples by ammonium acetate (1M NH4 OAc) at pH 7.0. Exchangeable Ca and Mg in
the extracts were analyzed using atomic absorption spectrophotometer, while Na and K by
flame photometer (Chapman, 1965). Cation exchange capacity was thereafter estimated
titrimetrically by distillation of ammonium from KCl filtrates (Chapman, 1965). The
percentage base saturation (PBS) was calculated by dividing the sum of charge equivalents
of base-forming cations (Ca, Mg, Na and K) by CEC of the soil and multiplying by 100.
The soil pH was measured in water and potassium chloride (1M KCl) suspensions in 1:2.5
(soil: liquid ratio) potentiometrically using a glass pH meter. The electrical conductivity
(EC) of soils was determined from soil water ratio of 1:2.5 socked for one hour by
electrical conductivity method as described by Udo (2009). The plant available
micronutrients (Fe, Cu, Zn and Mn) were extracted by DTPA and all these micronutrients
were quantified by atomic absorption spectrophotometer.
3.3.4 Land evaluation
The agricultural potentials of the soils were developed by matching the characteristics of
the soils with the requirements of the maize crop. The land suitability evaluation was done
using the principles of FAO Framework for land evaluation (FAO, 1976) and FAO
Guidelines on land evaluation for rain fed agriculture (FAO, 2006). Using the climatic
data, information obtained from the field and laboratory, together with the ecological
requirements of the selected crop (maize) and the relevant land qualities were used in
86
rating the soil by matching crop requirements with land qualities of each mapping unit.
The land suitability class for each mapping unit was obtained by subjective combination of
the individual ratings.
Land qualities used in this evaluation include annual rainfall, temperature regime, slope,
drainage, soil texture, and soil depth and nutrients availability. The suitability of the soils
was assessed for maize crop in the study area following the principles of the FAO
Framework (FAO, 1976). The ratings of the land qualities and characteristics for maize
requirement adopted by Sys (1985) were used for the purpose of maize suitability
evaluation in this study.
3.4 Results and Discussion
Most important local indicators of soil fertility with their technical equivalents are
presented in Table 3.1.The local indicators of soil fertility identified include soil colour,
soil texture, soil moisture retention capacity, soil structure, gravel and rock, soil depth,
plant species, and vegetations cover. Based on these soil properties, the soils were
classified as either good or poor soils. Good soils are assumed to have the desired
combination of the soils physical, chemical, and biological attributes or aspects of soil
fertility and productivity while bad soils are those soils with many limitations with respect
to crop production due to imbalances in the levels and interaction of the soils physical,
chemical and biological attributes or aspects of soil fertility and productivity.
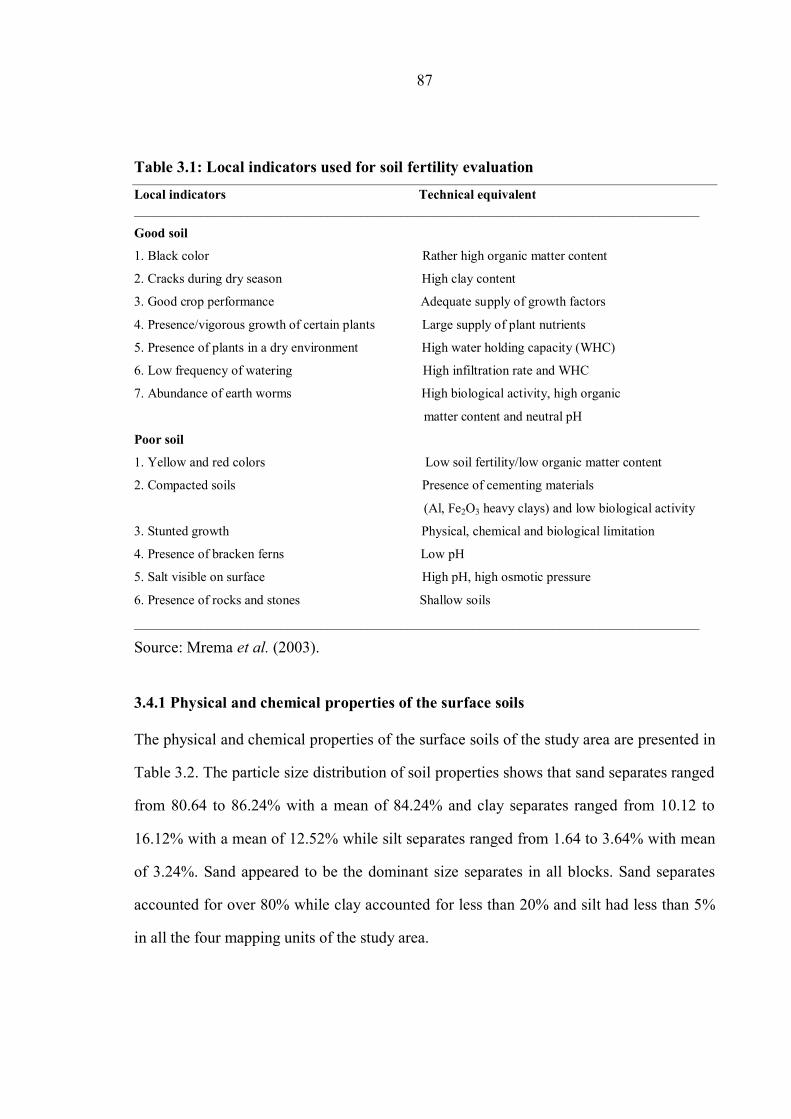
87
Table 3.1: Local indicators used for soil fertility evaluation
Local indicators Technical equivalent
_____________________________________________________________________________________
Good soil
1. Black color Rather high organic matter content
2. Cracks during dry season High clay content
3. Good crop performance Adequate supply of growth factors
4. Presence/vigorous growth of certain plants Large supply of plant nutrients
5. Presence of plants in a dry environment High water holding capacity (WHC)
6. Low frequency of watering High infiltration rate and WHC
7. Abundance of earth worms High biological activity, high organic
matter content and neutral pH
Poor soil
1. Yellow and red colors Low soil fertility/low organic matter content
2. Compacted soils Presence of cementing materials
(Al, Fe2O3 heavy clays) and low biological activity
3. Stunted growth Physical, chemical and biological limitation
4. Presence of bracken ferns Low pH
5. Salt visible on surface High pH, high osmotic pressure
6. Presence of rocks and stones Shallow soils
_____________________________________________________________________________________
Source: Mrema et al. (2003).
3.4.1 Physical and chemical properties of the surface soils
The physical and chemical properties of the surface soils of the study area are presented in
Table 3.2. The particle size distribution of soil properties shows that sand separates ranged
from 80.64 to 86.24% with a mean of 84.24% and clay separates ranged from 10.12 to
16.12% with a mean of 12.52% while silt separates ranged from 1.64 to 3.64% with mean
of 3.24%. Sand appeared to be the dominant size separates in all blocks. Sand separates
accounted for over 80% while clay accounted for less than 20% and silt had less than 5%
in all the four mapping units of the study area.
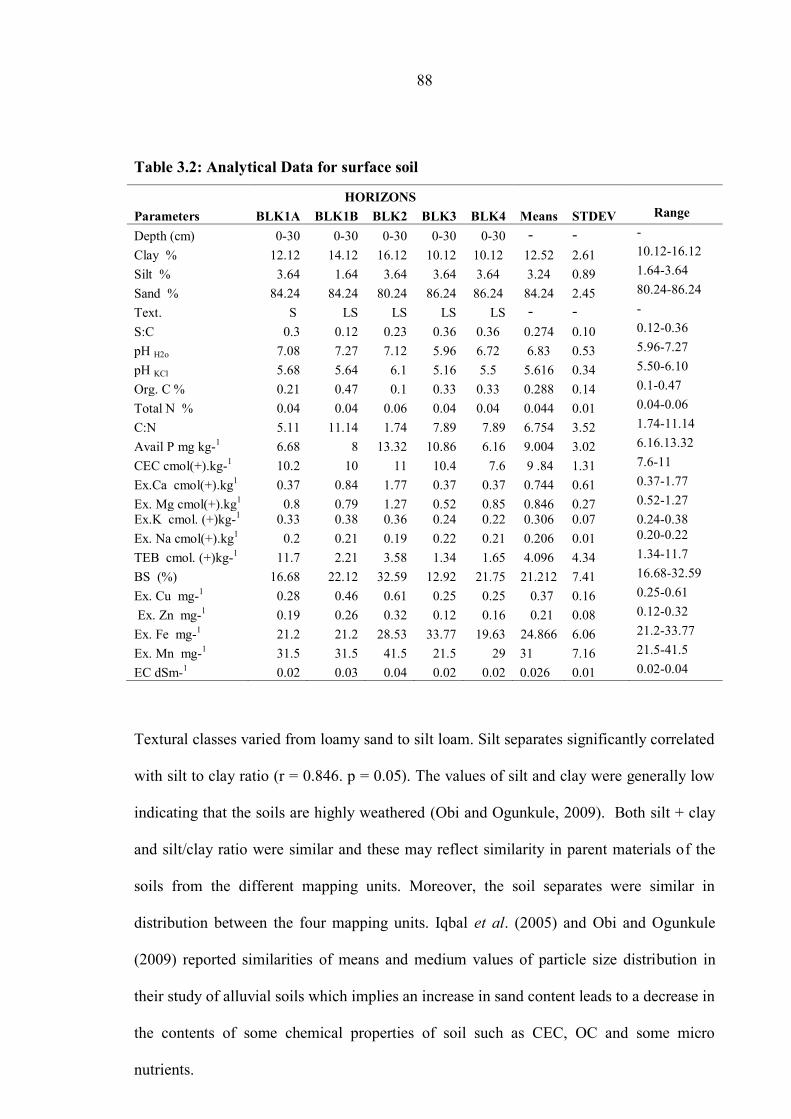
88
Table 3.2: Analytical Data for surface soil
HORIZONS
Parameters BLK1A BLK1B BLK2 BLK3 BLK4 Means STDEV Range
Depth (cm) 0-30 0-30 0-30 0-30 0-30 - - -
Clay % 12.12 14.12 16.12 10.12 10.12 12.52 2.61 10.12-16.12
Silt % 3.64 1.64 3.64 3.64 3.64 3.24 0.89 1.64-3.64
Sand % 84.24 84.24 80.24 86.24 86.24 84.24 2.45 80.24-86.24
Text. S LS LS LS LS - - -
S:C 0.3 0.12 0.23 0.36 0.36 0.274 0.10 0.12-0.36
pH H2o
7.08 7.27 7.12 5.96 6.72 6.83 0.53 5.96-7.27
pH KCl 5.68 5.64 6.1 5.16 5.5 5.616 0.34 5.50-6.10
Org. C % 0.21 0.47 0.1 0.33 0.33 0.288 0.14 0.1-0.47
Total N % 0.04 0.04 0.06 0.04 0.04 0.044 0.01 0.04-0.06
C:N 5.11 11.14 1.74 7.89 7.89 6.754 3.52 1.74-11.14
Avail P mg kg-1 6.68 8 13.32 10.86 6.16 9.004 3.02 6.16.13.32
CEC cmol(+).kg-1 10.2 10 11 10.4 7.6 9 .84 1.31 7.6-11
Ex.Ca cmol(+).kg1 0.37 0.84 1.77 0.37 0.37 0.744 0.61 0.37-1.77
Ex. Mg cmol(+).kg1 0.8 0.79 1.27 0.52 0.85 0.846 0.27 0.52-1.27
Ex.K cmol. (+)kg-1 0.33 0.38 0.36 0.24 0.22 0.306 0.07 0.24-0.38
Ex. Na cmol(+).kg1 0.2 0.21 0.19 0.22 0.21 0.206 0.01 0.20-0.22
TEB cmol. (+)kg-1 11.7 2.21 3.58 1.34 1.65 4.096 4.34 1.34-11.7
BS (%) 16.68 22.12 32.59 12.92 21.75 21.212 7.41 16.68-32.59
Ex. Cu mg-1 0.28 0.46 0.61 0.25 0.25 0.37 0.16 0.25-0.61
Ex. Zn mg-1 0.19 0.26 0.32 0.12 0.16 0.21 0.08 0.12-0.32
Ex. Fe mg-1 21.2 21.2 28.53 33.77 19.63 24.866 6.06 21.2-33.77
Ex. Mn mg-1 31.5 31.5 41.5 21.5 29 31 7.16 21.5-41.5
EC dSm-1 0.02 0.03 0.04 0.02 0.02 0.026 0.01 0.02-0.04
Textural classes varied from loamy sand to silt loam. Silt separates significantly correlated
with silt to clay ratio (r = 0.846. p = 0.05). The values of silt and clay were generally low
indicating that the soils are highly weathered (Obi and Ogunkule, 2009). Both silt + clay
and silt/clay ratio were similar and these may reflect similarity in parent materials of the
soils from the different mapping units. Moreover, the soil separates were similar in
distribution between the four mapping units. Iqbal et al. (2005) and Obi and Ogunkule
(2009) reported similarities of means and medium values of particle size distribution in
their study of alluvial soils which implies an increase in sand content leads to a decrease in
the contents of some chemical properties of soil such as CEC, OC and some micro
nutrients.
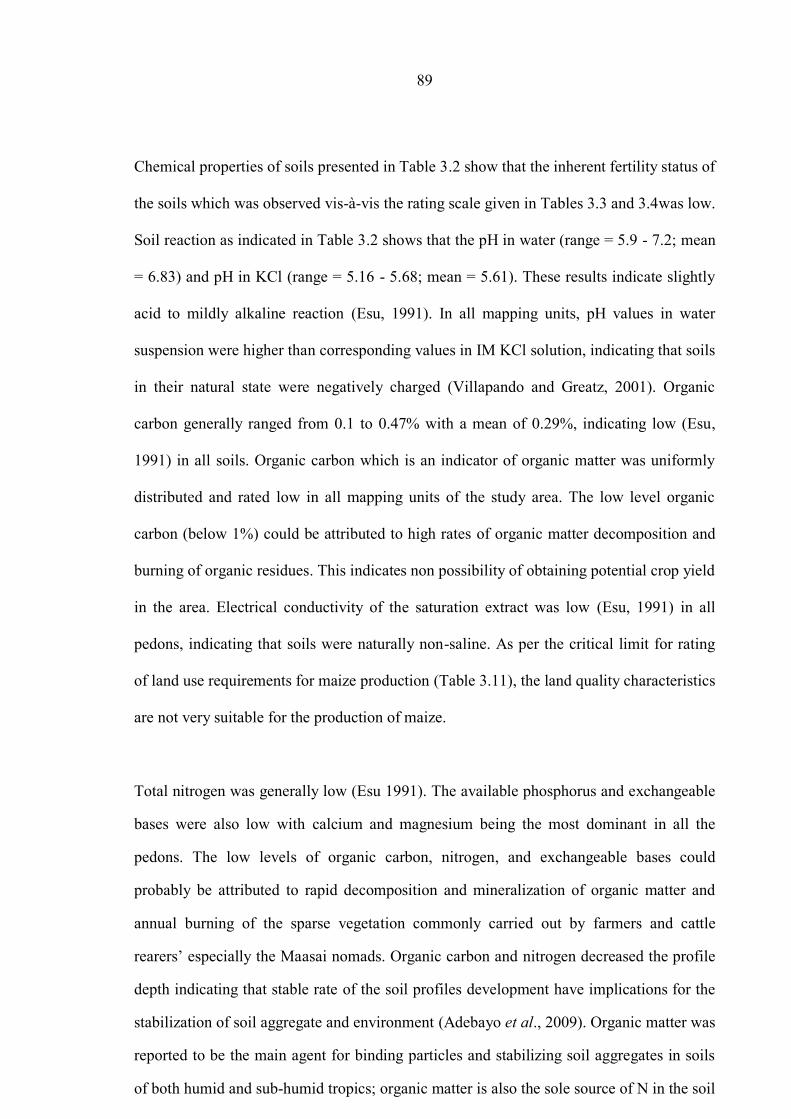
89
Chemical properties of soils presented in Table 3.2 show that the inherent fertility status of
the soils which was observed vis-à-vis the rating scale given in Tables 3.3 and 3.4was low.
Soil reaction as indicated in Table 3.2 shows that the pH in water (range = 5.9 - 7.2; mean
= 6.83) and pH in KCl (range = 5.16 - 5.68; mean = 5.61). These results indicate slightly
acid to mildly alkaline reaction (Esu, 1991). In all mapping units, pH values in water
suspension were higher than corresponding values in IM KCl solution, indicating that soils
in their natural state were negatively charged (Villapando and Greatz, 2001). Organic
carbon generally ranged from 0.1 to 0.47% with a mean of 0.29%, indicating low (Esu,
1991) in all soils. Organic carbon which is an indicator of organic matter was uniformly
distributed and rated low in all mapping units of the study area. The low level organic
carbon (below 1%) could be attributed to high rates of organic matter decomposition and
burning of organic residues. This indicates non possibility of obtaining potential crop yield
in the area. Electrical conductivity of the saturation extract was low (Esu, 1991) in all
pedons, indicating that soils were naturally non-saline. As per the critical limit for rating
of land use requirements for maize production (Table 3.11), the land quality characteristics
are not very suitable for the production of maize.
Total nitrogen was generally low (Esu 1991). The available phosphorus and exchangeable
bases were also low with calcium and magnesium being the most dominant in all the
pedons. The low levels of organic carbon, nitrogen, and exchangeable bases could
probably be attributed to rapid decomposition and mineralization of organic matter and
annual burning of the sparse vegetation commonly carried out by farmers and cattle
rearers’ especially the Maasai nomads. Organic carbon and nitrogen decreased the profile
depth indicating that stable rate of the soil profiles development have implications for the
stabilization of soil aggregate and environment (Adebayo et al., 2009). Organic matter was
reported to be the main agent for binding particles and stabilizing soil aggregates in soils
of both humid and sub-humid tropics; organic matter is also the sole source of N in the soil
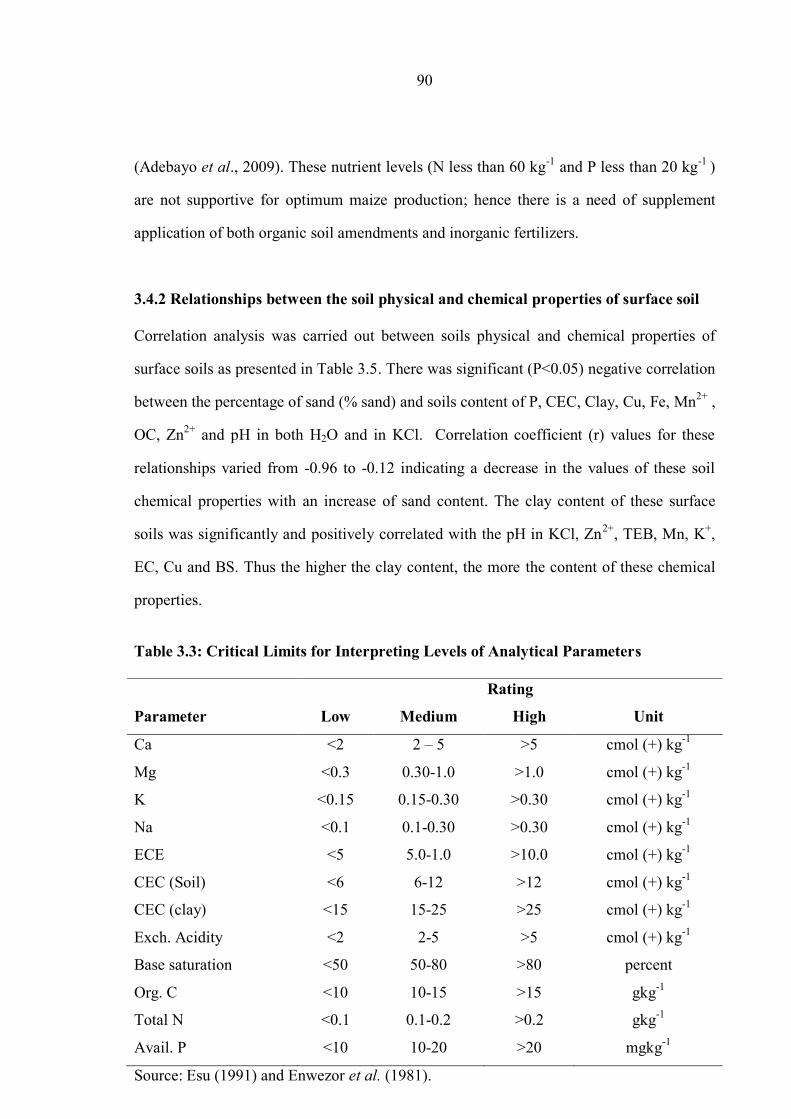
90
(Adebayo et al., 2009). These nutrient levels (N less than 60 kg-1
and P less than 20 kg-1
)
are not supportive for optimum maize production; hence there is a need of supplement
application of both organic soil amendments and inorganic fertilizers.
3.4.2 Relationships between the soil physical and chemical properties of surface soil
Correlation analysis was carried out between soils physical and chemical properties of
surface soils as presented in Table 3.5. There was significant (P<0.05) negative correlation
between the percentage of sand (% sand) and soils content of P, CEC, Clay, Cu, Fe, Mn2+
,
OC, Zn2+
and pH in both H2O and in KCl. Correlation coefficient (r) values for these
relationships varied from -0.96 to -0.12 indicating a decrease in the values of these soil
chemical properties with an increase of sand content. The clay content of these surface
soils was significantly and positively correlated with the pH in KCl, Zn2+
, TEB, Mn, K+,
EC, Cu and BS. Thus the higher the clay content, the more the content of these chemical
properties.
Table 3.3: Critical Limits for Interpreting Levels of Analytical Parameters
Parameter
Rating
Low Medium High Unit
Ca
Mg
K
Na
ECE
CEC (Soil)
CEC (clay)
Exch. Acidity
Base saturation
Org. C
Total N
Avail. P
<2
<0.3
<0.15
<0.1
<5
<6
<15
<2
<50
<10
<0.1
<10
2 – 5
0.30-1.0
0.15-0.30
0.1-0.30
5.0-1.0
6-12
15-25
2-5
50-80
10-15
0.1-0.2
10-20
>5
>1.0
>0.30
>0.30
>10.0
>12
>25
>5
>80
>15
>0.2
>20
cmol (+) kg-1
cmol (+) kg-1
cmol (+) kg-1
cmol (+) kg-1
cmol (+) kg-1
cmol (+) kg-1
cmol (+) kg-1
cmol (+) kg-1
percent
gkg-1
gkg-1
mgkg-1
Source: Esu (1991) and Enwezor et al. (1981).
91
Table 3.4: Copper (Cu), Zinc (Zn), manganese (Mn), iron (Fe), exchangeable acidity
(H+ and Al3+
) and (CEC) Ratings in the savannah zone (adopted from
Tisdale et al. 1995)
RATING
Parameters Low Medium High
________________________________________________________________________
Copper (Cu)(ppm) 0—2.5 2.6—4.5 >4.5
Zinc (Zn)(ppm) 1.0 - >1.0
Manganese (Mn)(ppm) 1.0 1.0 >1.0
Iron (Fe)(ppm) 0.25 2.6-4.5 >4.5
Exchangeable acidity 2 2-5 >5 cmo(+)kg-1
CEC (soil) 6 6-12 >12 cmo(+)kg+1
Sources: - Tisdale et al. (1995).

92
Table 3.5: Pearson correlation of some Surface composites Soil parameters Parameter 1 2 3 4 5 6 7 8 9 10 11 12 13 14 15 16 17 1/8 19 20 21 22 23
P 1
BS_% 0.4663 1
CEC 0.7226 0.1513 1
C_N -0.5476 -0.5203 -0.4135 1
Ca 0.7575 0.9063* 0.534 -0.5796 1
Clay_% 0.5466 0.8126* 0.6103 -0.4306 0.9118* 1
Cu 0.6575 0.874* 0.5518 -0.4133 0.9697** 0.9697** 1
EC_dS_m 0.7053 0.8922* 0.5304 -0.4473 0.9861** 0.9432** 0.9948*** 1
Fe 0.8106* -0.1205 0.6015 -0.2838 0.2319 0 0.1133 0.169 1
K 0.2368 0.4962 0.6233 -0.1541 0.6152 0.8827* 0.7624 0.6934 -0.1919 1
Mg 0.4172 0.9604** 0.1853 -0.6991 0.8602* 0.7855 0.8019* 0.8159* -0.1558 0.4891 1
Mn 0.3664 0.9201* 0.31 -0.6376 0.8571* 0.8839* 0.8504* 0.8394* -0.2263 0.6862 0.9672** 1
Na -0.323 -0.7841 -0.3557 0.7971* -0.7399 -0.7736 -0.6982 -0.6864 0.1894 -0.6067 -0.9146 -0.9495 1
OC_% -0.5186 -0.485 -0.3999 0.9989*** -0.5413 -0.3966 -0.373 -0.4063 -0.2747 -0.1317 -0.6733 -0.6125 0.7845 1
OM_% -0.5186 -0.485 -0.3999 0.9989*** -0.5413 -0.3966 -0.373 -0.4062 -0.2747 -0.1317 -0.6733 -0.6125 0.7845 1*** 1
S_C_ratio -0.1567 -0.4824 -0.3997 -0.2058 -0.5495 -0.7876 -0.7367 -0.675 0.2476 -0.8942 -0.356 -0.5269 0.3238 -0.238 -0.238 1
Sand_% -0.6496 -0.84 -0.6248 0.7125 -0.9393 -0.9393 -0.9177 -0.9129 -0.1234 -0.7304 -0.8802 -0.9267 0.8951* 0.6847 0.6847 0.5296 1
Silt_% 0.1855 -0.0688 -0.0684 -0.6958 -0.0857 -0.343 -0.3141 -0.25 0.338 -0.5734 0.1205 -0.039 -0.1961 -0.7188 -0.7188 0.846* 0 1
TEB 0.6609 0.9439** 0.4689 -0.6126 0.9879*** 0.9264* 0.9621** 0.972** 0.0976 0.6449 0.9224* 0.9261* -0.8228 -0.5769 -0.5769 -0.5541 -0.9601 -0.0715 1
TN_% 0.798* 0.8578* 0.4962 -0.7952 0.9432** 0.7717 0.8377* 0.875* 0.338 0.4067 0.8761* 0.8199* -0.7845 -0.7656 -0.7656 -0.252 -0.9129 0.25 0.9362** 1
Zn 0.4673 0.8765* 0.4751 -0.4029 0.9089* 0.9869*** 0.9669** 0.9429** -0.1162 0.8489* 0.8401* 0.9216** -0.7907 -0.3678 -0.3678 -0.7872 -0.9201 -0.3576 0.9381** 0.7641 1
pH_H2O -0.1682 0.6226 0.093 -0.1415 0.477 0.7282 0.6056 0.5414 -0.6763 0.8091* 0.6484 0.7875 -0.7079 -0.1261 -0.1261 -0.7398 -0.6047 -0.4671 0.582 0.3079 0.7856 1
pH_KCl 0.3414 0.8904* 0.3343 -0.6435 0.8343* 0.884* 0.8338* 0.8173* -0.2432 0.7126 0.951** 0.9975*** -0.9618 -0.6204 -0.6204 -0.5316 -0.9266 -0.0395 0.9076* 0.7976* 0.9164* 0.8067*
P BS_% CEC C_N Ca Clay Cu EC_dS_m Fe K Mg Mn Na OC_% OM_% S/C Sand% Silt% TEB TN_% Zn pHH2O pHKCl
*Significant at P=0.05 level, ** Significant at P=0.01 level, *** Significant at P=0.001 level, TN= Total nitrogen (N),TEB= Total exchangeable bases, S:C= Silt to
clay ration, C:N= Carbon to nitrogen ration
92
93
3.4.3 Relationships between soil physical and chemical properties of the soil profiles
Correlation analysis between the soil’s physical and chemical properties was carried out
separately for the representative profiles in the study area (Tables 3.6 – 3.9). The particle
size distribution of the soils shows that sand separates ranged from 60.64 to 90.24 %. Soil
reaction as indicated shows that the pH in water (range = 6.22 - 7.23 ;) and pH in Kcl
(range = 4.50 - 6.54). pH values in water suspension were higher than the corresponding
values in I M Kcl Solution, indicating that the soils in their natural state were negatively
charged (Villapando and Greatz, 2001). Organic Carbon generally ranges from 0.02 to
0.49 % indicating low level of organic carbon in the soils. The organic carbon which is an
indicator of organic matter (Sole Source of N) was uniformly distributed and rated low in
all the profiles of the study area. The low level of organic carbon (below 1 %) could be
attributed to high range of organic matter decomposition and burning of organic residues
and these indicate impossibility of obtaining potential crop yield in the area. Electrical
conductivity of the saturation extract was low in all the pedons, indicating that the soils
were naturally non-saline (Ogban et al., 2012).
There was a significant (p < 0.05) positive relationship between the percentage of clay
(% clay), CEC and EC with K, Mg and Na (Table 3.5.), while there was a significant
negative correlation with C: N and pHH20 with sand, Zn and Mn (Table 5.3). The TEB
showed a significant (P = 0.05) positive relationship with CEC and Ca, implying that the
measures of improving the status of basic cation would invariably increase the content of
the bases in the absorption complex and Base saturation percentage. CEC was
significantly (P = 0.05) and positively related with Mg, Na, Ca and TEB and with clay, Fe
and exchangeable bases (Table 3.7).
The correlation between Na and Ca as well as EC with K and Na was significant
(P = 0.05) (Tables 3.6 and 3.7). Mn content on the other hand had a significant positive
relationship with OC, OM and Zn with r values of 0.9963, 0.9963 and 0.9708 respectively
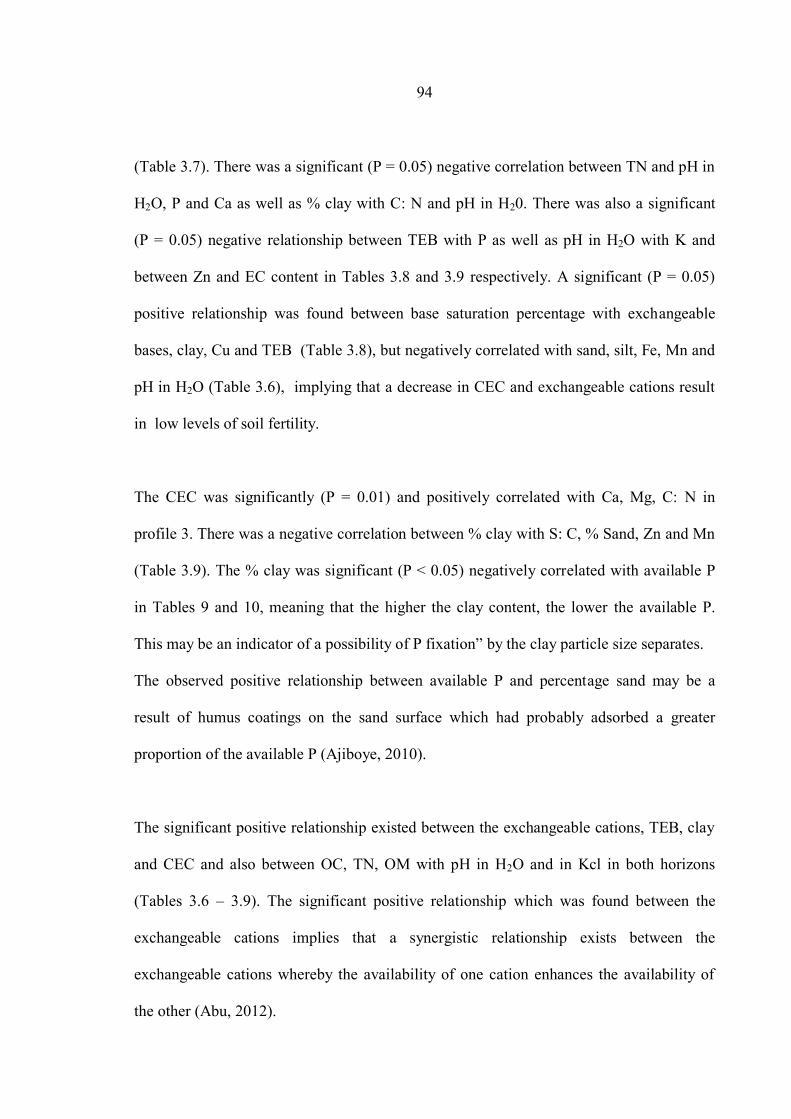
94
(Table 3.7). There was a significant (P = 0.05) negative correlation between TN and pH in
H2O, P and Ca as well as % clay with C: N and pH in H20. There was also a significant
(P = 0.05) negative relationship between TEB with P as well as pH in H2O with K and
between Zn and EC content in Tables 3.8 and 3.9 respectively. A significant (P = 0.05)
positive relationship was found between base saturation percentage with exchangeable
bases, clay, Cu and TEB (Table 3.8), but negatively correlated with sand, silt, Fe, Mn and
pH in H2O (Table 3.6), implying that a decrease in CEC and exchangeable cations result
in low levels of soil fertility.
The CEC was significantly (P = 0.01) and positively correlated with Ca, Mg, C: N in
profile 3. There was a negative correlation between % clay with S: C, % Sand, Zn and Mn
(Table 3.9). The % clay was significant (P < 0.05) negatively correlated with available P
in Tables 9 and 10, meaning that the higher the clay content, the lower the available P.
This may be an indicator of a possibility of P fixation” by the clay particle size separates.
The observed positive relationship between available P and percentage sand may be a
result of humus coatings on the sand surface which had probably adsorbed a greater
proportion of the available P (Ajiboye, 2010).
The significant positive relationship existed between the exchangeable cations, TEB, clay
and CEC and also between OC, TN, OM with pH in H2O and in Kcl in both horizons
(Tables 3.6 – 3.9). The significant positive relationship which was found between the
exchangeable cations implies that a synergistic relationship exists between the
exchangeable cations whereby the availability of one cation enhances the availability of
the other (Abu, 2012).
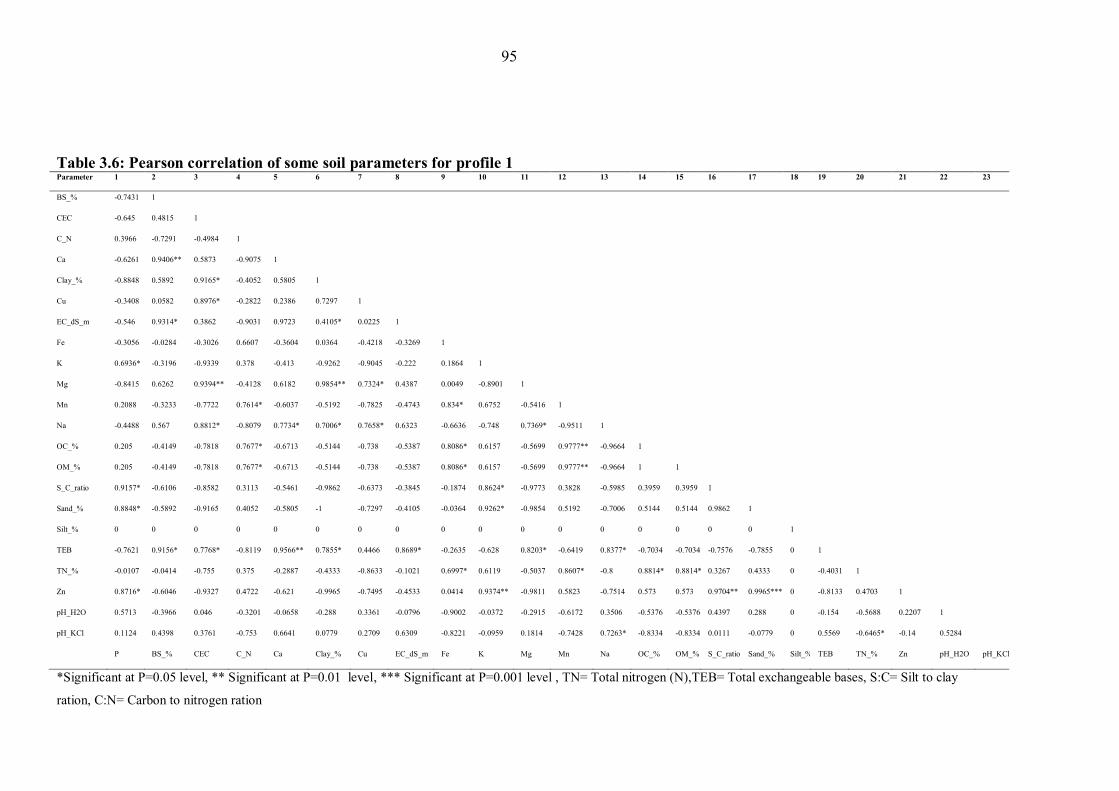
95
Table 3.6: Pearson correlation of some soil parameters for profile 1 Parameter 1 2 3 4 5 6 7 8 9 10 11 12 13 14 15 16 17 18 19 20 21 22 23
BS_% -0.7431 1
CEC -0.645 0.4815 1
C_N 0.3966 -0.7291 -0.4984 1
Ca -0.6261 0.9406** 0.5873 -0.9075 1
Clay_% -0.8848 0.5892 0.9165* -0.4052 0.5805 1
Cu -0.3408 0.0582 0.8976* -0.2822 0.2386 0.7297 1
EC_dS_m -0.546 0.9314* 0.3862 -0.9031 0.9723 0.4105* 0.0225 1
Fe -0.3056 -0.0284 -0.3026 0.6607 -0.3604 0.0364 -0.4218 -0.3269 1
K 0.6936* -0.3196 -0.9339 0.378 -0.413 -0.9262 -0.9045 -0.222 0.1864 1
Mg -0.8415 0.6262 0.9394** -0.4128 0.6182 0.9854** 0.7324* 0.4387 0.0049 -0.8901 1
Mn 0.2088 -0.3233 -0.7722 0.7614* -0.6037 -0.5192 -0.7825 -0.4743 0.834* 0.6752 -0.5416 1
Na -0.4488 0.567 0.8812* -0.8079 0.7734* 0.7006* 0.7658* 0.6323 -0.6636 -0.748 0.7369* -0.9511 1
OC_% 0.205 -0.4149 -0.7818 0.7677* -0.6713 -0.5144 -0.738 -0.5387 0.8086* 0.6157 -0.5699 0.9777** -0.9664 1
OM_% 0.205 -0.4149 -0.7818 0.7677* -0.6713 -0.5144 -0.738 -0.5387 0.8086* 0.6157 -0.5699 0.9777** -0.9664 1 1
S_C_ratio 0.9157* -0.6106 -0.8582 0.3113 -0.5461 -0.9862 -0.6373 -0.3845 -0.1874 0.8624* -0.9773 0.3828 -0.5985 0.3959 0.3959 1
Sand_% 0.8848* -0.5892 -0.9165 0.4052 -0.5805 -1 -0.7297 -0.4105 -0.0364 0.9262* -0.9854 0.5192 -0.7006 0.5144 0.5144 0.9862 1
Silt_% 0 0 0 0 0 0 0 0 0 0 0 0 0 0 0 0 0 1
TEB -0.7621 0.9156* 0.7768* -0.8119 0.9566** 0.7855* 0.4466 0.8689* -0.2635 -0.628 0.8203* -0.6419 0.8377* -0.7034 -0.7034 -0.7576 -0.7855 0 1
TN_% -0.0107 -0.0414 -0.755 0.375 -0.2887 -0.4333 -0.8633 -0.1021 0.6997* 0.6119 -0.5037 0.8607* -0.8 0.8814* 0.8814* 0.3267 0.4333 0 -0.4031 1
Zn 0.8716* -0.6046 -0.9327 0.4722 -0.621 -0.9965 -0.7495 -0.4533 0.0414 0.9374** -0.9811 0.5823 -0.7514 0.573 0.573 0.9704** 0.9965*** 0 -0.8133 0.4703 1
pH_H2O 0.5713 -0.3966 0.046 -0.3201 -0.0658 -0.288 0.3361 -0.0796 -0.9002 -0.0372 -0.2915 -0.6172 0.3506 -0.5376 -0.5376 0.4397 0.288 0 -0.154 -0.5688 0.2207 1
pH_KCl 0.1124 0.4398 0.3761 -0.753 0.6641 0.0779 0.2709 0.6309 -0.8221 -0.0959 0.1814 -0.7428 0.7263* -0.8334 -0.8334 0.0111 -0.0779 0 0.5569 -0.6465* -0.14 0.5284
P BS_% CEC C_N Ca Clay_% Cu EC_dS_m Fe K Mg Mn Na OC_% OM_% S_C_ratio Sand_% Silt_% TEB TN_% Zn pH_H2O pH_KCl
*Significant at P=0.05 level, ** Significant at P=0.01 level, *** Significant at P=0.001 level , TN= Total nitrogen (N),TEB= Total exchangeable bases, S:C= Silt to clay
ration, C:N= Carbon to nitrogen ration

96
Table 3.7: Pearson correlation of some Soil Parameters for Profile 2
Parameter 1 2 3 4 5 6 7 8 9 10 11 12 13 14 15 16 17 18 19 20 21 22 23
P 1
BS_% 0.6826 1
CEC -0.4679 0.3266 1
C_N 0.9275 0.36 -0.7643 1
Ca 0.9275 0.36 -0.7643 1 1
Clay_% -0.5809 0.1984 0.9912* -0.843 -0.843 1
Cu -0.1401 0.628 0.9406 -0.5 -0.5 0.8874 1
EC_dS_m 0.1018 0.7965 0.8316 -0.2774 -0.2774 0.7506 0.9707* 1
Fe -0.5789 0.2008 0.9915* -0.8417 -0.8417 1*** 0.8885 0.7522 1
K -0.5165 0.2733 0.9984* -0.7991 -0.7991 0.997* 0.9202 0.7993 0.9972* 1
Mg -0.5034 0.2879 0.9992* -0.7899 -0.7899 0.9958* 0.926 0.8083 0.996* 0.9999** 1
Mn 0.8919 0.2783 -0.8169 0.9963* 0.9963* -0.8862 -0.5727 -0.359 -0.8851 -0.8479 -0.8397 1
Na -0.3061 0.4868 0.9846* -0.6397 -0.6397 0.9527* 0.9855* 0.9159 0.9535* 0.9733* 0.9767* -0.7035 1
OC_% 0.9275 0.36 -0.7643 1 1 -0.843 -0.5 -0.2774 -0.8417 -0.7991 -0.7899 0.9963* -0.6397 1
OM_% 0.9275 0.36 -0.7643 1 1 -0.843 -0.5 -0.2774 -0.8417 -0.7991 -0.7899 0.9963* -0.6397 1 1
S_C_ratio 0.8911 0.2765 -0.818 0.9961* 0.9961* -0.8871 -0.5743 -0.3608 -0.8859 -0.8489 -0.8408 1** -0.7049 0.9961* 0.9961* 1
Sand_% 0.5382 -0.2487 -0.9967 0.8142 0.8142 -0.9987 -0.9099 -0.7837 -0.9988 -0.9997 -0.9992 0.8611 -0.9671 0.8142 0.8142 0.8621 1
Silt_% 0.9275 0.36 -0.7643 1 1 -0.843 -0.5 -0.2774 -0.8417 -0.7991 -0.7899 0.9963* -0.6397 1 1 0.9961* 0.8142 1
TEB -0.1382 0.6295 0.94 -0.4983 -0.4983 0.8864 1*** 0.9712* 0.8876 0.9194 0.9253 -0.5711 0.9852* -0.4983 -0.4983 -0.5726 -0.9091 -0.4983 1
TN_% 0 0 0 0 0 0 0 0 0 0 0 0 0 0 0 0 0 0 0 1
Zn 0.9744* 0.5007 -0.6547 0.9878* 0.9878* -0.7491 -0.3592 -0.1245 -0.7475 -0.6958 -0.6849 0.9708* -0.5124 0.9878* 0.9878* 0.9703* 0.7139 0.9878* -0.3574 0 1
pH_H2O 0.8321 0.1626 -0.8795 0.9791* 0.9791* -0.9348 -0.6658 -0.4671 -0.934 -0.9047 -0.8981 0.993* -0.7827 0.9791* 0.9791* 0.9932* 0.9153 0.9791* -0.6643 0 0.9355 1
pH_KCl 0.8751 0.2436 -0.8371 0.9926* 0.9926* -0.9022 -0.6018 -0.3923 -0.9012 -0.8664 -0.8587 0.9994* -0.7286 0.9926* 0.9926* 0.9994* 0.8788 0.9926* -0.6002 0 0.9615* 0.9966*
P BS_% CEC C_N Ca Clay_% Cu EC Fe K Mg Mn Na OC_% OM_% S_C_ratio Sand_% Silt_% TEB TN_% Zn pH_H2O pH_KCl
*Significant at P=0.05 level, ** Significant at P=0.01 level, *** Significant at P=0.001 level , TN= Total nitrogen (N),TEB= Total exchangeable bases, S:C= Silt to clay
ration, C:N= Carbon to nitrogen ration
96
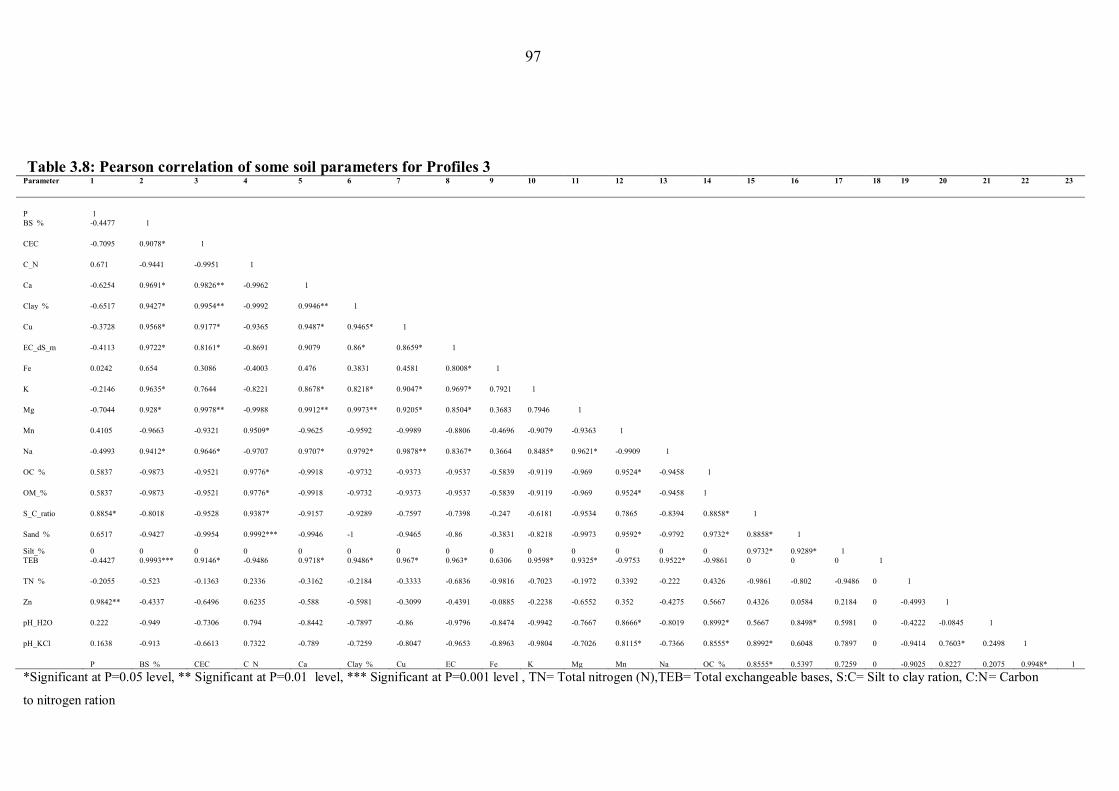
97
Table 3.8: Pearson correlation of some soil parameters for Profiles 3 Parameter 1 2 3 4 5 6 7 8 9 10 11 12 13 14 15 16 17 18 19 20 21 22 23
P 1
BS_% -0.4477 1
CEC -0.7095 0.9078* 1
C_N 0.671 -0.9441 -0.9951 1
Ca -0.6254 0.9691* 0.9826** -0.9962 1
Clay_% -0.6517 0.9427* 0.9954** -0.9992 0.9946** 1
Cu -0.3728 0.9568* 0.9177* -0.9365 0.9487* 0.9465* 1
EC_dS_m -0.4113 0.9722* 0.8161* -0.8691 0.9079 0.86* 0.8659* 1
Fe 0.0242 0.654 0.3086 -0.4003 0.476 0.3831 0.4581 0.8008* 1
K -0.2146 0.9635* 0.7644 -0.8221 0.8678* 0.8218* 0.9047* 0.9697* 0.7921 1
Mg -0.7044 0.928* 0.9978** -0.9988 0.9912** 0.9973** 0.9205* 0.8504* 0.3683 0.7946 1
Mn 0.4105 -0.9663 -0.9321 0.9509* -0.9625 -0.9592 -0.9989 -0.8806 -0.4696 -0.9079 -0.9363 1
Na -0.4993 0.9412* 0.9646* -0.9707 0.9707* 0.9792* 0.9878** 0.8367* 0.3664 0.8485* 0.9621* -0.9909 1
OC_% 0.5837 -0.9873 -0.9521 0.9776* -0.9918 -0.9732 -0.9373 -0.9537 -0.5839 -0.9119 -0.969 0.9524* -0.9458 1
OM_% 0.5837 -0.9873 -0.9521 0.9776* -0.9918 -0.9732 -0.9373 -0.9537 -0.5839 -0.9119 -0.969 0.9524* -0.9458 1
S_C_ratio 0.8854* -0.8018 -0.9528 0.9387* -0.9157 -0.9289 -0.7597 -0.7398 -0.247 -0.6181 -0.9534 0.7865 -0.8394 0.8858* 1
Sand_% 0.6517 -0.9427 -0.9954 0.9992*** -0.9946 -1 -0.9465 -0.86 -0.3831 -0.8218 -0.9973 0.9592* -0.9792 0.9732* 0.8858* 1
Silt_% 0 0 0 0 0 0 0 0 0 0 0 0 0 0 0.9732* 0.9289* 1
TEB -0.4427 0.9993*** 0.9146* -0.9486 0.9718* 0.9486* 0.967* 0.963* 0.6306 0.9598* 0.9325* -0.9753 0.9522* -0.9861 0 0 0 1
TN_% -0.2055 -0.523 -0.1363 0.2336 -0.3162 -0.2184 -0.3333 -0.6836 -0.9816 -0.7023 -0.1972 0.3392 -0.222 0.4326 -0.9861 -0.802 -0.9486 0 1
Zn 0.9842** -0.4337 -0.6496 0.6235 -0.588 -0.5981 -0.3099 -0.4391 -0.0885 -0.2238 -0.6552 0.352 -0.4275 0.5667 0.4326 0.0584 0.2184 0 -0.4993 1
pH_H2O 0.222 -0.949 -0.7306 0.794 -0.8442 -0.7897 -0.86 -0.9796 -0.8474 -0.9942 -0.7667 0.8666* -0.8019 0.8992* 0.5667 0.8498* 0.5981 0 -0.4222 -0.0845 1
pH_KCl 0.1638 -0.913 -0.6613 0.7322 -0.789 -0.7259 -0.8047 -0.9653 -0.8963 -0.9804 -0.7026 0.8115* -0.7366 0.8555* 0.8992* 0.6048 0.7897 0 -0.9414 0.7603* 0.2498 1
P BS_% CEC C_N Ca Clay_% Cu EC Fe K Mg Mn Na OC_% 0.8555* 0.5397 0.7259 0 -0.9025 0.8227 0.2075 0.9948* 1
*Significant at P=0.05 level, ** Significant at P=0.01 level, *** Significant at P=0.001 level , TN= Total nitrogen (N),TEB= Total exchangeable bases, S:C= Silt to clay ration, C:N= Carbon
to nitrogen ration
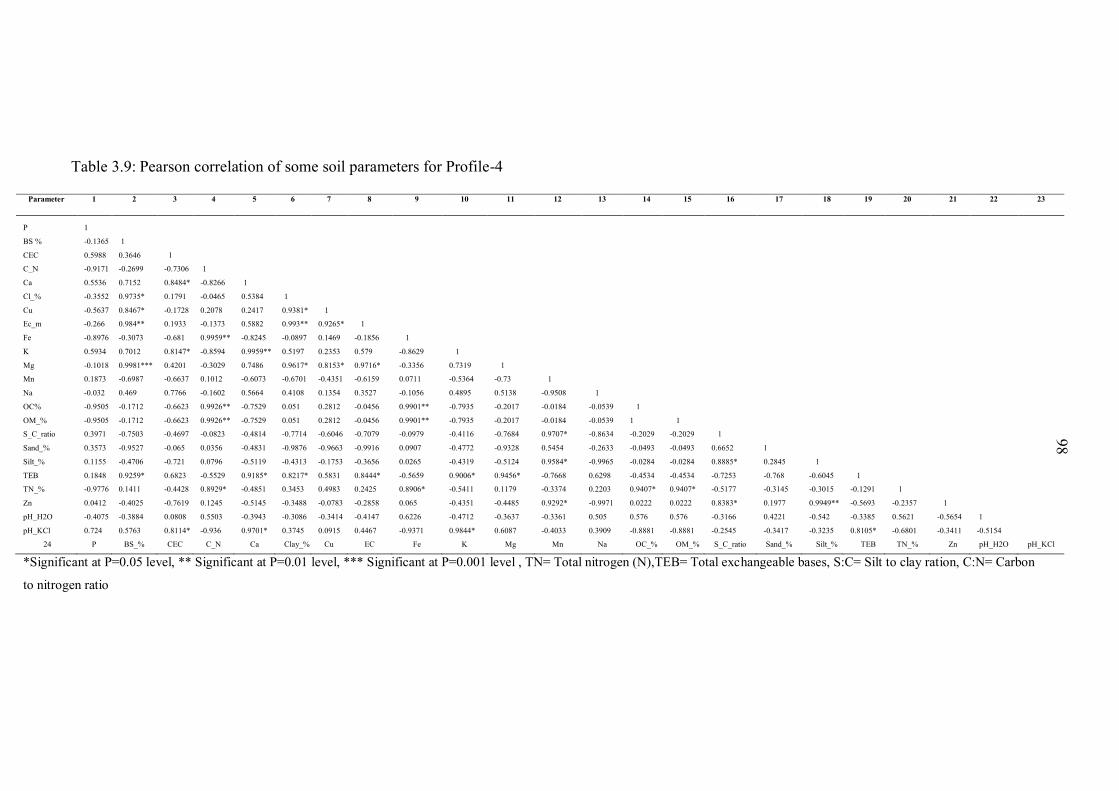
98
Table 3.9: Pearson correlation of some soil parameters for Profile-4
Parameter 1 2 3 4 5 6 7 8 9 10 11 12 13 14 15 16 17 18 19 20 21 22 23
1. P 1
2. BS % -0.1365 1
3. CEC 0.5988 0.3646 1
4. C_N -0.9171 -0.2699 -0.7306 1
5. Ca 0.5536 0.7152 0.8484* -0.8266 1
6. Cl_% -0.3552 0.9735* 0.1791 -0.0465 0.5384 1
7. Cu -0.5637 0.8467* -0.1728 0.2078 0.2417 0.9381* 1
8. Ec_m -0.266 0.984** 0.1933 -0.1373 0.5882 0.993** 0.9265* 1
9. Fe -0.8976 -0.3073 -0.681 0.9959** -0.8245 -0.0897 0.1469 -0.1856 1
10. K 0.5934 0.7012 0.8147* -0.8594 0.9959** 0.5197 0.2353 0.579 -0.8629 1
11. Mg -0.1018 0.9981*** 0.4201 -0.3029 0.7486 0.9617* 0.8153* 0.9716* -0.3356 0.7319 1
12. Mn 0.1873 -0.6987 -0.6637 0.1012 -0.6073 -0.6701 -0.4351 -0.6159 0.0711 -0.5364 -0.73 1
13. Na -0.032 0.469 0.7766 -0.1602 0.5664 0.4108 0.1354 0.3527 -0.1056 0.4895 0.5138 -0.9508 1
14. OC% -0.9505 -0.1712 -0.6623 0.9926** -0.7529 0.051 0.2812 -0.0456 0.9901** -0.7935 -0.2017 -0.0184 -0.0539 1
15. OM_% -0.9505 -0.1712 -0.6623 0.9926** -0.7529 0.051 0.2812 -0.0456 0.9901** -0.7935 -0.2017 -0.0184 -0.0539 1 1
16. S_C_ratio 0.3971 -0.7503 -0.4697 -0.0823 -0.4814 -0.7714 -0.6046 -0.7079 -0.0979 -0.4116 -0.7684 0.9707* -0.8634 -0.2029 -0.2029 1
17. Sand_% 0.3573 -0.9527 -0.065 0.0356 -0.4831 -0.9876 -0.9663 -0.9916 0.0907 -0.4772 -0.9328 0.5454 -0.2633 -0.0493 -0.0493 0.6652 1
18. Silt_% 0.1155 -0.4706 -0.721 0.0796 -0.5119 -0.4313 -0.1753 -0.3656 0.0265 -0.4319 -0.5124 0.9584* -0.9965 -0.0284 -0.0284 0.8885* 0.2845 1
19. TEB 0.1848 0.9259* 0.6823 -0.5529 0.9185* 0.8217* 0.5831 0.8444* -0.5659 0.9006* 0.9456* -0.7668 0.6298 -0.4534 -0.4534 -0.7253 -0.768 -0.6045 1
20. TN_% -0.9776 0.1411 -0.4428 0.8929* -0.4851 0.3453 0.4983 0.2425 0.8906* -0.5411 0.1179 -0.3374 0.2203 0.9407* 0.9407* -0.5177 -0.3145 -0.3015 -0.1291 1
21. Zn 0.0412 -0.4025 -0.7619 0.1245 -0.5145 -0.3488 -0.0783 -0.2858 0.065 -0.4351 -0.4485 0.9292* -0.9971 0.0222 0.0222 0.8383* 0.1977 0.9949** -0.5693 -0.2357 1
22. pH_H2O -0.4075 -0.3884 0.0808 0.5503 -0.3943 -0.3086 -0.3414 -0.4147 0.6226 -0.4712 -0.3637 -0.3361 0.505 0.576 0.576 -0.3166 0.4221 -0.542 -0.3385 0.5621 -0.5654 1
23. pH_KCl 0.724 0.5763 0.8114* -0.936 0.9701* 0.3745 0.0915 0.4467 -0.9371 0.9844* 0.6087 -0.4033 0.3909 -0.8881 -0.8881 -0.2545 -0.3417 -0.3235 0.8105* -0.6801 -0.3411 -0.5154
24 P BS_% CEC C_N Ca Clay_% Cu EC Fe K Mg Mn Na OC_% OM_% S_C_ratio Sand_% Silt_% TEB TN_% Zn pH_H2O pH_KCl
*Significant at P=0.05 level, ** Significant at P=0.01 level, *** Significant at P=0.001 level , TN= Total nitrogen (N),TEB= Total exchangeable bases, S:C= Silt to clay ration, C:N= Carbon
to nitrogen ratio
98
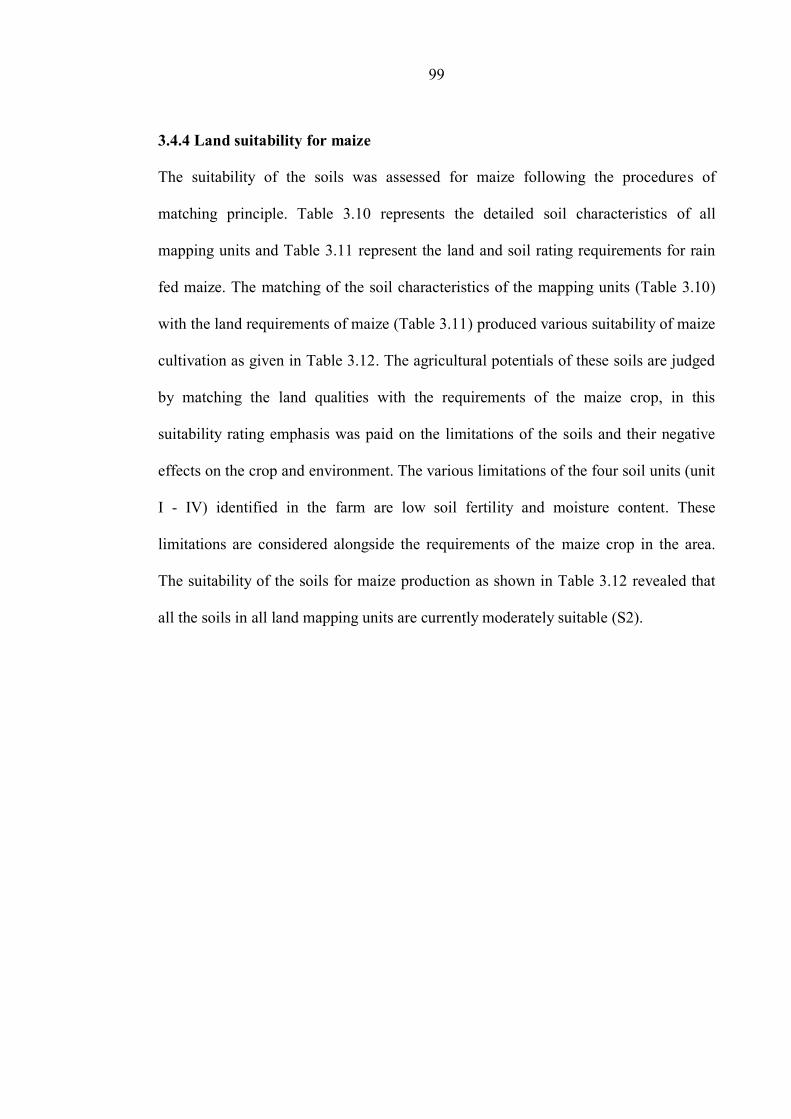
99
3.4.4 Land suitability for maize
The suitability of the soils was assessed for maize following the procedures of
matching principle. Table 3.10 represents the detailed soil characteristics of all
mapping units and Table 3.11 represent the land and soil rating requirements for rain
fed maize. The matching of the soil characteristics of the mapping units (Table 3.10)
with the land requirements of maize (Table 3.11) produced various suitability of maize
cultivation as given in Table 3.12. The agricultural potentials of these soils are judged
by matching the land qualities with the requirements of the maize crop, in this
suitability rating emphasis was paid on the limitations of the soils and their negative
effects on the crop and environment. The various limitations of the four soil units (unit
I - IV) identified in the farm are low soil fertility and moisture content. These
limitations are considered alongside the requirements of the maize crop in the area.
The suitability of the soils for maize production as shown in Table 3.12 revealed that
all the soils in all land mapping units are currently moderately suitable (S2).
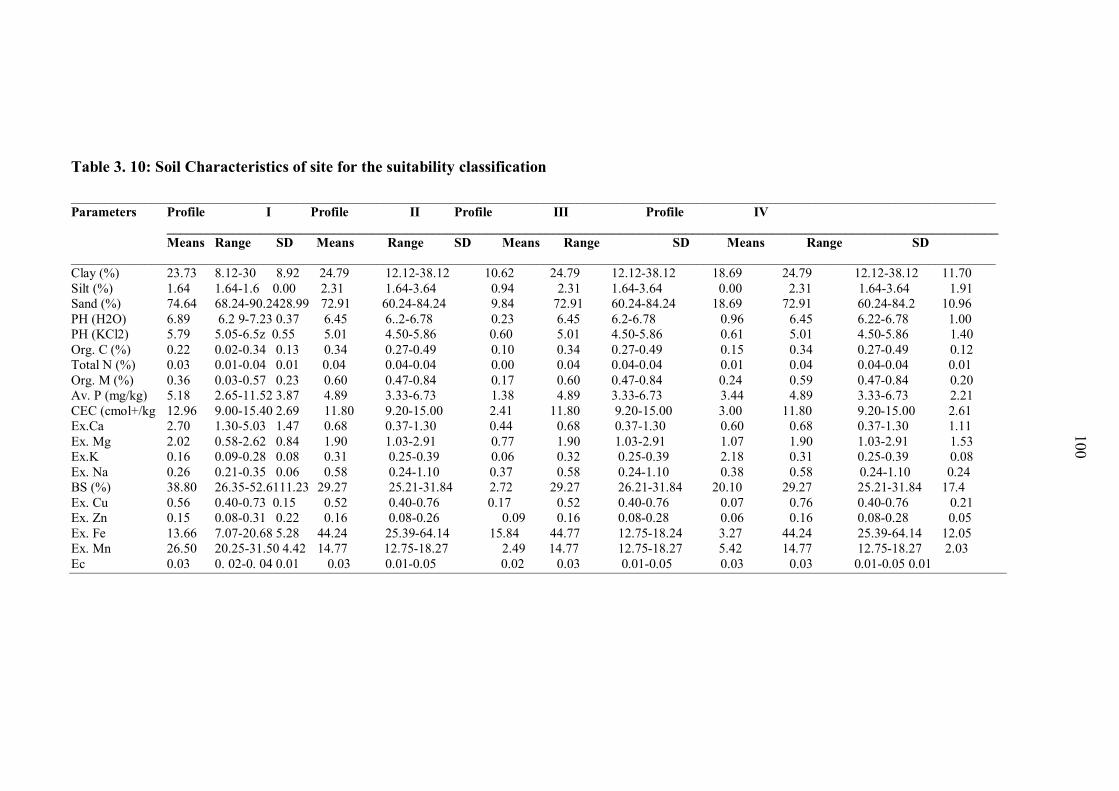
100
Table 3. 10: Soil Characteristics of site for the suitability classification
___________________________________________________________________________________________________________________________________________ Parameters Profile I Profile II Profile III Profile IV
_____________________________________________________________________________________________________________________________
Means Range SD Means Range SD Means Range SD Means Range SD
___________________________________________________________________________________________________________________________________________
Clay (%) 23.73 8.12-30 8.92 24.79 12.12-38.12 10.62 24.79 12.12-38.12 18.69 24.79 12.12-38.12 11.70
Silt (%) 1.64 1.64-1.6 0.00 2.31 1.64-3.64 0.94 2.31 1.64-3.64 0.00 2.31 1.64-3.64 1.91
Sand (%) 74.64 68.24-90.2428.99 72.91 60.24-84.24 9.84 72.91 60.24-84.24 18.69 72.91 60.24-84.2 10.96
PH (H2O) 6.89 6.2 9-7.23 0.37 6.45 6..2-6.78 0.23 6.45 6.2-6.78 0.96 6.45 6.22-6.78 1.00
PH (KCl2) 5.79 5.05-6.5z 0.55 5.01 4.50-5.86 0.60 5.01 4.50-5.86 0.61 5.01 4.50-5.86 1.40
Org. C (%) 0.22 0.02-0.34 0.13 0.34 0.27-0.49 0.10 0.34 0.27-0.49 0.15 0.34 0.27-0.49 0.12
Total N (%) 0.03 0.01-0.04 0.01 0.04 0.04-0.04 0.00 0.04 0.04-0.04 0.01 0.04 0.04-0.04 0.01
Org. M (%) 0.36 0.03-0.57 0.23 0.60 0.47-0.84 0.17 0.60 0.47-0.84 0.24 0.59 0.47-0.84 0.20
Av. P (mg/kg) 5.18 2.65-11.52 3.87 4.89 3.33-6.73 1.38 4.89 3.33-6.73 3.44 4.89 3.33-6.73 2.21
CEC (cmol+/kg 12.96 9.00-15.40 2.69 11.80 9.20-15.00 2.41 11.80 9.20-15.00 3.00 11.80 9.20-15.00 2.61
Ex.Ca 2.70 1.30-5.03 1.47 0.68 0.37-1.30 0.44 0.68 0.37-1.30 0.60 0.68 0.37-1.30 1.11
Ex. Mg 2.02 0.58-2.62 0.84 1.90 1.03-2.91 0.77 1.90 1.03-2.91 1.07 1.90 1.03-2.91 1.53
Ex.K 0.16 0.09-0.28 0.08 0.31 0.25-0.39 0.06 0.32 0.25-0.39 2.18 0.31 0.25-0.39 0.08
Ex. Na 0.26 0.21-0.35 0.06 0.58 0.24-1.10 0.37 0.58 0.24-1.10 0.38 0.58 0.24-1.10 0.24
BS (%) 38.80 26.35-52.6111.23 29.27 25.21-31.84 2.72 29.27 26.21-31.84 20.10 29.27 25.21-31.84 17.4
Ex. Cu 0.56 0.40-0.73 0.15 0.52 0.40-0.76 0.17 0.52 0.40-0.76 0.07 0.76 0.40-0.76 0.21
Ex. Zn 0.15 0.08-0.31 0.22 0.16 0.08-0.26 0.09 0.16 0.08-0.28 0.06 0.16 0.08-0.28 0.05
Ex. Fe 13.66 7.07-20.68 5.28 44.24 25.39-64.14 15.84 44.77 12.75-18.24 3.27 44.24 25.39-64.14 12.05
Ex. Mn 26.50 20.25-31.50 4.42 14.77 12.75-18.27 2.49 14.77 12.75-18.27 5.42 14.77 12.75-18.27 2.03
Ec 0.03 0. 02-0. 04 0.01 0.03 0.01-0.05 0.02 0.03 0.01-0.05 0.03 0.03 0.01-0.05 0.01
100
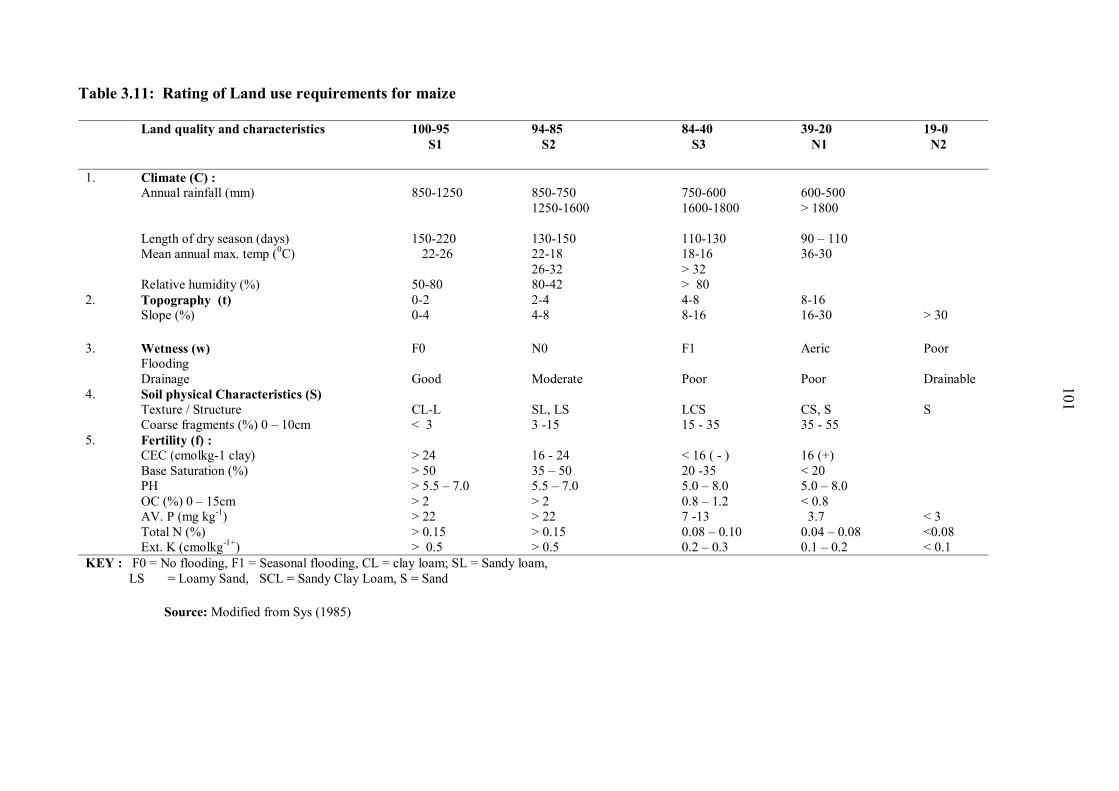
101
Table 3.11: Rating of Land use requirements for maize
Land quality and characteristics 100-95
S1
94-85
S2
84-40
S3
39-20
N1
19-0
N2
1. Climate (C) :
Annual rainfall (mm)
Length of dry season (days)
Mean annual max. temp (0C)
Relative humidity (%)
850-1250
150-220
22-26
50-80
850-750
1250-1600
130-150
22-18
26-32
80-42
750-600
1600-1800
110-130
18-16
> 32
> 80
600-500
> 1800
90 – 110
36-30
2. Topography (t)
Slope (%)
0-2
0-4
2-4
4-8
4-8
8-16
8-16
16-30
> 30
3. Wetness (w)
Flooding
Drainage
F0
Good
N0
Moderate
F1
Poor
Aeric
Poor
Poor
Drainable
4. Soil physical Characteristics (S)
Texture / Structure
Coarse fragments (%) 0 – 10cm
CL-L
< 3
SL, LS
3 -15
LCS
15 - 35
CS, S
35 - 55
S
5. Fertility (f) :
CEC (cmolkg-1 clay)
Base Saturation (%)
PH
OC (%) 0 – 15cm
AV. P (mg kg-1
)
Total N (%)
Ext. K (cmolkg-1+
)
> 24
> 50
> 5.5 – 7.0
> 2
> 22
> 0.15
> 0.5
16 - 24
35 – 50
5.5 – 7.0
> 2
> 22
> 0.15
> 0.5
< 16 ( - )
20 -35
5.0 – 8.0
0.8 – 1.2
7 -13
0.08 – 0.10
0.2 – 0.3
16 (+)
< 20
5.0 – 8.0
< 0.8
3.7
0.04 – 0.08
0.1 – 0.2
< 3
<0.08
< 0.1
KEY : F0 = No flooding, F1 = Seasonal flooding, CL = clay loam; SL = Sandy loam,
LS = Loamy Sand, SCL = Sandy Clay Loam, S = Sand
Source: Modified from Sys (1985)
101
102
Table 3.12: Maize suitability class of the mapping units in Solomon Mahlangu
Campus farm Soils
Land Quality and
characteristics
Mapping Units
1 2 3 4
Land quality
Annual rainfall (mm)
Mean annual max temperature
Slope (%)
Drainage
Land characteristics
Soil texture
Soil depth
Soil pH (1:1 water)
CEC Cmol (+) kg -1
Org. C (%)
Base saturation
AV. P (mgkg-1
)
Total N (%)
Limiting characteristics
S2
S1
S1
S2
S2
S1
S3
S3
NI
S1
S3
NI
f, m
S2
S1
S1
S2
S2
S1
S3
S3
N1
S3
NI
NI
f, m
S2
S1
S1
S2
S2
S2
S3
S2
NI
S1
S3
NI
f, m
S2
S1
S1
S2
S2
S1
S3
S2
NI
S2
NI
NI
f, m
Land suitability class symbols: S1 = highly suitable; S2 = moderately suitable S3 =
marginally suitable; N1 = currently not suitable. Land suitability subclass symbols; f = Soil
fertility limitation, m = moisture availability limitation
3.5 Conclusions and Recommendations
The results of this study established and evaluate the suitability classes of the soils of
SMC farm for maize cultivation. The suitability assessment result showed that there
was no highly suitable (S1) land for maize cultivation in the area. The area was
moderately suitable (S2), marginally suitable (S3) and currently non-suitable (N1) for
maize production. Even though some land qualities such as mean annual rainfall and
temperature are adequate for maize, but most of the land/soil characteristics such as
levels of organic carbon and CEC are low.
The study indicates that:
Physically the predominant textures of these soils were sandy, sandy clay loam,
sandy clay and loamy sand. None of the four mapping units fell under highly
suitable (SI) class, for maize production.

103
The major limitations in the surveyed area are low fertility status and moisture
content. Some of the soil fertility indicators have moderate, low or very low
values in all units
There was a significant (P < 0.05) positive correlation between the clay% and
the soil’s content of CEC, Zn, Cu, K, Mg, Na and EC, there was also a
significant relationship between the OC and pH in H2O and KCL and Equally,
TEB and BS were significantly (P < 0.001) and positively correlated (r =
0.9993).
For improved soils physical and chemical properties and hence productive
capacity of the study soil, an integrated nutrient management system should be
adopted to raise the soil fertility level for optimum production.
3.6 References
Abu, S.T. and Malgwi, W.B. (2012). Basicity and classification of soils formed on a
hilly terrain in a Nigerian Savanna. Nigerian Journal of Soil Science 20 (2):
163-173.
Adebayo, M.K., Osunde, A.O., Ezenwa, M.I., Odofia, A.J. and Bala, A. (2009).
Evaluation of the fertility status and suitability of some soils for arable cropping
in the Southern Guinea Savannah of Nigeria, Nigerian Journal of Soil Science
19(2): 115 – 120.
Ajiboye, G.A. and Ogunwale, I.A. (2010). Characteristics and classification of soils
developed over talc at Ejiba, Kogi State, Nigerian Journal of Soil Science 20
(1): 1-14.
Barrow, N.J. (1987). The effect of phosphate on zinc sorption by a soil. Soil Science
38: 453 – 459.
104
Bationo, A. and Mokwunye, A.U. (1991). Alleviating soil fertility constraints to
increased food production in West Africa: The experience of the Sahel,
Fertility Research 29:95-115.
Black, C.A. (1965). Method of Soil Analysis American Society Agronomy Medison,
Wisconsin. pp 12 – 3.
Brady, N.C. and Weil, R.R. (1996). The Nature and Properties of Soils. 11th Edition,
Prentice Hall International. 740 pp.
Chapman, H.D. (1965). Cation exchange capacity. In: Black, C.A. (Ed) Methods of Soil
Analysis. Part 2, ASA. Wisconsin, U.S.A. pp.891-901.
David, D. and Adams, A.A., (1985): Crops of drier regions of the tropics-Longman
Publishing Limited, Singapore. 92-98pp.
Enwezor, W.O., Udo, E.J. and Sabulo, R.A. (1981). Fertility status and productivity of the
Acid Sands of Southern Nigeria. Soil Science Society Nigeria Special
Publication Monograph 1: 56 - 73.
Esu, I.E. (1991). Detailed soil survey of NIHORT farm Bunkure, Kano State, Nigeria.
Institution for Agricultural Research, Ahmadu Bello University Zaria pp 7.
FAO (1976). A Framework for land evaluation. Soils Bulletin 3. FAO, Rome. 72 pp.
Fasina, A.S. and Ogunkunle (1995). Land quality and crop yield, an experience in maize
southwestern Nigeria African Soil 28:539-550.
Food and Agriculture Organization of the United Nations (FAO)./IUSS, (2006).
Guidelines for Soil Profile Description. 4th edition. rome.pp 66
Foth, H.D. (1990). Fundamental Soil Science. 8th
edition, New York 360pp.
Iqbal, J., Thomasson, J.A., Jenkins, J.N., Owens, P.R. and Whister, F.D. (2005).
Spatial variability analysis of physical properties of alluvial soils. Soil
Science Society of American Journal 69:1338 - 1350.
105
Julio, H.A. and Carlos, B. (1999). Nutrient depletion in the agricultural soils of Africa.
A 2020 Vision Brief 62, pp 1-2. International Food Policy Research Institute
Washington. DC, USA.
Kang, B.T. (1981). Nutrient requirement and fertilizer use for maize. In Agronomy
training manual for agro service agronomist NAFPP/IITA. FED. Dept.
Agr.Lagos, pp: 405-416.
Moberg, J.R. (2000). Soil and plant analysis Manual. The Royal Veterinary and
Agricultural University, Chemistry Department, Copenhagen, Denmark. 133
pp.
Mrema, J.P., Mowo, J.G., Shetto, M.C., Kajiru, G.J., Ngatoluwa, R. and Rwehumbiza,
F.B. (2003). Local strategies of soil fertility management and their impacts on
soil fertility and productivity. NRSP Project R8115.
Msanya B.M, Kaaya, A.K., Araki, S., Otsuka, H. and Nyadzi, G. (2003). Pedological
characteristics, general fertility and classification of some benchmark soils of
Morogoro district, Tanzania African Journal of Science and Technology
(AJST) Science and Engineering Series 4 (2): 101-112.
Mwango, S.B. (2000). Automated land evaluation for alternative uses in south western
part of the Uluguru Mountains in Morogoro Rural District, Tanzania
Dissertation for Award of M.Sc. Degree at Sokoine University of
Agriculture, Morogoro, Tanzania.
Obi, J.C. and Ogunkule, A.O. (2009). Influence of termite infestation on the spatial
variability of soil properties in the Guinea Savanna Region of Nigeria.
Geoderma 148: 357 - 368.
Ogban, P.I., Effiong, G.S., Obi, J.C. and Ibia, T.O. (2012). Properties and management of
inland swampland soils for crop production in Akwa Ibom State, Southeastern
Nigeria. Nigerian Journal of Soil Science 20 (1): 201-210.
106
Osei, B.A. (1993). Evaluation of some soils in South – Western Nigeria for arable crop
production. Common Soil and Plant Analysis 24 (788): 757- 773.
Rates, R. (2003). Maize market assessment and baseline study for Tanzania. Regional
Agricultural Trade Expansion Support Program, Nairobi, Kenya.
Sassi, M. (2004). Improving efficiency in the agriculture sector as an answer to
globalization, growth and equity: The case of Tanzania “Quaderno diricerca n.4.
pavia, Italy.
Singh, B.R. (1999). Fertility and salinity/sodicity status of Fadama Soil in North –
Western Nigeria I. Kebbi State Nigerian Journals of Basic and Applied
Science 8:1-14.
Sys, C. (1985). Land Evaluation, part I – III 2471. Publication No. 7 of the General
administration of cooperative Development placedechamps de mars, biote 57,
1050 Bruxelles.
Tisdale, S.L., W.L. Nelson, J.D. Beaton and Havlin, J.L. (1995). Soil fertility and
fertilizer, 5th
Ed. Prentice-Hall of India, New Delhi. 684p.
Udo, E.J., Ibia, T.O., Ogunwale, J.A., Ano, A.O. and Esu, I.E. (2009). Manual of soil
plant and water analysis. Sibon Books Ltd flat 15, BK 6 Fourth Avenue Festac,
Lagos.
Villapando, R.R. and Greatz, D.A. (2001). Phosphorus absorption and desorption
properties of the soil from selected Florida Spodosols. Soil Science Society of
American Journal 63:331 - 339.
Walkley, A. and Black, A. (1934). An examination of degtjaredd method of determining
soil organic matter and a proposed modification of the chromic acid titration
method. Soil Science 37: 29-38.

107
CHAPTER FOUR
4.0 RESPONSE OF MAIZE TO DIFFERENT RATES OF NITROGEN,
PHOSPHORUS AND FARMYARD MANURE APPLICATION, IN
MOROGORO, TANZANIA.
4.1 Abstract
Pot experiments were carried out in the screen house Department of Soil and
Geological Sciences College of Agriculture Sokoine University of Agriculture
Morogoro, Tanzania in 2014 and 2015 to determine the effects of different levels of
nitrogen, phosphorus and farmyard manure on the growth response, nutrient uptake
and dry matter yields of maize. The experiment was conducted in completely
randomized designed (CRD) with three replications. The treatments consisted of three
levels of nitrogen (0, 75 and 150 kg N ha-1
), three levels of phosphorus (0, 40 and 80
kg P ha-1
) and three levels of farm yard manure (0, 5 and 10 t FYM ha-1
). Plant growth
parameters which were determined included plant height, number of leaves, stem girth,
nutrients uptake and dry matter yields of maize at the age of week’s interval. The
results obtained showed that maximum plant height (66.75 and 115.4 cm), number of
leaves (8.50 and 9.00) and stem girth (4.90 and 5.85 cm) were achieved with the
application of 150 kg N ha-1
+ 80 kg P ha-1
+ 10 t FYM ha-1
. The results also showed
that, the combined rates of nitrogen, phosphorus and farmyard manure significantly
increased dry matter yield and N and P uptake of maize when compared with most of
the treatments and with the control. Root and shoot biomass ranged from 0.54 and 1.47
cm to 2.32 and 10.89 cm in 2014 and from 3.43 and 11.52 cm to 9.28 and 24.34 cm in
2015 respectively. The differences in the two years might be due to differences of the
soils used. The nutrient uptake ranged from 1.04 and 0.089% to 2.94 and 0.37% for N
and P in 2014 and from 0.367 and 0.037% to 2.55 and 0.31% for N and P respectively
in 2015. The effects of treatments combination on parameters which were determined
108
were significant (P≤0.05) in both experiments. The combined application of nitrogen,
phosphorus and farmyard manure at moderate rates (75 kg N ha-1
, 40 kg P ha-1
plus
FYM 5 t ha-1
) would be cost effective and sufficient for maize growth, dry matter yield
and nutrient content (N and P). It is recommended that field experiments have to be
conducted so as to confirm the results of this study.
Keyword: fertilizers, maize, plant height, leaves, green house nitrogen, phosphorus,
farmyard manure, dry mater yield.
4.2 Introduction
Maize is one of the highly consumed cereal crops ranked the first in terms of
production and third in terms of consumption among the ten staples that feed the world
(Allianz, 2010; FAOSTAT, 2011) and therefore the crop dominates agriculture in
many regions of the world. Maize was introduced in Africa in 1500s and has since
become one of the Africa’s dominant food crops and an important staple food for more
than 1.2 billion people in Sub – Saharan Africa and Latin America (IITA, 2012). The
declining soil fertility is widely perceived and regarded as a major limitation to
increasing yields and a threat to sustainability of the maize cropping systems
(Nkhuzenje et al., 2002). In Tanzania, it is estimated that the annual per capita
consumption of maize is over 115 kg and the national consumption is projected to be
three to four million tonnes per year (Rates, 2003). The popularity of maize is
evidenced by the fact that, it is grown in all the agro-ecological zones in the country
(Rates, 2003).
In Tanzania, continual cropping without concurrent use of organic/inorganic soil
amendments has reduced soil fertility, leading to low crop yields. A study to assess the
109
extent of nutrient mining conducted by Smaling and Janseen (1993) reported negative
balances of 27, 4 and 18 kg ha-1
, for N, P and K respectively; and this was attributed
to nutrients uptake by crops, and other losses like erosion and run-off. Consequently,
low yields ranging from 0.5 to 1.5 t ha-1
have been recorded, compared to potential
yield of 5 t ha-1
attainable with adequate nutrient supply (Ikerra and Kalumuma, 1991;
Ndaki, 2001). Nutrient replacement through the application of mineral or organic
amendments is possible, but small scale farmers are constrained by a multitude of
socio-economic factors such as high cost and scarcity of the amendments. The use of
inorganic fertilizers by small scale farmers is limited by their high prices, and which
are frequently not available in time and low benefit cost ratios (Palm et al., 1997;
2001) of the amendments, inadequate use of inputs such as fertilizer, lack of improved
maize seed, inadequate access to information and extension services, erratic rainfall
and high susceptibility of maize to drought (Palm et al., 2001).
Over three million hectares of land are under maize cultivation (Rates, 2003) in
Tanzania with average yields of between 1.2 and 1.5 tonnes per hectare. The crop
accounts for 31 percent of the total food production and constitutes more than 75
percent of the cereals consumption in the country (Rates, 2003). However with
continuous cultivation, most of the essential plant nutrients which were previously
adequate have declined to deficient levels, hence the need to apply them in the form of
fertilizers or other soil amendments. The three nutrients N, P and K are often the most
limiting in many soils, in the order N>P>K (Smalling and Janseen 1993).
Many studies have reported positive effect of both organic and inorganic fertilizers as
well as their combinations, in supporting higher growth of maize (Bhataacharyya et
al., 2008,; Mando et al., 2005; Donovan and Casey 1998; Achieng et al., 2010). The

110
use of inorganic fertilizers has not been that helpful as it is associated with increased
soil acidity and nutrient imbalance in savanna soil (Lombin, 1987). On the other hand,
organic manure has low nutrients content thus could hardly supply the quantity needed
by crops (Titiloye, 1982). However application of organic manure offers the best
advantage because apart from enhancing the availability of the plant nutrients it
improves the soil physical, chemical and biological properties (Tiwani et al., 2002;
Celik et al., 2004).
Based upon research findings across numerous countries and diverse agro ecological
zones of sub – Saharan Africa (SSA), a consensus has been reached that the highest
and the most sustainable gains in crop productivity per unit nutrient are achieved from
mixtures of inorganic fertilizers and organic inputs (Vanlauwe et al., 2001). The need
to combine organic inputs with inorganic fertilizers and farmer – available organic
resources are viewed as a major entry point (Sanchez, 1994). Indeed combining
mineral and organic inputs result in greater benefits than using either of the inputs
alone (Sanchez, 1994). Organic and organomineral fertilizers were found to
significantly increase yields of maize and vegetables such as pepper, tomato, okra,
melon and amaranths (Akanni and Ojeniyi, 2008; Makinde, 2007). The basic concept
underlying the integrated nutrient management system (INMS), nevertheless, remains
the maintenance and possible improvement of soil fertility for sustainable crop
productivity on long term-basis and also the reduction of inorganic (fertilizer) input
costs in crop production (Roy and Ange, 1991).
Maize requires adequate supply of nutrients particularly nitrogen, phosphorus and
potassium for good growth and high yields. Nitrogen and phosphorus are essential for
good vegetative growth and grain development in maize production (Kang, 1981; Oad,
111
2004). The estimate of the needed fertilizer usually vary depending upon the climate,
crop requirement, soil conditions, fertilizer type, soil organic matter content, tillage
methods and light intensity (Kang, 1981). Nitrogen is a vital plant nutrient and a major
yield determining factor required for maize production (Adediran and Banjoko, 1995;
Shanti et al., 1997). As Tisdale et al. (1993) revealed, nitrogen is an important plant
nutrient and is the most frequently deficient of all major nutrients required by plant.
The low nitrogen supplying power of soils calls for large additions of nitrogen
fertilizers to soils to meet the nitrogen needs of high yielding non legume crops (Foth,
1990). Since nitrogen in the soil is normally transient after breakdown of organic
matter, adequate supply of nitrogen is essential during the growing season of plant so
that growth and yields are not limited by N. N fertilizers were the first to be used and
are still predominant (FAO, 1995).
Phosphorus availability is equally critical during the early stages of plant growth
because the movement of P to the plant roots promote early root formation and growth
(Sharpley et al., 1994). Phosphorus is known as the master key to agriculture because
lack of available P in soils limits the growth of both cultivated and uncultivated plants
(Foth and Ellis, 1997).
The maize must have adequate quantity of nitrogen and phosphorus for profitable good
crop growth and development (Wondewosen, 2009; Tenaw et al., 2006). Regular
application of organic manure not only supply all the various macro and micro-
nutrients, although in small quantities, but also improves soil physical and biological
properties (Moyin Jesu, 2002; Olayinka, 2009). Generally, adequate soil nitrogen,
potassium and phosphorous are essential nutrients which can be supplied by organic or
inorganic fertilizer sources (Moritsuka et al., 2001).
112
Nitrogen and phosphorus have wider influence on both natural and agricultural
ecosystems than any other essential nutrient elements. In most natural ecosystems,
such as forests and grasslands, P uptake by plants is constrained by both the low total
quantity of the element in the soil and by very low solubility of the scarce quantity that
is present (Brady and Weil, 2002). In line with the above therefore, this study was
aimed at investigating the growth response, nutrient uptake (N and P) and biomass
production (DMY) of maize grown with different levels of organic and inorganic
fertilizers at the Sokoine University of Agriculture Solomon Mahalangu Campus Farm
Morogoro, Tanzania.
4.3 Materials and Methods
4.3.1 Description of the study area
The soils used in the screen house study were composite surface samples (0–30 cm)
that were collected at Solomon Mahlangu Campus farm. The study was conducted in
the screen house of the Department of Soil and Geological Sciences at College of
Agriculture Sokoine University of Agriculture, Morogoro district of Tanzania. The
study area lies between Latitude 5’58ʹʹN; 10’0ʹʹS and longitude 35’25ʹʹ; 35’30ʹʹE). It
experiences bimodal rainfall which ranges from 600 to 1200 mm and mean annual
temperatures of about 24°C monthly. The long rains (LR) starts from February to June,
and the short rains from October to December.
4.3.2 Collection and preparation of soil and farmyard manure samples
Bulked surface soil samples (400 kg) were collected from identified mapping units of
SMC farm, Sokoine University of Agriculture Morogoro at the depth of 0-30 cm for
the two pot experiments in 2014 and 2015, respectively while FYM samples were
collected from the dairy house of the farm. The soil samples were bulked and
113
thoroughly mixed so as to obtain a composite sample. The soil samples were air-dried,
ground and sieved to pass through 6 mm diameter sieve for the screen house
experiments and 2 mm diameter screen for sub samples used for laboratory analysis.
4.3.3 Laboratory analysis of soil and farmyard manure
The soil sub samples for year 2014 and 2015 were analyzed for particle size
distribution using the hydrometer method (Bouyoucos 1962), Soil pH (H20) in a 1:2.5
soil/solution ratio electrometrically. The total N was determined by the macro Kjedhal
method (Bremner and Mulvaney, 1982) and organic carbon (OC) was determined by
the dichromate wet oxidation method as outlined by Nelson and Sommers (1982).
Ammonium acetate (NSS, 1990) was used for the determination of CEC and
exchangeable bases (Ca, Mg, K and Na). Organic matter content was obtained by
multiplying organic carbon values by a factor of 1.724 as recorded by Eno et al.
(2009). Extractable micronutrients (Cu, Zn, Fe and Mn) were extracted by DTPA and
determined quantitatively by Atomic Absorption Spectrophotometer (AAS) (Senjobi,
2007). The analytical methods advocated as Moberg (2000) was used for these
analyses. The total analysis of composite FYM sample was conducted using
procedures described by Okalebo et al. (1993).
4.3.4 Experimental design and treatments
The experiment was 33 factorial fitted into a completely randomized design (CRD)
with three replications. The treatments consisted of three rates of nitrogen (0, 75 and
150 kg N ha-1
), three rates of phosphorus (0, 40 and 80 kg P ha-1
) and three rates of
farmyard manure (0, 5 and 10 t ha-1
), thus the experiments consisted of 27 treatments
(T) combination (Appendix 4.1).
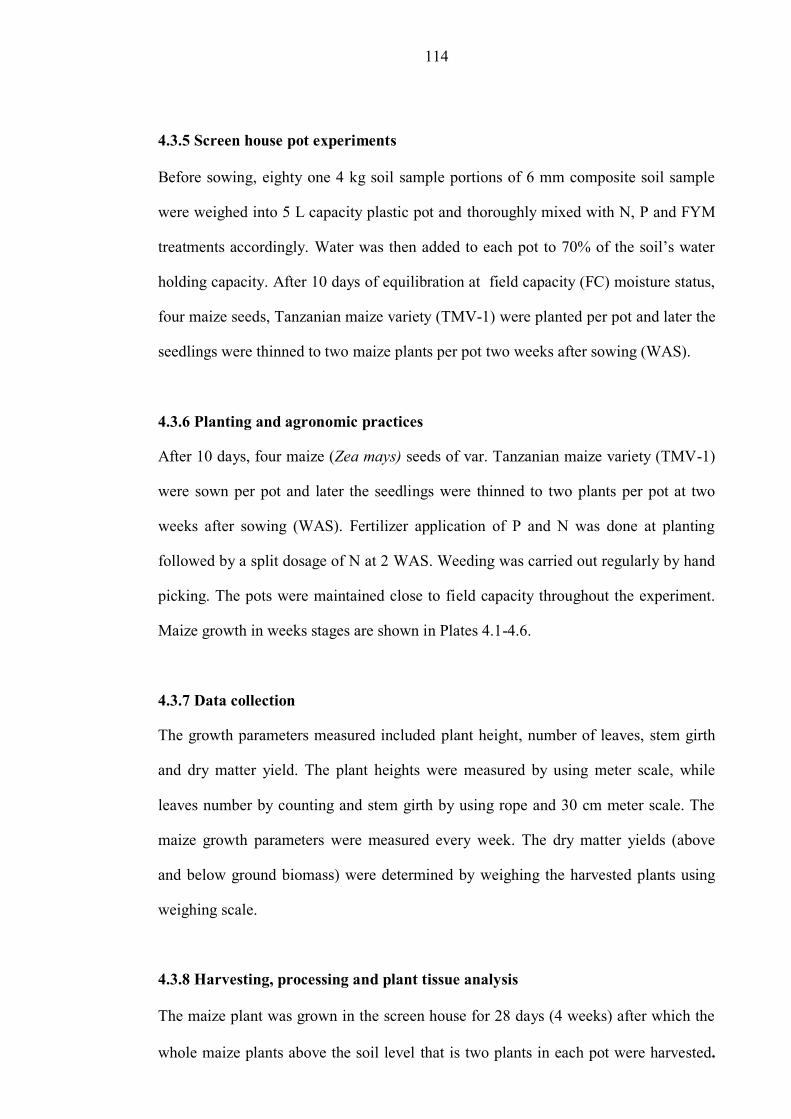
114
4.3.5 Screen house pot experiments
Before sowing, eighty one 4 kg soil sample portions of 6 mm composite soil sample
were weighed into 5 L capacity plastic pot and thoroughly mixed with N, P and FYM
treatments accordingly. Water was then added to each pot to 70% of the soil’s water
holding capacity. After 10 days of equilibration at field capacity (FC) moisture status,
four maize seeds, Tanzanian maize variety (TMV-1) were planted per pot and later the
seedlings were thinned to two maize plants per pot two weeks after sowing (WAS).
4.3.6 Planting and agronomic practices
After 10 days, four maize (Zea mays) seeds of var. Tanzanian maize variety (TMV-1)
were sown per pot and later the seedlings were thinned to two plants per pot at two
weeks after sowing (WAS). Fertilizer application of P and N was done at planting
followed by a split dosage of N at 2 WAS. Weeding was carried out regularly by hand
picking. The pots were maintained close to field capacity throughout the experiment.
Maize growth in weeks stages are shown in Plates 4.1-4.6.
4.3.7 Data collection
The growth parameters measured included plant height, number of leaves, stem girth
and dry matter yield. The plant heights were measured by using meter scale, while
leaves number by counting and stem girth by using rope and 30 cm meter scale. The
maize growth parameters were measured every week. The dry matter yields (above
and below ground biomass) were determined by weighing the harvested plants using
weighing scale.
4.3.8 Harvesting, processing and plant tissue analysis
The maize plant was grown in the screen house for 28 days (4 weeks) after which the
whole maize plants above the soil level that is two plants in each pot were harvested.

115
The shoot and the root were carefully harvested by cutting the shoot just above the soil
level and the roots were gently uprooted from the soil. The experiment was repeated
and all protocols were the same.
Plate 4.1: Response of maize to treatments at 1 WAS
Plate 4.2: Response of maize to treatments at 10 DAS
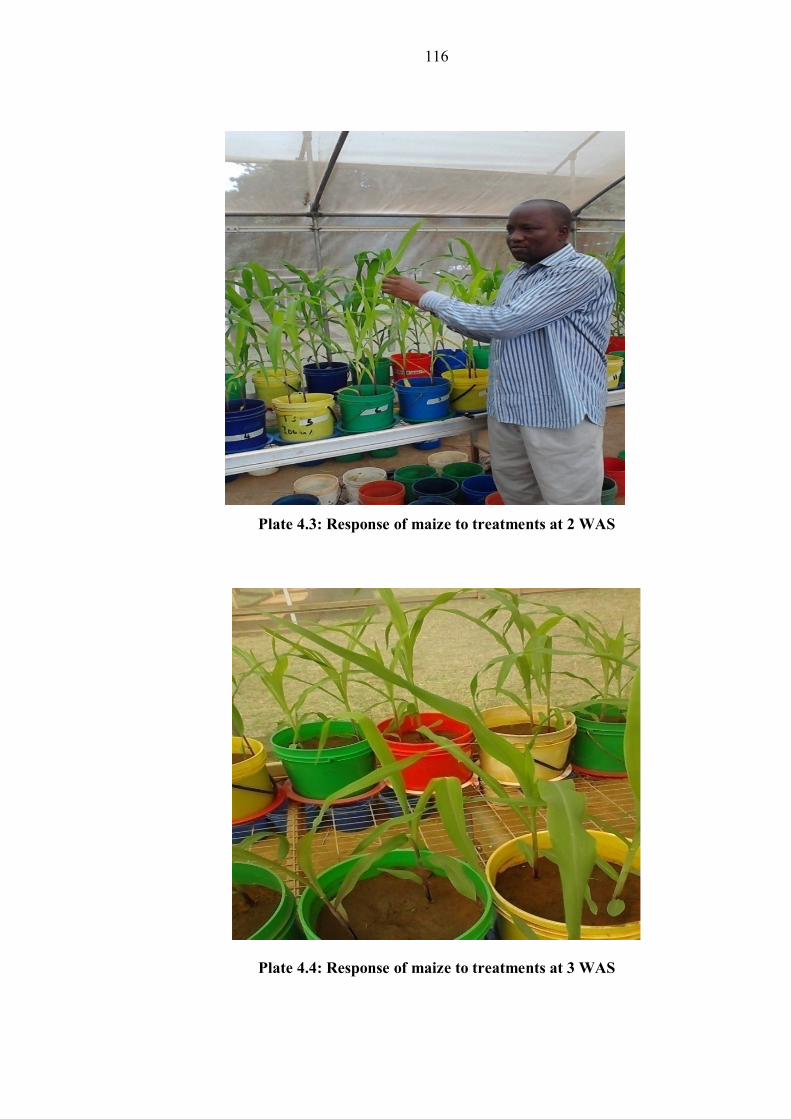
116
Plate 4.3: Response of maize to treatments at 2 WAS
Plate 4.4: Response of maize to treatments at 3 WAS
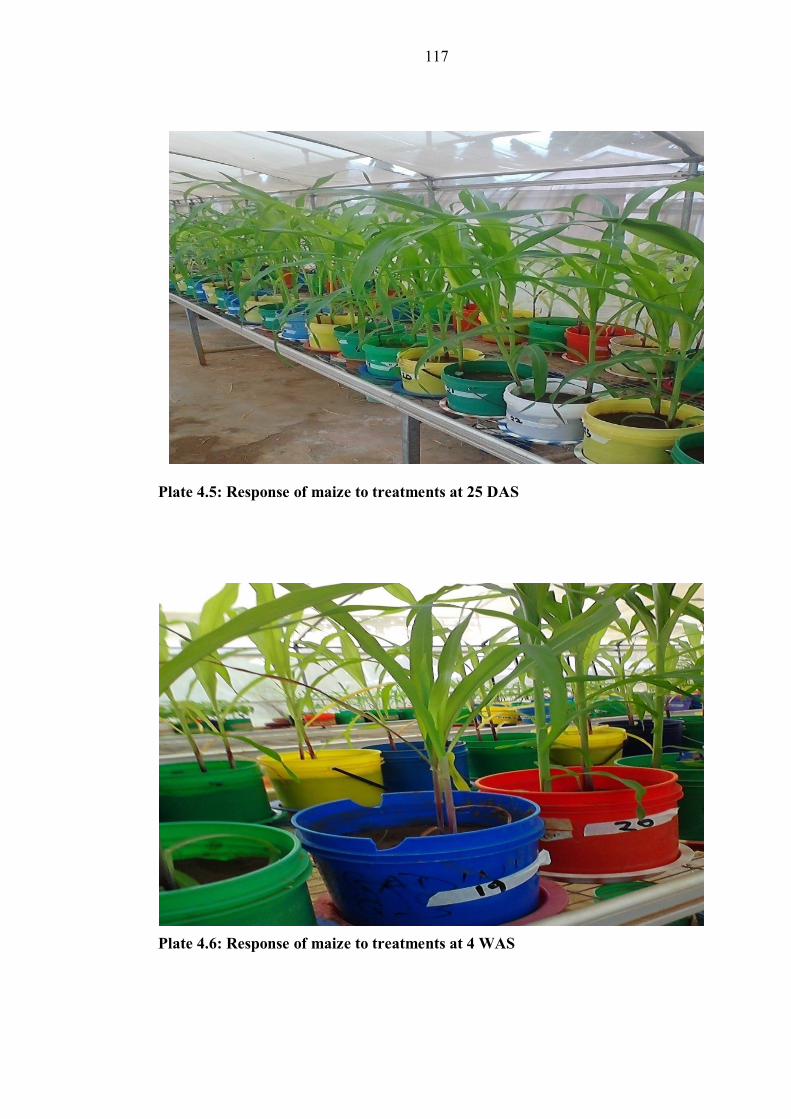
117
Plate 4.5: Response of maize to treatments at 25 DAS
Plate 4.6: Response of maize to treatments at 4 WAS
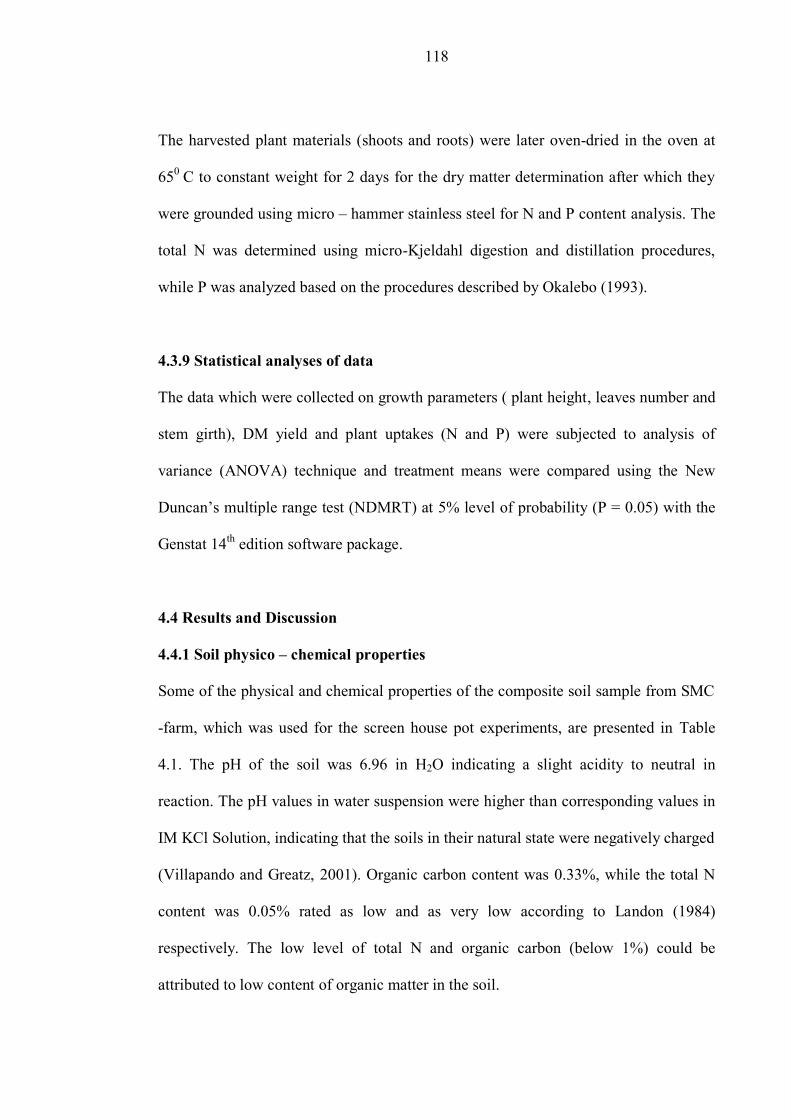
118
The harvested plant materials (shoots and roots) were later oven-dried in the oven at
650
C to constant weight for 2 days for the dry matter determination after which they
were grounded using micro – hammer stainless steel for N and P content analysis. The
total N was determined using micro-Kjeldahl digestion and distillation procedures,
while P was analyzed based on the procedures described by Okalebo (1993).
4.3.9 Statistical analyses of data
The data which were collected on growth parameters ( plant height, leaves number and
stem girth), DM yield and plant uptakes (N and P) were subjected to analysis of
variance (ANOVA) technique and treatment means were compared using the New
Duncan’s multiple range test (NDMRT) at 5% level of probability (P = 0.05) with the
Genstat 14th
edition software package.
4.4 Results and Discussion
4.4.1 Soil physico – chemical properties
Some of the physical and chemical properties of the composite soil sample from SMC
-farm, which was used for the screen house pot experiments, are presented in Table
4.1. The pH of the soil was 6.96 in H2O indicating a slight acidity to neutral in
reaction. The pH values in water suspension were higher than corresponding values in
IM KCl Solution, indicating that the soils in their natural state were negatively charged
(Villapando and Greatz, 2001). Organic carbon content was 0.33%, while the total N
content was 0.05% rated as low and as very low according to Landon (1984)
respectively. The low level of total N and organic carbon (below 1%) could be
attributed to low content of organic matter in the soil.
119
The total N level was directly proportional to the organic carbon content in the soils of
the study area. Ayolagha and Onuegbu (2002) also reported that, the higher the organic
carbon the higher the total N in the soil as the soil organic matter is the sole source of
nitrogen in the soil. The exchangeable bases values (Ca=0.37, Mg=0.82, K=0.74 and
Na=0.32) in the soil were rated as low to moderate, while micronutrients (Cu=0.25,
Zn=0.12 and Mn=33.77) were rated as low to high (Landon 1984) and available
phosphorus (10.86 mg kg-1
) was moderate to high. The low content for these
exchangeable bases (especially Ca and Mg) was due to low CEC of the soil resulting
in the low content of clay and organic matter (Adamu, 2013). The textural class of the
soil was sandy loamy.
The BS percentage (16.68 and 18.15%) was low and this may be due to the low
content of organic matter in the surface soils, as organic matter is the natural store of
the base elements and other plant nutrient elements from where they are slowly
released into the soil solution (Ogban, 2012).The values of Fe and Mn in these soils
are rated as medium to high. Also Alloway (2008) and Oluwolafe (2012) reported high
content of zinc in basic igneous rocks, such as basalts due to zinc occurring in
ferromagnesian minerals. The low levels of other micronutrients may be due to
continuous residues removal, and over grazing. The EC values were 0.02 dSm, which
indicates that the soil is non-saline. The values of soil chemical properties indicated
low fertility status indicating that the soils were low in fertility. Therefore, there is
need to apply fertilizers to the soil in order to boost its productivity.
Soil analysis before sowing indicated that the values of the soil chemical properties
were low thus translating low in soil fertility status which requires addition of
fertilizers to increase its fertility and productivity. FYM analysis indicated to have
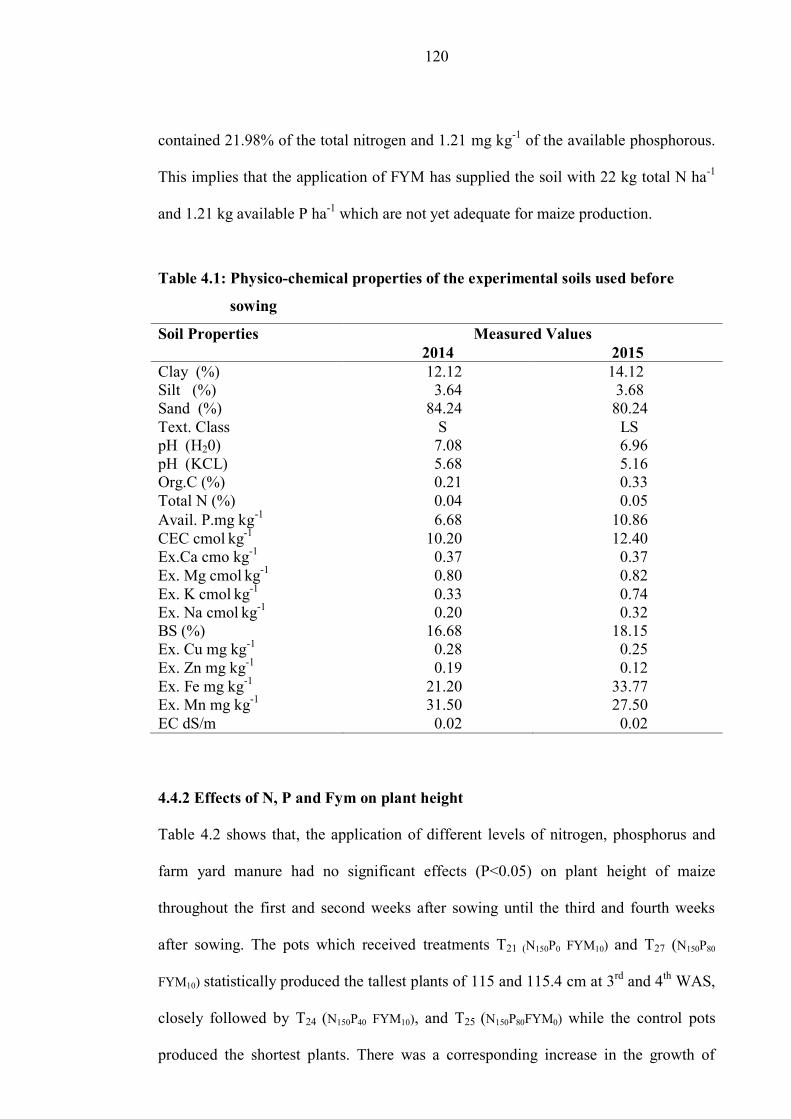
120
contained 21.98% of the total nitrogen and 1.21 mg kg-1
of the available phosphorous.
This implies that the application of FYM has supplied the soil with 22 kg total N ha-1
and 1.21 kg available P ha-1
which are not yet adequate for maize production.
Table 4.1: Physico-chemical properties of the experimental soils used before
sowing
Soil Properties Measured Values
2014 2015
Clay (%) 12.12 14.12
Silt (%) 3.64 3.68
Sand (%) 84.24 80.24
Text. Class S LS
pH (H20) 7.08 6.96
pH (KCL) 5.68 5.16
Org.C (%) 0.21 0.33
Total N (%) 0.04 0.05
Avail. P.mg kg-1
6.68 10.86
CEC cmol kg
-1 10.20 12.40
Ex.Ca cmo kg-1
0.37 0.37
Ex. Mg cmol kg
-1 0.80 0.82
Ex. K cmol kg
-1 0.33 0.74
Ex. Na cmol kg
-1 0.20 0.32
BS (%) 16.68 18.15
Ex. Cu mg kg-1
0.28 0.25
Ex. Zn mg kg-1
0.19 0.12
Ex. Fe mg kg-1
21.20 33.77
Ex. Mn mg kg-1
31.50 27.50
EC dS/m 0.02 0.02
4.4.2 Effects of N, P and Fym on plant height
Table 4.2 shows that, the application of different levels of nitrogen, phosphorus and
farm yard manure had no significant effects (P<0.05) on plant height of maize
throughout the first and second weeks after sowing until the third and fourth weeks
after sowing. The pots which received treatments T21 (N150P0 FYM10) and T27 (N150P80
FYM10) statistically produced the tallest plants of 115 and 115.4 cm at 3rd
and 4th
WAS,
closely followed by T24 (N150P40 FYM10), and T25 (N150P80FYM0) while the control pots
produced the shortest plants. There was a corresponding increase in the growth of
121
maize as the rate of manure increased. The pots which received higher dosage of
FYM, N and P rates gave the tallest plant (115.4 cm) and the control treatment
produced the shortest plant of 56.7 cm at the end of four weeks experiment
(Appendices. 4.2).
The findings in this experiment are in agreement with those of Makinde (2007) and
Ayoola and Makinde (2009) who reported better plant height of maize after the use of
integrated N, P and FYM. The use of 120 kg N ha-1
resulted in taller maize plants with
superior number of leaves and leaf area index, vigorous growth, thick canopy, efficient
light interception, and higher dry matter production (Titiloye 1982; Zhao et al., 2009;
Sumi and Kutayam, 2000; Oad et al., 2004).
4.4.3 Effects of N, P and Fym on number of leaves
The number of leaves produced by the maize plants at week interval stages of growth
is presented in Table 4.3. The number of leaves followed a similar trend with plant
height as the application of different rates of N, P and FYM significantly (p<0.05)
affect leaves number at 3 and 4 WAS. It was observed that at 1 and 2WAS all pots
with different N, P and FYM treatments have similar number of leaves.
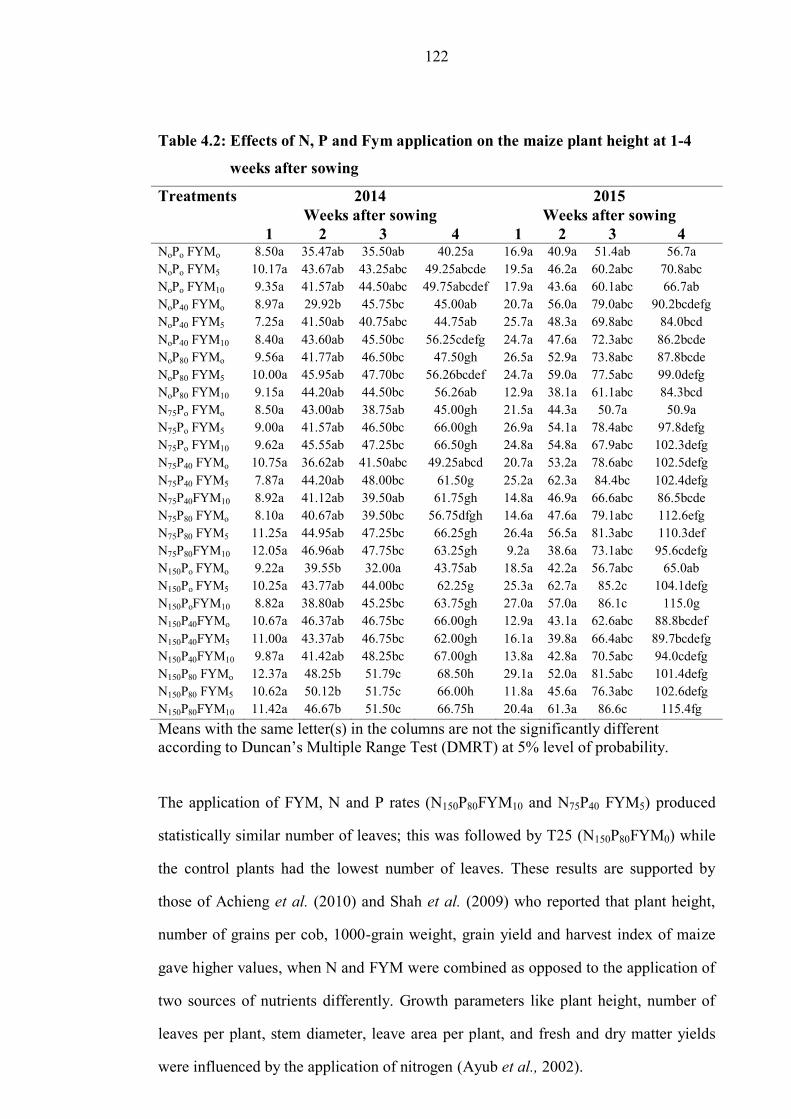
122
Table 4.2: Effects of N, P and Fym application on the maize plant height at 1-4
weeks after sowing
Treatments
2014 2015
Weeks after sowing Weeks after sowing
1 2 3 4 1 2 3 4 NoPo FYMo 8.50a 35.47ab 35.50ab 40.25a 16.9a 40.9a 51.4ab 56.7a
NoPo FYM5 10.17a 43.67ab 43.25abc 49.25abcde 19.5a 46.2a 60.2abc 70.8abc
NoPo FYM10 9.35a 41.57ab 44.50abc 49.75abcdef 17.9a 43.6a 60.1abc 66.7ab
NoP40 FYMo 8.97a 29.92b 45.75bc 45.00ab 20.7a 56.0a 79.0abc 90.2bcdefg
NoP40 FYM5 7.25a 41.50ab 40.75abc 44.75ab 25.7a 48.3a 69.8abc 84.0bcd
NoP40 FYM10 8.40a 43.60ab 45.50bc 56.25cdefg 24.7a 47.6a 72.3abc 86.2bcde
NoP80 FYMo 9.56a 41.77ab 46.50bc 47.50gh 26.5a 52.9a 73.8abc 87.8bcde
NoP80 FYM5 10.00a 45.95ab 47.70bc 56.26bcdef 24.7a 59.0a 77.5abc 99.0defg
NoP80 FYM10 9.15a 44.20ab 44.50bc 56.26ab 12.9a 38.1a 61.1abc 84.3bcd
N75Po FYMo 8.50a 43.00ab 38.75ab 45.00gh 21.5a 44.3a 50.7a 50.9a
N75Po FYM5 9.00a 41.57ab 46.50bc 66.00gh 26.9a 54.1a 78.4abc 97.8defg
N75Po FYM10 9.62a 45.55ab 47.25bc 66.50gh 24.8a 54.8a 67.9abc 102.3defg
N75P40 FYMo 10.75a 36.62ab 41.50abc 49.25abcd 20.7a 53.2a 78.6abc 102.5defg
N75P40 FYM5 7.87a 44.20ab 48.00bc 61.50g 25.2a 62.3a 84.4bc 102.4defg
N75P40FYM10 8.92a 41.12ab 39.50ab 61.75gh 14.8a 46.9a 66.6abc 86.5bcde
N75P80 FYMo 8.10a 40.67ab 39.50bc 56.75dfgh 14.6a 47.6a 79.1abc 112.6efg
N75P80 FYM5 11.25a 44.95ab 47.25bc 66.25gh 26.4a 56.5a 81.3abc 110.3def
N75P80FYM10 12.05a 46.96ab 47.75bc 63.25gh 9.2a 38.6a 73.1abc 95.6cdefg
N150Po FYMo 9.22a 39.55b 32.00a 43.75ab 18.5a 42.2a 56.7abc 65.0ab
N150Po FYM5 10.25a 43.77ab 44.00bc 62.25g 25.3a 62.7a 85.2c 104.1defg
N150PoFYM10 8.82a 38.80ab 45.25bc 63.75gh 27.0a 57.0a 86.1c 115.0g
N150P40FYMo 10.67a 46.37ab 46.75bc 66.00gh 12.9a 43.1a 62.6abc 88.8bcdef
N150P40FYM5 11.00a 43.37ab 46.75bc 62.00gh 16.1a 39.8a 66.4abc 89.7bcdefg
N150P40FYM10 9.87a 41.42ab 48.25bc 67.00gh 13.8a 42.8a 70.5abc 94.0cdefg
N150P80 FYMo 12.37a 48.25b 51.79c 68.50h 29.1a 52.0a 81.5abc 101.4defg
N150P80 FYM5 10.62a 50.12b 51.75c 66.00h 11.8a 45.6a 76.3abc 102.6defg
N150P80FYM10 11.42a 46.67b 51.50c 66.75h 20.4a 61.3a 86.6c 115.4fg
Means with the same letter(s) in the columns are not the significantly different
according to Duncan’s Multiple Range Test (DMRT) at 5% level of probability.
The application of FYM, N and P rates (N150P80FYM10 and N75P40 FYM5) produced
statistically similar number of leaves; this was followed by T25 (N150P80FYM0) while
the control plants had the lowest number of leaves. These results are supported by
those of Achieng et al. (2010) and Shah et al. (2009) who reported that plant height,
number of grains per cob, 1000-grain weight, grain yield and harvest index of maize
gave higher values, when N and FYM were combined as opposed to the application of
two sources of nutrients differently. Growth parameters like plant height, number of
leaves per plant, stem diameter, leave area per plant, and fresh and dry matter yields
were influenced by the application of nitrogen (Ayub et al., 2002).
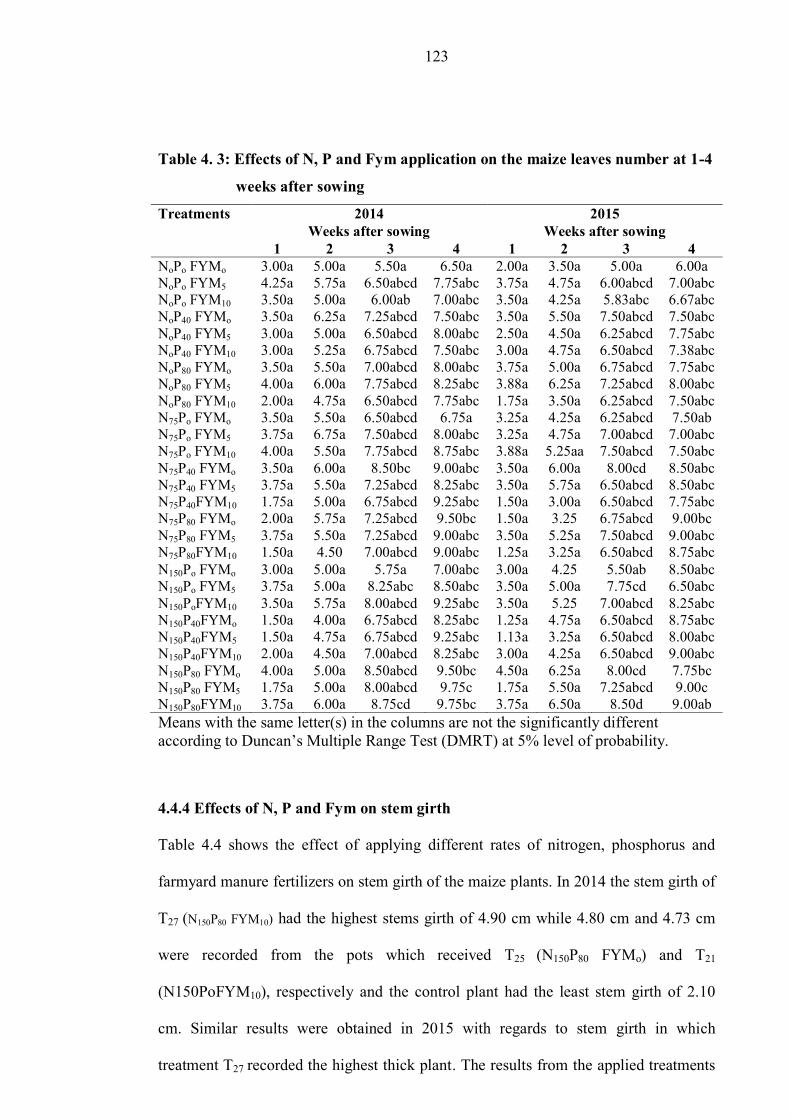
123
Table 4. 3: Effects of N, P and Fym application on the maize leaves number at 1-4
weeks after sowing
Treatments 2014 2015
Weeks after sowing Weeks after sowing
1 2 3 4 1 2 3 4
NoPo FYMo 3.00a 5.00a 5.50a 6.50a 2.00a 3.50a 5.00a 6.00a
NoPo FYM5 4.25a 5.75a 6.50abcd 7.75abc 3.75a 4.75a 6.00abcd 7.00abc
NoPo FYM10 3.50a 5.00a 6.00ab 7.00abc 3.50a 4.25a 5.83abc 6.67abc
NoP40 FYMo 3.50a 6.25a 7.25abcd 7.50abc 3.50a 5.50a 7.50abcd 7.50abc
NoP40 FYM5 3.00a 5.00a 6.50abcd 8.00abc 2.50a 4.50a 6.25abcd 7.75abc
NoP40 FYM10 3.00a 5.25a 6.75abcd 7.50abc 3.00a 4.75a 6.50abcd 7.38abc
NoP80 FYMo 3.50a 5.50a 7.00abcd 8.00abc 3.75a 5.00a 6.75abcd 7.75abc
NoP80 FYM5 4.00a 6.00a 7.75abcd 8.25abc 3.88a 6.25a 7.25abcd 8.00abc
NoP80 FYM10 2.00a 4.75a 6.50abcd 7.75abc 1.75a 3.50a 6.25abcd 7.50abc
N75Po FYMo 3.50a 5.50a 6.50abcd 6.75a 3.25a 4.25a 6.25abcd 7.50ab
N75Po FYM5 3.75a 6.75a 7.50abcd 8.00abc 3.25a 4.75a 7.00abcd 7.00abc
N75Po FYM10 4.00a 5.50a 7.75abcd 8.75abc 3.88a 5.25aa 7.50abcd 7.50abc
N75P40 FYMo 3.50a 6.00a 8.50bc 9.00abc 3.50a 6.00a 8.00cd 8.50abc
N75P40 FYM5 3.75a 5.50a 7.25abcd 8.25abc 3.50a 5.75a 6.50abcd 8.50abc
N75P40FYM10 1.75a 5.00a 6.75abcd 9.25abc 1.50a 3.00a 6.50abcd 7.75abc
N75P80 FYMo 2.00a 5.75a 7.25abcd 9.50bc 1.50a 3.25 6.75abcd 9.00bc
N75P80 FYM5 3.75a 5.50a 7.25abcd 9.00abc 3.50a 5.25a 7.50abcd 9.00abc
N75P80FYM10 1.50a 4.50 7.00abcd 9.00abc 1.25a 3.25a 6.50abcd 8.75abc
N150Po FYMo 3.00a 5.00a 5.75a 7.00abc 3.00a 4.25 5.50ab 8.50abc
N150Po FYM5 3.75a 5.00a 8.25abc 8.50abc 3.50a 5.00a 7.75cd 6.50abc
N150PoFYM10 3.50a 5.75a 8.00abcd 9.25abc 3.50a 5.25 7.00abcd 8.25abc
N150P40FYMo 1.50a 4.00a 6.75abcd 8.25abc 1.25a 4.75a 6.50abcd 8.75abc
N150P40FYM5 1.50a 4.75a 6.75abcd 9.25abc 1.13a 3.25a 6.50abcd 8.00abc
N150P40FYM10 2.00a 4.50a 7.00abcd 8.25abc 3.00a 4.25a 6.50abcd 9.00abc
N150P80 FYMo 4.00a 5.00a 8.50abcd 9.50bc 4.50a 6.25a 8.00cd 7.75bc
N150P80 FYM5 1.75a 5.00a 8.00abcd 9.75c 1.75a 5.50a 7.25abcd 9.00c
N150P80FYM10 3.75a 6.00a 8.75cd 9.75bc 3.75a 6.50a 8.50d 9.00ab
Means with the same letter(s) in the columns are not the significantly different
according to Duncan’s Multiple Range Test (DMRT) at 5% level of probability.
4.4.4 Effects of N, P and Fym on stem girth
Table 4.4 shows the effect of applying different rates of nitrogen, phosphorus and
farmyard manure fertilizers on stem girth of the maize plants. In 2014 the stem girth of
T27 (N150P80 FYM10) had the highest stems girth of 4.90 cm while 4.80 cm and 4.73 cm
were recorded from the pots which received T25 (N150P80 FYMo) and T21
(N150PoFYM10), respectively and the control plant had the least stem girth of 2.10
cm. Similar results were obtained in 2015 with regards to stem girth in which
treatment T27 recorded the highest thick plant. The results from the applied treatments
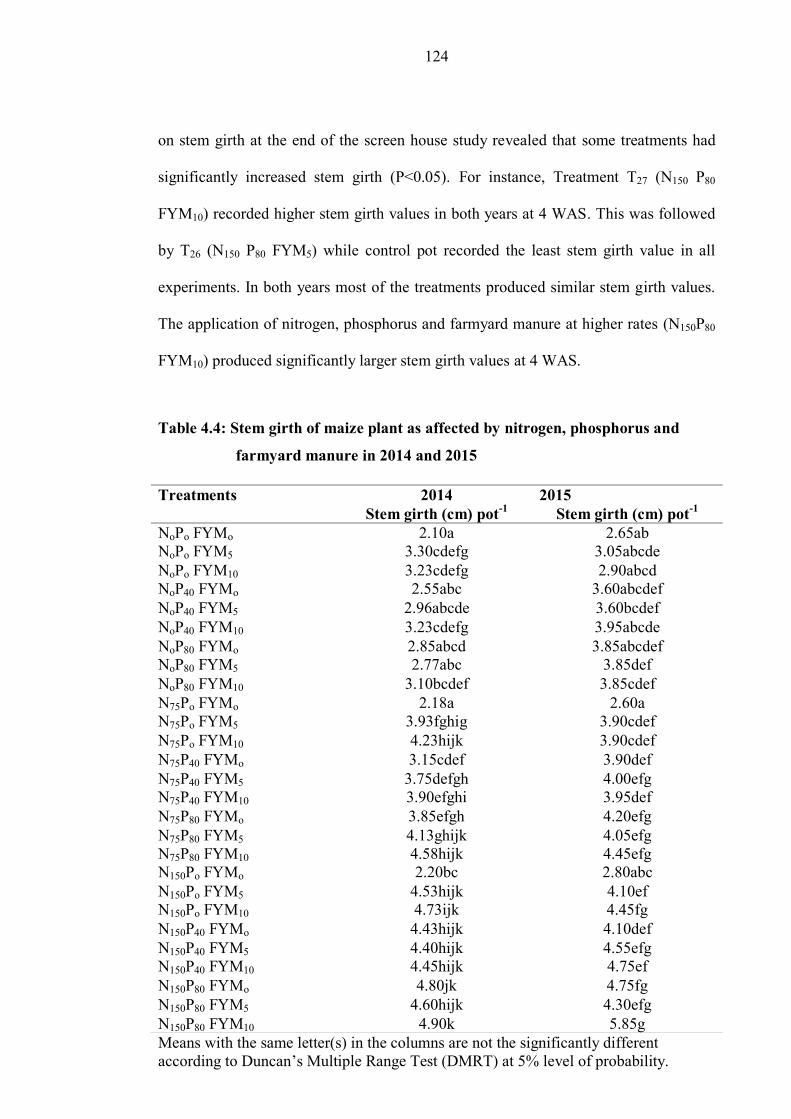
124
on stem girth at the end of the screen house study revealed that some treatments had
significantly increased stem girth (P<0.05). For instance, Treatment T27 (N150 P80
FYM10) recorded higher stem girth values in both years at 4 WAS. This was followed
by T26 (N150 P80 FYM5) while control pot recorded the least stem girth value in all
experiments. In both years most of the treatments produced similar stem girth values.
The application of nitrogen, phosphorus and farmyard manure at higher rates (N150P80
FYM10) produced significantly larger stem girth values at 4 WAS.
Table 4.4: Stem girth of maize plant as affected by nitrogen, phosphorus and
farmyard manure in 2014 and 2015
Means with the same letter(s) in the columns are not the significantly different
according to Duncan’s Multiple Range Test (DMRT) at 5% level of probability.
Treatments 2014 2015
Stem girth (cm) pot-1
Stem girth (cm) pot-1
NoPo FYMo 2.10a 2.65ab
NoPo FYM5 3.30cdefg 3.05abcde
NoPo FYM10 3.23cdefg 2.90abcd
NoP40 FYMo 2.55abc 3.60abcdef
NoP40 FYM5 2.96abcde 3.60bcdef
NoP40 FYM10 3.23cdefg 3.95abcde
NoP80 FYMo 2.85abcd 3.85abcdef
NoP80 FYM5 2.77abc 3.85def
NoP80 FYM10 3.10bcdef 3.85cdef
N75Po FYMo 2.18a 2.60a
N75Po FYM5 3.93fghig 3.90cdef
N75Po FYM10 4.23hijk 3.90cdef
N75P40 FYMo 3.15cdef 3.90def
N75P40 FYM5 3.75defgh 4.00efg
N75P40 FYM10 3.90efghi 3.95def
N75P80 FYMo 3.85efgh 4.20efg
N75P80 FYM5 4.13ghijk 4.05efg
N75P80 FYM10 4.58hijk 4.45efg
N150Po FYMo 2.20bc 2.80abc
N150Po FYM5 4.53hijk 4.10ef
N150Po FYM10 4.73ijk 4.45fg
N150P40 FYMo 4.43hijk 4.10def
N150P40 FYM5 4.40hijk 4.55efg
N150P40 FYM10 4.45hijk 4.75ef
N150P80 FYMo 4.80jk 4.75fg
N150P80 FYM5 4.60hijk 4.30efg
N150P80 FYM10 4.90k 5.85g
125
Plant height, number of leaves and stem girth were generally influenced by the
combined application of nitrogen, phosphorus and farmyard manure at various rates in
both 2014 and 2015 seasons. The results of this experiment are in agreement with the
results obtained by Titiloye (1982). Similarly, an increase in the number of leaves per
plant due to combined nutrient application was reported by Makinde (2007).
Biological yield is one of the measures of plant growth and reflects the relative growth
rate as regard to net assimilation rate (Khan et al., 2008). Biological yield was
significantly affected by the application of fertilizer at two locations during 2009 and
2010 (Achieng et al., 2010). The increase in biological and stalk yield could reflect the
better growth and development of maize plants due to balanced and more available
nutrients throughout the growing period. These results agree with those of Khan et al.
(2008) who reported that declining N uptake with progression of plant growth was
partly due to high assimilation rate from an increase in plant biomass with plant
growth. It was also reported that the concentration of N in the leaf stem and roots of
maize declined asymptotically from first to the last sampling dates (Aflakpui et al.,
1998). As crops grow, concentration of nutrient per unit of dry mass normally
decreases with time as more structural materials are produced due to the nutrient
concentration dilution effect (Gregory, 1997). The effect of the farmyard manure
application increased the parameters measured due to a gradual release of available
nutrients throughout the period of growth.
4.4.5 Effect of nitrogen, phosphorus and farmyard manure on root, shoot and
total dry matter yield of maize
Maize biomass production (root and shoot DMY) was measured at the end of each
screen house experiment and the results are presented in Table 4.5. In both years the
application of different rates of nitrogen, phosphorus and farmyard manure had
significant effects on the root, shoot, and dry matter yields of maize (Table 4.5).
126
In the 2014 experiment, the highest root, shoot and DM yield were obtained from pots
that received T27 followed by those pots which received T24 was and these were
significantly higher than the absolute control and the pots which were treated with
other nutrients levels. The highest total DM yields of 13.23 g pot-1
was obtained from
the plants treated with N150 kg ha-1
, P40 kg ha-1
+FYM10 t ha-1
, respectively. In the
second screen house experiment (2015), the root, shoot and total DM yield ranged
from 3.59, 11.52 and 15.26 g pot-1
to 9.23, 24.43 and 30.20 g pot-1
respectively (Table
4.5). With regards to root biomass; this was higher in the pot which received T11
followed by T8 and T14 with the least values recorded from the control (3.59 g pot-1
).
The highest shoot biomass was obtained from the plants treated with the highest rates
of all types of fertilizers T27 (24.43 g pot-1
) followed by T14 and T20.
In the second pot experiment, the total DM yields ranged from 15.26 to 30.20 g pot-1
with heavier DM significantly produced by the pot which was treated with T27
followed by T14 and T20, while the control pots produced significant lower total DM
value (Appendix. 4.3). The highest DM yield was observed in the pots which were
treated with treatments at full rates. This could have resulted from increased absorption
of N, P and K which may have contributed to the dry weight of maize. Bokhtair and
Sakurai (2005) also reported the increase in DM yield from a combined use of
different organic and inorganic sources of nutrients as the levels increase up to the
recommended rates by sugarcane.
As presented in Appendix 4.4, biomass production and P uptake increased with an
increase in FYM rate in both seasons; this could probably be due to the fact that
addition of organic manure in the soil improves the soil physical properties such as soil
texture, soil structure and soil moisture retention capacity and hence, encourages good
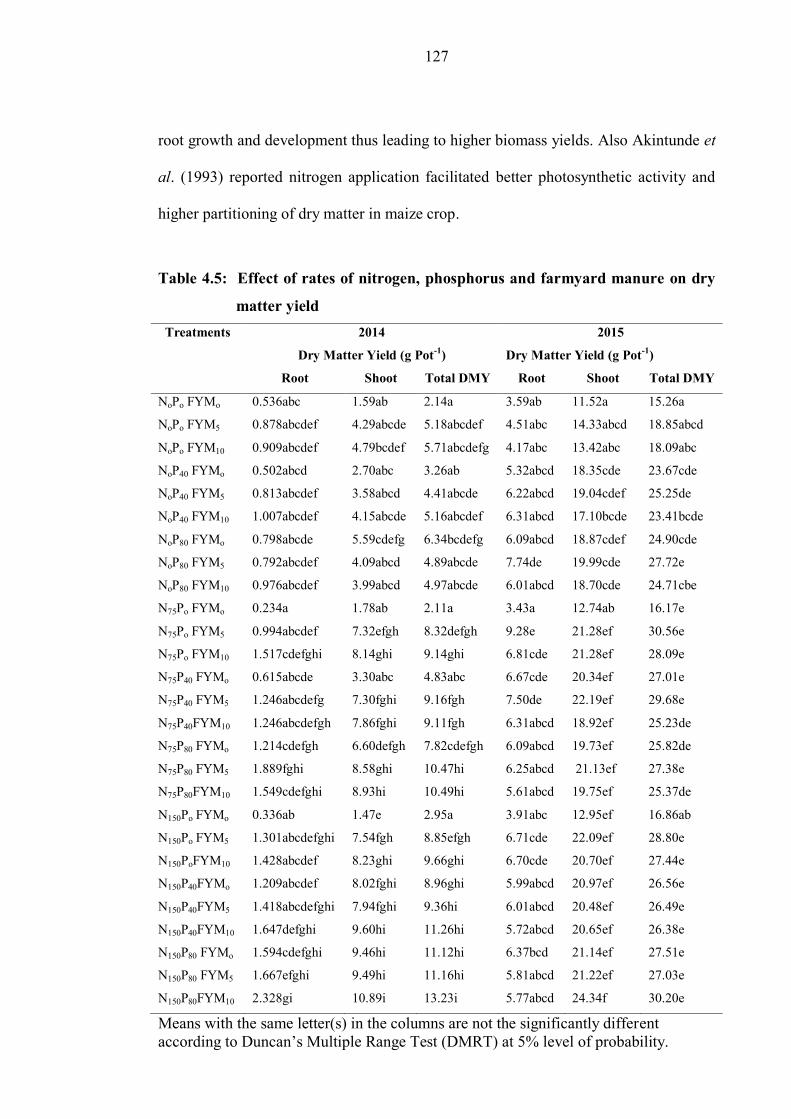
127
root growth and development thus leading to higher biomass yields. Also Akintunde et
al. (1993) reported nitrogen application facilitated better photosynthetic activity and
higher partitioning of dry matter in maize crop.
Table 4.5: Effect of rates of nitrogen, phosphorus and farmyard manure on dry
matter yield
Treatments 2014 2015
Dry Matter Yield (g Pot-1
) Dry Matter Yield (g Pot-1
)
Root Shoot Total DMY Root Shoot Total DMY
NoPo FYMo 0.536abc 1.59ab 2.14a 3.59ab 11.52a 15.26a
NoPo FYM5 0.878abcdef 4.29abcde 5.18abcdef 4.51abc 14.33abcd 18.85abcd
NoPo FYM10 0.909abcdef 4.79bcdef 5.71abcdefg 4.17abc 13.42abc 18.09abc
NoP40 FYMo 0.502abcd 2.70abc 3.26ab 5.32abcd 18.35cde 23.67cde
NoP40 FYM5 0.813abcdef 3.58abcd 4.41abcde 6.22abcd 19.04cdef 25.25de
NoP40 FYM10 1.007abcdef 4.15abcde 5.16abcdef 6.31abcd 17.10bcde 23.41bcde
NoP80 FYMo 0.798abcde 5.59cdefg 6.34bcdefg 6.09abcd 18.87cdef 24.90cde
NoP80 FYM5 0.792abcdef 4.09abcd 4.89abcde 7.74de 19.99cde 27.72e
NoP80 FYM10 0.976abcdef 3.99abcd 4.97abcde 6.01abcd 18.70cde 24.71cbe
N75Po FYMo 0.234a 1.78ab 2.11a 3.43a 12.74ab 16.17e
N75Po FYM5 0.994abcdef 7.32efgh 8.32defgh 9.28e 21.28ef 30.56e
N75Po FYM10 1.517cdefghi 8.14ghi 9.14ghi 6.81cde 21.28ef 28.09e
N75P40 FYMo 0.615abcde 3.30abc 4.83abc 6.67cde 20.34ef 27.01e
N75P40 FYM5 1.246abcdefg 7.30fghi 9.16fgh 7.50de 22.19ef 29.68e
N75P40FYM10 1.246abcdefgh 7.86fghi 9.11fgh 6.31abcd 18.92ef 25.23de
N75P80 FYMo 1.214cdefgh 6.60defgh 7.82cdefgh 6.09abcd 19.73ef 25.82de
N75P80 FYM5 1.889fghi 8.58ghi 10.47hi 6.25abcd 21.13ef 27.38e
N75P80FYM10 1.549cdefghi 8.93hi 10.49hi 5.61abcd 19.75ef 25.37de
N150Po FYMo 0.336ab 1.47e 2.95a 3.91abc 12.95ef 16.86ab
N150Po FYM5 1.301abcdefghi 7.54fgh 8.85efgh 6.71cde 22.09ef 28.80e
N150PoFYM10 1.428abcdef 8.23ghi 9.66ghi 6.70cde 20.70ef 27.44e
N150P40FYMo 1.209abcdef 8.02fghi 8.96ghi 5.99abcd 20.97ef 26.56e
N150P40FYM5 1.418abcdefghi 7.94fghi 9.36hi 6.01abcd 20.48ef 26.49e
N150P40FYM10 1.647defghi 9.60hi 11.26hi 5.72abcd 20.65ef 26.38e
N150P80 FYMo 1.594cdefghi 9.46hi 11.12hi 6.37bcd 21.14ef 27.51e
N150P80 FYM5 1.667efghi 9.49hi 11.16hi 5.81abcd 21.22ef 27.03e
N150P80FYM10 2.328gi 10.89i 13.23i 5.77abcd 24.34f 30.20e
Means with the same letter(s) in the columns are not the significantly different
according to Duncan’s Multiple Range Test (DMRT) at 5% level of probability.
128
Furthermore, the improved soil physical conditions such as soil texture, soil structure
and water holding capacity usually associated with organic amendments could have
supported higher crop performance and grain yields of most crops (Pan et al., 2009;
Tiwari et al., 2002). These results are supported by those of Achieng et al. (2010), and
Shah et al. (2009) who reported that plant height, number of grains per cob, 1000-seed
grain weight, grain yield and harvest index of maize gave higher values, when N and
FYM were integrated as opposed to the application of the two sources of nutrients
separately. As reported by Razwan et al. (2007) and Wakene et al. (2001a), the
integration of organic fertilizer with inorganic fertilizer increased the positive
intraction of the applied fertilizer thereby increased plant productivity. The findings in
this experiment are in agreement with those of Makinde (2007) and Ayoola and
Makinde (2009) who reported an increase in maize plant height by the use of organic
and inorganic nutrient sources thus indicates positive intraction of the amendments.
4.4.6 Effects of N, P and Fym on N and P uptakes by the maize plants
The effects of nitrogen, phosphorus and farmyard manure on the uptakes of N and P
by maize plants are presented in Table 4.6. Plants treated with N150 + P80 + FYM5 and
N75 +P80+FYM5 had significant higher nitrogen and phosphorus uptake in 2014 while
the lowest uptakes values of1.04 and 0.08 % were observed in treatments T5 and
control treatment respectively (Appendix 4.5). N uptake ranged from 1.032 and 0.36
7% to 2.94 and 2.55% in the two experiments, while P uptake ranged from 0.077 to
0.037% (Appendix 4.6).
The highest nitrogen and phosphorus uptakes in 2014 from a combination of fertilizers
treatment are similar to the findings of Lawal et al. (2010) who reported that
application of fertilizers at different rates above the control resulted in the highest
nitrogen, phosphorus and potassium uptakes by white yam. These results indicated that

129
an integrated nutrients management (INM) that combines organic sources of nutrients
and inorganic fertilizers (nitrogen, phosphorus and farm yard manure) enhanced maize
performance in the study area and this is in agreement with the findings of Adediran et
al. (1999), Oyinlola and Onekebhagbe, (2008), Adeoye et al. (2008), Ayoola and
Makinde (2009) and Ojeniyi (2010).
Table 4.6: Effect of nitrogen, phosphorus and farmyard manure on N and P
uptakes on maize plant
Treatments 2014 2015 Shoot N (%) Shoot P (%) Shoot N (%) Shoot P
(%) NoPo FYMo 1.400abcde 0.077a 0.367b 0.050b NoPo FYM5 1.155ab 0.249ab 0.507b 0.091ab NoPo FYM10 1.260abcd 0.336b 0.630b 0.140ab NoP40 FYMo 1.260abcd 0.250ab 0.507b 0.095ab NoP40 FYM5 1.032a 0.201ab 0.472b 0.147ab NoP40 FYM10 1.155ab 0.308ab 0.437b 0.174ab NoP80 FYMo 1.068a 0.206ab 0.542b 0.150ab NoP80 FYM5 1.260abcd 0.242ab 0.455b 0.136ab NoP80 FYM10 1.225abc 0.369b 0.507b 0.119ab N75Po FYMo 2.292hijkl 0.155ab 1.277b 0.037ab N75Po FYM5 1.802defghi 0.164ab 0.595b 0.057b N75Po FYM10 1.802defghi 0.312ab 0.577b 0.107ab N75P40 FYMo 2.450gjlm 0.158ab 0.712b 0.053b N75P40 FYM5 1.750cdefgh 0.302ab 0.630b 0.093ab N75P40 FYM10 1.907efghij 0.337ab 0.682b 0.126ab N75P80 FYMo 2.188fghijkl 0.290ab 1.190ab 0.101ab N75P80 FYM5 1.660bcdefg 0.386b 1.108ab 0.167ab N75P80 FYM10 1.575abcdef 0.316ab 1.272ab 0.177ab N150Po FYMo 2.188ghijkl 0.164ab 1.412ab 0.042b N150Po FYM5 2.555lm 0.200ab 1.102ab 0.054b N150Po FYM10 2.345ijkl 0.306ab 0.928ab 0.133ab N150P40 FYMo 2.485jklm 0.156ab 1.067ab 0.110ab N150P40 FYM5 2.363ijkl 0.309ab 1.242ab 0.108ab N150P40 FYM10 2.205ghijkl 0.296ab 1.470ab 0.212ab N150P80 FYMo 2.083ghijkl 0.220ab 1.785ab 0.222ab N150P80 FYM5 2.940m 0.325ab 2.555a 0.295e N150P80 FYM10 1.943efghijk 0.370b 1.890ab 0.308e
Means with the same letter(s) in the columns are not the significantly different
according to Duncan’s Multiple Range Test (DMRT) at 5% level of probability.
130
4.5 Conclusions and Recommendations
4.5.1 Conclusions
In conclusion, the soils of the study area were low in major macronutrients. This
suggests poor soil fertility that may require some extenuating measures to improve.
The results of the study also indicated that the combined application of nitrogen,
phosphorus and farmyard manure had a significant effect (P<0.05) on all agronomic
growth parameters like plant height, number of leaves and stem girth of maize, thus
implies the success of combined nutrients management for maize production in the
study area.
The results indicated further that the combined application of organic and inorganic
amendments reveals a significant influence (P<0.05) on dry matter yields and nutrient
uptakes (N and P) of maize.
4.5.2 Recommendations
The study recommends the followings;
i. Field studies to confirm the results from the study are advocated
ii. For enhanced maize growth and biomass production therefore, the combined
application of nitrogen, phosphorus and farm yard manure at reduce rates (75
kg N ha-1
, 40 kg P ha-1
plus FYM 5 t ha-1
) is therefore recommended at
Solomon Mahlangu Campus farm, SUA, Morogoro, Tanzania.
4.6 References
Achieng, J.O., Ouma, G., Odhiambo, G. and Muyekho, F. (2010). Effect of farmyard
manure and inorganic fertilizers on maize production on Alfisols and Ultisols
in Kakamega, western Kenya. Agriculture and Biological Journal of North
America 1(4): 430-439.
131
Adamu, U.K. (2013). Profile Distribution of some primary macro nutrients and
exchangeable bases in Kano University of Science and Technology, Research
and Commercial farm, Gaya. Techno Science African Journal 8: (2): 14 - 18.
Adediran, J.A. and Banjoko, V.A. (1995). Response of maize to nitrogen, phosphorus
and potassium fertilizers in the savanna zone of Nigeria. Commun. Soil Science
Plant Analysis 26: 593-606.
Adediran, J.A., Ogunbodede, B.O. and Ojo-Atere, J.O. (1999). Organic fertilizer and
maize production: ‘The Journey so far’. Profitable maize production and
utilization in fertilizer deregulated economy. Proceedings of the 4th
National
Workshop of Maize Association of Nigeria. May 1999, Ibadan. pp. 34-39.
Adeoye, G.O., AdeOluwa, O.O., Oyekunle, M., Sridhar, M.K.C., Makinde and
Olowoake, A.A. (2008). Comparative evaluation of organomineral fertilizer
(OMF) and mineral fertilizer (NPK) on yield quality of maize (Zea mays (L)).
Nigerian Journal of Soil Science 18: 132-137.
Aflakpui, G.K.S., Gregory, P.J. and Froud- Williams, R.I. (1998). Uptake and
partitioning of nitrogen by maize infected with Striga hermonthica. Annual
Bulletin 81: 287-294.
Akanni, D.I. and Ojeniyi, S.O. (2008). Residual effect of goat and poultry manures on
soil properties and yield of amaranthus in southwest Nigeria. Residual Jounal
of Agronomy 2: 44-47.
Akintunde, Y., Obigbesan, G.O. and Kim, S.K. (1993). Nitrogen use efficiency and
grain yields as influenced by nitrogen fertilization and hybrid maize varieties in
selected agro – ecological zones of Nigeria. In: Maize improvement production
and utilization in Nigeria. M.A.B.Fakorede, Ed., pp. 119 – 124, Adasanuri
press, Ile – Ife, Nigeria.
132
Allianz “Food Security, (2010). Ten Crop that feed the world”. Allianz
[http//Knowledge.allianz.com/?709/Food-crops] site visited 10/09/2015.
Alloway, B.J. (2008). Zinc in Soils 2nd
Edn,. IZA and IFA Brussels, Begium and Paris.
pp 135.
Ayolagha, G.A. and Onuegbu, B.A. (2002) Soils of Rivers State, Central Niger Delta.
Onyoma publication, Choba, port Harcour. pp 19 - 42.
Ayoola, O.T. and Makinde, E.A. (2009). Maize growth, yield and soil nutrient changes
with N-enriched organic fertilizer. African Journal of Food Agriculture
Nutrition and Development 9 (1): 580-592.
Ayub, M. Nadeen, M.A., Sharar, M.S. and Mohmood M. A. (2002). Response of
maize (Zea mays, L) Fodder to different levels of nitrogen and phosphorus.
Asian Journal of Plant Science 1 (4):352 – 354.
Bhattachavyya, R., Kundu, S., Prakash, V. and Chupta, H.S. (2008). Suitability under
combined application of mineral and organic fertilizers in a rain fed soy bean –
wheat system of the Indian Himalayas, European Journal of Agronomy 28:33 –
46.10.
Boktair, S.M. and Sarukai, K. (2005). Effects of organic manure and chemical
fertilizer on soil fertility and productivity of plant and ratoon crops of
sugarcane. Archives of Agronomy and Soil Science 51: 325 – 334.
Brady, N.C. and Weit, R.R. (2002). The nature and properties of Soils 13th
ed. Pearson
edu. India. pp 960.
Bremner, J.M. and Mulvaney, C.S. (1982). Total nitrogen. In (Page, L.A., Miller, R.H.
and Keeney, D.R. eds.) Methods of Soil Analysis, Part 2, 2nd Edition,
Agronomy Monograph no. 9, pp. 595-624. American Society of Agronomy,
Madison, Wisconsin.
133
Buoyoucos C.J. (1962). Hydrometer method improved for making particle size
analysis of soils. Agronomy Journal 54: 464 – 465.
Celik, I., Ortas, I. and Kilic, S. (2004). Effects of compost, mycorrhiza, manure and
fertilizer on some physical properties of a chromoxecent soil. Soil Tillage
Resource 78:59 – 67.
Donovan, G. and Casey (1998). Soil Fertility Management in sub – Saharan Africa.
Technical paper, World Bank, Washington DC. pp 408.
Eno, J.U., lbia, T.O., Ogunwale, J.A. Ano, A.O. and ESU, I.E. (2009). Manual of Soil.
Plant and Water Analysis Sibon Books Ltd. Lagos. 183.
Food and Agricultural Organization of the United Nations (FAO). (2011).
http:11/foastat.fao.org/site/567/Desktop Default aspx? Page IZ = 567#cancer.
Food and Agriculture Organization of the United Nations (FAO), (1995). United
Nations Education Scientific and Cultural Organization (UNESCO). 1995. The
Digital Soil Map of the World, Version 3.6., FAO, Rome.
Foth, H.D. (1990). Fundamental of Soil Science. 8th
ed. John Wiley and Sons, Inc.,
New York. 360pp.
Foth, H.D. and B.G. Ellis.(1997). Soil fertility, 2nd
Ed. Lewis CRC Press LLC., USA.
290 pp. 54.
Gregory, P.J., Simmon, L.P. and Warren, G.P. (1997). Interactions between plant
nutrients, water and carbon dioxide as factors limiting crop yields. Phil. Trans.
R. Soc. Lond, 352: 987- 996.
IITA (2012). Research to Nourish Africa. International Institute of Tropical
Agriculture Research Report. pp7 – 10.
Ikerra, S.T. and Kalumuna, M.C. (1991). Phosphorus adsorption characteristics of soils
and their influence on maize yield responses to phosphorus application along
the Mlingano Catena, Tanga, Tanzania. Paper presented at the 11th
Annual
General Meeting of the Soil Science Society of East Africa, 1 – 6 December
1991, Kampala, Uganda.
134
Kang, B.T. (1981). Nutrient requirement and fertilizer use for maize. In: Agronomy
training manual for agro service agronomist NAFPP/IITA. FED. Dept. Agr.
Lagos. pp. 405-416.
Khan, H.Z., Malik M.A. and Saleem, M.F. (2008).”Effect of rate and source of organic
materials on the production potential of spring maize (Zea mays L.)”, Pakistan
Journal of Agricultural. Science Vol. 45(1): 40-43.
Landon, J.R. (ed.) (1984). Tropical Soil Manual. A Handbook for Soil Survey and
Agricultural Land Evaluation in the Tropics and Subtropics. Longman, New
York. 199 pp.
Lawal, I.O., Adeoye, G.O., Asiedu, R. and Ojeniyi, S.O. (2010). Effect of organo –
mineral. Fertilizer on yield and nutrient uptake of white yam (Dioscores
rotundata poir) in Ibadan, South Western Nigeria. Proceedings of the 34th
Annual Conference of the Soil Science Society of Nigeria. pp. 173 – 182.
Lombin, G. (1987). Fertilizer requirements of major cereals of Nigerian Savanna.
Paper presented at the National Fertilizer Seminar, Port – Harcout. 50 pp.
Makinde, E.A. (2007). “Effects of an organo- mineral fertilizer application on the
growth and yield of maize”. Journal of Applied Sciences Research 3(10): 1152-
1155.
Mando, A., Bonzi, M., Wopevels, M.C.S., Lompo, F. and Stroosnijder, L. (2005).
Long-term effects of mineral and organic fertilization on soil organic matter
fraction and Sorghum yield under Sudano – Sahelian conditions. Soil Use
Management 21: 396 – 401.
Moberg, J.R. (2000). Soil and plant analysis Manual. The Royal Veterinary and
Agricultural University, Chemistry Department, Copenhagen, Denmark. 133
pp.
135
Moritsuka, N., Yancii, J. and Koski, T. (2001). Effect of application of inorganic and
organic fertilizer on the dynamics of soil nutrients in the rhizosphere, Soil
Science and Plant Nutrition 47 (1): 139 – 148.
Moyin – Jesu, E.I. (2002). Raising oil palm seedlings in urban cities using Sole and
amended forms of wood ash and saw dust. Journal of Tropical Agricultural
Science, Pertanika 25(2): 31 – 37.
Ndaki, S.M.M. (2001). Agronomic evaluation of some industrial wastes as alternative
sources of plant nutrients in Morogoro, District Tanzania. Unpublished
dissertation for award of MSc. degree of Sokoine University of Agriculture,
Morogoro, Tanzania. 98 pp.
Nelson, D.W. and Sommers, L.S. (1982). Total carbon. Organic carbon and organic
matter. In: page, E.L. et al (eds). Methods of Soil Analysis. Part 2. Agion.
Monogr. 9 (2nd
edition), pp. 539 - 579. ASA and SSSA. Madison wise.
Nkhuzenje, H., Mughogho, S.K., Sakala, W.D. and Saka, A.R. (2002). Contribution of
Promiscous and Specific improvement and maize yield for smallholder farmers
in Zomba District of Malawi.
NSS (1990). Laboratory Procedures for Routine Soil Analysis. 3rd
ed. Ministry of
Agriculture and Livestock, Development, National soil service (NSS). ARI.
Mlingano.
Oad, F.C., Buriro, U.A. and Agha, S.K. (2004). Effect of Organic and inorganic
fertilizer application on maize fodder production. Asian Journal of Plant
Science 3 (3): 375 – 377.
Ogban, P.I., Effiong, G.S., Obi, J.C. and Ibia, T.O. (2012). Properties and Management
of inland swampland soils for crop Production in Akwa Ibom State,
Southeastern Nigeria. Nigerian Journal of Soil.vol. 20 (1): 201-210.
136
Ojeniyi, E. (2010). Advances in integrated nutrient management for crop production in
Nigeria, A. (Monograph). pp18.
Okalebo, J.R., Gathna, K.W. and Woonor, P.L. (1993). Laboratory Method of Soil and
Plant Analaysis, A working manual. Tsts, Soil Science Society of East Africa
publication No. 1. 88pp.
Olayinka, A. (2009). Soil microorganisms, wastes and national food security.
Inaugural lecture series 222 Obafemi Awolowo University, ILe – Ife, Nigeria.
Olowolafe, E.A., Owonubi, A. and Omueti, J.A.I. (2012). Distribution of Copper and
Zinc in soils derived from volcanic parent materials on the jos plateau, Nigeria
journal of Soil Science 22 (2): 239 - 247.
Oyinlola, E.Y. and Onekebhagbe, V.O. (2008). Chemical analysis of urban wastes and
their effects on growth and heavy metals uptake of maize. Chemclass Journal
5: 94-100.
Palm, C.A., Gachengo, C.N., Delive, R.J., Cadisch, G and Giller, K.E. (2001). Organic
inputs for soil fertility management in tropical agro ecosystems: Agriculture
Ecosystems and Environments 83: 27 – 42.
Palm. C.A. Mycis, R.J.K., and Nandwa, S.M. (1997). Organic – Inorganic Nutrient
Interaction in Soil Fertility Replenishment. In: Replenishing soil fertility in
Africa. Soil Science Society of America, Madison Wisconsin. pp 193 – 218.
Pan, G., Zhou, P., Li, Z., Pete, S.li, L., Qin, D., Zhang, X., Xu, X., Shen, S. and Chen,
X (2009). Combined inorganic/organic fertilization entrances N efficiency and
increases rice productivity through organic carbon accumulation in a rice
paddy from the Tai Lake region, China, Agric. Ecosystem and Environment
131:274 – 280.
Rates, R. (2003). Maize market Assessment and Baseline study for Tanzania. Regional
Agricultural Trade Expansion Support Program, Nairobi, Kenya 230pp.
137
Razwan A., Shahzad, S.M., Khalid, A., Arshad, M. and Mahmood, M.H. (2007),
“Growth and yield response of Triticum aestivium L. and Maize (Zea mays L.)
to nitrogen and L-tryptophan enriched compost”. Pakistan Journal of Botany.
39(2): 541-549.
Roy, R.N. and Ange, A.L. (1991). In. Integrated plant nutrient systems (IPNS) and
sustainable agriculture. Proceedings of Annual Seminar, FAI, New Delhi. 12
pp.
Sanchez. P.A. (1994). Tropical Soil Fertility Research toward the Second Paradifin,
15th
. World Congress of Soil Science, Acapulco, Mexico. pp 65 – 88.
Senjobi, B.A. (2007). Comparative Assessment of the Effect of land use and land type
on soil degradation and productivity in Ogun State, Nigeria, PhD Thesis
submitted to the Department of Agronomy, University of Ibadan, Ibadan. 161
pp.
Shah, S. T. H., Zamir, M. S. I., Waseem, M., Ali, A., Tahir M. and Khalid, W. B.
(2009). Growth and yield response of maize (Zea mays L.) to organic and
inorganic sources of nitrogen. Pakistan Journal life social science 7(2): 108-
111.
Shanti, K.V.P., Rao, M.R. Reddy, M.S. and Sarma, R.S. (1997). Response of hybrid
and composite maize (Zea mays) to different levels of nitrogen. Indian Journal
of Agricultural Science 67: 424-425.
Sharpley, A. N., Chapra, S. C., Wedepohl, R., Sims, J. T., Daniel, T. C.and Reddy, K.
R. (1994). Managing agricultural phosphorus for protection of surface water:
issues and option. Journal of Environmental Quality 23: 437-451.
Smaling, E.M.A. and Janssen, B.H. (1993). Calibration of QUEFTS, a model
predicting nutrient uptake and yields from chemical soil fertility indices.
Geoderma 59:21 –44.
138
Sumi, A. and Katanyama, T.C. (2000). Effect of nitrogen fertilizer application and
solar radiation on the growth response of sorghum seedling to soil moisture.
Crop Science 69: 513 – 519.
Tenaw, W., Husni, M.H.A., Anuar, A.R. and Rahman. Z.A. (2006).”Effect of coffee
residue and intercropping on soil physicochemical properties and yield of
component crops in Southern Ethiopia”. Ethiopian Journal of Natural
Resources 8 (2): 199-216.
Tisdale, S.L., Nelson, W.L., Beaton, J.D. and Haulin, J.L. (1993). Soil fertility and
fertilizers. 5th
ed. Macmillan Publication Company, New York. 634pp.
Titiloye, E.O. (1982). The chemical composition of different sources of organic wastes
and their effects on growth and yield of maize (Zea mays L.) PhD. Thesis,
University of Ibadan, Nigeria. pp 316.
Tiwari, A., Dwivedi, A.K. Dikshit, P.R. (2002). Long term influence of organic and
inorganic fertilization on soil fertility and productivity of soybean. Journal of
Indian Society of Soil Science 50: 472 – 475.
Vanlauwe, B., Aihou, K., Aman, S., Iwuafor, E.N.O., Tossah, B.K., Diels, F.,
Sanginga, N., Merckx, R. and Deckers, S. (2001). Maize yield as affected by
organic inputs and urea in the West Africa mosit Savanna. Agronomy Journal
93: 1191 – 1199.
Villapando, R.R. and Greatz, D.A. (2001). Phosphorus adsorption and desorption
properties of the soil. Soil Science Society of American Journal 63: 331-339.
Wakene, N., Kefyalew, N., Frriesen, D.K., Ransom, J. and Abebe, Y. (2001).
“Determination of Optimum Farmyard Manure and NP Fertilizers for Maize
on Farmers’ Fields”, Seventh Eastern and Southern Africa Regional Maize
Conference. pp. 387-393.

139
Wondwosen, T. (2009). ”Identification of Growth Limiting Nutrient(s) In the Major
Soil Types of Kindo Koye and Delbo Atwaro Watersheds”, Abstract collections,
Hawassa University pp 26.
Zhao, Y., Wang, P., Li, J. Chen, Y., X. and Liu, S. (2009). The Effect of two organic
manures on soil properties and crop yields in calcareous soil under wheat –
maize copying system. European Journal of Agronomy 31: 36 – 42.
140
CHAPTER FIVE
5.0 GENERAL CONCLUSIONS AND RECOMMENDATIONS
5.1 General Conclusions
The soils at the Solomon Mahlangu Campus farm were described and distinguished on
the basis of parent materials and forms macro relief, geological formation, slope,
drainage class, vegetation, and land use, morphological and physical characteristics.
Soil colour varied from brown (7.5YR 4/2) through dark brown (7.5YR 4/4) to reddish
brown (2.5YR 4/6). The soil structure varied from being weak to moderate sub angular
blocky with dominant sand texture. The results of this study have indicated that, the
predominant soil textural classes of the study area were sand; sandy clay loam, sandy
clay and loamy sand. The general characteristics of the soils were high sand and low
silt contents. Most of the profiles had greater than 60 % sand, 20 % clay and less than
five percent (5 %) silt. The analytical results indicated that soil pH ranged from 5.2 to
6.9 which are slightly acidic to nearly neutral in reaction. The soil physico-chemical
properties in all the land mapping units indicate that in some areas there are
deficiencies of major nutrients and therefore the risky to sustainable crop production
including maize crop production in the area.
The suitability assessment result showed that there was no highly suitable (S1) land for
maize cultivation in the area. The area was moderately suitable (S2), marginally
suitable (S3) and currently non-suitable (N1) for maize production. Even though some
land qualities such as mean annual rainfall and temperature are adequate for maize, but
most of the soil characteristics such as levels of organic carbon and CEC are low.
The results of the screen house study shows that the combined application of nitrogen,
phosphorus and farmyard manure had a significant effect (P<0.05) on all agronomic
141
growth parameters such as plant height, number of leaves, and stem girth of maize,
thus implying the success of combined nutrients management for maize production in
the study area. The results also indicates that the combined application of organic and
inorganic amendments reveals a significant influence (P<0.05) on dry matter yields
and nutrient uptakes (N and P) of maize.
The study indicates further that:
i. All the soils belong to the soil order Ultisols and Ustalfs at suborder level in
the Soil Taxonomy while Alisols in the Reference Soil Group (RSG) - Tier 1
for the World Reference Base for Soil Resources soil legend.
ii. At great group and subgroup levels P1 was classified as Rhodustults and Typic
Rhodustults, P1 and P2 as Haplustults and Typic Haplustults, whereas, P4 was
classified as Haplustults and Arenic Haplustults (Soil Taxonomy), which
correspond to Haplic RhodicAlisols, HaplicAlisols, Haplic Chromic and
HaplicAlisols (World Reference Base) in the Tier 2 for RSG soil name for the
P1, P2, P3 and P4, respectively.
iii. None of the four mapping units fell under highly suitable (SI) class, for maize
production.
iv. The major limitations in the surveyed area are low fertility status and moisture
content.
v. There was significant (P < 0.05) positive correlation between the clay % and
the soil’s content of CEC, Zn, Cu, K, Mg, Na and EC, there was also a
significant relationship between the OC and pH in H2O and KCL and Equally,
TEB and BS were significantly (P < 0.001) and positively correlated (r =
0.9993).
142
vi. The combined treatments produced yields which were significantly higher than
the values obtained by control. The highest biomass yields of 30.2 g pot-1
were
obtained by a combined application of treatments at 150 kg N-1
, 80 kg P-1
plus
FYM 10 t ha-1
. The control obtained the lowest biomass yields of 15.26 g pot-1
respectively.
vii. The combined treatments of organic and inorganic manure had significantly
higher nutrient uptake values than the control. The highest nutrient uptakes of
2.94% N pot-1
and 0.32% P pot-1
was obtained under the combined application
of N, P and FYM at 150 kg N-1
, 80 kg P-1
plus FYM 5 t ha-1
.
5.2 Recommendations
The following recommendations were suggested in order to improve soil productivity
and sustain production of maize crop in the area (SMC farm) under investigation:
i. The low TN and OC contents in the soils need to be amended through N-
fertilizer management.
ii. An integrated nutrients management (INM) should be adopted which embraces
a holistic approach of integrated use and management of organic and inorganic
nutrient sources in a sustainable way.
iii. Thus, to enhance performance of maize in the study area; application of a
combination of fertilizers (nitrogen, phosphorus and farmyard manure) at
moderate rates (75 kg N ha-1
, 40 kg P ha-1
plus FYM 5 t ha-1
) would be cost
effective and sufficient for maize dry matter yield and nutrient uptakes (N and
P) in the test soil.
iv. Periodic soil tests of the site are very imperative to properly monitor and
evaluate the soil fertility status of other potential maize growing areas in the
143
same agro-ecological zone to understand the deficiency the soil fertility indices
and prevent soil fertility decline and degradation.
v. Field studies should be done to confirm the results of this study.
vi. Further studies are needed in similar abandoned farms in other agro-ecological
zones for sustainable maize production in Tanzania.
vii. Maintaining high level of organic matter in the soil to improve physical
condition of soil such as soil structure and CEC content to make soil support
good plant growth.
viii. A more detail soil survey of the site is advocated to put the land into best uses,
make predictions about the behavior of soils and evaluates/predicts the effects
of land use on the environment of the study area.
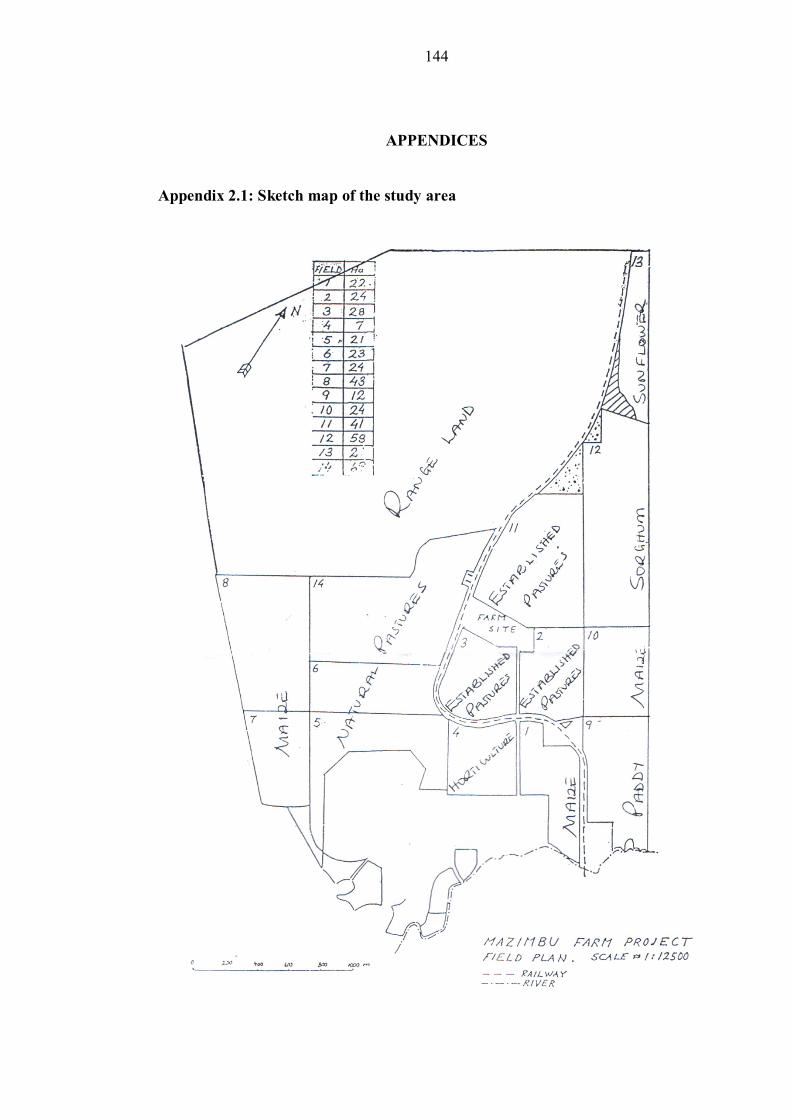
144
APPENDICES
Appendix 2.1: Sketch map of the study area
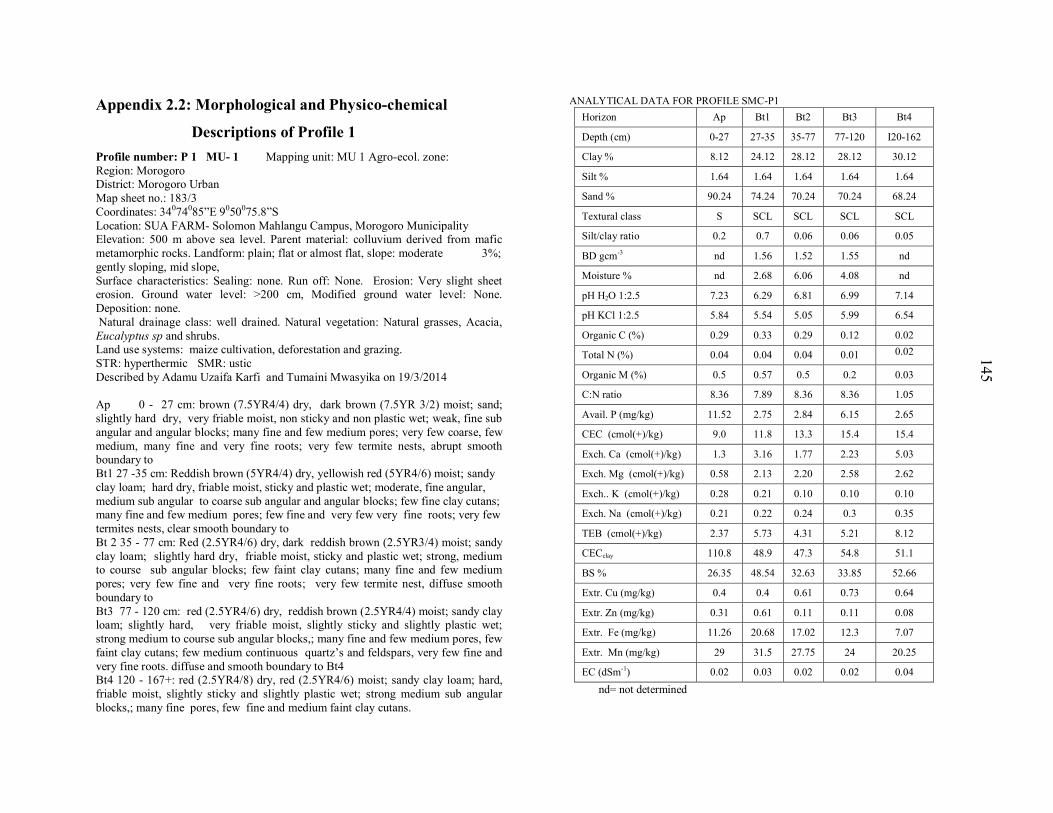
145
Appendix 2.2: Morphological and Physico-chemical
Descriptions of Profile 1
Profile number: P 1 MU- 1 Mapping unit: MU 1 Agro-ecol. zone:
Region: Morogoro District: Morogoro Urban
Map sheet no.: 183/3
Coordinates: 34074085”E 9050075.8”S
Location: SUA FARM- Solomon Mahlangu Campus, Morogoro Municipality Elevation: 500 m above sea level. Parent material: colluvium derived from mafic
metamorphic rocks. Landform: plain; flat or almost flat, slope: moderate 3%;
gently sloping, mid slope,
Surface characteristics: Sealing: none. Run off: None. Erosion: Very slight sheet erosion. Ground water level: >200 cm, Modified ground water level: None.
Deposition: none.
Natural drainage class: well drained. Natural vegetation: Natural grasses, Acacia,
Eucalyptus sp and shrubs. Land use systems: maize cultivation, deforestation and grazing.
STR: hyperthermic SMR: ustic
Described by Adamu Uzaifa Karfi and Tumaini Mwasyika on 19/3/2014
Ap 0 - 27 cm: brown (7.5YR4/4) dry, dark brown (7.5YR 3/2) moist; sand;
slightly hard dry, very friable moist, non sticky and non plastic wet; weak, fine sub
angular and angular blocks; many fine and few medium pores; very few coarse, few
medium, many fine and very fine roots; very few termite nests, abrupt smooth boundary to
Bt1 27 -35 cm: Reddish brown (5YR4/4) dry, yellowish red (5YR4/6) moist; sandy
clay loam; hard dry, friable moist, sticky and plastic wet; moderate, fine angular,
medium sub angular to coarse sub angular and angular blocks; few fine clay cutans; many fine and few medium pores; few fine and very few very fine roots; very few
termites nests, clear smooth boundary to
Bt 2 35 - 77 cm: Red (2.5YR4/6) dry, dark reddish brown (2.5YR3/4) moist; sandy
clay loam; slightly hard dry, friable moist, sticky and plastic wet; strong, medium to course sub angular blocks; few faint clay cutans; many fine and few medium
pores; very few fine and very fine roots; very few termite nest, diffuse smooth
boundary to
Bt3 77 - 120 cm: red (2.5YR4/6) dry, reddish brown (2.5YR4/4) moist; sandy clay loam; slightly hard, very friable moist, slightly sticky and slightly plastic wet;
strong medium to course sub angular blocks,; many fine and few medium pores, few
faint clay cutans; few medium continuous quartz’s and feldspars, very few fine and
very fine roots. diffuse and smooth boundary to Bt4 Bt4 120 - 167+: red (2.5YR4/8) dry, red (2.5YR4/6) moist; sandy clay loam; hard,
friable moist, slightly sticky and slightly plastic wet; strong medium sub angular
blocks,; many fine pores, few fine and medium faint clay cutans.
ANALYTICAL DATA FOR PROFILE SMC-P1
Horizon Ap Bt1 Bt2 Bt3 Bt4
Depth (cm) 0-27 27-35 35-77 77-120 I20-162
Clay % 8.12 24.12 28.12 28.12 30.12
Silt % 1.64 1.64 1.64 1.64 1.64
Sand % 90.24 74.24 70.24 70.24 68.24
Textural class S SCL SCL SCL SCL
Silt/clay ratio 0.2 0.7 0.06 0.06 0.05
BD gcm-3 nd 1.56 1.52 1.55 nd
Moisture % nd 2.68 6.06 4.08 nd
pH H2O 1:2.5 7.23 6.29 6.81 6.99 7.14
pH KCl 1:2.5 5.84 5.54 5.05 5.99 6.54
Organic C (%) 0.29 0.33 0.29 0.12 0.02
Total N (%) 0.04 0.04 0.04 0.01 0.02
Organic M (%) 0.5 0.57 0.5 0.2 0.03
C:N ratio 8.36 7.89 8.36 8.36 1.05
Avail. P (mg/kg) 11.52 2.75 2.84 6.15 2.65
CEC (cmol(+)/kg) 9.0 11.8 13.3 15.4 15.4
Exch. Ca (cmol(+)/kg) 1.3 3.16 1.77 2.23 5.03
Exch. Mg (cmol(+)/kg) 0.58 2.13 2.20 2.58 2.62
Exch.. K (cmol(+)/kg) 0.28 0.21 0.10 0.10 0.10
Exch. Na (cmol(+)/kg) 0.21 0.22 0.24 0.3 0.35
TEB (cmol(+)/kg) 2.37 5.73 4.31 5.21 8.12
CECclay 110.8 48.9 47.3 54.8 51.1
BS % 26.35 48.54 32.63 33.85 52.66
Extr. Cu (mg/kg) 0.4 0.4 0.61 0.73 0.64
Extr. Zn (mg/kg) 0.31 0.61 0.11 0.11 0.08
Extr. Fe (mg/kg) 11.26 20.68 17.02 12.3 7.07
Extr. Mn (mg/kg) 29 31.5 27.75 24 20.25
EC (dSm-1) 0.02 0.03 0.02 0.02 0.04
nd= not determined
145
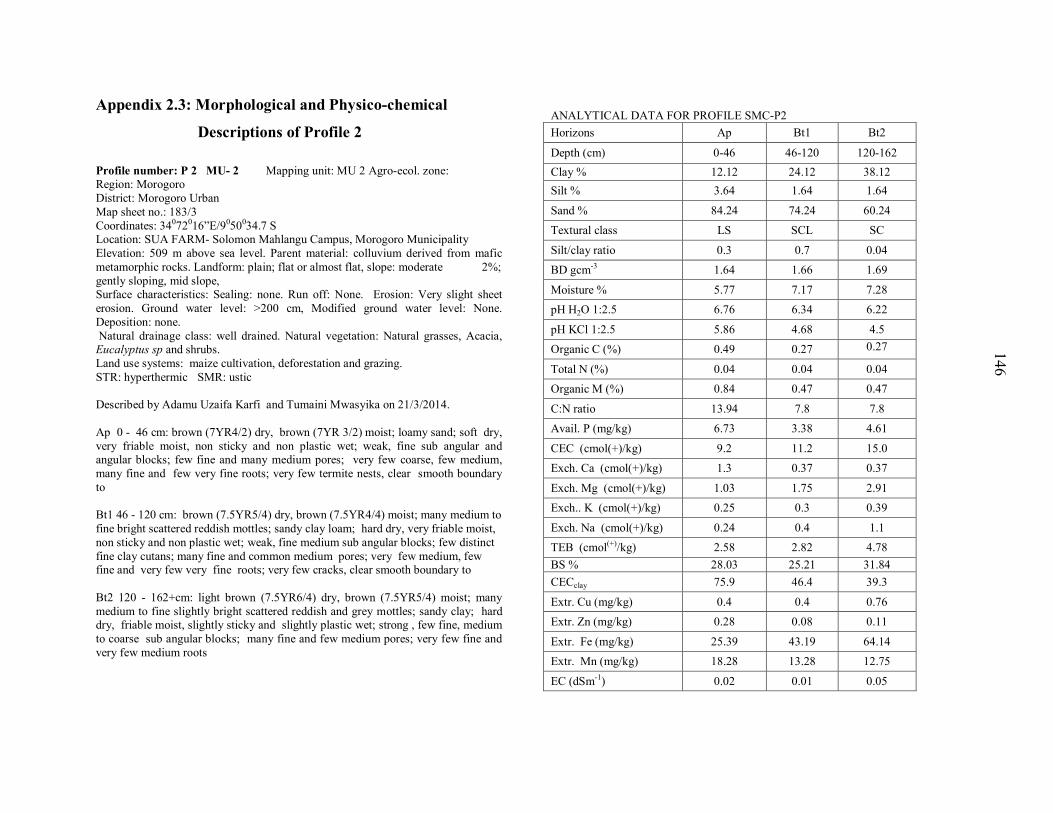
146
Appendix 2.3: Morphological and Physico-chemical
Descriptions of Profile 2
Profile number: P 2 MU- 2 Mapping unit: MU 2 Agro-ecol. zone: Region: Morogoro
District: Morogoro Urban
Map sheet no.: 183/3
Coordinates: 34072016”E/9050034.7 S Location: SUA FARM- Solomon Mahlangu Campus, Morogoro Municipality
Elevation: 509 m above sea level. Parent material: colluvium derived from mafic
metamorphic rocks. Landform: plain; flat or almost flat, slope: moderate 2%;
gently sloping, mid slope, Surface characteristics: Sealing: none. Run off: None. Erosion: Very slight sheet
erosion. Ground water level: >200 cm, Modified ground water level: None.
Deposition: none.
Natural drainage class: well drained. Natural vegetation: Natural grasses, Acacia, Eucalyptus sp and shrubs.
Land use systems: maize cultivation, deforestation and grazing.
STR: hyperthermic SMR: ustic
Described by Adamu Uzaifa Karfi and Tumaini Mwasyika on 21/3/2014.
Ap 0 - 46 cm: brown (7YR4/2) dry, brown (7YR 3/2) moist; loamy sand; soft dry,
very friable moist, non sticky and non plastic wet; weak, fine sub angular and angular blocks; few fine and many medium pores; very few coarse, few medium,
many fine and few very fine roots; very few termite nests, clear smooth boundary
to
Bt1 46 - 120 cm: brown (7.5YR5/4) dry, brown (7.5YR4/4) moist; many medium to
fine bright scattered reddish mottles; sandy clay loam; hard dry, very friable moist,
non sticky and non plastic wet; weak, fine medium sub angular blocks; few distinct
fine clay cutans; many fine and common medium pores; very few medium, few fine and very few very fine roots; very few cracks, clear smooth boundary to
Bt2 120 - 162+cm: light brown (7.5YR6/4) dry, brown (7.5YR5/4) moist; many
medium to fine slightly bright scattered reddish and grey mottles; sandy clay; hard dry, friable moist, slightly sticky and slightly plastic wet; strong , few fine, medium
to coarse sub angular blocks; many fine and few medium pores; very few fine and
very few medium roots
ANALYTICAL DATA FOR PROFILE SMC-P2
Horizons Ap Bt1 Bt2
Depth (cm) 0-46 46-120 120-162
Clay % 12.12 24.12 38.12
Silt % 3.64 1.64 1.64
Sand % 84.24 74.24 60.24
Textural class LS SCL SC
Silt/clay ratio 0.3 0.7 0.04
BD gcm-3 1.64 1.66 1.69
Moisture % 5.77 7.17 7.28
pH H2O 1:2.5 6.76 6.34 6.22
pH KCl 1:2.5 5.86 4.68 4.5
Organic C (%) 0.49 0.27 0.27
Total N (%) 0.04 0.04 0.04
Organic M (%) 0.84 0.47 0.47
C:N ratio 13.94 7.8 7.8
Avail. P (mg/kg) 6.73 3.38 4.61
CEC (cmol(+)/kg) 9.2 11.2 15.0
Exch. Ca (cmol(+)/kg) 1.3 0.37 0.37
Exch. Mg (cmol(+)/kg) 1.03 1.75 2.91
Exch.. K (cmol(+)/kg) 0.25 0.3 0.39
Exch. Na (cmol(+)/kg) 0.24 0.4 1.1
TEB (cmol(+)/kg) 2.58 2.82 4.78
BS % 28.03 25.21 31.84
CECclay 75.9 46.4 39.3
Extr. Cu (mg/kg) 0.4 0.4 0.76
Extr. Zn (mg/kg) 0.28 0.08 0.11
Extr. Fe (mg/kg) 25.39 43.19 64.14
Extr. Mn (mg/kg) 18.28 13.28 12.75
EC (dSm-1) 0.02 0.01 0.05
146

147
Appendix 2.4: Morphological and Physico-chemical
Descriptions of Profile 3
Profile number: P 3 MU- 3 Mapping unit: MU 3 Agro-ecol. zone: Region: Morogoro
District: Morogoro Urban
Map sheet no.: 183/3
Coordinates: 346928, UTM 9250335 Location: SUA FARM- Solomon Mahlangu Campus, Morogoro Municipality
Elevation: 522 m above sea level. Parent material: colluvium derived from mafic
metamorphic rocks. Landform: plain; flat or almost flat, slope: moderate 2%; gently
sloping, mid slope, Surface characteristics: Sealing: none. Run off: None. Erosion: Very slight sheet
erosion. Ground water level: >200 cm, Modified ground water level: None.
Deposition: none.
Natural drainage class: well drained. Natural vegetation: Natural grasses, Acacia, Eucalyptus sp and shrubs.
Land use systems: maize cultivation, deforestation and grazing.
STR: hyperthermic SMR: ustic
Described by Adamu Uzaifa Karfi and Tumaini Mwasyika on 19/3/2014
Ap 0 - 19 cm: brown (7.5YR4/3) dry, brown (7.5YR 4/2) moist; loamy sand;
slightly hard dry, very friable moist, non sticky and non plastic wet; weak, fine subangular and angular blocks; few fine and many medium pores; very few animal
burrows; gradual smooth boundary to
Bt1 19 - 40 cm: brown (7.5YR4/3) dry, brown (7.5YR4/2) moist; sandy clay loam; slightly hard dry, friable moist, non sticky and non plastic wet; moderate, fine and
medium sub angular and angular blocks; very few fine clay cutans; many fine and
few medium pores; very few medium, very few fine and very fine roots; clear
smooth boundary to Bt2 40 - 100 cm: Reddish brown (5YR4/4) dry, reddish brown (5YR4/3) moist;
sandy clay; hard dry, friable moist, non sticky and non plastic wet; moderate, fine
to medium sub angular blocks; few fine faint clay cutans; many fine and very few
medium pores; very few medium and fine roots; very few termite nests, diffuse smooth boundary to
Bt3 100 - 175+ cm: Yellowish red (5YR4/6) dry, reddish brown (5YR4/3) moist;
clay; very hard, friable moist, slightly sticky and slightly plastic wet; moderate fine,
medium and coarse sub angular and blocks,; many fine and very few medium pores, few faint clay cutans; few fine and very fine roots.: very few termite nests
ANALYTICAL DATA FOR PROFILE SMC-P3
Horizons Ap Bt1 Bt2 Bt3
Depth (cm) 0-19 19-40 40-100 100-175
Clay % 12.12 26.12 44.12 54.12
Silt % 1.64 1.64 1.64 1.64
Sand % 86.24 72.12 54.24 44.24
Textural class LS SCL SC C
Silt/clay ratio 0.14 0.06 0.04 0.03
BD gcm-3
1.51 nd 1.54 1.51
Moisture % 2.99 nd 9.45 12.51
pH H2O 1:2.5 7.12 6.92 6.84 5.06
pH KCl 1:2.5 5.53 5.42 5.49 4.27
Organic C (%) 0.51 0.39 0.31 0.16
Total N (%) 0.04 0.04 0.05 0.04
Organic M (%) 0.84 0.67 0.54 0.27
C:N ratio 12.07 9.29 6.37 4.46
Avail. P (mg/kg) 9.3 2.05 2.02 3.75
CEC (cmol(+)/kg) 11.2 13.8 16.8 17.8
Exch. Ca (cmol(+)/kg) 0.37 0.84 1.3 1.77
Exch. Mg (cmol(+)/kg) 0.74 1.72 2.65 3.16
Exch.. K (cmol(+)/kg) 0.36 0.52 1.25 5.00
Exch. Na (cmol(+)/kg) 0.18 0.28 0.77 0.98
TEB (cmol(+)/kg) 1.64 3.35 5.97 10.91
BS % 14.76 24.31 35.56 61.31
CECclay 92.4 50.9 38.1 32.9
Extr. Cu (mg/kg) 0.46 0.46 0.55 0.61
Extr. Zn (mg/kg) 0.23 0.1 0.12 0.13
Extr. Fe (mg/kg) 18.06 19.11 15.45 23.3
Extr. Mn (mg/kg) 15.28 14.65 8.40 3.90
EC (dSm-1
) 0.02 0.04 0.04 0.09
nd = not determined
147
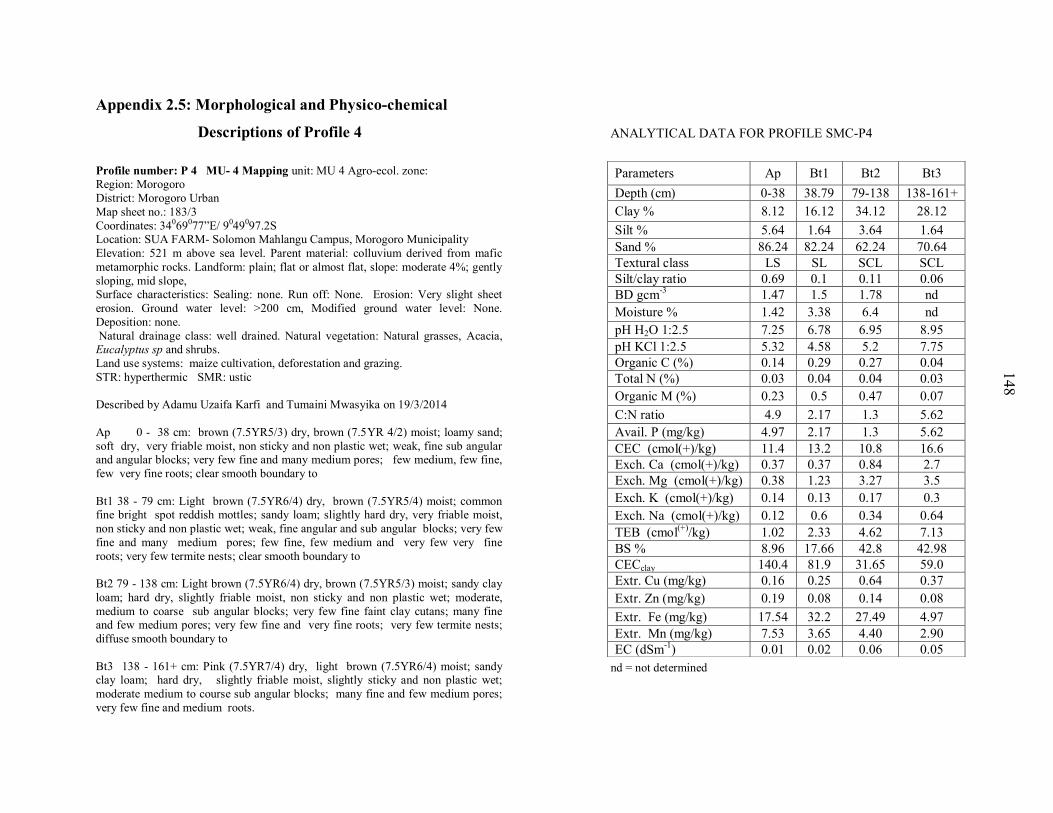
148
Appendix 2.5: Morphological and Physico-chemical
Descriptions of Profile 4
Profile number: P 4 MU- 4 Mapping unit: MU 4 Agro-ecol. zone: Region: Morogoro
District: Morogoro Urban
Map sheet no.: 183/3
Coordinates: 34069077”E/ 9049097.2S Location: SUA FARM- Solomon Mahlangu Campus, Morogoro Municipality
Elevation: 521 m above sea level. Parent material: colluvium derived from mafic
metamorphic rocks. Landform: plain; flat or almost flat, slope: moderate 4%; gently
sloping, mid slope, Surface characteristics: Sealing: none. Run off: None. Erosion: Very slight sheet
erosion. Ground water level: >200 cm, Modified ground water level: None.
Deposition: none.
Natural drainage class: well drained. Natural vegetation: Natural grasses, Acacia, Eucalyptus sp and shrubs.
Land use systems: maize cultivation, deforestation and grazing.
STR: hyperthermic SMR: ustic
Described by Adamu Uzaifa Karfi and Tumaini Mwasyika on 19/3/2014
Ap 0 - 38 cm: brown (7.5YR5/3) dry, brown (7.5YR 4/2) moist; loamy sand;
soft dry, very friable moist, non sticky and non plastic wet; weak, fine sub angular and angular blocks; very few fine and many medium pores; few medium, few fine,
few very fine roots; clear smooth boundary to
Bt1 38 - 79 cm: Light brown (7.5YR6/4) dry, brown (7.5YR5/4) moist; common fine bright spot reddish mottles; sandy loam; slightly hard dry, very friable moist,
non sticky and non plastic wet; weak, fine angular and sub angular blocks; very few
fine and many medium pores; few fine, few medium and very few very fine
roots; very few termite nests; clear smooth boundary to
Bt2 79 - 138 cm: Light brown (7.5YR6/4) dry, brown (7.5YR5/3) moist; sandy clay
loam; hard dry, slightly friable moist, non sticky and non plastic wet; moderate,
medium to coarse sub angular blocks; very few fine faint clay cutans; many fine and few medium pores; very few fine and very fine roots; very few termite nests;
diffuse smooth boundary to
Bt3 138 - 161+ cm: Pink (7.5YR7/4) dry, light brown (7.5YR6/4) moist; sandy clay loam; hard dry, slightly friable moist, slightly sticky and non plastic wet;
moderate medium to course sub angular blocks; many fine and few medium pores;
very few fine and medium roots.
ANALYTICAL DATA FOR PROFILE SMC-P4
nd = not determined
Parameters Ap Bt1 Bt2 Bt3
Depth (cm) 0-38 38.79 79-138 138-161+
Clay % 8.12 16.12 34.12 28.12
Silt % 5.64 1.64 3.64 1.64
Sand % 86.24 82.24 62.24 70.64
Textural class LS SL SCL SCL
Silt/clay ratio 0.69 0.1 0.11 0.06
BD gcm-3
1.47 1.5 1.78 nd
Moisture % 1.42 3.38 6.4 nd
pH H2O 1:2.5 7.25 6.78 6.95 8.95
pH KCl 1:2.5 5.32 4.58 5.2 7.75
Organic C (%) 0.14 0.29 0.27 0.04
Total N (%) 0.03 0.04 0.04 0.03
Organic M (%) 0.23 0.5 0.47 0.07
C:N ratio 4.9 2.17 1.3 5.62
Avail. P (mg/kg) 4.97 2.17 1.3 5.62
CEC (cmol(+)/kg) 11.4 13.2 10.8 16.6
Exch. Ca (cmol(+)/kg) 0.37 0.37 0.84 2.7
Exch. Mg (cmol(+)/kg) 0.38 1.23 3.27 3.5
Exch. K (cmol(+)/kg) 0.14 0.13 0.17 0.3
Exch. Na (cmol(+)/kg) 0.12 0.6 0.34 0.64
TEB (cmol(+)
/kg) 1.02 2.33 4.62 7.13
BS % 8.96 17.66 42.8 42.98
CECclay 140.4 81.9 31.65 59.0
Extr. Cu (mg/kg) 0.16 0.25 0.64 0.37
Extr. Zn (mg/kg) 0.19 0.08 0.14 0.08
Extr. Fe (mg/kg) 17.54 32.2 27.49 4.97
Extr. Mn (mg/kg) 7.53 3.65 4.40 2.90
EC (dSm-1
) 0.01 0.02 0.06 0.05
148
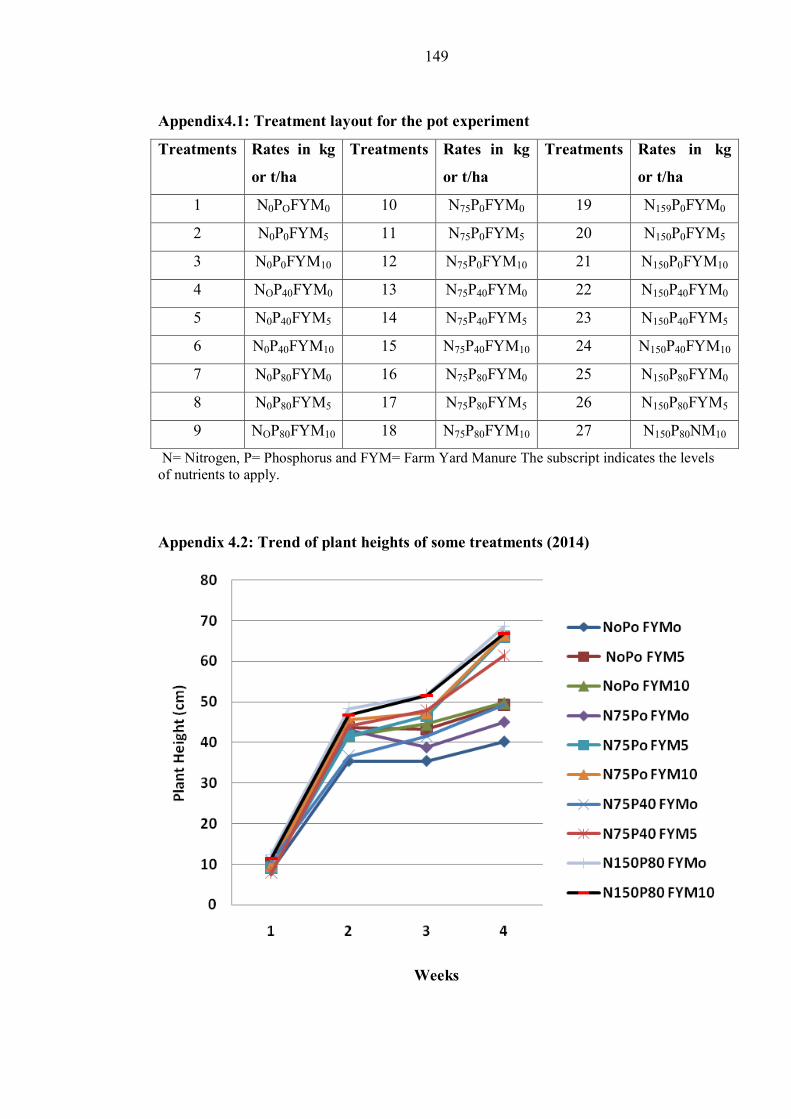
149
Appendix4.1: Treatment layout for the pot experiment
Treatments
Rates in kg
or t/ha
Treatments Rates in kg
or t/ha
Treatments Rates in kg
or t/ha
1 N0POFYM0 10 N75P0FYM0 19 N159P0FYM0
2 N0P0FYM5 11 N75P0FYM5 20 N150P0FYM5
3 N0P0FYM10 12 N75P0FYM10 21 N150P0FYM10
4 NOP40FYM0 13 N75P40FYM0 22 N150P40FYM0
5 N0P40FYM5 14 N75P40FYM5 23 N150P40FYM5
6 N0P40FYM10 15 N75P40FYM10 24 N150P40FYM10
7 N0P80FYM0 16 N75P80FYM0 25 N150P80FYM0
8 N0P80FYM5 17 N75P80FYM5 26 N150P80FYM5
9 NOP80FYM10 18 N75P80FYM10 27 N150P80NM10
N= Nitrogen, P= Phosphorus and FYM= Farm Yard Manure The subscript indicates the levels
of nutrients to apply.
Appendix 4.2: Trend of plant heights of some treatments (2014)
Weeks
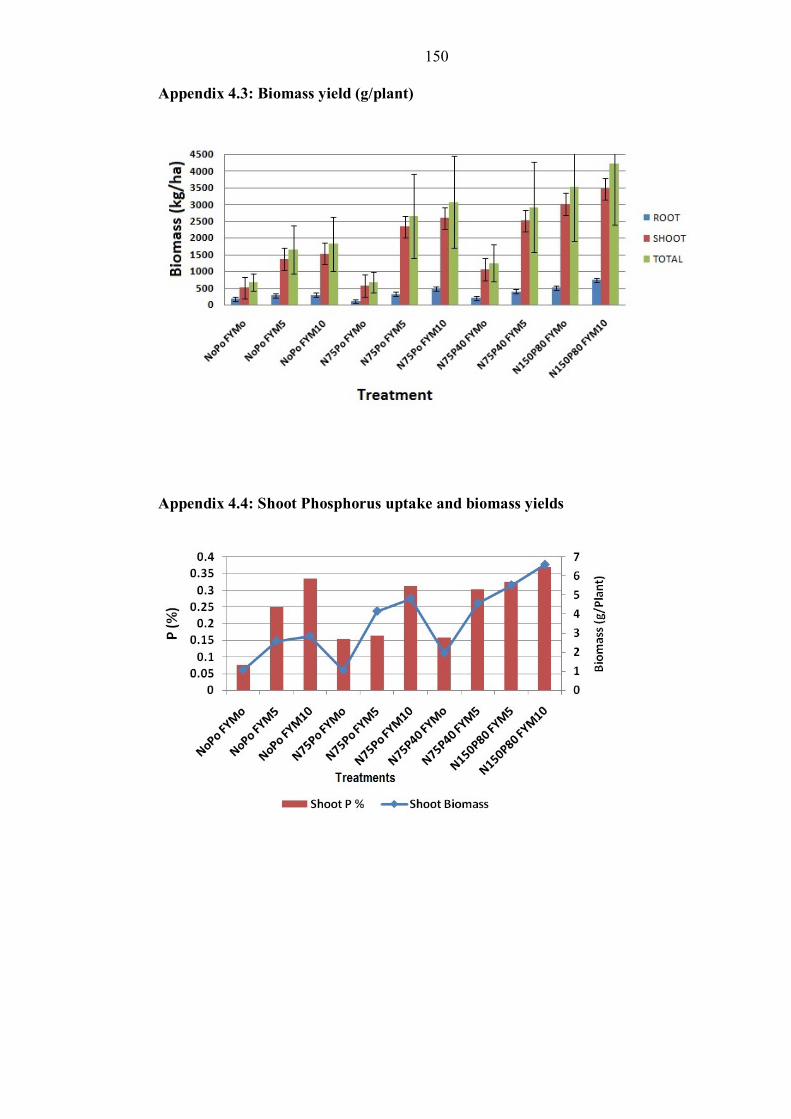
150
Appendix 4.3: Biomass yield (g/plant)
Appendix 4.4: Shoot Phosphorus uptake and biomass yields

151
Appendix 4.5: Shoot N uptake (%) (2014)
Appendix 4.6: Shoot P uptake (%) (2014)