Utilising high throughput technologies for the determination of the reaction network of the l...
22
The definitive version of this article is published and available online as: Novakovic K, Willis MJ, Wright AR, Utilising high throughput technologies for the determination of the reaction network of the L-proline catalysed aldol reaction, CLEAN TECHNOLOGIES AND ENVIRONMENTAL POLICY Volume: 10 Issue: 2 Pages: 155- 163 Published: MAY 2008 Utilising high throughput technologies for the determination of the reaction network of the L-proline catalysed aldol reaction KATARINA NOVAKOVIC, MARK J. WILLIS AND ALLEN R. WRIGHT School of Chemical Engineering & Advanced Materials, University of Newcastle, Newcastle upon Tyne, NE1 7RU, UK Fax: +44 191 222 5292 E-mail: [email protected] Abstract The objective of this work is to facilitate the determination of a reliable reaction network for the L-proline catalysed aldol reaction using high throughput technologies (HTT). The availability of reliable reaction network is fundamental to predictive kinetic modelling including scale up, replacing a batch process with a continuous one, optimisation, thermal safety, process simulation etc. The extent to which HTT experiments may be used to provide the necessary quantitative understanding of both physical and chemical phenomena of the system studied is assessed through a four stage development program. For this particular system it is shown that, in conjunction with appropriate experimental designs, meaningful data streams for mechanistic/kinetic studies can be generated. The experimental data allowed a reaction network for the L-proline catalysed aldol reaction to be proposed and verified through a kinetic modelling exercise. Introduction Robotic workstations are used mainly to support combinatorial chemistry and screening for new compounds and catalysts (Hagemeyer et al. 2004). Their potential to provide useful information regarding commercial, chemical engineering, safety and environmental aspects of process development is not yet fully explored. For instance, it is known that downscaling can alter the relative significance of physical phenomena, in particular handling and dispensing,
-
Upload
independent -
Category
Documents
-
view
4 -
download
0
Transcript of Utilising high throughput technologies for the determination of the reaction network of the l...
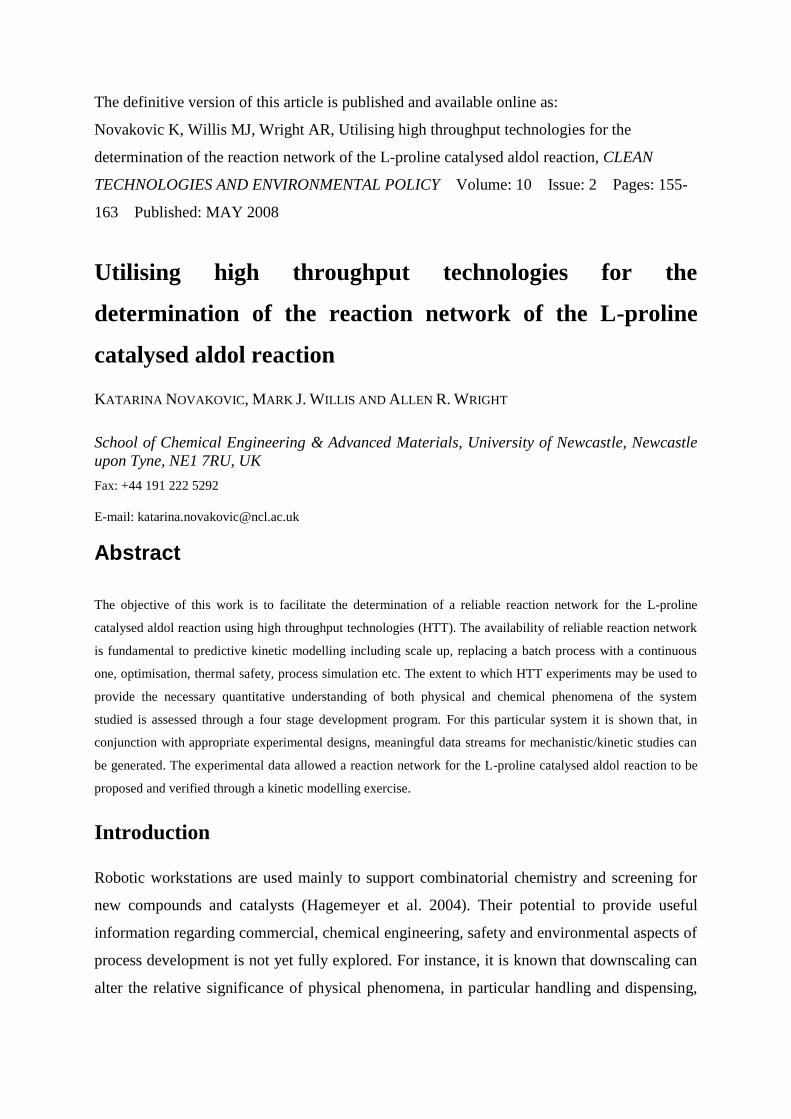
The definitive version of this article is published and available online as:
Novakovic K, Willis MJ, Wright AR, Utilising high throughput technologies for the
determination of the reaction network of the L-proline catalysed aldol reaction, CLEAN
TECHNOLOGIES AND ENVIRONMENTAL POLICY Volume: 10 Issue: 2 Pages: 155-
163 Published: MAY 2008
Utilising high throughput technologies for the
determination of the reaction network of the L-proline
catalysed aldol reaction
KATARINA NOVAKOVIC, MARK J. WILLIS AND ALLEN R. WRIGHT
School of Chemical Engineering & Advanced Materials, University of Newcastle, Newcastle
upon Tyne, NE1 7RU, UK
Fax: +44 191 222 5292
E-mail: [email protected]
Abstract
The objective of this work is to facilitate the determination of a reliable reaction network for the L-proline
catalysed aldol reaction using high throughput technologies (HTT). The availability of reliable reaction network
is fundamental to predictive kinetic modelling including scale up, replacing a batch process with a continuous
one, optimisation, thermal safety, process simulation etc. The extent to which HTT experiments may be used to
provide the necessary quantitative understanding of both physical and chemical phenomena of the system
studied is assessed through a four stage development program. For this particular system it is shown that, in
conjunction with appropriate experimental designs, meaningful data streams for mechanistic/kinetic studies can
be generated. The experimental data allowed a reaction network for the L-proline catalysed aldol reaction to be
proposed and verified through a kinetic modelling exercise.
Introduction
Robotic workstations are used mainly to support combinatorial chemistry and screening for
new compounds and catalysts (Hagemeyer et al. 2004). Their potential to provide useful
information regarding commercial, chemical engineering, safety and environmental aspects of
process development is not yet fully explored. For instance, it is known that downscaling can
alter the relative significance of physical phenomena, in particular handling and dispensing,

the accurate control of transport processes, mass transfer and mixing within the reaction
mixture as well as solid and fluid dynamics, all of which may impact on the rate and
reproducibility of reactions at larger scale (Hoyle 1999). If HTT are to be successfully
extended to process development, experimental results must be meaningful and reproducible
throughout scale up.
In this paper a robotic workstation and a larger scale automated reactor system are used in
combination with process system analysis tools for the purpose of reaction network and
associated rate constants determination. The work is performed in four stages. Stage 1
comprised the initial screening of potential solvents through the assessment of the solubility
and miscibility characteristics of the reactants and catalyst. In Stage 2 the concentrations of
reactants and catalyst that are appropriate for carrying out the reaction in larger scale is
determined. In Stage 3 experiments were performed to generate suitable data for detailed
mechanistic modelling. Finally in Stage 4 a reaction network is proposed and kinetic rate
constants are estimated.
The reaction used as the case study is the L-proline catalysed aldol reaction between p-
nitrobenzaldehyde and acetone (Manuel and Marques 2005, Novakovic et al. 2006).
Experimental equipment
The method combines (1) a HTT platform, enabling fast screening and cost reduction due to
the small volume of the vessels with (2) a larger scale reactor that provides tight temperature
control and a fast sampling rate.
The HTT platform (Chemspeed SLT 106) enables full automation of the experimental
workflow and data logging of all process parameters. This system can accommodate 12
reaction blocks carrying up to 192 reaction vessels. Agitation is applied by an orbital shaker
(0-1300 rpm) and a wide temperature range (-40-145 °C) can be achieved and controlled.
The platform enables the solid and liquid to be dosed automatically, using a robotic arm
connected to a solid dosing unit (SDU) and a liquid handling unit (LHU) respectively.
The larger scale experiments were conducted in an HEL SIMULAR reaction calorimeter. The
primary function of the SIMULAR is to measure the heat output of a chemical reaction (QR),
but it also provides a well instrumented, computer controlled larger scale reaction system. The
reactor is a one litre double jacketed glass vessel. Agitation is achieved through stirring (0-
600 rpm) while temperature control is achieved either by using an external oil heating/cooling
system that flows through the jacket or an electrical heater (0-150 W) placed inside the vessel
or a combination of both. In addition there is a solid, liquid and gas dosing unit, a sampling
unit, temperature probe (Pt 100), turbidity probe and a pH meter.
The analytical instruments used in this study were a GC-MS Varian Saturn 2200 with
autosamplerer, HPLC Varian with autosamplerer and HPLC Gilson (Novakovic et al. 2006).
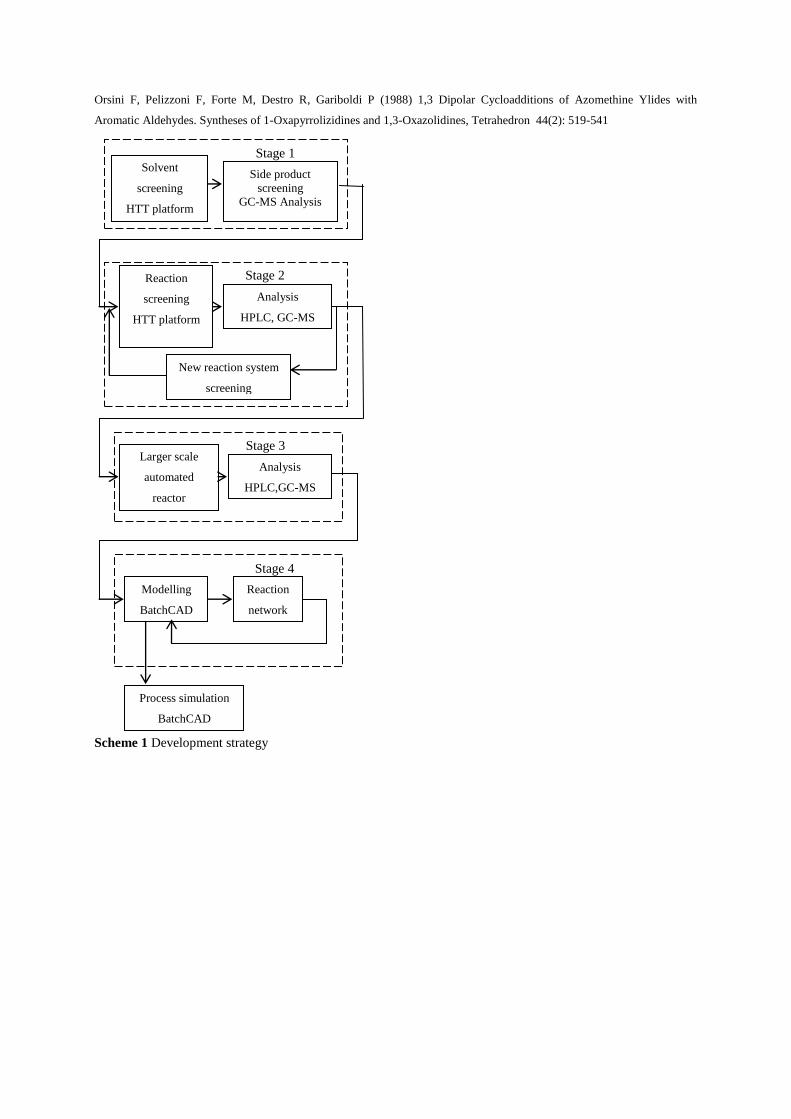
Development strategy
The starting point for the development study is knowledge of the reactants, desired products,
the catalyst, typical solvents and reaction temperatures. The methodology can be divided into
four stages (Scheme 1).
Scheme 1
Stage1: Experimental study conducted to gain a preliminary chemical and
physical understanding of the system
The HTT platform is used to gain both, a physical and chemical understanding of the system,
in particular, to find the solubility of reactants and catalyst in different solvents and also
assess the solvents mutual miscibility (this can be visually assessed). At this stage solvents
that act as reactants producing undesired by-products would be identified.
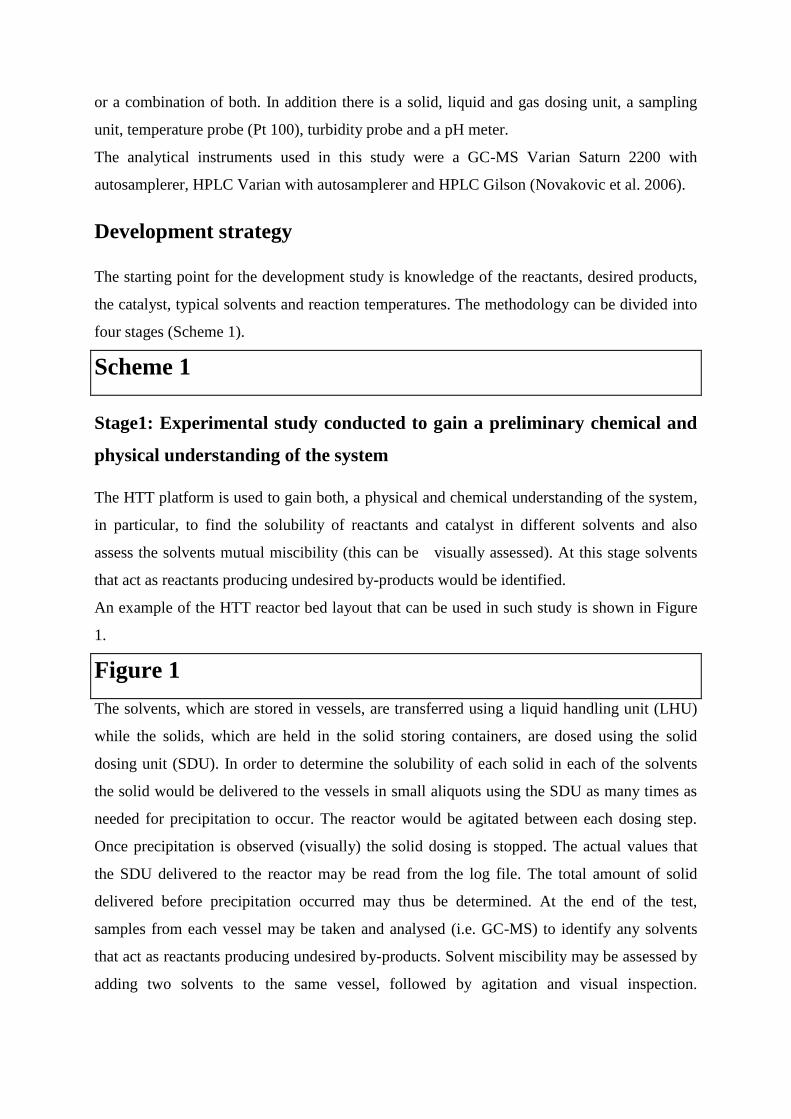
An example of the HTT reactor bed layout that can be used in such study is shown in Figure
1.
Figure 1
The solvents, which are stored in vessels, are transferred using a liquid handling unit (LHU)
while the solids, which are held in the solid storing containers, are dosed using the solid
dosing unit (SDU). In order to determine the solubility of each solid in each of the solvents
the solid would be delivered to the vessels in small aliquots using the SDU as many times as
needed for precipitation to occur. The reactor would be agitated between each dosing step.
Once precipitation is observed (visually) the solid dosing is stopped. The actual values that
the SDU delivered to the reactor may be read from the log file. The total amount of solid
delivered before precipitation occurred may thus be determined. At the end of the test,
samples from each vessel may be taken and analysed (i.e. GC-MS) to identify any solvents
that act as reactants producing undesired by-products. Solvent miscibility may be assessed by
adding two solvents to the same vessel, followed by agitation and visual inspection.
Information gained from this first screening stage facilitates the selection of potential
reactant-catalyst-solvent combination to be further tested in Stage 2.
Stage 2: Using a high throughput experimental programme to obtain
quantitative understanding of the reactant-catalyst-solvent combination
chosen in Stage1
The aim of this stage is to select the reactants and catalyst concentrations suitable for the
mechanistic/kinetic study in the larger scale reactor, ideally using as little as one run on the
HTT platform. The HTT reactor bed shown in Figure 1 can again be used.
The experimental design (DoE) methodology (Lazic 2004) may be beneficial. The defined
number of factors (reactants and catalyst) can be employed at certain number of levels (for
example two i.e. high and low concentrations) giving a total of (number of levels)number of factors
vessels to be involved in the experiment. The temperature of the reactor vessels should be
maintained constant throughout the experiment. As part of an automated procedure samples
would be taken and quenched. After the experiment is finished samples would be submitted
for analysis.
This experiment should verify the influence of the catalyst. Furthermore, through the
inspection of the experimental data the presence of any unexpected side reactions may be
observed. If the quantity of reactant/s consumed is not equal to quantity of product/s formed a
side reaction is likely to be present. Finally, Stage 2 should provide the choice of
concentration of the reactants-catalyst-solvent to be taken to the larger scale study.
Stage 3: Large scale experiments using the HEL SIMULAR reaction
calorimeter to obtain time-concentration profile data
Larger scale experiments are normally avoided during initial screening of a reaction for two
reasons; they are costly and time consuming. However, once small scale screening has been
conducted, there are number of reasons why a large scale automated reactor should be
employed. When compared to the HEL calorimeter, the Chemspeed SLT 106 synthesizer does
not provide tight temperature control. If there is no significant reaction exotherm the robotic
workstation may provide reliable time-concentration data but in a highly exothermic or
endothermic system it may not because of the slow response to temperature change.
Furthermore, the Chemspeed SLT 106 synthesizer (1) does not allow for temperature
measurement in individual reactors. Measurement is only available in the reference reactor so
in general the exact temperature profile is not available; (2) when sampling there is a reliance
on the accuracy of the sampling needle; (3) once the sample is in the vial, as there is no
facility to apply agitation to vials in the sample rack, precipitation can occur; (4) there is a
slow sampling rate as the robot needs to pick up tools etc. and move them around. This can
take time and therefore restrict the speed at which samples may be made. Therefore to obtain
time-concentration profile data and simultaneously assess the reaction thermo-chemistry it is
more appropriate to do the experiments in a calorimeter. The chosen chemistry (reactant-
catalyst-solvent of chosen concentration) should be experimentally studied at different
temperatures. Following these runs thermo-chemistry (heat of reaction) would be determined.
Also the time-concentration profile from the experimental runs would be made available for a
mechanistic modelling study.
Stage 4: Mechanistic modelling study
In this stage the proposed reaction network is tested through a mechanistic modelling study.
Methods for the estimation of kinetic rate constants normally fall into the class of iterative
techniques, which involve the repeated simulation (integration) of the ordinary differential
equations (ODEs) while adjusting the kinetic parameters using an optimisation algorithm until
the simulation closely matches the experimental data. Trial and error (through repeated
regression of potential ODE structures to the experimental data) employing the proposed
network would lead to the best set of ODEs. The kinetic rate constants obtained during the
modelling exercise at different temperatures are used to determine the parameters of the
Arrhenius temperature dependency function. If model is acceptable the predictions obtained
from the mathematical model when integrated across a batch of data compared to the actual
experimental data should give a satisfactory prediction at all temperatures.
Case study
The chemical system used as the case study is the L-proline catalysed aldol reaction between
p-nitrobenzaledehyde and acetone (Manuel and Marques 2005, Novakovic et al. 2006). This
is challenging system as it is potentially non homogenous and the reaction network is not
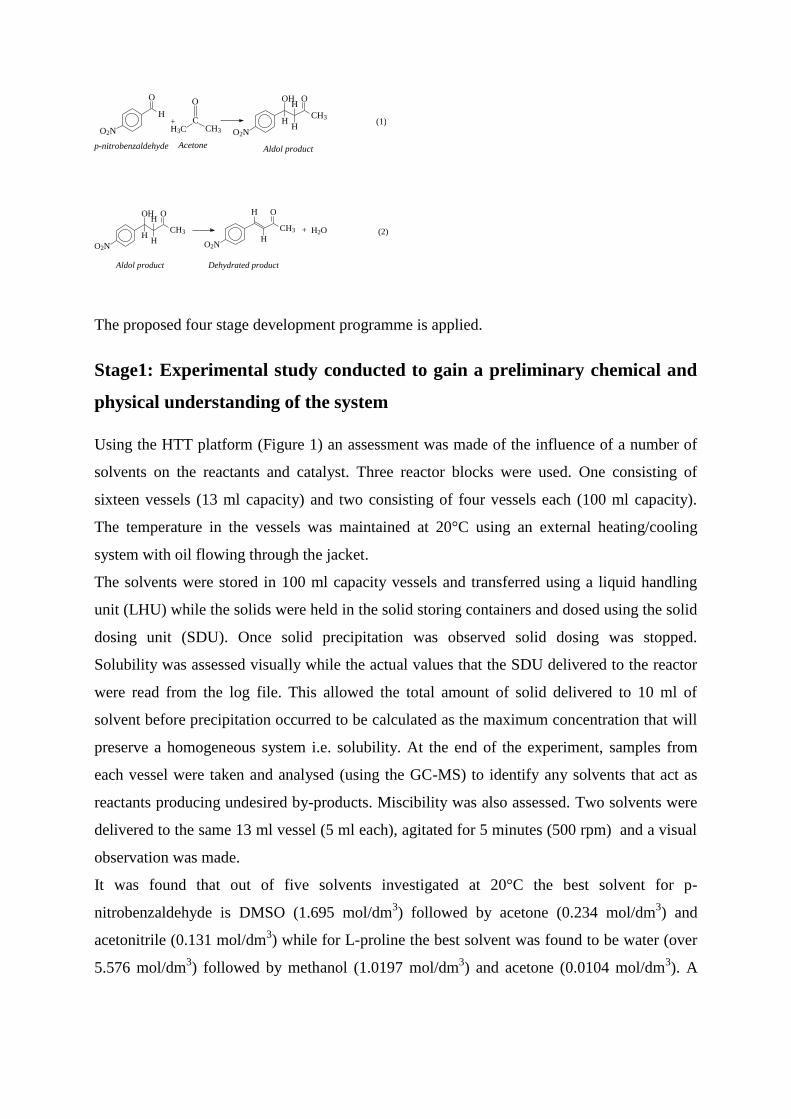
readily available (Pihko et al. 2006). The following chemical reactions are reported to take
place (Peng et al. 2003, Hayashi et al. 2004):
O2N
O
H+
O2N
CH3
OH
H
H
H
O
p-nitrobenzaldehyde Acetone Aldol product
(1)CCH3H3C
O
Aldol product Dehydrated product
O2N
CH3
OH
H
H
H
O
(2)
O2N
CH3
H
OH
+ H2O
The proposed four stage development programme is applied.
Stage1: Experimental study conducted to gain a preliminary chemical and
physical understanding of the system
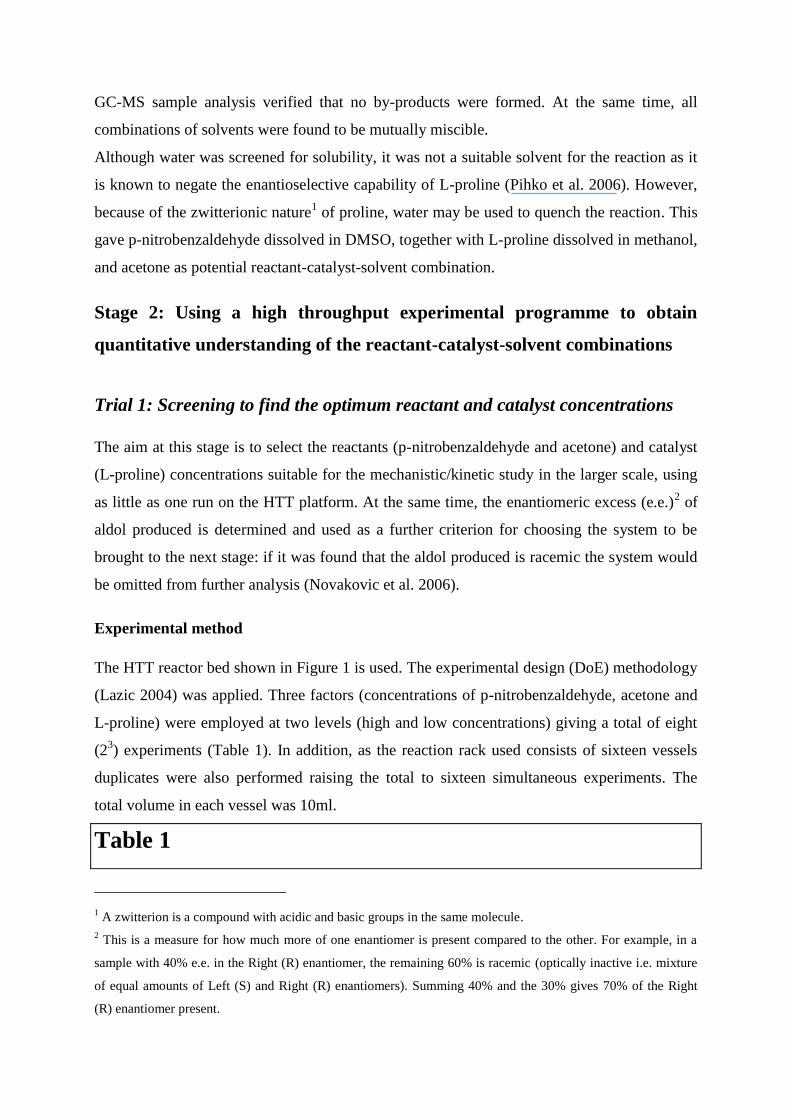
Using the HTT platform (Figure 1) an assessment was made of the influence of a number of
solvents on the reactants and catalyst. Three reactor blocks were used. One consisting of
sixteen vessels (13 ml capacity) and two consisting of four vessels each (100 ml capacity).
The temperature in the vessels was maintained at 20°C using an external heating/cooling
system with oil flowing through the jacket.
The solvents were stored in 100 ml capacity vessels and transferred using a liquid handling
unit (LHU) while the solids were held in the solid storing containers and dosed using the solid
dosing unit (SDU). Once solid precipitation was observed solid dosing was stopped.
Solubility was assessed visually while the actual values that the SDU delivered to the reactor
were read from the log file. This allowed the total amount of solid delivered to 10 ml of
solvent before precipitation occurred to be calculated as the maximum concentration that will
preserve a homogeneous system i.e. solubility. At the end of the experiment, samples from
each vessel were taken and analysed (using the GC-MS) to identify any solvents that act as
reactants producing undesired by-products. Miscibility was also assessed. Two solvents were
delivered to the same 13 ml vessel (5 ml each), agitated for 5 minutes (500 rpm) and a visual
observation was made.
It was found that out of five solvents investigated at 20°C the best solvent for p-
nitrobenzaldehyde is DMSO (1.695 mol/dm3) followed by acetone (0.234 mol/dm
3) and
acetonitrile (0.131 mol/dm3) while for L-proline the best solvent was found to be water (over
5.576 mol/dm3) followed by methanol (1.0197 mol/dm
3) and acetone (0.0104 mol/dm
3). A
GC-MS sample analysis verified that no by-products were formed. At the same time, all
combinations of solvents were found to be mutually miscible.
Although water was screened for solubility, it was not a suitable solvent for the reaction as it
is known to negate the enantioselective capability of L-proline (Pihko et al. 2006). However,
because of the zwitterionic nature1 of proline, water may be used to quench the reaction. This
gave p-nitrobenzaldehyde dissolved in DMSO, together with L-proline dissolved in methanol,
and acetone as potential reactant-catalyst-solvent combination.
Stage 2: Using a high throughput experimental programme to obtain
quantitative understanding of the reactant-catalyst-solvent combinations
Trial 1: Screening to find the optimum reactant and catalyst concentrations
The aim at this stage is to select the reactants (p-nitrobenzaldehyde and acetone) and catalyst
(L-proline) concentrations suitable for the mechanistic/kinetic study in the larger scale, using
as little as one run on the HTT platform. At the same time, the enantiomeric excess (e.e.)2 of
aldol produced is determined and used as a further criterion for choosing the system to be
brought to the next stage: if it was found that the aldol produced is racemic the system would
be omitted from further analysis (Novakovic et al. 2006).
Experimental method
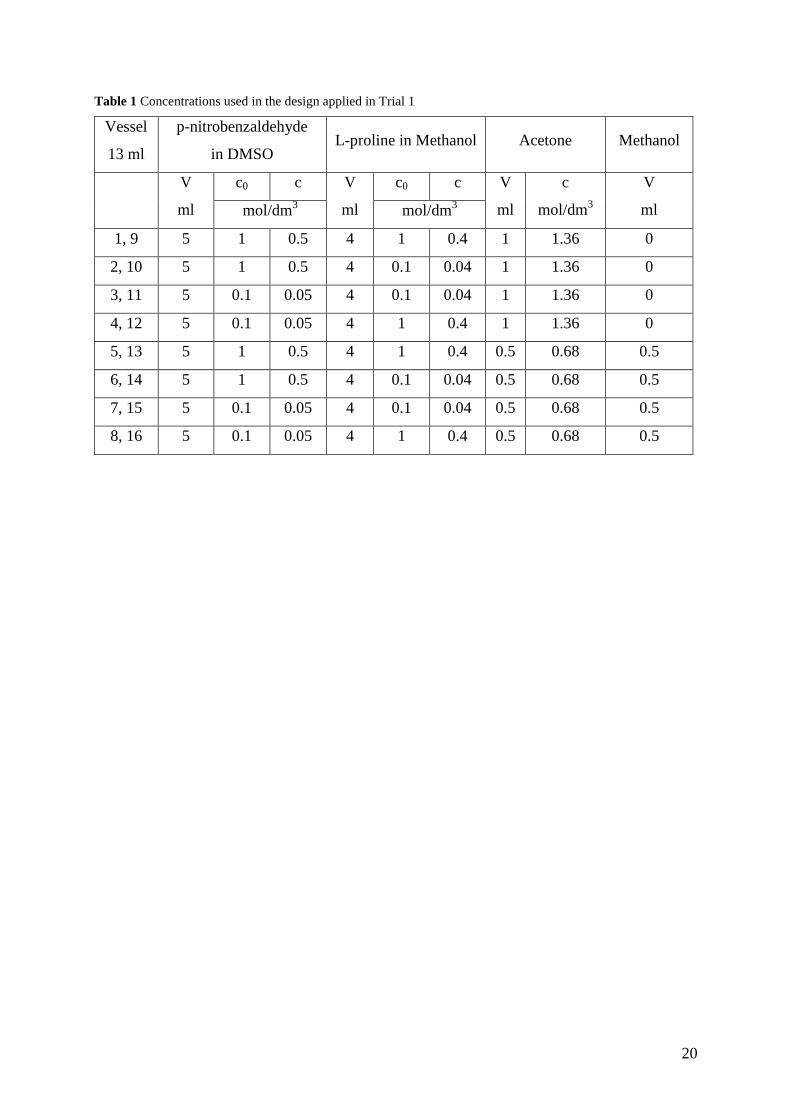
The HTT reactor bed shown in Figure 1 is used. The experimental design (DoE) methodology
(Lazic 2004) was applied. Three factors (concentrations of p-nitrobenzaldehyde, acetone and
L-proline) were employed at two levels (high and low concentrations) giving a total of eight
(23) experiments (Table 1). In addition, as the reaction rack used consists of sixteen vessels
duplicates were also performed raising the total to sixteen simultaneous experiments. The
total volume in each vessel was 10ml.
Table 1
1 A zwitterion is a compound with acidic and basic groups in the same molecule.
2 This is a measure for how much more of one enantiomer is present compared to the other. For example, in a
sample with 40% e.e. in the Right (R) enantiomer, the remaining 60% is racemic (optically inactive i.e. mixture
of equal amounts of Left (S) and Right (R) enantiomers). Summing 40% and the 30% gives 70% of the Right
(R) enantiomer present.
Prior to adding acetone, samples were taken from all sixteen reactors. The addition of the
acetone was taken as the starting time of the reaction. Over a 24h six samples were taken from
each vessel. As part of automated procedure samples were quenched with water and diluted
with acetonitrile. After the experiment was finished samples were submitted to the HPLC and
GC-MS for analysis.
Experimental results
The experiments verified that the concentration of L-proline has a significant influence on the
consumption of p-nitrobenzaldehyde (the higher the concentration of L-proline the more of p-
nitrobenzaldehyde is reacted). Furthermore, through inspection of the experimental data it
was observed that the conversion of p-nitrobenzaldehyde was significantly higher than the
combined conversions of aldol and dehydrated product. This indicated that at least one side
reaction that is consuming p-nitrobenzaldehyde is present. Finally, through analysis of the
samples submitted to the chiral HPLC it was found that the aldol was racemic (Novakovic et
al. 2006). For that reason this system of reactant-catalyst-solvent was not taken forward for
further analysis.
Trial 2: Screening to find the optimum reactant and catalyst concentrations
(with acetone as the solvent for p-nitrobenzaldehyde and L-proline)
In Stage 1 of the case study, it was found that the second best solvent for the p-
nitrobenzaldehyde and third best solvent for the L-proline was acetone. Therefore, in an
attempt to avoid the side reaction observed with the reactant-catalyst-solvent system used in
the previous trial and the formation of racemic product, the solvents used for p-
nitrobenzaldehyde and L-proline were switched to acetone.
Experimental method
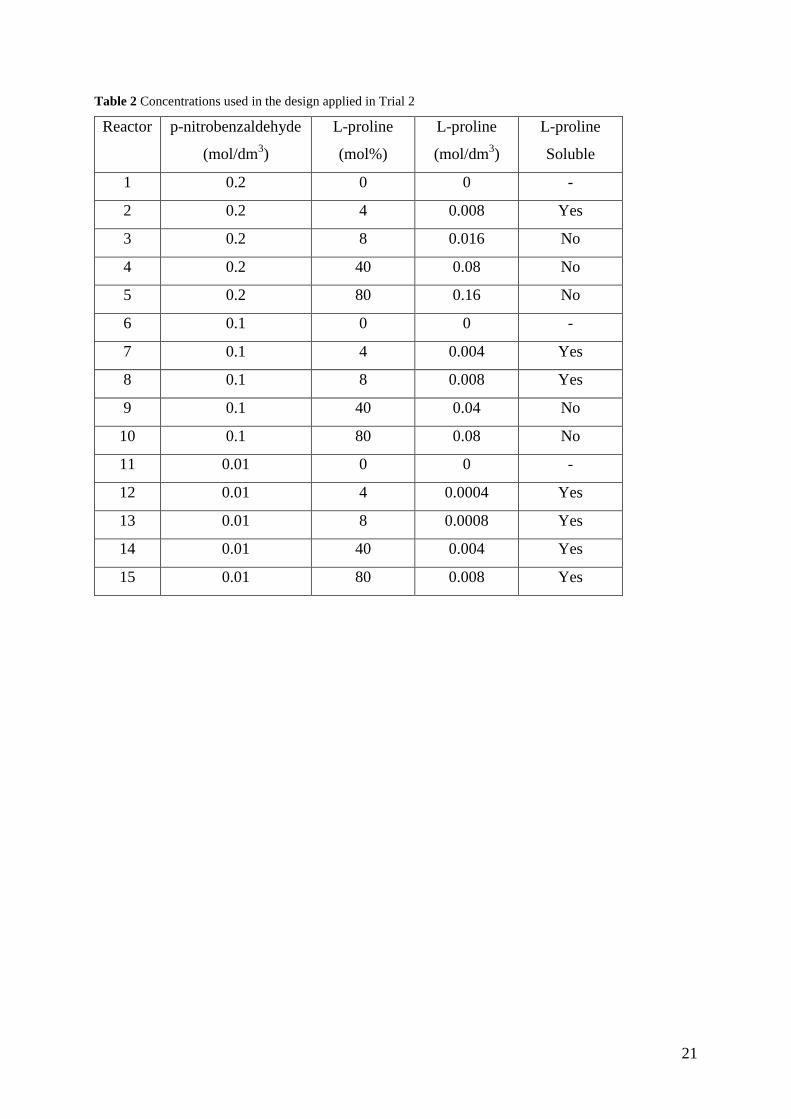
Two factors, the concentration of p-nitrobenzaldehyde and the concentration of L-proline
(expressed as molar percentage of p-nitrobenzaldehyde) were used. Furthermore, three levels
of p-nitrobenzaldehyde concentration (0.2, 0.1 and 0.01 mol/dm3) and five levels of L-proline
concentration (0, 4, 8, 40 and 80 mol% relative to p-nitrobenzaldehyde) in 10 ml of acetone,
required a total of fifteen experiments (Table 2).
Table 2
The addition of the L-proline was taken as the starting time of the reaction. In experiments
where no L-proline was added the addition of acetone was taken as the zero point of the
reaction. During each run six samples over 24 h were taken. The samples were automatically
quenched with water, diluted with acetonitrile and after run was finished submitted to the GC-
MS and HPLC for analysis.
Experimental results
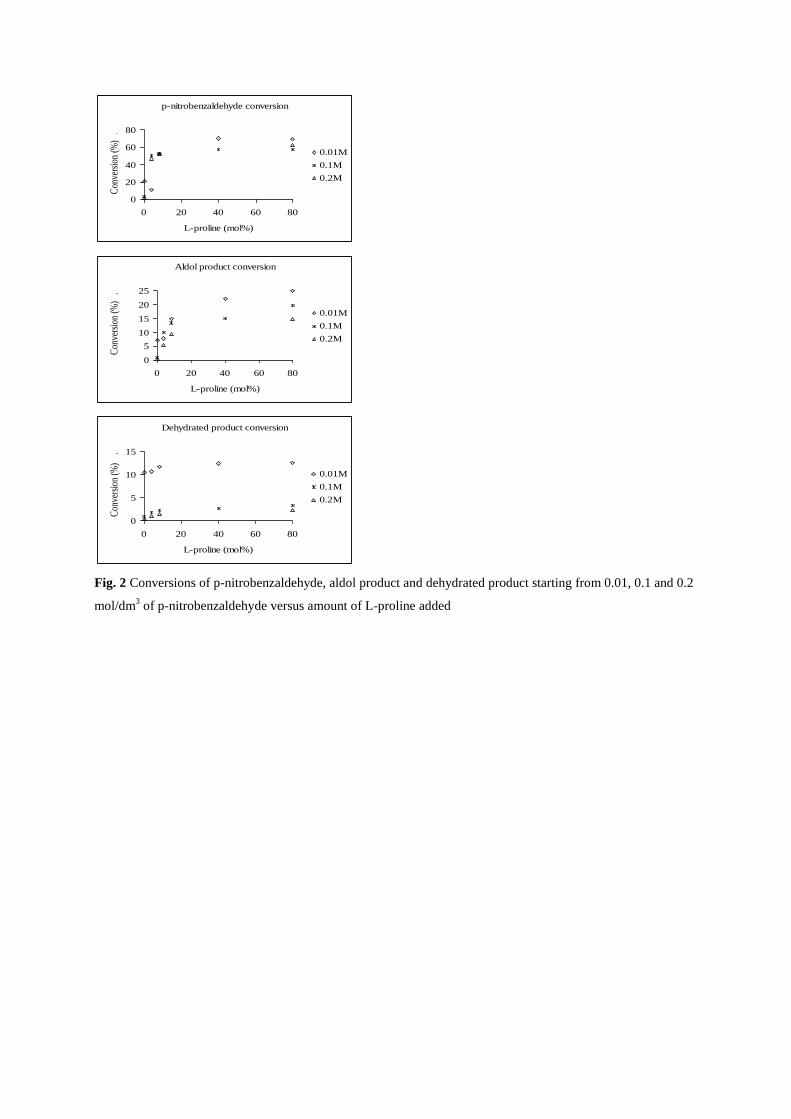
Results obtained from reactors 1-15 are shown in Figure 2. For the clarity of graphs only the
end point conversions (24 h) are shown. Conversions of p-nitrobenzaldehyde, aldol product
and dehydrated product starting from 0.01, 0.1 and 0.2 mol/dm3 of p-nitrobenzaldehyde
versus amount of L-proline added are presented. Reactor 4 (0.2 mol/dm3 p-nitrobenzaldehyde
and 40 mol% L-proline) was omitted from sampling as amount of L-proline initially added
was outside the limits set.
Figure 2
With no L-proline in the system, the conversion of p-nitrobenzaldehyde was found to be low
and approximately equal to total amount of aldol and dehydrated product formed. In reactions
with L-proline present an increase in the concentration of L-proline resulted in an increase in
the conversions of p-nitrobenzaldehyde, aldol and dehydrated product. The results obtained
from the homogeneous systems (initial concentration of p-nitrobenzaldehyd is 0.01 mol/dm3)
indicated that increasing the amount of L-proline above 40 mol% (relative to p-
nitrobenzaldehyde) does not significantly increase the amount of aldol and dehydrated
product formed.
All the reactors containing L-proline suffered from a mass imbalance between the amount of
p-nitrobenzaldehyde consumed and the amount of aldol and dehydrated product made,
indicating the presence of at least one side reaction. Therefore although the reactants and
catalyst were used with no additional solvents a side reaction occurred. The e.e. of aldol
produced was measured to be in the region of 73% after 24 h (Novakovic et al. 2006).
Summary
The experimental programme in Stage 2 (Trial 1 and Trial 2) suggests that a side reaction in
the system where p-nitrobenzaldehyde and acetone are used as reactants and L-proline is the
chosen catalyst could not be avoided. Orsini et al. (Orsini et al. 1988) demonstrated that the
addition of p-nitrobenzaldehyde, 4-pyridin aldehyde or phenylglyoxal to a suspension of
proline in DMSO results in a rapid dissolution of the amino acids and formation of
stereisomeric 1-oxapyrrolizidine derivatives. On the basis of spectral data, they concluded
that in DMSO, the reaction between one molecule of L-proline and two molecules of p-
nitrobenzaldehye occurs. In addition the e.e. of aldol produced in Trial 2 was in agreement
with literature (Pihko et al. 2006). Because of this and the fact that a side reaction between the
reactant and catalyst could not be avoided the reactant-catalyst-solvent combination applied in
Trial 2 was brought to the larger scale. The following concentrations were chosen: 0.01
mol/dm3 p-nitrobenzaldehyde and 40 mol% L-proline in acetone. The knowledge gained from
the previous experiments facilitated this choice of experimental conditions. In Trial 2 it was
seen that adding more than 40 mol% of L-proline does not significantly influence an increase
in the conversion of p-nitrobenzaldehyde, aldol and dehydrated product. Furthermore, a low
concentration of p-nitrobenzaldehyde was chosen so that the 40 mol% of L-proline would be
dissolved preserving homogeneity of the system.
Stage 3: Large scale experiments using the HEL SIMULAR reaction
calorimeter to obtain time-concentration profile data
To generate data suitable for detailed mechanistic modelling study and simultaneously assess
the reaction thermo chemistry experiments are performed in reaction calorimeter.
Experimental method
The following experimental conditions were used: 0.01 mol/dm3 p-nitrobenzaldehyde and 40
mol% L-proline in 300 ml of acetone. Three runs were performed at 20, 30 and 40°C.
Approximately twenty-five samples were taken over six hours. The samples were quenched
with water, diluted with acetonitrile and submitted to the HPLC for analysis.
Experimental results
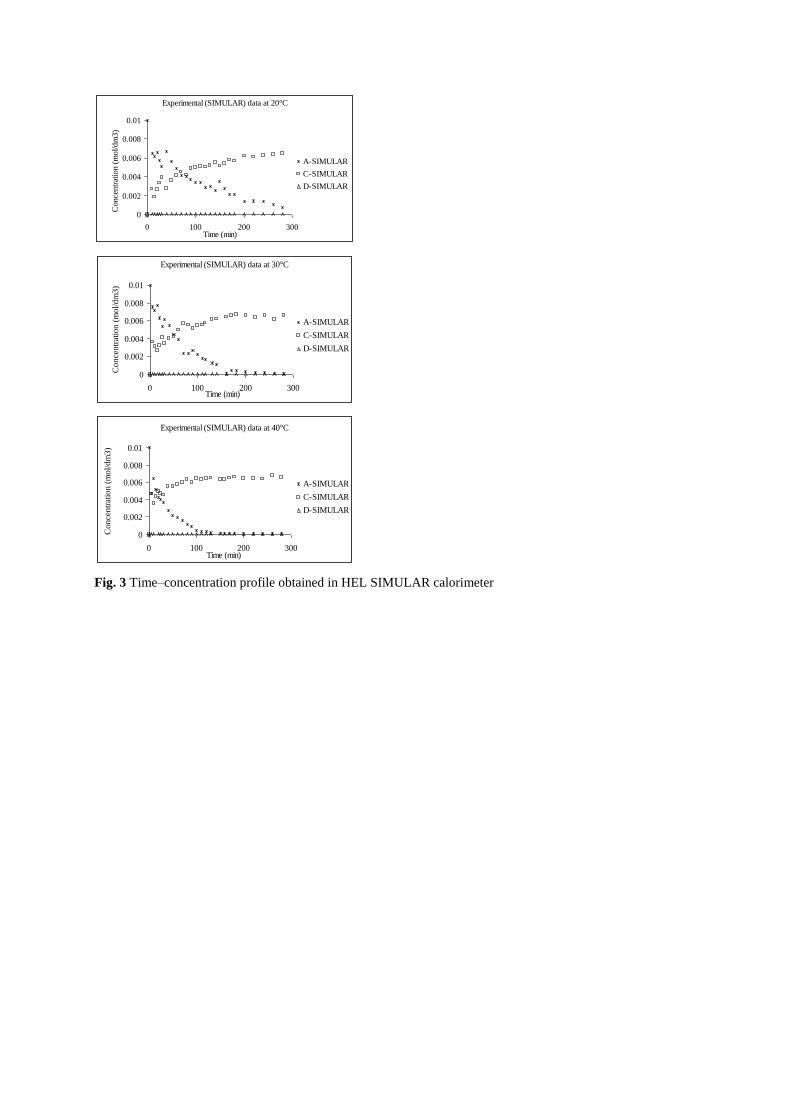
The thermo-chemistry (heat of reaction) was found to be negligible. For brevity throughout
the remainder of this paper the following notation will be used: A-p-nitrobenzaldehyde, B–
acetone, C-aldol product, D-dehydrated product, E-water, F-L-proline and G-side product.
The time-concentration profile data for A, C and D were obtained for the three experimental
runs (Figure 3).
Figure 3
It was observed that an increase in temperature produced an increase in conversion of A and
C while conversion of D decreased. In all three runs an increase in the e.e. of aldol product
with time was observed with the main enantiomer being the left (S) enantiomer except for the
first few samples (first two at 20°C and first one at 30°C) where the main enantiomer was the
right (R) enantiomer (Novakovic et al. 2006).
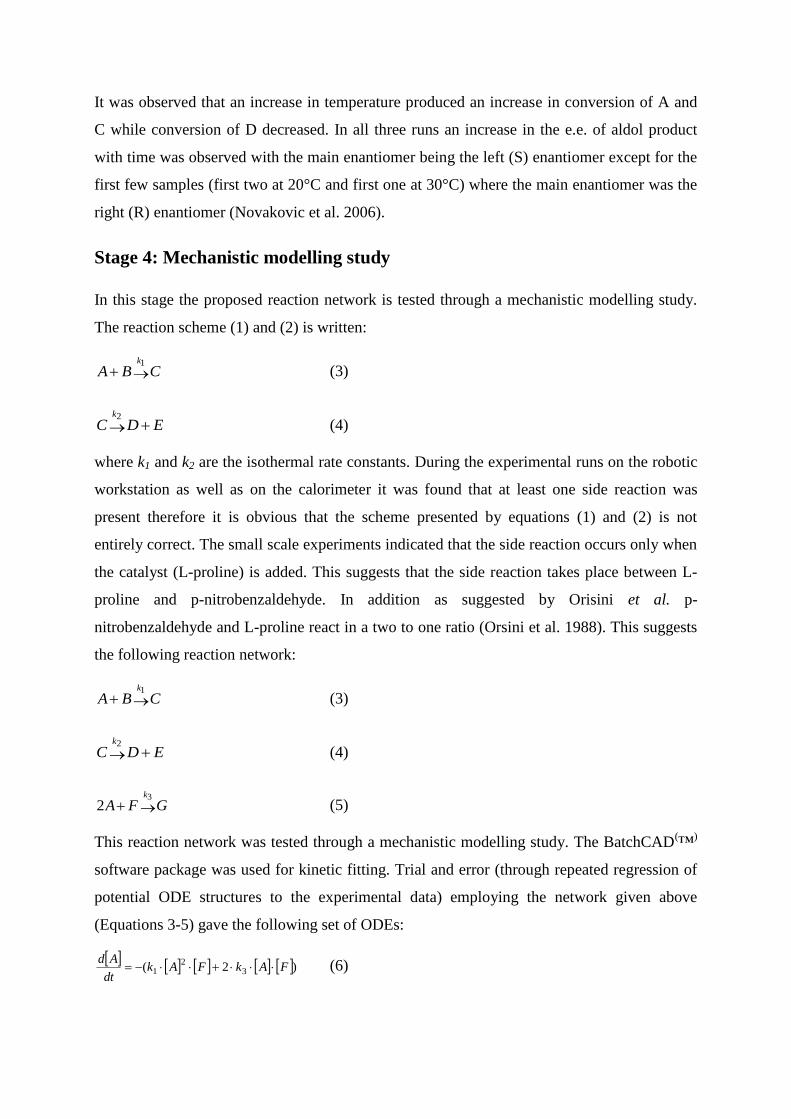
Stage 4: Mechanistic modelling study
In this stage the proposed reaction network is tested through a mechanistic modelling study.
The reaction scheme (1) and (2) is written:
CBAk
1
(3)
EDCk
2
(4)
where k1 and k2 are the isothermal rate constants. During the experimental runs on the robotic
workstation as well as on the calorimeter it was found that at least one side reaction was
present therefore it is obvious that the scheme presented by equations (1) and (2) is not
entirely correct. The small scale experiments indicated that the side reaction occurs only when
the catalyst (L-proline) is added. This suggests that the side reaction takes place between L-
proline and p-nitrobenzaldehyde. In addition as suggested by Orisini et al. p-
nitrobenzaldehyde and L-proline react in a two to one ratio (Orsini et al. 1988). This suggests
the following reaction network:
CBAk
1
(3)
EDCk
2
(4)
GFAk
3
2 (5)
This reaction network was tested through a mechanistic modelling study. The BatchCAD(™
)
software package was used for kinetic fitting. Trial and error (through repeated regression of
potential ODE structures to the experimental data) employing the network given above
(Equations 3-5) gave the following set of ODEs:
)2( 32
1 FAkFAkdt
Ad (6)
FAk
dt
Bd
2
1 (7)
CkFAk
dt
Cd 2
2
1 (8)
Ck
dt
Ed
dt
Dd 2
(9)
FAk
dt
Gd
dt
Fd 3
(10)
Here [A]p, [B]
q,…..[F]
r represent the respective species concentrations at the specified instant,
p, q, r etc. are the reaction orders with respect to each reactant and ki are the rate constants (for
an isothermal system). Note that in developing the rate expressions:
The concentration of F is included in the modelling of aldol formation (Equation (3)).
This is because F is the catalyst for this reaction.
The concentration of B is not included. This is because it is much larger than the
concentration of A and F and is therefore approximately constant during the reaction.
When modelling the rate of change of the concentration of A with respect to time, it
was found that a second order term with respect to reactant A disappearance gave a
better fit to the data (smaller objective function) than first order.
For the reaction that produced the side product, the best data fit was obtained when the
reaction was assumed to be first order with respect to the concentration of A. It is
conjectured that this reaction may be a two step reaction where addition of the first
molecule of A to F is the slowest step and therefore one determining rate of the entire
reaction.
The kinetic rate constants obtained during the modelling exercise were k1,20°C = 7.9638
dm6mol
-2s
-1, k1,30°C = 1.5947*10
1 dm
6mol
-2s
-1, k1,40°C = 3.0154*10
1 dm
6mol
-2s
-1; k2,20°C =
2.2671*10-7
s-1
, k2,30°C = 1.8136*10-7
s-1
, k2,40°C = 1.6143*10-7
s-1
; k3,20°C = 8.4695*10-3
dm3mol
-1s
-1, k3,30°C = 1.7567*10
-2 dm
3mol
-1s
-1, k3,40°C = 2.9384*10
-2 dm
3mol
-1s
-1; at 20, 30 and
40°C respectively. Using these estimated rate constants, the parameters of the Arrhenius
temperature dependency function were calculated and the following equations were proposed:
TRek
4100815.5
9
1 100492.9 (11)

TRek
410300.1
9
2 100774.1 (12)
TRek
4107546.4
6
3 105826.2 (13)
where R is universal gas constant (8.314 Jmol-1
K-1
) and T is temperature (K).
Note that the quantity of dehydrated product and water formed are very low hence the small
rate constant k2 in the model.
The predictions obtained from the mathematical model when integrated across a batch of data
compared to the actual experimental data are presented in Figure 4 for the three different
temperature runs. A satisfactory prediction of the data has been obtained at all three
temperatures.
Figure 4
Conclusions
The main contribution of this work is in demonstrating that a robotic workstation and a larger
scale automated reactor system may be used in combination with process system analysis
tools for the purpose of reaction network and associated rate constants determination.
Furthermore, through a four stage development programme, a potential reaction network and
associated rate constants have been proposed for the L-proline catalysed aldol reaction. This
reaction was used as a case study to access extent to which HTT experimentation may be used
to provide the necessary quantitative understanding of both physical and chemical phenomena
of the system studied. However, it was also chosen as the the reaction network is not readily
available (Pihko et al. 2006).
Screening experiments on a Chempeed SLT 106 synthesiser were used to select a suitable
reactant–catalyst-solvent combination. It was shown that by using a large number of small
scale vessels, parallel automated experiments enabled high speed screening and generation of
a quantitative understanding of the system studied. For the chosen system (p-
nitrobenzaldehyde, L-proline and acetone) it was found that the enantiomeric excess of aldol
produced after 24 h was 73%. Furthermore, the presence of a side reaction, between p-
nitrobenzaldehyde and L-proline was identified. This clearly demonstrates the potential that
robotic workstations have in the rapid generation of experimental data required for reaction
network determination and therefore enhanced process development.
Large scale experiments were performed in a reaction calorimeter at 20, 30 and 40°C using
0.01 mol/dm3 p-nitrobenzaldehyde and 40 mol% L-proline in 300 ml of acetone. With these
experimental conditions, the thermo-chemistry of the reaction was found to be negligible. The
time-concentration profile data obtained during the experiments were then used to develop a
chemical reaction network using the BatchCAD(™
) simulation software. The proposed
mechanistic model and regressed ODEs structures give a satisfactory prediction of the
measured experimental data. A significant result of the experiments which is validated
through this modelling exercise is that the reaction between p-nitrobenzaldehyde and L-
proline that is known to occur in DMSO (Orsini et al. 1988) has been shown to also take place
in acetone. For this reaction (Equation 5) the best data fit was obtained when the reaction was
assumed to be first order with respect to the concentration of p-nitrobenzaldehyde. This
suggests a two step reaction where the addition of the first molecule of p-nitrobenzaldehyde to
L-proline is the slowest step and therefore the one determining the rate of the entire reaction.
Future experimental work will further verify the validity of the model using, for instance, fed-
batch experiments at different temperatures to those reported in this paper.
Acknowledgements
The authors wish to acknowledge the UK Engineering and Physical Sciences Research
Council (EPSRC) grant No. GR/S85368/01 for funding this research.
We would also like to acknowledge Mrs Julie Parker for her assistance in experimental study.
References
Hagemeyer A, Strasser P, Volpe AF (2004) High-Throughput Screening in Heterogeneous Catalysis, Wiley-VCH
Hayashi Y, Tsuboi W, Shoji M, Suzuki N (2004) Application of high pressure, induced by water freezing, to the direct
asymmetric aldol reaction, Tetrahedron Letters 45: 4353-4356
Hoyle W (1999) Pilot Plants and Scale-up of Chemical Processes II, The Royal Society of Chemistry
Lazic Z (2004) Design of experiments in chemical engineering: a practical guide, Wiley-VCH
Manuel M, Marques B (2005) Asymmetric Cross-Aldol Reactions Of Aldehydes: A Formidable Synthetic Challenge,
Organic Chemistry Highlights
Novakovic K, Grosjean C, Schütz T, Willis MJ, Wright AR, Whiting A (2006) Enhancing process development using high
throughput technologies A case study using an L-proline catalysed aldol reaction, 9th Conference on Process Integration,
Modelling and Optimisation for Energy Saving and Pollution Reduction - PRES2006, H7.7 [583], Prague, Czech Republic
Peng Y, Ding Q, Li Z, Wang PG, Cheng J (2003) Proline catalyzed aldol reactions in aqueous micelles: an environmental
friendly reaction system, Tetrahedron Letters 44: 3871-3875
Pihko PM, Laurikainen KM, Usano A, Nyberg AI, Kaavi JA (2006) Effect of additives on the proline-catalyzed ketone-
aldehyde aldol reactions, Tetrahedron 62: 317-328
Orsini F, Pelizzoni F, Forte M, Destro R, Gariboldi P (1988) 1,3 Dipolar Cycloadditions of Azomethine Ylides with
Aromatic Aldehydes. Syntheses of 1-Oxapyrrolizidines and 1,3-Oxazolidines, Tetrahedron 44(2): 519-541
Scheme 1 Development strategy
Stage 1 Solvent
screening
HTT platform
Side product
screening
GC-MS Analysis
Stage 2
Reaction
screening
HTT platform
Analysis
HPLC, GC-MS
New reaction system
screening
Stage 3 Larger scale
automated
reactor
Analysis
HPLC,GC-MS
Stage 4
Modelling
BatchCAD
Reaction
network
Process simulation
BatchCAD
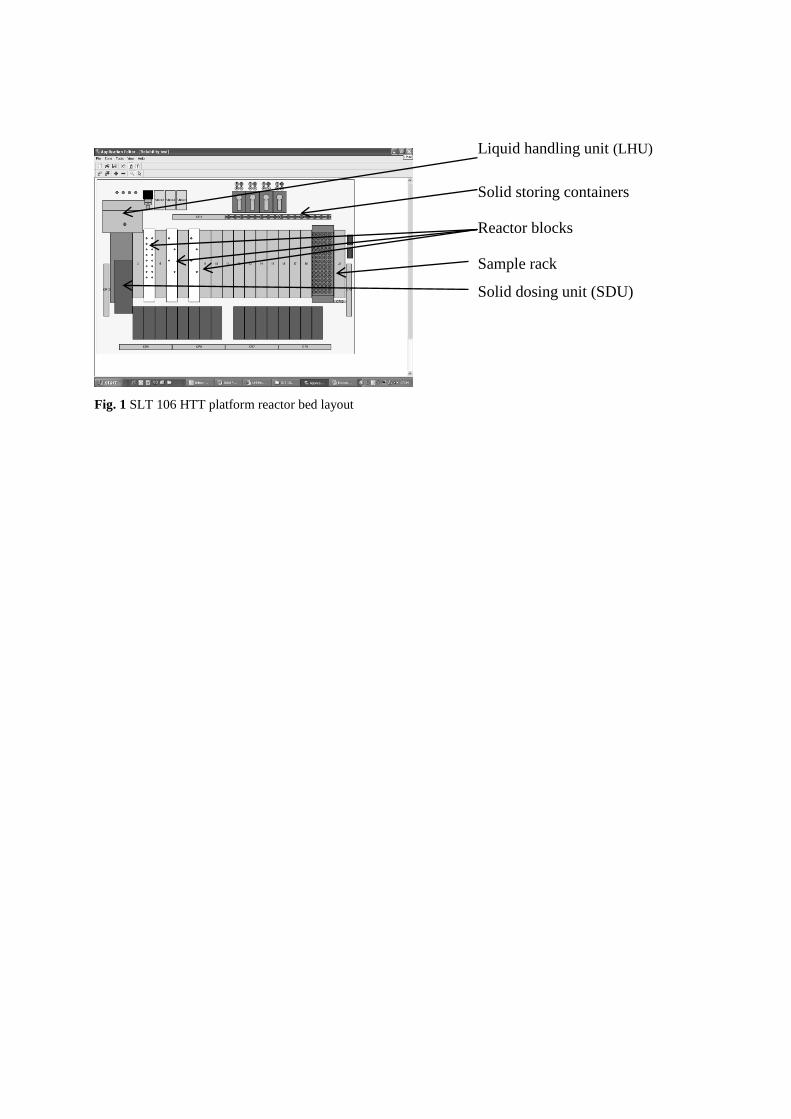
Fig. 1 SLT 106 HTT platform reactor bed layout
Reactor blocks
Solid storing containers
Liquid handling unit (LHU)
Sample rack
Solid dosing unit (SDU)
p-nitrobenzaldehyde conversion
0
20
40
60
80
0 20 40 60 80
L-proline (mol%)
Con
vers
ion
(%)
.
0.01M
0.1M
0.2M
Aldol product conversion
0
5
10
15
20
25
0 20 40 60 80
L-proline (mol%)
Con
vers
ion
(%)
.
0.01M
0.1M
0.2M
Dehydrated product conversion
0
5
10
15
0 20 40 60 80
L-proline (mol%)
Con
vers
ion
(%)
.
0.01M
0.1M
0.2M
Fig. 2 Conversions of p-nitrobenzaldehyde, aldol product and dehydrated product starting from 0.01, 0.1 and 0.2
mol/dm3 of p-nitrobenzaldehyde versus amount of L-proline added
Experimental (SIMULAR) data at 20°C
0
0.002
0.004
0.006
0.008
0.01
0 100 200 300Time (min)
Conce
ntr
atio
n (
mol/dm
3)
.
A-SIMULAR
C-SIMULAR
D-SIMULAR
Experimental (SIMULAR) data at 30°C
0
0.002
0.004
0.006
0.008
0.01
0 100 200 300Time (min)
Conce
ntr
atio
n (
mol/dm
3)
.
A-SIMULAR
C-SIMULAR
D-SIMULAR
Experimental (SIMULAR) data at 40°C
0
0.002
0.004
0.006
0.008
0.01
0 100 200 300Time (min)
Co
nce
ntr
atio
n (
mo
l/d
m3
) .
A-SIMULAR
C-SIMULAR
D-SIMULAR
Fig. 3 Time–concentration profile obtained in HEL SIMULAR calorimeter

Experimental (SIMULAR) versus fitted (BatchCAD) data
at 20°C
0
0.002
0.004
0.006
0.008
0.01
0 100 200 300Time (min)
Conce
ntr
atio
n (
mol/dm
3).
A-BatchCAD
C-BatchCAD
D-BatchCAD
A-SIMULAR
C-SIMULAR
D-SIMULAR
Experimental (SIMULAR) versus fitted (BatchCAD) data
at 30°C
0
0.002
0.004
0.006
0.008
0.01
0 100 200 300Time (min)
A-BatchCAD
C-BatchCAD
D-BatchCAD
A-SIMULAR
C-SIMULAR
D-SIMULARConce
ntr
atio
n (
mol/dm
3)
Experimental (SIMULAR) versus fitted (BatchCAD) data
at 40°C
0
0.002
0.004
0.006
0.008
0.01
0 100 200 300Time (min)
A-BatchCAD
C-BatchCAD
D-BatchCAD
A-SIMULAR
C-SIMULAR
D-SIMULAR
Co
nce
ntr
atio
n (
mo
l/d
m3
)
Fig. 4 Fitted versus experimental data for the L-proline catalysed aldol reaction at three different reaction
temperatures (20°C, 30
°C and 40
°C)
20
Table 1 Concentrations used in the design applied in Trial 1
Vessel
13 ml
p-nitrobenzaldehyde
in DMSO L-proline in Methanol Acetone Methanol
V
ml
c0 c
V
ml
c0 c
V
ml
c
mol/dm3
V
ml mol/dm3 mol/dm
3
1, 9 5 1 0.5 4 1 0.4 1 1.36 0
2, 10 5 1 0.5 4 0.1 0.04 1 1.36 0
3, 11 5 0.1 0.05 4 0.1 0.04 1 1.36 0
4, 12 5 0.1 0.05 4 1 0.4 1 1.36 0
5, 13 5 1 0.5 4 1 0.4 0.5 0.68 0.5
6, 14 5 1 0.5 4 0.1 0.04 0.5 0.68 0.5
7, 15 5 0.1 0.05 4 0.1 0.04 0.5 0.68 0.5
8, 16 5 0.1 0.05 4 1 0.4 0.5 0.68 0.5
21
Table 2 Concentrations used in the design applied in Trial 2
Reactor p-nitrobenzaldehyde
(mol/dm3)
L-proline
(mol%)
L-proline
(mol/dm3)
L-proline
Soluble
1 0.2 0 0 -
2 0.2 4 0.008 Yes
3 0.2 8 0.016 No
4 0.2 40 0.08 No
5 0.2 80 0.16 No
6 0.1 0 0 -
7 0.1 4 0.004 Yes
8 0.1 8 0.008 Yes
9 0.1 40 0.04 No
10 0.1 80 0.08 No
11 0.01 0 0 -
12 0.01 4 0.0004 Yes
13 0.01 8 0.0008 Yes
14 0.01 40 0.004 Yes
15 0.01 80 0.008 Yes

22