
Sustainable Kiosk Development Utilising Culturally Adaptive ...
277
Sustainable Kiosk Development Utilising Culturally Adaptive User Interfaces and a Novel Interaction Method Ryan Younger School of Computing and Engineering Submitted on October 1st 2018 A thesis submitted in partial fulfilment of the requirements of The University of West London for the degree of Doctor of Philosophy
-
Upload
khangminh22 -
Category
Documents
-
view
1 -
download
0
Transcript of Sustainable Kiosk Development Utilising Culturally Adaptive ...

Sustainable Kiosk Development Utilising
Culturally Adaptive User Interfaces and a
Novel Interaction Method
Ryan Younger
School of Computing and Engineering
Submitted on October 1st 2018
A thesis submitted in partial fulfilment of the requirements of The University of West London for the degree
of Doctor of Philosophy

ii

iii
Acknowledgements
Thanks to Dr José Abdelnour Nocera, Dr John Moore, and Dr Antonio Dariush Kheirkhahzadeh for
all of their help and support.

iv
Publications List
1. Predicting Kiosk Interaction Preferences of Culturally Indistinct Users using a Novel
Input Method, Interact 2017, Mumbai
2. CASIK, A Culturally Adaptive Sustainable Information Kiosk, Ubicomp/ISWC'15 Ad-
junct, September 07 - 11, 2015, Osaka, Japan, ACM 978-1-4503-3575-1
3. A sustainable information kiosk driven by sound, Sustainable Internet and ICT for Sus-
tainability, (SustainIT), 2015 (10.1109/SustainIT.2015.7101377)
4. A tone driven offline information kiosk, TVX '14: ACM International Conference on Inter-
active Experiences for TV and Online Video.
5. Ghost Listener: Using a second screen device to explore how viewers can collabo-
rate to understand content, Hackfest @ TVX '14: ACM International Conference on Inter-
active Experiences for TV and Online Video.
6. WAP and WML: Designing Usable Mobile Sites, 2011, (ISBN 1460936175) ACM Digital
Library
Abstract
Information kiosks are an important tool for delivering the benefits of information technol-
ogy across cultures, particularly in the developing world. Despite kiosk initiatives being
launched to help the poor in developing countries, in reality the poorest members of these
communities are rarely able to gain access to kiosks as owner operators are entrepre-
neurs that face a trade-off between the business viability of providing access to information
kiosks and serving the poor. Compounding this issue of restricted kiosk access is the fact
that websites are often localised unsuccessfully thereby excluding users from mixed cul-
tural backgrounds, or worse still, not localised at all due to prohibitive schedules and mon-
etary constraints. This thesis describes a culturally adaptive sustainable information kiosk
that has been designed to be adaptable to local cultures and environments in order to de-
mocratise the dissemination of information by making it universally consumable. This
adaptability presents itself not only in the form of an automatically reconfigurable on-
screen user interface but also in the form of physical multi modal interactions (‘gestures’).
This study placed importance on investigating non-traditional forms of input methods due
to the fact that the familiarity, in the western world, with traditional input methods such as a
keyboard and mouse, and even the Windows Icons Menus Pointers (WIMP) paradigm as
a whole, is not a trait necessarily shared with other cultures around the world
Keywords: culture, culturally adaptive, culturally flexible, sustainability, single-board com-
puter, adaptive interface, DTMF, tones, sound interface, multimodal, kiosk.

Contents
Chapter 1 Thesis Introduction .................................................................................................................................................. 1
1.1 Chapter Introduction ................................................................................................................................................... 1
1.2 Current Challenges with Website Localisation .......................................................................................................... 2
1.3 The Problem Statement.............................................................................................................................................. 6
1.4 Research Design ........................................................................................................................................................ 8
1.5 Ethical Considerations .............................................................................................................................................. 17
1.6 Formulation of Research Questions ........................................................................................................................ 18
1.7 Empirical Study of Cultural Preferences and Culturally Adaptive User Interfaces ................................................. 18
1.8 Sustainable Hardware Solutions for Kiosk Development ........................................................................................ 18
1.9 Theoretical Research Contributions ......................................................................................................................... 19
1.10 Thesis Structure ........................................................................................................................................................ 19
1.11 Chapter Summary ..................................................................................................................................................... 21
Chapter 2 Related Work ........................................................................................................................................................... 23
2.1 Chapter Introduction ................................................................................................................................................. 23
2.2 Literature Search Strategy and Inclusion Criteria .................................................................................................... 23
2.3 Information Kiosks and Multimodality ...................................................................................................................... 24
2.4 Socially Adaptive User Interfaces and Multimodality .............................................................................................. 30
2.5 Sustainable Computing ............................................................................................................................................ 32
2.6 Culture and HCI ........................................................................................................................................................ 37
2.7 Designing web interfaces using Hofstede’s cultural dimensions (Marcus and Gould) .......................................... 68
2.8 Culturally Adaptive User Interfaces .......................................................................................................................... 72
2.9 DTMF Tones ............................................................................................................................................................. 83
2.10 Chapter Summary ..................................................................................................................................................... 87
Chapter 3 Research Methodology ......................................................................................................................................... 89
3.1 Chapter Introduction ................................................................................................................................................. 89
3.2 Research Study Approach ....................................................................................................................................... 89
3.3 Ethical Considerations .............................................................................................................................................. 97
3.4 Chapter Summary ................................................................................................................................................... 102
Chapter 4 Designing Culturally Adaptive Kiosks ............................................................................................................... 103
4.1 Chapter Introduction ............................................................................................................................................... 103
4.2 Approach outline ..................................................................................................................................................... 104
4.3 Adapting an Interface using CSS ........................................................................................................................... 105

vii
4.4 UI Generation .......................................................................................................................................................... 108
4.5 Content Creation ..................................................................................................................................................... 110
4.6 Content Consumption ............................................................................................................................................. 117
4.7 Creating Sustainable Kiosk Solutions .................................................................................................................... 121
4.8 Initial Hardware Prototype Systems : ARM and Banana Pi .................................................................................. 129
4.9 Developing CASIK – A Culturally Adaptive Sustainable Information Kiosk ......................................................... 133
4.10 Platform: Intel Compute Stick with Ubuntu Linux OS ............................................................................................ 136
4.11 Chapter Summary ................................................................................................................................................... 138
Chapter 5 Empirical Evaluations of the Creation and Consumption Interfaces ............................................................ 141
5.1 Chapter Introduction ............................................................................................................................................... 141
5.2 Creation Interface (Submitting an Image) .............................................................................................................. 141
5.3 Summary of Findings .............................................................................................................................................. 151
5.4 Consumption Interface (Recalling an Image) ........................................................................................................ 151
5.5 Summary of Findings .............................................................................................................................................. 211
5.6 Chapter Summary ................................................................................................................................................... 215
Chapter 6 Qualitative Results ............................................................................................................................................... 216
6.1 Chapter Introduction ............................................................................................................................................... 216
6.2 Inductive and Deductive Approaches .................................................................................................................... 216
6.3 Thematic Analysis ................................................................................................................................................... 217
6.4 Summary of Findings .............................................................................................................................................. 221
6.5 Chapter Summary ................................................................................................................................................... 225
Chapter 7 Conclusion............................................................................................................................................................. 226
7.1 Chapter Introduction ............................................................................................................................................... 226
7.2 Limitations of the Study .......................................................................................................................................... 228
7.3 Testing the Hypotheses .......................................................................................................................................... 229
7.4 Contribution to Knowledge ..................................................................................................................................... 234
7.5 Future Work ............................................................................................................................................................ 237
Abbreviations .................................................................................................................................................................................. 240
Bibliography .................................................................................................................................................................................... 242
Appendix .......................................................................................................................................................................................... 252

8
List of Figures
Figure 1.0 The Research Process for this Thesis.. ......................................................................................... 29
Figure 1.1 Venn diagram illustrating the cross-section between theoretical fields. .......................................... 15
Figure 2.0 Amazon locker in-store ................................................................................................................. 28
Figure 2.1 Indian ‘Telecentre’ ........................................................................................................................ 29
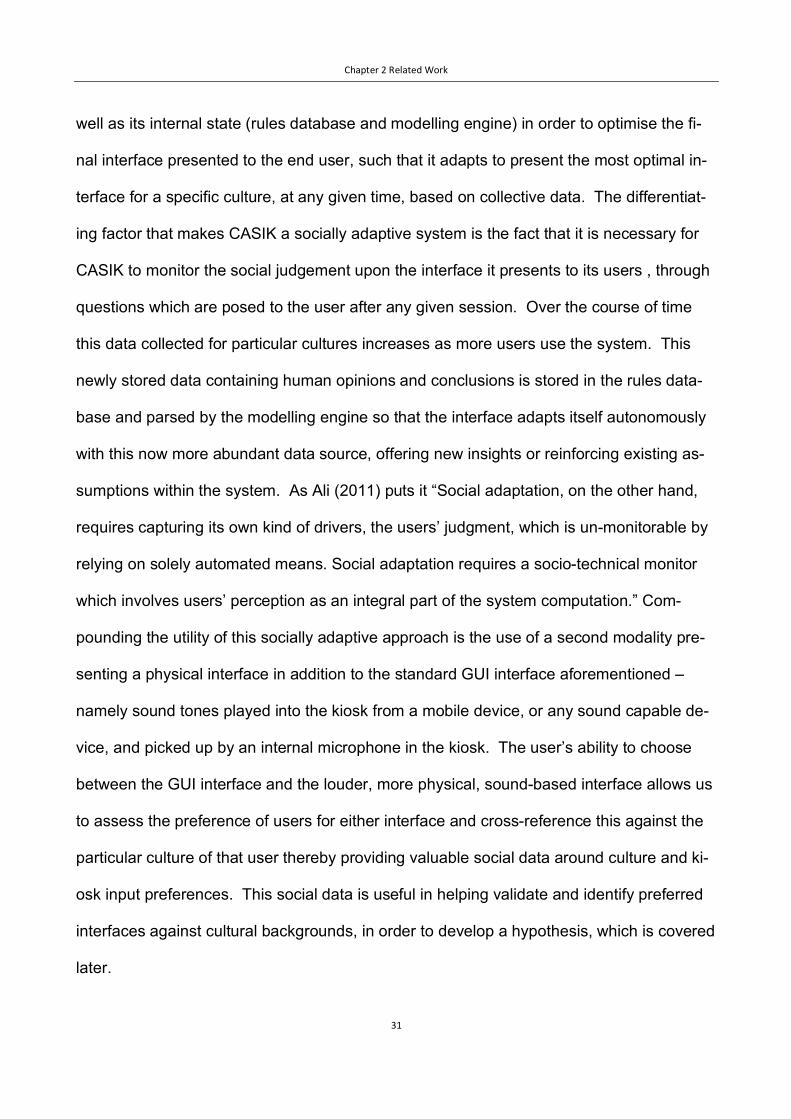
Figure 2.2 SoC architecture of a Tegra K1 ..................................................................................................... 36
Figure 2.3 Characteristics of culture (Terlutter et al.,2005) ............................................................................. 43
Figure 2.4 The Grid Group diagram Mary Douglas Natural Symbols (1970) ................................................... 47
Figure 2.5 The three cultural heroes Christian Brunner (1970) ....................................................................... 48
Figure 2.6 Hofstede, Geert (1991) Cultures and Organisations: Software of the Mind.................................... 50
Figure 3.0 Culture Selection .......................................................................................................................... 93
Figure 3.1 Slovakian Metadata Selection ....................................................................................................... 94
Figure 3.2 Listening for tone .......................................................................................................................... 96
Figure 3.3 Tone recognised ........................................................................................................................... 96
Figure 3.4 Entering the provided hex code using a keyboard ......................................................................... 98
Figure 3.5 CASIK’s UK adapted interface .................................................................................................... 100
Figure 3.6 CASIK’s Polish adapted interface ................................................................................................ 101
Figure 3.7 CASIK’s hybrid adapted interface ................................................................................................ 101
Figure 4.0 Email verification PHP code ........................................................................................................ 111
Figure 4.1 Oroo’ Crafting Game Screen 1 .................................................................................................... 123
Figure 4.2 Oroo’ Crafting Game Screen 2 .................................................................................................... 124
Figure 4.3 Prototype test with Low Cost Smartphone ................................................................................... 127
Figure 4.4 Prototype test with Android Tablet ............................................................................................... 127
Figure 4.5 Prototype test with Feature Phone .............................................................................................. 128
Figure 4.6 Banana Pi M1 ............................................................................................................................ 132
Figure 4.7 Kiosk Architecture ....................................................................................................................... 135
Figure 4.8 African community members using feature phones ..................................................................... 139
Figure 5.0 Represented Countries. Eckert III World Map Projection. ........................................................... 152
Figure 5.1 Size Comparison of Compute Stick against Raspberry Pi. .......................................................... 153
Figure 5.2 Power Distance........................................................................................................................... 157
Figure 5.3 High preference for the tone linked to high individualism ............................................................. 159
Figure 5.4 High preference for the tone linked to high ‘masculinity’............................................................... 163
Figure 5.5 High preference for the tone linked to high uncertainty avoidance ............................................... 165
Figure 5.6 Eastern Europe Quantitative Data Charts .................................................................................... 171
Figure 5.7 Western Europe Quantitative Data Charts ................................................................................... 182
Figure 5.8 North America Quantitative Data Charts ...................................................................................... 192
Figure 5.9 Asia Quantitative Data Charts ..................................................................................................... 197
Figure 5.10 Cultural Dimensions and Sound/Space Preferences .................................................................. 215
Figure 6.0 Word Cloud representation of Qualitative Responses (Consumption Interface) ............................ 224
Figure 6.1 Decision Support Tree ................................................................................................................ 225
Chapter 1 Thesis Introduction
9
List of Tables and Charts
Table 2.1 Pattern Variables Talcott Parsons and Edward Shils (1951).................................................... 44
Table 2.2 Value orientations Florence Kluckhohn and Fred Strodbeck (1961) ........................................ 45
Table 2.3 PDI Comparison (Culture GPS by ITIM International) .............................................................. 51
Table 2.4 IDV Comparison (Culture GPS by ITIM International) .............................................................. 53
Table 2.5 MAS Comparison (Culture GPS by ITIM International) ............................................................ 54
Table 2.6 UAI Comparison (Culture GPS by ITIM International) .............................................................. 55
Table 2.7 LTO Comparison ( Culture GPS by ITIM International) ............................................................ 56
Table 2.8 Multi-active, linear-active, and reactive scales – Richard D. Lewis "When Cultures Collide" 63
Table 2.9 – DTMF system frequency set (Artal J.S., Caraballo J. and Dufo R., 2014)........................... 85
Table 3.1 CASIK Process Flows .............................................................................................................. 120
Table 4.1 Specification of Raspberry Pi mk1 ........................................................................................... 130
Table 4.2 Banana Pi and Raspberry Pi Comparison ............................................................................... 133
Table 4.3 Banana Pi Model M1+ Specifications ...................................................................................... 133
Table 5.1 Age distribution (heat map) of users with and without a secondary cultural background...... 142
Table 5.2 Secondary cultural backgrounds ............................................................................................. 151
Table 5.3 Descriptive Statistics for Interaction Preferences .................................................................. 211
Table 5.4. ANOVA Analysis of Continent Groups ................................................................................... 212
Table 5.5 Predictions against actual scores for individual countries. .................................................... 213
Table 5.6 Western European countries. ................................................................................................. 213
Table 5.7 Asian countries. ....................................................................................................................... 214
Table 5.8. US and UK Comparison ......................................................................................................... 214
Table 6.1 Initial Coding Framework ........................................................................................................ 219
Table 6.2 List of categories (themes) ...................................................................................................... 220
Table 6.3 Final coding framework after reduction of the categories in the initial coding framework ..... 221
Chart 5.1 Education Level cross tabulated against Gender.................................................................... 143
Chart 6.1 Interface preference of users from a mixed cultural background ........................................... 147
Chart 6.2 Interface preference of users from a single cultural background ........................................... 148
Chart 6.3 Interface preference of users by gender.................................................................................. 148
Chart 6.4 Education and Interface Preference ........................................................................................ 150

Chapter 1 Thesis Introduction
1
Chapter 1 Thesis Introduction
1.1 Chapter Introduction
Website localisation is defined as the process of customising a website for a specific cul-
tural group so that it seems natural or “local” to constituents of that particular group (Singh
et al. 2006). Localising a website for a specific cultural audience is important and has a
strong impact on user perceptions of a website (Cyr and Trevor-Smith, 2004; Singh et al.,
2006, 2004; Tixier, 2005; Chakraborty et al., 2005). The consequence of not addressing
the issue of localisation can be the loss of a market presence in foreign markets and, ac-
cordingly, a loss of profits. Websites have been noted to have the potential to replace and
supplement a physical presence within foreign markets (Vila and Kuster, 2004;Shneor and
Flaten, 2008;; Petersen et al., 2002; Forsgren and Hagström, 2001) and Gong (2009)
notes that website design which is aligned with a national culture fosters online purchas-
ing. The first aim of this research is to analyse effective methods of facilitating cross-cul-
tural usability in a more efficient manner without the, often prohibitive, time and financial
costs. As Stanley (2009) notes “the strategy of localization is not frequently adopted be-
cause it can be time consuming and expensive”.
An additional aim of this research concordant with investigating culturally adaptive user in-
terfaces is an investigation into the development of sustainable information kiosks, utilising

Chapter 1 Thesis Introduction
2
a novel sound (DTMF) tone interaction method, from both a hardware and software per-
spective.
The final aim is to analyse whether it is possible to predict kiosk interaction preferences
based on a user’s culture. In this chapter an introduction to the thesis is provided outlining
its structure, the problem statement, current challenges with the subject domain, and the
research contributions which will be made.
1.2 Current Challenges with Website Localisation
The growth of the Internet and the World Wide Web has led to a necessity for the provision
of website interfaces to users from a broad range of diverse cultural backgrounds (Rotem,
2012). Websites tend to be developed for one region first, primarily the United States, and
then later adapted for other countries (Billingsley, 2008). This brings with it a plethora of
issues that will be reviewed in the subsequent sections.
The current localisation approach of using the Western English language version of a web-
site as the basis for every subsequent version contributes to a multitude of issues. Firstly,
there is the issue of language. Undertaking a direct translation of information created for a
specific culture can be extremely difficult due to the complex semantic intricacies of lan-
guage as well as cultural variances in understanding. For example, in English we are
happy to utilise a single phrase for personal pronouns whilst in German they distinguish
between ‘sie’ and ‘du’ as do the French with ‘tu’ and ‘vous’ (Barber et al. 2009). Consider,
as a second example, the German noun ‘Bruderschaft’, which translates literally as ‘broth-
erhood’, and which Harrap’s German and English dictionary defines as “(to drink) the
pledge of ‘brotherhood’ with someone (subsequently addressing each other as ‘du’).” It is
clear that the absence of a word in English for ‘Bruderschaft’ has something to do with the

Chapter 1 Thesis Introduction
3
fact that English does not make a distinction between an intimate or familiar ‘thou’ and a
more distant ‘you’, and that English-speaking societies do not have a common ritual of
pledging friendship through drinking (Wierzbicka, 1997). Other examples cited by
Wierzbicka (1997) include the Russian verb xristosovat’sja (“to Christ one another”), or the
Japanese word ‘miai’, which refers to a formal occasion when a prospective bride and her
family meet the prospective bridegroom and his family for the first time. Vladimir Nabokov
(1961), referring to the untranslatable Russian word ‘Poshlost’, stated that:
The Russian language is able to express by means of one pitiless word the idea of
a certain widespread defect for which the other three European languages I happen
to know possess no special term” (Vladimir Nabokov, 1961).
Another interesting example of research detailing cultural linguistic preferences is
Thatcher’s (1999) treatise on rhetorical and cultural adaptations for audiences within Latin
America, which duly noted that these cultures tend to have a distinct preference for accu-
mulative rather than analytical or hierarchical communication patterns. This issue of
cross-cultural communication difficulties is so pervasive that numerous scholars have at-
tempted to develop strategies to produce business and technical information in a manner
that allows consumption globally, across all cultures. An example of this is the work of Le-
ninger et al. (1998) who outlines three dimensions: geocentric, pycentric, and ethnocentric
as well as four categories of editing: linguistic, political, technical, and socio-cultural with
which editors can, theoretically, develop documents that are consistent with global corpo-
rate strategies.
Beyond linguistic semantics, another challenge is that of conveying an idea using infor-
mation that is aligned to the cultural literacy of the reader (Nantel, 2008) i.e. concepts
predicated upon the foundation of specific, assumed, cultural literacy is confusing when

Chapter 1 Thesis Introduction
4
this prerequisite knowledge or idea is not shared by the target culture. Beyond the chal-
lenges of linguistic semantics and cultural literacy an additional challenge encountered is
the particular structure and density of information presented within a website, particularly
in regard to technical data and specifications and its associated level of verbosity, particu-
larly on initial presentation. This issue stems from the fact that different cultures have dis-
tinct preferences as to how lengthy technical information should be displayed, for example,
countries such as England prefer information to be presented in a non-technical manner
without much depth initially whilst countries such as Germany prefer detailed technical in-
formation with a lot of depth and verbosity upfront (Cyr, 2008). Therefore, when develop-
ing a site for users in England the focus should be on using an approach of progressive
disclosure, where a user is initially presented with less technical information and can then
gradually drill-down to the technical information progressively instead of displaying tech-
nical information up-front as would be beneficial for German users.
Localising for different countries and cultures also presents a variety of design challenges.
Major structural design challenges relate to the fact that some countries read from right-to-
left rather than left-to-right (Kalbach, 2006). Discrepancies between word lengths across
different languages is also a common challenge, for example, the German and Finnish lan-
guages tend to have lengthier words than the English language requiring careful consider-
ation of page layouts and component sizing to allow for this increased length. Beyond
structural considerations, the perception of colour is also a pertinent design challenge. In
the United States, for example, red is associated with danger whilst in China red is seen
as a lucky and fortuitous colour (Cyr, 2008). Design challenges extend to page content
too, effecting the cultural interpretation of images and in many cases even require careful

Chapter 1 Thesis Introduction
5
consideration of legal ramifications. For example, one would need to be careful not to dis-
play prohibited images in some Muslim countries, such as alcohol or bare skin. Another
example of country-specific legal requirements is the ‘cookie law’ introduced in the United
Kingdom in 2011 which made it a legal requirement to notify website users when data is
being stored about their website activity in local ‘cookie’ data files (McStay, 2012). Consid-
ering the legal requirements for each website variant for a particular country or culture is a
fundamental aspect of localisation and one that requires careful research.
The knock-on effect of localising for specific countries, as detailed in the previous points, is
an increase in the cost and time of website design and development. Analysing designs,
content, images, regulations, and accessibility requirements for different countries can turn
a relatively straightforward website development project into an expensive, time-consum-
ing, and unsustainable project (Gonzalez, 2012), which is why it is often done poorly or not
at all.
Current theories around website localisation appear to be predicated upon the premise of
customising a website for a single country or culture, one at a time. The fact that a per-
son’s country and their corresponding cultural values are distilled down to a single unit
seems so overlook the fact that many end users, particularly in these times of vast globali-
sation and the Internet, have lived in more than one country and have therefore been ex-
posed to numerous different cultural influences and values. Therefore, this myopic locali-
sation approach of customising a site for a single country and culture does not really pro-
vide users with the best end user experience (Reinecke, 2011).
Compounding these myriad issues of ineffective website localisation approaches are kiosk
interaction approaches that also focus, in this same polarising manner, on designing for

Chapter 1 Thesis Introduction
6
one set of cultural values. Predominantly the majority culture within which the kiosk is lo-
cated (Bailey, 2014). This research aims to investigate the effect a user’s culture has on
their kiosk interaction preferences in order to determine whether adapting the kiosk inter-
action experience based on a user’s culture would provide a better experience than having
a single uniform interface that does not adapt to the culture of the current user. If it were
possible to predict interaction preferences for a particular culture with any level of accuracy
this would indicate that these preferences do exist within multimodal interactions, and also
that these preferences can therefore be used to improve the end-user kiosk experience.
The main theoretical platform which will serve as the foundation for these predictions are
Hofstede’s cultural dimensions as well as follow-up work undertaken by scholars which
builds upon these underpinnings.
1.3 The Problem Statement
The first part of the problem statement looks at adapting websites for different cultures. As
has been outlined in the previous section the use of websites and software within different
cultural backgrounds is impeded by the gap between the design of a website, typically tai-
lored for Western cultures, and the end users that must interpret these designs within their
own cultural frame. Despite research indicating that adapting interfaces for cultural prefer-
ences increases usability and user satisfaction, it is often overlooked as it is considered to
be time-consuming and expensive, or is executed in an ineffective manner focusing only
on a single culture. This research looks at culturally adaptive user interfaces within a so-
cial context as this is an area that has not been researched to any real extent previously.
Prior research by Reinecke (2011) on culturally adaptive user interfaces focussed on the
utilitarian domain of a to-do list application. The system this thesis describes, named the

Chapter 1 Thesis Introduction
7
‘Culturally Adaptive Sustainable Information Kiosk’ and hereafter referred to by its acronym
‘CASIK’ is a social image sharing system that allows a user to upload an image via a web-
site, accessible either on a phone or a computer, and then later recall that image from a
public kiosk using a code which is emailed to the user after uploading an image. This
code can be both played as a tone into a microphone or typed into a keyboard at the infor-
mation kiosk, proving two different modalities of input. The study will be based at the Uni-
versity of West London as well as a number of other high footfall locations in order to test
the interaction methods in realistic conditions. It is particularly important to test the sound
input method in a noisy environment to evaluate its real-world feasibility.
The second part of the problem statement is concerned with the development of sustaina-
ble information kiosks: As demonstrated in the preceding paragraphs, commercial kiosks
are prohibitively expensive to all but large organisations, despite being one of the most
popular channels for information delivery in developing countries. The introduction to this
thesis outlined the fact that, in the ‘Akshaya project’, an Information and communication
technologies for development, or ‘ITC4D’, initiative in India it was found that the poorest
members of a community could not gain access to information kiosks as the owner opera-
tors were entrepreneurs that faced a trade-off between business viability and serving the
poor (Kuriyan, Ray and Kammen, 2008).
The third part of the problem statement looks at novel kiosk interaction methods and their
efficacy cross-culturally. In order to develop sustainable information kiosks that are usable
across cultures and countries it is necessary for us to investigate novel kiosk interaction
methods as the majority of existing commercial kiosk input methods utilise cutting-edge
components such as laser based scanners, industrial grade keyboards, and touch screens

Chapter 1 Thesis Introduction
8
that are expensive and unsustainable. Users within developing countries are often not fa-
miliar with these modern technologies or paradigms, relying primarily on feature phones as
their main computing and data transfer device. Beyond developing countries, this re-
search utilises the novel interaction method of sound as a method to assess whether cul-
tural preferences for traditional (keyboard) vs novel (sound) preferences can be predicted
across cultures, facilitating an improvement in the kiosk user experience through the auto-
matic selection of the optimal interaction method to recall an image.
1.4 Research Design
Having outlined the importance of developing bespoke web interfaces for different cultures
within the context of globalisation, mass global Internet adoption, and the increasing ubiq-
uity of mobile computing devices accessing the World Wide Web and Internet it was noted
that, with an ever-growing global audiences of website users, the requirement for culturally
accessible websites is mounting and therefore the time and expense required for bespoke
localisation is rising proportionately. It was demonstrated that large organisations are still
approaching cultural adaptation in the same old-fashioned manner of creating a predomi-
nantly Western website initially and then attempting to adapt the language, design, and
cultural context for different countries on a case-by-case basis. The use of culturally adap-
tive user interfaces is not a familiar concept to many and is often left unexplored.
Reinecke (2011) has identified that the cost of developing websites for different cultures
would be dramatically decreased by using an adaptive interface engine.
Derived from the previous problem statement, the research design aims to answer the
questions outlined in section 1.6 based on the aims and objectives outlined in section
1.4.1.

Chapter 1 Thesis Introduction
9
1.4.1 Research Aims and Objectives
The research objectives are:
1. To analyse the effectiveness of culturally adaptive user interfaces within a recrea-
tional context,
2. To assess whether it is possible to predict the cultural interaction preferences of indi-
viduals consuming content in a public space.
3. To research the feasibility of developing sustainable kiosk solutions using sound as
novel input method.
Point 1 is addressed through the development of an image submission website with a cul-
turally adaptive interface focussed within a social application domain. Points 2 and 3 are
addressed through developing and testing a kiosk system within the University of West Lon-
don, and externally.
1.4.2 Overview of Research Methodology
The research takes the overall form of a multidisciplinary piece of research, drawing on the
fundamentals of numerous theoretical schools of knowledge including Computer Science,
Information Systems (IS), Human-computer interaction (HCI), and Information and Com-
munication Technologies for Development (ICT4D). Numerous strategies are traditionally
employed across these subject domains within design. Specifically, this research sits at
the cross-section of the paradigms of behavioural science and design science (Winter,
2008). The design-science paradigm has the objective of extending the boundaries of hu-
man and organisational competences by creating novel and original artefacts. Both para-
digms are foundational to the IS discipline, “positioned as it is at the confluence of people,

Chapter 1 Thesis Introduction
10
organizations, and technology”. (Hevner et al. 2007).
Organisations are motivated to implement information systems in order to improve their ef-
ficacy and productivity. Silver et al. (1995) states that the capabilities of the information
system and characteristics of the organization, its work systems, its people, and its devel-
opment and implementation methodologies together determine the extent to which that
purpose is achieved. Further, it is incumbent upon researchers in the Information Sys-
tems (IS) discipline to further knowledge that aids in the productive application of infor-
mation technology to human organisations and their management (ISR, 2002).
Numerous strategies are customarily used across these disciplines and within design-sci-
ence projects, with these research approaches being able to be classified as qualitative,
quantitative, and mixed, as well as being identified as either interpretivist or positivist. This
research will utilise a mixed research approach using both qualitative and quantitative re-
search methods. Specifically, empirical data will be gathered using a controlled quasi-ex-
perimental approach. This approach allows the retention of the logic of the experimental
approach whilst avoiding the ethical and feasibility issues of attempting to impose controls
on the relevant cultural or ethnic factors. To clarify, though it shall be ensured that candi-
dates are recruited from a range of different cultural groups and do have planned tasks for
subjects to undertake, the observation of events will be ‘as they naturally occur’
(Denscombe, 2010). Combining both quantitative and qualitative research will give addi-
tional perspectives and help to avoid the research being too limiting (Venkatesh, et al.
2013).
Chapter 1 Thesis Introduction
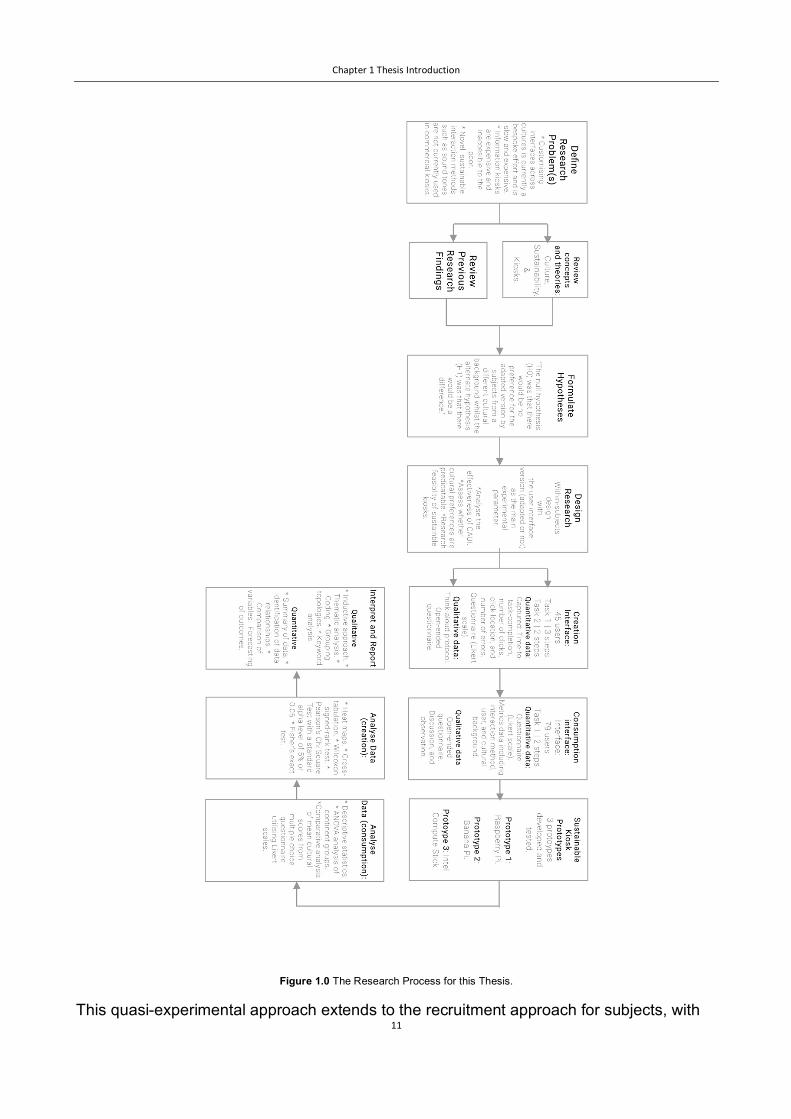
11
Figure 1.0 The Research Process for this Thesis.
This quasi-experimental approach extends to the recruitment approach for subjects, with

Chapter 1 Thesis Introduction
12
some being recruited in-situ where necessary through hallway-intercept testing. It also im-
pacts the system being used to undertake the kiosk research and mandates that for off-
site testing a portable version of the kiosk is developed that utilises a ‘Wizard of Oz’ ap-
proach for simulating the system response to dual-tone multi-frequency (DTMF) tones
played by the user, a technique which is indistinguishable to using the actual system,
thereby allowing user testing to take place in a variety of diverse locations in public. Using
this quasi (‘as if’) approach is useful as the majority of users within the study are outside of
their home country so it would therefore be incorrect to term the research ‘ethnographic’
despite its focus on cultural factors.
The specific incarnation of the Wizard of Oz technique being used for researching sound
input within this research is based upon the experimenter showing the end user a screen
indicating that the kiosk is ‘listening’, the controller in the experiment then uses a mouse
connected to the computer system to trigger the ‘tone received’ screen, once the user has
played the tone from a device.
The ‘Wizard of Oz’ paradigm takes its name from the L.F.Baum (1900) story. In this story
the eponymous wizard conjures up apparitions of himself, with a set of controls behind a
curtain, which people in the Land of Oz believe to be the Wizard himself. The Wizard of
Oz technique operates in much the same manner, with the researcher playing the role of
the wizard and controlling which screens are shown to the user giving the impression of a
fully functioning system. Green (1985) explains that this technique was formalised within
the Chapani’s communications lab at Hopkins. In a letter from Zoltan-Ford (1984) the
origin of the technique is explained. Zoltan-Ford outlines that the idea was conceived but
not fully implemented in 1975 during development of Michael Kelly’s PH.D. dissertation

Chapter 1 Thesis Introduction
13
(Kelly and Chapani, 1977), when Weeks was a research scientist at Hopkins. At this time
the Wizard of Oz technique was actually referred to as the ‘experimenter in the loop tech-
nique’. The first time this paradigm was used in practice was for a comparison of voice
and keyboard natural-language inputs, similar to this research comparison into sound and
keyboard input, using Randy Ford’s CHECKBOOK program (Zoltan, Weeks, and Ford
1982). The first time this theory was presented to the public was a year earlier when
Gould described his “listening typewriter” study undertaken at IBM (Gould, Conti,
Hovanyecz, 1983). Chapani’s clear explanation of the techniques merits at a symposium
(Chapani, 1982) was instrumental in drawing attention to the technique. With regard to the
methodology’s first appearance in print this was Jeff Kelley’s thesis (Kelley, 1983a, 1983b,
1984a). It is believed that the name was coined whilst Kelley was responding to a ques-
tion from the audience at a graduate seminar at Hopkins (Chapani, 1984; Kelley, 1984b).
A student asked “what happens if the subject sees the experimenter behind the curtain”?
Kelley answered, “Well, that’s just like what happened to Dorothy in the Wizard of Oz.”
And so, the name stuck (Green, 1985).
Though the story of the formalisation of the Wizard of Oz technique is interesting, it would
seem that as an approach it is largely common sense. In fact, this simulated approach of
emulating kiosk responses for remote testing was developed for as a testing method within
this research, before any formally labelled approach such as the Wizard of Oz technique
was identified. Simulating a system for user testing purposes when you cannot gain easy
access to the full system, for a portion of the time, seems a logical thing to do as long as
the end user is unaware of the simulation, as is the case with the testing undertaken within
this research.
It could be argued that the Turing test, which was developed by Alan Turing in 1950, is a
predecessor to the Wizard of Oz technique albeit from the contrary position of trying to

Chapter 1 Thesis Introduction
14
make a human think a human is a computer rather than attempt to make a human think a
computer is a human as with the Turing test, which proposed to test a machine’s ability to
answer as a human or to be indistinguishable from a human. The Turing test does not
seek to check the machine’s ability to get the correct answer, but rather to test how closely
a machine can mimic a typical human answer. The test was inspired by the “imitation
game.” In this game, a man and woman are sent into separate rooms. They must answer
a set of predetermined questions as if they are both women. The answers, which are
typeset, are then read back to the others present. Turing then substituted a computer for
one of the women. It was Turing’s desire to see if inserting a computer into one of the
roles would affect people’s ability to judge whether the answers had come from a human
or from the computer. In the years following 1950, the test was both highly influential and
much criticised. However, it has since become an essential concept in the philosophy of
artificial intelligence.
1.4.3 Designing the Field Work
The research design builds on erstwhile scholar’s empirical findings within three distinct
areas: culturally adaptive user interfaces, sustainable computing, and sound based inter-
action also referred to as the Internet of Sound (Fahey and Moretti, 2017). Figure 1.1 illus-
trates how CASIK sits at this cross-section using a Venn diagram.

Chapter 1 Thesis Introduction
15
Figure 1.1 Venn diagram illustrating the cross-section between theoretical fields.
This research holistically incorporates learnings from each of the bodies of empirical re-
search within these three areas.
1.4.3.1 Studying Kiosk (Consumption) Interactions
In the spirit of the quasi-experimental approach CASIK research experiments always take
place outside of ‘laboratory conditions’ with kiosk-based user testing taking place in public
locations, primarily within the University, which has the benefit of having the subject inter-
act with the kiosk in the real world scenario within which the system is intended to be used.
Asking the end user to ‘imagine they are in public’ within laboratory conditions would be an
unreliable test even though it would give more control over external variables. Denscombe
(2010) sums this up well stating that “With laboratory experiments there are question
marks about whether the experimental situation creates conditions comparable with the
Chapter 1 Thesis Introduction
16
‘real-world’ situations in which the behaviour/decisions would be made, or whether it en-
courages artificial responses in line with the artificial setting”.
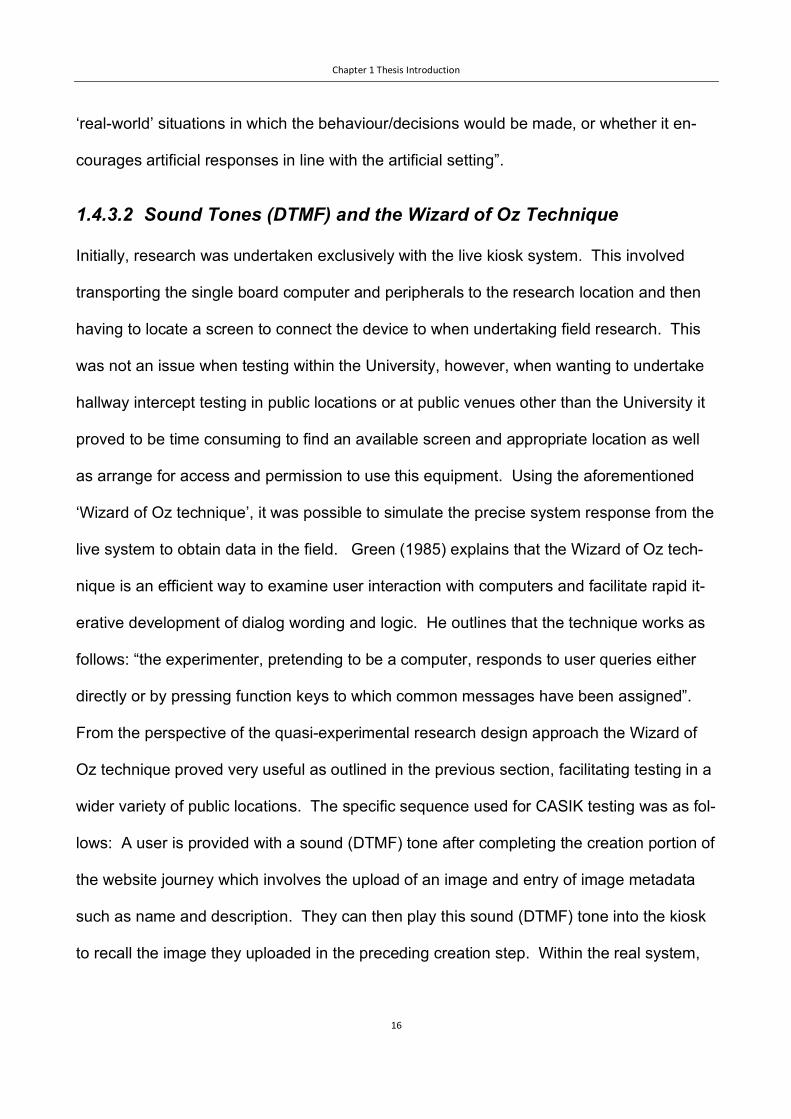
1.4.3.2 Sound Tones (DTMF) and the Wizard of Oz Technique
Initially, research was undertaken exclusively with the live kiosk system. This involved
transporting the single board computer and peripherals to the research location and then
having to locate a screen to connect the device to when undertaking field research. This
was not an issue when testing within the University, however, when wanting to undertake
hallway intercept testing in public locations or at public venues other than the University it
proved to be time consuming to find an available screen and appropriate location as well
as arrange for access and permission to use this equipment. Using the aforementioned
‘Wizard of Oz technique’, it was possible to simulate the precise system response from the
live system to obtain data in the field. Green (1985) explains that the Wizard of Oz tech-
nique is an efficient way to examine user interaction with computers and facilitate rapid it-
erative development of dialog wording and logic. He outlines that the technique works as
follows: “the experimenter, pretending to be a computer, responds to user queries either
directly or by pressing function keys to which common messages have been assigned”.
From the perspective of the quasi-experimental research design approach the Wizard of
Oz technique proved very useful as outlined in the previous section, facilitating testing in a
wider variety of public locations. The specific sequence used for CASIK testing was as fol-
lows: A user is provided with a sound (DTMF) tone after completing the creation portion of
the website journey which involves the upload of an image and entry of image metadata
such as name and description. They can then play this sound (DTMF) tone into the kiosk
to recall the image they uploaded in the preceding creation step. Within the real system,

Chapter 1 Thesis Introduction
17
the transmitted tone is decoded and the uploaded image is fetched from the backend data-
base after a few seconds. The simulated system designed for remote research replicated
this experience from a UI perspective. i.e. the Wizard of Oz prototype mirrored the front-
end UI of the information kiosk and requests the user play a tone in the same manner, the
operator then clicks a mouse button to change the display to indicate that a tone has been
received within the same time-frame as the actual system. Having the operator control the
timing delay between the loading of this image allows for realistic timing and an accurate
simulation of the image being loaded from the backend database. The user is unaware
that the operator is controlling the loading of this image.
1.5 Ethical Considerations
With a sensitive subject, such as culture, countries, and race, it is particularly important
that attention is paid to ethical considerations to ensure that the privacy of subjects is re-
spected and their confidentiality ensured. All of the subject’s data is anonymised and they
are informed that their information will not be shared with any third party during, or upon
completion, of the research. A record is not kept of a user’s racial classification during the
research, only their cultural background(s). All user’s names are anonymised and no
uniquely identifying data is stored. Cultural profiling was only undertaken to the extent that
once a quota for a particular region was filled no more participants were recruited from that
region. Care was taken to avoid any culturally sensitive elements or to use phraseology
that might run the risk of endorsing any stereotypes. More information on the ethical ap-
proach used within this research can be found in section 3.3 and the university’s ethical
guidelines, which were adhered to, can be found in appendix D.

Chapter 1 Thesis Introduction
18
1.6 Formulation of Research Questions
Two distinct types of research objectives have started to become apparent. Research ob-
jectives 1 and 2 focus on exploring the usability of particular interfaces by observing and
surveying users whilst research objective 3 focusses on the development of a system
based on empirical research, experimentation, and testing. Accordingly, explanatory re-
search is suitable for the first and second objective whilst the third research objective is
suited to exploratory research.
1.7 Empirical Study of Cultural Preferences and Culturally
Adaptive User Interfaces
RQ1 Is the personalised interface provided by CASIK be preferred by users over the non-
adapted version?
RQ2 Is it possible to predict an end user’s kiosk interaction preferences based on cul-
ture?
1.8 Sustainable Hardware Solutions for Kiosk Development
RQ3 Is it feasible and sustainable, in practice, for a mobile device to be used to control a
kiosk while maintaining a holistic user experience across both types of devices?
RQ4 How can a fit-for-purpose information kiosk be built using sustainable hardware so-
lutions.

Chapter 1 Thesis Introduction
19
1.9 Theoretical Research Contributions
This research contributes to an understanding of how cross cultural information systems
can be developed and a holistic analysis of the approach and technologies required to
make these systems feasible is contributed. The research project extends and integrates
theory and findings from several areas of research related to culturally adaptive user inter-
faces, information and communication technologies for development (ICT4D), and sustain-
able computing. An understanding of how to effectively plan and implement low-cost cen-
tralised information kiosks, using novel interaction methods, accessible across cultures is
put forth.
1.10 Thesis Structure
This thesis is divided into 8 chapters:
Chapter 2 Related Work
The first chapter of this thesis outlines the concept of website localisation as the bespoke
customisation of a website, on an individual per website basis, to cater to different cultures
and markets. This chapter reviews research and development literature related to culture,
and sustainable computing, from a human factors perspective. This includes culturally
adaptive user interfaces, sustainable computing, and novel interaction methods, multimo-
dality, kiosks, and culture.
Chapter 3 Research Methodology
Having outlined the main thesis approach, conducted a literature review, outlined design
approaches to sustainable information kiosks, and described ‘CASIK’ in some detail, this
Chapter 1 Thesis Introduction
20
section of the thesis will outline the research method including the purpose of the study,
participants included, an overview of the procedure, and an outline of the ethical consider-
ations undertaken when performing the research.
Chapter 4 Designing Culturally Adaptive Information Kiosks
This chapter begins with an outline of an approach to sustainable information kiosk devel-
opment and then proceeds to describe how CASIK’s interface is able to adapt to a user’s
culture through use of what this research terms the ‘interface adaptation engine’, as well
as describing how DTMF tones function and how they can be used to facilitate novel inter-
action input methods within the CASIK system. Additionally, detailed herein, are the key
prototypes which were developed as well as a summary of what was learned through this
research process.
Included at the end of this chapter a discussion of the final system developed is pre-
sented, including a summary of the custom-developed hardware configuration and an ex-
position of the functionality, operation, and benefits of this approach.
Chapter 5 Empirical Evaluations of the Creation and Consumption Interfaces
This portion of the thesis discusses the quantitative results for both the creation and con-
sumption interfaces.
Chapter 6 Qualitative Results
This chapter discusses the qualitative results obtained from users using the consumption
interface.
Chapter 7 Conclusion

Chapter 1 Thesis Introduction
21
This final chapter discusses the overall contribution to knowledge, limitations to the work,
future work, and real-world implications for practice.
1.11 Chapter Summary
In this chapter the concept of website localisation was introduced and there was a discus-
sion around the current high cost and time investment of developing bespoke versions of
websites for specific countries. The problem statement was defined, and a discussion of
the research contributions was put forth, as well as an outline of the thesis structure, re-
search objectives, and research questions.

Chapter 2 Related Work
2.1 Chapter Introduction
The first chapter of this thesis outlined the concept of website localisation as the bespoke
customisation of a website, on an individual per website basis, to cater to different cultures
and markets. This initial chapter also defined the original problem statement: to examine
how more effective cultural customisations can be made to websites both within low, and
high, modality environments. For example, mouse and keyboard peripherals with a WIMP
interface as opposed to purely sound-based interactions. This chapter reviews research
and development literature related to culture, and sustainable computing, from an HCI per-
spective. This includes culturally adaptive user interfaces, sustainable computing, and
novel interaction methods.
2.2 Literature Search Strategy and Inclusion Criteria
In selecting suitable literature, it was necessary to undertake a systematic search of rele-
vant literature using both manual as well as automated search tools and a robust keyword
strategy. Citations in highly relevant papers were logged and investigated and a compre-
hensive collection of relevant papers emerged throughout the course of the literature re-
view. The inclusion criteria for publications as part of this literature review was that they
must relate to the categories of culture, culturally adaptive user interfaces, information ki-
osks, sustainable computing, and novel interaction methods.

Chapter 2 Related Work
24
The inclusion criteria followed a systematic approach predicated around the research
questions and objectives. Once the context of the project was identified it was possible to
identify how this research fitted in with other research on the topic, derived from the re-
search questions. Analysing similar research within the subject area e.g. that by Reinecke
allowed an evaluation of what that author did to answer their own research questions as
well as the sources they identified in their own literature review and the conclusions they
reached in answering their own research questions. Reviewing the cited work as well as
citations which branched off these pieces of research helped build a picture of how this re-
search project fitted into related areas of preceding research. Analysing what is known
about the topics addressed allowed granularity to be applied to filtering what would and
would not be a good candidate for inclusion within this research.
2.3 Information Kiosks and Multimodality
Information kiosks provide information to a wide cross-section of users with diverse cul-
tural backgrounds and varying degrees of computer literacy. Therefore, it is vital that infor-
mation kiosks are easy to use in order to ensure the user experience is as enjoyable as
possible for the end user. Most kiosks in public service currently utilise a touch-based ap-
proach, however a body of research has been growing in the area of alternative kiosk in-
teraction methods, including a multimodal approach that makes use of multiple inputs and
outputs for a richer user experience.
Four key categories of kiosk are information kiosks, advertising kiosks, service kiosks and
entertainment kiosks (Borchers et al., 1995). Although touch screens are typically used for

Chapter 2 Related Work
25
each of these purposes other more novel interaction methods have proven useful to end-
users.
Bergweiler et al (2010) describe ‘Calisto’ a system that enables users to connect their mo-
bile devices to a large public terminal and share interesting facts and media via an intuitive
multimodal interaction. This seamless combination of a touch-screen kiosk and mobile de-
vice, a ubiquitous device in both developed and developing countries, presents a novel ap-
proach to the traditional kiosk interaction paradigm. In addition to touch and gesture
based interaction users are able to interact with the Calisto system via natural language.
Whereas scholars have written on multimodal systems that extend the traditional kiosk
paradigm, others have taken a new direction, focussing more on the social sciences and
human elements of HCI. One study found using an interactive robot to create a more so-
cial narrative for interactions with a kiosk system resulted in more politeness and self-dis-
closure from users as well as fewer negative behaviours (Lee et al. 1996). Another take
on this human approach to systems utilised a graphical speaking agent for output along
with a vision-based human sensing system rather than a keyboard, allowing the system to
interact with multiple users. (Rehm JM et al., 1997)
Kuriyan, Ray and Kammen (2008) write that one of the most popular channels for infor-
mation delivery in developing countries is through information kiosks (known as telecen-
tres). In the Akshaya project and other ICT4Dinitiatives in India it was found that despite
these kiosk initiatives being launched to help the poor, in reality the poorest members
could not gain access to the kiosks as the owner operators were entrepreneurs that faced
a trade-off between business viability and serving the poor. Entrepreneurs simply got a
better return on investment in their expensive kiosk systems from the better off, who are
higher up the economic ladder. Further, in countless provinces within India, and as is the

Chapter 2 Related Work
26
pattern in other developing countries, a restricted amount of resources combined with low-
textual literacy primarily due to a lack of poor data connectivity and technology exposure,
stemming from economic factors, inhibit individual communities from accessing infor-
mation from digital or hard copy resources (United Nations Development Programme,
2013). Though access to high-end devices such as desktop or laptop computers is low
the prevalence of mobile devices is high. Proportionally, a majority of the population own
a phone of some description ranging from a feature phone up to a low-end, previous gen-
eration, touchscreen smartphone and residents also have access to a limited version of an
app store (Vallina-Rodriguez et al, 2009; Telecom Regulatory Authority of India, 2012; Liu
et al. 2012). The ample availability of phones can be attributed to the factors of planned
obsolescence and advances made in sustainable computing, both of these topics are cov-
ered in more detail within this literature review.
Kearsley (1994), Heller and McKeeby (1993), Blank (1992), and Maguire (1999) outline
guidelines for the development of public access systems. A four stage model is proposed
by Kearsley (1994) outlining a model of a user’s interaction with a system such as infor-
mation kiosk, ATM, museum exhibit, POS unit, or messaging system. These systems of-
fer convenience in so much as being able to quickly obtain information or services wher-
ever and whenever they are required. The underlying motivation then is for a user to have
a desire to meet some requirement when interacting with one of these information sys-
tems. Whether it is to share photos with a University community via a kiosk-based system
in a communal area, withdraw money from an ATM, or find visitor or tourist information
within the local area, all users are driven by a desire to achieve a specific purpose and will
use a kiosk voluntarily if it helps them to meet this objective. If a user does not find the
system useful or interesting straight away, then they are likely to abandon the process and

Chapter 2 Related Work
27
find some other way of meeting their needs, this point dovetails into the theory of gradual
engagement. Kearsley (1994) defines 6 required characteristics which all public access
systems share in order to be usable, these will be listed out and then, in parentheses, a
discussion around how the design of CASIK plans to conform to these parameters will be
provided:
• The delivery stations are located in open public areas rather than private spaces
such as offices, classrooms, or homes. Kiosks could be located within a University
dining area, which is a public space with high footfall.
• There is no training associated with the use of a public access system; you simply
walk up and use it. Natural interaction methods such as sound could simply be
played at the push of a button and would automatically load corresponding infor-
mation.
• Public access systems are typically used standing up rather than sitting down, and
the interval of use is relatively brief e.g., a few minutes. Kiosk interfaces could run
on pre-existing informational screens which are designed to be viewed in a standing
position and are typically viewed on a brief basis whilst passing.
• Usage is unlimited and unsupervised. Kiosk systems within a University would re-
quire no direct supervision outside of the already present security monitoring within
the University.
• They are capable of responding to user input i.e., interactive. Kiosk interfaces are
interactive by way of a screen which updates depending on the inputs a user has
provided, sound could also be utilised for output.

Chapter 2 Related Work
28
In recent years the number of public service kiosks being made available are increasing at
a very rapid pace, as well as traditional kiosks such as ATMs, supermarket self-checkout
tills, and train station ticket collection kiosks a number of parcel collection kiosks are being
made available to the public. In August 2015, Amazon alone had 300 lockers in the UK
with that number increasing weekly. A typical Amazon locker is shown in figure 2.0. Ku-
riyan, Ray and Kammen (2008) write that one of the most popular channels for information
delivery in developing countries is through information kiosks located within ‘telecentres’.
An Indian telecentre is shown in figure 2.1.
Figure 2.0 Amazon locker in-store
Additional modalities of input that could be used with kiosks include touch screens and on
screen keyboards, the scanning of barcode and QR codes, voice recognition, gestures,
and sound recognition. The issue with these methods and modalities of input are that
there has not been any study as to cultural preferences in their use and many are expen-
sive and unsustainable.

Chapter 2 Related Work
29
Figure 2.1 Indian ‘Telecentre’
Providing a novel input method in a culture where the population are not comfortable using
it would seem an unwise approach. Similarly, omitting an input method likely to be popular
with a particular culture would also be problematic.

Chapter 2 Related Work
30
2.4 Socially Adaptive User Interfaces and Multimodality
In order to provide the most suitable interface for any particular end user it is necessary for
the software to be adaptive in nature, that is, the software should be able modify itself based
on the feedback of the end-user. This adaptation, particularly when based on collective
feedback, is known as social adaptation (Ali et al, 2011). Social adaptation mandates that
the system both store user preferences within the system and utilise a modelling and anal-
ysis engine of some sort to parse these user requirements and analyse them for patterns.
Ali et al, 2011 outline four properties of an a (self-) adaptive user interface, these are: ‘self-
protection’ - the ability to monitor security problems and recover from them, ‘self-optimisa-
tion’ - the ability to optimise the system for optimal performance within any particular sce-
nario, ‘self-healing’ – the ability to monitor faults and attempt to prevent them or fix them if
they have already occurred, and ‘self-configuration’ – the ability to monitor user preferences
collectively and adapt the system’s user interface accordingly. This last property is the one
which would be most useful within a kiosk system that presents a customisable interface.
One of the primary advantages of social adaptation within a system is that is saves time,
expense, and is feasible within these aforementioned constraints. The alternative, of having
a team of designers manually update the interface repeatedly based on collective user data,
is not manageable in the long-term (Ali et al, 2011).
The culturally adaptive sustainable information kiosk (CASIK) developed within this re-
search can be accurately described as a socially-adaptive system. At first glance CASIK
may seem to be a self-adaptive system rather than a socially adaptive system: It monitors
changes within its operational environment (the kiosk interface output and preferences) as
Chapter 2 Related Work
31
well as its internal state (rules database and modelling engine) in order to optimise the fi-
nal interface presented to the end user, such that it adapts to present the most optimal in-
terface for a specific culture, at any given time, based on collective data. The differentiat-
ing factor that makes CASIK a socially adaptive system is the fact that it is necessary for
CASIK to monitor the social judgement upon the interface it presents to its users , through
questions which are posed to the user after any given session. Over the course of time
this data collected for particular cultures increases as more users use the system. This
newly stored data containing human opinions and conclusions is stored in the rules data-
base and parsed by the modelling engine so that the interface adapts itself autonomously
with this now more abundant data source, offering new insights or reinforcing existing as-
sumptions within the system. As Ali (2011) puts it “Social adaptation, on the other hand,
requires capturing its own kind of drivers, the users’ judgment, which is un-monitorable by
relying on solely automated means. Social adaptation requires a socio-technical monitor
which involves users’ perception as an integral part of the system computation.” Com-
pounding the utility of this socially adaptive approach is the use of a second modality pre-
senting a physical interface in addition to the standard GUI interface aforementioned –
namely sound tones played into the kiosk from a mobile device, or any sound capable de-
vice, and picked up by an internal microphone in the kiosk. The user’s ability to choose
between the GUI interface and the louder, more physical, sound-based interface allows us
to assess the preference of users for either interface and cross-reference this against the
particular culture of that user thereby providing valuable social data around culture and ki-
osk input preferences. This social data is useful in helping validate and identify preferred
interfaces against cultural backgrounds, in order to develop a hypothesis, which is covered
later.

Chapter 2 Related Work
32
2.5 Sustainable Computing
Sustainable computing is focused on methods for harmonising economic, societal, and en-
vironmental needs with the focus on building a sustainable future. In 1965 Intel co-founder
Gordon Moore noticed that the number of transistors per square inch on integrated elec-
tronics had doubled every year since their invention. In terms of sustainability the negative
consequence of this is the desire by western computer users to covet the newest and fast-
est computing hardware, whether it be a mobile device or desktop computer. Users are
encouraged by telephone service providers to change their phones every 18 months yet a
phone remains usable, with the latest software, for approximately 3.5 years (G. Zadok,
2010). This ‘planned obsolescence’ by phone manufacturers and service providers places
the current generation within the most wasteful group in industrial history (Bossuet, 2013).
Planned obsolescence is a common strategy within markets for hardware and software.
The idea is to render usable hardware or software obsolete so that a user will spend more
money upgrading unnecessarily. This is done through a number of methods; these com-
monly include forcing operating system updates for hardware in order for new apps to re-
main compatible, slowing down older hardware in the process, or alternatively ending sup-
port for an operating system completely thereby rendering it a security risk, such as was
the case with Microsoft’s ‘Windows XP’. Another strategy is to make future add-ons for
hardware incompatible with the older version, for example, by using different ports or secu-
rity features on newer models. Waldman, 1993, Choi, 1994 and Ellison and Fudenberg,
2004) identify that these strategies of planned obsolescence are incentivised excessively
for durable goods monopolists by increased profitability. These scholars identify that this

Chapter 2 Related Work
33
approach of introducing new products that are incompatible with old units results in social
welfare being lowered.
The strategy of planned obsolescence was popularised in the 1960s by American indus-
trial designer Brooks Stevens who explained it as follows: “planned obsolescence results
from the consumer's desire to own something a little newer, a little better, a little sooner
than necessary” (Stevens, 1960). Many economic studies have been carried out analys-
ing planned obsolescence, however, recently scholars have started to criticise the ap-
proach from a sustainability perspective and new approaches have been suggested
(Guiltinan, 2009). Adaptivity can be considered a means to achieve sustainability as the
utility of a system is increased through adapting it for different users, reducing the speed at
which a system would become obsolete due to its inability to adapt to different back-
grounds and requirements of different users.
A sustainable computing strategy would mandate that a computer is used until it is no
longer functionally usable, however, research shows that although modern computers
have a life expectancy of around 80,000h they are actually used for only around 20,000
hours or about 2 years (Oliver et al. 2007), just one quarter of their life expectancy. This
reduced life expectancy combined with the high degree of usage of electronics technology
has serious environmental implications related to the manufacture of these devices.
Firstly, in terms of required energies, materials and fossil fuels. Secondly, in terms of the
disposable of these devices at the end of their life, a process that results in high degrees
of waste and toxicity.
Although there has been a great deal of work and independent research undertaken within
the area of sustainable computing within the last few years, there still remains a question
mark around what truly defines a sustainable computing definition. Pargman and

Chapter 2 Related Work
34
Raghavan (2014) reviewed four interlocking frameworks that, in combination, provide a rig-
orous definition of what constitutes a sustainable computing experience.
The United Nations Commission on Environment and Development produced a report in
1987 entitled “Our Common Future” (also often referred to as the Brundtland report). This
report stated that “Sustainable development is development that meets the needs of the
present without compromising the ability of future generations to meet their own needs”.
This definition seems vague and unmeasurable. The vagueness of this definition was ad-
dressed by Joseph Tainter (2006) who stated that “while this definition will no doubt con-
tinue to be widely cited, it has limited operational usefulness. Befitting a political leader,
the definition is too general to guide behaviour”.
With regard to progress within computer design, performance-wise computers have pro-
gressed staggeringly well. Machines are now faster than they have ever been whilst con-
suming proportionately less energy than in previous generations of machines. However,
the reality remains that the manufacture of computer systems involves the use of cad-
mium, mercury, lead, and other toxic substances. A computer system alone can contain
between 4 to 8 pounds of lead alone and used computer systems make up two-fifths of all
lead in landfills.
2.5.1 Sustainable Computing Architecture Developments
To provide some context there follows a summary of the interesting progress in computing
from large power inefficient computers to energy efficient sustainable single board comput-
ers. Power considerations historically have pushed the electronics industry to evolve from
producing large energy inefficient computers utilising vacuum tubes, to bipolar device tech-
nology, to ntype metal-oxide semiconductor, and finally to complementary metal-oxide

Chapter 2 Related Work
35
semiconductor technology which is in use today. Over the last 40 years, enhancements
within lithography have facilitated increased integration of component circuitry leading to a
decrease in the cost per function of a system. this trend was outlined earlier in this section
when Moore’s law was examined. Scaling guidelines were developed by Dennard and his
associates around this time allowing the design of even smaller devices which could oper-
ate at higher speeds while keeping their power density at a constant level. Fundamental
physical limitations, however, have been reached recently resulting in complementary
metal-oxide semiconductor technology deviating from this Low-Power, Massively Parallel,
Energy-Efficient model. The outcome of this was that computer manufacturers had to dis-
regard the notion of keeping a constant level of power density when trying to maintain or
increase the speed of their computer systems resulting in power dissipation becoming a
growing issue. It was perfectly conceivable in the past to shrink the lithography of a sys-
tem by a factor of 2 and expect the system to have twice the number of transistors in the
same area whilst maintaining the same level of power density, however, it is now the case
that power doubles for twice the number of transistors. With power already being a limita-
tion this was unwelcome news from a sustainability perspective. Complementary metal-
oxide semiconductor technology within the 45-nm group therefore required an innovation
to resolve these restrictions. The introduction of and adoption of parallelism within CPU
architectures provided this opportunity, many-core and multicore architectures have facili-
tated opportunities for power and performance improvements. Another area which further
reduced power dissipation was a System on a Chip (SoC), an integrated circuit (IC) that
integrates all standard components of a computer system into a single chip. SoC’s have
become very pervasive within mobile computing devices such as smartphones due to their
low power consumption.
Chapter 2 Related Work
36
A SoC typically includes a microcontroller, memory blocks, timing sources, peripherals, ex-
ternal interfaces, analogue interfaces, voltage regulators and power management circuitry.
These disparate components are connected together by industry standard or proprietary
BUS architectures with DMA controllers being utilised to route data between memory and
the external interfaces. An example of a microcontroller-based system on a chip can be
seen in figure 2.2. Single board computers, upon which a kiosk system could be based,
make use of both SoC circuitry as well as multicore processors resulting in a very power
efficient and sustainable solutions for compared to the current systems used in commercial
information kiosks.
Figure 2.2 SoC architecture of a Tegra K1
2.5.1.1 Heinberg’s Five Axioms of Sustainability
Any society that is unsustainable, by implication, cannot be maintained for long and at
some point will cease to function. While the specific time period over which this happens
is hard to define Heinberg suggests that it is reasonable to put this in relation to the dura-
tion of previous civilisations. Previous civilisations have sustained themselves from peri-
ods of hundreds of years to periods of thousands of years. A sustainable society should,

Chapter 2 Related Work
37
therefore, be able to support itself for many centuries at least. One example is the ancient
Egyptian civilisation that amalgamated itself around 3150 BC and then came to an end not
because of environmental degradation but because of military conquest when it became a
Roman province and a granary for Rome in 30BC.
In his 2010 text ‘What is sustainability?’ Richard Heinberg proposes five axioms that, when
combined, define sustainability:
1. A society that utilises minimal resources unsustainably will eventually collapse.
2. A growth in both population and the use of critical resources cannot be sustained.
3. Renewable resources must not be consumed at a rate that is higher than the level
of replenishment.
4. The use of non-renewable resources must proceed at a rate that is declining and
the rate of decline must be greater than or equal to the rate of depletion.
5. Substances introduced into the environment from human activities must be mini-
mised and rendered harmless to biosphere functions.
Each of Heinberg’s five axioms, within the context of the design of a kiosk system, have
been considered, and referenced, throughout the course of this research.
2.6 Culture and HCI
Cultural influences within HCI are well known; there is a proven effect in systems. Numer-
ous scholars have identified elements within websites, and technology in general, that
have different effects depending on the cultural background of the user, Smith, Dunckley,
French, Minocha and Chang (2004) in their paper ‘A process model for developing usable

Chapter 2 Related Work
38
cross-cultural websites’ introduce cultural attractors, which define interface design ele-
ments including colours, colour combinations, banner adverts, trust signs, use of meta-
phor, language cues, navigation controls, and similar visual effects that all serve to create
a look and feel to match the end users cultural expectations.
Their research is of note due to the fact that it was found that cultural elements that schol-
ars had not previously considered were having an impact on end users, such as linguistic
cues, colour combinations, and trust aspects instantiated from site branding and iconogra-
phy. This raises the question of just how deep of an effect culture actually has within HCI,
as scholars start to acknowledge that it is part of the fabric of the entire design and devel-
opment process and not just an exercise in modifying images and text for each cultural
group. Whilst scholars acknowledge that user’s usage patterns on websites are culturally
influenced by country of origin and genre it is interesting to note that some cultural markers
might even be particular to a given region within a country (Badre, 2001).
Badre (2001) was another scholar that, like Smith, Dunckley, French, Minocha and Chang
(2004) coming after him, identified elements that had a profound effect on users from dif-
ferent cultures. One notable example being Middle Eastern sites in Arabic and Hebrew
that have a high frequency of orienting graphics, text and links running from right-to-left as
opposed to left-to-right. This spatial orientation of information has immediate cultural usa-
bility implications; whilst in Western countries the left side of the page is likely to be the
first area of focus the right side would be the first for a Middle Easterner.
The ramifications of ignoring cultural HCI considerations when designing experiences is
well established, Marcus (2000) tested 20 American e-commerce sites (not culturally
adapted) with both American and European users. It was found that the ability for Ameri-
cans to successfully shop on the site was 61% whilst the Europeans ability to successfully

Chapter 2 Related Work
39
shop was only 47%. Thus these sites were potentially losing out on 33% of overseas rev-
enue by ignoring the impact of culture on technology. Marcus (2000) also found that cul-
tural factors went far beyond simply having a good quality language translation, citing the
website of a large European bank available in several languages which had excellent lan-
guage translations including an English version. Despite the language translation being
excellent American users still had difficulty using the site due to a magnitude of cultural dif-
ferences between America and Europe.
The existence of a body of research documenting cultural aspects within HCI and technol-
ogy, as a product, as well as the ramifications of ignoring it raises the question of why so
many websites and technologies fail to address this area effectively. One answer lies in
the identification of existing methods as being biased due to quantitative research tradi-
tions being dominant within HCI (Clemmensen, Torkil and Roese, 2010), this is a conse-
quence of the overriding focus on cross-cultural design to date being on technology as a
product rather than on the design process itself. The design process must encapsulate
the concepts employed and the designers themselves including their theories, concepts
and design methods (Clemmensen et al., 2009; Frandsen-Thorlacius et al.,2009; Vatrapu
and Perez-Quinones, 2006; Winschiers and Fendler, 2007).
It would be remiss to discuss design without giving it a formal definition, Winograd and Flo-
res (1998) define design as “interaction between understanding and creation”. Of course,
it is a cogent observation that understanding is shaped by one’s own cultural background
therefore we must understand the notion of culture in this context in order to create an in-
terface that can be understood by a user. Culture is not an easy subject to define, under-
stand, or assimilate, Williams (1976) defined culture as the most difficult and complex term
to define and understand in any language.

Chapter 2 Related Work
40
Within the context of HCI one can attempt to find a definition for culture by looking at the
work of previous scholars including Fernandes (1995) who speaks of the four main compo-
nents of culture being values, rituals, symbols, and heroes. Fernandes outlines that the
values associated with the term can be changed depending on the context, specifically the
qualifying phrase, used before the term “culture”. For example, “organisational culture”
(Bodker and Pedersen, 1991) specifically refers to the factors which characterise an or-
ganisation or organisations whilst “the American culture” refers to the distinctive set of val-
ues, symbols, rituals and heroes adopted by American citizens (Fernandes, 1995).
One must also consider the fact that in the context of culture things are not necessarily
black and white i.e. one cannot posit that a user from cultural background A will respond to
culturally relative stimuli in a substantially distinct way to a user from a different cultural
background (cultural background B) or that these users will be predictable in how they in-
teract or react to an information system. Outhwaite & Bottomore, 1993, for example, found
that “Cultural traits such as language, religious adherence or folk custom frequently cut
across each other”. Similarly we cannot treat cultures as tangible objects that can be la-
belled or sorted because the reality of social behaviour is that it is not ontologically objec-
tive, nor is it epistemically subjective (Searle, 1995).
Whilst we cannot treat culture as a tangible object we must not, at the same time, treat it
as occult entity or some kind of mystic force as noted by Geertz (1993) “though ideational,
it (culture) does not exist in someone’s head; though unphysical, it is not an occult entity”.
The reason, it would seem, that culture cannot be concretely defined or measured is that
culture is in essence a type of mass programming and therefore individuals react differ-
ently to this based on a multitude of factors including their social background, intelligence

Chapter 2 Related Work
41
level, and unique personality traits. As Geert Hofstede (1991) put it culture is "the collec-
tive programming of the mind which distinguishes the members of one group or category
of people from another."
Another factor which is important to consider is that of globalisation, which is discussed
further in the following section, since the mass adoption of the Internet and World Wide
Web in the developed world, subsequent to Hofstede’s and many other scholar’s founda-
tional studies, the cultural differences, or chasm, which once existed between these
groups has been diminished. Social media, streaming global television channels, and
community video sharing sites have played their part in broadening the cultural awareness
of different cultural groups and diluted, or broadened, the ‘cultural programming of the
mind’ Hofstede observed. Bruner (1996) defined culture as “an interplay between the ver-
sions of the world that people form under its institutional sway and the versions of it that
are products of their individual histories”, viewing this statement in the context of the mod-
ern world it is immediately apparent that the ‘institutional sway’ of culture is far less prevail-
ing and that the individual histories of different countries, or a countries bespoke presenta-
tion of its history, is less susceptible to manipulation or selective presentation.
2.6.1 Globalisation
Globalisation, in so much as it is relevant to this research, is the increased awareness and
consciousness of the citizens of our planet and the condensation of the world from the per-
spective of information and access to resources. Robertson (1992) eloquently sums it up
as a concept that “refers both to the compression of the world and the intensification of

Chapter 2 Related Work
42
consciousness of the world as a whole”. Robertson explains that the notion of globalisa-
tion is not a new one and has existed since the 15th century though the use of the word
globalisation as a noun in common usage did not occur until recent times.
In practice, and from the perspective of HCI, globalisation refers to homogenisation.
Strongly associated with colonialism and cultural expansionism this homogenisation is
clearly witnessed in the “Americanisation” of technology, products, brands, and services.
Fernandes (1995) argues that a design should consider the needs of each particular cul-
ture they are designing for and adapt their products to meet their needs rather than ex-
pecting the target cultural group to adapt to the product or service. Fernandes (1995) has
expressed concern at this cultural imperialism stating that “It will be a sad day when you
get on a plane, fly 600 miles and arrive in a place that looks identical to the one you left”.
Hazemi and Macaulay (1996) asserted that “the globalization of organizations will increase
the demand for supporting geographically distributed work groups where team members
work either in real-time or asynchronously”. This is evident in the widespread process of
outsourcing work to developing countries such as India and Colombia and the increased
use, and reliability of, video conferencing between remote teams. With this increased use
of systems and user interfaces across geographically disparate countries comes new HCI
challenges, primarily in attempting to provide an interface that can be utilised by users
from these distinct cultural backgrounds particularly when some users have more than one
cultural background e.g. they may have lived half of their lives in one country and the other
half in another.
Terlutter et al. (2005) classified cultural research into two distinct categories, namely those
studies concerned with objective criteria and those concerned with subjective criteria. Ob-
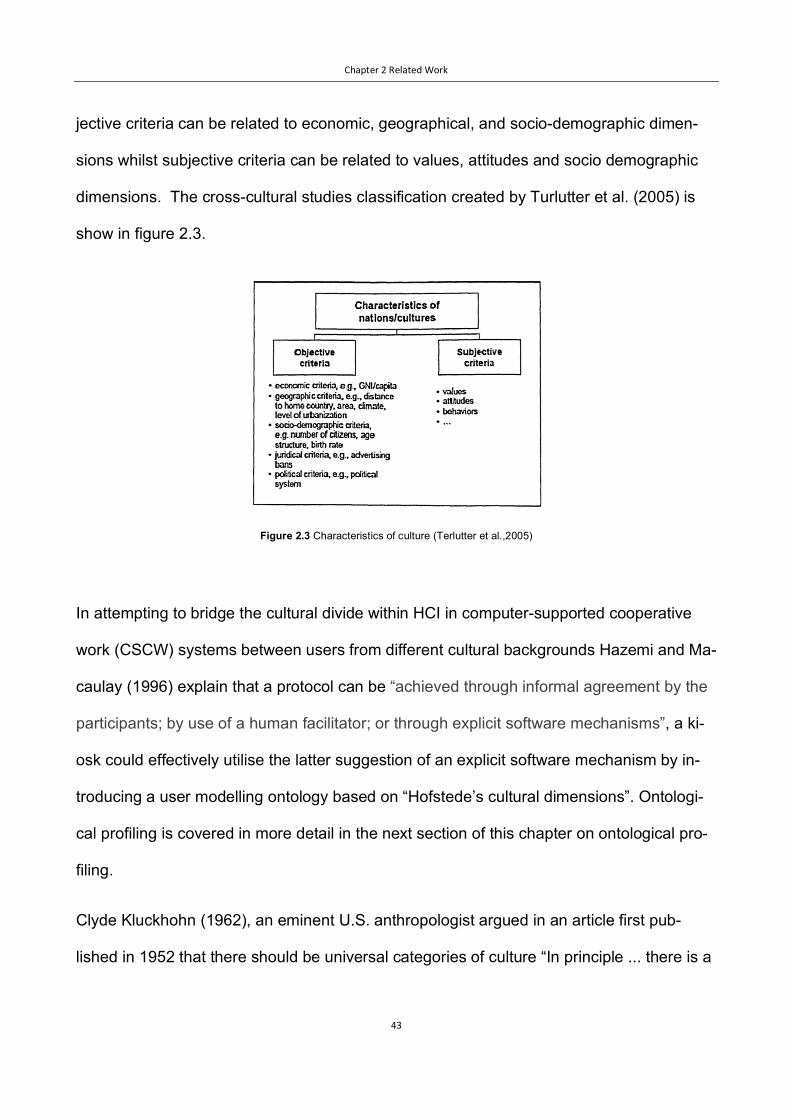
Chapter 2 Related Work
43
jective criteria can be related to economic, geographical, and socio-demographic dimen-
sions whilst subjective criteria can be related to values, attitudes and socio demographic
dimensions. The cross-cultural studies classification created by Turlutter et al. (2005) is
show in figure 2.3.
Figure 2.3 Characteristics of culture (Terlutter et al.,2005)
In attempting to bridge the cultural divide within HCI in computer-supported cooperative
work (CSCW) systems between users from different cultural backgrounds Hazemi and Ma-
caulay (1996) explain that a protocol can be “achieved through informal agreement by the
participants; by use of a human facilitator; or through explicit software mechanisms”, a ki-
osk could effectively utilise the latter suggestion of an explicit software mechanism by in-
troducing a user modelling ontology based on “Hofstede’s cultural dimensions”. Ontologi-
cal profiling is covered in more detail in the next section of this chapter on ontological pro-
filing.
Clyde Kluckhohn (1962), an eminent U.S. anthropologist argued in an article first pub-
lished in 1952 that there should be universal categories of culture “In principle ... there is a

Chapter 2 Related Work
44
generalized framework that underlies the more apparent and striking facts of cultural rela-
tivity. All cultures constitute so many distinct answers to essentially the same questions
posed by human biology and by the generalities of the human situation. ... Every society's
patterns for living must provide approved and sanctioned ways for dealing with such uni-
versal circumstances as the existence of two sexes; the helplessness of infants; the need
for satisfaction of the elementary biological requirements such as food, warmth, and sex;
the presence of individuals of different ages and of differing physical and other capacities.
(pp. 317-18).”. In a nutshell, we are all (as humans) dealing with a similar existence
largely but as distinct cultures come up with different mass consensus approaches, or ac-
tions, to dealing with these life circumstances. What then drives these actions? U.S. soci-
ologists Talcott Parsons and Edward Shils (1951, p. 77) proposed that all human action is
determined by five basic “pattern variables”, i.e. choices between pairs of alternatives.
These pattern variables are listed in table 2.1.
Variable 1 Affectivity (need gratification) versus affective neutrality (restraint of im-
pulses);
Variable 2 Self-orientation versus collectivist-orientation;
Variable 3 Universalism (applying general standards) versus particularism (taking par-
ticular relationships into account);
Variable 4 Ascription (judging others by who they are) versus achievement (judging
them by what they do);
Variable 5 Specificity (limiting relations to others to specific spheres) versus diffuse-
ness (no prior limitations to nature of relations).
Table 2.1 Pattern Variables Talcott Parsons and Edward Shils (1951)

Chapter 2 Related Work
45
Talcott Parsons and Edward Shils (1951) outlined that these choices are present at the in-
dividual (personality) level and at the normative (cultural) level. Subsequent to this re-
search anthropologists Florence Kluckhohn and Fred Strodbeck (1961, p. 12) undertook a
field study in five small, geographically close communities in the Southwestern Unites
States. These included peripatetic Navajo, Mexican-Americans, Texan homesteaders,
Zuni pueblo dwellers, and Mormon villagers. The communities were distinguished into the
value orientations shown in table 2.2.
Value orientation 1 An evaluation of human nature (evil - mixed - good);
Value orientation 2 The relationship of man to the surrounding natural environment (subjugation -
harmony - mastery);
Value orientation 3 The orientation in time (toward past - present - future);
Value orientation 4 The orientation toward activity (being - being in becoming - doing);
Value orientation 5 Relationships among people (linearity, i.e., hierarchically ordered positions – col-
laterality, i.e., group relationships – individualism).
Table 2.2 Value orientations Florence Kluckhohn and Fred Strodbeck (1961)
Kluckhohn and Strodbeck’s classification has been expanded by scholars to include other
social associations exempting the geographic limitations imposed, levels of aggregation,
and without any support from an empirical basis.
Following on from the work of Kluckhohn and Strodbeck, Mary Douglas a British anthropol-
ogist proposed the idea of a ‘grid-group’ cultural theory in her book natural symbols (Doug-
las, 1970), this book itself being a sequel to a prelude on the topic named Purity and Dan-
ger (1966). Douglas has stated in a 2007 paper that “Back in the 1960’s social anthropolo-
gists still felt it was necessary to vindicate the intelligence of colonial peoples, then known

Chapter 2 Related Work
46
as “natives” or “primitives.” A major objective of teaching and writing in anthropology was
to attack something described by Levy Bruhl as “primitive mentality,” which seemed to
mean “primitive irrationality.”
Prior to Douglas’s work Malinowski had demonstrated in the 1920’s (Malinowski, 1935)
that the primitive Trobrianders did in fact have laws and customs that were rational. Sub-
sequent to this Raymond Firth (2013) made the discovery that the basic laws of supply,
demand, and price existed within the Polynesian economies he studied which he referred
to as “primitive economics”. Post 1945, following World War 2 it was demonstrated by
Nadel and Gluckman that the Barotse and Nubian legal systems were complex in nature.
This was in itself innovative as noted by Mary Douglas “The very idea that the concept of
“jurisprudence” could apply to “the natives” was innovative. In the 1950’s and 1960’s we
continued to dismantle intellectual barriers assumed to distinguish “Them” from “Us.”
(Douglas, 1970).
Mary Douglas developed a typology of cultures based on a peoples need for classification.
In it, she sought to emphasise the organisation of work and division of labour with a view
to accounting for the distribution of values within a given population. Borrowing Bern-
stein’s two-dimensional scheme of family organisations, Douglas derived logically compati-
ble values for each variety. The grid-group model is shown in figure 2.4.

Chapter 2 Related Work
47
Figure 2.4 The Grid Group diagram Mary Douglas Natural Symbols (1970)
The group facet identifies the extent to which an individual’s life is controlled by the group
in which they live. The very fact that one belongs to any group confers responsibilities on
the individual, though to different degrees. Douglas (1970) cites the example of one being
a member of a religious group though they only turn up on Sundays, or sometimes annu-
ally. Whilst at the other end of the spectrum there are individuals, such as those living in
convents or monasteries which demand a full-time life commitment. The grid facet, on the
other hand, identifies the amount of control any particular member will accept. At the start
of the grid are peoples that live in an environment where they are free of social group pres-
sure and of any structural constraints, moving up to the other extreme are peoples that are
under comprehensive regulation and work in a hierarchy which is highly structured. Com-
bining the two groups leads to four incompatible types of social control and scope for mod-
ifying or mixing between the extremes.
Max Weber’s three types of rationality: religious charisma (the holy man with his halo), bu-
reaucracy (the stern bureaucrat with his briefcase), and market (the smug pioneer with his
pickaxe) intertwine with three of the grid-group cultures, positional, individualist, and secre-
tarian enclave, as depicted in figure 2.5 (Weber, 2009).

Chapter 2 Related Work
48
Figure 2.5 The three cultural heroes Christian Brunner (1970)
Numerous scholars (Grant and Bakhru, 2004; Chen, 2007; Samiee, 1998; Quelch and
Klein, 1996) have acknowledged the reality that, although the Internet is a vehicle of glob-
alisation as well as being a product, this does not eliminate the influence of specific loca-
tion-based factors, structural limitations, or forces.
2.6.2 Localisation
At the outset of this research thesis localisation was defined as the process of customising
a website for a specific cultural group so that it seems natural or “local” to constituents of
that particular cultural group (Singh et al. 2006). It was also noted that localising a web-
site for a specific cultural audience is important and has a strong impact on user percep-
tions of a website (Cyr and Trevor-Smith, 2004; Singh et al., 2006, 2004; Tixier, 2005;
Chakraborty et al., 2005), and that the folly of not addressing the issue of localisation can
be the loss of a market presence in foreign markets and accordingly a loss of profits. Prior
work has identified that culture impacts the layout, format and design of e-commerce sites
(Simon, 2005; Cyr and Trevor-Smith, 2004; Lo and Gong, 2005; Cyr et al. 2005) and the
Chapter 2 Related Work
49
depiction of content within these websites (Singh et al., 2005a; Okazaki, 2005; Singh et al.,
2005b; Singh et al., 2003; Singh and Baack, 2004; Singer et al., 2008).
In a different cross-country study examining e-commerce activities, Oxley and Yeung
(2001) found that although physical infrastructure explains a large portion of the variation
in internet use, a supportive institutional environment is critical for developing actual e-
commerce activities. And therefore, institutional environments must facilitate transactional
integrity, especially in ensuring the “rule of law”, and in the availability of credible payment
channels. In the same spirit, Guillén and Suárez (2010) have also undertaken a compre-
hensive cross-country analysis of internet use, and found that internet growth is driven not
only by socio-economic status, cost or accessibility but also by regulatory, political and so-
ciological variables; where governments can implement policies that enhance internet use.
A useful framework defining the various infrastructural conditions assumed to impact e-
commerce growth in foreign markets was suggested by Javalgi and colleagues ( Javalgi
and Ramsey, 2001; Javalgi et al., 2004). This framework includes four types of infrastruc-
tures, including – information technology (IT) and telecom, socio-cultural, commercial, and
government and legal infrastructures (GLI). This study adopts this framework for examin-
ing the impacts each of these factors may have on web site localisation decisions, while
expanding it to also include industry-specific demand in target markets, and the relative
position of target markets in terms of cultural and geographic distance between home and
target countries.
2.6.3 Hofstede’s Cultural Dimensions
Between 1967 and 1973 Geert Hofstede developed a theory for cross-cultural communica-
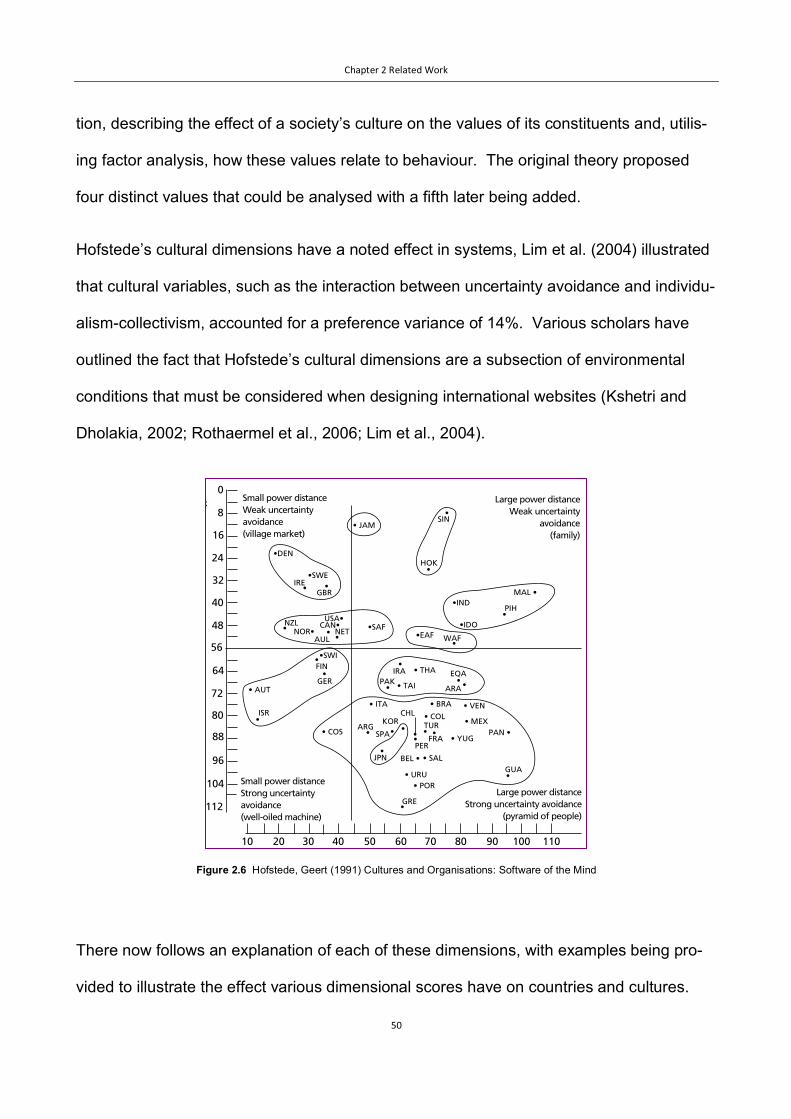
Chapter 2 Related Work
50
tion, describing the effect of a society’s culture on the values of its constituents and, utilis-
ing factor analysis, how these values relate to behaviour. The original theory proposed
four distinct values that could be analysed with a fifth later being added.
Hofstede’s cultural dimensions have a noted effect in systems, Lim et al. (2004) illustrated
that cultural variables, such as the interaction between uncertainty avoidance and individu-
alism-collectivism, accounted for a preference variance of 14%. Various scholars have
outlined the fact that Hofstede’s cultural dimensions are a subsection of environmental
conditions that must be considered when designing international websites (Kshetri and
Dholakia, 2002; Rothaermel et al., 2006; Lim et al., 2004).
Figure 2.6 Hofstede, Geert (1991) Cultures and Organisations: Software of the Mind
There now follows an explanation of each of these dimensions, with examples being pro-
vided to illustrate the effect various dimensional scores have on countries and cultures.
21
2
InterculturalLearning
T-Kit
0
10 20 30 40 50 60 70 80 90 100 110
8
16
24
32
40
48
56
64
72
80
88
96
104
112
• JAMSIN
MAL •
PIH•IND
IRAPAK • TAI
• THA EQA
ARA
•EAF WAF
•IDO
HOK•DEN
IRE•SWE
GBR
•SAF
•SWIFIN
GER• AUT
ISR
• COS
• ITA
ARGSPA
KORCHL
JPNPER
BEL • • SAL
• URU• POR
GRE
FRA
TUR• COL
• BRA • VEN
• MEX
• YUGPAN •
GUA
USA•CAN•
NETAUL
NOR•NZL
•
Small power distanceStrong uncertaintyavoidance(well-oiled machine)
Small power distanceWeak uncertaintyavoidance(village market)
Uncertaintyavoidance index
Large power distanceStrong uncertainty avoidance
(pyramid of people)
Power distance index
Large power distanceWeak uncertainty
avoidance(family)
•
•
•
•
•
•
•
••
• •••
•• •
•
•
•
••
• •
•
•
Fig. 2: The position of 50countries and 3regions on thepower distance and uncertaintyavoidance dimen-sions
Source: p. 141, Hofstede, Geert (1991) Culturesand organisations: software of the mind, London:McGraw-Hill. Copyright © Geert Hofstede,reproduced with permission.

Chapter 2 Related Work
51
2.6.3.1 Power Distance Index
This dimension measures the extent to which the less powerful members of an institution
or organisation accept the unequal distribution of power suggesting that a society’s level of
inequality is endorsed as much by its followers as by its leaders. As an example, the PDI
score for Germany is 35 according to Hofstede’s cultural scale analysis in comparison to
Arabic countries where the PDI score is much higher at 80 whilst in neighbouring Austria it
is much lower at a score of 11. Accordingly, Germany and Austria are at the lower to mid-
dle end of the three aforementioned countries having a small gap between the poor and
the wealthy and a strong belief in equality for each citizen whilst Arab countries are at the
more extreme end with an acceptance of a more unequal distribution of wealth between
rich and poor citizens.
Low PDI High PDI
Low dependence needs
Inequality minimised
Hierarchy for convenience
Superiors accessible
All should have equal rights
Change by evolution
High dependence
Inequality accepted
Hierarchy needed
Superiors often inaccessible
Power holders have privileges
Change by revolution
Austria, Denmark, Ireland India, Kuwait, Malaysia, Mexico
Table 2.3 PDI Comparison (Culture GPS by ITIM International)
2.6.3.2 Individualism
The dimension of individualism refers to the extent to which members of societies act as
individuals i.e. it is the opposite of collectivism where individuals are integrated into
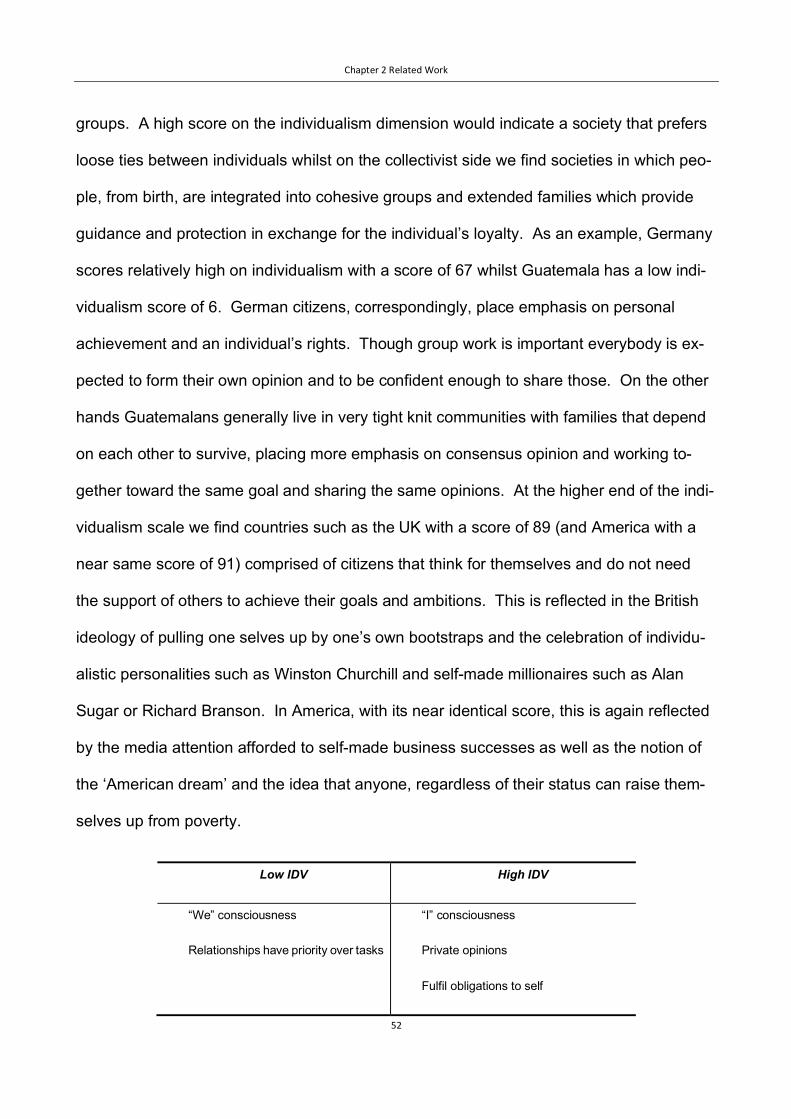
Chapter 2 Related Work
52
groups. A high score on the individualism dimension would indicate a society that prefers
loose ties between individuals whilst on the collectivist side we find societies in which peo-
ple, from birth, are integrated into cohesive groups and extended families which provide
guidance and protection in exchange for the individual’s loyalty. As an example, Germany
scores relatively high on individualism with a score of 67 whilst Guatemala has a low indi-
vidualism score of 6. German citizens, correspondingly, place emphasis on personal
achievement and an individual’s rights. Though group work is important everybody is ex-
pected to form their own opinion and to be confident enough to share those. On the other
hands Guatemalans generally live in very tight knit communities with families that depend
on each other to survive, placing more emphasis on consensus opinion and working to-
gether toward the same goal and sharing the same opinions. At the higher end of the indi-
vidualism scale we find countries such as the UK with a score of 89 (and America with a
near same score of 91) comprised of citizens that think for themselves and do not need
the support of others to achieve their goals and ambitions. This is reflected in the British
ideology of pulling one selves up by one’s own bootstraps and the celebration of individu-
alistic personalities such as Winston Churchill and self-made millionaires such as Alan
Sugar or Richard Branson. In America, with its near identical score, this is again reflected
by the media attention afforded to self-made business successes as well as the notion of
the ‘American dream’ and the idea that anyone, regardless of their status can raise them-
selves up from poverty.
Low IDV High IDV
“We” consciousness
Relationships have priority over tasks
“I” consciousness
Private opinions
Fulfil obligations to self
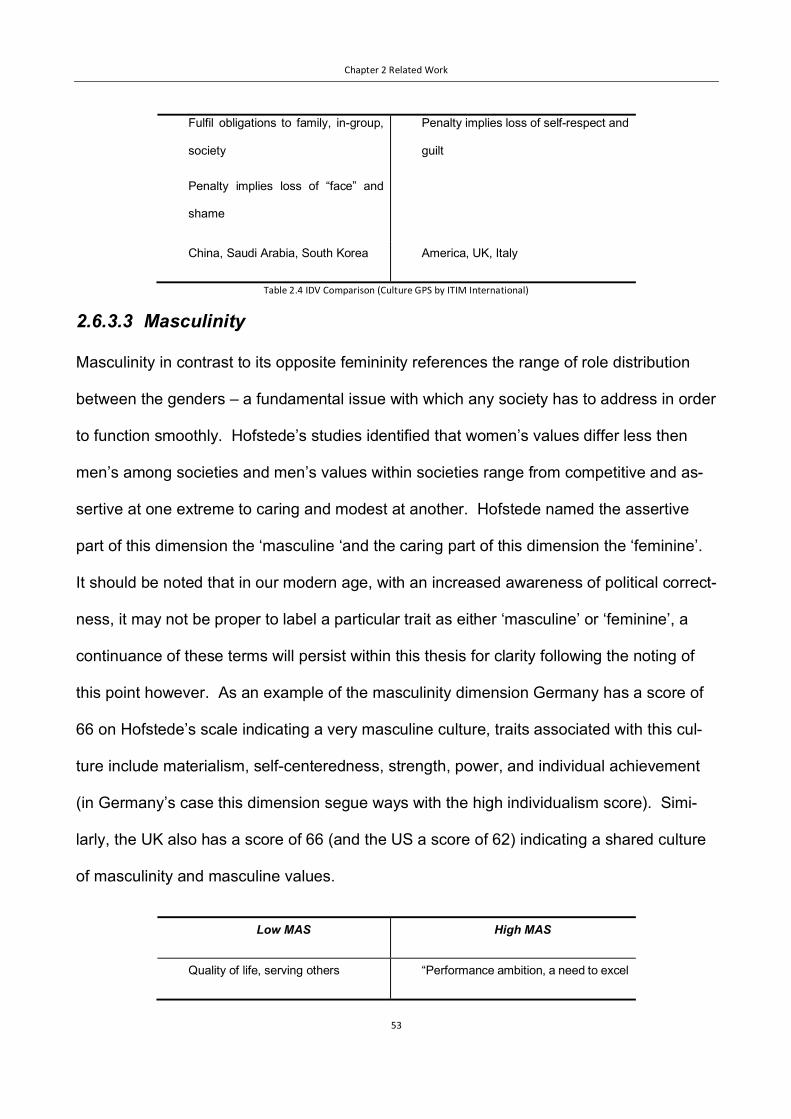
Chapter 2 Related Work
53
Fulfil obligations to family, in-group,
society
Penalty implies loss of “face” and
shame
Penalty implies loss of self-respect and
guilt
China, Saudi Arabia, South Korea America, UK, Italy
Table 2.4 IDV Comparison (Culture GPS by ITIM International)
2.6.3.3 Masculinity
Masculinity in contrast to its opposite femininity references the range of role distribution
between the genders – a fundamental issue with which any society has to address in order
to function smoothly. Hofstede’s studies identified that women’s values differ less then
men’s among societies and men’s values within societies range from competitive and as-
sertive at one extreme to caring and modest at another. Hofstede named the assertive
part of this dimension the ‘masculine ‘and the caring part of this dimension the ‘feminine’.
It should be noted that in our modern age, with an increased awareness of political correct-
ness, it may not be proper to label a particular trait as either ‘masculine’ or ‘feminine’, a
continuance of these terms will persist within this thesis for clarity following the noting of
this point however. As an example of the masculinity dimension Germany has a score of
66 on Hofstede’s scale indicating a very masculine culture, traits associated with this cul-
ture include materialism, self-centeredness, strength, power, and individual achievement
(in Germany’s case this dimension segue ways with the high individualism score). Simi-
larly, the UK also has a score of 66 (and the US a score of 62) indicating a shared culture
of masculinity and masculine values.
Low MAS High MAS
Quality of life, serving others “Performance ambition, a need to excel

Chapter 2 Related Work
54
Striving for consensus
Work in order to live
Small and slow are beautiful
Sympathy for the unfortunate
Intuition
Tendency to polarise
Live in order to work
Big and fast are beautiful
Admiration for the successful achiever
Decisiveness
Sweden, Netherlands Japan
Table 2.5 MAS Comparison (Culture GPS by ITIM International)
2.6.3.4 Uncertainty Avoidance
A society’s tolerance for uncertainty and ambiguity is the parameter that is defined by Hof-
stede’s uncertainty avoidance index dimension. This dimension indicates the extent to
which a society has been collectively programmed to feel comfortable (or uncomfortable)
with unstructured situations. We would define an unstructured situation as one that is un-
expected, novel, unusual, and surprising. Countries that score high on this dimension,
such as Malta with a score of 96, seek to minimise the possibility of these unstructured sit-
uations through the use of laws, statutes, and legislation as well as safety and security
measures. Whilst at the philosophical or religious level believing in a single truth (Malta is
a 98% practicing Catholic country). Similarly, Germany also has a high score on the un-
certainty avoidance index at 65 and, again, is a country that is not keen on uncertainty –
by planning everything meticulously Germans try to avoid uncertainty in line with its dimen-
sional score. The UK has a low score on the uncertainty avoidance index with a score of
35 and this is reflected in the culture, idioms such as ‘all’s well that ends well’ indicate an
acceptance that uncertainty is unavoidable and the end result is what we should be focus-
sing on.
Low UAI High UAI

Chapter 2 Related Work
55
Relaxed, less stress
Hard work is not a virtue per se
Emotions not shown
Conflict and competition seen as fair
play
Acceptance of dissent
Flexibility
Less need for rules
Anxiety, greater stress
Inner urge to work hard
Showing of emotions accepted
Conflict is threatening
Need for agreement
Need to avoid failure
Need for laws and rules
Denmark, Bhutan Italy, Turkey, Mexico, Russia
Table 2.6 UAI Comparison (Culture GPS by ITIM International)
2.6.3.5 Long Term Orientation
Long term orientation is the fifth dimension and was added subsequent to the original four
following research by Hofstede in Hong Kong. The rationale in adding this fifth dimension
was to facilitate the ability to distinguish between the East and West. i.e. this difference
could not be deduced using the dimensions derived from the original research. Cultures
that score highly on this dimension possess thrift, persistence, a sense of shame, and the
ordering of relationships by status whilst cultures that score low on this scale possess per-
sonal steadiness and stability, respect or tradition, reciprocation of favours, gifts, or greet-
ings, and the desire to protect ones ‘face’ or reputation.
Low LTO High LTO
Absolute truth
Conventional / traditional
Concern for stability
Many truths
Pragmatic
Acceptance of change

Chapter 2 Related Work
56
Quick results expected Perseverance
America, UK, Sweden China, Taiwan, Vietnam
Table 2.7 LTO Comparison ( Culture GPS by ITIM International)
2.6.3.6 Indulgence vs Self-Restraint
Referred to by some scholars as the ‘ambiguous dimension’ this sixth, most recent, cul-
tural dimension is centred around happiness research. Across cultures the notion of hap-
piness is viewed very differently and represented in different manners. Countries featuring
a high score on this dimension encourage and facilitate free gratification of one’s own
emotions and desires, such as enjoying in entertainment for its own sake and having fun.
Conversely a society with a low score on this dimension places more emphasis on the
suppression of instant gratification and far more regulation on the conduct of its citizen’s
behaviour through the enforcement of stricter cultural norms.
2.6.4 Criticisms of Hofstede’s Cultural Dimensions
2.6.4.1 A Brief History
It is important to include an analysis of the criticisms of Hofstede’s work as his work on cul-
ture it the most widely cited in existence (Hofstede 1997; Bond 2002) and plays such a piv-
otal role in this research. As Bhagwat and McQuaid eloquently put it “Undoubtedly, the
most significant cross-cultural study of work-related values is the one carried out by Hof-
stede” Bhagat and McQuaid (1982). Being such a seminal piece of work it is unsurpris-
ing that along with popularity comes criticism and scrutiny. Numerous scholars have at-
tempted to discredit Hofstede’s work in part or in whole.
Prior to Hofstede’s landmark study in 1980 there was the work of Bartels (1967) who
looked at the importance of culture, illustrating its importance within business ethics and
Chapter 2 Related Work
57
decision making. Bartels defined a set of criteria for effectively identifying cultural differ-
ences, which were: Law; Relation of Individual to State; Nature of Power and Authority;
Rights of Property; Customs and Mores; Concept of Deity; National Identity and Loyalty;
Values, Respect for individuality.
Hofstede’s own large-scale study began in 1980 comprising the dissemination of 116,000
questionnaires of which 60,000 responses were received from over 50 countries. Hof-
stede worked with Hermes, now identified as IBM, staff through the years 1967 to 1978 to
obtain his research data. Hofstede utilised a factor analysis of 32 questions in 40 coun-
tries to identify four bipolar dimensions: Power Distance, Individualism/Collectivism, Uncer-
tainty Avoidance, and Masculinity/Femininity, which became the basis with which he cate-
gorised the cultural parameters of each country (Schneider and Barsoux 1997, Dorfman
and Howell 1988, Hofstede 1980, d'Iribarne 1996).
The fifth element of Long Term/Short Term Orientation was added subsequent to another
study by Hofstede and Bond in 1988, this dimension is also referred to by ‘Confucian Dy-
namism’ and the purpose of its addition was as an attempt to fit the uncertainty avoidance
dimension into Asian cultures.
2.6.4.2 Problems with Cross-Cultural Research
Before an analysis of the criticisms of Hofstede’s specific research is provided it is im-
portant to outline some of the issues with cross-cultural research in general. Cavusgil and
Das (1997) identify that cross-cultural research is not an easy task. Firstly, comes the is-
sue of definition. The single word ‘culture’ has had over 164 definitions up until 1951 (Olie
1995, 128), considering this in the context of a questionnaire having to be translated into
multiple different languages one can imagine the difficulties omnipresent. In addition to
these problems of definition there are issues related to equivalency and methodological
Chapter 2 Related Work
58
simplicity. Equivalency can be divided into four categories conceptual, functional, instru-
ment, and measurement equivalence (Cavusgil and Das 1997). Conceptual equivalence
regards attitudinal or behavioural concepts and their cultural utility, for instance, company
loyalty in Asia may equate to displaying unquestioning loyalty to your company and em-
bracing the company philosophy and rules whilst in Australia it may simply be doing what
is instructed without breaking any rules (Cavusgil and Das 1997).
Functional equivalence relates to the assumption that the function of something in one
country is the same as another. For example, considering the usage of bicycles in Vietnam
and Australia, the two countries would perceive very different uses with Australians primar-
ily seeing a bicycle as recreational and Vietnamese individuals seeing the bicycle as an
important form of transport.
Instrument equivalence and measurement equivalence relate to the concept of cross-cul-
tural consistency of the research instrument. One example would be that of scaling, for
example, whereby some cultures are likely to provide extreme levels on scaled questions
whilst other cultures will not (Nasif et al. 1991).
Being aware of these factors is important and allows adequate scrutiny to be paid to these
methodological constraints and how they may impact cross-cultural research. It is critical
to adopt as unambiguous and unbiased a research instrument as is possible. A critical ex-
amination of some of the key arguments against Hofstede’s findings, and conversely argu-
ments in favour of them, therefore follow.
2.6.4.3 Arguments made against Hofstede’s Work
One of the most popular arguments against Hofstede relates to cultural homogeneity, with
critics arguing that in reality, assuming that culture is one homogenous whole is incorrect,

Chapter 2 Related Work
59
as analysis is constrained by the character of the individual being assessed and therefore
outcomes become arbitrary. Critics further outline that most nations are, in fact, groups of
ethnic units (Redpath 1997; Nasif et al. 1991).
Dorfman and Howell (1988) have argued that Hofstede, in his analysis, has on occasion
used the same questionnaire item across multiple scales and some have significant cross-
loadings. Hofstede’s analysis comprises 32 questions with only 40 cases, which Dorfman
and Howell argue takes great advantage of chance and builds the likelihood of error (Dorf-
man and Howell, 1988).
McSweeney (2000) criticised Hofstede’s research framework stating that the sampling was
flawed, being sparse, and unevenly distributed. McSweeney also criticised the idea that
nations are the correct units of analysis as culture is not necessarily neatly bound by these
geographical borders. Research by DiMaggio (1997) does show that culture is in fact frag-
mented across group and national lines, however, Hofstede points out that national identity
is the only clearly delineated and quantifiable measure we have of assessing cultural dif-
ferences (Hofstede 1998).
Other criticisms relate to the timing of the survey stating that data is lacking from socialist
countries and less affluent third world countries due to the survey taking place during the
midst of the cold war. Scholars single out the dimensions of Masculinity (Søndergaard
1994) and Uncertainty Avoidance (Newman, 1996) particularly in this regard.
Graves (1986), Olie (1995), and Søndergaard (1994) argued that analysing survey data
from a single company cannot possible reflects the cultural beliefs and systems of an en-
tire country. Hofstede’s response was that he was making an approximation and not tak-
ing an absolute measure, seeking merely to gauge metrics between culture, and therefore
this style of cross-sectional analysis was appropriate. Further, he outlined, basing the

Chapter 2 Related Work
60
study around a single company eliminated the effect of management practices and corpo-
rate policy from different companies influencing behaviour differently, thereby leaving only
national culture to explain any cultural differences (Hofstede 1980).
While some of the criticisms against Hofstede may be sound, Hofstede’s work stands as a
seminal piece of research that has many helpful attributes to those undertaking cross-cul-
tural research. In spite of McSweeney (2000) and Søndergaard (1994) arguments most
scholars agree that Hofstede’s research framework was based on rigorous design with a
coherent theory and systematic data collection. Søndergaard (1994), found, for instance
that Hofstede’s 1980 study had received 1036 citations whilst an another well regarded
cultural study on strategy by Miles and Snow received only 200 citations. Further, in Søn-
dergaard’s bibliographical analysis of Hofstede’s work where he compared the replications
(work similar to Hofstede’s study) of Hofstede’s work it was found that the majority of repli-
cations confirmed Hofstede’s findings. With 4 replications concurring fully and 15 concur-
ring partially. The only dimension that could not be fully confirmed was ‘Individualism’,
however Hofstede addressed this by explaining that cultures with shift over time. Hof-
stede’s work provides a robust foundation for the purposes of this research though it is still
important to keep in mind, any possible limitations, biases, or logical fallacies that could
stem from a lack of conscientiousness, which this critical analysis has been useful in
providing.

Chapter 2 Related Work
61
2.6.5 Other Models of Cultural Dimensions
2.6.5.1 Trompenaars and Charles Hampden-Turner’s Model
There is clearly parity between Hofstede’s cultural dimensions’ model and that developed
by Trompenaars and Charles Hampden-Turner. In the text “Riding on the Waves of Cul-
ture” Trompenaars and Turner describe seven dimensions, though not all of the dimen-
sions are identical to those outlined by Hofstede. There are five scales describing the
communication between any individual within a given culture, quantifying the notion of time
and defining the role of fate in one’s life (Trompenaars and Hampden-Turner 1998):
o Individualism vs. collectivism (Is independent thought valued? Do we make decisions
collectively as a group or as an individual?).
o Neutral vs. emotional (is it acceptable to display emotions?).
o Universalism vs. particularism (should rules be the same for all? Should relationships
influence communication or are rules more important? – see Hofstede’s uncertainty
avoidance cultural dimension).
o Specific vs. diffuse (is responsibility collective or individual? – see Hofstede’s individ-
ualism cultural dimension).
o Sequential vs. synchronic (do we do one thing at a time or multiple at once?)
o Internal vs. external control (fatalism: do we control our lives and environment or are
we controlled by it?)
o Achievement vs. ascription (is our status assigned to us as given or should we prove
being worthy of our position i.e. as in a meritocracy? – see Hofstede’s power distance
cultural dimension).

Chapter 2 Related Work
62
2.6.5.2 The Richard Lewis model
Richard Lewis is an international author on cultural differences that has developed a model
of culture which segments culture on a scale across three groups based on the way in
which they behave: multi-active, reactive, and linear-active. The fundamental tenets of this
model are derived from the concept of polychromic and monochromic cultures, however,
Richard Lewis has expanded these concepts and applied them to other aspects of cultural
life as well as combining them with a third dimension. The Lewis model is focused on effi-
ciency and culture, posing the question ‘what actions will yield the best results?’. Lewis
largely bases his model on Hofstede’s cultural indexes as well as including elements of
Hall’s, and Trompenaars and Hampden-Turner’s research. Lewis utilises a three axis
model to divide the world cultures between multi-active, reactive, and linear-active cultural
groups (Lewis, 1996).
Linear-active Multi-Active Reactive
introvert
patient
quiet
minds own business
likes privacy
plans ahead methodically
does one thing at a time
works fixed hours
punctual
extrovert
impatient
talkative
inquisitive
gregarious
plans grand outline only
does several things at once
works any hours
unpunctual
timetable unpredictable
introvert
patient
silent
respectful
good listener
looks at general principles
reacts
flexible hours
punctual
reacts to partners’ timetable

Chapter 2 Related Work
63
Table 2.8 Multi-active, linear-active, and reactive scales – Richard D. Lewis "When Cultures Collide"
Cultures on the multi-active scale are content with dedicating their time to multiple tasks
simultaneously and happy to change focus when a new interest or need arises. This multi-
dominated by timetables and sched-
ules
compartmentalises projects
sticks to plans
sticks to facts
gets information from statistics, refer-
ence books, databases
job-oriented
unemotional
works with department
follows correct procedures
accepts favours reluctantly
delegates to competent colleagues
completes action chains
likes fixed agendas
brief on telephone
uses memoranda
respects officialdom
dislikes losing face
confronts with logic
limited body language
rarely interrupts
separates social / professional
let’s one project influence another
changes plans
juggles facts
gets first-hand (oral) information
people-oriented
emotional
gets round all departments
pulls strings
seeks favours
delegates to relations
completes human transactions
interrelates everything
talks for hours
rarely writes memos
seeks out (top) key person
has ready excuses
confronts emotionally
unrestricted body language
interrupts frequently
interweaves social / professional
sees whole picture
makes slight changes
statements are promises
uses both types of information
people-oriented
quietly caring
all departments
inscrutable, calm
protects face of other
delegates to reliable people
reacts to partner
thoughtful
summarises well
plans slowly
ultra-honest
must not lose face
avoids confrontation
subtle body language
doesn’t interrupt
connects social and professional
Chapter 2 Related Work
64
tasking enables multi-active cultural constituents to be efficient as they manage to com-
plete multiple tasks in a short time. Latin cultures are a good example of this cultural
group, being animated, effusive, and changing their particular course of action according
to what needs arise at that particular moment. This cultural group is most content acquir-
ing information form their immediate contacts. This approach whilst being efficient in
terms of managing multiple tasks simultaneously could be argued to be inefficient in the
sense that tasks are not necessarily completed in the order in which they were set out to
be completed, though all tasks are completed eventually.
Cultures on the reactive scale incorporate those within Asia, particularly the collective orien-
tated countries as well as European countries that share similar cultural values such as
Finland. Constituents of this cultural group value courtesy and politeness and prefer to listen
and identify the course of action their collaborator decides to undertake before initiating any
action themselves. Establishing strong relationships by accommodating the needs of others
is the basis of business ventures within cultural groups that are incorporated under the re-
active scale.
Cultures on the linear-active scale enjoy organising and planning their daily tasks by focus-
sing on a single issue at any one time. Disturbances that draw their attention away from the
current task are viewed negatively and they seek to avoid these situations. Examples of
linear-active cultures would be Germany and the United States. Gossip and hearsay is
viewed negatively within linear-active cultures, with reliable information sources being iden-
tified as official, factual, and written sources. Though these cultures can be effectual with
their single task focus there is a risk of too much bureaucracy negatively impacting the ap-
Chapter 2 Related Work
65
proach to tasks, with a particularly detrimental impact within creative fields where an un-
structured approach may be more desirable. An example of this contrast wold be the design
approach of Germany (linear-active) vs Italy (multi-active). Whilst Italy is seen as a country
producing the best designers in the world, Germany is viewed as a culture that produces
very reliable products and operates in a more efficient manner.
2.6.5.3 The Edward Hall Model
In 1976 US Anthropologist Edward T Hall presented a set of parameters for defining cul-
ture in his book “Beyond Culture” (Hall, 1976). An interesting quote from Hall describing
the excessive bureaucracy of American schools has some parity with the point made in the
preceding section in regard to linear-active cultures being negatively affected by being
overly bureaucratic. Hall identifies, as detailed in the previous paragraph, the impact this
has on creativity (i.e. his reference to ‘no soul, no memory, and no conscience’):
“A key factor in explaining the sad state of American education can be found in over-
bureaucratization, which is seen in the compulsion to consolidate our public schools into
massive factories and to increase to mammoth size our universities even in underpopu-
lated states. The problem with bureaucracies is that they have to work hard and long to
keep from substituting self-serving survival and growth for their original primary objective.
Few succeed. Bureaucracies have no soul, no memory, and no conscience. If there is a
single stumbling block on the road to the future, it is the bureaucracy as we know it”. (Hall,
1976, p. 219). The parameters presented by Hall are monochromic vs polychromic cul-
tures, high context vs low context, and the need for personal space vs high or low territori-
ality.
Chapter 2 Related Work
66
The high vs low context parameter is an important factor within intercultural communica-
tion, an American person (which Hall defines as low-context) may remain ignorant of the
information that has been shared and decided at a meeting. Hall explains that this is due
to the English high-context manner of discourse, meaning that much of the information
conveyed through speech is conveyed in such a way as to be ‘between the lines’. The
consequence of this high-context communication is that individuals with a good level of
cultural literacy within the source country and a good knowledge of the subject background
remain informed as they know the unwritten rules of the local culture and subject domain,
whilst those that do not remain in the dark. As any westerner can substantiate, there is re-
sistance to ‘stating the obvious’ resulting in key information often not being included in
messages as it is ‘common sense’. Specific examples of this would be written contracts
and agreements, these are much shorter in high-context cultures as much of the infor-
mation necessary is considered subtext and obvious whilst in low-context cultures con-
tracts and agreements are much longer outlining every conceivable issue and eventuality
to avoid any vagueness or misunderstanding.
Hall identified a marked difference in the need for personal space across cultures. Hall re-
fers to this area as ‘proxemics’ – defined as the need for personal comfort as well as effi-
cient functioning. Intruding upon someone’s territory is seen as an act of aggression, or
even an act of war at a country level, and results in pronounced disquiet. Hall defines peo-
ples from cultures that give much attention to their area or possessions as a culture with
high territoriality whilst, conversely, defining cultures that are happy to share possessions
or space as cultures with low territoriality. The pervasive relationship is that low territorial-
ity in culture relates to high context as well as the inverse being true.

Chapter 2 Related Work
67
This culturally indicative parameter refers to the manner in which tasks are achieved and
things are done. Monochronic cultures enjoy to plan, schedule, and focus on the task at
hand in order to break it down and attack it logically working methodically from beginning
to end before starting a new task. This level of monochromic planning is very prevalent in
the west, particularly in connection with time management. The majority of monochromic
cultures are low-context preferring everything to be explicitly stated and defined. Poly-
chronic cultures, on the other hand, prefer to do things in their own time and at their own
pace. Polychronic cultures will eventually complete their tasks, however, this may be later
rather than immediately or within a prescriptively defined timescale. Other distractions
such as phone calls or an unexpected visit are given propriety as polychromic cultures
view this social interaction as more important that simply completing a task and getting it
over with.
2.6.5.4 Approach
The approach in this research to predicting user interaction preferences is grounded in the
HCI philosophy of Hofstede’s revised cultural dimensions and pays attention to Marcus
and Gould’s analysis of the interrelationship between website user interface design factors
and cultural dimensions as well as work in the same area by scholars including
Voehringer-Kuhnt (2002), Burgmann et al. (2006), Hermeking (2005), Dormann and Chi-
salita (2002), Brockner et al. (2001), and Reinecke (2011). Additionally, there is a review
of work around culture and multimodal interaction by scholars including Maynard (2009),
Rehm et al. (2009), and Paggio et al. (2011). Though predictions are primarily grounded
around Hofstede’s cultural dimension’s, results are also considered against the backdrop
of the other models of cultural dimensions outlined to consider factors from a multitude of
perspectives.
Chapter 2 Related Work
68
2.7 Designing web interfaces using Hofstede’s cultural di-
mensions (Marcus and Gould)
Aaron Marcus is a US user interface and data visualisation designer and artist who gradu-
ated from Yale in 1967. He has published more than 250 articles and written/co-written 6
books with a focus on effective user interface design: Human Factors and Typography for
More Readable Programs, Graphic Design for Electronic Documents and User Interfaces,
The Cross-GUI Handbook for Multiplatform User-Interface Design, Mobile TV: Customizing
Content and Experience. Due to Marcus’s interest in this area he undertook research with
Emilie Gould (Gould, 2000) examining Hofstede’s cultural dimensions and how these
could be applied to the design of web user interfaces. The relevant aspects of these re-
sults are outlined in the following section.
2.7.1.1 Power Distance Index
Based on this definition, a hypothesis is formulated that indicates a likelihood that power
distance will influence the following aspects of user-interface and Web design:
o Access to information: highly (high PD) vs. less-highly (low PD) structured.
o Hierarchies in mental models: tall vs. shallow.
o Emphasis on the social and moral order (e.g., nationalism or religion)and its sym-
bols: significant/frequent vs. minor/infrequent use.
o Focus on expertise, authority, experts, certifications, official stamps, or logos: strong
vs. weak.
o Prominence given to leaders vs. citizens, customers, or employees.

Chapter 2 Related Work
69
o Importance of security and restrictions or barriers to access: explicit, enforced, fre-
quent restrictions on users vs. transparent, integrated, implicit freedom to roam.
o Social roles used to organize information (e.g., a managers’ section obvious to all
but sealed off from non-managers): frequent vs. infrequent
2.7.1.2 Individualism vs Collectivism
Based on this definition, individualism and collectivism is likely, this research posits, to in-
fluence the following aspects of user-interface and Web design:
o Motivation based on personal achievement: maximized (expect the extra-ordinary)
for individualist cultures vs. underplayed (in favour of group achievement) for collec-
tivist cultures.
o Images of success: demonstrated through materialism and consumerism vs.
achievement of social-political agendas.
o Rhetorical style: controversial/ argumentative speech and tolerance or encourage-
ment of extreme claims vs. official slogans and subdued hyperbole and controversy.
o Prominence given youth and action vs. aged, experienced, wise leaders and states
of being. • Importance given individuals vs. products shown by themselves or with
groups. • Underlying sense of social morality: emphasis on truth vs. relationships.
o Emphasis on change: what is new and unique vs. tradition and history.
o Willingness to provide personal information vs. protection of personal data differen-
tiating the individual from the group.

Chapter 2 Related Work
70
2.7.1.3 Masculinity vs. Femininity
o High-masculinity cultures would focus on the following user-interface and design el-
ements:
o Traditional gender/family/age distinctions. • Work tasks, roles, and mastery, with
quick results for limited tasks.
o Navigation oriented to exploration and control. • Attention gained through games
and competitions.
o Graphics, sound, and animation used for utilitarian purposes. Feminine cultures
would emphasize the following user-interface elements:
o Blurring of gender roles.
o Mutual cooperation, exchange, and support, (rather than mastery and winning).
o Attention gained through poetry, visual aesthetics, and appeals to unifying values.
2.7.1.4 Uncertainty Avoidance
High-UA cultures would emphasise the following:
o Simplicity, with clear metaphors, limited choices, and restricted amounts of data.
o Attempts to reveal or forecast the results or implications of actions before users act.
o Navigation schemes intended to prevent users from becoming lost.
o Mental models and help systems that focus on reducing “user errors.”
o Redundant cues (colour, typography, sound, etc.) to reduce ambiguity. Low UA cul-
tures would emphasize the reverse:

Chapter 2 Related Work
71
o Complexity with maximal content and choices.
o Acceptance (even encouragement) of wandering and risk, with a stigma on “over-
protection.”
o Less control of navigation; for example, links might open new windows leading
away from the original location.
o Mental models and help systems might focus on understanding underlying concepts
rather than narrow tasks.
o Coding of colour, typography, and sound to maximize information (multiple links
without redundant cueing).
2.7.1.5 Long Term vs Short Term Orientation
Based on this definition, high long term oriented countries would underscore the following
aspects of user-interface design:
o Content focused on practice and practical value. • Relationships as a source of in-
formation and credibility.
o Patience in achieving results and goals. Low LT countries would emphasize the
contrary:
o Content focused on truth and certainty of beliefs.
o Rules as a source of information and credibility.
o Desire for immediate results and achievement of goals.
Chapter 2 Related Work
72
2.8 Culturally Adaptive User Interfaces
Having established the importance of considering cultural backgrounds when designing
user interfaces in a wider context, the natural follow up question is how one can seam-
lessly adapt an interface for the cultural background of the user interacting with the sys-
tem. That is, how can one adapt a system that is to be used by manifold users from a
wide variety of cultures, with some having mixed cultural backgrounds due to living in more
than one culturally diverse country? One solution is the use of culturally adaptive user in-
terfaces (CAUI), capable of adapting themselves to the current user of the system.
2.8.1 Western Orientated Interface Design Bias Unquestionably, one of the largest impediments to global software usability is the western
orientated interface design approach currently adopted by the majority of website designs.
Despite research indicating that marketplace success can be achieved by adapting user
interfaces for specific cultural preferences this procedure is often overlooked due to the
fact that it is time-consuming and costly (Reinecke, 2011). Analysing kiosk based systems
the issue is compounded by the fact that these are prohibitively expensive and therefore
out of reach of the vast majority of the world’s population. Traditional methods of adapting
user interfaces have proven ineffective within a commercial context. As well as being ex-
pensive, interface localisation is often ineffective - users frequently come from a mixed cul-
tural background, which the polarising approach of localising for a single country does not
cater for e.g. Someone may have spent 10 years of their adult life in the UK and another
10 years of their adult life in Poland yet these two interfaces have very distinct culturally
specific designs and approaches.

Chapter 2 Related Work
73
Cultural diversity extends far beyond the confines of language and effects the extent to
which a person is individualistic, their perception of traditional gender roles, the extent to
which they are willing to accept ambiguity and a lack of structure, their tolerance and ac-
ceptance of inequality and whether their orientation is toward the long-term or the short
term as defined by Hofstede (2001) with his concept of 'Cultural Dimensions'. In short, cul-
tural differences transcend language and are present in values, attitudes, social con-
science, cognitive styles, and aesthetic proclivity or as Hofstede (1984) put it culture is the
collective programming of the mind.
In the context of, and when applied to, user interface design Hofstede’s cultural dimen-
sions primarily relate to information design and visual design. Information design refers to
elements of a website which convey information to a user which is either accurate or inac-
curate (Cyr, 2008). For example, the layout, organisation, and priority of elements on a
webpage would be referred to as information architecture whilst the efficacy of symbols or
icons on a webpage communicating the correct message would fall within the domain of
information design. The majority of studies have placed information design under the um-
brella of usability along with other elements such as navigation, interaction design, and the
structure of the website itself.
Visual design, on the other hand, primarily focusses on aesthetics, colour theory, emo-
tional appeal, and the overall visual appeal of a website. This is applicable to shapes, col-
ours, images, fonts, as well as their absence (i.e. in the use of negative, or white, space on
a page). Hofstede’s cultural dimensions have been showed to have a substantial effect on
a user’s reaction to these visual design elements. For example, in Asia the colour orange
is a life-affirming, positive colour whilst in the US it is associated with traffic delays, road-
Chapter 2 Related Work
74
blocks and fast-food restaurants (Mario De Bortoli, 2001) similarly the colour red is a posi-
tive, lucky colour in China but signifies danger within the Unites States. The context within
which a colour is presented can change the meaning of a colour or group of colours, spe-
cifically, the accompanying images, symbols or lack thereof.
Culture also has a profound effect on a user’s preference for images, users from collectiv-
ist cultures such as China or Poland have a strong preference for visuals whereas more
individualistic cultures such as Germany prefer a more structured and logical page layout
with less images. In a study comparing Canadian, US, German, and Japanese users it
was found that Japanese users preferred a more visual approach which would appeal to
emotion.
2.8.2 Existing Culturally Adaptive Systems Whilst scholars have written widely about the area of cross-cultural user interface design
for specific groups there is little research specifically within the area of culturally adaptive
user interfaces. The only work which has tackled this specific area is research by Heim-
gartner (2007) in the area of cultural adaptivity in navigation systems, Kamentz (2005) in
the area of e-learning, and Reinecke (2011) in the area of adaptive user interfaces within
task management software.
Culturally adaptive driver information and assistance systems have been studied exten-
sively (Heimgartner, 2007), with the results of two online studies revealing interaction be-
haviour differences which were dependent upon the cultural background of the user. The
first tool to automatically modify the (navigation) interface based on a classification derived
from the cultural background of the user was developed during this study. Subsequent
scholars built on this approach, successive research within the area of e-learning utilised a
questionnaire to build a classification of the user and then place them into a predefined

Chapter 2 Related Work
75
cultural group (Kamentz, 2006). The questionnaire was presented in two parts with the
first part being based on Kolb’s classification of the Learning Style Inventory (1985) and
the second part focussing primarily on computer literacy and preferences concerning the
design and functionality of educational software. In addition, control variables such as
gender, age and mother tongue were also utilised.
Clearly there was consensus forming amongst scholars writing within the area of culturally
adaptive user interfaces that there was a requirement for a user-modelling component to
automatically customise the interface for users of different cultural backgrounds. In order
to create these user models from which the customisation would be derived a rules engine
of some sort needs to be utilised. Kamentz (2005) opted to use machine learning for this
task, while Reinecke (2011) developed a user modelling component.
Culturally adaptive systems need not be restricted to application domains with pre-existing
data or content, MOCCA, a task management application (Reinecke, 2011) relied entirely
on user generated content. One advantage of using such a system is that it does not pro-
vide any culturally-biased content as a news application or similar would. Results from
studies with MOCCA found that on a weighted average of a user’s current and former resi-
dences, the system was able to provide a personalised interface which matched a user’s
cultural preferences by 61% on average, compared to only 33% that could be achieved
when the user interface was randomly created. Users were 22% faster using these cultur-
ally adapted interfaces, needed fewer clicks, made fewer errors and reported greater over-
all satisfaction with the system.

Chapter 2 Related Work
76
As scholars get a handle on the process of designing culturally adaptive user interfaces,
profiling of different cultures is beginning to reveal that the mental models for user inter-
face design of different cultural groups may have been shaped by the influence of multina-
tional websites (Baharum et al., 2014).
Thus far scholars writing on culturally adaptive user interfaces have focussed their atten-
tion within the domain of a traditional computer system and desktop windows, icons,
menus, pointers (WIMP) metaphor, other than one study on a GPS navigation system
there have not been any studies undertaken on culturally adaptive user interfaces within
kiosk style systems. Kiosks are of particular note as they are one of the most popular
channels for information delivery in developing countries (Kuriyan, Ray and Kammen,
2008).
According to Hofstede (Hofstede, & Minkov, 2010), usage approaches differ from culture
to culture according to different power dimensions such as hierarchical vs flat or problem-
solving strategies being linear versus nonlinear (Honold, 2000; Röse, Zühlke, & Liu, 2010).
Until quite recently cultural adaptivity within HCI was considered solely a case of localizing
for a specific culture (Clemmensen, 2009). Even if ignoring the increased the cost reper-
cussions of localizing for each individual market localization mandates that a designer
know exactly what a user needs and in what context (Holzinger, 2005) as well as adapting
the HCI to their requirements (Clemmensen, Hertzum, Hornbæk, Shi, & Yammiyavar,
2009).
Hofstede’s study (Hofstede, 1980) was one of the most influential cultural studies to date.
His study included over 100,000 respondents and has been one of the most heavily cited
studies to date. The sampling frame was formed of IBM employees across more than 70
countries.

Chapter 2 Related Work
77
Throughout history there has been interaction between, and an awareness of (others), cul-
tures. The fundamental difference these days however is that the impact of modern tech-
nologies such as smart phones and the Internet have greatly increased this awareness
and interaction between different cultures. The globalisation effect has induced with it, a
necessary heightened awareness of the impact of culture and understanding particularly
for end users of computer systems. This accelerated comingling of cultures has greatly
increased the need for a robust system with which different cultures can access infor-
mation systems on a global level. To define or recommend an approach to culturally
adaptive interfaces one must first define a meaning for the term ‘design’, Winograd and
Flores (1988) define design as the "interaction between understanding and creation".
Winograd and Flores (1988) also argue that in order to analyse new technologies one
must not be confined to the methodology of conscious design but, rather, one must also
broach the broader issue of “how a society engenders inventions whose existence in turn
alters that society”. I.e. one must consider the impact that any particular design will have
on the society of users that are the target of that design, in this instance this is the design
of the kiosk interface, further one must consider that the designer themselves are part of a
cultural group and the influences of this cultural group will carry over into their designs. In
essence conscious design has the power to shape culture yet at the same time, as it is
created by a designer, it is itself shaped by culture and society. Computer systems and
the Internet are useful tools because of the effect of globalization whilst, at the same time,
have helped to shape the path of globalization.
Adapting for culture, including those from mixed cultural backgrounds, is one strategy for
kiosk design but why not simply standardize systems so that users across the globe learn
a common protocol in much the same way as driving a car? According to Norman (1988)

Chapter 2 Related Work
78
“Standardization is one type of cultural constraint. With standardization, once you have
learned to drive one car, you feel justifiably confident that you can drive any car, anyplace
in the world. Standardization provides a major breakthrough in usability.” However later in
his book Norman points out that standardization is in fact fundamentally a principle of des-
peration “Standardization is indeed the fundamental principle of desperation: when no
other solution appears possible, simply design everything the same way, so people only
have to learn once. If all makers of faucets could agree on a standard set of motions to
control amount and temperature (how about up and down to control amount—up meaning
increase—and left and right to control temperature, left meaning hot?), then we could all
learn the standards once, and forever afterward use the knowledge for every new faucet
we encountered.” Norman (1998)
Cleary it would only be possible to standardize a technology, or specifically an interface,
for a new entity. User interfaces already exist and cultural standards are in place globally
within each country or group of countries. Even when one does have a new technology or
type of interface it is an extremely laborious process to create a standard with one being
required to go through national and international standards committees to propose a new
standard and then reach consensus agreement on the parameters of this standard. Ironi-
cally the standards committees themselves differ based on their own culture and therefore
have their own standardised approach for the formation of standards. Once broad con-
sensus on a standard is reached it must be presented to a standards committee where it is
presented, then taken back to its sponsoring organization, sometimes a company or soci-
ety, where objections and counter-objections are recorded. It is then back to the stand-
ards committee to meet and discuss these objections and so on ad nauseum. Projecting
this process, or a similar variant thereof, globally provides an idea of how difficult creating

Chapter 2 Related Work
79
standards internationally can be. Oftentimes even standards themselves evolve differently
through cultural differences and individual country’s chronologies such as left and right
hand drive cars and the rules surrounding whether a constituent of a particular country is
required to drive on the right on the left.
2.8.3 Testing Adaptive Interfaces In order to effectively test an adaptive interface it is necessary to find a suitable application
domain in which the culturally adaptive elements can be effectively tested. This would
forego the use of non-user generated content as the structure of this could bias the con-
sumption of any information (Reinecke, 2011). Secondly this information needs to be con-
sumed, in the case of a kiosk system this information could be consumed on a large
screen device as the system is designed to display information on a large screen television
for consumption by one or more parties publicly within communal areas. In order to re-
search culturally adaptive user interfaces it is important to have a suitable use case, once
such use case would be the use of a photo sharing kiosk as photos make a very suitable
shareable ‘asset’ within a kiosk system designed for entertainment, this type of use case is
particularly useful due to the fact that culturally adaptive interfaces have not been studied
within the context of a social, fun, or hedonistic domain, with previous research from
Reinecke focussing on adaptive interfaces in a business or productivity context. It will be
interesting to see how a more social focussed domain approach would impact research
findings. This use case of a photo sharing kiosk system will now be explored in more de-
tail.
There are a large number of photo sharing tools already available, in addition to popular
online photo sharing services such as Flickr and Instagram there are numerous legacy ap-
plications that facilitated the sharing of photos these include Shoebox (Mills et al., 2000),
Chapter 2 Related Work
80
PhotoMesa (Bederson, 2001), Adobe Photoshop Album, ThumbsPlus, and ACDSee.
These tools allow the dissemination and sharing of photos with other users via remote
sharing and ‘shoulder-to-shoulder’ sharing as well as allowing users to browse their collec-
tions of photos.
A number of these tools, such as Kodak’s Photoquilt’ support a ‘gradual engagement’
model (Wroblewski, 2009) allowing users to upload photos without any registration require-
ments thereby increasing usage of the service by allowing users to become immediately
engaged and start using the tool.
In a typical web process users are required to sign up via a registration form before they
can actually use the tool itself, this is a paradox as users have not been allowed to form an
opinion as to whether the service in question is worth signing up for. Gradual engagement
focusses on the first time experience by either postponing registration or handling it behind
the scenes in order that the initial experience can provide users with an understanding of
how to use the service and why they should care to (Wroblewski, 2009). Will Wright
(2002) a successful developer of video games such as ‘The Sims’ has a belief that a game
or application should allow people to succeed in the first five seconds of usage.
Twitter undertook similar research and found that while high profile users such as celebri-
ties were a big draw to their service they did not cause users to continue using the applica-
tion (Dunlap et al. 2009). The core draws to the service, Twitter’s research revealed, were
that the users interests and hobbies as well as conversations with subject-matter experts
were kept them returning to the site and was therefore what a gradual engagement ap-
proach needed to convey to the end user.

Chapter 2 Related Work
81
Looking at the sign up flow for Twitter’s previous traditional registration process we can
see that users were required to undertake a number of cognitively demanding activities be-
fore even being able to use the application, this despite a number of users not actually fully
understanding what Twitter was at this stage:
i) Create a Twitter account.
ii) Find friends on Twitter by connecting to a web based email account such as Gmail.
iii) Optionally choose to follow a user from a presented selection.
iv) if the previous two steps were not completed (connecting to a web based email ac-
count and following from a presented selection of users) the user is presented with
a blank homepage and prompted to tell Twitter ‘what they are doing’.
Conversely, in the redesigned process The first thing a new user would see is a set of top-
ics they might be interested in. These are organized by the most popular subjects (statisti-
cally) and include curated content by editors. The new gradual engagement process ena-
bles users to curate content they are interested in initially with light interactions and pre-
vents the user meeting a blank page or ‘dead end’. Twitter found that this process in-
creased completions by 29% (Twitter, 2009) and users that had gone through the gradual
engagement process were more engaged.
Allowing users to upload photos to a kiosk without a lengthy sign up process, whilst also
displaying a slideshow of photos on a consumption interface (TV screen) coaches and
demonstrates to new users how an upload will be used within the system without lengthy
and tedious instructional lists.

Chapter 2 Related Work
82
2.8.4 Ontological Profiling for Web Personalisation
This section will cover the theory of ontological profiling, a concept culturally adaptive user
interfaces are predicated upon and therefore warrants some further analysis.
Within recent history there has been a marked increase within user’s reliance upon smart
systems and technologies within the area of Ambient Assisted Living (AAL). AAL is an
emergent technology-driven approach for assisting with activities of daily living (ADLs).
Developments in pervasive and sustainable computing have led to a paradigm shift from
traditional user operated computer terminals, requiring data entry by a user in order to cus-
tomise settings, to increases in the use of sensor and mobile technologies enabling middle
level intelligent data processing including context-aware applications. These context-
aware applications are able to passively obtain data from an end user without any explicit
system interaction being required. The reliance on relevant contextual information is ad-
dressed through sensors logging interval data, which can then be processed by a com-
puter system to adapt an environment or interface to the user behaviours or traits of a spe-
cific end user.
Two key concepts within this ontological service personalisation approach are machine
learning approaches and knowledge drive approaches. Ontology-based modelling has
garnered much attention within the subject domain of user-modelling, specifically within
context aware applications primarily due to its ability to enable knowledge sharing as well
as its interoperability facets. The COBRAONT ontology was developed by Chen et al.
(2003) as part of the Content Broker Architecture, providing context-reasoning and
knowledge sharing within context-aware applications.

Chapter 2 Related Work
83
Building on these ontological personalisation models developed primarily for smart sys-
tems, scholars have begun to utilise these ontological personalisation models for custom-
ising end user’s preferences on websites. Personalisation and recommendation models
are not new within the context of the World Wide Web (Adomavicius & Tuzhilin, 2005 ;
Challam et al. 2007 ; Tuzhilin, 2006 ; Lechani et al. 2008; Gorgoglione et al. 2006), how-
ever, though they are able to learn interests and provide tailored recommendations culmi-
nating in a personalised end user experience, they are not able to do so in a contextual
manner. Hawalah and Fasli (2011) proposed a novel approach to build personalised onto-
logical models based on the interests of a particular user. The discreet information and re-
lationships across concepts within the user profiles was used through the unearthing of se-
mantic relatedness between interests. These interests were then categorised into groups
interrelated to each other.
2.9 DTMF Tones
2.9.1 DTMF as an Input Method
A photo sharing kiosk could provide the option for users to recall an image they have up-
loaded by issuing a sound tone from a phone, namely a dual tone multi frequency (DTMF)
tone to recall their image. It is also possible to provide the option of typing in a short code
on a traditional QWERTY keyboard allowing the possibility to measure user satisfaction
and comfort with each of these methods. Though there exist incidences of scholars com-
paring speech to DTMF tones there does not yet seem to exist within the literature, a com-
parison of DTMF tones against keyboard entry within public spaces, as a manner to recall
previously submitted information. In regards to speech and DTMF tones Delogu et al.
(1998) found that task completion times were no different nor were the number of turns per

Chapter 2 Related Work
84
task when the two were compared. Their experiments focussed on three types of data –
full sentence recognition, simple command recognition, and number recognition. They
found that the digit system would only recognise numbers from 1 through to 9, whilst the
command system could recognise a small list of words including yes, no, skip, and next.
The full-sentence system recognised quite complex phrases such as “yes I do” or “please
skip to the next item”. When users were questioned on their preference for the DTMF or
speech system they overwhelmingly chose the DTMF tone based system for simple digit
and the simple command recognition systems and the speech system for the full-sentence
recognition system. It would be interesting to observe how the fact that users are in a pub-
lic space impacts their willingness to use either DTMF tones or a keyboard code as more
private or shy cultures may not be comfortable with broadcasting the loud beeping of
DTMF tones in a public space, even if it is quicker. This is a useful aspect of utilising
DTMF tones for research in this area. The dichotomy of loud vs discreet is an important
aspect of the research.
Karis (1997) conducted an experiment to gauge user’s preference between DTMF tones
and a speech interface, using 32 participants performing call management tasks on two
occasions – once using speech and once using DTMF tones. The majority of participants,
58%, preferred the use of DTMF tones over speech and were able to complete tasks more
quickly using the touch tone approach of DTMF tones. Interestingly there was only a loose
relationship found between a user’s preference for speech and the accuracy of the speech
engine itself i.e. even when the speech recognition engine performed poorly some users
still preferred to use speech. In analysing speech vs DTMF it is safe to draw the following
conclusions: in terms of system performance or task performance no difference has been
found between speech and DTMF tones Goldstein et al. (1999), though a voice system
may be better than a DTMF tone system for tasks requiring high spatial cognitive users. It
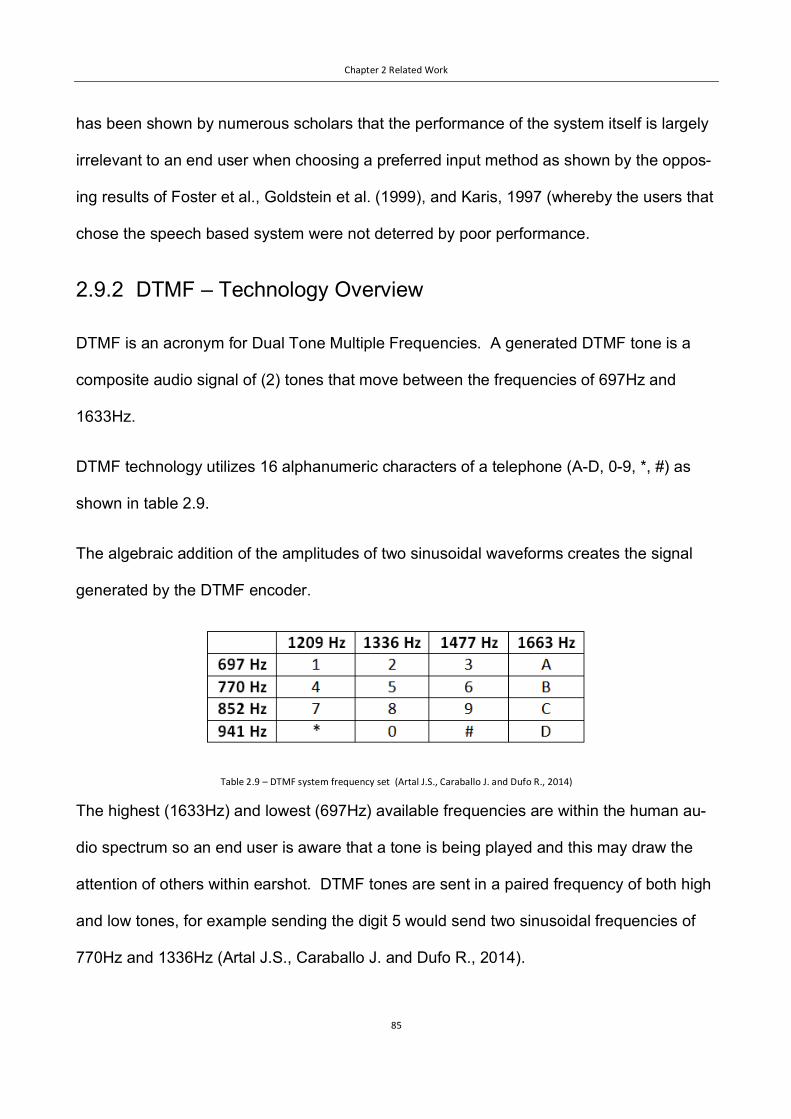
Chapter 2 Related Work
85
has been shown by numerous scholars that the performance of the system itself is largely
irrelevant to an end user when choosing a preferred input method as shown by the oppos-
ing results of Foster et al., Goldstein et al. (1999), and Karis, 1997 (whereby the users that
chose the speech based system were not deterred by poor performance.
2.9.2 DTMF – Technology Overview
DTMF is an acronym for Dual Tone Multiple Frequencies. A generated DTMF tone is a
composite audio signal of (2) tones that move between the frequencies of 697Hz and
1633Hz.
DTMF technology utilizes 16 alphanumeric characters of a telephone (A-D, 0-9, *, #) as
shown in table 2.9.
The algebraic addition of the amplitudes of two sinusoidal waveforms creates the signal
generated by the DTMF encoder.
Table 2.9 – DTMF system frequency set (Artal J.S., Caraballo J. and Dufo R., 2014)
The highest (1633Hz) and lowest (697Hz) available frequencies are within the human au-
dio spectrum so an end user is aware that a tone is being played and this may draw the
attention of others within earshot. DTMF tones are sent in a paired frequency of both high
and low tones, for example sending the digit 5 would send two sinusoidal frequencies of
770Hz and 1336Hz (Artal J.S., Caraballo J. and Dufo R., 2014).
Chapter 2 Related Work
86
An explanation of how a photo sharing kiosk could encode a DTMF tone within a system is
now provided. The majority of DTMF generators follow a buffered approach, resulting in
frames of data being sent within a continuous stream following execution of a DTMF tone.
Each frame within this stream contains either DTMF tone samples or pause samples (each
frame being either 15ms or 120 samples). A set of variables is used to control the pro-
gram flow of the DTMF tones. For example, we can have a variable named casikENCsta-
tus which reflects the status of the DTMF encoder. This variable can either be in idle
mode, not being used to encode digits (casikENCstatus=0) or it can be in active mode
generating DTMF tones and pauses of specific durations (casikENCstatus=1). To monitor
the tone and pause duration times we would introduce two more variables: casikToneTime
and casikPauseTime. The start of each encoding process initialises the variables casik-
ToneTime and casikPauseTime with the required values to recall an image from the kiosk
system (with numbers being used to represent a web URL) and the DTMF encode is acti-
vated (casikENCstatus=1). The DTMF encoder retrieves the initial digit from the digit
buffer and it is unpacked i.e. the digit is mapped to the row and column tone properties, in-
cluding initial conditions and oscillator coefficients, and pointers are loaded referencing the
relevant locations within the properties table. The encoder then proceeds to generate
DTMF tone frames and decrements the variable casikToneTime consequently. Once the
required tone duration is reached (casikToneTime=0) the encoder beings to output pause
frames. Whilst the encoder is decrementing the variable casikPauseTime with each pause
frame it reaches the required pause duration when casikPauseTime=0. This sequence
completes the encoding of the first digit in the digit buffer and now the encoder continues
with the next digit in the sequence. The variable casikToneTime has to be reinitialised be-
fore the encoder moves to the next tone and pause cycle. The encoder recognises that
Chapter 2 Related Work
87
the process of encoding the entire series of tones (representing a URL in CASIK) is com-
plete with a digit equal to -1 in the digit buffer and switches itself to an idle state by setting
the variable casikENCstatus=0.
2.10 Chapter Summary
In this chapter, the requirement for interfaces to be adapted to an end user’s cultural re-
quirements, including those from a mixed cultural background was demonstrated through
the results of empirical research. This research included a review of relevant research re-
lating to sustainable computing and the cultural and societal importance of deploying sus-
tainable information kiosks, both to the developing and developed world.
Hofstede’s original research was discussed and a number of cultural dimensions were
identified along with an explanation of how HCI researchers had used these dimensions to
identify specific design elements that could be modified to improve the end users experi-
ence based on their score on each dimension. Additionally, there was an analysis of other
models of cultural dimensions including those from Hall, Lewis, and Trompenaars and
Turner.
Within the literature review there was an analysis of work on systems which are able to
adapt to an end users culture. It was explained that that the only fully adaptive user inter-
face research existing at the time of writing this thesis was that by Katherina Reinecke
(2011) and that this was focussed on the serious task of organising a to-do list rather than
the application domain of a social system such as a photo sharing kiosk. Research on cul-
turally adaptive user interfaces for more hedonistic and fun purposes is clearly needed, in
order to identify whether the application domain for an adaptive interface affects the end
results, this is noted by Reinecke herself in her research. Further, there appears to be no

Chapter 2 Related Work
88
research on how Hofstede’s cultural dimensions affect user’s interactions with a system
within a shared physical space, particularly in relation to the degree of preference for novel
input methods such as sound rather than a traditional keyboard. The aim of this research,
then, is to investigate culturally adaptive user interfaces within a social application domain,
and also to test how an end users culture affects their interaction preference with a kiosk in
a physical space i.e. multimodal interaction preferences. Finally, there will be research
into how such a system can be built in a sustainable fashion, so as to give the research
some practical feasibility in real-world applications.

Chapter 3 Research Methodology –
89
Chapter 3 Research Methodology –
3.1 Chapter Introduction
Having outlined the thesis approach, conducted a literature review, outlined design ap-
proaches to sustainable information kiosks, and described the system development, this
section of the thesis will outline the research methodology including the purpose of the
study, participants being included, and an overview of the procedure, when undertaking
this research.
3.2 Research Study Approach
3.2.1 Purpose
The purpose of this study is threefold: to investigate the effectiveness of culturally adapted
kiosk user interfaces with a wide range of culturally diverse users, to analyse whether cul-
tural consumption preferences can be predicted, and to investigate the development of
sustainable kiosk systems. Design choices were made based upon hypotheses formed by
reviewing the research of scholars such as Aaron Marcus, whose work itself was predi-
cated upon work by Hofstede in an attempt to analyse how Hofstede’s cultural dimensions
impacted a user’s preferred UI layout. These well-established, peer-reviewed, pieces of
research provide a solid foundation upon which to test the hypotheses within this research.
3.2.2 Philosophy of Research
The philosophy of this research is predicated upon the overall form of a multidisciplinary

Chapter 3 Research Methodology –
90
piece of research, drawing on the fundamentals of numerous theoretical schools of
knowledge including Computer Science, Information Systems (IS), Human-computer inter-
action (HCI), and Information and Communication Technologies for Development (ICT4D).
Numerous strategies are traditionally employed across these subject domains within de-
sign. Specifically, this research sits at the cross-section of the paradigms of behavioural
science and design science (Winter, 2008). The design-science paradigm has the objec-
tive of extending the boundaries of human and organisational competences by creating
novel and original artefacts. Both paradigms are foundational to the IS discipline, “posi-
tioned as it is at the confluence of people, organizations, and technology”. (Hevner et al.
2007).
This research utilises a combination of explanatory and exploratory research within a de-
sign science framework.
Specifically, research objectives 1 and 2 focus on exploring the usability of particular inter-
faces by observing and surveying users utilising explanatory research whilst research ob-
jective 3 focusses on the development of a system based on empirical research, experi-
mentation, and testing utilising exploratory research.
3.2.3 Participants
124 subjects, in total, have been recruited from a variety of different cultural backgrounds.
Half of the subjects are from a single cultural background whilst the remainder are from a
mixed cultural background, having lived in up to 3 different countries. Subjects come from
across 27 different countries and 4 continents (Eastern Europe, Western Europe, Asia,
and America).

Chapter 3 Research Methodology –
91
In order to prevent any bias in the research, an exclusion criterion within the sampling
frame excluding subjects that are from an HCI, UX, psychology, or any culturally related
study domain, has been introduced. This was an important step in order to prevent any
effort to try and cross-analyse the testing procedure and design which could result in inac-
curate or biased data.
Inclusion criteria within the sampling frame mandates that all subjects must be computer
literate and be either current students or graduates holding at least a bachelor’s degree in
a relevant non-exempt topic. An attempt has been made to counterbalance genders in or-
der to control for any gender influences that may be present and which could influence re-
sults.
3.2.4 Procedure Overview
Prior to completing any tests, each subject must complete a short series of questions out-
lining their cultural background including their current country of residence and any previ-
ous countries of residence, their parent’s nationality, the amount of time they have been
resident in any country, languages spoken, religious background, gender, age, and educa-
tional background. In the interest of ethics all data pertaining to a subject will be made
anonymous with no names or other personally identifiable data being recorded.
It was required that testing used two distinct interaction paradigms within the research,
namely a creation interface and a consumption interface. The test procedure is docu-
mented in the following section, beginning with the creation interface.

Chapter 3 Research Methodology –
92
3.2.5 Creation Interface Procedure
To test the creation interface, shown in figures 3.0 and 3.1 (i.e. the culturally adaptive in-
terface for uploading an image from a smartphone or computer), 45 subjects have been
recruited from different cultural backgrounds (22 from a mixed cultural background and 23
from a single cultural background) with an age range between 18 and 54 years old. Edu-
cation levels range between college graduate as a minimum up to post graduate degree.
This variable was controlled for by mandating that subjects must have completed further
education. Within the study across both the consumption and creation interfaces partici-
pants from 27 different countries were included.
Subjects are initially tasked with completing 3 tasks within the creation interface, which are
conveyed in written form before the subject proceeds. The tasks are: 1. Select and upload
a file, 2. Find an existing image in the system, and 3. Delete a specified image within the
system. Quantitative data is captured within this portion of the research as follows: Either
a success or fail (Boolean 1 or 0) is recorded overall for each task 1-3, in addition time-to-
task-completion, number of clicks, click location, and number of errors are also recorded
against each task.
Following the set tasks users are provided with a questionnaire comprised of 5 questions
asking them open questions requiring them to describe, qualitatively, their experience of
the user interface. Finally, subjects are required to rate the interface across 4 questions
on a 7-point Likert scale.
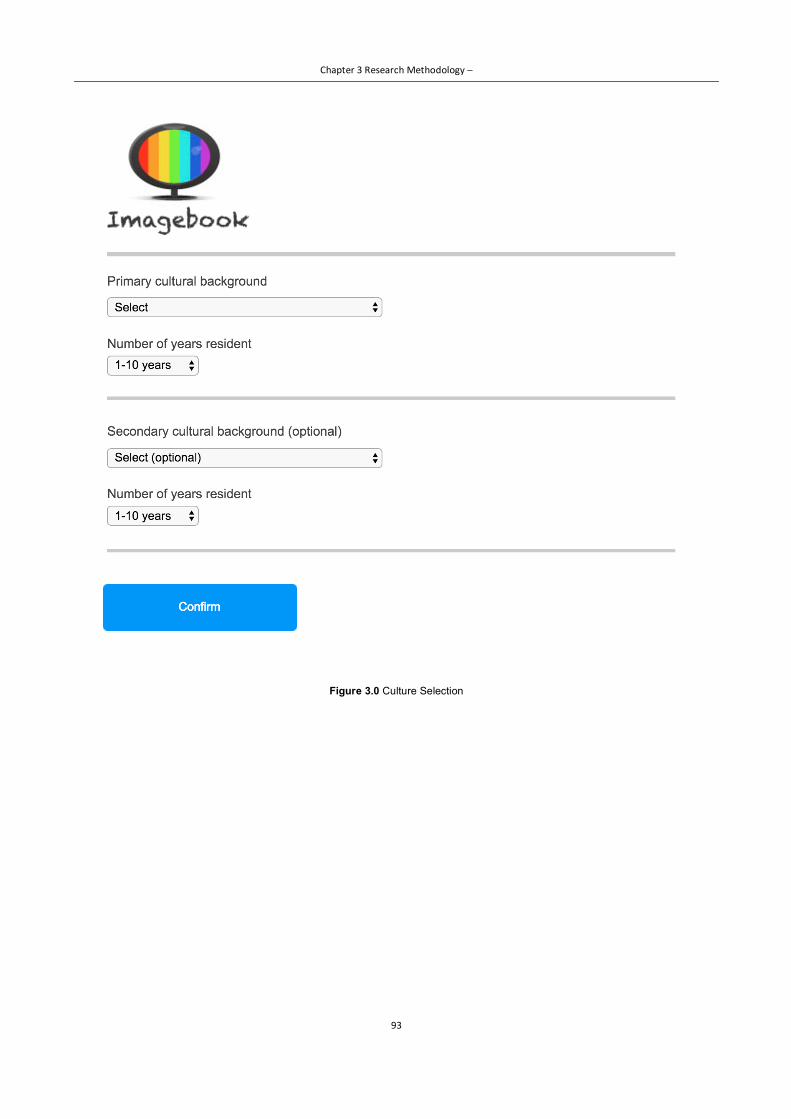
Chapter 3 Research Methodology –
93
Figure 3.0 Culture Selection
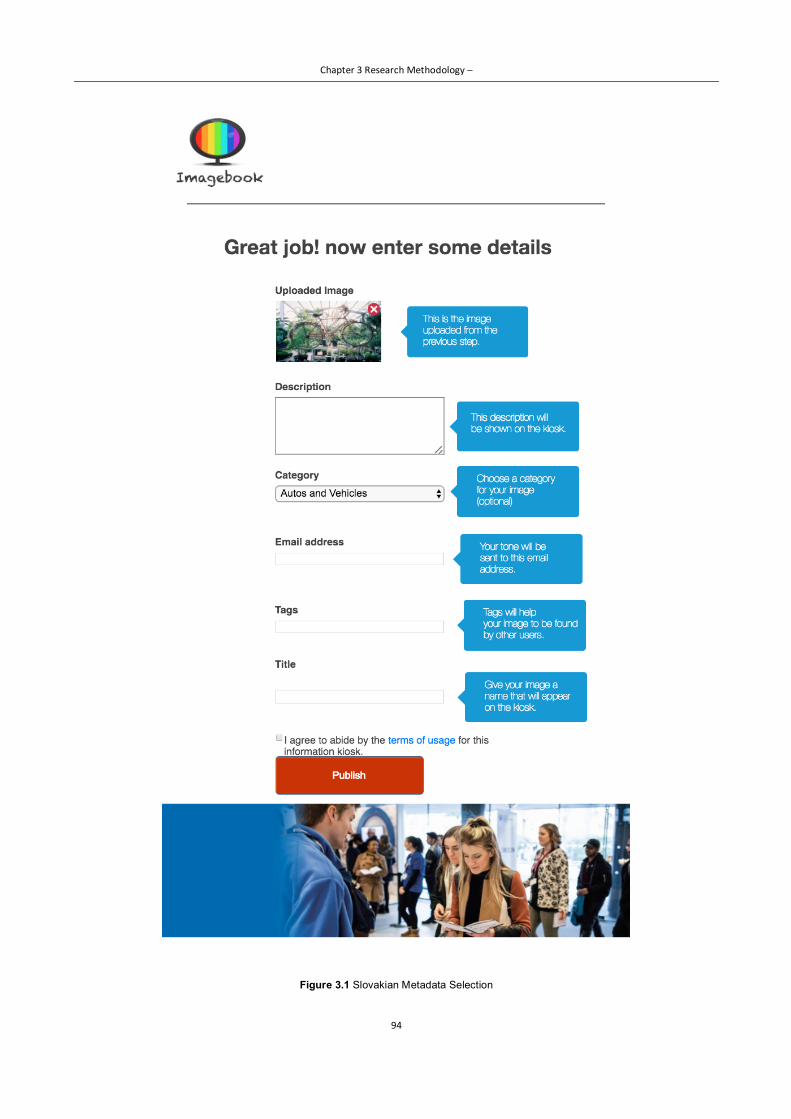
Chapter 3 Research Methodology –
94
Figure 3.1 Slovakian Metadata Selection

Chapter 3 Research Methodology –
95
3.2.6 Consumption Interface Procedure
To test the consumption interface,79 subjects have been recruited from different cultural
backgrounds, half from a mixed cultural background and half from a single cultural back-
ground, with an age range between 18 and 54 years old the participants represented East-
ern Europe, Western Europe, North America, and Asia.
Subjects are required to complete the following tasks within the consumption interface: 1.
Recall your uploaded image using a keyboard and mouse interface, 2. Recall your image
using a sound tone (DTMF tone). A success or fail (1 or 0) is logged against each of these
tasks as well as a log of time-to-completion and any errors. Following the tasks subjects
are requiring to complete a questionnaire comprising 3 questions and then choose which
consumption interface they preferred to recall their image (stating their rationale) – the tra-
ditional keyboard and mouse interface or the sound-based interface.
The non-adapted Western (UK/US) interface and the culturally responsive interface were
shown in equal measures to avoid any adverse influence arising from disproportionate ex-
posure of either.
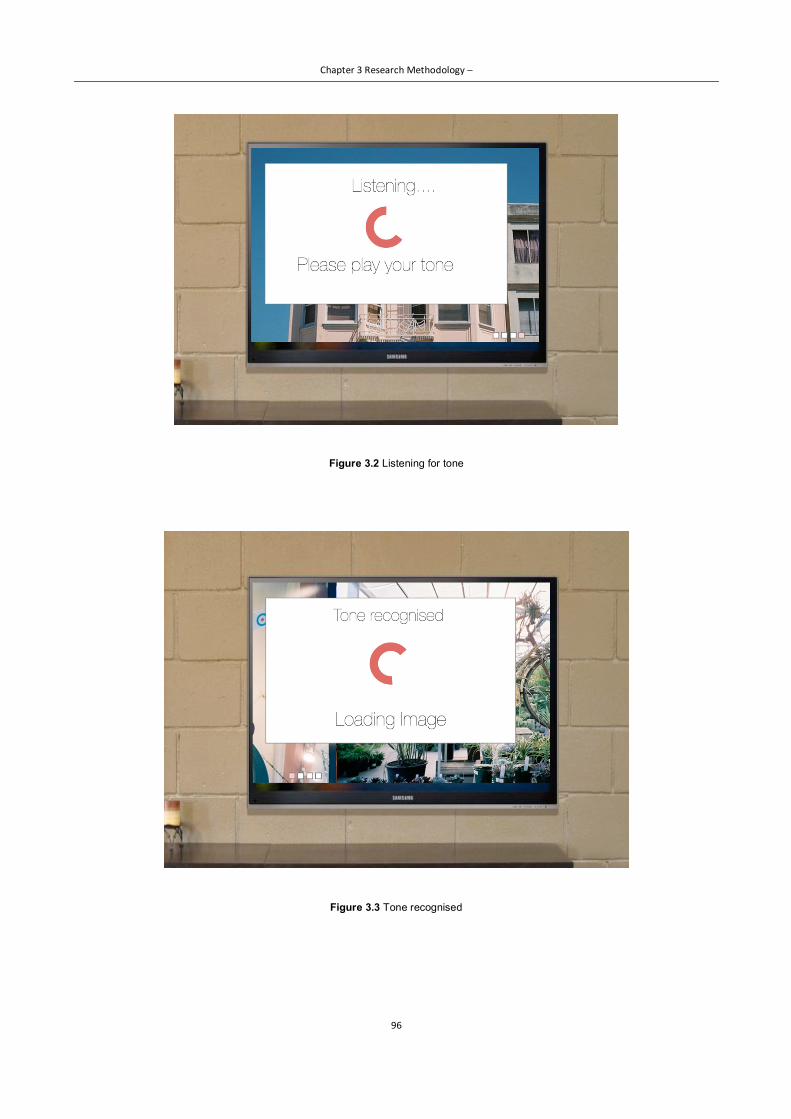
Chapter 3 Research Methodology –
96
Figure 3.2 Listening for tone
Figure 3.3 Tone recognised
Chapter 3 Research Methodology –
97
3.3 Ethical Considerations
Participants’ needs shall take precedence over the actual process of research. While the
success of the study depends upon the willingness of the individuals to participate, if at
any time such participation places an individual at risk or causes undue stress, participa-
tion will not be pursued. The informed consent of the following people will be obtained
prior to the commencement of the study:
• The principles of the nominated Universities.
• The appropriate community officers within the villages that research will take place.
• The participants across all studies.
The informed consent of any other individuals involved within the study will be sought at
the time they are approached to participate. All data will be treated in a way that protects
the confidentiality and anonymity of all participants. Coding will be used during the gather-
ing and processing of interview notes, tapes and transcripts. The university’s ethical
guidelines, which were strictly adhered to in this research, can be found in appendix D.

Chapter 3 Research Methodology –
98
Figure 3.4 Entering the provided 8 digit code using a keyboard
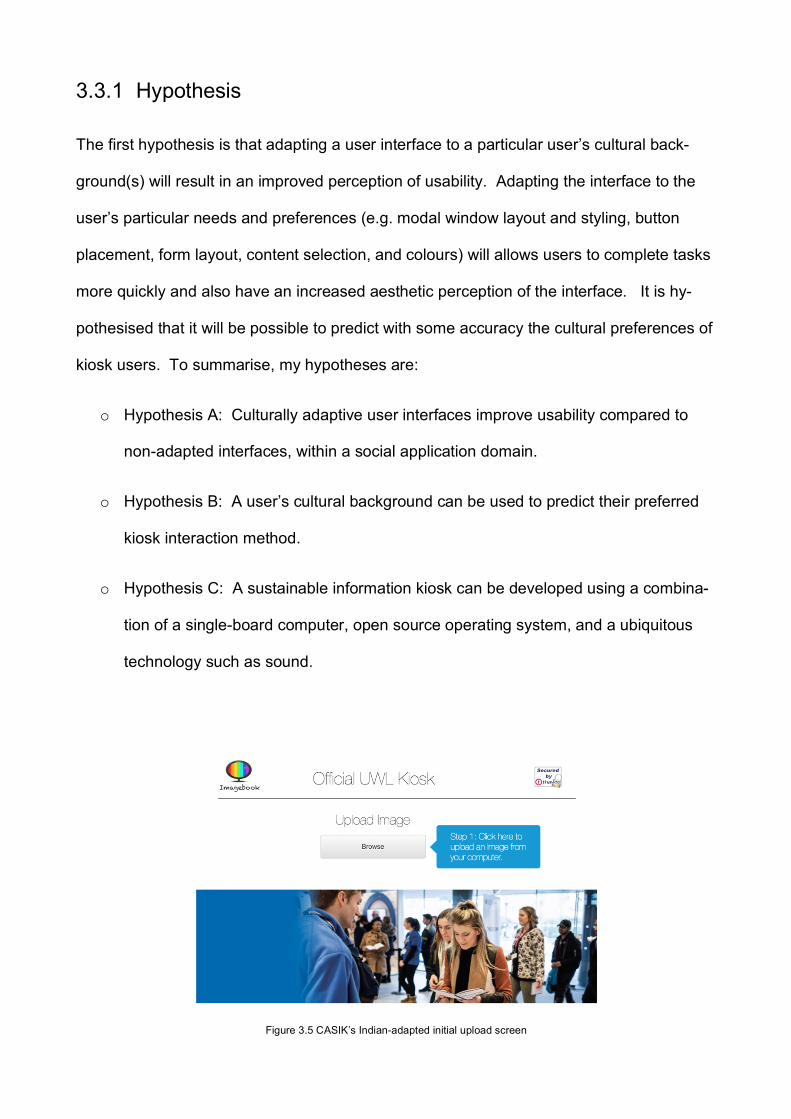
3.3.1 Hypothesis
The first hypothesis is that adapting a user interface to a particular user’s cultural back-
ground(s) will result in an improved perception of usability. Adapting the interface to the
user’s particular needs and preferences (e.g. modal window layout and styling, button
placement, form layout, content selection, and colours) will allows users to complete tasks
more quickly and also have an increased aesthetic perception of the interface. It is hy-
pothesised that it will be possible to predict with some accuracy the cultural preferences of
kiosk users. To summarise, my hypotheses are:
o Hypothesis A: Culturally adaptive user interfaces improve usability compared to
non-adapted interfaces, within a social application domain.
o Hypothesis B: A user’s cultural background can be used to predict their preferred
kiosk interaction method.
o Hypothesis C: A sustainable information kiosk can be developed using a combina-
tion of a single-board computer, open source operating system, and a ubiquitous
technology such as sound.
Figure 3.5 CASIK’s Indian-adapted initial upload screen

Chapter 3 Research Methodology –
100
Figure 3.5 CASIK’s UK adapted interface

Chapter 3 Research Methodology –
101
Figure 3.6 CASIK’s Polish adapted interface
Figure 3.7 CASIK’s hybrid adapted interface
Chapter 3 Research Methodology –
102
3.4 Chapter Summary
In this chapter an overview of the research methodology for this study was provided, in-
cluding a discussion of the purpose of the study, participants included, a procedural over-
view, as well as the creation and consumption interface procedures. In addition, the im-
portance of given to ethical considerations, due to the sensitive cultural nature of the work,
was underscored. The chapter concluded with an outline, and critical discussion of, the
research hypotheses.
Chapter 4 Designing Culturally Adaptive Kiosks
103
Chapter 4 Designing Culturally Adap-
tive Kiosks
4.1 Chapter Introduction
In the preceding chapters there was an outline of the thesis topic, a review of existing re-
lated literature, as well as a statement of research aims and objectives. This chapter will
focus on the portion of the research that deals with the development of sustainable infor-
mation kiosks. It details how CASIK will operate from a functional, software, and hardware
perspective as well as identifying effective strategies to undertake this development using
sustainable solutions.
Why should we consider information kiosks as a special case in relation to typical interac-
tion methods used for accessing websites or apps? Kiosks, in relation to this research,
are an extremely effective method for assessing preferences for discreet or verbose inter-
action methods, across cultures, within shared social spaces. For example, it would be
hypothesised that a user from a country with a high PDI such as China would prefer to use
the discreet, quiet, keyboard method for recalling a image as opposed to the noisy sound
based method due to social inequality within Chinese society. I.e. users would feel less
empowered to disturb other people around them or draw attention to themselves.
Attention is paid to sustainable information kiosks as, as outlined earlier in this research
thesis, they have become a prevalent aspect within society. Providing an automated

Chapter 4 Designing Culturally Adaptive Kiosks
104
method of convenient information retrieval to members of a community with minimal at-
tendance or management required by any one individual is also very important. Most ki-
osks in operation today are based on either bespoke physical interfaces such as an ATM
keypad or, more recently, touchscreen virtual controls.
Despite the pervasiveness and popularity of touchscreen interaction a body of research
has been growing within the area of alternate input methods, such as multimodal interac-
tions, that provide a richer and more natural user experience. Kiosks are able to be cate-
gorised depending upon their intended purpose Borchers et al. (1995) define four different
categories of kiosk; information kiosks, advertising kiosks, service kiosks and entertain-
ment kiosks. Bergweiler et al. (2010) describe Calisto, a system that enables users to con-
nect their mobile telephones to a large public terminal and share interesting media and
facts via an intuitive multimodal interaction paradigm.
This chapter begins with an outline of an approach to sustainable information kiosk devel-
opment and then moves onto describing how the CASIK interface is able to adapt to a
user’s culture using an interface adaptation engine as well as describing how DTMF tones
function and how they will be used them to facilitate a novel interaction input method within
the kiosk system. There is also a summary of the various prototypes that were developed
and what was learned from this research process.
4.2 Approach outline
There are a number of steps to be considered in designing a culturally adaptive kiosk user
experience, which will be outlined in this chapter. The core user journey within the CASIK

Chapter 4 Designing Culturally Adaptive Kiosks
105
system is outlined in the following section, where the creation interface refers to the desk-
top or mobile interface the user uses to upload content and the consumption interface re-
fers to the interface where the end user consumes data from the kiosk.
The essence of a culturally adaptive user interface is an engine that is able to reconfigure
and organise the layout of components on a page (the information architecture) as well as
the aesthetic design based on the user submitted inputs of [Primary cultural background]
and, optionally, [Secondary cultural background].
4.3 Adapting an Interface using CSS
CSS stands for Cascading Style Sheets and is a language that facilitates the descriptions
of styles within an HTML document. In order to allow the dynamic modification of the com-
ponents viewed by a user based on their cultural selection there is a requirement to make
use of what this research terms adaptive stylesheets. These stylesheets are able to mod-
ify their composition based on user selections, in the case of the CASIK, based on the se-
lections of culture. This is achieved by using the JavaScript scripting language to modify
the CSS operators in real time dependant on user selections. A brief technical explana-
tion of this is provided in the following sections as well as an outline of the process in a
more holistic manner.
4.3.1 Adaptive Stylesheets for a Single Culture
Suppose we have the following stylesheets defined within the HEAD section :
<link rel="stylesheet" type="text/css" title="UK_Adaptations" href="http://www.uwlki-
osk.com/css/UK.css">
Chapter 4 Designing Culturally Adaptive Kiosks
106
<link rel="alternate stylesheet" type="text/css" title="Maltese_Adaptations"
href="http://www.uwlkiosk.com/css/Maltese.css">
In the live system two dropdown combo boxes for each culture are used in combination
with a single submit button that checks these values when clicked, however, to simplify
and minimise the code for this explanation standard submit buttons are used. As an ex-
ample, suppose we have two submit buttons under ‘Primary culture’ one labelled as ‘UK’
and one labelled as ‘Malta’, we are able to configure these to initiate a function named
adapt_stylesheet to modify the CSS for the correct nationality when either button is clicked
using the following HTML code :
<form>
<input type="submit" onclick="dynamically_adapt('UK_Adaptations');return false;"
name="theme" value="UK Theme" id="UK">
<input type="submit" onclick=" dynamically_adapt ('Maltese_Adaptations');return false;"
name="theme" value="Maltese Theme" id="Malta">
</form>
This HTML code will create two buttons, which, when clicked will invoke the JavaScript on-
click handler, dynamically_adapt(). The function is passed either 'UK_Adaptations’ or
'Maltese_Adaptations'as it’s parameters, depending on the button clicked. The words
"UK" and "Malta" correspond to the attributes for the link elements that reference these
style sheets.

Chapter 4 Designing Culturally Adaptive Kiosks
107
The dynamically_adapt() function cycles through each of the link tags searching for a
stylesheet that has the same name as that which is specified in its parameter (or argu-
ment). If a match is found a property type disabled is set to false (0) thus resulting in that
style sheet being set to enabled, and activated. Any stylesheets that are either non
stylesheet link tags or are persistent are ignored by the function.
get_cookie() and set_cookie() allows us to set and retrieve cookies within the end users
web browser, cookies are pieces of data about site visitors and their actions. When the
function has finished adapting the user’s stylesheet a cookie is set with the necessary in-
formation regarding all of the stylesheet changes, which is configured in this example to be
30 days. This allows the visitor to visit the kiosk website from the same device and not
have to re-enter their cultural background for 30 days, there is also the option of registra-
tion which allows the user to restore their settings after the 30 day period without having to
set these parameters following cookie expiration. In order to ensure that these settings
persist cross the CASIK (creation) webpages by adding an onload attribute to the web
pages body tag.
4.3.2 Single Culture Selection
If a user selects a single culture the adaptive user interface engine references a design
customisation matrix to ascertain which style blocks should be added to the stylesheet that
will ultimately render the page. For example, if ‘UK’ is selected as the primary cultural
background the relevant CSS selections/blocks will be cross-referenced against the cus-
tomisation grid and the relevant CSS code blocks generated

Chapter 4 Designing Culturally Adaptive Kiosks
108
4.4 UI Generation
4.4.1 Cultural Background Set
The system requests that the user select a primary and secondary culture as shown in fig-
ure 4.0. The first selection is mandatory whilst the second is optional as indicated by the
bracketed comments. This interface is accessed by a URL accessible via the world wide
web, though there does exist an IP address based access control table to allow access
only to authorised users.
Figure 4.0 Culture Selection Screen
In order for the system to be able to calculate the required UI customisations the user must
enter a numeric value against their primary and optional secondary culture. This is
achieved within the UI by dragging a slider right to increase the value and left to decrease

Chapter 4 Designing Culturally Adaptive Kiosks
109
the value. Validation checks are in place to ensure that a minimum value of 15 is selected
with the slider that corresponds to the minimum age of the system (≥ 15).
4.4.2 CSS Code Generated and UI Displayed
In order to complete the following step of generating custom stylesheets the system calcu-
lates the required UI customisations.
In order to customise the front end interface, the system must build a custom stylesheet
based on predetermined blocks that can be selected on an ad-hoc basis and mixed and
match in order to fulfil the requirements defined by the system in the previous step.
Placeholder values can also be customised within the generated CSS file e.g. colour can
be set to the value of colour: #00ff00; or colour: #000000; in order to modify the colour of a
component within the stylesheet accordingly.
The final step in the UI generation process, the customised interface is displayed to the
user.

Chapter 4 Designing Culturally Adaptive Kiosks
110
4.5 Content Creation
4.5.1 Image uploaded to the system
CASIK, for the purposes of this research, is an image sharing system so therefore requires
that an image is uploaded to the system, which will subsequently be displayed on the infor-
mation kiosk in a public space. When the user clicks a Select button this initiates a dialog
allowing them to select a file on their local system.
4.5.2 Validation and security
Once an image is selected a validation check is run against the following parameters: [file
size], [file extension] and then place the image blob in the backend database with a Bool-
ean approval status of [0]. The approval status variable was added to the system due to
the nature of the CASIK system, as it is a public display system that allows users to upload
and automatically display any image it could be subject to abuse.
In addition to mandating that images require approval, additionally, users are only permit-
ted to upload images from a University email address in the form [[email protected]]. Fur-
ther, in addition to image approval and email address verification undertaken by CASIK
there is also active logging of the IP addresses of users uploading images in addition to
metrics covering pages visited, click trail etc. These steps provide ample security for the
purposes of this research.

Chapter 4 Designing Culturally Adaptive Kiosks
111
4.5.3 Email address entered
As outlined in the previous step a user can only upload an image if they hold a University
of West London email address in the format [[email protected]], the code for validating this
email address is shown in figure 3.2.
$email = $_POST['email'];
$allowed = array(uwl.ac.uk', '.edu', '.ac.uk');
// Check that the email address is permitted
if (filter_var($email, FILTER_VALIDATE_EMAIL))
{
$explodedEmail = explode('@', $email);
$domain = array_pop($explodedEmail);
if ( ! in_array($domain, $allowed))
{
// Email address is not allowed so call email error handling function
NonPermittedEmailEntered();
}
}
Figure 4.0 Email verification PHP code
4.5.4 Image Added to Database and Tone Generated
Once a file passes the validation checks within the system it is assigned a unique ID
(UDID) and stored as a blob file within the backend database.
Nibble is the term assigned to the DTMF technology which was developed during this re-
search. Specifically, the terms ‘nibble’ and ‘nibble daemon’ refer to the software (code)

Chapter 4 Designing Culturally Adaptive Kiosks
112
and hardware required for the processing of DTMF tones. At this stage the Nibble dae-
mon is invoked and generates a unique alphanumeric tone based on the UDID generated
in the previous step. The structure of the tone generated is shown in figure 4.2. This fig-
ure shows the structure of a DTMF tone, illustrating how the tone transmitted from the au-
dio device is broken down into a 13 tone message with an 8 tone payload, the remaining 5
tones being utilised to signal the start of the message and to encapsulate a checksum (sig-
nature) to verify that the message has been received correctly, if the checksum does not
match the received tone the receiving system can generate an error and request that the
tone is retransmitted.
Figure 4.1 Structure of transmitted DTMF tone
4.5.5 Interface is Updated to Show Image in Gallery Section.
The image is recalled from backend database and displayed within the gallery section of
the UI. Images are shown sequentially in a FIFO (first in first out) format. Within the cur-
rent system design users can view all images within the system but only have permissions
to delete their own images, there may be scope in a later iteration to allow a user to filter
between their own images and all images within the system.

Chapter 4 Designing Culturally Adaptive Kiosks
113
There are no privacy concerns associated with this approach as all images are for display
within a public kiosk system and unapproved images are not shown at this stage.
4.5.6 Unique Tone Emailed to User
The unique tone generated previously is emailed to the user using the University email ad-
dress they entered when submitting their image. The tone is encoded as a mono channel
Wave (.wav) file, at a sampling rate of 44100.0 Hz and 16-bit bit depth. The generated
sound file can be played on any device capable of storing and playing a sound file making
it extremely flexible as there are literally billions of ubiquitous devices capable of playing
sound files including but not limited to MP3 players, smart phones, feature phones, voice
recorders, personal computers, etc.
4.5.7 Sustainability Considerations within the Design
In chapter 2 There was a reference to Richard Heinberg’s five axioms which define sus-
tainability:
1. A society that utilises minimal resources unsustainably will eventually collapse.
2. A growth in both population and the use of critical resources cannot be sustained.
3. Renewable resources must not be consumed at a rate that is higher than the level
of replenishment.
4. The use of non-renewable resources must proceed at a rate that is declining and
the rate of decline must be greater than or equal to the rate of depletion.
5. Substances introduced into the environment from human activities must be mini-
mised and rendered harmless to biosphere functions.

Chapter 4 Designing Culturally Adaptive Kiosks
114
In the following sections there is an examination of how these axioms have been consid-
ered within the design of the kiosk system. I.e. how they relate specifically to sustainable
computing and even more specifically to the development of CASIK, one could interpret
the five axioms as follows: (1) Using technology that has been developed using minimal
resources and materials is paramount. Single-board computers utilise much less electrical
components than a full desktop PC with a full-size motherboard, CPU, graphics card etc.
(2) Relating to point 1, the use of critical resources is particularly careless with a growing
population. At the time of writing (2018) the global population is 7.616 billion and expected
to keep growing, with estimates putting it at 8.6 billion by mid-2050 according to ‘World
Population Prospects 2017’ published by the United Nations Department of Economic and
Social Affairs. (3) Consuming non-renewable resources must be kept to a minimum. (4)
Related to point 3 non-renewable resource usage must decline at a rate higher than the
rate of depletion. (5) Dangerous substances from PC manufacturing must be reduced.
There is a great deal of waste generated from the production of electrical components.
One impediment to the rollout of kiosk solutions, directly attributable to taking a non-sus-
tainable approach, is the prohibitive cost of currently available kiosk systems, this has a
particularly strong impact on deployments within developing countries and for those with-
out access to large amounts of capital. With the advent of single board computers such as
the Raspberry Pi there is now have a potential remedy to this issue. The system devel-
oped as part of this research is comprised of only a single board computer with storage
card, microphone, and the necessary cables and connectors. Having a screen to connect
the device to is a prerequisite though these are pervasive in the West and commonly
found in community centres in developing countries.
Chapter 4 Designing Culturally Adaptive Kiosks
115
A further impediment restricting access to these technologies is the cost of access to the
essential core infrastructure required to use these devices such as reliable electricity and
Internet connections. By utilising a single-board computer, open source computer soft-
ware, an existing screen and novel input mechanisms such as DTMF tones, a sustainable
information kiosk can be cheaply created that facilitates interaction using any sound capa-
ble device, such as a feature phone. From an infrastructure perspective, for the purposes
of this research, an Internet connection and power source would be required though there
has also been an investigation into, and the successful development of, an offline version
of CASIK.
Focussing on the development of sustainable kiosk devices and techniques for their devel-
opment not only offers advantages to the developing world but also to the developed
world, as information kiosks built using these sustainable approaches could also be uti-
lised within these countries to enable cost-effective dissemination of information within fa-
cilities that have limited budgets such as Universities or Hospitals. The use of sustainable
solutions is likely to increase adoption by these institutions, often subject to bootstrapped
budgets, thereby bringing about an improvement to the overall user experience of those
visiting these facilities.
It is important to clarify the specific elements of the system that constitute it being ‘sustain-
able’, these are primarily: (1) an open source operating system distribution in the form of a
free Linux distribution, (2) low-power consumption due to the use of a single-board com-
puter), (3) minimal peripherals and cheap hardware again due to a single-board computer,
(4) minimal required space or infrastructure, and (5) minimal required maintenance or
setup. The aforementioned items meet the requirement of being sustainable in the follow-

Chapter 4 Designing Culturally Adaptive Kiosks
116
ing manner: (1) Use of an open source OS results in no licensing fees or recurring sub-
scriptions to use the software, it also allows for greater customisability in the future to meet
any future needs or requirements allowing the system to be sustained indefinitely. Com-
mercial software often has an ‘end-of-life’, for example Microsoft stopped supporting Win-
dows XP in 2014 at which point no security updates or technical updates would be re-
leased thereby rendering the closed source OS unsustainable as it is a potential security
risk. As Microsoft puts it:
“After 12 years, support for Windows XP ended on April 8, 2014. There will be no more
security updates or technical support for the Windows XP operating system. It is very im-
portant that customers and partners migrate to a modern operating system such as Windows
10”. (Microsoft, 2014)
(2) A single-board computer such as a Raspberry Pi consumes far less power than a
standard desktop computer and is therefore sustainable from the perspective of affordance
and ecology ultimately resulting in less fossil fuels being burnt to sustain the system. To
examine just how sustainably a system based on a single-board computer can be run, in
regard to electrical costs, some projections have been calculated based on the consump-
tion costs in the UK of running a Raspberry Pi based kiosk all year-round in 2014. These
result in a conservative electricity usage estimate of just 4.06GBP a year and an extreme
use figure of 8.79GBP (12.50GBP taking into account a power loss coefficient) for the
Raspberry Pi in comparison to a desktop PC usage figure of 439.50GBP.

Chapter 4 Designing Culturally Adaptive Kiosks
117
(3) The hardware used within the system is based on a single-board computer, the initial
prototypes were developed using the first and second generation Raspberry Pi’s as well as
a third party single board computer named a ‘Banana Pi’. Since this research began, a
much more compact and cheap version of the Raspberry Pi was released named the ‘Pi
Zero’, this cost only £4 in 2014, approximately 1/5th the cost of the standard Raspberry Pi.
Allowing for the purchase of peripherals, a micro SD card, power adaptor, and HDMI ca-
ble, the single board computer is many times cheaper than the lowest price desktop com-
puter available. (4) Space is another key benefit of the single board computer approach.
single board computers have a very small footprint and can be affixed to a screen or moni-
tor negating any requirement for a custom enclosure as would be required with a full size
desktop computer. (5) Setup is extremely straightforward with the CASIK kiosk system as
all that is required is imaging of the storage media (micro SD card) used with the system.
Imaging the storage media can be undertaken in a desktop or laptop computer and takes
only a few minutes, coupled with optional adjustments to a configuration file this entire
build can be completed in a matter of minutes. Maintenance is also very straightforward,
unattended software updates can be easily enabled in Linux or manually invoked by the
system administrator at any point.
4.6 Content Consumption
4.6.1 DTMF Tone is Received, Transcoded, and Image Displayed
CASIK features two methods to recall an image, one is through the interruption of the gal-
lery slideshow with a keystroke on the provided keyboard, this will provide the code entry
modal. The other method is by playing a DTMF tone within range of the microphone of the
kiosk system. This research intends to gauge user preference for either method. In order
Chapter 4 Designing Culturally Adaptive Kiosks
118
to ensure that the system could process the DTMF tone from the mobile device consist-
ently, in a noisy environment, it was necessary to experiment with various types of micro-
phone. The problem of finding an adequate microphone was compounded by the fact that
the kiosk was originally intended to be placed in a public space within the University in an
area of high footfall though this was subsequently moved to the library area where back-
ground noise was less of an issue. Nevertheless, investigations into solutions to resolve
background noise interference were conducted including a noise insulation tunnel or tube
which would require the user to place their device in at one end with a directional micro-
phone placed at the other. Utilising a foil lined it was possible to reduce the ambient noise
levels to that which would drastically reduce any sound interference with the reception or
processing of the broadcast DTMF tone. With the original microphone used sounds be-
tween 70 dB and 90 dB could interfere with the tone approximately 40% of the time e.g.
when a room is very busy with many conversations occurring. Placing the microphone in
the tube through an aperture cut at the back and having the user play the tone into the
front of the tube by holding their smartphone microphone in front of it increased the pick-up
rate to more than 80%. However, further research and testing of microphones found that
using a specific directional microphone and adjusting the sensitivity of the microphone
within the Linux operating system also achieved a similar effect without the need for a tube
or additional noise reducing measures.
The unique tone is sent to the nibble service which is running as a daemon on the server.
This is then emailed out from the SMTP mail service running on the server.
Chapter 4 Designing Culturally Adaptive Kiosks
119
When a user submits their unique alphanumeric code either via DTMF tone or keyboard
inputs the image transcoded in the previous step is identified and recalled from the server
for display on the screen.

Chapter 4 Designing Culturally Adaptive Kiosks
120
Table 3.1 CASIK Process Flows
A. UI Generation
1. Input
a. Primary (and optional secondary) cultures are
entered.
b. Number of years resident in each culture is
set.
a. Required UI customisations are
calculated based on a weighted ranking.
b. System forms customised stylesheet
based on input from 2a.
a. Customised user interface is presented to
the user.
2. Process 3. Output
B. Content Creation
1. Input
a. Image uploaded to system.
b. Email address entered.
a. Image added to back end database and assigned unique alphanumeric ID.
b. DTMF tone generated by ‘nibble’ program daemon on server.
a. Interface is updated to show image in gallery
section.
c. Unique tone from 2b emailed to user.
2. Process 3. Output
C. Content Consumption
1. Input
a. DTMF tone is played into kiosk microphone
from mobile device.
-or-
b. Unique code is entered into keyboard.
a. Nibble daemon running on server transcodes
DTMF tone into unique alphanumeric code.
b. Kiosk system recalls image from web server
using code provided at 2a and displays on kiosk
screen.
2. Process 3. Output

Chapter 4 Designing Culturally Adaptive Kiosks
121
4.7 Creating Sustainable Kiosk Solutions
4.7.1 Initial Software Prototypes
Through the course of this research three different software applications were designed
and three different use cases were considered for CASIK. In the following section some of
the initial software and hardware prototypes are detailed and the ideas behind their design
examined.
The chapter concludes with an explanation of why the final system was chosen for con-
ducting the research. The first prototype developed was a crafting game for a tribe named
the Oroo' in Borneo.
4.7.1.1 First Software Prototype : Oroo’ Crafting Game
This tablet based instructional signs game is built upon a centrally shared database and
designed to preserve the Oroo’ language as well as teach existing signs to upcoming gen-
erations. It is demonstrated how a, now ubiquitous technology, can be used as a method
to teach the upcoming generation of Penan people the Oroo’ language. In addition to be-
ing an educational tool for preservation of existing signs this technology also acts as a fa-
cilitator for dissemination of new signs between users.
4.7.1.2 First Software Prototype : Background
The Penan people of Malaysian Borneo traditionally communicated with each other using
tangible real world objects arranged in a particular configuration to represent different
items or convey specific messages. The younger generation, impacted by settlement, are
no longer using the Oroo’ language. It is feared that the Oroo’ language will eventually be
Chapter 4 Designing Culturally Adaptive Kiosks
122
lost without intervention. It was within this backdrop of potential extinction of the Oroo’ sign
language that the Long Lamai community initiated a project in 2014 to preserve it digitally.
This digital preservation will ensure that the cultural, social, and scientific importance of
this form of communication is preserved. Digitisation is, however, only one step in the pro-
cess. There still remains a need to encourage the new generation of Penan peoples to uti-
lise and extend the language i.e. Oroo’ being consigned to a static digital artefact is not de-
sirable, rather the progression and extension of the language is sought. The proposed so-
lution draws on gamification concepts to incentivise user’s contributions to the signs data-
base in order to extend the Oroo’ language.
4.7.1.3 First Software Prototype: System Design
Each Oroo’ sign comprises the compilation and specific configuration of explicit elements
to form a decipherable shape to the end user. A new user learning existing signs would
need to firstly understand the required components within the ‘recipe’, and then secondar-
ily understand the specific configuration of these components, as well as the meaning of
the sign in order to form a valuable token.
This approach mandates the appropriation of a “crafting” approach to the user interface;
such interfaces have proven effective within sandbox games such as ‘Minecraft’ ranging
across age groups from 5 to 50, spanning a global audience. The game-based learning
system in Minecraft has been cited as an effective example of the constructivist learning
model. Coupling the game-based learning system with a touch interface provides an intui-
tive blended interaction due to the alignment with familiar and real-world concepts and in-
put methods. Cultural factors will be taken into account in regard to the information archi-
tecture of the application, particularly in regard to the layout of components on the page.

Chapter 4 Designing Culturally Adaptive Kiosks
123
The reference point for this work will be Hofstede’s cultural dimensions, as well as inter-
face layout research based on this by Reinecke (2011). There would be three different in-
terfaces selectable by the user in order that it can be ascertained which interface is prefer-
able. Running counts of user selections will be stored locally and uploaded to the central
computer within the community centre at the end of the day providing valuable quantitative
data. Users will also be invited to complete a desirability questionnaire within the commu-
nity centre in order for us to obtain qualitative data from users on the interface design and
corresponding user experience. The core crafting user interface components are shown in
figure 4.1. Available signs are displayed in the left column; once an item is selected it pop-
ulates the information pane on the right. In this example a boar item is selected under the
food category. The information pane Figure 4.2 shows the boar sign, gives a description of
what the sign means as well as the items required to make this sign. When the user has all
of the available components they are able to click the ‘Craft Boar Sign’ button which will
take them to the crafting screen for that item, alternatively a user can enter the new sign
builder interface, to add a new item, by clicking the “Add new item” button.
Figure 4.1 Oroo’ Crafting Game Screen 1

Chapter 4 Designing Culturally Adaptive Kiosks
124
The crafting screen provides more detailed information on how to craft the particular sign
through the provision of an instructions box at the bottom of the screen, it also provides
what this research has termed a “positional matrix” that indicates the positioning of each of
the components, ideally these would be graphical depictions of the items rather than the
words used in the diagram. Once a user has crafted the item, or decided not to, they can
click the back button to return to the previous screen.
Figure 4.2 Oroo’ Crafting Game Screen 2
Should the user wish to add a new sign they can do so through the “Add new item” screen,
this screen allows the user to take a photograph of their sign, give it a name, enter instruc-
tions detailing how to craft the item, and update the positional matrix with the relevant
components. At this stage the item will be saved to the local flash storage of the users tab-
let with a unique identifier, however, once they return to the community centre and their
tablet is connected to the central computer system a script is executed that collates all new
records from the tablet. All uniquely identified entries are added to the central database
with a “Validated” Boolean value of “0”, once the community centre admin has viewed and
validated the new sign they set the value of the “Validated field to “1” allowing it to be con-

Chapter 4 Designing Culturally Adaptive Kiosks
125
catenated with the local user database of any subsequent user’s tablets. This quality as-
surance process ensures that only high quality information is added to the database and
that there are no duplicates.
4.7.1.4 Second Software Prototype: Kiosk Lockbox Solution
A second solution which was considered was an innovative offline locker unit that would
be designed for deployment within businesses that need access to a sustainable and se-
cure lock box solution. Digital lock boxes are becoming more and more pervasive as a re-
sult of our modern working culture, online shopping, and lack of availability at home
throughout the day. This solution intended to focus on the research and development of a
smart solution to control, monitor, and secure these digital lock boxes using the sustaina-
ble, cross-cultural, and low-cost approach of tone-based identification, for unlocking the
locker, as well as culturally adaptive user interfaces for kiosk interface navigation. It could
be used by any organisation that needs to store or secure items and could also theoreti-
cally integrate with existing manual lock boxes. Through this research in sustainable com-
puting, embedded systems and socio-technical design, aspects of CASIK were reflected
on more deeply by framing the proposition of an information kiosk in a different light.
4.7.1.5 Second Software Prototype: Planned approach
1. Development and design of a working prototype digital lock box solution using a
sound based DTMF interface, including all hardware and software (control software,
mobile apps etc.).
2. Research of requirements from kiosk end users.

Chapter 4 Designing Culturally Adaptive Kiosks
126
3. Deployment of the prototype digital lock box solution in a real-world scenario.
4. Evaluation of the deployment and use of the digital lock box with end users.
5. Dissemination of findings.
4.7.1.6 Second Software Prototype: System Description
End users of secure storage services found in high streets, hotels, train stations and other
public spaces are increasing and yet adequate shared access to these secure storage fa-
cilities is an increasing urban problem. As a result, more high street storage providers are
emerging across cities such as London. They provide a service allowing products to be de-
posited from retailers including Amazon by providing access to a deposit box through way
of an electronic keypad using the supplied code. The overarching aim is to supplement this
interface with a novel interaction mechanism based on computer-generated sound tones.
The technology is based on the concept of transferring small amounts of data over sound
allowing the receiving microphone to elicit an 8-digit hex number from this provided data
stream. This technology is designed to support processing of the data on a single board
computer such as the Raspberry Pi or possibly a microcontroller. This work would aim to
explore the limits of carrying out signal processing and error correction on low-end hard-
ware, whilst also providing a natural user interface for use in a number of scenarios rang-
ing from unlocking devices to controlling information kiosks. Examining this technology
from a socio-technical point of view and exploring how the interface supports human com-
puter interaction in addition to standard interfaces such as numeric keypads will, hopefully,
reveal new insights into how end users interact with kiosk based systems across cultures.
An exploration of mobile interfaces and the systems required to support the generation

Chapter 4 Designing Culturally Adaptive Kiosks
127
and handling of sound-based keys with security being a prime concern. Through the de-
ployment of prototypes, it is possible to examine security in more detail within a real-world
system thereby providing valuable insights into the practical issues facing these new types
of kiosk system and in particular, CASIK.
4.7.1.7 Final Software and Hardware Testing
Figure 4.3 Prototype test with Low Cost Smartphone
Figure 4.4 Prototype test with Android Tablet

Chapter 4 Designing Culturally Adaptive Kiosks
128
Figure 4.5 Prototype test with Feature Phone
The final prototype was based on an HTML5 bootstrap code framework allowing the sys-
tem to be developed quickly whilst the backend utilised the open source MySQL database
system. The entire system was run on a ‘droplet’ at ‘DigitalOcean’, this provided a solution
that could be scaled and throttled in real time dependant on bandwidth usage and the
number of server requests. The program used to generate DTMF tones was integrated
into the backend of the web based system so that, when registered, a user would receive
an email containing a tone that could be used to recall their image on the system. The
frontend of the system presented the end user with two drop-down fields, the first being a
mandatory selection for primary culture and the second being an optional selection for sec-
ondary culture, and the third being an option for tertiary culture.
Once a user has selected their primary, and optionally secondary, culture the system
would use an algorithm to create a weighted ranking of desirable interface components
and aesthetic design based on previous scholar’s work on defining desirable interfaces
from Hofstede’s cultural dimensions. Dependant on this CASIK is able to generate CSS
code that will customise the front-end of the application in a bespoke manner for the cur-

Chapter 4 Designing Culturally Adaptive Kiosks
129
rent user. Following the development of the live system an offline prototype was also de-
veloped that could generate the same interfaces for a specific number of cultures and
could also simulate the consumption interface which are covered in the next paragraph,
this allowed us to undertake user testing when offline.
The consumption interface component of the system is based on HTML3 and CSS3 code
that runs a select query to return all stored images on the web server and then, after add-
ing them to an array, cycles through the array at pre-set intervals displaying a slideshow of
all images within the system. The consumption interface is also programmed to be inter-
ruptible by the user pressing a keyboard key, which would bring up the code entry inter-
face or by a DTMF tone being played to the microphone which is set to actively listen.
4.8 Initial Hardware Prototypes: ARM and Banana Pi
Several functional prototypes were built before CASIK. It was important to build a system,
for this research, that was low cost, highly sustainable, yet still had the requisite hardware
and software performance to provide a good user experience. The following two sections
look at two of these prototypes, one based on the ‘Raspberry Pi’ single board computer
and one based on the more powerful ‘Banana Pi’ single board computer.
4.8.1 Raspberry Pi Model A [ARMv6] with Arch Linux
The initial prototype was based on a single board computer named the Raspberry Pi
Model A. The Raspberry Pi is a system on chip (SoC), single board computer running on
an ARM processor at 700Mhz. The Raspberry Pi was originally selected as it was afforda-
ble, featured its own GPU, and had an adequate amount of RAM for my purposes at

Chapter 4 Designing Culturally Adaptive Kiosks
130
512MB. The full specification of the Raspberry Pi mk1 can be found in table 4.1 and an
image of the printed circuit board (PCB) can be seen in figure 4.7.
Table 4.1 Specification of Raspberry Pi mk1
Linux was chosen as the operating system using a distribution named Arch Linux ARM op-
timised for the Raspberry Pi powering the kiosk. Arch Linux ARM is a fork of Arch Linux
(desktop), a minimalist distribution of Linux released in March 11, 2002. Arch Linux ARM
was conceived by members of the Arch Linux PlugApps and ArchMobile development
teams with the primary developer being Kevin Mihelich.
Arch Linux ARM is ideal for the kiosk system as, unlike the desktop version targeted at x86
CPUs (IA-32 and x86-64), it is aimed at low-end and high-end ARM CPUs resulting in a
sustainable, low-power, and cost effective system.

Chapter 4 Designing Culturally Adaptive Kiosks
131
Figure 4.7 Raspberry Pi Model A
4.8.2 Banana Pi M1
Despite being promising in theory, and successfully developing a kiosk system based on
the Pi model A, it was found during testing that the overhead of transcoding DTMF tones
resulted in a laggy system which had a negative impact on usability. It was therefore nec-
essary to search for another solution that would still fulfil the research sustainability goals
but provide an improved end user experience. During this period there was, unfortunately,
no other Raspberry Pi available , though some time later a more powerful Model B was re-
leased, so it was necessary to continue researching single board computers, which even-
tually led to a more powerful non-official clone model named the ‘Banana Pi M1’.

Chapter 4 Designing Culturally Adaptive Kiosks
132
Figure 4.6 Banana Pi M1
The Banana Pi M1, like the Raspberry Pi Model A, is a low-power single-board computer
with an improved specification over the Raspberry Pi Model A, though not developed or re-
lated to the Raspberry Pi foundation. Its specification can be seen in table 4.3.
The main benefits of the Banana Pi M1 over the Raspberry Pi Model A are, as outlined in
table 4.3, 1GB of working RAM, and a dual core 1GHz CPU. Running the same Arch
Linux distribution yielded a much better performance and no more lag affecting usability of
the system. To test this system a third prototype was developed which allowed users to re-
call various flora and fauna from Borneo from a central wiki using any device capable of
playing sound tones. Stills from the initial system testing can be seen in figures 4.3, 4.4,
and 4.5 at the start of this chapter (4.7.1.7) and a video of this testing is also available on
request. Though this system tested well over the course of the research an improved op-
tion became available in the form of the ‘Intel Compute Stick’, which was used for the final
research system, this is detailed in the next chapter.
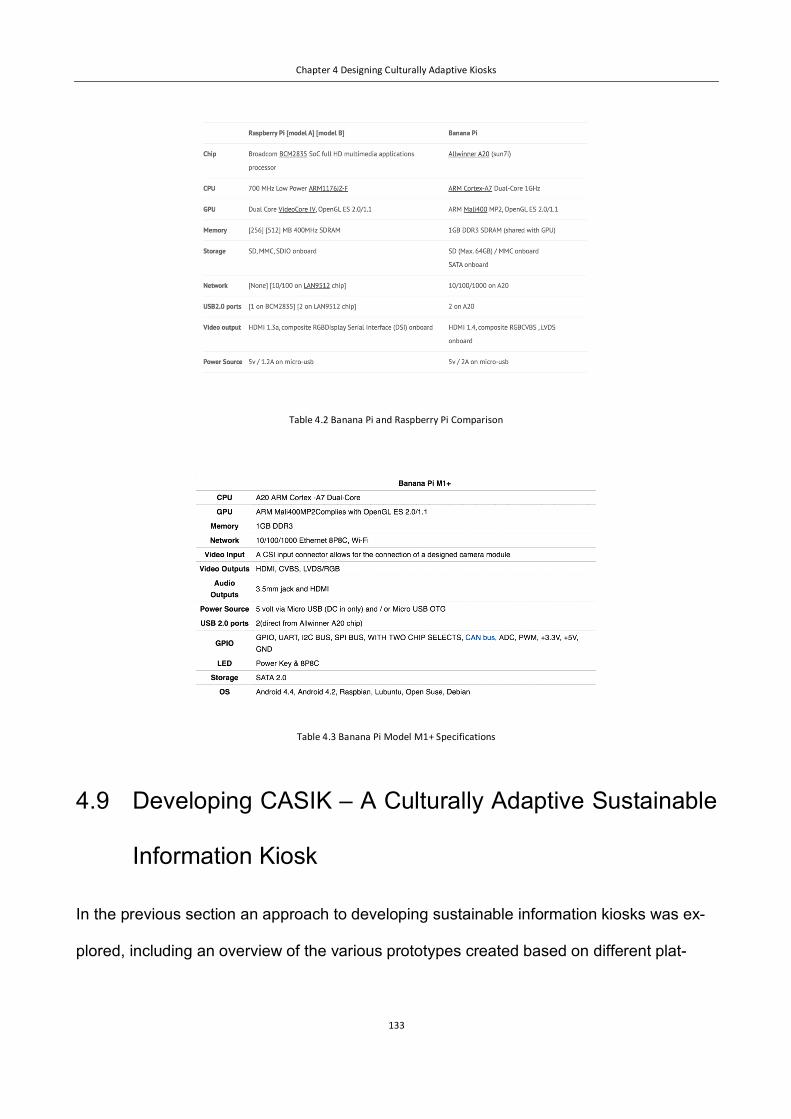
Chapter 4 Designing Culturally Adaptive Kiosks
133
Table 4.2 Banana Pi and Raspberry Pi Comparison
Table 4.3 Banana Pi Model M1+ Specifications
4.9 Developing CASIK – A Culturally Adaptive Sustainable
Information Kiosk
In the previous section an approach to developing sustainable information kiosks was ex-
plored, including an overview of the various prototypes created based on different plat-

Chapter 4 Designing Culturally Adaptive Kiosks
134
forms including a Raspberry Pi and Banana Pi as well as the valuable insights this proto-
type work provided as a precursor to developing the final CASIK system. In this chapter
the final CASIK system is detailed including an explanation of, and rationale for, the new
hardware platform of an Intel Compute Stick. Additionally, an exploration of the functional-
ity and operation of the final software solution is undertaken toward the tail-end of the
chapter. Despite being known colloquially as CASIK the name of the system built using
CASIK technology within the prototypes is ‘Imagebook’ as can be witnessed in some of the
later system screenshots provided in the figures. The rationale behind this name is that it
was important to users to ensure that the application had a friendly name and was seen as
a genuine website and app within the recreational and social domain space.
4.9.1 CASIK’s Cultural Adaptivity Engine
Figure 4.7 provides a high-level overview of the Culturally Adaptive Sustainable Infor-
mation Kiosk. The system is based on an Intel Compute Stick connecting to a University
information screen via it’s HDMI connector and a USB microphone is connected to receive
DTMF sound tones sent by the user. A persistent Internet connection is provided to the
Compute Stick via it’s in-built Wi-Fi adapter, which enables connection to the University’s
Wi-Fi network for the purposes of my testing. CASIK can also operate without an Internet
connection when necessary for use in developing countries, however, as testing takes
place using user generated web content a connection is necessary for this research.
4.9.2 CASIK Functional Description

Chapter 4 Designing Culturally Adaptive Kiosks
135
Figure 4.7 Kiosk Architecture
The basis of the system is that of an information retrieval and consumption kiosk, the
screens being used are situated in a communal area and are highly visible to students
walking through the University or stopping for refreshments or a meal. A web application
has been developed that allows a user to create a ‘post’ on a virtual ‘wall’ to which they
can add text, emoticons, images, or embed other Internet hosted content such as
YouTube videos. When adding content to the system from their own computer, the end us-
ers interface will be tailored to their specific cultural background through the use of a “user-
modelling engine”. The user-modelling engine is, in essence, an algorithm that assigns
values based on the user’s cultural background selections provided at registration and
then uses this weighted score to derive the required interface modifications based on ad-
aptation rules derived from work on the effect of Hofstede’s cultural dimensions on UI de-
sign.

Chapter 4 Designing Culturally Adaptive Kiosks
136
End users access this creation interface via a public website (http://www.uwlkiosk.com),
having a centralised website allows the monitoring of registrations remotely as well as vari-
ous website metrics which have configured. Were there any abuse of this system it would
be possible to block offending usernames and IP addresses. Users will initially sign up by
scanning a QR code on the kiosk booth with their smartphone or by manually visiting the
short URL listed next to the QR code on a device of their choosing. The web application is
responsive so should display correctly across a variety of different screen sizes and con-
figurations. The sign up page will ask them for basic user information as well as which
countries they have lived in before and how long they lived in each of those places. When
the user visits the homepage this information is used to customise the UI based on the
user’s cultural dimensions.
There are two versions of the interface in the final system: a non-adaptive version and a
culturally adaptive version. The version a user will see will be counter-balanced using an
algorithm that shows one of the two interfaces to a user on an alternating basis and tracks
what percentage of each version of the interface has been viewed by the current total us-
ers. The user will however be able to switch back to the interface they prefer should they
wish by using a menu on the left and this will be recorded as a preference metric.
4.10 Platform: Intel Compute Stick with Ubuntu Linux OS
Though the Banana Pi was an effective platform for the test system, a plant classification
system for a Malaysian tribe, plans to modify the final research system so that it would be
an image upload and display platform required a more powerful system still, therefore it

Chapter 4 Designing Culturally Adaptive Kiosks
137
was back to the drawing board to research suitably powerful systems for this task. Re-
search led to the first generation ‘Intel Compute Stick’ which Intel (2015) describe as a
new standard of computing which allows you to transform any display into a fully functional
computer simply by plugging in the stick. Intel outline the fact that the unit has built in Wi-
Fi and on-board storage as well as the fact that it can run both Windows and Linux.
The Intel Compute Stick specification, as used in the kiosk, is as follows: Quad-core Intel
Atom processor, On-board storage, On-board memory, Wi-Fi 802.11bgn, Bluetooth 4.0,
HDMI extension cable, Power adapter with USB cable, Security notch, USB 2.0 port,
Power Port, Power button, HDMI, Micro SD card slot.
Once Ubuntu Linux was installed on this system the remainder of the configuration re-
mained similar to previous prototypes. The system was Internet connected and pulled
down newly uploaded images on a regular cycle using a daemon to invoke this process.
Once images were downloaded they would continue to cycle within the slideshow view en-
suring that should the Internet connection not remain persistent, i.e. it dropped for any pe-
riod, this would not cause the system to fail. CASIK can also be configured to be an en-
tirely offline system or to operate only within a closed network without Internet access, it is
very flexible in this regard.
Another advantage with the Intel Compute Stick was the increased portability it offered as
the stick was fully self-contained out of the box requiring only the power adapter to be con-
nected and the unit to be plugged into a screen with a female HDMI port. Though the Intel
Compute Stick was more expensive than other single board computers such as the Rasp-
berry Pi, in these circumstances it made more sense, however, it should be duly noted that
since this research was completed a new Raspberry Pi has been released that increases
the specifications of the Pi Model B so this would be a viable option for the kiosk system

Chapter 4 Designing Culturally Adaptive Kiosks
138
from a performance perspective though one must also factor in the cost of a bespoke case
to prevent anti-static damage to components, as well as storage, on a Micro SD card, a
power adaptor, and HDMI cable (none of which are included). Once all of these additional
components are factored in the Raspberry Pi 3 is nearer to the Intel Compute Stick in cost
terms, particularly as the price for the Intel Compute Stick has dropped significantly since
this research was undertaken. With numerous single board computers constantly being
released it is necessary to undertake active research when planning a sustainable kiosk
and select the best unit to meet the needs of the system and it’s intended application at
that point in time. CASIK is flexible enough to run on any Linux-based system, being built
using technologies native to this open source OS, and highly adaptable so should be able
to operate on any single-board computer.
4.11 Chapter Summary
In preceding chapters, the research aims, objectives, and questions were established and
a review of the relevant literature was carried out. In this chapter an analysis of the vari-
ous technologies available to develop sustainable kiosk solutions was completed, resulting
in the development of two distinct hardware prototypes and the analysis of several differ-
ent real-world domains within which these prototypes could be employed. Having tested
each system and compared specifications including power usage, total cost of system,
system response times, and the level of sustainability each offers. It was concluded that
there would need to be further testing with a third prototype in order to offer an optimal
user experience. An explanation of the final system based on an ‘Intel Compute Stick’ run-
ning Linux, used to obtain the research data, was covered at the end of the chapter with a

Chapter 4 Designing Culturally Adaptive Kiosks
139
detailed explanation of the final implementation of the Culturally Adaptive Sustainable In-
formation Kiosk or CASIK was put forth. Including the fact that the foundation of CASIK is
the interaction between an end user and the kiosk itself, via sound (or specifically DTMF)
tones. It was also outlined that the reason this technology was chosen was that: (1) it is
ubiquitous. i.e. any device that is capable of storing and playing a sound file can be used.
(2) It is sustainable as no specialist equipment is needed to maintain the system or allow
interaction with the kiosk, which, itself can be setup to run on any available screen any-
where in the world. (3) It was explained in the closing paragraphs that users understand
the nature of sound as a ubiquitous means of transmitting information, including develop-
ing countries and tribes in remote locations, therefore making it a truly global interaction
method. A typical African community member using a feature phone can be seen in figure
4.8.
Figure 4.8 African community members using feature phones
The ubiquity of phones globally is a particularly important consideration in the CASIK kiosk
system and my research as the original prototype system was aimed at users in develop-
ing countries where users would generally not be familiar with peripherals such as key-
boards and mice or the user paradigm of WIMP (Windows, Icons, Menus, Pointers).

Chapter 4 Designing Culturally Adaptive Kiosks
140
Therefore, building a system that supported the prevalence of feature phones in many de-
veloping countries whilst still working with modern smartphones seems a logical approach
if the research supports my hypothesis that users will enjoy this novel input method, with
variances based on their cultural dimension’s score. Within the research domain of a pic-
ture upload and recall system situated in the University, sound also offers the advantage of
minimising any permanence or requirement to setup a complicated enclosure for a kiosk.
Using a keyboard and mouse would require a specialist enclosure that would prevent de-
facement or theft of the system. CASIK does not require any of these measures as the
only visible component is the screen that the kiosk is already running on, the microphone
need only be able to hear the tone; it does not necessarily need to be visible.
Chapter 5 Empirical Evaluations of the Creation and Consumption Interfaces
141
Chapter 5 Empirical Evaluations of the
Creation and Consumption Interfaces
5.1 Chapter Introduction
This section outlines the empirical evaluations which were undertaken, beginning with
quantitative results for the creation interface, primarily submitting an image, and then mov-
ing onto quantitative results for the consumption interface, primarily recalling an image
from the kiosk. Qualitative results for the consumption interface are then reviewed and
discussed subsequently.
5.2 Creation Interface (Submitting an Image)
5.2.1 Method
To test the creation interface, 45 subjects were recruited from different cultural back-
grounds, 22 from a mixed cultural background and 23 from a single cultural background
with an age range between 18 and 54 years old as shown in table 5.1. Education levels
ranged between college graduate as a minimum up to post graduate degree. Controls for
this variable were introduced by mandating that subjects must have completed further edu-
cation. Within the study across both the consumption and creation interfaces participants
from 27 different countries were included.

Chapter 5 Empirical Evaluations of the Creation and Consumption Interfaces
142
Table 5.1 Age distribution (heat map) of users with and without a secondary cultural background
Approximately half of the subjects using the creation interface had lived in a different coun-
try for more than 4 years.
In order to prevent any bias in the research, as outlined earlier, the exclusion criterion
within the sampling frame prevented subjects that are from an HCI, UX, psychology, or
culturally related study domain participating in the research. This was necessary in order
to prevent any attempt to pre-empt results or to try an antedate my hypotheses thus lead-
ing to the capture of inaccurate or biased data.
Inclusion criteria within the sampling frame mandates that all subjects must be computer
literate and be either current students or graduates holding at least a bachelor’s degree in
a relevant non-exempt topic. An attempt to include a counterbalance of genders in order
to control for any gender influences that may be present and which could influence results.
Chart 5.1 shows a cross tabulation of education level against gender.
The test approach consisted of two tasks using the non-adapted version against a version
that had been adapted, using the user modelling engine algorithm using inputs selected by

Chapter 5 Empirical Evaluations of the Creation and Consumption Interfaces
143
the user, to a user’s specific cultural background. Within the back-end a ‘switch’, a Bool-
ean value, that allowed the enabling or disabling of the culturally adapted version of the in-
terface at will was created such that the end user would not know which interface they
were using, whilst the researcher would. This allowed an accurate assessment of sub-
ject’s reactions and facilitated the gathering of objective feedback which eliminated filtered
comments or bias. Localisation elements such as reading direction or language were dis-
abled as this might allow an end user to ascertain which version of the interface was being
used (Reinecke, 2011).
Chart 5.1 Education Level cross tabulated against Gender

Chapter 5 Empirical Evaluations of the Creation and Consumption Interfaces
144
5.2.2 Tasks
5.2.2.1 Task 1
For task 1 subjects are tasked with completing 3 tasks within the creation interface, which
are conveyed in written form before the subject proceeds. The tasks are: 1. Select and
upload a file, 2. Find an existing image in the system, and 3. Delete a specified image
within the system. Quantitative data is captured within this portion of the research as fol-
lows: Either a success or fail (Boolean 1 or 0) is recorded overall for each task 1-3, in ad-
dition time-to-task-completion, number of clicks, click location, and number of errors are
also recorded against each task.
5.2.2.2 Task 2
Task 2 required the user to recall the image by accessing the email sent following task 1.
The user was able to recall their image using either a DTMF tone played from their mobile
device or by entering a short code using a traditional keyboard interface. The user was re-
quired to use each version of CASIK, though they would not know whether or not they
were using the adapted version. Subjects were required to complete the following tasks
within the consumption interface: 1. Recall your uploaded image using a keyboard and
mouse interface, 2. Recall your image using a sound tone (Nibble DTMF tone). A success
or fail (1 or 0) is logged against each of these tasks as well as a log of time-to-completion
and any errors.
On arrival at the testing location in the University, or agreed public location, users were re-
quired to read through a set of instructions outlining the requirements of the task to be
completed using either version of CASIK, after using each version users would complete a
Chapter 5 Empirical Evaluations of the Creation and Consumption Interfaces
145
questionnaire asking for their impression on the overall usability of the system, it’s aes-
thetic appeal, as well as any additional comments. On completing tasks on both versions
users were presented with a 7-point Likert scale requesting that they rate their experience
with each interface and provide written rationale for their these.
Prior to completing the tests, each subject must complete a short series of questions out-
lining their cultural background including their current country of residence and any previ-
ous countries of residence, their parent’s nationality, the amount of time they have been
resident in any country, languages spoken, religious background, gender, age, and educa-
tional background. In the interest of ethics all data pertaining to a subject will be made
anonymous with no names or other personally identifiable data being recorded.
5.2.3 Equipment
The experiments were conducted on a Macbook Pro with a 13 inch LED display, 2.7 GHz
Intel Core i5, 8 GB 1867 MHz DDR3, and Intel Iris Graphics 6100 1536 MB. At the time of
completing these experiments this is a top-end laptop and more than capable of providing
a smooth browsing experience. For recalling image data an ‘Intel Stick’ single board com-
puter was used by connecting it to both a microphone to capture DTMF tones and a stand-
ard mouse and QWERTY keyboard. For public testing a laptop was used with the ‘Wizard
of Oz’ technique to accurately emulate the public kiosk.
5.2.4 Design and analysis
The experiments were a within-subjects design with the user interface version (non-
adapted or adapted) as the main experimental parameter/factor. Metrics were captured

Chapter 5 Empirical Evaluations of the Creation and Consumption Interfaces
146
throughout the testing to obtain time to task completion, errors encountered, requests for
help, and number of clicks.
Participants sessions were recorded in order to capture the following metrics: time to task
completion, number of errors, click trail, bounce/failure rates, and requests for help. For
comparisons of errors, time, and number of clicks consideration was given to using the
student’s t-test for statistical hypothesis in which a test statistic follows a Student’s t-distri-
bution (or simply t-distribution) under the null hypothesis. Upon closer consideration, how-
ever, it was decided that this would not be a good choice as the data did not follow a nor-
mal distribution. A better fit was the Wilcoxon signed-rank test, a non-parametric statistical
hypothesis test which provides a good alternative to the t-distribution when values cannot
be assumed to be a normal (Gaussian) distribution, as in this case.
5.2.5 Hypotheses
5.2.5.1 Preferred Interface by Country
The null hypothesis (H0) was that there would be no preference for the adapted version by
subjects from a different cultural background whilst the alternate hypothesis (H1) was that
there would be a difference.
Cross tabulating a subject’s primary and/or secondary culture against their preferred inter-
face of adapted or non-adapted indicated that the alternate hypothesis, that there would be
a statistically significant preference for the adapted version, was supported. This was cal-
culated using Pearson’s Chi Square Test with a standard alpha level of 5% or 0.05, this re-
sulted in an asymptotic significance (2-sided) of .001 (45 cases).
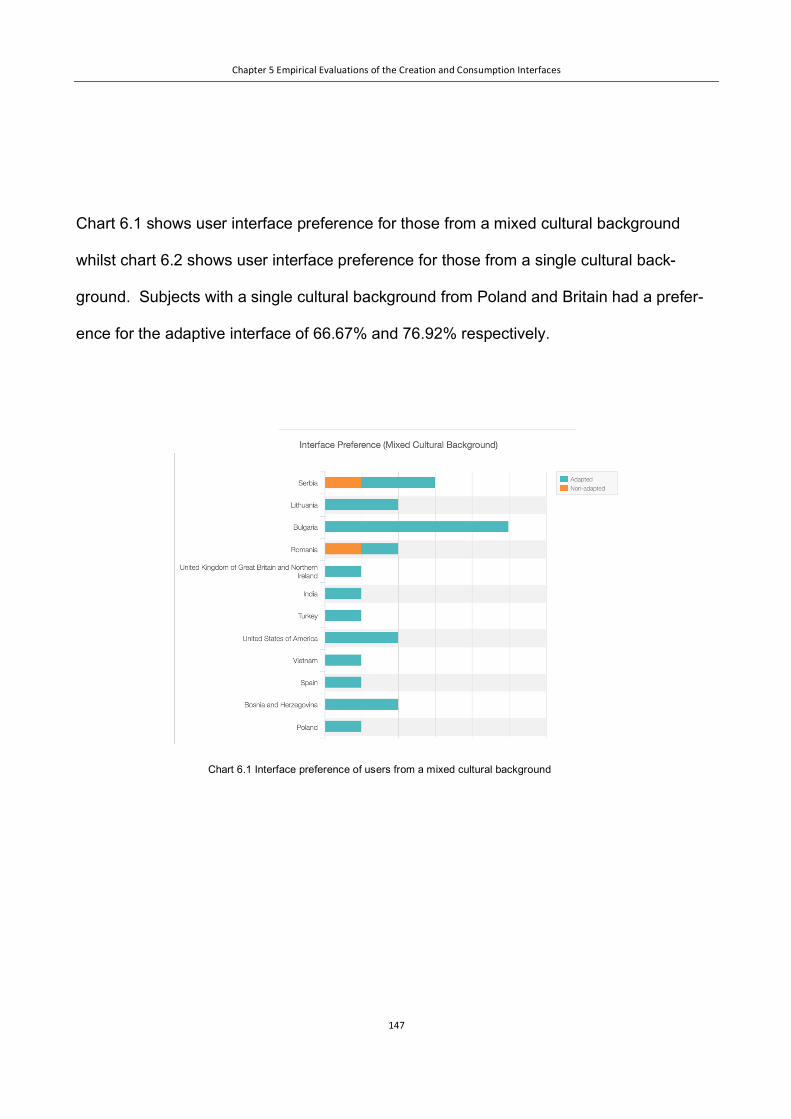
Chapter 5 Empirical Evaluations of the Creation and Consumption Interfaces
147
Chart 6.1 shows user interface preference for those from a mixed cultural background
whilst chart 6.2 shows user interface preference for those from a single cultural back-
ground. Subjects with a single cultural background from Poland and Britain had a prefer-
ence for the adaptive interface of 66.67% and 76.92% respectively.
Chart 6.1 Interface preference of users from a mixed cultural background
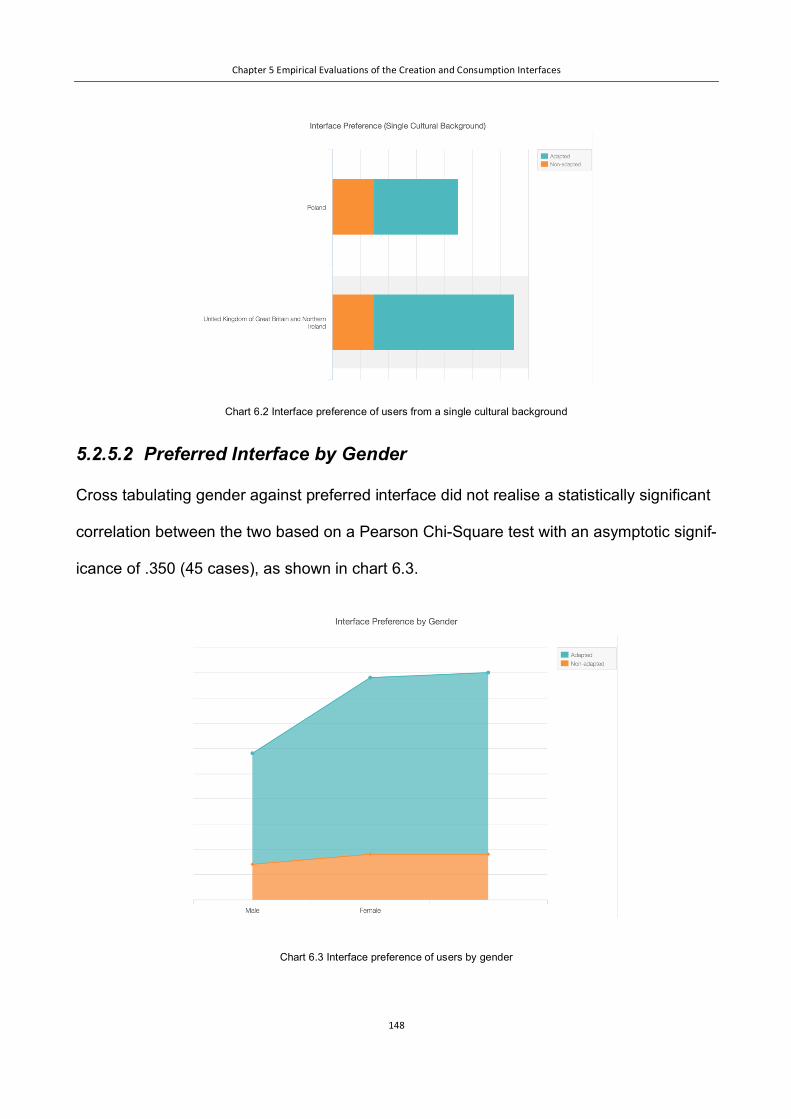
Chapter 5 Empirical Evaluations of the Creation and Consumption Interfaces
148
Chart 6.2 Interface preference of users from a single cultural background
5.2.5.2 Preferred Interface by Gender
Cross tabulating gender against preferred interface did not realise a statistically significant
correlation between the two based on a Pearson Chi-Square test with an asymptotic signif-
icance of .350 (45 cases), as shown in chart 6.3.
Chart 6.3 Interface preference of users by gender

Chapter 5 Empirical Evaluations of the Creation and Consumption Interfaces
149
Contrary to most other statistical tests, Fisher’s exact test does not utilise mathematical
functions to estimate the probability of a value of a test statistic; rather, a calculation of the
probability of getting the observed data is undertaken, and all data sets with extreme devi-
ations, under the null hypothesis that all of the proportions are the same. Utilising Fisher’s
exact test to analyse the data results in a value of .456 which supports statistical insignifi-
cance between gender and preferred interface, therefore any statistically significant link
between these two variables can be ruled out.
This is further confirmed when we visualize a cross tabulation of gender against interface
preference as shown in chart 8.10, male and female preference for the adapted interface
is very similar with percentages of 75.86% and 79.55% respectively.
5.2.5.3 Preferred Interface by Education Level
Cross tabulating education level against preferred interface did realise a statistically signifi-
cant correlation between the two based on a Pearson Chi-Square test with an asymptotic
significance of .001 with 45 cases indicating that there is a correlation between education
level and preferred interface. Overall, across all tested cultures, the data indicates the fol-
lowing preferences across educational subsets as illustrated in chart 6.4, in the format
[adapted preferred]% / [non-adapted preferred]%: 75% / 25% preference amongst post-
graduates, 80% / 20% preference amongst high-school graduates, 100% preference
against those with some college education, 90% / 10% preference amongst college gradu-
ates, and 66.67% / 33.33% amongst those with some postgraduate education.

Chapter 5 Empirical Evaluations of the Creation and Consumption Interfaces
150
Chart 6.4 Education and Interface Preference
5.2.5.4 Culturally Ambiguous Users
48% (23 of 47 users) had a secondary cultural background, having lived in another country
for more than 3 years, as an adult (a cross-section is shown in table 5.2). Of these users
82% (19) preferred the culturally adapted version of the CASIK creation interface over the
non-adapted version. International users from a single cultural background (22 users), on
the other hand, preferred the adapted version of CASIK in 72% of cases (16).
Gender Primary Culture Secondary Culture
Male Serbia United States of America
Male Lithuania United Kingdom of Great Britain and Northern Ireland
Female Bulgaria United Kingdom of Great Britain and Northern Ireland
Female Bulgaria United Kingdom of Great Britain and Northern Ireland
Male Romania United States of America
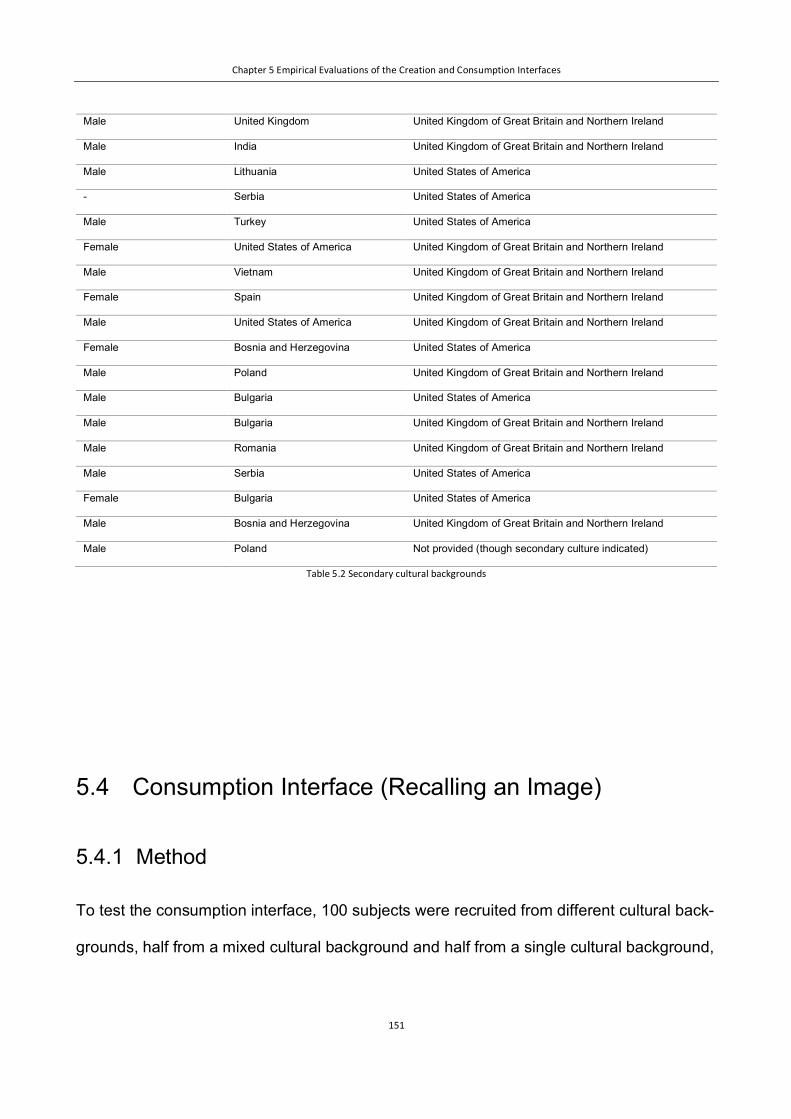
Chapter 5 Empirical Evaluations of the Creation and Consumption Interfaces
151
Male United Kingdom United Kingdom of Great Britain and Northern Ireland
Male India United Kingdom of Great Britain and Northern Ireland
Male Lithuania United States of America
- Serbia United States of America
Male Turkey United States of America
Female United States of America United Kingdom of Great Britain and Northern Ireland
Male Vietnam United Kingdom of Great Britain and Northern Ireland
Female Spain United Kingdom of Great Britain and Northern Ireland
Male United States of America United Kingdom of Great Britain and Northern Ireland
Female Bosnia and Herzegovina United States of America
Male Poland United Kingdom of Great Britain and Northern Ireland
Male Bulgaria United States of America
Male Bulgaria United Kingdom of Great Britain and Northern Ireland
Male Romania United Kingdom of Great Britain and Northern Ireland
Male Serbia United States of America
Female Bulgaria United States of America
Male Bosnia and Herzegovina United Kingdom of Great Britain and Northern Ireland
Male Poland Not provided (though secondary culture indicated)
Table 5.2 Secondary cultural backgrounds
5.3 Summary of Findings
5.4 Consumption Interface (Recalling an Image)
5.4.1 Method
To test the consumption interface, 100 subjects were recruited from different cultural back-
grounds, half from a mixed cultural background and half from a single cultural background,

Chapter 5 Empirical Evaluations of the Creation and Consumption Interfaces
152
with an age range between 18 and 54 years old the participants represented Eastern Eu-
rope, Western Europe, North America, and Asia. Specifically, the participants represented
the following countries: Bosnia and Herzegovina, Romania, Serbia, Croatia (Eastern Eu-
rope). Germany, UK, Spain (Western Europe). United States of America. Vietnam, Ma-
laysia, Philippines, Indonesia (Asia). Figure 5.0 shows these countries plotted on an Eck-
ert III world map projection (Eckert, 1906).
Figure 5.0 Represented Countries. Eckert III World Map Projection.
5.4.2 Equipment
The experiments were conducted on a MacBook Pro with a 13 inch LED display, 2.7 GHz
Intel Core i5, 8 GB 1867 MHz DDR3, and Intel Iris Graphics 6100 1536 MB. At the time of
completing these experiments this is a top-end laptop and more than capable of providing
a smooth browsing experience. For recalling image data, an ‘Intel Compute Stick’ (single
board computer) was used, as outlined earlier in this research thesis. This was connected
to both a compact condenser microphone, to capture DTMF tones, and a standard mouse
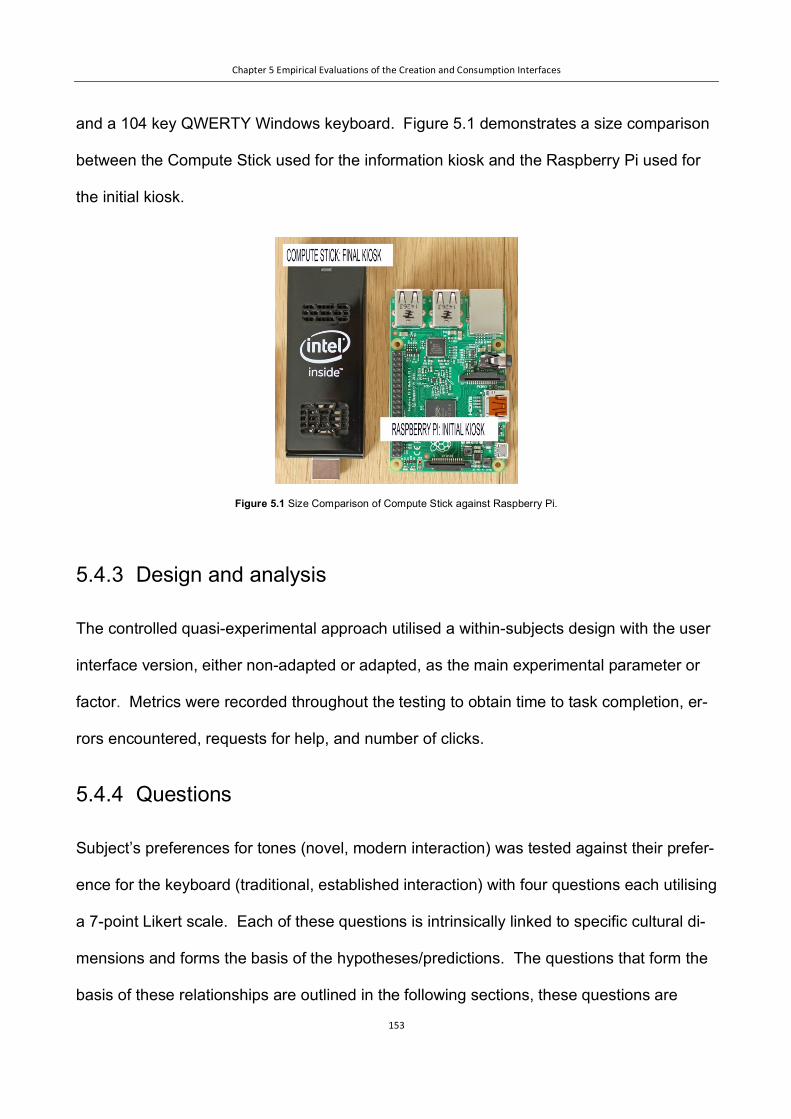
Chapter 5 Empirical Evaluations of the Creation and Consumption Interfaces
153
and a 104 key QWERTY Windows keyboard. Figure 5.1 demonstrates a size comparison
between the Compute Stick used for the information kiosk and the Raspberry Pi used for
the initial kiosk.
Figure 5.1 Size Comparison of Compute Stick against Raspberry Pi.
5.4.3 Design and analysis
The controlled quasi-experimental approach utilised a within-subjects design with the user
interface version, either non-adapted or adapted, as the main experimental parameter or
factor. Metrics were recorded throughout the testing to obtain time to task completion, er-
rors encountered, requests for help, and number of clicks.
5.4.4 Questions
Subject’s preferences for tones (novel, modern interaction) was tested against their prefer-
ence for the keyboard (traditional, established interaction) with four questions each utilising
a 7-point Likert scale. Each of these questions is intrinsically linked to specific cultural di-
mensions and forms the basis of the hypotheses/predictions. The questions that form the
basis of these relationships are outlined in the following sections, these questions are
Chapter 5 Empirical Evaluations of the Creation and Consumption Interfaces
154
asked after a subject has used both interfaces to recall an image, both adapted and non-
adapted:
o Question one: Which is more fun? [Tone entirely/Tone mostly/Tone somewhat/Nei-
ther/Keyboard code somewhat/Keyboard code mostly/Keyboard code entirely]
o Question two: Which is more efficient? [Tone entirely/Tone mostly/Tone some-
what/Neither/Keyboard code somewhat/Keyboard code mostly/Keyboard code en-
tirely]
o Question three: Which would you use on a regular basis in public? [Tone en-
tirely/Tone mostly/Tone somewhat/Neither/Keyboard code somewhat/Keyboard
code mostly/Keyboard code entirely]
o Question four: Which did you like best overall? [Tone entirely/Tone mostly/Tone
somewhat/Neither/Keyboard code somewhat/Keyboard code mostly/Keyboard code
entirely]
5.4.5 Mapping of Questions against Dimensions
The cultural dimensions that map to each of the aforementioned questions are as follows:
o Question one: Indulgence and Individualism.
o Question two: Masculinity*
o Question three: Power Distance.
o Question four: Uncertainty Avoidance*
*Long-term orientation may have an effect on these answers and so it not intrinsi-
cally linked to questions.
These questions and their mappings have been created based on research on multimodal
interactions and cultural dimensions from numerous scholars including Rehm et al. (2009),
Chapter 5 Empirical Evaluations of the Creation and Consumption Interfaces
155
Paggio et al. (2011), and Levinson (2006), as well as evolving from observations in my
preliminary user testing. Rehm (2009) researched how cultural dimension preferences
map to sound and space preferences, which played an important part in the development
of the prediction framework. An interpretation of Marcus and Gould’s analysis of the inter-
relationship between user interface design factors for websites and cultural dimensions
was carried out and applied these to physical interactions. This includes an analysis of the
body of work spun off from Marcus and Gould’s original work by key scholars including
Voehringer-Kuhnt (2002), Burgmann et al. (2006), Hermeking (2005), Dormann and Chi-
salita (2002), Brockner et al. (2001), and Reinecke (2011).
Analysing this body of empirical research allowed the identification of culturally specific
patterns in user behaviour and assurance that culture did in fact play a role in communica-
tive interactions as noted by Paggio et al. (2011): “these dimensions can be related to
communicative behaviour. For example, high power distance acceptance typically implies
more formal behaviour and more physical distance between strangers. Low uncertainty
avoidance, on the other hand, goes together with a tendency towards phlegmatic, non-
emotional behaviour”.
The score for uncertainty avoidance is not intrinsically linked to a question but is taken into
account when reviewing the final data. I.e. not against specific questions, but across all
questions. Marcus (2000) has noted this effect, stating that: “When Hofstede and Bond de-
veloped a survey specifically for Asia and revaluated earlier data, they found that long-
term orientation cancelled out some of the effects of Masculinity/Femininity and Uncer-
tainty Avoidance. They concluded that Asian countries are oriented to practice and the
search for virtuous behaviour while Western countries are oriented to belief and the search
for truth” Marcus (2000).

Chapter 5 Empirical Evaluations of the Creation and Consumption Interfaces
156
5.4.6 General Predictions against Dimensions
Having outlined the questions and their link to each cultural dimension a definition of each
cultural dimension will be provided through the provision of one of his, followed by general
predictions for the high and low end of each dimensional scale within the research.
5.4.6.1 Power Distance
“Power distance, that is, the extent to which the less powerful members of organizations
and institutions (such as the family) accept and expect that power is distributed unequally.
This represents inequality (more versus less) but is defined from below, not from above. It
suggests that a society’s level of inequality is endorsed by the followers as much as by the
leaders. Power and inequality, of course, are extremely fundamental facts of any society,
and anybody with some international experience will be aware that “all societies are une-
qual, but some are more unequal than others.” A society’s power distance level is bred in
its families through the extent to which its children are socialized toward obedience or to-
ward initiative.” (Hofstede et al. 2004)
The Power distance dimension indicates extremely elevated scores for countries within
Asian and African continents as well as the Arab world. Conversely, Anglo and Germanic
countries including the United Kingdom, Austria, Denmark, and Germany have very low
power distance scores indicating a lack of acceptance for power inequality. In the United
States, for example, a power distance score of 40 is present whilst in Guatemala the
power distance is very high at 95.

Chapter 5 Empirical Evaluations of the Creation and Consumption Interfaces
157
Figure 5.2 Power Distance
General Predictions: Countries that have a high power distance (and therefore more ac-
ceptance of the unequal distribution of power), it is predicted, will be less comfortable us-
ing the tone based interface as it is louder and, consequently, more likely to be disruptive
garnering more attention (from those more powerful, or with a higher social status, than
them) than the more discreet keyboard code. One might argue that the more powerful
members of such a society would actually feel more empowered to use the tone due to the
acceptance of the unequal distribution of power and their higher standing, however, it is
the case that those at the ‘top of the pile’ economically and politically are a minority and
therefore the majority of users will be the less empowered and statistically will therefore
form the basis of my predictions. The specific dimensional elements of a society with a
high power distance that have led to this conclusion are as follows:
Emphasis on the social and moral order (e.g., nationalism or religion) and its symbols: sig-
nificant/frequent vs. minor/infrequent use (Marcus and Gould). A sound based interface
could be seen to be disrupting the natural order of the environment that the user is within
and therefore be viewed as antisocial.
Prominence given to leaders vs. citizens, customers, or employees (Marcus and Gould).
i.e. The tone based system could be construed as being disrespectful to those in power.
Those in power represent a minority so statistically my predictions focus on the majority of
those without power. Importance of security and restrictions or barriers to access: explicit,
Chapter 5 Empirical Evaluations of the Creation and Consumption Interfaces
158
enforced, frequent restrictions on users vs. transparent, integrated, implicit freedom to
roam (Marcus and Gould). i.e. This emphasis on the importance acceptance of barriers,
restrictions, and rules could lead the user to feel uncomfortable with using an unorthodox
and loud method of interacting with a kiosk as well as an acceptance of restrictions.
Social roles used to organise information (e.g., a managers’ section obvious to all but
sealed off from non-managers): frequent vs. Infrequent (Marcus and Gould). i.e. This rein-
forcement of the accepted (physical) demarcation of differing hierarchical positions could
lead a user to feel disempowered to make the choice of using a sound based interaction
as it is an activity that could draw attention to oneself and this is something a disempow-
ered individual is unlikely to want to do within this type of political environment. If, on the
other hand, a user is from a culture that scores low on the cultural dimension of power dis-
tance the antithesis of the aforementioned points would be expected. With less ac-
ceptance of an unequal distribution of power these societies are focussed more on equal-
ity and its members are likely to feel more empowered to make novel choices such as that
of using a sound based interaction.
Rehm et al. [17] studied differences between German and Japanese speakers’ behaviour
in first encounters and found differences in gesture frequency, speed, and amplitude, with
Germans scoring higher on all three dimensions. Germany has a lower cultural dimension
score (Hofstede) of 35 to Japan’s 54, indicating a higher power distance in Japan. Paggio
et al. [42], as outlined in the opening to this section, also outline the more formal behaviour
associated with a high power distance which can be related to the keyboard.
5.4.6.2 Individualism
“Individualism versus its opposite, collectivism, refers to the degree to which individuals
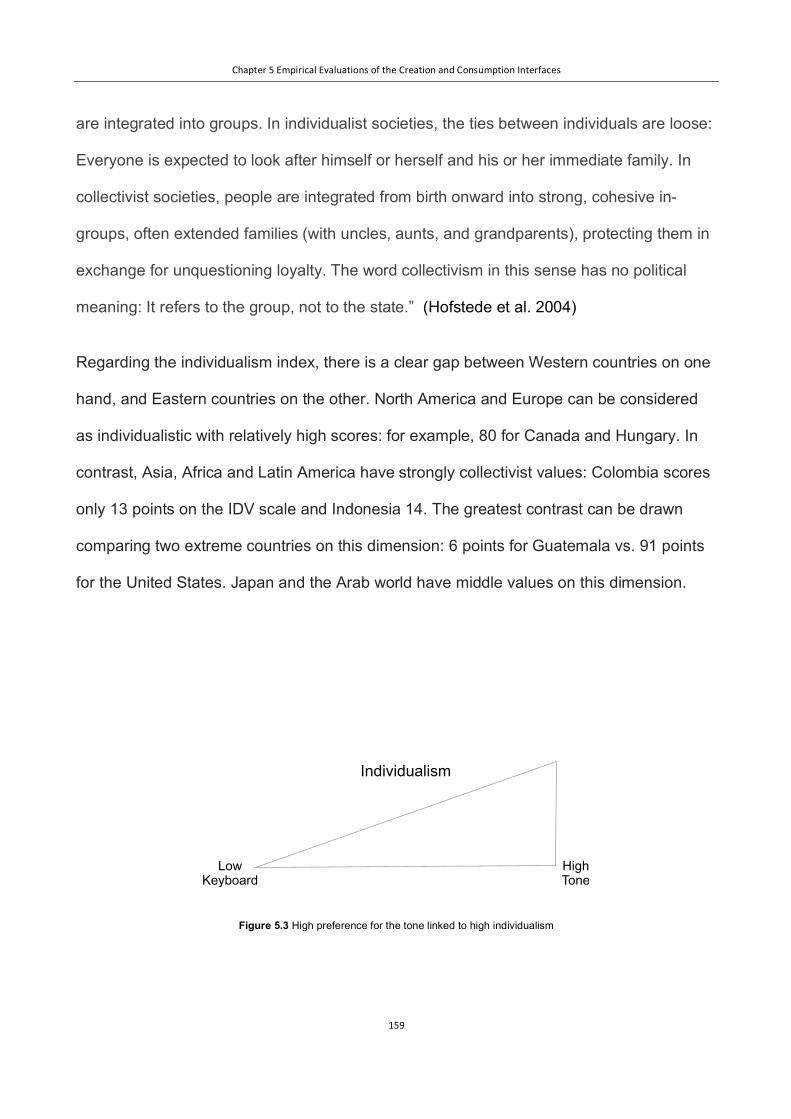
Chapter 5 Empirical Evaluations of the Creation and Consumption Interfaces
159
are integrated into groups. In individualist societies, the ties between individuals are loose:
Everyone is expected to look after himself or herself and his or her immediate family. In
collectivist societies, people are integrated from birth onward into strong, cohesive in-
groups, often extended families (with uncles, aunts, and grandparents), protecting them in
exchange for unquestioning loyalty. The word collectivism in this sense has no political
meaning: It refers to the group, not to the state.” (Hofstede et al. 2004)
Regarding the individualism index, there is a clear gap between Western countries on one
hand, and Eastern countries on the other. North America and Europe can be considered
as individualistic with relatively high scores: for example, 80 for Canada and Hungary. In
contrast, Asia, Africa and Latin America have strongly collectivist values: Colombia scores
only 13 points on the IDV scale and Indonesia 14. The greatest contrast can be drawn
comparing two extreme countries on this dimension: 6 points for Guatemala vs. 91 points
for the United States. Japan and the Arab world have middle values on this dimension.
Figure 5.3 High preference for the tone linked to high individualism
Individualism
LowKeyboard
HighTone

Chapter 5 Empirical Evaluations of the Creation and Consumption Interfaces
160
General Predictions: Countries that score highly on the individualism dimension, it is pre-
dicted, will be more comfortable using the tone based interface as they are more focussed
on meeting their own needs and achieving their own agenda due to the following aspects
of the individualism cultural dimension:
Motivation based on personal achievement: maximized (expect the extra-ordinary) for indi-
vidualist cultures vs. underplayed (in favour of group achievement) for collectivist cultures
(Marcus and Gould). i.e. The kiosk end user is most focussed on quickly accessing the
image content they require, their focus on personally achieving this image recall as quickly
as possible increases the higher they score on the individualism cultural dimension.
Images of success: demonstrated through materialism and consumerism vs. achievement
of social-political agendas (Marcus and Gould). i.e. Individuals from cultures scoring a
high individualism dimensional score are likely to want to demonstrate, conspicuously,
their novel interaction on using their modern smartphone vs merely typing a code into a
keyboard inconspicuously. This is due to their conspicuous materialism and consumerism.
These users are likely to be targets of planned obsolescence, resulting in them being early
adopters of novel technologies.
Rhetorical style: controversial/ argumentative speech and tolerance or encouragement of
extreme claims vs. official slogans and subdued hyperbole and controversy (Marcus and
Gould). i.e. The user with a high individualism score is less troubled with the notion of
drawing attention to themselves or potentially disrupting others by playing a sound tone.
They are less likely to be influenced by perceived decorum or dogma ignoring ‘official slo-
gans and subdued hyperbole and controversy’ including any social expectations around
behaviour in public.

Chapter 5 Empirical Evaluations of the Creation and Consumption Interfaces
161
Prominence given youth and action vs. aged, experienced, wise leaders and states of be-
ing. Importance given to individuals vs. products shown by themselves or with groups
(Marcus and Gould). i.e. Those users from countries with high individualism scores are
likely to be more focussed on youth, action, and the ‘new’ vs the old way of doing things.
Emphasis on change: what is new and unique vs. tradition and history (Marcus and
Gould). i.e. Those users from countries with a high individualism dimensional score are
more likely to embrace the new and unique sound tones vs the traditional keyboard inter-
face approach.
Willingness to provide personal information vs. protection of personal data differentiating
the individual from the group (Marcus and Gould). i.e. Users from countries that score
highly on the individualism cultural dimension are likely to be more comfortable with a
novel sound-based approach and have less security concerns than those from low scoring
countries. These more individualistic members of society will not have an issue with being
differentiated from their collective group through the use of new technology despite not un-
derstanding it’s specific operation and correspondingly whether or not any security or pri-
vacy issues might exist. If, on the other hand, a user is from a culture that scores low on
the cultural dimension of individualism they are more likely to prefer the keyboard code en-
try. They are likely to be less materialistic and driven to use the latest technology prefer-
ring traditional input methods with which they are historically used to using. With these us-
ers being focussed on the traditional way of doing things they are likely to be less willing to
change and more likely to have privacy and security concerns when using new technolo-
gies that they may not fully understand. These users are more likely to have concerns that
these technologies could personally identify them and cause them to be singled out from
their collective groups. Rehm et al. (2009) identify that high individualistic cultures prefer
Chapter 5 Empirical Evaluations of the Creation and Consumption Interfaces
162
loud sounds whilst low individualistic cultures prefer loud sounds. They also identified that
highly individualistic cultures prefer more space, which is facilitated by using the tone as
the keyboard requires closer proximity to the kiosk.
5.4.6.3 Masculinity
“Masculinity versus its opposite, femininity, refers to the distribution of emotional roles be-
tween the sexes, another fundamental problem for any society to which a range of solu-
tions are found. The IBM studies revealed that (a) women’s values differ less among soci-
eties than men’s values; and (b) men’s values vary along a dimension from very assertive
and competitive and maximally different from women’s values on one side to modest and
caring and similar to women’s values on the other. The assertive pole has been called
“masculine” and the modest, caring pole “feminine.” The women in feminine countries
have the same modest, caring values as the men; in masculine countries, they are some-
what assertive and competitive, but not as much as the men, so that these countries show
a gap between men’s values and women’s values”. (Hofstede et al. 2004)
Masculinity (as a dimension) is extremely low in Nordic countries: Norway scores 8 and
Sweden only 5. In contrast, Masculinity is very high in Japan (95), and in European coun-
tries like Hungary, Austria and Switzerland influenced by German culture. In the Anglo
world, masculinity scores are relatively high with 66 for the United Kingdom for example.
Latin countries present contrasting scores: for example Venezuela has a 73-point score
whereas Chile's is only 28.

Chapter 5 Empirical Evaluations of the Creation and Consumption Interfaces
163
Figure 5.4 High preference for the tone linked to high ‘masculinity’
General Predictions: It should be reiterated, before analysing this dimension, that it
could be deemed politically incorrect. Appearing to ascribe caring attributes to females
and assertiveness to males, even when this is not the intention, is a controversial stance in
our age of gender awareness and equality. Perhaps Hofstede could have used alternate
terms such as ‘assertive’ and ‘unassertive’ avoiding him giving the false impression that he
is characterising the constructs of male or female gender as overwhelmingly possessing
any one of these traits. Numerous other scholars have written on this topic and as Chris
Smit (2016) succinctly states: “The main problem lies in the association that many people
have or make when they hear these two words; often they are immediately associated with
gender; the woman man comparison. And that was never the intention. A better name for
this cultural dimension could be: Process versus Goal orientation. But most of academia
and most of the Internet search results still focus on the initial name”. The original terms
will continue to be used in the following sections having written this paragraph as an
acknowledgement of this issue and disclaimer.
It is predicted that cultures which score highly on the masculinity cultural dimension are
more likely to be comfortable using the tone based interface as they have more of a focus
on mastery of technology and tasks. The specific dimensional elements of a society with a
high masculinity dimensional score that have led me to this conclusion are as follows:
Work tasks, roles, and mastery, with quick results for limited tasks (Marcus and Gould). i.e.
Masculinity
LowKeyboard
HighTone
Chapter 5 Empirical Evaluations of the Creation and Consumption Interfaces
164
Mastery of newer technologies with quick results would be preferable, this criterion is met
by tones that can quickly load an image accurately but not by keyboard entry of hex codes
which is slower and more prone to errors.
Attention gained through games and competitions (Marcus and Gould). i.e. The most
‘gamified’ interaction method would be preferred by high masculinity country constituents,
in this case the tone is the more novel, and therefore would logically be the most fun to
use and, therefore, preferred in this instance.
Graphics, sound, and animation used for utilitarian purposes (Marcus and Gould). The
tone based interface serves the utilitarian purpose of recalling an image quickly and effi-
ciently without any unnecessary graphics, animation, or sound (sound is utilitarian and
necessary in this instance). If, on the other hand, a user is from a culture that scores low
on the cultural dimension of masculinity they are more likely to prefer the keyboard code
entry. These users would place less emphasis on the mastery of new technologies and
would be more focussed on a traditional approach. They would be less attracted to a
gamified interface and may, in fact, view it as being an unnecessary gimmick. These us-
ers would also be more likely to appreciate an interface that utilises graphics, animation,
and sound in a less utilitarian fashion. Rehm et al. identify that highly masculine cultures
prefer loud sounds and close space, the tone is able to meet both of these requirements
whilst the keyboard is not.
5.4.6.4 Uncertainty Avoidance
Description: “Uncertainty avoidance deals with a society’s tolerance for ambiguity. It indi-
cates to what extent a culture programs its members to feel either uncomfortable or com-
fortable in unstructured situations. Unstructured situations are novel, unknown, surprising,
and different than usual. Uncertainty-avoiding cultures try to minimize the possibility of
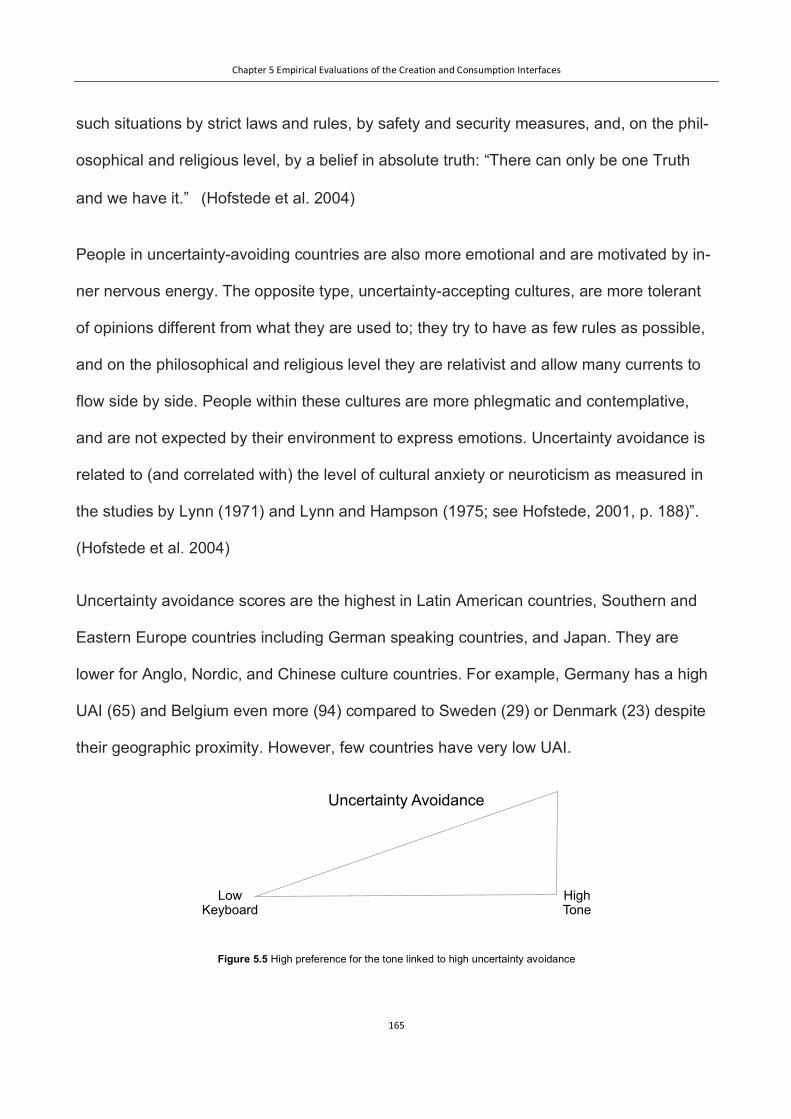
Chapter 5 Empirical Evaluations of the Creation and Consumption Interfaces
165
such situations by strict laws and rules, by safety and security measures, and, on the phil-
osophical and religious level, by a belief in absolute truth: “There can only be one Truth
and we have it.” (Hofstede et al. 2004)
People in uncertainty-avoiding countries are also more emotional and are motivated by in-
ner nervous energy. The opposite type, uncertainty-accepting cultures, are more tolerant
of opinions different from what they are used to; they try to have as few rules as possible,
and on the philosophical and religious level they are relativist and allow many currents to
flow side by side. People within these cultures are more phlegmatic and contemplative,
and are not expected by their environment to express emotions. Uncertainty avoidance is
related to (and correlated with) the level of cultural anxiety or neuroticism as measured in
the studies by Lynn (1971) and Lynn and Hampson (1975; see Hofstede, 2001, p. 188)”.
(Hofstede et al. 2004)
Uncertainty avoidance scores are the highest in Latin American countries, Southern and
Eastern Europe countries including German speaking countries, and Japan. They are
lower for Anglo, Nordic, and Chinese culture countries. For example, Germany has a high
UAI (65) and Belgium even more (94) compared to Sweden (29) or Denmark (23) despite
their geographic proximity. However, few countries have very low UAI.
Figure 5.5 High preference for the tone linked to high uncertainty avoidance
Uncertainty Avoidance
LowKeyboard
HighTone

Chapter 5 Empirical Evaluations of the Creation and Consumption Interfaces
166
General Predictions: This dimension is difficult to build a prediction around. On one
hand the fact that those from cultures with a high uncertainty avoidance score try to avoid
unstructured and novel situations point to a possibility that the tone would be less popular
in this instance. However, when analysing this against Aaron Marcus’ specific design
points it becomes clear that the tone would be more likely to be preferred. The reasons
this conclusion is reached is the fact that the preferences from users from a culture with a
high score on this dimension include simplicity with limited choices, such as redundant
cues which align with the tone e.g. the tone plays a sound and shows an animation indicat-
ing the sound has been received, though utilitarian and necessary the cues are there:
“Simplicity, with clear metaphors, limited choices, and restricted amounts of data” (Marcus
and Gould).
Redundant cues (colour, typography, sound, etc.) to reduce ambiguity (Marcus and
Gould). In this instance users may prefer the tone as the sound could be reassuring (the
tone plays a sound and shows an animation indicating the sound has been received,
though utilitarian and necessary the cues are there). On the converse, users from coun-
tries that score low on the cultural dimension of uncertainty avoidance are more likely to
embrace wandering and risk, with a stigma on “overprotection, it would seem the keyboard
code is more applicable here as it is open to errors (from mistaken input) and empowers
the user to interact and explore with the kiosk more. The sound could be deemed more
‘overprotective’ as it always accurately broadcasts the exact code. These users are also
likely to prefer complexity with maximal content and choices which, again, the keyboard
code is more closely aligned to requiring the user to enter a long hex code, our research
would posit that this constitutes ‘maximal content’ vs the minimal broadcast of the code,
which reduces the cognitive load on a user as identified by Marcus and Gould. Again this

Chapter 5 Empirical Evaluations of the Creation and Consumption Interfaces
167
point is support by Rehm. et al. (2009) in their research (high UA cultures being noted to
prefer loud sounds).
5.4.6.5 Long Term vs. Short Term Orientation
This dimension associates the connection of the past with the current and future ac-
tions/challenges. A lower degree of this index (short-term) indicates that traditions are hon-
oured and kept, while steadfastness is valued. Societies with a high degree in this index
(long-term) views adaptation and circumstantial, pragmatic problem-solving as a necessity.
A poor country that is short-term oriented usually has little to no economic development,
while long-term oriented countries continue to develop to a point. (Hofstede, 2015)
The long- versus short-term orientation refers to whether a society exhibits a pragmatic fu-
ture-oriented perspective or a conventional historic point of view. A long-term orientation
fosters virtues directed toward the future—in particular, perseverance and thrift and order-
ing relationships by status. A short-term orientation fosters virtues related to the past and
present—in particular, respect for tradition, preservation of "face," and personal steadiness
and stability.
High long term orientation scores are typically found in East Asia, with China having 118,
Hong Kong 96 and Japan 88. They are moderate in Eastern and Western Europe, and low
in the Anglo countries, the Muslim world, Africa and in Latin America. However, there is
less data about this dimension.
Predictions: The constituents of countries which score highly on the long term orientation
dimension, it is hypothesised, will be less comfortable using the tone based interface as
they are more focussed on achieving consistent results through patience and diligence ra-
ther than immediate results, due to the following aspects of the long term orientation cul-
tural dimension: Content focused on practice and practical value (Marcus and Gould). i.e.
Chapter 5 Empirical Evaluations of the Creation and Consumption Interfaces
168
The more traditional keyboard interface is a practical and well-practiced interaction
method. Patience in achieving results and goals. Low long term orientation countries
would emphasize the contrary (Marcus and Gould). i.e. High long term orientation fo-
cussed users would, it is hypothesised, be patient and focussed on tried and tested meth-
ods, not seeking to speed up or shortcut the code entry process thereby preferring to use
the traditional keyboard input method. On the contrary, it is hypothesised that constituents
of countries which score low on the long term orientation dimension will be more comforta-
ble using the tone based interface as they are less focussed on achieving consistent re-
sults through patience and diligence and would rather have immediate results due to the
following aspects of the long term orientation cultural dimension. These extrapolations are
by no means concrete as Rehm et al. has shown that users from this culture may both pre-
fer soft sounds in both cases, however, cross-referencing Marcus and Gould’s (2000) re-
search on culturally adaptive interface design indicates that the aforementioned focus on
consistent results will be more likely to support this prediction than the opposite.
5.4.6.6 Indulgence vs. Restraint
Hofstede (2015) explained that “this dimension is essentially a measure of happiness;
whether or not simple joys are fulfilled. Indulgence is defined as “a society that allows rela-
tively free gratification of basic and natural human desires related to enjoying life and hav-
ing fun.” Its counterpart is defined as ‘a society that controls gratification of needs and reg-
ulates it by means of strict social norms.’ Indulgent societies believe themselves to be in
control of their own life and emotions; restrained societies believe other factors dictate
their life and emotions.”

Chapter 5 Empirical Evaluations of the Creation and Consumption Interfaces
169
There is less data available about the sixth dimension, however indulgence scores are
highest in Latin America, parts of Africa, the Anglo world and Nordic Europe; restraint is
mostly found in East Asia, Eastern Europe and the Muslim world.
Predictions: Those with a high score on the indulgence dimension, it is predicted, will
prefer the sound based interaction due to the fact that using sound is novel and more
unique (fun) than the traditional keyboard code entry approach. Societies that score highly
on the indulgence dimension, as outlined previously, are encouraging of “relatively free
gratification of basic and natural human desires related to enjoying life and having fun.”
Further, users are more likely to feel empowered to use a novel interaction mechanism
due to the fact that indulgent societies believe themselves to be in control of their own life
and emotions as opposed to a restrained society where individuals feel less in control and
therefore less empowered to make novel choices.
5.4.7 Results
In this results section there follows an analysis of the six cultural dimensions (PDI, IDV,
MA, UA, LTO, IND) against each of the countries involved in the research. The format is
as follows: ‘Dimensional Descriptions and Predictions’, ‘Summary of Predictions’, and
‘Data (actual)’.
The Dimensional Descriptions and Predictions section for each lists the corresponding di-
mensional scores, along with an explanation, for each of these countries follows along with
a rating of either low, mid-low, mid, mid-high, or high. These descriptions were written us-
ing the Hofstede Centre’s (2016) ‘6-D Model’ as a starting point. The following part: ‘Sum-
mary of Predictions’ lists the scores along with the median value across all respondents
(μ1/2), and finally the ‘Data (Actual) portion provides the results from the user testing,

Chapter 5 Empirical Evaluations of the Creation and Consumption Interfaces
170
again based on the median values across all users for any particular country. Results are
arranged by continent as explained in the introductory ‘Method’ section (6.2.1).
5.4.7.1 Eastern Europe
The following countries have been grouped into the Eastern Europe results set:
Eastern Europe Results Set 1: Romania
Eastern Europe Results Set 2: Serbia
Eastern Europe Results Set 3: - Croatia
Note: Though a good quantity of data was collected for Bosnian subjects this data could
not be included, unfortunately, as accurate dimensional score’s for Bosnian subjects did
not exist at the time of writing.
A compilation of charts generated from the quantitative data for Eastern Europe can be
seen in figure 5.6.

Chapter 5 Empirical Evaluations of the Creation and Consumption Interfaces
171
Figure 5.6 Eastern Europe Quantitative Data Charts
5.4.7.1.1 Eastern Europe Results Set 1: Romania
5.4.7.1.1.1 Romania - Dimensional Descriptions and Predictions
A listing of each cultural dimension follows along with Romania’s score on that dimension
and a rating of low, mid-low, mid, mid-high, or high based on this score, Some insight is
then provided as to how Romania is effected culturally by this dimensional score. Follow-
ing this description there is a prediction as to what interface Romanians will prefer along
with a rationale for this. This builds on the general predictions given earlier but contextual-
ises it specifically for the country whose results are being provided (Romania in this case).
This approach will be used for each of the countries tested. There will, of course, be coun-
tries that share ratings and in these situations the descriptions will largely be repeated,
where possible repetitive descriptions will be kept brief to maintain readability, however, it
is important to include each country should anyone be skipping through countries as a ref-
erence, rather than reading straight through. Further, the current results will be contextual-
ised against the countries previously listed within that continent so there will be added con-
text.
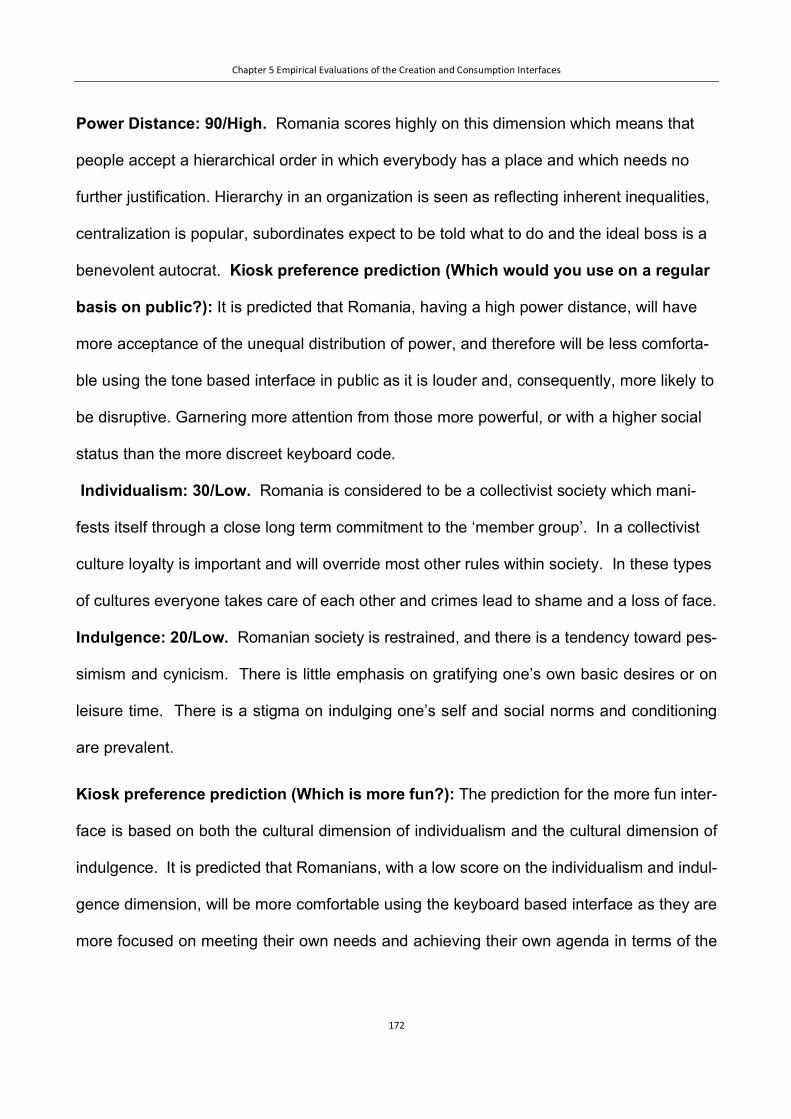
Chapter 5 Empirical Evaluations of the Creation and Consumption Interfaces
172
Power Distance: 90/High. Romania scores highly on this dimension which means that
people accept a hierarchical order in which everybody has a place and which needs no
further justification. Hierarchy in an organization is seen as reflecting inherent inequalities,
centralization is popular, subordinates expect to be told what to do and the ideal boss is a
benevolent autocrat. Kiosk preference prediction (Which would you use on a regular
basis on public?): It is predicted that Romania, having a high power distance, will have
more acceptance of the unequal distribution of power, and therefore will be less comforta-
ble using the tone based interface in public as it is louder and, consequently, more likely to
be disruptive. Garnering more attention from those more powerful, or with a higher social
status than the more discreet keyboard code.
Individualism: 30/Low. Romania is considered to be a collectivist society which mani-
fests itself through a close long term commitment to the ‘member group’. In a collectivist
culture loyalty is important and will override most other rules within society. In these types
of cultures everyone takes care of each other and crimes lead to shame and a loss of face.
Indulgence: 20/Low. Romanian society is restrained, and there is a tendency toward pes-
simism and cynicism. There is little emphasis on gratifying one’s own basic desires or on
leisure time. There is a stigma on indulging one’s self and social norms and conditioning
are prevalent.
Kiosk preference prediction (Which is more fun?): The prediction for the more fun inter-
face is based on both the cultural dimension of individualism and the cultural dimension of
indulgence. It is predicted that Romanians, with a low score on the individualism and indul-
gence dimension, will be more comfortable using the keyboard based interface as they are
more focused on meeting their own needs and achieving their own agenda in terms of the

Chapter 5 Empirical Evaluations of the Creation and Consumption Interfaces
173
individualism dimension, and also are less likely to lean toward the more novel and unique
tone due to a low indulgence score.
Masculinity: 42/Low. With a low score on this dimension Romania is considered a ‘femi-
nine’ society. Feminine societies focus on solidarity, equality, and quality in their lives.
There is a focus on equality over status and conflicts are resolved through negotiation and
compromise. Rehm et al. identify that highly masculine cultures prefer loud sounds and
close space, the tone is able to meet both of these requirements whilst the keyboard is
not. Kiosk preference prediction (Which is more efficient?): It is predicted that Roma-
nian individuals could find either interface more efficient due to be within a few points of a
mid-range score on this dimension.
Uncertainty Avoidance: 90/High. Romania has very high preference for avoiding uncer-
tainty. Unorthodox thoughts and ideas are frowned upon in these types of societies and,
consequently, individuals within these cultures maintain rigid codes of behaviour and pos-
sess an emotional need for rules and regulations. There is a focus on punctuality, hard
work, and security. Kiosk preference prediction (Which did you like best overall?):
It is predicted that Romanians will prefer the tone as users from high UA cultures prefer
simplicity with limited choices, and redundant cues (the tone plays a sound and shows an
animation indicating the sound has been received, which the keyboard does not).
5.4.7.1.1.2 Romania – Summary of Predictions
To summarise the analysis in the previous section, It was predicted that Romanian re-
spondents within the sampling frame would be most likely to have the following prefer-
ences (Romania, PDI 90 high, IDV 30 low, MA 42, UA 90 high, LTO 52 mid-high, indul-
gence 20 low):
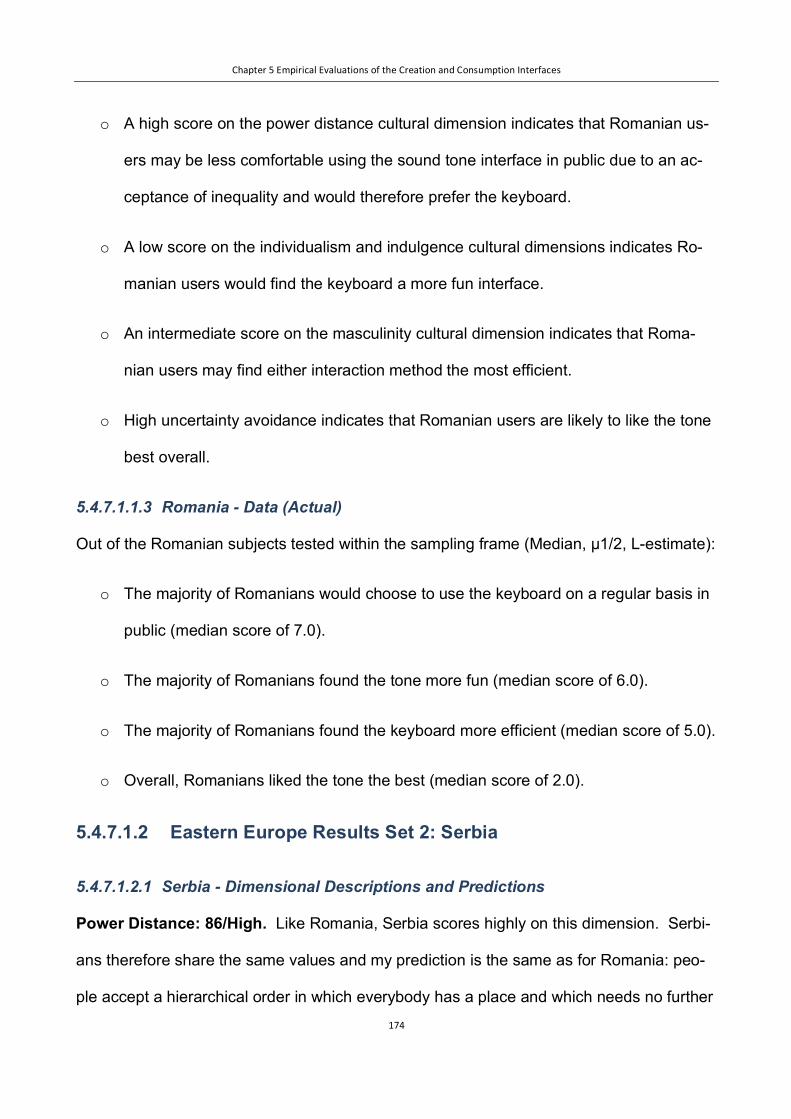
Chapter 5 Empirical Evaluations of the Creation and Consumption Interfaces
174
o A high score on the power distance cultural dimension indicates that Romanian us-
ers may be less comfortable using the sound tone interface in public due to an ac-
ceptance of inequality and would therefore prefer the keyboard.
o A low score on the individualism and indulgence cultural dimensions indicates Ro-
manian users would find the keyboard a more fun interface.
o An intermediate score on the masculinity cultural dimension indicates that Roma-
nian users may find either interaction method the most efficient.
o High uncertainty avoidance indicates that Romanian users are likely to like the tone
best overall.
5.4.7.1.1.3 Romania - Data (Actual)
Out of the Romanian subjects tested within the sampling frame (Median, μ1/2, L-estimate):
o The majority of Romanians would choose to use the keyboard on a regular basis in
public (median score of 7.0).
o The majority of Romanians found the tone more fun (median score of 6.0).
o The majority of Romanians found the keyboard more efficient (median score of 5.0).
o Overall, Romanians liked the tone the best (median score of 2.0).
5.4.7.1.2 Eastern Europe Results Set 2: Serbia
5.4.7.1.2.1 Serbia - Dimensional Descriptions and Predictions
Power Distance: 86/High. Like Romania, Serbia scores highly on this dimension. Serbi-
ans therefore share the same values and my prediction is the same as for Romania: peo-
ple accept a hierarchical order in which everybody has a place and which needs no further

Chapter 5 Empirical Evaluations of the Creation and Consumption Interfaces
175
justification. Hierarchy in an organization is seen as reflecting inherent inequalities, central-
isation is popular, subordinates expect to be told what to do and the ideal boss is a benev-
olent autocrat. Kiosk preference prediction (Which would you use on a regular basis
on public?): As with Romania, It is predicted that Serbia, having a high power distance,
will have more acceptance of the unequal distribution of power, will be less comfortable
using the tone based interface in public as it is louder and, consequently, more likely to be
disruptive. Garnering more attention from those more powerful, or with a higher social sta-
tus than the more discreet keyboard code.
Individualism: 25/Low. Serbia again shares a low score with Romania on this dimension
so will share the same description and prediction: Serbia is considered to be a collectivist
society which manifests itself through a close long term commitment to the ‘member
group’. In a collectivist culture loyalty is important and will override most other rules within
society. In these types of cultures everyone takes care of each other and crimes lead to
shame and a loss of face. It is predicted that Serbians, with a low score on the individual-
ism dimension, will be more comfortable using the keyboard based interface as they are
more focused on meeting their own needs and achieving their own agenda.
Indulgence: 20/Low. A low score of 28 on this dimension indicates that Serbian culture is
one of Restraint. Societies with a low score in this dimension have a tendency to cynicism
and pessimism. Also, in contrast to Indulgent societies, Restrained societies do not put much
emphasis on leisure time and control the gratification of their desires. People with this ori-
entation have the perception that their actions are Restrained by social norms and feel that
indulging themselves is wrong. Kiosk preference prediction for Serbia (Which is more
fun?): Again, having a cultural dimension score for individualism and indulgence in line with
Romania, It is predicted that Serbians will be more comfortable using the keyboard based

Chapter 5 Empirical Evaluations of the Creation and Consumption Interfaces
176
interface as they are more focused on meeting their own needs and achieving their own
agenda.
Masculinity: 43/Low. In line with its neighbour Romania, Serbia is classified as a femi-
nine country having a low dimensional score for masculinity. In Feminine countries the fo-
cus is on “working in order to live”, managers strive for consensus, people value equality,
solidarity and quality in their working lives. Conflicts are resolved by compromise and ne-
gotiation. Incentives such as free time and flexibility are favoured. Focus is on well-being;
status is not shown. Kiosk preference prediction (Which is more efficient?): It is pre-
dicted that Serbian individuals could find either interface more efficient due to be within a
few points of a mid-range score on this dimension.
Uncertainty Avoidance: 90/High. Serbia scores 92 on this dimension and thus has a
very high preference for avoiding uncertainty. Countries exhibiting high Uncertainty Avoid-
ance maintain rigid codes of belief and behaviour and are intolerant of unorthodox behav-
iour and ideas. In these cultures, there is an emotional need for rules (even if the rules
never seem to work) time is money, people have an inner urge to be busy and work hard,
precision and punctuality are the norm, innovation may be resisted, security is an im-
portant element in individual motivation. Kiosk preference prediction (Which did you
like best overall?): It is predicted that Serbians will prefer the tone as users from high UA
cultures prefer simplicity with limited choices, and redundant cues.
5.4.7.1.2.2 Serbia – Summary of Predictions
To summarise, it was hypothesised that Serbian respondents within the sampling frame
would be most likely to have the following preferences (Serbia, PDI 86 high, IDV 25 low,
MA 43 low, UA 92 high, LTO 52 mid, indulgence 28 low)
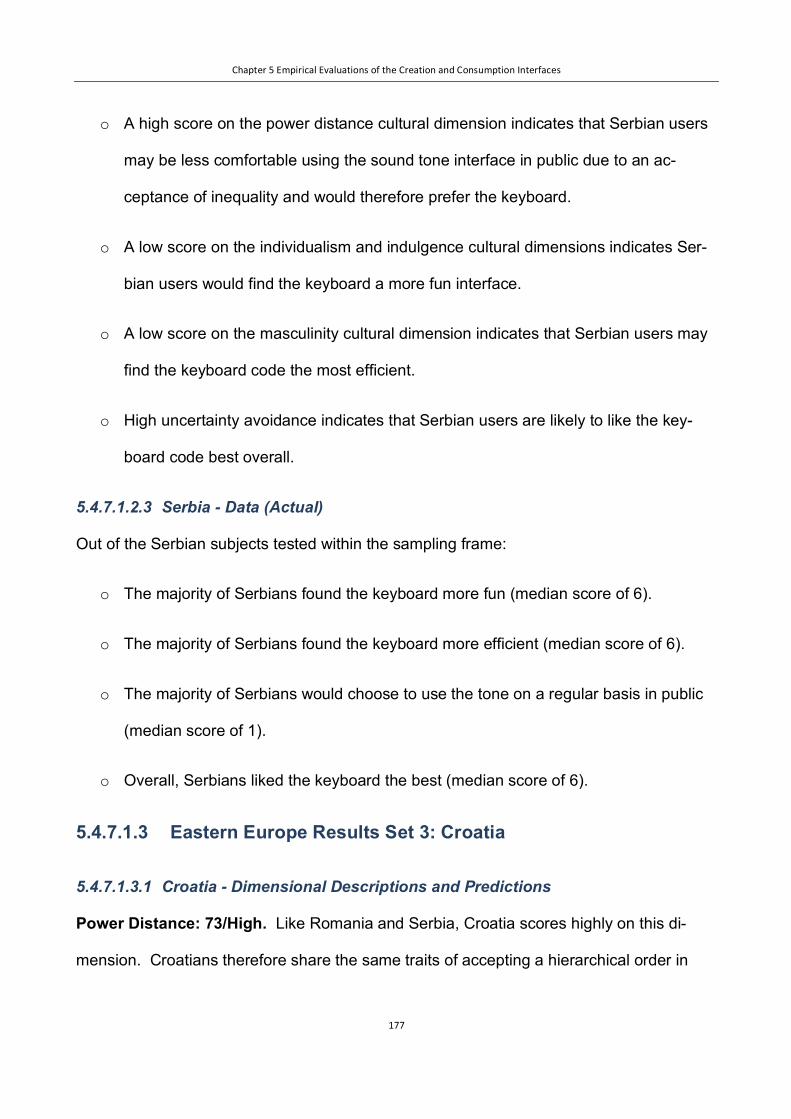
Chapter 5 Empirical Evaluations of the Creation and Consumption Interfaces
177
o A high score on the power distance cultural dimension indicates that Serbian users
may be less comfortable using the sound tone interface in public due to an ac-
ceptance of inequality and would therefore prefer the keyboard.
o A low score on the individualism and indulgence cultural dimensions indicates Ser-
bian users would find the keyboard a more fun interface.
o A low score on the masculinity cultural dimension indicates that Serbian users may
find the keyboard code the most efficient.
o High uncertainty avoidance indicates that Serbian users are likely to like the key-
board code best overall.
5.4.7.1.2.3 Serbia - Data (Actual)
Out of the Serbian subjects tested within the sampling frame:
o The majority of Serbians found the keyboard more fun (median score of 6).
o The majority of Serbians found the keyboard more efficient (median score of 6).
o The majority of Serbians would choose to use the tone on a regular basis in public
(median score of 1).
o Overall, Serbians liked the keyboard the best (median score of 6).
5.4.7.1.3 Eastern Europe Results Set 3: Croatia
5.4.7.1.3.1 Croatia - Dimensional Descriptions and Predictions
Power Distance: 73/High. Like Romania and Serbia, Croatia scores highly on this di-
mension. Croatians therefore share the same traits of accepting a hierarchical order in
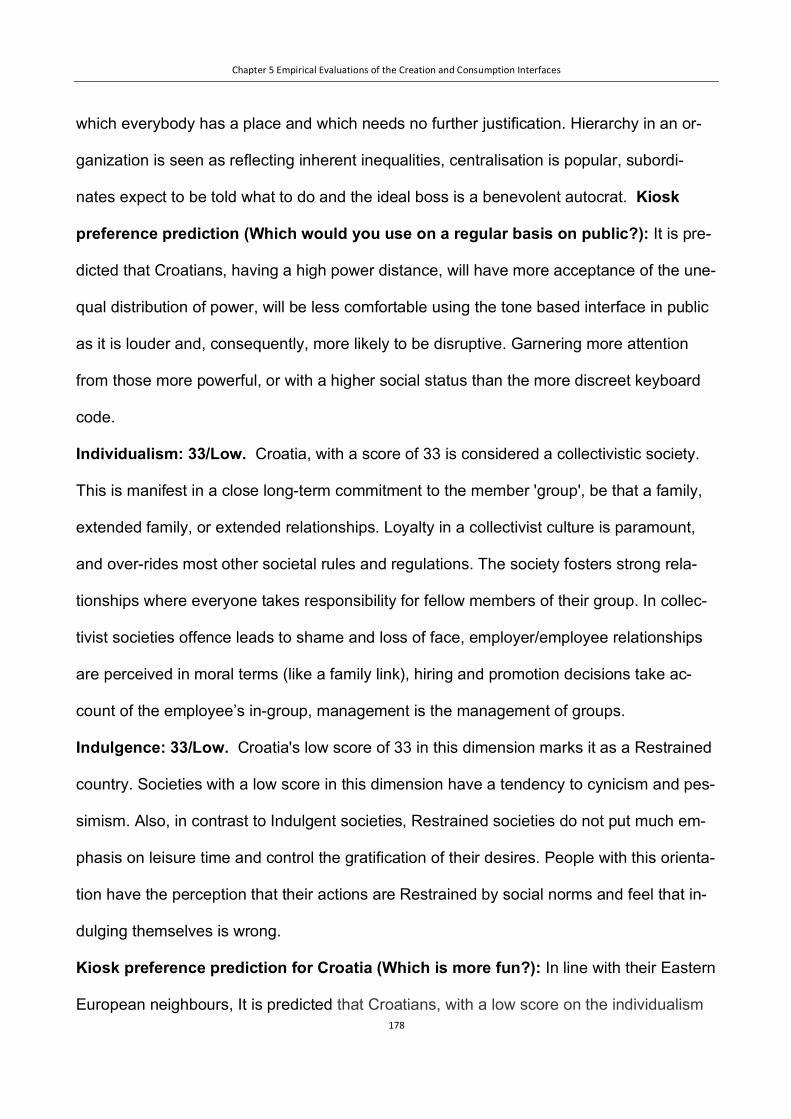
Chapter 5 Empirical Evaluations of the Creation and Consumption Interfaces
178
which everybody has a place and which needs no further justification. Hierarchy in an or-
ganization is seen as reflecting inherent inequalities, centralisation is popular, subordi-
nates expect to be told what to do and the ideal boss is a benevolent autocrat. Kiosk
preference prediction (Which would you use on a regular basis on public?): It is pre-
dicted that Croatians, having a high power distance, will have more acceptance of the une-
qual distribution of power, will be less comfortable using the tone based interface in public
as it is louder and, consequently, more likely to be disruptive. Garnering more attention
from those more powerful, or with a higher social status than the more discreet keyboard
code.
Individualism: 33/Low. Croatia, with a score of 33 is considered a collectivistic society.
This is manifest in a close long-term commitment to the member 'group', be that a family,
extended family, or extended relationships. Loyalty in a collectivist culture is paramount,
and over-rides most other societal rules and regulations. The society fosters strong rela-
tionships where everyone takes responsibility for fellow members of their group. In collec-
tivist societies offence leads to shame and loss of face, employer/employee relationships
are perceived in moral terms (like a family link), hiring and promotion decisions take ac-
count of the employee’s in-group, management is the management of groups.
Indulgence: 33/Low. Croatia's low score of 33 in this dimension marks it as a Restrained
country. Societies with a low score in this dimension have a tendency to cynicism and pes-
simism. Also, in contrast to Indulgent societies, Restrained societies do not put much em-
phasis on leisure time and control the gratification of their desires. People with this orienta-
tion have the perception that their actions are Restrained by social norms and feel that in-
dulging themselves is wrong.
Kiosk preference prediction for Croatia (Which is more fun?): In line with their Eastern
European neighbours, It is predicted that Croatians, with a low score on the individualism
Chapter 5 Empirical Evaluations of the Creation and Consumption Interfaces
179
and indulgence dimension, will be more comfortable using the keyboard based interface
as they are more focused on meeting their own needs and achieving their own agenda.
Masculinity: 40/Low. Croatia scores 40 on this dimension and is thus considered a rela-
tively Feminine society. In Feminine countries the focus is on “working in order to live”, man-
agers strive for consensus, people value equality, solidarity and quality in their working lives.
Conflicts are resolved by compromise and negotiation. Incentives such as free time and
flexibility are favoured. Focus is on well-being; status is not shown. Kiosk preference pre-
diction (Which is more efficient?): It is predicted that Croatians individuals could find ei-
ther are likely to find the keyboard code more efficient due to their relatively low score on
masculinity resulting in less emphasis being placed on the focus and mastery of new tech-
nologies.
Uncertainty Avoidance: 80/High. Croatia scores 80 on this dimension and thus has a
very high preference for avoiding uncertainty. Countries exhibiting high Uncertainty Avoid-
ance maintain rigid codes of belief and behaviour and are intolerant of unorthodox behav-
iour and ideas. In these cultures, there is an emotional need for rules (even if the rules
never seem to work) time is money, people have an inner urge to be busy and work hard,
precision and punctuality are the norm, innovation may be resisted, security is an im-
portant element in individual motivation. Kiosk preference prediction (Which did you
like best overall?): Continuing the theme so far running throughout the Eastern European
countries, It is predicted that Croatians will prefer the tone as their UA score aligns them
with simplicity with limited choices, and redundant cues.

Chapter 5 Empirical Evaluations of the Creation and Consumption Interfaces
180
5.4.7.1.3.2 Croatia – Summary of Predictions
To summarise, it was hypothesised that Croatian respondents within the sampling frame
would be most likely to have the following preferences (Croatia, PDI 73 high, IDV 33 low,
MA 40 low, UA 80 high, LTO 58 high, indulgence 33 low).
o A high score on the power distance cultural dimension indicates that Croatian users
may be less comfortable using the sound tone interface in public due to an ac-
ceptance of inequality and would therefore prefer the keyboard.
o A low score on the individualism and indulgence cultural dimensions indicates Croa-
tian users would find the keyboard a more fun interface.
o A low score on the masculinity cultural dimension indicates that Croatian users may
find the keyboard code the most efficient.
o High uncertainty avoidance indicates that Croatian users are likely to like the key-
board code best overall.
5.4.7.1.3.3 Croatia - Data (Actual)
Out of the Croatian subjects tested within the sampling frame:
o The majority of Croatians found the tone more fun (median score of 3).
o The majority of Croatians found either to be more efficient (median score of 4).
o The majority of Croatians would choose to use the tone on a regular basis in public
(median score of 3).
o Overall, Croatians liked the keyboard the best (median score of 5).

Chapter 5 Empirical Evaluations of the Creation and Consumption Interfaces
181
5.4.7.2 Western Europe
The following countries have been grouped into the Central Europe results set, using a
combination of the United Nations Statistics Division and CIA definitions of Western Eu-
rope to create this list as there are discrepancies as to which group each country belongs
to dependant on the definition you choose to follow (Spain will be included in this group as
the CIA definition includes it under Western Europe in the Southwestern sub region):
Western Europe Results Set 1: Germany
Western Europe Results Set 2: UK
Western Europe Results Set 3: Spain
A compilation of charts generated from the quantitative data for Western Europe can be
seen in figure 5.7.

Chapter 5 Empirical Evaluations of the Creation and Consumption Interfaces
182
Figure 5.7 Western Europe Quantitative Data Charts
5.4.7.2.1 Western Europe Results Set 1: Germany –
5.4.7.2.1.1 Germany - Dimensional Descriptions and Predictions
Power Distance: 35/Low. Highly decentralised and supported by a strong middle class,
Germany is not surprisingly among the lower power distant countries (score 35). Co-deter-
mination rights are comparatively extensive and have to be taken into account by the man-
agement. A direct and participative communication and meeting style is common, control is
disliked and leadership is challenged to show expertise and best accepted when it’s based
on it. Kiosk preference prediction (Which would you use on a regular basis on pub-
lic?): A low score on the power distance cultural dimension indicates that German users
may be more comfortable using the sound tone interface in public due to a low acceptance
of inequality.
Individualism: 67/High. The German society is a truly Individualist one (67). Small families
with a focus on the parent-children relationship rather than aunts and uncles are most com-
mon. There is a strong belief in the ideal of self-actualization. Loyalty is based on personal
preferences for people as well as a sense of duty and responsibility. This is defined by the
contract between the employer and the employee. Communication is among the most direct

Chapter 5 Empirical Evaluations of the Creation and Consumption Interfaces
183
in the world following the ideal to be “honest, even if it hurts” – and by this giving the coun-
terpart a fair chance to learn from mistakes.
Indulgence: 40/Low. The low score of 40 on this dimension indicates that the German
culture is Restrained in nature. Societies with a low score in this dimension have a tendency
to cynicism and pessimism. Also, in contrast to Indulgent societies, Restrained societies do
not put much emphasis on leisure time and control the gratification of their desires. People
with this orientation have the perception that their actions are Restrained by social norms
and feel that indulging themselves is wrong.
Kiosk preference prediction (Which is more fun?): A high score on the individualism
dimension and low score on the indulgence cultural dimensions indicates German may
find either method fun.
Masculinity: 66/High. With a score of 66 Germany is considered a Masculine society.
Performance is highly valued and early required as the school system separates children
into different types of schools at the age of ten. People rather “live in order to work” and
draw a lot of self-esteem from their tasks. Managers are expected to be decisive and asser-
tive. Status is often shown, especially by cars, watches and technical devices. Kiosk pref-
erence prediction (Which is more efficient?): A high score on the masculinity cultural
dimension indicates that German users may find the tone the most efficient.
Uncertainty Avoidance: 65/High. Germany is among the uncertainty avoidant countries
(65); the score is on the high end, so there is a slight preference for Uncertainty Avoidance.
In line with the philosophical heritage of Kant, Hegel and Fichte there is a strong preference
for deductive rather than inductive approaches, be it in thinking, presenting or planning: the
systematic overview has to be given in order to proceed. This is also reflected by the law
Chapter 5 Empirical Evaluations of the Creation and Consumption Interfaces
184
system. Details are equally important to create certainty that a certain topic or project is well-
thought-out. In combination with their low Power Distance, where the certainty for own de-
cisions is not covered by the larger responsibility of the boss, Germans prefer to compensate
for their higher uncertainty by strongly relying on expertise. Kiosk preference prediction
(Which did you like best overall?): High uncertainty avoidance indicates that German us-
ers are likely to like the keyboard code best overall.
5.4.7.2.1.2 Germany – Summary of Predictions
To summarise, it was hypothesised that German respondents within the sampling frame
would be most likely to have the following preferences (Germany, PDI 35 low, IDV 67 high,
MA 66 high, UA 65 high, LTO 83 high, indulgence 40 low):
o A low score on the power distance cultural dimension indicates that German users
may be more comfortable using the sound tone interface in public due to a low ac-
ceptance of inequality.
o A high score on the individualism dimension and low score on the indulgence cul-
tural dimensions indicates German may find either method fun.
o A high score on the masculinity cultural dimension indicates that German users may
find the tone the most efficient.
o High uncertainty avoidance indicates that German users are likely to like the key-
board code best overall.
o High LTO indicates a preference for keyboard tones.
5.4.7.2.1.3 Germany – Data (Actual)
Out of the German subjects tested within the sampling frame:
Chapter 5 Empirical Evaluations of the Creation and Consumption Interfaces
185
o The majority of Germans found either to be more fun (median score of 4).
o The majority of Germans found the keyboard to be more efficient (median score of
5).
o The majority of Germans would choose to use either on a regular basis in public
(median score of 4).
o Overall, Germans liked either method the best (median score of 4).
5.4.7.2.2 Western Europe Results Set 2: UK
5.4.7.2.2.1 UK - Dimensional Descriptions and Predictions
Power Distance: 35/Low. At 35 Britain sits in the lower rankings of PDI – i.e. a society
that believes that inequalities amongst people should be minimized. Interestingly is that re-
search shows PD index lower amongst the higher class in Britain than amongst the work-
ing classes. The PDI score at first seems incongruent with the well-established and histori-
cal British class system and its exposes one of the inherent tensions in the British culture –
between the importance of birth rank on the one hand and a deep seated belief that where
you are born should not limit how far you can travel in life. A sense of fair play drives a be-
lief that people should be treated in some way as equals. Kiosk preference prediction
(Which would you use on a regular basis on public?): A low score on the power dis-
tance cultural dimension indicates that British users may be more comfortable using the
sound tone interface in public due to a low acceptance of inequality.
Individualism: 89/High. At a score of 89 the UK is amongst the highest of the Individual-
ist scores, beaten only by some of the commonwealth countries it spawned i.e. Australia
and the USA. The British are a highly Individualist and private people. Children are taught

Chapter 5 Empirical Evaluations of the Creation and Consumption Interfaces
186
from an early age to think for themselves and to find out what their unique purpose in life is
and how they uniquely can contribute to society. The route to happiness is through per-
sonal fulfilment. As the affluence of Britain has increased throughout the last decade, with
wealth also ‘spreading North’, a much discussed phenomenon is the rise of what has been
seen as rampant consumerism and a strengthening of the ‘ME’ culture.
Indulgence: 69/High. A high score of 69 indicates that the British culture is one that is
classified as Indulgent. People in societies classified by a high score in Indulgence generally
exhibit a willingness to realise their impulses and desires with regard to enjoying life and
having fun. They possess a positive attitude and have a tendency towards optimism. In
addition, they place a higher degree of importance on leisure time, act as they please and
spend money as they wish. Kiosk preference prediction (Which is more fun?): A high
score on the individualism and indulgence cultural dimensions indicates British users will
find the tone more fun.
Masculinity: 66/High. At 66, Britain is a Masculine society – highly success oriented and
driven. A key point of confusion for the foreigner lies in the apparent contradiction between
the British culture of modesty and understatement which is at odds with the underlying
success driven value system in the culture. Critical to understanding the British is being
able to ‘’read between the lines’’ What is said is not always what is meant. In comparison
to Feminine cultures such as the Scandinavian countries, people in the UK live in order to
work and have a clear performance ambition. Kiosk preference prediction (Which is
more efficient?): A high score on the masculinity cultural dimension indicates that British
users may find the tone the most efficient.
Uncertainty Avoidance: 35/Low. At 35 the UK has a low score on Uncertainty Avoid-
ance which means that as a nation they are quite happy to wake up not knowing what the

Chapter 5 Empirical Evaluations of the Creation and Consumption Interfaces
187
day brings and they are happy to ‘make it up as they go along’ changing plans as new in-
formation comes to light. As a low UAI country the British are comfortable in ambiguous
situations - the term ‘muddling through’ is a very British way of expressing this. There are
generally not too many rules in British society, but those that are there are adhered to (the
most famous of which of course the British love of queuing which has also to do with the
values of fair play). In work terms this results in planning that is not detail oriented – the
end goal will be clear (due to high MAS) but the detail of how we get there will be light and
the actual process fluid and flexible to emerging and changing environment. Planning hori-
zons will also be shorter. Most importantly the combination of a highly Individualist and cu-
rious nation is a high level of creativity and strong need for innovation. What is different is
attractive! This emerges throughout the society in both its humour, heavy consumerism for
new and innovative products and the fast highly creative industries it thrives in – advertis-
ing, marketing, financial engineering. Kiosk preference prediction (Which did you like
best overall?): Low uncertainty avoidance indicates that British users are likely to prefer
the tone best overall.
5.4.7.2.2.2 UK – Summary of Predictions
To summarise, it was hypothesised that UK respondents within the sampling frame would
be most likely to have the following preferences (UK, PDI 35 low, IDV 89 high, MA 66 high,
UA 35 low, LTO 51 mid-high):
o A low score on the power distance cultural dimension indicates that British users
may be more comfortable using the sound tone interface in public due to a low ac-
ceptance of inequality.
o A high score on the individualism and indulgence cultural dimensions indicates Brit-
ish users will find the tone more fun.
Chapter 5 Empirical Evaluations of the Creation and Consumption Interfaces
188
o A high score on the masculinity cultural dimension indicates that British users may
find the tone the most efficient.
o Low uncertainty avoidance indicates that British users are likely to prefer the tone
best overall.
5.4.7.2.2.3 UK - Data (Actual)
Out of the British subjects tested within the sampling frame:
o The majority of Britons found the tone to be more fun (median score of 2).
o The majority of Britons found the keyboard to be more efficient (median score of 6).
o The majority of Britons would choose to use the keyboard on a regular basis in pub-
lic (median score of 7).
o Overall, Britons liked the keyboard the best (median score of 6)
5.4.7.2.3 Western Europe Results Set 3: Spain –
5.4.7.2.3.1 Spain - Dimensional Descriptions and Predictions
Power Distance: 57/High. Spain’s score on this dimension (57) is a high score, which
means that Spain has a hierarchical society. This means that people accept a hierarchical
order in which everybody has a place and which needs no further justification. Hierarchy in
an organisation is seen as reflecting inherent inequalities, centralisation is popular, subor-
dinates expect to be told what to do and the ideal boss is a benevolent autocrat. Kiosk
preference prediction (Which would you use on a regular basis on public?): A high
score on the power distance cultural dimension indicates that Spanish users may be less
comfortable using the sound tone interface in public due to a low acceptance of inequality
and would therefore prefer the keyboard code.
Chapter 5 Empirical Evaluations of the Creation and Consumption Interfaces
189
Individualism: 51/Mid. Spain, in comparison with the rest of the European countries (ex-
cept for Portugal) is Collectivist (because of its score in this dimension: 51). However,
compared with other areas of the world it is seen as clearly individualist. This has made
Spaniards quite easy to relate with certain cultures -mainly non-European- whereas other
cultures can be perceived as aggressive and blunt. On the other hand, teamwork is con-
sidered as something totally natural, employees tend to work in this way with no need for
strong motivation from Management.
Indulgence: 44/Low. With a low score of 44, Spain is not an Indulgent society. Societies
with a low score in this dimension have a tendency to cynicism and pessimism. Also, in
contrast to Indulgent societies, Restrained societies do not put much emphasis on leisure
time and control the gratification of their desires. People with this orientation have the per-
ception that their actions are Restrained by social norms and feel that indulging them-
selves is wrong. Kiosk preference prediction (Which is more fun?): A mid score on
the individualism dimension and low score on the indulgence cultural dimensions indicates
Spanish users will find the keyboard code more fun.
Masculinity: 42/Low. Spain scores 42 on this dimension and is a country where the key
word is consensus. So polarization is not well considered or excessive competitiveness
appreciated. Spanish children are educated in search of harmony, refusing to take sides or
standing out. There is a concern for weak or needy people that generate a natural current
of sympathy. Regarding management, managers like to consult their subordinates to know
their opinions and, according to it, make their decisions. In politics, it is desirable to have
participation of all the minorities, trying to avoid the dominant presence of just one winning
party. It is the country opposite to ‘the winner takes it all’. Kiosk preference prediction

Chapter 5 Empirical Evaluations of the Creation and Consumption Interfaces
190
(Which is more efficient?): A low score on the masculinity cultural dimension indicates
that Spanish users may find the keyboard the most efficient.
Uncertainty Avoidance: 86/High. If there is a dimension that defines Spain very clearly,
it is Uncertainty Avoidance, as is reflected in a high score of 86. Spain is considered the
second noisiest country in the world. People like to have rules for everything, changes
cause stress, but, at the same time, they are obliged to avoid rules and laws that, in fact,
make life more complex. Confrontation is avoided as it causes great stress and scales up
to the personal level very quickly. There is great concern for changing, ambiguous and un-
defined situations. Thus, for example, in a very recent survey 75% of Spanish young peo-
ple wanted to work in civil service (i.e. a job for life, no concerns about the future) whereas
in the USA only 17% of young people would like it. Kiosk preference prediction
(Which did you like best overall?): High uncertainty avoidance indicates that Spanish
users are likely to prefer the keyboard best overall.
5.4.7.2.3.2 Spain – Summary of Predictions
To summarise, it was hypothesised that Spanish respondents within the sampling frame
would be most likely to have the following preferences (Spain, PDI 57 high, IDV 51 mid,
MA 42 mid-low, UA 86 high, LTO 48 mid, IDV 44 low, indulgence 44 low):
o A high score on the power distance cultural dimension indicates that Spanish users
may be less comfortable using the sound tone interface in public due to a low ac-
ceptance of inequality and would therefore prefer the keyboard code.
o A mid score on the individualism dimension and low score on the indulgence cul-
tural dimensions indicates Spanish users will find the keyboard code more fun.

Chapter 5 Empirical Evaluations of the Creation and Consumption Interfaces
191
o A low score on the masculinity cultural dimension indicates that Spanish users may
find the keyboard the most efficient.
o High uncertainty avoidance indicates that Spanish users are likely to prefer the key-
board best overall.
5.4.7.2.3.3 Spain - Data (Actual)
Out of the Spanish subjects tested within the sampling frame:
o The majority of Spaniards found the tone to be more fun (median score of 2).
o The majority of Spaniards found the keyboard to be more efficient (median score of
7).
o The majority of Spaniards would choose to use the keyboard on a regular basis in
public (median score of 7).
o Overall, Spaniards liked the keyboard the best (median score of 6).
5.4.7.2.4 North America
A compilation of charts generated from the quantitative data for North America can be
seen in figure 5.8.

Chapter 5 Empirical Evaluations of the Creation and Consumption Interfaces
192
Figure 5.8 North America Quantitative Data Charts
5.4.7.2.5 North America Results Set
5.4.7.2.5.1 North America - Dimensional Descriptions and Predictions
Power Distance: 40/Low and Individualism: 91/High. The fairly low score on Power Dis-
tance (40) in combination with one of the most Individualist (91) cultures in the world reflects
itself in the following: The American premise of “liberty and justice for all.” This is evidenced
by an explicit emphasis on equal rights in all aspects of American society and government.
Within American organisations, hierarchy is established for convenience, superiors are ac-
cessible and managers rely on individual employees and teams for their expertise. Both
managers and employees expect to be consulted and information is shared frequently. At
Chapter 5 Empirical Evaluations of the Creation and Consumption Interfaces
193
the same time, communication is informal, direct and participative to a degree. The society
is loosely-knit in which the expectation is that people look after themselves and their imme-
diate families only and should not rely (too much) on authorities for support. There is also
a high degree of geographical mobility in the United States. Americans are the best joiners
in the world; however, it is often difficult, especially among men, to develop deep friendships.
Americans are accustomed to doing business or interacting with people they don’t know
well. Consequently, Americans are not shy about approaching their prospective counter-
parts in order to obtain or seek information. In the business world, employees are expected
to be self-reliant and display initiative. Also, within the exchange-based world of work we
see that hiring, promotion and decisions are based on merit or evidence of what one has
done or can do.
Indulgence: 68/High. The United States scores as an Indulgent (68) society on the sixth
dimension. This, in combination with a normative score, is reflected by the following contra-
dictory attitudes and behaviour: Work hard and play hard. The States has waged a war
against drugs and is still very busy in doing so, yet drug addiction in the States is higher than
in many other wealthy countries. It is a prudish society yet even some well-known televan-
gelists appear to be immoral.
Kiosk preference prediction (Which would you use on a regular basis on public?): A
low score on the power distance cultural dimension indicates that American users may be
more using the sound tone interface in public due to a low acceptance of inequality.
Kiosk preference prediction (Which is more fun?): A high score on the individualism
and indulgence cultural dimensions indicates American users will find the tone more fun.

Chapter 5 Empirical Evaluations of the Creation and Consumption Interfaces
194
Masculinity: 62/High. The score of the US on Masculinity is high at 62, and this can be
seen in the typical American behavioural patterns. This can be explained by the combina-
tion of a high Masculinity drive together with the most Individualist drive in the world. In
other words, Americans, so to speak, all show their Masculine drive individually. The Brit-
ish, however, have the same culture in this respect. The question, therefore, should be: is
the same drive not normally to be seen on the surface? This difference is a reflection of
the higher score of the US on Uncertainty Avoidance than of the UK. In other words, in
both societies we find the same drive, but Americans show it up-front whereas the British
will take you by surprise. This American combination reflects itself in the following: Be-
haviour in school, work, and play are based on the shared values that people should
“strive to be the best they can be” and that “the winner takes all”. As a result, Americans
will tend to display and talk freely about their “successes” and achievements in life. Being
successful per se is not the great motivator in American society, but being able to show
one’s success. Many American assessment systems are based on precise target setting,
by which American employees can show how well a job they did. There exists a “can-do”
mentality which creates a lot of dynamism in the society, as it is believed that there is al-
ways the possibility to do things in a better way. Typically, Americans “live to work” so that
they can obtain monetary rewards and as a consequence attain higher status based on
how good one can be. Many white collar workers will move to a fancier neighbourhood af-
ter each and every substantial promotion. It is believed that a certain degree of conflict will
bring out the best of people, as it is the goal to be “the winner”. As a consequence, we see
a lot of polarisation and court cases. This mentality nowadays undermines the American
premise of “liberty and justice for all.” Rising inequality is endangering democracy, be-
cause a widening gap among the classes may slowly push Power Distance up and Individ-
ualism down. Kiosk preference prediction (Which is more efficient?): A high score on
Chapter 5 Empirical Evaluations of the Creation and Consumption Interfaces
195
the masculinity cultural dimension indicates that American users may find the tone the
most efficient.
Uncertainty Avoidance: 46/Mid. The US scores below average, with a score of 46, on
the Uncertainty Avoidance dimension. As a consequence, the perceived context in which
Americans find themselves will impact their behaviour more than if the culture would have
either scored higher or lower. Thus, this cultural pattern reflects itself as follows: There is
a fair degree of acceptance for new ideas, innovative products and a willingness to try
something new or different, whether it pertains to technology, business practices or
food. Americans tend to be more tolerant of ideas or opinions from anyone and allow the
freedom of expression. At the same time, Americans do not require a lot of rules and are
less emotionally expressive than higher-scoring cultures. At the same time, 9/11 has cre-
ated a lot of fear in the American society culminating in the efforts of government to moni-
tor everybody through the NSA and other security organisations. Kiosk preference pre-
diction (Which did you like best overall?): Mid uncertainty avoidance indicates that
American users may like either input method best overall.
5.4.7.2.5.2 North America – Summary of Predictions
To summarise, it was hypothesised that United States respondents within the sampling
frame would be most likely to have the following preferences (US, PDI 40 low, IDV 91
high, MA 62 high, UA 46 mid, LTO 26 low, indulgence 68 high):
o A low score on the power distance cultural dimension indicates that American users
may be more using the sound tone interface in public due to a low acceptance of
inequality.

Chapter 5 Empirical Evaluations of the Creation and Consumption Interfaces
196
o A high score on the individualism and indulgence cultural dimensions indicates
American users will find the tone more fun.
o A high score on the masculinity cultural dimension indicates that American users
may find the tone the most efficient.
o Mid uncertainty avoidance indicates that American users may like either input
method best overall.
It should be noted that the US cultural dimensional scores are very similar to the United
Kingdom so the results, at least in theory, should share some parity, on balance. Analys-
ing these points, it would be hypothesised that United States subjects would enjoy using
the tone-based interface more on balance though a mid-low UA value and low LTO value
mean that preference for tone may not be significant.
5.4.7.2.5.3 North America - Data (Actual)
Out of the United States subjects tested within the sampling frame:
o The majority of Americans found the tone to be more fun (median score of 2).
o The majority of Americans found the keyboard to be more efficient (median score of
6).
o The majority of Americans would choose to use the keyboard on a regular basis in
public (median score of 6).
o Overall, Americans liked the keyboard the best (median score of 5).
5.4.7.3 Asia
The following countries have been grouped into the Asia results set:

Chapter 5 Empirical Evaluations of the Creation and Consumption Interfaces
197
Asia Results Set 1: Vietnam
Asia Results Set 2: Malaysia
Asia Results Set 3: Indonesia
Asia Results Set 4: Philippines
A compilation of charts generated from the quantitative data for Asia can be seen in figure
5.9.
Figure 5.9 Asia Quantitative Data Charts

Chapter 5 Empirical Evaluations of the Creation and Consumption Interfaces
198
5.4.7.3.1 Asia Results Set 1: Vietnam
5.4.7.3.1.1 Vietnam - Dimensional Descriptions and Predictions
Power Distance: 70/High. Vietnam scores high on this dimension (score of 70) which
means that people accept a hierarchical order in which everybody has a place and which
needs no further justification. Hierarchy in an organisation is seen as reflecting inherent in-
equalities, centralization is popular, subordinates expect to be told what to do and the ideal
boss is a benevolent autocrat. Challenges to the leadership are not well-received. Kiosk
preference prediction (Which would you use on a regular basis on public?): A high
score on the power distance cultural dimension indicates that Vietnamese users may be
less comfortable using the sound tone interface in public due to a low acceptance of ine-
quality and would therefore prefer the keyboard code.
Individualism: 20/Low. Vietnam, with a score of 20 is a collectivistic society. This is man-
ifest in a close long-term commitment to the “member” group, be that a family, extended
family or extended relationships. Loyalty in a collectivist culture is paramount and over-
rides most other societal rules and regulations. Such a society fosters strong relationships,
where everyone takes responsibility for fellow members of their group. In collectivistic soci-
eties, offence leads to shame and loss of face. Employer/employee relationships are per-
ceived in moral terms (like a family link), hiring and promotion take account of the em-
ployee’s in-group. Management is the management of groups.
Indulgence: 35/Low. A low score of 35 on this dimension indicates that the culture of Vi-
etnam is characterised as Restrained. Societies with a low score in this dimension have a
tendency to cynicism and pessimism. Also, in contrast to Indulgent societies, Restrained
societies do not put much emphasis on leisure time and control the gratification of their de-
sires. People with this orientation have the perception that their actions are Restrained by

Chapter 5 Empirical Evaluations of the Creation and Consumption Interfaces
199
social norms and feel that indulging themselves is wrong. Kiosk preference prediction
(Which is more fun?): A low score on the individualism and indulgence cultural dimen-
sions indicates Vietnamese users are likely to find the keyboard code more fun.
Masculinity: 40/Low. Vietnam scores 40 on this dimension and is thus considered a
Feminine society. In Feminine countries the focus is on “working in order to live”, manag-
ers strive for consensus, people value equality, solidarity and quality in their working lives.
Conflicts are resolved by compromise and negotiation. Incentives such as free time and
flexibility are favoured. Focus is on well-being; status is not shown. An effective manager
is a supportive one, and decision making is achieved through involvement. Kiosk prefer-
ence prediction (Which is more efficient?): A low score on the masculinity cultural di-
mension indicates that Vietnamese users may find the keyboard code the most efficient.
Uncertainty Avoidance: 30/Low. Vietnam scores 30 on this dimension and thus has a
low preference for avoiding uncertainty. Low UAI societies maintain a more relaxed atti-
tude in which practice counts more than principles and deviance from the norm is more
easily tolerated. In societies exhibiting low UAI, people believe there should be no more
rules than are necessary and if they are ambiguous or do not work they should be aban-
doned or changed. Schedules are flexible, hard work is undertaken when necessary but
not for its own sake, precision and punctuality do not come naturally, innovation is not
seen as threatening. Kiosk preference prediction (Which did you like best over-
all?): Low uncertainty avoidance indicates that Vietnamese users are likely to prefer the
tone best overall.

Chapter 5 Empirical Evaluations of the Creation and Consumption Interfaces
200
5.4.7.3.1.2 Vietnam – Summary of Predictions
It is predicted that Vietnamese respondents within the sampling frame will be most likely to
have the following preferences (Power Distance 70 high, Individualism 20 low, Masculinity
40 low, Uncertainty Avoidance 30 low, Long Term Orientation 57 high, Indulgence 35 low):
o A high score on the power distance cultural dimension indicates that Vietnamese
users may be less comfortable using the sound tone interface in public due to a low
acceptance of inequality and would therefore prefer the keyboard code.
o A low score on the individualism and indulgence cultural dimensions indicates Viet-
namese users are likely to find the keyboard code more fun.
o A low score on the masculinity cultural dimension indicates that Vietnamese users
may find the keyboard code the most efficient.
o Low uncertainty avoidance indicates that Vietnamese users are likely to prefer the
tone best overall.
5.4.7.3.1.3 Vietnam - Data (Actual)
Out of the Vietnamese subjects tested within the sampling frame:
o The majority of Vietnamese users found the tone to be more fun (median score of
1).
o The majority of Vietnamese users found the tone to be more efficient (median score
of 2).
o The majority of Vietnamese users would choose either method on a regular basis in
public (median score of 4).

Chapter 5 Empirical Evaluations of the Creation and Consumption Interfaces
201
o Overall, Vietnamese users liked the tone the best (median score of 1).
5.4.7.3.2 Asia Results Set 2: Malaysia
5.4.7.3.2.1 Malaysia - Dimensional Descriptions and Predictions
Power Distance: 100/High. Malaysia scores very high on this dimension (score of 100)
which means that people accept a hierarchical order in which everybody has a place and
which needs no further justification. Hierarchy in an organisation is seen as reflecting in-
herent inequalities, centralization is popular, subordinates expect to be told what to do and
the ideal boss is a benevolent autocrat. Challenges to the leadership are not well-received.
Kiosk preference prediction (Which would you use on a regular basis on public?): A
high score on the power distance cultural dimension indicates that Malaysian users may
be less comfortable using the sound tone interface in public due to a low acceptance of in-
equality and would therefore prefer the keyboard code.
Individualism: 26/Low. Malaysia, with a score of 26 is a collectivistic society. This is
manifest in a close long-term commitment to the “member” group, be that a family, ex-
tended family or extended relationships. Loyalty in a collectivist culture is paramount and
overrides most other societal rules and regulations. Such a society fosters strong relation-
ships, where everyone takes responsibility for fellow members of their group. In collec-
tivistic societies, offence leads to shame and loss of face. Employer/employee relation-
ships are perceived in moral terms (like a family link), hiring and promotion take account of
the employee’s in-group. Management is the management of groups.
Indulgence: 57/High. Malaysia's high score of 57 indicates that the culture is one of In-
dulgence. People in societies classified by a high score in Indulgence generally exhibit a
willingness to realise their impulses and desires with regard to enjoying life and having fun.
They possess a positive attitude and have a tendency towards optimism. In addition, they

Chapter 5 Empirical Evaluations of the Creation and Consumption Interfaces
202
place a higher degree of importance on leisure time, act as they please and spend money
as they wish. Kiosk preference prediction (Which is more fun?): A very low score on
the individualism dimension (26) and a mid-high score on the indulgence cultural dimen-
sion (57) indicates Malaysian users are likely to find the keyboard code more fun.
Masculinity: 50/Mid. With an intermediate score of 50, a preference for this dimension
cannot be determined. Kiosk preference prediction (Which is more efficient?): A mid
score on the masculinity cultural dimension indicates that Malaysian users may find either
interface the most efficient.
Uncertainty Avoidance: 36/Low. Malaysia scores 36 on this dimension and thus has a
low preference for avoiding uncertainty. Low UAI societies maintain a more relaxed atti-
tude in which practice counts more than principles and deviance from the norm is more
easily tolerated. In societies exhibiting low UAI, people believe there should be no more
rules than are necessary and if they are ambiguous or do not work, they should be abol-
ished or changed. Schedules are flexible, hard work is undertaken when necessary but not
for its own sake. Precision and punctuality do not come naturally; innovation is not seen as
threatening. Kiosk preference prediction (Which did you like best overall?): Low un-
certainty avoidance indicates that Malaysian users are likely to prefer the tone best overall.
5.4.7.3.2.2 Malaysia – Summary of Predictions
It is predicted that Malaysian respondents within the sampling frame will be most likely to
have the following preferences (Power Distance 100 high, Individualism 26 low, Masculin-
ity 50 mid, Uncertainty Avoidance 36 low, Long Term Orientation 41 low, Indulgence 57
high):

Chapter 5 Empirical Evaluations of the Creation and Consumption Interfaces
203
o A high score on the power distance cultural dimension indicates that Malaysian us-
ers may be less comfortable using the sound tone interface in public due to an ac-
ceptance of inequality and would therefore prefer the keyboard code.
o A very low score on the individualism dimension (26) and a mid-high score on the
indulgence cultural dimension (57) indicates Malaysian users are likely to find the
keyboard code more fun.
o A mid score on the masculinity cultural dimension indicates that Malaysian users
may find either interface the most efficient.
o Low uncertainty avoidance indicates that Malaysian users are likely to prefer the
tone best overall.
5.4.7.3.2.3 Malaysia - Data (Actual)
Out of the Malaysian subjects tested within the sampling frame:
o The majority of Malaysian users found the keyboard to be more fun (median score
of 6).
o The majority of Malaysian users found the keyboard to be more efficient (median
score of 5).
o The majority of Malaysian users would choose the keyboard on a regular basis in
public (median score of 6).
o Overall, Malaysian users liked the keyboard the best (median score of 6).
o When asked which was more fun 60% chose the tone whilst only 40% chose the
keyboard code.

Chapter 5 Empirical Evaluations of the Creation and Consumption Interfaces
204
5.4.7.3.3 Asia Results Set 3: Indonesia
5.4.7.3.3.1 Indonesia - Dimensional Descriptions and Predictions
Power Distance: 78/High. Indonesia scores high on this dimension (score of 78) which
means that the following characterises the Indonesian style: Being dependent on hierar-
chy, unequal rights between power holders and non-power holders, superiors in-accessi-
ble, leaders are directive, management controls and delegates. Power is centralized and
managers count on the obedience of their team members. Employees expect to be told
what to do and when. Control is expected and managers are respected for their position.
Communication is indirect and negative feedback hidden. High Power Distance also
means that Indonesian co-workers would expect to be clearly directed by the boss or man-
ager – it is the classic Guru-Student kind of dynamic that applies to Indonesia. Westerners
may be considerably surprised with the visible, socially acceptable, wide and unequal dis-
parity between the rich and poor. Kiosk preference prediction (Which would you use
on a regular basis on public?): A high score on the power distance cultural dimension
indicates that Indonesian users may be less comfortable using the sound tone interface in
public due to an acceptance of inequality and would therefore prefer the keyboard code.
Individualism: 14/Low. Indonesian children are committed to their parents, as are the
parents committed to them all their growing lives. Their desire is to make their parents' life
easier. There is a desire to take care of parents and give them support in their old age.
There is an Asian saying that is accepted in Indonesia, "You can get another wife or hus-
band but not another mother or father". This family loyalty is also apparent in the fact that
Indonesian families keep elders (such as grandparents) at home instead of sending them
to any institution. In Individualist societies the focus is on the nuclear family only.
Chapter 5 Empirical Evaluations of the Creation and Consumption Interfaces
205
Indulgence: 38/Low. The low score of 38 in this dimension shows that Indonesia has a
culture of Restraint. Societies with a low score in this dimension have a tendency to cyni-
cism and pessimism. Also, in contrast to Indulgent societies, Restrained societies do not
put much emphasis on leisure time and control the gratification of their desires. People
with this orientation have the perception that their actions are Restrained by social norms
and feel that indulging themselves is wrong. Kiosk preference prediction (Which is
more fun?): A very low score on the individualism dimension and low score on the indul-
gence cultural dimension indicates Indonesian users are likely to find the keyboard code
more fun.
Masculinity: 46/Mid. Indonesia scores (46) on this dimension and is thus considered low
Masculine. While not entirely like most North European countries who are very low in Mas-
culinity and thus considered Feminine, Indonesia is less Masculine than some other Asian
countries like Japan, China and India. In Indonesia status and visible symbols of success
are important but it is not always material gain that brings motivation. Often it is the posi-
tion that a person holds which is more important to them because of an Indonesian con-
cept called “gengsi” – loosely translated to be, “outward appearances”. It is important that
the “gengsi” be strongly maintained thereby projecting a different outward appearance
aimed at impressing and creating the aura of status. Kiosk preference prediction
(Which is more efficient?): A mid score on the masculinity cultural dimension indicates
that Indonesian users may find either interface the most efficient.
Uncertainty Avoidance: 48/Low. Indonesia scores (48) on this dimension and thus has
a low preference for avoiding uncertainty. This means that there is a strong preference in
Indonesia toward the Javanese culture of separation of internal self from external

Chapter 5 Empirical Evaluations of the Creation and Consumption Interfaces
206
self. When a person is upset, it is habitual for the Indonesian not to show negative emo-
tion or anger externally. They will keep smiling and be polite, no matter how angry they are
inside. This also means that maintaining work place and relationship harmony is very im-
portant in Indonesia, and no one wishes to be the transmitter of bad or negative news or
feedback. Another aspect of this dimension can be seen in Conflict resolution. Direct
Communication as a method of conflict resolution is often seen to be a threatening situa-
tion and one that the Indonesian is uncomfortable in. A tried and tested, successful
method of conflict diffusion or resolution is to take the more familiar route of using a third
party intermediary, which has many benefits. It permits the exchange of views without loss
of face as well as since one of the main manifestations of Indonesia’s Uncertainty Avoid-
ance is to maintain the appearance of harmony in the workplace; an intermediary removes
the uncertainty associated with a confrontation. Perhaps one very key phrase in Indonesia
that describes how this works is “Asal Bapak Senang” (Keep the Boss Happy). The rea-
sons are manifold; but if you extrapolate to UAI dimension you can see that keeping the
boss happy means you will be rewarded and if you are rewarded you have no economic or
status uncertainty as you will keep being a valuable member of the company. Kiosk pref-
erence prediction (Which did you like best overall?): Mid to low preference for uncer-
tainty avoidance indicates that Indonesian users may like either interface best overall.
Chapter 5 Empirical Evaluations of the Creation and Consumption Interfaces
207
5.4.7.3.3.2 Indonesia – Summary of Predictions
It is predicted that Indonesian respondents within the sampling frame would be most likely
to have the following preferences (PDI 78 high, IDV 14 low, MA 46 mid, UA 48 mid, LTO
62 high, IND 38 low):
o A high score on the power distance cultural dimension indicates that Indonesian us-
ers may be less comfortable using the sound tone interface in public due to an ac-
ceptance of inequality and would therefore prefer the keyboard code.
o A very low score on the individualism dimension and low score on the indulgence
cultural dimension indicates Malaysian users are likely to find the keyboard code
more fun.
o A mid score on the masculinity cultural dimension indicates that Malaysian users
may find either interface the most efficient.
o Mid uncertainty avoidance indicates that Indonesian users may like either interface
best overall.
5.4.7.3.3.3 Indonesia - Data (Actual)
Out of the Indonesian subjects tested within the sampling frame:
o The majority of Indonesian users found the tone to be more fun (median score of 3).
o The majority of Indonesian users found the keyboard to be more efficient (median
score of 7).
o The majority of Indonesian users would choose the keyboard on a regular basis in
public (median score of 7).

Chapter 5 Empirical Evaluations of the Creation and Consumption Interfaces
208
o Overall, Indonesian users liked the keyboard the best (median score of 5).
5.4.7.3.4 Asia Results Set 4: Philippines
5.4.7.3.4.1 Philippines - Dimensional Descriptions and Predictions
Power Distance: 94/High. With a score of 94, The Philippines is a hierarchical society.
This means that people accept a hierarchical order in which everybody has a place and
which needs no further justification. Hierarchy in an organization is seen as reflecting in-
herent inequalities, centralization is popular, subordinates expect to be told what to do and
the ideal boss is a benevolent autocrat. . Kiosk preference prediction (Which would
you use on a regular basis on public?): A high score on the power distance cultural di-
mension indicates that Filipinos may be less comfortable using the sound tone interface in
public due to an acceptance of inequality and would therefore prefer the keyboard code.
Individualism: 32/Low. The Philippines, with a score of 32, is considered a collectivistic
society. This is manifest in a close long-term commitment to the member 'group', be that a
family, extended family, or extended relationships. Loyalty in a collectivist culture is para-
mount, and over-rides most other societal rules and regulations. The society fosters strong
relationships where everyone takes responsibility for fellow members of their group. In col-
lectivist societies offence leads to shame and loss of face, employer/employee relation-
ships are perceived in moral terms (like a family link), hiring and promotion decisions take
account of the employee’s in-group, management is the management of groups.
Indulgence: 42/Low. With a low score of 42, the culture of the Philippines is one of Re-
straint. Societies with a low score in this dimension have a tendency to cynicism and pessi-
mism. Also, in contrast to Indulgent societies, Restrained societies do not put much empha-
sis on leisure time and control the gratification of their desires. People with this orientation
Chapter 5 Empirical Evaluations of the Creation and Consumption Interfaces
209
have the perception that their actions are Restrained by social norms and feel that indulging
themselves is wrong. Kiosk preference prediction (Which is more fun?): A very low score
on the individualism dimension and low score on the indulgence cultural dimension indicates
Filipino users are likely to find the keyboard code more fun.
Masculinity: 64/High. The Philippines scores 64 on this dimension and is thus a Mascu-
line society. In Masculine countries people “live in order to work”, managers are expected
to be decisive and assertive, the emphasis is on equity, competition and performance and
conflicts are resolved by fighting them out. Kiosk preference prediction (Which is more
efficient?): A high score on the masculinity cultural dimension indicates that Philippines
users may find the tone interface the most efficient.
Uncertainty Avoidance: 44/Low. The Philippines scores 44 on this dimension and thus
has a low preference for avoiding uncertainty. Low UAI societies maintain a more relaxed
attitude in which practice counts more than principles and deviance from the norm is more
easily tolerated. In societies exhibiting low UAI, people believe there should be no more
rules than are necessary and if they are ambiguous or do not work they should be aban-
doned or changed. Schedules are flexible, hard work is undertaken when necessary but
not for its own sake, precision and punctuality do not come naturally, innovation is not
seen as threatening. Kiosk preference prediction (Which did you like best overall?):
Low uncertainty avoidance indicates that Philippines users may like either interface best
overall.
Long Term Orientation: 27/Low. A very low score of 27 indicates that the Philippines are
more normative than pragmatic. People in such societies have a strong concern with estab-
lishing the absolute Truth; they are normative in their thinking. They exhibit great respect for
Chapter 5 Empirical Evaluations of the Creation and Consumption Interfaces
210
traditions, a relatively small propensity to save for the future, and a focus on achieving quick
results.
5.4.7.3.4.2 Philippines – Summary of Predictions
It is predicted that Philippines respondents within the sampling frame would be most likely
to have the following preferences (PDI 94 high, IDV 32 low, MA 64 high, UA 44 low, LTO
27 low, IND 42 low):
o A high score on the power distance cultural dimension indicates that Philippines us-
ers may be less comfortable using the sound tone interface in public due to an ac-
ceptance of inequality and would therefore prefer the keyboard code.
o A low score on the individualism dimension and low score on the indulgence cul-
tural dimension indicates Philippines users are likely to find the keyboard code more
fun.
o A high score on the masculinity cultural dimension indicates that Philippines users
may find the tone interface the most efficient.
o Low uncertainty avoidance indicates that Philippines users may like either interface
best overall.
5.4.7.3.4.3 Philippines - Data (Actual)
Out of the Philippines subjects tested within the sampling frame:
o The majority of Philippines users found the tone to be more fun (median score of 2).
o The majority of Philippines users found the keyboard to be more efficient (median
score of 6).
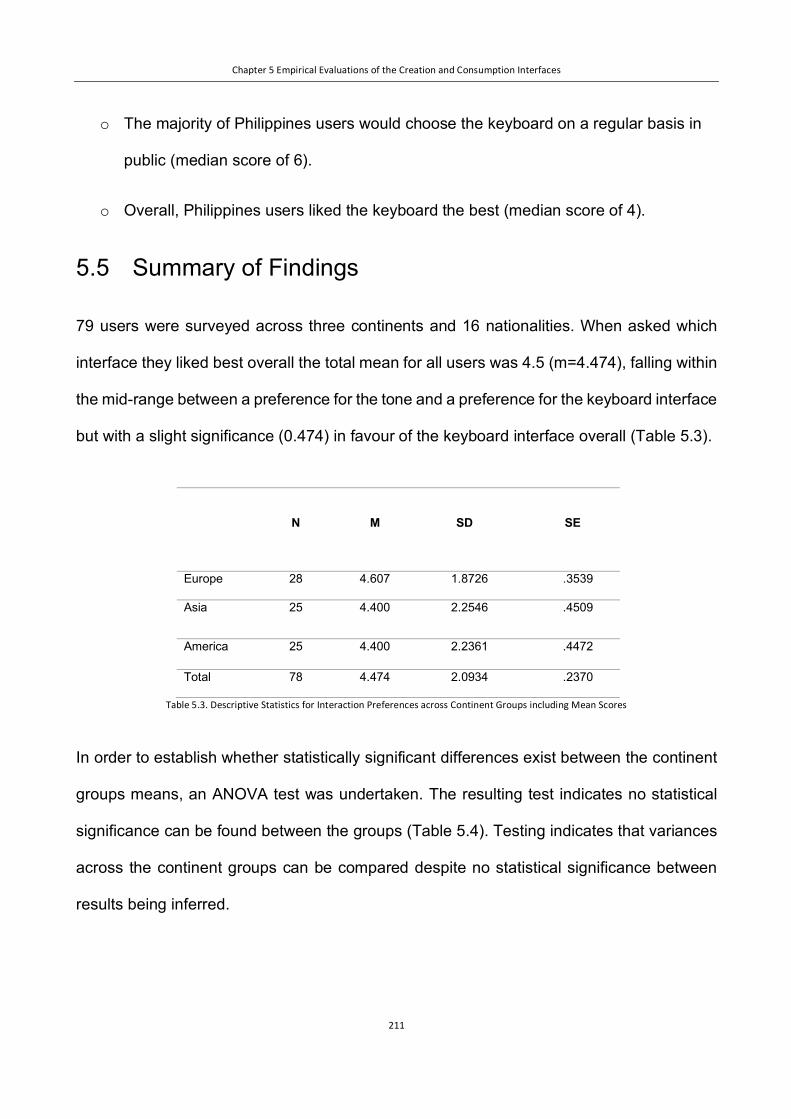
Chapter 5 Empirical Evaluations of the Creation and Consumption Interfaces
211
o The majority of Philippines users would choose the keyboard on a regular basis in
public (median score of 6).
o Overall, Philippines users liked the keyboard the best (median score of 4).
5.5 Summary of Findings
79 users were surveyed across three continents and 16 nationalities. When asked which
interface they liked best overall the total mean for all users was 4.5 (m=4.474), falling within
the mid-range between a preference for the tone and a preference for the keyboard interface
but with a slight significance (0.474) in favour of the keyboard interface overall (Table 5.3).
N
M
SD
SE
Europe 28 4.607 1.8726 .3539
Asia 25 4.400 2.2546 .4509
America 25 4.400 2.2361 .4472
Total 78 4.474 2.0934 .2370
Table 5.3. Descriptive Statistics for Interaction Preferences across Continent Groups including Mean Scores
In order to establish whether statistically significant differences exist between the continent
groups means, an ANOVA test was undertaken. The resulting test indicates no statistical
significance can be found between the groups (Table 5.4). Testing indicates that variances
across the continent groups can be compared despite no statistical significance between
results being inferred.
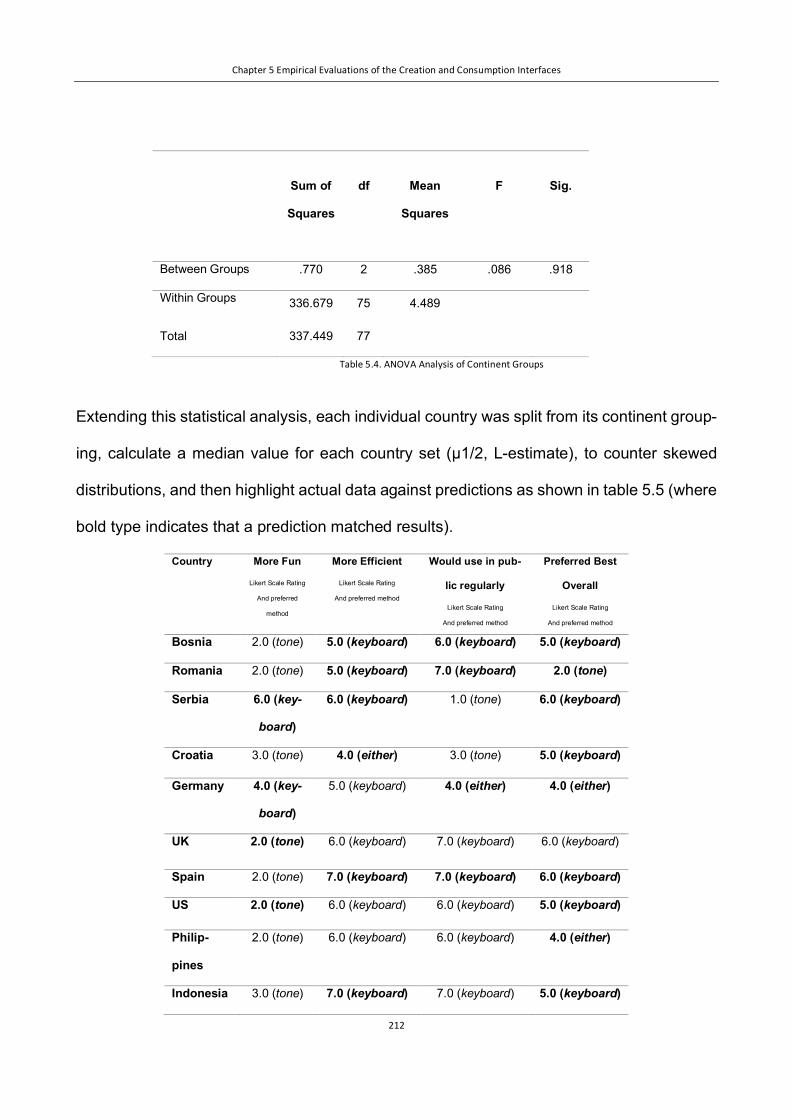
Chapter 5 Empirical Evaluations of the Creation and Consumption Interfaces
212
Sum of
Squares
df
Mean
Squares
F
Sig.
Between Groups .770 2 .385 .086 .918
Within Groups 336.679 75 4.489
Total 337.449 77
Table 5.4. ANOVA Analysis of Continent Groups
Extending this statistical analysis, each individual country was split from its continent group-
ing, calculate a median value for each country set (μ1/2, L-estimate), to counter skewed
distributions, and then highlight actual data against predictions as shown in table 5.5 (where
bold type indicates that a prediction matched results).
Country More Fun
Likert Scale Rating
And preferred
method
More Efficient
Likert Scale Rating
And preferred method
Would use in pub-
lic regularly
Likert Scale Rating
And preferred method
Preferred Best
Overall
Likert Scale Rating
And preferred method
Bosnia 2.0 (tone) 5.0 (keyboard) 6.0 (keyboard) 5.0 (keyboard)
Romania 2.0 (tone) 5.0 (keyboard) 7.0 (keyboard) 2.0 (tone)
Serbia 6.0 (key-
board)
6.0 (keyboard) 1.0 (tone) 6.0 (keyboard)
Croatia 3.0 (tone) 4.0 (either) 3.0 (tone) 5.0 (keyboard)
Germany 4.0 (key-
board)
5.0 (keyboard) 4.0 (either) 4.0 (either)
UK 2.0 (tone) 6.0 (keyboard) 7.0 (keyboard) 6.0 (keyboard)
Spain 2.0 (tone) 7.0 (keyboard) 7.0 (keyboard) 6.0 (keyboard)
US 2.0 (tone) 6.0 (keyboard) 6.0 (keyboard) 5.0 (keyboard)
Philip-
pines
2.0 (tone) 6.0 (keyboard) 6.0 (keyboard) 4.0 (either)
Indonesia 3.0 (tone) 7.0 (keyboard) 7.0 (keyboard) 5.0 (keyboard)
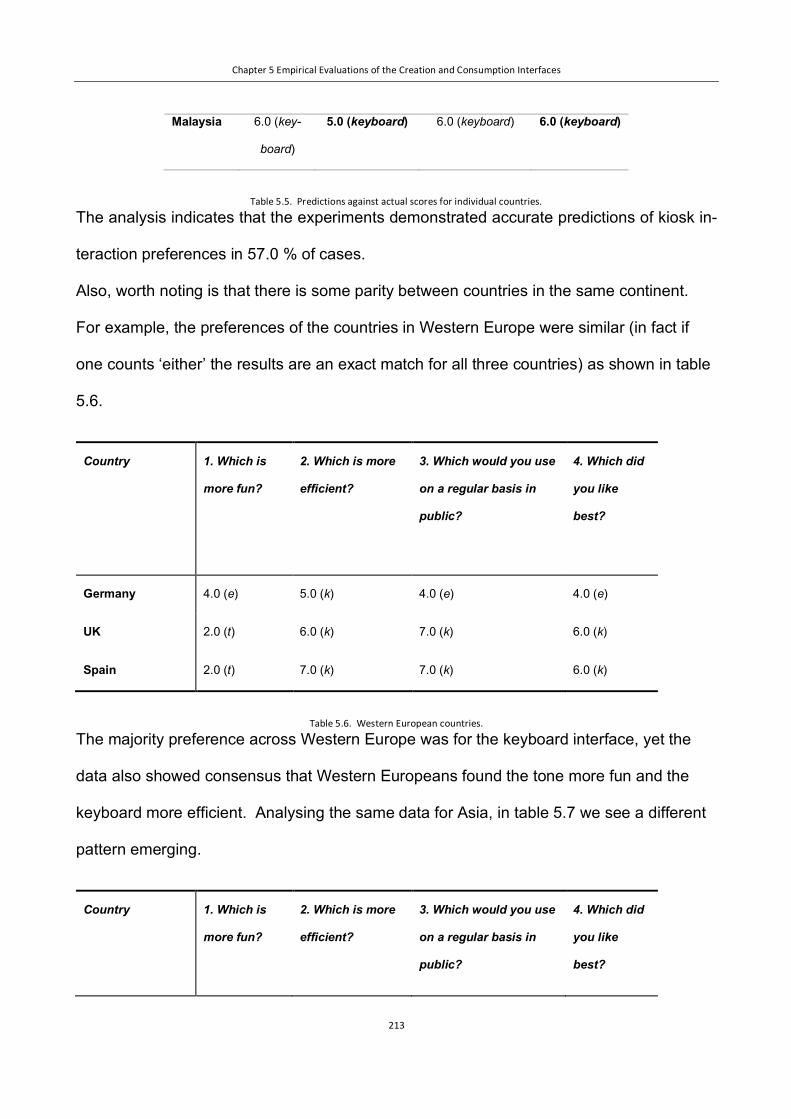
Chapter 5 Empirical Evaluations of the Creation and Consumption Interfaces
213
Malaysia 6.0 (key-
board)
5.0 (keyboard) 6.0 (keyboard) 6.0 (keyboard)
Table 5.5. Predictions against actual scores for individual countries.
The analysis indicates that the experiments demonstrated accurate predictions of kiosk in-
teraction preferences in 57.0 % of cases.
Also, worth noting is that there is some parity between countries in the same continent.
For example, the preferences of the countries in Western Europe were similar (in fact if
one counts ‘either’ the results are an exact match for all three countries) as shown in table
5.6.
Country 1. Which is
more fun?
2. Which is more
efficient?
3. Which would you use
on a regular basis in
public?
4. Which did
you like
best?
Germany 4.0 (e) 5.0 (k) 4.0 (e) 4.0 (e)
UK 2.0 (t) 6.0 (k) 7.0 (k) 6.0 (k)
Spain 2.0 (t) 7.0 (k) 7.0 (k) 6.0 (k)
Table 5.6. Western European countries.
The majority preference across Western Europe was for the keyboard interface, yet the
data also showed consensus that Western Europeans found the tone more fun and the
keyboard more efficient. Analysing the same data for Asia, in table 5.7 we see a different
pattern emerging.
Country 1. Which is
more fun?
2. Which is more
efficient?
3. Which would you use
on a regular basis in
public?
4. Which did
you like
best?
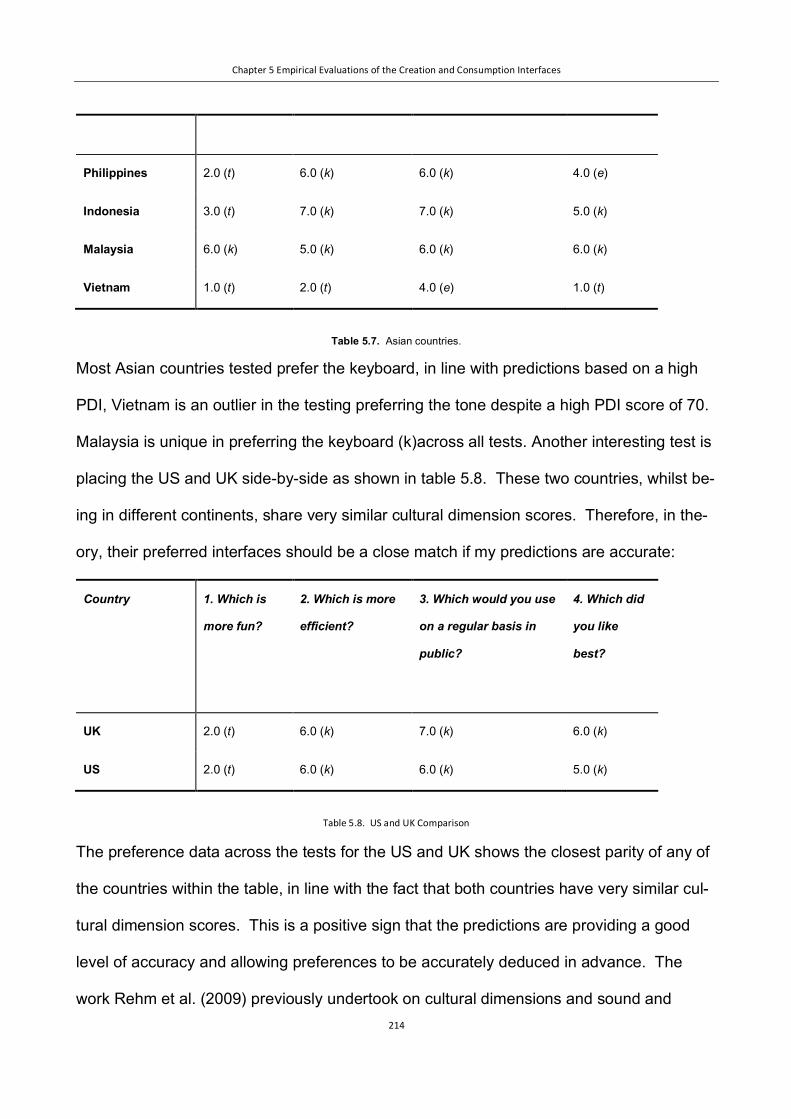
Chapter 5 Empirical Evaluations of the Creation and Consumption Interfaces
214
Philippines 2.0 (t) 6.0 (k) 6.0 (k) 4.0 (e)
Indonesia 3.0 (t) 7.0 (k) 7.0 (k) 5.0 (k)
Malaysia 6.0 (k) 5.0 (k) 6.0 (k) 6.0 (k)
Vietnam 1.0 (t) 2.0 (t) 4.0 (e) 1.0 (t)
Table 5.7. Asian countries.
Most Asian countries tested prefer the keyboard, in line with predictions based on a high
PDI, Vietnam is an outlier in the testing preferring the tone despite a high PDI score of 70.
Malaysia is unique in preferring the keyboard (k)across all tests. Another interesting test is
placing the US and UK side-by-side as shown in table 5.8. These two countries, whilst be-
ing in different continents, share very similar cultural dimension scores. Therefore, in the-
ory, their preferred interfaces should be a close match if my predictions are accurate:
Country 1. Which is
more fun?
2. Which is more
efficient?
3. Which would you use
on a regular basis in
public?
4. Which did
you like
best?
UK 2.0 (t) 6.0 (k) 7.0 (k) 6.0 (k)
US 2.0 (t) 6.0 (k) 6.0 (k) 5.0 (k)
Table 5.8. US and UK Comparison
The preference data across the tests for the US and UK shows the closest parity of any of
the countries within the table, in line with the fact that both countries have very similar cul-
tural dimension scores. This is a positive sign that the predictions are providing a good
level of accuracy and allowing preferences to be accurately deduced in advance. The
work Rehm et al. (2009) previously undertook on cultural dimensions and sound and

Chapter 5 Empirical Evaluations of the Creation and Consumption Interfaces
215
space distance is shown in table 5.10 and colludes with the results found in this more in-
depth study.
Figure 5.10 Cultural Dimensions and Sound/Space Preferences
5.6 Chapter Summary
In this chapter quantitative findings were presented from the consumption interface within
the kiosk. Countries were grouped by Eastern Europe, Western Europe, North America,
and Asia. It was demonstrated that it was possible to predict a countries preferred inter-
face with some accuracy. Emergent patterns were also identified within countries that
were geographically close, within the same continent, and also between countries that
shared similar dimensional scores such as the US and UK.

Chapter 6 Qualitative Results
216
Chapter 6 Qualitative Results
6.1 Chapter Introduction
In this section an outline of the qualitative results obtained from observing subjects using
the consumption interface is provided. Users were asked open-ended questions after the
tasks and the most frequent responses were recorded for this analysis.
6.2 Inductive and Deductive Approaches
In analysing qualitative data, we have two fundamental approaches at our disposal: the in-
ductive approach and the deductive approach, though each of these approaches can be
handled in a variety of different manners (Mahrer, 1988; Spradley, 1979; Taylor & Bogdan,
1984). The inductive approach is based on the analysis of data with little or no predeter-
mined framework, structure, or theory and uses the tangibility of the data itself in order to
derive any structure of analysis. The inductive approach is comprehensive albeit time con-
suming and is therefore most suitable in situations where little is known about the phenom-
enon being studied (Lathlean J, 2006).
Conversely, the deductive approach involves using a predetermined framework or struc-
ture to analyse the data set. i.e. the researcher imposes their own theories and structure
upon the data and then analyses transcripts using these theories (Williams et al. 2004).
This is a useful approach where the researcher is already aware of probable participant re-
sponses, however, particular care needs to be taken as the deductive approach can be in-

Chapter 6 Qualitative Results
217
flexible and even bias the data as the coding framework will need to be decided in ad-
vance of analysis (though the deductive approach, if executed properly, is relatively rapid).
An inductive approach has been selected for the analysis of the qualitative data.
6.3 Thematic Analysis
Numerous inductive approaches for analysing data are available, however, for the pur-
poses of this research thematic analysis was evaluated as the best method.
Thematic analysis is one of the most frequently used methods within qualitative research,
it focusses on examining, pinpointing, and recording themes (or patterns) within data sets.
These themes are comprised of patterns that are important to the explanation of particular
phenomena and are useful to address specific research questions. The categories for
analysis are defined by the themes, which in turn are associated to the specific research
questions. Coding phases within thematic analysis include data familiarity, initial coding
generation, theme coding identification and narrowing, theme review, theme definition, and
final report production (Benner, 1985; Leininger, 1985, Braun et al., 2006, Guest et al.,
2011). This process, as applied to the data gathered, will be covered in the following sec-
tion.
As data for the thematic analysis has already been gathered the next step is to identify all
data that relates to already classified patterns. In order to achieve this the transcript data
has been analysed ,both manually and with the assistance of a computer software pack-
age, to identify themes offering a summary word or statement for each element discussed,
this process is referred to as open coding. Any information that is completely off topic re-
mains un coded and is known as ‘dross’ (Morse et al. 1996).
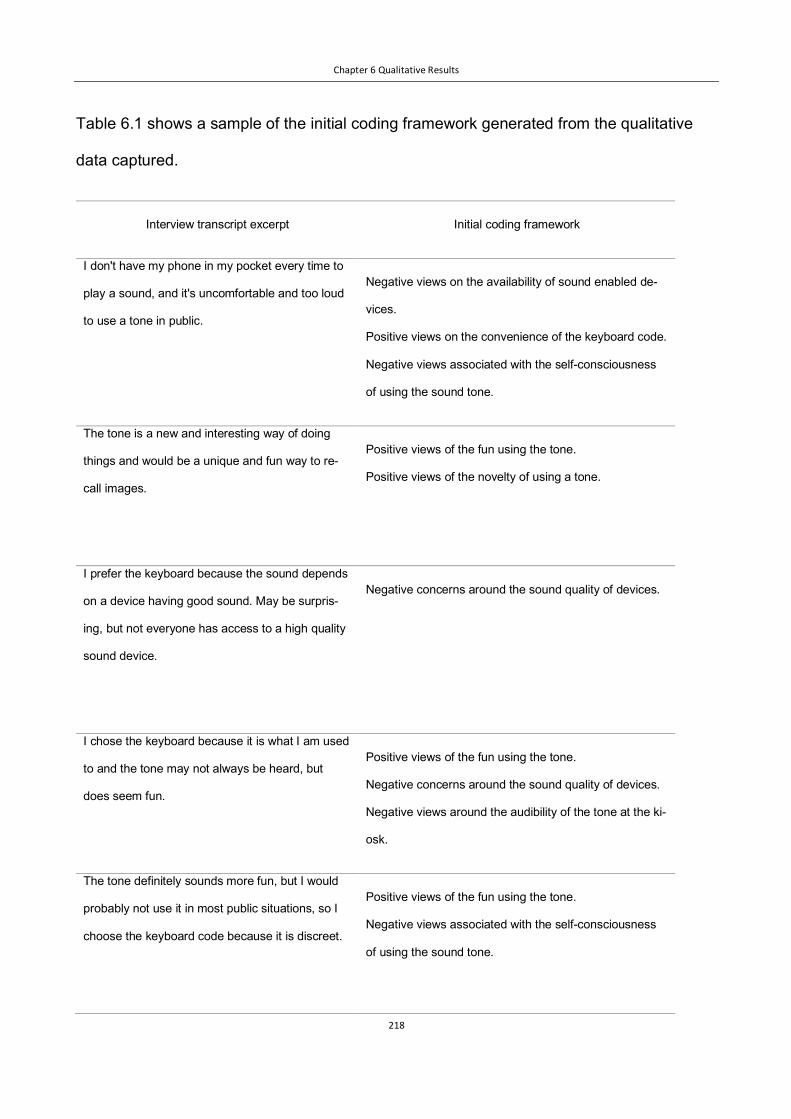
Chapter 6 Qualitative Results
218
Table 6.1 shows a sample of the initial coding framework generated from the qualitative
data captured.
Interview transcript excerpt Initial coding framework
I don't have my phone in my pocket every time to
play a sound, and it's uncomfortable and too loud
to use a tone in public.
Negative views on the availability of sound enabled de-
vices.
Positive views on the convenience of the keyboard code.
Negative views associated with the self-consciousness
of using the sound tone.
The tone is a new and interesting way of doing
things and would be a unique and fun way to re-
call images.
Positive views of the fun using the tone.
Positive views of the novelty of using a tone.
I prefer the keyboard because the sound depends
on a device having good sound. May be surpris-
ing, but not everyone has access to a high quality
sound device.
Negative concerns around the sound quality of devices.
I chose the keyboard because it is what I am used
to and the tone may not always be heard, but
does seem fun.
Positive views of the fun using the tone.
Negative concerns around the sound quality of devices.
Negative views around the audibility of the tone at the ki-
osk.
The tone definitely sounds more fun, but I would
probably not use it in most public situations, so I
choose the keyboard code because it is discreet.
Positive views of the fun using the tone.
Negative views associated with the self-consciousness
of using the sound tone.

Chapter 6 Qualitative Results
219
I think it is easiest to use keyboard.
Positive views on the convenience of the keyboard code.
Table 6.1: Initial Coding Framework
The second part of the thematic analysis involves collating all of the terms, words, and
phrases used into a fresh workbook. These are then able to be worked through to identify
any duplications thereby reducing the number of categories (Burnard, 1991, 2006). Using
the initial coding data, the list of categories or themes (with duplicates removed) is shown
in table 6.2.
Negative views on the availability of sound enabled devices.
Positive views on the convenience of the keyboard code.
Negative views associated with the self-consciousness of using the sound tone.
Positive views of the fun using the tone.
Positive views of the novelty of using a tone.
Negative concerns around the sound quality of devices.
Negative views around the audibility of the tone at the kiosk.
Positive views on the safety/security of the keyboard code.
Neutral views on both methods.
Positive views on the efficiency of the keyboard code.
Positive views on the reliability of the keyboard code.
Positive views of the practicality of using a tone.
Negative views on the availability of a mobile device.
Positive views on the familiarity of the keyboard.
Positive views on the efficiency of the sound tone.
Positive views on the convenience of the sound tone.
Positive views related to the tone being more modern.
Negative views related to the keyboard seeming outdated.
Negative views around a sound tone being too complicated.

Chapter 6 Qualitative Results
220
Positive views on the safety/security of the sound tone.
Negative views around the accessibility of a sound tone (for hearing impaired users).
Positive views around the accessibility of the keyboard (for hearing impaired users).
Positive views of the practicality of using a keyboard code.
Positive views on the discreteness of the keyboard code.
Table 6.2: List of categories (themes)
Following the collation of the list in table 6.2, the next step in the thematic analysis is to
look for similar or overlapping categories, which are informed by the theoretical and analyt-
ical positions developed through the course of the research. Refining these categories fur-
ther and reducing them is achieved through the process of identifying grouping topologies
(Pope et al. 1999). The reduced list used in the thematic analysis is shown in in table 6.3.
Final coding framework Initial coding framework
Accessibility Positive views around the accessibility of the keyboard (for
hearing impaired users).
Negative views around the accessibility of a sound tone (for
hearing impaired users).
Safety/Security Positive views on the safety/security of the sound tone.
Positive views on the safety/security of the keyboard code.
Technology Negative views on the availability of sound enabled devices.
Negative concerns around the sound quality of devices.
Positive views related to the tone being more modern.
Negative views related to the keyboard seeming outdated.
Negative views on the availability of a mobile device.
Negative views around the audibility of the tone at the kiosk.
Social Positive views on the discreteness of the keyboard code.
Positive views of the novelty of using a tone.
Positive views of the fun using the tone.
Negative views associated with the self-consciousness of us-
ing the sound tone.

Chapter 6 Qualitative Results
221
Practicality Positive views of the practicality of using a keyboard code.
Negative views around a sound tone being too complicated.
Positive views on the convenience of the sound tone.
Positive views on the efficiency of the sound tone.
Positive views on the familiarity of the keyboard.
Positive views of the practicality of using a tone.
Positive views on the reliability of the keyboard code.
Positive views on the efficiency of the keyboard code.
Positive views on the convenience of the keyboard code.
Table 6.3: final coding framework after reduction of the categories in the initial coding framework
6.4 Summary of Findings
The interviews demonstrated that users across cultures are able to manage contradictions
and contrasts around consumption interfaces with little effort. These incongruities are both
manifold and complex, encompassing negative and positive notions relating to preferred
interfaces and their consequences which can be grouped into the categories of accessibility,
safety/security, technology, social, and practicality:
“A sound isn't easy sometimes, like when multitasking, so I prefer the key-
board code.”
“I always choose the easiest and most efficient way over the fun way. Typ-
ing is just more common and using a sound seems too complicated.”
Chapter 6 Qualitative Results
222
Though it proved possible to predict a user’s preference with some accuracy, as outlined
in the quantitative data section (consumption), user’s stated rationale seemed to vary
across a broad spectrum dependent upon the user’s own personal values combined with
the collective ‘cultural programming of the mind’, that Hofstede discusses. Early adopters
(across all cultures) showed a marked preference for the tone, showing some heed to any
fears around disturbing others in public (where this was an omnipresent view in their
source culture), or any lack of reliability that may or may not be present in the technology
(either from the kiosk or the mobile device). The users that were in favour of the tone
spoke extremely positively about it and did not attempt to identify any potential shortcom-
ings, it was almost a polarised view of the technology:
“The tone is a new and interesting way of doing things and would be a
unique and fun way to recall images.”
“The tone is more practical.”
“I found the tone to be easier and quicker.”
“I think the tone's somehow easier.”
Some users even took to criticising the traditional approach:
“The tone sounds more modern, to me, typing a code seems old-school.”
A number of users acknowledged that though they thought the tone was efficient and fun
they would be too self-conscious to use it in public. These users predominantly originated
from cultures where with a high power distance where disturbing others would be frowned
upon due to a lack of equality:

Chapter 6 Qualitative Results
223
“The tone definitely sounds more fun, but I would probably not use it in
most public situations, so I choose the keyboard code because it is dis-
creet.”
“I don't have my phone in my pocket every time to play a sound, and it's
uncomfortable and too loud to use a tone in public.”
“People playing random sounds in public seems annoying.”
“I feel that playing sounds is only okay when I'm alone so prefer the key-
board.”
“I often wouldn't be able to play a sound, so would have to use the key-
board or not use the site.”
“I think typing a code is faster and more efficient than playing a sound. It's
also better because it won't disturb others in public.”
As shown in figure 6.0, the keyboard code (keyboard + code phrases) was mentioned
most by users) whilst the tone was mentioned next frequently in the respondent’s answers.
Overall there was more support for the keyboard than the code with the rationale mainly
being that the keyboard was familiar, more discreet, more reliable, and didn’t require any
other devices. Though a significant number of users that indicated support for the key-
board also acknowledged that the tone did seem more ‘fun’ to use. In fact, the adjective
fun appears across the answers and is one of the most frequently chosen terms within re-
spondent’s answers despite it not being used within the questionnaire or in the test direc-
tions. It is interesting that a significant number of participants from the countries that it was
predicted would prefer the keyboard (such as those in Asia) still acknowledged the tone as
the more fun method of interacting with the kiosk despite their culturally instilled discomfort

Chapter 6 Qualitative Results
224
with potentially upsetting members of the public. It is indicative of the veracity of culture
that the personal preferences of an individual user are often filtered through its conduit.
i.e. the same user that found the tone fun but discounted it due to their cultural program-
ming may have chosen the tone as their favourite had they been raised in a diametrically
opposed culture with different attitudes to public behaviour.
Figure 6.0 Word Cloud representation of Qualitative Responses (Consumption Interface)
The process of recalling an image, which this qualitative research investigated, is shown in
an actionable form in the decision support tree in figure 6.1. There were no errors generated
during the testing remarkably so the ‘display error message’ portion of the workflow was
never utilised.

Chapter 6 Qualitative Results
225
Figure 6.1 Decision Support Tree
6.5 Chapter Summary
In this chapter a thematic analysis was used to identify key patterns within the qualitative
feedback. As can be seen there is a mixture of responses seemingly transgressing the
‘cultural programming of the mind’ that Hofstede refers to. Beyond culture it would appear
one’s subjective attitude toward new technology is coming into play as early adopters
seem excited by the technology whilst traditionalists seem reluctant to embrace a change.

Chapter 7 Conclusion
226
Chapter 7 Conclusion
7.1 Chapter Introduction
Current kiosk solutions are expensive, formulaic, and do not take into account the cultural
preferences of an end user. In large their development is driven by large corporations,
therefore, making them accessible to people in the developing world is not a priority.
Compounding this issue is the fact that when websites are localised they are often done so
ineffectively, and additionally do not currently cater to users from mixed cultural back-
grounds. One to two traditional interaction methods are usually provided and there is little
consideration given to the relationship between different points and interfaces within the
user experience. E.g. websites and kiosk interfaces are often designed and localised as
independent entities rather than holistically.
Addressing these issues, this thesis proposed a new approach: A culturally adaptive sus-
tainable information kiosk (CASIK). The idea was to design a holistic system that would,
based on a user answering several questions, adapt the website creation interface and the
subsequent kiosk consumption interface to an individual’s cultural background even if they
were from one or more additional cultures. It was predicted that adapting these creation
and consumption interfaces to a person’s cultural background, holistically, would improve
the usability of the system thereby increasing satisfaction and efficiency when compared to
a non-adapted system.
In support of this thesis developments were made within three areas:

Chapter 7 Conclusion
227
Firstly, the concept of an ontological model was adopted and refined as previously outlined
in empirical work by other scholars including Chandramouli (2008), Reinecke (2011), Ro-
man (2005), Breuker (1999), Pahl (2005), so that a user’s culture could be used to custom-
ise the website creation interface, beyond a single culture. Additionally this model was
used as a basis to select an end users preferred interaction method within the consump-
tion interface through the utilisation of a prediction algorithm, predicated on Hofstede’s cul-
tural dimensions . This ontological engine was linked to a modelling engine that custom-
ised the interface preferences of the creation website accordingly as well as selecting the
default consumption interaction method. As outlined in the main body of the thesis, inter-
face preferences for the creation website were garnered from the work of previous
scholar’s that had investigated Hofstede’s model of cultural dimensions and its correlation
to interface preferences as well as work undertaken by scholars on multimodal interactions
and Hofstede’s cultural dimensions including key work by scholars including Voehringer-
Kuhnt (2002), Burgmann et al. (2006), Hermeking (2005), Dormann and Chisalita (2002),
Brockner et al. (2001), and Reinecke (2011). Additionally in regard to the consumption ki-
osk interface, there was a review of work around culture and multimodal interaction by
scholars including Maynard (2009), Rehm et al. (2009), and Paggio et al. (2011). The effi-
cacy of such a system was demonstrated through developing a fully working website and
kiosk system, within the context of a recreational context, namely an image sharing appli-
cation.
A kiosk interface was developed so that an end user could recall their uploaded image in
public. This kiosk system provided a traditional keyboard interface and a novel sound
based interface. It was demonstrated that, using existing empirical research on cultural di-
mensions, one could effectively predict, in the majority of cases, an end user’s interaction
Chapter 7 Conclusion
228
preferences when using the kiosk in public. The rationale behind wanting to predict prefer-
ences being that this knowledge could be used, in future systems, to present the end user
with the most optimal interface and therefore improve their user experience from the initial
website or mobile device through to the final kiosk interaction.
There was also an investigation into the development of sustainable kiosk systems, using
sound as a novel interaction method. This involved investigating and developing several
different functioning prototype systems based around single board (SoC) computer tech-
nology. These systems were approximately one eighth the cost of developing a kiosk so-
lution using traditional hardware, as well as being smaller and more power efficient.
This final chapter discusses the contribution to knowledge, limitations and future work, as
well as implications for practice.
7.2 Limitations and Threats to Validity Whilst it is impossible for any study to eliminate all threats to validity, decisions had to be
taken which were trade-offs between internal and external validity. This research stands
as a converging piece of evidence amongst similar studies as no single study can prove
anything on its own. One limitation of this study is the sample size and length of the study.
Although the sample size of 124 users provided a useful cross-sectional representation of
cultural audiences it could be argued that increasing the sample size would allow for a
deeper analysis, and validation, of findings through statistical analysis particularly within
specific cultural groups. A longitudinal study would be extremely useful to observe how fa-
miliarity with multimodal interfaces over time impacted the findings across the cultural
samples.

Chapter 7 Conclusion
229
Due to these limitations relationships among variables were interpreted with caution as
true causal inferences could only be drawn using longitudinal data. This is particularly im-
portant for a subject such as cultural preferences which is not static but rather a develop-
mental process that changes over time. Throughout the process of planning and conduct-
ing this study balanced decisions were made about the validity and quality of research by
breaking down and carefully thinking through research decisions logically as critical con-
sumers of research.
7.3 Testing the Hypotheses
In chapter 1 it was outlined that the research objectives were: (1) to analyse the effective-
ness of culturally adaptive user interfaces within a recreational context, (2) to assess the
cultural interaction preferences of individuals consuming content in a public space, and (3)
to research the feasibility of developing sustainable kiosk solutions.
These objectives provided a basis to formulate the four research questions which were:
(RQ1) Can the user interface be personalised by CASIK so as to be preferred by users
over a non-adapted version? (RQ2) What strategies can be used to build culturally adap-
tive kiosks using sustainable hardware solutions? (RQ3) How can a mobile device be
used to control a kiosk while maintaining a holistic user experience across both types of
devices? (RQ4) How can a fit-for-purpose information kiosk be built using sustainable
hardware solutions? The research questions were answered by conducting and analysing
subject’s responses to functioning prototype systems, using an observation based ap-
proach (think aloud protocol) as well as the use of questionnaires with both open-ended
questions, to obtain qualitative data, and a 7-point Likert scale to ascertain scaled re-

Chapter 7 Conclusion
230
sponses and provide useful quantitative data. To summarise: RQ1 and RQ3 were ad-
dressed through observation and questionnaires, whilst RQ3 and RQ4 were addressed by
undertaking research across journals, papers, and textbooks covering technological devel-
opments within sustainable computing. This research was then used as a foundation from
which to start experimenting with different hardware and software configurations inde-
pendently.
Using the aforementioned research objectives, research questions, and initial research
within the literature four hypotheses were formulated. The results of the testing and exper-
imentation support these four hypotheses, as outlined below:
Hypothesis A: Culturally adaptive user interfaces improve usability compared to
non-adapted interfaces, within a social application domain.
User testing was undertaken with an adapted and non-adapted interface with 45 users,
with half of the subjects from a mixed cultural background. The culturally adaptive, social
application, website interface improved usability and user satisfaction with 71% of subjects
indicating preference for this interface.
Hypothesis B: A user’s cultural background can be used to predict their preferred
kiosk interaction method.
It was possible to predict an end user’s kiosk interaction preferences with some accuracy.
The predictions made were accurate in 61% of cases with 124 users being tested. It was
demonstrated that it was possible to predict a countries preferred interface with some ac-
curacy. It was also identified that there were emergent patterns within countries that were
geographically close, within the same continent, and also between countries that shared
similar dimensional scores such as the US and UK.

Chapter 7 Conclusion
231
Hypothesis C: A sustainable information kiosk can be developed using a combina-
tion of a single-board computer, open source operating system, and a ubiquitous
technology such as sound.
Three fully functioning hardware prototypes were developed. The first system was based
on a ‘Raspberry Pi model B’, the second system on a ‘Banana Pi’, and the third system on
an ‘Intel Compute Stick’. All systems ran the open source Linux operating system, had low
power consumption, and only required a very cheap microphone and peripherals in order
to operate in line with the sustainable mandate outlined in the research methodology.
7.3.1 Creation Interface
It was found that the culturally adaptive interface improved usability and efficiency of the
system when compared to a non-adapted interface. The experiments undertaken indi-
cated that on overall 71% of users preferred the adapted creation interface to the non-
adapted version.
It was demonstrated that an adaptive interface is more efficient and cost effective than lo-
calising a bespoke application for each country or culture that a website will be used in.
Though it had been hypothesised that an adapted interface would be preferred, the margin
by which it was preferred was higher than expected. It was interesting that there seemed
to be no correlation between education level or gender, for instance, overall male prefer-
ence was 75.86% and overall female preference was 79.55%, when selecting a preferred
interface. It was clear to see, demonstrably through this research, that a far more efficient
approach than localisation exists which is yet to be adopted in any mainstream capacity.
Another notable point is the fact that the subject domain of the culturally adaptive user in-

Chapter 7 Conclusion
232
terface was previously untested distinguishing the approach to adaptive interfaces to previ-
ous research by Reinecke (2011). Reinecke had based her culturally adaptive ‘MOCCA’
to-do list application on a utilitarian task list whilst CASIK took a more hedonistic approach
by being based on a social image sharing application.
7.3.2 Consumption Interface
The predictions in regard to the consumption interface were that a user’s cultural dimen-
sion scores might correlate to whether they were more comfortable with using the tradi-
tional input method of a keyboard or the novel input method of a sound tone. Median val-
ues were used from the group cultural sample of users within the sampling frame to pro-
duce the final representative score. It was necessary to formulate a calculation to make
an accurate prediction for users that were from more than one cultural background, this
calculation created an average score based on the number of years the user had spent
within each culture.
The preference predictions were correct in 61% of the cases. This supports the original
hypothesis that cultural preferences for novel interaction methods within public spaces can
be predicted with some accuracy, a hypothesis itself derived from extensive study of exist-
ing empirical data as well as first-hand observations.
Though end user’s interaction preferences were predicted by a significant margin, there
were a number of extraneous factors that introduced an element of difficulty in making ac-
curate predictions. Firstly, as alluded to earlier in this research thesis there is the fact that
the long term orientation dimension “cancelled out some of the effects of masculinity/femi-
ninity and uncertainty avoidance” (Marcus, 2000) introducing an element of difficulty in sit-
uations where this pattern emerged. Secondly, there is the fact that a novel and unfamiliar
Chapter 7 Conclusion
233
technology, such as sound tones, is being introduced and users may need time to become
familiar with this before assessing its value regardless of their cultural background. For
example, were users asked to choose their preferred interaction method from two technol-
ogies they were familiar with, such as a keyboard and mouse, it is likely the prediction ac-
curacy may have been even higher as one could not account for ‘early adopters’ vs ‘lag-
gards’ within the calculations. I.e. It is believed that an end users preference for either in-
terface would significantly change over time, through prolonged use, and that a longitudi-
nal study would be likely to garner a different, possibly higher, prediction accuracy than a
short-term study. A method facilitating retrospective reporting would therefore be useful
for future studies to illicit this type of data for comparison. One such system is the ‘UX
Curve’, Kujala et al. (2010) sum up this retrospective reporting methodology as follows:
“So far, user experience studies have mostly focused on short-term evaluations and con-
sequently on aspects relating to the initial adoption of new product designs. Nevertheless,
the relationship between the user and the product evolves over long periods of time and
the relevance of prolonged use for market success has been recently highlighted.” In their
paper, they argued that for the cost-effective elicitation of longitudinal user experience data
a method such as the ‘‘UX Curve’’ could be used which aims at assisting users in retro-
spectively reporting how and why their experience with a product has changed over time.
The usefulness of the UX Curve was assessed by the researchers in a qualitative study
with 20 mobile phone users. In particular, they investigated how users’ specific memories
of their experiences with their mobile phones guide their behaviour and their willingness to
recommend the product or app to others. This technique would be very useful to integrate
within future longitudinal research looking at adaptive interfaces.

Chapter 7 Conclusion
234
7.3.3 Sustainable Kiosk Development
The investigation into sustainable kiosks has found, through the active development of
several functioning prototypes, that it’s possible to build a kiosk from affordable off-the-
shelf parts and open source software. The research demonstrated that, using open
source Linux software and single board computers, it was possible to build a robust soft-
ware solution incorporating automatic load from booting, stable operation through the mini-
misation of running processes, system monitoring through the use of system daemons,
and metric updates through scheduled data log transmissions. Utilising a test originally
designed for automated telling machines (ATMs) the CASIK kiosks were demonstrated to
be Automated, Consistent, Isolated, and Durable (ACID). The use of sound reduced the
complexity and cost of the system further and was useful for testing subjects reactions to
multimodal interactions, particularly as the tones were noisy and drew social attention.
7.4 Contribution to Knowledge
The research offers an insight into how the localisation process could be made more effec-
tive through the use of culturally adaptive user interfaces as well as how users from differ-
ent cultural backgrounds and regions react to interacting with kiosk based systems in pub-
lic spaces. The evidence of this research consists of observational notes and user-pro-
vided assessments of the interfaces they used. The research also investigated the devel-
opment of sustainable kiosk solutions, describing three distinct systems which were devel-
oped on different platforms as well as the software and hardware solution which drove
these. This included a novel interaction method based on sound.
There has been very little research undertaken on either culturally adaptive user interfaces
within a recreational domain or of multimodal cultural interaction preferences within a

Chapter 7 Conclusion
235
physical space. This thesis went beyond the existing research on culturally adaptive user
interfaces by developing several functioning prototypes and a fully functional web-based
system that users could submit data to and retrieve data from, and then applied well-de-
fined research methodologies for both qualitative and quantitative data gathering and anal-
ysis.
From a social perspective, the thesis contributes to an understanding of how users from
different cultures interact with a variety of devices including smartphones, laptops, desk-
tops, and kiosks within the modalities of both creation, in uploading an image from a desk-
top or laptop computer, and consumption, in retrieving an image from an information kiosk
within both private and shared public spaces.
The findings of this research are significant contributions to the improvement of localisation
processes holistically, the effective development of sustainable kiosk systems, the creation
of effective culturally adaptive website interfaces, and the development of effective multi-
modal adaptive interaction methods.
Measuring the efficacy of the automatic system customisation of the creation, or upload,
portion of the system based on a preconfigured set of rules derived from research by pre-
vious scholars, including Hofstede and Marcus, is a significant contribution particularly
within the recreational and social domain within which CASIK is based. The design and
use of dynamic adaptive stylesheets that allow the UI to adapt itself to any number of con-
figurations without bespoke localisation having to be undertaken are another novel aspect
of the creation interface. It was demonstrated, through usability testing the system, how
effective such a system could be as well as how it could actually be developed leading to
improvements in the usability and overall user satisfaction to users from both a single cul-
tural background and a mixed cultural background. CASIK supported numerous interface

Chapter 7 Conclusion
236
component configurations and the engine which was developed could order and structure
components in real-time, personalising the experience for the current user. Perhaps more
importantly, the system associates the creation and consumption interfaces together creat-
ing a holistic experience that begins at the creation interface, when a user selects their cul-
ture, and ends at the kiosk when the user ‘consumes’ their data by recalling their image.
Storing the user’s culture at the image upload (creation) stage allows the usage of this
data at the later kiosk stage, allowing the system to predict with some accuracy, an end
user’s preferred kiosk interaction method.
The result of the research on sustainable kiosk systems was the development of systems
that were approximately 1/8th the cost of the cheapest desktop computers available at the
time of writing and even significantly less than commercial kiosk systems. The systems
also consumed substantially less power than desktop based systems and had a smaller
footprint. An automated deployment solution whereby the single board computers could
be deployed to remote locations, powered on, and self-configured with input from the end-
user was also investigated. This opens up the possibility of easy kiosk distribution to re-
mote locations without specialist technical intervention being necessary.
The utilisation of the results can also be thought of in a wider context, for example, there is
great scope for the research findings to be used to leverage technology-assisted learning
in developing countries by utilising a main microphone-equipped display terminal within
schools and corresponding portable devices with which students could recall information
on the main screen by emitting sound tones, these portable devices could take the form of
any device capable of storing and transmitting sound files to the main terminal providing a
cheap method for these schools to facilitate digital learning which may have previously

Chapter 7 Conclusion
237
been out of reach. This research in fact began by looking at kiosk solutions for the devel-
oping world and this theme remained as an important element throughout the research.
7.5 Future Work
This research has opened up the possibility of thought-provoking future directions. It
would be interesting to analyse the effectiveness of culturally adaptive user interfaces
within different domains to see if this has any effect on preference. In terms of the con-
sumption interface there is scope to analyse an end user’s preferences within different
types of public and private environments. Of particular interest would ne reactions within
simulated virtual public environments using virtual reality and augmented reality interfaces
to see if, from a human factors and ethnographic perspective, this has any impact on an
end user’s preferences. Some subjects indicated they were uncomfortable playing a sound
tone within a shared public space. Introducing a virtually shared public space whilst the
user is actually interacting from within their own private space in reality is an interesting di-
chotomy from an anthropological perspective i.e. is the user less or more comfortable
when sharing a space virtually and what impact would this have on future interaction meth-
ods? How is this effected by culture, does it correlate with real public spaces? Another
pertinent question is whether a longitudinal study would find that this level of comfort
changes over time as the user’s experience evolves and they become more familiar with
the novel input method.
Extending the study to other multimodal kiosk interaction methods beyond sound tones in
an attempt to discern whether changing this variable has any effect on the data would be a
useful exercise in future studies. It would be thought-provoking to test culturally adaptive
user interfaces within different application domains. To date, including this research, the

Chapter 7 Conclusion
238
only domains that have been researched in respect to culturally adaptive user interfaces
are utilitarian and social domains. Other domains that it might be interesting to explore in-
clude health and fitness, education, news, finance, and games.
Emerging and existing technologies could be adopted by the proposed framework to im-
prove human-machine interaction. One example would be that of a traditional drive-thru
which makes use of a drive up kiosk equipped with a microphone to take orders. This
could be repurposed to receive DTMF sound tones and receive orders instead of someone
speaking into a microphone. This would require the development of a simple smartphone
app and a receiving microphone and system in the restaurant. Such a system would be
extremely cheap to implement but offer end-users the convenience of preparing their or-
ders before they arrive at the drive-thru as well as reducing the frequency of mistakes be-
ing made in comparison to the traditional spoken method. The technology developed
within this study has a myriad of other uses across numerous application domains and can
be cheaply and sustainably implemented unlike more expensive bespoke solutions.
Future work could look at scaling these systems down even further and reducing costs.
Since the development of the kiosk prototypes in this research the price of single-board
computers has been reduced further, as has their size and power consumption. There
may be scope for an all-in-one sustainable kiosk utilising a single-board computer and pico
projector, or perhaps even a mobile system in the form of a wearable device. Other mo-
dalities would also be interesting to investigate, voice control is advancing rapidly and ges-
tural input devices are becoming more pervasive, whilst new devices such as VR headsets
and peripherals enter the market at a rapid pace, spurred on by the increasing ubiquity of
advanced technology in the developed world. Adaptive kiosk interfaces have great poten-
tial to improve the lives of people around the globe, across cultural backgrounds and social

Chapter 7 Conclusion
239
classes, and help the information poor move toward equality with the information rich
through an intelligent use of cultural awareness and flexible multimodal input methods.

0 Abbreviations
240
Abbreviations
AAL Ambient Assisted Living
ADL Activities of Daily Living
AR Augmented Reality
ARM Advanced RISC Machine
ATM Automated Telling Machine
BUS Omnibus (contraction of the Latin word)
CASIK Culturally Adaptive Sustainable Information Kiosk
CAUI Culturally Adaptive User Interface
CPU Central Processing Unit
CSCW Computer Supported Cooperative Work
CSS Cascading Style Sheets
DDR Double Data Rate
DMA Direct Memory Access
DTMF Dual Tone Multi Frequency
FIFO First In First Out
GLI Government and Legal Infrastructures
GPS Global Positioning System
GPU Graphics Process Unit
HCI Human-Computer Interaction
HDMI High-Definition Multimedia Interface
Hex Hexadecmial
HTML Hyper Text Markup Language
IBM International Business Machines
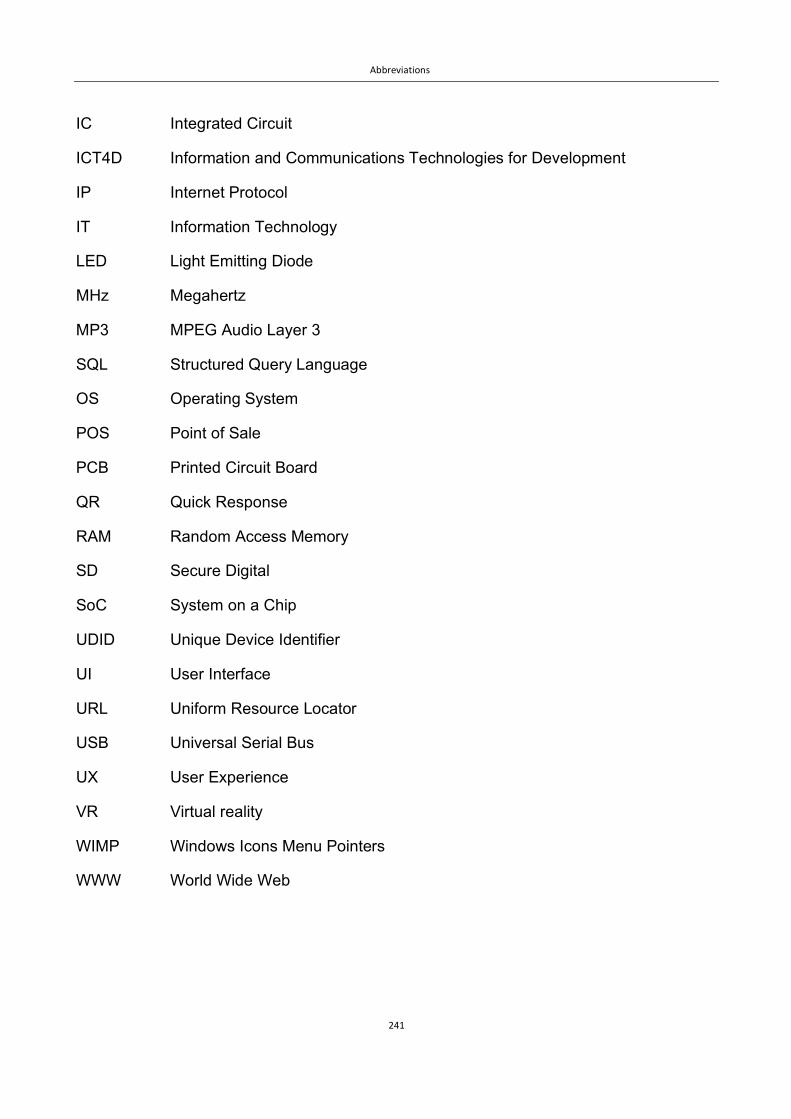
0 Abbreviations
241
IC Integrated Circuit
ICT4D Information and Communications Technologies for Development
IP Internet Protocol
IT Information Technology
LED Light Emitting Diode
MHz Megahertz
MP3 MPEG Audio Layer 3
SQL Structured Query Language
OS Operating System
POS Point of Sale
PCB Printed Circuit Board
QR Quick Response
RAM Random Access Memory
SD Secure Digital
SoC System on a Chip
UDID Unique Device Identifier
UI User Interface
URL Uniform Resource Locator
USB Universal Serial Bus
UX User Experience
VR Virtual reality
WIMP Windows Icons Menu Pointers
WWW World Wide Web
0 Bibliography
242
Bibliography
Adomavicius, G. and Tuzhilin, A., 2005. Toward the next generation of recommender systems: A survey of the state-of-the-art and possible extensions. IEEE transactions on knowledge and data engineering, 17(6), pp.734-749. Aronson, J., 1995. A pragmatic view of thematic analysis. The qualitative report, 2(1), pp.1-3. Avery, A.E., Baradwaj, B.G. and Singer, D.D., 2008. An examination of Hofstede's Cultural Dimensions. Bakos, Y., Lucas Jr, H.C., Oh, W., Simon, G., Viswanathan, S. and Weber, B.W., 2005. The impact of e-com-merce on competition in the retail brokerage industry. Information Systems Research, 16(4), pp.352-371. Banerjee, A. and Fudenberg, D., 2004. Word-of-mouth learning. Games and Economic Behavior, 46(1), pp.1-22. Baum, L.F., Arlen, H., Harburg, E.Y., IIarburg, E.Y., ArIen, H., Stodiart, H., Harburg, H.Y. and Arlen, H., 1900. THE WIZARD OF OZ. Bederson, B.B., 2001, November. PhotoMesa: a zoomable image browser using quantum treemaps and bub-blemaps. In Proceedings of the 14th annual ACM symposium on User interface software and technology (pp. 71-80). ACM. Beer, T., Anodenko, T. and Sears, A., 1997, October. A pair of techniques for effective interface evaluation: Cognitive walkthroughs and think-aloud evaluations. In Proceedings of the Human Factors and Ergonomics So-ciety Annual Meeting (Vol. 41, No. 1, pp. 380-384). SAGE Publications. Bergweiler, S., Deru, M. and Porta, D., 2010, November. Integrating a multitouch kiosk system with mobile de-vices and multimodal interaction. In ACM International Conference on Interactive Tabletops and Surfaces (pp. 245-246). ACM. Bhagat, Rabi S., and Sara J. McQuaid. "Role of subjective culture in organizations: A review and directions for future research." journal of Applied Psychology 67.5 (1982): 653. Billingsley, P., 2008. Probability and measure. John Wiley & Sons. Blackburn, P., Coombs, R. and Green, K., 1985. Introduction. In Technology, Economic Growth and the Labour Process (pp. 1-12). Palgrave Macmillan UK. Bødker, K. and Pedersen, J., 1991. Language, perspectives, and design. Design at Work: Cooperative Design of Computer Systems, pp.91-121. Borchers, G., 2003, May. The software engineering impacts of cultural factors on multi-cultural software devel-opment teams. In Proceedings of the 25th international conference on Software engineering (pp. 540-545). IEEE Computer Society. Borchers, J., Deussen, O. and Knörzer, C., 1995. Getting it across: layout issues for kiosk systems. ACM SIGCHI Bulletin, 27(4), pp.68-74.

0 Bibliography
243
Bossuet, L. and Hely, D., 2013, May. SALWARE: Salutary Hardware to design Trusted IC. In Workshop on Trustworthy Manufacturing and Utilization of Secure Devices, TRUDEVICE 2013. Braun, V. and Clarke, V., 2006. Using thematic analysis in psychology. Qualitative research in psychology, 3(2), pp.77-101. Brem, S., Bach, S., Kucian, K., Kujala, J.V., Guttorm, T.K., Martin, E., Lyytinen, H., Brandeis, D. and Richard-son, U., 2010. Brain sensitivity to print emerges when children learn letter–speech sound correspondences. Pro-ceedings of the National Academy of Sciences, 107(17), pp.7939-7944. Breuker, Joost, Antoinette Muntjewerff, and B. Bredewej. "Ontological modelling for designing educational sys-tems." Proceedings of the AI-ED 99 Workshop on Ontologies for Educational Systems. 1999. Brockner, Joel, et al. "Culture and procedural justice: The influence of power distance on reactions to voice." Journal of Experimental Social Psychology 37.4 (2001): 300-315. Bruner, J.S., 1996. The culture of education. Harvard University Press. Burgmann, Inga, Philip J. Kitchen, and Russell Williams. "Does culture matter on the web?." Marketing Intelli-gence & Planning 24.1 (2006): 62-76. Burnard, P., 1991. A method of analysing interview transcripts in qualitative research. Nurse education to-day, 11(6), pp.461-466. Challam, V., Gauch, S. and Chandramouli, A., 2007, May. Contextual search using ontology-based user profiles. In Large Scale Semantic Access to Content (Text, Image, Video, and Sound) (pp. 612-617). LE CENTRE DE HAUTES ETUDES INTERNATIONALES D'INFORMATIQUE DOCUMENTAIRE. Chandramouli, Krishna, et al. "CAE-L: An ontology modelling cultural behaviour in adaptive education." Seman-tic Media Adaptation and Personalization, 2008. SMAP'08. Third International Workshop on. IEEE, 2008. Chapanis, A., 1984. Taming and civilizing computers. Annals of the New York Academy of sciences, 426(1), pp.202-219. Clemmensen, T. and Roese, K., 2009. An overview of a decade of journal publications about Culture and Hu-man-Computer Interaction (HCI)-Department of Informatics Howitzvej DK (No. 03-2009). Working Paper. Clemmensen, T. and Roese, K., 2010. An overview of a decade of journal publications about Culture and Hu-man-Computer Interaction (HCI). In Human Work Interaction Design: Usability in Social, Cultural and Organiza-tional Contexts (pp. 98-112). Springer Berlin Heidelberg. Clemmensen, T., Hertzum, M., Hornbæk, K., Shi, Q. and Yammiyavar, P., 2009. Cultural cognition in usability evaluation. Interacting with computers, 21(3), pp.212-220. cultural factors in explanation of differences in Citibank international retail banking web Cyr, D. and Bonanni, C., 2005. Gender and website design in e-business. International Journal of Electronic Business, 3(6), pp.565-582. Cyr, D. and Trevor-Smith, H., 2004. Localization of Web design: An empirical comparison of German, Japanese, and United States Web site characteristics. Journal of the American society for information science and technol-ogy, 55(13), pp.1199-1208.

0 Bibliography
244
Cyr, D., 2008. Website design, trust and culture: An eight country investigation. SIGHCI 2008 Proceedings, p.11. Daoud, M., Tamine-Lechani, L. and Boughanem, M., 2008, October. Learning user interests for a session-based personalized search. In Proceedings of the second international symposium on Information interaction in context (pp. 57-64). ACM. Das, S., Konar, A. and Chakraborty, U.K., 2005, June. Two improved differential evolution schemes for faster global search. In Proceedings of the 7th annual conference on Genetic and evolutionary computation (pp. 991-998). ACM. Das, S., Konar, A. and Chakraborty, U.K., 2005, June. Two improved differential evolution schemes for faster global search. In Proceedings of the 7th annual conference on Genetic and evolutionary computation (pp. 991-998). ACM. Vancouver. De Bortoli, M. and Maroto, J., 2001. Colours across cultures: Translating colours in interactive marketing com-munications. In Elicit 2001: Proceedings of the European Languages and the Implementation of Communication and Information Technologies (Elicit) conference (pp. 3-4). UK: Paisley University Language Press. Delogu, C., Conte, S. and Sementina, C., 1998. Cognitive factors in the evaluation of synthetic speech. Speech Communication, 24(2), pp.153-168. Denscombe, M., 2010. The Good Research Guide: For Small-scale Social Research Projects (Open UP Study Skills). McGraw-Hill. DiMaggio, Paul. "Culture and cognition." Annual review of sociology 23.1 (1997): 263-287. Dormann, Claire, and Cristina Chisalita. "Cultural values in web site design." Proceedings of the 11th European Conference on Cognitive Ergonomics ECCE11. 2002. Douglas, J.D., 1970. Deviance & Respectability the Social Construction of Moral Meanings. Dunlap, J.C. and Lowenthal, P.R., 2009. Tweeting the night away: Using Twitter to enhance social pres-ence. Journal of Information Systems Education, 20(2), p.129. Ellison, Glenn, Drew Fudenberg, and Markus Möbius. "Competing auctions." Journal of the European Economic Association 2.1 (2004): 30-66. Fernandes, T., 1995. Global interface design: A guide to designing international user interfaces. Firth, R., 2013. Primitive polynesian economy. Routledge. Flores, F., Graves, M., Hartfield, B. and Winograd, T., 1988. Computer systems and the design of organizational interaction. ACM Transactions on Information Systems (TOIS), 6(2), pp.153-172. Forsgren, M. and Hagström, P., 2001. Ignorant internationalization? Internationalization patterns for internet-related firms. Communication & Strategies, (42). Frandsen-Thorlacius, O., Hornbæk, K., Hertzum, M. and Clemmensen, T., 2009, April. Non-universal usability?: a survey of how usability is understood by Chinese and Danish users. In Proceedings of the SIGCHI Conference on Human Factors in Computing Systems (pp. 41-50). ACM. Franke, R.H., Hofstede, G. and Bond, M.H., 1991. Cultural roots of economic performance: A research notea. Strategic management journal, 12(S1), pp.165-173.
0 Bibliography
245
Geertz, C., 1993. 1973. The interpretation of cultures: Selected essays. Gorgoglione, M., Palmisano, C. and Tuzhilin, A., 2006, December. Personalization in context: Does context mat-ter when building personalized customer models?. In Data Mining, 2006. ICDM'06. Sixth International Confer-ence on (pp. 222-231). IEEE. Gould, J.D., Conti, J. and Hovanyecz, T., 1983. Composing letters with a simulated listening typewriter. Commu-nications of the ACM, 26(4), pp.295-308. Grant, R.M. and Bakhru, A., 2004. The limits of internationalisation in e-commerce. Guest, G., MacQueen, K.M. and Namey, E.E., 2011. Applied thematic analysis. Sage. Guillén, M.F. and Suárez, S.L., 2010. The global crisis of 2007–2009: Markets, politics, and organizations. In Markets on Trial: The Economic Sociology of the US Financial Crisis: Part A (pp. 257-279). Emerald Group Publishing Limited. Guiltinan, J., 2009. Creative destruction and destructive creations: environmental ethics and planned obsoles-cence. Journal of Business Ethics, 89(1), pp.19-28. Hall, Edward T. "Beyond Culture. Anchor." Garden City, NY (1976). Hawalah, A. and Fasli, M., 2011, May. A graph-based approach to measuring semantic relatedness in ontolo-gies. In Proceedings of the International Conference on Web Intelligence, Mining and Semantics (p. 29). ACM. Hazemi, R. and Macaulay, L., 1996. Requirements for graphical user interface development environments for groupware. Interacting with Computers, 8(1), pp.69-88. Heimgärtner, R., 2007, July. Towards cultural adaptability in driver information and-assistance systems. In Inter-national Conference on Usability and Internationalization (pp. 372-381). Springer Berlin Heidelberg. Heimgärtner, R., 2015. Intercultural User Interface Design. Human-Computer Interaction: Concepts, Methodolo-gies, Tools, and Applications: Concepts, Methodologies, Tools, and Applications, p.1. Heinberg, R. and Lerch, D., 2010. What Is Sustainability?. The Post Carbon Reader, pp.11-19. Heller, R.S. and McKeeby, J., 1993. Computing access in public spaces: A case study. Interactive Learning En-vironments, 3(1), pp.77-89. Hermeking, Marc. "Culture and internet consumption: contributions from cross-cultural marketing and advertising research." Journal of Computer-Mediated Communication 11.1 (2005): 192-216. Hevner, A.R., 2007. A three cycle view of design science research. Scandinavian journal of information sys-tems, 19(2), p.4. Hofstede, G. and McCrae, R.R., 2004. Personality and culture revisited: Linking traits and dimensions of cul-ture. Cross-cultural research, 38(1), pp.52-88. Hofstede, G. and Minkov, M., 2010. Long-versus short-term orientation: new perspectives. Asia Pacific Business Review, 16(4), pp.493-504.
0 Bibliography
246
Hofstede, G., 1980. Motivation, leadership, and organization: do American theories apply abroad?. Organiza-tional dynamics, 9(1), pp.42-63. Hofstede, G., 1984. Culture's consequences: International differences in work-related values (Vol. 5). sage. Hofstede, G., 2015. Geert Hofstede| Hofstede dimension data matrix. Hofstede, G., 2016. Strategy, culture, change. The Hofstede Centre, https://geerthofstede. com/pakistan. html, Accessed on, 28, p.2016. Hofstede, G.H. and Hofstede, G., 2001. Culture's consequences: Comparing values, behaviors, institutions and organizations across nations. Sage. Holzinger, A., 2005. Usability engineering methods for software developers. Communications of the ACM, 48(1), pp.71-74. Honold, P., 2000. Culture and context: An empirical study for the development of a framework for the elicitation of cultural influence in product usage. International Journal of Human-Computer Interaction, 12(3-4), pp.327-345. Javalgi, R. and Ramsey, R., 2001. Strategic issues of e-commerce as an alternative global distribution sys-tem. International marketing review, 18(4), pp.376-391. Jiang, T. and Tuzhilin, A., 2006. Segmenting customers from population to individuals: Does 1-to-1 keep your customers forever?. IEEE Transactions on knowledge and data engineering, 18(10), pp.1297-1311. Kalbach, J. and Bosenick, T., 2006. Web page layout: A comparison between left-and right-justified site naviga-tion menus. Journal of Digital Information, 4(1). Kamentz, E., 2005. Culture and E-Learning: Automatic Detection of a Users’ Culture from Survey Data. Kearsley, G., 1994. Public Access Systems: Bringing Computer Power to the People. Intellect Books. Keller, B., Pérez-Quiñones, M.A. and Vatrapu, R., 2006, July. Cultural issues and opportunities in computing education. In 9th International Conference on Engineering Education (pp. 23-28). Kelley, J.F., 1983, December. An empirical methodology for writing user-friendly natural language computer ap-plications. In Proceedings of the SIGCHI conference on Human Factors in Computing Systems (pp. 193-196). ACM. Kelley, J.F., 1984. An iterative design methodology for user-friendly natural language office information applica-tions. ACM Transactions on Information Systems (TOIS), 2(1), pp.26-41. Kelly, M.J. and Chapanis, A., 1977. Limited vocabulary natural language dialogue. International Journal of Man-Machine Studies, 9(4), pp.479-501. Kin, B.J. and Pope, B., 1999. Creativity as a factor in psychological assessment and healthy psychological func-tioning. Journal of Personality Assessment, 72(2), pp.200-207. Kluckhohn, C., 1962. Culture and behavior. Kluckhohn, F.R. and Strodtbeck, F.L., 1961. Variations in value orientations.

0 Bibliography
247
Kolb, A.Y. and Kolb, D.A., 2005. Learning styles and learning spaces: Enhancing experiential learning in higher education. Academy of management learning & education, 4(2), pp.193-212. Kolb, D.A., 1981. Experiential learning theory and the learning style inventory: A reply to Freedman and Stumpf. Academy of Management Review, 6(2), pp.289-296. Kolb, D.A., 2000. Learning styles inventory. The Power of the 2 2 Matrix, p.267. Kshetri, N. and Dholakia, N., 2002. Determinants of the global diffusion of B2B e-commerce. Electronic Mar-kets, 12(2), pp.120-129. Kuriyan, R., Ray, I. and Kammen, D., 2008. How to use technology to spur development. Issues in Science and Technology, 24(2), pp.70-74. Kuriyan, R., Ray, I. and Kammen, D., 2008. How to use technology to spur development. Issues in Science and Technology, 24(2), pp.70-74. Landwehr, C.E., Bull, A.R., McDermott, J.P. and Choi, W.S., 1994. A taxonomy of computer program security flaws. ACM Computing Surveys (CSUR), 26(3), pp.211-254. Lathlean, J., Burgess, A., Coldham, T., Gibson, C., Herbert, L., Levett-Jones, T., Simons, L. and Tee, S., 2006. Experiences of service user and carer participation in health care education. Nurse education in practice, 6(6), pp.424-429. Lee, C. and Xu, Y., 1996, April. Online, interactive learning of gestures for human/robot interfaces. In Robotics and Automation, 1996. Proceedings., 1996 IEEE International Conference on (Vol. 4, pp. 2982-2987). IEEE. Leininger, M.M. ed., 1985. Qualitative research methods in nursing. WB Saunders Company. Levinson, Stephen C. "On the human" interaction engine"." Wenner-Gren Foundation for Anthropological Re-search, Symposium 134. Berg, 2006. Lewis, Richard D. "When culture collide." London, UK: Nicholas Brealey (1996). Lim, K.H., Leung, K., Sia, C.L. and Lee, M.K., 2004. Is eCommerce boundary-less? Effects of individualism–col-lectivism and uncertainty avoidance on Internet shopping. Journal of International Business Studies, 35(6), pp.545-559. Liu, C. and Jayakar, K., 2012. The evolution of telecommunications policy-making: Comparative analysis of China and India. Telecommunications Policy, 36(1), pp.13-28. Lo, B.W. and Gong, P., 2005. Cultural impact on the design of e-commerce websites: Part I–site format and lay-out. Issues in Information Systems, 6(2), pp.182-189. Lufkin, P. and Wroblewski, L., 2009. Web Form Design: Filling in the Blanks. Lynn, R. and Hampson, S., 1986. Intellectual abilities of Japanese children: An assessment of 212–812-year-olds derived from the McCarthy Scales of Children's Abilities. Intelligence, 10(1), pp.41-58.
0 Bibliography
248
Lynn, R. and Hampson, S.L., 1975. National differences in extraversion and neuroticism. British Journal of So-cial and Clinical Psychology, 14(3), pp.223-240. Ma, W.Y. and Chen, K.J., 2003, July. Introduction to CKIP Chinese word segmentation system for the first inter-national Chinese Word Segmentation Bakeoff. In Proceedings of the second SIGHAN workshop on Chinese lan-guage processing-Volume 17 (pp. 168-171). Association for Computational Linguistics. Maguire, P., 1999. Improving communication with cancer patients. European Journal of Cancer, 35(10), pp.1415-1422. Mahrer, A.R., 1988. Discovery-oriented psychotherapy research: Rationale, aims, and methods. American Psy-chologist, 43(9), p.694. Malinowski, Bronisław. "Coral gardens and their magic: a study of the methods of tilling the soil and of agricul-tural rites in the Trobriand Islands: with 3 maps, 116 illustrations and 24 figures. Vol. 1, The description of gar-dening." (1935). Marcus, A. and Gould, E.W., 2000. Crosscurrents: cultural dimensions and global Web user-interface design. in-teractions, 7(4), pp.32-46. Maschine Systemen." (2002). Mead, M., 1963. Sex and temperament in three primitive societies (Vol. 370). New York: Morrow. Mills, T.J., Pye, D., Sinclair, D. and Wood, K.R., 2000. Shoebox: A digital photo management system. AT&T La-boratories Cambridge. Microsoft Corporation, 2014 (http://windows.microsoft.com/en-us/windows/end-support-help). Morse, J.M., 1996. The science of comforting. Reflections/Sigma Theta Tau, 22(4), pp.6-8. Nabokov, Vladimir Vladimirovich. Nikolai Gogol. Vol. 78. New Directions Publishing, 1961. Nantel, J. and Glaser, E., 2008. The impact of language and culture on perceived website usability. Journal of Engineering and Technology Management, 25(1), pp.112-122. Nasif, Ercan G., et al. "Methodological problems in cross-cultural research: An updated review." MIR: Manage-ment International Review (1991): 79-91. Norman, D.A., 2013. The design of everyday things: Revised and expanded edition. Basic books. Okazaki, S., 2005. New perspectives on m-commerce research. Journal of Electronic Commerce Re-search, 6(3), p.160. Oliver, J.Y., Amirtharajah, R., Akella, V., Geyer, R. and Chong, F.T., 2007. Life cycle aware computing: Reusing silicon technology. Computer, 40(12). Outhwaite, W. and Bottomore, T., 1993. Twentieth-Century Social Thought. Twentieth-Century Social Thought. Oxley, J.E. and Yeung, B., 2001. E-commerce readiness: Institutional environment and international competi-tiveness. Journal of International Business Studies, 32(4), pp.705-723. Pargman, D. and Raghavan, B., 2014, October. Rethinking sustainability in computing: From buzzword to non-negotiable limits. In Proceedings of the 8th Nordic Conference on Human-Computer Interaction: Fun, Fast, Foundational (pp. 638-647). ACM.

0 Bibliography
249
Pahl, Claus. "Layered ontological modelling for web service-oriented model-driven architecture." European Con-ference on Model Driven Architecture-Foundations and Applications. Springer Berlin Heidelberg, 2005. Parsons, T. and Shils, E.A., 1951. Values, motives, and systems of action. Toward a general theory of ac-tion, 33, pp.247-275. Pearce, C., 2002. Sims, BattleBots, Cellular Automata God and Go. A Conversation with Will Wright. Game Studies, 2(1). Petersen, B., Welch, L.S. and Liesch, P.W., 2002. The Internet and foreign market expansion by firms. MIR: Management International Review, pp.207-221. Quelch, J.A. and Klein, L.R., 1996. Opinion: The Internet and international marketing. Sloan management re-view, 37(3), p.60. Redpath, Lindsay, and Marianne O. Nielsen. "A comparison of native culture, non-native culture and new man-agement ideology." Canadian Journal of Administrative Sciences 14.3 (1997): 327. Rehg, J.M., Loughlin, M. and Waters, K., 1997, June. Vision for a smart kiosk. In Computer Vision and Pattern Recognition, 1997. Proceedings., 1997 IEEE Computer Society Conference on (pp. 690-696). IEEE. Reinecke, K. and Bernstein, A., 2011. Improving performance, perceived usability, and aesthetics with culturally adaptive user interfaces. ACM Transactions on Computer-Human Interaction (TOCHI), 18(2), p.8. Robertson, R., 1992. Globalization: Social theory and global culture (Vol. 16). Sage. Roman, Dumitru, et al. "Web service modeling ontology." Applied ontology 1.1 (2005): 77-106. Röse, K., Zühlke, D. and Liu, L., 2003. Intops 2: The machine user interface design for the Chinese market. Fi-nal Report. Projektabschlußbericht des industriegeförderten Projektes ‚Design for Mainland China’im Zentrum für Mensch-Maschine-Interaktion, Fortschritt-Bericht pak, (8). Rosen, P.B., Weinstein, L.D., Favaloro, G., Kowalonek, J.A., Chigier, B., Goldstein, J.A., Purcell, T.C., Dash, G.R., Winston, D.E. and Bromberg, M.A., Compaq Computer Corp., 1999. Communication with a computer us-ing telephones. U.S. Patent 5,864,607. Rothaermel, F.T. and Deeds, D.L., 2006. Alliance type, alliance experience and alliance management capability in high-technology ventures. Journal of business venturing, 21(4), pp.429-460. Samiee, S., 1998. Exporting and the Internet: a conceptual perspective. International Marketing Review, 15(5), pp.413-426. Searle, J.R., 1995. The construction of social reality. Simon and Schuster. Shills, E.A., 1951. Towards a General Theory of Action. Cambridge: Harvard. Shneor, Rotem, and Flåten, B.T., 2008. The Internet-enabled internationalization process: a focus on stages and sequences. Silver, M.S., Markus, M.L. and Beath, C.M., 1995. The information technology interaction model: A foundation for the MBA core course. MIS quarterly, pp.361-390. Singh, N., Fassott, G., Chao, M.C. and Hoffmann, J.A., 2006. Understanding international web site usage: A

0 Bibliography
250
cross-national study of German, Brazilian, and Taiwanese online consumers. International Marketing Re-view, 23(1), pp.83-97. Singh, N., Fassott, G., Zhao, H. and Boughton, P.D., 2006. A cross-cultural analysis of German, Chinese and Indian consumers' perception of web site adaptation. Singh, N., Kumar, V. and Baack, D., 2005. Adaptation of cultural content: evidence from B2C e-commerce firms. European Journal of Marketing, 39(1/2), pp.71-86. sites. The Journal of Business and Economic Studies, 14(2), p.73. Smith, A., Dunckley, L., French, T., Minocha, S. and Chang, Y., 2004. A process model for developing usable cross-cultural websites. Interacting with computers, 16(1), pp.63-91. Spradley, I., P. 1979. The ethnographic interview. New York (ua). Stevens, B., 1960. Planned obsolescence. The Rotarian, 96(2), p.12. Tainter, J.A., 2006. Social complexity and sustainability. ecological complexity, 3(2), pp.91-103. Taylor, S.J. and Bogdan, R., 1984. Introduction to qualitative research methods: The search for meaning. Terlutter, R., Mueller, B. and Diehl, S., 2005. The influence of culture on responses to assertiveness in advertis-ing messages. In Advertising and Communication–Proceedings of the 4th International Conference on Research in Advertising (ICORIA), Saarbruecken (pp. 183-192). Thatcher, B.L., 1999. Cultural and rhetorical adaptations for South American audiences. Technical communica-tion, 46(2), pp.177-195. Tixier, M., 2005. Globalization and localization of contents: Evolution of major internet sites across sectors of industry. Thunderbird International Business Review, 47(1), pp.15-48. Tixier, M., 2005. Globalization and localization of contents: Evolution of major internet sites across sectors of industry. Thunderbird International Business Review, 47(1), pp.15-48. Trompenaars, Fons, and Charles Hampden-Turner. Riding the waves of culture: Understanding diversity in global business. Nicholas Brealey Publishing, 2011. Vallina-Rodriguez, N., Hui, P. and Crowcroft, J., 2009, August. Has anyone seen my goose? social network ser-vices in developing regions. In Computational Science and Engineering, 2009. CSE'09. International Conference on (Vol. 4, pp. 1048-1053). IEEE. Venkatesh, V., Brown, S.A. and Bala, H., 2013. Bridging the qualitative-quantitative divide: Guidelines for con-ducting mixed methods research in information systems. MIS quarterly, 37(1), pp.21-54. Vancouver. Vöhringer-Kuhnt, Thomas. "Kulturelle Einflüsse auf die Gestaltung von Mensch. Waldman, M., 1993. A new perspective on planned obsolescence. The Quarterly Journal of Economics, 108(1), pp.273-283. Wan, G., Lu, M. and Chen, Z., 2007. Globalization and regional income inequality: Empirical evidence from within China. Review of Income and Wealth, 53(1), pp.35-59.

0 Bibliography
251
Weber, M., 2009. From Max Weber: essays in sociology. Routledge. Wierzbicka, A., 1997. Understanding cultures through their key words: English, Russian, Polish, German, and Japanese (Vol. 8). Oxford University Press. Williams, A.C., Bower, E.J. and Newton, J.T., 2004. Research in primary dental care Part 6: Data analysis. Brit-ish dental journal, 197(2), pp.67-73. Williams, R., 1983. Culture and society, 1780-1950. Columbia University Press. Winschiers, H. and Fendler, J., 2007, July. Assumptions considered harmful. In International Conference on Us-ability and Internationalization (pp. 452-461). Springer Berlin Heidelberg. Yue, Gen Hua, et al. "Genetic variation and population structure of Asian seabass (Lates calcarifer) in the Asia-Pacific region." Aquaculture 293.1 (2009): 22-28. Zadok, Galit, and Riikka Puustinen. "The Green Switch: Designing for Sustainability in Mobile Computing." Sus-tainIT. 2010. Zhang, X., Cheng, G., Ge, W.Y. and Qu, Y.Z., 2009. Summarizing vocabularies in the global semantic web. Journal of Computer Science and Technology, 24(1), pp.165-174. Zoltan-Ford, E., 1991. How to get people to say and type what computers can understand. International Journal of Man-Machine Studies, 34(4), pp.527-547. Zoltan, E., Weeks, G. and Ford, W., 1983. Natural-language communication with computers: A comparison of voice and keyboard inputs. In G. Johannsen und J. Rijnsdorp, Hrsgg., Analysis, Design and Evaluation of Man-Machine Systems–Proceedings of the IFAC/IFIP/IFORS/IEA Conference Baden-Baden (pp. 255-260).

0 Appendix
252
Appendix
A
Single Board Computer and Desktop PC Electricity Usage
Projections
Conservative estimate (Raspberry Pi based kiosk power consumption):
• In testing the Pi based kiosk used 3.5W under normal load.
• 1kWh would take 285.71 hours to use.
• This would result in 30.77 units being used per year.
• Assuming a value of 13.2 pence per unit (direct debit nationwide average, 2012).
• Total running costs would be £4.06 per year.
High load estimate (Raspberry Pi based kiosk power consumption):
• Under maximum CPU load a Raspberry Pi uses 5W (this is a worst case scenario,
in theory the Raspberry Pi should not operate above 700mA (3.5W, in fact the doc-
umentation states the Pi will shut down at 1A).
• 1kWh would take 200 hours to use (1000Wh/5W = 200h).
• Assuming 8766 hours in a year and 8790 in a leap year.
• At this load level the Raspberry Pi would use 43.95 kWh per year (8790h/200hours
per kilowatt hour).

0 Appendix
253
• At the time of writing the most expensive energy tariff in the UK is just under £0.20
per kWh.
• Maximum theoretical electricity cost of a Raspberry Pi based kiosk therefore is
£8.79* (43.95kWh*£0.2).
* The actual watts used by the Raspberry Pi may be higher than this projection due to the
power loss coefficient of converting 240V from the wall to 5V at the Raspberry Pi. Assum-
ing a conservative 70% efficiency the worst case scenario goes from £8.79 to £12.50 per
year (62.76 units at 140.06 hours per kWh).
Conversely, Bluejay (2006) measures a desktop PC power draw as being 60-250 watts at
a typical level (active). This gives us the following power costs:
Active usage estimate (Desktop PC based kiosk power consumption):
• Under maximum CPU load a typical desktop PC uses 250W (Bluejay, 2006).
• 1kWh would take 4 hours to use (1000Wh/5W = 200h).
• Assuming 8766 hours in a year and 8790 in a leap year.
• At this load level the Raspberry Pi would use 2197.5 kWh per year (8790h/4hours
per kilowatt hour).
• At the time of writing the most expensive energy tariff in the UK is just under £0.20
per kWh.
• Maximum theoretical electricity cost of a Desktop PC based kiosk therefore is
£439.50* (43.95kWh*£0.2).

0 Appendix
254
B
Initial Coding of Qualitative Data (Creation Interface)
Interview transcript excerpt Initial coding framework
I don't have my phone in my pocket every time to
play a sound, and it's uncomfortable and too loud
to use a tone in public.
Negative views on the availability of sound enabled de-
vices.
Positive views on the convenience of the keyboard code.
Negative views associated with the self-consciousness
of using the sound tone.
The tone is a new and interesting way of doing
things and would be a unique and fun way to re-
call images.
Positive views of the fun using the tone.
Positive views of the novelty of using a tone.
I prefer the keyboard because the sound depends
on a device having good sound. May be surpris-
ing, but not everyone has access to a high quality
sound device.
Negative concerns around the sound quality of devices.
I chose the keyboard because it is what I am used
to and the tone may not always be heard, but
does seem fun.
Positive views of the fun using the tone.
Negative concerns around the sound quality of devices.
Negative views around the audibility of the tone at the ki-
osk.
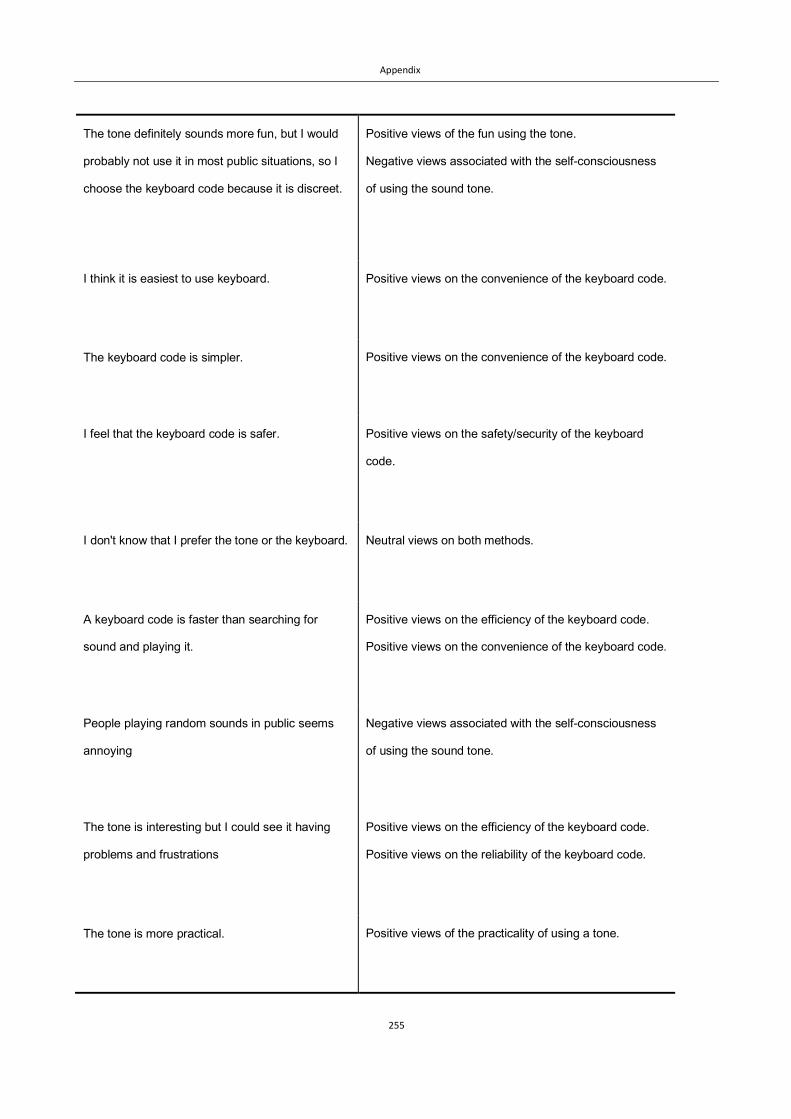
0 Appendix
255
The tone definitely sounds more fun, but I would
probably not use it in most public situations, so I
choose the keyboard code because it is discreet.
Positive views of the fun using the tone.
Negative views associated with the self-consciousness
of using the sound tone.
I think it is easiest to use keyboard.
Positive views on the convenience of the keyboard code.
The keyboard code is simpler.
Positive views on the convenience of the keyboard code.
I feel that the keyboard code is safer.
Positive views on the safety/security of the keyboard
code.
I don't know that I prefer the tone or the keyboard.
Neutral views on both methods.
A keyboard code is faster than searching for
sound and playing it.
Positive views on the efficiency of the keyboard code.
Positive views on the convenience of the keyboard code.
People playing random sounds in public seems
annoying
Negative views associated with the self-consciousness
of using the sound tone.
The tone is interesting but I could see it having
problems and frustrations
Positive views on the efficiency of the keyboard code.
Positive views on the reliability of the keyboard code.
The tone is more practical.
Positive views of the practicality of using a tone.

0 Appendix
256
You only need your mind to recall the keyboard
code so I prefer it.
Positive views on the convenience of the keyboard code.
Negative views on the availability of a mobile device.
I prefer the keyboard code because I use key-
boards often.
Positive views on the familiarity of the keyboard.
I found the tone to be easier and quicker.
Positive views on the efficiency of the sound tone.
Positive views on the convenience of the sound tone.
I think the tone's somehow easier.
Positive views on the convenience of the sound tone.
I feel that playing sounds is only okay when I'm
alone so prefer the keyboard.
Negative views associated with the self-consciousness
of using the sound tone.
The keyboard code is easier, and presents less
problems.
Positive views on the efficiency of the keyboard code.
Positive views on the convenience of the keyboard code.
Positive views on the reliability of the keyboard code.
The tone sounds more modern, to me, typing a
code seems old-school.
Positive views related to the tone being more modern.
Negative views related to the keyboard seeming out-
dated.
The keyboard code gives me more control.
Positive views on the efficiency of the keyboard code.
I think a tone is more effective than the keyboard.
Positive views on the efficiency of the keyboard code.

0 Appendix
257
I often wouldn't be able to play a sound, so would
have to use the keyboard or not use the site.
Negative views on the availability of sound enabled de-
vices.
Negative views associated with the self-consciousness
of using the sound tone.
The keyboard code is more easy and straightfor-
ward.
Positive views on the efficiency of the keyboard code.
Positive views on the convenience of the keyboard code.
The keyboard is simpler and probably quicker.
Positive views on the efficiency of the keyboard code.
Positive views on the convenience of the keyboard code.
Easier to me to just type the keyboard code.
Positive views on the efficiency of the keyboard code.
Positive views on the convenience of the keyboard code.
I think the keyboard code is easier to use.
Positive views on the efficiency of the keyboard code.
Positive views on the convenience of the keyboard code.
A keyboard code seems more convenient and
less prone to errors than a tone
Positive views on the efficiency of the keyboard code.
Positive views on the convenience of the keyboard code.
I think typing a code is faster and more efficient
than playing a sound. It's also better because it
won't disturb others in public.
Positive views on the efficiency of the keyboard code.
Positive views on the convenience of the keyboard code.
Negative views associated with the self-consciousness
of using the sound tone.
The keyboard code seems more secure to me.
Positive views on the safety/security of the keyboard
code.

0 Appendix
258
I would prefer to use a short tone than typing in a
many digit code.
Positive views of the practicality of using a tone.
I can remember or write down a code. I am not
sure how I could do that with a tone.
Positive views on the convenience of the keyboard code.
I always choose the easiest and most efficient
way over the fun way. Typing is just more com-
mon and using a sound seems too complicated.
Positive views on the convenience of the keyboard code.
Negative views around a sound tone being too compli-
cated.
The tone is easier and seems more secure since
someone could be over your shoulder watching
you type the keyboard code.
Positive views of the practicality of using a tone.
Positive views on the safety/security of the sound tone.
I would prefer the keyboard because I am used to
it.
Positive views on the convenience of the keyboard code.
Positive views on the familiarity of the keyboard.
I have hearing problems so would prefer the key-
board.
Negative views around the accessibility of a sound tone
(for hearing impaired users).
Positive views around the accessibility of the keyboard
(for hearing impaired users).
I prefer the keyboard since I find it the more accu-
rate and discreet method.
Positive views on the efficiency of the keyboard code.
Negative views associated with the self-consciousness
of using the sound tone.
I feel the tone is simpler to understand and use.
Positive views on the convenience of the sound tone.

0 Appendix
259
Keyboard for me, practicality over fun in this case.
Positive views of the practicality of using a keyboard
code.
Positive views of the fun using the tone.
I chose the keyboard code because it is more pri-
vate and discreet.
Positive views on the safety/security of the keyboard
code.
A sound isn't easy sometimes, like when multi-
tasking, so I prefer the keyboard code.
Positive views on the efficiency of the keyboard code.
Positive views on the convenience of the keyboard code.
The keyboard code method is easier and is the
least effort required for me.
Positive views on the efficiency of the keyboard code.
Positive views on the convenience of the keyboard code.
I chose the tone because it seems more intuitive
and less fiddly than typing on a keyboard.
Positive views on the efficiency of the sound tone.
Positive views on the convenience of the sound tone.
The keyboard code in public is best, as you don't
disturb people, but the sound tone is fun.
Negative views associated with the self-consciousness
of using the sound tone.
Positive views of the fun using the tone.
Positive views on the discreteness of the keyboard code.
I choose the keyboard code because it's the one I
am most familiar with.
Positive views on the familiarity of the keyboard.

0 Appendix
260
C
Hofstede’s Cultural Dimensions
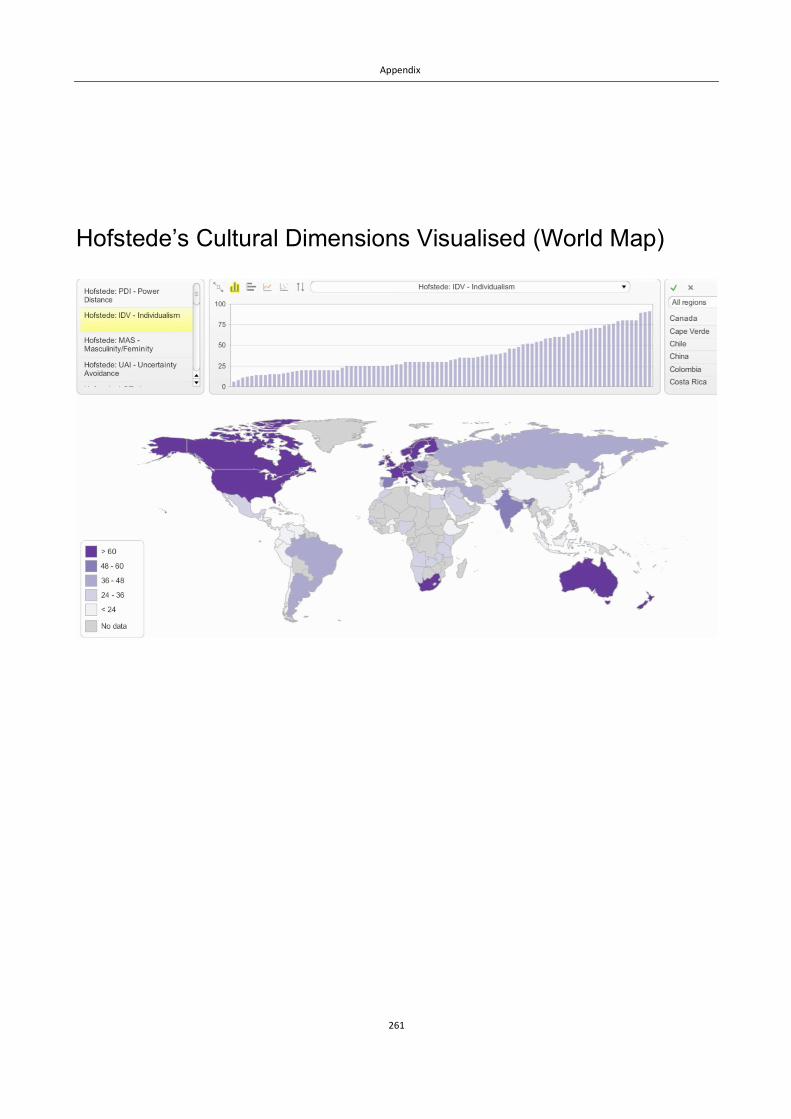
0 Appendix
261
Hofstede’s Cultural Dimensions Visualised (World Map)
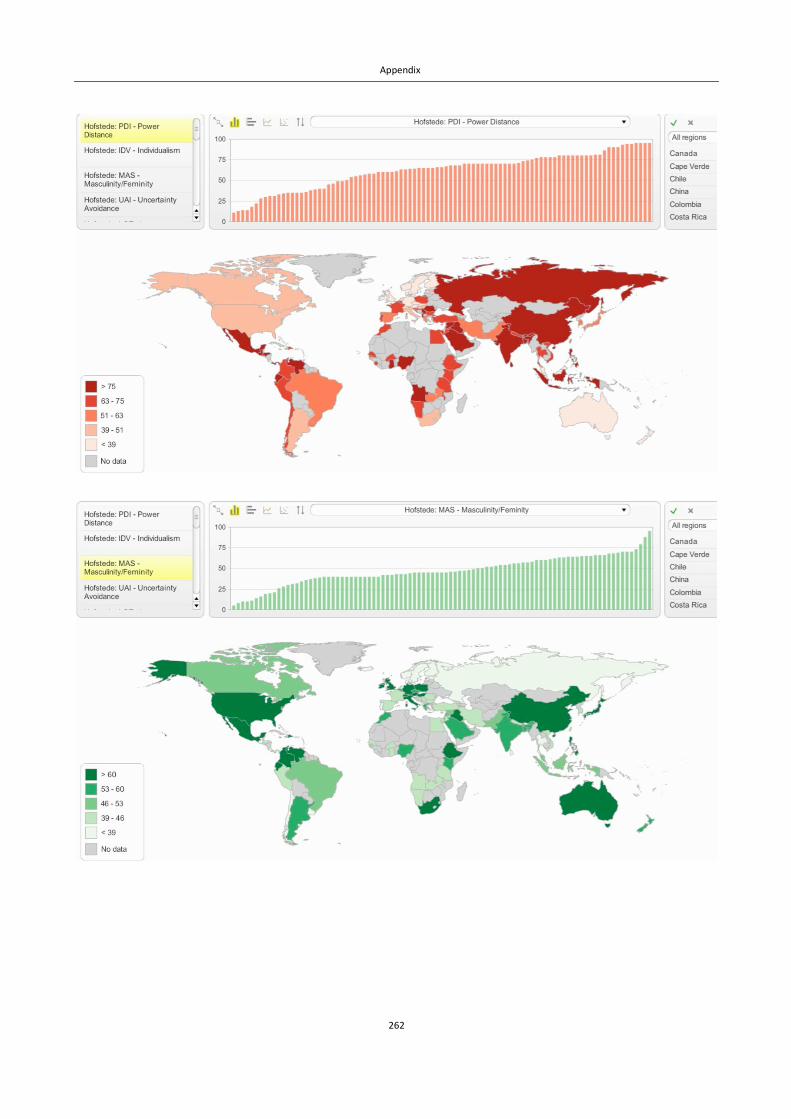
0 Appendix
262

0 Appendix
263

0 Appendix
264
D
Ethical Principles
The following pages outline the University of West London’s ethical principles which were
strictly adhered to throughout the course of this research.

0 Appendix
265

0 Appendix
266

0 Appendix
267

0 Appendix
268