Effects of a Culturally Responsive Teaching Project on ...
183
Effects of a Culturally Responsive Teaching Project on Teachers and Students in Selected Kanawha County, WV, Schools Georgia K. Hughes, AEL Kimberly S. Cowley, AEL Lisa D. Copley, AEL Nicole L. Finch, AEL Merrill L. Meehan, AEL Rebecca C. Burns, AEL Patricia S. Kusimo, Consultant to AEL Marian C. Keyes, AEL Sandra R. Orletsky, AEL David Holdzkom, Consultant to AEL December 2004 AEL P. O. Box 1348 Charleston, WV 25325
-
Upload
khangminh22 -
Category
Documents
-
view
1 -
download
0
Transcript of Effects of a Culturally Responsive Teaching Project on ...

Effects of a Culturally Responsive Teaching Project on Teachers and Students in Selected Kanawha County, WV, Schools
Georgia K. Hughes, AEL Kimberly S. Cowley, AEL
Lisa D. Copley, AEL Nicole L. Finch, AEL
Merrill L. Meehan, AEL Rebecca C. Burns, AEL
Patricia S. Kusimo, Consultant to AEL Marian C. Keyes, AEL
Sandra R. Orletsky, AEL David Holdzkom, Consultant to AEL
December 2004
AEL P. O. Box 1348
Charleston, WV 25325

ii
Founded in 1966 as a not-for-profit corporation, AEL provides services to educators, education publishers, and policymakers. Services include rigorous research design and implementation, research reviews, intensive product and program evaluation, randomized field trials, technical assistance, and award-winning professional development programs. AEL operates several contracts funded by the U.S. Department of Education: a Regional Educational Laboratory, the Region IV Comprehensive Center, and an Eisenhower Regional Consortium for Mathematics and Science Education.
To contact AEL about research, products, or services: P. O. Box 1348, Charleston, WV 25325; 304-347-0400 or 800-624-9120
[email protected] • www.ael.org
© 2004 by AEL Reproduction of this document is permitted provided credit is
given to AEL as the source.
This publication is based on work sponsored wholly or in part by the Institute of Education Sciences (IES), U.S. Department of Education, under contract number ED-01-CO-0016. Its contents do not necessarily reflect the positions or policies of IES, the Department, or any other agency of the U.S. government.
AEL is an Equal Employment Opportunity/Affirmative Action Employer.

iii
CONTENTS
EXECUTIVE SUMMARY………………………………………………………….. 1 Background……………………………………………………………………1 Research Design……………………………………………………………….2 Instruments and Data Collection........................................................................2 Data Analysis .....................................................................................................3 Findings..............................................................................................................4 Discussion and Conclusions ..............................................................................5 Recommendations..............................................................................................7 INTRODUCTION ....................................................................................................... 9 Literature Review of the Academic Achievement Gap ...................................10 Seeing the Gaps....................................................................................10 Achievement Gap Causes ....................................................................15 Closing the Gap....................................................................................17 Reducing class size ..................................................................17 Eliminating stereotyping..........................................................17 Improving teaching ..................................................................17 Promoting resilience ................................................................18
Background..............................................................................................……20 Research Component…… ...................................................................21 Research questions...................................................................22
Intervention Description ..................................................................................23 Culturally Responsive Teaching ..........................................................23 Target population .....................................................................25 Full Treatment......................................................................................26 Workshops ...............................................................................26 Bimonthly meetings .................................................................28 Teaching culturally responsive curriculum..............................30 Ongoing technical assistance ...................................................30 Partial Treatment..................................................................................31 No Treatment .......................................................................................32 METHODS ..................................................................................................33 Research Designs .............................................................................................33 Teacher Designs...................................................................................34 Student Design .....................................................................................35 Contextual Data Collection..................................................................35 Instruments and Data Collection Protocols......................................................36 AEL Continuous School Improvement Questionnaire ........................36 AEL Measure of School Capacity for Improvement ...........................37 Special Strategies Observation System................................................38 Classroom Observation Form (COF).......................................39 QAIT Assessment of Classroom..............................................41 Classroom Environment and Resources Checklist (CERC) ....41

iv
AEL Measure of Academic Supportiveness and Climate....................42 Student Achievement Assessment .......................................................42 Interview Design Process.....................................................................43 Data Collection ................................................................................................44 AEL Continuous School Improvement Questionnaire ........................44 AEL Measure of School Capacity for Improvement ...........................44 Special Strategies Observation System................................................44 AEL Measure of Academic Supportiveness and Climate....................46 Student Achievement Assessment .......................................................46 Interview Design Process.....................................................................47 Data Analysis ..................................................................................................48 AEL Continuous School Improvement Questionnaire ........................48 AEL Measure of School Capacity for Improvement ...........................48 Special Strategies Observation System................................................48 COF..........................................................................................48 QAIT........................................................................................49 CERC .......................................................................................49 Adherence Index ......................................................................49 AEL Measure of Academic Supportiveness and Climate....................50 Student Achievement Assessment .......................................................51 Interview Design Process.....................................................................51 FINDINGS ..................................................................................................52 AEL Continuous School Improvement Questionnaire ........................52 AEL Measure of School Capacity for Improvement ...........................52 SSOS Classroom Observations............................................................57 Classroom snapshot: Student engagement..............................60 Classroom snapshot: Groups and activities ............................63 Ongoing activities ....................................................................68 QAIT........................................................................................71 CERC .......................................................................................82 Adherence Index ......................................................................88 AEL Measure of Academic Supportiveness and Climate....................89 Student Achievement Assessment .......................................................90 Student achievement comparisons...........................................94 Interview Design Process.....................................................................96 Comparison: 2001 and 2004 .............................................................103 DISCUSSION AND CONCLUSIONS .....................................................................106 Overall Conclusions...........................................................................116 RECOMMENDATIONS...........................................................................................117 REFERENCES ................................................................................................119

v
APPENDIXES A: AEL’s Framework for Maximizing the Achievement of African American Children in Kanawha B: Monthly Curriculum for MAACK Pilot Team Meetings
C: Professional Development Materials for Principles of Culturally Responsive Instruction D: Lesson Plan Template E: Special Strategies Observation System (SSOS) Form F: Letter of Instruction for AEL CSIQ and AEL MSCI Administration G: Instructions for Administering the AEL MASC H: 2001 Focus Group Report I: SEDCAR Checklist

vi
LIST OF TABLES Table 1: National Assessment of Educational Progress, Comparison of Average
Scale Scores by Group ........................................................................................11Table 2: Scholastic Achievement Test, Comparison of Average Scores by Group..........13Table 3: Texas Assessment of Academic Skills (TASSA) Results...................................13Table 4: Texas Learning Index Results (Reading) by Ethnic Group ................................14Table 5: 2002-2003 SAT-9 Achievement Data for Pilot and Comparison Schools .........22Table 6: MAACK Pilot Schools Teacher Group Designations.........................................26Table 7: Selected Demographics of Pilot Schools ............................................................27Table 8: Selected Demographics of Comparison Schools ................................................27Table 9: Classroom Observation Completions by School and Time Period.....................46Table 10: Culturally Responsive Unit Components Aligned QAIT and CERC Items .......50Table 11: AEL CSIQ Subscale Descriptive Statistics and Differences by Full Group
and Building Level ..............................................................................................53Table 12: AEL MSCI Subscale Descriptive Statistics and Differences by Full Group
and Building Level ..............................................................................................55Table 13: AEL MSCI Subscale Descriptive Statistics and Differences for Pilot
Schools by Year of Administration.....................................................................56Table 14: Demographic Information by Grouping for Classroom Observations................58Table 15: Grade Level and Subject Information by Grouping for Classroom
Observations........................................................................................................59Table 16: Descriptive Statistics for Number of Students in SSOS Student
Engagement by Target Student or Teacher Focus and by Grouping ..................61Table 17: One-Way ANOVA Results for Number of Students in SSOS Student
Engagement by Target Student or Teacher Focus ..............................................64Table 18: Percent of Students in SSOS Student Engagement Categories by Grouping .....64Table 19: Descriptive Statistics for Number of Students in SSOS Groups and
Activities by Target Student or Teacher Focus and by Grouping.......................65Table 20: One-Way ANOVA Results for Number of Students in SSOS Groups and
Activities by Target Student or Teacher Focus...................................................68Table 21: Percent of Students in SSOS Groups and Activities by Grouping......................68Table 22: SSOS Individual Activities and Descriptions .....................................................69Table 23: Classroom Observation Individual Activities by Main Categories.....................73Table 24: Descriptive Statistics for Number of Minutes in SSOS Main Activity
Categories by Target Student or Teacher Focus and by Grouping .....................74Table 25: One-Way ANOVA Results for Number of Minutes in SSOS Main Activity
Categories by Target Student or Teacher Focus .................................................76Table 26: Descriptive Statistics of SSOS QAIT Items by Grouping ..................................77Table 27: Descriptive Statistics for SSOS QAIT Categories by Grouping.........................80Table 28: One-Way ANOVA Results for SSOS QAIT Categories ................................... 81Table 29: Numbers and Percentages for Presence of SSOS CERC Environmental
Indicators by Grouping ..................................................................................... .83 Table 30: Numbers and Percentages for Visibility of SSOS CERC Resources by
Grouping .............................................................................................................85Table 31: Numbers and Percentages for Use of SSOS CERC Resources by Grouping .....86

vii
Table 32: AEL MASC Subscale Descriptive Statistics and Differences by Full Group and Building Level...................................................................................91
Table 33: AEL MASC Subscale Descriptive Statistics and Differences for Pilot Schools by Year of Administration.....................................................................92
Table 34: Mastery of Mathematics for Pilot and Comparison Students by Grade Level....................................................................................................................93
Table 35: Mastery of Reading/Language Arts for Pilot and Comparison Students by Grade Level .........................................................................................................93
Table 36: Mastery of Science for Pilot and Comparison Students by Grade Level............94Table 37: Student Achievement Data Descriptive Statistics and Differences by Grade
Level....................................................................................................................95Table 38: Interview Design Process Results for Lessons learned about Teaching
African American Students .................................................................................97Table 39: Interview Design Process Results on Decisions Outside Classrooms that
Impact African American Students’ Ability to Reach Their Potential ...............99Table 40: Interview Design Process Results on Factors Contributing to African
American Students’ Higher Level Work...........................................................100Table 41: Interview Design Process Results on Factors Contributing to the
Achievement Gap..............................................................................................102Table 42: Interview Design Process Results on Promising Instructional Strategies for
Narrowing Achievement Gaps..........................................................................104

viii
LIST OF FIGURES Figure 1: Graphic Depiction of the Special Strategies Observation System (SSOS)
and Time Allotted to the QAIT and CERC .......................................................40Figure 2: Seating Arrangement for Interview Design Process..........................................47Figure 3: Mean Number of Students in SSOS Student Engagement Categories for
Target Student Focus by Grouping....................................................................62Figure 4: Mean Number of Students in SSOS Student Engagement Categories for
Teacher Focus by Grouping...............................................................................62Figure 5: Mean Number of Students in SSOS Groups and Activities for Target
Student Focus by Grouping ...............................................................................67Figure 6: Mean Number of Students in SSOS Groups and Activities for Teacher
Focus by Grouping.............................................................................................67Figure 7: Mean Number of Minutes in SSOS Individual Activities for Target
Student Focus.....................................................................................................72Figure 8: Mean Number of Minutes in SSOS Individual Activities for Teacher
Focus..................................................................................................................72Figure 9: Mean Number of Minutes in SSOS Main Activity Categories for Target
Student Focus by Grouping ...............................................................................75Figure 10: Mean Number of Minutes in SSOS Main Activity Categories for Teacher
Focus by Grouping.............................................................................................76Figure 11: Mean Ratings of SSOS QAIT Categories by Grouping ....................................81Figure 12: Percent of SSOS CERC Environmental Indicators Present by Grouping ..............84Figure 13: Percent of SSOS CERC Resources Present During Observations by
Grouping ...................................................................................................................87Figure 14: Percent of SSOS CERC Resources Used During Observations by Grouping .......88Figure 15: SSOS Culturally Responsive Instruction Adherence Index Score by
Grouping ...................................................................................................................89

1
EXECUTIVE SUMMARY
Differences in academic achievement among ethnic and socioeconomic groups, called achievement gaps, have been an issue in education for many years. Achievement gaps exist between upper- and lower-class students and between students of differing races and ethnic backgrounds. As a group, Black and Hispanic students perform less well on many standardized tests of academic achievement than do White and Asian American students. Following the passage of the No Child Left Behind Act of 2001, many states and districts have made increased efforts to close the achievement gap.
Background West Virginia is not exempt from the challenges associated with improving the achievement of African American children. In 2001, the Kanawha County Schools (KCS) district superintendent asked an AEL staff member for help with planning to improve the academic achievement of African American students in the county. That initial request ultimately resulted in a pilot schools project in which AEL worked with four schools and district leaders to improve instruction for all students, particularly those who are African American. The collaborative initiative is known as Maximizing the Achievement of African American Children in Kanawha (MAACK).
The current project was designed to research instructional practices useful in improving the academic achievement of all students, particularly African American students. Based on the research of Geneva Gay and Gloria Ladson-Billings, AEL staff hypothesized that the approach of working closely with school and district personnel to provide professional development and exemplary culturally responsive instructional materials in selected Kanawha County schools would yield differentiated teacher and student classroom behaviors. Further, AEL staff believed that this approach would build the schools’ capacity to continue improvement efforts aimed at raising the academic achievement of African American and other students. Culturally responsive teaching, the focus of the 2003-2004 pilot schools intervention, is based on the idea that culture is central to student learning and is guided by nine research-based principles as identified by the Knowledge Loom, developed by the Education Alliance at Brown University: (1) communication of high expectations, (2) active teaching methods, (3) teacher as facilitator, (4) positive perspectives on parents and families of culturally and linguistically diverse students, (5) cultural sensitivity, (6) reshaping the curriculum, (7) culturally mediated instruction, (8) student-controlled classroom discourse, and (9) small-group instruction and academically related discourse.
Four schools in Kanawha County (two elementary schools, one middle school, and one high school) were selected to participate in the project as pilot schools. The full- treatment group consisted of pilot team (PT) teachers at the pilot schools. PT teachers participated in professional development sessions and bimonthly meetings and received ongoing technical assistance. Some PT teachers taught culturally responsive curriculum

2
units (subgroup PTT), and others did not teach a culturally responsive unit (subgroup PTNT). The partial-treatment group consisted of the remaining, non-pilot team (NPT) teachers from each of the pilot schools. Some NPT teachers taught a culturally responsive unit (subgroup NPTT), and others did not (subgroup NPTNT). The comparison group (Comp.) consisted of two elementary schools, one middle school, and one high school within Kanawha County that were selected because their demographics and achievement levels most closely matched those of the pilot schools. Faculty and professional staff at comparison schools received no treatment.
Research Design
The research design for this project consisted of three quasi-experiments with two composed of only treatment and non-treatment groups (untreated matched control designs with pretests and posttests and various treatments) and with one design (untreated matched control design with dependent samples and various treatments) including a total of five groups: PTT, PTNT, NPTT, NPTNT, and Comp. Additionally, focus groups and interviews with project participants provided context for quantitative findings and added richness and depth to the quasi-experimental designs. Multiple perspectives were sought in order to triangulate data and increase the validity of findings.
Instruments and Data Collection
Various AEL paper-and-pencil instruments were administered to teachers and students at both pilot and comparison schools. The AEL Continuous School Improvement Questionnaire (AEL CSIQ) measures a faculty’s commitment to continuous learning and improvement. The AEL Measure of School Capacity for Improvement (AEL MSCI) assesses the degree to which schools possess the potential to become high-performing learning communities. The AEL Measure of Academic Supportiveness and Climate (AEL MASC) assesses students’ perceptions of themselves as students and of their school experiences and also asks students about their families’ awareness of and involvement in their children’s school lives. All instruments were administered during late April and early May of 2004. Additionally, the AEL MSCI and AEL MASC were administered to pilot schools during the spring of 2003.
AEL staff used the Special Strategies Observation System (SSOS) to collect classroom behavior data for the pilot and comparison schools at three times during the 2003-2004 school year (before, during, and after the culturally responsive units were taught in the pilot schools). This observation system, made up of three different instruments, is designed to collect data on essential elements of classroom behaviors related to instruction, management, and context. A total of 315 observations were completed in the pilot and comparison schools.
The West Virginia Educational Standards Test (WESTEST), a criterion-
referenced achievement test, is administered each spring to all West Virginia public

3
school students in Grades 3 through 8 and Grade 10 and addresses several content areas. In collaboration with KCS officials, AEL research staff collected scale scores and performance level data for students enrolled in classrooms that were observed for the pilot schools project during the course of the 2003-2004 school year.
Interview Design is a data collection process in which all participants ask questions, answer questions, and analyze responses. During the training workshop held on May 6, 2004, the Interview Design procedure was employed to gather data about participants’ perceptions of several issues, including factors contributing to the achievement gap, instructional strategies that hold promise for narrowing the achievement gap, and various other questions of interest.
Data Analysis
To compare the differences on the various AEL instruments (AEL CSIQ, AEL MSCI, AEL MASC) between the pilot schools and the comparison schools, independent t tests were computed on each instrument’s subscales for the full groups (pilot and comparison) and by building level (elementary, middle, and high school). To compare differences on the AEL MSCI and the AEL MASC between the two administrations (spring 2003 and spring 2004) of the instruments, independent t tests were computed on the instruments’ subscales. Effect sizes were calculated as appropriate.
Classroom observation data, collected using the three-instrument SSOS, were analyzed according to classroom grouping (i.e., PTT, PTNT, NPTT, NPTNT, Comp.). Descriptive statistics (e.g., frequencies, percentages) were calculated to describe the results observed in each of the five groups, and ANOVAs were conducted for various components of the classroom observation data to determine if statistically significant differences existed among the five groups of classrooms. As appropriate for the analyses, effect sizes were computed. In order to determine the adherence to the principles of culturally responsive teaching, an index score was generated from those observational data points that most closely aligned to the nine specific components.
The percentages of pilot and comparison students performing at or above mastery on the WESTEST were calculated for each grade level in each of three content areas (i.e., mathematics, reading/language arts, and science). AEL researchers also compared pilot and comparison students’ scale scores for each grade level in each of the content areas.
Responses to Interview Design questions were analyzed by theme and tabulated to provide a general, quantitative analysis of the most salient and prevalent issues that arose during the discussions.
4
Findings
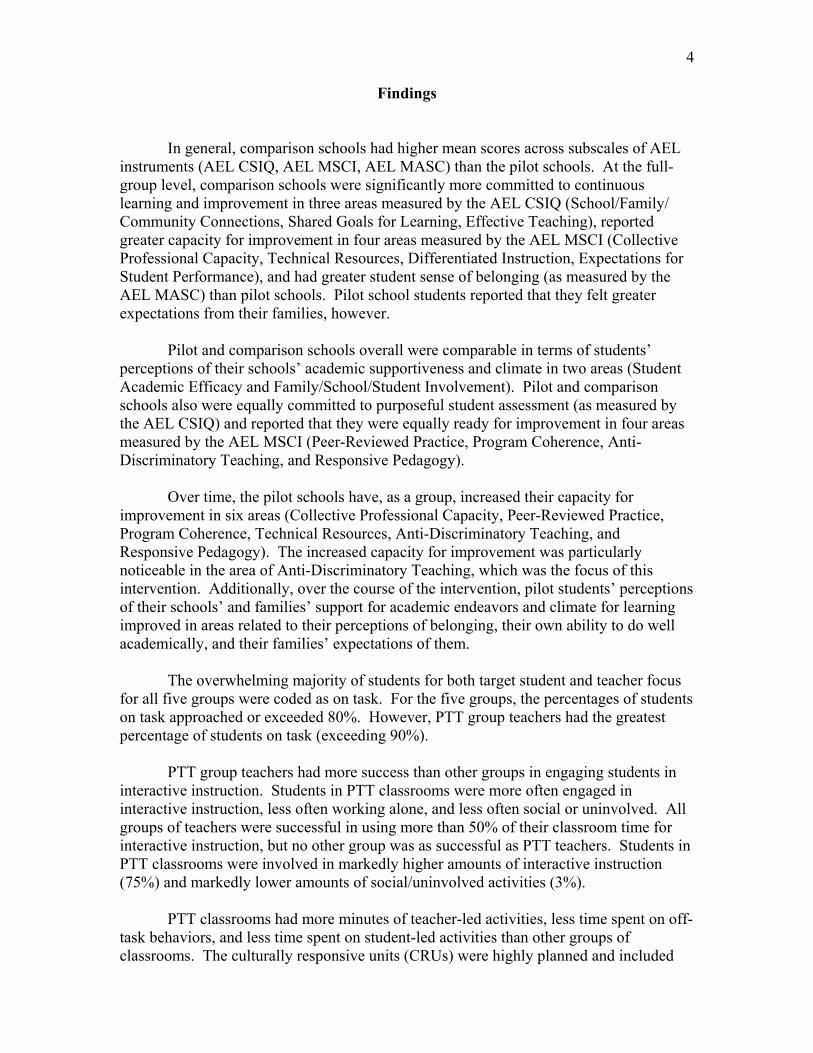
In general, comparison schools had higher mean scores across subscales of AEL instruments (AEL CSIQ, AEL MSCI, AEL MASC) than the pilot schools. At the full- group level, comparison schools were significantly more committed to continuous learning and improvement in three areas measured by the AEL CSIQ (School/Family/ Community Connections, Shared Goals for Learning, Effective Teaching), reported greater capacity for improvement in four areas measured by the AEL MSCI (Collective Professional Capacity, Technical Resources, Differentiated Instruction, Expectations for Student Performance), and had greater student sense of belonging (as measured by the AEL MASC) than pilot schools. Pilot school students reported that they felt greater expectations from their families, however.
Pilot and comparison schools overall were comparable in terms of students’
perceptions of their schools’ academic supportiveness and climate in two areas (Student Academic Efficacy and Family/School/Student Involvement). Pilot and comparison schools also were equally committed to purposeful student assessment (as measured by the AEL CSIQ) and reported that they were equally ready for improvement in four areas measured by the AEL MSCI (Peer-Reviewed Practice, Program Coherence, Anti-Discriminatory Teaching, and Responsive Pedagogy).
Over time, the pilot schools have, as a group, increased their capacity for
improvement in six areas (Collective Professional Capacity, Peer-Reviewed Practice, Program Coherence, Technical Resources, Anti-Discriminatory Teaching, and Responsive Pedagogy). The increased capacity for improvement was particularly noticeable in the area of Anti-Discriminatory Teaching, which was the focus of this intervention. Additionally, over the course of the intervention, pilot students’ perceptions of their schools’ and families’ support for academic endeavors and climate for learning improved in areas related to their perceptions of belonging, their own ability to do well academically, and their families’ expectations of them.
The overwhelming majority of students for both target student and teacher focus for all five groups were coded as on task. For the five groups, the percentages of students on task approached or exceeded 80%. However, PTT group teachers had the greatest percentage of students on task (exceeding 90%).
PTT group teachers had more success than other groups in engaging students in interactive instruction. Students in PTT classrooms were more often engaged in interactive instruction, less often working alone, and less often social or uninvolved. All groups of teachers were successful in using more than 50% of their classroom time for interactive instruction, but no other group was as successful as PTT teachers. Students in PTT classrooms were involved in markedly higher amounts of interactive instruction (75%) and markedly lower amounts of social/uninvolved activities (3%).
PTT classrooms had more minutes of teacher-led activities, less time spent on off-task behaviors, and less time spent on student-led activities than other groups of classrooms. The culturally responsive units (CRUs) were highly planned and included

5
many very specific components. Therefore, one could reasonably expect that there would be more time spent on teacher-led activities and less time for student-led activities as well as less student time spent off task. PTT teachers demonstrated a higher quality of instruction than all other groups and also exhibited better use of class time. Overall, PTT teachers had the most positive classroom learning environments, especially in terms of using culturally mediated instruction, student-controlled discourse, and multiracial materials in their classrooms. PTT group teachers were observed to have markedly greater use of journals/learning logs, instructional aids/props, and reference materials and markedly lower use of textbooks, workbooks, and worksheets than other groups of teachers, which is in line with the pilot schools intervention as planned. Use of journals, instructional aids, and reference materials was meant to be part of the CRUs, and use of textbooks, workbooks, and worksheets was not meant to be a large part of the units. Pilot team teachers had greater adherence to the principles of culturally responsive instruction than non-pilot team teachers and comparison teachers. PTT group teachers in particular followed the principles of culturally responsive instruction significantly more than non-pilot team teachers and comparison teachers.
In all, AEL researchers collected WESTEST data for 249 students observed at pilot schools and 362 students observed at comparison schools. Although the comparison schools generally had greater frequencies of students at or above the mastery level, pilot school students in some grades achieved mastery at a fairly comparable rate in some subject areas. In general, comparison schools had students with higher mean scale scores across the grades than did the pilot schools.
In 2001, pilot school focus group participants seemed hesitant to acknowledge that there was an achievement gap between African American students and students of other ethnicities. Participants in the 2004 Interview Design seemed more willing to acknowledge that there was an achievement gap between different ethnic groups and that students of different ethnicities might require different teaching or instructional strategies. Interview Design respondents frequently mentioned respecting students’ culture and cultural differences as an important lesson learned for teaching African American students. Participants offered many different instructional strategies that hold promise for narrowing achievement gaps, which indicates that these participants believe that a variety of methods, used together, will do the most to narrow achievement gaps.
Discussion and Conclusions It would be inappropriate to make a claim of gain or loss in students’ achievement, as measured by standardized tests, based on the circumscribed implementation of the current intervention. However, data show that teachers who learn about culturally responsive teaching practices and who teach standards-based lessons designed to be consistent with culturally responsive teaching principles are more likely to

6
keep students on learning tasks during the school day. Therefore, over time, continued participation in this intervention should produce higher student achievement due to less time spent off task. Three of the four pilot schools were low performing, by state standards, and none of the four comparison schools was designated as low performing. The AEL CSIQ assesses elements associated with high-performing learning communities and effectively discriminates among high- and low-performing schools. It is to be expected, therefore, that three of the pilot schools, which were identified as low-performing, would reflect this reality in their scores on the AEL CSIQ and that the comparison schools, which were not identified as low performing, generally would show a higher commitment to continuous school improvement than the pilot schools. Findings show that the intervention helped faculty in pilot schools increase their perceptions of their schools’ capacity to improve. The increased capacity for improvement is particularly notable in the area of anti-discriminatory teaching, which was the focus of the intervention. An increase in capacity to improve in anti-discriminatory teaching should create a school environment that supports the learning of all students, including African American and low-SES students. The intervention influenced students’ perceptions in a positive manner. Evidence supports the conclusion that the intervention was successful in improving students’ perceptions of their schools’ and families’ support for academic endeavors and climate for learning. It is encouraging that, after their schools participated in the intervention, pilot school students’ perceptions of their schools’ supportiveness improved significantly.
Pilot team teachers teaching a culturally responsive unit (CRU) demonstrated better instructional format than other groups of teachers, had the most positive classroom learning environments, and had significantly higher quality of instruction than all other groups. Further, the format, substance, and quality of instruction in a teacher’s class were more likely to conform to the principles of culturally responsive teaching if that teacher had been required to use an exemplar unit that demonstrated the principles of culturally responsive teaching. Thus, the intervention was powerful in terms of creating the positive, culturally responsive learning environment that was observed in the classrooms of those pilot team teachers using a CRU. The intervention was successful in helping teachers make effective use of classroom time and in strengthening teachers’ ability to incorporate interactive, effective instructional strategies. Because students and teachers in classrooms receiving the full application of the intervention (i.e., pilot team teachers using a CRU) were engaged in markedly lower amounts of off-task behavior and notably more amounts of interactive instruction, we conclude that students in these classrooms had greater opportunities to learn, were receiving more appropriate instruction, and were more engaged in learning tasks than their peers in other groups of classrooms. The findings of this research show that teachers’ interpretations of the achievement gap changed in substantive ways over time. The intervention was successful in addressing the implication that to see color would be to expect less from

7
children because one has noticed their color. Results of the Interview Design process show growth over time in participants’ understanding of the impact of culture and ethnicity on teaching and learning and the value of culturally relevant instruction in narrowing the achievement gap; this growth gives evidence that the project achieved much of its intent.
Overall, the intervention had a positive effect on teachers' beliefs, perceptions, and behaviors about the value of culturally responsive instruction and the role it may play in improving student achievement and narrowing the achievement gap. The more involvement teachers had with the intervention (e.g., being a member of the pilot team, teaching the CRU), the greater the adherence to the principles of culturally responsive instruction as presented and facilitated in this project. Thus, the intervention was more successful at progressive levels (i.e., the greater or more intense the involvement, the greater the adherence to or application of the principles of culturally responsive instruction).
Recommendations
• For the culturally responsive teaching intervention to be most effective, teachers must receive the full treatment, which in this project included the following:
- a skilled facilitator knowledgeable about the impact of culture, ethnicity, and socioeconomic status on teaching and learning and knowledgeable about culturally responsive instruction
- regular team meetings led by a skilled facilitator that included learning about and discussing how culture, ethnicity, and socioeconomic status impact teaching and learning; designing lessons that exemplify the principles of culturally responsive instruction; reflecting on and discussing lesson delivery and student response to lessons
_ participating in workshops on culturally responsive teaching and the experience of actually teaching culturally responsive curriculum units
• To experience the full effect of a culturally responsive teaching intervention, teachers need continuing assistance from a skilled facilitator. The facilitator could be a person from a school, district, or other agency who has received appropriate training in culturally responsive instructional strategies.
• For schools to get the maximum benefit from this intervention, implementation
throughout the whole school is necessary. • Culturally responsive curriculum units should be offered to teachers in
conjunction with the appropriate context and training (e.g., professional development, workshops, ongoing technical assistance). Offering these units

8
absent of such support does not result in the most effective teaching and does not produce the desired results in the classroom.
• Based on the findings of the possible amount of instructional time lost by students
due to off-task behavior in classrooms that did not participate in the full treatment, schools should consider implementing this process as one way to decrease student time off task, especially for African American students. Likewise, schools should consider using culturally responsive instruction as one way to increase student engagement and interactive instruction.
• Schools looking to increase their capacity to improve and develop as continuously
improving learning communities could adopt this model as one method for achieving those goals.
• Any implementation of this model should include the collection and examination
of student achievement data and other student data both before and after implementation of the intervention.
• Culturally responsive curriculum units, geared to state content standards, should
be developed as exemplars for all grade levels and multiple subject areas.
• Any future implementations of this model should be researched to determine whether results achieved in this study are replicated elsewhere.

9
INTRODUCTION
The achievement gap has been causing concern in education circles for many years. The term refers to the differences in academic achievement among ethnic and socioeconomic groups. Lucas (2000) notes that as early as 1785, Thomas Jefferson, in his notes on Virginia, saw the achievement gap as an important issue. Lucas also points out that W.E.B. Du Bois made elimination of the achievement gap a cornerstone of his agenda (as cited by D’Amico, 2001). According to Viadero (2000), the gap has been well documented since the 1960s at least.
An achievement gap often is seen between upper- and lower-class students and between students of differing races and ethnic backgrounds.1 The consensus among researchers is that race and class are two major contributors to the achievement gap, among several others. Lee and Burkam (2002) associate race and ethnicity with socioeconomic status and note that a high proportion of African Americans are categorized as having low socioeconomic status. They assert, therefore, that high proportions of African American students generally score lower on standardized tests. Although the effects of poverty are associated with lower student achievement, Rothman (2001-2002) notes that even in suburban, middle-class schools, White students outperform their African American peers.
The National Assessment of Educational Progress (NAEP) data from 1971 to1996 show that the Black-White reading gap shrank by almost half, and the math gap shrank by one third (Jencks & Phillips, 1998). But in the 1990s the gap for fourth-grade reading and eighth-grade mathematics began to widen again (Haycock, 2001). According to the NAEP data, White fourth graders scored an average of 30 points higher than their Black peers in 1998. While 38% of White students scored at the proficient level or above, only 9% of Black students scored at this level in fourth-grade reading. A 40-point achievement gap occurred in eighth-grade mathematics between White and Black students. Thirty-four percent of the nation’s White eighth graders scored at the proficient level or above, while only 5% of their African American peers scored at the same level in mathematics (Education Trust, 2002-2003).
Following the passage of the No Child Left Behind Act of 2001, many states and districts increased efforts to close the achievement gap. Haycock (2001) states that setting standards for what students should learn is key to solving the problem. These standards should set a clear guide for students, parents, teachers, and administrators. Kentucky was one of the first states to adopt a standards-based reform more than 13 years ago, which led to the adoption of the Kentucky Learner Goals and the expectation that all children would meet these goals. Kentucky officials admit that all students are not meeting these goals yet, but they are making clear and undeniable progress toward them (Haycock, 2001). In reading, 7 of the 20 top-performing Kentucky schools are
1 In this report the term African American refers to students who are of African American descent. The term Black incorporates many different ethnic groups, e.g., Jamaican, Haitian, or African immigrants. Therefore, ethnic designations are used in their appropriate context.

10
designated as high poverty; in math 8 of the 20, and in writing 13 of the top 20 are high- poverty schools (Haycock, 2001).
Literature Review of the Academic Achievement Gap*
Seeing the Gaps When student achievement statistics are disaggregated by race/ethnicity and gender, it is clear that gaps exist among the average scores of the different groups. Such gaps appear to persist over time. Table 1 shows the average scores of various groups, using the NAEP scale score in reading and mathematics as the metric. The NAEP is a useful database for examining this question, because it tests many diverse students from many schools across the nation, and it uses a scoring metric (scale scores) that allows for comparison across years and across grades.
Table 1 compares the average scale scores for students who took the test in Grades 4, 8, and 12 in 1990 and 2003. This table was constructed from data provided by NAEP and displayed on the Web site of the National Center for Education Statistics (NCES, 2002). If we examine just the 1990 mathematics data, we find that, on average, White students outperformed Black and Hispanic students, and that boys, on average, outperformed girls in all three grades. The same patterns held true for the 2003 mathematics data. It is clear that
• Black students in Grade 12, on average, scored lower (267.9) than did White students in Grade 8 (269.6) in 1990. By 2003, White students in Grade 8 scored 13.2 more points than did the average Black student in Grade 12.
• Hispanic students, on average, scored somewhat lower than White students
but somewhat higher than Black students in all three grades in both years of this comparison.
• Differences in average scores for boys and for girls were smaller than the
differences among racial/ethnic groups, but the gap was wider for Grade 4 in 2003 (3 points in Grade 4) than it was in 1990 (1 point). A similar pattern is visible for Grade 8 but not for Grade 12, where we find a smaller gap in 2003 than in 1990 (5.5 points had narrowed to 3.6 points). These differences, however, are not statistically significant.
* This review benefited greatly from an earlier paper by Steven L. Turner, University of Virginia, titled Falling Through the Gap. We are pleased to acknowledge Mr. Turner’s contribution.

11
Table 1 National Assessment of Educational Progress, Comparison of Average
Scale Scores by Group
Mathematics Reading Group 1990 2003 1992 2003
4th Grade Black 187.5 216.1 192 197.9 White 219.8 234.4 224.3 228.6 Male 213.5 236.4 212.8 214.6 Female 212.5 233.4 220.8 221.9 White 219.8 234.4 224.3 228.6 Hispanic 200.3 221.9 196.8 200.5
8th Grade Black 236.8 252.2 237.4 244.5 White 269.6 287.7 267 272.3 Male 263.2 278.5 253.7 258 Female 261.9 276.6 266.5 268.6 White 269.6 287.7 267 272.3 Hispanic 245.9 259 240.8 245.3
12th Grade Black 267.9 274.5 273.2 267.5 White 299.9 307.6 297.4 292.3 Male 297.1 302.9 286.9 278.6 Female 291.5 299.3 297.1 294.9 White 299.9 307.6 297.4 292.3 Hispanic 276.2 282.9 278.5 272.7

12
• While the gap between average Black and average White scores in Grade 4 mathematics narrowed between 1990 and 2003 (32.3 as compared to 18.3), it widened somewhat in the Grade 8 and Grade 12 comparisons (32.8 as compared with 35.5 and 32 as compared with 33.1).
For the mathematics comparison, the achievement gap between average Black
students and average White students, between average Hispanic students and average White students, and between average girls and average boys appears, at a basic level, to be consistent (we see it for all grades for both years) but somewhat unstable (the amount of difference changes in ways that may not be predictable). Were the same gaps evident in the reading scores? Again, inspection of Table 1 provides some answers.
Looking at comparisons between ethnic/racial groups, it is clear that White
students, on average, outperformed Black and Hispanic students, on average, for all three grades for both years. However, the average score for girls was higher than the average score for boys in all three grades for both years, reversing the trend we saw earlier in mathematics. However, these differences are not statistically significant. Compared over time, the gap between boys and girls shrank slightly in Grades 4 and 8, but not in Grade 12, where it actually widened considerably.
Another test many students take each year is the Scholastic Achievement Test
(SAT). Table 2 presents combined scores (that is, the verbal and mathematics scores have been summed) for students who took the SAT in 2000 through 2004. These national scores were reported in the North Carolina analysis of SAT results (North Carolina Department of Public Instruction, 2004). The scores are disaggregated by gender and by six racial/ethnic categories.
It is interesting to note, at the outset, that the SAT average score for all students
changes very slowly. During the first three years shown in Table 2, the scores changed by only 1 point. During the next two years, scores increased 6 points, although there was no change from 2003 to 2004. When we look at the disaggregated scores, however, a slightly different picture emerges. The average score for male test-takers, for example, increased by 9 points, while the score for female test-takers increased by only 3 points, thus widening the gap between genders over this five-year period.
Turning to the scores of various ethnic/racial groups, it is clear that the rank order
of the groups does not change over the five years, meaning that any gap we see in 2000 is still evident in 2004. As a group, Asian Americans earned the highest average scores on the SAT throughout the period, followed by Whites, other ethnic/races, Hispanics, American Indians, and Blacks. While the size of the gap between any two groups might change slightly from one year to another, the rank order of performance of groups does not change.

13
Table 2 Scholastic Achievement Test, Comparison of Average Scores by Group
Year
Group 2000 2001 2002 2003 2004 All Students 1019 1020 1020 1026 1026 Male 1040 1042 1041 1049 1049 Female 1002 1000 1002 1006 1005 American Indian 963 960 962 962 971 Asian American 1064 1067 1069 1083 1084 Black 860 859 857 857 857 Hispanic 918 914 911 912 916 White 1058 1060 1060 1063 1059 Other 1023 1015 1016 1014 1002
While the average scores for Asian Americans, American Indians, and Whites increased, the average scores for Blacks, Hispanics, and others fell by 2 to 21 points over the five years. Thus, the achievement gap between White students and Black students and between White students and Hispanic students actually grew over these five years, as did the gap between Asian American and White students.
The achievement gap also is evident when data collected by states are examined. Texas was an early leader among states that test all or most students annually. Thus, it has been able to measure students’ academic achievement and to track changes in the achievement gap. Tables 3 and 4 present Texas data similar to those collected in other states. Table 3 shows the percentages of students in Grade 5, disaggregated by ethnic/racial group, who passed the Texas Assessment of Academic Skills (TAAS) tests in 1994 and 2002 (Texas Education Agency, 1998, 2002). It is clear that much larger percentages of students passed these tests in 2002 than in 1994, although a visible gap among ethnic/racial groups persists.
Table 3
Texas Assessment of Academic Skills (TAAS) Results
5th Grade (Percent Passing) Year
Group 1994 2002 All 56% 91% Black 35% 84% White 68% 95% Hispanic 44% 88%
It should be noted that the TAAS results shown in Table 3 compare the
percentages of students meeting a criterion (earning a passing score) rather than

14
comparing specific score points, as was seen in Tables 1 and 2. Table 4 presents results measured in terms of Texas Learning Index scores for reading in elementary grades (3 through 5).
Table 4 Texas Learning Index Results (Reading) by Ethnic Group*
Year
Group 1994 1995 1996 1997 1998 Grade 3
Black 71.7 71.5 71.9 74.1 77.6 Hispanic 74.0 73.8 74.7 75.8 79.5 White 82.2 82 82.7 83.5 85.3
Grade 4 Black 71.2 73.2 72.9 74.7 79.2 Hispanic 74.3 76.5 75.8 77.1 81.3 White 82.6 83.9 84.1 84.9 87.8
Grade 5 Black 71.9 72.7 75 77.9 80.7 Hispanic 74.2 75.5 77.3 79.6 82.1 White 83.2 84.3 85.8 88 88.6
*TEA, 1998 Comprehensive Biennial Report to 76th Texas Legislature from the Texas Education Agency
Table 4 indicates that, while the achievement gap persisted through the years
displayed, the gap did shrink slightly, and all ethnic groups at all grade levels made progress throughout the period. Other states have been able to show similar patterns: the existence of the achievement gap continues but appears to shrink over time. The Education Trust, in a paper published in October 2004, reports that over a three-year period, the gap between Black and White students in reading shrank in 16 states, but widened in 3, while the gap between Black and White students in mathematics shrank in 17 states, grew in 2, and did not change in 1. Moreover, achievement scores were generally up, suggesting that perhaps thousands more students of all descriptions are improving their performance in mathematics and reading (Education Trust, 2004).
Inspection of these sets of scores, then, supports the conclusion that the achievement gap between genders and between racial/ethnic groups is present, persistent, and predictable, but the dynamics of the gap are unstable and unpredictable. That is, the gap changes, increasing in some years and decreasing in others, changing by greater amounts in some comparisons and in smaller amounts in other comparisons.
The Center on Education Policy, located in Washington, DC, has analyzed the achievement gap and reminds us that, on the whole, American students are doing better on many key tests of educational attainment than was true 30 years ago (Center on Education Policy [CEP], 2001, p. 2). Moreover, each ethnic/racial group has made gains during the extended period of 25 to 30 years. Furthermore, they point out, during the

15
1970s and 1980s, the achievement gap narrowed at least in part because of the initiation of federal programs such as Title I and Head Start. However, since “about 1988, the racial/ethnic achievement gap has stayed the same for some subjects and ages and widened for others” (CEP, 2001, p. 2). The gap clearly demonstrates that as a group, Black and Hispanic students perform less well on many of these tests of academic achievement than do White and Asian American students. What might account for the continued existence of this achievement gap?
Achievement Gap Causes
In recent years, many people have written in the education literature about the
achievement gap. Entering “academic achievement gap” into an Internet search engine (Google) results in 718,000 hits. Refining the search term to “academic achievement gap research” still yields 110,000 hits. In many cases, people who write about the achievement gap take an advocacy role, arguing for the necessity of eliminating the gap. In other cases, writers take a philosophical stance, arguing that the gap represents the unfinished business that was launched with the Supreme Court’s decision in Brown v. Board of Education in 1954. In still other cases, writers have tried to identify, in a logical way, some of the underlying causes of the achievement gap. Research studies have examined some of the factors that may underlie the achievement gap. In this literature review, we examine some of the writings representing each of these perspectives.
One of the difficulties of understanding the achievement gaps arises from the fact
that so many factors appear to impact children’s academic experiences, only some of which arise in the school or classroom. Paul Barton, in his 2003 policy information report for the Educational Testing Service, observes that the literature identifies a number of factors that might account for the variance in achievement. These include obvious individual characteristics such as intelligence, persistence, willingness to work hard, and so on. However, based on his review of competent syntheses and meta-analyses of hundreds of studies, Barton also identifies 14 factors associated with home, school, and the larger society that research has linked to academic achievement. These factors include Social-family factors: Low birth weight
Lead poisoning Hunger and nutrition Reading to young children Television watching Parent availability Student mobility Parent participation

16
In-school factors: Rigor of curriculum Teacher experience and attendance Teacher preparation Class size Technology-assisted instruction School safety
Barton found statistical data available for all the factors that can be linked to academic achievement, and notes that in every instance, a gap existed. Thus, he contends that the impact of multiple factors is associated with race/ethnicity and that these factors are also linked to student achievement. He concludes that achievement gaps by race/ethnicity and income reflect inequalities in those aspects of schooling, early life, and home circumstances that research also links to student achievement (Barton, 2003).
Barton recognizes that some factors, although affecting school performance of students, are outside the control of schools. These include such family factors as low birth weight, television-watching habits, and family mobility. Other factors on Barton’s list however, are under the control of schools. For example, Barton asserts, “having experienced teachers with at least five years of experience makes a difference in student achievement. Minority and low-income students are more likely to be taught by teachers with three or fewer years of experience and to be in schools with higher teacher turnover” (p. 12).
One implication of Barton’s analysis of the societal factors that depress student achievement is the impact of inadequate funding for schools in economically disadvantaged communities. Apart from the fact that students living in economically disadvantaged families may experience negative conditions (hunger, mobility) that influence their academic performance, they also are more likely to attend economically disadvantaged schools. That is, wealthier school districts can afford to hire better-prepared teachers, can afford to pay for more experienced teachers, and can afford to offer curricula not available to students in poorer school districts. Increased funding, however, may not hold the key to fixing the achievement gap. Former U.S. Secretary of Education Rod Paige observed that there has been a reduction in poverty rates and an increase in education spending during the 1990s, but these have not led to improved student performance in reading (see The Condition of Education 2002, NCES, 2002). Between 1992 and 2000, the percentage of school-age children living in poverty decreased from 20% to 16% and spending on K-12 education increased in constant dollars, from $5,822 to $6,619 per student, while NAEP reading scores remained flat. This echoes an argument made earlier by Eric Hanushek (cited in Grissmer, Flanagan, & Williamson, 1998). Hanushek observed that, measured in constant dollars, expenditures per pupil had doubled between the late 1960s and early 1990s, but the NAEP showed little improvement in average reading or mathematics scores. However, Grissmer, Flanagan, and Williamson point out that, in fact, schools’ real resources did not come close to doubling. More important, however, is the fact that much of the increase was expended on special education students, many of whom were not tested. Therefore, while the resources increased, this increase may have been largely offset by new expenditures for untested students.

17
Closing the Gap
Reducing class size. One change that may have accounted for some closure of the gap was identified by Grissmer (1998). They describe an experiment conducted in several districts in Tennessee in which randomly assigned students participated in classes of 15 students rather than in classes of 23. Reducing class size between kindergarten and Grade 3 raised third-grade scores by 0.24 standard deviations for White and 0.33 standard deviations for Black students. Similar effects were found for economically disadvantaged students when they were assigned to smaller classes in 17 other school districts. Thus, reducing class size appeared to benefit disadvantaged and minority students more than it did White students.
Eliminating stereotyping. A factor not included on Barton’s list—one very important to Joshua Aronson and also related to the experience of minority students—is stereotyping. Claude Steele theorized that minority group students might perform poorly in evaluative settings because of their fear that they are expected to do poorly (Steele, 1997). Aronson created several experiments that tested Steele’s notion. Writing in Educational Leadership, Aronson describes “stereotype threat” as a condition in which students replicate the effects of negative stereotyping. Aronson describes an experiment he conducted with his colleagues:
In our first experiment, we had African American and White college students take a challenging standardized verbal test. In the control condition of the experiment, we presented the test in the standard way—as a measure of intellectual ability and preparation. In the experimental condition we sought to reduce stereotype threat by removing the relevance of the stereotype. We told our test takers that we were not interested in using the test to measure their ability; we only wanted to use it to examine the psychology of verbal problem solving. . . . On the test that we presented in a nonevaluative manner, the Black students solved, on average, twice as many items as on the test that we presented in the standard way. The manner in which we presented the test had no effect whatsoever on the White students. (Aronson, 2004)
For Aronson, then, minority students may have internalized the negative
stereotype held by the larger society. This stereotype comes into play in evaluative settings, causing minority students to perform less well than they otherwise might.
Improving teaching. There is no doubt that teachers are enormously powerful in setting high academic expectations and standards for students, in providing learning opportunities on a daily basis, and in ensuring that students make progress. Using student achievement data from Tennessee, Sanders and Rivers calculated that the impact of a poor-performing teacher was discernable in students’ achievement for as many as two years afterwards (Sanders and Rivers, 1997). Unfortunately, Black students are more likely to receive a disproportionate amount of poor teaching (Haycock, Jerald and Huang, 2001).

18
For example, when compared to their White counterparts, Black students in Grade 8 are twice as likely to have teachers who place little emphasis on developing lab skills, four times as likely to be assessed using hands-on activities once or less per grading period, and twice as likely to have a science teacher who does not emphasize development of data-analysis skills at least twice per month. Moreover, Black eighth graders are more likely to have teachers who did not participate in professional development during the previous year, much less likely to have a certified teacher with subject competency, and four times less likely to have science classrooms with running water and laboratories as their White counterparts (Haycock, Jerald & Huang, 2001).
Ronald Ferguson (1998) cites some empirical evidence of differential treatment of Black and White students by teachers. He states that he knows of only four experimental studies dealing with teachers’ treatment of Black and White students. All four found that teachers were less supportive of Black than of White students. He describes an experiment by Merrylee Taylor, for example, in which students in a teacher-training program were told that a six-year-old student would be watching them from behind a screen and would respond to their instructions by pushing buttons to activate lights on a panel. In fact, all of the student feedback was provided by an adult who did not hear Taylor’s description. Some of the student teachers were told that the student they were working with was Black; others were told that the student was White. Taylor found that the Black “phantom” students received briefer feedback after errors, and less positive feedback after correct answers than was true for White “phantom” students. She concluded that White students were more likely to receive helpful feedback from teachers than were Black students. Ferguson found that studies of real classrooms confirm this hypothesis.
Promoting resilience. Both the issues of poverty and negative stereotyping were addressed in a study conducted by researchers Geoffrey Borman and Laura Rachuba at the Center for Research on the Education of Students Placed at Risk (CRESPAR), a research and development center at the Johns Hopkins University. Borman and Rachuba examined the individual characteristics of academically successful students from minority and low-socioeconomic-status backgrounds and compared these with characteristics of their less successful counterparts (Borman and Rachuba, 2001). That is, instead of focusing on why children fail, they focused on why children of color/poverty succeed. Recognizing the possibility that schools might compound the barriers to success experienced by poor/minority students, the researchers also tested four models of the risk factors and resilience-promoting features of schools.
Using data from Prospects: The Congressionally Mandated Study of Educational
Growth and Opportunity, researchers (Puma, et al., 1997) identified 925 students from the third-grade cohort. Using a variety of measures, the researchers studied both the performance of these students over a four-year period and the characteristics of their schools. At the conclusion of the study period, the researchers found that 521 students met the criterion of performing above expectation on mathematics achievement. The results of the study indicated that minority students from low-SES backgrounds were exposed to greater risk factors and fewer resilience-promoting conditions than were White students from low-SES backgrounds. Nevertheless, their results indicated that all low-SES students, regardless of ethnic/racial background, benefit from uniform
19
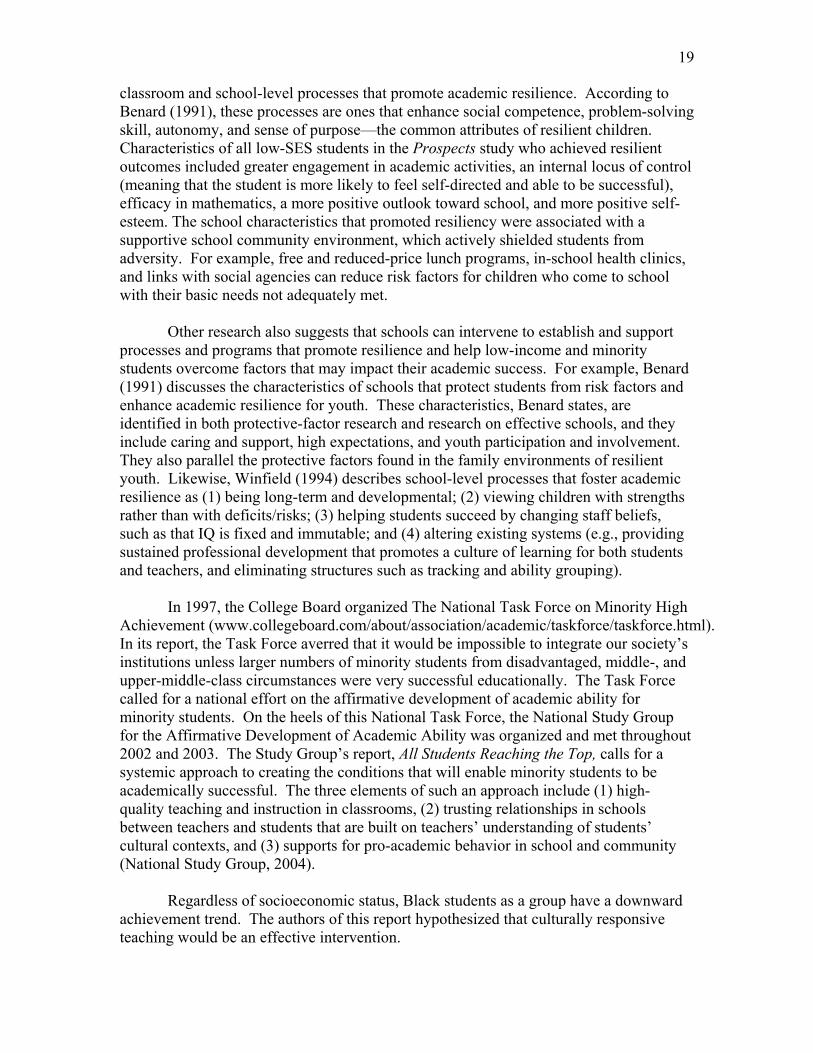
classroom and school-level processes that promote academic resilience. According to Benard (1991), these processes are ones that enhance social competence, problem-solving skill, autonomy, and sense of purpose—the common attributes of resilient children. Characteristics of all low-SES students in the Prospects study who achieved resilient outcomes included greater engagement in academic activities, an internal locus of control (meaning that the student is more likely to feel self-directed and able to be successful), efficacy in mathematics, a more positive outlook toward school, and more positive self-esteem. The school characteristics that promoted resiliency were associated with a supportive school community environment, which actively shielded students from adversity. For example, free and reduced-price lunch programs, in-school health clinics, and links with social agencies can reduce risk factors for children who come to school with their basic needs not adequately met. Other research also suggests that schools can intervene to establish and support processes and programs that promote resilience and help low-income and minority students overcome factors that may impact their academic success. For example, Benard (1991) discusses the characteristics of schools that protect students from risk factors and enhance academic resilience for youth. These characteristics, Benard states, are identified in both protective-factor research and research on effective schools, and they include caring and support, high expectations, and youth participation and involvement. They also parallel the protective factors found in the family environments of resilient youth. Likewise, Winfield (1994) describes school-level processes that foster academic resilience as (1) being long-term and developmental; (2) viewing children with strengths rather than with deficits/risks; (3) helping students succeed by changing staff beliefs, such as that IQ is fixed and immutable; and (4) altering existing systems (e.g., providing sustained professional development that promotes a culture of learning for both students and teachers, and eliminating structures such as tracking and ability grouping).
In 1997, the College Board organized The National Task Force on Minority High Achievement (www.collegeboard.com/about/association/academic/taskforce/taskforce.html). In its report, the Task Force averred that it would be impossible to integrate our society’s institutions unless larger numbers of minority students from disadvantaged, middle-, and upper-middle-class circumstances were very successful educationally. The Task Force called for a national effort on the affirmative development of academic ability for minority students. On the heels of this National Task Force, the National Study Group for the Affirmative Development of Academic Ability was organized and met throughout 2002 and 2003. The Study Group’s report, All Students Reaching the Top, calls for a systemic approach to creating the conditions that will enable minority students to be academically successful. The three elements of such an approach include (1) high-quality teaching and instruction in classrooms, (2) trusting relationships in schools between teachers and students that are built on teachers’ understanding of students’ cultural contexts, and (3) supports for pro-academic behavior in school and community (National Study Group, 2004). Regardless of socioeconomic status, Black students as a group have a downward achievement trend. The authors of this report hypothesized that culturally responsive teaching would be an effective intervention.

20
Background
Although West Virginia’s African American student population is small, consisting of approximately 4% of the state’s 3rd-through 11th -grade population, a disproportionate percentage of African American students score in the lower quartiles on standardized tests. According to 2001-2002 data from the No Child Left Behind–West Virginia Report Cards (http://wveis.k12.wv.us/nclb/pub/pickinfo.asp), only 39% of the state’s African American students in Grades 3 through 11 scored above the 50th percentile in basic skills on the Stanford 9. West Virginia, like other states across the nation, is not exempt from the challenges associated with improving the achievement of African American children and youth.
The seeds for a project focusing on improving the achievement of African American students found fertile ground in Kanawha County, which has one of the largest concentrations of African American student and adult populations in West Virginia. African Americans make up about 10% of the student population in Kanawha County Schools (KCS), Grades 3 through 11. However, the percentage of African American students in a school varies greatly within the county, with some schools having 78% African American student populations and others having 0%. Only 34% of Kanawha County’s African American students scored above the 50th percentile in basic skills on the Stanford 9, which is 5% lower than the statewide average of 39% for all students.
In 2001, KCS district officials asked an AEL staff member for help with planning
ways to improve the academic achievement of African American students in the county. Negative media reports about the district, social promotion of African American students from middle to high school, and inadequate performance on state assessments at schools with high percentages of African American students were all of concern to district officials. Additionally, an Office of Civil Rights citation for the disproportional representation of African American students in certain special education categories pointed to a need for increased dialogue and planned actions between district staff and members of the African American community.
That initial request ultimately resulted in a pilot school project in which AEL
worked with four schools and district leaders to improve instruction for all students, particularly those who are African American. The collaborative initiative is known as Maximizing the Achievement of African American Children in Kanawha (MAACK). In the fall of 2001, the KCS management team identified four schools to pilot efforts to improve academic achievement.
During the 2001-2002 and 2002-2003 school years, MAACK team members from all four schools attended professional development sessions led by AEL staff and, in some cases, KCS curriculum specialists. These sessions introduced topics such as culturally responsive instruction, peer observation, and reflective teaching practice. An AEL project staff member or consultant worked intensely with each pilot school, facilitating the twice-monthly MAACK team meetings, which were designed to extend learning from the professional development sessions and focus on how best to implement

21
culturally responsive schooling and instructional practices. AEL project staff also provided additional needs-based technical assistance when requested by the principal or teachers in their respective schools. For example, AEL staff conducted classroom observations and provided feedback to teachers and administrators, provided training for grade-level teams or departments in specific instructional strategies, and wrote a syllabus for an Extended Learning Lab period designed to help students improve Stanford 9 scores.
During the study year, school year 2003-2004, some teachers taught the culturally
responsive instructional units that were codeveloped by AEL and KCS. In addition, AEL staff provided ongoing professional development and technical assistance. These elements are described in the Intervention Description section of this report. Research Component
This project was designed to research instructional practices useful in improving the academic achievement of all students, particularly African American students. AEL believed that its approach of working closely with school and district personnel to provide professional development and exemplary culturally responsive instructional materials in selected Kanawha County schools would yield differentiated teacher and student classroom behaviors. Further, AEL believed that this approach would build the schools’ capacity to continue improvement efforts aimed at raising the academic achievement of African American and other students. The research component of the project involved teachers in four pilot schools and four comparison schools. Teachers in these schools were assigned to groups according to the amount of intervention they received. Researchers looked for effects of the intervention on teachers' instruction.
Table 5 contains achievement information for pilot and comparison schools, taken from 2002-2003 data in the No Child Left Behind-West Virginia Report Cards for the schools in the project, and county and state data (http://wveis.k12.wv.us/nclb/pub/pickinfo.asp). During the 2002-2003 school year in West Virginia, SAT-9 achievement tests were administered only to students in Grades 3 through 11.

22
Table 5
2002-2003 SAT-9 Achievement Data for Pilot and Comparison Schools
Locale
Number of Students in Grades 3-11
Percentage of White Students Scoring Above 50th Percentile
Percentage of African American Students scoring Above 50th
Percentile Pilot Schools
Elementary School A 104 34% 38% Elementary School B 241 56% 38%
Middle School C 709 50% 21% High School D 1,480 64% 23%
Comparison Schools Elementary School E 85 39% 29% Elementary School F 382 62% 50%
Middle School G 426 53% 45% High School H 851 63% 36%
County and State Data Countywide 19,330 60% 36% Statewide 193,131 59% 41%
Research questions. The MAACK Pilot Schools project suggested several key
questions around which research efforts were centered. These questions are as follows:
1. What is the effect on student achievement of schools’ participation in a pilot research and development project designed to be responsive to the cultural needs of African American and low-socioeconomic status (SES) students?
2. In what ways, if at all, does schools’ participation in a pilot research and
development project to improve the achievement of children, especially African American and low-SES students, affect school staffs’ sense of themselves as a high-performing learning community?
3. In what ways, if at all, does schools’ participation in a pilot research and
development project to improve the achievement of children, especially African American and low-SES students, affect schools’ capacity to undertake improvement initiatives?
4. In what ways, if at all, does schools’ participation in a pilot research and
development project to improve the achievement of children, especially African American and low-SES students, alter students’ perceptions of their schools’ and families’ support for students’ academic endeavors and school climate conducive to learning?

23
5. To what degree does a teacher’s participation in a full- or partial-treatment group affect the format, substance, and quality of his or her instruction?
6. To what degree does having a teacher in a full-treatment or partial-treatment
group affect student engagement?
7. Over the course of this project, how do educators’ interpretations of the achievement gap change?
Intervention Description
The MAACK intervention incorporates a five-component framework. Section I of the framework concerns research associated with improving the academic achievement of minority and economically disadvantaged students. Section II investigates school and district achievement data. Section III deals with culturally responsive curriculum planning and instructional design. Section IV addresses schooling practices that can negatively affect minority and economically disadvantaged students. Finally, Section V focuses on facilitating the change process. A detailed description of the framework appears in Appendix A. The MAACK project includes both technical assistance and research. In the third year (2003-2004), the research focused on Section III of the intervention framework, culturally responsive teaching. Following is a description of AEL’s culturally responsive teaching intervention, Section III of the MAACK intervention framework. Culturally Responsive Teaching
Culturally responsive teaching is based on the idea that culture is central to student learning. According to Ladson-Billings (1994), “It is an approach that empowers students intellectually, socially, emotionally, and politically by using cultural referents to impart knowledge, skills, and attitudes” (p.18). Gay (2002) concurs that culturally relevant teaching uses “the cultural characteristics, experiences, and perspectives of ethnically diverse students as conduits for teaching them more effectively” (p.106). This sociocultural approach to teaching, based on the work of Russian psychologist Lev Vygotsky, provides instructional scaffolding that encourages students to learn by building on the experiences, knowledge, and skills they bring to the classroom. To do this effectively, teachers need to be open to learning about the cultural particularities of the ethnic groups within their classrooms and transform that sensitivity into effective classroom practice (McIntyre, Rosebery, & Gonzalez, 2001). Explicitly, this means that culturally responsive teaching is guided by the following research-based principles, which are identified on The Knowledge Loom, a Web site developed by the Education Alliance at Brown University (www.knowledgeloom.org). Content, pedagogy, and teacher-student relationships are addressed in these principles.

24
• Communication of high expectations. There are consistent messages based on genuine respect for students and belief in student capacity, from both the teacher and the whole school that students will succeed. High expectations are directly related to rigorous, standards-based instruction.
• Active teaching methods. Instructional strategies promote student
engagement by requiring that students play an active role in crafting curriculum and developing learning activities that help them master important concepts and skills.
• Teacher as facilitator. Within an active teaching environment, the teacher’s
role is one of guide, mediator, and knowledgeable consultant, as well as instructor.
• Positive perspectives on parents and families of culturally and
linguistically diverse students. There is ongoing participation in dialogue with students, parents, and community members on issues important to them, along with inclusion of these individuals in classroom curriculum and activities.
• Cultural sensitivity. To maximize learning opportunities, teachers gain
knowledge of the cultures represented in their classrooms and translate this knowledge into standards-based instructional practice.
• Reshaping the curriculum. A reshaped curriculum is culturally responsive
to the background of the students. • Culturally mediated instruction. Instruction is characterized by the use of
culturally mediated cognition, culturally appropriate social situations for learning, and culturally valued knowledge in curriculum content.
• Student-controlled classroom discourse. Students have the opportunity to
control some portion of the lesson, providing teachers with insight into the ways that speech and negotiation are used in the home and community.
• Small-group instruction and academically related discourse. Instruction is
organized around low-pressure, student-controlled learning groups; this practice assists in the development of academic language and the mastery of key concepts and skills.
Selected teachers in each of the four pilot schools received curriculum units designed by AEL and KCS. These units are standards-based and illustrate the principles of culturally responsive teaching.

25
The elementary unit topic for grades K-2 was Get on Board! In this unit, students used books, their feelings, trains, and music as a bridge to greater understanding of African American cultural heritage. The learning activities emphasized the historical and social significance of the Underground Railroad, spirituals, and African American heroes within the overall context of nineteenth-century America.
The middle school unit topic for Grade 6 was Identity: Celebrating Who We Are. It included activities designed to build knowledge about students’ personal and cultural heritage. For example, students learned about Gardner’s Theory of Multiple Intelligences and completed an inventory to identify the ways they are “smart.” They also completed ethnic interest inventories. Students read biographies or autobiographies about famous African Americans and others who are leaders in various fields of work. Later, students wrote their own biographical poems and autobiographies.
The high school unit topic for Grade 11 was The Prayers and Protests of the
American Civil Rights Movement. The unit’s purpose was to give students a greater understanding of the sacrifices made by civil rights leaders such as Martin Luther King, Jr. and Malcolm X. Students studied literature and history from the period and related the events to current history and their own lives.
Target population. Selected teachers at four pilot schools in Kanawha County
(two elementary schools, one middle school, and one high school) formed the target population for this intervention. The high school volunteered to participate; the elementary schools and the middle school were selected by the county superintendent to participate. All four intervention schools have African American student populations of at least 25%. The project initially placed teachers in one of three groups: full treatment, partial treatment, or no treatment (comparison). Further, both the full- and partial-treatment groups were subdivided on the basis of whether they taught the special culturally responsive (CR) unit.
Table 6 provides brief descriptions of the three culturally responsive teaching intervention levels: (1) full-treatment groups, (2) partial-treatment groups, and (3) no-treatment groups used for comparison purposes.

26
Table 6 MAACK Pilot Schools Teacher Group Designations
Main Groups/Subgroups Designation Definition
(1) Full Treatment Pilot Team Teaching Pilot Team Not Teaching
PTT
PTNT
Full treatment and teaches Culturally Responsive Unit (CRU) Full treatment and does not teach CRU
(2) Partial Treatment Non-Pilot Team Teaching Non-Pilot Team Not Teaching
NPTT
NPTNT
Partial treatment and teaches CRU Partial treatment and does not teach CRU
(3) No Treatment Comparison schools
Comp. No treatment and does not teach CRU
The full treatment group consisted of pilot team teachers at the pilot schools.
These pilot school teams were composed of teachers who volunteered or were selected to participate in the project by their principal, and they ranged in size from 3 to10 members per school, as shown in Table 7. The partial treatment group consisted of the remaining teachers from each of the pilot schools. The comparison group consisted of two elementary schools, one middle school, and one high school (see Table 8). These schools were selected because, of the schools within Kanawha County, their demographics and achievement levels matched those of the pilot schools most closely.
Full Treatment
During the 2003-2004 school year, the full treatment group (pilot school MAACK teams) participated in professional development sessions, bimonthly meetings, and received ongoing technical assistance. Additionally, some full treatment staff taught culturally responsive curriculum units codeveloped by AEL and KCS. Thus, the full treatment group consisted of two subgroups: PTT (those who received the principles of training in culturally responsive instruction and taught culturally responsive instructional units) and PTNT (those who received the training but did not teach culturally responsive instructional units). Following are descriptions of all intervention levels.
Workshops. Two one-day workshops were provided, from 8:30 a.m. to 3:00
p.m., for pilot team members from all four schools. The objectives of the first workshop, held in October 2003, were: (1) to deepen participants’ understanding of culturally responsive instruction through the use of strategies that reflect the nine principles of culturally responsive instruction as defined by the Education Alliance at Brown University on the Web at (www.knowledgeloom.org); (2) to develop a common instructional vocabulary; and (3) to clarify roles, responsibilities, and next steps for the

27
Table 7 Selected Demographics of Pilot Schools
Full Treatment Pilot Team Teachers
Partial Treatment
Non-Pilot team Teachers
2002-2003
School Demographics*
School Level/Total Number of
Faculty Taught CRU
No CRU
Taught Taught CRU
No CRU
Taught
Percentage of African American students
Free or Reduced-
Price Lunch
PercentageTotal
StudentsHigh School D N=94 1 4 3 86 27% 33% 1,420
Middle C N= 51.5 2 8 10 31 35% 60% 668
Elementary A N=17.5 2 1 0 14.5 76% 78% 206
Elementary B N=17.5 1 3 5 8.5 34% 67% 257
*School demographic data are drawn from the common core of data; 2002-2003 is the most recent year for which data are available.
Table 8
Selected Demographics of Comparison Schools
2002-2003 School Demographics*
School Level/Total Number of Faculty
Comparison Teachers
Percentage of African American
Students
Free or Reduced-
Price Lunch
Percentage Total
StudentsHigh School H N=64 64 18% 28% 1,087
Middle School G N= 31 31 30% 55% 464
Elementary F N=12 21 59% 85% 226
Elementary E N=21 12 33% 60% 358 *School demographic data are drawn from the common core of data; 2002-2003 is the most recent year for which data are available.

28
2003-2004 school year. The workshop also gave teachers an opportunity to review curriculum units codeveloped by AEL and KCS, which some of the pilot team teachers at each of the four pilot schools would teach. Activities during the morning included an overview of disaggregated student achievement data for West Virginia, review of 2003 AEL Measure of Academic Supportiveness and Climate (AEL MASC) student survey data for each of the four schools, discussion of the possible causes of and remedies for the achievement gap, and a lecture and group activity on the principles of culturally responsive teaching, as defined on The Knowledge Loom. In the afternoon, teachers met in groups by elementary, middle school, and high school for an introduction to and discussion of the unit developed for each instructional level. AEL facilitators led each group through some of the unit activities and answered questions regarding implementation of the units. At the end of the day, each school team identified dates for teaching the unit at their school. The day concluded with completion of the Stages of Concern questionnaire and a workshop evaluation. The second workshop occurred in May 2004 and provided an opportunity for participants to reflect on their learning from previous months about culturally responsive teaching. The second workshop had three objectives relative to culturally responsive teaching: (1) to reflect on and explore the impact of race, ethnicity, SES, and culture on instruction and schooling practices; (2) to reflect on learning about culturally responsive instructional strategies and the achievement gap; (3) to reflect on how using data had improved student achievement in each school; and (4) to plan work for the 2004-2005 school year that would extend culturally responsive instructional practices throughout the school. Activities designed to promote reflection included Interview Design, a process in which all group participants ask questions, answer questions, and analyze data; Data on Display, a process used to generate data quickly from a large group of people and move people from thinking about individual responses to thinking about the implications of the group’s responses; Jigsaw, an instructional technique that promotes cooperative learning by dividing a task among individuals so they must pool their contributions to complete an assignment; school team planning to extend culturally responsive instructional practices throughout the school, with reports from each team about its plans; and completion of the Stages of Concern questionnaire and workshop evaluation. Participants also engaged in a reflection activity where they were asked to recall the tenets of culturally responsive teaching and provide a written explanation of their understanding of culturally responsive teaching.
Bimonthly meetings. Project staff members met bimonthly with the MAACK teams at their assigned schools. These meetings had the following objectives: (1) to reinforce learning about culturally responsive teaching, (2) to facilitate reflection on the team’s progress toward increasing achievement for African American students, and (3) to share lesson plans that reflect one or more principles of culturally responsive teaching. The meeting times were negotiated between the AEL facilitator and school team. Meetings ranged in length from 60 to 90 minutes, depending on the topic, time of day,

29
and interest of the pilot team. Teams met either before or after school, and team members were paid stipends for their participation in team meetings.
AEL facilitators discussed one or more of the culturally responsive principles according to a monthly schedule (see Appendix B). During one of the bimonthly team meetings at each school, a facilitator presented examples of the principle in lessons, research materials, and professional development videos. Appendix C contains a list (compendium) of the professional development materials used with each culturally responsive principle. Facilitators selected from this list materials that were appropriate for pilot teams in their respective schools. When making selections, facilitators considered the school’s grade levels, the team’s composition and disposition, and the applicability of a resource to the instructional needs of pilot team members.
Teachers were then asked to design and teach lessons that included the use of that particular principle, using the AEL-developed lesson plan template for culturally responsive teaching (see Appendix D). After teaching the lesson, teachers brought lesson plans and samples of student work to the second team meeting of the month. During the meeting they discussed with pilot team members their reflections on students’ engagement and learning.
Facilitators used a variety of group processes during pilot team meetings to engage team members in the learning process. These included
• guided discussion • viewing professional development videos • prepared discussion questions • group discussion of readings • group discussion of lesson plans • peer reflection on lessons taught
Team size and meeting length affected the depth of lesson discussion and the extent to which each team member could participate. Time constraints affected discussion. Meetings were expected to last for one hour, but when discussions were especially engaging, teams that met after school sometimes extended them beyond the scheduled time. However, one team met in the morning before the start of the school day, and their discussion time could not be extended. As in any school, weather or other emergencies sometimes interfered with regular meeting dates. When this happened, the facilitator rescheduled meetings so, in most cases, teams met twice each month. Nevertheless, on two occasions in one school, either the meeting could not be rescheduled during that month, or the rescheduled meeting was set for a day when school was again closed due to weather. In one school, the principal did not attend all meetings, and was generally unsupportive of the effort. Given the importance of the principal to any school improvement effort, AEL staff suggested to the superintendent that this school

30
not continue as part of the project. However, the superintendent was unwilling to release the school from participation. Teaching culturally responsive curriculum. Some MAACK team members (constituting subgroup PTT) were asked to teach the AEL-KCS codeveloped culturally responsive units. AEL researchers trained in the use of the AEL Special Strategies Observation System-Revised (SSOS-R) used this instrument to observe PPT teachers prior to, during, and following the teaching of the units. Other MAACK team members (subgroup PTNT) did not teach the culturally responsive unit, but their teaching was observed for comparison with the teaching of the full treatment group (PTT).
Ongoing technical assistance. Project staff provided needs-based technical assistance to teachers and administrators in the pilot schools as requested. This site-specific technical assistance was tailored to the requests of the principals at the four pilot schools. It included activities such as conducting classroom observations and providing informal feedback to teachers, leading schoolwide professional development sessions regarding the use of a peer observation protocol, conducting workshops for grade-level instructional teams on coteaching, leading a schoolwide professional development session on analyzing disaggregated test score data and understanding the achievement gap, and assisting with state testing data analysis. Following are details of the technical assistance AEL staff provided to each pilot school.
1. High School. At the principal’s request, AEL provided assistance with data
analysis, curriculum planning, and community relations. AEL provided technical assistance to the faculty as they prepared a grant for a ninth-grade academy. The academy was to serve students who were considered at risk for academic failure because their standardized test scores ranged between the 25th and 49th percentiles. Based on a prior study of ninth-grade academic course failures, students with these test scores were more likely to fail at least one ninth-grade course. AEL helped the counselor analyze data on the academic achievement of ninth-grade students and the impact of the counselor’s intervention. Additionally, in monthly meetings with the principal, AEL shared current research on the principal’s role as instructional leader.
2. Middle School. At the principal’s request, the AEL facilitator provided
assistance with state testing data analysis, developed and presented a series of workshops on coteaching for regular and special education teachers, assisted teachers with the development of benchmark tests to measure student achievement of state standards every nine weeks, and designed a syllabus for literacy instruction for an Extended Learning Lab class period. The facilitator worked collaboratively with a school improvement specialist from Project School Turnaround to assist the principal in developing leadership skills for school improvement, setting and communicating expectations for student achievement, and monitoring instruction and student achievement. At the end of school year 2003-2004, the AEL facilitator collaborated with the principal and a local consultant for character education and ethical decision making to design a plan for implementing four professional learning communities
31
(faculty study groups on the topics of literacy, ethical decision making, technology integration, and culturally responsive teaching) for the 2004-2005 school year.
3. Elementary School A. At the request of the principal, AEL staff helped a
MAACK pilot team member plan a workshop for the entire faculty on the effects of teacher expectations on academic achievement. AEL staff helped the Title I teacher administer reading tests to students, then plan and deliver reading instruction. AEL staff organized and supervised a peer reading program for students in Grades 1 through 5 twice weekly. During the one-hour sessions, AEL staff helped students show their younger peers how to read.
4. Elementary School B. At the end of the first year of implementation, the AEL
facilitator and other staff presented a two-day workshop for the full faculty on the achievement gap. The facilitator observed classes in the second year and, during the third year, conducted a reading group with a group of 6 fourth-grade African American boys.
Partial Treatment The partial treatment group was composed of faculty members at each pilot school who were not serving on the MAACK team. Some partial treatment staff taught the culturally responsive curriculum units provided by AEL. Thus, the partial treatment group consisted of two subgroups: NPTT (those who taught culturally responsive curriculum units) and NPTNT (those who did not teach culturally responsive instructional units).
• Bimonthly meetings. None.
• Culturally responsive curriculum. In all pilot schools, some teachers who
were not pilot-team members taught the culturally responsive unit (subgroup NPTT). AEL facilitators met with the teachers who would teach the culturally responsive curriculum units to answer questions or provide additional information to assist them with teaching the units. Teachers in subgroups NPTT and NPTNT had their teaching observed by AEL evaluators prior to, during, and following the teaching of the units.
• Ongoing technical assistance. None.
In summary, the key difference between the full and partial treatment groups was that the full treatment group received training in the principles of culturally responsive instruction and the partial treatment group did not.

32
No Treatment The four comparison schools received no treatment (Comp.). They included two
elementary schools, one middle school, and one high school (see Table 7 above). The superintendent selected these schools because their demographics were as similar to those of the pilot schools as was possible to find in Kanawha County.
• Professional development. None. • Bimonthly meetings. None. • Culturally responsive teaching. No materials were provided. These
teachers (Comp.) did not receive any assistance and did not teach the culturally responsive units. Teachers matched by content and grade with those who did teach the units were observed, and the data from those observations were compared with the partial and full treatment groups.
• Ongoing technical assistance. None.

33
METHODS
Research Designs
The optimum research design for the MAACK Pilot Schools Project would have been a randomized experiment. The reason for this is that, if done correctly, random assignment of the intervention to the “experimental units” makes most alternative explanations of the effects “less likely as causes of the observed treatment at the start of the study” (Shadish, Cook, & Campbell, 2002, pp. 13-14). However, use of this randomized experiment for the MAACK project was impossible for several reasons.
1. The superintendent of Kanawha County Schools selected both the pilot schools and comparison schools to participate in the project.
2. The MAACK project was involved in the pilot schools, in some fashion, for
parts of the two previous school years. 3. The pilot school team members were selected at the individual school by the
principal, not by the AEL research team.
Given the above, the research design for the MAACK project was a series of quasi-experiments. Shadish, Cook, and Campbell (2002) describe quasi-experiments as “experiments that lack random assignment of units to conditions but that otherwise have similar purposes and structural attributes to randomized experiments” (p. 104). They elaborate further by noting:
More importantly, researchers often have good reasons for using such designs, such as a need to devote more resources to construct validity or external validity; practical necessities imposed by funding, ethics, or administrators; or logistical constraints that occur when an intervention has already been fielded before the evaluation of that intervention is designed. Indeed, given such contingencies, sometimes one of these designs will be the best design for a given study, even if the causal inference itself may be weaker than might otherwise be possible (emphasis in original, p. 104).
Quasi-experimental research designs are noted by the artful selection of design elements that serve to reduce the number and plausibility of threats to the internal validity of the study. Shadish, Cook, and Campbell (2002, p. 157) categorize these design elements into four groups: (1) assignment, (2) measurement, (3) comparison grounds, and (4) treatment. Thus, while some quasi-experiments are well-known and have “regular” names, other design names combine several design elements in order to add causal inference, such as the pair of designs for the MAACK teacher variables cited below.

34
The research designs for this project are quasi-experimental, with two composed of only treatment and nontreatment groups, and with one design including a total of five groups: full treatment (subgroups PTT and PTNT), partial treatment (subgroups NPTT and NPTNT), and no treatment (Comp.). These quasi-experimental designs allowed some measure of statistical certainty that outcomes are due to MAACK pilot school activities rather than other education initiatives to which participants might have been exposed. These designs include three subdesigns: two for the teachers involved in this project and one for the students. Teacher Designs The first teacher design was based on dependent attitudinal variables and is labeled as “Untreated matched controls with pretests and posttests and various treatments” (Shadish, Cook, & Campbell, 2002, pgs. 153, 157). This design is diagrammed as
NR 01 X1 X2 X3 02
NR 02 This design was used for the teacher-completed, paper-and-pencil AEL instruments to measure staffs’ readiness for improvement and the extent to which the faculties were committed to continuous learning and improvement. The various treatment elements in the design refer to three different types of treatment available to them: external facilitation, internal facilitation, and implementation of culturally responsive curriculum units. This is a two-group design: treatment and control groups. A variation of this design for one instrument did not include a pretest. The second teacher design was based on dependent behavioral variables and is labeled as “Untreated matched controls with dependent samples and various treatments” (Shadish, Cook, & Campbell, 2002, pgs. 153, 157). This design is diagrammed as:
O2
NR O1 X1 X2 X3 O3
NR O1 X1 X2 O3 NR O1 X2 X3 O3 NR O1 X2 O3
NR O1
O2 O3 This design was employed for the systematic observation of teachers’ classrooms, hence the collection of dependent behavioral variables. This was a five-group design. Two groups were subgroups of the pilot teams (X1), one subgroup that did teach the culturally responsive curriculum unit (X1 + X2 + X3) and another subgroup that did all except teach
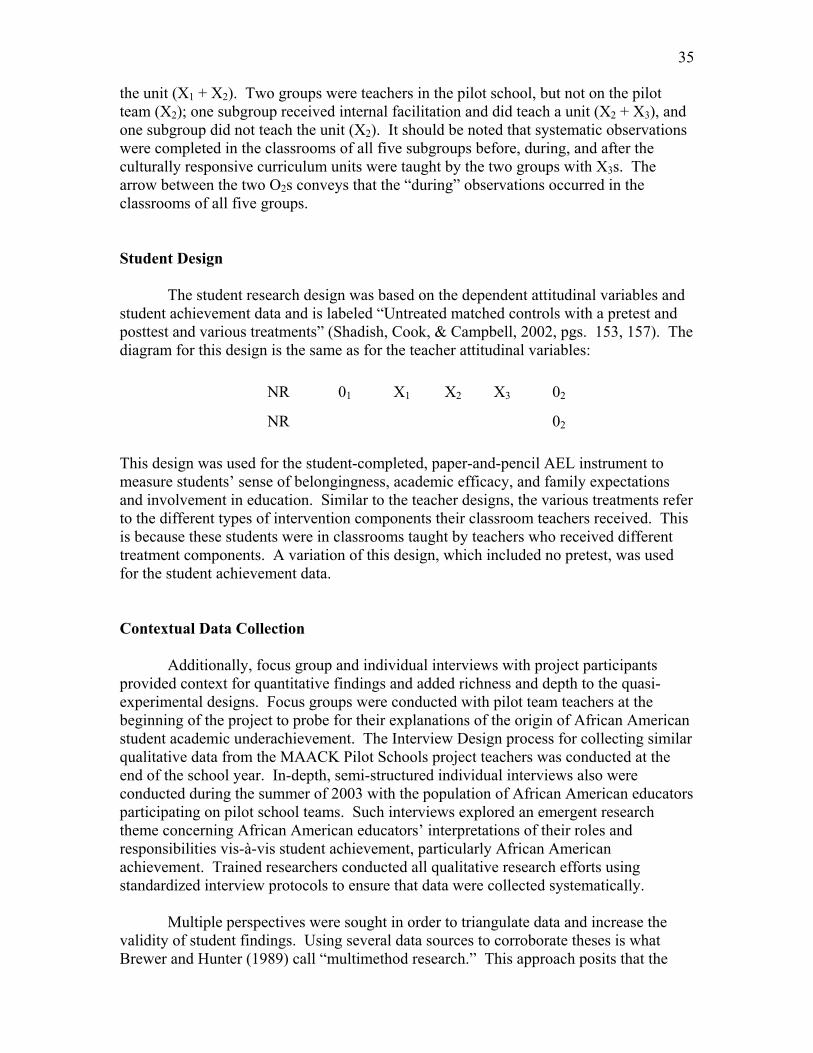
35
the unit (X1 + X2). Two groups were teachers in the pilot school, but not on the pilot team (X2); one subgroup received internal facilitation and did teach a unit (X2 + X3), and one subgroup did not teach the unit (X2). It should be noted that systematic observations were completed in the classrooms of all five subgroups before, during, and after the culturally responsive curriculum units were taught by the two groups with X3s. The arrow between the two O2s conveys that the “during” observations occurred in the classrooms of all five groups. Student Design
The student research design was based on the dependent attitudinal variables and student achievement data and is labeled “Untreated matched controls with a pretest and posttest and various treatments” (Shadish, Cook, & Campbell, 2002, pgs. 153, 157). The diagram for this design is the same as for the teacher attitudinal variables:
NR 01 X1 X2 X3 02
NR 02 This design was used for the student-completed, paper-and-pencil AEL instrument to measure students’ sense of belongingness, academic efficacy, and family expectations and involvement in education. Similar to the teacher designs, the various treatments refer to the different types of intervention components their classroom teachers received. This is because these students were in classrooms taught by teachers who received different treatment components. A variation of this design, which included no pretest, was used for the student achievement data. Contextual Data Collection
Additionally, focus group and individual interviews with project participants provided context for quantitative findings and added richness and depth to the quasi-experimental designs. Focus groups were conducted with pilot team teachers at the beginning of the project to probe for their explanations of the origin of African American student academic underachievement. The Interview Design process for collecting similar qualitative data from the MAACK Pilot Schools project teachers was conducted at the end of the school year. In-depth, semi-structured individual interviews also were conducted during the summer of 2003 with the population of African American educators participating on pilot school teams. Such interviews explored an emergent research theme concerning African American educators’ interpretations of their roles and responsibilities vis-à-vis student achievement, particularly African American achievement. Trained researchers conducted all qualitative research efforts using standardized interview protocols to ensure that data were collected systematically.
Multiple perspectives were sought in order to triangulate data and increase the validity of student findings. Using several data sources to corroborate theses is what Brewer and Hunter (1989) call “multimethod research.” This approach posits that the

36
strengths of each method will compensate for the weaknesses in others, ultimately providing a more complete account of that being studied. Thus, AEL relied on quantitative and qualitative data sources and analyses, and multiple perspectives were sought from study participants.
Instruments and Data Collection Protocols
AEL Continuous School Improvement Questionnaire
The AEL Continuous School Improvement Questionnaire (AEL CSIQ) is a 60-item instrument that measures a faculty’s commitment to continuous learning and improvement. Each of the six scales contains 10 items, which respondents rated using a scale of 1 to 6 (Not present to Present to a high degree). The names and definitions for the six scales are provided below.
• Learning Culture: This scale reflects how well the culture of the school encourages learning by allstudents, staff, and administration. It reflects the extent to which the school emphasizes learning rather than passive compliance, is a safe but exciting place to be, and encourages curiosity and exploration. It indicates the extent to which teachers have opportunities and encouragement to reflect on practice, work with others, and try new ways of teaching.
• School/Family/Community Connections: This scale reflects the degree to
which staff perceive that parents and community members are involved in and feel part of the school. This includes such activities as informing parents and community, forming meaningful partnerships, maintaining open communication, and honoring and respecting diverse points of view.
• Shared Leadership: This scale reflects the extent to which staff view
leadership as being sharedwhether school administrators dominate decision making or there are mechanisms for involving teachers, students, and parents. It measures opportunities for leadership development and the extent of open, two-way communication.
• Shared Goals for Learning: This scale assesses the extent to which the school
has clear, focused goals that are understood by all members of the school community. In addition, it reflects whether shared goals affect what is taught and how teachers teach, drive decisions about resources, focus on results for students, and are developed and “owned” by many rather than a few.
• Purposeful Student Assessment: This scale reflects the extent to which
respondents view student assessment data as meaningful; use data to guide instructional decisions; and believe data are communicated to the greater

37
school community, including teachers, parents, students, and the general community.
• Effective Teaching: This scale measures the extent to which teacher practice
aligns with research on effective teaching. It assesses whether teachers actively engage students in a variety of learning tasks, pose questions that encourage reflection and higher-order thinking, expect students to think critically, and use teaching strategies designed to motivate students.
The AEL CSIQ has demonstrated a high level of internal consistency reliability,
with a Cronbach’s alpha of .98 for the full instrument and alphas ranging from .91 to .96 for the six subscales (Meehan, Cowley, Craig, Balow, & Childers, 2002). The instrument has shown considerable stability over time, with test-retest correlations of .80 for the full instrument and range from .66 to .81 for the subscales. Concurrent validity for the AEL CSIQ was established using the School Climate Questionnaire, and the correlation between the total scores on both instruments was .75, indicating a strong relationship and satisfactory concurrent validity for the AEL CSIQ. The construct validity of the AEL CSIQ was demonstrated in a factor analysis, which revealed that all items loaded on the factors they were hypothesized to be associated with for both elementary teachers and high school teachers as well as for both groups of teachers combined (Meehan, et al.). AEL Measure of School Capacity for Improvement
The AEL Measure of School Capacity for Improvement (AEL MSCI) assesses the degree to which schools possess the potential to become high-performing learning communities. The AEL MSCI consists of 64 items and eight subscales, described below. For 31 items, professional staff are asked to rate the extent to which each item is true for their school, using a 4-point scale ranging from 1 (Not at all true) to 4 (Almost always true). For the remaining items, professional staff are asked to rate how often each item is true for their school using a similar 4-point scale ranging from 1 (Never true) to 4 (Frequently true). The instrument’s eight subscales are
• Collective Professional Capacity: This subscale measures the extent to which a faculty believes in its shared capability to positively influence student learning.
• Peer-Reviewed Practice: This subscale assesses the frequency with which
teachers and supervisors observe classes to provide meaningful feedback and improve teaching.
• Program Coherence: This subscale evaluates the extent to which the school’s
programs for student and staff learning are coordinated, focused on clear learning goals, and sustained over time.
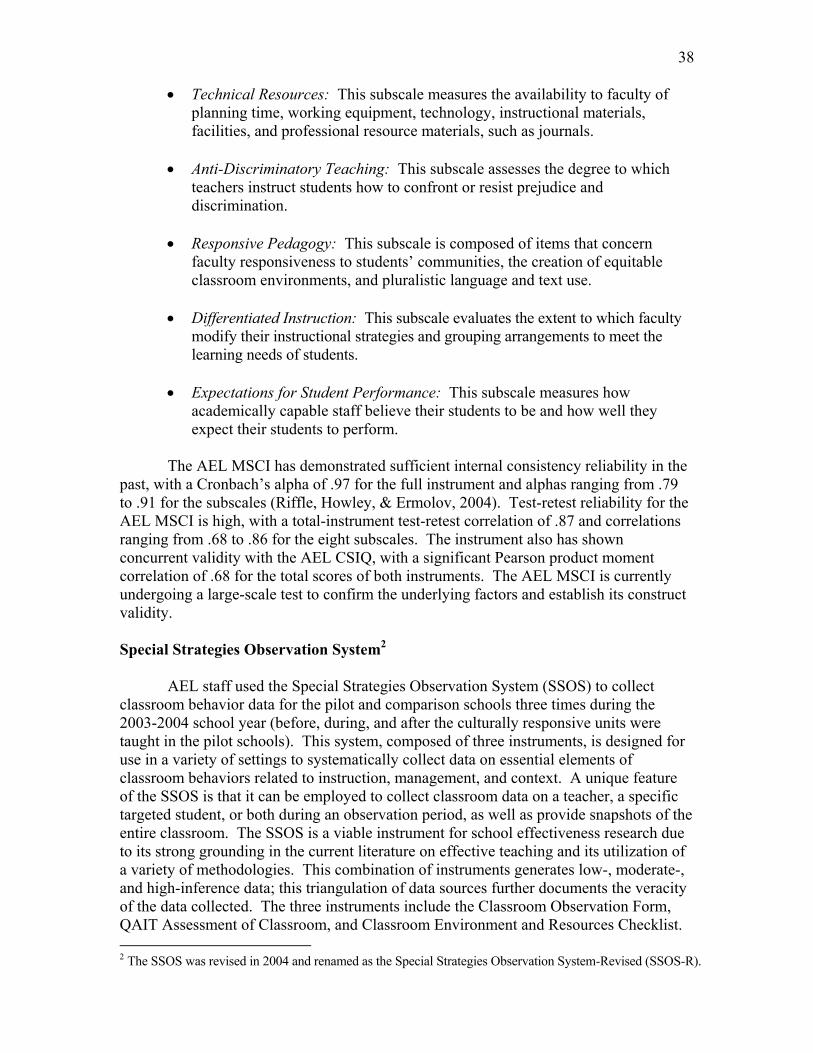
38
• Technical Resources: This subscale measures the availability to faculty of planning time, working equipment, technology, instructional materials, facilities, and professional resource materials, such as journals.
• Anti-Discriminatory Teaching: This subscale assesses the degree to which
teachers instruct students how to confront or resist prejudice and discrimination.
• Responsive Pedagogy: This subscale is composed of items that concern
faculty responsiveness to students’ communities, the creation of equitable classroom environments, and pluralistic language and text use.
• Differentiated Instruction: This subscale evaluates the extent to which faculty
modify their instructional strategies and grouping arrangements to meet the learning needs of students.
• Expectations for Student Performance: This subscale measures how
academically capable staff believe their students to be and how well they expect their students to perform.
The AEL MSCI has demonstrated sufficient internal consistency reliability in the
past, with a Cronbach’s alpha of .97 for the full instrument and alphas ranging from .79 to .91 for the subscales (Riffle, Howley, & Ermolov, 2004). Test-retest reliability for the AEL MSCI is high, with a total-instrument test-retest correlation of .87 and correlations ranging from .68 to .86 for the eight subscales. The instrument also has shown concurrent validity with the AEL CSIQ, with a significant Pearson product moment correlation of .68 for the total scores of both instruments. The AEL MSCI is currently undergoing a large-scale test to confirm the underlying factors and establish its construct validity. Special Strategies Observation System2
AEL staff used the Special Strategies Observation System (SSOS) to collect classroom behavior data for the pilot and comparison schools three times during the 2003-2004 school year (before, during, and after the culturally responsive units were taught in the pilot schools). This system, composed of three instruments, is designed for use in a variety of settings to systematically collect data on essential elements of classroom behaviors related to instruction, management, and context. A unique feature of the SSOS is that it can be employed to collect classroom data on a teacher, a specific targeted student, or both during an observation period, as well as provide snapshots of the entire classroom. The SSOS is a viable instrument for school effectiveness research due to its strong grounding in the current literature on effective teaching and its utilization of a variety of methodologies. This combination of instruments generates low-, moderate-, and high-inference data; this triangulation of data sources further documents the veracity of the data collected. The three instruments include the Classroom Observation Form, QAIT Assessment of Classroom, and Classroom Environment and Resources Checklist. 2 The SSOS was revised in 2004 and renamed as the Special Strategies Observation System-Revised (SSOS-R).

39
The entire observation could last a maximum of 60 minutes. Figure 1 portrays the SSOS system as a clock, with the time allotments specified for each instrument. The three instruments are described more fully below; see Appendix E for a copy of the SSOS form. Classroom Observation Form (COF). The COF is a combination observation system that is best described as a category system with low-inference items and multiple coding procedures (Nesselrodt & Schaffer, 1993; Sullivan & Meehan, 1983). It is based on the Stallings Observation System (Stallings, 1980) and the Classroom Activity Record designed by Evertson and Burry (1989). The top page of the COF collects typical demographic information, including the school, observer, date, teacher observed, number of adults and students in the class, grade level, subject being observed (teacher or target student), observation period (before, during, and after), and type of class. Type of class was divided into five groups as follows:
1. pilot school teachers who were members of the MAACK pilot project teams and were teaching one of the culturally responsive units (PTT);
2. pilot school teachers who were members of the MAACK pilot project teams
and were not teaching one of the culturally responsive units (PTNT); 3. pilot school teachers who were not members of the MAACK pilot project
teams and were teaching one of the culturally responsive units (NPTT); 4. pilot school teachers who were not members of the MAACK pilot project
teams and were not teaching one of the culturally responsive units (NPTNT); and
5. comparison school teachers (Comp.)
The COF segment of the observation includes a maximum of 58 minutes—2
minutes for coding the cover page and then 56 minutes for coding classroom behaviors. The 56 minutes are divided into seven 8-minute time periods; each 8-minute block is captured on a separate page. The first minute of each block focuses on the entire classroom and provides a class snapshot by looking at both student engagement (the number of students on task, off task, waiting, or out of the room) and groups and activities (whether students are clustered in teacher, aide, or student groups and their type of involvement, such as working alone, management, interaction, or socialization). The remainder of each 8-minute block (either 7 or 8 minutes, depending on the length of time required to fill in the snapshot information) is devoted to observing either the teacher or "target" student.

40
Figure 1 Graphic Depiction of the Special Strategies Observation System (SSOS)
and Time Allotted to the QAIT and CERC

41
For the MAACK pilot project, researchers decided to include both the teacher observation and a target student (African American youth were selected as the target students for observed classrooms). The focus of the observation switched from teacher to target student for each 8-minute block. There were a total of 27 discrete activities that could be chosen to describe the teacher and target student behaviors.
QAIT Assessment of Classroom. This instrument is best described as a moderate- and high-inference, simple coding, rating device. QAIT stands for Quality of Instruction, Appropriate Level of Instruction, Incentives for Learning, and Use of Time. This two-page instrument contains 40 items grouped under those four major categories. Each item has a Likert-type response scale of 1 to 5 (Unlike this class to Like this class). This instrument was completed at the end of each observation session. Classroom Environment and Resources Checklist (CERC). This instrument is a low-inference, simple coding, sign system. This one-page checklist contains 14 classroom attributes that are coded either as present or not present, such as adequate lighting, use of multiracial materials, posted assignments, etc. Two items were added that were specific to the MAACK pilot project: culturally mediated instruction and student-controlled classroom discourse. Next, 18 classroom resource items, such as textbooks, computers, and worksheets, are listed. Observers indicate first whether such resources were visible or not. If visible, observers then indicate whether the resources were used during the observation. This instrument was to be completed at the end of each observation session. The SSOS instruments were originally tested and used in a pilot test of the evaluation for the Kentucky Extended School Services program (Nesselrodt & Schaffer, 2000a, 2000b). They were then modified and converted to a scannable format by AEL staff in 2001 and used in AEL's evaluation of the Kentucky Extended School Services program (Cowley et al., 2002). Thus, these instruments possess face and content validity and have proven their utility in prior research. Further, a high degree of inter-rater reliability was achieved among the data collectors during the 2001 and 2003 SSOS training sessions. To assess the degree of internal consistency reliability, Cronbach Alpha coefficients were computed for this administration of the SSOS. For the COF instrument, the activity code section coefficient was .51, the student engagement coefficient was .76, and the grouping strategy coefficients were .76 for the grouping section and .38 for the number of students section. For the QAIT instrument, the coefficient for all 40 items was .96; by scale, the coefficients were .95 for quality of instruction, .69 for appropriate level of instruction, .91 for incentives for learning, and .91 for use of time. For the CERC instrument, the coefficient for all 50 items was .87; by section, the coefficients were .78 for the environment items, .81 for the visible resource items, and .44 for the used resource items.

42
AEL Measure of Academic Supportiveness and Climate The AEL Measure of Academic Supportiveness and Climate (AEL MASC) is a
student-completed, paper-and-pencil instrument. The 42-item instrument assesses students’ perceptions of themselves as students and of their school experiences, and also asks students about their families’ awareness of and involvement in their children’s school lives. Respondents rate each item using a scale ranging from 1 to 5 (Not at all True to Always True). The four scales within the instrument are: Student Belonging, Family Expectations, Student Academic Efficacy, and Family/School/Student Involvement. Taken together, these subscales assess the degree to which students think their schools and families provide them with academic nurturance and support, and the extent to which students view themselves as intellectually capable.
In addition to possessing face validity, the AEL MASC has been shown to have
concurrent validity with the Miami-Dade School Climate Survey, with a significant correlation of .56 for the total scores of both instruments (Cowley, Riffle, Howley, Voelkel, & Ermolov, 2004). Further, the AEL MSCI has demonstrated a high level of internal consistency reliability, with Cronbach’s alphas of .95 for the full instrument and alphas ranging from .78 to .93 for the four subscales. Test-retest analyses indicate that the instrument measures the constructs reliably over time; test-retest correlations have demonstrated stability for the full instrument over time (r = .68) and for the four factors (range from .52 to .76) (Cowley, et al). Factor analyses confirmed the four factors underlying the AEL MASC, thus demonstrating construct validity for the instrument. Student Achievement Assessment
The West Virginia Department of Education (WVDE) employs a customized test
to assess student achievement (WVDE, 2004). The West Virginia Educational Standards Test (WESTEST) is a criterion-referenced test that is designed to align with the state’s Content Standards and Objectives (CSOs). Several offices within WVDE collaborated with CTB/McGraw-Hill and educators around the state to develop the assessment and the standards for evaluating student performance (WVDE, 2004). WESTEST is administered to all public school students in Grades 3 through 8 and Grade 10, and addresses several content areas: mathematics, reading/language arts, science, social studies (except for Grade 10 in which social studies is not assessed). Items on the test include multiple choice, short answer, and constructed response, and the items require students to apply various thinking skills (e.g., knowledge/recall/recognition, synthesis/evaluation/extended thinking).
Student performance on WESTEST is measured by a scale score, which can then
be translated into a performance level. The five performance levels (Novice, Partial Mastery, Mastery, Above Mastery, Distinguished) are based on specific criteria for each grade level and content area (see WVDE, 2004, for more information about how scale scores are translated into performance levels). The performance levels are used to determine the percentage of students at or above mastery for the assessed skills, both to comply with NCLB accountability requirements and to inform instructional strategies for continuing student and school improvement.

43
Interview Design Process Interview Design is a data collection process in which all participants ask
questions, answer questions, and analyze responses. During the MAACK Pilot Schools training workshop held on May 6, 2004, Interview Design was employed to gather data concerning participants’ perceptions about several issues, including lessons learned about teaching African American students, decisions made outside the classroom that impact African American students, factors contributing to African American students’ higher level work, factors contributing to the achievement gap, and instructional strategies that hold promise for narrowing the achievement gap. The original research design called for researchers to conduct focus groups with teachers to collect data concerning these issues. However, collecting data via Interview Design during the workshop proved to be more opportune for researchers and participants. Thus, Interview Design data were substituted for focus group data. Participants in the spring 2004 workshop included teachers, administrators, and community members associated with the MAACK project. These workshop attendees participated in the Interview Design process and responded to the following questions:
1. Explain two or three things you have learned about teaching African
American students that you feel every teacher needs to understand to be effective, and explain why you feel those things are important.
2. Name one or two decisions, made outside the classroom, about how students experience and progress through school (e.g., course offerings, discipline procedures, scheduling methods) that you feel either hinder or help African American students reach their potential. Explain why you feel they hinder or help.
3. Think of a time in the past year when you witnessed an African American student or students working at a level beyond what had been typical. Describe the circumstances. To what do you attribute the student(s)' higher level of work?
4. What do you believe are the two or three most important factors that contribute to the achievement gap, and why?
5. What do you consider to be two or three instructional strategies that hold the most promise for narrowing the achievement gap between African American/low-SES students and other students, and why?

44
Data Collection
AEL Continuous School Improvement Questionnaire
The AEL CSIQ instruments were administered to the professional staffs at pilot
and comparison schools during late April and early May of 2004. AEL staff sent a letter to the principals of the eight participating schools requesting their assistance in the data collection efforts and outlining the instructions for administering the AEL instruments to the professional staff (see Appendix F). AEL staff encouraged school staff to administer instruments to the professional staff in a group setting. However, some schools may have distributed the questionnaires to their professional staff individually. After the questionnaires were completed, each school staff member enclosed their AEL CSIQ and AEL MSCI (see below) in an envelope, sealed the envelope, and returned it to the designated data collector at their school. The sealed envelopes containing the questionnaires were then returned to AEL’s offices. AEL staff received the completed instruments from the schools in early and mid-May of 2004. The data were then scanned, entered into databases, cleaned, and prepared for analysis.
AEL Measure of School Capacity for Improvement
The AEL MSCI was sent to the professional staffs at pilot and comparison schools at the same time as the AEL CSIQ. The AEL MSCI also was administered to pilot school professional staff in the spring of 2003. The procedures for administering the AEL MSCI in the spring of 2004 were identical to the data collection procedures used for the AEL CSIQ. School staff were asked to complete and return the AEL CSIQ and AEL MSCI at the same time. Thus, AEL MSCI instruments were received with the AEL CSIQ questionnaires in early and mid-May of 2004. As with the AEL CSIQ data, AEL MSCI data were scanned, entered into databases, cleaned, and prepared for analysis. Special Strategies Observation System
The six data collectors who were involved in the MAACK classroom
observations had been formally trained in the SSOS system in the fall of 2001. However, because the form was revised slightly and had a few MAACK pilot project modifications since that time, a refresher session was held in the fall of 2003 before the MAACK observations took place. Pairs of data collectors were assigned to specific schools, but each data collector completed his/her classroom observations individually. One pair of data collectors was assigned to Elementary School B and its comparison counterpart, Elementary School E. A second pair was assigned to Middle School C and its comparison counterpart, Middle School G. The third pair was assigned to two pilot schools (Elementary School A and High School D) and their comparison counterparts (Elementary School F and High School H).
All data collectors utilized the SSOS forms during the classroom observations. The COF instrument was fully completed while in the classroom. Given that some

45
observations ran consecutively, it was not always possible for the data collectors to fully complete the QAIT and CERC while in the classroom, but these instruments were completed as soon after the observations as possible.
Observations took place during the 2003-2004 school year before the culturally responsive units were taught (most of the "before" observations were completed by December 2003); while the units were being taught (most of the "during" observations were completed in January and February 2004); and after the units were taught (most of the "after" observations were completed from February through May 2004). Teachers were selected for participation in the observation process based on a number of criteria. First, MAACK pilot school teachers were grouped into four categories: (1) those who were members of the pilot team and were teaching a culturally responsive unit, (2) those who were members of the pilot team and were not teaching a unit, (3) those who were not members of the pilot team and were teaching a unit, and (4) those who were not members of the pilot team who were not teaching a unit. After pilot-team teachers who were teaching a culturally responsive unit were identified, along with the grade level and subject in which the unit was being taught, then classrooms were selected across the other three groupings (i.e., teachers from the other three MAACK groups with similar subjects and grade levels). Finally, teachers from the comparison schools were selected similarly, by trying to match subject and grade levels with the MAACK pilot school pilot-team teachers who were teaching a culturally responsive unit.
To facilitate this matching process, data collectors worked with staff at the eight
schools to obtain teaching schedules. Further, each data collector chose a "target" student for each classroom he/she observed; in some cases, a guidance counselor chose the target student. Given that the focus of the MAACK pilot project was on closing the achievement gap between White and minority youth, African American males and females were chosen as target students, when possible, for these observations. Further, the guidance counselors and/or the data collectors tried to select these target students as randomly as possible, and therefore selected students sitting in various locations throughout the classrooms. The number of classrooms selected for observation across the eight schools ranged from five to nine. Each data collector tried to conduct two observations of each selected classroom for each of the three time periods. In a few situations, only one of these observations took place, or scheduling/semester changes necessitated selecting additional classrooms, but overall, the end result of observations was very close to the desired number. Observations were fairly even across the three time periods (before, during, after) with 102, 107, and 106, respectively, for a total of 315 classroom observations during the 2003-2004 school year. See Table 9 for a complete depiction of classrooms observed, by school and time period.

46
Table 9 Classroom Observation Completions by School and Time Period
Number of Completed Observations
School
Number of Classrooms Observed
Before
During
After
`TOTAL
Pilot Schools: Elementary A 6 11 12 12 35 Elementary B 5 10 10 10 30 Middle C 8 16 16 16 48 High D 9 14 16 16 46 Comparison Schools: Elementary F 5 10 10 10 30 Elementary E 7 13 15 14 42 Middle G 8 16 16 16 48 High H 6 12 12 12 36 TOTAL 54 102 107 106 315
AEL Measure of Academic Supportiveness and Climate
The AEL MASC was administered to students at the pilot and comparison schools in April and May of 2004. The questionnaire also was administered to pilot school students in the spring of 2003. In early April of 2004, the superintendent of the school district sent a letter to the principals of the eight schools requesting their cooperation in the AEL MASC data collection efforts. The questionnaires were sent to the schools in late April, and school staff were asked to administer the instruments to all students during English and Language Arts classes. AEL staff included instructions for administering the AEL MASC in each classroom (see Appendix G). Although AEL staff requested that the instruments be administered in English and Language Arts classes, some schools may have administered the AEL MASC at different times (e.g., during enrichment time). School staff collected the completed AEL MASC surveys from the students, placed all completed questionnaires from each class in a large envelope, and returned the envelope to the designated data collector at their school. The schools then returned all completed questionnaires to AEL’s offices. AEL staff received the completed AEL MASC surveys during early and mid-May of 2004. The data were then scanned, entered into databases, cleaned, and prepared for analysis. Student Achievement Assessment
All public school students in West Virginia were given WESTEST in March of 2004. The tests were sent to CTB/McGraw-Hill for scoring. KCS officials received students’ scores in August of 2004, and AEL researchers were given access to those data in late August. In collaboration with the director of counseling and testing for Kanawha

47
County, AEL research staff collected scale scores and performance-level data for students enrolled in classrooms observed for the MAACK Pilot Schools project during the course of the 2003-2004 school year. AEL research staff, AEL facilitators, and staff at both the pilot and comparison schools worked together to compile class rosters for the observed classrooms. Those rosters then were used to identify students whose WESTEST scores were collected for the MAACK Pilot Schools project research component. Because the data involved individual students and because AEL staff were concerned about protecting students’ confidentiality, each case was assigned a unique code number that could not be used to identify the student or link WESTEST data with the individual. Interview Design Process
During the Interview Design process used at the spring 2004 workshop,
participants sat at long tables with two lines of five on each side. Each person received a colored sheet of paper with one of five questions printed on it, with room to record responses. Participants asked their question to the person in the facing chair and recorded the respondent’s answer. Participants were instructed to use their best listening and interviewing skills during this process and to use follow-up questions for clarification purposes only. After 3 to 5 minutes, the respondents and interviewers switched roles, and those who had previously been respondents asked their questions of their former interviewer. After an additional 3 to 5 minutes, one row of people at each table, who were designated as “movers,” were instructed to move one seat to the left, and the entire process was repeated five times until each person had responded to every question. Please see Figure 2 for a diagram demonstrating the process.
Figure 2
Seating Arrangement for Interview Design Process

48
Data Analysis AEL Continuous School Improvement Questionnaire
To compare the differences on the AEL CSIQ between the MAACK pilot schools and the comparison schools, independent t tests were computed on each subscale. The alpha level for these pilot schools to comparison schools t tests was set at the .05 level. To compare differences between comparison and pilot schools by building level (elementary, middle, high), independent t tests also were conducted for each subscale. To compensate for the multiple comparison problem of increasing the Type I error when analyzing more than two groups, the Bonferroni procedure was used to adjust the alpha level. The alpha level was originally set at .05; this was divided by three (for the number of building levels). Therefore, the revised alpha level for each building-level specific t test was set at .017. Effect sizes were computed as appropriate. AEL Measure of School Capacity for Improvement
To compare the differences on the AEL MSCI between the MAACK pilot schools
and the comparison schools, independent t tests were computed on each subscale. The alpha level for these pilot schools to comparison schools t tests was set at the .05 level. To compare differences between pilot and comparison schools at the building level (elementary, middle, high), independent t tests were also conducted for each subscale. To compensate for the multiple comparison problem of increasing the Type I error when analyzing more than two groups, the Bonferroni procedure was used to adjust the alpha level. The alpha level was originally set at .05; this was divided by three (for the number of building levels). Therefore, the revised alpha level for each building-level specific t test was set at .017. Effect sizes were computed as appropriate. To compare differences on the AEL MSCI between two administrations (spring 2003 and spring 2004) of the survey to pilot school staff, mean subscale scores and standard deviations were computed. In addition, independent t tests were computed using an alpha level of .05. Again, effect sizes were computed as appropriate. Special Strategies Observation System
AEL staff designed data entry templates using Remark scanning software. SSOS
data were scanned by observation period for each of the eight schools; data files were then cleaned and exported to SPSS. After another round of cleaning during the summer of 2004, data files were merged into one master file for statistical analysis. COF. COF activity data provided the number of minutes spent in any of 27 discrete activities for both the teacher and the target student. These numbers were summed across the 8-minute intervals for each observation by both teacher and target student. Up to four of the 8-minute blocks focused on the teacher and three on the target student (if the observation lasted the full hour). These data were analyzed using the 27

49
individual activities and by collapsing the data into four main categories of teacher-led, student-led, management/organization, and off-task. COF classroom snapshot data provided information on the student engagement (i.e., the number of students on task, off task, out of the room, or waiting during the first minute of each 8-minute block) and on the grouping and activities (i.e., the number of students involved with the teacher, any aide, or other student groupings, along with the type of activity taking place). The student engagement numbers were summed across the 8-minute intervals for each observation, by both teacher and target student, and also by determining the percentage of students engaged in each category (on task, off task, out of room, waiting). These data were analyzed using the four engagement codes of on or off task, out of the room, and waiting. For the groups and activities segment, the number of students involved with the teacher, aide, or other students by activity (interactive, working alone, management, or social/uninvolved) were summed across the 8-minute intervals for each observation by both teacher and target student. These data were analyzed by number of students per activity and also by determining the percentages of students engaged in each type of activity. Further, one-way ANOVAs were conducted for all of the COF data (activity, student engagement, and groups and activities) to determine if statistically significant differences existed among the five groups. Effect sizes were computed as appropriate. QAIT. QAIT data were analyzed by creating four scales composed of the 40 individual items: quality of instruction, appropriate level of instruction, incentives for learning, and use of time. Because there were unequal numbers of items in each scale, the item scores were summed and then averaged to generate the scale scores. Descriptive statistics were used to describe results for each of the five groups. Further, one-way ANOVAs were conducted to determine if statistically significant differences existed among the group scale scores. As appropriate for the analyses, effect sizes were also computed. CERC. CERC data were analyzed by calculating frequency percentages showing whether the classroom attributes were present and whether the classroom resources were visible and used during the observations for each of the five groups. Adherence Index. To determine the adherence to the principles of culturally responsive instruction, for those observed pilot and comparison school teachers who were teaching one of the units, an index score was generated from those data points that most closely aligned to any of the nine specific components of culturally responsive instruction. See Table 10 for a depiction of the nine components, along with the QAIT and CERC items most closely aligned with each component. The scores for these items were converted to z scores and then to a standardized Z score (multiplying the z score by 10 and adding 50 generates a mean of 50 with a standard deviation of 10). The mean score for each group of items per component was then generated as a new variable, which then was analyzed by grouping.

50
Table 10 Culturally Responsive Unit Components and Aligned QAIT and CERC Items
Component Instrument Item
Communication of high expectations
QAIT 10g. Communicating high expectations.
Active teaching methods QAIT 9a. Presenting surprising demonstrations. 9b. Relating topics to students' lives. 9c. Allowing students to discover information.
Teacher as facilitator QAIT 1a. Organizes information in an orderly way. 1b. Notes transitions to new topics. 1d. Frequently restates essential principles. 3. The teacher exhibits enthusiasm. 6. Teachers use appropriate pace to cover content. 7a. Accommodates students' levels of knowledge. 7b. Accommodates students' learning rates. 13a. Necessary time is allocated for instruction. 14a. The teacher uses effective management.
Positive perspectives on parents and families of culturally and linguistically diverse students
QAIT 1c. Uses many vivid images and examples.
Cultural sensitivity QAIT 2a. Uses devices such as advanced organizers. 2b. Reminds students of previously-learned mat. 9d. Presenting intrinsically interesting material.
Reshaping the curriculum -- No items directly aligned to this component. Culturally mediated instruction
CERC Culturally mediated instruction environmental indicator.
Student-controlled classroom discourse
CERC Student-controlled classroom discourse environmental indicator.
Small group instruction and academically related discourse
QAIT 8a. Uses in-class ability grouping. 8b. Has a class that is homogeneous in ability. 8c. Uses cooperative learning arrangements.
AEL Measure of Academic Supportiveness and Climate
To compare the differences on the AEL MASC between the MAACK pilot schools and the comparison schools, independent t tests were computed on each subscale.

51
The alpha level for these pilot schools to comparison schools t tests was set at the .05 level. To compare differences between comparison and pilot schools by building level (elementary, middle, high), independent t tests also were conducted for each subscale. To compensate for the multiple comparison problem of increasing the Type I error when analyzing more than two groups, the Bonferroni procedure was used to adjust the alpha level. The alpha level was originally set at .05; this was divided by three (for the number of building levels). Therefore, the revised alpha level for each building-level specific t test was set at .017. Effect sizes for these analyses were computed.
To compare differences on the AEL MASC between two administrations (spring
2003 and spring 2004) of the survey to pilot school students, mean subscale scores and standard deviations were computed. In addition, independent t tests were computed using an alpha level of .05. As with other analyses conducted in this research, effect sizes were computed as well. Student Achievement Assessment
Research staff examined WESTEST performance-level data and scale scores by
grade level and content area for pilot and comparison schools. Because social studies was not included among the content areas assessed for Grade 10 students, AEL researchers excluded social studies scores from data analyses. Thus, three content areas (mathematics, reading/language arts, science) were examined. Grade-level analyses were chosen because research staff believed that these comparisons would be most accurate.
Descriptive data (e.g., frequencies, measure of central tendency) were examined as appropriate. The percentages of students at or above mastery were calculated for each grade level in each of the three content areas (i.e., mathematics, reading/language arts, and science). Further, AEL researchers performed independent group t-tests using the scale scores for each grade level in each of the content areas. Because there was some concern about unequal sample sizes, Levine’s test for equality of variances was performed, and the correction for unequal variances was applied as necessary. Interview Design Process
Responses to Interview Design questions were entered into an electronic database
where they were sorted by question. Data were reviewed for overarching, repeating categories, which were assigned broad codes. Finer coding was employed as appropriate to identify emerging patterns within each broad category. The responses were then analyzed by theme and tabulated to provide a general, quantitative analysis of the most salient and prevalent issues that arose during the discussions.

52
FINDINGS AEL Continuous School Improvement Questionnaire
Each of the six AEL CSIQ subscales contains 10 items, which respondents rated using a scale of 1 to 6 (Not present to Present to a high degree). These ratings were added together to create subscale mean scores ranging from 10.00 to 60.00. Table 11 provides descriptive statistical summaries for the six subscales for the pilot and comparison schools and by building level for each of those groups. In general, comparison schools had higher mean scores across the six scales than the pilot schools. Standard deviations were fairly large across most scales, indicating greater dispersion within the scores for both groups.
When looking at the data for the full groups, statistically significant differences
were found on three of the six subscales. A small effect size (Cohen d column on Table 11), indicating practical meaningfulness, was found on School/Family/Community Connections (.40), Shared Goals for Learning (.28), and Effective Teaching (.27).
Independent t tests also were computed comparing pilot schools and comparison
schools at each building level on these six subscales. Statistically significant differences were found between elementary schools on four of the subscales. A medium effect size (practical meaningfulness) was found on Shared Goals for Learning (.66) and Effective Teaching (.67). A large effect size was found on Learning Culture (.80) and School/Family/Community Connections (1.00). At the middle school level, statistically significant differences were found on four of the subscales. A moderate effect size was found on Learning Culture (.69), Shared Goals for Learning (.75), and Shared Leadership (.79), and a large effect size was found on School/Family/Community Connections (.86). Statistically significant differences also were found on one subscale between high schools. A medium effect size of .72 was found on Shared Leadership. See Table 11 for more details.
AEL Measure of School Capacity for Improvement Each of the eight AEL MSCI subscales contains eight items, which respondents
rated using a scale of 1 to 4 (Not at all/Never true to Almost always/Frequently true). The ratings for each subscale were added together and divided by eight to create a mean

53
Table 11 AEL CSIQ Subscale Descriptive Statistics and Differences by Full Group and Building Level
Pilot Comparison Subscale Name School
Level N Mean SD N Mean SD df t p Dif. d
Elementary 27 48.37 7.67 29 53.62 5.15 54.0 3.03 .004 -5.25 0.80 Middle 45 44.44 7.84 27 49.48 6.73 70.0 2.78 .007 -5.04 0.69 High 53 47.28 8.21 57 45.18 8.58 108.0 1.31 ns 2.11 0.25
Learning Culture
Full Group 125 46.50 8.06 113 48.37 8.16 236.0 1.78 ns -1.88 0.23 Elementary 27 46.63 9.32 31 53.97 4.59 36.8 3.72 .001 -7.34 1.00 Middle 44 43.34 8.71 26 50.27 7.35 68.0 3.40 .001 -6.93 0.86 High 50 45.22 8.73 57 44.40 8.74 105.0 0.48 ns 0.81 0.09
School/Family/Community Connections
Full Group 121 44.85 8.87 114 48.34 8.53 233.0 3.07 .002 -3.49 0.40 Elementary 28 49.46 8.89 32 53.56 7.06 58.0 1.99 ns -4.10 0.51 Middle 46 42.20 11.04 27 50.26 9.30 71.0 3.19 .002 -8.06 0.79 High 51 45.75 8.80 60 38.92 10.24 109.0 3.73 .000 6.83 0.72
Shared Leadership
Full Group 125 45.27 10.00 119 45.43 11.37 242.0 0.11 ns -0.16 0.01 Elementary 27 50.11 8.16 31 54.81 5.82 56.0 2.55 .014 -4.70 0.66 Middle 43 43.07 8.54 26 49.50 8.43 67.0 3.05 .003 -6.43 0.75 High 48 48.85 7.75 55 46.31 8.43 101.0 1.59 ns 2.55 0.31
Shared Goals for Learning
Full Group 118 47.03 8.62 112 49.40 8.52 228.0 2.09 .037 -2.37 0.28 Elementary 26 50.46 7.56 31 53.81 5.28 55.0 1.96 ns -3.34 0.51 Middle 43 44.63 7.84 27 48.59 9.37 68.0 1.91 ns -3.96 0.46 High 51 47.16 7.41 56 44.43 8.74 105.0 1.73 ns 2.73 0.34
Purposeful Student Assessment
Full Group 120 46.97 7.84 114 47.96 8.97 232.0 0.91 ns -1.00 0.12 Elementary 27 50.85 6.73 31 54.65 4.28 56.0 2.60 .012 -3.79 0.67 Middle 44 46.14 8.73 27 50.44 6.51 69.0 2.21 ns -4.30 0.56 High 52 48.42 7.69 59 47.76 7.69 109.0 0.46 ns 0.66 0.09
Effective Teaching
Full Group 123 48.14 8.02 117 50.21 7.11 238.0 2.11 .036 -2.07 0.27

54
score for that subscale ranging from 1 to 4. Table 12 provides descriptive statistical summaries for the eight subscales for the pilot and comparison schools, as well as building-level scores for each of those groups. In general, comparison schools had higher subscale mean scores across the eight scales than did the pilot schools. Standard deviations were fairly small to moderate across the subscales, indicating less dispersion within the scores for both groups.
When looking at the data for the full group, statistically significant differences were
found on four of the eight subscales: Collective Professional Capacity, Technical Resources, Differentiated Instruction, and Expectations for Student Performance. A small effect size (Cohen d column on Table 12), indicating practical meaningfulness, was found on all of the subscales with the exception of Technical Resources (.59), which had a moderate effect size.
Independent t tests also were computed comparing pilot schools and comparison
schools at each building level on the eight subscales. Statistically significant differences were found between elementary schools on three of the subscales. A large effect size (practical meaningfulness) was found on Program Coherence (.92), Anti-Discriminatory Teaching (.92), and Technical Resources (1.22). At the middle school level, statistically significant differences were found on seven of the eight subscales. Large effect sizes ranging from .75 (Anti-Discriminatory Teaching) to 1.56 (Expectations for Student Performance) were found on the seven subscales. Statistically significant differences also were found on two subscales between high schools. Small effect sizes ranging of .47 were found for both Peer Reviewed Practice and Program Coherence.
Table 13 provides descriptive statistical summaries for the eight subscales across two
administrations of the AEL MSCI to pilot school professional staff. In general, the spring 2004 administration showed higher subscale mean scores across the eight scales than did the spring 2003 administration. Standard deviations were moderate across most of the subscales, indicating less dispersion within the scores for both administrations.
Independent t tests were computed comparing both administrations on the eight
subscales. Statistically significant differences were found on six of the eight subscales. A small effect size (Cohen d column on Table 13), indicating practical meaningfulness, was found on Peer-Reviewed Practice (.34). A moderate effect size was found on Collective Professional Capacity (.67), Responsive Pedagogy (.58), Technical Resources (.56), and Program Coherence (.48). A large effect size was found for Anti-Discriminatory Teaching (.97).

55
Table 12 AEL MSCI Subscale Descriptive Statistics and Differences by Full Group and Building Level
Pilot Schools Comparison Schools Subscale Name Level
N Mean SD N Mean SD df t p Dif. d
Elementary 29 3.30 0.28 33 3.47 0.36 60 2.02 ns -0.17 0.52 Middle 49 2.88 0.44 29 3.41 0.37 76 5.48 .000 -0.53 1.31 High 53 3.16 0.44 60 3.13 0.44 111 0.43 ns 0.04 0.08
Collective Professional Capacity
Full Group 131 3.09 0.44 122 3.28 0.43 251 3.63 .000 -0.20 0.46 Elementary 29 3.29 0.50 33 3.46 0.44 60 1.46 ns -0.17 0.37 Middle 49 2.88 0.59 29 3.17 0.49 76 2.17 ns -0.28 0.52 High 53 2.87 0.63 60 2.59 0.55 111 2.48 .015 0.28 0.47
Peer Reviewed Practice
Full Group 131 2.97 0.61 122 2.96 0.63 251 0.04 ns 0.003 0.01 Elementary 29 3.36 0.34 33 3.65 0.29 60 3.64 .001 -0.29 0.92 Middle 49 2.81 0.46 29 3.18 0.37 76 3.66 .000 -0.37 0.88 High 53 3.20 0.51 60 2.96 0.51 111 2.51 .014 0.24 0.47
Program Coherence
Full Group 131 3.09 0.51 122 3.20 0.52 251 1.67 ns -0.11 0.21 Elementary 29 2.85 0.48 33 3.38 0.38 60 4.84 .000 -0.53 1.22 Middle 49 2.72 0.44 29 3.08 0.30 76 3.88 .000 -0.36 0.95 High 53 2.85 0.43 60 2.88 0.45 111 0.47 ns -0.04 0.09
Technical Resources
Full Group 131 2.80 0.45 122 3.07 0.45 251 4.70 .000 -0.27 0.59 Elementary 29 3.75 0.22 33 3.92 0.14 45.53 3.55 .001 -0.17 0.92 Middle 49 3.53 0.48 29 3.82 0.27 75.89 3.42 .001 -0.29 0.75 High 52 3.67 0.38 60 3.50 0.43 110 2.14 ns 0.17 0.41
Anti-Discriminatory Teaching
Full Group 130 3.63 0.40 122 3.69 0.39 250 1.16 ns -0.06 0.15 Elementary 29 3.55 0.28 33 3.70 0.24 60 2.26 ns -0.15 0.57 Middle 49 3.23 0.52 29 3.63 0.29 75.80 4.38 .000 -0.40 0.95 High 53 3.35 0.49 60 3.19 0.47 111 1.74 ns 0.16 0.33
Responsive Pedagogy
Full Group 131 3.35 0.48 122 3.43 0.45 251 1.43 ns -0.08 0.18 Elementary 29 3.50 0.36 32 3.50 0.41 59 1.76 ns -0.17 0.45 Middle 49 3.05 0.50 29 3.52 0.47 76 4.12 .000 -0.47 0.97 High 53 3.20 0.55 60 3.11 0.54 111 0.93 ns 0.10 0.17
Differentiated Instruction
Full Group 131 3.21 0.52 121 3.36 0.55 250 2.14 .033 -0.14 0.27 Elementary 29 3.46 0.44 32 3.32 0.50 59 1.12 ns 0.14 0.29 Middle 49 2.80 0.47 29 3.47 0.38 76 6.47 .000 -0.67 1.56 High 53 3.20 0.51 60 3.22 0.54 111 0.16 ns -0.02 0.03
Expectations for Student Performance
Full Group 131 3.11 0.54 121 3.30 0.50 250 2.98 .003 -0.20 0.38

56
Table 13 AEL MSCI Subscale Descriptive Statistics and Differences for Pilot Schools by Year of Administration
Spring 2003 Spring 2004 Subscale Name
N Mean SD N Mean SD df t P Dif. d
Collective Professional Capacity 132 2.78 0.46 131 3.09 0.44 261 5.41 .000 0.30 0.67 Peer Reviewed Practice 130 2.12 0.84 131 2.42 0.94 259 2.75 .006 0.30 0.34 Program Coherence 132 2.87 0.40 131 3.09 0.51 246.94 3.88 .000 0.22 0.48 Technical Resources 132 2.60 0.59 131 2.91 0.52 261 4.57 .000 0.31 0.56 Anti-Discriminatory Teaching 131 3.24 0.40 130 3.63 0.40 259 7.87 .000 0.39 0.97 Responsive Pedagogy 131 3.09 0.42 131 3.35 0.48 260 4.72 .000 0.26 0.58 Differentiated Instruction 131 3.17 0.44 131 3.23 0.53 251.48 0.98 ns 0.06 0.12 Expectations for Student Performance 131 3.09 0.42 131 3.11 0.54 245.13 0.46 ns 0.03 0.06

57
SSOS Classroom Observations A total of 315 observations took place in eight schools (four pilot, four comparison) during the 2003-2004 school year. For each teacher selected, data collectors tried to complete 2 observations at three different time periods over the year (based on a schedule of before, during, and after teaching of the culturally responsive units at pilot schools), for a total of 6 observations per teacher. The number of classrooms observed per school ranged from 5 to 9, for a total of 54 different classrooms of the selected teachers. The total of 315 completed observations is only 9 short of the desired 324 (54 classrooms x 6 observations). The number of observations per school ranged from 30 to 48 over the school year. Two minutes were devoted to preliminary coding at the beginning of each observation, and 2 minutes at the end of each observation were devoted to completing the QAIT and CERC. That left a maximum of 56 minutes possible for the actual coding of classroom behaviors. The average number of minutes of classroom coding per observation was 41.5 (standard deviation of 8.4). The median and mode were both 42. The classroom coding ranged from a low of 18 minutes (<1%) to a high of the maximum 56 minutes (4%). A total of 13,073 classroom behavior minutes were coded. Adding the 4 other minutes per observation and multiplying by 315 observations (1,260 minutes) brings the total number of observation minutes to 14,333 minutes or 239 hours (equivalent to roughly 30 days of observations). As noted earlier, these observations focused on both entire classrooms (the class snapshot) and specific ongoing activities of the teacher and a selected target student. The target student for each classroom was either a male or female African American youth (unless there were none in a specific classroom). Data collectors and guidance counselors were instructed to try to randomly select target students that appeared to be of low, medium, and high academic ability. The number of classroom observations was fairly even across building levels, with 43% elementary school, 31% middle school, and 26% high school (four elementary schools, two middle schools, and two high schools were involved in this activity). The observations were almost evenly divided between pilot and comparison schools: 159 (50.5%) for pilot schools and 156 (49.5%) for comparison schools. However, the pilot school observations were further categorized into four groups: pilot teachers teaching a culturally responsive unit (PTT), pilot teachers not teaching a culturally responsive unit (PTNT), non-pilot teachers teaching a culturally responsive unit (NPTT), and non-pilot teachers not teaching a culturally responsive unit (NPTNT) (comparison school teachers are classified as Comp.). Within the pilot schools, classroom observations by the four groups were fairly even: 33 (21%) in PTT, 43 (27%) in PTNT, 36 (23%) in NPTT, and 47 (30%) in NPTNT.
The number of adults (teachers or aides) in the classrooms ranged from 1 to 3; the average number was 1 for all five groups (standard deviations ranged from .28 to .61). The number of students per classroom ranged from 6 to 29; the average number was 16 for PTT (standard deviation of 5); 18 for PTNT (standard deviation of 6); 17 for both NPTT and NPTNT (standard deviations of 2 and 4, respectively); and 18 for Comp.

58
(standard deviation of 5). Other demographic information is presented in Table 14, displayed by each of the five groups. A few points are worth noting: the NPTT group had no African American teachers, the PTT and NPTNT groups had no male teachers, and some of the NPTNT classrooms had no African American students, so 13% of the target students in this category are White.
Table 14 Demographic Information by Grouping for Classroom Observations
Grouping*
PTT PTNT NPTT NPTNT Comp.
Demographic Variable N
obs % N
obs % N
obs % N
obs % N
obs % Teacher ethnicity:
African American White
18 15
54% 46%
12 31
28% 72%
0 36
0% 100%
6 41
13% 87%
12 144
8% 92%
Teacher gender: Female Male
33 0
100% 0%
30 13
70% 30%
24 12
67% 33%
47 0
100%
0%
138 18
88% 12%
School level: Elementary Middle High
17 12 4
52% 36% 12%
12 19 12
28% 44% 28%
12 12 12
33% 33% 33%
24 5 18
51% 11% 38%
71 49 36
46% 31% 23%
Observation time: Before During After
9 12 12
27% 36% 36%
14 15 14
33% 35% 33%
12 12 12
33% 33% 33%
16 15 16
34% 32% 34%
51 53 52
33% 34% 33%
Target student ability level:** High Middle Low
10 11 12
30% 33% 36%
12 15 16
28% 35% 37%
12 12 12
33% 33% 33%
17 15 15
36% 32% 32%
57 49 50
36% 31% 32%
Target student ethnicity: African American White
33 0
100%
0%
43 0
100%
0%
36 0
100%
0%
41 6
87% 13%
156 0
100%
0% Target student gender:
Female Male
22 11
67% 33%
18 25
42% 58%
18 18
50% 50%
18 29
38% 62%
78 78
50% 50%
*PTT—pilot teacher teaching a culturally responsive unit; PTNT—pilot teacher not teaching a culturally responsive unit; NPTT—non-pilot teacher teaching a culturally responsive unit; NPTNT—non-pilot teacher not teaching a culturally responsive unit; Comp.—comparison school. **These ability levels are based on assumptions made by the data collectors or guidance counselors.

59
A variety of subject areas were observed at various grade levels within the classroom observations for each group, as shown in Table 15. More than a third of the PTT observations (36%) were at the 6th grade; the most frequent subjects were history (30%) and language arts (24%). Nearly half of the PTNT observations (44%) were at the 7th grade; most frequent subjects were science (42%) and math (37%). A third of the NPTT observations (33%) were at the 6th grade; nearly half of the observations focused on history (44%). The NPTNT group included a fairly even number of observations at the 11th grade (21%) and multiple grade levels (23%); most frequent subjects included math (26%) and language arts (21%). Finally, the comparison group had nearly equal numbers of observations at the 6th grade (16%) and 7th grade (15%); most frequent subjects included math (20%) and multiple subjects (15%).
Table 15 Grade Level and Subject Information by Grouping for Classroom Observations
Grouping*
PTT PTNT NPTT NPTNT Comp.
Demographic Variable N % N % N % N % N %
Grade level: Kindergarten 1st grade 2nd grade 3rd grade 4th grade 5th grade 6th grade 7th grade 8th grade 9th grade 10th grade 11th grade 12th grade Multiple grades
7 4 6 0 0 0 12 0 0 0 0 0 0 4
21% 12% 18% 0% 0% 0% 36% 0% 0% 0% 0% 0% 0% 12%
0 0 0 0 0 6 0 19 0 0 0 8 0 10
0% 0% 0% 0% 0% 14% 0% 44% 0% 0% 0% 19% 0% 23%
0 6 6 0 0 0 12 0 0 4 2 6 0 0
17% 17% 0% 0% 0% 0% 33% 0% 0% 11% 6% 17% 0% 0%
0 6 6 6 0 3 0 5 0 0 0 10 0 11
0% 13% 13% 13% 0% 6% 0% 11% 0% 0% 0% 21% 0% 23%
0 12 6 18 12 17 25 24 0 0 6 5 13 18
0% 8% 4% 12% 8% 11% 16% 15% 0% 0% 4% 3% 8% 12%
Subjects: English History Language arts Mathematics Reading Science Social studies Writing Interdisciplinary Other Multiple subjects
6 10 8 1 5 0 0 0 2 0 1
18% 30% 24% 3% 15% 0% 0% 0% 6% 0% 3%
0 0 0 16 1 18 7 0 0 0 1
0% 0% 0% 37% 2% 42% 16% 0% 0% 0% 2%
6 16 2 1 3 0 2 0 5 0 1
17% 44% 6% 3% 8% 0% 6% 0% 14% 0% 3%
7 0 10 12 6 6 1 0 0 0 5
15% 0% 21% 26% 13% 13% 2% 0% 0% 0% 11%
19 19 22 31 3 2 14 1 2 1 24
12% 12% 14% 20% 2% 13% 9% 1% 1% 1% 15%
*PTT—pilot teacher teaching a culturally responsive unit; PTNT—pilot teacher not teaching a culturally responsive unit; NPTT—non-pilot teacher teaching a culturally responsive unit; NPTNT—non-pilot teacher not teaching a culturally responsive unit; Comp.—comparison school.

60
The SSOS provides a "classroom snapshot" that looks at whole-class student engagement and grouping configurations every 8 minutes and "ongoing activities" of the teacher and a target student alternately for 7 or 8 consecutive minutes (depending on whether the snapshot coding took an entire minute). There was a maximum of seven 8-minute blocks; four of these were focused on the teacher and three were focused on the target student. During these blocks, 27 discrete activities could be coded in time segments of 1 to 8 minutes. As noted earlier, these blocks equaled a maximum of 56 minutes of the 60-minute observation; 2 minutes were dedicated to preliminary coding on the cover page at the beginning of the observation and 2 minutes each were allocated to completing the QAIT and CERC at the conclusion of the observation. Classroom snapshot: Student engagement. The four categories within student engagement included number of students on task, off task, out of the room, and waiting; these categories were further divided into those snapshots taken during a teacher-focused block or a target student-focused block. On a global level, the average number of students on task when the focus was the target student was 43, with a standard deviation (SD) of 15; for the teacher focus, the average was 49, with an SD of 18. For students off task, the overall average during the target student focus was 3 (SD = 5); for teacher focus, the average was 3 (SD = 6). For students out of the room, the target student-focused average was 3 (SD = 6); the teacher-focused average was 4 (SD = 7). Finally, for the number of students waiting, the target student-focused average was 2 (SD = 7); the teacher-focused average was 4 (SD = 9). Table 16 provides descriptive statistics for the student engagement variables (on task, off task, out of room, and waiting) by target student or teacher focus and by grouping (PTT, PTNT, NPTT, NPTNT, Comp.). Figures 3 and 4 provide a visual depiction of the average numbers of students in each engagement category by target student or teacher focus for each of the five groups. The overwhelming majority of students for both target student and teacher focus for all five groups were coded as on task. One-way ANOVAs were generated to determine whether statistically significant differences existed within these eight variables (on task, off task, out of the room, and waiting by either target student or teacher focus) by grouping (PTT, PTNT, NPTT, NPTNT, Comp.). Five of the eight ANOVAs did identify significant differences by grouping. Because the Levene test of homogeneity of variance was significant for these analyses, an unequal post hoc procedure (Dunnett's C) was selected to identify which groups were statistically significantly different from one another. For target student focus, the two categories of off task and out of the room resulted in statistically significant differences by group: for off task, PTT < PTNT, NPTT; for out of room, Comp. > PTT, PTNT, NPTT. For teacher focus, three categories of on task, off task, and out of the room were statistically significant by group: for on task, Comp. > NPTT; for off task, PTT < all four other groups; for out of room, Comp. > all four other groups. With one small effect size at .21 and the other four medium effect sizes above .25, these

61
Table 16 Descriptive Statistics for Number of Students in SSOS Student Engagement
by Target Student or Teacher Focus and by Grouping
Group
Statistic
Students On Task
Students Off Task
Students Out of Room
Students Waiting
Target Student Focus Pilot Teachers Teaching CRU*
N observed Mean SD
33 43 13
33 1 2
33 2 3
33 0 0
Pilot Teachers Not Teaching CRU
N observed Mean SD
43 45 16
43 4 6
43 1 2
43 1 4
Non-Pilot Teachers Teaching CRU
N observed Mean SD
36 40 9
36 6 9
36 2 3
36 3 6
Non-Pilot Teachers Not Teaching CRU
N observed Mean SD
47 41 16
47 3 5
47 2 5
47 4 11
Comparison Teachers
N observed Mean SD
156 45 15
156 2 4
156 5 7
156 2 6
Teacher Focus Pilot Teachers Teaching CRU*
N observed Mean SD
33 48 11
33 1 1
33 3 3
33 1 4
Pilot Teachers Not Teaching CRU
N observed Mean SD
43 48 20
43 6 9
43 2 2
43 5 10
Non-Pilot Teachers Teaching CRU
N observed Mean SD
36 40 13
36 6 10
36 2 3
36 5 8
Non-Pilot Teachers Not Teaching CRU
N observed Mean SD
47 47 14
47 3 5
47 3 5
47 4 8
Comparison Teachers
N observed Mean SD
156 52 19
156 3 4
156 6 9
156 5 10
*CRU = culturally responsive unit

62
Figure 3 Mean Numbers of Students in SSOS Student Engagement Categories
for Target Student Focus by Grouping
Figure 4 Mean Numbers of Students in SSOS Student Engagement Categories
for Teacher Focus by Grouping
WaitingOut of RoomOff TaskOn Task
Mea
n N
umbe
r of S
tude
nts
60
50
40
30
20
10
0
PTT
PTNT
NPTT
NPTNT
Comp.5
45
43
41
36
40
4
4543
1 2 2 1 2 2 0 1 2
WaitingOut of RoomOff TaskOn Task
Mea
n N
umbe
r of S
tude
nts
60
50
40
30
20
10
0
PTT
PTNT
NPTT
NPTNT
Comp.56
3
52
433
47
56
40
56
48
3
48
1 2 2 1

63
findings suggest that there was some practical significance. See Table 17 for a summary of these results. Finally, the percent of students engaged in each category (on task, off task, out of the room, or waiting) was calculated by the five groupings (PTT, PTNT, NPTT, NPTNT, Comp.). According to Stallings (1980), student engagement rates above 80% have been associated with high gains in student achievement. For four of the five groups (PTT, PTNT, NPTNT, Comp.), the percentage of students on task was above 80%, and for the PTT group, the percentage exceeded 90%. For the NPTT group, the percentage approached 80%. See Table 18 for a summary of category percentages by grouping.
Classroom snapshot: Groups and activities. This section of the COF focused on the teacher, aide, or student groups, as well as the activity taking place (interaction, working alone, management, or social/uninvolved). Table 19 provides descriptive statistics for the groups and activities variables (teacher, aide, or student groups and interactive, working alone, management, or social/uninvolved activities) by target student or teacher focus and by grouping (PTT, PTNT, NPTT, NPTNT, Comp.). Figures 5 and 6 provide a visual depiction of the average numbers of students in each category by target student or teacher focus for each of the five groups. One-way ANOVAs were generated to determine whether statistically significant differences existed within these 24 variables (interactive, work alone, management, or social for teacher, aide, and student groups by either target student or teacher focus) by grouping. Three of the 24 ANOVAs did identify significant differences by grouping. The Levene test of homogeneity of variance was significant for two of these analyses, so an unequal post hoc procedure (Dunnett's C) was selected to identify which groups were statistically significantly different from one another; for the remaining analysis, an equal post hoc procedure (Tukey) was selected. For target-student focus, the student group involved socially resulted in a significant difference by group: the PTT group had significantly fewer students involved in social activities or engaged in nonacademic activities than the NPTT group. For teacher focus, the PTNT group had significantly fewer students working alone than the comparison group, and the PTT group had significantly fewer students involved in social activities or engaged in nonacademic activities than any other group. All three effect sizes were medium (.33, .30, and .33, respectively), indicating there was some practical significance. See Table 20 for a summary of these results. Finally, the percent of students engaged in each type of activity (interaction, working alone, management, or social/uninvolved) was calculated by the five groupings (PTT, PTNT, NPTT, NPTNT, Comp.). In this instance, interactive instruction was defined as a measure of the percentage of students interacting with a teacher, aide, or other students on academic subjects. According to Stallings (1980), interactive instruction rates above 50% have been associated with highly effective classroom instruction. For each of the five groups, this interactive instruction percentage was above 50%, and the PTT group had 75% interactive instruction. See Table 21 for a summary of activity percentages by grouping.

64
Table 17 One-Way ANOVA Results for Number of Students in SSOS Student
Engagement by Target Student or Teacher Focus Engagement Category df F p Effect size Difference
Target Student Focus Students On Task
4, 310 1.46 .213 -- --
Students Off Task 4, 310 5.06 .001* .25 PTT < PTNT, NPTT
Students Out of Room 4, 310 5.61 .000* .28 Comp. > PTT, PTNT, NPTT
Students Waiting
4, 310 2.19 .070 -- --
Teacher Focus Students On Task
4, 310 3.55 .008* .21 Comp. > NPTT
Students Off Task 4, 310 5.34 .000* .26 PTT < other four groups
Students Out of Room 4, 310 5.65 .000* .27 Comp. > other four groups
Students Waiting
4, 310 1.37 .246 -- --
*Sig. < .05.
Table 18 Percent of Students in SSOS Student Engagement Categories by Grouping
Group On Task Off Task Out of Room Waiting
PTT
92%
2%
5%
1%
PTNT
84%
8%
3%
5%
NPTT
77%
12%
3%
8%
NPTNT
81%
6%
5%
8%
Comp.
81%
4%
9%
6%

65
Table 19 Descriptive Statistics for Number of Students in SSOS Groups and Activities
by Target Student or Teacher Focus and by Grouping
Grouping* Variables Statistic PTT PTNT NPTT NPTNT Comp.
Target Student Focus Teacher Interaction N observed
Mean SD
25 32.88 14.59
29 25.52 20.77
25 29.76 15.40
40 27.25 17.01
82 27.44 15.63
Teacher Working Alone
N observed Mean SD
1 0.00
--
6 0.00 0.00
5 0.00 0.00
5 0.00 0.00
9 0.00 0.00
Teacher Management
N observed Mean SD
9 6.11 11.02
7 3.43 4.32
11 6.73 9.41
23 3.87 5.96
33 5.09 9.83
Teacher Social/Uninvolved
N observed Mean SD
0 -- --
3 0.00 0.00
0 -- --
0 -- --
4 0.00 0.00
Aide Interaction
N observed Mean SD
1 2.00
--
0 -- --
1 3.00
--
5 10.60 2.79
8 7.88 7.32
Aide Working Alone
N observed Mean SD
3 0.00 0.00
2 0.00 0.00
0 -- --
0 -- --
3 0.00 0.00
Aide Management
N observed Mean SD
2 2.00 1.41
0 -- --
0 -- --
2 9.50 13.44
1 0.00
-- Aide Social/Uninvolved
N observed Mean SD
3 0.00 0.00
0 -- --
0 -- --
0 -- --
0 -- --
Student Interaction
N observed Mean SD
3 18.67 6.03
10 33.40 17.91
2 19.00 9.90
8 8.50 5.13
6 21.83 23.74
Student Working Alone
N observed Mean SD
9 16.56 12.71
19 22.05 13.77
15 22.07 14.62
23 18.61 14.86
53 20.70 13.77
Student Management
N observed Mean SD
0 -- --
0 -- --
0 -- --
0 -- --
1 10.00
-- Student Social/Uninvolved
N observed Mean SD
13 2.54 1.81
23 5.48 5.53
26 9.31 10.17
28 5.07 5.81
48 4.31 4.08

66
Table 19 (cont’d.)
Grouping* Variables Statistic PTT PTNT NPTT NPTNT Comp.
Teacher Focus Teacher Interaction N observed
Mean SD
25 34.28 13.56
32 29.53 20.53
25 29.44 18.12
40 29.50 12.59
81 26.98 16.77
Teacher Working Alone
N observed Mean SD
2 0.00 0.00
4 0.00 0.00
5 0.00 0.00
4 0.00 0.00
16 0.00 0.00
Teacher Management
N observed Mean SD
13 12.54 10.36
17 8.65 7.93
19 11.42 9.68
28 8.39 11.52
51 9.86 11.18
Teacher Social/Uninvolved
N observed Mean SD
3 5.33 9.24
4 0.00 0.00
3 0.00 0.00
3 0.00 0.00
4 9.25 9.00
Aide Interaction
N observed Mean SD
4 6.50 9.68
2 0.50 0.71
1 1.00
--
4 13.50 1.73
8 5.88 5.22
Aide Working Alone
N observed Mean SD
3 0.00 0.00
3 0.00 0.00
1 0.00
--
1 0.00
--
3 0.00 0.00
Aide Management
N observed Mean SD
3 0.00 0.00
1 2.00
--
2 0.50 0.71
3 6.67 11.55
1 0.00
-- Aide Social/Uninvolved
N observed Mean SD
2 0.00 0.00
1 0.00
--
0 -- --
1 0.00
--
2 0.00 0.00
Student Interaction
N observed Mean SD
4 13.75 6.65
10 22.70 14.20
2 8.50 0.71
4 15.25 8.54
8 24.75 21.89
Student Working Alone
N observed Mean SD
12 14.50 9.84
24 14.88 9.55
16 17.19 13.36
28 17.00 11.86
59 23.51 14.69
Student Management
N observed Mean SD
0 -- --
0 -- --
0 -- --
1 1.00
--
2 12.00 11.31
Student Social/Uninvolved
N observed Mean SD
12 2.00 0.95
23 10.96 12.02
25 11.92 12.46
29 6.45 6.46
56 6.55 6.57
*PTT—pilot teacher teaching a culturally responsive unit; PTNT—pilot teacher not teaching a culturally responsive unit; NPTT—non-pilot teacher teaching a culturally responsive unit; NPTNT—non-pilot teacher not teaching a culturally responsive unit; Comp. —comparison school.

67
Figure 5 Mean Numbers of Students in SSOS Groups and Activities for Target Student
Focus by Grouping
Figure 6 Mean Numbers of Students in SSOS Groups and Activities for Teacher Focus
by Grouping
Std. Social
Std. Management
Std. Working Alone
Std. Interaction
Aide Management
Aide Interaction
Tchr. Management
Tchr. Interaction
Ave
rage
Num
ber o
f Stu
dent
s
40
30
20
10
0
PTT
PTNT
NPTT
NPTNT
Comp.
Std. Social
Std. Management
Std. Working Alone
Std. Interaction
Aide Management
Aide Interaction
Tchr. Social
Tchr. Management
Tchr. Interaction
Ave
rage
Num
ber o
f Stu
dent
s
40
30
20
10
0
PTT
PTNT
NPTT
NPTNT
Comp.
68
Table 20 One-Way ANOVA Results for Numbers of Students in SSOS Groups and Activities
by Target Student or Teacher Focus Groups and Activities Category
df F p Effect size Difference
Target Student Focus Students Involved Socially or Uninvolved Academically 4, 133 3.76 .006* .33 PTT < NPTT
Teacher Focus Students Working Alone 4, 134 3.04 .020* .30 PTNT < Comp. Students Involved Socially or Uninvolved Academically 4, 140 4.01 .004* .33 PTT < other
four groups *Sig. < .05.
Table 21 Percent of Students in SSOS Groups and Activities by Grouping
Group Interaction Work Alone Management Social/Uninvolved
PTT
75%
14%
8%
3%
PTNT
58%
24%
6%
12%
NPTT
52%
20%
10%
17%
NPTNT
61%
23%
8%
8%
Comp.
58%
27%
8%
7%
Ongoing activities. This section of the SSOS included two components that alternately focused on the teacher (four 8-minute blocks) and a target student (three 8-minute blocks). The first component was to indicate which of 27 discrete activities was being observed during that particular time period (see Table 22 for a complete listing of all 27 activities, along with a brief description of each). The second component was to indicate how many minutes were spent engaged in a particular activity. The smallest time increment was 1 minute; the largest was 8 minutes (each page was an 8-minute block). The maximum number of teacher-focused activity minutes per observation was 32; for student-focused activity minutes, the maximum number was 24. Figure 7 presents a visual depiction of the number of minutes per each of the 27 individual activities for the

69
target student focus; Figure 8 presents the same information for the teacher focus. For both target student and teacher focus, the most frequent activity was independent inquiry by students; the least frequent was discipline for the target student focus and student-initiated questions.
Table 22 SSOS Individual Activities and Descriptions
Activity Description
A. Teacher presentation of content
Presenting academic content to whole class. Includes lecture, demonstration, and explanation of academic content. May include questioning or comments from students, but mainly to inform students, introduce/explain materials, including previously introduced material.
B. Recitation or discussion
Providing students practice of skills/review of material. Includes questioning of students, short written tasks, or content-oriented game/board work, interactive review, or reviewing textbook exercises.
C. Directions for assignments
Teacher is explaining to class exact procedures for doing an assignment, seatwork activity, or homework. Can include headings, numbering, or any information about form in which the assignment is to be done.
D. Small-group instruction
Teacher works with group of two or more students.
E. Tests Students work independently on a test, quiz, readiness test, or assessment; teacher may read questions aloud, as in a spelling test.
F. Checking The teacher and students are going over seatwork problems, a quiz, or assignment for the purpose of checking/grading it in class. Little/no teacher explanation or review is entailed.
G. Procedural or behavioral presentations
Presents/reviews class/school rules/procedures. Should be used when instituting/explaining class procedures/rules governing student behavior or when giving class feedback on behavior, discussing problems relating to behavior, or following class procedures.
H. Administrative routines
Teacher or student is checking attendance, making announcements, opening or closing routines without academic content, discussing grades, distributing graded papers, recording grades, or changing seating.
I. Transitions The teacher and students are involved in activities that entail changing from one activity to another, i.e., moving between small groups, getting supplies or materials for a different activity, or passing papers.
J. Nonacademic activity
Teacher involved with students in activities such as games, discussions, or television that are not related to content of the class.
K. Waiting time Students have no assigned task. Either they are finished and have no other assignment or they are just waiting for the next activity.
L. Discipline Students are involved in some discipline for misbehavior, i.e., putting their heads down on desks for a period of time for misbehavior.
M. Praising class The teacher is praising one or more students for work or tests completed, for behavior, etc.
N. Monitoring The teacher is moving from group to group, giving feedback to individual students.

70
Table 22 (cont’d.)
Activity Description O. Individual seatwork
Students are working at desks individually. This code includes activities that are content centered. Brief directions for seatwork or short teacher interruptions to explain or clarify directions would be left in seatwork time unless they last more than one minute.
P. Individual seatwork at computer
Students are working at computers individually. This code includes activities that are content-centered. Brief directions or short teacher interruptions to explain or clarify directions would not be coded unless at least one minute.
Q. Pairs or group seatwork
Students are involved in content-centered student- or teacher-initiated group projects or small-group tasks.
R. Pairs or group seatwork at computer
Students are grouped in pairs or groups at computers and are performing content-centered activities.
S. Sustained writing or composition
Students are involved in sustained writing.
T. Sustained reading Students are involved in sustained reading. U. Hands-on learning
Individual students or groups are using manipulatives to enhance learning, including experiments.
V. Independent inquiry or research
Students are working individually or in groups to conduct research for a unique product.
W. Student-initiated questions
Individual students generate in-depth (higher order) questions for the teacher.
X. Nonacademic activity
Students are involved as instructed in activities that are not related to instruction or classroom content, such as playing nonacademic games, puzzles, etc.
Y. Not occupied Students are not engaged in academic learning, neither are they involved in any type of nonacademic activity, i.e., just sitting at desk, etc.
Z. Off task Students are not doing whatever they were instructed to do, i.e., they are “goofing off,” talking to a classmate, “doodling,” etc.
ZZ. Out of room Students have left the room for some reason, such as going to restroom, going to some type of pull-out program, going home sick, etc.
The 27 activities were grouped into four main categories of teacher led,
management/organization, student led, and off task. Table 23 provides the classification of each item into one of these four categories.
On a global level, the average number of minutes spent on teacher-led activities when the focus was the target student was 10.93 with a standard deviation (SD) of 5.65; for the teacher focus, the average was 10.37 with an SD of 5.78. The average number of minutes spent on target student-focused management/organization activities was 2.71 with an SD of 1.97; for the teacher focus, the average was 5.17 with an SD of 3.54. For target student-focused student-led activities, the average number of minutes was 8.63 with an SD of 5.28; for the teacher focus, the average was 6.84 with an SD of 4.63. For target student-focused off task activities, the average was 5.54 with an SD of 3.99; for the teacher focus, the average was 6.70 with an SD of 4.61.

71
Table 24 provides descriptive statistics for the main activity categories (teacher
led, management/organization, student led, and off task) by target student or teacher focus and by grouping (PTT, PTNT, NPTT, NPTNT, Comp.). Figures 9 and 10 provide a visual depiction of the average numbers of minutes spent in each category by target student or teacher focus for each of the five groups. In general, the teacher-led activities were most prevalent for both target student and teacher focus across all five groups. One-way ANOVAs were generated to determine whether statistically significant differences existed within these eight variables (teacher led, management/organization, student led, and off task by either target student or teacher focus) by grouping (PTT, PTNT, NPTT, NPTNT, Comp.). Three of the eight ANOVAs did identify significant differences by grouping. Because the Levene test of homogeneity of variance was significant for these analyses, an unequal post hoc procedure (Dunnett's C) was selected to identify which groups were statistically significantly different from one another. For target student-focus, the two categories of student led and off task resulted in statistically significant differences by group: for student led, PTNT > PTT; for off task, NPTT > PTT and Comp. For teacher focus, one category of teacher led was statistically significant by group: NPTT < PTT and Comp. With two small and one moderate effect sizes in the low .20's and low .30's, these findings indicate that there was practical significance. See Table 25 for a summary of results.
QAIT. The QAIT assessment of classroom instrument measured four features of the classroom: quality of instruction, appropriate level of instruction, incentives for learning, and use of time. Forty specific features were rated on a 1 to 5 Likert-type scale (1 = Unlike this class to 5 = Like this class). A QAIT form was completed for each of the 315 classroom observations. Table 26 provides descriptive statistical information for each item by the five groups (PTT, PTNT, NPTT, NPTNT, Comp.). The PTT and Comp. groups scored highest on the teacher using effective management (means of 4.58 and 4.51, SDs of 0.75 and 1.06), the PTNT and NPTT groups on necessary time being allocated for instruction (means of 3.88, SDs of 1.35 and 1.08), and the NPTNT group on teachers using an appropriate pace to cover content (mean of 3.89, SDs of 1.27). Four of the groups (PTT, NPTT, NPTNT, and Comp.) scored lowest on the teacher using academic incentives such as small groups with individual incentives (means of 1.06, 1.28, 1.06, and 1.13, respectively, with SDs of 0.24, 0.78, 0.25, and 0.58, respectively). The PTNT group scored lowest on the teacher using extrinsic behavioral incentives such as tokens and rewards for improvement (mean of 1.29, SD of 0.80).

72
Figure 7 Mean Number of Minutes in SSOS Individual Activities for Target
Student Focus
Figure 8 Mean Number of Minutes in SSOS Individual Activities for Teacher Focus
ZZZYXWVUTSRQPONMLKJIHGFEDCBA
Mea
n N
umbe
r of M
inut
es
12
10
8
6
4
2
0
44
3
4
2
11
8
5
6
11
7
10
7
211
3
223
2
5
8
4
2
7
8
ZZZYXWVUTSRQPONMLKJIHGFEDCBA
Mea
n N
umbe
r of M
inut
es
12
10
8
6
4
2
0
5
6
45
3
11
8
66
87
7
5
54
3
54
444
5
7
8
4
88

73
Table 23 Classroom Observation Individual Activities by Main Categories
Main Categories Individual Activities
Teacher-Led A. Teacher presentation of content B. Recitation or discussion C. Directions for assignments D. Small-group instruction E. Tests F. Checking M. Praising class
Management/Organization G. Procedural or behavioral presentation H. Administrative routines I. Transitions N. Monitoring
Student-Led O. Individual seatwork P. Individual seatwork at computer Q. Pairs or group seatwork R. Pairs or group seatwork at computer S. Sustained writing or composition T. Sustained reading U. Hands-on learning V. Independent inquiry or research W. Student-initiated questions
Off Task J. Teacher nonacademic activity K. Waiting time L. Discipline X. Student nonacademic activity Y. Not occupied Z. Off task ZZ. Out of room

74
Table 24 Descriptive Statistics for Numbers of Minutes in SSOS Main Activity
Categories by Target Student or Teacher Focus and by Grouping
Group
Statistic
Teacher Led
Manage./ Organize.
Student Led
Off Task
Target Student Focus Pilot Teachers Teaching CRU*
N observed Mean SD
32 12.72 5.30
16 3.31 1.96
26 6.19 3.42
19 4.26 2.83
Pilot Teachers Not Teaching CRU
N observed Mean SD
34 9.94 6.76
19 2.74 1.70
34 10.62 6.29
28 6.07 4.26
Non-Pilot Teachers Teaching CRU
N observed Mean SD
29 9.59 4.87
11 3.18 1.60
25 8.60 4.67
29 8.31 5.54
Non-Pilot Teachers Not Teaching CRU
N observed Mean SD
43 10.35 5.51
28 2.39 1.77
35 9.03 5.24
36 6.33 4.14
Comparison Teachers
N observed Mean SD
141 11.22 5.56
80 2.64 2.15
112 8.46 5.27
110 4.63 3.11
Teacher Focus Pilot Teachers Teaching CRU*
N observed Mean SD
31 11.65 4.90
17 6.65 5.23
25 6.00 4.12
16 5.19 4.37
Pilot Teachers Not Teaching CRU
N observed Mean SD
34 9.32 5.66
20 4.40 2.44
34 8.47 5.47
22 7.14 4.54
Non-Pilot Teachers Teaching CRU
N observed Mean SD
29 7.62 4.40
22 4.23 2.47
22 6.00 3.46
26 7.88 3.99
Non-Pilot Teachers Not Teaching CRU
N observed Mean SD
37 9.89 5.30
26 6.12 4.13
29 7.10 4.60
34 7.97 4.91
Comparison Teachers
N observed Mean SD
130 11.09 6.20
102 5.03 3.35
100 6.60 4.61
91 6.04 4.61
*CRU = culturally responsive unit.
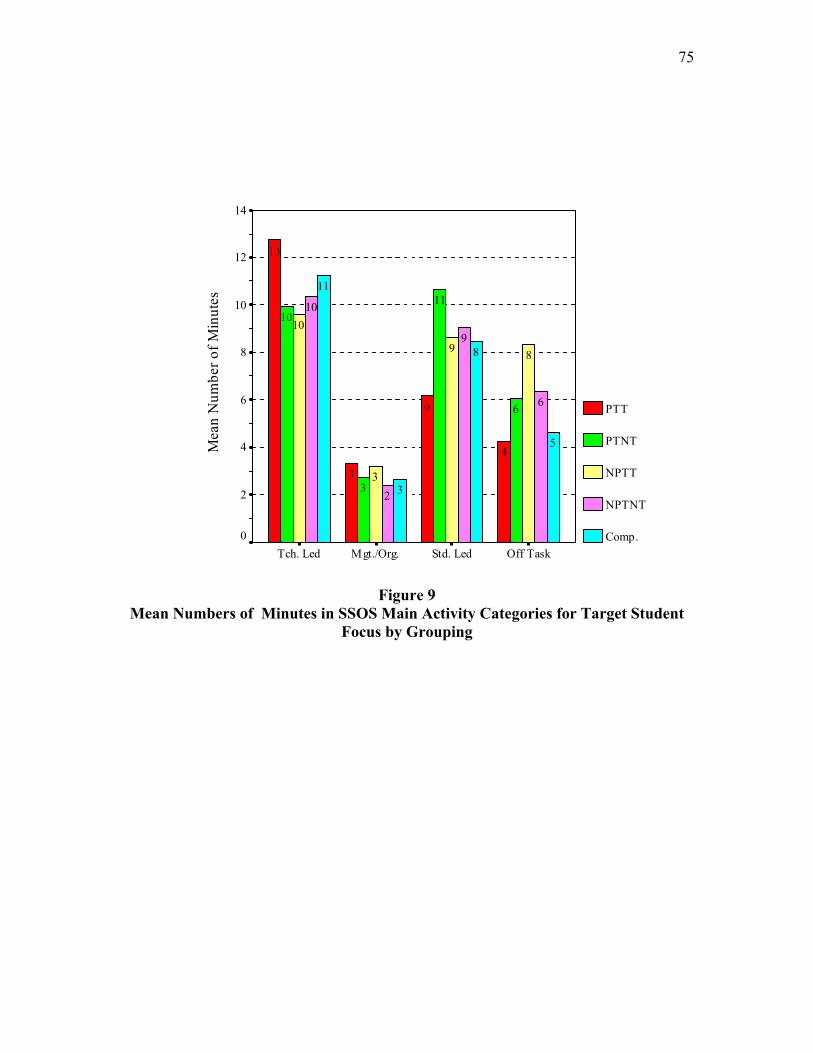
75
Figure 9 Mean Numbers of Minutes in SSOS Main Activity Categories for Target Student
Focus by Grouping
Off TaskStd. LedMgt./Org.Tch. Led
Mea
n N
umbe
r of M
inut
es14
12
10
8
6
4
2
0
PTT
PTNT
NPTT
NPTNT
Comp.
5
8
3
11
6
9
2
10
89
3
10
6
11
3
10
4
6
3
13

76
Figure 10 Mean Numbers of Minutes in SSOS Main Activity Categories for Teacher
Focus by Grouping
Table 25 One-Way ANOVA Results for Numbers of Minutes in SSOS Main Activity
Categories by Target Student or Teacher Focus
Category df F p Effect size Difference Target Student Focus
Teacher Led 4, 274 1.70 .151 -- -- Management/Organization 4, 149 0.73 .570 -- -- Student Led 4, 227 2.75 .029* .22 PTNT > PTT
Off Task 4, 217 6.48 .000* .34 NPTT > PTT, Comp.
Teacher Focus Teacher Led 4, 256 2.96 .020* .21 NPTT < PTT, Comp.
Management/Organization 4, 182 1.91 .111 -- -- Student Led 4, 205 1.55 .190 -- -- Off Task 4, 184 2.06 .088 -- -- *Sig. < .05.
Off TaskStd. LedMgt./Org.Tch. Led
Mea
n N
umbe
r of M
inut
es
14
12
10
8
6
4
2
0
PTT
PTNT
NPTT
NPTNT
Comp.
67
5
11
8
7
6
10
8
6
4
87
8
4
9
5
67
12

77
Table 26 Descriptive Statistics of SSOS QAIT Items by Grouping
Grouping*
Items Statistic PTT PTNT NPTT NPTNT Comp. Quality of Instruction
1. Lesson makes sense to students. The teacher: 1a. Organizes information in an orderly way.
N observed Mean SD
33 4.24 0.83
42 3.71 1.20
36 3.61 1.36
46 3.59 1.34
150 3.99 1.22
1b. Notes transitions to new topics.
N observed Mean SD
33 3.94 1.06
42 3.14 1.51
36 3.42 1.42
46 3.09 1.58
150 3.72 1.33
1c. Uses many vivid images and examples.
N observed Mean SD
33 3.85 1.06
42 3.05 1.56
36 2.92 1.27
46 2.72 1.46
149 3.41 1.41
1d. Frequently restates essential principles.
N observed Mean SD
33 4.42 0.75
42 3.57 1.43
36 3.39 1.32
46 3.02 1.47
149 3.84 1.32
2. Lessons relate to students’ background. The teacher: 2a. Uses devices such as advanced organizers
N observed Mean SD
32 3.69 1.12
42 2.93 1.33
35 2.54 1.29
46 2.54 1.33
149 3.19 1.46
2b. Reminds students of previously learned materials.
N observed Mean SD
33 4.42 0.79
41 3.83 1.26
36 3.61 1.22
46 3.59 1.28
150 4.07 1.12
3. The teacher exhibits enthusiasm.
N observed Mean SD
33 4.55 0.71
42 3.62 1.48
35 3.14 0.94
46 3.57 1.05
150 3.73 1.24
4. The teacher shows a sense of humor.
N observed Mean SD
33 3.91 0.88
42 3.26 1.53
36 3.11 1.12
46 3.22 1.07
148 3.36 1.34
5. Lesson objectives are clearly specified. The teacher: 5a. States lesson objectives orally or in writing.
N observed Mean SD
33 4.03 0.98
42 3.38 1.34
36 3.44 1.00
46 3.20 1.20
150 3.63 1.17
5b. Conducts formal and/or informal assessment.
N observed Mean SD
33 3.58 1.00
42 3.57 1.36
36 3.08 1.46
46 3.28 1.46
148 3.86 1.16
5c. Provides immediate and corrective feedback.
N observed Mean SD
31 4.00 1.00
42 3.69 1.51
36 3.31 1.37
46 3.48 1.44
149 3.72 1.34
6. Teachers use an appropriate pace to cover content.
N observed Mean SD
33 4.45 0.83
42 3.88 1.31
36 3.72 1.21
46 3.89 1.27
150 3.96 1.21
Appropriate Level of Instruction 7. Instructional strategies match students’ abilities. The teacher: 7a. Accommodates students’ levels of prior knowledge.
N observed Mean SD
32 3.25 1.46
42 2.90 1.51
35 3.03 1.58
47 2.23 1.49
152 2.88 1.45

78
Table 26 (cont’d.)
Grouping* Items Statistic PTT PTNT NPTT NPTNT Comp.
7b. Accommodates students' different learning rates.
N observed Mean SD
32 3.00 1.61
42 2.60 1.45
35 2.83 1.54
47 1.70 1.18
152 2.46 1.46
8. Grouping strategies enable students to work together or alone. The teacher: 8a. Uses in-class ability grouping.
N observed Mean SD
33 1.45 1.09
42 1.38 0.76
36 1.31 0.75
47 1.21 0.66
153 1.38 0.97
8b. Has a class that is homogeneous in ability.
N observed Mean SD
33 2.48 1.35
42 2.29 1.44
34 1.97 1.22
47 1.57 1.06
151 2.32 1.48
8c. Uses cooperative learning arrangements.
N observed Mean SD
33 1.70 1.16
42 2.19 1.63
35 1.74 1.12
47 1.36 1.07
152 1.52 1.12
8d. Bases individual instruction on mastery of skills and/or concepts.
N observed Mean SD
33 1.97 1.24
42 1.83 1.17
36 2.17 1.36
47 1.34 0.84
153 1.71 1.12
8e. Uses individualized instruction.
N observed Mean SD
33 1.42 0.66
42 1.98 1.35
36 1.81 1.22
46 1.30 0.70
151 1.52 0.92
Incentives for Learning 9. The teacher arouses students' curiosity by: 9a. Presenting surprising demonstrations.
N observed Mean SD
33 2.64 1.30
42 2.26 1.47
36 2.42 1.52
47 1.57 1.12
153 2.29 1.28
9b. Relating topics to students' lives.
N observed Mean SD
33 3.58 1.00
42 2.29 1.35
36 2.81 1.37
47 2.45 1.40
153 3.03 1.40
9c. Allowing students to discover information.
N observed Mean SD
33 3.24 1.42
41 3.27 1.40
36 3.19 1.26
47 2.09 1.43
153 2.88 1.44
9d. Presenting intrinsically interesting material.
N observed Mean SD
33 3.85 0.91
42 3.12 1.55
35 3.20 1.32
47 3.02 1.34
153 3.52 1.15
10. The teacher uses extrinsic academic incentives such as: 10a. Praise and feedback.
N observed Mean SD
33 4.06 1.14
41 3.37 1.37
36 2.94 1.31
47 2.62 1.64
151 3.32 1.37
10b. Accountability. N observed Mean SD
33 3.88 0.96
41 3.56 1.48
36 2.92 1.30
47 3.13 1.48
153 3.80 1.28
10c. Homework checks. N observed Mean SD
33 3.00 1.48
40 2.70 1.52
36 2.78 1.55
47 2.40 1.68
153 3.06 1.54
10d. Waiting for responses. N observed Mean SD
32 3.91 1.06
42 3.24 1.36
36 3.25 1.46
47 3.02 1.47
153 3.46 1.35

79
Table 26 (cont’d.)
Grouping* Items Statistic PTT PTNT NPTT NPTNT Comp.
10e. Guiding partial responses.
N observed Mean SD
33 3.70 1.24
42 3.43 1.40
36 3.31 1.39
47 2.81 1.60
151 3.67 1.38
10f. Tokens and rewards. N observed Mean SD
32 1.38 0.75
40 1.38 0.98
36 1.42 0.65
47 1.26 0.82
152 1.39 1.04
10g. Communicating high expectations.
N observed Mean SD
33 4.12 1.11
42 3.52 1.17
35 2.83 1.44
46 2.76 1.16
152 3.66 1.34
10h. Small groups with individual incentives.
N observed Mean SD
33 1.06 0.24
42 1.50 1.13
36 1.28 0.78
47 1.06 0.25
151 1.13 0.58
10i. Students encourage one another to achieve.
N observed Mean SD
33 2.39 1.30
42 1.83 1.15
36 2.00 1.22
47 1.51 0.88
148 1.72 1.07
10j. Group contingencies. N observed Mean SD
32 1.56 1.10
41 1.49 1.08
36 1.75 1.08
47 1.23 0.67
149 1.26 0.84
11. The teacher uses extrinsic behavioral incentives such as: 11a. Praise
N observed Mean SD
33 3.45 1.15
41 2.80 1.42
36 2.64 1.29
47 2.26 1.47
151 3.04 1.57
11b. Tokens and rewards for improvement.
N observed Mean SD
32 1.34 0.74
42 1.29 0.80
36 1.53 0.84
47 1.23 0.67
150 1.32 0.89
11c. Group contingencies. N observed Mean SD
33 1.64 1.14
42 1.52 1.09
36 1.72 1.19
47 1.26 0.74
150 1.22 0.71
12. The teacher provides instruction that is appropriate for students' abilities: Efforts by the student lead to success.
N observed Mean SD
33 4.18 0.81
41 3.80 1.10
34 3.59 0.96
47 3.51 1.06
150 3.93 0.85
Use of Time 13. Allocated time: Necessary time is allocated for instruction.
N observed Mean SD
33 4.30 0.85
42 3.88 1.35
36 3.97 1.08
47 3.81 1.21
151 4.17 1.09
14. Engaged rates: 14a. The teacher uses effective management.
N observed Mean SD
33 4.58 0.75
42 3.74 1.59
36 3.56 1.18
47 3.81 1.24
150 4.21 1.06
14b. Students attend to lessons.
N observed Mean SD
33 4.48 0.71
42 3.60 1.45
36 3.53 1.08
47 3.70 1.33
151 4.19 1.05
*PTT— pilot teacher teaching a culturally responsive unit; PTNT—pilot teacher not teaching a culturally responsive unit; NPTT—non-pilot teacher teaching a culturally responsive unit; NPTNT—non-pilot teacher not teaching a culturally responsive unit; Comp. —comparison school.

80
The 40 items were grouped into the four main features of the QAIT: quality of instruction, appropriate level of instruction, incentives for learning, and use of time. Table 27 provides descriptive statistical information for each of the four subscales by groups (PTT, PTNT, NPTT, NPTNT, Comp.). Figure 11 provides a visual depiction of the average ratings for each of these four subscales.
Table 27 Descriptive Statistics for SSOS QAIT Categories by Grouping
Group
Statistic
Quality of Instruction
Appropriate Level of
Instruction
Incentives for
Learning Use of Time
Pilot Teachers Teaching CRU*
N observed Mean SD
33 4.09 0.64
33 2.18 0.69
33 2.95 0.62
33 4.45 0.67
Pilot Teachers Not Teaching CRU
N observed Mean SD
42 3.47 1.20
42 2.17 0.86
42 2.56 0.88
42 3.74 1.41
Non-Pilot Teachers Teaching CRU
N observed Mean SD
36 3.28 0.97
36 2.10 0.90
36 2.53 0.81
36 3.69 0.95
Non-Pilot Teachers Not Teaching CRU
N observed Mean SD
46 3.26 1.11
47 1.54 0.66
47 2.18 0.79
47 3.77 1.19
Comparison Teachers
N observed Mean SD
151 3.70 0.96
153 1.97 0.64
153 2.66 0.71
151 4.19 1.07
*CRU = culturally responsive unit. One-way ANOVAs were generated to determine whether statistically significant differences existed within these subscale variables (quality of instruction, appropriate level of instruction, incentives for learning, and use of time) by grouping (PTT, PTNT, NPTT, NPTNT, Comp.). All four ANOVAs did identify significant differences by grouping. Because the Levene test of homogeneity of variance was significant for these analyses, an unequal post hoc procedure (Dunnett's C) was selected to identify which groups were statistically significantly different from one another. With moderate effect sizes all at .25 or above, the statistical significance was accompanied by practical significance. See Table 28 for a summary of these results.

81
Figure 11 Mean Ratings of SSOS QAIT Categories by Grouping
Table 28 One-Way ANOVA Results for SSOS QAIT Categories
Category df F p Effect size Difference
Quality of Instruction
4, 303
4.87 .001* .25 PTT > all other groups
Appropriate Level of Instruction
4, 306 6.12 .000* .28 NPTNT < all other groups
Incentives for Learning
4, 306 5.86 .000* .28 NPTNT < PTT, Comp.
Use of Time
4, 304 5.19 .001* .25 PTT > PTNT, NPTT, NPTNT; NPTT < Comp.
*Sig. < .05.
TimeIncentivesLevelQuality
Mea
n R
atin
g
5.0
4.0
3.0
2.0
1.0
PTT
PTNT
NPTT
NPTNT
Comp.
4.2
2.7
2.0
3.7 3.8
2.2
1.5
3.3
3.7
2.5
2.1
3.3
3.7
2.6
2.2
3.5
4.5
3.0
2.2
4.1
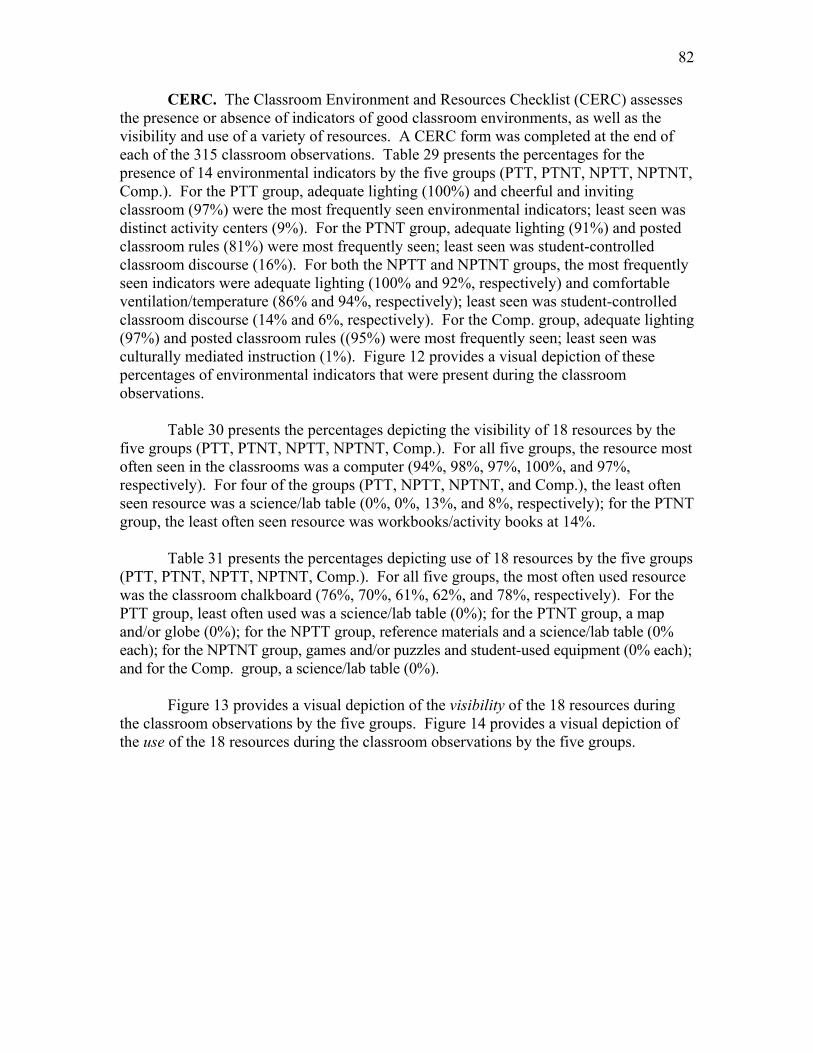
82
CERC. The Classroom Environment and Resources Checklist (CERC) assesses
the presence or absence of indicators of good classroom environments, as well as the visibility and use of a variety of resources. A CERC form was completed at the end of each of the 315 classroom observations. Table 29 presents the percentages for the presence of 14 environmental indicators by the five groups (PTT, PTNT, NPTT, NPTNT, Comp.). For the PTT group, adequate lighting (100%) and cheerful and inviting classroom (97%) were the most frequently seen environmental indicators; least seen was distinct activity centers (9%). For the PTNT group, adequate lighting (91%) and posted classroom rules (81%) were most frequently seen; least seen was student-controlled classroom discourse (16%). For both the NPTT and NPTNT groups, the most frequently seen indicators were adequate lighting (100% and 92%, respectively) and comfortable ventilation/temperature (86% and 94%, respectively); least seen was student-controlled classroom discourse (14% and 6%, respectively). For the Comp. group, adequate lighting (97%) and posted classroom rules ((95%) were most frequently seen; least seen was culturally mediated instruction (1%). Figure 12 provides a visual depiction of these percentages of environmental indicators that were present during the classroom observations. Table 30 presents the percentages depicting the visibility of 18 resources by the five groups (PTT, PTNT, NPTT, NPTNT, Comp.). For all five groups, the resource most often seen in the classrooms was a computer (94%, 98%, 97%, 100%, and 97%, respectively). For four of the groups (PTT, NPTT, NPTNT, and Comp.), the least often seen resource was a science/lab table (0%, 0%, 13%, and 8%, respectively); for the PTNT group, the least often seen resource was workbooks/activity books at 14%. Table 31 presents the percentages depicting use of 18 resources by the five groups (PTT, PTNT, NPTT, NPTNT, Comp.). For all five groups, the most often used resource was the classroom chalkboard (76%, 70%, 61%, 62%, and 78%, respectively). For the PTT group, least often used was a science/lab table (0%); for the PTNT group, a map and/or globe (0%); for the NPTT group, reference materials and a science/lab table (0% each); for the NPTNT group, games and/or puzzles and student-used equipment (0% each); and for the Comp. group, a science/lab table (0%). Figure 13 provides a visual depiction of the visibility of the 18 resources during the classroom observations by the five groups. Figure 14 provides a visual depiction of the use of the 18 resources during the classroom observations by the five groups.

83
Table 29
Numbers and Percentages for Presence of SSOS CERC Environmental Indicators by Grouping
Grouping*
Items Statistic PTT PTNT NPTT NPTNT Comp. Culturally-mediated instruction
N Percent
10 30%
9 21%
10 28%
6 13%
2 1%
Student-controlled classroom discourse
N Percent
8 24%
7 16%
5 14%
3 6%
15 10%
Use of multi-racial materials
N Percent
17 52%
11 26%
16 44%
24 51%
30 19%
Use of non-sexist materials N Percent
21 64%
21 49%
29 81%
28 60%
75 48%
Posted classroom rules N Percent
30 91%
35 81%
30 83%
41 87%
148 95%
Posted assignments N Percent
16 48%
29 67%
22 61%
23 49%
112 72%
Cheerful and inviting classroom
N Percent
32 97%
26 60%
26 72%
40 85%
137 88%
Distinct activity centers N Percent
3 9%
11 26%
8 22%
26 55%
65 42%
Adequate lighting N Percent
33 100%
41 95%
36 100%
43 92%
151 97%
Comfortable ventilation/ temperature
N Percent
31 94%
31 72%
31 86%
44 94%
135 86%
Student work displayed N Percent
26 79%
22 51%
9 25%
20 43%
94 60%
No distracting internal noises/ interruptions
N Percent
25 76%
20 46%
21 58%
31 66%
105 67%
No distracting external noises/ interruptions
N Percent
23 70%
26 60%
26 72%
26 55%
98 63%
Open, risk-free environment
N Percent
29 88%
30 70%
31 86%
42 89%
139 89%
*PTT—pilot teacher teaching a culturally responsive unit; PTNT—pilot teacher not teaching a culturally responsive unit; NPTT—non-pilot teacher teaching a culturally responsive unit; NPTNT—non-pilot teacher not teaching a culturally responsive unit; Comp.— comparison school.
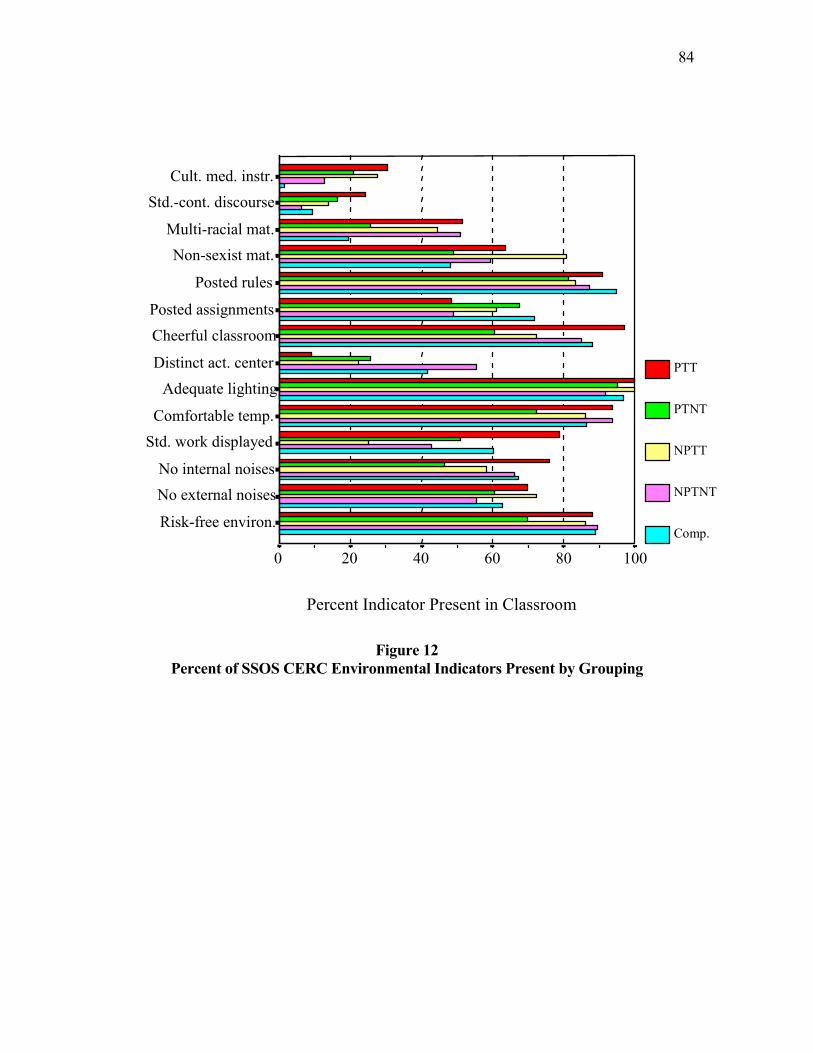
84
Figure 12 Percent of SSOS CERC Environmental Indicators Present by Grouping
Cult. med. instr. Std.-cont. discourse
Multi-racial mat. Non-sexist mat.
Posted rules
Posted assignments Cheerful classroom
Distinct act. center Adequate lighting
Comfortable temp. Std. work displayed
No internal noises No external noises
Risk-free environ.
Percent Indicator Present in Classroom
100 80 6040200
PTT
PTNT
NPTT
NPTNT
Comp.

85
Table 30 Numbers and Percentages for Visibility of SSOS CERC Resources
by Grouping
Grouping* Items Statistic PTT PTNT NPTT NPTNT Comp.
Textbooks N Percent
24 73%
33 77%
29 81%
43 92%
128 82%
Workbooks/activity books N Percent
12 36%
6 14%
6 17%
15 32%
42 27%
Worksheets/activity sheets N Percent
17 52%
21 49%
18 50%
27 57%
99 64%
Journals/learning logs N Percent
13 39%
9 21%
5 14%
8 17%
36 23%
Classroom library N Percent
27 82%
20 46%
20 56%
32 68%
114 73%
Reference materials N Percent
26 79%
30 70%
27 75%
34 72%
121 78%
Map and/or globe N Percent
18 54%
13 30%
30 83%
18 38%
103 66%
Games and/or puzzles N Percent
16 48%
8 19%
6 17%
19 40%
68 44%
Instructional aids/props N Percent
17 52%
20 46%
15 42%
28 60%
101 65%
Science/lab table(s) N Percent
0 0%
7 16%
0 0%
6 13%
13 8%
Classroom chalkboard N Percent
29 88%
34 79%
31 86%
45 96%
143 92%
Student-used equipment N Percent
8 24%
14 33%
6 17%
10 21%
15 10%
Overhead projector N Percent
25 76%
31 72%
19 53%
35 74%
141 90%
Television N Percent
29 88%
34 79%
23 64%
33 70%
137 88%
Computer N Percent
31 94%
42 98%
35 97%
47 100%
152 97%
Student manipulatives/hands-on materials
N Percent
10 30%
17 40%
9 25%
20 43%
61 39%
Audio resources N Percent
20 61%
13 30%
12 33%
21 45%
87 56%
Video resources N Percent
18 54%
16 37%
11 31%
19 40%
100 64%
*PTT—pilot teacher teaching a culturally responsive unit; PTNT—pilot teacher not teaching a culturally responsive unit; NPTT—non-pilot teacher teaching a culturally responsive unit; NPTNT—non-pilot teacher not teaching a culturally responsive unit; Comp. —comparison school.

86
Table 31 Numbers and Percentages for Use of SSOS CERC Resources by Grouping
Grouping*
Items Statistic PTT PTNT NPTT NPTNT Comp. Textbooks N
Percent 13
39% 20
46% 19
53% 26
55% 102 65%
Workbooks/activity books N Percent
2 6%
2 5%
2 6%
9 19%
33 21%
Worksheets/activity sheets N Percent
15 46%
18 42%
20 56%
27 57%
96 62%
Journals/learning logs N Percent
13 39%
8 19%
6 17%
7 15%
28 18%
Classroom library N Percent
6 18%
3 7%
4 11%
5 11%
25 16%
Reference materials N Percent
6 18%
3 7%
0 0%
4 8%
14 9%
Map and/or globe N Percent
4 12%
0 0%
3 8%
1 2%
8 5%
Games and/or puzzles N Percent
2 6%
3 7%
1 3%
0 0%
9 6%
Instructional aids/props N Percent
8 24%
5 12%
5 14%
8 17%
27 17%
Science/lab table(s) N Percent
0 0%
7 16%
0 0%
2 4%
0 0%
Classroom chalkboard N Percent
25 76%
30 70%
22 61%
29 62%
121 78%
Student-used equipment N Percent
3 9%
9 21%
2 6%
0 0%
6 4%
Overhead projector N Percent
7 21%
9 21%
4 11%
10 21%
49 31%
Television N Percent
1 3%
2 5%
4 11%
5 11%
8 5%
Computer N Percent
6 18%
8 19%
7 19%
7 15%
35 22%
Student manipulatives/ hands-on materials
N Percent
5 15%
7 16%
3 8%
9 19%
23 15%
Audio resources N Percent
3 9%
2 5%
7 19%
2 4%
4 3%
Video resources N Percent
1 3%
4 9%
4 11%
4 8%
3 2%
*PTT—pilot teacher teaching a culturally responsive unit; PTNT—pilot teacher not teaching a culturally responsive unit; NPTT—non-pilot teacher teaching a culturally responsive unit; NPTNT—non-pilot teacher not teaching a culturally responsive unit; Comp. —comparison school.

87
Figure 13 Percent of SSOS CERC Resources Present During Observations by Grouping
Textbooks Workbooks Worksheets
Journals Classroom library
Reference mat. Map and/or globe
Games/puzzles Instr. aids/props
Science/lab tables Class chalkboard
Std.-used equipment Overhead projector
Television Computer
Hands-on material Audio resources Video resources
Percent Resources Visible in Classroom
100 80 6040200
PTT
PTNT
NPTT
NPTNT
Comp.

88
Figure 14 Percent of SSOS CERC Resources Used During Observations by Grouping
Adherence index. This score reflects observed teachers’ adherence to the principles of culturally responsive instruction. Twenty-two items from the QAIT and CERC that most closely aligned to one of the nine specific components of the culturally responsive units were used in this analysis to form z scores for each component, which were then transformed to a standardized Z score variable (refer back to Table 10 to see which items make up each component score).
A one-way ANOVA was generated to determine whether statistically significant differences existed among the five groups for this adherence variable; the ANOVA was significant (F(4, 310) = 8.21, p < .05). Because the Levene test of homogeneity of variance was significant, an unequal post hoc procedure (Dunnett's C) was selected to identify which groups were significantly different from one another. The pilot team teachers who were teaching one of the units had a significantly higher adherence score than the NPTT, NPTNT, and Comp. group, but not significantly higher than the PTNT group. Further, the comparison group of teachers also had a significantly higher score than the nonpilot team teachers who did not teach such a unit. The medium effect size of
Textbooks Workbooks Worksheets
Journals Classroom library
Reference Materials Map and/or globe
Games/puzzles Instr. aids/props
Science/lab tables Class chalkboard
Std.-used equipment Overhead projector
Television Computer
Hands-on materials Audio resources Video resources
Percent Resources Used in Classroom
100 80 6040200
PTT
PTNT
NPTT
NPTNT
Comp.

89
.32 indicates some practical significance. Figure 15 provides a visual depiction of the Z scores for each of the five groups. This figure also shows that the pilot team teachers who were teaching one of the culturally responsive units had a much higher adherence index score than any of the other four groups.
Figure 15 SSOS Culturally Responsive Instruction Adherence Index Scores by Grouping
AEL Measure of Academic Supportiveness and Climate
The four subscales of the AEL MASC contain 19 (Student Belonging), 6 (Family
Expectations), 7 (Student Academic Efficacy), and 7 (Family/School/Student Involvement) items, which respondents rated using a scale ranging from 1 to 5 (Not at all True to Always True). The ratings for each subscale were added together and divided by the number of items in each subscale to create a mean score for that subscale ranging from 1 to 5. Table 32 provides descriptive statistical summaries for the four subscales for the pilot and comparison schools, as well as building-level scores for each of those groups. Pilot schools generally had higher subscale mean scores across three of the four scales than did the comparison schools. Standard deviations were fairly moderate to high across the subscales, indicating greater dispersion within the scores for both groups.
When looking at the data for the full group, statistically significant differences
were found on two of the four subscales (Student Belonging and Family Expectations). The difference favored the comparison schools on the former subscale and the pilot schools on the latter subscale. A small effect size (Cohen d column on Table 32),
Comp.NPTNTNPTTPTNTPTT
Mea
n Z
Scor
e100
80
60
40
20
0
51
26
45
54
81
90
indicating practical meaningfulness, was found on all of the subscales, ranging from .01 to .13.
Independent t tests also were computed, comparing pilot schools and comparison
schools at each building level on the four subscales. No statistically significant differences were found between elementary schools on the four subscales. A small effect size (practical meaningfulness) was found on all of the subscales at this level, with all less than .13. At the middle school level, a statistically significant difference favoring the pilot school group was found on one subscale (Student Academic Efficacy), and small effect sizes were found on all of the subscales (all under .19). Statistically significant differences also were found on two subscales (Student Belonging and Family Expectations) between high schools. Again, the difference favored the comparison schools on the former subscale and the pilot schools on the latter subscale. Small effect sizes were found on all of these subscales (.15 and .20).
Table 33 provides descriptive statistical summaries for the four subscales across
two administrations of the AEL MASC to students in the pilot school. In general, the spring 2004 administration showed higher subscale mean scores across the four scales than did the spring 2003 administration. Standard deviations were moderate across the subscales, indicating less dispersion within the scores for both administrations.
Independent t tests were computed comparing both administrations on the four
subscales. Statistically significant differences were found on three of the four subscales: Student Belonging, Family Expectations, and Student Academic Efficacy. A small effect size (Cohen d column on Table 33), indicating some practical meaningfulness, was found on the Family Expectations subscale.
Student Achievement Assessment In all, AEL researchers collected WESTEST data for 249 students observed at
pilot schools and 362 students observed at comparison schools. Of the pilot school students, 96 were enrolled at an elementary school, 148 were enrolled at a middle school, and 7 were high school students. Among comparison school students, 205 were elementary-level students, 121 were middle school students, and 36 were high school students. Students in Grades K through 7 and 9 through 12 were observed in the study; WESTEST, however, is administered only in Grades 3 through 8 and 10. High school students are particularly poorly represented in the sample, in part because the high school curriculum unit was developed for 11th-grade students. Thus, the majority of students observed at the high school level did not participate in the WESTEST during the 2003-2004 school year.

91
Table 32 AEL MASC Subscale Descriptive Statistics and Differences by Full Group and Building Level
Pilot Schools Comparison Schools Subscale Name Level
N Mean SD N Mean SD df t p Dif. d
Elementary 201 3.94 0.71 363 4.03 0.68 395.47 1.49 ns -0.09 0.13 Middle 460 3.53 0.73 313 3.43 0.87 587.83 1.67 ns 0.10 0.12 High 691 3.44 0.72 758 3.55 0.75 1447 2.93 .003 -0.11 0.15
Student Belonging
Full Group 1352 3.54 0.74 1434 3.64 0.80 2783.35 3.52 .000 -0.10 0.13 Elementary 200 4.70 0.62 363 4.68 0.70 561 0.33 ns 0.02 0.03 Middle 456 4.58 0.63 313 4.57 0.68 767 0.14 ns 0.01 0.01 High 691 4.60 0.65 756 4.46 0.76 1438.60 3.82 .000 0.14 0.20
Family Expectations
Full Group 1347 4.61 0.64 1432 4.54 0.73 2761.12 2.61 .009 0.07 0.10 Elementary 201 4.09 0.76 363 4.02 0.74 562 1.09 ns 0.07 0.10 Middle 460 3.83 0.76 313 3.68 0.82 771 2.66 .008 0.15 0.19 High 691 3.75 0.70 758 3.79 0.76 1446.56 0.93 ns -0.04 0.05
Student Academic Efficacy
Full Group 1352 3.83 0.74 1434 3.82 0.78 2784 0.25 ns 0.01 0.01 Elementary 201 4.38 0.66 363 4.30 0.68 562 1.41 ns 0.08 0.12 Middle 460 3.95 0.75 313 3.92 0.80 771 0.51 ns 0.03 0.04 High 691 3.58 0.81 758 3.51 0.85 1447 1.52 ns 0.07 0.08
Family/School/Student Involvement
Full Group 1352 3.82 0.82 1434 3.80 0.86 2783.71 0.73 ns 0.02 0.03

92
Table 33 AEL MASC Subscale Descriptive Statistics and Differences for Pilot Schools by Year of Administration
Spring 2003 Spring 2004 Subscale Name
N Mean SD N Mean SD df t p Dif. d
Student Belonging 1178 3.48 0.78 1352 3.54 0.74 2435.83 2.16 .031 0.07 0.09 Family Expectations 1169 4.46 0.73 1347 4.61 0.64 2340.24 5.45 .000 0.15 0.22 Student Academic Efficacy 1175 3.72 0.73 1352 3.83 0.74 2525 3.61 .000 0.11 0.14 Family/School/Student Involvement 1176 3.80 0.81 1352 3.82 0.82 2526 0.69 ns 0.02 0.03

93
The percentages of pilot and comparison school students below mastery and the percentages of those achieving or exceeding mastery for each content area were calculated for each grade level. Table 34 presents mastery data for mathematics, Table 35 presents the information for reading/language arts, and Table 36 presents mastery data for science.
Table 34 Mastery of Mathematics for Pilot and Comparison Students by Grade Level
Pilot Schools Comparison Schools
Grade Level N
Below Mastery
At or Above Mastery N
Below Mastery
At or Above Mastery
3rd 19 11 (57.9%) 8 (42.1%) 77 27 (35.1%) 50 (64.9%) 4th 6 0 ( 0.0%) 6 ( 100%) 51 26 (51.0%) 25 (49.0%) 5th 71 35 (49.3%) 36 (50.7%) 77 23 (29.9%) 54 (70.1%) 6th 62 31 (50.0%) 31 (50.0%) 64 19 (29.7%) 45 (70.3%) 7th 84 53 (63.1%) 31 (36.9%) 57 18 (31.6%) 39 (68.4%) 10th 7 5 (71.4%) 2 (28.6%) 36 9 (25.0%) 27 (75.0%) Total 249 135 (54.2%) 114 (45.8%) 362 122 (33.7%) 240 (66.3%)
Table 34 presents the percentages of pilot and comparison school students achieving mastery level performance in mathematics. For every grade level except Grade 4, comparison schools had a higher percentage of students achieving or exceeding mastery level than did pilot schools. In Grade 4, data were available for only 6 pilot school students, all of whom achieved at least the mastery level on the WESTEST for mathematics. Slightly less than half of the comparison students in the 4th grade achieved or exceeded mastery in mathematics; in all other grade levels more than half of the students achieved mastery. Only in Grades 5 and 6 did at least half of the pilot school students meet standards for mastery in mathematics.
Table 35 Mastery of Reading/Language Arts for Pilot and Comparison Students
by Grade Level
Pilot Schools Comparison Schools Grade Level
N Below
Mastery At or Above
Mastery N Below
Mastery At or Above
Mastery 3rd 19 11 (57.9%) 8 (42.1%) 77 26 (33.8%) 51 (66.2%) 4th 6 0 ( 0.0%) 6 ( 100%) 50 23 (46.0%) 27 (54.0%) 5th 71 27 (38.0%) 44 (62.0%) 77 23 (29.9%) 54 (70.1%) 6th 62 17 (27.4%) 45 (72.6%) 64 16 (25.0%) 48 (75.0%) 7th 83 35 (42.2%) 48 (57.8%) 57 20 (35.1%) 37 (64.9%) 10th 7 2 (28.6%) 5 (71.4%) 36 3 ( 8.3%) 33 (91.7%) Total 248 92 (37.1%) 156 (62.9%) 361 111 (30.7%) 250 (69.3%)
Table 35 presents the percentages of pilot and comparison school students achieving the standards for mastery in reading and language arts. More than half of comparison school students at all grade levels met or exceeded the standards for mastery level performance, and the vast majority (more than 91%) of 10th-grade comparison school students were at or above mastery in reading. Only in Grade 3 did fewer than half

94
of pilot school students meet or exceed mastery level performance. Compared to the results for mathematics, the pilot schools had greater percentages of students at or above mastery in reading and language arts. However, comparison schools continued to have a higher rate of students achieving or exceeding mastery (except for 4th grade in which only 6 pilot school students were observed). Although the comparison schools generally had greater frequencies of students at or above the mastery level for reading and language arts (75%), pilot school students in Grade 6 achieved mastery at a fairly comparable rate (73%).
Table 36 Mastery of Science for Pilot and Comparison Students by Grade Level
Pilot Schools Comparison Schools
Grade Level N
Below Mastery
At or Above Mastery N
Below Mastery
At or Above Mastery
3rd 19 10 (52.6%) 9 (47.4%) 77 22 (28.6%) 55 (71.4%) 4th 6 0 ( 0.0%) 6 ( 100%) 49 18 (36.7%) 31 (63.3%) 5th 71 30 (42.3%) 41 (57.7%) 77 26 (33.8%) 51 (66.2%) 6th 60 12 (20.0%) 48 (80.0%) 63 14 (22.2%) 49 (77.8%) 7th 81 27 (33.3%) 54 (66.7%) 57 18 (31.6%) 39 (68.4%) 10th 7 1 (14.3%) 6 (85.7%) 36 4 (11.1%) 32 (88.9%) Total 244 80 (32.8%) 164 (67.2%) 359 102 (28.4%) 257 (71.6%)
Table 36 displays the percentages of pilot and comparison school students achieving mastery-level performance in science. As with performance in mathematics and reading/language arts, all six pilot school fourth-grade students achieved or exceeded mastery level in science, and slightly less than half of pilot school third-grade students met standards for mastery. More than half of students in the remaining grade levels (grades 5, 6, 7, and 10) at the pilot schools met or exceeded the mastery level. At all grade levels in the comparison schools, more than half of the students were at or above mastery for science. Pilot school students in Grades 7 and 10 achieved mastery at rates comparable to their counterparts in comparison schools (67% and 86% to 68% and 89%, respectively). Pilot school students in Grade 6 met or exceeded mastery at a slightly higher rate than their peers at comparison schools (80% to 78%, respectively). With the exception of the performances of the six fourth-grade pilot school students, the science achievement of the sixth-grade pilot school students is the only instance in which pilot school students achieved or exceeded mastery at a higher rate than their comparison school counterparts.
Student achievement comparisons. Using the WESTEST scale scores, AEL researchers compared performance in each content area by grade level for pilot and comparison schools. Table 37 provides descriptive statistical summaries for those analyses. In general, comparison schools had higher mean scale scores across the grades than did the pilot schools. Standard deviations were fairly small to moderate across most of the grades, indicating less dispersion within the scores for both groups.
Independent t tests were computed comparing pilot schools and comparison
schools at each grade level for the three content areas. Statistically significant differences

95
Table 37 WESTEST, Student Achievement Data Descriptive Statistics and Differences by Grade Level
Pilot Schools Comparison Schools Content Area Grade Level
N Mean SD N Mean SD df t p Dif. d
Third 19 586.79 37.22 77 609.94 30.74 94 2.82 .006 -23.15 0.68 Fourth 6 657.83 22.62 51 624.65 35.40 55 2.23 .030 33.19 1.12 Fifth 71 647.56 32.20 77 653.60 44.15 146 0.94 ns -6.03 0.16 Sixth 64 636.47 121.34 64 673.73 28.54 69.95 2.39 .019 -37.27 0.42 Seventh 84 656.74 36.47 57 676.88 29.14 139 3.48 .001 -20.14 0.61
Mathematics
Tenth 7 705.00 16.03 36 725.25 27.61 41 1.87 ns -20.25 0.90 Third 19 594.68 61.26 77 618.12 43.80 22.74 1.57 ns -23.43 0.44 Fourth 6 656.00 20.93 51 610.61 97.67 55 1.13 ns 45.39 0.64 Fifth 71 638.07 40.32 77 651.86 35.75 146 2.21 .029 -13.79 0.36 Sixth 64 639.33 119.73 64 664.02 32.38 126 1.59 ns -24.69 0.28 Seventh 84 636.19 89.304 57 661.19 36.43 118.17 2.30 .023 -25.00 0.37
Reading/Language Arts
Tenth 7 676.14 21.39 36 704.58 20.25 41 3.37 .002 -28.44 1.37 Third 19 596.58 41.87 77 625.30 28.94 94 3.52 .001 -28.72 0.80 Fourth 6 648.50 26.22 51 603.29 127.53 55 0.86 ns 45.21 0.49 Fifth 71 635.80 38.79 77 644.61 33.41 146 1.48 ns -8.81 0.24 Sixth 64 639.94 145.94 64 655.45 89.72 126 0.73 ns -15.52 0.13 Seventh 84 643.52 129.10 57 676.32 25.12 92.09 2.27 .026 -32.79 0.35
Science
Tenth 7 684.86 30.97 36 709.14 21.68 41 2.53 .015 -24.28 0.91

96
were found for 3rd-grade students in two of the content areas (mathematics and science). A moderate effect size (practical meaningfulness) was found for mathematics (.68), and a large effect size was found for science (.80). At the 4th-grade level, a statistically significant difference was found for one content area (mathematics), which had a large effect size (1.12). At the 5th-grade level, a statistically significant difference was found for one content area (reading/language arts), which had a small effect size (.36). A statistically significant difference was also found for one content area (mathematics) for 6th-grade students. A small effect size of .42 was found for this area. Statistically significant differences were found for all three content areas for 7th-grade students. Small effect sizes were found for science (.35) and reading/language arts (.37), while a moderate effect size was found for mathematics (.61). Statistically significant differences were found for 10th-grade students in two of the content areas (reading/language arts and science). Large effect sizes ranging from .91 (science) to 1.37 (reading/language arts) were found for these two content areas.
Interview Design Process
The following section explains the results of the Interview Design process conducted at the spring 2004 training workshop. Results are presented by question. Question 1: Explain two or three things you have learned about teaching African American students that you feel every teacher needs to understand to be effective, and explain why you feel those things are important.
Participants in the Interview Design process were asked to explain two or three things they had learned about teaching African American students effectively. A total of 73 discrete comments were offered in response to this item, and 11 distinct categories emerged. Nine comments did not fit the categories that emerged and were included in an “other” category; two additional responses were unique. Table 38 presents the number of responses per category, as well as sample responses offered by participants.
Respondents most frequently mentioned respecting students’ culture and cultural differences as an important lesson learned for teaching African American students. Most responses in this category noted the importance of cultural sensitivity and understanding and incorporating students’ culture into instruction. Two responses indicated that some participants felt it inappropriate to “blame” culture for all differences between African American students and students of other ethnicities. Such a response could indicate that respondents understand that certain issues (e.g., behavior problems) are not a result of a student’s culture but rather of other characteristics that could occur regardless of culture (e.g., poor parenting). These sentiments could demonstrate that respondents understand the difference between respecting students’ cultures and using culture as an excuse for differences in behavior or performance.
Responses to this question mentioned a host of other lessons respondents felt were important for teaching African American students. The importance of building

97
Table 38 Interview Design Process Results for Lessons Learned about Teaching
African American Students Category n Sample Responses Respect culture and cultural differences 10 • Honor their cultural identities
• Individual culture – identify and explain culture before reaching that kid
• Cultural differences • You can’t blame the culture for all differences (e.g.,
differences within families) Build relationships 9 • Build relationships
• Make relationships/connections with kids • Be a positive role model to establish communication
Multiple learning styles and intelligences
8 • Teach different learning styles • Multiple intelligences • Classes will be more enjoyable…if there is a variety of
appropriate activities High expectations for students 7 • High expectations for all students are needed
• Consistent high expectations – affirmed from teachers as well as students
• Lesser expectations historically – “poor little kid” Positive teacher attitude 7 • Love to teach
• Some teachers don’t care and kids know! • Be patient
Students’ personal history 6 • Teachers should be more sensitive to problems African American students bring to schools
• Different sets of prior knowledge • Understand baggage [they] come with – deal first
before teaching Students are unique 5 • No two African American students are they same, they
are very different (like all students) • Everyone is unique and has a story
Raise students’ self esteem 4 • Make the kids feel worthy or that they can do it • Children need to feel that they are important regardless
of circumstances Atmosphere 2 • Major need for structure and stability Challenge the students 2 • You (the teacher) have to be motivated and
aggressively push them so that they know that you mean business and that they can learn
Discipline 2 • Management (discipline) Other 9 • Students don’t see relevance of what is being taught to
their individual lives • Teach, not assign to do
Unique 2 • No difference • Single parent family

98
positive relationships between teachers and students and the need to address multiple learning styles were both mentioned several times by respondents. Also, participants addressed the necessity of having high expectations for all students and the need for teachers to have positive attitudes. Question 2: Name one or two decisions, made outside the classroom, about how students experience and progress through school (e.g., course offerings, discipline procedures, scheduling methods) that you feel either hinder or help African American students reach their potential. Explain why you feel they hinder or help.
Interview design participants were asked to list a couple of decisions that are made outside the classroom and can either help or hinder African American students’ ability to reach their potential. Forty-nine discrete responses were offered for this item, and 12 categories emerged. Ten miscellaneous comments were included in an “other” category, and one response was unique and could not be classified. Table 39 presents the number of responses per category as well as sample responses for each.
Respondents offered a variety of responses to this item, and no one category was mentioned at a far greater rate than others . Additionally, most responses to this item focused on factors that hinder African American students’ ability to reach their full potential; only a very few (n = 5) responses made mention of factors that help. Such distribution of responses might indicate that, in the opinions of the Interview Design participants, there are myriad decisions made that impact African American students, and very few of those decisions are helping those students reach their full potential or achieve at higher levels.
Two categories of decisions were mentioned five times each: discipline issues and
placement decisions. Respondents were concerned that various discipline decisions, misunderstandings, and the ways in which discipline was applied both at home and at school could hinder African American students’ progress and experience at school. Respondents also expressed concern that decisions about placement of students in classrooms could adversely impact African American students’ experience (e.g., placing many “discipline problems” in one classroom could disrupt and hinder other students in the class). However, one respondent noted that changing a student’s classroom placement, either for academic reasons or at the request of a parent, could help that student’s ability to progress and provide a more positive experience.
Three categories of responses were mentioned four times each: extracurricular
activities (e.g., sports, clubs) as both a hindrance and a help; opportunities for students to enroll in higher level classes; and schoolwide scheduling procedures and issues. Two additional categories were mentioned three times each: weak support systems for African American students; and teacher attitudes and beliefs.

99
Table 39
Interview Design Process Results on Decisions Outside Classrooms that Impact African American Students’ Ability to Reach Their Potential
Category n Sample Responses Discipline 5 • Discipline – some don’t have it at home and then when it occurs at
school, they see it as negative and don’t make connections to cause and effect
• Discipline procedures inconsistent • Discipline…cultural clashes can sometimes lead to discipline referrals
Placement 5 • If they are grouped together and labeled low performers, then that is what they are going to be.
• Discipline problems are placed in certain classrooms; that hinders some classrooms…and some African American students from progressing
• Placing a student in a different classroom (parent/academic reasons) is a help
Extracurricular activities
4 • Clubs/exploratories: African American students are placed in a club/exploratory because other clubs are full. These students do not want the exploratory they are placed in and this is a hindrance.
• Sports activities as a motivator. Helps them make better grades. Helps them to reach their potential.
High level classes 4 • Grade requirements…stanine requirements for honors courses (grades don’t show true ability) – hindrance
• African American and low SES students who can achieve need to be forcefully encouraged to take honors and AP classes instead of being allowed to slide
Scheduling 4 • Scheduling issues • Scheduling procedures – parents not knowledgeable of tracking for their
students (hinder) Support system 3 • African American students’ experiences in school are hindered when
they do not receive any support from their home environments • Support system for African American students is not strong
Teacher attitudes and beliefs
3 • Uneducated teachers who refuse to advance or grow • Refusal of certain teachers to consider students’ ethnicity in ways of
responding to various situations. Hinders the students’ potential. Class size 2 • Some classrooms are too large – kids are left behind Consistency 2 • Consistent climate in school Counselor information 2 • Counselors not providing enough info/opportunities for African
American students Courses 2 • Hinder – course offerings Curriculum 2 • Curriculum design Other 10 • Lack of finances
• If an African American child is having difficulties, the school will seek out minority mentors (positive)
Unique 1 • Releasing names to the press is more hush-hush than it is at other schools

100
Question 3: Think of a time in the past year when you witnessed an African American student or students working at a level beyond what had been typical. Describe the circumstances. To what do you attribute the student(s)' higher level of work?
Interview Design respondents were asked to think of a time during the past year when they had seen African American students working at a higher level than was typical and then describe the factors to which they attributed the students’ higher-level work. Forty-five discrete responses were offered for this item. Five distinct categories emerged from the responses, and three responses were included in an “other” category because they did not fit into any of the five themes that emerged. Six responses were unique and could not be categorized. Table 40 presents the number of responses per category as well as sample participant responses.
Table 40
Interview Design Process Results on Factors Contributing to African American Students’ Higher Level Work
Category n Sample Responses Student factors (e.g., focus, motivation, excitement)
15 • He pays attention to instruction and he concentrates and focuses • Students were excited about learning and strived to excel in all
subjects • [student] had a goal, enjoyed the activity • The student was so interested in the subject area, he went home and
did some research on the Internet. He came to school with info and pictures to help with his project.
• During the Presidential fitness test, [students] received a letter from Mr. Ron in Iraq…His letter motivated the students to do well…
Teacher factors (e.g., support, encouragement)
12 • I attribute this enthusiasm to achieve further to…encouragement from teacher and principal
• Strategy and higher level thinking activities challenged by teacher. • Teacher influence and high expectations • Poetry material – teacher influenced creative expression • The student had teacher support
Family support 5 • Student’s parents were involved, respectful, and organized • Great family structure – family involvement
Challenging experiences 2 • Challenging experiences Peer support 2 • Student improved because he was working with others and not all on
his own. Helped build his confidence because of the help of his peers. Other 3 • She did everything she needed to…reach her score on the ACT…[She
took] an ACT prep class. Unique 6 • [Student’s name] – 1st place WV State Writing Contest
• Train Unit – making a connection • T’s link behavior to intelligence • 6th – F – writing/reading • Curriculum sp. [sic] • Poetry performance during alternative summer poem and performance
of poem in front of peers
For the most part, participants in the Interview Design process attributed higher levels of student work to student factors (n = 15) and teacher factors (n = 12).

101
Respondents mentioned student factors such as focus, excitement about a particular topic or project, motivation to excel, goal setting, and practice or preparation. Teacher involvement, instruction, support, and encouragement were mentioned as teacher-related factors, as were teachers’ high expectations for their students and teachers’ practice of challenging their students to work at higher levels. Three other categories were mentioned much less frequently: family involvement and support, challenging experiences, and peer support. Question 4: What do you believe are the two or three most important factors that contribute to the achievement gap, and why?
Participants (teachers, administrators, and community members associated with the MAACK project) in the Interview Design session were asked to offer their thoughts about which two or three factors were the most important contributors to the achievement gap. Eighty discrete responses were offered, and 10 distinct categories emerged. Five comments did not fit into the 10 categories that emerged and were thus included in an “other” category. Table 41 displays the number of responses in each category as well as sample responses given by participants. All responses indicated that participants acknowledged an achievement gap between African American students and their peers of other ethnicities. Of the 80 discreet responses offered for this item, more than 41% (n = 33) belonged to two categories: students’ home and family situations, and teacher and teaching-related factors. Seventeen responses focused on students’ home situations and family life as a major contributor to the achievement gap. Participants believed that some parents might not be interested or involved in their children’s education, might be unable to help because of work responsibilities, or might lack the resources (e.g., reading material) to encourage high educational attainment. In the opinions of respondents, some of these factors could create a cycle whereby, for instance, students perceive their parents’ lack of interest in education and then become uninterested in education themselves. Sixteen responses indicated teacher and teaching-related factors as major contributors to the achievement gap. Some respondents felt that some teachers might be unwilling to break away from currently used ineffective or culturally insensitive teaching practices, perhaps because those teachers are afraid to do so or are unwilling to learn new teaching styles. Other respondents cited lack of appropriate teacher training and materials, some teachers’ low expectations for or negative attitudes about African American students, and some teachers’ inexperience or unfamiliarity with teaching African American students. Several other factors were also perceived to contribute to the achievement gap and were mentioned much less frequently than students’ home situations and teacher-related factors. Several respondents posited that low socioeconomic status and students’ negative beliefs or attitudes about education contributed to the achievement gap (n = 8 for each category). The fifth and sixth most frequently mentioned contributors to the

102
achievement gap were factors related to students’ cultures (n = 7) and low expectations for African American students (n = 6).
Table 41 Interview Design Process Results on Factors Contributing
to the Achievement Gap Category n Sample Responses Home and family situations 17 • Parent/home life
• Lack of interest on part of parent which is passed on to student
• Lack of extra help at home – parents work 2-3 jobs to survive
• Lack of parental involvement/lack of family support • Lack of reading material in the home
Teacher and teaching factors 16 • Teachers afraid to break away from established teaching styles
• Lack of knowledge of culturally responsive instructional strategies that “reach kids”
• Teachers not accustomed to African American students • Need teacher training in culturally responsive teaching • Teacher accountability and lack of willingness to change
SES 8 • SES – biggest • Low socioeconomic status • Low socioeconomic level
Student beliefs and attitudes 8 • Lack of pride in own education • Lack of motivation • Children don’t see outside the “box” – don’t feel what’s
being taught will apply to them later Culture related factors 7 • Their culture clashes with school rules
• No consideration of the individual child and their culture • Socially programmed by the outside culture that
demonstrates negativity toward females and authority Expectations 6 • Lack of teacher high expectations
• A demand of higher expectations from all students in all areas
• Low expectations from teacher and principal Experiences 4 • Lack of experiences and exposure
• Lack of exposure/experiences Education is low priority 3 • Education is not a priority Low understanding of achievement gap
3 • Lack of acceptance/understanding of the gap
Role models 3 • Lack of positive role models Other 5 • As students get behind, it is not first noticed until
sometimes they are too far behind Question 5: What do you consider to be two or three instructional strategies that hold the most promise for narrowing the achievement gap between African American/low-SES students and other students, and why?

103
Interview Design respondents were asked to list two or three instructional strategies that hold the most promise for narrowing achievement gaps between African American and low-income students and students of other ethnicities and socioeconomic levels. Participants offered 70 discrete responses to this item. Five responses were unique and could not be categorized. Fifteen comments were included in an “other” category because they did not fit precisely into any of the 14 major categories that emerged. Table 42 presents the number of responses in each category as well as sample responses offered by respondents. Participants offered many different responses to this item, and only two categories were mentioned more than five times each. Such responses indicate that participants did not view one or two strategies as being vastly more promising than all others in terms of narrowing the achievement gaps between African American and low-income students and their peers of other ethnicities and socioeconomic statuses. These responses could mean that participants believe a variety of methods, used together, will do the most to narrow achievement gaps.
Of the categories that emerged during the analysis of this item, reading was mentioned most frequently as a potentially effective strategy for narrowing the achievement gap. Respondents who mentioned this strategy felt that incorporating more reading across the curriculum, sustained silent reading, directed reading, and accelerated reading programs could help decrease discrepancies in achievement between groups of students. The second most frequently mentioned category related to ensuring that instruction and instructional materials were culturally relevant. Respondents mentioned this category six times. Employing cooperative learning strategies and addressing multiple learning needs were mentioned as promising strategies five times each. Several other strategies were mentioned four of fewer times (see Table 42).
Comparison: 2001 and 2004
In late 2001, AEL staff conducted focus groups with teachers at the five schools then participating in the MAACK Pilot Schools project. The focus groups were conducted to determine teachers’ perceptions about the reasons behind an achievement gap in reading performance and to brainstorm strategies for improving instruction to narrow that gap. See Appendix H for a complete report of the 2001 focus groups.
In both 2001 and 2004, participants in the focus groups and in the Interview
Design process were asked what factors contributed to the achievement gap between African American students and their peers of other ethnicities. Several similarities exist between the 2001 focus group results and the 2004 interview design responses. In both years, participants posited that all of the following contributed to the achievement gap:
students’ home and family situations, family and parent attitudes toward education, lack of family and parent support or involvement, and placing a low priority on education.

104
Table 42 Interview Design Process Results on Promising Instructional
Strategies for Narrowing Achievement Gaps Category n Sample Responses Reading 9 • Reading – across the curriculum
• Accelerated reader • S.S.R. (Sustained Silent Reading) • Directed reading
Cultural relevance 6 • Cultural relevance • Culturally respectful when planning instruction • CRIS lesson plans
Cooperative learning 5 • Cooperative groups seem to work the best • Pair partners
Multiple learning styles 5 • Learning styles – multiple intelligence strategies • Multiple intelligences (projects, hands-on)
Small group instruction 4 • Small group instruction • Small group instruction led and/or observed by teacher
Student engagement 4 • Active involvement/learning – part of the process; students as teachers • Students involved
Classroom management 3 • Classroom management Assessment 2 • Various assessment techniques Direct instruction 2 • Direct instruction Expectations 2 • High expectations for all students Rewards 2 • Recognition for a job well done. Thinking skills 2 • Higher level thinking skills Visual 2 • Visual and modeling what is expected of all students Writing 2 • Writing – creative and across the curriculum Other 15 • Appropriate vocabulary for the situation
• Consistency with instruction • Modeling • Active teaching
Unique 5 • Lead time to get started • Graphic organizers • Bio-Poem • Music • Jig saw – allow them to be head of a heterogeneous grouping (gender
bending) Respondents in both years also contended that student beliefs and attitudes, teacher attitudes and related factors, and low expectations for African American students also accounted for differences in level of achievement. Respondents in both the focus groups and Interview Design process also mentioned cultural factors as contributors, but these responses were slightly more pronounced in the 2001 focus groups.
Although participants in 2004 mentioned student beliefs and attitudes as contributing factors, 2001 focus group respondents did so at a slightly higher rate (more than 18% of responses compared to 10% of 2004 responses). Additionally, though respondents in some of the 2001 focus groups did mention teacher attitude and teaching

105
style as contributors to the achievement gap,3 participants in the 2004 Interview Design process seemed to place more weight on this factor. These slight differences suggest a shift in perception of responsibility and accountability over the years from 2001 to 2004.
Other differences also existed between the focus groups and Interview Design
process. In 2001, respondents seemed hesitant to acknowledge that there was an achievement gap between African American students and students of other ethnicities. Respondents wanted to attribute any achievement gap to socioeconomic disparities, not ethnicity. Focus group participants responded that they “don’t see color” or “don’t need to focus on color” or race when instructing their students. Although participants in the 2004 interview design acknowledged socioeconomic status as a factor that contributed to the achievement gap, they seemed more willing to acknowledge that there was an achievement gap between different ethnic groups. Respondents in 2004 also seemed much more willing to admit that students of different ethnicities might require different teaching or instructional strategies.
Respondents in the 2004 interview design process did not address racial tensions
explicitly in their responses. Although respondents stated that teachers need to build and foster positive relationships with their students, no mention was made of current or existing weak or strained relationships between teachers and students of different ethnicities. Participants in the 2001 focus groups, however, stated that relationships between White teachers and African American students and relationships between African American teachers and White students were “fearful.” Racial tensions were mentioned explicitly in the 2001 focus groups.
Some other contributing factors that were mentioned in one year but not in the
other include problems with biased achievement tests (2001), low understanding or misunderstanding of the achievement gap (2004), students viewing Welfare as a more viable option than education (2001), and “genetic predispositions” (2001).
3 Participants in only two of the five focus groups mentioned teacher attitude or teaching style. Nearly half of all comments related to teacher and school factors came from one focus group session at one school. See Appendix H for the complete 2001 focus group report.

106
DISCUSSION AND CONCLUSIONS
The following section presents discussion and conclusions drawn from the findings of the current research project. The conclusions, preceded by bulleted summaries of findings, address the seven research questions posed at the outset of this project. Question 1. What is the effect on student achievement of schools’ participation in a pilot research and development project designed to be responsive to the cultural needs of African American and low-socioeconomic-status (SES) students?
• Overall, pilot and comparison students were comparable in terms of achieving mastery in the subject areas of reading/language arts and science. Comparison students, however, showed greater mastery of math than did the pilot students.
• In general, at each grade level except fourth grade, comparison
students outperformed pilot students with few exceptions. Thus, comparison school students observed in this research generally performed better than pilot students in terms of student achievement.
It would be inappropriate to make a claim of gain or loss in students’ achievement, as measured on standardized tests, based on the very circumscribed implementation of culturally responsive teaching practices within each school and the teaching of one culturally responsive unit. That we could not examine student achievement data over time was an artifact of the timing of the study rather than a flaw in the research design. If we had been afforded the opportunity to compare students’ standardized test scores across the years, as they were exposed to multiple teachers within their schools using culturally responsive teaching practices and lessons, we expect that we might have been able to show movement in pilot school students’ achievement scores, given the findings of improvement in other areas we examined over time. We would also need to ensure continuity of assessment instruments. In the current case, the state adopted a new criterion-referenced achievement test (WESTEST), which was administered to Grades 3 through 8 and Grade 10 during the 2003-04 school year. Prior to that time, the state used the SAT-9, a norm-referenced test, administered to Grades 3 through 11. We do know that when the culturally responsive units were taught by pilot team teachers, significantly fewer students were coded as off task. We also know that pilot team teachers and students using the culturally responsive units spent fewer minutes per hour engaged in off-task activities when compared to other groups. This finding, in light of the importance of student engagement in learning, is particularly promising. On-task behavior, of course, is associated with higher student achievement and increased levels of learning (Stallings, 1980).

107
Our data show that teachers who learn about culturally responsive teaching practices and teach standards-based lessons designed to be consistent with culturally responsive teaching principles are more likely to keep all students, including African American students, on learning tasks during the school day. Therefore, over time, continued participation in this intervention should produce higher student achievement due to less time spent off task. Question 2. In what ways, if at all, does schools’ participation in a pilot research and development project to improve the achievement of children, especially African American and low-SES students, affect school staffs’ sense of themselves as a high-performing learning community?
• At the full-group level, results from the 2004 administration of the AEL CSIQ show that comparison schools were significantly more committed to continuous learning and improvement on the subscales having to do with school/family/community connections, shared goals for learning, and effective teaching.
• At the building level, the pilot and comparison high schools were equally
committed to continuous school improvement on five of the six subscales (i.e., Learning Culture, School/Family/Community Connections, Shared Goals for Learning, Effective Teaching, and Purposeful Student Assessment).
• On the sixth subscale, Shared Leadership, the pilot high school showed
greater commitment to improvement than the comparison school.
• On the subscale Purposeful Student Assessment, pilot and comparison schools at all levels were equally committed.
To understand the results of school staffs’ perceptions of themselves as high-performing learning communities, it is important to learn how the three groups of schools in the study were chosen. The four pilot schools—two elementary schools, one middle school, and one high school—were part of the same feeder pattern. Three of the schools, the elementary and middle schools, were chosen by the superintendent to participate because they were low performing by state standards in effect during 2001-2002 and because their student bodies included high percentages of both low-income students and African American students. Of the leadership in those three schools, one was enthusiastic about participating, one was compliant, and one was resistant. The high school volunteered to participate. It had not been designated as a low-performing school, but it did have a significant percentage of African American students. The four comparison schools were chosen from other Kanawha County schools based on demographics that were as close as possible to the pilot schools. None of the four was designated low-performing. Although the percentages of students receiving free or reduced-price lunch were similar in all eight schools, the comparison schools had

108
lower percentages of African American students and higher test scores than the pilot schools. The field-tested and validated AEL Continuous School Improvement Questionnaire (AEL CSIQ) assesses elements associated with high-performing learning cultures. It is to be expected, therefore, that schools identified as low-performing would reflect this reality in their scores on the AEL CSIQ and that the comparison schools, which were not low-performing, would show a higher commitment generally to continuous school improvement. The pilot high school, not a low-performing school, was similar in scores with the comparison high school on most of the subscales. So, this is not unexpected as it helps to confirm why the other three pilot schools revealed themselves to be less committed to components of high-performing learning communities. The fact that schools are judged by student progress on state-mandated tests makes it unsurprising that all schools were equally committed to purposeful student assessment. Question 3. In what ways, if at all, does schools’ participation in this pilot research and development project to improve the achievement of children, especially African American and low-SES students, affect schools’ capacity to undertake improvement initiatives?
• Compared to the perceptions of pilot school staff, comparison school professional staff reported that their schools had greater capacity for improvement on four of eight subscales of the AEL Measure of School Capacity for Improvement (AEL MSCI): Collective Professional Capacity, Technical Resources, Differentiated Instruction, and Expectations for Student Performance.
• On four of the eight subscales of the AEL MSCI, pilot schools and
comparison schools reported that they were equally ready for improvement. The areas in which the two groups shared similar capacity to improve were Peer-Reviewed Practice, Program Coherence, Anti-Discriminatory Teaching, and Responsive Pedagogy.
• At the building level, staff at the pilot high school reported that their school
was slightly better prepared for improvement than the comparison high school on six of the eight subscales (Collective Professional Capacity, Peer-Reviewed Practice, Program Coherence, Anti-Discriminatory Teaching, Responsive Pedagogy, and Differentiated Instruction), with two of those subscales (Peer-Reviewed Practice and Program Coherence) indicating significantly greater capacity to improve.
• Over time, the pilot schools have, as a group, increased their capacity for
improvement on six of the eight AEL MSCI subscales: Collective Professional Capacity, Peer-Reviewed Practice, Program Coherence, Technical Resources, Anti-discriminatory Teaching, and Responsive Pedagogy.

109
• Pilot schools were equal to or lower than comparison schools on half of the AEL MSCI subscales on the 2004 administration; however, pilot school faculty members’ perceptions about their schools’ capacity to improve changed in a positive direction over the course of the pilot schools’ intervention.
These findings show that the pilot schools intervention helped faculty in pilot schools increase their perceptions of their schools’ capacity to improve. The increased capacity for improvement is particularly noticeable in the area of anti-discriminatory teaching, which was the focus of this intervention. These findings are particularly encouraging, given that the majority of faculty at the pilot schools were not directly involved in the project. One possible explanation for this phenomenon is the role pilot school principals played within their respective schools. Pilot school principals were asked to attend all full-day meetings and encouraged and invited to participate in biweekly pilot team meetings within their respective schools. Thus, the intervention sought to immerse the key gatekeeper to a school’s faculty in the intervention. Although we did not systematically collect evidence about the pilot school intervention and activities and information that were shared with the faculties at the respective pilot schools, we do know anecdotally that the principals gave their permission and, in many instances, requested that pilot team teachers share what they were learning with the entire faculty at the pilot schools. Thus, there was an information “spillover” from the pilot school intervention into the general faculty. The fact that anti-discriminatory teaching showed the greatest improvement is particularly encouraging. An increase in anti-discriminatory teaching should, in fact, create a school environment that supports the learning of all students, including African American students and low-SES students. Question 4. In what ways, if at all, does schools’ participation in a pilot research and development project to improve the achievement of children, especially African American and low-SES students, alter students’ perceptions of their schools’ and families’ support for students’ academic endeavors and school climate conducive to learning?
• In terms of students' perceptions of their schools’ academic supportiveness and climate, the two groups were relatively the same for two subscales: Student Academic Efficacy and Family/School/Student Involvement.
• Comparison students reported having a greater sense of belonging in their
schools, and pilot students reported that they felt greater expectations from their families.
• Over time, pilot students’ perceptions of their schools’ and families’ support
for academic endeavors and climate for learning improved significantly in

110
areas related to their perceptions of belonging, their own ability to do well academically, and their families’ expectations of them.
• Pilot school students were equal to or greater than comparison school students
in their perceptions of academic efficacy, family/school/student involvement, and family expectations.
• Students’ perceptions and experiences indicate essentially no differences
between pilot and comparison schools. However, faculty members seem to be differentiated in their perceptions of their schools’ commitment to continuous learning and readiness to improve in areas related to the pilot schools’ intervention.
The pilot school intervention did, in fact, influence students’ perceptions in a positive manner. Because those students directly affected by teachers who received the full intervention treatment are a relatively small portion of the full student body, particularly in the middle and high schools, it is remarkable that the three-year project appears to have produced improvements in overall student perceptions in areas directly addressed by the project. The finding that students improved in their perceptions of belonging and their own ability to do well academically may be explained by overall teacher growth in readiness to improve in the areas of anti-discriminatory teaching and responsive pedagogy. Also, because three of the four pilot schools were chosen because they were low performing, and their low performance was reflected in differences between pilot and comparison school teacher perceptions on the AEL CSIQ, it is notable that at the project’s end, there were essentially no differences between pilot and comparison school students’ perceptions and experiences on the AEL MASC. Evidence supports the conclusion that the intervention was successful in improving students’ perceptions of their schools’ and families’ support for academic endeavors and climate for learning. An additional factor that may account for some of the change in students’ perceptions is the leadership role that principals and pilot school teachers played in their respective schools. As pilot team members, including the principal, became aware of factors that influence students’ perceptions of belonging and academic efficacy, they intentionally undertook efforts at the building level to address students’ needs. For example, at one pilot school, the principal reviewed enrollments for advanced math. The principal discovered that there were academically qualified students, African American and White, who for other reasons were not allowed to take the class. The principal then took steps to remedy the situation. Consequently, more students were able to take advantage of more challenging curricula. Efforts such as these may increase students’ sense of being able to achieve at higher levels. In another instance, one pilot school teacher and the principal implemented a “student counselor” program using older students as peer counselors for incoming students, particularly those students they felt were socially isolated. This effort sought to

111
increase students’ sense of belonging. It is encouraging that, as a result of their school’s involvement in the pilot school intervention, students’ perceptions of their schools’ supportiveness did improve significantly. Question 5. To what degree does a teacher’s participation in the full or partial treatment groups affect the format, substance, and quality of his or her instruction?
• Pilot team teachers who taught a culturally responsive unit (CRU) demonstrated a higher quality of instruction than all other groups as measured by the Quality of Instruction, Appropriate Level of Instruction, Incentive, and Use of Time (QAIT) instrument.
• Pilot team teachers who taught a CRU had the most positive classroom
learning environments as measured by the Classroom Environment and Resources Checklist (CERC) instrument.
• Pilot team teachers had greater adherence to the principles of culturally
responsive instruction than non-pilot team teachers and comparison teachers as measured by a specially constructed adherence scale composed of items from the QAIT and CERC instruments.
The findings of this study indicate that, as expected, the teachers who were
members of the pilot team had a greater adherence to culturally responsive teaching principles than did non-pilot team teachers. An additional finding showing that pilot team teachers who taught the unit had greater adherence to culturally responsive teaching principles than did pilot team teachers not teaching the unit was unexpected. Because all groups of teachers were observed before, during, and after the unit, it appears that the experience of teaching the unit seemed to reinforce and strengthen a pilot teacher’s ability to teach in a culturally responsive manner. Our findings lead us to conclude that providing teachers with information about culturally responsive teaching was not sufficient to produce the greatest adherence or change in instructional practice. However, providing the information and asking teachers to put into practice the principles of culturally responsive teaching did produce the greatest adherence.
In this study, format is defined as the degree to which teachers’ lessons adhered to
the principles of culturally responsive instruction. Substance in this study includes instructional materials and methods used to create a positive learning environment. Quality of instruction in this study refers both to the use of principles of culturally responsive instruction and the use of best instructional practices, such as communicating high expectations, using appropriate pace, and relating topics to students’ lives. The format, substance, and quality of instruction in a teacher’s class are more likely to conform to the principles of culturally responsive teaching if that teacher has been required to use an exemplar unit that demonstrates principles of culturally responsive teaching. This finding also supports the hypothesis on which the intervention was based: providing teachers with materials and concepts that have immediate applicability to their

112
teaching, in addition to providing ongoing professional development, is a most effective way to increase professional growth.
In terms of instructional format, pilot team teachers teaching a culturally
responsive unit demonstrated better format than other groups of teachers. Observation data showed that these teachers had significantly higher adherence to the principles than any other treatment group. Also notable was the fact that teachers in the pilot schools who were not on the team and did not receive the CRU had the lowest adherence score of the four treatment groups and the comparison. This finding is powerful in that regarding the principles of culturally responsive instruction, NPTNT teachers have the most room to improve—even more so than comparison teachers. The fact that the adherence rate for the NPTNT group was the lowest of all treatment groups is not unexpected because this group had little or no opportunity, in some schools, to learn about the principles of culturally responsive instruction and no experience with teaching a CRU.
With regard to substance of instruction, overall, PTT group teachers had the most
positive classroom learning environments, especially in their use of culturally mediated instructional activities, student-controlled discourse, and multiracial materials. These three components reflect the principles of culturally responsive instruction; thus, the intervention increased teachers’ ability to use learning activities and materials that are culturally responsive. The AEL MSCI scores of pilot school teachers further validate this finding. Over the period of this intervention, the pilot school teachers’ perceptions of their readiness to use anti-discriminatory teaching and responsive pedagogy increased significantly.
Furthermore, PTT group teachers were observed to have markedly greater use of
journals/learning logs, instructional aids/props, and reference materials and markedly lower use of textbooks, workbooks, and worksheets than other groups of teachers. This is in line with the pilot schools intervention as planned. Use of journals, instructional aids, and reference materials was meant to be part of the CRU, and use of textbooks, workbooks, and worksheets was not meant to be part of the CRU. This is additional evidence to support our conclusion that teachers’ participation in the full treatment increased the quality of their instruction.
Also significant about the systematic classroom observation findings related to
substance of instruction was that the NPTNT group (who had not participated on the team or taught a CRU) had the least positive classroom learning environments in terms of appropriate levels of instruction and incentives for learning. This is not surprising, considering the fact that the pilot team teachers had attended workshops and bimonthly team meetings that provided them with strategies for creating positive learning environments. Moreover, these PTT teachers had designed lessons during the year that incorporated these strategies, taught them, and participated in reflective conversations with other team members and the facilitator about the effects of these strategies on student engagement and performance. Finally, they taught a culturally responsive unit that contained incentives for learning, a developmentally appropriate time frame and materials, and highly engaging learning activities. Here, again, we have further evidence

113
to support our conclusion that teachers’ participation in this full treatment improved the quality of their classroom instruction.
We hypothesized that students will learn more when they interact with materials
that are at the appropriate instructional level, over enough time, with enough inherent or external incentives, and presented through high-quality instruction. Overall, the pilot team teachers who taught the CRU demonstrated a significantly higher quality of instruction than all other groups. We conclude that this is attributable to the culturally responsive teaching project, given the fact that the intervention included providing teachers with information about and specific examples of noteworthy instructional and classroom management practices, especially in the CRU they taught. During the monthly team meetings, for example, the facilitator provided specific instructional strategies to illustrate a particular principle of culturally responsive instruction. Pilot team teachers then selected a strategy to implement in a lesson during the following two weeks. At the next team meeting, teachers shared their lessons and discussed their experiences with using the instructional strategies and their students’ responses to them. Through classroom application of the strategies and reflection on their effects on student learning, teachers were able to refine their skills in using culturally responsive teaching strategies.
Pilot team teachers who taught a CRU also had more minutes of teacher-led activities, as defined by the Special Strategies Observation System (SSOS) data collection instrument, than another group teaching a CRU, less time spent on off-task behaviors than both comparison teachers and other non-pilot team teachers using a CRU, and less time spent on student-led activities (as defined in this instrument) than in some classrooms where teachers were not using a CRU. These findings are perhaps not unexpected; the CRUs were highly planned and included many very specific components. Therefore, one could reasonably expect that there would be more time spent on teacher-led activities and less time for student-led activities, as well as less student time spent off task. Additionally, the observational findings suggest that the CRUs were implemented as they were designed. This is additional evidence to support our conclusion that teachers’ participation in the full treatment improved the quality of their instruction.
Based on this study, we conclude that pilot school teachers who did not receive
any component of the intervention (i.e., non-pilot teachers not teaching a CRU) have the most room to improve in terms of using an appropriate level of instruction and incentives for learning in their classroom instruction. Moreover, regarding the principles of good instruction generally and culturally responsive instruction specifically, those teachers again have the most room to improve—even more so than comparison teachers.
Finally, we conclude that the pilot schools intervention was powerful in terms of
creating the positive, culturally responsive learning environment that was observed in the PTT group teachers’ classrooms.

114
Question 6. To what degree does having a teacher in the full-treatment or partial-treatment group affect student engagement?
• PTT group teachers had more success than other groups in engaging students in interactive instruction. Students in PTT classrooms were more often engaged in interactive instruction, less often working alone, and less often social or uninvolved.
• PTT group teachers demonstrated better use of class time. • PTT teachers who taught a CRU kept more students engaged than other
groups.
In this research, we found that pilot team teachers who were teaching the unit were least likely to have students off task. Additionally, this group of teachers had the highest percentage of students engaged in interactive instruction. Students in the PTT group classes were involved in markedly higher amounts of interactive instruction than any other group (75%), which is at least 14% higher than the next highest group. Students in the PTT classrooms were also less often working alone than students in any other group. The volume of SSOS observational data, which is equivalent to at least 30 days of classroom instruction, allows us to make strong conclusions regarding this finding. Interactive instruction involvement rates above 50% have been associated with highly effective regular classroom instruction (Stallings, 1980). Interactive instruction is also indicative of active teaching, student controlled discourse, and small group instruction—three of the nine principles of culturally responsive instruction. Although all groups in the study were successful in using more than 50% of their classroom time for interactive instruction, no other groups were as successful as PTT teachers. The teaching strategies provided to the full-treatment group in workshops and team meetings, as well as the lessons in the CRU, were based on the premise that students learn more when they interact with teachers, with aides, or with peers on subjects related to the lesson. Therefore, we conclude that the full application of the intervention was successful in strengthening teachers’ ability to design and teach lessons that incorporate interactive strategies and highly effective instruction.
At the same time, students in PTT group classes were involved in markedly
lower amounts of off-task behavior such as social or uninvolved activities (3% of students) and “waiting” (1% of students). This would indicate that students in PTT classrooms were engaged in appropriate activities assigned by the teacher. This finding has significant implications for student learning and leads to the conclusions that students in the PTT classrooms had greater opportunities to learn and were receiving more appropriate instruction. Because the intervention was designed to maximize student learning, this finding points to its effectiveness in enhancing teachers’ skills in using appropriate instruction—which can translate to more culturally responsive and differentiated instruction.

115
Likewise, only 5% percent of the PTT group’s students were observed as out of the room, the second lowest percentage for the five groups. Generally, when students are out of the classroom they are not engaged in learning. Therefore, this finding translates into differences in opportunity to learn for students. Time out of the room, combined with the instructional time lost by some groups due to off-task behavior during class time, can have a serious negative effect on student learning. The intervention was successful, particularly for the PTT group, in helping teachers make effective use of classroom time, ergo providing opportunities for increasing student achievement.
Notably, the PTT group teachers had the most effective use of instructional time
of all the groups, including comparison teachers. The importance of time on task has long been documented as essential to student learning. On average, PTT teachers and students spent 9.45 fewer minutes per hour engaged in “off task” activities in their classrooms when compared to other groups. Projected to a full year, this amounts to a savings of 16.11 days of instructional time. This finding has strong implications for schools and districts about how effectively instructional time is used and what types of learning activities are most engaging for students. It also leads us to conclude that the intervention was effective in helping teachers improve their use of instructional time. The fact that PTT teachers taught a CRU that was purposefully designed to engage and challenge students, in addition to learning about and practicing culturally responsive teaching strategies throughout the year, led to their significantly greater ability than other groups to engage students and keep them on the learning tasks.
Question 7. Over the course of this project, how do educators’ interpretations of the achievement gap change?
• There is congruence between the findings of the Interview Design process and other findings in the current research.
• The MAACK Pilot Schools Project intervention made an impact on teachers'
behaviors and attitudes regarding components of culturally responsive instruction for their students. For instance, responses to the Interview Design questions indicate that pilot school faculty members believe that respecting students' cultures is important for teaching African American students. Likewise, pilot teachers perceive that their schools have made significant improvements in anti-discriminatory teaching practices and responsive pedagogy throughout the course of the project. Teachers’ behaviors also indicate that they have been successful in creating a culturally responsive learning environment (e.g., using culturally mediated instruction, using multiracial materials, encouraging student-controlled classroom discourse).
• Participants in the MAACK Pilot Schools intervention showed growth over time
in their understanding of (1) the impact of culture and ethnicity on teaching and learning in classrooms and (2) the value of culturally relevant instruction in narrowing the achievement gap.

116
The findings of our research show that educators’ interpretations of the achievement gap changed in substantive ways. Before work began in the pilot schools, facilitators conducted focus groups with the team members in each of the schools to determine their views about the causes of the achievement gap between African American and White students. Some teachers in the initial focus groups took the position that their responsibility was to treat all children the same, not to see color. The implication of such statements is that to see color would be to expect less from children because one has noticed their color, rather than that to see color would be to create the opportunity to use differences to enhance instruction. It was this unvoiced implication that the project was intended to address, and the project was successful in this respect, we conclude. The fact that the results of the Interview Design process conducted during the concluding project workshop show growth over time in participants’ understanding of the impact of culture and ethnicity on teaching and learning in classrooms and the value of culturally relevant instruction in narrowing the achievement gap gives evidence that the project achieved much of its intent. This success is further verified by classroom observations using the SOSS that show project team members exhibiting both a higher quality of instruction and greater adherence to the principles of culturally relevant instruction than their non-team colleagues. Interview Design responses also indicate project participants believe they have made progress in anti-discriminatory teaching practices, while initial focus group responses did not suggest the possibility that discrimination in classroom or schooling practices was an issue that needed addressing. Also, the fact that the AEL MSCI, an instrument completed by all project school faculties, showed growth in anti-discriminatory teaching and responsive pedagogy gives evidence that positive change in attitudes extended beyond school teams to the broader faculties. This is very encouraging news and helps to establish the spread of the findings from the two quantitative data collection methods. Overall Conclusions
Some general conclusions regarding the pilot schools project can be drawn from an examination of the research findings.
Overall, the pilot schools intervention has a positive effect on teachers' beliefs, perceptions, and behaviors about the value of culturally responsive instruction and the role it may play in improving student achievement and narrowing the achievement gap. Also, the more involvement teachers had with the intervention (e.g., being a member of the pilot team, teaching the CRU), the greater the adherence to the principles of culturally responsive instruction as presented and facilitated in this project. Thus, the intervention was more successful at progressive levels (i.e., the greater or more intense the involvement, the greater the adherence to or application of the principles of culturally responsive instruction).

117
RECOMMENDATIONS The following recommendations are based on the results of the pilot schools project research.
• For the culturally responsive teaching intervention to be most effective, teachers must receive the full treatment, which in this project included the following:
- a skilled facilitator knowledgeable about the impact of culture, ethnicity, and socioeconomic status on teaching and learning and knowledgeable about culturally responsive instruction
- regular team meetings led by a skilled facilitator that included learning about and discussing how culture, ethnicity, and socioeconomic status impact teaching and learning; designing lessons that exemplify the principles of culturally responsive instruction; reflecting on and discussing lesson delivery and student response to lessons
- participating in workshops on culturally responsive teaching and the experience of actually teaching culturally responsive curriculum units
• To experience the full effect of a culturally responsive teaching intervention, teachers need continuing assistance from a skilled facilitator. The facilitator could be a person from a school, district, or other agency who has received appropriate training in culturally responsive instructional strategies.
• For schools to get the maximum benefit from this intervention,
implementation throughout the whole school is necessary.
• Culturally responsive curriculum units should be offered to teachers in conjunction with the appropriate context and training (e.g., professional development, workshops, ongoing technical assistance). Offering these units absent of such support does not result in the most effective teaching and does not produce the desired results in the classroom.
• Based on the findings of the possible amount of instructional time lost by
students due to off-task behavior in classrooms that did not participate in the full treatment, schools should consider implementing this process as one way to decrease student time off task, especially for African American students. Likewise, schools should consider using culturally responsive instruction as one way to increase student engagement and interactive instruction.

118
• Schools looking to increase their capacity to improve and develop as continuously improving learning communities could adopt this model as one method for achieving those goals.
• Any implementation of this model should include the collection and
examination of student achievement data and other student data both before and after implementation of the intervention.
• Culturally responsive curriculum units, geared to state content standards,
should be developed as exemplars for all grade levels and multiple subject areas.
• Any future implementations of this model should be researched to determine
whether results achieved in this study are replicated elsewhere.

119
REFERENCES
Aronson, J. (2004). The threat of stereotype. Educational Leadership, 62(3), 16-ff. Barton, P. E. (2003). Parsing the achievement gap: Baselines for tracking progress.
Princeton, NJ: Educational Testing Service. Retrieved December 9, 2004, from www.ets.org/pic
Benard, B. (1991). Fostering resiliency in kids: Protective factors in the family, school,
and community. Portland, OR: Western Regional Center for Drug-Free Schools and Communities.
Borman, G. D., and Rachuba, L. T. (2001). Academic success among poor and minority
students: An analysis of competing models of school effects. Baltimore, MD: Center for Research on the Education of Students Placed at Risk.
Brewer, J., & Hunter, A. (1989). Multimethod research: A synthesis of styles. Newbury
Park, CT: Sage. Center on Education Policy. (2001). It takes more than testing: Closing the
achievement gap. Washington, DC: Author. College Board. (1997). The national task force on minority high achievement. Retrieved
December 1, 2004 from http://www.collegeboard.com/about/association/academic/taskforce/taskforce.html
Cowley, K. S., Meehan, M. L., Finch, N., Chadwick, K., Howley, C., Riffle, J., et al.
(2002). Comprehensive evaluation of the Kentucky extended school services program. Charleston, WV: AEL.
Cowley, K. S., Riffle, M. J. S., Howley, C. W., Voelkel, S., & Ermolov, L. (2004). Field
test of the AEL Measure of Academic Supportiveness and Climate (AEL MASC) student instrument. Charleston, WV: AEL.
D’Amico, J. (2001, Spring). A closer look at the minority achievement gap. ERS
Spectrum, 4-10. Education Trust. (Winter 2002-2003). Education watch. The nation. Key education
facts and figures. Retrieved June 16, 2003, from www.edtrust.org
Education Trust. (2004). Measured progress: Achievement rises and gaps narrow, but too slowly. Washington, DC: Author.

120
Evertson, C., & Burry, J. A. (1989). Capturing classroom context: The observation system as lens for assessment. Journal of Personnel Evaluation in Education, 2, 297-320.
Ferguson, R. F. (1998). Teachers’ perceptions and expectations and the Black-White
score gap. In The Black-White Test Score Gap, edited by Christopher Jencks and Meredith Phillips. Washington, DC: Brookings Institution.
Gay, G. (2002). Preparing for culturally responsive teaching. Journal of Teacher
Education, 53(2), March/April. Grissmer, D., Flanagan, A., & Williamson, S. (1998). Why did the Black-White score
gap narrow in the 1970s and 1980s? In The Black-White Test Score Gap, edited by Christopher Jencks and Meredith Phillips. Washington, DC: Brookings Institution.
Haycock, K. (2001). Closing the achievement gap. Educational Leadership, 58(6). Haycock, K., Jerald, C. & Huang, S. (2001). Closing the gap: Done in a decade.
Washington, DC: Education Trust. Jencks, C. & Phillips, M. (1998). America’s next achievement gap: Closing the Black-
White test score gap. The American Prospect, 9(40). Retrieved June 6, 2003, from http://www.prospect.org/print/V9/40/jencks-c.html
Ladson-Billings, G. (1994). The dreamkeepers: Successful teachers of African
American children. San Francisco: Josey-Bass Publishers. Lee, V., & Burkam, D. (2002). Inequality at the starting gate: Social background
differences in achievement as children begin school. Retrieved December 9, 2004, from http://epinet.org/content.cfm/books_starting_gate
Lucas, S. R. (2000). Hope, anguish, and the problem of our time: An essay on the
publication of the Black-White test score gap. Teachers College Record, 102, 461-473.
McIntyre, E., Roseberry, A., & Gonzalez, N. (Eds.). (2001). Classroom diversity:
Connecting curriculum to students’ lives. Portsmouth, NH: Heinemann. Meehan, M. L., Cowley, K. S., Craig, J. R., Balow, N., & Childers, R. D. (2002). AEL
Continuous School Improvement Questionnaire: User manual and technical report. Charleston, WV: AEL.
National Center for Education Statistics. (2002). The condition of education 2002.
Washington, DC: Author.

121
National Study Group for the Affirmative Development of Academic Ability. (2004). All students reaching the top. Naperville, IL: Learning Point Associates.
Nesselrodt, P. S, & Schaffer, E. C. (1993, April). The ISERP programme: A revised
classroom observation instrument. Paper presented at the annual meeting of the American Educational Research Association, Atlanta, GA.
Nesselrodt, P. S, & Schaffer, E. C. (2000a). External evaluation of Kentucky’s extended
school services, spring 2000: Phase 1 – final report. Carlisle, PA: Dickinson College.
Nesselrodt, P. S, & Schaffer, E. C. (2000b). External evaluation of Kentucky’s extended
school services, spring 2000: Phase 1 – final report, part 2. Carlisle, PA: Dickinson College.
No Child Left Behind Act of 2001, Pub. L. No. 107-110. (2002). North Carolina Department of Public Instruction. (2004). The North Carolina SAT
report. Raleigh, NC: Author. Puma, M., Karweit, N., Price, C., Ricciuti, A., Thompson, W., & Vaden-Kiernan, M.
(1997). Prospects: Student outcomes final report. Cambridge, MA: Abt Associates, Inc.
Riffle, M. J. S., Howley, C. W., & Ermolov, L. D. (2004). Measure of School Capacity
for Improvement (MSCI): Early field test findings. Charleston, WV: AEL. Rothman, R. (Winter 2001/2002). Closing the achievement gap: How schools are
making it happen. The Journal of the Annenberg Challenge, 5(2). Retrieved December 9, 2004, from www.annenbergchallenge.org/pubs/cj/gap_cj.htm
Sanders, W. & Rivers, J. (1997). Cumulative and residual effects of teachers on future
student achievement. Knoxville, TN: University of Tennessee Value-Added Research and Assessment Center.
Shadish, W. R., Cook, T. D., & Campbell, D. T. (2002). Experimental and quasi-
experimental designs for generalized causal inference. Boston, MA: Houghton Mifflin.
Stallings, J. (1980). Allocated learning time revisited: Or beyond time on task.
Educational Researcher, 9(11), 11-16. Steele, C. (1997). A threat in the air: How stereotypes shape intellectual test
performance. American Psychologist, 52, 613-629.

122
Sullivan, D. K., & Meehan, M. L. (1983, April). The development, pilot test, and field test of an instrument for the systematic observation of classroom interruptions. Paper presented at the annual meeting of the American Educational Research Association, Montreal, Canada.
Texas Education Agency. (1998). Comprehensive biennial report on Texas public
schools: A report to the 76th Texas legislature from the Texas Education Agency. Austin, TX: Author.
Texas Education Agency. (2002). Students earn high passing rates as TAAS era comes
to an end. Texas Education Today, 15(5), 1. Turner, S. (2003). Falling through the gap: An examination of instructional and
environmental factors that influence African American achievement. Unpublished paper. Charleston, WV: AEL.
Viadero, D. (March 22, 2000.) Lags in Minority achievement defy traditional
explanations. Education Week. Retrieved November 30, 2004, from http://www.edweek.org/ewstrory.cim?slug=causes.h19
West Virginia Department of Education (WVDE). (2004). WESTEST: West Virginia
Educational Standards Test. Retrieved November 30, 2004, from http://westest.k12.wv.us
Winfield, L. F. (1994). Developing resilience in urban youth. An Urban Education
Program Monograph. Chicago, IL: North Central Regional Educational Laboratory. Retrieved December 3, 2004, from www.ncrel./sdrs/areas/issues/leadership/le0win.htm

APPENDIXES

APPENDIX A
AEL’s Framework for Maximizing the Achievement of African American Children in Kanawha

AEL’s intervention framework incorporates current research and best practices for improving the achievement of African American students. The following information describes the intervention topics. Topics in sections I, II, and IV were addressed in workshops and team meetings during the first two years of the project. The third year project plan addressed topics III (culturally responsive teaching) and V (facilitating change in the real world of schools).
Section I of the framework acquaints educators with the research associated with improving minority student achievement and closing the achievement gaps. Section II of the framework provides tools to examine the achievement data for schools and districts. In Section III, curriculum planning and instructional strategies, the heart of improving student achievement, are addressed. Section IV provides materials, activities, and findings from research for making a critical analysis of the school’s instructional context (learning environment). According to Fullan (1993) and Hargreaves (1995), school change efforts should focus on reculturing the school’s learning environment. Restructuring alone is not sufficient to bring about school improvement. Once each topic in the framework has been introduced, it becomes a recurring theme in the biannual workshops and bimonthly meetings of the MAACK teams in each of the four pilot schools. Finally, Section V provides support for those individuals who will facilitate the change process. I. Understanding the causes of and remedies for the achievement gap between
African American and White students At least since the 1960s, the effects of poverty and low-socioeconomic status on children’s academic achievement have been widely recognized. Compensatory educational programs such as Title I were conceived to overcome the social conditions that were understood to cause low-income and minority children to perform less well in school than their more privileged peers. In the 1990s, however, educators and researchers began to consider not only the impact of social conditions on children’s learning, but also the impact of what they receive in school. Researchers found that, in general, less experienced and less well-qualified teachers teach disadvantaged and minority children. Their instruction is less rigorous, and educators expect less of them (Darling-Hammond, 1999; Haycock, 2001; Sanders & Rivers, 1996). Research has shown that children of color who are also poor have an even greater academic disadvantage (Oakes, 1990; Blau, 2003). The Education Trust (2003) tracks and reports on individual states’ progress on achievement and opportunity. Their research found that a number of schools, despite challenging home and community conditions, have succeeded in narrowing the achievement gap. Those schools that were successful held in common a determination to expect no less than high achievement from their students and the commitment to provide whatever support was needed to help them achieve that expectation.

2
At the same time, sociologists and psychologists such as Lev Vygotsky (1962), Jerome Bruner (1990), and others have used information from the fields of psychology and sociology to reinforce and extend Dewey’s theory of learning. Dewey believed that the most enduring learning is connected to real-world experience and that learning as a sociocultural activity. According to Vygotsky, who studied the master-apprentice relationship between teachers and learners, “(1) development and learning occur as a result of an individual’s interaction with society, and (2) this interaction takes place in and is informed by a particular cultural context” (LAB at Brown, 2002, p.6). Therefore, educators need to “understand and value students’ knowledge and perspectives on the world as resources to be tapped rather than problems to be solved” (LAB at Brown, 2002, p. 8). Instruction that accomplishes this goal is referred to as “culturally responsive instruction.” Given this understanding, the disjuncture between the sociocultural experience of economically disadvantaged and minority students and that of their teachers needs to be recognized and addressed if teachers are to help all children attain high academic standards. The No Child Left Behind (NCLB) Act of 2001 legislation acknowledges that the nation can no longer tolerate a significant percentage of its young people gaining insufficient skills and knowledge to contribute to the nation’s welfare. With the passage of this act, accountability for the learning to high standards of all children, regardless of their ethnicity or socioeconomic status, is no longer a choice for a few schools but a necessity for all schools.
This MAACK project asks teachers to develop their understanding of the issues that affect efforts to meet the demands of NCLB. It challenges some teachers to change their understanding of their professional responsibilities and to employ new, culturally responsive curriculum and instructional strategies. The methods used in this project ask teachers to analyze disaggregated achievement data for their district and school and to explore disparities among sub-populations of students; to consider together the ideas of key thinkers in the field of sociocultural research; to develop and test culturally responsive curriculum and instructional strategies. At the same time, district leaders are asked to make closing the achievement gap a public priority and support it with district resources. A companion project to the MAACK Pilot Schools, the MAACK Community Initiative, works to build relationships between local educators and minority community leaders and members so that they can be mutually supportive of the children whose well-being concerns them all. II. Analysis of student achievement data The charts and analysis questions in this section of the intervention framework help educators to look at student performance on standardized tests, considering not only how students in a district have performed in a particular year, but also how subpopulations of students are achieving, how students are achieving over time (through the grades), how one school’s student performance compares with overall district
3
performance, and where particular skills and knowledge within a content area indicate a need for instructional improvement. Even when standardized tests are administered only in selected grades, student performance on those tests reflects what they have learned throughout their school years, not just what they have learned during the selected grade (Sanders & Rivers, 1996). Data analysis may therefore be a schoolwide or even, when possible, a districtwide activity to allow shared understanding and decision making. Data analysis as a schoolwide activity strengthens awareness that student achievement is everyone’s responsibility and that teachers need to work together within and across schools (Schmoker & Marzano, 1999). Often educators believe that differences in test performance among ethnic groups are explained more by socioeconomic status than by cultural differences that need to be considered when planning instruction. Statistical data on student achievement do not support this belief. Although it is uncommon for districts to report data in ways that allow such comparisons, when they are reported, typically ethnic groups from the same SES level perform differently (Darling-Hammond & Ball, 1998; Edmonds, 1977; Education Trust, 2003). Once teachers and administrators have reviewed district and school data and identified two or three summary statements for both the school and district data, using the activities in this section of the intervention framework, they will identify methods to investigate causes and remedies for performance gaps among groups. The data considered up to this point provide no explanation. To develop an understanding of the reasons behind test performance variations among subpopulations of students requires gathering more information about school procedures, classroom instruction, and school-community relations. After teachers consider what specific information needs to be gathered, they work in groups to gather and analyze the information and determine appropriate actions to take. Finally, in this section of the intervention, teachers use test item analysis data to determine which concepts and skills students have not mastered. Using Bloom’s Taxonomy helps teachers compare the level of the test question with the instructional tasks and classroom assessments used to teach and assess the particular concepts and skills. Using scope and sequence documents or curriculum maps, teachers also can determine whether there is sufficient and/or timely instruction in the identified concepts and skills and make recommendations for instructional changes needed to improve student performance. III. Culturally Responsive Teaching
Culturally responsive instruction is based on the idea that culture is central to student learning. According to Ladson-Billings (1994), “It is an approach that empowers students intellectually, socially, emotionally, and politically by using cultural referents to impart knowledge, skills, and attitudes” (p.18). Gay (2002) concurs that culturally

4
relevant teaching uses “the cultural characteristics, experiences, and perspectives of ethnically diverse students as conduits for teaching them more effectively” (p.106). This sociocultural approach to teaching, based on the work of Russian psychologist Lev Vygotsky, provides instructional scaffolding that encourages students to learn by building on the experiences, knowledge, and skills they bring to the classroom. To do this effectively, teachers need to acquire knowledge about the cultural particularities of the ethnic groups within their classroom and transform that information into effective classroom practice (McIntyre, Rosebery, & Gonzalez, 2001). Explicitly, this means that culturally responsive instruction is guided by the following research-based principles, which are documented on The Knowledge Loom, a web site developed by the Education Alliance at Brown University (www.knowledgeloom.org).
• Communication of high expectations. There are consistent messages from both the teacher and the whole school that students will succeed, based upon genuine respect for students and belief in student capacity. High expectations are directly related to rigorous, standards-based instruction.
• Active teaching methods. Instruction is designed to promote student
engagement by requiring that students play an active role in crafting curriculum and developing learning activities that help them master important concepts and skills.
• Teacher as facilitator. Within an active teaching environment, the teacher’s
role is one of guide, mediator, and knowledgeable consultant, as well as instructor.
• Positive perspectives on parents and families of culturally and
linguistically diverse students. There is an ongoing participation in dialogue with students, parents, and community members on issues important to them, along with the inclusion of these individuals in classroom curriculum and activities.
• Cultural sensitivity. To maximize learning opportunities, teachers gain
knowledge of the cultures represented in their classrooms and translate this knowledge into standards-based instructional practice.
• Reshaping the curriculum. A reshaped curriculum is culturally responsive to
the background of the students.
• Culturally mediated instruction. Instruction is characterized by the use of culturally mediated cognition, culturally appropriate social situations for learning, and culturally valued knowledge in curriculum content.
• Student-controlled classroom discourse. Students are given the opportunity
to control some portion of the lesson, providing teachers with insight into the ways that speech and negotiation are used in the home and community.

5
• Small group instruction and academically related discourse. Instruction is
organized around low-pressure, student-controlled learning groups that can assist in the development of academic language and the mastery of key concepts and skills.
Elementary, middle school, and high school unit—examples of culturally
responsive curriculum that are founded in sociocultural theory, directly linked to the WV content standards and objectives, reflect the principles of culturally responsive instruction, and build on the strengths of African American students—are included in the intervention.
IV. The impact of schooling practices on the academic performance of African American youth
Researchers have identified other aspects of schooling, in addition to the formal
curriculum and instructional program, that impact the academic performance of African American children. (Delpit, 1996; Foster, 1997; Hooks, 1994; King, 1993a-b; Ladson-Billings, 1994; Stevens, F. & Grymes, J., 1993). These include
• ability of school staff to see and correct practices that produce inequitable
academic outcomes for students of color (Asuto, Clark, Read, McGree, & Fernandez, 1993; Ladson-Billings, 1994)
• academic advising and procedures used to assign students to classes or career
tracks (Haycock, 2001; Lipman, 1998).
• school discipline practices and policies (Carter, 1981; Kelcher, 2000; Skiba, Michael, Nardo, & Peterson, 2000)
• teachers’ willingness to engage in liberation pedagogies and nurture student
and community thirst for educational equity and opportunity; (Fultz, 1995; Savage, 2001; Walker, 2001)
The materials, research articles, and activities in this section of the intervention
framework are aimed at helping school personnel address each of these aforementioned aspects of schooling. Many teachers, both African American and White, who were raised in or who value the mainstream culture have neither the experience nor the training to recognize and build on the cultural strengths of students from other cultures or socioeconomic levels (Delpit, L., 1996; Ladson-Billings, 1994). Such teachers need the help of parents and community members to develop the necessary understanding to teach minority students effectively. Yet, while most teachers and administrators want to involve parents and community members, few know how to build positive, productive school-community relationships, and are fearful of trying. This fear creates what Joyce Epstein calls a “rhetoric rut,” in which educators are stuck. They express support for

6
partnerships without taking any action (Epstein, Coates, Salinas, Sanders, Simon, 1997, p.6). The kind of relationship Section IV of the intervention above seeks to develop is a partnership that includes two-way communication among equals. In this kind of relationship, schools look to community members not just for fund raising and volunteer help, but for knowledge about their students and their students’ cultures.
Parents and guardians need information about school rules, expectations, and decision-making structures in order to enter into true partnerships with school personnel and focus on a common goal of developing students’ academic abilities. A review of quantitative and qualitative research literature on parent and community involvement found that parents’ involvement with schools is less related to income level than to the quality and amount of communication from schools and their previous experience with schools (Keyes, M., & Gregg, S., 2001, p. 5). Community involvement is particularly valuable for African American students (Jeynes, 2003). Inadequate knowledge of schools and schooling practices has limited the influence African American parents and community members have had on decisions affecting their children’s education (Kusimo, 1999). Consequently, a vision of academic excellence for African American youth is never realized.
Public schools have an obligation to create environments that foster the academic
achievement of all students. The current educational system does in fact meet the educational needs of some children. Both quantitative and qualitative research studies show that as a group, middle class White children continue to prosper in schools, and this is certainly a good thing (Darling-Hammond & Ball, 1998; Haycock, 2001; Kober, 2001; Sanders & Rivers, 1996). However, schools have the same obligation to create schooling practices and structures that facilitate learning to high standards for African American students, economically disadvantaged students, and other students of color.
Schools must examine and change schooling practices that are detrimental to
those students who are most dependent upon them for their educational preparation and life training— African American children, children of color, and economically disadvantaged students (D’Amico, 2001; Delpit, 1996; Edmonds, 1977; Jencks & Phillips, 2001). If children who have been traditionally disadvantaged are excluded by schooling practices or policies from classrooms where the best curriculum and instructional practices occur, they cannot benefit. For example, if schools with gifted, honors, and AP classes fail to notice the absence of students of color or economically disadvantaged students in these classes, they abdicate their responsibility to prepare future leaders from all ethnic groups and social classes.
Schools must become comfortable in judging themselves not only by the number
of advantaged students who maintain and improve their advantage, but also by the number of disadvantaged students who move from educational disadvantage to educational advantage. This is the opportunity that NCLB offers every school and community in this nation.

7
V. Facilitating change in the real world of schools Just as students must connect new learning to current understanding, so must teachers. There are no magic processes to accomplish this task. Because the necessity of the task has only recently received widespread acknowledgement, there is little in the research literature about the success of programs addressing issues of race and culture that involve teachers who have not self-selected into them.
In this section of the intervention framework, facilitators ask educators to examine their assumptions about their low-income and minority students, and commit to redefining their professional roles. Through reading research-based materials, participating in structured dialogue about culturally relevant schooling and instructional practices, reflecting on their own instructional practice, analyzing student achievement data, and implementing new curriculum and instructional practices, teachers will learn to recognize and use the intellectual and cultural strengths of all their students. “If students in the past were expected to change to fit the school, there is now an understanding that schools and teachers must change to meet the needs of students” (LAB at Brown, 2002, p.2).
Based on our experience with the MAACK Pilot Schools project, it is
recommended that change facilitation be conducted in two ways.
• Bimonthly team meetings in schools where teachers and the principal - analyze disaggregated test results
- discuss key readings - develop and present lesson plans for peer consideration - examine student work to assess the effectiveness of lesson plans - reflect on student responses to instruction - plan activities to spread their learning among other teachers in the school
• Workshops that bring all district and school personnel involved in the intervention effort together to report and discuss their activities, to learn about culturally responsive instruction, and to continue the discourse about ethnicity as it affects schooling.
The project design is less like a clearly marked road map than it is like a journey
with a compass and a clear destination. Facilitators must recognize that topics of ethnicity, social status, and culture challenge deeply felt beliefs of some teachers—what Gloria Ladson-Billings (1994) calls “dysconscious racism” (pp. 31-33). Sufficient time to absorb new information and revise previously held views is essential for both teachers and administrators. Teachers need time and support to implement and perfect new instructional strategies and assess their impacts on student achievement and their own teaching practices. Administrators need time to monitor instruction and provide constructive feedback to teachers.
8
References Asuto, T., Clark, D., Read, A., McGree, K., & Fernandez, L. (1993). Challenges to
dominate assumptions controlling educational reform. Andover, MA: The Regional Laboratory for Educational Improvement of the Northeast and Islands.
Blau, J. (2003). Race in the schools: Perpetuating white dominance? Boulder, CO:
Lynne Rienner Publishers, Inc. Bruner, J. S. (1990). Acts of meaning. Cambridge, MA: Harvard University Press. Carter, D. (1981). Student discrimination, disproportionality and the law. Paper
presented at the annual meeting of the American Educational Research Association, Los Angeles, CA, April 13-17, 1981). ED208497
D’ Amico, J. (2001, Spring). A closer look at the minority achievement gap. ERS
Spectrum, 4-10. Darling-Hammond, L. (1999). Teacher quality and student achievement: A review of
state policy evidence. Seattle, WA: Center for the Study of Teaching Policy, University of Washington.
Darling-Hammond, L., & Ball, D. (1998, November). Teaching for high standards:
What policymakers need to know and be able to do. Consortium for Policy Research in Education Joint Report Series, copublished with the National Commission on Teaching and America’s Future, JRE-04.
Delpit, L. (1996). Other people’s children: Cultural conflict in the classroom. New
York: New Press. Edmonds, R. (1977). Search for effective schools: The identification and analysis of city
schools that are instructionally effective for poor children. ED142610 Education Trust. (2003). Links to Education Watch 2003 State Summary Reports.
Achievement Gap Summary Tables. Retrieved August 28, 2003, from the World Wide Web: http://www2.edtrust.org/EdTrust/states.html
Epstein, J., Coates, L., Salinas, K., Sanders, M., & Simon, B. (1997). School, family,
and community partnerships: Your handbook for action. Thousand Oaks, CA: Corwin Press, Inc.
Foster, M. (1997). Black teachers on teaching. New York: New Press. Fullan, M. (1993). Change forces: Probing the depths of educational reform. London:
Falmer Press.

9
Fultz, M. (1995). African American teachers in the South, 1890-1940: Powerlessness and the ironies of expectations and protest. History of Education Quarterly, 35(4), 401-422.
Gay, G. (2002). Preparing for culturally responsive teaching. Journal of Teacher
Education, 53(2), March/April. Hargreaves, D. (1995). School culture, school effectiveness, and school improvement.
School Effectiveness and School Improvement, 6(1), 23-46. Haycock, K. (2001). Closing the achievement gap. Educational Leadership 58(6). Hooks, B. (1994). Teaching to transgress: Education as the practice of freedom. New
York: Routledge. Jencks, C., & Phillips, M. (2001). Closing the black-white test-score gap. Retrieved
April 1l, 2002, from the World Wide Web: pbs.org/wgbh/pages/frontline/shows/sats/etc/gap.html
Jeynes, W. H. (2003). A meta-analysis: The effects of parental involvement on minority
children’s academic achievement. Education and Urban Society, 35(2), 202-218. Kelcher, T. (2000). Racial disparities related to school zero tolerance policies:
Testimony to the U.S. Commission on Civil Rights. Oakland, CA: Applied Research Center. ERIC Document ED454324
Keyes, M., & Gregg, S. (2001). School-community connections: A literature review.
Charleston, WV: AEL. Unpublished document. King, S. H. (1993a). Why did we choose teaching careers and what will enable us to
stay? Insights from one cohort of the African American teaching pool. Journal of Negro Education, 62(4), 475-492.
King, S. H. (1993b). The limited presence of African American teachers. Review of
Educational Research, 63(2), 115-149. Kober, N. (2001, April). It takes more than testing: Closing the achievement gap.
Center on Education Policy. Kusimo, P. (1999). Rural African Americans and education: The legacy of the Brown
decision. Charleston, WV: AEL. (ERIC Document Reproduction Service No. ED 425 050)
LAB at Brown University. (2002). The diversity kit: An introductory resource for social
change in education. Providence, RI: Brown University.

10
Ladson-Billings, G. (1994). The dreamkeepers: Successful teachers of African American children. San Francisco: Jossey-Bass Publishers.
Lipman, P. (1998). Race, class, and power in school restructuring. Albany, NY: State
University of New York Press. McIntyre, E., Rosebery, A., & Gonzalez, N. (Eds.). (2001). Classroom diversity:
Connecting curriculum to students’ lives. Portsmouth, NH: Heinemann. No Child Left Behind Act of 2001, Pub. L. No. 107-110, (2002). Oakes, J. (1990). Multiplying inequalities: The effects of race, social class, and
tracking on opportunities to learn mathematics and science. Santa Monica, CA: RAND Corporation.
Sanders, W., & Rivers, J. (1996). Cumulative and residual effects of teachers on future
student academic achievement. Knoxville, TN: University of Tennessee Value-Added Research and Assessment Center.
Savage, C. J. (2001). Because we did more for less: The agency of African American
teachers in Franklin, Tennessee: 1890-1967. Peabaody Journal of Education, 76(2), 170-203.
Schmoker, M., & Marzano, R. (1999, March). Realizing the promise of standards-based
education. Educational Leadership, 56(6). Skiba, R., Michael, R., Nardo, A., & Peterson, R. (2000). The color of discipline:
Sources of racial and gender disproportionality in school punishment. (Policy Research Report). Bloomington, IN: Indiana Education Policy Center. ED468512
Stevens, F. & Grymes, J. (1993). Opportunity to learn: Issues of equity for poor and
minority students. (ERIC Document Reproduction Service No. ED 356306) The Education Alliance at Brown University. (2002). The knowledge loom. Retrieved
December 9 from www.knowledgeloom.org Vygotsky, L. S. (1962). Thought and language (E. Hanfmann & G. Vakad, Trans.
and Eds.). Cambridge, MA: MIT Press. Walker, V. S. (2001). African American teaching in the South: 1940-1960. American
Educational Research Journal, 38(4), 751-779.
APPENDIX B
Monthly Curriculum for MAACK Pilot Team Meetings

MAACK TEAM MEETING CURRICULUM (Minimum of eight lessons with a particular focus)
2003-2004
October High Expectations November Student-Controlled Discourse December/January Small-Group Instruction Active Teaching February Teachers as Facilitators March Cultural Sensitivity Reshaping Curriculum April Culturally Mediated Instruction May Positive Perspectives on Parents and
Families

APPENDIX C
Professional Development Materials for Principles of Culturally Responsive Instruction

1
Bibliography
High Expectations
Cotton, K. (2001). Expectations and student outcomes. Portland, OR: Northwest Regional Educational Laboratory. Retrieved November 7, 2001, from http://www.nwrel.org/scpd/sirs/4/cu7.html
Daniel, C. & Pauley, R. (n.d.) Language and culturally relevant instruction: Strategies
for closing the gap. Unpublished paper, Marshall University Graduate College, South Charleston, WV.
Student-Controlled Discourse
Cummins, J. (2005). Empowering culturally and linguistically diverse students
with learning problems. (ERIC Digest). Reston, VA: ERIC Clearinghouse on Handicapped and Gifted Children. (ERIC Document Reproduction Service No. ED 440049). Retrieved February 16, 2004, from http://www.ericfacility.net/databases/ERIC_Digests/ed333622.html
Fletcher, A. (2003). Meaningful student achievement: Guide to inclusive school
change. Washington, DC: The Freechild Project. Instructional conversation. (1992). (ERIC Digest). Washington, DC: ERIC
Clearinghouse on Languages and Linguistics. (ERIC Document Reproduction Service No. ED 347850). Retrieved November 17, 2003, from
http://www.ericfacility.net/ericdigests/ed347850.html Kordalewski, J. (1999). Incorporating student voice into teaching practice.
(ERIC Digest). Washington, DC: ERIC Clearinghouse on Teaching and Teacher Education. ERIC Document Reproduction Service No. ED 333622). Retrieved November 11, 2003, from http://ericfacility.net/ericdigest/ed440049.html
Small-Group Instruction Aronson, E. (2000). Jigsaw Classroom: Overview of the technique. Retrieved
November 11, 2003, from http://www.jigsaw.org/overview.htm Felder, R., & Brent, R. (2001). Effective strategies for cooperative learning. The
Journal of Cooperation & Collaboration in College Teaching, 10(2), 65-75. North Carolina State University.

2
Ngeow, K. (1998). Enhancing student thinking through collaborative learning. (ERIC Digest). Bloomington, IN: ERIC Clearinghouse on Reading English and Communication. (ERIC Document Reproduction Service No. ED 422586). Retrieved December 8, 2003, from http://www.knowledgeloom.org/external.html?t=1&bpid=1130&aspect=5&location=2&pa
The Knowledge Loom. (n.d.). Practice: Active teaching methods—Instruction is
designed to promote student engagement by requiring that students play an active role in crafting curriculum and developing learning activities. Retrieved August 26, 2003, from http://knowledgeloom.org/ert
Active Teaching Furger, R. (2003, November 5). The little school that did. Edutopia.
Retrieved November 11, 2003, from htpp://glef.org/FMPro?-db=articles1.fp5&- lay=layout%20%231&learnliekeywords%3a%ajargonfr
Hirsch, J. (2000). HyperQuests: Interactive student-centered multimedia/internet
investigations and activities. Paper presented at NSBA technology and learning conference.
Hopkins, G. (2002, February 25). Simulations engage students in active learning.
Education World. Retrieved November 11, 2003, from http://www.education-world.com/a_curr/curr391.html
Teachers as Facilitators ASCD. (2003). A visit to a motivated classroom [videotape]. (Available from ASCD,
P. O. Box 79760, Baltimore, MD) Black, S. (2003). Engaging the disengaged: Research shows why some students are
immersed in learning while others are indifferent. American School Board Journal. Retrieved December 16, 2003, from http://www.asbj.com/current/research.html
Education Dividends. (2000). Teachers as facilitators. Education Beat. Retrieved
November 11, 2003, from http://www.educationaldividends.com/lt3/press/teachers.asp
Education Topics. (n.d.). Profile of an equitable classroom. The Eisenhower
National Clearinghouse for Mathematics and Science Education (ENC). Retrieved January 12, 2004, from http://www.enc.org/topics/equity/selfassessment/document.shtm.?input=ACQ-111590-1590_2

3
Ellsworth, J., (2001). Teacher as facilitator. ESE425 Classroom management of exceptional children. Center for Technology Enhanced Learning, Northern Arizona University. Retrieved February 9, 2004, from http://jan.ucc.nau.edu/~jde7/ese425/eco/optional/facilitator.html
Ferguson, R. (2003). We care, therefore they learn: Project about achievement gap
demonstrates that encouragement can lead to achievement. Journal of Staff Development, 24(4), 42-47.
The Knowledge Loom. (n.d.). Mary-Fran Honeyman’s second grade classroom.
Culturally Responsive Teaching. Retrieved January 7, 2004, from qhttp://www.knowledgeloom.org/practice_story.jsp?t=1&bpid=1123&storyid=1196&aspect=2&locatio
The Knowledge Loom. (n.d.). Practice: Teacher as facilitator—Within an active
teaching environment, the teacher’s role is one of guide, mediator, and knowledgeable consultant, as well as instructor. Culturally Responsive Teaching. Retrieved August 26, 2003, from http://knowledgeloom.org/crt
Webb, Carol. (n.d.). Graduating from teacher to facilitator in the technology-rich
classroom. Teacher Testimony. Retrieved November 2004, from http://4teachers.org/testimony/webb/index.shtn
Wittmer, J. & Myrick, R. D. (1989). The teacher as facilitator. Minneapolis, MN:
Educational Media Corporation. Zhang, H. (1995). Oral language development across the curriculum, k-12. (ERIC
Digest). Reston, VA: ERIC Clearinghouse on Disabilities and Gifted Education. (ERIC Document Reproduction Service No. ED 389029). . Retrieved January 7, 2004, from http://www.ericfacility.net/databases/ERIC_Digests/ed389029.html
Reshaping Curriculum Kober, N. (n.d.). What special problems do minority students face in science? What can
teachers and schools do? EDTALK: What We Know About Mathematics Teaching and Learning. Retrieved January 12, 2004, from http://www.enc.org/topics/equity/selfassessment/document.shtm?input=ACQ-111359-1359,00.shtm
Matsumoto-Grah, K. (n.d.). Diversity in the classroom: A checklist. The Eisenhower
National Clearinghouse for Mathematics and Science Education. Retrieved January 12, 2004, from http://www.enc.org/topics/equity/selfassessment/document.shtm.?input=ACQ-111594-1594_001

4
Shaw, C. C. (1997). Critical issue: Educating teachers for diversity. Naperville, IL: North Central Regional Educational Laboratory. Retrieved February 16, 2004, from http://www.ncrel.org/sdrs/areas/issues/educatrs/presrvce/pe300.htm
The Knowledge Loom. (n.d.). The practice: Reshaping the curriculum—A reshaped
curriculum is culturally responsive to the background of students. Culturally Responsive Teaching. Retrieved January 12, 2004, from http://www.knowledgeloom.org/practice_basedoc.jsp?t=1&bpid=&aspect=1&location=2&parent
Willis, A. I. (2000). Critical issue: Addressing literacy needs in culturally and
linguistically diverse classrooms. Naperville, IL: North Central Regional Educational Laboratory. Retrieved February 16, 2004, from http://www.ncrel.org/sdrs/areas/issues/educatrs/presrvce/pe300.htm
Cultural Sensitivity
Burnette, J. (999). Critical behaviors and strategies for teaching culturally
diverse students. (ERIC Digest). Reston, VA: ERIC Clearinghouse on Disabilities and Gifted Education. (ERIC Document Reproduction Service No. ED 435147). Retrieved January 7, 2004, from http://www.ericfacility.net/databases/ERIC_Digests/ed435147.html
Cummins, J. (1991). Empowering culturally and linguistically diverse students
with learning problems. (ERIC Digest). Reston, VA: ERIC Clearinghouse on Handicapped and Gifted Children. (ERIC Document Reproduction Service No. ED 333622). Retrieved February 16, 2004, from http://www.ericfacility.net/ericdigests/ed333622.html
Howard, T. (2002). Hearing footsteps in the dark: African American students’
descriptions of effective teachers. Journal of Education for Students Placed at Risk, 7(4), 425-444. Mahwah, NJ: Lawrence Erlbaum Associates, Inc.
Kusimo, P., Ritter, M., Busick, K., Ferguson, C., & Solano-Flores, E. (2000). Making
assessment work for everyone: How to build on student strengths. Assessment Laboratory Network Project of the Regional Educational Laboratories. San Francisco: WestEd.
McIntyre, E., Rosebery, A., & González. (2001). Classroom diversity: Connecting
curriculum to students’ lives. Portsmouth, NH: Heinemann. Shade, B. (1997). Teaching to an African-American cognitive style. Culture, style, and
the educative process: Making schools work for racially diverse students. Springfield, IL: Charles C. Thomas.

5
Culturally Mediated Instruction Polite, L. & Saenger, E. (December 2003). A Pernicious Silence: Confronting Race in
the Elementary Classroom. Phi Delta Kappan, 85(4), 274-278. Retrieved February 2, 2004, from http://www.pdkintl.org/kappan/k0312pol.htm
Shade, B. (1997). Culture and learning style within the African-American community.
Culture, style, and the educative process: Making schools work for racially diverse students. Springfield, IL: Charles C. Thomas.
Warger, C., & Burnette, J. (2000). Five strategies to reduce overrepresentation of culturally and linguistically diverse students in special education. (ERIC Digest). Reston, VA: ERIC Clearinghouse on Disabilities and Gifted Education. Retrieved February 16, 2004, from http://ericec.org/digests/e596.html
Positive Perspectives on Parents and Families Comuntzis-Page, G. (1996). Critical issue: Creating the school climate and structures
to support parent and family involvement. Naperville, IL: North Central Regional Educational Laboratory. Retrieved May 13, 2004, from http://www.ncrel.org/sdrs/areas/issues/envrnmnt/famncomm/pa300.htm
Denbo, S., & Beaulieu, L. (Eds.). (2002). The involvement of African American
families and communities in education: Whose responsibility is it? In Improving Schools for African American Students. Springfield, IL: Charles C. Thomas.
Henze, R., Katz, A., Norte, E., Sather, S., Walker, E. (2002). The ripple effect of conflict. In Leading for Diversity: How School Leaders Promote Positive Interethnic Relations. Thousand Oaks, CA: Corwin Press.
Miscellaneous
Meléndez, M. (2004, May 18). School boards fail ethnic-diversity test. Phoenix, AZ:
The Arizona Republic Newspapers in Education. Retrieved March 23, 2004, from wysiwyg://2/http://www.azcentral.com/ari/news/articles/0318 minorityboards18.htm
Merrow, J. ( February 2004). Meeting superman. Phi Delta Kappan, 85(6), 455-460. Rettig, M., McCullough, L., Santos, K., & Watson, C. (November 2003). A blueprint
for increasing student achievement. Educational Leadership. Alexandria, VA: Association for Supervision and Curriculum Development.

6
Schmoker, M. (February 2004). Tipping point: From feckless reform to substantive instructional improvement. Phi Delta Kappan, 85(6), 424-432.
The LPD Video Journal of Education. (2002). Closing the achievement gap [print, video, CD featuring Glenn Singleton, San Francisco, CA]. Vol. 12, Issue 1, ISBN 1-58740-122-3. (Available from The LPD Video Journal of Education, 8686 S. 1300 E., Sandy, UT 84094)

APPENDIX D
Lesson Plan Template

Unit Title: Grade(s): Content area(s): Teacher(s):
Lesson Title: Length of lesson: (number of days/hours/class periods) Lesson Objective/Purpose: Standards: (language arts, science, social studies, math, art, etc.) Resources/materials needed: Lesson steps: (How will you…?
• Recruit interest in the task: (e.g., Build on students’ funds of knowledge.)
• Communicate expectations: Model/demonstrate/display/discuss what constitutes quality work on the task. (e.g., Provide rubric and involve students in the development of criteria when appropriate.)
• Explain/clarify the task: (e.g., Give step-by-step directions.)

• Provide guided practice and support for struggling students: (Teaching strategies that differentiate instruction, respond to cultural diversity, keep students on task, and limit frustration)
• Provide extension/enrichment/modified activities for special student needs and interests:
• Assessment strategies:
• Reflection on student learning: What worked, what didn’t, and why? How do you know what students learned? What do students need next? What will you do differently next time?

APPENDIX E
Special Strategies Observation System (SSOS) Form

Adapted from Nesselrodt & Schaffer 2000. Machine Scannable Version © AEL 2003.
MAACK Pilot Schools Project: Special Strategies Observation System (SSOS)
Observer Date: number: (two-digit month, School day, number: year) # students in class: Target Student: Teacher #: Observation: O Before O During O After # adults in class: O Pilot School* OR O Comparison School
*If Pilot School, then select one below. Grade Level: O Kind. O 4th O 8th O Pilot teacher teaching Culturally Responsive Unit (CRU) O 1st O 5th O 9th O Pilot teacher NOT teaching CRU O 2nd O 6th O 10th O Non-Pilot teacher teaching CRU O 3rd O 7th O 11th O Non-Pilot teacher NOT teaching CRU O 12th Subjects: O English O Mathematics O Social Studies O History O Practical Living O Vocational Studies O Humanities O Reading O Writing O Language Arts O Science O Interdisciplinary O Other: ________________ Begin class observation at: _____:_____

Adapted from Nesselrodt & Schaffer 2000. Machine Scannable Version © AEL 2003.
____ minute of observation should begin at: _____:_____ Ongoing Activities of Teacher Class Snapshot
____ minute of observation Activity Code Time Spent on Activity
Student Engagement:
Number of students on task:
Number of students off task:
Number of students out of room:
Number of students waiting:
Groups and Activities: Task Number of Students Task Number of Students
Tchr. Stds.
Aide Stds.

Adapted from Nesselrodt & Schaffer 2000. Machine Scannable Version © AEL 2003.
MAACK Pilot Schools Project: QAIT* Assessment of Classroom Please indicate the extent to which the following items were observed by filling in the respective bubbles, using a scale of 1 (Unlike this class) to 5 (Like this class). Unlike Like Unlike Like this class this class this class this class Quality of Instruction 1. Lessons make sense to students. The teacher: a. Organizes information in an orderly way. b. Notes transitions to new topics. c. Uses many vivid images and examples. d. Frequently restates essential principles. 2. Lessons relate to students’ background. The teacher: a. Uses devices such as advanced organizers. b. Reminds students of previously learned materials. 3. The teacher exhibits enthusiasm.
Quality of Instruction (continued) 4. The teacher shows a sense of humor.
5. Lesson objectives are clearly specified. The teacher: a. States lesson objectives orally or in writing. b. Conducts formal and/or informal assessment. c. Provides immediate and corrective feedback.
6. Teachers use an appropriate pace to cover content.
*QAIT stands for Quality of Instruction, Appropriate Level of Instruction, Incentive, and Use of Time.
Continue ö

Addapted from Nesselrodt & Schaffer 2000. Machine Scannable Version © AEL 2003.
Unlike Like Unlike Like this class this class this class this class Appropriate Level of Instruction 7. Instructional strategies match students’ abilities. The teacher: a. Accommodates students’ levels of prior knowledge. b. Accommodates students’ different learning rates. 8. Grouping strategies enable students to work together or alone. The teacher: a. Uses in-class ability grouping. b. Has a class that is homogeneous in ability. c. Uses cooperative learning arrangements. d. Bases individual instruction on mastery of skills and/or concepts. e. Uses individualized instruction. Incentive 9. The teacher arouses students’ curiosity by: a. Presenting surprising demonstrations. b. Relating topics to students’ lives. c. Allowing students to discover information. d. Presenting intrinsically interesting material. 10. The teacher uses extrinsic academic incentives such as: a. Praise and feedback. b. Accountability. c. Homework checks.
Incentive (continued) d. Waiting for responses. e. Guiding partial responses. f. Tokens and rewards. g. Communicating high expectations. h. Small groups with individual incentives. i. Students encourage one another to achieve. j. Group contingencies. 11. The teacher uses extrinsic behavioral incentives such as: a. Praise.
b. Tokens and rewards for improvement. c. Group contingencies.
12. The teacher provides instruction that is appropriate for students’ abilities: a. Efforts by the student lead to success. Use of Time 13. Allocated time: a. Necessary time is allocated for instruction. 14. Engaged rates: a. The teacher uses effective management.
b. Students attend to lessons.

Adapted from Nesselrodt & Schaffer 2000. Machine Scannable Version © AEL 2003.
MAACK Pilot Schools Project: Classroom Environment and Resources Checklist Please indicate which of the following options Please indicate whether the following resources were visible in the were evident in the classroom by filling in the classroom (Vis.) and whether they were actually used during the respective bubbles. observation (Used) by filling in the respective bubbles. O Culturally mediated instruction Vis. Used Vis. Used
O Student-controlled classroom discourse O O Textbooks O O Overhead projector
O Use of multi-racial materials O O Workbooks/activity books O O Television
O Use of non-sexist materials O O Worksheets/activity sheets O O Computer
O Posted classroom rules O O Journals/learning logs O O Student manipulatives/
O Posted assignments O O Classroom library hands-on materials
O Cheerful and inviting classroom O O Reference materials O O Audio resources
O Distinct activity centers O O Map and/or globe (i.e., tapes, CDs, players)
O Adequate lighting O O Games and/or puzzles O O Video resources
O Comfortable ventilation/temperature O O Instructional aids/props (i.e., tapes, discs, players)
O Student work displayed O O Science/lab table(s)
O No distracting internal noises/interruptions O O Classroom chalkboard
O No distracting external noises/interruptions O O Student-used equipment
O Open, risk-free environment

APPENDIX F
Letter of Instruction for AEL CSIQ and AEL MSCI Administration

April 26, 2004 Dear Principal: As part of your school’s collaboration with AEL in the MAACK project, you and your staff are asked to complete the AEL Measure of School Capacity (MSCI) and AEL Continuous School Improvement Questionnaire. These instruments assess schools’ capacities to undertake significant change and their engagement in continuous school improvement activities. Both are self-report surveys, and therefore no right or wrong answers. Most respondents are able to complete the surveys in approximately 30 minutes. Because it is essential that information about individuals in schools be collected several times over the course of our partnership, the surveys ask respondents to create a tracking number. This will enable AEL staff to track instrument scores over time without revealing the identities of individuals. These tracking numbers will be used only by AEL researchers to monitor change. Findings will be reported only in the aggregate, and individuals will not be identified in any analysis or presentation of data. We ask that you administer the enclosed instruments to your entire professional staff (i.e., teachers, principals, counselors, librarians, etc.). Please instruct each individual to complete the surveys and place their completed instruments in the envelope provided, seal the envelope, and return it to you or your designee. These measures are taken to ensure staff that their replies will be kept anonymous and confidential. We strongly recommend that staff complete the surveys in a group setting to simplify the data collection process for you, and to ensure that your school submits complete data for all or most of its professional staff. After the surveys have been returned to you, please contact me or my assistant Lisa Ermolov to arrange for an AEL staff member to collect them from you. We request that surveys be completed and returned to AEL before May 5, 2004. Thank you very much for assisting us. If you have any questions about this activity, please contact Georgia Hughes at AEL at (304) 347-0400. Sincerely, Georgia Hughes Research & Evaluation Specialist

APPENDIX G
Instructions for Administering the AEL MASC
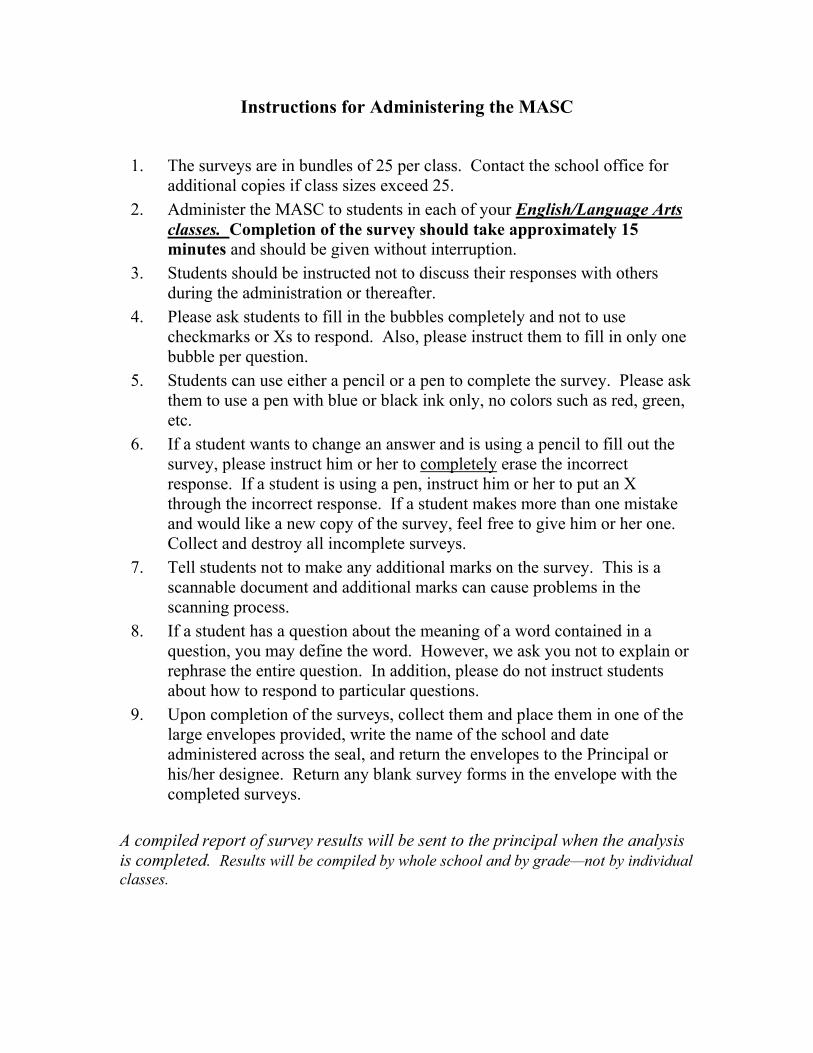
Instructions for Administering the MASC
1. The surveys are in bundles of 25 per class. Contact the school office for
additional copies if class sizes exceed 25. 2. Administer the MASC to students in each of your English/Language Arts
classes. Completion of the survey should take approximately 15 minutes and should be given without interruption.
3. Students should be instructed not to discuss their responses with others during the administration or thereafter.
4. Please ask students to fill in the bubbles completely and not to use checkmarks or Xs to respond. Also, please instruct them to fill in only one bubble per question.
5. Students can use either a pencil or a pen to complete the survey. Please ask them to use a pen with blue or black ink only, no colors such as red, green, etc.
6. If a student wants to change an answer and is using a pencil to fill out the survey, please instruct him or her to completely erase the incorrect response. If a student is using a pen, instruct him or her to put an X through the incorrect response. If a student makes more than one mistake and would like a new copy of the survey, feel free to give him or her one. Collect and destroy all incomplete surveys.
7. Tell students not to make any additional marks on the survey. This is a scannable document and additional marks can cause problems in the scanning process.
8. If a student has a question about the meaning of a word contained in a question, you may define the word. However, we ask you not to explain or rephrase the entire question. In addition, please do not instruct students about how to respond to particular questions.
9. Upon completion of the surveys, collect them and place them in one of the large envelopes provided, write the name of the school and date administered across the seal, and return the envelopes to the Principal or his/her designee. Return any blank survey forms in the envelope with the completed surveys.
A compiled report of survey results will be sent to the principal when the analysis is completed. Results will be compiled by whole school and by grade—not by individual classes.

APPENDIX H
2001 Focus Group Report

1
Race Away: Formative Evaluation of an Achievement Gap Reduction Project
Focus Group Findings Focus groups were conducted in all five schools participating in the project during the school year. Each school was assigned a facilitator to guide staff through the focus group sessions. The schools are Elementary School A, Elementary School I, Elementary School B, Middle School C and High School D. It is important to note that Elementary School I is no longer participating in the project because the school had too many other commitments. Further, school staff felt this project did not directly relate to issues at their school, as evidence by a small achievement gap. The focus groups were held to learn about teachers’ perspectives on why there is a reading achievement gap. Another reason for the focus groups is to get away from placing the blame on others and concentrate on what teachers can do to solve the problem. Each focus group session lasted approximately one hour. Four of the focus groups were taped and one was not due to an equipment malfunction; however, the facilitator wrote detailed notes during the interview and these were typed for use during data analysis. The participants were asked to share their comments, views, and visions. They were also asked to make recommendations for possible solutions to correct the disparities in reading achievement. Questions asked during the focus group sessions are as follows:
• List some factors that may help explain why there is an achievement gap. • Do you have any other thoughts or recommendations concerning the
achievement gap? • What information have I not asked for, but should have asked for?
The themes that emerged during the focus group sessions fit into four main categories: environment, family, students, and school/teacher. The main themes discussed in the sessions related to environment were economic factors, cultural factors, and racial issues. Parent involvement and attitudes were mentioned the most in relation to family. For the student category, the student’s attitudes/perceptions were cited frequently. Lastly, teacher attitudes and teaching style were alluded to most often in the school/teacher category. The focus group transcripts were manually analyzed by theme. Each theme was coded, and each occurrence was tabulated. In the analysis of the focus group transcripts, the themes inherent in the four main categories appear 284 times. For the purpose of this analysis, each appearance of the theme constitutes a response. Of the 284 responses noted, 81 (28.5%) fall into the environment category, 46 (16.2%) can be grouped under family, 52 (18.3%) pertain to students, and 105 (37%) relate to school/teacher. Although it would appear the participants agreed that the biggest

2
deterrent to closing the achievement gap between White and African American students lies with the school/teacher, almost half of the 105 responses came from one school. Table 1 summarizes the number of times each main category was touched on by the participants from each school.
Table 1 Main Categories of Themes and the Number of Times Noted
Category Elementary
School A Elementary
School B Elementary
School I Middle
School C High
School D
Environment 9 4 30 8 30
Family 14 7 12 7 6
Students 17 2 17 6 10
School/Teacher 8 3 18 51 25
Most of the responses from participants at Elementary School I and High School D placed the onus on the environment. The main reason for the gap in achievement between White and African American students discussed by participants from Elementary School B was family. Elementary School A participants placed the blame mainly with the students, while the participants at Middle School C tended to think the deficiencies lie with the school/teacher. Environment Economic Factors. The first theme contained in the environment category concerns economic factors. When asked “What accounts for the achievement gap between white and African American students?” one participant stated that she sees it as an income rather than a racial achievement gap. Another participant in the session agreed and added that she is a proponent of Ruby Payne, who theorizes that the silent rules of middle class values were in schools, and that low-income students did not understand those rules. In another session, the participants noted no difference in the socioeconomic status of the White and African American children attending their school. Following are two examples of the comments made by participants during one of the focus group sessions:
“You said that SES is not a factor, but I tend to think it is a contributing factor and it may be important for them to pay the bills, put food on the table, and dress, as opposed to you looking up your spelling words or memorizing your vocabulary this week.”
“I think some people’s perceptions and pressure from the certain class in the school district. I think it holds certain kids back. In the beginning of

3
the year, we had our math scores looked at and certain kids went to the higher math class. But then . . . when we looked at them again, we saw that there were children that were not put into that math class for whatever reason. And then some of those kids were never put in that math class, who should have been put in the math class. So, because of certain pressures from certain parents, it was never done. So, I think some teachers’ and parents’ perceptions and questions and pressures . . . because of that people feel them, they never give those higher expectations to the kids that they deserve. And it’s a shame because, again, I don’t even think it’s a Black-White issue. A lot of it was a class issue. What parents were going to go in there and say ‘Hey. I want my child in there.’ and what parents have no clue that their kids are supposed to be in this classroom.”
Cultural factors. The second theme under the category of environment relates to cultural factors. Participants from three of the five schools mentioned cultural differences or factors in their discussion of why the achievement gap exists. Responses included in the theme of cultural factors varied greatly. The difference in interaction between Whites and African Americans was mentioned most often in the discussions. These differences are explained as different ways of communicating and interacting with persons of different races, as well as differences in what the students see in their home environments as opposed to what they see in the school environment. As three participants intimated,
“You have the parents that say . . . Johnny does well at Sunday school. Okay, Johnny does . . . but when he comes to school, he doesn’t do well. Well, it’s two different worlds. At Sunday school, he’s in a predominantly Black church and there are ways that they’re talking to the kids and treating the kids.”
“Okay. What I’m thinking is where middle school, where it really becomes a problem. I think about those boys and they have their own culture and their own way of being and it is hard. It is very different than my way of living. It would be hard for me to know how to communicate with them or validate. Just think a little bit more about that whole issue of the African American boy as he comes to 5th, 6th, 7th grade and on and how he does or doesn’t fit into school.”
“Well, this person’s background, their life, everything that they live is different from what they’re exposed to. So, they never really buy into it. It’s a matter of adopting the expectations of a group that you don’t belong to, you know you don’t belong to.”

4
Another response related to cultural factors noted in the discussions is the existence of a “youth culture.” As one participant noted, “We’re fortunate in that we’ve all been around kids for so long, we know how to tune into the youth culture, but we have not been able to use our radar well enough to use the aspect of African American youth culture to their advantage.” Racial tension. A third theme included in the environment category is racial tension. This topic was touched on by participants in three different sessions a total of 22 times; however, one school accounted for 16 of the responses. Many of the responses referred to the “issue of color” or “I don’t see color,” while others contended that some use the issue of race to avoid accepting responsibility for their situation or actions. As one respondent stated, “I think that some people want to place blame that if they don’t do well and the easiest thing, like [she] said, to blame is color…” The two responses below pertain to the issue of African Americans using race to avoid accepting responsibility for their own situation.
“I think that some of it too comes from the post-slavery days. The ‘woe-is-me’ and ‘you owe me’ . . . wasn’t in their shoes and I can see it was a horrendous thing, but I would say…I’ve had kids try, but every one tried to act like, ‘Well, it’s just because I’m a Black kid.’ I say, ‘No, No, No. I’m not going to spend my life being accountable. I don’t owe you anything. You’, and I’ll tell you point-blank, ‘You owe it to yourself. I don’t owe you anything at all, but you owe it to yourself.’ I know that your staff says we have to have special focus groups, and I don’t have a problem with that. If this is the group of people that are having problems, for whatever the reason would be, then let’s focus on that. But, don’t sing the blues to me and act like ‘woe-is-us’ and ‘you owe it to us’. No, we don’t. You owe it to yourself. And that’s what I’m going to tell them.”
“They might want to blame their poverty on something. They might want to blame their race on something. They might want to say that a teacher is prejudiced one way or the other. I mean, they’ve gotta blame something instead of accepting it and changing it for the better.”
Another respondent claimed that when AEL asked the participants to complete the data form about the grades of African American and White students, she realized that she did not think that way. She did not know how many African American students were in her class, because she did not see color. A respondent from another school asserted, “You see it, but you don’t need to focus on it. You might not discriminate based on it, but to say you don’t see it is not right.” The following response also alludes to the issue of not seeing color.

5
“I expect the same from every child. I don’t care what color you are, what family you come from. I had the same expectations for every child in that classroom unless they’ve been identified for special services and those needs are being met. But we can’t speak for every teacher in Kanawha County. There may be some teachers—there are people who have attitudes because they’re people of color, but you can’t speak for all of them. I’d say pretty much in this building and pretty much for myself, no. What I expect from you, I expect from you. It’s makes no difference who you are, what color you are. You’re a human being.”
A participant at High School D gave a different perspective on the issue of color.
“If I were Jewish and walked into a room, nobody would know that. If I were an axe murderer and walked into a room, no one would know that. If I were something else, nobody would know that just by walking into the room. But if you are Black and you walk into a room, there’s a certain feeling that you get that it puts you on guard and you are never really totally relaxed. And you’re conscious of it in your own mind, somebody is looking at you as being less than what you actually are, and that causes you to be kind of like mean, to be kind of like on edge. And how I respond to you is how you approach me. And how comfortable you make me feel…and who you are and how you perceive me. And you have to do that in a group by being a Black person. I do. Always have. I don’t think you could ever get away from that and I think it’s large when you begin to understand, ‘Wait a minute. The world looks at me differently than it does other people.’ And that causes you to say, ‘I ain’t buying into that. I don’t have to. I don’t have to, and I ain’t until somebody can show me where it is comfortable for me to do that.’ And there are not a lot of teachers in the classroom that will do that for the majority of African American students. It speaks to your question. ‘Do you think the majority of kids. . . .’ That’s why I think the majority thing comes from. The teacher will identify with more and more, you’re going to see this gap. Unless you see things other than an attempt to reduce that gap in an indirect sense. Because expectations . . . of something we culturally embrace. Everybody did . . . even African Americans. But this thing we do, it’s not set up that way. So, a large number of students they are not buying into it. . . .”
Other factors. The final grouping under the category of environment is other factors. These other factors do not fit neatly into any of the three main groups identified above. A participant in one of the focus group sessions noted that, “Our minority students are our majority students. Okay? And our majority students are our minority students . . . . Look at it a different way.” In the same focus group session, it was also mentioned that “the majority of students here are scoring lower than the minority.”

6
As seen below, other comments touched on the predominance of White teachers in the schools, an inherent fear of change, and the value of education in society today.
“Look at your teachers. Who do you see? When you go home and don’t see the same things you see in your schools, you don’t see the same people. There are some people who can see their mothers and fathers in the office spaces in school and there are some kids who will never see those faces in a school building. Every now and then you’ll see a custodian and even then, they don’t see those. You’re definitely going to see a rare thing to see in a teacher, an administrator. So, it’s systemic.”
“It’s back to where we said earlier at the first meeting on that first day. People are ingrained. Your mind is ingrained and you’ve been brought up to believe something; therefore, you’ve got the box you don’t want to step out of it. There is a fear of change. Change is sometimes very fearful. People are fearful of change and especially in this sudden bursts of change and a lot of change. If you can change gradually, you have to do two things. You have to buy into it and you’ve gotta be willing to change your mind-set.”
“And the value of education. We were brought up that our parents said ‘Get an education. They can’t take that away from you.’ Society does not value education anymore.”
“Education doesn’t hold that sort of fascination because there’s so many things that you can do to make a whole lot of money and legally without being formally educated. So, why learn to read and write and become a part of ‘that man’s culture’ when you don’t see the relevance and the appropriateness of it.”
Family The second category, family, also contains four main groupings of the themes. They are parent education, parent involvement/attitudes, discipline/structure in the home, and other factors. Parent education. The first grouping, parent education, was referenced by participants in three different schools. The three comments below pertain to the education of the parent, or lack thereof, in connection with the learning potential of the student. The commonality in the responses is that the more educated parent would place a higher value on education and, therefore, so would the child. In contrast,

7
parents with less education would tend to place a higher value on other things, such as making sure there was food in the house and clothes to wear. Further, the less educated parent may not be able to help the student due to a lack of skills.
“First of all, I was really surprised that there was an achievement gap here at [the school] because in all of the things that I’ve read and heard about the achievement gap between Black students and White students, it is due to the fact that teachers are teaching more to White students. Well, this is a predominantly Black school. So, I was surprised. But then I started thinking about it and I wonder if one of the reasons could be that their parents are educated or their grandparents are educated. Because I know that because my mother was educated, I went to college. And I’m educated and my daughter is in college. But, there are people whose mothers did not go to college or didn’t graduate from high school and they followed that same pattern. So, I thought maybe that could be one of the problems. Maybe we could look into that.”
“If it wasn’t instilled in them when they were children, unless they’re educated, and I’m not saying that all uneducated parents don’t think that education is important to their children, but I’d say that some aren’t equipped to help their children. It’s not utmost and foremost in their lives. I’m sure they want their children to succeed, but may not have the means or skills to help them succeed, unfortunately.”
“The more educated parent would have a tendency to provide books and read to the younger child. If you have a single parent household, the tendency would be that the parent is working quite often and does not have the time to spend to read to the child. When you have more than one parent, you have a tendency to read a little bit more. I think that reading, the importance that a parent shows to reading at a young age transfers to the children. Not necessarily that they’ll be great readers, but the importance of reading.”
Parent involvement/attitudes. The second grouping, parent involvement/attitudes, was noted by participants in four different schools. The responses pertaining to this theme revolve around the involvement of parents in the education of their children, as well as the attitudes parents have toward the education of their children. A common theme in the responses is the lack of involvement on the part of the parents in the education of their children. One school pointed out that parents are not willing to be involved. The principal cited a Saturday family activity. The school provided bus transportation, but none of the parents of the students that they wanted to connect with came. The parents said they would be willing to drop off their children, but not to participate themselves. The principal observed the same was true of family nights held at the school. She stated that the parents of students with low achievement or poor behavior either did not show up or wanted to come only for the food. Another

8
participant remarked that when they did show up, they would complain about the amount of food provided. The attitudes of the parents toward the education of the children was also mentioned as a potential cause of the achievement gap. A participant at Elementary School B noted that the attitudes of the children are often formed by the attitudes and experiences of the parents; therefore, a child who has never experienced racism directly would experience it vicariously through the parents. Further, a participant at Elementary School I stated, “Who knows what they get from their parents. I mean, what attitude the parent takes and kids listen to their parents.” Another response dealt with the involvement of parents in the development of the child’s abilities. Also mentioned in this response was the fact that many of the parents of the children attending the school are children themselves.
“A lot of them have not been to preschool, and if they have it’s been a play preschool experience. It’s not where you’re going to sit down and you’re going to learn letters and you’re going to learn how to cut, and you’re going to learn how to listen. And the parents have not taken the time to do these things at home. They have not . . . I mean it’s like I saw a parent, a kid who’s had a baby. One of our former students. And I said, ‘Are you reading to the baby? Are you playing patty-cake with the baby? Are you doing things to enrich their language skills?’ She said, ‘Patty-cake? No! I don’t have time to do all that stuff.’ And I’m going, ‘But they need this.’ The parents don’t . . . we have a lot of parents, we have a lot of kids who are kids themselves having kids. And we have a lot of working poor parents who are out working at McDonald’s and Burger King.”
It was also noted by the participants from a different school that family structure plays a part in the development and education of the child. This was noted in the presence or absence of strong role models. Also cited was the problem of parents not raising their own children, but handing over this responsibility to grandparents.
“Listening to some of the successful African American men talk when we were meeting, plus what we’ve learned in our intergenerational poverty classes, it seems that children who come from families or communities where they have one person that kind of owns them a little bit and guides them and encourages them and follows them, keeps track of where they are, who they’re hanging around with, it reinforces the importance of education and guides them through their life and gives them a goal. I think that kids who have that succeed. . . . So many people don’t have families around any more. They have an uncle in this state, an aunt in that state. Parents aren’t raising their own children anymore. They’re having grandparents raise their grandchildren because

9
their parents, for whatever reason, don’t want to or are unable to. I think all these factors contribute to the problem.”
A possible solution suggested by a Middle School C staff member was holding parenting sessions. These sessions would be offered by the school counselors for parents who did not seem to show much interest in the education of their child and who rarely showed up for parent-teacher conferences.
“We’ll have to go to the community instead of having the community always come to you, because these walls are barriers to . . . Everybody knows there are people who didn’t feel comfortable to come into this building or to the educational environment. There’s a language that’s a barrier. There’s a dress code that’s a barrier. There are social-economic barriers. When you walk in these doors, you know that you’d better learn to speak the language because they’re gonna measure you. Are you wearing your best clothes? When you go to somebody’s house and you sit down in their community and you look around you, some of us may not feel that comfortable. Some of us are gonna see how they feel when they come here. We’ve gotta go out to them.”
Discipline/structure in the home. A third grouping of themes in the family category is the idea of discipline/structure in the home, as well as in school. One participant noted that most children have not had any formal structure in their lives prior to their arrival in kindergarten; therefore, they are not ready for the structured learning process they are to begin. Similarly, a second participant stated,
“They come in wild and by the time they get to third and fourth grade, they realize the pattern and understand the discipline, they’re so far behind in all the education they missed in K-1-2. . . . I have a lot of students now that their teachers say, ‘Oh my gosh. You should have seen them in Kindergarten, you should have seen them in first grade, you should have seen them in second grade’ that are wonderful for me. But, because they were so busy learning how to become students, they missed out on how to read, how to write, how to do that.”
Another participant noted that the structure of the home dictates the ability to conform to the structured environment in the classroom, while yet another commented that the problem lies in the fact that there is no discipline in the home. For example, in response to the comment that there is no longer discipline in the schools, specifically spanking, another participant remarked, “And there’s none at home!” Other factors. Again, there were some themes that did not fit into any of the aforementioned categories; therefore, a separate category of other factors was created to accommodate these. A participant in one of the sessions described a scenario where there are four African American children, all of whom have fathers and mothers in

10
prison. She feels that their behavior problems and “lack of boundaries” stem from the lack of parents. During one of the other focus group sessions, a participant related the story of a child whose mother kept a close watch on her every move. The child’s mother made sure that the girl did all of her homework. Also, her mother made it a point to know who the child’s friends were and kept her away from some of the other girls who the mother felt were a bad influence. This child went on to graduate from West Virginia State College. These comments were made in connection with the mother’s desire for her daughter to associate only with other African American children and not have any White friends. A third participant’s take on the subject was as follows:
“I think that’s because many of our parents are receiving help from welfare or whatever. I think now for the African American population in this school, they see that it’s an option. Whereas, I mean, I know that education is the only way out—to get out of this vicious cycle of poverty, then I’m going to respect whomever is in authority in that room. If I know welfare is an option and I’m still going to make it by drawing a check or having babies, then I don’t have to respect it. Twenty years ago, it wasn’t an option to be on welfare and I think they see it at home, I know how I’m going to make it. That’s an option. Whereas 20 years ago, you had better listen to your teacher and you’d better do the right thing because if you don’t, you’re not going to succeed.”
Students Student attitudes/perceptions. The main theme in this category is student attitudes/perceptions. It is important to note that participants from all five of the schools cited student attitudes or perceptions as a reason for the achievement gap. The responses in this category related to the student attitudes toward learning, as well as whether the student perceives that he/she is being treated the same as other students. For example, a participant from Elementary School I mentioned that, “You give them the time to do that and you do some things that are geared toward their strengths. It helps when they see White children that are disciplined and treated just like they are. And they know that it’s going to be fair and it’s going to be even. They know it’s going to be consistent.” Other comments relating to this theme are as follows:
“The parent blames the teacher and the teacher blames the parent and the kids in the middle of it say, ‘I don’t have any responsibility.’”
“I know your data says different. That’s what our whole focus is about, but I think it’s a personal thing. It’s not one group. I think it’s an individual and who they are, where they come from, what’s important in their lives, what’s important in their family’s lives, and go from there.”

11
“Individuals in families are different. You have one that has high expectations for himself, and you have two or three or four or even seven that have no expectations for themselves. Then you have students who are rather low, but have really high expectations for themselves, they achieve really high because they work really hard, more than the students who are just naturally gifted at that sort of thing and don’t have to work really hard at it. So it’s like you have all these different factors that play into it. Yes, some parents who care an awful lot about school push their kids really hard and those kids might not even succeed anyway. It depends on the individual.”
“Our kids are not so blind and so ignorant that they don’t know, they don’t see. Many of them feel disenfranchised and don’t know the word disenfranchised. They feel powerless and don’t know powerless. But that is…that becomes a part of the fact. Not only does it have an effect on them, it has a reciprocal effect on us who may not be like that.”
“The kids I have are 8th-grade special ed. They are so afraid now to walk outside of the box that we have put them in. And we certainly don’t want to devastate them, so you say, ‘Ok, we’re going to keep you in here,’ but when they get to [the high school] it will be a different picture. They opened up the box and put them out there. So, you know, I think this boxing them in is a little bit much for them.”
Student behavior. In connection with student attitudes and perceptions, participants also brought up student behavior as a theme in their discussions of the achievement gap. One response insinuated that there is a fear factor inherent in the relationship between African American students and White teachers, as well as between White students and African American teachers. Another response implied that the teachers are able to “weed out” the students with behavior problems. Respect or a lack of it was also listed as a problem with student behavior. One participant at High School D pointed out that some cultural differences are perceived as discipline problems.
“Because I think that first of all that African American students are a very oral group of students. For all African American students that I dealt with and had in schools, oral communication, and the body language that goes along with it, is such a finely honed skill that we don’t always recognize the importance of oral language in our students’ minds, and we don’t always direct it in ways that might be helpful to their learning process. I think that part of it is that we don’t understand it. First of all, we don’t recognize it and then we don’t understand it. We immediately see that as a behavior problem. And as the physicality of this oral communication is in some ways not intimidating, but disturbing, to some classroom situations or perceived that way.”

12
Peer pressure. Peer pressure is another theme encompassed by the student category. For the purpose of this discussion, peer pressure is defined as the way students feel they are perceived by their peers. In other words, they define their self-image by what other students think of them. One participant stated, “I think another thing that we have to do. Going back to the African American, we’re going to have to get the African American students to say ‘Look, this is a problem that I have.’ People are willing to help and we don’t want . . . it’s not looked down upon.” This statement can be interpreted as the ability to get African American students to admit they have a problem by helping them realize that they won’t be looked down on if they can’t read as well as someone else or can’t solve mathematical problems as fast as someone else. Two other participants mentioned peer pressure in connection with discipline problems.
“They hear it. They see it in elementary schools. You have groups. They see who’s placed in the lower reading groups. They hear it from peers, cliques, looked down on. When you have your referrals, they see who is disciplined a lot.” “Peer pressure within a group, within a class. And you saying, ‘You’re going to read this.’ If you’re a poor reader and you don’t want the world to think you’re dumb and you want to stay cool, you’re going to act up and let the teacher target behavior rather than target your academic disability in front of your peers. Now, it’s cool and it’s okay and it’s been accepted to be called down upon because you’re acting up.”
Other factors. As with the previous two categories, environment and family, some themes do not fit into a specific category and are consequently grouped under other factors. It is important to note that all of the other factors mentioned in this category came from one focus group session. One such theme is the learning style of the students. As one participant noted, “I tend to think about learning styles that may or may not mesh with the teaching strategies.” Another participant cited learning styles in conjunction with culture, “We’re either back to culture or learning style, because what you ask them to do in your classroom is sit still, not daydream, and it’s very different and it’s maybe…” A final theme pointed out in this discussion is that of genetic predisposition.
“I should say this too, and I probably shouldn’t say it, but I wonder sometimes and I hope I don’t lose my job over this kind of stuff and I’m not saying this to be rude. I was raised in an all Black community and my brothers were raised there too and people are people. I wonder sometimes . . . you ever look at the Black race and almost from the time that they’re children, you can help me out here Scott, they have, not all…it’s not a given, they have like rhythm. They can dance. They can sing. I watched that ball game last night. Look at your sports heroes. They’re predominantly Black. They have this almost innate thing for physical agility and I just wonder sometimes, and this is where I’m

13
probably going to get in trouble. I wonder sometimes if it is the genetic makeup of the brain. Each portion of the brain controls certain things within your body. It’s like it is heightened when it comes to like music and rhythm and things like that. I wonder if the cognitive part, and it’s not a given, and I’ve had some brilliant Black children, and I’ve had some White kids that could dance. But I wonder if it is the genetic makeup of the brain sometimes that accents certain things more than others.”
“Maybe it’s the part of the brain that’s stimulated more. Just look at all of these Irish boxers and now we have all of these Hispanic baseball players. They think they have the only chance to succeed in that area so they follow that course. I don’t think it’s necessarily what race you are, but I think it has something to do with coming from what you see.”
School/Teacher The final main category is that of school/teacher. This category can be broken into themes relating to teachers and themes relating to the schools. All of the responses intimate that the main deficiencies causing the achievement gap between White and African American students rest with the teachers and/or the schools. The themes mentioned in connection with teachers are teacher attitudes/teaching style and modeling, while the themes pertaining to schools are lack of discipline, problems relating to the curriculum being taught, the absence of a support structure for students, and deficiencies in testing policies. First, we will look at the themes concerning teachers. Teacher attitudes/teaching style. The first is teacher attitudes/teaching style. Only two groups discussed teacher attitudes or teaching style as being a contributing factor to the achievement gap. This theme relates to the attitudes of the teachers toward the students, both White and African American, as well as the style that the teachers are using to instruct students. Below are the responses referring to teacher attitudes.
“And we’ve had kids from other schools that we’ve been asked to take these kids because they were so bad. They come here and they’re fine. Does that mean we have lower expectations? No, we have higher expectations and we try to work with the whole child. We try to make sure there is something positive in this child’s life and we don’t always look for the negative in the child. Not all the teachers, I’m not going to say everybody does this but the majority of the teachers do this. They look for something positive. Even if it is that your toenails were clean. You know, you have pretty fingernail polish on. Whatever it’s going to take to keep this child excelling.”

14
“If we value these kids, we should be horrified. You can change and justify and say why are you surprised. You can look at genetic explanations. You can look at almost any reason to say, ‘It’s not me, it’s them.’ If you felt this was a part of your family, you would not allow this to happen. If it was your foot, you would do anything to save your foot. I’m just saying, I don’t care how well your hand feels, but if your foot is in pain, the body is in pain. And that’s where the suffering is heard and the suffering is responding to the family. And that’s what I’m saying about the reordering of the American mind-set. We have to embrace the whole family. And that’s where I don’t believe we’re there yet.”
“But, in this building, if we put a list of all the teachers in this building and I wouldn’t be afraid to do it, Carol might not do it, and put beside it, ‘Think they care, Don’t care, Don’t know if they care, Don’t want to care, Don’t want to be here, Could care less.’ You’d be surprised at the number of people that I think that I’ve dealt with that are here because it’s convenient to where they live and are here because they either went to school here or they have been here, but they are not here for the right reason, which is the kids. So, how do we change that attitude? And that’s what we need to do.”
“Let me tell you my second problem. Here I am again and I’m going to get racist and I’m sorry, but some of us here are here to help out that ‘poor little Black child.’ Lord have mercy. I was sent from Heaven, brought down into Hell, so I could change you heathens into civilized people. I don’t know how productive, but I’m gonna civilize you a little bit. That’s some of the attitude. That attitude needs to change. I saw that attitude over at [an elementary school]. Know what I did? I took my son out of there and took him to [another elementary school]. I said that he doesn’t need that. He doesn’t need somebody to feel sorry for him, but that’s the other attitude. They’ve gotta get out of that attitude there. ‘Oh, I’m here to help.’ Really, anybody has to care within . . . to want to help. It has to be an individual thing, not because statistics show or the boys say we’re gonna do this. That has to be self-empowered or self-motivated interest. I have to want to do this because it’s in me to want to do it. He has to do it because it’s in him. She has to do it because it’s in her.” “I’d like to say that I think if we were having this discussion 10 or 15 years ago, we’d have a much better chance of solving the problem because of the burnout, amount of paperwork, and things that have been added to us now. I think that getting teachers to buy in to some more work is going to be tough.”
The following responses pertain to the theme of teaching style, which, as previously mentioned, refers to the style that the teachers are using to instruct the students.

15
“As for reaching and teaching, I call it reaching and teaching, that doesn’t even enter into their head. They get the lesson plans out and they color code and they teach the lessons and they grade the tests and they give them back, but as far as reaching and teaching, they don’t. They won’t.”
“I just think they like to teach in a box…It’s like, I’m the king of this castle and . . . It’s going to be the way I want it and it’s the way I was taught and it’s just the way it’s going to be and if you don’t like it, you can go to the office or you can get out.”
Modeling. The use of modeling or lack thereof was a topic discussed in one focus group a total of nine times. Of the nine comments noted, eight related to teachers and one related to the schools. The comment relating to schools follows:
“This is where the students need the support all the way through. They have dropped the ball on the educational process. We are still in a model that was back in the 60s. Where you dropped reading after the grade school. Now our student clientele has changed greatly since this.”
Other comments pertained more to teachers. The following two comments about teachers are representative of the eight remaining responses given in the focus group session.
“Model in the classroom. When we model, we model the skills we use, the approach, the attitude, the self-talk, whatever. We model that for students in the class. We talk about the importance of it and then we ask them to come close to our models and they can’t. While they practice that skill, we coach them through it. We talk about how well they’re doing, how hard they’re working. ‘Aren’t you proud of yourself for what you’ve achieved?’ And we continue to model. Another model is needed. Not the same model, but a similar model that shows the same thing. Just thinking of a classroom model when I’m teaching a lesson, but also thinking behavioral models are important.”
“But I also think that teachers generally, and now that I’m in a lot of classrooms, I see a lot of range in the use of modeling or no use of modeling. I think that when teachers deliberately use it and when they talk about the importance of it, and when they talk about how all these conscious efforts to incorporate that into a learning experience to make a difference. Yes, at times, it’s difficult. Our first reaction, and I was one, teachers will say, ‘I don’t have time for that in my classroom. I have content to teach. I have too much stuff. I can’t get through the book anyway.’ What my own practice taught

16
me, and the practice of many of my very effective colleagues taught me, is that this deliberate setting up the situation, self-talk or modeling through the situation, and processing afterwards, especially processing afterwards, makes a difference about how the content is learned.”
School factors. Participants from three of the focus group sessions brought up problems with the school in connection with the achievement gap. One participant cited the lack of discipline in the school setting due to the inability to spank children today. Some of the other responses presented issues with the curriculum being taught in the schools, as well as the way that children are placed in classes. This theme was mentioned a total of 14 times. Below are 4 quotes that fairly represent the responses made concerning this theme.
“If you look at the literature that we ask these children to read. It many times has absolutely no relevance to the African American. It’s not about African Americans. It doesn’t include them or includes them in stereotyped roles. It’s not necessarily like. . . . Take the African American authors are not identified or recognized or appreciated. I think the literature that we use to help kids learn to read is not appropriate or not adequate. “In our curriculum, we have not embraced the whole thing. In how we discipline, we have not embraced the whole thing. Because if this way of doing it works for some kids, who are the kids that it works on, then you know who we value and if it doesn’t work for these kids then we devalue them. And that’s something we have to look for.” “In special ed, when I started to learn in the beginning, I had all of my kids just in my class where I started inclusion again in the 7th grade and I had social studies class out mixed with the regular ed and I have English mixed. It’s amazing how much more those kids are learning out in a regular classroom mixed with other kids who do have some higher abilities, but they are trying just as hard, even harder now, because they see those other kids working. Just by looking at the special ed. vs. regular ed. I think it’s the same kind of factors. You have to give children a chance. It’s just amazing.” “I think it’s just the way we’ve been doing things is that it’s the way it’s always been done. We always put the top kinds in one class and the bottom kids in another. But who determines which child goes to the top or what? Basically, it’s math. So, those are the ones that we look to as our national honor society and all that. These other kids, one of the reasons that we think they don’t know how to behave in these assemblies is because there’s nothing there for them. Because they’re not included in the whole structure of why we’re there. Unless we can include them in the regular classrooms, instead of homogeneously, just random group them, 1-3-4-6. Who are they going to hurt? I don’t understand.”

17
The participants at High School D mentioned that there is no support structure in place for the students. For instance, one participant stated, “Do you not feel that it is because we have Head Start. We have ‘let’s start them to school early.’ We have all of those things and by third grade their support means is not there for that kid. They play catch up to that point and they’re alright. Then in third grade, you get that separation because there is not that remediation, there’s not that support.” In response, another participant noted, “I think there is a reading achievement gap because of a breakdown. That support that was there for those kids in Head Start that helped them get there. Then there was a breakdown.” The participants at Elementary School I and Middle School C pointed out deficiencies in the testing policies as a reason for the achievement gap between White and African American students. The following are the pertinent responses within this theme.
“I think what we are judged by is standardized test scores. So, that’s what’s foremost in my brain because it’s the first thing that people ask about. The first thing that people look at. When I think of standardized tests, I know many children cannot succeed on the standardized test. Their reading style does not match what it takes to do the standardized test. That’s why I made that comment about learning styles and curriculum.” “No, any testing. Because you can look at standardized tests. You can look at the way the teachers test in their classes. The balances and the grades for the tests as opposed to everything else they do whether it’s a project, creativity, whether we prepare kids for testing . . . it’s all testing.”
Other themes were commented on by focus group participants less frequently. One such theme, mentioned in connection with all of the groups a total of six times, was the level of expectations held by family, students and teachers. Another theme noted once was the student’s craving for interaction with adults. Participants from one focus group session also cited deficiencies resting with the county school board and sSuperintendent as barriers to overcoming the achievement gap.

APPENDIX I
SEDCAR Checklist