Enhancing the Automotive E/E Architecture Utilising Container ...
234
Enhancing the Automotive E/E Architecture Utilising Container-Based Electronic Control Units PhD Thesis Nicholas Ayres This thesis is submitted in partial fulfilment of the requirements for the Doctor of Philosophy Faculty of Computing, Engineering and Media De Montfort University January 2021
-
Upload
khangminh22 -
Category
Documents
-
view
1 -
download
0
Transcript of Enhancing the Automotive E/E Architecture Utilising Container ...

Enhancing the Automotive E/E Architecture Utilising Container-Based Electronic Control
Units
PhD Thesis
Nicholas Ayres
This thesis is submitted in partial fulfilment of the requirements for the
Doctor of Philosophy
Faculty of Computing, Engineering and Media
De Montfort University
January 2021
i
Declaration of Authorship
I, Nicholas Ayres, declare that this thesis entitled Enhancing the Automotive E/E Architecture Utilising
Container-Based Electronic Control Units and its work are my own and original. It is submitted for the
degree of Doctor of Philosophy at De Montfort University. The work was undertaken between October
2016 and January 2021.
ii
Abstract
Over the past 40 years, with the advent of computing technology and embedded systems, such as
Electronic Control Units (ECUs), cars have moved from solely mechanical control to predominantly digital
control. Whilst improvements have been realised in terms of passenger safety and vehicle efficiency, there
are several issues currently facing the automotive industry as a result of the rising number of ECUs. These
include greater demands placed on power, increased vehicle weight, complexities of hardware and
software, dependency on software, software life expectancy, ad-hoc methods concerning automotive
software updates, and rising costs for the vehicle manufacturer and consumer. As the modern-day motor
car enters the autonomous age, these issues are predicted to increase because there will be an even
greater reliance on computing hardware and software technology to support these new driving functions.
To address the issues highlighted above, a number of solutions that aid hardware consolidation and
promote software reusability have been proposed. However, these depend on bespoke embedded
hardware and there remains a lack of clearly defined mechanisms through which to update ECU software.
This research moves away from these current practices and identifies many similarities between the
datacentre and the automotive Electronic and Electrical (E/E) architecture, demonstrating that
virtualisation technologies, which have provided many benefits to the datacentre, can be replicated within
an automotive context. Specifically, the research presents a comprehensive study of the Central Processor
Unit (CPU) and memory resources required and consumed to support a container-based ECU automotive
function. The research reveals that lightweight container virtualisation offers many advantages. A
container-based ECU can promote consolidation and enhance the automotive E/E architecture through
power, weight and cost savings, as well as enabling a robust mechanism to facilitate future software
updates throughout the lifetime of a vehicle. Furthermore, this research demonstrates there are
opportunities to adopt this new research methodology within both the automotive industry and industries
that utilise embedded systems, more broadly.

iii
Publications and Presentations
Conference Paper
N. Ayres, L. Deka and B. Passow, "Virtualisation as a Means for Dynamic Software Update within the
Automotive E/E Architecture," 2019 IEEE SmartWorld, Ubiquitous Intelligence & Computing, Advanced &
Trusted Computing, Scalable Computing & Communications, Cloud & Big Data Computing, Internet of
People and Smart City Innovation (SmartWorld/SCALCOM/UIC/ATC/CBDCom/IOP/SCI), Leicester, United
Kingdom, 2019, pp. 154-157, DOI: 10.1109/SmartWorld-UIC-ATC-SCALCOM-IOP-SCI.2019.00068.
Presentations
N. Ayres “Automotive Virtualisation as a Mechanism for Future Software Updates” 2018 Embedded World
Expo 2018, Nuremberg, Germany
N Ayres “Containerisation: A mechanism to provide seamless automotive software updates” 2019 Research
Poster Competition, De Montfort University (1st Place poster see Appendix E)
iv
Acknowledgements
This thesis would not have been completed without the advice, recommendations and encouragements
from many people. It is not possible to mention all of those here, but their contribution, guidance and
support are highly valued.
Thankfully, Dr Lipika Deka, my supervisor, was generous with her time, knowledge, and patience. She made
sure I kept on track when many times I went off on various tangents. Your thoughts, recommendations and
persistence are much appreciated.
Thank you to my second supervisor Dr Daniel Paluszczyszyn who provided another perspective to my
research and who’s insights were invaluable.
I would also like to thank Valentin Barraud, and Jean Baptiste, who’s assistance in setting up the automotive
testbed hardware and software was invaluable.
My final and most significant praise is for my family; my parents, partner, and son. The list of the sacrifices
they have made for me to complete this research is endless. Their support and love have been incredible.
v
Table of Contents
Chapter 1 Introduction ........................................................................................................................................ 1
1.1 Motivation.......................................................................................................................................... 1
1.2 Research Questions ........................................................................................................................... 6
1.3 Original Contributions ....................................................................................................................... 6
1.4 Thesis Outline .................................................................................................................................... 7
Chapter 2 Research Background .......................................................................................................................10
2.1 Introduction .....................................................................................................................................11
2.2 Chronology of Automotive Embedded Systems ............................................................................11
2.3 Automotive ECU Design Considerations ........................................................................................15
2.4 The Automotive ECU Architecture .................................................................................................16
2.5 ECU Types and Automotive Domains .............................................................................................18
2.6 Qualities of the Automotive ECU ....................................................................................................21
2.7 Chapter Summary ............................................................................................................................23
Chapter 3 Automotive E/E Architecture: Challenges and Complexities .........................................................24
3.1 Introduction .....................................................................................................................................25
3.2 Issues Associated with Automotive Computing Hardware ...........................................................25
3.3 Complexities ....................................................................................................................................31
3.4 State of the Art Hardware ...............................................................................................................33
3.5 Software Associated Issues .............................................................................................................34
3.6 Automotive Software Updating ......................................................................................................40
3.7 Chapter Summary ............................................................................................................................48
vi
Chapter 4 Automotive Virtualisation ................................................................................................................49
4.1 Introduction .....................................................................................................................................50
4.2 Overview of Virtualisation Technology ..........................................................................................50
4.3 The General Benefits of Virtualisation within the Automotive E/E Architecture.........................55
4.4 Future automotive E/E architectures utilising container-based virtualisation ............................57
4.5 Chapter Summary ............................................................................................................................61
Chapter 5 Container System Prototype ............................................................................................................62
5.1 Container System Prototype Introduction .....................................................................................63
5.2 Automotive Regulations ..................................................................................................................63
5.3 Control Systems and Control System Transactions .......................................................................65
5.4 Automotive Central Locking Mechanism .......................................................................................68
5.5 Automotive Central Locking Test System Model Requirements ..................................................69
5.6 Testbed ECU and Sensor Hardware ................................................................................................75
5.7 Testbed ECU Software .....................................................................................................................79
5.8 Research Testbed Build Stages .......................................................................................................81
5.9 Testbed Individual System Functional Testing and Data Verification ...........................................82
5.10 Chapter Summary ............................................................................................................................85
Chapter 6 System Resource Evaluation ............................................................................................................86
6.1 Introduction .....................................................................................................................................87
6.2 ECU System Testing .........................................................................................................................87
6.3 ECU Test Modes of Operation ........................................................................................................88
6.4 Test Measurement Methodology ...................................................................................................89
6.5 Key System Performance Metrics Overview ..................................................................................92
vii
6.6 CPU and Memory Monitoring Tools ...............................................................................................92
6.7 CPU Saturation Tests .......................................................................................................................97
6.8 CPU Utilisation Tests .................................................................................................................... 116
6.9 Memory Saturation ...................................................................................................................... 125
6.10 Memory Utilisation ....................................................................................................................... 133
6.11 Evaluation of Container Specific Resource Consumption .......................................................... 137
6.12 Testing the Suitability of Containers and the Possibility of ECU Consolidation ........................ 140
Chapter 7 Software Update Evaluation ......................................................................................................... 157
7.1 Introduction .................................................................................................................................. 158
7.2 Current Automotive Software Re-flashing Techniques .............................................................. 159
7.3 Benefits of Container-Based Automotive Software Updates ..................................................... 160
7.4 Types of Container-Based Software Updates ............................................................................. 161
7.5 The Case for Dynamic Software Updates .................................................................................... 162
7.6 Current Automotive DSU Techniques ......................................................................................... 163
7.7 The Benefits of Container Images to Automotive Software Updates ....................................... 164
7.8 Container Checkpoint and Restore.............................................................................................. 168
7.9 Chapter Summary ......................................................................................................................... 170
Chapter 8 Conclusion ...................................................................................................................................... 172
8.1 Research Summary ....................................................................................................................... 172
8.2 Key Findings .................................................................................................................................. 173
8.3 The Relevance of this Research ................................................................................................... 175
8.4 Future Work .................................................................................................................................. 177
References ....................................................................................................................................................... 179

viii
Appendices ...................................................................................................................................................... 193
Appendix A Software Tools ........................................................................................................................ 194
Appendix B Individual ECU runq-sz Results ............................................................................................... 198
Appendix C Individual ECU ldavg Results .................................................................................................. 199
Appendix D ECU CPU Utilisation Tests ....................................................................................................... 201
Appendix E 1st Prize DMU Research Poster Competition ......................................................................... 205
Appendix F Automotive Testbed Hardware .............................................................................................. 206
Appendix G ECU Functional Scripts ........................................................................................................... 207
Appendix H CPU Bound Process Script ...................................................................................................... 218
List of Figures
Figure 1: A typical automotive ECU) .................................................................................................................11
Figure 2: Mechanical vs digital control .............................................................................................................13
Figure 3: Shift from single to system innovation .............................................................................................14
Figure 4: Typical ECU hardware/software architecture ...................................................................................16
Figure 5: Middleware .........................................................................................................................................18
Figure 6: Example ECU layout within the modern motor car ..........................................................................19
Figure 7: ECU market by automotive domain ..................................................................................................26
Figure 8: Automotive E/E cost compared to overall vehicle cost ...................................................................27
Figure 9: Automotive E/E market worth ...........................................................................................................27
Figure 10: Electronic cost as a percentage of total car cost ............................................................................28
Figure 11: ECU power consumption .................................................................................................................30
Figure 12: U.S. vehicle recalls relating to electronic components ..................................................................35
Figure 13: Vehicle lifecycle ................................................................................................................................37
Figure 14: Consumer preferences in vehicle choice ........................................................................................39

ix
Figure 15: Example of a current safety recall procedure ................................................................................42
Figure 16: Cost multiplier of fixing a flaw at different stages of the SDLC .....................................................43
Figure 17: Estimated connected vs non-connected new vehicles ..................................................................46
Figure 18: Type 1 and Type 2 full system virtualisation ...................................................................................51
Figure 19: ETAS RTA embedded hypervisor .....................................................................................................52
Figure 20: Container architecture .....................................................................................................................53
Figure 21: Container creation cycle ..................................................................................................................54
Figure 22: Isolation from attack propagation ...................................................................................................56
Figure 23: An example CST ................................................................................................................................65
Figure 24: Example of a distributed software function across two ECUs .......................................................66
Figure 25: Audi reverse gear/light function .....................................................................................................67
Figure 26: Central locking context diagram ......................................................................................................68
Figure 27: Central locking mechanism functional architecture ......................................................................69
Figure 28: Central locking function process flowchart ....................................................................................74
Figure 29: ECU central locking function testbed hardware .............................................................................76
Figure 30: Testbed door central locking function ............................................................................................78
Figure 31: Test Plan Procedure .........................................................................................................................91
Figure 32: Software Tools and Architectural Areas of Testing ........................................................................93
Figure 33: vmstat sample output (ECU001) .....................................................................................................93
Figure 34: Example of a sar output ...................................................................................................................95
Figure 35: Context switching process ............................................................................................................ 124
Figure 36: Container Image layers ................................................................................................................. 165
Figure 37: Independent Image download – alpine-python2 Image ............................................................. 165
Figure 38: Independent Image download – alpine-python3 Image ............................................................. 166
Figure 39: alpine-python2 Image in local repository .................................................................................... 167
Figure 40: alpine-python3 image download ................................................................................................. 167
x
List of Tables
Table 1: Transmission activated door lock/unlock function by selected gear ................................................72
Table 2: Vehicle speed activated door lock/unlock function...........................................................................73
Table 3: CPU software tools quick reference ...................................................................................................96
Table 4: Memory software tool quick reference .............................................................................................97
Table 5: Container runq-sz averages .............................................................................................................. 101
Table 6: All native ECU load averages ............................................................................................................ 109
Table 7: All container ECU load averages ...................................................................................................... 110
Table 8: All ECU total function load ............................................................................................................... 110
Table 9: Scheduler statistics - time spent on CPU and runq ......................................................................... 111
Table 10: Native test ECU functional software timings ................................................................................ 114
Table 11: Engine ECU CPU utilisation data .................................................................................................... 119
Table 12: Gear ECU CPU utilisation data ....................................................................................................... 119
Table 13: Door ECU CPU utilisation data ....................................................................................................... 120
Table 14: Light ECU CPU utilisation data ....................................................................................................... 121
Table 15: All ECU CPU utilisation data ........................................................................................................... 122
Table 16: Total free memory, buffers and cache .......................................................................................... 129
Table 17: Standard image download and extraction times and storage requirements ............................. 166
Table 18: Shared image layers with reduced size on disk and download times ......................................... 168
Table 19: CRIU test cases on several Ubuntu OS versions ........................................................................... 168
xi
List of Charts
Chart 1: Example baseline runq-sz test ............................................................................................................99
Chart 2: Engine ECU runq-sz test ......................................................................................................................99
Chart 3: Gear ECU runq-sz .............................................................................................................................. 100
Chart 5: Light ECU runq-sz .............................................................................................................................. 100
Chart 4: Door ECU runq-sz .............................................................................................................................. 100
Chart 6: plist-sz Base mode test ..................................................................................................................... 102
Chart 7: plist-sz Native mode test .................................................................................................................. 102
Chart 8: plist-sz Container mode test ............................................................................................................ 102
Chart 9: Example ECU ldavg triplet test ........................................................................................................ 105
Chart 10: Engine ECU ldavg-1 test ................................................................................................................. 106
Chart 11: Engine ECU ldavg-5 test ................................................................................................................. 106
Chart 12: Engine ECU ldavg-15 test ............................................................................................................... 106
Chart 13: Gear ECU ldavg-1 test .................................................................................................................... 106
Chart 14: Gear ECU ladvag-5 test .................................................................................................................. 107
Chart 15: Gear ECU ldavg-15 test .................................................................................................................. 107
Chart 16: Door ECU ldavg-1 test .................................................................................................................... 107
Chart 17: Door ECU ldavg-5 test .................................................................................................................... 107
Chart 18: Door ECU ldavg-15 test .................................................................................................................. 108
Chart 19: Light ECU ldavg-1 test .................................................................................................................... 108
Chart 20: Light ECU ldavg-5 test .................................................................................................................... 108
Chart 21: Light ECU ldavg-15 test .................................................................................................................. 108
Chart 22: Time on CPU native and container test ......................................................................................... 111
Chart 23: Time on run queue native and container test .............................................................................. 112
Chart 24: Functional software total runtime ................................................................................................. 113
Chart 25: Functional software average delay time ....................................................................................... 113
Chart 26: Functional software maximum delay time .................................................................................... 113

xii
Chart 27: Sample %system across all CPUs ................................................................................................... 117
Chart 28: Sample %user across all CPUs ........................................................................................................ 117
Chart 29: Sample %utilisation across all CPUs .............................................................................................. 118
Chart 30: Engine ECU %user native and container test ................................................................................ 118
Chart 31: Engine ECU %system native and container test ........................................................................... 118
Chart 32: Engine ECU %utilisation native and container test ....................................................................... 118
Chart 33: Gear ECU %user native and container test ................................................................................... 119
Chart 34: Gear ECU %system native and container test............................................................................... 119
Chart 35: Gear ECU %utilisation native and container test .......................................................................... 119
Chart 36: Door ECU %user native and container test ................................................................................... 120
Chart 37: Door ECU %system native and container test .............................................................................. 120
Chart 38: Door ECU %utilisation native and container test .......................................................................... 120
Chart 39: Light ECU %user native and container test ................................................................................... 121
Chart 40: Light ECU %system native and container test .............................................................................. 121
Chart 41: Light ECU %utilisation native and container test .......................................................................... 121
Chart 42: Instructions per cycle - all ECUs, all tests ...................................................................................... 123
Chart 43: Native and container context switching across all ECUs .............................................................. 125
Chart 44: Gear ECU frmpg/s native and container test ................................................................................ 126
Chart 45: Door ECU frmpg/s native and container test ................................................................................ 126
Chart 46: Light ECU frmpg/s native and container test ................................................................................ 127
Chart 47: Engine ECU frmpg/s native and container test ............................................................................. 127
Chart 48: Door ECU buffers allocated native and container test ................................................................. 127
Chart 49: Engine ECU buffers allocated native and container test .............................................................. 127
Chart 50: Gear ECU buffers allocated native and container test ................................................................. 127
Chart 51: Light ECU buffers allocated native and container test ................................................................. 127
Chart 52: Engine ECU cached pages native and container test ................................................................... 128
Chart 53: Door ECU cached pages native and container test ...................................................................... 128
Chart 54: Gear ECU cached pages native and container test ....................................................................... 128

xiii
Chart 55: Light ECU cached pages native and container test ....................................................................... 128
Chart 56: Total page faults - all ECUs, all test modes ................................................................................... 131
Chart 57: Minor page faults raised by python script - all ECUs ................................................................... 132
Chart 58: Major page faults raised by python script - all ECUs .................................................................... 132
Chart 59: All page faults raised for shim execution ...................................................................................... 132
Chart 60: Door ECU memory use native and container test ........................................................................ 133
Chart 61: Engine ECU memory use native and container test ..................................................................... 133
Chart 62: Gear ECU memory use native and container test ........................................................................ 134
Chart 63: Light ECU memory use native and container test ........................................................................ 134
Chart 64: Unique set size memory - all ECUs, all tests ................................................................................. 135
Chart 65: Unique set size by process container test ..................................................................................... 135
Chart 66: Unique set size python only - all ECUs, native and container test ............................................... 135
Chart 67: Engine ECU container CPU use by process ................................................................................... 138
Chart 68: Gear ECU container CPU use by process ....................................................................................... 138
Chart 69: Door ECU container CPU use by process ...................................................................................... 138
Chart 70: Light ECU container CPU use by process ...................................................................................... 138
Chart 71: Gear ECU container memory use by process ............................................................................... 138
Chart 72: Engine ECU container memory use by process ............................................................................ 138
Chart 73:Door ECU container memory use by process ................................................................................ 139
Chart 74: Light ECU container memory use by process ............................................................................... 139
Chart 75: ldavg-1 stress test – no applied load ............................................................................................. 142
Chart 76: ldavg-5 stress test - no applied load.............................................................................................. 142
Chart 77: ldavg-15 stress test - no applied load ........................................................................................... 143
Chart 78: ldavg-5 stress test – CPU load applied .......................................................................................... 143
Chart 79: ldavg-1 stress test – CPU load applied .......................................................................................... 143
Chart 80: ldavg-15 stress test - CPU load applied ......................................................................................... 144
Chart 81: ldavg-1 stress test - memory load applied .................................................................................... 144
Chart 82: ldavg-5 stress test - memory load applied .................................................................................... 144

xiv
Chart 83: ldavg-15 stress test - memory load applied .................................................................................. 145
Chart 84: ldavg-1 stress test - I/O load applied ............................................................................................. 145
Chart 85: ldavg-5 stress test - I/O load applied ............................................................................................. 145
Chart 86: ldavg-5 stress test - all loads applied ............................................................................................ 146
Chart 87: ldavg-1 stress test - all loads applied ............................................................................................ 146
Chart 88: ldavg-15 stress test - I/O load applied .......................................................................................... 146
Chart 89: ldavg-15 - all loads applied ............................................................................................................ 147
Chart 90: ldavg triplet test - no applied load ................................................................................................ 147
Chart 91: ldavg triplet test - CPU load applied .............................................................................................. 148
Chart 92: ldavg triplet test - memory load applied ....................................................................................... 148
Chart 93: ldavg triplet test - I/O load applied ............................................................................................... 149
Chart 94: ldavg triple test - all loads applied ................................................................................................. 149
Chart 95: Script execution times - no applied load ....................................................................................... 150
Chart 96: Script execution times under CPU load ......................................................................................... 150
Chart 97: Script execution times under memory load .................................................................................. 150
Chart 98: Script execution times under I/O load........................................................................................... 151
Chart 99: Script execution times under all loads .......................................................................................... 151
Chart 100: Script execution time run average .............................................................................................. 152
Chart 101: Native CPU %user utilisation ....................................................................................................... 152
Chart 102: Native CPU %system utilisation ................................................................................................... 152
Chart 103: Container CPU %user utilisation .................................................................................................. 153
Chart 104: Container CPU %system utilisation ............................................................................................. 153
Chart 105: High priority %user CPU utilisation ............................................................................................. 153
Chart 106: High priority %system CPU utilisation ......................................................................................... 153
Chart 107: %user - all stress tests applied ..................................................................................................... 153
Chart 108: %system - all stress tests applied ................................................................................................ 153
Chart 109: CRUI Stages and associated completion times ........................................................................... 169
xv
Abbreviations ABS Anti-lock Braking System ADAS Advanced Driving Assistance Systems API Application Programming Interface ARM Advanced RISC Machine ASIL Automotive Safety Integrity Level BCM Body Control Module CAN Controller Area Network CLI Command Line Interface CST Control System Transaction DSRC Dedicated Short Range Communications DSU Dynamic Software Update E/E Electrical and Electronic EBCM Electronic Brake Control Module ECM Engine Control Module ECU Electronic Control Unit EMS Engine Management System GPIO General Purpose Input Output GPS Global Positioning System HIL Hardware In the Loop HMI Human Machine Interface IPC Instructions per Cycle LED Light Emitting Diode LiDAR Light Detection and Ranging LIN Local Interconnect Network LTE Long Term Evolution MIL Model In the Loop MOST Media Orientated System Transport OEM Original Equipment Manufacturer OS Operating System OtA Over the Air P2P Point to Point PCM Power Control Module PIL Processor In the Loop PSS Proportional Set Size r/min Revolutions per Minute RISC Reduced Instruction Set RSS Resident Set Size SIL Software In the Loop USB Universal Serial Port USS Unique Set Size V2I Vehicle to Infrastructure V2V Vehicle to Vehicle VM Virtual Machine VMM Virtual machine Monitor WLAN Wireless Local Area Network
1
Chapter 1 Introduction
1.1 Motivation
Since its introduction to a mass market in the early 1900s, the motorcar changed little in principle until the
late 1970s. For nearly 70 years the car was solely considered a mechanically connected, operated and
monitored system. To enable a vehicle to move, manoeuvre and stop, required physical driver inputs
through physical linkages connected to various vehicle components. Today, the motor car cannot be
considered a solely mechanical device because of the introduction of the automotive embedded system.
Embedded into various automotive subsystems throughout the modern motor car is a multitude of
computer-based hardware and software, commonly known as the Electronic Control Unit (ECU). An
automotive ECU similar to an embedded system is a "union of computer hardware and software" fused
into a physical system (Edwards et al., 1997). Over the past 40 years, since their introduction,
advancements in electronics, especially embedded computing technology, has extended ECU use into
every facet of the vehicle. This widespread use includes, but is not limited to, the vehicle’s engine,
suspension, braking, passenger safety and comfort. Specific motor vehicle models now incorporate more
than 100 ECUs often interconnected through several automotive networks providing thousands of vehicle
and passenger related functions (Petri et al., 2016). The driving force behind consumer vehicle choice and
purchase is no longer fuel efficiency, vehicle range or performance, rather, in-car technology is now the
main motivating factor influencing consumer choice (Breitschwerdt et al., 2017).
The automotive Electrical and Electronic (E/E) architecture has matured from simple single-function
microprocessor equipped hardware to multiple networked multicore systems, managing all aspects of the
vehicle’s operation and human-machine interactions. As more mechanical systems are digitised, they
undoubtedly promote safety and operational efficiency, but this provisioning is at the cost of continual
increases of computing hardware and software dependencies. The constant growth of technology within
the automotive E/E architecture adversely affects system and software development and implementation
2
and integration costs. However, cost is not the only concern with increasing technology use. Software has
become a vital and intrinsic component of the modern motor car.
The automotive industry is rapidly adopting autonomous driving features and functions which promote
vehicle occupant safety and lower the increasing global levels of vehicle-related accidents, injuries and
deaths (World Health Organization, 2018). Vehicle autonomy requires even more computing technology,
adding to an already burdened automotive E/E architecture. To address hardware and software challenges
facing the automotive E/E architecture and the automotive industry as a whole requires a new approach
to providing ECU functionality. The evolution of the automotive E/E architecture can draw many parallels
with the traditional datacentre. Within a datacentre, clients access systems and services from dedicated
servers. This arrangement is comparable to the modern motor car where sensors and actuators are the
clients sending and receiving data to and from ECUs, which are analogous to servers. The traditional
datacentre has historically endured ever-increasing numbers of underutilised hardware, where new
business functions often require a dedicated server to meet demand (Scheepers, 2014; Rolik et al., 2017).
Like the automotive E/E architecture, the traditional datacentre has suffered from several issues, including
hardware decentralisation, rising hardware implementation and operational costs, space constraints and
increasing complexity. A technology that has addressed many of the shortcomings of the datacentre is the
introduction of virtualisation. To promote system consolidation, multiple independent automotive
functions need to merge with fewer hardware devices. Thus, a new approach to the automotive E/E
architecture, similar to a datacentre model, is required. This empirical research explores how a specific
lightweight virtualisation technique can be deployed within the automotive E/E architecture, addressing
many of the current identified hardware and software issues and providing a standardised mechanism to
promote continual software updates throughout the vehicle's lifetime.
1.1.1 Lightweight container-based ECUs
Although not a new technology, full system virtualisation is slowly being incorporated into the modern
motor car and offers several key benefits to the automotive E/E architecture. These benefits include the
security and separation of different automotive ECU based functions on shared computing devices within
3
the vehicle. The main area where virtualisation is currently employed within the automotive E/E
architecture is within the human-machine interface (HMI), otherwise known as the vehicle head unit. The
HMI is a device shared between two different and distinct vehicle functions: occupant entertainment and
vehicle subsystem monitoring and configuration. Within this context, it offers a robust and secure
separation of specific vehicle functions (Campagna and Violante, 2012). However, this virtualisation
technique is not a suitable technology in ECU consolidation. Fundamentally, full system virtualisation is a
virtual representation of a complete computing system. Both hardware and software are emulated into a
virtual machine (VM) managed by a hypervisor or virtual machine monitor (VMM). The system resource
overheads required to support full system virtualisation are well documented (Walters et al., 2008; Padala
et al., 2008; Aguiar and Hessel, 2010; McDougall and Anderson, 2010; Campagna and Violante, 2012;
Bermejo and Juiz, 2020; Bermejo et al., 2019). However, to facilitate ECU consolidation more, ECUs need
to be brought within the sphere of virtualisation. Full system virtualisation is not ideal for embedded
systems primarily due to the limitations in available system resources.
A virtualisation technology that offers considerable potential to the automotive E/E architecture is
operating system virtualisation, better known as containers or containerisation. Unlike full system
virtualisation where a program in execution can see all of the virtualised system resources, the same
program executing within a container can only access the devices or resources explicitly assigned to it
during creation. A container-based ECU must support an automotive function by providing the same level
of service employed in the standard native hardware/software execution of that function. This research
evaluates the suitability of container-based ECUs within the modern automotive E/E architecture. Firstly, it
will investigate the specific system hardware and operating system (OS) kernel resources required to
support an ECU based automotive function within a container environment. Secondly, a custom system
resource testing methodology will be defined and used to evaluate this virtualisation technology. To test a
container-based automotive function, a custom hardware testbed will be constructed. This will include
several general-purpose computing devices similar in hardware architecture to an automotive ECU and
several specific hardware peripherals. This testbed will be used as a basis for modelling an automotive
central locking mechanism function. A series of utilisation, saturation and duration tests will be performed
4
to record and evaluate key system resource metrics across individual containers and the complete
simulated automotive function. Subsequently, this research will investigate how OS virtualisation can be
deployed as container-based ECUs to enhance the automotive E/E architecture through ECU consolidation.
A series of CPU, memory and Input-Output (I/O) stress tests will be conducted against the execution of a
control software program in native and container execution modes to understand the effect on program
execution. Ultimately, this research will determine the most suitable types of CPU, memory or I/O bound
containerised automotive functions that can be consolidated onto single platform ECUs to promote ECU
consolidation and all the potential benefits that entail.
1.1.2 Software integration through container-based ECUs
This research demonstrates that software is as vital as any significant physical element within the modern
motor car. According to Haghighatkhah et al., (2017) "over 80% of innovations in the automotive industry
are now realised by software-intensive systems". Over 100 million lines of software code across 100 ECUs
can be found within the automotive E/E architecture of many modern motor vehicles providing vehicle
functions from engine management to passenger comfort (Petri et al., 2016; Breitschwerdt et al., 2017).
These diverse functions make the modern motor car one of the most software-intensive systems we use
in our day-to-day lives (Coppola and Morisio, 2016; Petri et al., 2016; Riggs et al., 2018). There are regular
and periodic preventative and proactive maintenance procedures of a vehicle’s physical components
throughout its lifetime (Levitt, 2003). However, the same statement cannot be said concerning automotive
software. Despite the requirement for reliable software, bugs and errors are unintentional but appear
frequently within software code (Hangal and Lam, 2002; Onuma et al., 2016). How and why software code
contains errors and flaws are varied (Noergaard, 2005; Ebert and Jones, 2009; Heiser, 2009). Problems are
often introduced during the various stages of the software lifecycle. For example, bugs and errors in
software code can lead to unexpected results in the output of software-driven devices and functions. This
research will examine the current practice of automotive software updates and their specific associated
inadequacies.

5
A container-based ECU automotive E/E architecture can address many of the current software update
issues. It can provide a scalable and updateable solution that is not dependant on many applications of
individual hardware systems, which is the standard practice in current automotive E/E architectures. In
addressing the deficiency in automotive software updates, this research identifies several potential
automotive software update modes that can provide a software update mechanism to enable continuous
software deployment throughout the vehicle's lifetime. A series of tests will be conducted utilising the
container hardware testbed which will demonstrate how container-based ECU functionality can be altered,
enhanced and updated and the specific download and update times required to complete an update of a
particular ECU system.

6
1.2 Research Questions
This thesis will investigate four broad research questions:
- What are the specific differences in system hardware resource use of container-based ECUs compared
with current native ECU execution?
- The most suitable process types that can be consolidated on to a single container-based ECU
- How can container-based ECUs facilitate a robust software update mechanism?
- What are the specific software update procedures and benefits provided by container-based ECUs?
1.3 Original Contributions
This research advances current knowledge and understanding by making the following novel contributions:
Contribution 1: The novel use of container-based virtualisation techniques to support ECU software
functionality.
Contribution 2: A detailed study of the specific container system resource use focusing on CPU and memory
utilisation and saturation, to enhance understanding of the additional resources required to support a
container environment on small computing devices. This research will extend the work on performance
evaluation and discussion surrounding containers and the Internet of Things (IoT) devices presented by
Krylovskiy, (2015) and Xavier et al., (2013) in their work entitled “Performance Evaluation of Container-
Based Virtualization for High Performance Computing Environments”.
Contribution 3: A generic automotive testbed system that can be used to test container-based ECU
functionality against a novel testing methodology. This contribution extends the work on physical testbed
research by Hurst, et al., (2017) and the work presented by Johnston and Cox (2017) surrounding the
Raspberry Pi as a prototyping platform and host for container virtualisation.
Contribution 4: Currently, there is limited research exploring multiple memory, CPU and I/O bound
processes running within containers and how these affect overall container performance. The research will
7
demonstrate the most suitable container combinations that can be hosted on a single small computing
device.
Contribution 5: There is currently no standardised automotive software update mechanism. Furthermore,
the process is often ad-hoc depending on the manufacturer and vehicle model. This research evaluates
three identified modes of automotive software updates associated with a container-based ECU.
1.4 Thesis Outline
This thesis will be organised around the following themes:
• Chapter 2 Research Background
This chapter details the automotive ECU, including a chronology that provides context to the first
ECU use and how they are currently being utilised within the modern automotive E/E architecture.
It will investigate some of the specific considerations involving automotive ECU design and how
they have shaped and influenced the automotive ECU architecture. Subsequently, it will provide
an overview of the main types of ECUs found within the modern motor car and their organisation.
The chapter also highlights many of the benefits ECUs provide to the vehicle's operation and its
occupants.
• Chapter 3 Automotive E/E Architectures: Current Issues and Complexities
The first part of this chapter provides an overview of the issues and concerns facing the modern
automotive E/E architecture in the 21st century, also identifying sources of complexity found
within the automotive E/E architecture. The second part of this chapter divides the identified
issues and complexities between automotive hardware and software and explains the specific
associated problems. The chapter concludes with an overview of current automotive software
update procedures and practices and how these apply to automotive hardware and software.
8
• Chapter 4 Automotive Virtualisation
This chapter proposes the use of virtualisation to address the issues identified in chapter 3. It
provides an overview of the different types of virtualisation technology available and the specific
benefits virtualisation can offer the automotive E/E architecture. This chapter also examines how
container-based virtualisation is a crucial virtualisation technique that addresses the challenges
and complexities raised in chapter 2.
• Chapter 5 Container System Prototype
Firstly, this chapter will provide an overview of the design considerations necessary to implement
a modelled automotive function within an environment for testing the suitability of container
virtualisation. It will then present the rationale for modelling a vehicle central locking mechanism
and the various ECU types involved in providing this functionality. The interaction between the
various system components is detailed in several diagrams. A detailed description is also provided
of the necessary hardware and software required to model this function and the different
mechanism trigger functions.
• Chapter 6 Resource Evaluation
This chapter evaluates the research undertaken as part of this thesis. The proposed automotive
central locking function is modelled within the testbed in two distinct modes of operation: native
and container. The specific system resources required to support each of the operational modes
are measured utilising several software tools. A complete list of the software tools used and the
specific metrics they measure are provided. The chapter initially investigates two critical resource
use metrics - CPU saturation and utilisation - and how these are affected during each test mode
operation. Following CPU resource testing, the chapter examines overall memory saturation and
utilisation. The chapter then explores the specific resources required to support the automotive
function whilst running within a container ecosystem. Finally, the chapter investigates container
performance whilst artificial hardware resource stress loads are applied to understand the effects
on overall resource use and program execution timing.

9
• Chapter 7 Software Updates
This research identifies several issues concerning the increasing use and dependency on
automotive software to provide vehicle and occupant functionality. How new, updated or
modified software is deployed to a target vehicle is a problematic area of concern within the
automotive industry. This chapter will investigate the benefits that container virtualisation can
bring when addressing automotive software updates. The first section will look at the recognised
mechanisms of automotive software re-flashing. The chapter will then define three suitable
modes of container-based software updates and the associated vehicle operational states.
Dynamic Software Updates (DSU) will be investigated, including the benefits and factors to
consider when using this technique. The chapter concludes with a series of test cases detailing the
time taken to start, checkpoint and restore various sized containers from their associated images.
• Chapter 8 Conclusion
This final chapter summarises the research undertaken and revisits the original contributions.
Lastly, it proposes a series of areas for further associated research.

10
Chapter 2 Research Background
Research Background
Objectives
• Provide an overview and chronology of automotive embedded systems.
• Describe the design considerations of automotive ECUs.
• Investigate current automotive ECU architectures.
• Provide an overview of ECU types and automotive domains.

11
2.1 Introduction
This chapter introduces the embedded system within an automotive context and provides a chronology of
the principal automotive embedded system evolution stages. The various aspects and considerations of
automotive embedded system design are then highlighted before investigating the architectural hardware
characteristics and associated software of the automotive embedded system and their related functions.
Subsequently, this chapter provides an overview of the different embedded systems and automotive
domains found within the modern motor car. Finally, it lists some of the benefits that ECUs have brought
to the automotive E/E architecture. Figure 1 is a typical example of a modern automotive ECU.
Figure 1: A typical automotive ECU (ECU Technologies, 2014)
2.2 Chronology of Automotive Embedded Systems
In similar respects to embedded systems, automotive ECUs are computing-based systems fixed within a
piece of equipment within the car to monitor and control a particular function (Takada, 2012). ECUs
perform these tasks and functions repeatedly, often in real-time and within the harsh operating
environment of a functioning motor car where they are subjected to extreme external environmental
effects. During regular operation, a running motor car produces heat through combustion and vibration
from engine operation and movement. ECUs are exposed to external influences through atmospheric
conditions and G-Forces from the vehicle's acceleration and braking. Any ECU design must cope with these
conditions without impacting system performance or adversely affecting the designed task or function.
12
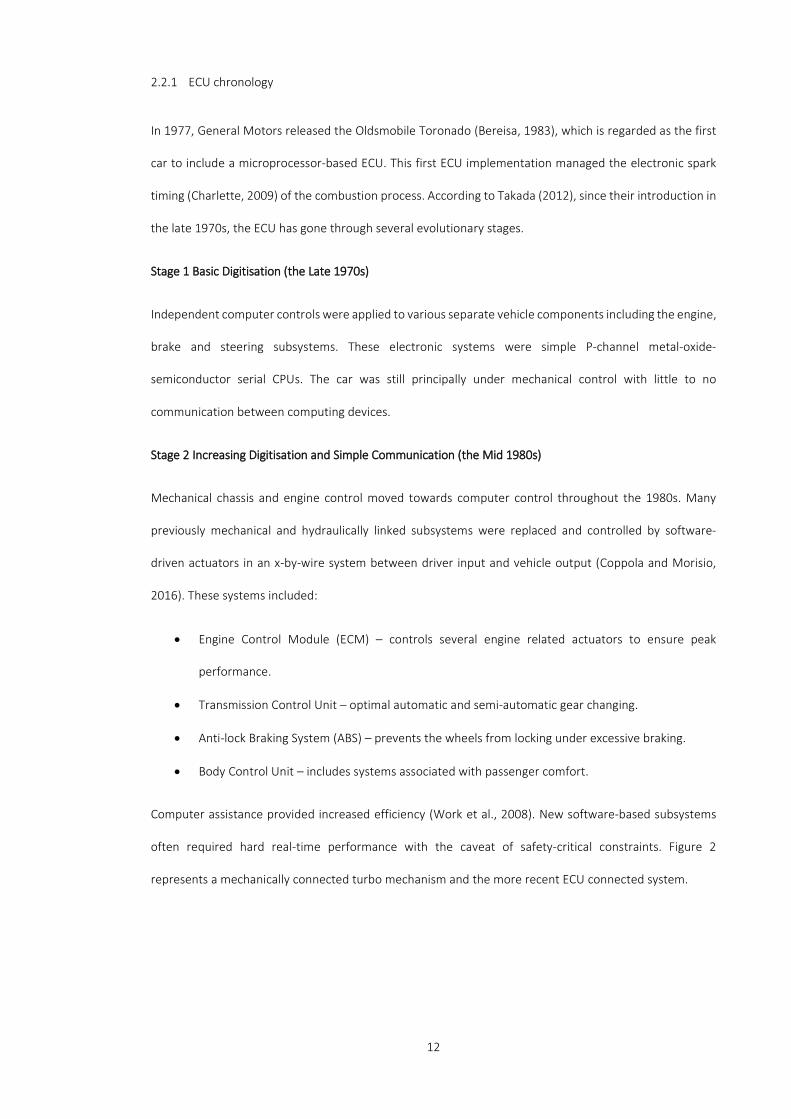
2.2.1 ECU chronology
In 1977, General Motors released the Oldsmobile Toronado (Bereisa, 1983), which is regarded as the first
car to include a microprocessor-based ECU. This first ECU implementation managed the electronic spark
timing (Charlette, 2009) of the combustion process. According to Takada (2012), since their introduction in
the late 1970s, the ECU has gone through several evolutionary stages.
Stage 1 Basic Digitisation (the Late 1970s)
Independent computer controls were applied to various separate vehicle components including the engine,
brake and steering subsystems. These electronic systems were simple P-channel metal-oxide-
semiconductor serial CPUs. The car was still principally under mechanical control with little to no
communication between computing devices.
Stage 2 Increasing Digitisation and Simple Communication (the Mid 1980s)
Mechanical chassis and engine control moved towards computer control throughout the 1980s. Many
previously mechanical and hydraulically linked subsystems were replaced and controlled by software-
driven actuators in an x-by-wire system between driver input and vehicle output (Coppola and Morisio,
2016). These systems included:
• Engine Control Module (ECM) – controls several engine related actuators to ensure peak
performance.
• Transmission Control Unit – optimal automatic and semi-automatic gear changing.
• Anti-lock Braking System (ABS) – prevents the wheels from locking under excessive braking.
• Body Control Unit – includes systems associated with passenger comfort.
Computer assistance provided increased efficiency (Work et al., 2008). New software-based subsystems
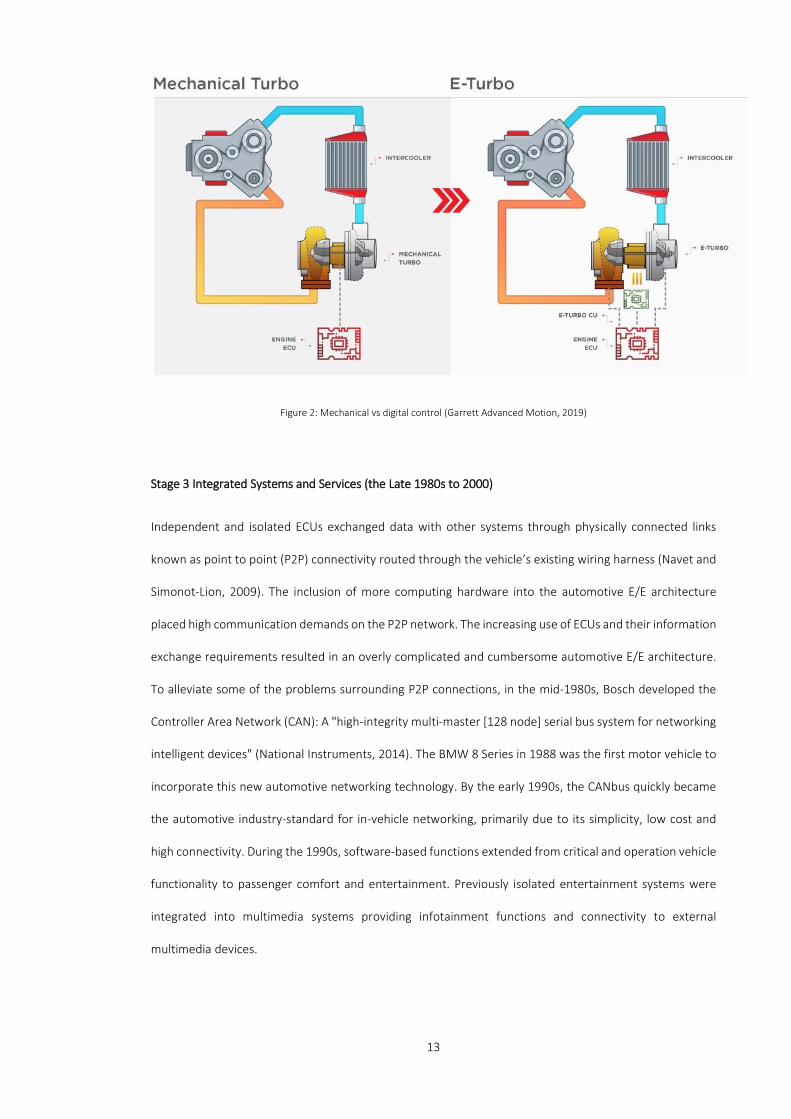
often required hard real-time performance with the caveat of safety-critical constraints. Figure 2
represents a mechanically connected turbo mechanism and the more recent ECU connected system.
13
Figure 2: Mechanical vs digital control (Garrett Advanced Motion, 2019)
Stage 3 Integrated Systems and Services (the Late 1980s to 2000)
Independent and isolated ECUs exchanged data with other systems through physically connected links
known as point to point (P2P) connectivity routed through the vehicle’s existing wiring harness (Navet and
Simonot-Lion, 2009). The inclusion of more computing hardware into the automotive E/E architecture
placed high communication demands on the P2P network. The increasing use of ECUs and their information
exchange requirements resulted in an overly complicated and cumbersome automotive E/E architecture.
To alleviate some of the problems surrounding P2P connections, in the mid-1980s, Bosch developed the
Controller Area Network (CAN): A "high-integrity multi-master [128 node] serial bus system for networking
intelligent devices" (National Instruments, 2014). The BMW 8 Series in 1988 was the first motor vehicle to
incorporate this new automotive networking technology. By the early 1990s, the CANbus quickly became
the automotive industry-standard for in-vehicle networking, primarily due to its simplicity, low cost and
high connectivity. During the 1990s, software-based functions extended from critical and operation vehicle
functionality to passenger comfort and entertainment. Previously isolated entertainment systems were
integrated into multimedia systems providing infotainment functions and connectivity to external
multimedia devices.

14
Stage 4 Increased Safety and System Innovation (Current Vehicle Development)
ECU development is starting to move away from single computer-based automotive innovations to full
system innovations requiring higher interoperability and information exchange levels to provide a
multifaceted system.
Figure 3: Shift from single to system innovation (Dannenberg and Burgard, 2015)
Since the start of the new millennium, safety has been pushed to the forefront as the number of vehicles
has increased globally, as have associated road-related accidents and deaths. In Europe, human error is
attributed to 90% of all vehicle-related accidents (Brookhuis et al., 2001). With massive increases in deaths
connected with vehicle use, there has been a focus on ECU controlled automotive safety systems.
Stage 5 Fully Integrated Autonomous Vehicles (the Future)
As the motor car enters the autonomous age, safety will move into Advanced Driver Assistance Systems
(ADAS). Autonomous vehicles require vast external sensor data from imaging systems including Light
Detection And Ranging (LiDAR), radar and video to enable the car 'to see' its surroundings so it can respond
to a rapidly changing environment. These systems rely solely on ECUs to provide all functionality as well as
vehicle subsystem integration. The vehicle will be a fully integrated digital system with no mechanical
backup. Through a fully ECU integrated system, the car for its entire journey will operate with or without
vehicle occupants or operator interaction.
15
2.3 Automotive ECU Design Considerations
General-purpose computing design reflects a modular architecture and incorporates the fastest processor
possible. The importance and focus of embedded systems, including automotive ECUs, are not necessarily
on performance but also reliability and dependability (Koopman, 2004). There are many ECUs within
modern motor vehicles realising all manner of vehicle-related tasks, not just the primary function (vehicle
operation) but passenger comfort and entertainment that require their own dedicated ECUs. Embedded
devices characteristically have tight functionality and implementation constraints, including:
2.3.1 Guaranteed real-time operation
Many vehicle-related functions, such as the engine combustion process, are a sequence of real-time
operations that require real-time data. Confirmation of optimum engine operation requires certain
guarantees where individual Engine Management System (EMS) tasks and processes are scheduled and
executed with real-time deadlines (Gajski and Vahid, 1995).
2.3.2 Weight limitations
According to Abinesh et al. (2014), 30% of a vehicle's weight is attributed to its electronics. Higher overall
weights result in higher fuel use and lower fuel efficiency. Poor performance in engine operation inevitably
produces higher CO2 emissions in fossil fuel burning engines or a potential reduction in overall range in a
hybrid or fully electric-powered vehicle (Onuma et al., 2016).
2.3.3 Size limitations
ECU size is an essential factor for consideration within the car. Space for the ECU is dictated by the vehicle's
overall size. ECUs often reside near the components they manage and their size can be influenced by the
constraints of individual vehicle space and aesthetics.
2.3.4 Optimising power consumption
ECUs, like all computing technology, require the consumption of electrical power for operation, which is
provided by the vehicle’s internal power systems. Embedded systems, by design, must conform to low

16
power consumption when compared with general-purpose computing. According to Otani, et al., (2019)
“the power consumption of automotive MCUs [Microcontroller] must be single-digit Watts”. However, the
more systems incorporated within the automotive E/E architecture will inevitably result in higher overall
power consumption.
2.3.5 Safety and reliability requirements
Safety is "freedom from those conditions that can cause death, injury, occupational illness, or damage to
or loss of equipment or property, or damage to the environment" (Leveson, 2011). Reliability is "the ability
of a system or component to perform its required functions under stated conditions for a specified period
of time" (Government Accountability Office, 2009). Safety and reliability are not necessarily
interchangeable – a safe system is not necessarily a reliable one. Automotive safety is measured using the
ISO26262 standard, which defines several Automotive Safety Integrity Levels (ASIL) depending on the
responsibility of the systems within the car. An event is measured against its severity, exposure and
controllability and an appropriate ASIL level is applied (Takada, 2012).
2.4 The Automotive ECU Architecture
ECUs, similar to other embedded systems, have several layers of hardware, firmware and software which
establish its overall architecture. Individual ECU layers include an upper application layer that provides
functionality. This functionality is supported by the underlying hardware which stores, processes and
manipulates data. Figure 4 depicts a typical ECU architectural layout.
Figure 4: Typical ECU hardware/software architecture
17
2.4.1 Application software layer
Application software is essentially a computer program consisting of a set of tasks and routines. These
programs can be single functions which perform a single simple task such as opening or unlocking the
vehicle doors. At the other end, there are highly complex, safety-critical applications involved in monitoring
and controlling multifaceted tasks such as engine function and management.
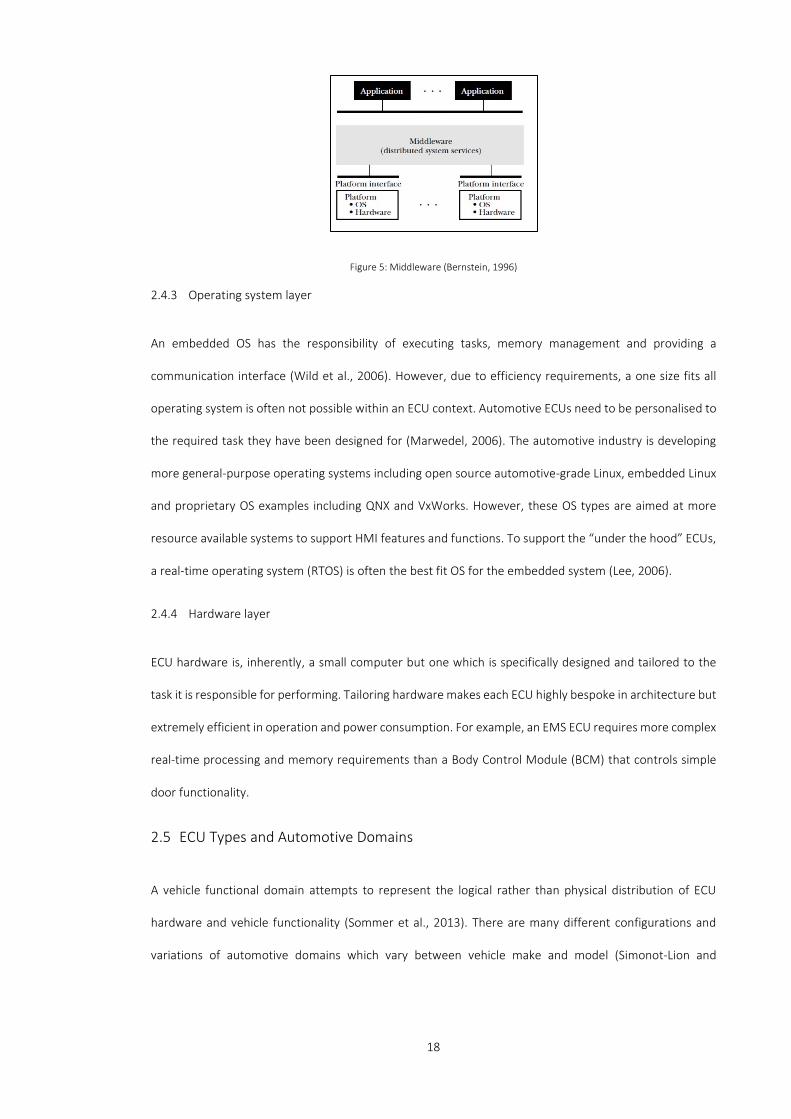
2.4.2 Middleware layer
The middleware layer, often referred to as a general-purpose service, sits between the top-level
applications and the underlying platform interface (Bernstein, 1996). In this context, Bernstein (1996)
defines a platform interface as a "set of low-level services and processing elements", which also includes
the operating system. Expanding on this, Krakowiak (2003) states that middleware provides services to the
application software layer when the operating system cannot offer those required services. Middleware
hides the heterogeneity of the ECU’s underlying hardware components from the upper application
software (Shan, 2006).
In an automotive ECU context, Broy et al. (2007) propose that middleware addresses the following key
issues:
• Hiding application distribution.
• Hiding OS hardware and communication protocol heterogeneity.
• Supplying standard services for application collaboration.
• Reusability.
18
Figure 5: Middleware (Bernstein, 1996)
2.4.3 Operating system layer
An embedded OS has the responsibility of executing tasks, memory management and providing a
communication interface (Wild et al., 2006). However, due to efficiency requirements, a one size fits all
operating system is often not possible within an ECU context. Automotive ECUs need to be personalised to
the required task they have been designed for (Marwedel, 2006). The automotive industry is developing
more general-purpose operating systems including open source automotive-grade Linux, embedded Linux
and proprietary OS examples including QNX and VxWorks. However, these OS types are aimed at more
resource available systems to support HMI features and functions. To support the “under the hood” ECUs,
a real-time operating system (RTOS) is often the best fit OS for the embedded system (Lee, 2006).
2.4.4 Hardware layer
ECU hardware is, inherently, a small computer but one which is specifically designed and tailored to the
task it is responsible for performing. Tailoring hardware makes each ECU highly bespoke in architecture but
extremely efficient in operation and power consumption. For example, an EMS ECU requires more complex
real-time processing and memory requirements than a Body Control Module (BCM) that controls simple
door functionality.
2.5 ECU Types and Automotive Domains
A vehicle functional domain attempts to represent the logical rather than physical distribution of ECU
hardware and vehicle functionality (Sommer et al., 2013). There are many different configurations and
variations of automotive domains which vary between vehicle make and model (Simonot-Lion and
19
Trinquet, 2009; NXP, 2013). However, there are four commonly recognised domains: powertrain,
propulsion, body and chassis, and infotainment and safety (Patterson, 2017). According to Simonot-Lion
and Trinquet (2009), these can be categorised as vehicle or passenger-centric:
• Vehicle-centric includes powertrain, chassis and active/passive safety systems.
• Passenger-centric includes multimedia, HMI and passenger comfort.
Grouping similar vehicle function ECUs into specific domains has numerous benefits associated with the
automotive E/E architecture. These benefits include reductions in cross-functional ECU communication and
a logical distribution of hardware or associated automotive functions. Any required cross-domain
communication is often provided by a single or several domain gateways.
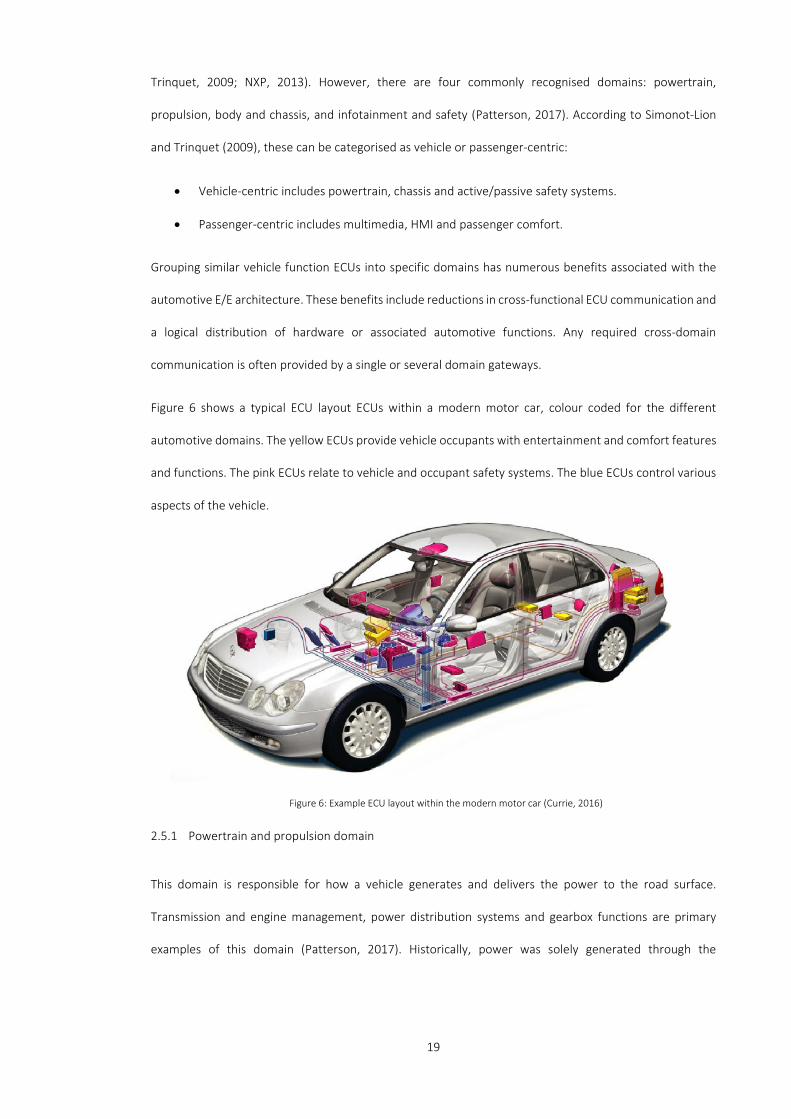
Figure 6 shows a typical ECU layout ECUs within a modern motor car, colour coded for the different
automotive domains. The yellow ECUs provide vehicle occupants with entertainment and comfort features
and functions. The pink ECUs relate to vehicle and occupant safety systems. The blue ECUs control various
aspects of the vehicle.
2.5.1 Powertrain and propulsion domain
This domain is responsible for how a vehicle generates and delivers the power to the road surface.
Transmission and engine management, power distribution systems and gearbox functions are primary
examples of this domain (Patterson, 2017). Historically, power was solely generated through the
Figure 6: Example ECU layout within the modern motor car (Currie, 2016)

20
combustion of fossil fuels. However, due to consumer demands and environmental concerns, automotive
propulsion systems are now starting to shift towards alternative power generation sources, including
hydrogen, hybrid electric and fully electric systems (Sharma and Strezov, 2017). The powertrain and
propulsion domain have had to adapt accordingly. For example, many sensors needed for a fossil-fuel
burning vehicle are not required in an electric vehicle. ECU types within this domain include the powertrain
control module (PCM) and the ECM. These ECUs are primarily responsible for engine management. Sensors
distributed throughout the engine send information to the PCM and ECM, which use multidimensional
performance maps, also known as lookup tables, to manipulate actuators to deliver the most optimal
engine performance (Brunemann et al., 2002). Before PCM and ECM systems, parameters such as air to
fuel mixtures and ignition timing were mechanically controlled through direct linkages.
2.5.2 Chassis and body domain
This domain includes all aspects of vehicle safety and passenger comfort. The main areas of automotive
functionality within this domain include vehicle braking, steering and suspension. Other functionalities
relate to direct passenger vehicle interactions, such as vehicle access control, lighting, cabin heating and
cooling. Example ECUs include the Electronic Brake Control Module (EBCM). The EBCM improves safety
through advanced braking mechanisms by monitoring the wheel state and comparing the received
information with stored data maps. Observed data relating to a potential wheel lock-up initiates safety
system including ABS and traction control, preventing the vehicle from wheel lock and subsequent
uncontrolled skidding. The BCM is a generic term for any computer-assisted function or system, not directly
related to engine function or operation. The tasks of a BCM can vary greatly depending upon the vehicle
make and model. Generally, BCM functions include door relays, exterior and internal lighting systems,
electric window motors and climate control.
2.5.3 Safety domain
This domain provides safety mechanisms for the vehicle as well as the vehicle's occupants. They are
categorised as active and passive safety. Active safety systems continually function whilst the vehicle is in
operation and aid in preventing an accident. They often have cross-functionality between the body and

21
chassis domain. Traditional safety functions include ABS, traction and stability control (Axelsson et al.,
2003). New and emerging active safety systems include brake assist, collision warning/avoidance and
intelligent speed adaptation (Braun et al., 2015). Passive safety systems deploy when an accident has been
detected or triggered, for example, airbags and seatbelt pre-tensioners, which are designed to minimise
vehicle occupant injuries.
2.5.4 Infotainment domain
Infotainment systems fuse information and entertainment, replacing old legacy cassette/CD multimedia
entertainment systems. Infotainment is a broad and generic term for a technology which may fuse multiple
features and functions including navigation, passenger entertainment, telematics and external
communication. It often comes with a whole host of features displayed on a centrally mounted screen
within the vehicle dashboard (Coppola and Morisio, 2016). The functionality provided by infotainment
requires high software-intensive systems. It may also include an Internet or wireless connectivity solution
utilising a shared personal portable communication device or connectivity technology embedded within
the vehicle. Infotainment systems can stream high levels of data into the car, providing the occupants with
information, music and video services.
2.6 Qualities of the Automotive ECU
Automotive ECUs have been a vital part of the modern motor car since their introduction in the late 1970s.
Their use has grown over the years from single isolated instances to a multitude of interconnected devices.
2.6.1 Reliability
Generally, vehicles are expensive items and consumers expect a long life and continual use from them.
Consumers' expectations of a vehicle’s life span are up to 10 - 15 years, or 150,000km travelled. These
figures are not uncommon with current motor vehicle technology. Moreover, safe and consistent vehicle
operational reliability over a vehicle’s life span is a fundamental requirement. Overall reliability is
underpinned through dependable vehicle subsystems. ECU reliability has to be very high to support a long

22
vehicle life span. To support this, the automotive sector boasts an ECU failure rate of 50*10-9 failures per
hour (Braun et al., 2015).
2.6.2 Dedicated function
The implementation of ECUs is often centred around providing dedicated hardware per dedicated function.
By dedicating ECU hardware and software design, and implementation ensures:
• only necessary hardware is used, keeping ECU hardware costs to a minimum.
• an increase in overall system efficiency.
2.6.3 Efficiency and utilisation
ECU efficiency is derived from a particular systems hardware requirement and includes only the bare
minimum components to accomplish the desired task. Peak load and performance on an ECU is predictable
at design and the hardware architecture is developed to match this, resulting in a reduced ECU unit cost
and energy consumption during operation. ECU technology promotes overall vehicle operational efficiency.
Efficiency can be observed by reducing fuel use which ultimately reduces vehicle pollution levels and
minimises vehicle operating costs (Kassakian et al., 1996).
2.6.4 Automotive function modularity
Many vehicle tasks and functions require computational power from a single simple ECU to accomplish
their goals. Other automotive functionality may in the course of operation utilise several ECUs, each
controlling or monitoring a specifically related subsystem to achieve a more complex function or task.
Shared information is exchanged between subsystems often via in-vehicle networks linking them together
to form an interconnected system. Smaller interconnected ECUs responsible for controlling their
corresponding subsystems are usually less complex and inexpensive than a single extensive complex system
(Wilmshurst, 2001).
23
2.7 Chapter Summary
This chapter provides an overview of the ECUs and how automotive E/E architecture has evolved since their
introduction. The chronology has highlighted some of the significant automotive system milestones which
have utilised embedded ECU computing technology. ECUs have replaced many of the mechanical linkages
between driver input and vehicle output which has undoubtedly promoted efficiency and reduced pollution
as well as overall vehicle operating costs. In particular, this chapter has emphasised several vital
considerations when designing automotive ECUs, especially automotive functional requirements, where a
combination of real-time and safety-critical data is required. A description of individual ECU architectures
reveals that ECU hardware and software are often highly bespoke and designed and implemented to
complete single tasks or functions. A summary of dedicated ECU tasks and functions within the car, grouped
into automotive domains, has been provided along with a description relating to each domain. Lastly, this
chapter has reviewed the benefits ECUs have had on the modern motor car, highlighting increased
operational efficiency, comfort and safety. The next chapter investigates and evaluates the complexities of
ECU hardware and software, and the issues facing the modern automotive E/E architecture on which the
rest of this thesis is based.
24
Chapter 3 Automotive E/E Architecture:
Challenges and Complexities
Objectives
• Provide an overview of the primary issues concerning the automotive E/E architecture.
• Identify the sources of complexity within the automotive E/E architecture.
• Investigate the issues associated with automotive computing hardware.
• Investigate the issues regarding automotive software.
• Provide an overview of current software update procedures and practices.
25
3.1 Introduction
This chapter aims to provide a detailed description of the principle issues and causes of complexity within
the modern automotive E/E architecture. The structure of this chapter concerns two core topics of interest:
automotive ECU hardware and software. The previous chapter detailed the benefits of ECU controlled and
monitored automotive functions, however, several persistent issues face the automotive industry and the
automotive E/E architecture as more technology is introduced. One of the critical problems of automotive
hardware is the rising numbers of ECUs within each vehicle model and section 3.2 highlights the associated
issues, including related costs, additional weight and increased power requirements. The increasing use
and reliance on more and more computing technology is a factor when considering automotive E/E
complexity. Overall automotive E/E architectural complexity is a growing concern and the sources of this
complexity are detailed in section 3.3. Decentralisation and high levels of hardware and software
optimisation are contributing factors and sources of automotive E/E architectural complexity. Increases in
functionality result in an increased requirement for software. The last sections of this chapter focus on
software bugs and errors, potential security threats and vulnerabilities, and the extended time frame
automotive software is expected to last. The final section reviews the current automotive software update
mechanisms and how they apply to the automotive industry.
3.2 Issues Associated with Automotive Computing Hardware
As embedded technology progresses, so does the required functionality of embedded systems. This has
resulted in embedded technology "groaning under the weight of requirements" (Lee, 2006). With each new
vehicle model, the automotive industry faces numerous challenges surrounding the inclusion of new
embedded technologies (Wallin and Axelsson, 2008; Schwazrl and Herrmann, 2018).

26
3.2.1 Increasing numbers of ECUs
Broy (2006) stated that the upward trend of ECUs being included in the motor car was set to continue over
the coming decades. This prediction has been realised, with growth seen from system digitisation, ADAS
and vehicle autonomy (Reinhardt and Kucera, 2013). Figure 7 shows the predicted increase over the next
decade in average ECU cost by domain.
Figure 7: ECU market by automotive domain (Burkacky, et al., 2019)
The principle issues associated with the increase in the number of ECUs within the modern motor car
include:
3.2.1.1 An overall increase in vehicle system development costs
The increasing use of ECU based features and functions within the modern motor vehicle results in cost
increases in system development. Consequently, system development costs have escalated to levels where
30-35% of the vehicle's total cost is directly associated with its electronics and software (Shavit et al., 2007).
The past and projected overall cost can be seen in Figure 8.
27 39 4523
29 3019
26 2614
13 11
9
9 10
0
1334
0
20
40
60
80
100
120
140
160
2020 2025 2030
USD
bill
ions
Year
ECU by Domain
AD
Chassis
Infotainment
ADAS
Body
Powertrain
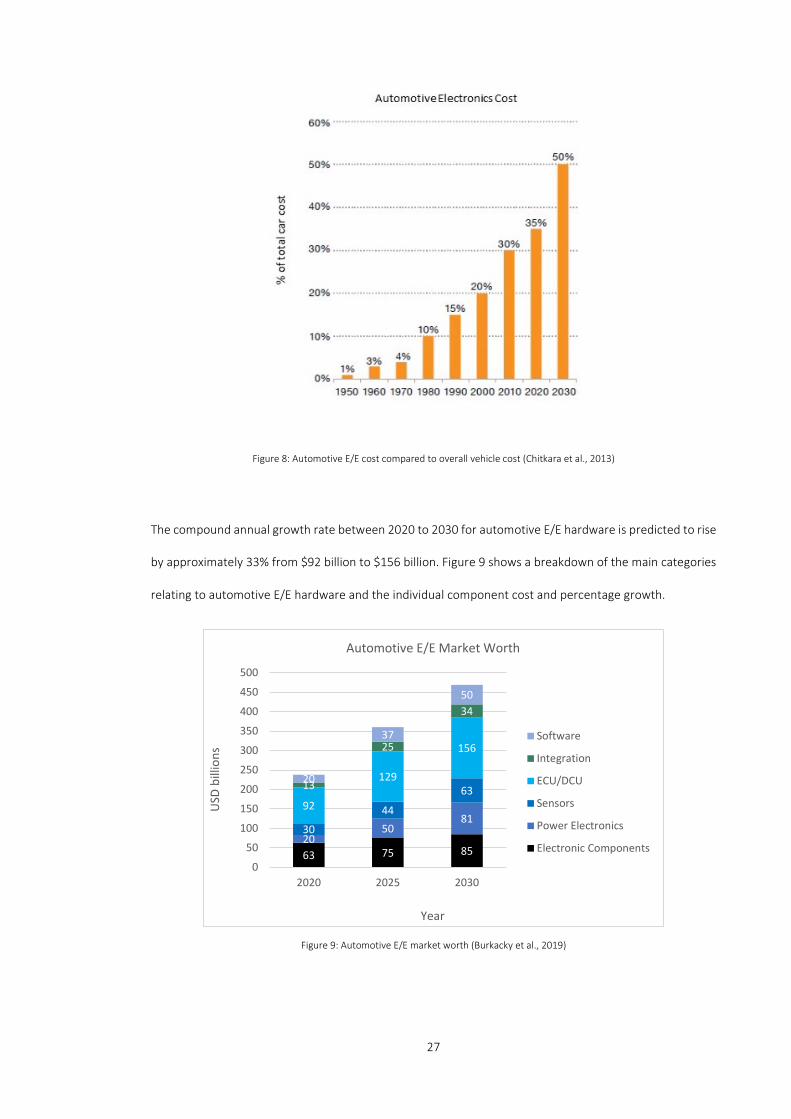
27
Figure 8: Automotive E/E cost compared to overall vehicle cost (Chitkara et al., 2013)
The compound annual growth rate between 2020 to 2030 for automotive E/E hardware is predicted to rise
by approximately 33% from $92 billion to $156 billion. Figure 9 shows a breakdown of the main categories
relating to automotive E/E hardware and the individual component cost and percentage growth.
Figure 9: Automotive E/E market worth (Burkacky et al., 2019)
63 75 8520
5081
30
44
6392
129
156
13
25
34
20
37
50
0
50
100
150
200
250
300
350
400
450
500
2020 2025 2030
USD
bill
ions
Year
Automotive E/E Market Worth
Software
Integration
ECU/DCU
Sensors
Power Electronics
Electronic Components
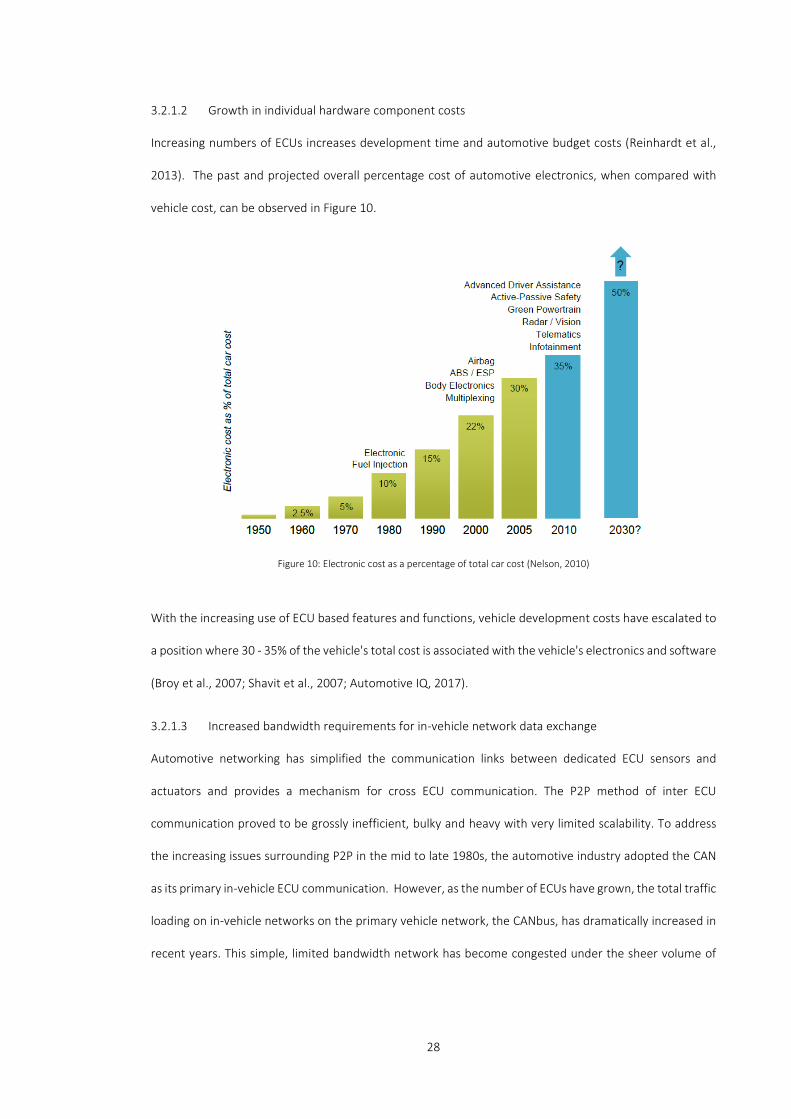
28
3.2.1.2 Growth in individual hardware component costs
Increasing numbers of ECUs increases development time and automotive budget costs (Reinhardt et al.,
2013). The past and projected overall percentage cost of automotive electronics, when compared with
vehicle cost, can be observed in Figure 10.
Figure 10: Electronic cost as a percentage of total car cost (Nelson, 2010)
With the increasing use of ECU based features and functions, vehicle development costs have escalated to
a position where 30 - 35% of the vehicle's total cost is associated with the vehicle's electronics and software
(Broy et al., 2007; Shavit et al., 2007; Automotive IQ, 2017).
3.2.1.3 Increased bandwidth requirements for in-vehicle network data exchange
Automotive networking has simplified the communication links between dedicated ECU sensors and
actuators and provides a mechanism for cross ECU communication. The P2P method of inter ECU
communication proved to be grossly inefficient, bulky and heavy with very limited scalability. To address
the increasing issues surrounding P2P in the mid to late 1980s, the automotive industry adopted the CAN
as its primary in-vehicle ECU communication. However, as the number of ECUs have grown, the total traffic
loading on in-vehicle networks on the primary vehicle network, the CANbus, has dramatically increased in
recent years. This simple, limited bandwidth network has become congested under the sheer volume of
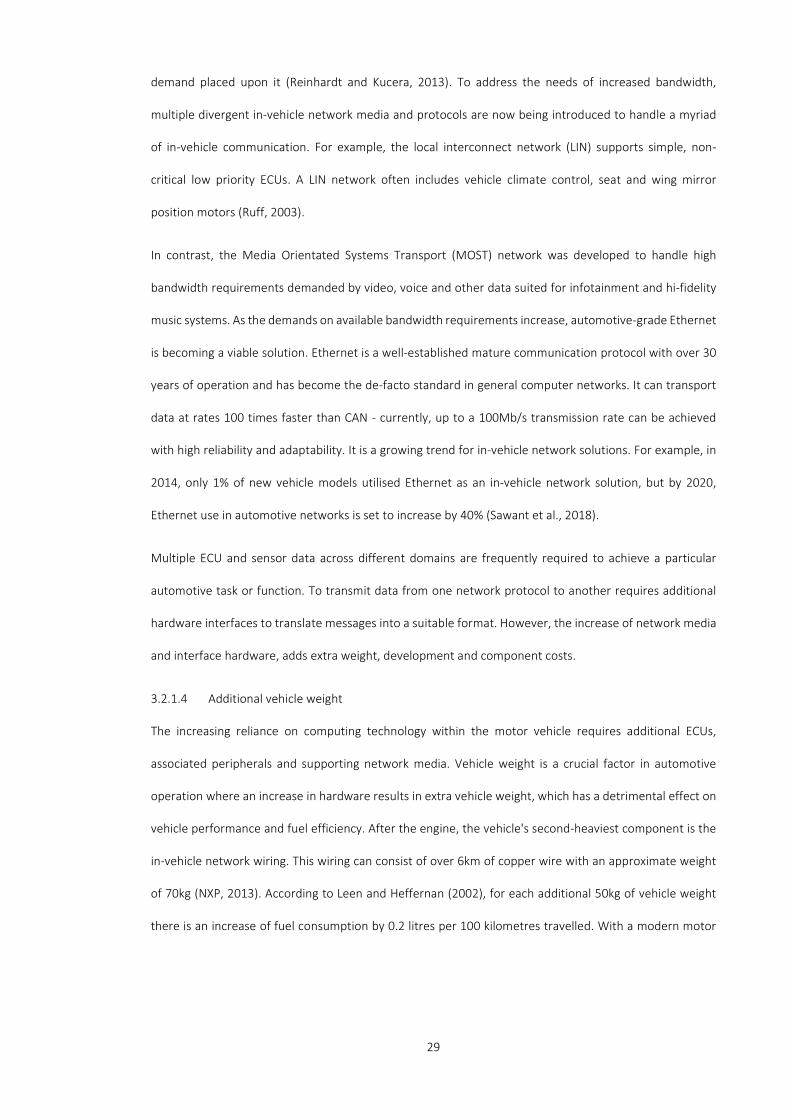
29
demand placed upon it (Reinhardt and Kucera, 2013). To address the needs of increased bandwidth,
multiple divergent in-vehicle network media and protocols are now being introduced to handle a myriad
of in-vehicle communication. For example, the local interconnect network (LIN) supports simple, non-
critical low priority ECUs. A LIN network often includes vehicle climate control, seat and wing mirror
position motors (Ruff, 2003).
In contrast, the Media Orientated Systems Transport (MOST) network was developed to handle high
bandwidth requirements demanded by video, voice and other data suited for infotainment and hi-fidelity
music systems. As the demands on available bandwidth requirements increase, automotive-grade Ethernet
is becoming a viable solution. Ethernet is a well-established mature communication protocol with over 30
years of operation and has become the de-facto standard in general computer networks. It can transport
data at rates 100 times faster than CAN - currently, up to a 100Mb/s transmission rate can be achieved
with high reliability and adaptability. It is a growing trend for in-vehicle network solutions. For example, in
2014, only 1% of new vehicle models utilised Ethernet as an in-vehicle network solution, but by 2020,
Ethernet use in automotive networks is set to increase by 40% (Sawant et al., 2018).
Multiple ECU and sensor data across different domains are frequently required to achieve a particular
automotive task or function. To transmit data from one network protocol to another requires additional
hardware interfaces to translate messages into a suitable format. However, the increase of network media
and interface hardware, adds extra weight, development and component costs.
3.2.1.4 Additional vehicle weight
The increasing reliance on computing technology within the motor vehicle requires additional ECUs,
associated peripherals and supporting network media. Vehicle weight is a crucial factor in automotive
operation where an increase in hardware results in extra vehicle weight, which has a detrimental effect on
vehicle performance and fuel efficiency. After the engine, the vehicle's second-heaviest component is the
in-vehicle network wiring. This wiring can consist of over 6km of copper wire with an approximate weight
of 70kg (NXP, 2013). According to Leen and Heffernan (2002), for each additional 50kg of vehicle weight
there is an increase of fuel consumption by 0.2 litres per 100 kilometres travelled. With a modern motor

30
vehicle expected to travel an estimated 250,000km operational range, this equates to an additional 500
litres of fuel over its lifetime.
3.2.1.5 Power consumption
Additional computing hardware technology consumes more power, which in the motor car is of a limited
quantity unless extra fuel (electrical or fossil-based) is consumed to generate additional power. Schmutzler
et al., (2012) suggest there are three associated problems with the increased use of automotive power:
• An overall increase of engine emissions within fossil fuel-burning vehicles
• A decrease in operational range, similar to an increase in vehicle weight
• Unnecessary power consumption due to continuous power supplied to ECUs, even ones which
have no operational functionality depending on the vehicle’s current state
Figure 11 below highlights power consumption concerning increasing ECU numbers.
Figure 11: ECU power consumption (Ebert and Jones, 2009)
Tiwari, et al, (1994) evaluate the average power consumed by a microprocessor while running a program
as:
𝐸𝐸 = (𝐼𝐼 ∗ 𝑉𝑉𝑉𝑉𝑉𝑉)(𝑁𝑁 ∗ τ)
E Energy consumed by a program
I Average current for an instruction sequence
VCC Supply voltage
N Number of cycles taken to execute
τ Time
1.1
31
Electrical power generation is accomplished in fossil fuel burning engines, commonly known as the vehicle
alternator. The primary function of this equipment is to maintain the vehicle's battery charge level and
provide power to its electrical system. However, the additional electronic components that must be
installed increase the total power requirement - alternator output or capacity must be improved to meet
this extra demand. An alternator requires a certain number of engine revolutions per minute (RPM) to
generate enough charge to meet the vehicle’s electrical system requirements, causing an increase in engine
CO2 emissions. In stark contrast to a fossil fuel burning vehicle, electric cars derive power for their
propulsion from an internal battery system. The battery system in an electric vehicle must also power the
subsystems included within the automotive E/E architecture. Excessive ECU power consumption must be
kept to a minimum to preserve the vehicle’s overall range (Reinhardt and Kucera, 2013).
Another pressing issue with ECU power consumption is the practice of continually powering ECUs within
the entire E/E architecture during vehicle operation. Many ECUs only operate under particular or exclusive
circumstances but are often powered up from the vehicle's initial start until the vehicle is powered down.
There is usually little consideration to placing these situational ECUs into a suspend or a temporary power-
down mode until required. According to Esch et al. (2012), "the boot lid ECU function is only needed for 3%
of total vehicle activity time. During the remaining 97%, electrical energy is merely consumed
unnecessarily".
3.3 Complexities
Vehicle functions are governed by hardware and software, often requiring data transmission through in-
vehicle networking solutions. Both Furst (2010), and Braun et al. (2015), agree that the principal causes of
automotive E/E architectural complexity are the continual increase and use of computing hardware
technology, associated software and in-vehicle networking solutions. Over the coming decade, the modern
motor car will see an influx of ADAS and vehicle autonomy functions. These emerging technologies will
considerably increase the amount of embedded software within the modern motor car.
32
3.3.1 Architectural decentralisation
One of the causes of system complexity is a decentralised automotive E/E architecture. Many vehicle
functions and operations cannot be realised by a single ECU and its associated peripherals. Vehicle
functions are often disseminated across several ECUs located throughout the vehicle (Kanajan et al., 2006).
To accomplish many vehicle functions and tasks, data is transmitted between multiple peripherals and ECUs
(Wallin and Axelsson, 2008). For example, depending upon vehicle make and model, a door central locking
function activates via several different trigger mechanisms, including the vehicle key fob or current vehicle
speed. These two triggering mechanisms reside across very different automotive domains, requiring cross-
domain communication to the central locking/unlocking function. With the recurrent increases in
automotive functionality, cross-domain interaction will inevitably grow, which will lead to higher
architectural complexity through ECU and automotive function decentralisation.
3.3.2 Hardware and software optimisation
The inclusion of more technology into the automotive E/E architecture inevitably results in higher costs.
ECU hardware is often highly optimised to address these rising costs (Broy et al., 2007). Embedded systems
usually have a configuration which is fixed during the hardware design stages (Belaggoun and Issarny,
2016). To reduce overall ECU costs, embedded hardware must be optimised and include the bare minimum
and necessary components to complete the required ECU task or function. However, additional
components result in a higher overall cost of the vehicle. Even the smallest additional component can incur
considerable costs when factoring the number of vehicle models by the total number of vehicles produced
over that vehicle model's lifetime. Broy et al., (2007) suggest that an additional hardware cost of €1 on a
single component over 500,000 units per year would yield additional costs of €3,500,000 for the lifespan
of a vehicle model production of seven years. High ECU hardware component optimisation produces a rigid,
bespoke design where hardware reusability between vehicle models is often not viable.
33
High levels of hardware optimisation inevitably lead to necessary software optimisation. High levels of
software optimisation have resulted in several additional adversities including:
• Increased software complexity.
• An increase in the number of code defects due to optimisation.
• A lack of software reusability.
Software code is written and subsequently optimised to the precise hardware specification (Broy et al.,
2007). High levels of software code optimisation can lead to software defects. The codebase footprint may
require certain levels of optimisation to fit within limited system resources including storage, memory and
processing capability. Software code must be able to complete the task it is designed and coded for, and
ensure code execution requirements do not exceed the limits of available hardware resources. The number
of software functions per ECU is often restricted due to the confines of available system resources,
including memory and processing capabilities (Törngren et al., 2009). High software optimisation and
specific limiting hardware architectures make software reusability difficult or, in some cases, impossible
when trying to port new and updated code to target hardware (Haghighatkhah et al., 2017). Broy (2006),
stated that after just three years, the automotive industry experienced discontinuation rates of 20 - 30%
of a vehicle model's ECUs. This relatively short hardware lifespan results in software having to be re-
integrated into the system. Due to high levels of hardware optimisation software, portability and reuse is a
problem for the automotive industry.
3.4 State of the Art Hardware
The automotive industry has faced many challenges since the introduction of the ECU. There have been
many solutions that the automotive industry has implemented or researched to address these issues and
complexities of the automotive E/E architecture. For example, to promote ECU consolidation, System on
Chip (SoC) integrates many complete system components into a single integrated circuit (Yamada and
Kimura, 2020). However, this technology is still bound by the same limited resource constraints as current
ECU hardware, which is a problem when addressing automotive software updates. Field programmable
gate arrays is a technology being adopted by the automotive industry but focuses on infotainment and

34
video and image processing applications associated with ADAS features (Oh et al., 2019). This technology
can be reprogrammed, which can provide a mechanism for supporting possible future software updates.
However, they are expensive in a mass production environment and require higher levels of power
consumption. Consolidation is also currently being researched at the domain level utilising automotive
domain controllers, which are much larger resource capable computing devices that can host multiple ECU
functionality on one system (Wang and Ganesan, 2020). However, these are all hardware-based solutions
that often still utilise embedded hardware. Constraining automotive functionality on the hardware level
does not promote a flexible software architecture, especially when software must be periodically updated
to address a software associated issue.
3.5 Software Associated Issues
Vehicle software is considered a significant component of the modern motor car. As the number of ECUs
increases, it inevitably results in more lines of software code to drive those systems.
3.5.1 Software bugs and errors
Automotive ECU software is often designed, developed and written by third party suppliers. However,
according to Noergaard (2005), "guessing what the designer's intentions were most often results in more
bugs". Studies into the quality of software indicate strong correlations between application size and the
total number of defects (Ebert and Jones, 2009). Heiser (2007), states that a system consisting of millions
of code lines could have tens of thousands of unknown or undetected bugs. The following figure highlights
the increasing trend of vehicle recalls associated with software.
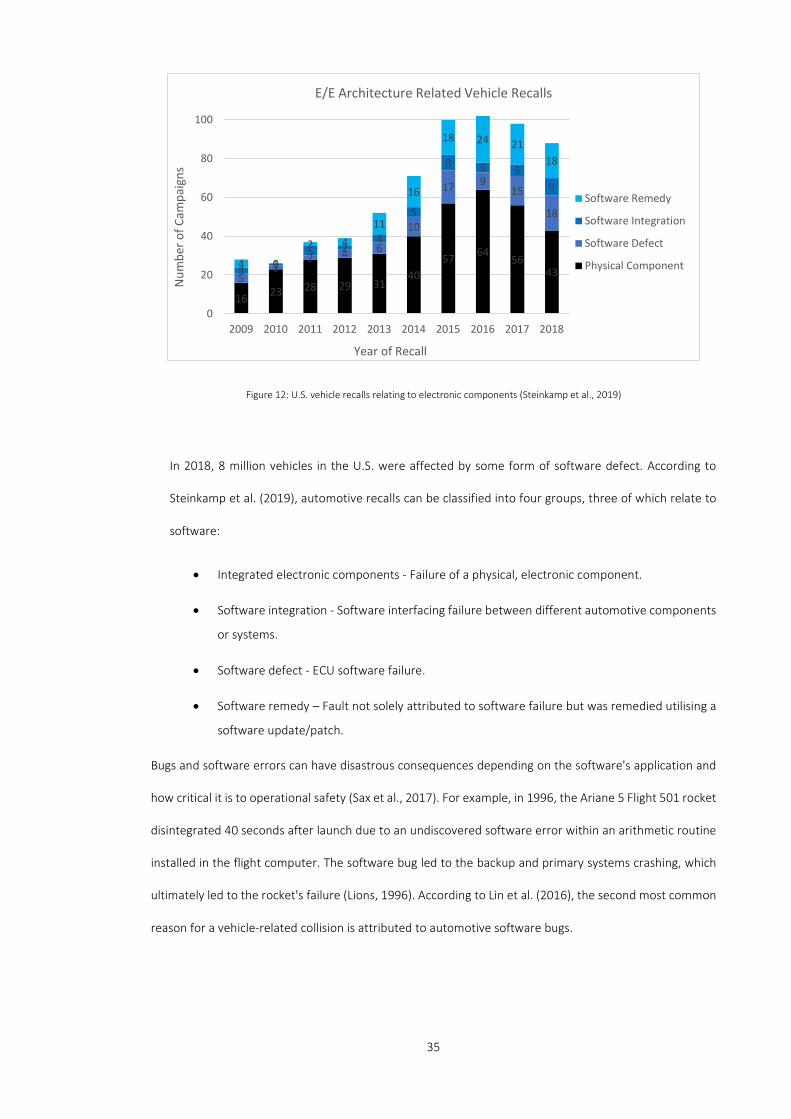
35
Figure 12: U.S. vehicle recalls relating to electronic components (Steinkamp et al., 2019)
In 2018, 8 million vehicles in the U.S. were affected by some form of software defect. According to
Steinkamp et al. (2019), automotive recalls can be classified into four groups, three of which relate to
software:
• Integrated electronic components - Failure of a physical, electronic component.
• Software integration - Software interfacing failure between different automotive components
or systems.
• Software defect - ECU software failure.
• Software remedy – Fault not solely attributed to software failure but was remedied utilising a
software update/patch.
Bugs and software errors can have disastrous consequences depending on the software's application and
how critical it is to operational safety (Sax et al., 2017). For example, in 1996, the Ariane 5 Flight 501 rocket
disintegrated 40 seconds after launch due to an undiscovered software error within an arithmetic routine
installed in the flight computer. The software bug led to the backup and primary systems crashing, which
ultimately led to the rocket's failure (Lions, 1996). According to Lin et al. (2016), the second most common
reason for a vehicle-related collision is attributed to automotive software bugs.
16 23 28 29 3140
57 6456
4352
2 4 6
10
17 915
18
3 15 2
4
5
8 5 69
4 0
2 411
16
18 24 2118
0
20
40
60
80
100
2009 2010 2011 2012 2013 2014 2015 2016 2017 2018
Num
ber o
f Cam
paig
ns
Year of Recall
E/E Architecture Related Vehicle Recalls
Software Remedy
Software Integration
Software Defect
Physical Component

36
Embedded software bugs and errors also cause control flow errors which are a flawed execution of the
program that can lead to actuator failure or a computer program hanging or crashing (Thati et al., 2019).
To mitigate against these types of errors in dependable and safety-critical systems, expensive hardware-
based countermeasures such as triple modular redundancy are required. This mitigation technique uses a
majority voting system where, if one of the three systems fail, the system will continue regular operation.
Many ECU systems within the modern motor car are safety-related or considered safety-critical. Any failure
in an automotive safety-critical system can potentially endanger vehicle occupant safety.
3.5.1 Software associated security threats
Vehicles are no longer closed systems that require direct physical access to gain unauthorised entry to the
car. Vehicle connectivity is gaining popularity as it offers vehicle occupants a mechanism to connect to the
Internet. However, the potential to compromise vehicle security through connectivity to gain access to an
internal vehicle system now has the potential to come from anywhere. Nevertheless, even though
connectivity systems have been incorporated into vehicles over the last few years, “car hacking” has not
been widespread due to the limited potential for cybercrime and cybercriminals.
In 2015, two security professionals, Charlie Miller and Chris Valasaek, demonstrated how to remotely
compromise a motor vehicle through its connectivity system and security vulnerabilities within its software
code. They gained access through the HMI unit known as the Uconnect system in the Gran Jeep Cherokee
target vehicle. This system incorporates an interface for particular vehicle operational and media functions.
Due to vulnerabilities in the HMI operating system software, the software update validation mechanism
was disabled, which permitted malware injection into the Uconnect software. Access to the CANbus vehicle
network was possible through the design of this device. Once compromised, the system enabled the
attackers to remotely inject spoofed CAN frames to ECUs which were responsible for vehicle control. The
HMI vulnerability allowed the hackers to interfere with various vehicle subsystems, including interior
climate control and vehicle windscreen wipers. They also manipulated safety-critical systems, including
shutting down the engine and limited steering control. The Uconnect HMI is a standard product supplied
by Fiat Chrysler and incorporated into numerous vehicle models across several different vehicle makes.
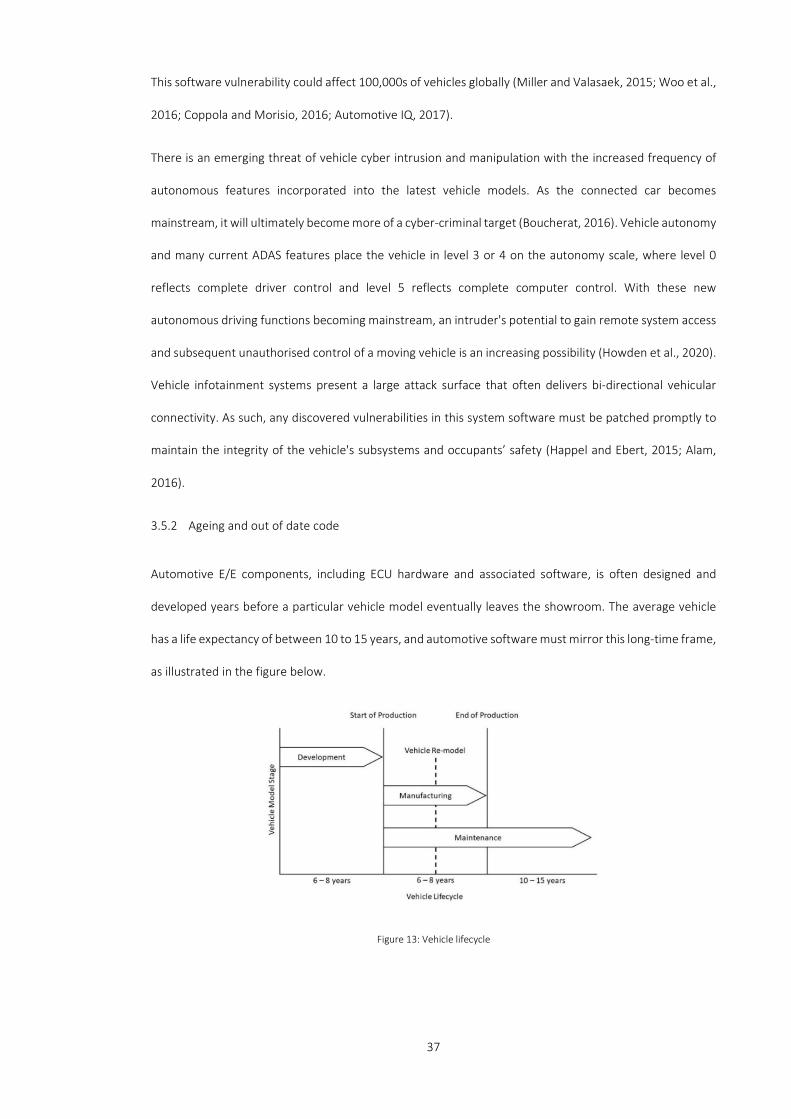
37
This software vulnerability could affect 100,000s of vehicles globally (Miller and Valasaek, 2015; Woo et al.,
2016; Coppola and Morisio, 2016; Automotive IQ, 2017).
There is an emerging threat of vehicle cyber intrusion and manipulation with the increased frequency of
autonomous features incorporated into the latest vehicle models. As the connected car becomes
mainstream, it will ultimately become more of a cyber-criminal target (Boucherat, 2016). Vehicle autonomy
and many current ADAS features place the vehicle in level 3 or 4 on the autonomy scale, where level 0
reflects complete driver control and level 5 reflects complete computer control. With these new
autonomous driving functions becoming mainstream, an intruder's potential to gain remote system access
and subsequent unauthorised control of a moving vehicle is an increasing possibility (Howden et al., 2020).
Vehicle infotainment systems present a large attack surface that often delivers bi-directional vehicular
connectivity. As such, any discovered vulnerabilities in this system software must be patched promptly to
maintain the integrity of the vehicle's subsystems and occupants’ safety (Happel and Ebert, 2015; Alam,
2016).
3.5.2 Ageing and out of date code
Automotive E/E components, including ECU hardware and associated software, is often designed and
developed years before a particular vehicle model eventually leaves the showroom. The average vehicle
has a life expectancy of between 10 to 15 years, and automotive software must mirror this long-time frame,
as illustrated in the figure below.
Figure 13: Vehicle lifecycle
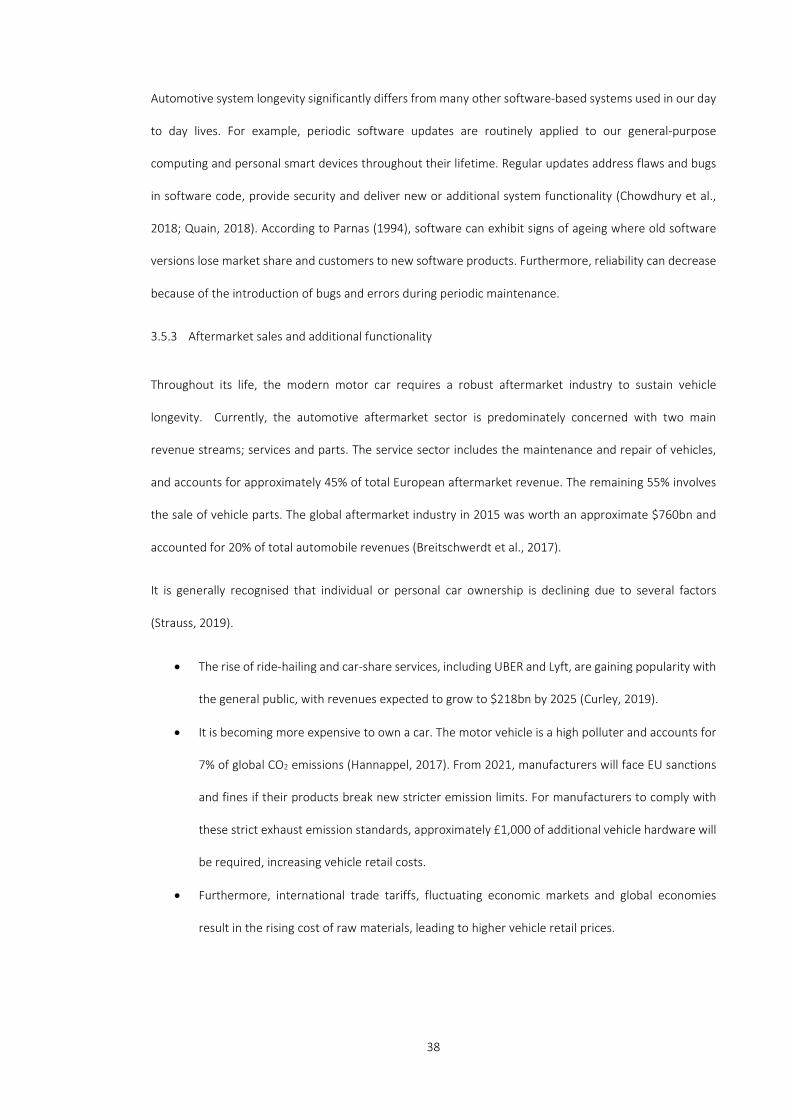
38
Automotive system longevity significantly differs from many other software-based systems used in our day
to day lives. For example, periodic software updates are routinely applied to our general-purpose
computing and personal smart devices throughout their lifetime. Regular updates address flaws and bugs
in software code, provide security and deliver new or additional system functionality (Chowdhury et al.,
2018; Quain, 2018). According to Parnas (1994), software can exhibit signs of ageing where old software
versions lose market share and customers to new software products. Furthermore, reliability can decrease
because of the introduction of bugs and errors during periodic maintenance.
3.5.3 Aftermarket sales and additional functionality
Throughout its life, the modern motor car requires a robust aftermarket industry to sustain vehicle
longevity. Currently, the automotive aftermarket sector is predominately concerned with two main
revenue streams; services and parts. The service sector includes the maintenance and repair of vehicles,
and accounts for approximately 45% of total European aftermarket revenue. The remaining 55% involves
the sale of vehicle parts. The global aftermarket industry in 2015 was worth an approximate $760bn and
accounted for 20% of total automobile revenues (Breitschwerdt et al., 2017).
It is generally recognised that individual or personal car ownership is declining due to several factors
(Strauss, 2019).
• The rise of ride-hailing and car-share services, including UBER and Lyft, are gaining popularity with
the general public, with revenues expected to grow to $218bn by 2025 (Curley, 2019).
• It is becoming more expensive to own a car. The motor vehicle is a high polluter and accounts for
7% of global CO2 emissions (Hannappel, 2017). From 2021, manufacturers will face EU sanctions
and fines if their products break new stricter emission limits. For manufacturers to comply with
these strict exhaust emission standards, approximately £1,000 of additional vehicle hardware will
be required, increasing vehicle retail costs.
• Furthermore, international trade tariffs, fluctuating economic markets and global economies
result in the rising cost of raw materials, leading to higher vehicle retail prices.
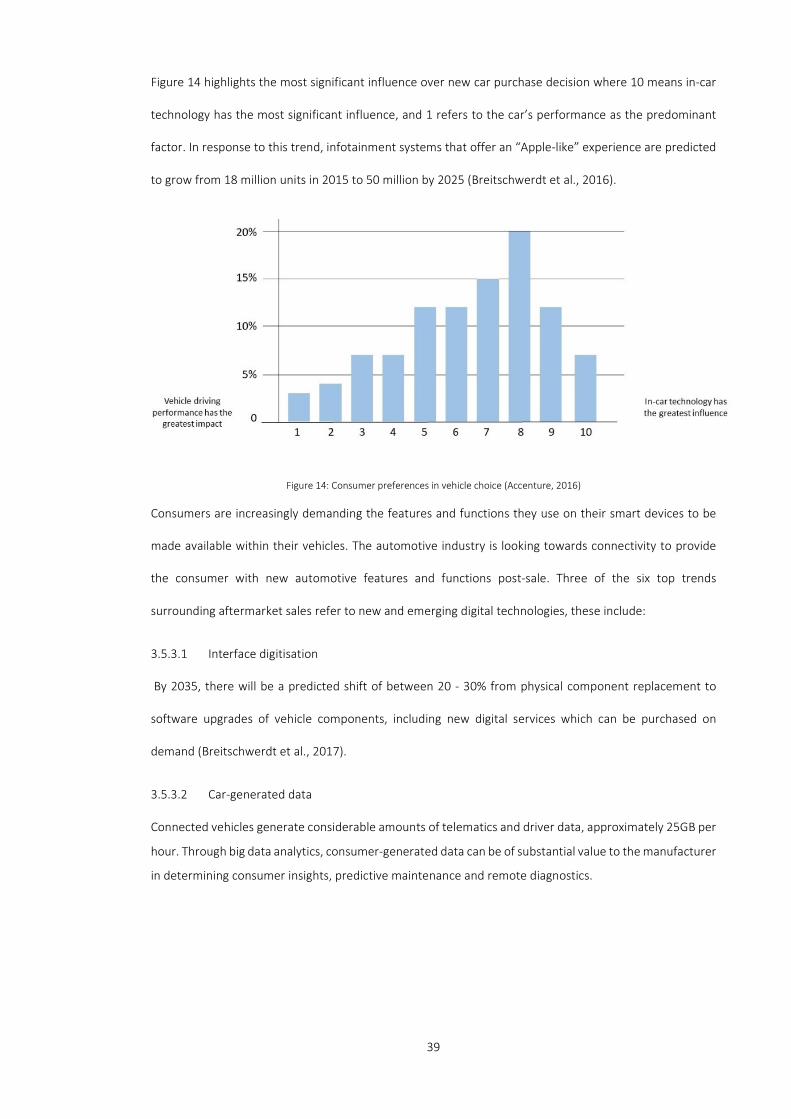
39
Figure 14 highlights the most significant influence over new car purchase decision where 10 means in-car
technology has the most significant influence, and 1 refers to the car’s performance as the predominant
factor. In response to this trend, infotainment systems that offer an “Apple-like” experience are predicted
to grow from 18 million units in 2015 to 50 million by 2025 (Breitschwerdt et al., 2016).
Figure 14: Consumer preferences in vehicle choice (Accenture, 2016)
Consumers are increasingly demanding the features and functions they use on their smart devices to be
made available within their vehicles. The automotive industry is looking towards connectivity to provide
the consumer with new automotive features and functions post-sale. Three of the six top trends
surrounding aftermarket sales refer to new and emerging digital technologies, these include:
3.5.3.1 Interface digitisation
By 2035, there will be a predicted shift of between 20 - 30% from physical component replacement to
software upgrades of vehicle components, including new digital services which can be purchased on
demand (Breitschwerdt et al., 2017).
3.5.3.2 Car-generated data
Connected vehicles generate considerable amounts of telematics and driver data, approximately 25GB per
hour. Through big data analytics, consumer-generated data can be of substantial value to the manufacturer
in determining consumer insights, predictive maintenance and remote diagnostics.
40
3.5.3.3 The increasing influence of digital intermediaries
Usage-based companies and technology companies are increasingly utilising vehicle-generated data. These
sectors will require mechanisms to facilitate the retrieval and frequent deployment of automotive
software.
3.5.4 State of the art software
The automotive industry has attempted to address specific software-related concerns and issues. For
example, AUTOSAR is a framework which can promote software reusability, but it does not address
hardware re-use (Bo et al., 2010). MISRA – the Motor Industry Standards Reliability Association - is an
automotive standard and guideline for the C programming language for developing embedded software
products (MISRA, 2020). Founded in 2009, the principal goal of the GENIVI Alliance was ECU OS integration
(GENIVI Alliance, 2020). However, there is still a heavy reliance on hardware, which is more challenging to
re-use between vehicle models due to the rapid advancements in computing technology. Automotive
Grade Linux (AGL) introduced in 2012 is an open-source project that aims to provide a Linux based
reference framework to reduce complexity and development costs. However, this technology's target
systems are intended for in-vehicle entertainment and telematics data, as such AGL has a limited
application when compared with other ECUs within the automotive E/E architecture (Sivakumar et al.,
2020). Lastly, vehicle longevity has led to inefficient practices and procedures in addressing how
automotive software is patched and updated when a potential software related problem has been
discovered.
3.6 Automotive Software Updating
In the modern motor car, almost all aspects of vehicle operation require considerable amounts of software
code (Onuma et al., 2016; Petri, et al., 2016; Holmes, 2018). However, as with all software, automotive
software needs to be periodically updated. In an increasingly software-centric automotive E/E architecture,
new software installations may be required several times during a vehicle's lifetime. Any software update
procedure must offer minimal disruption to the customer and be cost-effective to the manufacturer and
41
the supplier. There are several principle reasons why it is advantageous to update automotive software,
these include:
• Addressing system failure through software errors and bugs.
• Patching or enhancing the system and software security.
• Adding value post-sale through aftermarket content.
Current automotive software update practices and procedures are problematic because there is no clearly
defined mechanism or standard. Historically, when a common fault was discovered within a particular
installed physical component of a vehicle, the Original Equipment Manufacturer (OEM) could issue a vehicle
recall notice (Halder et al., 2020), especially if the fault concerned a severe safety issue.
3.6.1 Identified automotive update strategies
The current mechanisms for automotive software updates are ad hoc at best. This research has identified
three mechanisms, including:
• Manufacturer-initiated vehicle recall process.
• Guided user intervention.
• Over the air update.
3.6.1.1 Software update mechanism: manufacturer-initiated recall process
Vehicle recalls are relatively common. For example, since 1966 in the U.S., over 390 million vehicles have
been recalled due to safety issues (NHTSA, 2020). Like a physical component, a software-related problem,
depending upon the severity, needs to be addressed and resolved. The recall mechanism, for both physical
and software-related issues, requires the vehicle's return to a qualified engineer to rectify the problem (Sax
et al., 2017). Vehicle recalls are an expensive exercise for the manufacturer (Lonn and Freund, 2009; Drolia
et al., 2011; Sax et al., 2017). They are also a disruptive and time-consuming procedure for the customer
(Hesham and Gansesan, 2014; Mckenna, 2016). The lengthy process of an OEM initiated software recall is
outlined by Shavit et al. (2007), as outlined below, and as summarised in the subsequent figure.

42
1. Fault discovered in software.
2. Supplier / OEM tasked to provide a new updated software version.
3. The supplier provides OEM with new updated software version.
4. OEM notifies dealers and vehicle owner of a recall notice.
5. Vehicle owner takes the vehicle to a dealer.
6. Vehicle technician connects the vehicle to diagnostic hardware.
7. Technician updates and tests new software update.
8. Vehicle owner collects repaired vehicle from dealer.
Figure 15: Example of a current safety recall procedure (Halder et al., 2020)

43
The process of a physical component fix may differ from a software fix. Physical components are replaced
with new ones, often because of mechanical wear or a fault in the original component design or
construction. In contrast, a software fault may require specialist equipment and a new software version
installed on the existing hardware. However, this is not always possible with older embedded systems.
Legacy ECU systems have their code pre-set at component manufacture. According to Broy (2006), high
hardware optimisation often results in ECUs with minimal resources where limited storage, memory and
processing capacity cannot accommodate additional lines of new software code. Limitations in ECU
hardware resources require a similar exchange of hardware to repair a software-related fault. As such, like
a physical component, ECU hardware exchange may be the only option to repair a software-related defect.
This has led to a state where more than 50% of error-free hardware is replaced with entirely new hardware
to resolve a software-related issue.
Incurred manufacturer maintenance costs can be high if a previously undetected software error or design
flaw requires a vehicle recall (Kopetz, 2011). A much higher cost multiplier to repair a software fault post-
production is applied when compared with identifying the same fault much earlier in the software
development life cycle. Figure 16 highlights the cost multipliers associated with the different stages of the
software development lifecycle (SDLC).
Figure 16: Cost multiplier of fixing a flaw at different stages of the SDLC
0
5
10
15
20
25
30
Architecture Coding Testing AcceptanceTesting
Post-Release
Cost
Mul
tiplie
r
SDLC Stages
SDLC Cost Mutiplier
44
Cost is not the only factor in this update process. Customer confidence and brand loyalty can also be
affected by software bugs and errors (Riggs et al., 2018). In recent years this has been an issue with the
highly publicised Grand Jeep Cherokee cyber-attack (Miller and Valasaek, 2015; Coppola and Morisio, 2016;
Automotive IQ, 2017).
3.6.1.2 Software update mechanism: guided user intervention
This mechanism utilises a physical input port installed inside the vehicle. Many modern cars provide a
physical connection port for their owners’ portable electronic devices, such as external Global Positioning
System (GPS) and personal mobile devices, including MP3 players, mobile phones and tablets. These
devices are often connected to the vehicle via a universal serial bus (USB) port. Using this port, vehicle
owners are able to undertake their own software update either by inserting a supplied preloaded
removable storage device or downloading a specific update from the manufacturer onto a USB device.
Notably, Fiat Chrysler employed this type of update following the 2015 Grand Jeep Cherokee remote cyber-
attack. Using the postal system, Fiat Chrysler distributed preloaded USB memory sticks with updated
software to 1.4 million affected customers (Automotive IQ, 2017).
However, there are problems associated with this type of update mechanism. These include the following:
• Limited port functionality.
• Inaccessible code.
• Basic understanding of ICT.
• Willingness to undertake the task.
If any of the above prerequisites cannot be achieved, the software update will not be completed and it will
be left unresolved. This software update method relies heavily on the customer having a particular level of
technical knowledge and a willingness to perform the update process themselves. For example, there may
be a reluctance to complete a necessary software update task due to a fear that their actions could “break
the car”, rendering it unserviceable and them responsible for any additional costs. This was observed by
Fiat Chrysler during their guided user intervention update - many of the vehicles were not updated,
prompting a vehicle recall. Furthermore, there are inherent security risks. This method is open to potential

45
exploitation from malicious threat actors that could enable unauthorised vehicle system access or the
introduction of malware into the vehicle through compromised storage devices or software download files
(Checkoway et al., 2011).
3.6.1.3 Software update mechanism: over the air (OtA) update
OtA mechanisms can update automotive software without the need to return the vehicle to an authorised
garage or dealership, or relying on the customer to update themselves. Utilising on-board vehicle
connectivity, OtA updates can deliver new software as and when required (Rouse, 2018). There are several
options which can provide OtA software updates:
• Dedicated Short-Range Communication (DSRC) - is an 803.11p based wireless communication
technology utilised for vehicle to infrastructure (V2I) and vehicle to vehicle (V2V) communication
to aid and support ADAS and autonomous driving technologies. This communication technology
can be utilised to transfer software updates between fixed infrastructure or vehicles (Guo and
Balon, 2006; Vegni et al., 2013; Patterson, 2017). However, the primary issue with DSRC and
automotive software updates is the relatively short time frames involved in V2I and V2V, especially
when vehicles are travelling in the opposite direction.
• Cellular networks - in contrast to DSRC, cellular network technology (3G, 4G and 5G) can provide
a stable high bandwidth communication mechanism. Software updates are downloaded by
connecting to a particular cell tower within range, regardless of vehicle speed and travel direction.
However, coverage may be restricted due to geographical limitations. Nevertheless, by utilising
the extensive scope of cellular networks, future automotive software updates can be transmitted
and downloaded to the target vehicle regardless of that vehicle’s location. New software, when
released, can also be downloaded.
• Fixed location Wireless Local Area Network (WLAN) - is another potential option for receiving
software downloads. Updates can be sent to the target vehicle whilst parked, for example, at
home or at work. Tesla has been utilising this OtA update mechanism from 2017 by using P2P
wireless connections to download software from Tesla servers to target vehicles (Stegar et al.,
2017).

46
Whichever form of OtA update mechanism is chosen, requires a vehicle connectivity solution. There are
three modes of connectivity operation, depending upon the connection hardware type employed in the
vehicle:
• Mirrored – applications stored on a paired portable smart device are replicated onto the
vehicle’s HMI unit. The application processing is usually performed on the smart device with
screen updates sent to the HMI via a physical or wireless connection (Coppola and Morisio,
2016).
• Tethered – this type of connection utilises the paired device’s communication technology.
Applications are installed to the vehicle’s HMI unit and application data processing is
performed within the car.
• Embedded – a vehicle with this type of connectivity does not rely on a paired smart device but
utilises its own connectivity hardware and installed applications.
There has been a widespread introduction of Long-Term Evolution (LTE) technology within the motor
vehicle utilising one of the three aforementioned connectivity types in recent years. In fact, since 2019, this
technology is estimated to be available in more than half of all new cars as can be observed in Figure 17
below.
Figure 17: Estimated connected vs non-connected new vehicles (Coppola and Morisio, 2016)
0
10
20
30
40
50
60
70
80
% n
ew c
ars
Year
Estimates of Connected and Non-connected New Cars
Connected
Non Connected
2014 2015 2016 2017 2018 2019 2020

47
3.6.2 The significance of OtA software updates
There are several benefits associated with OtA software updates, making it a promising technology for the
automotive industry. This research has identified the following benefits:
• Reduction in vehicle recalls and associated costs.
• Vehicles can be updated in locations other than a dealership or maintenance garage.
• Centralised software – software updates can be distributed directly to the target vehicles without
distributing to dealers and maintenance garages.
• Time to market – new software can be distributed as and when required rather than waiting for
the customer to return the vehicle or waiting for periodic maintenance schedule.
• Convenience –updates can be performed at the customer’s desired location and discretion,
reducing vehicle downtime.
• Mandatory updates – new and updated software, especially where safety is concerned, can be
pushed to the target vehicle without waiting for customer participation.
• Increase in safety – OtA software updates can reduce the time a vehicle is operated under faulty
conditions.
• Proven technology – OtA updates are widespread in the telecommunication industry, which has
provided users with new updated software via OtA mechanisms.
Gissler (2016) predicted that vehicle connectivity could be in all new motor vehicles by 2025. In 2015, Braun
et al. (2015) suggested OtA software updates were an attractive technology for the OEM and the customer,
with cost savings expected to reach $35 billion by 2022.
48
3.7 Chapter Summary
This chapter has focused on how the rise in the number of ECUs deployed into the modern motor car has
increased overall automotive E/E architecture complexity. Decentralisation, as well as hardware and
software optimisation, has increased further this complexity. However, complexity is not the only concern
regarding the modern motor car and the automotive E/E architecture. There is no doubt that ECUs have
had a positive impact on the motor car through the years, but there are many associated issues regarding
its increasing use, relating to ECU hardware and software. As the number of ECUs rise, system costs
increase – for components as well as development. Weight and power consumption relating to hardware
are also contributing factors to cost.
In contrast to automotive hardware, automotive software contains several critical issues including how
software bugs, errors and potential vulnerabilities are addressed and resolved. This chapter has also
discussed changing attitudes towards new car purchases and the increased demand for post-sale
functionality. However, inflexible ECU design has constrained resource capacity, which does not easily
promote additional software-based functionality at a later stage. This chapter has investigated three
software update mechanisms and how the automotive industry, in general, has applied these to resolving
software related problems. The following chapter explores the benefits of virtualisation in addressing the
identified complexities and software and hardware related issues, as highlighted in this chapter.
49
Chapter 4 Automotive Virtualisation
Objectives
• Provide an overview of virtualisation technology.
• Identify the different types of virtualisation.
• Investigate the benefits of virtualisation within the Automotive E/E Architecture.
• How virtualisation can address the identified automotive challenges and complexity.
• Future automotive E/E architectures utilising container-based virtualisation.
50
4.1 Introduction
Chapter 3 highlighted the complexities and issues concerning the increasing use and reliance on ECU
hardware and related software. This chapter proposes using specific virtualisation technology to address
the challenges facing the automotive E/E architecture. Over recent years, virtualisation technology has
been employed by datacenters. This has led to considerably lower implementation and operational costs,
specifically through server consolidation and a reduction in overall architectural complexity. Many of the
benefits experienced by datacentre virtualisation can be realised within the automotive E/E architecture.
This chapter puts forward and develops the main concepts, advantages and weaknesses of virtualisation
technologies and how they can be applied within the modern motor car.
4.2 Overview of Virtualisation Technology
Virtualisation is not a new concept or technology and dates back to the 1960s. It was developed to divide
system resources into separate and isolated entities to promote efficiency in large, expensive mainframe
systems. Full system virtualisation refers to creating a virtual version of a physical computing system and
necessitates three basic fundamental requirements:
• Equivalence – a program running on a hypervisor should behave identically to a program
running directly within the OS and its underlying hardware.
• Resource control – the hypervisor must be in complete control of any virtualised resources.
• Efficiency – a portion of the overall machine instructions must be executed without hypervisor
involvement.
Within full system virtualisation, there are two distinct variants – Type 1 and Type 2. Type 1 virtualisation
runs directly on the underlying system hardware without the need for a host OS. The hypervisor or VMM
operates in kernel mode, enabling direct access to the underlying system hardware (Aguiar and Hessel,
2010). These hypervisors are secure as they reduce the overall attack surface by removing a host OS
requirement, which may have inherent security flaws and vulnerabilities (Plauth et al., 2017). In contrast,
hosted Type 2 virtualisation is an installed software program within the host OS. Type 2 virtualisation VMs
run as a process within the host OS (Popek and Goldberg, 1974). Any hardware access between upper-level
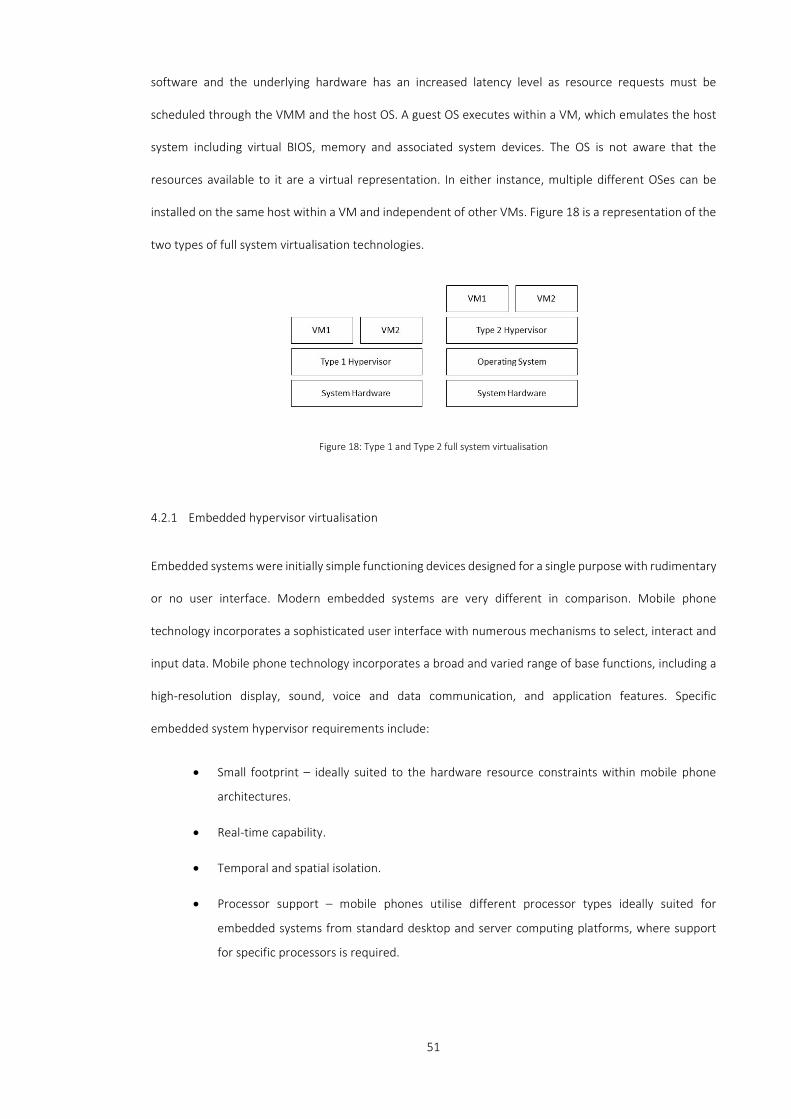
51
software and the underlying hardware has an increased latency level as resource requests must be
scheduled through the VMM and the host OS. A guest OS executes within a VM, which emulates the host
system including virtual BIOS, memory and associated system devices. The OS is not aware that the
resources available to it are a virtual representation. In either instance, multiple different OSes can be
installed on the same host within a VM and independent of other VMs. Figure 18 is a representation of the
two types of full system virtualisation technologies.
Figure 18: Type 1 and Type 2 full system virtualisation
4.2.1 Embedded hypervisor virtualisation
Embedded systems were initially simple functioning devices designed for a single purpose with rudimentary
or no user interface. Modern embedded systems are very different in comparison. Mobile phone
technology incorporates a sophisticated user interface with numerous mechanisms to select, interact and
input data. Mobile phone technology incorporates a broad and varied range of base functions, including a
high-resolution display, sound, voice and data communication, and application features. Specific
embedded system hypervisor requirements include:
• Small footprint – ideally suited to the hardware resource constraints within mobile phone
architectures.
• Real-time capability.
• Temporal and spatial isolation.
• Processor support – mobile phones utilise different processor types ideally suited for
embedded systems from standard desktop and server computing platforms, where support
for specific processors is required.

52
The mobile phone industry has significantly driven the development of embedded system virtualisation,
supported by capable hardware resources including 64-bit multi-core processors operating in the 2 – 3 GHz
range and system memory ranging in the GB range. The Apple iPhone 11, for example, includes 4GB of
system RAM and a 64-bit 2.65GHz Advanced RISC Machine (ARM)-based processor offering 18 CPU cores,
six-core CPU, four-core GPU and an eight-core Neural Engine processor supporting machine learning
processes (Surana et al., 2020).
The automotive embedded system, however, is very different to mobile phone design. Modern automotive
ECU design lacks some of the fundamental technologies to support a hypervisor environment. Automotive
embedded system microcontroller design lacks support for hypervisor memory management and CPU
privilege mode limitations required for hypervisor system hardware access. There have been various
unique approaches to automotive embedded hypervisor design. For example, the ETAS RTA Lightweight
Hypervisor utilises a multicore based ECU where one core known as the master core runs its OS and the
lightweight hypervisor (Dasari et al., 2020). Figure 19 shows the ETAS RTA hypervisor architecture. The
other CPU cores known as application cores are responsible for executing VMs (Reinhardt and Morgan,
2014; Hauser et al., 2017).
Figure 19: ETAS RTA embedded hypervisor (Hauser et al., 2017)
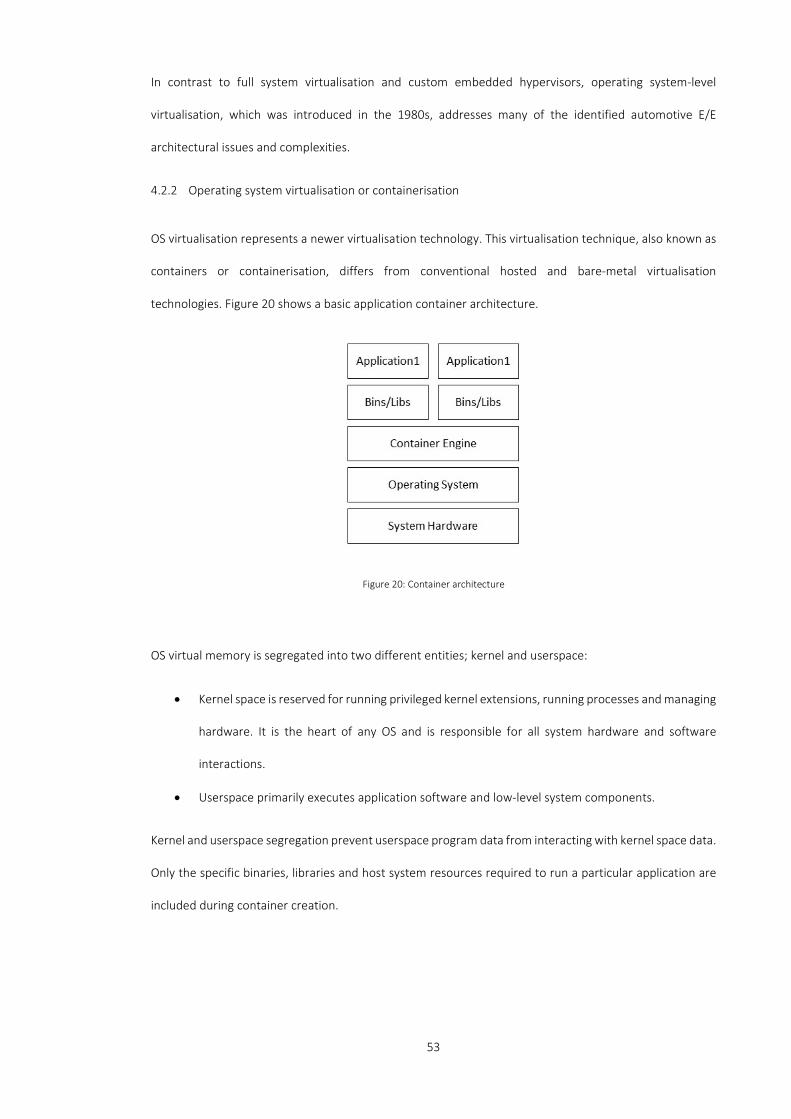
53
In contrast to full system virtualisation and custom embedded hypervisors, operating system-level
virtualisation, which was introduced in the 1980s, addresses many of the identified automotive E/E
architectural issues and complexities.
4.2.2 Operating system virtualisation or containerisation
OS virtualisation represents a newer virtualisation technology. This virtualisation technique, also known as
containers or containerisation, differs from conventional hosted and bare-metal virtualisation
technologies. Figure 20 shows a basic application container architecture.
Figure 20: Container architecture
OS virtual memory is segregated into two different entities; kernel and userspace:
• Kernel space is reserved for running privileged kernel extensions, running processes and managing
hardware. It is the heart of any OS and is responsible for all system hardware and software
interactions.
• Userspace primarily executes application software and low-level system components.
Kernel and userspace segregation prevent userspace program data from interacting with kernel space data.
Only the specific binaries, libraries and host system resources required to run a particular application are
included during container creation.
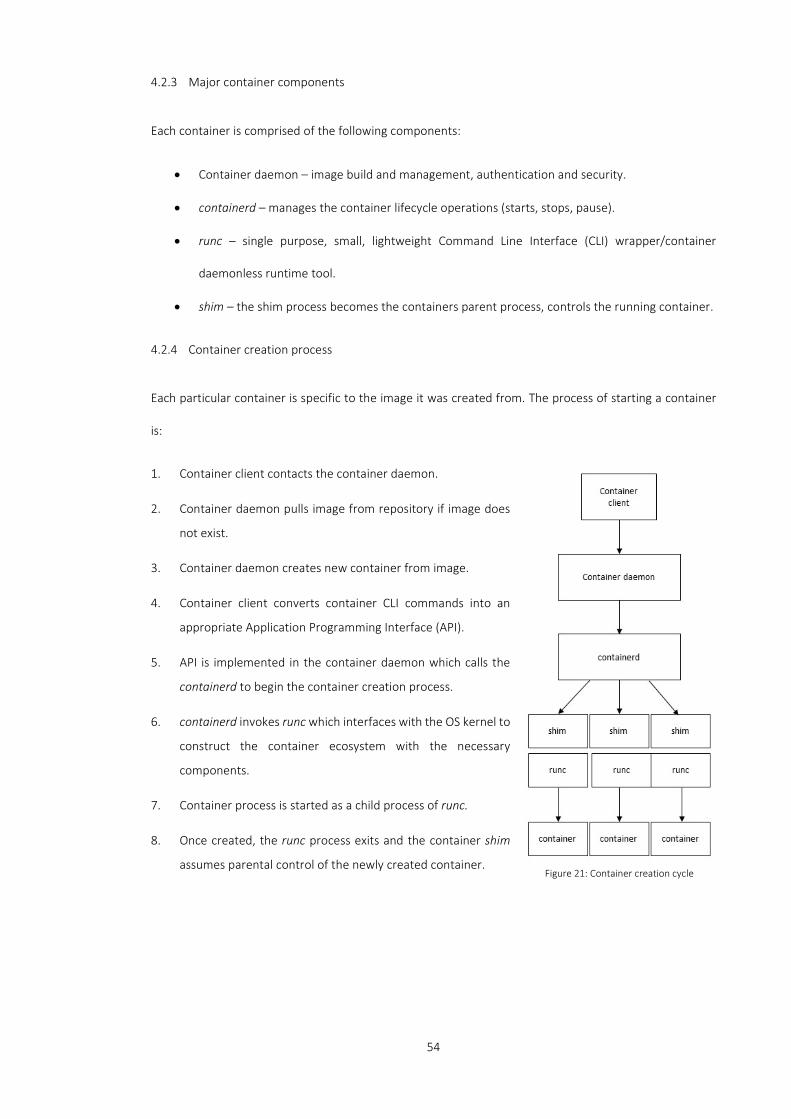
54
4.2.3 Major container components
Each container is comprised of the following components:
• Container daemon – image build and management, authentication and security.
• containerd – manages the container lifecycle operations (starts, stops, pause).
• runc – single purpose, small, lightweight Command Line Interface (CLI) wrapper/container
daemonless runtime tool.
• shim – the shim process becomes the containers parent process, controls the running container.
4.2.4 Container creation process
Each particular container is specific to the image it was created from. The process of starting a container
is:
1. Container client contacts the container daemon.
2. Container daemon pulls image from repository if image does
not exist.
3. Container daemon creates new container from image.
4. Container client converts container CLI commands into an
appropriate Application Programming Interface (API).
5. API is implemented in the container daemon which calls the
containerd to begin the container creation process.
6. containerd invokes runc which interfaces with the OS kernel to
construct the container ecosystem with the necessary
components.
7. Container process is started as a child process of runc.
8. Once created, the runc process exits and the container shim
assumes parental control of the newly created container.
Figure 21: Container creation cycle

55
4.3 The General Benefits of Virtualisation within the Automotive E/E Architecture
Virtualisation has seen some significant returns within client/server architectures, data storage and cloud
computing environments, especially in hardware consolidation and overall cost reduction. These benefits
include reducing infrastructure costs and hardware expenditure, higher system redundancy levels, and
increased productivity and security through strong levels of isolation. Similarly, virtualisation technology
within the automotive E/E architecture can address many of the concerns mentioned earlier in chapter 3.
However, virtualisation technology has not been rigorously studied within the automotive domain other
than the vehicle HMI device (Gaska et al., 2010; Reinhardt and Kucera, 2013).
4.3.1 How virtualisation can address hardware related issues
Consolidation through virtualisation has played a large part in reducing individual bespoke servers within
the datacentre, bringing them into a centralised, manageable location. Strobl et al. (2013) propose the
concept of “hardware obliteration”, where physical hardware is replaced by software (i.e. VM). Automotive
E/E architecture enables ECU consolidation, which can be achieved in conjunction with virtualisation
technology, where numerous individual hardware-based systems can be consolidated onto a single
platform, thus promoting operational efficiency and a reduction in overall complexity and running costs.
Dedicating multiple ECU instances onto a single system addresses many of the issues described in chapter
3. These include:
• Load balancing – hardware resources from other hosts can address peak system demands where
additional VMs are created on-demand on underutilised hosts. Before exceeding a specifically
defined threshold, on-demand VM creation can balance the overall system load across several
available computing platforms.
• Weight savings - the consolidation of individual ECUs reduces overall system weight. Grouping
similar functions onto single systems also reduces the requirement for inter ECU data transmission
via an in-vehicle network solution. Virtual ECU instances can communicate via virtual internal
networks, reducing network infrastructure and overall associated weight.

56
• Power consumption – energy conservation is a crucial problem within modern automotive E/E
architectures. Powering down dormant ECUs to save energy use through ECU shut down or
hardware sleep techniques is a concept that has been researched in several publications over the
years (Heiser, 2008; Navet and Simonot-Lion, 2009; Vegni et al., 2013). Underutilised computing
platforms can migrate active virtual instances to other hosts to power down redundant hardware
(Strobl et al., 2013).
4.3.2 Virtualisation addressing system security through isolation
Virtualisation offers isolation, which addresses two primary concerns - overall system security and
corruption propagation (Heiser, 2009; Compagna and Violante, 2012). Virtualisation provides a clear
separation of services whereby specific applications, processes and functions can be separated across
individual VMs. If a service within a particular VM is compromised for any reason, it will not directly affect
the integrity or security of other VMs within the same system. Figure 22 shows a potential attack on a VM
through its user interface, but this attack does not enable access to the different VMs hosted on the same
hypervisor/system.
Figure 22: Isolation from attack propagation (Heiser, 2007)
57
4.3.3 How virtualisation can address automotive software related issues
Chapter 3 highlighted many areas of concern relating to ECU hardware as well as its related software. As
mentioned previously, virtualisation has several hardware benefits but it also addresses numerous
software related concerns including security, bugs and errors, and how to address out of date code and
aftermarket sales. In particular, periodic software updates are easy to perform because they use a virtual
presence rather than a fixed hardware-based system, and are often much more accessible and cost-
effective to update and replace than hardware. Heiser (2009), stated that firmware OtA software updates
could be achieved through virtualisation where a hypervisor can reduce the amount of infrastructure
required to support new updated software, which is a limitation in fixed ECU hardware.
4.4 Future automotive E/E architectures utilising container-based virtualisation
There are some fundamental issues concerning the incorporation of full system virtualisation into an ECU
based automotive E/E architecture. There is no doubt that virtualisation is an ideal solution for system
consolidation because a single computing device hosts multiple services. Furthermore, consolidation
through virtualisation promotes the reduction of complexity and increases diverseness and manageability.
However, virtualisation heterogeneity comes at a cost when considering small scale embedded computing
devices. Some of the benefits realised by full system virtualisation do not apply to many ECUs found within
the automotive E/E architecture. Full system virtualisation or VMs create an emulated hardware platform
within a software environment, which often require a full-size OS. Full system virtualisation usually incurs
performance and memory disadvantages and an extensive software footprint depending on its
implementation. The hypervisor or VMM layer increases context switching. This has a detrimental effect
on I/O performance, which can be a critical factor in ECU functionality and often detrimental to an ECU
based system (Felter et al., 2015).
OS virtualisation is a promising technology for automotive ECUs because it addresses some of the problems
that arise from the use of full system virtualisation within the automotive E/E architecture whilst
maximising the benefits that virtualisation can provide.
58
4.4.1 The container ecosystem
Containers utilise two crucial aspects of the Linux kernel: cgroups and namespaces.
• Control groups (cgroups) - control and limit how much system resources a process can access, as
well as manage process prioritisation.
• Namespaces - isolate the process’s view of the system, including the filesystem and network
access.
Namespaces enable process isolation on the system level, whereas cgroups manage that process's
resources – combined, they provide an effective virtualisation technique. Full system virtualisation utilises
VMs that require an individual OS kernel and associated system resources to support services, applications
and software in execution. In contrast, containers share the host OS kernel, binaries and libraries. Without
the need to replicate these key OS components, this dramatically reduces individual container size, making
them a lightweight virtualisation technology. A container is constructed from a sequence of layers held
within an image. These image layers define container configuration and associated software, libraries and
binaries required to run a program within the container.
4.4.2 Additional hardware benefits of containers within the automotive E/E architecture
As identified previously, there are a number of benefits associated with full system virtualisation.
Container-based virtualisation can utilise these identified benefits, but can also realise additional specific
hardware-based advantages, which include:
• Performance - the hypervisor layer can impact system performance. However, a container can
perform at near-native speeds with little additional overhead required to run a containerised
application. Therefore, containers are ideally suited to embedded devices where quick response
times are vital to providing a safe system.
• Modularity and scalability - application functionality can be placed into a single container or
divided and distributed across multiple containers. Individual components can be upgraded or
updated independently if required.
59
• Heterogeneity - full system virtualisation requires large amounts of system resources to support
their VMs. Multiple VMs often require extensive resource available servers. Large computing
systems that support multiple VMs require more power and space, which is of limited supply
within an automotive context. Containers have a diverse array of hardware types that they are
suited too. Hardware architectures supporting container virtualisation are diverse, ranging from
large enterprise servers often found in cloud and datacentres to small embedded systems.
4.4.3 Additional software benefits of containers within the automotive E/E architecture
Container-based virtualisation utilises several benefits associated with full system virtualisation but also
realises additional specific software-based advantages, including:
• Isolation - containers have similar goals to VMs, namely application and dependency isolation.
Isolation becomes more granular as specific services are isolated within individual containers, thus
reducing the attack surface and increasing the trusted computing base.
• Lightweight - containers are quick to initialise. In comparison, VMs usually take longer whilst they
go through the process of booting up their underlying OS. ECU functionality is often a small
program or process running on a bespoke piece of hardware. These types of ECU are an ideal
candidate for container virtualisation rather than full system virtualisation. Their lightweight
architecture enables containers to be stopped and started within minimal time frames ranging in
milliseconds. An application can be isolated within its container without a separate OS to host
each application. A lightweight virtualisation approach results in multiple containers hosted on a
single hardware platform. Sharing common libraries and binaries results in image and container
footprints ranging in the megabyte range rather than the gigabyte range.
• Layered architecture – unlike a VM, where all its associated system and application software are
confined into a single software image, containers are created using a layered image. Containers
are constructed from a set of defined layers held within an image. Any subsequent change made
to a particular image layer affects all new containers built from that altered image. Unlike a VM, a
container image does not need to be replaced in its entirety. If an image layer is changed, only

60
that affected layer is downloaded and inserted into the existing image, similar to a delta/difference
file software update. These container image layer changes reflect configuration settings, new or
additional software, or particular changes to a software layer. Any changes within a layer will only
affect a new container started from the original updated image.
• Continuous software integration - new software code can be integrated into a particular system
with more frequency, which aids in more accurate and robust software code before being
delivered to the target ECU.
61
4.5 Chapter Summary
To facilitate the addition of new ADAS and autonomous driving technologies, the requirement for more
ECU computing power and vehicle subsystem digitisation will undoubtedly increase. A new architecture
design is required to address the issues and complexities of the automotive E/E architecture. Whilst there
are many benefits that can be applied to the automotive E/E architecture utilising virtualisation technology,
this research has identified that full system virtualisation does not suit automotive ECU design
requirements. For example, an OS and its applications executing within full virtualisation environments can
be considerably slower than native non-virtualised systems. This is because any privileged access to
memory or devices is initially trapped by the hypervisor, which then checks for availability before
forwarding requests - this can add additional latency to overall system performance. In contrast, containers
can operate at near-native speeds and offer similar advantages as full system virtualisation, providing other
hardware and software benefits as highlighted above.
62
Chapter 5 Container System Prototype
Objectives
• Design of the container-based automotive system prototype testbed.
• Describe the implementation of the container-based automotive system testbed.
• Identify and design a suitable automotive function for testing container-based ECUs.
63
5.1 Container System Prototype Introduction
This research aims to establish a container-based virtualised ECU architecture to support automotive
software functions and facilitate a structured software update mechanism. In order to test container
suitability, a test environment is required that models a specific ECU-based automotive process. The
literature reveals that automotive ECUs are specifically designed to undertake a particular vehicle task or
function, where supporting hardware is often bespoke and associated software is highly optimised. High
optimisation levels reduce costs, minimise system power use and promote speed of operation. However,
to address identified problems surrounding the increasing use of bespoke ECU hardware, a more generic
type of hardware is required to test the application of containers.
A crucial feature of any ECU based system is the microprocessor, which is usually an ARM processor (Wang
& Yang, 2004). This type of microprocessor has a Reduced Instruction Set Computing (RISC) architecture,
where every instruction within a process is broken down into small, simple steps executed during a single
clock cycle. ARM processors are ideal for embedded systems such as ECUs because they have minimal
power consumption rates yet high processing power. To replicate ECU hardware as closely as possible
within a testbed system, a hardware platform that utilises an ARM processor architecture is required. As
such, the proposed hardware test system comprises of multiple small generic ARM-based computing
devices. This chapter examines the requirements of a vehicle door central locking mechanism hosted within
a container-based ECU and presents the design and implementation of the required hardware and software
incorporated within the automotive testbed.
5.2 Automotive Regulations
The automotive industry is heavily regulated regarding the design and implementation of computing
systems deployed within the vehicle. To address the increasing use of safety-critical systems within the
modern motor car and identify their potential risk of failure the motor industry, has, since its publication in
2011 begun to apply the international standard for automotive safety: ISO 26262. It is an adaptation of the
non-automotive specific International Electrotechnical Commission IEC 61508 Programmable Electronic
64
Safety-related Systems standard (International Organization for Standardization, 2011). ISO 26262 applies
to safety-related automotive E/E systems [hardware and software] and addresses the potential dangers
from a safety-related systems failure (Smith and Simpson, 2016). The standard covers several significant
topics to support the automotive industry, including providing guidelines for the automotive lifecycle
incorporating management, development, production, operation, service and decommissioning.
To ensure and maintain high design specifications and safety within the ISO 26262 standard, each
automotive E/E safety-critical system is assigned an ASIL. ASIL is an extension of the IEC 61508 Safety
Integrity Level (SIL). ASIL levels are classified as:
• ASIL D – the most stringent level of safety (high risk).
• ASIL C.
• ASIL B.
• ASIL A – the least stringent level of safety (low risk).
• QM (Quality Management) non safety-related level.
An ASIL level comprises of the severity of injury, probability of exposure and controllability of the risk. An
example of an ASIL D level would be systems that interact with the steering and braking of the vehicle,
requiring the highest levels of safety during operation. For the purposes of this research, any automotive
function and responsible subsystem selected as part of the modelled automotive process will fall within
the ASIL A or QM level.
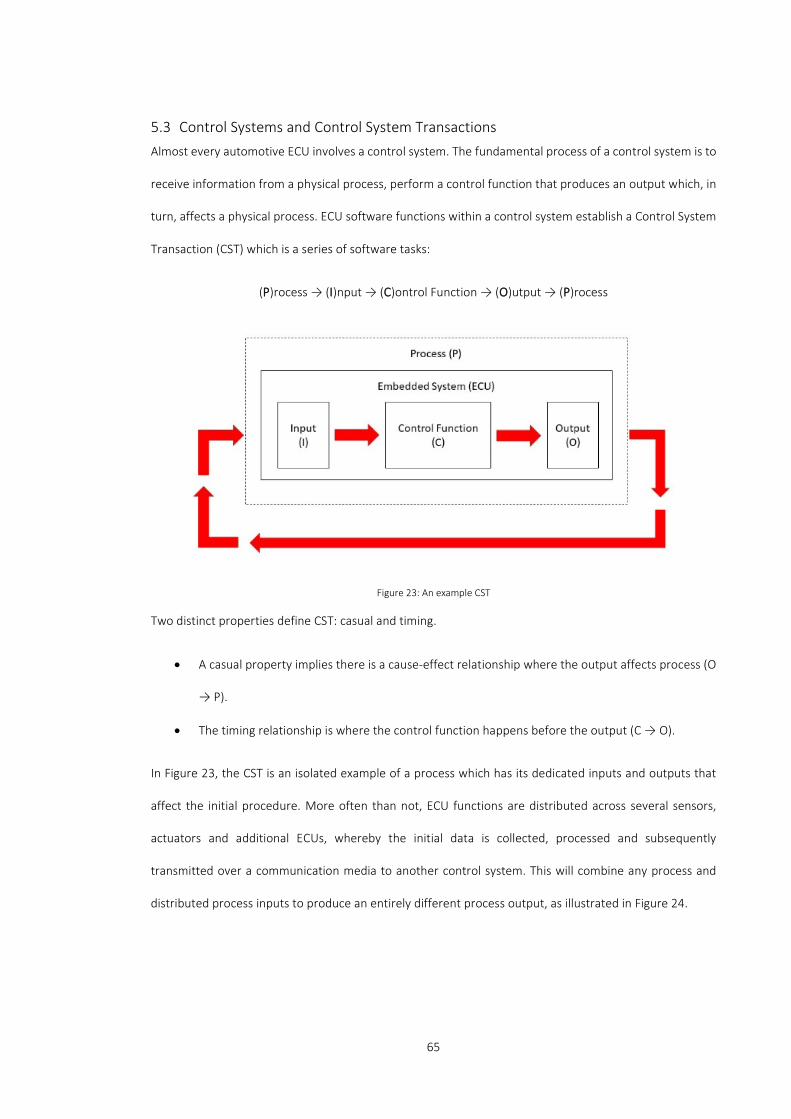
65
5.3 Control Systems and Control System Transactions Almost every automotive ECU involves a control system. The fundamental process of a control system is to
receive information from a physical process, perform a control function that produces an output which, in
turn, affects a physical process. ECU software functions within a control system establish a Control System
Transaction (CST) which is a series of software tasks:
(P)rocess → (I)nput → (C)ontrol Function → (O)utput → (P)rocess
Figure 23: An example CST
Two distinct properties define CST: casual and timing.
• A casual property implies there is a cause-effect relationship where the output affects process (O
→ P).
• The timing relationship is where the control function happens before the output (C → O).
In Figure 23, the CST is an isolated example of a process which has its dedicated inputs and outputs that
affect the initial procedure. More often than not, ECU functions are distributed across several sensors,
actuators and additional ECUs, whereby the initial data is collected, processed and subsequently
transmitted over a communication media to another control system. This will combine any process and
distributed process inputs to produce an entirely different process output, as illustrated in Figure 24.
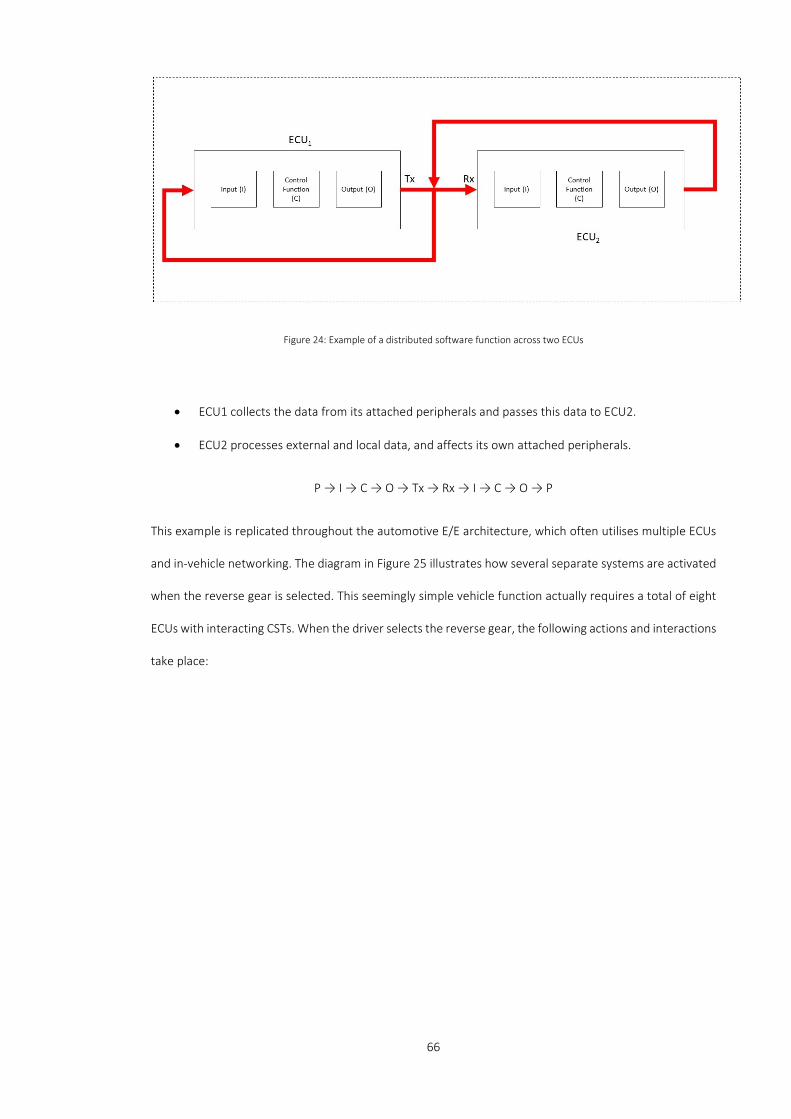
66
Figure 24: Example of a distributed software function across two ECUs
• ECU1 collects the data from its attached peripherals and passes this data to ECU2.
• ECU2 processes external and local data, and affects its own attached peripherals.
P → I → C → O → Tx → Rx → I → C → O → P
This example is replicated throughout the automotive E/E architecture, which often utilises multiple ECUs
and in-vehicle networking. The diagram in Figure 25 illustrates how several separate systems are activated
when the reverse gear is selected. This seemingly simple vehicle function actually requires a total of eight
ECUs with interacting CSTs. When the driver selects the reverse gear, the following actions and interactions
take place:

67
Figure 25: Audi reverse gear / light function
1. When the reverse gear is selected, the gearbox transmits data to the master body controller ECU.
2. The master body control module decides which subsystem ECU is required, depending upon the
input received.
3. Information is transmitted to the body control ECU rear which activates the lights.
Although the process has accomplished the primary task of illuminating the reverse light, more
dependencies are initiated as part of this function.
1. The same information passed to the body control ECU rear is used by the driver door control ECU
to dip the passenger mirror via the passenger door control ECU.
2. The roof control ECU un-dips the rear-view mirror.
3. If an attached trailer is detected, the trailer ECU activates the trailer lights.
4. If an attached trailer is detected, the vehicle parking sensors are deactivated via the parking ECU.
This simple mechanism of activating the vehicle’s reversing lights when the reverse gear is selected requires
distributed domain data and communication between the transmission and the body control domains with
numerous ECU interactions between various isolated body control ECUs. Hence, it is clear that to test a
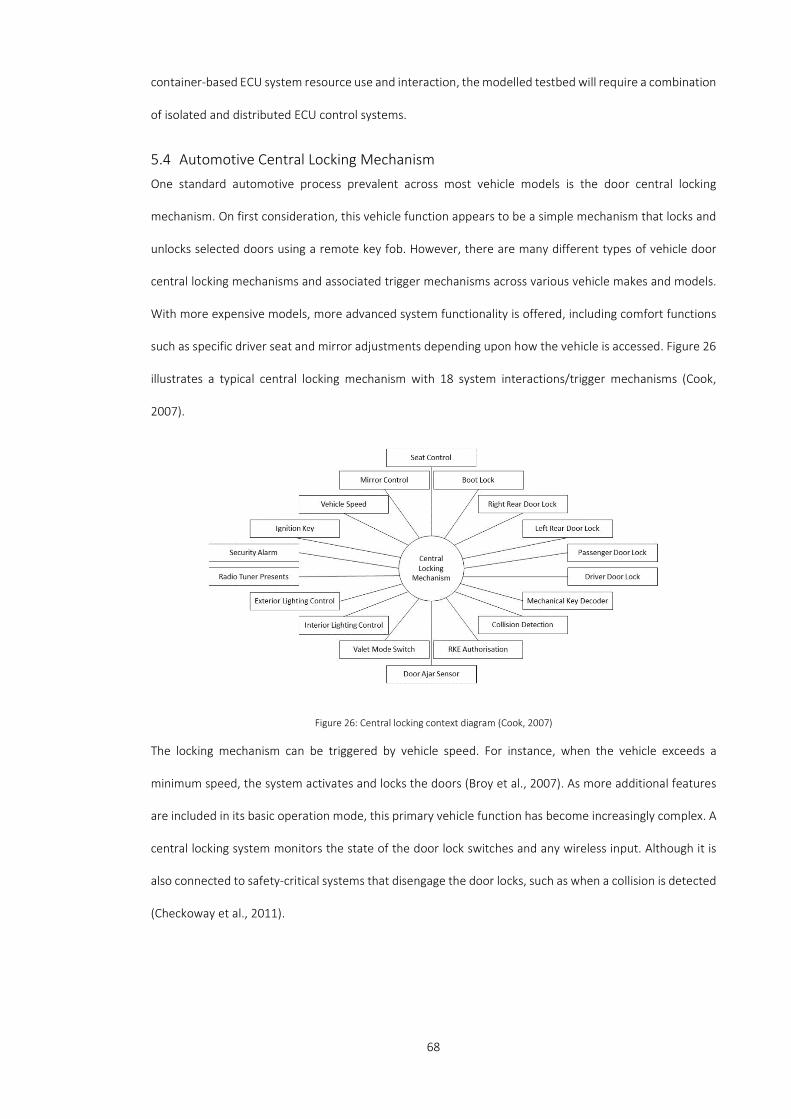
68
container-based ECU system resource use and interaction, the modelled testbed will require a combination
of isolated and distributed ECU control systems.
5.4 Automotive Central Locking Mechanism One standard automotive process prevalent across most vehicle models is the door central locking
mechanism. On first consideration, this vehicle function appears to be a simple mechanism that locks and
unlocks selected doors using a remote key fob. However, there are many different types of vehicle door
central locking mechanisms and associated trigger mechanisms across various vehicle makes and models.
With more expensive models, more advanced system functionality is offered, including comfort functions
such as specific driver seat and mirror adjustments depending upon how the vehicle is accessed. Figure 26
illustrates a typical central locking mechanism with 18 system interactions/trigger mechanisms (Cook,
2007).
Figure 26: Central locking context diagram (Cook, 2007)
The locking mechanism can be triggered by vehicle speed. For instance, when the vehicle exceeds a
minimum speed, the system activates and locks the doors (Broy et al., 2007). As more additional features
are included in its basic operation mode, this primary vehicle function has become increasingly complex. A
central locking system monitors the state of the door lock switches and any wireless input. Although it is
also connected to safety-critical systems that disengage the door locks, such as when a collision is detected
(Checkoway et al., 2011).

69
5.5 Automotive Central Locking Test System Model Requirements
A central locking mechanism incorporates distributed and isolated systems in conjunction with real and
non-real time data. This type of automotive process is an ideal candidate to model and test within a
container-based environment. To accurately model a “live” central locking mechanism, locking and
unlocking selected vehicle doors is the primary system function. This primary function is supported by
supplementary or sub-functions that trigger the mechanism and provide additional system functionality,
across different automotive domains. Figure 27 details the functional architecture of a central locking
mechanism.
Figure 27: Central locking mechanism functional architecture
The identified triggers for the modelled central locking function are:
• User-initiated manual locking of all doors via a remote wireless Infrared (IR) device.
• User-initiated manual unlocking of all doors via a remote wireless IR device.
• User-initiated manual locking of a single (driver) door.
• User-initiated manual unlocking of a single (driver) door.
• Automatic locking of all doors on the selection of a specific gear.
• Automatic unlocking of all doors on the selection of a specific gear.
70
• Automatic locking of all doors when a specific vehicle speed is achieved.
• Automatic unlocking of all doors when a safety mechanism is activated.
To meet the basic system functionalities, the test model will include a basic lock/unlock functionality
initiated by three individual triggers:
• IR remote.
• Gear selection.
• Vehicle speed.
The output of these triggers is the locking and unlocking of all vehicle doors or unlocking of the driver’s
door. Additional system functionality for the modelled central locking mechanism includes several visual
and safety features. When a central locking mechanism triggers on many vehicle models, the vehicle’s
external lights flash. Flashing lights signal that the lock/unlock mechanism has initiated and acts as a vehicle
locator. Safety is a primary consideration for vehicle egress. The modelled system will incorporate a
mechanism where all vehicle doors automatically unlock upon detection of a collision via a safety sensor.
5.5.1 Central doorl lock/unlock primary functionality
The primary function of the modelled system is to alter the current door state to a new door state through
specific trigger mechanisms. The vehicle doors can be in one of the following three states:
• All doors locked.
• All doors unlocked.
• Only driver’s door unlocked.
A particular door state is triggered depending upon received data from several distributed vehicle
subsystem processes, as outlined below.
71
5.5.2 Basic remote central locking door state selection
The vehicle doors can be locked and unlocked remotely. One of the three-door states are selected via a
remote IR transmitter, these include:
• Lock all doors.
• Unlock all doors.
• Unlock driver door only.
The door lock mechanism activates via a remote IR device simulating a vehicle key fob. An IR receiver sensor
reads the incoming signal sent via one of the selected keys on the remote IR device. The corresponding IR
code is transmitted to the Door ECU which, depending on the signal received, activates one of the three-
door states.
5.5.3 External vehicle lighting function
This auxiliary function activates in conjunction with the IR remote central locking/unlocking process. The
Light ECU is responsible for the vehicle’s headlight mode and operation, and often incorporates the
function of the vehicle’s direction indicators. In the context of this research, the lighting system has a simple
process that simulates the flashing of the vehicle indicators when the vehicle doors are locked/unlocked.
This feature is simulated using a Light Emitting Diode (LED) that flashes a specific number of times
depending on door state selection via the remote vehicle key fob. This vehicle function will only activate
when the vehicle is in a neutral transmission state. The lighting ECU will not trigger when the door
mechanism is activated automatically via the collision sensor, gear selection or vehicle speed. The external
lighting function activates when the IR receiver receives one of the three selectable door states.
• All doors locked → five light flashes.
• All doors unlocked → four light flashes.
• Drivers door unlocked → three light flashes.
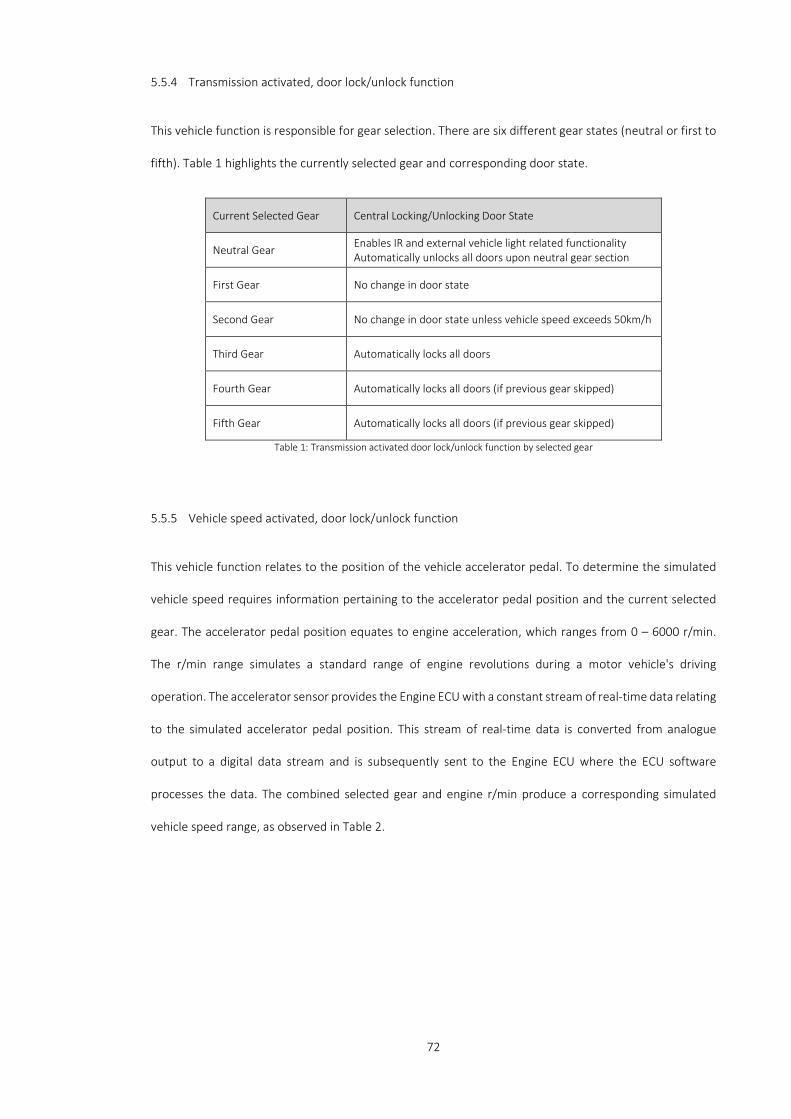
72
5.5.4 Transmission activated, door lock/unlock function
This vehicle function is responsible for gear selection. There are six different gear states (neutral or first to
fifth). Table 1 highlights the currently selected gear and corresponding door state.
Current Selected Gear Central Locking/Unlocking Door State
Neutral Gear Enables IR and external vehicle light related functionality Automatically unlocks all doors upon neutral gear section
First Gear No change in door state
Second Gear No change in door state unless vehicle speed exceeds 50km/h
Third Gear Automatically locks all doors
Fourth Gear Automatically locks all doors (if previous gear skipped)
Fifth Gear Automatically locks all doors (if previous gear skipped)
Table 1: Transmission activated door lock/unlock function by selected gear
5.5.5 Vehicle speed activated, door lock/unlock function
This vehicle function relates to the position of the vehicle accelerator pedal. To determine the simulated
vehicle speed requires information pertaining to the accelerator pedal position and the current selected
gear. The accelerator pedal position equates to engine acceleration, which ranges from 0 – 6000 r/min.
The r/min range simulates a standard range of engine revolutions during a motor vehicle's driving
operation. The accelerator sensor provides the Engine ECU with a constant stream of real-time data relating
to the simulated accelerator pedal position. This stream of real-time data is converted from analogue
output to a digital data stream and is subsequently sent to the Engine ECU where the ECU software
processes the data. The combined selected gear and engine r/min produce a corresponding simulated
vehicle speed range, as observed in Table 2.

73
Vehicle Speed Current Gear Central Locking/unlocking Door State
N/A Neutral Gear No change in system state
0 – 20km/h First Gear No change in system state
21 – 50km/h Second Gear No change in system state unless speed equals 50km/h
51 – 80km/h Third Gear No change in system state unless speed exceeds 50km/h
81 – 110km/h Fourth Gear No change in system state
111 – 160km/h Fifth Gear No change in system state
Table 2: Vehicle speed activated door lock/unlock function
5.5.6 Safety/collision sensor
This safety function overrides any current door state if a collision is detected.
• Collision detected → Unlock all doors if they are not already in an all unlock state.
• No collision detected → No change in system state.
The collision sensor is physically connected via the Door ECU General Purpose Input/Output (GPIO) pins -
when this sensor is activated, the “all doors unlock” function is activated. This safety function simulates an
automated collision detection function triggered via a dedicated impact detection sensor or vehicle airbag
deployment. This trigger mechanism overrides all other unlocking functionality (gear selection or vehicle
speed) and automatically unlocks all of the vehicle doors to allow for quick egress in the event of an
emergency.

74
5.5.7 Testbed system design
A modern vehicle door central locking function is triggered through a series of isolated and distributed CSTs
(Broy et al., 2007; Cook, 2007; Pretschner et al., 2007; Koscher et al., 2010). Figure 28 details the central
locking mechanism and its subsidiary functions developed for this research.
Figure 28: Central locking function process flowchart
Gear ECU
Engine ECU
Light ECU
Body ECU
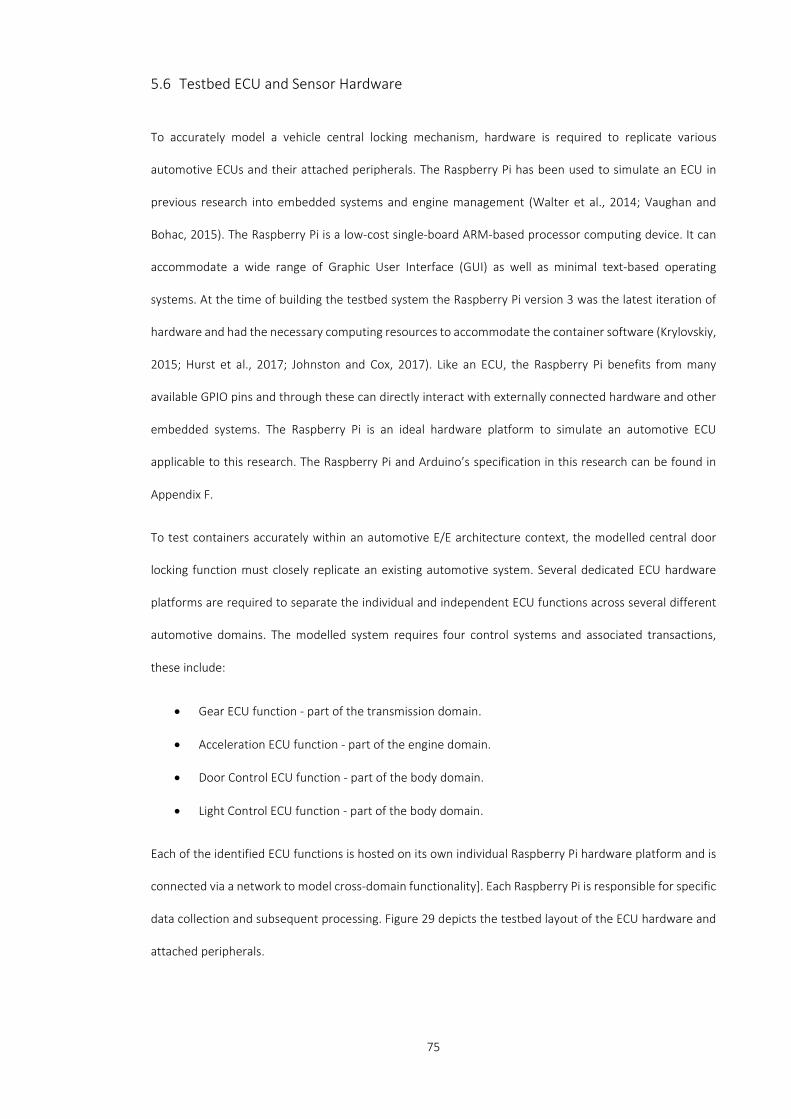
75
5.6 Testbed ECU and Sensor Hardware
To accurately model a vehicle central locking mechanism, hardware is required to replicate various
automotive ECUs and their attached peripherals. The Raspberry Pi has been used to simulate an ECU in
previous research into embedded systems and engine management (Walter et al., 2014; Vaughan and
Bohac, 2015). The Raspberry Pi is a low-cost single-board ARM-based processor computing device. It can
accommodate a wide range of Graphic User Interface (GUI) as well as minimal text-based operating
systems. At the time of building the testbed system the Raspberry Pi version 3 was the latest iteration of
hardware and had the necessary computing resources to accommodate the container software (Krylovskiy,
2015; Hurst et al., 2017; Johnston and Cox, 2017). Like an ECU, the Raspberry Pi benefits from many
available GPIO pins and through these can directly interact with externally connected hardware and other
embedded systems. The Raspberry Pi is an ideal hardware platform to simulate an automotive ECU
applicable to this research. The Raspberry Pi and Arduino’s specification in this research can be found in
Appendix F.
To test containers accurately within an automotive E/E architecture context, the modelled central door
locking function must closely replicate an existing automotive system. Several dedicated ECU hardware
platforms are required to separate the individual and independent ECU functions across several different
automotive domains. The modelled system requires four control systems and associated transactions,
these include:
• Gear ECU function - part of the transmission domain.
• Acceleration ECU function - part of the engine domain.
• Door Control ECU function - part of the body domain.
• Light Control ECU function - part of the body domain.
Each of the identified ECU functions is hosted on its own individual Raspberry Pi hardware platform and is
connected via a network to model cross-domain functionality]. Each Raspberry Pi is responsible for specific
data collection and subsequent processing. Figure 29 depicts the testbed layout of the ECU hardware and
attached peripherals.
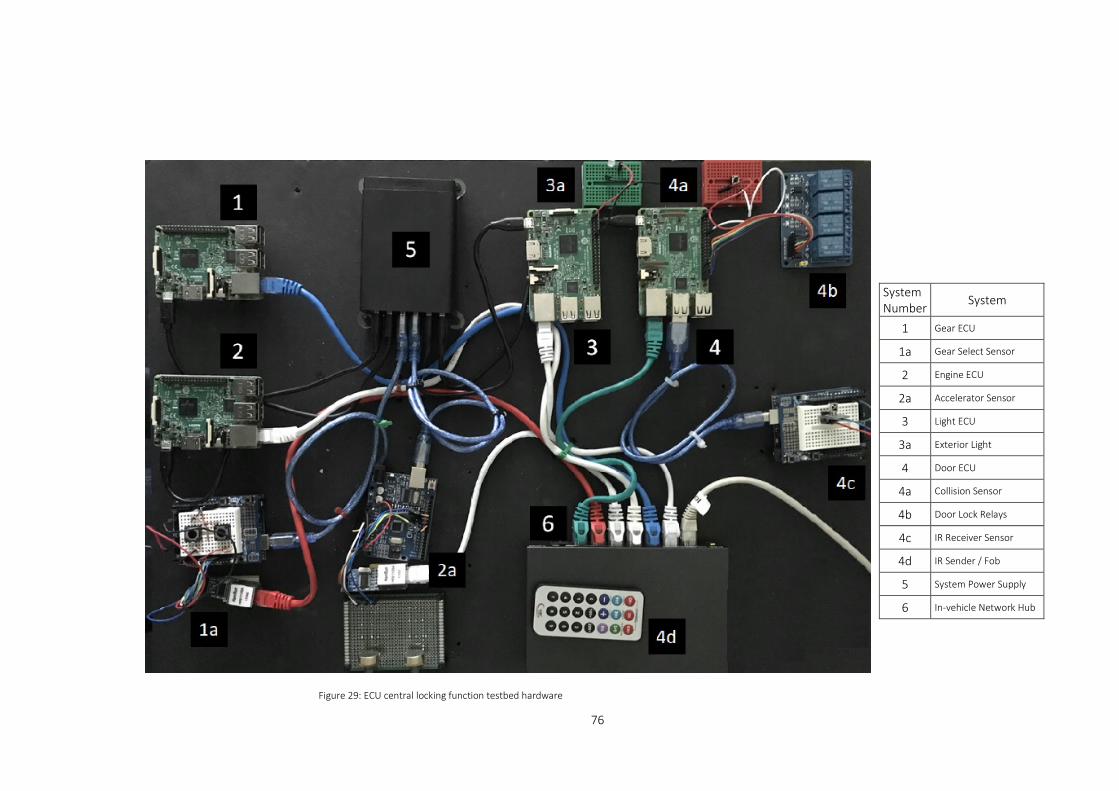
76
System Number
System
1 Gear ECU
1a Gear Select Sensor
2 Engine ECU
2a Accelerator Sensor
3 Light ECU
3a Exterior Light
4 Door ECU
4a Collision Sensor
4b Door Lock Relays
4c IR Receiver Sensor
4d IR Sender / Fob
5 System Power Supply
6 In-vehicle Network Hub
Figure 29: ECU central locking function testbed hardware
77
Several attached sensors provide the initial simulated automotive data. Actuators provide the door locking
mechanism and LEDs that simulate vehicle lights. The modelled system requires specific peripheral
hardware that includes:
• Central door locking mechanism - provided by a four-channel relay module. Each relay represents
a specific vehicle door. The vehicle doors are locked when the corresponding relay is in the closed
position.
• Remote door lock trigger - manual door states are affected via a remote IR transmitter device. The
IR transmitter sends one of three selectable door commands to an IR receiver. This particular
functionality is suspended if the current transmission state is in any gear other than neutral.
• External lighting - an LED simulates the vehicle headlights, which illuminates according to the
received door state.
• Gear position – the current selected gear is represented by a series of depressions on one of two
pushbutton sensors that either increase or decrease the gear.
• Vehicle acceleration – the simulated engine r/min is selected by a potentiometer position setting
with a data range of 0 – 1024.
• The collision sensor – a push-button sensor simulates the deployment of an airbag or activation
of a collision sensor and when pressed, activates the overriding safety mechanism.
Several system peripheral devices are directly connected via the GPIO pins of a particular ECU. Other
peripheral devices are connected via Arduino programmable circuit boards where raw sensor data is
collected, processed and subsequently transmitted to the relevant ECU via a simulated in-vehicle network.
Figure 31 is a block diagram of the modelled door central locking function simulation.

78
Figure 30: Testbed door central locking function

79
5.7 Testbed ECU Software Each simulated ECU requires a specific software program that provides a particular vehicle function. To
accomplish this, each testbed ECU needs an operating system, network stack, GPIO pin access and a high-
level programming language.
5.7.1 ECU operating systems
There are several operating systems tailored for use with containers. All are highly optimised Linux distros
and offer a small footprint with minimal additional software packages, system utilities and services, and no
GUI desktop environment. These optimised container distros include Alpine Linux, RancherOS, CoreOS and
VMWare Photon OS. Except for CoreOS, all are compatible with running on the Raspberry Pi with most of
these distros falling into the sub 100MB footprint. A fully optimised ECU operating system is an essential
factor for a live ECU environment. As such, a generic operating system will be used to provide the flexibility
necessary to install any required additional software tools and monitoring programs. The Raspbian Lite OS
provides a reduced text-based version of Raspbian and utilises fewer system resources than the GUI
version. Raspbian Lite is a Linux Debian-based operating system which is highly optimised to the Raspberry
Pi and approximately 300MB in size compared with the full version of Raspbian which is approximately
1.3GB in size.
Alpine Linux, RancherOS, CoreOS and VMWare Photon OS are all optimised OSes which include a container
virtualisation technology known as Docker. However, there are limitations with these OSes, for example:
• Alpine Linux, although a popular OS choice where container virtualisation is concerned, is more
suited to run within containers rather than as a hosting platform for container virtualisation.
• CoreOS is more suited towards large container-based applications. This OS requires a proprietary
orchestration system which is not required for this research.
Raspbian Lite is a complete general-purpose OS for the Raspberry Pi and incorporates all of the components
required to run a container environment, network stack and the necessary software monitoring tools.
80
Container system resource use is a crucial factor addressed by this research, with OS functionality being
preferable to an optimised embedded OS.
5.7.2 Functional programming scripts
Each ECU runs an identically configured OS but each ECU has its own individualised software program that
implements ECU system functionality. Each ECU within the testbed is responsible for its own dedicated
function but is often required to transmit data to other ECUs depending upon the given task. In the
automotive world, the high-level programming language of choice is C. There are numerous software
programming standards surrounding the use of this particular programming language, which ensure that
any harmful programming routines and code do not put the vehicle in an unsafe state, especially regarding
safety-critical vehicle functions.
Python is an interpreter-based language and supports object-orientated, procedural and functional
programming. Although Python is slower in comparison to compiler languages (including C), this research
utilises Python. It is an ideal programming language on the Raspbian Lite OS because it offers high flexibility
when accessing GPIO pins. In order to model the central locking system, each ECU requires a specialised
Python script that provides individual ECU functionality (i.e. gears, lights, engine and doors). When
combined, these simulate the central locking mechanism. By utilising Python multi-threading in this way,
the hardware is able to execute code faster, thus promoting operational efficiency.
The literature demonstrates that as the number of lines of code increases with each new vehicle model, so
do inherent errors. As such, each application script will be designed with minimal coding to keep the script
size as low and as efficient as possible. Minimal and efficient code has less of an impact on available system
resources. Previous chapters have highlighted the relationship and associated problems concerning ECU
hardware resource constraints and high automotive software optimisation levels. Although the Raspberry
Pi has large amounts of available resources, it is necessary to keep the functional software code to a
minimum to promote code efficiency within a live automotive system.

81
5.8 Research Testbed Build Stages
There are several procedural and functionality stages required in order to implement a fully functional
modelled central locking system.
5.8.1 Testbed procedural build stages
The identified high-level procedural stages required to build and implement a simulated central
locking/unlocking function into a suitable testbed include:
1) Installation and configuration of a base OS image on four suitable simulated ECU hardware platforms.
2) Installation of required sensors to produce simulated automotive system raw data
a) Potentiometer - vehicle accelerator pedal simulation.
b) Switches - vehicle gear selector simulation.
c) IR receiver - vehicle IR sensor.
3) Installation and configuration of three Arduino prototype boards to acquire and perform initial
processing of raw sensor data.
a) IR receiver ECU interface.
b) Gear selector ECU interface.
c) Acceleration ECU interface.
4) Development of four individual Python scripts to simulate ECU application software.
5) Configuration of an Ethernet-based network (simulated in-vehicle network) to enable ECU
communication.
5.8.2 Testbed functionality build stages
The following stages list how the simulated system works and interacts:
1) Initial system power-up is provided by a single power supply which simulates the vehicle ignition key
process.
2) Each ECU boots their own operating system.
3) Arduino prototype boards powerup and load program code into flash memory.

82
4) Automotive software automatically loads after system boot up.
5) Arduino prototype boards collect and process raw data.
6) Transmission of processed data to the corresponding host for ECU functional data processing.
7) ECU data is processed and produces corresponding output for isolated ECU functionality.
8) Processed data where required is transmitted to relevant waiting ECU for processing.
9) Distributed process data is processed and produces corresponding output for distributed ECU
functionality.
5.9 Testbed Individual System Functional Testing and Data Verification
To ensure the test system will meet the specified system requirements, several tests will be undertaken to
confirm that each subsystem works correctly, as well as overall system functionality.
5.9.1 Engine ECU
The Engine ECU process requires data from the accelerator sensor as well as the Gear ECU. The modelled
accelerator sensor within the testbed system utilises a potentiometer. The accelerator sensor is connected
to an Arduino development board which when system power is applied automatically runs a script to collect
raw sensor positional data from the accelerator sensor. The potentiometer’s resistance is measured
through its full range of motion and compared with the stated hardware specifications to ensure that the
potentiometer’s accuracy in operation and the sensor readings are correct. To verify that the data received
by the Arduino development board is accurate, the in-built Arduino sketch serial monitor will be used to
confirm that the analogue to digital conversion of the raw sensor data is being recorded and converted
accurately, depending upon the potentiometer setting.
The Engine ECU application script receives data from its dedicated sensor and compares it against a series
of predefined instructions. The accelerator sensor setting determines the simulated engine revolutions
(r/min). Although this ECU requires two different data values to generate a simulated vehicle speed, the
Engine ECU program will still produce and display a r/min value based on the received accelerator sensor
data.

83
5.9.2 Gear ECU
Gear selection simulation utilises two push-button switches. The switches select a gear sequentially either
up or down through the gear range. In standard gear stick operation, gears can be skipped during driving.
The testbed gear selection process simulates a sequential gear selection mechanism rather than a gear
stick operation selection procedure. An Arduino development board automatically runs a script and collects
raw data from the gear sensor gear selection. To verify the data collected by the Arduino development
board, the output of the push button switches will be observed using the Arduino serial monitor process
to ensure that each button press is registering as a gear selection.
The Gear ECU application script receives data from its dedicated sensor and increases or decreases the
current gear number depending upon the data it receives from the push button switch sensor. The last
gear number, including the previous gear, is displayed as part of this ECU functionality. The final gear
number is subsequently transmitted to the Engine ECU, to calculate vehicle speed. The same data is also
sent to the Door ECU as part of the automatic door lock/unlock function. Confirmation of the current gear
is displayed on the Engine ECU output display.
5.9.3 Light ECU
The Light ECU function is activated when the IR receiver detects a signal from the transmitter. The engine
or Gear ECU does not trigger the operation of this ECU. Data about the door state is sent from the Door
ECU. The Light ECU script compares the received code to one of three states and actives the appropriate
light flash sequence according to the received state. If the data received do not match any of the three
coded conditions, the system will not operate.
5.9.4 Door ECU
The Door ECU has two specific modes of operation: automatic and manual lock/unlock activation. These
two modes are triggered depending upon the current door state and received data relating to a change in
that state.
84
5.9.4.1 Central locking function: manual mode
In this mode, the system is activated by an IR receiver that reads a code generated by an IR transmitter. To
check the initial data gathered via the Arduino development board, the IR transmitter's output will be
observed via the Arduino serial monitor to ensure that each button press registers the correct factory set
code. The Door ECU application script receives data from its dedicated sensor and compares the received
code to one of three manual conditions. If any match, the current door state is displayed and the relevant
data is transmitted to the Light ECU and attached relay board which activates the door locks accordingly.
5.9.4.2 Central locking function: automatic mode
The system activates under two automatic trigger processes – gear selection or vehicle speed. The Door
ECU receives data from the Engine ECU relating to the vehicle's speed and the Gear ECU relating to the
current selected gear. In automatic mode, the door mechanism activates when one of three specific
conditions are met:
• Vehicle speed equals or exceeds 50km/h.
• Vehicle’s current gear is ≥ 3 and the current speed is less than 50km/h.
• Vehicle’s current gear is neutral.
The script has conditions relating to vehicle speed and current gear. If either of these conditions is met the
locking mechanism triggers. The locking mechanism trigger state will be verified by observing the Engine
ECU output when the door lock mechanism is activated. This output relays the current selected gear as well
as vehicle speed.

85
5.10 Chapter Summary
This chapter proposes that in order to test the validity of a container-based E/E architecture, a suitable
modelled distributed automotive function is required. An automotive process that incorporates data from
several different domain-based ECUs is an ideal candidate to meet this research's requirements and will be
achieved through a vehicle door central locking process. A modern central locking system has numerous
dependencies and related sub-functions that require data from distributed and isolated processes across
several automotive domains. Several different trigger mechanisms provide cross-domain ECU
communication from the engine and transmission automotive domains, and will accurately replicate a live
central locking function. This type of system often requires a combination of real and non-real time data to
accomplish the primary function of locking and unlocking selected vehicle doors. Within this chapter, the
modelled process and associated trigger mechanisms have been mapped using functional architecture and
a flow diagram. From this analysis, a suitable hardware platform has been chosen to replicate the required
system ECUs and associated hardware peripheral sensors. Lastly, ECU application scripts have been coded
that provide individual ECU functionality.
86
Chapter 6 System Resource Evaluation
Objectives
• Provide an overview of the system tests undertaken within this research.
• Measure and compare native and container CPU and memory saturation.
• Measure and compare native and container CPU and memory utilisation.
• Provide an overview of which system resource is best suited to a container-based ECU.
• Provide an overview of consolidation through bound process types

87
6.1 Introduction
Container-based virtualisation has many benefits as illustrated in Chapter 4. However, if the proposed
architecture underperforms in the context of system resource use (which includes CPU, memory and OS
kernel), it may be unsuitable for an automotive ECU application. This chapter investigates how containers
utilise available system resources, particularly processor and memory, as these are essential system
resources, especially within real-time systems where timing is fundamentally linked to safety. The following
tests in sections 6.7 and 6.8 are divided into two main categories of saturation and utilisation. Both are
essential metrics when determining overall system performance and resource use (Gregg, 2013). For each
of the three test modes (base, native and container), CPU and memory statistics were measured under
both saturation and utilisation categories. This chapter concludes with a series of tests investigating
consolidation through containerisation, where both native and container test performance is studied when
external stress loads are applied to the system.
6.2 ECU System Testing
As part of the requirements and testing phases of hardware and software development, the automotive
industry utilises “in the loop” testing mechanisms (Leen et al., 1999; Ebert and Jones, 2009). There are a
variety of in the loop mechanisms, including:
• Model In the Loop (MIL) testing is used to develop system and controller models to determine if
the modelled controller can control the logic, inputs and outputs between the controller and the
system.
• Software In the Loop (SIL) testing is concerned with aspects of the automotive functional software.
Software behaviour can be tested and validated in a modelled hardware environment before
actual hardware prototyping stages. This form of testing determines the necessary hardware
requirements to support operating software and detect coding errors.

88
• Processor In the Loop (PIL) testing uses cross-compiled code to test code execution and responses
from the processor architecture. This testing type detects code compiler or processor architecture
faults.
• Hardware In the Loop (HIL) aides in configuration development and testing of new ECU hardware.
New ECUs connect to a HIL test system which provides a simulated environment. Any actual
physical hardware is electrically modelled and software algorithms provide the necessary data
parameters. A HIL test system produces the same data outputs as a real engine. This data is then
inputted into the connected ECU to test its hardware and functional software under specific loads.
This research is concerned with validating containers as a mechanism to host multiple ECU software
functionalities within a future automotive E/E architecture. However, this research was prohibited from
using any of the above identified in the loop testing mechanisms because of cost and lack of availability.
Instead, an automotive central locking mechanism was selected to provide a suitable test environment, as
outlined in the preceding chapter. The testbed environment modelled existing automotive ECU systems,
incorporating specific hardware and necessary software scripts written to provide the modelled
automotive functionality.
6.3 ECU Test Modes of Operation
The CPU and memory resources required and consumed by an ECU function are predictable and
determined during the design and testing stages. This research proposes a container-based ECU
architecture which in implementation requires additional software and level of abstraction between the
application software and underlying hardware. By measuring the specific system resource use, an
understanding can be gained of how additional resources are required to support a container-based
automotive architecture when compared with current ECU configurations. To determine the additional
resources necessary for a container-based system, a series of test comparisons must be performed against
three identified system operational modes. These include:
89
6.3.1 Base system test mode
This initial test mode establishes a baseline benchmark of the system resources used when the modelled
ECU is in an idle state. Only the active processes relating to OS operation after system initialisation are in
execution. Any system overhead introduced by the ECU software across subsequent test modes can be
compared to this baseline set of results to determine the overheads when the ECU functional software is
executed natively and within a container.
6.3.2 Native system test mode
This test mode generally mirrors current automotive E/E architectures and ECU function operations. Native
system test mode is an extension of the base system test, including any additional processes initialised by
the ECU functional software. The same resource tests that run across all four modelled ECUs during the
base system tests are repeated in this test mode. During this test mode, the results will show specific
increases in system resource use when each ECU functional software is in execution compared with the
base system test.
6.3.3 Container system test mode
ECU software executing during the native test mode runs directly on top of the ECU OS. During the
container test mode, individual containers encapsulate the ECU functional software and any additional
software dependencies required for its operation. This test mode measures any other system resources or
resource overhead required to run the ECU software within a container when compared with native
operation.
6.4 Test Measurement Methodology
Two crucial system resources within any automotive ECU are the system processor and available memory.
These two resources and how they are used are fundamental aspects of this research. A set of test criteria
must be defined to ensure the same conditions are applied across all resource tests during the three test
modes. Best practice for data capture involves evaluating each specified metric over multiple data

90
collection instances and particular time frames, to fully understand the specific system resource usage.
Specific test times are divided into three distinct time frames (60-second, 600-second and 1200-second
duration), as described below:
• Δtime_60 = 60-second sample run - some tests investigate the specific resource use required
during the ECU software's initialisation. Thus, only the first few initial seconds are required for
analysis. A 60-second test run is a sufficient time to allow for an initial warm-up period before
script execution.
• Δtime_600 = 600-second sample run – these tests investigate the functional software's entire
lifecycle from initialisation to termination. These time frame tests include a system idle warm-up
period of 30 seconds, which eliminates any spikes in specific resources associated with the initial
stages of software execution. Script execution time for these timed tests is 500 seconds, at which
point the script terminates, with the final 30 seconds of the test being the cool-down period. CPU
and memory resource levels after script execution are a crucial area of investigation. They reveal
whether the system returns to a similar state before the script was executed. It is important to
understand the level of resources which are not released back to the system after execution,
particularly ECU systems that only activate periodically to accomplish a specific task or function.
• Δtime_1200 = 1200-second sample run – this test period investigates resource use trends over an
extended time to see if there are specific increases during long execution cycles. However, to
display this information, the published results must be a cross-section of the entire 1200-second
test, especially where test results show little to no observable activity.
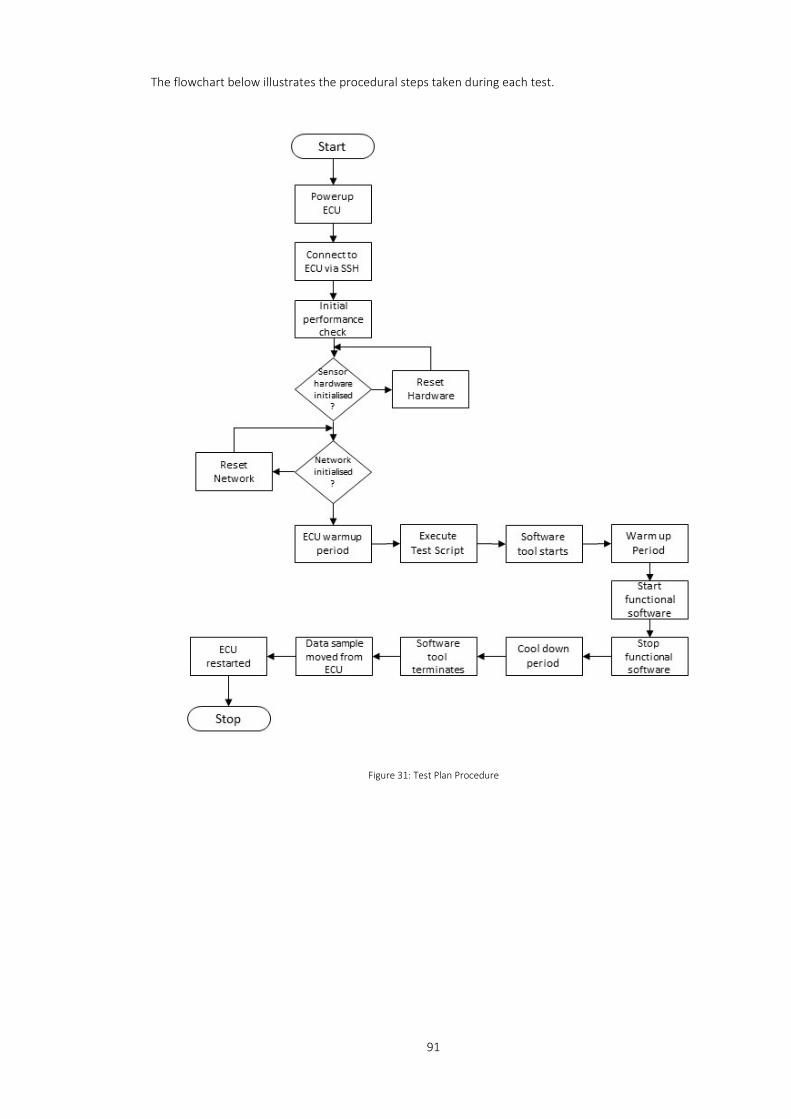
91
The flowchart below illustrates the procedural steps taken during each test.
Figure 31: Test Plan Procedure

92
6.5 Key System Performance Metrics Overview
This research draws comparisons between the current automotive E/E architecture and traditional client-
server architectures. In supporting a server environment, the Utilisation, Saturation and Errors (USE)
methodology can investigate performance issues and potential bottlenecks (Gregg, 2013; Hartmann,
2017). The Rate, Errors and Duration (RED) method can also be used to monitor microservices (Wilke, 2017;
Jackson, 2018). A combination of these two methods provides an ideal methodology for monitoring the
specific resources to support native and container-based ECU execution. However, it is not necessary to
utilise the errors component of the USE method nor the rate and errors components of the RED method
because these are more focused metrics for a web-based application. This research, therefore, combines
elements of the USE and RED methods, adopting a new methodology. In particular, it focuses on Utilisation,
Saturation and Duration (USD) components to identify performance across the target system CPU and
memory. The critical metrics for this research includes:
• Utilisation – the percentage of time a resource is busy compared to when that resource is available
over a given time interval.
• Saturation – the amount of work that is queued or waiting for an available resource, often
expressed as a queue length.
• Duration – the amount of time spent serving a request.
6.6 CPU and Memory Monitoring Tools
Numerous Linux software monitoring tools are available that measure key CPU and memory metrics. In
turn, these specific resources can be observed by applying the USD methodology to each ECU. The
following software tools can be used to monitor and record CPU and memory saturation for each modelled
ECU when an ECU system is idle and when the automotive function is running in both native and container
operational modes. The software tools that are used to monitor and record the key system metrics are
listed in the figure below and Appendix A.

93
Figure 32: Software Tools and Architectural Areas of Testing
6.6.1 vmstat (virtual memory statistics)
vmstat is a useful tool for identifying potential resource bottlenecks and corroborates the data collected
from several other monitoring tools. The metrics monitored include:
• The number of processes/tasks waiting runtime (R state) and those in interruptible sleep (D
state).
• The amount of free or idle system memory.
• Memory swap information.
• CPU statistics including %us, %sy and %id.
Figure 33: vmstat sample output (ECU001)

94
6.6.2 free (free and used memory)
This tool displays various memory statistics, including the total available free memory, used swap and
physical memory. Other observed metrics from this software monitoring tool include the buffers column
that reports the amount of allocated memory in use. The cache column reports the amount of allocated
memory swapped to disk or unallocated if other tasks require that resource.
6.6.3 pmap (process memory map)
pmap is a simple software tool used to monitor total memory use in kb of individual processes.
6.6.4 cat (concatenate files)
The cat command obtains OS kernel schedule statistics regarding individual processes. The values obtained
from the schedstat are a snapshot of the average time totals a process has spent on the CPU and waiting
for an available time slot on the CPU at the point when the cat /proc/<pid>/schedstat command is run.
The schedule statistics schedstat describes three statistics which define overall scheduling latency:
• Sum of time spent running processes in the processor.
• Sum of time spent waiting to run a task (often measured in jiffies).
• The number of time slices or voluntary and involuntary switches running on the CPU.
Automotive ECUs often have real-time operational requirements which habitually relate to system safety.
Understanding the overall scheduling latency between the native/bare metal and container ECU
operational modes is a crucial factor of this research.
6.6.1 sar (system activity reporter)
The sar monitoring tool is used extensively throughout this research. It is vital for monitoring ECU resource
use for both CPU and memory saturation and utilisation. Figure 33 is an example sar output. The following
configuration flags can be applied to this tool to monitor and record specific CPU and memory saturation
and utilisation metrics:

95
• sar -B - reported system paging statistics.
• sar -q – monitors CPU load, run queue and process list lengths.
• sar -R - monitors general memory statistics.
• sar -r - reports on the percentage of system memory used.
• sar -W - monitors swap in and swap out rates.
Figure 34: Example of a sar output
6.6.2 perf (performance analysis)
perf is a software tool that provides system-wide statistical profiling information for analysing the
performance of an application in execution. perf enhances understanding of the system scheduler
properties (sched latency and sched timehist) that measure latencies at the task/process level and latency
events, including the sched-in count, total run time, and average run time per sched-in count.
6.6.3 pidstat (process statistics)
pidstat is a software tool useful for monitoring individual kernel tasks and corresponding child processes.
It displays metrics for specific or all running processes and collects data on time spent by a task executing
at the user and system level.

96
6.6.1 top / htop / nmon
The three software programs nmon, top and htop are all dynamic software monitoring tools. They all
provide real-time data output about many aspects of the host system, including CPU, memory and
processes. These three tools validate the accuracy of the results obtained from the other more specialised
tools. They provide a real-time monitor for ECU functional software in execution at the process and thread-
level and report any other processes invoked during the native and container test modes.
6.6.2 CPU software tool quick reference (see Appendix A)
Test Case System Resource
Monitored Software Tool Metric Reference Reference
All cases
CPU
htop Collaboration and general monitoring tool Chapter 6
nmon Collaboration and general monitoring tool Chapter 6
Per process
cat Time spent on CPU/time spent waiting on the queue
Page 111
perf Average and maximum delay per schedule Page 113
pmap Total memory use Page 133
sar
Percentage per CPU idle time Page 117 - 122
Percentage per CPU system processes Page 117 - 122
Percentage per CPU user processes Page 117 - 122
tiptop Instructions per cycle Page 123
System
perf Total number over a sample time period Page 125
sar
Number of tasks awaiting runtime Page 99 - 100
CPU time per %system processes Page 117 - 122
CPU time per %user processes Page 117 - 122
Number of tasks in the task list Page 102
load average 1/5/15 min Page 106 -109
Context switches per second Page 125
vmstat
Number processes in sleep (D state) Page 99 - 100
Number processes waiting runtime (R state) Page 102 - 103
Percentage of ALL CPU system processes Page 117 - 122
Percentage of ALL CPU user processes Page 117 - 122
Table 3: CPU software tools quick reference
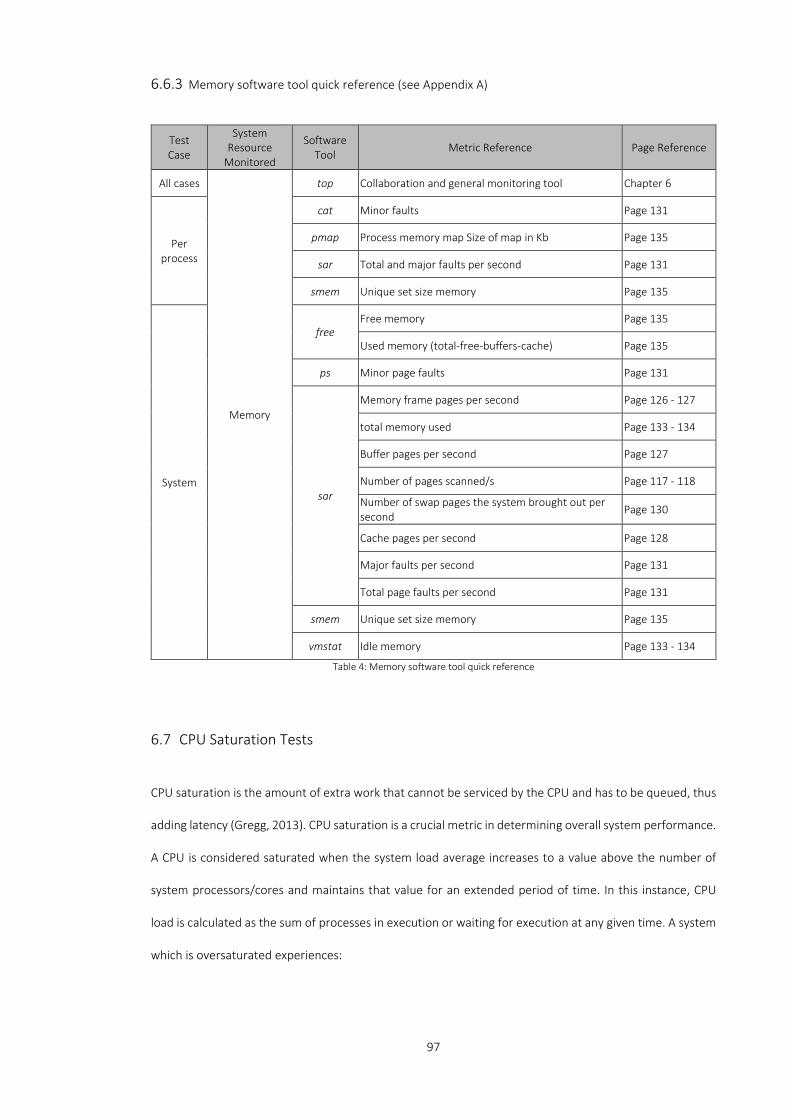
97
6.6.3 Memory software tool quick reference (see Appendix A)
Test Case
System Resource
Monitored
Software Tool
Metric Reference Page Reference
All cases
Memory
top Collaboration and general monitoring tool Chapter 6
Per process
cat Minor faults Page 131
pmap Process memory map Size of map in Kb Page 135
sar Total and major faults per second Page 131
smem Unique set size memory Page 135
System
free Free memory Page 135
Used memory (total-free-buffers-cache) Page 135
ps Minor page faults Page 131
sar
Memory frame pages per second Page 126 - 127
total memory used Page 133 - 134
Buffer pages per second Page 127
Number of pages scanned/s Page 117 - 118
Number of swap pages the system brought out per second
Page 130
Cache pages per second Page 128
Major faults per second Page 131
Total page faults per second Page 131
smem Unique set size memory Page 135
vmstat Idle memory Page 133 - 134
Table 4: Memory software tool quick reference
6.7 CPU Saturation Tests
CPU saturation is the amount of extra work that cannot be serviced by the CPU and has to be queued, thus
adding latency (Gregg, 2013). CPU saturation is a crucial metric in determining overall system performance.
A CPU is considered saturated when the system load average increases to a value above the number of
system processors/cores and maintains that value for an extended period of time. In this instance, CPU
load is calculated as the sum of processes in execution or waiting for execution at any given time. A system
which is oversaturated experiences:
98
• A longer wait for a process in an idle or wait state.
• An increase in overall request-response times.
• A subsequent increase in CPU utilisation.
Therefore, CPU saturation also refers to the number of processes, either queued or blocked awaiting CPU
time. If the number of instructions to be processed is more than the processor can accommodate due to
its speed, the program in execution is considered CPU bound. An example of a CPU bound process is an
algorithm which requires a large number of calculations that hold the CPU for as long as the scheduler
allows. The saturation tests conducted as part of this research use the standard inbuilt OS scheduler
(SCHED_OTHER), a conventional timed-shared process. The following set of load and queue length tests
display the difference in saturation load placed upon each of the modelled automotive ECUs depending on
the system mode of operation - base, native or container.
6.7.1 CPU run queue size (runq-sz) tests
The CPU queue length parameter (runq-sz) is the number of processes that are ready to run but paused,
waiting for CPU time allocation. This parameter has been used widely, for example by Pan et al., (2010) for
black-box data collection and monitoring, and Tichy and Zemanek (2001) to monitor and diagnose CPU
bottlenecks in the UNIX operating system. Pengfei and Lanfeng (2016) state that the runq-sz “reflects the
change situation of the physical host’s instantaneous load…. so, the instantaneous reference value has
more significance” when determining system load. The runq-sz can hold more significance than the overall
system load average, reflecting the CPU load average over a 1, 5, and 15-minute time frame. In contrast,
runq-sz refers to the physical host's instantaneous load. Individual ECU runq-sz tests can be found in
Appendix B.

99
A high runq-sz value indicates that the system is CPU bound and therefore starved of CPU time. A base test
runq-sz shown in Chart 1 was conducted over a 1200 second (20 minutes) time frame to understand the
number of waiting processes when the system was in an idle state and where only the operating system
was in execution. When analysing the data from this 1200 second baseline test, the results reveal very little
activity on the CPU run queue, as expected. Over the entire 1200 second test run, the system peaked at
two waiting tasks on five separate occasions.
The native and container ECU tests were also run for the same 1200 seconds. ECU functional software was
automatically executed midway through each test to allow for an extended period of the initial system and
post-execution system settling. Additional peaks in the number of R state tasks/processes were expected
to be observed during initial ECU software initialisation rather than as a trend over an extended time frame.
The entire 1200 second test result data were not suitable for data analysis and hence the full 1200 second
test results were capped between the 500 – 700 second range with software execution occurring at the
600-second mark. The following charts display the individual ECU native and container runq-sz test results.
Engine ECU Native Container %diff
Total Tasks 140 177 +21.43
Run Average 1.38 1.72 +24.63
Minimum 0 0 -
Maximum 4 5 +25.00
Tasks = 1 69 49 -23.44
Tasks = 2 29 38 +31.03
Tasks = 3 3 13 +333.33
Tasks = 4 1 2 +100.00
Tasks = 5 0 1 -
0
1
2
3
4
0 150 300 450 600 750 900 1050 1200Num
ber o
f Wai
ting
Task
s
Time (S)
Example runq-sz 1200 second Baseline Test Run
runq-sz
0.00
1.00
2.00
3.00
4.00
5.00
0 20 40 60 80 100 120 140 160 180 200Num
ber o
f wai
ting
task
s/pr
oces
ses
Time (s)
Engine ECU runq-sz native and container testContainer Native
Chart 1: Example baseline runq-sz test
Chart 2: Engine ECU runq-sz test

100
Gear ECU Native Container %diff
Total Tasks 168 341 +102.98
Run Average 1.65 3.40 +106.06
Minimum 0 0 -
Maximum 4 5 +25.00
Tasks = 1 42 5 -88.9
Tasks = 2 56 9 -83.92
Tasks = 3 2 37 +1750.00
Tasks = 4 2 43 +2050.00
Tasks = 5 0 7 -
Door ECU Native Container %diff
Total Tasks 141 149 +5.67
Run Average 1.40 1.46 +4.29
Minimum 0 0 -
Maximum 3 3 -
Tasks = 1 63 62 -1.59
Tasks = 2 36 36 -
Tasks = 3 2 5 +150.00
Tasks = 4 0 0 -
Tasks = 5 0 0 -
Light ECU Native Container %diff
Total Tasks 143 159 +11.19
Run Average 1.42 1.58 +11.27
Minimum 0 0 -
Maximum 2 4 +100.00
Tasks = 1 59 58 -1.69
Tasks = 2 42 31 -26.19
Tasks = 3 0 9 -
Tasks = 4 0 3 -
Tasks = 5 0 0 -
0.00
1.00
2.00
3.00
4.00
5.00
0 20 40 60 80 100 120 140 160 180 200
Num
ber o
f wai
ting
task
s/pr
oces
ses
Time (s)
Gear ECU runq-sz native and container test
Container Native
0.00
1.00
2.00
3.00
4.00
5.00
0 20 40 60 80 100 120 140 160 180 200
Num
ber o
f wai
ting
task
s/pr
oces
ses
Time (s)
Door ECU runq-sz native and container test
Container Native
0.00
1.00
2.00
3.00
4.00
5.00
0 20 40 60 80 100 120 140 160 180 200
Num
ber o
f wai
ting
task
s/pr
oces
ses
Time (s)
Light ECU runq-sz native and container testContainer
Native
Chart 3: Gear ECU runq-sz
Chart 5: Door ECU runq-sz
Chart 4: Light ECU runq-sz
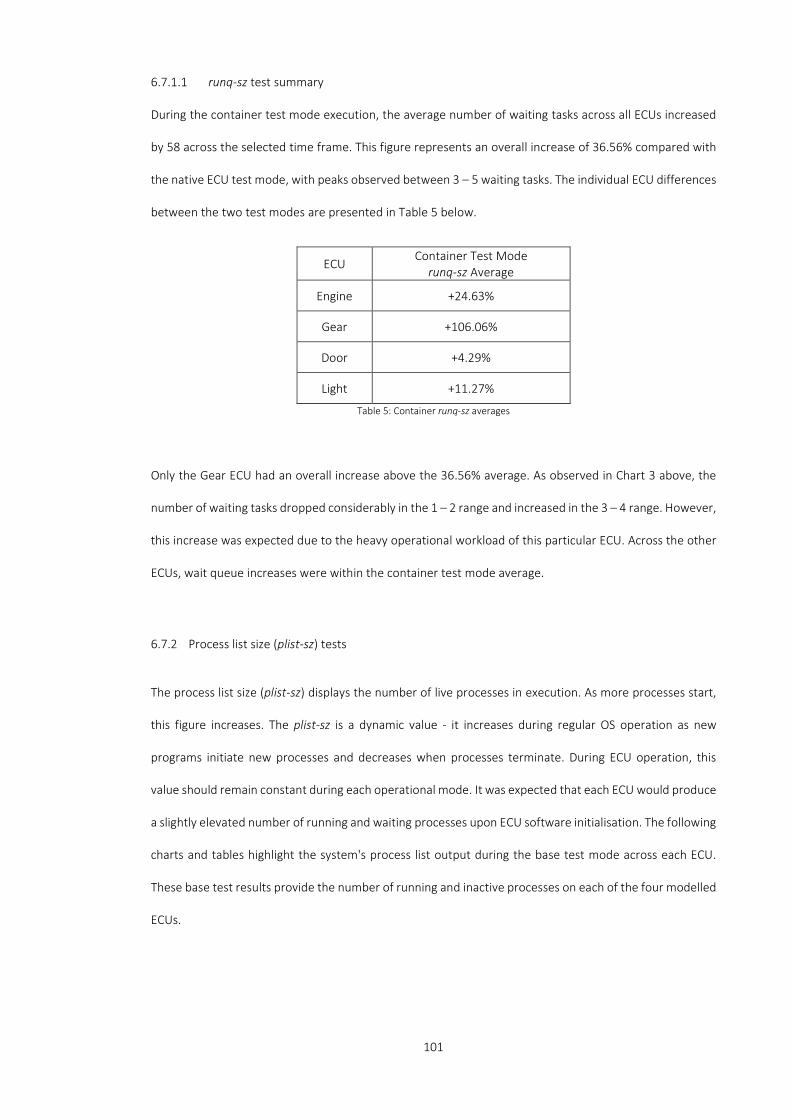
101
6.7.1.1 runq-sz test summary
During the container test mode execution, the average number of waiting tasks across all ECUs increased
by 58 across the selected time frame. This figure represents an overall increase of 36.56% compared with
the native ECU test mode, with peaks observed between 3 – 5 waiting tasks. The individual ECU differences
between the two test modes are presented in Table 5 below.
ECU Container Test Mode
runq-sz Average
Engine +24.63%
Gear +106.06%
Door +4.29%
Light +11.27%
Table 5: Container runq-sz averages
Only the Gear ECU had an overall increase above the 36.56% average. As observed in Chart 3 above, the
number of waiting tasks dropped considerably in the 1 – 2 range and increased in the 3 – 4 range. However,
this increase was expected due to the heavy operational workload of this particular ECU. Across the other
ECUs, wait queue increases were within the container test mode average.
6.7.2 Process list size (plist-sz) tests
The process list size (plist-sz) displays the number of live processes in execution. As more processes start,
this figure increases. The plist-sz is a dynamic value - it increases during regular OS operation as new
programs initiate new processes and decreases when processes terminate. During ECU operation, this
value should remain constant during each operational mode. It was expected that each ECU would produce
a slightly elevated number of running and waiting processes upon ECU software initialisation. The following
charts and tables highlight the system's process list output during the base test mode across each ECU.
These base test results provide the number of running and inactive processes on each of the four modelled
ECUs.
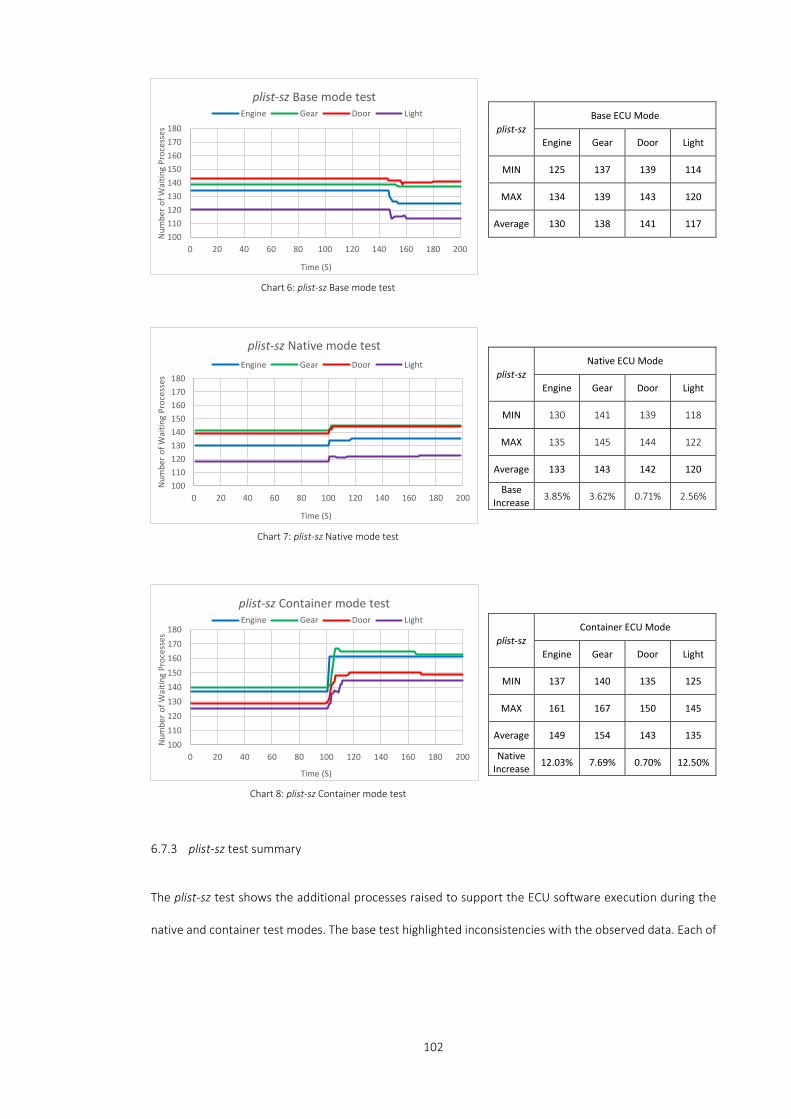
102
6.7.3 plist-sz test summary
The plist-sz test shows the additional processes raised to support the ECU software execution during the
native and container test modes. The base test highlighted inconsistencies with the observed data. Each of
plist-sz Base ECU Mode
Engine Gear Door Light
MIN 125 137 139 114
MAX 134 139 143 120
Average 130 138 141 117
plist-sz Native ECU Mode
Engine Gear Door Light
MIN 130 141 139 118
MAX 135 145 144 122
Average 133 143 142 120
Base Increase 3.85% 3.62% 0.71% 2.56%
plist-sz Container ECU Mode
Engine Gear Door Light
MIN 137 140 135 125
MAX 161 167 150 145
Average 149 154 143 135
Native Increase 12.03% 7.69% 0.70% 12.50%
100110120130140150160170180
0 20 40 60 80 100 120 140 160 180 200
Num
ber o
f Wai
ting
Proc
esse
s
Time (S)
plist-sz Base mode testEngine Gear Door Light
100110120130140150160170180
0 20 40 60 80 100 120 140 160 180 200
Num
ber o
f Wai
ting
Proc
esse
s
Time (S)
plist-sz Native mode testEngine Gear Door Light
100110120130140150160170180
0 20 40 60 80 100 120 140 160 180 200
Num
ber o
f Wai
ting
Proc
esse
s
Time (S)
plist-sz Container mode testEngine Gear Door Light
Chart 6: plist-sz Base mode test
Chart 7: plist-sz Native mode test
Chart 8: plist-sz Container mode test

103
the modelled ECUs had identical hardware and OS software configurations. However, there were
differences in the additional software required on various ECUs due to specific ECU functions and
peripheral hardware interactions, which resulted in an observed increased level of running processes on
some ECUs. Across each ECU, the level of processes was consistent with all ECUs experiencing a drop in the
number of running processes during the measured base test. The average process count on the process list
was 133, with a low of 129 and a high of 134.
During the native test mode, the plist-sz average increase across all for ECUs measured 5. However, with
only a small number of processes involved in executing ECU functional software, this was expected.
Nevertheless, when comparing the total averages across the 200-second test run, the door and Light ECUs
exhibited the same or slightly higher overall average increase at 4 and 5 processes respectively. Again, this
was due in part to the additional ECU supporting software.
Across the native and container tests, the ECU plist-sz average during the script execution was similar to
the maximum plist-sz values. Once the initial script execution was complete, there were fewer additional
increases or decreases observed. The observed increase in the plist-sz during the container test across all
ECUs was measured overall at an average of 32.92% compared with the native test. During the native test
mode, any additional processes raised were solely concerned with the functional software's operation. The
container test mode required additional processes to create and maintain the container shell as well as the
function software.
6.7.4 CPU load average
The system load average is measured over a 1-minute, 5-minute and 15-minute time frame (ldavg-1, ldavg-
5 and ldavg-15) and represents the time the CPU is busy. System load is the portion of work a system
performs over a given time frame. If the load is zero, the system is considered to be in an idle state. For
each process/task that is either waiting or consuming CPU runtime, the load is incremented by one. During
the specified load time frames (1, 5 and 15), the load average is sampled at a default rate of 5HZ/500 ticks
which equates to a sampling rate of 5 seconds.
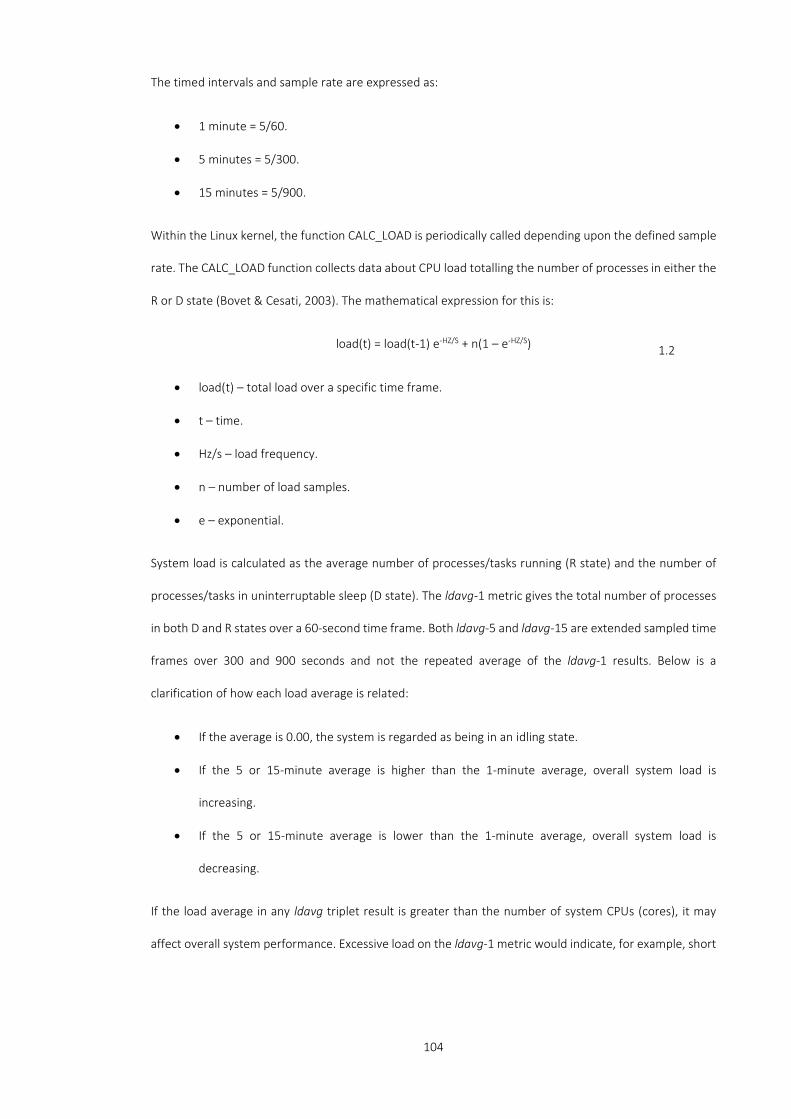
104
The timed intervals and sample rate are expressed as:
• 1 minute = 5/60.
• 5 minutes = 5/300.
• 15 minutes = 5/900.
Within the Linux kernel, the function CALC_LOAD is periodically called depending upon the defined sample
rate. The CALC_LOAD function collects data about CPU load totalling the number of processes in either the
R or D state (Bovet & Cesati, 2003). The mathematical expression for this is:
load(t) = load(t-1) e-HZ/S + n(1 – e-HZ/S)
• load(t) – total load over a specific time frame.
• t – time.
• Hz/s – load frequency.
• n – number of load samples.
• e – exponential.
System load is calculated as the average number of processes/tasks running (R state) and the number of
processes/tasks in uninterruptable sleep (D state). The ldavg-1 metric gives the total number of processes
in both D and R states over a 60-second time frame. Both ldavg-5 and ldavg-15 are extended sampled time
frames over 300 and 900 seconds and not the repeated average of the ldavg-1 results. Below is a
clarification of how each load average is related:
• If the average is 0.00, the system is regarded as being in an idling state.
• If the 5 or 15-minute average is higher than the 1-minute average, overall system load is
increasing.
• If the 5 or 15-minute average is lower than the 1-minute average, overall system load is
decreasing.
If the load average in any ldavg triplet result is greater than the number of system CPUs (cores), it may
affect overall system performance. Excessive load on the ldavg-1 metric would indicate, for example, short
1.2
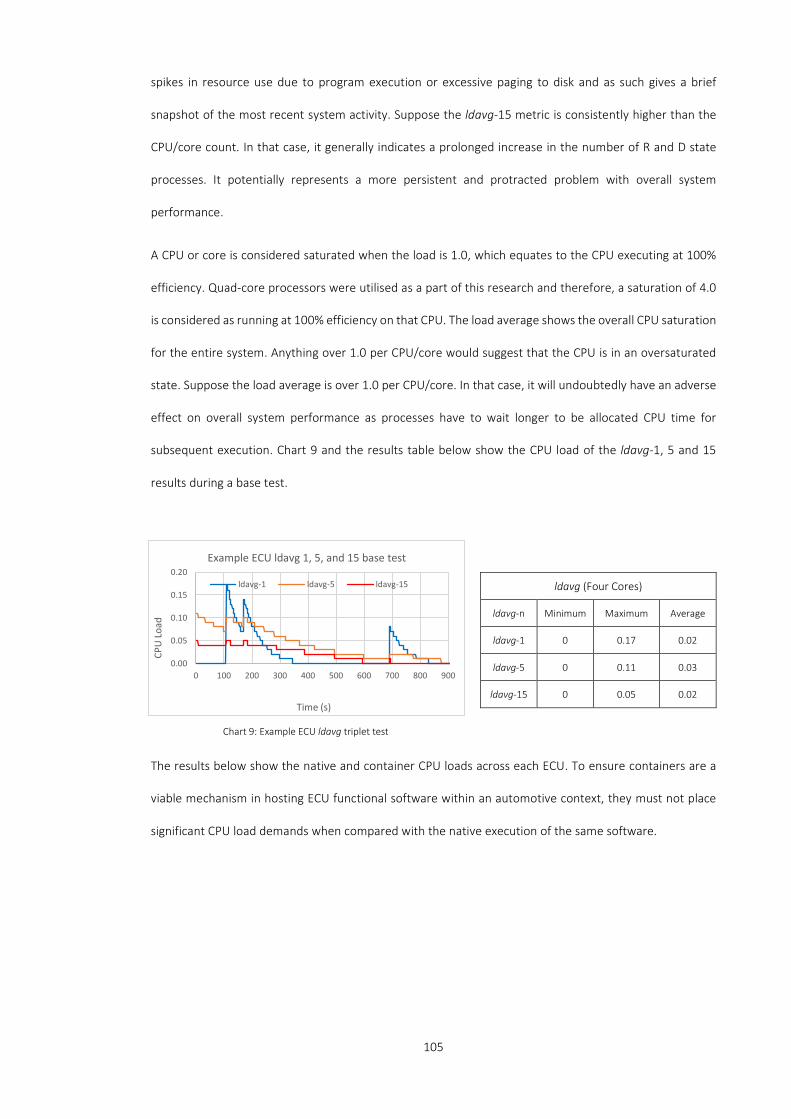
105
spikes in resource use due to program execution or excessive paging to disk and as such gives a brief
snapshot of the most recent system activity. Suppose the ldavg-15 metric is consistently higher than the
CPU/core count. In that case, it generally indicates a prolonged increase in the number of R and D state
processes. It potentially represents a more persistent and protracted problem with overall system
performance.
A CPU or core is considered saturated when the load is 1.0, which equates to the CPU executing at 100%
efficiency. Quad-core processors were utilised as a part of this research and therefore, a saturation of 4.0
is considered as running at 100% efficiency on that CPU. The load average shows the overall CPU saturation
for the entire system. Anything over 1.0 per CPU/core would suggest that the CPU is in an oversaturated
state. Suppose the load average is over 1.0 per CPU/core. In that case, it will undoubtedly have an adverse
effect on overall system performance as processes have to wait longer to be allocated CPU time for
subsequent execution. Chart 9 and the results table below show the CPU load of the ldavg-1, 5 and 15
results during a base test.
The results below show the native and container CPU loads across each ECU. To ensure containers are a
viable mechanism in hosting ECU functional software within an automotive context, they must not place
significant CPU load demands when compared with the native execution of the same software.
ldavg (Four Cores)
ldavg-n Minimum Maximum Average
ldavg-1 0 0.17 0.02
ldavg-5 0 0.11 0.03
ldavg-15 0 0.05 0.02
0.00
0.05
0.10
0.15
0.20
0 100 200 300 400 500 600 700 800 900
CPU
Load
Time (s)
Example ECU ldavg 1, 5, and 15 base test
ldavg-1 ldavg-5 ldavg-15
Chart 9: Example ECU ldavg triplet test

106
ldavg-1
Engine ECU Min Max Execution
Integration Diff. Native 0 1.75 772.73
Container 0 2.28 849.93 77.20
%Difference +9.99%
ldavg-5
Engine ECU Min Max Execution
Integration Diff. Native 0.08 1.25 491.82
Container 0.01 1.41 535.26 43.44
Difference +8.83%
ldavg-15
Engine ECU Min Max Execution
Integration Diff. Native 0.02 0.71 230.19
Container 0 0.78 247.45 17.26
Difference +7.49%
ldavg-1
Gear ECU Min Max Execution
Integration Diff. Native 0 1.68 802.64
Container 0 1.84 882.44 79.80
Difference +9.94%
0.000.250.500.751.001.251.501.752.002.252.50
0 150 300 450 600 750 900 1050 1200
CPU
Load
Time (S)
Engine ECU ldavg-1 native and container test
Bare Metal
Container
0.000.250.500.751.001.251.501.752.002.252.50
0 150 300 450 600 750 900 1050 1200
CPU
Load
Time (S)
Engine ECU ldavg-5 native and container test
Bare Metal
Container
0.000.250.500.751.001.251.501.752.002.252.50
0 150 300 450 600 750 900 1050 1200
CPU
Load
Time (S)
Engine ECU ldavg-15 native and container test
Bare Metal
Container
0.000.250.500.751.001.251.501.752.002.252.50
0 150 300 450 600 750 900 1050 1200
CPU
Load
Time (S)
Gear ECU ldavg-1 native and container test
Bare Metal
Container
Chart 10: Engine ECU ldavg-1 test
Chart 11: Engine ECU ldavg-5 test
Chart 12: Engine ECU ldavg-15 test
Chart 13: Gear ECU ldavg-1 test

107
ldavg-5
Gear ECU Min Max Execution
Integration Diff. Native 0.08 1.30 509.17
Container 0.01 1.46 555.89 46.72
Difference +9.16%
ldavg-15
Gear ECU Min Max Execution Integration Diff.
Native 0.02 0.71 239.38
Container 0 0.81 259.34 19.96
Difference +8.34%
ldavg-1
Door ECU Min Max Execution
Integration Diff. Native 0.03 1.65 683.00
Container 0.02 1.78 722.48 39.48
Difference +5.78%
ldavg-5
Door ECU Min Max Execution
Integration Diff. Native 0 1.11 429.20
Container 0.01 1.20 451.97 22.78
Difference +5.31%
0.000.250.500.751.001.251.501.752.002.252.50
0 150 300 450 600 750 900 1050 1200
CPU
Load
Time (S)
Gear ECU ldavg-5 native and container test
Bare Metal
Container
0.000.250.500.751.001.251.501.752.002.252.50
0 150 300 450 600 750 900 1050 1200
CPU
Load
Time (S)
Gear ECU ldavg-15 native and container test
Bare Metal
Container
0.000.250.500.751.001.251.501.752.00
0 150 300 450 600 750 900 1050 1200
CPU
Load
Time (S)
Door ECU ldavg-1 native and container test
ContainerNative
0.000.250.500.751.001.251.501.752.00
0 150 300 450 600 750 900 1050 1200
CPU
Load
Time (S)
Door ECU ldavg-5 native and container test
ContainerNative
Chart 14: Gear ECU ladvag-5 test
Chart 15: Gear ECU ldavg-15 test
Chart 16: Door ECU ldavg-1 test
Chart 17: Door ECU ldavg-5 test
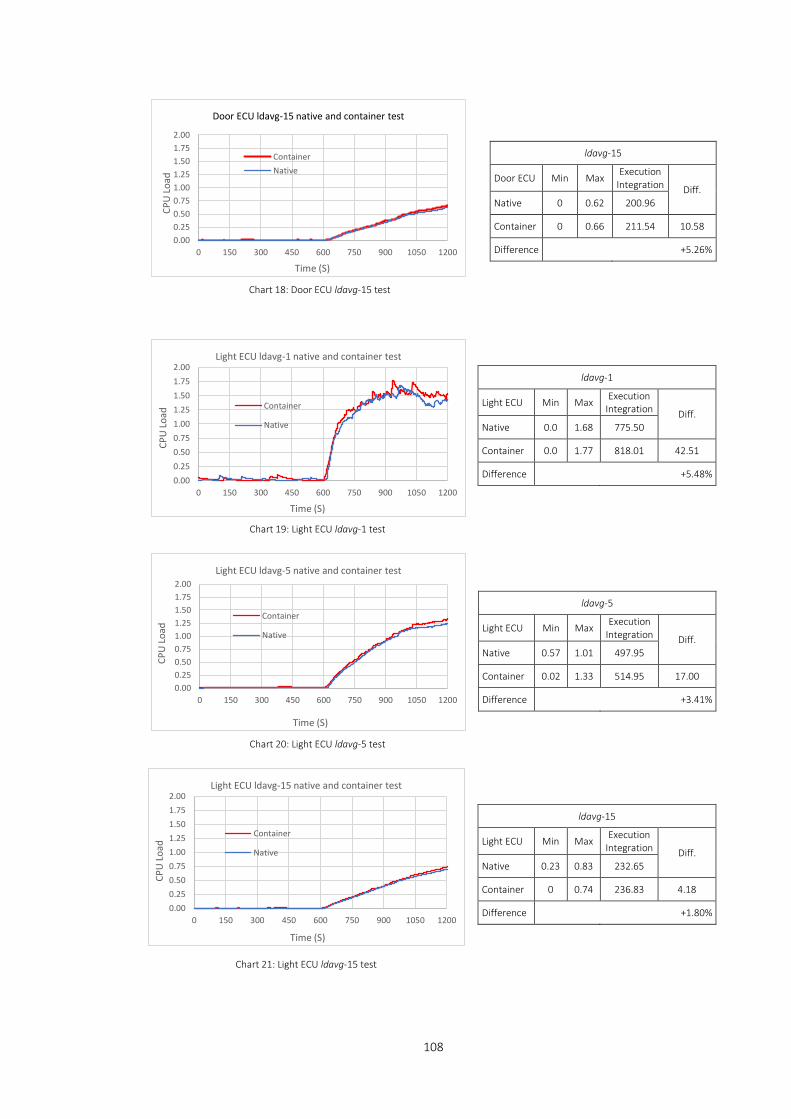
108
ldavg-15
Door ECU Min Max Execution
Integration Diff. Native 0 0.62 200.96
Container 0 0.66 211.54 10.58
Difference +5.26%
ldavg-1
Light ECU Min Max Execution
Integration Diff. Native 0.0 1.68 775.50
Container 0.0 1.77 818.01 42.51
Difference +5.48%
ldavg-5
Light ECU Min Max Execution
Integration Diff. Native 0.57 1.01 497.95
Container 0.02 1.33 514.95 17.00
Difference +3.41%
ldavg-15
Light ECU Min Max Execution
Integration Diff. Native 0.23 0.83 232.65
Container 0 0.74 236.83 4.18
Difference +1.80%
0.000.250.500.751.001.251.501.752.00
0 150 300 450 600 750 900 1050 1200
CPU
Load
Time (S)
Door ECU ldavg-15 native and container test
ContainerNative
0.000.250.500.751.001.251.501.752.00
0 150 300 450 600 750 900 1050 1200
CPU
Load
Time (S)
Light ECU ldavg-5 native and container test
Container
Native
0.000.250.500.751.001.251.501.752.00
0 150 300 450 600 750 900 1050 1200
CPU
Load
Time (S)
Light ECU ldavg-1 native and container test
Container
Native
0.000.250.500.751.001.251.501.752.00
0 150 300 450 600 750 900 1050 1200
CPU
Load
Time (S)
Light ECU ldavg-15 native and container test
Container
Native
Chart 18: Door ECU ldavg-15 test
Chart 19: Light ECU ldavg-1 test
Chart 20: Light ECU ldavg-5 test
Chart 21: Light ECU ldavg-15 test
109
6.7.5 CPU load average test summary
The baseline load average across all four ECUs was very low. A sample ECU was used to demonstrate the
baseline ldavg-1, 5 and 15. All experienced a minimum load of zero for extended periods with a ldavg-1
peaking periodically at 0.17 (17%). The ldavg-5 and 15 results were lower than expected at 0.11 (11%) and
0.05 (5%) respectively. The average load across the entire base test run was 0.02 (2%). The ldavg-5/15
showed a decreasing trend over the test run, consistent with a CPU principally in an idle state.
For the native and container tests, the execution integration (area under the curve) results were obtained
using the Trapezoidal rule. The difference between native and container test executions accurately display
the additional CPU load required to support the container environment. During the native test mode, the
load average across all three CPU load time frames was slightly elevated. Each ECU ldavg were very similar
in load output. From execution, the ldavg-1 rose and levelled out at approximately 200 seconds from initial
software execution. The ldavg-5 and 15 metrics saw gradual rises which were anticipated behaviour of a
system under some load.
Total observed function load is the combination of all the ECUs ldavg. This observed figure shows total CPU
load exhibited by the entire automotive function rather than individual ECUs. Table 6 below details the
native ldavg triplets total integration values for the observed activity during the test run across all ECUs.
The engine and Door ECU exhibited similar CPU loads with the gear and Light ECU displaying the highest
and lowest CPU load average levels.
Native All ECU ldavg 1, 5 and 15 averages (4 Cores)
ldavg-n Engine Gear Door Light
ldavg-1 772.73 802.64 775.50 683.00
ldavg-5 491.82 509.17 497.95 429.20
ldavg-15 230.19 239.38 232.65 200.96
Table 6: All native ECU load averages
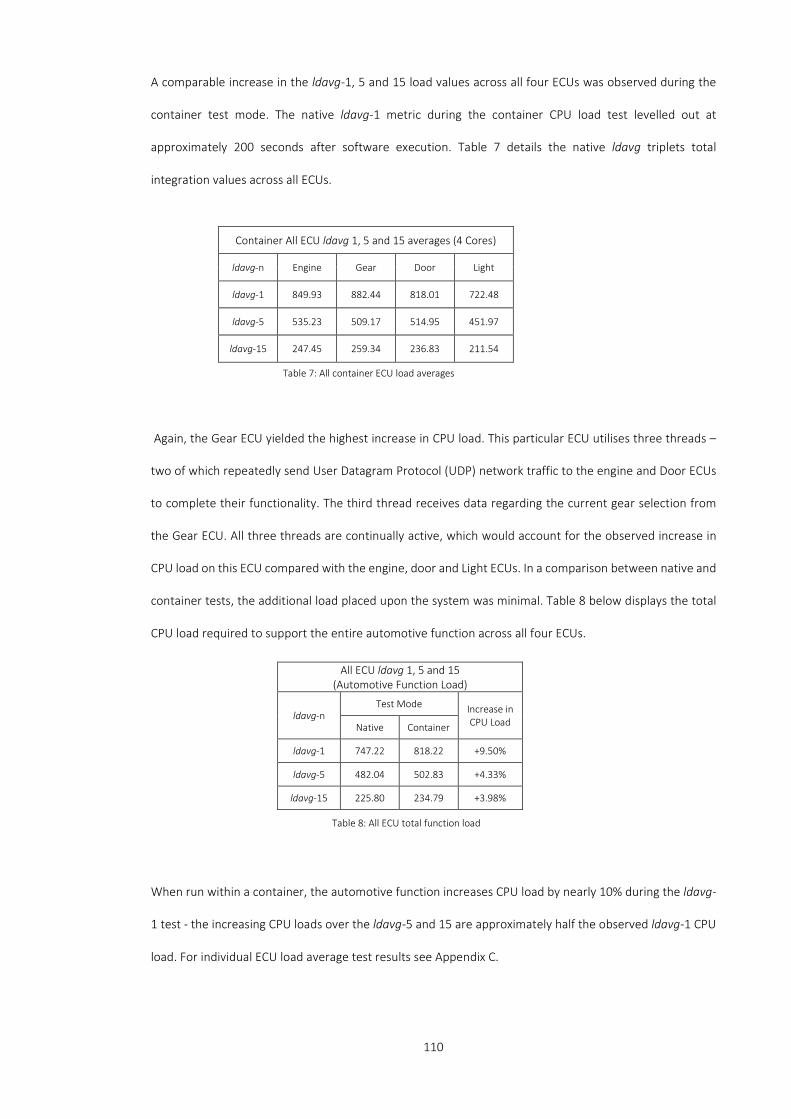
110
A comparable increase in the ldavg-1, 5 and 15 load values across all four ECUs was observed during the
container test mode. The native ldavg-1 metric during the container CPU load test levelled out at
approximately 200 seconds after software execution. Table 7 details the native ldavg triplets total
integration values across all ECUs.
Again, the Gear ECU yielded the highest increase in CPU load. This particular ECU utilises three threads –
two of which repeatedly send User Datagram Protocol (UDP) network traffic to the engine and Door ECUs
to complete their functionality. The third thread receives data regarding the current gear selection from
the Gear ECU. All three threads are continually active, which would account for the observed increase in
CPU load on this ECU compared with the engine, door and Light ECUs. In a comparison between native and
container tests, the additional load placed upon the system was minimal. Table 8 below displays the total
CPU load required to support the entire automotive function across all four ECUs.
When run within a container, the automotive function increases CPU load by nearly 10% during the ldavg-
1 test - the increasing CPU loads over the ldavg-5 and 15 are approximately half the observed ldavg-1 CPU
load. For individual ECU load average test results see Appendix C.
Container All ECU ldavg 1, 5 and 15 averages (4 Cores)
ldavg-n Engine Gear Door Light
ldavg-1 849.93 882.44 818.01 722.48
ldavg-5 535.23 509.17 514.95 451.97
ldavg-15 247.45 259.34 236.83 211.54
Table 7: All container ECU load averages
All ECU ldavg 1, 5 and 15 (Automotive Function Load)
ldavg-n Test Mode Increase in
CPU Load Native Container
ldavg-1 747.22 818.22 +9.50%
ldavg-5 482.04 502.83 +4.33%
ldavg-15 225.80 234.79 +3.98%
Table 8: All ECU total function load
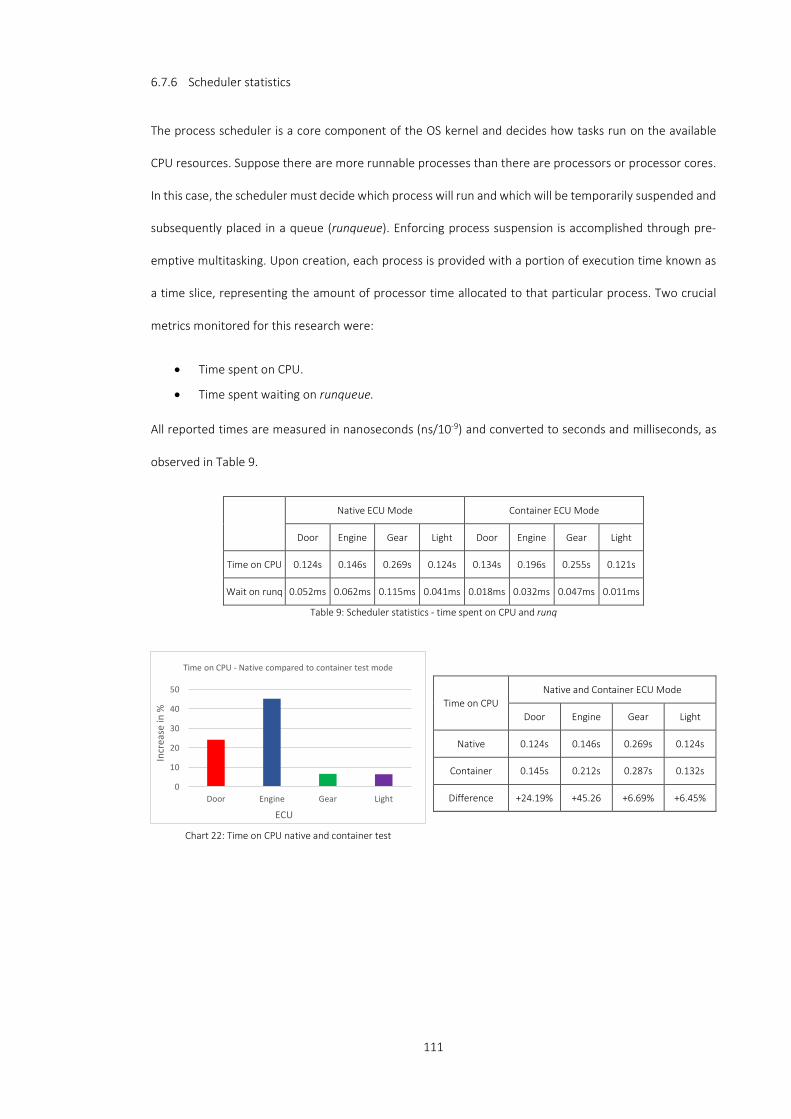
111
6.7.6 Scheduler statistics
The process scheduler is a core component of the OS kernel and decides how tasks run on the available
CPU resources. Suppose there are more runnable processes than there are processors or processor cores.
In this case, the scheduler must decide which process will run and which will be temporarily suspended and
subsequently placed in a queue (runqueue). Enforcing process suspension is accomplished through pre-
emptive multitasking. Upon creation, each process is provided with a portion of execution time known as
a time slice, representing the amount of processor time allocated to that particular process. Two crucial
metrics monitored for this research were:
• Time spent on CPU.
• Time spent waiting on runqueue.
All reported times are measured in nanoseconds (ns/10-9) and converted to seconds and milliseconds, as
observed in Table 9.
Native ECU Mode Container ECU Mode
Door Engine Gear Light Door Engine Gear Light
Time on CPU 0.124s 0.146s 0.269s 0.124s 0.134s 0.196s 0.255s 0.121s
Wait on runq 0.052ms 0.062ms 0.115ms 0.041ms 0.018ms 0.032ms 0.047ms 0.011ms
Table 9: Scheduler statistics - time spent on CPU and runq
Time on CPU Native and Container ECU Mode
Door Engine Gear Light
Native 0.124s 0.146s 0.269s 0.124s
Container 0.145s 0.212s 0.287s 0.132s
Difference +24.19% +45.26 +6.69% +6.45% 0
10
20
30
40
50
Door Engine Gear Light
Incr
ease
in %
ECU
Time on CPU - Native compared to container test mode
Chart 22: Time on CPU native and container test
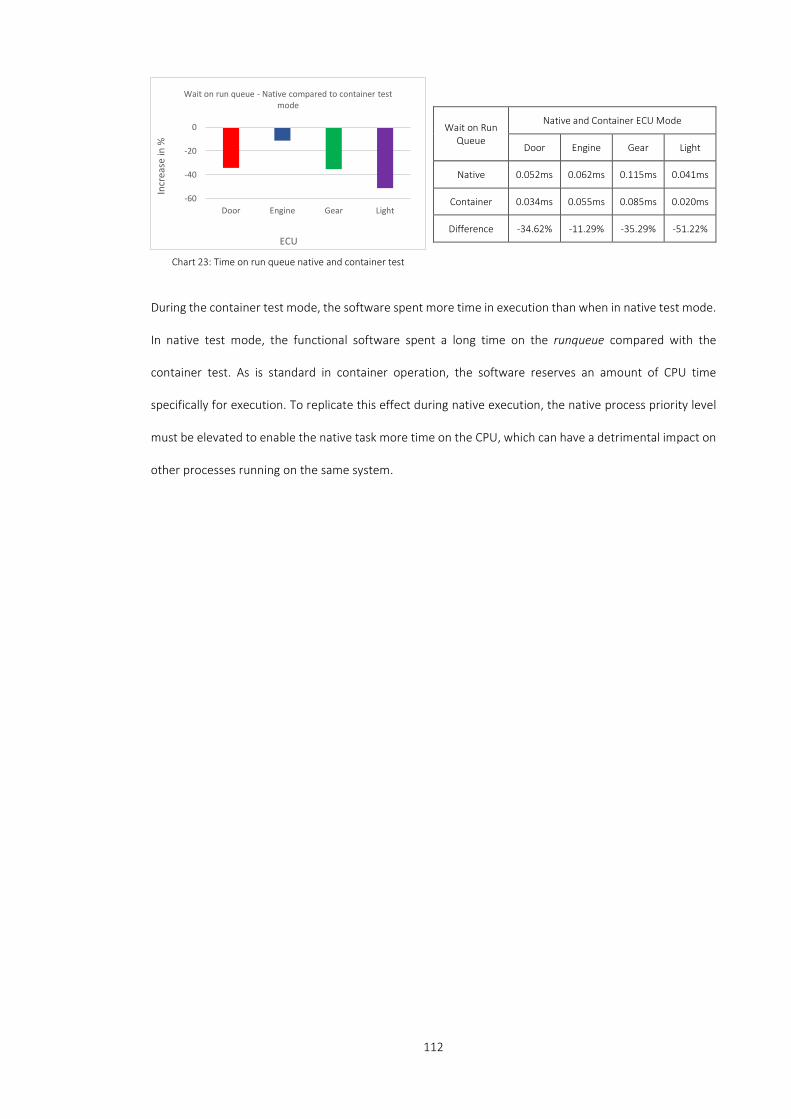
112
During the container test mode, the software spent more time in execution than when in native test mode.
In native test mode, the functional software spent a long time on the runqueue compared with the
container test. As is standard in container operation, the software reserves an amount of CPU time
specifically for execution. To replicate this effect during native execution, the native process priority level
must be elevated to enable the native task more time on the CPU, which can have a detrimental impact on
other processes running on the same system.
Wait on Run Queue
Native and Container ECU Mode
Door Engine Gear Light
Native 0.052ms 0.062ms 0.115ms 0.041ms
Container 0.034ms 0.055ms 0.085ms 0.020ms
Difference -34.62% -11.29% -35.29% -51.22%
-60
-40
-20
0
Door Engine Gear Light
Incr
ease
in %
ECU
Wait on run queue - Native compared to container test mode
Chart 23: Time on run queue native and container test

113
6.7.7 Task scheduling and system workload performance analysis
This test investigates the performance latency associated with the task scheduling of the system workload.
The results presented in Charts 24 – 26 below represent a snapshot of each ECU in execution, in both native
and container test modes. The perf tool collects large data sets relating to task scheduling and system
workload. High sample rates caused CPU and I/O overloads which corrupted the sample data. Over a 5-
second time frame, with the ECU in an idle state, 500 samples were collected, producing a report file size
of 0.238MB. In contrast, an ECU in execution resulted in 731,286 samples producing a report file size of
79.647MB. Due to the high volume of scheduler related data collected over a relatively short period when
the tool is in execution, it was decided that a 5-second data sample would be sufficient.
0
5000
10000
15000
20000
Door ECU Engine ECU Gear ECU Light ECU
Tim
e (m
s)
ECU
Functional software total runtime Native Container
0
5
10
15
20
Door ECU Engine ECU Gear ECU Light ECU
Tim
e (m
s)
ECU
Functional software maximum delayNative Container
0
0.02
0.04
0.06
Door ECU Engine ECU Gear ECU Light ECU
Tim
e (m
s)
ECU
Functional software average delayNative Container
Chart 25: Functional software average delay time Chart 24: Functional software total runtime
Chart 26: Functional software maximum delay time

114
6.7.8 CPU saturation test summary
There were three primary metrics involved in measuring overall CPU saturation during the three test
modes: runq-sz, plist-sz and ldavg. The runq-sz is a snapshot in time and represents the number of
processes in memory which are waiting for CPU time to run. A consistently high runq-sz indicates that the
CPU cannot service all processes requesting CPU time and therefore places the CPU in a state of saturation.
Overall, the runq-sz test results revealed little variance in the number of waiting tasks between the ECU
software running natively and a container implementation. The base test exhibited very little activity when
the system was idle with only the OS in execution. Across the entire 1200 second test time frame, the
observed runq-sz was predominately zero, with minor brief period fluctuations of between 1–2 waiting
tasks. The number of running processes within the runq-sz did not increase significantly during either the
native or container test modes. The overall average increase across all ECUs with the system in execution
in container test mode was 43.55% higher than in comparison with the native test mode runq-sz average.
However, this percentage equated, on average, to a single additional process/task but during both native
and container tests, it was the Gear ECU that produced additional workload above the average of 43.55%,
with peaks observed at 3–4 waiting tasks. Nevertheless, these additional waiting tasks were anticipated
because of the heavy workload of this particular ECU. All other ECU increases were within the container
runq-sz average. This specific test showed very little increase compared with native execution in the
number of processes waiting in memory for CPU time when the automotive function executes within
containers.
5 second Sample Native Test Mode (ECU Functional Software)
Container Test Mode (ECU Functional Software including shim)
Total Runtime (ms)
Average Delay (ms)
Maximum Delay (ms)
Total Runtime (ms)
Average Delay (ms)
Maximum Delay (ms)
Door ECU 8426.33 0.010 1.186 15549.91 0.056 1.93
Engine ECU 5442.862 0.011 0.354 7122.04 0.039 18.59
Gear ECU 6790.42 0.016 1.091 7843.49 0.033 10.67
Light ECU 4.40 0.047 0.062 7.41 0.013 0.58
Table 10: Native test ECU functional software timings
115
The plist-sz tests involved measuring the number of processes in memory and in execution. The more
processes that are on this queue, the more CPU time and scheduler activity is required, both of which can
have an overall detrimental effect on system performance. The base test run presented the current level
of processes for the process queue whilst the system was idle. Although all ECUs were identical in hardware
architecture, the software builds for each were different to reflect individual ECU functionality. During the
native test mode, the average increase in the number of processes on the process list across all ECUs was
observed at 135, representing an overall increase of 2.64% compared with the base test mode. The
minimum recorded plist-sz increase was 0.7%, with the highest observed at 5.26%. The average measured
increase in the plist-sz during the container test across all ECUs was 151 processes on the process queue,
which equated to a rise of 12.41%. The minimum container test plist-sz increase was 9.09% with a
maximum of 15.83%. The ECUs producing the highest plist-sz increases were the light and Door ECUs. These
results differed from the previous runq-sz tests, where the Gear ECU exhibited the highest waiting task
levels. The runq-sz averages for the Light and Door ECUs were higher than the Gear ECU because of the
minimum recorded process list values, which artificially elevated their overall averages. However, they both
exhibited the lowest plist-sz maximum, which was expected.
Compared to the plist-sz and runq-sz, the ldavg is not a snapshot in time and provides CPU load over a
period of predefined time frames. The ldavg base test was extremely low, with a load average across all
triplets of 0.02. All ECU hardware incorporated a quad-core processor which, at 100% CPU load equated to
a value of 4.0. The ldavg value is the number of processes running and in an uninterruptable sleep mode.
A ldavg value above 4.0 is considered as CPU oversaturation and the highest recorded loads across all of
the ldavg triplets were observed on the ldavg-1 triplet of the Gear ECU which was observed at 2.28.
However, this was a brief spike in CPU load rather than prolonged. The Gear ECU ldavg-1 value was as
expected due to the higher workload for this particular ECU. The lowest observed triplet values recorded
were from the Light ECU; again, these results were consistent compared with other test results. None of
the native or container test results exhibited an excessive loaded system or an increasing load over any of
the ldavg triplets. When comparing the CPU load results of both native and container tests, the results
showed a slightly elevated CPU load when an ECU operated under the container system state.

116
The increase in overall CPU saturation when all the ECUs were executing within containers did not create
excessive numbers of new tasks/processes nor did it add large numbers of processes on the process list or
place an unreasonable or a disproportionate load on the CPU. Notably, with the automotive function in
container operation, the average overall CPU load across all ECUs was 9.44% higher than with native
execution mode. These tests demonstrate that CPU saturation did not occur on any individual ECU whilst
the automotive function executed within a container environment.
6.8 CPU Utilisation Tests
CPU saturation refers to the amount of work or load that is waiting to be serviced, whereas CPU utilisation
is the measurement of the requirement divided by the capacity. High CPU utilisation can indicate poor
application performance where processes must remain in the processor queue for other processes to
complete execution. The principle CPU metrics monitored during these series of tests were:
• %user - percentage of CPU utilisation while executing processes at the application (user) level.
• %system - percentage of CPU utilisation while running processes at the system (kernel) level.
• %idle - percentage of time the CPU was inactive with no outstanding disk I/O requests.
• %nice - percentage of CPU utilisation executing higher-level processes at the user level.
• %iowait - percentage of time the CPU was idle with outstanding disk I/O requests.
The %user pertains to kernel activities such as servicing interrupts and resource management. The %user
metric measures the amount of CPU used to run user applications such as command shell, compiler and
software code. %user space programs and processes are subdivided under priority levels known as a nice
priority or value. The %nice value must also be considered when examining overall CPU utilisation - a
positive value indicates higher priority user-level processes which can affect overall CPU utilisation. A
system that exhibits high CPU utilisation levels with a relatively low %nice level can indicate that the
processor is servicing an increased number of processes that can ultimately degrade system performance.
The nice value for any process was not altered during the ECU resource tests. However, it was necessary to
manipulate the nice value for executing processes during the container suitability tests, which is explained
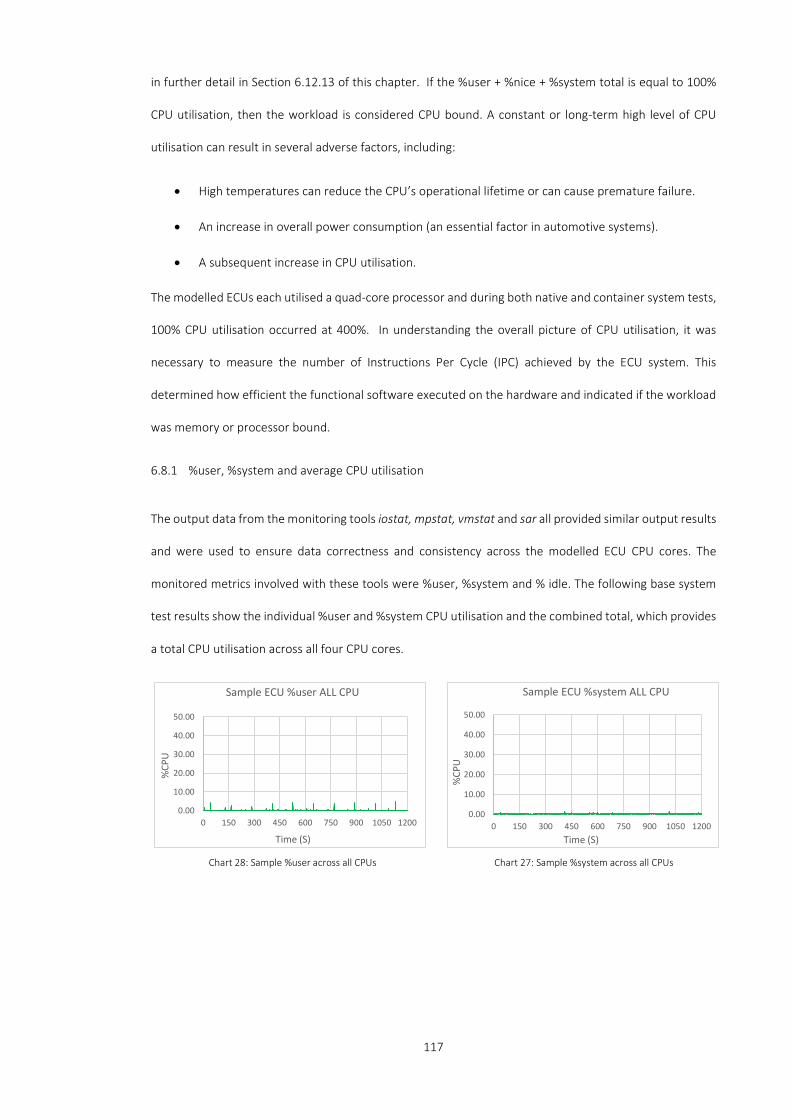
117
in further detail in Section 6.12.13 of this chapter. If the %user + %nice + %system total is equal to 100%
CPU utilisation, then the workload is considered CPU bound. A constant or long-term high level of CPU
utilisation can result in several adverse factors, including:
• High temperatures can reduce the CPU’s operational lifetime or can cause premature failure.
• An increase in overall power consumption (an essential factor in automotive systems).
• A subsequent increase in CPU utilisation.
The modelled ECUs each utilised a quad-core processor and during both native and container system tests,
100% CPU utilisation occurred at 400%. In understanding the overall picture of CPU utilisation, it was
necessary to measure the number of Instructions Per Cycle (IPC) achieved by the ECU system. This
determined how efficient the functional software executed on the hardware and indicated if the workload
was memory or processor bound.
6.8.1 %user, %system and average CPU utilisation
The output data from the monitoring tools iostat, mpstat, vmstat and sar all provided similar output results
and were used to ensure data correctness and consistency across the modelled ECU CPU cores. The
monitored metrics involved with these tools were %user, %system and % idle. The following base system
test results show the individual %user and %system CPU utilisation and the combined total, which provides
a total CPU utilisation across all four CPU cores.
0.00
10.00
20.00
30.00
40.00
50.00
0 150 300 450 600 750 900 1050 1200
%CP
U
Time (S)
Sample ECU %user ALL CPU
0.00
10.00
20.00
30.00
40.00
50.00
0 150 300 450 600 750 900 1050 1200
%CP
U
Time (S)
Sample ECU %system ALL CPU
Chart 27: Sample %system across all CPUs Chart 28: Sample %user across all CPUs

118
The %user metric shows slightly elevated activity when compared with the %system. The additional activity
observed in the %user results was the combination of several user-initiated processes, including the
monitoring tools used and the ssh and bash processes which enabled remote access to the ECU OS. In this
case, the %system results show the actual system CPU utilisation in an idle state. The following charts
(Charts 30 – 41) display the overall total CPU utilisation of each ECU in both native and container test
modes. For individual ECU CPU utilisation tests, see Appendix D.
Base CPU Utilisation
Engine ECU Min Max Average
%user 0% 4.76% 0.10%
%system 0% 1.51% 0.16%
%utilisation 0% 4.76% 0.26% 0.00
10.00
20.00
30.00
40.00
50.00
0 150 300 450 600 750 900 1050 1200
%CP
U
Time (S)
Sample ECU Total %utilisation ALL CPU
0.00
10.00
20.00
30.00
40.00
50.00
0 100 200 300 400 500 600
%CP
U
Time(s)
%user All CPUNative Container
0.00
10.00
20.00
30.00
40.00
50.00
0 50 100 150 200 250 300 350 400 450 500 550 600
%CP
U
Time(s)
%utilisation All CPUNative Container
0.00
10.00
20.00
30.00
40.00
50.00
0 100 200 300 400 500 600
%CP
U
Time(s)
%system All CPUNative Container
Chart 29: Sample %utilisation across all CPUs
Chart 32: Engine ECU %utilisation native and container test
Chart 30: Engine ECU %system native and container test Chart 31: Engine ECU %user native and container test

119
CPU Utilisation
Engine ECU
%user %system %utilisation
Native Container Difference Native Container Difference Native Container Difference
Minimum 9.04% 9.50% +5.09% 19.88% 23.58% +18.61% 13.51% 16.06% +18.87%
Maximum 16.01% 13.43% -16.11% 27.54% 29.11% +5.70% 22.41% 21.30% -4.95%
Average 32.29% 33.14% +2.63% 39.19% 43.05% +9.85% 35.91% 37.37% +4.07%
Table 11: Engine ECU CPU utilisation data
CPU Utilisation
Gear ECU %user %system %utilisation
Native Container Difference Native Container Difference Native Container Difference
Minimum 11.65% 12.24% +5.06% 27.11% +24.05% -11.29% 20.11% 18.60% -7.51%
Maximum 12.83% 24.17% +88.38% 28.81% +34.01% 18.05% 21.54% 29.01% +34.68%
Average 38.28% 40.85% +6.71% 44.66% +51.55% +15.43% 41.66% 47.61% +14.28%
Table 12: Gear ECU CPU utilisation data
0.00
10.00
20.00
30.00
40.00
50.00
0 100 200 300 400 500 600
%CP
U
Time(s)
%system All CPUNative Container
0.00
10.00
20.00
30.00
40.00
50.00
0 100 200 300 400 500 600%
CPU
Time(s)
%user All CPUNative Container
0.0010.0020.0030.0040.0050.0060.00
0 50 100 150 200 250 300 350 400 450 500 550 600
%CP
U
Time(s)
%utilisation All CPUNative Container
Chart 33: Gear ECU %user native and container test Chart 34: Gear ECU %system native and container test
Chart 35: Gear ECU %utilisation native and container test
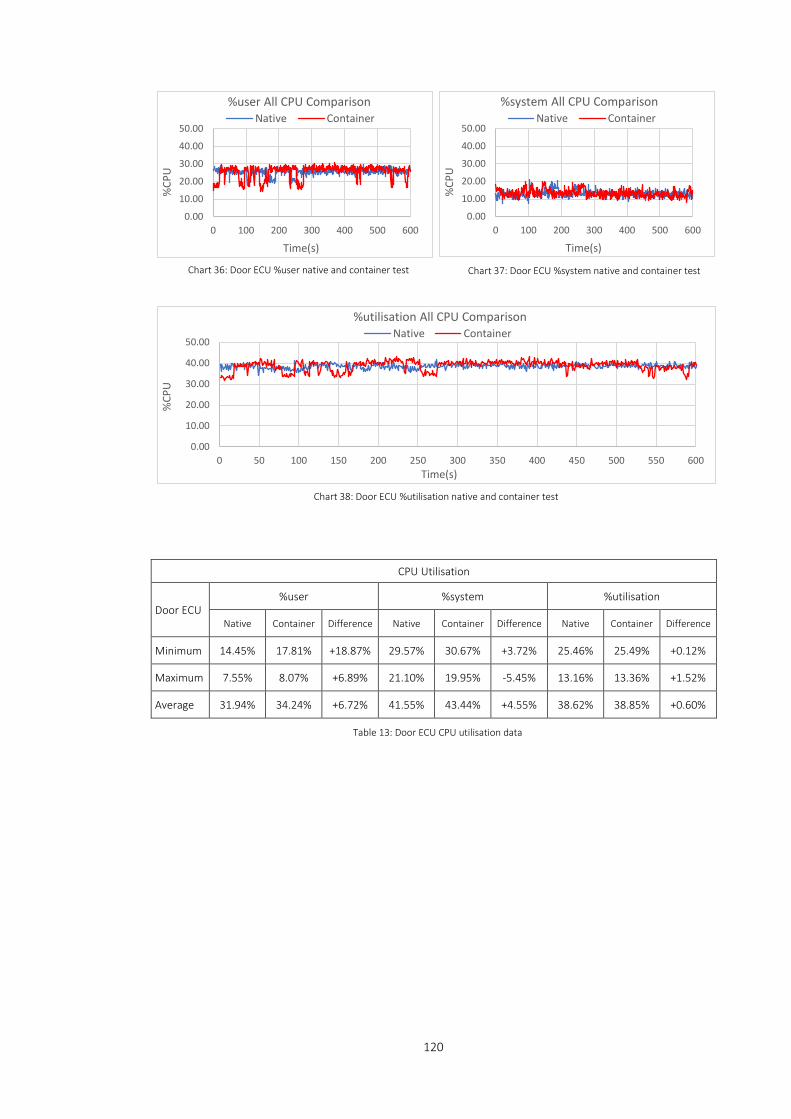
120
CPU Utilisation
Door ECU %user %system %utilisation
Native Container Difference Native Container Difference Native Container Difference
Minimum 14.45% 17.81% +18.87% 29.57% 30.67% +3.72% 25.46% 25.49% +0.12%
Maximum 7.55% 8.07% +6.89% 21.10% 19.95% -5.45% 13.16% 13.36% +1.52%
Average 31.94% 34.24% +6.72% 41.55% 43.44% +4.55% 38.62% 38.85% +0.60%
Table 13: Door ECU CPU utilisation data
0.00
10.00
20.00
30.00
40.00
50.00
0 100 200 300 400 500 600
%CP
U
Time(s)
%system All CPU ComparisonNative Container
0.00
10.00
20.00
30.00
40.00
50.00
0 100 200 300 400 500 600
%CP
U
Time(s)
%user All CPU ComparisonNative Container
0.00
10.00
20.00
30.00
40.00
50.00
0 50 100 150 200 250 300 350 400 450 500 550 600
%CP
U
Time(s)
%utilisation All CPU ComparisonNative Container
Chart 36: Door ECU %user native and container test Chart 37: Door ECU %system native and container test
Chart 38: Door ECU %utilisation native and container test
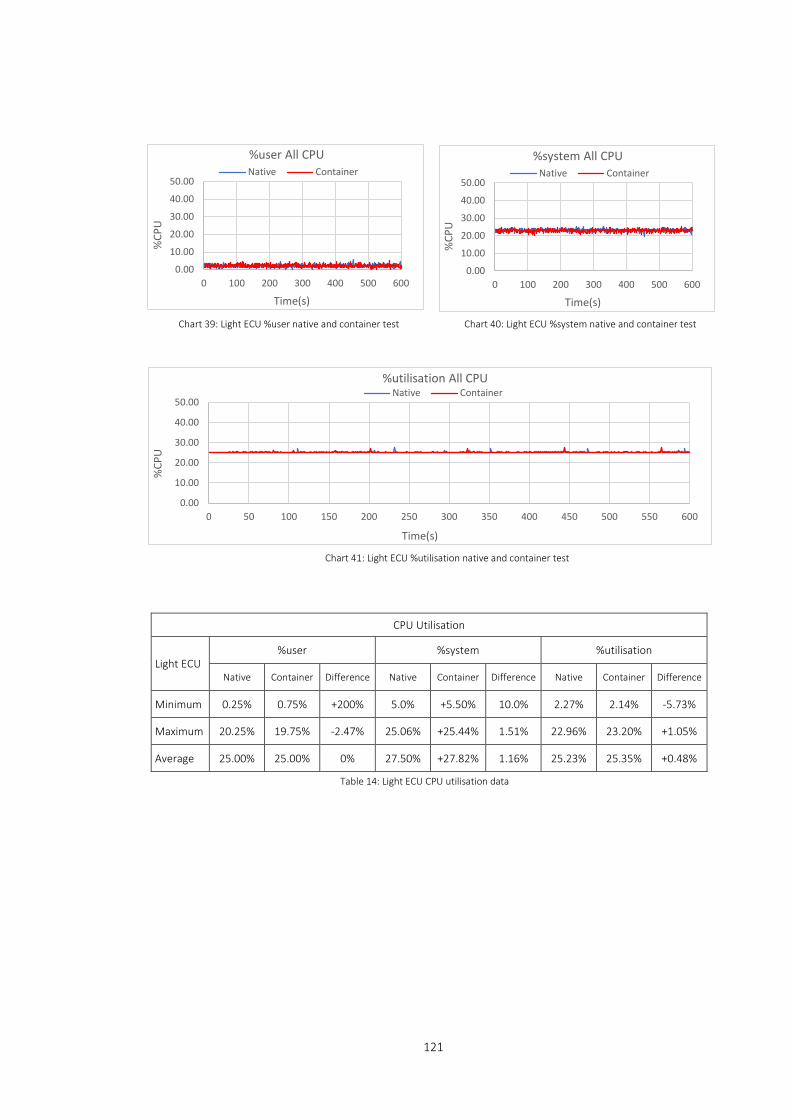
121
CPU Utilisation
Light ECU %user %system %utilisation
Native Container Difference Native Container Difference Native Container Difference
Minimum 0.25% 0.75% +200% 5.0% +5.50% 10.0% 2.27% 2.14% -5.73%
Maximum 20.25% 19.75% -2.47% 25.06% +25.44% 1.51% 22.96% 23.20% +1.05%
Average 25.00% 25.00% 0% 27.50% +27.82% 1.16% 25.23% 25.35% +0.48%
Table 14: Light ECU CPU utilisation data
0.00
10.00
20.00
30.00
40.00
50.00
0 100 200 300 400 500 600
%CP
U
Time(s)
%system All CPUNative Container
0.00
10.00
20.00
30.00
40.00
50.00
0 100 200 300 400 500 600
%CP
U
Time(s)
%user All CPUNative Container
0.00
10.00
20.00
30.00
40.00
50.00
0 50 100 150 200 250 300 350 400 450 500 550 600
%CP
U
Time(s)
%utilisation All CPUNative Container
Chart 40: Light ECU %system native and container test Chart 39: Light ECU %user native and container test
Chart 41: Light ECU %utilisation native and container test

122
6.8.1 CPU Utilisation Summary
Similar to CPU saturation baseline, tests exhibited minimal amounts of recorded overall CPU utilisation. The
average baseline CPU utilisation across all ECUs was 0.02%. However, the monitoring tool that was used
determined the overall metric output. For example, the monitoring tools top and htop showed a %CPU
value for utilisation. This value represents the sum of all CPU cores. The total %CPU use reported in a four-
core CPU totalled 400% which equates to 100% system CPU utilisation. The output results from the
utilisation tests represent CPU utilisation and in a four-core system, where 100% utilisation is measured
across all four cores. The overall utilisation measured for these tests constituted the sum of %user
(application) and %system (kernel). Table 15 below represents the averages of %user, %system and
%utilisation across all four ECUs.
The Gear ECU exhibited the highest recorded percentages during both the native and container test modes
where total CPU utilisation was 41.66% and 47.61% respectively. The lowest was the Light ECU where
native and container CPU utilisation experienced very similar levels of 25.23% and 25.35%. %user CPU
utilisation represents the ECU functional script in execution. The %user average increase was measured at
+5.25% when the script executed within the container. The %system utilisation container results show the
additional required processes/tasks needed to support the container. These additions include the container
shim, docker and containerd processes. The container %system utilisation represented an overall average
system function increase of 7.75%. The total additional %user and %system required to support the entire
modelled central locking system was 13.0% compared with the native mode of operation. The 13.0% figure
Average CPU Utilisation
ECU %user %system %utilisation
Native Container Difference Native Container Difference Native Container Difference
Engine 32.29% 33.14% +2.63% 39.19% 43.05% +9.85% 35.91% 37.37% +4.07%
Gear 38.28% 40.85% +6.71% 44.66% +51.55% +15.43% 41.66% 47.61% +14.28%
Door 31.94% 34.24% +6.72% 41.55% 43.44% +4.55% 38.62% 38.85% +0.60%
Light 25.00% 25.00% 0% 27.50% +27.82% 1.16% 25.23% 25.35% +0.48%
Table 15: All ECU CPU utilisation data

123
is relatively low, however, the Gear ECU has already been highlighted as a highly utilised ECU due to its
critical function within the modelled central locking mechanism.
6.8.2 Instructions per cycle
IPC measure how many instructions are completed during each CPU clock cycle. The modelled ECUs used
for this research incorporate a quad-core ARM Cortex-A53 processor. The stated IPC value for the ARM
Cortex-A53 processor is 2.0. This IPC value represents the total number of instructions that the CPU can be
executed per clock cycle. The ARM Cortex-A53 IPC value was used as a benchmark during the three test
modes to provide an overall value in understanding CPU utilisation concerning IPC. The IPC test results
obtained can be observed in Chart 42.
6.8.3 Instruction per cycle test summary
As the load on the CPU increases, it affects the overall IPC value. The maximum stated Cortex-A53 CPU IPC
value is documented at 2.0. However, when recorded during the base operation test mode, the base level
IPC value was between 0.57 and 0.62 across all four modelled ECUs. The results obtained from the native
and container test modes revealed that there was very little difference between the two test mode IPC
values. The Door ECU showed a slight decrease in the IPC value of -3.50% when executing within the
container. The results of this particular test highlight that regardless of ECU functional operation mode,
there was little to no drop in the number of instructions per second executed on the ECU processor.
60 second Sample
Instructions Per Cycle (IPC)
Base Native Container %diff
Door ECU 0.61 0.57 0.55 -3.50
Engine ECU 0.62 0.45 0.45 0.00
Gear ECU 0.57 0.43 0.43 0.00
Light ECU 0.59 0.58 0.58 0.00 0
0.1
0.2
0.3
0.4
0.5
0.6
0.7
Door ECU Engine ECU Gear ECU Light ECU
IPC
ECU
Instructions per Cycle
Base Native Container
Chart 42: Instructions per cycle - all ECUs, all tests
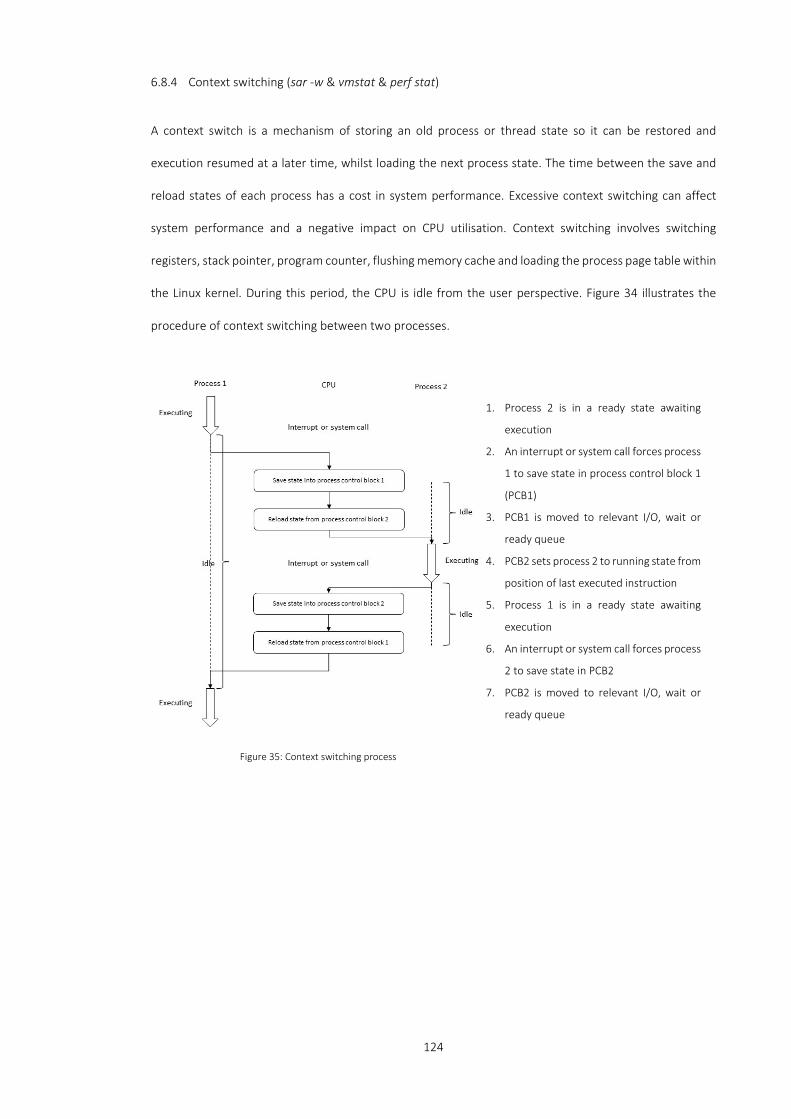
124
6.8.4 Context switching (sar -w & vmstat & perf stat)
A context switch is a mechanism of storing an old process or thread state so it can be restored and
execution resumed at a later time, whilst loading the next process state. The time between the save and
reload states of each process has a cost in system performance. Excessive context switching can affect
system performance and a negative impact on CPU utilisation. Context switching involves switching
registers, stack pointer, program counter, flushing memory cache and loading the process page table within
the Linux kernel. During this period, the CPU is idle from the user perspective. Figure 34 illustrates the
procedure of context switching between two processes.
1. Process 2 is in a ready state awaiting
execution
2. An interrupt or system call forces process
1 to save state in process control block 1
(PCB1)
3. PCB1 is moved to relevant I/O, wait or
ready queue
4. PCB2 sets process 2 to running state from
position of last executed instruction
5. Process 1 is in a ready state awaiting
execution
6. An interrupt or system call forces process
2 to save state in PCB2
7. PCB2 is moved to relevant I/O, wait or
ready queue
Figure 35: Context switching process
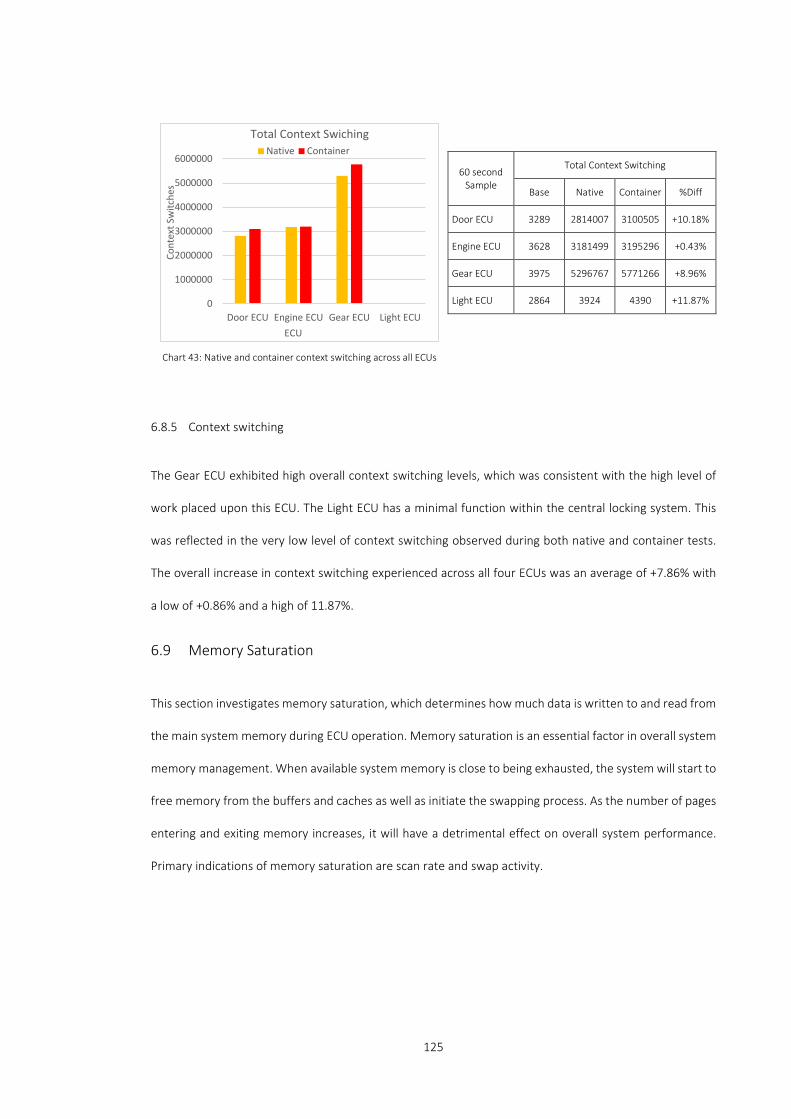
125
6.8.5 Context switching
The Gear ECU exhibited high overall context switching levels, which was consistent with the high level of
work placed upon this ECU. The Light ECU has a minimal function within the central locking system. This
was reflected in the very low level of context switching observed during both native and container tests.
The overall increase in context switching experienced across all four ECUs was an average of +7.86% with
a low of +0.86% and a high of 11.87%.
6.9 Memory Saturation
This section investigates memory saturation, which determines how much data is written to and read from
the main system memory during ECU operation. Memory saturation is an essential factor in overall system
memory management. When available system memory is close to being exhausted, the system will start to
free memory from the buffers and caches as well as initiate the swapping process. As the number of pages
entering and exiting memory increases, it will have a detrimental effect on overall system performance.
Primary indications of memory saturation are scan rate and swap activity.
60 second Sample
Total Context Switching
Base Native Container %Diff
Door ECU 3289 2814007 3100505 +10.18%
Engine ECU 3628 3181499 3195296 +0.43%
Gear ECU 3975 5296767 5771266 +8.96%
Light ECU 2864 3924 4390 +11.87% 0
1000000
2000000
3000000
4000000
5000000
6000000
Door ECU Engine ECU Gear ECU Light ECU
Cont
ext S
witc
hes
ECU
Total Context SwichingNative Container
Chart 43: Native and container context switching across all ECUs
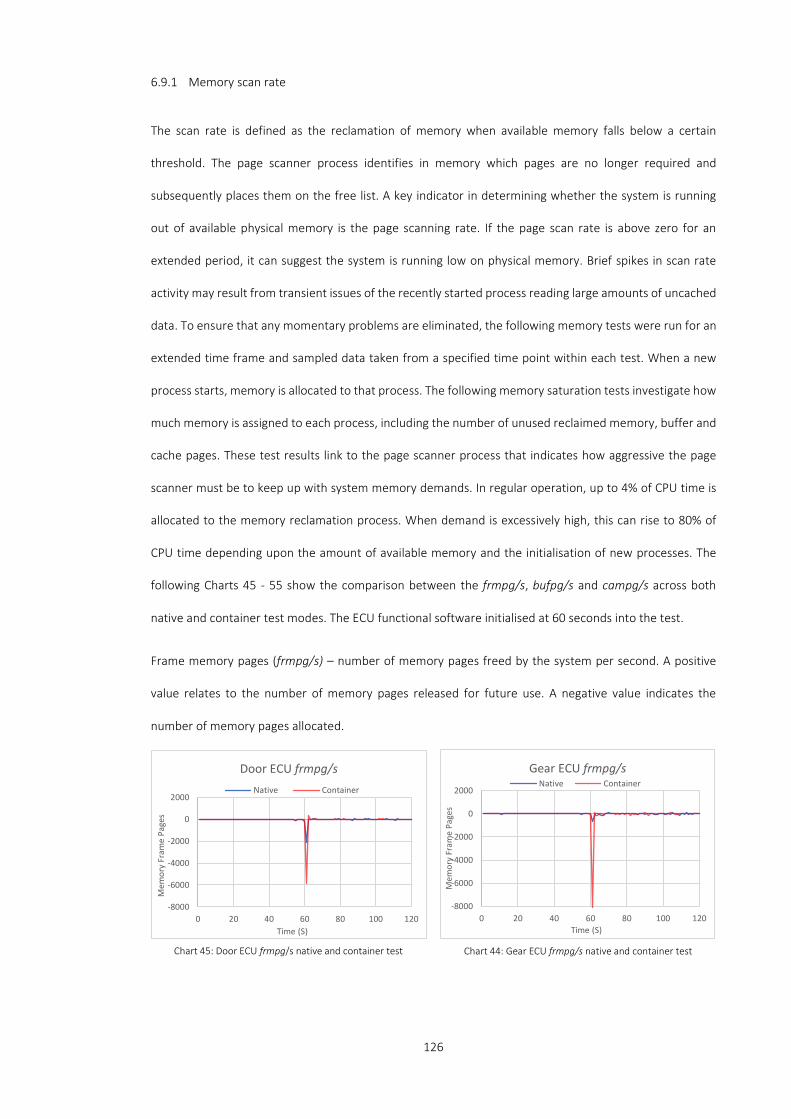
126
6.9.1 Memory scan rate
The scan rate is defined as the reclamation of memory when available memory falls below a certain
threshold. The page scanner process identifies in memory which pages are no longer required and
subsequently places them on the free list. A key indicator in determining whether the system is running
out of available physical memory is the page scanning rate. If the page scan rate is above zero for an
extended period, it can suggest the system is running low on physical memory. Brief spikes in scan rate
activity may result from transient issues of the recently started process reading large amounts of uncached
data. To ensure that any momentary problems are eliminated, the following memory tests were run for an
extended time frame and sampled data taken from a specified time point within each test. When a new
process starts, memory is allocated to that process. The following memory saturation tests investigate how
much memory is assigned to each process, including the number of unused reclaimed memory, buffer and
cache pages. These test results link to the page scanner process that indicates how aggressive the page
scanner must be to keep up with system memory demands. In regular operation, up to 4% of CPU time is
allocated to the memory reclamation process. When demand is excessively high, this can rise to 80% of
CPU time depending upon the amount of available memory and the initialisation of new processes. The
following Charts 45 - 55 show the comparison between the frmpg/s, bufpg/s and campg/s across both
native and container test modes. The ECU functional software initialised at 60 seconds into the test.
Frame memory pages (frmpg/s) – number of memory pages freed by the system per second. A positive
value relates to the number of memory pages released for future use. A negative value indicates the
number of memory pages allocated.
-8000
-6000
-4000
-2000
0
2000
0 20 40 60 80 100 120
Mem
ory
Fram
e Pa
ges
Time (S)
Door ECU frmpg/sNative Container
-8000
-6000
-4000
-2000
0
2000
0 20 40 60 80 100 120
Mem
ory
Fram
e Pa
ges
Time (S)
Gear ECU frmpg/sNative Container
Chart 45: Door ECU frmpg/s native and container test Chart 44: Gear ECU frmpg/s native and container test
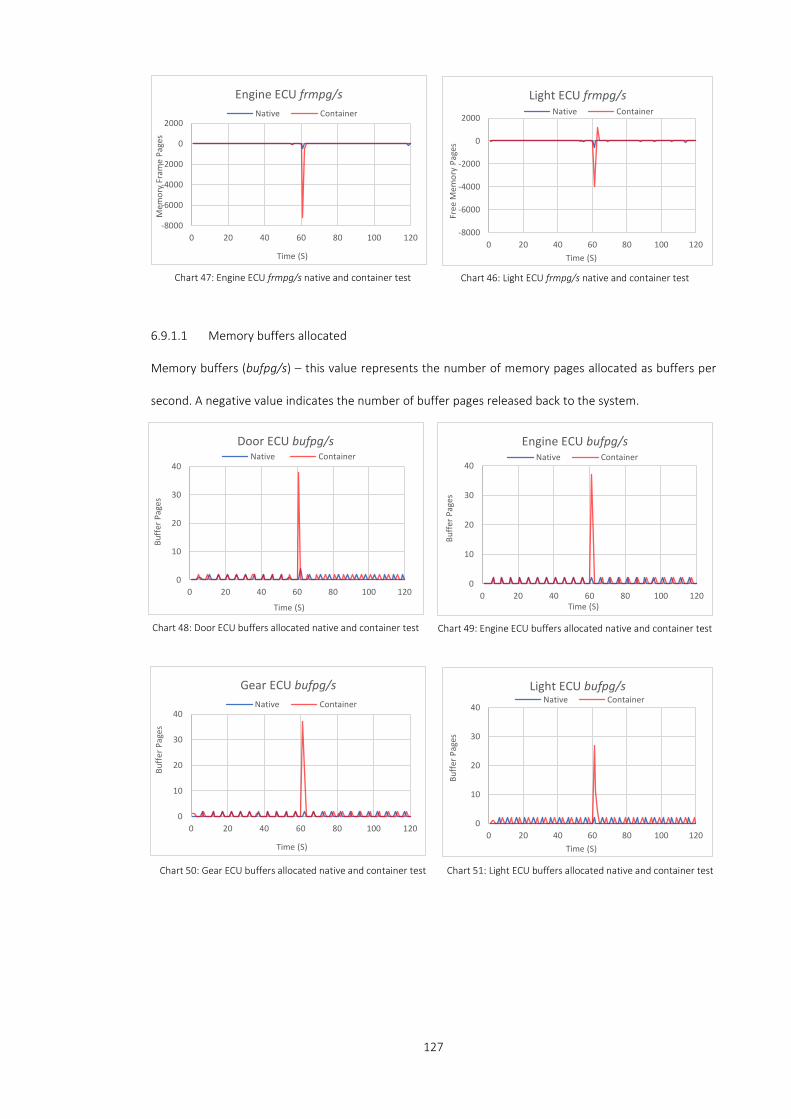
127
6.9.1.1 Memory buffers allocated
Memory buffers (bufpg/s) – this value represents the number of memory pages allocated as buffers per
second. A negative value indicates the number of buffer pages released back to the system.
-8000
-6000
-4000
-2000
0
2000
0 20 40 60 80 100 120
Mem
ory
Fram
e Pa
ges
Time (S)
Engine ECU frmpg/sNative Container
-8000
-6000
-4000
-2000
0
2000
0 20 40 60 80 100 120
Free
Mem
ory
Page
s
Time (S)
Light ECU frmpg/sNative Container
0
10
20
30
40
0 20 40 60 80 100 120
Buffe
r Pag
es
Time (S)
Door ECU bufpg/sNative Container
0
10
20
30
40
0 20 40 60 80 100 120
Buffe
r Pag
es
Time (S)
Engine ECU bufpg/sNative Container
0
10
20
30
40
0 20 40 60 80 100 120
Buffe
r Pag
es
Time (S)
Gear ECU bufpg/sNative Container
0
10
20
30
40
0 20 40 60 80 100 120
Buffe
r Pag
es
Time (S)
Light ECU bufpg/sNative Container
Chart 47: Engine ECU frmpg/s native and container test Chart 46: Light ECU frmpg/s native and container test
Chart 48: Door ECU buffers allocated native and container test Chart 49: Engine ECU buffers allocated native and container test
Chart 51: Light ECU buffers allocated native and container test Chart 50: Gear ECU buffers allocated native and container test
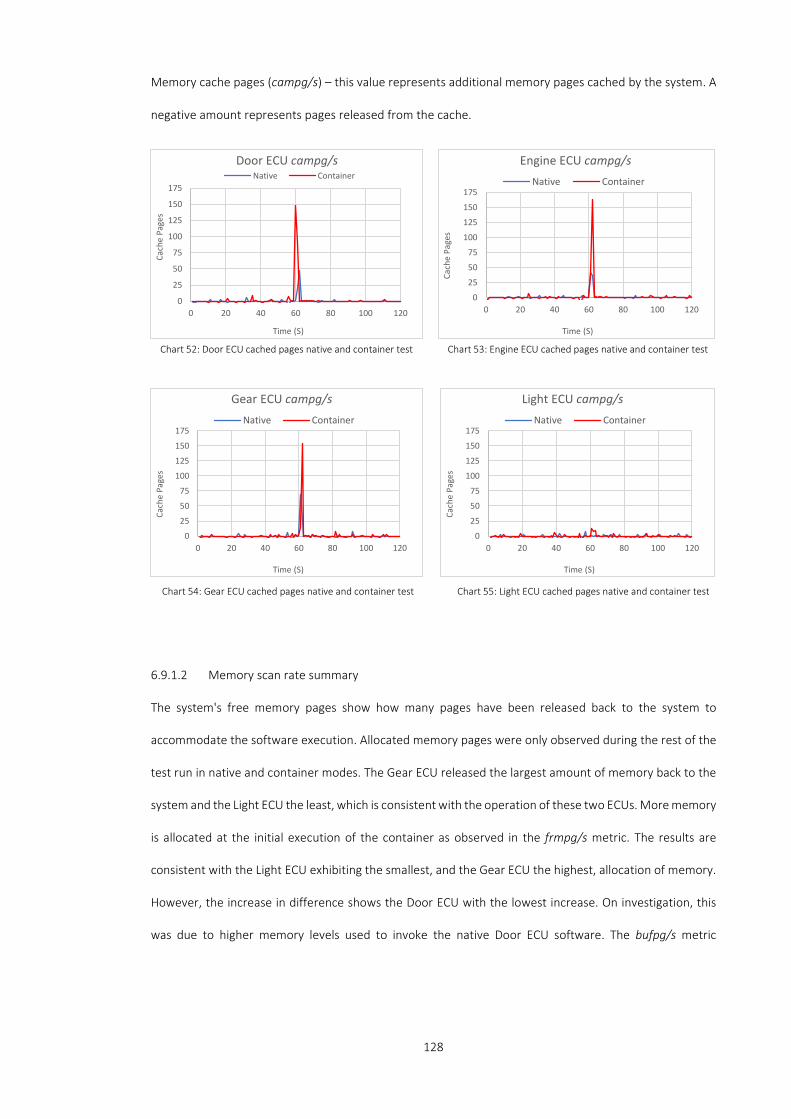
128
Memory cache pages (campg/s) – this value represents additional memory pages cached by the system. A
negative amount represents pages released from the cache.
6.9.1.2 Memory scan rate summary
The system's free memory pages show how many pages have been released back to the system to
accommodate the software execution. Allocated memory pages were only observed during the rest of the
test run in native and container modes. The Gear ECU released the largest amount of memory back to the
system and the Light ECU the least, which is consistent with the operation of these two ECUs. More memory
is allocated at the initial execution of the container as observed in the frmpg/s metric. The results are
consistent with the Light ECU exhibiting the smallest, and the Gear ECU the highest, allocation of memory.
However, the increase in difference shows the Door ECU with the lowest increase. On investigation, this
was due to higher memory levels used to invoke the native Door ECU software. The bufpg/s metric
0
25
50
75
100
125
150
175
0 20 40 60 80 100 120
Cach
e Pa
ges
Time (S)
Door ECU campg/sNative Container
0
25
50
75
100
125
150
175
0 20 40 60 80 100 120
Cach
e Pa
ges
Time (S)
Engine ECU campg/sNative Container
0
25
50
75
100
125
150
175
0 20 40 60 80 100 120
Cach
e Pa
ges
Time (S)
Gear ECU campg/sNative Container
0
25
50
75
100
125
150
175
0 20 40 60 80 100 120
Cach
e Pa
ges
Time (S)
Light ECU campg/sNative Container
Chart 52: Door ECU cached pages native and container test Chart 53: Engine ECU cached pages native and container test
Chart 54: Gear ECU cached pages native and container test Chart 55: Light ECU cached pages native and container test

129
represents the amount of memory required by the kernel to read information, which typically comes from
secondary storage to keep operational speeds to an optimum when accessing data from relatively slower
storage media types. The observed buffer allocation was periodic and low with a small observed spike in
allocation when ECU software initialisation occurred with no other observed spikes in buffer page
allocation. These results were consistent with little to no observed disk activity. The cache pages per second
metric were again observed at a low value across native and container test modes. Three of the four ECUs
had similar cache page allocation peaks of approximately 150 campg/s at script initialisation with little
activity recorded during the duration of the test run. The difference in percentages between native and
container test modes was high, especially within the frmpg/s metric, where the percentage difference was
an average of +572%. The bufpg/s and campg/s increases are smaller at +99% and +182% respectively.
Table 16 below is the summary of the associated individual component metrics of the memory scan rate
test.
Free Memory (pg/s) Buffers (pg/s) Cache (pg/s)
Native Container %diff
Native Container %diff
Native Container %diff
Total Total Total Total Total Total
Door ECU -2579 -5750 122.95 48 84 75.00 67 262 291.04
Gear ECU -1002 -8373 735.63 46 102 121.74 98 169 72.44
Engine ECU -818 -7706 842.18 46 96 108.70 87 238 173.56
Light ECU -758 -5205 586.66 46 88 91.30 10 29 190.00
Table 16: Total free memory, buffers and cache

130
6.9.2 Memory swap activity
Another aspect of memory saturation is concerned with paging. When a system runs out of available
physical memory, inactive memory pages swap from main memory to virtual memory which are usually
stored temporarily on a secondary storage device. Paging delay for a given CPU utilisation is defined as:
𝑃𝑃𝑃𝑃 =𝐶𝐶
1 − U∗ 𝑅𝑅 ∗ 𝑇𝑇
• PD = paging delay.
• C = CPU service time for a transaction.
• U = CPU utilisation (expressed as a decimal).
• R = paging out rate.
• T = service time for the swap device.
As paging increases, so does overall CPU utilisation. High rates of memory utilisation lead to slower memory
read times. This may increase CPU utilisation due to an increased level of CPU interrupts required to
manage the paging process. To maintain a responsive system, paging/swapping must be kept to a
minimum, ideally zero. The paging rate of 10 per second would account for 5% of overall CPU utilisation -
by increasing the paging rate to 20 per second would increase CPU utilisation by an additional 5%. Due to
the modelled ECU architecture, it was anticipated that paging would not be an issue across any of the test
modes but would still be observed.
Each ECU script is relatively small and the memory required to execute the script is minimal compared with
the amount of available ECU system memory. There was no observed swap activity across all four ECUs in
both native and container execution modes.
1.3
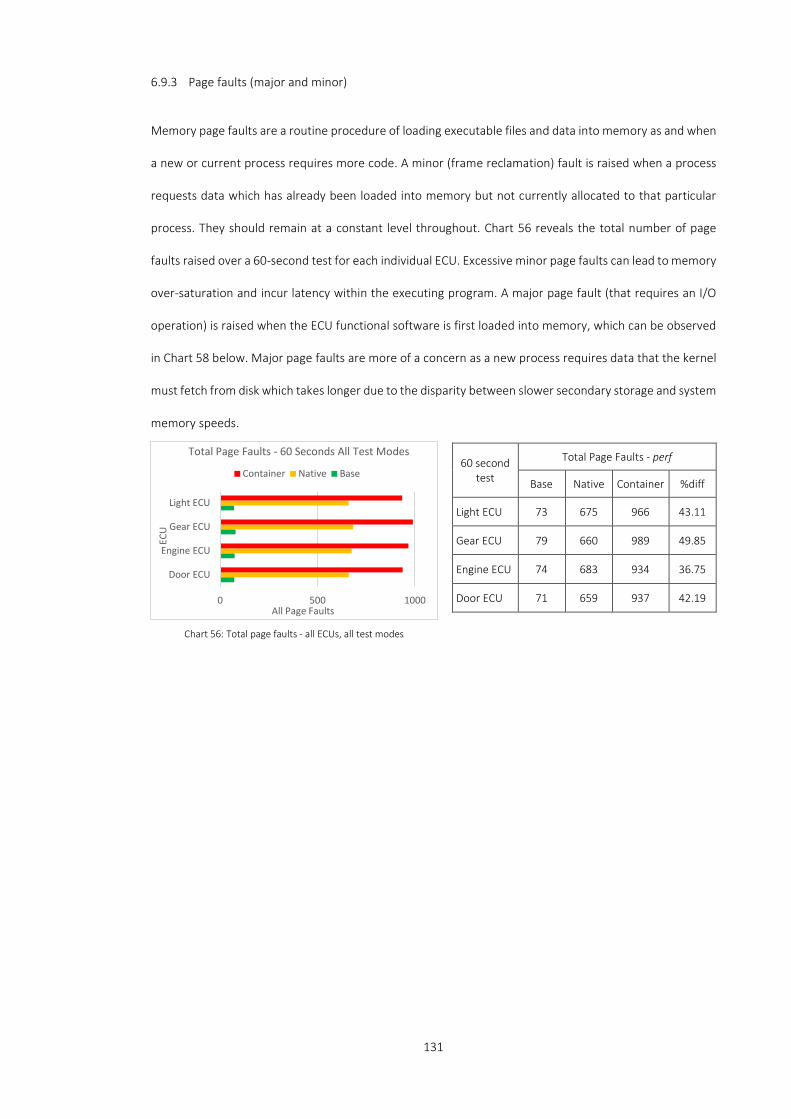
131
6.9.3 Page faults (major and minor)
Memory page faults are a routine procedure of loading executable files and data into memory as and when
a new or current process requires more code. A minor (frame reclamation) fault is raised when a process
requests data which has already been loaded into memory but not currently allocated to that particular
process. They should remain at a constant level throughout. Chart 56 reveals the total number of page
faults raised over a 60-second test for each individual ECU. Excessive minor page faults can lead to memory
over-saturation and incur latency within the executing program. A major page fault (that requires an I/O
operation) is raised when the ECU functional software is first loaded into memory, which can be observed
in Chart 58 below. Major page faults are more of a concern as a new process requires data that the kernel
must fetch from disk which takes longer due to the disparity between slower secondary storage and system
memory speeds.
60 second test
Total Page Faults - perf
Base Native Container %diff
Light ECU 73 675 966 43.11
Gear ECU 79 660 989 49.85
Engine ECU 74 683 934 36.75
Door ECU 71 659 937 42.19 0 500 1000
Door ECU
Engine ECU
Gear ECU
Light ECU
All Page Faults
ECU
Total Page Faults - 60 Seconds All Test Modes
Container Native Base
Chart 56: Total page faults - all ECUs, all test modes
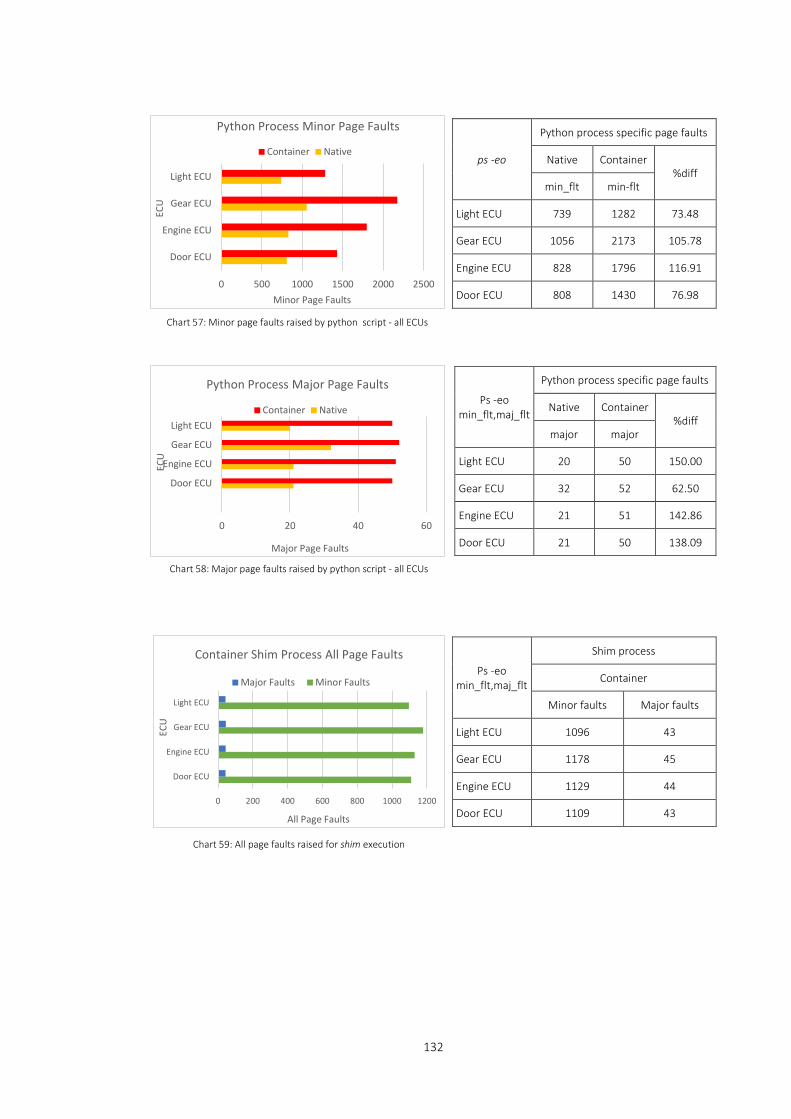
132
ps -eo
Python process specific page faults
Native Container %diff
min_flt min-flt
Light ECU 739 1282 73.48
Gear ECU 1056 2173 105.78
Engine ECU 828 1796 116.91
Door ECU 808 1430 76.98
Ps -eo min_flt,maj_flt
Python process specific page faults
Native Container %diff
major major
Light ECU 20 50 150.00
Gear ECU 32 52 62.50
Engine ECU 21 51 142.86
Door ECU 21 50 138.09
Ps -eo min_flt,maj_flt
Shim process
Container
Minor faults Major faults
Light ECU 1096 43
Gear ECU 1178 45
Engine ECU 1129 44
Door ECU 1109 43
0 500 1000 1500 2000 2500
Door ECU
Engine ECU
Gear ECU
Light ECU
Minor Page Faults
ECU
Python Process Minor Page Faults
Container Native
0 20 40 60
Door ECU
Engine ECU
Gear ECU
Light ECU
Major Page Faults
ECU
Python Process Major Page Faults
Container Native
0 200 400 600 800 1000 1200
Door ECU
Engine ECU
Gear ECU
Light ECU
All Page Faults
ECU
Container Shim Process All Page Faults
Major Faults Minor Faults
Chart 57: Minor page faults raised by python script - all ECUs
Chart 58: Major page faults raised by python script - all ECUs
Chart 59: All page faults raised for shim execution
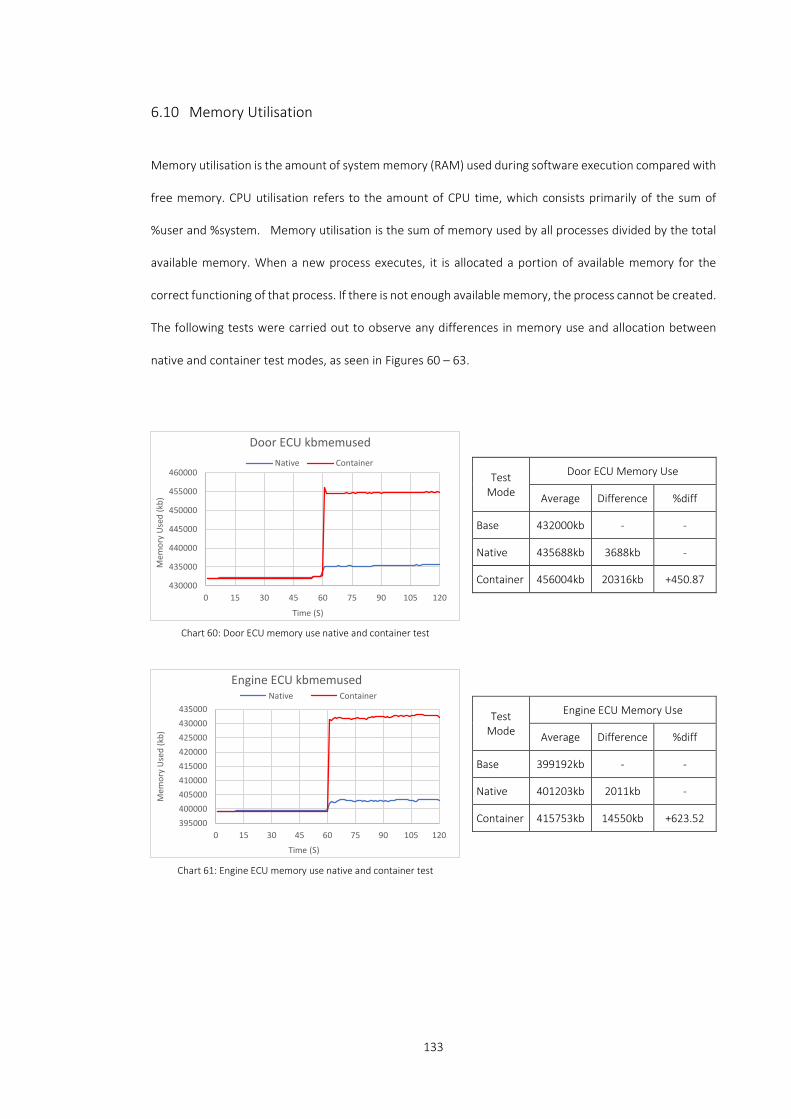
133
6.10 Memory Utilisation
Memory utilisation is the amount of system memory (RAM) used during software execution compared with
free memory. CPU utilisation refers to the amount of CPU time, which consists primarily of the sum of
%user and %system. Memory utilisation is the sum of memory used by all processes divided by the total
available memory. When a new process executes, it is allocated a portion of available memory for the
correct functioning of that process. If there is not enough available memory, the process cannot be created.
The following tests were carried out to observe any differences in memory use and allocation between
native and container test modes, as seen in Figures 60 – 63.
Test Mode
Door ECU Memory Use
Average Difference %diff
Base 432000kb - -
Native 435688kb 3688kb -
Container 456004kb 20316kb +450.87
Test Mode
Engine ECU Memory Use
Average Difference %diff
Base 399192kb - -
Native 401203kb 2011kb -
Container 415753kb 14550kb +623.52 395000400000405000410000415000420000425000430000435000
0 15 30 45 60 75 90 105 120
Mem
ory
Use
d (k
b)
Time (S)
Engine ECU kbmemusedNative Container
430000
435000
440000
445000
450000
455000
460000
0 15 30 45 60 75 90 105 120
Mem
ory
Use
d (k
b)
Time (S)
Door ECU kbmemusedNative Container
Chart 60: Door ECU memory use native and container test
Chart 61: Engine ECU memory use native and container test

134
6.10.1 Memory unique set size
Traditional memory monitoring tools focus on Resident Set Size (RSS). The RSS is the amount of physical
memory occupied by a process. However, the RSS is often an overestimation of process memory use and
shows little information on any memory pages shared between processes. The Proportional Set Size (PSS)
details the amount of main memory allocated to a process, which includes memory allocated for the sole
use of that process and the proportion of memory shared with other processes. It is essential to understand
how much memory is being used proportionally and exclusively by comparing memory use between native
and container test modes. The Unique Set Size (USS) is the amount of private, unshared memory allocated
Test Mode
Gear ECU Memory Use
Average Difference %diff
Base 458224kb - -
Native 459742kb 1518kb -
Container 473712kb 13970kb +820.29
Test Mode
Gear ECU Memory Use
Average Difference %diff
Base 402192kb - -
Native 403552kb 1360kb -
Container 412625kb 9073kb +567.13
455000460000465000470000475000480000485000490000495000
0 15 30 45 60 75 90 105 120
Mem
ory
Use
d (k
b)
Time (S)
Gear ECU kbmemusedNative Container
400000
405000
410000
415000
420000
425000
430000
0 15 30 45 60 75 90 105 120
Mem
ory
Use
d (k
b)
Time (S)
Light ECU kbmemusedNative Container
Chart 62: Gear ECU memory use native and container test
Chart 63: Light ECU memory use native and container test

135
solely to a specific process and is a true reflection of how much memory the kernel assigns to an individual
process. During the native and container test modes, the used memory data is shown in Charts 65 and 66.
ECU Total System Available Free Memory (kb)
Base Native Container Diff %
Door 546076 541464 467400 74064 +13.56
Gear 514048 510588 466884 43704 +8.50
Engine 504480 501556 411616 89940 +17.83
Light 550488 547932 479688 68244 +12.40
ECU Total Container Memory Use (kb)
python shim docker
Door 6596 5588 35128
Gear 7772 5624 45704
Engine 8688 5428 45960
Light 5724 5592 34580
ECU
Automotive Functional Software Memory Use (kb)
Native Container Diff %diff
Door 4125 6596 2471 +59.90
Gear 4496 7772 3647 +81.12
Engine 4172 8688 4192 +100.48
Light 3676 5724 1552 +42.22
0
10000
20000
30000
40000
50000
Door Gear Engine Light
Mem
ory
Use
(kb)
ECU
Container Memory Use by Process (USS)
python shim docker
0
2000
4000
6000
8000
10000
Door Gear Engine Light
Mem
ory
Use
d (k
b)
ECU
Python Only Memory Use (USS)
Native Container
0 100000 200000 300000 400000 500000 600000
Door
Gear
Engine
Light
Memory Free (kb)
ECU
Overall Fee Memory (USS)
container native Base
Chart 64: Unique set size memory - all ECUs, all tests
Chart 65: Unique set size by process container test
Chart 66: Unique set size python only - all ECUs, native and container test
136
6.10.2 Memory utilisation and saturation summary
The perf stat tool captured a 60-second snapshot regarding the total page faults (minor and major)
generated during each test mode. The base test mode, as expected, yielded a low level of page faults during
the execution of just the OS. The container operational mode displayed an average increase of 42.98%
compared with the native operation test, with a high of 49.85% and a low of 36.75%. During the native test
mode, both major and minor page faults related to the functional script's execution. In contrast, additional
page faults were observed due to additional services required to support the container ecosystem and the
embedded python script. The ps command examined the specific minor and major page faults raised since
python script execution and running the software tool. During a five-minute sample test run, the number
of minor faults raised whilst executing the python script during the container test resulted in an average
increase of 93.22% with a low of 73.48% and a high of 116.91%. The associated major page fault average
was 123.36% with a low of 62.50% and a high of 150.00%. Although the observed container major page
fault results show a considerable average increase of 121.74% this equates to just an additional 28 major
page faults across a five-minute test run.
Memory utilisation tests recorded the amount of memory used by the system in sole execution of the OS
to provide a baseline average. The average OS memory use across all four ECUs was observed at 422902kb.
The native test mode results highlight the amount of available memory used to support the ECU functional
script's execution. The average increase in memory use during the native test mode was 2495kb. The
container test mode includes additional memory required for the ECU functional script as per the native
execution but any additional memory needed to support the container ecosystem. Memory utilisation
observed across native and container test modes was relatively static once the software had been loaded
into main memory. There were minimal additional demands placed upon memory during script execution
in either test mode. The average increase in memory use to support container operation was observed at
+615.45%, an additional 12333kb of available system memory.
The USS reveals the amount of process allocated memory. The USS test results showed that the functional
software script requires considerably more memory when executing within a container environment. To
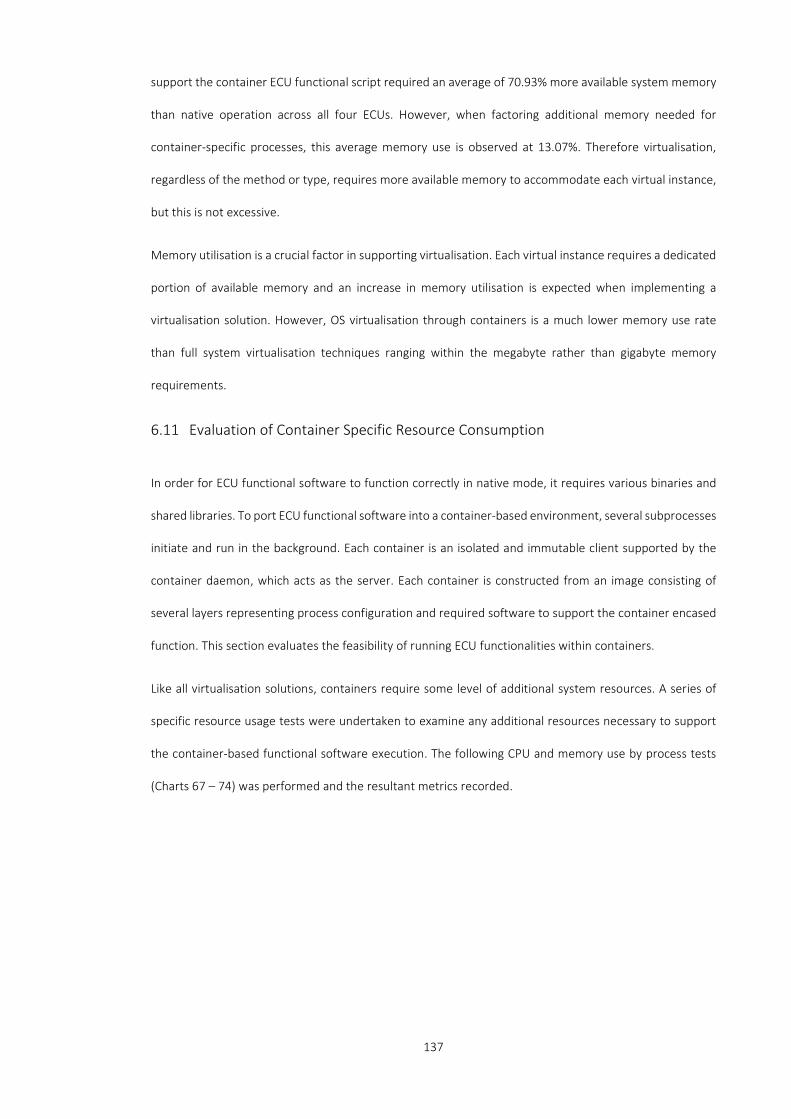
137
support the container ECU functional script required an average of 70.93% more available system memory
than native operation across all four ECUs. However, when factoring additional memory needed for
container-specific processes, this average memory use is observed at 13.07%. Therefore virtualisation,
regardless of the method or type, requires more available memory to accommodate each virtual instance,
but this is not excessive.
Memory utilisation is a crucial factor in supporting virtualisation. Each virtual instance requires a dedicated
portion of available memory and an increase in memory utilisation is expected when implementing a
virtualisation solution. However, OS virtualisation through containers is a much lower memory use rate
than full system virtualisation techniques ranging within the megabyte rather than gigabyte memory
requirements.
6.11 Evaluation of Container Specific Resource Consumption
In order for ECU functional software to function correctly in native mode, it requires various binaries and
shared libraries. To port ECU functional software into a container-based environment, several subprocesses
initiate and run in the background. Each container is an isolated and immutable client supported by the
container daemon, which acts as the server. Each container is constructed from an image consisting of
several layers representing process configuration and required software to support the container encased
function. This section evaluates the feasibility of running ECU functionalities within containers.
Like all virtualisation solutions, containers require some level of additional system resources. A series of
specific resource usage tests were undertaken to examine any additional resources necessary to support
the container-based functional software execution. The following CPU and memory use by process tests
(Charts 67 – 74) was performed and the resultant metrics recorded.

138
0.00
10.00
20.00
30.00
40.00
50.00
60.00
70.00
80.00
90.00
100.00
0 1 2 3 4 5 6 7 8 9 10 11 12 13 14 15 16 17 18 19 20
%CP
U
Time (mS)
Engine ECU - Container CPU Usage
containerdDockerShimPythonrunc
0.00
10.00
20.00
30.00
40.00
50.00
60.00
70.00
80.00
90.00
100.00
0 1 2 3 4 5 6 7 8 9 1011121314151617181920
%CP
U
Time (mS)
Gear ECU - Container CPU Usage
containerddockershimpythonrunc
0.00
10.00
20.00
30.00
40.00
50.00
60.00
70.00
80.00
90.00
100.00
0 1 2 3 4 5 6 7 8 9 1011121314151617181920
%CP
U
Time (mS)
Door ECU - Container CPU Usage
containerddockershimpythonrunc
0.00
10.00
20.00
30.00
40.00
50.00
60.00
70.00
80.00
90.00
100.00
0 1 2 3 4 5 6 7 8 9 1011121314151617181920
%CP
U
Time (mS)
Light ECU - Container CPU Usage
containerddockershimpythonrunc
0.00
1.00
2.00
3.00
4.00
5.00
6.00
7.00
8.00
9.00
10.00
0 50 100 150 200 250 300 350 400 450 500 550 600
%M
EM
Time (mS)
Engine ECU Memory UsageEngine containerd
Engine docker
Engine shim
Engine python
0.00
1.00
2.00
3.00
4.00
5.00
6.00
7.00
8.00
9.00
10.00
0 50 100 150 200 250 300 350 400 450 500 550 600
%M
EM
Time (mS)
Gear ECU Memory UsageGear containerd
Gear docker
Gear shim
Gear python
Chart 68: Gear ECU container CPU use by process
Chart 70: Light ECU container CPU use by process Chart 69: Door ECU container CPU use by process
Chart 71: Engine ECU container memory use by process Chart 72: Gear ECU container memory use by process
Chart 67: Engine ECU container CPU use by process
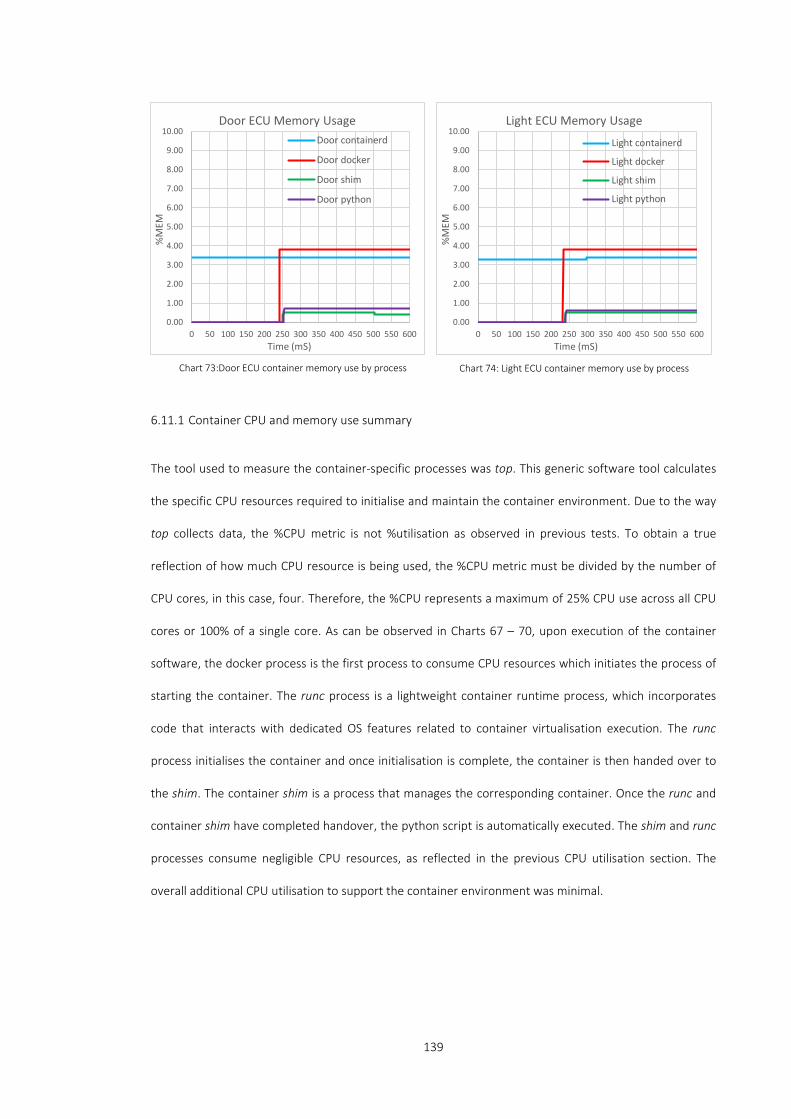
139
6.11.1 Container CPU and memory use summary
The tool used to measure the container-specific processes was top. This generic software tool calculates
the specific CPU resources required to initialise and maintain the container environment. Due to the way
top collects data, the %CPU metric is not %utilisation as observed in previous tests. To obtain a true
reflection of how much CPU resource is being used, the %CPU metric must be divided by the number of
CPU cores, in this case, four. Therefore, the %CPU represents a maximum of 25% CPU use across all CPU
cores or 100% of a single core. As can be observed in Charts 67 – 70, upon execution of the container
software, the docker process is the first process to consume CPU resources which initiates the process of
starting the container. The runc process is a lightweight container runtime process, which incorporates
code that interacts with dedicated OS features related to container virtualisation execution. The runc
process initialises the container and once initialisation is complete, the container is then handed over to
the shim. The container shim is a process that manages the corresponding container. Once the runc and
container shim have completed handover, the python script is automatically executed. The shim and runc
processes consume negligible CPU resources, as reflected in the previous CPU utilisation section. The
overall additional CPU utilisation to support the container environment was minimal.
0.00
1.00
2.00
3.00
4.00
5.00
6.00
7.00
8.00
9.00
10.00
0 50 100 150 200 250 300 350 400 450 500 550 600
%M
EM
Time (mS)
Door ECU Memory UsageDoor containerd
Door docker
Door shim
Door python
0.00
1.00
2.00
3.00
4.00
5.00
6.00
7.00
8.00
9.00
10.00
0 50 100 150 200 250 300 350 400 450 500 550 600
%M
EM
Time (mS)
Light ECU Memory Usage
Light containerd
Light docker
Light shim
Light python
Chart 73:Door ECU container memory use by process Chart 74: Light ECU container memory use by process
140
The observed container process-specific memory use is relatively static once the container is initialised and
under container shim management. The containerd process is a constant process initiated during system
start-up and is a continuous level from system initialisation to system shutdown. The containerd process
manages the container lifecycle and is often referred to as an executor of containers. The container daemon
and shim process are initiated to manage and maintain the container shell's memory requirements from
the start of container initialisation. The container daemon listens for API requests and manages other
container configuration functions, including images, networking and volumes, so the overall memory use
is notably higher. Once the shim has completed its initialisation, the python script executes and allocated
memory accordingly.
6.12 Testing the Suitability of Containers and the Possibility of ECU Consolidation
This research focuses on the additional resources consumed by a container ecosystem to support an
automotive ECU function distributed across multiple ECUs. Various data sources collected from multiple
sensors are sent to the corresponding ECU for processing which are used as part of that ECU functionality
or passed to other ECUs to aid in other automotive functionality. The initial tests and resulting data have
shown that container-based ECUs provide numerous benefits to the automotive E/E architecture with very
little additional resource overhead. The primary resource components tested were CPU and memory
saturation and utilisation. One of the principal benefits of a container-based ECU is hosting multiple
containers on the same hardware system, thus promoting consolidation of several single-function ECUs.
Some ECU functional software is highly dependent on large amounts of available CPU resources due to high
computational factors. Other programs may be more memory intensive and require increased use of
available system memory. Other ECU systems produce large amounts of I/O operations otherwise known
as I/O bound processes as part of their functionality.
Consolidation is a primary benefit addressed by container-based ECUs. However, to maintain a container's
optimal performance when in execution, specific resource-intensive software functions are distributed
among container-based ECUs, ensuring no particular resource is being oversaturated or over utilised.
141
6.12.1 Sample test program script
A test script was written (see Appendix H), which produced a CPU bound process when in execution. The
script involves high computation and thus requires a great deal of CPU time to complete execution. The
script was written in Python. Its primary function was to compute every square root value between 1 and
1,000,000 (the script code can be found in Appendix H). A single execution of the script repeats this function
1,000,000 times. The script used the Python timeit function to measure the time taken to execute this
particular piece of code. A complete script execution cycle repeats the function 100 times.
6.12.2 System stress tests
A single execution of the test script completed in an average time of 78.68ms and consumed about 100%
of available CPU single-core resource (~25% across all 4 CPU cores) and ~0.1% of the available memory. A
series of system-related stress tests were conducted to understand the effects of any additional load
applied to the system. The primary metrics recorded for these tests were to investigate any additional CPU
resource saturation and utilisation, and script execution time. There were three artificial loads placed on
the system, including CPU, memory and I/O. These synthetic loads were applied using the Linux stress-ng
software tool, which can apply various configurable levels of stress to a computer system. The main focus
was any extension to script execution times and additional CPU load and utilisation placed upon the system.
6.12.3 Process priority
As part of regular operation, when a new process starts the process priority, also known as the NICE value,
it is automatically set to default by the operating system. Linux NICE levels range from between -20 to 19
where -20 is reserved for the highest priority, 0 is considered the system default and 19 the lowest priority.
During native execution where the script is initiated within the OS, the new process's CPU allocation is
dependent upon all other system processes running equally. However, this was not the case when starting
the same script within a container. By default, the container environment reserves a portion of CPU
resource which is allocated to each new container. The same situation can only be accomplished natively
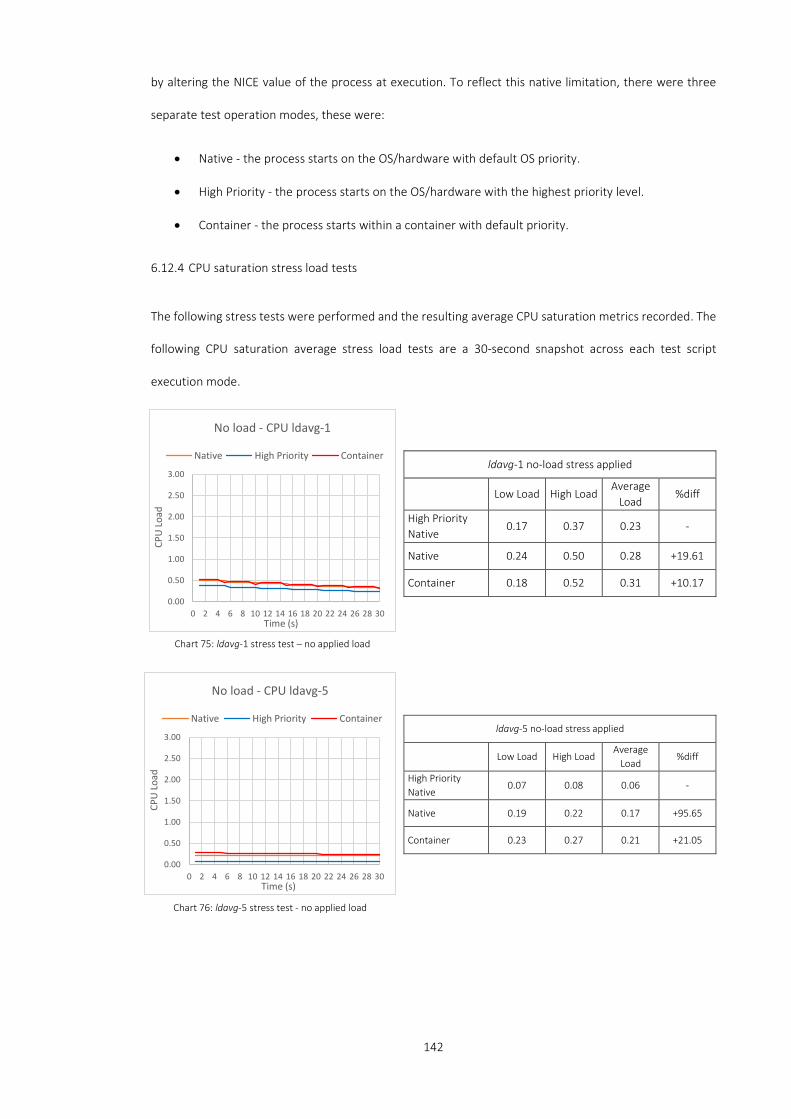
142
by altering the NICE value of the process at execution. To reflect this native limitation, there were three
separate test operation modes, these were:
• Native - the process starts on the OS/hardware with default OS priority.
• High Priority - the process starts on the OS/hardware with the highest priority level.
• Container - the process starts within a container with default priority.
6.12.4 CPU saturation stress load tests
The following stress tests were performed and the resulting average CPU saturation metrics recorded. The
following CPU saturation average stress load tests are a 30-second snapshot across each test script
execution mode.
ldavg-1 no-load stress applied
Low Load High Load Average
Load %diff
High Priority Native
0.17 0.37 0.23 -
Native 0.24 0.50 0.28 +19.61
Container 0.18 0.52 0.31 +10.17
ldavg-5 no-load stress applied
Low Load High Load Average
Load %diff
High Priority Native
0.07 0.08 0.06 -
Native 0.19 0.22 0.17 +95.65
Container 0.23 0.27 0.21 +21.05
0.00
0.50
1.00
1.50
2.00
2.50
3.00
0 2 4 6 8 10 12 14 16 18 20 22 24 26 28 30
CPU
Load
Time (s)
No load - CPU ldavg-1
Native High Priority Container
0.00
0.50
1.00
1.50
2.00
2.50
3.00
0 2 4 6 8 10 12 14 16 18 20 22 24 26 28 30
CPU
Load
Time (s)
No load - CPU ldavg-5
Native High Priority Container
Chart 75: ldavg-1 stress test – no applied load
Chart 76: ldavg-5 stress test - no applied load
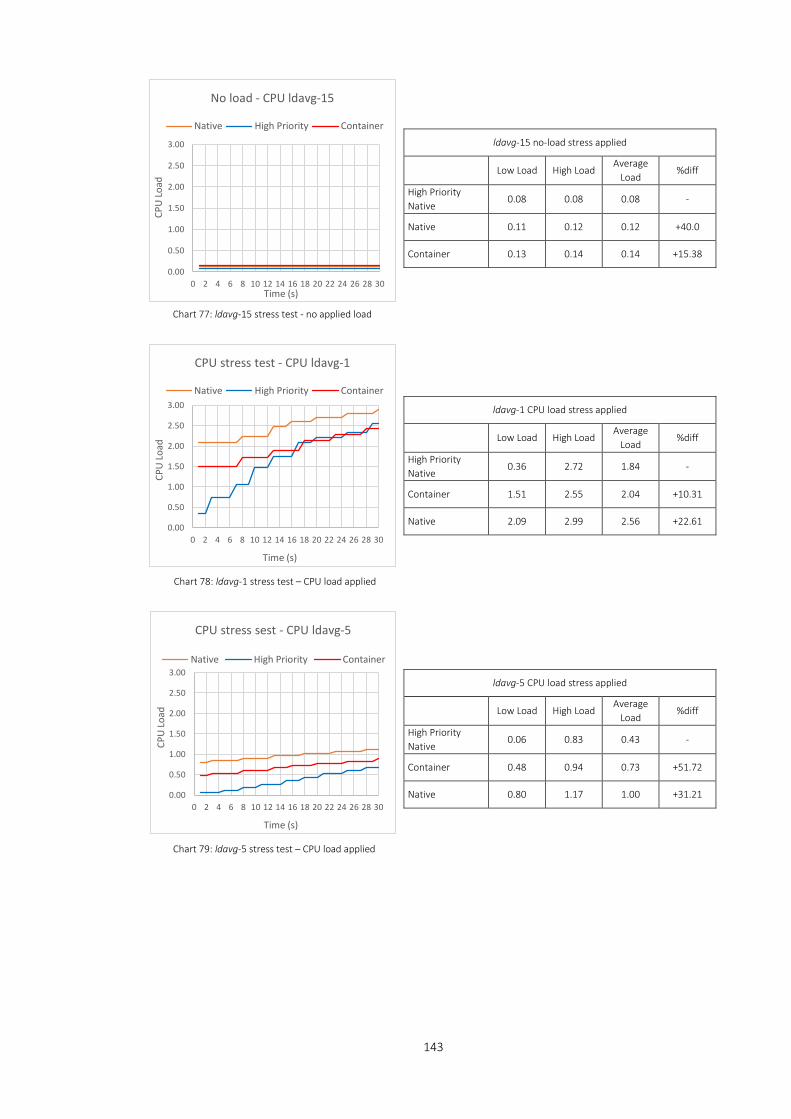
143
ldavg-15 no-load stress applied
Low Load High Load Average
Load %diff
High Priority Native
0.08 0.08 0.08 -
Native 0.11 0.12 0.12 +40.0
Container 0.13 0.14 0.14 +15.38
ldavg-1 CPU load stress applied
Low Load High Load Average
Load %diff
High Priority Native
0.36 2.72 1.84 -
Container 1.51 2.55 2.04 +10.31
Native 2.09 2.99 2.56 +22.61
ldavg-5 CPU load stress applied
Low Load High Load Average
Load %diff
High Priority Native
0.06 0.83 0.43 -
Container 0.48 0.94 0.73 +51.72
Native 0.80 1.17 1.00 +31.21
0.00
0.50
1.00
1.50
2.00
2.50
3.00
0 2 4 6 8 10 12 14 16 18 20 22 24 26 28 30
CPU
Load
Time (s)
No load - CPU ldavg-15
Native High Priority Container
0.00
0.50
1.00
1.50
2.00
2.50
3.00
0 2 4 6 8 10 12 14 16 18 20 22 24 26 28 30
CPU
Load
Time (s)
CPU stress sest - CPU ldavg-5
Native High Priority Container
0.00
0.50
1.00
1.50
2.00
2.50
3.00
0 2 4 6 8 10 12 14 16 18 20 22 24 26 28 30
CPU
Load
Time (s)
CPU stress test - CPU ldavg-1
Native High Priority Container
Chart 77: ldavg-15 stress test - no applied load
Chart 79: ldavg-5 stress test – CPU load applied
Chart 78: ldavg-1 stress test – CPU load applied

144
ldavg-15 CPU load stress applied
Low Load High Load Average
Load %diff
High Priority Native
0.02 0.31 0.17 -
Container 0.23 0.40 0.32 +61.22
Native 0.66 0.79 0.73 +78.09
ldavg-1 memory load stress applied
Low Load High Load Average
Load %diff
High Priority Native
0.57 2.88 2.06 -
Container 0.41 3.06 1.78 -14.58
Native 2.70 4.18 4.02 +77.24
ldavg-5 memory load stress applied
Low Load High Load Average
Load %diff
High Priority Native
0.65 1.32 1.03 -
Container 0.75 1.50 1.16 +11.87
Native 1.51 2.19 1.99 +52.70
0.00
0.50
1.00
1.50
2.00
2.50
3.00
0 2 4 6 8 10 12 14 16 18 20 22 24 26 28 30
CPU
Load
Time (s)
CPU stress test - CPU ldavg-15
Native High Priority Container
0.00
1.00
2.00
3.00
4.00
5.00
0 2 4 6 8 10 12 14 16 18 20 22 24 26 28 30
CPU
Load
Time (s)
Memory stress test - CPU ldavg-5
Native High Priority Container
0.00
1.00
2.00
3.00
4.00
5.00
0 2 4 6 8 10 12 14 16 18 20 22 24 26 28 30
CPU
Load
Time (s)
Memory stress test - CPU ldavg-1
Native High Priority Container
Chart 80: ldavg-15 stress test - CPU load applied
Chart 81: ldavg-1 stress test - memory load applied
Chart 82: ldavg-5 stress test - memory load applied
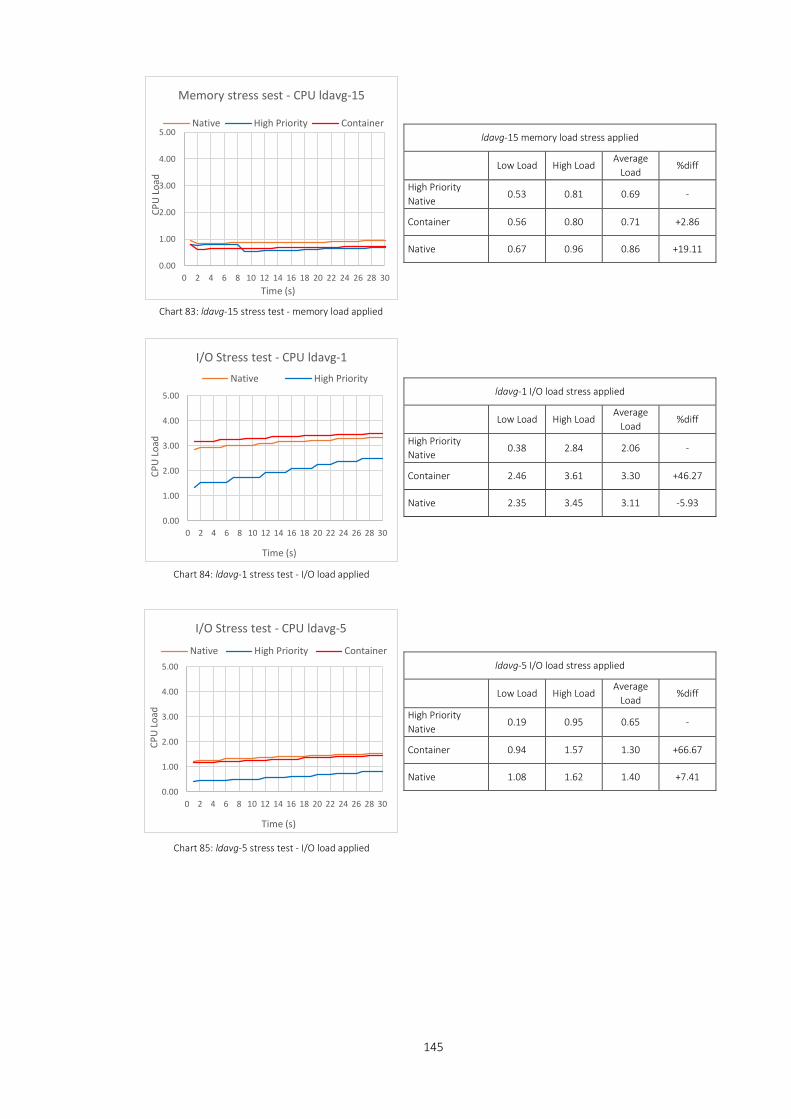
145
ldavg-1 I/O load stress applied
Low Load High Load Average
Load %diff
High Priority Native
0.38 2.84 2.06 -
Container 2.46 3.61 3.30 +46.27
Native 2.35 3.45 3.11 -5.93
ldavg-15 memory load stress applied
Low Load High Load Average
Load %diff
High Priority Native
0.53 0.81 0.69 -
Container 0.56 0.80 0.71 +2.86
Native 0.67 0.96 0.86 +19.11
ldavg-5 I/O load stress applied
Low Load High Load Average
Load %diff
High Priority Native
0.19 0.95 0.65 -
Container 0.94 1.57 1.30 +66.67
Native 1.08 1.62 1.40 +7.41
0.00
1.00
2.00
3.00
4.00
5.00
0 2 4 6 8 10 12 14 16 18 20 22 24 26 28 30
CPU
Load
Time (s)
I/O Stress test - CPU ldavg-1Native High Priority
0.00
1.00
2.00
3.00
4.00
5.00
0 2 4 6 8 10 12 14 16 18 20 22 24 26 28 30
CPU
Load
Time (s)
I/O Stress test - CPU ldavg-5
Native High Priority Container
0.00
1.00
2.00
3.00
4.00
5.00
0 2 4 6 8 10 12 14 16 18 20 22 24 26 28 30
CPU
Load
Time (s)
Memory stress sest - CPU ldavg-15
Native High Priority Container
Chart 83: ldavg-15 stress test - memory load applied
Chart 85: ldavg-5 stress test - I/O load applied
Chart 84: ldavg-1 stress test - I/O load applied

146
ldavg-15 I/O load stress applied
Low Load High Load Average
Load %diff
High Priority Native
0.39 0.64 0.54 -
Container 0.41 0.66 0.55 +1.83
Native 0.43 0.65 0.56 +1.80
ldavg-1 all load stress applied
Low Load High Load Average
Load %diff
High Priority Native
1.05 2.84 2.34 -
Container 1.23 2.98 2.68 +13.55
Native 1.40 3.19 2.93 +8.91
ldavg-5 all load stress applied
Low Load High Load Average
Load %diff
High Priority Native
2.49 2.87 2.74 -
Container 2.80 2.94 2.83 +3.23
Native 3.46 3.61 3.44 +19.46
0.00
1.00
2.00
3.00
4.00
0 2 4 6 8 10 12 14 16 18 20 22 24 26 28 30
CPU
Load
Time (s)
All stress tests - ldavg-1
Native High Priority Container
0.00
1.00
2.00
3.00
4.00
0 2 4 6 8 10 12 14 16 18 20 22 24 26 28 30
CPU
Load
Time (s)
All stress tests - ldavg-5
Native High Priority Container
0.00
1.00
2.00
3.00
4.00
5.00
0 2 4 6 8 10 12 14 16 18 20 22 24 26 28 30
CPU
Load
Time (s)
I/O Stress test - CPU ldavg-15
Native High Priority Container
Chart 86: ldavg-5 stress test - all loads applied
Chart 88: ldavg-1 stress test - all loads applied
Chart 87: ldavg-15 stress test I/O load applied

147
6.12.5 CPU saturation stress load test analysis
As expected, when the system was under no external stress load, the native high priority execution
exhibited the smallest saturation levels and the container average had the highest CPU saturation levels.
However, across all triplet load tests, the highest recorded saturation level was 0.52 (52% across a single
CPU core), observed during one of the container triplet tests.
Chart 90: ldavg triplet test - no applied load
As shown in Chart 91 below, the container CPU load averages outperformed the native execution when
under CPU stress load:
• ldavg-1 +22.61% when compared with container execution
• ldavg-5 +31.21% when compared with container execution
• ldavg-15 +78.09% when compared with container execution
0.00
1.00
2.00
3.00
4.00
ldavg-1 ldavg-5 ldavg-15
Aver
age
CPU
Loa
d
ldavg-n
No load - ldavg average triplet testNative High Priority Container
ldavg-15 all load stress applied
Low Load High Load Average
Load %diff
High Priority Native
2.06 2.23 2.17 -
Container 2.08 2.23 2.17 0.00
Native 2.11 2.33 2.23 +2.73 0.00
1.00
2.00
3.00
4.00
0 2 4 6 8 10 12 14 16 18 20 22 24 26 28 30
CPU
Load
Time (s)
All stress tests - ldavg-15
Native High Priority Container
Chart 89: ldavg-15 - all loads applied

148
Chart 91: ldavg triplet test - CPU load applied
During the memory stress load tests, the native ldavg-1 and ldavg-5 triplets experienced the highest CPU
saturation levels across all four sample. The container ldavg-1 results were lower than the native triplet
tests, which ranged from +77.24% to +19.11%. When placed in memory load stress, the CPU saturation
under container execution was similar to the high priority native performance. The ldavg-1, 5 and 15 load
averages for the container were recorded at -14.58%, +11.87% and 2.86%, respectively.
Chart 92: ldavg triplet test - memory load applied
The I/O stress load test showed that the load placed on the container was greater than either of the native
or high priority execution modes during the ldavg-1 triplet test. Native high priority execution
outperformed both native and container execution.
0.001.002.003.004.00
ldavg-1 ldavg-5 ldavg-15Aver
age
CPU
Loa
d
ldavg-n
CPU load - ldavg average triplet test
Native High Priority Container
0.001.002.003.004.00
ldavg-1 ldavg-5 ldavg-15
Aver
age
CPU
Loa
d
ldavg-n
Memory load - ldavg triplet test
Native High Priority Container
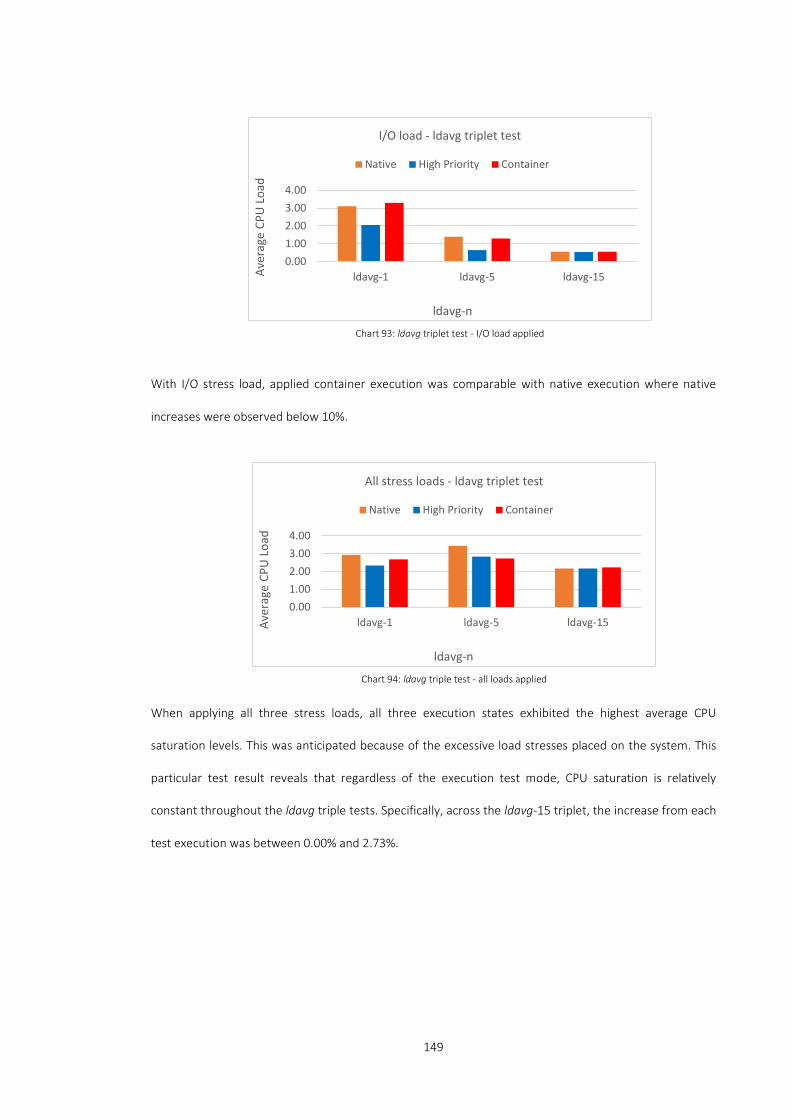
149
With I/O stress load, applied container execution was comparable with native execution where native
increases were observed below 10%.
When applying all three stress loads, all three execution states exhibited the highest average CPU
saturation levels. This was anticipated because of the excessive load stresses placed on the system. This
particular test result reveals that regardless of the execution test mode, CPU saturation is relatively
constant throughout the ldavg triple tests. Specifically, across the ldavg-15 triplet, the increase from each
test execution was between 0.00% and 2.73%.
0.001.002.003.004.00
ldavg-1 ldavg-5 ldavg-15Aver
age
CPU
Loa
d
ldavg-n
All stress loads - ldavg triplet test
Native High Priority Container
0.001.002.003.004.00
ldavg-1 ldavg-5 ldavg-15Aver
age
CPU
Loa
d
ldavg-n
I/O load - ldavg triplet test
Native High Priority Container
Chart 93: ldavg triplet test - I/O load applied
Chart 94: ldavg triple test - all loads applied
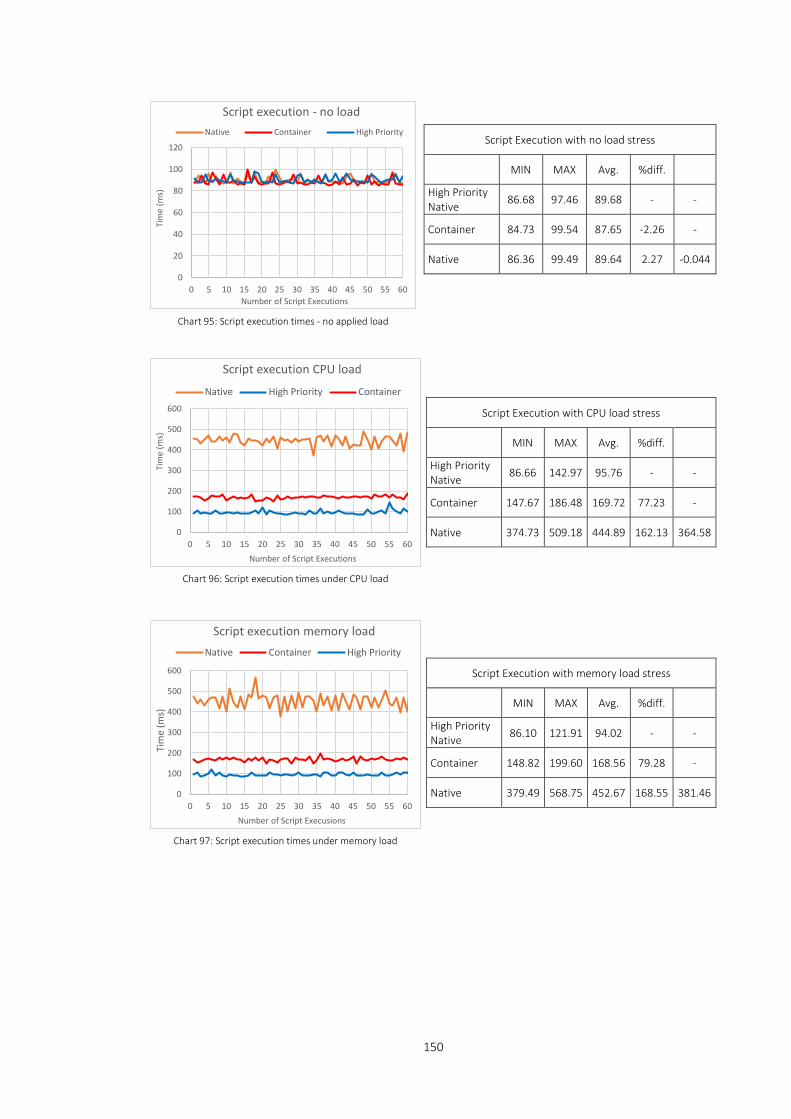
150
Script Execution with no load stress
MIN MAX Avg. %diff.
High Priority Native
86.68 97.46 89.68 - -
Container 84.73 99.54 87.65 -2.26 -
Native 86.36 99.49 89.64 2.27 -0.044
Script Execution with CPU load stress
MIN MAX Avg. %diff.
High Priority Native
86.66 142.97 95.76 - -
Container 147.67 186.48 169.72 77.23 -
Native 374.73 509.18 444.89 162.13 364.58
Script Execution with memory load stress
MIN MAX Avg. %diff.
High Priority Native 86.10 121.91 94.02 - -
Container 148.82 199.60 168.56 79.28 -
Native 379.49 568.75 452.67 168.55 381.46
0
20
40
60
80
100
120
0 5 10 15 20 25 30 35 40 45 50 55 60
Tim
e (m
s)
Number of Script Executions
Script execution - no loadNative Container High Priority
0
100
200
300
400
500
600
0 5 10 15 20 25 30 35 40 45 50 55 60
Tim
e (m
s)
Number of Script Executions
Script execution CPU load
Native High Priority Container
0
100
200
300
400
500
600
0 5 10 15 20 25 30 35 40 45 50 55 60
Tim
e (m
s)
Number of Script Execusions
Script execution memory load Native Container High Priority
Chart 95: Script execution times - no applied load
Chart 96: Script execution times under CPU load
Chart 97: Script execution times under memory load

151
6.12.6 Script execution time analysis
Under zero load, the high priority native tests exhibited the quickest average script execution across all
applied stress loads as observed in Chart 95. During the high priority native script execution, the average
execution times were 89.68ms to 100.02ms regardless of the system's stress load. I/O stress load had no
bearing on script execution time. For example, comparing average execution times, there was an average
increase of 10ms across all three test script execution modes. In contrast, placing the system under CPU
and memory stress loads had a considerable detrimental effect on native script execution times where the
average script execution increased to 448ms. When comparing the container execution test mode with the
high priority native test mode, the execution time increased across CPU and memory stress loads were
observed at approximately 78ms, see Chart 96 and 97. With the NICE value set to the highest userspace
Script Execution with I/O load stress
MIN MAX Avg. %diff.
High Priority Native
92.17 108.47 96.26 - -
Container 91.10 109.92 94.65 -1.67 -
Native 89.68 107.95 97.17 2.66 0.94
Script Execution with all load stress
MIN MAX Avg. %diff.
High Priority Native
92.98 113.83 100.02 - -
Container 162.17 196.81 178.22 78.18 -
Native 271.45 359.71 293.11 64.46 193.05
0
20
40
60
80
100
120
0 5 10 15 20 25 30 35 40 45 50 55 60
Tim
e (m
s)
Number of Script Executions
Script execution I/O load Native Container High Priority
Chart 98: Script execution times under I/O load
Chart 99: Script execution times under all loads
0
50
100
150
200
250
300
350
400
0 20 40 60 80 100
Exec
utio
n Ti
me
(ms)
Number of Executions
Execution Times All Stress TestsNative High Priority Container
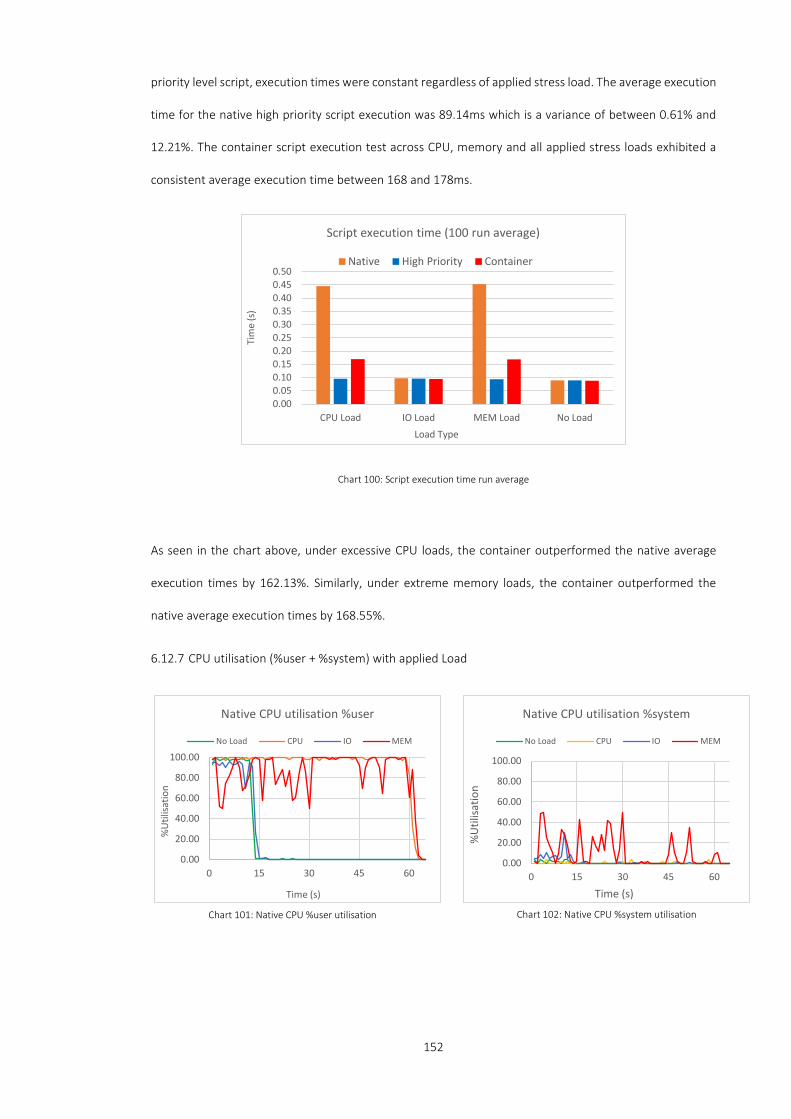
152
priority level script, execution times were constant regardless of applied stress load. The average execution
time for the native high priority script execution was 89.14ms which is a variance of between 0.61% and
12.21%. The container script execution test across CPU, memory and all applied stress loads exhibited a
consistent average execution time between 168 and 178ms.
Chart 100: Script execution time run average
As seen in the chart above, under excessive CPU loads, the container outperformed the native average
execution times by 162.13%. Similarly, under extreme memory loads, the container outperformed the
native average execution times by 168.55%.
6.12.7 CPU utilisation (%user + %system) with applied Load
0.000.050.100.150.200.250.300.350.400.450.50
CPU Load IO Load MEM Load No Load
Tim
e (s
)
Load Type
Script execution time (100 run average)
Native High Priority Container
0.00
20.00
40.00
60.00
80.00
100.00
0 15 30 45 60
%U
tilisa
tion
Time (s)
Native CPU utilisation %user
No Load CPU IO MEM
0.00
20.00
40.00
60.00
80.00
100.00
0 15 30 45 60
%U
tilisa
tion
Time (s)
Native CPU utilisation %system
No Load CPU IO MEM
Chart 102: Native CPU %system utilisation Chart 101: Native CPU %user utilisation
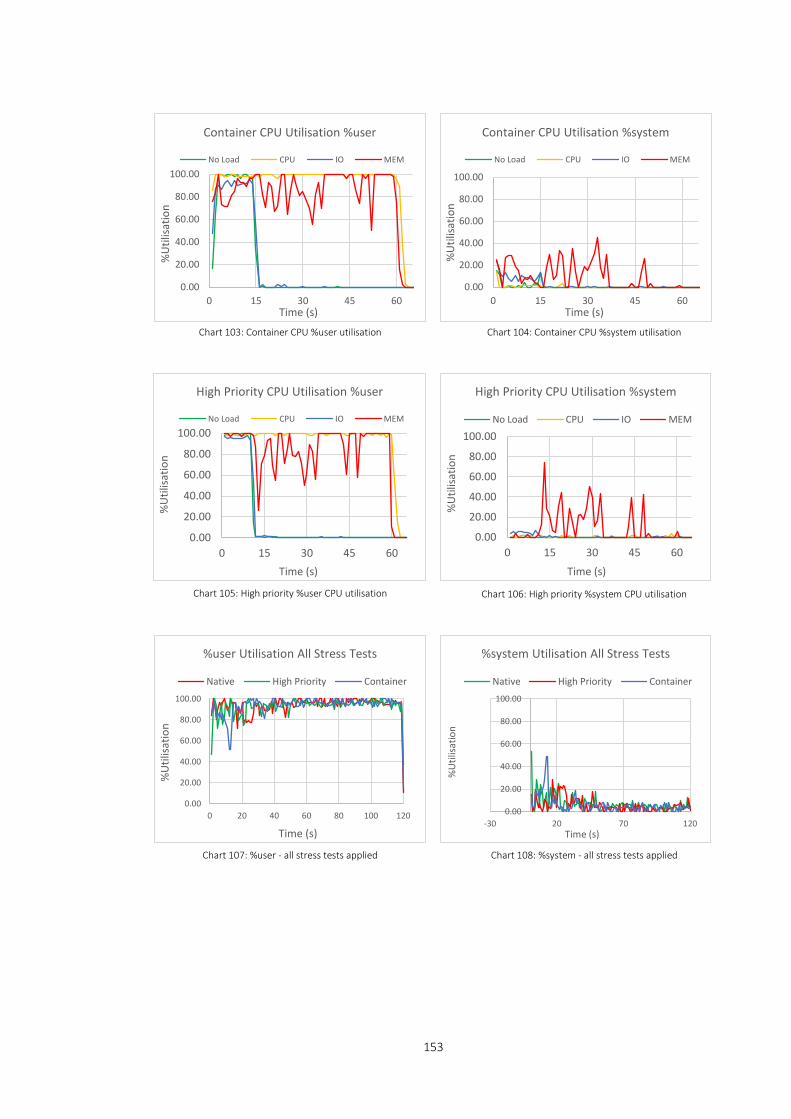
153
0.00
20.00
40.00
60.00
80.00
100.00
0 15 30 45 60
%U
tilisa
tion
Time (s)
Container CPU Utilisation %user
No Load CPU IO MEM
0.00
20.00
40.00
60.00
80.00
100.00
0 15 30 45 60
%U
tilisa
tion
Time (s)
Container CPU Utilisation %system
No Load CPU IO MEM
0.00
20.00
40.00
60.00
80.00
100.00
0 15 30 45 60
%U
tilisa
tion
Time (s)
High Priority CPU Utilisation %user
No Load CPU IO MEM
0.00
20.00
40.00
60.00
80.00
100.00
0 15 30 45 60
%U
tilisa
tion
Time (s)
High Priority CPU Utilisation %system
No Load CPU IO MEM
0.00
20.00
40.00
60.00
80.00
100.00
0 20 40 60 80 100 120
%U
tilisa
tion
Time (s)
%user Utilisation All Stress Tests
Native High Priority Container
0.00
20.00
40.00
60.00
80.00
100.00
-30 20 70 120
%U
tilisa
tion
Time (s)
%system Utilisation All Stress Tests
Native High Priority Container
Chart 104: Container CPU %system utilisation Chart 103: Container CPU %user utilisation
Chart 106: High priority %system CPU utilisation Chart 105: High priority %user CPU utilisation
Chart 108: %system - all stress tests applied Chart 107: %user - all stress tests applied
154
6.12.8 CPU utilisation with applied load analysis
As observed in the preceding graphs, under all three test modes, script execution was completed at around
15 seconds after implementation when no stress load or I/O stress load had been applied. In both CPU and
memory stress load tests across all three test modes, execution times increased to approximately 60
seconds.
The highest CPU utilisation activity levels were exhibited during the memory stress load tests across all
three test operation modes. A drop in %user CPU utilisation was mirrored by an increase in %system CPU
utilisation. Across all tests, there was very little CPU utilisation across any of the execution test modes when
I/O stress load was applied. As expected, high CPU utilisation was observed when CPU stress load was
applied due to the additional CPU tasks created by the stress tool.
6.12.9 Container suitability summary
During the CPU saturation tests, native test mode experienced some of the highest saturation levels shown
in Charts 75 - 89, especially when applying memory stress loading, as observed in Charts 81 - 83.
Throughout the I/O stress loading tests, the container test mode during the ldavg-1 test experienced the
highest CPU saturation levels, equivalent to native operation across the ldavg-5 and ldavg-15 metrics. As
expected, altering the NICE value to a higher priority enabled a more responsive system in almost all cases.
Observed script execution times were highest when applying CPU and memory load stress, particularly
during native execution. The average time taken to complete a single script execution was 568ms under
memory stress load and 509ms under CPU stress load. The high priority script execution exhibited the
lowest execution times across all individual stress load tests, as expected, with a combined total script
execution average of 100ms. The container execution performed well under all stress load conditions,
especially under CPU and memory loads where the average execution time was 170ms, which was 114%
lower than the native script execution times.
The designed test script produced a CPU bound process and higher levels of CPU utilisation were observed
across all three test modes. Under the native test with no stress load, script execution was completed at
155
around 15 seconds with almost 100% %user CPU utilisation and very little %system activity. During the CPU
load stress tests, similarly high levels of CPU utilisation were exhibited. Complete script execution time
extended to approximately 60 seconds. This fourfold increase in execution time was primarily due to the
script process competing with other stress loads placed on it. The memory test showed similarly high levels
of %user CPU utilisation and periods of high levels of %system where the memory load test was invoking
additional kernel activity.
The CPU experienced higher levels of CPU utilisation when the system was placed under memory stress
load. The memory stress load tests invoke several different memory-related system tasks, including
memory allocation and I/O operations. Time spent in the kernel should be kept to a minimum, ensuring
overall system response and efficiency. Altering the NICE value of a task can lead to CPU overload or an
unresponsive system. Manually setting a NICE value greater than zero to an individual process or task
increases its priority resulting in more CPU time and resources allocated to that particular task. In a
multitasking system where, multiple processes and tasks are competing for CPU time, tasks with a higher
priority can cause system bottlenecks for lower priority tasks and processes, whilst they wait for higher
priority tasks to complete. When the CPU is spending excessive amounts of time and resource servicing
%system processes and tasks, it has less availability overall to dedicate resources to %user processes and
tasks where userspace programs are running.
Containers do not suffer from the same slow response time issues experienced when system stress occurs
at the native level. Containers utilise a Linux kernel feature known as control groups (cgroups). This Linux
OS feature specifies how the kernel allocates resources to groups of processes. Linux based containers rely
on cgroups to share hardware resources as well as limiting an application to a set of resources or dedicating
additional resources to a particular container when required. When creating a container, cgroups set the
necessary level of hardware resources. Focusing on CPU load average, script execution times and CPU
utilisation, the container test performance was closely matched to the native high priority test in almost all
respects without manually elevating the process priority. In terms of consolidation, container performance
is slightly affected by excessive I/O operations. Nevertheless, combinations of CPU and memory-bound

156
processes do not overly affect system saturation, utilisation or program execution times, which are
comparable in speed to high priority processes.
157
Chapter 7 Software Update Evaluation
Objectives
• Provide an overview of current automotive software update procedures.
• Investigate the benefits of container-based automotive software updates.
• An overview of container images concerning automotive software updates.
• Define the types of container-based automotive software updates.
• Test checkpoint and restore procedures on a container.
158
7.1 Introduction
Whilst more vehicle subsystems have become digitised, there is an ever-increasing risk of software bugs,
errors and vulnerabilities, which must be rectified promptly once discovered. Chapter 3 has identified that
one of the principal mechanisms in resolving an automotive software failure is the “return or recall”.
However, this has its own limitations including cost to the manufacturer and inconvenience to the
consumer. In order to address these limitations, a new approach to automotive software updates is
required. One possibility exists within smart devices and computing technology, which are updated
periodically to provide software bug fixes and the latest security patches, and add new software
functionality or install newer versions. This is enabled through the device’s own connectivity hardware. The
benefits of this connectivity technology have been recognised by the automotive industry and in recent
years has become increasingly more popular within new vehicle models. Furthermore, connectivity
technology can play a crucial role in enabling automotive OtA software updates, which can address the
identified issues concerning the return/recall method currently employed throughout the industry.
According to a comparative study conducted by Halder et al. (2020), most car manufacturers only support
OtA software updates for GPS maps, navigation and infotainment systems (see also Placho et al., 2020).
However, Tesla has embraced OtA software updates and has extended its use to many aspects of the
vehicle’s ADAS and power management systems. Nevertheless, there are no vehicle manufacturers
currently addressing OtA software updates outside of these limited systems, i.e. GPS maps, infotainment,
ADAS and power management.
An automotive E/E architecture which incorporates container-based ECUs can offer many benefits
concerning standard ECU software updating, including application and OS software. The confines of
optimised ECU hardware architectures do not apply to container-based ECUs. The research presented in
this chapter investigates how software updates can be applied to a container-based ECU.

159
7.2 Current Automotive Software Re-flashing Techniques
The current practice of updating automotive ECUs involves software flashing or re-flashing techniques
(Onuma et al., 2018). The operating system and functional software of an ECU are generally held within
embedded FLASH memory. Depending upon the model, modern motor vehicles can have hundreds of
megabytes of FLASH memory spread across their ECUs. Under the return or recall mechanism, flashing or
re-flashing software is often completed by authorised personnel requiring the vehicle to be offline.
According to a whitepaper by NXP (2013), new or updated software content must conform to several
requirements when being applied to a target ECU:
• Safety – new software cannot be the cause of system failure. There needs to be some mechanism
whereby software can be rolled back to a last known good state.
• Security – the integrity of any new software must be verified, ensuring a third party has not
intercepted and altered the source code. Non-approved entities must not be able to perform a
software update on the target system.
• Transparency – regardless of how new software updates are conducted, they must not impact the
driver’s intended use of the vehicle.
New software is delivered to the target ECU in one of two formats - full binary and diff/Delta file (Mckenna,
2016).
7.2.1 Full binary re-flashing
ECU firmware is updated in its entirety through a process known as re-flashing, which conforms to ISO
14229-3/UDS and ISO 15765-2/DoCAN. As part of this process, the entire ECU software image is replaced
with a newer version and the time taken to update the software can often take hours to complete. This in
part depends on the size of the software update, the destination memory, protocol and whether encryption
is used (Howden, et al., 2020). Data compression algorithms offer one approach in reducing high re-flash
times with varying advantages and disadvantages (Suzuki, et al., 2019). The previously installed software
has no relevance on the new update, which can be beneficial if the previous version requires replacing in

160
its entirety rather than upgrading specific parts. The size of the image binary impacts the time taken to
transmit and download the file. The new updated software image must also be stored within the target
ECU, which requires redundant storage, potentially of an undetermined fixed amount in order to
accommodate any future software update (Mugarza et al., 2018).
7.2.2 Difference/delta file
Diff/delta file flashing is a concept that compares the base file with the new version file and creates a delta
or difference file, thus reducing the size of the update (Stegar et al., 2017). Compared with a full binary
software update, a diff/delta software update is approximately <10% of the full binary file size. Diff/delta
files are much quicker to transmit, decreasing overall transmission time by up to 90% (Bogdan et al., 2016).
This method requires considerably less redundant storage but it is reliant on the previous ECU software
version. A patching algorithm block erases the old data and writes new data in its place.
7.3 Benefits of Container-Based Automotive Software Updates
Containers offer many benefits to current and future automotive E/E architectures. For example, they
provide a standardised environment that can facilitate automotive embedded software updates and their
hardware is not fixed to a particular version or type of software. Consolidation is a crucial benefit of
container ECUs where multiple containers operate on larger, more resource capable embedded hardware
platforms. Containers are constructed from images based on a layered architecture. A container image
incorporates one or more layers which define all required software, libraries and binaries, and configuration
settings for any subsequent containers created from that image. Therefore, a container-based ECU must
also conform to the three principles of safety, security and transparency, as mentioned previously:
• Safety – new software containers can be rolled back to the ‘last known good’ image and known
safe containers can be reinstated.
• Security – new container images can be either pulled from an authorised repository to the target
vehicle or pushed by the manufacturer. All image layers utilise, for example, SHA256 encryption
and the checksum's validation before the image goes ‘live’.
161
• Transparency – new container images, once validated, can be checked within a sandbox area of
the vehicle’s automotive E/E architecture before deploying live containers, ensuring the updated
system's safe and continued service.
7.4 Types of Container-Based Software Updates
Current software upgrades and bug fixes require the car to be shut down whilst being updated and
subsequently brought back online when complete. Looking towards the automotive industry's future, OtA
is a software update mechanism that relays software from source to destination, utilising vehicle
connectivity. OtA updates can address customer disruption and the intrinsic delay between the availability
of a new software update and the deployment of that update to the target vehicle. Through vehicle
connectivity, new automotive software updates can be pushed or pulled to the target vehicle at any time.
However, the current primary focus of OtA is on applying a new update when the vehicle is solely offline.
The modern motor car is a system which operates utilising many subsystems of mixed-criticality. When in
operation, there are numerous safety-critical and continual service systems that require a real-time
response. The criticality of the software-related issue often determines the required type of software
update response. This research has identified three distinct container-based automotive software update
modes: offline, online and dynamic.
7.4.1 Offline update
Offline updates are initialised when the vehicle is powered down. Once the software update verification
and initial container creation are complete, any updates applied are available when the vehicle is next
started, similar to a system proposed by Tobolski et al. (2018). This process mirrors the current return or
recall procedure but does not incur any associated disruption to the manufacturer or consumer, or recall
costs (Furst and Bechter, 2016; Onuma et al., 2018; Herberth et al., 2019). Furthermore, this type of update
mechanism can be utilised for multiple system updates, which may affect numerous subsystems across
different automotive domains or involve safety-critical systems that cannot be updated safely with the
vehicle in operation.
162
7.4.2 Online update
New software updates can be pushed or pulled to the vehicle using onboard connectivity and applied whilst
the vehicle is powered up but not in operation. The update process is initiated and a new container is
created from the new updated image. The affected subsystem is then temporarily shut down before the
new container's initialisation with the updated software. This update method could be applied to any
automotive system but only where a system's required initialisation does not incur long time delays. For
example, small and frequent periodic updates and software security patches would be ideal candidate
systems and functions.
7.4.3 Dynamic update
DSU do not require the system to be taken offline (Seifzadeh et al., 2013). As such, they provide an essential
service where systems must offer a 100% uptime (Neamtiu et al., 2006; Hayden et al., 2012). Taking a
system offline to fix bugs, improve system performance or extend functionality causes delay and disruption.
Driverless vehicular technology promises non-stop long-haul trucks and round-the-clock lift-hailing rides
and therefore the window to administer software updates become shorter and downtime is a significant
disruption (Hörl, 2017; Shankwitz, 2017; Simpson et al., 2019). For the purposes of this research, a DSU
refers to a vehicle sub-system that can be updated and made available once completed, without the vehicle
requiring shut down and whilst it is still in a mode of operation. This type of automotive update is suited
ideally to any automotive function which is not involved in vehicle operation or safety. Potential systems
could include security software updates and patches, any software relating to autonomous driving
functions which are not in operation and passenger-related systems relating to comfort, heating and
occupant-vehicle interaction.
7.5 The Case for Dynamic Software Updates
DSU should be reserved for those critical instances where urgency in rectifying a software-related issue
must be conducted as soon as possible to maintain the integrity of the vehicle and safety of the occupants
(Gasper and Markelj, 2018). A scenario that could benefit from a DSU may involve an automotive software
163
vulnerability, which if compromised, could enable access to vehicle safety-critical subsystems including
engine, braking and steering, as seen in 2015 by Miller and Valasaek (2015). This type of attack is of
particular concern in vehicles capable of autonomous driving functions and with connectivity features. It
can be executed remotely and potentially affect an entire fleet of vehicles (ENISA, 2019).
To be updated dynamically, automotive subsystem updates should not interfere with the primary system
that would cause it to cease operation or place it in an unsafe or error state. To accomplish the DSU goal,
Hicks and Nettles (2005) have defined several criteria:
• Flexibility - any part of the vehicle subsystem should be updateable without requiring downtime.
• Robustness – errors should be minimised.
• Ease of use - the update procedure should be easy to use.
• Minimal overhead - a software update should have little impact on the overall system and
subsystem performance.
7.6 Current Automotive DSU Techniques
Although there is an array of literature on DSU techniques (Hayden et al., 2012; Seifzadeh et al., 2013;
Mugarza et al., 2018), there is little regarding its use within an automotive E/E architecture context with
the notable exception of DySCAS (Richard et al., 2007). The DySCAS project was a collaborative venture
between automotive manufacturers and suppliers, which ran between 2006 and 2008, with the aim of
provisioning a new automotive architecture. This new architecture promoted a dynamically reconfigurable
automotive control system when new hardware and software functionality or closed system re-
configuration was introduced (Richard et al., 2007). Whilst not a true DSU system, it added considerable
complexity to the automotive E/E architecture (Axelsson and Kobetski, 2013).
A true DSU mechanism is achieved through either a system or a software-based approach:
• A system approach achieves DSU through redundant hardware. The primary system operates until
an upgrade is required, at which point the secondary or redundant system is started. The primary
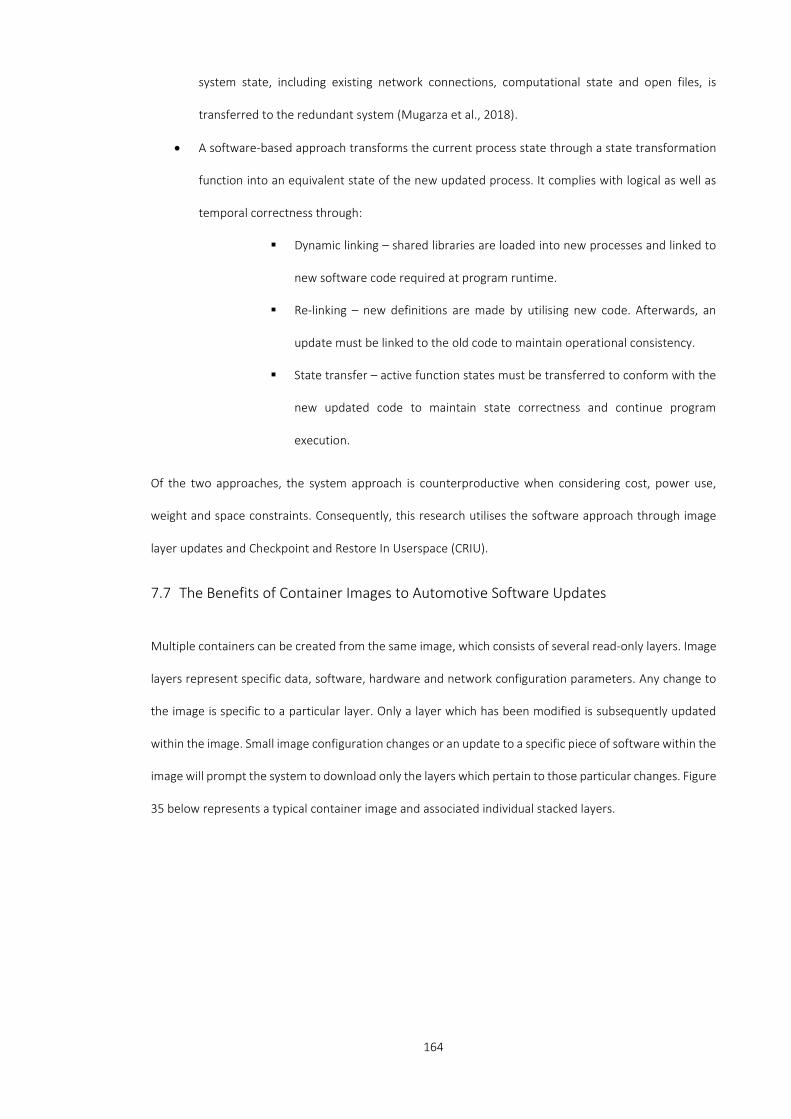
164
system state, including existing network connections, computational state and open files, is
transferred to the redundant system (Mugarza et al., 2018).
• A software-based approach transforms the current process state through a state transformation
function into an equivalent state of the new updated process. It complies with logical as well as
temporal correctness through:
Dynamic linking – shared libraries are loaded into new processes and linked to
new software code required at program runtime.
Re-linking – new definitions are made by utilising new code. Afterwards, an
update must be linked to the old code to maintain operational consistency.
State transfer – active function states must be transferred to conform with the
new updated code to maintain state correctness and continue program
execution.
Of the two approaches, the system approach is counterproductive when considering cost, power use,
weight and space constraints. Consequently, this research utilises the software approach through image
layer updates and Checkpoint and Restore In Userspace (CRIU).
7.7 The Benefits of Container Images to Automotive Software Updates
Multiple containers can be created from the same image, which consists of several read-only layers. Image
layers represent specific data, software, hardware and network configuration parameters. Any change to
the image is specific to a particular layer. Only a layer which has been modified is subsequently updated
within the image. Small image configuration changes or an update to a specific piece of software within the
image will prompt the system to download only the layers which pertain to those particular changes. Figure
35 below represents a typical container image and associated individual stacked layers.
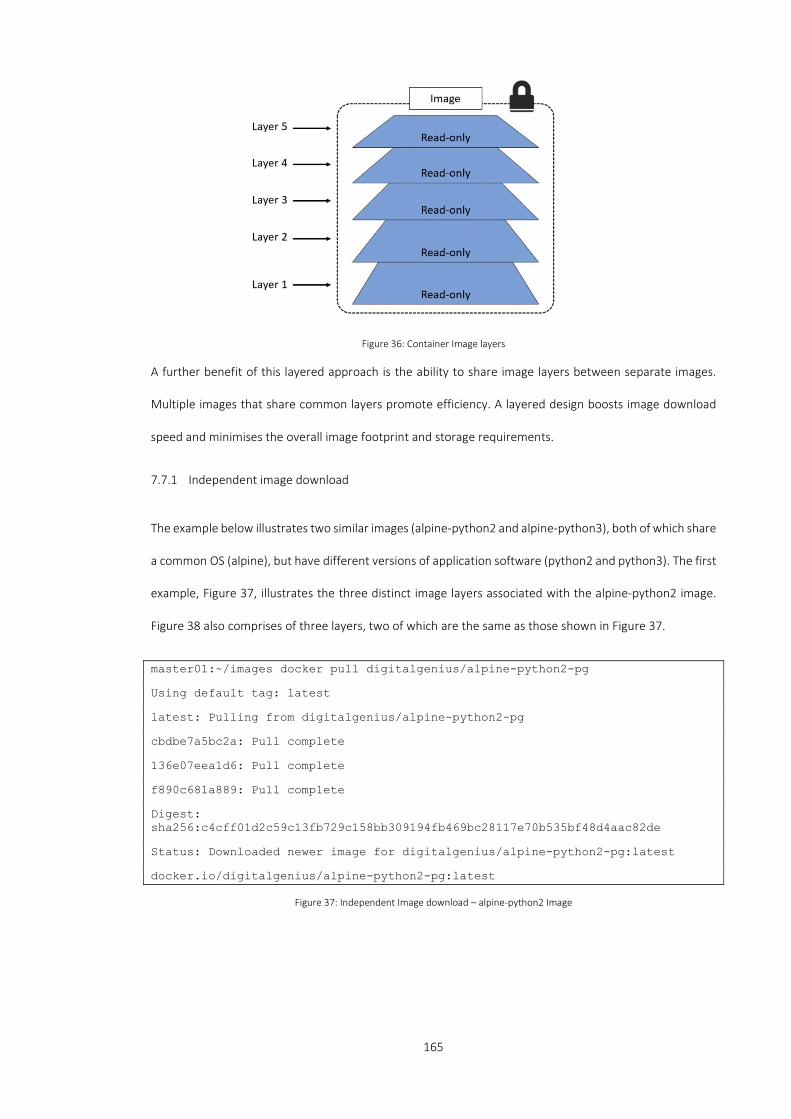
165
Figure 36: Container Image layers
A further benefit of this layered approach is the ability to share image layers between separate images.
Multiple images that share common layers promote efficiency. A layered design boosts image download
speed and minimises the overall image footprint and storage requirements.
7.7.1 Independent image download
The example below illustrates two similar images (alpine-python2 and alpine-python3), both of which share
a common OS (alpine), but have different versions of application software (python2 and python3). The first
example, Figure 37, illustrates the three distinct image layers associated with the alpine-python2 image.
Figure 38 also comprises of three layers, two of which are the same as those shown in Figure 37.
master01:~/images docker pull digitalgenius/alpine-python2-pg
Using default tag: latest
latest: Pulling from digitalgenius/alpine-python2-pg
cbdbe7a5bc2a: Pull complete
136e07eea1d6: Pull complete
f890c681a889: Pull complete
Digest: sha256:c4cff01d2c59c13fb729c158bb309194fb469bc28117e70b535bf48d4aac82de
Status: Downloaded newer image for digitalgenius/alpine-python2-pg:latest
docker.io/digitalgenius/alpine-python2-pg:latest
Figure 37: Independent Image download – alpine-python2 Image
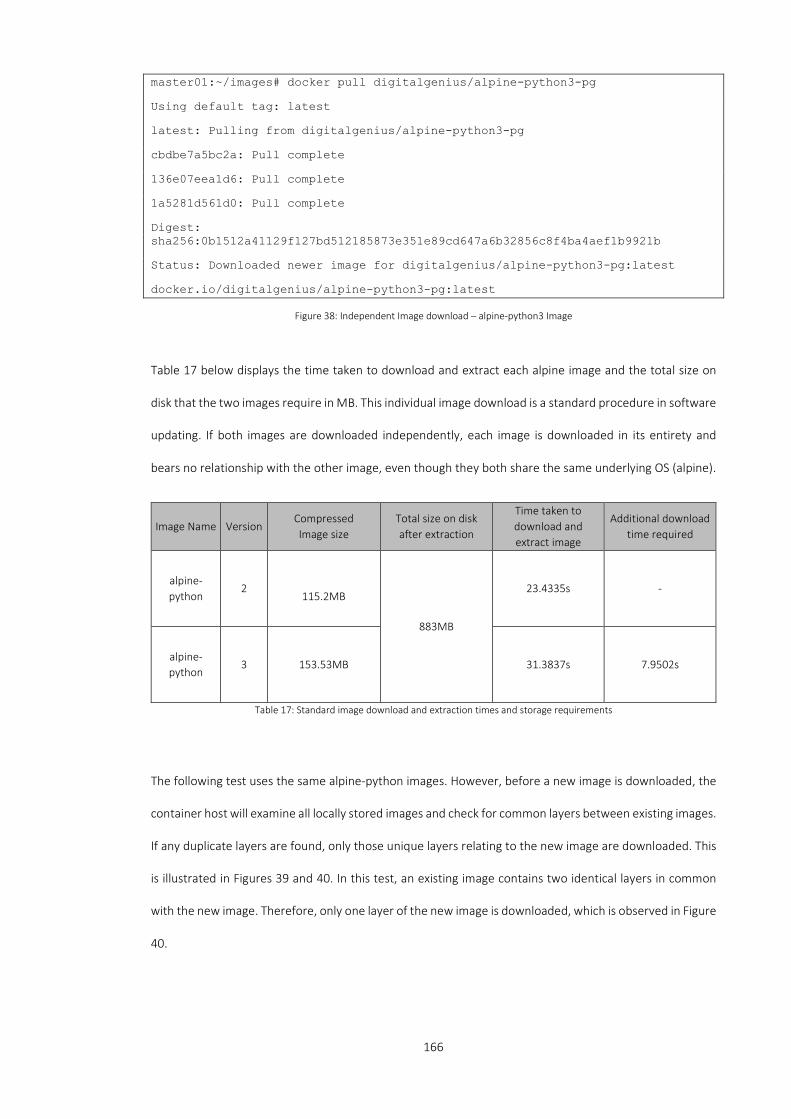
166
master01:~/images# docker pull digitalgenius/alpine-python3-pg
Using default tag: latest
latest: Pulling from digitalgenius/alpine-python3-pg
cbdbe7a5bc2a: Pull complete
136e07eea1d6: Pull complete
1a5281d561d0: Pull complete
Digest: sha256:0b1512a41129f127bd512185873e351e89cd647a6b32856c8f4ba4aef1b9921b
Status: Downloaded newer image for digitalgenius/alpine-python3-pg:latest
docker.io/digitalgenius/alpine-python3-pg:latest
Figure 38: Independent Image download – alpine-python3 Image
Table 17 below displays the time taken to download and extract each alpine image and the total size on
disk that the two images require in MB. This individual image download is a standard procedure in software
updating. If both images are downloaded independently, each image is downloaded in its entirety and
bears no relationship with the other image, even though they both share the same underlying OS (alpine).
Image Name Version Compressed Image size
Total size on disk after extraction
Time taken to download and extract image
Additional download time required
alpine-python
2
115.2MB
883MB
23.4335s -
alpine-python
3 153.53MB 31.3837s 7.9502s
Table 17: Standard image download and extraction times and storage requirements
The following test uses the same alpine-python images. However, before a new image is downloaded, the
container host will examine all locally stored images and check for common layers between existing images.
If any duplicate layers are found, only those unique layers relating to the new image are downloaded. This
is illustrated in Figures 39 and 40. In this test, an existing image contains two identical layers in common
with the new image. Therefore, only one layer of the new image is downloaded, which is observed in Figure
40.
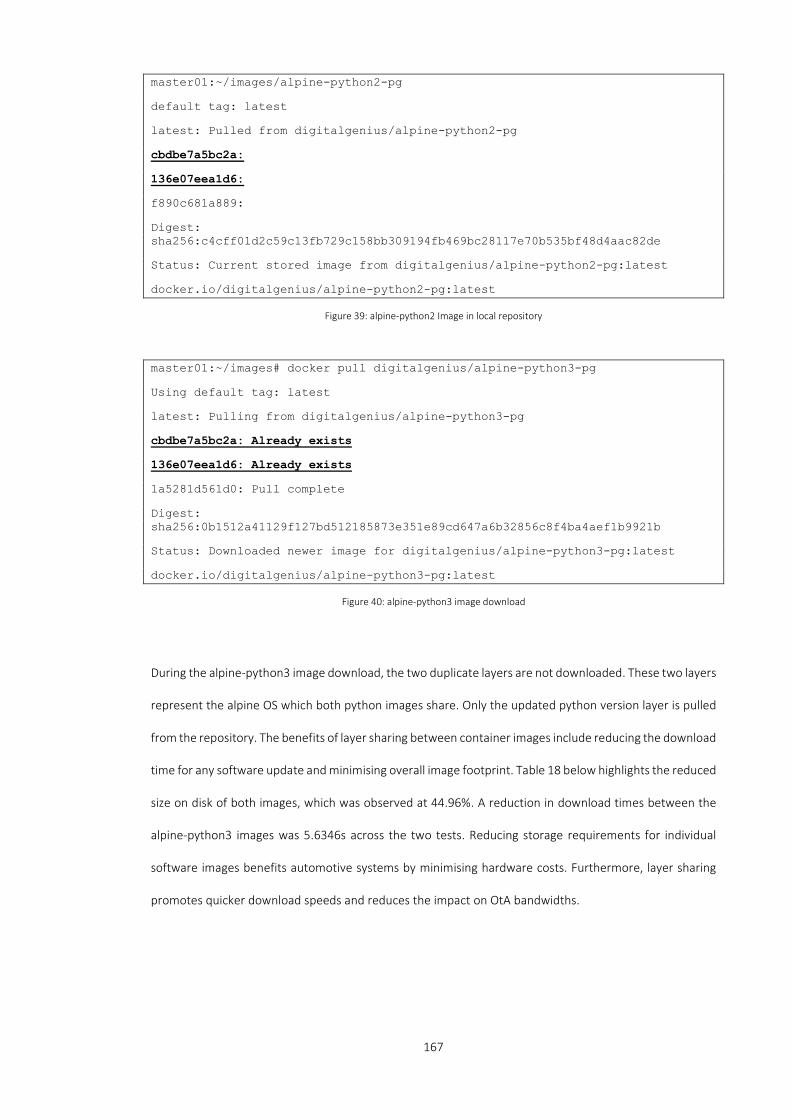
167
master01:~/images/alpine-python2-pg
default tag: latest
latest: Pulled from digitalgenius/alpine-python2-pg
cbdbe7a5bc2a:
136e07eea1d6:
f890c681a889:
Digest: sha256:c4cff01d2c59c13fb729c158bb309194fb469bc28117e70b535bf48d4aac82de
Status: Current stored image from digitalgenius/alpine-python2-pg:latest
docker.io/digitalgenius/alpine-python2-pg:latest
Figure 39: alpine-python2 Image in local repository
master01:~/images# docker pull digitalgenius/alpine-python3-pg
Using default tag: latest
latest: Pulling from digitalgenius/alpine-python3-pg
cbdbe7a5bc2a: Already exists
136e07eea1d6: Already exists
1a5281d561d0: Pull complete
Digest: sha256:0b1512a41129f127bd512185873e351e89cd647a6b32856c8f4ba4aef1b9921b
Status: Downloaded newer image for digitalgenius/alpine-python3-pg:latest
docker.io/digitalgenius/alpine-python3-pg:latest
Figure 40: alpine-python3 image download
During the alpine-python3 image download, the two duplicate layers are not downloaded. These two layers
represent the alpine OS which both python images share. Only the updated python version layer is pulled
from the repository. The benefits of layer sharing between container images include reducing the download
time for any software update and minimising overall image footprint. Table 18 below highlights the reduced
size on disk of both images, which was observed at 44.96%. A reduction in download times between the
alpine-python3 images was 5.6346s across the two tests. Reducing storage requirements for individual
software images benefits automotive systems by minimising hardware costs. Furthermore, layer sharing
promotes quicker download speeds and reduces the impact on OtA bandwidths.

168
Image Name Version Layer Layer Size Size on Disk after
download and extraction
Time Taken to Download
and Extract Image
Additional Download Time
Required
alpine-python 2
cbdbe7a5bc2a 2.81MB
486MB 23.4335s - 136e07eea1d6 38.92MB
f890c681a889 73.47MB
alpine-python 3 1a5281d561d0 111.80MB 25.7491s 5.6346s
Table 18: Shared image layers with reduced size on disk and download times
7.8 Container Checkpoint and Restore
CRIU is an experimental feature of the container software used within this research. It can freeze a running
container at a specific point in time and save its current state in a series of files to disk. The ‘freeze’ files
are used to restore the container to the exact point it was initially frozen. In Table 19 below, each image
was pulled from a centralised online repository. The download/pull times reflect the speed of the local
network and Internet download speed.
Image Version Size Image Pull Container Start Checkpoint Time Restart Container
Ubuntu 14.04 197MB 17.7051s 1.2662s 1.9744s 1.6811s
Ubuntu 16.04 131MB 12.9395s 1.2401s 1.9647s 1.6444s
Ubuntu 18.04 63.3MB 8.7451s 0.9692s 1.8933s 1.3225s
Ubuntu 20:04 72.9MB 8.9199s 1.1970s 1.9202s 1.3336s
Table 19: CRIU test cases on several Ubuntu OS versions
The table shows that the difference between the smallest (18.04 version) and largest (14.04 version) sized
images was 133.7MB, representing an increase of 211.21%. However, across all of the images, the time
taken to start the container was within a range of 0.2657s.
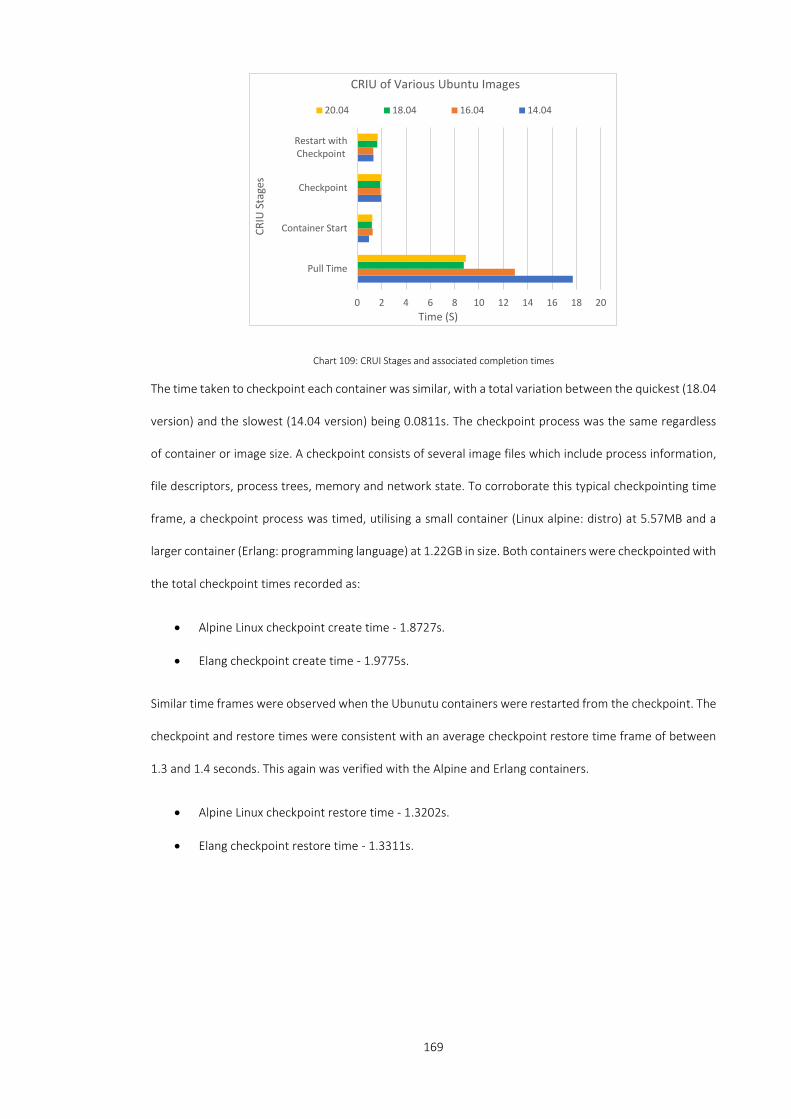
169
Chart 109: CRUI Stages and associated completion times
The time taken to checkpoint each container was similar, with a total variation between the quickest (18.04
version) and the slowest (14.04 version) being 0.0811s. The checkpoint process was the same regardless
of container or image size. A checkpoint consists of several image files which include process information,
file descriptors, process trees, memory and network state. To corroborate this typical checkpointing time
frame, a checkpoint process was timed, utilising a small container (Linux alpine: distro) at 5.57MB and a
larger container (Erlang: programming language) at 1.22GB in size. Both containers were checkpointed with
the total checkpoint times recorded as:
• Alpine Linux checkpoint create time - 1.8727s.
• Elang checkpoint create time - 1.9775s.
Similar time frames were observed when the Ubunutu containers were restarted from the checkpoint. The
checkpoint and restore times were consistent with an average checkpoint restore time frame of between
1.3 and 1.4 seconds. This again was verified with the Alpine and Erlang containers.
• Alpine Linux checkpoint restore time - 1.3202s.
• Elang checkpoint restore time - 1.3311s.
0 2 4 6 8 10 12 14 16 18 20
Pull Time
Container Start
Checkpoint
Restart withCheckpoint
Time (S)
CRIU
Sta
ges
CRIU of Various Ubuntu Images
20.04 18.04 16.04 14.04

170
7.9 Chapter Summary
With each new vehicle model, more and more software are included, adding to the burden of addressing
software-related problems. Automotive software update practices have followed the same vehicle recall
procedure as when a physical component fails. However, the recall process incurs consumer
inconvenience, system downtime, high monetary costs for the manufacturer and potentially reduced brand
reputation and customer loyalty. The motor industry is attempting to address the limited available options
regarding automotive software updates by utilising new automotive enabled connectivity.
To test the benefits of container-based software updating, several tests were conducted. Where new
software was required during a test, the software was pulled from a central software repository hosted on
the Internet. It is envisaged that any future software download would be conducted through automotive
connectivity utilising a static or mobile-based communication network and the Internet, or a central
repository which is either hosted with the vehicle manufacturer or third-party supplier.
The first test examined the benefits surrounding software update size and speed of download. To do this,
two images (alpine-python2 and alpine-python3) were chosen, both of which shared a common OS,
however, the application software within each image comprised of different versions. The test looked at
the specific download and extract times for each image when downloaded independently. The total
download and extract time for the two images was 54.8172s. The overall size on disk for the two images
was recorded at 883MB. These results provide a baseline for a standard software version upgrade, which
is similar to full binary re-flashing techniques. The second test used the same two images but utilised image
layer sharing provided by the container software. There were similarities between the two images as they
were both built using the same OS (alpine). As such, because both images shared two of the three image
layers, the OS layers were not downloaded. This reduced the overall download time by 5.6346s, which was
a 10.28% reduction in total download and extract time. Furthermore, when using container layer sharing,
the overall storage requirement was reduced considerably by 397MB or 44.96% when compared with the
first test.

171
The third test utilised a specific feature available to containers known as CRIU. Four versions (14.04, 16.04,
18.04 and 20.04) of the same Ubuntu OS were used, with each image ranging in size from 63-197MB. A
container was created from each of these images. Although there was an increase of 211.21% in size
between the largest and smallest image, each container's start time was within a range of 0.2657s.
Regardless of image size, similar times were also observed during the checkpoint stage (a range of 0.0811s
was observed) and the container restart (a range of 0.3586s was recorded). Regardless of image size, the
average container start, checkpoint and restart times were 1.1681s, 1.9381s and 1.4954s, respectively. This
test demonstrates that a container-based ECU, utilising CRIU, experiences an ECU function downtime of on
average 1.5s, which is incompatible with real-time deadlines but is a technique that could apply to an online
software update mode. It is also a potential technique that could be used in a DSU mode to update systems
that are not responsible for safety-critical or real-time functions.
Container virtualisation is an ideal platform to facilitate OtA software updates. This research demonstrates
that new software versions reflect changes within individual image layers, which result in shorter download
times as well as minimising storage requirements. CRIU, although currently an experimental feature, has
great promise in facilitating DSU where container downtime is approximately 1.5s. Container-based ECUs
and OtA software update mechanisms can provide a constant level of updated software and patches over
the vehicle's lifetime, installed independently of vehicle location. New software can be applied to the target
system as and when required. The vehicle can remain secure through revised security software and patches
when new vulnerabilities are discovered rather than waiting for it to be returned or the problem resolved
during periodic maintenance intervals. This chapter has demonstrated that container-based software
updates can be frequent and incremental. Consequently, the time taken to download and apply a
configuration change or new software version is minimal compared with traditional full binary or delta ECU
flashing.
172
Chapter 8 Conclusion
8.1 Research Summary
This research highlights several issues currently facing the automotive industry, many of which have arisen
with system digitisation, and more recently, the introduction of ADAS and autonomous driving functions.
Issues include increased weight, complexity and dependency on software, among others. Historically,
vehicle manufacturers have generally responded to these problems by increasing the number of ECUs. This
has inevitably led to larger amounts of automotive software and exacerbated problems associated with
software-intensive systems, including bugs, errors and vulnerabilities within the code. However,
automotive software is now regarded as a primary vehicle component, of similar importance to the engine
when considering basic vehicle functionality. As such, the automotive industry has responded by proposing
several different technologies to address the increasing number of ECUs and problems associated with this,
such as SoC, FPGA and automotive domain controllers. Nevertheless, many of these potential technologies
still rely on a hardware and software-based embedded device to provide automotive functionality. The
research presented in this thesis moves away from these current practices and identifies many similarities
between the datacentre and the automotive E/E architecture, arguing that virtualisation technologies,
which have provided many benefits to the datacentre, can be replicated within an automotive context.
Specifically, container virtualisation offers many advantages to the automotive E/E architecture. Notably,
containerisation can promote ECU consolidation and in turn, reduce overall costs as well as enhance vehicle
efficiency. It can also provide a robust mechanism to facilitate future software updates throughout the
lifetime of a vehicle.

173
8.2 Key Findings
In order to demonstrate that containers are an effective means of supporting automotive software, a
detailed study focusing on selected ECU’s CPU and memory saturation and utilisation was conducted,
utilising a custom research methodology. To test extensively container virtualisation within an automotive
context, a standard automotive function was chosen. This automotive function was modelled on several
small computing platforms with a similar hardware architecture to an automotive ECU. A number of
peripheral input and output devices were incorporated as part of this automotive testbed. The test system
was used as a hardware platform to investigate the specific resources required to support the automotive
function when executing in two distinct test modes (native and container). The first test mode followed the
standard practice of software running on dedicated hardware. In contrast, the second test mode
encapsulated the software within a container and evaluated the additional resources required to support
a container-based automotive function.
The results obtained from the CPU saturation tests demonstrate that there is a minimal increase in the
number of waiting, running and additional processes invoked when executing in container mode. This
increase is negligible and proves that the system is not over saturated. Whilst small spikes are observed
when ECU functional software is initially started, the total additional CPU load in container execution is
observed at only 6.73% across all triplets and ECUs. Similarly, the results obtained from the CPU utilisation
tests across both native and container test modes reveal little variance.
CPU resources are scheduled between all active processes on the system. In terms of memory, resources
are allocated per virtualisation instance, when that virtualisation instance starts. The more virtual instances
that are in execution, the more memory that is required. The memory requirements of container operation
are an important resource to observe because they determine how much additional memory is required
to support each container-based function. The results obtained reveal that the average increase across all
ECUs in required memory is approximately 13.07%. This is not excessive and equates in this series of tests
to an overall average of 275kb of memory, which is approximately 68kb per container.

174
One aspect of this research concerns ECU consolidation, where container virtualisation is a significant
facilitator. A number of load stress tests were conducted to understand the effects on resource saturation,
utilisation and program performance. With CPU, memory and I/O stress loads applied individually and
collectively, the container outperforms the native execution in almost all respects. The only way in which
native performance can be increased to match container performance is by altering the priority of the
process to the highest level. The results demonstrate that container operation, when excessive I/O load is
applied, has a slightly detrimental effect on CPU saturation levels when compared with native execution.
However, this is only observed during the ldavg-1 and 5 loads. Long term I/O load observed across the
ldavg-15, shows that native and container CPU saturation are similar. This research highlights that program
performance is impacted negatively to a greater degree when memory-bound processes are consolidated
than when CPU bound processes are consolidated, however, this difference is minimal.
Finally, this research investigates the benefits of software update practices for container-based ECUs
through a series of tests. It identifies three modes of software update relevant to a container-based ECU.
The tests highlight the benefits of container image layers and how this particular architecture can support
incremental software updates, as well as minimising individual container image footprints. The first series
of tests show that any duplicated layers within a new image are not downloaded but are reused from the
original stored image. They also demonstrate that under the same test conditions, where two similar
images share the same OS layers, layer duplication reduces overall download time by approximately 10%,
as well as saving almost 45% of additional storage space.
The second series of tests investigates how CRIU can be applied to container software updates. A single
image with different versions and of varying sizes were used to understand how quickly these containers
can be checkpointed and restored back to operation. CRIU enables running containers to store their current
state in a series of files that can be restored at a later stage. This technology can facilitate a rapid software
update procedure where the current state of a particular system or function must be preserved and then
restored into a new or updated version of that software. The results of this series of tests show that
regardless of container size, the checkpoint and restore times are very similar. These tests also highlight
that the system downtime experienced during the CRIU process is approximately 1.5 seconds. Despite this

175
relatively short downtime, this time frame does not fall within real-time deadlines and safety-critical time
frames. However, it is promising for any other system that does not require real-time or safety-critical
operation.
In summary, this research demonstrates that containers do not have any significant detrimental impact on
CPU memory and resources when running automotive software within a container. It also shows that either
CPU bound or memory bound processes, or a combination of the two, are suited ideally for ECU
consolidation when utilising container-based ECUs. Lastly, container virtualisation offers several benefits
for automotive software updates -layer duplication is a key technique for reducing the time to download
new updates, for minimising new software storage requirements and for facilitating OtA software updates
throughout the vehicle’s lifetime.
8.3 The Relevance of this Research
The findings from this research are of significance for both the automotive industry and industries that
utilise embedded systems, more broadly. Firstly, the research demonstrates that multiple ECU functionality
can be incorporated into individual containers on a single hardware platform, thus consolidating individual
bespoke embedded hardware and associated software. This results in a reduction of both physical
hardware and overall weight, which has a direct positive impact on the fuel economy and operational range
of the vehicle. Furthermore, containers offer several significant cost-savings to the automotive industry.
For example, savings can be achieved through a reduction in hardware development costs – this could have
a substantial impact when considering that costs related to bespoke ECU hardware development have
increased by 75% since 2000 and are expected to double by 2030. Savings can also be realised through a
reduction in individual ECU hardware components. In addition, by reducing costs for the manufacturer,
savings can be passed onto the consumer.
Secondly, the research shows that container-based ECUs can promote automotive software updates,
particularly OtA software updates in conjunction with vehicle connectivity. This can reduce significantly the
need to recall vehicles when encountering a software-related problem because the new software can be
deployed to a target vehicle remotely, as and when required. Notably, by utilising containers in this way,

176
overall vehicle security can be maintained and any potential software vulnerabilities can be addressed. This
has significant implications for the automotive industry. The number of vehicles recalls in the U.S.
associated with a software fault has risen dramatically by 1400% since 2010. Vehicle recalls are highly
disruptive to the consumer, expensive for the manufacturer and can, in some cases, reduce brand
reputation. It is estimated that resolving a software-related error post-sale is 30 times more expensive than
compared with fixing the same issue during the early stages of the SDLC. Compounding this, the current
automotive software update practices and procedures are not keeping pace with the rapid increase in the
number of lines of software code. The research findings demonstrate that these problems may be
overcome by utilising container-based ECUs, whereby errors, bugs and vulnerabilities can not only be
addressed promptly and effectively, but also throughout the vehicle’s lifetime. Additionally, container-
based OtA software updates can significantly reduce disruption to consumers. Consumers are also able to
incorporate additional or new functionality into a container-based ECU, which can generate additional
revenue for the manufacturer in terms of their aftermarket sales.
Lastly, the findings from this research have relevance for non-automotive industries that utilise embedded
systems. Although this research's primary focus is the automotive E/E architecture, the technologies and
techniques researched can be applied to a number of different applications. For example, any functionality
which requires embedded systems could benefit from container virtualisation. Virtualisation technology is
currently employed in Industrial automation and manufacturing, especially in Industry 4.0. Container
virtualisation can aid embedded technology within industrial machine controlling and monitoring. They
can be deployed within industrial manufacturing systems and supply-chain process to promote efficiency.
Production lines that require minimal downtime could benefit from the container-based software update
mechanisms presented within this research. Containers can hugely benefit the Internet of Things (IoT)
devices which are typically small, low-cost single-board devices where connectivity and functionality have
to be finely balanced with power consumption.

177
8.4 Future Work
This research focuses on the specific resources required to support an automotive function utilising
container within the automotive E/E architecture. There are opportunities to utilise this new research
methodology, and this section explores the following areas the current research which can be taken
forward.
8.4.1 Optimised container and OS configurations
This research uses standard versions of ECU OS as well as container software. These ensure the
functionality of the container software as well as enabling the installation of various software monitoring
tools. Both native and container test modes within this research utilise the same hardware and software.
To advance this research, the generic hardware and software could be developed from a number of
potential optimised OS and container platforms, which would enable a more optimised and efficient
container-based ECU specifically through kernel scheduling algorithms. This could potentially reduce
overall resource use, further improving and enhancing ECU consolidation by accommodating more
containers per hardware platform.
8.4.2 Automotive security and container-based ECUs
Various aspects of security are investigated briefly as part of this research. A more detailed study
concerning the security of container-based ECUs within the automotive E/E architecture is required.
Container virtualisation is not as secure as full system virtualisation because isolation is provided within the
OS kernel rather than through separate virtual machines. However, because containers have a much
smaller trusted computer base, they would benefit from further investigation. There are also opportunities
to investigate further the security aspects of OtA software updates, particularly regarding the accuracy of
received updates as well as verification and validation of any potential new software update.
178
8.4.3 Container-based ECUs and associated power consumption
Increased ECU power consumption within the automotive E/E architecture can increase fuel consumption
and reduce both vehicle performance and operational range. The hardware selected for this research had
limited functionality to monitor and analyse overall power consumption. However, the hardware selected
had similar power consumption rates to larger ECU systems found within the automotive E/E architecture.
Future research could assess the effect on overall power consumption by consolidating ECUs into fewer
container-based ECU platforms. This may also provide potential benefits for extending the operational
range of electric vehicles.
8.4.4 Networking
ECU consolidation reduces the requirement for inter-ECU communication via a physical in-vehicle network.
Whilst this was not a focus of the current research, it has the potential to reduce the requirement for
physical network media, which can reduce associated hardware, weight and complexity. Future studies
could explore and evaluate data transfer rates and associated benefits of container-based virtual networks.
8.4.5 Software updates, CRIU and real-time
Notably, this research provides a standard mechanism of automotive software update utilising container-
based ECUs. Across several tests, this method of software update was corroborated. Three modes of
software update were proposed within this research, which utilised vehicle connectivity and OtA
techniques. Additional research regarding both of these techniques, in terms of how they interact and the
security mechanisms required to provide a safe and robust update procedure, is required. Furthermore,
studies could explore open-source CRIU software and how it could be optimised to reduce the checkpoint
and restore procedure from seconds to milliseconds. This would then fall within real-time deadlines,
providing a true DSU technique.

179
9 References
Abinesh, S., Kathiresh, M. and Neelavenik, R., 2014, July. Analysis of multi-core architecture for
automotive applications. In 2014 International Conference on Embedded Systems (ICES) (pp. 76-79). IEEE.
Accenture, (2016). Reach Out and Touch the Future: Accenture Connected Vehicle Services, 2016
Accenture.
Aguiar, A. and Hessel, F., 2010, June. Embedded systems' virtualization: The next challenge?.
In Proceedings of 2010 21st IEEE International Symposium on Rapid System Prototyping (pp. 1-7). IEEE.
Alam, M., 2016. The software defined car: Convergence of automotive and Internet of Things. In Wireless
World in 2050 and Beyond: A Window into the Future! (pp. 83-92). Springer, Cham.
Anthony, R., Rettberg, A., Chen, D., Jahnich, I., de Boer, G. and Ekelin, C., 2007. Towards a dynamically
reconfigurable automotive control system architecture. In Embedded System Design: Topics, Techniques
and Trends (pp. 71-84). Springer, Boston, MA.
Automotive IQ, (2017). Automotive Software Development Realiability and Safety, August 2017.
Automotive IQ.
Axelsson, J. et al., 2003. A Comparative Case Study of Distributed Network Architectures for Different
Automotive Applications, s.l.: MRTC.
Axelsson, J., Fröberg, J., Hansson, H., Norström, C., Sandström, K. and Villing, B., 2005. A Comparative
Case Study of Distributed Network Architectures for Different Automotive Applications.
Belaggoun, A. and Issarny, V., 2016, September. Towards adaptive autosar: a system-level approach.
In FISITA 2016 World Automotive Congress. 2016
Bereisa, J., 1983. Applications of microcomputers in automotive electronics. IEEE Transactions on
Industrial Electronics, (2), (pp.87-96).
Bermejo, B. and Juiz, C., 2020. Virtual machine consolidation: a systematic review of its overhead
influencing factors. The Journal of Supercomputing, 76(1), (pp.324-361).
Bermejo, B., Juiz, C. & Guerrero, C., 2019. Virtualization and consolidation: a systematic review of the past
10 years of research on energy and performance. The Journal of Supercomputing, 75(2), (pp. 808-836).
Bernstein, P.A., 1996. Middleware: a model for distributed system services. Communications of the
ACM, 39(2), pp.86-98.
180
Bogdan, D., Bogdan, R. and Popa, M., 2016, May. Delta flashing of an ECU in the automotive industry.
In 2016 IEEE 11th International Symposium on Applied Computational Intelligence and Informatics
(SACI) (pp. 503-508). IEEE.
Bo, H., Hui, D., Dafang, W. and Guifan, Z., 2010, May. Basic concepts on AUTOSAR development. In 2010
International Conference on Intelligent Computation Technology and Automation (Vol. 1, pp. 871-873).
IEEE.
Boucherat, X., 2016. Make it safe, make it profitable: the writing’s on the wall for the connected car, April
2016, Automotive World. [Online]
Available at: https://www.automotiveworld.com/articles/make-safe-make-profitable-writings-wall-
connected-car/
[Accessed 25 March 2020].
Bovet, D.P. and Cesati, M., 2005. Understanding the Linux Kernel: from I/O ports to process management.
" O'Reilly Media, Inc.".
Braun, L., Armbruster, M. and Gauterin, F., 2015, October. Trends in vehicle electric system design: State-
of-the Art Summary. In 2015 IEEE Vehicle Power and Propulsion Conference (VPPC) (pp. 1-6). IEEE.
Breitschwerdt, D., Cornet, A., Kempf, S., Michor, L. and Schmidt, M., 2017. The changing aftermarket
game–and how automotive suppliers can benefit from arising opportunities. Study McKinsey.
Breitschwerdt, D., Cornet, A., Michor, L., Müller, N. and Salmon, L., 2016. Performance and disruption–A
perspective on the automotive supplier landscape and major technology trends. Hg. v. McKinsey &
Company, zuletzt geprüft am, 7, (p.2018).
Brookhuis, K. A., de Waard, D. & Janssen, J. H., 2001. Behavioural impacts of advanced driver assistance
systems–an overview. European Journal of Transport and Infrastructure Research, (pp. 245-253).
Broy, M., 2006, May. Challenges in automotive software engineering. In Proceedings of the 28th
international conference on Software engineering (pp. 33-42).
Broy, M., Kruger, I.H., Pretschner, A. and Salzmann, C., 2007. Engineering automotive
software. Proceedings of the IEEE, 95(2), (pp.356-373).
Brunemann, G., Dollmeyer, T.A. and Mathew, J.C., Cummins Inc, 2002. System and method for
transmission of application software to an embedded vehicle computer. U.S. Patent 6,487,717.
Burkacky, O., Deichmann, J. and Stein, J.P., 2019. Automotive software and electronics 2030: mapping the
sector’s future landscape. McKinsey & Company.
Charette, R.N., 2009. This car runs on code. IEEE spectrum, 46(3), (p.3).
181
Checkoway, S., McCoy, D., Kantor, B., Anderson, D., Shacham, H., Savage, S., Koscher, K., Czeskis, A.,
Roesner, F. and Kohno, T., 2011, August. Comprehensive experimental analyses of automotive attack
surfaces. In USENIX Security Symposium (Vol. 4, pp. 447-462).
Chitkara, R., Ballhaus, W., Kliem, B., Berings, Stan. and Weiss, B. (2013). Spotlight on Automotive,
September 2013, PwC Semiconductor Report.
Chowdhury, T., Lesiuta, E., Rikley, K., Lin, C.W., Kang, E., Kim, B., Shiraishi, S., Lawford, M. and Wassyng,
A., 2018, September. Safe and secure automotive over-the-air updates. In International Conference on
Computer Safety, Reliability, and Security (pp. 172-187). Springer, Cham.
Campagna, S. and Violante, M., 2012, June. On the Evaluation of the Performance Overhead of a
Commercial Embedded Hypervisor. In The First Workshop on Manufacturable and Dependable Multicore
Architectures at Nanoscale (MEDIAN’12) (pp. 59-63).
Cook, J.A., Kolmanovsky, I.V., McNamara, D., Nelson, E.C. and Prasad, K.V., 2007. Control, computing and
communications: technologies for the twenty-first century model T. Proceedings of the IEEE, 95(2),
(pp.334-355).
Coppola, R. and Morisio, M., 2016. Connected car: technologies, issues, future trends. ACM Computing
Surveys (CSUR), 49(3), (pp.1-36).
Curley, R., 2019. Global Ride Shareing Industry Valued at More than $61 Billion. [Online]
Available at: https://www.businesstraveller.com/business-travel/2019/01/04/value-of-global-ride-
sharing-industry-estimate-at-more-than-61-billion/
[Accessed 6 June 2020].
Currie, R., 2015. Developments in car hacking. SANS Institute, InfoSec Reading Room, Accepted Dec, 5(33),
(p.19).
Dasari, D., Pressler, M., Hamann, A., Ziegenbein, D. and Austin, P., 2020, March. Applying Reservation-
based Scheduling to a μC-based Hypervisor: An industrial case study. In 2020 Design, Automation & Test
in Europe Conference & Exhibition (DATE) (pp. 987-990). IEEE.
Deka, G.C., 2014. Cost-benefit analysis of datacenter consolidation using virtualization. IT
Professional, 16(6), (pp.54-62).
Drolia, U., Wang, Z., Pant, Y. and Mangharam, R., 2011, October. AutoPlug: An automotive test-bed for
electronic controller unit testing and verification. In 2011 14th International IEEE Conference on
Intelligent Transportation Systems (ITSC) (pp. 1187-1192). IEEE.
Ebert, C. and Jones, C., 2009. Embedded software: Facts, figures, and future. Computer, 42(4), (pp.42-52).
182
Edwards, S., Lavagno, L., Lee, E.A. and Sangiovanni-Vincentelli, A., 1997. Design of embedded systems:
Formal models, validation, and synthesis. Proceedings of the IEEE, 85(3), (pp.366-390).
ENISA, (2019). ENISA Good Practice for Security of Smart Cars, November 2019, Athens: ENISA.
Esch, S., Meyer, J. and Linn, G., 2012. Partial Networking Deactivation of Inactive
ECUs. ATZautotechnology, 12(1), (pp.52-57).
Felter, W., Ferreira, A., Rajamony, R. and Rubio, J., 2015, March. An updated performance comparison of
virtual machines and linux containers. In 2015 IEEE international symposium on performance analysis of
systems and software (ISPASS) (pp. 171-172). IEEE.
Fürst, S., 2010, March. Challenges in the design of automotive software. In 2010 Design, Automation &
Test in Europe Conference & Exhibition (DATE 2010) (pp. 256-258). IEEE.
Fürst, S. and Bechter, M., 2016, June. AUTOSAR for connected and autonomous vehicles: The AUTOSAR
adaptive platform. In 2016 46th annual IEEE/IFIP international conference on Dependable Systems and
Networks Workshop (DSN-W) (pp. 215-217). IEEE.
Gajski, D.D. and Vahid, F., 1995. Specification and design of embedded hardware-software systems. IEEE
Design & Test of Computers, 12(1), (pp.53-67). IEEE
Garrett Advanced Motion, 2019. Taking Control of Vehicle Complexity. [Online]
Available at: https://www.garrettmotion.com/news/media/garrett-blog/taking-control-of-vehicle-
complexity/
[Accessed 25 January 2021].
Gaska, T., Werner, B. and Flagg, D., 2010, October. Applying virtualization to avionics systems—The
integration challenges. In 29th Digital Avionics Systems Conference (pp. 5-E). IEEE.
Školc, G. and Markelj, B., 2018. Smart cars and information security. Journal of Criminal Justice and
Security, (2), (pp.218-236).
GENIVI Alliance, 2020. About GENIVI. [Online]
Available at: https://www.genivi.org/about-genivi
[Accessed 22 December 2020].
Gissler, A., 2016. The auto industry must get connected to fend off marginalisation, Penarth: Automotive
World Ltd.
Government Accountability Office, (2009). Applied Research and Methods: Assessing the Reliability of
Computer Processed Data, July 2009, Washington
183
Gregg, B., 2013. Thinking methodically about performance. Communications of the ACM, 56(2), (pp.45-
51).
Guo, J. and Balon, N., 2006. Vehicular ad hoc networks and dedicated short-range
communication. University of Michigan.
Haghighatkhah, A., Banijamali, A., Pakanen, O.P., Oivo, M. and Kuvaja, P., 2017. Automotive software
engineering: A systematic mapping study. Journal of Systems and Software, 128, (pp.25-55).
Halder, S., Ghosal, A. and Conti, M., 2020. Secure over-the-air software updates in connected vehicles: A
survey. Computer Networks, 178, p.107343.
Hangal, S. and Lam, M.S., 2002, May. Tracking down software bugs using automatic anomaly detection.
In Proceedings of the 24th International Conference on Software Engineering. ICSE 2002 (pp. 291-301).
IEEE.
Hannappel, R., 2017, August. The impact of global warming on the automotive industry. In AIP Conference
Proceedings (Vol. 1871, No. 1, p. 060001). AIP Publishing LLC.
Happel, A. and Ebert, C., 2015. Security in vehicle networks of connected cars. In 15. Internationales
Stuttgarter Symposium (pp. 233-246). Springer Vieweg, Wiesbaden.
Hartmann, H., 2017. System Monitoring with the USE Dashboard. [Online]
Available at: https://www.circonus.com/2017/08/system-monitoring-with-the-use-dashboard/
[Accessed 15 June 2020].
Hauser, M., Dickie, J. & Tracey, N., 2017. Virtual ECUs in Production Vehicles?, York: ETAS.
Hayden, C.M., Smith, E.K., Hardisty, E.A., Hicks, M. and Foster, J.S., 2011. Evaluating dynamic software
update safety using systematic testing. IEEE Transactions on Software Engineering, 38(6), (pp.1340-1354).
Heiser, G., 2007. Virtualization for embedded systems. Open Kernel Labs Technology White Paper.
Heiser, G., 2008, April. The role of virtualization in embedded systems. In Proceedings of the 1st workshop
on Isolation and integration in embedded systems. Glasgow, ACM, (pp. 11-16).
Heiser, G., 2009, January. Hypervisors for consumer electronics. In 2009 6th IEEE Consumer
Communications and Networking Conference (pp. 1-5). IEEE.
Herberth, R., Körper, S., Stiesch, T., Gauterin, F. and Bringmann, O., 2019. Automated scheduling for
optimal parallelization to reduce the duration of vehicle software updates. IEEE Transactions on Vehicular
Technology, 68(3), (pp.2921-2933).

184
Hicks, M., Moore, J.T. and Nettles, S., 2001. Dynamic software updating. ACM SIGPLAN Notices, 36(5),
(pp.13-23).
Holmes, F., 2018. Over-the-air updates moving from 'nice to have' to 'vital'. [Online]
Available at: https://www.automotiveworld.com/articles/over-the-air-updates-moving-from-nice-to-
have-to-vital/
[Accessed 8 April 2020].
Hörl, S., 2017. Agent-based simulation of autonomous taxi services with dynamic demand
responses. Procedia Computer Science, 109, Elsevier, (pp.899-904).
Howden, J., Maglaras, L. and Ferrag, M.A., 2020. The security aspects of automotive over-the-air
updates. International Journal of Cyber Warfare and Terrorism (IJCWT), 10(2), (pp.64-81).
Hurst, W., Shone, N., El Rhalibi, A., Happe, A., Kotze, B. and Duncan, B., 2017. Advancing the micro-CI
testbed for IoT cyber-security research and education. CLOUD COMPUTING 2017, Athens, IARIA, (p.139).
International Organization for Standardization, 2011. ISO 26262-1:2011 Road vehicles -- Functional safety
-- Part 1: Vocabulary. [Online]
Available at: https://www.iso.org/standard/43464.html
[Accessed 12 June 2017].
Jackson, J., 2018. The RED Method: A New Approach to Monitoring Microservices. [Online]
Available at: https://thenewstack.io/monitoring-microservices-red-method/
[Accessed 18 January 2021].
Johnston, S. J. & Cox, S. J., 2017. The Raspberry Pi: A Technology Disrupter, and the Enabler of Dreams.
Electronics, 3(51).
Kanajan, S., Pinello, C., Zeng, H. and Sangiovanni-Vincentelli, A., 2006, March. Exploring trade-off's
between centralized versus decentralized automotive architectures using a virtual integration
environment. In Proceedings of the Design Automation & Test in Europe Conference Munich, IEEE, (Vol. 1,
pp. 1-6).
Kassakian, J.G., Wolf, H.C., Miller, J.M. and Hurton, C.J., 1996. Automotive electrical systems circa
2005. IEEE spectrum, 33(8), (pp.22-27).
Koopman, P., 2004. Embedded system security. Computer, 37(7), (pp.95-97).
Kopetz, H., 1997. Design Principles for Distributed Embedded Application. New York: Springer.
185
Koscher, K., Savage, S., Roesner, F., Patel, S., Kohno, T., Czeskis, A., McCoy, D., Kantor, B., Anderson, D.,
Shacham, H. and Checkoway, S., 2010, May. Experimental security analysis of a modern automobile.
In 2010 IEEE Symposium on Security and Privacy (pp. 447-462). IEEE Computer Society.
Krakowiak, S., 2003. What is Middleware. [Online]
Available at: http://middleware.objectweb.org/index.html
[Accessed 6 April 2017].
Krylovskiy, A., 2015, December. Internet of things gateways meet linux containers: Performance
evaluation and discussion. In 2015 IEEE 2nd World Forum on Internet of Things (WF-IoT), Milan: IEEE, (pp.
222-227).
Lee, E.A., 2006, October. Cyber-physical systems-are computing foundations adequate. In Position paper
for NSF workshop on cyber-physical systems: research motivation, techniques and roadmap (Vol. 2, pp. 1-
9). Citeseer.
Leen, G., Heffernan, D. and Dunne, A., 1999. Digital networks in the automotive vehicle. Computing &
Control Engineering Journal, 10(6), (pp.257-266).
Leveson, N.G., 2016. Engineering a safer world: Systems thinking applied to safety (p. 560). The MIT Press.
Levitt, J., 2003. Complete Guide to Preventative and Predictive Maintenance. 1st edition. New York:
Industrial Press.
Lin, P.S., Wang, Z. and Guo, R., 2016. Impact of connected vehicles and autonomous vehicles on future
transportation. Bridging the East and West, (pp.46-53).
Lions, J.L., Luebeck, L., Fauquembergue, J.L., Kahn, G., Kubbat, W., Levedag, S., Mazzini, L., Merle, D. and
O’Halloran, C., 1996. Ariane 5 flight 501 failure report by the inquiry board.
Lönn, H. and Freund, U., 2009. Automotive architecture description languages. Automotive Embedded
Systems Handbook.
Marwedel, P., 2006. Embedded system design (Vol. 1). New York: Springer.
McDougall, R. and Anderson, J., 2010. Virtualization performance: perspectives and challenges
ahead. ACM SIGOPS Operating Systems Review, 44(4), (pp.40-56).
Mckenna, D., Automotive, B.U. and Semiconductors, N.X.P., 2016. Making full vehicle OTA updates a
reality. NXP, www. nxp. com/automoivesecurity. [Online]
Available at: http:// www. nxp. com/automoivesecurity
[Accessed 9 March 2018].
186
Miller, C. and Valasek, C., 2015. Remote exploitation of an unaltered passenger vehicle. Black Hat
USA, 2015(S 91).
MISRA, 2020. MISRA Compliance: 2020 Achieving compliance with MISRA Coding Guidelines, Nuneaton:
MISRA.
Mugarza, I., Parra, J. and Jacob, E., 2018, June. Cetratus: Towards a live patching supported runtime for
mixed-criticality safe and secure systems. In 2018 IEEE 13th International Symposium on Industrial
Embedded Systems (SIES) (pp. 1-8). IEEE.
National Instruments, 2014. Controller Area Network (CAN). [Online]
Available at: http://www.ni.com/white-paper/2732/en/
[Accessed 14 October 2016].
Navet, N. and Simonot-Lion F. 2017. Automotive embedded systems handbook. Boca Raton, CRC press.
Neamtiu, I., Hicks, M., Stoyle, G. and Oriol, M., 2006. Practical dynamic software updating for C. ACM
SIGPLAN Notices, 41(6), (pp.72-83).
Nelson, S., 2010. Automotive Market and Industry Update, NXP. [Online] Available at:
https://www.nxp.com/docs/en/supporting-information/WBNR_FTF10_AUT_F0747_PDF.pdf
[Accessed 21 June 2019].
NHTSA, 2020. National Highway Traffic Safety Administration. [Online]
Available at: https://nhtsa.org
[Accessed 2 May 2020].
Noergaard, T., 2012. Embedded systems architecture: a comprehensive guide for engineers and
programmers. Newnes.
NXP, (2013). Advancements in Body Electronics, NXP, Freescale Semiconductor Inc.
Odat, H.A. and Ganesan, S., 2014, June. Firmware over the air for automotive, fotamotive. In IEEE
International Conference on Electro/Information Technology (pp. 130-139). IEEE.
Oh, J.H., Yoon, Y.H., Kim, J.K., Ihm, H.B., Jeon, S.H., Kim, T.H. and Lee, S.E., 2019. An FPGA-based
Electronic Control Unit for Automotive Systems. In 2019 IEEE International Conference on Consumer
Electronics (ICCE) (pp. 1-2). IEEE.
Onuma, Y., Terashima, Y., Nakamura, S. and Kiyohara, R., 2018, January. A method of ECU software
updating. In 2018 International Conference on Information Networking (ICOIN) (pp. 298-303). IEEE.
187
Onuma, Y., Nozawa, M., Terashima, Y. and Kiyohara, R., 2016, June. Improved software updating for
automotive ECUs: Code compression. In 2016 IEEE 40th Annual Computer Software and Applications
Conference (COMPSAC) (Vol. 2, pp. 319-324). Atlanta, IEEE.
Otani, S., Otsuki, N., Suzuki, Y., Okumura, N., Maeda, S., Yanagita, T., Koike, T., Shimazaki, Y., Ito, M.,
Uemura, M. and Hattori, T., 2019, February. 2.7 A 28nm 600MHz Automotive Flash Microcontroller with
Virtualization-Assisted Processor for Next-Generation Automotive Architecture Complying with ISO26262
ASIL-D. In 2019 IEEE International Solid-State Circuits Conference-(ISSCC) (pp. 54-56). IEEE.
Padala, P., Zhu, X., Wang, Z., Singhal, S. and Shin, K.G., 2007. Performance evaluation of virtualization
technologies for server consolidation. HP Labs Tec. Report, 137.
Pan, X., Tan, J., Kavulya, S., Gandhi, R. and Narasimhan, P., 2010. Ganesha: Blackbox diagnosis of
mapreduce systems. ACM SIGMETRICS Performance Evaluation Review, 37(3), (pp.8-13).
Parnas, D.L., 1994, May. Software aging. In Proceedings of 16th International Conference on Software
Engineering (pp. 279-287). IEEE.
Patterson, A., 2017. The Evolution of Embedded Architectures for the Next Generation of
Vehicles. ATZelektronik worldwide, 12(2), (pp.26-33).
Petri, R., Springer, M., Zelle, D., McDonald, I., Fuchs, A. and Krauß, C., 2016. Evaluation of lightweight
TPMs for automotive software updates over the air. In Proc. of 4th International Conference on Embedded
Security in Car USA (pp. 1-15).
Placho, T., Schmittner, C., Bonitz, A. and Wana, O., 2020. Management of automotive software
updates. Microprocessors and Microsystems, 78, p.103257.
Plauth, M., Feinbube, L. and Polze, A., 2017. A performance evaluation of lightweight approaches to
virtualization. Cloud Computing, 2017, (p.14).
Popek, G.J. and Goldberg, R.P., 1974. Formal requirements for virtualizable third generation
architectures. Communications of the ACM, 17(7), (pp.412-421).
Pretschner, A., Broy, M., Kruger, I.H. and Stauner, T., 2007, May. Software engineering for automotive
systems: A roadmap. In Future of Software Engineering (FOSE'07) (pp. 55-71). IEEE.
Quain, J. R., 2018. The benefits – and risk – software updates are coming to the car. [Online]
Available at: https://www.digitaltrends.com/cars/over-the-air-software-updates-cars-pros-cons/
[Accessed 27 March 2020].
188
Reinhardt, D., Kaule, D. and Kucera, M., 2013. Achieving a scalable e/e-architecture using autosar and
virtualization. SAE International Journal of Passenger Cars-Electronic and Electrical Systems, 6(2013-01-
1399), (pp.489-497).
Reinhardt, D. and Kucera, M., 2013, February. Domain controlled architecture. In Proceedings 3rd
International Conference on Pervasive and Embedded Computing and Communication Systems (PECCS
2013), Barcelona.
Reinhardt, D. and Morgan, G., 2014, June. An embedded hypervisor for safety-relevant automotive E/E-
systems. In Proceedings of the 9th IEEE International Symposium on Industrial Embedded Systems (SIES
2014) (pp. 189-198). IEEE.
Riggs, C., Rigaud, C.E., Beard, R., Douglas, T. and Elish, K., 2018. A survey on connected vehicles
vulnerabilities and countermeasures. Journal of Traffic and Logistics Eng. Vol, 6(1), (pp. 11-16)
Rolik, O., Zharikov, E., Telenyk, S. and Samotyy, V., 2017. Dynamic virtual machine allocation based on
adaptive genetic algorithm. CLOUD COMPUTING 2017, (p.118).
Rouse, M., 2018. OTA update (over-the-air update). [Online]
Available at: https://searchmobilecomputing.techtarget.com/definition/OTA-update-over-the-air-update
[Accessed 4 November 2019].
Ruff, M., 2003, October. Evolution of local interconnect network (LIN) solutions. In 2003 IEEE 58th
Vehicular Technology Conference. VTC 2003-Fall (IEEE Cat. No. 03CH37484) (Vol. 5, pp. 3382-3389). IEEE.
Sawant, A., Lenina, S. and Joshi, M.D., 2018. CAN, FlexRay, MOST versus ethernet for vehicular
networks. Interntional Journal of Innovation in Adanced Computer Science (IJIACS), 7(4), (pp. 336-339).
Sax, E., Reussner, R., Guissouma, H. and Klare, H., 2017. A survey on the state and future of automotive
software release and configuration management. KIT, (pp. 1 – 19).
Scheepers, M.J., 2014, June. Virtualization and containerization of application infrastructure: A
comparison. In 21st twente student conference on IT (Vol. 21).
Schwarzl, C. and Herrmann, J., 2018, April. Systematic test platform selection: Reducing costs for testing
software-based automotive E/E systems. In 2018 IEEE 11th International Conference on Software Testing,
Verification and Validation (ICST) (pp. 374-383). IEEE.
Seifzadeh, H., Abolhassani, H. and Moshkenani, M.S., 2013. A survey of dynamic software
updating. Journal of Software: Evolution and Process, 25(5), (pp.535-568).
Shan, A., 2006. Heterogeneous processing: a strategy for augmenting Moore's law. Linux
Journal, 2006(142), (p.7).
189
Shankwitz, C., 2017. Long-haul Truck Freight Transport and the Role of Automation: Collaborative
Human–Automated Platooned Trucks Alliance (CHAPTA). Western Transport Institute, Bozeman.
Sharma, A. and Strezov, V., 2017. Life cycle environmental and economic impact assessment of
alternative transport fuels and power-train technologies. Energy, 133, (pp.1132-1141).
Shavit, M., Gryc, A. and Miucic, R., 2007. Firmware update over the air (FOTA) for automotive
industry (No. 2007-01-3523). SAE Technical Paper.
Simonot-Lion, F. & Trinquet, Y., 2009. Vehicle Functional Domains and Their Requirements. In:
Automotive Embedded Systems handbook. Boca Raton: CRC Press, (pp. 22-43).
Simpson, J.R., Mishra, S., Talebian, A. and Golias, M.M., 2019. An estimation of the future adoption rate of
autonomous trucks by freight organizations. Research in Transportation Economics, 76, p.100737.
Sivakumar, P., Devi, R.S., Lakshmi, A.N., VinothKumar, B. and Vinod, B., 2020, February. Automotive Grade
Linux Software Architecture for Automotive Infotainment System. In 2020 International Conference on
Inventive Computation Technologies (ICICT) (pp. 391-395). IEEE.
Smith, D.J. and Simpson, K.G., 2020. The Safety Critical Systems Handbook: A Straightforward Guide to
Functional Safety: IEC 61508 (2010 Edition), IEC 61511 (2015 Edition) and Related Guidance. Butterworth-
Heinemann.
Sommer, S., Camek, A., Becker, K., Buckl, C., Zirkler, A., Fiege, L., Armbruster, M., Spiegelberg, G. and
Knoll, A., 2013, October. Race: A centralized platform computer based architecture for automotive
applications. In 2013 IEEE International Electric Vehicle Conference (IEVC) (pp. 1-6). Barcelona, IEEE.
Stallings, W., 2012. Operating systems: internals and design principles. Boston: Prentice Hall.
Steger, M., Boano, C.A., Niedermayr, T., Karner, M., Hillebrand, J., Roemer, K. and Rom, W., 2017. An
efficient and secure automotive wireless software update framework. IEEE Transactions on Industrial
Informatics, 14(5), (pp.2181-2193).
Steinkamp, N., Levine, R. and Roth, R., 2019. Automotive Defect and Recall Report, Stout Risius Ross.
Strauss, D., 2019. Decline of Motor Industry Drives Global Economic Slowdown. November 2019,
Financial Times, [Online]
Available at: https://www.ft.com/content/cd2f8bdc-fef6-11e9-be59-e49b2a136b8d
[Accessed 20 November 2020].
Strobl, M., Kucera, M., Foeldi, A., Waas, T., Balbierer, N. and Hilbert, C., 2013, September. Towards
automotive virtualization. In 2013 International Conference on Applied Electronics (pp. 1-6). IEEE.

190
Surana, P., Madhani, N. and Gopalakrishnan, T., 2020, July. A Comparative Study on the Recent Smart
Mobile Phone Processors. In 2020 7th International Conference on Smart Structures and Systems
(ICSSS) (pp. 1-3). IEEE.
Suzuki, N., Hayashi, T. and Kiyohara, R., 2019, June. Data Compression for Software Updating of ECUs.
In 2019 IEEE 23rd International Symposium on Consumer Technologies (ISCT) (pp. 304-307). IEEE.
Takada, H., 2012. Introduction to Automotive Embedded Systems, Nagoya: Nagoya University. [Online]
Available at: https://cse.buffalo.edu/~bina/cse321/fall2015/Automotive-embedded-systems.pdf
[Accessed 2 January 2017].
Thati, V.B., Vankeirsbilck, J., Pissoort, D. and Boydens, J., 2019, September. Hybrid Technique for Soft
Error Detection in Dependable Embedded Software: a First Experiment. In 2019 IEEE XXVIII International
Scientific Conference Electronics (ET) (pp. 1-4). IEEE.
Tichy, M. & Zemanek, P., 2001. Performance and Tuning of the Unix Operating System. Journal of
Electrical Engineering, 52(3-4), (pp. 74-80).
Tiwari, V., Malik, S. and Wolfe, A., 1994. Power analysis of embedded software: A first step towards
software power minimization. IEEE Transactions on Very Large Scale Integration (VLSI) Systems, 2(4),
(pp.437-445).
Tobolski, T., Esselink, C.E., Westra, M.R. and Ellis, J.T., Ford Global Technologies LLC, 2018. Silent in-vehicle
software updates. U.S. Patent 10,140,109.
Törngren, M., Chen, D., Malvius, D. and Axelsson, J., 2017. Model-based development of automotive
embedded systems, Boca Raton: CRC Press, (pp. 21-30).
Vaughan, A. and Bohac, S.V., 2013. An extreme learning machine approach to predicting near chaotic
HCCI combustion phasing in real-time. arXiv preprint arXiv:1310.3567.
Vegni, A.M., Biagi, M. and Cusani, R., 2013. Smart vehicles, technologies and main applications in
vehicular ad hoc networks. Vehicular Technologies—Deployment and Applications.
Wallin, P. and Axelsson, J., 2008, March. A case study of issues related to automotive E/E system
architecture development. In 15th Annual IEEE International Conference and Workshop on the
Engineering of Computer Based Systems (ecbs 2008) (pp. 87-95). IEEE.
Walter, J., Fakih, M. and Grüttner, K., 2014, January. Hardware-based real-time simulation on the
raspberry pi. In 2nd. Workshop on Highperformance and Real-time Embedded Systems.
191
Walters, J.P., Chaudhary, V., Cha, M., Guercio, S. and Gallo, S., 2008, March. A comparison of
virtualization technologies for HPC. In 22nd International Conference on Advanced Information
Networking and Applications (aina 2008) (pp. 861-868). IEEE.
Wang, D. and Ganesan, S., 2020, September. Automotive Domain Controller. In 2020 International
Conference on Computing and Information Technology (ICCIT-1441) (pp. 1-5). IEEE.
Wang, R. and Yang, S., 2004. The design of a rapid prototype platform for ARM based embedded
system. IEEE Transactions on Consumer Electronics, 50(2), (pp.746-751).
Wild, D., Fleischmann, A., Hartmann, J., Pfaller, C., Rappl, M. and Rittmann, S., 2006. An architecture-
centric approach towards the construction of dependable automotive software (No. 2006-01-1222). SAE
Technical Paper.
Wilke, T., 2017. The RED Method: key metrics for microservices architecture. [Online]
Available at: https://www.weave.works/blog/the-red-method-key-metrics-for-microservices-
architecture/
[Accessed 18 January 2021].
Wilmshurst, T., 2001. An introduction to the design of small-scale embedded systems. Palgrave.
Woo, S., Jo, H.J., Kim, I.S. and Lee, D.H., 2016. A practical security architecture for in-vehicle CAN-FD. IEEE
Transactions on Intelligent Transportation Systems, 17(8), (pp.2248-2261).
Work, D., Bayen, A. and Jacobson, Q., 2008, April. Automotive cyber physical systems in the context of
human mobility. In National Workshop on high-confidence automotive cyber-physical systems (pp. 3-4).
World Health Organization, 2018. Global status report on road safety 2018: Summary (No.
WHO/NMH/NVI/18.20). World Health Organization.
Wyman, O., 2015. Car Innovation–A comprehensive study on innovation in the automotive
industry. Oliver Wyman’s automotive consultants.
Xavier, M.G., Neves, M.V., Rossi, F.D., Ferreto, T.C., Lange, T. and De Rose, C.A., 2013, February.
Performance evaluation of container-based virtualization for high performance computing environments.
In 2013 21st Euromicro International Conference on Parallel, Distributed, and Network-Based
Processing (pp. 233-240). IEEE.
Yamada, Y. and Kimura, K., 2020. Efficient System-on-Chip (SOC) for Automated Driving with High Safety.
In NANO-CHIPS 2030 (pp. 563-575). Springer, Cham.
192
Yu, P., Xia, M., Lin, Q., Zhu, M., Gao, S., Qi, Z., Chen, K. and Guan, H., 2010, December. Real-time
enhancement for Xen hypervisor. In 2010 IEEE/IFIP International Conference on Embedded and
Ubiquitous Computing (pp. 23-30). IEEE.
Zhao, P. and Zhou, L., 2015. The Processing Strategy of IO-intensive Application in Cloud Environment.
In Fourth International Conference on Information Science and Cloud Computing (ISCC2015) (p. 69).

193
Appendices
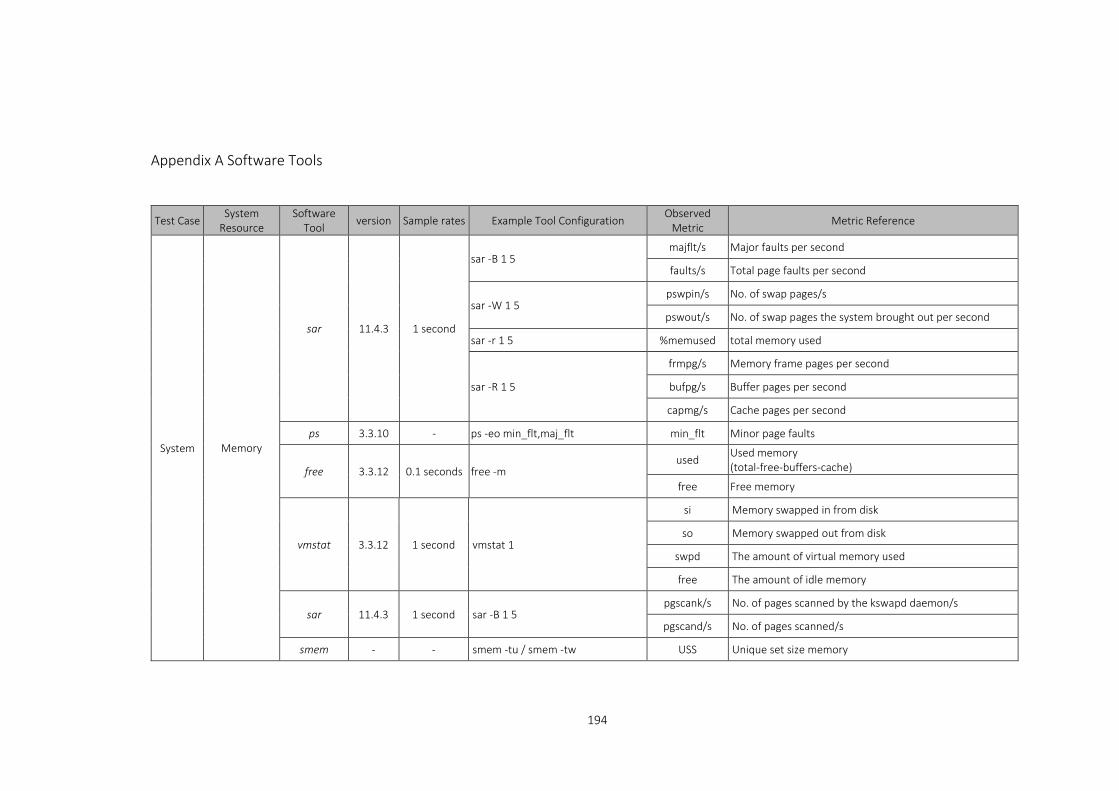
194
Appendix A Software Tools
Test Case System
Resource Software
Tool version Sample rates Example Tool Configuration Observed
Metric Metric Reference
System
Memory
sar 11.4.3 1 second
sar -B 1 5 majflt/s Major faults per second
faults/s Total page faults per second
sar -W 1 5 pswpin/s No. of swap pages/s
pswout/s No. of swap pages the system brought out per second
sar -r 1 5 %memused total memory used
sar -R 1 5
frmpg/s Memory frame pages per second
bufpg/s Buffer pages per second
capmg/s Cache pages per second
ps 3.3.10 - ps -eo min_flt,maj_flt min_flt Minor page faults
free 3.3.12 0.1 seconds free -m used Used memory
(total-free-buffers-cache)
free Free memory
vmstat 3.3.12 1 second vmstat 1
si Memory swapped in from disk
so Memory swapped out from disk
swpd The amount of virtual memory used
free The amount of idle memory
sar 11.4.3 1 second sar -B 1 5 pgscank/s No. of pages scanned by the kswapd daemon/s
pgscand/s No. of pages scanned/s
smem - - smem -tu / smem -tw USS Unique set size memory
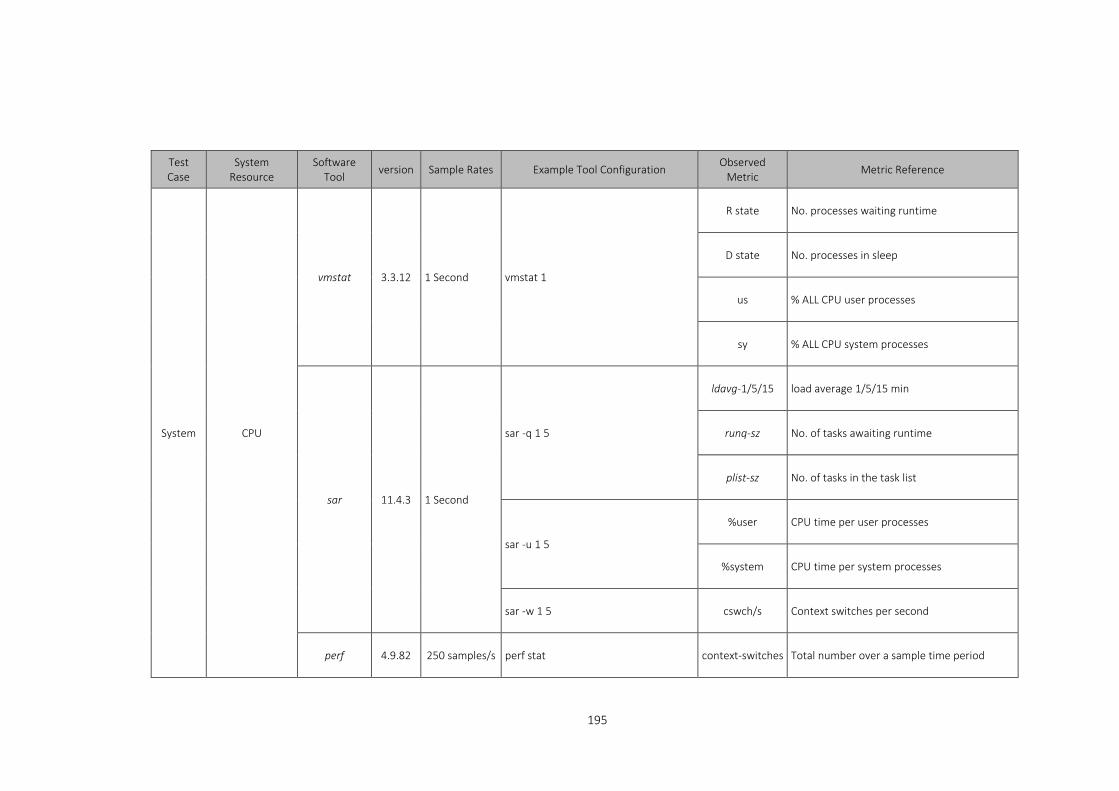
195
Test Case
System Resource
Software Tool
version Sample Rates Example Tool Configuration Observed
Metric Metric Reference
System CPU
vmstat 3.3.12 1 Second vmstat 1
R state No. processes waiting runtime
D state No. processes in sleep
us % ALL CPU user processes
sy % ALL CPU system processes
sar 11.4.3 1 Second
sar -q 1 5
ldavg-1/5/15 load average 1/5/15 min
runq-sz No. of tasks awaiting runtime
plist-sz No. of tasks in the task list
sar -u 1 5
%user CPU time per user processes
%system CPU time per system processes
sar -w 1 5 cswch/s Context switches per second
perf 4.9.82 250 samples/s perf stat context-switches Total number over a sample time period

196
Test Case
System Resource
Software Tool
version Sample Rate Example Tool Configuration Observed
Metric Metric
Reference
Per process
Memory
cat 8.25 - cat /proc/<pid>/stat | awk ‘{print $10} min_flt minor faults
pmap 3.3.12 - pmap -x <pid> kbytes Process memory map Size of map in Kb
sar 11.4.3 1 second sar -B 1 fault/s majflt/s
Total and major faults per second
smem - - smem -tu / smem -tw USS Unique set size memory
CPU
cat 8.25 - cat /proc/<pid>/schedstat time Time spent on CPU Time spent waiting on the queue
perf 4.9.82 250 samples/s perf sched record -- sleep 1 perf sched latency
runtime Max. delay
Avg. and max. delay per schedule
sar 11.4.3 1 second sar -P ALL 1 5
%user % per CPU user processes
%system % per CPU system processes
%idle % per CPU idle time
pmap 3.3.12 - pmap <pid> | tail -n 1 kb total memory use
tiptop 2.3 0.5 second tiptop -H -K
IPC Instructions per cycle
perf 4.9.82 250 samples/s perf stat
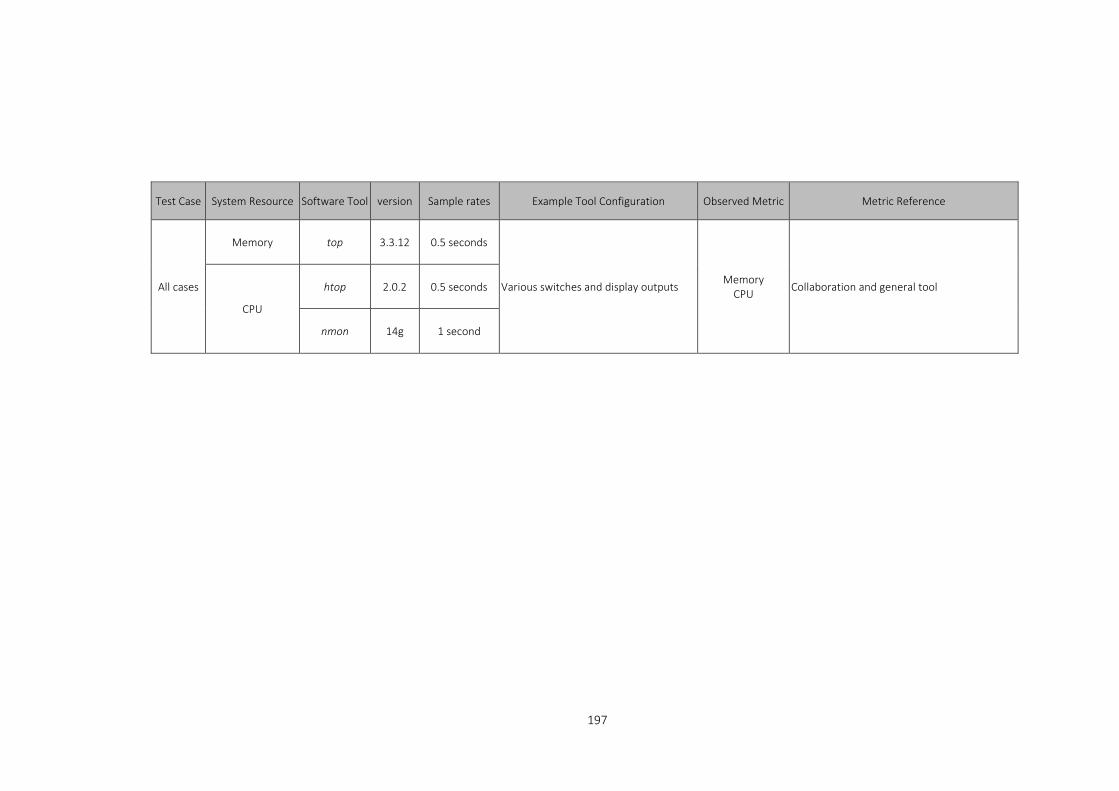
197
Test Case System Resource Software Tool version Sample rates Example Tool Configuration Observed Metric Metric Reference
All cases
Memory top 3.3.12 0.5 seconds
Various switches and display outputs Memory
CPU Collaboration and general tool
CPU
htop 2.0.2 0.5 seconds
nmon 14g 1 second
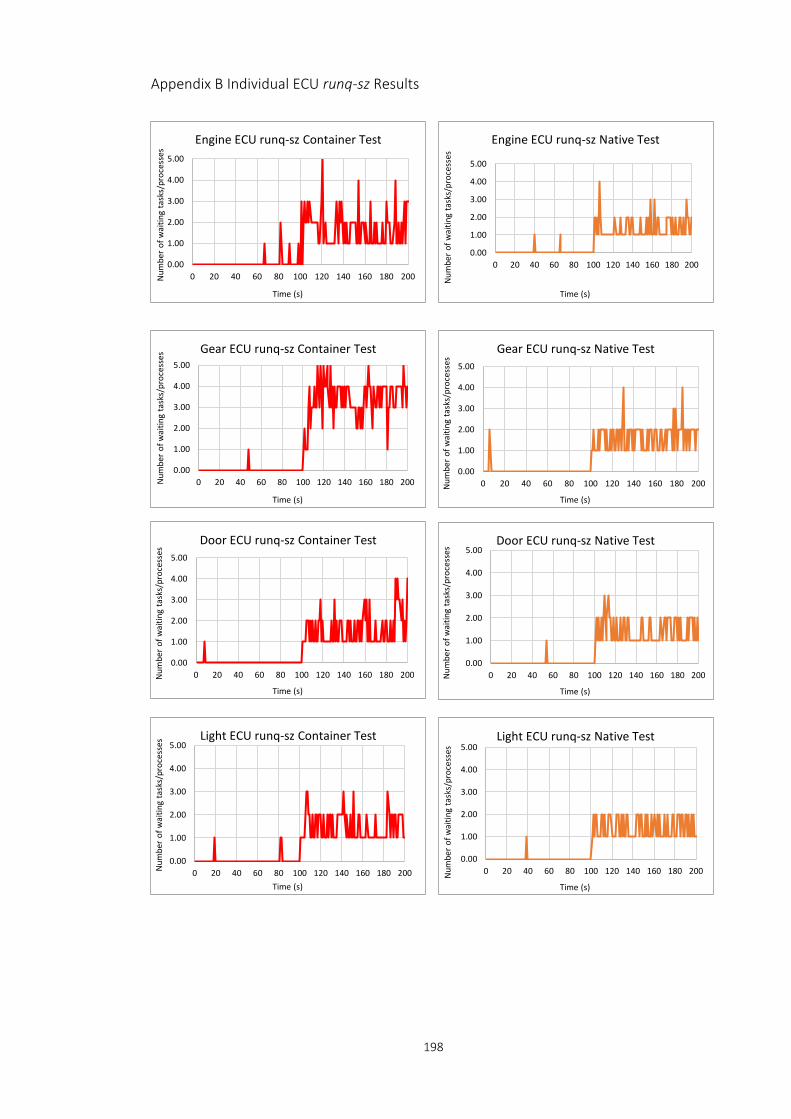
198
Appendix B Individual ECU runq-sz Results
0.00
1.00
2.00
3.00
4.00
5.00
0 20 40 60 80 100 120 140 160 180 200
Num
ber o
f wai
ting
task
s/pr
oces
ses
Time (s)
Engine ECU runq-sz Native Test
0.00
1.00
2.00
3.00
4.00
5.00
0 20 40 60 80 100 120 140 160 180 200Num
ber o
f wai
ting
task
s/pr
oces
ses
Time (s)
Gear ECU runq-sz Native Test
0.00
1.00
2.00
3.00
4.00
5.00
0 20 40 60 80 100 120 140 160 180 200Num
ber o
f wai
ting
task
s/pr
oces
ses
Time (s)
Door ECU runq-sz Native Test
0.00
1.00
2.00
3.00
4.00
5.00
0 20 40 60 80 100 120 140 160 180 200Num
ber o
f wai
ting
task
s/pr
oces
ses
Time (s)
Light ECU runq-sz Native Test
0.00
1.00
2.00
3.00
4.00
5.00
0 20 40 60 80 100 120 140 160 180 200Num
ber o
f wai
ting
task
s/pr
oces
ses
Time (s)
Light ECU runq-sz Container Test
0.00
1.00
2.00
3.00
4.00
5.00
0 20 40 60 80 100 120 140 160 180 200Num
ber o
f wai
ting
task
s/pr
oces
ses
Time (s)
Engine ECU runq-sz Container Test
0.00
1.00
2.00
3.00
4.00
5.00
0 20 40 60 80 100 120 140 160 180 200Num
ber o
f wai
ting
task
s/pr
oces
ses
Time (s)
Gear ECU runq-sz Container Test
0.00
1.00
2.00
3.00
4.00
5.00
0 20 40 60 80 100 120 140 160 180 200Num
ber o
f wai
ting
task
s/pr
oces
ses
Time (s)
Door ECU runq-sz Container Test

199
Appendix C Individual ECU ldavg Results
Engine ECU ldavg (4 Cores)
ldavg-n Minimum Maximum Average
ldavg-1 0 1.72 0.66
ldavg-5 0.08 1.24 0.42
ldavg-15 0.02 0.71 0.19
Gear ECU ldavg (4 Cores)
ldavg-n Minimum Maximum Average
ldavg-1 0 1.68 0.66
ldavg-5 0.08 1.30 0.41
ldavg-15 0.02 0.71 0.19
Door ECU ldavg (4 Cores)
Ldavg-n Minimum Maximum Average
ldavg-1 0.03 1.65 0.57
ldavg-5 0.01 1.11 0.36
ldavg-15 0 0.62 0.17
Light ECU ldavg (4 Cores)
Ldavg-n Minimum Maximum Average
ldavg-1 0 1.68 0.65
ldavg-5 0.57 1.01 0.41
ldavg-15 0.23 0.83 0.19
0.000.250.500.751.001.251.501.752.002.252.50
0 150 300 450 600 750 900 1050 1200
CPU
Load
Time (S)
Engine ECU ldavg Native Test
ldavg-1
ldavg-5
ldavg-15
0.000.250.500.751.001.251.501.752.002.252.50
0 150 300 450 600 750 900 1050 1200
CPU
Load
Time (S)
Gear ECU ldavg Native Test
ldavg-1
ldavg-5
ldavg-15
0.000.250.500.751.001.251.501.752.002.252.50
0 150 300 450 600 750 900 1050 1200
CPU
Load
Time (S)
Light ECU ldavg Native Test
ldavg-1
ldavg-5
ldavg-15
0.000.250.500.751.001.251.501.752.002.252.50
0 150 300 450 600 750 900 1050 1200
CPU
Load
Time (S)
Door ECU ldavg Native Test
ldavg-1
ldavg-5
ldavg-15

200
Engine ECU ldavg (4 Cores)
ldavg-n Minimum Maximum Average
ldavg-1 0 1.84 0.74
ldavg-5 0.01 1.46 0.48
ldavg-15 0 0.81 0.22
Gear ECU ldavg (4 Cores)
ldavg-n Minimum Maximum Average
ldavg-1 0 2.28 0.73
ldavg-5 0.01 1.41 0.46
ldavg-15 0 0.78 0.21
Door ECU ldavg (4 Cores)
ldavg-n Minimum Maximum Average
ldavg-1 0.03 1.78 0.62
ldavg-5 0.02 1.2 0.39
ldavg-15 0 0.66 0.18
Light ECU ldavg (4 Cores)
ldavg-n Minimum Maximum Average
ldavg-1 0 1.77 0.68
ldavg-5 0 1.33 0.43
ldavg-15 0 0.74 0.20
0.000.250.500.751.001.251.501.752.002.252.50
0 150 300 450 600 750 900 1050 1200
CPU
Load
Time (S)
Gear ECU ldavg Triplet Container Test
ldavg-1
ldavg-5
ldavg-15
0.000.250.500.751.001.251.501.752.002.252.50
0 150 300 450 600 750 900 1050 1200
CPU
Load
Time (S)
Engine ECU ldavg Triplet Container Test
ldavg-1
ldavg-5
ldavg-15
0.000.250.500.751.001.251.501.752.002.252.50
0 150 300 450 600 750 900 1050 1200
CPU
Load
Time (S)
Light ECU ldavg Triplet Container Test
ldavg-1
ldavg-5
ldavg-15
0.000.250.500.751.001.251.501.752.002.252.50
0 150 300 450 600 750 900 1050 1200
CPU
Load
Time (S)
Door ECU ldavg Triplet Container Test
ldavg-1
ldavg-5
ldavg-15
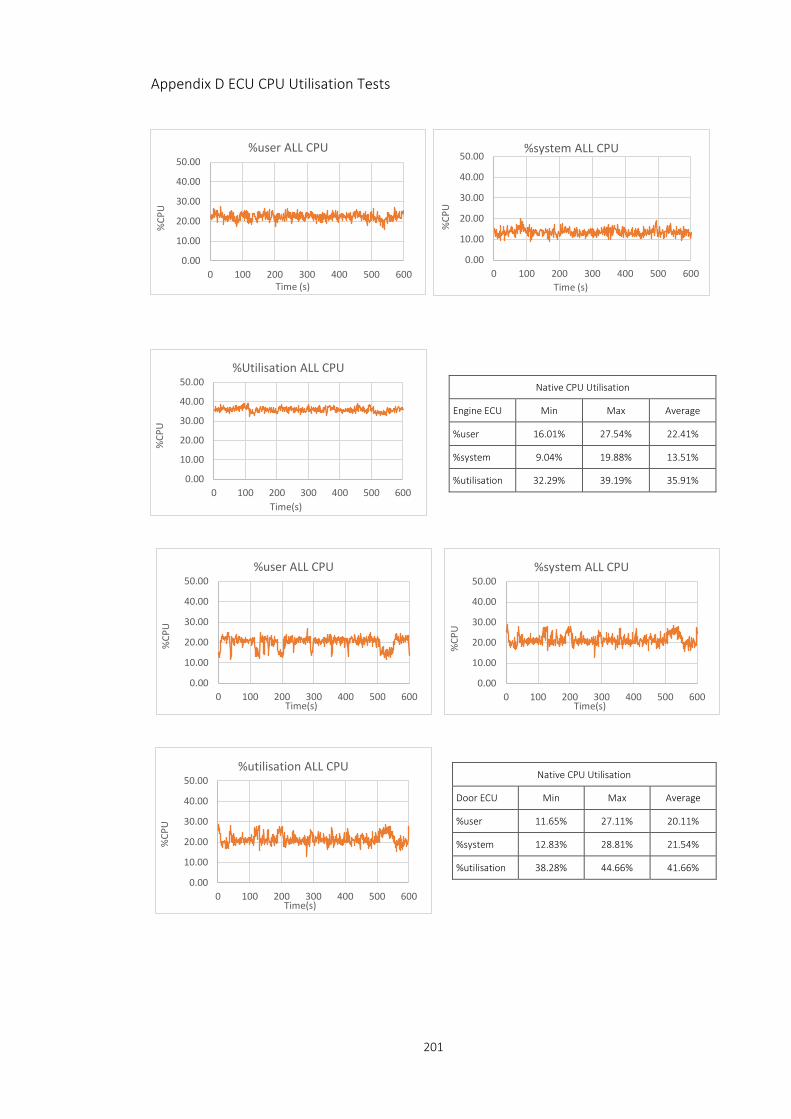
201
Appendix D ECU CPU Utilisation Tests
Native CPU Utilisation
Engine ECU Min Max Average
%user 16.01% 27.54% 22.41%
%system 9.04% 19.88% 13.51%
%utilisation 32.29% 39.19% 35.91%
Native CPU Utilisation
Door ECU Min Max Average
%user 11.65% 27.11% 20.11%
%system 12.83% 28.81% 21.54%
%utilisation 38.28% 44.66% 41.66%
0.00
10.00
20.00
30.00
40.00
50.00
0 100 200 300 400 500 600
%CP
U
Time (s)
%system ALL CPU
0.00
10.00
20.00
30.00
40.00
50.00
0 100 200 300 400 500 600
%CP
U
Time (s)
%user ALL CPU
0.00
10.00
20.00
30.00
40.00
50.00
0 100 200 300 400 500 600
%CP
U
Time(s)
%Utilisation ALL CPU
0.00
10.00
20.00
30.00
40.00
50.00
0 100 200 300 400 500 600
%CP
U
Time(s)
%user ALL CPU
0.00
10.00
20.00
30.00
40.00
50.00
0 100 200 300 400 500 600
%CP
U
Time(s)
%utilisation ALL CPU
0.00
10.00
20.00
30.00
40.00
50.00
0 100 200 300 400 500 600
%CP
U
Time(s)
%system ALL CPU
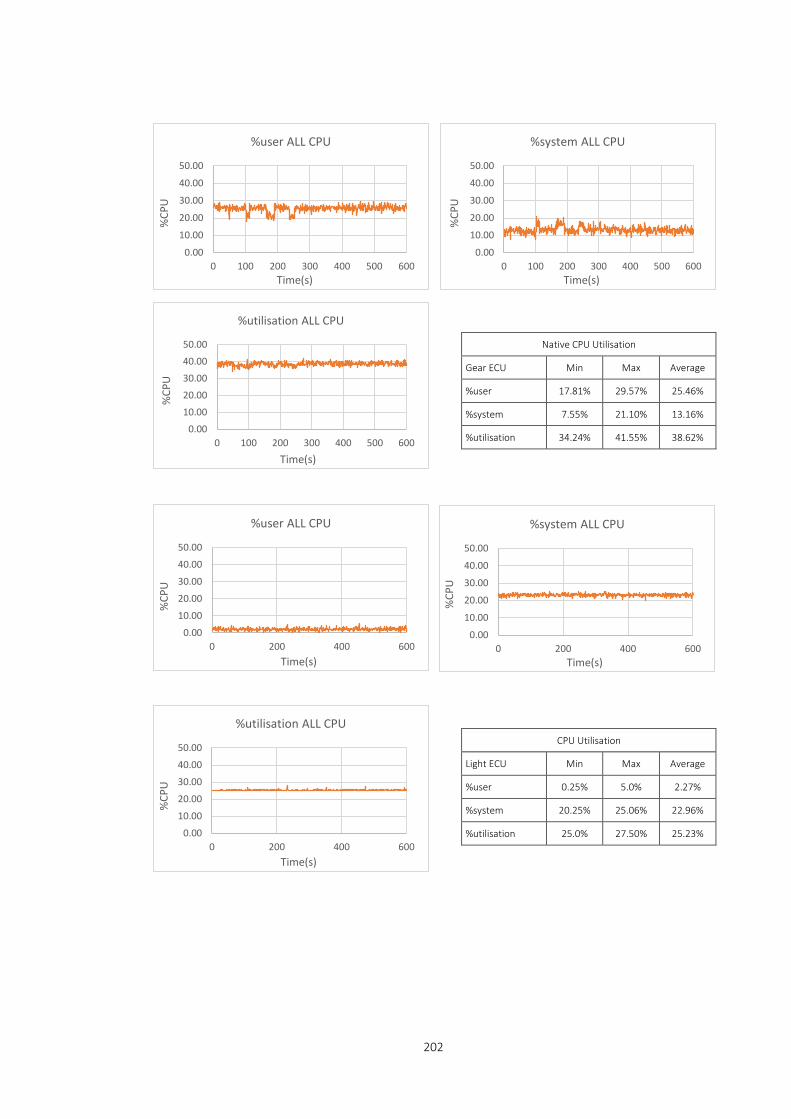
202
Native CPU Utilisation
Gear ECU Min Max Average
%user 17.81% 29.57% 25.46%
%system 7.55% 21.10% 13.16%
%utilisation 34.24% 41.55% 38.62%
CPU Utilisation
Light ECU Min Max Average
%user 0.25% 5.0% 2.27%
%system 20.25% 25.06% 22.96%
%utilisation 25.0% 27.50% 25.23%
0.00
10.00
20.00
30.00
40.00
50.00
0 100 200 300 400 500 600
%CP
U
Time(s)
%user ALL CPU
0.00
10.00
20.00
30.00
40.00
50.00
0 100 200 300 400 500 600
%CP
U
Time(s)
%utilisation ALL CPU
0.00
10.00
20.00
30.00
40.00
50.00
0 100 200 300 400 500 600
%CP
U
Time(s)
%system ALL CPU
0.00
10.00
20.00
30.00
40.00
50.00
0 200 400 600
%CP
U
Time(s)
%user ALL CPU
0.00
10.00
20.00
30.00
40.00
50.00
0 200 400 600
%CP
U
Time(s)
%utilisation ALL CPU
0.00
10.00
20.00
30.00
40.00
50.00
0 200 400 600
%CP
U
Time(s)
%system ALL CPU
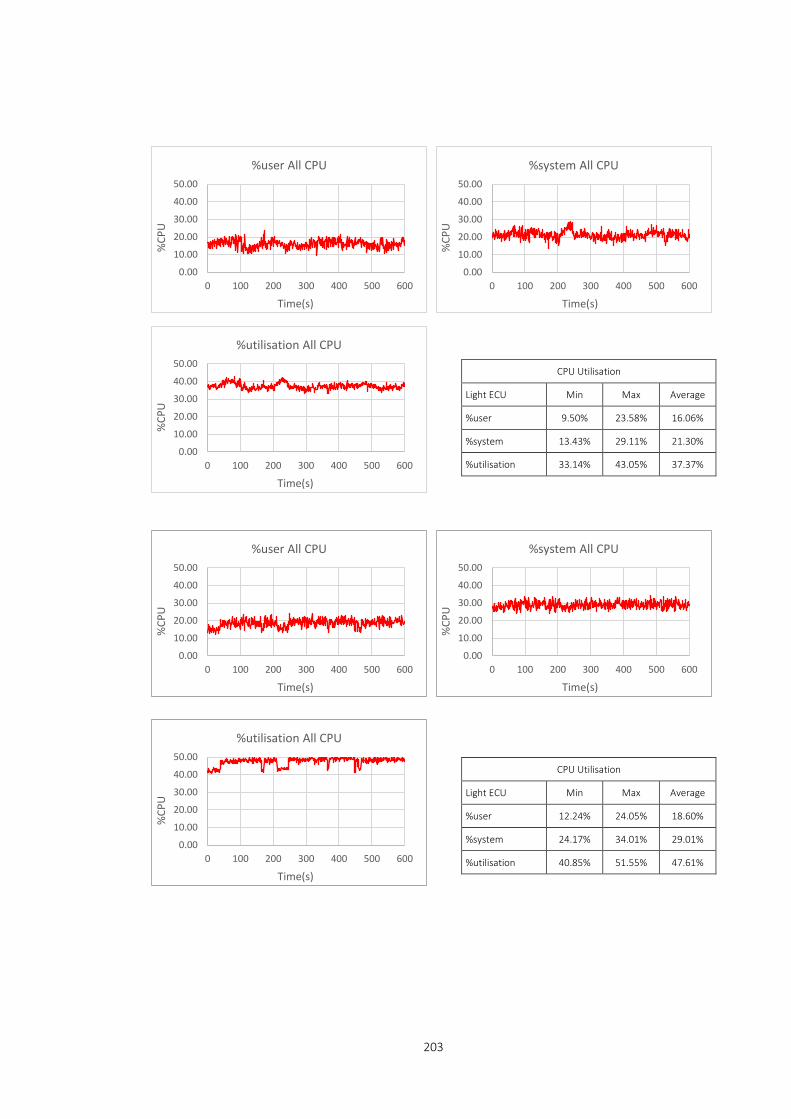
203
CPU Utilisation
Light ECU Min Max Average
%user 9.50% 23.58% 16.06%
%system 13.43% 29.11% 21.30%
%utilisation 33.14% 43.05% 37.37%
CPU Utilisation
Light ECU Min Max Average
%user 12.24% 24.05% 18.60%
%system 24.17% 34.01% 29.01%
%utilisation 40.85% 51.55% 47.61%
0.00
10.00
20.00
30.00
40.00
50.00
0 100 200 300 400 500 600
%CP
U
Time(s)
%user All CPU
0.00
10.00
20.00
30.00
40.00
50.00
0 100 200 300 400 500 600
%CP
U
Time(s)
%utilisation All CPU
0.00
10.00
20.00
30.00
40.00
50.00
0 100 200 300 400 500 600
%CP
U
Time(s)
%system All CPU
0.00
10.00
20.00
30.00
40.00
50.00
0 100 200 300 400 500 600
%CP
U
Time(s)
%user All CPU
0.00
10.00
20.00
30.00
40.00
50.00
0 100 200 300 400 500 600
%CP
U
Time(s)
%utilisation All CPU
0.00
10.00
20.00
30.00
40.00
50.00
0 100 200 300 400 500 600
%CP
U
Time(s)
%system All CPU

204
CPU Utilisation
Light ECU Min Max Average
%user 14.45% 30.67% 25.49%
%system 8.07% 19.95% 13.36%
%utilisation 31.94% 43.44% 38.85%
CPU Utilisation
Light ECU Min Max Average
%user 0.75% 5.50% 2.14%
%system 19.75% 25.44% 23.20%
%utilisation 25.00% 27.82% 25.35%
0.00
10.00
20.00
30.00
40.00
50.00
0 100 200 300 400 500 600
%CP
U
Time(s)
%user All CPU
0.00
10.00
20.00
30.00
40.00
50.00
0 100 200 300 400 500 600
%CP
U
Time(s)
%utilisation All CPU
0.00
10.00
20.00
30.00
40.00
50.00
0 100 200 300 400 500 600
%CP
U
Time(s)
%system All CPU
0.00
10.00
20.00
30.00
40.00
50.00
0 100 200 300 400 500 600
%CP
U
Time(s)
%user All CPU
0.00
10.00
20.00
30.00
40.00
50.00
0 100 200 300 400 500 600
%CP
U
Time(s)
%utilisation All CPU
0.00
10.00
20.00
30.00
40.00
50.00
0 100 200 300 400 500 600
%CP
U
Time(s)
%system All CPU
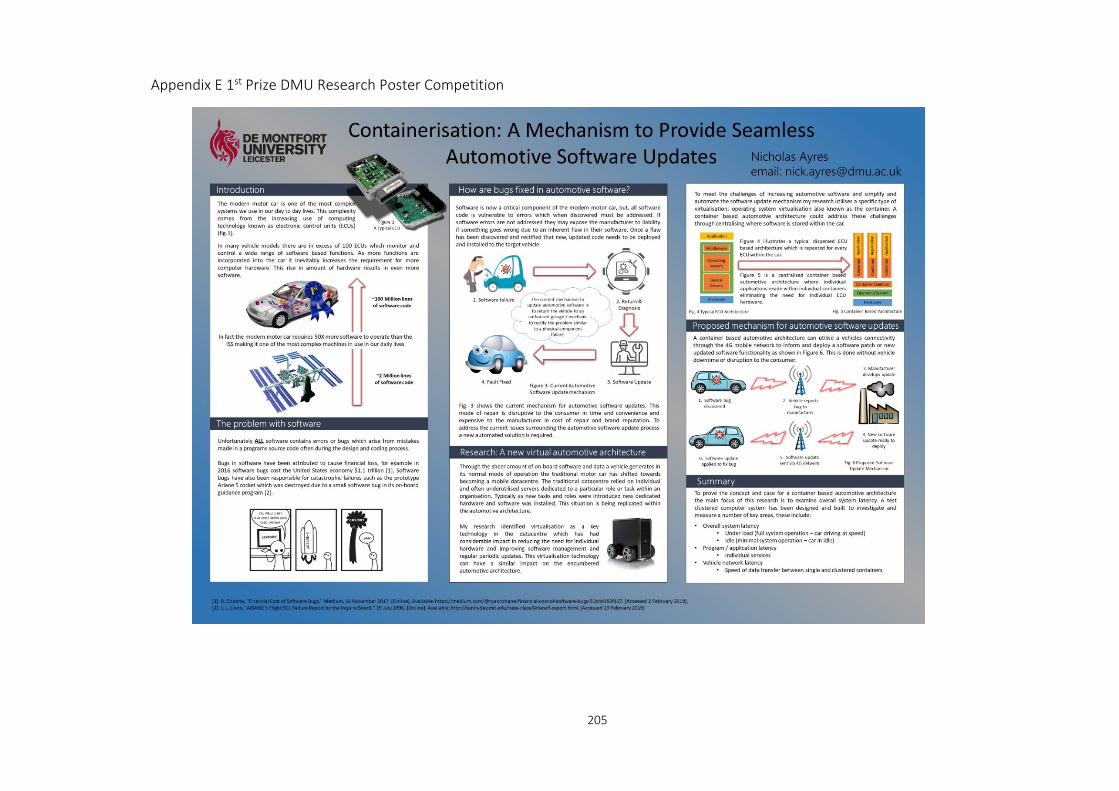
205
Appendix E 1st Prize DMU Research Poster Competition
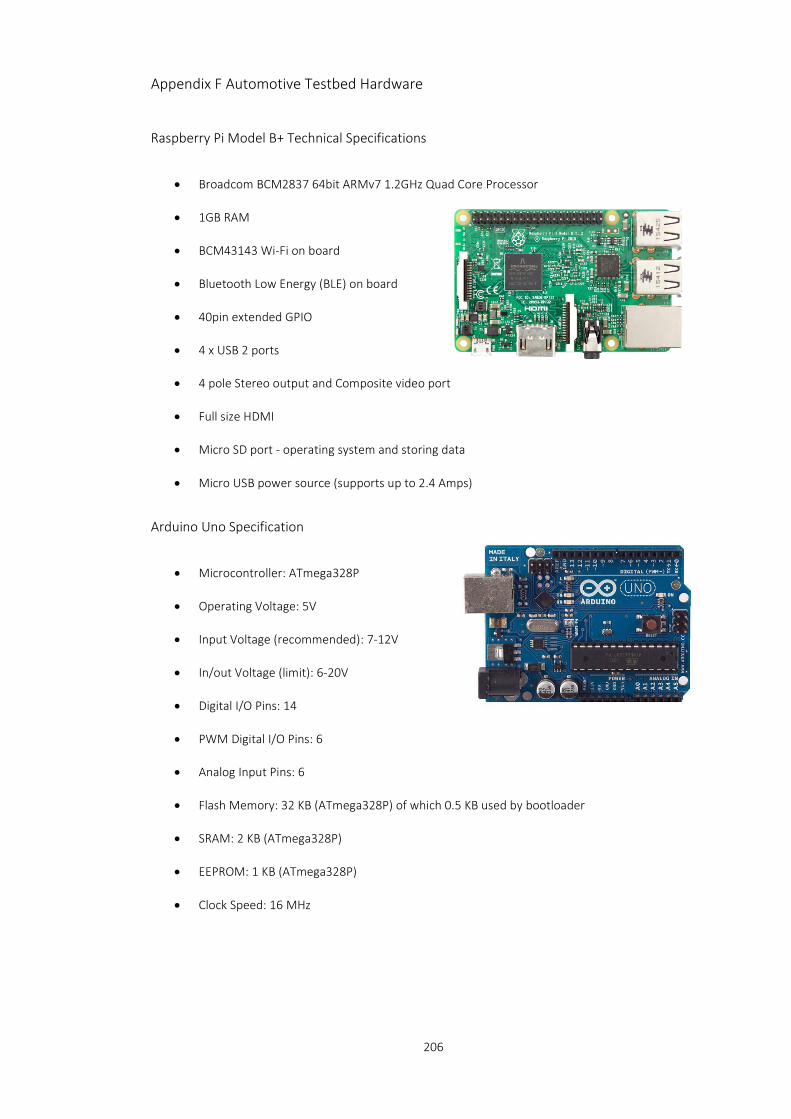
206
Appendix F Automotive Testbed Hardware
Raspberry Pi Model B+ Technical Specifications
• Broadcom BCM2837 64bit ARMv7 1.2GHz Quad Core Processor
• 1GB RAM
• BCM43143 Wi-Fi on board
• Bluetooth Low Energy (BLE) on board
• 40pin extended GPIO
• 4 x USB 2 ports
• 4 pole Stereo output and Composite video port
• Full size HDMI
• Micro SD port - operating system and storing data
• Micro USB power source (supports up to 2.4 Amps)
Arduino Uno Specification
• Microcontroller: ATmega328P
• Operating Voltage: 5V
• Input Voltage (recommended): 7-12V
• In/out Voltage (limit): 6-20V
• Digital I/O Pins: 14
• PWM Digital I/O Pins: 6
• Analog Input Pins: 6
• Flash Memory: 32 KB (ATmega328P) of which 0.5 KB used by bootloader
• SRAM: 2 KB (ATmega328P)
• EEPROM: 1 KB (ATmega328P)
• Clock Speed: 16 MHz
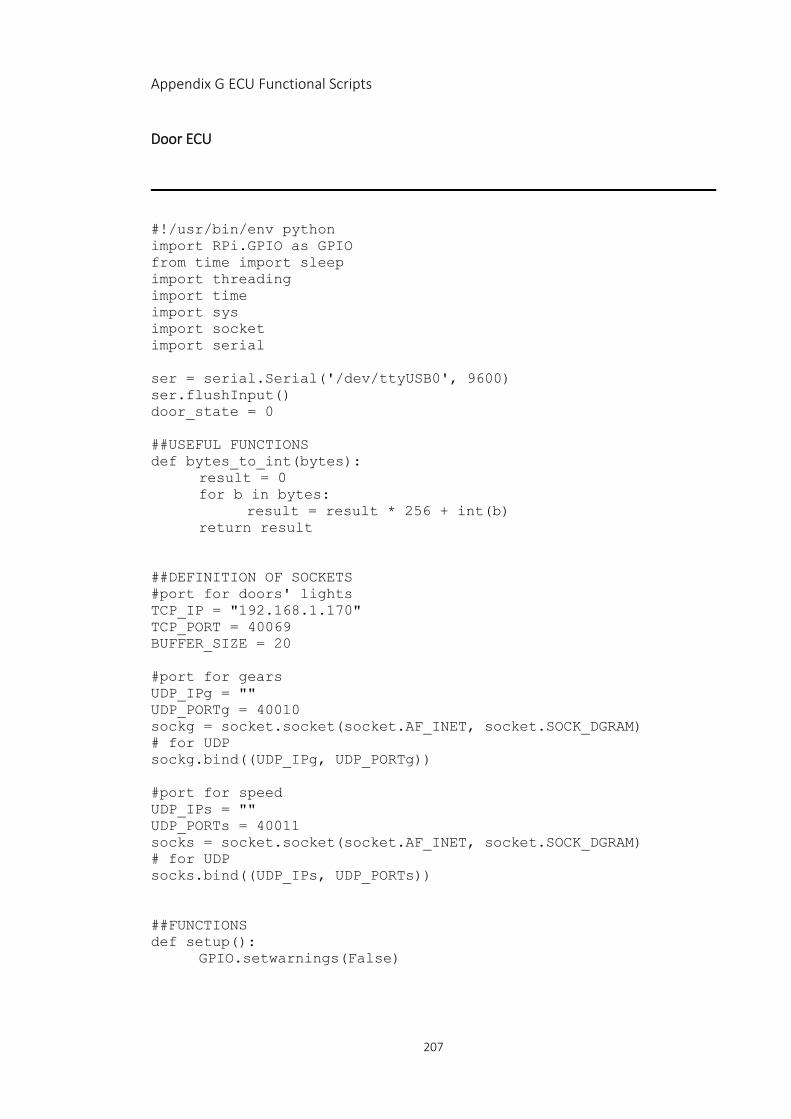
207
Appendix G ECU Functional Scripts
Door ECU
#!/usr/bin/env python import RPi.GPIO as GPIO from time import sleep import threading import time import sys import socket import serial ser = serial.Serial('/dev/ttyUSB0', 9600) ser.flushInput() door_state = 0 ##USEFUL FUNCTIONS def bytes_to_int(bytes): result = 0 for b in bytes: result = result * 256 + int(b) return result ##DEFINITION OF SOCKETS #port for doors' lights TCP_IP = "192.168.1.170" TCP_PORT = 40069 BUFFER_SIZE = 20 #port for gears UDP_IPg = "" UDP_PORTg = 40010 sockg = socket.socket(socket.AF_INET, socket.SOCK_DGRAM) # for UDP sockg.bind((UDP_IPg, UDP_PORTg)) #port for speed UDP_IPs = "" UDP_PORTs = 40011 socks = socket.socket(socket.AF_INET, socket.SOCK_DGRAM) # for UDP socks.bind((UDP_IPs, UDP_PORTs)) ##FUNCTIONS def setup(): GPIO.setwarnings(False)
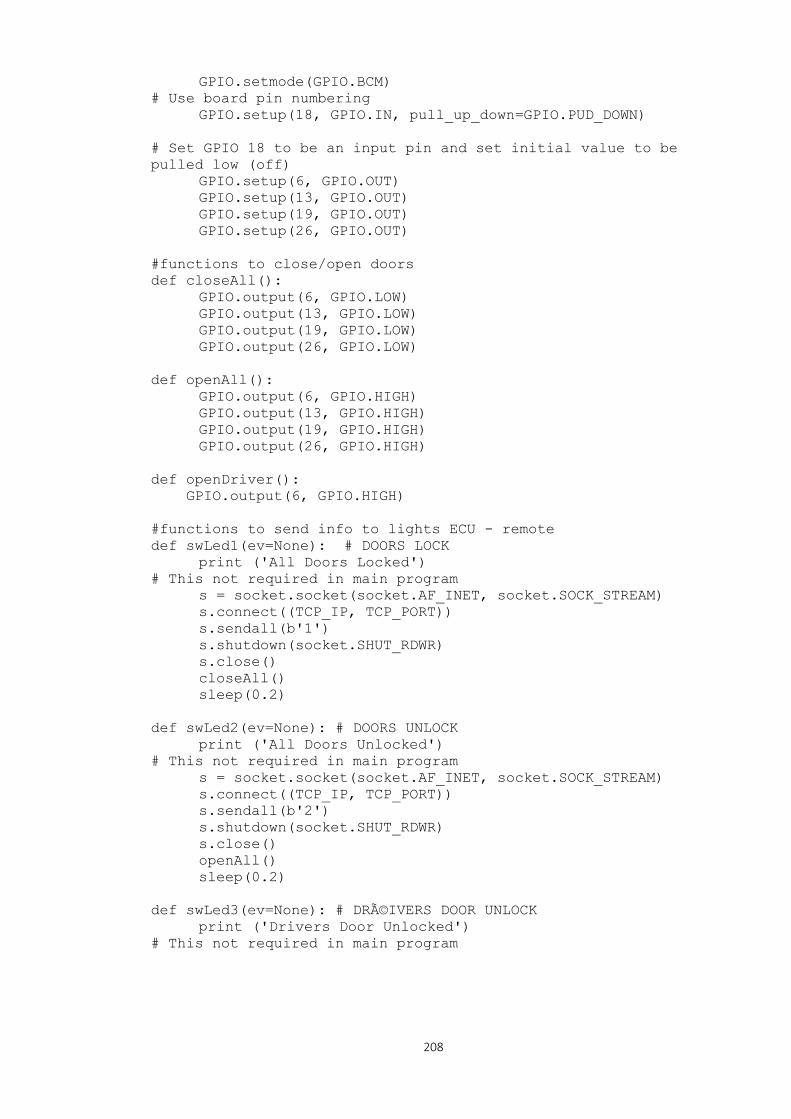
208
GPIO.setmode(GPIO.BCM) # Use board pin numbering GPIO.setup(18, GPIO.IN, pull_up_down=GPIO.PUD_DOWN) # Set GPIO 18 to be an input pin and set initial value to be pulled low (off) GPIO.setup(6, GPIO.OUT) GPIO.setup(13, GPIO.OUT) GPIO.setup(19, GPIO.OUT) GPIO.setup(26, GPIO.OUT) #functions to close/open doors def closeAll(): GPIO.output(6, GPIO.LOW) GPIO.output(13, GPIO.LOW) GPIO.output(19, GPIO.LOW) GPIO.output(26, GPIO.LOW) def openAll(): GPIO.output(6, GPIO.HIGH) GPIO.output(13, GPIO.HIGH) GPIO.output(19, GPIO.HIGH) GPIO.output(26, GPIO.HIGH) def openDriver(): GPIO.output(6, GPIO.HIGH) #functions to send info to lights ECU - remote def swLed1(ev=None): # DOORS LOCK print ('All Doors Locked') # This not required in main program s = socket.socket(socket.AF_INET, socket.SOCK_STREAM) s.connect((TCP_IP, TCP_PORT)) s.sendall(b'1') s.shutdown(socket.SHUT_RDWR) s.close() closeAll() sleep(0.2) def swLed2(ev=None): # DOORS UNLOCK print ('All Doors Unlocked') # This not required in main program s = socket.socket(socket.AF_INET, socket.SOCK_STREAM) s.connect((TCP_IP, TCP_PORT)) s.sendall(b'2') s.shutdown(socket.SHUT_RDWR) s.close() openAll() sleep(0.2) def swLed3(ev=None): # DRéIVERS DOOR UNLOCK print ('Drivers Door Unlocked') # This not required in main program
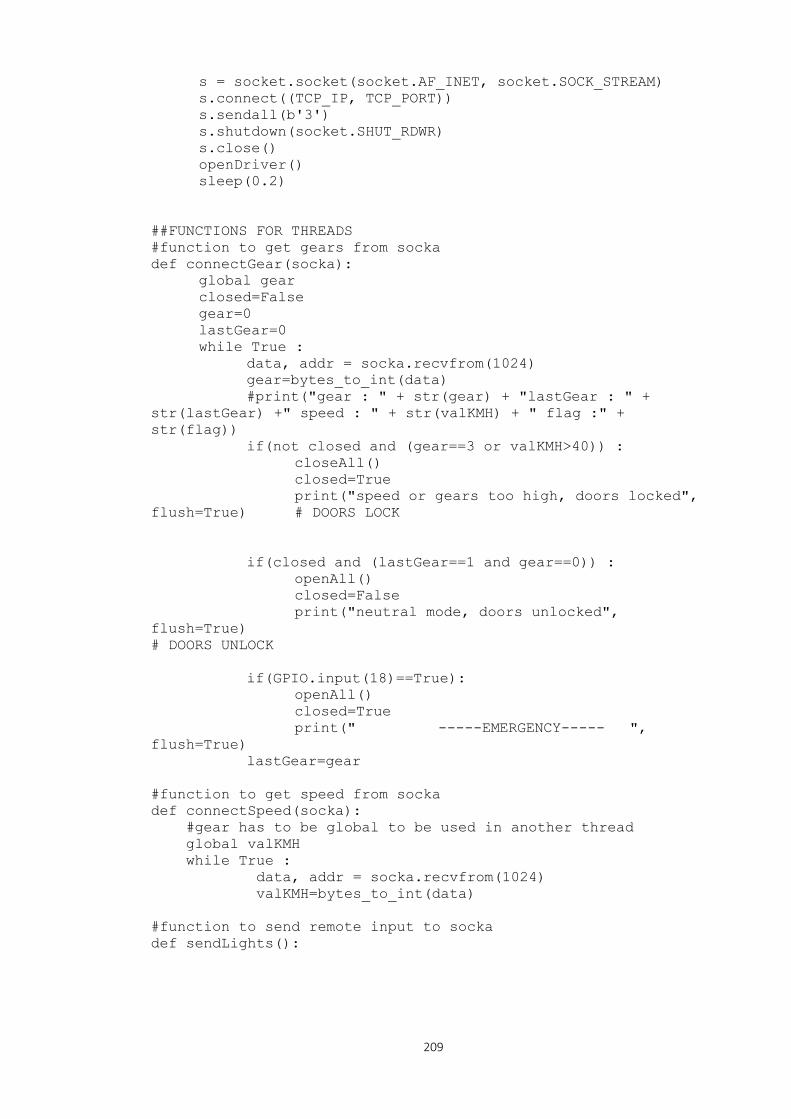
209
s = socket.socket(socket.AF_INET, socket.SOCK_STREAM) s.connect((TCP_IP, TCP_PORT)) s.sendall(b'3') s.shutdown(socket.SHUT_RDWR) s.close() openDriver() sleep(0.2) ##FUNCTIONS FOR THREADS #function to get gears from socka def connectGear(socka): global gear closed=False gear=0 lastGear=0 while True : data, addr = socka.recvfrom(1024) gear=bytes_to_int(data) #print("gear : " + str(gear) + "lastGear : " + str(lastGear) +" speed : " + str(valKMH) + " flag :" + str(flag)) if(not closed and (gear==3 or valKMH>40)) : closeAll() closed=True print("speed or gears too high, doors locked", flush=True) # DOORS LOCK if(closed and (lastGear==1 and gear==0)) : openAll() closed=False print("neutral mode, doors unlocked", flush=True) # DOORS UNLOCK if(GPIO.input(18)==True): openAll() closed=True print(" -----EMERGENCY----- ", flush=True) lastGear=gear #function to get speed from socka def connectSpeed(socka): #gear has to be global to be used in another thread global valKMH while True : data, addr = socka.recvfrom(1024) valKMH=bytes_to_int(data) #function to send remote input to socka def sendLights():
210
while True: if(ser.inWaiting()>0 and (gear==0)): # Serial waiting for input inputValue = ser.read(1) # Read incoming serial data if(inputValue == b'o'): swLed1() elif(inputValue == b'O'): swLed2() elif(inputValue == b'='): swLed3() ##DESTROY def destroy(socka): socka.close() ##MAIN if __name__ == '__main__': #defining the threads t1 = threading.Thread(target=connectGear, args=(sockg, )) t2 = threading.Thread(target=connectSpeed, args=(socks, )) t3 = threading.Thread(target=sendLights, args=()) setup() try: t1.daemon=True t2.daemon=True t3.daemon=True t2.start() t1.start() t3.start() while True: time.sleep(100) except KeyboardInterrupt: # When 'Ctrl+C' is pressed, the child program destroy() will be executed. destroy(sockg) destroy(socks) sys.exit()

211
Gear ECU
#!/usr/bin/env python
# coding: utf8 import sys import socket import threading import time from time import sleep # USEFUL FUNCTION # to translate int to bytes def int_to_bytes(value, length): result = [] for i in range(0, length): result.append(value >> (i * 8) & 0xff) result.reverse() return result # DEFINITION OF SOCKETS # to get gears from arduino UDP_IP = "" UDP_PORT = 40004 sock = socket.socket(socket.AF_INET, # for Internet socket.SOCK_DGRAM) # for UDP sock.bind((UDP_IP, UDP_PORT)) # to send gears to speed2 UDP_IP_send = "192.168.1.160" UDP_PORT_send = 40009 socksend = socket.socket(socket.AF_INET, # for Internet socket.SOCK_DGRAM) # for UDP # to send to door lock UDP_IP_sendlock = "192.168.1.140" UDP_PORT_sendlock = 40010 socksendlock = socket.socket(socket.AF_INET, # for Internet socket.SOCK_DGRAM) # for UDP # FUNCTIONS FOR THREADS # function to connect to Arduino and process gears def connectGear(socka): # gear has to be global to be used in another thread global gear gear = 0 lastgear = 0
212
while True: data, addr = socka.recvfrom(1024) # length of the buffer : 1024 bytes downShiftButton = data[0] upShiftButton = data[1] if((upShiftButton) == 1 and downShiftButton == 0 and lastGear == 0): if(gear < 5): gear = gear + 1 lastGear = 1 elif((downShiftButton) == 1 and (upShiftButton) == 0 and lastGear == 0): if(gear > 0): gear = gear - 1 lastGear = 1 else: gear = gear if(downShiftButton == 1 or (upShiftButton) == 1): lastGear = 1 else: lastGear = 0 # function to send gears to socka def sendGear(socka, IP, PORT): while True: gearbytes = bytes(int_to_bytes(gear, 1)) socka.sendto(gearbytes, (IP, PORT)) # DESTROY def destroy(socka): socka.close() # MAIN if __name__ == '__main__': # defining the threads t1 = threading.Thread(target=connectGear, args=(sock, )) t2 = threading.Thread( target=sendGear, args=(socksend, UDP_IP_send, UDP_PORT_send,)) t3 = threading.Thread(target=sendGear, args=( socksendlock, UDP_IP_sendlock, UDP_PORT_sendlock,)) try: t1.daemon = True t2.daemon = True t3.daemon = True t1.start() t2.start() t3.start() while True: time.sleep(100)
213
except KeyboardInterrupt: # When 'Ctrl+C' is pressed, the child program destroy() will be executed. print("-----QUITTING-----") destroy(sock) destroy(socksend) destroy(socksendlock) sys.exit()
Engine ECU
#!/usr/bin/env python # coding: utf8 import sys import socket import time import threading from time import sleep from datetime import datetime ##USEFUL FUNCTIONS #definition of the function for mapping a range values to another def translate(value, inputMin, inputMax, outputMin, outputMax): # Figure out how 'wide' each range is inputSpan = inputMax - inputMin outputSpan = outputMax - outputMin # Convert the input range into a 0-1 range (float) valueScaled = float(value - inputMin) / float(inputSpan) # Convert the 0-1 range into a value in the output range. return outputMin + (valueScaled * outputSpan) #to translate bytes into int def bytes_to_int(bytes): result = 0 for b in bytes: result = result * 256 + int(b) return result def int_to_bytes(value, length): result = [] for i in range(0, length): result.append(value >> (i * 8) & 0xff) result.reverse() return result ##DEFINITION OF SOCKETS

214
# Port to get gears UDP_IPg = "" UDP_PORTg = 40009 sockg = socket.socket(socket.AF_INET, # for Internet socket.SOCK_DGRAM) # for UDP sockg.bind((UDP_IPg, UDP_PORTg)) # Port to get speed from Arduino UDP_IPs = "" UDP_PORTs = 40002 socks = socket.socket(socket.AF_INET, # for Internet socket.SOCK_DGRAM) # for UDP socks.bind((UDP_IPs, UDP_PORTs)) # Port to send speed to door lock UDP_IP_send = "192.168.1.140" UDP_PORT_send = 40011 socksend = socket.socket(socket.AF_INET, # for Internet socket.SOCK_DGRAM) # for UDP ##FUNCTIONS FOR THREADS #function to connect to arduino and process gears def connectSpeed(socka): #speed has to be global to be used in another thread global valKMH valKMH=0 revsPC=0 while True : data, addr = socka.recvfrom(1024) hiValRPM = (data[0]) loValRPM = (data[1]) #Revs : Mapping from 0-1023 to 0-6000 if(hiValRPM == 0): revsPC = translate(loValRPM, 0, 255, 0, 1503) elif(hiValRPM == 1): revsPC = translate(loValRPM, 0, 255, 1504, 3004) elif(hiValRPM == 2): revsPC = translate(loValRPM, 0, 255, 3005, 4503) elif(hiValRPM == 3): revsPC = translate(loValRPM, 0, 255, 4504, 6000) #Speed : Mapping speed with gear value # 1st gear : 0-1023 to 0-20 km/h # 2nd gear : 0-1023 to 20-50 km/h # 3rd gear : 0-1023 to 50-80 km/h # 4th gear : 0-1023 to 80-110 km/h # 5th gear : 0-1023 to 110-160 km/h if(gear == 0): valKMH=translate(revsPC,0,6000,0,0)
215
elif (gear == 1): valKMH=translate(revsPC,0,6000,0,20) elif (gear == 2): valKMH=translate(revsPC,0,6000,20,50) elif (gear == 3): valKMH=translate(revsPC,0,6000,50,80) elif (gear == 4): valKMH=translate(revsPC,0,6000,80,110) elif (gear == 5): valKMH=translate(revsPC,0,6000,110,160) valMPH = valKMH * 0.62 print("RPM : " + str(round(revsPC,0)) + " // speed : " + str(round(valKMH,0)) + " // gear : " + str(gear)) #function to get gears from socka def connectGear(socka): #gear has to be global to be used in another thread global gear while True : data, addr = socka.recvfrom(1024) gear=bytes_to_int(data) #function to send speed to doorlock def sendSpeed(socka, IP, PORT): while True : kmhbytes = bytes(int_to_bytes(int(valKMH), 2) socka.sendto(str(int(valKMH)), (IP, PORT)) ##DESTROY def destroy(socka): socka.close() ##MAIN if __name__ == '__main__': #defining the threads t2 = threading.Thread(target=connectGear, args=(sockg, )) t1 = threading.Thread(target=connectSpeed, args=(socks, )) t3 = threading.Thread(target=sendSpeed, args=(socksend, UDP_IP_send, UDP_PORT_send,)) try: t1.daemon=True t2.daemon=True t3.daemon=True t1.start() t2.start() t3.start() while True: time.sleep(100)
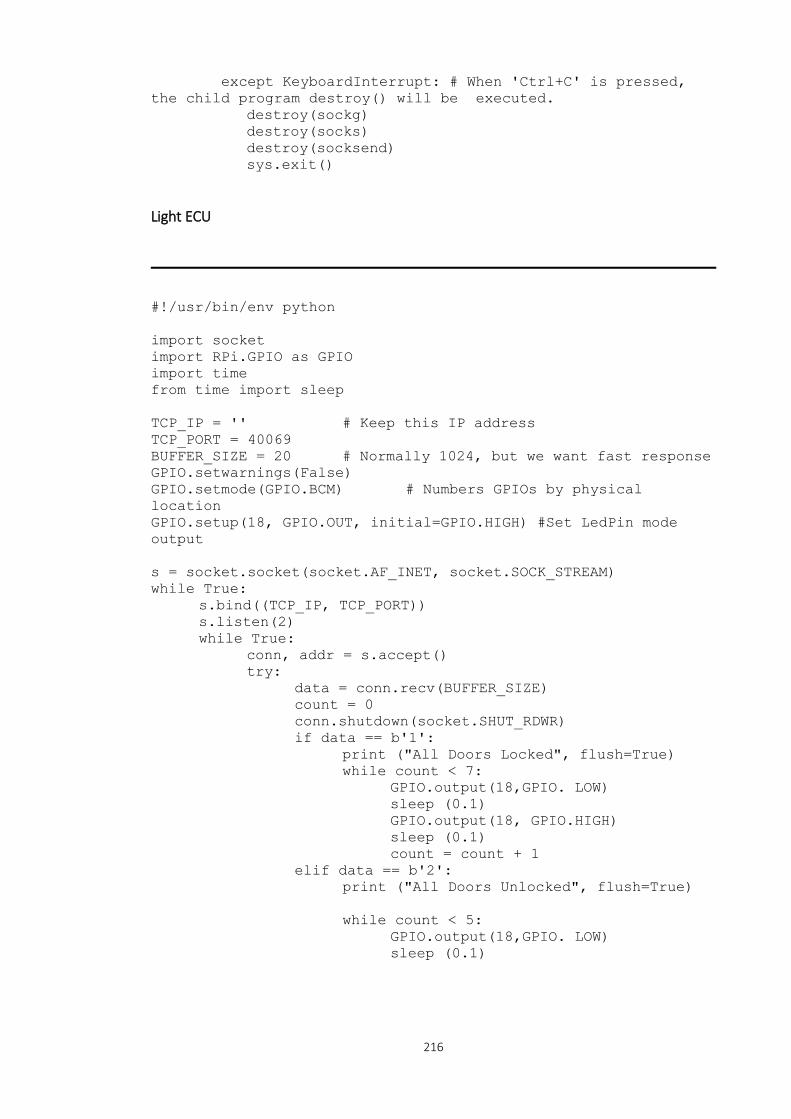
216
except KeyboardInterrupt: # When 'Ctrl+C' is pressed, the child program destroy() will be executed. destroy(sockg) destroy(socks) destroy(socksend) sys.exit() Light ECU
#!/usr/bin/env python import socket import RPi.GPIO as GPIO import time from time import sleep TCP_IP = '' # Keep this IP address TCP_PORT = 40069 BUFFER_SIZE = 20 # Normally 1024, but we want fast response GPIO.setwarnings(False) GPIO.setmode(GPIO.BCM) # Numbers GPIOs by physical location GPIO.setup(18, GPIO.OUT, initial=GPIO.HIGH) #Set LedPin mode output s = socket.socket(socket.AF_INET, socket.SOCK_STREAM) while True: s.bind((TCP_IP, TCP_PORT)) s.listen(2) while True: conn, addr = s.accept() try: data = conn.recv(BUFFER_SIZE) count = 0 conn.shutdown(socket.SHUT_RDWR) if data == b'1': print ("All Doors Locked", flush=True) while count < 7: GPIO.output(18,GPIO. LOW) sleep (0.1) GPIO.output(18, GPIO.HIGH) sleep (0.1) count = count + 1 elif data == b'2': print ("All Doors Unlocked", flush=True) while count < 5: GPIO.output(18,GPIO. LOW) sleep (0.1)

217
GPIO.output(18, GPIO.HIGH) sleep (0.1) count = count + 1 elif data == b'3': print ("Drivers Door Unlocked", flush=True while count < 3: GPIO.output(18,GPIO. LOW) sleep (0.1) GPIO.output(18, GPIO.HIGH) sleep (0.1) count+=1 finally: conn.close()
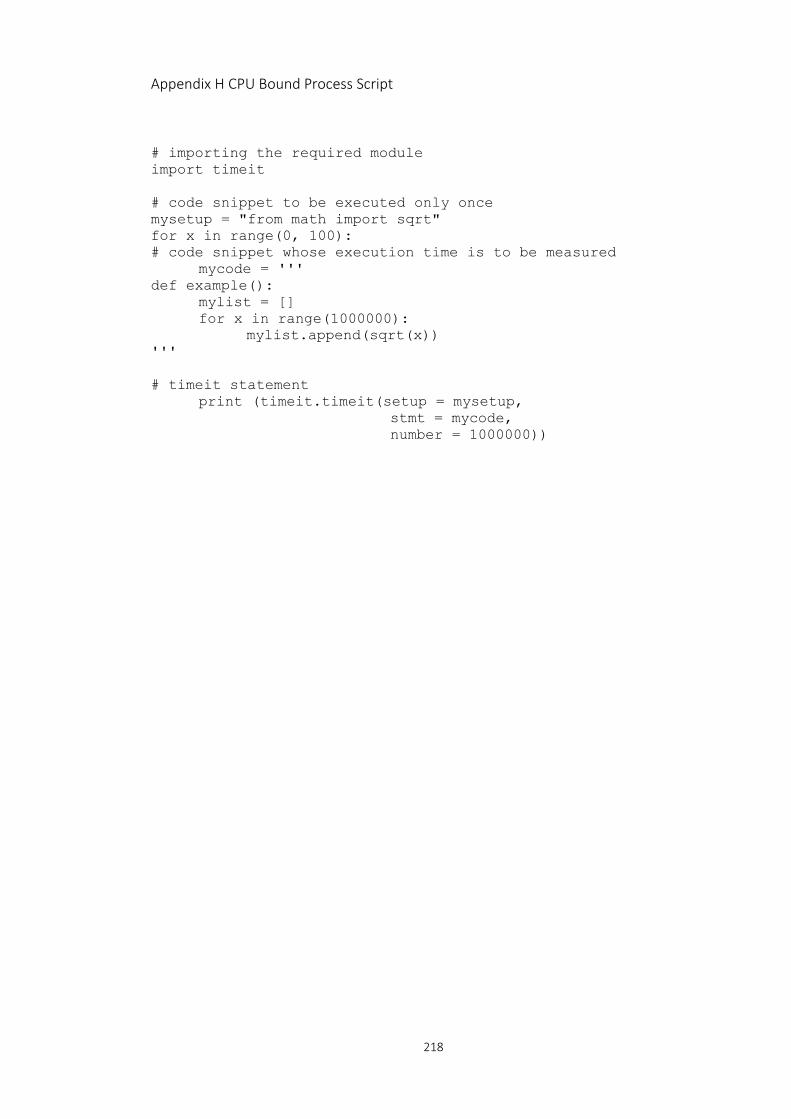
218
Appendix H CPU Bound Process Script
# importing the required module import timeit # code snippet to be executed only once mysetup = "from math import sqrt" for x in range(0, 100): # code snippet whose execution time is to be measured mycode = ''' def example(): mylist = [] for x in range(1000000): mylist.append(sqrt(x)) ''' # timeit statement print (timeit.timeit(setup = mysetup, stmt = mycode, number = 1000000))