
ANALYSIS OF THE PERFORMANCE OF CONTAINER ...
13
International Journal of Economics, Commerce and Management United Kingdom ISSN 2348 0386 Vol. VIII, Issue 10, Oct 2020 Licensed under Creative Common Page 73 http://ijecm.co.uk/ ANALYSIS OF THE PERFORMANCE OF CONTAINER TERMINAL OPERATIONS IN TINCAN ISLAND PORT, LAGOS, NIGERIA Mogbojuri Oluwagbenga Department Of Maritime Transport Studies, Maritime Academy Of Nigeria, 4, College Road, P.M.B 1089, Oron, Akwa Ibom State, Nigeria [email protected] Abstract Maritime transport plays a crucial role in being many nations’ major gateway for international trade and is an important tool for evaluating the economic wealth of any nation. This paper examined the annual growth rate, turnaround time, berth occupancy rate and container throughput, Tincan Island Port. Secondary data was used to analyse the collected data. Ordinary Least Square regression was used to analyse the secondary data, which are the annual growth rate of container throughput, turnaround time and berth occupancy rate. The result showed an R2 value of 92.3% (R2 = 0.923) in the annual growth rate of container throughput. However, a unit increase in the turnaround time at the terminal has a negative effect of about 8.3% on the annual growth rate. All the other variables (number of vessels, container throughput and berth rate were significant at p < 0.05 with R2 = 0.748, 0.603 and 0.031, respectively. Based on the findings of the study, it was concluded that there was an annual growth rate of container throughput and gross registered tonnage of the vessel from 2005 to 2015. It was recommended that terminal operators should invest more in modern handling equipment to ease the movement of containers at the terminal. Training and retraining of indigenous personnel by terminal operators that will handle fast and modern equipment. Keyword: Container terminal, turnaround time, berth occupancy rate, container throughput
-
Upload
khangminh22 -
Category
Documents
-
view
3 -
download
0
Transcript of ANALYSIS OF THE PERFORMANCE OF CONTAINER ...

International Journal of Economics, Commerce and Management United Kingdom ISSN 2348 0386 Vol. VIII, Issue 10, Oct 2020
Licensed under Creative Common Page 73
http://ijecm.co.uk/
ANALYSIS OF THE PERFORMANCE OF
CONTAINER TERMINAL OPERATIONS IN
TINCAN ISLAND PORT, LAGOS, NIGERIA
Mogbojuri Oluwagbenga
Department Of Maritime Transport Studies, Maritime Academy Of Nigeria,
4, College Road, P.M.B 1089, Oron, Akwa Ibom State, Nigeria
Abstract
Maritime transport plays a crucial role in being many nations’ major gateway for international
trade and is an important tool for evaluating the economic wealth of any nation. This paper
examined the annual growth rate, turnaround time, berth occupancy rate and container
throughput, Tincan Island Port. Secondary data was used to analyse the collected data.
Ordinary Least Square regression was used to analyse the secondary data, which are the
annual growth rate of container throughput, turnaround time and berth occupancy rate. The
result showed an R2 value of 92.3% (R2 = 0.923) in the annual growth rate of container
throughput. However, a unit increase in the turnaround time at the terminal has a negative effect
of about 8.3% on the annual growth rate. All the other variables (number of vessels, container
throughput and berth rate were significant at p < 0.05 with R2 = 0.748, 0.603 and 0.031,
respectively. Based on the findings of the study, it was concluded that there was an annual
growth rate of container throughput and gross registered tonnage of the vessel from 2005 to
2015. It was recommended that terminal operators should invest more in modern handling
equipment to ease the movement of containers at the terminal. Training and retraining of
indigenous personnel by terminal operators that will handle fast and modern equipment.
Keyword: Container terminal, turnaround time, berth occupancy rate, container throughput

© Mogbojuri Oluwagbenga
Licensed under Creative Common Page 74
INTRODUCTION
Maritime transport plays a vital role in being many nations’ major gateway for international trade
and is a veritable tool for evaluating the economic wellbeing of any nation (Ogunsiji 2010,
UNCTAD, 2007). Notably, the seaborne trade accounts for about 90 per cent of the world
international trade (Gabriel, 2019). Seaport is, therefore, regarded as the strategic driver for
national economic development. It comprises all enterprises involved in constructing,
manufacturing, the business of designing, supplying, operating, repairing and/or maintaining
vessels, or component parts: managing and/or operating shipping lines, freight forwarding,
custom brokerage services, marine docks, shipyards, dry docks, marine railways, stevedoring
services and similar enterprises. These enterprises can be linked with the various parastatals
and agencies, and other players in the private sector (Branch, 1986).
Maritime transportation has the largest share among all other transportation modes with
its cost-effectiveness. Regarding growth in container traffic, ports business grown into a much
more challenging environment. It is, therefore, crucial to the proper operation of any country’s
economy and an essential component of a nation’s transport infrastructure. Igbokwe (2001),
asserted the statement that transport is to the Nigerian economy what the artery is to the blood
circulation. Therefore, ports are highly significant in facilitating international trade. They are
component of the international supply chain network (Pomeroy, 1994). The ultimate purpose of
a container terminal is to manage vessels at the place of the berth, inbound container
unloading, outbound container loading and storage yards as aptly as possible. Such an
objective can be achieved by coordinating the berthing time of vessels, the resources needed
for handling the workload, the waiting time of customer trucks and, at the same time, ensuring
that congestion is reduced on the roads, at the storage blocks and docks. Each of these
activities cogently influences port efficiency with consequences on the local and global economy
of the freight transport system. (Armando and Francesco, 2010) However, in Nigeria, Nigerian
Ports Authority regulates the activities of the ports, ensuring that all activities are in the interest
of the port, administers land and ensures the maintenance of the infrastructure including the
depth of the berths (Pinwa, 1999). Nigerian Ports Authority (NPA) constructs specialised ports
such as the container Terminal and RORO ports all in Lagos. This Authority enjoys operational
benefits of terminal ownership: it ensures, by priority use of the facility, a level of service tailored
to the line and it allows exercising a greater dominance over costs. Sadly, the situation in
Nigerian ports is intolerable due to some factors influencing the operational performance of
container terminals. These constraints are constraints of berth allocation and scheduling,
handling equipment, storage yard capacity and the delivery system (Somuyiwa and Ogundele,
2015).

International Journal of Economics, Commerce and Management, United Kingdom
Licensed under Creative Common Page 75
Onwumere (2008) asserted that vessels on arrival consume more time waiting to berth and
consequently, more ships tend to queue at the channels and outside the bar waiting for
berthage. This often results to delay and congestion in the terminal. His view was that
congestion arises when cargoes coming into the port are more than what the storage facilities
can handle. Similarly, Emeghara (1992) asserted that from 1975-76, ship congestions at the
Nigerian seaports were not due to lack of berthing facilities, but due to the fact that the cargoes
stacking areas were not relieved of traffic as early as they should be. He further explained that
inefficient, inadequate and cost-effective transport linkages with the hinterlands of the ports
pose operational problems which mitigate against capacity utilisation. This paper was set out to
analyse the performance of container terminal operations in Tincan Island Port and to suggest
possible solutions so as to ensure a sustainable system.
LITERATURE REVIEW
Transport researchers have simply described a seaport as a geographic nodal point along a
given shoreline where the mode of transportation changes from land to sea or water, or vice
versa and involves the provision and presence of geographical opportunities and merits, socio-
economic potentialities and endowments, state of technological advancement and political
considerations (Patrick, 1999). Studies have shown that a port provides for the transfer of cargo
from one mode of transportation to another. Olaogbebikan et al, (2014) defined port as a
location on a coast or shore constituting one or more harbours where ships are docked and
transfer people or cargo to or from the land. Port locations are selected to optimise access to
land and navigable water, for commercial demand, and for shelter from wind and waves. A port
comprises of three elements, and they are:
Physical structure: This includes wharves, dock, storage, space and cranes
Port Authority: The management of the business entity
Service providers: Such as longshoreman and terminal operators.
However, the Nigerian Ports Authority owns the land and infrastructure and the infrastructure is
leased to private operating companies. The private operating company provides and maintains
the equipment and employs labour to handle cargo. For this kind of port, only the cost of
infrastructure falls under the account of the Port Authority; the stevedore covers all other costs.
Tincan Island port which serves as the scope of this study consists of one or more container
terminals.

© Mogbojuri Oluwagbenga
Licensed under Creative Common Page 76
Productivity Concept
The concept of productivity is defined as a ratio of the volume measure of output to the volume
measure of input used, whereas efficiency is a relative concept, i.e. the performance of a firm is
compared to a benchmark (OECD, 2001). Karen (2001) traditionally defined productivity by the
production function, which correlates quantities of input with quantities of output. However, there
is a difference between productivity and output. A port, for example, could handle more cargo at
a berth by employing more men per gang, more gangs, more equipment and building more
storage space. You will certainly be increasing berth output but not necessarily improving
productivity. Marlow and Paixo (2003) argued that most researches conducted on port
productivity are based on quantitative measures, as it is easier in assessing port performance.
Ports are regarded as service-oriented; therefore, efficiency is of great However, Meyrick and
Tasman Asia Pacific (1998) asserted that there are two categories of partial productivity
measures which have been used in port productivity studies. Firstly, labour productivity which is
the annually lifts per employee and is defined as the number of container movements (container
lifts) per terminal employee. Secondly, net crane rate (capital productivity), and is defined as the
number of container movements (container lifts) per net crane hour. This is the keyword of an
efficient container terminal to show to the stakeholders for high productivity.
JOC (2013) was of the opinion that Marine terminal productivity in individual scenarios
isn’t an unalterable reality based on local circumstances of labour, capital, management,
infrastructure and politics. Rather, productivity is of great importance, as ports themselves factor
into trade facilitation - where effectiveness in productivity translates into spinoff benefits or
bottlenecks in supply chains, availability of goods on store shelves, employment. However,
some literature in port productivity has their major focus on terminal equipment such as yard
crane and truck (Ng, 2003) quay crane (kim et al, 2004: Kozan, 2001) and rubber-tyred gantry
crane (zhang et al., 2002). Their focus is to ensure that terminal operators are able to maximise
these kinds of equipment. In maritime subsector, Tongzon, (2005) revealed that port productivity
and performance are measured in terms of a number of containers moved through a port,
known as cargo throughput, on the presumption that ports are throughput maximisers. He also
suggested an alternative port performance indicator easier than UNCTAD, (1976) postulated,
when he focused on location, frequency of vessel calls, port charges, economic and terminal
efficiency, which Tongzon (1994) harmonised into three: economic, location and operational.
However, JOC, (2013), argued that improving terminal productivity is becoming more urgent, in
large part because vessels are getting ever larger. Importance in determining moves per hour
for loading and discharging container from and onto the vessel.

International Journal of Economics, Commerce and Management, United Kingdom
Licensed under Creative Common Page 77
The largest ship afloat in 1990 could uphold 4,800 20-foot-equivalent container units. Today,
vessels in the major trade lanes typically carry 8,000 to 13,000 TEUs. Hence port productivity
concept is a viable concept used in measuring port performance.
Functions and configuration of the container port/terminal
The container was designed to improve handling efficiency, primarily port handling efficiency,
but also for all the handling between different transport modes. Standardisation of cargo
handling, therefore requires highly specialised facilities (Qianwen, 2010). The facilities of a
container port are the same, regardless of their size and regulatory policy. The basic function of
a seaport is to transfer goods and passengers between ships and shore and/or between ships
(Goss, 1990).
The basic function of a port is to provides different kinds of facilities and services. The
World Bank classifies port assets into four different categories: basic port infrastructure,
operational infrastructure, superstructure, and equipment. Table 1 explained the categories of
port assets.
Table 1: categories of port assets
Basic infrastructure Access channel, breakwater, locks, berths, rail and road connection
Operational
infrastructure
Inner channels and turning, revetments, quay walls, jetties, navigation aids,
buoys, beacons, mooring docks
Superstructure Paving, surfacing, lighting offices, repair shops
Equipment Tugs, line handling vessels, dredging equipment, ship and shore handling
equipment and cargo handling equipment
Source: World Bank (2007, p. 95)
Container ports are multifaceted organisations accommodating multiple simultaneous activities,
e.g. tugging, pilotage, mending, etc., but container handling is the principal function of a
container port, with handling constituting over 80% of the charges faced by a carrier bringing a
container vessel to a port for loading and unloading (Tovar, Trujillo and Jara-Diaz, 2004).
According to Qianwen (2010), a container port consists of one or more container terminals. In
order to convey containers from ship to shore and within the port, the prerequisite facilities
include berths for ships to park, area for container stacking and storage, and handling
equipment to load and offload containers. Among those facilities, the container handling
equipment differentiates container ports from other ports.

© Mogbojuri Oluwagbenga
Licensed under Creative Common Page 78
There is a huge diversity of container handling equipment, but they can be classified
into two main groups: quay crane and yard handling system. On the quayside,
containers are transported between ship and shore and container quay cranes are
the main equipment used for ship loading and unloading. It can be either mounted on the
ship (ship-mounted cranes), or located on the quay, ship-to-shore (STS) cranes; the latter is
widely used in container ports and terminals. On the yard side, containers are transferred to
land transport modes or are arranged to be loaded on to other ships. Two types of
activities occur in the yard area: stacking of container and horizontal transport.
Before containers are moved away they are stacked in the yard area. Stacking
equipment for containers includes Straddle Carriers, Rubber Tired Gantry Cranes
(RTGs), Rail Mounted Gantry Cranes (RMGs), Reach stackers, and Stackers for Empty
Containers. Horizontal terminal transport is the movement of containers between the
STS, the stacking area, and the landside operation. Equipment for horizontal transport
includes trucks, trailers, straddle carriers, Automated Guided Vehicles (AGV), and reach
stackers.
In addition to the handling facility, terminal size, berth length, storage and trained
labour are all important to the operation of container handling. A container port can be seen
as the collection of its terminals in terms of physical structure. However, the operation
objectives of ports and terminals cannot be compared because the operating agents are
different (Liu,2010).
METHODOLOGY
Tincan Island Port Complex was used as the study area. It is situated in Apapa, Lagos,
Nigeria. It is about seven kilometers due west of the city center of Lagos across Lagos
Harbor Wikipedia, (2016). It is termed as the second busiest Port in Nigeria after Apapa Port
with her coordinates 6.4328° N, 3.3452° E and has bearing of Latitude 620N Longitude
30023E.
Secondary data were used for the purpose of this study. The secondary data was
obtained from Nigerian Ports Authority. Both descriptive and inferential statistics were used to
analyse the data. Ordinary Least Square Regression was used to analyse the data. Figure 1
show the digital map of the study area.

International Journal of Economics, Commerce and Management, United Kingdom
Licensed under Creative Common Page 79
Figure 1: Digital map of Tincan Island Port, Lagos
Source: Department of Survey and Geoinformatics, University of Lagos, Nigeria (2016)
RESULTS AND DISCUSSION
Table 2 shows the annual Growth Rate of container throughput turnaround time and berth
occupancy rate from 2005 to 2015. Figure 2 shows the trend of container throughput from
2005 to 2015. There is an increase in term of container throughput from 2005 to 2013. This
is an upward trend. However, there is a downward trend from 2013 to 2015. The economic
recession was the factor that causes a decrease in the trend of container throughput from
2013 to 2015.
However, Okedu (2013) asserted that there was an annual growth rate of cargo
throughput in the year 2013. This due to port reforms in the Nigeria maritime industry.
Olaogbebikan et al, (2014) opined that the concession of the port is responsible for this upward
movement in cargo trend.

© Mogbojuri Oluwagbenga
Licensed under Creative Common Page 80
Figure 2: Graph of container throughput
Figure 3 shows the downward trend of turnaround time from 2005 to 2015. It decrease
drastically from an average of 9.00 days to 4.27 in 2011 and increase to 5.25 days in 2012 and
later drop to 4.13 days in 2015.
Figure 3: Graph of turnaround time

International Journal of Economics, Commerce and Management, United Kingdom
Licensed under Creative Common Page 81
However, Olaogbebikan et al, (2014) stated that turnaround time of vessel is high at the
average rate of 5.25 days in 2012 as against the International Maritime Organization 48hrs
stipulations. Moreover, the drop in the turnaround time in the year 2015 is due to modern cargo
handling equipment.
Furthermore, figure 4 shows the trend of berth occupancy rate from 2005 to 2015. The
berth occupancy rate increases immediately after concession era from 2005 to 2007 and drop
2008 then later increase from 2009 to 2010 and decline in the year 2015. Similarly, Omoke et al
(2015) asserted that the substantial decline in 2008 could be seen as a natural trend or pattern
observable in relationships portraying changes in demand and supply capacities of goods
and services.
Figure 4: Graph of berth occupancy rate.
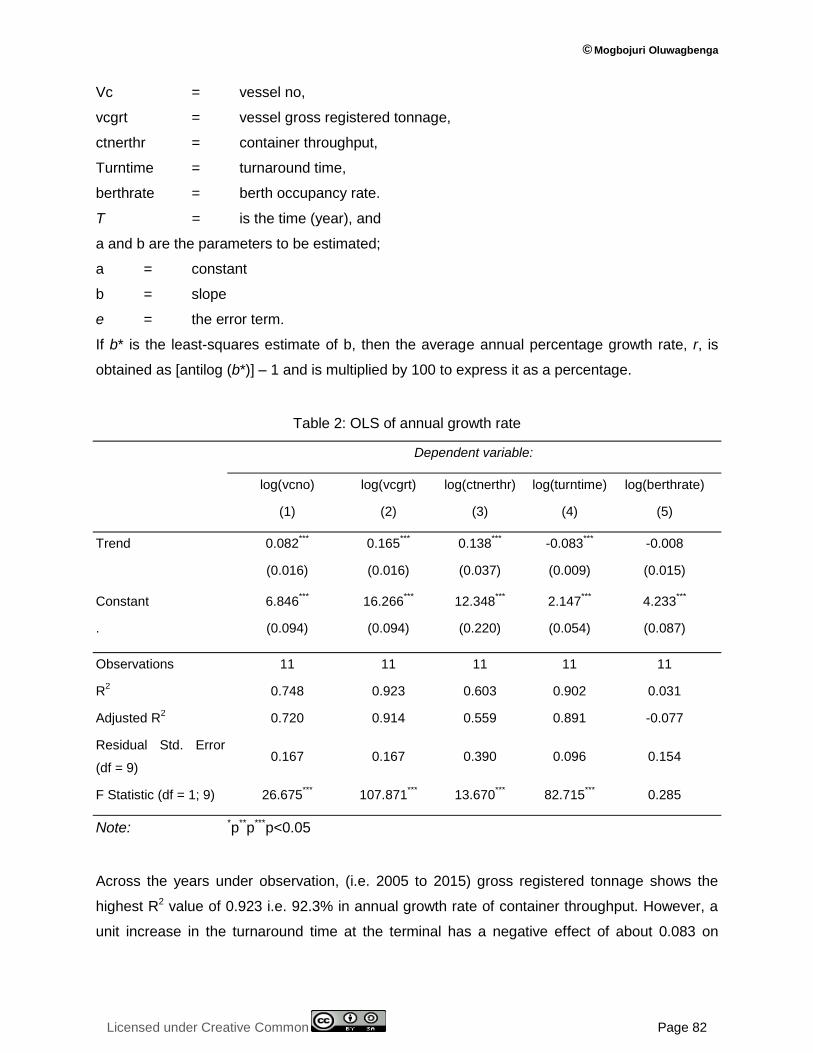
Table 2 analysed the annual growth rate of container throughput turnaround time and berth
occupancy rate from 2005 to 2015. Average annual growth rates were calculated for each
period by the least-squares regression method. The least-squares growth rate, r, is estimated
by fitting a least-squares trend regression line to the logarithmic annual value of the variable in
the relevant period.
© Mogbojuri Oluwagbenga
Licensed under Creative Common Page 82
Vc = vessel no,
vcgrt = vessel gross registered tonnage,
ctnerthr = container throughput,
Turntime = turnaround time,
berthrate = berth occupancy rate.
T = is the time (year), and
a and b are the parameters to be estimated;
a = constant
b = slope
e = the error term.
If b* is the least-squares estimate of b, then the average annual percentage growth rate, r, is
obtained as [antilog (b*)] – 1 and is multiplied by 100 to express it as a percentage.
Table 2: OLS of annual growth rate
Dependent variable:
log(vcno) log(vcgrt) log(ctnerthr) log(turntime) log(berthrate)
(1) (2) (3) (4) (5)
Trend 0.082***
0.165***
0.138***
-0.083***
-0.008
(0.016) (0.016) (0.037) (0.009) (0.015)
Constant 6.846***
16.266***
12.348***
2.147***
4.233***
. (0.094) (0.094) (0.220) (0.054) (0.087)
Observations 11 11 11 11 11
R2 0.748 0.923 0.603 0.902 0.031
Adjusted R2 0.720 0.914 0.559 0.891 -0.077
Residual Std. Error
(df = 9) 0.167 0.167 0.390 0.096 0.154
F Statistic (df = 1; 9) 26.675***
107.871***
13.670***
82.715***
0.285
Note: *p**p***p<0.05
Across the years under observation, (i.e. 2005 to 2015) gross registered tonnage shows the
highest R2 value of 0.923 i.e. 92.3% in annual growth rate of container throughput. However, a
unit increase in the turnaround time at the terminal has a negative effect of about 0.083 on

International Journal of Economics, Commerce and Management, United Kingdom
Licensed under Creative Common Page 83
annual growth rate. All the other variables (number of vessels, container throughput and berth
rate are all significant at p < 0.05 with R2 = 0.748, 0.603 and 0.031 respectively. Among all
these identified variables, berth occupancy rate is at the lowest ebb based on these findings
with reference to years under observation.
CONCLUSION AND RECOMMENDATIONS
Based on the findings of the study, it was concluded that there was an annual growth rate of
container throughput and gross registered tonnage of vessel from 2005 to 2015. It was also
revealed that there is a downward trend of turnaround time from 2005 to 2015. Similarly, there
was an increase in the annual growth of berth occupancy rate which later decline in 2008 due to
unknown variables. Omoke et al (2015) asserted that the substantial decline in 2008 could be
seen as a natural trend or pattern observable in relationships portraying changes in
demand and supply capacities of goods and services. The following recommendations are
put forward based on the findings of the study:
i. Sophisticated equipment that will ensure the optimisation and utilisation of vessel traffic
should be provided.
ii. Terminal operators should invest more on modern handling equipment to ease the
movement of containers at the terminal
iii. Training and retraining of indigenous personnel by terminal operators that will handle
fast and modern equipment.
iv. Policy that will enhance the productivity of container terminal operations should be
enacted
SCOPE FOR FURTHER STUDIES
Southwestern ports can be adopted for further studies which comprise of Tincan Island port and
Lagos port complex in Nigeria. Other reviews can also examine the idle time of vessels at berth
and the dwell time of cargo at the terminal.
REFERENCES
Armando C. and Francesco R. (2010). Regional freight transport distribution model.
Avriel, M., Penn, M., and Witteboon, S. (1998). Stowage planning for containerships to reduce the number of shifts. Annals of Operations Research, 76, pp. 55-71.
Branch, A.E (1986). Element of port operation and management, Shapman and Hall, New York
Department of Survey and Geoinformatics, University of Lagos, Nigeria (2016). Digital map of Tincan Island Port, Lagos
Emeghara G.C (1992). Capacity utilisation of Nigeria Ports. An unpublished M.Sc presented to the Department of Transport Management Technology, FUTA, Owerri

© Mogbojuri Oluwagbenga
Licensed under Creative Common Page 84
Gabriel, Maero Eto (2019). The Nigerian maritime environment and industry: issues, challenges and prospects. Published by Heaven Rule Heritage Enterprises Limited Lagos, Nigeria. ISBN: 978-978-966-721-5.
Igbokwe, M. I. (2001). The importance of maritime transport in the Nigeria economy. www.mikeigbokwe.com
Igbokwe, M. I. (2013). Major Problems Associated with the Nigerian Ports System and Suggested Solutions. An Unpublished Seminar Paper written in 2001.
JOC (2013). Key findings on terminal productivity performance across ports, countries and region. www.joc.com/port_productivity
Kadiri W. A. (2003). Freight Transportation and the Nigerian economy: The role of infrastructural facilities in Waheed, (et al). Organisation and management of freight transport in Nigeria.
Karen L. (2001). Measuring faculty productivity. www.researchgate.net
Kareem, W. A. (2000). “Tenets of a User – Friendly Port”, Constraints and Remedies for Nigerian Cargo Interest: A Seminar paper presented on fighting Corruption and Sharp Practices in the Ports’ System Organised by the Nigerian Ports Authority pp 20-30.
Kim, K. H. and Park, K. T. (2004). A Note on A Dynamic Space – Allocation Method for outbound Containers. European Journal of Operational Research. 92 – 101.
Kozan, E. (2001). Optimising Container Transfer at Multimodal Terminals. Mathematical and Computing Modelling.:235 – 243.
Kozan, E. and Preston, P. (1999). Genetic algorithms to schedule container transfers at multimodal terminals. International Transactions in Operational Research, 6 (3), pp. 311-329.
Marlok E. K. (2002). Introduction to transportation Engineering and planning, McGraw Hill Book company, New York.
Marlow, P.B and Paixao A.C (2003). Measuring ports performance. International journal of transport management, pg 189-202
Meersman P.I. and Dekker R. (2001). Operations research supports container handling. Econometric Research Paper
Meyrick A. and Tasman Asia Pacific (1998). Measures to promote effective and efficient container port practices: marine and ports group of the Australian Transport Councils.
Ng W.C,(2003). Crane Scheduling in Container yards with Intercrane Interference. European Journal of Operational Research 1- 15.
OECD Maritime Transport Committee (2003), Availability and training of seafarers. Precious Associates Limited January 2003. Available online at: http://www.oecd.org/dataoecd/32/62/2489394.pdf. Accessed 22.5.2012
Ogunsiji, A. S. (2011). Comparative Port Performance Efficiency Measurement in Developing Nations: A Matching Framework Analysis, European journal of Social Sciences – Vol. 18, Number 4.
Ogunsiji, O.O (2010). Measures of improving ports logistics efficiency in Nigeria: A case study of Tincan Island Port, Lagos Nigeria. Unpublished master thesis, Herriot-Watt University Edinburgh U.K
Okeudo G.N (2013). Effect of port reform on cargo throughput level at Onne seaport, Nigeria. A comparative study before and after reform. pg 71-78
Olaogbebikan et al (2014). Performance evaluation of Nigerian ports: pre and post concession eras.
Omoke et al (2015). Infrastructural financing management: the impact of concession on the operations and performance of Nigerian Seaports.
Onwumere, (2008). Handout on Maritime Transport, Operations and Management, Certified Institute of Shipping, Lagos.
Patrick M.A. (1999). Port management and operations. Sweden
Pinwa T. N (1999). The assessment of the performance of the landlord port in Nigeria.
Pomeroy S.R (1994). Communtiy management and common property of coastal fisheries in Asia and the pacific concepts, methods and and experience, Manilo, Icarm
Qianwen Liu (2010). Efficiency of container ports and terminals. A thesis submitted for the degree of doctor of philosophy of University College, London

International Journal of Economics, Commerce and Management, United Kingdom
Licensed under Creative Common Page 85
Somuyiwa A.O and Ogundele A.V. (2015). Correlate of port productivity components in tin can island port, Apapa, Lagos
Tongzon J (1995). Determinants of port performance and efficiency. Transportation research: A policy and practice
29 (3) 245 - 252
Tongzon, J. and Heng, W. (2005). Port Privatization, Efficiency and Competitiveness: Some Empirical Evidence from Container Ports (Terminals). Transportation Research Part A, 39, pp.405-424
UNCTAD (1976). Port performance Indicator. Geneva: United Nations. http://www.unctad.org/en/docs /rmt2004_en.pdf