Experimental Evaluation of the Seismic Performance of Reinforced Concrete Bridge Columns
Upload
khangminh22Category
view
0download
0
SEISMIC PERFORMANCE, ANALYSIS, AND DESIGN OF HYBRID
CONCRETE-MASONRY
A Dissertation
Presented to
The Academic Faculty
by
Laura M. Redmond
In Partial Fulfillment
of the Requirements for the Degree
Doctorate of Philosophy in the
School of Civil and Environmental Engineering
Georgia Institute of Technology
May 2015
Copyright © by Laura M. Redmond 2015

SEISMIC PERFORMANCE, ANALYSIS, AND DESIGN OF HYBRID
CONCRETE-MASONRY
Approved by:
Dr. Reginald DesRoches, Advisor
School of Civil and Environmental Engineering
Georgia Institute of Technology
Dr. Lawrence Kahn
School of Civil and Environmental
Engineering
Georgia Institute of Technology
Dr. Russell Gentry
School of Architecture
Georgia Institute of Technology
Dr. Kimberly Kurtis
School of Civil and Environmental
Engineering
Georgia Institute of Technology
Dr. Barry Goodno
School of Civil and Environmental Engineering
Georgia Institute of Technology
Dr. Andreas Stavridis
Department of Civil, Structural, and
Environmental Engineering
University of Buffalo
Date Approved: November 19, 2014
iv
ACKNOWLEDGEMENTS
I would like to thank my advisor, Dr. Reginald DesRoches, for placing me on the
Caribbean Hazard Assessment Mitigation and Preparedness (CHAMP) Project, giving me
the freedom to pursue this dissertation topic, and providing the resources to conduct the
experiments. He has been a great mentor and advocate for me throughout my time as a
PhD student at Georgia Tech. I would like to thank Dr. Lawrence Kahn, whose advice
regarding the experimental program was instrumental to its success. I appreciated the
time Dr. Andreas Stavridis took to teach me the finite element modeling method from
which I began my analytical work. I am indebted to numerous undergraduate students
who worked so diligently and weren't afraid to get messy in the lab: Andrew Johnson,
Carlee Hayden, Derek Zittrauer, Parker Haren, Harrison Parker, Kasey Henneman, Coli
Smith, Leonardo Rogliero, and George Chrysochos. I am also grateful for the donations
from Simpson Strong Tie, United Forming and Jollay Masonry for the project. Finally, I
would like to thank my husband, Matt. He continually supported me, helped put things
into perspective when I took work too seriously, and lent me his muscles for a few late
nights in the lab.
v
TABLE OF CONTENTS
ACKNOWLEDGEMENTS ............................................................................................... iv
LIST OF TABLES ............................................................................................................. ix
LIST OF FIGURES .......................................................................................................... xii
NOMENCLATURE ........................................................................................................xxv
SUMMARY .....................................................................................................................xxx
CHAPTER 1: INTRODUCTION ........................................................................................1 1.1 Motivation ..................................................................................................................1 1.2 Background ................................................................................................................4
1.3 Overview ..................................................................................................................11 1.4 Document Outline ....................................................................................................14
CHAPTER 2: LITERATURE REVIEW ...........................................................................16 2.1 Finite Element Modeling of Concrete and Masonry Structures ..............................16
2.1.1 Cracking Models ...............................................................................................17
2.1.1.1 Discrete Crack Models ...............................................................................17
2.1.1.2 Smeared Crack Models ..............................................................................18 2.1.1.3 Crack Band Models....................................................................................23 2.1.1.4 Microplane Models ....................................................................................24
2.1.2 Material Models ................................................................................................26 2.1.2.1 Tensile Behavior ........................................................................................26
2.1.2.2 Compressive Behavior ...............................................................................28 2.1.2.3 Combined Failure Material Models ...........................................................29
2.1.2.3.1 Mohr-Coulomb Yield Criterion ..........................................................29
2.1.2.3.2 Drucker-Prager Yield Criterion ..........................................................30 2.1.2.3.3 Wiliiam-Warnke Yield Criterion ........................................................31 2.1.2.3.4 Modified Compression Field Theory ..................................................32
2.1.2.3.5 Disturbed Stress Model .......................................................................33
2.2 Simplified Modeling of Unreinforced Masonry Infill .............................................33
2.2.1 FEMA 356 and ASCE 41-06 ............................................................................34 2.2.2 TMS 402-11 ......................................................................................................35 2.2.3 Eurocode 8 ........................................................................................................35
2.3 Experimental Studies and Field Observations on the Seismic Performance of
Concrete and Masonry Walls .........................................................................................36
2.3.1 Masonry Infill ...................................................................................................37 2.3.1.1 System Description ....................................................................................37 2.3.1.2 Experimental Studies .................................................................................37 2.3.1.3 Performance in Past Earthquakes ...............................................................41
2.3.2 Confined Masonry ............................................................................................44
2.3.2.1 System Description ....................................................................................44

vi
2.3.2.2 Experimental Studies .................................................................................45 2.3.2.3 Performance in Past Earthquakes ...............................................................46
2.3.4 Hybrid Masonry Systems ..................................................................................48 2.3.4.1 System Description ....................................................................................48
2.4 Chapter Summary ....................................................................................................50
CHAPTER 3: CONSTITUTIVE FINITE ELEMENT MODEL AND VALIDATION
STUDIES ...........................................................................................................................51 3.1 Modeling Scheme ....................................................................................................51 3.2 Element Formulation ...............................................................................................53
3.3 Material Calibration .................................................................................................58 3.3.1 Concrete ............................................................................................................58
3.3.2 Masonry Assembly ...........................................................................................60 3.4 Model Validation .....................................................................................................64
3.4.1 Pure Tension and Pure Compression ................................................................65 3.4.2 Flexure Column ................................................................................................68
3.4.3 Shear Column....................................................................................................70 3.4.4 Bare Frame ........................................................................................................73
3.4.5 Masonry Walls ..................................................................................................75 3.4.5.1 Test Set Up and Analytical Model .............................................................76 3.4.5.2 Material Calibration ...................................................................................78
3.4.5.3 Results ........................................................................................................79 3.4.6 Three-Story, Three-Bay RC Frame with Unreinforced Masonry Infill ............82
3.4.6.1 Specimen Description ................................................................................82 3.4.6.2 Finite Element Model ................................................................................84
3.4.6.3 Material Calibration ...................................................................................85 3.4.6.4 Results ........................................................................................................87
3.5 Chapter Summary ....................................................................................................91
CHAPTER 4: FINITE ELEMENT MODELING OF HYBRID CONCRETE-MASONRY
............................................................................................................................................92
4.1 Modeling Scheme ....................................................................................................93 4.2 Material Calibration for Partially Grouted Masonry ...............................................96
4.2.1 Compression Behavior of Grouted Masonry ....................................................98
4.2.2 Tensile Behavior of Grouted Masonry Units ....................................................99 4.2.3 Shear and Tensile Behavior of Grouted Bed Joints ........................................100
4.2.3.1 The Concept of Shear Friction .................................................................101
4.2.3.2 Application of Shear Friction Principles to Grouted Bed Joints..............103 4.2.4 Accounting for the Contribution of Reinforcement ........................................111
4.3 Modeling Dowel Connections ...............................................................................119 4.3.1 Modeling Scheme for Dowel Reinforcement .................................................120 4.3.2 Validation of Dowel Reinforcement Modeling Scheme .................................121
4.3.2.1 Finite Element Model and Material Calibration ......................................121 4.3.2.2 Results ......................................................................................................123
4.3.3 Studies on Variation of Effective Dowel Area ...............................................128 4.4 Initial Finite Element Models ................................................................................129
4.4.1 Concrete Properties .........................................................................................130

vii
4.4.2 Ungrouted Masonry Properties .......................................................................131 4.4.3 Grouted Masonry Properties ...........................................................................133
4.5 Chapter Summary ..................................................................................................137
CHAPTER 5: EXPERIMENTAL DESIGN ....................................................................140
5.1 RC Frame ...............................................................................................................140 5.1.1 Design .............................................................................................................140 5.1.2 Material Properties ..........................................................................................143 5.1.3 Construction Details........................................................................................144
5.2 Reinforced Masonry Infill and Connections to RC Frame ....................................153
5.2.1 Design .............................................................................................................153 5.2.2 Material Properties ..........................................................................................157
5.2.3 Construction Details........................................................................................160 5.3 Test Set Up .............................................................................................................165
5.3.1 Overview .........................................................................................................165 5.3.2 Loading Protocol .............................................................................................169
5.4 Instrumentation Plan ..............................................................................................173 5.4.1 Strain Gages ....................................................................................................173
5.4.2 Displacement Sensors .....................................................................................177 5.4.3 Load Cells .......................................................................................................180
5.5 Chapter Summary ..................................................................................................181
CHAPTER 6: EXPERIMENTAL AND ANALYTICAL RESULTS .............................183
6.1 Observations from Experiments and Analytical Models .......................................184 6.1.1 General Behavior ............................................................................................185
6.1.1.1 Damage Sequence ....................................................................................185
6.1.1.2 Gravity Loads...........................................................................................208 6.1.1.3 Force-Displacement Behavior .................................................................209
6.1.2 Interface Behavior ...........................................................................................213 6.1.2.1 Beam-Wall Interface ................................................................................214 6.1.2.2 Column-Wall Interfaces ...........................................................................215
6.1.2.3 Foundation-Wall Interface .......................................................................217 6.1.3 Masonry Wall Behavior ..................................................................................217
6.1.3.1 Shear Strains ............................................................................................218
6.1.3.2 Reinforcement ..........................................................................................219 6.1.4 Column Behavior ............................................................................................222
6.1.4.1 Curvature and Shear Strain ......................................................................222
6.1.4.2 Reinforcement ..........................................................................................223 6.2 Influence of Masonry and Connections on the Behavior of the RC frame ............225 6.3 Improvement of Finite Element Models Based on Experimental Observations ...227
6.3.1 Masonry Modeling and Material Properties ...................................................228 6.3.2 Interface Properties .........................................................................................229
6.3.3 Dowel Reinforcement Modeling.....................................................................229 6.3.4 Concrete Fracture Energy ...............................................................................230
6.4 Results of Revised Finite Element Models ............................................................231 6.4.1 Damage Sequence ...........................................................................................231
6.4.2 Force-Displacement Behavior ........................................................................238
viii
6.4.3 Yielding of Reinforcement .............................................................................240 6.5 Chapter Summary ..................................................................................................241
CHAPTER 7: APPLICATIONS FOR ENGINEERING PRACTICE.............................245 7.1 Analytical Study on Design Changes ....................................................................246
7.1.1 Alternative Connections of the Infill to the RC frame ....................................246 7.1.2 Suggested Changes Based on Experimental Observations .............................248
7.2 Parametric Study on Infill Properties .....................................................................249 7.2.1 Reinforcement Sizes and Spacing ...................................................................250
7.2.1.1 Methodology ............................................................................................250
7.2.1.2 Results ......................................................................................................251 7.2.2 Masonry Material Properties...........................................................................253
7.2.2.1 Methodology ............................................................................................254 7.2.2.2 Results ......................................................................................................255
7.2.3 Discussion .......................................................................................................263 7.3 Simplified Models ..................................................................................................264
7.3.1 Elastic Transformed Section Model................................................................264 7.3.2 Cracked Section Model ...................................................................................266
7.3.3 Modification of TMS 402 Strut Model for Infills with Connections .............267 7.4 Chapter Summary ..................................................................................................271
CHAPTER 8: SUMMARY, CONCLUSIONS, AND RECCOMENDATIONS ............274
8.1 Summary of Experimental Work ...........................................................................275
8.2 Conclusions from the Experimental work .............................................................275 8.3 Summary of Analytical Work ................................................................................276 8.4 Conclusions from the Analytical Work .................................................................277
8.5 Recommendations ..................................................................................................280 8.6 Significance ...........................................................................................................282
8.7 Future Work ...........................................................................................................284
APPENDIX A: NOTES FROM SITE VISITS TO THE CARIBBEAN ........................285
APPENDIX B: MATERIAL DATA ...............................................................................291
APPENDIX C: SUPPLEMENTAL DATA FOR FINITE ELEMENT MODELS .........304
APPENDIX D: SUPPLEMENTAL DATA AND EXAMPLE CALCULATIONS FROM
EXPERIMENTS ..............................................................................................................329
APPENDIX E: CALCULATIONS FOR SIMPLIFIED MODELS ................................339
APPENDIX F: PROPOSED MODIFICATION OF THE TMS 402 STRUT MODEL
FOR PARTICIPATING INFILLS ...................................................................................344
REFERENCES ................................................................................................................347
ix
LIST OF TABLES
Table 1:Dimensions and applied stress for wall specimens............................................. 76
Table 2: Observed damage of the HCT specimen in the experiment (Ezzatfar et. al. 2014)
and finite element model ................................................................................. 89
Table 3: Test data on the bond strength of grouted prisms ............................................ 104
Table 4: Summary of effect of vertical truss reinforcement elements on the shear capacity
of grouted bed joints ...................................................................................... 114
Table 5: Observed damage of the MRM specimen in the experiment (Ezzatfar et.al. 2012)
and finite element model ............................................................................... 126
Table 6: Initial cracking in the finite element models ................................................... 187
Table 7: Initial cracking patterns of revised finite element models ............................... 233
Table 8: Damage sequence for revised finite element models ...................................... 235
Table 9: Influence of ungrouted prism strength on the damage sequence for Frame 1 (full
connection) .................................................................................................... 256
Table 10: Influence of ungrouted prism strength on the damage sequence for Frame 2
(Connection only at the base) ........................................................................ 257
Table 11: Influence of fully grouting infill wall on the damage sequence for Frame 1 (full
connection) .................................................................................................... 260
Table 12: Influence of fully grouting infill wall on the damage sequence for Frame 2
(connection only at the base) ......................................................................... 261
Table 13: Material and construction data gathered from site visits to the Caribbean.... 285
Table 14: Notes regarding Caribbean design practices .................................................. 289
Table 15: Concrete compressive strength ...................................................................... 291
Table 16: Concrete tensile strength from split cylinders ............................................... 292
Table 17: Concrete elastic modulus ............................................................................... 292
Table 18: Rebar properties ............................................................................................. 293
Table 19: Masonry prism compressive strength ............................................................ 293
Table 20: Prism elastic modulus .................................................................................... 297
x
Table 21: Concrete used for grouted cells-compressive strength .................................. 298
Table 22: Mortar compressive strength ......................................................................... 299
Table 23: Tensile bond strength from bond wrench tests .............................................. 300
Table 24: Mortar interface element parameters for study on the influence of masonry
head joint bond strength on seismic performance of URM walls ................. 304
Table 25: Head joint bond strength study: initial and final cracking patterns for URM
wall MI1 4.92f t x 6.56ft (1.5m x 2m), 174psi (1.2 MPa)............................. 305
Table 26: Head joint bond strength study: initial and final cracking patterns for URM
wall MI2 4.92f t x 6.56ft (1.5m x 2m), 58psi (0.4MPa)................................ 306
Table 27: Head joint bond strength study: initial and final cracking patterns for URM
wall MI3 4.92ft x 9.84ft (1.5m x 3m), 174psi (1.2 MPa).............................. 307
Table 28: Head joint bond strength study: initial and final cracking patterns for URM
wall MI4 4.92ft x 9.84ft (1.5m x 3m), 58psi (0.4MPa)................................. 308
Table 29: Material properties for FE models of column test (Nosho et. al. 1996) ........ 313
Table 30: Material properties for FE models of column test (Lynn et. al. 1998) .......... 314
Table 31: Model properties for cyclic test of RC frame (Teymur et al. 2012) .............. 315
Table 32: Parameters for calibration to URM walls (Magenes and Calvi 1992) ........... 316
Table 33: Summary of material properties and model parameters for the 3-story 3-bay RC
frame with HCT infills .................................................................................. 318
Table 34: Summary of material properties and model parameters for the initial models of
the hybrid concrete-masonry test frames ....................................................... 319
Table 35: Summary of material properties and model parameters for revised models of
the hybrid concrete-masonry test frames ....................................................... 321
Table 36: Summary of material properties and model parameters for parametric study on
masonry material properties-increased grout strength (x2) ........................... 325
Table 37: Summary of material properties and model parameters for parametric study on
masonry material properties-decreased grout strength ( 2) ......................... 326
Table 38: Summary of material properties and model parameters for parametric study on
masonry material properties-increased ungrouted prism strength (x2) ......... 327
Table 39: Summary of material properties and model parameters for parametric study on
masonry material properties-type N mortar .................................................. 328

xi
Table 40: Crack data Frame 1, column in tension during positive (push) cycles ......... 334
Table 41: Crack data Frame 2, column in tension during positive (push) cycles ......... 335
Table 42: Crack data Frame 2, column in compression during positive (push) cycles 336

xii
LIST OF FIGURES
Figure 1: Construction of a duplex (left) and an apartment (right) in Belize ..................... 2
Figure 2: Soft story collapse observed during the 2010 Haiti Earthquake (DesRoches et.
al. 2011) .............................................................................................................................. 2
Figure 3: Map of the Caribbean showing current building codes, the status of
enforcement and the earthquake risk .................................................................................. 4
Figure 4: Condominiums (left) and close up of CMU infill wall (right) under construction
in Jamaica............................................................................................................................ 6
Figure 5: Construction drawings for bracket connections of the infill wall and provision
of an isolation gap ............................................................................................................... 7
Figure 6: Typical Belizian construction, placing column rebar and the infill wall ............ 8
Figure 7: Close up of vertical rebar spacing (left) and rebar connection to column (right) 8
Figure 8: Methods for connection of the reinforced CMU wall to the concrete frame ...... 9
Figure 9: Examples of horizontal wall reinforcement ...................................................... 11
Figure 10: Diagram of cracked property axes................................................................... 19
Figure 11: Illustration of stress-locking in smeared crack elements (Rots and
Blaauwendraad 1989) ....................................................................................................... 22
Figure 12: (a) illustration of microplane locations (b) mapping of strains from microplane
to macroplane strain tensor (Ozbolt et. al. 2001) ............................................................. 25
Figure 13: Characteristic nodes around a band of cracked elements (Bazant and Cedolin
1979) ................................................................................................................................. 28
Figure 14: Comparison of exponential and bilinear compression curves ......................... 29
Figure 15: Normalized Mohr-Coulomb yield surfaces with tensile cut-off (Chen, 2007) 30
Figure 16: Unreinforced masonry wall test showing interface cracking and bed joint
sliding (Mosalam 2005) .................................................................................................... 37
Figure 17:Shear failure due to short-column effect from crushing of masonry at corners
(Corte et. al. 2008) ............................................................................................................ 38
Figure 18:Large diagonal crack formed during shake table test (Stavridis et. al. 2012) .. 38
xiii
Figure 19: Damage from the Wenchuan earthquake: shear failure and collapse of
masonry (left) and collapse of a 5 story building (right) (Li et al. 2008) ......................... 42
Figure 20: Solid infill which helped prevent building collapse (Li et al. 2008) ............... 43
Figure 21: (a and b) Details of toothed connections to tie-columns and (c) shear
connections (Meli et.al. 2011) .......................................................................................... 44
Figure 22: Comparison of behavior under seismic action of (a) an infill wall and (b) a
confined masonry wall (Meli et al. 2011) ......................................................................... 45
Figure 23:Cyclic test of two bay confined masonry wall (Perez-Gavilan et al. 2009) ..... 46
Figure 24: (a) In-plane shear failure of first story (b) Out-of-plane failure of second story
(Brzev et al. 2010)............................................................................................................. 48
Figure 25: Buckling of rebar at foot of column (left) and shear failure of first story
column (right) (Brzev et al. 2010) .................................................................................... 48
Figure 26: Diagrams of hybrid masonry systems types I-III (left to right) (Hybrid
Masonry Design 2009) ...................................................................................................... 50
Figure 27: Assembly of smeared crack elements, interface elements, and truss elements to
model reinforced concrete (Stavridis and Shing 2010) ..................................................... 52
Figure 28: Assembly of smeared crack and interface elements to model masonry
(Stavridis and Shing 2010)................................................................................................ 53
Figure 29: Failure surface for masonry and concrete (Lotfi and Shing 1991) .................. 54
Figure 30: Equations governing compressive behavior (Lotfi and Shing 1991) .............. 55
Figure 31: Stress vs. strain normal to the crack surface (Lotfi and Shing 1991) .............. 55
Figure 32: Local axis and complete yield surface diagram for interface element (Lotfi and
Shing 1994) ....................................................................................................................... 56
Figure 33: Effect of internal variables on interface element yield surface ....................... 57
Figure 34: Schematic of interface element tension test and resulting stress-displacement
curve .................................................................................................................................. 59
Figure 35: Isotropic compression curve for concrete calibrated to orthotropic compression
curve .................................................................................................................................. 60
Figure 36: Shear behavior of mortar interface elements calibrated to test data (Magenes
and Calvi 1992) ................................................................................................................. 61
Figure 37: Results of pure tension tests with and without interface elements .................. 65

xiv
Figure 38: Tensile stress vs. strain behavior with mesh refinement, with and without
interface elements ............................................................................................................. 66
Figure 39: Results of pure compression tests with and without interface elements ......... 67
Figure 40: Compression stress vs. strain behavior with mesh refinement, with and without
interface elements ............................................................................................................. 67
Figure 41: Concrete compression behavior ...................................................................... 69
Figure 42:Cracking and crushing of column after failure in the experiment (Nosho et al.
1996) and analytical models ............................................................................................. 69
Figure 43: Force displacement curves for the flexure column experiment (Nosho et. al.
1996) and analytical models ............................................................................................. 70
Figure 44: Concrete compression behavior ...................................................................... 71
Figure 45: Force displacement curves for the shear column experiment (Lynn et. al.
1998) and analytical models ............................................................................................. 72
Figure 46:Cracking of column after failure in the experiment (Lynn et al. 1998) and
analytical models .............................................................................................................. 73
Figure 47:Test specimen and reinforcement details (Teymur et al. 2012) ....................... 74
Figure 48:Observed cracking in the experiment (Teymur et al. 2012) and analytical
model. Failed interface elements have been colored red .................................................. 74
Figure 49: Base shear vs. drift for the bare frame experiment (Teymur et. al. 2012) and
analytical model ................................................................................................................ 75
Figure 50: Geometry and test set up for the walls ............................................................ 77
Figure 51: Tracked reactions from experiment (Magenes and Calvi 1992) and analytical
model for wall MI2 ........................................................................................................... 77
Figure 52: Assembly of smeared crack and interface elements to model masonry .......... 78
Figure 53: Force-displacement behavior and cracking patterns of the finite element
models compared to the test data (Magenes and Calvi 1992) .......................................... 81
Figure 54: Test frame details (Ezzatfar et. al. 2012): (a) test frame dimensions (b) test set-
up (c) hollow clay tile brick (d) column section detail (e) beam section detail (* denotes
additional reinforcement and change in spacing in confined region, dimensions are in
mm) ................................................................................................................................... 82
Figure 55: Ground motions (Ezzatfar et. al. 2012) ........................................................... 83

xv
Figure 56: Finite element model showing the truss members used for load distribution . 85
Figure 57: Base shear vs. top story displacement of the experiment (Ezzatfar et. al. 2014)
and the finite element model for the HCT specimen ........................................................ 90
Figure 58: Schematic for partially grouted reinforced masonry ....................................... 94
Figure 59: Vertical cracking path compared to element modules .................................... 95
Figure 60: Connectivity of truss elements for different horizontal reinforcement types .. 96
Figure 61: Preference for cracking along the grouted joints of reinforced cells (Minaie
2009). Crack 2 has been highlighted in red ...................................................................... 97
Figure 62: Components of shear friction ........................................................................ 101
Figure 63: Results from shear tests of concrete joints by Harries (2012) ....................... 103
Figure 64: Hyperbolic yield surface of the interface element......................................... 104
Figure 65: Normalized bond strength of grouted masonry prisms as a function of grout
strength (Test data from Table 3).................................................................................... 105
Figure 66: Development of the equation for shear friction factor of grouted bed joints 106
Figure 67: Data for cohesion of grouted bed joints and proposed function .................... 107
Figure 68: Comparison of data from shear tests of grouted and un-grouted assemblies to
the data points calculated by the proposed calibration method. Weak grout-2080 psi
(14.34 MPa), Strong grout-5350 psi (36.89 MPa) .......................................................... 108
Figure 69: Example of linear fit to obtain the interface element failure surface. Weak
grout-2080 psi (14.34 MPa), Strong grout-5350 psi (36.89 MPa) .................................. 109
Figure 70: Triplet test model with reinforcement ........................................................... 112
Figure 71: Shear stress vs. lateral displacement for grouted bed joints with and without
vertical reinforcement without pre-compression. Weak grout-2080 psi (14.34 MPa),
Strong grout-5350 psi (36.89 MPa) ................................................................................ 113
Figure 72: Shear stress vs. lateral displacement for grouted bed joints with and without
vertical reinforcement at 100 psi (0.7 MPa) of pre-compression. Weak grout-2080 psi
(14.34 MPa), Strong grout-5350 psi (36.89 MPa) .......................................................... 113
Figure 73: Shear stress vs. lateral displacement for grouted bed joints with and without
vertical reinforcement at 200 psi (1.4 MPa) of pre-compression. Weak grout-2080 psi
(14.34 MPa), Strong grout-5350 psi (36.89 MPa) .......................................................... 114

xvi
Figure 74: Additional steel elements to capture dowel action of reinforcement in grouted
bed joints ......................................................................................................................... 117
Figure 75: Model results of shear tests without pre-compression on grouted bed joints
with and without reinforcement. Weak grout-2080 psi (14.34 MPa), Strong grout-5350
psi (36.89 MPa) ............................................................................................................... 118
Figure 76: Model results of shear tests with 100 psi (0.7 MPa) pre-compression on
grouted bed joints with and without reinforcement. Weak grout-2080 psi (14.34 MPa),
Strong grout-5350 psi (36.89 MPa) ................................................................................ 119
Figure 77: Model results of shear tests with 200 psi (1.38 MPa) pre-compression on
grouted bed joints with and without reinforcement. Weak grout-2080 psi (14.34 MPa),
Strong grout-5350 psi (36.89 MPa) ................................................................................ 119
Figure 78: Modeling scheme for dowel reinforcement ................................................... 121
Figure 79: Reinforcement details for the MRM infills (Ezzatfar et al. 2012) ................ 122
Figure 80: Schematic of the modeling scheme for MRM specimen .............................. 123
Figure 81: Base shear vs. top story displacement of the experiment (Ezzatfar et. al. 2012)
and the finite element model ........................................................................................... 127
Figure 82: Concrete properties........................................................................................ 130
Figure 83: Ungrouted masonry properties ...................................................................... 131
Figure 84: Set up and testing of masonry triplet ............................................................. 132
Figure 85: Ungrouted bed joint interface element shear stress vs. normal stress ........... 133
Figure 86: Grouted masonry properties .......................................................................... 134
Figure 87: Bond strength equation with results from bond wrench tests on grouted
specimens ........................................................................................................................ 135
Figure 88: Cohesion equation with results from grouted triplet tests ............................. 135
Figure 89: Friction factor equation with results from grouted triplet tests ..................... 136
Figure 90: Grouted bed joint interface element shear stress vs. normal stress ............... 136
Figure 91: Design of the RC frame ................................................................................. 141
Figure 92: Proposed geometries and loading configurations .......................................... 142
Figure 93: Variation in force-displacement behavior of the models .............................. 143

xvii
Figure 94: Position of centerline beam nodes during analysis for each model from 1.2%
to 2.0% drift .................................................................................................................... 143
Figure 95: Construction of the post-tensioned slab beginning with the end sections ..... 145
Figure 96: Construction of the post-tensioned slab, continuing with the middle section 145
Figure 97: Installation of column forms and reinforcement ........................................... 146
Figure 98: Lifting slab .................................................................................................... 146
Figure 99: Post-tensioning slab to strong floor ............................................................... 147
Figure 100: Construction of the beams ........................................................................... 148
Figure 101: Conveyor used to pour the top half columns ............................................... 148
Figure 102: Disassembly of the shoring and formwork (a) and close up of frame with
dowel connections (b) ..................................................................................................... 149
Figure 103: Reinforced concrete frame .......................................................................... 150
Figure 104: Post-tensioned slab ...................................................................................... 151
Figure 105: Post-tensioned slab section detail ................................................................ 152
Figure 106: Masonry details for frame without dowel connections ............................... 155
Figure 107: Masonry details for frame with dowel connections .................................... 156
Figure 108: Construction of grout prisms made from weak concrete ............................ 158
Figure 109: Constructing and bagging the (a) ungrouted prisms and (b) grouted prisms
......................................................................................................................................... 159
Figure 110: Masonry triplet (a) construction and (b) testing .......................................... 159
Figure 111: Masonry-mortar bond specimen (a) construction and (b) testing ............... 160
Figure 112: Volumetric batching of the mortar .............................................................. 160
Figure 113: Placement of first row of masonry showing (a) the dowel bars and (b) the
mortar at the wall-column interface ................................................................................ 161
Figure 114: Horizontal reinforcement (a) placed over grouted webs and (b) spliced with
dowel bars from columns ................................................................................................ 162
Figure 115: Measuring slump for weak concrete used to fill reinforced cells ................ 162

xviii
Figure 116: Reinforced cells filled with concrete (a) and consolidated with a rod (b) .. 163
Figure 117: Splicing vertical reinforcement ................................................................... 163
Figure 118: Dowel reinforcement extending down from the RC beam.......................... 164
Figure 119: At the top of the masonry wall, (a) face shell of the grouted cell was
removed, (b) weak concrete was poured into the 3 courses below, and (c-d) the last
course was dry packed .................................................................................................... 165
Figure 120: Test set up .................................................................................................... 166
Figure 121: Column loads applied through transfer beam .............................................. 167
Figure 122: Gap between the top of the infill wall and the RC frame ............................ 167
Figure 123: Hydraulic used to apply lateral loads and stiffened plate on left side of
loading cage .................................................................................................................... 168
Figure 124: Stiffened plate on right side of loading cage ............................................... 168
Figure 125: Set up for controller and data acquisition .................................................... 169
Figure 126: Deformation controlled loading history (FEMA 461) ................................ 170
Figure 127: Force displacement results for finite element models with and without dowel
connections ..................................................................................................................... 171
Figure 128: Loading protocol for testing of hybrid concrete-masonry frames ............... 172
Figure 129: Strain gages in the masonry wall: (a) at base of vertical reinforcement, (b) at
mid-height of vertical reinforcement, (c) at center of horizontal reinforcement, and (d) on
dowel bars ....................................................................................................................... 174
Figure 130: Grinding vertical column reinforcement to apply strain gages ................... 175
Figure 131: Strain gage layout ........................................................................................ 176
Figure 132: Column shear and flexural deformations measured by (a) string pots and (b)
dial gages ........................................................................................................................ 178
Figure 133: Lateral displacement of the columns measured by (a) string potentiometers
accounting for (b) slip at the foundation ......................................................................... 178
Figure 134: String potentiometers measuring shear and flexural deformation of the
masonry infill and dial gages to measure slip ................................................................. 179
Figure 135: Displacement sensor layout ......................................................................... 180

xix
Figure 136: Load cells to measure column load throughout the test .............................. 181
Figure 137: Damage in the experimental frames and finite element models at 0.05 inches
(1.3 mm) of lateral displacement. Damage is predicted in the finite element models at this
displacement, but no damage was observed in either frame during the experiment. ..... 186
Figure 138: Cracking patterns in the experimental frames and finite element models at
0.15 inches (3.8 mm) lateral displacement. The cracks observed in the experiments are
traced in black for the positive cycles and red for the negative cycles ........................... 189
Figure 139: Damage in the experimental frames and finite element models at 0.3 inches
(7.6 mm) of lateral displacement. The cracks observed in the experiments are traced in
black for the positive cycles and red for the negative cycles. ......................................... 191
Figure 140: Damage in the experiments and finite element models at 0.42 inches (10.7
mm) of lateral displacement. The cracks observed in the experiments are traced in black
for the positive cycles and red for the negative cycles. .................................................. 193
Figure 141: Close up of masonry wall in Frame 1 (full connection). The cracks in the
experiments are traced in black for the positive cycles and red for the negative cycles. 194
Figure 142: Close up of the masonry wall in Frame 2 (connection only at the base). The
cracks in the experiments are traced in black for the positive cycles and red for the
negative cycles. ............................................................................................................... 195
Figure 143: Damage in the experimental frames and finite element models at 0.58 inches
(14.7 mm) of lateral displacement. The cracks observed in the experiments are traced in
black for the positive cycles and red for the negative cycles. ......................................... 196
Figure 144: Observing bend which formed in the tension column beginning above the
second course of masonry ............................................................................................... 197
Figure 145: Close up of crushing of the masonry face shells near the diagonal cracks . 198
Figure 146: Damage in the experimental frames and the finite element models at 0.82
inches (20.8 mm) of displacement. The cracks observed in the experiments are traced in
black for the positive cycles and red for the negative cycles. ......................................... 199
Figure 147: Damage in the experimental frames and the finite element models at 1.2
inches (30.5 mm) of lateral displacement. The cracks observed in the experiments are
traced in black for the positive cycles and red for the negative cycles. .......................... 201
Figure 148: Large portion of masonry face shell (a) fell out of plane and revealed (b)
grouted cores with shear cracks in Frame 1 .................................................................... 202
Figure 149: Large portion of masonry face shell (a) fell out of plane and revealed (b)
grouted cores which had debonded from the vertical reinforcement in Frame 2 ........... 203

xx
Figure 150: Top section of masonry wall of Frame 2 (connection only at the base) was in
danger of out-of-plane collapse ...................................................................................... 204
Figure 151: Comparison of shear cracks in the columns of (a) Frame 2 (connection only
at the base) and (b) Frame 1 (full connection) ................................................................ 204
Figure 152: Damage in the experimental frames and the finite element models at 1.8
inches (45.7 mm) of lateral displacement. The cracks observed in the experiments are
traced in black for the positive cycles and red for the negative cycles. .......................... 206
Figure 153: Damage in the experimental frames and the finite element models at 2.4
inches (61.0 mm) of lateral displacement. The cracks in the experiments are traced in
black for the positive cycles and red for the negative cycles. ......................................... 208
Figure 154: Force-displacement plot of the experimental and analytical Frame 1 (full
connection) ...................................................................................................................... 210
Figure 155: Force-displacement plot of the experimental and analytical Frame 2
(connection only at the base) .......................................................................................... 211
Figure 156: Comparison of the experimental force-displacement behavior for Frame 1
and Frame 2..................................................................................................................... 211
Figure 157: Interface cracking for a) Frame 1 (full connection) and b) Frame 2
(connection only at the base). ......................................................................................... 214
Figure 158: Shear strain in the masonry infill vs. lateral displacement of experimental and
analytical Frame 1 (full connection) and Frame 2 (connection only at the base) ........... 218
Figure 159: Yielding in the masonry reinforcement of the finite element model of Frame
1 (full connection) ........................................................................................................... 220
Figure 160: Yielding in the masonry reinforcement of the finite element model of Frame
2 (connection only at the base) ....................................................................................... 220
Figure 161: The horizontal reinforcement placed at the center of the unit caused the
masonry web to split ....................................................................................................... 221
Figure 162: Bending of horizontal reinforcement just past the termination of the dowel
bar in the Frame 1 ........................................................................................................... 222
Figure 163: Strains in the flexural reinforcement of the columns in the finite element
model of Frame 1 (full connection) ................................................................................ 224
Figure 164: Strains in the flexural reinforcement of the columns in the finite model of
Frame 2 (connection only at the base) ............................................................................ 225
Figure 165: Strut mechanisms observed during the experiments ................................... 227

xxi
Figure 166: Force-displacement plot of the experimental and analytical Frame 1 (full
connection) ...................................................................................................................... 239
Figure 167: Force-displacement plot of the experimental and analytical Frame 2
(connection only at the base) .......................................................................................... 239
Figure 168: Strains in the reinforcement of the revised finite element model of Frame 1
(full connection) .............................................................................................................. 241
Figure 169: Strains in reinforcement of the revised finite element model of Frame 2
(connection only at the base) .......................................................................................... 241
Figure 170: Force vs. displacement of the finite element models with different
connections of the infill to the bounding RC frame ........................................................ 247
Figure 171: Influence of increasing the length of the column close tie spacing zone from
20 inches (50.8 cm) to 40 inches (101.6 cm) on the force-displacement behavior of
Frames 1 and 2 ................................................................................................................ 249
Figure 172: Percent change in peak strength for changes in masonry infill reinforcement
detailing........................................................................................................................... 252
Figure 173: Percent change in displacement at peak strength for changes in masonry infill
reinforcement detailing ................................................................................................... 253
Figure 174: Percent change in peak strength for changes in masonry infill properties .. 262
Figure 175: Percent change in displacement at peak strength for changes in masonry infill
properties......................................................................................................................... 262
Figure 176: Schematic of the transformed section and shear flow for the test frames ... 264
Figure 177: Schematic of cracked section model ........................................................... 266
Figure 178: Proposed strut overlaid on experimental frames at 0.82in (20.8 mm) lateral
displacement ................................................................................................................... 268
Figure 179: Resultant forces and forces for design from strut and tie models. Applied
forces are labeled in blue, resultant forces are labeled in black and are shear forces, u.n.o.
......................................................................................................................................... 270
Figure 180: Concrete mix design for RC frame .............................................................. 291
Figure 181: Test set up to determine the Elastic Modulus of concrete ........................... 292
Figure 182: Preparation of prisms................................................................................... 294
Figure 183: Prisms bagged for curing at ambient temperature ....................................... 294
xxii
Figure 184: Gypsum plaster capping applied to all prisms............................................. 295
Figure 185: Test set up for compressive strength of masonry prisms ............................ 295
Figure 186: Failure patterns for ungrouted prisms: (a) face shell separation and crushing,
(b) face shell separation and shear, and (c) cone and shear ............................................ 296
Figure 187: Failure patterns for grouted prisms: (a) face shell separation, (b) face shell
separation and shear, (c) shear and crushing .................................................................. 296
Figure 188: Test set up for Elastic Modulus of (a) ungrouted and (b) grouted prisms ... 297
Figure 189: Grout cube mold as specified by ASTM 1019 ............................................ 298
Figure 190: Grout cube (a) testing and (b) failure .......................................................... 299
Figure 191: Mortar cube (a) testing and (b) failure ........................................................ 300
Figure 192: Bond wrench test set up............................................................................... 300
Figure 193: Failures of ungrouted bed joints .................................................................. 301
Figure 194: Failures of grouted bed joints ...................................................................... 301
Figure 195: Shear stress vs. normal stress plot of ungrouted triplet tests ....................... 301
Figure 196: Shear stress vs. normal stress data from grouted triplet tests ...................... 302
Figure 197: Triplet test set up ......................................................................................... 302
Figure 198: Failure of ungrouted triplet .......................................................................... 303
Figure 199: Failure of grouted triplet (a) while still on the testing platform and (b)
removed from the testing machine .................................................................................. 303
Figure 200: Influence of head joint bond strength on wall MI1 [4.92f t x 6.56ft (1.5m x
2m), 174psi (1.2 MPa) compression] *mortar properties from Table 24, Magenes and
Calvi (1992) .................................................................................................................... 309
Figure 201: Influence of head joint bond strength on wall MI1 [4.92f t x 6.56ft (1.5m x
2m), 174psi (1.2 MPa) compression] *mortar properties from Table 24, Mortar with 2x
Bond Strength and Cohesion .......................................................................................... 309
Figure 202: Influence of head joint bond strength on wall MI2 [4.92f t x 6.56ft (1.5m x
2m), 58psi (0.4MPa) compression] *mortar properties from Table 24, Magenes and Calvi
(1992) .............................................................................................................................. 310
xxiii
Figure 203: Influence of head joint bond strength on wall MI2 [4.92f t x 6.56ft (1.5m x
2m), 58psi (0.4MPa) compression] *mortar properties from Table 24, Mortar with 2x
Bond Strength and Cohesion .......................................................................................... 310
Figure 204: Influence of head joint bond strength on wall MI3 [4.92ft x 9.84ft (1.5m x
3m), 174psi (1.2 MPa) compression] *mortar properties from Table 24, Magenes and
Calvi (1992) .................................................................................................................... 311
Figure 205: Influence of head joint bond strength on wall MI3 [4.92ft x 9.84ft (1.5m x
3m), 174psi (1.2 MPa) compression] *mortar properties from Table 24, Mortar with 2x
Bond Strength and Cohesion .......................................................................................... 311
Figure 206: Influence of head joint bond strength on wall MI4 [4.92ft x 9.84ft (1.5m x
3m), 58psi (0.4MPa) compression] *mortar properties from Table 24, Magenes and Calvi
(1992) .............................................................................................................................. 312
Figure 207: Influence of head joint bond strength on wall MI4 [4.92ft x 9.84ft (1.5m x
3m), 58psi (0.4MPa) compression]*mortar properties from Table 24, Mortar with 2x
Bond Strength and Cohesion .......................................................................................... 312
Figure 208: Concrete compressive stress vs. strain curve for finite element model of bare
RC frame ......................................................................................................................... 315
Figure 209: Masonry material calibration for models of URM walls (Magenes and Calvi
1992) ............................................................................................................................... 316
Figure 210: Concrete, brick and mortar material calibrations for (a) tension and (b)
compression in the model of the 3-story 3-bay RC frame with HCT infills................... 317
Figure 211: Compressive stress vs. strain for concrete, grouted masonry, and ungrouted
masonry in the initial finite element models of the hybrid concrete-masonry test frames
......................................................................................................................................... 320
Figure 212: Tensile stress vs. strain for concrete, grouted CMU, ungrouted CMU, mortar
and bed joints in grouted cells* in the initial finite element models of the hybrid concrete-
masonry test frames *bed joints in grouted cells are the grout and mortar interface ..... 320
Figure 213: Ungrouted bed joint interface element failure surface in initial finite element
models of hybrid concrete-masonry test frames and test data from bond wrench tests and
triplet tests ....................................................................................................................... 321
Figure 214: Grouted bed joint interface element failure surface in initial finite element
models of hybrid concrete-masonry test frames and test data from bond wrench tests and
triplet tests ....................................................................................................................... 321
Figure 215: Compressive stress vs. strain for concrete, grouted masonry, and ungrouted
masonry in the revised finite element models of the hybrid concrete-masonry test frames
......................................................................................................................................... 322

xxiv
Figure 216: Tensile stress vs. strain for concrete, ungrouted CMU, grout cores and mortar
in the revised finite element models of the hybrid concrete-masonry test frames .......... 323
Figure 217: Ungrouted bed joint interface element failure surface in revised finite
element models of hybrid concrete-masonry test frames and test data from bond wrench
tests and triplet tests ........................................................................................................ 323
Figure 218: Portal frame ................................................................................................. 330
Figure 219: Frame 1 column loads ................................................................................. 331
Figure 220: Frame 2 column loads ................................................................................. 332
Figure 221: Shear deformation schematic ...................................................................... 333
Figure 222: Gage length diagram ................................................................................... 333
Figure 223: Processed and raw force-displacement data for Frame 1 with dowel
connections on all edges of the masonry infill ................................................................ 337
Figure 224: Processed and raw force-displacement data for Frame 2 with dowel
connections only at the base of the masonry infill .......................................................... 338
Figure 225: Shear flow through transformed section ..................................................... 339
Figure 226: Schematic of cracked section model ........................................................... 340
Figure 227: Transformed section of bounding column from test frames ....................... 341

xxv
NOMENCLATURE
.............................................................. area of concrete in the shear plane of the joint
............................................................................................................ area of grout core
.............................................................................................. area of grouted bed joint
.............................................................................................................................. area of grouted masonry unit
............................................................................................................. area of mortar
............................................................................................................................ net area
..................................................................................... area of concrete masonry unit
..................................................... area of shear reinforcement crossing the shear plane
a...................................................................................... width of equivalent diagonal strut
b............................................................................................................................. thickness
c ............................................................................................................................. cohesion
d.............................................................................................................................. distance
.......................................................................................... stiffness of interface element
........................................................................... shear stiffness of the interface element
............................................................................................................................. stiffness
....................................................................... elastic modulus of the bounding column
............................................................................ elastic modulus of the frame material
.................................................................................................................. grout stiffness
........................................................................................ stiffness of grouted bed joint
............................................................................elastic modulus of the masonry prism
........................................................................................................... mortar stiffness

xxvi
..................................................................................... elastic modulus of reinforcement
....................................................................................... stiffness of the masonry unit
f ...............................................................................................function of the yield surface
................................................................................. compressive strength at the point of initial softening
......................................................................................... uniaxial compressive strength
.......................................................................................... compressive strength of grout
........................................................................................ masonry compressive strength
................................................................................... compressive strength of mortar
............................................................................................. effective tensile strength
................................................................................................. tensile strength of grout
....................................................................................................................................................................... tensile strength
......................................................................................................... normal shear stress
...................................................................................... yield stress of the reinforcement
............................................................ yield function of the interface element
................................................................................................................... shear modulus
.................................................................................................... mode I fracture energy
.................................................................................................. mode I fracture energy
................................................................................................ height of the infill panel
...................................................................................................................................................... height of the column
...................................................................................... first invariant of the stress tensor
.................................. moment of intertia of the bounding column in the bending plane
.............................................. moment of inertia of the column in the plane of bending
............................................................ moment of interia of the transformed section
xxvii
................................................................ second invariant of the diviatoric stress tensor
k .......................................................... material parameter in Drucker-Prager yield surface
....... terms which represent the plastic work which governs strength degradation
........................................................ shear critical zone for seismically detailed columns
......................................................................................................................... dead load
.............................................................................................................................................................. Calibration point 1
.............................................................................................................................................................. Calibration point 2
.............................................................................................................................................................. Calibration point 3
.............................................................................................................................................................. Calibration point 4
.............................................................................................................................................................. Calibration point 5
Q .................................................................................................... static moment of inertia
.......................... formulation for the plastic potential of the interface element
r ..................... material parameter which is a function of the biaxial compressive strength
r ................................................................... radius of the interface element failure surface
............................................. initial value for radius of interface element failure surface
......................................................................................................................... diagonal length of the infill panel
........................................................................................... ratio of residual compression
...................................................................................... residual compressive strength
........................................... residual value for radius of interface element failure surface
.............................................................................. coefficient of residual tensile strength
................................................................................. tensile strength of interface element
S ................................................................................................................ sensitivity index
...................................................................... initial tensile strength of interface element
xxviii
............................................................................................................ bed joint spacing
................................................................... residual tensile strength of interface element
............................................................................................................................. thickness
............................................................................................................................... thickness of the masonry infill
.......................................................................................... net thickness of the infill
............................................................................................................ applied shear force
......................................................................................................... cracking load
................................................................................................... shear capacity of a joint
......................................................................................................... unit weight of grout
......................................................................................................... width of the infill
...................................................................................... modeling parameter being varied
.......................................................................................... baseline modeling parameter
........................................................................................................................ distance 1
........................................................................................................................ distance 2
. value of peak capactity of the model as a result of a change in the modeling parameter
............................................................................... peak capacity of the baseline model
α................................................................... controls the rate of reduction of for the interface element
....................................................... material parameter in Drucker-Prager yield surface
................. parameter which varies according to joint casting condition (Harries 2012)
..................................................................................................................... shape factor
β ................................................................................................................................ controls the rate of reduction of r
...................................................................................................... strain at peak strength
......................................................................................... plastic strain at peak strength

xxix
.......................................................................................................................................... strain at the transition point
.......................................................................... the plastic strain at the transition point
................................................................................................................................................................ strain at cracking
................................................................................................................. scales dilatency
θ ........................................... angle whose tangent is the infill height to length aspect ratio
..........................................the angle of the infill diagonal with respect to horizontal
.......................................... coefficient used to determine equivalent width of infill strut
.................................................................characteristic stiffness parameter for infill
.. slope of the yield surface for the interface element, equivalent to shear friction factor
...................................................... residual slope of yield surface for interface element
.......................................................... initial slope of yield surface for interface element
.................................................................................................................... poissons ratio
..................................................................................................................... normal stress
........................................................................................... principal stresses
......................................................................................................................... shear stress
ϕ ........................................................................................................ internal friction angle

xxx
SUMMARY
Caribbean-style hybrid concrete-masonry structures consist of a reinforced
concrete frame with partially grouted and reinforced infill masonry walls. The infill walls
are typically connected to the RC frame with cast-in-place dowel reinforcement along
one or more edges of the wall. There is limited guidance in masonry codes to design
these types of structures, and their seismic performance has not been characterized with
experimental tests. In this work, an experimental program characterized the seismic
behavior of hybrid concrete-masonry frames and showed they do not exhibit the typical
strut mechanism observed in unreinforced masonry infill structures. In addition, a
detailed finite element modeling scheme and calibration methodology was developed for
modeling partially grouted masonry. This model includes a novel calibration method to
account for the difference in the shear and tensile behavior of bed joints with grouted and
ungrouted cells, and a method to account for the contribution of vertical reinforcement to
the shear capacity of the bed joints with grouted cells. Finally, simplified models were
proposed for use in engineering design. A modification of the TMS 402 strut model for
hybrid concrete-masonry was suggested to incorporate the effects of the masonry infill
and connections in large models.
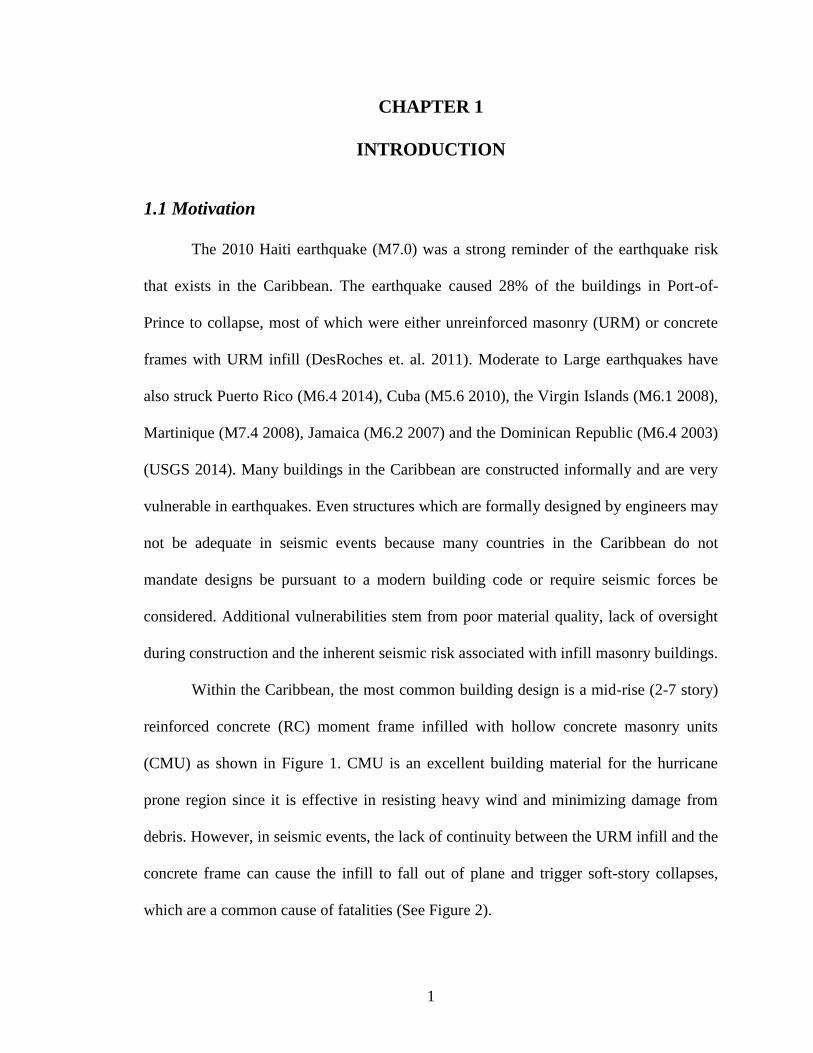
1
CHAPTER 1
INTRODUCTION
1.1 Motivation
The 2010 Haiti earthquake (M7.0) was a strong reminder of the earthquake risk
that exists in the Caribbean. The earthquake caused 28% of the buildings in Port-of-
Prince to collapse, most of which were either unreinforced masonry (URM) or concrete
frames with URM infill (DesRoches et. al. 2011). Moderate to Large earthquakes have
also struck Puerto Rico (M6.4 2014), Cuba (M5.6 2010), the Virgin Islands (M6.1 2008),
Martinique (M7.4 2008), Jamaica (M6.2 2007) and the Dominican Republic (M6.4 2003)
(USGS 2014). Many buildings in the Caribbean are constructed informally and are very
vulnerable in earthquakes. Even structures which are formally designed by engineers may
not be adequate in seismic events because many countries in the Caribbean do not
mandate designs be pursuant to a modern building code or require seismic forces be
considered. Additional vulnerabilities stem from poor material quality, lack of oversight
during construction and the inherent seismic risk associated with infill masonry buildings.
Within the Caribbean, the most common building design is a mid-rise (2-7 story)
reinforced concrete (RC) moment frame infilled with hollow concrete masonry units
(CMU) as shown in Figure 1. CMU is an excellent building material for the hurricane
prone region since it is effective in resisting heavy wind and minimizing damage from
debris. However, in seismic events, the lack of continuity between the URM infill and the
concrete frame can cause the infill to fall out of plane and trigger soft-story collapses,
which are a common cause of fatalities (See Figure 2).
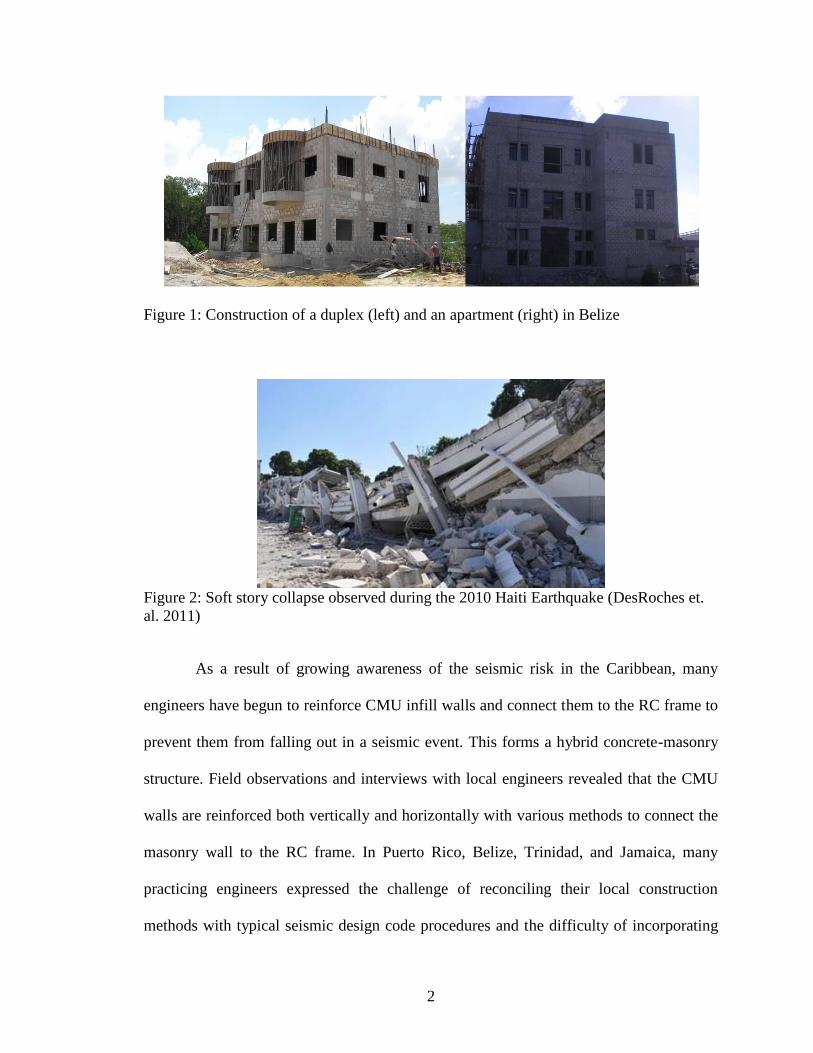
2
Figure 1: Construction of a duplex (left) and an apartment (right) in Belize
Figure 2: Soft story collapse observed during the 2010 Haiti Earthquake (DesRoches et.
al. 2011)
As a result of growing awareness of the seismic risk in the Caribbean, many
engineers have begun to reinforce CMU infill walls and connect them to the RC frame to
prevent them from falling out in a seismic event. This forms a hybrid concrete-masonry
structure. Field observations and interviews with local engineers revealed that the CMU
walls are reinforced both vertically and horizontally with various methods to connect the
masonry wall to the RC frame. In Puerto Rico, Belize, Trinidad, and Jamaica, many
practicing engineers expressed the challenge of reconciling their local construction
methods with typical seismic design code procedures and the difficulty of incorporating
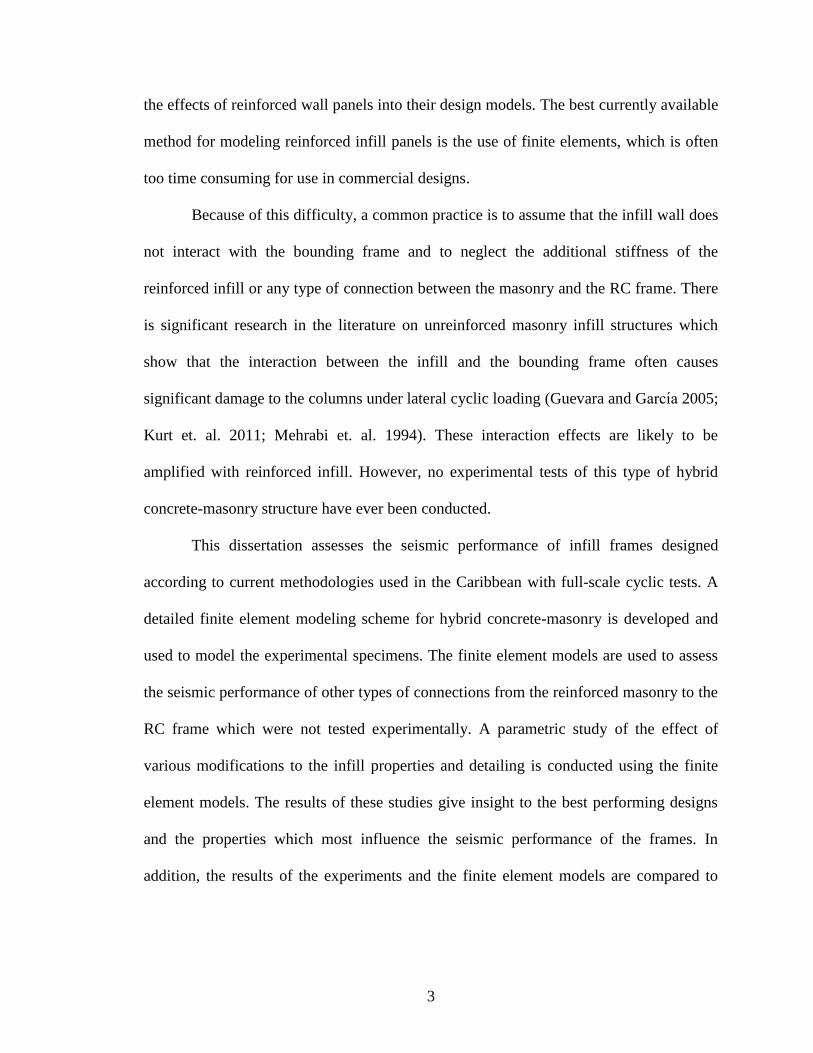
3
the effects of reinforced wall panels into their design models. The best currently available
method for modeling reinforced infill panels is the use of finite elements, which is often
too time consuming for use in commercial designs.
Because of this difficulty, a common practice is to assume that the infill wall does
not interact with the bounding frame and to neglect the additional stiffness of the
reinforced infill or any type of connection between the masonry and the RC frame. There
is significant research in the literature on unreinforced masonry infill structures which
show that the interaction between the infill and the bounding frame often causes
significant damage to the columns under lateral cyclic loading (Guevara and G 2005;
Kurt et. al. 2011; Mehrabi et. al. 1994). These interaction effects are likely to be
amplified with reinforced infill. However, no experimental tests of this type of hybrid
concrete-masonry structure have ever been conducted.
This dissertation assesses the seismic performance of infill frames designed
according to current methodologies used in the Caribbean with full-scale cyclic tests. A
detailed finite element modeling scheme for hybrid concrete-masonry is developed and
used to model the experimental specimens. The finite element models are used to assess
the seismic performance of other types of connections from the reinforced masonry to the
RC frame which were not tested experimentally. A parametric study of the effect of
various modifications to the infill properties and detailing is conducted using the finite
element models. The results of these studies give insight to the best performing designs
and the properties which most influence the seismic performance of the frames. In
addition, the results of the experiments and the finite element models are compared to

4
several proposed simplified models which may be more practical to use for building
design.
1.2 Background
Most of the other Caribbean islands have similar seismic and hurricane risk to
Haiti, but the design practices, building codes and the degree of enforcement of building
codes across the islands vary greatly (See Figure 3). Knowledge about the current design
practices in Puerto Rico, Trinidad, Belize, and Jamaica was obtained from in-person
interviews with design engineers and government officials, research institutions and
building authorities with funding from the Speedwell Foundation as part of the Caribbean
Hazard Assessment Mitigation and Preparedness (CHAMP) Project.
Figure 3: Map of the Caribbean showing current building codes, the status of
enforcement and the earthquake risk

5
Interviewees expressed that since there is currently limited codified guidance for
reinforced infill, their designs are often based on engineering judgment. Thus,
reinforcement sizes and spacing within the CMU infills varied from firm to firm.
However, in every firm where hybrid concrete-masonry was utilized, the CMU wall was
reinforced both vertically and horizontally. There is also a lack of guidance regarding the
connection of the infill wall to the concrete frame. The commentary of TMS 402 B.3.2
m kes the following st tement eg ding onne tions of infill m son y, “while
mechanical connectors, including the use of reinforcement are permitted, they must be
detailed to preclude load transfer between the infill and the bounding frame.” Be use of
this ambiguity, there are many different methods used to connect the reinforced infill
walls to the frame.
One method to connect the wall is to use cast-in place dowel reinforcement to
connect the masonry to the RC frame either vertically (to the beams and foundation) or
vertically and horizontally (to the columns, beams, and foundation) (See Figures 4, 8a.
and 8b). The dowel reinforcing bars typically have a 90 degree hook and are embedded at
least 4-6 inches into the concrete frame, although the depth of embedment varied among
the firms interviewed (l1 in Figures 8a and 8b). Additionally, there is no standard splice
length for splicing the connection from the interior wall reinforcement to the dowel
reinforcement. Some firms specified 30 bar diameters, while others specified 40 bar
diameters or through one unit of masonry (l2 in Figures 8a and 8b). Usually the CMU is
placed directly up against the columns with mortar in the joint, and at the top of the wall
bits of concrete may be shoved in with extra mortar to fill any void between the wall and
the beam.

6
Figure 4: Condominiums (left) and close up of CMU infill wall (right) under construction
in Jamaica
Another method to connect the walls to the RC frame is to try to isolate the
reinforced CMU wall from the RC frame. L-brackets are sometimes used at the top of the
masonry wall to connect it to the beam (See Figure 5). Dowel reinforcement is either
cast-in-place, or drilled and epoxied into the foundation or beam below, then the
reinforced CMU wall is constructed. An isolation gap is provided between the CMU wall
and the columns and the beam above. This is sometimes filled with a flexible material.
Like the first connection method, there does not seem to be a single methodology for
determining the depth the dowel bars extend into the frame (l1 in Figure 8c) or the splice
length of the connection to the vertical reinforcement within the CMU wall (l2 in Figure
8c).

7
Figure 5: Construction drawings for bracket connections of the infill wall and provision
of an isolation gap
The third method to connect the CMU walls is actually to reverse the construction
order and finish the masonry wall before pouring the RC frame. The reinforcement from
the CMU wall is run through the space where the columns and beams will be poured (See
Figure 6, 7 and 8d). However, this practice was only observed in Belize. Like the
reinforced infill structures, the wall is not designed to act integrally with the frame. In
this type of construction, the RC frame is often designed for the majority of the gravity
and lateral forces, and then the masonry walls are designed for the remainder of the loads.

8
Figure 6: Typical Belizian construction, placing column rebar and the infill wall
Figure 7: Close up of vertical rebar spacing (left) and rebar connection to column (right)
9
Figure 8: Methods for connection of the reinforced CMU wall to the concrete frame
The strengths of CMU and concrete in the Caribbean are much lower than the
standard strengths achieved by CMU block and concrete manufactured in the United
States. The aggregates are predominately limestone or a mix of limestone and quartz,
which are weaker than the aggregate in the U.S. Additionally, the concrete mix designs
are very lean; typically four sacks of cement per batch. The strength variation for
concrete is between 3000 psi (20.7 MPa) and 4500 psi (31 MPa), and CMU unit strengths
are between 2000 psi (13.8 MPa) and 3500 psi (24.1 MPa). CMU block in Jamaica is an
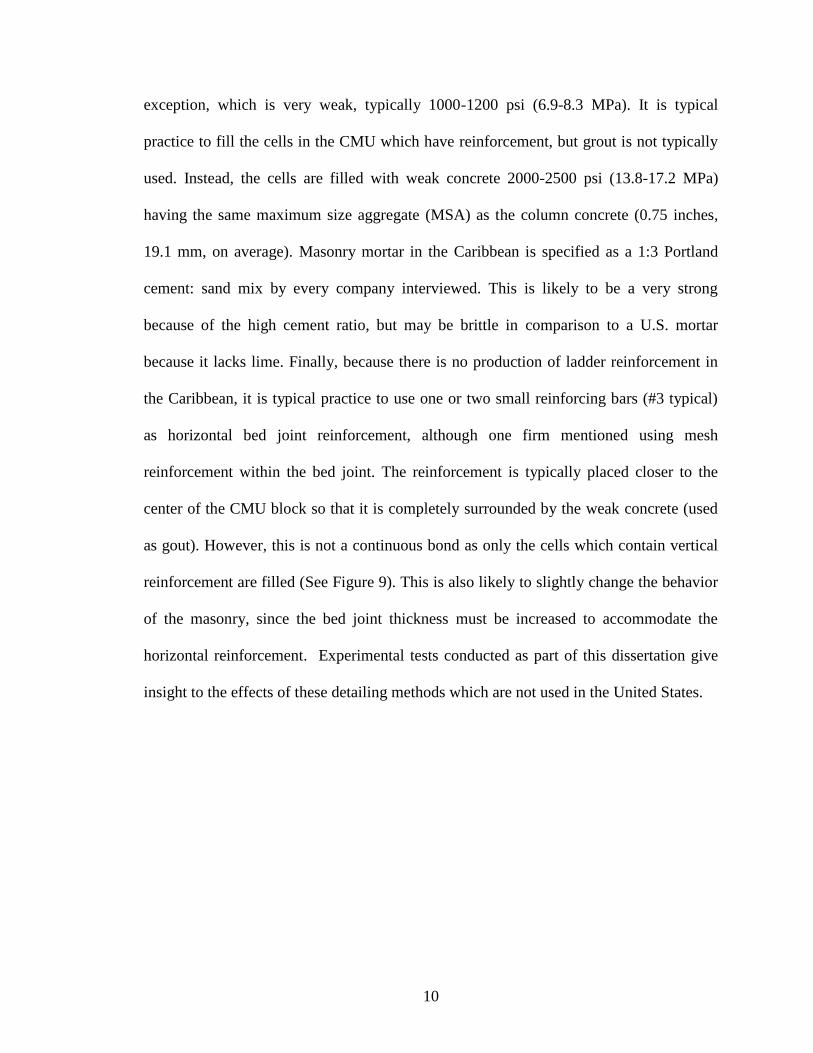
10
exception, which is very weak, typically 1000-1200 psi (6.9-8.3 MPa). It is typical
practice to fill the cells in the CMU which have reinforcement, but grout is not typically
used. Instead, the cells are filled with weak concrete 2000-2500 psi (13.8-17.2 MPa)
having the same maximum size aggregate (MSA) as the column concrete (0.75 inches,
19.1 mm, on average). Masonry mortar in the Caribbean is specified as a 1:3 Portland
cement: sand mix by every company interviewed. This is likely to be a very strong
because of the high cement ratio, but may be brittle in comparison to a U.S. mortar
because it lacks lime. Finally, because there is no production of ladder reinforcement in
the Caribbean, it is typical practice to use one or two small reinforcing bars (#3 typical)
as horizontal bed joint reinforcement, although one firm mentioned using mesh
reinforcement within the bed joint. The reinforcement is typically placed closer to the
center of the CMU block so that it is completely surrounded by the weak concrete (used
as gout). However, this is not a continuous bond as only the cells which contain vertical
reinforcement are filled (See Figure 9). This is also likely to slightly change the behavior
of the masonry, since the bed joint thickness must be increased to accommodate the
horizontal reinforcement. Experimental tests conducted as part of this dissertation give
insight to the effects of these detailing methods which are not used in the United States.
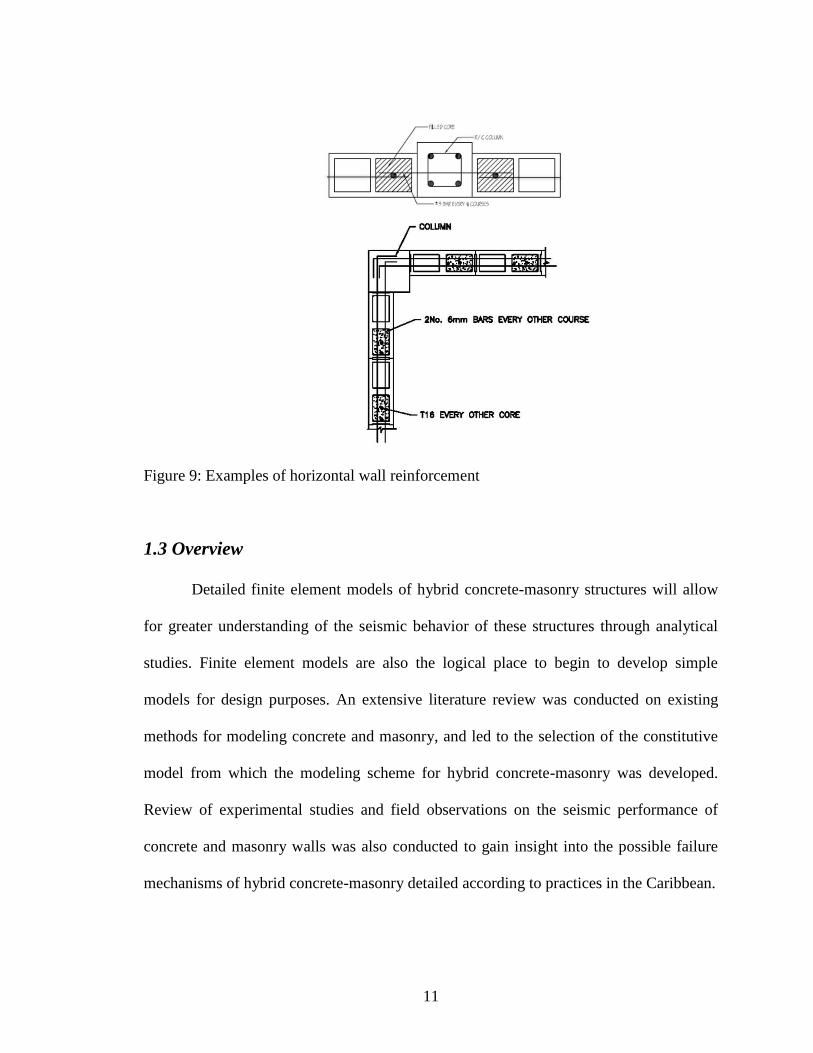
11
Figure 9: Examples of horizontal wall reinforcement
1.3 Overview
Detailed finite element models of hybrid concrete-masonry structures will allow
for greater understanding of the seismic behavior of these structures through analytical
studies. Finite element models are also the logical place to begin to develop simple
models for design purposes. An extensive literature review was conducted on existing
methods for modeling concrete and masonry, and led to the selection of the constitutive
model from which the modeling scheme for hybrid concrete-masonry was developed.
Review of experimental studies and field observations on the seismic performance of
concrete and masonry walls was also conducted to gain insight into the possible failure
mechanisms of hybrid concrete-masonry detailed according to practices in the Caribbean.

12
After compiling information from the available literature, finite element models
for hybrid concrete-masonry were developed. First, extensive validation of the
constitutive model was performed, beginning with element-level tests and progressing
through component-level tests and finally validating the existing model with results from
a 3-story 3-bay infill specimen tested dynamically. Then, since the validation established
confidence in the constitutive model, it was adapted to include a modeling scheme for
hybrid concrete-masonry. As part of this modeling scheme, a new methodology for
calibrating the interface elements representing bed joints with grouted cells was
developed based on the concept of shear friction in concrete. Shear and tensile tests on
grouted bed masonry samples validated the proposed method to calculate the properties
of grouted bed joints as a function of the compressive strength of the grout and mortar.
Validation of the interface properties and the modeling of the connections between the
reinforced masonry infill and the RC frame was postponed until after the data from the
experimental program was obtained.
The initial finite element models calibrated with material test data were used to
aid in the design of the experimental program. Models helped determine loading
conditions for the frames and were used in tandem with hand calculations to bound the
capacity of the structure, since there are no design tools to estimate the true capacity of
hybrid concrete-masonry frames. The two test specimens were single-story, single-bay
test frames with an additional half story to simulate the stiffness of the masonry wall
above. The specimens were designed to be as similar to current design practices in the
Caribbean. Because design and construction practices vary so greatly in the Caribbean, it
was not practical to test every variation of concrete frame and connection of the CMU

13
infill to the RC frame. Two variations of connections of the CMU infill were assessed:
Frame 1 had cast-in-place dowel reinforcement connecting all edges of the masonry infill
to the RC frame, and Frame 2 had cast-in-place dowel reinforcement only at the base of
the infill. The frames were tested using a displacement-controlled cyclic loading protocol
which closely followed FEMA 461.
Cyclic tests of the two specimens were compared to one another to determine the
effect of the different connections from the infill to the RC frame. Global force-
displacement plots from the tests were compared to the expected behavior of a bare frame
to determine the influence the reinforced masonry wall had on the frame behavior.
Additional data was obtained regarding the slip at the interface between the masonry and
the RC frame; the strains in the reinforcement of the columns and the infill wall; and the
shear and flexural deformations at the top and bottom of the columns and the infill wall.
This data was used to assess rather the infill participated as a structural element, even
though it was designed as a non-structural element.
The results of the finite element models were compared to the data obtained
during the experiments. Although the initial models provided very good predictions of
the force-displacement behavior and generally captured the failure patterns of the frames,
a revised model was created in order to better capture the effect of the dowel connections
and fully calibrate the interface properties in the model.
The validated finite element models were then used for analytical studies. First,
the finite element model was used to explore several changes to the design of hybrid
concrete-masonry structures. This includes different types of connections which were
observed in the Caribbean, but not tested experimentally and proposed improvements

14
based on observations during the experiments. Second, a parametric study was conducted
to characterize the influence of the infill properties on the seismic performance of hybrid
concrete-masonry frames. The study includes the influence of masonry material
properties and the influence of reinforcement detailing.
Finally, several simplified models were developed and compared to the results of
the finite element models and the experimental data. An elastic transformed section
model was proposed to predict the cracking load and a cracked section model was
proposed to predict the ultimate shear capacity of the experimental frames. A
modification of the typical TMS 402 strut model was also suggested to account for the
effect of the dowel connections on the geometry and behavior of the masonry diagonal
strut in hybrid concrete-masonry structures.
Although major policy changes to address limited building regulation in the
Caribbean and minimal guidance for hybrid concrete-masonry is unlikely to occur in the
near future, many local engineers choose to engage in best practice design. These
practices transfer down to contractors who mimic the typical construction details seen in
large projects, for structures that are constructed informally. By providing data on the
seismic performance of hybrid concrete-masonry, suggesting detailing methods which
perform best in earthquakes, and proposing simplified models, this work will help
engineers to expand and improve upon their existing design tools and methodologies.
1.4 Document Outline
Chapter 2 is a collection of the literature reviewed in preparation for this work. It
contains a literature review of modeling methods for concrete and masonry structures,
and a review of experimental studies and field observations on the seismic performance

15
of concrete and masonry walls. Chapter 3 is titled, Constitutive Finite Element Model and
Validation Studies. It contains a detailed description of the constitutive model, followed
by extensive model validation. Chapter 4 describes the finite element modeling method
and newly proposed calibration methodology for hybrid concrete-masonry. It also
presents the initial finite element models used to predict the behavior of the experimental
specimens and aid in the experimental design. Chapter 5 covers the design of the
experimental program including: the specimen design, the material properties, the
construction details, the experimental set up, the loading protocol and the instrumentation
plan. Chapter 6, titled "Experimental and Analytical Results," contains all the results of
the experimental program and the initial finite element models. It also contains the
rationale behind the changes that were made to the revised finite element models and
compares these results with the experimental data. Chapter 7 describes the analytical
studies conducted using the finite element models to determine the effect of design
changes on the seismic performance of the hybrid concrete-masonry frames. It also
contains the simplified models proposed to calculate the cracking load and peak capacity
of the walls and a modification of the TMS 402 strut model for infill walls with
connections to the RC frame. Chapter 8 contains the summary, conclusions and
recommendations which resulted from this work.
16
CHAPTER 2
LITERATURE REVIEW
The development of a finite element modeling scheme for hybrid concrete-
masonry structures is the starting point of this dissertation. The combined smeared crack
and interface element constitutive model from which this scheme is developed has
distinct advantages over other modeling methods which exist in the literature. In order to
understand these advantages, an extensive review of existing finite element modeling
schemes is presented. Finite element models are necessary for hybrid concrete-masonry
because the existing simplified models for masonry infill structures are limited to
unreinforced masonry infill without connections to the reinforced concrete frame. The
current simplified modeling methods for unreinforced masonry infill structures are
summarized.
Tests of hybrid concrete-masonry structures analogous to those in the Caribbean
cannot be found in the literature. This necessitates testing of hybrid concrete-masonry
walls to validate the finite element models and gain an understanding of the seismic
performance of these structures. Experiments from the literature for other systems which
are constructed of concrete and masonry are reviewed in order to establish a baseline for
interpreting the failure mechanisms observed during cyclic tests of hybrid concrete-
masonry walls.
2.1 Finite Element Modeling of Concrete and Masonry Structures
Modeling masonry or concrete in finite element is very similar because of their
analogous material properties. Masonry and concrete both exhibit strain hardening and
subsequent softening after yielding in compression, and are brittle in tension. The

17
primary difference between modeling masonry and modeling concrete is that masonry
has mortar joints which are much weaker than the masonry bricks. This literature review
does not elaborate on the different methods to model the mortar joints, but instead
focuses on finite element (FE) models used to represent masonry bricks and concrete.
The most significant difference between existing finite element modeling schemes
for concrete and masonry units is the method used for modeling cracking. The
predominate methods are: discrete crack models, smeared crack models, crack band
models and microplane models. For each of these methods, finite element material
behavior must be defined to characterize the initial yield surface. Additionally, a
plasticity model must be selected to determine the transformation of the yield surface
after yielding of the element. Finally, a plastic potential should be defined, from which to
derive the plastic strain increment beyond yielding. The plasticity model and plastic
potential predominately affect the solution in the post-peak regime and have not received
much attention in the literature. Thus the focus of this review will be on the cracking
models and the material models which govern the initial yield surface.
2.1.1 Cracking Models
2.1.1.1 Discrete Crack Models
Discrete crack modeling is the earliest modeling scheme which was proposed to
model concrete fracture. In a discrete formulation, cracks occur as displacement
discontinuities at the element boundaries (Ngo and Scordelis 1967; Nilson 1968). The
advantage of discrete formulations is that the stresses at the free surface on either side of
the crack come down to zero, just as it does in the physical cracking process. The original
formulations were very limited in their capability as cracks could only occur along
18
element boundaries. Some improvement to capturing cracking patterns was observed
using Rigid Body Spring Networks, developed by Kawai (1978) discretely model
cracking in spring elements which connect elastic elements of arbitrary shape. Because
the mesh is not constrained to a quadrilateral or tetrahedral element, Bolander (1998) was
able to successfully capture realistic cracking patterns for double edged notched concrete
panels loaded in shear. However, because the elements are rigid, a rigid body spring
network model cannot capture stress distribution.
Later formulations of discrete crack finite element models were proposed to allow
discrete cracking inside an element (Goodman et. al. 1968; Ngo and Scordelis 1967) , but
these methods also require re-meshing at every time step and thus were computationally
expensive. Later models resolved the re-meshing issue by incorporating an interface
element with initially coincident corner nodes to model this displacement (Lotfi and
Shing 1994; Stavridis 2009). In this way, the crack was modeled discretely at
predetermined locations where cracks were likely to occur, but did not permit a physical
separation to form between the elements on either side of the interface. These interface
elements were given large values of stiffness prior to violating the cracking criterion
(stress condition), and then the interface elements were given a different set of properties
to represent the cracked state.
2.1.1.2 Smeared Crack Models
Smeared crack models are commonly used in commercial software to represent
the fracture of concrete or masonry because it has significantly less computational
expense than a discrete formulation. In a smeared crack model, cracking is represented by

19
a change in the stiffness matrix from un-cracked isotropic properties to orthotropic ones
representing the cracked state as shown in Figure 10.
Figure 10: Diagram of cracked property axes
In the initial formulation (Rashid 1968), the smeared crack element orthotropic
cracked stiffness matrix was formulated by zeroing out stiffness in the crack plane. This
caused shear stresses along the crack to abruptly drop to zero and did not represent the
ability of concrete to retain shear strength through aggregate interlock. In subsequent
formulations, shear retention factors (Hegger et. al. 2004; Li et. al. 2003; Mahini 2005;
Suidan and Schnobrich 1973) helped resolve much of the numerical difficulties
associated with the original method. In the initial formulation, the cracking plane and
material property axis was fixed after initial cracking of the element. This allowed tensile
stresses to build up at angles different from the cracking axis. Stresses at these new
orientations could exceed cracking stress without causing any change of tensile capacity
in that direction, since a new cracking plane could not develop (Crisfield and Wills
1989). Softening rules in tension were developed to address this issue (Gopalaratnam and
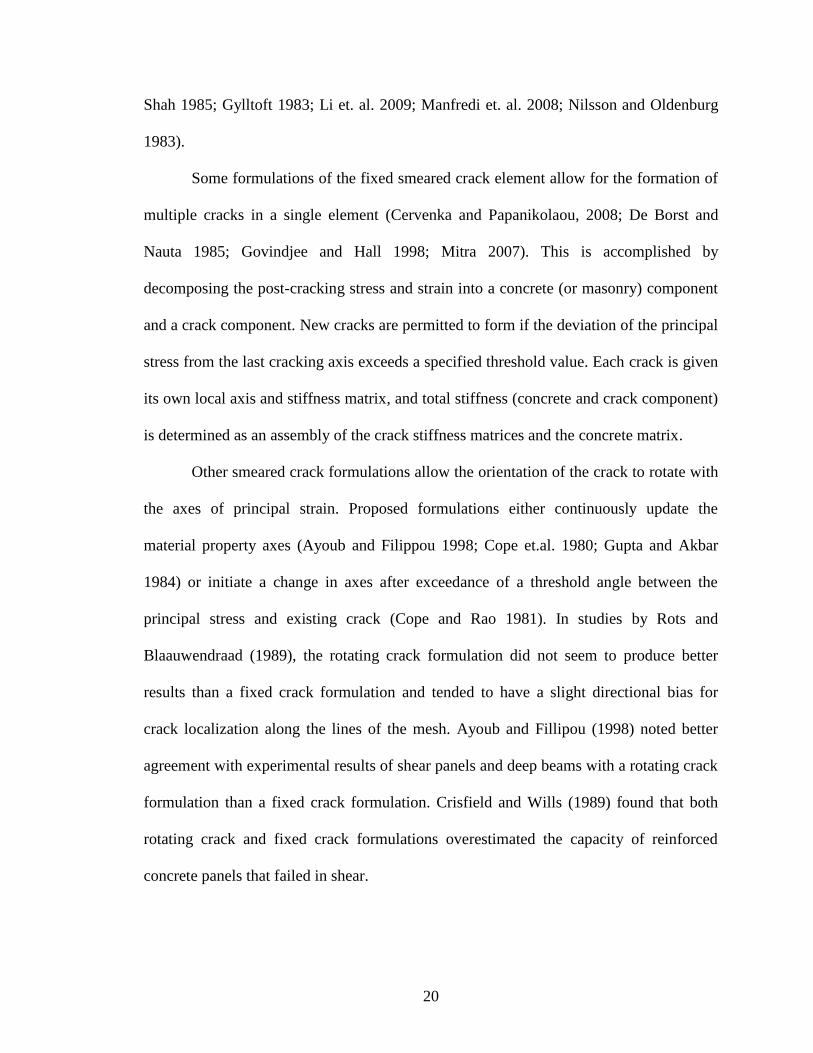
20
Shah 1985; Gylltoft 1983; Li et. al. 2009; Manfredi et. al. 2008; Nilsson and Oldenburg
1983).
Some formulations of the fixed smeared crack element allow for the formation of
multiple cracks in a single element (Cervenka and Papanikolaou, 2008; De Borst and
Nauta 1985; Govindjee and Hall 1998; Mitra 2007). This is accomplished by
decomposing the post-cracking stress and strain into a concrete (or masonry) component
and a crack component. New cracks are permitted to form if the deviation of the principal
stress from the last cracking axis exceeds a specified threshold value. Each crack is given
its own local axis and stiffness matrix, and total stiffness (concrete and crack component)
is determined as an assembly of the crack stiffness matrices and the concrete matrix.
Other smeared crack formulations allow the orientation of the crack to rotate with
the axes of principal strain. Proposed formulations either continuously update the
material property axes (Ayoub and Filippou 1998; Cope et.al. 1980; Gupta and Akbar
1984) or initiate a change in axes after exceedance of a threshold angle between the
principal stress and existing crack (Cope and Rao 1981). In studies by Rots and
Blaauwendraad (1989), the rotating crack formulation did not seem to produce better
results than a fixed crack formulation and tended to have a slight directional bias for
crack localization along the lines of the mesh. Ayoub and Fillipou (1998) noted better
agreement with experimental results of shear panels and deep beams with a rotating crack
formulation than a fixed crack formulation. Crisfield and Wills (1989) found that both
rotating crack and fixed crack formulations overestimated the capacity of reinforced
concrete panels that failed in shear.
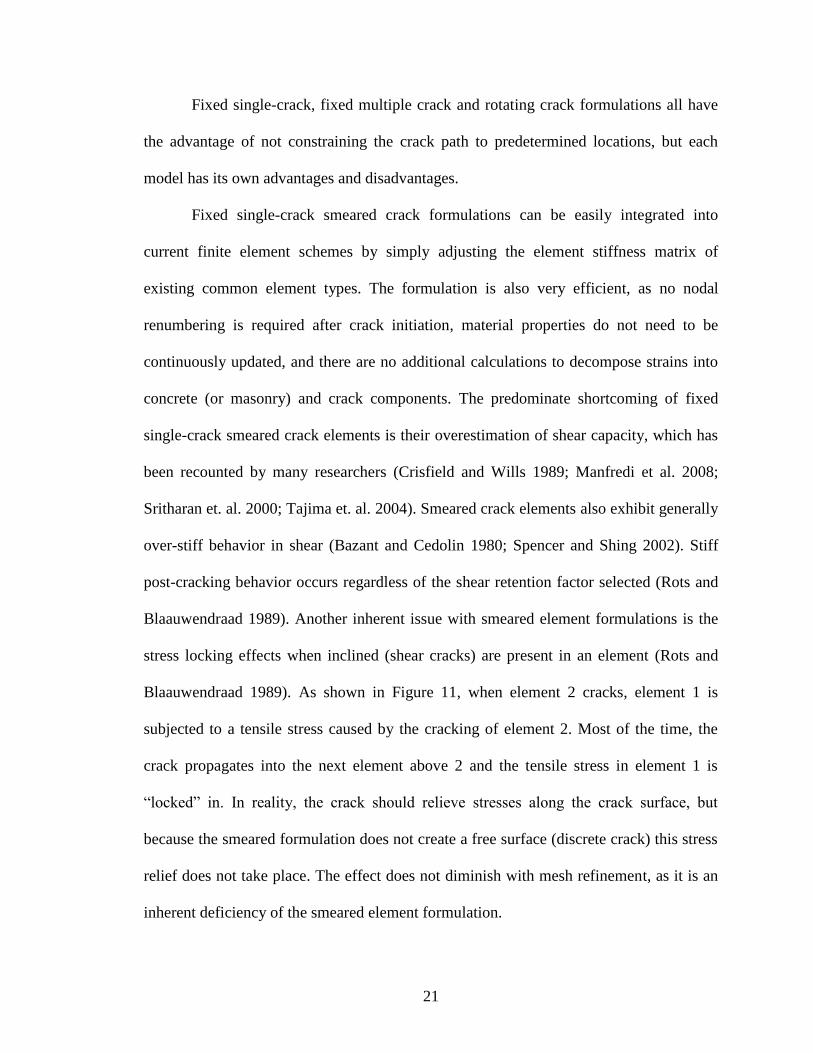
21
Fixed single-crack, fixed multiple crack and rotating crack formulations all have
the advantage of not constraining the crack path to predetermined locations, but each
model has its own advantages and disadvantages.
Fixed single-crack smeared crack formulations can be easily integrated into
current finite element schemes by simply adjusting the element stiffness matrix of
existing common element types. The formulation is also very efficient, as no nodal
renumbering is required after crack initiation, material properties do not need to be
continuously updated, and there are no additional calculations to decompose strains into
concrete (or masonry) and crack components. The predominate shortcoming of fixed
single-crack smeared crack elements is their overestimation of shear capacity, which has
been recounted by many researchers (Crisfield and Wills 1989; Manfredi et al. 2008;
Sritharan et. al. 2000; Tajima et. al. 2004). Smeared crack elements also exhibit generally
over-stiff behavior in shear (Bazant and Cedolin 1980; Spencer and Shing 2002). Stiff
post-cracking behavior occurs regardless of the shear retention factor selected (Rots and
Blaauwendraad 1989). Another inherent issue with smeared element formulations is the
stress locking effects when inclined (shear cracks) are present in an element (Rots and
Blaauwendraad 1989). As shown in Figure 11, when element 2 cracks, element 1 is
subjected to a tensile stress caused by the cracking of element 2. Most of the time, the
crack propagates into the next element above 2 and the tensile stress in element 1 is
“lo ked” in. In e lity, the k should elieve st esses long the k su f e, but
because the smeared formulation does not create a free surface (discrete crack) this stress
relief does not take place. The effect does not diminish with mesh refinement, as it is an
inherent deficiency of the smeared element formulation.

22
Figure 11: Illustration of stress-locking in smeared crack elements (Rots and
Blaauwendraad 1989)
Fixed multiple-crack formulations can more accurately capture the progression of
damage within a material and explicitly track crack behavior, but they are challenging to
implement and have yielded mixed results. Crisfield and Wills (1989) attempted to
implement the multiple crack formulation proposed by De Borst and Nauta (1985) but
ultimately used a traditional single crack formulation, because they encountered many
numerical instabilities involving the threshold angle. Rots and Blaauwendraad (1989)
found if low threshold angles were used to initiate new cracks, multiple smeared crack
models tended to have directional bias along the lines of the mesh, and if high threshold
angles were used, they exhibited the same over-stiffening in shear as traditional smeared
crack elements. Barzeyar-Jamshidi and Schnobrich (1986) successfully employed a
multiple crack model based upon the work of De Borst and Nauta (1985) which captured
shear failure of monotonically loaded panels, provided a sufficient shear retention factor
was utilized.
Rotating crack formulations, which do not suffer from such stiff post-cracking
behavior, have a slight directional bias (Rots and Blaauwendraad 1989) and cannot
capture shear sliding (Spencer and Shing 2002). Failure of smeared crack elements

23
regardless of the type of cracking model is typically flexure dominated, because most
formulations are governed by tensile strength. (Lotfi and Shing 1991). Using alternative
material models which account for shear failure can improve this behavior, but cannot
alleviate the stress-locking or overly-stiff post-cracking response inherent to continuum
models.
2.1.1.3 Crack Band Models
Crack band models are essentially a cross-bread of the smeared cracking element
and a discrete crack formulation. These models allow a bifurcation, or singular band, to
form within the element. In the original formulations, crack widths were assumed based
on previous material tests and all deformation once crack propagation began took place
within this crack band. These models had the advantage of capturing localized behavior
like a discrete model, without constraining crack propagation to predetermined paths
(Belytschko et. al. 1988; Oritz et. al. 1987; Pieruszczak and Moroz 1981). Subsequent
improvements on the method decomposed strains into concrete strains and crack strains.
Continuity of displacement in the singular band (crack) was maintained, but displacement
gradients were not smooth. This allowed for crack widths to vary and they were
calculated as a function of cumulative crack strain (Cervera et. al. 1987; Rots et. al.
1985). Other formulations allowed for the formation of coincident singular lines normal
along the initial crack path. As the material cracks, the difference between the two
initially coincident singular points in the displacement field on each end of the singular
band was crack width (Oliver 1989).
This method is capable of capturing localization of cracks and relatively broad
crack distributions, represented by the crack band width. It is also insensitive to mesh

24
size, so long as the finest mesh width is greater or equal to the expected crack width.
However, crack band models are computationally expensive, and require input
parameters which must be obtained through iterative calibration. Such parameters
include: the characteristic crack length and crack band width limits, which contribute to
the governing equations for the angle of crack propagation and energy based criterion for
crack initiation and weighting functions to enforce compatibility between the crack band
and the rest of the element (Bazant 1986; Bazant and Pijaudier-Cabot 1989; Oliver 1989).
Additionally, the relations for a singular band occurring at any location within an element
require nonlocal continuum formulations in which one must formulate some type of
averaging operator to obtain a symmetric stiffness matrix (Bazant 1986).
2.1.1.4 Microplane Models
Microplane models are a modification of a smeared crack model used to model
the brittle failure of concrete and masonry. In a microplane model, the concrete or
masonry is divided into a series of planes which represent damage planes or weak planes
like those between aggregate (See Figure 12). The microplanes have material failure
surfaces which determine both the normal and deviatoric stresses and strains along those
planes.

25
Figure 12: (a) illustration of microplane locations (b) mapping of strains from microplane
to macroplane strain tensor (Ozbolt et. al. 2001)
Microplane models which follow a static constraint map the stresses from the
microplanes unto the smeared crack elements representing concrete (Taylor 1938). This
method was found to be unstable for tensile failure of concrete due to snap-back effects
(Bazant 1984; Bazant and Gambarova 1984; Bazant and Oh 1983). Microplane models
which follow a kinematic constraint map the strains from the microplanes unto the
smeared crack elements representing concrete (Bazant and Prat 1988; Ozbolt and Bazant
1992). Kinematic microplane models have the advantage of being able to accurately
predict failure along three-dimensional planes for multiple failure mechanisms including:
tension, shear and compression. The model is also able to capture initial anisotropy from
material defects.
One fallback with kinematic microplane models is that after tensile failure, the
models incorrectly predict lateral expansion (Ozbolt et al. 2001). This occurs because the
total stress is decomposed into the volumetric stress and deviatoric stress, which must
sum to zero in the cracked state. The cracked state implies volumetric stress goes to zero
as the volumetric (tensile) stiffness is greatly reduced after cracking. In order for the
26
deviatoric stress to equal zero, either (I) the deviatoric strain must equal zero, or (II) the
deviatoric stiffness must reduce to zero. Because the deviatoric (compression) stiffness is
10 times the volumetric (tensile) stiffness for concrete, a softening curve which maintains
numeric stability cannot satisfy condition II and thus condition I is imposed. However, if
the material does not undergo negative deviatoric strain under tension, the material is
expanding, which is physically unrealistic. Some work has been done to remove this
expansion, but in doing so the material modeling must be discontinuous with a relaxation
in the kinematic constraints after fracture (Ozbolt et al., 2001). This significantly
increases the modeling complexity and can make calibration difficult due to excessive
number of modeling parameters without a physical interpretation.
The other inherent issue with the microplane formulation is that the kinematic
constraint necessitates the use of the Voight estimate for elastic modulus, which is an
upper-bound for material stiffness (Bazant and Prat 1988). Excessive stiffness of
numerical simulations compared to experimental data has been confirmed by several
researchers (Eligehausen et. al. 2009; Ozbolt et al. 2001)
2.1.2 Material Models
Most finite element models for concrete and masonry either implements separate
material models for tension and compression behavior, or utilize a combined failure
surface model which accounts for multiple failure mechanisms.
2.1.2.1 Tensile Behavior
Rankine Theory is widely employed by many smeared crack modeling schemes
(Cervenka and Papanikolaou 2008; De Borst and Nauta 1985; Lotfi and Shing 1991) to
represent the failure surface of the element in tension. Rankine Theory states that failure

27
occurs whenever principal stress exceeds the tensile stress of the material at failure when
loaded in pure tension (Rankine 1857). Most formulations utilize a form of exponential
softening curve for the post-cracking tensile strength in order to avoid numerical
instabilities (Gopalaratnam and Shah 1985; Gylltoft 1983; Li et al. 2009; Manfredi et al.
2008; Nilsson and Oldenburg 1983). Unfortunately, the use of the Rakine yield criterion
as a crack criterion results in mesh sensitivity issues. As the width of the element ahead
of the crack front decreases, the stress within that element will increase. Thus, with mesh
refinement, the crack front propagates infinitely at virtually zero load (Bazant and
Cedolin 1979).
To resolve the mesh sensitivity exhibited in the original models Bazant and
Cedolin, in 1979 proposed the fracture energy crack criterion. It is based on theories of
crack advance in elastic continuums (Rice 1968). This method alleviates mesh size bias
but the computational expense is significantly greater than using a tensile stress crack
criterion (Bazant and Cedolin 1979).
Another alternative to modeling tensile cracking is the use of a stress intensity
factor (Bazant and Cedolin 1979; Saouma and Ingraffea 1981). When the computed
stress intensity factor exceeds fracture toughness of the material, element cracking is
initiated. The formulations for stress intensity factor are based on the expected length of
crack propagation and its direction, as is typically done for discrete cracks. An equivalent
crack length and direction is determined by fitting displacements at characteristic nodes
around a band of cracked elements as shown in Figure 13. Solutions using this method
are highly dependent on selection of characteristic nodes, and the algorithms can be very
tedious to implement.

28
Figure 13: Characteristic nodes around a band of cracked elements (Bazant and Cedolin
1979)
2.1.2.2 Compressive Behavior
There is a great deal of agreement among researchers in the modeling of concrete
and masonry in compression. Nearly all proposed models include some type of
exponential curve for the material behavior , in order to capture the initial stiffness and
subsequent softening after peak compressive stress has been exceeded (Chung and
Ahmad 1995; Desayi and Krishnan 1964; Kent and Park 1971; Kupfer et. a;. 1969; Lotfi
and Shing 1991). Some formulations have more simplified bilinear equations
representing initial stiffness state and a slightly reduced stiffness state after compression
stress has exceeded 1/3 of peak strength (Tajima et al. 2004). A comparison between the
two types of compression models is shown in Figure 14.
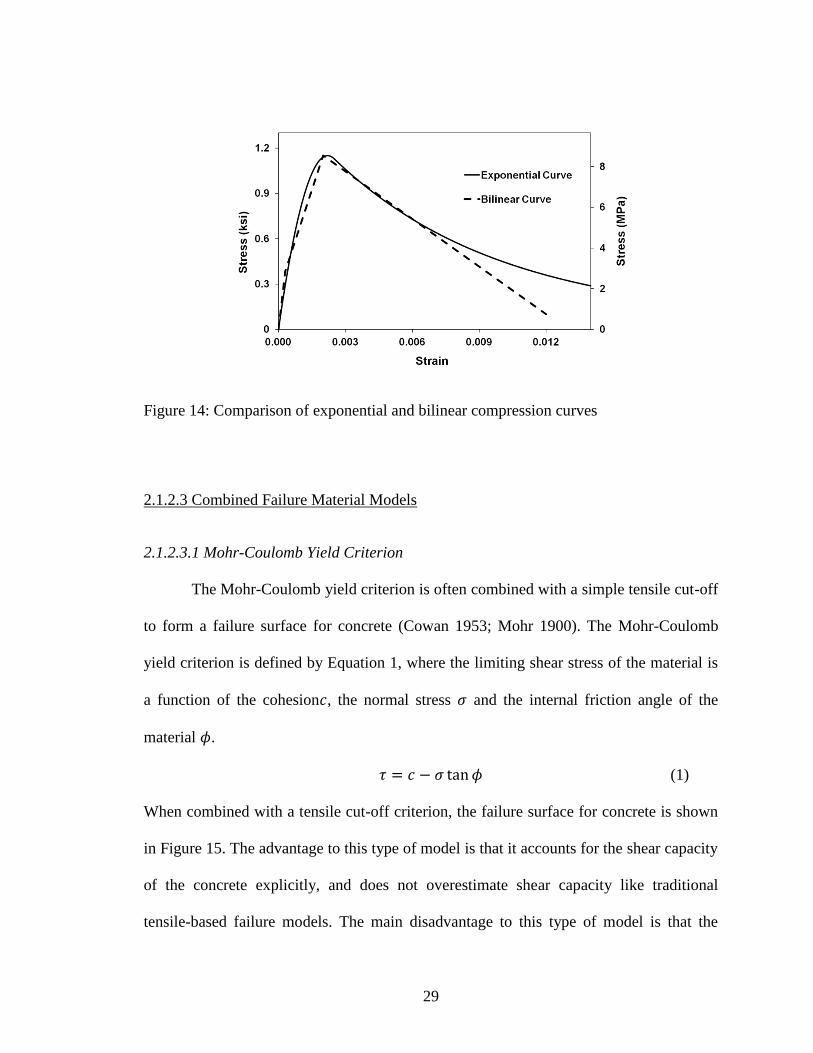
29
Figure 14: Comparison of exponential and bilinear compression curves
2.1.2.3 Combined Failure Material Models
2.1.2.3.1 Mohr-Coulomb Yield Criterion
The Mohr-Coulomb yield criterion is often combined with a simple tensile cut-off
to form a failure surface for concrete (Cowan 1953; Mohr 1900). The Mohr-Coulomb
yield criterion is defined by Equation 1, where the limiting shear stress of the material is
a function of the cohesion , the normal stress and the internal friction angle of the
material .
(1)
When combined with a tensile cut-off criterion, the failure surface for concrete is shown
in Figure 15. The advantage to this type of model is that it accounts for the shear capacity
of the concrete explicitly, and does not overestimate shear capacity like traditional
tensile-based failure models. The main disadvantage to this type of model is that the
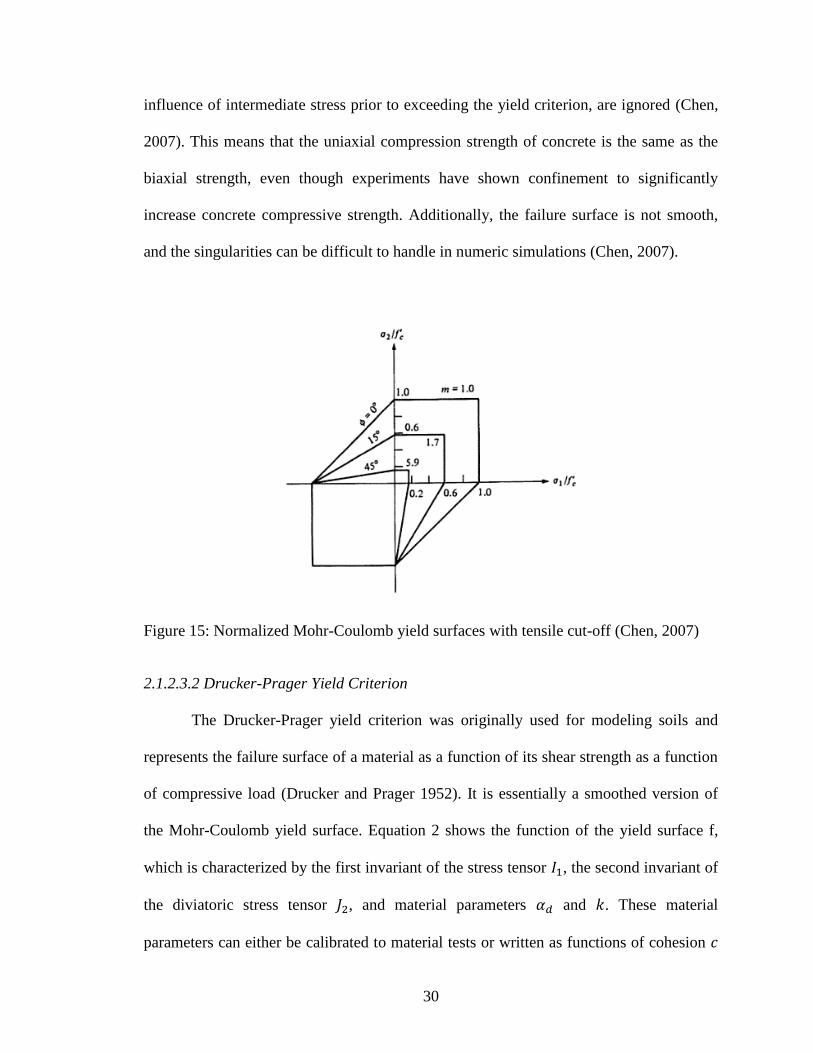
30
influence of intermediate stress prior to exceeding the yield criterion, are ignored (Chen,
2007). This means that the uniaxial compression strength of concrete is the same as the
biaxial strength, even though experiments have shown confinement to significantly
increase concrete compressive strength. Additionally, the failure surface is not smooth,
and the singularities can be difficult to handle in numeric simulations (Chen, 2007).
Figure 15: Normalized Mohr-Coulomb yield surfaces with tensile cut-off (Chen, 2007)
2.1.2.3.2 Drucker-Prager Yield Criterion
The Drucker-Prager yield criterion was originally used for modeling soils and
represents the failure surface of a material as a function of its shear strength as a function
of compressive load (Drucker and Prager 1952). It is essentially a smoothed version of
the Mohr-Coulomb yield surface. Equation 2 shows the function of the yield surface f,
which is characterized by the first invariant of the stress tensor , the second invariant of
the diviatoric stress tensor , and material parameters and . These material
parameters can either be calibrated to material tests or written as functions of cohesion
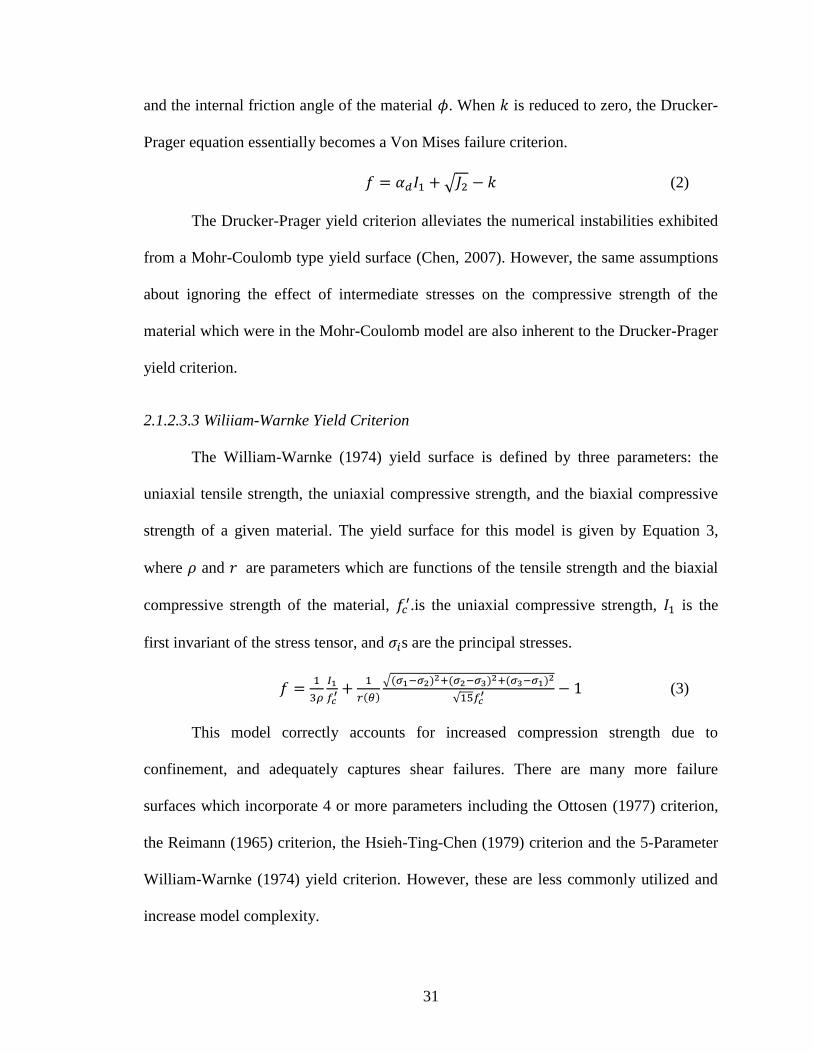
31
and the internal friction angle of the material . When is reduced to zero, the Drucker-
Prager equation essentially becomes a Von Mises failure criterion.
(2)
The Drucker-Prager yield criterion alleviates the numerical instabilities exhibited
from a Mohr-Coulomb type yield surface (Chen, 2007). However, the same assumptions
about ignoring the effect of intermediate stresses on the compressive strength of the
material which were in the Mohr-Coulomb model are also inherent to the Drucker-Prager
yield criterion.
2.1.2.3.3 Wiliiam-Warnke Yield Criterion
The William-Warnke (1974) yield surface is defined by three parameters: the
uniaxial tensile strength, the uniaxial compressive strength, and the biaxial compressive
strength of a given material. The yield surface for this model is given by Equation 3,
where and are parameters which are functions of the tensile strength and the biaxial
compressive strength of the material, .is the uniaxial compressive strength, is the
first invariant of the stress tensor, and s are the principal stresses.
(3)
This model correctly accounts for increased compression strength due to
confinement, and adequately captures shear failures. There are many more failure
surfaces which incorporate 4 or more parameters including the Ottosen (1977) criterion,
the Reimann (1965) criterion, the Hsieh-Ting-Chen (1979) criterion and the 5-Parameter
William-Warnke (1974) yield criterion. However, these are less commonly utilized and
increase model complexity.
32
2.1.2.3.4 Modified Compression Field Theory
Modified compression field theory (MCFT) (Vecchio and Collins 1986) is
somewhat different from the other material models, because it can be used to represent
reinforced concrete as a single material rather than use discrete truss elements for
reinforcement. MCFT was adapted from compression field theory by accounting for the
ability of cracked concrete to transfer some tensile stress rather than assuming zero
tensile capacity. Element failure mechanisms in MCFT are all a function of the direction
of principal compression stress, which is determined iteratively. Failure mechanisms
include: slipping on the crack, crushing, shear failure, or reinforcement yielding, which
are all formulated with respect to average stress and strain in the element. Additional
variables which must be determined are the parameters governing crack control. These
include reinforcement ratio and spacing, which are used to calculate crack width, and
max aggregate size which is used to calculate shear stress. Modified Compression Field
Theory (Vecchio and Collins 1986) has been the basis for many different element
formulations used to model concrete and masonry (Bhide and Collins 1989; Kaufmann
and Marti 1998; Kollegger and Mehlhorn 1990).
Deficiencies with the formulation for modeling shear behavior have been noted.
Kollegger and Mehlhorm (1998) found that MCFT underestimated the stiffness and shear
strength of heavily reinforced panels. Bhide and Collins (1989) found that MCFT
overestimated the stiffness and strength of lightly reinforced concrete panels subjected to
uniaxial tension and shear.

33
2.1.2.3.5 Disturbed Stress Model
Another model which incorporates the effects of reinforcement is the disturbed
stress model (Vecchio, 2000). It differs from MCFT because stresses are a function of the
angle of principal tensile stress, principal stress and strain are not required to be
coincident, and shear stress in the element is a function of local behavior at the crack
boundary rather than global stresses. Shear stress is calculated from local reinforcement
stresses. These local stresses are determined from local reinforcement strains, which are a
function of the average element strains and the relative angle between the reinforcement
at the normal to the crack plane. This method has not been widely used in literature
compared to MCFT.
2.2 Simplified Modeling of Unreinforced Masonry Infill
The most widely employed method for modeling masonry infill is the equivalent
strut concept. The masonry infill is assumed to act like a diagonal compression-only strut
between the structural columns. The most recognizable and significant work on the topic
was conducted by Bryan Stafford-Smith, who developed models to calculate the
equivalent stiffness and strength of a compression-only strut to model unreinforced
masonry infill (Stafford-Smith 1967). His equations were validated against results of four
different series of experiments and are the basis for most simplified methods in current
design codes.
Subsequent improvements on the model have incorporated effects of strength
degradation and slip in hysteretic behavior (Madan et. al. 1997; Puglisi et. al. 2009;
Rodrigues et. al. 2010), or added limit states to the strut model for other failures like
corner crushing (Flanagan and Bennett 1999). Others have proposed methods to calculate

34
equivalent struts for unreinforced wall panels with openings (Kakaletsis 2009;
Mohebkhah et. al. 2007; Schneider et. al. 1998). Investigations have also been conducted
on changing the governing force-displacement behavior of the strut and the number of
struts used to represent the infill panel (Fiore et. al. 2012; Uva et. al. 2012).Still, these
improvements have not been codified, likely because most code procedures are based on
an equivalent static linear analysis rather than dynamic analysis and these improvements
vastly increase model complexity. The major codes which contain guidance for modeling
unreinforced masonry infill are FEMA 356, ASCE 41-06, TMS 402-11, and Eurocode 8.
2.2.1 FEMA 356 and ASCE 41-06
The procedure to determine the equivalent diagonal compression strut for
masonry infill is identical in FEMA 356 and ASCE 41-06 and is given in Section 7.5.2.1
of FEMA 356 and 7.4.2 of ASCE 41-06 (ASCE 2000, 2006) . The equivalent diagonal
strut has the same thickness and elastic modulus as the infill it represents. The width , is
calculated using Equations 4 and 5.
(4)
(5)
In Equation 4, is a coefficient used to determine equivalent width of the infill
strut, is the height of the column between centerlines of the beams, and is the
diagonal length of the infill panel. In Equation 4, is the elastic modulus of the
masonry, is the thickness of the masonry infill, is the angle (in radians) whose
tangent is the infill height to length aspect ratio, is the elastic modulus of the frame

35
material, is the moment of inertia of the column in the plane of bending, and is
the height of the infill panel.
2.2.2 TMS 402-11
The equivalent strut method for masonry infill is given in Appendix B of the TMS
402-11 code and has a thickness equivalent to the infill thickness and elastic modulus
equal to the elastic modulus of the masonry prism (MSJC 2011). The width , is
calculated by Equations 6 and 7.
(6)
(7)
In Equation 6, is the characteristic stiffness parameter for infill and
is the angle of the infill diagonal with respect to horizontal, in degrees. In Equation 7,
is the elastic modulus of the masonry prism, is the net thickness of the infill,
is the elastic modulus of the bounding column, is the moment of inertia of the
bounding column in the bending plane, and is the vertical dimension of the infill.
2.2.3 Eurocode 8
Although Eurocode 8 does not give a specific equation for calculating the width
of the equivalent strut, guidance is given on the method by which to calculate it (CEN
2003). Additionally, several limitations to the design are imposed, and a different
behavior factor (Section 6.3.2) is used for moment resisting frames with infills. The
limitations on the design of the structure is given in Section 4.3.6 and includes
requirements for regularity in the distribution of infill panels in plan and elevation, and a
36
requirement to detail the columns for the local effects of frame-infill interaction. Section
5.9 gives the details of accounting for these local effects. If a column bounding an infill
wall does not have masonry on either side of it, the column must be detailed as though
the entire height were the critical region. The length of the column over which the
diagonal strut force is applied, must be capable of resisting the shear force induced by the
masonry strut. The force is assumed to be equal to the horizontal shear strength of the
masonry panel based on the bed joint strength. The width of the diagonal strut must be
justified by calculation, but no direct procedure for determining the width is given.
2.3 Experimental Studies and Field Observations on the Seismic
Performance of Concrete and Masonry Walls
There are three main types of reinforced concrete and masonry construction: infill
walls, confined masonry walls, and hybrid masonry systems. In reviewing the literature,
it is clear that the specimens tested as part of this dissertation do not neatly fall into one
of these structural types. However, an understanding of the behavior of previously
studied reinforced concrete and masonry structures establishes a baseline for interpreting
the failure mechanisms observed in the physical tests of the wall specimens designed
according to practices in the Caribbean. Within this survey, each structural type is first
defined. Then a summary of the major conclusions from past experimental studies is
presented. Finally, a brief record of the performance in past earthquakes is given. The
focus of this survey is on single panel behavior, without the presence of openings, as this
is the type of structure to be tested in the experimental program.

37
2.3.1 Masonry Infill
2.3.1.1 System Description
Unreinforced masonry infill structures are by far the most extensively studied of
combined concrete and masonry structural systems. Typically, the reinforced concrete
frame is designed for all gravity loads, partition loads, and lateral loads from wind or
seismic forces. The frame is constructed first, then "filled-in" with brick units to form the
walls of the structure. The infill walls are not designed to carry any of the loads placed on
the building. Reinforced masonry infill differs from unreinforced infill because internal
reinforcement is added to the masonry wall. All of the experimental programs on
reinforced infill structures do not contain connections to the reinforced concrete frame.
2.3.1.2 Experimental Studies
Unreinforced masonry infill panels can fail in any combination of six primary
modes: interface cracking, corner crushing, diagonal cracking, horizontal sliding, shear
failure in the column, or a combined sliding and diagonal cracking mode (Moghaddam
and Dowling 1987) (See Figures 16-18).
Figure 16: Unreinforced masonry wall test showing interface cracking and bed joint
sliding (Mosalam 2005)
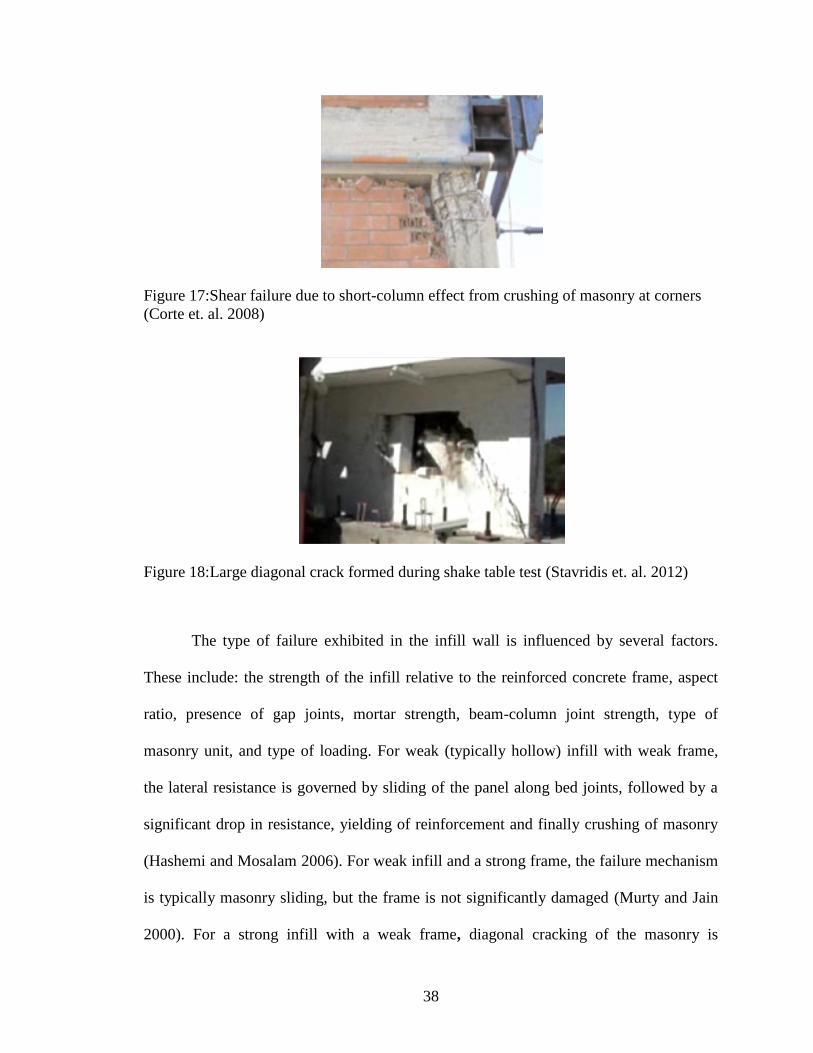
38
Figure 17:Shear failure due to short-column effect from crushing of masonry at corners
(Corte et. al. 2008)
Figure 18:Large diagonal crack formed during shake table test (Stavridis et. al. 2012)
The type of failure exhibited in the infill wall is influenced by several factors.
These include: the strength of the infill relative to the reinforced concrete frame, aspect
ratio, presence of gap joints, mortar strength, beam-column joint strength, type of
masonry unit, and type of loading. For weak (typically hollow) infill with weak frame,
the lateral resistance is governed by sliding of the panel along bed joints, followed by a
significant drop in resistance, yielding of reinforcement and finally crushing of masonry
(Hashemi and Mosalam 2006). For weak infill and a strong frame, the failure mechanism
is typically masonry sliding, but the frame is not significantly damaged (Murty and Jain
2000). For a strong infill with a weak frame, diagonal cracking of the masonry is

39
followed by sliding along the bed joint and shear failure in the column being pushed. This
type of failure leads to faster degradation of resistance than a weak frame with weak infill
and a quick brittle failure of the frame columns (Corte et al. 2008). For strong infill with
a strong frame, the failure is governed by corner crushing of the infill followed by
immediate shear cracking in the columns, but not shear failure, due to the large amount of
shear reinforcement in the columns.
Aspect ratio (h/l) primarily effects the diagonal cracking mode (Moghaddam and
Dowling 1987). The higher the aspect ratio of the wall, the more likely diagonal cracking
will occur and the initial stiffness of the wall decreases as aspect ratio increases.
Increased mortar strength increases tensile capacity and reduces the likelihood of
diagonal cracking and shear horizontal bed joint sliding (Moghaddam and Dowling
1987). The influence of mortar strength is more significant for hollow units because the
shear capacity is solely a function of the bond strength. In infill walls constructed of solid
brick, shear capacity is a function of bond strength and internal friction. The presence of
gap joints between the masonry and the columns may facilitate bed joint sliding,
especially for weak infill (Gostic and Zarnic 1999). The strength of beam-column joints
probably has a great influence on the likelihood of column hinging after crushing of the
masonry, as tests of frames without seismic detailing exhibit poor performance with shear
failures through the joints and soft story collapses. The type of brick unit also has a large
impact on the failure mode. Hollow units are more likely to exhibit shear sliding, and will
generally be weaker and less stiff than solid units (Mehrabi et. al. 1996). Finally, the
loading method can also greatly impact test results. Monotonic loading generally captures
the same failure mechanisms as cyclic loading, but the crack patterns often do not
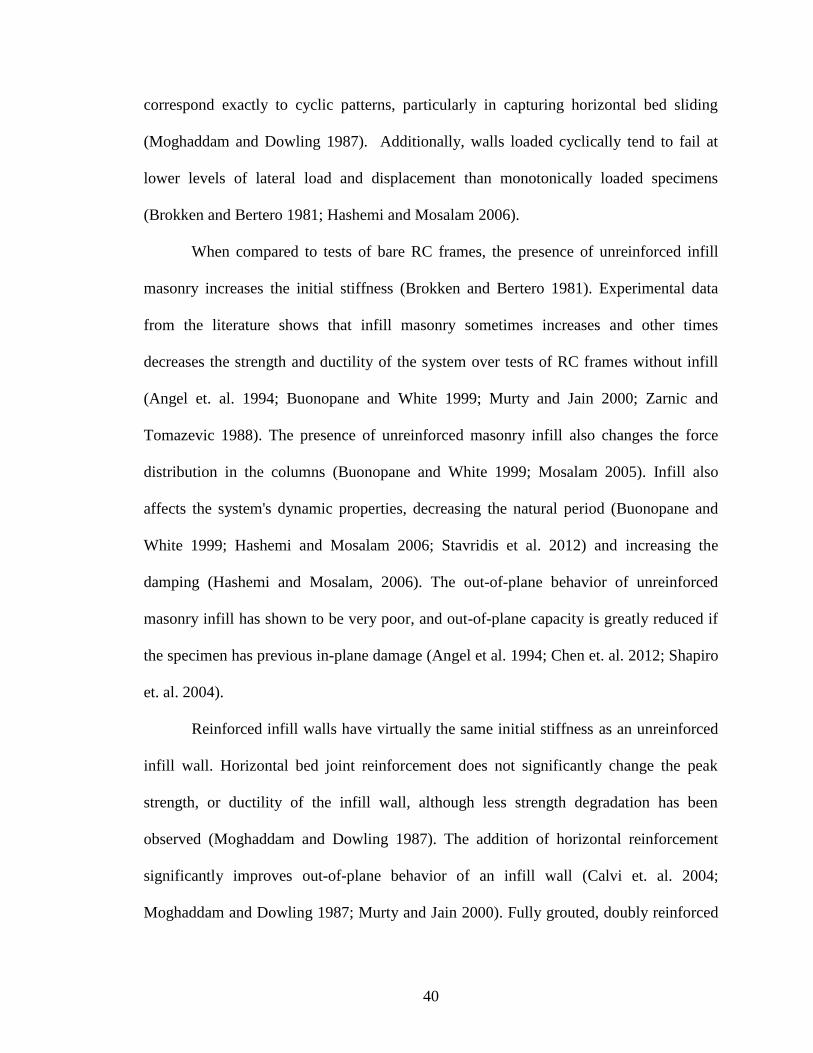
40
correspond exactly to cyclic patterns, particularly in capturing horizontal bed sliding
(Moghaddam and Dowling 1987). Additionally, walls loaded cyclically tend to fail at
lower levels of lateral load and displacement than monotonically loaded specimens
(Brokken and Bertero 1981; Hashemi and Mosalam 2006).
When compared to tests of bare RC frames, the presence of unreinforced infill
masonry increases the initial stiffness (Brokken and Bertero 1981). Experimental data
from the literature shows that infill masonry sometimes increases and other times
decreases the strength and ductility of the system over tests of RC frames without infill
(Angel et. al. 1994; Buonopane and White 1999; Murty and Jain 2000; Zarnic and
Tomazevic 1988). The presence of unreinforced masonry infill also changes the force
distribution in the columns (Buonopane and White 1999; Mosalam 2005). Infill also
affects the system's dynamic properties, decreasing the natural period (Buonopane and
White 1999; Hashemi and Mosalam 2006; Stavridis et al. 2012) and increasing the
damping (Hashemi and Mosalam, 2006). The out-of-plane behavior of unreinforced
masonry infill has shown to be very poor, and out-of-plane capacity is greatly reduced if
the specimen has previous in-plane damage (Angel et al. 1994; Chen et. al. 2012; Shapiro
et. al. 2004).
Reinforced infill walls have virtually the same initial stiffness as an unreinforced
infill wall. Horizontal bed joint reinforcement does not significantly change the peak
strength, or ductility of the infill wall, although less strength degradation has been
observed (Moghaddam and Dowling 1987). The addition of horizontal reinforcement
significantly improves out-of-plane behavior of an infill wall (Calvi et. al. 2004;
Moghaddam and Dowling 1987; Murty and Jain 2000). Fully grouted, doubly reinforced
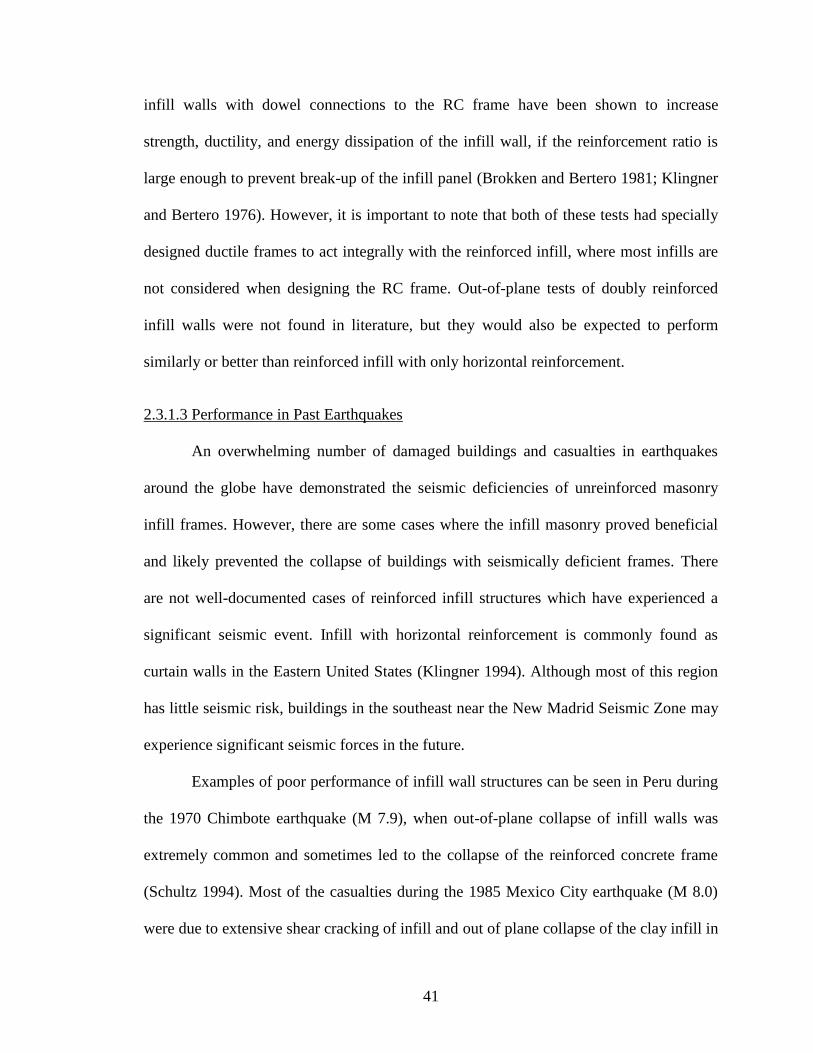
41
infill walls with dowel connections to the RC frame have been shown to increase
strength, ductility, and energy dissipation of the infill wall, if the reinforcement ratio is
large enough to prevent break-up of the infill panel (Brokken and Bertero 1981; Klingner
and Bertero 1976). However, it is important to note that both of these tests had specially
designed ductile frames to act integrally with the reinforced infill, where most infills are
not considered when designing the RC frame. Out-of-plane tests of doubly reinforced
infill walls were not found in literature, but they would also be expected to perform
similarly or better than reinforced infill with only horizontal reinforcement.
2.3.1.3 Performance in Past Earthquakes
An overwhelming number of damaged buildings and casualties in earthquakes
around the globe have demonstrated the seismic deficiencies of unreinforced masonry
infill frames. However, there are some cases where the infill masonry proved beneficial
and likely prevented the collapse of buildings with seismically deficient frames. There
are not well-documented cases of reinforced infill structures which have experienced a
significant seismic event. Infill with horizontal reinforcement is commonly found as
curtain walls in the Eastern United States (Klingner 1994). Although most of this region
has little seismic risk, buildings in the southeast near the New Madrid Seismic Zone may
experience significant seismic forces in the future.
Examples of poor performance of infill wall structures can be seen in Peru during
the 1970 Chimbote earthquake (M 7.9), when out-of-plane collapse of infill walls was
extremely common and sometimes led to the collapse of the reinforced concrete frame
(Schultz 1994). Most of the casualties during the 1985 Mexico City earthquake (M 8.0)
were due to extensive shear cracking of infill and out of plane collapse of the clay infill in
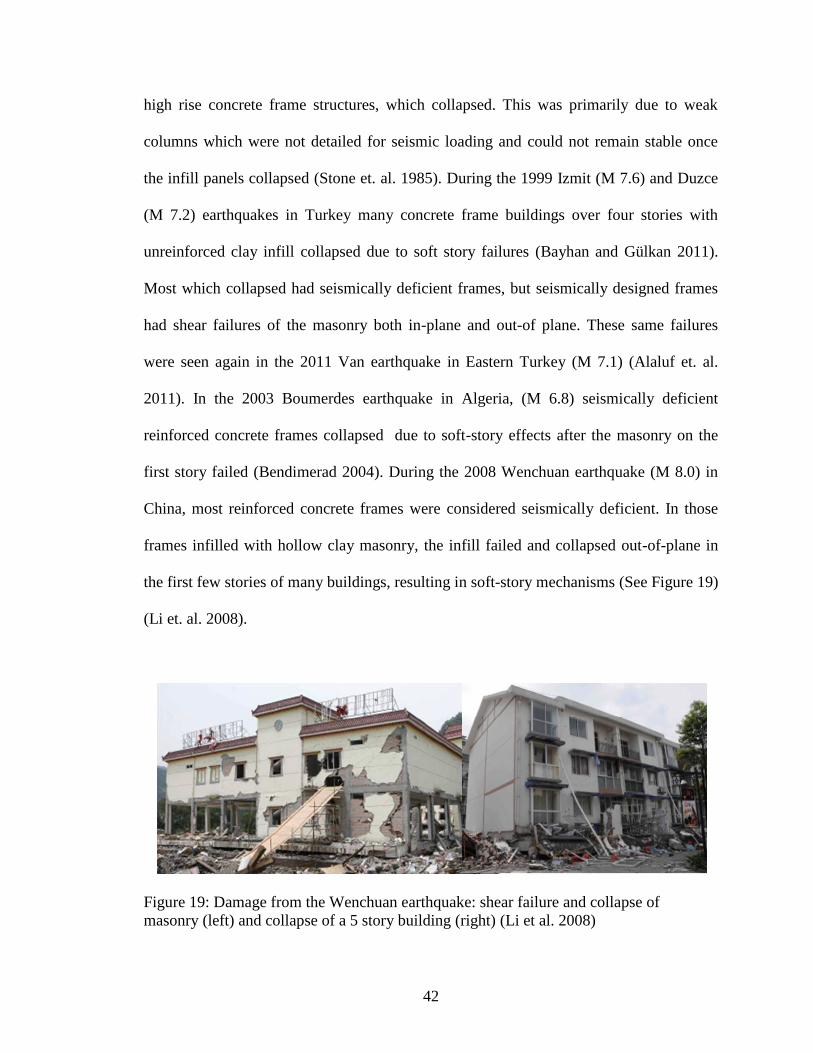
42
high rise concrete frame structures, which collapsed. This was primarily due to weak
columns which were not detailed for seismic loading and could not remain stable once
the infill panels collapsed (Stone et. al. 1985). During the 1999 Izmit (M 7.6) and Duzce
(M 7.2) earthquakes in Turkey many concrete frame buildings over four stories with
unreinforced clay infill collapsed due to soft story failures (Bayhan and Gülkan 2011).
Most which collapsed had seismically deficient frames, but seismically designed frames
had shear failures of the masonry both in-plane and out-of plane. These same failures
were seen again in the 2011 Van earthquake in Eastern Turkey (M 7.1) (Alaluf et. al.
2011). In the 2003 Boumerdes earthquake in Algeria, (M 6.8) seismically deficient
reinforced concrete frames collapsed due to soft-story effects after the masonry on the
first story failed (Bendimerad 2004). During the 2008 Wenchuan earthquake (M 8.0) in
China, most reinforced concrete frames were considered seismically deficient. In those
frames infilled with hollow clay masonry, the infill failed and collapsed out-of-plane in
the first few stories of many buildings, resulting in soft-story mechanisms (See Figure 19)
(Li et. al. 2008).
Figure 19: Damage from the Wenchuan earthquake: shear failure and collapse of
masonry (left) and collapse of a 5 story building (right) (Li et al. 2008)
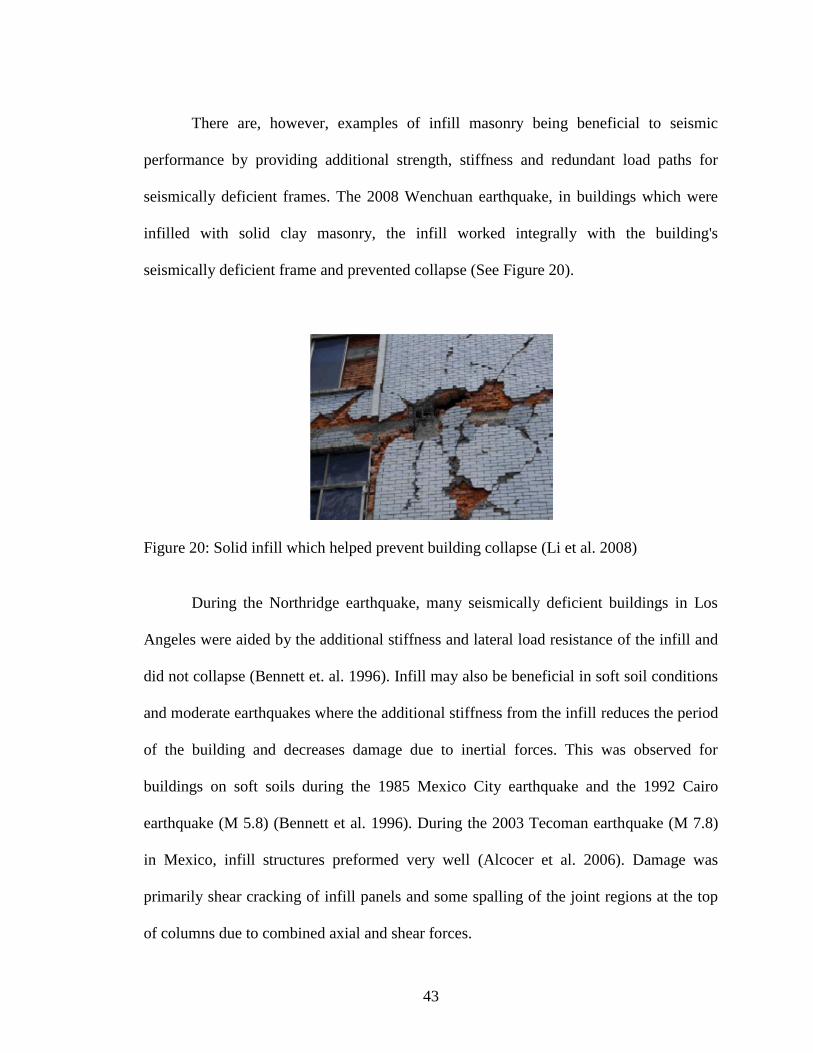
43
There are, however, examples of infill masonry being beneficial to seismic
performance by providing additional strength, stiffness and redundant load paths for
seismically deficient frames. The 2008 Wenchuan earthquake, in buildings which were
infilled with solid clay masonry, the infill worked integrally with the building's
seismically deficient frame and prevented collapse (See Figure 20).
Figure 20: Solid infill which helped prevent building collapse (Li et al. 2008)
During the Northridge earthquake, many seismically deficient buildings in Los
Angeles were aided by the additional stiffness and lateral load resistance of the infill and
did not collapse (Bennett et. al. 1996). Infill may also be beneficial in soft soil conditions
and moderate earthquakes where the additional stiffness from the infill reduces the period
of the building and decreases damage due to inertial forces. This was observed for
buildings on soft soils during the 1985 Mexico City earthquake and the 1992 Cairo
earthquake (M 5.8) (Bennett et al. 1996). During the 2003 Tecoman earthquake (M 7.8)
in Mexico, infill structures preformed very well (Alcocer et al. 2006). Damage was
primarily shear cracking of infill panels and some spalling of the joint regions at the top
of columns due to combined axial and shear forces.
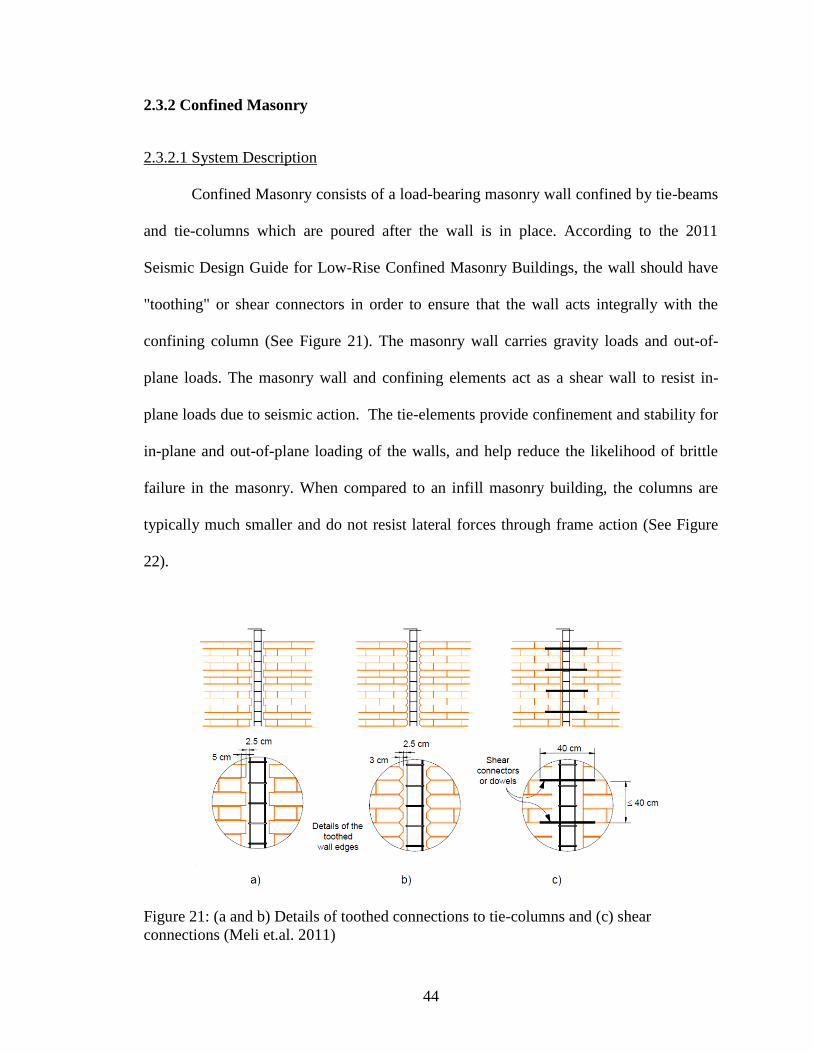
44
2.3.2 Confined Masonry
2.3.2.1 System Description
Confined Masonry consists of a load-bearing masonry wall confined by tie-beams
and tie-columns which are poured after the wall is in place. According to the 2011
Seismic Design Guide for Low-Rise Confined Masonry Buildings, the wall should have
"toothing" or shear connectors in order to ensure that the wall acts integrally with the
confining column (See Figure 21). The masonry wall carries gravity loads and out-of-
plane loads. The masonry wall and confining elements act as a shear wall to resist in-
plane loads due to seismic action. The tie-elements provide confinement and stability for
in-plane and out-of-plane loading of the walls, and help reduce the likelihood of brittle
failure in the masonry. When compared to an infill masonry building, the columns are
typically much smaller and do not resist lateral forces through frame action (See Figure
22).
Figure 21: (a and b) Details of toothed connections to tie-columns and (c) shear
connections (Meli et.al. 2011)
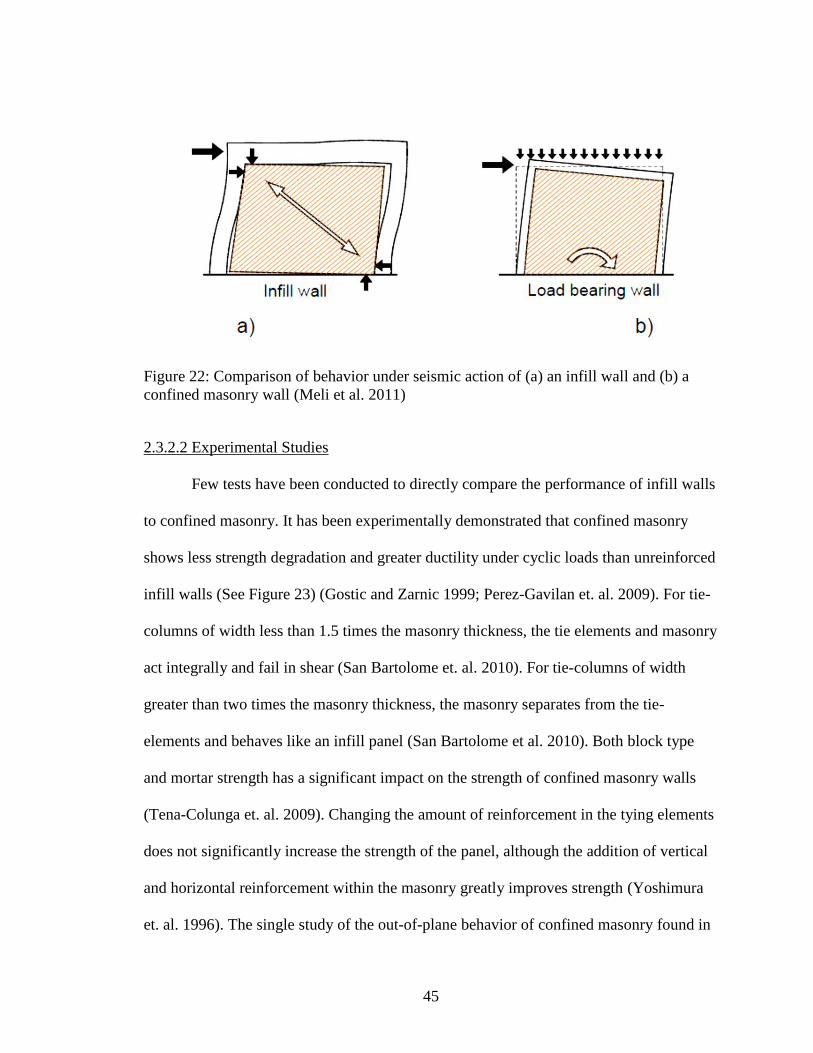
45
Figure 22: Comparison of behavior under seismic action of (a) an infill wall and (b) a
confined masonry wall (Meli et al. 2011)
2.3.2.2 Experimental Studies
Few tests have been conducted to directly compare the performance of infill walls
to confined masonry. It has been experimentally demonstrated that confined masonry
shows less strength degradation and greater ductility under cyclic loads than unreinforced
infill walls (See Figure 23) (Gostic and Zarnic 1999; Perez-Gavilan et. al. 2009). For tie-
columns of width less than 1.5 times the masonry thickness, the tie elements and masonry
act integrally and fail in shear (San Bartolome et. al. 2010). For tie-columns of width
greater than two times the masonry thickness, the masonry separates from the tie-
elements and behaves like an infill panel (San Bartolome et al. 2010). Both block type
and mortar strength has a significant impact on the strength of confined masonry walls
(Tena-Colunga et. al. 2009). Changing the amount of reinforcement in the tying elements
does not significantly increase the strength of the panel, although the addition of vertical
and horizontal reinforcement within the masonry greatly improves strength (Yoshimura
et. al. 1996). The single study of the out-of-plane behavior of confined masonry found in
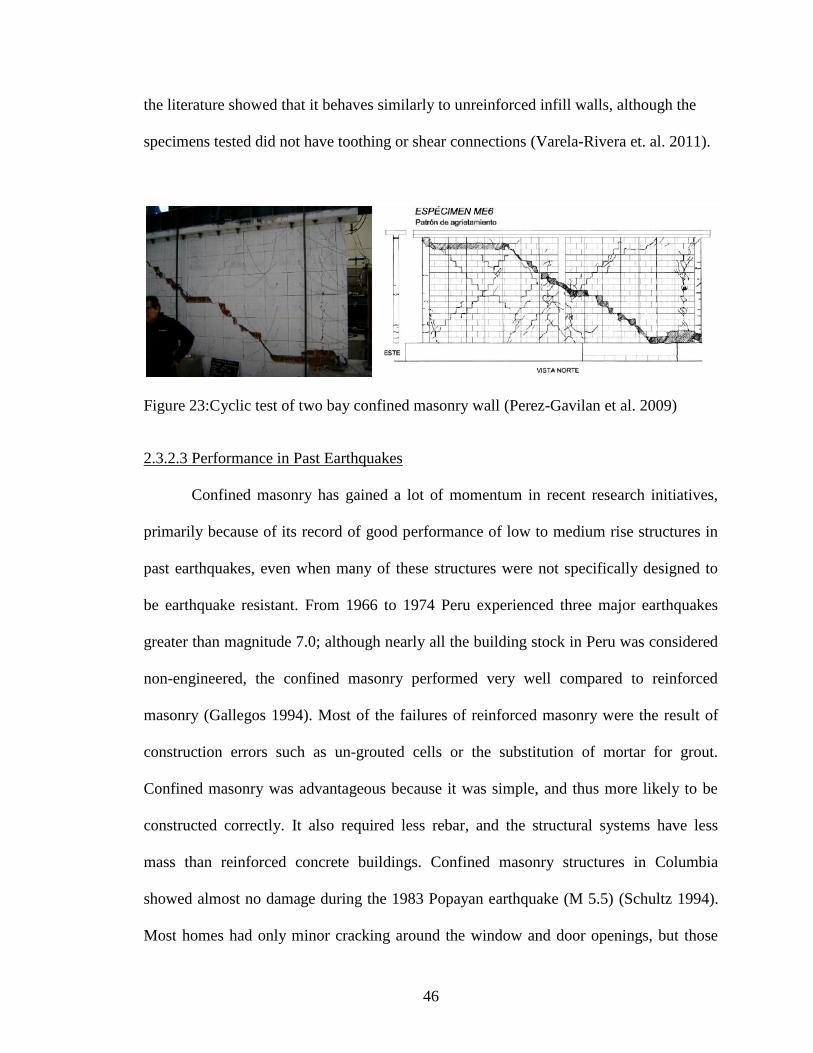
46
the literature showed that it behaves similarly to unreinforced infill walls, although the
specimens tested did not have toothing or shear connections (Varela-Rivera et. al. 2011).
Figure 23:Cyclic test of two bay confined masonry wall (Perez-Gavilan et al. 2009)
2.3.2.3 Performance in Past Earthquakes
Confined masonry has gained a lot of momentum in recent research initiatives,
primarily because of its record of good performance of low to medium rise structures in
past earthquakes, even when many of these structures were not specifically designed to
be earthquake resistant. From 1966 to 1974 Peru experienced three major earthquakes
greater than magnitude 7.0; although nearly all the building stock in Peru was considered
non-engineered, the confined masonry performed very well compared to reinforced
masonry (Gallegos 1994). Most of the failures of reinforced masonry were the result of
construction errors such as un-grouted cells or the substitution of mortar for grout.
Confined masonry was advantageous because it was simple, and thus more likely to be
constructed correctly. It also required less rebar, and the structural systems have less
mass than reinforced concrete buildings. Confined masonry structures in Columbia
showed almost no damage during the 1983 Popayan earthquake (M 5.5) (Schultz 1994).
Most homes had only minor cracking around the window and door openings, but those

47
with confining elements around the opening showed no observable damage. Low-rise
structures (less than four stories) performed well during the 1985 Mexico City earthquake
(M 8.0), with only minor cracking (Schultz 1994). Taller structures exhibited diagonal
cracking on the first floors due to shear, and out-of-plane failures on the top levels, which
are subjected to the greatest inertial forces during earthquakes. Good seismic
performance of confined masonry structures was also observed in the 1985 Llolleo, Chile
earthquake (M 7.5). Only 22% of confined masonry buildings 3-5 stories tall had severe
damage, whereas 63% of reinforced masonry structures had severe damage (Moroni et.
al. 2004). As with most structures, poor construction quality will result in poor seismic
performance. Two-story residencies in Ecuador showed extensive damage or collapsed
during the 1990 Pomasqui earthquake (M 5.3), as most buildings were missing tie-
members in some of the walls (Schultz 1994).
The most recent Chile earthquake in 2010, again showed that well-constructed
confined masonry structures perform very well, as only two collapsed (Brzev et. al.
2010). The large magnitude of the 2010 earthquake (8.8) left significant damage in many
confined masonry structures. Masonry walls had some in-plane shear cracking at the first
story and out-of-plane damage at the upper stories as shown in Figure 24. A new failure
mode was observed, wherein the rebar at the foot of the column buckled after masonry
crushing, rather than a shear failure at the top of the column which is common in infill
construction (See Figure 25). Some shear failures were observed at the tops of first story
columns, but these structures did not appear to have shear connectors or toothing (See
Figure 25).

48
Figure 24: (a) In-plane shear failure of first story (b) Out-of-plane failure of second story
(Brzev et al. 2010)
Figure 25: Buckling of rebar at foot of column (left) and shear failure of first story
column (right) (Brzev et al. 2010)
2.3.4 Hybrid Masonry Systems
2.3.4.1 System Description
The study of hybrid masonry systems was first introduced by David Biggs in
2007. Essentially, it is a system in which the infill panel is designed to act integrally with

49
the frame to carry a portion of the seismic load. Thus far, no experimental studies have
been conducted, but research is currently in progress at the University of Illinois on steel-
frame hybrid masonry structures. Daniel Abrams has suggested that hybrid masonry
systems consisting of steel frames with reinforced masonry panels would help to reduce
the cost of steel structures by eliminating the need for bracing, and still provide adequate
seismic performance.
The International Masonry Institute and National Concrete Masonry Association
has defined three types of hybrid masonry systems (Hybrid Masonry Design 2009). The
three types are shown in Figure 26. In all cases, the infill panel is reinforced to
accommodate the design forces in tension and shear. A type I system transmits out-of-
plane loads and in-plane shear loads and gaps are provided between the masonry and the
bounding frame. Out-of-plane loads are transferred through anchors at the top which
should not transmit axial loads. Anchors may also be used at the column-masonry
interface, but they should not transfer shear loads, and the columns should not bear
against the masonry under the expected design-level drifts. A type II hybrid masonry
system is constructed with the wall tight to the beam and top anchors are provided which
transfer shear, out-of-plane load, and axial load into the masonry. Gaps are provided
between the columns and the infill, and if anchors are provided they should not transfer
shear loads. In a type II system the infill wall becomes a load-bearing wall, unlike the
type I system. A Type III masonry system is confined within the framing and is designed
to support axial, shear and out-of-plane loads. The behavior of these types of systems
becomes more complex, and testing is underway to better understand the response of
these structures to seismic loading (Abrams 2011; Abrams et. al. 2010).

50
Figure 26: Diagrams of hybrid masonry systems types I-III (left to right) (Hybrid
Masonry Design 2009)
2.4 Chapter Summary
In reviewing the existing finite element models for concrete and masonry, the lack
of simplified models, and the existing literature on similar concrete and masonry
structures, one can see the necessity of a new type of modeling scheme for hybrid
concrete masonry and seismic testing of these structures. It is anticipated that like
traditional masonry infill and confined masonry, hybrid concrete-masonry will exhibit
complex failure mechanisms which must be captured by the finite element model. The
models which are solely of a discrete crack or a smeared crack formulation all have
distinct trade-offs with respect to model accuracy and complexity of the formulation. For
this reason, a combined smeared crack and interface element constitutive model was
chosen from which the modeling scheme for hybrid concrete-masonry is developed.

51
CHAPTER 3
CONSTITUTIVE FINITE ELEMENT MODEL AND VALIDATION
STUDIES
This work utilizes and expands on the finite element modeling scheme first
proposed by Lotfi and Shing (1991) and subsequently improved upon by: Lotfi and Shing
(1994), Mehrabi and Shing (1997) and Stavridis (2009). The formulation uses fixed
smeared crack elements to model compression and tension failure of the masonry and
concrete, combined with discrete interface elements to model shear failure and tension
failure. The interface elements prevent direct contact of smeared crack elements. This
reduces the undesirable stress-locking, spurious mode effects, and mesh-sensitivity
exhibited in traditional smeared crack element models. In the subsequent chapter, the
modeling scheme is first outlined. Then details of the element formulation are described,
followed by the procedure for calibrating the model to material data for concrete and
masonry. Finally, a series of validation studies are presented ranging from single element
tests to a model of a multi-story infill structure. The results of the validation studies
indicate the constitutive model is robust and can be used with confidence as the basis for
the development of finite element models of hybrid concrete-masonry structures.
3.1 Modeling Scheme
To model concrete, the interface elements are placed in a module with smeared
crack elements such that crack locations do not need to be known a priori (Stavridis and
Shing 2010). Each module consists of four triangular smeared-crack elements connected
with four, diagonally placed, double-noded, zero-thickness interface elements as shown

52
in Figure 27. Each module is connected to the adjacent modules with horizontal and
vertical interface elements. Using this meshing scheme, discrete cracks can develop at
angles of 0°, 90°, nd ±θ with θ being s lose to 45° s pe mitted, in o de to represent
possible diagonal shear cracks. Reinforcement is modeled with discrete truss elements
which connect a node of the smeared crack element to the corresponding node in the
smeared crack element below (See Figure 27). The behavior of the steel truss elements is
governed by an elastic perfectly plastic stress-strain curve. Horizontal reinforcement is
modeled with two truss elements placed in a cross pattern to ensure that they are effective
in shear, rather than sliding along the horizontal interfaces.
Figure 27: Assembly of smeared crack elements, interface elements, and truss elements to
model reinforced concrete (Stavridis and Shing 2010)
The masonry infill wall is modeled with smeared crack elements that represent a
half block with a vertical brick interface element in the center as shown in Figure 28.
Mortar bed and head joints are also modeled using interface elements.

53
Figure 28: Assembly of smeared crack and interface elements to model masonry
(Stavridis and Shing 2010)
3.2 Element Formulation
The smeared crack elements utilize a plasticity-based formulation for the
compressive behavior of uncracked material. The failure surface is governed by a Von
Mises failure criterion as shown in Figure 29. The compressive behavior of the element
between the initial yield surface and the failure surface is governed by a curve that
captures strain hardening and subsequent softening observed in concrete and brick
(Figure 30a). The shape of the plasticity curve is governed by , the compressive
strength at the point of initial softening; , the peak compressive strength; , the
plastic strain at peak strength; , the plastic strain at the transition point; and , the
residual compressive strength.
The tensile failure is initiated when the maximum principal stress reaches a
Rankine-type cut-off criterion. The material then becomes orthotropic with the axes of
orthotropy fixed perpendicular and parallel to the crack. The compressive behavior
parallel to the crack is captured with a parabola with an exponentially decaying tail that is
shown in Figure 30(b). Like the plasticity curve, the orthotropic compressive behavior is
a function of the peak compression strength, , and the residual compression strength of
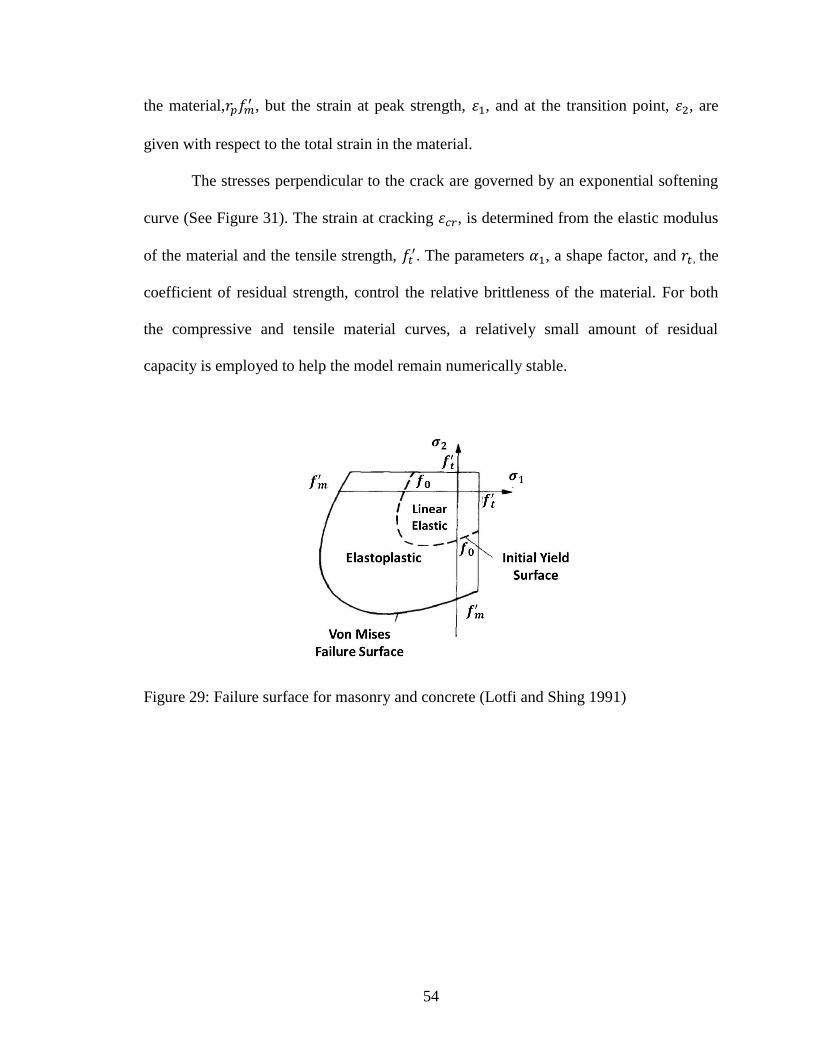
54
the material, , but the strain at peak strength, , and at the transition point, , are
given with respect to the total strain in the material.
The stresses perpendicular to the crack are governed by an exponential softening
curve (See Figure 31). The strain at cracking , is determined from the elastic modulus
of the material and the tensile strength, . The parameters , a shape factor, and , the
coefficient of residual strength, control the relative brittleness of the material. For both
the compressive and tensile material curves, a relatively small amount of residual
capacity is employed to help the model remain numerically stable.
Figure 29: Failure surface for masonry and concrete (Lotfi and Shing 1991)
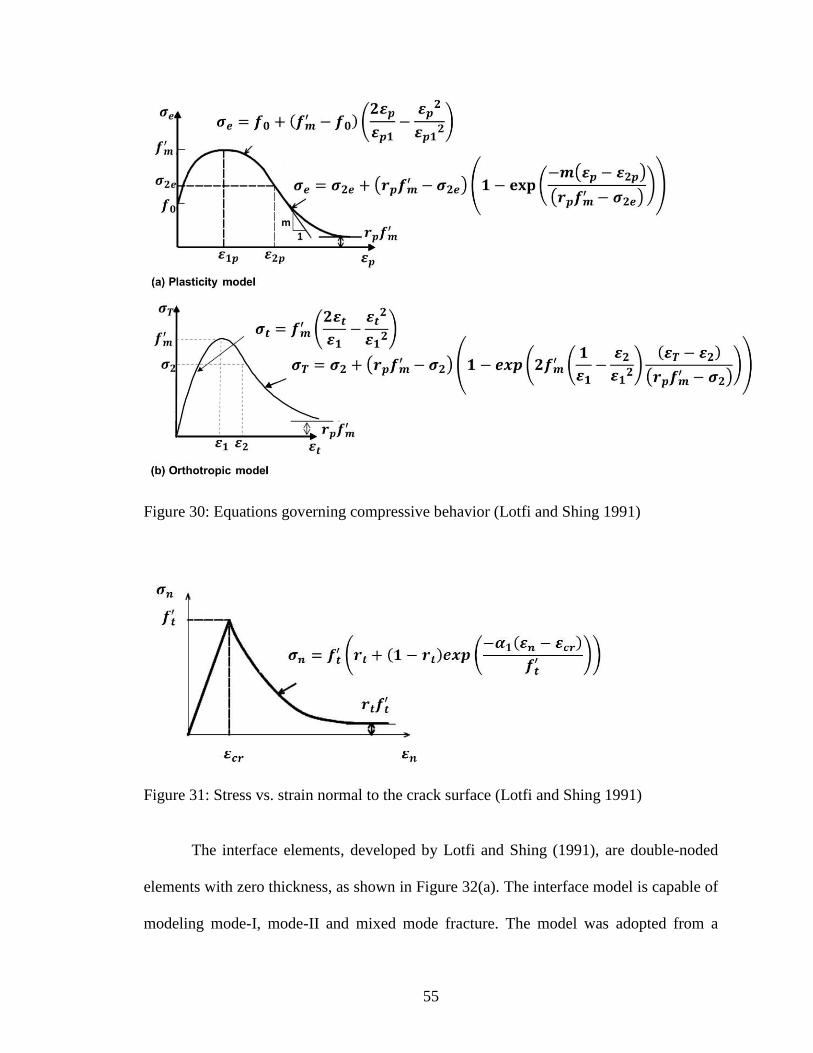
55
Figure 30: Equations governing compressive behavior (Lotfi and Shing 1991)
Figure 31: Stress vs. strain normal to the crack surface (Lotfi and Shing 1991)
The interface elements, developed by Lotfi and Shing (1991), are double-noded
elements with zero thickness, as shown in Figure 32(a). The interface model is capable of
modeling mode-I, mode-II and mixed mode fracture. The model was adopted from a

56
traditional discrete formulation to incorporate the effects of shear dilatation observed in
concrete and masonry. The interface elements do not fail in compression, as their main
function is to capture the opening of cracks. The stress strain relation is based on
plasticity theory with a hyperbolic yield surface (See Figure 32b), which is described
with Equation 8.
Figure 32: Local axis and complete yield surface diagram for interface element (Lotfi and
Shing 1994)
(8)
Essentially the yield surface is a smooth transition from a Mohr-Coulomb to a
tensile cut off criterion. The yield function becomes the Mohr-Coulomb criteria when
equals zero and the yield criteria is equal to the tension cut-off criteria for extremely large
values of and (See Figure 33).

57
Figure 33: Effect of internal variables on interface element yield surface
The softening rules for each of the variables , , and , which govern the
evolution of the yield surface from its initial to residual state, are provided in Equation set
9. In the equations, and
are mode I and mode II fracture energies, and control the
rate of reduction of and , and the terms represent the plastic work which governs the
strength degradation.
,
, (9)
The displacements of the nodes during plastic flow are determined using the
classical incremental plasticity definition of a flow rule (
). The formulation for
the plastic potential, , takes into account the effects of shear dilatation with the
appropriate calibration of the parameter (Equation 10). This parameter scales the
dilatancy, which decreases as the material wears.
(10)

58
3.3 Material Calibration
3.3.1 Concrete
When calibrating the module of smeared crack and interface elements which
represent concrete, the tensile relations of the smeared crack elements and the interface
elements must be calibrated such that crack propagation is not favored in either element.
To do this, the tensile behavior of the interface elements is first calibrated and then the
constitutive relations for the interface element are used to calibrate the smeared crack
elements.
It is sufficient to use split cylinder tests to calibrate tensile strength, ft’, be use
the presence of rebar in the concrete columns and beams reduces the influence of the
tensile strength of the concrete on the flexure behavior of the frame. Since the interface
elements should not influence the concrete stiffness prior to fracture, the value for
interface element stiffnesses, and , should be made artificially high, but not high
enough to ill-condition the solution. Mode I fracture energy, , can be taken from
typical values or calculated using empirical formulas (Bazant and Becq-Giraudon 2002).
Mode II fracture energy is difficult to obtain, but previous studies have shown to
can be between 10 (Lotfi and Shing 1991) and 25 (Bazant 1986). Using these values
and assuming typical values (Stavridis and Shing 2010) for , , , , and , a
single-element tensile test can be conducted. Once the stress-displacement curve is
determined, the values of , , , , and , can be adjusted to achieve the desired
fracture energy (See Figure 34).
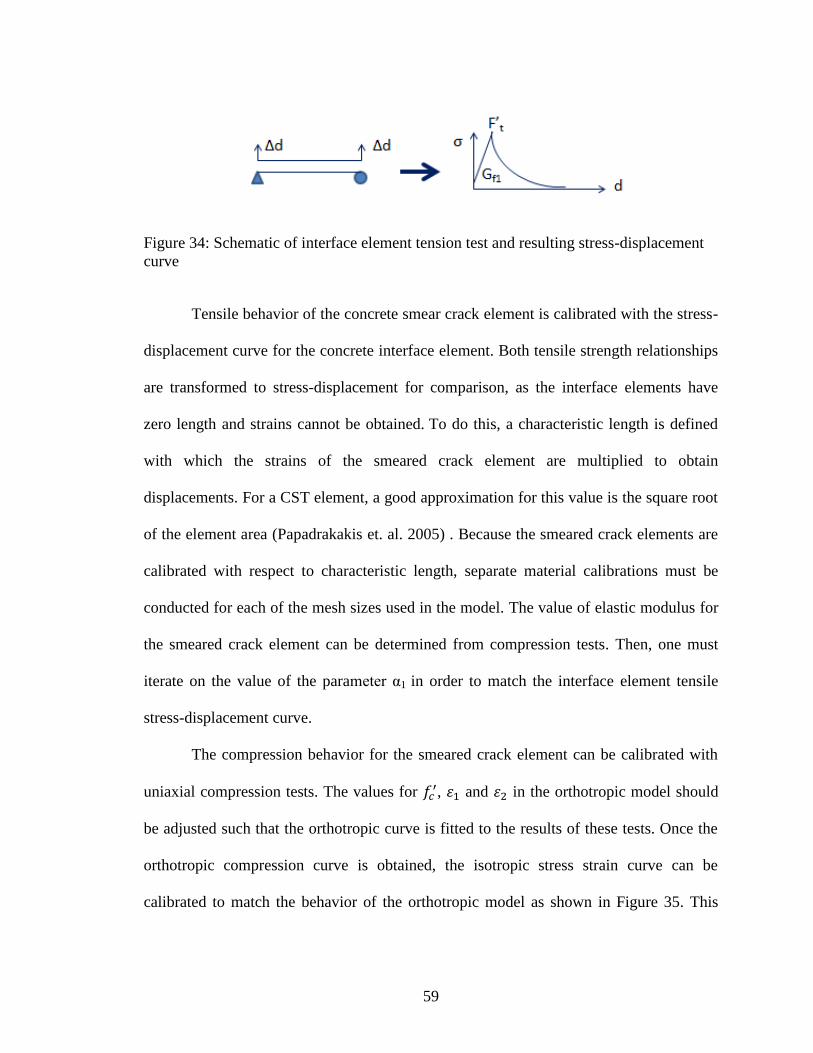
59
Figure 34: Schematic of interface element tension test and resulting stress-displacement
curve
Tensile behavior of the concrete smear crack element is calibrated with the stress-
displacement curve for the concrete interface element. Both tensile strength relationships
are transformed to stress-displacement for comparison, as the interface elements have
zero length and strains cannot be obtained. To do this, a characteristic length is defined
with which the strains of the smeared crack element are multiplied to obtain
displacements. For a CST element, a good approximation for this value is the square root
of the element area (Papadrakakis et. al. 2005) . Because the smeared crack elements are
calibrated with respect to characteristic length, separate material calibrations must be
conducted for each of the mesh sizes used in the model. The value of elastic modulus for
the smeared crack element can be determined from compression tests. Then, one must
iterate on the value of the paramete α1 in order to match the interface element tensile
stress-displacement curve.
The compression behavior for the smeared crack element can be calibrated with
uniaxial compression tests. The values for , and in the orthotropic model should
be adjusted such that the orthotropic curve is fitted to the results of these tests. Once the
orthotropic compression curve is obtained, the isotropic stress strain curve can be
calibrated to match the behavior of the orthotropic model as shown in Figure 35. This
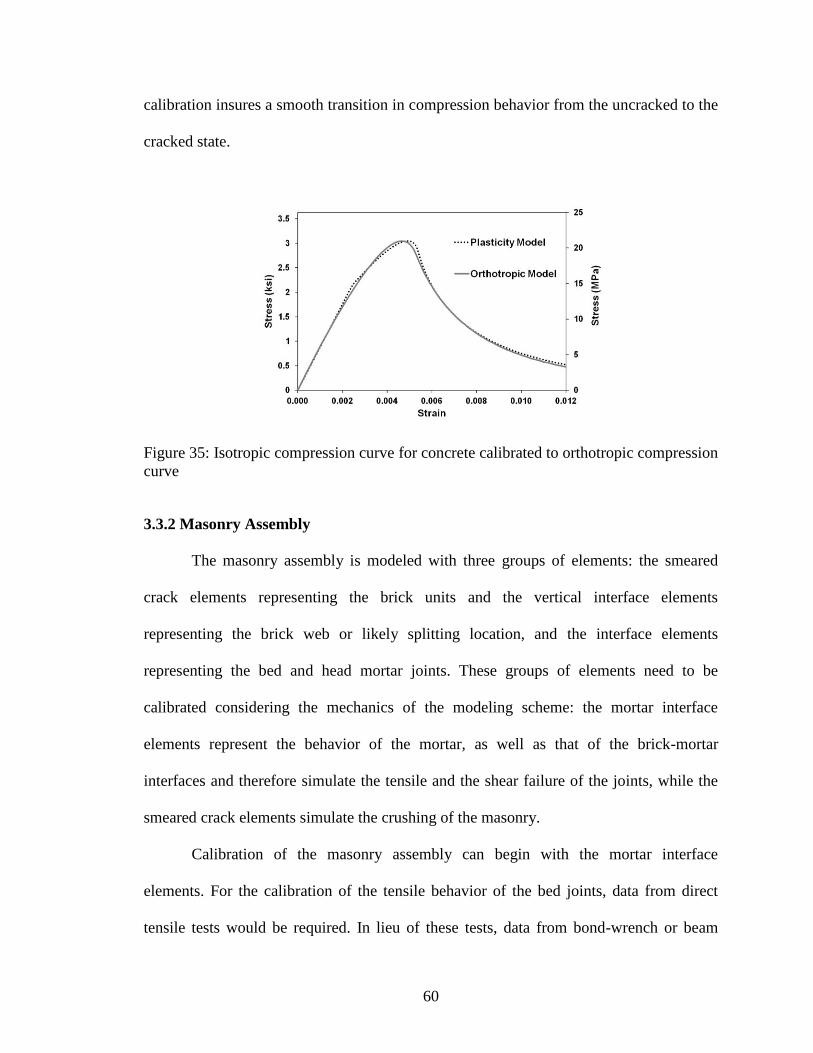
60
calibration insures a smooth transition in compression behavior from the uncracked to the
cracked state.
Figure 35: Isotropic compression curve for concrete calibrated to orthotropic compression
curve
3.3.2 Masonry Assembly
The masonry assembly is modeled with three groups of elements: the smeared
crack elements representing the brick units and the vertical interface elements
representing the brick web or likely splitting location, and the interface elements
representing the bed and head mortar joints. These groups of elements need to be
calibrated considering the mechanics of the modeling scheme: the mortar interface
elements represent the behavior of the mortar, as well as that of the brick-mortar
interfaces and therefore simulate the tensile and the shear failure of the joints, while the
smeared crack elements simulate the crushing of the masonry.
Calibration of the masonry assembly can begin with the mortar interface
elements. For the calibration of the tensile behavior of the bed joints, data from direct
tensile tests would be required. In lieu of these tests, data from bond-wrench or beam

61
tests can be used. The shear behavior of the mortar bed joints can be calibrated with data
from masonry assembly tests that consider the interaction between the mortar joints and
brick units. The peak and residual shear stress values can be obtained from direct shear
tests (Amadei et. al. 1989; Manzuri 1995; Mehrabi 1994), triplet tests (EN 1052-3), or
shove tests repeated under different values of normal stress As shown in Figure 36, the
peak strengths can be used for the calibration of the initial yield surface, i.e.
parameters , , and , while the residual strengths can be used for the calibration of
the final yield surface that is defined by parameters (equal to zero), , and .
Assembly shear tests can also provide information on the elastic tangential stiffness, ,
and the mode II fracture energy, . The elastic stiffness of the mortar joint under
normal stress, , can be assumed to be .
Figure 36: Shear behavior of mortar interface elements calibrated to test data (Magenes
and Calvi 1992)

62
The mode I and II fracture energies express work per unit area and they are used
to determine the rate of loss of the tensile strength of the interface elements as shown in
Equation 9. The value of mode-I fracture energy, , can be obtained considering that the
ratio of to
can be between 10 (Lotfi and Shing 1991) and 25 (Bazant 1986). The
material parameters and which control the rate of loss of cohesive strength and
frictional resistance as indicated in Equation 9, and the parameter , which scales the
shear dilatation as shown in Equation 8, can be calibrated with data from shear tests.
Mortar head joints are generally considered to have poor bond strength compared
to mortar bed joints because they are more difficult to place and do not have the benefit
of axial compression to reduce shrinkage stresses (Drysdale et. al. 1994; NCMA 2004).
Numerical representations of mortar head joints typically fall in one of two categories.
Either the bed joints and head joints are given the same properties (Lotfi and Shing 1994;
Lourenco 1996) or the head joints are assumed to have little or no bond strength
(Mojsilovic and Marti 1997; Schlegel and Rautenstrauch 2004). For the constitutive
model presented here, the ratio of head joint bond strength to bed joint bond strength has
very little influence on the peak lateral strength and initial stiffness of unreinforced
masonry walls (See Appendix C for results of the parametric study). At very low ratios of
head joint to bed joint bond strength, the cracking patterns change to significantly to
favor head joint cracking. In light of the study, the head joint to bed joint bond strength
will be initiated at 0.5 for all models and increased if cracking patterns are inconsistent
with the experimental observations.
As illustrated in Figure 28, the brick units are modeled with a combination of
smeared crack and interface elements, which must be consistently calibrated to capture
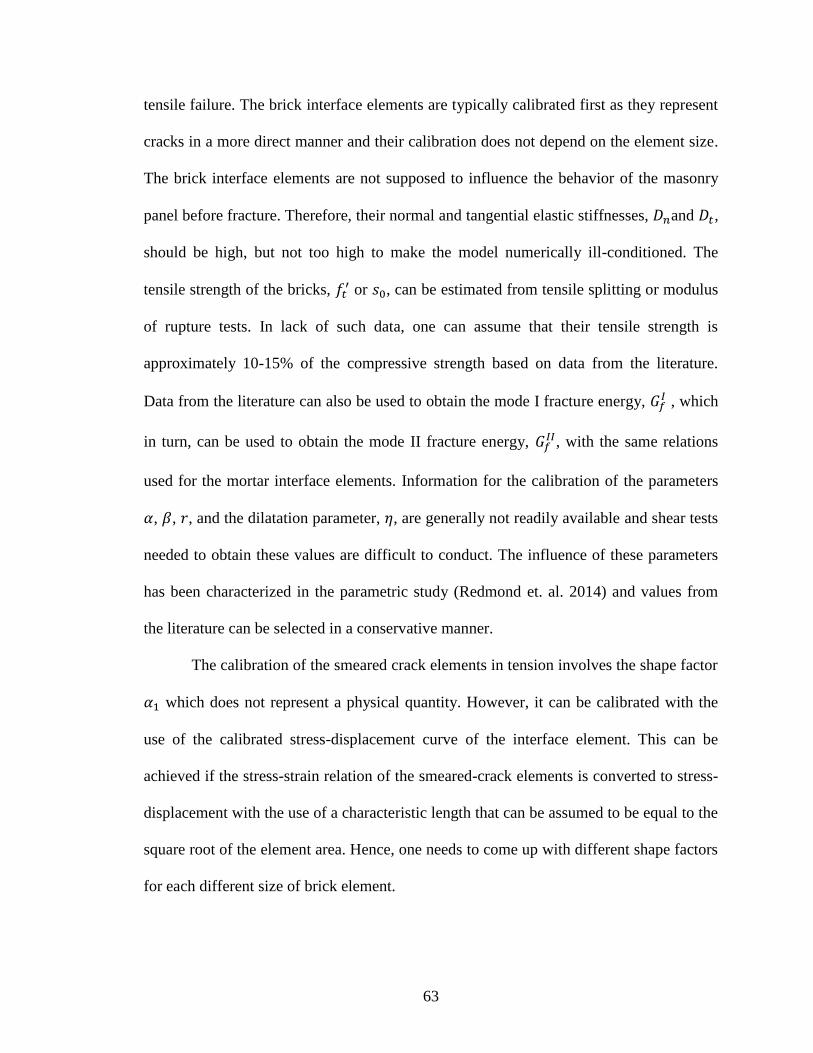
63
tensile failure. The brick interface elements are typically calibrated first as they represent
cracks in a more direct manner and their calibration does not depend on the element size.
The brick interface elements are not supposed to influence the behavior of the masonry
panel before fracture. Therefore, their normal and tangential elastic stiffnesses, and ,
should be high, but not too high to make the model numerically ill-conditioned. The
tensile strength of the bricks, or , can be estimated from tensile splitting or modulus
of rupture tests. In lack of such data, one can assume that their tensile strength is
approximately 10-15% of the compressive strength based on data from the literature.
Data from the literature can also be used to obtain the mode I fracture energy, , which
in turn, can be used to obtain the mode II fracture energy, , with the same relations
used for the mortar interface elements. Information for the calibration of the parameters
, , , and the dilatation parameter, , are generally not readily available and shear tests
needed to obtain these values are difficult to conduct. The influence of these parameters
has been characterized in the parametric study (Redmond et. al. 2014) and values from
the literature can be selected in a conservative manner.
The calibration of the smeared crack elements in tension involves the shape factor
which does not represent a physical quantity. However, it can be calibrated with the
use of the calibrated stress-displacement curve of the interface element. This can be
achieved if the stress-strain relation of the smeared-crack elements is converted to stress-
displacement with the use of a characteristic length that can be assumed to be equal to the
square root of the element area. Hence, one needs to come up with different shape factors
for each different size of brick element.

64
The compressive failure of masonry is caused by the Poisson ratio mismatch
between the brick units and the mortar joints which leads to tensile splitting of the bricks.
The plane-stress elements used here cannot directly capture this phenomenon. However,
the brick smeared crack elements can be calibrated to represent the compressive strength
of the masonry assembly that is usually obtained from prism tests (Lourenco 1996). The
flexibility of the mortar interface elements should be considered so that one brick
smeared-crack element and one mortar interface element represent the prism stress-strain
curve.
The uniaxial compressive behavior of the orthotropic model can be calibrated first
as it requires the selection of only three parameters. The compressive strength, , can be
selected as the strength of the prisms. With the stiffness of the mortar element already
defined, one can select the strain at peak strength, , and the strain which determines the
onset of exponential decay, , such that the assembly matches the prism behavior. The
ratio of the residual compression, , is typically taken as 5% of the compressive strength
for numerical stability. Finally, the plasticity model employed to model the compressive
behavior of the uncracked material can be calibrated to match the orthotropic
compression curve so that there is a smooth transition to the latter once a crack initiates.
3.4 Model Validation
The finite element modeling scheme is evaluated in a series of models ranging
from single element behavior to replicating large scale dynamic tests. First, element level
tests in pure tension and compression are used to understand the influence of the interface
element on the local behavior of the smeared crack elements. Next, the combined
smeared crack and interface element model is compared to traditional continuum models

65
with only smeared crack elements for a column failing in flexure and a column failing in
shear. Next, component-level validations are conducted by modeling a cyclic test of a
bare RC frame and cyclic tests of a series of unreinforced masonry walls. Finally, the
proficiency of the composite model to represent the behavior of the entire concrete and
masonry system is demonstrated by modeling a pseudo-dynamic test of a three bay, three
story, reinforced concrete frame with unreinforced masonry infill.
3.4.1 Pure Tension and Pure Compression
In order to characterize the effect of adding the interface elements to the
boundaries of the smeared crack element, pure tension tests and pure compression tests
were conducted on a 12x12 inch square discretized with one element, four elements and
nine elements, with and without interface elements. Figure 37 shows the cracking
patterns of the tensile specimens. The presence of interface elements at the boundaries
does not influence the cracking patterns nor the displacement at which cracking occurs.
Figure 37: Results of pure tension tests with and without interface elements

66
Although interface elements do not directly correct the mesh sensitivity of the
smeared crack elements in the post-peak softening behavior, the tensile calibration
method assures consistent post-peak behavior with mesh refinement (See Figure 38).
Figure 38: Tensile stress vs. strain behavior with mesh refinement, with and without
interface elements
Figure 39 shows the crushing patterns of the compression specimens. The
presence of interface elements at the boundaries does not influence the crushing patterns
for the specimen or the displacement at which crushing occurred.

67
Figure 39: Results of pure compression tests with and without interface elements
The presence of interface elements does not correct the mesh sensitivity in the
post-peak softening behavior present in smeared crack elements. This is shown in Figure
40. Thus, it is desirable to choose the element size based on expected failure area and
calibrate the smeared crack element compression curve to material behavior.
Figure 40: Compression stress vs. strain behavior with mesh refinement, with and without
interface elements
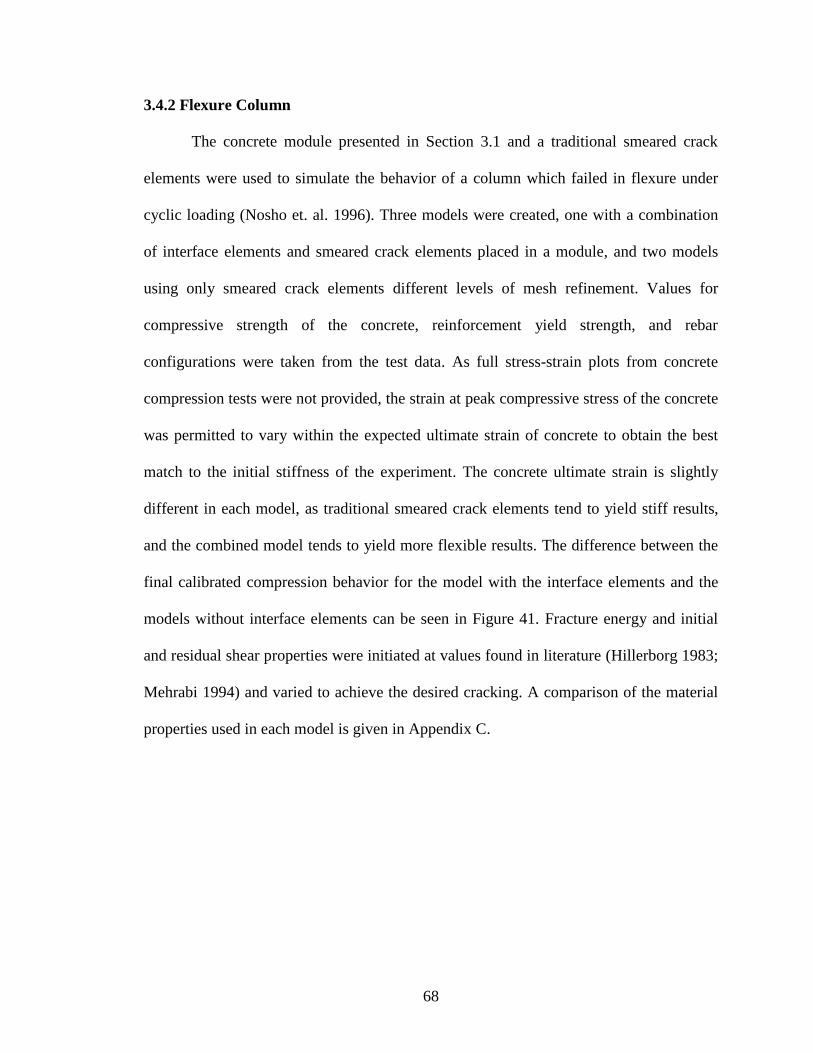
68
3.4.2 Flexure Column
The concrete module presented in Section 3.1 and a traditional smeared crack
elements were used to simulate the behavior of a column which failed in flexure under
cyclic loading (Nosho et. al. 1996). Three models were created, one with a combination
of interface elements and smeared crack elements placed in a module, and two models
using only smeared crack elements different levels of mesh refinement. Values for
compressive strength of the concrete, reinforcement yield strength, and rebar
configurations were taken from the test data. As full stress-strain plots from concrete
compression tests were not provided, the strain at peak compressive stress of the concrete
was permitted to vary within the expected ultimate strain of concrete to obtain the best
match to the initial stiffness of the experiment. The concrete ultimate strain is slightly
different in each model, as traditional smeared crack elements tend to yield stiff results,
and the combined model tends to yield more flexible results. The difference between the
final calibrated compression behavior for the model with the interface elements and the
models without interface elements can be seen in Figure 41. Fracture energy and initial
and residual shear properties were initiated at values found in literature (Hillerborg 1983;
Mehrabi 1994) and varied to achieve the desired cracking. A comparison of the material
properties used in each model is given in Appendix C.

69
Figure 41: Concrete compression behavior
The cracking patterns for the experimental specimen, the model with interface
elements and the two models without interface elements are shown in Figure 42. The
failed interface elements are colored red to show the flexural cracking present in the first
model. All models capture the flexural cracks and crushing of the bottom portion of the
column.
Figure 42:Cracking and crushing of column after failure in the experiment (Nosho et al.
1996) and analytical models

70
All of the models predict capacity within 7% of the peak column strength
recorded in the experiment (See Figure 43). The model with interface elements permits
more stress release as the interface elements open and thus does not fail as early as the
models using traditional smeared crack elements. The model with interface elements
predicts displacement at peak strength within 1% of the displacement recorded in the
experiment. The model without interface elements using the coarse mesh has 18% error
in predicting displacement at peak strength, and the model without interface elements
using a fine mesh has 18.5% error.
Figure 43: Force displacement curves for the flexure column experiment (Nosho et. al.
1996) and analytical models
3.4.3 Shear Column
The concrete module presented in Section 3.1 and a traditional smeared crack
elements were also used to simulate the behavior of a column which failed in shear under
cyclic loading (Lynn et. al. 1998). The study provided values for compressive strength of

71
the concrete, reinforcement yield strength, and rebar configurations. As with the flexure
column models, the concrete compressive stress-strain curve for each model was
calibrated separately and permitted to vary within the expected range of ultimate strain in
concrete. The difference between the calibrated stress-strain behavior in compression for
the two models can be seen in Figure 44. Fracture energy and initial and residual shear
properties have been selected within the range of typical values from the literature
(Hillerborg 1983; Mehrabi 1994) as no material data for these parameters was provided
in the study. A comparison of the material properties used in each model is given in
Appendix C.
Figure 44: Concrete compression behavior
The results of the two models show that the model without interface elements
vastly over predicts the strength of the column (See Figure 45). The composite model
correctly predicts strength within 1% of the experimental peak, and the traditional
smeared crack element model over predicts strength by 16.7%. The displacement at peak
72
strength is nearly the same between the model with interface elements and smeared crack
elements and the model with only smeared crack elements.
Figure 45: Force displacement curves for the shear column experiment (Lynn et. al.
1998) and analytical models
The cracking patterns of both models are representative of those which occurred
in the experiment as shown in Figure 46. It is more difficult to see the shear crack in the
model without interface elements as no crack opening occurs and the lack of stress relief
causes additional crushing at the corner of the shear crack. Although the two models
showed similar results in the flexural column test, the module of smeared crack and
interface elements is far better at capturing shear behavior than smeared crack elements
alone.
73
Figure 46:Cracking of column after failure in the experiment (Lynn et al. 1998) and
analytical models
3.4.4 Bare Frame
In order to demonstrate the combined smeared crack and interface element
model's ability to capture joint behavior and frame action, a cyclic test of a bare RC
frame was modeled. The RC frame does not contain seismic detailing like hoops in the
joint region, seismic hooks, or closely spaced horizontal reinforcement (Teymur et. al.
2012). Figure 47 shows the test specimen and reinforcement detailing. As with the
previous column tests, only the concrete compression strength, reinforcement yield
strength, geometry and rebar configurations were provided in the study. The concrete
calibration was conducted in the same manner as the previous column tests. Interface
element properties were initiated using values from Stavridis and Shing (2010) and
permitted to vary within the ranges specified by their parametric study. The material
properties used in the model are found in Appendix C.

74
Figure 47:Test specimen and reinforcement details (Teymur et al. 2012)
The model does an excellent job of capturing the cracking patterns of the
specimen. Figure 48 shows the cracking present in the experiment and in the analytical
model.
Figure 48:Observed cracking in the experiment (Teymur et al. 2012) and analytical
model. Failed interface elements have been colored red
The model predicts peak strength within 2% of the experimental results (See
Figure 49). However, the analytical model is slightly stiff compared to the experimental
specimen and peak strength occurs earlier than in the physical test. This is in agreement
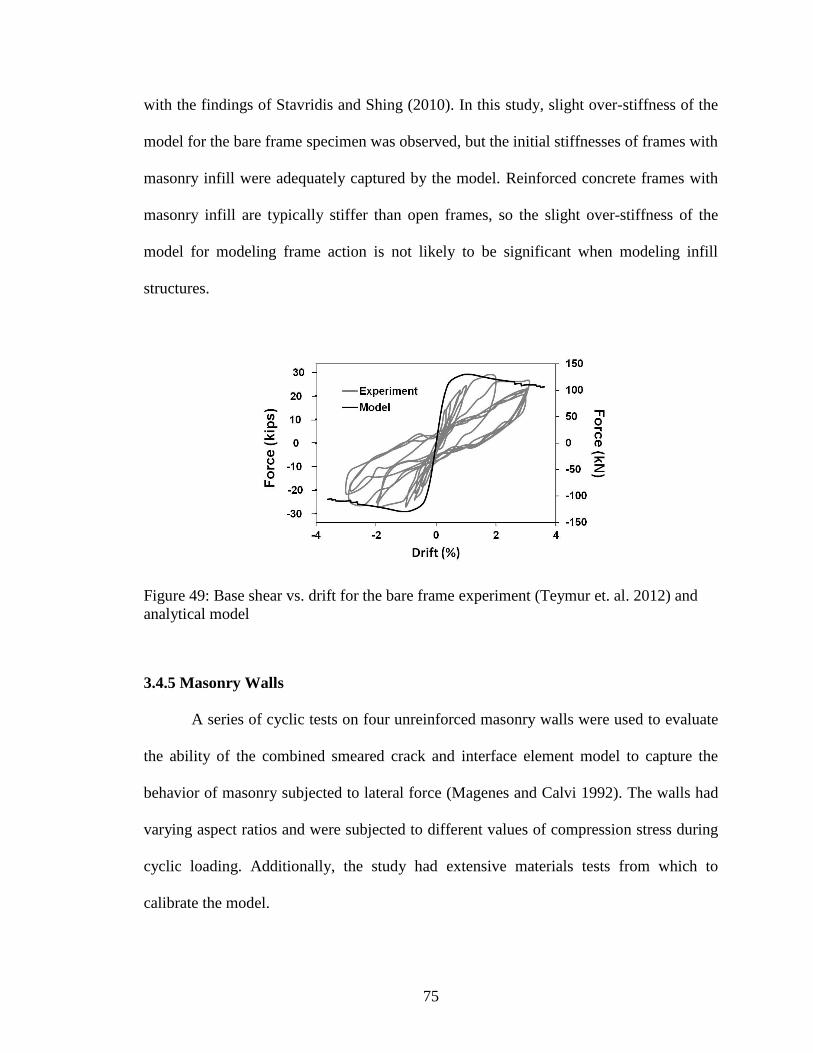
75
with the findings of Stavridis and Shing (2010). In this study, slight over-stiffness of the
model for the bare frame specimen was observed, but the initial stiffnesses of frames with
masonry infill were adequately captured by the model. Reinforced concrete frames with
masonry infill are typically stiffer than open frames, so the slight over-stiffness of the
model for modeling frame action is not likely to be significant when modeling infill
structures.
Figure 49: Base shear vs. drift for the bare frame experiment (Teymur et. al. 2012) and
analytical model
3.4.5 Masonry Walls
A series of cyclic tests on four unreinforced masonry walls were used to evaluate
the ability of the combined smeared crack and interface element model to capture the
behavior of masonry subjected to lateral force (Magenes and Calvi 1992). The walls had
varying aspect ratios and were subjected to different values of compression stress during
cyclic loading. Additionally, the study had extensive materials tests from which to
calibrate the model.
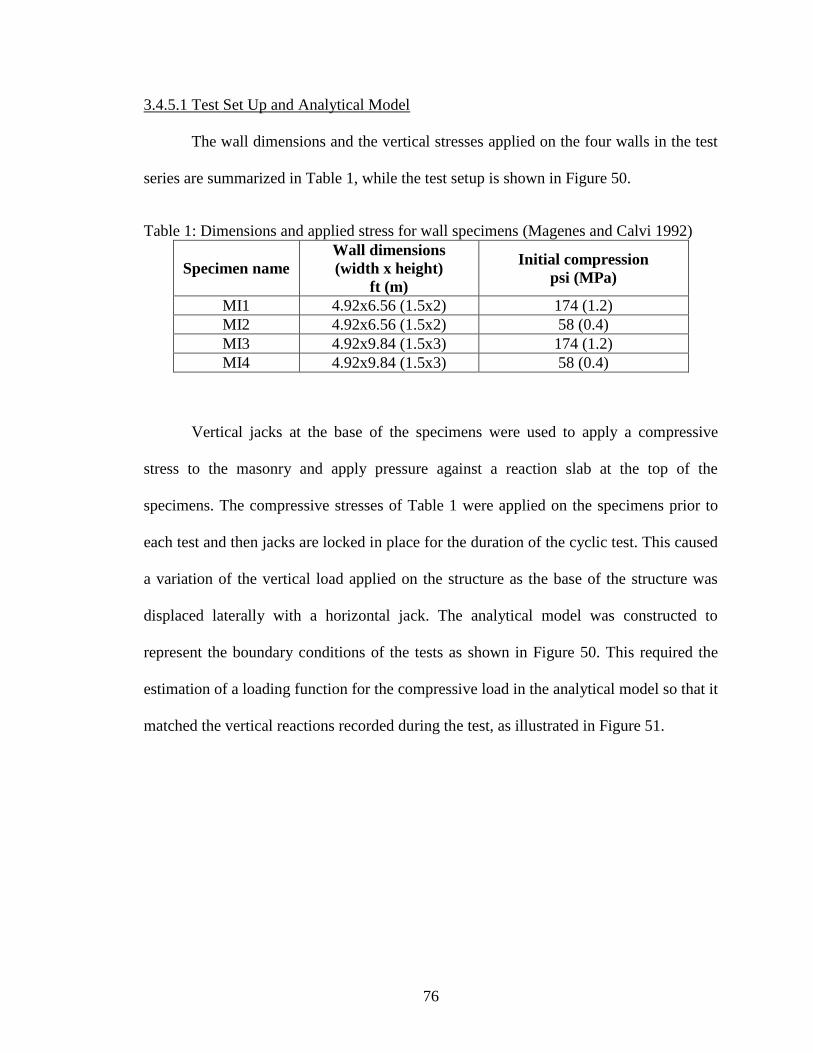
76
3.4.5.1 Test Set Up and Analytical Model
The wall dimensions and the vertical stresses applied on the four walls in the test
series are summarized in Table 1, while the test setup is shown in Figure 50.
Table 1: Dimensions and applied stress for wall specimens (Magenes and Calvi 1992)
Specimen name
Wall dimensions
(width x height)
ft (m)
Initial compression
psi (MPa)
MI1 4.92x6.56 (1.5x2) 174 (1.2)
MI2 4.92x6.56 (1.5x2) 58 (0.4)
MI3 4.92x9.84 (1.5x3) 174 (1.2)
MI4 4.92x9.84 (1.5x3) 58 (0.4)
Vertical jacks at the base of the specimens were used to apply a compressive
stress to the masonry and apply pressure against a reaction slab at the top of the
specimens. The compressive stresses of Table 1 were applied on the specimens prior to
each test and then jacks are locked in place for the duration of the cyclic test. This caused
a variation of the vertical load applied on the structure as the base of the structure was
displaced laterally with a horizontal jack. The analytical model was constructed to
represent the boundary conditions of the tests as shown in Figure 50. This required the
estimation of a loading function for the compressive load in the analytical model so that it
matched the vertical reactions recorded during the test, as illustrated in Figure 51.

77
Figure 50: Geometry and test set up for the walls
Figure 51: Tracked reactions from experiment (Magenes and Calvi 1992) and analytical
model for wall MI2
The constitutive modeling scheme developed by Stavridis and Shing (2010)
modeled walls with a running bond is shown in Figure 52(a). The modeling scheme was
been modified to represent the English bond used in the walls by Magenes and Calvi

78
(1992) as shown in Figure 52(b). Two quarter block elements are connected to a half
brick element with interface elements to represent the bricks in the stretcher rows. In the
header rows, alternating bricks are represented by either one half brick element or two
quarter brick elements. The horizontal interface elements connecting the rows of bricks
represent the mortar bed joint.
Figure 52: Assembly of smeared crack and interface elements to model masonry
3.4.5.2 Material Calibration
The material tests conducted by Magenes and Calvi (1992) have been used to
obtain the compressive strengths of the bricks, masonry prisms, elastic modulus of the
prism, tensile strength of the brick and mortar, and shear strength of the mortar. Fracture
energy properties, and
, and internal variables, and , which control softening of
the interface element parameters have been selected based on values from literature
(Bocca 1989; A. Mehrabi 1994). The vertical interface elements representing the mortar
head joints were assigned the same properties as the bed joints, except their bond strength
which was reduced by 50%. Appendix C contains the compressive curve for the masonry
prism and the shear behavior of the mortar interface elements which were both calibrated

79
to tests conducted by Magenes and Calvi (1992). A list of all parameters used in the
models is also given in Appendix C.
3.4.5.3 Results
The force-displacement behavior and cracking patterns of the finite element
models are compared to the test results in Figure 53. In all four cases, the finite element
models capture the important features of the response, as well as the failure mechanism
of their experimental counterparts. The peak and residual capacities of the numerical
models are in good agreement with the data from the experiment. For walls MI1 and
MI2, that had aspect ratios equal to 1.33, the capacity of the heavily-loaded wall, MI1, is
within 7% of the experiment while the capacity of the lightly-loaded wall, MI2, is within
15% of the experimentally measured capacity. For the walls with aspect ratios equal to
2.0, the capacity of the heavily-loaded wall, MI3, was within 10% of the experimental
data, and the capacity of the lightly-loaded wall, MI4, is within 1% of the peak strength
recorded in the experiment. The models in all cases predict accurately the failure patterns
of the walls that is dominated by tensile splitting of the brick units or tensile and shear
failure of the mortar joints. Both failure mechanisms are captured through the nonlinear
behavior of interface elements. The failure of a number of these elements at one instant
indicates the initiation of a dominant crack and results in a drop in the load carrying
capacity as indicated by the force-displacement curves shown in Figure 53.
The initial stiffness and the stiffness after the apparent yield point up to the peak
load also match well with the experimental behavior for all specimens except for MI1. In
this case, the model is initially weaker than the experiment and the model reaches its full
strength at a larger drift than in the experiment. This discrepancy may be due to batch-to-

80
batch variation of the mortar properties in the tests which is not reflected in the
calibration of the numerical models. An analysis carried out with increased values for the
stiffness and the fracture energy of the mortar element indicated that the initial stiffness
of the numerical model can increase significantly. However, it was decided to use the
same properties for the models presented here for consistency. For MI3, the other heavily
loaded wall, which had an aspect ratio of 2.0, the model also reaches its strength at a
slightly larger drift than the test specimen. For the two lightly loaded specimens, MI2 and
MI4, the peak strength of the finite element models at occurs at slightly lower drift levels
than the drifts at peak strengths of the test specimens, but in all cases the difference is
within 25%.
The comparison of the numerical and experimental results indicates that the
modeling scheme can predict the failure mechanisms and cracking patterns of the
masonry walls. Moreover, the numerical results for the peak strength are in all cases
within 15% of the experimental values. The initial stiffness and stiffness degradation of
the models is in good agreement with the experiment for all but one of the models, and
this deviation could be attributed to test-to-test variability in the mortar properties.
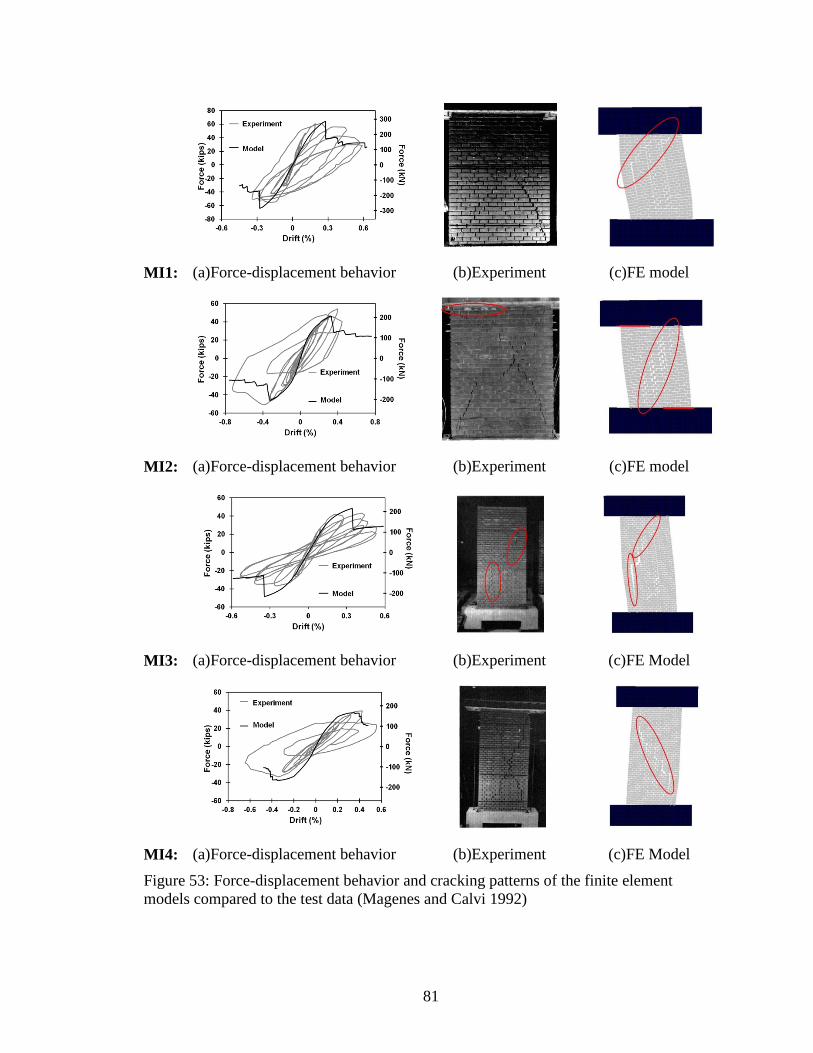
81
MI1: (a)Force-displacement behavior (b)Experiment (c)FE model
MI2: (a)Force-displacement behavior (b)Experiment (c)FE model
MI3: (a)Force-displacement behavior (b)Experiment (c)FE Model
MI4: (a)Force-displacement behavior (b)Experiment (c)FE Model
Figure 53: Force-displacement behavior and cracking patterns of the finite element
models compared to the test data (Magenes and Calvi 1992)
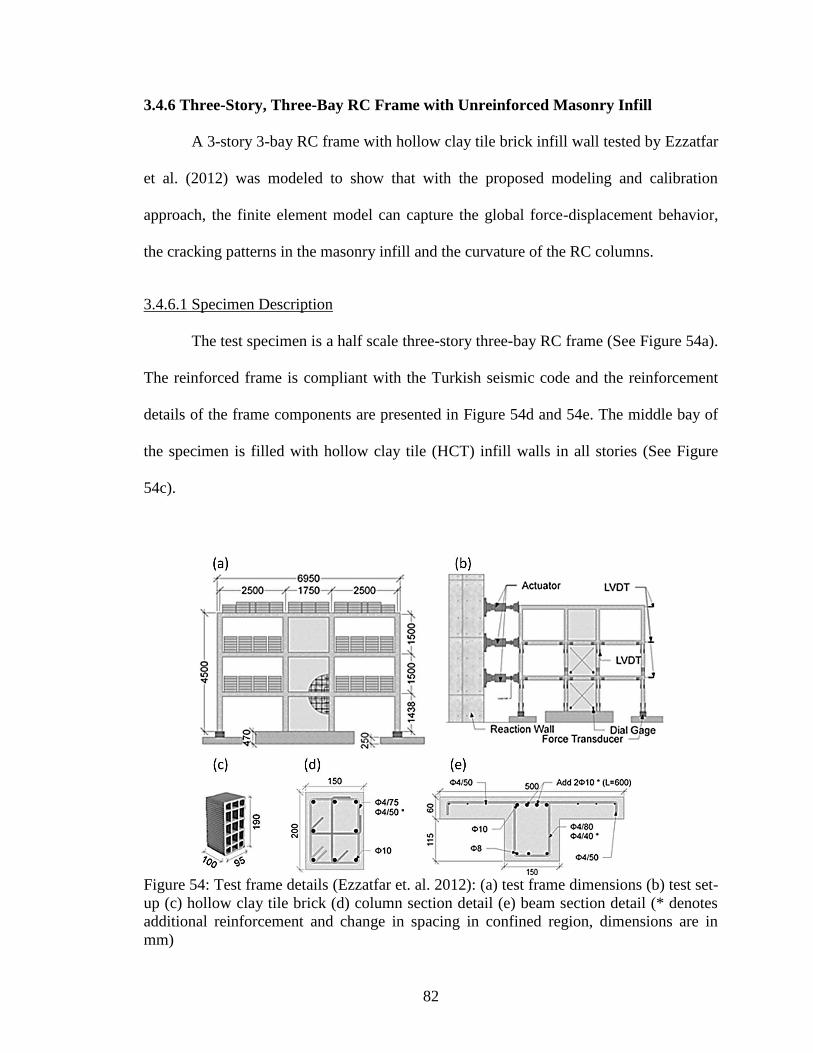
82
3.4.6 Three-Story, Three-Bay RC Frame with Unreinforced Masonry Infill
A 3-story 3-bay RC frame with hollow clay tile brick infill wall tested by Ezzatfar
et al. (2012) was modeled to show that with the proposed modeling and calibration
approach, the finite element model can capture the global force-displacement behavior,
the cracking patterns in the masonry infill and the curvature of the RC columns.
3.4.6.1 Specimen Description
The test specimen is a half scale three-story three-bay RC frame (See Figure 54a).
The reinforced frame is compliant with the Turkish seismic code and the reinforcement
details of the frame components are presented in Figure 54d and 54e. The middle bay of
the specimen is filled with hollow clay tile (HCT) infill walls in all stories (See Figure
54c).
Figure 54: Test frame details (Ezzatfar et. al. 2012): (a) test frame dimensions (b) test set-
up (c) hollow clay tile brick (d) column section detail (e) beam section detail (* denotes
additional reinforcement and change in spacing in confined region, dimensions are in
mm)
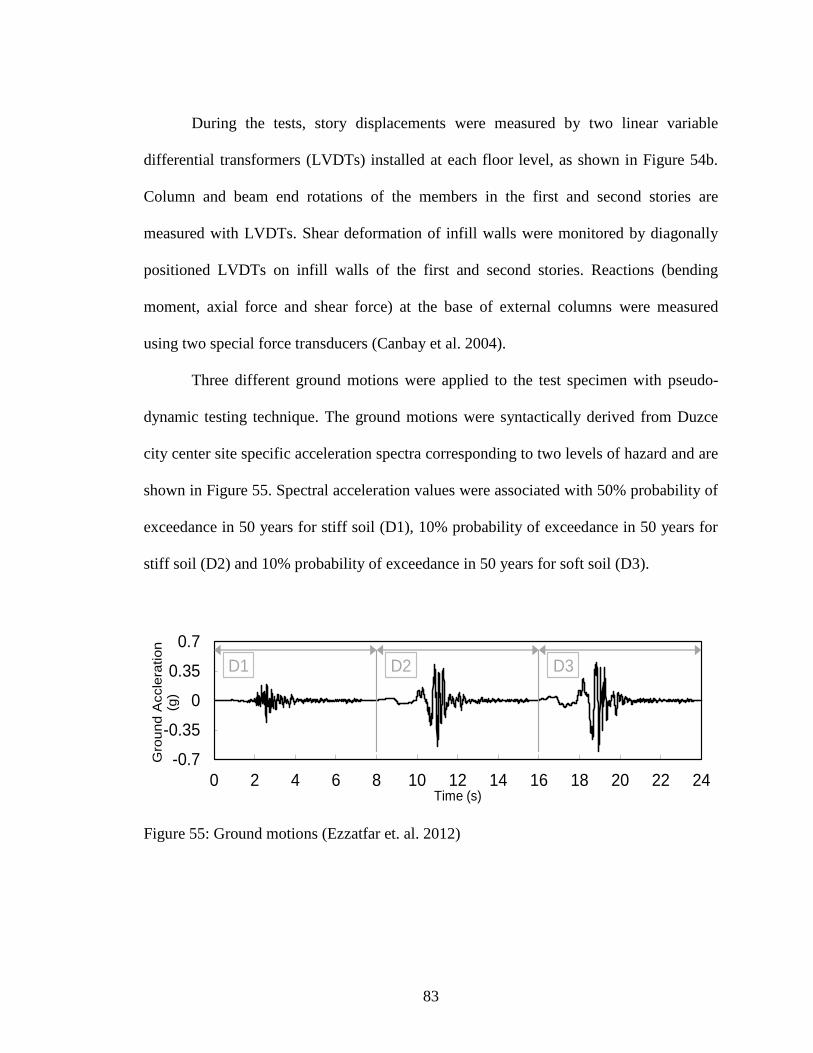
83
During the tests, story displacements were measured by two linear variable
differential transformers (LVDTs) installed at each floor level, as shown in Figure 54b.
Column and beam end rotations of the members in the first and second stories are
measured with LVDTs. Shear deformation of infill walls were monitored by diagonally
positioned LVDTs on infill walls of the first and second stories. Reactions (bending
moment, axial force and shear force) at the base of external columns were measured
using two special force transducers (Canbay et al. 2004).
Three different ground motions were applied to the test specimen with pseudo-
dynamic testing technique. The ground motions were syntactically derived from Duzce
city center site specific acceleration spectra corresponding to two levels of hazard and are
shown in Figure 55. Spectral acceleration values were associated with 50% probability of
exceedance in 50 years for stiff soil (D1), 10% probability of exceedance in 50 years for
stiff soil (D2) and 10% probability of exceedance in 50 years for soft soil (D3).
Figure 55: Ground motions (Ezzatfar et. al. 2012)
D1 D2 D3
-0.7
-0.35
0
0.35
0.7
0 2 4 6 8 10 12 14 16 18 20 22 24
Gro
un
d A
ccle
ratio
n
(g)
Time (s)
84
3.4.6.2 Finite Element Model
Most of the finite element model was constructed in the same manner as
described by the constitutive modeling scheme. Modifications to the constitutive model
were made in order to include the effect of plaster applied over the surface of the HCT
infill walls. The out-of-plane thickness of the smeared crack elements representing the
HCT units was approximated as the effective thickness based on net area of the unit.
Mortar bed joints were also modeled using the effective thickness of the brick, but head
joints were modeled using the full thickness of the HCT unit. The effect of the 10 mm
(0.39 in) of plaster applied over the masonry was accounted for using a transformed
section. The plaster thickness was converted to an equivalent thickness of brick in
proportion to its compressive strength, as compressive strength has the greatest effect on
global structural behavior. This same process was followed to determine the thickness of
the mortar bed joints which represented both the mortar and the plaster applied over the
mortar.
The mortar interface elements at the boundaries between the masonry and the
concrete frame were given the same properties as the mortar interface elements in the
interior of the masonry wall, with the exception of the interface between the top of the
masonry wall and the beam. During construction, mortar was not injected between the
last layer of masonry and the beam above, so the interface elements were given very low
stiffness and tensile strength.
Figure 56 shows the structural model used for the analysis. Artificial truss
elements are modeled to apply forces to the floor levels closely as possible to the forces
applied during the experiment. The distances X1 and X2 were calculated by averaging the

85
first mode eigenvectors obtained from the time domain identification of the pseudo-
dynamic test results.
Figure 56: Finite element model showing the truss members used for load distribution
3.4.6.3 Material Calibration
Material data to calibrate the model was taken from the study and from other tests
in the literature and followed the procedure outlined in Section 3.3. The calibration of the
concrete is first discussed, followed by the calibration of the mortar and the masonry
units.
The tensile behavior of the concrete interface elements is typically calibrated with
data from split cylinder tests of concrete. Such tests were not conducted at the time of the
experiment, hence the tensile strength of concrete was be taken as 15% of the tested
compressive strength as suggested by the literature (Oluokun 1991). The value for mode I
fracture energy, , was obtained from typical values for concrete with the same tensile
strength (Hillerborg 1983). The tensile behavior of the concrete smear crack elements

86
was then calibrated with the stress-displacement curve for the concrete interface element
following the calibration procedure in Section 3.3.1. The compression behavior for the
concrete smeared crack element was calibrated with uniaxial compression tests.
The masonry walls include the following three groups of elements: the bed joint
and head joint interface elements, the brick smeared crack elements, and the brick
interface elements joining the half brick units. For this experiment, assembly tests like
tensile pull off tests, triplet tests and prism tests to obtain the material properties were not
conducted. In the absence of these tests, literature values and the compression tests of the
brick units and mortar cubes were used to calibrate the model. The tensile strength of the
mortar bed joint interface elements was approximated as 10% of the compression
strength of the mortar cubes based on the tests reported by Stavridis (2009). The tensile
strength of the mortar head joints was reduced by 50% to account for poor bond due to
shrinkage cracking. Mode I fracture energy was taken as proportional to the tensile
strength and the value used in the model was interpolated from values in the literature
(Xu and Zhu 2007). In order to obtain shear properties for the mortar interface elements
the slope of the yield surface (µ), and the radius of the yield surface (r), were initiated
using values from Stavridis and Shing (2010) assuming shear strength and cohesion
increased in proportion to the strength of the mortar. For the bed joints, these values were
adjusted to account for increased cohesion due to mortar drippings which dried and
partially filled the voids in the hollow units. An increase in cohesion of the bed joints was
achieved by increasing the radius of the failure surface (r). Stiffness of the mortar bed
joints and head joints were determined as part of the calibration of the compression
behavior of the masonry assembly.

87
Due to the lack of data from prism tests, the compression tests of the brick units
have been used to calculate the prism strength using a best fit line to the test data
provided in the TMS 402-13 commentary. The estimated prism strength and stiffness has
been verified to be within the ranges provided in statistical studies on masonry prism
strength (Atkinson and Yan 1990). The stiffness of the prism has been assumed to be 300
times the compressive strength of the masonry prism (Kaushik et. al. 2007) and the
stiffness of the brick smeared crack elements and the mortar interface elements are
adjusted to achieve this stiffness following the procedure suggested by Stavridis and
Shing (2010).
As was done for the concrete elements, the calibration of the tensile behavior of
the brick was initially conducted for the brick interface elements, and then the
constitutive relations for the interface element were used to calibrate the smeared crack
elements. The tensile strength was assumed to be 15% of the compressive strength of the
masonry unit. Mode I fracture energy was taken to be proportional to tensile strength and
has been interpolated from literature (Bocca 1989).
The stress-strain curves for the tensile and compressive behavior of the concrete,
the mortar and the masonry are found in Appendix C. Appendix C also contains a table
with all of the modeling parameters.
3.4.6.4 Results
The observed damage during the experiment on the HCT specimen and cracking
patterns from the finite element model are presented in Table 2. The photos presented in
Table 2 were taken after the application of each ground motion and the experimental drift
levels are the maximum first story drift when the damage was observed. The images from

88
the finite element model were taken at the step in which damage initiates and the
specified drift corresponds to the first story drift at this step in the simulation.
During D1 earthquake, the specimen experienced minor damage at first story drift
levels of 0.06-0.08%. Interface cracks between infill wall and frame and minor toe
crushing were observed at the first level. In the finite element model, cracking initiates
along the interface between the infill and the boundary column of the first story at
0.055% drift. There are also minor bed joint cracks in the finite element model.
Further damage occurred during the D2 earthquake between 0.4% and 0.7% first
story drift. Diagonal and sliding cracks occurred in the first story infill walls and shear
cracks formed at the boundary columns. A diagonal crack also opened in the second story
infill wall. In the finite element model, combined diagonal and sliding cracks in the infill
wall and slight shear cracking of the boundary columns are initiated at 0.1% first story
drift. Minor diagonal cracking of the second story infill wall is observed at 0.44% first
story drift.
During the D3 earthquake, intensive damage occurred in the boundary columns
and the infill walls of the HCT specimen between 1.5-2% first story drift. The diagonal
cracks and sliding mechanism of the first story infill wall extended and flexural cracks
propagated along the height of the first story boundary columns. The diagonal crack of
the second story infill wall also expanded and shear cracking of the second story
boundary columns was also observed. Cracking patterns very similar to the experimental
results are obtained from the finite element simulation. Additional shear and flexural
cracks at the boundary columns and sliding cracks in the first story infill initiate at 0.73%

89
drift. The simulation also captures the diagonal cracking of the infill wall and shear
cracks of columns in the second story.
Table 2: Observed damage of the HCT specimen in the experiment (Ezzatfar et. al. 2014)
and finite element model
Experiment FE Model
D1
Ea
rth
qu
ak
e
0.06-0.08%
0.055%
D2
Ea
rth
qu
ak
e
(1)
0.1%
(2)
0.4-0.7%
0.44%
D3
Ea
rth
qu
ak
e
1.5-2.0%
0.73%

90
Figure 57 presents the base shear vs. roof displacement for the three PSD tests on
the HCT specimen and the envelope curve obtained from the finite element model. The
initial stiffness of the model is 29% less than the stiffness calculated from the
experimental data of the D1 ground motion. However, the slight underestimation in
stiffness may also be due to interface cracking initiating earlier in the model than the
experiment. The peak strength of the model is 8% greater than the experimentally
measured strength. The model can capture the behavior of the test up until the second
large shear crack opens at the base of the right boundary column adjacent to the masonry
infill wall. This occurs just after peak capacity of the model is achieved and results in a
drop of load in the force-displacement curve.
Figure 57: Base shear vs. top story displacement of the experiment (Ezzatfar et. al. 2014)
and the finite element model for the HCT specimen

91
3.5 Chapter Summary
The constitutive modeling scheme, element formulation and material calibration
process have been described in detail. The series of validation studies shows that the
combined interface and smeared crack element yields consistent results over a range of
models of increasing complexity.
Patch tests in pure compression and pure tension show that the use of interface
elements does not affect the material behavior of the model with respect to the timing of
failure. The calibration process alleviates tensile mesh sensitivity observed in traditional
continuum models. The results of the single column tests indicate that the combined
interface and smeared crack element model is equally able to model flexural behavior as
traditional continuum models, and much superior in its capability to model shear failure.
The results of the bare frame model were slightly stiff compared to the experiment. Given
that infill structures tend to be stiffer than RC frames, the slight over-stiffness in
modeling frame action is not expected to be significant for the models of hybrid concrete-
masonry structures. The models of the series of cyclic tests on unreinforced masonry
walls were in good agreement with the tests with respect to initial stiffness, peak strength
and cracking patterns. The large model of the 3-story 3-bay RC frame with masonry infill
also had predictions for initial stiffness, peak strength and timing of failure mechanisms
which were close to the experiment.
The results of the validation studies confirm that the constitutive model is robust
and appropriate for the basis of the modeling scheme for hybrid concrete-masonry.
92
CHAPTER 4
FINITE ELEMENT MODELING OF HYBRID CONCRETE-
MASONRY
In order to model hybrid concrete-masonry in finite element, there are three
components which must be properly characterized: the RC frame, the partially grouted
masonry infill, and the connections from the masonry wall to the RC frame. Validation
studies of the constitutive finite element model demonstrated its ability to model the RC
frame in Chapter 3. In this chapter, modeling methods for partially grouted reinforced
masonry infill and the connections from the masonry wall to the RC frame are proposed.
Accurately modeling the exact types of connections used in the Caribbean is a challenge
which requires tests of hybrid concrete-masonry structures to characterize the properties
of the interface. For this reason, the proposed modeling method was validated with cyclic
tests of full-scale hybrid concrete-masonry structures which are discussed in Chapter 6.
Within this chapter, the modeling scheme for hybrid concrete-masonry is
described. Next, the material calibration for the partially grouted masonry infills is
presented. The newly proposed methodology for calibrating the interface elements
representing grouted bed joints is developed based on the concept of shear friction in
concrete. Then, a method for modeling dowel connections from the masonry to the RC
frame is presented. This method is validated using a model of a 3-story, 3-bay RC frame
with infill and mesh reinforced mortar (MRM). Finally, preliminary models of the hybrid
concrete-masonry frames used for the cyclic tests are presented. Material calibrations for
the finite element models are compared to materials tests conducted on concrete,
masonry, mortar and grout specimens. The shear and tensile tests on grouted bed

93
masonry samples validate the proposed method to calculate the properties of grouted bed
joints as a function of the compressive strength of the grout and mortar. The summary for
the chapter outlines the newly proposed process for calibrating the interface elements
representing grouted bed joints using numbered steps.
4.1 Modeling Scheme
There are seven distinct elements in the proposed modeling scheme for partially
grouted reinforced masonry: smeared crack elements for grouted cells, interface elements
within grouted cells, smeared crack elements for un-grouted cells, interface elements for
the masonry head joints, interface elements for the mortar head joints, interface elements
for the bed joints in grouted cells, and interface elements for the bed joints in ungrouted
cells, all of which are shown in Figure 58. In the figure, the interface elements are
separated from the smeared crack elements in an exploded view in order to show which
boundaries contain interface elements. Thus, the single lines shown represent the double-
noded, zero-thickness interface elements used in the constitutive model. This convention
is used for all the figures in this dissertation. The interface elements for the bed joints
within grouted cells represent the mortar over the face shells and masonry webs and the
grout within the cores. These will be referred to as grouted bed joints. The interface
elements for the bed joints in ungrouted cells will be referred to as ungrouted bed joints.
The smeared crack elements representing grouted cells are the full unit thickness.
They are configured in an eight element smeared crack module with interface elements to
allow reinforcement to be placed at the center of each grouted cell and permit shear
cracks to open within the grouted cells (See Figure 59b). This module also permits
vertical cracking within the grouted cell which has been observed in the grouted cells

94
containing jamb reinforcement at the edges of partially grouted masonry walls (See
Figure 59a). The new eight element module is used instead of the 4-element module
proposed by Sayah et. al. (2013) (See Figure 59c) because the eight element module
permits the horizontal truss elements to be connected at the same location as the vertical
truss elements for horizontal reinforcement within the bed joints (See Figure 60a and b)
or within a bond beam (See Figure 60c).
Figure 58: Schematic for partially grouted reinforced masonry

95
Figure 59: Vertical cracking path compared to element modules
The ungrouted cells are not modeled with the eight element module since
crushing is expected to be the dominate failure of the hollow units. The smeared crack
elements representing un-grouted cells have a thickness equal to the sum of the face shell
thickness. The interface elements representing the masonry web are the full unit
thickness. The thickness of the mortar bed joints is determined by calculating the net
mortared area and dividing by the length of the CMU. The mortar head joints have a
thickness equal to the thickness of the masonry unit and are given the same properties as
the ungrouted bed joints, except for their bond strength which is reduced by 50% (See
Section 3.3.2).
The method used to model reinforcement is shown in Figure 60. Twelve truss
elements are used to model the vertical reinforcement in the grouted cells and joint
reinforcement is modeled with two truss elements which connect at the center of each
grouted cell regardless of whether bed joint or bond beam reinforcement is modeled.
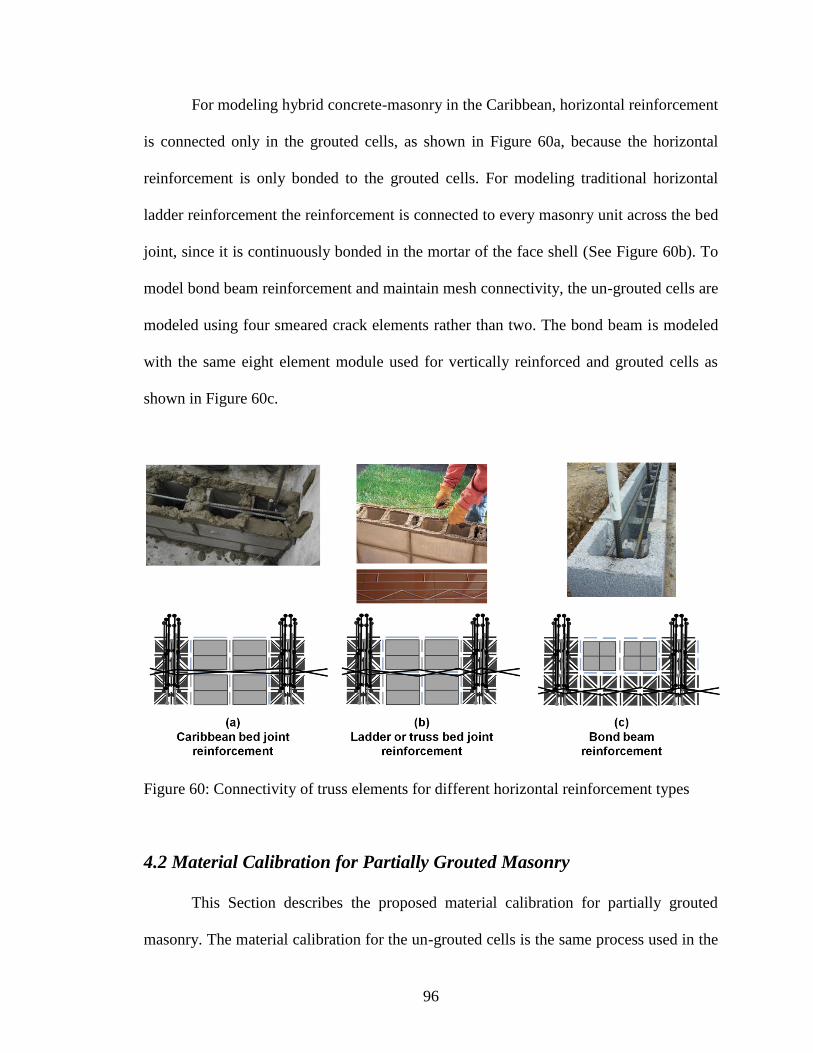
96
For modeling hybrid concrete-masonry in the Caribbean, horizontal reinforcement
is connected only in the grouted cells, as shown in Figure 60a, because the horizontal
reinforcement is only bonded to the grouted cells. For modeling traditional horizontal
ladder reinforcement the reinforcement is connected to every masonry unit across the bed
joint, since it is continuously bonded in the mortar of the face shell (See Figure 60b). To
model bond beam reinforcement and maintain mesh connectivity, the un-grouted cells are
modeled using four smeared crack elements rather than two. The bond beam is modeled
with the same eight element module used for vertically reinforced and grouted cells as
shown in Figure 60c.
Figure 60: Connectivity of truss elements for different horizontal reinforcement types
4.2 Material Calibration for Partially Grouted Masonry
This Section describes the proposed material calibration for partially grouted
masonry. The material calibration for the un-grouted cells is the same process used in the

97
constitutive model which was detailed in Chapter 3 (Stavridis and Shing 2010). It is
important to remember that in the proposed modeling scheme, the characteristic length of
the smeared crack elements used to represent un-grouted cells will be less than in the
formulation by Stavridis (2010) as the elements are half the height.
While it is preferable to have assembly tests for calibration of the finite element
model, limited data can be found in the literature for grouted masonry. Accurately
modeling the shear behavior of grouted bed joints is particularly important for partially
grouted masonry, which is likely to favor joints above and below grouted cells when
sliding cracks or stair-stepped cracks propagate from the un-grouted masonry through the
grouted cells (See Figure 61). Thus, a new calibration methodology which does not
require assembly tests is proposed in the subsequent section.
Figure 61: Preference for cracking along the grouted joints of reinforced cells (Minaie
2009). Crack 2 has been highlighted in red
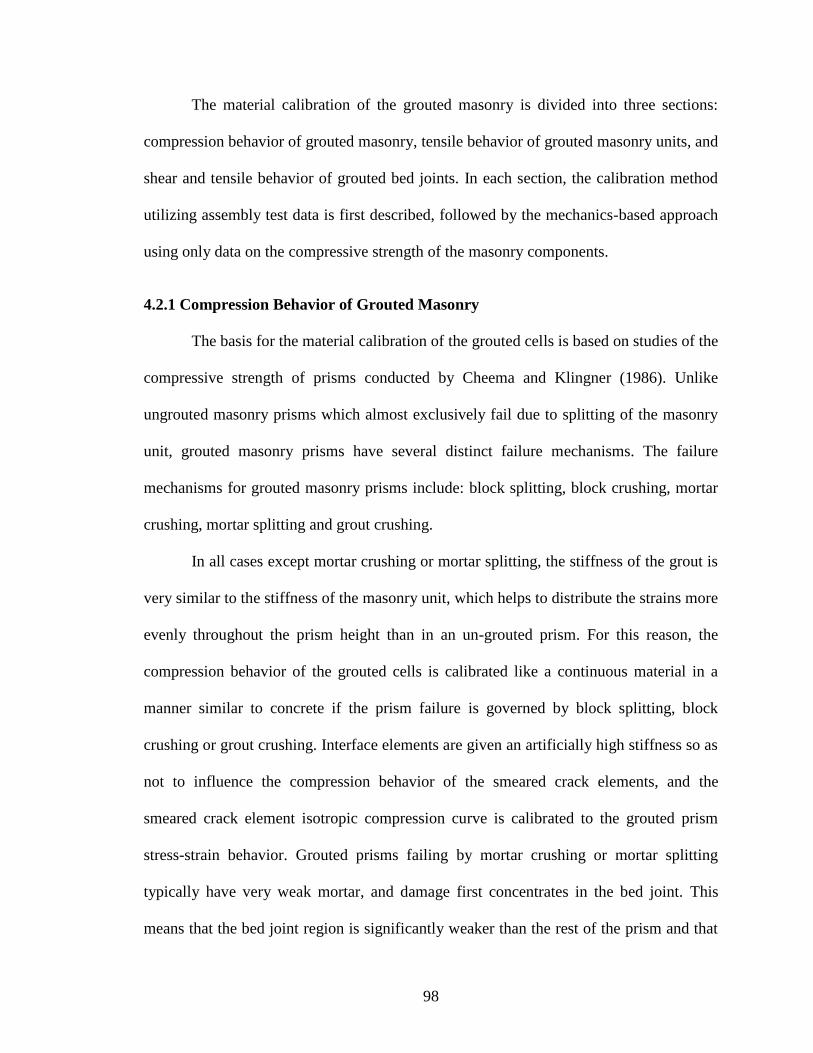
98
The material calibration of the grouted masonry is divided into three sections:
compression behavior of grouted masonry, tensile behavior of grouted masonry units, and
shear and tensile behavior of grouted bed joints. In each section, the calibration method
utilizing assembly test data is first described, followed by the mechanics-based approach
using only data on the compressive strength of the masonry components.
4.2.1 Compression Behavior of Grouted Masonry
The basis for the material calibration of the grouted cells is based on studies of the
compressive strength of prisms conducted by Cheema and Klingner (1986). Unlike
ungrouted masonry prisms which almost exclusively fail due to splitting of the masonry
unit, grouted masonry prisms have several distinct failure mechanisms. The failure
mechanisms for grouted masonry prisms include: block splitting, block crushing, mortar
crushing, mortar splitting and grout crushing.
In all cases except mortar crushing or mortar splitting, the stiffness of the grout is
very similar to the stiffness of the masonry unit, which helps to distribute the strains more
evenly throughout the prism height than in an un-grouted prism. For this reason, the
compression behavior of the grouted cells is calibrated like a continuous material in a
manner similar to concrete if the prism failure is governed by block splitting, block
crushing or grout crushing. Interface elements are given an artificially high stiffness so as
not to influence the compression behavior of the smeared crack elements, and the
smeared crack element isotropic compression curve is calibrated to the grouted prism
stress-strain behavior. Grouted prisms failing by mortar crushing or mortar splitting
typically have very weak mortar, and damage first concentrates in the bed joint. This
means that the bed joint region is significantly weaker than the rest of the prism and that
99
displacements may initially concentrate in the bed joint in a manner more similar to un-
grouted masonry. In this case, the calibration of the four smeared crack element module
and one grouted bed joint interface element is calibrated to the prism behavior in a
manner similar to the procedure for ungrouted prisms suggested by Stavridis and Shing
(2010).
The compressive failure mechanism for the grouted masonry used in the
construction of the hybrid concrete-masonry walls was determined from prism tests
conducted as part of this study. However, the most likely failure mechanism and the
corresponding calibration method can also be determined using proposed equations from
Cheema and Klingner (1986) if data from prism tests are not available. If no assembly
data is available to obtain the compressive stress vs. strain curve, the process developed
by Cheema and Klingner (1986) can be used to calculate the prism strength and expected
failure mechanism. Alternatively, data from literature for grouted prisms with similar
grout and unit strengths can be used to estimate the prism strength and elastic modulus
from which to calibrate the compression behavior of the masonry assembly.
4.2.2 Tensile Behavior of Grouted Masonry Units
Within the grouted masonry units, it is important that the tensile strengths of the
interface elements and of the smeared crack elements are calibrated consistently so that
the failure of one is not favored over the other. Just as in the calibration process for the
tensile behavior of concrete, the interface elements are calibrated first.
The effective tensile strength of the grouted masonry unit, is determined by
first converting the area of the unit into an equivalent area of grout using a transformed
section approach. Then the effective tensile strength is calculated by dividing the total

100
tensile capacity of the transformed section by the actual area of the grouted masonry bed
joint, . This process is summarized by Equation 11, where is the area of grout,
is the stiffness of the masonry unit, is the stiffness of the grout, is the area of
CMU, and is the tensile strength of the grout.
(11)
To finish calibrating the interface element, fracture energy of the grouted masonry
unit must be determined. Tests for fracture energy are difficult to conduct, and tests for
the fracture energy of grout have not been found in the literature. In lieu of test data,
fracture energy of concrete or mortar with similar strength to the grout is used. The
tensile behavior of the smear crack element is calibrated with the stress-displacement
curve of the interface element. In order to compare the two element types, both tensile
strength relationships are transformed to stress-displacement by multiplying the strains of
the smeared crack elements by its characteristic length.
4.2.3 Shear and Tensile Behavior of Grouted Bed Joints
The tensile and shear behavior of the grouted bed joint interface elements can be
calibrated with shear tests and bond wrench tests of grouted assemblies in the same
manner as was done for ungrouted bed joints (Section 3.3.2). However, these tests are
difficult to conduct and few tests can be found in the literature. Additionally, the
calibration method described in Chapter 3 does not capture the effect of the
reinforcement on the shear properties of the joint.
The grouted bed joint shear and tensile properties can also be calculated as a
function of the compressive strength of the masonry components using the newly
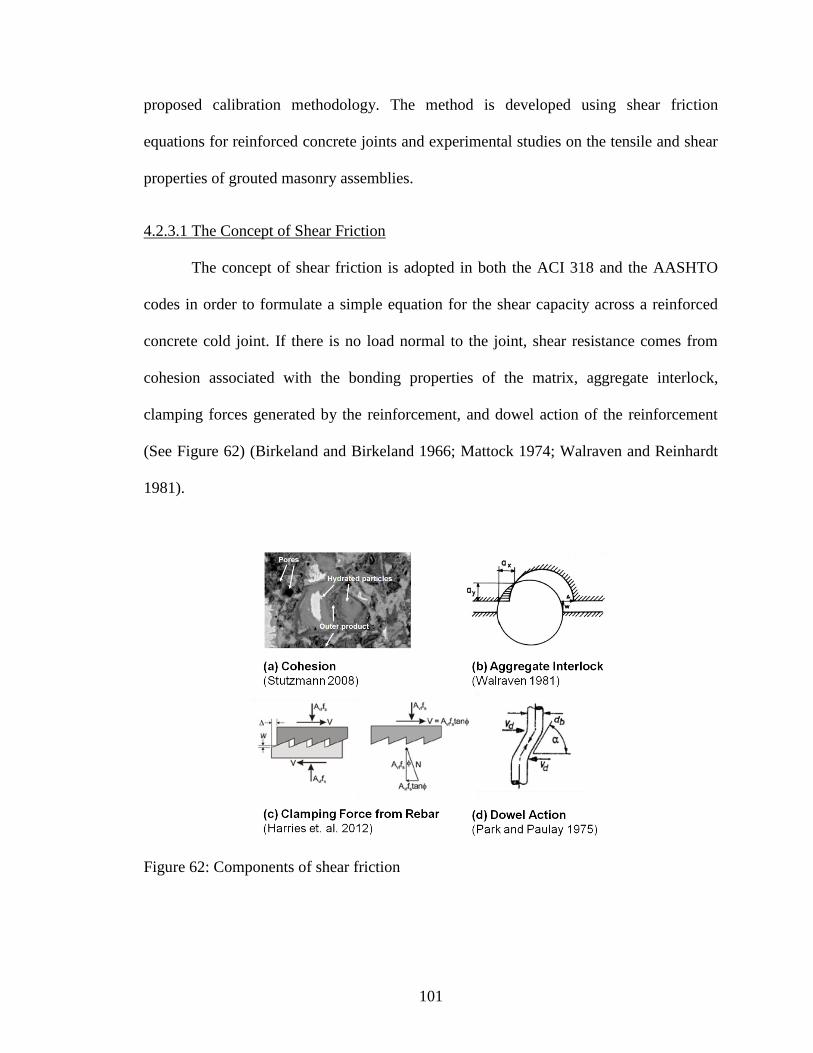
101
proposed calibration methodology. The method is developed using shear friction
equations for reinforced concrete joints and experimental studies on the tensile and shear
properties of grouted masonry assemblies.
4.2.3.1 The Concept of Shear Friction
The concept of shear friction is adopted in both the ACI 318 and the AASHTO
codes in order to formulate a simple equation for the shear capacity across a reinforced
concrete cold joint. If there is no load normal to the joint, shear resistance comes from
cohesion associated with the bonding properties of the matrix, aggregate interlock,
clamping forces generated by the reinforcement, and dowel action of the reinforcement
(See Figure 62) (Birkeland and Birkeland 1966; Mattock 1974; Walraven and Reinhardt
1981).
Figure 62: Components of shear friction
102
The last mechanism of dowel action is typically neglected since it has been
shown through tests by Walraven (1981) to contribute only marginally to the shear
capacity of the joint. With additional compression force applied normal to the joint, the
clamping action of the reinforcement becomes negligible.
In the ACI 318 code, shear capacity of a joint ( ) is given by Equation 12, where
is the area of shear reinforcement crossing the shear plane and is the yield stress of
the einfo ement. The she f i tion f to (μ) ounts fo both the l mping fo e f om
the reinforcement and the effect of aggregate interlock. The ACI 318 shear friction factor
is not a function of concrete strength, but varies according to the roughness and initial
bond condition of the joint surface. Several researchers have found that this form of
equation may not reflect the true mechanisms of shear friction, as the reinforcement
across concrete joints is typically only marginally engaged and does not reach yield prior
to the peak shear strength of the joint (Harries et. al. 2012; Kahn and Mitchell 2002;
Walraven and Reinhardt 1981).
(12)
for monolithic connection
for a cold joint with 1/4in roughness amplitude
for a cold joint with a smooth concrete surface
The majority of the shear capacity of the joint can be attributed to the concrete
component which falls to a residual value while the steel component of the shear capacity
continues to increase after the peak shear load is achieved (See Figure 63). The shear
strength of the joint has been shown to increase for increasing concrete strengths (Harries
et al. 2012; Kahn and Mitchell 2002). In light of the experimental data, Harries (2012)
proposed Equation 13 for the calculation of the shear capacity of the concrete joint.

103
Figure 63: Results from shear tests of concrete joints by Harries (2012)
(13)
The parameter varies according to the casting condition of the joint, is the
area of concrete in the shear plane of the joint, is the compressive strength of concrete,
and is the elastic modulus of the reinforcement. The quantity is used instead
of the yield strength of the steel as the steel has been shown experimentally to have
stresses much below yield stress at the peak shear resistance of the joint.
4.2.3.2 Application of Shear Friction Principles to Grouted Bed Joints
Very similar shear friction mechanisms are present along the bed joints of grouted
cells of reinforced masonry. The concepts of shear friction must be combined with
experimental data on the flexural and shear properties of grouted masonry to develop a
formula for the failure surface of the interface element. The first focus is to develop a
model for the behavior of grouted cells without reinforcement.

104
The hyperbolic failure surface of the interface element is shown in Figure 64. The
first point to be determined is s, is the tensile strength of the bed joint. Although the
tensile strength of the bed joint is dominated by the grout, flexural tension (bond
strength) of a grouted assembly is often less than the tensile strength of the grout (about
10% of compressive strength). Table 3 shows a compilation of the available data from the
literature for bond strength of grouted prisms.
Figure 64: Hyperbolic yield surface of the interface element
Table 3: Test data on the bond strength of grouted prisms
Researchers Mean Compressive
Strength of Grout
psi (MPa)
Mean Tensile
Strength of Grout
psi (MPa)
Mean Bond
Strength
psi (MPa)
Hamid and Drysdale
(1988)*
GN-3060(21.1)
GW-1987 (13.7)
GS-5946 (41.0)
GN-304.6 (2.1)
GW-188.5 (1.3)
GS-522.1 (3.6)
GN-203.1 (1.4)
GW-203.1 (1.4)
GS-246.6 (1.7)
Hamid et. al. (1992) 3272 (22.6) 298 (2.1) 323 (2.2)
Brown and
Melander (1999)
6192 (42.7) N/A 152.4 (1.1)
*GN-normal grout, GW-weak grout, GS-strong grout
The bond strength of the grouted prisms ranges from about 2% of the compressive
strength for strong grouts to 10% of the grouted strength for weak grouts. Based on the
limited amount of data, the tensile strength of the grouted assembly is varied linearly
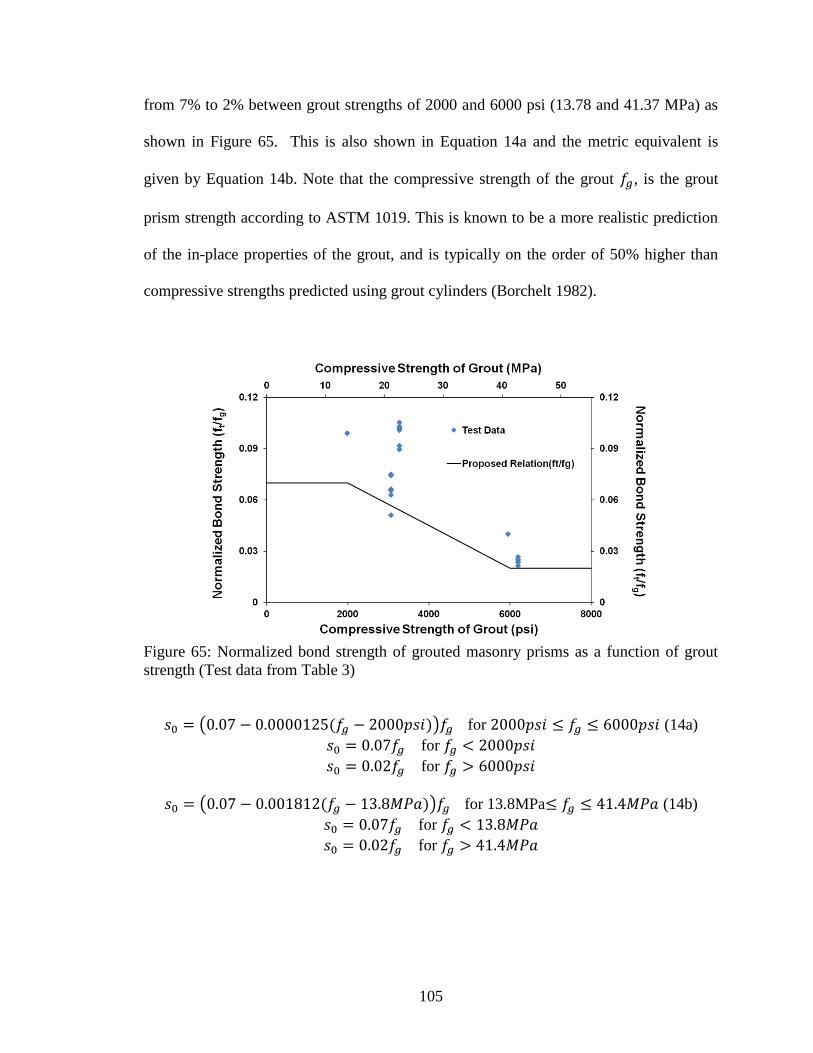
105
from 7% to 2% between grout strengths of 2000 and 6000 psi (13.78 and 41.37 MPa) as
shown in Figure 65. This is also shown in Equation 14a and the metric equivalent is
given by Equation 14b. Note that the compressive strength of the grout , is the grout
prism strength according to ASTM 1019. This is known to be a more realistic prediction
of the in-place properties of the grout, and is typically on the order of 50% higher than
compressive strengths predicted using grout cylinders (Borchelt 1982).
Figure 65: Normalized bond strength of grouted masonry prisms as a function of grout
strength (Test data from Table 3)
for (14a)
for
for
for 13.8MPa (14b)
for
for
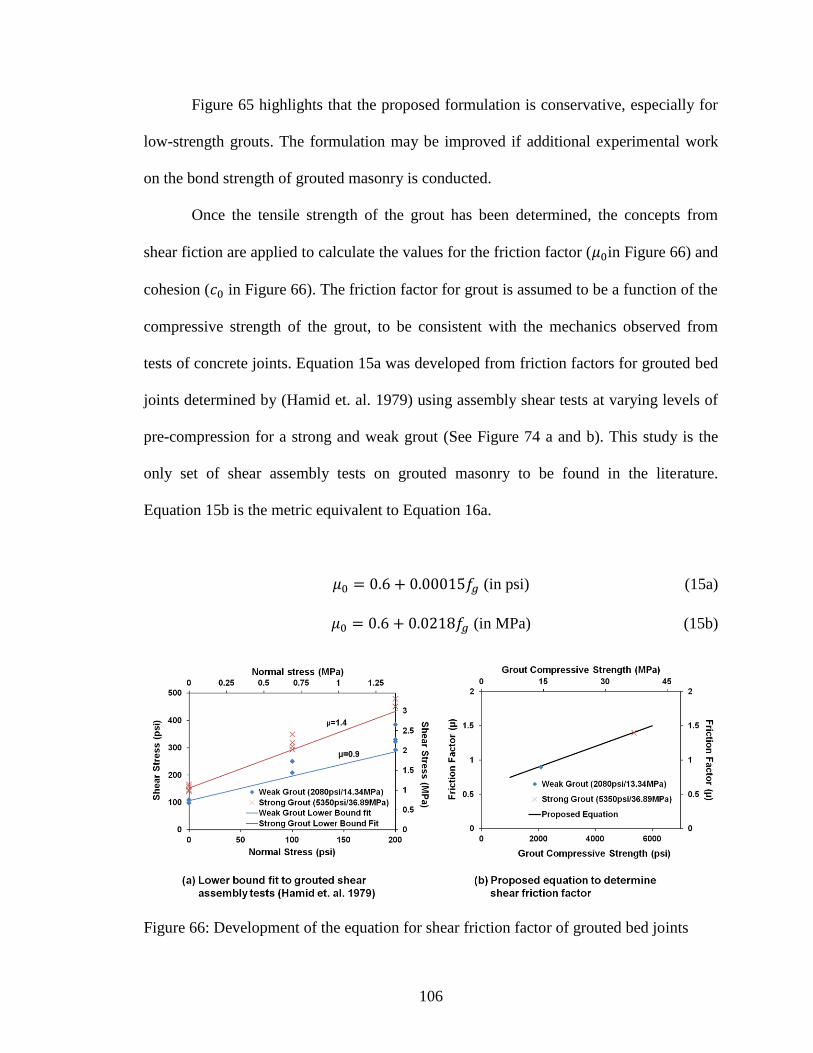
106
Figure 65 highlights that the proposed formulation is conservative, especially for
low-strength grouts. The formulation may be improved if additional experimental work
on the bond strength of grouted masonry is conducted.
Once the tensile strength of the grout has been determined, the concepts from
shear fiction are applied to calculate the values for the friction factor ( in Figure 66) and
cohesion ( in Figure 66). The friction factor for grout is assumed to be a function of the
compressive strength of the grout, to be consistent with the mechanics observed from
tests of concrete joints. Equation 15a was developed from friction factors for grouted bed
joints determined by (Hamid et. al. 1979) using assembly shear tests at varying levels of
pre-compression for a strong and weak grout (See Figure 74 a and b). This study is the
only set of shear assembly tests on grouted masonry to be found in the literature.
Equation 15b is the metric equivalent to Equation 16a.
(in psi) (15a)
(in MPa) (15b)
Figure 66: Development of the equation for shear friction factor of grouted bed joints

107
The cohesion of the grout was also assumed to be linearly related to the
compressive strength of the grout, consistent with the formulation by Harries (2012) for
concrete joints. Using data from Hamid et. al. (1979) and equation was fit to the values
for cohesion of tests on a weak, normal and strong grout (See Figure 67 and Equation 16
a and b). It was decided to use a linear fit with a non-zero y-intercept, because
constraining the linear fit to a zero intercept resulted in a very low r2 value. Until more
experimental data have been gathered on the shear behavior of grouted cells, the
proposed formula should work well for normal grout strengths (1500 psi-6000 psi, 10.24
MPa-41.37 MPa).
Figure 67: Data for cohesion of grouted bed joints and proposed function
(16a)
(16b)

108
Going through the proposed calibration process for the weak and strong grout in
the study by Hamid et. al. (1979) yields piece-wise linear functions which do not easily
conform to the hyperbolic yield surface assumed for the interface element. This is
because the shear friction values and the bond strength of the grouted masonry assembly
are higher than the values typical for un-grouted bed joints, while the cohesion of the
grouted assembly appears to be only marginally increased (See Figure 68).
Figure 68: Comparison of data from shear tests of grouted and un-grouted assemblies to
the data points calculated by the proposed calibration method. Weak grout-2080 psi
(14.34 MPa), Strong grout-5350 psi (36.89 MPa)
There are no studies which contain both bond wrench tests and shear assembly
tests of the same type of grouted masonry assembly by which to validate the
methodology as a whole. Future work on the element formulation may include further
testing of grouted masonry assemblies to establish the tensile bond, cohesion and shear
friction value for the same masonry prisms. This will confirm or refute the trends
observed from the data currently available in the literature and help to determine the form

109
of the interface element failure surface curve which better models the behavior of grouted
bed joints.
Conducting a study to determine if these changes are necessary is beyond the
scope of this research, but shear tests and bond wrench tests of grouted assemblies were
conducted as part of the experimental program. This may be the first data set containing
both tensile and shear assembly tests on the same batch of grouted masonry units. Until
further data have been gathered, a sufficient match to the calculated values can be
determined by a linear fit to five or more evenly spaced points on the bilinear curve
between the maximum expected compressive stress in the bed joint and its tensile
strength. An example for a fit with 0.2ksi (1.4MPa) maximum expected compressive
stress for the strong and weak grout tested by Hamid (1979) is shown in Figure 69.
Figure 69: Example of linear fit to obtain the interface element failure surface. Weak
grout-2080 psi (14.34 MPa), Strong grout-5350 psi (36.89 MPa)

110
No study has been conducted to characterize the residual shear resistance of
grouted bed joints after the joint has failed. Until future experimental work is conducted,
the shear strength of the grouted bed joint is expected to degrade in a manner similar to
ungrouted bed joints. In tests by Mehrabi (1994) the residual shear strengths of bed joints
under pre-compression ranged from 63% to 71.5% of the peak shear capacity.
Conservative results are obtained by using the same friction factor ( and setting
the tensile capacity of the failed joint equal to zero.
Finally, it is important to calculate the shear modulus of the grouted bed joints for
accurate representation of shear behavior. The elastic modulus of the grouted bed joint
interface element is calibrated to prism behavior as part of the masonry assembly. Simply
assuming the shear modulus is related to this elastic modulus by equations of elasticity
would lead to over-stiff behavior in shear.
To more accurately determine the shear modulus of the grouted bed joint, the bed
joint stiffness can be approximated as a composite material according to Equation 17.
The variable is the stiffness of the grouted bed joint and is the total area of the
grouted bed joint. The proportion of the grouted bed joint area occupied by the grout and
mortar is denoted as and , respectively. The grout stiffness, is calculated with
Equation 18 (Cheema and Klingner 1986), where is the unit weight of grout in lbs/ft3
and is the compressive strength of the grout in psi. The stiffness of mortar, is
approximated as 500 times the mortar compressive strength ( (Cheema and
Klingner 1986) (Equation 19). Once the stiffness of the bed joint ( ) is established, the
stiffness of the interface element representing the grouted bed joint ( ) is determined by

111
dividing by the bed joint spacing ( ) (Equation 20). Then the shear stiffness of the
grouted bed joint interface element ( ) can be calculated according to Equation 21.
(17)
(18)
(19)
(20)
(21)
4.2.4 Accounting for the Contribution of Reinforcement
To determine if the addition of vertical reinforcement in a grouted cell merits
altering the meshing scheme or material calibration of the grouted bed joint, the influence
of the truss elements on the joint shear behavior must be characterized. Horizontal
reinforcement has been shown to have a negligible effect on the shear capacity of bed
joints (Hamid 1978).
In order to characterize the influence of the vertical reinforcement, a triplet test
model was created in FEAP (See Figure 70). Several variants of the model were created,
one model without reinforcement, and three models with the reinforcement area varied
from #3 to a #5 bar. The material properties for the models were calibrated to the strong
and weak grouts in the tests by Hamid (1979). This results in two versions of each model,
one for the weak grout and one for the strong grout. Each of the eight models was run
with applied pre-compression stresses of 0 psi (0 MPa), 100 psi (0.689 MPa) and 200 psi
(1.379 MPa).

112
A comparison of the force-displacement behavior for the models with no pre-
compression is shown in Figure 71. Figure 72 and Figure 73 show the same data for 100
psi (0.689 MPa) and 200 psi (1.379 MPa) of pre-compression. The percent difference in
the peak shear capacity of each of the models with reinforcement over the case with no
reinforcement is summarized in Table 4.
Figure 70: Triplet test model with reinforcement

113
Figure 71: Shear stress vs. lateral displacement for grouted bed joints with and without
vertical reinforcement without pre-compression. Weak grout-2080 psi (14.34 MPa),
Strong grout-5350 psi (36.89 MPa)
Figure 72: Shear stress vs. lateral displacement for grouted bed joints with and without
vertical reinforcement at 100 psi (0.7 MPa) of pre-compression. Weak grout-2080 psi
(14.34 MPa), Strong grout-5350 psi (36.89 MPa)

114
Figure 73: Shear stress vs. lateral displacement for grouted bed joints with and without
vertical reinforcement at 200 psi (1.4 MPa) of pre-compression. Weak grout-2080 psi
(14.34 MPa), Strong grout-5350 psi (36.89 MPa)
Table 4: Summary of effect of vertical truss reinforcement elements on the shear capacity
of grouted bed joints
Weak Grout Strong Grout
Pre-compression
psi (MPa) 0 100 (0.7) 200 (1.4) 0 100 (0.7)
200
(1.4)
% Difference
with a # 3 bar +0.5% -1.7% -2.3% +0.7% -0.8% -1.9%
% Difference
with a # 4 bar +1.5% -2.8% -4.2% +1.6% -1.5% -3.17%
% Difference
with a # 5 bar +2.5% -3.9% -6.0% +2.6% -2.3% -4.5%
*weak grout-2080 psi (14.34 MPa), strong grout-5350 psi (36.89 MPa)
The data indicates that the presence of the reinforcement has a minimal effect on
the peak shear capacity of the joint. This makes sense because the truss elements have
pinned end conditions. The peak difference in shear capacity occurs for the weak grout
with a #5 bar and a pre-compression load of 200 psi (1.379 MPa), but even this case is
only 6% less than the shear capacity without reinforcement. At no pre-compression, the
rebar appears to minimally increase peak shear capacity and slightly reduce the residual

115
shear capacity of the joint. At moderate pre-compression and high levels of pre-
compression, 100 psi (0.689 MPa) and 200 psi (1.379 MPa), the presence of
reinforcement appears to slightly decrease both the peak and residual shear capacity of
the joint. In reality, the normal stress in the bed joint is slightly reduced because the
reinforcement serves to increase the effective area of the grouted joint. Less normal stress
in the bed joint leads to a reduction in shear strength, which is captured by the slight
reduction in shear capacity as reinforcement area is increased.
Because this does not accurately represent the physical behavior of reinforced
joints subjected to shear, the contribution of the reinforcement to the shear capacity must
be accounted for by altering the calibration of the grouted bed joint.
Two conditions should be satisfied from the presence of reinforcement across the
grouted bed joint. First, initial failure surface of the interface element should reflect an
increase in cohesion from the presence of reinforcement and a less significant change in
the peak shear strength at higher levels of pre-compression. This is because the clamping
force from the reinforcement is expected to become negligible with increasing pre-
compression, consistent with findings from experimental studies on concrete joints
(Harries et al. 2012). Second, the residual shear capacity of the grouted interface element
should increase with increasing amounts of shear reinforcement, as the main contribution
of reinforcement is to limit crack widths after the grout has cracked. Because the
interface tensile capacity goes to zero after the element has failed, it is not possible to
account for the residual cohesion by adjusting the failure surface of the interface element
representing the grouted bed joint.

116
Thus it is necessary to add truss elements to the meshing scheme such that the
additional steel elements could resists shear sliding across the bed joint once the interface
element has failed (See Figure 74). The effective shear area for the added reinforcement
can determined based on literature values for dowel action of rebar in concrete. These
values typically range from 25% to 50% of the physical bar area (Dulacska 1972;
Soroushian et al. 1986; Paulay et. al. 1974). The additional truss elements have a slight
influence on the bending behavior of the grouted cell. However, the curvature for
masonry in bending is typically very small, so these elements remain nearly horizontal
and do not significantly influence the bending behavior of the masonry. In tension, the
capacity of the joint is also marginally increased by the presence of the additional truss
elements.
A validation study was conducted with models of stacks of 3 reinforced grouted
cells as shown in Figure 70, with additional truss elements representing the shear
contribution of the vertical reinforcement (See Figure 74). These models were subjected
to pure tension and pure bending loading conditions. Two different grout properties were
selected from the tests by Hamid (1979): a weak grout with 2080 psi (14.34 MPa)
compressive strength and a strong grout with 5350 psi (36.89 MPa) compressive strength.
Each model had a #4 vertical reinforcing bar and additional truss elements to model shear
resistance of the vertical reinforcement. The additional truss elements in the baseline
models were given zero area. For the strong grout, modeling effective dowel areas
ranging from 25%-50% led to an increases in tensile capacity over the baseline model
which were less than 0.5% and increases in bending resistance which were between 6%
and 6.5% for all cases. For the weak grout with 25%-50% effective dowel area, the

117
tensile capacity of the grouted bed joint was increased by less than 0.5%, but the ultimate
bending resistance was increased by 21-22%. Decreasing the effective dowel area to 10%
or less reduced the increase in bending capacity to less than 10%. Based on the results of
these models, 25% effective dowel area is recommended to capture the additional shear
resistance of the vertical reinforcement unless the grout is weak (less than 2,500 psi
(17.24 MPa)) and bending is expected to dominate the wall failure. In all cases, it is
advisable to conduct a small study to verify the selected dowel area does not significantly
influence the bending behavior of the reinforced and grouted masonry.
Any increase in bending resistance of the grouted bed joints is unlikely to have a
significant effect on the models of hybrid concrete-masonry walls. The RC frames limit
the curvature of the masonry infills and the masonry walls primarily resist lateral forces
through shear mechanisms.
Figure 74: Additional steel elements to capture dowel action of reinforcement in grouted
bed joints

118
The influence of variation in dowel area on the shear resistance of the grouted bed
joint is shown for the weak and strong grout from tests by Hamid (1979) with a #4
reinforcing bar (See Figures 75-77). The results indicate that explicitly modeled
reinforcement permits the interface element to fail first, resulting in softening prior to
reaching peak shear capacity when the reinforcement yields. However, this effect
diminishes with higher levels of pre-compression, which is in accordance with the
observations in experimental tests from the literature.
Figure 75: Model results of shear tests without pre-compression on grouted bed joints
with and without reinforcement. Weak grout-2080 psi (14.34 MPa), Strong grout-5350
psi (36.89 MPa)
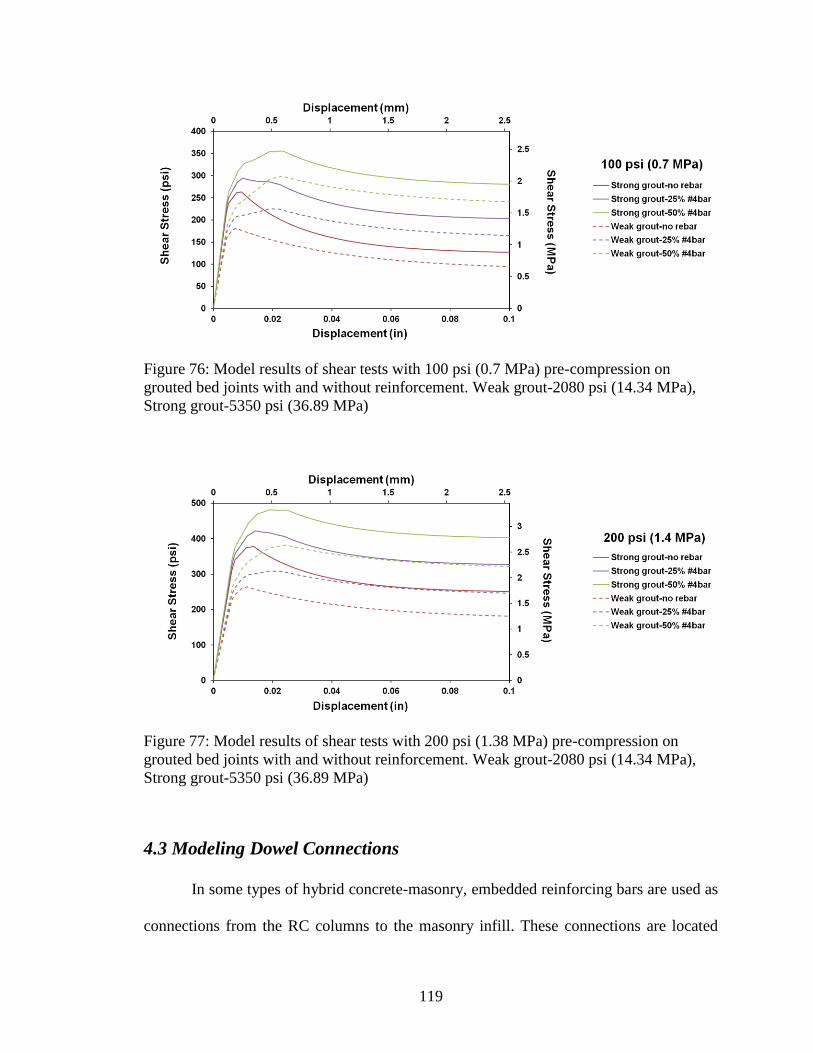
119
Figure 76: Model results of shear tests with 100 psi (0.7 MPa) pre-compression on
grouted bed joints with and without reinforcement. Weak grout-2080 psi (14.34 MPa),
Strong grout-5350 psi (36.89 MPa)
Figure 77: Model results of shear tests with 200 psi (1.38 MPa) pre-compression on
grouted bed joints with and without reinforcement. Weak grout-2080 psi (14.34 MPa),
Strong grout-5350 psi (36.89 MPa)
4.3 Modeling Dowel Connections
In some types of hybrid concrete-masonry, embedded reinforcing bars are used as
connections from the RC columns to the masonry infill. These connections are located

120
within the masonry bed joints and provide resistance primarily through dowel action
rather than bending. Thus, it is simplest to use two-elements in an X configuration to
model the reinforcement. The effective area of dowel reinforcement to be used in the
finite element model is formulated based on theories of dowel action in reinforcement
embedded in concrete.
A 3-story 3-bay RC frame with hollow clay tile brick infill walls and externally
applied mesh reinforced mortar (MRM) tested by Ezzatfar et al. (2012) is modeled using
the proposed method for discrete modeling of anchorage dowels. The results show that
this modeling technique adequately represents the behavior of the experimental
specimen. Additional studies are conducted to demonstrate the importance of modeling
anchorage dowels and characterize the sensitivity of the model's initial stiffness and peak
capacity to a change in the effective dowel area.
4.3.1 Modeling Scheme for Dowel Reinforcement
Dowel reinforcement is modeled using a pair of truss elements connected from
the masonry infill to the RC frame. The resistance provided by the truss elements to
interface sliding is illustrated in Figure 78. The cross-sectional area of these truss
elements must be selected so that the resistance from the element in tension added to the
resistance of the truss element in compression is equivalent to the shear resistance of the
dowel.

121
Figure 78: Modeling scheme for dowel reinforcement
4.3.2 Validation of Dowel Reinforcement Modeling Scheme
The test specimen is the retrofitted frame modeled in Section 3.4.6 to validate the
constitutive model. For the second phase of testing, the frame was repaired and new
infills with mesh reinforced mortar (MRM) were placed in the middle bays (See Figure
79). Because much of the specimen description and material calibration has already been
reported in Section 3.4.6, only the aspects of the model which are unique to the MRM
specimen are presented.
4.3.2.1 Finite Element Model and Material Calibration
The mesh consists of a 7.9 inch by 7.9 inch (200 mm by 200 mm) grid of 0.2 inch
(5 mm) deformed bars attached to both sides of the HCT infill. These meshes are
anchored to the boundary frame with 8-mm deformed anchor dowels and the entire mesh
is covered in plastering mortar (See Figure 79). No repair action was taken for the frame
elements.

122
Figure 79: Reinforcement details for the MRM infills (Ezzatfar et al. 2012)
Three different ground motions were applied to the test specimen with pseudo-
dynamic testing technique, just as was done for the unretroffited specimen (Section
3.4.6). The D1 earthquake was completely applied. However due to the technical
malfunctions encountered after the major peaks of D2 ground motion, the same ground
motion (D2) was applied four times. These successive D2 motions were named as D2-1,
D2-2, D2-3 and D2-4 respectively. At the end, quasi-static reversed cyclic test was
conducted to obtain lateral load bearing and displacement capacity of the enhanced
frame.
The details of the modeling scheme used for the MRM infill are shown in Figure
80. The smeared crack elements representing the hollow clay tile units is the thickness of
two face shells and the plaster is modeled explicitly with overlay elements. The dowels
are modeled using the proposed 2-element model, with each of the truss elements having
an area equal to 12.5% of an 8mm bar, so that the total effective dowel area is 25% as
suggested by Paulay et. al. (1974). The mesh reinforcement is modeled explicitly with
truss elements. the stiffness of the concrete columns on the first story was reduced by
50% from the unretrofitted frame to account for the damage from the first phase of
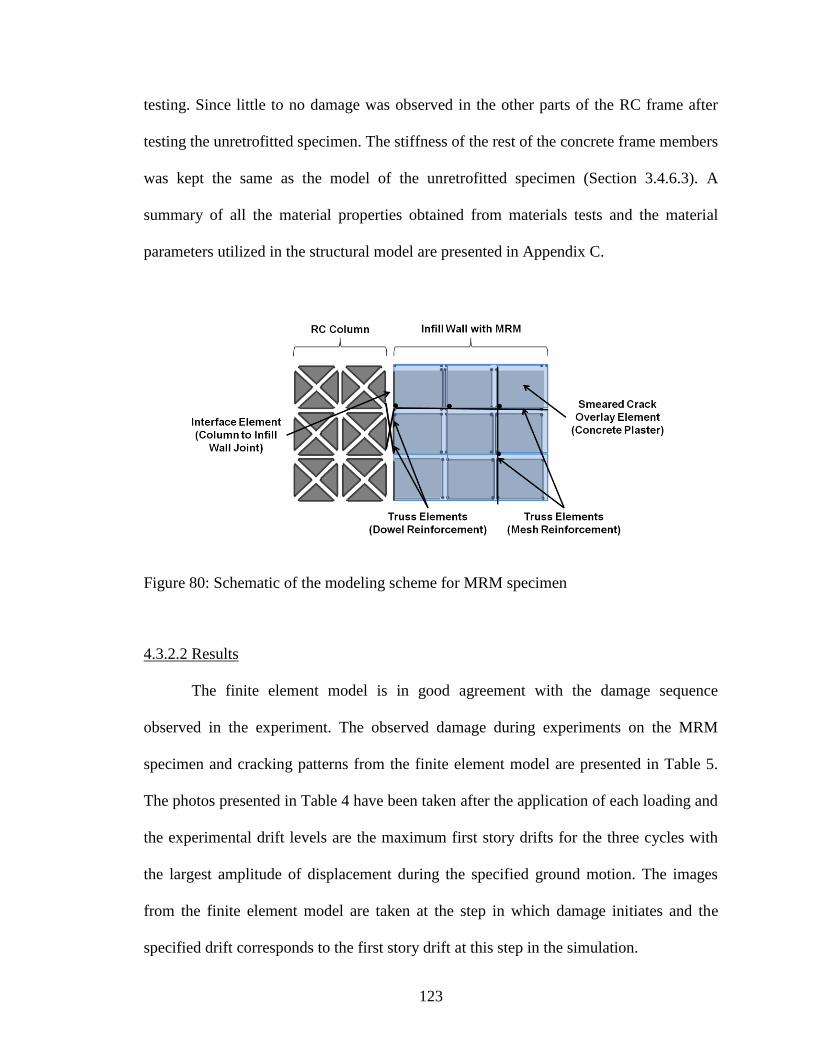
123
testing. Since little to no damage was observed in the other parts of the RC frame after
testing the unretrofitted specimen. The stiffness of the rest of the concrete frame members
was kept the same as the model of the unretrofitted specimen (Section 3.4.6.3). A
summary of all the material properties obtained from materials tests and the material
parameters utilized in the structural model are presented in Appendix C.
Figure 80: Schematic of the modeling scheme for MRM specimen
4.3.2.2 Results
The finite element model is in good agreement with the damage sequence
observed in the experiment. The observed damage during experiments on the MRM
specimen and cracking patterns from the finite element model are presented in Table 5.
The photos presented in Table 4 have been taken after the application of each loading and
the experimental drift levels are the maximum first story drifts for the three cycles with
the largest amplitude of displacement during the specified ground motion. The images
from the finite element model are taken at the step in which damage initiates and the
specified drift corresponds to the first story drift at this step in the simulation.

124
During D1 earthquake, the MRM specimen experiences only minor interface
cracking between the columns and the first story infill and the maximum drift in the first
story is 0.06%. In the finite element model, cracking initiates along the interface between
the infill and the boundary column of the first story at 0.056% drift. There are also minor
bed joint cracks in the finite element model.
The D2 earthquake was applied to the MRM specimen four times. Each time the
experiment had to stop at around two seconds into the D2 experiment due to the technical
problem in the actuators (these experiments are named as D2-1, D2-2, etc.). The
maximum first story drifts observed during these trials are between 0.32% and 0.62%. At
around 0.25% drift in the first story, a diagonal crack initiates in the first story infill. This
same crack initiates in the finite element model at 0.14% drift. The onset of shear and
flexural cracks are premature in the finite element model, initiating at the same time as
the first diagonal crack. The next damage patterns observed during testing are distributed
diagonal cracks which form within the first story infill wall and cracking of the first story
boundary columns. A diagonal crack also initiates in the second story infill wall. All of
this damage occurs during the first trial of ground motion D2 which has a maximum first
story drift of 0.32%. Similar damage patterns are also observed in the finite element
model at 0.39% first story drift, although slight cracking of the first story boundary
columns had already begun at 0.13% drift. In the experiment, distributed cracking of the
second story infill wall and the second story boundary columns occurs between 0.5% and
0.62% first story drift. In the finite element model, distributed cracking of the second
story infill wall initiates after the diagonal crack and cracking of the boundary columns
occurs simultaneously with the initial diagonal crack at a first story drift of 0.39%.

125
The cyclic tests on the MRM specimen result in crushing of the masonry at the
top corners of the first story infill wall and ultimately shear failure of the first story
boundary columns. Peak capacity of the frame was achieved at around 0.95% first story
drift. In the finite element model, crushing initiates at 0.33% first story drift and the peak
capacity of the frame is achieved at 1.23% drift.
(space left blank intentionally)

126
Table 5: Observed damage of the MRM specimen in the experiment (Ezzatfar et.al. 2012)
and finite element model
Experiment FE Model
D1
Ea
rth
qu
ak
e
0.04-0.06%
0.056%
D2
Ea
rth
qu
ak
e
(1)
0.13%
(2)
0.39%
(3)
0.32-0.62%
Cy
clic
Tes
t
0.95%
1.23%

127
The global force-displacement response of the model is also in good agreement
with the experiment. Figure 81 presents the base shear vs. roof displacement for the three
PSD tests on the MRM specimen and the envelope curve obtained from the finite element
model. The initial stiffness of the model is within 5% of the initial stiffness of the
experimental data, as interface cracking occurred at similar drift levels in the finite
element model and the experiment. The softening of the analytical model is also
consistent with the data from the D2-1 and D2-2 experiments, but the subsequent
applications of D2-3 and D2-4 induce further damage to the structure which is not
captured by the model. The peak strength of the model is 8.9% greater than the
experimentally measured strength.
Figure 81: Base shear vs. top story displacement of the experiment (Ezzatfar et. al. 2012)
and the finite element model
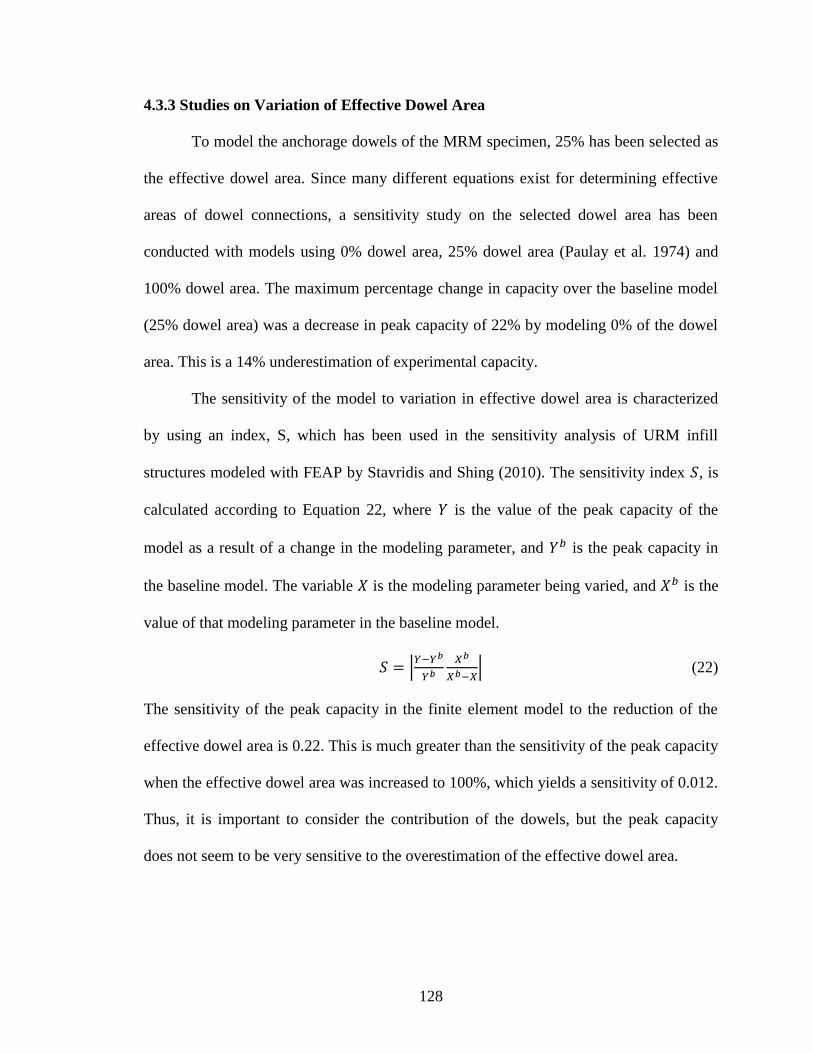
128
4.3.3 Studies on Variation of Effective Dowel Area
To model the anchorage dowels of the MRM specimen, 25% has been selected as
the effective dowel area. Since many different equations exist for determining effective
areas of dowel connections, a sensitivity study on the selected dowel area has been
conducted with models using 0% dowel area, 25% dowel area (Paulay et al. 1974) and
100% dowel area. The maximum percentage change in capacity over the baseline model
(25% dowel area) was a decrease in peak capacity of 22% by modeling 0% of the dowel
area. This is a 14% underestimation of experimental capacity.
The sensitivity of the model to variation in effective dowel area is characterized
by using an index, S, which has been used in the sensitivity analysis of URM infill
structures modeled with FEAP by Stavridis and Shing (2010). The sensitivity index , is
calculated according to Equation 22, where is the value of the peak capacity of the
model as a result of a change in the modeling parameter, and is the peak capacity in
the baseline model. The variable is the modeling parameter being varied, and is the
value of that modeling parameter in the baseline model.
(22)
The sensitivity of the peak capacity in the finite element model to the reduction of the
effective dowel area is 0.22. This is much greater than the sensitivity of the peak capacity
when the effective dowel area was increased to 100%, which yields a sensitivity of 0.012.
Thus, it is important to consider the contribution of the dowels, but the peak capacity
does not seem to be very sensitive to the overestimation of the effective dowel area.
129
4.4 Initial Finite Element Models
Initial finite element models of hybrid concrete-masonry structures were used to
aid in the design of the experimental program and predict the behavior of the frames.
These models are calibrated to materials tests which were conducted prior to the
experiment and utilize the proposed modeling methodology and material calibration
outlined in this chapter.
Testing of a hybrid concrete-masonry frame is required to adequately define the
interface properties and the effectiveness of the dowel connections, so several
assumptions were made in the preliminary models. First, the interface elements between
the masonry infill and the RC frame were given the same properties as the mortar bed
joints even though the mortar was unlikely to bond as well to the concrete as the masonry
units. Second, the effective dowel area for the additional truss elements used to model the
shear contribution of the vertical reinforcement within grouted cells was assumed to be
25% of the actual bar area. Third, all dowel connections from the partially grouted
masonry were modeled as 100% of the actual bar area, because the previous models of
concrete frames with masonry infill and mesh reinforced mortar indicated that the finite
element models are more sensitive to an underestimation in the effective dowel area than
an overestimation.
The material calibrations for the concrete, ungrouted masonry and grouted
masonry are presented and compared to results from materials tests. The materials were
selected to closely resemble properties of materials typically used in the Caribbean which
is discussed in detail in Chapter 5, Experimental Design. Appendix B contains detailed
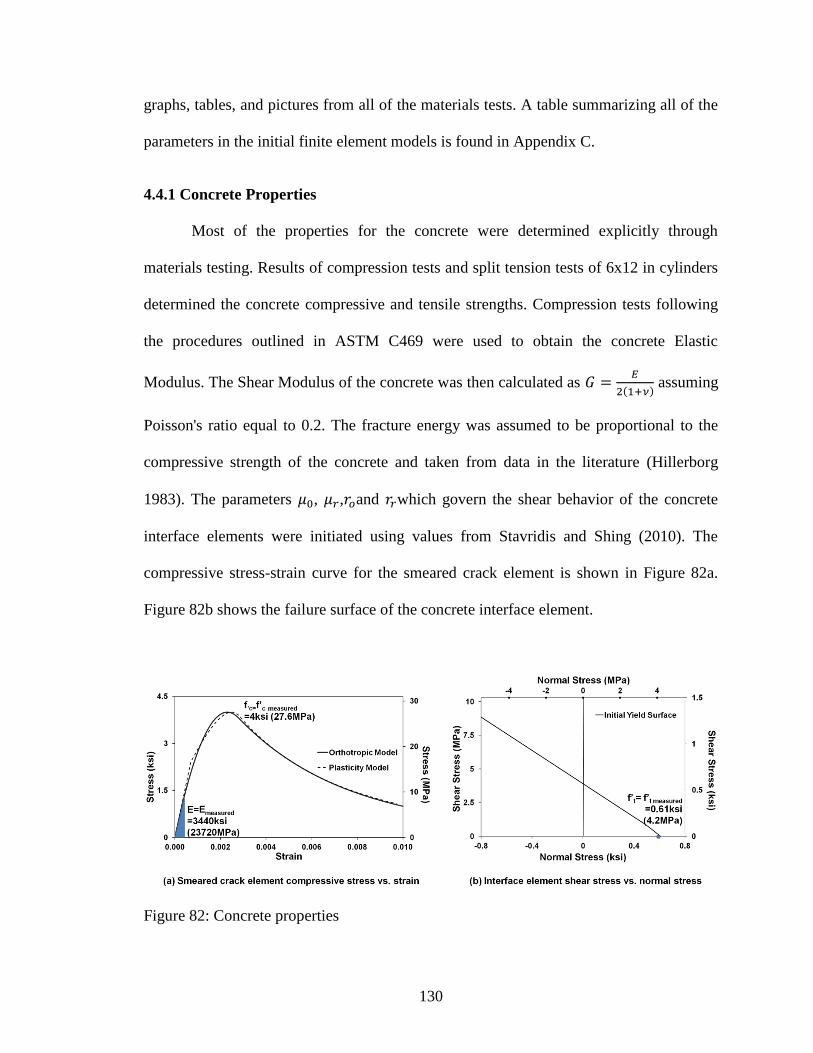
130
graphs, tables, and pictures from all of the materials tests. A table summarizing all of the
parameters in the initial finite element models is found in Appendix C.
4.4.1 Concrete Properties
Most of the properties for the concrete were determined explicitly through
materials testing. Results of compression tests and split tension tests of 6x12 in cylinders
determined the concrete compressive and tensile strengths. Compression tests following
the procedures outlined in ASTM C469 were used to obtain the concrete Elastic
Modulus. The Shear Modulus of the concrete was then calculated as
assuming
Poisson's ratio equal to 0.2. The fracture energy was assumed to be proportional to the
compressive strength of the concrete and taken from data in the literature (Hillerborg
1983). The parameters , , and which govern the shear behavior of the concrete
interface elements were initiated using values from Stavridis and Shing (2010). The
compressive stress-strain curve for the smeared crack element is shown in Figure 82a.
Figure 82b shows the failure surface of the concrete interface element.
Figure 82: Concrete properties
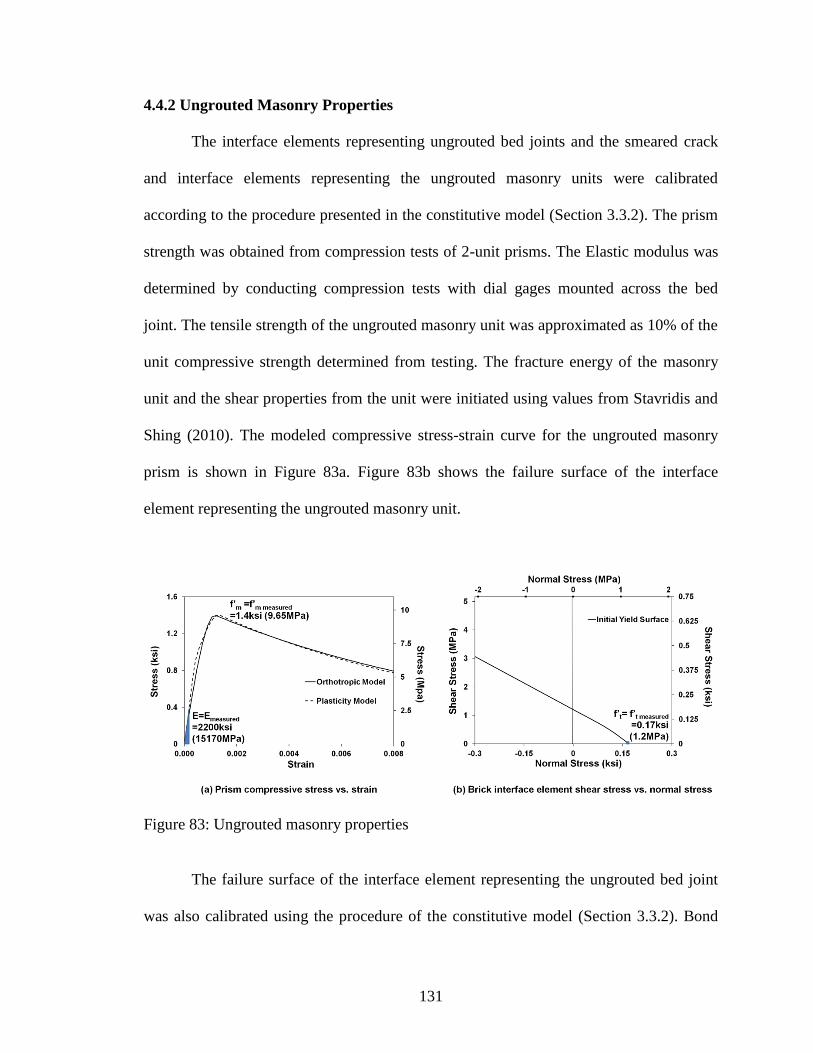
131
4.4.2 Ungrouted Masonry Properties
The interface elements representing ungrouted bed joints and the smeared crack
and interface elements representing the ungrouted masonry units were calibrated
according to the procedure presented in the constitutive model (Section 3.3.2). The prism
strength was obtained from compression tests of 2-unit prisms. The Elastic modulus was
determined by conducting compression tests with dial gages mounted across the bed
joint. The tensile strength of the ungrouted masonry unit was approximated as 10% of the
unit compressive strength determined from testing. The fracture energy of the masonry
unit and the shear properties from the unit were initiated using values from Stavridis and
Shing (2010). The modeled compressive stress-strain curve for the ungrouted masonry
prism is shown in Figure 83a. Figure 83b shows the failure surface of the interface
element representing the ungrouted masonry unit.
Figure 83: Ungrouted masonry properties
The failure surface of the interface element representing the ungrouted bed joint
was also calibrated using the procedure of the constitutive model (Section 3.3.2). Bond
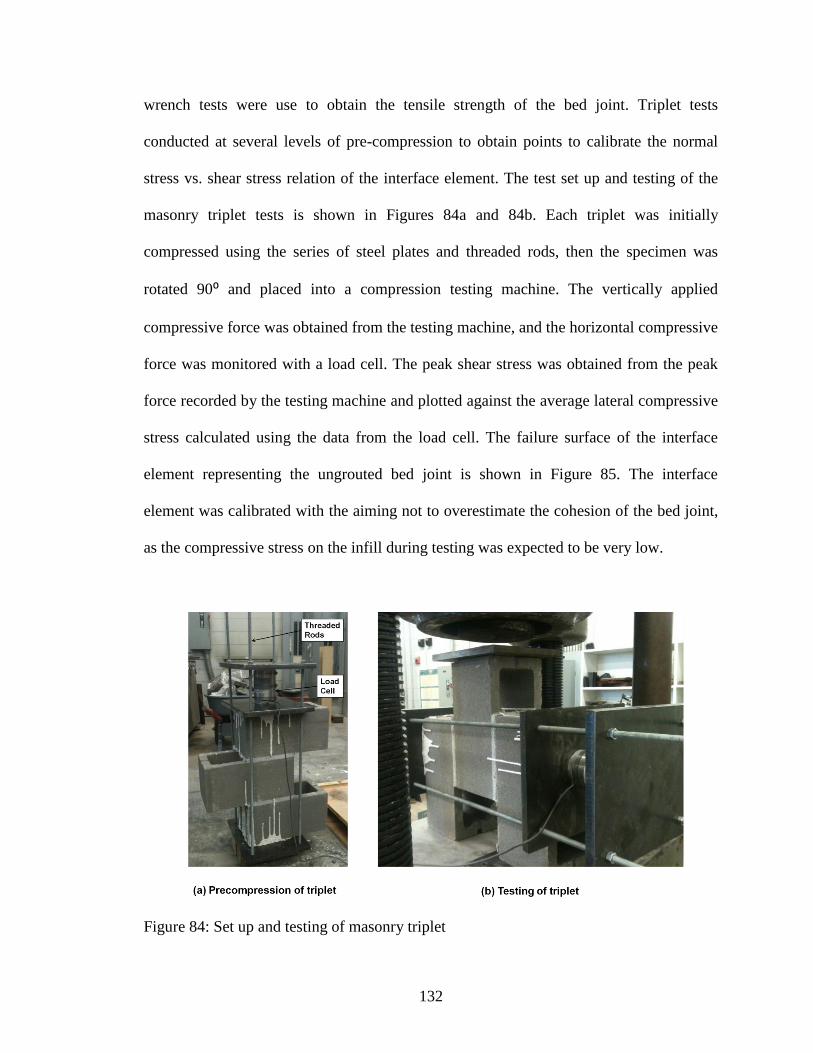
132
wrench tests were use to obtain the tensile strength of the bed joint. Triplet tests
conducted at several levels of pre-compression to obtain points to calibrate the normal
stress vs. shear stress relation of the interface element. The test set up and testing of the
masonry triplet tests is shown in Figures 84a and 84b. Each triplet was initially
compressed using the series of steel plates and threaded rods, then the specimen was
rotated 90⁰ and placed into a compression testing machine. The vertically applied
compressive force was obtained from the testing machine, and the horizontal compressive
force was monitored with a load cell. The peak shear stress was obtained from the peak
force recorded by the testing machine and plotted against the average lateral compressive
stress calculated using the data from the load cell. The failure surface of the interface
element representing the ungrouted bed joint is shown in Figure 85. The interface
element was calibrated with the aiming not to overestimate the cohesion of the bed joint,
as the compressive stress on the infill during testing was expected to be very low.
Figure 84: Set up and testing of masonry triplet
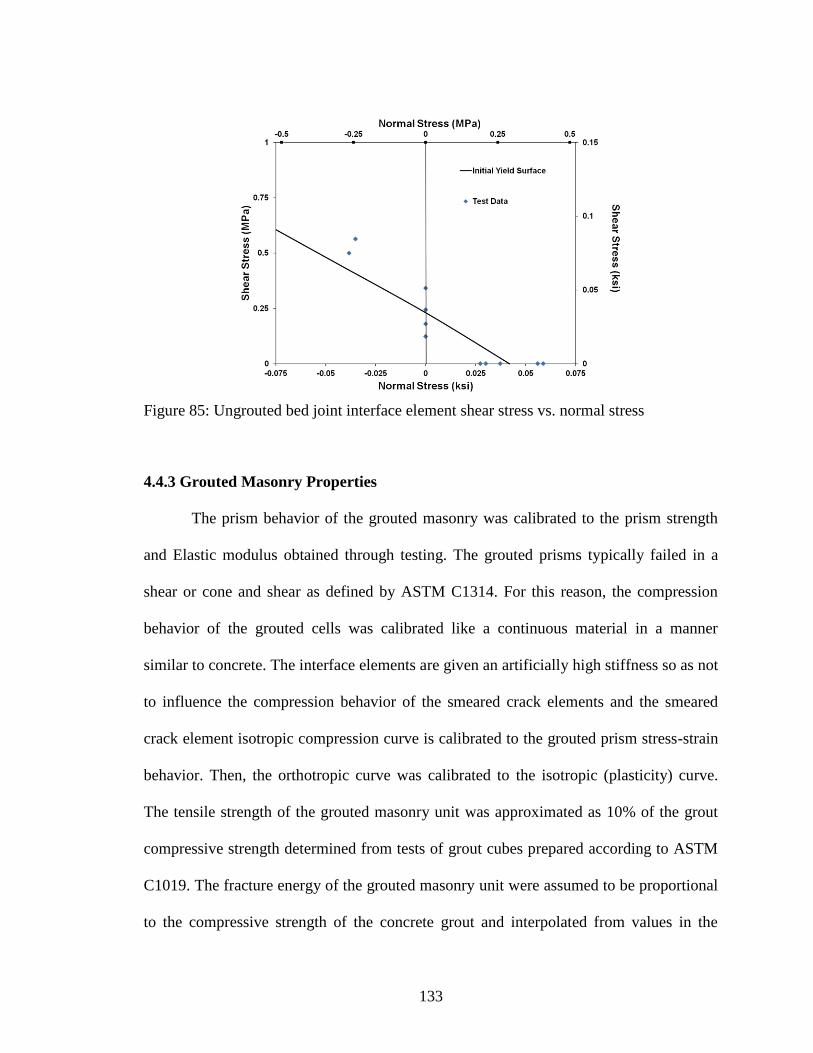
133
Figure 85: Ungrouted bed joint interface element shear stress vs. normal stress
4.4.3 Grouted Masonry Properties
The prism behavior of the grouted masonry was calibrated to the prism strength
and Elastic modulus obtained through testing. The grouted prisms typically failed in a
shear or cone and shear as defined by ASTM C1314. For this reason, the compression
behavior of the grouted cells was calibrated like a continuous material in a manner
similar to concrete. The interface elements are given an artificially high stiffness so as not
to influence the compression behavior of the smeared crack elements and the smeared
crack element isotropic compression curve is calibrated to the grouted prism stress-strain
behavior. Then, the orthotropic curve was calibrated to the isotropic (plasticity) curve.
The tensile strength of the grouted masonry unit was approximated as 10% of the grout
compressive strength determined from tests of grout cubes prepared according to ASTM
C1019. The fracture energy of the grouted masonry unit were assumed to be proportional
to the compressive strength of the concrete grout and interpolated from values in the

134
literature (Hillerborg 1983). The values of , , and were initiated using values for
concrete from Stavridis and Shing (2010). The modeled compressive stress-strain curve
for the grouted masonry prism is shown in Figure 86a. Figure 86b shows the failure
surface of the interface element representing the grouted masonry unit.
Figure 86: Grouted masonry properties
The proposed equations based on the compressive strength of the grout and
mortar were used to calculate the tensile bond strength, cohesion and shear friction factor
for the grouted cells. The equations are shown in Figures 87-89 with new data points
from the tests of grouted shear triplets and bond wrench tests on grouted prisms added to
the data collected from the literature. The tests confirm that the equations from the
proposed calibration methodology yield close predictions for the bond strength, cohesion
and shear friction of grouted bed joints. Note that the triplet tests under zero pre-
compression have a very wide scatter, so the mean value for cohesion was taken as the y-
intercept of the linear best fit to the shear stress vs. normal stress data collected from all
the triplets. The data also confirms the trend of a bi-linear relation of shear stress to

135
normal stress in grouted bed joints which does not fit well with the current hyperbolic
yield surface of the interface element (See Figure 90). Even so, the proposed
methodology using a linear fit to determine the failure surface of the grouted bed joint
interface element (Section 4.2.3.2) provides a close estimate of the grouted bed joint
shear capacity (See Figure 90).
Figure 87: Bond strength equation with results from bond wrench tests on grouted
specimens
Figure 88: Cohesion equation with results from grouted triplet tests

136
Figure 89: Friction factor equation with results from grouted triplet tests
Figure 90: Grouted bed joint interface element shear stress vs. normal stress

137
4.5 Chapter Summary
The proposed meshing scheme for hybrid concrete masonry structures has the
flexibility to model truss and bond beam reinforcement and explicitly accounts for the
contribution of vertical reinforcement to the shear capacity of grouted bed joints. The
material calibration of the newly proposed meshing scheme can be conducted using the
same materials tests suggested for calibrating the constitutive model. However, many of
the materials tests necessary to calibrate the behavior of grouted bed joints are difficult to
conduct and not available in literature. Thus, an alternative calibration method has been
proposed to calculate properties as a function of the compressive strength of the grout.
This method is developed using concepts of shear friction in concrete joints. Although
previous methodologies did not explicitly account for the contribution of vertical
reinforcement to the shear capacity of the grouted bed joint, a methodology also was
suggested to account for this effect. The steps for the calibration of grouted bed joints are
listed below:
1. Obtain the compressive strength of the grout from compressive tests of grout
cubes prepared according to ASTM C1019,
2. Calculate the tensile bond strength of the grouted bed joint using Equation 14,
3. Calculate the shear friction factor of the grouted bed joint using Equation 15,
4. Calculate the cohesion of the grouted bed joint using Equation 16,
5. Calculate at least 5 points from which to create a linear best fit line of the initial
failure surface of the interface element representing the grouted bed joint, where
the x is normal stress and y is shear stress and stresses to are normal
stresses within the expected range of stress for the masonry being modeled:
138
a.
b.
c.
d.
e.
6. Select values for , , and so that the initial failure surface of the interface
element representing the grouted bed joint matches the linear fit to through ,
7. Determine the residual failure surface by letting and equal and and
setting the tensile capacity of the failed joint to zero,
8. Determine the shear stiffness of the interface element representing the grouted
bed joint by Equations 17-21,
9. If the grouted bed joint contains vertical reinforcement, add two additional truss
elements across the bed joint as shown in Figure 74. The total area of the two
truss elements should equal 25% of the actual bar area, representing the shear
resistance of the vertical reinforcement,
Further, a methodology for modeling dowel connections from masonry infill to
RC column has been validated using a model of a 3-story, 3-bay RC frame with infill and
mesh reinforced mortar (MRM). The results indicate that the proposed modeling method
can adequately capture the influence of the dowel reinforcement on the peak strength of
the RC frame with infill masonry. The results also suggest that the peak capacity of the
frame has minimal sensitivity to overestimation of the effective dowel area
Finally, the preliminary finite element models used to design the experimental
program and predict the seismic behavior of hybrid concrete masonry frames has been

139
presented. The triplet tests and bond wrench tests conducted on samples of grouted
masonry validate the proposed methodology for calculating shear and tensile properties
of the grouted bed joint as a function of the grout compressive strength.

140
CHAPTER 5
EXPERIMENTAL DESIGN
The main objective of the experimental program is to validate the proposed Finite
element models. Of particular interest is the behavior of the interface between the
reinforced masonry infill and the reinforced concrete (RC) frame. The scope of the
testing regimen was limited to observing the effect of two different methods to connect
the reinforced masonry infill wall to the RC frame on the seismic performance of the
hybrid concrete masonry wall. These two tests serve as validation points for the Finite
element models which can then be used to predict the seismic performance of other types
of hybrid concrete masonry structures. The experimental program is the first laboratory
tests of these types of structures and yields detailed information about the stiffness,
progression of damage, peak strength and failure modes of hybrid concrete structures.
The design and construction details for the RC frames are identical between the
two test specimens and are presented first. Then, the design and construction details for
the masonry infill and the two different methods for connecting the infill to the RC frame
are discussed. The test set up, including gravity loading and the application of lateral
loads is explained next. Finally, the instrumentation plan for localized measurements of
the RC frames and infill walls is presented.
5.1 RC Frame
5.1.1 Design
In order to isolate the effect of different connections of the reinforced masonry
wall to the RC frame, both specimens were designed to be identical except for the

141
variation in connection type. The International Building Code was selected as the design
code for the RC frame because it is the most commonly used code among the engineers
surveyed during site visits to the Caribbean and a separate analytical study determined
that the modern codes in the region seem to yield designs which have similar drift and
demand to capacity ratios as the IBC (Redmond et. al. 2013).
The RC test frame was taken from the bottom story of a five story office building
(See Figures 91 b and c) designed by the 2009 International Building Code (IBC) to the
highest level of seismic hazard in Trinidad (See Figure 91 a). The RC frame was
designed to carry all of the gravity and lateral loads, and the masonry infill was accounted
for with a line load (500lb/ft, 7.3 kN/m), as is typically done by engineers interviewed on
the site visits to the Caribbean. The design was based on a concrete strength of 4,500 psi
(31.03 MPa) and reinforcement yield strength of 60,000 psi (413.69 MPa). The soil type
was taken as an IBC 2009 site class D. The slab was designed as a one-way slab, and the
experimental frame was taken from the direction of the beams rather than the girders as
the stiff wall is more likely to influence the weaker beams than the girders.
Figure 91: Design of the RC frame
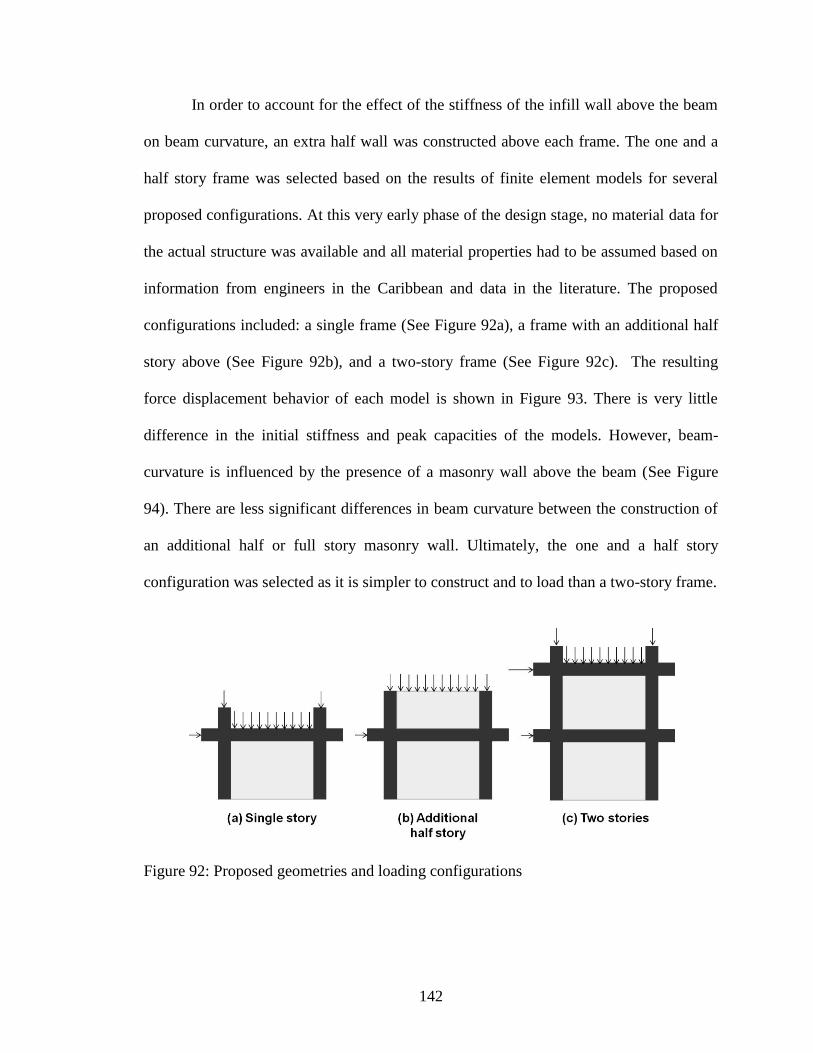
142
In order to account for the effect of the stiffness of the infill wall above the beam
on beam curvature, an extra half wall was constructed above each frame. The one and a
half story frame was selected based on the results of finite element models for several
proposed configurations. At this very early phase of the design stage, no material data for
the actual structure was available and all material properties had to be assumed based on
information from engineers in the Caribbean and data in the literature. The proposed
configurations included: a single frame (See Figure 92a), a frame with an additional half
story above (See Figure 92b), and a two-story frame (See Figure 92c). The resulting
force displacement behavior of each model is shown in Figure 93. There is very little
difference in the initial stiffness and peak capacities of the models. However, beam-
curvature is influenced by the presence of a masonry wall above the beam (See Figure
94). There are less significant differences in beam curvature between the construction of
an additional half or full story masonry wall. Ultimately, the one and a half story
configuration was selected as it is simpler to construct and to load than a two-story frame.
Figure 92: Proposed geometries and loading configurations
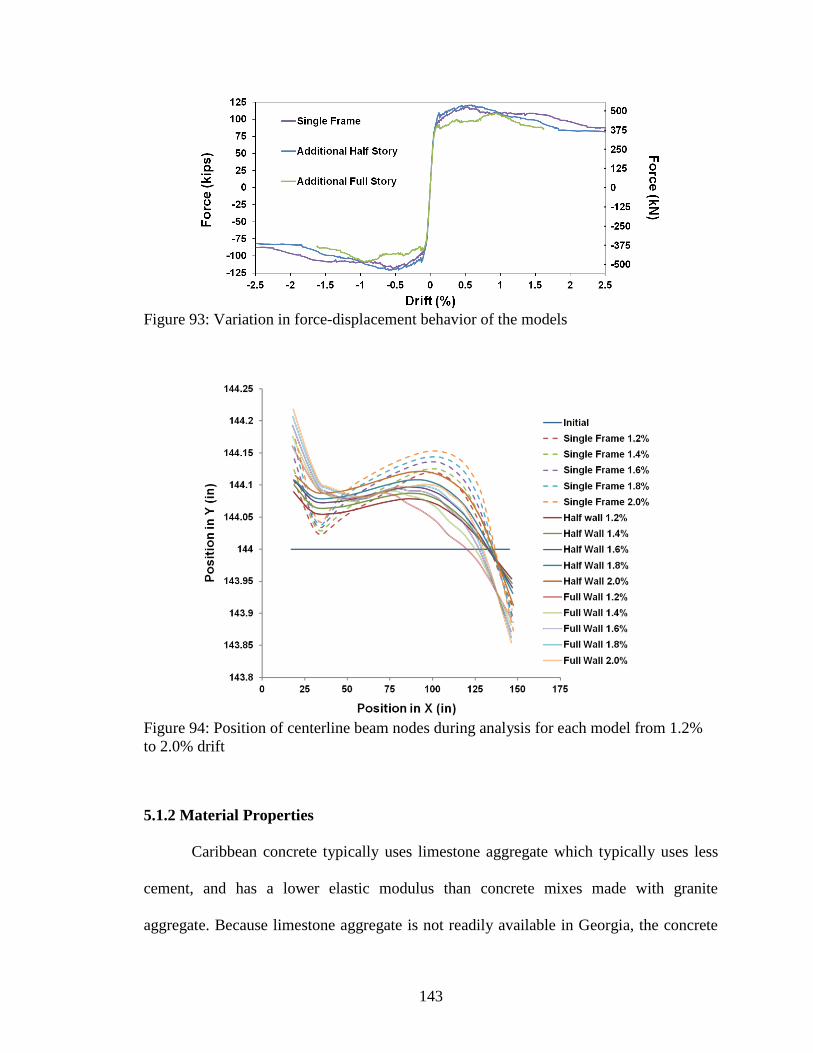
143
Figure 93: Variation in force-displacement behavior of the models
Figure 94: Position of centerline beam nodes during analysis for each model from 1.2%
to 2.0% drift
5.1.2 Material Properties
Caribbean concrete typically uses limestone aggregate which typically uses less
cement, and has a lower elastic modulus than concrete mixes made with granite
aggregate. Because limestone aggregate is not readily available in Georgia, the concrete

144
mix was prepared using granite with the goal of achieving similar peak strengths, while
recognizing that the material would be slightly stiffer than the concrete in the Caribbean.
The mix design had a 0.75 inch (19.1 mm) maximum aggregate size, water-to-
cement (w/c) ratio within the range of 0.5 to 0.55 and was designed to achieve a
maximum strength of 4500 psi (31.03 MPa). Because most concrete plants design a batch
to achieve greater than specified strength, the greatest concern was that the concrete
strength would be greater than in the Caribbean. To avoid this, the nominal specified
strength of the final mix was been 3000 psi (20.68 MPa), and the average 28-day strength
of the mix was tested to be 4055 psi (27.96 MPa). This is slightly under the design
strength of 4500 psi (31.03 MPa), but well within the range of concrete strength in the
Caribbean, which vary from 3000 to 4500 psi (20.68 to 31.03 MPa). The notes from
interviews with design firms in the Caribbean regarding construction practices and
material properties are presented in Appendix A. The elastic modulus of the concrete was
determined using the procedure outlined by ASTM C469. The average value for the
elastic modulus was 3,440,000 psi (23700 MPa).
The reinforcement was a standard mild steel rebar. The average tensile yield
strength as calculated by the 0.2% offset method was 78,500 psi (541 MPa). Additional
graphs and tabulated data for the materials tests conducted on the concrete and the
reinforcement is given in Appendix B.
5.1.3 Construction Details
First, a deep post-tensioned slab was provided to allow for full development
length of the #8 column bars and to allow for loading plates to be embedded in the
foundation to post-tension the beam and columns with gravity loads. Figures 95 and 96
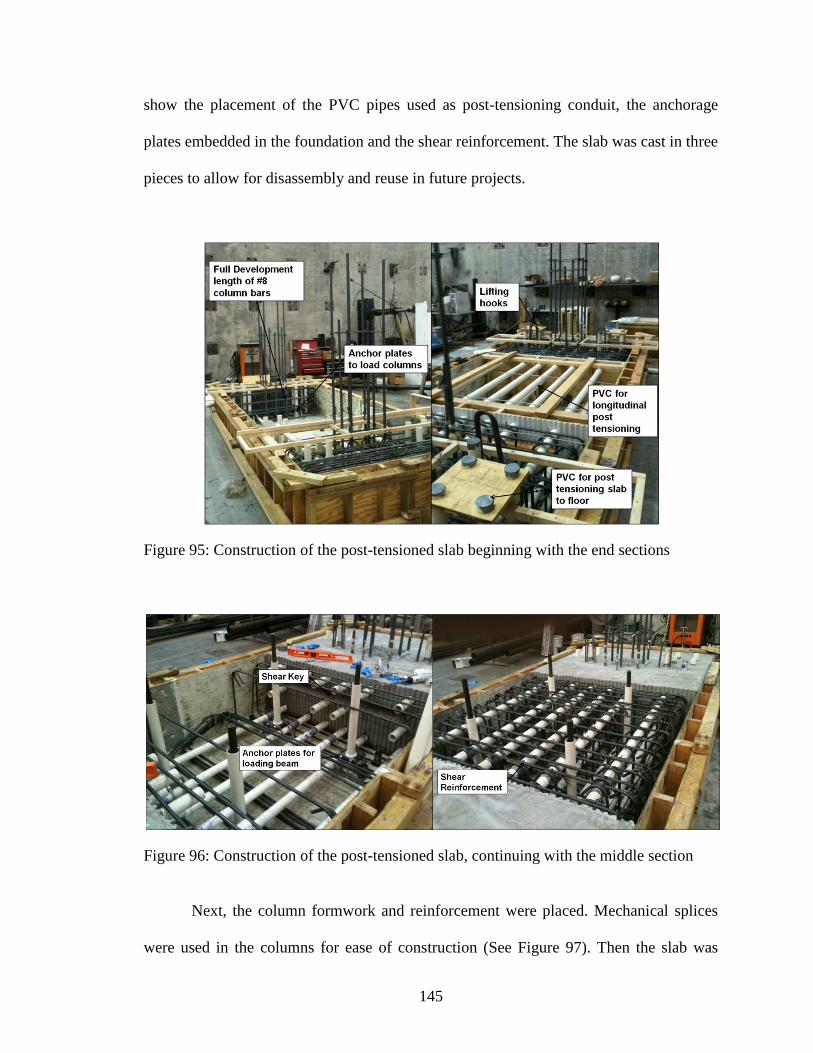
145
show the placement of the PVC pipes used as post-tensioning conduit, the anchorage
plates embedded in the foundation and the shear reinforcement. The slab was cast in three
pieces to allow for disassembly and reuse in future projects.
Figure 95: Construction of the post-tensioned slab beginning with the end sections
Figure 96: Construction of the post-tensioned slab, continuing with the middle section
Next, the column formwork and reinforcement were placed. Mechanical splices
were used in the columns for ease of construction (See Figure 97). Then the slab was

146
post-tensioned and lifted to remove the forms and placed back over the anchors on the
strong floor as shown in Figure 98. The slab was post-tensioned to the floor to provide
additional resistance against sliding during the experiment (See Figure 99).
Figure 97: Installation of column forms and reinforcement
Figure 98: Lifting slab

147
Figure 99: Post-tensioning slab to strong floor
After the columns were cast, shoring was constructed for the beam forms and
reinforcement was placed (See Figure 100). Stub beams were extended past the joint
region to allow for a loading plate to be placed on the end of the stub beam rather than
directly on the joint, permitting more realistic rotation of the beam-column joint during
testing. The longitudinal beam reinforcement was extended through the joint and
terminated in the stub beams without any lap splices.

148
Figure 100: Construction of the beams
Finally, the reinforcement for the top half columns was placed and the columns
were poured using a conveyor truck (See Figure 101). Figure 102a shows the removal of
the form work and Figure 102b shows the dowel connections which have been cast-in-
place in one of the two frames. The complete construction drawings for the RC frame are
shown in Figures 103-105. The cast-in-place dowels used to connect the masonry infill to
the RC frame in one of the two frames are not shown.
Figure 101: Conveyor used to pour the top half columns
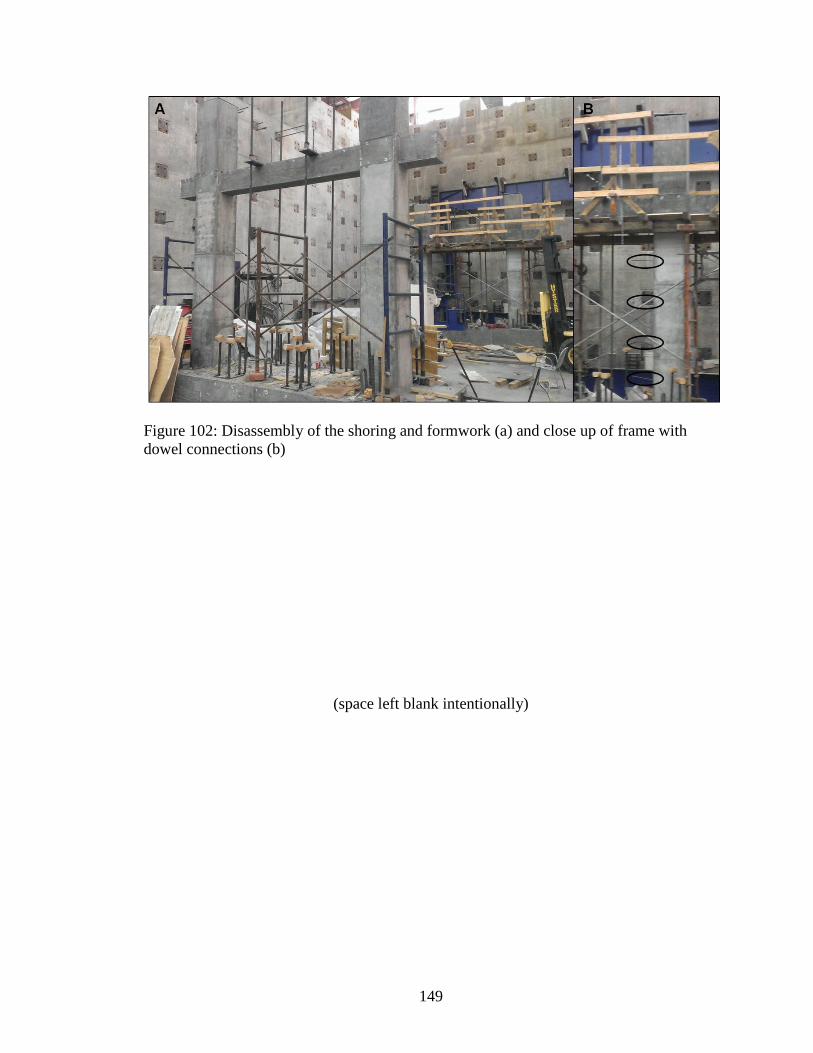
149
Figure 102: Disassembly of the shoring and formwork (a) and close up of frame with
dowel connections (b)
(space left blank intentionally)

150
Figure 103: Reinforced concrete frame

151
Figure 104: Post-tensioned slab
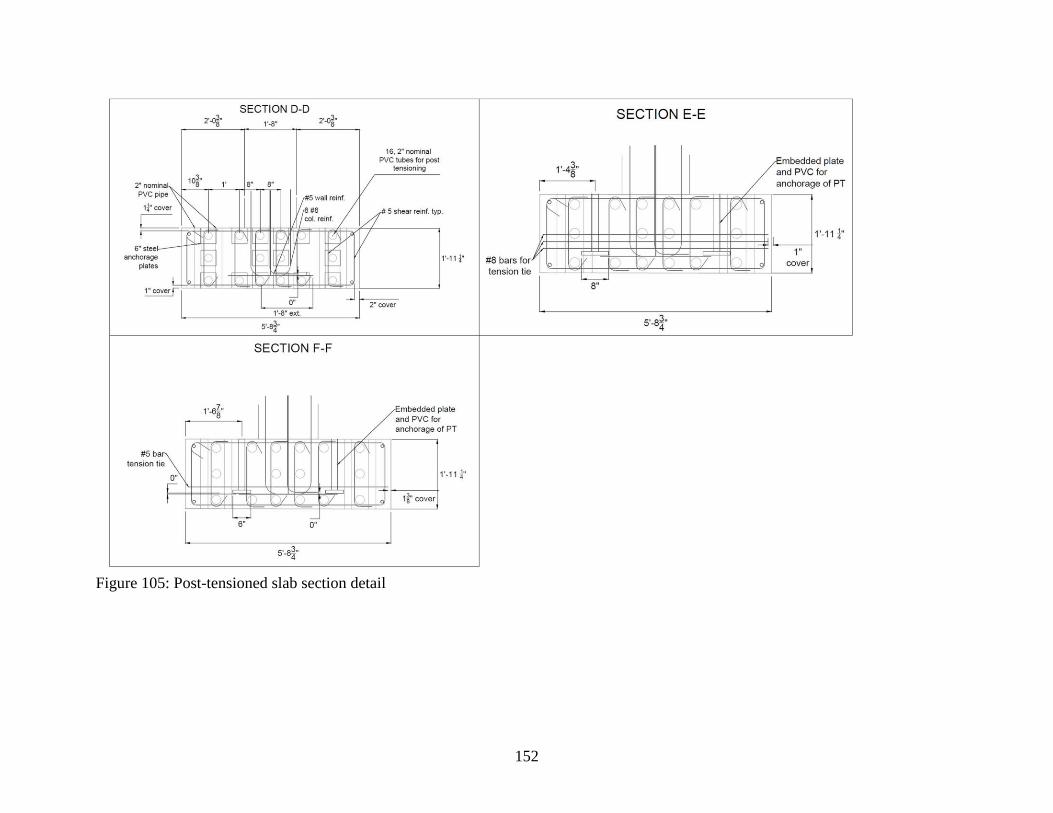
152
Figure 105: Post-tensioned slab section detail

153
5.2 Reinforced Masonry Infill and Connections to RC Frame
5.2.1 Design
The masonry infill walls of both test frames were constructed using 8x8x16 inch
(20.3x20.3x40.6 cm) hollow CMU as is typical in the Caribbean. The strength of the
units in the Caribbean is much lower than the typical strength of American CMUs,
typically 1000-3500 psi (6.90-24.13 MPa). However, a low strength batch of CMU which
had been improperly cured was obtained from an American supplier.
The internal wall reinforcement was kept the same between the two specimens.
The masonry reinforcement sizes and spacing were based on what is most common
among all the firms interviewed and does not reflect an exact detailing method for a
particular firm. The horizontal reinforcement within the masonry wall was a single #3
rebar placed in the bed joint and down the centerline of the wall, spaced every three
courses. This typically leads to a larger bed joint than given by TMS 402. Ladder
reinforcement is not available in the Caribbean, and bond beams are not used. The
vertical reinforcement was a #5 rebar spaced every 32 inches (81.3 cm). The cells with
vertical reinforcement were filled with a watered-down concrete and consolidated every
three to four courses with a rod, in accordance with practices observed in the Caribbean.
For both frames, #5 dowel bars for the vertical wall reinforcement were cast into
the foundation. The splice lengths for the dowel bars and the lap splices within the walls
were determined based on TMS 402 in order to adhere as much as possible to current
design codes, although it is more common within the Caribbean to specify a splice length
in terms of bar diameters (30-40db). Lap splices for the vertical masonry reinforcement

154
were placed every four courses, in accordance with the most common local practices. In
one of the frames, cast-in-place connections were placed in the RC frame both vertically
(#5 dowel bars) and horizontally (#3 dowel bars). The 90⁰ hooks at the end of each dowel
were extended as close to the far face of the columns and beams as possible to be
consistent with typical ACI 318 detailing. The final construction drawing for the masonry
infill wall without dowel connections is shown in Figure 106. The construction drawing
for the infill wall with dowel connections is shown in Figure 107.
The concrete used to fill the reinforced cells was designed to be as close to the
practices observed in the Caribbean. Often, the same concrete is used to fill the cells as
would be used for the construction of an RC frame, except that water is added to the mix
to achieve a large slump. The strength of the concrete used to fill the grouted cells is
typically between 2000 and 3000 psi (13.79 and 20.68 MPa).
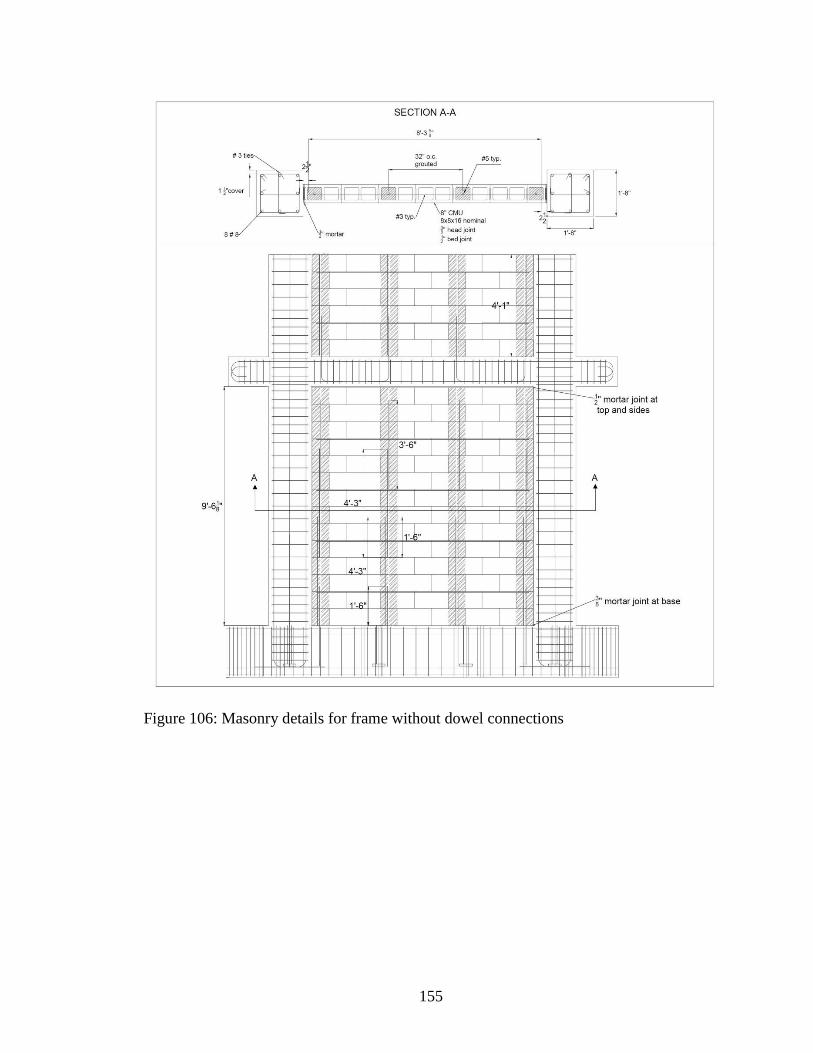
155
Figure 106: Masonry details for frame without dowel connections

156
Figure 107: Masonry details for frame with dowel connections

157
5.2.2 Material Properties
The masonry infill walls of both test frames were constructed using 8x8x16 in
(20.3x20.3x40.6 cm) hollow CMU with unit strength of 1700 psi (11.72 MPa). The CMU
strength was selected based upon what was available from local U.S. suppliers and was
within the range of CMU strengths typical to the Caribbean.
The mortar was mixed volumetrically in a ratio of three parts sand to one part
Portland cement. Every firm interviewed used this type of mortar. To determine the
compressive strength of the mortar, 2 inch (5.08 cm) cube specimens were taken at the
time of construction and cured in the fog room for twenty-eight days. The average
compressive strength of the mortar was 4430 psi (30.54 MPa).
The mix design for the weak concrete was designed using ACI 211 for 3000 psi
(20.68 MPa) and a 7 inch (17.8 cm) slump. Then, during construction water was added to
achieve a 9 inch (22.9 cm) slump. The compressive strength of the concrete was
determined by two different methods. First, traditional 6x12 inch (15.2x30.5 cm) cylinder
molds were cast and cured in the fog room. Second, grout prisms were formed according
to ASTM C1019. The grout prisms are thought to better represent in-place properties of
the grout, since the CMU block absorbs some of the water from the concrete which
results in greater compressive strength (See Figure 108). The average compressive
strength of the concrete as given by the grout prisms was 3040 psi (20.96 MPa), and the
average compressive strength as given by the cylinder tests was 2760 psi (19.03 MPa).

158
Figure 108: Construction of grout prisms made from weak concrete
Masonry prisms were constructed for both ungrouted masonry and grouted
masonry (See Figure 109 a and b). The average 28-day strength of the prisms was 1430
psi (9.86 MPa) and 2570 psi (17.72 MPa), for the ungrouted and the grouted prisms
respectively. The shear and tensile properties of the grouted and ungrouted bed joints
were determined using masonry triplets (See Figure 110 a and b) and prisms tested with a
bond wrench machine (See Figure 111 a and b). Additional pictures of the test set ups,
failed masonry samples and tabulated data for the materials tests conducted on the
mortar, the concrete used to fill the grouted cells and the masonry assemblies are given in
Appendix B.

159
Figure 109: Constructing and bagging the (a) ungrouted prisms and (b) grouted prisms
Figure 110: Masonry triplet (a) construction and (b) testing

160
Figure 111: Masonry-mortar bond specimen (a) construction and (b) testing
5.2.3 Construction Details
The construction of the masonry wall primarily was done by a professional mason
to ensure a consistent quality for both walls. The mortar for the masonry wall was
volumetrically proportioned (See Figure 112). The bed joints were increased to a 0.5 inch
(1.27 cm) thickness to accommodate the #3 reinforcing bars. The head joints were left at
the standard 0.375 inch (0.952 cm) thickness. All mortar joints were tooled.
Figure 112: Volumetric batching of the mortar

161
For both specimens, the dowel bars were cast into the foundation to be spliced
with the vertical reinforcement for the wall as shown in Figure 113a. At the end of each
course mortar was placed in the gap between the CMU and the column (See Figure
113b).
Figure 113: Placement of first row of masonry showing (a) the dowel bars and (b) the
mortar at the wall-column interface
For each course, the masonry block was slid over the reinforcing bars and laid in
place. Every third course, a single #3 reinforcing bar was placed in the center of the bed
joint. The mortar was first placed on the webs before placing the reinforcement to ensure
that the bar is fully encased in mortar (See Figure 114a). For Frame 1, the bottom of the
block often had to be notched out to accommodate the horizontal dowel bar from the
column and keep a consistent 0.5 inch (1.27 cm) bed joint thickness (See Figure 114b).
Every four courses, construction was paused to fill the reinforced cells with concrete. The
concrete was hand batched and watered down to achieve 8-10 inches (20.3-25.4 cm) of
slump (See Figure 115). The concrete was placed in the reinforced cells and consolidated

162
with a rod (See Figure 116). The next vertical bar was then tied in place and construction
of the wall resumed (See Figure 117).
Figure 114: Horizontal reinforcement (a) placed over grouted webs and (b) spliced with
dowel bars from columns
Figure 115: Measuring slump for weak concrete used to fill reinforced cells
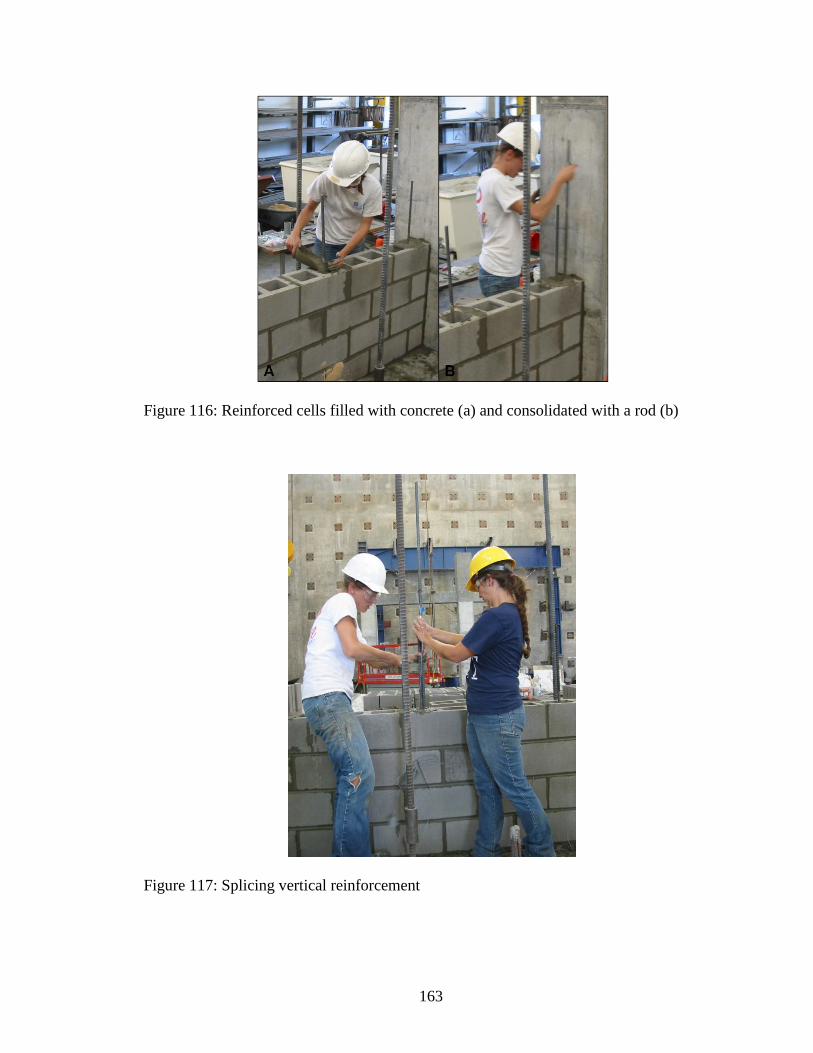
163
Figure 116: Reinforced cells filled with concrete (a) and consolidated with a rod (b)
Figure 117: Splicing vertical reinforcement

164
At the top courses of the wall with dowel connections, the webs of the masonry
blocks were notched out to fit the block over the dowel bars which extended down from
the RC beam (See Figure 118). For both frames, the face shells of the grouted cells in the
last course of masonry were cut out in order to place the concrete in the cells. A dry pack
was then used to fill in the top of the grouted cells where the face shells had been
removed (See Figure 119).
Figure 118: Dowel reinforcement extending down from the RC beam
(space left blank intentionally)

165
Figure 119: At the top of the masonry wall, (a) face shell of the grouted cell was
removed, (b) weak concrete was poured into the 3 courses below, and (c-d) the last
course was dry packed
5.3 Test Set Up
5.3.1 Overview
Cyclic tests were conducted to determine the seismic performance of the frames
and to gain insight into the behavior of entire buildings constructed with these types of
infills. The test setup is shown in Figure 120.
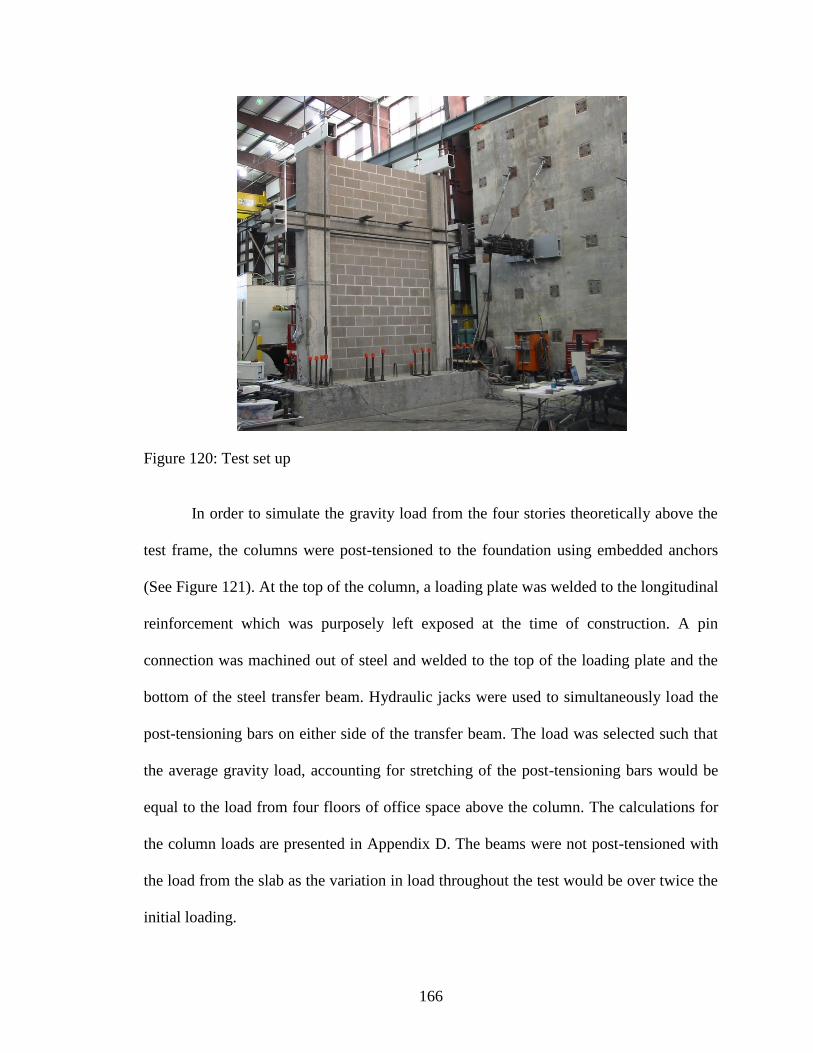
166
Figure 120: Test set up
In order to simulate the gravity load from the four stories theoretically above the
test frame, the columns were post-tensioned to the foundation using embedded anchors
(See Figure 121). At the top of the column, a loading plate was welded to the longitudinal
reinforcement which was purposely left exposed at the time of construction. A pin
connection was machined out of steel and welded to the top of the loading plate and the
bottom of the steel transfer beam. Hydraulic jacks were used to simultaneously load the
post-tensioning bars on either side of the transfer beam. The load was selected such that
the average gravity load, accounting for stretching of the post-tensioning bars would be
equal to the load from four floors of office space above the column. The calculations for
the column loads are presented in Appendix D. The beams were not post-tensioned with
the load from the slab as the variation in load throughout the test would be over twice the
initial loading.
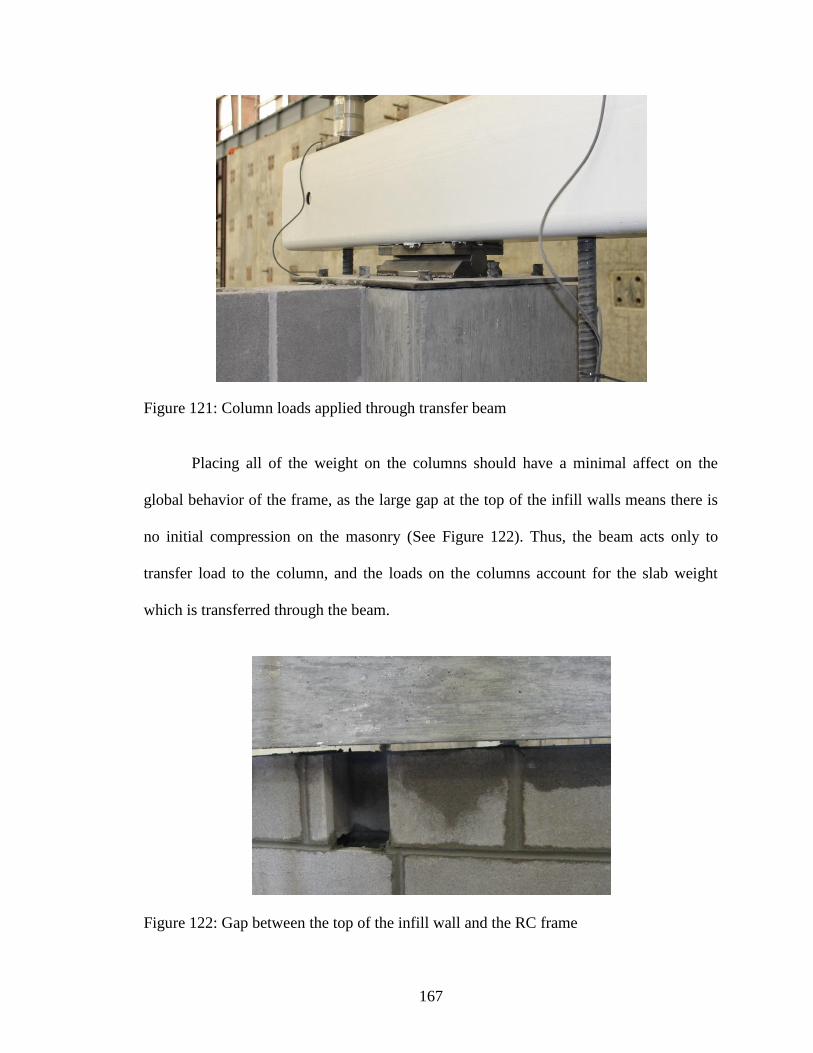
167
Figure 121: Column loads applied through transfer beam
Placing all of the weight on the columns should have a minimal affect on the
global behavior of the frame, as the large gap at the top of the infill walls means there is
no initial compression on the masonry (See Figure 122). Thus, the beam acts only to
transfer load to the column, and the loads on the columns account for the slab weight
which is transferred through the beam.
Figure 122: Gap between the top of the infill wall and the RC frame

168
The lateral load was applied using a hydraulic actuator attached to a loading cage
around the RC beam to permit a single actuator to both push and pull the specimen
(Figures 123 and 124). The loading cage consisted of two stiffened plates attached to the
RC stub beams with bolts and Simpson Strong-Tie cast-in-place loop anchors. These
plates were tied to one another with four DYWIDAG bars and nuts.
Figure 123: Hydraulic used to apply lateral loads and stiffened plate on left side of
loading cage
Figure 124: Stiffened plate on right side of loading cage
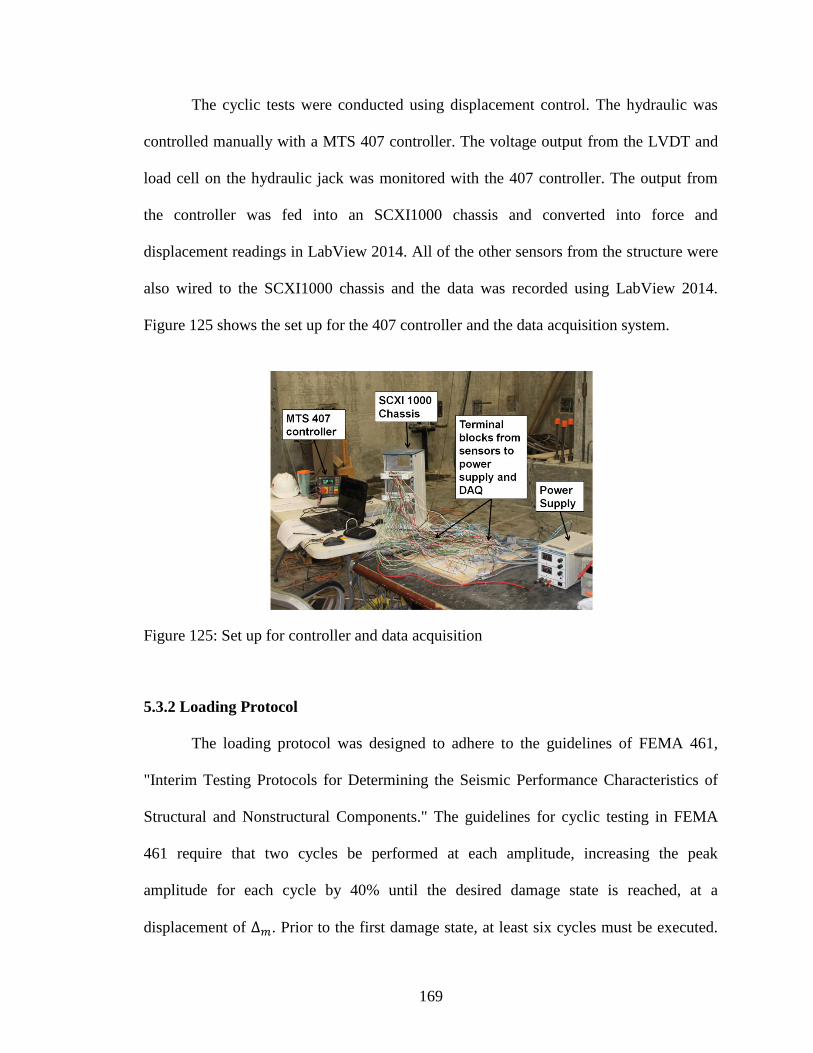
169
The cyclic tests were conducted using displacement control. The hydraulic was
controlled manually with a MTS 407 controller. The voltage output from the LVDT and
load cell on the hydraulic jack was monitored with the 407 controller. The output from
the controller was fed into an SCXI1000 chassis and converted into force and
displacement readings in LabView 2014. All of the other sensors from the structure were
also wired to the SCXI1000 chassis and the data was recorded using LabView 2014.
Figure 125 shows the set up for the 407 controller and the data acquisition system.
Figure 125: Set up for controller and data acquisition
5.3.2 Loading Protocol
The loading protocol was designed to adhere to the guidelines of FEMA 461,
"Interim Testing Protocols for Determining the Seismic Performance Characteristics of
Structural and Nonstructural Components." The guidelines for cyclic testing in FEMA
461 require that two cycles be performed at each amplitude, increasing the peak
amplitude for each cycle by 40% until the desired damage state is reached, at a
displacement of . Prior to the first damage state, at least six cycles must be executed.

170
The amplitude may be further increased past by increments of 0.3 in order to
examine further degradation of the structure. The total recommended number of cycles in
a test is twenty. Figure 126 shows a plot from FEMA 461 of this proposed loading
protocol.
Figure 126: Deformation controlled loading history (FEMA 461)
In order to define damage states for the structures, preliminary finite element
models were created of each frame. These were calibrated to the materials tests
conducted prior to the experiment and utilized the proposed modeling methodology and
material calibration outlined in Chapter 4. Because testing is required to adequately
define the interface properties and the effectiveness of the dowel connections from the
RC frame to the masonry infill, conservative assumptions were made. The aim of any
assumption was to result in a model that may be stiffer or stronger than reality rather than
more flexible and weaker as the assumption would ensure that the selected amplitudes for
the initial cycles were small enough that at least six cycles would be completed prior to

171
the first damage state. Appendix D gives the parameters and material calibration for the
initial finite element models.
The force displacement results of the two finite element models are shown in
Figure 127. Since the structures were expected to be very stiff and it was anticipated that
the interfaces between the masonry infill and the RC frame would fail at very low drift
levels, the test would be excessively long if testing began prior to the finite element
model's predictions for interface failure and continuously increased by 40%.
Figure 127: Force displacement results for finite element models with and without dowel
connections
In order to capture the initial behavior of the masonry wall-RC frame interfaces,
four cycles were conducted at very low amplitudes, two at 0.05 inches (1.3 mm) of
displacement, and two at 0.15 inches (3.8 mm) of displacement. Then, testing followed
the recommendations of FEMA 461 with displacements beginning at 0.3 inches (7.6 mm)
and increasing by 40%. Based on the finite element models, this protocol meets the
requirements for at least six cycles prior to the first damage state which was predicted to
be crushing of the masonry for both test frames. The final damage state was determined

172
s the y le in whi h the fi st deg d tion of st ength is obse ved (∆m). After this cycle,
the amplitudes were increased in increments of 0.5% drift up to 2% drift. The 2% drift
level was selected to compare performance of the hybrid concrete-masonry wall to a
traditional RC frame. The tests did not continue beyond this level of drift as the masonry
in the top half story became unstable and was likely to fall. The loading protocol for the
hybrid concrete-masonry frames is shown in Figure 128. Each ramp is named using a
two-tiered numbering system. The first number corresponds to the set of cycles at the
amplitude 1-8, where amplitude 1 is the first amplitude, 0.05 inches (1.3 mm), and
amplitude 9 is the last amplitude, 2.4 inches (61.0 mm). The second number corresponds
to the ramp number within the set at a particular amplitude, numbered 1-8. The loading
rate was initially kept very small to permit pausing as soon as new cracks occurred (0.02
in/min, 0.4 mm/min) and increased up to 0.2 in/min (5.1 mm/min) for the 2.4 inch (61.0
mm) amplitude cycles. The amplitude of the negative cycles had to be increased during
testing to account for stretching of the bars attached to the beam loading plates. Sample
calculations for the adjusted cycle amplitudes are found in Appendix D.
Figure 128: Loading protocol for testing of hybrid concrete-masonry frames

173
5.4 Instrumentation Plan
In order to gain further insight into the interaction between the RC frame and the
reinforced masonry infill, the test specimens were heavily instrumented. The instruments
can be divided into 3 groups: strain gages, displacement sensors and load cells.
5.4.1 Strain Gages
Determining the contribution of the reinforced infill wall to the behavior of the
RC frame was the primary goal of the strain gages used for the test. First, electrical
resistance strain gages were placed on the vertical reinforcement within the walls both at
the base of the wall and at mid-height (See Figures 129 a and b). These were used to
determine if the vertical bars in the masonry wall yielded before or after the column
reinforcement and to observe the strain distribution within the wall. Next, electrical
resistance strain gages were placed at the center of each horizontal bar to determine if
they contribute to the lateral load resisting system (See Figure 129 c). For the frame with
dowel connections to the columns, gages were placed on the dowel bars in each column
at mid-height of the wall and at the ends of the horizontal bar which was placed in the
same bed joint (See Figure 129 d). The aim of these gages is to determine if the dowel
connections were transferring force to the horizontal reinforcement. The dowel action of
these connections via bending cannot be measured with strain gages. In the columns,
strain gages were placed on the longitudinal reinforcement near the base (See Figure
130). Data from these gages were used to determine when the reinforcement in the frame
began to yield. The strain gage layout for the test specimen with dowel connections is
shown in Figure 131.

174
Figure 129: Strain gages in the masonry wall: (a) at base of vertical reinforcement, (b) at
mid-height of vertical reinforcement, (c) at center of horizontal reinforcement, and (d) on
dowel bars

175
Figure 130: Grinding vertical column reinforcement to apply strain gages
(space left blank intentionally)
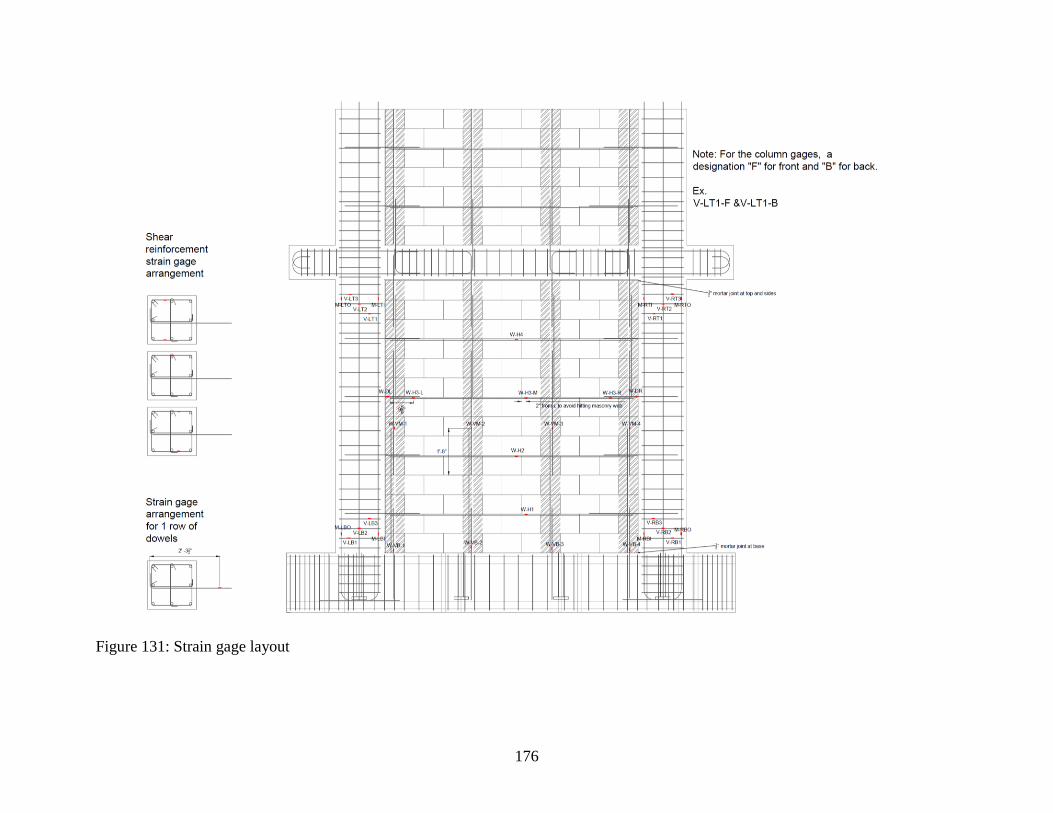
176
Figure 131: Strain gage layout
177
5.4.2 Displacement Sensors
The displacement sensors on the test specimens were a combination of string
potentiometers and dial gages. On the columns, a set of six displacement sensors were
placed in a 12 inch (30.5 cm) square and X configuration at the top and bottom of each
column to measure the shear and flexural deformations in anticipated hinging zones (See
Figure 132 a and b). At each of these locations, a string potentiometer was also used to
measure the lateral displacement of the column at the top of each square (See Figure
133a). The slip at the base of the foundation was recorded with a dial gage and any slip
was subtracted from the measurements for lateral displacement of the columns (See
Figure 133b)
The shear and flexural deformations of the masonry wall were measured with
string potentiometers placed in a square and X configuration 4 inches (10.2 cm) from the
edge of the RC frame as shown in Figure 134. Around the perimeter of the wall, dial
gages were used to detect slip between the masonry infill and the RC frame. The slip
gages are also shown in Figure 134. A total of twenty-eight slip gages were used, with
seven gages evenly spaced along each edge of the masonry wall. Figure 135 shows the
instrumentation plan for the displacement sensors.

178
Figure 132: Column shear and flexural deformations measured by (a) string pots and (b)
dial gages
Figure 133: Lateral displacement of the columns measured by (a) string potentiometers
accounting for (b) slip at the foundation

179
Figure 134: String potentiometers measuring shear and flexural deformation of the
masonry infill and dial gages to measure slip
(space left blank intentionally)

180
Figure 135: Displacement sensor layout
5.4.3 Load Cells
The simulated gravity loads on the columns were anticipated to change slightly
throughout the test as the post-tensioning bars were stretched due to the displacement of
the frame. In order to measure the initial load on the columns and the change in load
during the tests, load cells were placed under the loading plates of the post-tensioning
bars as shown in Figure 136.

181
Figure 136: Load cells to measure column load throughout the test
5.5 Chapter Summary
Best efforts were taken to replicate the construction practices observed in the
Caribbean when building the two test specimens. The two specimens were full-scale
models of frames of the exterior, bottom floor of a five-story office building, and they
were identical except that one frame had cast-in-place dowel connections extending from
the columns into the reinforced bed joints and dowel bars extending down from the beam
into grouted cells. The material properties for the concrete in the RC frame,
reinforcement, masonry units, mortar and weak concrete for the grouted cells were kept
within typical ranges based on responses from engineers in the Caribbean. Detailed notes
from site visits to the Caribbean regarding material properties and construction practices
is presented in Appendix A. Comprehensive material data from all the various tests
conducted is given in Appendix B.
The simulated building gravity loads were applied to the columns by externally
post-tensioning the columns such that the average load throughout the tests would be
182
equal to the gravity load of four floors of office space. The calculations for the column
loads are presented in Appendix D. The lateral loads were applied using a hydraulic jack
and a system constructed of steel loading plates and DYWIDAG bars to permit one jack
to pull and push the frames. The initial loading protocol was determined using finite
models of the frames and FEMA 461.
The instrumentation consisted of electrical resistance strain gages, displacement
sensors and load cells. Strain gages were placed on the reinforcement within the masonry
infill wall, on the horizontal dowel reinforcement and at the base of the columns. String
potentiometers and dial gages were used to measure shear and flexural deformations of
the RC columns and the masonry infill walls. Dial gages were also used to measure the
slip between the RC frame and the masonry infill. Load cells tracked the change in
gravity load on the columns due to stretching of the post-tensioning bars as the structure
displaces laterally. A load cell and an LVDT inside the hydraulic jack monitored the
applied displacements and lateral loads.

183
CHAPTER 6
EXPERIMENTAL AND ANALYTICAL RESULTS
The experimental program consisted of two Caribbean-style hybrid concrete-
masonry structures. Frame 1 had cast-in-place connections on all four boundaries of the
partially grouted infill wall, but Frame 2 had cast-in-place connections at the base only.
Both frames failed at similar loads and drift levels, exhibiting a compression strut
mechanism and combined flexural and shear cracking in the columns of the bounding
frame. The hybrid concrete-masonry frames had approximately twice the capacity of the
bare frame and achieved peak strength at lower ductility levels. These results are very
similar to observations from tests of unreinforced masonry infill structures found in the
literature (Angel et al. 1994; Brokken and Bertero 1981; Mehrabi 1994; Stafford-Smith
1967). However, the cracking patterns of the columns in the hybrid concrete-masonry
frames suggest that the typical strut mechanism observed in unreinforced masonry infill
structures was altered due to the connections from the reinforced concrete frame to the
grouted cores of the masonry infill. The dowel connections at the base of the masonry
wall also significantly stiffened the courses of masonry though the height of the dowels
and shifted the hinging of the columns up to the location at which the dowels were
terminated.
The finite element models predicted the behavior of the hybrid concrete-masonry
frames very well. Predictions for peak strength and were within 10% of the experiment
strengths, and predictions for displacement at peak strength were within 21% of the
experimental displacement. The predicted failure progression closely matched the
experiments for both models, but damage generally occurred earlier in the finite element

184
models than in the experiments. Additionally, the hinging zone in the columns was
predicted to be at the base of the columns by the model, but the columns in the
experimental frames hinged just above the height of the dowel bars from the foundation.
Although the initial models provided very good predictions of the force-
displacement behavior and generally captured the failure patterns of the frames, a revised
model was created in order to better capture the effect of the dowel connections and fully
calibrate the interface properties in the model. A better match to the cracking patterns in
the masonry wall, the cracking order of the interfaces and the location of yielding in the
reinforcement was achieved with the revised models.
6.1 Observations from Experiments and Analytical Models
The two experimental frames were subjected to the same loading conditions and
are compared to one another to highlight the influence of dowel connections on the
seismic performance of hybrid concrete-masonry structures. The results from the
experiments are also compared to the behavior predicted by the initial finite element
models, which were presented in Section 4.4.
First, the general behavior of the frames with regard to cracking patterns and force
displacement behavior is presented. Second, the slip at the interfaces between the
masonry infill and the RC frame is examined and the influence of the interface bond on
the frame behavior is hypothesized based on cracking patterns observed in the
experiments. Third, to determine if the masonry infill participates as a structural element,
the shear deformation of the masonry panel and the yielding of the reinforcement within
the wall are examined. Finally, the local behavior of the columns is presented, including
curvature data, shear deformations, and the yielding of the reinforcement.

185
6.1.1 General Behavior
The general behavior of the frames was characterized by the observed cracking
patterns, the displacements at which the damage occurred, and the force-displacement
curves.
6.1.1.1 Damage Sequence
During the initial cycles at 0.05 inches (1.3 mm) amplitude (0.00417% drift), no
observable damage occurred in either frame (See Figure 137 a and b). Damage initiated
in the initial finite element models much sooner than was observed in the experiments
(See Table 6). For both the models, the initial cracking began at the same displacement,
with the interface along the left (tensile) column, and head joint cracking at the top left
quadrant of the masonry wall. Then, the interfaces between the masonry wall and the top
RC beam as well as between the masonry wall and right (compressive) column cracked.
Simultaneously, diagonal cracking of the ungrouted cells and stair-stepped cracks
through the mortar joints occurred throughout the wall. The timing of initial damage was
slightly accelerated in the model of Frame 1, which had dowel connections on all edges
of the masonry wall, compared to the model of Frame 2, which had connections only at
the base. By 0.05 inches (1.3 mm) of displacement (0.00417% drift), both finite element
models were virtually identical (See Figure 137 c and d). The top and side interfaces
between the masonry infill and the RC frame cracked, and the interface between the wall
and the foundation partially cracked. Some of the stair-stepped mortar joint cracks
propagated through the grouted bed joints, and there were diagonal cracks in the
ungrouted units.
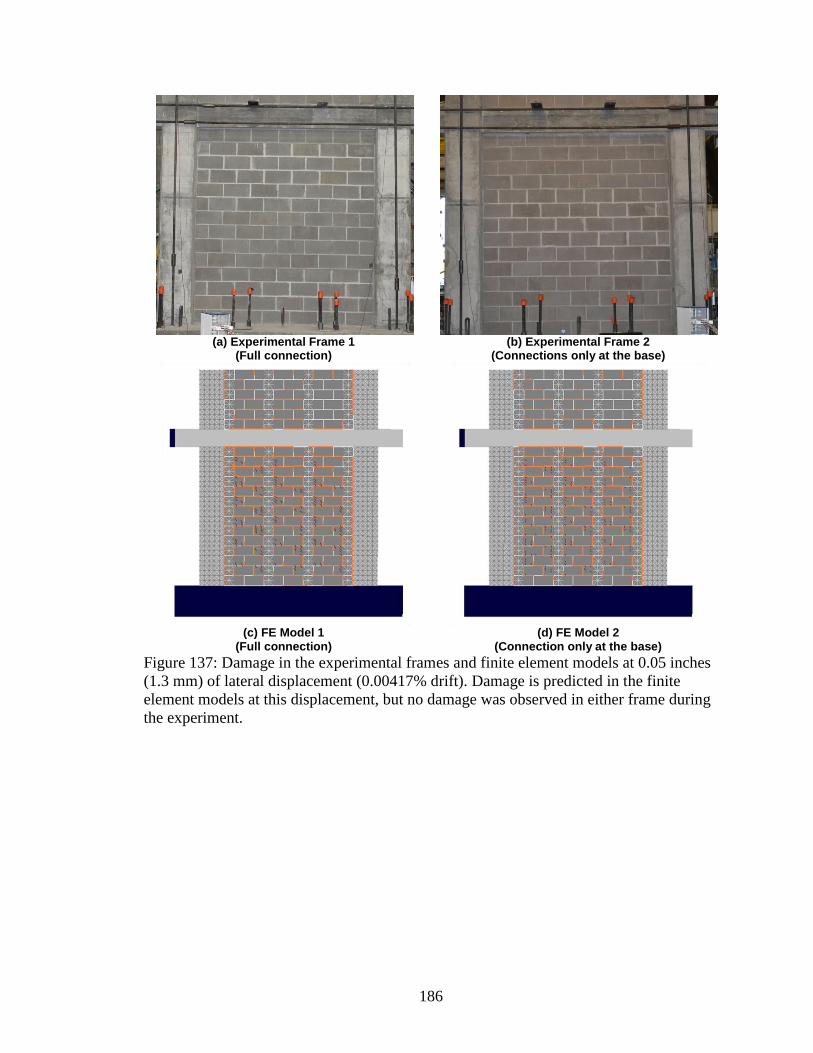
186
(a) Experimental Frame 1
(Full connection)
(b) Experimental Frame 2
(Connections only at the base)
(c) FE Model 1
(Full connection)
(d) FE Model 2
(Connection only at the base)
Figure 137: Damage in the experimental frames and finite element models at 0.05 inches
(1.3 mm) of lateral displacement (0.00417% drift). Damage is predicted in the finite
element models at this displacement, but no damage was observed in either frame during
the experiment.

187
Table 6: Initial cracking in the finite element models FE Model 1
(Full connection) FE Model 2
(Connection only at the base)
0.007 in (0.2 mm), 0.00583% drift
0.007 in (0.2 mm), 0.00583% drift
0.01 in (0.3 mm), 0.00833% drift
0.01 in (0.3 mm), 0.00833% drift
0.02 in (0.5 mm), 0.0167% drift
0.02 in (0.5 mm), 0.0167% drift
0.05 in (1.3 mm), 0.00417% drift
0.05 in (1.3 mm), 0.00417% drift

188
Just before the completion of the first cycle to 0.15 inches (3.8 mm) of
displacement (0.125% drift), a small "pop" was heard in Frame 1. No visible damage was
seen in the frame or the masonry wall (See Figure 138a). For Frame 2, the 0.15 inch (3.8
mm, 0.125% drift) cycles caused bed joint sliding cracks which were concentrated near
the columns from courses two to twelve (See Figure 138b). The initial damage pattern of
the finite element model of Frame 2 was consistent with the first observation of cracking
in the experiment, but occurred between 0.007 inches (0.2 mm) and 0.02 inches (0.5 mm)
of displacement (0.00583% and 0.0167% drift), rather than between 0.05 inches (1.3
mm) and 0.15 inches (3.8 mm) of displacement (0.0417% and 0.125% drift), as observed
in the experiment (See Figure 138c). The cracking load in the Frame 2 model was 14.21
kips (63.21 kN), which was also much lower than the load recorded for experimental
Frame 2, 30.8 kips (137.0 kN). The same cracking pattern and cracking load was
observed in the model of Frame 1, which had connections on all edges of the infill (See
Figure 138d). In both finite element models, cracks propagated through several grouted
cells, and minor cracks formed at the base of the right (compressive) column and the top
of the left (tensile) column by 0.15 inches (3.8 mm) of displacement (0.125% drift). The
model of Frame 2 had slightly more cracking at the top of the left (tensile) column than
the model of Frame 1.
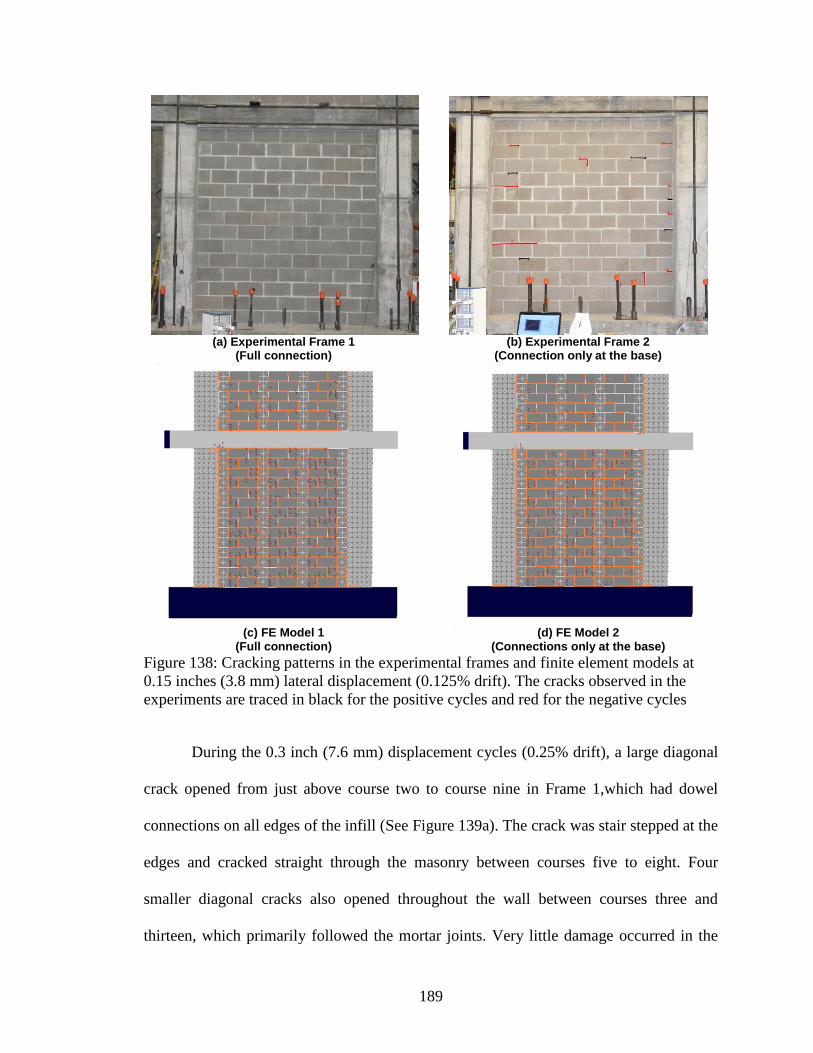
189
(a) Experimental Frame 1
(Full connection)
(b) Experimental Frame 2
(Connection only at the base)
(c) FE Model 1
(Full connection)
(d) FE Model 2
(Connections only at the base)
Figure 138: Cracking patterns in the experimental frames and finite element models at
0.15 inches (3.8 mm) lateral displacement (0.125% drift). The cracks observed in the
experiments are traced in black for the positive cycles and red for the negative cycles
During the 0.3 inch (7.6 mm) displacement cycles (0.25% drift), a large diagonal
crack opened from just above course two to course nine in Frame 1,which had dowel
connections on all edges of the infill (See Figure 139a). The crack was stair stepped at the
edges and cracked straight through the masonry between courses five to eight. Four
smaller diagonal cracks also opened throughout the wall between courses three and
thirteen, which primarily followed the mortar joints. Very little damage occurred in the
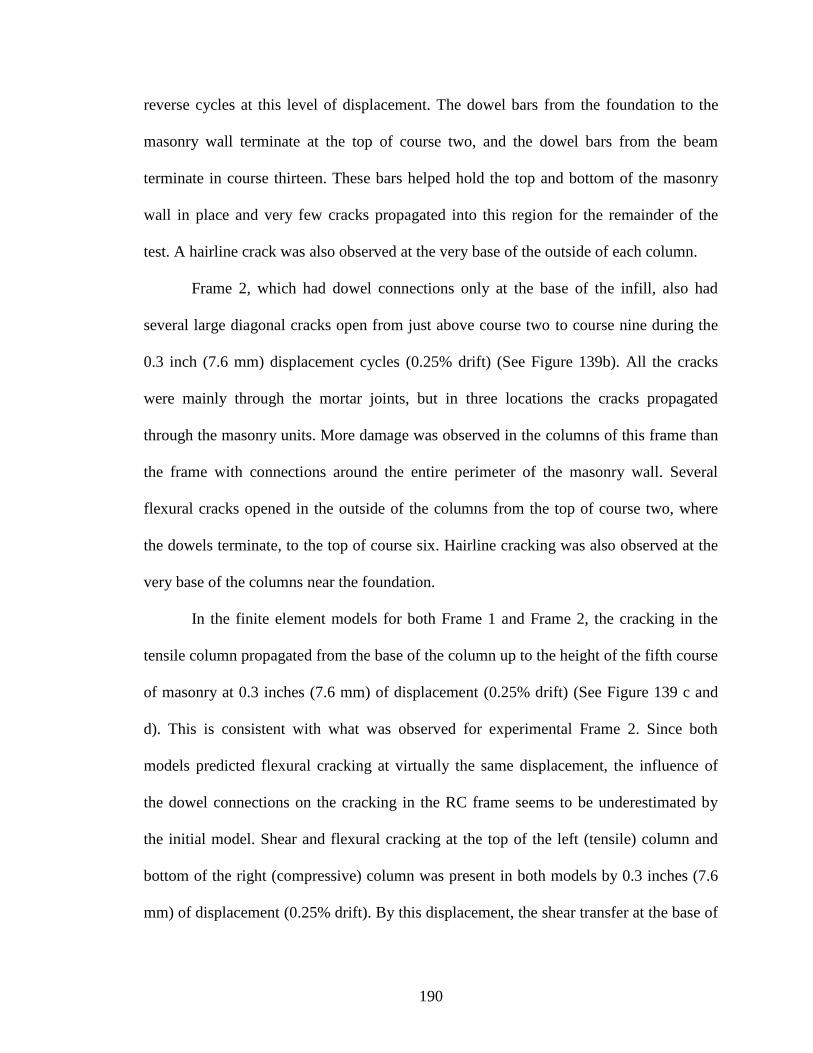
190
reverse cycles at this level of displacement. The dowel bars from the foundation to the
masonry wall terminate at the top of course two, and the dowel bars from the beam
terminate in course thirteen. These bars helped hold the top and bottom of the masonry
wall in place and very few cracks propagated into this region for the remainder of the
test. A hairline crack was also observed at the very base of the outside of each column.
Frame 2, which had dowel connections only at the base of the infill, also had
several large diagonal cracks open from just above course two to course nine during the
0.3 inch (7.6 mm) displacement cycles (0.25% drift) (See Figure 139b). All the cracks
were mainly through the mortar joints, but in three locations the cracks propagated
through the masonry units. More damage was observed in the columns of this frame than
the frame with connections around the entire perimeter of the masonry wall. Several
flexural cracks opened in the outside of the columns from the top of course two, where
the dowels terminate, to the top of course six. Hairline cracking was also observed at the
very base of the columns near the foundation.
In the finite element models for both Frame 1 and Frame 2, the cracking in the
tensile column propagated from the base of the column up to the height of the fifth course
of masonry at 0.3 inches (7.6 mm) of displacement (0.25% drift) (See Figure 139 c and
d). This is consistent with what was observed for experimental Frame 2. Since both
models predicted flexural cracking at virtually the same displacement, the influence of
the dowel connections on the cracking in the RC frame seems to be underestimated by
the initial model. Shear and flexural cracking at the top of the left (tensile) column and
bottom of the right (compressive) column was present in both models by 0.3 inches (7.6
mm) of displacement (0.25% drift). By this displacement, the shear transfer at the base of

191
the masonry wall was very minimal in the finite element models as the entire foundation-
wall interface had cracked. This may explain why shear cracking at the base of the right
(compressive) column was observed so early in the models compared to the experiments.
A slight distinction can be made between the two models as the shear crack at the top of
the left (tensile) column was larger in the model of Frame 2 than in the model of Frame 1.
Both finite element models had slight crushing throughout the masonry wall which
initiated at 0.25 inches (6.4 mm) of displacement (0.208% drift).
(a) Experimental Frame 1
(Full connection)
(b) Experimental Frame 2
(Connections only at the base)
(c) FE Model 1
(Full connection)
(d) FE Model 2
(Connection only at the base)
Figure 139: Damage in the experimental frames and finite element models at 0.3 inches
(7.6 mm) of lateral displacement (0.25% drift). The cracks observed in the experiments
are traced in black for the positive cycles and red for the negative cycles.

192
During the test of Frame 1, which had dowel connections around the entire
perimeter of the infill, cracking of the columns did not initiate until the 0.42 inch (10.7
mm) amplitude cycles (0.35% drift) (See Figure 140a). Two large flexural cracks opened
in the base of the columns, one at the top of course two and one just above course four.
Additional diagonal cracks also formed throughout the masonry wall. These cracks were
primarily diagonal, but a sliding type mechanism was observed at the top of course eight.
Corner crushing at the top left of the masonry wall was also observed. In experimental
Frame 2, which had dowel connections only at the base, additional diagonal cracks also
formed in the masonry at 0.42 inches (10.7mm) of displacement (0.35% drift) (See
Figure 140b). These cracks were primarily diagonal and closely followed the stair-
stepped cracks from the 0.3 inch (7.6 mm, 0.35% drift) cycles. The flexural cracks which
had formed in the columns during the 0.3 inch (7.6 mm, 0.35% drift) cycles also
expanded, and a few new cracks formed spanning between the top of the second course
of masonry to the top of the fifth course.
In both finite element models, the flexural and shear cracks of the columns which
initiated earlier in the simulation expanded (See Figure 140 c and d). More crushing
occurred throughout the walls, and a few more cracks opened through the grouted cells.
At this stage of the simulation, both models looked nearly the same.
By
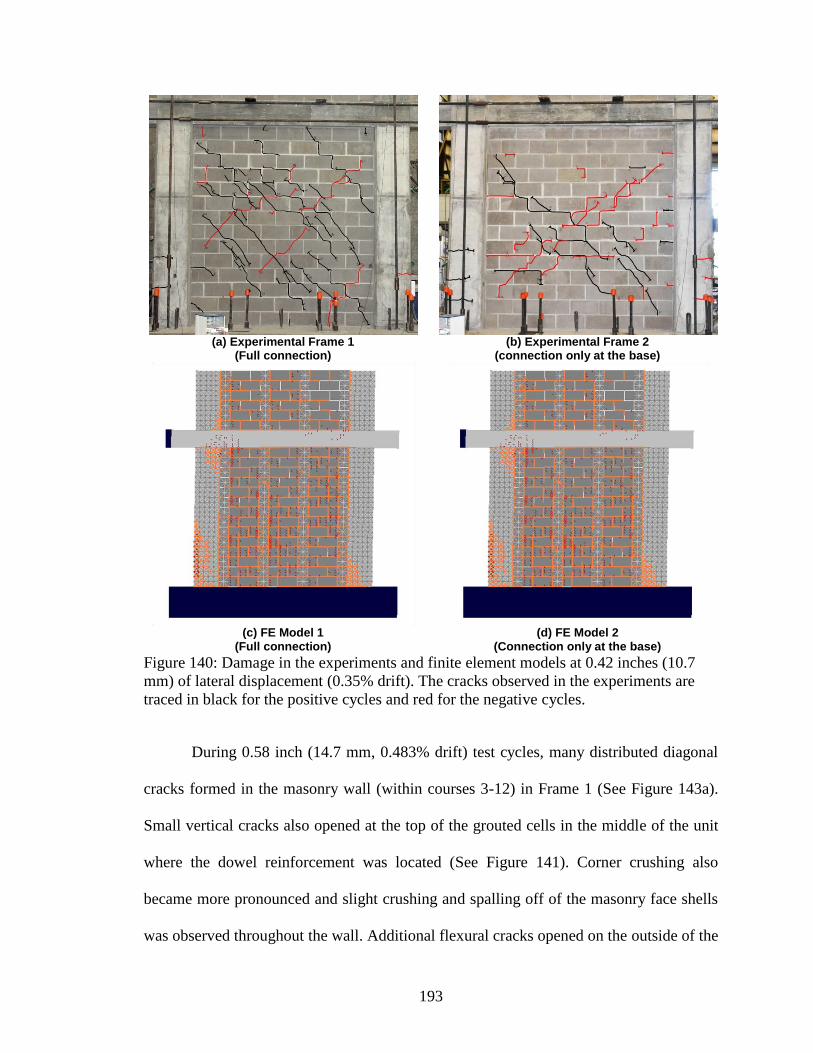
193
(a) Experimental Frame 1
(Full connection)
(b) Experimental Frame 2
(connection only at the base)
(c) FE Model 1
(Full connection)
(d) FE Model 2
(Connection only at the base)
Figure 140: Damage in the experiments and finite element models at 0.42 inches (10.7
mm) of lateral displacement (0.35% drift). The cracks observed in the experiments are
traced in black for the positive cycles and red for the negative cycles.
During 0.58 inch (14.7 mm, 0.483% drift) test cycles, many distributed diagonal
cracks formed in the masonry wall (within courses 3-12) in Frame 1 (See Figure 143a).
Small vertical cracks also opened at the top of the grouted cells in the middle of the unit
where the dowel reinforcement was located (See Figure 141). Corner crushing also
became more pronounced and slight crushing and spalling off of the masonry face shells
was observed throughout the wall. Additional flexural cracks opened on the outside of the

194
columns from the height of the second course of masonry to the top of course eight.
Small flexural cracks opened at the inside of the base of the columns within the height of
the second course of masonry. Two cracks also opened at the top of the left and right
columns within the top two courses of masonry, and one crack propagated across the
bottom of the right beam-column joint. These cracks had a shallow angle to them
suggesting they were due to combined flexure and shear forces.
Figure 141: Close up of masonry wall in Frame 1 (full connection) at 0.58 inches (14.7
mm) of lateral displacement (0.483% drift). The cracks in the experiments are traced in
black for the positive cycles and red for the negative cycles.
By 0.58 inches (14.7 mm) of displacement (0.483% drift), many small distributed
diagonal cracks also formed within courses three to twelve in Frame 2 (See Figure 143b).
A large vertical crack along the right of the second grouted core opened from the top of
the masonry wall down three courses as shown in Figure 142. Slight spalling of the

195
masonry face shells was seen in a few locations in the center of the wall, but not as much
crushing as was observed in Frame 1. Additional flexural cracks opened at the outside of
each column, which were evenly distributed from two courses up to mid-height of the
column. Additional flexural cracks were also observed on the inside of the columns at the
base. At the tops of both columns, shear cracks opened following the shear cracks along
the diagonal struts in the masonry (See Figure 143 a and b). The cracking patterns
observed for Frame 2 at 0.58 inches (14.7 mm) of displacement (0.483% drift) were
nearly identical to those in Frame 1, except that the cracks in the tops of the columns
initiated slightly lower and had a much steeper slope, indicating they were more
dominated by shear forces than the cracks in the columns of Frame 1.
Figure 142: Close up of the masonry wall in Frame 2 (connection only at the base) at 0.58
inches (14.7 mm) of lateral displacement (0.483% drift). The cracks in the experiments
are traced in black for the positive cycles and red for the negative cycles.
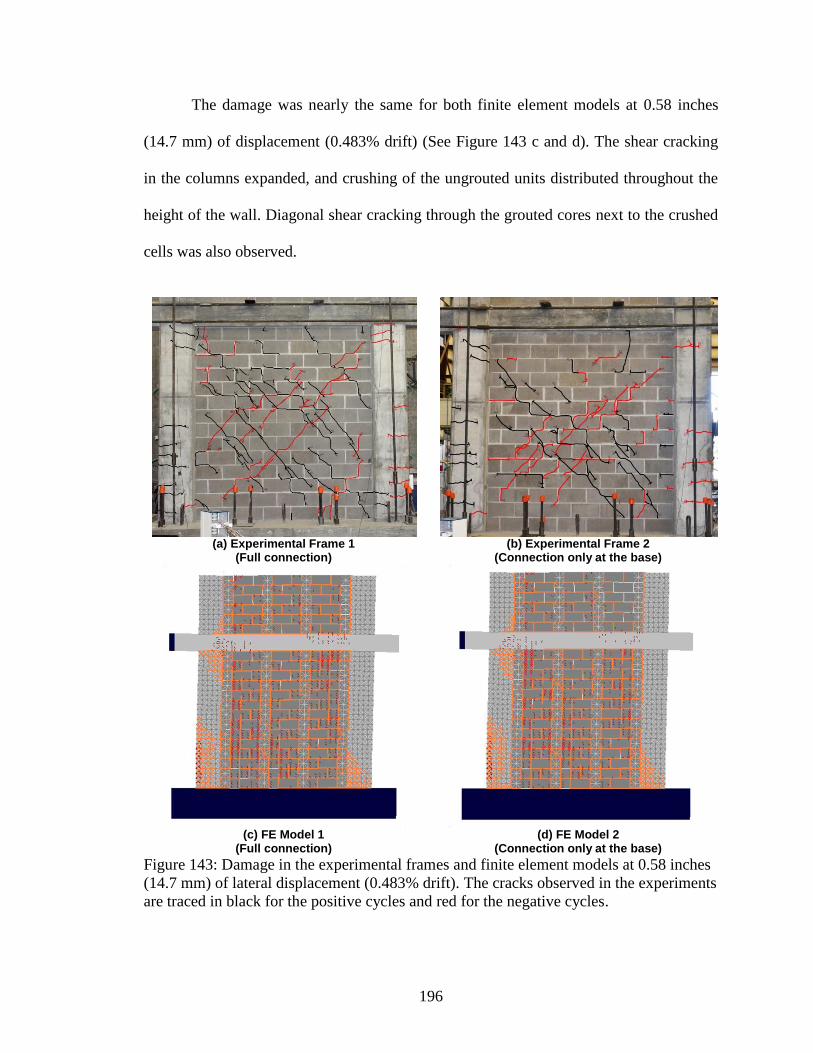
196
The damage was nearly the same for both finite element models at 0.58 inches
(14.7 mm) of displacement (0.483% drift) (See Figure 143 c and d). The shear cracking
in the columns expanded, and crushing of the ungrouted units distributed throughout the
height of the wall. Diagonal shear cracking through the grouted cores next to the crushed
cells was also observed.
(a) Experimental Frame 1
(Full connection)
(b) Experimental Frame 2
(Connection only at the base)
(c) FE Model 1
(Full connection)
(d) FE Model 2
(Connection only at the base)
Figure 143: Damage in the experimental frames and finite element models at 0.58 inches
(14.7 mm) of lateral displacement (0.483% drift). The cracks observed in the experiments
are traced in black for the positive cycles and red for the negative cycles.

197
During the 0.82 inch (20.8 mm) amplitude cycles of the experiments (0.683%
drift), two additional shear cracks opened at the top of the left column and one additional
shear crack opened at the top of the left column in Frame 1, which had dowel connections
on all edges of the infill (See Figure 146a). Small cracks were also observed at the base
of the beam near each beam-column joint. The crack at the right end of the beam
extended into the beam-column joint. Flexural cracks at the base of the column continued
to extend and two more opened moving down towards the foundation. A large bend in the
column of approximately 34⁰ was observed with the rotation beginning at the top of the
second course of masonry (See Figure 144). Additional crushing was also observed at the
center of the masonry wall. Because no additional strength was gained after this cycle,
the hinging observed just above the second course of masonry was most likely the cause
of failure of the frame.
Figure 144: Observing bend formed in the tension column beginning above the second
course of masonry at 0.82 inches (20.8 mm) of lateral displacement (0.683% drift).

198
In Frame 2, which had connections only at the base of the masonry infill wall, the
cracking in the frame was fairly similar to Frame 1. More shear cracks opened and the
initial shear cracks expanded at the top of both columns during the 0.82 inch (20.8 mm)
amplitude cycles (0.683% drift) (See Figure 146b). Joint cracking was also observed and
several large cracks propagated through the height of the beam, beginning at the base of
the beam near the top corners of the masonry wall. A few flexural cracks also opened
near the base of both columns. The initial diagonal strut crack opened to a width of 0.04
inches (1.0 mm) and slight crushing was observed near the diagonal cracks and at the top
corners of the masonry wall (See Figure 145). The main difference between the two
frames was that during these cycles the interface cracks at the sides and top of the
masonry wall in Frame 2 had a visible gap at 0.82 inches (20.8 mm) of displacement
(0.683% drift), but no gap had opened in Frame 1.
Figure 145: Close up of crushing of the masonry face shells near the diagonal cracks at
0.82 inches (20.8 mm) of lateral displacement (0.683% drift).

199
At 0.82 inches (20.8 mm) of displacement (0.683% drift), the damage to the
columns in the finite element models looked fairly similar to the damage at 0.58 inches
(14.7 mm) of displacement (0.483% drift) (See Figure 146 c and d). More crushing of the
ungrouted units and shear cracking of the grouted units was present in both finite element
models. The model of Frame 2 had a gap between the right (compressive) column and the
masonry infill wall (See Figure 146d). No gap was predicted in the Frame 1 model (See
Figure 146c). This behavior is consistent with experimental observations.
(a) Experimental Frame 1
(Full connection)
(b) Experimental Frame 2
(Connection only at the base)
(c) FE Model 1
(Full connection)
(d) FE Model 2
(Connection only at the base)
Figure 146: Damage in the experimental frames and the finite element models at 0.82
inches (20.8 mm) of displacement (0.683% drift). The cracks observed in the experiments
are traced in black for the positive cycles and red for the negative cycles.

200
During the experimental cycles with an amplitude of 1.2 inches (30.5 mm, 1.0%
drift), more crushing of the masonry was observed and the masonry at the top corners
began to fall out of plane in Frame 1 (See Figure 147a). Additional cracks propagated up
from the bottom of the beam at both ends near the joints. An additional shear crack
formed in the top of the right column and the initial shear crack at the top of the left
column opened to a width of 0.02 inches (0.5 mm). The flexural cracks along the outside
face of the columns expanded, and a few new cracks formed on the inside face of the
columns near the base.
The same general failure mechanisms were observed during the 1.2 inch (30.5
mm) amplitude cycles (1.0% drift) for Frame 2 as were observed for Frame 1 (See Figure
147b). The main differences between the behavior of the two frames at this stage was that
Frame 2 had more cracking in the beam-column joints, along the inside faces of the
columns near the foundation, and along the top of the beam, than Frame 1.
Again, the finite element models predicted more severe damage at 1.2 inches
(30.5 mm) of displacement (1.0% drift) than was observed in the experiments (See Figure
147 c and d). The damage to the frame remains fairly constant for further displacement in
the simulations. Crushing of the ungrouted masonry units increased in both models, but
there was slightly more crushing at the top of the masonry wall in the Frame 2 model
than the Frame 1 model.
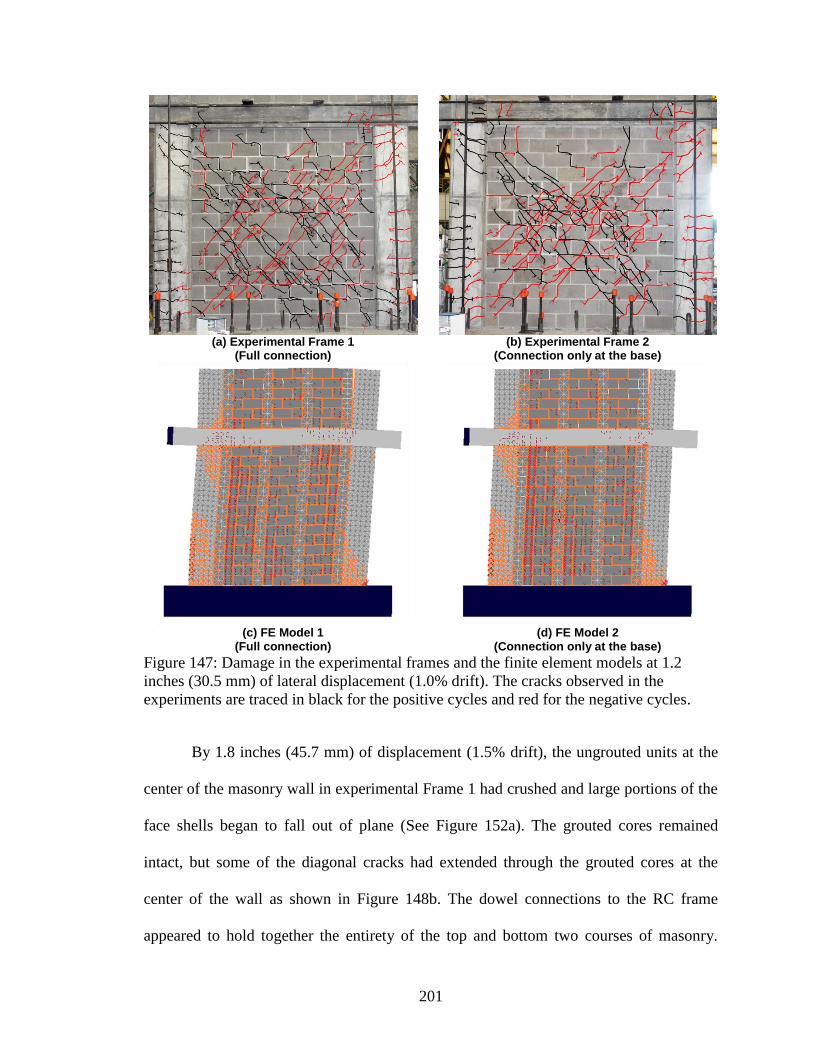
201
(a) Experimental Frame 1
(Full connection)
(b) Experimental Frame 2
(Connection only at the base)
(c) FE Model 1
(Full connection)
(d) FE Model 2
(Connection only at the base)
Figure 147: Damage in the experimental frames and the finite element models at 1.2
inches (30.5 mm) of lateral displacement (1.0% drift). The cracks observed in the
experiments are traced in black for the positive cycles and red for the negative cycles.
By 1.8 inches (45.7 mm) of displacement (1.5% drift), the ungrouted units at the
center of the masonry wall in experimental Frame 1 had crushed and large portions of the
face shells began to fall out of plane (See Figure 152a). The grouted cores remained
intact, but some of the diagonal cracks had extended through the grouted cores at the
center of the wall as shown in Figure 148b. The dowel connections to the RC frame
appeared to hold together the entirety of the top and bottom two courses of masonry.

202
Additional flexural cracks opened in the columns and more cracks were observed through
the beam-column joints and the RC beam.
Figure 148: Large portion of masonry face shell (a) fell out of plane and revealed (b)
grouted cores with shear cracks in Frame 1 at 1.8 inches (45.7 mm) of lateral
displacement (1.5% drift).
During the 1.8 inch (45.7 mm) amplitude cycles (1.5% drift), there was a clear
distinction in the behavior of the two frames. Frame 2 had much more damage to the
masonry infill than Frame 1 (See Figure 152b). The ungrouted masonry fell out of plane
in the center of the wall and across the diagonals where the compression strut had formed
(See Figure 149a). This region extended from the top of course two all the way to the top
of the infill wall. It exposed the grouted cores which in many places had de-bonded from
the vertical reinforcement as shown in Figure 149b. The entire top section of the wall,
between the regions where the masonry had already fallen out, was bent out of plane and
in danger of collapsing. For safety reasons, no additional cracks were marked on the
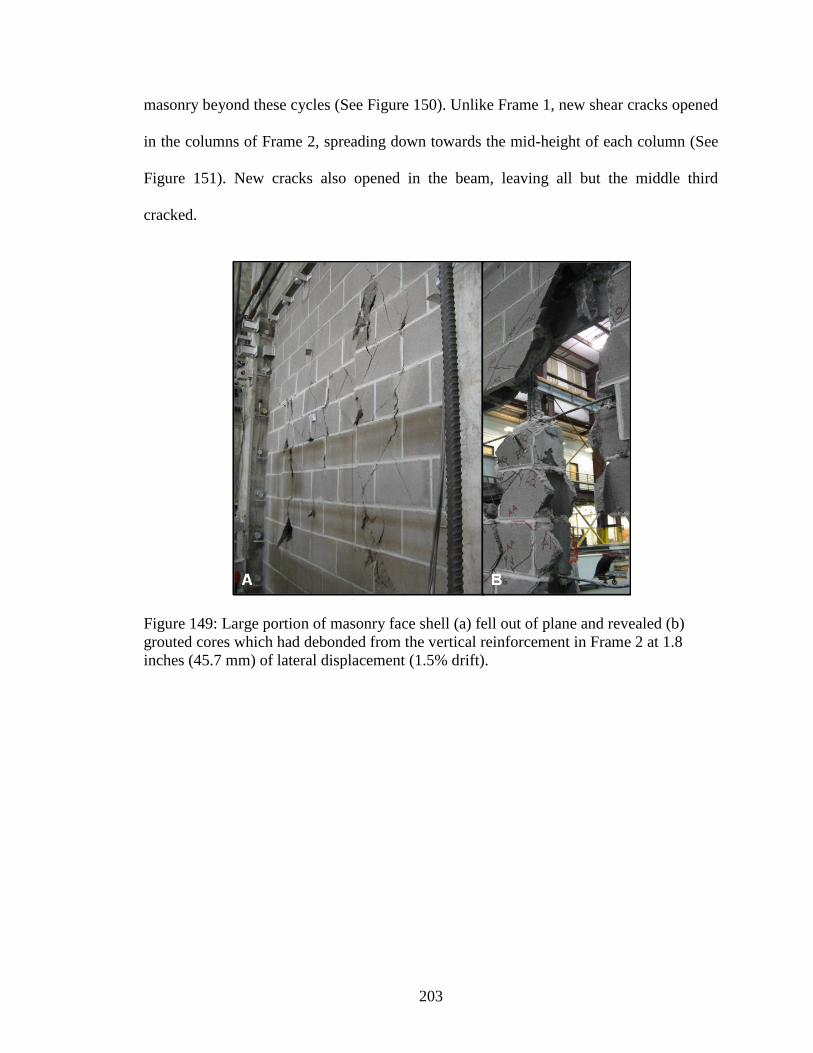
203
masonry beyond these cycles (See Figure 150). Unlike Frame 1, new shear cracks opened
in the columns of Frame 2, spreading down towards the mid-height of each column (See
Figure 151). New cracks also opened in the beam, leaving all but the middle third
cracked.
Figure 149: Large portion of masonry face shell (a) fell out of plane and revealed (b)
grouted cores which had debonded from the vertical reinforcement in Frame 2 at 1.8
inches (45.7 mm) of lateral displacement (1.5% drift).

204
Figure 150: Top section of masonry wall of Frame 2 (connection only at the base) was in
danger of out-of-plane collapse by 1.8 inches (45.7 mm) of lateral displacement (1.5%
drift).
Figure 151: Comparison of shear cracks in the columns of (a) Frame 2 (connection only
at the base) and (b) Frame 1 (full connection) at 1.8 inches (45.7 mm) of lateral
displacement (1.5% drift).

205
There were only two noticeable differences between the finite element models at
1.8 inches (45.7 mm) of displacement (1.5% drift) (See Figure 152 c and d). First, there
was a large gap in between the right (compressive) column and the masonry infill in the
model of Frame 2, but there was no gap in the model of Frame 1. Second, there was
cracking on the outside of the top left (compressive) column in the model of Frame 1
which was not present in the model of Frame 2. There was little difference in the degree
of crushing of the masonry units between the two finite element models, whereas the
experimental frames had widely varying degrees of damage to the masonry infill at 1.8
inches (45.7 mm) of displacement (1.5% drift). The cracking and crushing patterns of
both models closely resembled Frame 2.
(space left blank intentionally)

206
(a) Experimental Frame 1
(Full connection)
(b) Experimental Frame 2
(Connection only at the base)
(c) FE Model 1
(Full connection)
(d) FE Model 2
(Connection only at the base)
Figure 152: Damage in the experimental frames and the finite element models at 1.8
inches (45.7 mm) of lateral displacement (1.5% drift). The cracks observed in the
experiments are traced in black for the positive cycles and red for the negative cycles.
During the final experimental cycles which had an amplitude of 2.4 inches (61.0
mm, 2.0% drift), the ungrouted cells fell out from the center of the masonry wall in
Frame 1 (See Figure 153a). No new cracks formed in the beam or the beam-column
joints. The flexural cracks in the frame continued to expand, and at the peak displacement
(2.4 inches, 61.0 mm, 2.0% drift), the crack between the base of the tensile column and
the foundation was 0.1 inches (2.5 mm) wide.

207
Frame 2 had slightly more damage to the frame by the end of the 2.4 inch (61.0
mm, 2.0% drift) cycles (See Figure 153b). Due to the unstable portion of the masonry
wall, no additional cracks were marked out on the beam or the beam-column joints. The
masonry wall continued to crush and the grouted cores at the center of the wall had also
fallen out of plane due to debonding from the reinforcement. At each cycle, a very large
separation was observed between the masonry wall and the columns of the infill frame.
Very little change was predicted in the finite element models from 1.8 inches
(45.7 mm, 1.5% drift) to 2.4 inches (61.0 mm) of displacement (2.0% drift) (See Figure
153 c and d). Crushing of the ungrouted masonry continued to expand and the corners of
the RC columns near the foundation and beam-column joints crushed slightly. The
primary differences between the models were still the same as those observed at 1.8
inches (45.7 mm) of displacement (1.5% drift): crushing which was present in Frame 1
but not Frame 2, and a gap which was present in Frame 2 but not Frame 1.
(space left blank intentionally)

208
(a) Experimental Frame 1
(Full connection)
(b) Experimental Frame 2
(Connection only at the base)
(c) FE Model 1
(Full connection)
(d) FE Model 2
(Connection only at the base)
Figure 153: Damage in the experimental frames and the finite element models at 2.4
inches (61.0 mm) of lateral displacement (2.0% drift). The cracks in the experiments are
traced in black for the positive cycles and red for the negative cycles.
6.1.1.2 Gravity Loads
In order to compare the force displacement behavior of the experimental frames to
the analytical models, the gravity load data from the load cells was examined. The gravity
loads had been applied to the columns in the experimental frames using DYWIDAG bars
to post-tension a steel section down over the top of each column. The initial loads were

209
applied such that the average monitored load over the course of the cyclic tests would
equal the gravity load of the five-story design structure (See Appendix D for
calculations). Hinge connections were used at the tops of the columns to minimize any
moment imposed by the loading. The average recorded load on the columns in each
frame was within 1% of the desired gravity load. Although at the peak displacement of
2.4 inches (61.0 mm) (2.0% drift) when the post-tensioning bars were stretched most, the
average load on the columns in both experiments was 40% above the gravity load for the
tension columns and 21.5% below the gravity load for the compression columns.
Because the gravity loading was less than 10% of the compressive strength of the
column, the additional load at these large displacements was unlikely to have a
significant effect on the capacity of the frames. Additionally, the maximum deviation
from gravity load on the columns at any time during the experiments prior to the failure
of the frames was only 20% (See Appendix D for additional graphs). The gravity load
applied in the analytical models was the constant, targeted, gravity load.
6.1.1.3 Force-Displacement Behavior
Figures 154 and 155 show the force displacement behavior for the two frames and
the results of the initial finite element models. Frame 1, which had connections around
the entire perimeter of the infill, achieved a peak strength of 197.16 kips (877.01 kN) at
0.86 inches (21.8 mm) of displacement, or 0.7% drift. Frame 2, which had connections
only at the base of the infill, had a peak strength of 193.4 kips (860.30 kN) which
occurred at 1.1 inches (27.9 mm) of displacement. This is equivalent to a drift of 0.9%.
The Frames achieved peak strength at much lower drift levels than a seismically detailed
RC moment frame without masonry infill, which typically can sustain a 2.0% drift before

210
reaching its peak capacity. However, the capacities of the Frames were also increased by
about 200% over the capacity of a bare RC moment frame with the same reinforcement
detailing and concrete strength. A portal frame calculation for the bare frame capacity
was 91.2 kips (405.7 kN) and the capacity predicted by the finite element models with the
infill removed was 109.4 kips (486.6 kN) (See Appendix D for calculations). The force-
displacement curves of the two experiments are shown together in Figure 156. Frame 2
slightly more pinching in the hysteresis curve than Frame 1. The secant stiffness at 0.05
inches (1.3 mm) of displacement was 37% greater in Frame 1 than the Frame 2.
Figure 154: Force-displacement plot of the experimental and analytical Frame 1 (full
connection)

211
Figure 155: Force-displacement plot of the experimental and analytical Frame 2
(connection only at the base)
Figure 156: Comparison of the experimental force-displacement behavior for Frame 1
and Frame 2

212
The predictions of the initial finite element models for peak force and
displacement at peak force were very close to the experimental results. The analytical
model of Frame 1 with connections on all edges of the masonry wall predicted peak
capacity to be 198.31 kips (882.13 kN) at 0.85 inches (29.6 mm) of displacement and is
shown in Figure 154. These results were both within 2% of the experimentally recorded
data. The analytical model of Frame 2 predicted peak capacity of 183.82 kips (817.67
kN) at 0.87 inches (22.1 mm) of displacement (See Figure 155). These results trend with
the results from the experiments, but the analytical model underestimated the capacity of
the frame by 9.6% and underestimated the displacement at peak capacity by 20.9%.
The initial stiffness of both models was greater than the stiffness observed
experimentally. Since these frames had a weak masonry infill, the force-displacement
behavior is dominated by the behavior of the RC frame. In validation studies of the
constitutive model (Section 3.4.4) and in the work by Stavridis and Shing (2010), the
constitutive model was found to overestimate the initial stiffness of bare frames. The
finite element models also showed less strength degradation than the experimental
frames. This may be related to how the ungrouted masonry units were modeled. When
the initial finite element models were created, it was assumed that the ungrouted masonry
would primarily fail due to crushing. Thus, they were modeled using smeared crack
elements only to simplify the meshing scheme. However, since shear cracking through
the ungrouted masonry was present in the experimental frames, it is probably more
appropriate to model them with a combination of smeared crack and interface elements.
213
6.1.2 Interface Behavior
The interfaces between the partially grouted infill wall and the RC frames played
a crucial role in altering the shear transfer zone for the masonry compression struts in
both experimental frames. The influence of the reinforcement on the behavior of the
interfaces can clearly be observed by comparing the slip gage data gathered from the two
experiments, shown in Figure 157. The dial gages had a resolution of 0.001 inches (0.03
mm). Slip was defined to have occurred once a dial gage read at least 0.01 inches (0.25
mm) of displacement. These results are compared to the cracking of the interfaces in the
initial finite element models. Each interface is discussed separately in the order in which
it failed, beginning with the beam-wall interface.
(space left blank intentionally)

214
Figure 157: Interface cracking for a) Frame 1 (full connection) and b) Frame 2
(connection only at the base).
6.1.2.1 Beam-Wall Interface
The top interface cracked almost immediately in both frames. The entire interface
slipped when the experiment was stopped for the first time to collect dial gage data at
0.05 inches (1.3 mm) of lateral displacement (0.0417% drift) (See Figure 157). The
connection was probably very weak due to the fact that during construction, a small gap
215
was left at the top of the masonry wall between the masonry and the concrete beam. This
gap was filled with mortar, but the bond did not appear to be very effective. The
maximum slip recorded at the top interface of the masonry wall for both walls was about
0.2 inches (5.1 mm) at 1.2 inches (30.5 mm) of lateral displacement (1.0% drift). After
this point, most of the gages fell off the masonry walls.
The connections from the reinforced concrete beam to the top of the masonry
infill wall were crucial to preventing out-of-plane failure of the masonry. During the
cyclic test of Frame 2, which did not have connections to the beam, the masonry shifted
out of plane several inches and would have likely fallen out in a dynamic test (See Figure
150). Frame 1, which had connections at the top of the wall to the RC beam, did not have
the masonry wall shift out of plane during testing.
In the initial finite element models, the interface between the beam and the
masonry wall was assumed to have the same properties as the bed joints. The models
predicted cracking at about the same time as bed joint cracking initiated in the model
(See Table 6). This boundary should be revised in the finite element models to reflect the
weak bond between the beam and the masonry wall.
6.1.2.2 Column-Wall Interfaces
The timing of cracking in the column-wall interfaces suggested that the
connections from the reinforced concrete columns into the bed joints of the masonry had
little to no influence in delaying the cracking of the interfaces between the masonry wall
and the reinforced concrete columns. For both Frame 1 and Frame 2, the slip initiated
during the 0.15 inch (3.8 mm) amplitude (0.125% drift) cycles (0.05-0.15 in, 1.3-3.8 mm)
and the entire interface had slipped by the 0.3 inch (7.6 mm) amplitude cycles (0.25%
216
drift). However, it appears the vertical dowel connections in Frame 1 delayed interface
cracking within the height of the vertical dowel connections. For Frame 1, the middle
portion of the column-wall interface from course three to course nine slipped first, then
the regions within the height of the vertical dowel connections. For Frame 2, the column-
wall interface from course three to the top of the wall cracked first, followed by the
interface from course one to three within the height of the dowel. This behavior is
probably related to the bending mechanism observed in both columns suggests the dowel
connection at the base of the wall served to stiffen the bottom portion of the masonry wall
and move the hinging zone up in the column. If the connection at the top of the wall also
stiffened that zone, it would make sense that the more flexible portions of the wall would
permit slip to initiate first. The dial gages at these interfaces recorded a maximum slip of
0.16-0.2 inches (4.1-5.1 mm) for both frames at 1.2inches (30.5 mm) of lateral
displacement (1.0% drift). Beyond this point, many of the gages broke off the masonry
walls.
The finite element models predicted the onset of cracking of the column-wall
interface to be the same in both frames (See Table 6). This suggests that the effect of the
dowel connections on the column-wall interface was underestimated by the model.
Additionally, this interface was predicted to crack before the masonry wall. This is not
consistent with the observations from the experiments. In experimental Frame 1, cracking
in the wall did not initiate until between 0.15 and 0.3 inches (3.8 and 7.6 mm) of
displacement (0.125% and 0.25% drift). In experimental Frame 2, cracking in the
masonry initiated between 0.05 and 0.15 inches (1.3 and 3.8 mm) of displacement
(0.00417% and 0.125% drift).

217
6.1.2.3 Foundation-Wall Interface
The foundation-wall interface behaved very similarly between the two frames.
The interface on the compression side of the wall did not slip until the 0.82 inch (20.8
mm) cycles in either frame (0.683% drift). Slip along this interface initiated during the
0.3 inch (7.6 mm) amplitude (0.25% drift) cycles for both frames, but in different
locations. For Frame 1, which had dowel connections on all edges of the infill, the slip
initiated in the zone between the two grouted cells in the middle of the wall, beginning
with the tensile portion and propagating through the ungrouted bed joints laterally to the
center of the wall. In Frame 2, which connections only at the base of the infill, the bottom
interface slip began at the corner of the tension side of the propagated across the bottom
interface.
In the finite element models, the boundary between the masonry wall and the
foundation was the last interface to crack, consistent with the trend observed in the
experiments. The cracking began in the ungrouted bed joints at 0.05 inches (1.3 mm) of
displacement (0.0417% drift) See Figure 137) and went through the entire foundation-
wall interface by 0.42 inches (10.7 mm) of displacement (0.35% drift) (See Figure 140).
The crack propagation was slightly faster in the foundation-wall interface of the model
with connections only at the base of the masonry wall. Because the gage readings were
only taken at the beginning and end of each cycle, this trend cannot be verified or refuted
by the experimental data.
6.1.3 Masonry Wall Behavior
The shear and flexural deformations of each masonry infill wall was determined
using data from string pots around the perimeter and across the diagonals of the masonry

218
walls. Details of the calculations are found in Appendix D. The primary deformation of
the masonry walls was in shear, and the curvature was negligible for the range of lateral
displacements that the string pots recorded data. After the 0.82 inch (20.8 mm, 0.683%
drift) cycles, too much debris fell on the cables to accurately measure the wall
deformations. Strains in the vertical and horizontal rebar within the wall and the dowel
connections at the base and to the columns were recorded by strain gages
6.1.3.1 Shear Strains
The shear strain in each of the masonry infill walls for the experimental and
analytical frames is shown in Figure 158. Although there is more noise in the data from
Frame 2, the data shows Frame 2 experienced less shear strain than the infill in Frame 1.
This trend was confirmed by the finite element models, but the difference is not very
significant until beyond 0.5 inches of lateral displacement (0.417% drift).
Figure 158: Shear strain in the masonry infill vs. lateral displacement of experimental and
analytical Frame 1 (full connection) and Frame 2 (connection only at the base)

219
This trend makes sense if the connections to the RC frame constrain the masonry
wall to deform more in conjunction with the frame. Although these connections did little
to influence the slip at the column-wall interface, they prevented a gap from forming
between the column and the masonry wall. A gap was observed in Frame 2 which had
connections only at the base.
6.1.3.2 Reinforcement
The vertical reinforcement in both masonry walls had strain gages at the base, at a
location 4.0 inches (10.2 cm) above the foundation, and at the mid-height of the wall.
These gages did not show any yielding of the bars in these locations for either test. Based
on the cracking patterns in the grouted cores once the face shells were removed, most of
the damage to the cores was concentrated in the center of the wall for Frame 1. The
damage to the grouted cores was both at the mid-height and the top of the wall in Frame
2. The yielding of the reinforcement in both finite element models was consistent with
the observations from the experiments (See Figures 159 and 160). Both finite element
models predicted the vertical reinforcement to yield first at the base of the right
(compression side) of the masonry wall, followed by yielding within the height of the
second course of masonry. Yielding propagated further up the vertical bars in the finite
element model of Frame 1, but only reached mid-height in one of the bars at the very end
of the simulation. In the finite element model of Frame 2, the yielding occurred later in
the simulation and the reinforcement was most strained at the base of the masonry wall.

220
Figure 159: Yielding in the masonry reinforcement of the finite element model of Frame
1 (full connection)
Figure 160: Yielding in the masonry reinforcement of the finite element model of Frame
2 (connection only at the base)
The gages placed at the center of the horizontal bars indicated no yielding during
the entire test for either frame. As the ungrouted bricks fell away, these bars did not
appear to have any deformation, and likely did not contribute much to the capacity of the

221
infill walls. In some of the bricks it was noted that the bar placed at the center of the
masonry unit actually caused the masonry web to split (See Figure 161).
Figure 161: The horizontal reinforcement placed at the center of the unit caused the
masonry web to split
In Frame 1, which had connections around the entire perimeter of the infill, the
gages placed just past the dowel bar connecting the horizontal reinforcement to the
columns indicated a large sudden increase in strain during the late stages of the test (1.8
inch (45.7 mm, 1.5% drift) cycles and 2.4 inch (60.9 mm, 2.0% drift) cycles. This was
probably due to the bending of the bar, which occurred after the middle section of the
masonry wall began to fall apart, shown in Figure 162.

222
Figure 162: Bending of horizontal reinforcement just past the termination of the dowel
bar in the Frame 1
6.1.4 Column Behavior
Dial gages and string potentiometers in a 12 inch (30.48 cm) square configuration
with diagonals were used to calculate the shear strain and curvature at the top and bottom
of the columns. Example calculations are given in Appendix D. Strain gage data was also
recorded for the flexural reinforcement at the base of each column. Crack sizes and
spacing were used to estimate the strains in the reinforcement further up the height of the
columns. Appendix D contains a table with the recorded crack data and the calculations
for estimated strain in the rebar.
6.1.4.1 Curvature and Shear Strain
The data indicated that very little flexural deformation occurred at the top and
bottom of the columns in either test. The curvature in these regions was less than 0.0002
radians for the entire duration of the tests. This is in agreement with the observed
cracking patters of the columns and the strain gage data which suggests hinging occurred
at the level of the second course of masonry.

223
The shear strains were also very small at the base of the columns in both frames,
which was less than 0.001. The top of the columns did have larger values for shear
strains, which exceeded 0.002.
6.1.4.2 Reinforcement
The strain gages placed on the flexural reinforcement at the base of the columns
indicated no yielding of the bars at that location for the entire duration of both tests. By
using the crack widths and spacing between flexural cracks in the columns, an estimate of
the strain in the reinforcement was obtained at 0.86 and 2.4 inches (21.8 and 61.0 mm) of
lateral displacement (0.717% and 2.0% drift) for Frame 1. The same type of measurement
was taken at 1.8 and 2.4 inches (45.7 mm and 61.0 mm) of displacement (1.5% and 2.0%
drift) in Frame 2. In both frames, the data indicated yielding began well above the
foundation. In Frame 1, yielding in the column rebar began 17.25 inches (43.82 cm)
above the foundation. In Frame 2, yielding began 16.5 inches (41.9 mm) above the
foundation. This confirms hinging began just above the second course of masonry where
the dowel bars terminated.
At the end of the tests, at 2.4 inches (61.0 mm) of lateral displacement (2.0%
drift), the column rebar in Frame 1 had a maximum strain of 0.0086 at 7.5 inches (19.05
cm) above the foundation. The strains ranged from 0.0065 at 39.3 inches (99.82 cm)
above the foundation to 0.002 at 11.5 inches (29.21 cm) above the foundation. The same
trends were observed in Frame 2. At 2.4 inches (61.0 mm) of lateral displacement (2.0%
drift), the column rebar had a maximum strain of 0.0055 at 6.5 inches (16.51 cm) above
the foundation. The strains in the rebar from 14.5 to 40 inches (36.83 to 101.6 cm) above
the foundation ranged from 0.004 to 0.0022.

224
The shear strain data at the top of the columns indicated the shear reinforcement
may have yielded, as shear strains exceeded 0.002. The width of the shear cracks in the
top of the columns remained very small for both tests, and yielding of the bars could not
be confirmed by crack width data.
In both of the finite element models, the flexural reinforcement first yielded at the
base of the columns at 0.5 inches (12.7 mm) of displacement (0.417% drift). This
suggests that the effect of the dowel connections at the base of the masonry wall may be
underestimated by the initial finite element models. Yielding of the vertical reinforcement
propagated up the left (tensile) column to the height of the fourth course of masonry in
the model of Frame 1 (See Figure 163). In the model of Frame 2, the yielding propagated
slightly higher, reaching the middle of the fifth course of masonry (See Figure 164).
Frame 2 also had slightly less yielding at the top of the left (tensile) column and slightly
more yielding at the base of the right (compressive) column than Frame 1.
Figure 163: Strains in the flexural reinforcement of the columns in the finite element
model of Frame 1 (full connection)

225
Figure 164: Strains in the flexural reinforcement of the columns in the finite model of
Frame 2 (connection only at the base)
6.2 Influence of Masonry and Connections on the Behavior of the RC
frame
The cracking patterns, interface slip and yielding of the reinforcement in the
hybrid concrete-masonry frames suggest that the typical strut mechanism observed in
unreinforced masonry infill structures was altered due to the connections from the
reinforced concrete frame to the grouted cores of the masonry infill. The presence of the
connection at the top of the frame was key to preventing out-of-plane failure of the
masonry, but did not significantly affect the ductility or capacity of the frame. The
connections from the masonry wall to the columns constrained the grouted cores at the
edge of the wall to displace with the columns, but did not appear to alter the cracking
patterns or force-displacement behavior of the frame. Thus, the effect of the top and side
connections can be neglected when characterizing the influence of the masonry and
connections on the behavior of the RC frame.

226
The bond between the masonry wall and the RC beam was very weak due to the
gap that was left at the top of the masonry infill wall during construction and the poor
cohesion properties of the 3:1 sand-cement mortar. The shear transfer at this interface can
be assumed to be very limited due to the early initiation of slip observed in the
experiment. The cracking patterns of the columns also indicated the bearing area for the
masonry strut was primarily at the top of the RC column, centered at about one to two
courses down from the top of the masonry wall (See Figure 165 a-d). The shear cracking
at the top of the column in Frame 2 propagated through a zone equivalent to 36% of the
total column height.
The presence of the connections at the base of the masonry wall in both frames
had significant influence on the behavior of the RC frame. This boundary slipped last,
providing a zone to transfer shear forces. In both frames, the initial shear bearing area for
the compression was through the stiffened zone at the base of the masonry wall through
the height of the cast-in-place dowel connections (See Figure 165 a and b). This was
more apparent in Frame 1 than Frame 2. As the tests progressed, the crack patterns of the
frames both indicate the masonry strut was supported on the column at the mid-height of
the stiffened zone at the base of the wall. By drawing the masonry struts in a manner
consistent with the cracking observed in the experiments (See Figure 165 c and d), the
shear critical zone for the columns is moved up compared to what would be assumed in a
typical strut and tie analysis.

227
(a) Initial Strut in Experimental Frame 1
(Full connection)
(b) Initial Strut in Experimental Frame 2
(Connection only at the base)
(c) Struts in Experimental Frame 1 (full
connection) at 0.82in (20.8 mm) displacement (0.683% drift)
(d) Strut in Experimental Frame 2 (connection
only at the base) at 0.82in (20.8 mm) displacement (0.683% drift)
Figure 165: Strut mechanisms observed during the experiments
6.3 Improvement of Finite Element Models Based on Experimental
Observations
Although the initial finite element models gave very close predictions for the
peak strengths of the frames and predicted the same general failure mechanisms as were
observed in the experiments, several improvements can be made.
228
6.3.1 Masonry Modeling and Material Properties
In general, the mortar joints in the finite element models cracked at much lower
displacements than was observed in the experiments. In the revised model, interface
element failure surface, representing the mortar was changed to match the upper bound of
the triplet test data, rather than the average. Also, the shear cracks which were observed
in the ungrouted cells of the experimental frames were not captured by the initial finite
element models. Prior to the experiment, it was thought that the ungrouted units would
primarily crush and would not exhibit shear cracking. Thus, they were modeled with a
single smeared crack element for simplicity even though it is well known that smeared
crack elements can overestimate shear capacity. In the revised finite element models, the
ungrouted units have been modeled using the same eight element module as was used for
the grouted cores in order to capture shear cracking.
In the initial model, it was assumed that the grouted cores would act in unison
with the masonry face shells. However, many of the shear cracks which initially spread
across the grouted cores of the experimental frames were through the face shells alone.
Very few shear cracks were observed in the grouted cores once the face shells had fallen
off. The initial finite element models do not capture any shear cracks across the grouted
cells, as the stresses are not high enough to cause the entire core to crack. As a result, the
grouted cells in the revised model were represented with two layers of 8 element modules
with shared nodes to permit shear cracking to spread over the face shells of the grouted
shells. One layer was used to model the grout cores and the other was used to model the
masonry and mortar joints. The nodes for both layers are shared so the is constrained to

229
displace together, but face shells are permitted to crack even when the grouted cores do
not.
For the initial models, the head joints were given a bond strength equal to half the
bed joint bond strength. This resulted in the head joints cracking first, instead of stair-
stepped cracks like those observed in the experimental frames. In the revised models, the
head joint bond strength was increased to 75% of the bed joint bond strength, which
resulted in stair-stepped cracking like the experiments.
6.3.2 Interface Properties
The interfaces in the initial finite element models were given the same properties
as the mortar bed joints. This resulted in the initial finite element models predicting
interface cracking beginning with the column-wall interfaces, then the top beam-wall
interface and finally the foundation-wall interface. The experiment showed cracking very
early at the top interface, followed by the column-wall interfaces and finally the
foundation-wall interface. In the revised models, the top interface was given a very high
flexibility, with stiffness equal to 10% of the mortar joint stiffness. The top interface was
also reduced to 50% of the mortar bed joint tensile strength, shear friction and cohesion.
The column-wall and foundation-wall interfaces were kept the same as the bed joints in
the rest of the masonry wall.
6.3.3 Dowel Reinforcement Modeling
The influence of the connections on the RC frame behavior appeared to be
underestimated by the initial finite element models. This was evidenced by the flexural
cracking of the columns in both models, which initiated at the base of the column rather
than just above the second course of masonry where the splice for the dowel

230
reinforcement terminated. In addition, no difference between the cracking patterns of the
RC frames was observed between the two initial models. However, in the experiments
flexural cracking initiated earlier, and more shear cracks developed in the columns of
Frame 2 than developed in the columns of Frame 1.
The influence of the dowel reinforcement was more pronounced after the
following revisions to the initial finite element models. First, the grouted cores through
the height of the dowel were given an increased shear stiffness and shear strength
compared to the grouted cores in the rest of the wall. The elastic modulus of the grouted
cores through the height of the dowels was not increased, because the truss elements used
to model the vertical reinforcement already account for the normal stiffness of the
reinforcement. Instead, only the shear stiffness was increased. The increased shear
modulus was calculated assuming the grouted cells were a matrix with steel fibers, and
resulted in an increase in shear stiffness of 10% through the height of the dowels (See
Appendix C for calculations). Second, the vertical reinforcement in the grouted cores was
partially distributed to the edges of the grouted unit to account for its contribution to the
bending capacity of the grouted core (See Appendix C for calculations).
6.3.4 Concrete Fracture Energy
In the post-peak regime, the finite element models could be improved by
exhibiting more strength degradation. By reducing the fracture energy of the concrete by
33%, the revised models exhibit more brittle behavior and degrade faster than the initial
finite element models.

231
6.4 Results of Revised Finite Element Models
6.4.1 Damage Sequence
The initial cracking patterns of the revised model are much closer to those
observed in the experiments. Table 7 shows the initial cracking patterns for both revised
models. The interface elements representing the grout cores, masonry and concrete have
been colored the same as the smeared crack elements for clarity. The order of interface
cracking is more in tune with the experiment, as cracking begins at the beam-wall
interface much earlier than the initial finite element models. Additionally, the initial
cracks through the masonry correspond well to the experiments. The cracks propagate
through both the units and the mortar joints instead of beginning only in the mortar joints
like the initial models.
Cracking in the revised models begins much later than in the initial models, at
0.014 in (0.4 mm) of lateral displacement for both frames (0.0117% drift). This is more
consistent with the experimental observations than the initial models which predicted
cracking of both frames to initiate at 0.007 inches (0.2 mm) of lateral displacement
(0.00583% drift). Even though cracking is still predicted at a lower displacement than
what was recorded in the experiments, the load at first cracking of the masonry is very
close to what was recorded in the experiments. In Frame 1, the experimentally recorded
cracking load was 103.6 kips (460.84 kN) and the revised analytical model predicts
masonry cracking at 37.3 kips (165.92 kN) of load. Although the model predicts cracking
too early, it does predict a larger cracking load for this frame than the frame with
connections only at the base, a trend which was not captured by the initial models. In the
Frame 2, the revised analytical model predicts masonry cracking at 33.06 kips (147.06
232
kN) of load which is within 8% of the experimentally recorded cracking load, 30.8 kips
(137 kN). This is a significant improvement over the initial model prediction which was
54% below the actual cracking load.
It is also important to note that cracking propagates faster in the model of Frame 2
than in the model of Frame 1 (See Table 7 0.025in (0.6 mm), 0.00208% drift). This is
consistent with experimental observations and was not captured by the initial finite
element models. In the revised models, the cracking propagates into the face shells of the
grouted shells by 0.05 in (1.27mm) of displacement (0.0417% drift).
(space left blank intentionally)

233
Table 7: Initial cracking patterns of revised finite element models FE Model 1
(Full connection) FE Model 2
(Connection only at the base)
Initial Cracking-
0.014 in (0.36 mm), 0.0117% drift
Initial Cracking-
0.014 in (0.36 mm), 0.0117% drift
0.025 in (0.64 mm), 0.0208% drift
0.025 in (0.64 mm), 0.0208% drift
0.05 in (1.3 mm), 0.417% drift
0.05 in (1.3 mm), 0.417% drift

234
The timing of damage and the cracking patterns in the RC frames are also
improved in the revised models. Both the initial and revised models correctly predict the
first damage to the columns as hairline cracks at the foundation (See Figure 138 and
Table 8 0.15 inches (3.8 mm), 0.125% drift). The revised models correctly predict the
next crack to occur just above the location where the dowel bars terminate, whereas the
initial models predicted the cracking to spread upwards from the foundation (See Figure
139 and Table 8 0.3 inches (7.6 mm), 0.25% drift). This crack occurs at the same
displacement in both models, even though experimental Frame 2 cracked slightly earlier
than experimental Frame 1.
Shear cracking at the top of the columns occurs in both revised models (See Table
8 0.3 inches (7.6 mm), 0.25% drift). The cracks at the top left and bottom right of the
frames are more clearly combined shear and flexural cracks, where the initial models had
primarily shear cracking in these locations. Beyond 0.82 inches (20.8 mm) of
displacement (0.683% drift), slight differences between the two frames can be detected.
The Frame 2 model has slightly more damage to the top left column and flexural cracks
extend higher up in the right column than the Frame 1 model. In the experiments, more
damage was observed in Frame 2 than Frame 1, and this difference was not captured by
the initial models.
Crushing of the masonry initiates in both revised models at about 0.25 inches (6.4
mm) lateral displacement (0.208% drift), about the same as the initial finite element
models. In the Frame 1 model, crushing primarily stays below the top courses where the
dowel bars are located, until very late in the simulation. In the Frame 2 model, crushing
spreads to the top courses of masonry much earlier than the in the Frame 1 model. This is

235
consistent with the experimental observations. The initial models had predicted the same
crushing damage pattern for both walls
Table 8: Damage sequence for revised finite element models FE Model 1
(Full connection) FE Model 2
(Connection only at the base)
0.15 in (3.8 mm), 0.125% drift
0.15 in (3.8 mm), 0.125% drift
0.3 in (7.6 mm), 0.25% drift
0.3 in (7.6 mm), 0.25% drift

236
0.42 in (10.7 mm), 0.35% drift
0.42 in (10.7 mm), 0.35% drift
0.58 in (14.7 mm), 0.483% drift
0.58 in (14.7 mm), 0.483% drift
0.82 in (20.8 mm), 0.683% drift
0.82 in (20.8 mm), 0.683% drift

237
1.2 in (30.5 mm), 1.0% drift
1.2 in (30.5 mm), 1.0% drift
1.8 in (45.7 mm), 1.5% drift
1.8 in (45.7 mm), 1.5% drift
2.4 in (61.0 mm), 2.0% drift
2.4 in (61.0 mm), 2.0% drift

238
6.4.2 Force-Displacement Behavior
There does not seem to be any significant improvements in the representation of
the force-displacement behavior from the initial to the revised models. The capacity
predictions of the initial models were very close to the experimental values. The revised
models have peak strengths which occur at a slightly larger displacement than in the
initial models, but the error on the capacity prediction is about the same as the previous
models. The peak capacity of the revised model for Frame 1 was 205.15 kips (912.55 kN)
at 1.07 inches (27.2 mm) of displacement (0.892% drift). This is within 5% of the
capacity and 25% of the displacement at peak strength of Frame 1, which achieved a peak
strength of 197.16 kips (877.01 kN) at 0.86 inches (21.8 mm) of displacement (0.717%
drift). The peak capacity of the revised model of Frame 2 was 189.03 kips (840.85 kN) at
1.4 inches (35.6 mm) of displacement (1.167% drift). Experimental Frame 2 had a peak
strength of 193.4 kips (860.29 kN) at 1.1 inches (27.9 mm) of displacement (0.917%
drift). The predictions of the revised model are within 3% of the capacity and 28% of the
displacement at peak strength of experimental Frame 2, and closer than the prediction of
the initial model of Frame 2.
The force-displacement plots for the initial and revised models as well as the
experiments are shown in Figures 166 and 167. It is clear that the initial and revised force
displacement curves for the models are almost indistinguishable. The revised models
have a slightly more defined peak and degrade slightly more than the initial models.
Additionally, the revised models are slightly more brittle because of the reduced fracture
energy in the concrete which causes the sudden drop in capacity when a large shear crack
forms in the frame with connections only at the base.
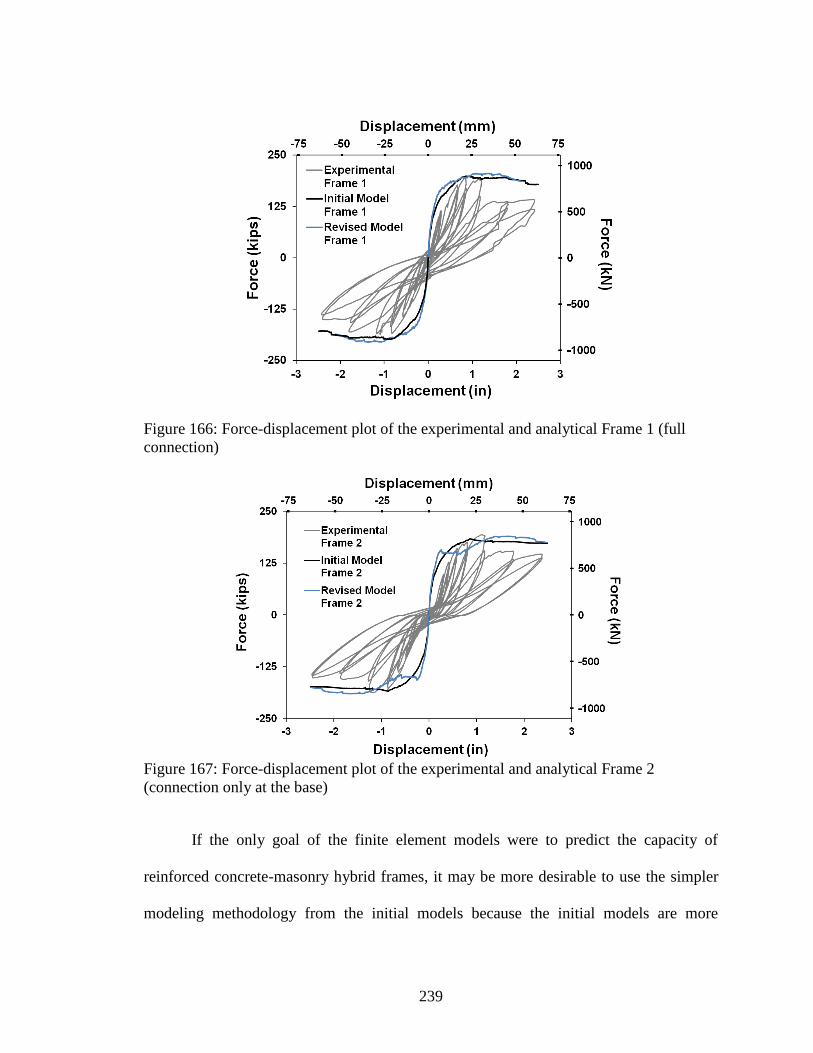
239
Figure 166: Force-displacement plot of the experimental and analytical Frame 1 (full
connection)
Figure 167: Force-displacement plot of the experimental and analytical Frame 2
(connection only at the base)
If the only goal of the finite element models were to predict the capacity of
reinforced concrete-masonry hybrid frames, it may be more desirable to use the simpler
modeling methodology from the initial models because the initial models are more
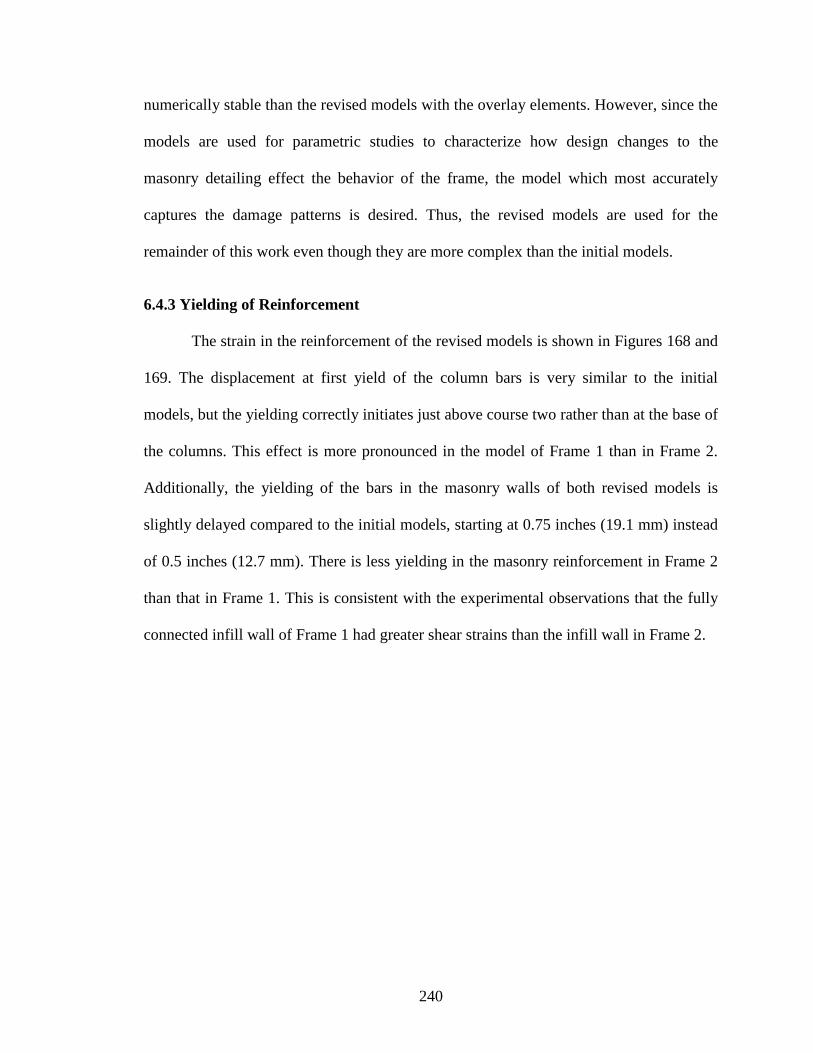
240
numerically stable than the revised models with the overlay elements. However, since the
models are used for parametric studies to characterize how design changes to the
masonry detailing effect the behavior of the frame, the model which most accurately
captures the damage patterns is desired. Thus, the revised models are used for the
remainder of this work even though they are more complex than the initial models.
6.4.3 Yielding of Reinforcement
The strain in the reinforcement of the revised models is shown in Figures 168 and
169. The displacement at first yield of the column bars is very similar to the initial
models, but the yielding correctly initiates just above course two rather than at the base of
the columns. This effect is more pronounced in the model of Frame 1 than in Frame 2.
Additionally, the yielding of the bars in the masonry walls of both revised models is
slightly delayed compared to the initial models, starting at 0.75 inches (19.1 mm) instead
of 0.5 inches (12.7 mm). There is less yielding in the masonry reinforcement in Frame 2
than that in Frame 1. This is consistent with the experimental observations that the fully
connected infill wall of Frame 1 had greater shear strains than the infill wall in Frame 2.

241
Figure 168: Strains in the reinforcement of the revised finite element model of Frame 1
(full connection)
Figure 169: Strains in reinforcement of the revised finite element model of Frame 2
(connection only at the base)
6.5 Chapter Summary
The experimental program consisted of two Caribbean-style hybrid concrete-
masonry structures, one which had cast-in-place connections on all edges of the partially
grouted infill wall, and one which had connections only at the base. Both frames failed at

242
similar loads and drift levels, exhibiting a compression strut mechanism and combined
flexural and shear cracking in the columns of the bounding frame.
Cast-in-place connections at the base of the masonry wall were present in both
frames and permitted shear transfer into the foundation. The dowel connections at the
base of both masonry walls also significantly stiffened the courses of masonry though the
height of the dowels and shifted the hinging of the columns up to the location at which
the dowels were terminated.
Connections from the reinforced concrete beam to the top of the masonry infill
wall were crucial to preventing out-of-plane failure of the masonry in Frame 1. During
the cyclic test of Frame 2, which did not have these connections, the masonry shifted out
of plane several inches and would have likely fallen out in a dynamic test. It is also likely
that the connection at the top of the masonry wall to the reinforced concrete beam
provided some additional shear transfer as the shear cracking at the top of the columns in
the frame with connections was not as severe as the frame without connections. The
primary bearing zone for the masonry compression strut for both frames was at the top of
the columns rather than shared between the column and beam. This was because the bond
between the top course of masonry and the reinforced concrete beam was very weak.
Connections from the reinforced concrete columns into the bed joints of the
masonry had little to no influence in delaying the cracking of the interfaces between the
masonry wall and the reinforced concrete columns. However, interface cracking was
delayed in the stiffened zones within the height of the vertical dowel connections.
Delayed interface cracking was observed at the bottom two courses of both walls and the

243
top two courses of the wall with connections around the entire perimeter of the infill wall
(Frame 1).
The results suggest that partially grouting and reinforcing weak masonry infill and
providing connections at the top and bottom of the wall may minimize out-of-plane
failure of the masonry and alter the strut mechanism typically observed in RC frames
with unreinforced infill. The shear critical zone in the RC columns appears to be larger
than what is expected in a seismically designed moment frame.
The finite element models used to predict the behavior of the hybrid concrete-
masonry frames gave very close predictions for peak strength and the displacement at
peak strength, which were within 10% of the experimental capacity and 21% of the
displacement values for both frames. The progression of failure closely matched the
experiments for both models, but damage generally occurred earlier in the finite element
models than the experiments, and the hinging zone was predicted to be at the base of the
columns rather than just above the height of the dowel bars from the foundation. The
timing of damage was nearly identical between the two models and very close to the
timing of damage in experimental Frame 2, which had connections only at the base of the
infill.
The unde estim tion of the dowel onne tions’ effe t w s dete mined to be the
underlying cause of the deficiencies in the initial model. The finite element models were
revised to account for the increased stiffness in the masonry in the localized cells with
cast-in-place dowel connections. The grouted cells were also modeled as two separate
layers, one for the face shells and one for the grout. This was done to permit the face
shells to crack while the grouted cores remained intact, consistent with experimental

244
observations. The ungrouted cells were modeled with an 8-element module to better
capture the shear cracking observed in the experiments. The top interface between the
masonry wall and the RC beam was also modeled with increased flexibility and lower
tensile strength to better represent the poor bond at the top of the infill wall. Finally,
fracture energy of the concrete was slightly reduced to lower the residual strength of the
models. A better match to the cracking patterns in the masonry walls, the cracking order
of the interfaces and the location of yielding in the reinforcement was achieved with the
revised models.

245
CHAPTER 7
APPLICATIONS FOR ENGINEERING PRACTICE
A high degree of confidence can be placed in the finite element models because
they exhibited a close match to the cracking patterns and capacities of the experimental
frames. The finite element models are used to conduct several analytical studies to obtain
information which will be useful to practicing engineers. In addition, the results of the
finite element models are compared to several proposed simplified models which may be
more practical for design purposes.
First, the finite element model is used to explore several changes to the design of
hybrid concrete-masonry structures. This includes different types of connections which
were observed in the Caribbean, but not tested experimentally, and proposed
improvements based on observations from the experiments. Second, a parametric study is
conducted to characterize the influence of the infill properties on the seismic performance
of hybrid concrete-masonry frames. The study includes the influence of masonry material
properties and the influence of reinforcement details. Finally, several simplified models
are presented and compared to the results of the finite element models. An elastic
transformed section model is used to predict the cracking load and a cracked section
model is used to predict the ultimate shear capacity of the experimental frames. A
modification of the typical TMS 402 strut model is also suggested to account for the
effect of the dowel connections on the geometry and behavior of the masonry diagonal
strut in hybrid concrete-masonry structures.

246
7.1 Analytical Study on Design Changes
Alternative methods to connect the partially grouted infill wall to the bounding
reinforced concrete frame are explored with analytical models. Two new models were
created with the same material properties and geometry as the models of experimental
Frames 1 and 2, but each has an alternative method to connect the infill to the bounding
frame. One model has no connections to the bounding RC frame and one wall has only
vertical connections from the infill to the foundation and the RC beam.
Next, an analytical study on a possible improvement in the design of the
reinforced concrete frame is presented. Observations from the experiments led to the
suggestion to increase the length of the zone of closely spaced ties in the RC columns in
order to improve the seismic performance of the hybrid concrete-masonry wall. Two
additional models were created from the validated finite element models of Frame 1 and
Frame 2 by increasing the region of the closely spaced ties in the RC columns of each
model. The size of the close tie spacing region was selected so that it bounds the region in
which shear cracks were observed in the test specimens. The results of these models are
compared to the results from the finite element models of the experimental frames to
determine if the suggested change improves the seismic performance.
7.1.1 Alternative Connections of the Infill to the RC frame
To assess the behavior of hybrid concrete masonry frames with alternative
connections to the bounding frame, two additional finite element models were created.
Each model utilized the same geometry and material properties as the experimentally
validated finite element models, but one had no connections to the RC frame and the
other had connections from the infill to the foundation and to the RC beam but not to the

247
columns. The results of the models are compared to the experimentally validated finite
element models in Figure 170.
Figure 170: Force vs. displacement of the finite element models with different
connections of the infill to the bounding RC frame
The results show that the model with no connections from the infill to the RC
frame behaves nearly the same as the model with connections only at the base. The peak
strength of the model with no connections is 185.86 kips (286.75 kN), which is only
1.7% less than the model with connections at the base. The displacement at peak strength
is also almost identical between the two models, 1.4 inches (35.6 mm) and 1.41 inches
(35.8 mm) for the model with no connections and the model with connections at the base,
respectively (1.167% and 1.175% drift, respectively).
The study also shows that very little gain in peak strength is observed from the
connections to the RC columns. The model with connections on all edges has greater
peak strength than the model with connections at the top and bottom of the infill, but
achieves peak strength at a lower displacement. For the model with connections on all
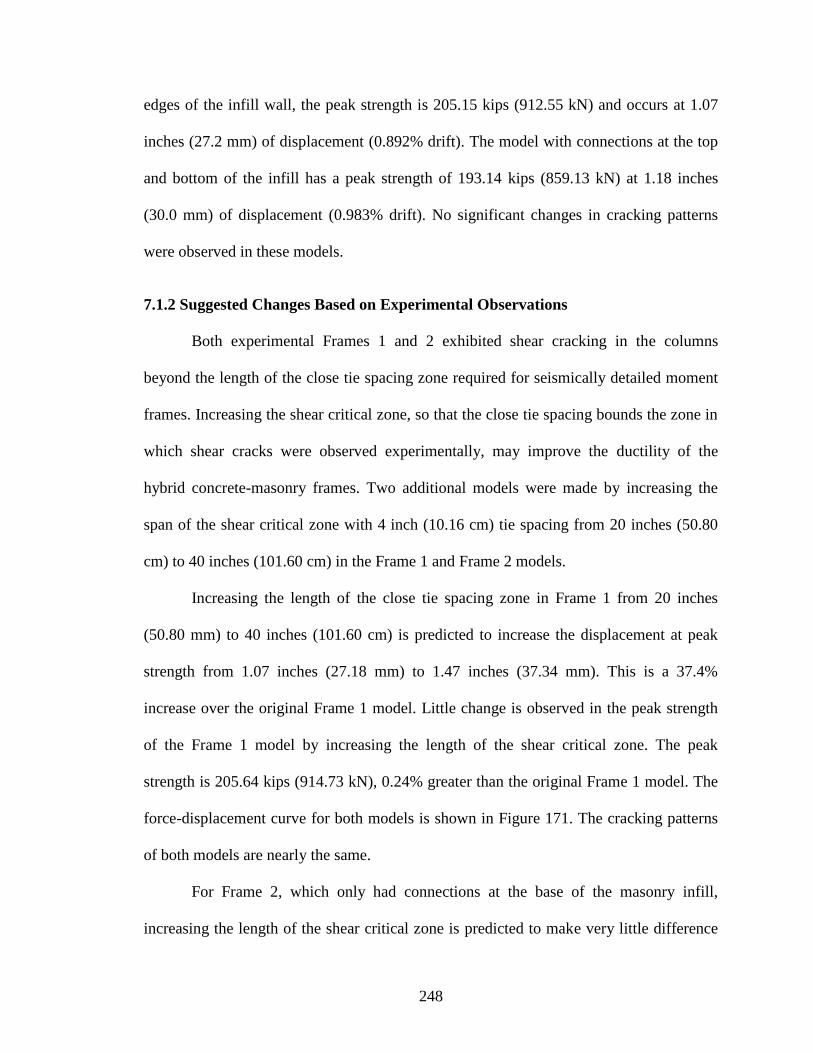
248
edges of the infill wall, the peak strength is 205.15 kips (912.55 kN) and occurs at 1.07
inches (27.2 mm) of displacement (0.892% drift). The model with connections at the top
and bottom of the infill has a peak strength of 193.14 kips (859.13 kN) at 1.18 inches
(30.0 mm) of displacement (0.983% drift). No significant changes in cracking patterns
were observed in these models.
7.1.2 Suggested Changes Based on Experimental Observations
Both experimental Frames 1 and 2 exhibited shear cracking in the columns
beyond the length of the close tie spacing zone required for seismically detailed moment
frames. Increasing the shear critical zone, so that the close tie spacing bounds the zone in
which shear cracks were observed experimentally, may improve the ductility of the
hybrid concrete-masonry frames. Two additional models were made by increasing the
span of the shear critical zone with 4 inch (10.16 cm) tie spacing from 20 inches (50.80
cm) to 40 inches (101.60 cm) in the Frame 1 and Frame 2 models.
Increasing the length of the close tie spacing zone in Frame 1 from 20 inches
(50.80 mm) to 40 inches (101.60 cm) is predicted to increase the displacement at peak
strength from 1.07 inches (27.18 mm) to 1.47 inches (37.34 mm). This is a 37.4%
increase over the original Frame 1 model. Little change is observed in the peak strength
of the Frame 1 model by increasing the length of the shear critical zone. The peak
strength is 205.64 kips (914.73 kN), 0.24% greater than the original Frame 1 model. The
force-displacement curve for both models is shown in Figure 171. The cracking patterns
of both models are nearly the same.
For Frame 2, which only had connections at the base of the masonry infill,
increasing the length of the shear critical zone is predicted to make very little difference

249
in the peak strength or the displacement at peak strength. The model with the increased
length of the column close-tie spacing zone has a peak strength of 192.31 kips (855.44
kN), which is 3.47% greater than the original Frame 2 model. The model with the
increased length of the column close-tie spacing zone has a displacement at peak strength
of 1.37 inches (34.80 mm), which is only 2.84 % less than the displacement at peak
strength of 1.41 inches (35.81 mm) predicted in the original Frame 2 model. The force-
displacement curve for both models is shown in Figure 171. The cracking patterns
between the two models are also virtually identical.
Figure 171: Influence of increasing the length of the column close tie spacing zone from
20 inches (50.8 cm) to 40 inches (101.6 cm) on the force-displacement behavior of
Frames 1 and 2
7.2 Parametric Study on Infill Properties
An analytical study is presented which characterizes the sensitivity of the peak
strength and displacement at peak strength of the hybrid concrete masonry walls to
changes in the reinforcement detailing and properties of the masonry infill. The initial
stiffness of the models are not compared, since the validated finite element models were

250
unable to capture the difference in initial stiffness between experimental Frames 1 and 2.
If these changes significantly alter the general behavior of the frames, the cracking
patterns and new failure mechanisms are also discussed.
7.2.1 Reinforcement Sizes and Spacing
In order to characterize the influence of changes to the detailing of the masonry
infill on the seismic performance of hybrid concrete-masonry walls, a small parametric
study was conducted. The parametric study was conducted with the revised models of
Frame 1 and Frame 2 by varying each of the model parameters to a value above and
below its initial value.
7.2.1.1 Methodology
The effect of changing the area of the reinforcing bars was examined first. Four
models were made by first increasing the area of the vertical reinforcement in each model
by a factor of two, then decreasing the area of the vertical reinforcement by a factor of
two in the Frame 1 and Frame 2 models. Four more models were also created by varying
the area of the horizontal reinforcement by a factor of two in each model. Yet four more
models were made by increasing then decreasing the area of the vertical dowel
reinforcement by a factor of two in the Frame 1 and Frame 2 models. Only Frame 1 had
horizontal dowel reinforcement, so only two models were created by varying the area of
the horizontal dowel reinforcement by a factor of two.
Next, the spacing of the vertical and horizontal reinforcement was varied from
their initial spacing of 32 inches (81.28 cm) and 24 inches (60.96 cm) on center,
respectively. The vertical reinforcement spacing was decreased to 16 inches (40.64 cm)
on center and increased to 48 inches (121.92 cm) on center in the revised models of

251
Frame 1 and Frame 2, making four new models. Four more models were created by
decreasing the horizontal reinforcement spacing to 16 inches (40.64 cm) on center then
increasing the spacing to 40 inches (101.6 cm) on center in both models.
7.2.1.2 Results
The peak strength of the models was not significantly influenced by the variation
in the masonry reinforcement detailing. This can be seen from the histogram in Figure
172. A consistent trend could not be found for many of the cases which were tested.
However, an increase in the area of the vertical reinforcing bars resulted in an increase in
peak strength for both Frame 1 and 2. Likewise, a decrease in the area of the vertical or
horizontal reinforcing bars resulted in a decrease in peak strength for both frames. Most
of the models have a peak strength which was within 6% of the baseline models. The
exception is that for the model of Frame 1, which has connections on all edges of the
infill, decreasing the spacing of the vertical reinforcement to 16 inches (40.64 cm) on
center resulted in a 9.4% increase in capacity. Likewise, increasing the spacing of the
vertical reinforcement to 48 inches (121.92 cm) on center resulted in a 9.8% decrease in
capacity.
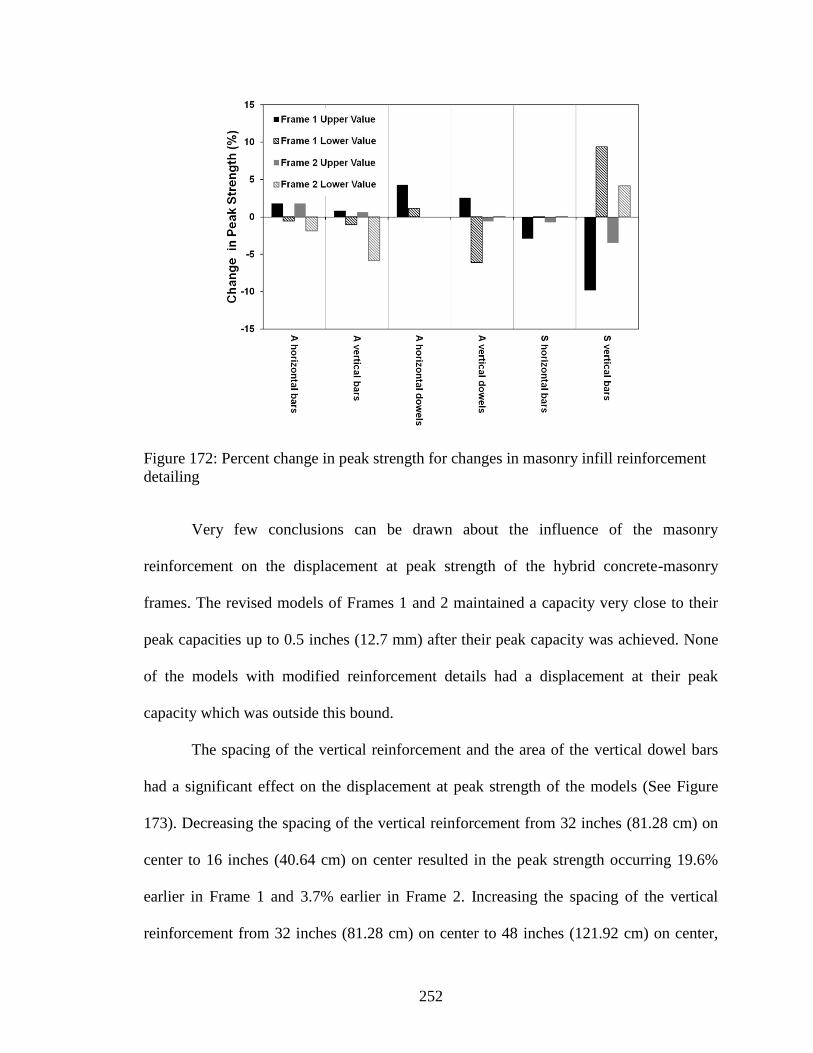
252
Figure 172: Percent change in peak strength for changes in masonry infill reinforcement
detailing
Very few conclusions can be drawn about the influence of the masonry
reinforcement on the displacement at peak strength of the hybrid concrete-masonry
frames. The revised models of Frames 1 and 2 maintained a capacity very close to their
peak capacities up to 0.5 inches (12.7 mm) after their peak capacity was achieved. None
of the models with modified reinforcement details had a displacement at their peak
capacity which was outside this bound.
The spacing of the vertical reinforcement and the area of the vertical dowel bars
had a significant effect on the displacement at peak strength of the models (See Figure
173). Decreasing the spacing of the vertical reinforcement from 32 inches (81.28 cm) on
center to 16 inches (40.64 cm) on center resulted in the peak strength occurring 19.6%
earlier in Frame 1 and 3.7% earlier in Frame 2. Increasing the spacing of the vertical
reinforcement from 32 inches (81.28 cm) on center to 48 inches (121.92 cm) on center,

253
resulted in an increase in the displacement at peak strength by 17% in Frame 1 and a
decrease in the displacement at peak strength of 15.7% in Frame 2. Changing the area of
the vertical dowel reinforcing bars had a greater influence on Frame 1 than Frame 2.
Decreasing the area of the vertical dowel reinforcement resulted in a reduced
displacement at peak strength for both models, but had a greater influence on Frame 1
than Frame 2.
Figure 173: Percent change in displacement at peak strength for changes in masonry infill
reinforcement detailing
7.2.2 Masonry Material Properties
The influence of the masonry material properties on the seismic performance of
the hybrid concrete-masonry frames was also examined. Unlike the study on the
reinforcement sizes and spacing, each parameter examined does not necessarily have a

254
higher and a lower value. The specific changes made to each model are presented in the
methodology.
7.2.2.1 Methodology
The first property which was examined was the influence of the prism strength of
the ungrouted masonry on the seismic behavior of the frames. The prism strength of the
ungrouted masonry was increased by a factor of two. The elastic modulus, strain at peak
compressive strength, strain at the transition zone, tensile strength and fracture energy
were also changed in a manner consistent with the calibration method discussed in
Chapter 2. The prism strength of the ungrouted masonry was decreased below that
measured in the experiment because the masonry was already very weak.
Next, the influence of the compressive strength of the grout was examined. The
compressive strength of the grout was increased and decreased by a factor of two in the
models of Frame 1 and Frame 2. The elastic modulus, strain at peak compressive strength
and strain at the transition zone were changed to keep within the range of expected values
for grout. The tensile strength was kept equal to 10% of the compressive strength and the
fracture energy in the model was assumed to increase proportionally to the tensile
strength.
Then, two models were created by replacing the type M mortar, which is common
in the Caribbean and used in Frames 1 and 2, with a type N mortar. Type N mortar
contains lime and has better bond characteristics than the type M mortar used in the
experimental frames. The mortar interface elements were calibrated to data from
Stavridis 2007. Tables containing the material properties used in each of these models are
presented in Appendix C.
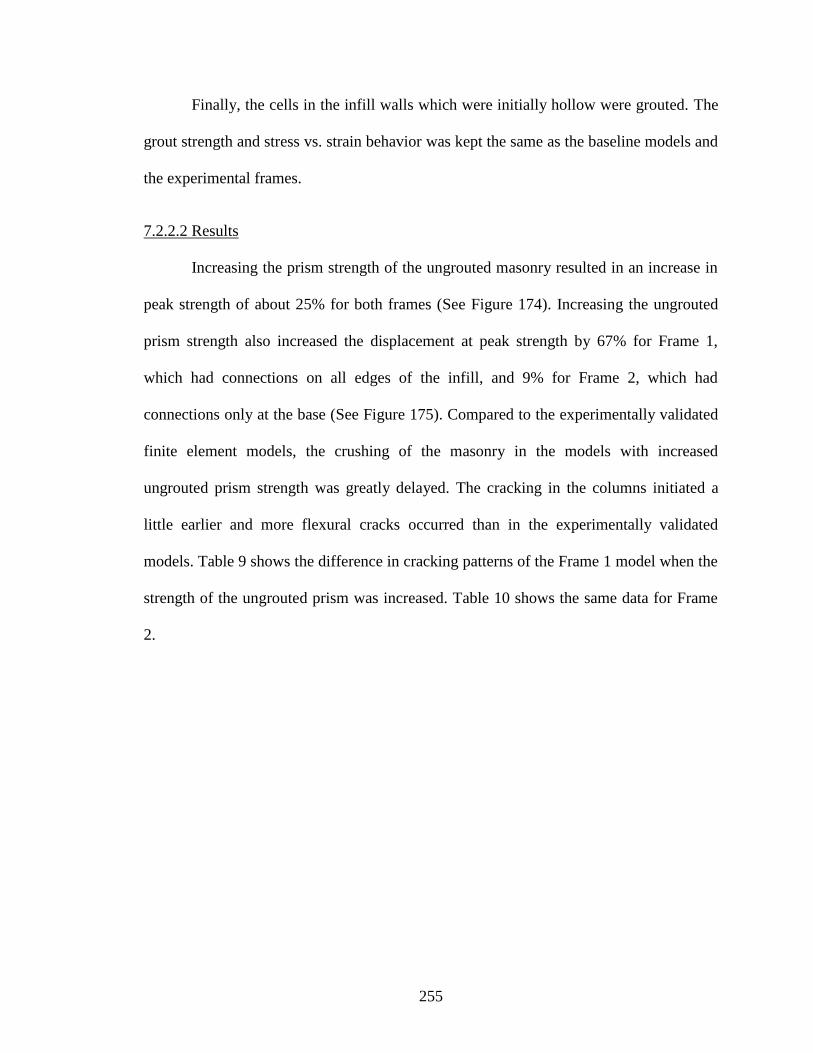
255
Finally, the cells in the infill walls which were initially hollow were grouted. The
grout strength and stress vs. strain behavior was kept the same as the baseline models and
the experimental frames.
7.2.2.2 Results
Increasing the prism strength of the ungrouted masonry resulted in an increase in
peak strength of about 25% for both frames (See Figure 174). Increasing the ungrouted
prism strength also increased the displacement at peak strength by 67% for Frame 1,
which had connections on all edges of the infill, and 9% for Frame 2, which had
connections only at the base (See Figure 175). Compared to the experimentally validated
finite element models, the crushing of the masonry in the models with increased
ungrouted prism strength was greatly delayed. The cracking in the columns initiated a
little earlier and more flexural cracks occurred than in the experimentally validated
models. Table 9 shows the difference in cracking patterns of the Frame 1 model when the
strength of the ungrouted prism was increased. Table 10 shows the same data for Frame
2.
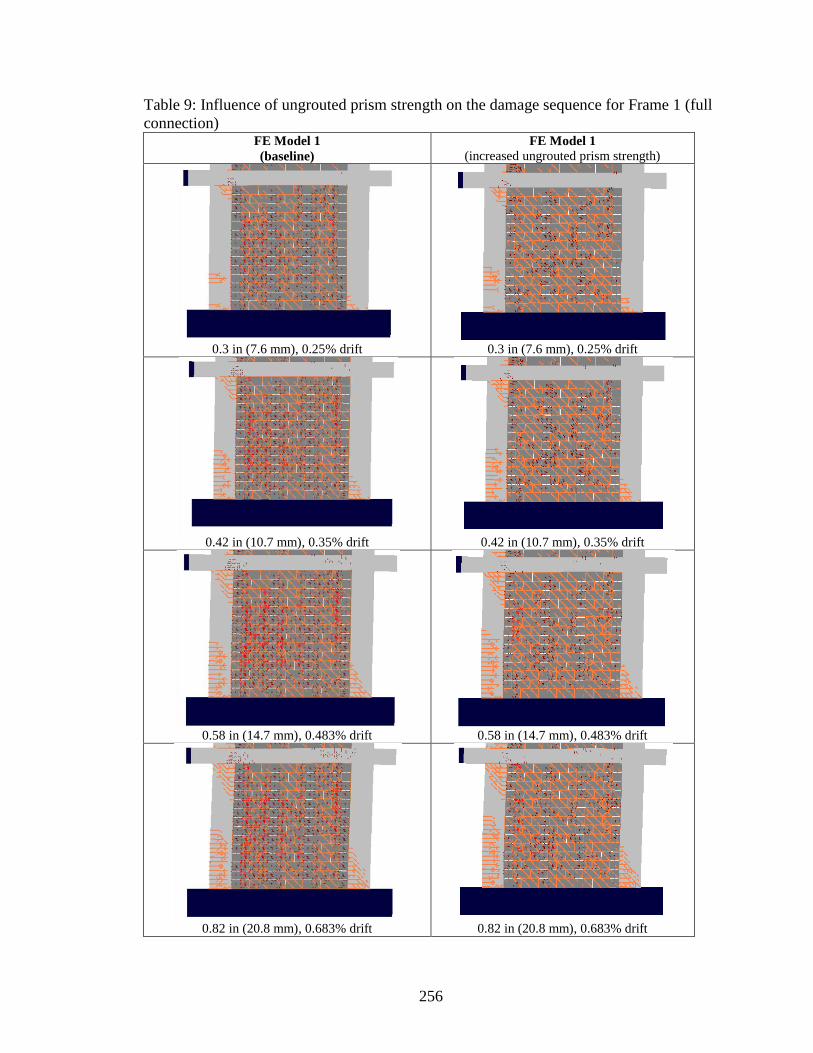
256
Table 9: Influence of ungrouted prism strength on the damage sequence for Frame 1 (full
connection) FE Model 1
(baseline) FE Model 1
(increased ungrouted prism strength)
0.3 in (7.6 mm), 0.25% drift
0.3 in (7.6 mm), 0.25% drift
0.42 in (10.7 mm), 0.35% drift
0.42 in (10.7 mm), 0.35% drift
0.58 in (14.7 mm), 0.483% drift
0.58 in (14.7 mm), 0.483% drift
0.82 in (20.8 mm), 0.683% drift
0.82 in (20.8 mm), 0.683% drift

257
Table 10: Influence of ungrouted prism strength on the damage sequence for Frame 2
(connection only at the base) FE Model 2
(baseline) FE Model 2
(increased ungrouted prism strength)
0.3 in (7.6 mm), 0.25% drift
0.3 in (7.6 mm), 0.25% drift
0.42 in (10.7 mm), 0.35% drift
0.42 in (10.7 mm), 0.35% drift
0.58 in (14.7 mm), 0.483% drift
0.58 in (14.7 mm), 0.483% drift
0.82 in (20.8 mm), 0.683% drift
0.82 in (20.8 mm), 0.683% drift

258
Increasing and decreasing the strength of the grout had little effect on the peak
strength of Frame 1 or 2 (See Figure 174). The displacement at peak strength for Frame
1, which had connections on all edges of the infill, was increased 38% by doubling the
compressive strength of the grout. Reducing the grout compressive strength by one-half
resulted in a reduction of the displacement at peak strength of 35% for Frame 1 (See
Figure 175). The displacement at peak strength of Frame 2 was hardly influenced by
increasing or decreasing the grout compressive strength (<7.5% change). The cracking
patterns of the models with different grout strengths were nearly the same as the
experimentally validated finite element models.
Changing the mortar in the models from a type M mortar to a type N mortar
changed the peak strength by less than 2.5% in either frame (See Figure 174). The
displacement at peak strength was greatly increased for Frame 1, increasing 66.8% (See
Figure 175). The displacement at peak strength of Frame 2 increased by only 8.6% (See
Figure 175). Changing the mortar from a type M to a type N delayed the initial cracking
of the masonry for both frames. Ultimately, the delay in initial damage did not
significantly influence the behavior of the frames later in the simulation.
Fully grouting the wall lead to a significant increase in peak strength of both
models. The capacity of Frame 1 increased by 57.7% and the capacity of Frame 2
increased by 60.8% (See Figure 174). Fully grouting the wall decreased the displacement
at peak strength of Frame 1 by 35.5% and decreased the displacement at peak strength of
Frame 2 by 33.6% (See Figure 174). Compared to the baseline models, the cracking of
the frame occurred much earlier and the column cracking was much more extensive. The
infill exhibited very little crushing compared to the baseline models. These trends can be

259
seen from Tables 11 and 12. However, the increased stiffness of the infill walls did not
lead to a brittle failure of the frames. The columns in the models with fully grouted infills
still exhibited combined flexural and shear cracking.
(space left blank intentionally)

260
Table 11: Influence of fully grouting infill wall on the damage sequence for Frame 1 (full
connection) FE Model 1
(baseline) FE Model 1
(fully grouted infill wall)
0.3 in (7.6 mm) , 0.25% drift
0.3 in (7.6 mm), 0.25% drift
0.42 in (10.7 mm), 0.35% drift
0.42 in (10.7 mm), 0.35% drift
0.58 in (14.7 mm), 0.483% drift
0.58 in (14.7 mm), 0.483% drift
0.82 in (20.8 mm), 0.683% drift
0.82 in (20.8 mm), 0.683% drift
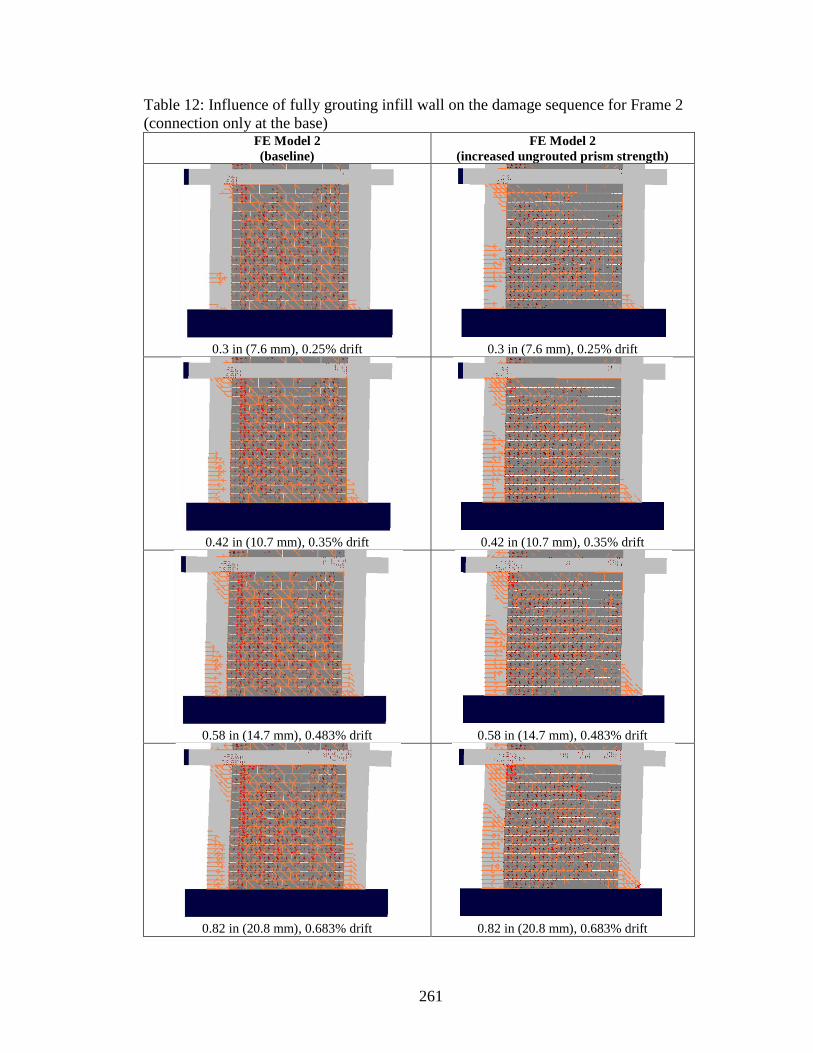
261
Table 12: Influence of fully grouting infill wall on the damage sequence for Frame 2
(connection only at the base) FE Model 2
(baseline) FE Model 2
(increased ungrouted prism strength)
0.3 in (7.6 mm), 0.25% drift
0.3 in (7.6 mm), 0.25% drift
0.42 in (10.7 mm), 0.35% drift
0.42 in (10.7 mm), 0.35% drift
0.58 in (14.7 mm), 0.483% drift
0.58 in (14.7 mm), 0.483% drift
0.82 in (20.8 mm), 0.683% drift
0.82 in (20.8 mm), 0.683% drift
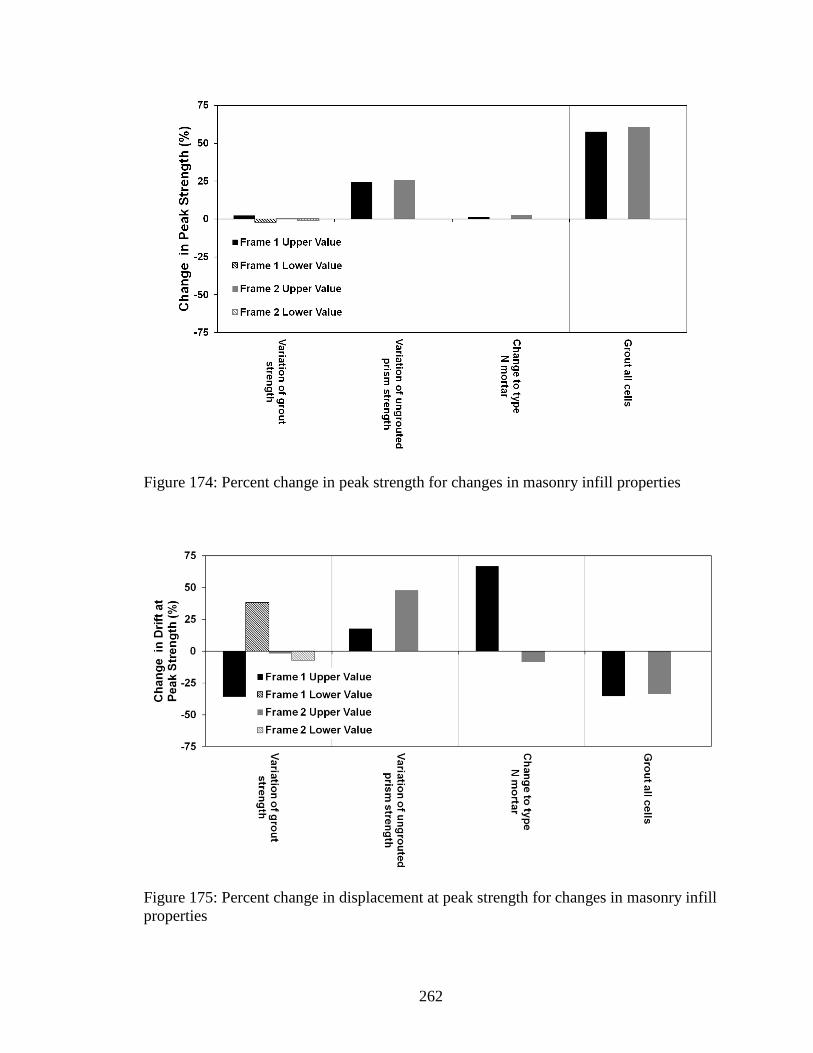
262
Figure 174: Percent change in peak strength for changes in masonry infill properties
Figure 175: Percent change in displacement at peak strength for changes in masonry infill
properties
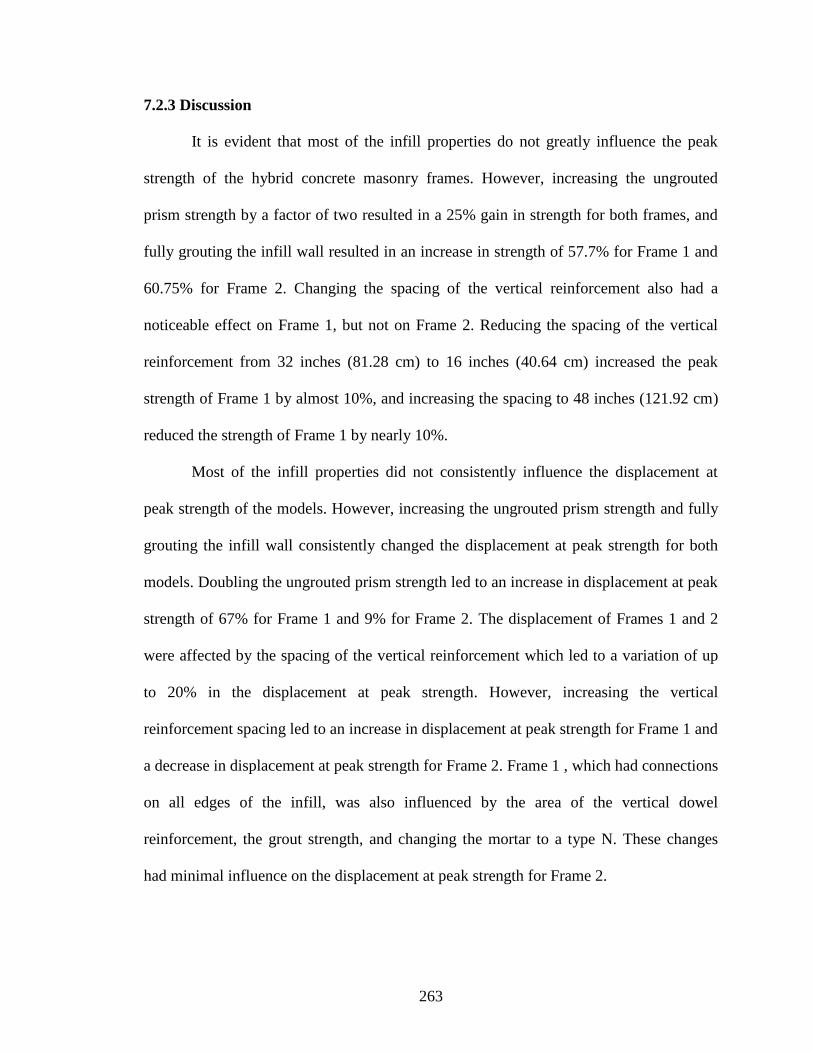
263
7.2.3 Discussion
It is evident that most of the infill properties do not greatly influence the peak
strength of the hybrid concrete masonry frames. However, increasing the ungrouted
prism strength by a factor of two resulted in a 25% gain in strength for both frames, and
fully grouting the infill wall resulted in an increase in strength of 57.7% for Frame 1 and
60.75% for Frame 2. Changing the spacing of the vertical reinforcement also had a
noticeable effect on Frame 1, but not on Frame 2. Reducing the spacing of the vertical
reinforcement from 32 inches (81.28 cm) to 16 inches (40.64 cm) increased the peak
strength of Frame 1 by almost 10%, and increasing the spacing to 48 inches (121.92 cm)
reduced the strength of Frame 1 by nearly 10%.
Most of the infill properties did not consistently influence the displacement at
peak strength of the models. However, increasing the ungrouted prism strength and fully
grouting the infill wall consistently changed the displacement at peak strength for both
models. Doubling the ungrouted prism strength led to an increase in displacement at peak
strength of 67% for Frame 1 and 9% for Frame 2. The displacement of Frames 1 and 2
were affected by the spacing of the vertical reinforcement which led to a variation of up
to 20% in the displacement at peak strength. However, increasing the vertical
reinforcement spacing led to an increase in displacement at peak strength for Frame 1 and
a decrease in displacement at peak strength for Frame 2. Frame 1 , which had connections
on all edges of the infill, was also influenced by the area of the vertical dowel
reinforcement, the grout strength, and changing the mortar to a type N. These changes
had minimal influence on the displacement at peak strength for Frame 2.
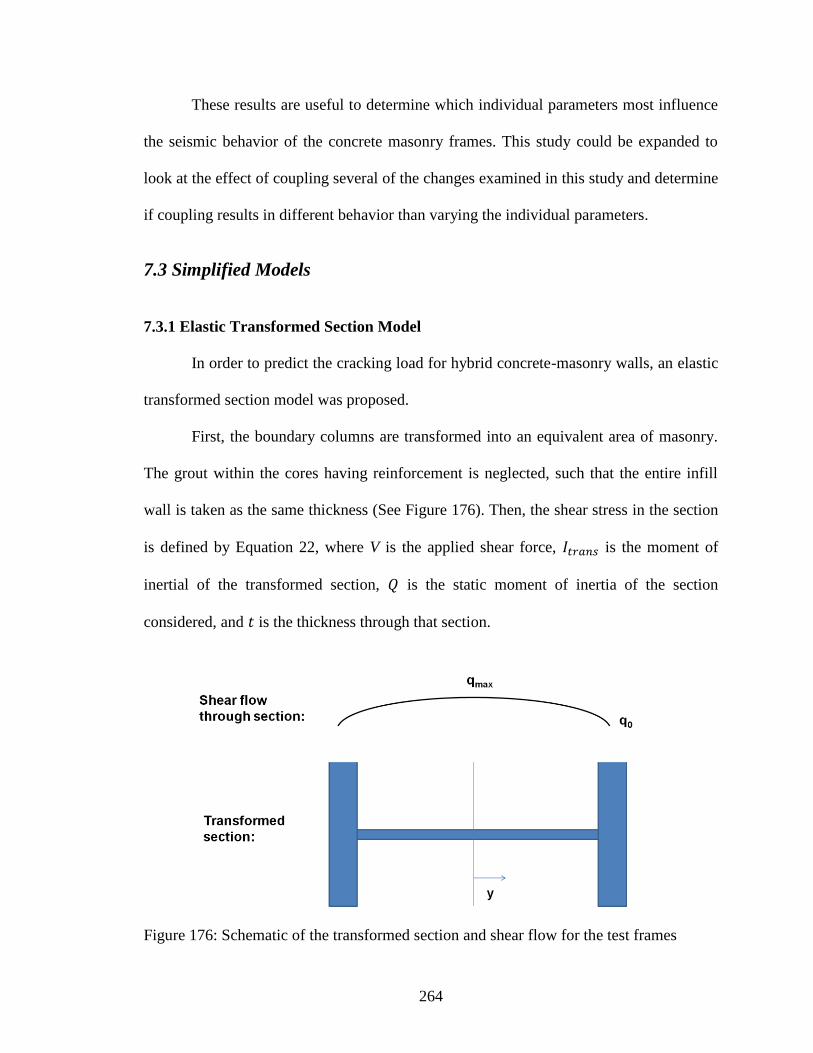
264
These results are useful to determine which individual parameters most influence
the seismic behavior of the concrete masonry frames. This study could be expanded to
look at the effect of coupling several of the changes examined in this study and determine
if coupling results in different behavior than varying the individual parameters.
7.3 Simplified Models
7.3.1 Elastic Transformed Section Model
In order to predict the cracking load for hybrid concrete-masonry walls, an elastic
transformed section model was proposed.
First, the boundary columns are transformed into an equivalent area of masonry.
The grout within the cores having reinforcement is neglected, such that the entire infill
wall is taken as the same thickness (See Figure 176). Then, the shear stress in the section
is defined by Equation 22, where V is the applied shear force, is the moment of
inertial of the transformed section, is the static moment of inertia of the section
considered, and is the thickness through that section.
Figure 176: Schematic of the transformed section and shear flow for the test frames

265
(22)
Taking maximum shear flow to be at the center of the wall, the cracking load
can be solved for by Equation 23. The normal shear stress in the masonry, ,
is taken as the allowable in-plane shear stress for unreinforced masonry from TMS 402-
13 Section 3.2.4. The net area, , is the transformed section area and is the dead
load.
(23)
(24)
This calculation was carried out for the experimental frames and is given in
Appendix E. The cracking load predicted by the transformed section model was 22.27
kips (99.06 kN). The cracking load prediction was the same for both Frame 1 and Frame
2 because this method does not account for the influence of different connection types.
The cracking load predicted by the elastic transformed section method was lower than the
cracking load the finite element models predicted. The Frame 1 finite element model,
which had dowel connections on all edges of the infill, predicted cracking of the infill to
occur at 37.30 kips (165.92 kN) of lateral load. The Frame 2 finite element model, which
had dowel connections only at the base of the infill, predicted the cracking load to be
33.06 kips (147.06 kN). In the experiments, the infill of Frame 1 first cracked at 103.6
kips (460.8 kN) of lateral load and the infill of Frame 2 cracked at 30.8 kips (137.0 kN)
of lateral load.
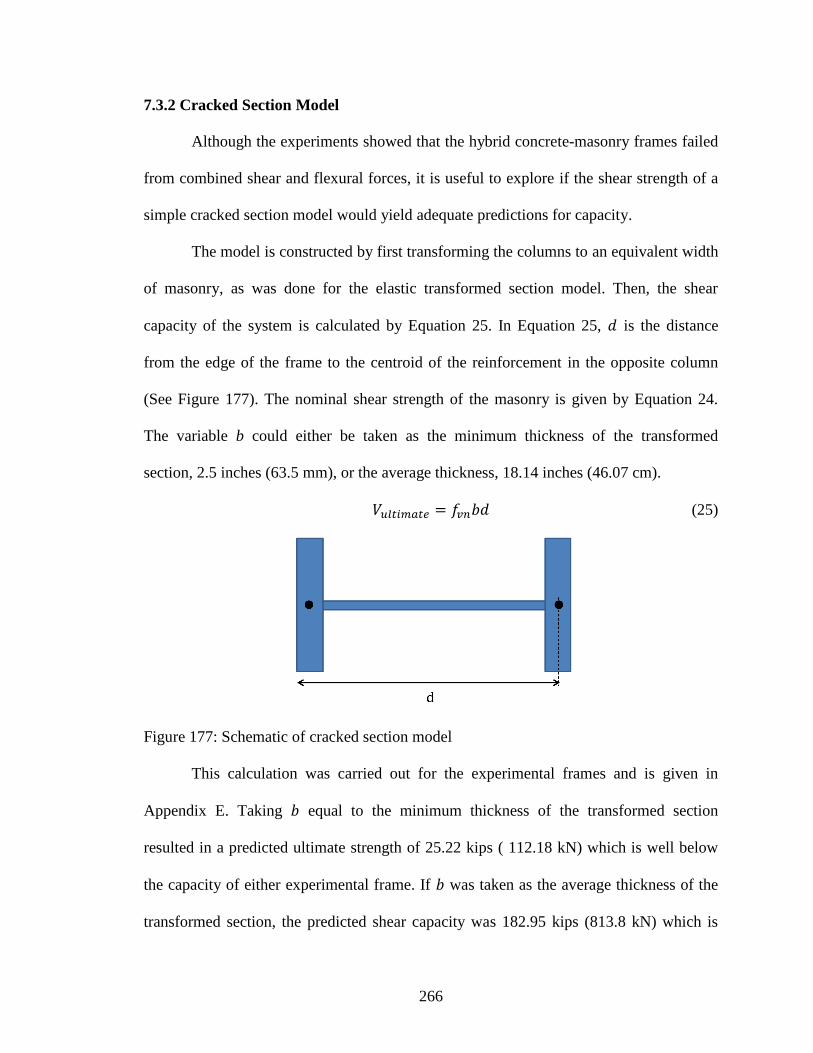
266
7.3.2 Cracked Section Model
Although the experiments showed that the hybrid concrete-masonry frames failed
from combined shear and flexural forces, it is useful to explore if the shear strength of a
simple cracked section model would yield adequate predictions for capacity.
The model is constructed by first transforming the columns to an equivalent width
of masonry, as was done for the elastic transformed section model. Then, the shear
capacity of the system is calculated by Equation 25. In Equation 25, is the distance
from the edge of the frame to the centroid of the reinforcement in the opposite column
(See Figure 177). The nominal shear strength of the masonry is given by Equation 24.
The variable b could either be taken as the minimum thickness of the transformed
section, 2.5 inches (63.5 mm), or the average thickness, 18.14 inches (46.07 cm).
(25)
Figure 177: Schematic of cracked section model
This calculation was carried out for the experimental frames and is given in
Appendix E. Taking equal to the minimum thickness of the transformed section
resulted in a predicted ultimate strength of 25.22 kips ( 112.18 kN) which is well below
the capacity of either experimental frame. If was taken as the average thickness of the
transformed section, the predicted shear capacity was 182.95 kips (813.8 kN) which is

267
7.2% less than the capacity of Frame 1and 3.2% less than the capacity of Frame 2. The
cracked section model may be an appropriate model for predicting the peak capacity of
hybrid concrete-masonry structures provided is taken as the average thickness of the
transformed section.
7.3.3 Modification of TMS 402 Strut Model for Infills with Connections
A modification to the TMS 402 strut procedure for partially grouted reinforced
infill with cast-in-place connections was proposed in order to capture the mechanisms
observed during the experiments.
To construct the model, the bottom node of the compression strut is assumed to be
attached to the column at the mid height of the dowel splice at the base of the masonry
wall. The strut is assumed to only bear on the column, at a distance equal to
.
The angle and dimension of the strut are solved for iteratively, using Equations B-1 and
B-2 in the TMS 402-13 code, assuming the ungrouted masonry properties for and
.
For the frames tested, this yielded an equivalent strut width of 23.74 inches (60.3
cm) and a strut angle of 42.48⁰. The calculated strut is shown over the cracking patterns
of the frames at the 0.82 inch (20.8 mm) amplitude cycles in Figure 178.

268
(a) Proposed Strut in Experimental Frame 1
(full connection)
(b) Initial Strut in Experimental Frame 2
(connection only at the base)
Figure 178: Proposed strut overlaid on experimental frames at 0.82in (20.8 mm) lateral
displacement (0.683% drift)
Using the proposed methodology, the bounding column is now divided into three
separate members: the shear critical region above the strut node, the shear critical region
below the strut node, and the middle region. TMS 402-13 Appendix B requires that the
columns and beams of the bounding frame be designed for 1.1 times the forces resulting
from an elastic analysis with the equivalent struts. In addition, the shear in the columns
and the beams must be augmented by the horizontal and vertical components of the
compression force in the masonry strut. With the proposed methodology, the shear forces
in top and bottom segments of the columns already include the horizontal component of
the masonry compression strut, and only need to be amplified by the design factor of 1.1.
The middle segment of the column and the beam must be amplified by the suggested 1.1
factor and augmented with the components of the force in the masonry strut. It is
suggested that the segments of the columns be detailed as three separate members,
following the seismic detailing ACI 318. Such detailing would ensure close tie spacing

269
within a distance on either side of the node where the compression strut is assumed to
bear on the column.
The stiffness prediction for the experimental frames using a traditional elastic
strut analysis with ungrouted masonry properties and the newly proposed strut analysis
were very similar. The model using the proposed methodology had a stiffness that was
approximately 8% lower than the traditional strut and tie analysis. Both models were very
close to the initial stiffness of Frame 1, which had connections on all edges of the
masonry wall. The newly proposed model was within 30% of the initial stiffness and the
traditional model was within 40%. The newly proposed model overestimated the stiffness
of Frame 2, which had connections only at the base, by 96% and the traditional strut
model overestimated initial stiffness of Frame 2 by 112%. Both strut models were closer
to the initial stiffness of the frames than the finite element models, which overestimated
initial stiffness by 113 % for Frame 1 and 214% for Frame 2. However, the finite element
models are still useful, since the strut models are elastic and cannot give predictions for
peak strength or displacement at peak strength, which were very closely predicted by the
finite element models.
The major difference between the traditional strut model and the proposed
modification was the force distribution on the columns. The shear forces on the columns
and beams as well as the compression force in the masonry strut of both models are
shown in Figure 179a and b for a 100 kip lateral load. Once the shear forces are amplified
by the 1.1 design factor and augmented by the components of the compression strut, the
design forces are essentially the same between the two models (See Figure 179 c and d).
However, treating the column as three separate members as suggested in the proposed
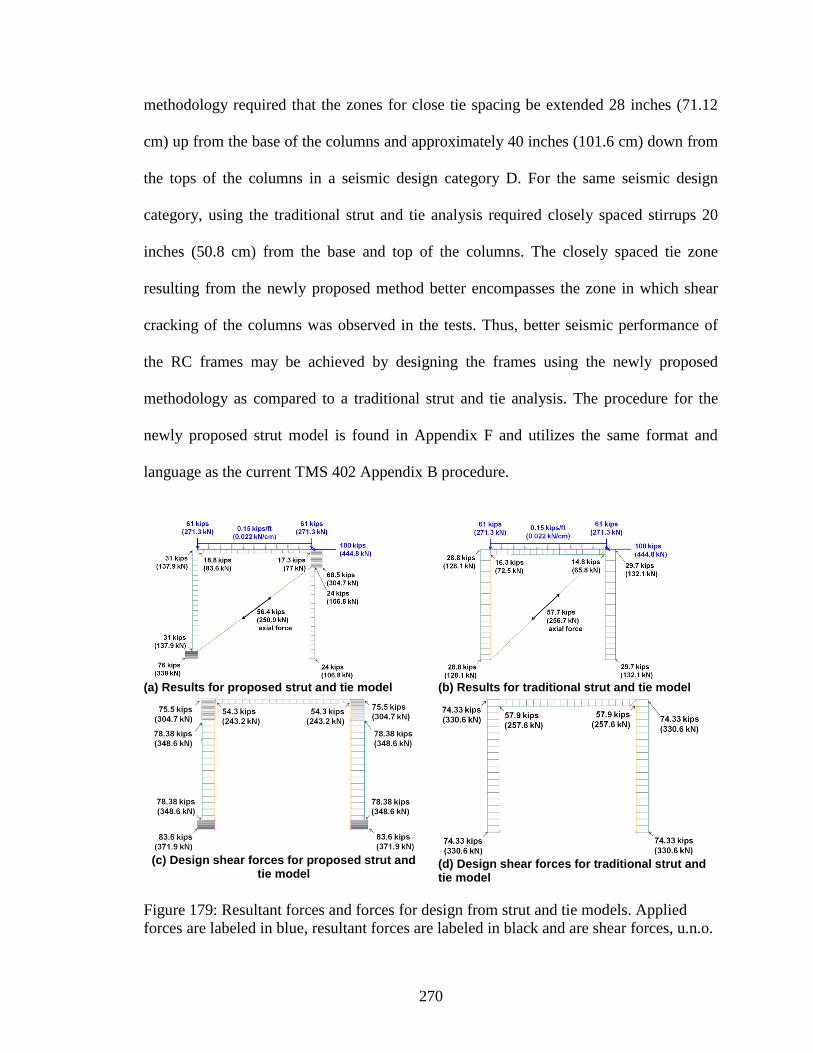
270
methodology required that the zones for close tie spacing be extended 28 inches (71.12
cm) up from the base of the columns and approximately 40 inches (101.6 cm) down from
the tops of the columns in a seismic design category D. For the same seismic design
category, using the traditional strut and tie analysis required closely spaced stirrups 20
inches (50.8 cm) from the base and top of the columns. The closely spaced tie zone
resulting from the newly proposed method better encompasses the zone in which shear
cracking of the columns was observed in the tests. Thus, better seismic performance of
the RC frames may be achieved by designing the frames using the newly proposed
methodology as compared to a traditional strut and tie analysis. The procedure for the
newly proposed strut model is found in Appendix F and utilizes the same format and
language as the current TMS 402 Appendix B procedure.
(a) Results for proposed strut and tie model
(b) Results for traditional strut and tie model
(c) Design shear forces for proposed strut and
tie model
(d) Design shear forces for traditional strut and tie model
Figure 179: Resultant forces and forces for design from strut and tie models. Applied
forces are labeled in blue, resultant forces are labeled in black and are shear forces, u.n.o.

271
7.4 Chapter Summary
The analytical studies using the experimentally validated finite element models
revealed several important characteristics of hybrid concrete masonry structures. First,
the force-displacement behavior of hybrid concrete-masonry frames with infill walls
connected on all edges appear to behave the same as frames with infills connected to the
RC frame at the top and bottom only. This analytical result reinforces the experimentally
obtained conclusion that the horizontal dowel reinforcement has little influence over the
global behavior of the frame and is consistent with other studies in the literature on dowel
connections for infill retrofitting schemes (Kyriakides 2011). Likewise, hybrid concrete-
masonry frames with infills connected only at the base exhibit the same force-
displacement behavior as frames with infill walls which are not connected to the
bounding frame.
Increasing the shear critical zone in the bounding columns of the frames did not
appear to have any significant influence on the force-displacement behavior. The
parametric studies on changes to the infill properties revealed that only increasing the
ungrouted prism strength and grouting all cells within the infill wall significantly affected
the capacity of both frames. As the ungrouted prism strength was increased by a factor of
2, the strength of the frames increased by 25%. Fully grouting the infill wall while
maintaining the same grout strength as the experimental frames led to an increase in
capacity of around 60% for both frames. Most of the infill properties did not consistently
influence the displacement at peak strength of the models. However, doubling the
ungrouted prism strength increased the displacement at peak strength by 17.8% for Frame
1 and 47.9% for Frame 2. Fully grouting the infill wall while maintaining the same grout

272
strength as the experimental frames led to a decrease in the displacement at peak strength
of 35.5% for Frame 1 and 33.6% for Frame 2.
The Frame 1 model, which had connections on all edges of the infill, appeared
more sensitive to changes in the infill properties than Frame 2, which only had
connections at the base. An increase of about 10% lateral capacity was observed in Frame
1 by decreasing the spacing of the vertical masonry reinforcement. The displacement of
Frame 1 was also influenced by the area of the vertical dowel reinforcement, the grout
strength, and changing the mortar to a type N.
It is important to note that the models used for the experimental studies are 2D
and do not capture out-of-plane effects. The experiments demonstrated the advantage of
connections at the top of the masonry infill to prevent out-of-plane failure of the infill. It
is also important to note that the parametric studies looked at the influence of single
parameter variation on the behavior of the models. Future work may include expanding
the study to look at the influence of parameters as they are coupled. For example, fully
grouting the infill wall did not lead to brittle failure of Frame 1 or 2, but fully grouting
the infill wall while increasing the grout strength may lead to brittle failure.
Several simplified approaches were presented for modeling hybrid concrete
masonry walls. The elastic transformed section method predicted initial cracking loads
which were lower than the finite element model predictions and the experimental data. As
a result, it may be a useful design tool because the approach is conservative. The elastic
transformed section model predicted a cracking load which was 40% less than the
cracking load of the Frame 1 finite element model and 78% lower than experimental
Frame 1. The predicted cracking load from the elastic transformed section model was
273
33% lower than the Frame 2 finite element model and 28% lower than the experimentally
recorded value. The elastic transformed section method could be improved by
incorporating the delay in cracking due to the connections of the infill to the bounding
frame.
The cracked section model resulted in very close predictions for the peak
capacities of the experimental frames, provided that the width was taken as the average
of the width of the hybrid-concrete masonry wall (See Section 7.3.2). The prediction for
peak strength was conservative and within 8% of the experimentally recorded strengths
for both frames. However, given the small margin on this prediction, more experimental
studies should be conducted to determine rather this equation is adequate.
Most importantly, the proposed modification to the TMS 402 strut model for
hybrid concrete-masonry frames gave a closer match to the initial stiffness of the frames
than the finite element models. Compared to a traditional TMS 402 strut model, the
design forces in the proposed model were nearly identical, but the predictions for initial
stiffness were slightly lower. In addition, the new methodology ensures close tie spacing
within a distance on either side of the node where the compression strut is assumed to
bear on the column.

274
CHAPTER 8
SUMMARY, CONCLUSIONS, AND RECCOMENDATIONS
The focus of this study was the seismic performance, analysis and design of
Caribbean hybrid concrete-masonry structures. Although few studies have been done on
reinforced masonry infill, hybrid concrete-masonry structures are unique because the
masonry is only partially grouted and reinforced because the masonry infill contains
various types of connections to the reinforced concrete frame.
The aim of the experimental study was to conduct full-scale tests which would
give insight into the seismic performance of hybrid concrete-masonry and provide
validation for finite element models. The purpose of the analytical work was to develop
high-fidelity finite element models which could be used to assess the effect of design
changes to the masonry infill. Several simplified models also were proposed as part of the
analytical work which could be incorporated into engineering models for design. Both the
proposed calibration method for the shear and tensile behavior of mortared bed joints of
concrete masonry units with grouted cells and the proposed modification of the TMS 402
equivalent strut equation for infills with connections have significant applications beyond
Caribbean structures.
In this section, a brief summary of the experimental and analytical work is
presented along with the major conclusions which resulted from this research.
Recommendations on the construction and design of hybrid concrete masonry are given
based on the experimental and analytical results; and the significance of the findings is
presented. Areas for future work are identified.
275
8.1 Summary of Experimental Work
Two full-scale test specimens were constructed to model frames of the exterior,
bottom floor of a five-story office building in Trinidad. The RC frames were seismically
detailed and had partially grouted and reinforced masonry infill. Frame 1 had cast-in-
place dowel connections extending from the foundation into the grouted cells, from the
columns into the reinforced bed joints and from the beam extending down into grouted
cells. Frame 2 only had dowel connections extending from the foundation into the
grouted cells of the infill wall. The material properties for the concrete in the RC frame,
reinforcement, masonry units, mortar and weak concrete for the grouted cells were kept
within typical ranges based on responses from engineers in the Caribbean. The seismic
performance of the two frames was assessed with cyclic testing. Both frames failed at
similar loads and drift levels, exhibiting a compression strut mechanism in the masonry
and combined flexural and shear cracking in the columns of the bounding frame.
8.2 Conclusions from the Experimental work
Several major conclusions resulted from the experimental program:
The failure mechanism, peak strength and displacement at peak strength were
very similar between the two test frames, even though they had different
connections from the infill to the RC frame. However, the connections at the top
of the infill in Frame 1 prevented the out-of-plane failure of the masonry which
was evident in Frame 2 at drift levels over 1.5%. (See Section 6.1.1 and 6.1.2).
The experimental test frames achieved about twice the analytically predicted peak
strength of a seismically-detailed RC frame, but the infilled frames achieved peak
276
strength at a drift level which was about one-half that of the plain moment frame.
(See Section 6.1.1).
The cracking patterns, strain gage data and shear deformations in the infills and
the RC frame indicated the typical strut mechanism observed in unreinforced
masonry infill structures was altered due to the vertical connections from the
reinforced concrete frame to the grouted cores of the masonry infill. In both
frames, the initial shear/bearing area for the wall onto the frame was through the
stiffened zone at the base of the masonry wall through the height of the cast-in-
place dowels. As the tests progressed, the node for the masonry strut was on the
column at a height approximately one course up from the bottom of the wall. (See
Section 6.2).
8.3 Summary of Analytical Work
The work proposed a meshing scheme for hybrid concrete masonry structures
which has the flexibility to model truss and bond beam reinforcement and explicitly
accounts for the contribution of vertical reinforcement to the shear capacity of mortared
bed joints with grouted cores. Because many of the materials tests needed to calibrate the
model are difficult to conduct, an alternative calibration method was proposed to
calculate shear and tensile properties of bed joints with grouted cores as a function of the
compressive strength of the grout core ( ). The triplet tests and bond wrench tests
conducted on samples of grouted masonry validate the proposed methodology for
calculating shear and tensile properties of the bed joints with grouted cores as a function
of the grout compressive strength ( ).

277
The finite element models utilized the proposed modeling scheme and predicted
the behavior of the hybrid concrete-masonry frames. The models gave very close
predictions for peak strength and the displacement at peak strength, which were within
10% of the experimental capacity and 21% of the displacement values for both frames.
The finite element models were then refined, based on the experiments to give more
precise cracking patterns in the masonry infill and to improve the match between the drift
levels predicted by the models and the drift of the experimental frames when the masonry
wall-to-RC frame interfaces cracked. The refined finite element models were then used to
conduct analytical studies on the effect of changing the detailing of the RC frame, the
connections of the infill to the RC frame, and the properties of the masonry infill and
masonry reinforcement.
Three different simplified models were proposed to determine the cracking load,
peak strength and elastic force-displacement behavior of the hybrid concrete-masonry
frames. The cracking load is determined based on an elastic transformed section model.
The peak strength was determined using a cracked section model. Finally, a modification
of the TMS 402 equivalent strut model was proposed for masonry infills with
connections to the RC frame. This model gave a better match to the initial stiffness of the
frames than the finite element models.
8.4 Conclusions from the Analytical Work
Several major conclusions resulted from the analytical work:
The proposed methodology to predict the bond strength, shear friction factor, and
cohesion of bed joints with grouted cores as a function of the compressive

278
strength of the components was validated with triplet tests and bond wrench tests.
(See Section 4.2.2).
The constitutive finite element model was shown to neglect the shear contribution
of the vertical reinforcement across the bed joint via dowel action. This effect was
accounted for in the newly proposed model by using a pair of discrete truss
elements. (See Section 4.2.4).
A high degree of confidence can be placed in the finite element models, since
they were able to predict the cracking patterns observed in the experiments and
predict the peak force within 2% of the experimentally recorded strength for
Frame 1 and within 10% of Frame 2. The drift at peak strength of the model of
Frame 1 was within 2% of the drift at peak strength of experimental Frame 1 and
the drift at peak strength of the model of Frame 2 was within 20% of the
experimentally recorded drift. (See Section 6.1.1.3).
Analytical studies varying the type of connection of the infill to the RC frame
showed that frames with no connections and frames with connections only at the
base have very similar force-displacement behavior. Likewise, frames with
connections on all edges and frames with connections only at the top and bottom
of the masonry wall behave the same. (See Section 7.1.1).
The parametric study on infill properties revealed that only increasing the strength
of the ungrouted masonry units and fully grouting the infill walls significantly
influenced the peak strength and displacement at peak strength for both frames.
When the ungrouted prism strength was doubled, the peak strength increased by
approximately 25% for both Frame 1 and Frame 2. Doubling the ungrouted prism

279
strength also increased the drift at peak strength for both frames (67% increase for
Frame 1 and 9% increase for Frame 2). When the infill wall was fully grouted, the
capacity of Frame 1 increased by 57.7% and the capacity of Frame 2 increased by
60.8%. Fully grouting the infill wall decreased the displacement at peak strength
of Frame 1 by 35.5% and decreased the displacement at peak strength of Frame 2
by 33.6%. (See Section 7.2).
The parametric study revealed that Frame 1 with connections on all edges of the
masonry was much more sensitive to changes in the masonry infill properties than
Frame 2, which had connections only at the base. Decreasing the spacing of the
vertical reinforcement by half increases the peak strength of Frame 1 by almost
10%. All other changes to the infill properties resulted in a change in the peak
strength of less than 10%. The displacement at peak strength for Frame 1 was
reduced by the decreasing the spacing of the vertical reinforcement, increased by
increasing the area of the vertical dowel reinforcement, decreased by increasing
the grout strength, and increased by changing the mortar to a type N. (See Section
7.2).
The elastic transformed section model yielded predictions for cracking loads
which were less than the cracking loads in both experiments and the predictions
of the finite element models. However, it may still be a useful design tool because
the approach is simple and conservative. (See Section 7.3.1).
The cracked section model resulted in very close predictions for the peak
capacities of the experimental frames, provided that the width b is taken as the
average of the width of the hybrid-concrete masonry wall. (See Section 7.3.2).
280
The proposed modification of the TMS 402 strut model for hybrid concrete-
masonry frames gives a closer match to the initial stiffness of the frames than the
finite element models. Compared to a traditional TMS 402 strut model, the design
forces in the proposed model are nearly identical, but the predictions for initial
stiffness are slightly lower. In addition, the new methodology ensures close tie
spacing within a distance on either side of the node where the compression strut
is assumed to bear on the column. (See Section 7.3.3).
8.5 Recommendations
The conclusions from the experimental and analytical work lead to
recommendations for the design and detailing of Caribbean-style hybrid concrete-
masonry frames. Caution should be used against extending these conclusions to masonry
infill with ungrouted prism strengths greater than 1400 psi (9.65 MPa) or infills with
heavy reinforcement, as stronger infills may lead to more brittle behavior and higher
shear stresses in the columns of the bounding frames. Parametric studies were performed
which indicate that the behavior of the frames remained somewhat ductile, failing in
combined flexure and shear when changes in any one of the relevant parameters
(reinforcement areas, spacing and the strength of the masonry) occur. However, these
results have not been validated with experiments, and combining several changes to the
infill design may lead to a more brittle and undesirable failure mechanism.
The most efficient use of steel for hybrid concrete-masonry structures with
seismically detailed RC frames is to partially reinforce the wall only in the vertical
direction and to connect the masonry infill to the foundation and the beam with cast-in-
place dowel reinforcement. Lightly reinforced, partially grouted masonry with
281
connections at the top and bottom of the masonry wall have increased capacity compared
to infills without connections. They also prevent out-of-plane collapse of the wall and do
not significantly influence the ductility of the frame. In these experiments, the horizontal
reinforcement placed down the center of the bed joint had little effect on the behavior of
the frame.
The partially grouted reinforced infill connected to the bounding frame may be
accounted for in engineering models using the proposed modification of the strut model
for infill frames TMS 402. This procedure will lead to close tie spacing within a distance
on either side of the node where the compression strut is assumed to bear on the
column. Close tie spacing near the bearing zone of the compression strut reduces the
chances of shear failures in these zones.
The experimental work also leads to several recommendations specific to
Caribbean construction practices. First, the aggregate in the concrete of the grouted cores
may lead to voids in the cores if they are not consolidated properly. No issues with voids
or settlement were observed in the experimental frames which were filled with concrete
and tamped with a rod every three courses. Using a standard grout with aggregate size
less th n ⅜-in. (10 mm) would reduce the possibility of voids in the grouted cores.
Second, poor bond strength was observed between the Caribbean-style mortar (3 parts
sand to 1 part Portland cement) and the concrete masonry units (See Appendix B). Using
a Type N mortar, which contains lime, would increase the bond strength of the bed joints.
Third, the single # 3 bar placed in the center of the masonry bed joint led to splitting of
the unit and did not significantly contribute to the lateral capacity of the infill wall (p.
215, Section 6.1.3.2). Using wire ladder joint reinforcement or deformed wired placed in
282
the mortar along the face shell of the masonry unit will prevent the bar from splitting the
unit as it is compressed. Smaller reinforcement placed in the mortar is also more likely to
contribute to the lateral capacity of the infill as the reinforcement is continuously bonded
to the masonry.
The analytical models for the shear and tensile capacity of mortared bed joints
with grouted cores and the results of the small tests on masonry assemblies led to several
recommendations for modeling grouted masonry. The shear friction factor and tensile
bond strength of grouted masonry appear to be significantly greater than ungrouted
masonry. The cohesion of grouted masonry is only marginally greater than ungrouted
masonry. These trends were confirmed by the assembly tests (Section 4.4.3) and data
from the literature (Section 4.2.3.2). The equations proposed in Section 4.2.3.2 can be
used to approximate these properties based on the compressive strength of the grout core.
8.6 Significance
This work contained several significant contributions. First, the experimental
program characterized the seismic behavior of hybrid concrete-masonry frames and
showed they do not exhibit the typical strut mechanism observed in unreinforced
masonry infill structures. Second, a detailed finite element modeling scheme and
calibration methodology was developed for modeling partially grouted masonry. This
model includes a novel calibration method to account for the difference in the shear and
tensile behavior of mortared bed joints with and without grouted cores, and a method to
account for the contribution of vertical reinforcement to the shear capacity of the bed
joints with grouted cores. Neither phenomenon was incorporated into previous finite
element modeling schemes. Third, simplified models were proposed for use in

283
engineering design. The modification of the TMS 402 strut model for hybrid concrete-
masonry could be used in large models to incorporate the effects of the masonry infill and
connections. This was identified as one of the primary desires of engineers in the
Caribbean, who struggled to reconcile their local construction methods with typical
seismic design code procedures
This work clearly has significance to the local engineers in the Caribbean, who
can use the results of the experimental and analytical studies, recommendations for
seismic detailing, and simplified models to expand upon their existing design methods.
However, the work also lends itself to several applications beyond Caribbean-style hybrid
concrete-masonry structures. First, the data from the grouted masonry triplets and bond
wrench specimens indicate shear friction factor and tensile strength of bed joints with
grouted cores are significantly greater than ungrouted masonry, while cohesion of bed
joints with grouted cores are only marginally greater than ungrouted masonry. Equations
to determine the shear friction, cohesion and bond strength of masonry bed joints with
grouted cores were also developed. If the proposed equations were incorporated in the
TMS 402 code, their use could lead to a reduction in the shear reinforcement required in
reinforced masonry walls. Second, the proposed modification of the TMS 402 strut model
for infill frames with connections would encourage the use of such connections. The
experiments verified that the connections improved the out-of-plane behavior of the
masonry infill. The current TMS 402 code allows for out-of-plane restraints, but they
must be designed to avoid the transfer of in plane loads. An modification of the TMS 402
code like the one suggested in this research would allow for simple out-of-plane restraints
which do not have to be designed to prevent in-plane load transfer.

284
8.7 Future Work
The following areas are identified which could build upon the results of this
study:
More experimental tests of grouted masonry triplets and bond wrench specimens
with varying grout mixes and unit strengths could be conducted to refine the
formulas proposed in Chapter 5 for possible adaptation into the TMS 402 code.
More extensive parametric studies on the seismic performance of hybrid concrete-
masonry structures, examining the effect of simultaneously combining several
design changes to the masonry infill and connections could be conducted. It is
possible that the trends of the variation in individual parameters compound when
multiple changes are considered, or some combination may lead to a significantly
different failure mechanism than observed in the experiment.
Additional experiments on masonry infill structures with cast-in-place dowel
connections to the RC frames would be useful to validate or refine the proposed
modification of the TMS 402 strut model. If the finite element modeling scheme
and material calibration proposed in this work gives close predictions for the
seismic performance of other experimental frames, the models can be used to
generate many different frames to validate the simplified model.

285
APPENDIX A
NOTES FROM SITE VISITS TO THE CARIBBEAN
Table 13: Material and construction data gathered from site visits to the Caribbean
COMPANY INFORMATION MATERIAL DATA
ADDITIONAL NOTES
REGARDING
CONSTRUCTION PRACTICES
Company
Number*
Company
Location Company Type Concrete
Concrete
Masonry Units
(CMU)
Grout Mortar Rebar
1 Belize Construction
w/c ratios of 0.4 to
0.6
Course aggregate:
limestone
Fines: natural sand
remove anything
less than 200mm
MSA: 3/4in and
larger is used
28 day strength:
3500psi
1 day strength:
650psi
standard 8in units
- - - -
2 Belize Construction
Limestone
aggregate
3/4in MSA
- - - - -
3 Belize Design
3500psi
compressive
strength typical.
3/8in MSA
1000psi specified
minimum
compressive
strength
2000psi
compressive
strength
specified by
cylinder testing
(but not always
done)
"Grout" is
actually weak
concrete, 3/8in
MSA
Face shells and
webs are
mortared
1:3 Portland
cement to sand
no lime
Masonry horizontal rebar
is one number 3 bar just
placed in mortar, straight
connections into the
columns
Masonry vertical rebar is
one number 5 bar placed
in a grouted cell, 2' on
center. The vertical bars
typically have a "starter"
bar with a splice length of
CMU blocks are laid first with rebar
protruding into the spaces where
columns and beams are poured.
Grout is poured in after about the
fifth or sixth course. Vibrators are
usually not used in grout, but a
piece of rebar is used to "rod" it
down.

286
~20-30in then the bar is
continuous for the wall
height
4 Jamaica Concrete and
Ready Mix
Type 1 and 1P
(p=local local
pozzolanic
volcanic ash)
MSA:3/4in(most
popular), 3/8in also
produced
Use masonry sand
and construction
sand (ASTM)
3000psi cylinder
strength
- - - -
7day removal of forms for 1P
cement
Cement may often be too hot when
poured as warm weather pours are
typical
5 Jamaica Design
limestone
aggregate
3000psi 28 day
strength
6in hollow units
1000-1200 psi
compressive
strength
concrete used as
grout 2500-2600
psi compressive
strength, 4in
slump
Face shells and
webs are
mortared
1:3 Portland
cement to sand
no lime
Masonry reinforcement:
1/2in rebar at 18incrs
vertically and 3/8in rebar
every three block height
horizontally placed at
center. Vertical and
horizontal bars are
doweled into the frame
(see construction
practices)
Splice lengths are usually
taken from ACI 318 or
about 30*bar diameter
Usually limit to one or
two splices per wall.
All reinforcement:
deformed bars
60 and 40 ksi is common
The vertical and horizontal bars are
dowelled about 4 to 6 inches into
the column and beam frame. Cast-
in-place with a 90 degree bend. (or
in some cases drilled and epoxied
into the frame) In some instances a
rubberized sealant is placed to
create a joint. In other instances it
buts against the frame and filled
with mortar. (splices within the wall
are typically 30*db)
Not typically vibrated they are
usually just rodded, but more
contractors are now using the
vibrators.
At the top of the wall, the face shell
of the masonry must be knocked out
in order to place over the dowel bar
and permit grouting.
6 Jamaica Design - - - - block masonry every other
core filled with rebar -
7 Trinidad Concrete and
Ready Mix
Compression
Strength (2ksi) - - - - -

287
residential, 30MPa
3-7story (4.35ksi)
MSA: 10mm or
20mm depending
on design
FM: 2.8-3.1
w/c: 0.36-0.59 with
plasticizer, 0.59-
0.7 without
Type IP cement
quartz or mix of
limestone and
quartz
(25% pozzolans)
2% air content
8 Trinidad CMU producer
190x190x390mm
(8in block
equivalent)
mortar grooves
1 day
strength=6MPa,
7day strength=
13MPa
9 Trinidad CMU producer
standard 8in,6in
and 4in block
(8x8x16 most
common)
mortar grooves
f'c=11.7MPa
3:1 sand
cement, no lime
common to use caster bars, and fill
with grout every 3-5 blocks
10 Trinidad Design
30MPa
compressive
strength most
common
MSA 30mm, but
20 or 10 have been
specified for some
projects
15MPa
compressive
strength
Grout with same
concrete as
frame (watered
down)
Use a powder
product
(CEMEX 100
is common
throughout the
island), it is
Portland
cement based,
often just
mixed "by eye"
Masonry Rebar: first
placed in foundation and
in columns (cast-in-place
connections)
Follow ACI 318 for splice
lengths
Vertical rebar is one T12
bar every other core
(grouted)
Horizontal rebar is one
10mm bar at the center of
Only shear walls are connected both
to the columns and the beams.
Construction sequence: pour frame,
wait 12 hours, take off form work
and begin constructing wall. The
shear walls are grouted every 4
courses (wait 1 day between lifts)
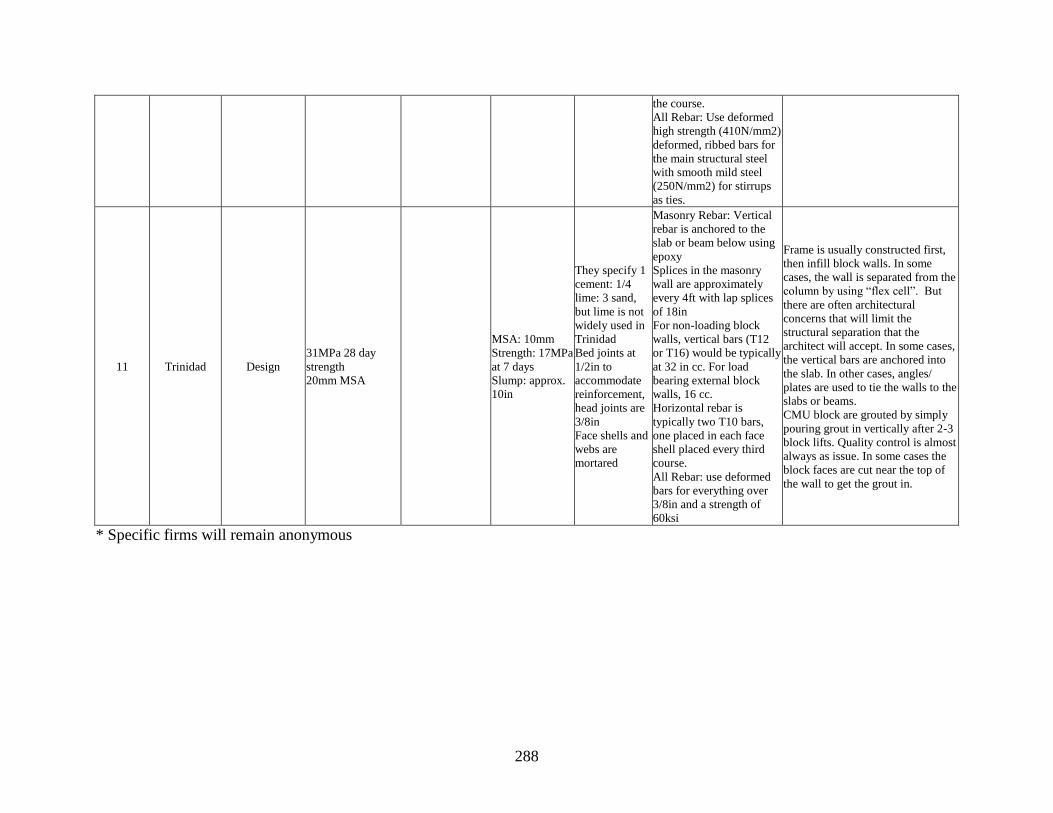
288
the course.
All Rebar: Use deformed
high strength (410N/mm2)
deformed, ribbed bars for
the main structural steel
with smooth mild steel
(250N/mm2) for stirrups
as ties.
11 Trinidad Design
31MPa 28 day
strength
20mm MSA
MSA: 10mm
Strength: 17MPa
at 7 days
Slump: approx.
10in
They specify 1
cement: 1/4
lime: 3 sand,
but lime is not
widely used in
Trinidad
Bed joints at
1/2in to
accommodate
reinforcement,
head joints are
3/8in
Face shells and
webs are
mortared
Masonry Rebar: Vertical
rebar is anchored to the
slab or beam below using
epoxy
Splices in the masonry
wall are approximately
every 4ft with lap splices
of 18in
For non-loading block
walls, vertical bars (T12
or T16) would be typically
at 32 in cc. For load
bearing external block
walls, 16 cc.
Horizontal rebar is
typically two T10 bars,
one placed in each face
shell placed every third
course.
All Rebar: use deformed
bars for everything over
3/8in and a strength of
60ksi
Frame is usually constructed first,
then infill block walls. In some
cases, the wall is separated from the
olumn by using “flex ell”. But
there are often architectural
concerns that will limit the
structural separation that the
architect will accept. In some cases,
the vertical bars are anchored into
the slab. In other cases, angles/
plates are used to tie the walls to the
slabs or beams.
CMU block are grouted by simply
pouring grout in vertically after 2-3
block lifts. Quality control is almost
always as issue. In some cases the
block faces are cut near the top of
the wall to get the grout in.
* Specific firms will remain anonymous

289
Table 14: Notes regarding Caribbean design practices
COMPANY INFORMATION NOTES REGARDING DESIGN PRACTICES
Company
Number*
Company
Location
Company
Type
3 Belize Design
The predominate feeling in Belize is that most of their buildings are short (5 or fewer stories)
and regular in plan and elevation, so earthquake design is not taken into account at all, but
seismic details are included. They do not have seismic maps of their own, and when the
building is irregular or the customer asks specifically for seismic design they use spectral maps
from Florida or Guatemala.
When earthquake forces are considered, there is uncertainty about the percent of lateral forces
taken by the frame system and the masonry wall. Common design practice is to model the RC
frame and apply some % of lateral forces then design the wall for the rest. The R values
selected for earthquake design (when it is considered) are those for moment frames.
The types of models used for design are typically 2D and do not include P-delta effects or
eccentricity. The masonry is accounted for as a cladding load.
Soils are highly variable and there is no formal soil testing in Belize. As a consequence,
foundation piles are sometimes driven which literally disappear, and a second is placed down
on top. Foundations are sized for the building without account for the expected friction of the
soil and engineers do not have the design parameters needed to do a proper foundation design.
5 Jamaica Design
Steel structures are rarely used, only sometimes for commercial facilities. The foundations
mainly consist of strip foundation. 3D models are to analyze their structures. For earthquake
design, two directional forces are taken. A shear wall design is done with STAAD to account
for the masonry infill. The lateral pressure on the reinforced masonry and a torsion check are
done by hand calculations.
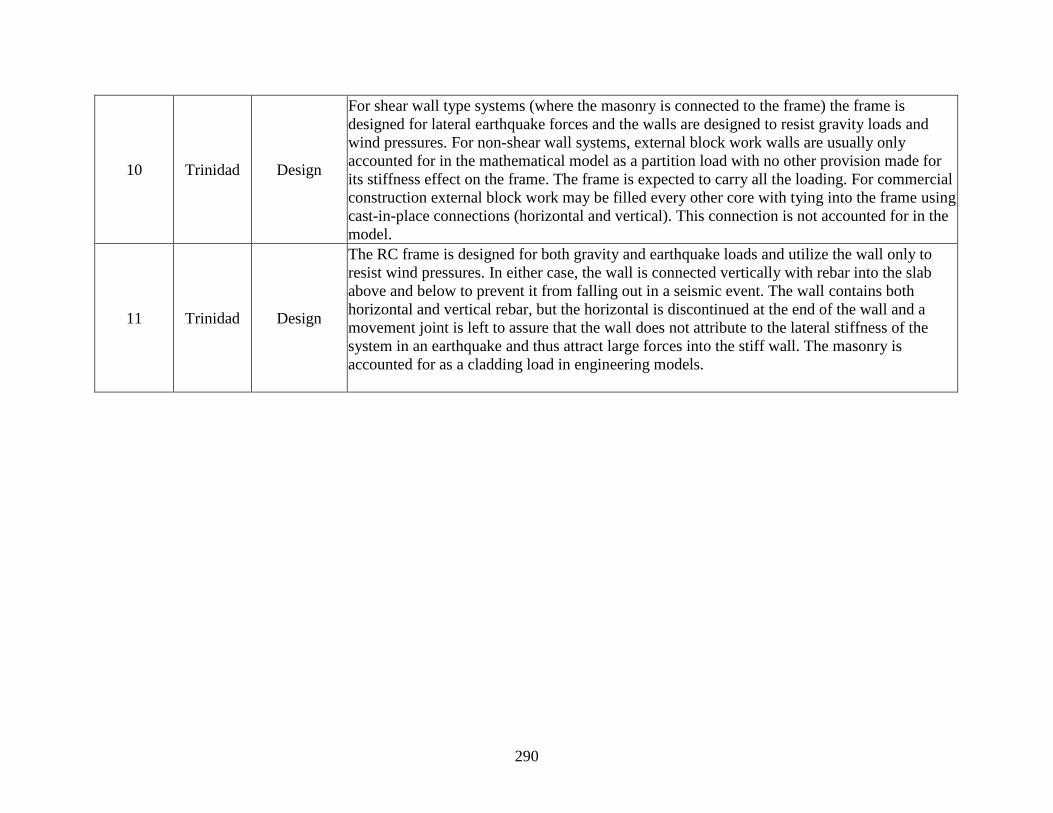
290
10 Trinidad Design
For shear wall type systems (where the masonry is connected to the frame) the frame is
designed for lateral earthquake forces and the walls are designed to resist gravity loads and
wind pressures. For non-shear wall systems, external block work walls are usually only
accounted for in the mathematical model as a partition load with no other provision made for
its stiffness effect on the frame. The frame is expected to carry all the loading. For commercial
construction external block work may be filled every other core with tying into the frame using
cast-in-place connections (horizontal and vertical). This connection is not accounted for in the
model.
11 Trinidad Design
The RC frame is designed for both gravity and earthquake loads and utilize the wall only to
resist wind pressures. In either case, the wall is connected vertically with rebar into the slab
above and below to prevent it from falling out in a seismic event. The wall contains both
horizontal and vertical rebar, but the horizontal is discontinued at the end of the wall and a
movement joint is left to assure that the wall does not attribute to the lateral stiffness of the
system in an earthquake and thus attract large forces into the stiff wall. The masonry is
accounted for as a cladding load in engineering models.

291
APPENDIX B
MATERIAL DATA
Figure 180: Concrete mix design for RC frame
Table 15: Concrete compressive strength Compressive Strength
ksi (MPa)
7-day 28-day Day of Test*
Foundation Pour 1
-truck 1
6.29 (43.37) 7.39 (50.95) 11.13 (76.74)
5.99 (41.30) - 10.78 (74.33)
Foundation Pour 1
-truck 2
4.61 (31.78) 5.30 (36.54) 7.69 (53.02)
4.97 (34.27) 5.60 (38.61) 8.38 (57.78)
Foundation Pour 2 4.98 (34.34) 6.83 (47.09) 9.27 (63.91)
5.47 (37.71) 5.63 (38.82) 7.82 (53.92)
Foundation-Average 5.35 (36.89) 6.33 (43.64) 9.02 (62.19)
Column Pour 2.82 (19.44) 3.91 (26.96) 5.04 (34.75)
3.07 (21.17) 4.02 (27.72) 4.50 (31.03)
Beam Pour 3.00 (20.68) 3.85 (26.54) 5.88 (40.54)
3.12 (21.51) 4.16 (28.68) 5.44 (37.51)
Top 1/2 Column Pour 3.17 (21.86) 3.61 (24.89) 6.26 (43.16)
3.09 (21.30) 4.79 (33.03) 6.01 (41.44)
Frame-Average 3.05 (21.03) 4.05 (27.92) 5.52 (38.06)
* Day of Test Data was collected the week following the second test. The two tests were
conducted 6 weeks apart and the age of the concrete ranged from 147 to 249days
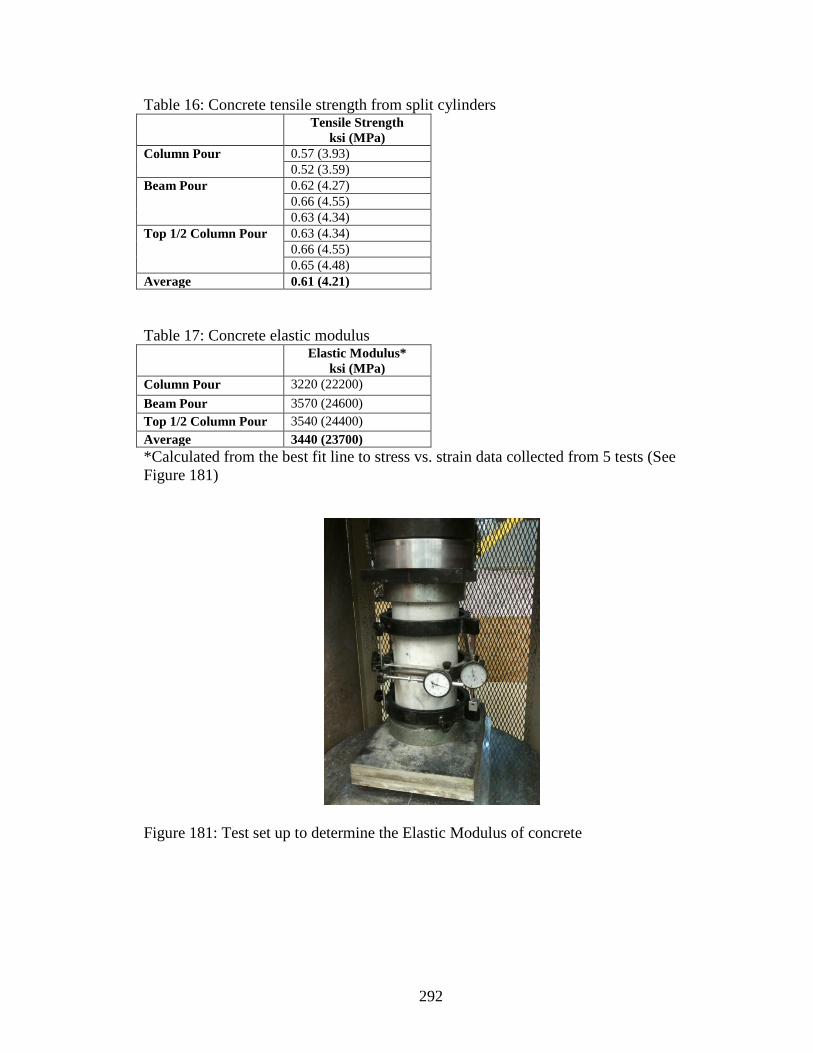
292
Table 16: Concrete tensile strength from split cylinders Tensile Strength
ksi (MPa)
Column Pour 0.57 (3.93)
0.52 (3.59)
Beam Pour 0.62 (4.27)
0.66 (4.55)
0.63 (4.34)
Top 1/2 Column Pour 0.63 (4.34)
0.66 (4.55)
0.65 (4.48)
Average 0.61 (4.21)
Table 17: Concrete elastic modulus Elastic Modulus*
ksi (MPa)
Column Pour 3220 (22200)
Beam Pour 3570 (24600)
Top 1/2 Column Pour 3540 (24400)
Average 3440 (23700)
*Calculated from the best fit line to stress vs. strain data collected from 5 tests (See
Figure 181)
Figure 181: Test set up to determine the Elastic Modulus of concrete
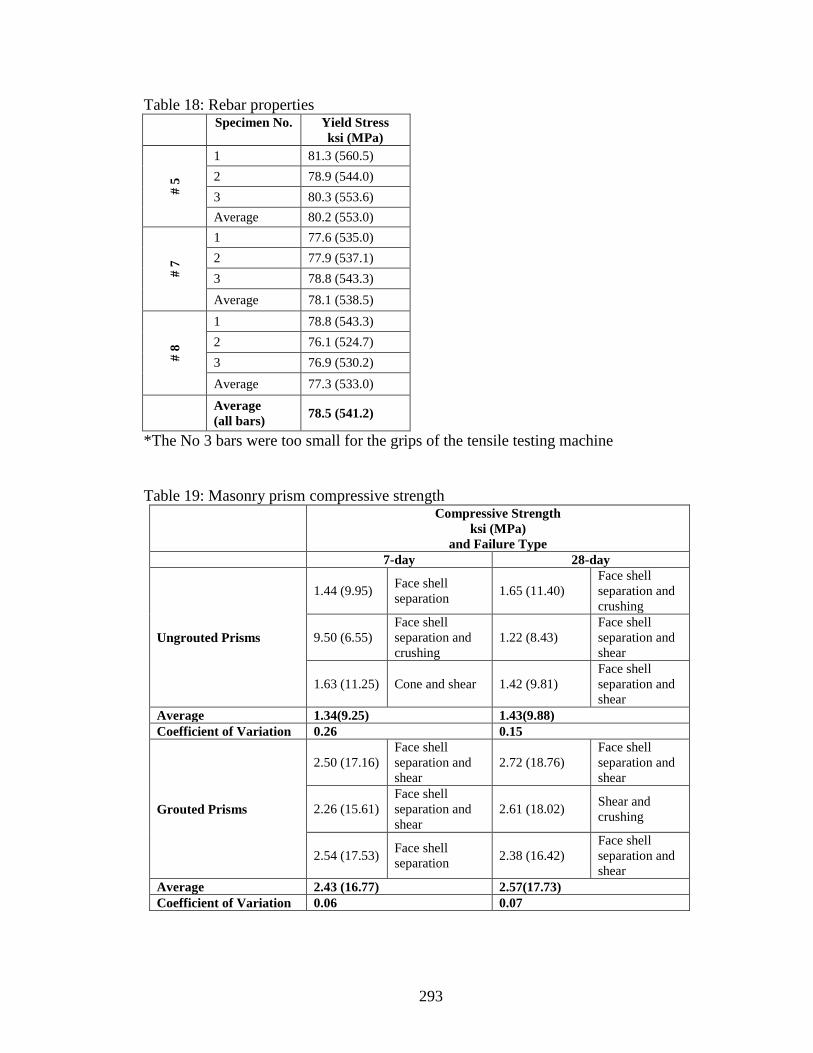
293
Table 18: Rebar properties
Specimen No. Yield Stress
ksi (MPa)
# 5
1 81.3 (560.5)
2 78.9 (544.0)
3 80.3 (553.6)
Average 80.2 (553.0)
# 7
1 77.6 (535.0)
2 77.9 (537.1)
3 78.8 (543.3)
Average 78.1 (538.5)
# 8
1 78.8 (543.3)
2 76.1 (524.7)
3 76.9 (530.2)
Average 77.3 (533.0)
Average
(all bars) 78.5 (541.2)
*The No 3 bars were too small for the grips of the tensile testing machine
Table 19: Masonry prism compressive strength Compressive Strength
ksi (MPa)
and Failure Type
7-day 28-day
Ungrouted Prisms
1.44 (9.95) Face shell
separation 1.65 (11.40)
Face shell
separation and
crushing
9.50 (6.55)
Face shell
separation and
crushing
1.22 (8.43)
Face shell
separation and
shear
1.63 (11.25) Cone and shear 1.42 (9.81)
Face shell
separation and
shear
Average 1.34(9.25) 1.43(9.88)
Coefficient of Variation 0.26 0.15
Grouted Prisms
2.50 (17.16)
Face shell
separation and
shear
2.72 (18.76)
Face shell
separation and
shear
2.26 (15.61)
Face shell
separation and
shear
2.61 (18.02) Shear and
crushing
2.54 (17.53) Face shell
separation 2.38 (16.42)
Face shell
separation and
shear
Average 2.43 (16.77) 2.57(17.73)
Coefficient of Variation 0.06 0.07

294
Figure 182: Preparation of prisms
Figure 183: Prisms bagged for curing at ambient temperature
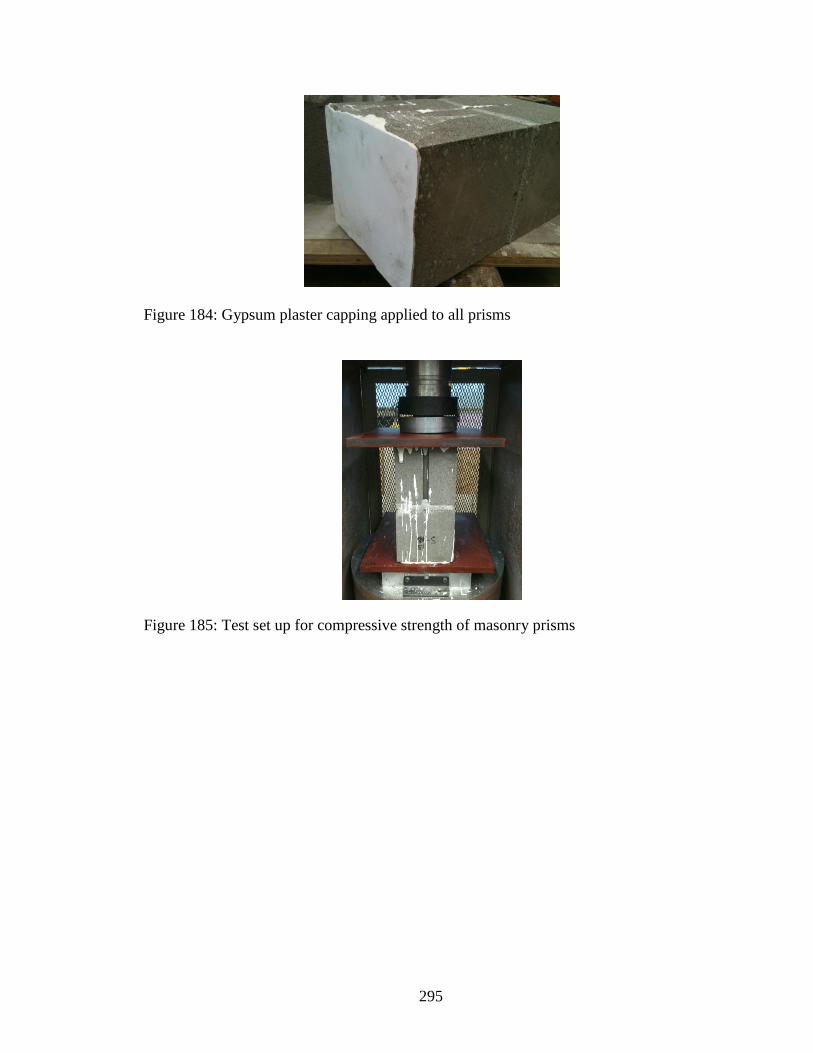
295
Figure 184: Gypsum plaster capping applied to all prisms
Figure 185: Test set up for compressive strength of masonry prisms
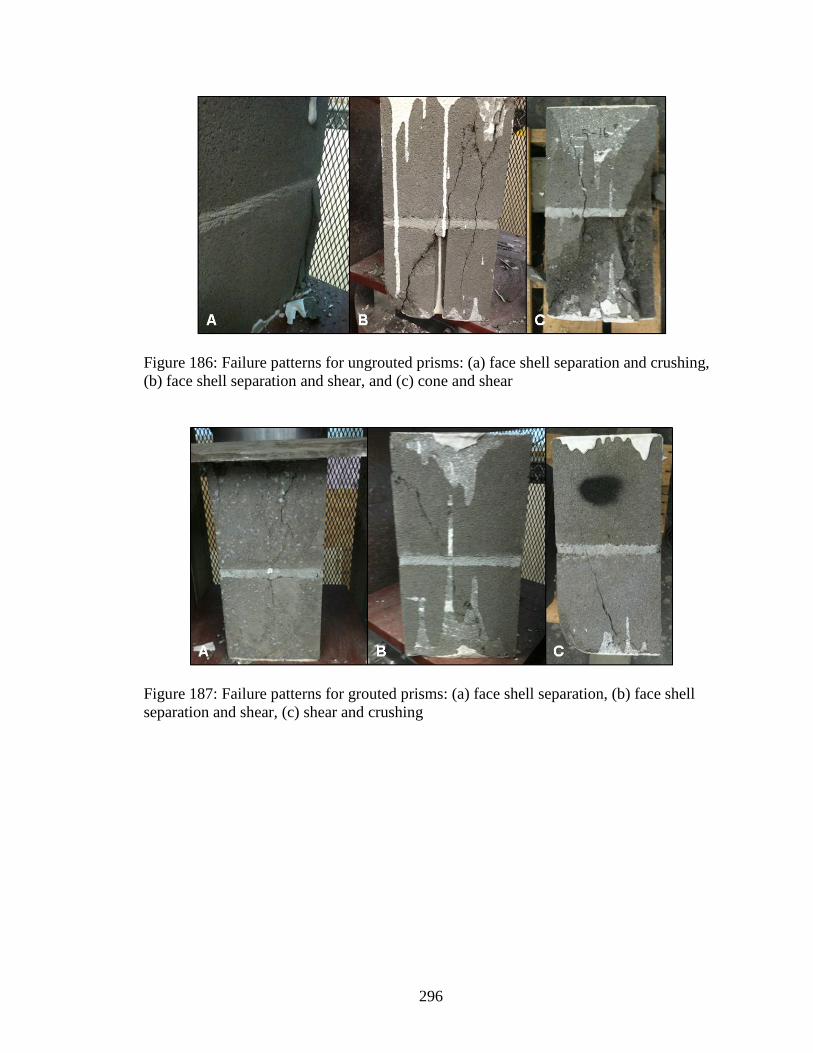
296
Figure 186: Failure patterns for ungrouted prisms: (a) face shell separation and crushing,
(b) face shell separation and shear, and (c) cone and shear
Figure 187: Failure patterns for grouted prisms: (a) face shell separation, (b) face shell
separation and shear, (c) shear and crushing
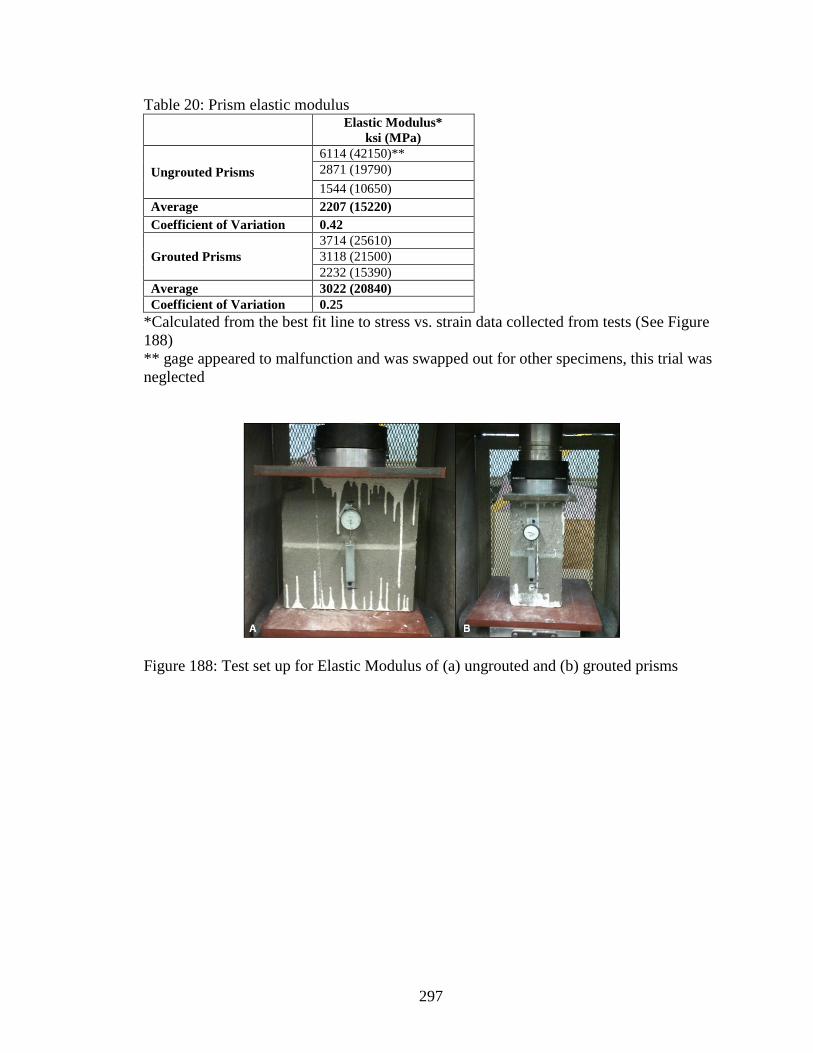
297
Table 20: Prism elastic modulus Elastic Modulus*
ksi (MPa)
Ungrouted Prisms
6114 (42150)**
2871 (19790)
1544 (10650)
Average 2207 (15220)
Coefficient of Variation 0.42
Grouted Prisms
3714 (25610)
3118 (21500)
2232 (15390)
Average 3022 (20840)
Coefficient of Variation 0.25
*Calculated from the best fit line to stress vs. strain data collected from tests (See Figure
188)
** gage appeared to malfunction and was swapped out for other specimens, this trial was
neglected
Figure 188: Test set up for Elastic Modulus of (a) ungrouted and (b) grouted prisms

298
Table 21: Concrete used for grouted cells-compressive strength Compressive Strength
ksi (MPa)
Grout Cubes
(ASTM C1019)
2.97 (20.48)
3.50 (24.13)
1.81 (12.48)*
2.68 (18.48)
Average 3.05 (21.03)
Coeff. of Var. 0.13
Grout Cylinders**
2.22 (15.31)
2.72 (18.75)
3.13 (21.58)
2.93 (20.20)
2.95 (20.34)
2.92 (20.13)
2.46 (16.96)
Average 2.76 (19.03)
Coefficient of Variation 0.11
*thrown out as cube had a lot of air voids
**In the Caribbean, the concrete for grout is often specified by cylinder strength
Figure 189: Grout cube mold as specified by ASTM 1019

299
Figure 190: Grout cube (a) testing and (b) failure
Table 22: Mortar compressive strength Compressive Strength
ksi (MPa)
Mortar Cubes
(ASTM C109)
3.67 (25.30)
3.06 (21.1)
5.46 (37.65)
5.28 (36.40)
3.53 (24.34)
4.86 (33.51)
5.14 (35.44)
5.48 (37.78)
5.53 (38.13)
4.99 (34.40)
5.07 (34.96)
2.50 (17.24)
5.23 (36.06)
4.00 (27.58)
2.68 (18.48)
Average 4.43 (30.54)
Coefficient of Variation 0.24

300
Figure 191: Mortar cube (a) testing and (b) failure
Table 23: Tensile bond strength from bond wrench tests Tensile Bond Strength
psi (MPa)
Ungrouted Bed Joints
37.27 (0.26)
30.09 (0.21)
27.36 (0.19)
56.03 (0.39)
58.80 (0.41)
Average 41.91 (0.29)
Coeff. of Var. 0.35
Grouted Bed Joints
230.96 (1.59)
231.53 (1.60)
213.05 (1.47)
219.67 (1.51)
201.06 (1.39)
Average 219.25 (1.51)
Coefficient of Variation 0.06
Figure 192: Bond wrench test set up
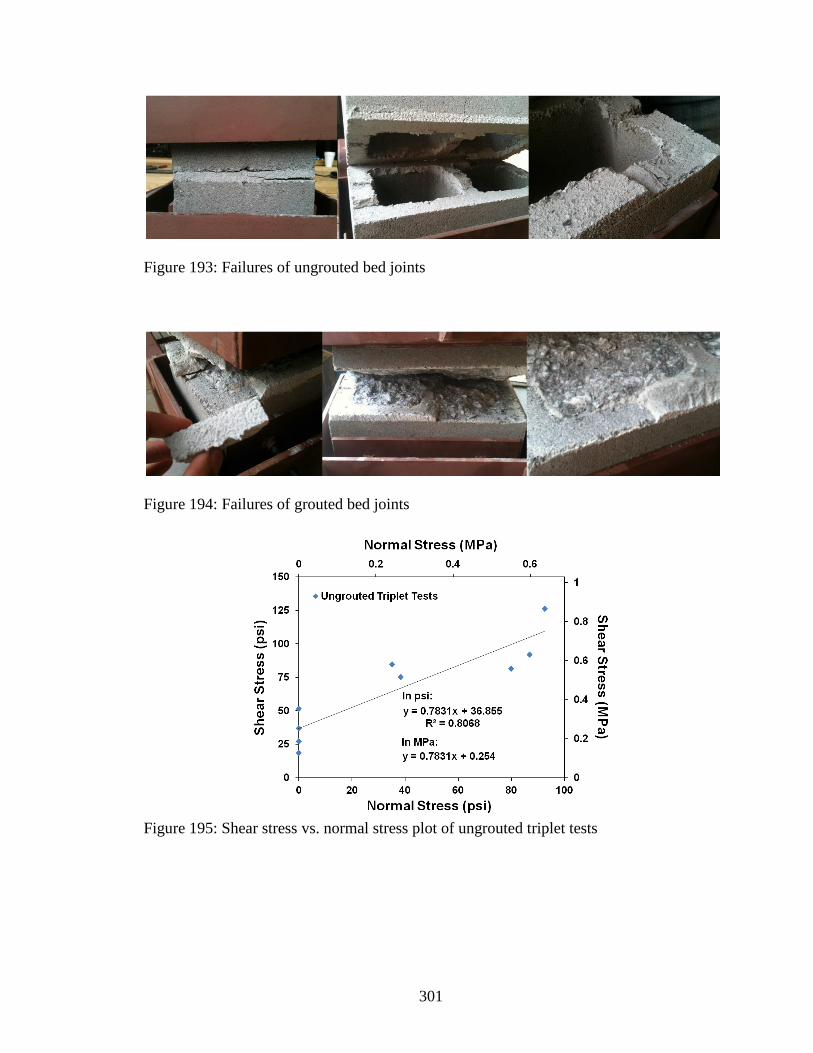
301
Figure 193: Failures of ungrouted bed joints
Figure 194: Failures of grouted bed joints
Figure 195: Shear stress vs. normal stress plot of ungrouted triplet tests
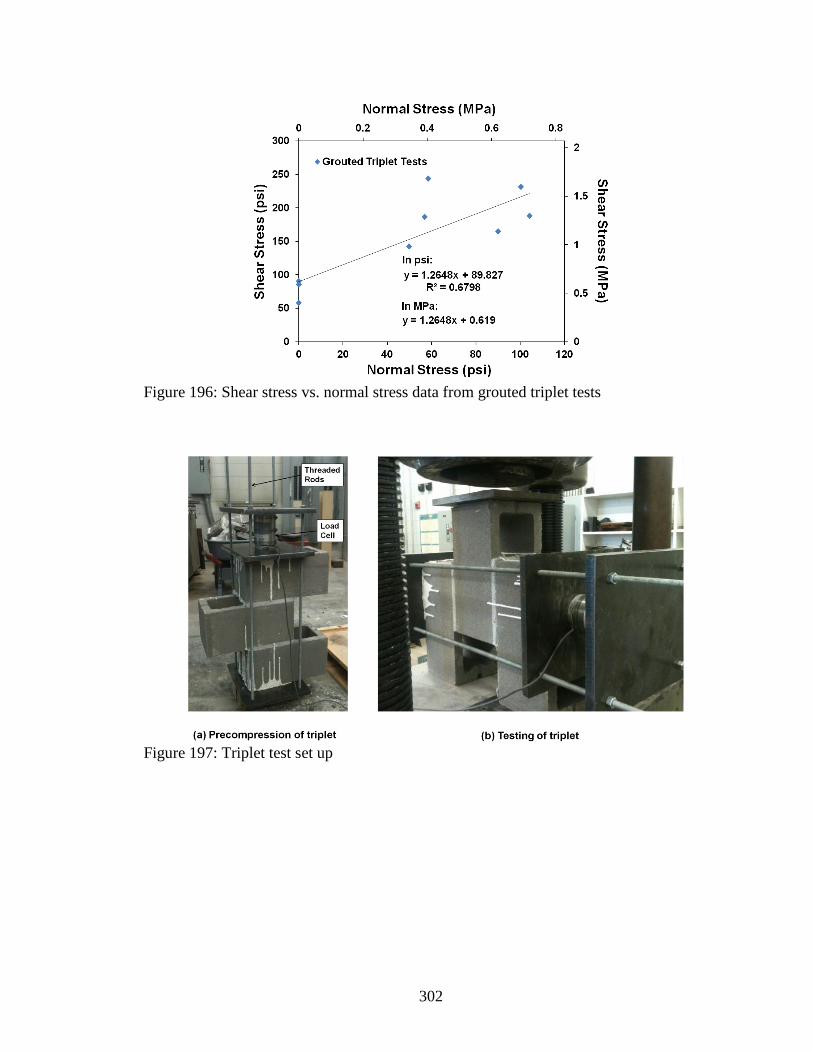
302
Figure 196: Shear stress vs. normal stress data from grouted triplet tests
Figure 197: Triplet test set up

303
Figure 198: Failure of ungrouted triplet
Figure 199: Failure of grouted triplet (a) while still on the testing platform and (b)
removed from the testing machine
*the ungrouted portions of the triplets broke off very easily when they were removed
from the testing machine

304
APPENDIX C
SUPPLEMENTAL DATA FOR FINITE ELEMENT MODELS
Table 24: Mortar interface element parameters for study on the influence of masonry
head joint bond strength on seismic performance of URM walls*
Mortar from Magenes and Calvi (1992)
Baseline
Variables Bed
Joint
Head
Joint
Bed
Joint
Head
Joint
Bed
Joint
Head
Joint
Bed
Joint
Head
Joint
ksi
(MPa)
0.009
(0.062)
0.009
(0.062)
0.009
(0.062)
0.0009
(0.0062)
0.009
(0.062)
0.0045
(0.031)
0.009
(0.062)
0.0081
(0.056)
0.50 0.50 0.50 0.50 0.50 0.50 0.50 0.50
0.40 0.40 0.40 0.40 0.40 0.40 0.40 0.40
ksi
(MPa)
0.01
(0.069)
0.01
(0.069)
0.01
(0.069)
0.01
(0.069)
0.01
(0.069)
0.01
(0.069)
0.01
(0.069)
0.01
(0.069)
ksi
(MPa)
0.005
(0.034)
0.005
(0.034)
0.005
(0.034)
0.005
(0.034)
0.005
(0.034)
0.005
(0.034)
0.005
(0.034)
0.005
(0.034)
Mortar with 2x Bond Strength and Cohesion
Baseline
Variables Bed
Joint
Head
Joint
Bed
Joint
Head
Joint
Bed
Joint
Head
Joint
Bed
Joint
Head
Joint
ksi
(MPa)
0.02
(0.138)
0.02
(0.138)
0.02
(0.138)
0.002
(0.0138)
0.02
(0.138)
0.01
(0.069)
0.02
(0.138)
0.018
(0.124)
0.50 0.50 0.50 0.50 0.50 0.50 0.50 0.50
0.40 0.40 0.40 0.40 0.40 0.40 0.40 0.40
ksi
(MPa)
0.02
(0.138)
0.02
(0.138)
0.02
(0.138)
0.02
(0.138)
0.02
(0.138)
0.02
(0.138)
0.02
(0.138)
0.02
(0.138)
ksi
(MPa)
0.005
(0.034)
0.005
(0.034)
0.005
(0.034)
0.005
(0.034)
0.005
(0.034)
0.005
(0.034)
0.005
(0.034)
0.005
(0.034)
*all other model parameters were taken from the URM wall models for tests by Magenes
and Calvi (1992)-See Table 32
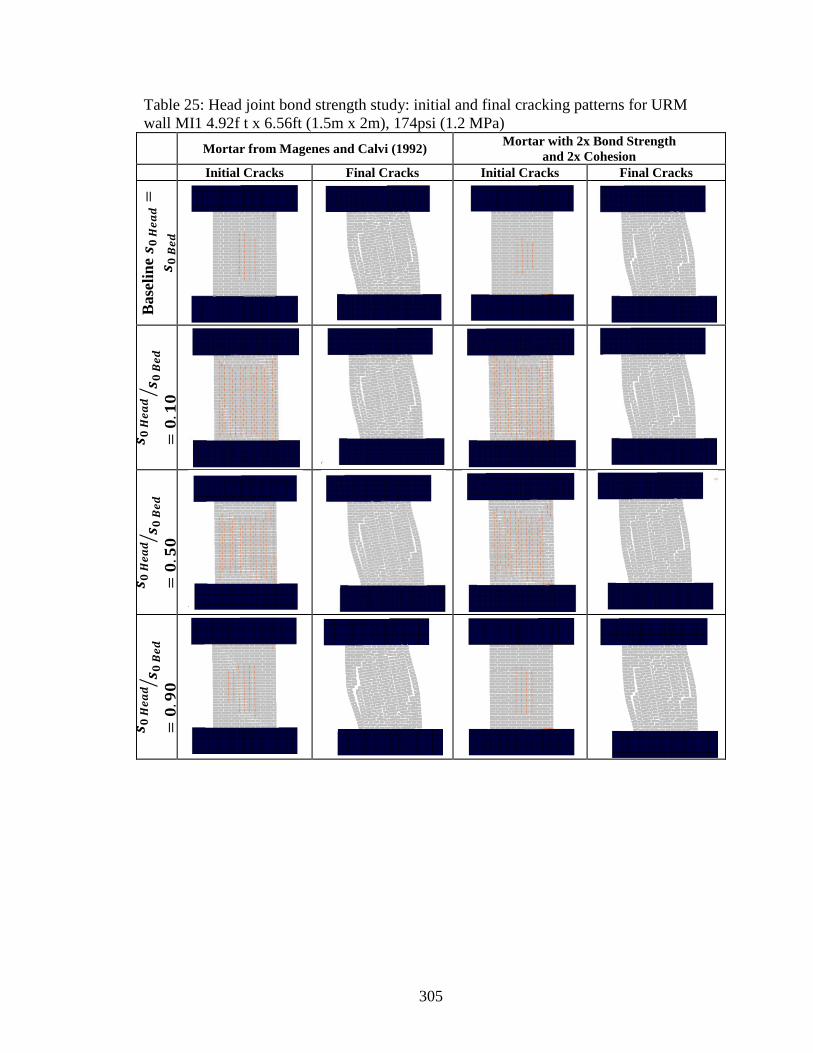
305
Table 25: Head joint bond strength study: initial and final cracking patterns for URM
wall MI1 4.92f t x 6.56ft (1.5m x 2m), 174psi (1.2 MPa)
Mortar from Magenes and Calvi (1992) Mortar with 2x Bond Strength
and 2x Cohesion
Initial Cracks Final Cracks Initial Cracks Final Cracks
Base
lin
e
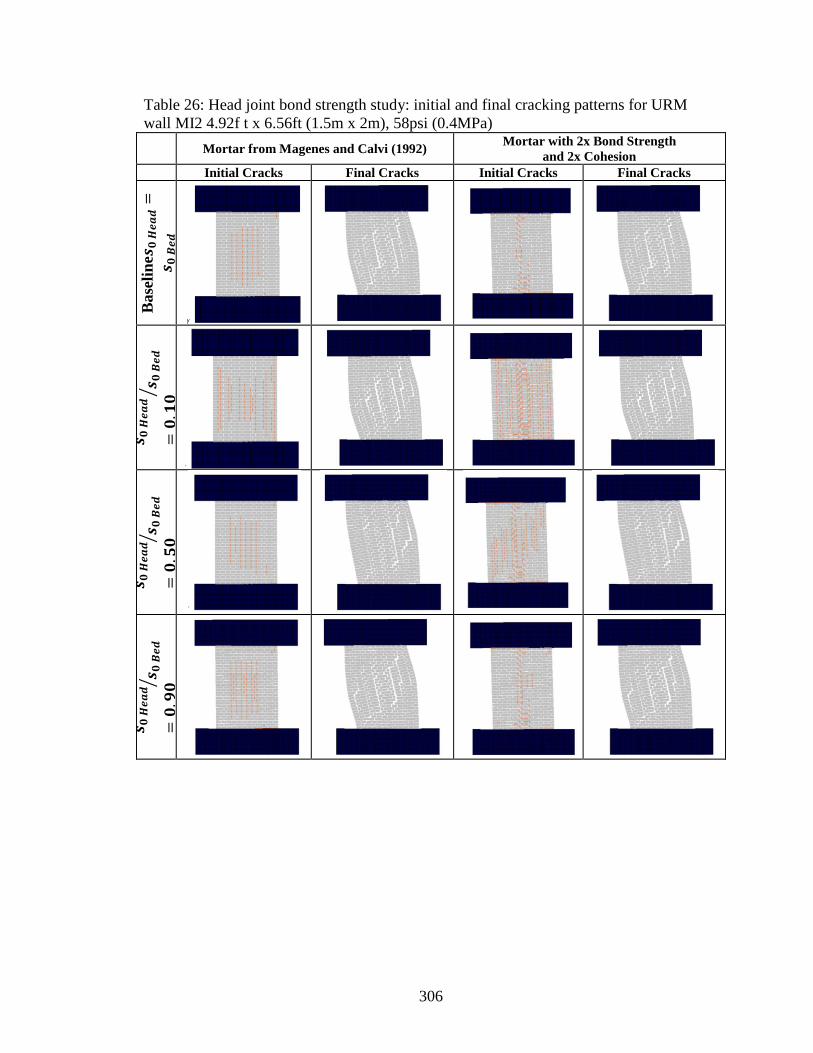
306
Table 26: Head joint bond strength study: initial and final cracking patterns for URM
wall MI2 4.92f t x 6.56ft (1.5m x 2m), 58psi (0.4MPa)
Mortar from Magenes and Calvi (1992) Mortar with 2x Bond Strength
and 2x Cohesion
Initial Cracks Final Cracks Initial Cracks Final Cracks
Base
lin
e

307
Table 27: Head joint bond strength study: initial and final cracking patterns for URM
wall MI3 4.92ft x 9.84ft (1.5m x 3m), 174psi (1.2 MPa)
Mortar from Magenes and Calvi (1992) Mortar with 2x Bond Strength
and 2x Cohesion
Initial Cracks Final Cracks Initial Cracks Final Cracks
Base
lin
e

308
Table 28: Head joint bond strength study: initial and final cracking patterns for URM
wall MI4 4.92ft x 9.84ft (1.5m x 3m), 58psi (0.4MPa)
Mortar from Magenes and Calvi (1992) Mortar with 2x Bond Strength
and 2x Cohesion
Initial Cracks Final Cracks Initial Cracks Final Cracks
Base
lin
e
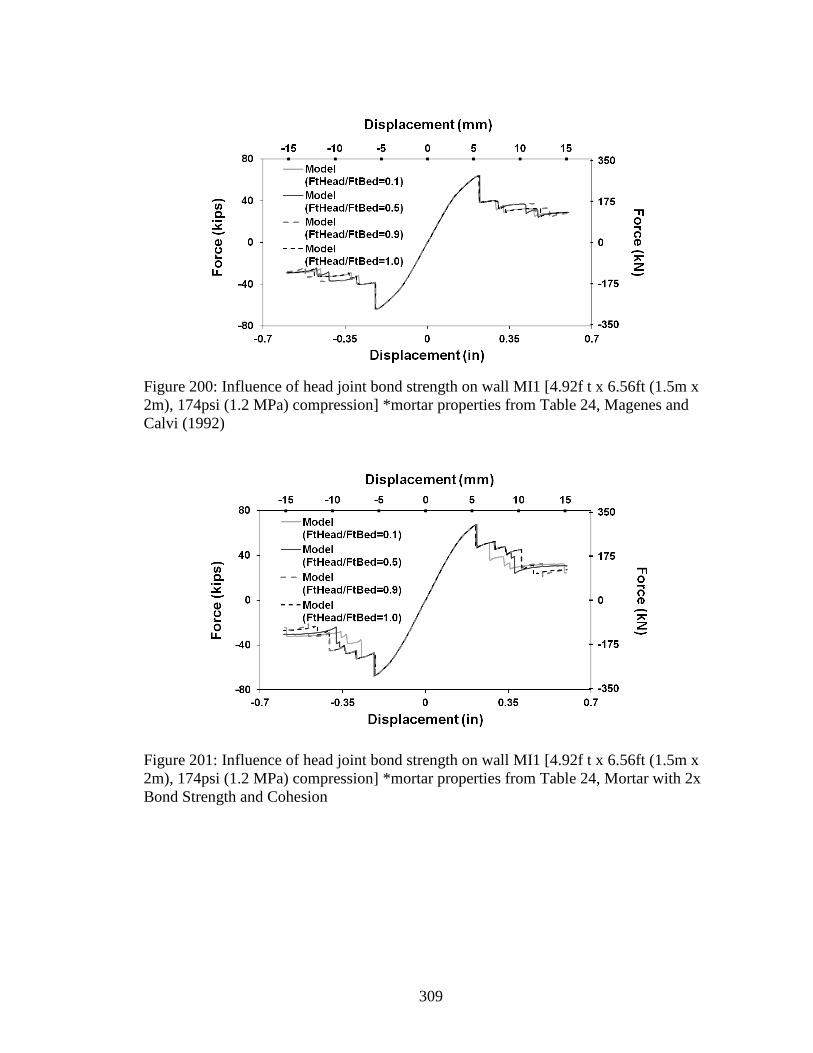
309
Figure 200: Influence of head joint bond strength on wall MI1 [4.92f t x 6.56ft (1.5m x
2m), 174psi (1.2 MPa) compression] *mortar properties from Table 24, Magenes and
Calvi (1992)
Figure 201: Influence of head joint bond strength on wall MI1 [4.92f t x 6.56ft (1.5m x
2m), 174psi (1.2 MPa) compression] *mortar properties from Table 24, Mortar with 2x
Bond Strength and Cohesion

310
Figure 202: Influence of head joint bond strength on wall MI2 [4.92f t x 6.56ft (1.5m x
2m), 58psi (0.4MPa) compression] *mortar properties from Table 24, Magenes and Calvi
(1992)
Figure 203: Influence of head joint bond strength on wall MI2 [4.92f t x 6.56ft (1.5m x
2m), 58psi (0.4MPa) compression] *mortar properties from Table 24, Mortar with 2x
Bond Strength and Cohesion
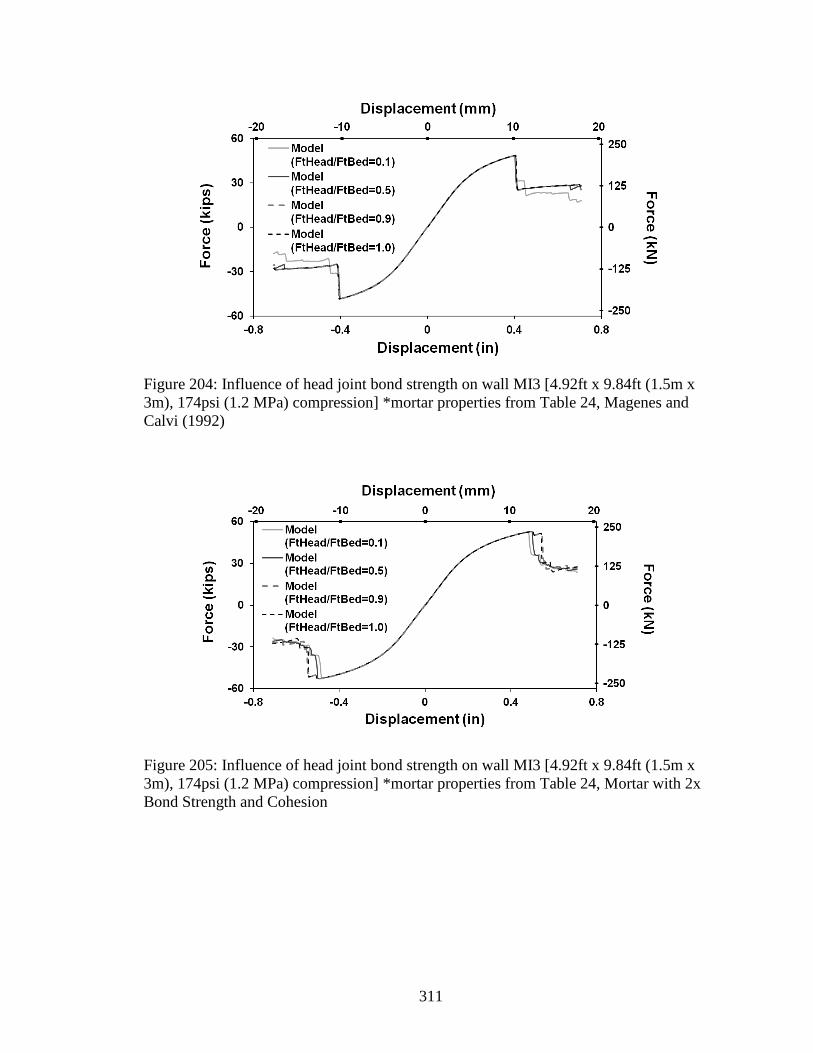
311
Figure 204: Influence of head joint bond strength on wall MI3 [4.92ft x 9.84ft (1.5m x
3m), 174psi (1.2 MPa) compression] *mortar properties from Table 24, Magenes and
Calvi (1992)
Figure 205: Influence of head joint bond strength on wall MI3 [4.92ft x 9.84ft (1.5m x
3m), 174psi (1.2 MPa) compression] *mortar properties from Table 24, Mortar with 2x
Bond Strength and Cohesion
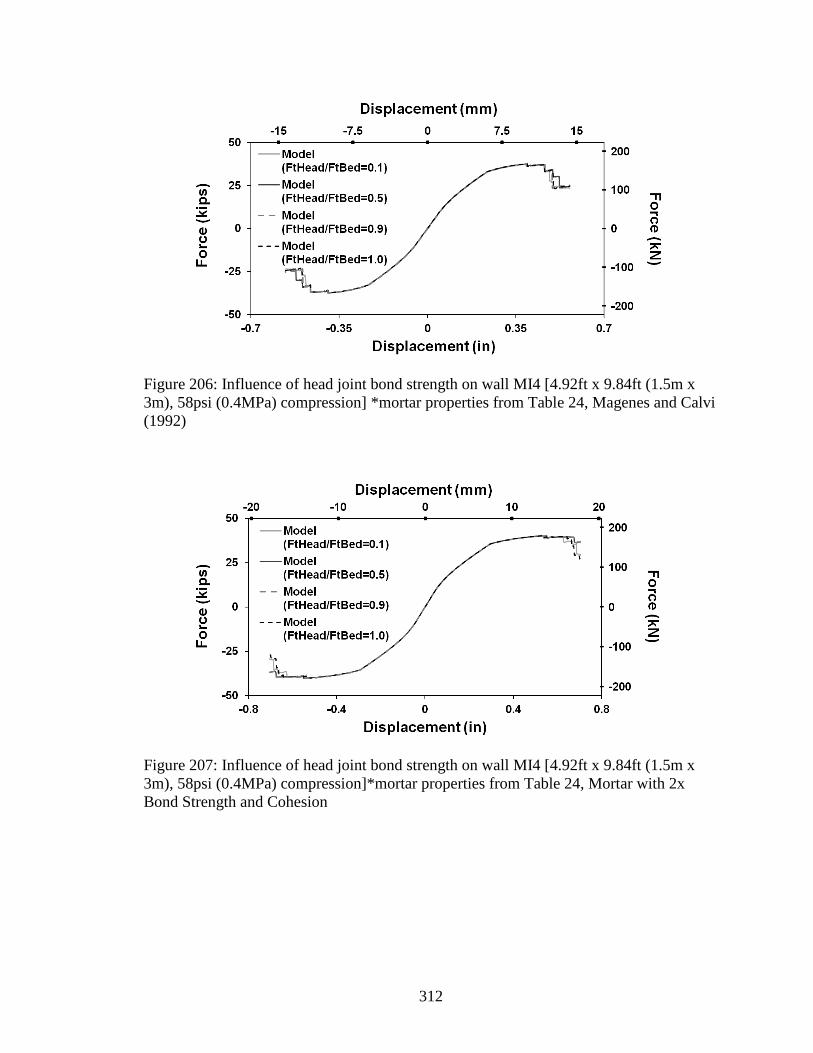
312
Figure 206: Influence of head joint bond strength on wall MI4 [4.92ft x 9.84ft (1.5m x
3m), 58psi (0.4MPa) compression] *mortar properties from Table 24, Magenes and Calvi
(1992)
Figure 207: Influence of head joint bond strength on wall MI4 [4.92ft x 9.84ft (1.5m x
3m), 58psi (0.4MPa) compression]*mortar properties from Table 24, Mortar with 2x
Bond Strength and Cohesion
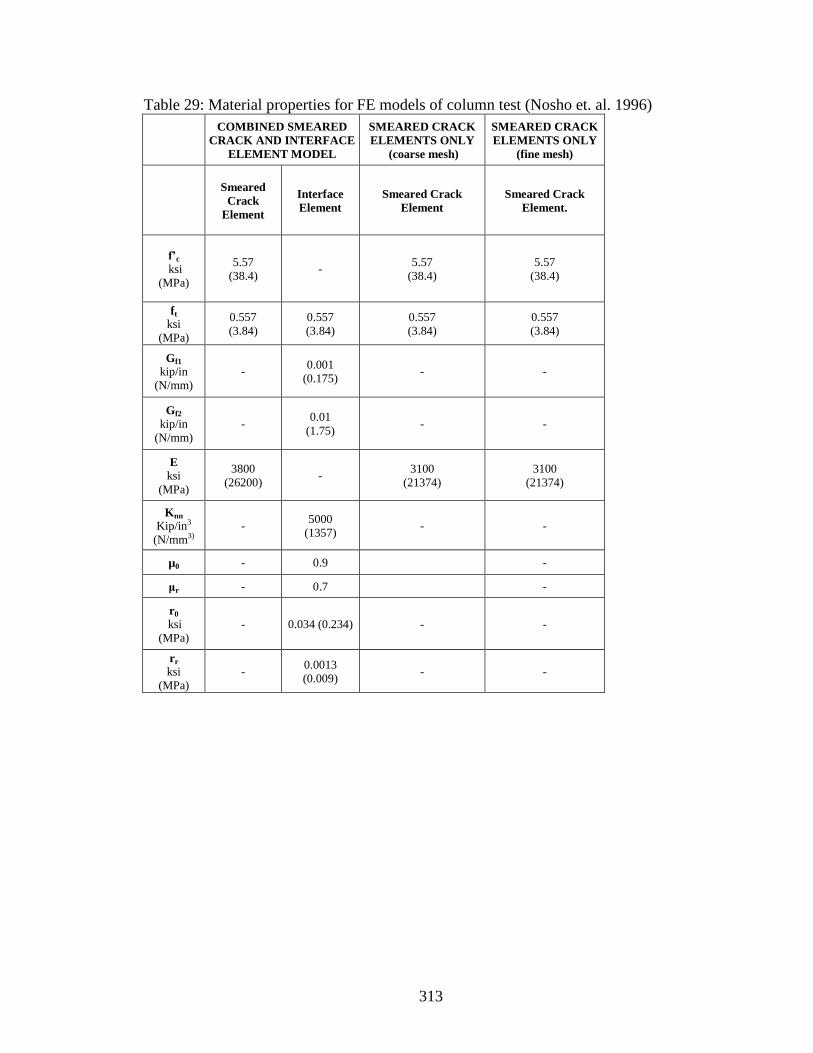
313
Table 29: Material properties for FE models of column test (Nosho et. al. 1996)
COMBINED SMEARED
CRACK AND INTERFACE
ELEMENT MODEL
SMEARED CRACK
ELEMENTS ONLY
(coarse mesh)
SMEARED CRACK
ELEMENTS ONLY
(fine mesh)
Smeared
Crack
Element
Interface
Element
Smeared Crack
Element
Smeared Crack
Element.
f’c
ksi
(MPa)
5.57
(38.4) -
5.57
(38.4)
5.57
(38.4)
ft ksi
(MPa)
0.557
(3.84)
0.557
(3.84)
0.557
(3.84)
0.557
(3.84)
Gf1 kip/in
(N/mm)
- 0.001
(0.175) - -
Gf2
kip/in
(N/mm)
- 0.01
(1.75) - -
E
ksi
(MPa)
3800
(26200) -
3100
(21374)
3100
(21374)
Knn
Kip/in3
(N/mm3)
- 5000
(1357) - -
µ0 - 0.9
-
μr - 0.7
-
r0
ksi
(MPa)
- 0.034 (0.234) - -
rr ksi
(MPa)
- 0.0013
(0.009) - -
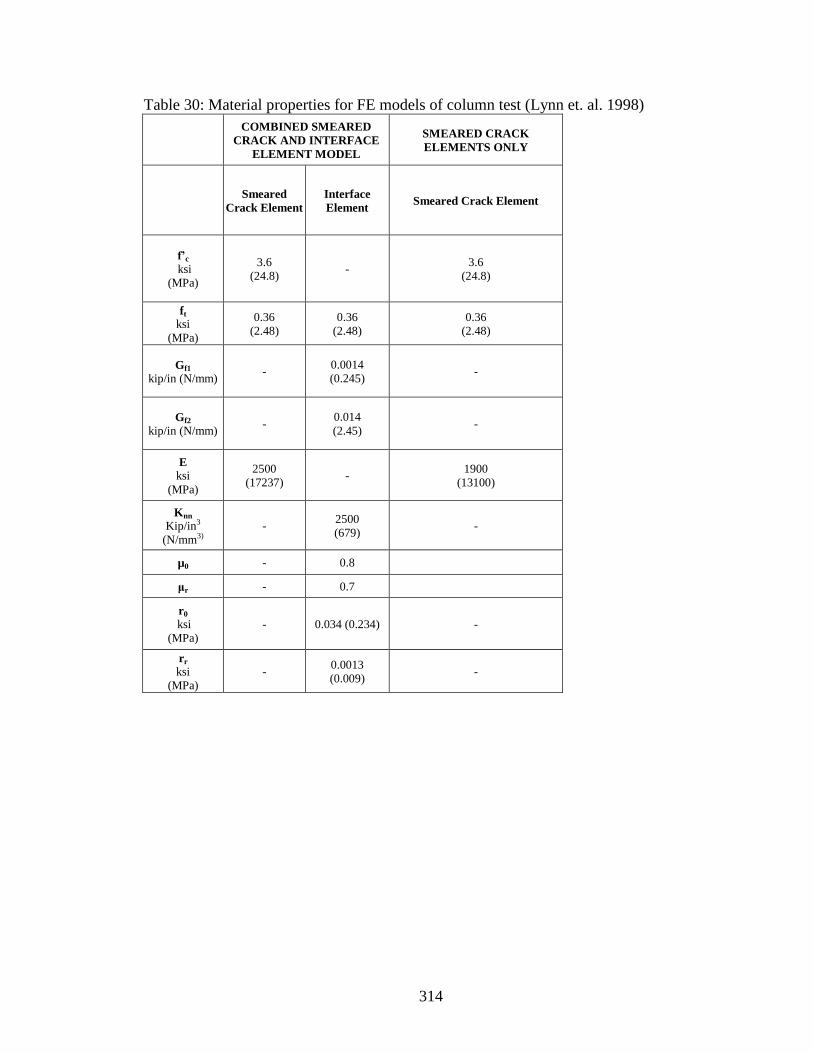
314
Table 30: Material properties for FE models of column test (Lynn et. al. 1998)
COMBINED SMEARED
CRACK AND INTERFACE
ELEMENT MODEL
SMEARED CRACK
ELEMENTS ONLY
Smeared
Crack Element
Interface
Element Smeared Crack Element
f’c
ksi
(MPa)
3.6
(24.8) -
3.6
(24.8)
ft ksi
(MPa)
0.36
(2.48)
0.36
(2.48)
0.36
(2.48)
Gf1 kip/in (N/mm)
- 0.0014
(0.245) -
Gf2
kip/in (N/mm) -
0.014
(2.45) -
E
ksi
(MPa)
2500
(17237) -
1900
(13100)
Knn
Kip/in3
(N/mm3)
- 2500
(679) -
µ0 - 0.8
μr - 0.7
r0
ksi
(MPa)
- 0.034 (0.234) -
rr ksi
(MPa)
- 0.0013
(0.009) -

315
Table 31: Model properties for cyclic test of RC frame (Teymur et al. 2012)
COMBINED SMEARED CRACK AND
INTERFACE ELEMENT MODEL
Smeared Crack
Element Interface Element
f’c
ksi
(MPa)
2.5
(17.2) -
ft ksi
(MPa)
0.3
(2.07)
0.3
(2.07)
Gf1
kip/in
(N/mm)
- 0.0008
(0.14)
Gf2
kip/in
(N/mm)
- 0.008
(1.4)
E
ksi
(MPa)
2000
(13790) -
Knn
Kip/in3
(N/mm3)
- 3000
(814)
µ0 - 0.9
μr - 0.7
r0
ksi
(MPa)
- 0.02 (0.14)
rr ksi
(MPa)
- 0.001
(0.007)
Figure 208: Concrete compressive stress vs. strain curve for finite element model of bare
RC frame
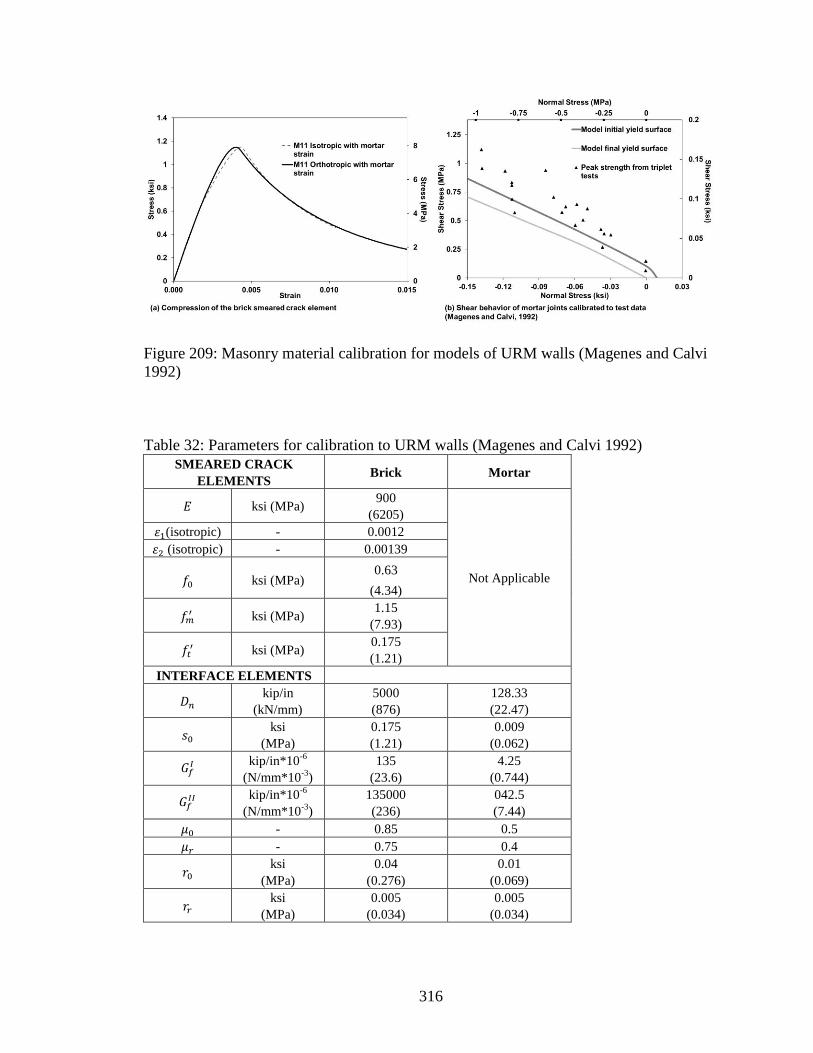
316
Figure 209: Masonry material calibration for models of URM walls (Magenes and Calvi
1992)
Table 32: Parameters for calibration to URM walls (Magenes and Calvi 1992)
SMEARED CRACK
ELEMENTS Brick Mortar
ksi (MPa) 900
(6205)
Not Applicable
(isotropic) - 0.0012
(isotropic) - 0.00139
ksi (MPa) 0.63
(4.34)
ksi (MPa)
1.15
(7.93)
ksi (MPa)
0.175
(1.21)
INTERFACE ELEMENTS
kip/in
(kN/mm)
5000
(876)
128.33
(22.47)
ksi
(MPa)
0.175
(1.21)
0.009
(0.062)
kip/in*10-6
(N/mm*10-3
)
135
(23.6)
4.25
(0.744)
kip/in*10
-6
(N/mm*10-3
)
135000
(236)
042.5
(7.44)
- 0.85 0.5
- 0.75 0.4
ksi
(MPa)
0.04
(0.276)
0.01
(0.069)
ksi
(MPa)
0.005
(0.034)
0.005
(0.034)
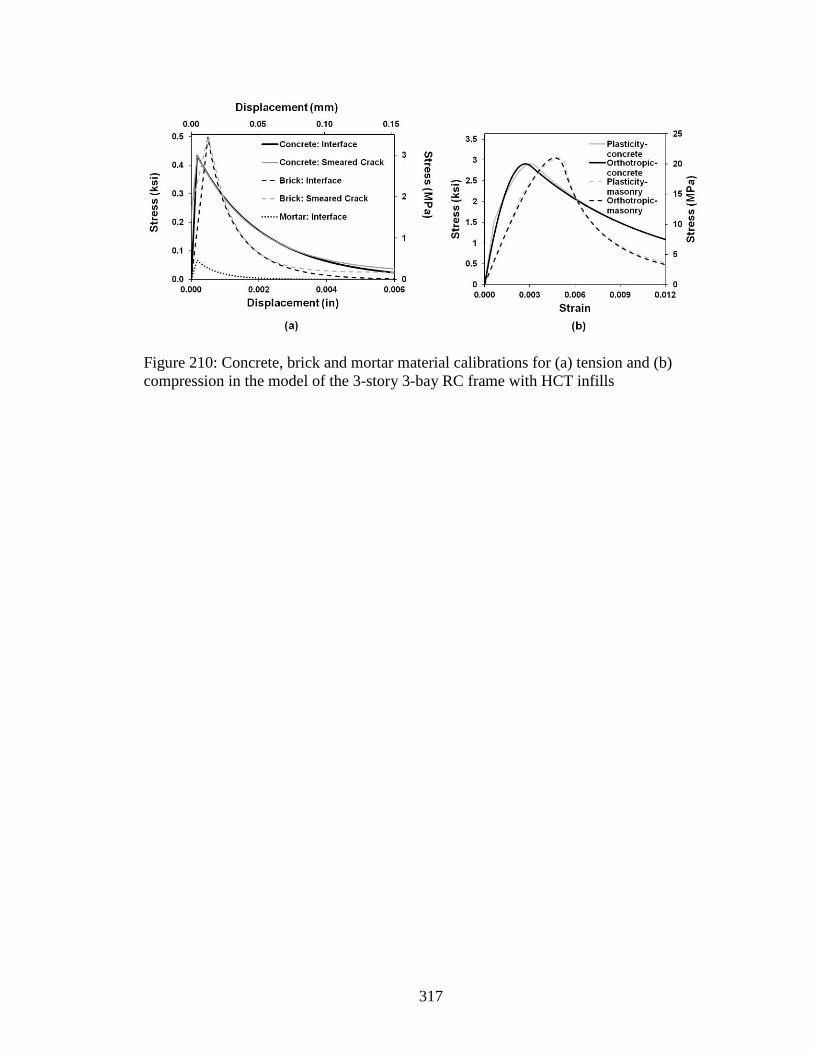
317
Figure 210: Concrete, brick and mortar material calibrations for (a) tension and (b)
compression in the model of the 3-story 3-bay RC frame with HCT infills

318
Table 33: Summary of material properties and model parameters for the 3-story 3-bay RC
frame with HCT infills
CONCRETE BRICK MORTAR
Smeared
Crack
Element
Interface
Element
Measured
Prop.
Smeared
Crack
Element
Interface
Element
Measured
Prop.
Bed Joint
Interface
Element
Head Joint
Interface
Element
Measured
Prop.
f’c
ksi
(MPa)
2.9
(20) -
2.9
(20)
3.05
(21) -
3.7
(25.5)
unit
strength
- - 0.7-
(4.7)
ft ksi
(MPa)
0.44
(3)
0.44
(3) -
0.46
(3.15)
0.46
(3.15) -
0.068
(0.47)
0.068
(0.47) -
Gf1 kip/in
(N/mm)
- 0.001
(0.175) - -
0.0006
(0.099) -
0.00005
(0.0087)
0.00005
(0.0087) -
Gf2
kip/in
(N/mm)
- 0.01
(1.75) - -
0.006
(0.99) -
0.0005
(0.087)
0.0005
(0.087) -
E
ksi
(MPa)
3050
(21000) - -
2030
(14000) - - - - -
Knn
Kip/in3
(N/mm3)
- 2578
(700) - -
1013
(275) -
387
(105)
387
(105) -
µ0 - 1.0 -
0.9 - 0.9 0.9 -
μr - 0.9 -
0.8 - 0.8 0.8 -
r0
ksi
(MPa)
- 0.049
(0.34) - -
0.049
(0.34) -
0.078
(0.54)
0.049
(0.34) -
rr ksi
(MPa)
- 0.01
(0.07) - -
0.001
(0.007) -
0.007
(0.05)
0.007
(0.05) -
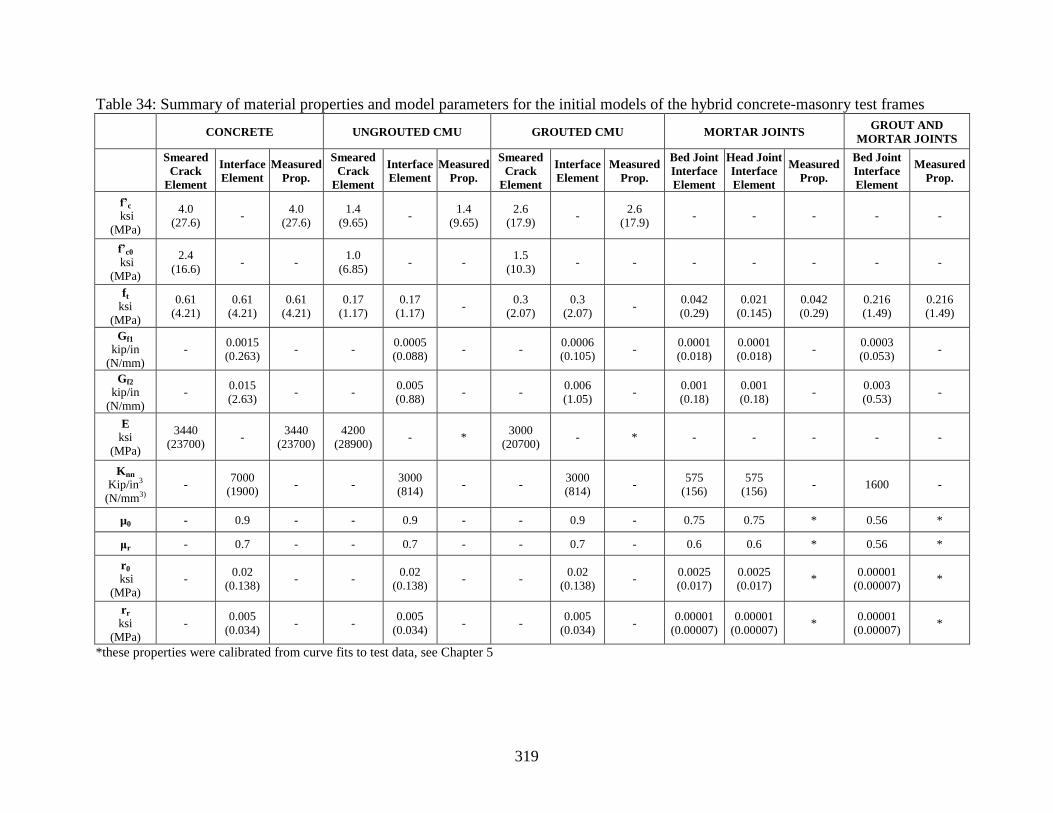
319
Table 34: Summary of material properties and model parameters for the initial models of the hybrid concrete-masonry test frames
CONCRETE UNGROUTED CMU GROUTED CMU MORTAR JOINTS
GROUT AND
MORTAR JOINTS
Smeared
Crack
Element
Interface
Element
Measured
Prop.
Smeared
Crack
Element
Interface
Element
Measured
Prop.
Smeared
Crack
Element
Interface
Element
Measured
Prop.
Bed Joint
Interface
Element
Head Joint
Interface
Element
Measured
Prop.
Bed Joint
Interface
Element
Measured
Prop.
f’c
ksi
(MPa)
4.0
(27.6) -
4.0
(27.6)
1.4
(9.65) -
1.4
(9.65)
2.6
(17.9) -
2.6
(17.9) - - - - -
f’c0
ksi
(MPa)
2.4
(16.6) - -
1.0
(6.85) - -
1.5
(10.3) - - - - - - -
ft ksi
(MPa)
0.61
(4.21)
0.61
(4.21)
0.61
(4.21)
0.17
(1.17)
0.17
(1.17) -
0.3
(2.07)
0.3
(2.07) -
0.042
(0.29)
0.021
(0.145)
0.042
(0.29)
0.216
(1.49)
0.216
(1.49)
Gf1 kip/in
(N/mm)
- 0.0015
(0.263) - -
0.0005
(0.088) - -
0.0006
(0.105) -
0.0001
(0.018)
0.0001
(0.018) -
0.0003
(0.053) -
Gf2
kip/in
(N/mm)
- 0.015
(2.63) - -
0.005
(0.88) - -
0.006
(1.05) -
0.001
(0.18)
0.001
(0.18) -
0.003
(0.53) -
E
ksi
(MPa)
3440
(23700) -
3440
(23700)
4200
(28900) - *
3000
(20700) - * - - - - -
Knn
Kip/in3
(N/mm3)
- 7000
(1900) - -
3000
(814) - -
3000
(814) -
575
(156)
575
(156) - 1600 -
µ0 - 0.9 - - 0.9 - - 0.9 - 0.75 0.75 * 0.56 *
μr - 0.7 - - 0.7 - - 0.7 - 0.6 0.6 * 0.56 *
r0
ksi
(MPa)
- 0.02
(0.138) - -
0.02
(0.138) - -
0.02
(0.138) -
0.0025
(0.017)
0.0025
(0.017) *
0.00001
(0.00007) *
rr ksi
(MPa)
- 0.005
(0.034) - -
0.005
(0.034) - -
0.005
(0.034) -
0.00001
(0.00007)
0.00001
(0.00007) *
0.00001
(0.00007) *
*these properties were calibrated from curve fits to test data, see Chapter 5

320
Figure 211: Compressive stress vs. strain for concrete, grouted masonry, and ungrouted
masonry in the initial finite element models of the hybrid concrete-masonry test frames
Figure 212: Tensile stress vs. strain for concrete, grouted CMU, ungrouted CMU, mortar
and bed joints in grouted cells* in the initial finite element models of the hybrid concrete-
masonry test frames *bed joints in grouted cells are the grout and mortar interface

321
Figure 213: Ungrouted bed joint interface element failure surface in initial finite element
models of hybrid concrete-masonry test frames and test data from bond wrench tests and
triplet tests
Figure 214: Grouted bed joint interface element failure surface in initial finite element
models of hybrid concrete-masonry test frames and test data from bond wrench tests and
triplet tests

322
Table 35: Summary of material properties and model parameters for revised models of
the hybrid concrete-masonry test frames
CONCRETE UNGROUTED CMU GROUT CORES MORTAR JOINTS
Smeared
Crack
Element
Interface
Element
Smeared
Crack
Element
Interface
Element
Smeared
Crack
Element
Interface
Element
Bed Joint
Interface
Element
Head Joint
Interface
Element
Beam-Wall
Interface
Element
f’c
ksi
(MPa)
4.77
(32.89) -
1.4
(9.65) -
3.0
(20.68) - - - -
f’c0
ksi
(MPa)
2.9
(20.00) -
1.0
(6.85) -
1.8
(12.41) - - - -
ft ksi
(MPa)
0.73
(5.03)
0.73
(5.03)
0.17
(1.17)
0.17
(1.17)
0.3
(2.07)
0.3
(2.07)
0.056
(0.386)
0.042
(0.290)
0.028
(0.193)
Gf1 kip/in
(N/mm)
- 0.001
(0.18) -
0.0005
(0.088) -
0.0006
(0.105)
0.0001
(0.018)
0.0001
(0.018)
0.0001
(0.018)
Gf2
kip/in
(N/mm)
- 0.01
(1.8) -
0.005
(0.88) -
0.006
(1.05)
0.001
(0.18)
0.001
(0.18)
0.001
(0.18)
E
ksi
(MPa)
3760
(25900) -
4200
(28900) -
3120
(21500) - - - -
Knn
Kip/in3
(N/mm3)
- 5000
(1360) -
3000
(814) -
3000
(814)
575
(156)
575
(156)
50
(13.57)
µ0 - 1.0 - 0.9 - 0.8 0.8 0.8 0.8
μr - 0.8 - 0.8 - 0.7 0.7 0.7 0.7
r0
ksi
(MPa)
- 0.02
(0.138) -
0.02
(0.138) -
0.02
(0.138)
0.007
(0.048)
0.007
(0.048)
0.005
(0.034)
rr ksi
(MPa)
- 0.005
(0.034) -
0.005
(0.034) -
0.005
(0.034)
0.00001
(0.00007)
0.00001
(0.00007)
0.00001
(0.00007)
Figure 215: Compressive stress vs. strain for concrete, grouted masonry, and ungrouted
masonry in the revised finite element models of the hybrid concrete-masonry test frames

323
Figure 216: Tensile stress vs. strain for concrete, ungrouted CMU, grout cores and mortar
in the revised finite element models of the hybrid concrete-masonry test frames
Figure 217: Ungrouted bed joint interface element failure surface in revised finite
element models of hybrid concrete-masonry test frames and test data from bond wrench
tests and triplet tests

324
Calculation to Account for Additional Shear Stiffness in the Grouted Masonry Cells
through the Splice Region of Dowel Connections:
Grout Shear Modulus,
Steel Shear Modulus,
"Fiber Volume" of Steel Reinforcement, 2 #5 bars:
where is the area of the grouted core
Composite Shear Modulus:
assumed 10% increase in shear stiffness due to presence of splice.
Local Bending Contribution of Vertical Masonry Reinforcement:
Bending capacity of single #5 bar
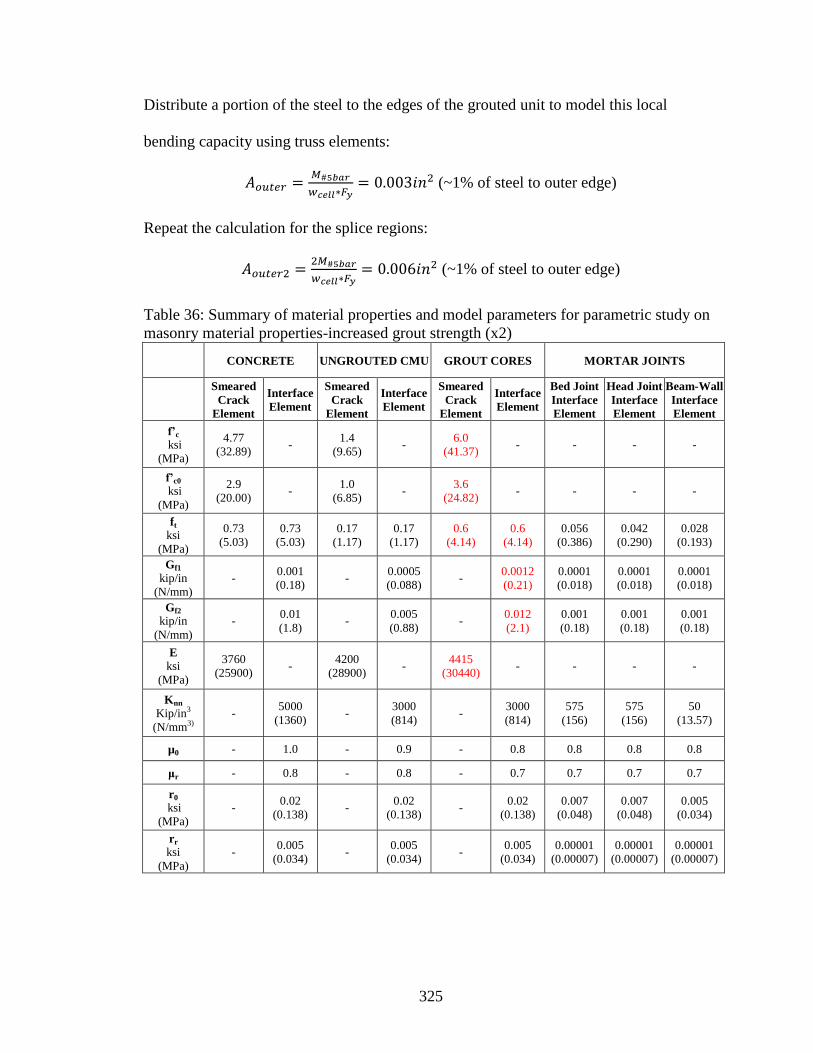
325
Distribute a portion of the steel to the edges of the grouted unit to model this local
bending capacity using truss elements:
(~1% of steel to outer edge)
Repeat the calculation for the splice regions:
(~1% of steel to outer edge)
Table 36: Summary of material properties and model parameters for parametric study on
masonry material properties-increased grout strength (x2)
CONCRETE UNGROUTED CMU GROUT CORES MORTAR JOINTS
Smeared
Crack
Element
Interface
Element
Smeared
Crack
Element
Interface
Element
Smeared
Crack
Element
Interface
Element
Bed Joint
Interface
Element
Head Joint
Interface
Element
Beam-Wall
Interface
Element
f’c
ksi
(MPa)
4.77
(32.89) -
1.4
(9.65) -
6.0
(41.37) - - - -
f’c0
ksi
(MPa)
2.9
(20.00) -
1.0
(6.85) -
3.6
(24.82) - - - -
ft ksi
(MPa)
0.73
(5.03)
0.73
(5.03)
0.17
(1.17)
0.17
(1.17)
0.6
(4.14)
0.6
(4.14)
0.056
(0.386)
0.042
(0.290)
0.028
(0.193)
Gf1 kip/in
(N/mm)
- 0.001
(0.18) -
0.0005
(0.088) -
0.0012
(0.21)
0.0001
(0.018)
0.0001
(0.018)
0.0001
(0.018)
Gf2
kip/in
(N/mm)
- 0.01
(1.8) -
0.005
(0.88) -
0.012
(2.1)
0.001
(0.18)
0.001
(0.18)
0.001
(0.18)
E
ksi
(MPa)
3760
(25900) -
4200
(28900) -
4415
(30440) - - - -
Knn
Kip/in3
(N/mm3)
- 5000
(1360) -
3000
(814) -
3000
(814)
575
(156)
575
(156)
50
(13.57)
µ0 - 1.0 - 0.9 - 0.8 0.8 0.8 0.8
μr - 0.8 - 0.8 - 0.7 0.7 0.7 0.7
r0
ksi
(MPa)
- 0.02
(0.138) -
0.02
(0.138) -
0.02
(0.138)
0.007
(0.048)
0.007
(0.048)
0.005
(0.034)
rr ksi
(MPa)
- 0.005
(0.034) -
0.005
(0.034) -
0.005
(0.034)
0.00001
(0.00007)
0.00001
(0.00007)
0.00001
(0.00007)

326
Table 37: Summary of material properties and model parameters for parametric study on
masonry material properties-decreased grout strength ( 2)
CONCRETE UNGROUTED CMU GROUT CORES MORTAR JOINTS
Smeared
Crack
Element
Interface
Element
Smeared
Crack
Element
Interface
Element
Smeared
Crack
Element
Interface
Element
Bed Joint
Interface
Element
Head Joint
Interface
Element
Beam-Wall
Interface
Element
f’c
ksi
(MPa)
4.77
(32.89) -
1.4
(9.65) -
1.5
(10.34) - - - -
f’c0
ksi
(MPa)
2.9
(20.00) -
1.0
(6.85) -
0.9
(6.21) - - - -
ft ksi
(MPa)
0.73
(5.03)
0.73
(5.03)
0.17
(1.17)
0.17
(1.17)
0.15
(1.03)
0.15
(1.03)
0.056
(0.386)
0.042
(0.290)
0.028
(0.193)
Gf1 kip/in
(N/mm)
- 0.001
(0.18) -
0.0005
(0.088) -
0.0003
(0.053)
0.0001
(0.018)
0.0001
(0.018)
0.0001
(0.018)
Gf2
kip/in
(N/mm)
- 0.01
(1.8) -
0.005
(0.88) -
0.003
(0.53)
0.001
(0.18)
0.001
(0.18)
0.001
(0.18)
E
ksi
(MPa)
3760
(25900) -
4200
(28900) -
2210
(15200) - - - -
Knn
Kip/in3
(N/mm3)
- 5000
(1360) -
3000
(814) -
3000
(814)
575
(156)
575
(156)
50
(13.57)
µ0 - 1.0 - 0.9 - 0.8 0.8 0.8 0.8
μr - 0.8 - 0.8 - 0.7 0.7 0.7 0.7
r0
ksi
(MPa)
- 0.02
(0.138) -
0.02
(0.138) -
0.02
(0.138)
0.007
(0.048)
0.007
(0.048)
0.005
(0.034)
rr ksi
(MPa)
- 0.005
(0.034) -
0.005
(0.034) -
0.005
(0.034)
0.00001
(0.00007)
0.00001
(0.00007)
0.00001
(0.00007)

327
Table 38: Summary of material properties and model parameters for parametric study on
masonry material properties-increased ungrouted prism strength (x2)
CONCRETE UNGROUTED CMU GROUT CORES MORTAR JOINTS
Smeared
Crack
Element
Interface
Element
Smeared
Crack
Element
Interface
Element
Smeared
Crack
Element
Interface
Element
Bed Joint
Interface
Element
Head Joint
Interface
Element
Beam-Wall
Interface
Element
f’c
ksi
(MPa)
4.77
(32.89) -
2.8
(19.31) -
3.0
(20.68) - - - -
f’c0
ksi
(MPa)
2.9
(20.00) -
1.96
(13.51) -
1.8
(12.41) - - - -
ft ksi
(MPa)
0.73
(5.03)
0.73
(5.03)
0.17
(1.17)
0.17
(1.17)
0.3
(2.07)
0.3
(2.07)
0.056
(0.386)
0.042
(0.290)
0.028
(0.193)
Gf1 kip/in
(N/mm)
- 0.001
(0.18) -
0.0005
(0.088) -
0.0006
(0.105)
0.0001
(0.018)
0.0001
(0.018)
0.0001
(0.018)
Gf2
kip/in
(N/mm)
- 0.01
(1.8) -
0.005
(0.88) -
0.006
(1.05)
0.001
(0.18)
0.001
(0.18)
0.001
(0.18)
E
ksi
(MPa)
3760
(25900) -
4200
(28900) -
3120
(21500) - - - -
Knn
Kip/in3
(N/mm3)
- 5000
(1360) -
3000
(814) -
3000
(814)
575
(156)
575
(156)
50
(13.57)
µ0 - 1.0 - 0.9 - 0.8 0.8 0.8 0.8
μr - 0.8 - 0.8 - 0.7 0.7 0.7 0.7
r0
ksi
(MPa)
- 0.02
(0.138) -
0.02
(0.138) -
0.02
(0.138)
0.007
(0.048)
0.007
(0.048)
0.005
(0.034)
rr ksi
(MPa)
- 0.005
(0.034) -
0.005
(0.034) -
0.005
(0.034)
0.00001
(0.00007)
0.00001
(0.00007)
0.00001
(0.00007)
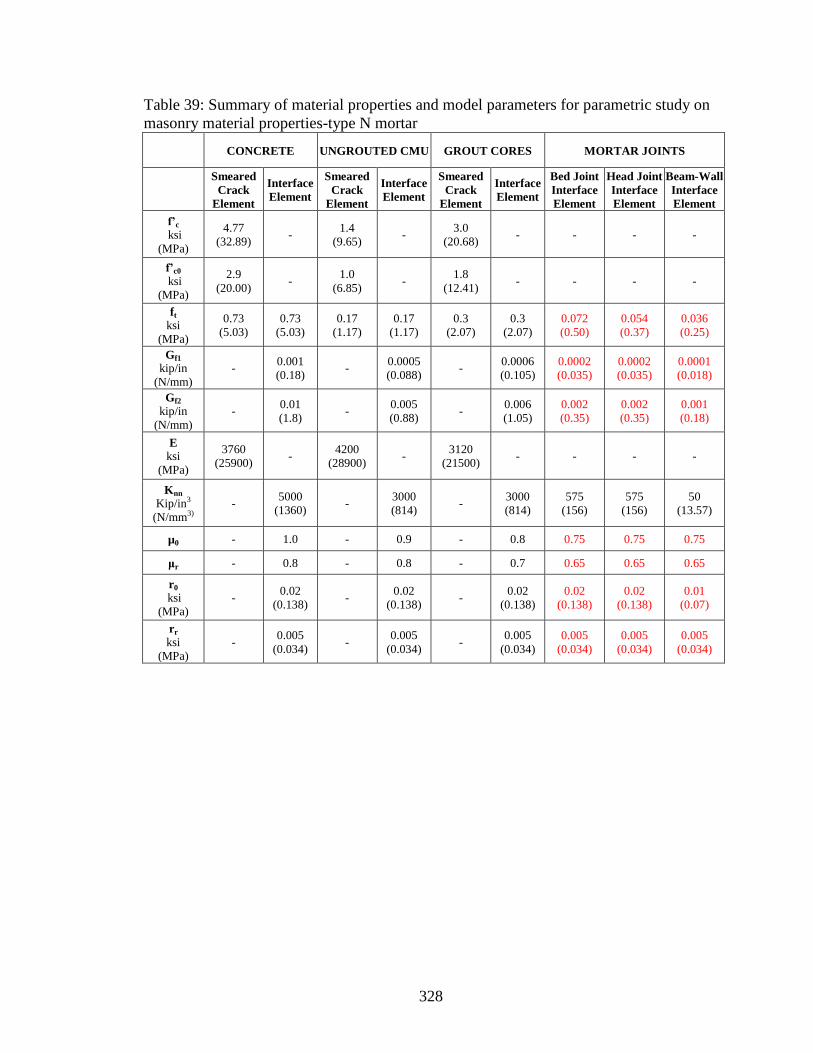
328
Table 39: Summary of material properties and model parameters for parametric study on
masonry material properties-type N mortar
CONCRETE UNGROUTED CMU GROUT CORES MORTAR JOINTS
Smeared
Crack
Element
Interface
Element
Smeared
Crack
Element
Interface
Element
Smeared
Crack
Element
Interface
Element
Bed Joint
Interface
Element
Head Joint
Interface
Element
Beam-Wall
Interface
Element
f’c
ksi
(MPa)
4.77
(32.89) -
1.4
(9.65) -
3.0
(20.68) - - - -
f’c0
ksi
(MPa)
2.9
(20.00) -
1.0
(6.85) -
1.8
(12.41) - - - -
ft ksi
(MPa)
0.73
(5.03)
0.73
(5.03)
0.17
(1.17)
0.17
(1.17)
0.3
(2.07)
0.3
(2.07)
0.072
(0.50)
0.054
(0.37)
0.036
(0.25)
Gf1 kip/in
(N/mm)
- 0.001
(0.18) -
0.0005
(0.088) -
0.0006
(0.105)
0.0002
(0.035)
0.0002
(0.035)
0.0001
(0.018)
Gf2
kip/in
(N/mm)
- 0.01
(1.8) -
0.005
(0.88) -
0.006
(1.05)
0.002
(0.35)
0.002
(0.35)
0.001
(0.18)
E
ksi
(MPa)
3760
(25900) -
4200
(28900) -
3120
(21500) - - - -
Knn
Kip/in3
(N/mm3)
- 5000
(1360) -
3000
(814) -
3000
(814)
575
(156)
575
(156)
50
(13.57)
µ0 - 1.0 - 0.9 - 0.8 0.75 0.75 0.75
μr - 0.8 - 0.8 - 0.7 0.65 0.65 0.65
r0
ksi
(MPa)
- 0.02
(0.138) -
0.02
(0.138) -
0.02
(0.138)
0.02
(0.138)
0.02
(0.138)
0.01
(0.07)
rr ksi
(MPa)
- 0.005
(0.034) -
0.005
(0.034) -
0.005
(0.034)
0.005
(0.034)
0.005
(0.034)
0.005
(0.034)
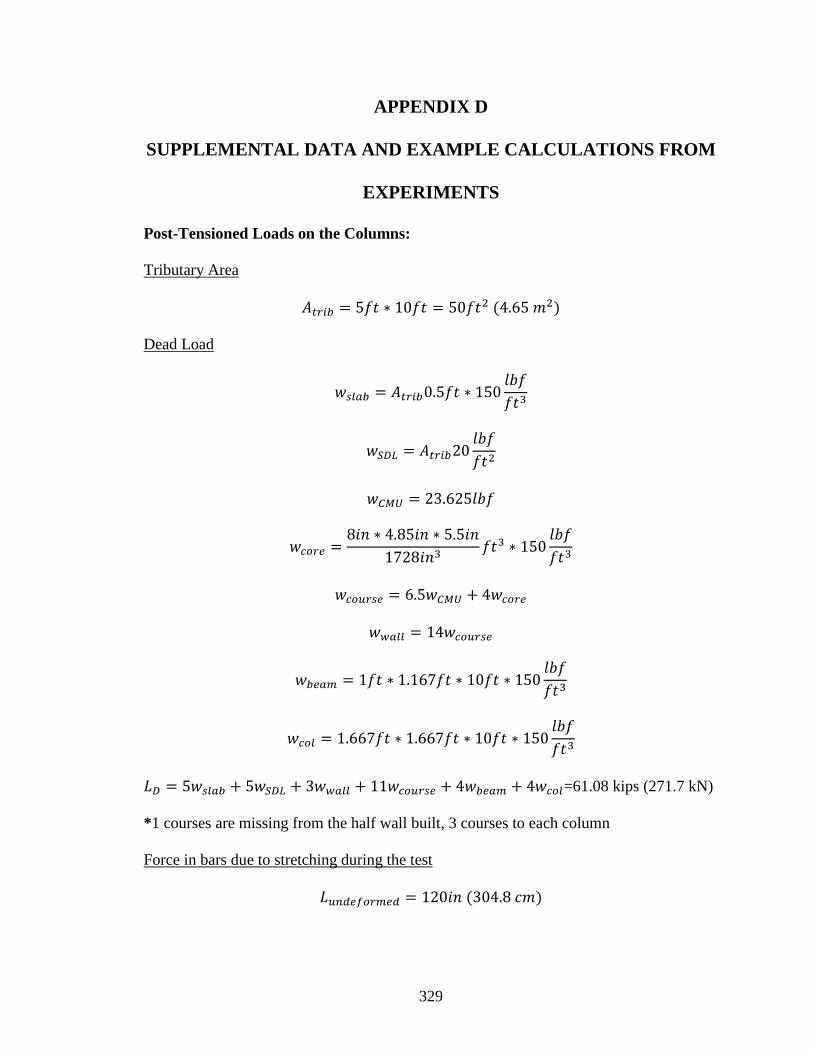
329
APPENDIX D
SUPPLEMENTAL DATA AND EXAMPLE CALCULATIONS FROM
EXPERIMENTS
Post-Tensioned Loads on the Columns:
Tributary Area
Dead Load
=61.08 kips (271.7 kN)
*1 courses are missing from the half wall built, 3 courses to each column
Force in bars due to stretching during the test

330
*anticipated max displacement was approximately 4in. Designed for 2in. average
displacement.
Post-tensioning load in each column
Moment Capacity of a Bare RC Frame with the Same Reinforcement as the
Experimental Frames:
Figure 218: Portal frame
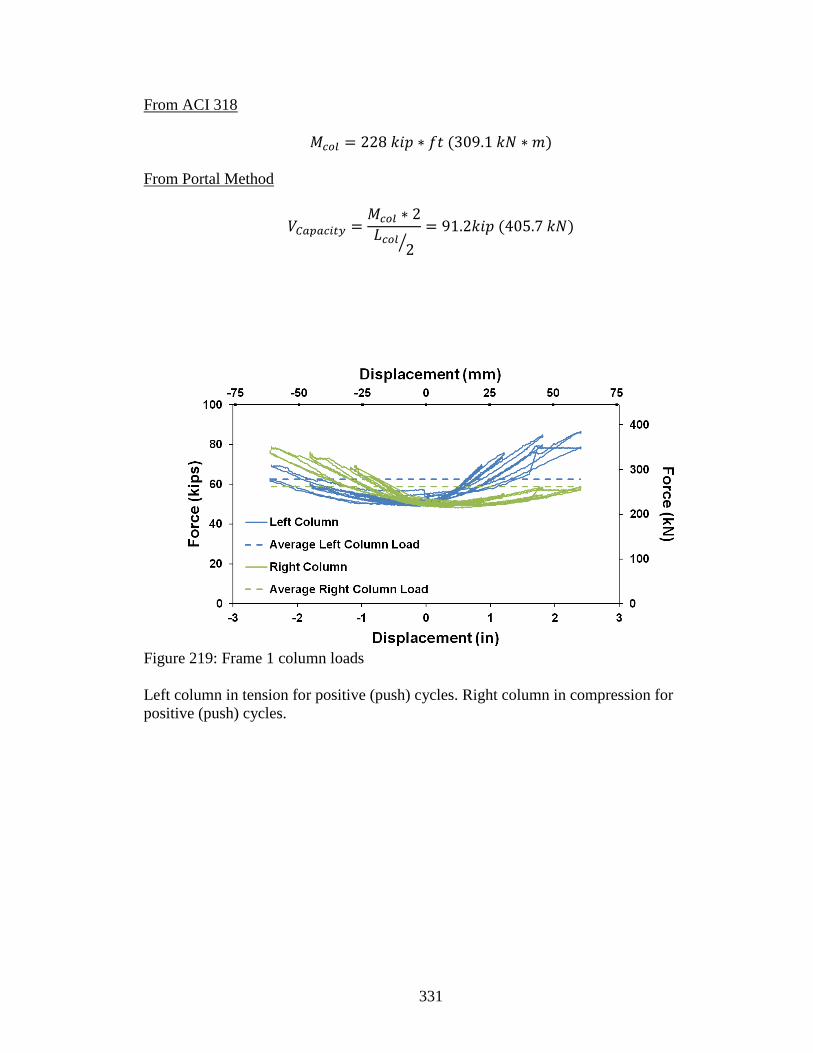
331
From ACI 318
From Portal Method
Figure 219: Frame 1 column loads
Left column in tension for positive (push) cycles. Right column in compression for
positive (push) cycles.
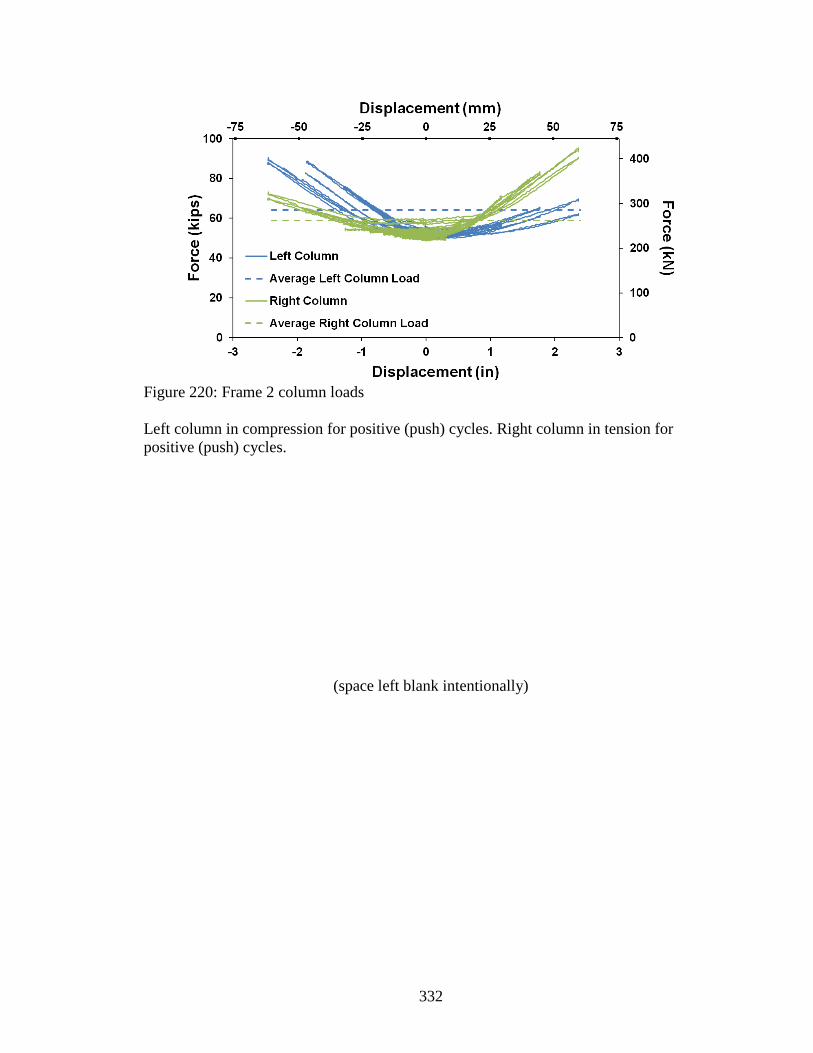
332
Figure 220: Frame 2 column loads
Left column in compression for positive (push) cycles. Right column in tension for
positive (push) cycles.
(space left blank intentionally)

333
Calculation for Shear and Flexural Deformations in the RC columns and the
Masonry Infill:
Figure 221: Shear deformation schematic
Shear Strain
Figure 222: Gage length diagram

334
Curvature
for small deformations curvature can be approximated as
Table 40: Crack data Frame 1, column in tension during positive (push) cycles
0.86 inches (20.85 mm) Lateral Displacement
To
pm
ost cr
ack
⟶B
otto
m cra
ck
Crack width
in (mm)
Distance from
last crack*
in (cm)
Gage length
in (cm)
Strain in bar
0.016 (0.406) 13 (33.02)
0.013 (0.330) 4.25 (10.80) 8.625 (21.91) 0.0015
0.005 (0.127) 6.25 (15.98) 5.25 (13.34) 0.00095
0.01 (0.254) 6 (15.24) 6.125 (15.56) 0.0016
0.01 (0.254) 4.75 (12.07) 5.375 (13.65) 0.0019
0.003 (0.076) 12.5 (31.75) 8.625 (21.91) 0.00024
2.4 inches (60.96 mm) Lateral Displacement
To
pm
ost cr
ack
⟶B
otto
m cra
ck
Crack width
in (mm)
Distance from
last crack*
in (cm)
Gage length
in (cm)
Strain in bar
0.005 (0.127) 12.5 (31.75)
0.005 (0.127) 4.5 (11.43) 8.5 (21.59) 0.00059
0.005 (0.127) 6.5 (16.51) 5.5 (13.97) 0.00091
0.007 (0.178) 5.5 (13.97) 6 (15.24) 0.0012
0.016 (0.406) 4.5 (11.43) 5 (12.7) 0.0032
0.016 (0.406) 12.25 (31.11) 8.375 (21.27) 0.0019
0.025(0.635) 5.8 (14.73) 9.025 (22.92) 0.0028
0.025 (0.635) 5.25 (13.34) 5.525 (14.03) 0.0045
0.03 (0.762) 4 (10.16) 4.625 (11.74) 0.0065
0.05 (1.270) 7.5 (19.05) 5.75 (14.61) 0.0087
*for the bottom crack, this is the distance from the foundation

335
Table 41: Crack data Frame 2, column in tension during positive (push) cycles
1.8 inches (45.72 mm) Lateral Displacement
To
pm
ost cr
ack
⟶B
otto
m cra
ck
Crack width
in (mm)
Distance from
last crack*
in (cm)
Gage length
in (cm)
Strain in bar
0.005 (0.127) 6 (15.24)
0.007(0.178) 4.5 (11.43) 5.25 (13.34) 0.0013
0.005 (0.127) 5 (12.70) 4.75 (12.07) 0.0011
0.01 (0.254) 12.5 (31.75) 8.75 (22.22) 0.0011
0.025 (0.635) 10.5 (26.67) 11.5 (29.21) 0.0022
0.025 (0.635) 11 (27.94) 10.75 (27.31) 0.0023
0.009 (0.229) 5.5 (13.97) 8.25 (20.96) 0.0011
2.4 inches (60.96 mm) Lateral Displacement
To
pm
ost cr
ack
⟶B
otto
m cra
ck
Crack width
in (mm)
Distance from
last crack*
in (cm)
Gage length
in (cm)
Strain in bar
0.005 (0.127) 6 (15.24)
0.007(0.178) 4.5 (11.43) 5.25 (13.34) 0.0013
0.005 (0.127) 5 (12.70) 4.75 (12.07) 0.0011
0.016 (0.406) 12.5 (31.75) 8.75 (22.22) 0.0018
0.035 (0.889) 10.5 (26.67) 11.5 (29.21) 0.0030
0.035 (0.889) 11 (27.94) 10.75 (27.31) 0.0033
0.04 (1.016) 5.5 (13.97) 8.25 (20.96) 0.0048
*for the bottom crack, this is the distance from the foundation

336
Table 42: Crack data frame 2, column in compression during positive (push) cycles
1.8 inches (45.72 mm) Lateral Displacement
To
pm
ost cr
ack
⟶B
otto
m
cra
ck
Crack width
in (mm)
Distance from
last crack*
in (cm)
Gage length
in (cm)
Strain in bar
0.007(0.178) 10.5 (26.67)
0.016 (0.406) 4 (10.16) 7.25 (18.42) 0.0022
0.01 (0.254) 5 (12.70) 4.5 (11.43) 0.0022
0.013 (0.330) 3.5 (8.89) 4.25 (10.80) 0.0031
0.015 (0.381) 9 (22.86) 6.25 (15.88) 0.0024
0.02 (0.508) 3.5 (8.89) 6.25 (15.88) 0.0032
0.02 (0.508) 8 (20.32) 5.75 (14.61) 0.0035
0.035(0.889) 7 (17.78) 7.5 (19.05) 0.0047
2.4 inches (60.96 mm) Lateral Displacement
To
pm
ost cr
ack
⟶B
otto
m
cra
ck
Crack width
in (mm)
Distance from
last crack*
in (cm)
Gage length
in (cm)
Strain in bar
0.007(0.178) 10.5 (26.67)
0.016 (0.406) 4 (10.16) 7.25 (18.42) 0.0022
0.016 (0.406) 5 (12.7) 4.5 (11.43) 0.0036
0.013 (0.330) 3.5 (8.89) 4.25 (10.80) 0.0031
0.02 (0.508) 9 (22.86) 6.25 (15.88) 0.0032
0.025 (0.635) 3.5 (8.89) 6.25 (15.88) 0.004
0.02 (0.508) 8 (20.32) 5.75 (14.61) 0.0035
0.04 (1.016) 7 (17.78) 7.5 (19.05) 0.0053
*for the bottom crack, this is the distance from the foundation
Calculation for Strains in the Vertical Column Reinforcement as a Function of
Crack Width and Location:
Gage length
where is the distance to crack under consideration from crack below and is the
distance to crack under consideration from crack above.
where is the crack width

337
Calculation for Adjusting Amplitude of Negative (Pull) Cycles for Bar Stretching:
1. Record force required to reach displacement
2. Calculate the stress in the DYWIDAG bars if the same force was applied in the
negative cycle:
3. Calculate the strain in the bars
4. Calculate the displacement of the loading plate due to stretching of the bars
5. Calculate the displacement to pull the structure in the negative cycle
The same stretching was subtracted from the recorded displacement at the actuator head:
Figure 223: Processed and raw force-displacement data for Frame 1 with dowel
connections on all edges of the masonry infill
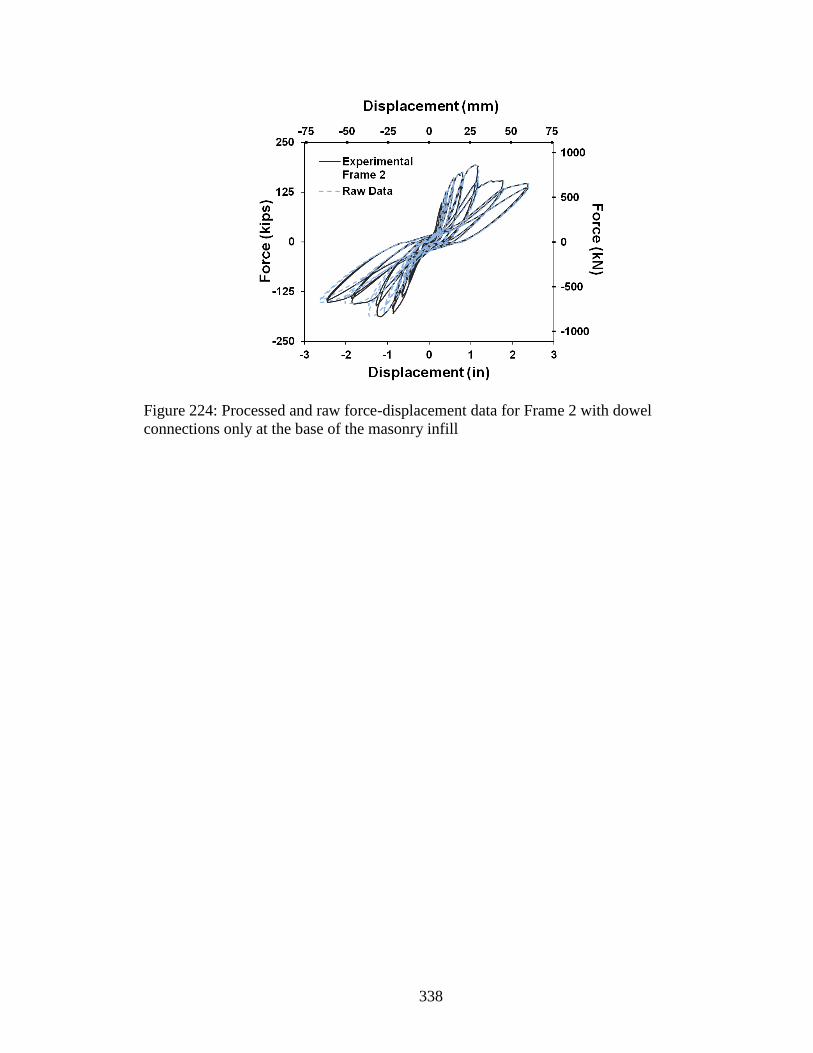
338
Figure 224: Processed and raw force-displacement data for Frame 2 with dowel
connections only at the base of the masonry infill

339
APPENDIX E
CALCULATIONS FOR SIMPLIFIED MODELS
Elastic Transformed Section Model:
Figure 225: Shear flow through transformed section

340
Cracked Section Model:
Figure 226: Schematic of cracked section model
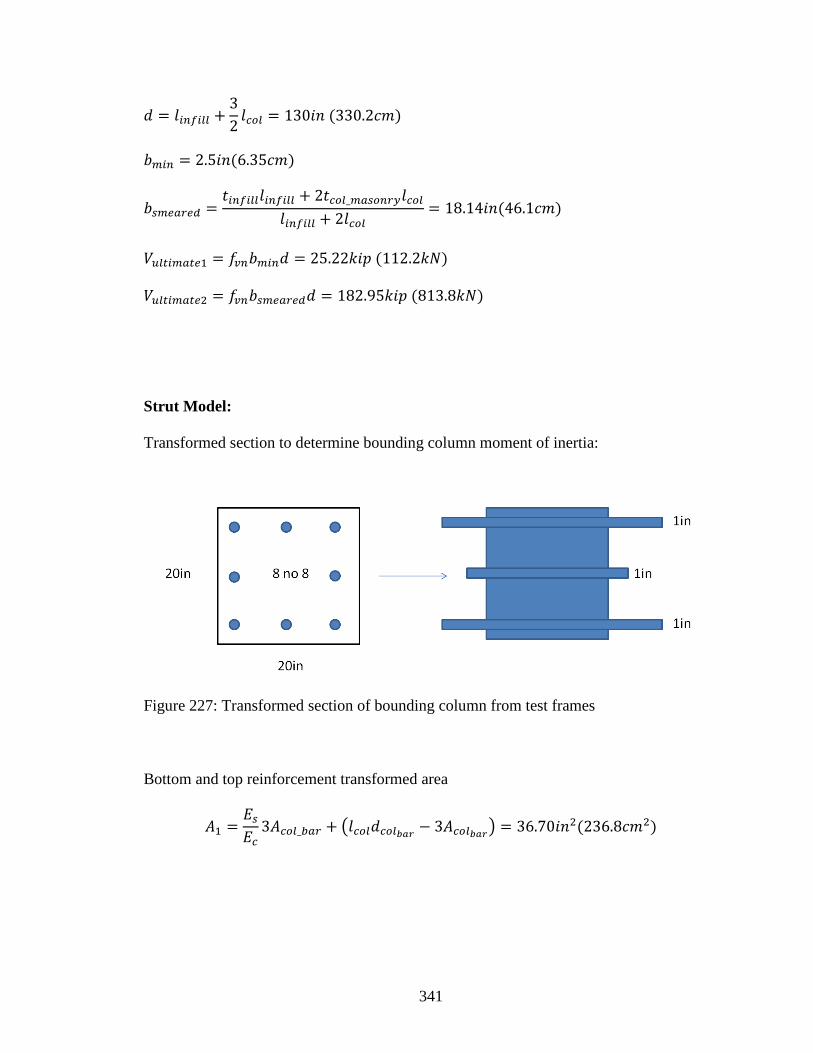
341
Strut Model:
Transformed section to determine bounding column moment of inertia:
Figure 227: Transformed section of bounding column from test frames
Bottom and top reinforcement transformed area

342
Middle reinforcement area
Calculate moment of inertias of respective sections
col
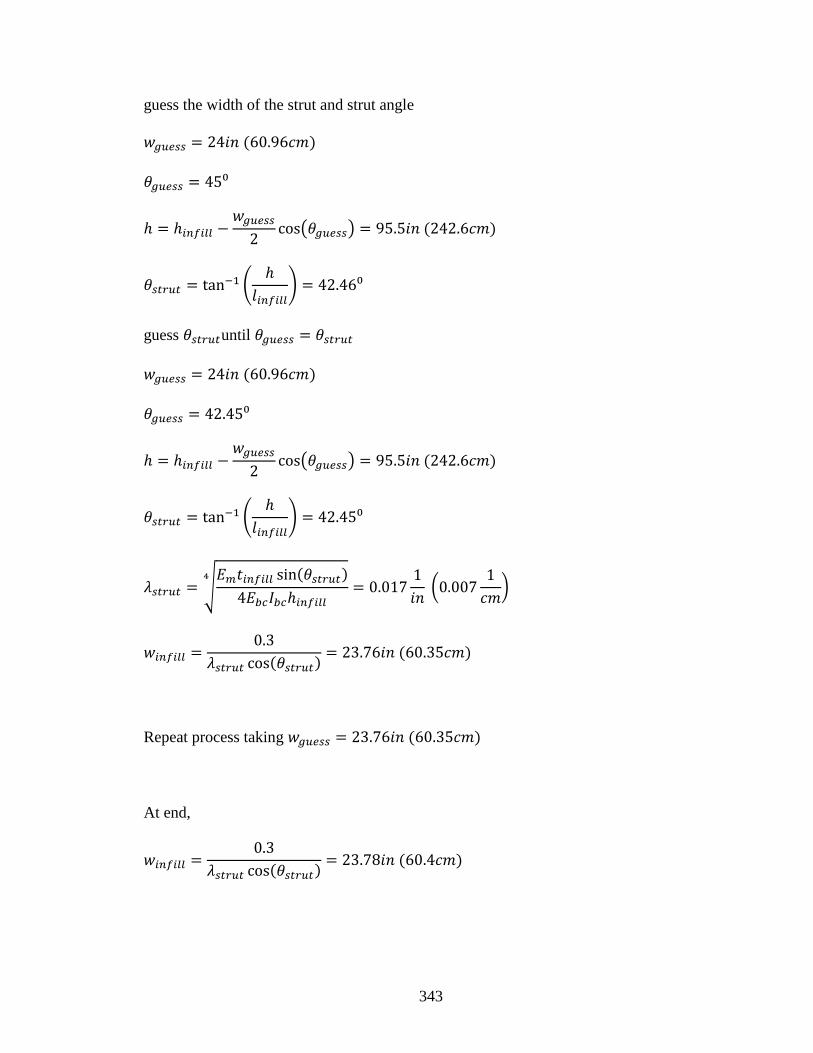
343
guess the width of the strut and strut angle
⁰
⁰
guess until
⁰
⁰
Repeat process taking
At end,
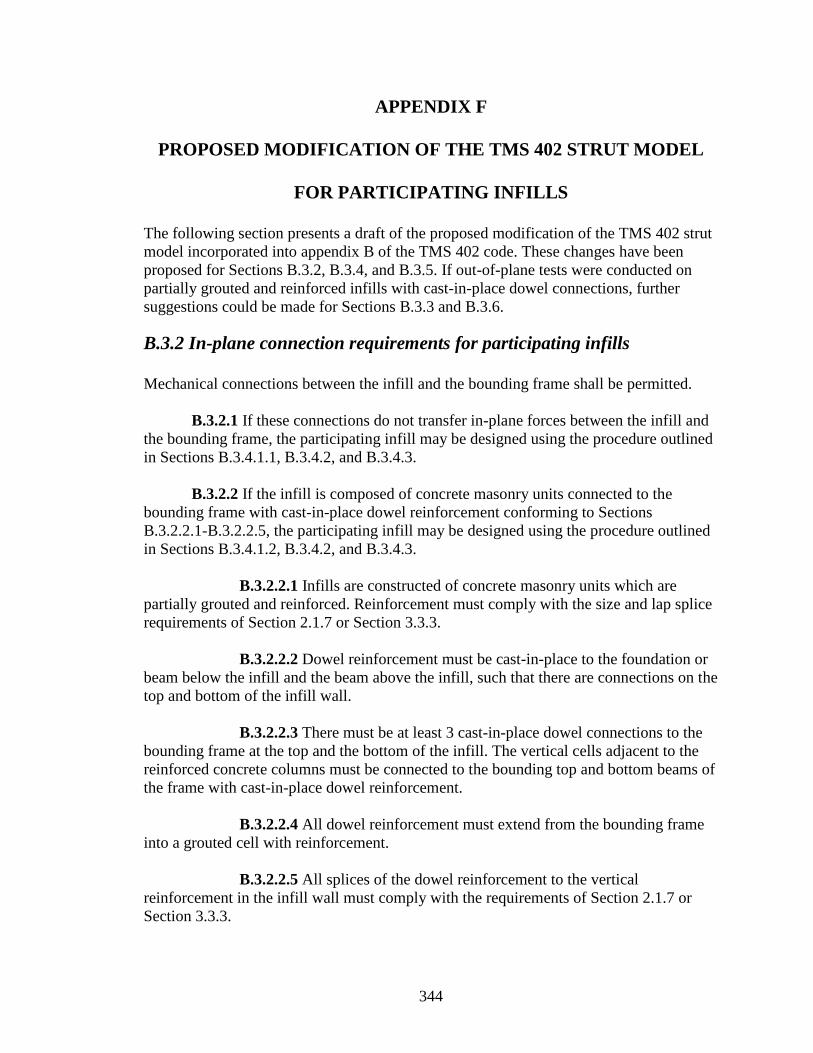
344
APPENDIX F
PROPOSED MODIFICATION OF THE TMS 402 STRUT MODEL
FOR PARTICIPATING INFILLS
The following section presents a draft of the proposed modification of the TMS 402 strut
model incorporated into appendix B of the TMS 402 code. These changes have been
proposed for Sections B.3.2, B.3.4, and B.3.5. If out-of-plane tests were conducted on
partially grouted and reinforced infills with cast-in-place dowel connections, further
suggestions could be made for Sections B.3.3 and B.3.6.
B.3.2 In-plane connection requirements for participating infills
Mechanical connections between the infill and the bounding frame shall be permitted.
B.3.2.1 If these connections do not transfer in-plane forces between the infill and
the bounding frame, the participating infill may be designed using the procedure outlined
in Sections B.3.4.1.1, B.3.4.2, and B.3.4.3.
B.3.2.2 If the infill is composed of concrete masonry units connected to the
bounding frame with cast-in-place dowel reinforcement conforming to Sections
B.3.2.2.1-B.3.2.2.5, the participating infill may be designed using the procedure outlined
in Sections B.3.4.1.2, B.3.4.2, and B.3.4.3.
B.3.2.2.1 Infills are constructed of concrete masonry units which are
partially grouted and reinforced. Reinforcement must comply with the size and lap splice
requirements of Section 2.1.7 or Section 3.3.3.
B.3.2.2.2 Dowel reinforcement must be cast-in-place to the foundation or
beam below the infill and the beam above the infill, such that there are connections on the
top and bottom of the infill wall.
B.3.2.2.3 There must be at least 3 cast-in-place dowel connections to the
bounding frame at the top and the bottom of the infill. The vertical cells adjacent to the
reinforced concrete columns must be connected to the bounding top and bottom beams of
the frame with cast-in-place dowel reinforcement.
B.3.2.2.4 All dowel reinforcement must extend from the bounding frame
into a grouted cell with reinforcement.
B.3.2.2.5 All splices of the dowel reinforcement to the vertical
reinforcement in the infill wall must comply with the requirements of Section 2.1.7 or
Section 3.3.3.

345
B.3.4Design of Participating Infills for In-Plane Forces
B.3.4.1 Unless the stiffness of the infill is obtained by a more comprehensive
analysis, a participating infill shall be analyzed as an equivalent strut using either Section
B.3.4.1.1 or B.3.4.1.2.
B.3.4.1.1 For unreinforced masonry infills without in-plane connections or
in-plane connections complying with Section B.3.2.1, a participating infill shall be
analyzed as an equivalent strut, capable of resisting compression only; whose width is
calculated using Equation B-1; whose thickness is the specified thickness of the infill;
and whose elastic modulus is the elastic modulus of the infill.
(Equation B-1)
where
(Equation B-2)
(Equation B-3)
B.3.4.1.2 For partially grouted reinforced masonry infills with cast-in-place
connections complying with Section B.3.2.2, a participating infill shall be analyzed as an
equivalent strut, capable of resisting compression only; whose width is determined using
the procedure below; whose thickness is equal to two face shell thicknesses; and whose
elastic modulus is the elastic modulus of the ungrouted prism.
Iteratively determine the width of the compression strut and the angle of the strut subject
to the following constraints:
(Equation B-4)
where
(Equation B-5)
(Equation B-6)
and
The bottom node of the compression strut attached to the column at the mid height of the
dowel splice at the base of the masonry wall:
(Equation B-7)

346
The top node of the compression strut must be attached to the column such that the
bearing area for the strut begins at the top of the column:
(Equation B-8)
B.3.4.2 Design forces in equivalent struts as defined in Section B.3.4.1.1 or Section
B.3.4.1.2, shall be determined from an elastic analysis of a braced frame including such
equivalent struts.
B.3.5 Design of Frame Elements with Participating Infills for In-Plane
Loads
B.3.5.1 Design each frame member not in contact with an infill for shear,
moment, and axial force not less than the results from the equivalent strut frame analysis.
B.3.5.2 Design each bounding column in contact with an infill for shear and
moment equal to not less than 1.1 times the results from the equivalent strut frame
analysis, and for axial force not less than the results from that analysis. In addition,
follow the applicable procedure of Sections B.3.5.2.1 or B.3.5.2.2.
B.3.5.2.1 For unreinforced masonry infills without in-plane connections or
in-plane connections complying with Section B.3.2.1,augment the design shear at the end
of the column by the horizontal component of the equivalent strut force acting on that end
under design loads.
B.3.5.2.2 For partially grouted reinforced masonry infills with cast-in-
place connections complying with Section B.3.2.2, treat the bounding columns as three
separate members, a member above the top node of the compression strut, a member
below the bottom node of the compression strut, and a member for the middle segment.
Augment the design shear at the ends of the middle segment of the column by the
horizontal component of the equivalent strut force acting on that end under design loads.
When prescribing the reinforcement for the column, treat the column as three separate
members with their own close tie-spacing region such that close tie spacing is ensured
on either side of the node where the compression strut is assumed to bear on the column.
B.3.5.3 Design each beam in contact with an infill for shear and moment equal to
not less than 1.1 times the results from the equivalent strut frame analysis, and for axial
force not less than the results from that analysis. In addition, augment the design shear at
each end by the vertical component of the equivalent strut force acting on that end under
design loads.

347
REFERENCES
Abrams, D. (2011). Hybrid Masonry Seismic Structural Systems. Paper presented at the
NEES and MCEER Quake Summit, Buffalo, NY.
Abrams, D., Fahnestock, L., and Eidini, M. (2010). Basic Mechanisms for Hybrid
Masonry Structures. Paper presented at the ASCE Structures Congress.
Alaluf, R. et. al. (2011). The M 7.1 Ercis-Van, Turkey Earthquake of October 23, 2011
EERI Special Earthquake Report: Earthquake Engineering Research Institute.
Alcocer, S., Klinger, R., Greene, M., Nathe, S., Austin, V., and Gilland, E. (2006). The
Tecoman Mexico Earthquake January 21, 2003: EERI and SMIS.
Amadei, B., Strure, S., and Saeb, S. (1989). An Evaluation of Masonry Joint Shear
Strength in Existing Buildings. Report for the National Science Foundation.
University of Colorado at Boulder. Boulder, CO.
Angel, R., Abrams, D., Shapiro, D., Uzarski, J., and Webster, M. (1994). Behavior of
Reinforced Concrete Frames with Masonry Infills. Report for the National
Science Foundation. University of Illinois. Urbana-Champaign, IL.
ASCE. (2000). FEMA 356: Sesimic Rehabilitation of Buildings.
ASCE. (2006). ASCE 41-06 Seismic Rehabilitation of Exsisting Buildings. Reston, VA.
Atkinson, R., and Yan, G. (1990). A Statistical Study of Masonry Deformability,
Development of a Database for Compressive Stress-Strain Behavior of Masonry.
University of California Earthquake Engineering Research Center. Richmond,
CA.
Ayoub, A., and Filippou, F. (1998). Nonlinear Finite Element Analysis of RC Shear
Panels and Walls. Journal of Structural Engineering, March, 298-308.
Barzegar-Jamshidi, F., and Schnobrich, W. (1986). Nonlinear Finite Element Analysis of
Reinforced Concrete under Short Term Monotonic Loading. University of
Illinios. Urbana-Champaign, IL.
Bayhan, B., and Gülkan, P. (2011). Buildings Subjected to Recurring Earthquakes: A
Tale of Three Cities. Earthquake Spectra, 27(3), 635-659.
Bazant, Z. P. (1984). Size Effect in Blunt Fracture: Concrete, Rock, Metal. Journal of
Engineering Mechanics, 110, 518-535.
Bazant, Z. P. (1986). Mechanics of Distributed Cracking. Applied Mechanics Rev, 39(5).
348
Bazant, Z. P., and Becq-Giraudon, E. (2002). Statistical Prediction of Fracture Parameters
of Concrete and Implications for Choice of Tesing Standard. Cement and
Concrete Research, 32, 529-556.
Bazant, Z. P., and Cedolin, L. (1979). Blunt Crack Band Propagation in Finite Element
Analysis. Journal of the Engineering Mechanics Division, 105(2), 297-315.
Bazant, Z. P., and Cedolin, L. (1980). Effect of Finite Element Choice in Blunt Crack
Band Analysis. Computer Methods in Applied Mechanics and Engineering, 24,
305-316.
Bazant, Z. P., and Gambarova, P. (1984). Crack Shear in Concrete: Crack Band
Microplane Model. Journal of Engineering Mechanics, 110, 2015-2035.
Bazant, Z. P., and Oh, B. (1983). Crack Band Theory for Fracture of Concrete. Materials
and Structures, 93(16), 155-177.
Bazant, Z. P., and Pijaudier-Cabot, G. (1989). Measurement of Characteristic Length of
Nonlocal Continuum. Journal of Engineering Mechanics, 115, 755-767.
Bazant, Z. P., and Prat, P. (1988). Microplane Model for Brittle-Plastic Material Part I.
Journal of Engineering Mechanics, 114, 1672-1702.
Belytschko, T., Fish, J., and Engelmann, B. (1988). Finite Element with Embedded
Localization Zones. Computer Methods in Applied Mechanics and Engineering,
70, 59-89.
Bendimerad, F. (2004). The 21 May 2003 Boumerdes Earthquake, Lessons Learned and
Recommendations. Paper presented at the 13th World Conference on Earthquake
Engineering, Vancouver, B.C.
Bennett, R., Flanagan, R., Adham, S., Fischer, W., and Tenbus. (1996). Evaluation and
Analysis of the Performance of Masonry Infills During the Northridge
Earthquake. Report for the National Science Foundation.
Bhide, S., and Collins, M. (1989). Influence of Axial Tension on Shear Capacity of
Reinforced Concrete Members. Journal of Structural Engineering, 86(5), 570-
581.
Biggs, D. (2007). Hybrid Masonry Structures. Paper presented at the 10th North
American Masonry Conference, St. Lewis, MO.
Birkeland, P., and Birkeland, H. (1966). Connections in Precast Concrete Construction.
ACI Journal, 63(3), 345-368.
Bocca, P. (1989). Fracture Mechanics of Brick Masonry: Size Effects and Snap-Back
Analysis. Materials and Structures, 22, 364-373.

349
Bolander, J., and Saito, S. (1998). Fracture Analyses using Spring Networks with
Random Geometry. Engineering Fracture Mechanics, 61, 569-591.
Borchelt, J. G. (1982). Masonry, Materials, Properties, and Performance: A Symposium.
American Society for Testing and Materials.
Brokken, S., and Bertero, V. (1981). Studes on Effects of Infills in Seismic Resistant RC
Construction. Report for the National Science Foundation. University of
California. Berkeley, CA.
Brzev, S., Astroza, M., and Yadlin, M. (2010). Performance of Confined Masonry
Buildings in the February 27, 2010 Chile Earthquake. Report for the Earthquake
Engineering Research Institute.
Buonopane, S., and White, R. (1999). Pseudodynamic Testing of Masonry Infilled
Reinforced Concrete Frame. Journal of Structural Engineering, 578-589.
Calvi, G., Bolognini, D., and Penna, A. (2004). Seismic Performance of Masonry-Infilled
R.C. Frames: Benefits of Slight Reinforcements. Paper presented at the 6th
Congresso Nacional de Sismologia e Engenharia. Sísmica, Italy.
CEN. (2003). Eurocode 8: Design of Structures for Earthquake Resistance: European
Committee for Standardization.
Cervenka, J., and Papanikolaou, V. (2008). Three Dimensional Combined Fracture-
Plastic Material Model for Concrete. International Journal of Plasticity, 24, 2192-
2220.
Cervera, M., Hinton, E., and Hassan, O. (1987). Nonlinear Analysis of Reinforced
Concrete and Shell Structures using 20-Noded Isoparametric Brick Elements.
Computers and Structures, 25(6), 845-869.
Cheema, T., and Klingner, R. (1986). Compressive Strength of Concrete Masonry
Prisms. ACI Journal, Jan.-Feb., 88-97.
Chen, F. W. (2007). Plasticity in Reinforced Concrete: J Ross Publishing.
Chen, W.-W., Yeh, Y.-K., Hwang, S.-J., Lu, C.-H., and Chen, C.-C. (2012). Out-of-Plane
Seismic Behavior and CFRP Retrofitting of RC Frames Infilled with Brick Walls.
Engineering Structures, 34, 213-224.
Chung, W., and Ahmad, S. (1995). Analytical Model for Shear Critical Reinforced-
Concrete Members. Journal of Structural Engineering, 121, 1023-1029.
Cope, R., and Rao, P. (1981). Nonlinear Finite Element Strategies for Bridge Slabs.
Reports of the working comissions IABSE, (pp. 273-288). Liverpool University.
Liverpool, England.

350
Cope, R., Rao, P., Clark, L., and Norris, P. (1980). Modeling of Reinforced Concrete
Behavior for Finite Element Analysis of Bridge Slabs. Numerical Methods for
Nonlinear Problems (pp. 457-470). Pineridge Press.
Corte, G., Fiorino, L., and Mazzolani, F. (2008). Lateral-Loading Tests on a Real RC
Building Including Masonry Panels with and without FRP Strengthening. Journal
of Materials in Civil Engineering, 419-431.
Cowan, H. (1953). The strength of Plain, Reinforced and Prestressed Concrete under the
Action of Combined Stresses, with Particular Reference to the Combined Bending
and Torsion of Rectangular Sections. Magazine of Concrete Research, 5, 75-86.
Crisfield, M., and Wills, J. (1989). Analysis of RC Panels using Different Concrete
Models. Journal of Engineering Mechanics, 115, 578-597.
De Borst, R., and Nauta, P. (1985). Non-Orthogonal Cracks in a Smeared Finite Element
Model. Engineering Computations, 2, 35-46.
Desayi, P., and Krishnan, S. (1964). Equation for the Stress-Strain Curve of Concrete.
Journal of the American Concrete Institute, 61, 345-350.
DesRoches, R., Comerio, M., Eberhard, M., Mooney, W., and Rix, G. (2011). Overview
of the 2010 Haiti Earthquake. Earthquake Spectra, 27(S1), 1-23.
Drucker, D., and Prager, W. (1952). Soil Mechanics and Plastic Analysis for Limit
Design. Quarterly of Applied Mathematics, 10(2), 157-165.
Drysdale, R., Hamid, A., and Baker, L. (1994). Masonry Structures Behavior and Design.
Prentice Hall. Eaglewood Cliffs, New Jersey.
Eligehausen, G., Ozbolt, J., and Pampanin, S. (2009). 3D Analysis of Seismic Response
of RC Beam-Column Exterior Joints Before and After Retrofit. Concrete Repair,
Rehabilitation and Retrofitting II. Taylor and Francis Group. London.
Ezzatfar, P., Binici, B., Kurc, O., C nb y, E., Su uoğlu, H., nd Özcebe, G. (2012).
Application of Mesh Reinforced Mortar for Performance Enhancement of Hollow
Clay Tile Infill Walls. Paper presented at the Advances in Civil Engineering
Conference, Ankara, Turkey.
Fiore, A., Netti, A., and Monaco, P. (2012). The Influence of Masonry Infill on the
Seismic Behaviour of RC Frame Buildings. Engineering Structures, 44, 133-145.
Flanagan, R., and Bennett, R. (1999). In-Plane Behavior of Structural Clay Tile Infilled
Frames. Journal of Structural Engineering, 125, 590-599.
Gallegos, H. (1994). Masonry in Peru. Masonry in the Americas, 307-331.
351
Goodman, R. E., Taylor, R. L., and Brekke, T. L. (1968). A Model for the Mechanics of
Jointed Rock. Journal of Soil Mechanics and Foundation Div. ASCE, 94(3), 637-
659.
Gopalaratnam, V., and Shah, S. (1985). Softening Response of Plain Concrete in Direct
Tension. ACI Journal May-June, 310-323.
Gostic, S., and Zarnic, R. (1999). Cyclic Lateral Response of Masonry Infilled RC
Frames and Confined Masonry Walls. Paper presented at the 8th North American
Masonry Conference, Austin, TX.
Govindjee, S., and Hall, G. (1998). A Local Integration Method for Coupled Damage and
Plasticity. Report for Earthquake Engineering Research Center. University of
California, Berkeley.
Guevara, L. T., and , L. E. (2005). The Captive- and Short-Column Effects.
Earthquake Spectra, 21(1), 141.
Gupta, A., and Akbar, H. (1984). Cracking in Reinforced Concrete Analysis. Journal of
Structural Engineering, 110(8), 1735-1746.
Gylltoft, K. (1983). Fracture Mechanics Models for Fatigue in Concrete Structures. PhD
dissertation, Lulea University of Technology, Lulea, Sweeden.
Hamid, A. (1978). Behaviour Characteristics of Concrete Masonry. PhD dissertation,
McMaster University, Ontario, Canada.
Hamid, A., Drysdale, R., and Heidebrecht, A. (1979). Shear Strength of Concrete
Masonry Joints. ACI Journal of the Structural Division, 105(7), 1227-1240.
Harries, K., Zeno, G., and Bahram, S. (2012). Toward an Improved Understanding of
Shear-Friction Behavior. ACI Structural Journal, 109(6), 835-844.
Hashemi, A., and Mosalam, K. M. (2006). Shake-Table Experiment on Reinforced
Concrete Structure Containing Masonry Infill Wall. Earthquake Engineering and
Structural Dynamics, 35(14), 1827-1852.
Hegger, J., Sherif, A., and Wolfgang, R. (2004). Nonlinear Finite Element Analysis of
Reinforced Concrete Beam-Column Connections. ACI Structural Journal, Sept-
Oct, 604-614.
Hillerborg, A. (1983). Concrete Fracture Energy Tests Performed by 9 Laboratories
According to a Draft RILEM Recommendation. Report to RILEM. Lund.
Sweeden.
Hsieh, S., Ting, C., and Chen, W. F. (1979). An Elastic-Fracture Model for Concrete.
Paper presented at the 3rd Engineering Mechanics Division Special Conference,
Austin, TX.

352
Hybrid Masonry Design. (2009). Technology Brief. International Masonry Institute.
Kahn, L., and Mitchell, A. (2002). Shear Friction Tests with High-Strength Concrete.
ACI Structural Journal, 99(1), 98-103.
Kakaletsis, D. (2009). Analytical Modeling of Masonry Infills with Openings. Structural
Engineering and Mechanics, 31(4), 423-437.
Kaufmann, W., and Marti, P. (1998). Structural Concrete: Cracked Membrane Model.
Journal of Structural Engineering, 124, 1467-1475.
Kaushik, H., Rai, D., and Jain, S. (2007). Stress-Strain Characteristics of Clay Brick
Masonry under Uniaxial Compression. Journal of Materials in Civil Engineering,
September, 728-739.
Kawai, T. (1978). New Discrete Models and their Application to Seismic Response
Analysis of Structures. Nuclear Engineering and Design, 48, 207-229.
Kent, D., and Park, R. (1971). Flexural Members with Confined Concrete. ACI Journal of
the Structural Division, 7, 1969-1990.
Klingner, R. (1994). Review of Masonry Construction in the United States of America.
Masonry in the Americas, 205-237.
Klingner, R., and Bertero, V. (1976). Infilled Frames in Earthquake-Resistant
Construction. Report for the Earthquake Engineering Research Center. University
of California, Berkeley, CA.
Kollegger, J., and Mehlhorn, G. (1990). Experimentelle Untersuchungen zur Bestimmung
der Druckfestigkeit des gerissenen Stahlbetons bei einer Querzugbeanspruchung.
Deutscher Ausschuss fu¨r Stahlbeton. Berlin.
Kupfer, H., Hilsdorf, H., and Rusch, H. (1969). Behavior of Concrete under Biaxial
Stress. ACI Journal, 656-666.
Kurt, E., Bini i, B., u , O., Canbay, E., and ebe, G. (2011). Seismic Performance
of a Deficient Reinforced Concrete Test Frame with Infill Walls. Earthquake
Spectra, 27(3), 817.
Li, B., Tran, C., and Pan, T. (2009). Experimental and Numerical Investigations on the
Seismic Behavior of Lightly Reinforced Concrete Beam-Column Joints. Journal
of Structural Engineering, 135, 1007-1018.
Li, B., Wang, Z., Mosalam, K., and Xie, H. (2008). Wenchuan Earthquake Field
Reconnaissance on Reinforced Concrete Framed Buildings with and without
Masonry Infill Walls. Paper presented at the 14th World Conference on
Earthquake Engineering, Beijing, China.

353
Li, B., Wu, Y., and Pan, T. (2003). Seismic Behavior of Non-Seismically Detailed
Interior Beam-Wide Column Joints-Part II: Theoretical Comparisons and
Analytical Studies. ACI Structural Journal, 100(1), 56-65.
Lotfi, H., and Shing, B. (1991). Appraisal of Smeared Crack Models for Masonry Shear
Wall Analysis. Computers and Structures, 41(3), 413-425.
Lotfi, H., and Shing, B. (1994). Interface Model Applied to Fracture of Masonry
Structures. Journal of Structural Engineering, 120(1), 63-80.
Lourenco, P. B. (1996). Computational Strategies for Masonry Structures. PhD
dissertation, Delft University, Delft, The Netherlands.
Lynn, A., Moehle, J. P., Mahin, S. A., and Holmes, W. T. (1998). Seismic Evaluation of
Existing Reinforced Concrete Building Columns. Earthquake Spectra, 12(4), 715-
739.
Madan, A., Reinhorn, A., Mander, J., andd Valles, R. (1997). Modeling of Masonry Infill
Panels for Structural Analysis. Journal of Structural Engineering, 123, 1295-
1302.
Magenes, G., and Calvi, G. (1992). Cyclic Behaviour of Brick Masonry Walls. Paper
presented at the 10th World Conference on Earthquake Engineering, Madrid,
Spain.
Mahini, S. (2005). Rehabilitation of Exterior RC Beam-Column Joints using CFRP
Sheets. PhD dissertation, University of Queensland, Australia.
Manfredi, G., Verderame, G., and Lignola, G. (2008). A FEM Model for the Evaluation
of the Seismic Behavior of Internal Joints in Reinforced Concrete Frames. Paper
presented at the 14th World Conference on Earthquake Engineering, Beijing,
China.
Manzuri, T. (1995). Nonlinear Finite Element Analysis and Experimental Evaluation of
Retrofitting Techniques for Unreinforced Masonry Structures. PhD dissertation,
University of Colorado at Boulder. Boulder, CO.
Mattock, A. (1974). Shear Transfer in Concrete having Reinforcement at an Angle to the
Shear Plane. Shear in Reinforced Concrete (pp. 17-42). American Concrete
Institute. Farmington Hills, MI.
Mehrabi, A. (1994). Performance of Masonry-Infilled RC Frames Under In-Plane
Lateral Loads. PhD dissertation, University of Colorado at Boulder. Boulder, CO.
Mehrabi, A., and Shing, B. (1997). Finite Element Modeling of Masonry Infilled RC
Frames. Journal of Structural Engineering, 123(5), 604-614.

354
Mehrabi, A., Shing, B., Schuller, M., and Noland, J. (1994). Performance of Masonry
Infilled RC Frames under In-Plane Lateral Loads Structural Engineering and
Structural Mechanics Research Series: University of Colorado at Boulder.
Boulder, CO.
Mehrabi, A., Shing, B., Schuller, M., and Noland, J. (1996). Experimental Evaluation of
Masonry Infilled RC Frames. Journal of Structural Engineering, March, 228-237.
Meli, R. et. al. (2011). Seismic Design Guide for Low-Rise Confined Masonry Buildings.
A Project of the World Housing Encylopedia. Earthquake Engineering Research
Institute.
Minaie, E. (2009). Behavior and Vulnerability of Reinforced Masonry Shear Walls.PhD
dissertation. Drexel University, Philadelphia, PA.
Mitra, N. (2007). An Analytical Study of Reinforced Concrete Beam-Column Joint
Behavior under Seismic Loading. PhD dissertation, University of Washington,
Seattle, WA.
Moghaddam, H., and Dowling, P. (1987). State of the Art in Infilled Frames. Report for
ESEE. Imperial College of Science and Technology. London, England.
Mohebkhah, A., Tasnimi, A., and Moghadam, H. (2007). A Modified Three Strut Model
for Masonry-Infilled Steel Frames with Openings. Journal of Seismology and
Earthquake Engineering, 9(1), 39-48.
Mohr, O. (1900). Welche Umstiinde Bedingen die Elastizititsgrcnze und den Bruch eines
Materiales. Zeitschrift des Vereines Deutscher Ingenieure, 44, 1524-1530, 1572-
1577.
Mojsilovic, N., and Marti, P. (1997). Strength of Masonry Subjected to Combined
Actions. ACI Structural Journal, 94(57), 633-641.
Moroni, M., Astroza, M., and Acevedo, C. (2004). Performance and Seismic
Vulnerability of Masonry Housing Types used in Chile. Journal of Performance
of Constructed Facilities, 18(3), 173-179.
Mosalam, K. (2005). Shake Table Test on One-Story RC Structure with and without
Masonry Infill. Paper presented at the NATO International Workshop on
Advances in Earthquake Engineering for Urban Risk Reduction, Istanbul, Turkey.
MSJC. (2011). TMS 402-11 Building Code Requirements and Specification for Masonry
Structures. The Masonry Society.
Murty, C., and Jain, S. (2000). Beneficial Influence of Masonry Infill Walls on Seismic
Performance of RC Frame Buildings. Paper presented at the 12th World
Conference on Earthquake Engineering Auckland, New Zealand.
355
NCMA. (2004). TEK 14-7A Allowable Stress Design of Concrete Masonry. National
Concrete Masonry Association.
Ngo, D., and Scordelis, A. C. (1967). Finite Element Analysis of Reinforced Concrete
Beams. Journal of American Concrete Institute, 64(14), 152-163.
Nilson, A. H. (1968). Nolinear Analysis of Reinforced Concrete by the Finite Element
Method. Journal of American Concrete Institute, 65(9), 757-766.
Nilsson, L., and Oldenburg, M. (1983). Nonlinear Wave Propogation in Plastic
Fracturing Materials--A Constitutive Modeling and Finite Element Analysis.
Paper presented at the IUTAM Symposium of Nonlinear Deformation Waves,
Swansea.
Nosho, K., Stanton, J., and MacRae, G. (1996). Retrofit of Rectangular Reinforced
Concrete Columns using Tonen Forca Tow Sheet Carban Fiber Wrapping.
Masters thesis, University of Washington, Seattle, WA.
Oliver, J. (1989). A Consistent Characteristic Length for Smeared Cracking Models.
International Journal for Numerical Methods in Engineering, 28, 461-474.
Oluokun, F. (1991). Prediction of Concrete Tensile Strength from its Compressive
Strength: Evaluations of Existing Relations for Normal Weight Concrete. ACI
Materials Journal, 88(302-309).
Oritz, M., Leroy, Y., and Needleman, A. (1987). A Finite Element Method for Localized
Failure Analysis. Computer Methods in Applied Mechanics and Engineering, 61,
189-214.
Ottosen, N. (1977). Failure and Elasticity of Concrete. Journal of Engineering
Mechanics, 103, 527-535.
Ozbolt, J., and Bazant, Z. P. (1992). Microplane Model for Cyclic Triaxial Behavior of
Concrete. Journal of Engineering Mechanics, 118(7), 1365-1386.
Ozbolt, J., Li, Y., and Kozar, I. (2001). Microplane Model for Concrete with Relaxed
Kinematic Constraint. International Journal of Solids and Structures, 38, 2683-
2711.
Papadrakakis, M., Papadopoulos, V., Georgioudakis, M., Hofstetter, G., and Feist, C.
(2005). Reliability Analysis of a Plain Concrete Beam. IALAD Project Report.
Austria.
Perez-Gavilan, J., Flores, L., and Cruz, O. (2009). Testing of Masonry Walls with
Different lengths: Kinematics and Lateral Stiffness. Paper presented at the XVII
National Conference on Earthquake Engineering, Puebla, Mexico.

356
Pieruszczak, S., and Moroz, Z. (1981). Finite Element Analysis of Strain Softening
Materials. International Journal for Numerical Methods in Engineering, 17, 327-
334.
Puglisi, M., Uzcategui, M., and Flórez-López, J. (2009). Modeling of Masonry of Infilled
Frames, Part I: The Plastic Concentrator. Engineering Structures, 31(1), 113-118.
Rankine, W. (1857). On the Stability of Loose Earth (Vol. 147). Royal Society of
London.
Rashid, Y. (1968). Ultimate Strength analysis of Prestressed Concrete Pressure Vessels.
Nuclear Engineering and Design, 7, 334-344.
Redmond, L., Stroecker, R., and DesRoches, R. (2013). Impact of Seismic Codes on
Building Performance in the Caribbean. Paper presented at the 4th International
Conference on Computational Methods in Structural Dynamics and Earthquake
Engineering, Kos, Greece.
Redmond L., Stavridis A., and DesRoches R. (2014). Evaluation of Modeling Scheme for
Unreinforced Masonry under Seismic Loading. The Masonry Society Journal,
December.
Reimann, H. (1965). Kritische Spannungszustande der Betons bei mehrachsiger.
Auschess Stahlbeton, 175.
Rice, J. R. (1968). Mathematical Analysis in the Mechanics of Fracture (Vol. 2).
Academic Press. New York, N.Y.
Rodrigues, H., Varum, H., and Costa, A. (2010). Simplified Macro-Model for Infill
Masonry Panels. Journal of Earthquake Engineering, 14(3), 390-416.
Rots, J. G., and Blaauwendraad, J. (1989). Crack Models for Concrete: Discrete or
Smeared? Fixed, Multi-Directional or Rotating? Heron, 34(1), 1-59.
Rots, J. G., Nauta, P., Kusters, G. M. A., and Blaauwendraad, J. (1985). Smeared Crack
Approach and Fracture Localization in Concrete. Heron, 30(1), 1-48.
San Bartolome, A., Bernardo, J., and Pena, M. (2010). The Effect of Column Depth on
Seismic Behavior of Confined Masonry Walls. Paper presented at the Chilean
Conference on Seismology and Earthquake Engineering, Valdiva-Santiago, Chile.
Saouma, V., and Ingraffea, A. (1981). Fracture Mechanics Analysis of Discrete Cracking.
Reports of the working commissions for IABSE (Vol. 34).
Schlegel, R., and Rautenstrauch, K. (2004). Failure Analysis of Masonry Shear Walls.
Paper presented at the 1st International UDEC/3DEC Symposium on Numerical
Modeling of Discrete Materials in Geotechnical Engineering, Civil Engineering,
and Earth Science, Bochem, Germany.

357
Schneider, S., Zagers, B., and Abrams, D. (1998). Lateral Strength of Steel Frames with
Masonry Infills having Large Openings. Journal of Structural Engineering, 124,
896-904.
Schultz, A. (1994). Performance of Masonry structures in Extreme Lateral Loading
eEvents. Masonry in the Americas, 85-125.
Shapiro, D., Uzarski, J., Webster, M., Angel, R., and Abrams, D. (2004). Estimating Out-
of-Plane Strength of Cracked Masonry Infills. Report for the Nastional Science
Foundation. SOH and Associates. San Francisco, CA.
Spencer, B., and Shing, B. (2002). Stress Hybrid Embedded Crack Element for Analysis
of Concrete Fracture. American Concrete Institute Structural Journal, 205, 323-
345.
Sritharan, S., Priestly, M., and Seible, F. (2000). Nonlinear Finite Element Analyses of
Concrete Bridge Joint Systems Subjected to Seismic Actions. Finite Elements in
Analysis and Design, 36, 215-233.
Stafford-Smith, B. (1967). Methods for Predicting the Lateral Stiffness and Strength of
Multi-Storey Infilled Frames. Building Science, 2, 247-257.
Stavridis, A. (2009). Analytical and Experimental Study of Seismic Performance of
Reinforced Concrete Frames Infilled with Masonry Walls. PhD dissertation.
University of California, San Diego.
Stavridis, A., Koutromanos, I., and Shing, B. (2012). Shake-Table Tests of a Three-Story
Reinforced Concrete Frame with Masonry Infill Walls. Earthquake Engineering
and Structural Dynamics, 41(6), 1089-1108.
Stavridis, A., and Shing, B. (2010). Finite-Element Modeling of Nonlinear Behavior of
Masonry-Infilled RC Frames. Journal of Structural Engineering, 136(3), 285-296.
Stone, W., Yokel, F., Celebi, M., Hanks, T., and Leyendecker, E. (1985). Engineering
Aspects of the September 19, 1985 Mexico Earthquake. National Bureau of
Standards Building Science Series 165.
Suidan, M., and Schnobrich, W. (1973). Finite Element Analysis of Reinforced Concrete.
ASCE Journal of the Structural Division, 99, 2109-2122.
Tajima, K., Mishima, T., and Shirai, N. (2004). 3-D Finite Element Cyclic Analysis of RC
Beam/Column Joint using Special Bond Model. Paper presented at the 13th World
Conference on Earthquake Engineering, Vancouver, BC, Canada.
Taylor, G. (1938). Plastic Strain in Metals. Journal of the Institute of Metals, 62, 307-
324.
358
Tena-Colunga, A., Juárez-Ángeles, A., and Salinas-Vallejo, V. H. (2009). Cyclic
Behavior of Combined and Confined Masonry Walls. Engineering Structures,
31(1), 240-259.
Teymur, P., Pala, S., and Yuksel, E. (2012). Retrofitting of Vulnerable Reinforced
Concrete Frames with Wet-Mixed Shotcrete Panels. Advances in Structural
Engineering, 15(1), 1-14.
USGS. (2014). Earthquake Hazards Program, from earthquake.usgs.gov
Uva, G., Raffaele, D., Porco, F., and Fiore, A. (2012). On the Role of Equivalent Strut
Models in the Seismic Assessment of Infilled RC Buildings. Engineering
Structures, 42, 83-94.
Varela-Rivera, J. L., Navarrete-Macias, D., Fernandez-Baqueiro, L. E., and Moreno, E. I.
(2011). Out-of-Plane Behaviour of Confined Masonry Walls. Engineering
Structures, 33(5), 1734-1741.
Vecchio, F. (2000). Disturbed Stress Field Model for Reinforced Concrete: Formulation.
Journal of Structural Engineering, 126, 1070-1077.
Vecchio, F., amd Collins, M. (1986). The Modified Compression-Field Theory for
Reinforced Concrete Elements Subjected to Shear. ACI Journal, 219-231.
Walraven, J., and Reinhardt, H. (1981). Theory and Experiments on the Mechanical
Behavior of Cracks in Plain and Reinforced Concrete. Heron, 26(1A), 1-68.
William, K., and Warnke, E. (1974). Constitutive Model for the Triaxial Behaviour of
Concrete. IABSE reports of the working commissions (Vol. 19).
Xu, S., and Zhu, Y. (2007). Experiment Studies on Fracture Energy of Cement Paste and
Mortar. Key Engineering Materials, 348-349, 169-172.
Yoshimura, K., Kikuchi, K., Okamoto, T., and Sanchez, T. (1996). Effect of Vertical and
Horiztonal Wall Reinforcement on Seismic Behavior of Confined Masonry Walls.
Paper presented at the 11th World Conference on Earthquake Engineering.
Zarnic, R., and Tomazevic, M. (1988). An Experimentally Obtained Method for the
Evaluation of Behaviour of Masonry Infilled R/C frames. Paper presented at the
Ninth World Conference on Earthquake Engineering, Tokyo-Kyoto, Japan.
Copyright © 2022 FDOKUMEN