Assessment of seismic design procedures based on the total cost
36
Assessment of seismic design procedures based on the total cost NIKOS D. LAGAROS †1,2 , ANDREAS D. FOTIS 2 , STILIANOS A. KRIKOS 2 1 Institute of Structural Analysis & Seismic Research, National Technical University of Athens, 9, Iroon Polytechniou Str., Zografou Campus, 157 80 Athens, Greece e-mail: [email protected] 2 Department of Civil Engineering University of Thessaly, Pedion Areos, 383 34 Volos, Greece e-mail: {afotis,skrikos}@uth.gr SUMMARY The assessment of seismic design codes has become the subject of intensive research work which revealed several weak points of the codes that originated from the limitations in predicting with acceptable precision the response of a structure under a moderate or severe earthquake. Most of the seismic design codes belong to the class of prescriptive procedures where if certain constraints are fulfilled the structure is considered safe. Prescriptive design procedures fail to provide acceptable levels of structural performance over its life because, in most of them, the structure is assessed using only one design earthquake. Performance-based design is a different philosophy for designing against hazards; the structure is designed to meet a number of performance objectives. In this study the Greek national seismic design code is compared with a performance-based design procedure with respect to the total cost of the structure, which is equal to the initial cost plus the life-cycle cost. The performance-based design procedure employed in this study is using three performance objectives. KEY WORDS: prescriptive design procedures, performance-based design, life-cycle cost, pushover analysis † Corresponding Author 1
Transcript of Assessment of seismic design procedures based on the total cost

Assessment of seismic design procedures
based on the total cost
NIKOS D. LAGAROS†1,2, ANDREAS D. FOTIS2, STILIANOS A. KRIKOS2
1Institute of Structural Analysis & Seismic Research, National Technical University of Athens,
9, Iroon Polytechniou Str., Zografou Campus, 157 80 Athens, Greece e-mail: [email protected]
2Department of Civil Engineering University of Thessaly,
Pedion Areos, 383 34 Volos, Greece e-mail: {afotis,skrikos}@uth.gr
SUMMARY
The assessment of seismic design codes has become the subject of intensive research work which revealed
several weak points of the codes that originated from the limitations in predicting with acceptable precision
the response of a structure under a moderate or severe earthquake. Most of the seismic design codes belong
to the class of prescriptive procedures where if certain constraints are fulfilled the structure is considered
safe. Prescriptive design procedures fail to provide acceptable levels of structural performance over its life
because, in most of them, the structure is assessed using only one design earthquake. Performance-based
design is a different philosophy for designing against hazards; the structure is designed to meet a number of
performance objectives. In this study the Greek national seismic design code is compared with a
performance-based design procedure with respect to the total cost of the structure, which is equal to the
initial cost plus the life-cycle cost. The performance-based design procedure employed in this study is
using three performance objectives.
KEY WORDS: prescriptive design procedures, performance-based design, life-cycle cost, pushover
analysis
†Corresponding Author
1

1. INTRODUCTION
In the past the requirements and provisions of the seismic design codes for buildings have
been based on the experience and they were periodically revised after disastrous
earthquakes. Most of the current seismic design codes define a single design earthquake
that it is used for assessing the structural performance against earthquake hazard. These
codes though have many inherent assumptions built in the design procedure regarding the
behaviour of the structure against earthquake loading. Severe damages caused by recent
earthquakes made the engineering community to question the effectiveness of the current
seismic design codes [1-3]. Given that the primary goal of contemporary seismic design
is the protection of human life it is evident that additional performance targets and
earthquake intensities should be considered in order to assess the structural performance
in many hazard levels. In the last decade the concept of Performance-Based Design
(PBD) for structures subjected to seismic loading conditions was introduced [4-6]. In
PBD more accurate but time consuming analysis procedures are employed based on
nonlinear structural response. The progress that took place in the last two decades in the
fields of computational mechanics as well as in hardware technology, made possible to
use performance-based seismic design procedures.
Most of the current seismic design codes belong to the category of the
prescriptive design procedures (or limit state design procedures), where if a number of
checks, expressed in terms of forces, are satisfied the structure is considered safe and that
it will not collapse. A typical limit state based design can be viewed as one (i.e. ultimate
strength) or two limit state approach (i.e. serviceability and ultimate strength). All
modern seismic design procedures are based on the principal that a structure will avoid
collapse if it is designed to absorb and dissipate the kinetic energy that is imparted in it
2

during the seismic excitation. Most of the modern seismic codes express the ability of the
structure to absorb energy through inelastic deformation using the reduction or behaviour
factor q. The capacity of a structure to resist seismic actions in the nonlinear range
generally permits their design for seismic loads smaller than those corresponding to a
linear elastic response. The seismic loads are reduced using the behaviour factor q. The
numerical confirmation of the behavior factor became a subject of research work during
the past decade [7,8] in order to check the validity of design theory assumptions and to
make structural performance more predictable from engineering point of view.
ATC-40 [4] and FEMA-273 [5] were the first guidelines for performance-based
seismic rehabilitation of existing buildings while in the report Vision 2000 [6] these ideas
were extended to the design process of new buildings. The main objective of this kind of
design procedures is to increase the safety against natural hazards and in the case of
earthquake hazard to design earthquake resistant structures with a predictable and
reliable performance. According to PBD procedures, the structures should be able to
resist earthquakes in a quantifiable manner and to present target performance levels of
possible damages. PBD procedures are multi-level design approaches where various
levels of structural performance are considered. For example FEMA-356 [9] suggests the
following performance levels: operational level, immediate occupancy, life safety and
collapse prevention. For assessing the structural performance the guidelines suggest the
use of various types of analysis methods: linear static, nonlinear static, linear dynamic
and nonlinear dynamic. The most commonly used approach is the nonlinear static
analysis also called as pushover analysis method. Pushover analysis allows for the direct
evaluation of the performance of the structure at each limit state as opposed to the
prescriptive seismic design procedures, such as that of Eurocode 2 [10] or the 2000 Greek
3

national design code for RC buildings (EKOS 2000) [11], where the structure is designed
for the ultimate strength limit state.
Two are the main objectives of this study: (i) to verify the value of the behavior
factor q that the 2000 Greek national seismic design code (EAK 2000) [12] suggests for
the design of RC building structures and (ii) to compare the EAK 2000 prescriptive
design code with a performance-based seismic design procedure employing three
performance objectives. The two design procedures are compared with respect to the
total cost of the obtained design, which is the sum of the initial and the life-cycle cost.
Life-cycle cost, as considered in this study, represents monetary-equivalent losses due to
seismic events that are expected to occur during the design life of the structure. Other
parameters that influence life-cycle cost, such as operating costs and inspection costs are
not accounted.
2. SEISMIC DESIGN PROCEDURES
The majority of the seismic design codes belong to the category of the prescriptive
building design codes, which include: site selection and development of conceptual,
preliminary and final design stages. According to a prescriptive design code the strength
of the structure is evaluated at one limit state between life-safety and near collapse using
a response spectrum corresponding to one design earthquake [12]. In addition,
serviceability limit state is usually checked in order to ensure that the structure will not
deflect or vibrate excessively during its functioning. On the other hand, PBD is a
different approach for the seismic design which includes, apart from the site selection and
the development of the design stages, the construction and maintenance of the building in
order to ensure reliable and predictable seismic performance over its life.
4

2.1. EAK - EKOS design procedures
According to the Greek national design codes a number of checks must be considered in
order to ensure that the structure will meet the design requirements. Each candidate
design is assessed using these constraints. All EKOS 2000 checks must be satisfied for
the gravity loads using the following load combination
1.35 " "1.50d kjjS G= +∑ ∑ kii
Q
kiiQ
(1)
where “+” implies “to be combined with”, the summation symbol “Σ” implies “the
combined effect of”, Gkj denotes the characteristic value “k” of the permanent action j and
Qki refers to the characteristic value “k” of the variable action i. If the above constraints
are satisfied, multi-modal response spectrum analysis is performed, according to EAK
2000, and earthquake loading is considered using the following load combination
2" " " "d kj d ijS G E ψ= + +∑ ∑ (2)
where Ed is the design value of the seismic action for the two components (longitudinal
and transverse) respectively and ψ2i is the combination coefficient for the
quasi-permanent action i, here taken equal to 0.30.
The main principle of new provisions, EAK 2000 included, is to design structural
systems based on energy dissipation and on ductility in order to control the inelastic
seismic response. Designing a multistory RC building for energy dissipation comprises
the following features: (i) fulfillment of the strong column/weak beam rule, (ii) member
verification in terms of forces and resistances for the ultimate strength limit state under
the design earthquake (with return period of 475 years, probability of exceedance 10% in
50 years), with the elastic spectrum reduced by the q-factor equal to 3.5 times, (iii)
5

damage limitation for the serviceability limit state and (iv) capacity design of beams and
columns against shear failure.
2.2. Performance-based design procedure
Performance-based seismic design has the following distinctive features with respect to
the prescriptive design codes: (i) allows the owner, architect, and structural engineer to
choose both the appropriate level of seismic hazard and the corresponding performance
level of the structure, (ii) the structure is designed to meet a series of combinations of
hazard levels in conjunction with corresponding performance levels.
The proposed PBD process is a displacement-based design procedure where the
design criteria and the capacity demand comparisons are expressed in terms of
displacements rather than forces [13,14]. The main part in a performance-based seismic
design procedure is the definition of the performance objectives that will be used. The
proposed PBD process can be described with the following two steps:
1) Proportioning of the longitudinal and transverse reinforcement of all members on
the basis of the serviceability limit state.
2) Use of pushover analysis in order to estimate the structural capacities of the
design in the different intensity levels employed. Revise the reinforcement and
the dimension of the members so that the capacities exceed the seismic demands
[14].
The completion of the Step 1 is necessary for the Step 2 as the structural capacity depends
both on the reinforcement and the dimensions of the members.
The constraints considered for Step 2 of the PBD procedure are related to the
maximum interstorey drift limits Δ, which is the largest value of the height-wise peak
6

interstorey drift ratios for each hazard level. This is a commonly used measure of both
structural and non-structural damage because of its close relationship to plastic rotation
demands on individual beam-column connection assemblies. In this study three
performance objectives are considered that correspond to 50, 10 and 2 percent
probabilities of exceedance in 50 years hazard levels. The drift limits Δ, for the three
performance objectives considered, are equal to 0.25, 0.5 and 3.0 percent, respectively.
The Δ values obtained at the three hazard levels are also used for the calculation of the
life-cycle cost, as will be described in a following section. The framework for the PBD
procedure employed in this study is shown schematically in Figure 1.
One performance objective is defined as the combination of a performance level
for a specific hazard level. In this work three performance objectives have been
considered corresponding to the “Enhanced Objectives” of FEMA 356 [9]. The first step
in the definition of the performance objectives is the selection of the performance levels.
The performance levels that have been considered are the following:
i) Operational: the overall damage level is characterized as very light. No permanent
drift is encountered, while the structure essentially retains original strength and
stiffness.
ii) Life Safety: the overall damage level is characterized as moderate. Permanent drift is
encountered while strength and stiffness has left in all stories. Gravity-load bearing
elements continue to function while there is no out-of plane failure of the walls. The
overall risk of life-threatening injury as a result of structural damage is expected to be
low. It should be possible to repair the structure; however, for economic reasons this
may not be practical.
7
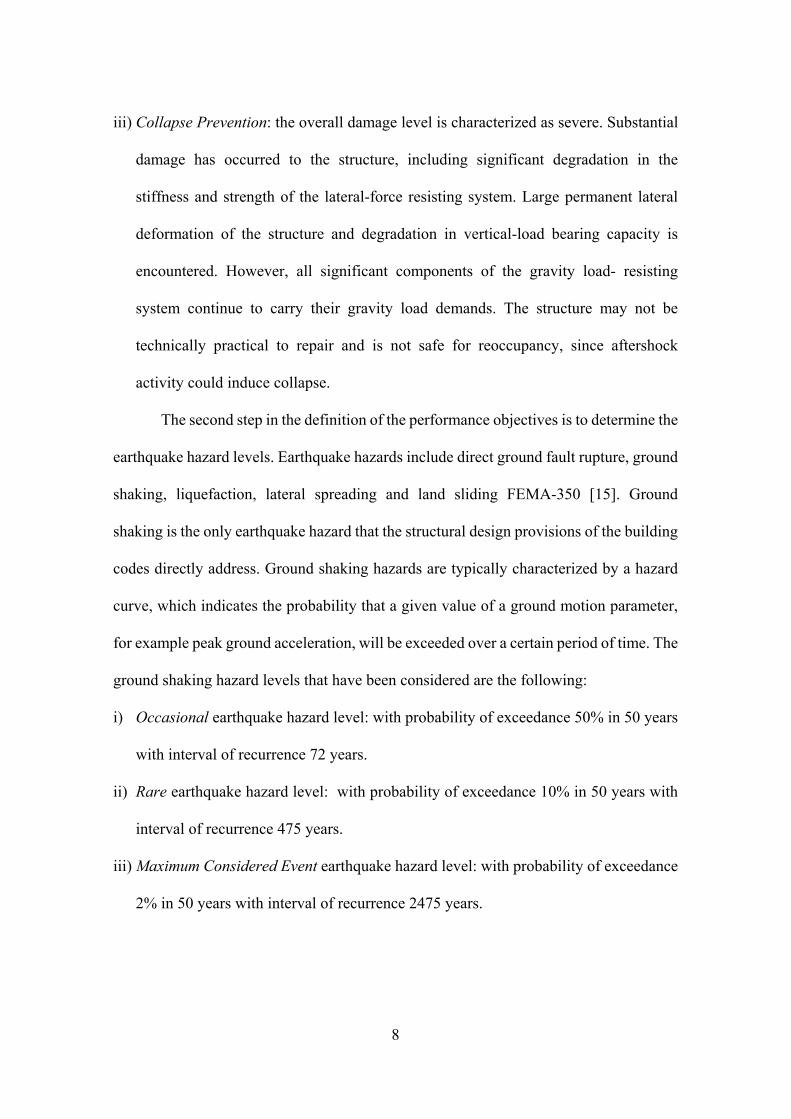
iii) Collapse Prevention: the overall damage level is characterized as severe. Substantial
damage has occurred to the structure, including significant degradation in the
stiffness and strength of the lateral-force resisting system. Large permanent lateral
deformation of the structure and degradation in vertical-load bearing capacity is
encountered. However, all significant components of the gravity load- resisting
system continue to carry their gravity load demands. The structure may not be
technically practical to repair and is not safe for reoccupancy, since aftershock
activity could induce collapse.
The second step in the definition of the performance objectives is to determine the
earthquake hazard levels. Earthquake hazards include direct ground fault rupture, ground
shaking, liquefaction, lateral spreading and land sliding FEMA-350 [15]. Ground
shaking is the only earthquake hazard that the structural design provisions of the building
codes directly address. Ground shaking hazards are typically characterized by a hazard
curve, which indicates the probability that a given value of a ground motion parameter,
for example peak ground acceleration, will be exceeded over a certain period of time. The
ground shaking hazard levels that have been considered are the following:
i) Occasional earthquake hazard level: with probability of exceedance 50% in 50 years
with interval of recurrence 72 years.
ii) Rare earthquake hazard level: with probability of exceedance 10% in 50 years with
interval of recurrence 475 years.
iii) Maximum Considered Event earthquake hazard level: with probability of exceedance
2% in 50 years with interval of recurrence 2475 years.
8

3. ANALYSIS PROCEDURES
According to FEMA-356 [9] four alternative analytical procedures, based on linear and
nonlinear structural response, are recommended for the structural analysis of buildings
under earthquake loading. The linear procedures can be either the linear static procedure
(LSP) or the linear dynamic procedure (LDP). For the linear dynamic procedures there
are two alternatives, the response spectrum method (which in EAK 2000 [12] is referred
as Multi-modal Response Spectrum (MmRS) analysis), and the time history method. In a
similar fashion the nonlinear methods are distinguished to the nonlinear static procedure
(NSP), also known as pushover analysis, and the nonlinear dynamic procedure (NDP),
also referred as inelastic or nonlinear time history analysis. Procedures that are not based
on dynamic time history analysis, when applied in the framework of a seismic design
code, usually resort to a regional response spectrum. Design procedures based on
non-linear analysis are not so popular due to the increased computational cost needed and
the requirements for highly trained engineers to put into practice more elaborate analysis
methods. However, when a linear analysis method is employed simplifying assumptions
of the structural response are made, resulting either to conservative and therefore to more
expensive designs, or to designs with reduced safety since phenomena that have not been
accounted for during the design phase may influence the load carrying capacity of the
structure during its functioning. In the case of the EAK 2000 seismic design procedure
the MmRS analysis method is used, while in the PBD procedure the pushover analysis
procedure is used.
The purpose of pushover analysis procedure is used in order to assess the
structural performance in terms of strength and deformation capacity for the whole
structure, as well as at the element level. The pushover analysis step is performed as soon
9

as the structure has satisfied the serviceability limit state. For assessing the performance
of the structure for the three performance levels considered a lateral load distribution that
follows the fundamental mode is adopted, while the pushover analysis is terminated as
soon as a target displacement that corresponds to the 2% in 50 (2/50) years earthquake is
reached, or earlier if the algorithm fails to converge because a collapse mechanism has
been formed.
The assessment of the design with respect to its structural performance in the
three hazard levels considered is based on the target displacement method [9], where in
the place of the design response spectrum that is provided by the design codes; response
spectra obtained from the natural records are used corresponding to the two components
of the ground motion. The target displacements are obtained from the FEMA-356 [9]
formula:
2
0 1 2 3 24e
tTC C C C Sa gδπ
= (3)
where C0, C1, C2, C3, are modification factors. C0 relates the spectral displacement to the
likely building roof displacement. C1 relates the expected maximum inelastic
displacements to the displacements calculated for linear elastic response. C2 represents
the effect of the hysteresis shape on the maximum displacement response and C3 accounts
for P-Δ effects. Te is the effective fundamental period of the building in the direction
under consideration. Sa is the response spectrum acceleration corresponding to the Te
period. The pushover curve is converted to a bilinear curve with a horizontal post-yield
branch that balances the area above and below the curve.
Pushover is limited with regard to evaluation of the simultaneous response to
ground shaking in different directions. In this work the recommendation of FEMA-350
10

[15] is employed where multidirectional excitation effects are accounted for by
combining 100% of the response due to loading in the longitudinal direction with 30% of
the response due to loading in the transverse direction, and by combining 30% of the
response in the longitudinal direction with 100% of the response in the transverse
direction. The worst of these two combinations in each of the three hazard levels is used
in order to assess the structural performance in the corresponding performance levels.
4. DEFINITION OF SEISMIC RESPONSE SPECTRA
The most common approach for the definition of the seismic action is the use of design
code response spectrum. This is a general approach which is easy to implement. However
if a more realistic design is required the use of spectra derived from natural earthquake
records is more appropriate. Since significant dispersion on the structural response, due
to the use of different natural records, has been observed these spectra must be scaled to
the same desired earthquake intensity. The most commonly applied scaling procedure is
based on the peak ground acceleration (PGA).
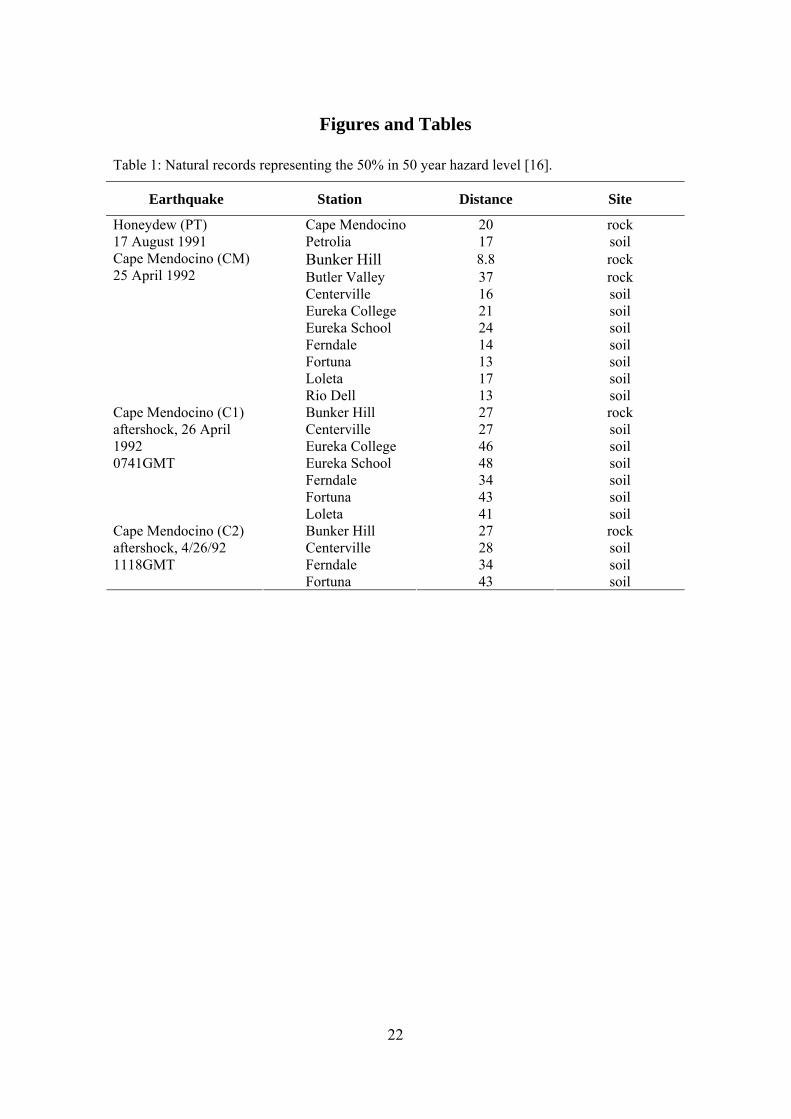
In this study three sets of natural records, i.e. sets with their longitudinal and their
transverse components, are used. The records have been selected from the database of
Somerville and Collins [16]. The basic characteristics of these records are provided in
Tables 1, 2 and 3 corresponding to the three hazard levels, 50, 10 and 2 percent in 50
years, respectively. It can be seen that each record corresponds to different earthquake
magnitudes and soil properties. The records are scaled to the same PGA in order to ensure
compatibility between the records, according to the hazard curves for Greece obtained
from the work of Papazachos et al. [17] (Table 4). The response spectrum for each scaled
record and for each component is shown in Figures 2, 3 and 4 for the three hazard levels.
11

It has been observed that the response spectra follow the lognormal distribution [18].
Therefore the median spectra, also shown in Figures 2, 3 and 4, are calculated from the
above set of spectra using the following expression
nd,ii 1
ln(R (T))x̂ exp
n=
⎡ ⎤⎢=⎢ ⎥⎣ ⎦
∑ ⎥ (4)
where Rd,i(T) is the response spectrum value for period equal to T of the i-th record
(i=1,…,n). n = 22 for the 50% in 50 years hazard level, n = 19 for the 10% in 50 years and
n = 6 for the 2% in 50 years.
5. INITIAL AND LIFE-CYCLE COST
The term initial cost of a new structure refers to the cost during its construction stage. The
initial cost is related to the material and the labor cost for the construction of the building
which includes concrete, steel reinforcement and labor cost for placement. Other
parameters that affect the initial cost, like the cost of nonstructural components, the cost
of coating against fire or corrosion, the cost of heating or electrical installments or any
sort of aesthetic components, are not considered in this study.
The term life-cycle cost refers to the potential damage cost from earthquakes that
may occur during the life of the structure. It accounts for the cost of the repairs after an
earthquake, the cost of loss of contents, the cost of injury recovery or human fatality and
other direct or indirect economic losses. Other expenses, not related to earthquake
damages, but may arise during the life of the structure, such as maintenance costs, are
omitted. The quantification of the losses in economical terms depends on several
socio-economic parameters. For example, there are a number of approaches for the
calculation of the cost of the loss of a human life, ranging from purely economic
12

approaches to more sensitive that consider the loss of a person irreplaceable. Therefore,
the estimate of the cost of exceedance of the collapse prevention damage state will vary
considerably according to which approach is adopted.
For the purpose of this work the cost of exceedance of a damage state is obtained
as a percentage of the initial cost from the Table 5 of ATC-13 [19]. Based on a Poisson
process model of earthquake occurrences and an assumption that damaged buildings are
immediately retrofitted to their original intact conditions after each major
damage-inducing seismic attack, Wen and Kang [20] proposed the following formula for
the life-cycle cost function considering N damage states:
( )1
1N
tLC
i
C e λνλ
−
=
= − ∑ i iC P
1)+
(5)
where
1( ) (i i i i iP P P+= Δ > Δ − Δ > Δ (6)
and
( ) ( 1/ ) ln[1 (i i iP t PΔ > Δ = − ⋅ − Δ − Δ )]i (7)
Pi is the probability of the ith damage state being violated given the earthquake occurrence
and Ci is the corresponding cost (see Table 5); (iP )iΔ − Δ is the annual exceedance
probability of the maximum interstorey drift value Δi; ν is the annual occurrence rate of
significant earthquakes, modeled by a Poisson process and t is the service life of a new
structure or the remaining life of a retrofitted structure. The first component of Eq. (5)
that contains the exponential term is used in order to express CLC in present value, where
λ is the annual momentary discount rate considered to be constant and equal to 5%. It is
13
assumed that after the occurrence of an earthquake the structure is fully restored to its
initial state.
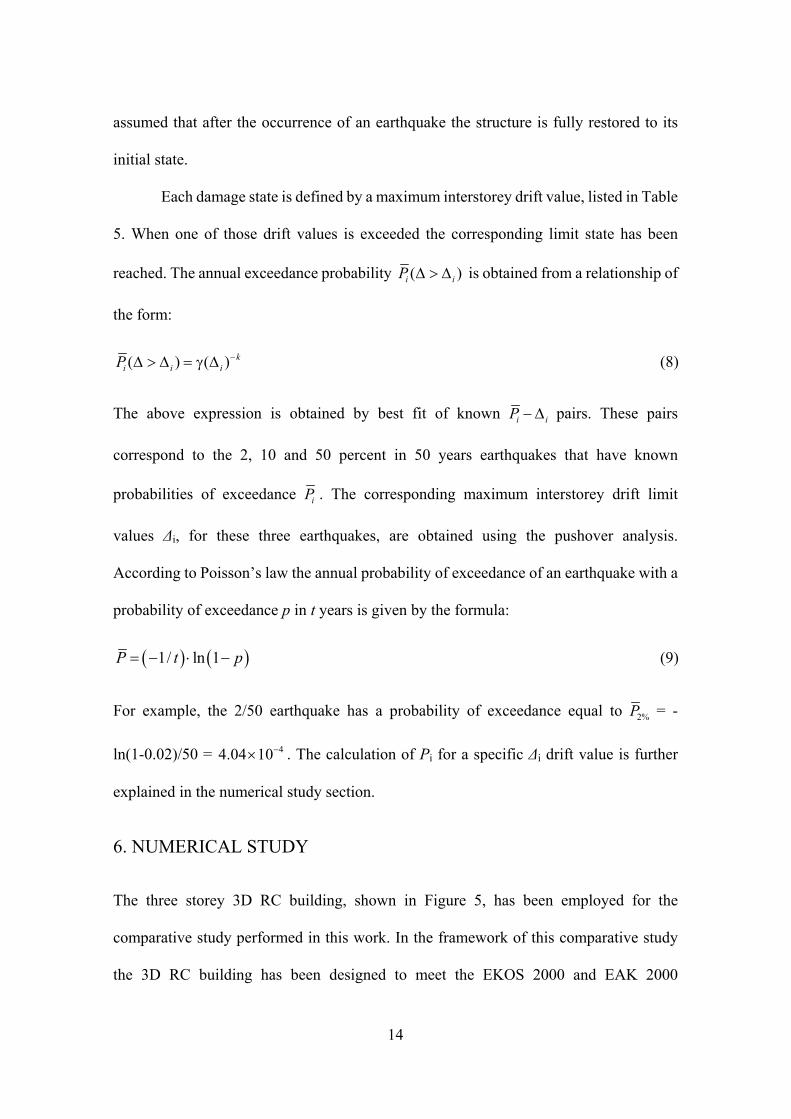
Each damage state is defined by a maximum interstorey drift value, listed in Table
5. When one of those drift values is exceeded the corresponding limit state has been
reached. The annual exceedance probability (iP )iΔ > Δ is obtained from a relationship of
the form:
( ) ( ki i iP −Δ > Δ = γ Δ ) (8)
The above expression is obtained by best fit of known iP i− Δ pairs. These pairs
correspond to the 2, 10 and 50 percent in 50 years earthquakes that have known
probabilities of exceedance iP . The corresponding maximum interstorey drift limit
values Δi, for these three earthquakes, are obtained using the pushover analysis.
According to Poisson’s law the annual probability of exceedance of an earthquake with a
probability of exceedance p in t years is given by the formula:
( ) (1/ ln 1P t= − ⋅ − )p (9)
For example, the 2/50 earthquake has a probability of exceedance equal to 2%P = -
ln(1-0.02)/50 = . The calculation of Pi for a specific Δi drift value is further
explained in the numerical study section.
44.04 10−×
6. NUMERICAL STUDY
The three storey 3D RC building, shown in Figure 5, has been employed for the
comparative study performed in this work. In the framework of this comparative study
the 3D RC building has been designed to meet the EKOS 2000 and EAK 2000
14

requirements for different values of the behaviour factor q ranging from 1.0 to 6.0 with a
step size equal to 0.5. The lateral forces were derived from the design response spectrum
(5%-damped elastic spectrum divided by the behaviour factor q) at the fundamental
period of the building. Concrete of class C16/20 (nominal cylindrical strength of 16MPa)
and class S500 steel (nominal yield stress of 500MPa) are assumed. The base shear is
obtained from the response spectrum for soil type B (stiff soil θ = 1.0, with characteristic
periods Τ1 = 0.15sec and Τ2 = 0.60sec) and a PGA of 0.31 g. Moreover, the importance
factor γI was taken equal to 1.0 (importance category Σ2), while damping correction
factor is equal to 1.0, since a damping ratio of 5% has been considered (as it is suggested
by EAK 2000 for RC structures).
The slab thickness is equal to 15 cm and in the design is considered to contribute
to the moment of inertia of the beams with an effective flange width according to EKOS
2000. In addition to the self weight of the beams and the slab, a distributed dead load of 2
kN/m2 due to floor finishing and partitions and imposed live load with nominal value of
1.5 kN/m2 are considered. In the combination of gravity loads (“persistent design
situation”) nominal dead and live loads are multiplied with load factors of 1.35 and 1.5,
respectively (Eq. 1). Following EAK 2000, in the seismic design combination, dead loads
are considered with their nominal value while live loads with 30% of the nominal value
(Eq. 2).
6.1. Design with Greek national design codes and PBD
The parametric study resulted in eleven different designs depending on the value of the
behavioural factor q, plus one design resulted from the proposed PBD procedure. Thus, in
total twelve designs have been obtained. The design process both for the Greek design
15

code and the PBD procedure started with the same initial design having the same
minimum dimensions for the beams and the columns. The minimum dimensions that
have been considered were the following: columns 25x25 cm2 and beams 25x30 cm2. The
dimensions of the columns and the beams were increased until fulfilling the requirements
and provisions of either the EAK 2000 for the current value of the behaviour factor q or
the requirements of the proposed PBD procedure. Beams and columns that fail to meet
the constraints imposed by EAK and EKOS design codes were increased in size
according to the following procedure: (i) columns: increase the size of the smallest
dimension by 5 cm and if column constraints are not yet satisfied increase the size of the
second dimension by 5 cm, this rule is processed until satisfying all the constraints, (ii)
beams: increase the size of the height of the beam by 5 cm and if constraints are not yet
satisfied the width of the web is increased by 5 cm (the with width of the web was
restricted not to exceed 35 cm) until satisfying all the constraints, similarly with the
columns. A similar procedure was followed for the case of the PBD starting with same
initial design, the only requirement imposed by the PBD procedure are those of the Step1
and 2 described in previous section.
In the first part of this study a comparative study with respect to the steel and
concrete quantities is performed. Table 6 compares the weight of the steel and the
concrete quantities required for the eleven designs obtained with the Greek national
design codes and the design obtained based on the proposed PBD procedure. The
quantities accounted in Table 6 are related to the initial cost of the structure that will be
examined in the second part of this study. In order to evaluate the performance of the
different designs achieved, four characteristic designs were selected. These designs
correspond to the two extreme designs with respect to the value of the behavioural factor
16

q. The first extreme design, denoted as Dq=1, is the one achieved for q=1 (permitting
linear behaviour only) and the second extreme design is denoted as Dq=6.0, corresponding
to the largest value of the behaviour factor examined in this study. The third design that is
employed, denoted as Dq=3.5, corresponds to the design obtained for q=3.5 that is the
behavioural factor suggested by EAK 2000 for this type of structures and the fourth
design, denoted as DPBD, corresponds to the design obtained with the PBD procedure.
The final reinforcement for the four selected designs are shown in Figures 6 to 9 for the
Dq=1, Dq=6, Dq=3.5 and DPBD designs, respectively. In Table 7 details on the required
longitudinal and transverse reinforcement is also provided. DPBD design requires
approximately 30% less longitudinal reinforcement compared to the Dq=1, while it
requires 50% and 35% more compared to the Dq=6 and Dq=3.5 designs, respectively. On
the other hand DPBD design requires approximately 25% less transverse reinforcement
compared to the Dq=1, while it requires 85% and 70% more compared to the Dq=6 and
Dq=3.5 designs, respectively.
6.2. Comparison with respect to the total cost
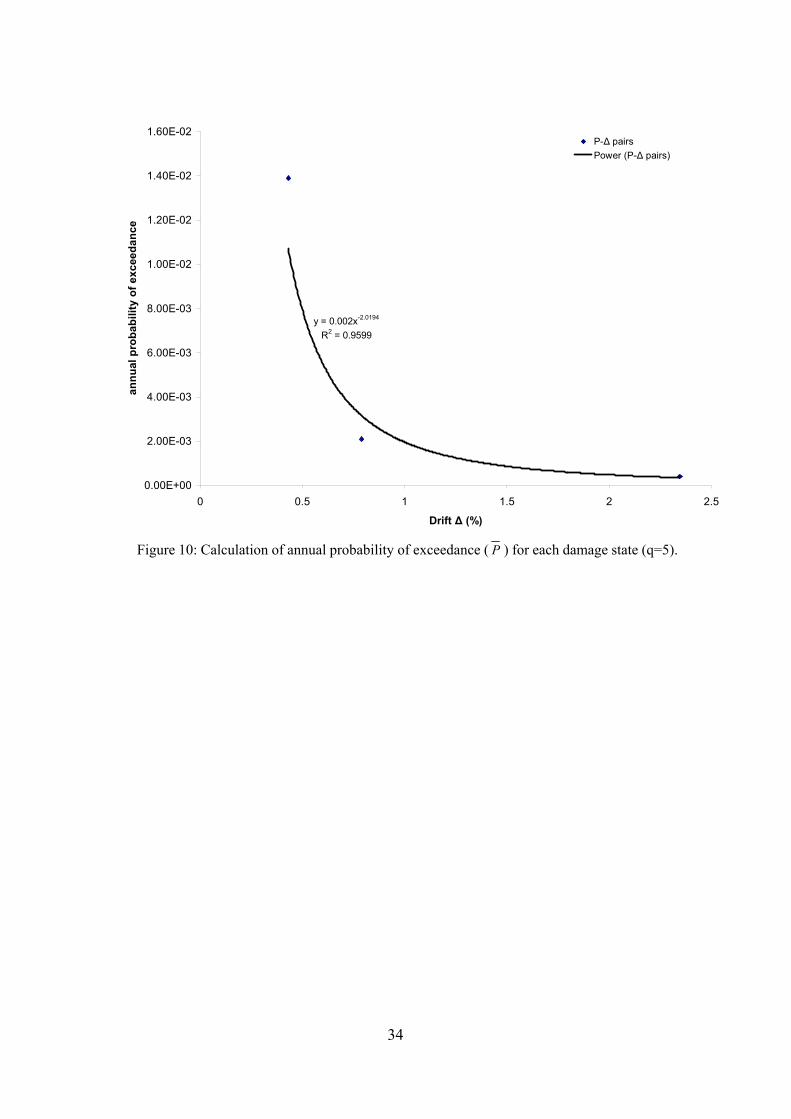
In the second part of this study a comparative study with respect to the total cost is
performed. In order to calculate the life-cycle cost for the design achieved according to
the EAK 2000 provisions for q=5 the following procedure is carried out: pushover
analysis is performed and three pairs of annual probability of exceedance and maximum
interstorey drift ( i iP − Δ ) were obtained (4.308×10⁻³, 0.0139), (7.907×10⁻³, 0.0021),
(2.347×10⁻², 0.000404). These pairs correspond to the three hazard levels with given
annual probabilities of exceedance. Subsequently, a power function as in Eq. 8 is fitted,
by performing regression to obtain the curve shown in Figure 10. In this picture the
17

expression of the best fitted curve is also depicted along with the R-squared value which
is a number between 0 to 1, which reveals how closely the estimated values compared to
the actual ones are. Once the function of the best fitted curve is known the annual
probabilities of exceedance iP for the seven damage states of Table 5 are easily
calculated. Finally iP is substituted to Eqs. (4) to (6) in order to calculate the life-cycle
cost value as a function of the initial volume.
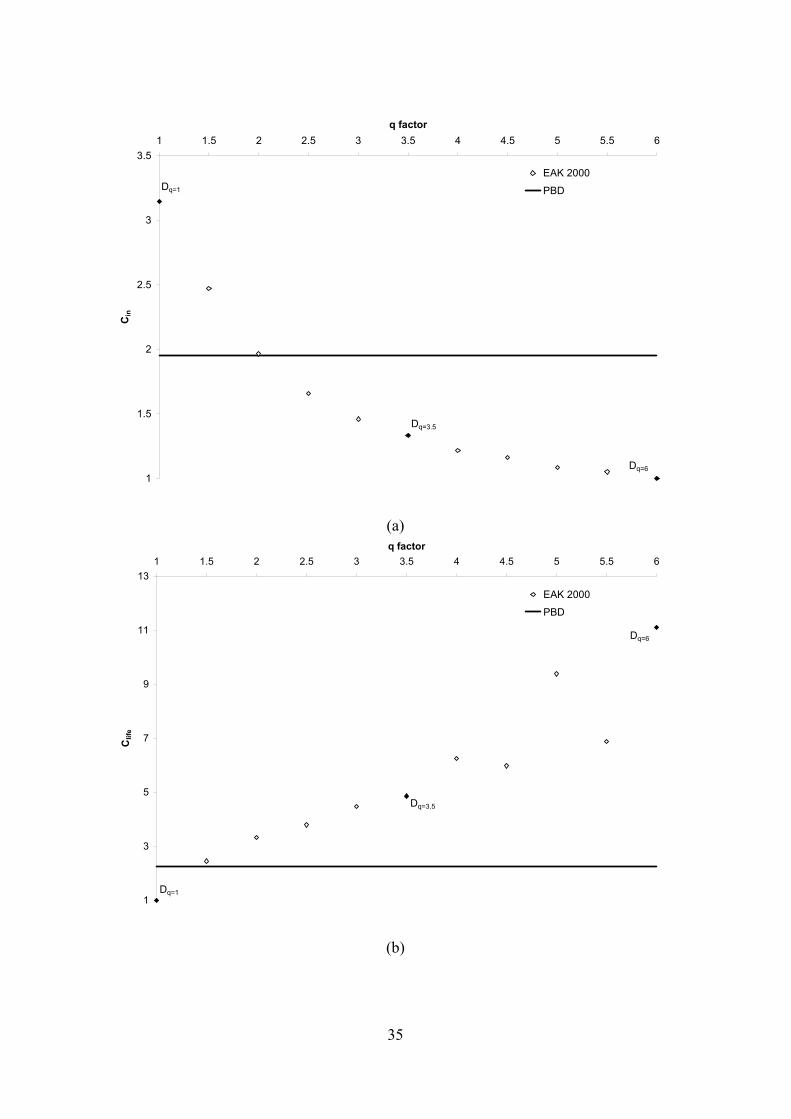
In Figures 11 (a), (b) and (c) the initial, life-cycle and total cost, for each of the
twelve designs, are presented. The designs obtained using the EAK 2000 procedure
depict, as expected, a reverse trend on the value of the initial and life-cycle cost. Dq=6
corresponds to the cheapest design with respect to the initial cost, but to the most
expensive one with respect to the life-cycle cost, on the other hand, the second extreme
design Dq=1 corresponds to the most expensive design with respect to the initial cost but
to the cheapest one with respect to the life-cycle cost. Among the twelve designs, Dq=6 is
the cheapest one with respect to the initial cost, Dq=1 with respect to the life-cycle cost
while DPBD with respect to the total cost.
The design obtained according to the EAK 2000 provisions. Dq=3.5, will be used as
the reference point design. Dq=3.5 is cheaper, with respect to the initial cost, by 62%
compared to Dq=1 and by 32% compared to DPBD, while it is more expensive by 25%
compared to the Dq=6. On the other hand Dq=3.5 is more expensive, with respect to the
life-cycle cost, by 80% compared to Dq=1 and by 54% compared to DPBD, while it is
cheaper by 56% compared to the Dq=6. Ending the comparison Dq=3.5 is more expensive,
with respect to the total cost, by 32% compared to Dq=1 and by 32% compared to DPBD,
while it is cheaper by 50% compared to the Dq=6. It can be seen from this comparative
study that for the test example examined the life-cycle cost is the dominant part of the
18

total cost. The life-cycle cost contains information about the performance of the design in
future earthquake events which is the most crucial factor when designing a building to
withstand against earthquake.
7. CONCLUSIONS
In this work a parametric study has been performed in order to assess the design obtained
using either the 2000 Greek national design codes or a performance-based design
procedure with three performance objectives. In the case of the 2000 Greek national
seismic design code a linear static analysis procedure has been used, while in the
performance-based design procedure the nonlinear static analysis procedure has been
performed in order to determine the damage levels for different earthquake intensities.
The two design procedures have been applied for the design of a 3D RC building. For the
test example considered it has been shown that when designing with the behaviour factor
suggested by the 2000 Greek national seismic design code the resulting design will be
more vulnerable to future earthquakes leading to a much higher total cost compared to the
design obtained with the performance-based procedure or the design obtained when
permitting only linear behaviour (q=1).
It has also been demonstrated how the concept of performance-based design can
be integrated in a structural design procedure in order to obtain a design that fulfill the
provisions of contemporary design codes like the three performance objectives employed
in this study. Even though these conclusions cannot be generalized, it is an indication
about the performance of the designs according to a prescriptive design code and to a
performance-based design procedure.
19

REFERENCES
1. Panagiotakos, TB, Fardis, MN. Seismic performance of RC frames designed to Eurocode 8
or to Greek Codes 2000, Bulletin of Earthquake Engineering 2004; 2: 221-259.
2. Browning, J. Proportioning earthquake-resistant RC frames in central/eastern U.S.,
Earthquake Engineering & Structural Dynamics 2002; 31(6): 1267-1280.
3. Qiang Xue. Need of performance-based earthquake engineering in Taiwan: a lesson from
the Chichi earthquake, Earthquake Engineering & Structural Dynamics 2000; 29(11):
1609-1627.
4. Applied Technology Council (ATC), Methodology for evaluation and upgrade of
reinforced concrete buildings, Report N. ATC-40, California Seismic Safety Commission,
Sacramento, California, 1996.
5. Applied Technology Council (ATC), NEHRP Guidelines for seismic rehabilitation of
buildings, Report No. FEMA-273, Federal Emergency Management Agency, Washington,
DC, 1997.
6. Structural Engineers Association of California (SEAOC), Vision 2000 a framework for
performance-based seismic engineering, Structural Engineers Association of California,
Sacramento, California, 1995.
7. Fajfar, P. Towards nonlinear methods for the future seismic codes, In Seismic design
practice into the next century, Booth (Ed.), Balkema, 1998.
8. Mazzolani, FM, Piluso, V. The theory and design of seismic resistant steel frames, E & FN
Spon, 1996.
9. American Society of Civil Engineers. Prestandard and Commentary for the Seismic
Rehabilitation of Buildings, FEMA-356, Federal Emergency Management Agency,
Washington, DC, 2000.
10. European Committee for Standardization. Draft for Development of Eurocode 2: Design of
concrete structures. ENV 1992-1-1, 1992.
20

11. EKOS 2000, National code for concrete building structures of Hellas, 2000.
12. EAK 2000, National seismic code of Hellas, 2000.
13. Sullivan, TJ, Calvi, GM, Priestley, MJN, Kowalsky, MJ. The limitations and performances
of different displacement based design methods, Journal of Earthquake Engineering,
2003; 7(1): 201-241
14. Panagiotakos, TB, Fardis, MN. A displacement-based seismic design procedure for RC
buildings and comparison with EC8, Earthquake Engineering & Structural Dynamics
2001; 30, 1439-1462.
15. FEMA 350: Recommended Seismic Design Criteria for New Steel Moment-Frame
Buildings. Federal Emergency Management Agency, Washington DC, 2000.
16. Somerville, P, Collins, N. Ground motion time histories for the Humboldt bay bridge,
Pasadena, CA, URS Corporation, 2002, www.peertestbeds.net/humboldt.htm.
17. Papazachos, BC, Papaioannou, ChA, Theodulidis, NP. Regionalization of seismic hazard
in Greece based on seismic sources, Natural Hazards 1993; 8(1), 1-18.
18. Chintanapakdee, C, Chopra, AK. Evaluation of modal pushover analysis using generic
frames. Earthquake Engineering & Structural Dynamics 2003; 32(3), 417-442.
19. ATC-13. Earthquake damage evaluation data for California. Applied Technology Council,
Redwood City, California, 1985.
20. Wen, Y. K. and Kang, Y. J. 2001: Minimum building life-cycle cost design criteria. IΙ:
Applications. J. Str. Eng. 127(3), 338-346.
21
Figures and Tables
Table 1: Natural records representing the 50% in 50 year hazard level [16].
Earthquake Station Distance Site
Cape Mendocino 20 rock Honeydew (PT) 17 August 1991 Petrolia 17 soil
Bunker Hill 8.8 rock Butler Valley 37 rock Centerville 16 soil Eureka College 21 soil Eureka School 24 soil Ferndale 14 soil Fortuna 13 soil Loleta 17 soil
Cape Mendocino (CM) 25 April 1992
Rio Dell 13 soil Bunker Hill 27 rock Centerville 27 soil Eureka College 46 soil Eureka School 48 soil Ferndale 34 soil Fortuna 43 soil
Cape Mendocino (C1) aftershock, 26 April 1992 0741GMT
Loleta 41 soil Bunker Hill 27 rock Centerville 28 soil Ferndale 34 soil
Cape Mendocino (C2) aftershock, 4/26/92 1118GMT
Fortuna 43 soil
22

Table2: Natural records representing the 10% in 50 year hazard level [16].
Earthquake Station Distance Site
Dayhook 14 rock Tabas (TB) 16 September 1978 Tabas 1.1 rock
Cape Mendocino 6.9 rock Cape Mendocino (CM) 25 April 1992 Petrolia 8.1 soil
TCU052 1.4 soil TCU065 5.0 soil TCU067 2.4 soil TCU068 0.2 soil TCU071 2.9 soil TCU072 5.9 soil TCU074 12.2 soil TCU075 5.6 soil TCU076 5.1 soil TCU078 6.9 soil TCU079 9.3 soil TCU089 7.0 rock TCU101 4.9 soil TCU102 3.8 soil
Chi-Chi (CC), Taiwan 20 September 1999
TCU129 3.9 soil
Table3: Natural records representing the 2% in 50 year hazard level [16].
Earthquake Station Distance Site
Vina del Mar 30 soil Valparaiso (VL), Chile 3 May 1985 Zapaller 30 rock
Caleta de Campos 12 rock La Union 22 rock La Villita 18 rock
Michoacan (MI), Mexico 19 September 1985
Zihuatenejo 21 rock
Table 4: Seismic hazard levels [17].
Event Recurrence Interval Probability of Exceedence PGA (g)
Frequent 21 years 90% in 50 years 0.06 Occasional 72 years 50% in 50 years 0.11
Rare 475 years 10% in 50 years 0.31 Very Rare 2475 years 2% in 50 years 0.78
23

Table 5: Damage State drift limits and cost.
Performance level Damage State Interstorey Drift (%) Cost
(% of initial cost)
1 None Δ<0.1 0 2 Slight 0.1<Δ<0.2 0.5 3 Light 0.25<Δ<0.5 5 4 Moderate 0.5<Δ<1.0 20 5 Heavy 1.0<Δ<2.0 45 6 Major 2.0<Δ<4.0 80 7 Destroyed 4.0<Δ 100
Table 6: Comparison of steel and concrete quantities in the twelve designs.
Columns Beams Design procedure Steel (kg.) Concrete (m3) Steel (kg.) Concrete (m3)
Dq=1 12700 32 6940 27 Dq=1.5 10030 26 5330 21 Dq=2 7720 21 4180 17 Dq=2.5 6510 18 3490 15 Dq=3 5730 15 3170 13 Dq=3.5 5210 15 2640 13 Dq=4 4600 14 2490 11 Dq=4.5 4280 14 2260 11 Dq=5 4010 12 2140 11 Dq=5.5 3870 12 2050 10 Dq=6 3750 11 1940 10 DPBD 8657 17 4685 14
Table 7: Comparison of steel quantities (kg) in the four selected designs.
Columns Beams Design procedure Longitudinal Transverse Longitudinal Transverse
Dq=1 10207 2493 4696 2244 Dq=3.5 4344 866 1958 682 Dq=6 3473 277 1627 313 DPBD 6787 1870 3304 1381
24
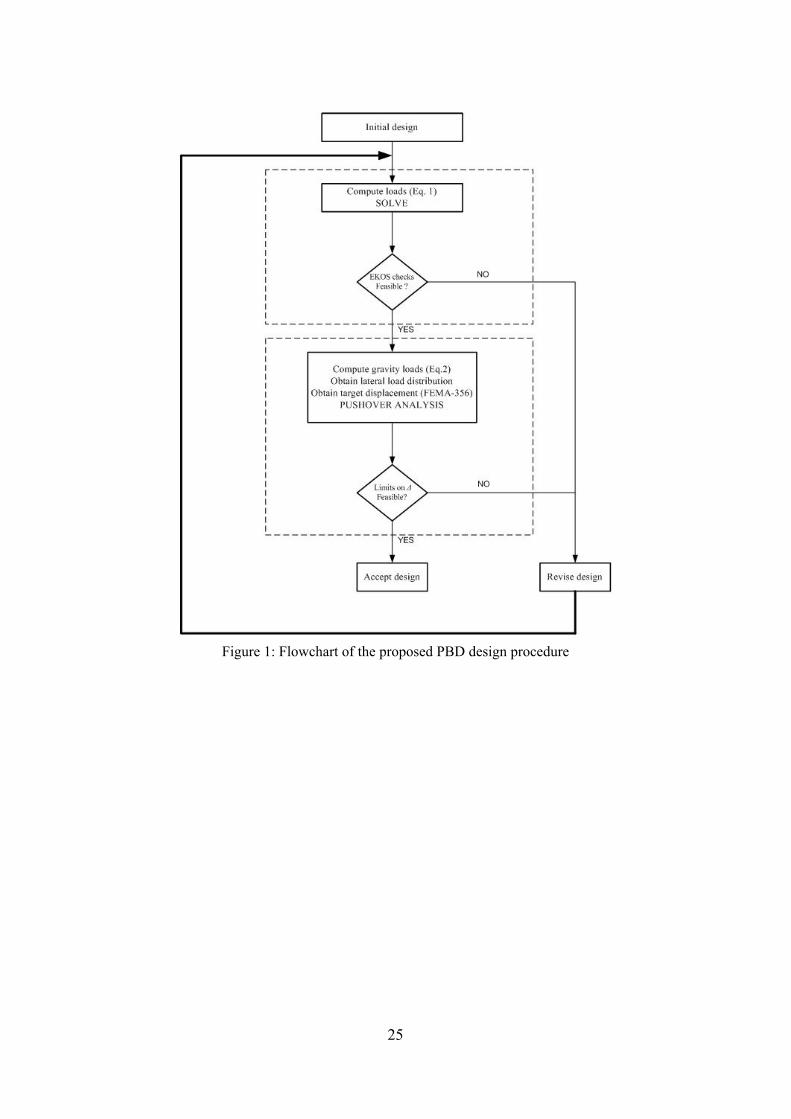
Figure 1: Flowchart of the proposed PBD design procedure
25

0.0
1.0
2.0
3.0
4.0
5.0
6.0
7.0
0.0 0.5 1.0 1.5 2.0 2.5 3.0 3.5 4.0 4.5 5.0 5.5 6.0
Period T(sec)
SA (m
/sec2 )
Bunker Hill (C1) Centerville (C1)Eureka College (C1) Eureka School (C1)Ferndale (C1) Fortuna (C1)Loleta (C1) Bunker Hill (C2)Centerville (C2) Ferndale (C2)Fortuna (C2) Bunker Hill (CM)Butler Valley (CM) Centerville (CM)Eureka College (CM) Eureka School (CM)Ferndale (CM) Fortuna (CM)Loleta (CM) Rio Dell (CM)Cape Mendocino (PT) Petrolia (PT)Median 50in50 X
(a)
0.0
1.0
2.0
3.0
4.0
5.0
6.0
0.0 0.5 1.0 1.5 2.0 2.5 3.0 3.5 4.0 4.5 5.0 5.5 6.0
Period T(sec)
SA (m
/sec
2 )
Bunker Hill (C1) Centerville (C1)Eureka College (C1) Eureka School (C1)Ferndale (C1) Fortuna (C1)Loleta (C1) Bunker Hill (C2)Centerville (C2) Ferndale (C2)Fortuna (C2) Bunker Hill (CM)Butler Valley (CM) Centerville (CM)Eureka College (CM) Eureka School (CM)Ferndale (CM) Fortuna (CM)Loleta (CM) Rio Dell (CM)Cape Mendocino (PT) Petrolia (PT)Median 50in50 Y
(b)
Figure 2: Natural records response spectra and their median (Hazard level/component) a)
50in50/Longitudinal(x), b) 50in50/Transverse(y).
26

0.0
2.0
4.0
6.0
8.0
10.0
12.0
14.0
16.0
0.0 0.5 1.0 1.5 2.0 2.5 3.0 3.5 4.0 4.5 5.0 5.5 6.0
T (sec)
SA (m
/sec
2 )Dayhook (TB) Tabas (TB)Cape Mendocino (CM) Petrolia (CM)TCU052 (CC) TCU065 (CC)TCU067 (CC) TCU068 (CC)TCU071 (CC) TCU072 (CC)TCU074 (CC) TCU075 (CC)TCU076 (CC) TCU078 (CC)TCU079 (CC) TCU089 (CC)TCU101 (CC) TCU102 (CC)TCU129 (CC) Median 10in50 X
(a)
0.0
2.0
4.0
6.0
8.0
10.0
12.0
14.0
0.0 0.5 1.0 1.5 2.0 2.5 3.0 3.5 4.0 4.5 5.0 5.5 6.0
T (sec)
SA (m
/sec
2 )
Dayhook (TB) Tabas (TB)Cape Mendocino (CM) Petrolia (CM)TCU052 (CC) TCU065 (CC)TCU067 (CC) TCU068 (CC)TCU071 (CC) TCU072 (CC)TCU074 (CC) TCU075 (CC)TCU076 (CC) TCU078 (CC)TCU079 (CC) TCU089 (CC)TCU101 (CC) TCU102 (CC)TCU129 (CC) Median 10in50 Y
(b)
Figure 3: Natural records response spectra and their median (Hazard level/component) a)
10in50/Longitudinal(x), b) 10in50/Transverse(y).
27

0.0
5.0
10.0
15.0
20.0
25.0
30.0
35.0
40.0
0.0 0.5 1.0 1.5 2.0 2.5 3.0 3.5 4.0 4.5 5.0 5.5 6.0
T(sec)
SA (m
/sec
2 )
Vina del Mar (VL)Zapaller (VL)Caleta de Campos (MI)La Union (MI)La Villita (MI)Zihuatenejo (MI)Μedian 2in50 X
(a)
0.0
5.0
10.0
15.0
20.0
25.0
30.0
35.0
40.0
45.0
0.0 0.5 1.0 1.5 2.0 2.5 3.0 3.5 4.0 4.5 5.0 5.5 6.0
T(sec)
SA (m
/sec
2 )
Vina del Mar (MI)Zapaller (VL)Caleta de Campos (MI)La Union (MI)La Villita (MI)Zihuatenejo (MI)Median 2in50 Y
(b)
Figure 4: Natural records response spectra and their median (Hazard level/component) a)
2in50/Longitudinal(x), b) 2in50/Transverse(y).
28

(a)
(b)
Figure 5: Geometry of the three storey 3D building (a) layout, (b) front view
29

(a)
(b)
Figure 6: Design Dq=1.0, beam-column reinforcement of characteristic frames in the ground storey
(a) frame in the longitudinal direction x, (b) frame in the transverse direction y.
30

(a)
(b)
Figure 7: Design Dq=6.0, beam-column reinforcement of characteristic frames in the ground storey
(a) frame in the longitudinal direction x, (b) frame in the transverse direction y.
31

(a)
(b)
Figure 8: Design Dq=3.5, beam-column reinforcement of characteristic frames in the ground storey
(a) frame in the longitudinal direction x, (b) frame in the transverse direction y.
32

(a)
(b)
Figure 9: Design DPBD, beam-column reinforcement of characteristic frames in the ground storey
(a) frame in the longitudinal direction x, (b) frame in the transverse direction y.
33
y = 0.002x-2.0194
R2 = 0.9599
0.00E+00
2.00E-03
4.00E-03
6.00E-03
8.00E-03
1.00E-02
1.20E-02
1.40E-02
1.60E-02
0 0.5 1 1.5 2 2.5
Drift Δ (%)
annu
al p
roba
bilit
y of
exc
eeda
nce
P-Δ pairsPower (P-Δ pairs)
Figure 10: Calculation of annual probability of exceedance ( P ) for each damage state (q=5).
34
1
1.5
2
2.5
3
3.51 1.5 2 2.5 3 3.5 4 4.5 5 5.5 6
q factorC
in
EAK 2000
PBDDq=1
Dq=3.5
Dq=6
(a)
1
3
5
7
9
11
131 1.5 2 2.5 3 3.5 4 4.5 5 5.5 6
q factor
Clif
e
EAK 2000
PBD
Dq=1
Dq=3.5
Dq=6
(b)
35

1
1.2
1.4
1.6
1.8
2
2.2
2.4
2.6
2.8
31 1.5 2 2.5 3 3.5 4 4.5 5 5.5 6
q factorC
tota
l
EAK 2000
PBD
Dq=1
Dq=3.5
Dq=6
(c)
Figure 11: Comparison of the designs achieved with respect to (a) initial, (b) life-cycle and (c)
total cost.
36