
Research on Shanghai export container freight index ...
83
World Maritime University World Maritime University The Maritime Commons: Digital Repository of the World Maritime The Maritime Commons: Digital Repository of the World Maritime University University World Maritime University Dissertations Dissertations 8-27-2021 Research on Shanghai export container freight index fluctuation Research on Shanghai export container freight index fluctuation based on Arma-Garch-X model based on Arma-Garch-X model Weihang Xu Follow this and additional works at: https://commons.wmu.se/all_dissertations Part of the Analysis Commons, Economics Commons, and the Transportation Commons Recommended Citation Recommended Citation Xu, Weihang, "Research on Shanghai export container freight index fluctuation based on Arma-Garch-X model" (2021). World Maritime University Dissertations. 1622. https://commons.wmu.se/all_dissertations/1622 This Dissertation is brought to you courtesy of Maritime Commons. Open Access items may be downloaded for non-commercial, fair use academic purposes. No items may be hosted on another server or web site without express written permission from the World Maritime University. For more information, please contact [email protected].
-
Upload
khangminh22 -
Category
Documents
-
view
0 -
download
0
Transcript of Research on Shanghai export container freight index ...

World Maritime University World Maritime University
The Maritime Commons: Digital Repository of the World Maritime The Maritime Commons: Digital Repository of the World Maritime
University University
World Maritime University Dissertations Dissertations
8-27-2021
Research on Shanghai export container freight index fluctuation Research on Shanghai export container freight index fluctuation
based on Arma-Garch-X model based on Arma-Garch-X model
Weihang Xu
Follow this and additional works at: https://commons.wmu.se/all_dissertations
Part of the Analysis Commons, Economics Commons, and the Transportation Commons
Recommended Citation Recommended Citation Xu, Weihang, "Research on Shanghai export container freight index fluctuation based on Arma-Garch-X model" (2021). World Maritime University Dissertations. 1622. https://commons.wmu.se/all_dissertations/1622
This Dissertation is brought to you courtesy of Maritime Commons. Open Access items may be downloaded for non-commercial, fair use academic purposes. No items may be hosted on another server or web site without express written permission from the World Maritime University. For more information, please contact [email protected].

WORLD MARITIME UNIVERSITY DISSERTATION FOR
INTERNATIONAL TRANSPORT AND LOGISTICS
i
RESEARCH ON SHANGHAI EXPORT CONTAINER FREIGHT
INDEX FLUCTUATION BASED ON ARMA-GARCH-X MODEL
by
XU WEIHANG
China
Dissertation submitted to the World Maritime University in partial
Fulfillment of the requirements for the award of the degree of
MASTER OF SCIENCE
In
MARITIME AFFAIRS
INTERNATIONAL TRANSPORT AND LOGISTICS
2021
Copyright Xu Weihang, 2021
WORLD MARITIME UNIVERSITY Malmö, Sweden

WORLD MARITIME UNIVERSITY DISSERTATION FOR
INTERNATIONAL TRANSPORT AND LOGISTICS
ii
DECLARATION
I certify that all the material in this dissertation that is not my own work has been
identified and that no material is included for which a degree has previously been
conferred on me.
The contents of this dissertation reflect my own personal views and are not necessarily
endorsed by the University.
(Signature): …………………………..
(Date): …………………………..
Supervised by
Professor Chen Shun
Shanghai Maritime University

WORLD MARITIME UNIVERSITY DISSERTATION FOR
INTERNATIONAL TRANSPORT AND LOGISTICS
iii
ACKNOWLEDGEMENT
I would like to express my gratitude to all those who helped me during the writing of
this thesis. My deepest gratitude goes first and foremost to Professor Chen Shun, my
supervisor, for her constant encouragement and guidance. She has walked me through
all the stages of the writing of this thesis. Without her consistent and illuminating
instruction, this thesis could not have reached its present form.
I also owe a special debt of gratitude to all the professors in International Transport
and Logistics (ITL) Program, from whose devoted teaching and enlightening lectures
I have benefited a lot and academically prepared for the thesis. Special thanks should
go to my friends especially Jue who has put considerable time and effort into her
comments on the draft.
I should finally like to express my gratitude to my beloved parents who have always
been helping me out of difficulties and supporting me without a word of complaint.

WORLD MARITIME UNIVERSITY DISSERTATION FOR
INTERNATIONAL TRANSPORT AND LOGISTICS
iv
ABSTRACT
KEYWORDS: Shanghai Port, Export, Index, SCFI(Singapore), ARM-GARCH -X model,
Title of dissertation: Research on Shanghai Export Container Freight Index Fluctuation Based on ARMA-GARCH-X Model Degree: Master of Science Currently, container liner shipping plays an important role in the economic and trade development of China and Asia. This article takes the Shanghai Containerized Freight Index (Singapore) as the research object, and studies the Shanghai Port as a modern observation of the world, resulting in freight index prices. This article first introduces the China Export Container Freight Index, Shanghai Export Container Freight Index, and Shanghai Export Container Freight Index, analyzes the relationship between them, and describes the internal impact of these three through data. Second, the ARMA-GARCH model is used for ocean freight rates and this paper specific studies from SCFI to SCFI(Singapore). Third, the proposed exogenous variable X, and more importantly, the relevant factors can be used as a reference to raise the fit of the model to determine the accuracy in the process. Finally, the impact of COVID-19 will be reconsidered to promote the connection between the transportation index and the global economy, and the suggestions are made to enterprises to promote the normal operation of the market.

WORLD MARITIME UNIVERSITY DISSERTATION FOR
INTERNATIONAL TRANSPORT AND LOGISTICS
v
TABLE OF CONTENTS
DECLARATION ....................................................................................................... ii
ACKNOWLEDGEMENT ........................................................................................ iii
ABSTRACT ............................................................................................................... iv
TABLE OF CONTENTS .......................................................................................... v
LIST OF ABBREVIATIONS ................................................................................. vii
LIST OF FIGURES ................................................................................................ viii
LIST OF TABLES .................................................................................................... ix
Chapter1 Introduction .............................................................................................. 1
1.1 Research background ......................................................................................... 1 1.2 Research objectives ............................................................................................ 3 1.3 Research implications ........................................................................................ 4 1.4 Research structure .............................................................................................. 5
Chapter2 Literature Review ..................................................................................... 7
2.1 A Survey on the ARMA-GARCH model .......................................................... 8 2.2 A Survey on risk measurement of Shipping Freight Index ............................... 9 2.3 A Survey on the Containerized Freight Index ................................................. 10 2.4 A Survey on the influence of COVID-19 on the shipping industry ................ 11
Chapter3 Introduction of Shanghai Containerized Freight Index ..................... 14
3.1 Shanghai Containerized Freight Index ............................................................ 14 3.1.1 Data and analysis of China's export container freight index .................... 15 3.1.2 Data and Analysis of Shanghai Export Container Freight Index .............. 18 3.1.3 Analysis of Shanghai-Singapore Export Container Index ........................ 21 3.1.4 CCFI, SCFI and SCFI (Singapore) index analysis and comparison ......... 24
3.2 Influencing factors of Shanghai Containerized Freight Index ......................... 26
Chapter4 Research methods ................................................................................... 29
4.1 ARMA Model .................................................................................................. 29 4.2. GARCH Model ............................................................................................... 30 4.3. ARMA-GARCH-X Model ............................................................................. 32

WORLD MARITIME UNIVERSITY DISSERTATION FOR
INTERNATIONAL TRANSPORT AND LOGISTICS
vi
Chapter5 Empirical Analysis of Volatilities of SCFI (Singapore) Based On the ARMA-GARCH-X Model ....................................................................................... 34
5.1. Description of data and statistical properties .................................................. 34 5.1.1. Basic statistical features of data ............................................................... 34 5.1.2. Stationary test and correlation analysis ................................................... 36
5.2. The choice of Exogenous variables (X) .......................................................... 40 5.2.1. Selection process ...................................................................................... 40 5.2.2. Granger causality ..................................................................................... 44 5.2.3. The impact of the US dollar exchange rate on the trend of SCFI ............ 45
5.3. Estimates of the ARMA-GARCH-X Model ................................................... 47 5.3.1. Estimates of ARMA-GARCH Model ...................................................... 47 5.3.2. Estimates of ARMA-GARCH-X Model .................................................. 51
5.4. Main findings .................................................................................................. 54 5.4.1. Model analysis ......................................................................................... 54 5.4.2. Advantages of the ARMA-GARCH-X model ......................................... 57
Chapter6 Conclusions and Recommendation ....................................................... 60
6.1 Main work ........................................................................................................ 60 6.1.1. Analysis conclusion ................................................................................. 60 6.1.2. Modeling conclusion ................................................................................ 63
6.2 Suggestions ...................................................................................................... 65 6.3Shortcomings and prospects ............................................................................. 67
References ................................................................................................................. 69

WORLD MARITIME UNIVERSITY DISSERTATION FOR
INTERNATIONAL TRANSPORT AND LOGISTICS
vii
LIST OF ABBREVIATIONS
ADF Augmented Dickey and Fuller AIC Akaike Information Criterion ARCH Autoregressive Conditional Heteroskedasticity ARMA Autoregressive Moving Average ARIMA Autoregressive Integrated Moving Average CECFI China Export Container Freight Index CCFI China containerized Freight Index CICFI China Import Container Freight Index GARCH Generalised Autoregressive Conditional Heteroskedasticity OECD Organization for Economic Co-operation and Development Q Quantile SCFI Shanghai Containerized Freight Index USD United States dollar VAR Value at Risk WTO World Trade Organization

WORLD MARITIME UNIVERSITY DISSERTATION FOR
INTERNATIONAL TRANSPORT AND LOGISTICS
viii
LIST OF FIGURES
Figure 3.1 Statistics of China Export Containerized Freight Index(CCFI) ............... 16 Figure 3.2 Statistics of Shanghai Export Container Freight Index (SCFI) ................ 19 Figure 3.3 Annual container throughput statistics of Shanghai Port and Singapore
Port ..................................................................................................................... 22 Figure 3.4 Statistics of Shanghai's Export to Singapore Container Freight Index
(SCFI Singapore) ............................................................................................... 23 Figure 3.5 CCFI, SCFI, SCFI (Singapore) freight index comprehensive statistics ... 25 Figure 5.1 Statistical chart of the return rate of SCFI (Singapore) ............................ 35 Figure 5.2 Q-Q Chart of SCFI (Singapore) ............................................................... 36 Figure 5.3 SCFI(Singapore) and Exchange rate ........................................................ 44 Figure 5.4 Granger causality in container transportation .......................................... 45 Figure 5.5 Response of SCFI to Exchange rate ......................................................... 46 Figure 5.6 Time-sequence diagram of SCFI (Singapore) .......................................... 48 Figure 5.7 Actual, Residual and Fitted Line Chart .................................................... 54 Figure 5.8 Container Freightage Index Rate of Return from Shanghai to Singapore
Container Freightage Index ............................................................................... 55 Figure 5.9 The Residuals of Two Model ................................................................... 58

WORLD MARITIME UNIVERSITY DISSERTATION FOR
INTERNATIONAL TRANSPORT AND LOGISTICS
ix
LIST OF TABLES
Table 3.1 SCFI Description ....................................................................................... 18 Table 5.1 DF test of the return rate of SCFI (Singapore) .......................................... 38 Table 5.2 Correlation coefficient diagram of SCFI (Singapore) ............................... 39 Table 5.3 Main M&A cases from the end of 2015 .................................................... 41 Table 5.4 Granger Causality Test .............................................................................. 45 Table 5.5 ARMA(1, 1) model parameters ................................................................. 47 Table 5.6 Correlation coefficient graph of residual variance of SCFI (Singapore) ... 49 Table 5.7 Arch-LM test results .................................................................................. 49 Table 5.8 ARCH-LM test results of GARCH(1,1) .................................................... 50 Table 5.9 GARCH-X model parameter detection ..................................................... 52 Table 5.10 ARCH-LM test results of GARCH (2,1)-X ............................................. 53 Table 5.11 AIC, SC and HQ Value Table ................................................................. 57

WORLD MARITIME UNIVERSITY DISSERTATION FOR
INTERNATIONAL TRANSPORT AND LOGISTICS
1
Chapter1 Introduction
1.1 Research background
Currently, container liner transportation is playing an increasingly important role in
China and Asia's economic and trade development. The global container capacity has
reached 2.6 million TEU in the first half-year of 2020, accounting for 11.2% of the
global total capacity. As two largest container transport ports in Asia, Shanghai Port
and Singapore Port have a significant impact on the world.
In 2020, the international container shipping market experienced a rise and fall but
finally achieved a strong rebound. COVID-19 affected the shipping industry in the first
half of the year, resulting in a significant drop in container demand due to epidemic
detection and other reasons. Therefore, the development of international trade is
hindered, the market trend is not good, ships are out of service, and the situation of
empty containers is serious.
The first half of 2020 is taken as an example. The total traffic capacity of routes from
Asia to Europe decreased by 17.8% over the period, from March to May. The routes
in the west coast and the east coast of the United States reduced by 15% and 13%
respectively. In conclusion, based on the data obtained from Clarkson, it can be seen

WORLD MARITIME UNIVERSITY DISSERTATION FOR
INTERNATIONAL TRANSPORT AND LOGISTICS
2
that the shipping freight price experienced a sharp decline in the first year of 2020
because of the shock by COVID-19.
From the third quarter of 2020, as the global COVID-19 situation has been alleviated
to a certain extent, the centralized transportation market has stabilized and rebounded.
In the fourth quarter, the COVID-19 situation in Europe and the United States
fermented, stimulating the concentrated release of living and medical goods and other
just needs, which also let transportation demand continued to run at a high level. In
particular, in December 2020, China's export containerized freight index (CCFI) rose
to a new high since 2005. In general, CCFI will remain between 830 and 1,600 points
in 2020, with an average value of 971 points, up 14.0% year on year. At the same time,
in terms of main routes, the average freight index of European routes, North American
routes, and South American routes were 1,135 points, 886 points, and 717 points,
respectively, up 3.8%, 27.1%, and 25.2% year on year respectively. By the end of
December 2020, the total market share of the world's top ten liner companies' transport
capacity has reached 83.9%, which was 0.9 percentage points higher than the 83.0%
at the end of 2019.
Therefore, the influence of COVID-19 has strengthened the global container market.
By the end of 2020, with the support of the South Korean government, five South
Korean shipping enterprises will set up "k-alliance" to enhance the competitiveness of
Southeast Asian routes. This is also the first time in the history of South Korean
shipping enterprises to set up an enterprise alliance.
From the perspective of the future development trend, with the gradual easing of
COVID-19, the container shipping trade will return to the growth track. It is estimated

WORLD MARITIME UNIVERSITY DISSERTATION FOR
INTERNATIONAL TRANSPORT AND LOGISTICS
3
that the global container shipping throughput will increase by 5.0% in 2021, while the
global container fleet capacity will increase by about 3.4% estimated by the Shanghai
Shipping Exchange (SSE), and the relationship between supply and demand in the
container shipping market will be significantly improved. With the shipping market
greatly improved, the global container ship-building market will also usher in a new
round of orders. At the same time, it can be seen that COVID-19 has a strong influence
on the economy of the container industry, but till now, the container market lacks an
effective model to help the market recover from the post-crisis (such as COVID-19)
and to maximize economic benefits for the shipping industry.
1.2 Research objectives
This paper mainly studies the economic characteristics of Shanghai to Singapore
export containerized freight index (SCFI Singapore) and uses the risk measurement
model by considering the "uncommon event." In this paper, variable X is introduced
in the existing risk measurement model, which establishes a new combined model
ARMA-GARCH-X model to analyze the economic characteristics of SCFI
(Singapore).
The container throughput of Shanghai Port has been ranked first in the world for 11
consecutive years since 2010 and exceeded 40 million TEUs for four consecutive years.
Taking the data of 2020 as an example, Shanghai Port International Transit completed
more than 5.3 million TEU, with a year-by-year growth of more than 14%; The total
domestic trade container throughput exceeded 6 million TEU, with a year-by-year
growth of about 15%, breaking the historical record of Shanghai port's domestic trade
container throughput; The water to water ratio reached 51.6%, with a year-by-year

WORLD MARITIME UNIVERSITY DISSERTATION FOR
INTERNATIONAL TRANSPORT AND LOGISTICS
4
increase of about 3%. It can be seen that Shanghai port has a prominent position in
global hub port. To have a deep understanding of Shanghai port, this paper will focus
on the study of Shanghai Containerized Freight Index(briefed as SCFI) and choose
one of the 13 exporting countries, Singapore, as the main country. So, this paper
mainly studies the economic characteristics of SCFI and SCFI (Singapore). In this
paper, the ARMA-GARCH-X model will be used to analyze which factors will affect
SCFI and judge its change characteristics by a subsection of the special data collected
from SCFI (Singapore) in the past ten years and especially the year 2020.
1.3 Research implications
Firstly, from the perspective of the shipping industry, the appearance of COVID-19
was concluded as an “uncommon event” in the establishment of the economic model
in this paper in order to have a thorough analysis of the economic characteristic of
SCFI. Research based on such “uncommon events” can help the shipping industry
observe the change of the shipping market faced with a special crisis and help the
shipping industry make more reasonable and more feasible predictions in the future.
Secondly, from the perspective of government, this paper will establish an effective
model and propose visible options to help government have reasonable and effective
emergency measures when faced with this kind of “uncommon event.” This model can
maximize possible effective policies to protect small and medium-sized container
management enterprises against dramatic change due to market demand caused by the
economic crisis.

WORLD MARITIME UNIVERSITY DISSERTATION FOR
INTERNATIONAL TRANSPORT AND LOGISTICS
5
Finally, from the perspective of stakeholders, this model can help stakeholders make
a quick and clear decision and help them recover from the economic loss when faced
with an “uncommon event.” As an example, when stakeholders are faced with negative
conditions, they can quickly avoid risks and seize the opportunity when they are faced
with positive conditions to win the unsustainable accumulated market dividend after
the “uncommon event” period.
1.4 Research structure
This paper utilizes weekly data of SCFI and SCFI (Singapore) from October 2009 to
January 2021 and mainly studies the volatility of SCFI (Singapore) and analyzes the
economic characteristics of SCFI (Singapore). The structure of this paper is as follows:
In Chapter One, the container transportation market and the background of the
Shanghai container transportation market are introduced, followed by the purpose and
significance of the paper.
In Chapter Two, the methods regarding the container freight index are introduced,
followed by the explanation of the Shanghai Containerized Freight Index (SCFI) and
China Containerized Freight Index (CCFI).
In Chapter Three, This chapter first studies the economic characteristics of China
containerized freight index (CCFI) and makes a comparative study of Shanghai
containerized freight index (SCFI) according to their economic characteristics. Then
SCFI (Singapore) is chosen as a specific object by studying its economic
characteristics.

WORLD MARITIME UNIVERSITY DISSERTATION FOR
INTERNATIONAL TRANSPORT AND LOGISTICS
6
In Chapter Four, three time-series models: ARMA, GARCH and then, combing the
two models and introducing the variable X in order to have a deeper introduction of
the economic characteristics of the SCFI (Singapore), which established the ARMA-
GARCH-X model.
In Chapter Five, this chapter uses the ARMA-GARCH-X model to conduct statistical
analysis and volatility research of SCFI (Singapore) and pick up the most suitable
model for the data based on the analysis characteristics of SCFI (Singapore).
In Chapter Six, this chapter introduces the research and hypothesis on the causes of
SCFI volatility and uses Granger causality to analyze the relationship between SCFI
(Singapore) and the currency exchange rates of China and the United States.
In Chapter Seven, this chapter describes how SCFI affects the operations and
investment of shipping companies. In view of the conclusions and prospects, the
deficiencies of this paper and future research directions are analyzed in the last part of
the pape

WORLD MARITIME UNIVERSITY DISSERTATION FOR
INTERNATIONAL TRANSPORT AND LOGISTICS
7
Chapter2 Literature Review
As an important factor of economic development, shipping development has played
an important role in the development of the city and even the country. Among them,
Shanghai port as the largest port of container transportation in China, has a huge
impact on China and the world. In recent years, the optimization of port turnover and
the drastic increase of annual port throughput were led by the intelligentization of
container port handling tools which makes container transportation more and more
widely used in shipping transportation.
With the development of the global economy and trade trend, the world environment
is more complex which the whole world is faced with increasing uncertain and
unstable factors. The impact of COVID-19 has extended rapidly, which affects the
international economy, science, technology even the shipping industry. The world is
now entering a new period of turbulence, and the global economy will experience a
difficult process in the near future as well. Therefore, starting from the freight index,
this paper studies and analyzes the economic significance of SCFI, which helps the
shipping market and economic market have a deeper understanding of Shanghai
containerized freight index, so that Shanghai port can always keep competitive
position in the world.

WORLD MARITIME UNIVERSITY DISSERTATION FOR
INTERNATIONAL TRANSPORT AND LOGISTICS
8
2.1 A Survey on the ARMA-GARCH model
Zhai and Li (2006) selected five-year copper futures prices, according to the
characteristics of financial assets peak and thick tail, and used the GARCH model
based on t distribution to study the market risk. The empirical results show that the
Shanghai copper futures yield usually follows a small fluctuation after a small
fluctuation, and followed by a large fluctuation after a large fluctuation; ARCH (1,1)
model based on t distribution can capture the market risk of futures very well, and it is
also a suitable choice of a risk measurement method for different indexes.
Mei(2010) established the ARMA-GARCH model to study the futures data. She found
that there are many factors affecting the futures price, and the futures price fluctuates
greatly, so it is difficult to make an accurate forecast. But the price fluctuation of the
futures market has its own inherent characteristics. This paper uses Eviews software
to build ARMA and GARCH models to forecast and compare the futures price.
Zhuang(2017) selected the daily return rate of the Shanghai Composite Index from
2012 to 2016 to test the stationarity, autocorrelation, partial autocorrelation, and
ARCH effect. She found that it is possible to build ARMA-GARCH models, normal
distribution models, and generalized Pareto distribution models. Through the test, she
found that the volatility aggregation and the thick tail after volatility can reflect the
characteristics of the data, which can provide a reference for the Shanghai Stock Index
to predict the value of risk and provide a reference for the test of the financial market.
Yang(2018) analyzed the income fluctuation risk of Internet monetary funds such as
Yu Ebao and Jingdong Treasury, calculated the VaR value of sample funds by

WORLD MARITIME UNIVERSITY DISSERTATION FOR
INTERNATIONAL TRANSPORT AND LOGISTICS
9
constructing the GARCH model, and evaluated the performance of sample funds by
using the RAROC index, and concluded that the risk-adjusted return rate of Internet
monetary funds is much higher than that of traditional monetary funds.
Lu and Li(2004) used the traditional time series method for data statistics of the BFI
freight rate index and established an ARMA model for risk measurement and
prediction after extracting specific data according to index characteristics.
2.2 A Survey on risk measurement of Shipping Freight Index
Lu and Li(2004) used the traditional time series method for data statistics of the BFI
freight rate index and established an ARMA model for risk measurement and
prediction after extracting specific data according to index characteristics.
Chen(2004) proposed to apply the ARCH family model to dry bulk freight rate return
rate and extended the model to the EGARCH model and GARCH model. Since then,
risk measurement has been widely used in shipping.
Wang(2007) first proposed to use the economic measurement method in the
international dry bulk freight index. He used the VaR method to calculate and study
the log daily return rate of the Baltic Cape of good hope freight index, the Baltic
Panamax freight index, and the Baltic handy freight index, and then calculated their
VaR value. His research mainly helps international dry bulk shipping operators and
investors to formulate their own business strategies and investment strategies based on
the maximum estimated risk so as to better avoid risks and improve profits.
Li(2015) established the ARMA-GARCH model to study the volatility of the Baltic
dry bulk freight index. In order to reflect the pre-index of international trade, this paper

WORLD MARITIME UNIVERSITY DISSERTATION FOR
INTERNATIONAL TRANSPORT AND LOGISTICS
10
selects the daily rate of return of dry bulk freight index and tries to establish an ARMA-
GARCH model to study the volatility of the BDI index after considering that the rate
of return index obeys arch. Experiments show that the index can well reflect the
fluctuation law and sensitivity of the dry bulk freight index.
Wang(2018) studied the volatility of the container freight index and its derivatives
based on the GARCH model. Through the establishment of the GARCH family model,
he analyzed the volatility characteristics of the Shanghai container freight index (SCFI)
European route and US west route index and SCFI derivatives (European route and
US West Route). It is found that GARCH (1,1) is optimal and has strong volatility.
2.3 A Survey on the Containerized Freight Index
Li(2003)found that there was a correlation between container freight index (CFI)
fluctuations and shipping capacity indicators. A prediction model and a platform for
the generation and technical analysis of freight index can be established due to this
relationship. The platform also can be used in EDI information of ports and shipping.
Liang(2013) found the fluctuation characteristics of SCFI and got the conclusion that
SCFI derivatives were most applicable to small and medium-sized shipowners.
Gong(2015) chose two variables, namely the Shanghai export container freight index
and export trade volume, based on a VAR model was established. For the first time,
impulse response function and Granger causality test had been used to analyze the
correlation between two variables.

WORLD MARITIME UNIVERSITY DISSERTATION FOR
INTERNATIONAL TRANSPORT AND LOGISTICS
11
Gui(2020) used the exponential smoothing method to predict the container throughput
of Shanghai because Shanghai Port is the largest container port in China. In recent
years, the container throughput of Shanghai Port has been at the forefront in the
development of the global port economy. The three-time exponential smoothing
method is used to predict the container throughput of Shanghai Port, which provides a
decision-making basis and an important reference for the construction and
development of Shanghai Port.
Tang(2021) used complex network theory and Granger causality test methods, and
from a new systematic perspective, thirteen routes freight fluctuation of Shanghai
Export Containerized Freight Index (SCFI) Granger causality network was constructed.
Cargo fluctuations on SCFI routes have short average transmission distances and fast
transmission speeds; cargo fluctuations have different transmission ranges and
influence ranges on different routes, as well as different media capacity and
aggregation effects.
Wang(2021) analyzed the three factors of transportation cost under the relationship of
supply and demand, the shipping market, and the economic environment and combine
the linear model and non-linear model of the China Import and Export Container
Freight Index (CCFI) are concluded in this article.
2.4 A Survey on the influence of COVID-19 on the shipping industry
Jia(2020) wrote in the paper that the transportation structure in China is adjusted, and
the status of container transportation is increasing day by day. During the COVID-19

WORLD MARITIME UNIVERSITY DISSERTATION FOR
INTERNATIONAL TRANSPORT AND LOGISTICS
12
period, there are three principles of container transportation, port construction, and
other shipping-related industries, which are safety, intelligence, and efficiency.
United Nations publications(2020) released the review of maritime transport in 2020.
According to the interdependence of countries around the world caused by COVID-
19, this paper forecasts the new trend of maritime transport patterns. The review points
out that the COVID-19 situation sets off the importance of maritime transportation,
which is an indispensable sector for the continuous transportation of key materials and
hull in the global trade after the recovery stage and returning to normal due to the
maritime crisis and puts forward the trend and forecast of the growth of the maritime
industry headed by containers in 2021.
Sun(2021) found that the demand of the shipping market is booming because of the
COVID-19, especially the container transportation demand. With the acceleration of
the foreign rail container express transportation like light container cargo, cold chain
cargo, and port container cargo, the Chinese rail container transportation business has
also been developed. E-commerce products and other types of products in the central
and western regions are becoming more abundant, and China's container market has a
good development trend.
In conclusion, through the research on the combination of risk measurement and
shipping freight index, we can see that with the continuous development and
improvement of economic measurement methods, using risk measurement to measure
shipping freight index can not only see the characteristics of shipping index but can
predict and assess the risk of its freight index through risk measurement, which is very

WORLD MARITIME UNIVERSITY DISSERTATION FOR
INTERNATIONAL TRANSPORT AND LOGISTICS
13
helpful for the risk prediction in the next stage. However, at present, the risk
measurement for the shipping market, especially the container market, is still not
widely used. The main reason may be that the freight index of a specific market has
its own unique risk characteristics. Thus, finding the economic characteristics of
freight indices can be a good combination of risk measurement methods for effective
risk measurement. Therefore, according to the existing ARMA-GARCH model, this
paper will analyze the economic characteristics of SCFI (Singapore) and introduce the
variable X to establish the ARMA-GARCH-X model in order to predict the change of
container freight index in the case of "uncommon events" such as COVID-19.

WORLD MARITIME UNIVERSITY DISSERTATION FOR
INTERNATIONAL TRANSPORT AND LOGISTICS
14
Chapter3 Introduction of Shanghai Containerized Freight
Index
3.1 Shanghai Containerized Freight Index
Shanghai Shipping Exchange (SSE) is an official center built to cooperate with the
construction of the Shanghai International Shipping Center in 1996, which is the first
national-level shipping exchange center in China. This exchange center is a real-time
trading venue center that is focused on the shipping market. It revolves around the
shipping market to carry out various types of shipping transactions and provides
dynamic information on shipping transactions for various markets.
The data research scope of the Shanghai Exchange Center includes the whole shipping
information of Shanghai and all domestic and foreign shipping routes. It provides
timely information communication for both home and abroad container shipping
markets. At the same time, Shanghai Exchange Center regulates the price behavior of
the shipping transaction market. For the interests of various types of shipping traders,
it also has greatly promoted the positive development of the Shanghai shipping market.
At present, the real-time data of the container freight index of the Shanghai
International Shipping Exchange include: China Export Container Freight Index

WORLD MARITIME UNIVERSITY DISSERTATION FOR
INTERNATIONAL TRANSPORT AND LOGISTICS
15
(CECFI), Shanghai Export Container Freight Index (SCFI), China Import Container
Freight Index (CICFI) and so on.
3.1.1 Data and analysis of China's export container freight index
The China Containerized Freight Index (CCFI: China Containerized Freight Index)
divides the world region into different sectors according to thirteen routes for shipping,
which are divided into Hong Kong, South Korea, Japan, Southeast Asia, Australia and
New Zealand, the Mediterranean, Europe, the Western United States and the Eastern
United States. The index for eleven sub-routes including East and West Africa, South
Africa, South America, etc. The freight index was first compiled and released by the
Shanghai Shipping Exchange in 1998, with the freight index on January 1, 1998, as
the benchmark, and the benchmark was set at 1000 points.
The selection of sample routes also divides the different geographical locations of
regions according to the freight index. According to the suitable route and port
characteristics as the dividing standard, divides Shanghai to international regions into
eleven routes, and major domestic ports are divided into ten routes, which cover the
country's ten major ports and representative ports in different regions.
The provision of freight information comes from the summary of real-time freight
information of large shipping companies. Therefore, the collection of freight
information selects 16 large shipping companies with many routes on the market and
a good reputation. These shipping companies have various sources from home and
abroad. Most of these types are compiled by the branches of Shanghai and foreign
shipping companies in China. The 16 large-scale shipping companies are compiled
WORLD MARITIME UNIVERSITY DISSERTATION FOR
INTERNATIONAL TRANSPORT AND LOGISTICS
16
and called committees to share information on the freight index of the Shanghai
Shipping Exchange. The freight index is also released in a unified way: Friday of each
week is the release date of the Shanghai Shipping Institute freight index, and the
comprehensive data of CCFI, SCFI, CICFI, and corresponding routes of the current
week will be released based on the data obtained in the current week.
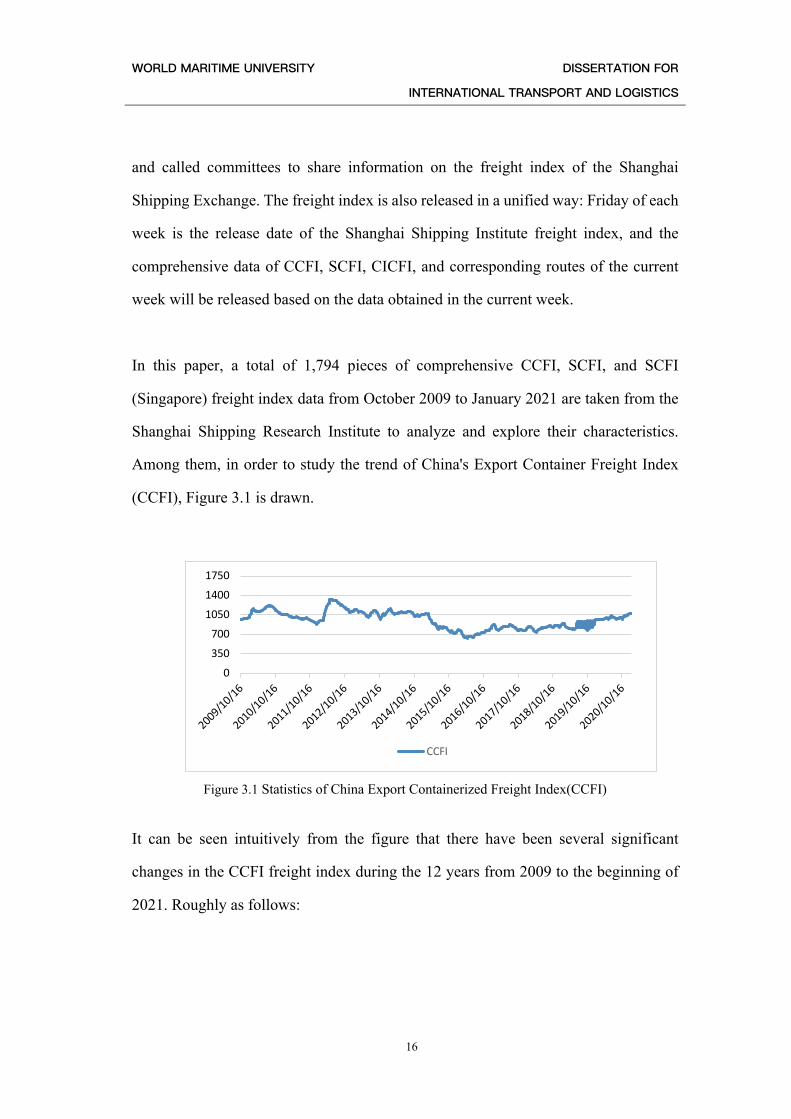
In this paper, a total of 1,794 pieces of comprehensive CCFI, SCFI, and SCFI
(Singapore) freight index data from October 2009 to January 2021 are taken from the
Shanghai Shipping Research Institute to analyze and explore their characteristics.
Among them, in order to study the trend of China's Export Container Freight Index
(CCFI), Figure 3.1 is drawn.
Figure 3.1 Statistics of China Export Containerized Freight Index(CCFI)
It can be seen intuitively from the figure that there have been several significant
changes in the CCFI freight index during the 12 years from 2009 to the beginning of
2021. Roughly as follows:
0
350
700
1050
1400
1750
2009/10/16
2010/10/16
2011/10/16
2012/10/16
2013/10/16
2014/10/16
2015/10/16
2016/10/16
2017/10/16
2018/10/16
2019/10/16
2020/10/16
CCFI

WORLD MARITIME UNIVERSITY DISSERTATION FOR
INTERNATIONAL TRANSPORT AND LOGISTICS
17
● From the end of 2009 to the middle of 2012, CCFI fluctuated in large containers,
and the freight index fluctuated in the range of 900 -1,336 points, with the range
of change within 38%. First, due to the huge impact of the sub-prime mortgage
crisis on the global financial system in the second half of 2009, global trade was
reduced, which in turn had a huge impact on the entire shipping market, as did
container shipping; after that, the index rebounded.
● From mid-2012 to mid-2016, affected by the global economic depression, CCFI
has been showing a downward trend, from the highest peak of 1,336 points to 636
points, a drop of 48.8% (almost half).
● Since mid-2016, CCFI has been in another range of rising and box fluctuations,
and the range of index fluctuations is not large. Fortunately, the index has broken
through the 6-year downtrend line in the second half of 2018 and will usher in a
new growth period. Unfortunately, 2019 will be affected by the trade war initiated
by the United States. Otherwise, China's export container index will be on an
upward trend. At the end of 2020, due to the release of the backlog of trade demand
due to the COVID-19, CCFI showed a clear upward trend.
If the two troughs (the index in mid-2009 and the index in mid-2016) are linked
together and counted as a cycle with a time interval of about seven years, then the next
trough should be around mid-2023.
It can be seen from the above that the CCFI fluctuates with the stability of the global
financial system and fluctuations in economic growth; fortunately, the index has

WORLD MARITIME UNIVERSITY DISSERTATION FOR
INTERNATIONAL TRANSPORT AND LOGISTICS
18
broken through the 6-year downward trend line in the second half of 2018 and will go
into a new growth period; 2021 will be accompanied by a significant increase because
the release of world trade. At the same time, it can be predict that the next trough may
occur around the middle of 2023.
3.1.2 Data and Analysis of Shanghai Export Container Freight Index
The Shanghai International Shipping Exchange Center officially released the Shanghai
Containerized Freight Index (SCFI) for the first time in December 2005. The freight
index can not only reflect the export capacity of containers in Shanghai and the trend
of the ship leasing market but also can reflect the economic development capacity of
Shanghai and surrounding cities. The first SCFI is 1,084.81 points, which includes
European routes, North America, Australia, and New Zealand, South America, Japan,
Singapore, Hong Kong, Taiwan, and other routes. The specific routes and freight
weights are shown in Table 3.1:
Table 3.1 SCFI Description
Routes Units Weights Europe (Basic Port) USD/TEU 20.00% Mediterranean Sea (Basic Port) USD/TEU 10.00% Messi (Basic Port) USD/TEU 20.00% U.S. East (Basic Port) USD/TEU 7.50% Persian Gulf (Dubai) USD/TEU 7.50% ANZ (Melbourne) USD/TEU 5.00% West Africa (Lagos) USD/TEU 2.50% South Africa (Durban) USD/TEU 2.50% South America (Santos) USD/TEU 5.00% Kansai, Japan (Basic Port) USD/TEU 5.00% Kanto, Japan (Basic Port) USD/TEU 5.00%

WORLD MARITIME UNIVERSITY DISSERTATION FOR
INTERNATIONAL TRANSPORT AND LOGISTICS
19
South East Asia (Singapore) USD/TEU 7.50% South Korea (Busan) USD/TEU 2.50%
This paper has taken the Shanghai Export Container Freight Index (SCFI) from
October 2009 to the beginning of 2021 from Shanghai Shipping Research Institute and
drew the following trend chart Figure 3.2.
Figure 3.2 Statistics of Shanghai Export Container Freight Index (SCFI)
It can be seen intuitively from the figure that there were several significant changes in
the CCFI freight index during the ten years from the second half of 2009 to the
beginning of 2021. Roughly as follows:
● From the beginning of 2009 to the beginning of 2012, SCFI fluctuated from 879
to 583 points. Due to the subsequent impact of the financial crisis in the second
half of 2009, it showed an upward trend and then fell and rebounded
0.00200.00400.00600.00800.00
1,000.001,200.001,400.001,600.001,800.00
2009.10.16
2010.03.26
2010.08.27
2011.02.18
2011.07.22
2011.12.23
2012.05.25
2012.11.09
2013.04.12
2013.09.06
2014.02.07
2014.07.04
2014.12.05
2015.05.08
2015.10.09
2016.03.11
2016.08.05
2017.01.06
2017.06.02
2017.11.03
2018.03.30
2018.08.17
2019.01.18
2019.06.28
2019.11.22
17/04/2020
11/09/2020
SCFI

WORLD MARITIME UNIVERSITY DISSERTATION FOR
INTERNATIONAL TRANSPORT AND LOGISTICS
20
● From the beginning of 2012 to the beginning of 2016, affected by the global
economic depression, SCFI has been showing a downward trend, from the highest
peak of 1,500 points to 400 points, a decline of 73% (almost 3/4).
● Since mid-2016, SCFI has been in another range of rising, and the range of SCFI
fluctuations is not large. The positive side is that SCFI has broken through the 10-
year downward trend line at the end of 2019 and will usher in new growth. It is a
pity that 2019 was affected by the trade war initiated by the United States.
Otherwise, the Shanghai Export Container Index has already broken through the
downward trend line and is in an upward trend. If the peak in early 2012 is
connected with the trough in early 2016, it is counted as a half-cycle, and the time
interval is about four years, then a cycle is about eight years.
● According to the news released by Shanghai Shipping Exchange, SCFI has
experienced a directional growth in 2020. In the first week of January 2020, SCFI
is 1022.72, which will be the lowest on April 24, 2020, with the SCFI of 818.16.
In the last week of December 2020, SCFI is 2783.03, with a difference of 3.4 times.
There are two reasons for this phenomenon: one is the insufficient input of
container ship capacity, the other is the insufficient supply of containers. After a
large number of containers arrived in Europe and the United States from the Far
East, during the COVID-19 period, the empty containers could not be returned to
the Far East, which made it difficult for Chinese coastal ports to obtain one
container. This characteristic of the container liner market is not possessed by the
dry bulk carrier market and tanker market.
WORLD MARITIME UNIVERSITY DISSERTATION FOR
INTERNATIONAL TRANSPORT AND LOGISTICS
21
It can be seen from the above that SCFI (Shanghai Export Container Freight Index)
has also broken through the 10-year downward trend line with the fluctuation of
economic growth rate, and will usher in a new growth period; in 2020, with the
relaxation of China-US trade relations, SCFI will see a significant rise.
3.1.3 Analysis of Shanghai-Singapore Export Container Index
Affected by the weak international trade, the total throughput of the top 25 container
ports is 395.7 million TEU in 2020, which shows a 0.55% increase compared to 2019,
which is 393.5 million TEU. Among them, the overall situation of container
throughput of Shanghai port is low in the first half-year, but it changed after, reaching
43.5 million TEU in the whole year, ranking first in the world. Singapore reached 36.9
million TEU, down 0.9%, ranking second in the world. So, it can see that Shanghai
Port and Singapore Port are the two largest ports in the world in terms of annual
container throughput. The throughput between SCFI and the SCFI (Singapore) is
worth studying. Therefore, this paper focuses on studying the SCFI (Singapore). The
price index will carry out an in-depth data feature analysis and establish a model to
analyze its risk measurement.
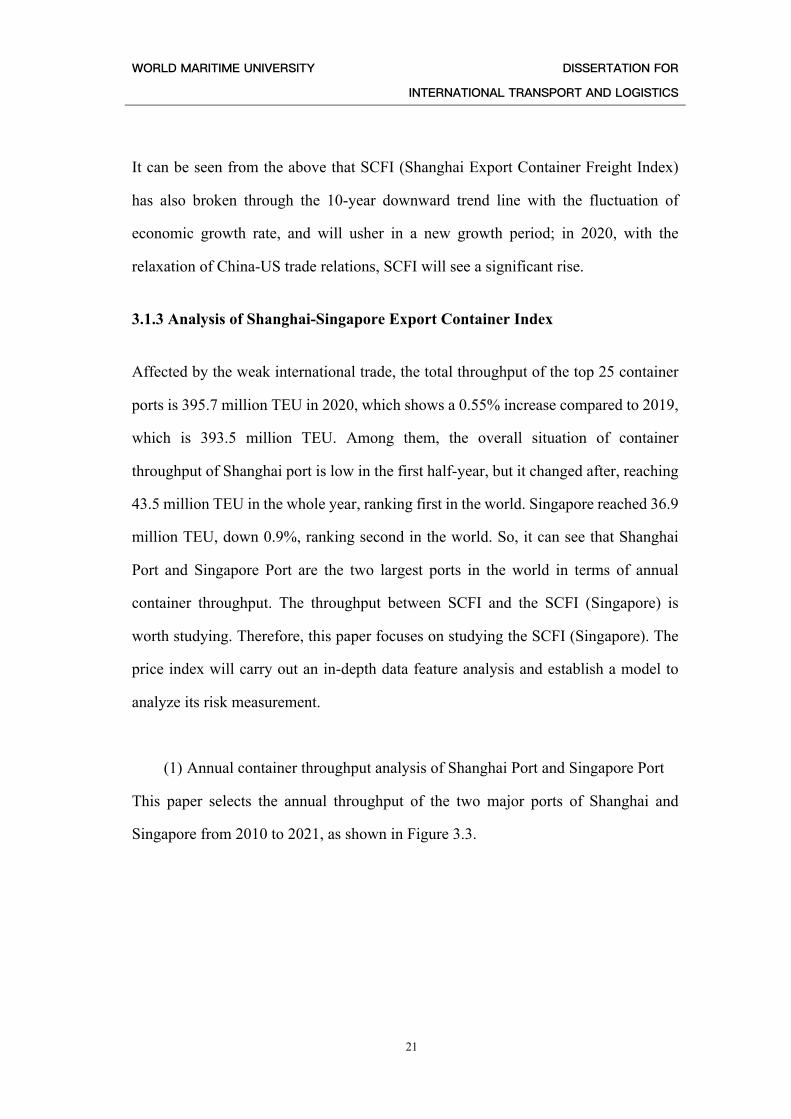
(1) Annual container throughput analysis of Shanghai Port and Singapore Port
This paper selects the annual throughput of the two major ports of Shanghai and
Singapore from 2010 to 2021, as shown in Figure 3.3.

WORLD MARITIME UNIVERSITY DISSERTATION FOR
INTERNATIONAL TRANSPORT AND LOGISTICS
22
Figure 3.3 Annual container throughput statistics of Shanghai Port and Singapore Port
Shanghai Port reached the top throughput from 2010 while Singapore always the
second port. The main reason is that the port has a large container throughput base,
coupled with automated terminals and shoreline resources. The port is in a state of
high-load operation all year round. At the same time, the surrounding city ports around
Shanghai are feed ports which are very effective to assist Shanghai Port to complete
the huge annual throughput. At the same time, Singapore is affected by the
reorganization of the shipping alliance in 2017, changing the port of call for Asian
liner companies, of which Singapore and Tanjong Palapas ports are proposed to
operate in the two core straits Hub. Thus the annual throughput of Singapore increased
rapidly from 2017 to 2018.
(2) SCFI (Singapore) analysis
This paper takes the data of SCFI (Singapore) from October 2009 to the end of 2019
from the Shanghai Shipping Exchange Center, which shows in the following figure.
The trend chart Figure 3.4 is drawn as follows: For the convenience of analysis, an
additional item is added in the figure.
40
50
60
70
80
Year
2010
/1/1
2011
/1/1
2012
/1/1
2013
/1/1
2014
/1/1
2015
/1/1
2016
/1/1
2017
/1/1
2018
/1/1
2019
/1/1
2020
/1/1
2021
/1/1
Annual throughput of Singapore Port (10,000 tons)
Annual throughput of Shanghai Port (10,000 tons)

WORLD MARITIME UNIVERSITY DISSERTATION FOR
INTERNATIONAL TRANSPORT AND LOGISTICS
23
Figure 3.4 Statistics of Shanghai's Export to Singapore Container Freight Index (SCFI
Singapore)
It can be seen intuitively from the figure that there were several significant changes in
the CCFI freight index during the ten years from the second half of 2009 to the end of
2019. Roughly as follows:
● From mid-2009 to mid-2010, it was on an upward trend. SCFI (Singapore)
fluctuated from 235 to 440 points, with an increase of 87%, mainly due to the
recovery of the financial crisis in the second half of 2009, showing an upward trend.
● From mid-2010 to mid-2016, affected by the global economic depression, SCFI
(Singapore) has been showing a downward trend, from the highest peak of 444
points to 53 points, a drop of 88% (almost 5/6). Since mid-2016, the index has been
in another range of rising, and box fluctuations and the range of index fluctuations
is not large; the positive side is that SCFI (Singapore) has broken through the 9-
year downward trend line at the end of 2018 and will usher in new growth. It is a
pity that in 2019, affected by the trade war initiated by the United States, the index
050100150200250300350400450500
2009.10.16
2010.03.12
2010.07.30
2010.12.31
2011.05.27
2011.10.14
2012.03.02
2012.07.27
2012.12.14
2013.05.03
2013.09.13
2014.01.31
2014.06.13
2014.10.31
2015.03.20
2015.07.31
2015.12.18
2016.05.06
2016.09.16
2017.02.03
2017.06.16
2017.11.03
2018.03.16
2018.07.20
2018.12.07
2019.04.26
2019.09.12
SCFI(Singapore)

WORLD MARITIME UNIVERSITY DISSERTATION FOR
INTERNATIONAL TRANSPORT AND LOGISTICS
24
fell back to the trend line and then officially rose with a larger magnitude. If the
peaks in 2010 and the troughs in 2016 are linked together.
It can be seen from the above that SCFI (Singapore) fluctuates with fluctuations in
global economic growth. Fortunately, the index broke through the 9-year downward
trend line at the end of 2018. There is a clear downward trend in 2019. The reason is
that COVID-19 is raging around the world, world trade has fallen into a stage of
epidemic prevention, import and export requirements have become stricter, and the
supply side has fallen into panic. However, by the end of 2020, the lagging of trade
demand has restarted, especially in Europe and the United States, entering a period of
cyclical consumption such as holidays and shopping days. However, the insufficient
supply of shipping equipment has caused a surge in shipping freight, the supply of
containers is difficult, and freight rates have also fallen into In a vicious circle, prices
rose for a while.
3.1.4 CCFI, SCFI and SCFI (Singapore) index analysis and comparison
The previous chapter introduced and analyzed the respective indicators of CCFI, SCFI,
and SCFI (Singapore). In this chapter, this paper merges these three indicates together
and observes the difference between them. The time is uniformly intercepted from
October 16, 2009, to January 22, 2021 (nearly 11 years), and the specific data content
is shown in the attachment. The picture is as follows:

WORLD MARITIME UNIVERSITY DISSERTATION FOR
INTERNATIONAL TRANSPORT AND LOGISTICS
25
Figure 3.5 CCFI, SCFI, SCFI (Singapore) freight index comprehensive statistics
As can be seen from the above Figure 3.5, the volatility of SCFI (orange-red line) is
much greater than that of CCFI (blue line), and the peaks and valleys are more obvious;
SCFI (Singapore) (gray line) is relatively stable in comparison. The trends of these
three lines are roughly similar, except that the timing of the turning point is different;
the common peak appeared in mid-2010, and the common trough appeared from the
end of 2015 to the beginning of 2016; but since the bottom in 2016, it is slowly
recovering. In 2019, the index declined due to COVID-19, and it rebounded
significantly at the end of 2019 and early 2020 and maintained its upward momentum
until the beginning of 2021.
The overall trends of CCFI and SCFI freight rates are similar, and the fluctuation
cycles are basically similar. However, there are still some differences. SCFI tends to
indicate the actual price of the current market and the freight index of specific routes
in each market, while CCFI pays more attention to settlement and actual bargaining.
0
200400
600
800
1000
1200
1400
16001800
16/10/2009
16/10/2010
16/10/2011
16/10/2012
16/10/2013
16/10/2014
16/10/2015
16/10/2016
16/10/2017
16/10/2018
16/10/2019
16/10/2020
CCFI SCFI SCFI(Singapore)

WORLD MARITIME UNIVERSITY DISSERTATION FOR
INTERNATIONAL TRANSPORT AND LOGISTICS
26
Therefore, the overall freight rate of SCFI is lower than CCFI, and fluctuations in the
market are greater than CCFI; because SCFI is a spot of the market price, the quotation
at the beginning or end of the month is often higher, so that taking into account the
decline in freight rates, economic losses can be avoided. This phenomenon does not
appear in CCFI, so in the long run, from a statistical analysis point of view, CCFI is
about three weeks behind SCFI.
SCFI (Singapore) is a route of SCFI in Southeast Asia, accounting for about 7.5% of
SCFI's whole account, which is not a large proportion. It is obvious from the legend
that the time trends of SCFI (Singapore) and SCFI are different. For example, from
2015 to 2016, the SCF overall freight index showed a downward trend in volatility and
gradually stabilized at the end of 2015, while SCFI (Singapore) lags by about half a
year. The reason is mainly related to the change of route and port of call.
Both CCFI and SCFI are compiled by the Shanghai Shipping Exchange Center, which
subjectively reflects the export situation and phenomenon, but cannot reflect the
differences between container shipping companies. Among them, in the field of
container transportation, both CCFI and SCFI have data authority and are recognized
as container freight index. In contrast, SCFI can more intuitively affect the current
market conditions of different routes.
3.2 Influencing factors of Shanghai Containerized Freight Index
In addition to the loss of route operations caused by insufficient capacity, technological
progress also will lead to a decline in container freight rates. Large-scale ships,
intelligent terminals, port throughput, and ship utilization rates will all affect the

WORLD MARITIME UNIVERSITY DISSERTATION FOR
INTERNATIONAL TRANSPORT AND LOGISTICS
27
operation of the entire voyage. The cost has an inseparable impact. From the analysis
of the economic characteristics of the freight index of the overall container liner, the
main factors are summarized three conclusions here:
● Supply and demand in the shipping market. From the perspective of container
transportation demand, China experienced rapid foreign trade growth in 2010
which the world economy freight rates are also good at that time. Therefore,
between 2008 and August 2010, China rationally arranged container transportation
capacity control, and the freight rates were fast. The decline in transportation
capacity will inevitably lead to a decline in freight rates, and it also happens from
October to December every year due to the holiday-month supply and demand.
● Shipping costs and operating costs. The transportation cost of ships and the
operating cost of shipping companies account for most of the economic costs of
container liner transportation and are also the core part of the freight rate.
Especially in the off-season, the lack of capacity and high transportation costs
make many shipping companies lose money for a long time. Some routes have to
be closed, so every year, many routes are closed, or the main carrier is replaced.
Also, changes in fuel prices are an important factor. Rising oil prices and currency
exchange rate fluctuations will greatly affect the price of fuel, especially during
the financial crisis, and tensions in the Middle East will greatly affect
transportation costs. At the same time, with the sulfur limit promulgated in 2020,
oil prices will show an upward trend, and routes need to adjust capacity and
operating expenses in a timely manner according to transportation costs. In
operating costs, the impact of exchange rates occupies a large part. The

WORLD MARITIME UNIVERSITY DISSERTATION FOR
INTERNATIONAL TRANSPORT AND LOGISTICS
28
appreciation and depreciation of the exchange rate will affect the operating cost of
the transit. For example, when the exchange rate is depreciated, if the transit is to
be carried out, the additional cost of the ship, the cost of raw materials, and the
inspection fee will all cause the overall transportation cost to rise.
● Export taxes and other policies. In 2010, the Ministry of Finance and the Ministry
of Taxation issued export tax rebates for 406 tax codes. This tax rebate policy
caused a small increase in freight rates in a short period of time and increased the
number of exported goods. Therefore, the freight rate trend in the two years after
2010 upward trend. However, from a long-term perspective, after two years of the
2010 tax rebate policy, there is no longer a long-term growth phenomenon but a
steady or even downward trend. At the same time, the no longer temptation of this
policy also prevents more businesses from choosing the transportation mode of
liner transportation, resulting in a drop in capacity and a drop in freight rates.
Therefore, policies such as taxes and fees issued by the state will also cause short-
term or long-term fluctuations in freight rates.

WORLD MARITIME UNIVERSITY DISSERTATION FOR
INTERNATIONAL TRANSPORT AND LOGISTICS
29
Chapter4 Research methods
4.1 ARMA Model
The retrospective automatic moving average Model (ARMA) is an important method
to study time series. It is composed of the auto-regressive Model (AR model for short)
and moving average Model (MA model for short). In the research of the different
markets, it is often used to study long-term tracking data, such as Panel research, which
is used to study the change of consumption behavior pattern; In retail research, it is
used to forecast sales volume and market size with seasonal variations.
The principle of the ARMA model is that the data series formed by the prediction
index over time is regarded as a random series, and the interdependence of this group
of random variables reflects the continuity of the original data in time. On the one hand,
the influence of influencing factors; on the other hand, it has its own variation law.
Assume that the influencing factors are X1, X2..., Xk, by regression analysis, as the
formula (4.1) shows,
𝑌! = 𝛽"𝑋" + 𝛽#𝑋# +∙∙∙ +𝛽$𝑋$ + 𝑍 (4.1)
Where Y is the observed value of the predicted object, and Z is the error. As the
predicted object, Yt is affected by its own changes, and its rule can be reflected by the
following formula, as the formula (4.2) shows,

WORLD MARITIME UNIVERSITY DISSERTATION FOR
INTERNATIONAL TRANSPORT AND LOGISTICS
30
𝑌! = 𝛽"𝑌!%" + 𝛽#𝑌!%# +∙∙∙ +𝛽$𝑌!%$ + 𝑍! (4.2)
The error term has a dependent relationship in different periods, which is expressed by
the following formula. As the formula (4.3) shows,
𝑍! = 𝜖! + 𝛼"𝜖!%" + 𝛼#𝜖!%# +∙∙∙ +𝛼&𝜖!%& (4.3)
Thus, the ARMA model expression is obtained as follows (formula 4.4):
𝑌! = 𝛽' +𝛽"𝑌!%" + 𝛽#𝑌!%# +∙∙∙ +𝛽$𝑌!%$ + 𝜖! + 𝛼"𝜖!%" + 𝛼#𝜖!%# +∙∙∙
+𝛼&𝜖!%& (4.4)
4.2. GARCH Model
This chapter uses the GARCH model to analyze the volatility of the container freight
price series. The GARCH model is called the Generalized Auto-regressive Conditional
Heteroskedastic Model, which is an extension of the Auto-regressive Conditional
Heteroskedastic Model (ARCH) first proposed by Bollerslev. It can also be considered
that the ARCH model is a special case of the GARCH model when there is no
conditional variance lag on the right side of the equal sign of the conditional variance
equation, that is, when the conditional variance auto-regressive order p=0, the
GARCH(0,q) model is ARCH( q) Model.
The ARCH model is actually only suitable for the short-term auto-correlation process
of the heteroscedasticity function. Compared with the ARCH model, the GARCH
model can better reflect the long-term memory properties of the actual data.

WORLD MARITIME UNIVERSITY DISSERTATION FOR
INTERNATIONAL TRANSPORT AND LOGISTICS
31
Poleslev proposed the GARCH model after Engle proposed the ARCH model to
analyze the conditional heteroscedasticity of time series. It is a regression model
tailored specifically to the measurement of financial data. The GARCH model further
models the error variance, which is the biggest difference between it and the ordinary
regression model. Under the condition that the long-term variance is constant, the
ARMA model is established for the short-term variance of the Model. The shipping
market is changing rapidly, and the optimal investment time window is fleeting. At
this time, shipping companies often do not care about long-term market trends but
focus on short-term market fluctuations. Short-term market volatility is closely related
to conditional variance. Therefore, the GARCH type is particularly suitable for
volatility analysis and forecasting. Such analysis can provide very important guidance
for investors' decision-making and can also predict and analyze the value itself.
The GARCH model can be expressed as formula 4.5 and 4.6 shows:
𝑟! = 𝜇! = 𝑢! (4.5)
ℎ!# = 𝛽' + ∑ 𝛽(𝑢!%(# + ∑ 𝛼(ℎ!%(#&(*" &
(*" (4.6)
Among them, ut is an independent and identically distributed random variable, ht is a
conditional variance, ut/ut-1 and ht/ht-1 are independent, and ut is a standard normal
distribution. Formula(4.5) is called the conditional mean equation. The general form
of the conditional mean equation is an ARMA model, which is replaced by ut here.
Formula (4.6) is called the conditional variance equation, which reflects the changing
characteristics of the conditional variance of the time series.

WORLD MARITIME UNIVERSITY DISSERTATION FOR
INTERNATIONAL TRANSPORT AND LOGISTICS
32
In order to adapt to the empirical distribution of the return sequence with the
characteristics of peak tail thickness, or assume that ut obeys other distributions, for
example, Poleslev (1987) assumes that the return is subject to the broad t-distribution,
using the GED distribution and so on. (1991) proposed the EGARCH model. Many
evidence studies have shown that the characteristic of thick peak tails exists in the
distribution of returns, and there is still asymmetry in the return residuals that affect
the returns. When the market is subjected to varying degrees of negative impact, the
freight rate decreases, and the conditional variance of the rate of return becomes larger,
resulting in greater volatility between the rate of return and the rate of freight; on the
contrary, when the freight rate rises, at this time Volatility changes small. If the freight
rate falls, the value of the shipping company's stock will also start to fall. If the
company's financial leverage is assuming that the company's debt remains unchanged
at this time, the risk of holding the shipping company's stock becomes higher.
Therefore, the leverage effect is caused by the influence of negative shocks on the
conditional variance. GARCH model can't characterize revenue the asymmetry of the
fluctuation of the conditional variance of the rate is that the impact of positive and
negative shocks on the conditional variance in the Model is symmetric.
4.3. ARMA-GARCH-X Model
As an important part of time series, the mean equation and variance equation can
provide researchers with a lot of help, but in a separate when using the two models,
the ARMA model, for example, tend to ignore the variance equation because of its
residual error is white noise, do not have any information can be mining, so generally
only write an ARMA model as the research object. In the GARCH model, it is often
WORLD MARITIME UNIVERSITY DISSERTATION FOR
INTERNATIONAL TRANSPORT AND LOGISTICS
33
assumed that the mean value equation is a constant, and the residual has an ARCH
effect. Therefore, attention is focused on the residual, and the mean is omitted.
ARMA-GARCH models mean and variance separately. In other words, it is a random
process in which the mean value satisfies the ARMA process, and the residual value
satisfies the GARCH process. Such a model is helpful for a comprehensive
understanding of the characteristics of the mean value equation and variance equation
and for a more comprehensive study.
ARMA-GARCH-X model is based on the ARMA-GRCH model, adding new
exogenous variable X as the variable, which is completely determined by the outside
of the system and entered into the system. Bringing the X variable into the ARMA-
GARCH model is an innovative attempt. The X variable in this Model only affects the
system and is not affected by the system, which is very suitable for the shipping
industry. By inputting exogenous variables and comparing them with the traditional
ARMA-GARCH model, it is hoped that the fit of the new Model will be more
optimized than the traditional Model.
WORLD MARITIME UNIVERSITY DISSERTATION FOR
INTERNATIONAL TRANSPORT AND LOGISTICS
34
Chapter5 Empirical Analysis of Volatilities of SCFI
(Singapore) Based On the ARMA-GARCH-X Model
5.1. Description of data and statistical properties
This paper chooses data of SCFI and SCFI (Singapore) from September 2009 to
January 2021 as the research object. These two indices are weekly data, which are very
typical and authoritative.
This paper used Eviews software to analyze the characteristics of 560 weekly SCFI
(Singapore) freight indexes collected from October 16, 2009, to January 22, 2021, and
modeled the data from three aspects: statistical characteristics, data pre-processing and
testing, and model testing.
5.1.1. Basic statistical features of data
In order to define the data characteristics of SCFI (Singapore) and find the
corresponding risk measurement method, this paper uses Eviews software to calculate
the return rate of SCFI (Singapore) from October 2009 to January 2021 and analyzes
the basic characteristics of its rate of return. The frequency is taken as the statistical
standard to summarize the results, as shown in Figure 5.1.

WORLD MARITIME UNIVERSITY DISSERTATION FOR
INTERNATIONAL TRANSPORT AND LOGISTICS
35
Figure 5.1 Statistical chart of the return rate of SCFI (Singapore)
According to Figure 5.1, it can be observed that the overall return rate has a sharp peak
and a thick tail, which is not the normal distribution under normal circumstances.
There are many extreme data values on the left side. According to the logarithmic
frequency sequence statistic chart of SCFI (Singapore), its standard deviation is 0.066,
and the skewness is 1.720. When the skewness is greater than 0, it indicates a right-
skewness distribution, indicating that there will be a greater probability of substantial
losses. The kurtosis coefficient is 36.617, and higher than three belongs to a high
coefficient. J.B. statistical value is 27977.88, indicating that the actual distribution of
return rate is greatly different from the normal distribution. To further verify whether
the logarithmic rate of return of SCFI (Singapore) freight index is characterized by a
sharp peak and a thick tail, and to further test its rate of return, this paper draws a Q-Q
diagram, as shown in Figure 5.2

WORLD MARITIME UNIVERSITY DISSERTATION FOR
INTERNATIONAL TRANSPORT AND LOGISTICS
36
Figure 5.2 Q-Q Chart of SCFI (Singapore)
According to Figure 5.2, it can be clearly observed that this figure is except for the
normal distribution line, the shape is curved on the whole, and there are many freely
swinging points at the tail. According to Fig. 5.1 and 5.2, it can be shown that the
image actually has the characteristic of a thick tail. The preliminary judgment shows
that the data conforms to the basic characteristics of the ARCH regression model, so
the model is established for it. In order to verify whether the model is applicable to the
model, the stability and correlation of the rate index rate of return are analyzed first.
5.1.2. Stationary test and correlation analysis
In order to verify whether the freight index has "pseudo-regression" volatility
characteristics, we use Eviews software to test the stability of the unit root time series.
First of all, by observing the sequence diagram, to determine whether the unit root
should include a constant term and a trend term. Observing the raw data through the

WORLD MARITIME UNIVERSITY DISSERTATION FOR
INTERNATIONAL TRANSPORT AND LOGISTICS
37
Quick-Graph-Line operation, it can be seen that if the data has no obvious upward or
downward trend over time, there is no trend item. If it fluctuates around zero, there is
no trend term. There are two views on whether to include the constant term. One is
that the intercept is not zero, and the constant term is taken; the other is that if the
average value of the sequence is not zero, then the constant term is taken. Here, in
order to unify the data interval and make the data easier to model, we make a first-
order difference on the original data, and the data group after the difference is called
DINSCFI. Open the DINSCFI file and perform a unit root test on the file. After many
experiments, the unit root of the test is set as the first difference, excluding the intercept
term.
After the test, the unit root test with no intercept and no time trend is determined to be
the most appropriate metadata, among which the hypothesis is correct according to the
conclusion AIC and S.C. values.
Second, to determine the lag order. The optimal lag order is mainly determined
according to AIC and S.C. criteria. After selecting the test method and determining the
constant and trend terms, try from 0 to 7 in the column of lagged Differences. Through
observation, when the lag order is 1, the values of AIC and S.C. in the bottom column
of the conclusion are the smallest, so the optimal lag order is determined to be 1.
As can be seen from Table 5.2, ADF value is -18.35493, and the confidence interval
values of 1%, 5%, and 10% are -2.568907, -1.941363, and -1.616337, respectively,
which are far greater than ADF value, and the corresponding P-value is 0.

WORLD MARITIME UNIVERSITY DISSERTATION FOR
INTERNATIONAL TRANSPORT AND LOGISTICS
38
Further, T statistic the absolute value of absolute value is greater than the 1% level, so
we can determine that the basic data is rejected the null hypothesis at 1% level on, so
the index of the original sequence according to the model do not have a unit root, is a
stationary series, by calculating the p-value is equal to 0.0000, thus proved that the
freight index yield is 0.00% sure to accept the null hypothesis, there are 100.00% sure
reject the null hypothesis.
Table 5.1 DF test of the return rate of SCFI (Singapore)
Null Hypothesis: DINSCFI has a unit root
Exogenous: None
Lag Length: 0 (Automatic - based on SIC, maxlag=18)
t-Statistic Prob.*
Augmented Dickey-Fuller test statistic -18.35493 0 Test critical values: 1% level -2.568907
5% level -1.941363
10% level -1.616337
In order to verify the existence of series auto-correlation of the return rate of SCFI
(Singapore), it is necessary to establish a time series correlation graph to judge the
auto-regressive process of its time series. As the above tests have shown that the
original sequence of the freight rate index is an unstable sequence, the auto-correlation
test of the freight rate index is required.
From the result of Eviews software, correlation analysis can be carried out on sequence
and sequence group objects so as to determine whether sequence objects have auto-
correlation problems. The first column of original numbers in the table on the right

WORLD MARITIME UNIVERSITY DISSERTATION FOR
INTERNATIONAL TRANSPORT AND LOGISTICS
39
means the lag values from 1 to 15 (maximum lag), corresponding to auto-correlation
and partial auto-correlation graphs. The "A.C." column is the estimated self-
correlation value, and the "PAC" column is the estimated partial self-correlation value.
Their values correspond to the figure on the left. "Q-stat" represents the value of Q
statistic, and "Prob" represents the probability that the value of Q statistic is greater
than the calculated value of Q for this sample. The null hypothesis of this Q statistic is
that the sequence is non-autocorrelation. If the P-value is greater than the given
significance level (e.g., 1%), the null hypothesis is accepted. That is, the sequence is
non-autocorrelation. If the p-value is less than the given significance level, the null
hypothesis is rejected, i.e., the sequence is auto-correlated. The P-value in the
Correlogram Specification shows that the sequence object DINSCFI is auto-correlated.
As shown in Table 5.2 below:
Table 5.2 Correlation coefficient diagram of SCFI (Singapore)
It can be seen from the graph that the values of the autocorrelation function and partial
correlation function obviously fall near the boundary domain of the value. With the

WORLD MARITIME UNIVERSITY DISSERTATION FOR
INTERNATIONAL TRANSPORT AND LOGISTICS
40
increase of the lag period of its data, the auto-correlation quickly tends to zero and
gradually becomes stable. Therefore, the original sequence of the index can be
considered to be stable.
5.2. The choice of Exogenous variables (X)
5.2.1. Selection process
The choice of exogenous variables has a crucial impact on the establishment of the
model. Good exogenous variables will significantly improve the fit of the model,
making it better simulate the actual situation and facilitate later observation and
analysis.
In the process of selecting exogenous variables, through reading the literature and
searching for information, it was found that the following three phenomena will cause
fluctuations in container freight rates. The first point is the impact of the epidemic,
such as COVID-19. The second point is the impact of container shipping companies.
The company's strategic adjustments include corporate mergers, corporate acquisitions,
corporate bankruptcies, and so on. Third, when the foreign exchange rate fluctuates,
especially when the US dollar exchange rate fluctuates, it will cause changes in
container freight rates.
First of all, the impact of COVID-19 on Shanghai, China, can be summarized from
January 15, 2020, to May 1, 2020, a period of 106 days. During this period of time,
SCFI (Singapore) has this obvious volatility. An indicator is established, called an
instrumental variable, which is set to 1 when COVID-19 is present, and set to 0 when

WORLD MARITIME UNIVERSITY DISSERTATION FOR
INTERNATIONAL TRANSPORT AND LOGISTICS
41
there is no COVID-19. After intercepting this period of time and establishing the
model, it is found that it can indeed increase the degree of fit of the model. However,
when I searched the data of the Shanghai epidemic in other time periods on the Internet,
there was a deviation in the division of the epidemic time. There was no authoritative
data to count the exact time when the epidemic occurred in Shanghai in other years.
This has resulted in a lack of authority and research data. Therefore, the idea of
bringing the epidemic situation into the equation as an exogenous variable is different
and can only be exchanged for other variables.
Second, I selected data that is authoritative on the Internet and has a very clear time
period, which is related to the strategic adjustment of shipping companies. Corporate
strategic adjustments include corporate mergers, corporate acquisitions, and corporate
bankruptcies. Such corporate strategic changes have a significant impact on container
freight rates. We all know that under a specific shipping route, the pricing strategy of
freight rates is quite monopolistic. Several large shipping companies under the
shipping route have absolute pricing power. When a large company merges, a small
company is acquired, or a shipping company goes bankrupt, it will lead to fluctuations
in freight rates, such as the shipping companies in the Table 5.3 below.
Table 5.3 Main M&A cases from the end of 2015
Event Content
CMA CGM acquires Oriental Ocean Emperor
CMA CGM officially announced in December 2015 that it intends to acquire the Oriental Ocean Emperor Group, which has now been completed.

WORLD MARITIME UNIVERSITY DISSERTATION FOR
INTERNATIONAL TRANSPORT AND LOGISTICS
42
Merger of COSCO and China Shipping
In December 2015, COSCO Container Lines announced that it would lease all the container capacity of China Shipping Container Lines and acquire all of its sales network, which has now been completed.
Hapag-Lloyd and the Arabian Wheel
In June 2016, Hapag-Lloyd and Arab Steamship announced that they would merge, and they are currently in the process of merging.
Han Jin goes bankrupt
In August 2016, Hanjin Shipping announced that it entered bankruptcy protection and is currently in bankruptcy liquidation. Three shipping companies in Japan
Three shipping companies in Japan
In November 2016, three Japanese shipping companies, Mitsui, Nippon Yusen, and Kawasaki announced their combined transportation business. The joint venture company is scheduled to be established on July 1, 2017 and start operations on April 1, 2018.
Due to the reorganization of major global shipping companies at the end of 2015, the
top 16 shipping companies in the market have become ten. Among the mainstream
shipping companies, Maersk (Denmark), Mediterranean (Switzerland), Evergreen
(Taiwan), Yangming (Taiwan), Hamburg South America (Germany), and Orient
Overseas (Hong Kong) have successively integrated actions. Market operators have
decreased, concentration has increased, and freight rates have experienced greater
fluctuations. As there are fewer competitors in the market, pricing power is largely
concentrated on large shipping companies, which has caused freight rates to rise.
However, when quantifying this type of impact to a certain value, I find it difficult to
accurately and correctly assign weights to shipping companies of different sizes. The

WORLD MARITIME UNIVERSITY DISSERTATION FOR
INTERNATIONAL TRANSPORT AND LOGISTICS
43
impact of changes in the strategies of shipping companies of different sizes is different.
By reading the literature, few studies have analyzed how the strategic adjustments of
shipping companies of different sizes will affect freight rates and how their weights
are distributed. Because the quantification process of this variable is too complicated
and difficult to express accurately, this variable is discarded.
Finally, the exchange rate of USD to RMB has become the best choice of exogenous
variables in this article. First of all, the U.S. dollar, as the currency of shipping freight
settlement, is a strong currency accepted by all countries in international trade and has
strong research significance. Secondly, changes in exchange rates in shipping
transportation affect the operating costs of shipping companies. As an inevitable cost
factor, shipping companies are more sensitive to changes in exchange rates because
exchange rate fluctuations are likely to cause operating costs in a short period of time.
The increase will cause losses to the enterprise, so there is a potential relationship
between the exchange rate and the container freight rate. The following Figure 5.3
selects the exchange rate between SCFI and the U.S. dollar from January 2019 to
December 2020 as an example. It can be clearly observed that there is a certain
relationship between them. Finally, as important data in the international financial
market, the U.S. dollar exchange rate has accurate data every second, so it is easy to
obtain accurate data on the U.S. dollar exchange rate and generate a time series
according to needs.

WORLD MARITIME UNIVERSITY DISSERTATION FOR
INTERNATIONAL TRANSPORT AND LOGISTICS
44
Figure 5.3 SCFI(Singapore) and Exchange rate
5.2.2. Granger causality
In order to test whether the dollar exchange rate can be brought into the model as an
exogenous variable of SCFI, the Granger causality test is used here. After the first-
order difference of the exchange rate, the processed U.S. dollar exchange rate data is
named INX. The unit root test and stationarity test are performed on the data, and the
conclusions reject the null hypothesis. There is no unit root, and the data is stable, so
the Granger causality test can be performed. The Granger causality test is performed
on the SCFI (Singapore) and the real effective exchange rate of the U.S. dollar, and
the results are shown in Table 5.4. It can be seen that the U.S. dollar exchange rate is
the GRANGER reason for SCFI (Singapore), and SCFI (Singapore) is not the
GRANGER reason for the U.S. dollar exchange rate. Therefore, the U.S. dollar
-100
-50
0
50
100
Jan-19
Feb-19
Mar-19
Apr-19
May-19
Jun-19
Jul-1
9
Aug-19
Sep-19
Oct-19
Nov-19
Dec-19
Jan-20
Feb-20
Mar-20
Apr-20
May-20
Jun-20
Jul-2
0
Aug-20
Sep-20
Oct-20
Nov-20
SCFI Exchange

WORLD MARITIME UNIVERSITY DISSERTATION FOR
INTERNATIONAL TRANSPORT AND LOGISTICS
45
exchange rate meets the conditions of being an exogenous variable, which will only
affect the SCFI and not receive the influence of the SCFI.
Table 5.4 Granger Causality Test
Null Hypothesis: Obs F-Statistic Prob.
INX does not Granger Cause DINSCFI 584 5.08632 0.0005 DINSCFI does not Granger Cause INX 1.90683 0.1078
Therefore, exchange rate changes have a significant impact on the changes in SCFI
(Singapore) and SCFI (Singapore), which in turn will not affect the exchange rate.
There is a strong negative correlation between them. A summary of Granger causality
is shown in Figure 5.4.
Figure 5.4 Granger causality in container transportation
5.2.3. The impact of the US dollar exchange rate on the trend of SCFI
The impulse response model is used here to study the dynamic impact of the U.S.
dollar exchange rate on SCFI (Singapore). The so-called impulse response is to study
the changes of one unit of the U.S. dollar exchange rate in the current period, which
will trigger the changes of SCFI (Singapore) in the next several periods.

WORLD MARITIME UNIVERSITY DISSERTATION FOR
INTERNATIONAL TRANSPORT AND LOGISTICS
46
Figure 5.5 Response of SCFI to Exchange rate
It can be seen from the Figure 5.5 that a unit change in the U.S. dollar exchange rate
will trigger a positive change in the SCFI (Singapore) in the first two months and a
reverse change in the next month. This effect will gradually weaken over time.
Because the change in the U.S. dollar exchange rate precedes the change in the SCFI,
we can use the current U.S. dollar exchange rate to predict the change in the SCFI,
indicating that the U.S. dollar exchange rate is helpful to the establishment of the entire
model and can make the model closer to the actual situation.

WORLD MARITIME UNIVERSITY DISSERTATION FOR
INTERNATIONAL TRANSPORT AND LOGISTICS
47
5.3. Estimates of the ARMA-GARCH-X Model
5.3.1. Estimates of ARMA-GARCH Model
The lag model ARIMA(p,d,q) in the ARCH model is established. Since the above tests
all show a stationary sequence, the index can be presented in the form of a single
integral without order, that is,d is 0. Since A.C. is shown in the table as third-order
trailing, and PAC is also third-order trailing, the ARIMA model can be established for
this exponential sequence according to the model rules. After many experiments, by
comparing AIC, SC, and H.Q. and other indicators, it is concluded that ARMA(1,1) is
the optimal model, so the next step is to analyze ARMA(1,1). The model parameters
are shown below in Table 5.5.
Table 5.5 ARMA(1, 1) model parameters
Dependent Variable: DINSCFI Method: ARMA Generalized Least Squares (Gauss-Newton) Sample: 10/23/2009 1/22/2021 Included observations: 588 Convergence achieved after 6 iterations Coefficient covariance computed using outer product of gradients d.f. adjustment for standard errors & covariance Variable Coefficient Std. Error t-Statistic Prob. AR(1) 0.668550 0.094252 7.093219 0 MA(1) -0.437934 0.113929 -3.843903 0.0001
The expression of the model can be obtained as:
𝑌! = 0.669𝑌!%" − 0.438𝜖!%" + 𝜖! (5.1)
After passing the autocorrelation and independence tests, it can be judged that the
model meets the basic requirements of the ARCH model. In order to test whether there

WORLD MARITIME UNIVERSITY DISSERTATION FOR
INTERNATIONAL TRANSPORT AND LOGISTICS
48
is heteroscedasticity in the residual of the return, it is necessary to perform a
heteroscedasticity test on the data return, that is, the ARCH test.
Before the analysis of variance of residual differences, the time series diagram was
drawn to analyze the phenomenon of residual variance from a visual perspective. The
linear diagram is shown in Figure 5.6 below:
Figure 5.6 Time-sequence diagram of SCFI (Singapore)
The figure5.6 shows that the volatility clustering sequence of SCFI (Singapore), the
volatility of each period is different, generally in the larger fluctuation appeared after
some concomitant of the larger fluctuations in the small fluctuation often appears after
concomitant smaller fluctuations can determine the basic existence of
heteroscedasticity, therefore draw the auto-correlation function of the residual
variance square first observation, the results as shown in Table 5.6:

WORLD MARITIME UNIVERSITY DISSERTATION FOR
INTERNATIONAL TRANSPORT AND LOGISTICS
49
Table 5.6 Correlation coefficient graph of residual variance of SCFI (Singapore)
As can be seen from table 5.6 that the autocorrelation coefficient graphs presented by
this data group all fall outside the 95% confidence interval, which indicates that most
auto-correlation functions pass the confidence interval and their statistical significance
value is not zero, and the corresponding Q value is also significant. The correlation
coefficient graph shows that all the functions exceed the 95% confidence interval,
which rejects the null hypothesis that the residue-squared sequence does not have auto-
correlation, and it can be judged that the original sequence has the ARCH effect.
In order to verify this step, this paper adopts the heteroscedasticity ARCH-LM test,
and the results are shown in Table 5.7 show:
Table 5.7 Arch-LM test results
Heteroskedasticity Test: ARCH F-statistic 99.74761 Prob. F(1,585) 0.0000 Obs*R-squared 85.50865 Prob. Chi-Square(1) 0.0000

WORLD MARITIME UNIVERSITY DISSERTATION FOR
INTERNATIONAL TRANSPORT AND LOGISTICS
50
According to the ArchLM test, the statistic of L.M. was 85.5087, and its corresponding
p=0.0000 was less than the significance level of 0.01. Therefore, the null hypothesis
could be rejected at least at the level of 99% confidence interval. Meanwhile, the test
proved that the residual sequence had an ARCH effect, and after analysis of specific
economic characteristics, the sequence also had a high-order ARCH effect, namely the
GARCH effect. Therefore, the GARCH model is established for this data.
For the establishment of the GARCH model, this paper studies SCFI (Singapore) of
the ARCH rush thick tail and heteroscedasticity phenomenon. At the same time, in
order to get more accurate results in this paper, the results of the existing characteristics
of residual sequence use other extensions of the ARCH model for further inspection.
In the first step, through the existing analysis and the specific data satisfying other
ARCH models, it is found that the low-order GARCH model can depict and fit the
features of the exponential return rate more accurately. In order to obtain a higher-
order ARCH that is more convenient for research, this paper uses AIC criteria and S.C.
criteria to conduct parameter test on all models from GARCH(1,1) to GARCH(2,2),
and finally decide to choose the Garch(1,1) model.
In order to verify the feasibility of GARCH(1,1), a GARCH-LM test was conducted
on it. The results are shown in Table 5.8:
Table 5.8 ARCH-LM test results of GARCH(1,1)
Heteroskedasticity Test: ARCH F-statistic 0.012786 Prob. F(1,584) 0.9100 Obs*R-squared 0.012830 Prob. Chi-Square(1) 0.9098

WORLD MARITIME UNIVERSITY DISSERTATION FOR
INTERNATIONAL TRANSPORT AND LOGISTICS
51
As shown in table, the absolute values of F and R squared in the ARCH-LM test were
0.012786 and 0.012830, respectively, and the corresponding p is 0.9100 and 0.9098.
This means that the P was greater than the significance level, meaning that the yield
test was meant to reject the null hypothesis or accept the null hypothesis, indicating
that the ARCH effect had been eliminated in the model.
The ARMA-GARCH equation can be expressed as:
8𝑌! = 0.669𝑌!%" − 0.438𝜖!%" + 𝜖!
𝜖! = 𝜎!𝜇!𝜎!# = 0.0014 + 0.846𝑢!%"# + 0.1351𝜎!%"#
(5.2)
5.3.2. Estimates of ARMA-GARCH-X Model
In order to study the impact of exogenous variables on SCFI (Singapore), this article
introduces possible exogenous variables into the model and observes statistical
indicators to determine whether they can be used as appropriate exogenous variables
for analysis.
In the experiment process, by taking national policies, taxes and fees increase or
decrease, whether the market demand is strong, etc. as instrumental variables as X into
the original equation, it is found that the fitting effect is not good, so it is not elaborated,
and the cost of container ship transportation There are many changing factors and the
data is not easy to search, so the U.S. dollar exchange rate is selected as the exogenous
variable X to be brought into the experiment.

WORLD MARITIME UNIVERSITY DISSERTATION FOR
INTERNATIONAL TRANSPORT AND LOGISTICS
52
● First, it needs to be made clear that if you want to bring exogenous variables into
the GARCH model, which need to make sure that there is a potential relationship
between the index and the U.S. dollar exchange rate. Through the Granger
causality test, the exogenous variable X has a relationship with SCFI (Singapore),
and the effect is significant.
● Second, it needs to bring variables into the equation to make the model fit better.
By experimenting with the X variable lagging one order, the original model fits
better.
● Finally, it is necessary to determine the size of the GARCH-X(p,q) parameters and
introduce the order of 1~2 into the model analysis. Through experiments,
GARCH-X(1, 1) is more suitable for this model than other p and q values, so
ARMA(1,1)-GARCH-X(1, 1)-X is used as the research object.
Table 5.9 GARCH-X model parameter detection
Variable Coefficient Std. Error z-Statistic Prob.
AR(1) 0.622635 0.119809 5.196901 0.0000 MA(1) -0.305313 0.127423 -2.396061 0.0166 Variance Equation C 0.001493 6.35E-05 23.53389 0.0000 RESID(-1)^2 0.585144 0.082198 7.118722 0.0000 GARCH(-1) 0.148954 0.038520 3.866898 0.0001 ILXR -0.006430 0.001991 -3.22886 0.0012
Table 5.9 shows the estimated results of the GARCH-X model, which is also mainly
divided into four parts, and each part is basically the same as the GARCH model. The
only difference is that the mean equation of the GARCH-X model contains an
exogenous variable (i.e., X) term, which is used to measure the relationship between

WORLD MARITIME UNIVERSITY DISSERTATION FOR
INTERNATIONAL TRANSPORT AND LOGISTICS
53
exogenous variables and return rate. By observing the GARCH item shown in the
figure, the estimated coefficient is -0.0284, which indicates economically that the
greater the fluctuation of the foreign exchange market, the smaller the return rate,
which may be related to the special fluctuations of the Shanghai-Singapore route in
the sample interval selected in this case. From the perspective of statistical significance,
the probability P-value of X term is 0.0000, which is less than the significance level of
5%. Therefore, the X term is considered to have statistical significance in the mean
value equation. In general, the GARCH-X model is better than the GARCH model to
fit the Shanghai Containerized Freight Index. The estimation expression of the
corresponding GARCH-X model can be written.
The ARMA-GARCH-X equation can be expressed as:
8Y+ = 0.623Y+%" − 0.305ϵ+%" + ϵ+
ϵ+ = σ+µ+σ+# = 0.0015 + 0.585u+%"# + 0.149σ+%"# − 0.0064X
(5.3)
As shown in Table 5.10, the absolute values of F and R squared in the ARCH-LM test
were 0.0002430 and 0.002438, respectively, and the corresponding values of p were
0.9607 and 0.9606.
Table 5.10 ARCH-LM test results of GARCH (2,1)-X
Heteroskedasticity Test: ARCH F-statistic 0.002430 Prob. F(1,584) 0.9607 Obs*R-squared 0.002438 Prob. Chi-Square(1) 0.9606
This meant that the alpha P was greater than the significance level, meaning that the
yield test was meant to reject the null hypothesis or accept the null hypothesis,
indicating that the ARCH effect had been eliminated in the model.

WORLD MARITIME UNIVERSITY DISSERTATION FOR
INTERNATIONAL TRANSPORT AND LOGISTICS
54
5.4. Main findings
Analyzing the GARCH-X model to generate actual values, fitted values, and residual
values, as shown in Figure 5.7.
Figure 5.7 Actual, Residual and Fitted Line Chart
It can be seen from Figure 5.7 that the fitted value of the return is basically at zero,
which is consistent with the previous return.
5.4.1. Model analysis
1. Conditional standard deviation Chart of Shanghai Export Container Freight Index Through the Eviews, the conditional variance diagram of return series is shown in Figure 5.8:

WORLD MARITIME UNIVERSITY DISSERTATION FOR
INTERNATIONAL TRANSPORT AND LOGISTICS
55
Figure 5.8 Container Freightage Index Rate of Return from Shanghai to Singapore Container
Freightage Index
As can be seen from the conditional variance graph of the SCFI (Singapore) return rate,
this graph is obtained according to the requirements of the GARCH model. As can be
seen from the conditional variance chart, the SCFI(Singapore) yield shows several
peaks and several continuous fluctuations, indicating the long-term fluctuation state of
the data rather than repeated fluctuations all the time. In the middle of 2009, it reached
the highest value in the first five years, and then from 2010 to 2011, it is in the stable
phase of this image and has continuously fluctuated little, indicating the SCFI freight
rate (Singapore) in this phase of the sustained low prices. After lagging behind a short-
term peak in December 2011, it reached a four-year low. From 2012 to 2015, the
fluctuation of the Shanghai Containerized Freight Index was always at a low level,
indicating that the risk level of the Shanghai Containerized Freight Index was very low

WORLD MARITIME UNIVERSITY DISSERTATION FOR
INTERNATIONAL TRANSPORT AND LOGISTICS
56
during this period. Since the beginning of 2015, the volatility of the Shanghai
Containerized Freight Index began to rise rapidly, among which the volatility reached
its peak in the third quarter of 2015, indicating that the container market was very risky
during this period. In fact, during this time, the SCFI experienced huge fluctuations,
from 243 to 53 and then to 108. After entering the 19th year, the graph fluctuates
significantly. In the early part of 2020, due to the outbreak of COVID-19, the graph
fluctuated gradually, and in the middle and end of 2020, the price first soared and then
fell back. Therefore, the conditional variance diagram of the ARCH GARCH model's
SCFI(Singapore) return rate can well explain the volatility and related economic
characteristics of the SCFI index, indicating that the GARCH model is suitable for
short-term prediction of the SCFI index return rate. It can be seen that the conditional
variance sequence of dependent variables calculated based on the GARCH model can
well describe the volatility of the dependent variable.
As can be seen from the figure, there are four obvious sharp fluctuations. 1. The drastic
fluctuations from June to September 2009 lasted for three months. 2. There were mid-
term fluctuations between May 2011 and July 2011. 3. From April 2015 to January
2016, the shock lasted for 8 months. 4. From September 2020 to December 2020, the
three-month period fluctuates greatly. Combining the above discussion, this article
introduces the data into the GARCH-X extended model for empirical analysis and
obtains its characteristics.
2. The influence of exogenous variable X on the model
After many experiments, it can be concluded that the exchange rate between China
and United States for one period (one week) has the most significant effect in
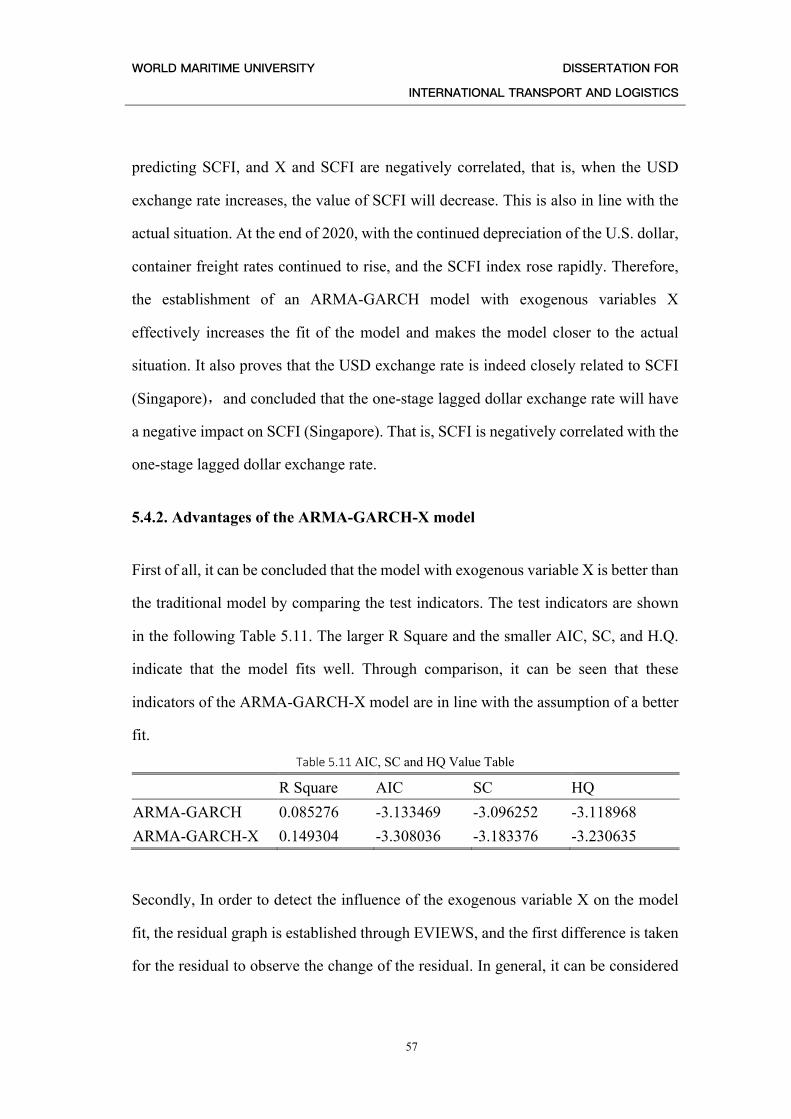
WORLD MARITIME UNIVERSITY DISSERTATION FOR
INTERNATIONAL TRANSPORT AND LOGISTICS
57
predicting SCFI, and X and SCFI are negatively correlated, that is, when the USD
exchange rate increases, the value of SCFI will decrease. This is also in line with the
actual situation. At the end of 2020, with the continued depreciation of the U.S. dollar,
container freight rates continued to rise, and the SCFI index rose rapidly. Therefore,
the establishment of an ARMA-GARCH model with exogenous variables X
effectively increases the fit of the model and makes the model closer to the actual
situation. It also proves that the USD exchange rate is indeed closely related to SCFI
(Singapore),and concluded that the one-stage lagged dollar exchange rate will have
a negative impact on SCFI (Singapore). That is, SCFI is negatively correlated with the
one-stage lagged dollar exchange rate.
5.4.2. Advantages of the ARMA-GARCH-X model
First of all, it can be concluded that the model with exogenous variable X is better than
the traditional model by comparing the test indicators. The test indicators are shown
in the following Table 5.11. The larger R Square and the smaller AIC, SC, and H.Q.
indicate that the model fits well. Through comparison, it can be seen that these
indicators of the ARMA-GARCH-X model are in line with the assumption of a better
fit. Table 5.11 AIC, SC and HQ Value Table
R Square AIC SC HQ ARMA-GARCH 0.085276 -3.133469 -3.096252 -3.118968 ARMA-GARCH-X 0.149304 -3.308036 -3.183376 -3.230635
Secondly, In order to detect the influence of the exogenous variable X on the model
fit, the residual graph is established through EVIEWS, and the first difference is taken
for the residual to observe the change of the residual. In general, it can be considered

WORLD MARITIME UNIVERSITY DISSERTATION FOR
INTERNATIONAL TRANSPORT AND LOGISTICS
58
that the smaller the residual, the higher the fit of the model. Observing the generated
picture, we can get that the model after adding exogenous variable X has a better fit
than the traditional ARMA-GARCH model, and the residual statistics can be
effectively reduced by 36.3%, which is a good fit for the data taken in the paper. The
new model can better fit the actual index changes and improve the credibility of the
model. The change of the residual value can be seen intuitively from the figure below.
The simulation degree of the peak is better, but there is no obvious change for the
frequently oscillating value. It can be concluded that the addition of the exogenous
variable X (USD exchange rate) makes the model respond to severely fluctuating data.
It has a positive effect and can better fit the actual situation compared with the
traditional ARMA-GARCH model.
Figure 5.9 The Residuals of Two Model
Finally, by bringing extreme data into the two formulas for comparison, it can be
obtained that the ARMA-GARCH model with exogenous variables has a better fit for
peaks and volatile values. Compared with the traditional ARMA-GARCH model,
when extreme data appears, the model with X can better reduce the error from the
actual situation.

WORLD MARITIME UNIVERSITY DISSERTATION FOR
INTERNATIONAL TRANSPORT AND LOGISTICS
59
ARMA-GARCH model equation:
8𝑌! = 0.669𝑌!%" − 0.438𝜖!%" + 𝜖!
𝜖! = 𝜎!𝜇!𝜎!# = 0.0014 + 0.846𝑢!%"# + 0.1351𝜎!%"#
(5.4)
ARMA-GARCH-X model equation:
8Y+ = 0.623Y+%" − 0.305ϵ+%" + ϵ+
ϵ+ = σ+µ+σ+# = 0.0015 + 0.585u+%"# + 0.149σ+%"# − 0.0064X
(5.5)

WORLD MARITIME UNIVERSITY DISSERTATION FOR
INTERNATIONAL TRANSPORT AND LOGISTICS
60
Chapter6 Conclusions and Recommendation
6.1 Main work
6.1.1. Analysis conclusion
This paper first elaborates on the purpose and significance of the topic selection of the
thesis, domestic and foreign-related research; then briefly summarizes the constituent
elements of the international container transportation market, and analyzes the supply
and demand conditions of the international container transportation market. The
factors of freight index fluctuation are analyzed. Therefore, it is possible to
preliminarily determine the components that affect the trend of the Shanghai export
container freight index. Then this paper focuses on the deterministic trend and random
trend of SCFI and removes the trend from the freight index to obtain a stable time
series. The volatility study was conducted using the GARCH model. Finally, it
summarizes the aforementioned research and findings in this article and provides
suggestions for the operation and decision-making of shipping companies, with a view
to avoiding shipping cycle risks for Chinese shipping companies through counter-
cyclical operations and complementary industrial operations and reducing the severe
impact of shipping cycles on corporate operations. This provides a basis for decision-
making. The main work is as follows:

WORLD MARITIME UNIVERSITY DISSERTATION FOR
INTERNATIONAL TRANSPORT AND LOGISTICS
61
● Having completed a review of relevant research at home and abroad. Through
collecting and consulting a large number of relevant documents, I have a
comprehensive understanding of the SCFI index and summarized relevant research
results at home and abroad.
● Summarizing the deficiencies of previous studies. Existing research focuses on
considering the game of the container shipping market from the perspective of liner
company alliances. Through a comprehensive study of the cycles and fluctuations
of the container shipping market,the market cycle is precisely the most important
role for shipping companies to make strategic decisions. There is a clear
understanding of the seasonality within a year, and the performance of the cycle
over a year is for shipping companies. Also, industry management provides
tremendous help. In addition, trend research is a step before volatility research. If
the volatility model contains some unidentified trends, then the final result is
questionable. The simplest example is a false return.
● Analyzing the influence of seasonal trends on shipping companies. It is very
necessary for shipping-related organizations to identify and measure seasonality in
the shipping market. This can help them determine future plans, make them aware
of temporary market supply and demand changes that occur at specific times of the
year be prepared.
● Analyzing the impact of cyclical trends on the company. The business cycle theory
studies the fluctuations of the overall economy around trends. A typical business
cycle is characterized by volatility, and the peaks and troughs of such volatility
appear with a frequency of 3-5 years. The theoretical business cycle model believes

WORLD MARITIME UNIVERSITY DISSERTATION FOR
INTERNATIONAL TRANSPORT AND LOGISTICS
62
that the trend (or growth path) is clearly defined, but the actual data is often not the
case. Real economic activities often include shocks of different frequencies, some
of which will quickly disappear, while others may still affect the economy for a
long time or even permanently after the shock occurs. In addition, general
economic recessions and economic activity flow (such as seasonal changes),
special local market characteristics (such as supply and demand constraints), and
random macroeconomic impacts (caused by political, economic, and even climate
influences) will also shape and Affect the economic data studied. The shipping
cycle is driven by the market's required capacity determined by supply and demand.
On the demand side, the most important cause of the shipping cycle is the broader
economic business cycle. When the macro-economy improves, seaborne trade
grows, which in turn affects freight rates. Seaborne trade volume is the key to
affecting dry bulk cargo shipping services. Furthermore, freight can affect the
carrier's decision, such as adjusting the size of the ship, which in turn affects the
supply of container transportation services.
● It was establishing the freight rate fluctuation model after the trend was proposed.
After proposing the trend, the freight rate fluctuation model is established. Make
the corresponding difference to the sequence in step 4. Finally, a stable freight rate
sequence on each route is obtained. On this basis, the GARCH model was
established. It can be used for short-term forecasting of freight rates. Although this
forecast can only be used as a reference for shipping companies' decision-making,
the conditional variance sequence given by the GARCH model can accurately tell
the shipping companies the severity of freight rate fluctuations. This is very helpful
for risk-related decision-making.
WORLD MARITIME UNIVERSITY DISSERTATION FOR
INTERNATIONAL TRANSPORT AND LOGISTICS
63
6.1.2. Modeling conclusion
This article selects weekly data of SCFI and SCFI (Singapore) as the research object.
The closing price of the Shanghai Export Container Freight Index is from October 16,
2009, to January 22, 2021. A time series is constructed, and Eviews software is used
to study the fluctuation of the Shanghai Export Container Freight Index and correlation
between characteristics and exogenous variables. The ARMA-GARCH-X model is
constructed through software to fit market fluctuations and conduct empirical analysis.
Through multi-model comparison, the best fitting model is ARMA (1,1) -
GARCH(1,1). The study found that the ARMA-GARCH-X model can effectively
integrate freight index data and historical information and effectively fit the fluctuation
characteristics of freight index data.
According to the empirical analysis results of this paper, the following conclusions are
obtained:
● Firstly, from the weekly descriptive statistics of the SCFI and SCFI (Singapore)
time series, it can be found that the kurtosis of the index is greater than three, and
the skewness is negative, which has good statistical characteristics. It introduces
the peak and thick tail characteristics of SCFI (Singapore). The degree of departure
means that the Shanghai export container market is sufficiently stable and will be
greatly affected by the market.
● Secondly, it can be seen from the auto-correlation test results that at the 5% level,
there is no such a significant auto-correlation phenomenon between SCFI. By

WORLD MARITIME UNIVERSITY DISSERTATION FOR
INTERNATIONAL TRANSPORT AND LOGISTICS
64
establishing the GARCH-X model, it is found that the GARCH(1,1) model can
eliminate the ARCH effect, and the model fitting effect is better. According to the
GARCH(1,1) model, at the 5% significance level, the regression coefficient of the
foreign trade market is significant, and the value is less than zero. The results show
that in the case of severe fluctuations in the foreign trade market, the volatility of
the Shanghai Export Container Freight Index has increased, but this effect is not
significant. The β coefficient is 0.566877, which indicates that the volatility of the
series is positively correlated. The volatility of the SCFI index is negatively
correlated with the USD exchange rate, which is one-stage lagging. That is, the
USD exchange rate rises while the SCFI declines. The β coefficient is 0.0012,
which also indicates that the volatility of the series is negatively correlated.
● Thirdly, the fluctuation of container freight rates is closely related to the outbreak
of COVID-19. At the beginning of the outbreak, the global demand for containers
dropped sharply. Container manufacturers, liner companies, and container leasing
companies actively reduce the supply of containers and keep container prices
stable. However, since the third quarter, as China's integrated market leads the
recovery, consumer spending in overseas markets has shifted from service
products to container products, and the demand for containers has been growing.
At the same time, factors such as the poor circulation of global containers have led
to a situation of "difficult to find one box" in the market. Due to the shortage of
"ship + container" supply and the cyclical recovery of European and American
demand, container freight rates continue to operate at a high level, and the
container industry is showing a trend of high volume and high prices.

WORLD MARITIME UNIVERSITY DISSERTATION FOR
INTERNATIONAL TRANSPORT AND LOGISTICS
65
● Finally, SCFI (Singapore) reflects the balance of Asian container supply and
demand to a certain extent. When severe fluctuations in demand lead to insufficient
container supply, the range of freight index will change very seriously. In addition,
the impact of foreign trade market fluctuations on SCFI (Singapore) also exists and
is negatively correlated, but the effect is not significant, but it is also predictive.
6.2 Suggestions
Although SCFI volatility is complicated, there are certain rules to follow. This can be
seen from the above analysis. Only by accurately clarifying market differences and
mastering market rules can shipping companies increase operating returns and
effectively avoid risks. It can be seen that the research on the fluctuation characteristics
of SCFI plays an important guiding role in the operation of container shipping
companies. We propose several suggestions for container shipping companies to use
as a reference when formulating business strategies:
● Because the SCFI index measures the maritime transportation price of industrial
products, China, as a world factory, may have different trends in major trade areas.
This article focuses on Southeast Asian routes and analyzes the Singapore freight
index. The main reason is that the author believes that it is a good business strategy
to take the transportation market positioned in a certain trade area as the key
development direction of liner routes. In order to obtain a higher market share in
the transportation market of this route, the market is segmented, and the target is
concentrated. Therefore, how the liner company chooses the main ship type needs
to analyze the company's own strength, economic location elements, and anti-risk

WORLD MARITIME UNIVERSITY DISSERTATION FOR
INTERNATIONAL TRANSPORT AND LOGISTICS
66
ability, combined with the characteristics of freight fluctuations on the route as a
basis.
● The container transportation market cycle is mainly reflected in the cyclical
fluctuations of SCFI. Since the market performance is fluctuating, we need to
analyze the various factors affecting the market changes to make sure that the
market changes are relatively low. And the high point, at an appropriate time, the
capacity will be changed to maintain the appropriate freight rate. In addition, when
the market is relatively high, the same type of transport ships with advanced
technical performance can be rented at similar rental levels to supplement the lack
of capacity, and the less competitive cargo ships in the company's transport fleet
can be leased for a long period of time. The method can not only adjust the
company's cargo capacity composition but also effectively lock in the cost of
freight ships.
● SCFI is a symbol for the fluctuations in the Shanghai container transportation
market. Market changes directly affect the profits of shipping companies. To make
decisions and improve the ability of shipping companies to implement them, they
must cultivate three-dimensional and multi-channel collection and analysis of
market information.
● It is to ensure the smooth flow of market information channels. To ensure its
smoothness, it is necessary to capture information in shipping and related fields in
a timely and effective manner through modern media to open up potential markets.

WORLD MARITIME UNIVERSITY DISSERTATION FOR
INTERNATIONAL TRANSPORT AND LOGISTICS
67
● It is to increase the company's market development. It is necessary to optimize the
allocation of all shipping resources within the company's business scope, enhance
the competitiveness of the company in the already occupied shipping market, and
then strive to open up the transportation market of a third country and complete its
own development by opening up new markets.
● The investment of shipping companies should be determined on the basis of
comprehensive research on the market feasibility. The structure and total capacity
of shipping companies should be adjusted in time according to the changes and
development of the shipping market. After judging and analyzing the trend of the
market, the strategy of combining multiple methods adopted when chartering ships.
In the course of operation, if a container transportation company wants to ensure
the profitability of some ship transportation, it must be based on the advantages of
the company's own transportation fleet, sign a transportation contract with a large-
scale production company for part of the company's transportation capacity to
ensure cost reduction—risks caused by the impact of market fluctuations on the
corporate transport fleet.
6.3Shortcomings and prospects
First, this article uses SCFI (Singapore) data from October 16, 2009, to January 2021
as the research object and establishes the ARMA-GARCH-X model, but in the process
of data integration, the author found that the exogenous variable X(weekly data) is
difficult to find, which causes many possible exogenous variables to be unable to be
added to the experiment, and it is impossible to judge whether they can match the

WORLD MARITIME UNIVERSITY DISSERTATION FOR
INTERNATIONAL TRANSPORT AND LOGISTICS
68
model. Therefore, in order to ensure the quantity of experimental data and the ease of
finding exogenous variables, monthly data will be more suitable in the future.
Second, there is a phenomenon of poor fit in the model building, and the analysis of
the reasons can be summarized into two points. First, the volatility of the selected data
is too strong, and the sudden increase or collapse caused the decline of the model's fit.
Second, there are dramatic changes in world trade in the selected time period.
Although the data was re-selected in the later period, the optimal time period was not
found to meet the requirements of volatility and data volume.
Third, this thesis only studies SCFI (Singapore) instead of all SCFIs. The conclusions
are somewhat one-sided. Future research can choose the top 5 transportation lines
freight indices in SCFI as the research object, which may be more comprehensive.

WORLD MARITIME UNIVERSITY DISSERTATION FOR
INTERNATIONAL TRANSPORT AND LOGISTICS
69
References
Alexander Mafusalov,Alexander Shapiro, Stan Uryasev. (2018).Estimation and asymptotics for the buffered probability of exceedance[J]. Elsevier B.V.,2018,270(3).
Alexander Mafusalov,Stan Uryasev.(2018). Buffered Probability of Exceedance:
Mathematical Anđelković Aleksandra.(2017).Proactive supply chain risk management approach:
The case of Serbia[J]. Faculty of Economics, Belgrade,2017,62(214). Bai, MY.(2010).Research on port logistics performance evaluation (Master's thesis,
Yanshan University). Bory, Georges.(2013).Value at Risk: The New Data Challenge[J].
ProQuest,2013,28(45). Chen, QH.(2004).Research on the fluctuation characteristics of freight index in the
international dry bulk shipping market segment (Master's thesis, Dalian Maritime University).
Christos Argyropoulos, Ekaterini Panopoulou. (2019).Backtesting VaR and ES under
the magnifying glass[J]. Elsevier Inc.,2019,64. Dominique Guegan,Bertrand K. Hassani.(2018).More accurate measurement for
enhanced controls: VaR vs. ES?[J]. Elsevier B.V.,2018,54. Du, Y., Gou, QF., Yang, J., He, PY., Qian, YL., Yang, JC.(2019).Grid investment
project portfolio optimization model based on relatively robust CVaR Type Research[J].Mathematics in Practice and Understanding,2019,49(09):42-52.
Gong, CX.(2015).Research on the Correlation between Shanghai Export Container
Freight Index and Export Trade (Master's thesis, Ocean University of China).

WORLD MARITIME UNIVERSITY DISSERTATION FOR
INTERNATIONAL TRANSPORT AND LOGISTICS
70
Gong, CX.(2015).Research on the Correlation between Shanghai Export Container Freight Index and Export Trade (Master's thesis, Ocean University of China).
Gui, DH. & Zhang, XX.(2020). Shanghai Port Container Throughput Forecast
Analysis Based on the Triple Exponential Smoothing Method. Industry and Technology Forum (24), 59-60.
Jia, DH. & Cai, P.(2020).The development trend and suggestions of my country's port
container transportation during the "14th Five-Year Plan" period. Containerization (11), 1-5.
Jia, ZF.(2018).Risk measurement analysis based on VaR model and ES model[J].
Cooperative Economy and Technology, 2018(17):79-81. Li, G., Zhao, JL. & Su, Y.(2012). Research on World Container Ship Orders Forecast
Based on ARMA Model. (In Chinese). Science and Technology Management Research (16), 217-221.
Li, ZB., Wang, YZ., Li, KN. & Tu, GH.(2019).Short-term analysis and forecast of
Shanghai export container freight index based on ARIMA and ARCH models. Navigation (03), 66-70.
Li, ZH.(2003).Shipping freight index technical analysis research and application
platform realization (Master's degree thesis, Shanghai Maritime University). Li, ZH.(2003).Shipping freight index technical analysis research and application
platform realization (Master's degree thesis, Shanghai Maritime University). Li, ZH.(2004).Research and prediction on the fluctuation law of Baltic shipping price
index. (In Chinese). Journal of Shanghai Maritime University (04), 69-72. Liang, W.(2013).Research on the Applicability and Valuation of Shanghai Export
Container Freight Index Derivatives (Master's thesis, Shanghai Jiaotong University).
Liang, W.(2013).Research on the Applicability and Valuation of Shanghai Export
Container Freight Index Derivatives (Master's thesis, Shanghai Jiaotong University).

WORLD MARITIME UNIVERSITY DISSERTATION FOR
INTERNATIONAL TRANSPORT AND LOGISTICS
71
Liu, BC. & Zhang, P. (2021).Port container throughput forecast based on machine learning. (In Chinese). China Storage & Transportation (03), 123-124.
Lu, J., Chen, QH. (2003).The fluctuation law of shipping price index. (In Chinese).
Journal of Dalian Maritime University (01), 1-4. Meng, W.,Stuart X. Zhu,Ruud H. Teunter. (2014).A risk-averse competitive
newsvendor problem under the CVaR criterion[J]. Elsevier B.V.,2014,156. Muhammad Kashif Ali Shah, Zulfiqar Hyder & Muhammad Khalid
Pervaiz.(2009).Central bank intervention and exchange rate volatility in Pakistan: an analysis using GARCH-X model. Applied Financial Economics(18).
Ou, TH.(2007).Real estate price index prediction based on ARMA model. (In Chinese).
Statistics and Decision (14), 92-93. Rachel Campbell,Ronald Huisman,Kees Koedijk.(2001).Optimal portfolio selection
in a Value-at-Risk framework[J]. Elsevier B.V.,2001,25(9). Rasmus Søndergaard Pedersen & Anders Rahbek. (2019).TESTING GARCH-X
TYPE MODELS. Econometric Theory(5),. Ruida Futures.(2021).CCFI rises and falls. Futures Daily, 008. Shang, DJ.,Victor Kuzmenko,Stan Uryasev. (2018).Cash flow matching with risks
controlled by Tered probability of exceedance and conditional value-at-risk[J]. Springer US,2018,260(1).
Sun, XY. Lei, YL. Zhang, T. Zhan, J. & Wang, L. (2021).Analysis on the Development
of my country's Railway Container Express Transportation. (In Chinese). Railway Technical Supervision (01), 57-62.
Sun, Y.(2005).Comparative analysis of China's export container freight index and
Baltic shipping price index (Master's thesis, Shanghai Maritime University). Tang, X, Kuang, HB. & Guo, YY.(2021).Research on the Volatility Transmission
Characteristics of Shanghai Export Container Freight Index Based on Complex Networks. Management Review (02), 289-297.

WORLD MARITIME UNIVERSITY DISSERTATION FOR
INTERNATIONAL TRANSPORT AND LOGISTICS
72
Tang, X, Kuang. HB & Guo, YY.(2021).Research on the Volatility Transmission Characteristics of Shanghai Export Container Freight Index Based on Complex Networks.(In Chinese). Management Review (02), 289-297.
Tang, X., Kuang, HB., Meng, B. & Feng, WW.(2017).Volatility characteristics of
China's export container freight index based on EMD. Scientific Research Management (12), 144-154.
The new hybrid value at risk approach based on the extreme value theory[J]. Estudios
de economía,2016,43(1). Tian, J. Feng, Y. Wang, XF. Sun, JY & Bi, SS.(2013).Quantitative Evaluation Method
of Container Port Route Competitiveness. (In Chinese). Journal of Dalian Maritime University (Social Science Edition) (02), 24-26.
Wang, DP., Zhao, ZT.(2016).Asset Allocation and Risk Integration of China’s
Insurance Industry——Based on the Virtual Reality Ratio, Copula-CVaR Model and an empirical study of Monte Carlo algorithm[J]. (In Chinese). Sankei Review,2016,7(02):71-82.
Wang, YF.(2021).A review of maritime freight index research. Foreign Economic
Relations and Trade (01), 36-40. Wang, YF.(2021).Summary of research on ocean freight index. (In Chinese). Foreign
Economic Relations and Trade (01), 36-40. Xiang, F.(2010).Research on the compilation of container freight index (Master's
thesis, Dalian Maritime University). Xie, LL.(2017).Comparative study on the benefits of overbooked and non-overbooked
container spaces. (In Chinese). Journal of Guangzhou Institute of Navigation (04), 12-15.
Yang, MY.(2015).Research on the fluctuation characteristics of Dalian foreign trade
container freight index (Master's thesis, Dalian University of Technology). Yang, WL.(2018).Risk Analysis of Internet Monetary Funds Based on GARCH
Model[J]. (In Chinese). Times Finance, 2018(14):208-209.

WORLD MARITIME UNIVERSITY DISSERTATION FOR
INTERNATIONAL TRANSPORT AND LOGISTICS
73
Zhang, B.(2013).Research on the fluctuation of Shanghai export container freight index[J]. Economic Forum.
Zhang, H.(2019).An Empirical Study of MC-GARCH Model in Internet Financial
Risk Measurement [J]. Journal of Chongqing Technology and Business University (Natural Science) (Study Edition), 2019, 36(06): 48-56.
Zhang, HP.(2020).Optimization of risk control in financial markets based on particle
swarm optimization algorithm[J]. Elsevier B.V.,2020,368. Zhang, RW., Zhao, QY.(2019).Empirical analysis of stock index futures hedging
model based on GARCH-CVaR [J]. Statistics and Decision Policy, 2019, 35(04): 170-172.
Zhang, ZY.(2014).Baltic International Dry Bulk Freight Index Risk Measurement[D].
(In Chinese). Zhejiang University of Finance and Economics, 2014. Zheng, W. & Zhang, SF.(2010).Quantitative analysis of transport efficiency of
liquefied steamships, oil tankers and container ships (English). Journal of Dalian Maritime University (S1), 176-178+182.
نارھتراداھب قاروا سروب ماھس یھدزاب یتابثیب رب یداصتقا نالک یاھریغتم ریثات.(2016).هدازاضر یلع :
لدم ھیاپ رب یتادھاشم GARCH-X. Quarterly Journal of Applied Theories of Economics(2),.