U/Th systematics and ages of authigenic carbonates from Hydrate Ridge, Cascadia Margin: recorders of...
13
doi:10.1016/S0016-7037(03)00128-5 U/Th Systematics and ages of authigenic carbonates from Hydrate Ridge, Cascadia Margin: Recorders of fluid flow variations B. M. A. TEICHERT, † A. EISENHAUER,* ,a G. BOHRMANN, † A. HAASE-SCHRAMM, B. BOCK, and P. LINKE GEOMAR, Forschungszentrum fu ¨r marine Geowissenschaften, Wischhofstr. 1-3, 24148 Kiel, Germany (Received July 5, 2002; accepted in revised form February 5, 2003) Abstract—Uranium (U) concentrations and activity ratios ( 234 U) of authigenic carbonates are sensitive recorders of different fluid compositions at submarine seeps of hydrocarbon-rich fluids (“cold seeps”) at Hydrate Ridge, off the coast of Oregon, USA. The low U concentrations (mean: 1.3 0.4 g/g) and high 234 U values (165–317‰) of gas hydrate carbonates reflect the influence of sedimentary pore water indicating that these carbonates were formed under reducing conditions below or at the seafloor. Their 230 Th/ 234 U ages span a time interval from 0.8 to 6.4 ka and cluster around 1.2 and 4.7 ka. In contrast, chemoherm carbonates precipitate from marine bottom water marked by relatively high U concentrations (mean: 5.2 0.8 g/g) and a mean 234 U ratio of 166 3‰. Their U isotopes reflect the 234 U ratios of the bottom water being enriched in 234 U relative to normal seawater. Simple mass balance calculations based on U concentrations and their corresponding 234 U ratios reveal a contribution of about 11% of sedimentary pore water to the bottom water. From the U pore water flux and the reconstructed U pore water concentration a mean flow rate of about 147 68 cm/a can be estimated. 230 Th/ 234 U ages of chemoherm carbonates range from 7.3 to 267.6 ka. 230 Th/ 234 U ages of two chemoherms (Alvin and SE-Knoll chemoherm) correspond to time intervals of low sealevel stands in marine isotope stages (MIS) 2, 4, 5, 6, 7 and 8. This observation indicates that fluid flow at cold seep sites sensitively reflects pressure changes of the hydraulic head in the sediments. The 18 O PDB ratios of the chemoherm carbonates support the hypothesis of precipitation during glacial times. Deviations of the chemoherm 18 O values from the marine 18 O record can be interpreted as to reflect temporally and spatially varying bottom water and/or vent fluid temperatures during carbonate precipitation between 2.6 and 8.6°C. Copyright © 2003 Elsevier Science Ltd 1. INTRODUCTION Submarine venting of hydrocarbon-rich, cold fluids into the seawater occurs in many different settings around the world (e.g., Kulm et al., 1986; Aharon et al., 1992; Polikarpov et al., 1992; Rendsbergen et al., 2002) and is thought to be due to the breakdown of gas hydrates deeper in the sedimentary column. Methane (CH 4 ), a main component of gas hydrates, is a strong greenhouse gas, which can potentially have a strong effect on global climate (e.g., Sloan et al., 1992; Hudson and Magoon, 2002). Therefore, it is critical to know whether venting from these cold seep sites is a continuous process or whether venting occurs discontinuously, and is controlled by external factors. The subseafloor plumbing system of these cold seep sites is sometimes provided by faults. These faults tap at depth a fluid reservoir containing free gas (often methane) and reach up through the sediments to the seafloor (Moore et al., 1990). When the discharge area is situated within the gas hydrate stability field, seismic records often show a bottom simulating reflector (BSR). This reflector is interpreted to result from the contrast between hydrate-filled sediment above and a zone containing free gas below the BSR (Holbrook et al., 1996). At the seafloor, the hydrocarbon emission sites are inhabited by a remarkable benthic chemosynthetic fauna of bivalves, tube worms and bacterial mats that derive their energy and nourish- ment from oxidation of advecting reduced sulfur species and/or hydrocarbon compounds (Sibuet and Olu, 1998). In addition to the chemosynthetic communities, the venting sites are associ- ated with authigenic carbonates that occur as extensive or sporadic seafloor pavements, concretions, chimney- or dough- nut-like forms, and as steep and gently climbing carbonate mounds. The carbonates are composed of aragonite, calcite or dolo- mite (Ferrel and Aharon, 1994; Bohrmann et al., 1998; Greinert et al., 2001). Different processes of carbonate formation can be distinguished. Their formation is triggered by the increase in alkalinity during anaerobic methane oxidation via sulfate re- duction (AMO; see Eqn. 1). CH 4 SO 4 2 3 HCO 3 HS H 2 O (1) The reaction is controlled by the upward flux of methane that reaches the sulfate zone and supports an interface of enhanced microbial activity. A consortium of methanogenic archaea and sulfate reducing bacteria that mediate the anaerobic oxidation of methane has recently be identified by Boetius et al. (2000). Carbonates precipitated in this environment will be formed close to the sediment surface and adjacent or even in gas hydrates (Bohrmann et al., 1998). These carbonates are known as gas hydrate carbonates and occur in two lithologies: As breccia composed of micrite-cemented monomict clasts and as pure aragonite precipitate (Bohrmann et al., 2002). Another possible scenario of above-seafloor carbonate for- mation is characterized by vigorous methane flux from below through a network of fault zones. Carbonates will then be formed at the same place over a long period of time. Eventu- * Author to whom correspondence should be addressed ([email protected]). † Present address: Forschungszentrum Ozeanra ¨nder, Universita ¨t Bre- men, Postfach 330440, 28334 Bremen, Germany. Pergamon Geochimica et Cosmochimica Acta, Vol. 67, No. 12, pp. 000 – 000, 2003 Copyright © 2003 Elsevier Science Ltd Printed in the USA. All rights reserved 0016-7037/03 $30.00 .00 1
-
Upload
independent -
Category
Documents
-
view
0 -
download
0
Transcript of U/Th systematics and ages of authigenic carbonates from Hydrate Ridge, Cascadia Margin: recorders of...

doi:10.1016/S0016-7037(03)00128-5
U/Th Systematics and ages of authigenic carbonates from Hydrate Ridge, CascadiaMargin: Recorders of fluid flow variations
B. M. A. TEICHERT,† A. EISENHAUER,*,a G. BOHRMANN,† A. HAASE-SCHRAMM, B. BOCK, and P. LINKE
GEOMAR, Forschungszentrum fu¨r marine Geowissenschaften, Wischhofstr. 1-3, 24148 Kiel, Germany
(Received July 5, 2002;accepted in revised form February 5, 2003)
Abstract—Uranium (U) concentrations and activity ratios (�234U) of authigenic carbonates are sensitiverecorders of different fluid compositions at submarine seeps of hydrocarbon-rich fluids (“cold seeps”) atHydrate Ridge, off the coast of Oregon, USA. The low U concentrations (mean: 1.3� 0.4�g/g) and high234Uvalues (165–317‰) of gas hydrate carbonates reflect the influence of sedimentary pore water indicating thatthese carbonates were formed under reducing conditions below or at the seafloor. Their230Th/234U ages spana time interval from 0.8 to 6.4 ka and cluster around 1.2 and 4.7 ka. In contrast, chemoherm carbonatesprecipitate from marine bottom water marked by relatively high U concentrations (mean: 5.2� 0.8�g/g) anda mean�234U ratio of 166� 3‰. Their U isotopes reflect the�234U ratios of the bottom water being enrichedin 234U relative to normal seawater. Simple mass balance calculations based on U concentrations and theircorresponding�234U ratios reveal a contribution of about 11% of sedimentary pore water to the bottom water.From the U pore water flux and the reconstructed U pore water concentration a mean flow rate of about 147� 68 cm/a can be estimated.230Th/234U ages of chemoherm carbonates range from 7.3 to 267.6 ka.230Th/234U ages of two chemoherms (Alvin and SE-Knoll chemoherm) correspond to time intervals of lowsealevel stands in marine isotope stages (MIS) 2, 4, 5, 6, 7 and 8. This observation indicates that fluid flowat cold seep sites sensitively reflects pressure changes of the hydraulic head in the sediments. The�18OPDB
ratios of the chemoherm carbonates support the hypothesis of precipitation during glacial times. Deviationsof the chemoherm�18O values from the marine�18O record can be interpreted as to reflect temporally andspatially varying bottom water and/or vent fluid temperatures during carbonate precipitation between 2.6 and8.6°C. Copyright © 2003 Elsevier Science Ltd
1. INTRODUCTION
Submarine venting of hydrocarbon-rich, cold fluids into theseawater occurs in many different settings around the world(e.g., Kulm et al., 1986; Aharon et al., 1992; Polikarpov et al.,1992; Rendsbergen et al., 2002) and is thought to be due to thebreakdown of gas hydrates deeper in the sedimentary column.Methane (CH4), a main component of gas hydrates, is a stronggreenhouse gas, which can potentially have a strong effect onglobal climate (e.g., Sloan et al., 1992; Hudson and Magoon,2002). Therefore, it is critical to know whether venting fromthese cold seep sites is a continuous process or whether ventingoccurs discontinuously, and is controlled by external factors.
The subseafloor plumbing system of these cold seep sites issometimes provided by faults. These faults tap at depth a fluidreservoir containing free gas (often methane) and reach upthrough the sediments to the seafloor (Moore et al., 1990).When the discharge area is situated within the gas hydratestability field, seismic records often show a bottom simulatingreflector (BSR). This reflector is interpreted to result from thecontrast between hydrate-filled sediment above and a zonecontaining free gas below the BSR (Holbrook et al., 1996).
At the seafloor, the hydrocarbon emission sites are inhabitedby a remarkable benthic chemosynthetic fauna of bivalves, tubeworms and bacterial mats that derive their energy and nourish-
ment from oxidation of advecting reduced sulfur species and/orhydrocarbon compounds (Sibuet and Olu, 1998). In addition tothe chemosynthetic communities, the venting sites are associ-ated with authigenic carbonates that occur as extensive orsporadic seafloor pavements, concretions, chimney- or dough-nut-like forms, and as steep and gently climbing carbonatemounds.
The carbonates are composed of aragonite, calcite or dolo-mite (Ferrel and Aharon, 1994; Bohrmann et al., 1998; Greinertet al., 2001). Different processes of carbonate formation can bedistinguished. Their formation is triggered by the increase inalkalinity during anaerobic methane oxidation via sulfate re-duction (AMO; see Eqn. 1).
CH4 � SO42�3 HCO3
� � HS� � H2O (1)
The reaction is controlled by the upward flux of methane thatreaches the sulfate zone and supports an interface of enhancedmicrobial activity. A consortium of methanogenic archaea andsulfate reducing bacteria that mediate the anaerobic oxidationof methane has recently be identified by Boetius et al. (2000).Carbonates precipitated in this environment will be formedclose to the sediment surface and adjacent or even in gashydrates (Bohrmann et al., 1998). These carbonates are knownas gas hydrate carbonates and occur in two lithologies: Asbreccia composed of micrite-cemented monomict clasts and aspure aragonite precipitate (Bohrmann et al., 2002).
Another possible scenario of above-seafloor carbonate for-mation is characterized by vigorous methane flux from belowthrough a network of fault zones. Carbonates will then beformed at the same place over a long period of time. Eventu-
* Author to whom correspondence should be addressed([email protected]).† Present address: Forschungszentrum Ozeanra¨nder, Universita¨t Bre-men, Postfach 330440, 28334 Bremen, Germany.
Pergamon
Geochimica et Cosmochimica Acta, Vol. 67, No. 12, pp. 000–000, 2003Copyright © 2003 Elsevier Science LtdPrinted in the USA. All rights reserved
0016-7037/03 $30.00� .00
1
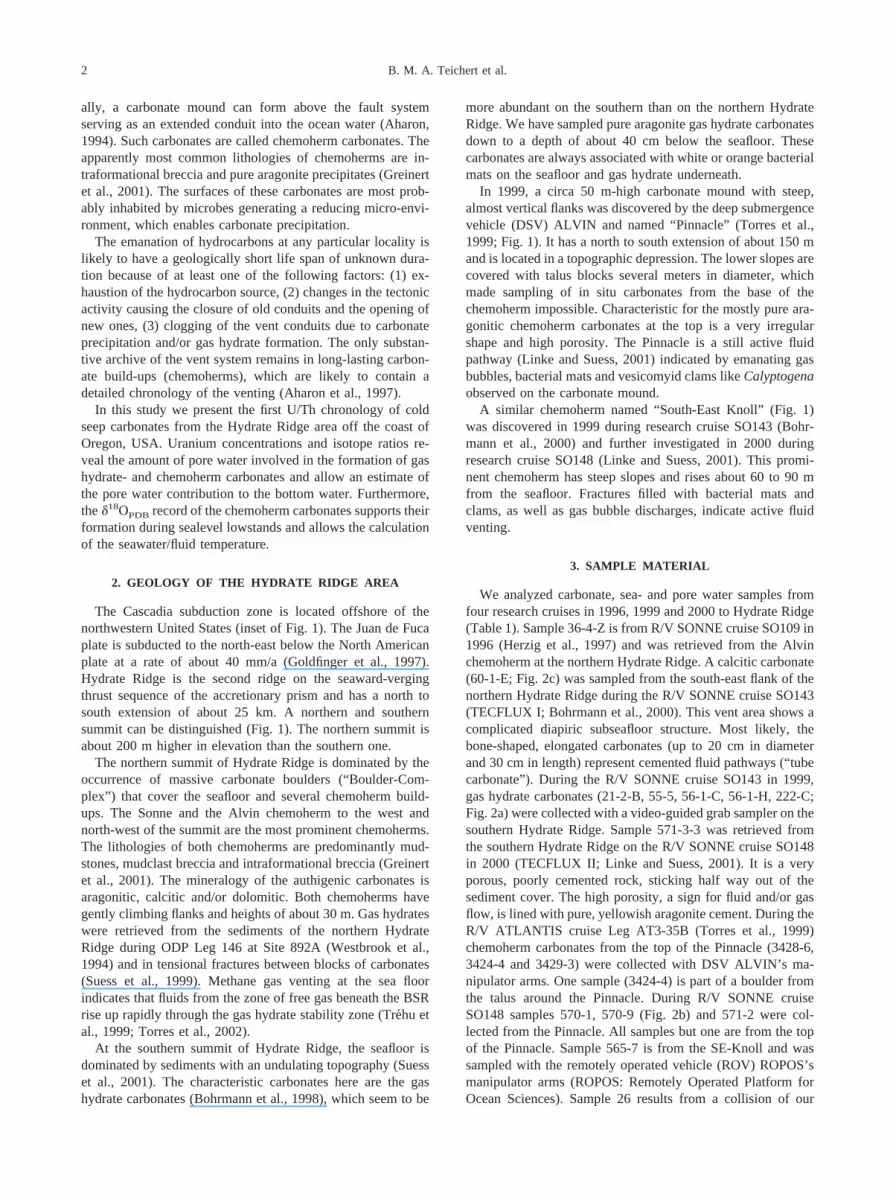
ally, a carbonate mound can form above the fault systemserving as an extended conduit into the ocean water (Aharon,1994). Such carbonates are called chemoherm carbonates. Theapparently most common lithologies of chemoherms are in-traformational breccia and pure aragonite precipitates (Greinertet al., 2001). The surfaces of these carbonates are most prob-ably inhabited by microbes generating a reducing micro-envi-ronment, which enables carbonate precipitation.
The emanation of hydrocarbons at any particular locality islikely to have a geologically short life span of unknown dura-tion because of at least one of the following factors: (1) ex-haustion of the hydrocarbon source, (2) changes in the tectonicactivity causing the closure of old conduits and the opening ofnew ones, (3) clogging of the vent conduits due to carbonateprecipitation and/or gas hydrate formation. The only substan-tive archive of the vent system remains in long-lasting carbon-ate build-ups (chemoherms), which are likely to contain adetailed chronology of the venting (Aharon et al., 1997).
In this study we present the first U/Th chronology of coldseep carbonates from the Hydrate Ridge area off the coast ofOregon, USA. Uranium concentrations and isotope ratios re-veal the amount of pore water involved in the formation of gashydrate- and chemoherm carbonates and allow an estimate ofthe pore water contribution to the bottom water. Furthermore,the �18OPDB record of the chemoherm carbonates supports theirformation during sealevel lowstands and allows the calculationof the seawater/fluid temperature.
2. GEOLOGY OF THE HYDRATE RIDGE AREA
The Cascadia subduction zone is located offshore of thenorthwestern United States (inset of Fig. 1). The Juan de Fucaplate is subducted to the north-east below the North Americanplate at a rate of about 40 mm/a (Goldfinger et al., 1997).Hydrate Ridge is the second ridge on the seaward-vergingthrust sequence of the accretionary prism and has a north tosouth extension of about 25 km. A northern and southernsummit can be distinguished (Fig. 1). The northern summit isabout 200 m higher in elevation than the southern one.
The northern summit of Hydrate Ridge is dominated by theoccurrence of massive carbonate boulders (“Boulder-Com-plex” ) that cover the seafloor and several chemoherm build-ups. The Sonne and the Alvin chemoherm to the west andnorth-west of the summit are the most prominent chemoherms.The lithologies of both chemoherms are predominantly mud-stones, mudclast breccia and intraformational breccia (Greinertet al., 2001). The mineralogy of the authigenic carbonates isaragonitic, calcitic and/or dolomitic. Both chemoherms havegently climbing flanks and heights of about 30 m. Gas hydrateswere retrieved from the sediments of the northern HydrateRidge during ODP Leg 146 at Site 892A (Westbrook et al.,1994) and in tensional fractures between blocks of carbonates(Suess et al., 1999). Methane gas venting at the sea floorindicates that fluids from the zone of free gas beneath the BSRrise up rapidly through the gas hydrate stability zone (Trehu etal., 1999; Torres et al., 2002).
At the southern summit of Hydrate Ridge, the seafloor isdominated by sediments with an undulating topography (Suesset al., 2001). The characteristic carbonates here are the gashydrate carbonates (Bohrmann et al., 1998), which seem to be
more abundant on the southern than on the northern HydrateRidge. We have sampled pure aragonite gas hydrate carbonatesdown to a depth of about 40 cm below the seafloor. Thesecarbonates are always associated with white or orange bacterialmats on the seafloor and gas hydrate underneath.
In 1999, a circa 50 m-high carbonate mound with steep,almost vertical flanks was discovered by the deep submergencevehicle (DSV) ALVIN and named “Pinnacle” (Torres et al.,1999; Fig. 1). It has a north to south extension of about 150 mand is located in a topographic depression. The lower slopes arecovered with talus blocks several meters in diameter, whichmade sampling of in situ carbonates from the base of thechemoherm impossible. Characteristic for the mostly pure ara-gonitic chemoherm carbonates at the top is a very irregularshape and high porosity. The Pinnacle is a still active fluidpathway (Linke and Suess, 2001) indicated by emanating gasbubbles, bacterial mats and vesicomyid clams like Calyptogenaobserved on the carbonate mound.
A similar chemoherm named “South-East Knoll” (Fig. 1)was discovered in 1999 during research cruise SO143 (Bohr-mann et al., 2000) and further investigated in 2000 duringresearch cruise SO148 (Linke and Suess, 2001). This promi-nent chemoherm has steep slopes and rises about 60 to 90 mfrom the seafloor. Fractures filled with bacterial mats andclams, as well as gas bubble discharges, indicate active fluidventing.
3. SAMPLE MATERIAL
We analyzed carbonate, sea- and pore water samples fromfour research cruises in 1996, 1999 and 2000 to Hydrate Ridge(Table 1). Sample 36-4-Z is from R/V SONNE cruise SO109 in1996 (Herzig et al., 1997) and was retrieved from the Alvinchemoherm at the northern Hydrate Ridge. A calcitic carbonate(60-1-E; Fig. 2c) was sampled from the south-east flank of thenorthern Hydrate Ridge during the R/V SONNE cruise SO143(TECFLUX I; Bohrmann et al., 2000). This vent area shows acomplicated diapiric subseafloor structure. Most likely, thebone-shaped, elongated carbonates (up to 20 cm in diameterand 30 cm in length) represent cemented fluid pathways (“ tubecarbonate” ). During the R/V SONNE cruise SO143 in 1999,gas hydrate carbonates (21-2-B, 55-5, 56-1-C, 56-1-H, 222-C;Fig. 2a) were collected with a video-guided grab sampler on thesouthern Hydrate Ridge. Sample 571-3-3 was retrieved fromthe southern Hydrate Ridge on the R/V SONNE cruise SO148in 2000 (TECFLUX II; Linke and Suess, 2001). It is a veryporous, poorly cemented rock, sticking half way out of thesediment cover. The high porosity, a sign for fluid and/or gasflow, is lined with pure, yellowish aragonite cement. During theR/V ATLANTIS cruise Leg AT3-35B (Torres et al., 1999)chemoherm carbonates from the top of the Pinnacle (3428-6,3424-4 and 3429-3) were collected with DSV ALVIN’s ma-nipulator arms. One sample (3424-4) is part of a boulder fromthe talus around the Pinnacle. During R/V SONNE cruiseSO148 samples 570-1, 570-9 (Fig. 2b) and 571-2 were col-lected from the Pinnacle. All samples but one are from the topof the Pinnacle. Sample 565-7 is from the SE-Knoll and wassampled with the remotely operated vehicle (ROV) ROPOS’smanipulator arms (ROPOS: Remotely Operated Platform forOcean Sciences). Sample 26 results from a collision of our
2 B. M. A. Teichert et al.

OFOS (Ocean Floor Observation System) with the chemohermSE-Knoll.
Bottom water was sampled by ROV ROPOS. Samples arefrom the location SO148/566-1 (bubbling vent location) and571-1. All bottom water samples were taken about 5 to 10 mabove seafloor.
Sediment pore water samples are from location SO143/55-2(multicore) and 221-2 (gravity core) on the southern HydrateRidge. Both sites were active vent sites indicated by the occur-
rence of chemoautotrophic clams (Calyptogena), surficial bac-terial mats and subseafloor gas hydrates.
4. SAMPLE PREPARATION AND ANALYTICALMETHODS
4.1. 230Th/234U Measurements
For U-series dating we chose 15 pure aragonite samples (�97 wt.%aragonite) and one sample composed of calcitic cemented sediment(high Mg-calcite with 11 mol.% MgCO3; Table 1). The mineralogical
Fig. 1. Map shows the regional bathymetry of Hydrate Ridge. Filled stars mark sampling locations. Name of samplingarea and calculated U/Th ages are given in the boxes (NHR: northern Hydrate Ridge, SHR: southern Hydrate Ridge). Insetshows plate tectonic setting of the Cascadia convergent margin (modified after Duncan and Kulm, 1989). Jagged, dashedline is the subduction zone.
3U/Th Systematics and ages of carbonates from Hydrate Ridge

composition was determined by X-ray diffraction (XRD). StandardXRD analyses allowed calculation of semiquantitative abundance ofcarbonate phases. All samples were cut and subsamples were takenusing a microdrill. The weight of the analyzed samples varied from0.17 to 1.12 g depending on the available material. The procedures forchemical separation and purification of U and Th, as well as the datingprocedures, are close to those described by Chen et al. (1986) andEdwards et al. (1987), respectively. From the high Mg-calcite sample(60-1-E), we prepared three aliquots to obtain an U/Th-isochron. Onealiquot was prepared for a whole rock analysis. From the other part, weseparated the calcitic and the detrital aliquot by leaching the calcite onehour with 0.1 N suprapur acetic acid (Merck). Note, that all sampleswith 230Th/232Th activity ratios lower then 20 (almost all gas hydratecarbonates) have to be corrected for inherited 230Th (Table 2). Tocorrect for inherited 230Th, we used the 230Th/232Th activity ratio of1.92 of sample 60-1-Eb (detritus) as a representative for the local
sediments of Hydrate Ridge. To verify the corrected U/Th-ages (Table2, column 10), we also calculated isochron ages. For the calculation ofthese isochron ages, we used the individual sample values and the valueof sample 60-1-E as an initial value for all samples. Comparison of the230Th corrected U/Th ages with their corresponding isochron ages doesnot show any difference, which implies that the corrected U/Th-agescan be considered reliable.
For pore water analyses, cores were capped directly after retrievaland immediately transferred to the cold room. Squeezing was per-formed immediately after recovery at 4°C under argon gas atmosphereat about 3 atm. The bulk solution was filtered into acid cleaned bottles.The two pore water samples were acidified and ultrasonically treatedbefore chemical separation.
After retrieval of the bottom water samples from ROV ROPOS’sNiskin bottles (SO148), the bulk solution was filtered, acidified, andtransferred to previously cleaned polyethylene bottles.
Table 1. Location of carbonate and water samples used in this study.
Sample Cruise Type Location Latitude °N Longitude °W Water depth (m)
21-2-B SO143 GhC SHR 44°34 212 125°08 810 78855-5 SO143 GhC SHR 44°34 210 125°08 830 78756-1-C SO143 GhC SHR 44°34 220 125°08 798 78756-1-H SO143 GhC SHR 44°34 220 125°08 798 787222-C SO143 GhC SHR 44°34 238 125°08 843 772571-3 SO148 GhC SHR 44°34 216 125°08 810 7663428-6-A AT3-35b CC Pinnacle/SHR 44°34 092 125°09 046 7743434-4-A AT3-35b CC Pinnacle/SHR 44°34 104 125°09 170 8123429-3-A AT3-35b CC Pinnacle/SHR 44°34 100 125°09 170 772570-1 SO148 CC Pinnacle/SHR 44°34 094 125°09 141 762571-2 SO148 CC Pinnacle/SHR 44°34 107 125°09 172 776570-9 SO148 CC Pinnacle/SHR 44°34 088 125°09 180 76226 SO148 CC SE-Knoll 44°27 119 125°01 746 620565-7 SO148 CC SE-Knoll 44°26 989 125°01 966 61636-4-Z SO109 CC Alvin/NHR 44°40 443 125°07 368 66860-1-E SO143 TC vent area/NHR 44°37 560 125°04 670 924571-1 SO148 bw Pinnacle/SHR 44°34 120 125°09 167 769566-1 SO148 bw NHR 44°34 230 125°08 840 57755-2# SO143 pw SHR 44°34 230 125°08 840 788221-2* SO143 pw SHR 44°34 211 125°08 811 785
Fig. 2. Different types of authigenic carbonates: (a) Pure, aragonitic gas hydrate carbonate (sample 21-2-B). (b) Pure,aragonitic chemoherm carbonate with very irregular shape and high porosity (sample 570-9). (c) Calcitic tube carbonate(sample 60-1).
4 B. M. A. Teichert et al.

Uranium- and Th isotope dilution measurements were performedwith a 233U/236U double spike and a 229Th single spike by thermalionisation mass spectrometry (TIMS) on a Finnigan MAT 262 RPQ�
at the GEOMAR Forschungszentrum, Kiel, Germany. Thirty-one mea-surements of New Brunswick Laboratories Certified Reference Mate-rial 112a (NBL-112a, formerly NBS SRM 960 and CRM-145) gave amean 234U/238U atomic ratio of 5.31 � 0.04 · 10�5 (2 s.d.: two standarddeviations) corresponding to a �234U(0) value of �33 � 7‰ (�234U(0)
� ((234U/238U)activity ratio �1) · 1000) based on the recently new defineddecay constant of 234U (Cheng et al., 2000b). Our �234U(0) mean valueof NBL-112a tends to be about 3 to 4‰ higher than that of previousmeasurements, but is still in statistical accordance with the earlierreported �234U(0) values of Cheng et al. (2000b): �37 � 8‰ (2 s.d.),Eisenhauer et al. (1996): �36 � 4‰ (2 s.d.) and Edwards et al. (1993):�37 � 3‰ (2 s.d.). Note, that the Eisenhauer et al. (1996) and Edwardset al. (1993) values were recalculated with the new decay constant for234U from Cheng et al. (2000b).
4.2. �18O Measurements
Carbonate samples for determination of oxygen stable isotopes wereobtained by using a hand-held microdrill. Carbonate powders werereacted with 100% phosphoric acid (density �1.9; Wachter and Hayes,1985) at 75°C in an online carbonate preparation line (Carbo-Kiel-single sample acid bath) connected to a Finnigan Mat 252 massspectrometer (Geologisches Institut der Universitat Erlangen, Germa-ny). All values are reported in permil (‰) relative to V-PDB (Peedee
Belemnite) by assigning a �18O value of �2.20‰ PDB to NBS 19.Results are expressed in the usual �-notation relative to the PDB-standard. Reproducibility was verified by replicate analyses of labora-tory standards and is better than about 0.02‰ (1�) for �18O.
4.3. Determination of Ca Concentrations
Ca concentrations of a pore water sample and authigenic carbonateswere determined by ICP-AES (JY 170 Ultratrace) at GEOMAR Fors-chungszentrum, Kiel, Germany. For the carbonates, repeated measure-ments (n�6) of a Ca-standard (Spex) gave a reproducibility of 13 �g/g(2 s.d.), which corresponds to a statistical uncertainty of about 5%.Accuracy was verified by repeated measurements of the IAPSO sea-water standard.
5. RESULTS AND DISCUSSION
5.1. U Concentrations and �234U in Bottom Water, PoreWater and Authigenic Carbonates
All U and Th results are given in Table 2 and are graphicallydisplayed in Figure 3a–c. The U concentrations of our bottomwater samples (Ubw; average: 3.0 � 0.2 ng/g) are about 4 to12% lower then the expected uranium seawater concentration(Usw) of 3.261 � 0.007 ng/g for the Pacific Ocean (Chen et al.,
Table 2. U and Th isotopic compositions of authigenic carbonates, bottom- and pore water and 230Th/234U ages of authigenic carbonates.
Sample Location 238U (�g/g) 230Th (pg/g)
230Th/232Thactivity ratio
�234U(0)
(‰)�234U(T)
(‰)
230Th/234Uactivity ratio Age (a) Age (a) Th corr.
21-2-B-1 SHR 1.1406 � 0.0009 0.39 � 0.03 5.5 � 0.4 214 � 5 215 � 5 0.017 � 0.001 1,900 � 300 1,300 � 40021-2-B-2 SHR 1.1561 � 0.0005 0.341 � 0.005 7.6 � 0.1 166 � 4 167 � 4 0.0155 � 0.0002 1,700 � 100 1,300 � 20055-5-3 SHR 1.377 � 0.001 0.63 � 0.02 2.8 � 0.1 164 � 4 164 � 4 0.0240 � 0.0006 2,600 � 100 800 � 90056-1-C-2 SHR 1.4907 � 0.0008 1.01 � 0.03 89.8 � 3.2 173 � 4 175 � 4 0.032 � 0.001 3,500 � 300 3,400 � 30056-1-C-1 SHR 0.3451 � 0.0004 0.14 � 0.02 18.3 � 0.7 315 � 5 317 � 5 0.019 � 0.003 2,000 � 700 1,800 � 70056-1-C-5 SHR 1.812 � 0.001 1.53 � 0.03 14.7 � 0.3 178 � 4 180 � 4 0.044 � 0.001 4,900 � 200 4,300 � 40056-1-H-1 SHR 1.885 � 0.001 2.01 � 0.03 8.1 � 0.1 187 � 4 189 � 4 0.0550 � 0.0008 6,200 � 200 4,800 � 70056-1-H-2 SHR 1.600 � 0.003 2.16 � 0.05 9.7 � 0.2 175 � 8 179 � 8 0.070 � 0.002 7,800 � 400 6,400 � 800222-C-1 SHR 0.8159 � 0.0005 0.300 � 0.008 6.0 � 0.2 207 � 2 208 � 2 0.0186 � 0.0005 2,000 � 100 1,400 � 300571-3-3 SHR 2.581 � 0.001 0.59 � 0.03 6.2 � 0.3 170 � 3 171 � 3 0.0120 � 0.0005 1,300 � 100 800 � 3003428-6-A-1 Pinnacle/SHR 4.569 � 0.002 8.2 � 0.2 1076 � 31 153 � 3 158 � 3 0.095 � 0.003 10,800 � 600 10,900 � 6003424-4-A-2 Pinnacle/SHR 4.439 � 0.003 5.48 � 0.06 1009 � 11 156 � 6 159 � 6 0.065 � 0.001 7,300 � 200 7,300 � 2003429-3-A-2 Pinnacle/SHR 6,806 � 0.003 10.4 � 0.2 398 � 6 155 � 4 159 � 4 0.081 � 0.001 9,100 � 300 9,200 � 3003429-3-A-8a Pinnacle/SHR 6.396 � 0.005 9 � 1 924 � 108 155 � 8 159 � 8 0.078 � 0.009 8,900 � 2,000 8,800 � 2,0003429-3-A-8b Pinnacle/SHR 6.396 � 0.005 11.9 � 0.5 1338 � 61 158 � 6 163 � 6 0.099 � 0.004 11,400 � 1,000 11,400 � 1,000570-1-3 Pinnacle/SHR 5.442 � 0.002 7.73 � 0.04 1025 � 5 149 � 3 153 � 3 0.0755 � 0.0004 8,500 � 100 8,500 � 100571-2-1 Pinnacle/SHR 4.529 � 0.003 7.3 � 0.1 690 � 10 167 � 5 171 � 5 0.085 � 0.001 9,600 � 300 9,700 � 300571-2-2 Pinnacle/SHR 5.005 � 0.002 8.0 � 0.5 1777 � 111 149 � 2 153 � 2 0.085 � 0.005 9,700 � 1,200 9,800 � 1,200570-9-5 Pinnacle/SHR 5.088 � 0.002 9.06 � 0.07 1794 � 14 158 � 2 160 � 2 0.095 � 0.001 11,000 � 200 10,900 � 20026 SE-Knoll 2.389 � 0.003 38.52 � 0.08 4905 � 25 60 � 6 127 � 6 0.930 � 0.002 267,700 � 5,500 267,600 � 5,50026-1 SE-Knoll 3.191 � 0.001 45.7 � 0.3 14065 � 83 77 � 3 128 � 3 0.817 � 0.004 177,300 � 4,200 177,700 � 4,20026-3 SE-Knoll 8.416 � 0.004 132.2 � 0.4 15595 � 59 82 � 3 153 � 3 0.887 � 0.003 221,500 � 4,500 221,700 � 4,500565-7-7 SE-Knoll 4.412 � 0.001 15.8 � 0.2 633 � 9 155 � 2 168 � 2 0.189 � 0.003 22,300 � 700 22,300 � 70036-4-Z-1 Alvin/NHR 3.606 � 0.002 31.9 � 0.2 1023 � 8 139 � 4 168 � 4 0.474 � 0.003 68,900 � 1,400 68,700 � 1,40036-4-Z-2 Alvin/NHR 6.684 � 0.002 61.1 � 0.2 343.8 � 1.4 138 � 2 169 � 2 0.490 � 0.002 72,000 � 600 71,700 � 60060-1-Ea, total vent area/NHR 1.1300 � 0.0004 16.40 � 0.05 1.844 � 0.006 63 � 2 0.828 � 0.00360-1-Eb,
calcitevent area/NHR 0.6377 � 0.0005 0.27 � 0.01 6.7 � 0.3 153 � 4 152 � 4 0.0179 � 0.0008 2,000 � 200 1,400 � 300
60-1-Eb,detritus
vent area/NHR 1.0497 � 0.0004 17.2 � 0.6 1.92 � 0.07 37 � 2 0.95 � 0.03
Bottom water (ng/g)571-1a Pinnacle/SHR 2.882 � 0.004 168 � 7571-1b Pinnacle/SHR 3.128 � 0.005 163 � 9566-1 NHR 2.856 � 0.003 166 � 7Pore water55-2-C SHR 6.291 � 0.006 153 � 7221-2a SHR 6.056 � 0.005 352 � 9221-2b SHR 5.81 � 0.01 361 � 21
5U/Th Systematics and ages of carbonates from Hydrate Ridge

1986) whereas uranium concentrations in the pore water (Upw)are about a factor of 2 higher than bottom water (Fig. 3a). Theaverage �234U value of the bottom water samples of 166 � 3‰(2 s.d.) is higher than the presently accepted mean value formodern seawater of 145.8 � 1.7‰ (Cheng et al., 2000a; Fig.3b). The �234U values of all pore water samples are generallyhigher than bottom water and show a large variation in their�234U ratios from 153 to 361‰ (Fig. 3b).
The average U concentration of the gas hydrate carbonates(UGhC) and the calcite fraction of the tube carbonate (averageUGhC: 1.4 � 0.4 �g/g) is almost a factor of 4 lower than the
average chemoherm carbonate U concentration (UCC; averageUCC: 5.2 � 0.8 �g/g; Fig. 3a). The �234U ratios of the chemo-herm carbonates cluster closely around an average value ofabout 161 � 4‰ (except for samples 26 and 26-1) being closeto the mean value of our measured bottom water (166 � 3‰).In contrast, the �234U activity ratios of the gas hydrate carbon-ates show a large variation, similar to that of the sediment porewater, from about 165 to 317‰. Such variations occur evenwithin the aragonitic layer of a single carbonate sample (e.g.,sample 21-2-B).
The U concentration of suboxic to anoxic pore water is
Fig. 3. (a) Uranium concentrations of chemoherm-, tube- and gas hydrate carbonates, pore- and bottom water are plottedtogether. Note the break in scale and changing units. Measured Upw are in brackets. Arrow points to the reconstructed Upw.Dashed vertical line gives the seawater U concentration of Chen et al. (1986). (b) �234U ratios of chemoherm-, tube- andgas hydrate carbonates, pore- and bottom water are plotted together. Dashed vertical lines mark the literature �234U valueof modern “seawater” (Cheng et al., 2000a) and measured “bottom water” (mean value) at Hydrate Ridge (this work). (c)230Th/234U ages of chemoherm-, tube- and gas hydrate carbonates. Note the break in scale.
6 B. M. A. Teichert et al.

expected to be lower than seawater because U is highly solubleunder oxic conditions but highly insoluble under reducingconditions (cf. Barnes and Cochran, 1988). Consequently, theUGhC (mean: 1.4 � 0.4 �g/g) precipitated from anoxic porewater is expected to be lower than the Ucc (mean: 5.2 � 0.8�g/g) precipitated from the bottom water (Table 2, Fig. 3a). Incontrast to the expected low U concentrations in the pore water,our pore water samples are enriched in U (mean: 6.1 � 0.3ng/g). They are even enriched relative to the U concentrationsof our bottom water samples (mean: 3.0 � 0.2 ng/g; Fig. 3a).Therefore, we propose that these values do not reflect theoriginal Upw; rather, they reflect the reoxidizing and leaching ofU from the adjacent sediment during pore water samplingprocedures onboard the research vessel. Henderson et al.(1999) have documented enrichment of U in pore watersqueezed under air. Thus, the measured U concentrations arenot considered to be representative of pore water and areneglected in the following discussion.
To reconstruct Upw, we can use two different approaches: (1)a simple binary mixing calculation, and (2) using the calculatedpartition coefficient (Kd) for the U/Ca ratio in aragonite. Fol-lowing approach (1) we may calculate from the average �234Uratio of pore water (357 � 6‰), bottom water (166 � 3‰) andnormal seawater (145.8 � 1.7‰; Cheng et al., 2000a) that thebottom water consists of about 90% normal seawater and about10% pore water (see Appendix 1). Upw can be estimated to beof the order of about 0.1 � 0.2 ng/g (�234Upw � 357� 6‰,�234Ubw � 166 � 3‰). However, this value has a largestatistical uncertainty, because of the small contribution of Upw
to Ubw by propagation of errors. Therefore, we also use analternative way to estimate Upw.
Our second approach (2) is to calculate a partition coefficient(Kd) with:
Kd � �U
Ca�CC
��U
Ca�SW
(2)
for U in aragonite of about 1.83 at 4.7°C (with mean UCC �5.16 �g/g (see Table 2); mean CaCC � 356000 � 5000 �g/g (2s.d., n�11); Usw � 3.261 ng/g, Chen et al., 1986; averageseawater (IAPSO) Casw � 412 �g/g).
With the Kd of 1.83, we can then calculate Upw to be about0.24 � 0.06 ng/g with a measured Ca concentration in the porewater (Capw) of 110 �g/g (gravity core 221-2, 1.15 m depth)and the mean values of U and Ca concentrations in the gashydrate carbonates (mean UGhC � 1.4 �g/g (see Table 2);mean CaGhC � 361 � 7 �g/g (2 s.d., n�12)). The calculatedvalue may be considered as a reliable approximation of the trueUpw, although we are aware of the fact that the U concentrationin carbonate depends on many other factors apart from the Uconcentration of the precipitating fluid. Mineralogy is obvi-ously important, as is the morphology of the mineral. Otherfactors such as temperature are also known to play a role insome carbonates (e.g., Shen and Dunbar, 1995). Although ourcalculated value for Upw certainly has a considerable degree ofuncertainty, it is most likely more reliable than those basedupon measurements that contain systematic errors due to reoxi-dizing of pore water during the sampling procedure. In addi-tion, from a statistical point of view our Kd approach (2)provides a much more precise constrain on the original Upw
than the binary mixing approach (1). Previously reported valuesof U concentrations in reduced pore waters are in the samerange of about 0.93 to 0.07 ng/g (Henderson et al., 1999).
5.2. Quantification of the Exchange of Uranium acrossthe Sediment Seawater Interface above Cold SeepAreas
5.2.1. Mixing of pore water uranium with seawater uranium
As a consequence of the �-recoil effect, the �234U ratio ofsedimentary pore water tends to be higher than the �234U ratioof seawater (Kigoshi, 1971) resulting in an increase of the�234U ratio in gas hydrate carbonates (Table 2, Fig. 3b). Ourobservations also show that the average �234U value of thechemoherm carbonates (161 � 4‰) as well as for the bottomwater samples (166 � 3‰) is significantly higher than theexpected seawater value (145.8‰; Cheng et al., 2000a). Thelatter observation may reflect a net flux of 234U enriched porewater from the sediment to the seawater above the cold seeparea. This water mass above the cold seep area is then enrichedin 234U and therefore has a different isotopic signature thannormal seawater. Using a simple box model we are able toestimate the contribution of the pore water U flux (Fpw) relativeto U seawater flux (Fsw) (see Appendix 2).
From the average �234U values of the seawater (�234Usw �145.8‰; Cheng et al., 2000a), the bottom water (�234Ubw �166‰) and the deep pore water (�234Upw � 357‰) we are ableto calculate a ratio of the U pore water flux to the U seawaterflux of the order of 0.11. The latter value indicates that about11% of the U present in the bottom water is supplied from thesedimentary pore water. If we calculate the pore water contri-bution for the chemoherm carbonates, we obtain a value ofabout 8% (with �234UCC � 161‰). Note that both values are ingood agreement, although the 11% pore water contribution tothe bottom water is a recent, single measurement value, whilethe 8% for the chemoherm carbonate is a mean value over time.In addition, our values are also consistent with earlier estimatesbased on the major ion composition of ambient bottom waterwhere vent fluids contribute about 4 to 12% to the bottom water(Suess et al., 1999).
5.2.2. Estimation of uranium fluxes out of cold seepsediments
The value for the U pore water flux (Fpw) can be quantifiedfrom previously determined U seawater fluxes (Fsw) into or-ganic rich sediments, which are summarized in Ivanovich andHarmon (1992). Values for Fsw vary in between 100 ng/(cm2 ·a) (Barnes and Cochran, 1990) in the Black Sea to about 770ng/(cm2 · a) for the Baltic Sea (Nikolayev et al., 1966). A meanvalue for the available U fluxes into organic rich sedimentscorresponds to about 321 � 148 ng/(cm2 · a) (2�, n�10). Note,that U fluxes into organic rich sediments are on average a factorof 8 higher (Ivanovich and Harmon, 1992) than those into oxicand suboxic sediments. If we take the calculated value for thecontribution of sedimentary pore water into account (11%), wecan calculate a mean value of 35 � 16 ng/(cm2 · a) with aminimum and maximum value for Fpw in the order of about 11ng/(cm2 · a) and 85 ng/(cm2 · a), respectively.
7U/Th Systematics and ages of carbonates from Hydrate Ridge
5.2.3. Constraints on average advection rates
To constrain advection rates (v) related to cold seep envi-ronments, values of 46 cm/a to 353 cm/a (mean: 147 � 68cm/a) can be calculated with:
v �Fpw
Upw(3)
from the Fpw values and our reconstructed U pore water con-centration (Upw) of about 0.24 ng/g.
Our Fpw values can hardly be verified because direct mea-surements of U fluxes are difficult to perform. However, thecalculated flow rate can be compared with other independentestimates of flow rates at Hydrate Ridge. At the northern andsouthern Hydrate Ridge direct measurements of in- and outflowof fluids revealed a flow rate of about 10 cm/a at clam sites to1000 cm/a at areas covered with microbial mats indicative ofextensive outflow of methane-rich fluids. At the southern Hy-drate Ridge tide-controlled flow rates in the order of mm/a tocm/a have been observed (Tryon and Brown, 2001). These flow
rates are in general agreement with the results presented in thisstudy.
5.2.4. Constraints on the origin of the uranium in gashydrate carbonates
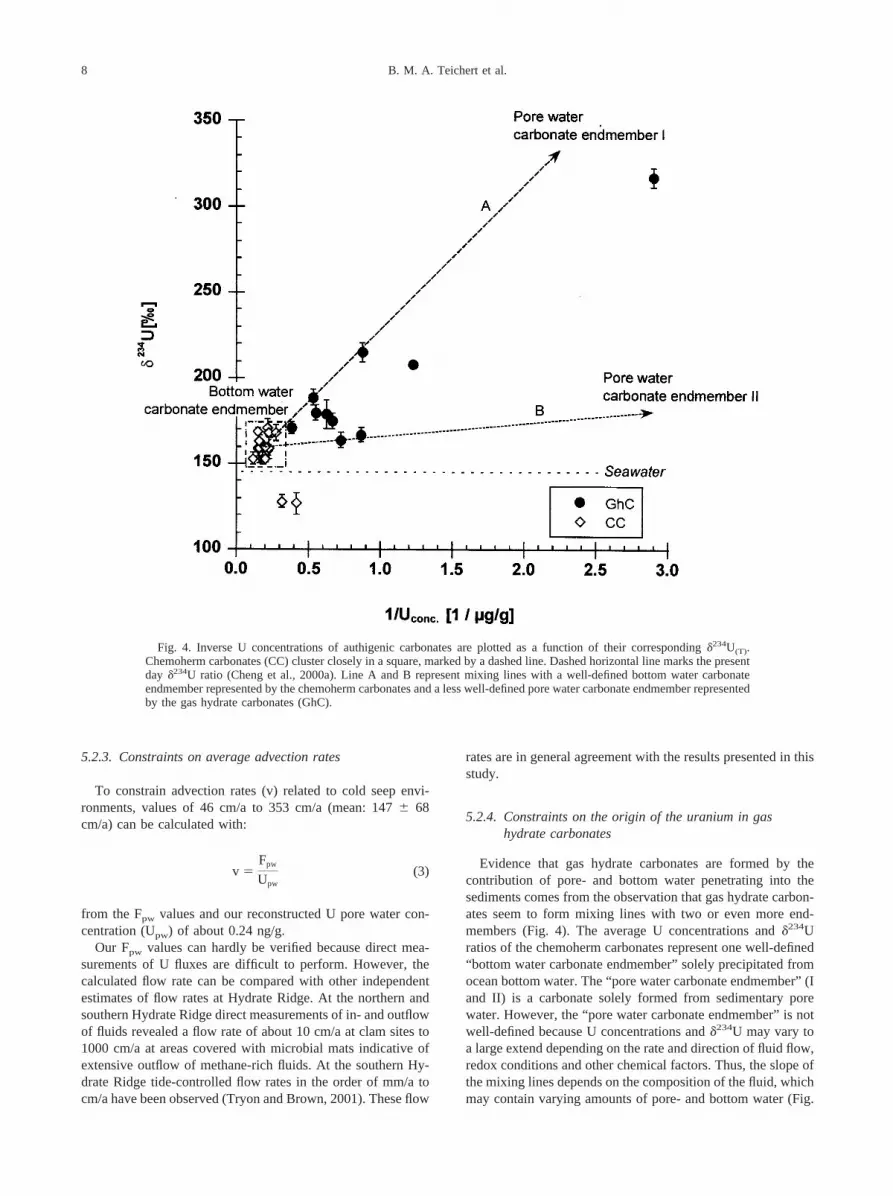
Evidence that gas hydrate carbonates are formed by thecontribution of pore- and bottom water penetrating into thesediments comes from the observation that gas hydrate carbon-ates seem to form mixing lines with two or even more end-members (Fig. 4). The average U concentrations and �234Uratios of the chemoherm carbonates represent one well-defined“bottom water carbonate endmember” solely precipitated fromocean bottom water. The “pore water carbonate endmember” (Iand II) is a carbonate solely formed from sedimentary porewater. However, the “pore water carbonate endmember” is notwell-defined because U concentrations and �234U may vary toa large extend depending on the rate and direction of fluid flow,redox conditions and other chemical factors. Thus, the slope ofthe mixing lines depends on the composition of the fluid, whichmay contain varying amounts of pore- and bottom water (Fig.
Fig. 4. Inverse U concentrations of authigenic carbonates are plotted as a function of their corresponding �234U(T).Chemoherm carbonates (CC) cluster closely in a square, marked by a dashed line. Dashed horizontal line marks the presentday �234U ratio (Cheng et al., 2000a). Line A and B represent mixing lines with a well-defined bottom water carbonateendmember represented by the chemoherm carbonates and a less well-defined pore water carbonate endmember representedby the gas hydrate carbonates (GhC).
8 B. M. A. Teichert et al.

4). Following our simplified approach, we propose for mixingline “A” that “pore water carbonate endmember I” represents acarbonate precipitated from anoxic sedimentary pore waterhighly enriched in 234U but depleted in U. Whereas for mixingline “B,” “ pore water carbonate endmember II” corresponds toa carbonate precipitated from a fluid with relatively low �234Uratios but high U concentrations.
5.3. 230Th/234U Ages of Authigenic Carbonates fromHydrate Ridge
5.3.1. 230Th/234U ages of gas hydrate carbonates
The gas hydrate carbonate samples from five different sta-tions at the southern Hydrate Ridge show U/Th ages in between0.8 and 6.4 ka (Table 2, Figs. 1 and 3c). It seems that there aretwo time intervals of enhanced carbonate precipitation. Onerelatively recent period with a mean age around 1.2 � 0.3 ka(21-2-B, 55-5, 56-1-C-1, 222-C, 571-3) and an older periodaround 4.7 � 1.2 ka (56-1-C-2, 56-1-C-5, 56-1-H). Gas hydratecarbonate precipitation is closely linked to the supply of meth-ane-rich fluids. Hence, the environmental conditions duringthese two time intervals must have been favorable for enhancedmethane fluxes through the sediment. We speculate that earth-quakes or other tectonic movements opened new and enlargedold conduits for the supply of methane-rich fluids at HydrateRidge. In addition, second order sealevel variations introducedby vertical neotectonic movement along the west coast of theUSA may also have opened new conduits through the sedimentto the ocean bottom water (Pirazzoli, 1991).
Our observation that U/Th ages cluster in certain periodsindicates that carbonate precipitation is not continuous butrather occurs in distinct intervals.
5.3.2. 230Th/234U ages of chemoherm carbonates
The chemoherm carbonate samples from the Alvin, Pinnacleand SE-Knoll chemoherm are older than the gas hydrate car-bonates. Their ages vary between 7.3 and 267.6 ka (Table 2 andFig. 3c). The youngest chemoherm is the Pinnacle with ages
ranging from 7.3 to 11.4 ka. The Alvin chemoherm has aminimum age of 68.7 to 71.7 ka. The samples from the SE-Knoll show the oldest ages ranging from 22.3 up to 267.6 ka.
Except for the samples from the Pinnacle, the ages of all theother chemoherm carbonates correspond to time intervals oflow sealevel in marine isotope stages (MIS: 2, 4, 5, 6, 7, 8;Table 3). Given that this coincidence is statistically significant,our observation appears to imply that the growth of the che-moherms is a discontinuous process with relatively high ratesof carbonate precipitation, probably induced by enhancedmethane degassing during glacial periods, and lower or evennegligible rates of carbonate precipitation during interglacialperiods related to decreased methane degassing. The relation-ship of carbonate precipitation, glacial periods and sea levellowstands, as well as the exception of the Pinnacle samples,will be discussed in the section below.
5.4. �18O Variations and Reconstruction of SeawaterTemperature during Chemoherm Precipitation
Our observation that the chemoherm carbonates are predom-inantly precipitated during glacial periods is supported by theircorresponding �18OPDB ratios (Table 3). The measured�18OPDB ratios of the chemoherm carbonates are up to 0.9‰enriched in 18O relative to their expected modern isotopeequilibrium value of �18OPDB � 3.47‰ for a modern bottomwater temperature of about 4.7°C and relative to a �18OSMOW
ratio of 0‰ (corresponding �29.94 (PDB)) for modern sea-water (�18OPDB � 0.97006 · �18OSMOW - 29.94; Friedman andO’Neil, 1977). The latter observation of heavier values than theexpected modern equilibrium value may correspond to theobservation that during glacial periods the �18OSMOW of sea-water tends to be heavier than the present value due to theamount of seawater stored in the continental ice shields (Schraget al., 1996). The exact value for the different glacial periods isstill under discussion although Duplessy et al. (2002) give avalue of about 1.05‰ as a good estimate for variation of the�18O of deep-ocean water between the Last Glacial Maximum(LGM) and the Holocene. However, this 1.05‰ variation does
Table 3. Measured �18OPDB of chemoherm carbonate samples, ��18OPDB from Karner et al. (2002), past �18OSMOW seawater values, fractionationfactor �aragonite-seawater, reconstructed past seawater/fluid temperature and marine isotopic stages (MIS) in chronological order.
Sample Location Age [ka]�18OPDB ofsample [‰]
�18OSMOW ofsample [‰]
��18OPDB
Karner etal. (2002)
[‰]�18OSMOWofseawater [‰] �arag.-sw
T offluid/SW
[°C] MIS
3424-4-A-2 Pinnacle 7.3 � 0.2 3.95 � 0.03 34.93 �0.64 �0.02 1.03496 2.6 I570-1-3 Pinnacle 8.5 � 0.1 4.02 � 0.03 35.00 �0.58 0.05 1.03495 2.6 I3429-3-A-2 Pinnacle 9.2 � 0.3 3.78 � 0.03 34.76 �0.52 0.10 1.03465 3.9 I571-2-1 Pinnacle 9.7 � 0.3 4.12 � 0.01 35.10 �0.48 0.15 1.03495 2.7 I571-2-2 Pinnacle 9.8 � 1.2 3.95 � 0.04 34.93 �0.47 0.16 1.03477 3.4 I3429-3-A-8 Pinnacle 10.1 � 1.5 3.78 � 0.03 34.76 �0.45 0.18 1.03458 4.2 I3428-6-A-1 Pinnacle 10.9 � 0.6 4.00 � 0.04 34.98 �0.37 0.26 1.03471 3.6 I570-9-5 Pinnacle 10.9 � 0.2 4.04 � 0.03 35.02 �0.38 0.25 1.03476 3.4 I565-7-7 SE-Knoll 22.3 � 0.7 4.08 � 0.03 35.07 0.46 1.11 1.03392 6.8 II36-4-Z-1 Alvin 68.7 � 1.4 3.45 � 0.02 34.42 0.24 0.89 1.03350 8.6 IV36-4-Z-2 Alvin 71.7 � 0.6 3.86 � 0.02 34.84 0.17 0.82 1.03400 6.5 V26-1 SE-Knoll 177.7 � 4.2 4.34 � 0.03 35.34 0.34 0.99 1.03431 5.2 VI26-3 SE-Knoll 221.7 � 4.5 3.99 � 0.04 34.97 �0.35 0.28 1.03468 3.7 VII26 SE-Knoll 267.6 � 5.5 4.17 � 0.03 35.16 0.34 0.99 1.03414 5.9 VIII
9U/Th Systematics and ages of carbonates from Hydrate Ridge

not necessarily apply for other isotopic stages (e.g., Labeyrie etal., 1987) but is a good approximation of the true value. Thelatter value of about 1‰ is in general accord with our findingsthat the �18OPDB values of the chemoherm carbonates are up toabout 0.9‰ heavier than predicted from modern seawater.
Past seawater temperatures during the time of the chemo-herm precipitation (for details see Table 3) can be reconstructedusing past �18OSMOW seawater values (reconstructed from arecently published benthic stack from Karner et al., 2002)together with our �18O values from the chemoherm carbonates.Note, that seawater temperature reconstructions presented inTable 3 neglect any effect of pH, salinity and kinetic fraction-ation during gas hydrate formation.
From Table 3 and Figure 5 it can be seen that the recon-structed past seawater temperatures during carbonate precipi-tation vary in space and time between 2.6 and 8.6°C. TheHolocene chemoherm samples from the Pinnacle indicate tem-peratures in between 2.6 and 4.2°C. In contrast, seawater tem-peratures reconstructed from the SE-Knoll and the Alvin che-moherm indicate temperatures during carbonate precipitationof between 3.7 to 8.6°C.
Temperature fluctuations in the order of about 1°C havealready been observed in modern cold seeps fluids (Linke andSuess, 2001). However, our seawater temperature reconstruc-tion indicates variations on the order of about 3°C. Temporaland spatial fluctuations of seawater temperature at cold seep
areas can be expected because of the glacial/interglacialchanges of ocean currents and the temperature variations ofseep fluids. At the moment, we can not make further refinedinferences concerning seawater temperature changes. Furtherinvestigation may help to clarify if chemoherm carbonates canbe used as a new archive for the reconstruction of past seawatertemperature.
6. LATE QUATERNARY CHANGES OF FLUID FLOW INTHE HYDRATE RIDGE AREA
At Hydrate Ridge, advective fluid flow occurs mainly due todeformation-induced overpressuring of the sediment pore wa-ter. Overpressure can be produced by the following processes:(1) increase of compressive stress (i.e., reduction of the porevolume) caused by disequilibrium compaction and tectoniccompression, (2) changes in the volume of the pore fluid causedby temperature increase (aquathermal pressuring), diagenesisand hydrocarbon generation, (3) fluid movement and (4) pro-cesses related to density differences between fluid and gascaused by a hydraulic (potentiometric) head, osmosis and buoy-ancy (Osborne and Swarbrick, 1997).
Many different processes can be postulated for the temporalmodulation of the fluid flow causing short- and long-termvariations. These include short-term variations in pressure as-sociated with tides, ocean swell, storm surges, bottom current
Fig. 5. Plot shows age as a function of the �18OSMOW sealevel curve. On the secondary y-axis the � sealevel change isshown, assuming that the entire scale for the sealevel curve is about 1‰ (Schrag et al., 1996) and that the entire sealevelscale is 125 m (Fairbanks and Matthews, 1978; Fairbanks, 1989). The �18OSMOW sealevel curve was obtained by assigningthe first data point at 4 ka 0‰ SMOW (as the present seawater value) and multiplying with 1.03086 to account for theconversion from PDB to SMOW. Symbols show the �18OSMOW for the seawater that the chemoherm carbonates precipitatedfrom and the corresponding sealevel stand. Note that the age for 3429-3-A-8 is a mean value of sample a and b.
10 B. M. A. Teichert et al.
velocities, biologic pumping, episodic gas release; long-termvariations may result from tectonic processes, thermohalineconvection, thermal convection and sealevel changes. For ourobservations at Hydrate Ridge, only the long-term variations offluid flow are relevant. Tectonic processes are active on a timescale probably exceeding by far the observed variations andmay therefore not be relevant. Fluid flow caused by halineconvection can be excluded as driving mechanism for HydrateRidge from today’s standard of knowledge. Likewise, changesin pore water volume due to temperature increase may also notbe relevant for the cold seeps at Hydrate Ridge. There is onlyone instance of a warm pulse of advective fluid flow docu-mented during long-term monitoring of ODP site 892 on Hy-drate Ridge (Davis et al., 1995).
On the time scale of glacial/interglacial changes, their cor-responding sealevel variations may significantly influence fluidflow at Hydrate Ridge. In particular, a glacial sealevel loweringwould shift the bottom of the gas hydrate stability zone intoshallower depths followed by gas hydrate decomposition indeeper sediments. Enhanced decomposition of gas hydratesmay then generate enhanced gas and fluid flow in the cold seepareas. In addition, decomposition of gas hydrates as a conse-quence of the heightening of the gas hydrate stability zone alsoreleases considerable amounts of fresh water into the sedimentpore space thereby increasing pore fluid buoyancy. In thiscontext, it is most crucial for fluid buoyancy that the hydraulicpressure of the ascending fluids in the plumbing system withinthe sediments has to exceed the pressure of the overlyingseawater column (Carson and Screaton, 1998).
At least two scenarios can be distinguished when we con-sider pore water pressure changes due to sealevel variations: (1)seawater pressure exceeds the hydraulic pressure of the plumb-ing system below a chemoherm inhibiting the rise of fluids. (2)Seawater pressure is lower than the hydraulic pressure of theplumbing system and vigorous fluid venting occurs. Followingthis conceptual model, we propose that during glacial stagescorresponding to low sealevel the pressure difference betweenwater column and hydraulic pressure is largest. This triggersmaximum rates of fluid flow through the chemoherms, exten-sive microbial activity and relatively large rates of carbonateprecipitation. In contrast, the increase of the seawater pressuredue to a climatically induced sealevel rise at glacial/interglacialtransitions reduces the pressure difference between the oceanwater column and the hydraulic pressure of the plumbing system.This effect restricted the flow rate and the corresponding rate ofcarbonate precipitation during interglacials. The latter scenario hasalready been observed for tidally controlled short-term sealevelfluctuations. High rates of fluid flow were measured at low tideswhereas high tides were characterized by low rates of fluid flow(Linke et al., 1999; Tryon and Brown, 2001).
Besides sealevel oscillation there are other factors like den-sity differences that are a possible explanation for fluid flowvariations. The difference between the height of the watercolumn and the height of the hydraulic head is crucial incontrolling cold seep fluid flow. Thus, vigorous fluid flow mayalso be generated during sealevel highstands as long as theheight of the hydraulic head exceeds the height of the watercolumn. This interpretation may be valid for the Pinnaclesamples showing U/Th ages corresponding to early Holoceneages from 7.3 to 11.4 ka when sealevel closely approached
present-day levels. These Holocene ages indicate that fluidventing started much later at this location than at the Alvin andSE-Knoll chemoherm.
Although a conceptual model for cold seep fluid flow ispresented above, the relationship between climatically drivensealevel changes and enhanced carbonate precipitation at coldvent sites cannot be considered proven and must await furtherconfirmation. In particular, factors not controlled by climatechange like the fluid buoyancy or the height of the hydraulichead may cause fluid flow variations and have yet to be exam-ined in detail in combination with hydrological and geophysicalmeasurements. In addition, further U/Th measurements anddrilling of chemoherms are required to better constrain thechronology of the geochemical evolution of the chemohermcarbonates relative to glacial/interglacial transitions during theLate Quaternary.
7. SUMMARY
U concentrations and �234U values are sensitive indicatorsfor the fluid composition in cold seep sediments. Bottom waterenriched in 234U indicates a flux of U out of cold seep areas. Itcan be estimated that about 11% of the bottom water U origi-nates from the sedimentary pore water. From the calculatedpore water U flux (mean: Fpw � 35 � 16 ng/(cm2 · a)) and thereconstructed U pore water concentration (0.24 ng/g) a fluidflow between 46 cm/a and 353 cm/a (mean: 147 � 68 cm/a)can be estimated.
The U concentrations and �234U values of gas hydrate car-bonates reflect their precipitation from bottom water and porewater under reducing conditions. Their U/Th ages reflect peri-ods of intense fluid flow around 1.2 � 0.3 and 4.7 � 1.2 ka.Time intervals of enhanced carbonate precipitation may becontrolled by earthquakes, vertical neotectonic movement andsecond order variations of the sealevel.
The chemoherm carbonates are precipitated mostly frombottom water and show U/Th ages from 7.3 up to 267.6 ka.Their U/Th ages tend to correspond to periods of low sealevelat glacial climatic stages. Presumably, the hydraulic pressuredifference between the plumbing system below the chemo-herms and the pressure of the water column control the outflowof hydrocarbon-rich fluids at the sediment-seawater interface.
The comparison of chemoherm �18OPDB values with themarine �18OSMOW record allows the reconstruction of seawaterand/or fluid temperature during carbonate calcification. Seawa-ter temperature variations from 2.6 to 8.6 °C reconstructedfrom the different chemoherm sites vary in space and time.Most likely, they reflect changes in ocean current temperatureand/or fluid flow.
The correspondence of the chemoherm carbonate ages toglacial stages is interpreted to reflect sealevel variations. In aconceptual model, we infer that the hydraulic head is crucial forthe rate of fluid flow. During glacials, when the pressurehydraulic head is low, extensive fluid flow occurs. In contrast,during interglacial periods, when the pressure of the hydraulichead is large, the rate of fluid flow is small.
Acknowledgments—This study was made possible by the programsTECFLUX I & II (Tectonically induced Fluxes, 03G0143A &03G0148A) and LOTUS (Long-term Observatory for the Study ofControl Mechanisms for the Formation and Destabilisation of Gas
11U/Th Systematics and ages of carbonates from Hydrate Ridge

Hydrates, 03G0165A) supported by the Bundesministerium fur Bil-dung und Forschung (BMBF, Germany). This is publicationGEOTECH-2 of the program GEOTECHNOLOGIEN of the BMBFand the Deutsche Forschungsgemeinschaft (DFG). Many thanks to F.Bohm and N. Gussone for helpful comments and discussions. Thanksto D. Rickert for providing Ca pore water concentrations. We thank theofficers, crew and shipboard scientific parties of RV SONNE forexcellent support during expeditions SO143 and SO148, especially theROPOS crew. B. Domeyer, J. Heinze, A. Kolevica and R. Surberg areacknowledged for technical support. A Ph.D. scholarship to B.M.A.Teichert in the graduate school “Dynamik globaler Kreislaufe imSystem Erde” funded by the “Deutsche Forschungsgemeinschaft”(GRK 171) is gratefully acknowledged. The reviews of S.J.G. Galer,G.M. Henderson, J.M. Gieskes and S. Pichat helped significantly toimprove this manuscript.
Associate editor: S. Galer
REFERENCES
Aharon P. (1994) Geology and biology of modern and ancient subma-rine hydrocarbon seeps and vents: An introduction. Geo-MarineLetters 14, 69–73.
Aharon P., Roberts H. H., and Snelling R. (1992) Submarine venting ofbrines in the deep Gulf of Mexico: Observations and geochemistry.Geology 20, 483–486.
Aharon P., Schwarcz H. P., and Roberts H. H. (1997) Radiometricdating of submarine hydrocarbon seeps in the Gulf of Mexico. Geol.Soc. Am. Bull. 109(5), 568–579.
Barnes C. and Cochran J. K. (1988) The geochemistry of uranium inmarine sediments. In Radionuclides; a tool for oceanography (eds. J. C.Guary, P. Guegueniat, and R. J. Pentreath), pp. 162–170. Elsevier.
Barnes C. E. and Cochran J. K. (1990) Uranium removal in oceanicsediments and the oceanic U balance. Earth Planet. Sci. Lett. 97,94–101.
Bassinot F. C., Labeyrie L. D., Vincent E., Quidelleur X., ShackletonN. J., and Lancelot Y. (1994) The astronomical theory of climate andthe age of the Brunhes-Matuyama magnetic reversal. Earth Planet.Sci. Lett. 126, 91–108.
Boetius A., Ravenschlag K., Schubert C. J., Rickert D., Widdel F.,Gieseke A., Amann R., Jorgensen B. B., Witte U., and PfannkucheO. (2000) A marine microbial consortium apparently mediatinganaerobic oxidation of methane. Nature 407, 623–626.
Bohm F., Joachimski M. M., Dullo W.-C., Eisenhauer A., Lehnert H.,Reitner J., and Worheide G. (2000) Oxygen isotope fractionation inmarine aragonite of coralline sponges. Geochim. Cosmochim. Acta64(10), 1695–1703.
Bohrmann G., Greinert J., Suess E., and Torres M. (1998) Authigeniccarbonates from the Cascadia subduction zone and their relation togas hydrate stability. Geology 26(7), 647–650.
Bohrmann G., Linke P., Suess E., and Pfannkuche O. (2000) R/VSONNE cruise report, SO143 TECFLUX-I-1999. GEOMAR, Kiel.
Bohrmann G., Suess E., Greinert J., Teichert B. and Naehr T. (2002)Gas hydrate carbonates from Hydrate Ridge, Cascadia ConvergentMargin: Indicators of near-seafloor clathrate deposits. Proc. FourthInt. Conf. Gas Hydrates, pp. 102–107.
Carson B. and Screaton E. J. (1998) Fluid flow in accretionary prisms:Evidence for focused, time-variable discharge. Rev. Geophys. 36(3),329–351.
Chen J. H., Edwards R. L., and Wasserburg G. J. (1986) 238U, 234U and232Th in seawater. Earth Planet. Sci. Lett. 80, 241–251.
Cheng H., Adkins J., Edwards R. L., and Boyle E. A. (2000a) U-Thdating of deep-sea corals. Geochim. Cosmochim. Acta 64(14), 2401–2416.
Cheng H., Edwards R. L., Hoff J., Gallup C. D., Richards D. A., andAsmerom Y. (2000b) The half-lives of uranium-234 and thorium-230. Chem. Geol. 169, 17–33.
Davis E. E., Becker K. Wang K. and Carson B. (1995) Long-termobservations of pressure and temperature in Hole 892B, Cascadiaaccretionary prism. In Cascadia Margin, Proc. ODP, Sci. Res. 146,Pt.1. (ed. B. Carson, G. K. Westbrook, R. J. Musgrave, and E.Suess), pp. 299–311. College Station, TX (Ocean Drilling Program).
Duncan R. A. and Kulm L. D. (1989) Plate tectonic evolution of theCascades arc-subduction complex. In The Eastern Pacific Ocean andHawaii (eds. E. L. Winterer, D. M. Hussong, and R. W. Decker), Vol.1, pp. 413–438. Geological Society of America, Boulder, Colorado.
Duplessy J.-C., Labeyrie L., and Waelbroeck C. (2002) Constraints onthe ocean oxygen isotopic enrichment between the Last GlacialMaximum and the Holocene: Paleoceanographic implications. Quat.Sci. Rev. 21, 315–330.
Edwards R. L., Chen J. H., and Wasserburg G. J. (1987) 238U-234U-230Th-232Th systematics and the precise measurement of time overthe past 500,000 years. Earth Planet. Sci. Lett. 81, 175–192.
Edwards R. L., Beck J. W., Burr G. S., Donahue D. J., ChappellJ. M. A., Bloom A. L., Druffel E. R. M., and Taylor F. W. (1993) Alarge drop in atmospheric 14C/12C and reduced melting in theYounger Dryas, documented with 230Th ages of corals. Science 260,962–968.
Eisenhauer A., Zhu Z. R., Collins L. B., Wyrwoll K. H., and EichstatterR. (1996) The Last Interglacial sea level change: New evidence fromthe Abrolhos islands, West Australia. Geol. Rundsch. 85, 606–614.
Fairbanks R. G. (1989) A 17,000-year glacio-eustatic sea level record:Influence of glacial melting rates on the Younger Dryas event anddeep-ocean circulation. Nature 342, 637–642.
Fairbanks R. G. and Matthews R. K. (1978) The marine oxygen isotoperecords in Pleistocene coral, Barbados, West Indies. Quat. Res. 10,181–196.
Ferrel R. E. and Aharon P. (1994) Mineral assemblages occuringaround hydrocarbon vents in the northern Gulf of Mexico. Geo-Marine Letters 14, 74–80.
Friedman I., and O’Neil J. R. (1977) Compilation of stable isotopefractionation factors of geochemical interest. U. S. Geol. Surv. Prof.Pap. 440-KK. U.S. Geological Survey, Reston, VA.
Goldfinger C., Kulm L. D., Yeats R. S., McNeill L., and Hummon C.(1997) Oblique strike-slip faulting of the central Cascadia submarineforearc. J. Geophys. Res. 102(B4), 8217–8243.
Greinert J., Bohrmann G., and Suess E. (2001) Gas hydrate-associatedcarbonates and methane-venting at Hydrate Ridge: Classification,distribution and origin of authigenic lithologies. In Natural gashydrates: Occurrence, distribution, and detection (eds. C. K. Paulland W. P. Dillon), Vol. 124, pp. 99–113. American GeophysicalUnion, Washington, DC.
Henderson G. M., Slowey N. C., and Haddad G. A. (1999) Fluid flowthrough carbonate platforms: Constraints from 234U/238U and Cl- inBahamas pore-waters. Earth Planet. Sci. Lett. 169, 99–111.
Herzig P., Suess E., and Linke P. (1997) R/V SONNE cruise report,SO109: Hydrotrace. GEOMAR, Kiel.
Holbrook W. S., Hoskins H., Wood W. T., Stephen R. A., LizzaraldeD., and Party L. S. (1996) Methane hydrate and free gas on the BlakeRidge from vertical seismic profiling. Science 273, 1840–1843.
Hudson T. L. and Magoon L. B. (2002) Tectonic control on greenhousegas flux to the Paleogene atmosphere from the Gulf of Alaskaaccretionary prism. Geology 30(6), 547–550.
Ivanovich M. and Harmon R. S. (1992) Uranium-series disequilibrium:Applications to earth, marine, and environmental sciences. (2ndedition). Oxford University Press, Oxford.
Jaffey A. H., Flynn K. F., Glendenin L. E., Bently W. C., and EsslingA. M. (1971) Precision measurements of half-lives and specificactivities of 235U and. 238U. Phys. Rev. Lett. C 4, 1889–1906.
Karner D. B., Levine J., Medeiros B. P., and Muller R. A. (2002)Constructing a stacked benthic �18O record. Paleoceanography17(3), 10.1029/2001PA000667.
Kigoshi K. (1971) Alpha-recoil thorium-234; dissolution into water andthe uranium-234/uranium-238 disequilibrium in nature. Science 173,47–48.
Kulm L. D., Suess E., Moore J. C., Carson B., Lewis B. T., RitgerS. D., Kadko D. C., Thornburg T. M., Embley R. W., Rugh W. D.,Massoth G. J., Langseth M. G., Cochrane G. R., and Scamman R. L.(1986) Oregon subduction zone: Venting, fauna, and carbonates.Science 231, 561–566.
Labeyrie L. D., Duplessy J. C., and Blanc P. L. (1987) Variations inmode of formation and temperature of oceanic deep waters over thepast 125 000 years. Nature 327, 477–482.
Linke P. and Suess E. (2001) R/V SONNE cruise report, SO148TECFLUX-II-2000. GEOMAR, Kiel.
12 B. M. A. Teichert et al.

Linke P., Pfannkuche O., Torres M. E., Collier R. W., Witte U.,McManus J., Hammond D. E., Brown K. M., Tryon M. D., andNakamura K. (1999) Variability of benthic flux and discharge ratesat vent sites determined by in situ instruments. EOS TransactionsAGU. 80(46), F509.
Ludwig K. R. and Titterington D. M. (1994) Calculation of 230Th/Uisochrons, ages, and errors. Geochim. Cosmochim. Acta 58(22),5031–5042.
Moore J. C., Orange D., and Kulm L. D. (1990) Interrelationship offluid venting and structural evolution: Alvin observations from thefrontal accretionary prism, Oregon. J. Geophys. Res. 95(B6), 8795–8808.
Nikolayev D. S., Lazarev K. F., Korn O. P., and Drozhzhin V. M.(1966) Geochemical balance of radioactive elements in the basin ofthe Black Sea. Radiokhim. 8, 469–476.
Osborne M. J. and Swarbrick R. E. (1997) Mechanisms for generatingoverpressure in sedimentary basins: A reevaluation. AAPG Bull.81(6), 1023–1041.
Pirazzoli P. A. (1991) World Atlas of Holocene Sea-Level Changes.Elsevier.
Polikarpov G. G., Egorov V. N., Gulin S. B., Gulin M. B., andStokozov N. A. (1992) Gas seeps from the bottom of the Black Sea -a new object of molismology. In Molismology of the Black Sea (ed.G. G. Polikarpov), pp. 10–28, Naukova Dumka, Kiev (in Russian).
Rendsbergen P. V., Batist M. D., Klerkx J., Hus R., Poort J., VannesteM., Granin N., Khlystov O., and Krinitsky P. (2002) Sublacustrinemud volcanoes and methane seeps caused by dissociation of gashydrates in Lake Baikal. Geology 30(7), 631–634.
Schrag D. P., Hampt G., and Murray D. W. (1996) Pore fluid con-straints on the temperature and oxygen isotope composition of theglacial ocean. Science 272, 1930–1932.
Shen G. T. and Dunbar R. B. (1995) Environmental controls on uraniumin reef corals. Geochim. Cosmochim. Acta 59(10), 2009–2024.
Sibuet M. and Olu K. (1998) Biogeography, biodiversity and fluiddependence of deep-sea cold-seep communities at active and passivemargins. Deep-Sea Res. II 45, 517–567.
Sloan L. C., Walker J. C. G., Moore T. C. Jr., Rea D. K., and ZachosJ. C. (1992) Possible methane-induced polar warming in the earlyEocene. Nature 357, 320–322.
Suess E., Torres M. E., Bohrmann G., Collier R. W., Greinert J., LinkeP., Rehder G., Trehu A., Wallmann K., Winckler G., and Zuleger E.(1999) Gas hydrate destabilization: Enhanced dewatering, benthicmaterial turnover and large methane plumes at the Cascadia conver-gent margin. Earth Planet. Sci. Lett. 170, 1–15.
Suess E., Torres M. E., Bohrmann G., Collier R. W., Rickert D.,Goldfinger C., Linke P., Heuser A., Sahling H., Heeschen K., JungC., Nakamura K., Greinert J., Pfannkuche O., Trehu A., Klinkham-mer G., Whiticar M. J., Eisenhauer A., Teichert B., and Elvert M.(2001) Sea floor methane hydrates at Hydrate Ridge, Cascadia Mar-gin. In Natural Gas Hydrates: Occurrence, Distribution, and Dy-namics (eds. C. K. Paull and W. P. Dillon), Vol. 124, pp. 87–98.American Geophysical Union, Washington, DC.
Torres M. E., Bohrmann G., Brown K., deAngelis M., Hammond D.,Klinkhammer G., McManus J., Suess E., Trehu A. (1999) Geo-
chemical observations on Hydrate Ridge, Cascadia Margin dur-ing R/V-ATLANTIS-Cruise AT3–35b, July 1999. Oregon StateUniversity.
Torres M. E., McManus J., Hammond D. E., Angelis M. A. d.,Heeschen K. U., Colbert S. L., Tryon M. D., Brown K. M., and SuessE. (2002) Fluid and chemical fluxes in and out of sediments hostingmethane hydrate deposits on Hydrate Ridge, OR, I: Hydrologicalprovinces. Earth Planet. Sci. Lett. 201(3–4), 525–540.
Trehu A. M., Torres M. E., Moore G. F., Suess E., and Bohrmann G.(1999) Temporal and spatial evolution of a gas hydrate-bearingaccretionary ridge on the Oregon continental margin. Geology27(10), 939–942.
Tryon M. D. and Brown K. M. (2001) Complex flow patterns throughHydrate Ridge and their impact on seep biota. Geophys. Res. Lett.28(14), 2863–2866.
Wachter E. and Hayes J. M. (1985) Exchange of oxygen isotopes incarbon-dioxide - phosphoric acid systems. Chem. Geology 52, 365–374.
Westbrook G. K., Carson B., Musgrave R. J., and et al. (1994) Proc.ODP, Init. Repts., 146, Pt.1. College Station, TX. (Ocean DrillingProgram).
APPENDIX 1
Binary mixing calculation in order to estimate Upw
Calculation of mixing factor X:
�234Ubw � X · �234Upw � (1 � X) · �234Usw
It follows:
X � (�234Ubw � �234Usw)/(�234Upw - �234Usw)
Calculation of Upw:
Upw � (Ubw � (1 � X) · Usw)/X
APPENDIX 2
Estimation of the Fpw using a 1-box-model
�234Ubw · Fbw � �234Usw · Fsw � �234Upw · Fpw
with:
Fbw � Fsw � Fpw
It follows:
Fpw � Fsw · ���234Ubw � �234Usw�/��234Ubw � �234Upw��
13U/Th Systematics and ages of carbonates from Hydrate Ridge