Tsunami in Troia, Antik Kaynakların Işığında Troia'da Tsunami, Bilim ve Ütopya 2006
Upload
independentCategory
view
0download
0
Applied Geography 29 (2009) 158–170
Contents lists available at ScienceDirect
Applied Geography
journal homepage: www.elsevier .com/locate/apgeog
Tsunami exposure estimation with land-cover data: Oregonand the Cascadia subduction zone
Nathan Wood*
Western Geographic Science Center, US Geological Survey, 1300 SE Cardinal Court, Building 10, Vancouver, WA 98683, USA
Keywords:VulnerabilityTsunamiOregonCascadiaC-CAPLandSat Thematic MapperLand cover
* Tel.: þ1 360 993 8951; fax: þ1 360 993 8980.E-mail address: [email protected].
0143-6228/$ – see front matter Published by Elsevidoi:10.1016/j.apgeog.2008.08.009
a b s t r a c t
A Cascadia subduction-zone earthquake has the potential to generate tsunami waveswhich would impact more than 1000 km of coastline on the west coast of the UnitedStates and Canada. Although the predictable extent of tsunami inundation is similar forlow-lying land throughout the region, human use of tsunami-prone land varies, creatingvariations in community exposure and potential impacts. To better understand suchvariations, land-cover information derived from midresolution remotely-sensed imagery(e.g., 30-m-resolution Landsat Thematic Mapper imagery) was coupled with tsunami-hazard information to describe tsunami-prone land along the Oregon coast. Land-coverdata suggest that 95% of the tsunami-prone land in Oregon is undeveloped and isprimarily wetlands and unconsolidated shores. Based on Spearman rank correlationcoefficients (rs), correlative relationships are strong and statistically significant (p< 0.05)between city-level estimates of the amount of land-cover pixels classified as developed(impervious cover greater than 20%) and the amount of various societal assets, includingresidential and employee populations, homes, businesses, and tax-parcel values.Community exposure to tsunami hazards, described here by the amount and relativepercentage of developed land in tsunami-prone areas, varies considerably among the 26communities of the study area, and these variations relate to city size. Correlative rela-tionships are strong and significant (p< 0.05) for community exposure rankings based onland-cover data and those based on aggregated socioeconomic data. In the absence ofsocioeconomic data or community-based knowledge, the integration of hazards infor-mation and land-cover information derived from midresolution remotely-sensed imageryto estimate community exposure may be a useful first step in understanding variations incommunity vulnerability to regional hazards.
Published by Elsevier Ltd.
Introduction
Disaster risk is a function of the hazards (natural or technological) and the societal vulnerability of a place and is influencedby human decisions and policies made before, during, and after an extreme event. Vulnerability, defined as the characteristicsof a system that increase the potential for hazard-related losses, is determined by how a community occupies and functions inpredicted hazard zones. Extreme natural events may cause damage to individual assets and communities, but the choicesa society makes with regards to land use and its political, economic, and social systems prior to an event set the stage for theselosses by creating unsafe conditions (Mileti, 1999; Wisner, Blaikie, Cannon, & Davis, 2004).
er Ltd.

N. Wood / Applied Geography 29 (2009) 158–170 159
Community vulnerability assessments characterize the exposure, sensitivity, and resilience of a community and its assetsrelative to a hazard (Turner et al., 2003), unlike risk assessments which predict loss probability of an asset. Vulnerabilityassessments are critical if land use and emergency-management practitioners are to develop, prioritize and implement realisticpre-event mitigation and preparedness efforts. They are also required elements of natural hazard mitigation plans that must beprepared and adopted by local US governments to qualify for project grant funds under the Hazard Mitigation Grant Program, asmandated by the Disaster Mitigation Act of 2000 (DMA 2000), Public Law 106-390. These local assessments are then aggregatedin State mitigation plans to describe vulnerability in relative terms by the jurisdictions most threatened by identified hazards.
Emergency management and land-use practitioners often lack the knowledge, time, or financial resources to determinethe loss potential or probability for every structure, individual or asset in their jurisdiction or across a region. In some cases,the inability to precisely measure uncertainties in the potential for extreme events and resulting damages to assets makesrealistic risk assessments unattainable (Weichselgartner, 2001). In addition, certain risk-reduction activities implemented atregional or State scales, such as evacuation planning and awareness programs, may only require an approximation ofcommunity vulnerability to hazards and not detailed site-specific assessments. Practitioners and researchers therefore willoften overlay easily-accessible national socioeconomic databases, such as US Census Bureau data, and hazard informationwith geographic information system (GIS) tools to estimate elements of community vulnerability and to identify potentialhot-spots for further site- or asset-specific risk assessments (Cutter, Boruff, & Shirley, 2003; Wood & Good, 2004).
Another small-scale database that may support vulnerability assessments is land-cover information derived from mid-resolution remotely-sensed satellite imagery. Land-cover information at this scale has supported ecological assessments(Loveland, Gallant, & Vogelmann, 2005), urbanization studies (Auch, Taylor, & Acevedo, 2004) and resource assessments(National Oceanic and Atmospheric Administration Coastal Services Center, 2007a), but has not played a major role incommunity vulnerability studies. Although insight on human land use can only be inferred and not derived from analyzingspectral signatures of remotely-sensed imagery, land-cover information can identify regional landscape patterns, specificallythe distribution of human development, upon which extreme natural events occur. This information can be useful at regionalto international scales and when there are insufficient resources or time to analyze more-detailed socioeconomic data. Forexample, land-cover data are important inputs in global ambient population modeling (Bhaduri, Bright, Coleman, & Dobson,2002) and results of these efforts, typically available to the public at the 1-km2 scale, are used in immediate postdisasterimpact assessments (Earle, Wald, & Lastowka, 2005; Oak Ridge National Laboratory, 2006). These modeling efforts focus onestimating the number of people occupying individual pixels based on the pixel’s land-cover type and other related infor-mation, such as distance to roads and slope. Although great effort has gone into using land-cover data at the pixel level toestimate assets, less attention has been given to examining the use of aggregated land-cover data for the purposes of city-level comparisons – a goal of many practitioners who seek to allocate limited resources for specific risk-reduction strategies oradditional, more-detailed studies. In addition, risk-reduction practitioners, in the process of developing local and State hazardmitigation plans in the United States, are interested in not only population estimates but also other community attributes,including the number of homes, businesses, employees and other economic assets.
With these issues in mind, this paper examines the utility of land-cover information derived from midresolution remotely-sensed imagery in assessing variations in community vulnerability to natural hazards. Discussion of using land-coverdistributions to estimate community vulnerability is limited to comparisons of exposure, defined as the amount and relativepercentage of a community’s developed land in hazard zones, and does not include other aspects of vulnerability, such ascommunity sensitivity or resilience to extreme events. This case study focuses on Oregon coastal communities in the USPacific Northwest and variations in their exposure to tsunami hazards related to a Cascadia subduction-zone (CSZ) earth-quake. As the 2004 Sumatra–Andaman earthquake and tsunami in the Indian Ocean demonstrated, tsunamis are significantthreats to the safety, security and economic well-being of coastal communities and the US Pacific Northwest may be the nextto experience a regional tsunami-related disaster. This study area and specific hazard were chosen due to a call for animproved understanding about how vulnerability varies among the numerous communities that face similar tsunami threatsfrom a Cascadia earthquake (US Government Accountability Office, 2006).
This paper focuses on four applications of midresolution land-cover data to better understand community vulnerability totsunami hazards: (1) describing hazard-prone landscapes, (2) approximating city-level estimates of community assets, (3)assessing variations in community exposure to tsunamis, and (4) comparing city-level exposure assessments based onapproximate (e.g., land-cover) and actual (e.g., socioeconomic) data. The approaches illustrated in the paper are uniquebecause they focus on city-level estimates of hazard exposure using aggregated land-cover data rather than on estimatingasset values for individual pixels. This emphasis on relative comparisons at the community level, instead of absolute estimatesat the pixel level, was chosen to support State and regional emergency managers that focus on city-level comparisons in theirregional mitigation, response, and recovery plans. In addition, the ability to estimate and compare community exposure usingland-cover derived from midresolution remotely-sensed imagery could serve as one element in a national vulnerabilitymonitoring program to identify at-risk areas – a priority identified in recent national research agendas (Cutter, Richardson, &Wilbanks, 2003; McMahon et al., 2005).
Study area
Historical and geologic evidence suggest that the US Pacific Northwest coast has experienced numerous earthquakes andtsunamis and is likely to experience more (Atwater et al., 1995; Atwater & Hemphill-Haley, 1997). The most significant

N. Wood / Applied Geography 29 (2009) 158–170160
tsunami threat for coastal communities are waves generated by an earthquake within the Cascadia subduction zone (CSZ), theinterface of the North American and Juan de Fuca tectonic plates that extends over 1000 km from northern California tosouthern British Columbia (Fig. 1). Geologic evidence suggests that the last CSZ-related tsunamigenic earthquake occurred in1700 AD (Atwater et al., 1995; Satake, Shimazaki, Tsuji, & Ueda 1996), and researchers estimate a 10–14% probability thatanother could occur in the next 50 years (Petersen, Cramer, & Frankel, 2002). Future CSZ-related earthquakes have beenpredicted to be of magnitude 8 or greater and could generate a series of tsunami waves possibly 8 m or higher that wouldinundate the coast in tens of minutes after initial ground shaking (Cascadia Region Earthquake Workgroup, 2005; Geist, 2005;Myers, Baptista, & Priest, 1999). Based on geologic evidence of past events and tsunami-propagation modeling of futureevents related to a CSZ earthquake, the Oregon Department of Geology and Mineral Industries created a potential tsunami-inundation zone for the Oregon coast to delineate the upper limit of area expected to be covered by flood water froma tsunami caused by a magnitude 8.8 CSZ earthquake (Oregon Geospatial Enterprise Office, 2008; Priest, 1995).
Occupation and use of tsunami-prone land in the US Pacific Northwest varies considerably, from small fishing villages tolarge industrial cities, and these variations in land use influence a community’s vulnerability to a tsunami. Although much hasbeen done to describe past tsunami events (Atwater et al., 1995), assess current hazard zones (Geist, 2005; Priest, 1995; Priest,Baptista, Myers, & Kamphaus, 2001) and develop tsunami-detection systems (McCreery, 2001), less has been done tounderstand the potential impacts and societal vulnerability to tsunamis (US Government Accountability Office, 2006).Research to date on community vulnerability to CSZ-related tsunamis has focused on specific sectors at a regional scale
Toledo
Bandon
Yachats
Wheeler
Seaside
Newport
Nehalem
Astoria
Waldport
Lakeside
Gearhart
Coos Bay
Bay City
Warrenton
Tillamook
ManzanitaGaribaldi
Depoe Bay
Brookings
North Bend
Gold Beach
Port Orford
Lincoln City
Cannon Beach
Ore
go
n
Florence
0 50 Kilometers
North
P a c i f i cO c e a n
Wash.Juan
de FucaPlate
PacificPlate
Su
bd
uc
t i on
Zo
ne
Oreg.
Calif.
Cascadia
NorthAmerican
Plate
Brit.Colum.
0 50 Miles
Fig. 1. Map of the Cascadia subduction zone and Oregon coastal communities containing tsunami-prone land. The Cascadia subduction-zone line came fromCascadia Region Earthquake Workgroup (2005).

N. Wood / Applied Geography 29 (2009) 158–170 161
(Charland & Priest, 1995; Lewis, 2007), perception studies (Johnston et al., 2005; Wood & Good, 2005), local case studies(Preuss & Hebenstreit, 1996; Wood & Good 2004; Wood, Good, & Goodwin, 2002) and regional inventories of communityassets in tsunami-hazard zones (Wood, 2007; Wood & Soulard, 2008). The regional scale of tsunami hazards posed bya Cascadia subduction zone provides an excellent case study to demonstrate the utility of land-cover information derivedfrom midresolution remotely-sensed imagery to approximate aspects of community vulnerability, specifically communityexposure, to natural hazards.
Methods and digital data
Vulnerability studies and subsequent assessment methods vary considerably depending on scale, region, and researcherorientation (Weichselgartner, 2001); therefore, it is important to define research perspectives at the outset. For thepurposes of this study, analysis and discussion of community vulnerability is limited to community exposure relative topredicted tsunami-hazard zones, where community exposure calculations include the amounts and relative percentages ofvarious societal assets in tsunami-prone areas. Percentages are calculated to approximate the overall impact to a commu-nity if assets in hazard-prone areas were lost or damaged. This paper does not discuss other aspects of communityvulnerability, such as sensitivity (e.g., differences in impacts among societal subgroups and institutional structures),resilience (e.g., adaptive capacity to respond to extreme events), or the underlying determinants of vulnerability (Wisner,Blaikie, Cannon, & Davis, 2004). Results presented here, however, will ideally provide a foundation for further studies onthese topics.
To examine the utility of using land-cover data to assess and compare community exposure, GIS tools were used to overlayvarious socioeconomic datasets and land-cover data derived from midresolution remotely-sensed imagery with tsunami-hazard and city-level administrative boundaries. For this case study of tsunami hazards in the US Pacific Northwest, analysis islimited to the State of Oregon coast and the 26 communities (Fig. 1) where 2003 city-limit boundaries intersect a predictedCSZ-related, tsunami-inundation zone (Oregon Geospatial Enterprise Office, 2008). The number of residents, households,businesses, employees, and land-cover pixels classified as developed, as well as the total dollar value of tax parcels, wasdetermined for each community (delineated by city limits) and for the tsunami-prone areas within the community. Selectedsocioeconomic assets were chosen because US jurisdictions are encouraged to collect similar data when they inventorycommunity assets in the development of state and local mitigation plans (Federal Emergency Management Agency, 2001).GIS-based spatial overlays and supporting statistical tests focused on four elements:
� Describing tsunami-prone land by summarizing land-cover types in predicted hazard zones;� Determining the correlative strength between city-level estimates of selected community assets and of land-cover pixels
classified as developed;� Calculating the amount and relative percentage of land-cover pixels classified as developed in tsunami-hazard zones for
each community; and� Determining the correlative strength between city-level rankings of community exposure to CSZ-related tsunamis based on
land-cover data and those based on detailed socioeconomic data.
The number of residents and households in each community, and in the hazard-prone areas within them, were based onthe overlay of tsunami-hazard information and city-limit boundaries with block-level population counts compiled for the2000 US Census (US Census Bureau, 2008). Tax-parcel values were determined in a similar way using parcel polygonscollected in September 2005 from tax assessor offices for the seven coastal counties in Oregon. When census-block and tax-parcel polygons overlapped the tsunami-inundation line, totals for each ‘‘sliver’’ polygon were assigned values proportionateto the amount of spatial overlap. Economic data include business and employee counts culled from the 2005 InfoUSAEmployer Database (InfoUSA, 2005).
Land-cover information for the Oregon coast is represented by 2001 data of the National Oceanic and AtmosphericAdministration’s (NOAA) Coastal Change Analysis Program (C-CAP), a nationally standardized land-cover database for UScoastal regions (Dobson et al., 1995). This database represents NOAA’s contribution to the National Land-Cover Database(NLCD) 2001 effort through the interagency Multi-Resolution Land Characteristics (MRLC) consortium. NLCD land-coverproducts are automatically derived and field verified from Landsat Thematic Mapper (TM) digital satellite imagery, which isproduced at a 30-m spatial resolution. With a base scale of 1:100,000 for mapping applications and accuracy standards of 85%,NLCD data are intended for identifying regional landscape patterns and not individual features. There are 29 standard land-cover classes in C-CAP data, of which four classes identify areas of human development:
� High-intensity developed pixels contain more than 80% of impervious surfaces, contain little or no vegetation and typicallyrepresent heavily built-up urban centers, large buildings, and large paved surfaces, such as runways and interstatehighways;� Medium-intensity developed pixels contain between 50% and 79% of impervious surfaces, are a mix of constructed and
vegetated surfaces, and typically represent single family housing units, and large sheds;� Low-intensity developed pixels contain 21–49% of impervious surfaces, and are similar to medium-intensity developed
pixels with the addition of streets and roads with associated trees; and

N. Wood / Applied Geography 29 (2009) 158–170162
� Open-space developed pixels contain less than 20% of impervious surfaces and represent parks, golf courses, and otherlandscaped areas (National Oceanic and Atmospheric Administration Coastal Services Center, 2007b).
For the purposes of this study on the distribution of people and structures, developed areas are defined by pixels classifiedas low-, medium-, or high-intensity developed. Pixels classified as open-space developed are grouped with similar naturalclasses such as grasslands and pastures. Fig. 2 demonstrates how maps of land-cover, city boundaries and predicted hazardzones can quickly illustrate potential community exposure to tsunami hazards. Based on the distribution of C-CAP pixelsclassified as high-, medium-, and low-intensity developed, the majority of development is outside of the tsunami-hazardzone in the City of Bandon (Fig. 2a) and in the City of Newport (Fig. 2b). In contrast, most development in the City of Seaside isinside the hazard zone (Fig. 2c). Maps of land-cover data that highlight developed pixels may provide quicker situationalawareness to response personnel than aerial photographs, where determining areas of human development requires addi-tional visual interpretation.
Describing hazard-prone land
A first step in understanding the potential impacts of a CSZ-related tsunami is to determine what kind of land is inpredicted tsunami-hazard zones. Within the CSZ tsunami-hazard zone, no pixels from the 2001 C-CAP database are classifiedas tundra, snow/ice, estuarine forested wetland, estuarine scrub/shrub wetland or unclassified. In addition, pixels classified aswater and aquatic beds (both palustrine and estuarine) were excluded in the analysis because city-limit boundaries forOregon coastal communities have significant offshore components and inclusion of these marine C-CAP classes wouldimproperly distort estimates of land-based community vulnerability to tsunamis. Of the remaining standard land-coverclasses, seven summary classes were created for ease of reporting:
� Cultivated crops, grassland, open-space developed, and pastures;� Forest (including deciduous forest, evergreen forest, and mixed forest) and scrub/shrub;� High-intensity developed;� Medium-intensity developed;
Tsunami Inundation LineCity Limit
Land-cover Class
0 1 km 0 1 km
Open waterGrassland and open spaceDeveloped, low intensityDeveloped, medium intensityDeveloped, high intensityUnconsolidated shore and bare landForestWetland
Pacific
Ocean
0 1 km
Pacific
Ocean
Pacific
Ocean
N N N
a b c
Fig. 2. Examples of 2001 NOAA C-CAP land-cover and tsunami-inundation data for (a) City of Bandon, (b) City of Newport, and (c) City of Seaside, Oregon.
N. Wood / Applied Geography 29 (2009) 158–170 163
� Low-intensity developed;� Unconsolidated shore and bare land; and� Wetland (including palustrine forest, palustrine scrub/shrub, palustrine emergent, and estuarine emergent wetlands).
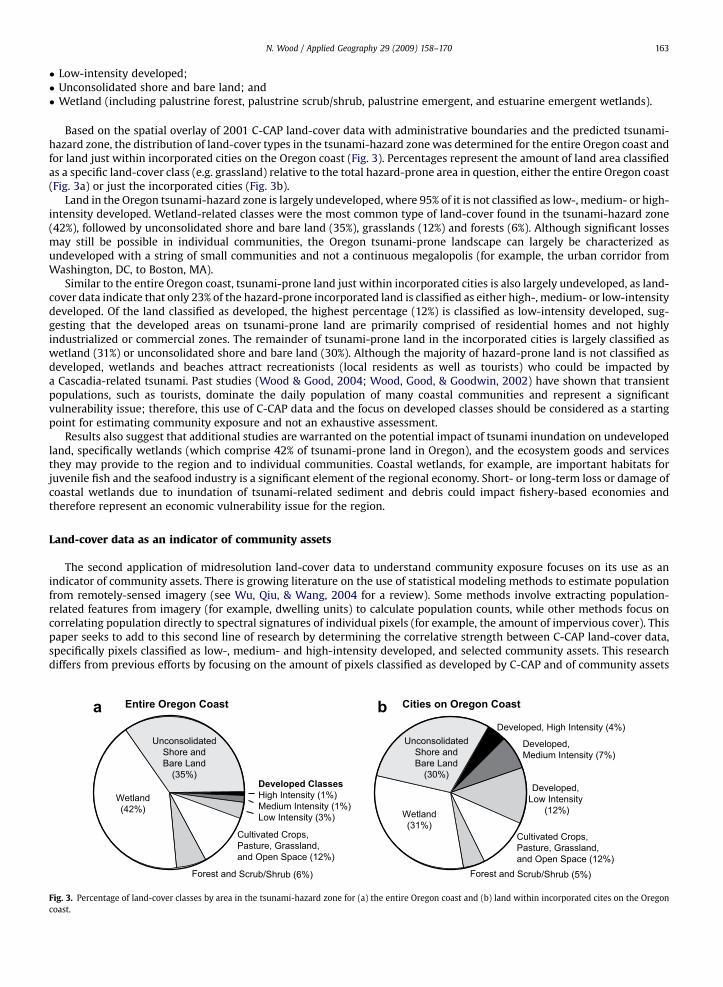
Based on the spatial overlay of 2001 C-CAP land-cover data with administrative boundaries and the predicted tsunami-hazard zone, the distribution of land-cover types in the tsunami-hazard zone was determined for the entire Oregon coast andfor land just within incorporated cities on the Oregon coast (Fig. 3). Percentages represent the amount of land area classifiedas a specific land-cover class (e.g. grassland) relative to the total hazard-prone area in question, either the entire Oregon coast(Fig. 3a) or just the incorporated cities (Fig. 3b).
Land in the Oregon tsunami-hazard zone is largely undeveloped, where 95% of it is not classified as low-, medium- or high-intensity developed. Wetland-related classes were the most common type of land-cover found in the tsunami-hazard zone(42%), followed by unconsolidated shore and bare land (35%), grasslands (12%) and forests (6%). Although significant lossesmay still be possible in individual communities, the Oregon tsunami-prone landscape can largely be characterized asundeveloped with a string of small communities and not a continuous megalopolis (for example, the urban corridor fromWashington, DC, to Boston, MA).
Similar to the entire Oregon coast, tsunami-prone land just within incorporated cities is also largely undeveloped, as land-cover data indicate that only 23% of the hazard-prone incorporated land is classified as either high-, medium- or low-intensitydeveloped. Of the land classified as developed, the highest percentage (12%) is classified as low-intensity developed, sug-gesting that the developed areas on tsunami-prone land are primarily comprised of residential homes and not highlyindustrialized or commercial zones. The remainder of tsunami-prone land in the incorporated cities is largely classified aswetland (31%) or unconsolidated shore and bare land (30%). Although the majority of hazard-prone land is not classified asdeveloped, wetlands and beaches attract recreationists (local residents as well as tourists) who could be impacted bya Cascadia-related tsunami. Past studies (Wood & Good, 2004; Wood, Good, & Goodwin, 2002) have shown that transientpopulations, such as tourists, dominate the daily population of many coastal communities and represent a significantvulnerability issue; therefore, this use of C-CAP data and the focus on developed classes should be considered as a startingpoint for estimating community exposure and not an exhaustive assessment.
Results also suggest that additional studies are warranted on the potential impact of tsunami inundation on undevelopedland, specifically wetlands (which comprise 42% of tsunami-prone land in Oregon), and the ecosystem goods and servicesthey may provide to the region and to individual communities. Coastal wetlands, for example, are important habitats forjuvenile fish and the seafood industry is a significant element of the regional economy. Short- or long-term loss or damage ofcoastal wetlands due to inundation of tsunami-related sediment and debris could impact fishery-based economies andtherefore represent an economic vulnerability issue for the region.
Land-cover data as an indicator of community assets
The second application of midresolution land-cover data to understand community exposure focuses on its use as anindicator of community assets. There is growing literature on the use of statistical modeling methods to estimate populationfrom remotely-sensed imagery (see Wu, Qiu, & Wang, 2004 for a review). Some methods involve extracting population-related features from imagery (for example, dwelling units) to calculate population counts, while other methods focus oncorrelating population directly to spectral signatures of individual pixels (for example, the amount of impervious cover). Thispaper seeks to add to this second line of research by determining the correlative strength between C-CAP land-cover data,specifically pixels classified as low-, medium- and high-intensity developed, and selected community assets. This researchdiffers from previous efforts by focusing on the amount of pixels classified as developed by C-CAP and of community assets
Developed ClassesHigh Intensity (1%)Medium Intensity (1%)Low Intensity (3%)
Cities on Oregon CoastEntire Oregon Coast
UnconsolidatedShore andBare Land
(35%)
Wetland(42%)
Forest and Scrub/Shrub (6%)
Cultivated Crops, Pasture, Grassland, and Open Space (12%)
Developed, High Intensity (4%)Unconsolidated
Shore andBare Land
(30%)
Wetland(31%)
Forest and Scrub/Shrub (5%)
Developed, Medium Intensity (7%)
Developed, Low Intensity
(12%)
Cultivated Crops, Pasture, Grassland, and Open Space (12%)
a b
Fig. 3. Percentage of land-cover classes by area in the tsunami-hazard zone for (a) the entire Oregon coast and (b) land within incorporated cites on the Oregoncoast.

N. Wood / Applied Geography 29 (2009) 158–170164
within jurisdictional boundaries (the city limits), instead of approximating values for individual pixels based on percentagesof impervious cover. This emphasis on comparing jurisdictions and not on individual pixel assessments is chosen to emulatethe perspective of risk-reduction practitioners.
For the correlation analysis, two sets of values were calculated for each community in the study area. The first set includesthe amounts of C-CAP pixels classified as high-, medium- and low-intensity developed in each of the 26 Oregon communitiesand for the land within the tsunami-hazard zone of each of these communities. The second set of values include the amountsof selected community attributes, including housing units, residents, businesses, employees, and parcel values, for eachcommunity at these two levels – the amount within the entire community and the amount within the hazard-prone areas ofthat same community. Shapiro–Wilk normality tests (W) indicate that both datasets (city-level estimates of developed landand of selected socioeconomic attributes) are non-normally distributed (p-value< 0.05).
Due to the non-normal distribution of data, nonparametric Spearman rank correlation values (rs) were calculated todetermine correlative strength between city estimates of developed land and of selected socioeconomic assets, withsignificance based on a p-value of 0.05 with 24 degrees of freedom (n¼ 26 communities). The null hypothesis was that nostatistically-significant correlation exists between the city-level estimates. City-level estimates of socioeconomic informationwere compared to four sets of C-CAP land-cover information: (1) pixels classified as low-intensity developed, (2) pixelsclassified as medium-intensity developed, (3) pixels classified as high-intensity developed, and (4) pixels classified as eitherlow-, medium- or high-intensity developed. With Spearman correlation tests, one tests the correlative strength betweenrankings based on two different criteria. For this study, community rankings based on the amount of pixels classified asdeveloped are compared to rankings based on the amount of selected assets within each community. Therefore, analysis isa relative assessment that is germane only to the study area.
Regression analyses were not considered appropriate, as dependence between datasets could not be assumed. The amountof impervious cover in a community may change as the amount of residents, employees, businesses and housing units changebut it is not reasonable to assume that there are independent and dependent variables (Zar, 1984). For example, a highnumber of C-CAP land-cover pixels classified as low-, medium- or high-intensity developed may represent cemeteries, airportrunways, parking lots or roads, with no businesses or housing units present and only dynamic populations moving throughthe area. In addition, the amount of impervious cover in two pixels may be the same, although in reality one pixel representsa five-story building with 50 employees and the other represents a 50-story building with 500 employees. In both cases, thereis a relationship between the amount of impervious cover and the amount of community assets; however, there is nofunctional dependence between the datasets As such, simple correlation tests were conducted to determine the linearrelationship between datasets.
Nonparametric Spearman correlation tests indicate a significant relationship (p< 0.05) between community estimates ofsocioeconomic data and of developed land in all cases (Table 1). Therefore, the null hypothesis is rejected in each case. Forresidential information summarized at the city level, the highest rs values, therefore the strongest relationships, wereobserved between the number of pixels classified as developed (either low-, medium- or high-intensity developed) with thenumber of housing units (rs¼ 0.96), number of residents (rs¼ 0.96), and total parcel values (rs¼ 0.78) within communities.For residential information summarizing the tsunami-prone areas of each community, the highest rs values were observedwith the number of pixels classified as low-intensity developed (rs¼ 0.91 for housing units, rs¼ 0.90 for residents, andrs¼ 0.80 for total parcel values). For business information summarized at the city level, the highest rs values were observedbetween the number of pixels classified as high-intensity developed and the number of employees (rs¼ 0.95) and businesses(rs¼ 0.91) within communities. For business information summarizing the hazard-prone areas of each community, thehighest rs values were observed with the number of pixels classified as medium-intensity developed (rs¼ 0.74 for employees
Table 1Results of nonparametric Spearman correlation (rs) statistical tests between socioeconomic data and C-CAP land-cover pixels classified as either low-,medium- and (or) high-intensity developed aggregated to (a) tsunami-prone land and (b) the city level.
Amount of cells classified as:
Low-intensitydeveloped (rs)
Medium-intensitydeveloped (rs)
High-intensitydeveloped (rs)
All developedclasses (rs)
(a) Amount in hazard zoneHousing units 0.91 0.90 0.70 0.91Residents 0.90 0.87 0.68 0.89Total parcel value ($) 0.80 0.77 0.49 0.76Employees 0.67 0.74 0.64 0.70Businesses 0.77 0.81 0.69 0.80
(b) Entire cityHousing units 0.93 0.95 0.94 0.96Residents 0.93 0.94 0.93 0.96Total parcel value ($) 0.76 0.77 0.72 0.78Employees 0.85 0.89 0.95 0.90Businesses 0.81 0.84 0.91 0.85
All correlations are statistically significant at p< 0.05 (df¼ 24, N¼ 26 communities).

N. Wood / Applied Geography 29 (2009) 158–170 165
and rs¼ 0.81 for businesses). Overall, city level and tsunami-related results presented here follow previous studies that showhigh correlations between impervious cover and population estimates for individual pixels (Wu, Qiu, & Wang, 2004).
In general, higher rs values, therefore stronger relationships, were observed between city-level estimates of the amount ofsocioeconomic assets and the amount of pixels classified as developed than estimates for just the hazard-prone areas ofcommunities. Lower correlation values for data representing tsunami-prone areas may reflect variations in land use withinthese areas among the 26 communities, as past studies have correlated variations in population counts with different land-use types classified from remotely-sensed imagery (Wu, Qiu, & Wang, 2004). For example, although not tested here, differentrs values for the number of businesses and land-cover pixels classified as high-intensity developed in communities deter-mined at the hazard (rs¼ 0.69, Table 1) and city level (rs¼ 0.91, Table 1) may reflect variations in land use. The relationshipbetween amounts of impervious surfaces and the number of businesses may not deviate greatly in non-coastal portions of the26 communities, regardless of type (for example, tourist- or manufacturing-based economies). However, although theamount of impervious cover may not vary, the actual land use may vary significantly in the low-lying areas of tourism-basedand manufacturing-based communities. Communities with higher tourism-based economies will likely have a highernumber of smaller businesses and larger parking lots in areas close to shore. Communities with manufacturing-basedeconomies will have business districts, but they may use low-lying land adjacent to waterways for shipping or storagefacilities. Although the amounts of impervious cover may not vary in these communities, what the impervious coverrepresents does vary (stores and parking lots versus warehouses and shipping containers), possibly resulting in lowercorrelations for hazard-prone land between the amount of pixels classified as developed and the amount of communityassets.
Regardless of these potential differences between coastal and non-coastal land use within communities, the high,statistically-significant correlation values found in all comparisons (Table 1) suggest that the aggregation of land-cover pixelsclassified as low-, medium- and high-intensity developed may be a useful first approximation of community assets,specifically residential and business populations.
Variations in community exposure
The third application of midresolution land-cover data in understanding community exposure focuses on its use indetermining the degree to which communities occupy predicted hazard zones and assessing variations among the 26 Oregoncommunities. Variations in community exposure to tsunami hazards were estimated by calculating the amount andpercentage of land-cover pixels classified as either low-, medium- or high-intensity developed in tsunami-hazard zoneswithin city-limit boundaries. Although not a loss estimate, assessing the distribution of developed areas in relation to pre-dicted hazard zones provides some insight of the potential impact to community assets, based on results in the previoussection that demonstrate a high correlation between land-cover data and community assets.
Results indicate that the amount (Fig. 4a) and percentage (Fig. 4b) of land classified as either low-, medium- or high-intensity developed in tsunami-hazard zones varies dramatically along the Oregon coast. Cities on both y-axes are arranged indescending geographic order from the City of Astoria in the north to the City of Brookings in the south (Fig. 1). Because of thenon-normal distribution and extreme range of values found in the data, median values are used to summarize regional trendsand third quartiles are noted to identify communities that are significantly above these regional trends.
Although the median values for the amount and percentage of developed land in hazard-prone lands are only 0.31 km2
and 13%, respectively, some communities are well above these medians. The City of Seaside, for example, has 3.26 km2 ofdeveloped land (largely low- and medium-intensity developed) in hazard-prone areas, representing 83% of its developedland. In general, results indicate that communities on the northern Oregon coast have higher amounts and percentages ofassets on tsunami-prone land than other communities. Results also indicate that high amounts of developed land inhazard-prone areas in a community do not always mean high percentages. For example, the amounts of developed land intsunami-prone areas of Lincoln City, Newport, and North Bend exceed the regional third quartile of 0.87 km2, yet theseamounts represent a minority of the overall urban footprint in these larger communities (17%, 13%, and 17%, respectively).Conversely, smaller cities of Cannon Beach, Waldport, and Yachats have less than 0.87 km2 of developed land in tsunami-prone land but these low amounts represent a significant portion of each town’s total development (49%, 33%, and 40%,respectively). Therefore, while some communities have high amounts of assets in tsunami-prone areas, others have highpercentages of their assets in these areas. Only a few communities, such as the cities of Warrenton, Gearhart, Seaside, andRockaway Beach are above the third quartile values in both categories.
If higher-resolution socioeconomic information is unavailable and (or) immediate response is required, estimates ofcommunity exposure based on midresolution land-cover data provides emergency managers with an initial approximation ofwhere disaster-related issues may be greatest across a large geographic area and where to focus risk reduction, awareness,and preparedness efforts. However, it remains the responsibility of risk-reduction practitioners and emergency managers todetermine where they should expend limited resources: communities with potentially high amounts but low percentages ofassets in hazard-prone areas, or communities with low amounts but high percentages of assets in these areas. The former mayneed greater assistance in immediate response and relief efforts, while the latter may need greater assistance in long-termrecovery from an extreme event.
Exposure estimates based on land-cover patterns were not calculated to suggest that certain communities are ignoringscientific findings and are deliberately developing hazard-prone areas. The threat of Cascadia-related tsunamis in the US

0% 50% 100%
Percentage of Developed Land
in Tsunami Hazard Zone
0 1.0 2.0 4.0
AstoriaWarrenton
GearhartSeaside
Cannon BeachManzanita
NehalemWheeler
Rockaway BeachGaribaldiBay City
TillamookLincoln CityDepoe Bay
NewportToledo
WaldportYachatsFlorenceLakeside
North BendCoos Bay
BandonPort Orford
Gold BeachBrookings
3rd Quartile - 0.87 km2
Amount of Developed Land (km2)
in Tsunami Hazard Zone
AstoriaWarrenton
GearhartSeaside
Cannon BeachManzanita
NehalemWheeler
Rockaway BeachGaribaldiBay City
TillamookLincoln CityDepoe Bay
NewportToledo
WaldportYachatsFlorenceLakeside
North BendCoos Bay
BandonPort Orford
Gold BeachBrookings
3rd Quartile - 30%
High IntensityMedium IntensityLow Intensity
3.0
a b
Fig. 4. The (a) amount and (b) percentage of land classified as developed in the tsunami-hazard zone for each community. City names are ordered geographicallyfrom north to south, with the most northern town at the top.
N. Wood / Applied Geography 29 (2009) 158–170166
Pacific Northwest has been recognized only in the past few decades. Estimates were calculated to show that the developmentof low-lying, and subsequently tsunami-prone, areas is not constant in the 26 Oregon communities. Although the potential fortsunami-hazard inundation is similar for these areas, communities have made different decisions over time on how andwhere development occurs. These decisions and the resulting variations in land-cover patterns shape the communityvulnerability to future extreme events. Future studies of land-cover and land-cover change in this region will shed light onwhether development patterns shift away from hazard-prone land in these 26 communities, as our understanding improvesof the catastrophic potential for Cascadia-related earthquakes and tsunamis.
Approximating exposure rankings using land-cover data
Emergency managers, especially those with State or Federal agencies, seek to assess community vulnerability often inrelative, comparative terms to prioritize limited risk-reduction resources. They frequently, however, lack the resources(financial, human, or knowledge base) to compile and analyze socioeconomic databases, such as Census information, taxassessor records and business datasets, in relation to predicted hazard zones. Therefore, the fourth application of mid-resolution land-cover data for understanding vulnerability seeks to address this issue and focuses on the use of land-coverdata as a proxy for detailed socioeconomic information when ranking community exposure to tsunamis. To do this, statisticaltests were conducted to determine the correlative strength between city level, tsunami exposure rankings based on land-cover data and those based on detailed socioeconomic data.
Four rank values were calculated for each community – two rankings describing the amount and percentage of developedland in tsunami-prone areas and two rankings describing the amount and percentage of community assets in tsunami-proneareas based on socioeconomic data. In each case, the 26 Oregon communities were ranked from 1 (lowest) to 26 (highest) forthe various attributes. For the two rankings based on land-cover data, communities were ranked by the amount and then bythe percentage of its total land classified as developed (low-, medium- and high-intensity) that fall within the predictedtsunami-inundation zone. Pixels classified as either low-, medium- or high-intensity developed were chosen for the cityrankings because the sum of the three classes demonstrated consistently higher correlation values (rs) to socioeconomic datathan the any of the three classes taken separately (Table 1). For the two rankings based on socioeconomic data, communities

N. Wood / Applied Geography 29 (2009) 158–170 167
were ranked based on the amount and then by the percentage of socioeconomic assets in tsunami-prone areas. Individualranks were calculated for each of the assets, including residents, housing units, businesses, employees, and parcel values.Overall ranks were then calculated for each community based on a sum of its five ranks for the individual assets.
Nonparametric Spearman correlation values (rs) were calculated to determine the correlative strength betweencommunity exposure rankings based on land-cover data and on socioeconomic data, with significance based on a p-valueof 0.05 (df¼ 24, n¼ 26 communities). Correlation values were calculated for community rankings based on the amountof assets in tsunami-prone areas and for rankings based on the percentage of assets in these areas. Like the earliersection, nonparametric correlation tests were considered more appropriate than simple linear regressions due to theordinal, non-independent, and non-normal nature of the rankings. A correlation index (r2
s ) is calculated by squaring thecorrelation coefficient (rs) and, as in a regression analysis, is considered a measure of the strength of the correlationrelationship (Zar, 1984).
Simple correlation tests indicate significant relationships (p< 0.05) between community exposure rankings based onland-cover pixels (x-axis) and those based on socioeconomic data (y-axis) for both the amount (Fig. 5a) and percentage(Fig. 5b) of community assets in tsunami-hazard zones. In both Fig. 5a and b, a hypothetical series of points (denoted as graysquares) are included to illustrate the distribution of cities if the relationships between the exposure rankings were perfect(i.e., rs¼ 1.0). Although relationships were significant with high correlation values (rs) and indices (r2
s ) in both cases, thesevalues are higher for community exposure comparisons (r¼ 0.87; r2¼ 0.76) than for sensitivity comparisons (r¼ 0.81;r2¼ 0.65). Therefore, there is a stronger relationship between rankings based on land-cover data and socioeconomic datawhen estimating variations in the amount of assets in tsunami-prone areas than there is when estimating variations in thepercentage of assets in these areas. Although the overall correlative relationship is not as strong when comparing percentage-related rankings, the distribution of points in Fig. 5a and b do suggest that rankings based on land-cover pixels did a better jobof identifying the communities that have the highest percentages than those with the highest amounts. In Fig. 5b, rankingsbased on land-cover pixels and socioeconomic data were identical or very close for the top seven communities; whereasrankings in Fig. 5a were consistent only for the top two communities. In summary, results indicate that there is a strongcorrelative relationship between exposure rankings based on land-cover data and socioeconomic data.
Land-cover data were then used to test an assertion of Cross (2001) that city size is an essential element in understandingcommunity vulnerability, specifically that smaller communities are vulnerable in different ways than larger communities.A simple linear regression was performed to test the predictive power of city size as an indicator of community exposure totsunami hazards on the Oregon coast (Fig. 6). City size, the independent variable (x-axis), is defined as the amount of low-,medium- and high-intensity developed pixels within city limits of each community. The dependent variable (y-axis) for thisexercise is the sum of ranks for the amount of the five socioeconomic assets discussed earlier (e.g., housing units, residents,businesses, employees, and parcel values) in tsunami-prone areas minus the sum of ranks for the percentage of assets intsunami-prone areas. A positive value in this exercise indicates that a community’s rank for the amount of assets in tsunami-prone areas is higher than its rank for the percentage of its assets in these areas. Unlike the statistical tests in previous sectionsof this article, a simple linear regression was considered appropriate for this section due to the interval nature of the data andbecause the hypothesis being tested assumes functional dependence between datasets (Zar, 1984).
Simple linear regression analysis indicates a strong and statistically-significant relationship (p< 0.05; r2¼ 0.83) betweencity size and the difference between amount and percentage ranks (Fig. 6). In general, smaller cities (lower amounts of totaldeveloped pixels on the x-axis) tend to have a negative sum of ranks, meaning they have lower amount ranks than percentage
Amount of Assets in Tsunami-Prone Areas
Ran
k b
y S
ocio
eco
no
mic
Att
rib
ute
s
1
5
10
15
20
25
1 5 10 15 20 25
Rank by Land-cover Pixels Classified
as Developed
p < 0.05r 2s = 0.76rs = 0.87
CitiesCities, if rs = 1.0
Percentage of Assets in Tsunami-Prone Areas
Ran
k b
y S
ocio
eco
no
mic
Att
rib
ute
s
1 5 10 15 20 25
1
5
10
15
20
25
Rank by Land-cover Pixels Classified
as Developed
p < 0.05r 2s = 0.65rs = 0.81
CitiesCities, if rs = 1.0
a b
Fig. 5. Comparison of community exposure rankings based on land-cover data and socioeconomic data for (a) the amount of community assets in tsunami-proneareas and (b) the percentage of community assets in tsunami-prone areas. Higher rankings signify higher amounts and percentages.

p < 0.001R2 = 0.83
-30
-20
-10
0
10
20
30
40
50
2 4 6 8 100
CityTrend line
Su
m o
f R
an
ks C
om
pari
so
n
(Am
ou
nt
- P
erc
en
tag
e)
Amount of developed land in km2
Fig. 6. Comparison of the sum of ranks for the amount and percentage of community assets in tsunami-prone areas, ordered by city size. Positive values signifythat the amount sum of ranks is higher than the percentage sum of ranks for a community.
N. Wood / Applied Geography 29 (2009) 158–170168
ranks. Conversely, larger cities (higher amounts of developed pixels on the x-axis) tend to have positive sum of ranks,meaning they have larger amount ranks than percentage ranks. In summary, larger cities tend to have greater amounts ofassets in tsunami-prone areas, but smaller cities tend to have higher percentages of their assets in tsunami-prone areas on theOregon coast. These findings support Cross’ (2001) assertion that although smaller communities have smaller populations atrisk, they may have higher proportions of their populations in hazard-prone land. Therefore, while larger cities may havehigher numbers of societal resources (for example, homes and businesses) in hazard-prone land, an event may not causecommunity-wide failure, as it may in a smaller community. Understanding the differences and implications of having highamounts and/or high percentages of assets in hazard-prone areas and the variations in the occupation of hazard-prone land,the question for State-level agencies again becomes where to prioritize and allocate pre-event risk-reduction resources andpost-event disaster relief aid – to the larger communities that may incur great losses or to the smaller communities that maynot be able to recover from the loss of the majority of their assets?
Discussion
Results of this study demonstrate that midresolution land-cover data can be used to visualize and assess geographicvariations in the spatial coincidence of developed areas and tsunami-hazard zones as one indicator of community vulner-ability. Although this study focuses on community exposure to tsunami hazards on the Oregon coast, methods presented herefor using land-cover data to assess community exposure could be applied to any potential extreme event where hazard zonescan be delineated, such as volcanic lahars, floods, landslides, and hurricane storm-surge inundation.
The strength of the methods presented here is the regional/national scope they provide to emergency managers who havelimited analytical resources. Exposure results generated by these methods, however, should be considered only as firstapproximations, not exhaustive statements, of community vulnerability. Although methods here can provide insight ofdeveloped areas and their relation to hazard zones, they are unable to determine the finer elements of vulnerability, such asinfrastructure fragility, demographic sensitivity (be it residents, employees or tourists), economic inequities within andbetween communities, cultural issues of risk tolerance and willingness to pay, the political realities of potential risk-reductionefforts and the postdisaster adaptive capacity of communities. As presented here, methods also fail to capture activitiesrelated to community function that fall outside of jurisdictional boundaries, such as rural areas just outside city limits thatmay either rely upon or contribute to city services and the economic role of offshore fishing and agriculture in nearbyunincorporated land for some coastal communities. By focusing only on developed areas within communities, this study doesnot shed light on urban footprints, which includes net inflows of resources and net outflows of wastes. This method cannotestablish how and why communities and larger systems are specifically vulnerable to various hazards, but it can highlightareas where there are high amounts and percentages of developed land in hazard zones and where additional site-specificstudies may be warranted.
Presented methods may be more useful for assessing variations in hazard exposure among small- to mid-sizecommunities across a larger geographic area and less useful when comparing large cities and metropolitan area, especiallyin less-developed countries where population densities in large cities may be significantly higher than US cities. In largercities, the high amounts of impervious surfaces that are associated with high-rise construction, parking garages and otherhigh-occupancy structures may preclude the use of land-cover data to realistically approximate societal exposure to naturalhazards and compare that with smaller communities. Due to the lack of metropolitan areas in predicted CSZ-related,tsunami-hazard zones, this issue cannot be tested here in this paper. However, if this method does have limited utility inmetropolitan areas, emergency managers for large, urbanized areas in the United States (e.g., Seattle, New York City, Los

N. Wood / Applied Geography 29 (2009) 158–170 169
Angeles) typically have greater data, human, and financial resources than smaller communities to calculate communityexposure to hazards and will not need to rely on land-cover data and methods presented here. The more-rural and smallercommunities will likely have limited resources and may need greater assistance in understanding geographic variations incommunity exposure to hazards.
Community exposure indicators based on land-cover data could be a valuable tool in a national vulnerability monitoringprogram that also includes broad-scale assessments of critical facilities, economic trends, and demographic sensitivity topredicted hazard zones. National databases on these topics exist or are in development, such as critical infrastructure (Hicks,2005), population (US Census Bureau, 2008), and demographic sensitivity (Cutter, Boruff, & Shirley, 2003) but none have yetto be realistically coupled with hazard information on an operational basis at the national level. A national vulnerabilitymonitoring program that integrates regional assessments of hazards and these indicators of human development could helpthe public- and private-sector at various scales (for example, county, state or national) generate political and communityinterest in threats facing their cities, identify where to focus awareness efforts and determine where to focus limitedresources for more-detailed assessments of specific communities, assets and issues. Estimation of community exposure basedon land-cover patterns may be a starting point of many communities in understanding their vulnerability to natural hazards,to be later refined with higher-resolution and (or) community-based socioeconomic information to examine other aspects ofcommunity vulnerability (i.e., infrastructure sensitivity, community resilience). For other communities or agencies withnational perspectives, it may be the only approach available if the geographic scale of a hazard is so large that the collection ofhigher-resolution data is not feasible or if resources are not available for further detailed studies. Whether it is a first step ora last step, the approach outlined here provides practitioners and policymakers with methods for visualizing and estimatingthe implications of human development on the risk of future disasters.
Conclusions
This case study of community vulnerability to tsunami hazards on the Oregon coast was intended to examine the utility ofland-cover data derived from midresolution remotely-sensed imagery in assessing and visualizing the relationship betweendeveloped areas and predicted hazard zones. Results presented here demonstrate that the use of midresolution land-coverdata can be an effective first step in understanding geographic variations in community exposure to natural hazards. Theoverlay of GIS-based land-cover and tsunami-hazard zone data indicate that the majority of tsunami-prone land along theOregon coast is undeveloped and primarily wetlands and unconsolidated shores. The amount and percentage of land-coverpixels classified as low-, medium- and high-intensity developed within tsunami-prone land in cities show high correlationwith socioeconomic data, such as the number of people, businesses, and parcel values. Based on the distribution of land-coverpixels classified as developed, community exposure to tsunamis varies considerably along the Oregon coast and is greatest innorthern cities. Statistical analyses indicate significant and strong correlative relationships between exposure rankings basedon land-cover data and those based on socioeconomic attributes. Finally, statistical tests also indicate a strong relationshipbetween city size and community exposure to tsunami hazards, where larger cities have higher amounts of assets in tsunami-prone areas and smaller cities have higher percentages of their assets in these areas.
Acknowledgements
This study was supported by the ‘‘Risk and Vulnerability’’ project managed by the US Geological Survey GeographicAnalysis and Monitoring Program. Mara Tongue, Susan Benjamin, Len Gaydos, Anne Wein, and Zhong Lu of the USGS and twoanonymous reviewers gave insightful reviews of the manuscript.
References
Atwater, B., Nelson, A., Clague, J., Carver, G., Yamaguchi, D., Bobrowsky, P., et al. (1995). Summary of geologic evidence for past great earthquakes at theCascadia subduction zone. Earthquake Spectra, 11(1), 1–18.
Atwater, B. F., & Hemphill-Haley, E. (1997). Recurrence intervals for great earthquakes of the past 3,500 years at northeastern Willapa Bay, Washington(USGS Professional Paper 1576). Reston, VA: United States Geological Survey.
Auch, R., Taylor, J., & Acevedo, W. (2004). Urban growth in American cities: glimpses of US urbanization (USGS Circular 1252). Reston, VA: United StatesGeological Survey.
Bhaduri, B., Bright, E., Coleman, P., & Dobson, J. (2002). LandScan: locating people is what matters. Geoinformatics, 5(2), 34–37.Cascadia Region Earthquake Workgroup. (2005). Cascadia subduction zone earthquakes: A magnitude 9.0 earthquake scenario (DOGAMI open-file report O-05-05).
Portland, OR: Oregon Department of Geology and Mineral Industries.Charland, J., & Priest, G. (1995). Inventory of critical and essential facilities vulnerable to earthquake or tsunami hazards on the Oregon coast (DOGAMI open-file
report O-95-02). Portland, OR: Oregon Department of Geology and Mineral Industries.Cross, J. (2001). Megacities and small towns: different perspectives on hazard vulnerability. Environmental Hazards, 3, 63–80.Cutter, S., Boruff, B., & Shirley, W. (2003). Social vulnerability to environmental hazards. Social Science Quarterly, 84(2), 242–261.Cutter, S. L., Richardson, D., & Wilbanks, T. (2003). A research and action agenda. In S. Cutter, D. Richardson, & T. Wilbanks (Eds.), The geographical dimensions
of terrorism (pp. 223–229). New York: Routledge.Dobson, J., Bright, E., Ferguson, R., Field, D., Wood, L., Haddad, K., et al. (1995). NOAA coastal change analysis program: guidance for regional implementation
version 1.0 (NOAA technical report NMFS 123). Silver Springs, MD: US Department of Commerce National Oceanic and Atmospheric Administration.Earle, P., Wald, D., & Lastowka, L. (2005). PAGER – rapid assessment and notification of an earthquake’s impact (USGS fact sheet 3026). Reston, VA: US
Geological Survey.Federal Emergency Management Agency. (2001). State and local mitigation planning how-to guide #2: understanding your risks (FEMA 386-2). Washington,
DC: U.S. Government Printing Office.

N. Wood / Applied Geography 29 (2009) 158–170170
Geist, E. (2005). Local tsunami hazards in the Pacific Northwest from Cascadia subduction zone earthquakes (USGS professional paper 1661-B). Reston,VA: US Geological Survey.
Hicks, R. (2005). GEOINT enhances stateside force protection. Pathfinder, 3(4), 21–22.InfoUSA. (2005). Employer database. http://www.infousagov.com/employer.asp Retrieved 1.09.05.Johnston, D., Paton, D., Crawford, G., Ronan, K., Houghton, B., & Burgelt, P. (2005). Measuring tsunami preparedness in coastal Washington, United States.
Natural Hazards, 35(1), 173–184.Lewis, D. (2007). Implementation of 2005 Senate Bill 2 relating to public safety, seismic safety and seismic rehabilitation of public buildings (DOGAMI report to the
seventy-fourth Oregon Legislative Assembly). Portland, OR: Oregon Department of Geology and Mineral Industries. 148 p.Loveland, T. R., Gallant, A. L., & Vogelmann, J. E. (2005). Perspectives on the use of land-cover data for ecological investigations. In J. Wiens, & M. Moss (Eds.),
Issues and perspectives in landscape ecology. London: Cambridge University Press.McCreery, C. (2001). Impact of the national tsunami hazard mitigation program on the operations of the Pacific Tsunami Warning Center. Proceedings of the
international tsunami symposium, national tsunami hazard mitigation program review 109–117.McMahon, G., Benjamin, S., Clarke, K., Findley, J., Fisher, R., Graf, W., et al. (2005). Geography for a changing world: a science strategy for the geographic
research of the US Geological Survey, 2005–2015 (USGS Circular 1281). Reston, VA: US Geological Survey.Mileti, D. (1999). Disasters by design: A reassessment of natural hazards in the United States. Washington DC: Joseph Henry Press.Myers, E., Baptista, A., & Priest, G. (1999). Finite element modeling of potential Cascadia subduction zone tsunamis. Science of Tsunami Hazards, 17(10), 3–18.National Oceanic and Atmospheric Administration Coastal Services Center. (2007a). Land cover analysis – state project summaries. http://www.csc.noaa.gov/
crs/lca/apps.html Retrieved 20.08.08.National Oceanic and Atmospheric Administration Coastal Services Center. (2007b). Land cover analysis – C-CAP classification scheme. http://www.csc.
noaa.gov/crs/lca/tech_cls.html Retrieved 20.08.08.Oak Ridge National Laboratory. (2006). Hundreds of licenses. Oak Ridge National Laboratory Review, 39(3), 17.Oregon Geospatial Enterprise Office. (2008). Oregon Geospatial Enterprise Office (GEO) Spatial Data Library. Retrieved 20.08.08. Tsunami inundation line.
http://gis.oregon.gov/DAS/EISPD/GEO/alphalist.shtml#T.Petersen, M., Cramer, C., & Frankel, A. (2002). Simulations of seismic hazard for the Pacific Northwest of the United States from earthquakes associated with
the Cascadia subduction zone. Pure and Applied Geophysics, 159, 2147–2168.Preuss, J., & Hebenstreit, G. (1996). Integrated tsunami-hazard assessment for a coastal community, Grays Harbor, Washington. (USGS professional paper
1560). In A. Rogers, T. Walsh, W. Kockleman, & G. Priest (Eds.), Assessing earthquake hazards and reducing risk in the Pacific Northwest (pp. 77–90). Reston,VA: United States Geological Survey.
Priest, G. (1995). Explanation of mapping methods and use of the tsunami hazard maps of the Oregon coast (DOGAMI open-file report O-95-67). Portland,OR: Oregon Department of Geology and Mineral Industries.
Priest, G., Baptista, A., Myers, E., III, & Kamphaus, R. (2001). Tsunami hazard assessment in Oregon. Proceedings of the International Tsunami Symposium,National Tsunami Hazard Mitigation Program Review 55–65.
Satake, K., Shimazaki, K., Tsuji, Y., & Ueda, K. (1996). Time and size of a giant earthquake in Cascadia inferred from Japanese tsunami records of January 1700.Nature, 379, 246–249.
Turner, B., Kasperson, R., Matson, P., McCarthy, J., Corell, R., Christensen, L., et al. (2003). A framework for vulnerability analysis in sustainability science.Proceedings of the National Academy of Sciences, 100(14), 8074–8079.
US Census Bureau. (2008). Census 2000. Retrieved 20.08.08. Census 2000 Gateway. http://www.census.gov/main/www/cen2000.html.US Government Accountability Office. (2006). US tsunami preparedness: Federal and state partners collaborate to help communities reduce potential impacts,
but significant challenges remain (GAO Report#GAO-06-519). Washington, DC: US Government Printing Office.Weichselgartner, J. (2001). Disaster mitigation: the concepts of vulnerability revisited. Disaster Prevention and Management, 10(2), 85–94.Wisner, B., Blaikie, P., Cannon, T., & Davis, I. (2004). At risk: Natural hazards, people’s vulnerability and disasters (2nd ed.). New York: Routledge.Wood, N. (2007). Variations in community exposure and sensitivity to tsunami hazards in Oregon (USGS scientific investigations report 2007-5283). Reston,
VA: United States Geological Survey. 43 p.Wood, N., & Good, J. (2004). Vulnerability of a port and harbor community to earthquake and tsunami hazards: the use of GIS in community hazard
planning. Coastal Management, 32(3), 243–269.Wood, N., & Good, J. (2005). Perceptions of earthquake and tsunami issues in U.S. Pacific Northwest port and harbor communities. International Journal of
Mass Emergencies and Disasters, 23(3), 103–138.Wood, N., & Soulard, C. (2008). Variations in community exposure and sensitivity to tsunami hazards on the open-ocean and Strait of Juan de Fuca coasts of
Washington (USGS scientific investigations report 2008-5004). Reston, VA: United States Geological Survey. 34 p.Wood, N., Good, J., & Goodwin, R. (2002). Vulnerability assessment of a port and harbor community to earthquake and tsunami hazards: integrating
technical expert and stakeholder input. Natural Hazards Review, 3(4), 148–157.Wu, S., Qiu, X., & Wang, L. (2004). Population estimation methods in GIS and remote sensing: a review. GIScience & Remote Sensing, 42(1), 80–96.Zar, J. (1984). Biostatistical analysis (2nd ed.). New Jersey: Prentice Hall.
Copyright © 2022 FDOKUMEN