Tsunami Hazard Assessment of Chabahar Bay Related to Megathrust Seismogenic Potential of the Makran...
16
ORIGINAL PAPER Tsunami hazard assessment of Chabahar bay related to megathrust seismogenic potential of the Makran subduction zone A. R. Payande • M. H. Niksokhan • H. Naserian Received: 8 March 2014 / Accepted: 14 October 2014 Ó Springer Science+Business Media Dordrecht 2014 Abstract Tsunami inundation mapping is the first step in the development of effective evacuation plans for communities at risk. These maps also provide bases for land use planners in communities to reduce risk by locating critical facilities out of the potential tsunami flood plain. The Makran subduction zone, located off the Indian Ocean coasts of Iran and Pakistan, is an important tsunamigenic zone for the region. On the 27th November, 1945, it was the site of a major earthquake with a moment magnitude of 8.1 and killed about 4,000 people. This event is a proof that Makran coastal areas are unsafe since the tsunami is quite probable. The objective of this study was providing tsunami inundation and hazard maps in Chabahar bay which is located in South East of Iran and the northern coast of Oman Sea. Three different source magnitude scenarios along Makran subduction zone are considered and for each scenario, numerical modeling of tsunami propagation is performed using MIKE 21 FM numerical software. Because the Makran subduction zone is very close to the Chabahar bay, unstructured triangular mesh with a higher level of refinement closer to the area of interest was used so that the tsunami was not numerically dissipated. After analyzing the data obtained from the results, inundation maps were produced, and by combining these maps, tsunami hazard map was provided for the bay. Tsunami wave amplification has been observed mainly in the outer coasts of the bay where the uplifted rocky shore experience up to 18 m wave height. Chabahar bay omega form and two eastern and western headlands cause a considerable depreciation in tsunami wave. Longer distance of coasts within the bay is another reason of tsunami depreciation inside the bay. Based on the generated inundation and hazard maps, two flood zones are specified. The first zone associated with no inundation or low inundation on cliffy shores, and the second zone would experience extensive inundation on the coast of kenarak areas, areas with sandy beaches and gentle slope. A. R. Payande Á H. Naserian Yekom Consulting Engineers, Tehran, Iran M. H. Niksokhan (&) Graduate Faculty of Environment, University of Tehran, Tehran, Iran e-mail: [email protected] 123 Nat Hazards DOI 10.1007/s11069-014-1476-x Author's personal copy
Transcript of Tsunami Hazard Assessment of Chabahar Bay Related to Megathrust Seismogenic Potential of the Makran...

ORI GIN AL PA PER
Tsunami hazard assessment of Chabahar bay relatedto megathrust seismogenic potential of the Makransubduction zone
A. R. Payande • M. H. Niksokhan • H. Naserian
Received: 8 March 2014 / Accepted: 14 October 2014� Springer Science+Business Media Dordrecht 2014
Abstract Tsunami inundation mapping is the first step in the development of effective
evacuation plans for communities at risk. These maps also provide bases for land use
planners in communities to reduce risk by locating critical facilities out of the potential
tsunami flood plain. The Makran subduction zone, located off the Indian Ocean coasts of
Iran and Pakistan, is an important tsunamigenic zone for the region. On the 27th
November, 1945, it was the site of a major earthquake with a moment magnitude of 8.1 and
killed about 4,000 people. This event is a proof that Makran coastal areas are unsafe since
the tsunami is quite probable. The objective of this study was providing tsunami inundation
and hazard maps in Chabahar bay which is located in South East of Iran and the northern
coast of Oman Sea. Three different source magnitude scenarios along Makran subduction
zone are considered and for each scenario, numerical modeling of tsunami propagation is
performed using MIKE 21 FM numerical software. Because the Makran subduction zone is
very close to the Chabahar bay, unstructured triangular mesh with a higher level of
refinement closer to the area of interest was used so that the tsunami was not numerically
dissipated. After analyzing the data obtained from the results, inundation maps were
produced, and by combining these maps, tsunami hazard map was provided for the bay.
Tsunami wave amplification has been observed mainly in the outer coasts of the bay where
the uplifted rocky shore experience up to 18 m wave height. Chabahar bay omega form and
two eastern and western headlands cause a considerable depreciation in tsunami wave.
Longer distance of coasts within the bay is another reason of tsunami depreciation inside
the bay. Based on the generated inundation and hazard maps, two flood zones are specified.
The first zone associated with no inundation or low inundation on cliffy shores, and the
second zone would experience extensive inundation on the coast of kenarak areas, areas
with sandy beaches and gentle slope.
A. R. Payande � H. NaserianYekom Consulting Engineers, Tehran, Iran
M. H. Niksokhan (&)Graduate Faculty of Environment, University of Tehran, Tehran, Irane-mail: [email protected]
123
Nat HazardsDOI 10.1007/s11069-014-1476-x
Author's personal copy

Keywords Makran subduction zone � Chabahar bay � Hazard map � Inundation map �Oman Sea � Iran
1 Introduction
Prior to 2004, most of the studies in the field of tsunami were focused on the Pacific Ocean,
but in 2004, occurring Indonesian tsunami killing over 230,000 people that generated by
Sumatra subduction zone in Indian Ocean, tsunami research in this region became
important. The main subduction zones in the Indian Ocean are subduction district of
Sumatra, in the west of Indonesia and Makran subduction zone (MSZ) located in the
northwest of Indian Ocean and southern parts of Iran and Pakistan (Heidarzadeh et al.
2008). These subduction zones are shown in (Fig. 1).
Makran subduction zone was previously the origin of several tsunamis and had gen-
erated the deadliest tsunami in the Indian Ocean region prior to the 2004 tragedy, i.e.,
Makran tsunami of 1945 with the death toll of about 4,000 people (Heck 1947). This zone
extends east from the Strait of Hormoz in Iran to near Karachi in Pakistan with the length
of about 900 km. This subduction zone is formed between the Arabian plate and the
Eurasian plate (Farhoudi and Karig 1977). Recent studies employing a network of 27 GPS
(Global Position System) stations revealed that the subduction rate of MSZ was
19.5 mm y-1 (Vernant et al. 2004; Heidarzadeh and Satake 2014). Compared to the
convergence rate of the other subduction zones, Makran is a relatively slow-moving
subduction zone, and unlike the other subduction zones, there is no oceanic trench at the
location of the MSZ (Schluter et al. 2002). Makran is characterized by an extremely high
sediment thickness of about 7 km (Koppa et al. 2000). This is a unique feature of MSZ
because other subduction zones usually have low sediment thickness (Kearey and Vine
1996a, b). According to Byrne et al. (1992), this huge volume of sediment is not neces-
sarily a sign of low potential in this zone for large earthquakes and such sediments have the
potential to fail and cause large underwater tsunamigenic slides.
Heidarzadeh et al. (2008) collected a list of tsunamis occurred in the region. According
to this study, it seems that the occurrence of earthquakes with higher magnitudes of 8 Mw
in this area is quite probable, as has already occurred.
Smith et al. (2013) found that landslides similar to 2004 earthquake with the magnitude
of 9.3 which caused great tsunami in Indonesia are possible in the MSZ. Their research was
based on the principle that plate boundaries in subduction zones are prone to slide when
their temperature is between 150 and 450 �C. They prepared a map of areas prone to
landslide in the region by thermal modeling. Accordingly, landslide area extends 350 km
to the north which is unusually broad unlike other subduction zones. Based on their
findings, the wide thickness of the sediment can be a contributing factor to intensify
earthquake strength. Deeper sediments will be more compressed and warmer. The heat and
pressure make the sediments stronger. This results in the shallowest part of the subduction
zone fault being potentially capable of slipping during an earthquake. These combined
factors mean the MSZ is potentially capable of producing major earthquakes, up to
magnitude 8.7–9.2. Past assumptions may have significantly underestimated the earth-
quake and tsunami hazard in this region.
The management and analysis of flood hazards is of great socioeconomic and ecological
importance as it was estimated that 50 % of world’s population resides and works within
Nat Hazards
123
Author's personal copy

the costal zone till 2030. Studying tsunami and detection of area with high tsunami hazard
risk play an important role in the field of coastal management and future development of
coastal areas. Producing inundation and hazard maps for the coasts is important and has
many applications, both before and during the tsunami, and also is important in the field of
crisis management. Tsunami inundation mapping is the first step in the development of
effective evacuation plans for communities at risk. These maps also provide bases for land
use planners in communities to reduce risk by locating critical facilities like schools and
public places, out of the potential tsunami flood plain.
Makran remains one of the least-studied regions in the Indian Ocean region. Until the
present, no tsunami hazard assessment is performed for this subduction zone, and thus, the
level of hazard faced by different Makran coasts is not known. According to Walker
(2005), failure to accurately assess the risks associated with tsunamis in the Indian Ocean
and absence of a general understanding of the destructive potential of tsunamis were key
elements recognized as contributing factors in the 2004 tragedy. In this region only, there
are a few modeling-based studies which have estimated the general pattern of tsunami
wave propagation. As an instance, (Synolakis and Okal 2005) modeled a magnitude 8.5
earthquake in the MSZ rupturing the fault 1945 and reported as the 1945 Makran tsunami
has been reaching a height of about 12–15 m in some Makran coasts, and caused 2-m run-
up in Mumbai, about 1,300 km distant from the tsunami source.
Generally, there are two methods for tsunami hazard calculation. Lin and Tung (1982)
suggested that tsunami hazard can be calculated following the idea underlying seismic
hazard analysis. They combined simple seismological and hydrodynamic models and
analyzed tsunami hazard as the probability of the event that the water elevation at a site
exceeds an arbitrary but specified level. Despite their hydrodynamic and seismological
models were rather simple, the methodology used by Lin and Tung (1982) was novel, and
later was employed by several researchers. An alternative approach is to examine the past
Fig. 1 Subduction zones located in the Indian Ocean
Nat Hazards
123
Author's personal copy

record of tsunami at individual locations to determine whether a scaling relationship
describes the record (Burroughs and Tebbens 2005). Using run-up data from ten locations
in Japan, Burroughs and Tebbens (2005) examined the cumulative frequency-size distri-
butions and determined the scaling relationships and recurrence intervals for run-up
heights. It is evident that the run-up data based on this method is applicable only when
adequate historical information and measurements of tsunami run-up are available. In the
present study, we employ the modeling-based method for the Makran tsunami hazard
assessment. The historical data of tsunamis in the Makran region are rather poor. Only one
tsunami (the 1945 event) is instrumentally recorded in this region. Therefore, it is clear that
the probabilistic method cannot yield useful results, and thus, we employ the modeling-
based method. The DHI program MIKE 21 FM (Danish Hydraulic Institute 2004) was used
to simulate the propagation of tsunami-generated waves around the Chabahar bay. For this
model, the discretization of the equations in geographical and spectral space is performed
using the cell-centered finite-volume method. Most tsunami modeling is performed simply
using the shallow-water equations because wavelengths of the tsunamis are so long. MIKE
21 is an appropriate tool for modeling tsunami as it is a modeling system based on the
numerical solution of two-dimensional shallow-water equations. MIKE 21 model has been
widely used in researching marine environments, and it has been generally and scientifi-
cally acknowledged in the world (Bolanos et al. 2014; Payandeh et al. 2014).
2 Study area
Chabahar omega-shaped bay is located in the southeast of Iran, near to Iran–Pakistan
border (Fig. 2). It is the largest bay of Iran bordering Oman Sea with a 13.5-km-wide
entrance and 17 km length in the south–north direction. Chabahar is situated on the
Makran coast of the Sistan and Baluchestan province of Iran and is officially designated as
a free trade and industrial zone by Iran’s government. Due to its free trade zone status, the
city has increased in significance in international trade. Chabahar is the name of a city
located in Chabahar bay, and it is also the capital of Chabahar County, Sistan and Balu-
chestan Province, Iran. At the 2006 census, its population was 71,070, in 13,837 families.
Chabahar is Iran’s closest and best access point to the Indian Ocean. For this reason,
Chabahar is the focal point of Iranian development of the east of the country through
expansion and enhancement of transit routes among countries situated in the northern part
of the Indian Ocean and Central Asia. As this part of the Iranian coastline faces the open
sea, most of the coasts receive persistent swell waves from south direction. Southeast and
west directions are the most predominant wind directions according to long-term wind data
of synoptic stations. The Indian Ocean monsoon has a strong seasonal effect on the
currents of Sea of Oman (Shankar et al. 2002).
There are different methods for producing tsunami inundation maps. In the simplest
case, line of the tsunami height in the coast is considered as inundation line. Even though
this method is simple, it does not consider the dynamics of tsunami. In fact, the intensity of
the tsunami may lead to flooding in parts with the higher heights than tsunami wave or in
some parts no flow even in lower places than tsunami wave. Of course, in some cases,
produced maps in this method could be modified using historical tsunami data, but the lack
of historical data is the main problem in this field. Another method is numerical modeling
of the tsunami wave which is used in the present study.
Here, numerical modeling techniques were employed to further evaluate the general
propagation pattern of tsunami in the Makran region. The motivation for doing so was to
Nat Hazards
123
Author's personal copy

prepare tsunami hazard maps of this bay. Tsunami simulation was done using MIKE 21
FM. For verifying the model, we have simulated the 1945 Makran tsunami. For this event,
not only is there some recorded seismic information, but also there are some run-up
estimates enabling us to further verify the model and constrain the source mechanism.
Inundation maps for Chabahar bay were provided at the first step, and then, tsunami hazard
maps were prepared for Chabahar bay. Inundation maps obtained using numerical mod-
eling under different scenarios and after combining these maps, comprehensive tsunami
hazard mapping was conducted for the region. Table 1 shows details of 1945 earthquake
(used for verification) and three scenarios considered for tsunami modeling in Chabahar
bay. In all three scenarios, specified location with mentioned coordinate in Table 1 is
Fig. 2 Geographical location of Chabahar bay and satellite image (Landsat) of the study area
Table 1 Characteristics of 1945 earthquake and three assumed scenarios
Earthquake Epicenter Focal depth (km) Magnitude (Mw)
Long Lat
1945 tsunamia 63 24.5 25 8.1
Weak Scenario 1 60.5 24.8 10 7.5
Moderate Scenario 2 60.5 24.8 25 8.1
Strong Scenario 3 60.5 24.8 30 9.1
a based on Smith et al. (2013)
Nat Hazards
123
Author's personal copy

Fig. 3 Resulting water surface disruption under a scenario 1, b scenario 2, c scenario 3 and d 1945 tsunami
Nat Hazards
123
Author's personal copy

selected as the epicenter of the earthquake. According to objective of the study and
position of MSZ which is parallel to northern coasts of Oman Sea, this epicenter was
selected. The epicenter is right in front of Chabahar bay and is located at MSZ, which leads
to the worst condition of tsunami occurrence for Chabahar bay.
3 Model setup
According to tsunami generation mechanism, tsunami modeling includes two main sepa-
rate parts: 1—Simulation of initial earthquake and deformation of plates and then pro-
ducing initial water surface levels. 2—Using initial water surface levels as input in
hydrodynamic modeling and simulation of tsunami wave propagation and run-up.
In the first part, earthquake bathymetry adjustment (EBA) Module of MIKE 21 model
was used. There are a number of methods available to calculate deformation of plates
caused by earthquakes, widely used is Okada’s double-couple method (Okada 1985; DHI
2007), and MIKE 21 EBA is based on this method. In this method, a homogeneous
isotropic elastic earth’s crust is assumed. Its advantage is that all required parameters are
available within minutes in the Internet. Furthermore, different scaling laws have been
implemented to account for different types of earthquakes. They are used to calculate fault
dimensions, which are used within Okada’s method. Figure 3 shows water surface dis-
ruption under scenario 1, 2, 3, and 1945 tsunami. The greatest increase in water level is
9.5 m under the third scenario. Also an earthquake with magnitude of 7.5 Mw and focal
depth of 10 km is capable of handling the water column up to 45 cm.
In the second part, HD module of MIKE 21 Flow Model(FM) was used for simulation
of tsunami wave propagation and run-up. Initial surface elevations obtained from the first
part was used as initial condition of hydrodynamic model. MIKE 21 FM has been widely
used in researching water environment, and it has been generally and scientifically
acknowledged in world (Scott et al. 2011; Xing et al. 2012).
MIKE 21–HD is a modeling system based on flexible mesh approach. The modeling
system has been developed for application within oceanographic, coastal and estuarine
environments. MIKE 21 is specially suitable for modeling of propagation and coastal
amplification of long waves as the system is based on the numerical solution of the two
Fig. 4 Computational mesh used for studying tsunami in the study area
Nat Hazards
123
Author's personal copy

dimensional incompressible Reynolds averaged Navier–Stokes equations invoking the
assumption of Boussinesq and of hydrostatic pressure. Thus, the model consists of con-
tinuity, momentum, temperature, salinity and density equations and it is closed by a
turbulent closure scheme (DHI 2007). Model grids were generated by MIKE Mesh Gen-
erator, which uses hydrography data and user defined grid limits. Hydrography of the
region was carried out by Iranian Port and Maritime Organization (PMO) in 1/1,000,
1/2,000 and 1/5,000 scales. ETOPO2 Satellite altimetry and ship depth soundings data
were used in Oman Sea and northern parts of Indian Ocean. The bathymetry and the mesh
of the chosen model for chabahar bay is shown in Fig. 4, noting that the unstructured
triangular mesh has a higher level of refinement closer to the area of interest around
Chabahar bay and south of Pakistan (where the 1945 tsunami occurred).
4 Verification
Various sensitivity tests were carried out to analyze the effect of variations of different
model parameters on the results including bed resistance, mesh resolution, and eddy vis-
cosity. This analysis revealed that the modeling was sensitive to some parameters. Model
outputs were sensitive to mesh resolution. After increasing the resolution a few times, the
outputs became insensitive to mesh resolution. Sensitivity analysis indicated that the
modeling is very sensitive to bed resistance. It can be calculated either through the
manning number or Chezy number. Examining the manning numbers between 20 and
50 m1/3/s, a value of 45 m1/3/s was chosen. Eddy viscosity coefficient is another important
parameter defining the turbulence mixing in the water. Turbulence mixing is generally
larger in places where the velocity gradient is large. There are two available options
provided in MIKE 21 FM for eddy viscosity, i.e., constant eddy viscosity and Smagorinsky
eddy viscosity, which is a function of velocity gradients. The Smagorinsky eddy viscosity
(Smagorinsky 1963) with the coefficient of 0.28 was adopted for the simulation.
The 1945 tsunami is the only recorded tsunami in MSZ region. This tsunami simulated
and based on recorded and observed information, and a model was calibrated and verified.
Figure 5 shows the tsunami wave propagation in different times.
As can be seen in Fig. 5, maximum run-up heights due to the 1945 tsunami in Pasni,
Raan of Kutch and Gulf of Kutch are about 5, 1 and 0.6 m, respectively. These results are
in agreement with the observed run-up during the 1945 event reported by Page et al. (1979)
and Ambraseys and Melville (1982). Pendse (1946) and Berninghausen (1966) have
assigned extreme run-up of 12–15 m for the 1945 Makran tsunami. (Heidarzadeh et al.
2008) has interpreted this discrepancy between the results of the numerical modeling and
the observed wave height of about 12–15 m. Heidarzade found that the reports of 12–15-m
run-up were an exaggeration. He also enumerates some other reasons including submarine
landslide triggered by the 1945 earthquake and large displacements on splay fault which
can produce huge run-ups.
We believe that the accuracy of tsunami modeling is very sensitive to hydrography data
of the near-field coasts. The main increase in tsunami wave height occurs in near-field and
shallow areas. Without accurate hydrography data, wave propagation would be incomplete,
and therefore, simulation will result in underestimated tsunami heights. Tidal level in the
time of 1945 is also important which can affect in tsunami heights.
Nat Hazards
123
Author's personal copy
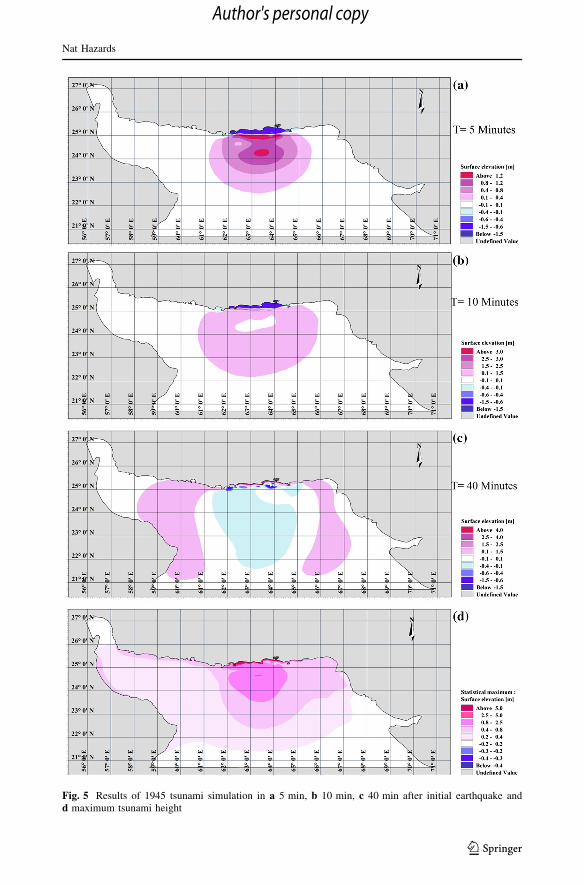
Fig. 5 Results of 1945 tsunami simulation in a 5 min, b 10 min, c 40 min after initial earthquake andd maximum tsunami height
Nat Hazards
123
Author's personal copy

5 Results and discussion
Figure 6 shows tsunami wave propagation under scenario 1 in 5 and 100 min after initial
earthquake. As can be seen in Fig. 6, prior to tsunami attack to the coasts, extensive parts
are facing water regression and beach dryness. As the modeling was done in high-tide
mode, even the earthquake under scenario 1 with magnitude of 7.5 Mw affects extensive
parts of the land.
For better comparison of water level changes in different scenarios, surface elevation
time series in all scenarios is shown in Fig. 7 for two different points. As can be seen in
Fig. 7, increasing the magnitude of the earthquake results in tsunami wave height increase.
In point A, the maximum height of the tsunami in scenario 1 is 4.5 m, in scenario 2, 8 m,
and in scenario 3 is 18 m. Also, the height of tsunami decreases within the bay. In point B,
the maximum height of tsunami under scenario 1 is 4.4 m, under scenario 2, 5.5 m, and
under scenario 3 is 8.4 m. In all scenarios, the tsunami height in location B inside the bay is
less than point A in Chabahar port.
Fig. 6 Simulated tsunami wave height under scenario 1 in a 5 min and b 100 min after initial earthquake
Nat Hazards
123
Author's personal copy

Figure 8 shows tsunami propagation within Chabahar city coasts under scenario 3.
Wave height growth is quite evident when it reaches to shallow places. Ten minutes after
initial earthquake, tsunami wave reaches to the Chabahar coasts, and after 15 min,
expanded parts of Chabahar city are faced with inundation, but the time of wave travel to
the interior coasts of the bay is 35 min. These short time intervals show the importance of
immediate and on-time warning to evacuate citizens of the coasts.
After occurrence of inundation in lands, some parts would not discharge the water, and
the water remains within these areas due to their topographic condition. This issue is one of
the most striking consequences of tsunami that makes rescue and aid activities more
difficult. Based on the results, maximum inundation of coasts, along with the highest
tsunami height in all scenarios, was calculated. Figures 9, 10, and 11 show the inundation
map of the tsunami in scenarios 1, 2, and 3, respectively.
Fig. 7 Simulated surface elevation time series in Point A and B during tsunami occurrence
Nat Hazards
123
Author's personal copy

In all cases, the highest wave of the tsunami hit the eastern and western mouths.
Kenarak city which is protected by western headland would face flooding, even in scenario
1. The main reason for this problem is the low height of this city from mean sea level.
It is clear that when earthquake magnitude increases, return period would be increased
too, so probability of the scenario 1 is more than scenario 2 and probability of scenario 2 is
Fig. 8 Tsunami propagation within Chabahar city coasts under scenario 3 in a 5 min, b 10 min, andc 100 min after initial earthquake
Nat Hazards
123
Author's personal copy

Fig. 9 Inundation map of Chabahar bay under scenario 1
Fig. 10 Inundation map of Chabahar bay under scenario 2
Fig. 11 Inundation map of Chabahar bay under scenario 3
Nat Hazards
123
Author's personal copy

Fig. 12 Tsunami hazard map for Chabahar bay
Fig. 13 Tsunami hazard map for Chabahar city coasts
Nat Hazards
123
Author's personal copy

more than scenario 3. Based on this principal, tsunami hazard map is produced using GIS
software and is presented in Fig. 12. Figure 13 also shows tsunami hazard map with more
details near Chabahar city. Different land uses were considered in these maps.
6 Conclusion
In this study, three different source magnitude scenarios along Makran subduction zone are
considered, and for each scenario, numerical modeling of tsunami propagation is per-
formed by MIKE 21 FM numerical software and the inundation and hazard maps at
Chabahar bay are calculated. It has been observed that the Kenarak coasts of Chabahar bay
are the most vulnerable coastlines in the region to the impact of tsunami and would damage
even in the case of a moderate tsunamigenic earthquake. The main reason of this high
vulnerability is the low height of this city from the sea level. Tsunami wave amplification
has been observed mainly in the outer coasts of the bay where the uplifted rocky shore
experience up to 18 m wave height. Chabahar bay omega form and two eastern and
western headlands cause a considerable depreciation in tsunami wave. Longer distance of
coasts within the bay is another reason of tsunami depreciation inside the bay.
Based on the generated inundation and hazard maps, two flood zones are specified. The
first zone associated with no inundation or low inundation on cliffy shores, and the second
zone would experience extensive inundation on the coast of Kenarak areas, areas with
sandy beaches and gentle slope. Based on this classification, most of the Chabahar city
parts are located in low tsunami hazard zone. In the case of occurring strong earthquakes
(above 9 Mw), while all parts of Kenarak city would be located in high tsunami hazard
zone and would be damaged by tsunamis generated by weaker earthquakes. In creating
further spatial and urban plans, protection from tsunami hazard will represent a very
important segment of planning the purpose of land and land use, especially in vulnerable
regions. Considering this, specific spatial planning should be applied to potentially risky
zones, with regionalization of the surfaces according to the degree of risk.
The study presented here is the first attempt for providing tsunami hazard map for the
region. Having high potential of landslide in MSZ, studies are limited in this case and
needs more attention. The public education especially in the case of near-field hazard such
as Makran is vital in risk and vulnerability reduction. People who live in coastal areas
should be provided with information on the risks of tsunamis. Also, the development of a
regional tsunami-warning system in the Makran zone is necessary since there is a high
probability for tsunamis in all Makran coasts.
References
Ambraseys NN, Melville CP (1982) A history of persian earthquakes. Cambridge University Press, BritainBerninghausen WH (1966) Tsunamis and Seismic seiches reported from regions adjacent to the Indian
Ocean. Bull Seismol Soc Am 56(1):69–74Bolanos R, Tornfeldt sorenson JV et al (2014) Modelling ocean currents in the northern Adriatic Sea. Cont
Shelf Res. doi:10.1016/j.csr.2014.03.009Burroughs SM, Tebbens SF (2005) Power-law scaling and probabilistic forecasting of tsunami runup
heights. Pure Appl Geophys 162:331–342Byrne D, Sykes LR, Davis DM (1992) Great thrust earthquakes and aseismic slip along the plate boundary
of the Makran subduction zone. J Geophys Res 97:449–478
Nat Hazards
123
Author's personal copy

Danish Hydraulic Institute (2004) MIKE 21 Flow Model user guide and scientific documentation, vol 1.DHI, Horsholm
DHI (2007) MIKE 3 flow model user guide and scientific documentation, Danish Hydraulic Institute 3–27Farhoudi G, Karig DE (1977) Makran of Iran and Pakistan as an active arc system. Geology 5:664–668Heck NH (1947) List of seismic sea wave. Bull Seismol Soc Am 37(4):269–286Heidarzadeh M, Satake K (2014) Possible sources of the tsunami observed in the northwestern Indian Ocean
following the 2013 September 24 Mw 7.7 Pakistan inland earthquake. Geophys J Int. doi:10.1093/gji/ggu297
Heidarzadeh M, Dolatshahi P, Hajizadeh Zaker N, Yalciner AC (2008) Historical tsunamis in the Makransubduction zone off Southern Coasts of Iran and Pakistan and results of preliminary numericalmodeling. Ocean Eng 35:774–786
Kearey Ph, Vine F (1996a) Global tectonics, 2nd edn. Blackwell Science Ltd, MaldenKearey Ph, Vine FJ (1996b) Global tectonics, 2nd edn. Blackwell Science Ltd, MaldenKoppa C, Fruehn J, Flueh ER, Reichert C, Kukowski N, Bialas J, Klaeschen D (2000) Structure of the
Makran subduction zone from wide-angle and reflection seismic data. Tectonophysics 329:171–191Lin IC, Tung CC (1982) A preliminary investigation of tsunami hazard. Bull Seismol Soc Am
72:2323–2337Okada Y (1985) Surface deformation due to shear and tensile faults in a half-space. Bull Seismol Soc Am
75(4):1135–1154Page WD, Alt JN, Cluff LS, Plafker G (1979) Evidence for the recurrence of large magnitude earthquakes
along the Makran Coast of Iran and Pakistan. Tectonophysics 52:533–547Payandeh A, HadjizadehZaker N, Niksokhan MH (2014) Numerical modeling of pollutant load accumu-
lation in the Musa estuary. Environmental Earth Sciences, Persian Gulf. doi:10.1007/s12665-014-3409-0
Pendse CG (1946) The Mekran earthquake of the 28th November 1945. India Meteorol Dep Sci Notes10(125):141–145
Schluter HU, Prexl A, Gaedicke Ch, Roeser H, Reichert Ch, Meyer H, von Daniels C (2002) The Makranaccretionary wedge: sediment thicknesses and ages and the origin of mud volcanoes. Mar Geol185:219–232
Scott T, Masselink G, Russell P (2011) Morphodynamic characteristics and classification of beaches inEngland and Wales. Mar Geol 286:1–20
Shankar D, Vinayachandran PN, Unnikrishnan AS (2002) The monsoon currents in the north Indian Ocean.Oceanography 52(1):63–120
Smagorinsky J (1963) General circulation experiment with the primitive equations. Mon Weather Rev91:99–164
Smith GL, McNeill LC, Wang K, He J, Henstock TJ (2013) Thermal structure and megathrust seismogenicpotential of the Makran subduction zone. Geophys Res Lett. doi:10.1002/grl.50374
Synolakis CE, Okal EA (2005) 1992–2002: perspective on a decade of post—tsunami surveys. In: Tsunami,Satake K (ed) Advances in natural and technological hazards research 23:1–30
Vernant Ph, Nilforoushan F, Hatzfeld D, Abbasi MR, Vigny C, Masson F, Nankali H, Martinod J, AshtianiA, Bayer R, Tavakoli F, Chery J (2004) Present-day crustal deformation and plate kinematics in themiddle east constrained by GPS measurements in Iran and Northern Oman. Geophys J Int 157:381–398
Walker DA (2005) Critical evaluations for the state of Hawaii subsequent to the 26 December 2004 Asiantsunami. Sci Tsunami Hazards 23:17–24
Xing F, Ping Wang Y, Wang HV (2012) Tidal hydrodynamics and fine-grained sediment transport on theradial sand ridge system in the southern Yellow Sea. Mar Geol 291–294:192–210
Nat Hazards
123
Author's personal copy