Progressive offset and surface deformation along a seismogenic blind thrust in the Po Plain foredeep...
49
©2014 American Geophysical Union. All rights reserved. Progressive offset and surface deformation along a seismogenic blind thrust in the Po Plain foredeep (Southern Alps, Northern Italy) Authors: Franz A. Livio, Andrea Berlusconi, Andrea Zerboni, Luca Trombino, Giancanio Sileo, Alessandro M. Michetti, Helena Rodnight, Christoph Spötl Affiliations: (Livio F., Berlusconi A., Michetti A.M., Sileo G.) Dipartimento di Scienza e Alta Tecnologia, University of Insubria. Via Valleggio 11 - 22100 Como (Italy). (Sileo G., now at:) Università degli Studi della Basilicata - Scuola D'Ingegneria - Laboratorio Di Analisi dei Dati Satellitari (LADSAT). Campus di Macchia Romana - 85100 Potenza (Italy). (Zerboni A., Trombino L.) Dipartimento di Scienze della Terra “A. Desio”, Università degli Studi di Milano. Via L. Mangiagalli 34 - 20133 Milano (Italy). (Rodnight H., Spötl C.) Institut für Geologie, Universität Innsbruck. Innrain 52 - 6020 Innsbruck (Austria). Corresponding Author: Franz A. Livio, [email protected] Dipartimento di Scienza ed Alta Tecnologia, University of Insubria. Via Valleggio 11 - 22100 Como (Italy) This article has been accepted for publication and undergone full peer review but has not been through the copyediting, typesetting, pagination and proofreading process which may lead to differences between this version and the Version of Record. Please cite this article as doi: 10.1002/2014JB011112
-
Upload
uninsubria -
Category
Documents
-
view
1 -
download
0
Transcript of Progressive offset and surface deformation along a seismogenic blind thrust in the Po Plain foredeep...
©2014 American Geophysical Union. All rights reserved.
Progressive offset and surface deformation along a seismogenic
blind thrust in the Po Plain foredeep (Southern Alps, Northern
Italy)
Authors: Franz A. Livio, Andrea Berlusconi, Andrea Zerboni, Luca Trombino, Giancanio
Sileo, Alessandro M. Michetti, Helena Rodnight, Christoph Spötl
Affiliations:
(Livio F., Berlusconi A., Michetti A.M., Sileo G.) Dipartimento di Scienza e Alta Tecnologia,
University of Insubria. Via Valleggio 11 - 22100 Como (Italy).
(Sileo G., now at:) Università degli Studi della Basilicata - Scuola D'Ingegneria - Laboratorio
Di Analisi dei Dati Satellitari (LADSAT). Campus di Macchia Romana - 85100 Potenza
(Italy).
(Zerboni A., Trombino L.) Dipartimento di Scienze della Terra “A. Desio”, Università degli
Studi di Milano. Via L. Mangiagalli 34 - 20133 Milano (Italy).
(Rodnight H., Spötl C.) Institut für Geologie, Universität Innsbruck. Innrain 52 - 6020
Innsbruck (Austria).
Corresponding Author: Franz A. Livio, [email protected] Dipartimento di Scienza ed
Alta Tecnologia, University of Insubria. Via Valleggio 11 - 22100 Como (Italy)
This article has been accepted for publication and undergone full peer review but has not been through the copyediting, typesetting, pagination and proofreading process which may lead to differences between this version and the Version of Record. Please cite this article as doi: 10.1002/2014JB011112

©2014 American Geophysical Union. All rights reserved.
Abstract
Here we present, for the first time in the Po Plain foredeep (N Italy), the Middle-to-Late
Pleistocene growth history of an outcropping secondary fold and related faults, whose
progressive deformation over an intermediate time window (105
We trenched and logged an outcropping decametric secondary anticline, related to a deeper
blind compressional structure, which deforms fluvial sediments and an overlying loess-
paleosol sequence. Folded units were dated, using radiocarbon and OSL methods, to the Late
Pleistocene - Holocene and tentatively correlated with glacial-interglacial phases occurring
during the time interval from MIS 6 to the Present. A multistep retro-deformation of the fold
allowed us to calculate uplift rates for this secondary and shallow anticline, varying between
0.02 - 0.1 mm/yr since ca. 200 kyr. Trishear forward deformation modeling of the fold
indicates that the amplification of the observed fold could be caused by two shallow thrusts
formed through a break-backward activation. This generated a decametric surface fold
whose most recent growth was associated with bending-moment normal faulting in the
crestal and forelimb region.
yrs) is driven by an
underlying seismogenic blind thrust.
Our observations demonstrate that near-surface compressive tectonics can be caused by
blind thrusting, via a complex array of fault and folds: upward strain propagation and
generation of shallow low-angle thrust and related folding seem to be mainly due to
secondary fold-related faulting, according to an out-of-syncline thrusting mechanisms.
Keypoints: active tectonics, Po Plain foredeep, blind thrust, secondary surface faulting,
loess-paleosol sequence

©2014 American Geophysical Union. All rights reserved.
1. Introduction
Foredeep basins are problematic settings for fault displacement hazard analysis since surface
faulting by blind thrusting can be elusive or unlikely, especially in regions characterized by
moderate deformation rates and/or seismic potential. Nevertheless, strain can propagate to the
surface via secondary folding and faulting, posing some important issues about fault
displacement hazard analysis but also offering the possibility to directly investigate
deformation due to blind thrusting seismic sources.
The Po Plain foredeep (N Italy) illustrates this point very clearly. While Late Pleistocene to
Holocene surface faulting in the piedmont belts of the N Apennines and S Alps has been
proposed by several authors [e.g., Serva, 1990; Castaldini and Panizza, 1991; Benedetti et al.,
2000; Picotti and Pazzaglia, 2008; Boccaletti et al., 2011; Bruno et al., 2011; Borgatti et al.,
2012], no agreed published record of coseismic or paleoseismic surface displacement exists
in the entire Po Plain. Conversely, evidence of broad and subtle surface deformations
affecting the drainage and landscape evolution of the plain area over a ≈ 10 4 yrs time window
has been frequently described in the literature [e.g., Wilson et al., 2009; Ponza et al., 2010;
Burrato et al., 2012; Gunderson et al., 2013; 2014]. Coseismic uplift of the ground surface
during blind thrusting earthquakes has been observed during the 2012 Emilia sequence (two
main shocks: 20th and 29th
As a matter of fact, a first evidence of paleoseismic ground rupture due to the growth of
surface decameter-scale folding in the Po Plain foredeep (Monte Netto site) is reported by
Livio et al. [2009] (see also Galadini et al., 2012). This has been interpreted as somehow
caused by the recent activity of a S-Alps blind backthrust imaged in seismic reflection data.
Still some issues remained unsolved about these shallow tectonic structures such as:
May, 2012, Mw 5.9 and 5.7, respectively [Scognamiglio et al.,
2012; Ventura and Di Giovanbattista, 2013]) with a maximum surface deformation of 10 –
15 cm over an area 10 km wide [Bignami et al., 2012].
©2014 American Geophysical Union. All rights reserved.
a) a detailed stratigraphic description and dating of the outcropping deformed sequence
which would have allowed to define their rates of uplift/slip ;
b) a model describing their structural characteristics at the scale of tens to hundreds meters,
such as the geometry and detachment levels of the faults related to these folds, and
c) their structural relation with the seismic source at depth, that is, how strain can propagate
from underlying seismogenic thrusts to such shallow levels.
To solve these open questions we present a detailed structural analysis of the decameter-scale
folds and related bending-moment faults outcropping at Monte Netto site, located in the N
sector of the Po Plain, about 130 km NW of Modena (Fig. 1). Additional quarry works,
performed in 2013, exposed some new remarkable outcrops of these folded sediments,
offering a detailed 3D view of the local tectonic structures and of a loess-paleosol sequence
deposited during their progressive displacement. We conducted a detailed meso-structural
analysis of the new exposures, trenched the base of a quarry wall and logged it in order to
structurally resolve the outcropping anticline. Radiometric and optically stimulated
luminescence (OSL) dating on loess-paleosol sediments allows us to constrain a sequence of
depositional and pedogenic events correlated to mid-late Pleistocene glacial/interglacial
phases. Based on this new dataset it was possible to constrain the timing of the fold growth
and to develop a kinematic solution for the observed surface deformation, consistent with
shallow secondary thrusting, folding and normal faulting induced by a deeper buried thrust.
Finally, we model the geometric and kinematic characteristics of the fault related to the
observed fold, suggesting a possible structural solution linking these very shallow
compressive tectonic features with the underlying thrust. The structural relationships between
blind faulting at depth and coseismic secondary surface rupture illustrated at the Monte Netto
site provide a unique case study for the Po Plain foredeep, and with only few similar
analogues known in the literature for regions under active crustal shortening [e.g.,
©2014 American Geophysical Union. All rights reserved.
Meghraoui et al., 1996; Champion et al., 2001; Heddar et al., 2013].
We argue that the insights obtained at Monte Netto are relevant for assessing the probability
of secondary displacement induced by strong blind thrusting earthquakes, and the maximum
expected magnitude for the Po Plain (one of the most industrialized and developed areas of
the world) and other similar seismically active foredeep settings.
2. Geological setting
The Po Plain foredeep is characterized by the convergence of two chains that face each other
beneath the Po River floodplain: the western Southern Alps (i.e. the conjugate retro-wedge of
the Alps) and the northern Apennines [e.g., Castellarin and Vai 1986, Castellarin et al., 1992,
Carminati et al., 2004, Fantoni et al., 2004]. The buried structural front of the western
Southern Alps is a structural belt characterized by an array of E-W trending thin-skinned
thrust sheets bound to the East by the Giudicarie and the Schio-Vicenza fault systems [e.g.
Castellarin and Cantelli, 2000; Castellarin et al., 2006; Pola et al., 2014; Fig. 1].
The opposite-facing structural fronts of the northern Apennines are buried beneath the Plio-
Pleistocene sediment fill of the Po Basin and show three main salients from west to east: the
Monferrato, Emilia and Ferrara arcs (Fig. 1). The latter generated the May 2012 seismic
sequence culminating in two Mw ≈ 6 thrust fault earthquakes.
The distribution and segmentation of the southalpine blind structures, in the area between
Lake Garda and Adda River (Fig. 2), have been previously defined by regional mapping,
using an extensive database of ca. 18,000 km of seismic profiles provided by ENI E&P
calibrated by several deep boreholes [Livio et al., 2009]. The Capriano del Colle Fault
System (Figs. 2 and 3) is a structural wedge composed by a main south-vergent forethrust
(Capriano del Colle forethrust) and an associated high-angle backthrust (Capriano del Colle
backthrust – CCB hereafter) whose structural culmination is marked by the presence of a

©2014 American Geophysical Union. All rights reserved.
small isolated hill, Monte Netto, representing the topographic expression of the structural
relief of the underlying structures [e.g., Desio, 1965; Livio et al., 2009]. The thrust sheet
mainly involves a foreland and foredeep syntectonic sequence of terrigenous units that range
from Oligocene to Miocene in age, referred to as the Gonfolite Lombarda Group. Faults
typically ramp up from the top of the underlying Mesozoic carbonates [e.g., Fantoni et al.,
2004] and are associated with fault-related folds deforming the overlying infilling of the
basin. The deep geometry of thrusts and fault-related folds (Fig. 3) has been reconstructed
using constant-thickness kink band models [e.g.; Suppe and Medwedeff, 1990]. This clearly
illustrates the gentle folding of Quaternary beds, unconformably resting upon the CCB fault-
related fold, just below Monte Netto site; and the presence of a shallow south-vergent thrust
(CCα in Fig. 3) whose ramp sector is pinned, at its base, with the synclinal axial surface on
the CCB [Livio et al., 2009].
On the basis of industrial seismic reflection profiles and deep boreholes stratigraphy, the
overlying Plio-Pleistocene basin fill has been divided into four stacked bodies separated by
three sequence stratigraphic surfaces (Fig. 3) dated using calcareous nannofossils to ca. 1.6,
1.2 and 0.89 Myr [Carcano and Piccin, 2002]. These reflectors correspond to boundaries of
lithostratigraphic units firstly defined along the southern sector of the Po Plain subsurface
[Muttoni et al., 2003; Amorosi and Pavesi, 2010], as well as in the Apennines piedmont area
(Amorosi et al., 1998; Gunderson et al., 2014), that are, respectively, A) the base of Argille
Azzurre Fm. and B) the equivalent, in the northern Po Plain, of the base of the Sabbie di
Imola Fm. and Lower Emilia-Romagna synthem.
The resulting subdivision of the Plio-Pleistocene syn-growth strata allowed us to calculate
fold uplift and fault slip rates for the fault system, assuming a fill-to-the-top growth model
[e.g., Suppe et al., 1992; Masaferro et al., 2002]. The Capriano del Colle backthrust moved at
ca. 2.5 mm/yr between 1.6 and 0.89 Myr and slowed down to ca. 0.43 mm/yr during the most
©2014 American Geophysical Union. All rights reserved.
recent resolvable time window, i.e. 0.89 Myr to present [Livio et al., 2009].
The ongoing compressional tectonics is also demonstrated by geodetic data indicating NNE-
SSW shortening rates in the range of 1.1 mm/yr at the longitude of Lake Iseo [e.g., Devoti et
al., 2011; Bennet et al., 2012; Michetti et al., 2012]. Historical and instrumental seismicity
records moderate-to-strong earthquakes, characterized by long recurrence intervals, often
unrelated with known seismogenic structures ([e.g., Magri and Molin, 1986; Guidoboni,
1986; Serva, 1990; Burrato et al., 2003; Guidoboni and Comastri, 2005]; Fig. 1). This was the
case for one of the strongest known historical earthquake of northern Italy, the Dec. 25, 1222,
Io IX-X (MCS) Brescia event [e.g., Guidoboni, 1986; Serva, 1990], whose epicenter is
located close to the study area (Fig. 1).
Monte Netto is an isolated hill, deeply eroded on its sides, almost rectangular in shape (5 km
in length and 2 km in width), trending 110 and standing ca. 30 m above the surrounding
alluvial plain. The latter is a vast outwash fan, developed during the Last Glacial Maximum
by a network of meltwater channels [e.g., Baroni and Cremaschi, 1986; Marchetti, 1996]
incised by the Holocene drainage. The vertical surface projection of the Capriano del Colle
backthrust is located just north of Monte Netto hill and the projected traces of the hinge zones
coincide with local structural and topographic relief (Fig. 3).
The core of the hill exposes a gently folded sequence of Lower-to-Middle Pleistocene fluvial
sediments (floodplain environment – FL1 and FL2 in Fig. 2). This oldest fluvial sequence is
made up of continental Lower Pleistocene greenish-grey fine sands and floodplain deposits
with abundant shell remains, tentatively correlated to similar sediments, 0.89 Myr old, drilled
in the Ghedi core [Carcano and Piccin, 2002; Scardia et al., 2006], ca. 80 m below the surface
and 10 km SE from the site. Younger fluvial sediments (Middle-Upper Pleistocene) onlap the
hill on both sides and locally fill small erosional valleys excavated across the hill (Fig. 3).
Loess strata interlayered by paleosols cover both the units on the top of the hill (Cremaschi,
©2014 American Geophysical Union. All rights reserved.
1987). As already mentioned, chronological constraints available in the literature for the
above fluvial and loess sequence are poorly defined, which motivated our investigation for
new radiocarbon, OSL and pedostratigraphic dating, as described below.
3. Methods
We conducted an interdisciplinary study of the Monte Netto site by collecting and comparing
data from field mapping, structural analysis, pedostratigraphy and dating techniques. In the
following a brief overview of the methods applied for each approach is described.
3.1 Geologic survey and structural analysis
In order to reconstruct with refined resolution the recent (Middle to Late Pleistocene)
structural evolution of the Monte Netto, we first mapped the geology of the hilltop area at a
scale of 1:10,000, and conducted a detailed stereoscopic interpretation of aerial photo-
coverages available for the area (IGM photo-series, 1954, ca. 1:33.000 scale; Regione
Lombardia coverage, 1992, ca. 1:22.000 scale). The aim was to look for suitable outcrops, to
map the different lithostratigraphic units (following e.g., Boni et al., 1970; Fig. 2) and to
correlate surface geology with shallow drill logs and with the dated units recognized in the
relatively deep boreholes performed in the nearby area by Regione Lombardia down to ca.
200 meters of depth [e.g., Scardia et al., 2006].
This was followed by a detailed field survey of the study site, located in a quarry area,
mapping the stratigraphic units both in section and in plan-view. One of the quarry walls,
oriented perpendicular to the fold trend, was investigated in detail. We extended the
outcropping area downward by digging a trench at the base of the quarry wall. The resulting
surface was logged at a scale of 1:20 distinguishing both lithostratigraphic and
pedostratigraphic units.
©2014 American Geophysical Union. All rights reserved.
The evolution of the folded sequence was reconstructed by progressively removing syn-
growth strata and unfolding the beds exposed in the quarry wall to a near-horizontal
depositional geometry. Fold limbs where translated and rotated using the Midland Valley
2DMOVE® structural geology software and considering constraints given by growth strata
onlap position or overlap. This allowed to calculate the uplift rates of the structure as
constrained by dated syn-growth strata and according to a fill-to-the-top model, following a
procedure already applied in similar tectonic settings [e.g., Leon et al., 2007, Streig et al.,
2007]. Finally, trishear modeling of the fold shape was used to obtain the best fitting
parameters of the thrust driving the fold growth (tip position, cumulated slip, ramp angle,
apical angle and propagation/slip ratio) [e.g., Erslev, 1991; Hardy and Ford, 1997].
Computations were made using the FaultFold 5.4 trishear code [e.g., Allmendinger, 1998;
Zehnder and Allmendinger, 2000] which used an inverse method for bed restoration,
assuming a reference bed and postulating its initial planar geometry. Calculations were made
performing a grid search over reasonable ranges of the considered parameters, resulting in
thousands of possible combinations for each grid search. Best fitting parameters were chosen
assuming that the restored reference bed is planar at the start of folding and then calculating a
simple least squares linear regression between the deformed and the reference bed (see
Supporting Information).
3.2 Pedostratigraphy
The interpretation of the pedostratigraphic features of the section mostly relied on the field
properties of strata. Field description of soil horizons followed the internationally accepted
guidelines proposed by FAO [2006], adapted to the interpretation of paleosols [sensu Zerboni
et al., 2011]. Main sedimentological and pedological properties are listed in Table 1, together
with the palaeoenvironmental significance of each layer. Field description was supported by
grain-size analyses, which permitted to better distinguish between fluvial, colluvial and
©2014 American Geophysical Union. All rights reserved.
aeolian sediments, and pedological bodies originated by weathering these units. Grain-size
analyses [Gale and Hoare, 1991] were performed after drying samples and removing organics
by hydrogen peroxide (130 vol) treatment. Bulk samples were then air-dried and particle size
distribution analyzed by sieving the >63 μm fraction, while the grain-size distribution of fine
fraction (< 63 μm) was determined by the aerometer method. Sediments were wet sieved
(grain size 2000 to 63 µm), and the silt plus clay fraction (<63 mm) was determined using
Casagrande’s aerometer. Results are expressed as cumulative grain-size curves. Oriented and
undisturbed samples of sediment were collected in correspondence of some vertical fractures
filled with illuvial clay of different origin in order to understand the relation between seismic
events, faults opening and infilling of clay corresponding to subsequent weathering phases.
Thin sections (5x9 cm) were manufactured after impregnation by resin according to standard
methods [Murphy 1986]. The micromorphological study of thin sections employed a Leica
Laborlux 12pol petrographic microscope with an Olympus C4040 digital camera. Thin
sections were observed under plane-polarized light (PPL), cross-polarized light (XPL) and
oblique incident light. The terminology and concepts of Stoops [2003] and Stoops et al.,
[2010] were used in thin-section descriptions and interpretations.
3.3 Dating
Constraints on the age of the litho- and pedostratigraphic units was obtained by both
radiocarbon and OSL.
Organic-bearing sediment samples from the upper part of the pedosequence were submitted
to 14
The samples provided for OSL analysis were prepared in the laboratory at Innsbruck.
C dating by accelerator mass spectrometry at the CEDAD Laboratory (Lecce, Italy). The
uncalibrated dates were calibrated (2 sigma) according to INTCAL13 [Reimer et al., 2013]
using Calib 7.0 [Stuiver et al., 2013].

©2014 American Geophysical Union. All rights reserved.
Approximately 20 g of each sample was used for water content measurement and dosimetric
analyses. The remainder was prepared for OSL analysis following standard techniques
[Wintle, 1997]; this involved initial pre-treatment with 10 % hydrochloric acid, followed by
20 volumes hydrogen peroxide to remove carbonates and organic matter prior to dry sieving.
Following initial preparation, 1 mg of the 4-11 µm polymineral fraction was obtained by
settling following Stokes’ Law for analysis. The cosmic dose rate was estimated for each
sample using the depth of overburden and the geomagnetic latitude, assuming a sampling
location at 45.5° N and 10.1° E and an elevation of 118 m a.s.l. [Prescott and Hutton, 1994],
with the assumption that the overlying sediment would have accumulated rapidly following
deposition, making a correction for changing overburden thickness unnecessary. The water
content for each sample was measured in the laboratory and calculated as the mass of water
divided by the mass of dry sediment, multiplied by 100 (Table 1). The containers that the
samples were collected in were airtight, and thus the water content measured in the laboratory
will have been close to the field value. The dose rate was calculated on the basis of the water
content value measured in the laboratory with an error of ± 5%.
The luminescence analysis was undertaken using the double single-aliquot regenerative-dose
(SAR) protocol [Banerjee et al., 2001; Roberts and Wintle, 2001] with a preheat of 220°C for
10 s, and a cutheat of 160°C.
The De
The D
values were obtained from the blue LED-stimulated measurements, and thus are
based on the quartz component of the polymineral fine-grain mixture.
e was measured for 24 aliquots of samples 8/CC01-03. From the De
dataset of 24
values for each sample, the burial dose was calculated using the Central Age Model
[Galbraith et al., 1999].

©2014 American Geophysical Union. All rights reserved.
The dose rates were calculated using the conversion factors of Adamiec and Aitken [1998]
using the program ADELE [Kulig, 2005] and using an alpha effectiveness value for quartz of
0.03 ± 0.01 [Mauz et al., 2006].
4. Results
4.1 Stratigraphic and structural data
The trench site (see Figs. 2 and 4 for location) is located in the ‘Cava Danesi’ clay quarry, on
the top of the hill. The pre-existing N-S directed quarry wall, ca. 35 m long and 7 m high,
was logged and an explorative trench was excavated at the foot of the wall (Fig. 4a). Two
anticlines, N295 trending, characterized by a wavelength of tens of meters and an amplitude
varying between 4 and 9 m, were exposed along the deepened quarry wall. We focused on the
northernmost anticline (NAN herein after) logging at a scale of 1:20 an area of 32 x 13 m
centered on its southern forelimb (Fig. 4).
From a stratigraphic point of view, the studied section includes a fluvial fining-upward
sequence (Fig. 5), overlain by a loess-paleosol pedosequence. The latter wraps the fluvial
deposits and displays a lateral thickening of up to 5 m, levelling the structural relief created
by the folding of non-aeolian sediments. Stratigraphic and pedostratigraphic units are
distinguished by color, lithology and degree of weathering, and are labeled from oldest to
youngest. A description is summarized in Table 1, while sedimentological data are
summarized in Fig. 6.
Units FG1 to FG8 constitute the fluvial sequence. From the base: unit FG8 is a clast-
supported fluvial conglomerate, probably deposited in a paleo-channel of the Mella River.
The gravel is massive and intercalated with rare, thin lenses of medium to coarse sand.
Roughly imbricated clasts indicate a paleocurrent flow from the west. FG7 consists of a
fining-upward sequence of interbedded silt and medium sand representing settling of

©2014 American Geophysical Union. All rights reserved.
suspended load in an overbank environment. Fining-upward coarse sands and conglomerates
of FG6 occupied a swale carved into FG7, probably representing a crevasse-channel. In the
lowermost part of the unit, just above an erosive surface, a lag deposit was present, consisting
in rip-up clasts belonging to FG7. FG5 is a 50 cm-thick overbank upward-coarsening
sequence. Sediments belonging to FG4, FG3 and FG2 represent three or more crevasse-splay
episodes. FG4 and FG2 showed a complete rising-waning flow sequence. FG1, the youngest
fluvial sediments in the sequence, consisted of levee deposits.
The upper part of the section is characterized by the occurrence of a loess cover, developed
during the Late Pleistocene and interlayered by buried paleosols, which displayed different
degrees of weathering. These cyclic loess-paleosol sequences typically reflect, in the Po
Plain, the alternation of cold/warm periods, with loess sedimentation under dry/cold climate
conditions and subsequent soil development during the following warmer and humid interval
[Cremaschi, 1987; Amit and Zerboni, 2013]. For a detailed description of the
pedostratigraphic and sedimentological characteristics of this sequence, which is beyond the
scope of the present work, please refer to the companion paper by Zerboni et al., [2014].
The loess sequence is exposed along the entire wall of the quarry and was marked by a
decreasing thickness toward the North, where the core of the anticline is located. As a
consequence, in the synclinal hinge, south of the anticline, the loess-paleosol cover reached
more than 5 m in thickness, in contrast to only ca. 2 m at the anticline culmination. At the
southernmost part of the section we observed, from the bottom, a silty to sandy layer (CL),
including a large amount of spherical Mn-concretions, interpreted as evidence of recycled
loess [e.g., Mroczek, 2013] after the colluviation of primary loess was deposited on the top of
the anticline. The CL unit is weathered and covered by PL3, which is the deeper primary
loess layer identified on the top of Monte Netto; its top is marked by the first soil developed
on loess (S3) and shows a moderate increase in clay content. Sedimentological analyses (Fig.
©2014 American Geophysical Union. All rights reserved.
6) highlight the occurrence of PL2 at the top of S3; these two units were separated by a layer
rich in Mn-concretions. PL2 is shallow and, at its top, the S2 soil is present, richer in clay and
in Mn-concretions. At the top of the sequence the thicker loess cover (PL1) is present,
reaching up to 1.5 m; loess is poorly weathered and at its top the S1 unit includes a soil useful
for agriculture (Ap horizon). The same pedostratigraphic sequence is quite evident also in the
proximity of the gravity graben, but due to co-seismic deformation, the thickness of each
layer/soil differs. Furthermore, this part of the sequence is cut by vertical fissures related to
deformational stress, which we interpret as seismipedoturbations [sensu Previtali, 1992].
Fractures were filled by a clay-rich plasma, which displays, in thin section of undisturbed
blocks, different generations of clay infillings characterized by different colors (from red to
orange) and textures (from pure clay to silty/clay). Therefore, differences in appearance
indicate multiple infillings [Kühn et al, 2010], whose formation required a multi-step process
of fissure opening and illuviation by pedogenetic clay (Fig.8), i.e. coseismic movements.
Finally, at the top of the anticline a highly rubified, polycyclic buried paleosol (S4’; Fig. 7) is
present, and it is covered by a thin layer of poorly or unweathered loess. S4’ is a buried,
polycyclic paleosol that formed over a long time span and therefore shows a high degree of
reddening; it was shaped by the same pedogenetic processes responsible for the development
of the stacked S3 to S2 soils.
The NAN is a slightly conical fold showing a clear vergence to the south and a hinge
plunging 295/10 (cfr. Fig. 2b), thus suggesting a periclinal termination of a fold whose
structural culmination is located farther to the southeast, in an area now deeply re-worked by
quarry activity. The periclinal termination has been exposed in 2012 by the new quarry
excavations. High-angle reverse faults were identified at the foot of the exposed walls,
composed by two sub-vertical secondary splays, N130 trending and dipping to the NE. The
tip of these reverse faults is located in the stratigraphic unit FG1 (see Table. 1). Several

©2014 American Geophysical Union. All rights reserved.
bending-moment faults offset the culmination of the anticline (Fig. 4) creating a main graben
structure and other secondary, mainly extensional, structures. The maximum offset (ca. 2 m)
was recorded on the S-dipping bending-moment fault of the gravity graben and its throw dies
out downward. The observed kinematics indicators (slickensides) show a pure dip-slip
movement. Joints are common, usually filled by illuvial clay. All faults and joints were
subdivided into two subsets, based on cross-cutting relationships with an erosive
unconformity located in the lowermost part of the section (Fig. 7). The oldest pre-
unconformity subset includes faults and joints deforming the pre-unconformity units and
clearly truncated upward by the erosive surface. The younger subset is composed of
structures cross-cutting the unconformity. The restoration of the pre-unconformity subset to
an horizontal datum, rotating the data according to the local bedding attitude, provides a good
match with the post-unconformity subset, thus indicating that the younger brittle deformation
mainly developed at the very end of fold amplification. The youngest subset also includes a
cluster of high-angle normal faults, ca. E-W trending and belonging to a normal fault system,
developed in the outer part of the fold. These structures are located at the fold hinge and are
not fully consistent with the retrodeformation of the oldest subset.
4.2 Chronological constraints
Eight samples were collected and analyzed from five units to constrain the age of the
sequence (Fig. 5 and Fig. 7). Radiocarbon and OSL results indicate that the pedostratigraphic
units in the trench exposures are Upper Pleistocene to Holocene in age (Fig. 5 and Table 2).
Radiocarbon dating was performed on the organic fraction of three samples, collected at the
top of the pedosedimentary sequence, at depths ranging from 1 to 0.4 m. The lowest sample
(CAP03), dated between 16241 and 15772 cal yr BP (2σ), corresponds to the upper and very
poorly weathered silt deposit, which is interpreted as a final phase of loess deposition,
probably dating to Lateglacial stadials preceding the Bølling-Allerød. Sample CAP03 was
©2014 American Geophysical Union. All rights reserved.
collected from a weakly developed soil on loess and possibly represents the age of a soil
developed under glacial conditions in a tundra steppe environment with prolonged
accumulation of organics and microcharcoals and later isolated from the surface; it therefore
represents a mean value for the time of soil development [Zerboni et al., 2014]. This result is
comparable to the cumulic soil described at the top of the Val Sorda loess sequence
[Cremaschi et al., 1997; Ferraro, 2009], not far from Monte Netto. The dating CAP03
indicates a period almost contemporaneous with dust sedimentation recorded in other loess
sequences along the northern margin of the Po Plain Loess Basin [Cremaschi and Lanzinger,
1984, Cremaschi et al., 1987; Ferraro, 2009; Wacha et al., 2011]. Samples CAP01 and CAP2
gave Holocene ages for the upper part of the sequence (7483–7287 and 5574–5094 cal yr
BP). These young radiocarbon ages possibly reflect anthropogenic reworking of the loess and the
Holocene soil developed on it and post-date loess deposition (Zerboni et al., 2014).
OSL samples (Table 4), collected from the lower part of PL1, yielded ages between 27.5 and
15.8 kyr (Fig. 5), while samples coming from higher levels, inside PL1, yield considerably
younger ages. An OSL sample collected near the top of PL2 yielded an age of 49.8 to 39.0
kyr.
As stated above, PL2 deposition is constrained by OSL to ca. 44 kyr and radiocarbon and
OSL dating both bracket the age for PL1 deposition. Moreover, two archaeological findings
support the radiometric chronology of the sequence. Paleolithic finds from the top of CL do
not present a clear Levellois technology, and, on the basis of their similarity with other lithic
assemblages described in the region [Zorzi, 1959; Cremaschi, 1974], they are dated to the
Lower/Middle Paleolithic. On the contrary, at a depth of c. 1.2-1.5 m, we found a rich set of
Mousterian artifacts, which fit well with the OSL dating. Moreover, regional comparisons
also confirm a good correspondence between loess deposition and Mousterian frequentation
of the Po Plain [Cremaschi and Christopher, 1984; Peresani et al., 2008].
©2014 American Geophysical Union. All rights reserved.
After integrating OSL and radiocarbon age constraints with archeological finds, observations
from other pedosequence in the area [Cremaschi, 1987] and with data on the Pleistocene
evolution of the northern sector of the Po Plain, a tentative correlation between the described
loess-paleosol sequence and the Marine Isotope Stages (MIS, e.g., Waelbroeck et al., 2002]
can be proposed. These correlations indicate that the Monte Netto sequence represents a long
stratigraphic recording of cold/warm climate stages (Fig. 5). Radiometric dating are limited to
the upper part of the stratigraphic section, but a tentative model illustrating the evolution of
the whole sequence can be summarized as follow:
- The lowermost part of the sequence corresponds to fluvial to fluvio-glacial sediments
deposited in the Po Plain in the Early and Middle Pleistocene [e.g., Muttoni et al.,
2003; Scardia et al., 2006]. The top of this part of the sequence possibly suffered
intense weathering during an interglacial of the Middle Pleistocene, which triggered
the formation of a rubified soil.
- After the initial deformation (uplift) of the top of the hill, the upper part of the fluvial
to fluvio-glacial sequence and the soil at its top underwent colluviation and the CL
unit formed. Subsequently, the upper part of the CL unit underwent strong
pedogenesis under interglacial conditions (formation of soil S4). On the basis of the
properties of the S4 paleosol and comparison with other sites of the Po Plain [e.g.,
Ferraro, 2009], the formation of this soil can be dated back to the MIS 5e interglacial,
under warm conditions. As a consequence, colluvial processes were attributed to a
glacial phase preceding the MIS 5e, possibly the MIS6. A correlation with an older
glacial (for instance MIS8) is also possible, but it would imply a significant hiatus in
the loess/paleosol sequence for which we see no evidence in the exposed quarry wall
(no unconformity, no erosional surfaces), and thus we consider unlikely.
- During the cold and arid period following the Eeemian MIS 5e, the soil S4 was buried
©2014 American Geophysical Union. All rights reserved.
by a thick accumulation of loess (PLs 3 to 1), which formed in a long polycyclic cold
phase encompassing (according to radiometric dating) the MIS5d – 2. Each one of the
three loess strata so long identified is capped by a thin soil, whose formation requires
environmental conditions typical of the upper Pleistocene interstadials.
- At Monte Netto the loess sedimentation, which in the Po Plain generally lasted up to
the end of the Last Glacial Maximum, continued up to the stadial preceding the
Bølling-Allerød interstadial; after this phase a soil (S1) developed during the
Lateglacial interstadials and in the Early and Middle Holocene.
5. Structural evolution of the fold
The structural crest of the NAN roughly matches the topographic culmination of the hill,
standing ca. 30 m above the surrounding alluvial plain. A direct correlation between the
highest uplifted fluvial unit (FG1) and correlative sediments buried in the plain cannot be
easily done due to the lack of dated material in the surrounding borehole stratigraphic logs for
intervals younger than 0.89 Myr. However, the pedogenetic overprint of the colluvial unit
(CL) marked the first emergence of a morphological relief in the plain, preserved from
erosional process. This in turn allowed the subsequent deposition of loess on the hilltop. The
minimum uplift rate of the hill, considering the height difference between CL and the
surrounding alluvial plain (ca. 30 m) and a time window from CL deposition to the present, is
ca. 0.16 mm/yr.
Based on trench data it is possible to reconstruct the Middle to Late Pleistocene evolution of
these secondary structures, placing some important constraints on the activity of the main
blind thrust fault. Uplift values were calculated according to a fill-to-the-top model, where
systematic changes in unit thickness are due to contemporary gain in structural relief of
underlying structures; onlapping of strata can thus provide only a minimum value for

©2014 American Geophysical Union. All rights reserved.
contemporary uplift. Uplift rates were then calculated considering uplift differences over two
successive dated units.
Fig. 9 shows a 6-step reconstruction of folding-faulting and deposition on the NAN. The
southern termination of the fold is considered as a local datum for the calculation of structural
relief and tilting. In step 1 the top of FG3 was restored to a horizontal datum and the resulting
strata geometry clearly shows bed thinning toward the south. This geometry is consistent with
the growing of a shallow thrust fault (Fault 1 in Fig. 9), whose propagating tip reaches the
surface at step 2, soon after the deposition of units FG 2-1 which are partially displaced by
the fault. Structural relief, cumulated during the deposition of FG7 to FG3, is ca. 2.7 m.
Thinning of FG7 is uncertain, since the base of overlying FG6 is erosive. Several secondary
normal faults develop in the fault hangingwall, accommodating deformation in the incipient
fold crest. These faults have a limited length and cross-cut only units FG 5–3 while
displacement rapidly dies out upward not allowing to pre-date faults movement.
Nevertheless their back-rotated orientation at this step is consistent with the accommodation
of extension in the fold crest and thus a principal stress vertically orientated; a later
activation, conversely, would imply a low angle normal faulting not consistent with the local
stress field and with a contemporary development of the main gravity-graben.
From step 2 onward, most of the deformation is due to folding of the whole sequence with a
structural culmination placed at the northern termination of the logged wall. This anticline is
a fault-propagation fold, associated with an underlying buried thrust fault, whose tip is
concealed below the base of the section. Fault 1 is not growing anymore (excepting a re-
activation at step 5 along a secondary splay), as proved by growth-strata geometry and
shifting of the fold structural culmination toward the north. Fold vergence is to the south, as
suggested by the asymmetry. From this step on the fold can be approximately divided into
four kink-bands that experienced differential tilting during fold amplification. These are,

©2014 American Geophysical Union. All rights reserved.
from north to south, anticline crest, forelimb I, forelimb II and forelimb III (Fig. 9). Uplift
occurred contemporary with the deposition of unit CL and of the overlying stacked bodies of
loess cover.
From step 5 on, forelimb I and II were separated by a collapse structure made of a main
south-dipping synthetic normal fault and an antithetic one. These are bending-moment faults
that accommodated stretching in the outer part of the fold, causing collapse into the
developing graben. This non-seismogenic surface faulting, characterized by a decimeter
offset, is nevertheless caused by the fold amplification which, in turn, is driven by the slip on
the underlying seismogenic thrust. In a simple rigid plate model (Fig. 10), the equivalent area
of the graben (A) should be equal to the void space created by differential tilting (A’) where
the plate height (r) is equal to the length of the main normal fault of the graben, measured
considering the downward dying out of the graben displacement.
Since A’ can be approximated to a circle sector area of radius r and angle α:
The resulting value of α is ca. 9o and is consistent with the total differential tilting between
forelimb I and II, which is equal to 12o
Uplift rates of the anticline were calculated for each interval between step 3 and 6 (cfr. Fig.
9), considering the cumulative uplift recorded at the end of each sedimentary phase (based on
the correlation with the MIS and/or absolute dating) and according to a fill-to-the top model
(Fig. 11). It is important to note that these values can be affected by uncertainties in the
numerical ages and correlations and to errors in evaluating the unit thickness (colluviation,
soil formation). CL correlation with MIS, as stated before, is uncertain and so two end-
member uplift rate values were considered, based on different bracketing ages.
.

©2014 American Geophysical Union. All rights reserved.
Differential uplift rates vary between ca. 0.02 and 0.1 mm/yr. An increase in the rate with
time is highlighted by the data, with an average uplift value, over the entire time window
considered, of ca. 0.03 mm/yr. Calculated anticline uplift rates are also typically lower than
the medium-term Monte Netto uplift rate (ca. 0.16 mm/yr) and consistent with secondary
structures linked to a deeper fault-related fold, driving the growth of the hill. The uplift rate
of the Capriano del Colle backthrust, in fact, calculated over the last 0.89 Ma, is 0.22 mm/yr
[Livio et al., 2009].
A consistent structural solution for the thrust generating this anticline can be obtained
through a kinematic restoration of the fold in order to restore the fold frontlimb to a straight
horizontal datum. The fold geometry was approximated to the top of FG3, considered as a
good proxy for pre-growth strata, and six different parameters (including fault ramp
geometry, total slip, trishear apical angle and P/S ratio) were modeled using the FaultFold 5.4
trishear code [e.g., Allmendinger, 1998; Zehnder and Allmendinger, 2000].
The best-fitting combination of the considered parameters (R2 = 0.96) included a 24o
6. Discussion
north-
dipping thrust, a fault tip position ca. 20 m below the present-day topography and a
cumulated slip of 35 m (Fig. 12a). The calculated strain field (Fig. 12b) shows a good
orientation fitting between LNFE (Lines of No Finite Elongation, considered as good proxies
for shear plane orientation and shear sense) and the observed faults, supporting the modeled
fold geometry. Moreover, the south-dipping bending-moment fault (Fig. 12b) fits well with
the LNFE and is consistent with a near-vertical σ1 stress orientation, thus strengthening the
interpretation of a late-stage formation of the gravity graben.
6.1 Structural Interpretation
The detailed stratigraphic analysis of the loess paleosol sequence exposed at Monte Netto

©2014 American Geophysical Union. All rights reserved.
site, together with dating and the structural reconstruction of the NAN, allowed to pose some
important constraints on the local tectonic evolution.
The growth of the NAN is characterized by a progressive and continuous deformation over
the entire time window considered (ca. 200 kyr) which is younger than the most recent period
investigable in this region through industrial seismic reflection data. Uplift rates calculated
for both the NAN and Monte Netto hill are consistent, considering a longer time window
(0.89 Ma – present; Livio et al. [2009]), with uplift and slip values calculated for the
underlying backthrust, CCB. We can infer a genetic relationship between the observed
surface structures and CCB whose medium-term uplift rates can therefore be extended over
younger time windows. In extrapolating on deeper structures activity trends obtained from
shallow ones, however, some restrictions are necessary. The NAN uplift rates show, for
example, an apparent increase in the last 50 kyr (Fig. 11) but this trend could be equally
possibly due to a) a contemporary increase in the activity of the underlying main thrust; b)
changes in the partitioning of the strain propagating to the surface, which, due to the
kinematic evolution of the underlying system, had started to be preferably expressed at the
site; c) a combination of the two previous causes.
A major point to make clear is how the underlying steeplydipping backthrust can cause
shallow S-verging thrusting and related folding. Fig. 12c shows in cross-section the
outcropping Southern and Northern anticlines, the modeled Fault 2 and, below these
structures, the shallowest fault interpreted by Livio et al. [2009] (CCα). Fault 2 ramp
enucleates from the triangle zone indicating growth strata of CCα fault-bend fold. No
evidence of a downward projection of Fault 2 ramp can be found neither in seismic reflection
data (whose signal-quality is by-far too low in such shallow sectors) nor from fault modeling.
We have thus to suppose that Fault 2 is not rooted at the CCα fault plane; its formation can
be the result i.e. of localized strain accommodation connected to CCα synclinal active axial

©2014 American Geophysical Union. All rights reserved.
surface (Fig. 12c). The structural reconstruction of the NAN highlights a break backward
activation of reverse and thrust faults generating the fold (i.e., Fault 1 and, successively, Fault
2): this is consistent with a progressive passive movement of the limb through the fixed
active axial surface, and a consequent progressively northward migration of strain through
activation of i.e out-of-syncline thrusting. Further interpretations cannot unfortunately be
drawn basing solely on these data lacking high-resolution geophysical investigations filling
the gap between typical resolution of commercial seismic reflection data and the scale of
surveyed structures.
A summary reconstruction that best matches these data and modeling results offering an
explanation of upward strain propagation starts with a coseismic activation of the deep blind
CCB, considered as a seismogenic source [Livio et al., 2009; Galadini et al., 2012]. Upward
strain accommodation is partly granted by shallow structures, possibly multibend flexural-
slip faults, like CCα, whose activity is driven by synclinal axial surface of the CCB-related
fold. Finally, in turn, CCα causes near-surface localized deformation, expressed as out-of-
syncline thrusting and related folding. This model implies that a major role in upward strain
propagation through compressive structures can be played by synclinal axial surfaces pinned
to changes in ramp angles. Timing and sequence of fault/fold activation (i.e. break-forward
vs -backward activation) can help in distinguish between different structural solutions and
models for surface deformations induced by deeper structures. The results obtained confirm
that restoration models provide a powerful tool in documenting the growth history of
compressive structures [e.g. Suppe et al., 1992; Shaw and Suppe, 1994; Allmendinger and
Shaw, 2000].
6.2 Surface faulting at Monte Netto site and paleoseismic potential.
The structural evolution of the NAN and, in general, the shallow tectonic deformations
observed at Monte Netto site offer new data on the tectonic evolution of the area and

©2014 American Geophysical Union. All rights reserved.
significantly constraint the debate about surface faulting along shallow blind thrust systems.
Modes of strain partitioning and upward propagation of deformation is a major challenge for
studies on fault displacement hazard analysis, especially regarding blind structures and this
case study proves that very shallow compressive tectonics was caused by upward strain
propagation from underlying blind thrust through both decametric-scale folding and shallow
thrusting. Fold-related faulting can play an important role in causing localized surface
displacement; in this sense, even if this second- or higher-order structure cannot be easily
related and structurally linked through a balanced solution to the underlying main structure,
the calculated uplift rates and the evidence of progressive offset and deformation on the
outcropping structure can be considered as a proxy for the activity of the main thrust at depth
[i.e. Yeats, 1986; Galadini et al., 2012; Michetti et al., 2012]. Moreover secondary structures,
such as bending-moment faults, can provide good paleoseismological records of the
underlying blind structures. Paleoseismic analyses of the events recorded by the bending-
moment faults at the Monte Netto site are in progress; paleoseismic evidence at this site,
which is clearly related to the growth of a recent compressional structure, is significant to
assess the threshold for coseismic surface rupture along compressive capable faults in the Po
Plain foredeep and raises some important issues about the assessment of fault displacement
hazard. Indeed, environmental effects similar to those recorded at the Monte Netto site are
typically associated with macroseismic intensities > IX on the MCS (Mercalli Cancani
Sieberg; Sieberg, 1930) and ESI 2007 intensity scales [Michetti et al., 2007]. In fact, the ESI
2007 scale has been calibrated with the MCS scale, commonly used in Italy [Michetti et al.,
2004]. It is possible, therefore, to infer an epicentral intensity for the earthquake accompanied
by the surface faulting effects observed at Monte Netto of Io = IX MCS or greater .
Following the empirical relations between Io and Mw for shallow crustal earthquakes that
are currently used in Italy,

©2014 American Geophysical Union. All rights reserved.
we obtain an Mw = 5.65 – 6.33 for an earthquake with Io = IX. This equation has been used
in the most recent compilation of the catalogue of Italian earthquakes [Gruppo di Lavoro
CPTI, 2004] in order to evaluate the seismic hazard on the Italian peninsula.
During the 2012 seismic sequence in Emilia, only few tens of km SE of Monte Netto, the two
Mw 5.9 and 5.8 (Io VIII MCS) main shocks generated ca. 10 – 15 cm of surface cumulative
uplift along the causative blind anticlines, accompanied by severe liquefaction effects, but no
surface faulting. We argue that the threshold for surface faulting earthquakes in the Po Plain
might be on the order of Mw 6.5 and Io IX-X; such conditions were observed perhaps only
during the Jan. 13, 1117, Verona, and Dec. 25, 1222, Brescia events. This is consistent with
Maximum Expected Magnitudes in the range of Mw 5.9 – 6.8 calculated by Livio et al.
(2009) and Michetti et al. (2012) for the Capriano del Colle fault system based on fault
rupture area and fault slip, considering different rupturing scenarios.
7. Conclusions
Logging and trenching of a quarry wall in the Monte Netto site (Brescia, N Italy), together
with radiocarbon and OSL age constraints on the exposed loess layers, allow us to unravel the
fold growth history of a secondary fault-related fold, linked to a blind backthrust in the Po
Plain whose activity has been previously documented through seismic reflection data (Livio
et al. 2009).
In summary from above, the following conclusions can be drawn from this study:
- recent uplift rates of the Monte Netto hill can be constrained as ca. 0.16 mm/yr from
MIS6 to present, considering ca. 30 m of uplift of the entire hill;
- the uplift rates calculated for a secondary fold on the hill (Northern anticline - NAN)
indicate values ranging between 0.02 and 0.1 mm/yr;

©2014 American Geophysical Union. All rights reserved.
- the reconstructed structural evolution of the NAN highlights that two shallow thrusts
formed through a break-backward activation and resulting in a fold whose later growth
was associated with bending-moment normal fault in the crestal and forelimb region;
- the modeling of a trishear kinematic solution for the NAN indicates that the fold-
causative thrust has a ramp sector rooted at ca. 70 m below surface and I characterized
by a high P/S ratio, thus promoting upward strain propagation;
- upward strain propagation and generation of shallow low-angle thrust and related folding
seem to be mainly due to secondary fold-related faulting, like out-of-syncline thrusting
mechanisms.
- secondary near-surface structures offer a good opportunity to investigate through a
paleoseismological approach the activity of the underlying seismogenic source.
Acknowledgments
Data on grain-size curves, uplift rates, structural data and trishear model methods and results
are respectively available as in Supporting Information Table S1, Table S2, Table S3 and
TRISHEAR modeling files.
We thank the municipality of Capriano del Colle, Brescia Province administration and
Fornaci Laterizi Danesi S.p.A. and for permission to site access and trenching. In particular
we would like to thank Dr. Febbrari, Dr. Zamboni and Alessandro at F.lli Arici S.r.l. for their
logistic support.
This work has been in part funded by grants from the Operational Programme Cross Border
Cooperation IT / CH 2007-2013 - project "SITINET: census, networking and development of
geological and archaeological sites" ID 7621984. This research has also benefited from
funding provided by the Italian Presidenza del Consiglio dei Ministri - Dipartimento della
Protezione Civile (DPC). Scientific papers funded by DPC do not represent its official
©2014 American Geophysical Union. All rights reserved.
opinion and policies. An Academic License of MOVE® suite software was provided by
Midland Valley and was used for fault/fold restoration. Many thanks to the municipality of
Capriano del Colle (BS) and Soprintendenza per i Beni Archeologici della Lombardia for
their support.
References
Adamiec, G. and M. Aitken (1998), Dose-rate conversion factors: update, Ancient TL, 16, 37 - 49.
Allmendinger, R. (1998), Inverse and forward numerical modelling of trishear fault-propagation folds, Tectonics, 17(4), 640-656.
Amit, R. and A. Zerboni (2013), Report on the INQUA-AEOMED field-trip workshop ‘Reconsidering Loess in Northern Italy’ (Po Plain, 1-3 July 2013), AMQ – Alpine and Mediterranean Quaternary, 26(2), xi-xv.
Amorosi, A., M. Barbieri, F. Castorina, M. L. Colalongo, G. Pasini and S.C. Vaiani (1998), Sedimentology, micropaleontology, and strontium-isotope dating of a lower-middle Pleistocene marine succession (" Argille Azzurre") in the Romagna Apennines, northern Italy, Bollettino della Società geologica italiana,117(3), 789-806.
Amorosi, A. and M. Pavesi (2010), Aquifer stratigraphy from the middle-late Pleistocene succession of the Po basin, Mem. Descrittive Carta Geol. Ital. XC, 7-20.
Banerjee, D., A. Murray, L. Bøtter-Jensen and A. Lang (2001), Equivalent dose estimation using a single aliquot of polymineral fine grains, Radiation Measurements, 41, 73 - 94.
Baroni, C. and M. Cremaschi (1986), Geologia e pedostratigrafia della Collina di Ciliverghe (Brescia), Natura Bresciana, Ann. Mus. Civ. Sci. Nat., 23, 55-78.
Benedetti, L., P. Tapponier, C. King, B. Meyer and I. Manighetti (2000), Growth folding and active thrusting in the Montello region, Veneto, Northern Italy, Journ. Geophys. Res., 105(B1), 739-766.
Bennet, R. A., E. Serpelloni, S. Hreinsdóttir, M.T. Brandon, G. Buble, T. Basic, G. Casale, A. Cavaliere, M. Anzidei, M. Marjonovic, G. Minelli, G. Molli and A. Montanari (2012), Syn-convergent extension observed using RETREAT GPS network, northern Apennines. Italy, Journal of Geophysical Research–Solid Earth, 117, B04408, doi:10.1029/2011JB008744.
Bignami, C., P. Burrato, V. Cannelli, M. Chini, E. Falcucci, A. Ferretti, S. Gori, C. Kyriakopoulos, D. Melini, M. Moro, F. Novali, M. Saroli, S. Stramondo, G. Valensise and P. Vannoli (2012), Coseismic deformation pattern of the Emilia 2012 seismic sequence imaged by Radarsat-1 interferometry, Annals of Geophysics, 55(4), 789 – 795.
Boccaletti, M., G. Corti and L. Martelli (2011), Recent and active tectonics of the external zone of the Northern Apennines (Italy), International Journal of Earth Sciences, 100(6), 1331-1348.
©2014 American Geophysical Union. All rights reserved.
Boni A., G. Cassinis and S. Venzo (1970), Note illustrative della Carta geologica d’Italia alla scala 1:100000. Foglio 47 Brescia. – Geological Map of Italy, 1:100.000 scale. Serv. Geol. d’Italia, 93 pp., Poligrafica & Cartevalori, Ercolano (Napoli).
Bruno, P.P.G., F.J. Pazzaglia, and V. Picotti (2011), Evidence for active folding and faulting at the northern Apennines mountain front near Bologna, Italy from high resolution seismic reflection profiling, Geophysical Research Letters, 38(16).
Burrato, P., F. Cucci, and G.Valensise (2003), An Inventory of river anomalies in the Po Plain, Northern Italy: evidence for active blind thrust faulting, Annals of Geophys., 46(5), 865-882.
Carcano, C. and A. Piccin (2002), Geologia degli acquifi Padani della Regione Lombardia. Firenze: S.EL.CA.
Carminati, E., C. Doglioni and D. Scrocca (2004), Alps vs. Apennines, Special volume of the Italian Geological Society for the IGC 32, Florence 2004, 141-151.
Castaldini D. and M. Panizza (1991), Inventario delle faglie attive tra i fiumi Po e Piave e il Lago di Como (Italia settentrionale), Il Quaternario, 4 (2), 333-410.
Castellarin, A. and L. Cantelli (2000), Neo-Alpine evolution of the Southern Eastern Alps, Journal of Geodynamics, 30, 251-274.
Castellarin, A., L. Cantelli, A.M. Fesce, J.L. Mercier, V. Ricotti, G.A. Pini, G. Prosser and L. Selli (1992), Alpine compressional tectonics in the Southern Alps; relationships with the N-Apennines, Annales Tectonicae, 6 (1), 62-94.
Castellarin, A. and G.Vai (1986), Southalpine versus Po Plain Apeninic Arcs, in C. W. (Editor), The origin of Arcs, p. 253-280, Elsevier Science Publisher B. V., Amsterdam.
Castellarin, A., G.Vai and L. Cantelli (2006), The Alpine evolution of the Southern Alps around the Giudicarie faults: a Late Cretaceous to Early Eocene transfer zone, Tectonophysics, 414, 203-223.
Champion, J., K. Mueller, A. Tate and M. Guccione (2001), Geometry, numerical models and revised slip rate for the Reelfoot fault and trishear fault-propagation fold, New Madrid seismic zone, Engineering Geology, 62, 31-49.
Cremaschi, M. (1974), Manufatti del Paleolitico medio - inferiore, provenienti da Monte Netto di Brescia e loro rapporti con i depositi quaternari del Colle. Natura Bresciana - Ann. Mus. Civ. St. Nat. Brescia, 11, 41-57.
Cremaschi, M. (1987), Paleosol and vetusols in the Central Po Plain (Northern Italy) a study in Quaternary geology and soil development, Ed. Unicopli, Milan.
Cremaschi M. and C. Christopher (1985), Palaeolithic settlement and environment in the Middle Pleistocene of Northern Italy: the Ghiardo site. The Third Conference of Italian Archaeology, vol I, the environment, B.A.R. London, pp. 87-104.
Cremaschi, M. and M. Lanzinger (1984), La successione stratigrafica e le fasi pedogenetiche del sito epigravettiano di Andalo, i loess tardiglaciali della Val d'Adige, Preistoria Alpina, 19, 179 - 188.
Cremaschi, M., M. Alessio, L. Allegri, C. Azzi, G. Calderoni, C. Cortesi, V. Petrone and C. Spezzi Bottiani (1987), Una data radiocarbonica del paleosuolo su loess incluso nella successione stratigrafica della Val Sorda (sistema morenico del Garda), Rediconti della Società Geologica Italiana, 10, 29 - 32.

©2014 American Geophysical Union. All rights reserved.
Cremaschi, M., A. Zerboni, C. Nicosia, F. Negrino, H. Rodnight and C. Spötl (2014), Age, soil-forming processes, and archaeology of the loess deposits at the Apennine margin of the Po Plain (northern Italy). New insights from the Ghiardo area. Quaternary International, DOI: 10.1016/j.quaint.2014.07.044, in press.
Desio, A. (1965), I rilievi isolati della Pianura Lombarda ed i movimenti tettonici del Quaternario. Rend Ist Lom Acc Sc Lett, Sez A, 99, 881-894.
Devoti, R., A. Esposito, G. Pietrantonio, A. Pisani and F. Riguzzi (2011), Evidence of large scale deformation patterns from GPS data in the Italian subduction boundary, Earth Planet. Sci. Lett., 311, 230 - 241.
Erslev, E. (1991), Trishear fault-propagation folding, Geology, 19, 617-620.
Fantoni, R., R. Bersezio and F. Forcella (2004), Alpine structure and deformation chronology at the Southern Alps-Po Plain border in Lombardy, Bollettino della Società Geologica Italiana, 123(3), 463-476.
Ferraro, F. (2009), Age, sedimentation and soil formation in the Val Sorda loess sequence, Northern Italy, Quaternary International, 204, 54 - 64.
Galadini F., E. Falcucci, P. Galli, B. Giaccio, S. Gori, P. Messina, M. Moro, M. Saroli, G. Scardia, and A. Sposato (2012), Time intervals to assess active and capable faults for engineering practices in Italy, Engineering Geology, 39–140, 50-65, ISSN 0013-7952, 10.1016/j.enggeo.2012.03.012.
Galbraith, R., R. Roberts, G. Laslett, H. Yoshida and J.Olley (1999), Optical dating of single and multiple grains of quartz from Jinmium rock shelter, northern Australia: Part I, Experimental design and statistical models, Archaeometry, 41, 339 - 364.
Gale, S.J. and P.G. Hoare (1991), Quaternary sediments. New York: Belhaven Press.
Guidoboni, E. (1986), The earthquake of December 25th, 1222: analysis of a myth, Geol. Appl. Idr., 21, 413-424.
Guidoboni, E. and A. Comastri (2005), Catalogue of earthquakes and tsunamis in the Mediterranean area from the 11th to the 15th century, SGA Storia Geofisica Ambiente srl., Bologna.
Gunderson, K.L., D.J. Anastasio, F.J. Pazzaglia and V. Picotti (2013), Fault slip rate variability on 104–105
Gunderson, K.L., F.J. Pazzaglia, V. Picotti, D.A. Anastasio, K.P. Kodama, T. Rittenour, K.F. Frankel, A. Ponza, C. Berti, A. Negri and A. Sabbatini (2014), Unraveling tectonic and climatic controls on synorogenic growth strata (Northern Apennines, Italy), Geological Society of America Bulletin, B30902-1.
yr timescales for the Salsomaggiore blind thrust fault, Northern Apennines, Italy, Tectonophysics,608, 356-365.
Hardy, S. and M. Ford (1997), Numerical modeling of trishear fault-propagation folding and associated growth strata, Tectonics, 16, 841-854.
Heddar, A., C. Authemayou, H. Djellit, A. Yelles, J. Déverchère, S. Gharbi, A. Boudiaf and B. Van Vliet Lanoe (2013), Preliminary results of a paleoseismological analysis along the Sahel fault (Algeria): New evidence for historical seismic events. Quaternary International, 302, 210–223.
Kühn, P., J. Aguilar and R. Miedema (2010), Textural pedofeatures and related horizons. In:

©2014 American Geophysical Union. All rights reserved.
Stoops, G., Marcelino, V., Mees, F., (Eds.), Interpretation of micromorphological features of soils and regoliths. Elsevier, Amsterdam, 217-250.
Kulig, G. (2005), Erstellung einer Auswertesoftware zur Altersbestimmung mittels Lumineszenzverfahren unter spezieller Berücksichtigung des Einflusses radioaktiver Ungleichgewichte in der 238U-Zerfallsreihe. Freiberg: Unpublished BSc thesis, Technical University Bergakademie Freiberg.
Leon, L., S. Christofferson, J. Dolan, J. Shaw and T. Pratt (2007), Earthquake-by-earthquake fold growth above the Puente Hills blind thrust fault, Los Angeles, California: implications for fold kinematics and seismic hazard, Journal of Geophysical Research, 112 (B3), DOI: 10.1029/2006JB004461.
Livio, F., A. Berlusconi, A.M. Michetti, G. Sileo, A. Zerboni, L. Trombino, M. Cremaschi, K. Mueller, E. Vittori, C. Carcano and S. Rogledi (2009), Active fault-related folding in the epicentral area of the December 25, 1222 (Io = IX MCS) Brescia earthquake (northern Italy): seismotectonic implications, Tectonophysics, 476, 320-335.
Magri, G. and D. Molin (1986), I terremoti del 3 Gennaio 1117 e del 25 Dicembre 1222. ENEA-RTI-PAS-ASPGEOL-LO, 2.
Marchetti, M. (1996), Variazioni idrodinamiche dei corsi d'acqua della Pianura Padana centrale connesse con la deglaciazione, Il Quaternario, 9, 465-472.
Masaferro, J.L., M. Bulnes, J. Poblet and G.P. Eberli (2002), Episodic folding inferred from syntectonic carbonate sedimentation: the Santaren anticline, Bahamas foreland. Sedimentary Geology, 146(1), 11-24.
Mauz, B., S. Packman and A. Lang (2006), The alpha effectiveness in silt-sized quartz: New data obtained by single and multiple aliquot protocols, Ancient TL, 24, 47 - 52.
Meghraoui, M. and F. Doumaz (1996), Earthquake-induced flooding and paleoseismicity of the El Asnam, Algeria, fault-related fold, Journal of geophysical research, 101(B8), 17617-17.
Michetti A.M., E. Esposito, L. Guerrieri, S. Porfido, L. Serva, R. Tatevossian, E. Vittori, F. Audemard, T. Azuma, J. Clague, V. Comerci, A. Gürpinar, J. Mc Calpin, B. Mohammadioun, N.A. Mörner, Y. Ota and E. Roghozin (2007), Environmental Seismic Intensity Scale 2007 – ESI 2007. In: Vittori, E. and L. Guerrieri (eds.) Memorie Descrittive della Carta Geologica d’Italia, LXXIV. Servizio Geologico d’Italia, Dipartimento Difesa del Suolo, APAT, SystemCart Srl, Roma, Italy, 7–54.
Michetti, A.M., F. Giardina, F. Livio, K. Mueller, L. Serva, G. Sileo, E. Vittori, R. Devoti, F. Riguzzi, C. Carcano, S. Rogledi, L. Bonadeo, F. Brunamonte and G. Fioraso (2012), Active compressional tectonics, Quaternary capable faults and the seismic landscape of the Po Plain (Northern Italy), Annals of Geophysics, 55(5), 969 - 1001.
Mroczek, P. (2013), Recycled loesses: A micromorphological approach to the determination of local source areas of Weichselian loess, Quaternary International, 296, 241-250.
Murphy C.P. (1986), Thin section preparation of soils and sediments, AB Academic Publishers, Berkhamsted, Herts.
Muttoni, G., C. Carcano, E. Garzanti, M. Ghielmi, A. Piccin, R. Pini, S. Rogledi and D. Sciunnach (2003), Onset of major Pleistocene glaciations in the Alps, Geology, 31(11), 989-992.
Peresani, M., M. Cremaschi, F. Ferraro, C. Falguères, J.J. Bahain, G. Gruppioni, E. Sibilia,
©2014 American Geophysical Union. All rights reserved.
G. Quarta, L. Calcagnile and J.M. Dolo (2008), Age of the final Middle Palaeolithic and Uluzzian levels at Fumane Cave, Northern Italy, using 14C, ESR, 234U/230Th and thermoluminescence methods. Journ. Arch. Sci, 35, 2986-2996,
Picotti, V. and F.J. Pazzaglia (2008), A new active tectonic model for the construction of the Northern Apennines mountain front near Bologna (Italy), Journal of Geophysical Research: Solid Earth (1978–2012) 113.B8 (2008).
Pola, M., A. Ricciato, R. Fantoni, P. Fabbri, & D. Zampieri (2014), Architecture of the western margin of the North Adriatic foreland: the Schio-Vicenza fault system, Italian Journal of Geosciences, 133(2), 223-234.
Ponza, A., F.J. Pazzaglia and V. Picotti (2010), Thrust-fold activity at the mountain front of the Northern Apennines (Italy) from quantitative landscape analysis, Geomorphology, 123(3), 211-231.
Prescott, J. and J. Hutton (1994), Cosmic ray contributions to dose rates for luminescence and ESR dating: large depths and long-term variations, Radiation Measurements, 23, 497 - 500.
Previtali, E. (1992), Seismipedoturbations in Volcanic Soils in North-Eastern Ecuador, CATENA 19, 441-450.
Reimer P.J., E. Bard, A. Bayliss, J.W. Beck, P.G. Blackwell, C. Bronk Ramsey, C.E. Buck, R.L. Edwards, M. Friedrich, P.M. Grootes, T.P. Guilderson, H. Haflidason, I. Hajdas, C. Hatté, T.J. Heaton, D.L. Hoffman, A.G. Hogg, K.A. Hughen, K.F. Kaiser, B. Kromer, S.W. Manning, M. Niu, R.W. Reimer, D.A. Richards, M. Scott, J.R. Southon, R.A. Staff, , C.S.M. Turney and J. van der Plicht (2013), INTCAL13 and MARINE13 radiocarbon age calibration curves 0-50,000 years cal BP, Radiocarbon, 55, 1869-1887.
Roberts, H. and A. Wintle (2001), Equivalent dose determinations for polymineralic fine-grains using the SAR protocol: application to a Holocene sequence of the Chinese Loess Plateau, Quaternary Science Reviews, 20, 895 - 863.
Rovida, A., R. Camassi, P. Gasperini and M. Stucchi (2011), CPTI11, la versione 2011 del Catalogo Parametrico dei Terremoti Italiani. http://emidius.mi.ingv.it/CPTI. Milano, Bologna.
Scardia, G., G. Muttoni and D. Sciunnach (2006), Subsurface magnetostratigraphy of Pleistocene sediments from the Po Plain (Italy): Constraints on rates of sedimentation and rock uplift, Geological Society of America Bulletin, 118(11/12), 1299-1312.
Scognamiglio L., L. Margheriti, F.M. Mele, E. Tinti, A. Bono, P. De Gori, V. Lauciani, F.P. Lucente, A.G. Mandiello, C. Marcocci, S. Mazza, S. Pintore and M. Quintiliani (2012), The 2012 Pianura Padana Emiliana seimic sequence: locations, moment tensors and magnitudes. Annals of Geophysics, 55(4)), doi: 10.4401/ag-6159.
Serva, L. (1990), Il ruolo delle Scienze della terra nelle analisi di sicurezza di un sito per alcune tipologie di impianti industriali; il terremoto di riferimento per il sito di Viadana (MN), Boll. Soc. Geol. Ital., 109, 375-411.
Shaw, J. H., and Suppe, J. (1994), Active faulting and growth folding in the eastern Santa Barbara Channel, California. Geological Society of America Bulletin, 106(5), 607-626.
Sieberg A. (1930), Geologie der Erdbeden, in Handbuch der Geophysik, 2, 4,550-555.
©2014 American Geophysical Union. All rights reserved.
Stoops, G. (2003), Guidelines for analysis and description of soil and regolith thin sections. Soil Science Society of America, Madison, WI.
Stoops, G., V. Marcellino, and F. Mees (2010), Interpretation of micromorphological features of soil and regoliths. Elsevier, Amsterdam.
Streig, A., C.W.S. Rubin, Y. Chen, L. Lee, S. Thompson, C. Madden and S. Lu (2007), Evidence for prehistoric coseismic folding along the Tsaotun segment of the Chelungpu fault near Nan-Tou, Taiwan. Journal of Geophysical Research, 112 (B3), DOI: 10.1029/2006JB004493.
Stuvier, M. and H. Polach (1977), A discussion and reporting of 14
Stuvier, M., P.J. Reimer and R. Reimer (2013): Calib Radiocarbon Calibration version 7.0. – http://calib.qub.ac.uk/calib/
C data, Radiocarbon, 19, 355 - 363.
Suppe, J., and D. Medwedeff (1990), Geometry and kinematics of fault-propagation folding, Eclog. Geol. Helv., 83, 409-454.
Suppe, J., G. Chou and S. Hook (1992), Rates of folding and faulting determined from growth strata, in K. McClay, Thrust tectonics (p. 105-120), Chapman & Hall, London.
Ventura, G. and R. Di Giovambattista (2013), Fluid pressure, stress field and propagation style of coalescing thrusts from the analysis of the 20 May 2012 ML 5.9 Emilia earthquake (Northern Apennines, Italy), Terra Nova, 25(1), 72-78.
Yeats, R.S. (1986), Active faults related to folding. Active tectonics, 63-79.
Wacha, L., S. Pavlakovic, A. Novothny, M. Crnjakovic and M. Frechen (2011), Luminescence dating of Upper Pleistocene loess from the Island of Susak in Croatia, Quaternary International, 234, 50 - 61.
Waelbroeck, C., L. Labeyrie, E. Michel, J. Duplessy, J. McManus and K. Lambeck (2002), Sea-level and deep water temperature changes derived from benthic foraminifera isotopic records, Quaternary Science Reviews, 21, 295 - 305.
Wilson, L.F., F.J. Pazzaglia and D.J. Anastasio (2009), A fluvial record of active fault-propagation folding, Salsomaggiore anticline, northern Apennines, Italy, Journal of Geophysical Research: Solid Earth (1978–2012), 114(B8).
Wintle, A. (1997), Luminescence dating: laboratory procedures and protocols, Radiation Measurements, 27, 769 - 817.
Zehnder, A.T. and R.W. Allmendinger (2000), Velocity field for the trishear model. Journal of Structural Geology, 22(8), 1009-1014.
Zerboni, A., L. Trombino, C. Frigerio, F. Livio, A. Berlusconi, A.M. Michetti, H. Rodnight and C. Spötl (2014), The loess-paleosol sequence at Monte Netto: a record of climate change in the Upper Pleistocene of the central Po Plain, northern Italy, Journal of Soils and Sediments. DOI: 10.1007/s11368-014-0932-2. – in press
Zorzi, F. (1959), Un’Amigdala Acheuleana scoperta a Lughezzano di Valpantena nel quadro del paleolitico inferiore e medio Veronese, Memorie del Museo Civico di Storia Naturale di Verona, vol. III.
©2014 American Geophysical Union. All rights reserved.
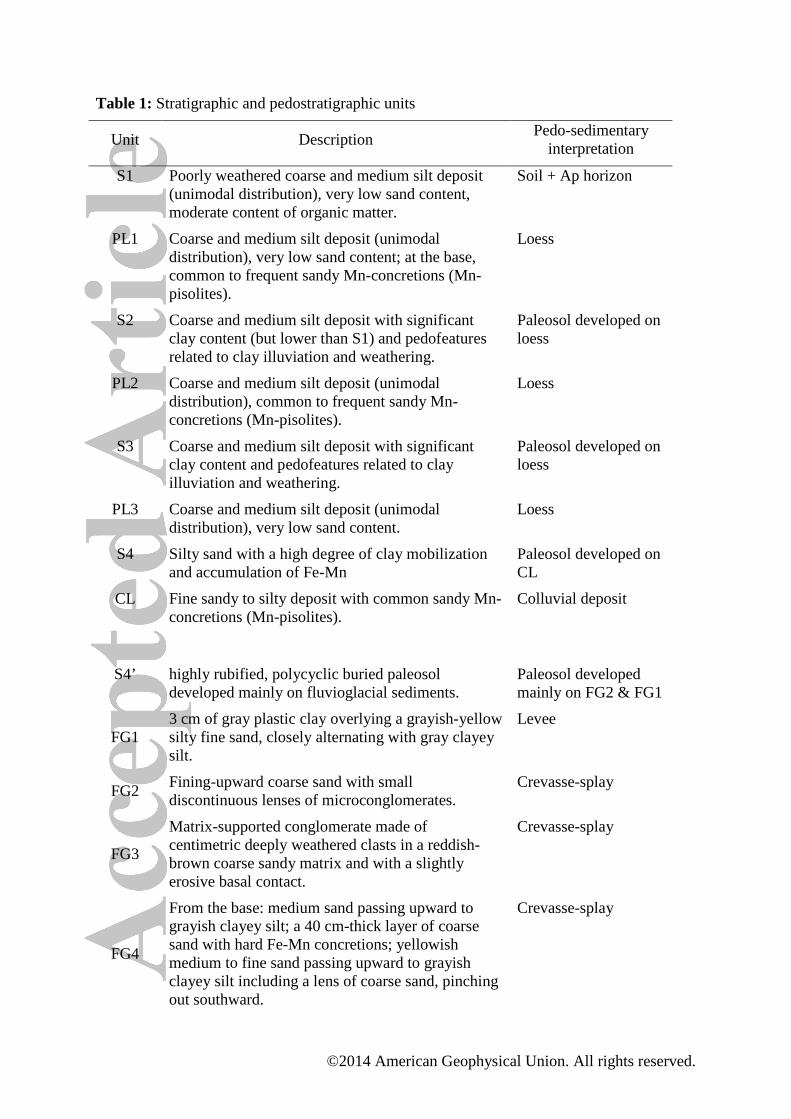
Table 1: Stratigraphic and pedostratigraphic units
Unit Description Pedo-sedimentary interpretation
S1 Poorly weathered coarse and medium silt deposit (unimodal distribution), very low sand content, moderate content of organic matter.
Soil + Ap horizon
PL1 Coarse and medium silt deposit (unimodal distribution), very low sand content; at the base, common to frequent sandy Mn-concretions (Mn-pisolites).
Loess
S2 Coarse and medium silt deposit with significant clay content (but lower than S1) and pedofeatures related to clay illuviation and weathering.
Paleosol developed on loess
PL2 Coarse and medium silt deposit (unimodal distribution), common to frequent sandy Mn-concretions (Mn-pisolites).
Loess
S3 Coarse and medium silt deposit with significant clay content and pedofeatures related to clay illuviation and weathering.
Paleosol developed on loess
PL3 Coarse and medium silt deposit (unimodal distribution), very low sand content.
Loess
S4 Silty sand with a high degree of clay mobilization and accumulation of Fe-Mn
Paleosol developed on CL
CL Fine sandy to silty deposit with common sandy Mn-concretions (Mn-pisolites).
Colluvial deposit
S4’ highly rubified, polycyclic buried paleosol developed mainly on fluvioglacial sediments.
Paleosol developed mainly on FG2 & FG1
FG1 3 cm of gray plastic clay overlying a grayish-yellow silty fine sand, closely alternating with gray clayey silt.
Levee
FG2 Fining-upward coarse sand with small discontinuous lenses of microconglomerates.
Crevasse-splay
FG3
Matrix-supported conglomerate made of centimetric deeply weathered clasts in a reddish-brown coarse sandy matrix and with a slightly erosive basal contact.
Crevasse-splay
FG4
From the base: medium sand passing upward to grayish clayey silt; a 40 cm-thick layer of coarse sand with hard Fe-Mn concretions; yellowish medium to fine sand passing upward to grayish clayey silt including a lens of coarse sand, pinching out southward.
Crevasse-splay

©2014 American Geophysical Union. All rights reserved.
FG5 Upward-coarsening brownish-green silt passing to silty sand.
Levee
FG6
Coarse sand and matrix-supported microconglomerates passing upward to brownish fine sand. Fe-Mn concretions concentrate locally at the upper interface of intercalated silty and fine sand lenses. The base is marked by an erosive surface.
Crevasse-channel
FG7
From the base: a thin lens of fining-upward brownish-yellow silty fine sand with intercalated medium sand lenses. Soft Fe-Mn pisolitic concretions are present. Silt and greenish-grey clay, at the top, are truncated by an erosive surface.
Levee and floodplain fines
FG8
Clast-supported conglomerate in a sandy reddish-brown matrix; rounded and flatted clasts (max 5 – 6 cm). Both crystalline and carbonate clasts are deeply weathered and mm-thick coatings are common.
Channel facies; outwash braided plain

©2014 American Geophysical Union. All rights reserved.
Table2: Bulk radiocarbon analyses of samples collected in trenches.
Sample Code
Stratigraphic unit
Depth below
ground surface (m)
Radiocarbon age (yr BP)*
δ13 Calibrated age C (‰)
yr BP†
CAP01 PL1 (upper part) 0.4 4635 ± 45 -22.5 ±
0.3 5574 - 5094
CAP02 PL1 (upper part) 0.5 6485 ± 50 -28.0 ±
0.3 7483 - 7287
CAP03 PL1 (lower part) 1.0 13313 ± 75 -33.7 ±
0.5 16241 - 15772
*Quoted in radiocarbon years BP using the Libby half-life of 5568 yr and following the conventions of Stuiver and Polach [1977]; uncertainty ±1σ.
† Calibrated radiocarbon ages (±2σ) calculated using Calib 7.0 [Stuiver et al., 2013] and INTCAL 13 (Reimer et al., 2013).

©2014 American Geophysical Union. All rights reserved.
Table 3. Details of dosimetry calculations
Sample code
Grain size
(µm)
Water content
(%) K (%) U (ppm) T (ppm)
Cosmic dose-rate
(mGy/kyr)
Total dose-rate (Gy/kyr)*
CC01 4 - 11 9.5 1.99 ± 0.10 15.9 ± 0.8 4.5 ± 0.2 176 ± 18 7.01 ± 0.83
CC02 4 - 11 7.3 1.95 ± 0.10 16.6 ± 0.8 4.8 ± 0.2 176 ± 18 7.37 ± 0.88
CC03 4 - 11 6.3 1.65 ± 0.08 16.8 ± 0.8 4.9 ± 0.2 161 ± 16 7.22 ± 0.89
* The total effective dose-rate from the environment to quartz grains 4-11 µm in diameter was calculated taking into account the alpha efficiency factor.

©2014 American Geophysical Union. All rights reserved.
Table 4: Results for OSL dating
Sample code
number of
samples
Burial dose (Db
(Gy) )*
Environmental dose-rate (Gy/kyr)
Stratigraphic unit Age (kyr)
CC02 24 146 ± 3 7.37 ± 0.88 PL1 (middle part) 19.9 ± 2.3
CC01 24 173 ± 4 7.01 ± 0.83 PL1 (few cm upon S4’) 24.6 ± 2.9
CC03 24 321 ± 9 7.22 ± 0.89 PL2 44.4 ± 5.4
*Calculated using the central age model.
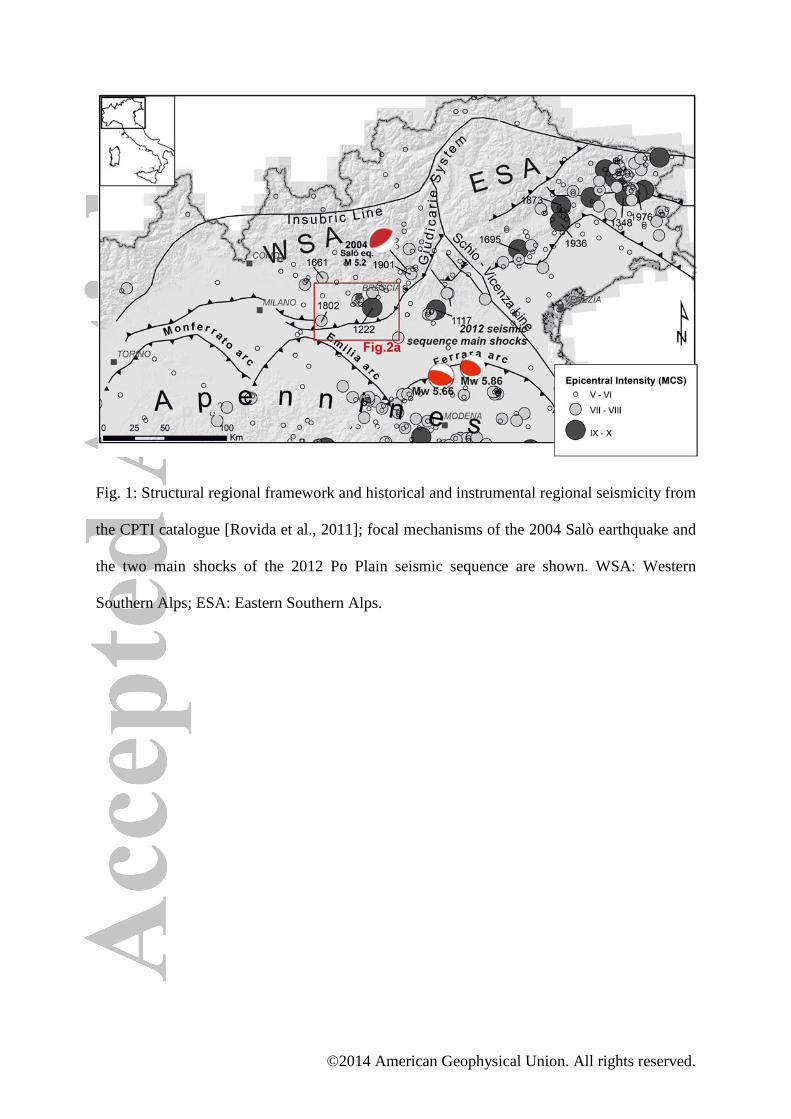
©2014 American Geophysical Union. All rights reserved.
Fig. 1: Structural regional framework and historical and instrumental regional seismicity from
the CPTI catalogue [Rovida et al., 2011]; focal mechanisms of the 2004 Salò earthquake and
the two main shocks of the 2012 Po Plain seismic sequence are shown. WSA: Western
Southern Alps; ESA: Eastern Southern Alps.
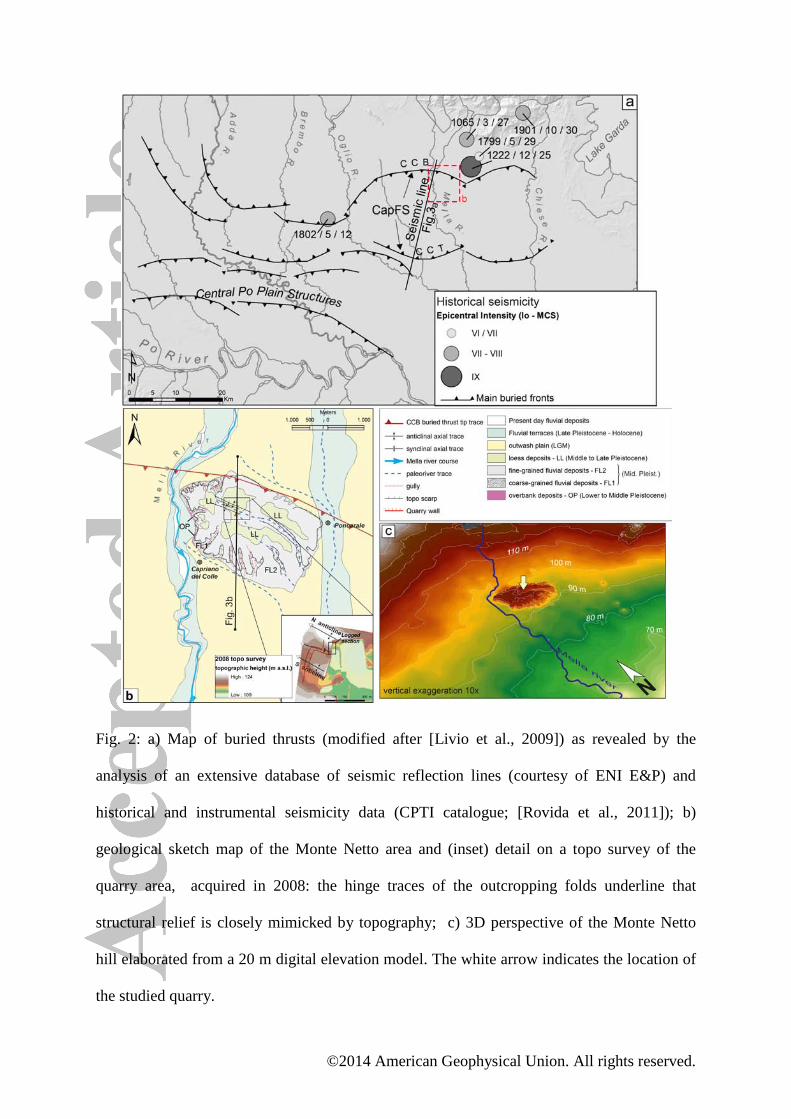
©2014 American Geophysical Union. All rights reserved.
Fig. 2: a) Map of buried thrusts (modified after [Livio et al., 2009]) as revealed by the
analysis of an extensive database of seismic reflection lines (courtesy of ENI E&P) and
historical and instrumental seismicity data (CPTI catalogue; [Rovida et al., 2011]); b)
geological sketch map of the Monte Netto area and (inset) detail on a topo survey of the
quarry area, acquired in 2008: the hinge traces of the outcropping folds underline that
structural relief is closely mimicked by topography; c) 3D perspective of the Monte Netto
hill elaborated from a 20 m digital elevation model. The white arrow indicates the location of
the studied quarry.

©2014 American Geophysical Union. All rights reserved.
Fig. 3: a) Interpreted seismic reflection profile (for line trace see Fig. 2); b) close up to the
Monte Netto hill area (see Fig. 2b for section trace). Modified after [Livio et al., 2009].
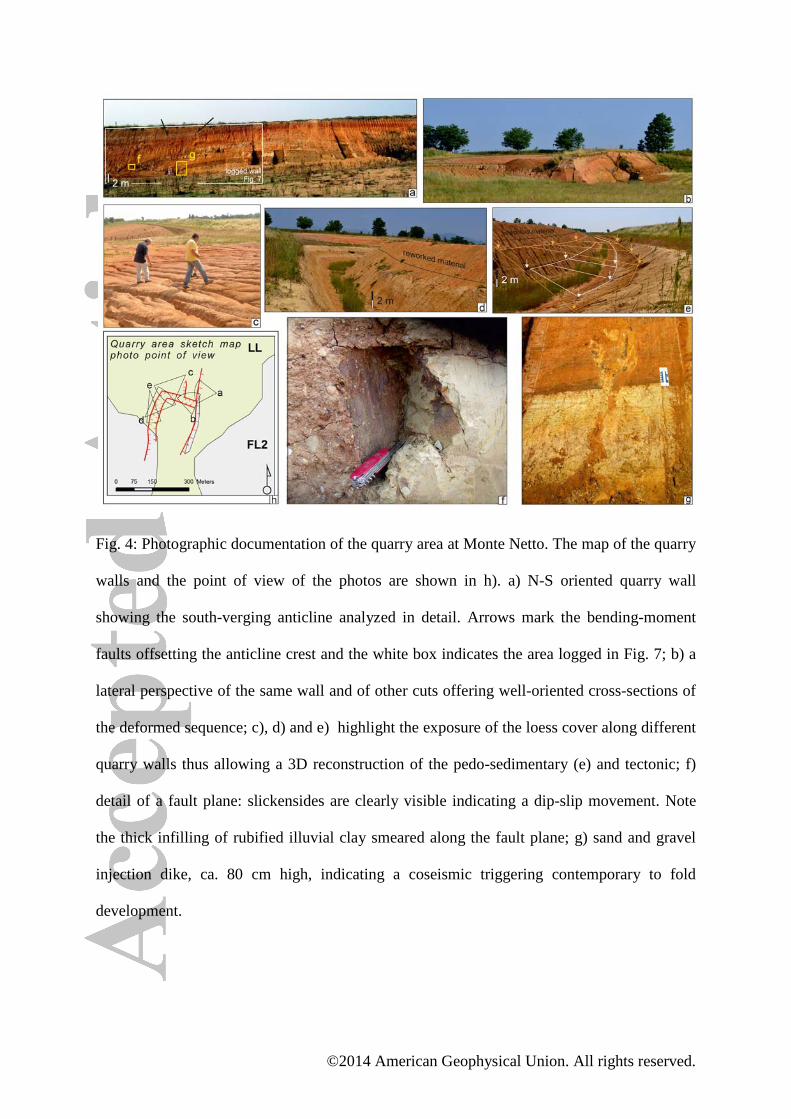
©2014 American Geophysical Union. All rights reserved.
Fig. 4: Photographic documentation of the quarry area at Monte Netto. The map of the quarry
walls and the point of view of the photos are shown in h). a) N-S oriented quarry wall
showing the south-verging anticline analyzed in detail. Arrows mark the bending-moment
faults offsetting the anticline crest and the white box indicates the area logged in Fig. 7; b) a
lateral perspective of the same wall and of other cuts offering well-oriented cross-sections of
the deformed sequence; c), d) and e) highlight the exposure of the loess cover along different
quarry walls thus allowing a 3D reconstruction of the pedo-sedimentary (e) and tectonic; f)
detail of a fault plane: slickensides are clearly visible indicating a dip-slip movement. Note
the thick infilling of rubified illuvial clay smeared along the fault plane; g) sand and gravel
injection dike, ca. 80 cm high, indicating a coseismic triggering contemporary to fold
development.

©2014 American Geophysical Union. All rights reserved.
Fig. 5: a) stratigraphic column of the analyzed sequence exposed at the Monte Netto quarry.
A brief description of the Units is provided in Table 1; for the complete Log of the section
see Fig. 7. Dating positions and the archeological findings are reported; b) the inferred
correlation with the chronological scale, the marine isotope curve [Waelbroeck et al., 2002]
and the paleomagnetic chronology is given for comparison.
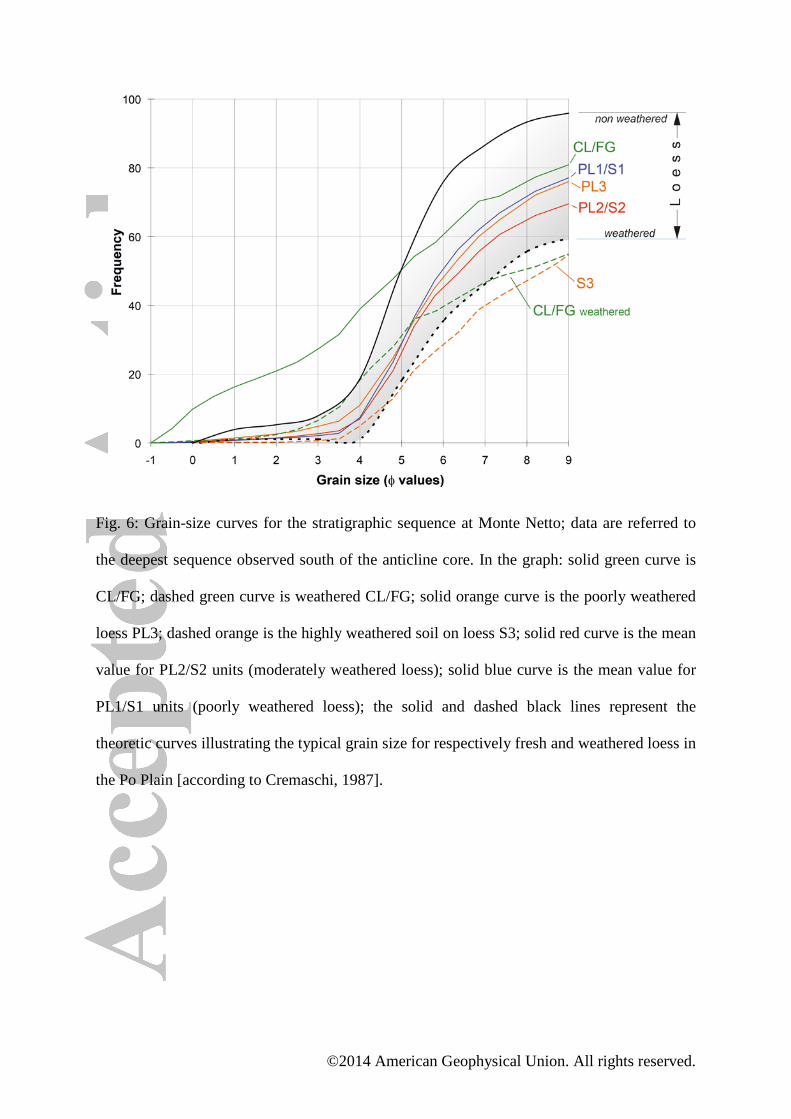
©2014 American Geophysical Union. All rights reserved.
Fig. 6: Grain-size curves for the stratigraphic sequence at Monte Netto; data are referred to
the deepest sequence observed south of the anticline core. In the graph: solid green curve is
CL/FG; dashed green curve is weathered CL/FG; solid orange curve is the poorly weathered
loess PL3; dashed orange is the highly weathered soil on loess S3; solid red curve is the mean
value for PL2/S2 units (moderately weathered loess); solid blue curve is the mean value for
PL1/S1 units (poorly weathered loess); the solid and dashed black lines represent the
theoretic curves illustrating the typical grain size for respectively fresh and weathered loess in
the Po Plain [according to Cremaschi, 1987].
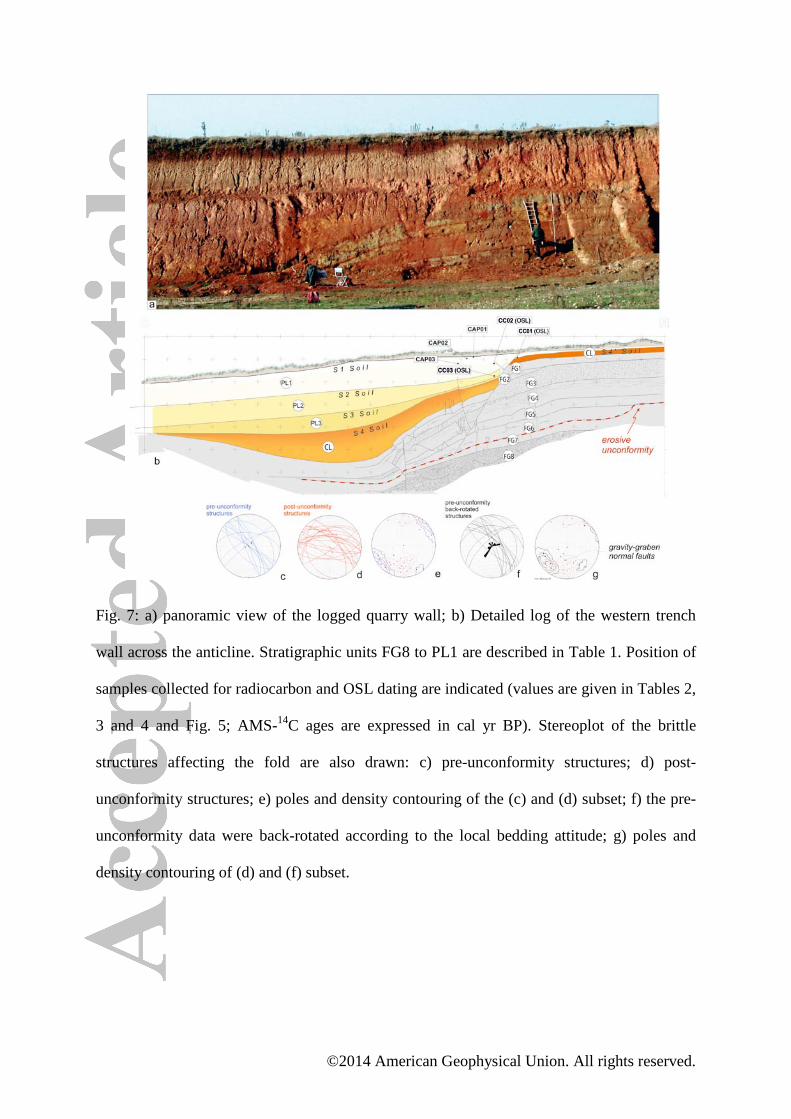
©2014 American Geophysical Union. All rights reserved.
Fig. 7: a) panoramic view of the logged quarry wall; b) Detailed log of the western trench
wall across the anticline. Stratigraphic units FG8 to PL1 are described in Table 1. Position of
samples collected for radiocarbon and OSL dating are indicated (values are given in Tables 2,
3 and 4 and Fig. 5; AMS-14
C ages are expressed in cal yr BP). Stereoplot of the brittle
structures affecting the fold are also drawn: c) pre-unconformity structures; d) post-
unconformity structures; e) poles and density contouring of the (c) and (d) subset; f) the pre-
unconformity data were back-rotated according to the local bedding attitude; g) poles and
density contouring of (d) and (f) subset.
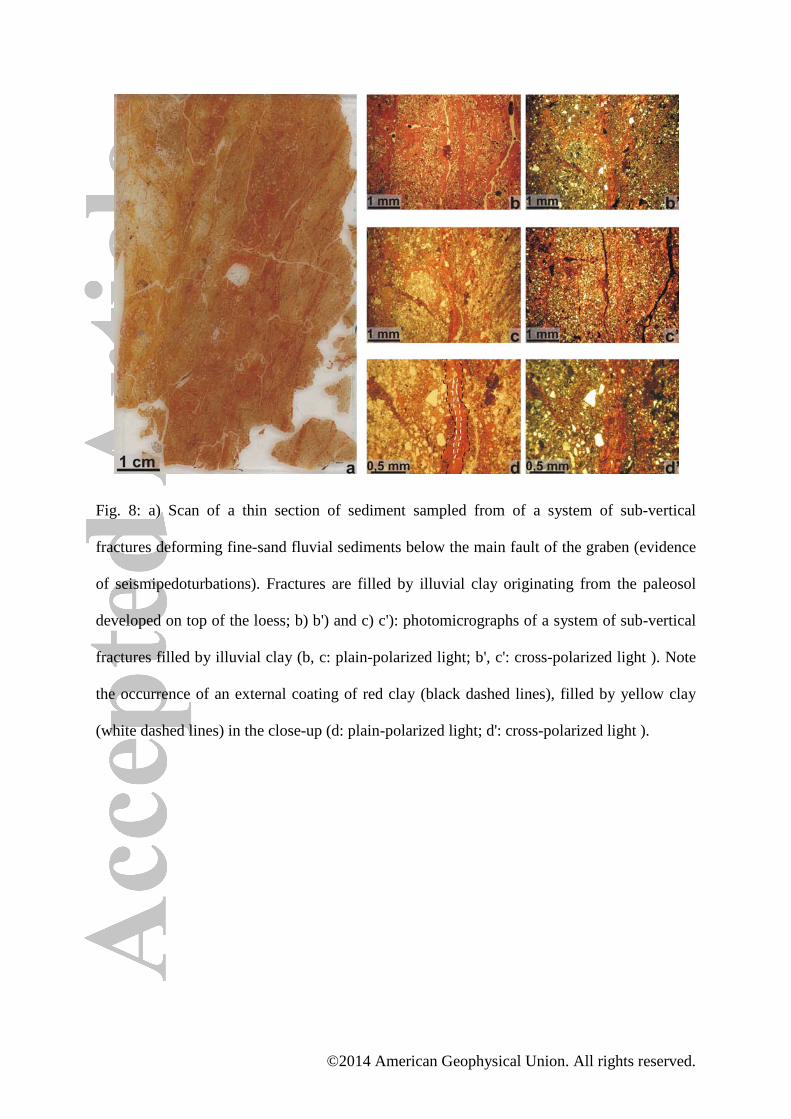
©2014 American Geophysical Union. All rights reserved.
Fig. 8: a) Scan of a thin section of sediment sampled from of a system of sub-vertical
fractures deforming fine-sand fluvial sediments below the main fault of the graben (evidence
of seismipedoturbations). Fractures are filled by illuvial clay originating from the paleosol
developed on top of the loess; b) b') and c) c'): photomicrographs of a system of sub-vertical
fractures filled by illuvial clay (b, c: plain-polarized light; b', c': cross-polarized light ). Note
the occurrence of an external coating of red clay (black dashed lines), filled by yellow clay
(white dashed lines) in the close-up (d: plain-polarized light; d': cross-polarized light ).
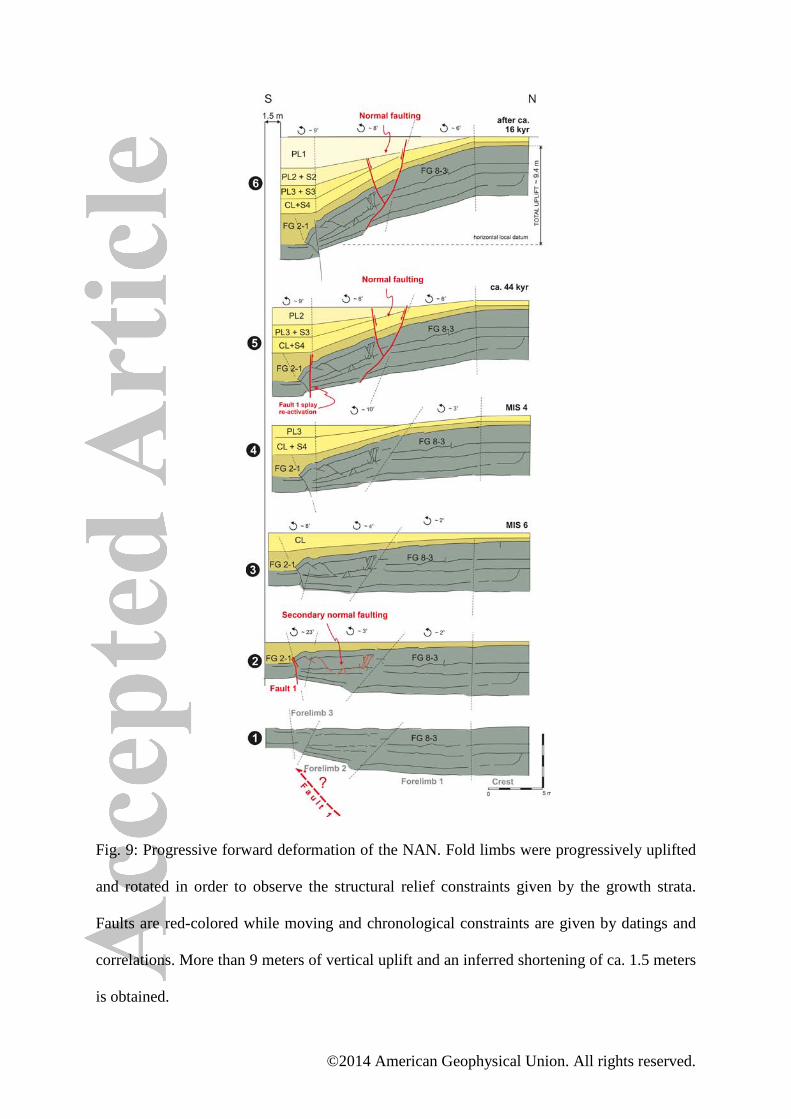
©2014 American Geophysical Union. All rights reserved.
Fig. 9: Progressive forward deformation of the NAN. Fold limbs were progressively uplifted
and rotated in order to observe the structural relief constraints given by the growth strata.
Faults are red-colored while moving and chronological constraints are given by datings and
correlations. More than 9 meters of vertical uplift and an inferred shortening of ca. 1.5 meters
is obtained.

©2014 American Geophysical Union. All rights reserved.
Fig. 10: Simplified model for area balancing of the moment-bending faults affecting the
anticline: void space, created by the gravity graben, along a differential limb rotation (α), is
approximately equal to the area (α’) subtended by the circle sector described by a rigid-plate
tilting.

©2014 American Geophysical Union. All rights reserved.
Fig. 11: Uplift measured along the anticline; calculated uplift rates are indicated for each
considered step.

©2014 American Geophysical Union. All rights reserved.
Fig. 12: a) Fault parameters obtained from the anticline modeling, using a Trishear velocity
field code [e.g., Allmendinger, 1998]; b) detail of the modeled forelimb: strain ellipses and
LFNE (Lines of No Finite Elongation) are indicated; pale-pink lines are the observed
geometry of units, thick grey lines represent modeled unit horizons. Note the good orientation
correlation between LNFE and brittle deformation on the fold frontlimb; c) comparison
between a detail of the shallowest part of the interpreted seismic line (see Fig. 3b for
location) and the modeled fault ramp: northern and southern outcropping anticlines are
indicated as blue lines.