April 2012 intra-oceanic seismicity off Sumatra boosted by the Banda-Aceh megathrust
6
LETTER doi:10.1038/nature11520 April 2012 intra-oceanic seismicity off Sumatra boosted by the Banda-Aceh megathrust Matthias Delescluse 1 , Nicolas Chamot-Rooke 1 , Rodolphe Cattin 2 , Luce Fleitout 1 , Olga Trubienko 1 & Christophe Vigny 1 Large earthquakes nucleate at tectonic plate boundaries, and their occurrence within a plate’s interior remains rare and poorly docu- mented, especially offshore. The two large earthquakes that struck the northeastern Indian Ocean on 11 April 2012 are an exception: they are the largest strike-slip events reported in historical times 1,2 and triggered large aftershocks worldwide 3 . Yet they occurred within an intra-oceanic setting along the fossil fabric of the extinct Wharton basin, rather than on a discrete plate boundary 4–8 . Here we show that the 11 April 2012 twin earthquakes are part of a continu- ing boost of the intraplate deformation between India and Australia that followed the Aceh 2004 and Nias 2005 megathrust earthquakes, subsequent to a stress transfer process recognized at other sub- duction zones 9,10 . Using Coulomb stress change calculations, we show that the coseismic slips of the Aceh and Nias earthquakes can promote oceanic left-lateral strike-slip earthquakes on pre- existing meridian-aligned fault planes. We further show that per- sistent viscous relaxation in the asthenospheric mantle several years after the Aceh megathrust explains the time lag between the 2004 megathrust and the 2012 intraplate events. On a short timescale, the 2012 events provide new evidence for the interplay between megathrusts at the subduction interface and intraplate deformation offshore. On a longer geological timescale, the Australian plate, driven by slab-pull forces at the Sunda trench, is detaching from the Indian plate, which is subjected to resisting forces at the Himalayan front 6,8,11 . The first and largest shock of 11 April 2012 (moment magnitude M w 8.6) occurred 330 km west-southwest of the Aceh 2004 epicentre, but only 120 km southwest of the subduction front. It was followed 2 h later on the same day by an M w 8.2 twin earthquake, located some 180 km south of the main event. The oceanic fabric there is characterized by a set of more or less north–south-oriented fracture zones, well captured by satellite-derived gravity measurements (Fig. 1) and mapped in situ using multi-beam bathymetry 4 . These are fossil trans- form faults that were active during the opening of the Wharton basin that shut off some 45 Myr ago. Recent reactivation of these faults 12 was confirmed by seismic reflection profiling showing basement and sedi- ment offsets as well as sea-floor expression 13 . The epicentres of the two 11 April 2012 events align along a 022u direction, which is within a few degrees of one of the nodal planes for both earthquakes. The two twin shocks thus seem to have involved slip on one of these very long fossil fracture zones that can be followed for several hundred kilometres 6 . The perpendicular normal fault orientation only offers limited continuous fault length to the rupture as it is offset by fracture zones 14 . However, we cannot rule out slip on the conjugate plane 15 as such slip happened further south in the Wharton basin in the year 2000 7 . For the M w 8.6 event, aftershocks (Fig. 1) and back-projection analysis indicate the activation of N110uE planes 16,17 . The entire oceanic fabric, normal faults included, seems to be somewhat reacti- vated by these complex events. The 11 April 2012 earthquake sequence is located in an area previ- ously recognized as part of the diffuse deformation zone between the Indian and Australian plates 18 . Intraplate deformation is active on 1 Laboratoire de Ge ´ ologie, Ecole Normale Supe ´ rieure and CNRS UMR8538, 75005 Paris, France. 2 Ge ´ osciences Montpellier, Universite ´ Montpellier II and CNRS UMR5243, 34090 Montpellier, France. –4° –2° 0° 2° 4° 6° 8° 10° 12° 14° 16° 1 cm yr –1 (rel. to India) 10.0 × 10 –9 yr –1 1 cm yr –1 (rel. to Sunda) M w 8.6 86° 88° 90° 92° 94° 96° 98° 100° CIB CIB NYR NYR WB WB CIB NYR WB M w 8.2 8.2 M w 8.2 Longitude Latitude Figure 1 | Present-day kinematics of the India–Australia plate. The 11 April 2012 M w 8.6 and M w 8.2 earthquakes, shown here by their blue and white focal mechanisms (‘beachballs’), occurred in the Wharton basin (WB), at the heart of the diffuse plate boundary between India and Australia. Ninetyeast Ridge (NYR), which is the Kerguelen hotspot trail, separates the Wharton basin from the central Indian basin (CIB). Off trench, the background is the 120 km high- pass-filtered satellite free-air gravity anomaly, illuminating meridian aligned fracture zones. Three convergence vectors are displayed east of the Sumatra- Andaman trench, calculated at the location of the 2004 Aceh epicentre. The blue vector is India/Sunda vector (IN/SU) predicted by the MORVEL 33 global model (46 mm yr 21 towards N22uE), while the green vector is the Australia/ Sunda prediction using the same model (54 mm yr 21 towards N8uE). The true convergence vector is in between, since the subducting plate is neither India nor Australia. The black vector (56 mm yr 21 towards N20uE) is an estimation of the convergence rate that takes into account a non-rigid India-Australia plate. This non-rigid crustal velocity field is shown as red vectors with their 95% error ellipses at knot points west of the trench line. The corresponding strain-rate field is shown as green double arrows. At the latitude of the April 2012 earthquake sequence, motion of the Wharton basin with respect to India progressively increases west to east, from negligible close to Ninetyeast ridge to 10 mm yr 21 close to the trench. 240 | NATURE | VOL 490 | 11 OCTOBER 2012 Macmillan Publishers Limited. All rights reserved ©2012
Transcript of April 2012 intra-oceanic seismicity off Sumatra boosted by the Banda-Aceh megathrust
LETTERdoi:10.1038/nature11520
April 2012 intra-oceanic seismicity off Sumatraboosted by the Banda-Aceh megathrustMatthias Delescluse1, Nicolas Chamot-Rooke1, Rodolphe Cattin2, Luce Fleitout1, Olga Trubienko1 & Christophe Vigny1
Large earthquakes nucleate at tectonic plate boundaries, and theiroccurrence within a plate’s interior remains rare and poorly docu-mented, especially offshore. The two large earthquakes that struckthe northeastern Indian Ocean on 11 April 2012 are an exception:they are the largest strike-slip events reported in historical times1,2
and triggered large aftershocks worldwide3. Yet they occurredwithin an intra-oceanic setting along the fossil fabric of the extinctWharton basin, rather than on a discrete plate boundary4–8. Here weshow that the 11 April 2012 twin earthquakes are part of a continu-ing boost of the intraplate deformation between India and Australiathat followed the Aceh 2004 and Nias 2005 megathrust earthquakes,subsequent to a stress transfer process recognized at other sub-duction zones9,10. Using Coulomb stress change calculations, weshow that the coseismic slips of the Aceh and Nias earthquakescan promote oceanic left-lateral strike-slip earthquakes on pre-existing meridian-aligned fault planes. We further show that per-sistent viscous relaxation in the asthenospheric mantle several yearsafter the Aceh megathrust explains the time lag between the 2004megathrust and the 2012 intraplate events. On a short timescale,the 2012 events provide new evidence for the interplay betweenmegathrusts at the subduction interface and intraplate deformationoffshore. On a longer geological timescale, the Australian plate,driven by slab-pull forces at the Sunda trench, is detaching fromthe Indian plate, which is subjected to resisting forces at theHimalayan front6,8,11.
The first and largest shock of 11 April 2012 (moment magnitudeMw 8.6) occurred 330 km west-southwest of the Aceh 2004 epicentre,but only 120 km southwest of the subduction front. It was followed 2 hlater on the same day by an Mw 8.2 twin earthquake, located some180 km south of the main event. The oceanic fabric there is characterizedby a set of more or less north–south-oriented fracture zones, wellcaptured by satellite-derived gravity measurements (Fig. 1) andmapped in situ using multi-beam bathymetry4. These are fossil trans-form faults that were active during the opening of the Wharton basinthat shut off some 45 Myr ago. Recent reactivation of these faults12 wasconfirmed by seismic reflection profiling showing basement and sedi-ment offsets as well as sea-floor expression13. The epicentres of the two11 April 2012 events align along a 022u direction, which is within a fewdegrees of one of the nodal planes for both earthquakes.
The two twin shocks thus seem to have involved slip on one of thesevery long fossil fracture zones that can be followed for several hundredkilometres6. The perpendicular normal fault orientation only offerslimited continuous fault length to the rupture as it is offset by fracturezones14. However, we cannot rule out slip on the conjugate plane15 assuch slip happened further south in the Wharton basin in the year20007. For the Mw 8.6 event, aftershocks (Fig. 1) and back-projectionanalysis indicate the activation of N110uE planes16,17. The entireoceanic fabric, normal faults included, seems to be somewhat reacti-vated by these complex events.
The 11 April 2012 earthquake sequence is located in an area previ-ously recognized as part of the diffuse deformation zone between theIndian and Australian plates18. Intraplate deformation is active on
1Laboratoire de Geologie, Ecole Normale Superieure and CNRS UMR8538, 75005 Paris, France. 2Geosciences Montpellier, Universite Montpellier II and CNRS UMR5243, 34090 Montpellier, France.
–4°
–2°
0°
2°
4°
6°
8°
10°
12°
14°
16°
1 cm yr–1 (rel. to India)
10.0 × 10⁻⁹ yr–1
1 cm yr–1 (rel. to Sunda)
Mw 8.6
86° 88° 90° 92° 94° 96° 98° 100°
CIBCIB
NY
RN
YR
WBWB
CIB
NY
R
WB
Mw 8.2 8.2Mw 8.2
Longitude
Latit
ude
Figure 1 | Present-day kinematics of the India–Australia plate. The 11 April2012 Mw 8.6 and Mw 8.2 earthquakes, shown here by their blue and white focalmechanisms (‘beachballs’), occurred in the Wharton basin (WB), at the heart ofthe diffuse plate boundary between India and Australia. Ninetyeast Ridge(NYR), which is the Kerguelen hotspot trail, separates the Wharton basin fromthe central Indian basin (CIB). Off trench, the background is the 120 km high-pass-filtered satellite free-air gravity anomaly, illuminating meridian alignedfracture zones. Three convergence vectors are displayed east of the Sumatra-Andaman trench, calculated at the location of the 2004 Aceh epicentre. Theblue vector is India/Sunda vector (IN/SU) predicted by the MORVEL33 globalmodel (46 mm yr21 towards N22uE), while the green vector is the Australia/Sunda prediction using the same model (54 mm yr21 towards N8uE). The trueconvergence vector is in between, since the subducting plate is neither India norAustralia. The black vector (56 mm yr21 towards N20uE) is an estimation of theconvergence rate that takes into account a non-rigid India-Australia plate. Thisnon-rigid crustal velocity field is shown as red vectors with their 95% errorellipses at knot points west of the trench line. The corresponding strain-ratefield is shown as green double arrows. At the latitude of the April 2012earthquake sequence, motion of the Wharton basin with respect to Indiaprogressively increases west to east, from negligible close to Ninetyeast ridge to10 mm yr21 close to the trench.
2 4 0 | N A T U R E | V O L 4 9 0 | 1 1 O C T O B E R 2 0 1 2
Macmillan Publishers Limited. All rights reserved©2012
both sides of Ninetyeast Ridge, predominantly as reverse faults withnorth–south compressive axes (P-axes) west of it19–21 and strike-slipfaults with northwest–southeast P-axes east of it4,8. Large-scale foldingof the oceanic lithosphere was found both in the equatorial IndianOcean and in the Wharton basin, and interpreted as a direct con-sequence of large in-plate stresses11. The present-day kinematics ofthe Indian and Australian plates is now well established, based onGlobal Positioning System (GPS) measurement away from the deform-ing zone. Following the approach of Holt and Haines5,22 (Methods), wehave derived a self-consistent non-rigid velocity field8 (Fig. 1) thatcombines far-field boundary conditions (GPS over Australia andIndia, plus a few islands within the deforming zone) and local con-straints from the deformation zone itself (style of deformation fromfocal mechanisms and heat flow as a proxy for strength). Offshore fromSumatra, the motion exhibits a gradual south–north evolution from theAustralian plate velocity to the Indian plate velocity. The predictedamount of shear across the set of meridian aligned faults is of the orderof 10 mm yr21.
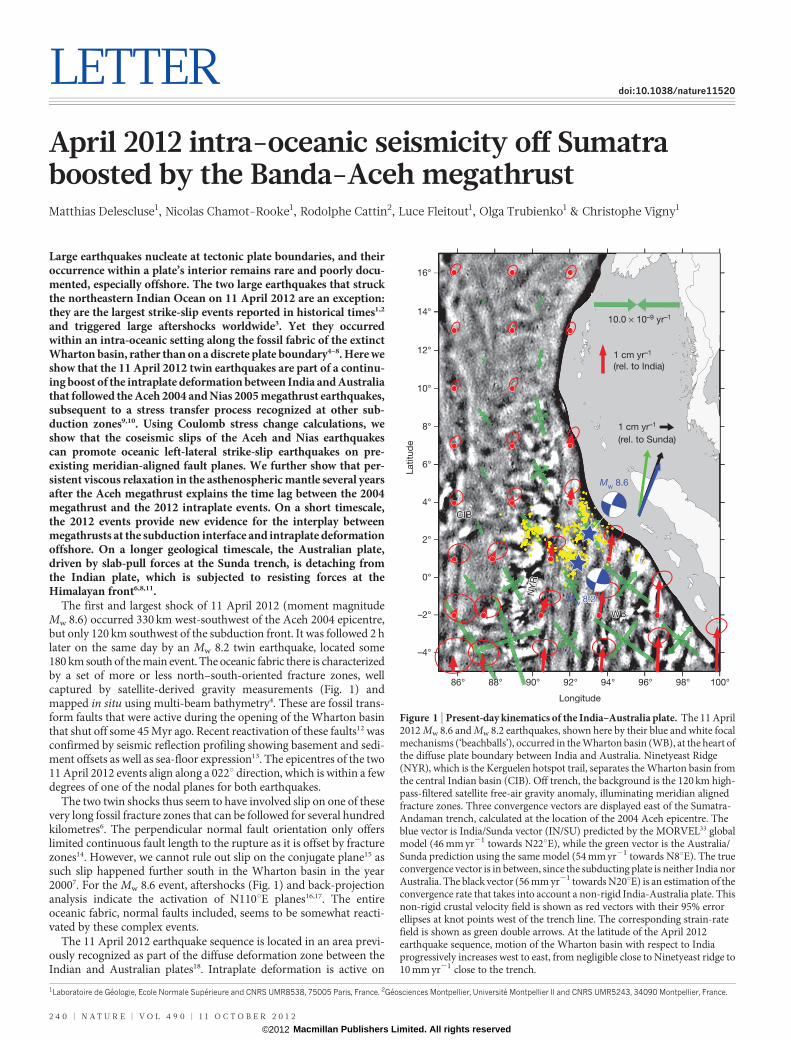
Intraplate seismicity has been boosted by the Aceh and Nias ruptures.We show in Fig. 2 a chrono-spatial chart of the seismicity of theWharton basin, covering the 8 years before and the 8 years after theAceh earthquake. An increase in the rate of seismicity immediatelyfollowed the Aceh and Nias earthquakes, especially for the portionsof oceanic lithosphere experiencing peak slip rate on the failure planeof the Aceh megathrust. The Nias earthquake that followed the Acehearthquake triggered oceanic earthquakes in a region that remainedsilent during the time lag of three months between the two events.We also estimated the net increase in intraplate seismic moment release.On the basis of a century-long catalogue8, the mean moment release forthe entire deforming Indian Ocean (including the central Indian basinand the Wharton basin) was about 2.3 3 1019 N m yr21 before the Acehearthquake, two-thirds of it being released in the Wharton basin. In theyear 2005, this number jumped to 1.2 3 1020 N m for the Whartonbasin only. For comparison, seismic moment release for the two 11
April earthquakes is above 1.4 3 1022 N m, which is about 1,000 timesthe yearly release estimated from the century-long catalogue.
We compiled focal mechanisms of 47 earthquakes (Mw . 5) thatoccurred off Sumatra in the oceanic plate from December 2004 (Acehearthquake) until 15 April 2012 (from the Global CMT catalogue).We excluded earthquakes within the slab portions already engaged insubduction, although many of them are clearly related to intraplatedeformation and reactivation of the oceanic fabric7, such as thePadang earthquake of 2009 (Mw 7.6, depth .80 km). The post-Acehoceanic earthquakes fall into two categories: normal faults at the externalwall of the trench (18 events), and earthquakes with a northwest–southeast P-axis corresponding to the release of India-Australia intra-plate stress (29 earthquakes). Among the compressive events, only oneseems unrelated to the oceanic fabric, the other 28 being strike-slipearthquakes with one left-lateral meridian aligned nodal plane(015u6 005u). The very consistent orientation of the nodal planes overa wide region is strong evidence for reactivation of the oceanic fabric inthe area.
To test the effect of the Aceh 2004 and Nias 2005 ruptures on thereactivation of the Wharton basin oceanic fabric, we calculated the far-field static Coulomb stress changeDCFF 5Dt 2 m9Dsn resulting fromthe coseismic displacement on the subduction interface, up to 250 kmseaward of the trench axis. Here Dt is the static shear stress change onthe failure planes (positive in the direction of fault slip), Dsn the staticnormal stress change (positive if the fault is clamped) and m9 theeffective friction coefficient (see Methods and ref. 23). A positiveCoulomb stress change favours rupture.
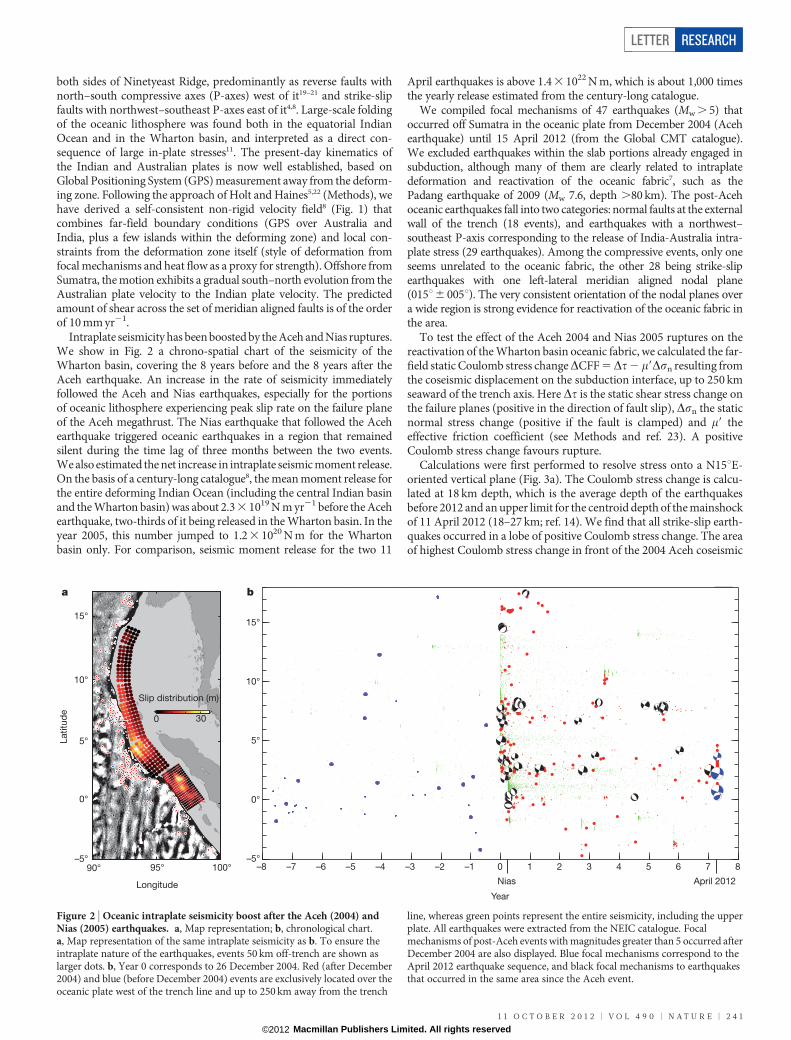
Calculations were first performed to resolve stress onto a N15uE-oriented vertical plane (Fig. 3a). The Coulomb stress change is calcu-lated at 18 km depth, which is the average depth of the earthquakesbefore 2012 and an upper limit for the centroid depth of the mainshockof 11 April 2012 (18–27 km; ref. 14). We find that all strike-slip earth-quakes occurred in a lobe of positive Coulomb stress change. The areaof highest Coulomb stress change in front of the 2004 Aceh coseismic
–5°
0°
5°
10°
15°
–8 –7 –6 –5 –4 –3 –2 –1 0 1 2 3 4 5 6 7 8
Year
90° 95° 100°–5°
5°
10°
15°
0°
0 30
Slip distribution (m)
Nias April 2012
Latit
ude
Longitude
a b
Figure 2 | Oceanic intraplate seismicity boost after the Aceh (2004) andNias (2005) earthquakes. a, Map representation; b, chronological chart.a, Map representation of the same intraplate seismicity as b. To ensure theintraplate nature of the earthquakes, events 50 km off-trench are shown aslarger dots. b, Year 0 corresponds to 26 December 2004. Red (after December2004) and blue (before December 2004) events are exclusively located over theoceanic plate west of the trench line and up to 250 km away from the trench
line, whereas green points represent the entire seismicity, including the upperplate. All earthquakes were extracted from the NEIC catalogue. Focalmechanisms of post-Aceh events with magnitudes greater than 5 occurred afterDecember 2004 are also displayed. Blue focal mechanisms correspond to theApril 2012 earthquake sequence, and black focal mechanisms to earthquakesthat occurred in the same area since the Aceh event.
LETTER RESEARCH
1 1 O C T O B E R 2 0 1 2 | V O L 4 9 0 | N A T U R E | 2 4 1
Macmillan Publishers Limited. All rights reserved©2012
slip corresponds to a shear stress increase and to a normal stressdecrease. This situation favours left-lateral strike-slip on the N15uEvertical faults independently of the value of the effective friction co-efficient (unclamping). We further tested the effect of the azimuth ofthe vertical planes and the variation of the Coulomb stress change withdepth (Fig. 3b). The mainshock of 11 April 2012 locates the exact limitwhere N20uE planes are still positively favoured by the Aceh 2004 slip.The Coulomb stress change is much higher if we consider that the Mw
8.6 event nucleated on a N110uE plane with dextral motion (see Sup-plementary Information), as suggested by seismological studies16,17.Depth does not really affect the result for the considered 5–45 kmrange. The 2005 Nias rupture also favours the occurrence ofearthquakes on N15uE-oriented vertical planes, but focal mechanisms
there indicate normal rather than strike-slip events. Most of thenormal faults oriented along the trench strike are located in areas ofpositive Coulomb stress change for their respective receiver fault ori-entation (see Supplementary Information). Slip on newly formedthrust faults perpendicular to the intraplate P-axis are inhibited bythe Aceh earthquake coseismic stresses (see Supplementary Informa-tion). Over the long term, only a few reverse faults were active duringthe past century7, as stresses apparently rarely reached the levelrequired to create a new fault.
The Coulomb stress change distribution is highly sensitive to thecoseismic slip distribution. The high sensitivity of the model to shallowslip, in particular, may partly be due to assumptions underlying theCoulomb model, such as a flat-plane subduction interface and an
14/04/2012
0 10 20 30
Slip distribution (m)
−100 −50 0 50 100
Coulomb stress change(103 Pa)
–10
–15
–20
–25
–30
–35
–40
–45
–5
Dep
th (k
m)
Vertical fault azimuth(degrees)
80400–40–80
90° 95° 100°
20°
15°
10°
5°
0°
–5°
Z1Z1Z1
Z2Z2Z2
Z3Z3Z3
Dep
th (k
m)
Dep
th (k
m)
–10
–15
–20
–25
–30
–35
–40
–45
–5
–10
–15
–20
–25
–30
–35
–40
–45
–5
Longitude
Latit
ude
a b
Vertical fault azimuth(degrees)
80400–40–80
Vertical fault azimuth(degrees)
80400–40–80
29/07/200529/07/200529/07/2005
19/04/200619/04/200619/04/2006
02/04/200502/04/200502/04/2005
10/01/2012 10/01/2012 10/01/2012 8.68.68.6
11/04/2012 11/04/2012 11/04/2012
8.28.28.214/04/2012 14/04/2012 14/04/2012
04/10/200704/10/200704/10/2007
15/02/200515/02/200515/02/2005
08/01/200508/01/200508/01/2005
18/06/200518/06/200518/06/2005
Z3Z3Z3
Z2Z2Z2
19/01/200519/01/200519/01/2005
12/04/2012 12/04/2012 12/04/2012
07/01/2011 07/01/2011 07/01/2011
1/01/20051/01/20051/01/2005
03/03/2008 03/03/2008 03/03/2008
Z1Z1Z1
06/08/200706/08/200706/08/200727/12/200427/12/2004 06/01/200506/01/200506/01/200506/01/2005
13/04/2010 13/04/2010
13/06/2010 13/06/2010 25/06/201025/06/2010
27/12/2004 06/01/200506/01/2005
13/04/2010
13/06/2010 25/06/2010
02/02/200502/02/2005
30/06/200530/06/2005
24/07/200524/07/2005
10/11/2009 10/11/2009
12/06/2010 12/06/2010 24/06/2010 24/06/2010
02/02/2005
30/06/2005
24/07/2005
10/11/2009
12/06/2010 24/06/2010
Figure 3 | Static Coulomb stress change calculation offshore the Sumatra-Andaman subduction. a, Each colour pixel represents a N15uE-orientedvertical fault plane. Note that the slip colour scale is adapted to the Acehearthquake slip distribution, and requires division by a factor of three to obtainthe Nias earthquake slip values. b, The Coulomb stress change has been tested
for different depths and azimuths of the fault planes at three different locations,from north to south: Z1 (30 June 2005 earthquake location), Z2 (1 January 2005earthquake location) and Z3 (11 April 2012 mainshock location). White barsbound the azimuths of the oceanic fabric. Slip on the oceanic fabric is bestfavoured to the north of the area.
RESEARCH LETTER
2 4 2 | N A T U R E | V O L 4 9 0 | 1 1 O C T O B E R 2 0 1 2
Macmillan Publishers Limited. All rights reserved©2012
homogeneous elastic half-space. Many coseismic solutions (see, forexample, refs 24–29) have been proposed for the Aceh and Nias earth-quakes based on the inversion of various data sets, including GPSdisplacements, coral reef observations, long-period teleseismic data,tide-gauge records and satellite altimetry measurements. We use herethe slip distributions obtained in refs 24 and 25, for the Aceh and Niasearthquakes, respectively. First-order properties of the slip distribu-tions obtained in these two models are consistent with several otherstudies26–29. Our best choice for slip distribution was however drivenby one significant observation: triggered intraplate earthquakes,both normal (see Supplementary Information) and strike-slip, occurextremely close to the toe of the trench. Our sensitivity tests showedthat only slip distributions including shallow, near trench displace-ment successfully produce a positive Coulomb stress change closeenough to the trench9. Most coseismic slip inversions are ratherinsensitive to shallow displacements at the toe of the subduction,which is generally too far from the land stations where measurementsare available. They thus tend to minimize the amount of shallowrupture there. However, marine constraints30 (2011 Tohoku Mw 9.0earthquake, Japan), and geodetic measurements close to the failureplane31 (2010 Maule Mw 8.8 earthquake, Chile) have shown that thecoseismic displacement of giant earthquakes does reach the toe of thetrench.
A clear drawback of the Coulomb stress calculation is that it fails tomodel time-dependent stress transfers because the underlying rhe-ology is elastic. In these elastic models, promoted faults should breakshortly after the megathrust event, as the extensional stress within theoceanic plate off the trench begins to decrease immediately after theearthquake with the start of a new interseismic loading cycle. Yet thetime lag between Aceh and the 2012 earthquake sequence is more than7 years, which indicates another mechanism producing a northeast–southwest unclamping that is larger than the slow buildup of northeast–southwest compressive stress during interseismic loading. Transienttriggering may be related to the viscoelastic properties of the astheno-sphere. In Supplementary Information, we present a simple two-dimensional viscoelastic model of the earthquake cycle that predictsthe time evolution of the stresses linked to subduction earthquakes as afunction of distance to the trench. The observed time lag between theAceh and Nias earthquakes and the April 2012 earthquake sequence isfound to be compatible with a rheology of the asthenosphere indepen-dently required to explain near field to far field GPS constraints in theSunda block, on the other side of the trench32. The maximum post-seismic relaxation stress is reached between 7 and 10 years after themegathrust in the area of the 2012 events. The further from the trench,the longer the time lag until maximum post-seismic relaxation stress isreached. Similar three-dimensional finite element viscoelastic calcula-tions32, using a more realistic rupture zone geometry, further confirmthat at the locations of the two events of April 2012, the net stress effectis unclamping in the northeast direction, in agreement with the two-dimensional viscoelastic model and the Coulomb stress change calcula-tions presented here.
The two large earthquakes of 11 April 2012 are typical of the intraplatedeformation between the Indian and Australian plates, the fossil fabric ofthe oceanic lithosphere being re-activated across the entire IndianOcean19,21. The mega-earthquakes of Aceh and Nias acted as instant-aneous boosters, suddenly illuminating where and how intraplatedeformation was at work. Viscous relaxation in the asthenosphericmantle is responsible for short-term stress building, still contributingseveral years to several tens of years after the megathrust events. Long-term stress building there11 is the direct consequence of the high mech-anical coupling of the Indian plate to the Eurasian plate at the Himalayanfront that started some 8 Myr ago. Dense oceanic slabs engaged at theSunda trench inexorably drive the Australian plate northward, while thismotion is resisted at the Himalayas. The long-term scenario is that anascent plate tectonic boundary is forming: the Australian plate isbecoming detached from the Indian plate.
METHODS SUMMARYKinematic modelling. The kinematic model is detailed elsewhere8. It includesconstraints from far-field GPS measurements and style of deformation from acentury-long intraplate earthquake catalogue.Coulomb stress change calculations. Coseismic stresses are computed usingmegathrust slip distributions described as displacement discontinuities in anhomogeneous elastic half-space23. The shear and normal stresses are thenextracted for a chosen plane geometry that is supposed to pre-exist in the entireoceanic lithosphere.Post-seismic relaxation. A two-dimensional finite element model featuring vari-able rheological parameters is used (Z-set/Zebulon; see Methods). The rheologicalparameters fit the upper plate GPS constraints.
Full Methods and any associated references are available in the online version ofthe paper.
Received 30 April; accepted 23 August 2012.
Published online 26 September 2012.
1. Robinson, D. P. A rare great earthquake on an oceanic fossil fracture zone.Geophys. J. Int. 186, 1121–1134 (2011).
2. McGuire, J. J. & Beroza, G. C. A rogue earthquake off Sumatra. Science 336,1118–1119 (2012).
3. Pollitz, F. F., Stein, R. S., Sevilgen, V. & Burgmann, R. The 11 April 2012 east IndianOcean earthquake triggered large aftershocks worldwide. Nature http://dx.doi.org/10.1038/nature11504 (this issue).
4. Deplus, C. et al. Direct evidence of active deformation in the eastern Indian oceanicplate. Geology 26, 131–134 (1998).
5. Tinnon, M., Holt, W. E. & Haines, A. J. Velocity gradients in the northern IndianOcean inferred from earthquake moment tensors and relative plate velocities.J. Geophys. Res. 100, 24315–24329 (1995).
6. Deplus, C. Indian Ocean actively deforms. Science 292, 1850–1851 (2001).7. Abercrombie, R. E., Antolik, M. & Ekstrom, G. The June 2000 Mw 7.9 earthquakes
south of Sumatra: deformation in the India-Australia plate. J. Geophys. Res. 108,2018, http://dx.doi.org/10.1029/2001JB000674 (2003).
8. Delescluse, M. & Chamot-Rooke, N. Instantaneous deformation and kinematics ofthe India-Australia plate. Geophys. J. Int. 168, 818–842 (2007).
9. Dmowska, R., Rice, J. R., Lovison, L. C. & Josell, D. Stress transfer and seismicphenomena in coupled subduction zones during theearthquake cycle. J.Geophys.Res. 93, 7869–7884 (1988).
10. Lay, T., Ammon, C. J., Kanamori, H., Xue, L. & Kim, M. J. Possible large near-trenchslip during the 2011 Mw 9.0 off the Pacific coast Tohoku earthquake. Earth PlanetsSpace 63, 713–718 (2011).
11. Gerbault, M. At what stress level is the central Indian Ocean lithosphere buckling?Earth Planet. Sci. Lett. 178, 165–181 (2000).
12. Rajendran, K., Andrade, V. & Rajendran, C. P. The June 2010 Nicobar earthquake:fault reactivation on the subducting oceanic plate. Bull. Seismol. Soc. Am. 101,2568–2577 (2011).
13. Graindorge, D. et al. Impact of lower plate structure on upper plate deformation atthe NW Sumatran convergent margin from seafloor morphology. Earth Planet. Sci.Lett. 275, 201–210 (2008).
14. Satriano, C., Kiraly, E., Bernard, P. & Vilotte, J. P. The 2012 Mw 8.6 Sumatraearthquake: evidence of westward sequential seismic ruptures associated to thereactivation of a N-S ocean fabric. Geophys. Res. Lett. 39, L00B07, http://dx.doi.org/10.1029/2012GL052387 (2012).
15. Hwang, L. J. & Kanamori, H. Rupture process of the 1987–1988 Gulf of Alaskaearthquake sequence. J. Geophys. Res. 97, 19881–19908 (1992).
16. Yue, H., Lay, T. & Koper, K. D. En echelon and orthogonal fault ruptures of the 11April 2012 great intraplate earthquakes. Nature http://dx.doi.org/10.1038/nature11492 (this issue).
17. Meng, L. et al. Earthquake in a maze: compressional rupture branching during the2012 Mw 8.6 Sumatra earthquake. Science 337, 724–726 (2012).
18. Royer, J. Y., Gordon,R.G.,DeMets, C.&Vogt, P.R.New limits on themotionbetweenIndia and Australia since Chron 5 (11 Ma) and implications for lithosphericdeformation in the equatorial Indian Ocean. Geophys. J. Int. 129, 41–74 (1997).
19. Bull, J. M. & Scrutton, R. A. Fault reactivation in the central Indian Ocean and therheology of oceanic lithosphere. Nature 344, 855–858 (1990).
20. Chamot-Rooke, N. et al. Intraplate shortening in the central Indian Oceandetermined from a 2100-km-long north-south deep seismic reflection profile.Geology 21, 1043–1046 (1993).
21. Delescluse, M.,Montesi, L.G. J.& Chamot-Rooke,N. Fault reactivation andselectiveabandonment in the oceanic lithosphere. Geophys. Res. Lett. 35, L16312, http://dx.doi.org/10.1029/2008GL035066 (2008).
22. Haines, A. J. & Holt, W. E. A procedure for obtaining the complete horizontalmotions within zones of distributed deformation from the inversion of strain ratedata. J. Geophys. Res. 98, 12057–12082 (1993).
23. Cattin, R. et al. Stress change and effective friction coefficient along the Sumatra-Andaman-Sagaing fault system after the 26 December 2004 (Mw59.2) and the28 March 2005 (Mw58.7) earthquakes. Geochem. Geophys. Geosyst. 10, Q03011,http://dx.doi.org/10.1029/2008GC002167 (2009).
24. Rhie, J., Dreger, D., Burgmann, R. & Romanowicz, B. Slip of the 2004 Sumatra-Andaman earthquake from joint inversion of long-period global seismicwaveforms and GPS static offsets. Bull. Seismol. Soc. Am. 97, S115–S127 (2007).
LETTER RESEARCH
1 1 O C T O B E R 2 0 1 2 | V O L 4 9 0 | N A T U R E | 2 4 3
Macmillan Publishers Limited. All rights reserved©2012

25. Ji, C. Preliminary result of the March 28, 2005 Mw 8.68 Nias earthquake. http://www.geol.ucsb.edu/faculty/ji/big_earthquakes/2005/03/smooth/nias.html(2005).
26. Vigny, C. et al. Insight into the 2004 Sumatra-Andaman earthquake from GPSmeasurements in southeast Asia. Nature 436, 201–206 (2005).
27. Chlieh, M. et al. Coseismic slip and afterslip of the great Mw 9.15 Sumatra-Andaman earthquake of 2004. Bull. Seismol. Soc. Am. 97, S152–S173 (2007).
28. Briggs, R. et al. Deformation and slip along the Sunda megathrust in the great2005 Nias-Simeulue earthquake. Science 311, 1897–1901 (2006).
29. Banerjee, P., Pollitz, F., Nagarajan, B. & Burgmann, R. Coseismic slip distributionsof the 26 December 2004 Sumatra-Andaman and 28 March 2005 Niasearthquakes from GPS static offsets. Bull. Seismol. Soc. Am. 97, S86–S102 (2007).
30. Fujiwara, T. et al. The 2011 Tohoku-Oki earthquake: displacement reaching thetrench axis. Science 334, 1240 (2011).
31. Vigny, C. et al. The 2010 Mw 8.8 Maule megathrust earthquake of Central Chile,monitored by GPS. Science 332, 1417–1421 (2011).
32. Fleitout, L. et al. Far away motions associated with giant subduction earthquakesandthemechanicalproperties of the lithosphere-asthenosphere system.Geophys.Res. Abs., 14, EGU2012–10899 (2012 EGU General Assembly, 2012).
33. DeMets, C., Gordon, R. G. & Argus, D. F. Geologically current plate motions.Geophys. J. Int. 181, 1–80 (2010).
Supplementary Information is available in the online version of the paper.
Acknowledgements Epicentres of intraplate earthquakes were obtained from theNational Earthquake Information Center (NEIC) catalogue. Focal mechanisms wereobtained from the Global Centroid-Moment-Tensor (CMT) Project. Figures wereprepared with GMT software. We thank R. Abercrombie for comments.
Author Contributions M.D. and N.C.-R. wrote the manuscript and prepared most of thefigures with contributions from all co-authors. R.C. wrote the Coulomb stress code, L.F.and O.T. prepared the post-seismic relaxation figures and texts. C.V. has beenmeasuring GPS velocities in southeast Asia for years, some of them being used in thekinematic model.
Author Information Reprints and permissions information is available atwww.nature.com/reprints. The authors declare no competing financial interests.Readers are welcome to comment on the online version of the paper. Correspondenceand requests for materials should be addressed to M.D. ([email protected]).
RESEARCH LETTER
2 4 4 | N A T U R E | V O L 4 9 0 | 1 1 O C T O B E R 2 0 1 2
Macmillan Publishers Limited. All rights reserved©2012
METHODSIntraplate kinematics using the Haines and Holt method. The Haines andHolt22 method derives continuous velocity and strain-rate fields by interpolatingmodelled velocities that are fitted in a least-squares sense to GPS velocities. A3u3 3u grid was defined to cover the entire India-Australia plate. The cells locatedwithin the rigid Australia plate were not allowed to deform, as opposed to theequatorial Indian Ocean and the Indian continent. Cells are allowed to deformthrough an anisotropic strain-rate variance. Focal mechanisms are used to definethe anisotropic variance so that the direction of the strain-rate field is controlled bythe principal axis of deformations from observed seismic moment tensors. Noticethat only the directions are used, as the magnitude and sign of strain-rate along theprincipal axis are not an input to the model. The general level of variance in cells isalso a proxy for the rheology of the lithosphere. Non-uniform variance allowslocalization of deformation where the variance is high. In our model, heat flow isused as the proxy for the rheology of the lithosphere. As a result, cells includinghigh heat-flow measurements are allowed to deform more. Details of the modeland the earthquake catalogue can be found elsewhere8.Coulomb stress change calculations. We describe the two rupture zones of the2004 and 2005 megathrust events by surfaces of displacement discontinuities inisotropic homogeneous elastic half-space. Details of the properties of slip distribu-tions can be found elsewhere24,25,34. Each dislocation induces a three-dimensionalstress change field, which is calculated from the analytical solution of ref. 35 using aPoisson ratio n 5 0.25 and a Young’s modulus E 5 75 GPa. The Coulomb stresschange is calculated on specified oriented vertical planes. To study the effect of theconsidered nodal planes, we assume two different receiver-fault orientations:N15uE and N110uE.
The effective friction coefficient m9 depends on the friction coefficient m andpore-fluid migration properties related to the Skempton coefficient B on the failureplane36. Laboratory experiments typically find values for m of around 0.6 to 0.85 formost rock material, apart from those rich in clay minerals37. The Skempton co-efficient is a less well-known parameter ranging between 0.4 and 0.9 for granite,sandstone and marble38, but still unconstrained for other rocks. Values of m9
between 0 and 0.75 are commonly assumed39. When m9 is high, the pore pressuredoes not strongly affect the normal stress. At the other extreme, when m9 5 0, therock is so saturated that the pore pressure annihilates the effect of the normal stresson the plane. Following the commonly used values39,40 and our previous studies23,here we assume an effective friction coefficient of 0.4.
The threshold for a Coulomb stress increase that affects seismicity is still amatter of debate. Some studies41,42 propose a threshold of 0.01 MPa. Here colourscales are saturated for a Coulomb stress change of 0.1 MPaPost-seismic relaxation. A two-dimensional finite element model featuring vari-able rheological parameters is used (Z-set/Zebulon43). The model considers not a
single earthquake but a seismic cycle with repeating periodic earthquakes44, with aperiod chosen equal to 170 yr.
An earthquake is modelled as a 10-m sudden displacement over the subductioninterface. The thickness of the elastic lithosphere is chosen equal to 50 km. Thisvalue is intermediate between the thermal thickness and the flexural elastic thick-ness, appropriate for mimicking the lithosphere response for long timescales andlarge stress perturbations45. The asthenosphere extends between depths of 50 and170 km. The asthenosphere deforms either as a Maxwell viscoelastic solid with aviscosity of 3 3 1018 Pa s or as a Burgers body (Kelvin-Voigt with viscosityg 5 3 3 1018 Pa s, transient shear modulus m 5 melas/3, and long-term viscosity3 3 1019 Pa s). The Kelvin-Voigt viscosity is used to model the short-term viscousresponse of the asthenosphere. The mantle below the asthenosphere has a viscosityof 1021 Pa s (of little impact on our results). Supplementary Fig. 3 only presents thecentral part of the finite element mesh. The computation is performed for adomain that extends horizontally from –4,000 to 14,000 km from the trenchand from the Earth’s surface to 1,500 km depth.
34. Ji, C., Wald, D. J. & Helmberger, D. V. Source description of the 1999 Hector Mine,California earthquake; part I: wavelet domain inversion theory and resolutionanalysis. Bull. Seismol. Soc. Am. 92, 1192–1207 (2002).
35. Okada, Y. Internal deformation due to shear and tensile faults in a half space. Bull.Seismol. Soc. Am. 82, 1018–1040 (1992).
36. Cocco, M. & Rice, J. Pore pressure and poroelasticity effects in Coulomb stressanalysis of earthquake interactions. J. Geophys. Res. 107, 2030, http://dx.doi.org/10.1029/2000JB000138 (2002).
37. Byerlee, J. Friction of rocks. Pure Appl. Geophys. 116, 615–626 (1978).38. Roeloffs, E. Poroelastic techniques in the study of earthquake-related hydrologic
phenomena. Adv. Geophys. 37, 135–195 (1996).39. King, G., Stein, R. & Lin, J. Static stress changes and the triggering of earthquake.
Bull. Seismol. Soc. Am. 84, 935–953 (1994).40. Pollitz, F., Banerjee, P., Burgmann, R., Hashimoto, M. & Choosakul, N. Stress
change along the Sunda trench following the 26 December 2004 Sumatra-Andaman and 28 March 2005 Nias earthquakes. Geophys. Res. Lett. 33, L06309,http://dx.doi.org/10.1029/2005GL024558 (2006).
41. Reasenberg, P. & Simpson, R. Response of regional seismicity to the static stresschange produced by the Loma Prieta earthquake. Science 255, 1687–1690(1992).
42. Stein, R. The role of stress transfer in earthquake occurrence. Nature 402,605–609 (1999).
43. Z-set. Z-set: material and structure analysis suite. http://www.zset-software.com/(2011).
44. Thatcher, W. & Rundle, J. B. A viscoelastic coupling model for the cyclicdeformation due to periodically repeated earthquakes at subduction zones.J. Geophys. Res. 89, 7631–7640 (1984).
45. Watts, A. B., Bodine, J. H. & Steckler, M. S. Observation of flexure and the state ofstress in the oceanic lithosphere. J. Geophys. Res. 85, 6369–6376 (1980).
LETTER RESEARCH
Macmillan Publishers Limited. All rights reserved©2012