An induced seismicity experiment across a creeping segment of the Philippine Fault
(This is a sample cover image for this issue. The actual cover is not yet available at this time.)
This article appeared in a journal published by Elsevier. The attachedcopy is furnished to the author for internal non-commercial researchand education use, including for instruction at the authors institution
and sharing with colleagues.
Other uses, including reproduction and distribution, or selling orlicensing copies, or posting to personal, institutional or third party
websites are prohibited.
In most cases authors are permitted to post their version of thearticle (e.g. in Word or Tex form) to their personal website orinstitutional repository. Authors requiring further information
regarding Elsevier’s archiving and manuscript policies areencouraged to visit:
http://www.elsevier.com/copyright

Author's personal copy
The relationship of intermediate- and deep-focus seismicity to the hydrationand dehydration of subducting slabs
C. Grace Barcheck a,n, Douglas A. Wiens a, Peter E. van Keken b, Bradley R. Hacker c
a Department of Earth and Planetary Sciences, Washington University in St. Louis, Campus Box 1169, 1 Brookings Drive, St. Louis, MO 63130, USAb Department of Earth and Environmental Sciences, University of Michigan, 2534 C. C. Little Building, 1100 North University Ave, Ann Arbor, MI 48109-1005, USAc Department of Earth Science, University of California, 1006 Webb Hall – MC 9630, Santa Barbara, CA 93106-9630, USA
a r t i c l e i n f o
Article history:Received 29 February 2012Received in revised form25 June 2012Accepted 26 June 2012
Keywords:deep earthquakesdehydration embrittlementsubduction zonewater
a b s t r a c t
Previous studies suggest that intermediate- and deep-focus earthquakes in subducting slabs may resultfrom dehydration reactions. We investigate the importance of dehydration in facilitating intermediate-and deep-focus earthquakes by comparing the seismicity rate with the calculated slab dehydration flux(van Keken et al., 2011) as a function of depth in 56 subduction zones worldwide. For each region, theseismicity rate per km of trench length per year as a function of depth between 1990 and 2009 wasdetermined from the Preliminary Determination of Epicenters (PDE) catalog. The number of earth-quakes between 75 and 240 km depth was compared to the calculated slab dehydration flux in 25 kmincrements. Deeper than 240 km, dehydration rates were not calculated, so seismicity is insteadcompared to the calculated flux of water that remains mineralogically bound in the slab at that depth.No strong correlation between the dehydration flux and the seismicity rate was found at any depth.This suggests that some factor besides the presence of water, such as the stress state of the slab,controls intermediate-focus seismicity. For depths greater than 240 km, there is a correlation betweenthe amount of mineralogically-bound H2O and the seismicity rate. In particular, although deep slabswith small amounts of bound water show a wide range of seismicity rates (and many have noseismicity whatsoever), all deep slabs with appreciable water transported below 240 km showsignificant seismicity. We conclude that the presence of water may be a necessary condition for deepseismicity in conjunction with other factors. We also note that slab temperature and dehydration arelinked. Traditionally the limitations on deep earthquake occurrence have been linked to temperature,but this study suggests that similar arguments can be made linking deep earthquakes with the presenceof water.
& 2012 Elsevier B.V. All rights reserved.
1. Introduction
Earthquakes generated by sudden brittle shear failure ought tobe inhibited at depths greater than about 40–70 km whereincreased pressure and temperature favor ductile rather thanbrittle failure (Houston, 2007; Frohlich, 2006). Nevertheless,earthquakes have been observed to depths of nearly 700 km sincethe early days of seismology (Wadati, 1928). These ‘‘deep earth-quakes’’ can be roughly separated into two populations based ontheir depth. Globally, deep earthquakes are characterized by anapproximately exponentially decreasing number of events downto about 300 km depth, a minimum between 300 and 450 kmdepth, and another active zone between 450 and 680 km depthwith a peak around 550–600 km (Houston, 2007; Frohlich, 2006).
Here, we use the common convention to refer to earthquakesbetween 60 and 300 km depth as ‘‘intermediate-focus’’ events,and events deeper than 300 km as ‘‘deep-focus’’ events. ‘‘Deepearthquakes’’ refers to all events deeper than 60 km.
The exact mechanism of these earthquakes remains elusive,though several different possibilities have been proposed. Earlyworkers suggested an implosive phase change could releaseseismic energy (e.g., Leith and Sharpe, 1936), but subsequentanalysis has failed to find the large isotropic componentexpected in deep events caused by such a mechanism (e.g.,Kawakatsu, 1991; Okal, 1996; Russakoff et al., 1997; Estabrook,1999). Other suggested mechanisms include shear instabilities(Ogawa, 1987; Kelemen and Hirth, 2007), catastrophic plasticshear (Hobbs and Ord, 1988), transformational faulting andanticrack formation (e.g., Kirby, 1987; Green and Burnley,1989; Green and Houston, 1995; Kirby et al., 1996), anddehydration embrittlement (e.g., Hubbert and Rubey, 1959;Griggs and Handin, 1960; Raleigh and Paterson, 1965; Green
Contents lists available at SciVerse ScienceDirect
journal homepage: www.elsevier.com/locate/epsl
Earth and Planetary Science Letters
0012-821X/$ - see front matter & 2012 Elsevier B.V. All rights reserved.http://dx.doi.org/10.1016/j.epsl.2012.06.055
n Corresponding author. Tel.: !1 314 941 2652.E-mail address: [email protected] (C.G. Barcheck).
Earth and Planetary Science Letters 349–350 (2012) 153–160
Author's personal copy
and Houston, 1995; Dobson et al., 2002; Hacker et al., 2003; Junget al., 2004). It is important to note that ‘dehydration embrittle-ment’ sensu stricto refers to the embrittlement of rock activelydehydrating, whereas ‘hydration embrittlement’ is a betterterm for embrittlement produced by the presence of fluidproduced at any distance from the fault and at any time.The former has only been demonstrated in experiments (e.g.,Lee and Kirby, 1984)—and requires special circumstances tooperate—whereas the latter is a central tenet of rock mechanicsat all scales (e.g., Scholz, 1989).
The presence of subducted water is crucial for several pro-posed mechanisms of intermediate and/or deep seismicity. Thedehydration embrittlement mechanism suggests that as sub-ducted material sinks into the mantle and is subjected to highertemperature and pressure, hydrated crustal and mantle mineralsdehydrate. Theoretically, this fluid increases pore pressure,reduces normal stress and friction across a potential fault, andfacilitates brittle fracture and slip. Subducted water may also playa role in mechanisms in which lenses of ultra-fine-grainedbyproducts of dehydration reactions form in subducting rocks,enabling faulting (Frohlich, 2006). Zhang et al. (2004) proposedanother mechanism in which hydroxyl defects in eclogite pre-cipitate at grain boundaries, producing small amounts of melt andcreating another dehydration-related faulting instability. Theysuggested that this mechanism could be important in the transi-tion zone (400–700 km depth), where earthquakes occur despiteall major hydrous phases likely having decomposed in the uppermantle (Green et al., 2010).
There is significant evidence from thermal–petrologic models,fieldwork, and laboratory work that dehydration embrittlement isthe probable mechanism for intermediate-focus events. Severalworkers have found the locations of earthquakes to correspondwell with predicted dehydration loci in downgoing slabs, suggest-ing that intermediate-focus earthquakes are caused or facilitatedby dehydration reactions (Hacker et al., 2003; Yamasaki and Seno,2003; Mishra and Zhao, 2004). These models, which are based onthermal and petrological modeling (Yamasaki and Seno, 2003;Hacker et al., 2003) and P-wave velocity structure models (Mishraand Zhao, 2004) extend only to the upper few hundred km of themodeled subduction zones, leaving the deeper parts of subductedslabs less understood.
Evidence of dehydration embrittlement is abundant in natu-rally deformed rocks (e.g., Healy et al., 2009), and has beenreported in a wide variety of experimentally deformed materials(e.g., Raleigh and Paterson, 1965; Murrell and Ismail, 1976; Leeand Kirby, 1984; Dobson et al., 2002; Jung et al., 2004; Cholletet al., 2009). Whether similar mechanisms operate in Earth’stransition zone remains unclear, given the difficulty of reprodu-cing those conditions in the lab and the improbability of findingrocks from extreme depths exhumed to the surface.
If dehydration reactions are the primary mechanism for producingintermediate and/or deep earthquakes, we should expect to see somerelationship between seismicity and the amount of water subductedto various depths. At a minimum, dehydration reactions require thepresence of water, and subducting slabs at temperatures and pres-sures greater than the dehydration conditions should be anhydrousand thus aseismic if dehydration embrittlement is operative. We mayalso expect to find a correlation between modeled dehydration fluxesand the seismicity rate, if the seismicity mechanism is sensitive to theamount and distribution of water in the slab. This paper investigatesthe relationship between subducted water and seismicity rates bycomparing the locations and depths of earthquakes in the globalcatalog to results from the dehydration models of van Keken et al.(2011) for 56 subduction zones worldwide. The results provide someconstraints on the possible role of water in producing intermediateand deep seismicity.
2. Methods
2.1. Slab dehydration calculations
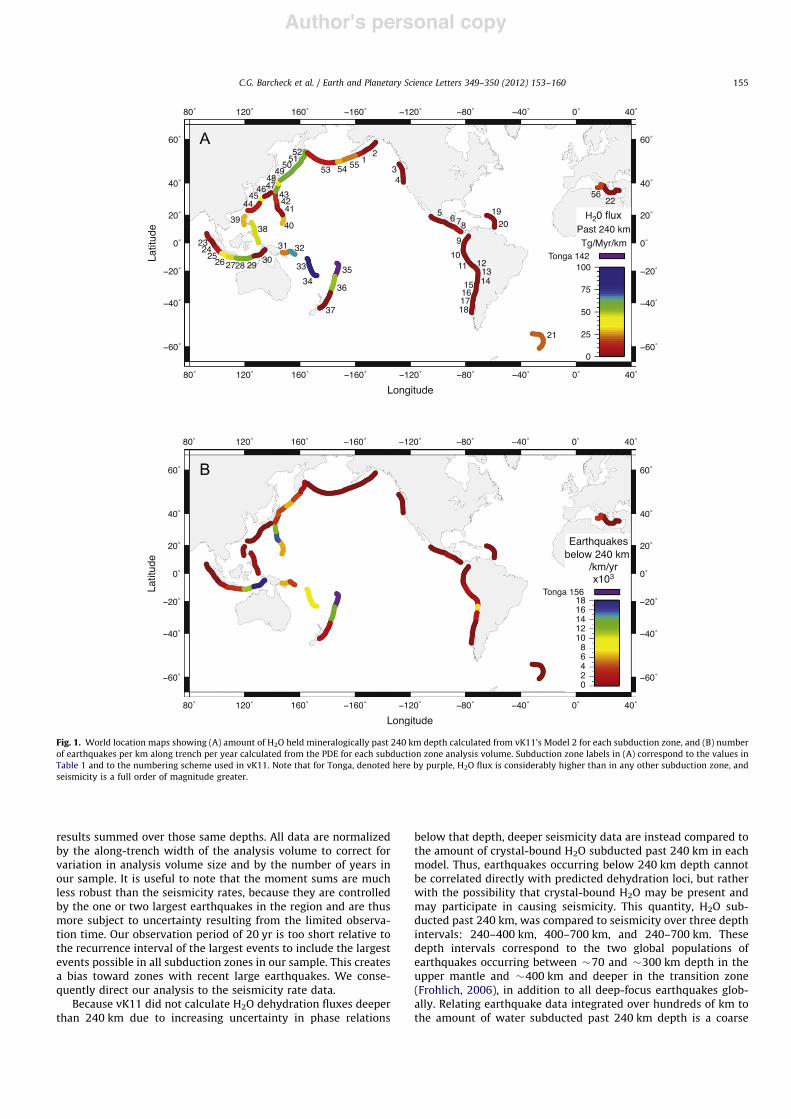
Van Keken et al. (2011), hereafter referred to as ‘‘vK11’’produced models of the metamorphic facies and H2O content of56 subducting slabs worldwide using the ‘‘D80’’ thermal modelsof Syracuse et al. (2010). These models use updated subduction-zone geometries based on Syracuse and Abers (2006) and repre-sent nearly all active trenches worldwide (see Fig. 1). The relevantequations are solved on a high-resolution, finite-element mesh toproduce petrological models of subducting slabs and calculationsof the dehydration flux at various depths down to 240 km. Slabcrust is modeled following Hacker (2008), with a variable-thick-ness sediment layer, a 300 m thick upper volcanic layer, a 300 mthick lower volcanic layer, 1.4 km of dikes, and 5 km of gabbro.Because the hydration state of the upper mantle is poorlyconstrained, vK11 produced three models with different hydra-tion assumptions for the upper 2 km of the mantle: dry, 2 wt%H2O, and fully hydrated. Subsolidus phase relations in the slaband overlying mantle wedge were calculated using Perple_X(Connolly, 2009), the 2004 version of the Holland and Powell(1998) thermodynamic database, and Syracuse et al. (2010) ‘‘D80’’thermal models. Hypersolidus phase relations for crustal rockswere determined from the experimental literature, primarily fromSchmidt et al. (2004).
We use vK11’s moderate upper mantle hydration case—2 wt%H2O in the upper 2 km of the mantle—as a conservative model ofupper mantle hydration (Model 1). A less conservative model ismotivated by seismic results from Van Avendonk et al. (2011),who used mantle Vp velocities from the subducting Cocos plate offNicaragua to estimate "3.5 wt% bound H2O. This model (Model2) has 4 wt% H2O in the upper 4 km of the mantle and 2 wt% H2Oto 8 km depth. We compare the calculated dehydration fluxes inModel 1 and Model 2 with actual slab seismicity between1 January 1990 and 31 March 2009 to assess whether there is arelationship between seismicity and dehydration.
2.2. Seismicity rate determination
We determine appropriate analysis volumes for each of vK11’s56 trench locations based on the extent of the adjacent seismi-cally active area, the azimuth of slab subduction, and proximity tothe next datum. If nearby data are unavailable, the end of thetrench or the edge of the seismically active area determines theedges of the analysis volume. The seismically active area isdetermined by visually examining earthquake event data inmap view. Earthquakes inside these analysis volumes are con-sidered to be related to the slab mineralogy and other slabparameters at the data point.
We use the surface coordinates of the corners of these volumesto query two databases, the Preliminary Determination of Epi-centers (PDE) database and the Centroid Moment Tensor (CMT)catalogue, between 1 January 1990 and 31 March 2009. The PDEdatabase provides data on the number of earthquakes above achosen body wave magnitude threshold at predetermined depthswithin each analysis volume, and the CMT catalogue providesdata on the sum of the seismic moments of all earthquakes atthose same predetermined depths. We select a body-wave mag-nitude threshold of mbZ4.5, as the catalog is relatively completeat this magnitude level for most slabs. We do not remove after-shocks from our data because aftershock sequences that can berecorded globally are rare following intermediate- or deep-focusearthquakes (Frohlich, 2006). We gather the data from the PDEand the CMT into bins in 25 km increments between 75 and240 km depth for comparison with the corresponding vK11 model
C.G. Barcheck et al. / Earth and Planetary Science Letters 349–350 (2012) 153–160154
Author's personal copy
results summed over those same depths. All data are normalizedby the along-trench width of the analysis volume to correct forvariation in analysis volume size and by the number of years inour sample. It is useful to note that the moment sums are muchless robust than the seismicity rates, because they are controlledby the one or two largest earthquakes in the region and are thusmore subject to uncertainty resulting from the limited observa-tion time. Our observation period of 20 yr is too short relative tothe recurrence interval of the largest events to include the largestevents possible in all subduction zones in our sample. This createsa bias toward zones with recent large earthquakes. We conse-quently direct our analysis to the seismicity rate data.
Because vK11 did not calculate H2O dehydration fluxes deeperthan 240 km due to increasing uncertainty in phase relations
below that depth, deeper seismicity data are instead compared tothe amount of crystal-bound H2O subducted past 240 km in eachmodel. Thus, earthquakes occurring below 240 km depth cannotbe correlated directly with predicted dehydration loci, but ratherwith the possibility that crystal-bound H2O may be present andmay participate in causing seismicity. This quantity, H2O sub-ducted past 240 km, was compared to seismicity over three depthintervals: 240–400 km, 400–700 km, and 240–700 km. Thesedepth intervals correspond to the two global populations ofearthquakes occurring between "70 and "300 km depth in theupper mantle and "400 km and deeper in the transition zone(Frohlich, 2006), in addition to all deep-focus earthquakes glob-ally. Relating earthquake data integrated over hundreds of km tothe amount of water subducted past 240 km depth is a coarse
Fig. 1. World location maps showing (A) amount of H2O held mineralogically past 240 km depth calculated from vK11’s Model 2 for each subduction zone, and (B) numberof earthquakes per km along trench per year calculated from the PDE for each subduction zone analysis volume. Subduction zone labels in (A) correspond to the values inTable 1 and to the numbering scheme used in vK11. Note that for Tonga, denoted here by purple, H2O flux is considerably higher than in any other subduction zone, andseismicity is a full order of magnitude greater.
C.G. Barcheck et al. / Earth and Planetary Science Letters 349–350 (2012) 153–160 155
Author's personal copy
comparison, necessitated by uncertainties in the phase diagramsof hydrous materials below 240 km depth. Nevertheless, thiscomparison may hold important insights.
Our analysis volumes are designed to select the population ofseismic events most related to the present-day subduction para-meters used in vK11. We consider the current geometry of eachsubduction zone and our analysis volumes are therefore chosenalong the present-day azimuth of slab convergence (fromSyracuse et al., 2010), which we note is not always an accuratereflection of slab convergence in the past. For a small number ofslabs, the azimuth of convergence is extremely oblique to thetrench normal, and it is highly uncertain whether we areassociating the correct population of deep events with vK11’sdehydration calculations. Because of this uncertainty, weremoved from our figures all data from zones in which thepresent-day azimuth of slab subduction differs from trench-normal by more than 551. Consequently, data from the NewBritain, North Marianas, North Philippines, and East Banda Seasubduction zones are not shown in our figures. Nor are seismicityrates calculated at the Nankai subduction zone, which overliesdeep earthquakes occurring along the contours of the Pacific platesubducting at the Japan and Izu–Bonin trenches. These deepevents are best associated with the Izu or Central Honshusubduction zones, and it is unclear which, if any, events shouldbe associated with Nankai.
3. Results
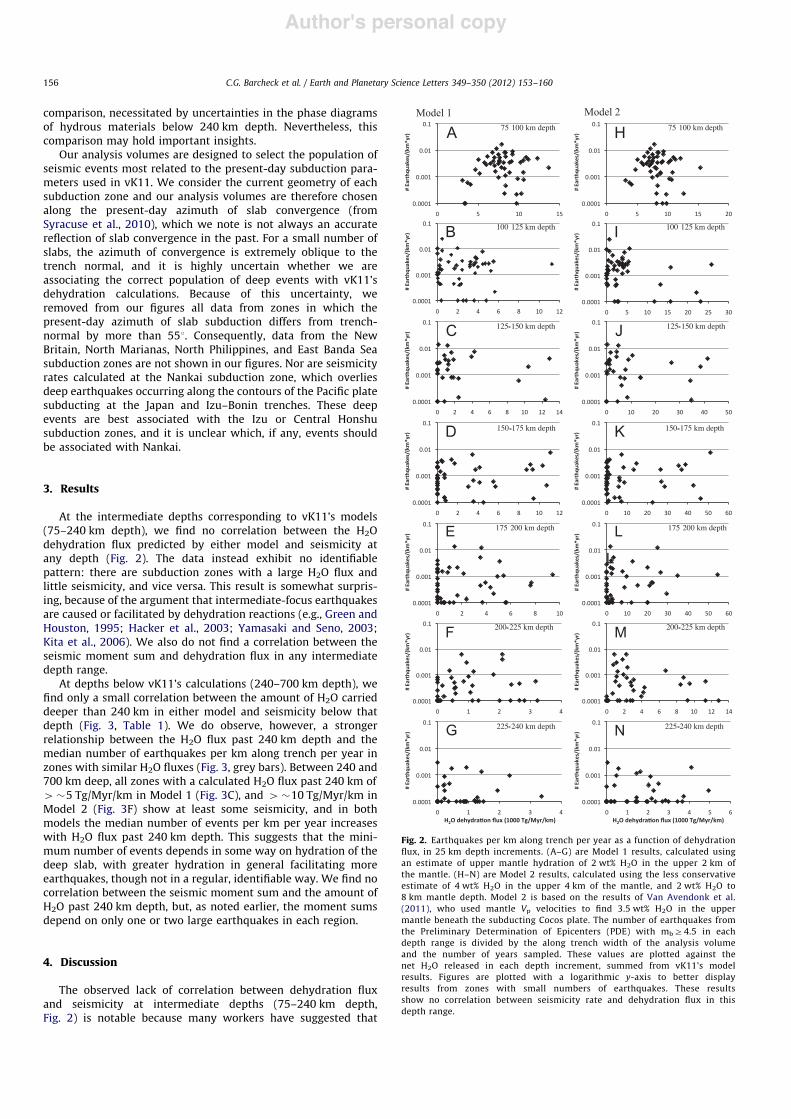
At the intermediate depths corresponding to vK11’s models(75–240 km depth), we find no correlation between the H2Odehydration flux predicted by either model and seismicity atany depth (Fig. 2). The data instead exhibit no identifiablepattern: there are subduction zones with a large H2O flux andlittle seismicity, and vice versa. This result is somewhat surpris-ing, because of the argument that intermediate-focus earthquakesare caused or facilitated by dehydration reactions (e.g., Green andHouston, 1995; Hacker et al., 2003; Yamasaki and Seno, 2003;Kita et al., 2006). We also do not find a correlation between theseismic moment sum and dehydration flux in any intermediatedepth range.
At depths below vK11’s calculations (240–700 km depth), wefind only a small correlation between the amount of H2O carrieddeeper than 240 km in either model and seismicity below thatdepth (Fig. 3, Table 1). We do observe, however, a strongerrelationship between the H2O flux past 240 km depth and themedian number of earthquakes per km along trench per year inzones with similar H2O fluxes (Fig. 3, grey bars). Between 240 and700 km deep, all zones with a calculated H2O flux past 240 km of4"5 Tg/Myr/km in Model 1 (Fig. 3C), and 4"10 Tg/Myr/km inModel 2 (Fig. 3F) show at least some seismicity, and in bothmodels the median number of events per km per year increaseswith H2O flux past 240 km depth. This suggests that the mini-mum number of events depends in some way on hydration of thedeep slab, with greater hydration in general facilitating moreearthquakes, though not in a regular, identifiable way. We find nocorrelation between the seismic moment sum and the amount ofH2O past 240 km depth, but, as noted earlier, the moment sumsdepend on only one or two large earthquakes in each region.
4. Discussion
The observed lack of correlation between dehydration fluxand seismicity at intermediate depths (75–240 km depth,Fig. 2) is notable because many workers have suggested that
Fig. 2. Earthquakes per km along trench per year as a function of dehydrationflux, in 25 km depth increments. (A–G) are Model 1 results, calculated usingan estimate of upper mantle hydration of 2 wt% H2O in the upper 2 km ofthe mantle. (H–N) are Model 2 results, calculated using the less conservativeestimate of 4 wt% H2O in the upper 4 km of the mantle, and 2 wt% H2O to8 km mantle depth. Model 2 is based on the results of Van Avendonk et al.(2011), who used mantle Vp velocities to find 3.5 wt% H2O in the uppermantle beneath the subducting Cocos plate. The number of earthquakes fromthe Preliminary Determination of Epicenters (PDE) with mbZ4.5 in eachdepth range is divided by the along trench width of the analysis volumeand the number of years sampled. These values are plotted against thenet H2O released in each depth increment, summed from vK11’s modelresults. Figures are plotted with a logarithmic y-axis to better displayresults from zones with small numbers of earthquakes. These resultsshow no correlation between seismicity rate and dehydration flux in thisdepth range.
C.G. Barcheck et al. / Earth and Planetary Science Letters 349–350 (2012) 153–160156

Author's personal copy
intermediate-focus events are related to dehydration embrittle-ment (e.g., Green and Houston; 1995, Hacker et al., 2003;Yamasaki and Seno, 2003). Our observations suggest four possi-bilities to explain the lack of correlation. First, slab input para-meters and local geometry variations may not be known wellenough for vK11’s resulting model to accurately reflect actualdehydration rates in all cases. Thus, any relationship betweendehydration and seismicity may be obscured because of thelimitations of the dehydration model. Second, dehydration reac-tions may not cause or facilitate intermediate-focus events at all;some entirely different mechanism is at work. Third, other factorssuch as slab stress or strain rate may also participate in determin-ing the rate of intermediate-focus seismicity. For example, twoidentical slabs with different stress states may exhibit differentamounts of seismicity despite having the same dehydration flux.Or, finally, intermediate-focus events may be caused by the
hydrous products of dehydration rather than the dehydrationreaction itself. If those products facilitate seismicity only undercertain conditions, the events could occur at some distance inspace and time from this initial zone of dehydration. In this case,there would be no clear relationship between dehydration andseismicity, similar to what we observe. Our results suggest thatdehydration embrittlement cannot be the primary factor control-ling the occurrence of intermediate-focus earthquakes.
Deeper than 240 km, our results are more intriguing. Fig. 3A–Fshow a lot of scatter, similar to our shallower results. However,Fig. 3C and F do show a relationship between H2O flux past240 km depth and a minimum amount of seismicity. Between 240and 700 km depth, all zones with an H2O flux past 240 km of4"5 Tg/Myr/km (Model 1) or 4"10 Tg/Myr/km (Model 2) havesome earthquakes (Fig. 3C and F), and in general the minimumnumber of events increases with H2O flux past 240 km.
Fig. 3. Intermediate- and deep-focus results, in depth ranges of 240 to 400 km depth, 400 to 700 km depth, and integrated between 240 and 700 km depth. (A–C) areModel 1 results (2 wt% H2O in the upper 2 km of the mantle). (D–F) are Model 2 results (4 wt% H2O in the upper 4 km of the mantle, 2 wt% H2O to 8 km). Diamonds indicatethe number of earthquakes per km along trench per year in each analysis volume plotted against the amount of H2O retained mineralogically in the slab past 240 kmdepth, which is the deepest that the dehydration flux is calculated in vK11’s models. Open diamonds indicate South American subduction zones (Peru through SouthCentral Chile) that likely retain more water past 240 km depth than in vK11’s model. Grey bars represent the median number of events per km along trench in eachsubduction zone binned by H2O flux past 240 km depth. Model 1 results are binned in increments of 5#103 Tg/Myr/km. Model 2 results are binned in increments of10#103 Tg/Myr/km up to 50#103 Tg/Myr/km, and 25#103 Tg/Myr/km thereafter. ND indicates no median data; blank columns are zero values. We observe an increasingminimum number of earthquakes per km per year with increasing H2O flux past 240 km between 240 and 700 km depth (C,F). Generally, subduction zones with higherH2O fluxes past 240 km depth also have higher median numbers of earthquakes per km per year at all depths below 240 km. Tonga and South Vanuatu are labeled; Tongahas by far the largest amount of subducted water due to the fast subduction of old oceanic lithosphere. The South Vanuatu subduction zone formed recently, and thus it isunclear whether the slab has yet penetrated to depths greater than 400 km, possibly explaining the lack of deep-focus seismicity (e.g., Hamburger and Isacks, 1987).
C.G. Barcheck et al. / Earth and Planetary Science Letters 349–350 (2012) 153–160 157
Author's personal copy
This suggests that H2O plays some role in facilitatingdeeper seismicity, but the total number of events depends onsome other factor. In support of this idea, Fig. 3A–F show that, ingeneral, subduction zones with a greater H2O flux past 240 kmdepth tend to have more earthquakes. The trend is stronger inModel 2, but it is evident in both models.
Fig. 3 suggests that H2O plays a role in seismicity beneath240 km, and that slabs containing significant water cannot becompletely aseismic. Whether the actual mechanism is dehydra-tion embrittlement or whether H2O facilitates some other rupturemechanism is unclear. Below the 410 km discontinuity, themechanism may not be the same embrittlement mechanism as
Table 1
Subduction zone H2O subducted past 240 km depth Seismicity rate Thermalparameter (F)
Model 1 Model 2 240–400 km depth 400–700 km depth(1000 Tg/Myr/Km) (1000 Tg/Myr/Km) (# earthquakes/(km# yr)#103) (# earthquakes/(km# yr)#103) (km)
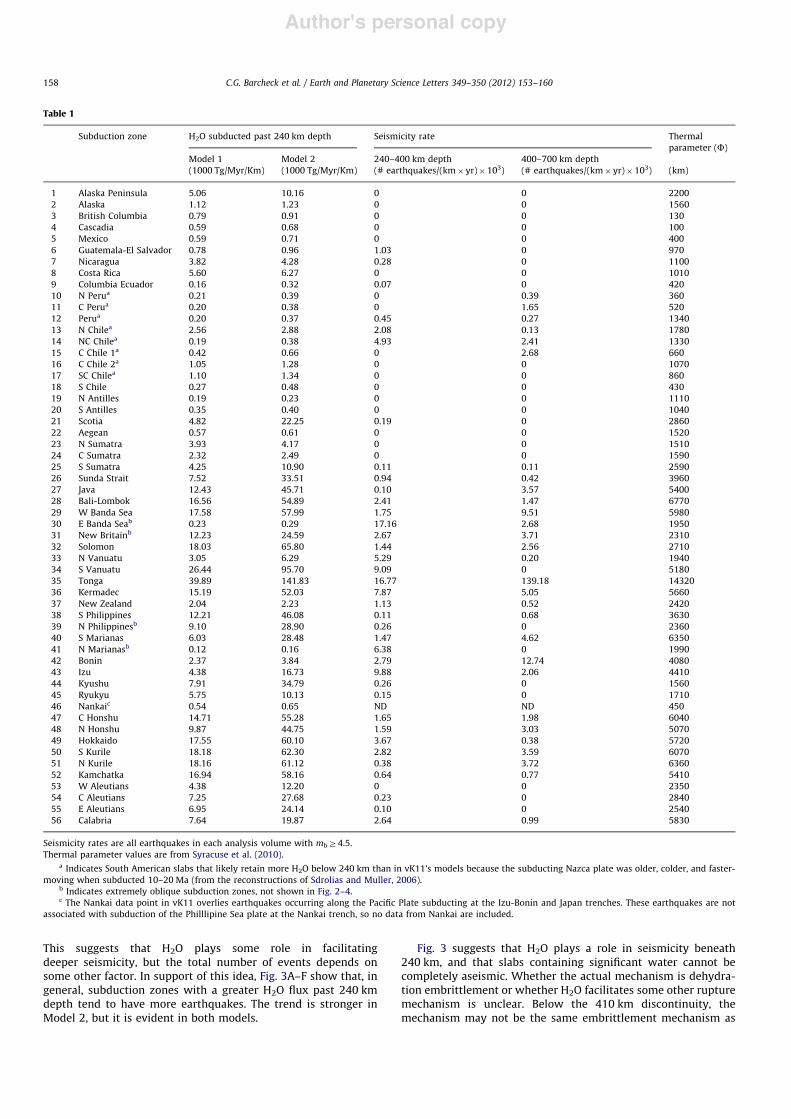
1 Alaska Peninsula 5.06 10.16 0 0 22002 Alaska 1.12 1.23 0 0 15603 British Columbia 0.79 0.91 0 0 1304 Cascadia 0.59 0.68 0 0 1005 Mexico 0.59 0.71 0 0 4006 Guatemala-El Salvador 0.78 0.96 1.03 0 9707 Nicaragua 3.82 4.28 0.28 0 11008 Costa Rica 5.60 6.27 0 0 10109 Columbia Ecuador 0.16 0.32 0.07 0 42010 N Perua 0.21 0.39 0 0.39 36011 C Perua 0.20 0.38 0 1.65 52012 Perua 0.20 0.37 0.45 0.27 134013 N Chilea 2.56 2.88 2.08 0.13 178014 NC Chilea 0.19 0.38 4.93 2.41 133015 C Chile 1a 0.42 0.66 0 2.68 66016 C Chile 2a 1.05 1.28 0 0 107017 SC Chilea 1.10 1.34 0 0 86018 S Chile 0.27 0.48 0 0 43019 N Antilles 0.19 0.23 0 0 111020 S Antilles 0.35 0.40 0 0 104021 Scotia 4.82 22.25 0.19 0 286022 Aegean 0.57 0.61 0 0 152023 N Sumatra 3.93 4.17 0 0 151024 C Sumatra 2.32 2.49 0 0 159025 S Sumatra 4.25 10.90 0.11 0.11 259026 Sunda Strait 7.52 33.51 0.94 0.42 396027 Java 12.43 45.71 0.10 3.57 540028 Bali-Lombok 16.56 54.89 2.41 1.47 677029 W Banda Sea 17.58 57.99 1.75 9.51 598030 E Banda Seab 0.23 0.29 17.16 2.68 195031 New Britainb 12.23 24.59 2.67 3.71 231032 Solomon 18.03 65.80 1.44 2.56 271033 N Vanuatu 3.05 6.29 5.29 0.20 194034 S Vanuatu 26.44 95.70 9.09 0 518035 Tonga 39.89 141.83 16.77 139.18 1432036 Kermadec 15.19 52.03 7.87 5.05 566037 New Zealand 2.04 2.23 1.13 0.52 242038 S Philippines 12.21 46.08 0.11 0.68 363039 N Philippinesb 9.10 28.90 0.26 0 236040 S Marianas 6.03 28.48 1.47 4.62 635041 N Marianasb 0.12 0.16 6.38 0 199042 Bonin 2.37 3.84 2.79 12.74 408043 Izu 4.38 16.73 9.88 2.06 441044 Kyushu 7.91 34.79 0.26 0 156045 Ryukyu 5.75 10.13 0.15 0 171046 Nankaic 0.54 0.65 ND ND 45047 C Honshu 14.71 55.28 1.65 1.98 604048 N Honshu 9.87 44.75 1.59 3.03 507049 Hokkaido 17.55 60.10 3.67 0.38 572050 S Kurile 18.18 62.30 2.82 3.59 607051 N Kurile 18.16 61.12 0.38 3.72 636052 Kamchatka 16.94 58.16 0.64 0.77 541053 W Aleutians 4.38 12.20 0 0 235054 C Aleutians 7.25 27.68 0.23 0 284055 E Aleutians 6.95 24.14 0.10 0 254056 Calabria 7.64 19.87 2.64 0.99 5830
Seismicity rates are all earthquakes in each analysis volume with mbZ4.5.Thermal parameter values are from Syracuse et al. (2010).
a Indicates South American slabs that likely retain more H2O below 240 km than in vK11’s models because the subducting Nazca plate was older, colder, and faster-moving when subducted 10–20 Ma (from the reconstructions of Sdrolias and Muller, 2006).
b Indicates extremely oblique subduction zones, not shown in Fig. 2–4.c The Nankai data point in vK11 overlies earthquakes occurring along the Pacific Plate subducting at the Izu-Bonin and Japan trenches. These earthquakes are not
associated with subduction of the Philllipine Sea plate at the Nankai trench, so no data from Nankai are included.
C.G. Barcheck et al. / Earth and Planetary Science Letters 349–350 (2012) 153–160158
Author's personal copy
at shallower depths. Nevertheless, deep seismicity appears to besomewhat correlated with the presence of H2O or its capacity tofacilitate rupture via an unidentified mechanism, with the totalnumber of events depending on some other factor.
If deep-focus seismicity is caused entirely by dehydrationreactions, slabs should exhibit no seismicity below the depth offull dehydration. However, Fig. 3 illustrates that several slabs havea zero or near-zero calculated H2O flux past 240 km, yet stillexhibit relatively high seismicity. Several of these slabs, from NorthPeru through South-Central Chile, are all subduction zones wherethe Nazca plate is descending beneath South America. Recentrelative plate-motion reconstructions show that plate-motion rateshave slowed and the age of the subducting lithosphere hasdecreased considerably over the past 10–20 Myr (Sdrolias andMuller, 2006; Capitanio et al., 2011). Because lithosphere now atdepths of "300 km beneath South America would have subductedat roughly 10 Myr, and lithosphere at 600 km depth subducted at20 Myr, the present-day subduction parameters used in vK11 maynot be appropriate for lithosphere now at these depths. Olderlithosphere subducting faster at 10–20 Myr would result in acolder slab than in vK11’s model and allow more water to besubducted past 240 km depth. In this scenario, the South Americansubduction zones are not deep seismic zones occurring withoutsignificant subducted water, as our data and vK11’s model suggest.Instead, South American slabs likely retain considerably morewater past 240 km depth than the model indicates and are moresimilar to deep hydrous slabs in other colder subduction zones.Indeed, taking this caveat into account, nearly all of the remainingsubduction zones with little or no water subducted past 240 kmshow no seismicity below 240 km. Thus, the data are consistentwith a hypothesis that some subducted water is necessary toproduce seismicity below 240 km.
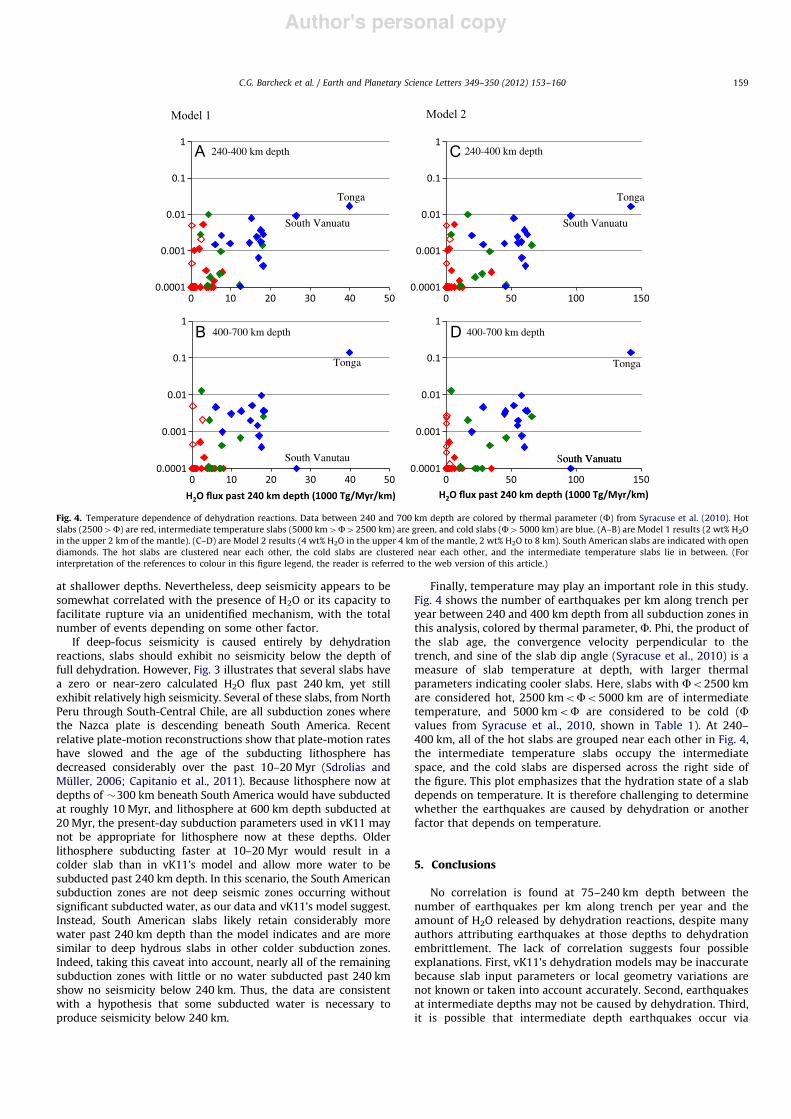
Finally, temperature may play an important role in this study.Fig. 4 shows the number of earthquakes per km along trench peryear between 240 and 400 km depth from all subduction zones inthis analysis, colored by thermal parameter, F. Phi, the product ofthe slab age, the convergence velocity perpendicular to thetrench, and sine of the slab dip angle (Syracuse et al., 2010) is ameasure of slab temperature at depth, with larger thermalparameters indicating cooler slabs. Here, slabs with Fo2500 kmare considered hot, 2500 kmoFo5000 km are of intermediatetemperature, and 5000 kmoF are considered to be cold (Fvalues from Syracuse et al., 2010, shown in Table 1). At 240–400 km, all of the hot slabs are grouped near each other in Fig. 4,the intermediate temperature slabs occupy the intermediatespace, and the cold slabs are dispersed across the right side ofthe figure. This plot emphasizes that the hydration state of a slabdepends on temperature. It is therefore challenging to determinewhether the earthquakes are caused by dehydration or anotherfactor that depends on temperature.
5. Conclusions
No correlation is found at 75–240 km depth between thenumber of earthquakes per km along trench per year and theamount of H2O released by dehydration reactions, despite manyauthors attributing earthquakes at those depths to dehydrationembrittlement. The lack of correlation suggests four possibleexplanations. First, vK11’s dehydration models may be inaccuratebecause slab input parameters or local geometry variations arenot known or taken into account accurately. Second, earthquakesat intermediate depths may not be caused by dehydration. Third,it is possible that intermediate depth earthquakes occur via
outh Vanuatu
240-400 km depth
400-700 km depth
240-400 km depth
400-700 km depth
Model 1 Model 2
South VanuatuSouth Vanutau
South VanuatuSouth Vanuatu
Tonga
Tonga
Tonga
Tonga
Fig. 4. Temperature dependence of dehydration reactions. Data between 240 and 700 km depth are colored by thermal parameter (F) from Syracuse et al. (2010). Hotslabs (25004F) are red, intermediate temperature slabs (5000 km4F42500 km) are green, and cold slabs (F45000 km) are blue. (A–B) are Model 1 results (2 wt% H2Oin the upper 2 km of the mantle). (C–D) are Model 2 results (4 wt% H2O in the upper 4 km of the mantle, 2 wt% H2O to 8 km). South American slabs are indicated with opendiamonds. The hot slabs are clustered near each other, the cold slabs are clustered near each other, and the intermediate temperature slabs lie in between. (Forinterpretation of the references to colour in this figure legend, the reader is referred to the web version of this article.)
C.G. Barcheck et al. / Earth and Planetary Science Letters 349–350 (2012) 153–160 159
Author's personal copy
dehydration embrittlement, but that other factors such as slabstress control the seismicity rate. Finally, the hydrous products ofdehydration reactions may cause intermediate-focus earthquakes,but those events may not occur in exactly the same places as thedehydration reactions.
We find that subduction zones with a higher H2O flux past240 km depth have a larger median number of earthquakes atdepths of 240–700 km. All slabs subducting a significant amountof water past 240 km depth show some deep seismicity. Thissuggests that H2O may enable deep earthquakes in the presenceof some other factor that modulates the seismicity rate. We donote with caution that dehydration reactions depend chiefly ontemperature, so it is difficult to distinguish the effects of tem-perature and dehydration when doing comparative studies ofsubduction zones.
Acknowledgments
We thank Patrick Shore for computer assistance. This workwas funded by the National Science Foundation under grantsOCE-0752476 and EAR-0842295 and EAR- 0745588.
References
Capitanio, F.A., Faccenna, C., Zlotnink, S., Stegman, D.R., 2011. Subductiondynamics and the origin of Andean orogeny and the Bolivian orocline. Nature480, 83–86, http://dx.doi.org/10.1038/nature10596.
Chollet, M., Daniel, I., Koga, K.T., Petitgirard, S., Morard, G., 2009. Dehydrationkinetics of talc and 10 A phase: Consequences for subduction zone seismicity.Earth Planet. Sci. Lett. 284, 57–64, http://dx.doi.org/10.1016/j.epsl.2009.04.008.
Connolly, J.A.D., 2009. The geodynamic equation of state: What and how. Geochem.Geophys. Geosyst. 10, Q10014, http://dx.doi.org/10.1029/2009GC002540.
Dobson, D.P., Meredith, P.G., Boon, S.A., 2002. Simulation of subduction zoneseismicity by dehydration of serpentine. Science 298, 1407–1410, http://dx.doi.org/10.1126/science.1075390.
Estabrook, C.H., 1999. Body wave inversion of the 1970 and 1963 South Americanlarge deep-focus earthquakes. J. Geophys. Res. 104, 28751–28767, doe10.1029/1999JB900244.
Frohlich, C., 2006. Deep Earthquakes. Cambridge University Press, Cambridge,England 23, 101–108, 267–279.
Green, H.W., Burnley, P.C., 1989. A new self-organizing, mechanism for deep-focusearthquakes. Nature 341, 733–737, http://dx.doi.org/10.1038/341733a0.
Green, H.W., Houston, H., 1995. The mechanics of deep earthquakes. Ann. Rev.Earth Planet. Sci. 23, 169–213.
Green, H.W., Chen, W., Brudzinski, M., 2010. Seismic evidence of negligible watercarried below 400-km depth in subducting lithosphere. Nature 467, 828–831,http://dx.doi.org/10.1038/nature09401.
Griggs, D., Handin, J., 1960. Observations on fracture and a hypothesis of earth-quakes. Geol. Soc.. Amer: Mem. 79, 347–373.
Hacker, B.R., 2008. H2O Subduction beyond arcs. Geochem., Geophys., Geosyst. 9,Q03001, http://dx.doi.org/10.1029/2007GC001707.
Hacker, B.R., Peacock, S., Abers, G.A., Holloway, S.D., 2003. Subduction factory 2:Are intermediate-depth earthquakes in subducting slabs linked to meta-morphic dehydration reactions? J. Geophys. Res. 108 (B1).
Hamburger, M.W., Isacks, B.L., 1987. Deep Earthquakes in the Southwest Pacific: aTectonic Interpretation. J. Geophys. Res. 92 (B13), 13,841–13,854.
Healy, D., Reddy, S.M., Timms, N.E., Gray, E.M., Brovarone, A.V., 2009. Trench-parallel fast axes of seismic anisotropy due to fluid-filled cracks in subductingslabs. Earth Planet. Sci. Lett. 283, 75–86, http://dx.doi.org/10.1016/j.epsl.2009.03.037.
Hobbs, B.E., Ord, A., 1988. Plastic instabilities: implications for the origin ofintermediate and deep focus earthquakes. J. Geophys. Res. 93, 10521–10540.
Holland, T.J.B., Powell, R., 1998. An internally consistent thermodynamic data setfor phases of petrological interest. J. Metamorph. Geol. 16, 309–343, http://dx.doi.org/10.1111/j.1525-1314.1998.00140.x.
Houston, H., 2007. Deep Earthquakes. In: Schubert, G. (Ed.), Treatise on Geophysics,Volume 4. Earthquake Seismology, Elsevier, Amsterdam, pp. 321–350.
Hubbert, M.K., Rubey, W.W., 1959. Role of fluid pressure in overthrust faulting.Geol. Soc. Amer: Null. 70, 115–206.
Jung, H., Green, H.W., Dobrzhinetskaya, L.F., 2004. Intermediate-depth erthquakefaulting by dehydration embrittlement with negative volume change. Nature428, 545–549, http://dx.doi.org/10.1038/nature02412.
Kawakatsu, H., 1991. Insignificant isotropic component in the moment tensor ofdeep earthquakes. Nature 351, 50–53, http://dx.doi.org/10.1038/35100a0.
Kelemen, P.B., Hirth, G., 2007. A periodic shear-heating mechanism for intermedi-ate-depth earthquakes in the mantle. Nature 446, 787–790, http://dx.doi.org/10.1038/nature05717.
Kirby, S.H., 1987. Localized Polymorphic Phase Transformations in High-PressureFaults and Applications to the Physical Mechanism of Deep Earthquakes.J. Geophys. Res. 92, 13789–13800.
Kirby, S.H., Stein, S., Okal, E.A., Rubie, D., 1996. Deep earthquakes and metastablemantle phase transformations in subducting oceanic lithosphere. Rev. Geo-phys. Space Phys. 34, 261–306.
Kita, S., Okada, T., Nakajima, J., Matsuzawa, T., Hasegawa, A., 2006. Existence of aseismic belt in the upper plane of the double seismic zone extending in thealong-arc direction at depths of 70-100 km beneath NE Japan. Geophys. Res.Lett 33, L24310.
Lee, R.W., Kirby, S.H., 1984. Experimental deformation of topaz crystals: possibleembrittlement by intracrystalline water. J. Geophys. Res. 89, 4161–4166, http://dx.doi.org/10.1029/JB089iB06p04161.
Leith, A., Sharpe, J.A., 1936. Deep-focus earthquakes and their geological signifi-cance. J. Geol. 44, 877–917.
Mishra, O.P., Zhao, D., 2004. Seismic evidence for dehydration embrittlement ofsubducting Pacific slab. Geophys. Res. Lett. 31 http://dx.doi.org/10.1029/2004GL019489.
Murrell, S.A.F., Ismail, I.A.H., 1976. The effect of decomposition of hydrousminerals on the mechanical properties of rocks at high pressures andtemperatures. Tectonophysics 31, 207–258.
Ogawa, M., 1987. Shear instability in a viscoelastic material as the cause of deepfocus earthquakes. J. Geophys. Res. 92, 13,801–13,810.
Okal, E.A., 1996. Radial modes from the great 1994 Bolivian earthquake: noevidence for an isotropic component to the source. Geophys. Res. Lett. 23,431–434, http://dx.doi.org/10.1029/96GL00375.
Raleigh, C.B., Paterson, M.S., 1965. Experimental deformation of serpentinite andits tectonic implications. J. Geophys. Res. 70, 3965–3985.
Russakoff, D., Ekstrom, G., Tromp, J., 1997. A new analysis of the great 1970Colombia earthquake and it isotropic component. J. Geophys. Res. 102,20423–20434, http://dx.doi.org/10.1029/97JB01645.
Schmidt, M.W., Vielzeuf, D., Auzanneau, E., 2004. Melting and dissolution ofsubducted crust at high pressures: The key role of white mica. Earth Planet.Sci. Lett. 228, 65–84, http://dx.doi.org/10.1016/j.epsl.2004.09.020.
Scholz, C.H., 1989. Mechanics of faulting. Annu. Rev. Earth Planet. Sci. 17, 309–334.Sdrolias, M., Muller, R.D., 2006. Controls on back-arc basin formation. Geochem.
Geophy. Geosys 7 http://dx.doi.org/10.1029/2005GC001090.Syracuse, E.M., Abers, G.A., 2006. Global compilation of variations in slab depth
beneath arc volcanoes and implications. Geochem. Geophys. Geosyst. 7,Q05017, http://dx.doi.org/10.1029/2005GC001045.
Syracuse, E.M., van Keken, P.E., Abers, G.A., 2010. The global range of subductionzone thermal models. Phys. Earth and Planet. Int. 183, 73–90, http://dx.doi.org/10.1016/j.pepi.2020.02.004.
Van Avendonk, H.J.A., Holbrook, W.S., Lizarralde, D., Denyer, P., 2011. Structure ofthe subducting Cocos plate offshore Nicaragua and Costa Rica. Geochem,Geophys, Geosyst. 12, Q06009, http://dx.doi.org/10.1029/2011GC003592.
Van Keken, P.E., Hacker, B.R., Syracuse, E.M., Abers, G.A., 2011. Subduction Factory4: Depth-dependent flux of H2O from subducting slabs worldwide,. J. Geophys.Res. 116 http://dx.doi.org/10.1029/2010JB007922.
Wadati, K., 1928. Shallow and deep earthquakes. Geophy. Mag 1, 161–202.Yamasaki, T., Seno, T., 2003. Double seismic zone and dehydration embrittlement of the
subducting slab. J. Geophys. Res. 108 http://dx.doi.org/10.1029/2002JB001918.Zhang, J., Green, H.W., Bozhilov, K., Jin, Z., 2004. Faulting induced by precipitation
of water at grain boundaries in hot subducting oceanic crust. Nature 428,633–636, http://dx.doi.org/10.1038/nature02475.
C.G. Barcheck et al. / Earth and Planetary Science Letters 349–350 (2012) 153–160160
Copyright © 2022 FDOKUMEN