Using Multivariate Analyses to Assess Effects of Fluvial Type on Plant Species Distribution in a...
11
ARTICLE Using Multivariate Analyses to Assess Effects of Fluvial Type on Plant Species Distribution in a Mediterranean River Claudia Angiolini & Alessia Nucci & Flavio Frignani & Marco Landi Received: 12 April 2010 / Accepted: 1 November 2010 / Published online: 12 January 2011 # Society of Wetland Scientists 2011 Abstract We propose a method to assess the distribution of plant assemblages along rivers delimiting homogeneous fluvial types using cluster analysis applied to morphological features, quantified with aerial photos and geographic information system software. A stratified random sampling design along the elevational gradient was used to analyze riparian plant species. Multivariate statistics were applied to detect patterns of variation in the species data, and among functional and ecological groups. Cluster analysis identified four fluvial types: headwater, low sinuosity, braided, and incised. Canonical Correspondence Analysis, INdicator SPe- cies ANalysis, and partial ordinations all suggested that fluvial types were characterized by well-defined indicator species. The differences found by Redundancy Analysis and non- parametric analysis of variance for functional and ecological groups also supported the fluvial type division, showing different distributional trends for annual and woody species, and the greatest ecological distance between braided and headwater types. Based on the ordination results, dividing fluvial types according to morphological features was justified by environmental and floristic differences, although plant species variability was only partially described. Our results illustrated that the fluvial type classification created using this methodology was consistent with natural plant species distribution patterns. Keywords Ellenberg indicator values . Floristic assemblages . Functional groups . Morphology . Riparian vegetation . River classification Introduction In many regions, riparian areas constitute a small propor- tion of the total watershed area, yet they play a prominent ecological role. They are important pathways and migration corridors for the flow of energy, matter, and organisms across the landscape, and act as ecotones between terrestrial and aquatic zones (Malanson 1993; Forman 1997). More- over, riparian habitats are considered hotspots of biodiver- sity (Dècamps and Tabacchi 1994; Dudgeon et al. 2006). Unfortunately, streams and rivers throughout the world have been degraded by human activities (Baattrup-Pedersen et al. 2005). Mediterranean rivers, in particular, have a long history of human disturbances at basin and corridor scales (Di Castri 1991; Aguiar and Ferreira 2005). Given the magnitude of past loss and conversion of floodplains, as well as on-going threats, we should better understand how best to conserve remnant habitats. Rapid assessment of plant species diversity and distribution along rivers would be useful (Stohlgren et al. 1997), but resources or expertise to quantify total biodiversity of an area are lacking (Pharo et al. 1999; Hermy and Cornelis 2000). Determining the main factors influencing plant species distribution in riparian areas has become a priority. Recent studies revealed river morphology to be a strong determinant of riparian ecosystem function. Reviews by Steiger et al. (2005) and Corenblit et al. (2007) establish how landforms and physical processes drive the dynamics of biological communities. Strong linkages exist among watershed morphometry, stream hydro-geomorphology, and C. Angiolini : F. Frignani : M. Landi Department of Environmental Sciences “G. Sarfatti”, University of Siena, P.A. Mattioli 4, 53100 Siena, Italy A. Nucci (*) Department of Botany, University of Cagliari, Viale Sant’Ignazio da Laconi 13, 09123 Cagliari, Italy e-mail: [email protected] Wetlands (2011) 31:167–177 DOI 10.1007/s13157-010-0118-7
Transcript of Using Multivariate Analyses to Assess Effects of Fluvial Type on Plant Species Distribution in a...
ARTICLE
Using Multivariate Analyses to Assess Effectsof Fluvial Type on Plant Species Distributionin a Mediterranean River
Claudia Angiolini & Alessia Nucci & Flavio Frignani &Marco Landi
Received: 12 April 2010 /Accepted: 1 November 2010 /Published online: 12 January 2011# Society of Wetland Scientists 2011
Abstract We propose a method to assess the distribution ofplant assemblages along rivers delimiting homogeneousfluvial types using cluster analysis applied to morphologicalfeatures, quantified with aerial photos and geographicinformation system software. A stratified random samplingdesign along the elevational gradient was used to analyzeriparian plant species. Multivariate statistics were applied todetect patterns of variation in the species data, and amongfunctional and ecological groups. Cluster analysis identifiedfour fluvial types: headwater, low sinuosity, braided, andincised. Canonical Correspondence Analysis, INdicator SPe-cies ANalysis, and partial ordinations all suggested that fluvialtypes were characterized by well-defined indicator species.The differences found by Redundancy Analysis and non-parametric analysis of variance for functional and ecologicalgroups also supported the fluvial type division, showingdifferent distributional trends for annual and woody species,and the greatest ecological distance between braided andheadwater types. Based on the ordination results, dividingfluvial types according tomorphological features was justifiedby environmental and floristic differences, although plantspecies variability was only partially described. Our resultsillustrated that the fluvial type classification created using thismethodology was consistent with natural plant speciesdistribution patterns.
Keywords Ellenberg indicator values . Floristicassemblages . Functional groups .Morphology .
Riparian vegetation . River classification
Introduction
In many regions, riparian areas constitute a small propor-tion of the total watershed area, yet they play a prominentecological role. They are important pathways and migrationcorridors for the flow of energy, matter, and organismsacross the landscape, and act as ecotones between terrestrialand aquatic zones (Malanson 1993; Forman 1997). More-over, riparian habitats are considered hotspots of biodiver-sity (Dècamps and Tabacchi 1994; Dudgeon et al. 2006).Unfortunately, streams and rivers throughout the world havebeen degraded by human activities (Baattrup-Pedersen et al.2005). Mediterranean rivers, in particular, have a longhistory of human disturbances at basin and corridor scales(Di Castri 1991; Aguiar and Ferreira 2005). Given themagnitude of past loss and conversion of floodplains, as wellas on-going threats, we should better understand how best toconserve remnant habitats. Rapid assessment of plant speciesdiversity and distribution along rivers would be useful(Stohlgren et al. 1997), but resources or expertise to quantifytotal biodiversity of an area are lacking (Pharo et al. 1999;Hermy and Cornelis 2000). Determining the main factorsinfluencing plant species distribution in riparian areas hasbecome a priority.
Recent studies revealed river morphology to be a strongdeterminant of riparian ecosystem function. Reviews bySteiger et al. (2005) and Corenblit et al. (2007) establishhow landforms and physical processes drive the dynamicsof biological communities. Strong linkages exist amongwatershed morphometry, stream hydro-geomorphology, and
C. Angiolini : F. Frignani :M. LandiDepartment of Environmental Sciences “G. Sarfatti”,University of Siena,P.A. Mattioli 4,53100 Siena, Italy
A. Nucci (*)Department of Botany, University of Cagliari,Viale Sant’Ignazio da Laconi 13,09123 Cagliari, Italye-mail: [email protected]
Wetlands (2011) 31:167–177DOI 10.1007/s13157-010-0118-7
riparian plant communities in ephemeral stream networks(Shaw and Cooper 2008). An examination of the influenceof landform features on the distribution of vegetation onfloodplains along small channels in North America (Mollotet al. 2008) found that landforms exerted a strong influenceon the distribution of trees, shrubs, and understory plantspecies. Vegetation along a Chinese river was mostlyinfluenced by soil characteristics, and both vegetation andsoil were influenced by topography (Xu et al. 2008). InMediterranean areas, Tabacchi et al. (1998) assumed thatsince every river system has its own unique geomorpho-logical structure, reciprocal control between hydrology andvegetation could be analyzed from a geomorphologicaltemplate. However, few studies have assessed plant speciesdistribution in Mediterranean riparian areas in relation toriverbed morphology. As a result, a limited understandingexists of how landforms define plant species assemblages,and particularly of how a morphological classification ofriparian ecosystems is consistent with actual riparianspecies patterns (Puhakka et al. 1992; Nilsson et al.2002), or how it can be used as a local scale environmentalsurrogate (Lombard et al. 2003; Olivier et al. 2004).
Classification of freshwater ecosystems is essential todeveloping biological assessment frameworks (Gerritsenet al. 2000). A variety of classification systems to assessalluvial river channel patterns have been developed, but nodefinitive classification system has emerged (Corenblit etal. 2007). A common problem encountered in riparianecosystems is that biological information is not alwaysconsistent with fluvial or stream type classificationsderived from remote sensing and geographic informationsystems (GIS) (Kupfer and Franklin 2000). In order toaddress these problems and to investigate whether fluvialtypes can serve as biodiversity surrogates at local scales,we present a scientifically sound but easily applicablemethod using GIS and multivariate statistics to determineriver types and to link morphological classification toecological types. It is based on the classification of readilyrecognized morphological features, measured through theuse of aerial photos to identify major fluvial types.Advances in computer technology and GIS now enablemodelling of large landscapes (Barrett 2001). While thereis nothing particularly new about using GIS and remotesensing for mapping and spatial analysis, its applicationfor assessing riparian landscape structure has rarely beenexploited (Herzog et al. 2001). We propose usingmultivariate analyses to examine how the distribution ofriparian plant assemblages varies with morphological rivertypes along the length of a medium sized Mediterraneanriver, to assess the relative importance on floristiccomposition of fluvial type with respect to elevation, andfinally to test the correspondence between fluvial typesand floristic analyses of plots.
Methods
Study Area
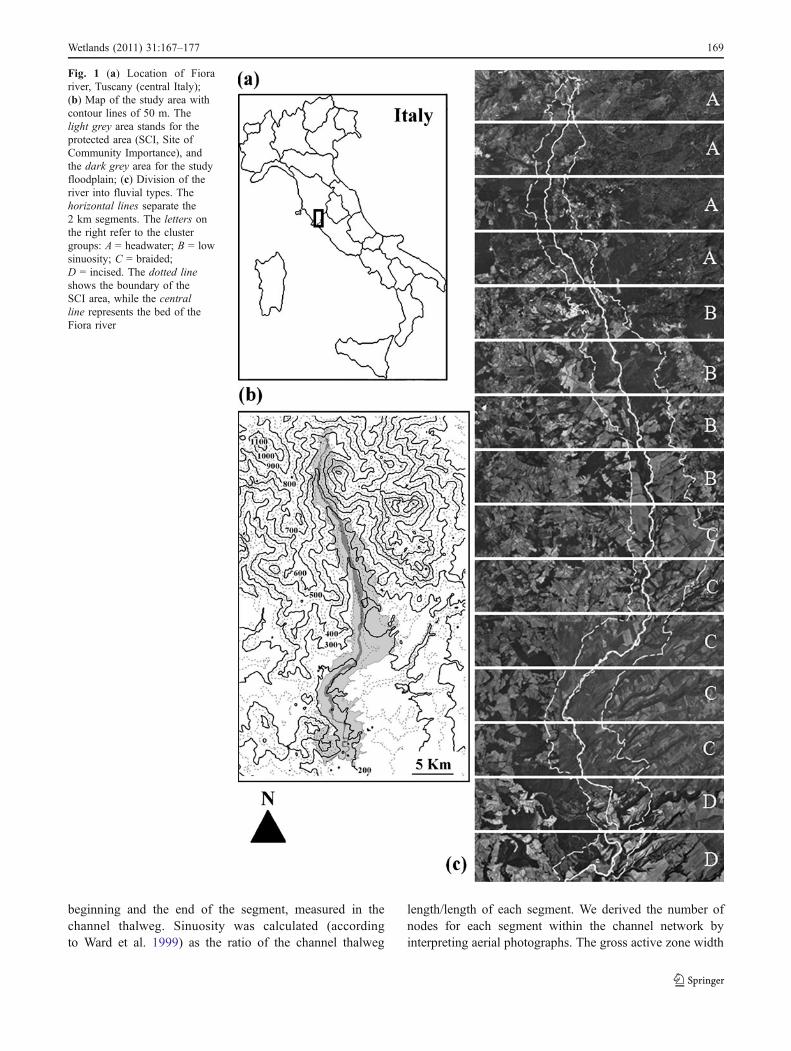
The study was conducted in the Tuscan part of the Fiorariver (central Italy, between 42°34′ N, 11°34′E and 42°49′N, 11°35′E). This area is a natural river corridor protectedunder the European Habitats Directive through its designa-tion as a Site of Community Importance (Fig. 1a,b). Theriver corridor is about 32 km long with elevation rangingfrom 687 to 130 m asl; its catchment area is about 423 km2.The geology consists of shales, sandstones, and cobbles inthe upper part, with effusive and pyroclastic rocks in thelower part. On the valley floor, apart from bedrock reaches,there is extensive drift of fluvial alluvium. Climate is humidMediterranean (Barazzuoli et al. 1993), with total annualrainfall ranging from 903 to 1,003 mm and a meantemperature range of 11.2 to 14.5°C. The river typicallydries during summer, and flood events occur in autumn andspring. The catchment area is primarily covered by forest,including Fagus sylvatica forest mixed with Abies alba andoak forest, dominated by Quercus cerris or mixed Q. cerrisand Quercus pubescens (De Dominicis et al. 1992), withscattered pasture and cropland (mostly cereal and foddercrops). Disturbance associated with low intensity agro-pastoral systems has not resulted in native complexes beingreplaced by non-native ones. Thus, natural dynamicprocesses mainly affected the structure of the riparianvegetation.
Derivation of Map-based Measurements
Analyses were based on information derived from digitalaerial photos (2003), a Digital Elevation Model (DEM), andgeological layers. Although the scale chosen for moststudies involving river morphology is usually 1:10.000(Ward et al. 1999; Gurnell et al. 2000, 2001), we decided touse a more detailed scale (1:5000) for all the GIS analysesto improve detection of environmental features and deriveparameters chosen for morphological classification moreprecisely and consistently. To identify the floodplain, wefirst selected areas with alluvial lithology, then we removedany cultivated land near the river. In the resulting floodplainarea, a total of 15 river segments (sensu Poole 2002) weredrawn at 2 km intervals along the river, from the source tothe valley. For the morphological characterization of theriver segments we chose to consider physical features thatare widely used in riparian morphology studies including:slope, sinuosity, number of nodes, gross active zone width,gross riparian zone width, and full channel width (Ward etal. 1999; Gurnell et al. 2000; Parsons and Gilvear 2002).Using DEM (75×75 m), the slope of each segment wascalculated from the difference in elevation between the
168 Wetlands (2011) 31:167–177
beginning and the end of the segment, measured in thechannel thalweg. Sinuosity was calculated (accordingto Ward et al. 1999) as the ratio of the channel thalweg
length/length of each segment. We derived the number ofnodes for each segment within the channel network byinterpreting aerial photographs. The gross active zone width
Fig. 1 (a) Location of Fiorariver, Tuscany (central Italy);(b) Map of the study area withcontour lines of 50 m. Thelight grey area stands for theprotected area (SCI, Site ofCommunity Importance), andthe dark grey area for the studyfloodplain; (c) Division of theriver into fluvial types. Thehorizontal lines separate the2 km segments. The letters onthe right refer to the clustergroups: A = headwater; B = lowsinuosity; C = braided;D = incised. The dotted lineshows the boundary of theSCI area, while the centralline represents the bed of theFiora river
Wetlands (2011) 31:167–177 169
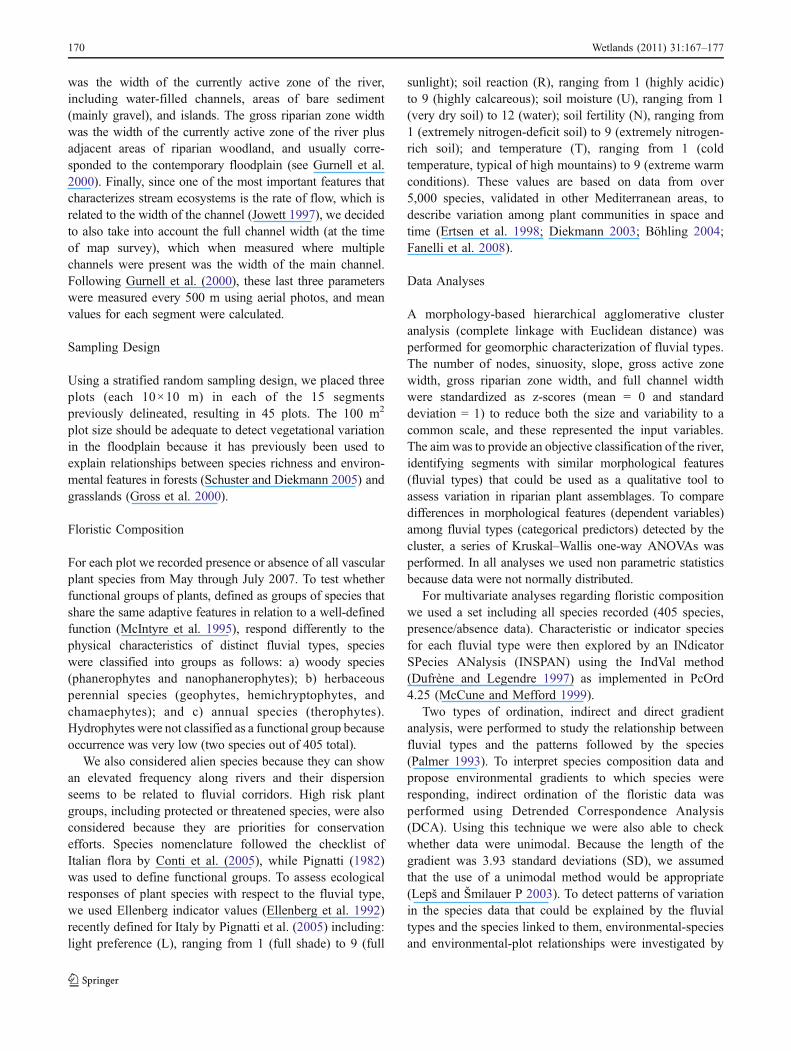
was the width of the currently active zone of the river,including water-filled channels, areas of bare sediment(mainly gravel), and islands. The gross riparian zone widthwas the width of the currently active zone of the river plusadjacent areas of riparian woodland, and usually corre-sponded to the contemporary floodplain (see Gurnell et al.2000). Finally, since one of the most important features thatcharacterizes stream ecosystems is the rate of flow, which isrelated to the width of the channel (Jowett 1997), we decidedto also take into account the full channel width (at the timeof map survey), which when measured where multiplechannels were present was the width of the main channel.Following Gurnell et al. (2000), these last three parameterswere measured every 500 m using aerial photos, and meanvalues for each segment were calculated.
Sampling Design
Using a stratified random sampling design, we placed threeplots (each 10×10 m) in each of the 15 segmentspreviously delineated, resulting in 45 plots. The 100 m2
plot size should be adequate to detect vegetational variationin the floodplain because it has previously been used toexplain relationships between species richness and environ-mental features in forests (Schuster and Diekmann 2005) andgrasslands (Gross et al. 2000).
Floristic Composition
For each plot we recorded presence or absence of all vascularplant species from May through July 2007. To test whetherfunctional groups of plants, defined as groups of species thatshare the same adaptive features in relation to a well-definedfunction (McIntyre et al. 1995), respond differently to thephysical characteristics of distinct fluvial types, specieswere classified into groups as follows: a) woody species(phanerophytes and nanophanerophytes); b) herbaceousperennial species (geophytes, hemichryptophytes, andchamaephytes); and c) annual species (therophytes).Hydrophytes were not classified as a functional group becauseoccurrence was very low (two species out of 405 total).
We also considered alien species because they can showan elevated frequency along rivers and their dispersionseems to be related to fluvial corridors. High risk plantgroups, including protected or threatened species, were alsoconsidered because they are priorities for conservationefforts. Species nomenclature followed the checklist ofItalian flora by Conti et al. (2005), while Pignatti (1982)was used to define functional groups. To assess ecologicalresponses of plant species with respect to the fluvial type,we used Ellenberg indicator values (Ellenberg et al. 1992)recently defined for Italy by Pignatti et al. (2005) including:light preference (L), ranging from 1 (full shade) to 9 (full
sunlight); soil reaction (R), ranging from 1 (highly acidic)to 9 (highly calcareous); soil moisture (U), ranging from 1(very dry soil) to 12 (water); soil fertility (N), ranging from1 (extremely nitrogen-deficit soil) to 9 (extremely nitrogen-rich soil); and temperature (T), ranging from 1 (coldtemperature, typical of high mountains) to 9 (extreme warmconditions). These values are based on data from over5,000 species, validated in other Mediterranean areas, todescribe variation among plant communities in space andtime (Ertsen et al. 1998; Diekmann 2003; Böhling 2004;Fanelli et al. 2008).
Data Analyses
A morphology-based hierarchical agglomerative clusteranalysis (complete linkage with Euclidean distance) wasperformed for geomorphic characterization of fluvial types.The number of nodes, sinuosity, slope, gross active zonewidth, gross riparian zone width, and full channel widthwere standardized as z-scores (mean = 0 and standarddeviation = 1) to reduce both the size and variability to acommon scale, and these represented the input variables.The aim was to provide an objective classification of the river,identifying segments with similar morphological features(fluvial types) that could be used as a qualitative tool toassess variation in riparian plant assemblages. To comparedifferences in morphological features (dependent variables)among fluvial types (categorical predictors) detected by thecluster, a series of Kruskal–Wallis one-way ANOVAs wasperformed. In all analyses we used non parametric statisticsbecause data were not normally distributed.
For multivariate analyses regarding floristic compositionwe used a set including all species recorded (405 species,presence/absence data). Characteristic or indicator speciesfor each fluvial type were then explored by an INdicatorSPecies ANalysis (INSPAN) using the IndVal method(Dufrène and Legendre 1997) as implemented in PcOrd4.25 (McCune and Mefford 1999).
Two types of ordination, indirect and direct gradientanalysis, were performed to study the relationship betweenfluvial types and the patterns followed by the species(Palmer 1993). To interpret species composition data andpropose environmental gradients to which species wereresponding, indirect ordination of the floristic data wasperformed using Detrended Correspondence Analysis(DCA). Using this technique we were also able to checkwhether data were unimodal. Because the length of thegradient was 3.93 standard deviations (SD), we assumedthat the use of a unimodal method would be appropriate(Lepš and Šmilauer P 2003). To detect patterns of variationin the species data that could be explained by the fluvialtypes and the species linked to them, environmental-speciesand environmental-plot relationships were investigated by
170 Wetlands (2011) 31:167–177
Canonical Correspondence Analysis (CCA), with thefluvial types identified by the cluster analysis as dummyenvironmental variables. The options chosen for DCA andCCA were down-weighting rare species and inter-speciesdistances by Hill’s scaling (ter Braak and Šmilauer 2002);otherwise default options were accepted.
In order to assess the relative importance of fluvial typesand elevation on the floristic composition, we used a partialordination (Lepš and Šmilauer 2003), where partial CCAswith the four-step procedure described by Borcard et al.(1992) were performed. To search for potential patterns ofvariation in the functional and ecological groups among thefluvial types, Redundancy Analysis (RDA) was alsoperformed with functional types and Ellenberg Indicatorvalues as species, and fluvial types as dummy variables.These values were used after calculating the weightedaverage of their values in the plots. We assumed that theresponse curve would be monotonic. We used RDA becausethe length of the gradient in the DCA was only 1.91 SD.Since the first axis in the RDA explained a high percentageof variance, while the second had weak explanatory power,we performed another RDA with the scaling focused oninter-sample distances (Lepš and Šmilauer 2003). A (non-parametric) analysis of variance (ANOVA) was used toidentify significant differences in the distribution among thefluvial types of the different plant functional and ecologicalgroups considered. This analysis was performed on the basisof various analyses by (partial) RDAs using only one species(plant functional or ecological group) as an environmentalvariable and the remaining species as covariables; partialconstrained methods enabled us to examine the effects of theenvironmental variables of interest after partialling out theeffect of the covariables (Lepš and Šmilauer 2003).
Finally, in order to test the reliability of fluvial types forexplaining variation of floristic data, the values of ordina-tion analyses were compared and sample scores on the firsttwo axes were analyzed by standard linear regression tocompare the ordination of species and plots provided byDCA vs. CCA and RDA. The goodness-of-fit of theregression lines was interpreted as an expression ofordination similarity. According to ter Braak (1986), ifordination of species and sites by indirect and directgradient analyses are not fundamentally different, noimportant environmental variable has been overlooked.
Monte Carlo tests (499 random permutations) were usedto test the significance of indicator species from INSPAN,ordination axes and environmental variables in all theordinations, and the trace statistics and the first eigenvaluein the partial CCAs performed in this study. The signifi-cance level of the tests in the partial RDAs was adjustedusing Bonferroni correction to rectify type I errors due torepeated statistical tests. We used STATISTICA (StatSoftInc 1995) for univariate analyses, and PcOrd 4.25 (McCune
and Mefford 1999) and CANOCO 4.5 (ter Braak andŠmilauer 2002) for multivariate analyses.
Results
Fluvial Types
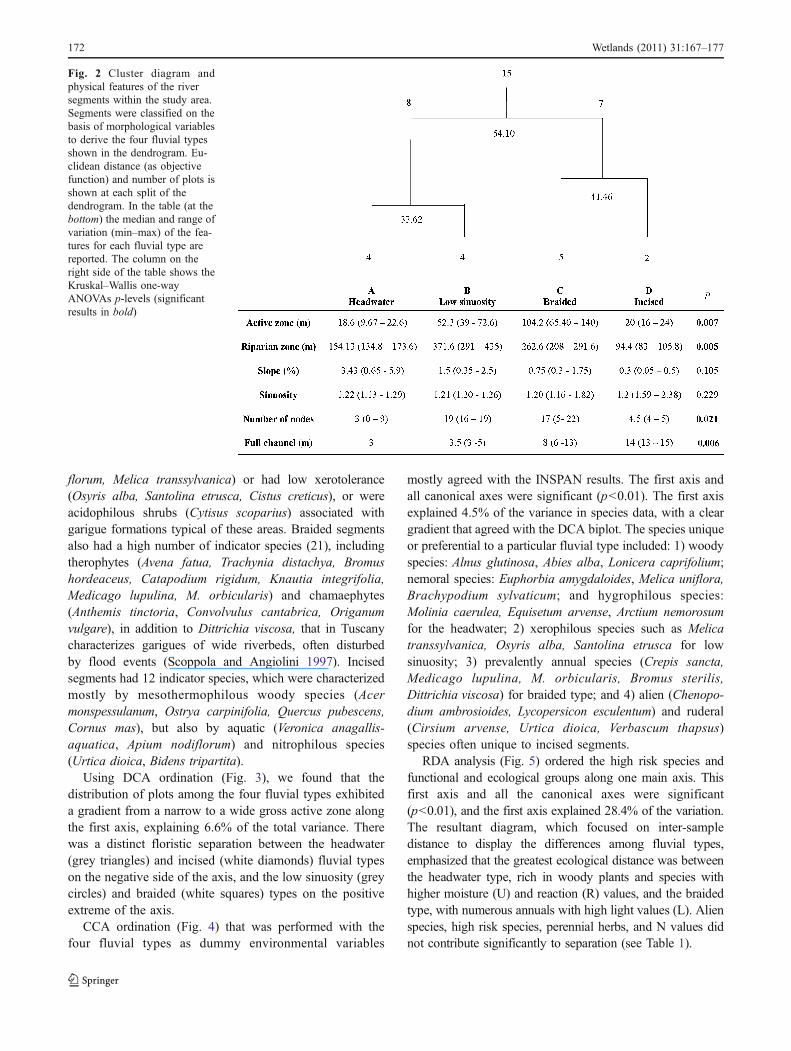
Four clusters provided the most informative classificationof segments (Figs. 1c, 2), and other clusters provideadditional, but less well-defined, morphological patterns(<70% similarity). The four clusters differed significantly(Kruskal–Wallis test, Fig. 2) and key morphologicalfeatures defining them were active zone width, riparianzone width, full channel width, and number of nodes.
Cluster "A" consisted of four segments located in theuppermost part of the study area. Important features of thisportion of the river were steep slopes (average 3.4%), narrowactive zones, narrow full channels, and a low number ofnodes. We denote this group as “headwater”. Cluster "B"consisted of four segments with wider riverbeds, a highnumber of nodes, and low and very homogeneous sinuosityvalues. We denote this group as “low sinuosity”. Cluster "C"consisted of five segments characterized by the widest activezones and most contemporary floodplain of the entire river.The slope values were homogeneous but the number of nodeswas high. We denote this group as being “braided”. Cluster"D" consisted of the lowest two segments, where riverbedswere constrained into narrow channels. Key features of thesesegments were: low slopes (only 0.05% to 0.5%), highsinuosity values, narrow riparian zones, and wide fullchannels. We call this fluvial type “incised”.
Relationship Between Floristic Compositionand Fluvial Types
In total, 405 plant species were found, of which 35.1% wereunique to one of the clusters. INSPAN indicated that 17% ofthe species (67) were significantly associated (p<0.05) withone fluvial type compared to the others. Headwater was thefluvial type with the highest number of indicator species(23), including hygrophilous species (Alnus glutinosa andEupatorium cannabinum), woody species (trees: Acerpseudoplatanus, Robinia pseudacacia; shrubs: Cornussanguinea, Crataegus monogyna, Euonymus europaeus,Prunus spinosa, Rubus ulmifolius), and herbaceousforest species (Hedera helix, Melica uniflora, Viola alba,Brachypodium sylvaticum, Stachys sylvatica). The lowsinuosity segments had 12 indicator species, mostlyherbaceous species linked to succession following theabandonment of crop fields on silty–clayey soils that areable to retain moisture for long periods (Avena barbata,Foeniculum vulgare, Gastridium ventricosum, Lolium multi-
Wetlands (2011) 31:167–177 171
florum, Melica transsylvanica) or had low xerotolerance(Osyris alba, Santolina etrusca, Cistus creticus), or wereacidophilous shrubs (Cytisus scoparius) associated withgarigue formations typical of these areas. Braided segmentsalso had a high number of indicator species (21), includingtherophytes (Avena fatua, Trachynia distachya, Bromushordeaceus, Catapodium rigidum, Knautia integrifolia,Medicago lupulina, M. orbicularis) and chamaephytes(Anthemis tinctoria, Convolvulus cantabrica, Origanumvulgare), in addition to Dittrichia viscosa, that in Tuscanycharacterizes garigues of wide riverbeds, often disturbedby flood events (Scoppola and Angiolini 1997). Incisedsegments had 12 indicator species, which were characterizedmostly by mesothermophilous woody species (Acermonspessulanum, Ostrya carpinifolia, Quercus pubescens,Cornus mas), but also by aquatic (Veronica anagallis-aquatica, Apium nodiflorum) and nitrophilous species(Urtica dioica, Bidens tripartita).
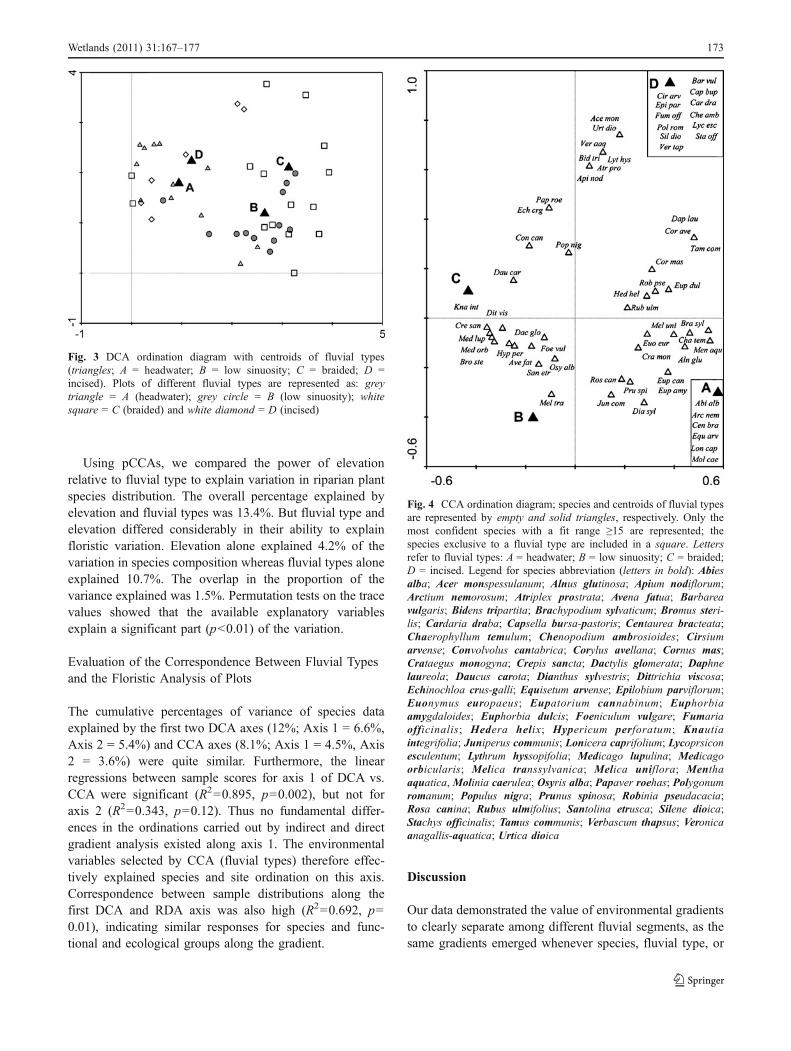
Using DCA ordination (Fig. 3), we found that thedistribution of plots among the four fluvial types exhibiteda gradient from a narrow to a wide gross active zone alongthe first axis, explaining 6.6% of the total variance. Therewas a distinct floristic separation between the headwater(grey triangles) and incised (white diamonds) fluvial typeson the negative side of the axis, and the low sinuosity (greycircles) and braided (white squares) types on the positiveextreme of the axis.
CCA ordination (Fig. 4) that was performed with thefour fluvial types as dummy environmental variables
mostly agreed with the INSPAN results. The first axis andall canonical axes were significant (p<0.01). The first axisexplained 4.5% of the variance in species data, with a cleargradient that agreed with the DCA biplot. The species uniqueor preferential to a particular fluvial type included: 1) woodyspecies: Alnus glutinosa, Abies alba, Lonicera caprifolium;nemoral species: Euphorbia amygdaloides, Melica uniflora,Brachypodium sylvaticum; and hygrophilous species:Molinia caerulea, Equisetum arvense, Arctium nemorosumfor the headwater; 2) xerophilous species such as Melicatranssylvanica, Osyris alba, Santolina etrusca for lowsinuosity; 3) prevalently annual species (Crepis sancta,Medicago lupulina, M. orbicularis, Bromus sterilis,Dittrichia viscosa) for braided type; and 4) alien (Chenopo-dium ambrosioides, Lycopersicon esculentum) and ruderal(Cirsium arvense, Urtica dioica, Verbascum thapsus)species often unique to incised segments.
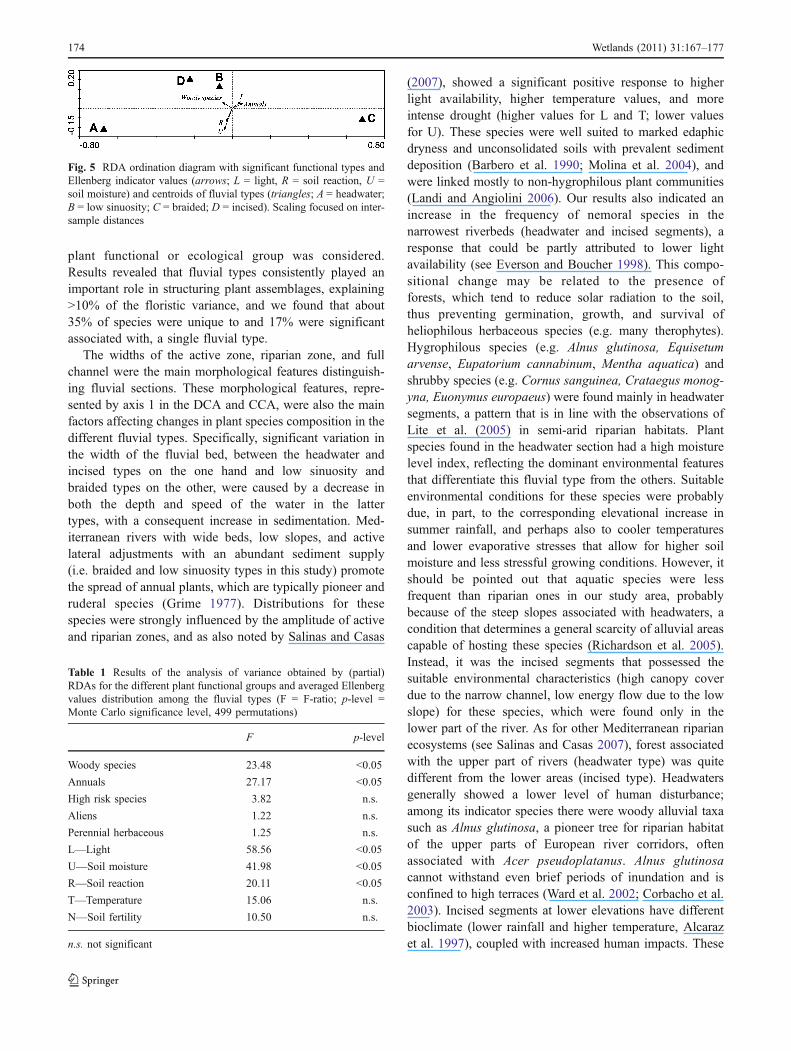
RDA analysis (Fig. 5) ordered the high risk species andfunctional and ecological groups along one main axis. Thisfirst axis and all the canonical axes were significant(p<0.01), and the first axis explained 28.4% of the variation.The resultant diagram, which focused on inter-sampledistance to display the differences among fluvial types,emphasized that the greatest ecological distance was betweenthe headwater type, rich in woody plants and species withhigher moisture (U) and reaction (R) values, and the braidedtype, with numerous annuals with high light values (L). Alienspecies, high risk species, perennial herbs, and N values didnot contribute significantly to separation (see Table 1).
Fig. 2 Cluster diagram andphysical features of the riversegments within the study area.Segments were classified on thebasis of morphological variablesto derive the four fluvial typesshown in the dendrogram. Eu-clidean distance (as objectivefunction) and number of plots isshown at each split of thedendrogram. In the table (at thebottom) the median and range ofvariation (min–max) of the fea-tures for each fluvial type arereported. The column on theright side of the table shows theKruskal–Wallis one-wayANOVAs p-levels (significantresults in bold)
172 Wetlands (2011) 31:167–177
Using pCCAs, we compared the power of elevationrelative to fluvial type to explain variation in riparian plantspecies distribution. The overall percentage explained byelevation and fluvial types was 13.4%. But fluvial type andelevation differed considerably in their ability to explainfloristic variation. Elevation alone explained 4.2% of thevariation in species composition whereas fluvial types aloneexplained 10.7%. The overlap in the proportion of thevariance explained was 1.5%. Permutation tests on the tracevalues showed that the available explanatory variablesexplain a significant part (p<0.01) of the variation.
Evaluation of the Correspondence Between Fluvial Typesand the Floristic Analysis of Plots
The cumulative percentages of variance of species dataexplained by the first two DCA axes (12%; Axis 1 = 6.6%,Axis 2 = 5.4%) and CCA axes (8.1%; Axis 1 = 4.5%, Axis2 = 3.6%) were quite similar. Furthermore, the linearregressions between sample scores for axis 1 of DCA vs.CCA were significant (R2=0.895, p=0.002), but not foraxis 2 (R2=0.343, p=0.12). Thus no fundamental differ-ences in the ordinations carried out by indirect and directgradient analysis existed along axis 1. The environmentalvariables selected by CCA (fluvial types) therefore effec-tively explained species and site ordination on this axis.Correspondence between sample distributions along thefirst DCA and RDA axis was also high (R2=0.692, p=0.01), indicating similar responses for species and func-tional and ecological groups along the gradient.
Discussion
Our data demonstrated the value of environmental gradientsto clearly separate among different fluvial segments, as thesame gradients emerged whenever species, fluvial type, or
Fig. 4 CCA ordination diagram; species and centroids of fluvial typesare represented by empty and solid triangles, respectively. Only themost confident species with a fit range ≥15 are represented; thespecies exclusive to a fluvial type are included in a square. Lettersrefer to fluvial types: A = headwater; B = low sinuosity; C = braided;D = incised. Legend for species abbreviation (letters in bold): Abiesalba; Acer monspessulanum; Alnus glutinosa; Apium nodiflorum;Arctium nemorosum; Atriplex prostrata; Avena fatua; Barbareavulgaris; Bidens tripartita; Brachypodium sylvaticum; Bromus steri-lis; Cardaria draba; Capsella bursa-pastoris; Centaurea bracteata;Chaerophyllum temulum; Chenopodium ambrosioides; Cirsiumarvense; Convolvolus cantabrica; Corylus avellana; Cornus mas;Crataegus monogyna; Crepis sancta; Dactylis glomerata; Daphnelaureola; Daucus carota; Dianthus sylvestris; Dittrichia viscosa;Echinochloa crus-galli; Equisetum arvense; Epilobium parviflorum;Euonymus europaeus; Eupatorium cannabinum; Euphorbiaamygdaloides; Euphorbia dulcis; Foeniculum vulgare; Fumariaofficinalis; Hedera helix; Hypericum perforatum; Knautiaintegrifolia; Juniperus communis; Lonicera caprifolium; Lycoprsiconesculentum; Lythrum hyssopifolia; Medicago lupulina; Medicagoorbicularis; Melica transsylvanica; Melica uniflora; Menthaaquatica, Molinia caerulea; Osyris alba; Papaver roehas; Polygonumromanum; Populus nigra; Prunus spinosa; Robinia pseudacacia;Rosa canina; Rubus ulmifolius; Santolina etrusca; Silene dioica;Stachys officinalis; Tamus communis; Verbascum thapsus; Veronicaanagallis-aquatica; Urtica dioica
Fig. 3 DCA ordination diagram with centroids of fluvial types(triangles; A = headwater; B = low sinuosity; C = braided; D =incised). Plots of different fluvial types are represented as: greytriangle = A (headwater); grey circle = B (low sinuosity); whitesquare = C (braided) and white diamond = D (incised)
Wetlands (2011) 31:167–177 173
plant functional or ecological group was considered.Results revealed that fluvial types consistently played animportant role in structuring plant assemblages, explaining>10% of the floristic variance, and we found that about35% of species were unique to and 17% were significantassociated with, a single fluvial type.
The widths of the active zone, riparian zone, and fullchannel were the main morphological features distinguish-ing fluvial sections. These morphological features, repre-sented by axis 1 in the DCA and CCA, were also the mainfactors affecting changes in plant species composition in thedifferent fluvial types. Specifically, significant variation inthe width of the fluvial bed, between the headwater andincised types on the one hand and low sinuosity andbraided types on the other, were caused by a decrease inboth the depth and speed of the water in the lattertypes, with a consequent increase in sedimentation. Med-iterranean rivers with wide beds, low slopes, and activelateral adjustments with an abundant sediment supply(i.e. braided and low sinuosity types in this study) promotethe spread of annual plants, which are typically pioneer andruderal species (Grime 1977). Distributions for thesespecies were strongly influenced by the amplitude of activeand riparian zones, and as also noted by Salinas and Casas
(2007), showed a significant positive response to higherlight availability, higher temperature values, and moreintense drought (higher values for L and T; lower valuesfor U). These species were well suited to marked edaphicdryness and unconsolidated soils with prevalent sedimentdeposition (Barbero et al. 1990; Molina et al. 2004), andwere linked mostly to non-hygrophilous plant communities(Landi and Angiolini 2006). Our results also indicated anincrease in the frequency of nemoral species in thenarrowest riverbeds (headwater and incised segments), aresponse that could be partly attributed to lower lightavailability (see Everson and Boucher 1998). This compo-sitional change may be related to the presence offorests, which tend to reduce solar radiation to the soil,thus preventing germination, growth, and survival ofheliophilous herbaceous species (e.g. many therophytes).Hygrophilous species (e.g. Alnus glutinosa, Equisetumarvense, Eupatorium cannabinum, Mentha aquatica) andshrubby species (e.g. Cornus sanguinea, Crataegus monog-yna, Euonymus europaeus) were found mainly in headwatersegments, a pattern that is in line with the observations ofLite et al. (2005) in semi-arid riparian habitats. Plantspecies found in the headwater section had a high moisturelevel index, reflecting the dominant environmental featuresthat differentiate this fluvial type from the others. Suitableenvironmental conditions for these species were probablydue, in part, to the corresponding elevational increase insummer rainfall, and perhaps also to cooler temperaturesand lower evaporative stresses that allow for higher soilmoisture and less stressful growing conditions. However, itshould be pointed out that aquatic species were lessfrequent than riparian ones in our study area, probablybecause of the steep slopes associated with headwaters, acondition that determines a general scarcity of alluvial areascapable of hosting these species (Richardson et al. 2005).Instead, it was the incised segments that possessed thesuitable environmental characteristics (high canopy coverdue to the narrow channel, low energy flow due to the lowslope) for these species, which were found only in thelower part of the river. As for other Mediterranean riparianecosystems (see Salinas and Casas 2007), forest associatedwith the upper part of rivers (headwater type) was quitedifferent from the lower areas (incised type). Headwatersgenerally showed a lower level of human disturbance;among its indicator species there were woody alluvial taxasuch as Alnus glutinosa, a pioneer tree for riparian habitatof the upper parts of European river corridors, oftenassociated with Acer pseudoplatanus. Alnus glutinosacannot withstand even brief periods of inundation and isconfined to high terraces (Ward et al. 2002; Corbacho et al.2003). Incised segments at lower elevations have differentbioclimate (lower rainfall and higher temperature, Alcarazet al. 1997), coupled with increased human impacts. These
Fig. 5 RDA ordination diagram with significant functional types andEllenberg indicator values (arrows; L = light, R = soil reaction, U =soil moisture) and centroids of fluvial types (triangles; A = headwater;B = low sinuosity; C = braided; D = incised). Scaling focused on inter-sample distances
Table 1 Results of the analysis of variance obtained by (partial)RDAs for the different plant functional groups and averaged Ellenbergvalues distribution among the fluvial types (F = F-ratio; p-level =Monte Carlo significance level, 499 permutations)
F p-level
Woody species 23.48 <0.05
Annuals 27.17 <0.05
High risk species 3.82 n.s.
Aliens 1.22 n.s.
Perennial herbaceous 1.25 n.s.
L—Light 58.56 <0.05
U—Soil moisture 41.98 <0.05
R—Soil reaction 20.11 <0.05
T—Temperature 15.06 n.s.
N—Soil fertility 10.50 n.s.
n.s. not significant
174 Wetlands (2011) 31:167–177
environmental conditions supported higher numbers ofmore drought-tolerant (mesothermophilous) pioneer woodyspecies (A. monspessulanum and O. carpinifolia).
Alien species richness, in contrast to other studies inriparian communities (Deferrari and Naiman 1994; Strom-berg and Chew 1997; Hood and Naiman 2000), was verylow in this river (2.9% of the total). A similar trend hasbeen observed in other Mediterranean rivers (Tabacchi et al.1996) and in more mesic rivers in Portugal, where aliensrepresented only 10% of all species or less (Ferreira andMoreira 1995; Aguiar et al. 2001). Our results, in line withthose of Groves and Di Castri (1991), showed that aliensare not suited to the riparian semi-arid habitats that arefrequent in the Mediterranean region, particularly in widerriverbeds. Generally speaking, alien and nitrophilousspecies richness increases downstream (Ferreira andMoreira 1995; Planty-Tabacchi et al. 1996; Tabacchi et al.1996; Aguiar et al. 2006). But this pattern failed to emergein our study, probably because even if the (lower) incisedpart of the river was surrounded by cultivated lands, thegulley valley provided a (vertical) spatial separation, thusminimizing direct contact with human impacted areas.
In our study area, fluvial type did not substantially affectthe distribution patterns of high risk species or perennialherbaceous species. Many studies have demonstrated thatdifferent vegetation layers have unique and independentresponses to environmental gradients in riparian areas(Lyon and Sagers 1998; Decocq 2002; Lite et al. 2005).
The relatively weak differences in floristic compositionamong the fluvial types and a lack of agreement between axis2 of the DCA and CCA, suggests that other environmentalfactors, only marginally linked to fluvial types (i.e., transver-sal gradients), may have a significant influence on thedistributional features of the floristic assemblages in ourstudy river. For example, results from partial CCA demon-strated that elevation influenced plant species distribution,although less than fluvial type. Based on our statisticalanalyses, we can affirm that dividing fluvial types accordingto morphological features was an effective way to assessfloristic differences, including indicator species and function-al/ecological groups (although variability was only partiallydescribed). The DCA floristic analysis indicated a congruencewith fluvial types that was restricted to the first ordinationaxis. At this ordination level, different physical conditions(narrow/wide fluvial bed, soil deposition/erosion) also corre-sponded to different biological conditions (and thus todifferent floristic composition). In contrast to what observedby Hawkins et al. (2000) for invertebrates, we found that thephysical features of riparian ecosystems influenced floristicsimilarity more than spatial continuity between sites. Theheadwater and braided types were characterized best, withnumerous indicator species and particular distributionalpatterns for functional and ecological groups.
Conclusions
Our method demonstrated the clear influence of fluvialtypes on plant species assemblages, which were found todiffer significantly by species compositions and functionaland ecological groups. Our results allowed us to considermorphological classifications as a potential surrogate forriparian plant assemblages in a Mediterranean river withlow human-impact. In fact, our strategy could be apreliminary, rapid, and cost-effective approach to defineplant species distributions at local scales, thus providingbasic knowledge for conservation management, particularlyin areas where critical datasets are either not available or ofpoor quality. Further investigations on other rivers areclearly required for validation.
Acknowledgments We thank Francesco Geri for support in definingsampling design, Petr Šmilauer for suggestions about statisticalanalyses, and Duccio Rocchini, Darold Batzer and two anonymousreferees for useful comments that improved the manuscript.
References
Aguiar FC, Ferreira MT (2005) Human-disturbed landscapes: effectson composition and integrity of riparian woody vegetation in theTagus River basin, Portugal. Environmental Conservation 32:30–41
Aguiar FC, Ferreira MT, Moreira IS (2001) Exotic and nativevegetation establishment following channelization of a westernIberian river. Regulated Rivers: Research and Management17:509–526
Aguiar FC, Ferreira MT, Albuquerque A, Moreira IS (2006) Alien andendemic flora at reference and non reference sites in Mediterra-nean type streams in Portugal. Aquatic Conservation 17:335–347
Alcaraz F, Ríos S, Inocencio C, Robledo A (1997) Variation in theriparian landscape of the Segura River Basin, SE Spain. Journalof Vegetation Science 8:597–600
Baattrup-Pedersen A, Friberg N, Larsen SE, Riis T (2005) Theinfluence of channelization on riparian plant assemblages.Freshwater Biology 50:1248–1261
Barazzuoli P, Guasparri G, Salleonini M (1993) Il clima. In: Giusti F(ed) La storia naturale della Toscana Meridionale. Pizzi Editore,Cinisello Balsamo. pp 141–171
Barbero M, Bonin G, Loisel R, Quézel P (1990) Changes anddisturbances of forest ecosystems caused by human activities inthe western part of the Mediterranean basin. Vegetatio 87:151–173
Barrett TM (2001) Models of vegetative change for landscapeplanning: a 946 comparison of FETM, LANDSUM, SIMPPLLE,and VDDT. General Technical Report. RMRS-GTR-76-WWW.USDA Forest Service, Rocky Mountain 948 Research Station,Ogden, UT
Böhling N (2004) Southern Aegean indicator values—derivation,application and perspectives. Proceedings 10th MEDECOSConference, Rhodes, Greece, Arianoutsou and Papanastasis (eds)
Borcard D, Legendre P, Drapeau P (1992) Partialling out the spatialcomponent of ecological variation. Ecology 73:1045–1055
Conti F, Abbate G, Alessandrini A, Blasi C (2005) An annotatedchecklist of Italian Vascular Flora. Palombi Eds, Rome
Wetlands (2011) 31:167–177 175
Corbacho C, Sánchez JM, Costillo E (2003) Patterns of structuralcomplexity and human disturbance of riparian vegetation inagricultural landscapes of a Mediterranean area. AgricultureEcosystems and Environment 95:495–507
Corenblit D, Tabacchi E, Steiger J, Gurnell AM (2007) Reciprocalinteractions and adjustments between fluvial landforms andvegetation dynamics in river corridors: a review of complemen-tary approaches. Earth-Science Reviews 84:56–86
Dècamps H, Tabacchi E (1994) Species richness in vegetation alongriver margins. In: Giller PS, Hildrew AG, Rafaelli DG (eds)Aquatic ecology: scale, pattern and process. Blackwell Science,Oxford. pp 1–20
Decocq G (2002) Patterns of plant species and community diversity atdifferent organization levels in a forested riparian landscape.Journal of Vegetation Science 13:91–106
De Dominicis V, Loppi S, Chiarucci A, Mariotti MG, Perini C,Angiolini C (1992) The woods with Abies alba Miller of Mt.Amiata (Central Italy). Documents Phytosociologiques 14:178–194
Deferrari CR, Naiman RJ (1994) A multi-scale assessment of exoticplants on the Olympic Peninsula, Washington. Journal ofVegetation Science 5:247–258
Di Castri F (1991) An ecological overview of the five regions of theworld with a Mediterranean climate. In: Groves RH, Di Castri F(eds) Biogeography of Mediterranean invasions. CambridgeUniversity Press, Cambridge, pp 3–16
Diekmann M (2003) Species indicator values as an important tool inapplied plant ecology—a review. Basic and Applied Ecology4:493–506
Dudgeon D, Arthington AH, Gessner MO, Kawabata ZI, Knowler DJ,Lévêque C, Naiman RJ, Prieur-Richard AH, Soto D, StiassnyMLJ, Sullivan CA (2006) Freshwater biodiversity: importance,threats, status and conservation challenges. Biological Reviews81:163–182
Dufrène M, Legendre P (1997) Species assemblages and indicatorspecies: the need for a flexible asymmetrical approach. Ecolog-ical Monographs 67:345–366
Ellenberg H, Weber HE, Düll R, Wirth V, Werner W, Paulißen D(1992) Zeigerwerte von Pflanzen in Mitteleuropa. ScriptaGeobotanica 18:1–248
Ertsen ACD, Alkemade JRM, Wassen MJ (1998) CalibratingEllenberg indicator values for moisture, acidity, nutrient availabilityand salinity in the Netherlands. Plant Ecology 135:113–124
Everson DA, Boucher DH (1998) Tree species-richness and topo-graphic complexity along the riparian edge of the Potomac River.Forest Ecology and Management 109:305–314
Fanelli G, Lestini M, Serafini Sauli A (2008) Floristic gradients ofherbaceous vegetation and P/N ratio in soil in a Mediterraneanarea. Plant Ecology 194:231–242
Ferreira MT, Moreira IS (1995) The invasive component of river floraunder the influence of Mediterranean agricultural systems. In:Pysek P, Prach K, Rejmanek M, Wade M (eds) Plant invasions—general aspects and special problems. SPB Academic Publishing,Amsterdam. pp 117–127
Forman RTT (1997) Land mosaics: the ecology of landscapes andregions. Cambridge University Press, Cambridge
Gerritsen J, Barbour MT, King K (2000) Apples, oranges andecoregions: on determining pattern in aquatic assemblages.Journal of the North American Benthological Society 19:487–497
Grime J (1977) Evidence for the existence of three primary strategiesin plants and its relevance to ecological and evolutionary theory.American Naturalist 111:1169–1194
Gross KL, Willig MR, Gough L, Inouye R, Cox SB (2000) Patterns ofspecies density and productivity at different spatial scales inherbaceous plant communities. Oikos 89:417–427
Groves RH, Di Castri F (1991) Biogeography of Mediterraneaninvasions. Cambridge University Press
Gurnell AM, Petts GE, Harris N, Ward JV, Tockner K, Edwards PJ,Kollmann J (2000) Large wood retention in the river channels:the case of the Fiume Tagliamento, Italy. Earth Surface Processesand Landforms 25:255–275
Gurnell AM, Petts GE, Hanna DM, Smith BPG, Edwards PJ,Kollmann J, Ward JV, Tockner K (2001) Riparian vegetationand island formation along the gravel-bed Fiume Tagliamento,Italy. Earth Surface Processes and Landforms 26:31–62
Hawkins CP, Norris RH, Gerritsen J, Hughes RM, Jackson SK,Johnson RK, Stevenson RJ (2000) Evaluation of the use oflandscape classifications for the prediction of freshwater biota:synthesis and recommendations. Journal of the North AmericanBenthological Society 19:541–556
HermyM, Cornelis J (2000) Towards a monitoring method and a numberof multifaceted and hierarchical biodiversity indicators for urbanand suburban parks. Landscape and Urban Planning 49:149–162
Herzog F, Lausch A, Muller E, Thulke H, Steinhardt U, Lehmann S(2001) Landscape metrics for assessment of landscape destructionand rehabilitation. Environmental Management 27:91–107
Hood WG, Naiman RJ (2000) Vulnerability of riparian zones toinvasion by exotic vascular plants. Plant Ecology 148:105–114
Jowett IG (1997) Instream flow methods: a comparison of approaches.Regulated Rivers: Research and Management 13:115–127
Kupfer JA, Franklin SB (2000) Evaluation of an ecological land typeclassification system, Natchez Trace State Forest, westernTennessee, USA. Landscape and Urban Planning 49:179–190
Landi M, Angiolini C (2006) The vegetation gradient along thelongitudinal profile of a braided stream: a case study in centralItaly. Belgian Journal of Botany 139:220–232
Lepš J, Šmilauer P (2003) Multivariate analysis of ecological datausing CANOCO. Cambridge University Press
Lite SJ, Bagstad KJ, Stromberg JC (2005) Riparian plant speciesrichness along lateral and longitudinal gradients of water stressand flood disturbance, San Pedro River, Arizona. Journal of AridEnvironment 63:785–813
Lombard AT, Cowling RM, Pressey RL, Rebelo AG (2003)Effectiveness of land classes as surrogates for species inconservation planning for the Cape Floristic Region. BiologicalConservation 112:45–62
Lyon J, Sagers CL (1998) Structure of herbaceous plant assemblagesin a forested riparian landscape. Plant Ecology 138:1–16
Malanson GP (1993) Riparian Landscapes. Cambridge, UK, CambridgeUniversity Press.
McCune B, Mefford MJ (1999) PC-ORD for Windows (4.25)Multivariate analysis of Ecological Data. MjM Software, GlenedenBeach, Oregon, USA
McIntyre S, Lavorel S, Tremont RM (1995) Plant life–historyattributes: their relationship to disturbance response in herbaceousvegetation. Journal of Ecology 83:31–44
Molina JA, Pertìñez C, Dìez A, Casermeiro MA (2004) Vegetationcomposition and zonation of a Mediterranean braided riverfloodplain. Belgian Journal of Botany 137:140–154
Mollot LA, Bilby RE, Chapin DM (2008) A multivariate analysisexamining the effect of landform on the distribution of riparian plantcommunities of Washington, USA. Community Ecology 9:59–72
Nilsson C, Andersson E, Merritt DM, Johansson ME (2002) Differencesin riparian flora between riverbanks and river lakeshores explainedby dispersal traits. Ecology 83:2878–2887
Olivier I, Holmes A, Dangerfield JM, Gillings M, Pik AJ, Britton DR,Holley M, Montgomery ME, Raison M, Logan V, Pressey RL,Beattie A (2004) Land systems as surrugates for biodiversity inconservation planning. Ecological Applications 3:485–503
Palmer MW (1993) Putting things in even better order: the advantagesof canonical correspondence analysis. Ecology 74:2215–2230
176 Wetlands (2011) 31:167–177
Parsons H, Gilvear DJ (2002) Valley floor landscape change followingalmost 100 years of flood embankment abandonment on awandering gravel-bed river. River Research and Applications18:461–479
Pharo EJ, Beattie AJ, Binns D (1999) Vascular plant diversity as asurrogate for bryophyte and lichen diversity. ConservationBiology 13:282–292
Pignatti S (1982) Flora d’Italia. Voll. 1–3. Edagricole, BolognaPignatti S, Menegoni P, Pietrosanti S (2005) Bioindicator values of
vascular plants of the Flora of Italy. Braun-Blanquetia 39:3–95Planty-Tabacchi AM, Tabacchi E, Naiman RJ, Deferrari C, Décamps
H (1996) Invasibility of species-rich communities in riparianzones. Conservation Biology 10:598–607
Poole G (2002) Fluvial landscape ecology: addressing uniquenesswithin the river discontinuum. Freshwater Biology 47:641–660
Puhakka M, Kalliola R, Rajasilta M, Salo J (1992) River types, siteevolution and successional vegetation in Peruvian Amazonia.Journal of Biogeography 19:651–665
Richardson JS, Naiman RJ, Swanson FJ, Hibbs DE (2005) Ripariancommunities associated with pacific northwest headwaterstreams: assemblages, processes, and uniqueness. Journal of theAmerican Water Resources Association 41:921–934
Salinas JM, Casas JJ (2007) Riparian vegetation of two semi-aridMediterranean rivers: basin-scale responses of woody and herba-ceous plants to environmental gradients. Wetlands 27:831–845
Schuster B, Diekmann M (2005) Species richness and environmentalcorrelates in deciduous forests of Northwest Germany. ForestEcology and Management 206:197–205
Scoppola A, Angiolini C (1997) Vegetation of stream-bed garigues inthe Antiapennine range of Tuscany and Latium (central Italy),especially the new association Santolino etruscae- Saturejetummontanae. Phytocoenologia 27:1–26
Shaw JR, Cooper DJ (2008) Linkages among watersheds, streamreaches, and riparian vegetation in dryland ephemeral streamnetworks. Journal of Hydrology 350:68–82
StatSoft Inc (1995) STATISTICA 6.0 for Windows (Computerprogram manual). Tulsa, OK
Steiger J, Tabacchi E, Dufour S, Corenblit D, Peiry JL (2005)Hydrogeomorphic processes affecting riparian habitat withinalluvial channel–floodplain river systems: a review for thetemperate zone. River Research and Application 21:719–737
Stohlgren TJ, Chong GW, Kalkhan MA, Schell LD (1997) Multiscalesampling of plant diversity: effects of minimum mapping unitsize. Ecological Application 7:1064–1074
Stromberg JC, Chew MK (1997) Herbaceous exotics in Arizona’sriparian ecosystems. Desert Plants 13:11–17
Tabacchi E, Planty-Tabacchi AM, Salinas MJ, Decamps H (1996)Landscape structure and biodiversity in riparian plant communities:a longitudinal comparative study. Regulated Rivers: Research andManagement 12:367–390
Tabacchi E, Correll DL, Hauer R, Pinay G, Planty-Tabacchi AM,Wissmar RC (1998) Development, maintenance and role ofriparian vegetation in the river landscape. Freshwater Biology40:497–516
ter Braak CJF (1986) Canonical correspondence analysis: a neweigenvector technique for multivariate direct gradient analysis.Ecology 67:1167–1179
ter Braak CJF, Šmilauer P (2002) CANOCO reference manual andCanoDraw for Windows user’s guide: software for canonicalcommunity ordination (version 4.5). Microcomputer Power,Ithaca, NY
Ward JV, Tockner K, Edwards PJ, Kollmann J, Bretschko G, GurnellAM, Petts GE, Rossaro B (1999) A reference river system for theAlps: the “Fiume Tagliamento”. Regulated Rivers: Research andManagement 15:63–75
Ward JT, Tockner K, Arscott DB, Claret C (2002) Riverine landscapediversity. Freshwater Biology 47:517–539
Xu X, Ma KM, Fu BJ, Song CJ, Liu W (2008) Relationships betweenvegetation and soil and topography in a dry warm river valley,SW China. Catena 75:138–145
Wetlands (2011) 31:167–177 177