Using indigenous knowledge in land use investigations: a participatory study in a semi-arid...
16
Agriculture, Ecosystems and Environment 86 (2001) 247–262 Using indigenous knowledge in land use investigations: a participatory study in a semi-arid mountainous region of Lebanon Rami Zurayk a,∗ , Faraj el-Awar a , Shady Hamadeh a , Salma Talhouk a , Christine Sayegh a , Abdel-Ghani Chehab b , Kassem al Shab c a Faculty of Agricultural and Food Sciences, American University of Beirut, P.O. Box 11-236, Beirut, Lebanon b Khatib & Alami Consultants, Beirut, Lebanon c Association for Rural Development in Aarsal, Aarsal, Lebanon Received 19 October 1999; received in revised form 16 May 2000; accepted 19 September 2000 Abstract The implementation of land use studies in most developing nations is often faced with the lack of data. Participatory studies offer the possibility of complementing data sets by tapping into indigenous knowledge. They also encourage the adoption of sustainable land management practices by establishing partnership and dialogue among stakeholders. This paper reports on a study in Aarsal, a semi-arid mountainous locality (36,000 ha) in Lebanon where conflicts in land use have recently emerged between pastoralists and growers. The study aimed at supporting sustainable land management in Aarsal by carrying out a land capability classification and a land use analysis. Indigenous knowledge was used as one of the information sources for the land capability classification. Participatory rural appraisal was used to describe the indigenous agroecological zoning and local soil classification. Geographic information system (GIS) technology was used to produce a land capability map and to analyze the current land use. Most of the land area was found to be too marginal for conventional farming, and nearly 5000ha are in serious danger of land degradation. Moreover, the shrinkage of the grazing lands caused by the expansion of orchards partly explains the reduction in the size of small ruminant flocks. The combination of participatory approach, land capability evaluation and GIS provided a satisfactory understanding of the physical and biological land management constraints in Aarsal, fostered dialogue between the different stakeholders, and created opportunities for the identification of sustainable land management options. © 2001 Elsevier Science B.V. All rights reserved. Keywords: Participatory rural appraisal; Land evaluation; Geographic information systems; Indigenous knowledge; Drylands 1. Introduction The evaluation of land resources and other land use studies involve a complex and laborious process by the end of which a landscape may be divided into ∗ Corresponding author. Tel.: +961-1-374374/ext. 4571; fax: +961-1-744460. E-mail address: [email protected] (R. Zurayk). relatively homogeneous units for which an appropriate land use can be allocated. This process typically re- quires large sets of data as inputs, including biophysi- cal characters as well as socio-economic determinants (Dent and Young, 1981; Davidson, 1992). Geographic information systems (GISs) are commonly used in the process, as they offer the speed, flexibility, and power to synthesize large quantities of data (Bouma et al., 1993; Hansen et al., 1998; Bydekerke et al., 1998). 0167-8809/01/$ – see front matter © 2001 Elsevier Science B.V. All rights reserved. PII:S0167-8809(00)00287-5
-
Upload
independent -
Category
Documents
-
view
0 -
download
0
Transcript of Using indigenous knowledge in land use investigations: a participatory study in a semi-arid...

Agriculture, Ecosystems and Environment 86 (2001) 247–262
Using indigenous knowledge in land use investigations:a participatory study in a semi-arid mountainous
region of Lebanon
Rami Zurayk a,∗, Faraj el-Awar a, Shady Hamadeh a, Salma Talhouk a,Christine Sayegh a, Abdel-Ghani Chehab b, Kassem al Shab c
a Faculty of Agricultural and Food Sciences, American University of Beirut, P.O. Box 11-236, Beirut, Lebanonb Khatib & Alami Consultants, Beirut, Lebanon
c Association for Rural Development in Aarsal, Aarsal, Lebanon
Received 19 October 1999; received in revised form 16 May 2000; accepted 19 September 2000
Abstract
The implementation of land use studies in most developing nations is often faced with the lack of data. Participatory studiesoffer the possibility of complementing data sets by tapping into indigenous knowledge. They also encourage the adoption ofsustainable land management practices by establishing partnership and dialogue among stakeholders. This paper reports on astudy in Aarsal, a semi-arid mountainous locality (36,000 ha) in Lebanon where conflicts in land use have recently emergedbetween pastoralists and growers. The study aimed at supporting sustainable land management in Aarsal by carrying out aland capability classification and a land use analysis. Indigenous knowledge was used as one of the information sources forthe land capability classification. Participatory rural appraisal was used to describe the indigenous agroecological zoning andlocal soil classification. Geographic information system (GIS) technology was used to produce a land capability map andto analyze the current land use. Most of the land area was found to be too marginal for conventional farming, and nearly5000 ha are in serious danger of land degradation. Moreover, the shrinkage of the grazing lands caused by the expansionof orchards partly explains the reduction in the size of small ruminant flocks. The combination of participatory approach,land capability evaluation and GIS provided a satisfactory understanding of the physical and biological land managementconstraints in Aarsal, fostered dialogue between the different stakeholders, and created opportunities for the identification ofsustainable land management options. © 2001 Elsevier Science B.V. All rights reserved.
Keywords: Participatory rural appraisal; Land evaluation; Geographic information systems; Indigenous knowledge; Drylands
1. Introduction
The evaluation of land resources and other land usestudies involve a complex and laborious process bythe end of which a landscape may be divided into
∗ Corresponding author. Tel.: +961-1-374374/ext. 4571;fax: +961-1-744460.E-mail address: [email protected] (R. Zurayk).
relatively homogeneous units for which an appropriateland use can be allocated. This process typically re-quires large sets of data as inputs, including biophysi-cal characters as well as socio-economic determinants(Dent and Young, 1981; Davidson, 1992). Geographicinformation systems (GISs) are commonly used in theprocess, as they offer the speed, flexibility, and powerto synthesize large quantities of data (Bouma et al.,1993; Hansen et al., 1998; Bydekerke et al., 1998).
0167-8809/01/$ – see front matter © 2001 Elsevier Science B.V. All rights reserved.PII: S0 1 6 7 -8 8 09 (00 )00287 -5

248 R. Zurayk et al. / Agriculture, Ecosystems and Environment 86 (2001) 247–262
Due to technical and technological requirements,land evaluation has been traditionally carried out byplanning authorities operating at central governmentor district level, and enforced through regulatorymechanisms. This top-down approach commonlyresults in poor adoption of the directives by theconcerned community (Chambers, 1983; Moote andMcLaran, 1997). The issue is more complex in somedeveloping countries where regulations are difficultto implement in rural and tribal lands. Since the1980s, non-traditional approaches based on the par-ticipation of the stakeholders at every stage of theplanning process have evolved, and are now beingproposed as a viable alternative for resource manage-ment (Lanyon, 1994; Pretty and Shah, 1997; Ashbyet al., 1996; Moote and McLaran, 1997). The par-ticipatory approach can be combined with moderntechnologies, such as the GIS to provide the “best ofboth worlds”. This approach, termed “participatoryassistance” (Lanyon, 1994) has been found to pro-mote innovations in farming, research, education, andpolicy formulation.
The implementation of land use studies in develop-ing countries is also faced with the problem of dataavailability. The information base is poor, unreliableand often inappropriate for the modern land evalua-tion frameworks. There is, therefore, a pressing needfor an adapted framework for land use studies that isappropriate for data-poor environments, and that lendsitself readily to stakeholder participation.
Rural communities often rely on some form ofindigenous land resource evaluation in their tradi-tional land management systems. The incorporationof indigenous land resource evaluation has recentlybeen advocated to improve the relevance of land sur-veys. Reports from Egypt, for instance, indicate thatBedouins rely on a number of soil properties suchas texture and nutrient supply, as well as landscapecharacteristics such as flooding risks and soil loss inorder to make decisions with regard to the choiceof crop and cultivation site, and that the indigenoussoil classification can serve as a basis for land useplanning (Briggs et al., 1998).
This paper reports on a study that was a componentof a 3-years multidisciplinary project that ended inMarch 1999. The study area was Aarsal, a large high-land village (population 36,000, land area 36,000 ha)on the western slopes of the arid Anti-Lebanon
mountain range (annual rainfall 250–300 mm) (Fig. 1).Traditionally an agropastoral area dominated by inte-grated cereal cropping and semi-nomadic small rumi-nant farming systems, Aarsal has witnessed in the pastfew years a significant shift toward an orchard-basedcropping system, with about 1.5 million cherry andapricot trees planted in the past 20 years. This hasbeen accompanied by a decline in the number ofsmall ruminants from 90,000 to 60,000 heads and bythe emergence of conflicts between pastoralists andorchard growers. Like many other areas of Lebanon,there is virtually no climatic or other land resourcedata available.
The project was funded by the International De-velopment Research Center (IDRC, Canada), and im-plemented by an interdisciplinary team of researchersfrom the American University of Beirut (AUB), inpartnership with a local non-governmental organiza-tion, the Association for Rural Development in Aarsal(ARDA). The comprehensive findings of the projectwere presented by Hamadeh (1999).
This land use study aimed at supporting sustainableland management in Aarsal by investigating severalland use scenarios as requested by the local commu-nity. To achieve this goal, a participatory approach wasadopted, which linked indigenous knowledge (as onesource of information on land resources), conventionalfield surveys, an adapted framework for land capabil-ity classification, and GIS technologies. The specificobjectives of the study were: (1) to understand anddescribe the indigenous knowledge related to agroe-cological zoning and to soils; (2) to carry out a landcapability classification using an adapted frameworkbearing relevance to the local population; and (3) tocarry out a land analysis for evaluating the sustain-ability of the current land use and of the shift in thedominant farming system from agropastoral to horti-cultural.
2. Materials and methods
2.1. Approach
Data required for the land capability classificationwas collected from primary and secondary sourcesusing Participatory Rural Appraisal (for indigenousknowledge), conventional surveys and field investiga-

R. Zurayk et al. / Agriculture, Ecosystems and Environment 86 (2001) 247–262 249
Fig. 1. Location map (in box), ecozones according to the indigenous system, and contours map of Aarsal, Lebanon (total area 36,000 ha).
Fig. 2. Combined grazing and land cover map of Aarsal, Lebanon. The grazing map was derived from field surveys and the land covermap from SPOT multispectral satellite image.

250 R. Zurayk et al. / Agriculture, Ecosystems and Environment 86 (2001) 247–262
tions (for soils and grazing management) and remotesensing (for land cover/land use). The following sec-tions detail these methodologies.
2.2. Participatory rural appraisal
Participatory Rural Appraisal (PRA) has becomean established procedure for investigating indige-nous resource management systems (Webber andIson, 1994). It is defined as an “intensive, systematicbut semi-structured learning experience carried outin a community by a multidisciplinary team whichincludes community members” (Theis and Grady,1991). One of the main advantages of PRAs is thatthey help provide a holistic vision from the perspec-tive of the end-user, and makes use of their experi-ence, which is integrated with that of the researchers,in order to broaden the common knowledge-base(Chambers, 1994a,b).
Three PRAs were carried out, among a group of15–20 participants. The group comprised three re-searchers from AUB (one female and two males), and12–17 members of the community, with ages rang-ing between 21 and 66 (four to six females and 8–11males). The constitution of the local group was vari-able, some members did not contribute to all the PRAs,and new members joined sometimes in the course ofa session.
The first PRA investigated the indigenous soils andagroecological knowledge. The second PRA was usedto identify the determinants of land degradation andto identify specific land management queries. In thethird PRA, the results of these queries was presentedand discussed. The PRAs took the form of relaxedsemi-structured interviews following a guiding frame-work, which outlined the sequence of events and pointsto remember. The researchers behaved mostly as ac-tive listeners and observers. The classical PRA tools(maps, sketches, diagrams, ranking) were used.
2.3. Thematic maps
2.3.1. The soil mapA soil map was produced from the combination of
indigenous soil knowledge and field survey. The soilsof the Aarsal area were first described by the PRAparticipants according to their local classification. Apreliminary soil map of Aarsal was extracted from the
digital soil map of Lebanon (Gèze, 1956). This map(1:200,000) was produced using aerial photographsas well as geological and topographical maps fordelineating soil mapping units. A semi-detailed fieldsurvey was then carried out to complement the infor-mation base (Darwish and Zurayk, 1996). During thissurvey, the soil units identified and described by thePRA participants were investigated. This resulted ineither keeping or altering the initial unit boundariesdescribed by the PRA participants, and in definingtaxonomic units according to the US soil taxonomy(USDA, 1975).
The methodology followed for the semi-detailedsurvey was that of Breimer et al. (1986). This typeof survey is suggested when particular soil prop-erties are of interest, as in the current project. Atotal of 31 soil profiles were described (landform,horizons, colors, structure) in all the soil mappingunits represented in Aarsal. Soil samples were ob-tained from each horizon. Routine analysis (texture,EC, pH, soil organic matter, CaCO3, stoniness) wasperformed on fine earth samples following the proce-dures detailed in Breimer et al. (1986). Permeabilityclasses of the upper subsoil were inferred from thetextural classes using the procedure of Chow et al.(1988).
2.3.2. The contour map and slope classes mapThe contour map (50 m intervals) was manually
digitized from the 1:100,000 maps developed by theDepartment of Geographic Affairs of the LebaneseArmy (DGA) in 1962 (Fig. 1). The slope map was de-rived from the contour map of Aarsal using ArcTINand Digital Terrain Modeling. The grid was then con-verted to slope polygon coverages with the desiredslope classes.
2.3.3. The land cover mapThe land cover map was derived from Spot Multi-
spectral Satellite image (20 m × 20 m resolution) thatwas taken in August 1992. This image was then pro-cessed using the ERDAS Imagine software. Groundtruthing was carried out over a period of 15 days in anextensive field survey that covered all the accessibleareas of Aarsal. Five land cover classes were identi-fied: Annual cropping, Grazing/old fallow, Fruit trees,Grapes, Not agriculture (including urban areas, roadsand quarries) (Fig. 2).

R. Zurayk et al. / Agriculture, Ecosystems and Environment 86 (2001) 247–262 251
2.3.4. The grazing mapThe grazing map of Aarsal was derived by monitor-
ing and surveying the grazing patterns of small rumi-nants in 20 herds, comprising the totality of the Aarsalsmall ruminants. The survey took place over threeyears. A detailed questionnaire was administered topastoralists on the grazing sites in order to determinegrazing intensity and duration for each season and eco-zone. Mean values were computed over 3 years. Themap includes information about the stocking rate andthe grazing season.
2.4. Geographic information systems
A GIS was used in order to integrate the data fromdifferent sources into one coherent whole. The GIS
Fig. 3. Framework for land capability classification, based on the US land capability classification system, and adapted to suit the local soiltypes. For slope gradients > 2.5◦ and <4.5◦, if depth > 50 cm then land capability class (LCC) = III, if depth < 50 cm then LCC = IV.For slope gradient > 4.5◦ and <7◦, then LCC = IV.
used was the PC Arc Info platform (EnvironmentalSystems Research Institute, Redland, CA), running ona Pentium II, 200 MHz, 32 MB RAM, with supportfrom the Arc Info platform running on a SUN mi-crostation for complex data treatment such as slopeanalysis.
2.5. Procedure application
2.5.1. Land capability classificationThe US land capability classification system
(Klingebiel and Montgomery, 1966) as adapted byHudson (1981), was further adapted to suit the localenvironment and the extent of available data (Fig. 3).This classical framework is simple and well suited tothe data-poor environment of Lebanon. The procedure

252 R. Zurayk et al. / Agriculture, Ecosystems and Environment 86 (2001) 247–262
is hierarchical, with four indicators: slope classes,topsoil texture, effective depth, and permeability ofupper subsoil. Land units with similar attributes areclassified into one of eight land capability classes.Classes I–IV can be used for cultivation and classesV–VIII cannot be cultivated in their present stateunder normal management.
Based on the data from the soil map and the slopeanalysis, an independent coverage was created for eachsoil attribute. The coverages were then overlaid inARC/INFO to produce one composite layer (land ca-pability classes), on which a series of queries wereperformed according to the flow chart in Fig. 3. Thisresulted in assigning each land polygon to its appro-priate class. Where polygons were smaller than 5 ha,they were combined and assigned a combined classsymbol (such as I/III, in which the first digit indicatesthe dominant land capability class).
Fig. 4. Flowchart of the indigenous ecological zoning process in Aarsal, Lebanon. Primary zoning is based on climatic characters extrapolatedfrom indirect indicators. Secondary zoning is based on indigenous soil classification.
2.5.2. Land management queriesThe results of the land capability assessment were
presented to the community of Aarsal in a workshopattended by 40 farmers, 20 pastoralists, and conductedby the project staff, including a soil conservation ex-pert and a horticulture expert, as well as two ARDAmembers.
3. Results and discussion
3.1. Indigenous agroecological zoning
One of the outcomes of this study was the under-standing and description of the indigenous agroeco-logical zoning process. The process is systematic,and integrates climate and soil attributes (Fig. 4). Thepeople of Aarsal distinguish three general areas in

R. Zurayk et al. / Agriculture, Ecosystems and Environment 86 (2001) 247–262 253
their lands: the highlands (Jurd), the valleys (Wadis)and the steppe (Plain). These are further divided intosix different farming zones (Fig. 1, Table 1). In theseagroecozones, the climatic conditions are sufficientlyuniform to determine potentials and constraints forcrops. In the classification process, climatic data isnot measured, but inferred from the duration of thesnow cover and the incidence of frost, which are usedas indicators of temperature and moisture (Table 1).Ecological indicators of local climates are also usedto delineate the agroecological zones. The distributionof Poterium spinosum, a thorny ground-bush usuallycharacteristic of the more humid highlands of theWestern mountain range of Lebanon, delineates thelimits of the Western ecozone. Similarly, the occur-rence of Artemiasa herba-alpa, a desert plant, delin-eates the Eastern steppe. The result of the indigenousagroecological zoning is a landscape division that isclearly delineated and that is commonly used andrecognized by the entire community.
3.2. Indigenous soil classification
Soil variability in Aarsal is limited due to therelatively homogeneous parent rock formation(Cenomano-Turonian hard limestone). Yet, due tovariations in local climate and in landform, severalsoil types may be distinguished. These are named bythe local people in relation to their geographic loca-tion (e.g. the soils of Rahweh, in the middle Jurd).Our inquiry about the difference among different soiltypes revealed that the local farmers categorize theirsoils in different classes, which reflect their agro-nomic potential, following a multi-descriptors systemthat includes depth, color, texture/water relations, andany other existing limitations (Fig. 4). Farmers do notcarry out soil investigations for the purpose of deter-mining these descriptors, but learn about them duringland preparation and planting operations. Knowledgehas evolved dramatically over the past decade asnew agricultural technologies, especially mechani-cal tillage, have allowed literally a more “in-depth”perception of soil.
Soil depth is used as a main descriptor, as it hasdirect implications on crop yield and moisture reserve.Soil color is the second descriptor in the indigenoussoil taxonomy, as it is locally believed to be related tofertility. Light colored soils (locally described as pale
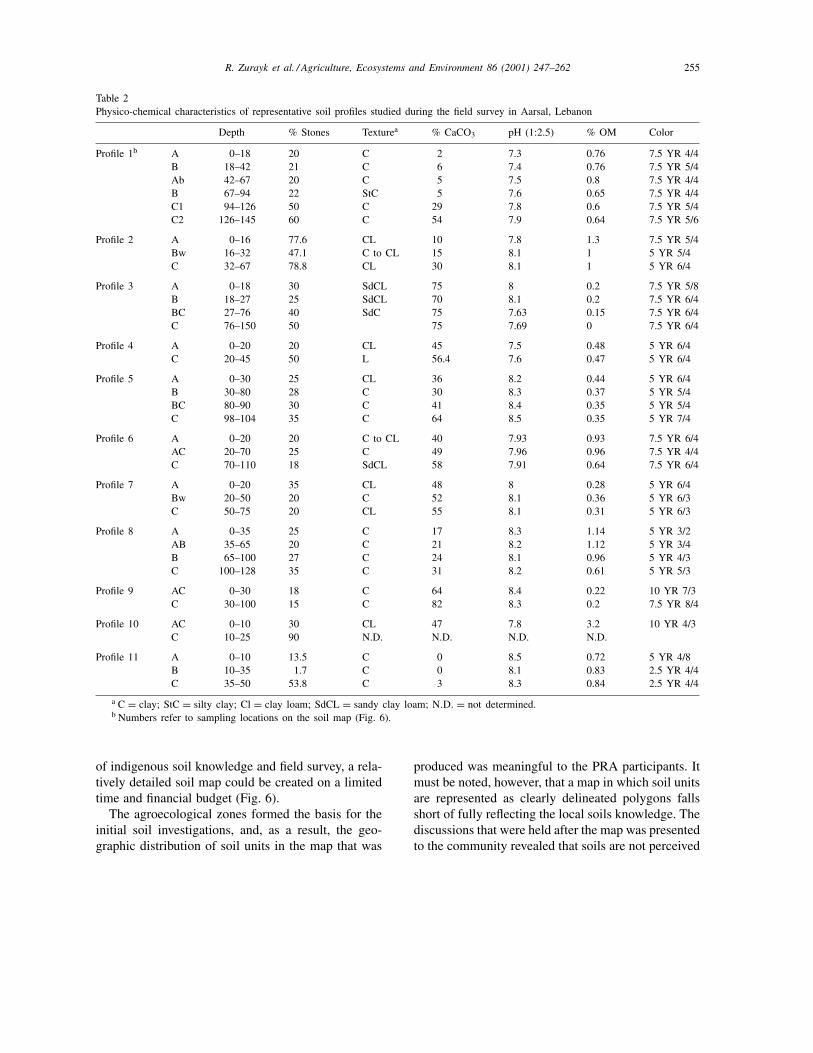
yellow or grayish) are believed to be less fertile thanred or brown soils. Field survey data (Table 2) showedthat soil color ranged from strong brown (7.5YR 5/6)to very pale brown (10YR 7/4), and that there was apositive association between color and total CaCO3content (Fig. 5).
Several studies of Lebanese soils (Gèze, 1956; Lam-ouroux, 1972; Darwish and Zurayk, 1997) confirmsthe CaCO3/color association. For instance, under gooddrainage, soils formed on hard limestone (such as theAarsal soils) will become decarbonated and rubefied,which imparts them with a characteristic reddish color(profile 11). These same soils will remain brown andcalcareous if drainage is insufficient to induce decalci-fication and oxidation of Fe, which is the case of mostof the soils of Aarsal (profiles 2 and 3). Where erosionis intense, and AC horizons evolve, these are oftenlighter in color due to the contribution of the weath-ered parent material, hence the lighter shades and thelarge CaCO3 content (profile 9). Thus, it appears that,in Aarsal, a connection between CaCO3 and specificaspects of soil fertility may be justified, especially atvery high levels of CaCO3. However, the linkages aretoo tenuous and the relationship too complex for soilcolor to be an adequate indicator of soil fertility. Thislocal indicator of soil suitability was, therefore, notincluded in the adapted framework for land capabilityclassification.
Soil texture and water relations (a combination ofpermeability and moisture holding characteristics)constitute the third descriptor. Finally, the presenceof a limitation, such as the petrocalcic horizon in theEastern area serves as a fourth descriptor. Thus, intheir indigenous soil classification, the local commu-nity relies on physical factors that can be observedvisually. This supports earlier findings (Kundiri et al.,1997; Briggs et al., 1998), which show color and tex-ture to be the key soil characteristics for farmers inNigeria and Egypt.
Most of the local descriptors of soil suitability ap-pear directly or indirectly in the framework for landcapability classification that was used (Fig. 3). Effec-tive soil depth is the combination of soil depth (themain local descriptor) and of the “limitation” factor,such as the petrocalcic horizon. The combination ofsoil texture and subsoil permeability appears in the lo-cal indicators as the third level descriptor “soil textureand water relations”. Thus, based on the combination

254R
.Z
urayket
al./Agriculture,
Ecosystem
sand
Environm
ent86
(2001)247–262
R. Zurayk et al. / Agriculture, Ecosystems and Environment 86 (2001) 247–262 255
Table 2Physico-chemical characteristics of representative soil profiles studied during the field survey in Aarsal, Lebanon
Depth % Stones Texturea % CaCO3 pH (1:2.5) % OM Color
Profile 1b A 0–18 20 C 2 7.3 0.76 7.5 YR 4/4B 18–42 21 C 6 7.4 0.76 7.5 YR 5/4Ab 42–67 20 C 5 7.5 0.8 7.5 YR 4/4B 67–94 22 StC 5 7.6 0.65 7.5 YR 4/4C1 94–126 50 C 29 7.8 0.6 7.5 YR 5/4C2 126–145 60 C 54 7.9 0.64 7.5 YR 5/6
Profile 2 A 0–16 77.6 CL 10 7.8 1.3 7.5 YR 5/4Bw 16–32 47.1 C to CL 15 8.1 1 5 YR 5/4C 32–67 78.8 CL 30 8.1 1 5 YR 6/4
Profile 3 A 0–18 30 SdCL 75 8 0.2 7.5 YR 5/8B 18–27 25 SdCL 70 8.1 0.2 7.5 YR 6/4BC 27–76 40 SdC 75 7.63 0.15 7.5 YR 6/4C 76–150 50 75 7.69 0 7.5 YR 6/4
Profile 4 A 0–20 20 CL 45 7.5 0.48 5 YR 6/4C 20–45 50 L 56.4 7.6 0.47 5 YR 6/4
Profile 5 A 0–30 25 CL 36 8.2 0.44 5 YR 6/4B 30–80 28 C 30 8.3 0.37 5 YR 5/4BC 80–90 30 C 41 8.4 0.35 5 YR 5/4C 98–104 35 C 64 8.5 0.35 5 YR 7/4
Profile 6 A 0–20 20 C to CL 40 7.93 0.93 7.5 YR 6/4AC 20–70 25 C 49 7.96 0.96 7.5 YR 4/4C 70–110 18 SdCL 58 7.91 0.64 7.5 YR 6/4
Profile 7 A 0–20 35 CL 48 8 0.28 5 YR 6/4Bw 20–50 20 C 52 8.1 0.36 5 YR 6/3C 50–75 20 CL 55 8.1 0.31 5 YR 6/3
Profile 8 A 0–35 25 C 17 8.3 1.14 5 YR 3/2AB 35–65 20 C 21 8.2 1.12 5 YR 3/4B 65–100 27 C 24 8.1 0.96 5 YR 4/3C 100–128 35 C 31 8.2 0.61 5 YR 5/3
Profile 9 AC 0–30 18 C 64 8.4 0.22 10 YR 7/3C 30–100 15 C 82 8.3 0.2 7.5 YR 8/4
Profile 10 AC 0–10 30 CL 47 7.8 3.2 10 YR 4/3C 10–25 90 N.D. N.D. N.D. N.D.
Profile 11 A 0–10 13.5 C 0 8.5 0.72 5 YR 4/8B 10–35 1.7 C 0 8.1 0.83 2.5 YR 4/4C 35–50 53.8 C 3 8.3 0.84 2.5 YR 4/4
a C = clay; StC = silty clay; Cl = clay loam; SdCL = sandy clay loam; N.D. = not determined.b Numbers refer to sampling locations on the soil map (Fig. 6).
of indigenous soil knowledge and field survey, a rela-tively detailed soil map could be created on a limitedtime and financial budget (Fig. 6).
The agroecological zones formed the basis for theinitial soil investigations, and, as a result, the geo-graphic distribution of soil units in the map that was
produced was meaningful to the PRA participants. Itmust be noted, however, that a map in which soil unitsare represented as clearly delineated polygons fallsshort of fully reflecting the local soils knowledge. Thediscussions that were held after the map was presentedto the community revealed that soils are not perceived

256 R. Zurayk et al. / Agriculture, Ecosystems and Environment 86 (2001) 247–262
Fig. 5. Relationship between lime content and soil “redness” in 31 soil samples collected from Aarsal, Lebanon.
Fig. 6. Soils map of Aarsal, Lebanon, produced from the combination of existing soil map, indigenous knowledge and field survey. Ap-proximate FAO equivalent for the USDA soil classification: Xerifluventic Haplocambids ∼= Haplic Calcisols; Petrocalcic Paleargids ∼= PetricCalcisols; Mollic Rhodoxeralf ∼= Luvic Calcisols; Lithic Rhodoxeralf ∼= Chromic Luvisols; Xeric Haplocalcid ∼= Haplic Calcisols; TypicAnthracambid ∼= Haplic Calcisols; Mollic Palexeralf ∼= Luvic Calcisols; Aridic Haploxeroll ∼= Mollic Leptosols; Lithic Haploxeroll ∼= MollicLeptosols; Xeric Paleargids ∼= Haplic Calcisols.
R. Zurayk et al. / Agriculture, Ecosystems and Environment 86 (2001) 247–262 257
by the local people as clearly defined patches on thelandscape, with well delineated boundaries. They forma continuum in which different soil types intergradeinto one another, in a perspective that more faithfullyrepresent reality. When asked to name the soil in aland area of manageable size, farmers will often an-swer “mostly this, with some of that”. This soil nam-ing process, which does away with boundaries, is verysimilar to that used in Highland New Guinea (Silli-toe, 1998), and allows flexibility to adapt to changesin the landscape, which is necessary in the dissectedhighland areas where the relief can create a multitudeof soil types. This process conflicts, however, withthe classical soil mapping approach in which parcelswith specific landscape characters are represented asclearly delineated polygons.
3.3. Determinants of land degradation
The second PRA investigated the local perceptionof the causes of soil erosion and land degradation.This information was required in order to determinethe relevance of the indicators of land capability inthe adapted land evaluation framework. The partici-pants in the PRA first agreed on a common notion ofland degradation and defined it as the reduction in thecapacity of land to produce desirable biomass. For afarming community, this is synonymous with the lossof utility of the land, and carries, therefore, an intrin-sic economic dimension.
Following that, the major determinants of landdegradation were identified and ranked. These were:(1) water shortage, including reduced moisture avail-ability and storage; (2) gullying following extremerainfall events; (3) soil loss on steep land, associatedwith plowing up-and-down the slope especially instone fruit orchards; and (4) reduced soil fertility.
The PRA also indicated that the main stress onland resources in Aarsal is soil erosion, associatedwith poor land management practices in the stonefruit orchards, especially the lack of soil conserva-tion structure on slopes sometimes steeper than 20◦,accompanied with tillage up-and-down the slope.Farmers acknowledged that this form of land use isinappropriate, and realized the damage resulting frompoor agricultural practices, but rationalize every de-cision they take. They justify the use of steep landsfor expansion as being the only lands available. The
absence of structural soil conservation measures suchas the traditional stone walled bench terraces is ex-plained by the cost associated with their constructionand maintenance. Tillage up-and-down the slope isalso deemed necessary as the tractors would other-wise overturn on the steep slopes. These issues aresimilar to those reported from other steepland loca-tions in Lebanon (Zurayk, 1994) as well as in LatinAmerica (Altieri, 1992), where mountain agricul-ture is becoming increasingly difficult to implementwithout endangering the soil resource base.
The ranking of the determinants of land degradationconfirmed that the parameters used in the frameworkfor land evaluation (slope, texture, effective depth andsubsoil permeability) were adequate, as they reflectedthe local perception. The land capability frameworkand the thematic data maps were then presented to theparticipants who were asked to suggest three land useissues they would like to investigate. Agreement wasreached on the following queries:
1. Where could orchards be expanded with minimalrisks of land degradation?
2. What are the geographic locations of the orchardsthat were established on the wrong land capabilityclasses?
3. Is the grazing pressure intensified by the reductionin the effective grazing area due to the expansionof the orchards?
3.4. Land analysis
3.4.1. Orchard developmentSustainable expansion of the orchards would imply
that it would only take place on the appropriate landcapability classes. The following scenarios were con-sidered: (1) only class I–III lands will be used; (2)class IV lands can be used; and (3) annual croppingcan be replaced with orchards in the four agriculturalland classes (I–IV). An overlay analysis of the landcapability map, the land cover map and the agroeco-zone map was performed using GIS. The results ofthis analysis are summarized in Table 3.
It appears that the expansion of orchards on landclasses I–III is impossible as all of these lands arealready cropped. Expansion on class IV lands ispossible, and would add 9300 ha, but these wouldrequire heavy investments in soil conservation

258 R. Zurayk et al. / Agriculture, Ecosystems and Environment 86 (2001) 247–262
Table 3Outcomes of the GIS land use analysis in Aarsal, Lebanon (Fig. 7)
Ecozone Land capability classesa
I II(withreplacementof annualcropping)
III(withreplacementof annualcropping)
IV(withoutreplacementof annualcropping)
IV(withreplacementof annualcropping)
Inappropriateland use on IV
Inappropriateland use onV–VIII
Low Jurd – 236 – 595 963 315 516Middle Jurd – – 588 1685 2424 892 1105High Jurd – 575 – 2038 2412 423 224Eastern area – 1206 441 4704 5114 650 1741Western area – – 47 105 165 110 237Wadis – 90 – 181 269 194 52
Total – 2107 1076 9308 11347 2584 3875
a Figures in each column refer to the area (ha) on which orchards may be expanded in the six ecozones under different replacementscenarios (columns 2–6). Columns 7 and 8 indicate inappropriate land use, i.e. orchards and vineyards on land use classes IV and V–VIII.
structures. Should annual cropping be replaced (whichis the current trend), this would add nearly 2100 ha ofclass II lands and 1000 ha of class III lands. If annualcropping was to be replaced in class IV lands, thisalone would add in excess of 11,000 ha. However,this option was discussed and eventually rejected bythe group, who reasoned that the shift from annualcropping to orchards (a more intensive monoculture)would increase the risks of soil erosion. A large pro-portion of the potential lands in classes II and III werefound to be located on the lowlands of the easternecozone and are, therefore, not suited for stone fruitsproduction due to climatic constrains. This wouldleave at least 1500 ha of lands in classes II and IIIin the appropriate agroecological zones, on whichorchards may be expanded.
The GIS analysis allowed us also to locate theseareas geographically. They were delineated on alarge scale map which was made available to thecommunity.
3.4.2. Delineation of inappropriate land use areasThis issue was brought about by the remark that
annual cropping was already taking place on classIV lands. This query was aimed at locating the landswhere orchards and vineyards were planted on the in-appropriate land capability classes. For this purpose,a digital coverage of the orchards and vineyards landuse types was created and overlaid with the land ca-pability map (Fig. 7).
Table 3 shows the breakdown of the total area inwhich land use is inappropriate (orchards or grapeslocated on classes IV and V–VIII lands). Nearly5350 ha are improperly used, which explains the re-ports of high rates of land degradation in orchards.These “hot spots” were delineated on the map andconsidered as priority intervention areas for soilconservation. This analysis was followed with 10quadrant and transect studies on selected “hot spots”(data not shown). The GIS analysis was confirmedin nearly 65% of the study areas, where fields es-tablished on abrupt terrain and showing clear signsof active soil erosion, were located. In nearly 35%of the cases, however, the orchards were located onnatural terraces or on flat depressions between es-carpments, and which are protected from erosion bytheir location. These fields, usually 0.5–2 ha, are lo-cally known as “shoab” and are very fertile as theyreceive run off water and sediments from their micro-catchments.
The GIS land evaluation procedure, therefore, mis-allocated good cultivable land, because of the coarseresolution of the slope map, which was extracted fromthe 50 m intervals contour map. These maps wereused because they were accessible, and did not re-quire further digitizing. Hammer et al. (1995) reportslimited accuracy of GIS produced slope attributesusing 30 m spaced contour lines, and recommends10 m contour lines in order to capture landscapeheterogeneity.

R. Zurayk et al. / Agriculture, Ecosystems and Environment 86 (2001) 247–262 259
Fig. 7. Overlay map of the land capability classification and the “fruit trees or vineyards” land use class (diagonal lines pattern) inAarsal, Lebanon. Areas where the diagonal lines pattern appears over a white background indicates orchards and vineyards located onnon-agricultural land, and therefore, high soil erosion hazard. This map was used for the land use analysis (Table 3).
3.4.3. Understanding the dynamics of pastoralismConflicts have emerged between pastoralists and
fruit growers, as animals are not allowed to graze inorchards. A query was added by the researchers toevaluate whether the effective constriction of the graz-ing lands as a result of the expansion of the orchardswould increase overgrazing in spite of the reductionin the flock size.
For the above analysis an overlay of the land covermap and the grazing map were used (Fig. 2). The re-sults of this query appear in Table 4. The effectivegrazing area was considered to be equal to the totalland area of Aarsal less the areas planted with vine-
yards and orchards (effective grazing area, where an-imals are not allowed to graze). It appears that mostof the reduction in grazing area (total–effective) hastaken place in the middle and high Jurd ecozones,where it has mirrored the expansion of orchards. As aresult, the total land available for grazing was reducedby nearly 30%. During that same period, the flockshave been reduced by 30% (from 90,000 to 60,000).
Although it is unlikely that the shrinkage of theeffective grazing area alone can explain the reduc-tion in the flock size, it may have been a significantdeterminant of this change. The issue was investi-gated further during the PRA, and one of the reasons

260 R. Zurayk et al. / Agriculture, Ecosystems and Environment 86 (2001) 247–262
Table 4Total and effective grazing areas in the six ecozones in Aarsal,Lebanon, obtained from GIS overlay analysis of the grazing mapwith the land cover map (Fig. 2)
Ecozone Areaa (ha)
Total Effective
Low Jurd 1186 811Middle Jurd 2894 1752High Jurd 3528 2578Eastern area 2959 2444Western area 238 131Wadis 190 94
Total 10995 7810
a The total grazing area is the geographic area within thegrazing polygons on the map. The effective grazing area is thetotal grazing area less the area under orchards, which are off limitsto the flocks.
proposed by the PRA participants to explain the de-cline in flock number was pasture impoverishment,which was linked to an increase in the pressure onthe land. It may be that pastoralists have adapted tothe changing land use by reducing the flock num-bers to maintain a steady stocking rate. Reduction inflock in response to changes in land use is commonlyacknowledged as one of the response models of no-madic or semi-nomadic pastoralists (Dodd, 1994). Inthis case, however, it is difficult to dissociate the im-pact of land use changes from other environmental orsocio-economic variables such as shrinking markets,feed availability and drought, all of which were con-currently taking place during the past 30 years.
4. Implications of participatory land analysis
Implementing the participatory land analysis wasan enriching process for the researchers and the com-munity. For the researchers, the insights gained intothe indigenous knowledge were invaluable in many re-spects. Indigenous knowledge was a crucial resourcefor identifying the bio-physical characters of the landrelevant to the land evaluation process. Conventionaloptions, such as baseline surveys, would have eitherbeen impossible (there are currently no weather datacollection facilities in the area), or too costly. Adoptingthe local nomenclature for the agroecological zoneshad a number of positive outcomes: it greatly enhanced
the trust-building process, as the community appre-ciated the fact that the researchers acknowledged thevalue of their knowledge. It also increased the localpeople’s commitment to the project and to its out-comes. It gave the researchers valuable insights intothe way the local people perceive their environment,which may be useful for improving the quality of landstudies. One of the best examples is provided by theindigenous soil knowledge.
As pointed out earlier, the people of Aarsal perceivetheir soils in a “fuzzy” perspective, while conventionalsoil surveys provide geographic information on thebasis of points, lines and polygons with defined, uni-form characters. This concurs with recent interest inthe application of fuzzy set methodology in soil sur-veys and land evaluation (Burrough, 1989). Severalcase studies reports indicate that the fuzzy approach ismore intuitive as it takes account of spatial variabilityand differences in factor weighting (Davidson et al.,1994, Burrough et al., 1992). The perception of thelocal people of Aarsal confirm that this is, indeed, anendeavor worth pursuing as it offers a picture closerto reality.
The participatory process also revealed some of thelimitations regarding the use of GIS technology. Theadvantages of GIS in land use studies are clear: thetool’s capabilities of data storage and processing pro-vide an invaluable, time saving support system. Thepresentation capabilities of GIS were, however, muchmore appreciated by the researchers than by the localfarmers. The farmers’ lack of familiarity with mapsand other forms of geographic representations, suchas contour lines and land cover polygons may partlyaccount for that. As a result, throughout the PRAs,the majority of the participants were unable to use themaps freely, which required the researchers to act asinterpreters.
Comprehension of visual presentation material bynon-specialists is a major issue in the use of GIS. Drap-ing these 3D models with particular digital coverages(soils, land cover) has been suggested as one meanto achieve that (Theocharopoulos et al., 1995). Ourexperience in this project shows that a 3D model re-mained poorly comprehensible by the rural populationof Aarsal. It was found, however, that the landownerscould visualize their lands as cadastral parcels withclearly defined boundaries, as it relates in their per-ceptions to land ownership and tenure. During the
R. Zurayk et al. / Agriculture, Ecosystems and Environment 86 (2001) 247–262 261
PRAs, the farmers were (understandably) more con-cerned by the bio-physical characters of their parcelsthan by those of the village lands, even though the lat-ter may include common lands of public access (forgrazing, for instance). The classical map representa-tion using polygons and lines gained local relevancewhen the attributes were expressed on a parcel basis.In other words, the project researchers were more in-terested in the holistic perspective of the land and ofits potentials, while the local people were more in-terested in a micro-level analysis that would informthem about their own parcel in the greatest possibledetail. However, the lands covered by the project areainclude thousands of parcels, which were impossibleto represent digitally during the project’s time frame.
The participatory approach to land use studies isbeing increasingly advocated as a critical step for thedevelopment of sustainable land management options(Röling, 1994). These options are built on the compro-mises, and on conflict avoidance and resolution. VanIttersum et al. (1998) present a comprehensive reviewof the role of land use studies in solving conflicts overland use. Their analysis applies well to the current sit-uation in Aarsal, where differences in the perceptionof what constitutes sustainable land use among settledfarmers and pastoralists has lead to disagreement onland use. By getting together and participating in theprocess, the stakeholders have achieved a commonperception of land as multifunctional units, and haverealized that any decision must be built on trade-off.However, Van Ittersum et al. (1998), also raise thepertinent issue of the usefulness of land use stud-ies and of their impact in situations where strategicthinking is overcome by day-to-day realities, as is thecase in Aarsal. For instance, the project has helped inidentifying classes II and III land parcels, currentlyunder annual cropping, on which orchard cultivationmay be expanded. Although this shift may result inlarger cash inflows in the short term, the long-termeffects on both the community and the land may bevery damaging. Annual cropping, based on the tradi-tional legume–cereal rotation, is a sustainable, fertilityconserving and pest limiting system, while orchards,practically a monoculture, require large externalinputs. Such a shift would improve the economicsustainability as perceived by the stake holder, whilepotentially endangering the ecological sustainabilityof the farming system.
5. Conclusion
This participatory study was successful in initiatingthe debate on the future land use in Aarsal. The com-munity has gained awareness of the different risks andof the possibilities, while the consequence of variousland use choices were made evident. The database thatwas produced is now available for use by other teamsof researchers, as well as by the community in orderto support and guide local land management efforts.The question remains whether this endeavor is likelyto initiate any significant change in land use on thebehalf of farmers. Genuine interest was expressed bythe farming population in knowing where expansionin the orchards could take place. This was answeredusing what is essentially a classical, simple landcapability evaluation framework which incorporatesindigenous knowledge. This framework, however,overlooks the socioeconomic dimensions of the land,such as land tenure. However, land tenure is the fore-most determinant of land use in Aarsal as in manyother areas, and the decision of where to expand andhow to manage the land greatly depends on the form ofownership. This explains why farmers who have onlyaccess to marginal lands, or whose ownership is tem-porary or illegal will establish new orchards, in spiteof their awareness of land degradation hazards. Thisunderscores the pressing need for a more completeland analysis framework which incorporates landtenure as one of its components.
References
Altieri, M.A., 1992. Where the rhetoric of sustainability ends,agro-ecology begins. Ceres 134, 33–39.
Ashby, A.J., Beltràn, J.A., Guerrero, M.P., Ramos, H.F., 1996.Improving the acceptability to farmers of soil conservationpractices. J. Soil Water Conserv. 51 (4), 309–312.
Bouma, J., Wagenet, R.J., Hoosbeek, M.R., Hutson, J.L., 1993.Using expert systems and simulation modelling for landevaluation at farm level: a case study from New York State.Soil Use Manage. 9 (4), 131–139.
Breimer, R.F., van Kekem, A.J., van Reuler, H., 1986. Guidelinesfor Soil Survey and Land Evaluation in Ecological Research.UNESCO, France.
Briggs, J., Pulford, I.D., Badri, M., Shaheen, A.S., 1998.Indigenous and scientific knowledge: the choice andmanagement of cultivation sites by bedouin in Upper Egypt.Soil Use Manage. 14 (4), 240–245.

262 R. Zurayk et al. / Agriculture, Ecosystems and Environment 86 (2001) 247–262
Burrough, P.A., 1989. Fuzzy mathematical methods for soil surveyand land evaluation. J. Soil Sci. 40, 477–492.
Burrough, P.A., MacMillan, R.A., van Deurser, W., 1992. Fuzzyclassification methods for determining land suitability from soilprofile observations and topography. J. Soil Sci. 43, 193–210.
Bydekerke, L., van Ranst, E., Vanmechelen, L., Groenemans, R.,1998. Land suitability assessment for cherimoya in SouthernEcuador using expert knowledge and GIS. Agric. Ecosyst.Environ. 69 (2), 89–98.
Chambers, R., 1983. Rural Development. Putting the Last First.Longman, London, UK.
Chambers, R., 1994a. Participatory rural appraisal (PRA): analysisof experience. World Dev. 22 (9), 1253–1268.
Chambers, R., 1994b. Participatory rural appraisal (PRA):challenges, potentials, and paradigm. World Dev. 22 (10),1437–1454.
Chow, V.T., Maidment, D.R., Mays, L.W., 1988. AppliedHydrology. McGraw-Hill, New York.
Darwish, T.M., Zurayk, R.A., 1996. Studying, mapping, andclassifying the mountain soils of Lebanon. Second stage: Irsalregion (Bekaa valley). Lebanese National Council for ScientificResearch, Beirut, Lebanon.
Darwish, T.M., Zurayk, R.A., 1997. Distribution and nature of RedMediterranean soils in Lebanon along an altitudinal sequence.Catena 28, 191–202.
Davidson, D.A., 1992. The Evaluation of Land Resources.Longman, London, UK.
Davidson, D.A., Theocharopoulos, S.P., Bloksman, R.J., 1994. Aland evaluation project in Greece using GIS and based onBoolean and fuzzy set methodologies. Int. J. Geogr. Inf. Syst.8, 369–384.
Dent, D., Young, A., 1981. Soil Survey and Land Evaluation.George Allen and Unwin, London, UK.
Dodd, J.L., 1994. Desertification and degradation in sub-SaharanAfrica. The role of livestock. BioScience 44 (1), 28–34.
Gèze, B., 1956. Carte de reconnaissance des sols du Liban.Ministry of Agriculture, Lebanon.
Hamadeh, S.K., 1999. Sustainable improvement of marginal landsin Lebanon: Irsal, a case study. Report to the InternationalDevelopment Research Centre, Canada, American Universityof Beirut, Beirut, Lebanon.
Hammer, R.D., Young, F.J., Wollenhaupt, N.C., Barney, T.L.,Haithcoate, T.W., 1995. Slope class maps from soil survey anddigital elevation models. Soil Sci. Soc. Am. J. 59, 509–519.
Hansen, J.W., Beinroth, F.H., Jones, J.W., 1998. Systems-basedland-use evaluation at the south coast of Puerto Rico. Appl.Eng. Agric. 14 (2), 191–200.
Hudson, N.W., 1981. Soil Conservation. Bastford, UK.Klingebiel, A.A., Montgomery, P.H., 1966. Land capability
classification. USDA Soil Conserv. Serv. Agric. Handbook, 210.Kundiri, A.M., Jarvis, M.G., Bullock, P., 1997. Traditional soil
and land appraisal on fadama lands in northeast Nigeria. SoilUse Manage. 13, 205–208.
Lamouroux, M., 1972. Etude des sols formés sur rochescarbonatées. Pédogenèse fersiallitique au Liban. Office de laRecherche Scientifique et Technique Outre-Mer, Paris, France.
Lanyon, L.E., 1994. Participatory assistance: an alternative totransfer of technology for promoting change on farms. Am. J.Altern. Agric. 9 (3), 136–142.
Moote, M.A., McLaran, M.P., 1997. Viewpoint: implications ofparticipatory democracy for public land planning. J. RangeManage. 50, 473–481.
Pretty, J.N., Shah, P., 1997. Making soil and water conservationsustainable: from coercion and control to partnerships andparticipation. Land Degrad. Dev. 8 (1), 39–58.
Röling, N., 1994. Platforms for decision-making about ecosystems.In: Fresco, L.O., Stroosnijder, L., Bouma, J., van Keulen, H.(Eds.), The Future of the Land: Mobilising and IntegratingKnowledge for Land Use Options. Wiley, Chichester, UK,pp. 385–393.
Sillitoe, P., 1998. Knowing the land: soil and land resourceevaluation and indigenous knowledge. Soil Use Manage. 14 (4),188–193.
Theis, J., Grady, H.M., 1991. Participatory rapid appraisalfor community development: a training manual based onexperiences in the Middle East and North Africa. InternationalInstitute for Environment and Development, London, UK.
Theocharopoulos, S.P., Davidson, D.A., McArthur, J.N.,Tsouloucha, F., 1995. GIS as an aid to soil surveys and landevaluation in Greece. J. Soil Water Conserv. 118–124.
Van Ittersum, M.K., Rabbinge, R., van Latesteijn, H.C., 1998.Exploratory land use studies and their role in strategic policymaking. Agric. Syst. 58 (3), 309–330.
Webber, L.M., Ison, R.L., 1994. Participatory rural appraisaldesign: conceptual and process issues. Agric. Syst. 47107–131.
Zurayk, R.A., 1994. Rehabilitating the ancient terraced lands ofLebanon. J. Soil Water Conserv. 49 (2), 106–112.