Using geographically weighted regression for housing market segmentation
17
Int. J. Business Intelligence and Data Mining, Vol. 9, No. 2, 2014 161 Copyright © 2014 Inderscience Enterprises Ltd. Using geographically weighted regression for housing market segmentation Benedetto Manganelli, Piergiuseppe Pontrandolfi, Antonello Azzato and Beniamino Murgante* School of Engineering, University of Basilicata, 10, Viale dell’Ateneo Lucano, 85100, Potenza, Italy E-mail: [email protected] E-mail: [email protected] E-mail: [email protected] E-mail: [email protected] *Corresponding author Abstract: Urban real estate property values are mainly conditioned by several aspects, which can be summarised in two main classes: intrinsic and extrinsic ones. Intrinsic characters are specific goods while extrinsic features are related to a diversity of goods. Therefore, there is an extremely close correlation between ‘rigidity location’ of property (fixed location) and its value. Possibilities offered by recent developments of statistical techniques, principally geographically weighted regression (GWR), in analysing housing market have given a new impetus in mass appraisal of urban property. More particularly, geographically weighted regression has been adopted in analysing housing market, in order to identify homogeneous areas and to define the marginal contribution that a single location (outlined by these areas) gives to the market value of the property. The model has been built on a sample of 280 data, related to the trades of residential real estate units occurred between 2008 and 2010 in the city of Potenza (Basilicata, southern Italy). The results of territory zoning into homogeneous market areas, in addition to the undoubted usefulness in the field of real estate valuations, has useful implications in terms of taxation, programming territorial transformations and checking ongoing or ex post planning decisions. Keywords: real estate market; urban planning; geographically weighted regression; GWR; spatial autocorrelation; spatial statistics. Reference to this paper should be made as follows: Manganelli, B., Pontrandolfi, P., Azzato, A. and Murgante, B. (2014) ‘Using geographically weighted regression for housing market segmentation’, Int. J. Business Intelligence and Data Mining, Vol. 9, No. 2, pp.161–177. Biographical notes: Benedetto Manganelli is an Associate Professor of Real Estate Appraisal at the University of Basilicata, where he has been since 2007. During 2001–2007, he was a Researcher at the University of Salerno. He received his PhD in the Economic Evaluation of Projects from the University of Reggio Calabria in 2000. His research interests include the analysis of urban land value and housing market dynamics, the development of methods for valuing individual properties and methods for data analysis and mass appraisal.
Transcript of Using geographically weighted regression for housing market segmentation

Int. J. Business Intelligence and Data Mining, Vol. 9, No. 2, 2014 161
Copyright © 2014 Inderscience Enterprises Ltd.
Using geographically weighted regression for housing market segmentation
Benedetto Manganelli, Piergiuseppe Pontrandolfi, Antonello Azzato and Beniamino Murgante* School of Engineering, University of Basilicata, 10, Viale dell’Ateneo Lucano, 85100, Potenza, Italy E-mail: [email protected] E-mail: [email protected] E-mail: [email protected] E-mail: [email protected] *Corresponding author
Abstract: Urban real estate property values are mainly conditioned by several aspects, which can be summarised in two main classes: intrinsic and extrinsic ones. Intrinsic characters are specific goods while extrinsic features are related to a diversity of goods. Therefore, there is an extremely close correlation between ‘rigidity location’ of property (fixed location) and its value. Possibilities offered by recent developments of statistical techniques, principally geographically weighted regression (GWR), in analysing housing market have given a new impetus in mass appraisal of urban property. More particularly, geographically weighted regression has been adopted in analysing housing market, in order to identify homogeneous areas and to define the marginal contribution that a single location (outlined by these areas) gives to the market value of the property. The model has been built on a sample of 280 data, related to the trades of residential real estate units occurred between 2008 and 2010 in the city of Potenza (Basilicata, southern Italy). The results of territory zoning into homogeneous market areas, in addition to the undoubted usefulness in the field of real estate valuations, has useful implications in terms of taxation, programming territorial transformations and checking ongoing or ex post planning decisions.
Keywords: real estate market; urban planning; geographically weighted regression; GWR; spatial autocorrelation; spatial statistics.
Reference to this paper should be made as follows: Manganelli, B., Pontrandolfi, P., Azzato, A. and Murgante, B. (2014) ‘Using geographically weighted regression for housing market segmentation’, Int. J. Business Intelligence and Data Mining, Vol. 9, No. 2, pp.161–177.
Biographical notes: Benedetto Manganelli is an Associate Professor of Real Estate Appraisal at the University of Basilicata, where he has been since 2007. During 2001–2007, he was a Researcher at the University of Salerno. He received his PhD in the Economic Evaluation of Projects from the University of Reggio Calabria in 2000. His research interests include the analysis of urban land value and housing market dynamics, the development of methods for valuing individual properties and methods for data analysis and mass appraisal.
162 B. Manganelli et al.
Piergiuseppe Pontrandolfi is an Associate Professor of Spatial Planning at the University of Basilicata. His research interests are transfer of development rights models, analysis and classification of urban land value and public participation and citizens’ involvement in urban renewal and regeneration processes.
Antonello Azzato is a Research Fellow in urban planning at the University of Basilicata. His research interests are transfer of development rights models, analysis and classification of urban land value and public participation and citizens’ involvement in urban renewal and regeneration processes.
Beniamino Murgante is a Senior Lecturer of Spatial Planning at the University of Basilicata (Southern Italy). He took his PhD in ‘Sciences and methods for European cities and territory’ at the Department of Civil Engineer of the University of Pisa and he carried out other researches in Lyon at the Laboratory for Information System Engineering directed by Robert Laurini. He has published papers and books in the field of spatial analysis, modelling, geocomputation and planning. He is member of scientific committees of several international conferences and he is Chair/co-Chair of several international workshops. He is General co-Chair of the International Conference on Computational Science and its Applications (ICCSA). He is a member of the editorial board of several international journals.
This paper is a revised and expanded version of a paper entitled ‘Using geographically weighted regression for housing market segmentation’ presented at the 13th International Conference on Computational Science and its Applications (ICCSA 2013), Ho Chi Minh City, Vietnam, 24–27 June 2013.
1 Introduction
Goods traded in real estate market are characterised by spatial rigidity, longevity, low substitutability and low capacity to adapt to changes on demand. Consequently, a possible transformation process would be slow and expensive. These factors and a limited availability of data and information influence the choice of analysis method in this market.
The value of urban real estate property is influenced by several factors. Excluding general aspects (macro-economic situation, security profitability, general and real estate taxation, accessibility to credit), all others are classified into two main categories: intrinsic and extrinsic features. While the former ones are specific goods and are positional (e.g., orientation, front), technological or productive, extrinsic characters are related to a diversity of goods, especially in urban areas, where the value function is indifferent to location variable. In other words, in urban areas. the balance between supply and demand is not conditioned by position, because spatial context, in the opinion of market actors, is uniform in terms of infrastructure (accessibility to public services, accessibility to public transport, the presence of basic commercial services, etc.) and environment (social context, absence of noise, building density, clean air, etc.).
Extrinsic features are the determinants of the market price which geographically identify the property (The Institute for Urban Land Use and Housing Studies, Columbia University, 1993).
Using geographically weighted regression for housing market segmentation 163
Therefore, an extremely close correlation between ‘rigidity location’ of property (fixed location) and its value exists.
The decomposition of urban areas in homogeneous zones market is a crucial element for both local authorities and private organisations active in processes of city management and transformation (Goodman and Thibodeau, 2003). This information can be, also, useful for owners and investors in purchasing and selling choices or in other building initiatives.
The definition of a homogeneous market area obviously depends on its specific use (Islam and Asami, 2010).
For mass appraisal purposes of real estate property, a homogeneous area should include only properties that differ only by intrinsic characters, which are specific to the individual property. This increases accuracy of housing estimated values, with the use of statistical models (Bourassa et al., 2003, 2007; Goodman and Thibodeau, 2003; Islam and Asami, 2011) less affected by possible errors related to the correlation between variables. Position effects cause residuals that are spatially correlated and, therefore, violate one of the basic requirements of hedonic prices analysis.
Zoning also allows a better analysis of price dynamics in time and space (Watkins, 2001; Alkay, 2008); it reduces research costs before an investment and, therefore, the risk of the investment itself or its associated financing; it makes more effective and equalises taxation of real estate; finally, it allows a more effective urban planning (Royuela and Duque, 2013; Hu et al., 2012). The most used techniques in segmentation of real estate market employ hedonic price model (Michaels and Smith, 1990; Can, 1992; Adair et al., 1996; Day, 2003; Belasco et al., 2012).
Other techniques have been subsequently tested, in some cases integrating them within the hedonic model: cluster analysis (Bourassa et al., 1999; Wu and Sharma, 2012; Royuela and Duque, 2013), GIS and ESDA analysis (Tu et al., 2007), cointegration analysis (Jones et al., 2003), fuzzy clustering (Hwang and Thill, 2009), non-parametric smoothing and spline functions (Pavlov, 2000), neural networks (Kauko, 2004; Kauko et al., 2002; Manganelli and Murgante, 2012), classification regression trees (Fan et al., 2006), and household mobility patterns (Jones et al., 2004; Royuela and Vargas, 2009).
These studies showed that the size of a homogeneous market area depends on structural factors. The value of an area is dependent on the presence of infrastructures, services and it is influenced by the possibility to enjoy a particular landscape.
On the other hand, this value also reflects the perception of market operators about location, neighbourhood, area where the property is located and inhabitants characteristics, in practice place identity.
Identity is a sociological aspect which may help determining value of soils, but it is not measurable, compared to other extrinsic features. The latter characteristics, unfortunately, do not contain information on the unit of spatial observation.
It may happen that two similar properties, located in neighbourhoods with a comparable level of urbanisation and infrastructure, can have different values.
Social science provides useful guidelines on the concept of places spatial identity and how this identity can influence the demand (Galster, 2001). Unfortunately, these guidelines are not explicitly related to real estate prices. It is therefore necessary to include social as well as spatial heterogeneity as an important element of urban analysis. Studies consolidated in the literature deal with this problem using an exogenous a priori definition of these market segments (Leggett and Bockstael, 2000; McFadden and Train, 2000; Lipscomb and Farmer, 2005).

164 B. Manganelli et al.
The need to take into account elements that are strongly related to the good location, but not measurable even with the use of proxy variables, necessarily involves the use of spatial analysis techniques that are able to process the location variable.
This study aims to formalise and test a procedure, which adopts geographically weighted regression (GWR) in analysing housing market, in order to identify homogeneous areas and to define the marginal contribution that a single location (outlined by these areas) gives to the market value of the property.
Traditional statistical methods, such as multiple regression analysis (MRA), are normally adopted in mass appraisal of real estate property. But often they are ineffective, because the property position is not integrated in the analysis (Gao et al., 2006). In MRA, position effects cause residues that are spatially correlated, infringing one of the basic requirements of the analysis.
In last decades the development of spatial statistical techniques made possible detailed analysis of real estate data, with geographical reference giving a new impetus in mass appraisal of urban property.
In this work GWR has been adopted to locate zones with homogeneous value within urban areas. More particularly, zones of urban areas with homogeneous environmental, structural and positional variables have been defined, excluding variables connected to specificity of property. An attempt to isolate and highlight the phenomenon of urban rent has been developed.
This approach differentiates this work by elaborations already carried out adopting spatial statistical inference in analysing real estate market, where the phenomenon can be analysed in two ways: on the basis of sample data or by means of a random decomposition of space characterised by a predefined grid (Kulczycki and Ligas, 2007) or deductively defined during the first approximation analysis (Manganelli and Murgante, 2012).
2 An overview of GWR
GWR (Casetti, 1972; Jones and Casetti, 1992; Fotheringham et al., 1996, 1997, 2002; Brunsdon et al., 1996) is a method which allows to analyse how a phenomenon spatially changes within a particularly place. Starting from Tobler (1970) first law of geography “everything is related to everything else, but near things are more related than distant things”, GWR can be considered as a spatial extension of multiple linear regression. GWR is not limited to global parameters, but it considers also local parameters. Also, the mathematical formulation is very similar to the typical regression analysis [equations (1), (2)].
0 1 1 2 2 with 1i i i m mi iy x x x ε i n= + + + + + =… …β β β β (1)
where
yi dependent variable
xi independent (also the term explanatory is adopted) variables
β0 coefficients (sometimes the term parameters is used) expressing the relationship between dependent and independent variables

Using geographically weighted regression for housing market segmentation 165
εi residuals, i.e., the part of dependent variable not explained in the model.
( ) ( ) ( ) ( )0 1 1 2 2, , , ,i i i i i i i i i m i i mi iy u v u v x u v x u v x ε= + + + + +…β β β β (2)
In GWR the term (ui, vi) is also considered, which represents coordinates of point i in the space.
It is possible to have positive or negative relationships between dependent and independent variables: according to the kind of relationship, a sign (+/–) is associated to the coefficients.
In order to model in the best way the phenomenon to be investigated it is fundamental to define all factors which may influence the analyses. The central point is to find the main variables in phenomenon modelling, defining the dependent variable and identifying the possible independent variables. It is also important, before analysing data with GWR, to test with ordinary least squares the possible independent variables to adopt.
Two main measures of ordinary least squares are useful in understanding if the variables adopted in the analysis are meaningful: r2 or adjusted r2 and Akaike. r2 results are generally included between 0 and 1. A better predictive performance has been highlighted by values close to 1. Akaike information criterion (AIC) (Hurvich et al., 1998; Akaike, 1973) has not an absolute scale of measure, but it is useful in comparing two models, with the same dependent variable, in order to assess which of them fits better the phenomenon. Smaller values of the AIC indicate a better simulation, if the difference is not big, less than 3, two models can be considered equivalent.
Another important check in model performance concerns residuals. It is fundamental to analyse that spatial dependence does not occur in residuals, verifying a random spatial distribution. Residuals have to be analysed by Moran Index I. Moran Index I (Moran, 1948) is a global measure of spatial autocorrelation and its values can be included between –1 and 1. If Moran Index I is close to zero data are randomly distributed, if the term is higher than zero, autocorrelation is positive, otherwise it is negative.
Regression coefficients are estimated using nearby feature values. Consequently, main parameters are kernel and bandwidth which provide a definition of nearby.
There are two kinds of kernel, fixed and adaptive: the first one defines nearby according to determined fixed distance band; while adaptive kind defines nearby according to determined number of neighbours.
Fixed kernel is adopted if observation points are regularly located, otherwise, if observation points are clustered, adaptive kernel is more suitable.
Bandwidth controls the size of kernel and can be defined in three ways: directly by the analyst (it is possible to directly define distance or neighbours number), by means of AICc method, which minimises AIC, or by using CV, which minimises the cross validation score.
3 The model structure
The model is built on a sample of 280 data, related to the trades of residential real estate units occurred between 2008 and 2010 in the city of Potenza (Basilicata, southern Italy).

166 B. Manganelli et al.
Figure 1 Study area and location of 280 sample data in Potenza municipality (elaboration based on OpenStreetMap) (see online version for colours)
The 280 data used in this study were selected from a database of approximately 650 prices found in documents registered at ‘Agenzia delle Entrate’, a branch of the Italian Ministry of Economy and Finance, which includes the territorial agency. The Agency provided, for each transaction, trading act details (date and price), cadastral data of property, cadastral area and details about area (i.e., distinguishing residential use and different types of outbuildings).
The opportunity of having a so large database in Italy, is the consequence of Law N. 266 of 2005 (2006 Budget Law) which produced a more transparent market in residential property trading between privates. This changed perspective could also allow the repetition in time of the procedure developed in this paper for the analysis of housing market dynamics in order to verify the efficiency of planning decisions (e.g., urban regeneration programs).
The static nature of buildings contrasts with the relative mobility determined by socio-economic context change or the variation of city dimensions. To properties with known price, a measure of a series of independent variables, useful to describe qualitative and quantitative features of flats and buildings, has been associated.
First results and elaborations of statistical tests suggested to exclude some variables from the model. Other tests have suggested the aggregation of some parameters. Ancillary dwelling units have been summed to residential areas adopting weighting coefficients that express an ordinary commercial relationship. Even the period of construction has been aggregated to last year restructuring. Other variables included in the function of the price were outdoor common areas, parking areas and presence of elevators.

Using geographically weighted regression for housing market segmentation 167
4 Results
The five variables illustrated in the previous chapter have been tested using ordinary least squares in order to understand in which measure they are reliable.
More particularly r2 was 0.47 and AIC was 7,065. Ordinary least squares results were useful for residual spatial distribution (Table 1).
Figure 2 Spatial distribution of standardised residual values (see online version for colours)
Table 1 Main statistical indicators with six variables
Number of observations: 280 Number of variables: 6 – price (dependent), areas, year of construction (restructuring), outdoor common areas, parking areas, presence of elevators. Ordinary least squares GWR AIC 7,065.671937 7,061.97172458772 Multiple R-squared 0.473717 0.6398887212743609 Adjusted R-squared 0.464113 0.5413448055700345
A first summary assessment can be made looking at location standardised residual values (Figure 2) and it is noticeable that spatial distribution of residuals is completely random.

168 B. Manganelli et al.
More particularly, standardised values of residuals, calculated by means of ordinary least squares, have been used as input data in calculating spatial autocorrelation, in order to understand if residuals were autocorrelated or not.
Spatial autocorrelation has been calculated adopting Moran scatter plot and considering standardised variables of residuals as abscissa and spatial weighted standardised variable of residuals as ordinate. In the graph, Moran Index corresponds to direction coefficient of linear regression, which represents the scatter plot. Positive autocorrelation corresponds to spatial clusters in upper right and lower left quadrants. Lower right and upper left quadrants can be classified as spatial outliers (Hsieh, 2012; Murgante and Rotondo, 2012).
Figure 3 shows that the slope of Moran Index is equal to zero coinciding with abscissas axis.
Figure 3 Moran scatter plot of residuals standardised variable (see online version for colours)
As expected GWR results are better than those achieved with OLS: namely, r2 was 0.64 and AIC was 7,061 (Table 1).
From GWR, many different price functions ensue for each geographical location of initial data, obtaining also different coefficients of explanatory variables functions. These coefficients represent the implicit marginal prices, or, in other words, the marginal contribution that each selected variable provides to price explanation.
Including only intrinsic features in the function, allows us to say that values of the coefficient related to the area reflect only effects of localisation.
It may have occurred that residential units with identical building features have been traded in different parts of the city. In this condition the difference relative to the equilibrium price is an expression of urban rent. In particular, it is an expression of rent rate defined as differential. Differential rent depends on land position occupied in urban aggregation and it is distinguished from absolute rent, more dynamic, which is mainly a function of resource scarcity compared to demand. Absolute rent is determined by the

Using geographically weighted regression for housing market segmentation 169
planning choice or, simply, by the presumption of market actors about the future planned development.
Urban land rent is a value that belongs to land owner and not to entrepreneur investing his capital in the transformation process (Manganelli, 2013). It is therefore a distinctive feature of the area. According to this consideration, in this work the delimitation of homogeneous urban market areas is attributed to the exiting difference in land rent. Values ranges adopted in identifying and classifying different homogeneous urban areas (Figures 4 and 5) have been chosen using the guidelines provided by the Decree of the President of Italian Republic (D.P.R. 138/98) “Rules for the review of census areas and valuation prices executing Law 662/96”.
Known the minimum and the maximum value of marginal implicit price of the area variable (Figures 4 and 5), the corresponding interval has been classified according to the following rules:
• within each class, the ratio between maximum and minimum market values (square metre) is not higher than two
• percent deviation between mean values (square metre) of each class of property units in two adjacent areas is not less than 30%.
Figure 4 Classification of area variable coefficient of 280 sample data according to D.P.R.138/98 (see online version for colours)
170 B. Manganelli et al.
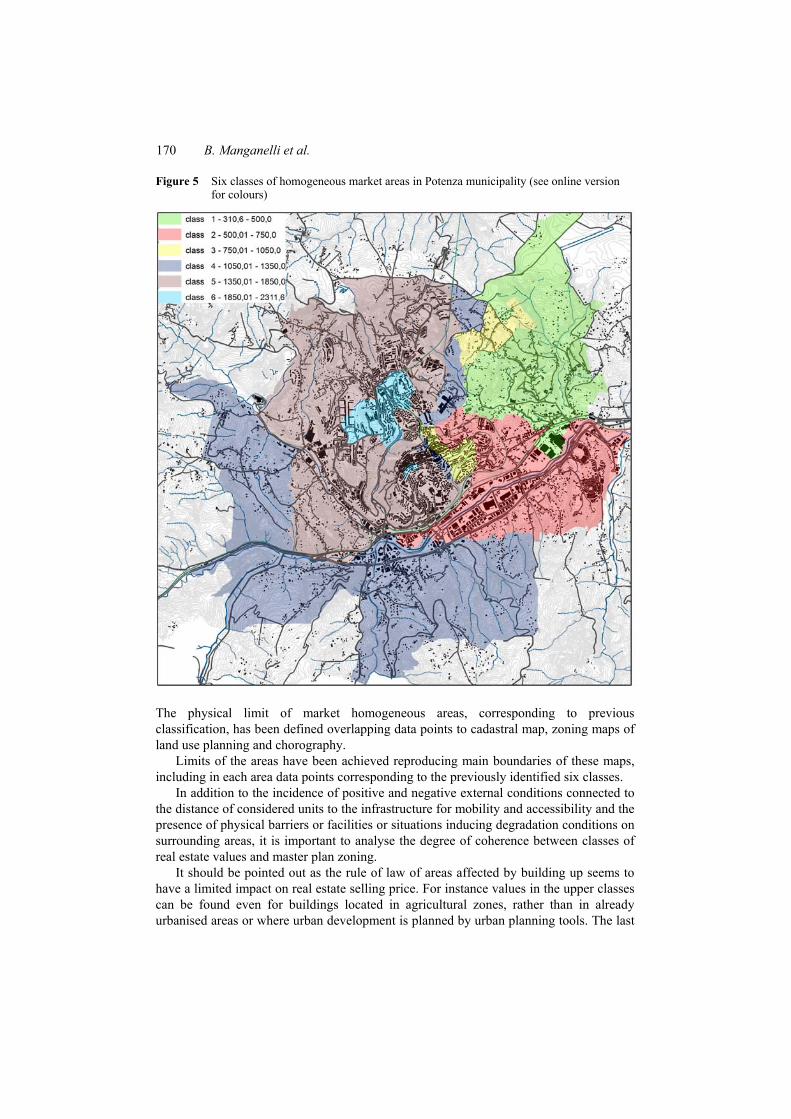
Figure 5 Six classes of homogeneous market areas in Potenza municipality (see online version for colours)
The physical limit of market homogeneous areas, corresponding to previous classification, has been defined overlapping data points to cadastral map, zoning maps of land use planning and chorography.
Limits of the areas have been achieved reproducing main boundaries of these maps, including in each area data points corresponding to the previously identified six classes.
In addition to the incidence of positive and negative external conditions connected to the distance of considered units to the infrastructure for mobility and accessibility and the presence of physical barriers or facilities or situations inducing degradation conditions on surrounding areas, it is important to analyse the degree of coherence between classes of real estate values and master plan zoning.
It should be pointed out as the rule of law of areas affected by building up seems to have a limited impact on real estate selling price. For instance values in the upper classes can be found even for buildings located in agricultural zones, rather than in already urbanised areas or where urban development is planned by urban planning tools. The last

Using geographically weighted regression for housing market segmentation 171
case can be due to amnesties for infringement of building regulations of most of the constructions realised in the past for urban uses in agricultural zones and to a particular interest received, in relation to housing demand, in past periods by the settlement pattern of isolated houses. This situation is particularly true in areas located in the western part of the town. The price of housing in areas marginal to urban environment is influenced by the proximity and accessibility to areas with services and facilities.
The ancient part of the city does not seem to be affected by significantly higher values than in neighbouring areas; values of properties situated in the western part of the old town have the same classification of modern neighbourhoods in peri-urban areas located in north-western zone of the city. Homogeneity of real estate values found in this large area can be explained by the decentralisation of functions and services from Old Town to areas located in the western part of the city. Within the Old Town there are different conditions. In particular, the eastern part falls into a class of significantly lower values, which includes the social housing neighbourhoods placed in the south-eastern part of the city and close to the Old Town.
A strong coherence between real estate values, significantly lower, and urban planning zones can be found in external zones of the south-eastern part of the city, characterised by the presence of an industrial area, the cemetery and infrastructures such as two railway lines, which represent a physical barrier to urbanisation continuity. The eastern part of the city, despite its proximity to the main regional hospital and the University, achieves significantly lower real estate values because of a scattered and unorganised residential settlement. In particular, in this area, extending from the rural zone to part of the urban area, the lowest real estate values have been found.
The highest property values have been found in an area located in the northern part of the city, developed in the middle of last century, in a zone with an urban continuity with the oldest part of the town. In particular, highest values are concentrated in two social housing neighbourhoods with a good level of services and highly integrated with the remaining part of the city. In these neighbourhoods real estate values are significantly higher despite these areas are usually affected by traffic congestion.
Results of this processing have been verified running a new GWR elaboration, considering other variables related to building location. Such parameters have been defined on the basis of hypotheses formulated in a deductive way, to identify market homogeneous areas. Proximity of a property to urban elements, such as infrastructures, facilities, services or natural elements with environmental value, leads to a possible value increase (e.g., proximity to park, healthcare facility, railway station, university campus, etc.) or, in some cases, to a probable depreciation (e.g., proximity to road junctions, environmental pollution sources or noise generators).
The measure of these real estate advantages (or disadvantages) generated by the presence in the proximity of a natural or anthropic element is measured by geographical distance.
However, when market assigns an advantage to the property in relation to the possibility of direct use of an urban element, walking (travel) time defines the proximity to this element. The walking (travel) time is obviously closely related to roads, and to the presence of anthropic or natural barriers (e.g., a railway, a cliff, a river).
Consequently, all resources and possible sources of differentials value in property residential use have been located in a GIS platform.

172 B. Manganelli et al.
Table 2 Main statistical indicators with ten variables
Number of observations: 280
Number of variables: 10 – price (dependent), areas, year of construction (restructuring), outdoor common areas, parking areas, presence of elevators, proximity to education, proximity to elevators (escalators), proximity to road junctions, proximity to cemeteries. Ordinary least squares GWR AIC 7,061.691576 7,064.447187383407 Multiple R-squared 0.495760 0.5090279296599384 Adjusted R-squared 0.478952 0.4819957053077123
These elements constitute the centre of isochrones that are traced starting from several geographic information:
1 the road network
2 the presence of barriers in connections between urban areas
3 the presence of interruptions to these barriers (e.g., pedestrian paths, elevators, escalators, etc.)
4 pedestrian travel times.
Time ranges have been defined and isochrones have been calculated according to the different travel times needed to reach the previously defined element. The weighted overlap of all isochrones for the same element category allowed us to assign a rate for each extrinsic feature reference to each property.
Figure 6 Isochrones of travel time to equipment for education and to elevators or escalators (see online version for colours)
Also for this elaboration, preliminary statistical tests led to the selection of the most significant variables and the final calibration of the model.

Using geographically weighted regression for housing market segmentation 173
The new variables included were: proximity to equipment for education, proximity to elevators or escalators, proximity to road junctions, proximity to cemeteries.
The new elaboration provided an implicit verification of the previously achieved zoning. In fact, it reduces variability range of implicit marginal price to a percentage, measured on the average value of the same interval, of approximately 8% (min. €/m2 1,286, max €/m2 1,400).
The introduction of the new variables actually made negligible differences in marginal prices values of the area. The new variables can almost completely explain the phenomenon of differential rent.
Figure 7 GWR coefficients of new variables (see online version for colours)
Coefficients of these variables help to understand their relative weight. It is obvious that the phenomenon of urban differential rent does not depend only on them, but can be a valid approximation.
5 Conclusions
Spatial heterogeneity is a factor that makes fallible an already complex process of real estate assessment. The development of statistical techniques, such as GWR has given a new impetus in mass appraisal of urban property and in analysing real estate market.

174 B. Manganelli et al.
The implemented procedure adopts GWR in order to analyse the value of urban land for residential use and to define market homogeneous areas. The subdivision of the urban territory in homogeneous market areas is useful both for predictive purposes and interpretation of actual mechanism of making real estate values.
Territory zoning in homogeneous areas can be a good support in planning process and it can also be conducted with both compensatory tools and transfer of development rights (Manganelli, 2010) for fiscal purposes and investment location choices. The model presented in this paper, if applied repeatedly over time can highlight dynamics of city development. It also allows to balance possible previous wrong choices or to contrast undesirable imbalances in urban fabric (Murgante et al., 2012).
The results of territory zoning into homogeneous market areas, in addition to the undoubted usefulness in the field of real estate valuations, has useful implications in terms of taxation, programming territorial transformations and checking ongoing or ex post planning decisions (Murgante and Danese, 2011).
The experimentation highlights the benefits achieved with the use of the model and the consistency of the results in real estate market conditions. The model also allows a perfect adaptability of real estate market to territory transformation and its related dynamics. The definition of a model such as the one presented in this paper, if repeatedly applied over time, is able to highlight dynamics of city development. Despite an extensive literature analysis on structure and function of urban real estate markets, the analysis of temporal stability of submarkets is quite rare (Jones et al., 2003; Ling and Hui 2013).
Future developments of this research will analyse the dynamics of city zoning in order to understand evolution of the urban structure. This can allow planners and city managers to contrast undesirable imbalances in urban fabric adopting careful planning policies.
Spatial zoning, generated by mechanisms capable of adapting results to territorial transformations and market dynamics, contributes to the creation of a tax system able to update the rent to be taxed in a quickly and equalised way.
Acknowledgements
The authors would like to thank ‘Agenzia delle Entrate’ agency of Potenza, a branch of the Italian Ministry of Economy and Finance for providing data analysed in this paper.
References Adair, A.S., Berry, J.N. and McGreal, W.S. (1996) ‘Hedonic modeling, housing submarkets and
residential valuation’, Journal of Property Research, Vol. 13, No. 1, pp.67–83. Akaike, H. (1973) ‘Information theory and an extension of the maximum likelihood principle’, in
Petrov, B. and Csaki, F. (Eds.): 2nd Symposium on Information Theory, Budapest, Akadé miai Kiadó, pp.267–281.
Alkay, E. (2008) ‘Housing submarkets in Istanbul’, International Real Estate Review, Vol. 11, No. 1, pp.113–127, Asian Real Estate Society.
Belasco, E., Farmer, M.C. and Lipscomb, C.A. (2012) ‘Using a finite mixture model of heterogeneous households to delineate housing submarkets’, JRER, Vol. 34, No. 4, pp.577–594.
Using geographically weighted regression for housing market segmentation 175
Bourassa, S.C., Cantoni, E. and Hoesli, M. (2007) ‘Spatial dependence, housing submarkets, and house prices’, Journal of Real Estate Finance and Economics, Vol. 35, No. 2, pp.143–160.
Bourassa, S.C., Hamelink, F., Hoesli, M. and MacGregor, B.D. (1999) ‘Defining housing submarkets’, Journal of Housing Economics, Vol. 8, No. 2, pp.160–183.
Bourassa, S.C., Hoesli, M. and Peng, V.S. (2003) ‘Do housing submarkets really matter?’, Journal of Housing Economics, Vol. 12, No. 1, pp.12–28.
Brunsdon, C., Fotheringham, A.S. and Charlton, M. (1996) ‘Geographically weighted regression: a method for exploring spatial non-stationarity’, Geographical Analysis, Vol. 28, No. 4, pp.281–298
Can, A. (1992) ‘Specification and estimation of hedonic housing price models’, Regional Science and Urban Economics, Vol. 22, No. 3, pp.453–474.
Casetti, E. (1972) ‘Generating models by the expansion method: applications to geographic research’, Geographical Analysis, Vol. 4, No. 1, pp.81–91.
Day, B. (2003) Submarket Identification in Property Markets: A Hedonic Housing Price Model for Glasgow, CSERGE Working Paper EDM 03-09.
Fan, G.Z., Ong, S.E. and Koh, H.C. (2006) ‘Determinants of house price: a decision tree approach’, Urban Studies, Vol. 43, No. 12, pp.2301–2316.
Fotheringham, A.S., Brunsdon, C. and Charlton, M. (1996) ‘The geography of parameter space: an investigation of spatial non-stationarity’, International Journal of Geographical Information Systems, Vol. 10, No. 5, pp.605–627.
Fotheringham, A.S., Brunsdon, C. and Charlton, M. (2002) Geographically Weighted Regression: the Analysis of Spatially Varying Relationships, Wiley, Chichester.
Fotheringham, A.S., Charlton, M. and Brunsdon, C. (1997) ‘Two techniques for exploring non-stationarity in geographical data’, Geographical Systems, Vol. 4, pp.59–82.
Galster, G. (2001) ‘On the nature of neighbourhood’, Urban Studies, Vol. 38, No. 12, pp.2111–2124.
Gao, X., Asami, Y. and Chung, C.F. (2006) ‘An empirical evaluation of spatial regression models’, Computers & Geosciences, Vol. 32, No. 8, pp.1040–1051.
Goodman, A.C. and Thibodeau, T.T. (2003) ‘Housing market segmentation and hedonic prediction accuracy’, Journal of Housing Economics, Vol. 12, No. 3, pp.181–201.
Hsieh, B.M. (2012) ‘A study on spatial dependence of housing prices and housing submarkets in Tainan Metropolis, Taiwan, Territorio Italia – land administration, Cadastre’, Real Estate, June, Vol. 2, No. 1, pp.9–22.
Hu, S., Cheng, Q., Wang, L. and Xie, Q. (2012) ‘Multifractal characterization of urban residential land price in space and time’, Applied Geography, May, Vol. 34, pp.161–170.
Hurvich, C.M., Simonoff, J.S. and Tsai, C-L. (1998) ‘Smoothing parameter selection in nonparametric regression using an improved Akaike information criterion’, Journal of Royal Statistical Society, Series B, Vol. 60, No. 2, pp.271–293.
Hwang, S. and Thill, J.C. (2009) ‘Delineating urban housing submarkets with fuzzy clustering’, Environment and Planning B – Planning & Design, Vol. 36, No. 5, pp.865–882.
Islam, K.S. and Asami, Y. (2010) ‘Housing market segmentation: a review’, Review of Urban and Regional Development Studies, Vol. 21, Nos. 2–3, pp.93–109.
Islam, K.S. and Asami, Y. (2011) ‘Addressing structural instability in housing market segmentation of the used houses of Tokyo, Japan’, Procedia – Social and Behavioral Sciences, Vol. 21, pp.33–42.
Jones, C., Leishman, C. and Watkins, C. (2003) ‘Structural change in a local urban housing market’, Environment and Planning A, Vol. 35, No. 7, pp.1315–1326.
Jones, C., Leishman, C. and Watkins, C. (2004) ‘Intra-urban migration and housing submarkets: theory and evidence’, Housing Studies, Vol. 19, No. 2, pp.269–283.
Jones, J.P. and Casetti, E. (1992) Applications of the Expansion Method, Routledge, London.
176 B. Manganelli et al.
Kauko, T. (2004) ‘A comparative perspective on urban spatial housing market structure: some more evidence of local sub-markets based on a neural network classification of Amsterdam’, Urban Studies, Vol. 41, No. 13, pp.2555–2579.
Kauko, T., Hooimeijer, P. and Hakfoort, J. (2002) ‘Capturing housing market segmentation: an alternative approach based on neural network modelling’, Housing Studies, Vol. 17, No. 6, pp.875–894.
Kulczycki, M. and Ligas, M. (2007) ‘Spatial statistics for real estate data, strategic integration of surveying services’, FIG Working Week, Hong Kong SAR, China, 13–17 May 2007.
Leggett, C. and Bockstael, N.E. (2000) ‘Evidence of the effects of water quality on residential land prices’, J. Environ. Econ. Manage., Vol. 39, No. 2, pp.121–144.
Ling, Z. and Hui, E.C.M. (2013) ‘Structural change in housing submarkets in burgeoning real estate market: a case of Hangzhou, China’, Habitat International, July, Vol. 39, pp.214–223.
Lipscomb, C.A. and Farmer, M.C. (2005) ‘Household diversity and market segmentation within a single neighborhood’, Ann. Reg. Sci., Vol. 39, No. 4, pp.791–810.
Manganelli, B. (2010) ‘Stime e valutazioni economiche nella perequazione urbanistica’, in Las Casas, G., Pontrandolfi, P. and Murgante, B. (Eds.): Informatica e Pianificazione Urbana e Territoriale, Vol. 3, pp.173–188, Melfi(PZ): Libria, ISBN: 9788896067475.
Manganelli, B. (2013) ‘Maintenance, building depreciation and land rent’, Applied Mechanics and Materials, Vols. 357–360, pp.2207–2214.
Manganelli, B. and Murgante, B. (2012) ‘Spatial analysis and statistics for zoning of urban areas’, World Academy of Science, Engineering and Technology, Vol. 6, No. 11, pp.98–102.
McFadden, D. and Train, K. (2000) ‘Mixed MNL models for discrete response’, J. Appl. Econ., Vol. 15, No. 5, pp.447–470.
Michaels, R. and Smith, V.K. (1990) ‘Market segmentation and valuing amenities with hedonic models: the case of hazardous waste sites’, Journal of Urban Economics, Vol. 28, No. 2, pp.223–242.
Moran, P. (1948) ‘The interpretation of statistical maps’, Journal of the Royal Statistical Society, Vol. 10, No. 2, pp.243–251.
Murgante, B. and Danese, M. (2011) ‘Urban versus rural: the decrease of agricultural areas and the development of urban zones analyzed with spatial statistics’, International Journal of Agricultural and Environmental Information Systems (IJAEIS), Vol. 2, No. 2, pp.16–28, IGI Global, ISSN 1947-3192, DOI: 10.4018/jaeis.2011070102.
Murgante, B. and Rotondo, F. (2012) ‘A geostatistical approach to measure shrinking cities: the case of Taranto’, in Montrone, S. and Perchinunno, P. (Eds.): Statistical Methods for Spatial Planning and Monitoring, pp.119–142, Contributions to Statistics, Vol. 158, Springer-Verlag, Berlin, DOI: 10.1007/978-88-470-2751-0_6.
Murgante, B., Las Casas, G. and Danese, M. (2012) ‘Analyzing neighbourhoods suitable for urban renewal programs with autocorrelation techniques’, in Burian, J. (Ed.): Advances in Spatial Planning, InTech – Open Access, DOI: 10.5772/33747, ISBN:978-953-51-0377-6.
Pavlov, A.D. (2000) ‘Space-varying regression coefficients: a semi-parametric approach applied to real estate markets’, Real Estate Economics, Vol. 28, No. 2, pp.249–283.
Royuela, V. and Duque, J.C. (2013) ‘HouSI: heuristic for delimitation of housing submarkets and price homogeneous areas’, Computers, Environment and Urban Systems, Vol. 37, No. 1, pp.59–69.
Royuela, V. and Vargas, M. (2009) ‘Defining housing market areas using commuting and migration algorithms. Catalonia (Spain) as an applied case study’, Urban Studies, Vol. 46, No. 11, pp.2381–2398.
The Institute for Urban Land Use and Housing Studies, Columbia University (1993) Housing Market Analysis: A Study of Theory and Methods, Housing and Home Finance Agency, Washington, DC.
Tobler, W. (1970) ‘A computer movie simulating urban growth in the Detroit region’, Economic Geography, Vol. 46, No. 2, pp.234–240.

Using geographically weighted regression for housing market segmentation 177
Tu, Y., Sun, H. and Yu, S.M. (2007) ‘Spatial autocorrelations and urban housing market segmentation’, Journal of Real Estate Finance and Economics, Vol. 34, No. 3, pp.385–406.
Watkins, C.A. (2001) ‘The definition and identification of housing submarkets’, Environment and Planning A, Vol. 33, No. 12, pp.2235–2253.
Wu, C. and Sharma, R. (2012) ‘Housing submarket classification: the role of spatial contiguity’, Applied Geography, Vol. 32, No. 2, pp.746–756.