Mainly continental Miocene and Pliocene deposits from Lower Tagus and Mondego Tertiary basins.
Upload
independentCategory
view
4download
0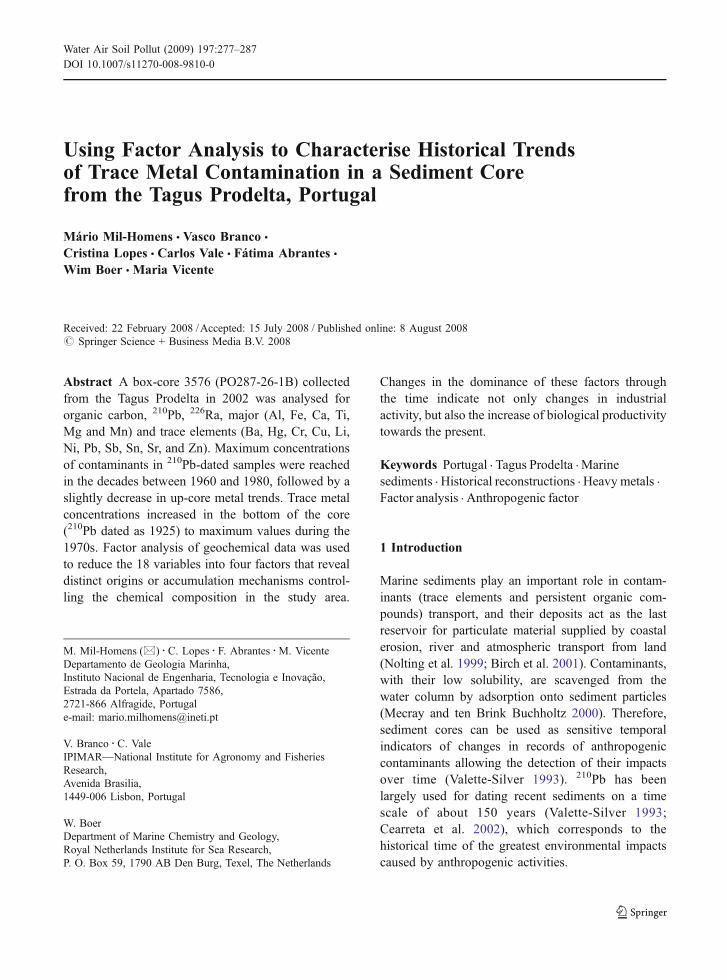
Using Factor Analysis to Characterise Historical Trendsof Trace Metal Contamination in a Sediment Corefrom the Tagus Prodelta, Portugal
Mário Mil-Homens & Vasco Branco &
Cristina Lopes & Carlos Vale & Fátima Abrantes &
Wim Boer & Maria Vicente
Received: 22 February 2008 /Accepted: 15 July 2008 / Published online: 8 August 2008# Springer Science + Business Media B.V. 2008
Abstract A box-core 3576 (PO287-26-1B) collectedfrom the Tagus Prodelta in 2002 was analysed fororganic carbon, 210Pb, 226Ra, major (Al, Fe, Ca, Ti,Mg and Mn) and trace elements (Ba, Hg, Cr, Cu, Li,Ni, Pb, Sb, Sn, Sr, and Zn). Maximum concentrationsof contaminants in 210Pb-dated samples were reachedin the decades between 1960 and 1980, followed by aslightly decrease in up-core metal trends. Trace metalconcentrations increased in the bottom of the core(210Pb dated as 1925) to maximum values during the1970s. Factor analysis of geochemical data was usedto reduce the 18 variables into four factors that revealdistinct origins or accumulation mechanisms control-ling the chemical composition in the study area.
Changes in the dominance of these factors throughthe time indicate not only changes in industrialactivity, but also the increase of biological productivitytowards the present.
Keywords Portugal . Tagus Prodelta .Marinesediments . Historical reconstructions . Heavy metals .
Factor analysis . Anthropogenic factor
1 Introduction
Marine sediments play an important role in contam-inants (trace elements and persistent organic com-pounds) transport, and their deposits act as the lastreservoir for particulate material supplied by coastalerosion, river and atmospheric transport from land(Nolting et al. 1999; Birch et al. 2001). Contaminants,with their low solubility, are scavenged from thewater column by adsorption onto sediment particles(Mecray and ten Brink Buchholtz 2000). Therefore,sediment cores can be used as sensitive temporalindicators of changes in records of anthropogeniccontaminants allowing the detection of their impactsover time (Valette-Silver 1993). 210Pb has beenlargely used for dating recent sediments on a timescale of about 150 years (Valette-Silver 1993;Cearreta et al. 2002), which corresponds to thehistorical time of the greatest environmental impactscaused by anthropogenic activities.
Water Air Soil Pollut (2009) 197:277–287DOI 10.1007/s11270-008-9810-0
M. Mil-Homens (*) :C. Lopes : F. Abrantes :M. VicenteDepartamento de Geologia Marinha,Instituto Nacional de Engenharia, Tecnologia e Inovação,Estrada da Portela, Apartado 7586,2721-866 Alfragide, Portugale-mail: [email protected]
V. Branco : C. ValeIPIMAR—National Institute for Agronomy and FisheriesResearch,Avenida Brasilia,1449-006 Lisbon, Portugal
W. BoerDepartment of Marine Chemistry and Geology,Royal Netherlands Institute for Sea Research,P. O. Box 59, 1790 AB Den Burg, Texel, The Netherlands
Despite previous works have identified the occur-rence of significant anthropogenic enrichments in theTagus estuary (Figuères et al. 1985; Vale 1990;Caçador et al. 1996; Araújo et al. 1998; Canárioet al. 2003, 2005), the relative scarce informationconcerning temporal variations in trace metal contentsin the Tagus Prodelta motivates the present paper.Factor analysis (R-mode) was used in order tosimplify our geochemical dataset by finding correla-tions among variables and, therefore, allowing thereduction of their original number (18) to a fewfactors that are able to explain the variability in theoriginal dataset.
2 Materials and Methods
2.1 Site Description
The conjunction of large river sediment input andwater supply derived from the Tagus River, withfavourable hydrodynamic and environmental condi-tions, allows the formation of fine-grained shelf
deposits, such as the Tagus Prodelta, belonging to thedeltaic system identified by Vanney and Mougenot(1981). This depositional area receives the impact ofboth natural and anthropogenic inputs from the TagusEstuary. Furthermore, marine contributions resultingfrom local marine biological productivity are alsoexpected (Moita et al. 2003; Cabeçadas and Oliveira2005). The Tagus River has one of the largest estuariesin Europe with an area of 320 km2 and a relativelynarrow river mouth (c.a. 2.5 km). In addition, it has ahigh demographic density (ca. 2.5 million of persons)and it is highly contaminated by industrial activities(e.g. chloralkali plant, pyrite roasting plant, smelter,shipyards) since the 1940s.
2.2 Sample Collection
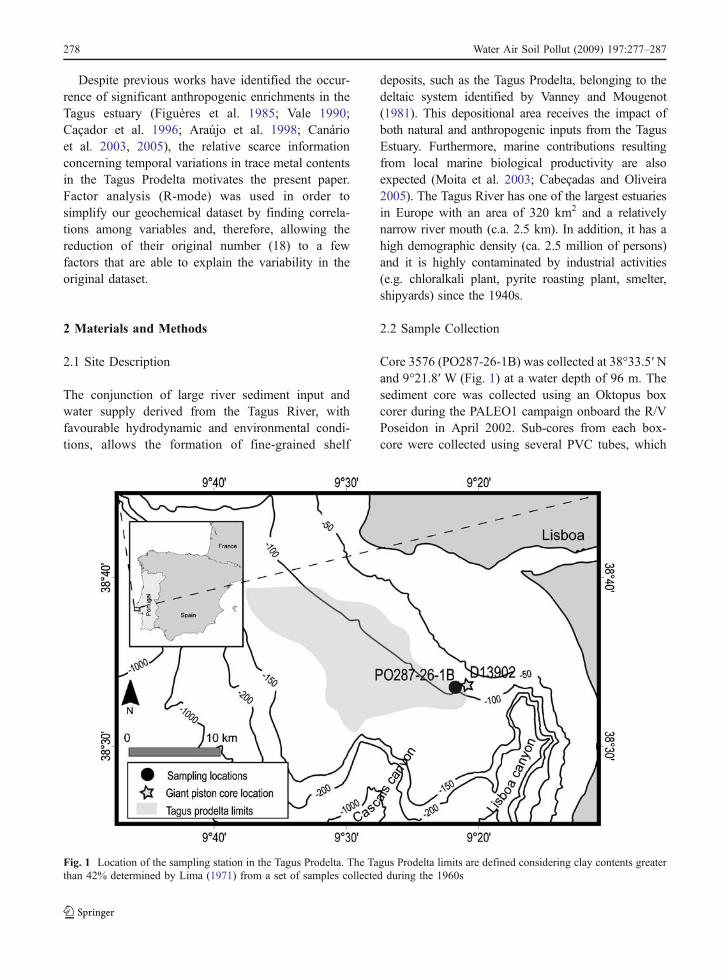
Core 3576 (PO287-26-1B) was collected at 38°33.5′ Nand 9°21.8′ W (Fig. 1) at a water depth of 96 m. Thesediment core was collected using an Oktopus boxcorer during the PALEO1 campaign onboard the R/VPoseidon in April 2002. Sub-cores from each box-core were collected using several PVC tubes, which
Fig. 1 Location of the sampling station in the Tagus Prodelta. The Tagus Prodelta limits are defined considering clay contents greaterthan 42% determined by Lima (1971) from a set of samples collected during the 1960s
278 Water Air Soil Pollut (2009) 197:277–287
were pressed into the sediment. Each tube wassectioned onboard into 1 cm horizontal slices andthe sediment samples kept refrigerated (ca. 2°C).
2.3 Sediment Core Dating
The age model of the box-core 3576 (PO287-26-1B)was based on 210Pb measurements using 18 samplesper core. 210Pb's granddaughter 210Po was measuredindirectly with α-spectrometry. Polonium isotopeswere deposited onto silver after an extraction of210Po from oven-dried and ground sediment withconcentrated HCl. 210Pb (22.3 year half-life) is aradionuclide occurring naturally with a constantatmospheric source and is removed from the watercolumn by adsorption onto settling particulate matter(van Weering et al. 2002). The sediment accumulationrates were determined using the excess 210Pb values,which is equivalent to the total 210Pb activity minusthe supported 210Pb activity that is in equilibrium withsedimentary 226Ra. Given that, 210Pb values did notreach the stable background, supported 210Pb activity(31.4 Bq/kg) was obtained from the measurement of226Ra activity in four deeper samples of piston coreD13902 collected nearby core 3576 (Fig. 1). Two ofthese four samples were dated by accelerator massspectrometry (AMS) 14C as 92±39 BP and 760±45 BP (Abrantes et al. 2005).
2.4 Total and Inorganic Carbon Analysis
Weight percents of total carbon in the fraction <2 mmwere determined in 2 mg of dried ground andhomogenised sediment with a Leco CHNS 932element analyser. Total inorganic carbon was obtainedafter combustion of the organic carbon for 8 hthrough a predefined three stepwise increase intemperature up to 400°C by the same equipment.Organic carbon contents were obtained by thedifference between total and inorganic carbon. Therelative precision of two repeated measurements ofboth samples and standards was 0.03 wt.%.
2.5 Major and Trace Element Analyses
Major and trace element (except Hg) were determinedin the fraction <2 mm by ICP-MS (InductivelyCoupled Plasma—Mass Spectrometer) after total aciddigestion using HNO3, HF, HClO4 and HCl of 0.25 g
of dried and ground sample. Mercury was determinedby atomic absorption spectrometry using a silicon UVdiode detector Leco AMA-254, after pyrolisys of eachsample (approximately 0.1 g) in a combustion tube at750°C under an oxygen-rich atmosphere and collec-tion on a gold amalgamator following the proceduredescribed by Costley et al. (2000). Concentrations ofmajor (Al, Fe, Ca, Ti, Mg and Mn) and trace elements(Ba, Cr, Cu, Hg, Li, Ni, Pb, Sb, Sn, Sr, and Zn) werereported in weight percent and microgram per gram ofdry sediment, respectively.
Analytical precision was measured using analysisof a group of sample duplicates selected randomlyfrom the entire set of samples using the methodmodified by Li et al. (1995) from that described byThompson and Howarth (1976). Precision was betterthan 10% (2σ) for Al, Ca, Fe, Mg, Mn, Ba, Cu, Li,Ni, Pb, Sr and Zn 14% (2σ) for Ti, Sb and Sn and18% (2σ) for Cr. Precision for Hg expressed asrelative standard deviation of 30 replicate sampleswas less than 3% (2σ). Accuracy was controlled byanalysing replicate samples of certified referencematerials. We used MESS-3 (marine sediments,NRCC) and PACS-2 (harbour sediments, NRCC) forHg and MAG-1 (Marine mud, USGS) for the rest ofthe selected elements. The results for Hg (15replicates) indicate recoveries of 97% and 100%,respectively. The analytical results for the rest of theelements analysed indicate major agreement betweencertified and analytical values, with the recovery (%)of measured elements based on the mean valuescalculated for certified reference materials was prac-tically complete (Table 1).
2.6 Factor Analysis
Factor analysis is a multivariate statistical method thatallows data reduction (simplification) by extractingeigenvalues and eigenvectors from a covariance or acorrelation matrix (Davis 2002). The original numberof variables in the dataset is reduced to factors havingin consideration not only the correlations betweenvariables but also between variables and factors. Thenumber of factors to retain depends on their eigen-values and on the amount of variance they are able toexplain (Davis 2002). The factors can then be used tointerpret the processes that control trace metalsdistributions in our core (Loring 1991; Buckleyet al. 1995). Multivariate statistical analysis was
Water Air Soil Pollut (2009) 197:277–287 279
conducted using the STATISTICA software (Statsoft,Inc., USA; version 6). Principal Component was theextraction method used. From the set of eigenvalues,four are higher than 1 and were therefore consideredto represent statistically significant groups of varia-bles, resulting in the retaining of four factors (Kaiser1960). In addition, Varimax orthogonal rotation wasapplied in order to identify the variables that aremore significant for each factor based on thesignificance of their correlations that are expressedas factor loadings (Buckley et al. 1995; Davis 2002).Therefore large factor loadings (>0.70) reflect signif-icant correlations of each variable in the factor.Factor loadings <0.40 were not considered significantand were not presented in the results (Buckley et al.1995; Mecray and ten Brink Buchholtz 2000).Moreover, communalities for four factors are ≥0.7.Communalities evaluate the efficiency of the numberof factors retained in the analysis and have a rangefrom zero (not efficient at all) to one (maximumefficiency) (Davis 2002).
Each sediment sample contains characteristicsof all retained factors, however there is alwaysone factor that dominates over the others (Buckleyet al. 1995). Factor scores (the projection of thefactor loadings for each sample) can therefore be
plotted with the age model. The variability of thefactor scores through time indicates the temporalvariability of the environmental or sedimentarycharacteristics.
3 Results and Discussion
3.1 210Pb Chronology
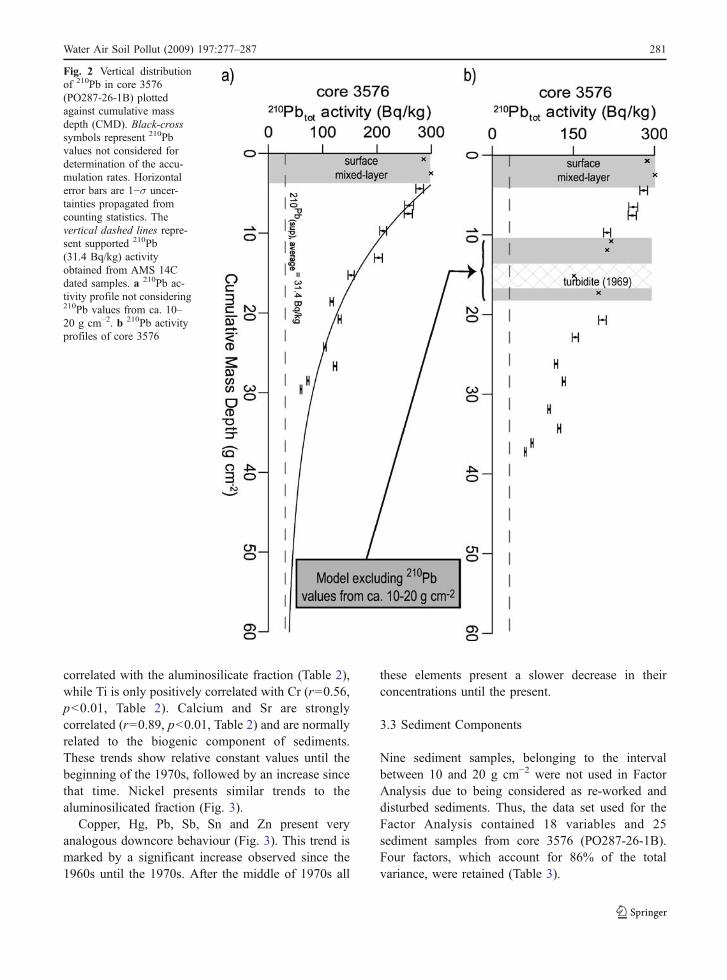
The depth distribution of 210Pb isotopes in core 3576(PO287-26-1B) is shown in Fig. 2. In order to reduceproblems related with sediment compaction throughtime or core compression during sampling, sedimentaccumulation rates (SAR) were determined. The210Pb profile exhibits a surface mixed-layer (SML)of approximately 4 g cm−2. 210Pb values from ca. 10–20 g cm−2 interval in core age’s model were notincluded (Fig. 2a) due to the similar values of 210Pb,which probably reflect the presence of reworkedmaterial. The depth profiles of 210Pb indicate SARof 0.34 g cm−2 year−1, which is in agreement with anAMS 14C analysis performed on the bottom level ofcore 3576 (PO287-16-1B) indicating an age of 40±25 BP (1899 AD) (Abrantes et al. 2005).
3.2 Organic Carbon and Elemental Historical Trends
The historical distribution of Corg, Al, Fe, Ca, Mg, Ti,Mn, Ba, Zn, Sr, Pb, Li, Cr, Cu, Ni, Sn, Sb and Hg incore 3576 (PO287-26-1B) are presented in Fig. 3.Sediment samples considered as re-worked anddisturbed material as was discussed above were notshown. The Pearson’s correlation matrix of elementaland Corg contents in core 3576 is given in Table 2.Organic carbon presents positive correlations with Caand Sr (both related to biogenic components) andnegative correlations with elements commonly asso-ciated with the aluminosilicate fraction (Al, Fe, Mg,Ba, Li; Table 2), which is in agreement with itsdistinct temporal trends marked by an increase onCorg contents towards the present. The slightlydecrease up-core trend of the elements associatedwith the aluminosilicated fraction may reflect adecrease of sediments supplied by the river, whichhas been retained by several dams built along theTagus River. Titanium, Mn and Cr profiles aremarked by an absence of any significant downcoretrends (Fig. 3). Nevertheless, Mn is positively
Table 1 Total Al, Fe, Ca, Mg, Ti, Mn (%), Ba, Cr, Cu, Li, Ni,Pb, Sb, Sn, Sr and Zn concentrations (μg g−1) in the CRMMAG-1 determined in the present study (n=10 for all studiedelements). The certified and obtained concentrations arepresented
Elements Certified(mean ± std dev)
Obtained(mean ± std dev)
Recovery(%)
Al (%) 8.7±0.2 8.2±0.7 106Fe (%) 4.8±0.4 4.8±0.3 100Ca (%) 1.0±0.1 1.0±0.1 100Mg (%) 1.81±0.06 1.69±0.14 107Ti (%) 0.45±0.01 0.42±0.03 107Mn (%) 0.08±0.01 0.08±0.01 100Ba (μg g−1) 480±41 480±25 100Cr (μg g−1) 97±8 93±11 104Cu (μg g−1) 30±3 29±2 103Li (μg g−1) 79±4 78±5 101Ni (μg g−1) 53±8 48±3 110Pb (μg g−1) 24±3 27±1 89Sb (μg g−1) 0.96±0.10 0.89±0.06 108Sn (μg g−1) 3.6 3.5±0.2 103Sr (μg g−1) 150±15 132±7 114Zn (μg g−1) 130±6 140±9 93
280 Water Air Soil Pollut (2009) 197:277–287
correlated with the aluminosilicate fraction (Table 2),while Ti is only positively correlated with Cr (r=0.56,p<0.01, Table 2). Calcium and Sr are stronglycorrelated (r=0.89, p<0.01, Table 2) and are normallyrelated to the biogenic component of sediments.These trends show relative constant values until thebeginning of the 1970s, followed by an increase sincethat time. Nickel presents similar trends to thealuminosilicated fraction (Fig. 3).
Copper, Hg, Pb, Sb, Sn and Zn present veryanalogous downcore behaviour (Fig. 3). This trend ismarked by a significant increase observed since the1960s until the 1970s. After the middle of 1970s all
these elements present a slower decrease in theirconcentrations until the present.
3.3 Sediment Components
Nine sediment samples, belonging to the intervalbetween 10 and 20 g cm−2 were not used in FactorAnalysis due to being considered as re-worked anddisturbed sediments. Thus, the data set used for theFactor Analysis contained 18 variables and 25sediment samples from core 3576 (PO287-26-1B).Four factors, which account for 86% of the totalvariance, were retained (Table 3).
Fig. 2 Vertical distributionof 210Pb in core 3576(PO287-26-1B) plottedagainst cumulative massdepth (CMD). Black-crosssymbols represent 210Pbvalues not considered fordetermination of the accu-mulation rates. Horizontalerror bars are 1−σ uncer-tainties propagated fromcounting statistics. Thevertical dashed lines repre-sent supported 210Pb(31.4 Bq/kg) activityobtained from AMS 14Cdated samples. a 210Pb ac-tivity profile not considering210Pb values from ca. 10–20 g cm−2. b 210Pb activityprofiles of core 3576
Water Air Soil Pollut (2009) 197:277–287 281
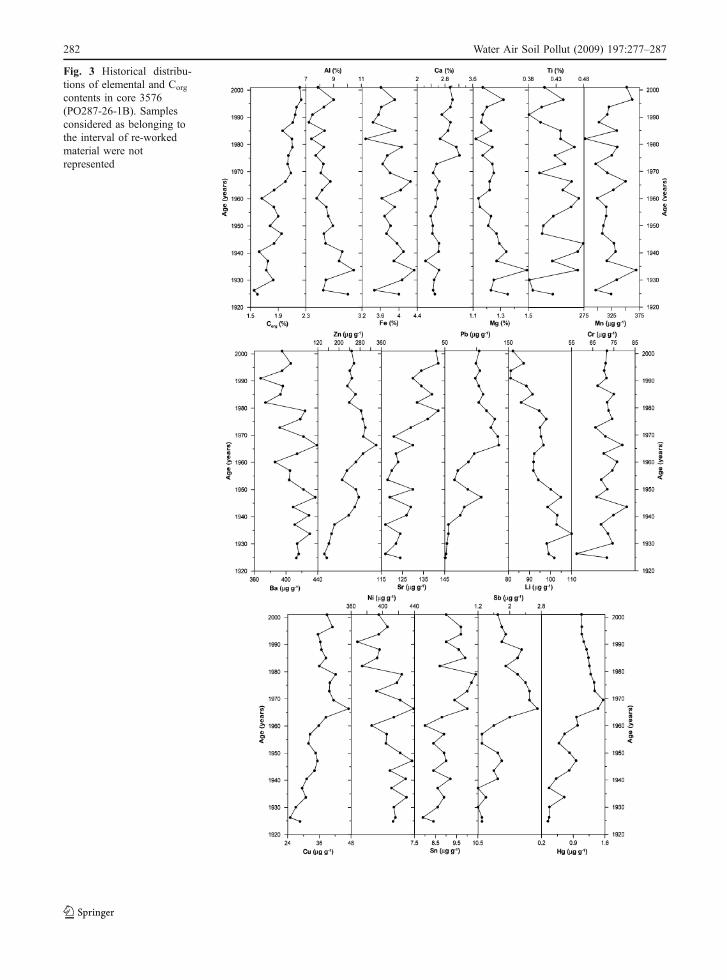
Fig. 3 Historical distribu-tions of elemental and Corg
contents in core 3576(PO287-26-1B). Samplesconsidered as belonging tothe interval of re-workedmaterial were notrepresented
282 Water Air Soil Pollut (2009) 197:277–287
Factor 1 accounts for 43.3% of the total varianceand includes all trace metals commonly derived fromanthropogenic activities (except Ni and Cr) and non-associated with the detrital component of sediments.Despite these elements being derived from different
industries they are all included in the same factor,which is probably revealing the importance of mixingand homogenising processes originated by tidal andwind regimes, that happen inside of the estuary, andlater transport and deposition at the continental shelf.
Table 2 Pearson’s correlation coefficients (r) for elemental and Corg contents for core 3576 (PO287-26-1B) (25 samples)
Al Fe Mg Mn Ca Sr Ti Cr Li Ba Ni Sn Sb Cu Pb Zn Hg Corg
Al 1 0.72a 0.87a 0.52a −0.34 −0.26 0.33 0.10 0.68a 0.56a 0.70a −0.15 −0.43b −0.38 −0.54a −0.41b −0.56a −0.55a
Fe 1 0.68a 0.75a −0.09 −0.07 0.48b 0.50b 0.57a 0.68a 0.87a 0.18 −0.06 0.05 −0.17 0.04 −0.21 −0.31Mg 1 0.59a −0.19 −0.17 0.28 0.02 0.68a 0.55a 0.61a −0.05 −0.27 −0.29 −0.41b −0.35 −0.40b −0.38Mn 1 0.33 0.35 0.27 0.41b 0.14 0.42b 0.63a 0.30 −0.01 0.22 −0.02 0.04 −0.02 0.13
Ca 1 0.89a 0.11 .20 −0.47b −0.18 −0.23 0.68a 0.48a 0.53a 0.52a 0.34 0.55a 0.63a
Sr 1 0.14 0.29 −0.51a −0.24 −0.17 0.69a 0.51a 0.61a 0.56a 0.42b 0.58a 0.68a
Ti 1 0.56a 0.26 0.18 0.37 0.12 0.10 0.25 0.04 0.30 0.09 −0.20Cr 1 −0.01 0.05 0.41b 0.16 0.14 0.34 0.18 0.37 0.20 0.06
Li 1 0.76a 0.57a −0.20 −0.25 −0.39 −0.40b −0.27 −0.46b −0.70a
Ba 1 0.63a 0.14 0.04 0.00 −0.05 0.06 −0.19 −0.35Ni 1 −0.02 −0.22 −0.11 −0.30 −0.10 −0.34 −0.38Sn 1 0.79a 0.75a 0.76a 0.63a 0.72a 0.66a
Sb 1 0.87a 0.94a 0.83a 0.91a 0.59a
Cu 1 0.92a 0.91a 0.92a 0.72a
Pb 1 0.90a 0.96a 0.73a
Zn 1 0.84a 0.54a
Hg 1 0.76a
Corg 1
a Correlation is significant at the 0.01 level (two-tailed)b Correlation is significant at the 0.05 level (two-tailed)
Table 3 Factor analysis matrix after Varimax orthogonal rotation showing the contribution of each variable identified with PrincipalComponents. Italic type indicates loadings > 0.70. Only loadings greater than 0.4 are shown
Variables Communalities Factor 1 Factor 2 Factor 3 Factor 4
Pb 0.98 0.96 – – –Sb 0.93 0.95 – – –Zn 0.93 0.92 – – –Cu 0.94 0.91 – – –Hg 0.94 0.90 – – –Sn 0.86 0.76 – 0.48 –Fe 0.92 – 0.87 – –Ba 0.84 – 0.85 – –Mg 0.81 – 0.85 – –Al 0.85 – 0.82 – –Ni 0.79 – 0.79 – –Li 0.86 – 0.74 – –Mn 0.86 – 0.70 0.56 –Sr 0.88 0.41 – 0.82 –Ca 0.82 – – 0.81 –Corg 0.83 0.58 – 0.61Cr 0.84 – – – 0.87Ti 0.69 – – – 0.76
Water Air Soil Pollut (2009) 197:277–287 283
Loading factors for Sr and Corg are probably reflect-ing the divergent trends with trace elements related toanthropogenic activities occurring after the 1970s(Fig. 3) that may indicate that organic matter has notbeen acting as a metal concentrator at least in recentsediments of the Tagus Prodelta.
Variables included in Factor 2 accounts for 26.2%of the total variance. Elements in this factor arereflecting the composition of fine-grained detritalminerals. The group includes Fe and Mn in thisfactor, suggesting an absence of dominating diageneticprocesses. Factor 3 is dominated by two variablesaccounting for 9.4% of the total variance. Calcium andSr are related to biogenic components of sediments,suggesting a probable source from the biologicalproductivity originated by the Cape Roca coastalupwelling filament (Moita et al. 2003). The weakassociation of organic carbon with these biogenic compo-nents may also indicate that organic matter is not only
derived from biological productivity but also resultingfrom a mixture of sources as it is shown by δ13C and Corg/Norg results (Mil-Homens et al. (in prep)). Factor 4explains 7.5% of the total variance and is characterisedby high loadings of Ti and Cr probably indicating otherdetrital components, such as heavy minerals.
3.4 Temporal Variation of Sediment Components’Dominance
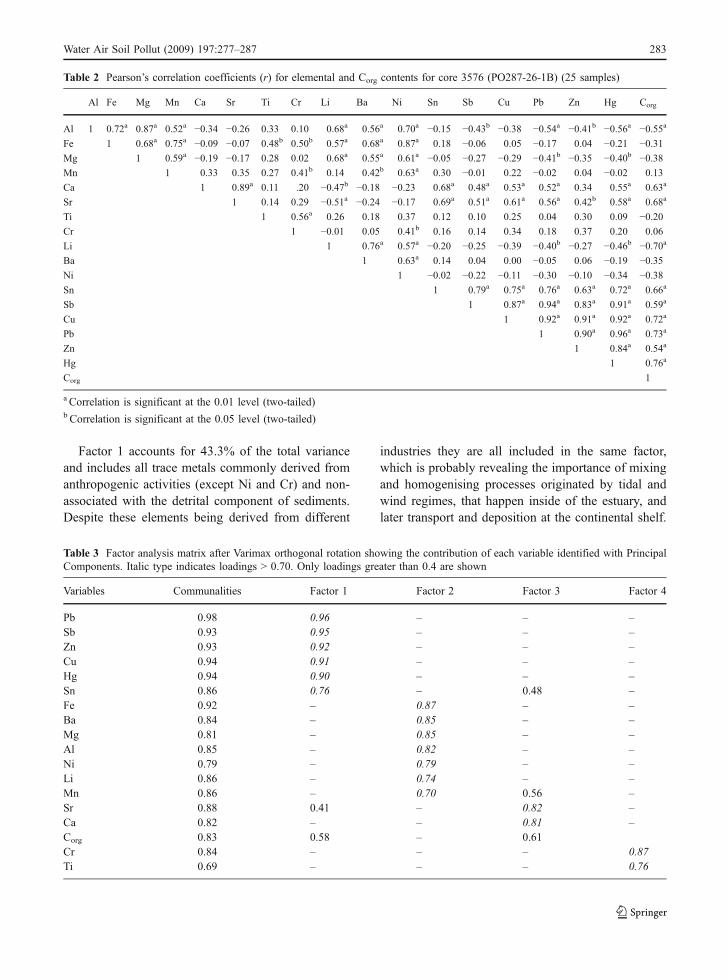
The behaviour of the four factors through time isshown in Fig. 4. Sediments deposited at the site ofcore 3576 are characterised by high variability in thedominant factors that occur over time. Both detritalcomponents derived from the Tagus River dominate untilthe 1960s. Biogenic component presents a continuousincreasing trend since the 1970s, becoming the dominantfactor since the middle of the 1980s. It is observed anincrease of the anthropogenic factor since the bottom of
Fig. 4 Plot of factor scoresfor the four factors overtime from box-core 3576(PO287-26-1B). The high-est positive factor scoredefines dominant factor
284 Water Air Soil Pollut (2009) 197:277–287
the core until the 1960s. However, the anthropogenicfactor is the dominant factor since themiddle of the 1960suntil the beginning of the 1980s. After that, it is observeda continuous decreasing trend of this importance.
3.5 Quantification of Metal Enrichments
Enrichment Factors (EF) were used to quantify the levelof metal enrichments in the studied core. The EFs arenon-dimensional and are calculated based on the ratiobetween the metal Li-normalised values and the metalLi-normalised background values to reduce the grain-size effects [EF = (Met/Li)sample/(Met/Li)background].Lithium was chosen as the normalising element fortrace elements because it is one of the elementsincorporated in the lattice of fine-grained aluminosili-cate trace-metal-bearing minerals (phyllosilicates andclay minerals), and is not significantly influenced byanthropogenic inputs (Loring 1990). In the presentwork the average content of the last two levels of core3576 (PO287-26-1B) (dated as 1925) are considered asthe background values.
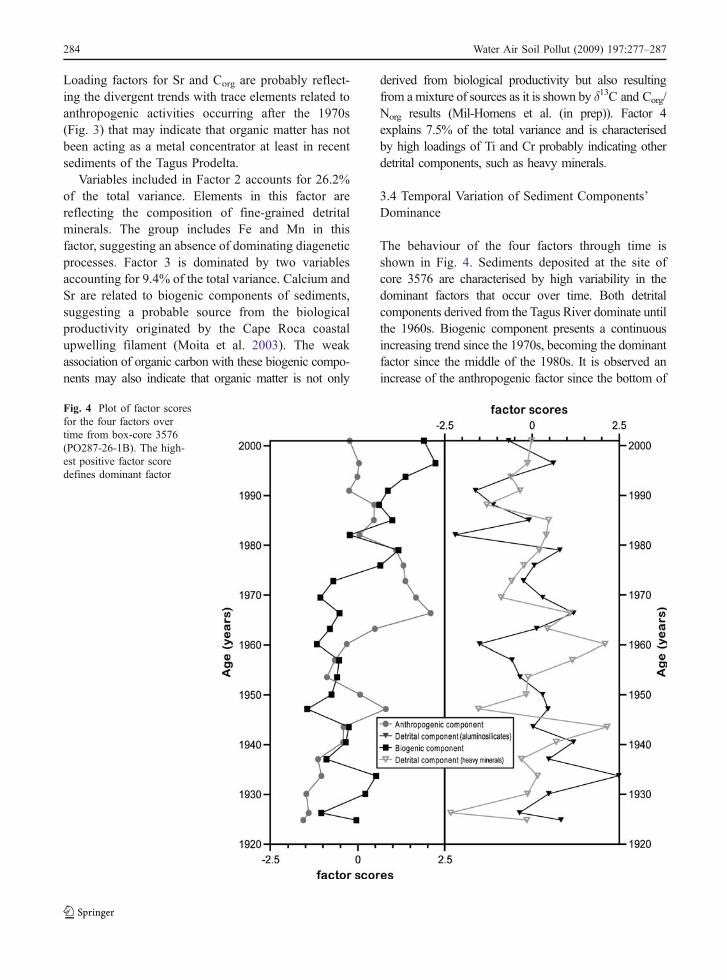
The element that presents the highest level ofenrichment relative to the bottom of core is Hg
followed by Pb, Zn, Sb, Cu and Sn (Fig. 5). Allelements present very similar up-core enrichmenttrends, excepting Sn, which is characterised by acontinuous slight increase towards the present. Thesignificant increase in metal enrichments starts inthe middle of the 1950s, which is in agreement withthe later development (when compared to Europe) ofindustrial activities (e.g. shipyards, pyrite roast plant,smelter, chloralkali plant) existing on both sides of theTagus estuary, together with the increase of domesticeffluents associated with the population growth ofLisbon’s metropolitan area. The closing of someindustries (e.g. shipyard), the implementation of moreefficient techniques for industrial and domesticeffluents treatment, together with the use of unleadedgasoline may be responsible by the slight decrease inHg, Pb and Sb enrichments after the 1970s. Never-theless, this slight attenuation or the maintenance ofthe enrichment levels (Zn and Cu) is probably relatedto the continuous sediment reworking caused bynatural (e.g. tidal and wind regimes, erosion, flooding,bioturbation, redox cycling,) and/or anthropogenic(e.g. commercial trawling, dredging) processes occur-ring both inside of the estuary and also on the adjacent
Fig. 5 Historical Enrichment Factors (EF) profiles of Hg, Pb, Zn, Sb, Cu and Sn in core 3576 (PO287-26-1B). The average contentsof deepest two samples are used as background values
Water Air Soil Pollut (2009) 197:277–287 285
shelf area. These processes are responsible by puttingthe sediment components back in suspension withconsequently release of trace metals into the ecosystemand subsequent adsorption onto fine-grained particlesand organic matter and deposition at the bottom.
4 Summary and Conclusions
The studied elements are grouped by factor analysisinto four dominant factors that indicate commonsources, physical and/or chemical processes dominatingsediment deposition. Factor 1 includes the anthropo-genic contaminants (Cu, Hg, Pb, Sb, Sn and Zn). Factors2 and 4 include elements associated with naturalsediment detrital component while Factor 3 groupedthe elements associated with the biogenic component.
Metal contamination of sediments in the TagusProdelta sediments increased rapidly since the bottomof the core (middle of the 1920s) until the middle ofthe 1960s. After that period, metal enrichment trendshave a slight decrease (Hg, Pb) or remain quite constant(Zn, Cu, Sb) towards the present, probably revealing theimportance of mixing processes (wind and tidal regime),happening inside of the estuary and later transfered tothe adjoining coastal areas. This is not reflected insediment composition, and is probably the result of theimprovement in effluents treatment in conjunction withthe closing of some industrial point sources in the twolast decades. Nevertheless, it is observed a decrease inthe importance of the anthropogenic component sincethe 1980s, along with an increase in the importanceof the biogenic component that can reflect the domi-nance of the marine biological productivity instead ofthe detrital input by the Tagus River.
Acknowledgments This article is a contribution of FCT projectTAGUSED (POCTI/2001/CTA/41411). INGMAR project fundedthe PALEO1 cruise where sediment samples were collected. Theauthors acknowledge the comments and suggestions of the threeanonymous reviewers.
References
Abrantes, F., Lebreiro, S., Rodrigues, T., Gil, I., Bartels-Jonsdottir,H., Oliveira, P., et al. (2005). Shallow-marine sediment coresrecord climate variability and earthquake activity off Lisbon(Portugal) for the last 2000 years.Quaternary Science Reviews,24, 2477–2494. doi:10.1016/j.quascirev.2004.04.009.
Araújo, F., Pinheiro, T., Alves, L. C., Valerio, P., Gaspar, F., &Alves, J. (1998). Elemental composition in sediments and
water in the Trancao river basin. A preliminary study.NuclearInstruments & Methods in Physics Research. Section B,Beam Interactions with Materials and Atoms, 136–138,1005–1012. doi:10.1016/S0168-583X(97)00745-3.
Birch, G., Taylor, S., & Matthai, C. (2001). Small-scale spatialand temporal variance in the concentration of heavy metalsin aquatic sediments: a review and some new concepts.Environmental Pollution, 114, 357–372. doi:10.1016/S0269-7491(00)00182-2.
Buckley, D., Smith, J., & Winters, G. (1995). Accumulation ofcontaminant metals in marine sediments of HalifaxHarbour, Nova Scotia: environmental factors and historicaltrends. Applied Geochemistry, 10, 175–195. doi:10.1016/0883-2927(94)00053-9.
Cabeçadas, L., & Oliveira, A. P. (2005). Impact of aCoccolithus braarudii bloom on the carbonate system ofPortuguese coastal waters. Journal of NannoplanktonResearch, 27, 141–147.
Caçador, I., Vale, C., & Catarino, F. (1996). Accumulation ofZn, Pb, Cu, Cr,and Ni in sediments between roots of theTagus Estuary Salt Marshes, Portugal. Estuarine, Coastaland Shelf Science, 42, 393–403. doi:10.1006/ecss.1996.0026.
Canário, J., Vale, C., & Caetano, M. (2005). Distribution ofmonomethylmercury and mercury in surface sediments ofthe Tagus Estuary (Portugal). Marine Pollution Bulletin,50, 1142–1145. doi:10.1016/j.marpolbul.2005.06.052.
Canário, J., Vale, C., Caetano, M., & Madureira, M. (2003).Mercury in contaminated sediments and pore watersenriched in sulphate (Tagus Estuary, Portugal). Environ-mental Pollution, 126, 425–433. doi:10.1016/S0269-7491(03)00234-3.
Cearreta, A., Irabien, M., Uribelarri, I., Yusta, I., Croudace, I.,& Cundy, A. (2002). Recent salt marsh development andnatural regeneration of reclaimed areas in the PlentziaEstuary, N. Spain. Estuarine, Coastal and Shelf Science,54, 863–886. doi:10.1006/ecss.2001.0862.
Costley, C. T., Mossop, K. F., Dean, J. R., Garden, L. M.,Marshall, J., & Carroll, J. (2000). Determination ofmercury in environmental and biological samples usingpyrolysis atomic absorption spectrometry with gold amal-gamation. Analytica Chimica Acta, 405, 179–183.doi:10.1016/S0003-2670(99)00742-4.
Davis, J. C. (2002). Statistics and data analysis in geologyp. 638. New York: Wiley.
Figuères, G., Martin, J., Meybeck, M., & Seyler, P. (1985). Acomparative study of mercury contamination in the Tagusestuary (Portugal) and major French estuaries (Gironde,Loire, Rhone). Estuarine, Coastal and Shelf Science, 20,183–203. doi:10.1016/0272-7714(85)90037-X.
Kaiser, H. (1960). The application of electronic computers tofactor analysis. Educational and Psychological Measure-ment, 20, 141–151. doi:10.1177/001316446002000116.
Li, X., Coles, B. J., Ramsey, M. H., & Thornton, I. (1995).Sequential extraction of soils for multielement analysis byICP-AES. Chemical Geology, 124, 109–123. doi:10.1016/0009-2541(95)00029-L.
Lima, L. (1971). Distribuição dos minerais argilosos naplataforma continental entre os cabos Raso e Espichel,(paper presented at the 1° Congresso Hispano-Luso-Americano de Geologia Económica, Madrid).
286 Water Air Soil Pollut (2009) 197:277–287
Loring, D. (1990). Lithium—a new approach for the granulo-metric normalization of trace metal data.Marine Chemistry,29, 155–168. doi:10.1016/0304-4203(90)90011-Z.
Loring, D. (1991). Normalization of heavy-metal data fromestuarine and coastal sediments. ICES Journal of MarineScience, 48, 101–115. doi:10.1093/icesjms/48.1.101.
Mecray, E., & ten Brink Buchholtz, M. (2000). Contaminantdistribution and accumulation in the surface sediments of LongIsland Sound. Journal of Coastal Research, 16, 575–590.
Moita, M. T., Oliveira, P. B., Mendes, J. C., & Palma, A. S.(2003). Distribution of chlorophyll a and Gymnodiniumcatenatum associated with coastal upwelling plumes offcentral Portugal. Acta Oecologica. Proceedings of thePlankton Symposium, Espinho, Portugal, 24, S125–S132.
Nolting, R., Ramkema, A., & Everaarts, J. (1999). Thegeochemistry of Cu, Cd, Zn, Ni and Pb in sediment coresfrom the continental slope of the Banc d’Arguin (Mauritania).Continental Shelf Research, 19, 665–691. doi:10.1016/S0278-4343(98)00109-5.
Thompson, M., & Howarth, R. (1976). Duplicate analysis ingeochemical practice: part 1—theoretical approach andestimation of analytical reproducibility. Analyst (London),101, 690–698. doi:10.1039/an9760100690.
Vale, C. (1990). Temporal variations of particulate metals in theTagus River estuary. The Science of the Total Environment,97–98, 137–154. doi:10.1016/0048-9697(90)90236-N.
Valette-Silver, N. (1993). The use of sediment cores toreconstruct historical trends in contamination of estuarineand coastal sediments. Estuaries, 16, 577–588. doi:10.2307/1352796.
Vanney, J.-R., & Mougenot, D. (1981). La plate-formecontinentale du Portugal et les provinces adjacentes:Analyse Geomorphologique. Memórias dos Serviços Geo-lógicos de Portugal, 28, 86.
van Weering, T., de Stigter, H., Boer, W., & de Haas, H. (2002).Recent sediment transport and accumulation on the NWIberian margin. Progress in Oceanography, 52, 349–371.doi:10.1016/S0079-6611(02)00015-0.
Water Air Soil Pollut (2009) 197:277–287 287
Copyright © 2022 FDOKUMEN