environmental contamination following a major nudesr
465
environmental contamination following a major nudesr Vol. 2 accident PROCEEDINGS OF A SYMPOSIUM, VIENNA, 16-20 OCTOBER 1989 JOINTLY ORGANIZED BY FAO, IAEA, UNEP, WHO
-
Upload
khangminh22 -
Category
Documents
-
view
2 -
download
0
Transcript of environmental contamination following a major nudesr

environmentalcontaminationfollowing
a major nudesr
Vol. 2 accidentPROCEEDINGS OF A SYMPOSIUM, VIENNA, 16-20 OCTOBER 1989
JOINTLY ORGANIZED BY FAO, IAEA, UNEP, WHO
ENVIRONMENTAL CONTAMINATION FOLLOWING A MAJOR NUCLEAR ACCIDENT
N U C LE AR SAFE TY
IN FO RM ATIO N L IB R AR Y
P L E A S E R E T U R N
A2843

P R O C E E D IN G S SERIES
E N V I R O N M E N T A L C O N T A M I N A T I O N
F O L L O W I N G
A M A J O R N U C L E A R A C C I D E N T
PROCEEDINGS OF AN INTERNATIONAL SYMPOSIUM
ON ENVIRONMENTAL CONTAMINATION
FOLLOWING A MAJOR NUCLEAR ACCIDENT
JOINTLY ORGANIZED BY THE
FOOD AND AGRICULTURE ORGANIZATION
OF THE UNITED NATIONS,
THE INTERNATIONAL ATOMIC ENERGY AGENCY,
THE UNITED NATIONS ENVIRONMENT PROGRAMME
AND THE WORLD HEALTH ORGANIZATION
AND HELD IN VIENNA, 16-20 OCTOBER 1989
I n t w o v o l u m e s
V O L U M E 2
INTERNATIONAL ATOMIC ENERGY AGENCY
VIENNA, 1990

ENVIRONMENTAL CONTAMINATION
FOLLOWING A MAJOR NUCLEAR ACCIDENT
IAEA, VIENNA, 1990
STI/PUB/825
ISBN 92-0-020190-3
ISSN 0074-1884
© IA EA , 1990
Permission to reproduce or translate the information contained in this publication may be obtained by writing to the International Atomic Energy Agency, Wagramerstrasse 5, P.O. Box 100, A-1400 Vienna, Austria.
Printed by the IA E A in Austria July 1990

F O R E W O R D
Since the beginning of nuclear power production on a large scale, a small num
ber of accidents have been reported in which nuclear facilities have been damaged.
During one such accident, at Chernobyl in 1986, significant amounts of radioactive
materials were released into the atmosphere and caused contamination of the
environment both locally and in other countries. The extent and effects of the poten
tial contamination due to a major accident at a nuclear facility are still matters of pub
lic concern. Scientific research on the after-effects of the Chernobyl accident on the
environment and on human health has provided new data pertaining to large scale
contamination, and much more information is expected to come from Chernobyl
related studies in the near future.
The objective of the symposium was to review present knowledge of the extent
and magnitude of environmental contamination occurring after a massive release of
radioactive materials. Papers and posters covered a wide range of subjects, includ
ing: monitoring of radioactive contaminants in the environment, levels of radioactive
contamination of farmland, agricultural crops and dairy products in subsequent
years, and methods for minimizing contamination of feed and food. A special session
on ‘hot particles’ drew attention to the potential risk from inhaling particles contain
ing high levels of alpha and beta emitting radionuclides, and the importance of setting
up valid descriptive radioecological models.
The symposium demonstrated that on technical matters there is a clear and
urgent need for international communication and co-operation concerning the har
monization of guidelines and terminology and the adoption of acceptable reference
levels for radionuclides in food and feed moving in international trade.
The presentations and discussions showed clearly that national authorities in
affected countries had prepared for nuclear accidents and acted accordingly with pro
tective measures in most cases based on sound technical reasoning, ranging from
evacuation of people to guidelines on safer preparation of food. However, these
measures in turn caused psychological stress and financial losses without proper
compensation among the affected and dependent communities. Some of these conse
quences had been neither foreseen nor prepared for, either nationally or inter
nationally. A new challenge for the international community is thus to determine how
to deal with the technically less well defined consequences of large (nuclear) acci
dents having long term adverse effects on life in affected areas.
The symposium was organized by the International Atomic Energy Agency
together with the Food and Agriculture Organization of the United Nations, the
United Nations Environment Programme and the World Health Organization, and
was attended by approximately 250 participants from some fifty countries.

Radiation protection and health physics evaluation of movements of
radioactive caesium and strontium from soils to plants and to
milk in the Ukraine (IAEA-SM-306/143P) .................................................. 96
I . P . L o s ’ , I . A . L i k h t a r e v , N . K . S h a n d a l a , K.5. R e p i n ,
O . A . B o b y l e v a , I . Y u . K o m a r i k o v , A . Y u . V a s i l ’e v , G . M . G u l ’k o ,
¡ . A . K a j r o , L . N . K o v g a n , V . N . S t e p a n e n k o , V . V . A n d r e e v a
Transport of ,3II and 137Cs from air to cow milk produced on a
northwestern Italian farm following the Chernobyl accident
(IAEA-SM-306/24P) ...................................................................................... 99
P . S p e z z a n o , R . G i a c o m e l l i
PART IV: COUNTERMEASURES TO REDUCE RADIONUCLIDE CONTAMINATION OF FOOD CHAINS
Evaluation of countermeasures in agriculture and food processing
(IAEA-SM-306/67) ......................................................................................... 103
C . L e i s i n g , E . W i r t h
Evaluación de contramedidas para la recuperación de suelo agrícola
(IAEA-SM-306/103) ...................................................................................... I l l
J . M . M a r t i , G . A r a p i s , E . I r a n z o
Review of countermeasures used in agriculture following a major nuclear
accident (IAEA-SM-306/44) .......................................................................... 129
F . J . S a n d a l l s
Influence of fertilization, utilization and plant species on 137Cs content
of grassland growth since the Chernobyl accident (IAEA-SM-306/17) .... 141
G . S c h e c h t n e r , E . H e n r i c h
Effects of remedial measures on long term transfer of radiocaesium
from soil to agricultural products as calculated from Swedish field
experimental data (IAEA-SM-306/32) .......................................................... 151
H . L o n s j o , E . H a a k , K . R o s é n
The effects of some agricultural techniques on soil to plant transfer
of radionuclides under field conditions (IAEA-SM-306/2) ........................ 163
J . F . L e m b r e c h t s , J . H . v a n G i n k e l , J . H . d e W i n k e l , J . F . S t o u t j e s d i j k
Transfer of 137Cs from Chernobyl fallout to meat and milk in Hungary
(IAEA-SM-306/104) ..............................................................................
Z . K e s z t h e l y i , J . E . J o h n s o n , B . K a n y á r , A . K e r e k e s ,
U . P . K r a l o v a n s z k y , G . M . W a r d
Experience with the use of caesium binders to reduce radiocaesii"11
contamination of grazing animals (IAEA-SM-306/39) ......................
K . H o v e , H . S . H a n s e n , P . S t r a n d

Measures introduced in Norway after the Chernobyl accident:
A cost-benefit analysis (IAEA-SM-306/36) ................................................ 191
P . S t r a n d , L . I . B r y n i l d s e n , O . H a r b i t z , U . T v e t e n
Evaluation of long term countermeasures in mitigating consequences
of environmental contamination following a nuclear accident
(IAEA-SM-306/57) ......................................................................................... 203
J . J . R o s s i , S . J . V . V u o r i
Radioactivity transfer during food processing and culinary preparation
(IAEA-SM-306/10) ......................................................................................... 211
A . G r a u b y , F . L u y k x
Development of a detailed plan for site restoration following a nuclear t
reactor accident (IAEA-SM-306/72) ..................................................... 217
J . J . T a w i l
P o s t e r p r e s e n t a t i o n s
Some aspects of the measurement and sampling programme and the costs
of countermeasures in Austria after the Chernobyl accident
(IAEA-SM-306/46P) ...................................................................................... 231
F . S c h ô n h o f e r
Use of different substances as decontaminators of l37Cs and 134Cs in
bulls, cows and calves (IAEA-SM-306/16P) ............................................... 234
R . L e i t g e b , N . R a t h e i s e r
Caesium decontamination of lambs by different feeds and additives
(IAEA-SM-306/18P) ...................................................................................... 236
F . R i n g d o r f e r
Problems of feeding populations affected by large nuclear accidents
(IAEA-SM-306/140P) ..................................................................................... 239
A . E . R o m a n e n k o , V . N . K o r z u n , L A . L i k h t a r e v , К S. R e p i n ,
V . l . S a g l ó , A . N . P a r a i s , L . A . G o r o b e t s , A . A . P e n ’k o v
Radiocaesium and radioiodine contamination in ewes: Countermeasures
(IAEA-SM-306/79P) ...................................................................................... 241
F . D a b u r o n , Y . A r c h i m b a u d , J . C o u s i , G . F a y a r t
Effects of ferric ferrocyanide (Prussian blue) on uptake and elimination
of radioactive caesium in humans (IAEA-SM-306/14IP) ........................... 244
V . N . K o r z u n , I . A . L i k h t a r e v , I . P . L o s ’ , I . B . D e r e v y a g o ,
L . A . L i t v i n e t s , V . N . G a b a r a e v
Influence of hydrated aluminium silicate supplementation of feed on
caesium contamination of animal products under natural and
experimental conditions (IAEA-SM-306/136P) ........................................... 246
G . P e t h e s , P . R u d a s , T . B a r t h a

Decontamination of structurally contaminated meat of small ruminants
(IAEA-SM-306/81P) ................................................................... .................. 248
Z M i l o s e v i c , R . K l j a j i c , E . H o r s i c
PART V: RADIATION EXPOSURE OF POPULATIONS
Worldwide radiation exposure from the Chernobyl accident
(IAEA-SM-306/94) ........................................................................................ 251
B . G . B e n n e t t
Setting derived intervention levels for food (IAEA-SM-306/126) ................. 261
P . J . W a i g h t
Response of the European Communities to environmental contamination
following the Chernobyl accident (IAEA-SM-306/120) ............................. 269
F . L u y k x
Radioecological models for assessment of radiological consequences after
major nuclear accidents (IAEA-SM-306/26) ............................................... 289
H . G . P a r e t z k e , P . J a c o b , H . M i i l l e r , G . P r ô h l
Limitations of models used in deriving reference levels for radiological
protection (IAEA-SM-306/27) ....................................................................... 301
L . F r i t t e l l i , T . S a n d
Long term prediction of population exposure in the areas contaminated
after the Chernobyl accident (IAEA-SM-306/119) ......... ........................... 311
R . M . B a r k h u d a r o v , K . I . G o r d e e v , M . N . S a v k i n
Dietary changes and doses from food in some Norwegian population
groups after the Chernobyl accident (IAEA-SM-306/38) ........................... 319
P . S t r a n d , E . B e e , O . H a r b i t z
Radiocaesium levels, intakes and consequent doses in a group of
adults living in southern England (IAEA-SM-306/29) ............................... 327
G . E t h e r i n g t o n , M . - D . D o r r i a n
Comparison of dose estimates derived from whole body counting
and intake calculations based on average food activity concentration
(IAEA-SM-306/6) .......................................................................................... 339
F . S t e g e r , K . M i i c k , K . E . D u f t s c h m i d
P o s t e r p r e s e n t a t i o n s
Radioactive iodine concentrations in elements of the environment and
evaluation of exposure doses to the thyroid among inhabitants
of Kiev after the Chernobyl accident (IAEA-SM-306/144P) ..................... 351
I . A . L i k h t a r e v , N . K . S h a n d a l a , A . E . R o m a n e n k o , G . M . G u l ’k o ,
I . A . K a j r o , К 5. R e p i n

H u m a n r a d i o c a e s iu m l e v e l s i n t h e S t r a t h c l y d e r e g i o n o f S c o t la n d
f o l l o w i n g t h e C h e r n o b y l a c c i d e n t ( I A E A - S M - 3 0 6 / 3 0 P ) ........................................ 3 5 4
W .S . W a ts o n
C h e r n o b y l r a d i o c a e s iu m i n t h e S c o t t i s h p o p u la t i o n a n d i t s r e l a t i o n s h ip
t o p r e d i c t e d v a l u e s ( I A E A - S M - 3 0 6 / 5 9 P ) ......................................................................... 3 5 7
; B . W . E a s t , /. R o b e r ts o n
W h o l e b o d y r a d i o c a e s iu m c o n t e n t i n H u n g a r i a n i n d i v i d u a l s a f t e r t h e
C h e r n o b y l a c c i d e n t : M o d e l l i n g a n d m e a s u r e m e n t s
( I A E A - S M - 3 0 6 / 7 6 P ) .................................................................................... .................... 3 5 9
A . K e re k e s , G . A n d r á s i , N . F i i lô p , B . K a n y á r , E . K e le m e n ,
L . K o v á c s , L .B . S z ta n y ik
D y n a m i c s o f r a d i o a c t i v e c o n t a m in a t i o n i n f o o d i n B u l g a r i a a f t e r
1 M a y 1 9 8 6 ( I A E A - S M - 3 0 6 / 9 8 P ) ....................................................................................... 3 6 1
Z . H in k o v s k i , V . M a r in o v , M . D z o r e v a
P A R T V I: R A D IO N U C L ID E S A N D IN T E R N A T IO N A L T R A D E IN FO O D
C h e r n o b y l p o s t s c r i p t : R i s k m a n a g e m e n t i n t h e g l o b a l v i l l a g e
( I A E A - S M - 3 0 6 / 1 2 3 ) ..................................................................................................................... 3 6 7
R .W . G i l l
R o l e o f t h e U n i t e d S t a t e s F o o d S a f e t y a n d I n s p e c t io n S e r v i c e a f t e r t h e
C h e r n o b y l a c c i d e n t ( I A E A - S M - 3 0 6 / 1 9 ) ........................................................................... 3 7 1
R .E . E n g e l , V . R a n d e c k e r , W . J o h n s o n
S t a t u s o f U n i t e d S t a t e s r e c o m m e n d a t i o n s f o r c o n t r o l o f a c c i d e n t a l
r a d i o a c t i v e c o n t a m in a t i o n o f f o o d a n d a n im a l f e e d s ( I A E A - S M - 3 0 6 / 3 4 ) . . 3 7 9
B .M . B u r n e t t , M . R o s e n s te in
R e v i e w o f t h e im p a c t o f a l a r g e s c a l e a c c i d e n t o n a r e m o t e f a r f i e l d
( I A E A - S M - 3 0 6 / 6 9 ) ......................................................................................................................... 3 8 9
L . F . C . C o n t i , H . L . P . A z e v e d o , M . E . C . M . V ia n n a , L . M . J . B . F e r r e i r a
P o s t e r p r e s e n ta t io n s
R a d i o a c t i v i t y l e v e l s i n m i l k m a r k e t e d i n P a n a m a ( I A E A - S M - 3 0 6 / 2 2 P ) ............. 3 9 7
J . E s p in o s a G o n z á le z , K . B u n z l
S t u d y o f l37C s c o n t a m ia n t i o n i n v a r i o u s f o o d s t u f f s e n t e r in g N e p a l a f t e r
t h e C h e r n o b y l a c c i d e n t ( I A E A - S M - 3 0 6 / 1 1 2 P ) ............................................................ 4 0 1
L o k n a th S u b b a , B h im B a h a d u r B a m
S o m e p r o j e c t i o n s o n r a d i o a c t i v i t y c o n c e n t r a t io n s a n d d o s e s a r i s i n g f r o m
in g e s t i o n o f f o o d c o n t a in i n g C h e r n o b y l c o n t a m in a t io n
( I A E A - S M - 3 0 6 / 7 0 P ) .................................................................................................................... 4 0 3
L .R . d e la P a z , M .V . P a la t t a o , J .F . E s ta c io

S p e c i a l S e s s io n : H o t P a r t i c l e s ...................................................................................................... 4 0 7
S u m m a r y o f S y m p o s iu m : I m p o r t a n t I s s u e s w i t h S i g n i f i c a n c e
f o r t h e F u t u r e .................................................................................................................................... 4 1 1
C h a i r m e n o f S e s s i o n s a n d S e c r e t a r i a t o f t h e S y m p o s iu m ............................................ 4 1 5
L i s t o f P a r t i c i p a n t s ................................................................................................................................ 4 1 7
A u t h o r I n d e x ............................................................................................................................................ 4 4 1
I n d e x o f P a p e r s a n d P o s t e r s b y N u m b e r ............... ................................................................. 4 4 7
S u b j e c t I n d e x .................................................................................. ....................................................... . 4 4 9

Part III
RADIOACTIVE CONTAMINATION OF AGRICULTURAL LAND
AND AGRICULTURAL PRODUCE


I A E A - S M - 3 0 6 / 1 2 4
Invited Paper
R A D I O A C T I V E C O N T A M I N A T I O N A N D
D E C O N T A M I N A T I O N I N T H E 30 k m Z O N E
S U R R O U N D I N G T H E C H E R N O B Y L
N U C L E A R P O W E R P L A N T
V . l . K O M A R O V
W o r l d A s s o c i a t i o n o f N u c l e a r O p e r a t o r s ,
M o s c o w
Abstract
RAD IO AC TIVE C O N TA M IN A T IO N A N D D E C O N TAM IN ATIO N IN THE 30 km ZONE
SURROUNDING THE CH ERNO BYL N U CLEAR POWER PLAN T.
The author analyses the mechanism by which the radioactive release occurred, the iso
topic composition o f the release and the forms and behaviour o f radioactive isotopes in soils
and water bodies having different physicochemical characteristics. These characteristics are
the main element in forecasting the distribution o f radionuclides in soils as well as their rate
o f migration and their concentration in water bodies. The actual quantities o f radioactive waste
located in the 30 km zone surrounding the Chernobyl plant are indicated. Finally, the author
proposes a comprehensive programme for further work in that zone.
1. B A C K G R O U N D
T h e d i s c h a r g e o f r a d i o n u c l i d e s b e y o n d t h e b o u n d s . o f t h e d a m a g e d u n i t o f t h e
C h e r n o b y l n u c l e a r p o w e r p l a n t w a s a p r o c e s s e x t e n d i n g o v e r t w o w e e k s a n d c o n
s i s t e d o f a n u m b e r o f s t a g e s .
I n t h e f i r s t s t a g e t h e r e w a s a d i s c h a r g e o f d i s p e r s e d f u e l f r o m t h e d a m a g e d
r e a c t o r ; ' t h e r a d i o n u c l i d e c o m p o s i t i o n c o r r e s p o n d e d a p p r o x im a t e l y t o t h a t i n t h e
s p e n t f u e l , b u t w a s e n r i c h e d i n v o l a t i l e i s o t o p e s o f i o d i n e , t e l l u r i u m , c a e s iu m a n d
n o b l e g a s e s .
I n t h e s e c o n d s t a g e , f r o m 2 6 A p r i l t o 2 M a y 1 9 8 6 , t h e in t e n s i t y o f t h e d i s c h a r g e
b e y o n d t h e d a m a g e d u n i t d e c r e a s e d , o w i n g t o t h e m e a s u r e s t a k e n t o c u r t a i l t h e b u r n
i n g o f g r a p h i t e a n d t o f i l t e r t h e d i s c h a r g e s ; t h e c o m p o s i t i o n o f r a d i o n u c l i d e s i n t h is
p e r i o d w a s s i m i l a r t o t h a t i n t h e f u e l ; t h e f i n e l y d i s p e r s e d f u e l w a s r e m o v e d f r o m
t h e r e a c t o r w i t h a s t r e a m o f h o t a i r a n d w i t h p r o d u c t s f r o m t h e b u r n i n g o f g r a p h i t e .
T h e t h i r d s t a g e o f d i s c h a r g e w a s c h a r a c t e r i z e d b y a r a p id i n c r e a s e i n t h e i n t e n
s i t y o f f i s s i o n p r o d u c t e s c a p e b e y o n d t h e l i m i t s o f t h e r e a c t o r u n i t ; i n t h e f i r s t p a r t
o f t h is s t a g e , i t w a s p r im a r i l y t h e r e m o v a l o f v o l a t i l e c o m p o n e n t s , e s p e c i a l l y i o d i n e ,
t h a t w a s n o t e d ; s u b s e q u e n t l y t h e r a d i o n u c l i d e c o m p o s i t i o n a g a i n b e c a m e s i m i l a r t o
3

4 K O M A R O V
t h a t o f t h e s p e n t f u e l . T h i s w a s a r e s u l t o f t h e h e a t i n g o f t h e f u e l i n t h e c o r e t o a
t e m p e r a t u r e o f m o r e t h a n 1 7 0 0 ° C d u e t o a f t e r h e a t . I t w a s a l s o a r e s u l t o f t h e t e m p e r
a t u r e d e p e n d e n t m i g r a t i o n o f f i s s i o n p r o d u c t s f r o m t h e f u e l m a t r i x , a n d t h e i r r e m o v a l
i n a e r o s o l f o r m w i t h t h e p r o d u c t s o f b u r n i n g g r a p h i t e .
T h e f o u r t h s t a g e , b e g i n n i n g a f t e r 4 M a y , w a s c h a r a c t e r i z e d b y a r a p id d e c r e a s e
i n d i s c h a r g e . T h i s w a s a c o n s e q u e n c e o f t h e s p e c i a l m e a s u r e s t a k e n t o f o r m h i g h e r
m e l t i n g c o m b i n a t i o n s o f f i s s i o n p r o d u c t s a s a r e s u l t o f t h e i r i n t e r a c t io n w i t h t h e
m a t e r ia l s i n t r o d u c e d a n d o f t h e s t a b i l i z a t i o n a n d s u b s e q u e n t l o w e r i n g o f t h e f u e l t e m
p e r a t u r e , a s w e l l a s o f t h e p o s s i b l y c o m p l e t e o x i d a t i o n o f t h e g r a p h i t e a n d t h e i n t e n
s i t y o f t h e p r o c e s s e s o f c o o l i n g t h e f u e l c o m p o s i t i o n , w i t h a c o r r e s p o n d i n g d e c r e a s e
i n t e m p e r a t u r e .
2 . I S O T O P I C C O M P O S I T I Q N O F T H E R E L E A S E
I n s a m p le s o f a i r a n d f a l l o u t , f i s s i o n p r o d u c t s w e r e f o u n d i n t h e f o r m o f
i n d i v i d u a l r a d i o n u c l i d e s ( n o t i n c l u d i n g r a d i o a c t i v e n o b l e g a s e s ) , a c c o u n t i n g f o r
a p p r o x im a t e l y 5 0 M C i 1, w h i c h c o r r e s p o n d t o a b o u t 3 . 5 % o f t h e t o t a l q u a n t i t y o f
r a d i o n u c l i d e s i n t h e r e a c t o r a t t h e t im e o f t h e a c c i d e n t [ 1 ] . T h e c o m p o s i t i o n o f t h e
d i s c h a r g e a s d e s c r i b e d a b o v e , i n c o m b in a t i o n w i t h t h e m e t e o r o l o g i c a l c o n d i t i o n s ,
w e r e t h e f a c t o r s u s e d t o d e f i n e t h e p l a i n z o n e s o f c o n t a m in a t io n i n t h e a r e a a n d t h e i r
s u b s e q u e n t i r r e g u l a r p a t t e r n i n t e r m s p f i s o t o p i c c o m p o s i t i o n a n d l e v e l o f r a d ia t i o n .
A f t e r t h e a c c i d e n t , t h e m a i n z o n e s o f c o n t a m in a t i o n f o r m e d i n t h e w e s t e r n ,
n o r t h w e s t e r n a n d n o r t h e a s t e r n d i r e c t i o n s f r o m t h e C h e r n o b y l p l a n t a n d t o a le s s e r
e x t e n t t o t h e s o u t h .
S t u d i e s o f s a m p le s f r o m v a r i o u s m e d i a o v e r a p r o l o n g e d p e r i o d m a d e i t p o s s i
b l e t o f o r m a g e n e r a l p i c t u r e o f t h e r a d i o a c t i v e c o n t a m in a t i o n o f a l l t h e l a n d in t h e
3 0 k m z o n e s u r r o u n d i n g t h e p l a n t , i n c l u d i n g a l a r g e n u m b e r o f i n h a b i t e d p l a c e s ,
p r o d u c t i o n s i t e s , r e s e r v o i r s a n d t h e i r b o t t o m d e p o s i t s , a s w e l l a s t h e a i r , t h e
b i o s p h e r e , e t c . T h e d a t a o b t a in e d p r o v id e d p o in t s o f d e p a r t u r e f o r p r e d i c t i n g t h e
f u t u r e r a d i a t i o n s i t u a t io n a n d f o r s t u d y in g t h e c h r o n o l o g y a n d n a t u r e o f t h e a c c i d e n t
i n t e r m s o f t h e e s c a p e a n d b e h a v i o u r o f f i s s i o n p r o d u c t s a s w e l l a s o f t h e i r s u b s e q u e n t
m ig r a t i o n .
I n t h e p e r i o d t h a t h a s e la p s e d s i n c e t h e a c c i d e n t , t h e r a d i a t i o n s i t u a t io n i n t h e
a r e a a f f e c t e d b y t h e d i s c h a r g e f r o m t h e p l a n t h a s s h o w n a s i g n i f i c a n t im p r o v e m e n t
i n s e v e r a l r e s p e c t s [ 2 ] . A s a r e s u l t o f r a d i o a c t i v e d e c a y a l o n e , t h e e x p o s u r e d o s e r a t e
( E D R ) h a s d e c r e a s e d b y a f a c t o r o f 4 0 c o m p a r e d w i t h t h e r a t e o f J u l y 1 9 8 6 ; t h e r e a l
d e c r e a s e w a s e v e n m o r e s i g n i f i c a n t : i n s o m e p l a c e s i t i s l e s s t h a n 1 % o f t h e o r i g i n a l
v a lu e . D u r i n g t h e p a s t y e a r a l o n e , t h e E D R d e c r e a s e d o n a v e r a g e b y o n e h a l f . T h e
5 m R / h E D R l i n e i s n o w a p p r o x im a t e l y w h e r e t h e 2 0 m R / h l i n e w a s i n 1 9 8 7 . 2
1 1 Ci = 3.7 x 10ю Bq.
2 1 R = 2.58 x 10'4 C/kg.

I A E A - S M - 3 0 6 / 1 2 4 5
Over 600 Ci/km2------- 200 Gi/km2
I 45-200 Ci/km2 — 15 Ci/km2 .............. 3 Gi/km2
FIG. 1. Distribution of 90 Sr in the area of the 5 km zone.
H o w e v e r , s u r f a c e c o n t a m in a t i o n o f t h e s o i l w i t h t h e i s o t o p e s 137C s , 90S r a n d 239P u
s t i l l r e m a in s a t a h i g h l e v e l ; i n t h e c a s e o f 137C s , s o m e o f t h e l a n d i s c o n t a m in a t e d
w i t h u p t o 1 0 0 0 C i / k m . A s a r e s u l t o f n a t u r a l s e l f - p u r i f i c a t i o n p r o c e s s e s a n d a l s o o f
t h e e f f o r t s t o d e c o n t a m in a t e t h e a r e a b y d u s t s u p p r e s s i o n , t h e t o t a l r a d i o n u c l i d e c o n
c e n t r a t i o n i n a i r h a s b e e n r e d u c e d b y a f a c t o r o f i d 0 0 0 - 1 0 0 0 0 0 ; i n s u r f a c e w a t e r
( t a k in g w a t e r p r o t e c t i o n m e a s u r e s in t o a c c o u n t ) , t h d c o n c e n t r a t i o n h a s b e e n r e d u c e d
b y a f a c t o r o f 1 0 0 - 1 0 0 0 0 , a l t h o u g h t h e s e l e v e l s a r e s t i l l 1 0 - 1 0 0 t im e s h i g h e r t h a n
t h e p r e - a c c i d e n t l e v e l s .

6 K O M A R O V
A t p r e s e n t , t h e r a d i a t i o n s i t u a t io n i s g o v e r n e d m a i n l y b y t h e p r e s e n c e o f l o n g
l i v e d r a d i o n u c l i d e s . A c c o r d i n g t o e s t im a t e s , t h e t o t a l c o n t e n t o f t h e s e n u c l i d e s i n t h e
3 0 k m z o n e i s a s f o l l o w s ( n o t i n c l u d i n g a c t i v i t y c o n c e n t r a t e d a t w a s t e d i s p o s a l
p o in t s ) : 137C s : 1 1 0 0 0 0 C i , 90S r : 1 0 0 0 0 0 C i a n d 239P u , 240P u : 8 0 0 C i .
A s h a s b e e n r e p o r t e d o n s e v e r a l o c c a s i o n s , t h e d i s t r i b u t i o n o f t h e r a d i o n u c l i d e s
i n t h e a r e a i s e x t r e m e l y i r r e g u l a r . T h i s a l s o a p p l i e s t o t h e z o n e c l o s e r t o t h e p la n t .
B y w a y o f a n e x a m p l e , F i g . 1 p r e s e n t s a d i a g r a m o f t h e c o n t a m in a t i o n o f t h e 5 k m
z o n e w i t h 90S r . I t w i l l b e s e e n t h a t t h e s p o t s o f c o n t a m in a t io n w i t h a s p e c i f i c
a c t i v i t y o f 6 0 0 C i / k m 2 a r e a d j a c e n t t o s e c t o r s w i t h s i g n i f i c a n t l y le s s c o n t a m in a t io n .
F r o m M a y t o S e p t e m b e r o f 1 9 8 7 , t h e s u r f a c e ( 1 - 2 c m ) l a y e r o f s o i l i n t h e
3 0 k m z o n e w a s c o n t a m in a t e d w i t h t h e f o l l o w i n g i s o t o p e s : 144C e , 134C s , 137C s ,
95Z r , 95N b , 106R u , 90S r , 238P u , 239P u , 240P u , 241A m , 243A m a n d 242C u a n d 244C u .
A t p r e s e n t , t h e m a i n d o s e f o r m in g c o n t r i b u t i o n i s m a d e b y t h e i s o t o p e s 144C e ,
l37C s , l37C s , 90S r a n d 239P u .
3 . R A D I O N U C L I D E F O R M S A N D B E H A V I O U R S
K n o w l e d g e o f t h e f o r m i n w h i c h r a d i o n u c l i d e s f r o m t h e C h e r n o b y l d i s c h a r g e
a r e p r e s e n t a n d o f t h e p a t t e r n s o f t h e i r m i g r a t i o n i n t h e e n v i r o n m e n t p r o v id e s t h e
f o u n d a t i o n f o r t h e t h e o r e t i c a l c o n s i d e r a t i o n s e n t e r in g in t o h y d r o l o g i c a l , h y d r o -
g e o l o g i c a l , m e d i c o b i o l o g i c a l a n d t e c h n i c a l p l a n n i n g . W i t h o u t t h is k n o w le d g e , t h e
p r a c t i c a l p r o b l e m s i n v o l v e d i n e l im in a t i n g t h e c o n s e q u e n c e s o f t h e a c c i d e n t ( c le a n u p
o p e r a t io n s ) c a n n o t b e s o lv e d .
T h e r a d i o n u c l i d e s a r e c o n f i n e d t o p a r t i c l e s h a v in g a m a t r i x o f u r a n i u m o x id e ,
g r a p h i t e , i r o n - c e r a m i c a l l o y s , s i l i c a t e - r a r e e a r t h a n d s i l i c a t e c o m b in a t i o n s o f t h e s e
m a t e r ia l s .
O w i n g t o t h e i n f l u e n c e o f o x i d a t i o n b y a t m o s p h e r i c o x y g e n a n d n u c l e a r r a d i a
t i o n , t h e f i s s i o n p r o d u c t s c o n t a in e d i n ‘ h o t p a r t i c l e s ’ o r i g i n a t i n g f r o m f u e l a r e c o n
v e r t e d t o m o r e m o b i l e f o r m s o w i n g t o t h e d e s t r u c t io n o f t h e m a t r i x . T h e m o b i l e
f o r m s c a n b e b o u n d w i t h h i g h m o l e c u l a r o r g a n i c s u b s t a n c e s f o r m in g h u m i c c o m
p l e x e s a n d , u p o n d e s t r u c t i o n , b e in g c o n v e r t e d t o l o w m o l e c u l a r f u l v i c c o m p l e x e s .
I n l i n e w i t h t h e s a m e p a t t e r n , w a t e r s o l u b l e c o m p o u n d s w i t h l o w e r m o l e c u l a r w e i g h t
a r e f o r m e d . I n t h i s p r o c e s s , t h e m o b i l i t y o f t h e r a d i o n u c l i d e s in c r e a s e s i n t h e f o l l o w
i n g o r d e r : 106R u , l44C e , 134C s , 137C s a n d 90S r ( T a b l e I ) .
T h e d i s t r i b u t i o n o f r a d i o n u c l i d e s i n t h e s o i l a n d t h e f o r m i n w h i c h t h e y a r e
p r e s e n t d e p e n d o n t h e p h y s i c o c h e m i c a l p r o p e r t i e s o f t h e g r o u n d a n d o n t h e c h e m i c a l
p r o p e r t i e s o f t h e f i s s i o n p r o d u c t s . T h e i r o c c u r r e n c e i n s o i l s i s d i s t r i b u t e d i n t h e f o l
l o w i n g w a y :

I A E A - S M - З О б / 1 2 4 7
W a t e r s o l u b l e 0 . 5
H u m i c c o m p l e x e s 5 - 2 5
F u l v i e c o m p l e x e s 1 - 1 0
O r g a n o m in e r a l c o m p l e x e s 5 0 - 9 0 .
M i n e r a l c o m p l e x e s 1 0 - 6 0
T h e b u l k o f t h e f i s s i o n p r o d u c t s i s d i s t r i b u t e d b e t w e e n t h e o r g a n o m in e r a l a n d
m i n e r a l p a r t s o f t h e s o i l , m a i n l y i n h u m ic c o m p l e x e s .
S i n c e t h e p e r c e n t a g e o f r a d i o n u c l i d e s b o u n d w i t h h u m i c a c i d s a r id , i n p a r t ,
w i t h f u l v i c a c i d s i n c r e a s e s w i t h i n c r e a s i n g d e p t h s a l o n g t h e s o i l p r o f i l e , t h e m i g r a t i o n
o f f i s s i o n p r o d u c t s a l s o t a k e s p l a c e o w i n g t o m o v e m e n t w i t h t h e s e f r a c t i o n s .
F o r m D i s t r i b u t i o n ( % )
T A B L E I . C O N T E N T O F R A D I O N U C L I D E S ( C i / s a m p le 3) A N D T H E I R
W A T E R S O L U B L E F O R M ( % ) I N H O T P A R T I C L E S
Activity o f radionuclide and % o f water soluble part
Mass number ------------------------------------- ----------------------- ;— ----- ------ --------------
o f particle Ce-144 Cs-134 Cs-137 Ru-106 I
100 1.6 X IO"9 1.5 X 10⁻¹° 8.7 x 1 0 10 9.1 x IO-ю 3.5 X 10“98.3 5.6 10.4
88 3.1 X io -9 3.5 X 10-m 1.5 X 10⁻⁹ 1.3 X 10"9 6.3 X 10"95.4 1.9 5.3
102 3.2 X io -9 1.3 X JQ-10 7.6 X l 0-l° 1.7 X 10 "9 5.7 X 10‘ 93.9 10.9 5.45 9.0
89 5.4 X io -9 3.9 X 10⁻¹° 1.9 x 10⁻⁹ 2.6 X io-9 1.0 X 10'84.8 8.0 4.2 5.6
105 5.5 X 10‘9 4.9 X Ю-m 1.9 x 10⁻⁹ 2.4 X 10⁻⁹ 1.0 X 10"87.3 15.2 12.6 33.3
133 1.2 X io -9 6.1 X 10“n 4.3 x 10‘ 10 2.4 X Ю - Ш 1.9 X 1Ó’9 '5.7 28.9 6.9 32.5
144 9.6 X j q - io 2.5 X K T " 4.6 X 10“" 7.3 X 10"" 1.1 X 10‘ 950.2 23.3 55.2
119 1.5 X io-9 5.2 X io -11 2.0 x 10-'° 1.9 X 10‘ 9 3.7 X 10'961.0 30.4 8.4
112 3.3 X 1 0 10 7.7 X 10“" 4.0 x 10⁻¹° 1.7 X 10:9 2.2 X IO 918.7 18.6 7.5 6.1
1 C i = 3 . 7 X 1 0 ' ° B q .

8 K O M A R O V
A s t h e a m o u n t o f o r g a n i c m a t t e r in c r e a s e s , t h e m i g r a t i o n o f r a d i o n u c l i d e s i n
t h e s o i l a l s o in c r e a s e s ; t h e c a p a c i t y f o r m i g r a t i o n in c r e a s e s i n t h e s e q u e n c e : s o d d y -
p o d z o l -4 p o d z o l « t p e a t y - m a r s h y .
A c c o r d i n g t o v a r i o u s d a t a :
( a ) C o e f f i c i e n t s f o r t h e l e a c h i n g o f r a d i o n u c l i d e s f r o m s o i l b y w a t e r a r e 0 . 1 - 1 0 %
f o r 90S r a n d 0 . 0 2 - 2 % f o r 137C s . T h e m i n im u m v a lu e s ( 1 - 5 % f o r 90S r ) w e r e
o b t a i n e d i n t h e 5 k m z o n e a n d t h e m a x im u m v a lu e s ( u p t o 1 5 % ) i n t h e
‘ c a e s i u m ’ s p o t s i n t h e c o n t i g u o u s a r e a s a n d a t c o n s i d e r a b l e d i s t a n c e s , i n t h e
B r y a n s k , G o m e l ’ a n d C h e r n i g o v d i s t r i c t s . I n t h e 3 0 k m z o n e , 9 5 % o f t h e
r a d i o n u c l i d e s w e r e c o n c e n t r a t e d i n t h e 1 - 5 c m l a y e r o f t h e s o i l [ 3 ] . T h e l i x i v i a
t i o n o f t h e p a r t i c l e s ( m o v e m e n t i n t h e p o r e s p a c e o f t h e s o i l ) i s i n s i g n i f i c a n t .
A t a d e p t h o f 5 - 1 0 c m e v e n i n t h e n e a r z o n e , t h e y a m o u n t t o o n l y 0 . 0 0 1 % o f
s u r f a c e a c t i v i t y . S o m e o f t h e r a d i o n u c l i d e s i n t h e z o n e o f a e r a t io n a r e i n
p s e u d o c o l l o i d a l a n d a d s o r b e d f o r m s . W a t e r s o l u b l e f o r m s p e n e t r a t e d e e p ly
( t r a c e s o f 90S r h a v e b e e n f o u n d a t d e p t h s o f 4 0 - 5 0 c m a n d t r a c e s o f 137C s a t
1 0 c m ) .
( b ) T o p h o r i z o n s o f s o i l , w h i c h a r e s u b j e c t t o e r o s i o n a n d r e m o v a l i n t o a r i v e r s y s
t e m , a r e d e p l e t e d b y w a t e r s o l u b l e f o r m s o f r a d i o n u c l i d e s . F o r t h i s r e a s o n , t h e
e n t r y o f t h e s e s u s p e n s io n s i n t o th e r i v e r n e t w o r k w i l l n o t le a d t o a n a p p r e c i a b l e
in c r e a s e i n t h e c o n t e n t o f s o l u b l e S r a n d C s i n w a t e r .
( c ) S o i l s i n t h e i r n a t u r a l s t a te ( w i t h o u t m e l i o r a t i v e a d d i t i v e s ) a r e r e l i a b l e g e o c h e m
i c a l b a r r i e r s . T h e a p p l i c a t i o n e v e n o f c l i n o p t i l o l i t e i s u s e le s s i n t h e c a s e o f
0 . 0 0 0 0 0 0 0 1 - 0 . 0 0 0 0 0 0 0 0 0 1 C i / L c o n t a m in a t i o n o f w a t e r .
( d ) E r e c t i o n o f h y d r o t e c h n i c a l s t r u c t u r e s , s u c h a s d a m s , i n c a t c h m e n t a r e a s h a s
p r o v e d t o b e i n e f f e c t i v e .
I n t h e n e a r z o n e , i n 1 9 8 7 , t h e p r o p o r t i o n o f m o b i l e f o r m s w a s i n s i g n i f i c a n t
( f r a c t i o n s o f a p e r c e n t o f y e m i t t e r s a n d a f e w p e r c e n t o f 90S r ) . A t p r e s e n t ,
h o w e v e r , t h e r e i s a t e n d e n c y ( t h o u g h n o t e n t i r e l y c l e a r ) t o w a r d s a n i n c r e a s e o v e r
t im e i n t h e l e a c h a b i l i t y o f S r , C s a n d , t o s o m e e x t e n t , R u . D a t a w e r e o b t a i n e d s h o w
i n g t h a t t h e s i l t o f t h e K i e v R e s e r v o i r w a s d e p l e t e d i n 90S r c o m p a r e d w i t h p a r t i c l e s
o f t h e n e a r z o n e . A n a n a l y s i s o f s t u d ie s c o n d u c t e d b y t h e E x t e r n a l D o s im e t r y S e c t i o n
o f t h e ‘ K o m b i n a t ’ I n d u s t r i a l A s s o c i a t i o n i n 1 9 8 7 - 1 9 8 8 s h o w e d a m o n o t o n i e i n c r e a s e
i n t h e c o n c e n t r a t i o n o f t h e r a d i o n u c l i d e ^ S r a n d s o m e d e c r e a s e i n 137C s i n p r a c t i
c a l l y a l l r e s e r v o i r s o f t h e n e a r z o n e , w h i c h a r e g r o u n d s f o r a s s u m in g t h e b e g i n n i n g
o f a p r o c e s s o f d e s t r u c t i o n o f t h e f u e l m a t r i x a n d i n t h e n e a r z o n e , p o s s i b l y , f o r t h e
t im e b e in g , o n l y i n t h e s p e c i a l c o n d i t i o n s o f r e s e r v o i r s . I n t h e w a t e r o f t h e c o o l i n g
p o n d o f t h e C h e r n o b y l p l a n t , a t p r e s e n t , t h e r e i s a b o u t 5 % 90S r a c t i v i t y f r o m it s
c o n t e n t s i n b o t t o m d e p o s i t s . I n J u l y 1 9 8 7 , t h e r e w a s t e n t im e s l e s s 90S r i n t h e w a t e r
t h a n i n 1 9 8 9 .
S t r o n t iu m - 9 0 i s l e a c h e d s e l e c t i v e l y o u t o f t h e m a t r i x ( u p t o 1 0 % ) ; t h e w a y i n
w h i c h 90S r o c c u r s i n s o l u t i o n m a y b e i o n i c a s w e l l a s i n t h e f o r m o f n e u t r a l o r

I A E A - S M - 3 0 6 / 1 2 4 9
n e g a t i v e l y c h a r g e d c o m p l e x e s ( u p t o 5 % ) . T h e la t t e r m i g r a t e f r e e l y i n t h e w a t e r s y s
t e m s o f t h e g r o u n d , s o i l s , r i v e r w a t e r a n d g r o u n d w a t e r .
S u b s e q u e n t t a s k s f o r in v e s t i g a t i o n i n c l u d e d e t e r m in in g t h e f o r m i n w h i c h
r a d i o n u c l i d e s a r e p r e s e n t i n e a c h o f t h e 3 6 r e g i o n a l g e o c h e m ic a l z o n e s w h i c h h a v e
b e e n d e f in e d . I n t h e s e z o n e s i t i s n e c e s s a r y t o d e t e r m in e t h e m i g r a t i o n c a p a c i t y o f
t h e r a d i o n u c l i d e s i n t h e v a r i o u s f o r m s i n w h i c h t h e y o c c u r i n t h e s p e c i f i c g e o c h e m i
c a l s i t u a t io n . T h e s e d a t a a r e o f b a s i c im p o r t a n c e f o r f o r m u l a t i n g r e c o m m e n d a t i o n s
w i t h r e g a r d t o t h e r a t i o n a l u s e o f t h e c o n t a m in a t e d a r e a s f r o m t h e p o in t o f v i e w o f
t h e n a t io n a l e c o n o m y .
4 . C L E A N U P O P E R A T I O N S
A c c o r d i n g t o t h e n a t u r e o f t h e w o r k b e in g p e r f o r m e d , t h e c l e a n u p o p e r a t io n s
f o r e l im i n a t i n g t h e c o n s e q u e n c e s o f t h e a c c i d e n t a t t h e C h e r n o b y l n u c l e a r p o w e r
p l a n t c a n b e d i v i d e d in t o t w o a r b i t r a r y s t a g e s : t h e in t e n s i v e s t a g e , f r o m 1 9 8 6 t o 1 9 8 8 ,
a n d t h e l o n g t e r m s t a g e , f r o m 1 9 8 9 t o t h e y e a r 2 0 0 0 . O p e r a t i o n s i n t h e f i r s t s t a g e
w e r e c a r r i e d o u t f o r t h e p u r p o s e o f l o c a l i z i n g t h e a c c i d e n t s e c t o r s m o s t d a n g e r o u s
t o h u m a n l i f e , i n p a r t i c u l a r , a v o i d i n g t h e d i s s e m in a t i o n o f r a d i o n u c l i d e s b e y o n d t h e
b o u n d s o f t h e f o u r t h r e a c t o r o f t h e p la n t . F i r s t o f a l l , t h e d a m a g e d r e a c t o r w a s
s w i t c h e d o f f a n d t h e n t h e p l a n t a r e a w a s f r e e d o f r e a c t o r f r a g m e n t s . T h e t h i r d s t a g e
o f t h e p r i o r i t y w o r k w a s f i x i n g t h e d u s t - l i k e p a r t i c l e s f r o m t h e a c c i d e n t a l d i s c h a r g e
in t h e a r e a o f t h e n e a r z o n e . A s o f J u n e 1 9 8 6 , t h e t a s k s o f f i x i n g r a d i o a c t i v e d u s t
in a n d b e y o n d t h e a r e a o f t h e 3 0 k m z o n e w e r e s o l v e d , i n o r d e r t o p r e v e n t s e c o n d a r y
c o n t a m in a t i o n o f d e c o n t a m in a t e d a r e a s .
4.1. In the immediate plant area
T h e w o r k o n d e c o n t a m in a t i n g t h e C h e r n o b y l p l a n t a n d a l s o o n t h e c o n s t r u c t i o n
o f a p l a t e u n d e r t h e r e a c t o r a n d a s e p a r a t i n g w a l l i n t h e m a c h in e h a l l a s w e l l a s o n
t h e e r e c t i o n o f a ‘ c a p ’ w a s h e ld u p b e c a u s e o f t h e h i g h r a d i a t i o n l e v e l s i n t h e p l a n t
a r e a a n d i t s b u f f e r z o n e . T h e q u e s t io n o f r e m o v i n g c o n t a m in a t e d s o i l l a y e r s , a s p h a l t
a n d c o n c r e t e i n t h e a r e a o f t h e p l a n t a n d t h e n e a r z o n e b e c a m e a m a t t e r o f u r g e n c y .
B y c o v e r i n g t h e s e s i t e s w i t h c l e a n r u b b l e a n d d r y c o n c r e t e , a n d a l s o b y l a y i n g c o n
c r e t e p l a t e s , a s o l i d c o v e r i n g w a s b u i l t o v e r t h e d e c o n t a m in a t e d z o n e t o p e r m i t t h e
s u b s e q u e n t o r g a n i z a t i o n o f t h e f l o w o f c o n s t r u c t i o n m a t e r ia l s , m a c h in e r y a n d p e o p le ,
t h u s e x t e n d i n g t h e d e c o n t a m in a t e d z o n e . I n t h is w a y , t h e p r e l im i n a r y d e c o n t a m in a
t i o n o f t h e n e a r z o n e o f t h e C h e r n o b y l p l a n t ( a n a r e a o f 1 4 0 0 h a ) w a s c a r r i e d o u t .
T h i s p e r m i t t e d t h e E D R t o b e r e d u c e d a n d c o n s t r u c t i o n w o r k o n t h e c a p t o g o f o r
w a r d . I t a l s o m a d e i t p o s s i b l e t o p r o c e e d w i t h t h e d e c o n t a m in a t io n w o r k i n t h e p l a n t
p r e m is e s a n d t o s t a r t u p p o w e r u n i t s 1 , 2 a n d 3 .

10 K O M A R O V
25 27 29 1 3 5 7 9 11 13 15 17 19 21 23June 1987 July 1987
FIG. 2. Changes in air contamination with the application of the dust protection measures
in the ‘Reddish Forest’ area.
4.2. In the ‘Reddish Forest’ area
I n t h e in t e r e s t o f f u r t h e r s t a b i l i z a t i o n a n d im p r o v e m e n t o f t h e r a d i o e c o l o g i c a l
s i t u a t io n i n 1 9 8 6 - 1 9 8 7 , c o n t a m in a t e d o b j e c t s w e r e l o c a l i z e d i n t h e ‘ R e d d i s h F o r e s t ’
a n d ‘ O l d C o n s t r u c t i o n B a s e ’ s e c t o r s ( w i t h a t o t a l a r e a o f 3 0 0 h a ) . T h e s e o p e r a t io n s
n o t o n l y m a d e p r o v i s i o n f o r l o c a l d e c o n t a m in a t io n , b u t a l s o p r e v e n t e d s p o n t a n e o u s
d i s c h a r g e o f h i g h l y a c t i v e r a d i o n u c l i d e s w h i c h w e r e s o u r c e s o f a t m o s p h e r i c c o n t a m i
n a t io n b y a e r o s o l s a n d d u s t ( F i g . 2 ) .
I n t h e R e d d i s h F o r e s t , t h e c o n t e n t o f a c t i v i t y w a s e s t im a t e d t o b e a s f o l l o w s :
u p t o 8 0 0 0 C i l37C s , u p t o 7 0 0 0 C i 90S r a n d u p t o 6 0 0 0 0 C i t o t a l g a m m a e m it t e r s .

I A E A - S M - 3 0 6 / 1 2 4 1 1
I n t h e e v e n t o f a f o r e s t f i r e a n d u n d e r u n f a v o u r a b l e w e a t h e r c o n d i t i o n s , t h e a r e a o f
t h e z o n e c o u l d i n c r e a s e c o n s i d e r a b l y . T h e p a r t s o f t h e R e d d i s h F o r e s t i n t h e z o n e
f u r t h e r a w a y f r o m t h e C h e r n o b y l p l a n t w e r e t r e a t e d i n a c c o r d a n c e w i t h f i r e p r e v e n
t i o n r e g u l a t i o n s i n 1 9 8 6 - 1 9 8 7 ( a n a r e a o f 2 5 0 0 h a ) . T h e l o c a l i z a t i o n t e c h n o l o g y u s e d
i n t h e R e d d i s h F o r e s t c o n s i s t e d o f f e l l i n g t h e t r e e s a n d b u r y i n g t h e t r u n k s , t h e f o r e s t
f l o o r i n g a n d o t h e r l i t t e r i n a t r e n c h 1 . 5 - 2 . 0 m d e e p , w i t h s u b s e q u e n t s t r e w in g o f
c l e a n s a n d o v e r t h e e n t i r e a r e a t o a h e ig h t o f 0 . 5 - 1 . 0 m . A s a r e s u l t , t h e E D R
d e c r e a s e d b y a f a c t o r o f m o r e t h a n 1 0 0 . i n t h e i n d u s t r i a l p r o d u c t i o n a r e a o f t h e
C h e r n o b y l p l a n t a n d i n t h e a r e a o f t h e R e d d i s h F o r e s t . S u b s e q u e n t l y , t h e d o s e r a t e
d e c r e a s e d s t i l l f u r t h e r a s a r e s u l t o f t h e d e c a y o f r e l a t i v e l y s h o r t l i v e d n u c l i d e s
( 95Z r , 95N b ) a n d o f t h e c o n t i n u e d d e c o n t a m in a t i o n w o r k ; a t p r e s e n t , t h e d o s e r a t e
d o e s n o t e x c e e d 2 0 m R / h . I n t h i s w a y , p o in t s f o r t h e t e m p o r a r y l o c a t i o n o f r a d i o a c
t i v e w a s t e w e r e e s t a b l i s h e d i n t h e a r e a o f t h e R e d d i s h F o r e s t a n d t h e O l d C o n s t r u c
t i o n B a s e o f t h e C h e r n o b y l p l a n t . I t i s e s t im a t e d t h a t t h e r e a r e a p p r o x im a t e l y 8 0 0
s u c h p o in t s i n t h e n e a r z o n e o f t h e C h e r n o b y l p l a n t , a t w h i c h s o m e 4 x 1 0 6 m 3 o f
s l i g h t l y a c t i v e s o l i d r a d i o a c t i v e w a s t e a r e lo c a t e d .
U n d e r s t a n d a b l y , t h e m e t h o d s a d o p t e d f o r r e d u c in g t h e E D R i n t h e n e a r z o n e
m u s t b e c o n s i d e r e d n o n - e c o l o g i c a l , b u t t h e r a p id d e c o n t a m in a t io n o f t h e s e a r e a s
r u l e d o u t t h e p o s s i b i l i t y o f a o n e s h o t r e m o v a l o f r a d i o a c t i v e s u b s t a n c e s in t o o t h e r
r e g i o n s a n d r e d u c e d c o n s i d e r a b l y t h e d o s e b u r d e n s o f t h o s e i n d i v i d u a l s d e a l i n g w i t h
t h e a c c i d e n t a s w e l l a s t h e d o s e o f t h o s e o n t h e C h e r n o b y l s t a f f .
4.3. Soil treatments
I n s e c t o r s w i t h u n f i x e d s a n d y s o i l , w o r k s t a r t e d e a r l y i n 1 9 8 7 a n d i s p l a n n e d
t o c o n t i n u e u n t i l 1 9 9 0 o n f i x i n g t h e u p p e r l a y e r w i t h c h e m i c o b i o l o g i c a l s o lu t i o n s o f
l a t e x a n d o i l r e s i d u e s . A s a g r a s s c o v e r f o r m s o n t h e s i t e s im p r o v e d w i t h f e r t i l i z e r s ,
t u r f a n d p r o t e c t i v e p l a n t s , t h e c h e m i c o b i o l o g i c a l m e t h o d i s r e p la c e d b y a b i o l o g i c a l
m e t h o d o f f i x i n g t h e s u r f a c e o f a n a r e a f o r t h e p u r p o s e o f p r e v e n t i n g w a t e r a n d w i n d
e r o s i o n o f t h e f e r t i l e l a y e r w i t h c o n t a m in a t io n . I n t h e s e a r e a s , a y e a r a f t e r t h e s o w in g
o f g r a s s e s , a p l a n t c o v e r f o r m s o n t h e s a n d y s o i l . I n 1 9 8 7 , g r a s s s o w in g w i t h p r o t e c
t i v e r y e w a s c a r r i e d o u t o n a 1 5 0 h a s a n d y p l a t e a u , o n t h e a r e a o f t h e O l d C o n s t r u c
t i o n B a s e a n d t h e R e d d i s h F o r e s t o f t h e C h e r n o b y l p l a n t ( w i t h a n a r e a o f 2 0 0 h a ) .
I n 1 9 8 8 , t h e g r a s s - s o w n a r e a s in c r e a s e d t o 3 0 0 h a a n d i n 1 9 8 9 t o 6 0 0 h a . F r o m . 1 9 8 8 ,
i n a d d i t i o n t o t h e s o w in g o f g r a s s , b u s h e s a n d w o o d s w e r e p l a n t e d i n t h e n e a r z o n e
o f t h e C h e r n o b y l p l a n t , o v e r a n a r e a o f 1 2 0 h a a n d a l o n g t h e m a i n r o a d s o f t h is z o n e .
I n 1 9 8 9 , w o o d y s p e c i e s w e r e s e t o u t o v e r a n a r e a o f 2 0 0 h a . F r o m 6 0 t o 9 0 p e r c e n t
o f t h e f a l s e a c a c i a , , m o u n t a in a s h , b i r c h a n d p i n e t o o k r o o t . A p r o j e c t f o r t h e
r e f o r e s t a t i o n o f t h e t i d a l l a n d o f t h e P r i p y a t R i v e r i n t h e n e a r z o n e o f t h e p l a n t w a s
c a r r i e d o u t o v e r a n a r e a o f 1 0 0 h a . T h e c o n t i n u a t i o n o f t h e w o r k u n t i l 1 9 9 0 w a s
p l a n n e d . T h e n e x t s t e p w i l l b e t h e r e f o r e s t a t i o n o f t h e f l o o d p l a i n o f t h e P r i p y a t R i v e r

1 2 K O M A R O V
over an area of 600 ha in 1991-1992, taking into account the geographical, geochemical and radioecological features of the region, its water supply characteristics, its flooding situations and the capacity of its banks for treatment.
Finally, in view of the fact that for the next 50 years a considerable part of the area undergoing cleanup will not be available for normal agricultural production by the traditional methods, there is a plan in the Ukrainian-Byelorussian Poles’e region (which is not rich in chernozem soils) and in the contaminated sectors (an area of some 40 000 ha) to plant a mixed forest, with the prospect of harvesting in 30-40 years.
4.4. Dust suppression operations
Obviously, the dust suppression and dust containment necessary in the first stage of cleaning up will become unnecessary with time (after 3-5 a), owing to the natural process of the localization of the contamination and its fixation. The volume of dust suppression work will also be reduced through compliance with the regulations governing activities relating to the decontamination of transport and the elimination of road contamination in the area.
At present, dust suppression operations of the ‘Kombinat’ Industrial Association are being conducted over a 4000 ha area; 1200 ha are being recultivated (sowing of grass and planting of forests). From May to October, almost every day, the roads in the zone are sprinkled with water three times; this is also done in the area beyond, up to the populated watchout post of Zelenyj My s. The railway line between the Chernobyl plant and Slavutich is treated with latex and distillery residues twice a month for the purpose of reducing the transfer of dust into the clean zone.
One part of the set of operations for fixing dust and preventing the migration of contamination together with the flow of transport consists of the decontamination of road and rail transport at appropriate health treatment points in the villages of Lelev, Rudnya-Veresnya, Dibrovo, Parishev and Iolcha.
4.5. Health service centres
On the border of the 30 km zone and in the zone itself, health service decontamination centres have been in operation since 1986-1987 for 5000 persons for the benefit of the Chernobyl plant and other services of the ‘Kombinat’ Industrial Association. There are three places for 2800 persons to change clothes in the town of Slavutich and at the Pusodovo station on the Chernobyl-Slavutich railway line; on the Chernobyl-Slavutich motorway, there are two places for 1500 people to change clothing. These health measures prevent contamination from being carried out on working clothes into the clean zone.

I A E A - S M - 3 0 6 / 1 2 4 13
Apart from the transmission of contamination from the cleanup zone by air and other means of transport, there is also the possibility of radionuclide migration in surface and groundwater flows. Beginning in 1986, a large scale programme was carried out for protecting surface and underground water from contamination. Since1986-1987, over 100 filtration dams and non-overflow dams have been used. Eight water storage structures in the near zone of the Chernobyl plant are serviced by the Kombinat. The remaining 12 are served by a section of the Water Economy Ministry of the Ukrainian Soviet Socialist Republic. Constant control is maintained over the groundwater in 61 wells in the most dangerous places. The concentrations in the drinking water resources and in the Pripyat River are considerably lower than the permissible level. The river reservoirs of the near zone of the Chernobyl plant are not unduly dangerous in the low water period. However, in order to avoid the danger of contamination being transported out of the flood plain of the Pripyat River as a result of flooding, a set of measures meeting the ecological requirements of the region has been worked out: damming up the banks, deepening the riverbed, washing out the bottom deposits, developing riverside plant growth, strengthening the banks, etc.
Water conservation methods at decontamination centres and other points where water is used in a closed cycle preclude the outflow of contaminated water into the Pripyat River in dangerous quantities and concentrations. However, as the breakdown of solid phase contamination progresses and radionuclides are leached out of the humic layer of soil and bottom deposits owing to the action of organic acids of silt, the process of contamination of the Pripyat River by filtered water and surface discharge can be accelerated. To prevent this, there is a plan to organize the development of acceptor vegetation in reservoirs and river areas (with high concentrations of radionuclides) and also in the cooling pond.
5. RESULTS OF THE CLEANUP OPERATIONSRegarding the decontamination of equipment at the Chernobyl plant, it should
be mentioned that the method applied here was mainly the ‘wet’ type of decontaminations used at the decontamination stations since 1986 for cleanup work. The principal mechanism for removing contamination from the surface of an object is the cleaving action of the hydrophilic property of surface active substances in an aqueous or acidic solution. This is followed by customary rinsing to remove the contamination toa slurry. In the area of the near zone of the Chernobyl plant, a shop for the decontamination of equipment was built in 1986 for the purpose of restoring to the production process at Chernobyl and other plants, rolled metal, cable products, fittings, electrical engineering apparatus and other machine parts and power generation
4 . 6 . W a t e r p r o t e c t i o n m e a s u r e s
14 K O M A R O V
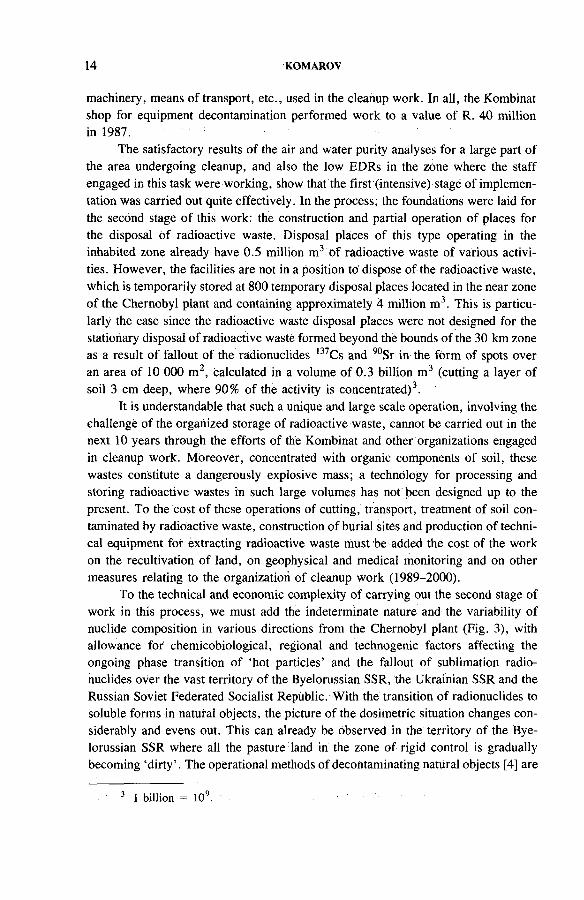
machinery, means of transport, etc., used in the cleanup work. In all, the Kombinat shop for equipment decontamination performed work to a value of R. 40 million in 1987.
The satisfactory results of the air and water purity analyses for a large part of the area undergoing cleanup, and also the low EDRs in the zone where the staff engaged in this task were working, show that the first (intensive) stage of implementation was carried out quite effectively. In the process; the foundations were laid for the second stage of this work: the construction and partial operation of places for the disposal of radioactive waste. Disposal places of this type operating in the inhabited zone already have 0.5 million m3 of radioactive Waste of various activities. However, the facilities are not in a position to dispose of the radioactive waste, which is temporarily stored at 800 temporary disposal places located in the near zone of the Chernobyl plant and containing approximately 4 million m3. This is particularly the case since the radioactive waste disposal places were not designed for the stationary disposal of radioactive waste formed beyond the bounds of the 30 km zone as a result of fallout of the radionuclides 137Cs and 90Sr in the form of spots over an area of 10 000 m2, calculated in a volume of 0.3 billion m3 (cutting a layer of soil 3 cm deep, where 90% of the activity is concentrated)3.
It is understandable that such a unique and large scale operation, involving the challenge of thé organized storage of radioactive waste, cannot be carried out in the next 10 years through the efforts of the Kombinat and other organizations engaged in cleanup work. Moreover, concentrated with organic components of soil, these wastes constitute a dangerously explosive mass; a technology for processing and storing radioactive wastes in such large volumes has not been designed up to the present. To the cost of these operations of cutting, transport, treatment of soil contaminated by radioactive waste, construction of burial sites and production of technical equipment for extracting radioactive waste must be added the cost of the work on the recultivation of land, on geophysical and medical monitoring and on other measures relating to the organization of cleanup work (1989-2000).
To the technical and economic complexity of carrying out the second stage of work in this process, we must add the indeterminate nature and the variability of nuclide composition in various directions from the Chernobyl plant (Fig. 3), with allowance for chemicobiological, regional and technogenic factors affecting the ongoing phase transition of ‘hot particles’ and the fallout of sublimation radionuclides over the vast territory of the Byelorussian SSR, the Ukrainian SSR and the Russian Soviet Federated Socialist Republic. With the transition of radionuclides to soluble forms in natural objects, the picture of the dosimetric situation changes considerably and evens out. This can already be observed in the territory of the Byelorussian SSR where all the pasture land in the zone of rigid control is gradually becoming ‘dirty’. The operational methods of decontaminating natural objects [4] are
3 1 billion = 109.

I A E A - S M - 3 0 6 / 1 2 4 15
1987 1988
FIG. 3. Changes in the radionuclide concentration in air in the region of Chernobyl nuclear
power plant (1— 1 km zone; 2 — 15-30 km zone).
gradually coming under suspicion (cutting the contaminated layer, ploughing the land). The processes of contamination dilution proceed more rapidly than was assumed. Consequently, in order that the second stage of the cleanup operation may be conducted rationally, it must be co-ordinated with the rates of sublimation fallout activity, decay of hot particles in the zone and beyond it, and also with the rates of migration of contamination into the food chain and into underground and surface water in the regions of the Union of Soviet Socialist Republics.
6. CONCLUSIONSThe main task in the 30 km zone is the stabilization of the radioecological situ
ation in this area and beyond, on the basis of the experience of the work in

1 6 K O M A R O V
1987-1988. Implementation of the task takes the form of the following set ofmeasures:(1) Preventing the atmospheric transport of contamination to clean areas; develop
ing methods for the recultivation of the affected land (sowing grass, reforestation, forestry in the resettlement zone);
(2) Fixing the contamination by biological engineering methods in alluvial sectors of the Pripyat River and its reservoir, which constitute a potential danger in the event of floods;
(3) Developing and introducing ways and means for the long term storage of contaminated materials at places for temporary placement of solid and liquid waste (cooling ponds, alluvial reservoirs), and also for such storage sites that can be flooded;
(4) Eliminating contaminated underground water and open water bodies in and beyond the cleanup zone;
(5) Developing and introducing methods for the efficient utilization of contaminated areas;
(6) Co-ordinating cleanup operations and applying experience more widely.
REFERENCES
(in Russian)
[1] SOBOTOVICH, Eh.V., BONDARENKO, G .N., O L 'K H O V IK , Yu .A .,
KO M ARO V, V .I., “ Occurrence forms o f fission products in accident discharges from
the Chernobyl nuclear power plant” , Cleanup Operation (Proc. 1st Mtg Chernobyl,
1988), Vol. 1, ‘Kombinat’ Industrial Association, Pripyat (1988) 104.
[2] SOBOTOVICH, Eh.V., KO M ARO V, V .I., CHEBANENKO, S.I., ibid., p. 32.
[3] KO M ARO V, V .I., et al., “ Migration o f radionuclides in soils o f the 30 km zone o f
the Chernobyl nuclear power plant” , ibid., p. 389.
[4] ARCH IPO V, N .P ., et al., “ Current problems in dealing with the area and natural
objects in the zone o f resettlement o f the Chernobyl nuclear power plant” , ibid.,
Vol. 2, p. 292.

I A E A - S M - 3 0 6 / 1 1 6
ACCUMULATION OF CHERNOBYL RADIONUCLIDES IN AGRICULTURAL PLANTS DURING 1986-1988 IN RELATION TO CONTAMINATION CONDITIONS AND SOIL CHARACTERISTICS
V.A. VETROV, G.A. ANDRIANOVALaboratory for Environmental and Climatic Monitoring,USSR State Committee for Hydrometeorology
and USSR Academy of Sciences,MoscowR.N. OLEJNIKUkrainian Scientific Research Institute for Hydrometeorology,KievUnion of Soviet Socialist Republics
AbstractAC C U M U LA T IO N OF CH ERNO BYL RADIONUCLIDES IN AG R IC U LTU R A L
PLAN TS DURING 1986-1988. IN R ELATIO N TO C O N TA M IN A T IO N CONDITIONS
A N D SOIL CHARACTERISTICS.
Since August o f 1986, the uptake o f Chernobyl radionuclides in the soil to plant system
has been under observation (monitoring) at a network o f agroecological testing sites and sam
pling grounds in the contaminated provinces in the Ukrainian and Byelorussian Soviet Socialist
Republics. The main aim o f this monitoring is to determine transfer factors (K t) for plant
produce in relation to environmental conditions (soil type, agrochemical and climatic charac
teristics, contamination conditions, etc.) and time. The network o f sampling grounds or uncul
tivated meadowlands is included in the monitoring o f herbaceous plant contamination. The
radionuclide concentrations in the soil layers and in plants (green matter, grain, straw, root
crops, tubers, etc.) are measured annually. The amount o f precipitation, humidity and other
climate and soil characteristics are being compiled on all o f the sites and experimental fields.
The results o f observations, obtained up to October 1988, show that the K t values fluctuate
within wide ranges (by up to two orders o f magnitude) and there is no obvious dependence
on physical contamination conditions and soil types. The main conclusion is that in order to
predict radioactive contamination on a specific individual farm or in a particular agroindustrial
region, one must carry out special research into the uptake o f Chernobyl radionuclides by
agricultural plants under the real conditions prevailing in that farm or region.
17

18 V E T R O V e t a l .
During the first weeks and months after the accident at the Chernobyl nuclear power plant, monitoring of external radiation doses received by the population from local food products was a serious problem in the campaign to limit the radiological consequences. Furthermore, when the measures to limit and reduce population exposure and modify economic structures were being planned (for regions with very high radioactive contamination levels), the evaluation and prognosis of radioactive contamination of agricultural produce from those regions became two of the most important tasks within the general effort to monitor the radiation situation.
As is stated in Ref. [1], we devised our methodological approach to the study and monitoring of the migrational characteristics of the Chernobyl radionuclides in the light, first and foremost, of the specific complexity and variety of the radionuclide composition and the physicochemical characteristics of the radioactive fallout; we also took into account the scale and intensity of contamination of various types of environmental complex under a wide range of soil-climate conditions.
Uptake of Chernobyl radionuclides into the soil-agricultural plant system is the first and, in many cases, the only link (excluding technological reprocessing) in the food chain through which Chernobyl radionuclides are transferred from the soil to human beings. The extent of this transfer is determined by several factors: the physicochemical characteristics of the radioactive particles contaminating the soil; the ‘age’ of the radioactive contamination; the chemical characteristics of the compounds of the radionuclide itself; the agrochemical and physical characteristics of the soil; the type of plant; and the meteorological and climatic conditions.
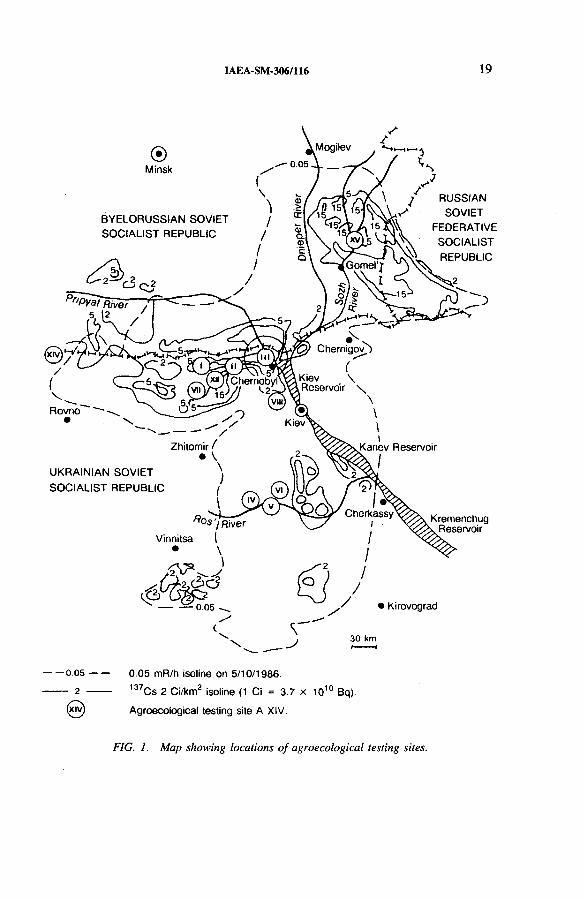
In view of the high number of determining factors, the problem of deciding the effect of each of those factors can be solved only by long term observation of a suitably wide variety of soil-plant systems under various soil, climatic, and physical contamination conditions. This is the methodological approach we used to monitor radioactive contamination of agricultural plants in a network of agroecologi- cal testing sites (Fig. 1).
The network of testing sites was planned in such a way as to include the widest possible variety of soil-climate conditions and agricultural crops, allowing us in principle to extrapolate the results obtained for application over the entire contaminated territory. Each agroecological testing site comprised a system of crop rotation fields within one farm having more or less the same conditions and contamination characteristics (the observational monitoring grounds were called experimental fields).
This paper also looks at wild herbaceous plants on natural (untilled) pastures (meadows) as well as at agricultural plants, since a significant proportion of the fodder ration for cows comes from natural pastureland. Meadowland grounds for monitoring the migration of Chernobyl radionuclides from the soil into grass were set up within the system of landscape-geochemical testing sites.
1 . M E T H O D O L O G Y
I A E A - S M - 3 0 6 / 1 1 6 1 9
®Minsk
BYELORUSSIAN SOVIET SOCIALIST REPUBLIC
Mogilev t .j4
У/ RUSSIAN15 SOVIET' в д / Л FEDERATIVE
^4.5 4 nV\ SOCIALIST
Zhitomir f • V
\
SOCIALIST REPUBLIC /
----------0 . 0 5 -----------
------ 2 ------
(xiv)
0.05 mR/h isoline on 5/10/1986.137Cs 2 Ci/km2 isoline (1 Ci = 3.7 x io’° Bq). Agroecological testing site A XIV.
FIG. 1. Map showing locations of agroecological testing sites.


I A E A - S M - 3 0 6 / 1 1 6 2 1
One of the main objectives of our research is to ascertain the generalized characteristics of agricultural plant contamination; this is usually expressed in the form of transfer factors for uptake of the i-th Chernobyl radionuclide from the soil into the plant:
Kt = (km2/kg)
where a¡ is the specific activity level of the i-th Chernobyl radionuclide in the dry plant mass (Ci/kg)1 ; cr¡ is the total amount of Chernobyl radionuclides in the soil (Ci/km2); all activity levels are for the point in time where the samples were taken.
These Kt factors are usually used when switching from the contamination level of an area or agricultural land (arable land) to the content of the i-th Chernobyl radionuclide in plants. As observations have shown, the values for these factors fluctuate within wide ranges, and the link between the uptake of Chernobyl radionuclides into plants and one or another group of factors has not been elucidated as yet owing to lack of sufficient data. Therefore, at the present stage of work, we are having to group the results by using fairly crude indicators (time after accident, soil type, plant type) in the hope of obtaining a reliable accumulation of interceptor factor limits for the most typical soil-plant systems.
2. CONTAMINATION OF MEADOWLAND PLANT LIFETable I gives the K, values for the main long lived Chernobyl radionuclides
grouped into three radioactive contamination zones (see Fig. 1):Zone I — Northern branch, the southern regions of Byelorussia, 50-250 km from
the source, turfy podzol soils on alluvial deposits with varying degrees of podzolization;
Zone II — Close branch, areas of the Ukrainian and Byelorussian Poles’e woodlands, up to 100 km from the source, turfy podzol and gleized soils;
Zone III — Southern branch, 100-300 km from the source, podzolized soils on loess deposits and forest-steppe zone chernozems.
As may be seen from the data in Table I, in July 1986 no significant differenceswere discovered in the uptake of individual Chernobyl radionuclides into herbaceous plants within Zone I. At the same time, Kt shows a clear tendency to increase as one moves from north to south, varying from (10-90) X 10“9 km2/kg in the Mogilev region to (200-1000) x . 10~9 km2/kg in the southern part of the Kiev region (see Fig. 1). We attribute this to the predominantly aerial (extra-root) contamination of
1 1 Ci = 3.7 X 10¹⁰ Bq.
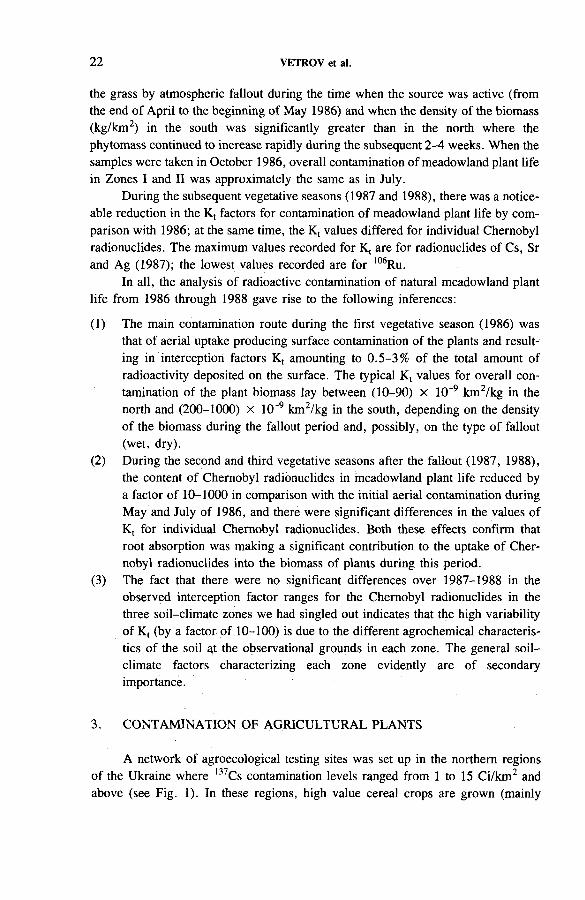
2 2 V E T R O V e t a l .
the grass by atmospheric fallout during the time when the source was active (from the end of April to the beginning of May 1986) and when the density of the biomass (kg/km2) in the south was significantly greater than in the north where the phytomass continued to increase rapidly during the subsequent 2-4 weeks. When the samples were taken in October 1986, overall contamination of meadowland plant life in Zones I and II was approximately the same as in July.
During the subsequent vegetative seasons (1987 and 1988), there was a noticeable reduction in the Kt factors for contamination of meadowland plant life by comparison with 1986; at the same time, the Kt values differed for individual Chernobyl radionuclides. The maximum values recorded for Kt are for radionuclides of Cs, Sr and Ag (1987); the lowest values recorded are for 106Ru.
In all, the analysis of radioactive contamination of natural meadowland plant life from 1986 through 1988 gave rise to the following inferences:(1) The main contamination route during the first vegetative season (1986) was
that of aerial uptake producing surface contamination of the plants and resulting in interception factors Kt amounting to 0.5-3% of the total amount of radioactivity deposited on the surface. The typical Kt values for overall contamination of the plant biomass lay between (10-90) X 10”9 km2/kg in the north and (200-1000) X 10 9 km2/kg in the south, depending on the density of the biomass during the fallout period and, possibly, on the type of fallout (wet, dry).
(2) During the second and third vegetative seasons after the fallout (1987, 1988), the content of Chernobyl radionuclides in meadowland plant life reduced by a factor of 10-1000 in comparison with the initial aerial contamination during May and July of 1986, and there were significant differences in the values of Kt for individual Chernobyl radionuclides. Both these effects confirm that root absorption was making a significant contribution to the uptake of Chernobyl radionuclides into the biomass of plants during this period.
(3) The fact that there were no significant differences over 1987-1988 in the observed interception factor ranges for the Chernobyl radionuclides in the three soil-climate zones we had singled out indicates that the high variability of Kt (by a factor of 10-100) is due to the different agrochemical characteristics of the soil at the observational grounds in each zone. The general soil- climate factors characterizing each zone evidently are of secondary importance.
3. CONTAMINATION OF AGRICULTURAL PLANTSA network of agroecological testing sites was set up in the northern regions
of the Ukraine where 137Cs contamination levels ranged from 1 to 15 Ci/km2 and above (see Fig. 1). In these regions, high value cereal crops are grown (mainly

I A E A - S M - 3 0 6 / 1 1 6 23
winter wheat), and sugar beet, potatoes and vegetables are produced. A significant proportion of the cultivated land is used to produce fodder crops — maize, sown grasses and fodder beets.
Observations at agroecological testing sites commenced in August of 1986. In each experimental field a typical plot measuring approximately 300 m X 500 m was selected and the content of Chernobyl radionuclides in the ploughed layer determined 1-2 times per season (the 0-5, 5-15, 15-25, 25-35 cm layers were tested separately). Samples of the biomass of agricultural plants were taken on the same plot in the following manner: grasses, maize and peas were sampled when the foliage was most full, and later at harvest time, the grain was sampled; 3-4 mowings of perennial grasses (green matter) were taken beween May and August; the remaining crops were sampled before the harvest.
To determine the level of surface contamination, all plant samples were analysed in two ways — in their natural (market ready) state, i.e. without the surface contamination having been washed off, and after they had been washed with a large quantity of water.
In addition to determining the Chernobyl radionuclide content in soil and plant samples, measurements were also taken of rainfall levels, soil humidity and the main agrometeorological characteristics, and of the harvest, at all agroecological testing sites. In addition, the soil and agrochemical characteristics in all the experimental fields were determined regularly: mechanical composition, pH level, humus content, salt content, etc.
The generalized contamination characteristics for main agricultural crops from1986 to 1988 (on the basis of observations made over the whole network of agroecological testing sites) are given in Table II in the form of the typical fluctuation ranges for the interception factors K, for major long lived radionuclides. All the data given in Table II are for samples of produce in a market ready state. Analysis of these data shows that, as for natural meadowland plant life, in August-September of 1986, surface contamination of the exposed portions of plants was responsible principally for the total content of Chernobyl radionuclides in the dry biomass. In subsequent years, one can see that there is a noticeable reduction in the contamination of the grain of grasses and maize, but there are no significant changes in the contamination ranges for the vegetative organs (straw, green matter). One should also note that there are no stable differences in the capacity of individual Chernobyl radionuclides to accumulate in the plant biomass (during one vegetative period). The exception is 90Sr; uptake of this radionuclide into all types of agricultural plants, apart from maize grain, is much higher than the uptake for the other Chernobyl radionuclides.
The similar content of the different Chernobyl radionuclides (apart from 90Sr) observed in the vegetative organs of plants shows that, for these Chernobyl radionuclides, surface contamination remained the significant factor in overall contamination of agricultural plants during 1987 and 1988. This inference is confirmed by the results of experiments in which the plant samples were washed. Thus, in 1987, no

TABLE
II. UPT
AKE
OF THE
CH
ERNO
BYL
RADIO
NUCL
IDES
INTO
AGRIC
ULTU
RAL
PLANT
S DU
RING
1986-1
988
(К, (10
'9 km2
/kg))
2 4 V E T R O V e t a l .
X>to
О
vOО
03<u
с мIчо
оICMОо
с<я"а.
СиН
а>&§
g_с£ сл1—о
^ оО I^ 3о о
сп 40 mо О ON о
О 1СП1 о1 1
сп1 о О г-> о
гм о о о о о
СМinсм о
О о ó о1 1 1 СП 1 1см СП WH смо о о о о оо о о V о о
(NIrj-
О(N NOоI _О r f о I-Н о оо о о о
1Пen
^ ОО II г- о о<N О I I О О СПО О О О
О-о
г м
оI£ 1 I
оIг->о
СП *Tiо о СП СП 00 СП
оСМ «Г> см
оо
о о о1 о ó о 1 о 1 г- о о
1 1 00 1 1 1 1о »о 1 40 см о 40 о 1Г)
СП о о 1 О о о о о см о о
о о о о о о о о о ó о
ЧО г- 00 40 Г" оо г- 00 г» 00 40 г- 00оо оо 00 со оо оо оо 00 00 00 оо оо ооON On ON ON ON ON ON ON ON ON ON ON ON*—« **н 1—» «"Ч *-*
% олCQ
л2
О
iо
О I» Ti
en О
«*
о о1 ONсмсмо
оо
Tt
© ON 1Г)1 40 о 1 1 1 1 о 1СМ
81 СП СП СП 1 СП 40о о о о о СП о
о о о о о о о о о о
оСП1
г-оó1
00оó1 СП о
»оооо1«о 40 1 1 40о о о СП о
о о о о о о
тГ О ОI I I
VO Г-" 00 о о о © о о On On On
о

I A E A - S M - 3 0 6 / 1 1 6
соI
40 40<N о ог-
11г- 1
ON1
СЧ40 o о оО о о о
in inTt CN Tt 40
^ ^ о - ^ (N ОON M I I О 1 1¡ 1 Tt 00 1 vo со40 —- C4 m o orsi о о о О О О
СО 40Tt 00 г-
чо о о1 1 11 СП m TfСО ОО О О О
оо СО ОСО00оCN (Ч 11 1со 1о
о о О о
г- 00 г-* 0000 00 00 00ON On Оч ON
TDT3ОÜ-
>Об
I I ITt
C O
о
(N О О о
гмо
( N I
О Sо о
^ оО I I чо — о to о о
О О О
Ю Г' 0 0 0 0 0 0 0 0 O n O n O n
О
овоCU
<ХЗ*
I I
оII »П (NI о о о о
С О
оI vo 00 о о о о о
vn (N
°° О О I 1 ^ со о
О О
SO ОI чо «Л <N О О
О О О
40 Г- 0 0 0 0 0 0 00 On ON On
03
Л § Vh JS<я о ед о> .? £00

26 V E T R O V e t a l .
TABLE III. MEAN FACTORS FOR UPTAKE OF 134Cs, 137Cs INTO PLANT PRODUCE IN VARIOUS SOIL-CLIMATE ZONES IN THE SOUTHERN UKRAINE FROM 1987 THROUGH 1988 (Kt (1СГ9 km2/kg))
Poles’e woodlands Forest-steppe regions
1987 1988 1987 1988
Winter wheat and rye:
Grain
Straw
0.21
0.73
0.15
0.24
0.06
0.56
0.02
0.13
Barley and oats:
Grain 0.05 0.10 0.06 0.02
Straw 0.31 0.14 0.26 0.08
Maize:
Grain 0.11 0.07 0.03
Green matter 1)23 0.43 0.32 0.54
Fodder grasses:
Clover 6.2 1.0 3.6 0.53
Alfalfa — 0.26 0.35 0.51
Potatoes
(mechanically washed) 0.29 0.23 — 0.15
more than 50% of the radioactive caesium was taken up into the plant biomass via root uptake.
Table III gives the mean Kt values for Chernobyl radioactive caesium. These data show the contamination dynamics for major marketable plant produce in two soil-climate zones corresponding approximately to Zones II and III, which were singled out during the analysis of data on contamination of meadowland plant life (see Table I). From the data in Table III one can see that, in the Ukrainian Poles’e
I A E A - S M - 3 0 6 / 1 1 6 27
woodlands (Zone II), higher radioactive caesium accumulation levels in cereal and fodder crops were observed in general than in the forest-steppe regions.
The results given in Table III are averaged observation results grouped by using two factors (zone and time after accident), and they show a noticeable downward tendency in the uptake of radioactive caesium into agricultural plants over the years 1987-1988 in the main types of plant produce. There may be many different reasons for this tendency which can only be elucidated by analysing suitably long and detailed series of consecutive observations. It should be noted that the uptake of radioactive caesium into the vegetative mass of agricultural plants (straw, green matter, fodder grasses) over 1987-1988 was much lower than uptake in natural grasses (Table I, Zones II and III). This is linked obviously to the reduction in the concentration of the Chernobyl radionuclides in the soil brought about by the mechanical working of agricultural fields (ploughing, cultivation).
4. CONCLUSIONSThe extent of uptake of the Chernobyl radionuclides into agricultural plants
from 1986 through 1988 depends on many factors. For this reason, the overall contamination characteristics — the interception factors from the soil into the plant Kt — fluctuate within wide ranges (by up to two orders of magnitude) and there is no obvious dependence on physical contamination conditions and soil types. One can only identify the main factors affecting contamination of plants by one or another of the Chernobyl radionuclides by using statistical methods to analyse suitably lengthy series of observations for a whole range of soil-climate and agrochemical conditions in a network of agroecological testing sites.
Thus, to predict radioactive contamination of plant produce on a specific farm or in an agroindustrial region, one must carry out special research into the uptake of Chernobyl radionuclides within the soil-agricultural plant system under the real conditions prevailing in that farm or region. The use of certain mean (generalized) transfer factors in predictive models can produce errors amounting to factors of tens in the evaluation of contamination of agricultural produce and, consequently, in the evaluations of dose levels delivered to specific groups of the population.
R EFER EN C E
[1] IZR A E H L ’ Yu. A . , et al., Ecological consequences o f the radioactive contamination o f
the environment in the region affected by the Chernobyl nuclear power plant accident,
At. Ehnerg. 64 1 (1988) 28, 40 (in Russian).

I A E A - S M - 3 0 6 / 4
137Cs S O I L T O P L A N T
T R A N S F E R F A C T O R S D E R I V E D
F R O M P O T E X P E R I M E N T S
A N D F I E L D S T U D I E S
O. HORAK, K. MÜCK, M.H. GERZABEK Austrian Research Centre Seibersdorf,Seibersdorf, Austria
Abstract
I37Cs SOIL TO P L A N T TRANSFER FACTORS DERIVED FROM POT EXPERIMENTS
A N D FIELD STUDIES.
Soil to plant transfer factors (TF ) o f l37Cs for different crop plants were determined
in pot experiments, in outdoor experiments with plastic containers o f 50 L volume and in field
studies. In all cases the soil contamination with l37Cs resulted from fallout after the
Chernobyl reactor accident. Mean TF derived for outdoor plants on a fresh weight basis
ranged from 0.0017 (leaf vegetables) to 0.059 (rye straw) and showed characteristic
differences, depending on the plant part and species. Generally, for fruits and potato tubers,
lower TF were found than for vegetative plant parts. Moreover, the data were compared with
those from experiments carried out before the Chernobyl accident. There is a good agreement
for cereals (with the exception o f rye), fruits, vegetables and fodder crops, while actual TF
are substantially lower for potatoes and leaf and root vegetables, but higher for rye. A
significant negative correlation was observed between the TF and the soil activity
concentrations for l37Cs. In container experiments the TF were found to be influenced
mainly by the clay content o f the soil.
1. INTRODUCTIONMost soil to plant transfer factors (TF) up to the present have been derived
from pot experiments with artificially contaminated soils, carried out under greenhouse conditions. Not all data from field grown crops could be evaluated formerly with adequate precision because of continuous fallout during and after the period of nuclear weapons testing.
As a consequence of the Chernobyl reactor accident in April 1986, large parts of central Europe were contaminated by radioactive fallout, mainly caesium isotopes. Unlike the weapons fallout, the deposition from Chernobyl lasted only for a short period of approximately 10 days. After this period, the deposition — as determined primarily by the activity concentration in air — was less than 0.03% of that of the peak values [1]. The radionuclides deposited on the soil were then distributed by cultivation processes. The deposition levels of 137Cs in Austrian agricultural regions ranged from about 0.7 to more than 90 kBq/m2 [2].
29

30 H O R A K e t a l .
Corresponding 137Cs soil activity concentrations can be expected to be in a range from 2.5 (background) up to 300 Bq/kg, based on an average of 300 kg soil/m2. This situation makes possible the investigation of caesium transfer under natural conditions and without errors due to contamination by a continuous fallout. In this paper a preliminary report is given about transfer studies, carried out in the years1987 and 1988.
2. MATERIALS AND METHODSPlants were cleaned of soil particles, dried (lyophilized), oven dried at 100°C,
ground by a laboratory mill and then ashed in a muffle furnace at a temperature not exceeding 450°C. The activity concentration in the plant ash was determined on a Ge(Li) detector with 30% relative efficiency. Owing to a long measurement time of 50 000-200 000 s and a sample weight of approximately 1 kg, a detection limit of 0.08 Bq/kg 137Cs was obtained.
Soil samples were air dried, sieved through a 2 mm steel screen and measured on the same detector for 5000-10 000 s. The sample weight of about 0.7 kg resulted in a detection limit of approximately 1.5 Bq/kg 137Cs. Other soil parameters were determined by standard soil analytical methods.
The TF are expressed as the ratio between the specific activity of plants, based on fresh weight, and the specific activity of soil, based on dry weight. Owing to the measurement of both the soil and the vegetation sample on the same detector, errors due to calibration of the detector are practically eliminated. Errors in the derived TF are only due to the different geometries of soil and ash samples on the detector and to counting errors. The relative error due to the sample-detector geometry is estimated to be less than 3%, the counting error ranges from 1.2 to 8% for soils, and from 2 to 80% for plants, depending in both cases on the activity concentration of the sample. Thus, the overall error of the TF is dominated by counting statistics in the vegetation measurement.
3. RESULTS AND DISCUSSIONMitscherlich (5 kg) pot experiments were conducted with two highly contami
nated brown soils from a region with high fallout (Upper Austria) from the Chernobyl accident. The soils were taken in July 1986 from the upper 5 cm layer of sugar beet fields. The 137Cs activity concentrations in the two soil samples were 1735 and 2098 Bq/kg; clay contents were 23.4 and 30.1%, respectively [3].

I A E A - S M - 3 0 6 / 4 31
TABLE I. AVERAGE SOIL-PLANT TRANSFER FACTORS (TF) DERIVED FROM POT EXPERIMENTS
Plant TF Standard deviationNumber
o f samples
Endive 0.002 8 ± 0.001 1 36
Spinach 0.002 4 ± 0.001 5 36
Barley: straw 0.009 0 ± 0.001 1 36
grain 0.000 94 ± 0.000 26
Maize: straw 0.005 7 ± 0.001 0 28
grain 0.002 8 ± 0.000 9
Wheat: straw 0.010 4 ± 0.003 9 28
grain 0.000 7 ± 0.000 4
ЕЭ TF О Clay
Thurnau Ritzlhof Haid Eferding1800 2972 1381 617±246 ±210 ±57 ±43
FIG. 1. The l37Cs soil-plant transfer factors (TF)for endive grown in container experiments
in four soils with different contamination levels and clay contents in four locations in Austria.

32 H O R A K e t a l .
Average TF derived for various crop plants (Table I) show characteristic values for vegetative plant parts, in which different water contents are the determining factors. Water contents were in a wide range, e.g. for straw: 15-30%, for grains: 14% (standardized value) and for leaf vegetables: >90%. The values of the TF in cereal grains (generative plant parts) are substantially lower than in straw and other vegetative plant parts. Caesium is known to be a mobile element similar in behaviour to potassium [4]. From certain experiments [5] and a great number of other investigations on nutrient contents, there is evidence that potassium is also generally more concentrated in vegetative parts than in seeds. Relationships between the caesium transfer and soil properties or fertilization treatments were not observed [3].
Another series of experiments was carried out under outdoor conditions in 50 L plastic containers which were filled with four different soils from a high fallout region in Upper Austria. Wheat, spinach and endive were grown as experimental plants.
Figure 1 gives the data for endive; however, similar results were obtained also for the other crops. The values of the TF were found in a considerable range, e.g. for wheat grains: 0.0013 + 0.0011, wheat straw: 0.0041 ± 0.0027, and spinach:0.0019 + 0.0011. In all cases the highest caesium transfer was found on Eferding soil with the lowest clay content. This is in agreement with former findings [6, 7], which show the strong influence of soil clay content on the caesium uptake by plants.
Soil to plant TF for 137Cs were determined in a great number of field grown crops at different locations and in different soil types in the Austrian provinces of Lower Austria, Styria and Burgenland. As a result of intermixture by ploughing and other tillage methods, the soil activity concentrations were generally lower than those in the pot and container experiments. On sites with low contamination levels, located in the eastern parts of Austria, activity concentrations for 137Cs of 10-30 Bq/kg soil were measured, while the most highly contaminated sites showed activity concentrations in a range between 100 and 300 Bq/kg soil.
Generally, there is a good agreement between the TF determined in field grown plants and those of pot and container experiments; however, a large variation of values within the different plant species itself indicates that the soil to plant transfer of caesium from the Chernobyl accident is governed by site specific factors, such as soil properties or climatic conditions. In Table II, average TF derived from field grown crops and plants in outdoor containers are presented. The data were calculated for important plant species or plant groups of similar properties. A remarkable result is the different distribution of caesium between the grain and the straw of cereal crops, which may be a consequence of a specific variation of translocation intensity, but also of growth conditions and of the general supply of nutrients. As already observed in the Mitscherlich pot experiments, there was a lower grain/straw activity ratio in barley and wheat but a higher one in maize than in experiments conducted under outdoor conditions or in field studies, where activity ratios range from 9.5 to 61%. The large discrepancies between grain and straw

I A E A - S M - 3 0 6 / 4 33
TABLE II. AVERAGE TF DERIVED FROM FIELD CROPS AND OUTDOOR CONTAINER EXPERIMENTS
Plant, part TF (x ± s)Number *
o f samples
Activity ratio
(grain/straw only)
Maize, straw 0.019 ± 0.018 10
Maize, grain 0.0018 ± 0.0017 9 0.095
Wheat, straw 0.023 + 0.026 . 10
Wheat, grain 0.0055 ± 0.0056 9 0.239
Barley, straw 0.024 ± 0.019 8
Barley, grain 0.013 ± 0.015 8 0.542
Rye, straw 0.059 ± 0.079 3
Rye, grain 0.036 ± 0.049 3 0.61
Potato, shoot 0.0136 ± 0.0083 4
Potato, tuber 0.0027 ± 0.0020 6
Leaf vegetables
(lettuce, endive and spinach) 0.0017 ± 0.0017 8
Root and shoot vegetables
(carrots, celery,
cauliflower, etc.) 0.0034 ± 0.0033 10
Fruit vegetables
(cucumber, tomato,
red pepper, etc.) 0.012 ± 0.021 7
Fodder plants
(grass, leguminous plants
and rape) 0.016 ± 0.018 9
activity concentration are of considerable importance in predicting realistic caesium intake values for the general public after nuclear accidents with significant releases.
It is of considerable interest to compare the actual data with results obtained in former experiments, as reported in a comprehensive study of the literature [4, 8]. There is a good agreement for cereals (with the exception of rye), fruits, vegetables and fodder crops, while actual TF data are substantially lower for potatoes and leaf and root vegetables, but higher for rye. The actual data of caesium transfer agree

34 H O R A K e t a l .
S o il (B q /k g )
FIG. 2. The ,37Cs transfer factors for wheat in response to the 137Cs activity concentration
in the soil.
in most cases with more recent experimental results which were published before the Chernobyl accident [9, 10]. In pot experiments [9] similar TF for wheat, barley and vegetables, but lower values for fodder plants, were found. Lysimeter experiments under outdoor conditions [10] show generally good agreement with actual data for cereals and leaf and root vegetables, but a lower transfer for fruit vegetables. Also there is evidence [10] of a large variation of the caesium transfer rate within a plant species, which is dependent on soil properties.
Soil parameters are of great importance for the prediction of caesium transfer on a regional scale. A significant correlation was found between TF and soil activity concentrations of ,37Cs. Figure 2 represents this correlation for wheat straw and grain but other plants showed similar results. A study of caesium transfer to the aquatic vegetation of Styria during the growth period of 1987 [11] also gave evidence

I A E A - S M - 3 0 6 / 4 35
of a negative correlation between TF and sediment activity concentrations. Explanations for the decreasing l37Cs transfer with increasing isotope concentration in soil may be a non-linear relation between ion uptake by plant roots and ion concentration in the rooting medium, variations in soil properties or climatic conditions determining the magnitude of contamination by resuspension.
. Among other important soil properties, the pH value shows no significant influence, but the clay content probably correlates with the TF. This was shown particularly by the results of the container experiments (Fig. 1). The further aim of this work will be the complete analysis of soils from all field sites and the investigation of the influence between clay, humus and exchangeable potassium content on caesium uptake by plants.
4. CONCLUSIONSThe actual experiments were carried out on soils contaminated by environ
mental conditions after the Chernobyl accident. The TF derived for l37Cs are generally lower than those from earlier experiments carried out in the greenhouse and under conditions influenced by aerial contamination due to the nuclear weapons testing. The transfer data obtained here agree much better with results obtained shortly before the Chernobyl accident when obviously the fallout from nuclear weapons testing had practically decreased to zero. Even here, substantially lower values were observed for potatoes and leaf and root vegetables.
To obtain proper estimates of intake values and the derived ingestion doses to be expected for the public after significant fallout contamination, a good knowledge of realistic soil to plant transfer values is vital, particularly in regard to proper decisions on the countermeasures to be adopted. The values obtained in the actual work reported here should help in coming to a better understanding of transfer modelling. This is particularly true for decreasing transfer rates with increasing soil contamination, which has significant implications for the countermeasures to be taken after serious radionuclide releases.
A C K N O W L E D G E M E N T S
The authors wish to thank the Austrian Ministry of Science and Research for financial support of this work.

36 H O R A K e t a l .
REFERENCES[1] MÜCK, K., Variations in activity concentration and radionuclide ratio in air after the
Chernobyl accident and its relevance to inhalation dose estimates, Radiat. Prot. Dosim. 22 4 (1988) 219-229.
[2] HORAK, O., GERZABEK, M.H., Basisdaten zur regionalen Prognose der Strahlen- belastung des Menschen nach dem Modell ECOSYS, Rep. OEFZS-Ber. 4447, LA-198/88, Austrian Research Centre Seibersdorf (1988).
[3] GERZABEK, M.H., ULLAH, S.M., MÜCK, K., “ Cs-137 transfer into plants fromcontaminated Austrian soils” , After-Effects o f Chernobyl (Proc. 19,h ESNA Conf. Vienna, 1988) (GERZABEK, M.H., Ed.), Austrian Research Centre Seibersdorf (1989).
[4] HAUNOLD, E., HORAK, O., GERZABEK, M.H., Umweltradioaktivitat und ihre Auswirkung auf die Landwirtschaft. I. Das Verhalten von Radionukliden in Boden und Pflanze, Bodenkultur 38 (1987) 95-118.
[5] HORAK, O., Zur Bedeutung des Nickels für Fabaceae. I. Vergleichende Unter- suchungen iiber den Gehalt vegetativer Teile und Samen an Nickel und anderen Elementen, Phyton 25 (1985) 135-146.
[6] ANDERSEN, A.J., Investigations on the Plant Uptake o f Fission Products fromContaminated Soils. I. Influence of Plant Species and Soil Types on the Uptake ofRadioactive Strontium and Cesium, Riso Rep. No. 170, Agricultural Research Department, Danish Atomic Energy Commission, Riso (1967.
[7] D ’SOUZA, T.J., FAGNIART, E „ KIRCHMANN, R., Effects o f Clay Mineral Type and Organic Matter on the Uptake o f Radiocesium by Pasture Plants, Rep. BGL 538, Studiecentrum voor Kernenergie, Petten (1980).
[8] HAUNOLD, E., DANNEBERG, O.H., HORAK, O., TUSCHL, P., “ Die Nutz- barkeit radioaktiv kontaminierten Acker- und Weidelandes nach grossràumigen Verstrahlungen in Abhângigkeit von der Zeit” , Beitràge Umweltschutz Lebens- mittelangelegenheiten, Veterinàrverwaltung, Umweltradioaktivitat, Bundesministerium für Gesundheit und Umweltschutz, Vienna (1982).
[9] HAISCH, A., CAPRIEL, P., FORSTER, S., Câsiumverfügbarkeit für Pflanzen auf drei verschiedenen Boden. Transferfaktoren Boden-Pflanze, Landwirtsch. Forsch. 38 (1985) 229-236.
[10] STEFFENS, W., MITTELSTAEDT, W., FÜHR, F., FÓRSTEL, H., KLAES, J., Abschátzung der Aufnahme des abgelagerten Cs-137 und Sr-90 über die Wurzel, Atom- wirtsch. Atomtech. (Jul. 1986) 389-392.
[11] AHAMER, G., et al., “ The uptake o f radioactive cesium into the aquatic vegetation o f Styria/Austria” , After-Effects o f Chernobyl (Proc. 19th ESNA Conf. Vienna, 1988) (GERZABEK, M.H., Ed.), Austrian Research Centre Seibersdorf (1989).
I A E A - S M - 3 0 6 / 5 0
F O L I A R U P T A K E O F R A D I O N U C L I D E S
A N D T H E I R D I S T R I B U T I O N IN T H E P L A N T
P. KOPP, W. GÓRLICH, W. BURKART Radiation Hygiene Division, Radioecology,Paul Scherrer Institute,VilligenH.J. ZEHNDERSwiss Federal Research Station for Arboriculture,
Viticulture and Horticulture,WadenswilSwitzerland
Abstract
FO LIAR U PTAKE OF RADIONUCLIDES A N D THEIR DISTRIBUTION IN THE
PLA N T.
The most important pathway for radionuclide contamination o f the food chain is the
uptake by plants from the ground through the roots or through the leaves. Once the contami
nated foods have been ingested by man or animals, the radionuclides produce an internal radia
tion dose in the specific organs where they have accumulated: After the Chernobyl accident
unexpectedly high caesium activities were found among a variety o f agricultural products such
as fruits and nuts. These relatively high caesium concentrations could not be explained by root
uptake or external contamination. Therefore experiments to study the time dependent foliar
uptake o f 134Cs and 85Sr in strawberries, as well as the uptake and distribution o f l34Cs, 85Sr
and 45Ca in various berry bushes, such as red currant, gooseberry, blueberry and strawberry,
were carried out. The results showed the following decreasing order o f foliar uptake:
Cs > Ca > Sr.
1. INTRODUCTIONRadionuclides released as fallout can be deposited either as wet or dry
deposition on the ground or on the leaves of plants. These isotopes can be taken up subsequently by plants either through their roots or their leaves.
The problems arising from direct foliar deposition of 90Sr released from the testing of nuclear devices in the atmosphere were very well described by Russell [1, 2]. Since the ban on nuclear weapons testing, relatively few investigations have been undertaken in this direction, so we had to study the literature on foliar fertilization [3] to gain some insight into this field.
37

38 K O P P e t a l .
The Chernobyl accident has demonstrated how important it is to have a good knowledge and understanding of the initial uptake and the time dependent distribution of radionuclides to the various parts of plants.
Activity measurements of various vegetables [4], fruits and nuts [5] after Chernobyl, as well as our initial experiments [6], have shown that, in contrast to many plants which take up these radionuclides from the soil, the fruits and nuts growing on bushes and trees must have taken up these radioactive substances from fallout deposited on the leaves. The comparatively high content of radionuclides could not be explained by root uptake because of the slow penetration of the radioactive fallout through the soil as well as the short time interval between the incident and harvest. Direct contamination of fruits and nuts can also be excluded since the fallout occurred before the development of the edible parts. It was concluded after considering all of these factors that radionuclides had been taken up through the plant leaves.
Our main interest is to study the effect of the accumulated fallout isotopes on the food chain and the activity in fruit and storage organs of plants (roots, tubers, etc.) which are important for human nutrition, rather than in those plant organs which have an intermediate host, e.g. cattle. The basic principles of foliar uptake are described in Refs [7-12].2. EXPERIMENTS
The leaves of all plants were experimentally contaminated by depositing small droplets of solutions of 134CsCl (95 kBq/0.1. mL), 85SrCl2 (130 kBq/0.1 mL) or 45CaCl2 (185 kBq/0.1 mL) on the leaves with a microsyringe. The plants were then left to grow. At the stage when the berries were developed yet still green, one of each of the bushes was removed, the berries picked and the bushes classified into leaves (contaminated and uncontaminated), branches, wood with the bark removed, bark, and roots. The activity of the soil was also measured.
This procedure was repeated again with another bush when the berries had reached the ripe stage and finally with a bare bush, in autumn, after the leaves had fallen.
The radioactivity of the samples was determined as follows: the activity of 134Cs and 85Sr by y spectrometry with a Ge detector, and that of 45Ca (after separation) by liquid scintillation counting.
A slightly different procedure was adopted with the strawberries. As with our earlier experiments [6] we wanted to study the kinetics of incorporation of the radionuclides into the plant. Only two. leaves per plant were contaminated with 134Cs (38 kBq/0.1 mL) or 85Sr (52 kBq/0.1 mL). The contaminated leaves were removed from each plant at relatively short intervals and washed with 50 mL of distilled water. The leaves were dried and the activities of the washing water and. the leaves were determined.
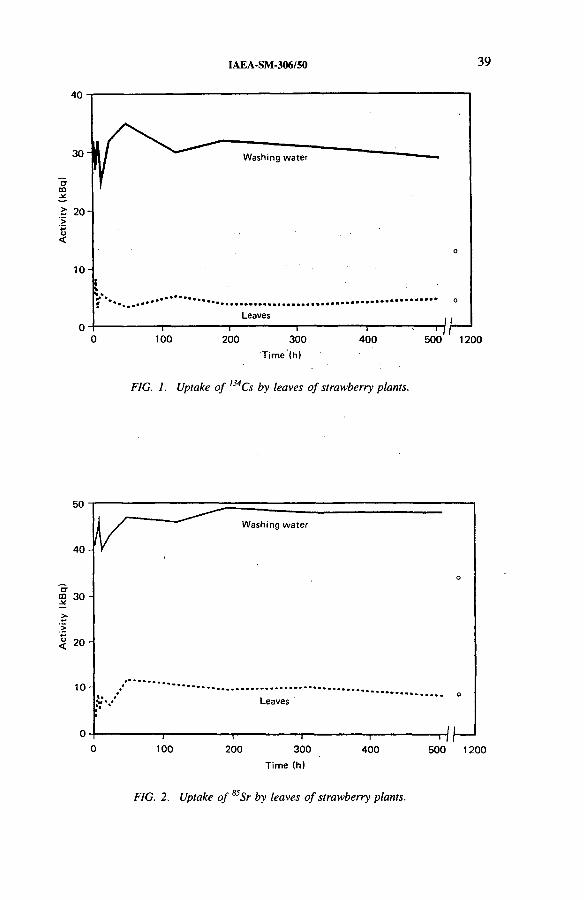
Act
ivity
(k
Bq)
A
ctiv
ity
(kB
q)
I A E A - S M - 3 0 6 / 5 0 39
FIG. 1. Uptake of 134Cs by leaves of strawberry plants.
T im e (h)
FIG. 2. Uptake of 85Sr by leaves of strawberry plants.

40 K O P P e t a l .
In a further experiment, some strawberry plants were contaminated in the same way as the berry bushes with l34Cs and 85Sr only. Whole strawberry plants and the respective activities of the plant parts were classified as: fruit, washed leaves, stalks, inner leaves and shoots, stems, sepals, and roots.
3. RESULTSThe results of the kinetic experiments on the uptake of 134Cs and 85Sr by
strawberries are shown in Figs 1 and 2, respectively. They show that the maximum amount of radioactivity retained by the leaves is about the same for both isotopes and that it was reached by the time the first sample was taken (2 hours). It remained at
TABLE I. DISTRIBUTION OF RADIONUCLIDES IN STRAWBERRIES
................... In ripe stageRadionuclide Plant part ,y (Bq/part)
Washed leaves 50 724
Stalks, buds,
shoots 11 859
Sepals, stems 4 207
Fruit 20 374
Roots 2 644
Runners, new
plants 2 048
Washed leaves 57 418
Stalks, buds,
shoots 3 996
Sepals, stems 608
Fruit 403
Roots 145
Runners, new
plants 306

I A E A - S M - 3 0 6 / 5 0 4 1
T A B L E I I . D I S T R I B U T I O N O F R A D I O N U C L I D E S I N R E D C U R R A N T S
D U R I N G T H R E E D I F F E R E N T S T A G E S ( B q / p a r t )
Radionuclide Plant part Unripe Ripe Bare
Cs-134 Leaves 46 740 13 249 n.s.a
Whole branches 7 290 3 044 3 725
Wood without bark 886 5 711 995
Bark 1 577 3 395 1 627
Berries 362 1 924 n.s.
Stalks 67 627 n.s.
Washing water n.s. 18 129 n.s.
Roots 1 944 4 219 3 062
Sr-85 Leaves 133 902 25 188 n.s.
Whole branches 17 33 962
Wood without bark 8 11 12
Bark 8 33 100
Berries 5 4 n.s.
Stalks 2 26 n.s.
Washing water n.s. 84 160 n.s.
Roots 3 1 112
Ca-45 Leaves 211 712 23 387 n.s.
Whole branches 1 999 2 013 5 088
Wood without bark 756 42 7
Bark 736 192 4 228
Berries 55 343 n.s.
Stalks 30 27 n.s.
Washing water n.s. 88 320 n.s.
Roots 15 228 114
a n.s. — no sample.

42 K O P P e t a l .
T A B L E I I I . D I S T R I B U T I O N O F R A D I O N U C L I D E S I N G O O S E B E R R I E S
D U R I N G T H R E E D I F F E R E N T S T A G E S ( B q / p a r t )
Radionuclide Plant part Unripe Ripe Bare
Cs-134 Leaves 64 405 22 895 n.s.a
Whole branches 1 364 ' 4 370 13 344
Wood without bark 243 846 1 534
Bark 155 483 1 519
Berries 4 552 3 264 n.s.
Stalks n.s. n.s. n.s.
Washing water n.s. 44 351 n.s.
Roots 812 2 738 3 475
Sr-85 Leaves 133 947 25 641 n.s.
Whole branches 4 940 6 273 33 796
Wood without bark 14 11 20
Bark 31 150 103
Berries 260 2 739 n.s.
Stalks n.s. n.s. n.s.
Washing water n.s. 110 971 n.s.
Roots 15 25 90
Ca-45 Leaves 267 824 44 053 n.s.
Whole branches 10 148 68 301 2 817
Wood without bark 78 123 4
Bark 239 3 112 1 792
Berries 560 5 064 n.s.
Stalks n.s. n.s. n.s.
Washing water n.s. 87 708 n.s.
Roots 137 49 310
a n.s. — no sample.

I A E A - S M - 3 0 6 / 5 0 43
T A B L E I V . D I S T R I B U T I O N O F R A D I O N U C L I D E S I N B L U E B E R R I E S
D U R I N G T H R E E D I F F E R E N T S T A G E S ( B q / p a r t )
Radionuclide Plant part Unripe Ripe Bare
Cs-134 Leaves 23 500 9 263 n.s:a
Whole branches 4 200 2 582 2 760
Wood without bark 1 400 935 862
Bark 2 000 290 403
Berries 776 648 n.s.
Stalks n.s. n.s. n.s.
Washing water 51 700 27 600 n.s.
Roots 1 200 2 485 608
Sr-85 Leaves 15 856 7 263 n.s.
Whole branches 2 934 1 432 2 744
Wood without bark 18 133 67
Bark 35 26 117
Berries 6 20 n.s.
Stalks n.s. n.s. n.s.
Washing water 131 100 74 800 n.s.
Roots ' 7 20 23
Ca-45 Leaves 15 930 30 646 n.s.
Whole branches 6 542 347 1 792
Wood without bark 374 29 0
Bark 338 58 280
Berries 102 33 n.s.
Stalks n.s. n.s. n.s.
Washing water 266 800 169 800 n.s.
Roots 368 21 44
a n.s. — no sample.

44 K O P P e t a l .
that level for 3 weeks. After a longer contact period of 62 days, we noticed a high loss of 134Cs (54%) and a limited loss of 85Sr (18%), a decrease in the activity of the washing waters, but no increase in the activity of the leaves. This finding is being reinvestigated.
The distribution of 134Cs and 85Sr in strawberry plants is shown in Table I. The largest amounts remained in the leaves. Apart from the leaves, l34Cs was distributed in different parts whereas 85Sr was accumulated mainly in stalks, buds and shoots (about 6%), the remaining parts containing only fractions of a per cent.
In red currants (Table II), gooseberries (Table III) and blueberries (Table IV), a similar distribution of radioactivity was found. Caesium-134 was distributed in most parts of the plant, whereas with both 85Sr and 45Ca, nearly 100% remained on or in the leaves (unripe plants) and in the washing water (ripe stage). In red currants,0.6% of the deposited 134Cs activity was transported to the unripe fruit and 3.4% to the ripe berries, while only minute amounts of 85Sr (0.004% unripe) and 45Ca (0.03% unripe and 0.2% ripe) had been transferred to the edible parts. In gooseberries the corresponding amounts were 4.4% (unripe) and 3.7% (ripe) of I34Cs; 0.2% (unripe) and 0.7% (ripe) of 85Sr; and 0.2% (unripe) and 2.1% (ripe) of 45Ca. In blueberries there were concentrations of 0.7% (unripe) and 1.8% (ripe) of 134Cs;0.002% (unripe) and 0.02% (ripe) of 85Sr; and 0.03% (unripe) and 0.8% (ripe) of 45Ca.4. DISCUSSION
These experiments are only preliminary since the originally conceived procedure was altered during the course of the investigation to yield additional information. For instance the leaves of the unripe plants were not washed. The additional information that could be gained from this procedure was realized only during the experiment.
In all plants the greatest part of the activity remained on or in the leaves. In bushes at the half-ripe stage, no distinction was made between fixed and removable radionuclides. In plants at the ripe stage, differences appeared among plant species. With 134Cs on red currants, about one third of the activity seemed to be fixed and a similar amount was removable. With 134Cs on gooseberries, about twice the amount of the fixed isotope could be removed by washing the leaves with water; and with blueberries about one quarter of the activity was fixed on or in the leaf, while the remainder could be washed off the leaves.
The results obtained show that 96-100% of the activity of 85Sr and l34Cs remained associated with the leaf in all unripe plants. In the ripe plants, about three quarters of the activity could be removed by washing, with the exception of 45Ca on gooseberry bushes where about one third of the activity was found in the branches (neither on the rind nor in the wood). Of the two bivalent cations, calcium seems to be slightly more mobile.

I A E A - S M - 3 0 6 / 5 0 45
Our results have shown that transfer took place in all of the plants. There are substantially large differences in the amounts taken up by the fruits of the different species. Strawberries, for instance, contained 22% of the 134Cs and 0.6% of the applied 85Sr. Gooseberries absorbed about 4% of the l34Cs and 1.9% of the 85Sr, and red currants 3.8% of the 134Cs but only traces of 85Sr. Whether this is a result of a difference in a leaf structure, the pores or any other morphological characteristics is still unknown. The tendency of the fruit is to increase the concentration of all three radionuclides at ripening.
At present we cannot say in which ways this transport took place, but further experiments will give us more information. Competition with other elements for the uptake has not yet been investigated.
Further results of our study have shown that in contrast to earlier reports [7, 10, 13], translocation of 85Sr and 45Ca within the plants does take place (with differences between species) and, as expected, calcium is translocated better than strontium.
During the development and ripening of the fruit and seeds, substantial amounts of certain elements are translocated from the leaves to the fruit. Research has been carried out by others on cereals [14], on castor oil plants and on prickly plumes [13]. Our results show the same tendency, with the exceptions of 134Cs in gooseberries and 45Ca in blueberries.
R EFERENCES
[1] RUSSELL, R.S., Interception and retention o f airborne material on plants — an
introductory review, Health Phys. 11 (1965) 1305-1315.
[2] RUSSELL, R.S., Radioactivity and Human Diet, Pergamon Press, Oxford and New
York (1966).
[3] ALE X AN D ER , A . (Ed.), Foliar Fertilization, Nijhoff, Dordrecht (1984).
[4] KOPP, P., ÓSTLING, O., BU RKART, W ., “ Transfer o f radionuclides to food plants:
root versus foliar uptake” , Methods for Assessing the Reliability o f Transfer Model
Predictions (Proc. Workshop Athens, 1986) (DESMET, G., Ed.), Elsevier, Amster
dam and New York (1987) 67.
[5] ZEHNDER, H.J., Radioaktivitàt in Frtichten, Niissen and verarbeiteten Produkten,
Schweiz. Zeitschr. Obst- und Weinbau 124 (1986/87) 101-102.
[6] ÓSTLING , О., KOPP, P., B U RKART, W ., Foliar uptake o f cesium, iodine and stron
tium and their transfer to the edible parts o f beans, potatoes and radishes, Radiat. Phys.
Chem. 33 (1989) 551-554.
[7] CH EVALIER , S., HUGUET, C., PARIS, N ., BEOUD, М ., Absorption o f foliar
applied Ca in peach trees, Biol. Cell. 56 (1986) 259-270.
[8] FRANKE, W., “ The basis o f foliar absorption o f fertilizers with special regard to the
mechanism” , Foliar Fertilization (ALE X AN D ER , A ., Ed.), Nijhoff, Dordrecht
(1984).

46 K O P P e t a l .
[9] GUSTAFSON, F .G ., Comparative absorption o f cobalt-60 by upper and lower
epidermis o f leaves, Plant Physiol. 32 (1957) 141-142.
[10] H ILL , J., The remobilization o f nutrients from leaves, J. Plant Nutr. 2 (1980) 407-444.
[11] OERTLI, J.J., Einfluss von Verkehrsemissionen auf das Strassenbegleitgriin. Kali —
Briefe (Biintehof) 18 (1987) 661-672.
[12] SCHÔNHERR, J., BUKOV AC , M.J., Penetration o f stomata by liquids. Dependence
on surface tension, wettability, and stomatal morphology, Plant Physiol. 49 (1972)
813-819.
[13] HOCKING, P.J., Accumulation o f mineral nutrients by developing fruits o f prickly
plume (Grevillea annulifera F. Muell.), Aust. J. Bot. 29 (1981) 507-520.
[14] STEFFENS, W ., FÜHR, F., M ITTELSTAED T, W ., KLAES, J., FÔRSTEL, H.,
Untersuchungen des Transfers von ^Sr, l37Cs, MCo and 54Mn vom Boden in die
Pflanze und der wichtigsten, den Transfer beeinflussenden Bodenparameters, Rep.
Jül-2250, Kernforschungsanlage Jülich, Federal Republic o f Germany (1988).
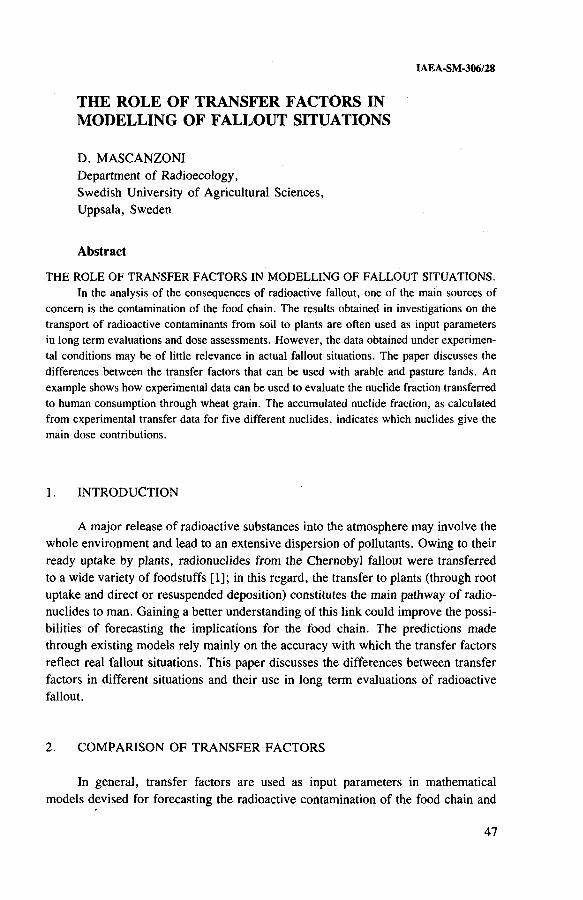
I A E A - S M - 3 0 6 / 2 8
T H E R O L E O F T R A N S F E R F A C T O R S IN
M O D E L L I N G O F F A L L O U T S I T U A T I O N S
D. MASCANZONI Department of Radioecology,Swedish University of Agricultural Sciences,Uppsala, Sweden
Abstract
THE ROLE OF TRANSFER FACTORS IN M O D ELLING OF F A LLO U T SITUATIONS.
In the analysis o f the consequences o f radioactive fallout, one o f the main sources o f
concern is the contamination o f the food chain. The results obtained in investigations on the
transport o f radioactive contaminants from soil to plants are often used as input parameters
in long term evaluations and dose assessments. However, the data obtained under experimen
tal conditions may be o f little relevance in actual fallout situations. The paper discusses the
differences between the transfer factors that can be used with arable and pasture lands. An
example shows how experimental data can be used to evaluate the nuclide fraction transferred
to human consumption through wheat grain. The accumulated nuclide fraction, as calculated
from experimental transfer data for five different nuclides, indicates which nuclides give the
main dose contributions.
1. INTRODUCTIONA major release of radioactive substances into the atmosphere may involve the
whole environment and lead to an extensive dispersion of pollutants. Owing to their ready uptake by plants, radionuclides from the Chernobyl fallout were transferred to a wide variety of foodstuffs [1]; in this regard, the transfer to plants (through root uptake and direct or resuspended deposition) constitutes the main pathway of radionuclides to man. Gaining a better understanding of this link could improve the possibilities of forecasting the implications for the food chain. The predictions made through existing models rely mainly on the accuracy with which the transfer factors reflect real fallout situations. This paper discusses the differences between transfer factors in different situations and their use in long term evaluations of radioactive fallout.
2. COMPARISON OF TRANSFER FACTORSIn general, transfer factors are used as input parameters in mathematical
models devised for forecasting the radioactive contamination of the food chain and47

48 M A S C A N Z O N I
estimating the dose to man. In these models the biosphere is often divided into a number of compartments, whereby the transport of radionuclides between any two of them is governed by concentration ratios (CRs) and transfer equations [2-4]. Agricultural land is often categorized as a well mixed type to simulate land subject to frequent ploughing and cultivation [5, 6] and the contaminant is assumed to be well mixed in each compartment. These conditions are adopted for simplicity to fit experimental situations. Of course, the natural system is much more complex and, as also discussed by others [7-9],- no obvious correspondence exists between the results obtained under experimental conditions and an actual fallout situation.
Transfer factors will here be defined with respect to their significance in different situations. After a single fallout, the total deposition d can be described as:
d = dv + dg (1)where dv is the amount of fallout retained by vegetation (Bq/m2) and dg is the ground deposition (Bq/m2).
The quantity dv depends on the type of crop and its growing stage, i.e. the season of the year in which the deposition occurred. This issue is particularly important for determining the transfer rate and has been widely discussed [10]. If R indicates the interception factor, or fraction of d retained by the vegetation, then:
dv = R d (2)The value of R can vary from zero, in the case of fallout on arable land (where d=dg), to over 0.5 for pasture land. Since the Chernobyl accident, observations of R of up to 0.7 have been reported [11].
Accordingly, the radioactive transport to plants can be expressed by the transfer factor from total deposition (TFd):
TFd (m2/kg) = activ'ty in plant dry matter (Bq/kg) (3)total deposition (Bq/m2)
TFd relates the activity content in the plant to the total radioactive deposition per square metre, independent of where the radioactive substances have fallen. In practice, if Y is the yield, or amount of vegetation per square metre (kg/m2), R can be written as:
R = Y TFd (4)Equation (4) is particularly important for pasture land, where the density of the
plant cover at the time of the fallout is crucial for both the interception and the trans-

I A E A - S M - 3 0 6 / 2 8 49
fer of radioactive substances to grass cuts [12]. In the case of radioactive deposition on arable land with no vegetation grown (dv = 0, d = dg) the radioactive transport to plants can be expressed by the transfer factor from ground deposition (TFg):
^ , 2 /, ч activity in plant dry matter (Bq/kg)TFg (m /kg) = -----------------------------activity deposited on soil surface (Bq/m )
TFg associates plant uptake with surface deposition and applies well in a fallout situation. However, the parameter more commonly used in environmental modelling for describing the radioactive transport between the compartments ‘soil’ and ‘plant’ is the soil-plant transfer factor TFsp, defined as [13]:
activity in plant dry matter (Bq/kg)TF = ----------------------------------------------------------- (6 )activity in dry soil (Bq/kg)
TFsp relates the activity in the plant to that in a well mixed soil volume to a depth of 20 cm and, as such, is subject to the assumption that the volume weight of the soil will exert a real influence on the transfer. In contrast, TFg, being based on the deposition per unit area, gives a measure of the transfer independent of the underlying soil’s specific mass and is unaffected by the variations that the distributions of radionuclides and the root system exhibit along the soil profile. It is thus evident that experimental TFsp results, if expressed as TFg, should fit fallout situations more adequately.
3. LONG TERM EVALUATIONS FROM EXPERIMENTAL DATAThe results obtained in many investigations the world over are expressed as
TFsp and several of them have been collected in extensive databanks. Undoubtedly the soil-plant transfer factors provide a valuable tool in classifying the behaviour of different crops and soils and have contributed to a better understanding of the parameters governing the transport of radionuclides in a terrestrial ecosystem. In real fallout situations these experimental TFsp data can still gain relevance if expressed as TFg through the transformation:
TFg = TFsp/Q20 (7)where Q2q is the quantity o f soil in 1 m 2 to a depth o f 20 cm (kg/m2).

1 (p
ea
t)
2 (s
an
d)
50 M A S C A N Z O N I
dav
о о о о
dav
dav
о
dav FIG. 1. Accumulated
radionuclide fraction (ARF)
transferred
(in a hypothetical contamination) to
human
consumption
through
grain foods,
as calculated on the
basis
of experimental transfer results
obtained for
the
nuclides 54Mn,
6SZn,
63Ni,
90Sr and
137Cs.

I A E A - S M - 3 0 6 / 2 8 5 1
Equation (7) makes it possible to employ site specific TFsp data in realistic evaluations of long term radionuclide transport to the food chain after a single deposition. In the analysis of the consequences of radioactive fallout, TFsp data can find a practical application in the determination of the amount of radionuclides that reach the human population.
In the case of fallout on arable land, the contaminated layer is homogenized in the root profile by cultivation practices and, during the following year, the root uptake takes place in a soil volume which is reasonably close to that described by the model previously mentioned. If the crop is wheat, the harvested grain will gradually reach the consumers during the following year through different grain foods. The consumption of these products takes place during the whole year and follows a temporal distribution influenced by innumerable parameters. In order to simplify the calculations, the whole year’s grain consumption is assumed to occur at the following year’s midpoint, 1 July. The experimental TFsp values valid for the particular crop and soil conditions at the fallout site can then be transformed, using Eq. (7), into TFg values. With these data as input parameters, the radionuclide fraction (RF) transferred to human consumption through grain crops during a single year can be estimated as [14]:
RF = TFg Y x 0.75 e~Xt (8)where Y is the yield (kg/m2), 0.75 is the fraction of harvested grain which reaches consumption after losses due to refinement and transport [15], e"Xt is the decay factor to 1 July in the following year, X is the decay constant In 2/T]/2, where T1/2 is the radionuclide’s physical half-life, and t is the time elapsed between contamination and consumption (1 year).
An application of Eq. (8) is given in the following example. The input data are the experimental results obtained in a four year investigation on the transfer of corrosion and fission products to spring wheat. The investigation was carried out in open field in plots designed as a type of lysimeter open underneath with the soils contaminated to a depth of 20 cm; for further details on this experiment the reader is referred to Ref. [16]. The accumulated radionuclide fraction (ARF) transferred to consumption during this four year period can be determined from Eq. (8) as:
4
ARF = £ TFg. Y¡ X 0.75 e'Xti+1 (9)i = 1
The temporal ARF distribution as obtained in a hypothetical soil contamination caused by 54Mn, 65Zn, 63Ni, 90Sr and l37Cs is displayed in Fig. 1. The results are given for four different soils to show the variations that the radionuclide fractions exhibit in soils with different characteristics (Table I).

5 2 M A S C A N Z O N I
T A B L E I . P H Y S I C A L A N D C H E M I C A L P R O P E R T I E S O F S O I L S
_ _ _ Soluble nutrientsSml Organic Base , ____. . (mg/100 g dry soil)
classi- pH(aq) matter saturationfication3 (% ) (% )
1 Peat 5.5 75.4 57 8.3 26.5 650
2 Sand 5.5 8.7 46 7.2 5.5 88
3 Loam 7.0 18.4 80 12.6 11.0 870
4 Clay 5.7 3.1 39 1.3 15.5 154
a According to the standard o f the United States Department o f Agriculture.
b Fraction extractable with ammonium lactate acetic acid [17].
The greatest fractions of 54Mn and 65Zn are transferred to human consumption during the first year; this reflects the high initial uptake exhibited by these micronutrients. Then, radioactive decay and decreasing uptake cause the gradients to diminish and the curves flatten to a plateau. In contrast, the fractions of the long lived 63Ni, 90Sr and B7Cs transferred each year are smaller, but owing to steady uptake and longer half-lives, the ARF curves exhibit steeper slopes and nearly constant gradients. This implies that, in spite of lower root uptake, the significance of the long lived radionuclides increases over the years, and in the long term the main part of the dose contribution is due to these elements. It should be noted, however, that the extrapolations of the obtained ARF curves are conservative, since no account has been taken of diminished availability due to possible radionuclide ageing in soil and the consequent decreasing gradient. Nevertheless, it is evident that the implications for the food chain are subject to change with time and can, over a longer period, become quite different from those that appeared in the initial stage.
It is well established that the root uptake is affected by the soil’s physical and chemical properties and by the level of soil nutrients. The influence of these parameters on the transfer results used in the previous example has been reported [16, 18]. The ARF results obtained reflect these findings: poor, acidic soils such as the sand (soil 2) exhibit considerably higher ARFs than well fertilized, base saturated soils such as the loam (soil 3). This emphasizes the importance of using site specific data to predict the migration of radionuclides to the food chain.

I A E A - S M - 3 0 6 / 2 8 5 3
In the event of a radioactive release, actions should be directed to limiting the dose caused by contamination of agricultural products through direct deposition and root uptake. In the long term, the transport from soil to plant governs the radioactive transfer to food and animal feed. Transfer factors constitute the main tool in helping to forecast the amounts of radionuclides that may reach the human population. However, transfer data obtained under experimental conditions may have little relevance in actual fallout situations and different transfer factors should be used to fit arable and pasture lands. It has been shown how appropriate, site specific transfer factors can be employed to evaluate the radionuclide fraction transferred to human consumption through wheat grain, thereby providing valuable information for assessing the dose caused by agricultural products.
R EFERENCES
[1] M ASC AN ZO N I, D., Chernobyl’ s challenge to the environment: A report from
Sweden, Sci. Total Environ. 67 (1987) 133-148.
[2] NG, Y .C ., COLSHER, C.S., THOM PSON, S.E., “ Transfer factors for assessing the
dose from radionuclides in agricultural products” , Biological Implications o f Radionu
clides Released from'Nuclear Industries (Proc. Symp. Vienna, 1979), Vol. 2, IA E A ,
Vienna (1979) 295-318.
[3] SIMMONDS, J.R., L IN S LEY , G.S., A dynamic modelling system for the transfer o f
radioactivity in terrestrial food chains, Nucl. Saf. 22 (1981) 766-777.
[4] W HICKER, F .W ., SCHULTZ, V ., Radioecology: Nuclear Energy and the Environ
ment, Vol. 2, CRC Press, Boca Raton, FL (1982) 228 pp.
[5] C O M M ISSARIAT A L ’ENERGIE ATO M IQ U E, N A T IO N A L R AD IO LO G IC AL
PROTECTION BOARD, Methodology for Evaluating the Radiological Consequences
o f Radioactive Effluents Released in Normal Operations, Doc. V/3865/79-En FR 1979,
CEC, Luxembourg (1979).
[6] PRÔHL, G., FR IED LAND , W ., PARETZKE, H .G ., Intercomparison o f the Terres
trial Food Chain Models FOOD-MARC and ECOSYS, Rep. GSF-18/86, Inst, fur
Strahlenschutz, Neuherberg (1985).
[7] V A N DORP, F., ELEVELD, R., FRISSEL, M.J., “ A new approach for soil-plant
transfer calculations” , Biological Implications o f Radionuclides Released from Nuclear
Industries (Proc. Symp. Vienna, 1979), Vol. 2, IA E A , Vienna (1979) 399-406.
[8] NG, Y .C ., A review o f transfer factors for assessing the dose from radionuclides in
agricultural products, Nucl. Saf. 23 (1982) 57-71.
[9] COUGHTREY, P.J., THORNE, M .C ., Radionuclide Distribution and Transport in
Terrestrial and Aquatic Ecosystems, Vol. 1, Balkema, Rotterdam (1983) 496 pp.
[10] SIMMONDS, J.R., The Influence o f the Season o f the Year on the Transfer o f Radio
nuclides to Terrestrial Foods Following an Accidental Release to Atmosphere,
Rep. NRPB-M121, Natl Radiological Protection Board, Chilton, U K (1985).
4 . C O N C L U S I O N S

54 M A S C A N Z O N I
[11] HAUGEN, L .E ., “ Transport mechanisms and plant availability o f radionuclides in
different soil types” , Forskningsprogram om Radioaktivt Nedfall (Proc. Sem. Asker,
1988), No. 1 1989, Norwegian Agricultural Information Service, Oslo (1989) 65-74
(in Norwegian).
[12] ERIKSSON, À ., “ Use o f Chernobyl data in modelling cesium transfer to grassland
crops” , Proc. 19th ESNA Annu. Mtg Vienna, 1988, Rep. OEFZS-4489, LA-210/89,
Ósterreichisches Forschungszentrum Seibersdorf (1989) 182-195.
[13] UN ION IN TE R N A T IO N A LE DES RADIOECOLOGISTES, 3rd Report o f W ork
group on Soil-to-Plant Transfer Factors, Natl Inst, o f Public Health and Environmental
Protection, Bilthoven (1984).
[14] M ASC AN ZO N I, D., Predicting the radionuclide fraction transferred to consumption
through grain foods, Health Phys. 57 (1989) 601-605.
[15] H A A K , E., Long-term Consequences o f Radioactive Fallouts in Agriculture,
Rep. SLU-REK-57, Dept, o f Radioecology, Swedish Univ. o f Agricultural Sciences,
Uppsala (1983) (in Swedish with English summary).
[16] M ASC AN ZO N I, D., Plant uptake o f activation and fission products in a long-term field
study, J. Environ. Radioact. 10 (1989) 233-249.
[17] EGNÉR, H., RIEHM, H., DOM INGO, W .R ., Chemical soil analysis as basis for the
evaluation o f the soil nutrient state. II, Extraction method for determination o f phospho
rus and potassium, Lantbruks-Hôgsk. Ann. 26 (1960) 199-215 (in German).
[18] M ASC AN ZO N I, D., Influence o f lime and nutrient treatments on plant uptake o f
54Mn, 57Co, 63Ni, 65Zn and ^Sr, Swed. J. Agrie. Res. 18 (1988) 185-189.

I A E A - S M - 3 0 6 / 6 1
M O D E L F O R P R E D I C T I O N O F
R A D I O C A E S I U M C O N T A M I N A T I O N O F M I L K
E. ETTENHUBER, F. HÔLZER, M. KÜMMEL,D. WEISS, H.-U. SIEBERT National Board for Atomic Safety
and Radiation Protection,Berlin
Abstract
MODEL FOR PREDICTION OF RADIOCAESIUM CONTAMINATION OF MILK. , On the basis of the results obtained from monitoring the radioactive contamination of
milk after the Chernobyl accident, a model was developed to calculate the temporal changes in the concentration of radiocaesium in milk after a single deposition of radioactivity. By using this model, it was possible to calculate the concentration of radiocaesium in milk not only when a cow is continuously grazing the contaminated pasture but also during the winter following the event. In addition, the model was used for predicting the radiation dose to man for the first year after the event.
1. INTRODUCTIONAs an essential component of the human diet, milk plays an important role in
the transport to man of radionuclides released in a reactor accident. The transfer of most contaminants from the cow forage to milk proceeds rapidly (within a few days). Consequently, the contamination of milk varies according to the forage contamination. Knowledge of the expected contamination level in milk and its variations with time is indispensable to the assessment of the radiation dose to man and to the formulation of protective measures to be used in contamination situations caused by a nuclear accident.
2. TEMPORAL CHANGES IN RADIOCAESIUM CONCENTRATION IN MILK AFTER REACTOR ACCIDENTSMonitoring of the radiocaesium content in milk in 1986 showed that the con
tamination level in milk was of importance not only during the first weeks after radioactivity deposition on pastures, but also in the following weeks and months.
5 5

56 E T T E N H U B E R e t a l .
FIG. 1. The l34Cs and l37Cs concentrations in milk in 1986 (monthly arithmetic means) for
a district of the German Democratic Republic.
Figure 1 shows the typical variation of radiócaesium concentration in milk in 1986. The monthly results are arithmetic averages calculated on the basis of the radiocaesium concentration measured in a limited area. As can be seen, the radiocaesium concentration in milk declined gradually in the first months after the deposition of radioactivity. With the beginning of winter feeding, however, the concentration rose again and very soon reached the same level as in June 1986. The reason for this increase is the use of forage harvested in the months of May and June.
With the continuous use of such forage, the contamination level in milk remained approximately constant until the beginning of pasture grazing the following April. Under the breeding and feeding conditions characteristic of the German Democratic Republic and of other areas in central Europe, such a temporal change in the radiocaesium contamination has to be expected in all cases where the deposition of radioactivity, limited to a short period, occurs in spring or in summer. A general description of the resulting radiocaesium concentration in milk and its variations with time is therefore of importance to predictions in accident situations. Such predictions form the basis for making decisions on whether and to what extent protective measures have to be taken.

I A E A - S M - 3 0 6 / 6 1 5 7
3. MODEL FOR PREDICTING RADIOCAESIUM CONCENTRATION IN MILKAccording to the model of Ng et al. [1], the time dependence of the concentra
tion of a radionuclide in the milk of a cow grazing continuously in a pasture contaminated by a single event can be described by :
CM(ts) is the concentration of the radionuclide in milk at time ts (Bq/L), Ic(ts = 0) is the initial rate of ingestion of the radionuclide by the cow
(Bq/d),
The parameters required for calculation were determined by Ng et al. [1] on the basis of experimental investigations. Monitoring in 1986 provided the possibility for verifying the validity of the model of Ng et al. [1].
As shown by the data on radiocaesium contamination of grass in the course of 1986, the concentration dropped more rapidly during the first 20 d after the deposition of radioactivity than thereafter. Figure 2 compares the decrease of 137Cs contamination of grass, which was experimentally determined, with that calculated by Ng et al. [1] (Xeff = 0.05/d). During the first year after the contamination, the transfer from the soil is not yet important. For a period of up to 20 d the result for both l34Cs and 137Cs is Xeff = 0.087/d, and for the following period Xeff = 0.02/d. Over the whole period Xeff can be equated approximately to 0.03/d. Immediately after the deposition, the loss of radioactivity from grass depended strongly on the removal by wind and rainfall, on the growth rate of grass and on the physical decay. In the subsequent period after 20 d, however, only the physical decay and the gradually declining growth are the determining factors for the value of Xeff. The removal by weather is negligible during that time since radioactivity deposited on the plant surface is taken up through the surface of leaves and retained in the plant.
CM(ts) = Ic(ts = 0) £ A, exp(-XME.ts) - exp(—Xeffts) \iff — ME¡ (D
where
A, is the coefficient of the i-th exponential term, which describes thesecretion in milk (1/L),
XME. is the effective elimination rate of the i-th milk component (1/d),^ME¡ = + ^MB,>
'is the radioactive decay constant (1/d),is the biological elimination rate of the i-th milk component (1/d), is the effective rate of removal of the nuclide from the pasture (1/d), and
ts is the time of ingestion by the cow of pasture grass contaminatedby a single event (d).

Cae
sium
-137
co
nce
ntr
atio
n
in gr
ass
(Bq
/kg
)
5 8 E T T E N H U B E R e t a l .
T im e (d)
FIG. 2. (a) The ,37Cs concentration measured in grass in comparison with (b) the caesium
concentration calculated by using the effective removal rate \eg = 0.05/d and (c) the contamination level resulting from the soil to plant transfer.

I A E A - S M - 3 0 6 / 6 1 59
The model of Ng et al. [1] describes the course of the radionuclide concentration in milk during pasture grazing. The increase of milk contamination with the beginning of winter feeding has not been considered. On the other hand, the course of contamination during this winter period can also be described by this model if it is assumed that Xeff = XR. The variation with time of the 137Cs concentration in milk in winter is then given by:
n it \ _ t it — n\ V4 л exp( Xm e ^w) exp( XRtw)'-'Mvtw/ lc\tw / j A¡
- Ame¡
where+ CmOi) exp(—Xmeíw) (2)
tw is the time of ingestion of stored feed by the cow (d),CM(t|) is the concentration in milk at the end of pasture grazing,
EA-XME = ~—-J— (according to Ref. [1]),EA¡/Xme¡
Ic(tw = 0) is the initial rate of ingestion of the radionuclide with stored feed by the cow.
An analogous approach is possible for all other radionuclides if the XME¡ values are known. Figure 3 shows the variation of 134Cs and 137Cs concentrations in the course of a year after the deposition of radioactivity, using Xeff = 0.03/d during the period of grazing and Xeff = XR for the winter period.
In winter (from the months of November through March), however, not only forage harvested at the time of radioactivity deposition or immediately thereafter is used but also several feedingstuffs (hay, silage, etc.) harvested at different times after the deposition of radioactivity are fed simultaneously. This is why Ic(tw = 0) has to be determined for this period by
mIc(tw = 0) = £ Kj Fj (3)
j = 1 ..
where Kj is the radionuclide concentration of the forage component and F¡ the quantity of the forage component j per day.
On the basis of these changes in the model, the variation with time of the l37Cs concentration in milk was calculated for a limited area and then compared with the results of monitoring in 1986 (Fig. 4). This figure demonstrates the good agreement between the calculated values and the measured values.

60 E T T E N H U B E R e t a l .
FIG. 3.
Computed course of
milk contamination
by different
radionuclides. The
initial rate of
ingestion
by the
cow
is 1 Bq/d and
the forage used during the
winter feeding period was
harvested
immediately
after a single deposition in
the months of
April and
May.
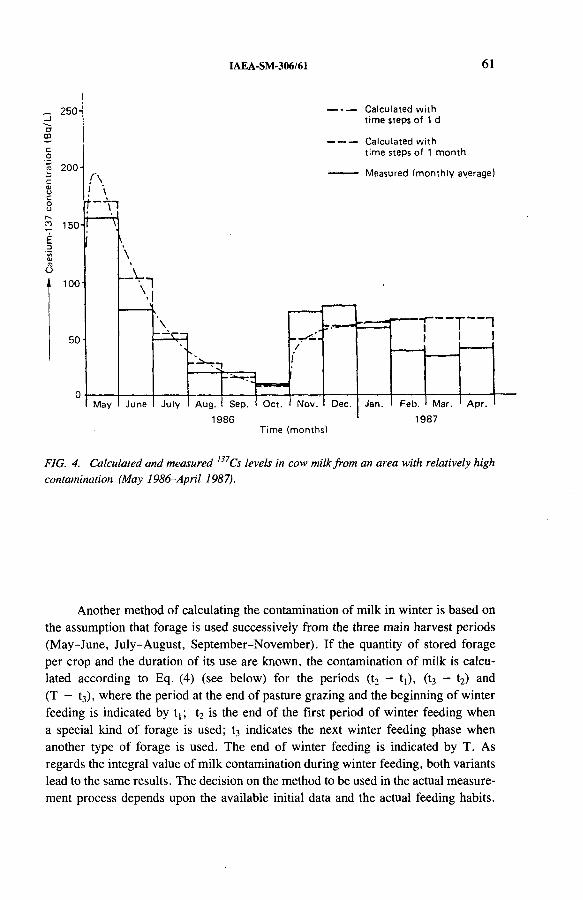
IAEA-SM-306/61 61
_ 250-
200-
O
150-
100
50
Л ! \
t"\ ~i
V
C alcu lated w ith tim e steps o f 1 d
Ca lcu lated w ith tim e steps o f 1 m on th
M easu red (m o n th ly average)
\
--V-\
'1 I
M a y June J u ly A u g . Sep. I Oct. N ov.
1986T im e (m on th s)
Dec. J a n . Feb. Mar.
1987
Apr.
FIG. 4. Calculated and measured 137Cs levels in cow milk from an area with relatively high contamination (May 1986-April 1987).
Another method o f calculating the contamination o f m ilk in winter is based on
the assumption that forage is used successively from the three main harvest periods
(M ay-June, July-A ugust, Septem ber-Novem ber). I f the quantity o f stored forage
per crop and the duration o f its use are known, the contamination o f m ilk is calcu
lated according to Eq. (4) (see below) for the periods (t2 — t,), (t3 — t2) and
(T — t3), where the period at the end o f pasture grazing and the beginning o f winter
feeding is indicated by t t; t2 is the end o f the first period o f winter feeding when
a special kind o f forage is used; t3 indicates the next winter feeding phase when
another type o f forage is used. The end o f winter feeding is indicated by T. A s
regards the integral value o f m ilk contamination during winter feeding, both variants
lead to the same results. The decision on the method to be used in the actual measure
ment process depends upon the available initial data and the actual feeding habits.
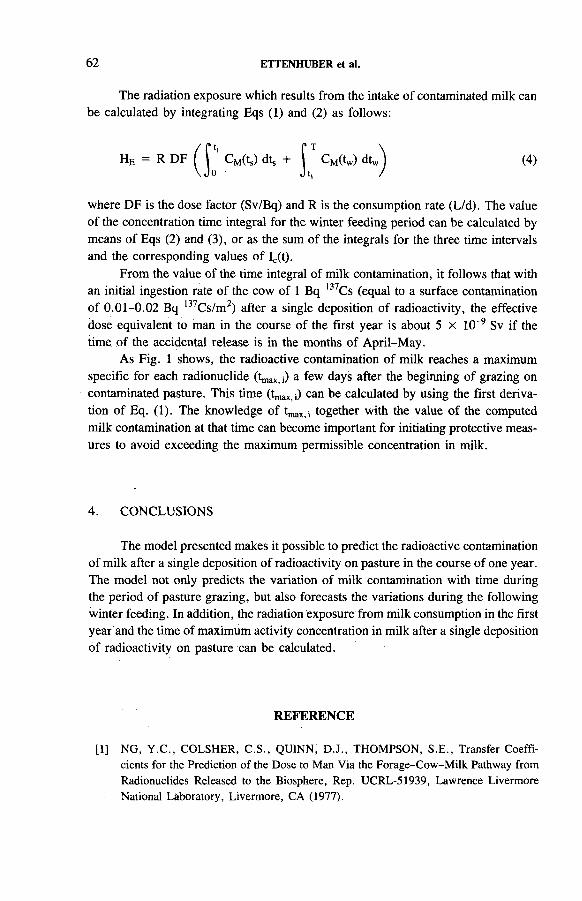
62 E T T E N H U B E R et al.
The radiation exposure which results from the intake o f contaminated m ilk can
be calculated by integrating Eqs (1) and (2) as follows:
HE = R D F ^ ^ C M(ts) dts + I C M(tw) dtw
where D F is the dose factor (Sv/Bq) and R is the consumption rate (L/d). The value
o f the concentration time integral for the winter feeding period can be calculated by
means o f Eqs (2) and (3), or as the sum o f the integrals for the three time intervals
and the corresponding values o f Ic(t).
From the value o f the time integral o f milk contamination, it follows that with
an initial ingestion rate o f the cow o f 1 Bq 137Cs (equal to a surface contamination
o f 0.01-0.02 Bq 137Cs/m 2) after a single deposition o f radioactivity, the effective
dose equivalent to man in the course o f the first year is about 5 x 10~9 Sv i f the
time o f the accidental release is in the months o f A p ril-M ay.
A s Fig. 1 shows, the radioactive contamination o f m ilk reaches a maximum
specific for each radionuclide (tmax i) a few days after the beginning o f grazing on
contaminated pasture. This time (tmax ¡) can be calculated by using the first deriva
tion o f Eq. (1). The knowledge o f tmax i together with the value o f the computed
m ilk contamination at that time can become important for initiating protective meas
ures to avoid exceeding the maximum permissible concentration in milk.
4. C O N C L U SIO N S
The model presented makes it possible to predict the radioactive contamination
o f milk after a single deposition o f radioactivity on pasture in the course o f one year.
The model not only predicts the variation o f m ilk contamination with time during the period o f pasture grazing, but also forecasts the variations during the following
winter feeding. In addition, the radiation exposure from m ilk consumption in the first
year and the time o f maximum activity concentration in milk after a single deposition
o f radioactivity on pasture can be calculated.
R E F E R E N C E
[1] NG, Y .C ., COLSHER, C.S., QUINN, D.J., THOMPSON, S.E., Transfer Coefficients for the Prediction of the Dose to Man Via the Forage-Cow-Milk Pathway from Radionuclides Released to the Biosphere, Rep. UCRL-51939, Lawrence Livermore National Laboratory, Livermore, CA (1977).

IAEA-SM-306/77
R A D I O C A E S I U M U P T A K E I N A
H U M A N P O P U L A T I O N
D E P E N D E N T O N C A R I B O U
B .L . T R A C Y , G .H . K R A M E R
Bureau o f Radiation and M edical Devices,
Department o f National Health and W elfare,
Ottawa, Ontario, Canada
Abstract
RADIOCAESIUM UPTAKE IN A HUMAN POPULATION DEPENDENT ON CARIBOU.This study was undertaken to obtain a better understanding of radiocaesium uptake in
the lichen-caribou-human food chain. The study was carried out in February 1989 in the community of Baker Lake in Canada’s Northwest Territories. The residents of Baker Lake are mostly Inuit (Eskimos) and rely on caribou as their main source of protein. Whole body monitoring for radiocaesium was performed on 416 people. An effort was made to achieve a balance among the various sex and age groups. All participants over 16 years of age were asked to complete a diet survey questionnaire. The average ,37Cs body burdens were 1.97 kBq for men ( > 20 years) and 0.84 kBq for women. The average consumption of caribou meat was 2.26 kg/week for men and 1.54 kg/week for women. The average concentration of 137Cs in the caribou meat being eaten at that time was 210 ± 20 Bq/kg. The calculations show that only about 20% of the radiocaesium is absorbed into the human body from the gastrointestinal tract, whereas conventional models assume 100% absorption.
1. IN T R O D U C T IO N
When one is assessing the health consequences o f the widespread radioactive
contamination o f food supplies, it is important to have realistic values for radio
nuclide transfer coefficients and biokinetic parameters in humans. Values taken from
the models used to set regulatory limits and guidelines may not always be the most
appropriate. First, such values tend to be conservative and can lead to large over
estimates o f the actual radiation doses received. A lso the models are intended to
apply mainly to adult workers and may not be relevant to children, the elderly or
to cultures which have a diet and lifestyle different from the conventional North
Am erican diet.
Follow ing the Chernobyl accident in 1986, the most significant long lived
contaminants o f food supplies were the caesium isotopes l34Cs and 137Cs. Predic
tions o f health effects and limits for contamination o f domestic and imported foods
were based on conservative models such as that described in the International
Commission on Radiological Protection (ICRP) Publication 30 for radiocaesium [1].
63

64 T R A C Y and K R A M E R
This model assumes 100% radiocaesium absorption from the gastrointestinal (Gl)
tract. A review o f the literature, such as the research carried out by Schwarz and
Dunning [2], shows this value to be based on the ingestion o f pure caesium chloride
by human volunteers. One is led to ask whether this value is appropriate for the low
levels o f radiocaesium found in food. The IC R P gives a biological half-time o f
110 days for the elimination o f radiocaesium from the body. From their review o f
the literature, Schwarz and Dunning have derived half-times o f 96 + 23 days for
adult males and 65 ± 29 days for adult females.
W e present here a report on a recent study that was carried out in northern
Canada, one which may contribute to a greater understanding o f the uptake and
retention o f radiocaesium from food. It has been known since the early days o f
atmospheric nuclear weapons testing that the lichen-caribou or reindeer-human food
chain is an important one for radiocaesium uptake. In 1960, Liden [3] reported
elevated l37C s burdens in reindeer and in Swedish Laplanders. He estimated that
about 50% o f the 137Cs in reindeer meat was absorbed by the people eating it.
Westerlund et al. [4] summarized the measurements o f 137C s in Norwegian Lapps
from 1965 to 1983 and found the body burdens in humans to be strongly correlated
with the concentrations in reindeer meat. Hanson [5] has reported on extensive
l37C s measurements carried out on Alaskan Inuit (Eskimos) as well as on caribou
and lichens between 1962 and 1979. He assumed a G l absorption factor o f 100%
to estimate the average amounts o f caribou meat eaten by the Inuit. Bird [6] and
Mohinda [7] reported studies on l37Cs in Canadian native peoples and in caribou.
They did not estimate precisely the consumption o f caribou meat but divided people
into three categories: occasional, moderate or heavy eaters o f labelled caribou. They
found a strong correlation o f 137C s body burdens with consumption category.
With the cessation o f atmospheric nuclear weapons testing, interest in the
radiocaesium body burdens o f residents in the northern areas o f Canada gradually
faded. This interest was revived very suddenly in 1986 after the reports o f extra
ordinarily high levels o f l34Cs and l37C s in Scandinavian reindeer [8]. A t that time,
our laboratory began a comprehensive study o f radiocaesium levels in all the major
caribou herds in Canada. In 1989, this study was extended to include whole body
monitoring o f people who rely on caribou as their main supply o f meat. An attempt
was made to assess accurately the amounts o f caribou meat eaten. The levels o f
radiocaesium in both animals and people were much lower than those levels
measured in the 1960s, or in some other countries-in 1986 after the Chernobyl
accident. Only about 25% o f the 137C s in caribou measured in Lapland after the
Chernobyl accident had resulted from the Chernobyl release; the remainder was
apparently fallout from earlier atmospheric nuclear weapons testing. Nevertheless,
the programme afforded an excellent opportunity to test the accepted models for
radiocaesium uptake and retention in humans.

IAEA-SM-306/77 65
2.1. Location
The whole body monitoring study described in this paper was carried out in
the community o f Baker Lake in the Northwest Territories o f Canada during
February 1989. The community is located about 250 km south o f the Arctic C ircle
and an equal distance west o f Hudson Bay. About 90% o f the population o f 1050 are
Inuit, who rely on hunting for a large part o f their food supply. Com m ercial meat
and fresh fruits and vegetables are expensive and difficult to obtain. Furthermore,
since Baker Lake is an inland community, there is no access to marine mammals or
ocean fish, although freshwater fish are available in the rivers and lakes during the
brief summer. The surrounding land is tundra, so the variety o f w ildlife is very
limited; however, caribou are abundant. They roam the barren ground in large herds
and feed on lichens and other sparse vegetation. It is not unusual for a single family
to kill and use 40 caribou per year. V ery little o f the animal is wasted; most o f the
internal organs and the blood are consumed.
2.2. Whole body monitoring
The whole body monitoring equipment was set up at the nursing station
in Baker Lake. Tw o Harshaw N al(Tl) scintillation detectors were used: a
127 mm x 102 mm detector placed near the abdomen and just above the thighs o f
the subjects, and a 76 mm x 76 mm detector placed near the chest. The subject sat
in a movable chair, so that his/her position could be adjusted easily. For a small
child, the upper or chest detector was removed. Counting times were five minutes
each.
The signals from the two detectors were passed through a Harshaw N B-25A
pre-amplifier and a Canberra 1465A sum-invert amplifier before being processed by
a Canberra S100 data acquisition system. This system cannot adequately resolve the
gamma peaks o f 134Cs from the 661.6 keV peak o f 137C s. H owever, several
measurements carried out with a germanium spectrometer showed the contribution
o f 134C s to be less than 7% o f the 137Cs photopeak area. This contribution has been
subsequently ignored. The system gave an immediate printout o f the gamma ray
spectrum and the resulting radiocaesium body content. This printout was given to the subject along with an explanation, through an interpreter, o f what the results
meant. The data were also stored on diskettes for future analysis.
The counting system had been calibrated for 137Cs at our laboratory in
Ottawa before being transported to Baker Lake. Phantoms were constructed to
represent an adult male, a ten year old, and a four year old. Various seating
geometries were used and corrections were made for individual variations in height
and weight. Background and stability checks were carried out daily. Because o f very
2. S T U D Y D E S IG N

6 6 T R A C Y and K R A M E R
low background radiation at the nursing station, a minimum detectable activity o f
0.1 kBq was obtained. Norm ally, this limit is about 0.2-0.3 kBq.
A total o f 416 people, or 40% o f the population o f Baker Lake, were moni
tored. An effort was made to achieve a reasonable balance among the various sex
and age categories.
2.3. Dietary survey
Each participant’ s name, sex and age were recorded. The height and weight
o f each person were measured, and for most participants over 16 years o f age, a
dietary questionnaire was administered. Dietary information was not obtained for
children. Since many participants did not speak English or French, an Inuktituk
interpreter assisted with the questionnaire. Through a series o f questions, the survey
sought to elicit the amounts o f caribou meat and other native foods eaten, as well
as any variations in the food amounts with different seasons. M odels representing
100, 200, 400 and 800 g pieces o f meat were used to assist participants in expressing the amounts eaten.
To complete the dietary survey, samples o f meat from six caribou taken during
recent hunting expeditions were returned to our laboratory in Ottawa for l34C s and
l37C s determinations with a germanium spectrometer system. The results were
compared with those o f our longer term survey o f caribou herds in the area.
3. R E SU L T S A N D D ISCU SSIO N
3.1. Radiocaesium body burdens and daily intakes
The 137C s body burdens and daily intakes are summarized in Table I for each sex and age group, and are presented in Figs 1 and 2. The daily intakes o f 137Cs
were calculated from the reported consumptions o f caribou meat in kg/week together
with our measurement o f 210 ± 20 Bq/kg (mean ± standard error o f the mean) in
the six animals sampled during the time o f the whole body monitoring. Although this
value is based on only six animals, it is in good agreement with a larger number o f
measurements carried out on local herds over the past two years.
The consumption o f caribou meat varied from 1 kg/week for the 21-30 year
age group up to nearly 4 kg/week for men aged 51-6 0 . The average consumptions
were 2.26 kg/week for all men over 20, and 1.54 kg/week for all women. Although
there was considerable scatter in the reported consumptions o f individuals, the
average values should be reasonably free o f bias. The reported consumptions were
very similar to those o f another survey that was carried out among the Dene people
at Rae-Edzo, Northwest Territories, over 1000 km to the west o f Baker Lake.

Body burden (kBg)
IAEA-SM-306/77 67
Males: Baker Lake
Bq/d intake
FIG. 1. Caesium-137 body burden versus daily intake for each male monitored at Baker Lake. A linear regression, forced through the origin, is given by the equation: y = 0.0237 x.

68 T R A C Y and K R A M E R
Females: Baker Lake
Bq/d intake
FIG. 2. Caesium-137 body burden versus daily intake for each female monitored at Baker Lake. A linear regression, forced through the origin, is given by the equation: y = 0.0151 x.

IAEA-SM-306/77 69
,73Cs intake (Bq/d)
FIG. 3. Caesium-137 body burden versus daily intake. Each point on the graph represents the average body burden and average daily intake for one specific sex and age category, as given in Table I. The linear regression is given by the equation y — —0.480 ± 0.0333 x with a correlation coefficient of +0.931.

70 T R A C Y and K R A M E R
T A B L E I. 137C s B O D Y B U R D EN S A N D D A IL Y IN T A K E S FO R D IFFER EN T
SEX A N D A G E G R O U P Sa
Age Number of Cs-137 body burden Cs-137 intakegroup people (kBq) (Bq/d)
Male Female Male Female Male Female
0-10 41 45 0.11 ± 0.02 0.07 ± 0.02 _b —
11-20 37 27 0.71 ± 0.12 0.31 ± 0.04 —
21-30 36 56 1.13 ± 0.23 0.45 + 0.04 31 ± 5 33 ± 5
31-40 32 29 1.63 + 0.22 0.56 ± 0.08 71 ± 12 40 ± 9
41-50 22 29 2.46 ± 0.35 1.22 ± 0.11 72 + 14 55 ± 8
51-60 16 18 3.29 ± 0.27 1.49 ± 0.15 113 ± 17 63 ± 11
>60 16 12 2.58 ± 0.29 1.45 ± 0.18 87 ± 16 68 ± 9
A ll ages 200 216 1.36 ± 0.07 0.61 ± 0.03 —
All >20 122 144 1.97 ± 0.07 0.84 ± 0.04 67 ± 8 46 ± 6
a All errors are standard errors of the mean. b Diet survey was not carried out for children.
The question arises as to whether caribou account for all o f the daily 137Cs
intake. The diet survey showed that the consumption o f freshwater fish and wild
plant foods was confined mainly to the summer months (June-August) and that these
items constituted only a small fraction o f the annual diet. The highest 137C s concen
tration observed in fish, 20 Bq/kg, is less than one tenth o f that in caribou. Other
mammals and birds were consumed much less frequently than caribou, and none o f the other species were known to contain elevated levels o f l37Cs. Thus we have
concluded that at least 90% o f the total radiocaesium intake came from caribou.
Figures 1 and 2 indicate the degree o f scatter o f results from individual
participants. Nevertheless, there is a correlation between body burden and daily
intake, as shown by the linear regressions. M uch o f this scatter is eliminated in
F ig. 3, where the average body burdens for each sex and age group from Table I
have been plotted versus the average daily 137C s intakes.

IAEA-SM-306/77 71
The results in Table I show very low body burdens for children (0-10 years)
and adolescents (11-2 0 years). Thereafter, the body burdens increased with age until
about 60 years. Body burdens for men were consistently higher than for women;
daily intakes were also higher for men. One strength o f the present study is that it
involved an adequate number o f subjects in each sex and age category to make
meaningful statistical inferences.
3.2. Biokinetic parameters
The above results allow existing uptake and retention models to be tested. The
biological half-times o f radiocaesium in the human body were assumed to be 96 days
for men and 65 days for women [2]. There is every reason to believe these values
are realistic since they were based on a careful review o f results from a large number
o f subjects. Furthermore, some unpublished data from our own laboratory during the
1960s indicate a value o f 90-100 days for Inuit men. From this, w e estimate the GI
absorption factor, f b as follows:
Body burden (kBq) X 1000 X In 2 /i4f| = (1)
Daily intake (Bq/day) x biological half-time (days)
This expression assumes that the body burden o f l37C s is at equilibrium. This
assumption is supported by two observátions. The seasonal variations in reported
T A B L E II. E ST IM A T E S O F TH E G A S T R O IN T E S T IN A L A B SO R PTIO N
F A C T O R FO R D IFFE R E N T SE X A N D A G E G RO U PS
Age groupNumber of people GI fractional absorption
Male Female Male Female
21-30 36 56 0.26 ± 0.07 0.15 ± 0.03a
31-40 32 29 0.17 ± 0.04 0.15 ± 0.04
41-50 22 29 0.25 ± 0.06 0.24 ± 0.04
51-60 16 18 0.21 ± 0.04 0.25 ± 0.05
>60 16 12 0.21 ± 0.05 0.23 ± 0.04
All >20 122 144 0.21 ± 0.03 0.19 ± 0.03
(From slopes of graphs in Figs 1 and 2) 0.17 0.16
a All errors are standard errors of the mean.

72 T R A C Y and K R A M E R
caribou consumption were small. In addition, our measurements o f the caribou herds
over the previous two years did not show significant seasonal variations in
radiocaesium concentrations.
The resulting values o f f] are given in Table II. It is remarkable how well the
values for different sex and age groups agree, given the wide variations in body
burdens and daily intakes. The agreement for the two sexes would not have been as
good if the same half-time had been used for both sexes. This supports the use o f
different half-times (96 and 65 days) for men and women, respectively. From these
results, an f| value o f 0.20 ± 0.03 would seem to be appropriate for both men and
women in all age groups. This value is much smaller than the value o f 1.00 assumed
by the IC R P [1]. W e have mentioned that earlier data by Liden for Lapps indicated
fi = 0.50 [3]. A similar survey by this laboratory (to be published elsewhere) was
carried out among the Dene people o f Rae-Edzo, Northwest Territories, in
March 1989. This survey showed a GI absorption factor near 0.30. Tw o other recent
studies [9, 10] have indicated GI absorption factors significantly less than 1.00.
It is unlikely that our results could be in error enough to account for the dis
crepancy between 0.20 (or 0.30) and 1.00. For a value o f 1.00 to occur, the daily
caribou consumption would have to be overestimated by a factor o f four. This is
improbable, given our knowledge o f the lifestyle o f the people. Another possibility
is that the biological half-time is very short, perhaps — 20 days, but this is contrary
to a large amount o f existing data. A possible non-equilibrium in the I37Cs body
burdens could lead to an underestimate o f f b but the error would not be more than
10 or 20 per cent.
W e are thus led to the conclusion that, for radiocaesium in meat in an Inuit
culture, the GI absorption factor is not 100% but nearer 20 or 30%.
A C K N O W L E D G E M E N T S
W e wish to thank D . Simailak, M ayor o f Baker Lake, and J. Killulark,
Community Health Representative for their support and assistance with this study.
Our interpreters, A . Q iyuk and M . Kreelak, performed an admirable service.
D. Kinloch, S. F leck and L . Poole provided valuable advice in the design o f the
study. A bove all, we are grateful to the people o f Baker Lake for participating in
the whole body monitoring survey.
R E F E R E N C E S
[1] INTERNATIONAL COMMISSION ON RADIOLOGICAL PROTECTION, Limits for Intakes of Radionuclides by Workers, ICRP Publication 30, Pergamon Press, Oxford and New York (1978).

IAEA-SM-306/77 73
[2] SCHWARZ, G., DUNNING, D.E., Imprecision in estimates of dose from ingested l37Cs due to variability in human biological characteristics, Health Phys. 43 5 (1982) 641-645.
[3] LIDEN, K ., Cesium-137 burdens in Swedish Laplanders and reindeer, Acta Radiol. 56 (1961) 237-240.
[4] WESTERLUND, E .A., BERTHELSEN, T ., BERTEIG, L., Cesium-137 bodyburdens in Norwegian Lapps, 1965-1983, Health Phys. 52 2 (1987) 171-177.
[5] HANSON, W .C., 137Cs concentrations in northern Alaskan Eskimos, 1972-1979: effects of ecological, cultural and political factors, Health Phys. 42 4 (1982) 433-447.
[6] BIRD, P.M ., Studies of fallout l37Cs in the Canadian north, Arch. Environ. Health 17(1968) 631-638.
[7] MOHINDA, K ., Cesium-137 in the Canadian north, Acta Radiol. 6 (1967) 481.[8] MacKENZIE, D., The rad-dosed reindeer, New Sci. 18 (1986) 37-40.[9] HUNT, G.J., LEONARD, D.R.P., FRY, F .A ., High-rate seafood consumers near
Sellafield: comparison of conventional assessments of l37Cs intakes with the results of whole-body monitoring, Radiat. Prot. Dosim. 27 1 (1989) 35-41.
[10] HENRICHS, K ., PARETZKE, H.G., VO IG Î, G ., BERG, D., Measurements of Cs absorption and retention in man, Health Phys. 57 4 (1989) 571-578

IAEA-SM-306/82
C O M P A R I S O N O F B I O S P H E R I C
R A D I O C O N T A M I N A T I O N I N T H E
C E N T R A L A N D N O R T H E R N
P A R T S O F Y U G O S L A V I A ,
1985-1988
R. K L JA JIC *, E. H O R SIC *, Z . M IL O S E V IC *, A . B A U M A N * * ,
A . M IH A LJ*, D . S A M E K *
* Veterinary Faculty,
University o f Sarajevo,
Sarajevo
** Department o f Radiation Protection,,
Institute for M edical Research
and Occupational Health,
University o f Zagreb,
Zagreb
Yugoslavia
Abstract
COMPARISON OF BIOSPHERIC RADIOCONTAMINATION IN THE CENTRAL AND NORTHERN PARTS OF YUGOSLAVIA, 1985-1988.
A review of fission product contamination levels from the central and northern parts of Yugoslavia for the years 1985-1988 is presented in the paper. The most significant pathway to the population after the Chernobyl accident was ingestion of contaminated food. Data are compared concerning the levels of fission products in air, fallout, leafy vegetables, lamb meat, baby beef and milk. The effective dose equivalents for 131I, 134Cs and 137Cs from May to December 1986 were calculated. The results show that after the Chernobyl accident the level of food contamination increased by l.'O X 103. The effective dose equivalents caused by ingestion of food contaminated with 13li, l34Cs and 137Cs from May to December 1986 surpassed the average yearly population dose from all sources of radiation. In 1987 and 1988 the level of contamination in food by fission products decreased almost to that level detected before 26 April 1986. This decrease was caused by the low migration capability of caesium isotopes and their strong adsorption on soil particles.
75

76 K U A J lC et al.
1. IN TR O D U C TIO N
The presence o f radioactive substances has become an important ecological
factor in the human environment. In the event o f an accident in a nuclear power
plant, an uncontrolled release o f fission products may take place and enter the eco
logical cycle in air, water and soil. Considering the vast territory which can be con
taminated, the source o f highest contamination is the air [1]. Radionuclides in the
air are widely dispersed by wet and dry deposition over plants and soil. Through
migration and transfer, the radionuclides ertter the food chain and pass to humans
in plant and animal products [2].
Since the most important pathway for radionuclides entering the human organ
ism is through contaminated food, the control o f radionuclides in food represents the
most important means o f protection.
The level o f radiation in the population through acute contamination, such as
that which occurred after the Chernobyl accident, depends mostly on the type and
quantity o f nutrition and food habits. The highest contamination o f the central and
northern parts o f Yugoslavia happened between 1 and 10 M ay 1986 [3]. Over 90%
o f the total radioactivity fell during a period o f intensive plant growth and caused
serious control problems. Studies have been initiated to compare the levels o f radio
active contamination before and after the Chernobyl accident.
2. M A T E R IA L S A N D M ETH O D S
The research described in this paper was performed at six locations in central
Yugoslavia and in two northern regions o f Yugoslavia where data existed for the
period between 1985 and 1988. A ir was collected on a 24 hour basis with a high
volume sampler and glass fibre filters. Monthly samples from over 30 000 m 3 were
measured by gamma spectrometry. During 1985, 1987 and 1988 fallout was col
lected on a monthly basis and samples o f leafy vegetables, lamb meat, baby b eef and
cow m ilk were collected twice yearly (early in the growing season and at the end
o f the last growing period). The amounts o f the samples were 5 kg o f lamb meat and
baby beef, 3 kg o f leafy vegetables (lettuce and spinach) and 30 L o f milk (monthly
samples). During this period these samples were mineralized and measured by
gamma spectrometry.
The samples were collected every day during M ay 1986 and from June through
December they were collected once every month in quantities o f 1 kg o f vegetables
and meat and 1 L o f milk. A ir was collected at the rate o f 1000-1500 m 3/24 h. The
same fallout collectors were used on an hourly and daily basis. Gamma spectrometric
analysis during this time was performed directly on samples without mineralization
using a Ge(Li) detector with a relative efficiency o f 16% and resolution o f 2.1 keV
connected to a 4096 channel analyser j

IAEA-SM-306/82 7 7
The estimate o f the population dose was calculated on the basis o f measured
radioactivity data for 131I, 134Cs and 137Cs; relevant dose coefficients were taken
from data published by the International Atom ic Energy A gency [4].
Yugoslavian statistical data were used for effective dose equivalents for the
following:
(a) Leafy vegetables: daily intake o f 0.3 kg for adults and 0 .14 kg for children
(one year o f age),
(b) Lamb and beef: daily intake o f 0 .15 kg for adults and 0.05 kg for children,
(c) M ilk: daily intake o f 0.4 L for adults and 0.5 L for children.
The total calculation was based on conservative estimates taking into consider
ation the worst case circumstances and conditions.
3. R E SU LT S A N D D ISCU SSIO N
The radioactive contamination o f the central and northern parts o f Yugoslavia
after the Chernobyl accident began on 29 and 30 April 1986, but the maximum
occurred between 2 and 5 M ay through sporadic intensive fallout. Because the
increase o f radioactivity started during the grazing season, the ruminants were
immediately contaminated and products such as m ilk and meat in some cases greatly
exceeded prescribed levels.
The passing o f the Chernobyl cloud produced serious contamination o f vegeta
tion through intensive rainfall (Tables I, II). The deposition o f the three biologically
most significant radionuclides ranged for:
— 131I, from 1.2 X 10⁴ to 8.6 x 10⁴ Bq/m2,
— 134C s, from 5 .1 X 102 to 2.0 X 10³ Bq/m2,
— 137C s, from 6.1 X 10² to 6.2 X 10³ Bq/m2.
O ver 90% o f the total radionuclide deposition after the accident fell between
1 and 10 M ay 1986. Comparing the level o f 137C s before and immediately after the
accident (Table III), one sees that an increase o f 1.0 x 10³ was registered. In addi
tion to 137C s, significant quantities o f l31I and 134C s and over 20 other radionuclides
were found in the environment [5]. The entire area under investigation was subjected
to considerable radioactive contamination. The contamination o f the leafy vegetables
was mainly foliar, so that for the first days after contamination the vegetables could
be successfully decontaminated by washing with water. Root vegetable contamina
tion was expected later because o f the high content o f radionuclides in the soil. Unex
pectedly this did not occur since the permanent fixation o f the bulk o f caesium
isotopes resulted in low mobility o f small amounts o f caesium. This was the reason
that during 1987 and 1988 no significant contamination o f root vegetables was
detected. In comparison, in 1986 the contamination o f domestic animals and their

78 K L JA J IC et al.
T A B L E I. H IGH EST G A M M A A C T IV IT IE S (Bq/m3) IN A IR IN C E N T R A L
A N D N O R TH E R N Y U G O S L A V IA
Radionuclide 1985 1986 1987 1988
Be-7 1.1 x 10 "2 a 1.6 x 10“ 2 7.8 x 10⁻³
Mn-54 a a a a
Zr-95 a 6.3 X 10~2 a a
Ru-106 a a a a
Sb-125 a a a a
Cs-137 a 8.8 x 10~‘ 5.5 x 10~4 8.0 x 10“ 5
Cs-134 — 7.3 x 10~‘ 2.8 x 10“ 4 4.0 x 10_5b
Ce-144 a 7.0 x 10“2 a a
1-131 — 2.5 x 10' - —
a Activity below the detection limit.b The highest values in 1988 were obtained for l34Cs in January.
T A B L E II. T O T A L Y E A R L Y A C T IV IT Y (Bq/m2) O F 134Cs
F A L L O U T IN C E N T R A L A N D N O R TH ER N Y U G O S L A V IAA N D I37Cs IN
Year Radionuclide
Location
1 2 3
1985 Cs-134 — — —
Cs-137 — — < 3 .7 x 10~3
1986 Cs-134 5.8 x 10' 1.3 x 10² 3.8 x 10²
Cs-137 2.6 x 10² 3.7 x 10² 1.1 x 10³
1987 Cs-134 5.8 X 10' : 1.3 x 10² 3.8 x 101
Cs-137 2.6 x 10² 3.7 x 10² 1.1 x 10³
1988 Cs-134 3.6 x 10° 5.1 x 10² 1.6 x 10²
Cs-137 4.0 x 101 3.5 x 10' 7.2 x 10²

IAEA-SM-306/82 79
T A B L E III. M A X IM U M FISSIO N R A D IO N U C L ID E A C T IV IT IE S IN FO O D
(FRESH W EIGH T) FR O M 1985 TH R O U G H 1988
F o o d 198 5 M a y -D e c e m b e r 1986 19 8 7 1988
(m easu red in C s - 1 3 7 1 -13 1 C s -1 3 4 C s -1 3 7 C s -1 3 4 C s - 1 3 7 C s -1 3 4 C s -1 3 7
six lo catio n s) (B q/kg) (kB q /k g) (B q/kg) (B q/kg)
L e a fy v eg eta b le s
1 0 .3 7 3 .1 7 1.0 2 4 .2 0 10 .50 3 0 .15 1 .1 5 4 .2 8
2 2 .30 2 .5 3 0 .6 4 1 .2 4 19.20 40 .30 1.5 8 3 .2 4
3 4 .6 1 16 .0 6 3 .2 1 8 .93 1 4 .1 5 3 5 .8 5 1 .3 4 6 .8 2
4 3 .30 1.80 1.2 4 4 .2 4 3 0 .7 5 8 1.2 5 3 .7 1 8 .24
5 0 .6 2 2 .3 3 1 .1 7 1 .8 7 9 .20 2 0 .3 5 0 .93 2.58
6 0 .1 7 0 .4 4 0 .0 7 0 .2 1 3 .1 0 8.50 0.08 0 .20
L a m b m eat
1 0 .22 0 .3 2 1.0 3 2.8 0 8 .30 2 0 .1 5 1.8 4 4 .4 7
2 1 .7 9 0 .18 0 .8 7 1 .7 2 5 .2 0 12.80 1 .5 4 2 .9 5
3 1 .7 8 0 .5 1 2 .98 6 .7 4 10 .50 30 .45 2 .1 0 4 .4 0
4 1 .4 3 0 .22 0 .90 1 .7 9 3 .1 0 6 .7 0 1 .1 5 2 .3 0
5 0 .6 1 0 .3 1 1 .1 8 3 .2 9 4 .2 5 9 .1 0 1.40 3.00
6 0 .0 9 0.03 0.11 0 .2 6 1 .1 0 2 .3 0 0 .24 0 .4 7
B a b y b e e f
1 0 .2 5 0.03 0.05 0.0 9 3 .1 5 6 .7 5 0 .42 2 .3
2 1 .1 5 0 .03 0 .0 7 0 ,1 1 2 .3 0 4.8 5 0 .7 0 1.80
3 1.2 3 0 .03 0 .1 2 0 .1 9 5 .2 0 1 1 .8 5 1 .1 5 2 .4 0
4 1 .1 2 0.02 0 .08 0 .1 3 4 .3 0 9 .10 0 .95 2 .1 0
5 0 .6 7 0 .02 0 .0 5 0.09 1 .8 5 3.90 0 .45 1.00
6 0.11 0 .0 1 0 .0 2 0 .0 4 0 .80 1 .9 5 0 .2 1 0.68
M ilk
1 0 .1 4 1.3 2 0 .48 1.0 1 1 .1 0 2 .8 0 0 .3 2 1 .3 1
2 - 0 .7 7 1 .7 4 0 .60 1 .3 1 1 .5 0 3.20 0 .5 5 1.6 0
3 0 .7 0 2 .0 1 0 .7 3 1 .5 2 2 .1 5 4 .6 0 1.00 2 .2 5
4 ■ 0 .23 1.8 1 0 .65 1.40 1.3 0 2 .7 0 0 .7 5 1.8 0
5 0 .1 8 1 .1 7 0 .3 7 0 .8 1 0 .90 1.9 0 0 .40 0 .9 5
6 0.02 0 .23 0 .0 4 0 .09 0 .3 0 0 .7 5 0 .0 7 0 .1 9

80 K L J A J lC et al.
T A B L E IV . E F F E C T IV E D O SE E Q U IV A L E N T S <>Sv) C A U S E D B Y FO O D
IN G E STIO N FR O M M A Y -D E C E M B E R 1986
F o o d
(m easured in six
location s)
1-13 1
C h ild ren A d u lts
C s -1 3 4
C h ild re n A d u lts
C s -1 3 7
C h ild ren Adults
L e a fy veg eta b les
1 224 5 7 - 33 71 107 2 12
2 179 45 21 24 32 62
3 1 1 3 7 288 104 222 228 4 5 1
4 128 32 40 86 108 2 14
5 165 42 38 81 48 94
6 31 8 2 5 5 11
L a m b m eat
1 11 4 35 105 7 7 2 14
2 7 2 30 90 4 7 131
3 18 , 6 102 306 185 5 13
4 8 3 31 93 49 136
5 11 4 40 1 1 2 90 250
6 1 0 .43 4 12 7 20
B a b y b e e f
1 1 0 .40 2 6 2 7
2 1 0.43 2 7 3 9
3 1 0.38 4 16 5 14
4 1 0 .3 6 3 9 4 10
5 0 .6 7 0 .24 2 5 3 7
6 0 .5 6 0.20 0 .78 2 0.83 2
M ilk
1 622 61 112 89 169 130
2 820 81 140 112 220 169
3 949 93 170 136 254 195
4 855 84 151 121 235 181
5 554 55 86 69 136 105
6 1 10 11 9 7 15 11
IAEA-SM-306/82 8 1
products happened so quickly that 24 hours after the deposition o f radionuclides on
vegetation and soil, contamination appeared in meat and milk.
The contamination level o f lamb meat was significantly higher than that o f b eef
as the result o f different grazing habits o f the lambs that grazed on the immediate
soil surface, and therefore consumed contaminated soil particles. In the central part
o f Yugoslavia, sheep and lambs are raised extensively on the higher mountain
pastures by nomadic methods. Cow s are raised indoors and fed the preceding year’s
fodder with the addition o f concentrates. The fodder fed to the cows was therefore
not contaminated. Besides, some farmers engaged mainly in cattle fattening and milk
production followed the instructions given on radio and T V at the beginning o f the
deposition and fed their cattle with the previous year’ s supply o f fodder, thus avoid
ing contamination.
Contamination levels o f m ilk in territories where the farmers followed the
instructions are visibly different from the results presented in Table III, despite the
fact that the deposition o f radionuclides was lower in location 6. On the basis o f
experimental results, the overall contamination increased by 1.0 x 10³ so that
several food products had to be withdrawn from human consumption in accordance
with the European Community limits adopted.
The levels o f contamination differed widely between the regions (the differ
ences were 1:50) owing to meteorological conditions. In later years (1987-1988)
root uptake by fodder had minimal influence on the contamination o f animal
products.
The central and northern parts o f Yugoslavia after the Chernobyl accident
showed an increase o f the effective dose equivalent caused by ingestion o f contami
nated food. The calculated effective dose equivalents are given in Table IV for differ
ent food products and for each biologically important radionuclide. Tw o groups o f
the population were evaluated — children (up to 1 year) and adults. The results o f
these evaluations show that the highest doses were received by children. They were
also the critical population group especially in the presence o f high concentrations
o f 13,I.
The average yearly dose was exceeded by a factor o f 1-2 from 1 M ay until 31 Decem ber 1986.
The annual effective dose equivalent for m ilk in later years was calculated for
adults, so that during 1987 for l37Cs it amounted to 9.5 m Sv and during 1988 to
1 .7 fjiSv. Compared to 1986, the internal contamination o f the population was
negligible.
4. C O N C L U SIO N
A fter the Chernobyl accident the level o f fission product contamination o f the
central and northern parts o f Yugoslavia increased by 1.0 x 10³. The differences

82 K L J A J lt et al.
in contamination levels between different areas ranged from 1 to 50 as a result o f
varying m eteorological conditions at the time that the radioactive cloud passed over
the territory. The effective dose equivalent by ingestion o f leafy vegetables, meat and
m ilk contaminated by 131I, 134C s and 137C s in the period o f M ay-D ecem ber 1986
exceeded the average yearly radiation dose for the population by a factor o f 1-2 . The
critical population groups were children as in other countries and also migratory
shepherds who consumed sheep meat and milk.
R E F E R E N C E S
[1] E I S E N B U N D , M . , E n viro n m en tal R a d io a c tiv ity , 3rd edn , A c a d e m ic P ress, N e w Y o r k
(19 8 7 ) 4 7 5 .
[2] K L I A J I C , R . , P r ilo g p o zn av an ju tran sfera S r-90 i C s -1 3 7 u o d red jen o m ek o lo sk o m
lan cu sa p o stavljan jem m o d ela p ro g n o ze , P h D T h e sis , V ete rin a ry F a c u lty , U n iv e rsity
o f S a ra je v o (19 8 4 ) 1 4 1 .
[3] K L J A J IC , R . , et a l . , ‘ ‘ T ra n sfe r o f fis s io n rad io n u clid es in the e c o lo g ic a l ch ain o f s o il -
g ra s s - la m b m eat in M a y 19 8 6 ” , C u rren t P ro b lem s and C o n ce rn s in the F ie ld o f R a d ia
tion P ro tectio n (P ro c . 14th I R P A R eg io n a l C o iig r . K u p a ri, D u b ro v n ik , 19 8 7 ), Intern a
tion al R ad iatio n P ro tectio n A ss o c ia tio n , W ash in g to n , D C (19 8 7 ) 2 6 7 - 2 7 1 .
[4] I N T E R N A T I O N A L A T O M I C E N E R G Y A G E N C Y , D e riv e d Interven tion L e v e ls fo r
A p p lica tio n in C o n tro llin g R ad iatio n D o ses to the P u b lic in the E ve n t o f a N u c le a r A c c i
dent o r R a d io lo g ic a l E m e r g e n c y — P rin c ip le s , P ro ced u res and D a ta , S a fe ty S eries
N o . 8 1 , I A E A , V ie n n a (19 8 6 ).
[5] U N I T E D N A T I O N S , S o u rce s and E ffe c ts o f Io n izin g R ad iatio n , S c ie n tific C o m m ittee
on the E ffe c ts o f A to m ic R adiation ( U N S C E A R ), U N , N e w Y o r k (198 8 ).
IAEA-SM-306/33
L O N G T E R M S T U D Y
O F F O O D C O N T A M I N A T I O N
I N N O R T H E A S T E R N P O L A N D
A F T E R T H E C H E R N O B Y L A C C I D E N T
Z . P IE T R Z A K -F L IS , W . L A D A
Central Laboratory for Radiological Protection,
W arsaw, Poland
Abstract
L O N G T E R M S T U D Y O F F O O D C O N T A M I N A T I O N IN N O R T H E A S T E R N P O L A N D
A F T E R T H E C H E R N O B Y L A C C I D E N T .
F ro m M a rch 198 7 to A p r il 1989 l37C s , l34C s and 90S r w e re d eterm in ed in the d a ily
d ie t and fo o d stu ffs in northeastern P o lan d . T h e annual intake eva lu ated fro m the a ctiv ity
con cen tration o f rad io n u clid es in fo o d stu ffs and th eir con su m p tion w a s h ig h er than that
e va lu ated fro m the d a ily d iet, the d iffe re n c e b e in g e sp e c ia lly la rg e in the first y e a r a fte r the
C h e rn o b y l a ccid en t. In the first y e a r the annual in take o f l37C s fro m the d a ily d iet w as
4 7 8 2 B q and that fro m fo o d stu ffs w a s 79 7 8 B q ; in the third y e a r the re sp ectiv e v a lu e s w e re
10 79 B q and 122 4 B q . T h e l37C s b o d y burden estim ated fro m the d a ily d iet fo r three
co n se cu tive y e a rs w a s 114 0 B q , 7 6 1 B q and 658 B q , w h erea s that fro m fo o d stu ffs w as
1902 B q , 12 2 7 B q and 9 47 B q . D o s e eq u iva len ts fro m rad io caesiu m fo r the first three y e a rs ,
as eva lu ated fro m the d a ily d iet and fro m fo o d stu ffs , w e re 128 fiSv and 204 ¿tSv, re sp ectiv e ly .
1. IN TR O D U C TIO N
Radiation doses to the population after the Chernobyl accident have been
evaluated from monitoring and modelling in many countries. The collected data have
provided the United Nations Scientific Committee on the Effects o f Atom ic Radiation
(U N SC E A R ) with the basis for evaluating in more detail the effect o f the accident
on the population [1].
The assessment based on the early data after the Chernobyl accident requires
further refinement, particularly regarding the long lived radionuclides. Am ong these
radionuclides, the largest biological effect is exerted by 137C s, 90Sr and 239Pu. The
most significant in this respect has been l37Cs. The evaluated release o f 137Cs and
90Sr from the damaged reactor was 3 .7 x 10 16 Bq and 8.0 x 10 15 Bq, respectively
[2]. Strontium-90 was deposited mainly in the close vicinity o f the accident; in the
European part o f the Soviet Union, the 90Sr amount was about 20% o f the 137Cs,
whereas in the other European countries it constituted only about 1% o f l37Cs [3].
83

84 P IE T R Z A K -F L IS and L A D A
The aim o f the present study was to obtain data on the intake o f 137C s and
90Sr in the northeastern region o f Poland during a three year period after the
Chernobyl accident. The data obtained have made possible the assessment o f the
body burden and radiation doses from the ingested radionuclides.
2. M A T E R IA L S A N D M ETH O D S
2.1. Sampling
Intake o f radiocaesium and 90Sr with food was evaluated from the analysis o f
daily diets and o f foodstuffs. Samples were collected from M arch 1987 to April 1989
from the districts o f Suwalki and Bialystok, located in the northeastern part o f
Poland. Samples o f the daily diet were taken from the meals o f the staff members
o f a hospital. The samples were collected for five consecutive days four times a year.
M eals were prepared mainly from products purchased in local shops. These products
came from the region studied as well as from other parts o f the country; some o f
the products were imported. In addition, foodstuffs were collected two times a year.
They originated, however, only from the region studied.
2.2. Sample preparation and analytical methods
Diet samples o f each day were homogenized, dried and dry mineralized or
ashed at temperatures below 450°C . The edible parts o f vegetables, apples, meat and
fish were dried, whereas milk was evaporated. Dry samples were dry mineralized;
flour was, however, mineralized without drying.
In mineralized samples caesium isotopes were measured by gamma spectrometry. The gamma spectrometer consisted o f a high purity germanium detector with
an energy resolution o f 1.8 keV at 60C o (1332 keV) and a relative efficiency o f
33% . The detector was placed inside a lead shield with walls 10 cm thick and lined with a 2 mm layer o f copper. The detector was connected to a multichannel analyser,
Canberra series 90.
The calibration o f the gamma spectrometer was performed with a standard
solution o f l34C s and 137C s from Oripi, Poland. The standard solution was mixed
with matrix prepared from mineralized samples and then dried at a temperature o f
70 °C . The ash from the studied samples was measured in the same geometry as the
standards. Collection time was chosen to maintain the counting error for the 137Cs
peak area at no greater than 10% at a confidence level o f 9 5.5% .
The 90Sr was determined by thé V olchok et al. method [4] with modifications
as described in Ref. [5]. The 90Y activity was measured by anticoincidence count
ing equipment with a background o f about 2 counts per minute. The statistical
standard error o f the activity measurement did not exceed 10%.

IAEA-SM-306/33 85
T A B L E I. C O N T E N T O F I37C s, l34Cs A N D 90Sr (Bq/d) IN D A IL Y D IET
C O L L E C T E D IN N O R TH E A STE R N P O L A N D FRO M 1987 TO 1989
Y e a r and m onth C s -1 3 7 C s -1 3 4 Sr-90
1987
M ar. 12 .9 ± 2 .4 a 5 .2 ± 1.0 0 .2 6 ± 0 .1 6
A p r. 13 .3 + 5 .0 4 .8 ± 1.9 0 .1 9 + 0.03
M a y 7 .9 ± 2 .1 3 .1 ± 0 .9 0 .23 + 0 .0 9
S ep . 3 .3 + 1.0 1 .1 ± 0 .3 0 .22 + 0 .1 7
1988
F eb . 3 .5 + 1 .7 1 .1 ± 0 .5 0 .1 7 ± 0.05
A p r . 1 .6 ± 0 .6 0 .4 ± 0 .2 0 .23 ± 0 .0 6
June 1 .6 ± 0 .3 0 .4 + 0 .1 0 .1 9 + 0.08
A u g . 1.3 ± 0 .2 0 .3 ± 0 .1 0 .1 9 + 0 .0 4
1989
Jan. 4 .1 ± 1.3 0 .9 ± 0 .2 0 .23 ± 0 .04
A p r. 4 .8 ± 1 .7 1 .1 ± 0 .3 0 .23 + 0 .1 6
a M ea n ± S D (cou ntin g erro r).
3. R E SU LTS
The average contents o f 137C s, 134Cs and 90Sr in daily diets in the period from
March 1987 to April 1989 are presented in Table I. The content o f l37Cs in March
and in April 1987 was almost the same; in M ay it was lower, and in September 1987
it was significantly lower. Similar values for M arch and April 1987 can be attributed
to the origination o f food products from the harvest in 1986. In M ay 1987 some
products originated from 1987, and in September the majority came from 1987. In
1988 the level o f radiocaesium in February was similar to that in September 1987,
whereas in other months it remained nearly at the same level, being below one half
o f that for February. In 1989 a significant rise in caesium content was observed.
Changes in the content o f l34Cs reflected those o f l37C s, although the ratio o f
l34Cs to l37Cs decreased according to the shorter half-life o f 134Cs.
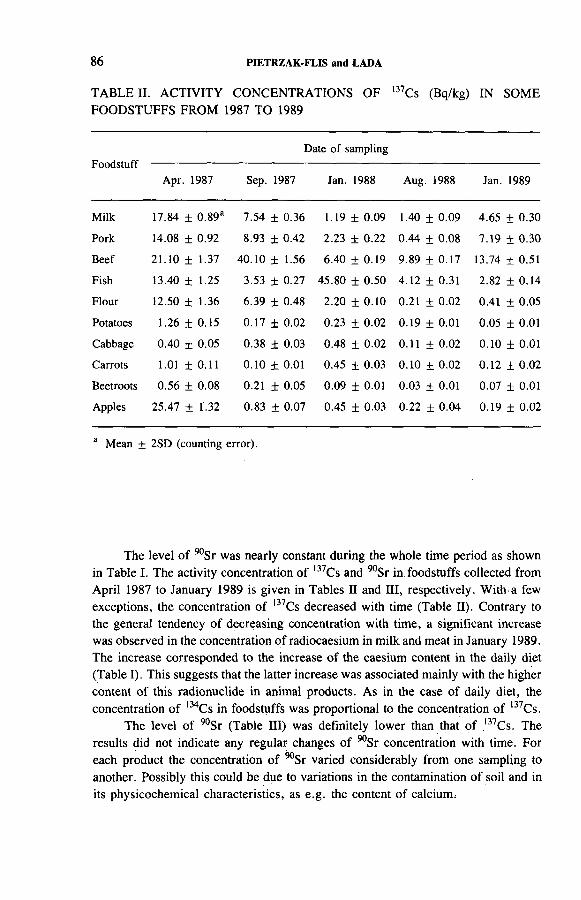
86 P IE T R Z A K -F L IS and L A D A
T A B L E II. A C T IV IT Y C O N C E N T R A T IO N S O F l37Cs (Bq/kg) IN SO M E
FO O D S T U FF S FR O M 1987 T O 1989
Date of samplingFoodstuff -------------------------------------------------------------------------------------------------
Apr. 1987 Sep. 1987 Jan. 1988 Aug. 1988 Jan. 1989
M ilk 1 7 .8 4 ± 0 .8 9 a 7 .5 4 ± 0.36 1 .1 9 ± 0.09 1.40 ± 0.0 9 4.6 5 ± 0.30
P o rk 14.0 8 ± 0.92 8.93 ± 0 .42 2 .2 3 ± 0 .2 2 0 .4 4 ± 0.08 7 .1 9 ± 0 .3 0
B e e f 2 1 .1 0 ± 1 .3 7 4 0 .10 ± 1.5 6 6.40 ± 0 .1 9 9 .8 9 ± 0 .1 7 13 .7 4 ± 0 .5 1
F ish 13 .4 0 ± 1.2 5 3 .5 3 ± 0 .2 7 4 5 .8 0 ± 0 .50 4 .1 2 ± 0 .3 1 2 .82 ± 0 .1 4
F lo u r 1 2 .5 0 ± 1.3 6 6 .3 9 ± 0.48 2.20 ± 0 .1 0 0 .2 1 ± 0 .0 2 0 .4 1 ± 0.0 5
P otatoes 1.2 6 ± 0 .1 5 0 .1 7 ± 0.02 0.23 ± 0.0 2 0 .1 9 ± 0 .0 1 0.05 ± 0 .0 1
C a b b a g e 0 .40 ± 0 .0 5 0.38 ± 0.03 0.48 ± 0.02 0 .1 1 ± 0.02 0 .10 ± 0 .0 1
C a rro ts 1 .0 1 ± 0 .1 1 0 .1 0 ± 0.0 1 0 .45 ± 0.03 0 .1 0 ± 0 .0 2 0 .1 2 ± 0 .0 2
B eetro o ts 0 .5 6 ± 0.08 0 .2 1 ± 0.05 0.09 ± 0 .0 1 0.03 ± 0 .0 1 0 .0 7 ± 0 .0 1
A p p le s 2 5 .4 7 ± 1.3 2 0 .83 ± 0 .0 7 0 .45 ± 0.03 0 .22 ± 0.0 4 0 .1 9 ± 0.02
a Mean ± 2SD (counting error).
The level o f 90Sr was nearly constant during the whole time period as shown
in Table I. The activity concentration o f 137Cs and 90Sr in foodstuffs collected from
April 1987 to January 1989 is given in Tables II and III, respectively. With a few
exceptions, the concentration o f l37Cs decreased with time (Table II). Contrary to
the general tendency o f decreasing concentration with time, a significant increase
was observed in the concentration o f radiocaesium in m ilk and meat in January 1989.
The increase corresponded to the increase o f the caesium content in the daily diet
(Table I). This suggests that the latter increase was associated mainly with the higher
content o f this radionuclide in animal products. A s in the case o f daily diet, the
concentration o f l34C s in foodstuffs was proportional to the concentration o f 137Cs.
The level o f 90Sr (Table III) was definitely low er than that o f 137C s. The
results did not indicate any regular changes o f 90Sr concentration with time. For
each product the concentration o f ^ S r varied considerably from one sampling to
another. Possibly this could be due to variations in the contamination o f soil and in
its physicochemical characteristics, as e .g . the content o f calcium.

IAEA-SM-306/33 87
T A B L E III. A C T IV IT Y C O N C E N T R A T IO N S O F 90Sr (mBq/kg) IN SO M E
FO O D ST U FF S FR O M 1987 T O 1989
Date of samplingFoodstuff ----------------------------------------------------------------------------------------------
Apr. 1987 Sep. 1987 Jan. 1988 Aug. 1988 Jan. 1989
Milk 64 ± 6a
Pork < 10
Beef < 10
Fish 50 ± 5
Flour 168 ± 1 0
Potatoes 81 ± 7
Cabbage 236 ± 9
Carrots 636 ± 30
Beetroots 413 ± 20
Apples 13 ± 5
27 ± 6 20 ± 3
<10 54 ± 9
393 ± 30 24 ± 8
33 ± 8 45 ± 11
289 ± 12 152 ± 6
41 ± 7 24 ± 5
383 ± 10 187 ± 5
487 ± 12 1160 ± 10
842 ± 12 156 ± 5
219 ± 7 29 ± 8
80 ± 8 50 ± 4
28 ± 11 < 10
20 ± 3 46 ± 6
20 ± 4 30 ± 7
70 ± 9 100 ± 8
74 ± 6 29 ± 5
128 ± 4 95 ± 6
545 ± 6 220 ± 1 0
494 ± 13 390 ± 19
53 ± 10 18 ± 3
a Mean ± SD (counting error).
The data obtained served as a basis for the evaluation o f the annual intake o f
the radionuclides. The average daily intake in the first year after the Chernobyl acci
dent was evaluated from the content o f radionuclides in samples collected in M arch
and April 1987. The foodstuffs used for the preparation o f meals came from the
harvest in 1986; it has been assumed therefore that they represent the average intake
o f the radionuclides for the first year after the accident.
For the next two years, the average daily intake was taken as equal to the mean
■from analyses in a given year. The average annual intake was determined both from
the daily diets and foodstuffs, taking into account the average annual consumption
o f these foodstuffs [5 ,6 ]. The intake from foodstuffs in the first and second year after
the Chernobyl accident is given in Table IV .
In the entire period studied, m ilk was the main source o f radiocaesium. It
contributed about 62% to the annual intake o f radiocaesium in the first year and
about 5 1% in the second year. The other important sources o f radiocaesium were
meat and flour; in the first year apples also contributed significantly to the annual
entry o f radiocaesium.

88 P IE T R Z A K -F L IS and L A D A
T A B L E IV . E ST IM A T E D A N N U A L IN T A K E O F 137C s, l34C s A N D 90Sr
IN TH E FIR ST A N D TH E SE C O N D Y E A R A F T E R TH E C H E R N O B Y L
A C C ID E N T FR O M TH E A C T IV IT Y C O N C E N T R A T IO N S IN F O O D STU FFS A N D A N N U A L C O N SU M PTIO N
FoodstuffAverage
individualconsumption
(kg/a)
May 1986-Apr. 1987 Averageindividual
consumption(kg/a)
May 1987-Apr. 1988
Cs-137
(Bq)
Cs-134
(Bq)
Sr-90
(Bq)
Cs-137
(Bq)
Cs-134
(Bq)
Sr-90
(Bq)
Milk3 280 4995 1859 17.9 270 1179 385 6.3
Pork 34.2 482 203 0.3 35.2 196 77 1.1
Beef 16.9 357 143 0.2 16.7 388 129 3.5
Fish 6.8 91 45 0.3 6.7 165 59 0.3
Flourb 71 888 320 11.9 71 305 95 15.7
Potatoes 144 181 88 11.7 143 29 8 4.6
Vegetables 114 75 29 48.8 116 33 9 62.2
Apples 35.7 909 364 0.5 18.9 12 3 2.3
Total intake 7978 3051 91.6 2307 765 96
a Included milk products without butter.b Consumption of flour was estimated from the consumption of cereals [6, 7].
Intake o f 90Sr was low; surprisingly, with vegetables, as much as about 53%
o f 90Sr was introduced in the first year, and about 65% in the second year.
Annual intakes evaluated from the analyses o f daily diets and foodstuffs for the
three years after the Chernobyl accident are given in Table V . The data from food
stuffs for the third year were calculated assuming that the consumption was equal
to that in the previous year.
Values o f annual intake determined from the foodstuffs were higher than those
from the daily diets. With time, the differences between these values decreased. In
the first year the value for 137C s determined from the foodstuffs was about 1.7
times higher, whereas in the third year it was only 1.1 times higher, than that evalu
ated from the daily diets.
A considerable drop in the intake o f radiocaesium was observed particularly
in the second year; it amounted to 70% . In the third year, the drop was much lower.

IAEA-SM-306/33 89
T A B L E V . A N N U A L IN T A K E (Bq) O F 137C s, 134Cs A N D 90Sr IN N O R TH
E A ST E R N P O L A N D E ST IM A T E D FR O M D A IL Y D IETS (DD) A N D F O O D
ST U FFS (F)
PeriodCs-137 Cs-134 Sr-90
DD F DD F DD F
May 1986- Apr. 1987
4782 7978 1825 3051 82 92
May 1987- Apr. 1988
1487 2307 520 765 78 96
May 1988- Apr. 1989
1077 1224a 246 257a 77 70a
a Consumption was taken from the period from July 1987 through June 1988 [7].
T A B L E VI. l37C s A N D ,34C s B O D Y B U R D EN S E ST IM A T E D FR O M D A IL Y
D IETS (DD) A N D F O O D ST U FF S (F) A N D TH E R E S U L T A N T R A D IA T IO N
D O SES
Body burden Radiation dose
(Bq) OxSv)
PeriodCs-137 Cs-134 Cs-137 Cs-134
Cs-137 plus Cs-134
DD F DD F DD F DD F DD F
May 1986— Apr. 1987
1140 1902 435 727 37 61 22 37 59 98
May 1987- Apr. 1988
761 1227 279 441 24 39 14 22 38 61
May 1988- Apr. 1989
658 947 208 302 21 30 10 15 31 45

90 P IE T R Z A K -F L IS and L A D A
The intake o f 90Sr, as determined from the diets, decreased only a little with
time. A larger drop was indicated by results from the foodstuffs for the third year;
this drop was evidently due to lower concentrations o f 90Sr in vegetables.
The annual intakes were used for the estimation o f body burdens and radiation
doses for the adult population. For the calculation o f the body burden, it was taken
into account that the retention o f radiocaesium in the body is described by an
exponential expression with short and long term components [8]. It was assumed that
the intake was continuous and equal to the annual average. The dose equivalent
was estimated from the 137Cs and I34Cs content in the body. For the estimation
the values used for the average dose equivalent per Bq/d were those given in
Ref. [9], equal to 8.78 x 1 0 -5 /¿Sv-Bq-1 -d _1 for 137C s plus l37Ba and
1.38 X 10 -4 /iS v-B q -1 -d _1 for 134C s.
The results (Table VI) show that the body burdens and doses decreased with
time more slow ly than did the activity concentrations in food (Table V ). This differ
ence is due to the relatively long biological half-life o f caesium in the human body.
The doses evaluated from the daily diet and foodstuffs from ingested radiocaesium
were 128 /xSv and 204 /¿Sv, respectively, for the first three years. The contribution
o f l34Cs was about 36% .
4. D ISCU SSIO N
The contamination o f the region studied was about 1.5 times higher than the
average for Poland [10]. The results obtained have shown that in this region the
intake o f l37C s in the first year after the Chernobyl accident was 7978 Bq as
evaluated from foodstuffs. This result is very close to the average intake o f 137Cs
in Poland (8160 Bq) as reported by U N SC E A R [1]. In the second year a considerable
drop in the contamination o f food was observed (2307 Bq o f l37Cs). The high level
o f l37C s in the first year can be ascribed to the direct contamination o f plants by the
fallout. The contamination o f the harvest in the next years should have been due
mainly to transfer via roots.An unexpected increase o f radiocaesium was observed in January 1989 in
animal products (milk and meat) and in daily diets collected in January and
April 1989. The reason for this increase is not understood; the animals might have
been fed with the hay harvested much earlier.
In comparison to the intake o f radiocaesium, that o f 90Sr was very
low. Assum ing that the dose equivalent factor for 90Sr plus 90Y is equal to
3.8 x 10 ~2 ¡xSv/Bq [11], the committed effective dose equivalent from the 3 year
intake o f 90Sr was about 9 /¿Sv.The determination o f intake from foodstuffs gave higher values than those from
the daily diet. Values o f intake from daily diets may be underestimated, since people
may eat more than the served diet. The intake values from foodstuffs can be overesti
IAEA-SM-306/33 91
mated due to some losses during food processing; however, this overestimation
should be diminished by the fact that not all food products have been included in the
analysis.The evaluated body burdens and radiation doses from radiocaesium were close
to the ones evaluated from urine analysis for the W arsaw inhabitants [12]. In the first
year the average vàlués from foodstuffs for northeastern Poland were about 123%
o f the average for W arsaw, whereas in the second year they were about 86% o f that
for W arsaw. This indicates that the stronger contamination o f the northeastern region
o f Poland occurred only in the first year after the reactor accident. Probably this was
due largely to the higher direct deposition o f radiocaesium on. the growing plants.
In the later period, the transfer o f radiocaesium to plants should have been mainly
through the root system, thus leading to the smoothing o f the regional differences.
A C K N O W L E D G E M E N T
The work was sponsored by Research Project C PB R -5.10 in Poland and was
performed under International Atom ic Energy A gency Research Agreement
No. 5038/CF. The authors wish to thank B. Gorniak for laboratory assistance.
R E F E R E N C E S
[1] UNITED NATIONS, Sources, Effects and Risks of Ionizing Radiation (Report to the General Assembly), Scientific Committee on the Effects of Atomic Radiation (UNSCEAR), UN, New York (1988).
[2] INTERNATIONAL NUCLEAR SAFETY ADVISORY GROUP, Summary Report on the Post-Accident Review Meeting on the Chernobyl Accident, Safety Series No. 75-INSAG-1, IAEA, Vienna (1986).
[3] HOHENEMSER, C., The accident at Chernobyl: health and environmental consequences and the implications for risk management, Annu. Rev. Energy 13 (1988) 383-428.
[4] VOLCHOK, H.J., KULP, J.L., ECKELMANN, W .R., GAETJEN, I.E., Ann. N.Y. Acad. Sci. 71 (1957) 295.
[5] LINIECKI, J., CZOSNOWASKA, W ., PIETRZAK-FLIS, Z ., The strontium-90 level in milk and bones of cattle and human beings in Poland in 1958, Nukleonika 5 (1960) 301-313 (in Polish).
[6] GLOWNY URZAD STATYSTYCZN Y, Rocznik Statystyczny 1987, Warsaw (1987).[7] GLOWNY URZAD STATYSTYCZN Y, Rocznik Statystyczny 1988, Warsaw (1988).[8] INTERNATIONAL COMMISSION ON RADIOLOGICAL PROTECTION, Limits
for Intakes of Radionuclides by Workers, Publication 30, Part 1, Pergamon Press, Oxford and New York (1971).

92 P IE T R Z A K -F L IS and L A D A
[9] SNYDER, W .S., FORD, M .R., WARNER, G .G ., WATSON, S.B., A Tabulation ofDose Equivalent per Microcurie-Day for Source and Target Organs of an Adult for Various Radionuclides, Rep. ORNL-5000 (Part 2), Oak Ridge National Laboratory, TN (1975).
[10] ZARNOWIECKI, K ., Analysis of Radioactive Contaminations and Radiological Hazards in Poland after the Chernobyl Reactor Accident, Rep. CLOR No. 120/D, Central Laboratory for Radiological Protection, Warsaw (1988).
[11] NOSSKE, D ., GERICH, B., LANGER, S., Dosisfaktoren fur Inhalation Oder Ingestion von Radionuklidverbindungen (Erwachsene), Rep. ISH-Heft 63, Institut fflr Strah- lenhygiene, Bundesgesundheitsamt, Neuherberg (1985).
[12] PIETRZAK-FLIS, Z ., ROSTEK, J., LAD A, W ., Estimation of l37Cs and l34Cs body burden in Warsaw after the Chernobyl accident, Radiat. Prot. Dosim. 25 (1988) 101-105.

P O S T E R P R E S E N T A T I O N S
IAEA-SM-306/137P
M O N I T O R I N G O F F A L L O U T R A D I O N U C L I D E S
IN M I L K IN C Z E C H O S L O V A K I A
A F T E R T H E C H E R N O B Y L A C C I D E N T
D. D R Á B O V Á , P. R U L ÍK , I. M A L Á T O V Á ,
I. B U C IN A , Z . H Ó L G Y E
Centre o f Radiation Hygiene,
Institute o f Hygiene and Epidem iology,
Prague, Czechoslovakia
After the Chernobyl accident, nationwide monitoring and research on radio
active substances in various components o f the environment were undertaken regu
larly in Czechoslovakia by a monitoring network comprising laboratories o f many
institutions. The results have been collected and evaluated in the Centre o f Radiation
Hygiene o f the Institute o f Hygiene and Epidem iology, which is the national
authority responsible for the monitoring o f environmental radioactivity.
A n extensive monitoring programme was undertaken in Czechoslovakia to
determine the radioactive contamination o f m ilk because milk and milk products
were from the very beginning important contributors to dietary intake o f the most
significant radionuclides — 131I, 134Cs and l37Cs.The main part o f the m ilk surveillance was based on regular sampling in about
25 selected dairies distributed almost uniformly over the Czechoslovak territory and
covering about 30% o f the total production o f m ilk to be consumed directly. In the
beginning m ilk was sampled daily, after the end o f June 1986 w eekly, and since
October 1986, monthly [1].
In addition five separate nationwide surveys o f all the dairies producing milk
to be consumed directly were carried out in M ay, June and December 1986 and in
M arch and July 1987. These surveys were aimed at:
(1) Finding the areas with high levels o f milk contamination;
(2) Testing the representativeness o f the selected dairies network, taking into
account production o f individual dairies, local lack o f homogeneity o f fallout,
differences in composition o f feeding mixtures, regional mixing o f feed and
gradual use o f feed with different levels o f contamination;
(3) Evaluating the relationship between the level o f contamination o f milk and the
level o f fallout in collecting areas o f given dairies. (No strong correlation was
found, correlation coefficients being from 0.3 to 0.5 [2].)
93

TAB
LE
I. R
ESU
LT
S OF
N
AT
ION
WID
E
SUR
VE
YS
OF
RA
DIO
AC
TIV
E
CO
NT
AM
INA
TIO
N
OF
MIL
K IN
94 PO S T E R P R E S E N T A T IO N S
&ÛcceOí
co
oa tí 8 m >> W
.2 Û та КЛ
I s
cC*
. c S лco o)
ÛcoO
адc
c«rH Wm U2 S
■ < Я < > o - jьоOœuwN
U
c■S Q
ü ЦÜ S
O
û
O00 co 00 (N
r - r f ONo o o O o
Os Г - 00
i/~> VO0\ <N
«/“> г-l t/~> <N(N
vû c4
oo co УГ) r- vq
■'tf-1 es irio o ©•.
1O
VOÓ
on4 G 4/Л(N «O
vq 00 -H ’’¡tc i ON ¿ CN <4 CM (N ©
voIOs
VOOn
CSI
o
VOON 3
o. I
vOOvô00ON
O n<NIЮCnJ
CMIora
ÛслO
geom
etric
st
anda
rd
devi
atio
n.

PO S T E R P R E S E N T A T IO N S 95
1 0 0 c
с 1 0 : о
0.1
щ-г
г I I I I 11 i г I I Г I I I I I п n 5 7 9 11 1 3 5 7 9 11 1
1 9 8 6 1 9 8 7
N a t io n w id e s u r v e y
I I 1 I 1 I I I I I I I 1 !3 5 7 9 11 1 3 ( m o n t h s !
1 9 8 8
I I S e le c te d d a ir ie s
1 9 8 9
FIG. I. Time course of mean ,37Cs activity concentration in milk.
A ctivity concentrations o f radionuclides in m ilk samples were determined by
means o f semiconductor gamma spectrometry. Up to July 1987, samples were meas
ured without any preconcentration; then the method based on sorption on a freshly
prepared precipitate o f Cu(II) hexacyanoferrate was introduced for the separation o f
radiocaesium [3].
The data gained in nationwide surveys were evaluated under the assumption
o f log-normal distribution [4]. Table I gives medians (geometric means), geometric
standard deviations (GSD) and production weighted arithmetic mean values o f activity concentrations o f individual radionuclides found in respective surveys. The
most common radionuclides found in the majority o f samples were 134C s and l37Cs.
In the beginning 13 *1 was o f importance and was measurable up to the end o f
June 1986. Short lived 136C s was found in a part o f the m ilk samples up to mid-
M ay 1986. Caesium -136 mean activity concentration in samples from the first survey
(4 Bq/L) was estimated from its theoretical ratio to 137C s given by inventory and
release data [5], found values being in good agreement with the data. In Fig. 1 the
time course o f the mean activity concentration o f l37C s in m ilk from selected dairies
is shown together with the values gained in nationwide surveys. These data support
the assumption o f the representativeness o f the network o f selected dairies.
R E F E R E N C E S
[1] CENTRE OF RADIATION HYGIENE, INSTITUTE OF HYGIENE AND EPIDEMIOLOGY, Report on the Radiation Situation in CSSR after the Chernobyl Accident, Institute of Hygiene and Epidemiology, Prague (1986).

[2] DRÁBOVÁ, D., et al., “ Radioactive contamination of milk after the Chernobyl accident” , paper presented at 21st Int. Symp. on Radiation Protection Physics, Bad Schan- dau, German Democratic Republic, 1989.
[3] HÔLGYE, Z., DRÁBOVÁ, D., Determination of Cs-134 and Cs-137 in milk by sorption on freshly prepared precipitate of Cu(II) hexacyanoferrate in combination with gamma spectrometry, Collect. Czech. Chem. Commun. 53 (1988) 3058-3066.
[4] DRÁBOVÁ, D., et al., Results of Nation-wide Surveys of the Content of Artificial Radionuclides in Milk after the Chernobyl Accident, Czechoslovakian Atomic Energy Commission, Prague (1988) (in Czech).
[5] USSR STATE COMMITTEE ON THE UTILIZATION OF ATOMIC ENERGY, The Accident at the Chernobyl Nuclear Power Plant and Its Consequences, Information compiled for IAEA Experts Mtg, Vienna, 1986.
9 6 PO S TE R P R E S E N T A T IO N S
IAEA-SM-306/143P
R A D I A T I O N P R O T E C T I O N A N D H E A L T H PHYSICS
E V A L U A T I O N O F M O V E M E N T S O F R A D I O A C T I V E
C A E S I U M A N D S T R O N T I U M F R O M SOILS T O P L A N T S
A N D T O M I L K IN T H E U K R A I N E
I.P. L O S ’ , I.A . L IK H T A R E V , N .K . S H A N D A L A , V .S . REPIN,
O .A . B O B Y L E V A , I.Y u . K O M A R IK O V , A .Y u . V A S IL ’E V ,
G .M . G U L ’K O , I .A . KA JR O , L .N . K O V G A N ,
V .N . ST E P A N E N K O , V .V . A N D R E E V A
All-Union Scientific Centre for Radiation M edicine,Kiev,
Union o f Soviet Socialist Republics
The purpose o f this work was to study the contamination o f the environment
by radioactive caesium and strontium and to determine their transfer coefficients
from soil to plants and from plants to milk in the territory covered by the Ukrainian
woodlands. Altogether we examined more than 1000 samples o f soil, plant material
and milk.
A fter the Chernobyl accident, the western branch o f the radioactive plume
track covering the Ukrainian woodlands was enriched appreciably in radioactive
caesium. The soil contamination density over this territory varies widely: from 18.5
to 1500 kBq/m2, and the radioactive strontium concentration varies from 3.7 to
92.5 kBq/m2.

P O S TE R P R E S E N T A T IO N S 97
Analysis o f radioactive caesium transfer coefficients in the soil-plant chain
shows values o f (0 .1-1 .0 ) x 10~9 M B q-kg~‘ -(B q -n T 2) " 1 at distances relatively
close to the Chernobyl nuclear power plant (Kiev Province), and values o f
(5.0-8.0) x 10“9 at greater distances from the plant, as for example in Rovensk
Province. In all cases, the l37Cs transfer coefficients from soil to grass were sub
stantially lower than the corresponding coefficients for global fallout (8.0 x 10~8);
furthermore, their magnitude varied as a function o f distance from the Chernobyl
power plant.
A similar picture was observed in analysing the distributions o f 90Sr transfer
coefficients from soil to grass in various regions o f the Ukrainian woodlands, coeffi
cients which varied within the range (1.0-9.0) x 10~9 M Bq • kg~1 • (Bq • rrT2)~1 and
were also lower than the corresponding global coefficients.
To analyse the further migration o f long lived radionuclides through the soil—
plant-foodstuff-m an chain, w e studied the activity o f radioactive caesium and
strontium in m ilk and the soil-m ilk transfer coefficients.
Table I shows the 137Cs and 90Sr transfer coefficients from soil to milk
obtained at various distances from the Chernobyl plant for areas lying in the so-called
western track o f the accident; the figures reflect the status as o f summer 1989.
Analysing the data in this table, one can see that the caesium transfer coeffi
cients found in regions close to the Chernobyl plant are 2-9 times lower than the cor
responding global coefficients obtained for turf-podzol loam soils at the end o f the
1960s (2.8 x 10⁻⁹ M B q - L '1 -(B q -m '2) " 1); in the Narodichi and O levsk Districts o f
T A B L E I. C O E FFIC IE N T S FO R TH E T R A N S F E R O F R A D IO A C T IV E
C A E SIU M A N D STR O N TIU M FR O M SO IL T O M IL K IN TH E U K R A IN IA N
W O O D L A N D S IN 1989
Region studied Average distance from reactor
(km)
Type of soil Soil to milk transfer coefficients
(10-9 M Bq-L-1 -(Bq-nT2)-1)
Caesium Strontium
30 km zone 30 Turf-podzol 0.30 0.03
Polessk District 45 Turf-podzol 1.15 0.10
Narodichi District 60 Turf-podzol 2.10 0.20
Olevsk District 140 Turf-podzol 2.50 0.23
Rovensk Province (north)
200 Acidic peat- marsh soils
50.00 0.14
98 PO S TE R P R E S E N T A T IO N S
Zhitomir Province the transfer coefficients were close to the global coefficients, and
in Rovensk Province almost 20 times higher. I f one compares the strontium transfer
coefficients with the global coefficients (1 X 10“9 M B q -L "1-(B q-m -2) ' 1), one
finds that the coefficients thus obtained are from 30 (for the 30 km zone) to 4 (for
other regions investigated) times lower than the global figures.
The differences observed between the values o f caesium and strontium transfer
coefficients for different zones are due not only to different soil contamination levels
but also to the agrochemical properties o f the soils, in particular the concentration
o f exchangeable calcium. This indicator varies from 25-30 mg eq per 100 g o f soil
in K iev Province to 4 -10 in Rovensk Province. Zonal differences are to be seen also
in the humus content o f the soil: from 1 to 4% and higher. The pH o f aqueous and
salt extracts can be viewed as an integral characteristic o f radionuclide mobility in
soils. The slightly acid podzolized grey forest soils in the wooded areas o f K iev
Province, with an aqueous extract o f pH 6-6.5, gradually go over to the acidic turf-
podzol soils o f the Zhitomir woodlands and the acidic peat-marsh soils o f Rovensk
Province with a salt extract o f pH 4.5-5.5 .
The apparent differences in radioactive caesium and strontium transfer coeffi
cients can also be explained, in part, by the fact that the nature o f radioactive fallout
in the areas close to Chernobyl was characterized by a larger concentration o f coarse,
dispersed, insoluble, ‘hot’ particles, whereas at greater distances the fallout consisted
o f more finely dispersed particles.
In forecasting internal exposure doses, including lifetime dose commitments
(over a period o f 70 years), w e use the so-called ‘ milk coefficient’ (the coefficient
reflecting the transfer o f the radionuclide from soil to m ilk), expressed as:
K m - qla
where q is the volumetric activity o f the nuclide in m ilk, expressed in Bq/L; and
a is the density o f soil contamination in Bq/m2.
A s can be seen from the data presented in Table I, the numerical values o f the
transfer coefficients vary over a rather large range. From the numerical evaluations
o f transfer coefficients that have been carried out on the basis o f the human food
chain and other indicators, it follows that our calculations o f current internal
exposure and also our forecasts o f anticipated internal doses, based on soil contami
nation density values, carry an uncertainty factor o f at least 2, especially if these dose evaluations are extended to the inhabitants o f regions encompassing a large number
o f areas and zones with a soil structure similar to that found in the zones investigated.
Since important decisions are frequently based on forecasts o f this kind — decisions
implying the use o f substantial resources — w e believe that we should use not
regional but local transfer coefficients, each covering perhaps only one district. Fur
thermore, the transfer coefficients should be taken into account in planning and
executing whatever agrochemical measures seem to be indicated.

P O S T E R P R E S E N T A T IO N S 99
T R A N S P O R T O F 131I A N D 137Cs F R O M AIR T O C O W M I L K
P R O D U C E D O N A N O R T H W E S T E R N ITALIAN F A R M
F O L L O W I N G T H E C H E R N O B Y L A C C I D E N T
P. S P E Z Z A N O , R. G IA C O M E L L I
Centro Ricerche Energía Saluggia,
Comitato Nazionale per la Ricerca e per lo Sviluppo
d ell’Energia Nucleare e delle Energie Alternative (E N E A),
Saluggia, V ercelli,
Italy
The air-pasture-cow -m ilk pathway is o f particular concern for the transport
o f l31I and 137C s from the environment to man. Follow ing the Chernobyl accident,
air concentrations, fallout deposition and total precipitation were measured at the
Centro Ricerche Energia Saluggia, situated about 35 km northeast o f Turin. The
transfer o f 13'i and 137C s from pasture grass to m ilk was evaluated on a small farm
situated about 16 km southeast o f the Nuclear Centre o f Saluggia, where the
concentrations o f gamma emitting nuclides were measured in the ingested grass and
in the milk produced by some cows fed exclusively with fresh grass starting from
1 M ay 1986. It was assumed that concentrations in air and mean weather conditions
were the same as those measured at Saluggia.
The time integrated concentrations in air (B q -d -1 -m -3), in vegetation
(B q -d _1 - k g ^ ) and in m ilk (B q -d _ 1- L _l) were, respectively, 29.5, 2 .1 X 105
and 9.5 X 10³ for l3lI and 4 .7 , 1 .1 X 105 and 3.2 x 10³ for 137Cs. The concen
tration ratios for vegetation to air (C v/Ca), m ilk to vegetation (C m/Cv) and m ilk to
air (C m/Ca) were compared with the values obtained from an internationally recog
nized model for assessing the transfer o f radionuclides through terrestrial food chains
[1]. From the site specific conditions, the following parameters were evaluated or
presumed: a plume height o f 1500 m; a distribution o f 131I in air o f 28% particu
late, 10% elemental and 62% organic; a precipitation rate o f 0 .14 mm/h and a daily
intake o f 14 kg (dry weight) o f contaminated pasture. Other parameters were taken
as default values from the model. Results are summarized in Table I.
Experimental values o f C v/Ca and C m/Cv obtained for l3lI fall at the
higher side o f the range o f values (1 .1 X 104 to 9.5 X 10² m 3/kgdry and
5 .1 x 1 0 ~2 to 5 .2 x 10~3 kgdry/L, respectively) measured in several European
countries following the Chernobyl accident and reported by Hoffmann et al. [2],
while the experimental C m/Ca value was higher than those previously reported
(1 .2 x 102—1.4 X 10 1 m 3/L) [2]. From the measured C m/Cv ratios, milk transfer
coefficients (Fm) o f 4.6 X 1 0 _ 3d /L fo r l31I a n d o f 2 .1 X 10~3 d /L fo r I37Cs were
IAEA-SM-306/24P

100 PO S T E R P R E S E N T A T IO N S
T A B L E I. M E A SU R E D A N D P R E D ICTE D C O N C E N T R A T IO N R A TIO S FO R
TH E T R A N SP O R T O F 131I A N D 137Cs FR O M A IR T O V E G E T A T IO N A N D TO M ILK
Radionuclidecv/ca
(m3/kgdry)cm/cv
(kgdry/L)С /с-nv -a(m3/L)
i31j Measured Predicted
7.0 x 10³ 4.6 x 10“ 2 3.2 x 1021.8 x 104 9.9 x 10“ 2 1.8 x 10³
i37ç Measured Predicted
2.3 x 10⁴ 3.0 x 10“ 2 6.9 x 1021.0 x 105 1.1 x 10“ ' 1.1 x 10⁴
obtained. Variations in published F m values are probably due to differences in feed
ing conditions and metabolic characteristics o f dairy cows as w ell as the result o f
seasonal and environmental variability.
The concentration ratios predicted by the model for 13 *1 were higher than
those derived from Chernobyl fallout by factors o f 2.6, 2 and 5.6 for the vegetation
to air, the m ilk to vegetation and the m ilk to air ratios, respectively. Calculated
values o f C v/Ca, C m/Cv and C m/Ca obtained for 137C s were higher than experimen
tal values by factors o f 4 .3, 3 .7 and 16, respectively. H owever, in this case the time
integrating interval was certainly not sufficiently long.
The overestimation in predicted values can be attributed to the default values
assumed for the mass interception factor (R/Y), for the effective decay constants for
the removal o f radionuclides from vegetation (Xv) and for the m ilk transfer coeffi
cients (Fm) which were higher than the experimental ones.
R E F E R E N C E S
[1] INTERNATIONAL ATOMIC ENERGY AGENCY, Generic Models and Parameters for Assessing the Environmental Transfer of Radionuclides from Routine Releases, Safety Series No. 57, IAEA, Vienna (1982).
[2] HOFFMANN, F.O., AM ARAL, E., MOHRBACHER, D .A ., DEMING, E.J., J. Environ. Radioact. 8 (1988) 53.

Part IV
C O U N T E R M E A S U R E S T O R E D U C E
R A D I O N U C L I D E C O N T A M I N A T I O N
O F F O O D C H A I N S


IAEA-SM-306/67
E V A L U A T I O N O F C O U N T E R M E A S U R E S
I N A G R I C U L T U R E A N D F O O D P R O C E S S I N G
C . LEISIN G , E. W IRTH
Institute for Radiation Hygiene
o f the Federal Health O ffice,
Neuherberg,
Federal Republic o f Germany
A b stract
EVALUATION OF COUNTERMEASURES IN AGRICULTURE AND FOOD PROCESSING.
Different countermeasures to decrease the contamination of plant and animal products after a nuclear accident are discussed. These countermeasures include the discarding and storing of contaminated goods as Well as the use of additional agricultural techniques and industrial processing. Impending meat and milk contamination may be countered by feeding strontium and caesium sorbents such as calcium alginates, bentonite, and potassium hexacyanoferrates, thus inhibiting the strontium and caesium resorption in the gastrointestinal tract, or by distributing fodder with a higher contamination level to livestock used for breeding and not for meat and milk production. Techniques involving industrial decontamination include milk processing as well as alcohol and starch production. The removal or processing of highly contaminated by-products is given special attention. For all countermeasures the probable contamination reduction as well as the costs involved are stated. A method to optimize the selection of adequate countermeasures in a given situation is discussed. The different suggestions are designed to help political decision makers in the event of radioactive contamination.
1. G E N E R A L A S P E C T S
A s the possibility o f a widespread radioactive contamination o f the environ
ment can never be completely excluded, it is necessary to evaluate appropriate
countermeasures to minimize the dose to man. The relation between the costs o f such
countermeasures and the respective dose reduction should be taken into account in
such an evaluation.
The countermeasures discussed in this paper are confined to those which w ill
reduce the ingestion dose and which are o f concern to food producers and proces
sors. There are generally four w ays to reduce the contamination o f food: discarding,
storing, additional agricultural techniques and industrial processing.
103

104 L E IS IN G and W IR T H
2.1. Discarding
This countermeasure is reserved for food and foodstuffs which are highly
contaminated either by long lived radionuclides or by short lived radionuclides if the
product is not storable. Plant products from fields with contaminated plants should
be ploughed under instead o f being harvested. In some cases it might be necessary
to chop the crop first to facilitate subsequent ploughing and to promote decomposing
processes. The activity contribution o f the ploughed under plant material to the soil
will be relatively small compared to direct deposition during the fallout or washout
after a nuclear accident. With ploughing the activity o f plants w ill be distributed and
thus diluted throughout the ploughed layer. Since the soil to plant transfer rates are
very low for most radionuclides, the contribution o f the ploughed under plants to the
contamination o f crops grown later w ill be negligible.
High contamination o f animal products should be prevented by appropriate
feeding and slaughtering policies and discarding meat should only be considered in
em ergency cases. M ilk might either be discarded on the farm where the milk is
produced or by the dairy.
Costs which have to be taken into account are deficiency payments to the
producers (to farmers or to the respective dairy) and, i f necessary, compensation for
higher transportation rates and for the disposal o f contaminated products. Additional
costs may arise for subsidizing trade in replacing the discarded products.
2.2. Storing
This countermeasure will apply for storable food and foodstuffs which are
mainly contaminated by short lived radionuclides. The decontamination effect is time
dependent according to the physical half-life o f the respective radionuclide. Plant
products, such as cereals and legumes, can easily be stored as can canned food, milk
preserves and some meat products. In case o f 13*1 contamination, storage for
2 weeks w ill reduce the contamination to 30% o f the original activity concentration.
This measure might result in additional costs for storage and, i f necessary, for
transportation to the storage buildings.
The contamination level o f non-storable plant products such as lettuce and also green forage might be reduced likewise by postponing the harvesting date. W hile a
short delay o f the harvest will hardly involve any additional costs for plant
producers, longer time lags w ill lead to a qualitative depreciation o f the yield, which
has to be assessed and reimbursed. There w ill be, however, no additional storage
costs.
In animal production a postponement o f the slaughtering date may be effective
in reducing contamination not only by short lived radionuclides but also by long lived
2. D IS C U S S IO N O F C O U N T E R M E A S U R E S

IAEA-SM-306/67 105
radionuclides, if their biological half-lives are relatively short and i f there is enough
uncontaminated fodder in stock.
For pigs, for instance, the effective caesium half-life is only 18 days, thus the
caesium contamination is reduced in 2 weeks to 60% o f its initial value. For a
fattening enterprise a later slaughtering date implies a lower rotation rate. For
fattening pigs the normal annual rotation rate o f 2.2 [1] would thus be decreased to
2 .1 , implying that approximately 5% o f the pig price actually received would have
to be paid to cover the additional expenses o f this countermeasure.
2.3. Additional agricultural techniques
There are several additional agricultural measures which may cut down on
contamination due to direct deposition. Depending on the prognosticated time lag
between the release o f radioactive material and the arrival o f the plume, different
precautionary measures are applicable.
I f a serious contamination is to be expected, farmers should be advised to
hasten the harvest o f vegetables and fodder. The stock o f uncontaminated fodder and
foodstuffs thus accumulated would later provide a country with more time for
surveying the contamination situation and with more possibilities for reacting. These
anticipatory measures w ill be primarily limited by the respective capacities o f
harvesting equipment, storehouses, manpower, and most o f all by the limited time
span. The depreciation o f yield owing to premature harvesting would have to be
reimbursed. A lso additional expenditures o f w ork might be additional cost factors.
Several methods, such as closing greenhouses and sheltering livestock, as well
as covering vegetables and stores o f fodder and foodstuffs, are most effective i f they
are applied shortly before a fallout situation. The achievable dose reduction may vary
widely depending on the radionuclide composition o f the fallout, on the time when
these actions are taken, as well as on the type o f crop or livestock and the respective
shielding facilities.A s a countermeasure to be applied immediately after dry fallout, sprinkler
irrigation o f crops may wash o ff one third o f the deposited activity [2].
Since these simple methods involve hardly any costs, they should be recom
mended as precautions even before exact fallout data are available.
After the contamination o f the environment, the subsequent soil-plant transfer
may be reduced by soil management, e .g . activity dilution by deep ploughing or
fertilizing o f nutrient deficient soil [2].
The choice o f crops offers additional possibilities. Deep rooting alfalfa will
take up less superficially deposited activity than pasture. In severe cases pasture may
be afforested and arable land used for non-food production, e .g . rape cultivation for
oil production [2, 3].

106 L E IS IN G and W IR T H
In animal production, feeding uncontaminated fodder is best suited for farmers
who are well stocked with fodder. If uncontaminated fodder has to be rationed, it
should be saved primarily for the last weeks o f the fattening period o f cattle, pigs
and poultry. This feeding period should be limited according to the individual
effective half-life o f the dominant radionuclide and the desired decontamination
effect.
Other methods, such as feeding additives (e.g. alginates, com plex ferrocyano
compounds or clay minerals) to reduce the strontium and caesium resorption by
livestock, are more expensive and difficult to enforce.
M ixing bentonite or other clay minerals into contaminated feed reduces the
caesium resorption, but also the palatability o f the respective feed. A daily rate o f
500-600 g bentonite for cows and 100 g for sheep is considered as the upper limit
and not more than 50 g/kg foodstuffs should be given to swine. The caesium activity
in m ilk o f cow s and ewes can thus be reduced by 50 to 80% and by up to 50% in
meat o f cow s, sheep and swine [4-7].
For feeding additives such as alginates or complex cyano compounds, the
present law in the Federal Republic o f Germany on foodstuffs would have to be
changed or supplemented accordingly. Cyano compounds like Prussian blue are very
effective in reducing the caesium resorption. Daily rates o f 2 g for sheep and 3 g
for cattle may reduce the caesium contamination in milk by about 80% and in meat
by 70-90% [2, 8]. Administered to calves, lambs and pigs at daily rates o f 1 to 3 g,
this compound reduces the caesium activity in meat by 85-95% [6, 7].
Sodium or calcium alginates must be given at a higher dose to prevent
strontium absorption. This amount reduces the palatability o f feed and consequently
its uptake. W hen fed to dairy cows at a daily rate o f 800 g, this dose decreased the
strontium level in m ilk to one third o f the control level without greatly altering the
calcium metabolism [9]. For chickens the opposite effect was registered; they
seemingly react in a different w ay from mammals. Alginates did not reduce the
skeletal deposition o f strontium, but did lower the uptake o f the essential homologue
calcium [10]. This measure o f feeding alginates should therefore be limited to cattle,
sheep and swine.
Farmers have to be w ell instructed and motivated to carry out these measures
diligently. The ensuing activity reduction under normal farming conditions can be
estimated only vaguely since present knowledge is based merely on a few small scale
experiments. Little is yet known about the long term effects o f these feed supple
ments and whether they w ill not lead to a deprivation o f essential homologue
minerals. A wide range o f further investigations in this field is still necessary.
The costs involved in carrying out these measures vary depending on the type
o f measure considered. In addition to the specific costs o f the uncontaminated fodder
or feed supplement, the necessary amount also has to be taken into account. These
factors w ill in turn influence the costs o f transportation and administration.

IAEA-SM-306/67 107
With the exception o f m ilk processing, the possibility o f industrial processing
is more or less confined to the decontamination o f plant products. M ilk processing
is an effective passive countermeasure for short lived radionuclides owing to long
processing periods (hard cheese) and/or the production o f m ilk preserves. The
decontamination effect is completely time dependent. This processing w ill probably
create no additional costs for storing but w ill lead to higher transportation rates,
owing to the distribution o f contaminated m ilk to several dairies, according to their
individual capacities, in exchange for uncontaminated m ilk for direct consumption
in the highly contaminated areas. In the Federal Republic o f Germany only
about 25% o f the produced m ilk is consumed as drinking m ilk and would have to
be transferred to highly contaminated areas or to other companies for processing into
cheese [11].
According to Lagoni [12] a complete extraction o f caesium and strontium is
achieved by processing the contaminated milk into butter fat. In the corresponding
by-products, such as buttermilk, the strontium activity is reduced by 50% while the
caesium activity remains unchanged. In skim m ilk the strontium (+ 1 3 % ) and the
caesium (+ 4 % ) contents are slightly enriched. For strontium decontamination o f
skim m ilk, further processing into rennet whey is effective. W hereas the caesium
content is thus increased by 5 % , strontium is reduced to 10% o f that o f the
unprocessed milk. The simultaneously produced casein concentrates the strontium
content by a factor o f almost 30 and might therefore be difficult to discard. A s an
alternative, highly contaminated m ilk and dairy products can be excluded from direct
human consumption by processing them into different species o f feed concentrates
for breeding calves and pigs or for fur bearing animals.
The costs involved depend on the selection o f the specific m ilk processes which
in turn depend on the required decontamination effect.
Complete strontium and caesium decontamination, for example, would be
achieved by producing butter fat and discarding all the resulting by-products, the cost
o f which would then have to be reimbursed. Additional costs would have to be
included for transporting the contaminated milk to dairy plants with the required
facilities and capacities.
There are also several methods for decontaminating meat, either passively by
producing goods to be stored or actively by suitable cooking methods which,
however, w ill also reduce the palatability. B y curing or pickling and discarding the
respective liquid, meat may lose 40-95% o f its original caesium activity [6, 13]. The
sole expense for these measures would be developing an information policy to aid
the individual household.
Sausage with natural skin w ill have 30-50% less caesium activity than that with
synthetic skin [6]. The costs for using natural skin consist o f the price difference
2 .4 . In d u s tr ia l p ro c e s s in g

108 L E IS IN G and W IR T H
between natural and synthetic sausage skins and their consumption rate per kilogram
o f sausage.
The industrial processing o f plant products may result in nutrition and/or
non-nutrition products. Cereals, potatoes and fruits may be decontaminated by
distillation, rendering output rates o f 34, 10 and 3-5 L o f alcohol respectively per
100 kg o f raw material [14, 15].
Alcohol production in the Federal Republic o f Germany is regulated by the
Federal Monopol Administrations which in the event o f a nuclear accident would
have to expand distillery licences, perhaps lower the alcohol prices and suspend other
regulations, such as the obligation o f agricultural distilleries to feed the distiller’ s
wash to cattle, sheep or pigs. The swill might instead be used for energy production
by anaerobic digestion [16], as fertilizer, stored as compost or fed into the
manure pit.
In the case o f the distillation o f potatoes, the refunds would consist o f the price
difference between potatoes for food and industrial potatoes and, if necessary,
additional transportation and storing costs and a subsidy for the price o f alcohol. If
the distiller’s wash (1.3 L per kg o f potatoes) is to be discarded, the farmers have
to be supplied with alternative feedstuffs.
Cereals and potatoes can also be converted into starch. Rape and sunflowers
might be decontaminated without extra costs by processing into oil or liquid fuel
[17]. Costs may only arise in discarding the by-products. Up to the time o f writing
no exact data were yet available on the potential strontium and caesium reduction
achieved with these procedures nor on their activity distribution among the individual
by-products.
Products like alcohol, oil and starch have the advantage o f being easily
storable. A lso a surplus o f these products may easily be absorbed by the non-food market i f their prices are subsidized and thus cheaper than their synthetic
substitutes [18].
3. SE L E C T IO N O F CO U N T E R M E A SU R E S
In the event o f an accident with a significant radionuclide release, the first
requirement is to survey the actual contamination situation and assess what the future
food contamination would be if no measures were taken. The resulting values have
to be compared with the recommended international exemption limits, which should
be used as guidelines. In choosing the most adequate countermeasure the following
equation w ill be helpful:
H = m A g (1)
where H is the total effective ingestion dose prevented by the considered measure

IAEA-SM-306/67 109
(Sv), m is the mass o f the contaminated products concerned (kg), A is the reduced
specific activity (Bq/kg) and g is the dose conversion factor (Sv/Bq).
The total dose reduction may be compared with the total cost o f the applied
measure and is calculated as follows:
C t = C spm (2)
where C, is the total costs o f the considered measure calculated in Deutschmarks
(D M ), C sp is the specific costs o f the considered measure (DM/kg) and m is the
mass o f the products involved (kg).
W hereas the specific costs consist o f a sum o f different singular cost
parameters, which w ill be o f a particular value for each individual measure, the
specific costs for storing, for instance, would include the respective transport and
storing costs. In some cases this sum o f specific costs would have to be corrected
by possible benefits. I f wheat is to be ploughed under, for example, not only the
reimbursement o f the lost yield has to be taken into account but also the savings o f
specific subsidies normally spent to counter overproduction.
Before imposing any countermeasure, one should estimate the possible dose
reduction o f each contrivable measure and take into account the actual consumption
habits o f the population. The ingestion dose reduction for an individual can be
calculated according to Eq. (1) i f the size o f the average annual intake rate is
inserted.The effectiveness o f a countermeasure is dependent not only on the anticipated
specific activity reduction but also on the intake rate. For the individual dose
reduction, for example, it makes a great difference whether the yield o f a field o f
parsley or cabbage is discarded. Even i f the final decisions w ill not be based solely
on cost-benefit relations, it is advisable to compare the anticipated dose reduction
to the respective costs. Linear optimization as used for farm planning [19-20] could
also be a tool for finding the most appropriate set o f countermeasures in a given
situation. The objective would be to minimize the costs involved to keep the activity
concentration o f foodstuffs below certain levels by combination and recombination
o f the types and the extents o f different countermeasures.
R E F E R E N C E S
[1] RUHR-STICKSTOFF AG, Faustzahlen fiir Landwirtschaft und Gartenbau, Landwirt- schaftsverlag, Miinster-Hiltrup (1988).
[2] REITEMEIER, R.F., et al., “ Reclamation of agricultural land following accidental radioactive contamination” , Protection of the Public in the Event of Radiation Accidents (Proc. FAO/IAEA/WHO Sem. Geneva, 1965), World Health Organization, Geneva (1965) 265-274.

110 L E IS IN G and W IR T H
[3] APFELBECK, R., “ Possibilities of relieving the EEC agricultural market through energy production e.g. rape and short-rotation forestry” , Energy from Biomass (Proc. Int. Conf. Venice, 1985) (PALZ, W ., et al., Eds), Elsevier, Amsterdam and New York (1985) 1034-1038.
[4] BERESFORD, N .A., The effect of treating pastures with bentonite on the transfer of l37Cs from grazed herbage to sheep, J. Environ. Radioact. 9 (1989) 251-264.
[5] GIESE, W., RUDNICKI, S., Zum Einsatz von Radiocàsium-bindenden Stoffen in der Tierischen Produktion, DLG-Forschungsbericht Nr. 538030, Deutsche Landwirtschafts-Gesellschaft, Frankfurt (1988).
[6] HECHT, H., Bundesanstalt fiir Fleischforschung, Kulmbach, Federal Republic of Germany, personal communication, 1989.
[7] PIVA, G., et al., Effects of bentonite on transfer of radionuclides from forage to milk, Health Phys. 57 1 (1989) 181-182.
[8] HOWARD, B., LIVENS, F., May sheep safely graze? New Sci. (Apr. 1987) 46-49.[9] COMAR, C .L ., et al., Incorporation and Control of Strontium, Caesium, and
Iodine Secretion in Milk — A Summary of the Final Report, NRDL Contract No. N 00228-68-C-1445, Naval Radiological Defense Laboratory, San Francisco, CA(1969).
[10] COLVIN, L .B ., et al., Effects of sodium alginate on absorption and deposition of radioactive cations in chicken, Proc. Soc. Exp. Biol. Med. 124 (1967) 566-568.
[11] BUNDESMIN1STERIUM FÜR ERNÂHRUNG, LANDWIRTSCHAFT UND FORSTEN, Statistisches Jahrbuch iiber Ernáhrung, Landwirtschaft und Forsten der Bundesrepublik Deutschland, Landwirtschaftsverlag, Miinster-Hiltrup (1988).
[12] LAGONI, H., Dekontamination von Milchprodukten mit Hilfe molkereitechnischer Verfahren, Strahlenschutz 26 (1965) 195-205.
[13] WAHL, R., KALLEE, E., Decontamination puts meat in a pickle, Nature (London) 323 (1986) 208.
[14] KREIPE, H., Getreide- und Kartoffelbrennerei, Ulmer, Stuttgart (1981).[15] PIEPER, H.J., et al., Technologie der Obstbrennerei, Ulmer, Stuttgart (1977).[16] WULFERT, K ., WEILAND, P., “ Two-phase digestion of distillery slops using a fixed
bed reactor for biomethanation” , Energy from Biomass (Proc. Int. Conf. Venice, 1985) (PALZ, W., et al., Eds), Elsevier, Amsterdam and New York (1985) 562-566.
[17] STÜRMER, H., et al., “ Immediately available liquid fuel crops in the EEC” , ibid., pp. 348-349.
[18] MEINHOLD, K., KÔGL, H., “ Zuragrarpolitischen Bedeutung der Ethanolproduktion in der Bundesrepublik Deutschland” , ibid., pp. 84-89.
[19] STEINHAUSER, H., et al., Einffihrung in die landwirtschaftliche Betriebslehre, Vol. 1, Ulmer, Stuttgart (1972) 196-242.
[20] HILL, M .D., et al., Protection of the public and workers in the event of accidental releases of radioactive materials into the environment, J. Radiol. Prot. 8 4(1988) 197-207.

IA E A -S M -ЗОб/103
E V A L U A C I O N D E C O N T R A M E D I D A S
P A R A L A R E C U P E R A C I O N
D E S U E L O A G R I C O L A
J.M . M A R T I, G . A R A P IS , E. IR A N Z O
Instituto de Protección Radiológica y M edio Ambiente,
Centro de Investigaciones Energéticas,
Medioambientales y Tecnológicas,
Madrid, España
Abstract-Resumen
EVALUATION OF COUNTERMEASURES FOR THE RECOVERY OF AGRICULTURAL LAND.
The paper presents a review of the different countermeasures taken in the past to recover agricultural land following radioactive contamination. The principal countermeasures were evaluated on the basis of an analysis of their application in scenarios where, in the past, there has been an accident, a nuclear test or radioactive contamination followed by an impact on the agricultural environment, as well as in the light of relevant field and laboratory research. The evaluation of these measures took into consideration their efficiency, cost and practicability. The removal of vegetation and of the top soil layer are measures which bring about actual decontamination. Other countermeasures (ploughing, leaching, application of fixatives or fertilizers, etc.) do not result in decontamination of the agricultural environment, but rather in a dilution or stabilization of the contaminants, which reduces the problems of resuspension, external radiation levels and the capability of radionuclides to be transferred to agricultural products. Thus, removing the vegetation can yield a decontamination efficiency of up to 50%, while removing a surface layer of 10 cm of soil can give decontamination efficiencies o f more than 95%. On the other hand, superficial ploughing and the application of fertilizers are the easiest methods to use, being normal agricultural techniques. In conclusion, it would seem that the countermeasure to be applied depends on the characteristics of the contamination (radionuclides and their concentration in the medium), the characteristics of the area (land and crops) and the climatic conditions; thus, it is necessary to elaborate specific models to determine the countermeasures to be applied and to evaluate their consequences in the medium and the long term.
EVALUACION DE CONTREMEDIDAS PARA LA RECUPERACION DE SUELO AGRICOLA.
En este trabajo se presenta una revisión de las distintas contramedidas aplicadas en el pasado para la recuperación del suelo agrícola después de una contaminación radiactiva. Las principales contramedidas se han evaluado a partir del análisis de su aplicación en los escenarios donde, en el pasado, se originó un accidente, se realizó una prueba nuclear o se produjo una contaminación radiactiva seguida de impacto en el medio agrícola, así como de las investigaciones en campo y de laboratorio realizadas al respecto. La evaluación de las mismas se ha llevado a-cabo teniendo en cuenta su eficiencia, coste y praticabilidad. La retirada de la
111

112 M A R T I et al.
vegetación y de la capa superior del suelo son medidas que dan lugar a una descontaminación real. Otras contramedidas (arado, lixiviado, aplicación de fijativos o fertilizantes, etc.) no suponen una descontaminación del medio agrícola, pero sí una dilución o estabilización de los contaminantes, disminuyéndose los problemas de resuspensión, los niveles de radiación externa y la capacidad de transferencia de los radionucleidos a los productos agrícolas. Así, la eliminación de la vegetación puede suponer hasta una eficiencia de descontaminación de un 50%, mientras que retirando una capa superficial de 10 cm de suelo se alcanzan eficiencias de descontaminación superiores al 95%. Por otro lado, la realizacióin de un arado no profundo y la aplicación de fertilizantes resultan ser los métodos más fáciles de aplicar, ya que son técnicas agrarias normales. Por último, parece que la contramedida a aplicar debe depender de las características de la contaminación (radionucleidos y su concentración en el medio), de las peculiaridades de la zona (terreno y cultivos) y de las condiciones climatológicas, lo que implica la necesidad de elaborar modelos específicos para deducir las contramedidas a aplicar y evaluar sus consecuencias a medio y largo plazo.
1. IN T R O D U C C IO N
L a dispersión accidental de contaminantes radiactivos en el suelo agrícola da
lugar a la contaminación aguda de las cosechas existentes y crónica de las siguientes
que allí se cultiven, y en consecuencia de los productos que de ellas se obtengan,
implicando la perturbación socioeconómica de las zonas afectadas. Con el fin de re
cuperar el suelo agrícola para su uso normal, es preciso utilizar técnicas y métodos
que reduzcan el impacto dé la contaminación. En este trabajo se revisan las distintas
contramedidas aplicadas en el pasado para la recuperación del suelo agrícola. La eva
luación de las mismas se ha realizado teniendo en cuenta su eficiencia, coste y
practicabilidad.
Las principales contramedidas se han evaluado a partir del análisis de su aplica
ción en los escenarios donde, en el pasado, se originó un accidente, se realizó una
prueba nuclear o se produjo una contaminación radiactiva seguida de un impacto en
el medio agrícola, así como de las investigaciones en campo y de laboratorio realiza
das al respecto. Los escenarios analizados, con sus referencias bibliográficas más
significativas, son:
— Accidentes: W indscale (Reino Unido, 1957) [1], Palomares (España,
1966) [2, 3], Thule (Dinamarca, 1968) [4, 5] y Chernobyl (U RSS, 1986) [6, 7].— Pruebas nucleares: Los atolones de Bikini (Estados Unidos de Am érica,
1946-58) [8, 9] y Enewetak (Estados Unidos de Am érica, 1948-58) [10, 11], y
Nevada (Estados Unidos de Am érica, 19 5 1-7 5) [12, 13].
— Operaciones industriales: Los Alam os (Estados Unidos de Am érica,
1942-65) [14, 15] y Rocky Flats Plant (Estados Unidos de Am érica,
1958) [16 -17].
— Estudios de laboratorio y de campo [18-22].

CU
AD
RO
I.
EV
AL
UA
CIO
N
DE
LA
RE
TIR
AD
A
DE
LA
VE
GE
TA
CIO
N
EN
LOS
DIS
TIN
TO
S E
SC
EN
AR
IOS
IAEA-SM-306/103 113
cdT3
<U o cd*a X ) ‘Cca 'B ucd <D cda «cd T3 Eo C/5cd jdCAcd £ 4>ü * o
e 3 C<L>t :
sD ,
'Oocd
'> C
c
<Ü
cdjC
o1
"ü
cdoC
CA cd 4d"S ВД3 i-.
CO CA cd O
0)o<3CA
«jCucd
u<DCa>D, — a) «
û o
cd <u 2 'oЙ «3O, uca D
'■3 e-
cd cd o
O
o>"зo e
cd
-o 'O
s ET3c c oа. Й<u o û Q
oU
oT3cd
OT3cd c-i¡ Io* io
Z:s -r
•Д <N <D On
WsoOm
coNcdCз
ocW
< J2
<L> cdCOa. o>3 ■oCA
jDC'O
43 o3 oCA 3ТЭVU Lri■oM
cdCcd Da. 3cdu
Æ
las
una
oaxCL.Ю>.3So
£
cdЛcd
o 2
o(X3CQ
oTDO
S
cd a" 1 "Os go
<ua.o
eoD (ü2 5
* e «£d c- fl> ü *cd«2 e
В oo ;§a , 43 cd cd
<u oû _> ]SJ *a
oT3c
o£
Oû
OÙa>>
oJ
o43cdW)
*cd D
Ü o^ -sg 1 Э 'S
3ûû
0)■DO
Ш
cMs
£ocШ
cd£"ëdCU

CU
AD
RO
II
. E
VA
LU
AC
ION
DE
LA
R
ET
IRA
DA
DE
SU
ELO
EN
LO
S D
IST
INT
OS
ES
CE
NA
RIO
S
114 M A R T I et al.
o
Щ
o-oo
s
oUiCU
a e
2 u ce
ceo *2O iCP3 w ЧТЗ • j-— 1: O 3
00Г-I 00
£ 2 0\ W
E O f”* v 0\ o O VO m r-
'OT3 'O•o
u .
ce3
■o
tu
ooo
- ^ 2 яce _ cu-
© O ”1
1 r'- c ^•I 11сл 4 ' Ш
oXJ
ев
o3•o
ее-o
сЮ
o«o .3
o« Nce O
« s3< -Otu 0>
Û
Ш oс
a5
cu£<uсtí
со
^ о 2 о о ^
0 ¿1 '-§ и
Й. оо«¡г ^° а* ¿9 CQ
■8 I¡ л
О"2а>
-о
аз12
"й>*осю
«ceСEев
осteо
'É■2с
ОсслевС
слОТЭевслислЯ слк_ С 2
оо ОN сисио О ЬО
и•и
сл сл«-*Оа.
сл*6 «л<1>
Осли*о
<и*иев
Са> О.£*3
£ Ооvoa <ио
сСа> "3 ст“а>
13 3 *о <и 33сл1)*о
оv->о.<DТЭев
иоо.ев
s.и.■22с
х>>>о
оW<иси
евсл
Ёи<ÚслО
£Hсл
<*-О
а>с'О
•о•q.хв
nación o'
е<и
3сла>
<Г) Z *a <! о c¿ св
с'О
сю
3•о
•осоо
>тэ
оtí « О
U 515 *1 ОС
tu
о
Св
c¿tu
оо .
оТ5
О43
евCU
Ооя

IAEA-SM -306/103
о-С
ОО.Е
оD-
з0Q
CM00On
2r-»ON
'О-о
г-
X
X .л ’с? о
S Iп £ О
ослОслОи
'ОЧЭ
rtX
Й оо .2 , гм cd X)саЕ
СЛЩ
■о2
оогм
3*о
1-1 5 о л §
4> О•S ?Е -с о г-
.5 D p /I« U Г- «щ
СО
Cdс:• <и3СО
1й<L>
о3*о
g 5- <и 3
ш
л3с
ш
отз
cdЬн
О ■§0 й cd 3 oí)I s
соослотзCd
отэcdÛÛ
О ГО СМ ГМ ос
tu
оОС
3
н Chern
obyl
5-10
cm
superi
ore
s
rasp
ados
Conta
min
ació
n
dis
min
uid
a
en
Pro
ble
mas
de
vis
ión
al
uti
li-
con
bulldozers
un
fa
cto
r de
20
a 30
za
r se
nso
res
par
a contr
ola
r la
maquin
ari
a
ro
bo
tizada

CU
AD
RO
II
I. E
VA
LU
AC
ION
D
EL
AR
AD
O
EN
LOS
DIS
TIN
TO
S E
SC
EN
AR
IOS
116 M A R T I et al.
<D О■о -оcd
О О’S «çd s
-оcdтз
Си
Ч)3 сa- 'I
Cdс/э с
и •° 30 Ь1 ■§ з NI ЬО о8 Ё О sС •"а ^2 оÛ- О
лс
S
32
ои
тзcd■оо£43> с со *зС "е0) Г"- сл 40U • •3 •§I 2.5 «СЛ 1)Щ -о
£'Осо о о <л 'Л
S
сш
О и
о “■> g с « -g ■a а 1 ¡a t §U- ü 5 « • 5 8S .а 8 S o -0 Ë ■§ í cd с 73> <d u
« tS -343<L>C¿
,g 5
5Êsq cs t í oirT o í os vOOs os 00 00 00
oT3o
o Tg o ^J- '-o2 SO <Gcd or*“ >-H O-
o"O
o•o
o■S1>
o•o
< < 'hJ <
cd3ЭДcdсoü0 <2■§ «1 s* «
Ш
<uzoсШ
иz Pa
lom
ares
Tr
acto
r co
n ar
ado
(30
cm Fa
ctor
de
dilu
ción
: 4,5
10
Bue
napr
ofun
dida
d)
de 0,
01
cm a
45 cm
Exce
pto
en co
linas
do
nde
sehi
zo
man
ualm
ente

CU
AD
RO
IV
. E
VA
LU
AC
ION
D
EL
USO
DE
PR
OD
UC
TO
S Q
UIM
ICO
S (E
ST
AB
ILIZ
AN
TE
S)
Y R
EST
RIC
CIO
NE
S
EN
LO
S
ES
CE
NA
RIO
S
I A E A-SM-306/103
o•o
"OcdЧЭ
O2cu
<vrti 5/3 iá л « 6 o 5
с -o 5 oV5U3£ ü ¡i g S M s .s 3 g0 g.1 I
coü<L>Ocd-C
cdCasCÛ
feQ.S Ê 0> ° •§
OU
eo
O cd Cl C cd
ON
сл J2 -Si £2 a ^ чэo „. ©.Ы !/) ü -H— % Я Я и'«о .У r9 осо ^ u U О.
оСш
4)■оС
( N cdCN o( N с
'3СOи
cdС3
cdeoNС
ГЧ
£ü> *CT"
CQ
• o О0 0
сю
£В cd с “О О ’и о 3
-о* е
*о у
g &о 3Г- сл
01 '4> 2
ОО,
cd£зcu(ЛШ
ücdЕ>>cd
3 '«'cd ш> ü fe.1 -i o ed
< ‘C
UO
c*>4>
Z Win
dsca
le
Res
tric
ción
de
l co
nsum
o de
Buen
a B
uena
le
che
si >
3700
B
q/L

118 M A R T I et al.
C U A D R O V . C O ST E S R E PR E SE N T A T IV O S P A R A D IV E R SA S O P E R A
CIO N E S D E D E SC O N T A M IN A C IO N D E SU E L O A G R IC O L A [25]
Operación m2/hCoste (1982 dóls./m2)
Total Trabajo Equipo Material
Agua 2149 0,0219 0,0092 0,0127
Fijadores 2922 0,2061 0,0068 0,0094 0,19
Lixiviado 1814 0,052 0,0109 0,0151 0,026
Rasqueta 875 0,31 0,13 0,18
Arado normal 8500 0,004 0,001 0,002
Arado profundo 5000 0,06 0,005 0,055
Quitar escombros 543 0,026 0,009 0,017
Cubrir con suelo 549 0,371 0,106 0,265
Precios actuales para las operaciones en Palomares
— Arado: 1200 ptas/ha (dóls. 100/ha)— Retirada capa superior de suelo: 3000 a 4000 ptas/h (dóls. 25 a 33/h)— Camiones moviéndose 4 veces la distancia de 25 a 30 km, 8 hora diarias: 2500 ptas/h
(dóls. 21/h) -— Precio medio de cargar, retirar y transportar suelo: 900 ptas/m3 (dóls. 7,5/m3).
2. L A S C O N T R A M E D ID A S Y SU E V A L U A C IO N
Las principales contramedidas aplicadas en dichos escenarios fueron:
— Retirada de la vegetación y cosechas contaminadas.
— Retirada de la capa superior del suelo (10 cm).
— Arado o emplazamiento profundo de la contaminación.
— L ix iv ia c ió n ..
— Aplicación de agentes fijadores y fertilizantes.
Las características del medio (terreno, cultivos, condiciones climatológicas,
etc.), de los contaminantes (tipo y concentración de radionucleidos) y sus vías
críticas de exposición y contaminación de las personas (irradiación, inhalación e
ingestión) tuvieron distinta importancia relativa para la elección de la contramedida
que se aplicó de manera específica en cada escenario.
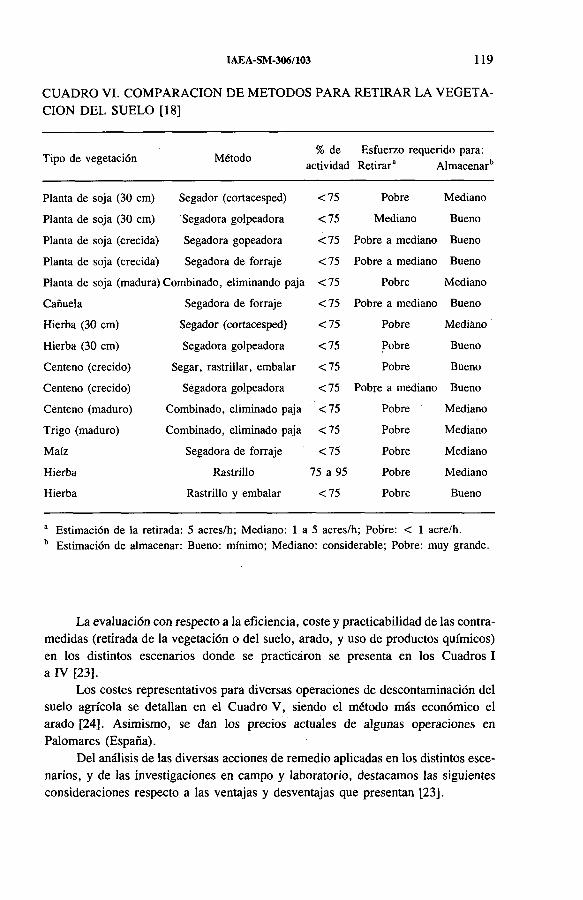
IA E A -S M -ЗОб/103 119
C U A D R O V I. C O M P A R A C IO N D E M E TO D O S P A R A R E T IR A R L A V E G E T A
CIO N D E L SU E L O [18]
Tipo de vegetación Método% de
actividadEsfuerzo requerido para:
Retirar3 Almacenar6
Planta de soja (30 cm) Segador (cortacesped) <75 Pobre Mediano
Planta de soja (30 cm) Segadora golpeadora <75 Mediano Bueno
Planta de soja (crecida) Segadora gopeadora <75 Pobre a mediano Bueno
Planta de soja (crecida) Segadora de forraje <75 Pobre a mediano Bueno
Planta de soja (madura) Combinado, eliminando paja <75 Pobre Mediano
Cañuela Segadora de forraje <75 Pobre a mediano Bueno
Hierba (30 cm) Segador (cortacesped) < 75 Pobre Mediano
Hierba (30 cm) Segadora golpeadora <75 Pobre Bueno
Centeno (crecido) Segar, rastrillar, embalar <75 Pobre Bueno
Centeno (crecido) Segadora golpeadora <75 Pobre a mediano Bueno
Centeno (maduro) Combinado, eliminado paja <75 Pobre ' Mediano
Trigo (maduro) Combinado, eliminado paja <75 Pobre Mediano
Maíz Segadora de forraje <75 Pobre Mediano
Hierba Rastrillo 75 a 95 Pobre Mediano
Hierba Rastrillo y embalar <75 Pobre Bueno
a Estimación de la retirada: 5 acres/h; Mediano: 1 a 5 acres/h; Pobre: < 1 acre/h. b Estimación de almacenar: Bueno: mínimo; Mediano: considerable; Pobre: muy grande.
La evaluación con respecto a la eficiencia, coste y practicabilidad de las contra
medidas (retirada de la vegetación o del suelo, arado, y uso de productos químicos)
en los distintos escenarios donde se practicáron se presenta en los Cuadros I
a IV [23].
Los costes representativos para diversas operaciones de descontaminación del
suelo agrícola se detallan en el Cuadro V , siendo el método más económico el
arado [24]. Asim ism o, se dan los precios actuales de algunas operaciones en
Palomares (España).
Del análisis de las diversas acciones de remedio aplicadas en los distintos esce
narios, y de las investigaciones en campo y laboratorio, destacamos las siguientes
consideraciones respecto a las ventajas y desventajas que presentan [23].
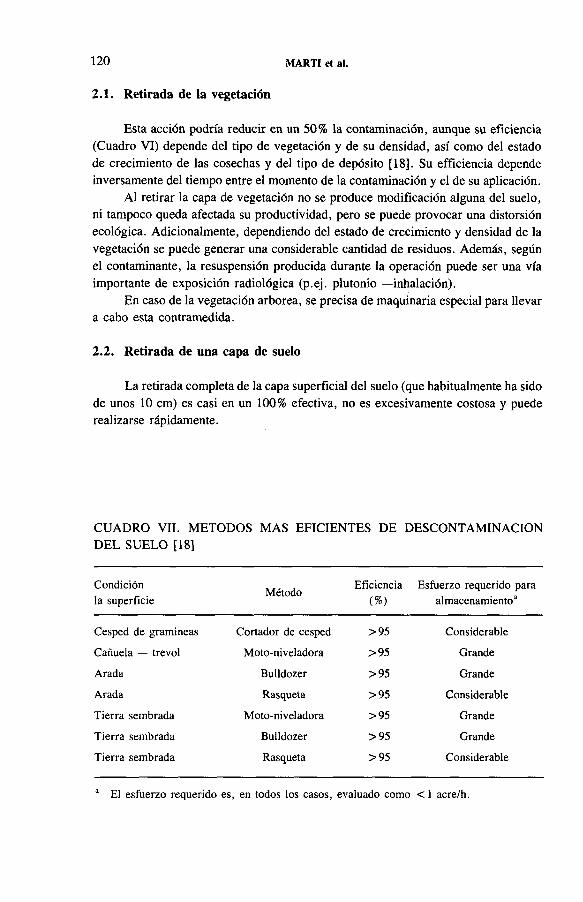
120 M A R T I et al.
2.1. Retirada de la vegetación
Esta acción podría reducir en un 50% la contaminación, aunque su eficiencia
(Cuadro VI) depende del tipo de vegetación y de su densidad, así como del estado
de crecimiento de las cosechas y del tipo de depósito [18]. Su efficiencia depende
inversamente del tiempo entre el momento de la contaminación y el de su aplicación.
A l retirar la capa de vegetación no se produce modificación alguna del suelo,
ni tampoco queda afectada su productividad, pero se puede provocar una distorsión
ecológica. Adicionalmente, dependiendo del estado de crecimiento y densidad de la
vegetación se puede generar una considerable cantidad de residuos. Adem ás, según
el contaminante, la resuspensión producida durante la operación puede ser una vía
importante de exposición radiológica (p.ej. plutonio — inhalación).
En caso de la vegetación arbórea, se precisa de maquinaria especial para llevar
a cabo esta contramedida.
2.2. Retirada de una capa de suelo
La retirada completa de la capa superficial del suelo (que habitualmente ha sido
de unos 10 cm) es casi en un 100% efectiva, no es excesivamente costosa y puede
realizarse rápidamente.
C U A D R O VII. M E TO D O S M A S EFICIEN TE S D E D E SC O N T A M IN A C IO N
D E L SU E L O [18]
Condic ión
la superficieM étodo
Eficiencia
(% )
Esfuerzo requerido para
almacenam iento8
Cesped de gramíneas Cortador de cesped > 9 5 Considerable
Cañuela — trevol Moto-niveladora > 9 5 Grande
Arada Bulldozer > 9 5 Grande
Arada Rasqueta > 9 5 Considerable
Tierra sembrada Moto-niveladora > 9 5 Grande
Tierra sembrada Bulldozer > 9 5 Grande
Tierra sembrada Rasqueta > 9 5 Considerable
a El esfuerzo requerido es, en todos los casos, evaluado corno < 1 acre/h.

CU
AD
RO
V
III.
E
VA
LU
AC
ION
DE
M
ET
OD
OS
DE
DE
SC
ON
TA
MIN
AC
ION
EN
N
EV
AD
A
TEST
SI
TE
[24]
IAEA-SM-306/103 121
_3"cd>Щ
с *T2'О
O.
oТЭo
oa0)U*UDH
OT3
с o o з сu
^ вo 3 тз Cl, с
'Cd Oос и
+ 1
823П
cd
£>3
О-осcd3
с <иО N ё О.5 тз
3х>•° а« *О U
- s 1 с *2 ° ю g зО О —на а ис о _
оcdU*
cd ОСЛ ÇJ
О о 4> isI-и ^а. g ° а.“ Вcd О
С D —1
О“О
О «S Яа wЕ 2 о с о is2 cd'h с •Й « Н а.
ьо cd и -геев
ОТЗ
g 3
с 2 Ü с 3 <Ú CQ J
>•> сл
д 3
СОоиО)тэ сл 4)
§ â я о тзи
*оcdТЭ
cd
bû is
s = 1 « 2 и
О"O
отзcd
с осл оcd
cdСоN <L>с с «> о о -о
<D
>•> ¡лs 8cd cd Он *
О
§ 9
О ГЗ
и я3 Ьм 00 00
отз3X»
я я cdо <и сл
О3 "О О(ЛО
соcdи
О(Л
ТЭ <и cdО 3 сOû оо с Nтзсл
cdВ cd
cdсо
отз
JU3
N с "слcd а>
с N о<и « оcd
•р 3 ОD Z
отз
о■а
о-оо
*3 о О Z
2 £
>•> (/) JS 8cd cd
CU
ОоОI—
с'О«с
>cdвО-С
*«?X)0)•о
О
тэсотэслcdсо
О *■* С сл 4> cd 3 — 00
<и-ос
3 SО О и ТЗ
cd "О3и
Си3
cd3йЛcd
со
2‘а.е3

122 M A R T I et al.
En los Cuadros VII y VIII se evalúan el esfuerzo y la practicabilidad de distin
tos métodos para la retirada de una capa superficial de terrenos con distintas condi
ciones superficiales [18, 25]; en la primera evaluación se consideran solamente los
métodos más efectivos, mientras que la segunda corresponde a los métodos aplicados
en Nevada Test Site. La practicabilidad depende del tipo de terreno así como de las
características topográficas, que son las que determinan principalmente la
maquinaria a utilizar.
Los principales inconvenientes son: que se requiere una maquinaria especial,
se originan muchos residuos (10 5 m 3 por km 2) y se produce resuspensión. A di
cionalmente, al retirar la capa superior más rica en materia orgánica se produce una
pérdida de fertilidad del suelo, lo que puede compensarse si se añade tierra
fresca-fértil o fertilizantes.
La replantación, en general, será extremadamente difícil, pero puede facilitar
se si, durante la retirada del suelo, parte de la vegetación se deja in situ.
2 .3 . E m plazam iento profundo de la contam inación
La contaminación del suelo normalmente afecta a la capa superior del mismo
( = 5 cm). Por tanto, inviniendo las capas superiores de la tierra, los contaminantes
podrían ser enterrados a profundidades mayores que las raíces de las plantas, por lo
que la disponibilidad de los contaminantes para su transferencia a la vegetación será
menor.
Además de reducirse la tasa de radiación externa en el futuro, la resuspensión
producida durante y después de las operaciones puede ser mínima.
Esta operación supone una distorsión de las capas del suelo y una pérdida de
fertilidad.Por otro lado, para aplicar correctamente esta técnica es preciso mejorar
algunos de sus aspectos técnicos.
2 .4. A ra d o norm al y profundo
L a disponibilidad de los contaminantes para las plantas dependerá entre otros
del radionucleido (su concentración y forma química), de las características del suelo
y del tipo de vegetación y tamaño de sus raíces.
Con el arado se consigue una dilución de los contaminantes y una reducción
de los niveles de exposición y de resuspensión.Si durante el arado se añaden productos químicos que controlen el crecimiento
de las raíces, se podría obtener una reducción de la absorción de contaminantes por
parte de las mismas.
Dicho arado puede ser realizado con la maquinaria tradicional de las granjas,
siendo una de las contramedidas más económicas (Cuadro V ) y , si se realiza arado
I A E A - S M -ЗОб/103 1 2 3
profundo (=1 m), podría constituir uno de los métodos más eficaces para reducir la absorción de los contaminantes.
El principal inconveniente de esta medida es que los radionucleidos permanecen en el medio, y el arado profundo puede modificar de forma importante la fertilidad del suelo.
2.5. Lixiviado
El lixiviado de los contaminantes por irrigación con agua o soluciones especiales reduce considerablemente la resuspensión y no es caro.
La movilidad de los radionucleidos es generalmente pequeña, dependiendo del tipo de suelos, de su perfil y del contaminante en sí. Por otro lado, la productividad del suelo podría quedar afectada ya que los nutrientes también serían lixiviados, haciendo necesaria la utilización de fertilizantes.
Al igual que en el caso de la aplicación del arado, los contaminantes continúan siendo accesibles a las plantas.
En algunos casos, el uso de lixiviado es desaconsejable, ya que favorecería la absorción de los contaminantes por la planta, o la contaminación de las capas freáticas.
2.6. Fijación de los contaminantes con aceites, asfaltos, espumas, etc.
Su aplicación detiene la dispersión y resuspensión de los contaminantes y aumenta la efectividad de operaciones posteriores que requieran la retirada de la superficie contaminada. Así, con la aplicación de 5 cm de espuma de poliuretano se puede retirar hasta el 85% de la actividad presente [26]. Es por ello que estos métodos pueden ser utilizados como un primer paso para posteriores operaciones de descontami nación.
La aplicación de los fijadores no genera residuos, pero sí su retirada, es menos caro que otros tratamientos y, aunque no es permanente, puede durar varios años.
Las principales desventajas que presentan son: que el suelo no es utilizable durante el período que está cubierto, y que el agua no penetra la cubierta aplicada.
2.7. Aplicación de fertilizantes
En el Cuadro IX se muestra el efecto sobre la reducción de la absorción del 90Sr tras la aplicación de distintos agentes (ácido cálcico, fertilizantes nitrogenados, arcillas, compuestos orgánicos, amonio y potasio), siendo en general la reducción <75% [18]. Esta disminución es debida al aporte de iones que compiten con los contaminantes o a la producción de la precipitación de éstos.

124 M A R T I et al.
CUADRO IX. COMPARACION DE DISTINTOS ADITIVOS PARA REDUCIR LA ABSORCION DE 90Sr [18]
Método
Reducción de
absorción (^Sr)
(%)
Esfuerzo
requerido3
Efecto sobre la
productividad*1
Aplicación de cal,
2-10 tons./acre 50-95 Bueno Bueno
Fertilizantes nitrogenados <75 Bueno Bueno
Fertilizantes fosfatados <75 Bueno Bueno
Fertilizantes con potasio <75 Bueno Bueno
Compuestos orgánicos,
5-20 tons./acre <75 Mediano Bueno
Minerales arcillosos,
5-20 tons./acre <75 Mediano Bueno a mediano
Fosfato amónico o potásico,
2-10 tons./acre 75-95 Mediano Mediano a pobre
a Estimación del esfuerzo: Bueno: no más que las prácticas normales; Mediano: precisando
extra equipo, material y personal; Pobre: se requiere gran esfuerzo, equipo y material.
b Estimación del efecto sobre la productividad: Bueno: aumenta o no hay cambio de produc
tividad; Mediano: productividad reducida <20%; Pobre: productividad reducida >20%.
Las principales ventajas son: que su apliación es más fácil comparada con otros tratamientos, que permiten una absorción selectiva de los radionucleidos y que corrigen tanto la fertilidad como la acidez del suelo.
Ninguno de los productos es altamente eficaz; su uso depende del tipo de suelo, del tipo de contaminante y de la disponibilidad de las grandes cantidades de estos fertilizantes que habitualmente son necesarias. Por otro lado, ciertos fertilizante podrían aumentar la absorción de los contaminantes, como es el caso de los nitrogenados respecto al Sr y Cs.
3. CONCLUSIONES
De las contramedidas mencionadas anteriormente, sólo la retirada de la vegetación y de la capa superior del suelo son medidas que dan lugar a una descontaminación real. Las otras conramedidas no suponen una descontaminación del medio

IAEA-SM-306/103 125
agrícola, pero sí una dilución o estabilización de los contaminantes, disminuyéndose los problemas de resuspensión, los niveles de radiación externa y la transferencia de los radionucleidos a los productos agrícolas.
La eliminación de la vegetación puede suponer hasta una eficiencia de descontaminación de un 50%, mientras que retirando una capa superficial de 10 cm de suelo se alcanzan eficiencias de-descontaminación superiores al 95%.
Por otro lado, la realización de un arado normal y la aplicación de fertilizantes resultan ser los métodos más fáciles de aplicar, ya que son técnicas agrarias tradicionales.
A partir de las consideraciones anteriores se concluye que la contramedida a aplicar depende de las características de la contaminación (radionucleidos y su concentración en el medio), de las peculiaridades de la zona (terreno y cultivos) y de las condiciones climatológicas.
Además de estas contramedidas que se aplican directamente al suelo agrícola, existen algunas alternativas que se aplican a las cosechas, tales como el cambio de las costumbres agrarias y el procesamiento de los productos obtenidos, lo que es eficaz para la reducción de la transferencia de la contaminación al hombre.
Para la recuperación de una zona agrícola como consecuencia de un accidente nuclear es necesario elaborar modelos generales para deducir las contramedidas adecuadas a utilizar, y estimar las consecuencias posibles de su aplicación a medio y largo plazo.
AGRADECIMIENTOS
Este trabajo se ha realizado bajo el contrato de la CEC número BI6-0266-E. Se agradece al Ministerio de Educación y Ciencia Español por el contrato del cual el Dr. G. Arapis ha sido beneficiario.
REFERENCIAS
[1] DUNSTER, H.J., H O W E L L S , H., T E M P L E T O N , W.L., “District surveys following
the Windscale incident, October 1957”, Peaceful Uses of Atomic Energy (Proc. 2nd
Int. Conf. Geneva, 1958), Vol. 18, UN, N e w York (1958) 296-308.
[2] IRANZO, E., ESPINOSA, A., IRANZO, C.E., “Evaluation of remedial actions taken
in agricultural area contaminated by transuranides”, The Impact of Accidents of Nucle
ar Origin on the Environment (Proc. Symp. Cadarache, 1988), CEA, Centre d’études
nucléaires de Cadarache, Saint-Paul-lez-Durance (1988) Section F.l.
[3] IRANZO, E., M I N G A R R O , E., S A L V A D O R , S., IRANZO, C.E., RIVAS, P.,
“Distribución geoquímica del plutonio y americio en los suelos de Palomares”,
Cycling of Long-Lived Radionuclides in the Biosphere: Observations and Models
(Proc. Sem. Madrid, 1986), Vol. 2, Centro de Investigaciones Energéticas, Medio
ambientales y Tecnológicas, Madrid (1987).

126 M A R T I et al.
[4] K O CH, J., “A preliminary report on the B-52 accident in Greenland on January 21,
1968”, Radiological Protection of the Public in a Nuclear Mass Disaster (Proc. Symp.
Interlaken, 1968), Fachverband fur Strahlenschutz, Karlsruhe (1968) 39-45.
[5] A A R K R O G , A., Radiological investigations of plutonium in Arctic marine environ
ment, Health Phys. 20 (1971) 31-47.
[6] IL’IN, L.A., PAVLOVSKIJ, O.A., “Radiological consequences of the Chernobyl ac
cident in the Soviet Union and measures taken to mitigate their impact”, Nuclear Power
Performance and Safety (Proc. Conf. Vienna, 1987), Vol. 3, IAEA, Vienna (1988)
149-166.
[7] K O R N E E V , N.A., et al., “The sector of agro-industrial production: Post-accident
radiological consequences and the basic protective measures”, ibid., Vol. 4,
pp. 383-397.
[8] SMITH, A.E., M O O R E , W.E., Report of the Radiological Clean-up of Bikini Atoll,
Rep. SWRHL-lllr, Southwestern Radiological Health Lab., Las Vegas, N V (1972).
[9] BECK, H.L., BENNETT, B.G., M c C R A W , T.F., External Radiation Levels on Bikini
Atoll — May 1967, Rep. HASL-190 (TID-4500), Health and Safety Lab., Energy
Research and Development Administration, N e w York (1967).
[10] FRIESEN, В. (Ed.), Enewetak Radiological Support Project, Final Report, Rep.
NVO-213, Holmes and Narver, Orange, C A (1982).
[11] BLISS, W., Enewetak Fact Book (A Résumé of Pre-Cleanup Information), Rep.
NVO-214, Nevada Operations Office, USDOE, Las Vegas, N V (1982).
[12] W A L L A C E , A., R O M N E Y , E.M., Feasibility and Alternate Procedures for Decon
tamination and Post-treatment Management of Pu-contaminated Areas in Nevada, Rep.
U C L A 12-973, Univ. of California, Los Angeles (1974).
[13] Environmental Monitoring Report for the Nevada Test Site and Other Test Areas Used
for Underground Nuclear Detonations, Rep. NERC-LV-539-39, US Environmental
Protection Agency, Las Vegas, N V (1975).
[14] AHLQUIST, A.J., STOKER, A.K., TROCKI, L.K., Radiological Survey and Decon
tamination of Former Main Technical Area (TA-1) at Los Alamos, N ew Mexico, Rep.
LA-6887, Los Alamos Scientific Lab., N M (1977).
[15] Final Report of Remedial Action at the Acid/Pueblo Canyon Site, Los Alamos, New
Mexico, Rep. DOE/OR/20722-15, Bechtel National (1975).
[16] BARKER, R.D., Removal of Plutonium-contaminated Soil from the 903 Lip Area
during 1976 and 1978, Rep. RFP-3226, Rocky Flats Plant, Golden, C O (1982).
[17] H A Y D E N , J.A., R U T H E R F O R D , D.W., G A L L A G H E R , K.Y., A R N O L D , P.M.,
STEVENS, J.R., Soil Decontamination Criteria Report, November 1980, Rep.
RFP-3162, Rocky Flats Plant, Golden, C O (1980).
[18] M E N Z E L , R.G., JAMES, P.E., Treatments for Farmland Contaminated with Radio
active Material, Agriculture Handbook No. 395 (TID-25845), US Dept, of Agriculture
(1971).
[19] TAWIL, J.J., BOLD, F.C., Guide to Radiation Fixatives, Rep. PNL-4903, Pacific
Northwest Lab., Richland, W A (1983).
[20] S U N D E R L A N D , N.R., The Removal of Plutonium Contaminants from Rocky Flats
Plant Soil (1987), Rep. DOE/NV/10471-T1, US Dept, of Energy (1987).

IAEA-SM-306/103 1 2 7
[21] O R C UTT, J.A., Cleanup and Treatment (CAT) Test: A Land-area Decontamination
Project Utilizing a Vacuum Method of Soil Removal, Rep. DOE/NV/00410-70, US
Dept, of Energy (1982).
[22] OLSEN, R.L., H A Y D E N , J.A., ALFORD, C.E., K O C H E N , R.L., STEVENS, J.R.,
Soil Decontamination at Rocky Flats, Rep. RFP-2901, Rocky Flats Plant, Golden, C O
(1979).
[23] MARTI, J.M., ARAPIS, G., IRANZO, E., Evaluation of the Countermeasures
Applied Against Nuclear Contamination of Land, Rep. CIEMAT/PRYMA/GIT/
M5A03/-1/89, Centro de Investigaciones Energéticas, Medioambientales y Tecnológi
cas, Madrid (1989).
[24] TAWIL, J.J., BOLD, F.С., H A R RER, B.J., CURRIE, J.W., Off-site Consequences
of Radiological Accidents: Methods, Costs and Schedules for Decontamination, Rep.
NUREG/CR-3413, PNL-4790, Pacific Northwest Lab., Richland, W A (1985).
[25] S T R A U M E , T., KELLNER, C.R., O S W A L D , K.M., Cleanup of Radioactive M ud
Spill U20aa Postshot Drilling Site NTS, Rep. UCID-17423, Lawrence Livermore Lab.,
С A (1977).
[26] LINDSAY, J.W., MICHELS, D.E., MARTINEZ, J.A., Scavenging Contaminated
Soil with Polyurethane Foam, Rep. RFP-1949, Rocky Flats Plant, Golden, C O (1973).


IAEA-SM-306/44
R E V I E W O F C O U N T E R M E A S U R E S
U S E D I N A G R I C U L T U R E
F O L L O W I N G A M A J O R
N U C L E A R A C C I D E N T
F.J. SANDALLS Harwell Laboratory,United Kingdom Atomic Energy Authority,Didcot, Oxfordshire,United Kingdom
Abstract
R E V I E W O F C O U N T E R M E A S U R E S U S E D IN A G R I C U L T U R E F O L L O W I N G A
M A J O R N U C L E A R ACCIDENT.
Various accident scenarios for the contaminated agricultural environment are presented
and various countermeasures with their advantages and disadvantages are discussed. The
important pathways for exposure are external irradiation and uptake into the food chain. The
alpha emitting nuclides can enter the food chain but, in addition, they present a hazard through
the inhalation of resuspended material. The countermeasures discussed focus on caesium,
strontium and plutonium but they would also be effective on most other radioelements. Radio
nuclides may be removed from land by taking away vegetation and/or a layer of soil or by
being mixed into the soil. Land management techniques involving the addition of chemicals
offer some attractive alternatives to soil disturbance. On soils with low calcium content,
strontium uptake may be reduced by the addition of calcium, and caesium uptake can be
reduced by the addition of potassium. Production of fruit and vegetables might be replaced
by the production of oil crops or sugar. Some food processing methods would result in the
extraction of the contamination and prevent it from entering the food chain. In upland areas
of low fertility, the generally organic soils lead to enhanced uptake of radiocaesium and
subsequent contamination of domestic grazing animals. In these cases, little can be done in
terms of treatment of the land, but food additives have been employed successfully to render
caesium less available for gut uptake. The animals can then be fed for just a matter of days
or weeks to reduce their body burdens to an acceptable level. In some cases, the soil’s own
defence mechanism would be effective and no action other than suppression of resuspension
would be called for: this would apply to strontium on calcareous soils and caesium on clay
soils. An advance knowledge of the sensitivity of the various soils with respect to potential
radioactive contaminations would be of benefit in the event of a nuclear accident.
129

130 S A N D A L L S
In the event of a severe NPP accident leading to the release of radioactive materials to the atmosphere and subsequent contamination of agricultural land, countermeasures against contamination of arable crops, grassland and fodder would be valuable elements of nuclear accident contingency planning. Countermeasures in agriculture have been reviewed by Van Dorp et al. [1], Howorth and Sandalls [2] and Neilsen and Strandberg [3].
The potential for the widespread contamination of land was tragically emphasized by the accident at Chernobyl in 1986. Deposition from the site occurred throughout the Northern Hemisphere. Even in parts of the United Kingdom, on land more than 2000 km from Chernobyl, the radiocaesium levels on grazing land were sufficiently elevated for restrictions to be placed on the movement and slaughter of some 5 million sheep. Those restrictions are still in force today and some half a million sheep are still affected.
Since few countries can afford to write any agricultural land off permanently, or even transfer production to other areas, countermeasures against land contamination should be laid down. The problems of monitoring the contamination, the financial costs of lost production and the technical requirements for returning the land to productive agricultural use must all be considered. The need for preplanned strategies in each of these areas is essential, not only to aid decision making after the accident but also to reassure the general public that adequate consideration has been given to the problem and that contingency plans have been formulated.
A major accident would release a mixture of radionuclides which would consist of the noble gases xenon and krypton, volatile elements such as iodine and caesium, and refractory elements such as strontium and plutonium. The subsequent behaviour of the various elements would vary greatly with respect to dispersion, radiological significance, behaviour in soils and ability to enter food chains.
The influence of season of the year has been discussed by Simmonds [4]. For those radionuclides which deposit on agricultural land there will be three
primary causes for concern:
(1) Contamination of standing crops,(2) Long term systemic contamination of crops through root uptake and foliar
intake from resuspension,(3) Inhalation doses to agricultural workers and local inhabitants from
resuspension.
Possible countermeasures against each of the above potential contamination problems are discussed in this paper with special emphasis being placed on the long lived biologically and radiologically important radionuclides of caesium, strontium and plutonium. Nevertheless, many of the countermeasures against these elements would be equally effective against other elements.
1. I N T R O D U C T I O N

IAEA-SM-306/44 131
This paper also discusses the behaviour of caesium, strontium and plutonium in soils, general principles to be considered when selecting methods of decontamination and reclamation, specific countermeasures and their practicability with regard to equipment and time.
Essentially, all countermeasures fall into the following five categories:
(a) Prompt action to remove a standing crop carrying surface contamination,(b) Removal of a layer of contaminated soil,(c) Burying as well as burying and mixing of contaminated soil,(d) Chemical amendment to reduce soil to plant transfer,(e) Change of land usage.
2, COUNTERMEASURES
2.1. Countermeasures against contamination on standing crops
The actions which might be taken are:
(i) Harvesting and disposing of the crops,(ii) Harvesting and mixing with binders (e.g. mixing mordenite or Prussian blue
with hay or silage) and feeding to livestock,(iii) Harvesting and feeding to pelt animals,(iv) Processing (or cooking) to produce a clean product.
The ‘natural field loss factor’ (i.e. the reduction in contamination of the herbage by processes other than radioactive decay) may be expressed either per unit area of land or per unit mass of vegetation. For contamination on grassland in the growing season, regardless of whether the deposition was wet or dry, the field loss half-life is about 13 d if the activity is expressed per unit area of land, and about 8 d if expressed per unit mass of vegetation as growth of the sward dilutes the activity [5-10]. The field loss half-life increases with time.
The main studies on decontamination by the removal of crops were conducted at the United States Department of Agriculture’s Agricultural Station at Beltsville, Maryland, using simulated fallout [11-14]. Generally, the effectiveness of crop removal was dependent upon whether the contamination was applied in wet or in dry form. The best results were obtained after wet applications. For crops giving dense ground coverage, and where prompt action is taken, removal of as much as 80% of the contamination might be expected.

1 3 2 S A N D A L L S
2.2.1. Behaviour o f caesium, strontium and plutonium in soils
Caesium, strontium and plutonium all show very little mobility in soils and movement down the soil profile is very slow. On many undisturbed soils, even the 137Cs fallout from the 1960s nuclear weapons tests is still within 10 cm of the soil surface. The mobility of strontium is somewhat greater than that of caesium; after 3.5 a about 80% of surface deposited strontium was still in the topmost 10 cm for most soil types [15]. Plutonium moves hardly at all. Generally, movement down the soil profile is the result of mechanical disturbance such as drying and cracking or through the activities of animals (worms).
The fact that these important radionuclides remain close to the soil surface has both advantages and disadvantages. A non-mobile species remaining close to the soil surface will be available for uptake by shallow rooted plants (e.g. grasses), but at the same time could be removed efficiently by skimming off a relatively shallow layer of topsoil (5 cm approximately). The low mobility has some advantages; it means that migration to groundwater will be very slow and provided surface runoff does not occur, there is no need for prompt action.
2.2.2. Removal of surface soil
Complete removal of the contaminated layer of surface soil is without doubt the most effective and most publicly acceptable means of decontamination. On high quality land, where fertility and drainage would not be impaired by removing a shallow layer (5-10 cm) of soil, this is an effective but expensive countermeasure [11, 16]. The disadvantages are the enormous logistic and disposal problems. A 5 cm layer of soil over an area of 1 ha has a volume of 500 m3 and a mass of about 1000 t. An alternative to removing the waste from the site would be to place it in self-shielding piles. A typical mound could be a flat topped pyramid 3 m high, with a base 15 m X 30 m [17]. If the top 5 cm were removed from a field, the base of such a mound would occupy only 3% of the surface area of the field. Resuspension from the mound could be prevented by growing grass or even covering with, for example, asphalt.
2.2.3. Mixing and burial
The use of normal agricultural practices, such as ploughing, would be the most practical and cost effective countermeasures. Normal ploughing (to a depth of 20-30 cm) would immediately suppress any tendency to resuspension and greatly
2.2. C o u n t e r m e a s u r e s against contamination of arable soils

IAEA-SM-306/44 1 3 3
reduce root uptake by many plant species. With the use of a modified plough with a skimmer attachment, a discrete surface layer can be placed at the bottom of the furrow [18]. A ‘skim and burial plough’ would be better still, if found to be feasible. This type of plough would remove the topmost 5-10 cm of soil and place it as a discrete layer beneath a 20-30 cm layer of non-inverted soil. Efforts to construct such a plough are being made at the Rise National Laboratory in Denmark [19].
Deep ploughing (to a depth of 1 m) would be a much more effective countermeasure than normal depth ploughing, but special ploughs and special tractors would be required. The advantages of deep ploughing are:
(1) Activity may be placed deep enough so as not to be disturbed by subsequent normal ploughing.
(2) Contamination may be placed out of reach of the roots of many crops.(3) Reduction in radiation at the ground surface would be greater. Roed
[20] achieved a dose reduction of 95% by ploughing in 86Rb (gamma energy: 1.08 MeV).
The disadvantage of ploughing is that if this action were subsequently shown to have been misguided, it would be very difficult to remedy the situation.
2.2.4. Addition o f fertilizers and other additives
Many soils are ‘self-neutralizing’ . The transfer factor for a given chemical element is a function of soil type. In some cases there would be no requirement for any countermeasures to suppress soil to plant transfer. If radiostrontium were deposited on a highly calcareous soil, then the addition of a small mass of strontium to the large pool of available alkaline earth (essentially calcium) would result in little uptake of the strontium. Conversely, calcium deficient soils would be much more sensitive to radiostrontium contamination and the addition of calcium in order to reduce the partial molar concentration of alkaline earths in the soil water would be an effective countermeasure.
A situation similar to the calcium/strontium relationship holds for potassium/ caesium: by increasing the potassium/caesium ratio, less caesium will be taken up by the plant.
Tests on the islands of Bikini Atoll have investigated ways to reduce the 137Cs in locally produced foodstuffs. Application of a potassium based fertilizer at a rate of 625 kg-ha'1-a'1 produced a tenfold reduction in the concentration of 137Cs in coconut meat and milk [21]. Similarly, measurements on Swedish soils [22] showed reduced caesium uptake following the addition of potassium to soils of low potassium level. Nitrogen fertilizers, unlike potassium fertilizers, can increase the uptake of caesium from soil [23, 24]. The addition of soluble phosphates at the rate of 4 to 12 t/ha has been shown to give a 90% reduction in strontium uptake [13].

134 S A N D A L L S
An alternative to decontamination is to change the usage of the land. The land could be used for the production of crops which would not lead to assimilation, of radionuclides into food chains. However, this action does not consider the question of external irradiation dose except where land has been switched to forestry.
Some crops contribute little or no radioactivity to humans even if these crops are grown on highly contaminated soil. For example, sugar and oil crops would have most of their radioactive content removed by refining before reaching humans [13]. Care should be taken, however, if any contaminated plant wastes are fed to cattle. Forestry represents a longer term usage for areas with high levels of contamination [25].
It would be possible, therefore, to reduce the intake of radionuclides by controlling the usage of agricultural land. Production of sensitive crops such as most fruits and vegetables could be moved to areas of low contamination, while other crops were grown in the areas of high contamination.
2.3. Countermeasures against contamination of permanent grassland andingestion by grazing animals
On high quality grazing land, removal of the topmost 5 cm layer would be an effective means of decontamination. The effectiveness of sod cutters in removing surface contamination was assessed on 50 m2 test areas, using simulated fallout [26]. Sod cutters were used to shave off thin, uniform layers which were left in place on the ground. The strips were cut manually into suitable lengths, rolled and placed in carriers. Maximum efficiency was achieved when the cut depth was set at 3-4 cm as this minimized the bulk of material to be removed, while providing sufficient thickness to roll the turf. Removal of surface sods carried away between 97 and 99% of deposited material, but stones and roots can cause the cut to be uneven, leaving holes in the turf. The technique was most effective on moist, but not wet, turf.
The rate at which turf can be cut, rolled and removed is about 0.01 ha/h. The sods would be in a form amenable to collection and transportation. However, 1 ha of pasture land would give rise to approximately 500 m3 of waste requiring disposal.
The Chernobyl accident highlighted the problems created when radiocaesium falls on upland peaty soils used for sheep grazing. Such land is of low productivity and often supports only about one sheep per hectare; soil to herbage transfer is high and the sheep flesh becomes contaminated. In this situation, the simplest countermeasure is to feed the animals on non-contaminated feedstuffs for a few days or weeks to reduce the body burden to permissible levels before selling or slaughtering the animals. The biological half-life for caesium in sheep that have been moved onto non-contaminated pasture is about 10 d [27]. Additives such as bentonite, mordenite
2.2.5. Land management

IAEA-SM-306/44 1 3 5
and Prussian blue have all been used successfully to reduce gut uptake of caesium. In some cases the additives were in the feedstuffs; in other cases the additives were placed in the stomach of the animal. Forberg et al. [28] used artificial mordenite as a means, of decreasing the uptake of caesium by goats and lambs and also to accelerate the rate of excretion of absorbed caesium. At a dose of 10 g mordenite/d, the amount of caesium excreted was more than double the amount ingested with the fodder. Piva et al. [29] used bentonite in forage to reduce the transfer of radiocaesium to cow milk. Unsworth et al. [30] assessed chemical means of blocking uptake of caesium from fodder by using bentonite, clinoptilolite and Prussian blue. All were effective in depressing the transfer of dietary radiocaesium to milk. Clinoptilolite was less effective than bentonite and both were less effective than Prussian blue, the reductions being 35%, 62% and.85%, respectively.
2.3.1. Food processing
Iodine-131 contamination of cow milk is the most probable occurrence which would call for countermeasures. The half-life of this.radionuclide is sufficiently short (8 d) for the problem to be circumvented by substituting dried milk for fresh milk. The presence of 13 *1 in milk products with a reasonably long shelf life (cheese and chocolate) would not present problems; it would enable contaminated milk to be used safely.
Cooking and pickling are both effective methods of extracting, radiocaesium from foodstuffs. One kilogram of roebuck meat, containing 218 Bq 137Cs, was cut into fifty pieces and added to 100 g of crystalline NaCl and 500 mL of NaCl solution (1.7 M). Each day thereafter the meat was removed from the brine and washed with 100 mL of water. The pickling treatment reduced the 137Cs content of the meat by 95% in 5 d [31]. Rantavaara [32] showed that parboiling edible fungi in water can remove > 80% of the caesium: even soaking in water can remove around 80%. Similar amounts were removed by soaking' small fish in brine. Potatoes boiled in water lost only 20-30%.
Forage crops could perhaps be pulped and pressed so that much of the contaminant would be removed in the liquid phase. The pressed pulp could be used as silage and incorporated into dried animal feedstuffs.'
Cambray et al. [33] made a hard cheese from contaminated milk and found that >95% of the caesium was retained in the whey.
3. RADIOSENSITIVITY OF SOILS: PREPLANNED STRATEGIES
There is a clear requirement for a proper understanding of the sensitivity of soils with respect to contamination by caesium and strontium. Because soil to plant transfer factors are predominantly a function of soil type, it should be feasible to have

136 S A N D A L L S
advance knowledge of the relative sensitivity of various soils. The countermeasures called for may vary enormously from place to place depending on soil type. Maps indicating the degree of sensitivity of soils in various regions would be a valuable aid to decision making in the aftermath of a nuclear accident. In many cases, the degree of sensitivity is readily gauged; for example in the case of caesium, the magnitude of the soil to plant transfer for grasses is a function of the amount of organic matter in the soil. However, the key factor influencing uptake is likely to be some constituent of the inorganic fraction of the soil. This problem has recently been addressed by Cremers et al. [34] who have developed a technique to measure quantitatively the potential caesium specific adsorption sites in soils. The technique is now well established for lowland soils but, in its present form, is less useful for the highly organic upland soils.
4. SUMMARY
Contamination of milk by 13 *1 would be short lived and dried milk could be substituted for fresh milk. The contaminated milk would be used in dairy products with a shelf life sufficiently long enough for the radioactivity to decay to an acceptable level. In the event of the widespread contamination of agricultural land, the time of year would be an important consideration when planning countermeasures. Crops giving dense ground coverage (e.g. mature cereals) would intercept much of the fallout and removal of the standing crop would be an effective countermeasure. Where bare soil is contaminated, complete removal of the contaminated soil would be the most effective and most publicly acceptable method of decontamination. Since the important long term contaminants (caesium and plutonium) are of very low mobility in most soils in the United Kingdom, the removal of as little as 5 cm of topsoil could remove virtually all the contamination. The removal of this thin layer of soil would not affect adversely the fertility of most agricultural land. The whole operation of removing and disposing of the soil could be carried out using conventional, readily available equipment such as motor graders, road scrapers and bulldozers.
The most serious disadvantage of removing surface soil is the bulk of the material which would need to be removed, transported and stored. A layer of soil of 5 cm thickness covering an area of 1 ha would have a mass of 1000 t. Storage could be in pits or through placement in self-shielding piles. During removal and storage of the soil, the application of an immobilizing, surface sealing polymer would be advantageous in reducing the resuspension hazard. Even wetting the soil would be effective in reducing the resuspension, in addition to being an aid to removing a well defined layer. A removal rate of 0.1 ha/h should be achievable using standard agricultural and road maintenance equipment. The cost of removing and transporting the upper 5 cm layer of soil is likely to be of the order of £6000-£10 000/ha (UK price 1989).

IAEA-SM-306/44 1 3 7
Surface removal from grassed areas could be carried out cleanly and accurately using a sod cutting machine. Sod cutters normally operate at about 0.01 ha/h.
In areas where the levels of contamination are insufficient to warrant the removal of the surface layer, ploughing would be an effective means of reducing both the external irradiation dose rate and the resuspension potential. Subsequent ploughing would tend to homogenize the topsoil and the dose rate might then increase slightly, but overall the reduction in the external irradiation dose from radiocaesium could be of the order of 80%. The primary advantage of ploughing is in the low costs entailed. Since much of the arable land would eventually be ploughed as a normal agricultural practice, the additional costs are minimal. Even if ploughing were carried out purely as a countermeasure, the cost would be approximately 100 times less than the cost of removing a layer of soil. The main disadvantage of ploughing is that if it were subsequently decided that the contamination should be completely removed and disposed of, an enormous amount of soil would have to be removed — 5000 t/ha. In many cases, removal of such large amounts of topsoil would affect adversely fertility and drainage.
Deep ploughing to a depth of 1 m can reduce the external irradiation dose by about 98%. However, as standard agricultural ploughs work at depths of only 20-30 cm, special ploughs would be required to achieve this greater depth. Disturbance of the soil to a depth of 1 m could seriously affect the productivity of the land, even to the point of rendering an area unproductive. Man-made drains would also be destroyed and the effort required to pull the ploughs would be substantially higher than that required for conventional ploughs.
Where very large areas of low productivity land are involved, only land management techniques are probably worthy of consideration at present. The uptake of caesium by crops has been shown to be influenced by the addition of fertilizers to the soil. For soils of low potassium content, the addition of potassium suppresses the caesium uptake. In intensively cultivated areas, the use of additional fertilizers may be an economic countermeasure, but it is unlikely to be economical for sheep rearing on low grade upland pastures.
The uptake of radionuclides into the food chain may also be controlled by a suitable choice of the crops grown on the land. For example, production of fruits and vegetables could be changed to the production of oil crops or sugar. Forestry represents another long term use which should be considered for areas with high levels of contamination, but countermeasures of this nature would lead to drastic changes in the way of life of the local inhabitants.
Cooking, pickling and processing can all be very effective and practicable means of reducing radiocaesium levels in foodstuffs. However, irrigation and leaching have not been shown to be successful methods for treating deposited caesium, although some success in reducing surface concentrations of plutonium has been achieved.

138 S A N D A L L S
In the event of a decontamination operation, not one but a combination of techniques would be used. The choice would be determined largely by the levels of contamination, the physical characteristics of each area and the availability of equipment and manpower. Advance knowledge of the radiosensitivity of soils in various regions would be a valuable aid to decision making.
ACKNOWLEDGEMENT
This paper was based largely on a review published in September 1987 [2] which was funded by the United Kingdom Ministry of Agriculture, Fisheries and Food.
REFERENCES
[1] V A N DORP, F., ELEVELD, R., FRISSEL, M.J., Agricultural Measures to Reduce
Radiation Doses to Man Caused by Severe Nuclear Accidents, Rep. EUR-7370-EN,
Commission of the European Communities, Brussels (1980).
[2] H O W O R T H , J.M., SANDALLS, F.J., Decontamination and Reclamation of
Agricultural Land Following a Nuclear Accident: A Literature Review, Rep. AERE-
R-12666, Atomic Energy Research Establishment, Harwell, U K (1987).
[3] NEILSEN, B., S T R A N D B E R G , М., A Literature Study of the Behaviour of Caesium,
Strontium and Plutonium in the Soil-Plant Ecosystem, Ris0 National Laboratory, Rise,
Denmark (1988).
[4] S I M M O N D S , J.R., “The influence of season of the year on the agricultural conse
quences of accidental releases of radionuclides to the atmosphere”, Transfer of Radio
active Materials in the Terrestrial Environment Subsequent to an Accidental Release to
Atmosphere (Proc. Sem. Dublin, 1983), Vol. 2, Commission of the European
Communities, Brussels (1983).
[5] M I L B O U R N , G.M., T A Y L O R , R., The contamination of grassland with radioactive
strontium, I. Initial retention and loss, Radiat. Bot. 5 (1965) 337-347.
[6] C H A M B E R L A I N , A.C., C H A D W I C K , R.C., Deposition of airborne radioiodine
vapour, Nucleonics 11 (1953) 22-25.[7] B O O K E R , D.V., Physical Measurement of Activity in Samples from Windscale,
Rep. AERE-HP/R 2607, Atomic Energy Research Establishment, Harwell, U K
(1958).
[8] MILLARD, G.C., FRALEY, L., M A R K H A M , O.D., Deposition and retention of
14lCe aerosols on cool desert vegetation, Health Phys. 44 (1980) 349-357.[9] W I T H E R S P O O N , J.P., T A Y LOR, F.G., Interception and retention of a simulated
fallout by agricultural plants, Health Phys. 19 (1970) 492-499.[10] PINDER, J.E., D O S W E L L , A.C., Retention of 238Pu-bearing particles by corn
plants, Health Phys. 49 (1985) 771-776.

IAEA-SM-306/44 1 3 9
[11] M E N Z E L , R.G., ROBERTS, H., JAMES, P.E., Removal of radioactive fallout from
farmland, Agrie. Eng. 42 (1961) 698-699.
[12] M E N Z E L , R.G., Decontamination of soils, Plant Food Rev. 8 Part 2 (1962) 8-12.
[13] M E N Z E L , R.G., JAMES, P.E., Treatments for Farmland Contaminated with Radio
active Material, Agricultural Handbook No. 395, Agricultural Research Service,
Department of Agriculture, Beltsville, M D (1961).
[14] JAMES, P.E., M E N Z E L , R.G., Research on Removing Radioactive Fallout from
Farmland, Technical Bulletin No. 1462, Agricultural Research Service, Department of
Agriculture, Beltsville, M D (1973).
[15] SQUIRE, H.M., M I D D L E T O N , L.J., Absorption of Strontium-90 and Caesium-137
from Soil, Rep. ARCR L - 8-66, Agricultural Research Council Radiobiology Labora
tory, Letcombe, U K (1962).
[16] LEE, H., SARTOR, J.D., V A N H O RN, W.H., Stoneham II Test of Reclamation
Performance, Vol. 4, Performance Characteristics of Land Reclamation Procedures,
Rep. USNRDL-TR-337, US Naval Radiological Defense Laboratory, San Francisco,
С A (1959).
[17] SMITH, C.B., L A M B E R T , J.S., “Technology and costs for cleaning-up land
contaminated with plutonium”, Selected Topics: Transuranium Elements in the
General Environment, Technical Note, ORP/CSD-78-1, Environmental Protection
Agency, Washington, D C (1978) 490-545.
[18] A G R O L U X LTD, 5 Bluestem Road, Nacton Road, Ipswich, Suffolk, UK, personal
communication, 1989.
[19] ROED, J., Riso National Laboratory, Rise, Denmark, personal communication, 1989.
[20] ROED, J., Reduktion af Dosis ved Nedplojning of Gamma-Aktive Isotopes,
Rep. RÍS0-M-2275, Riso National Laboratory, Riso, Denmark (1982).
[21] L A W R E N C E L I V E R M O R E N A T I O N A L L A B O R A T O R Y , Energy and Technology
Review, June-July 1986 (CABAYAN, H.S., Ed.) LLNL, Livermore, C A (1986) 71.
[22] F R E D R I K S S O N , L., G A R N E R , R.J., RUSSELL, R.S., “Caesium-137”, Radio
activity and Human Diet (RUSSELL, R.S., Ed.), Pergamon Press, Oxford and Ne w
York (1966) 317-352.
[23] ALEKSAKHIN, R.M., Radioactive Contamination of Soils and Plants, Izdatel’stvo
Akademii Nauk SSSR, Moscow (in Russian) [English translation: US Atomic Energy
Commission, AEC-tr-6631 (1965) 68-86].
[24] EVANS, E.J., DEKKER, A.J., Effect of nitrogen on caesium-137 in soils and its
uptake by oat plants, Can. J. Soil Sci. 49 (1968) 349-355.
[25] BAES, C.F., III, G A R T E N , C.T., Jr., T A Y L O R , F.G., W I T H E R S P O O N , J.P.,
Long-term Environmental Problems of Contaminated Land: Sources, Impacts and
Countermeasures, Rep. ORNL-6146, Oak Ridge Natl Lab., T N (1986).
[26] COBBIN, W.C., O W E N , W.C.L., Development and Test of a Sod-Removal Proce
dure for Moist Lawns Contaminated by Simulated Fallout, Rep. USNRDL-TR-965, US
Naval Radiological Defense Laboratory, San Francisco, C A (1965).
[27] H O W A R D , B.J., et al., A comparison of caesium-137 and caesium-134 activity in
sheep remaining on upland areas contaminated by Chernobyl fallout with those removed
to less active lowland pastures, J. Soc. Radiol. Prot. 7 2 (1987).

140 S A N D A L L S
[28] FORBERG, S., JONES, B., W E S T M A R K , T., Can zeolites decrease the uptake and
accelerate the excretion rate of radio-caesium in ruminants?, Sci. Total Environ.
(1989) 7937-7941.
[29] PIVA, G., et al., Effects of bentonite on transfer of radionuclides from forage to milk,
Health Phys. 57 1 (1989) 181-182.
[30] U N S W O R T H , E.F., et al., Investigations of the use of clay minerals and Prussian blue
in reducing the transfer of dietary radiocaesium to milk, Sci. Total Environ. (1989)
(in press).
[31] W A H L , R., KALLEE, E., Letter, Nature (London) 323 (1986) 208.
[32] R A N T A V A A R A , A., “Minskningen av radiocaesium i maten”, paper presented at
АКТ Seminar, Asker, Norway, 1989.
[33] C A M B R A Y , R.S., et al., Observations on radioactivity from the Chernobyl accident,
Nucl. Energy 26 2 (1987) 77-101.
[34] C R E MERS, A., ELSEN, A., D E PRETER, P., MAES, A., Quantitative analysis of
radiocaesium retention in soils, Nature (London) 335 (1988).
BIBLIOGRAPHY
FREDRIKSSON, L., H A A K , E., ERIKSSON, A., Studies on Plant Accumulation of Fission
Products under Swedish Conditions. XI. Uptake of 90Sr by Different Crops as Influenced by
Liming and Soil Tillage Operations, Rep. FOA-4 C-4395-28, Forsvarets Forskningsanstalt,
Stockholm (1969).
IRANZO, E., IRANZO, E.C., “Evaluation of remedial actions taken in agricultural areas
contaminated by transuranides”, paper presented at 4th Int. Symp. on the Impact of
Accidents of Nuclear Origins on the Environment, Cadarache, France, 1988.
RUSSELL, R.S., Radioactivity and Human Diet, Pergamon Press, Oxford and N ew York
(1966).
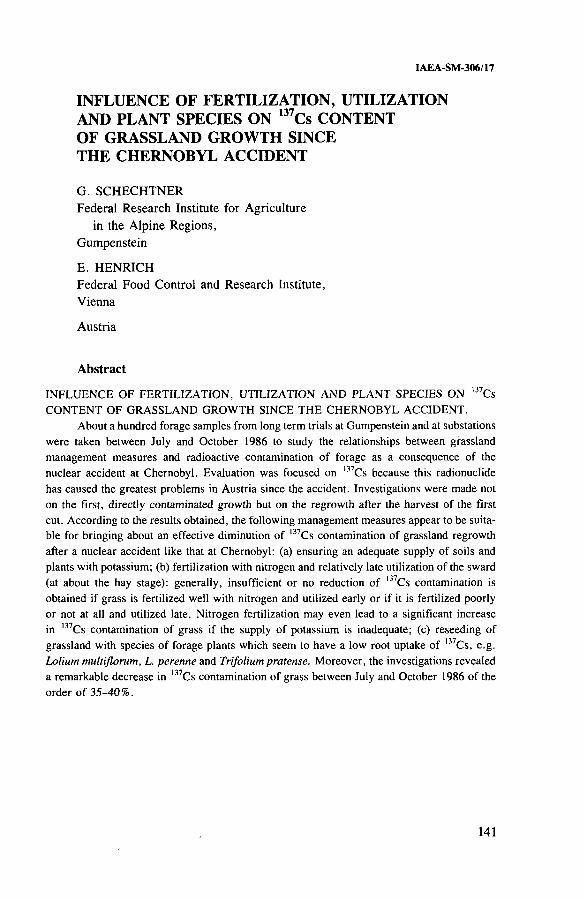
IAEA-SM-306/17
I N F L U E N C E O F F E R T I L I Z A T I O N , U T I L I Z A T I O N
A N D P L A N T S P E C I E S O N 1 37C s C O N T E N T
O F G R A S S L A N D G R O W T H S I N C E
T H E C H E R N O B Y L A C C I D E N T
G. SCHECHTNERFederal Research Institute for Agriculture
in the Alpine Regions,Gumpenstein
E. HENRICHFederal Food Control and Research Institute,Vienna
Austria
Abstract
I N F L U E N C E O F FERTILIZATION, UTILIZATION A N D P L A N T SPECIES O N 137Cs
C O N T E N T O F G R A S S L A N D G R O W T H SINCE T H E C H E R N O B Y L ACCIDENT.
About a hundred forage samples from long term trials at Gumpenstein and at substations
were taken between July and October 1986 to study the relationships between grassland
management measures and radioactive contamination of forage as a consequence of the
nuclear accident at Chernobyl. Evaluation was focused on 137Cs because this radionuclide
has caused the greatest problems in Austria since the accident. Investigations were made not
on the first, directly contaminated growth but on the regrowth after the harvest of the first
cut. According to the results obtained, the following management measures appear to be suita
ble for bringing about an effective diminution of l37Cs contamination of grassland regrowth
after a nuclear accident like that at Chernobyl: (a) ensuring an adequate supply of soils and
plants with potassium; (b) fertilization with nitrogen and relatively late utilization of the sward
(at about the hay stage): generally, insufficient or no reduction of l37Cs contamination is
obtained if grass is fertilized well with nitrogen and utilized early or if it is fertilized poorly
or not at all and utilized late. Nitrogen fertilization may even lead to a significant increase
in l37Cs contamination of grass if the supply of potassium is inadequate; (c) reseeding of
grassland with species of forage plants which seem to have a low root uptake of l37Cs, e.g.
Lolium multiflorum, L. perenne and Trifolium pratense. Moreover, the investigations revealed a remarkable decrease in l37Cs contamination of grass between July and October 1986 of the
order of 35-40%.
141
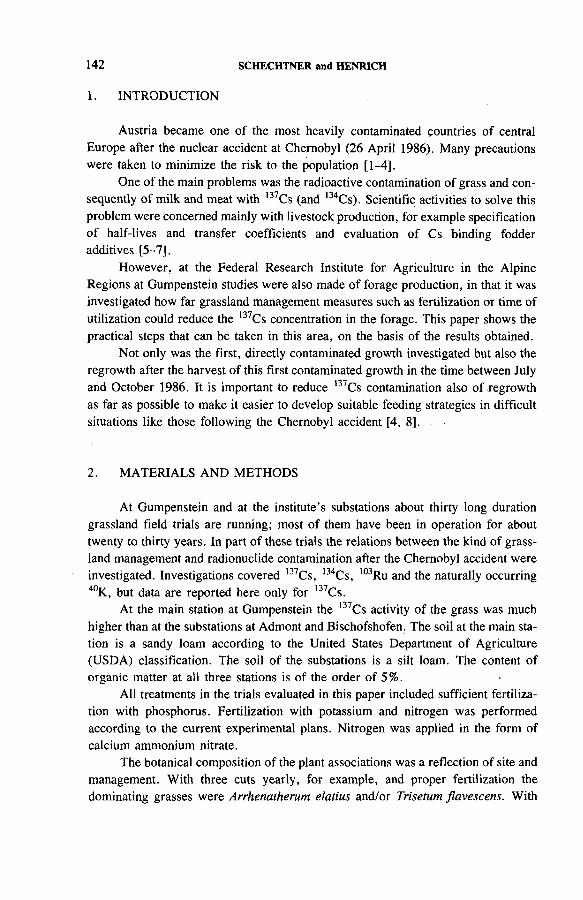
142 S C H E C H T N E R and H E N R I C H
1. INTRODUCTION
Austria became one of the most heavily contaminated countries of central Europe after the nuclear accident at Chernobyl (26 April 1986). Many precautions were taken to minimize the risk to the population [1-4].
One of the main problems was the radioactive contamination of grass and consequently of milk and meat with 137Cs (and l34Cs). Scientific activities to solve this problem were concerned mainly with livestock production, for example specification of half-lives and transfer coefficients and evaluation of Cs binding fodder additives [5-7].
However, at the Federal Research Institute for Agriculture in the Alpine Regions at Gumpenstein studies were also made of forage production, in that it was investigated how far grassland management measures such as fertilization or time of utilization could reduce the l37Cs concentration in the forage. This paper shows the practical steps that can be taken in this area, on the basis of the results obtained.
Not only was the first, directly contaminated growth investigated but also the regrowth after the harvest of this first contaminated growth in the time between July and October 1986. It is important to reduce 137Cs contamination also of regrowth as far as possible to make it easier to develop suitable feeding strategies in difficult situations like those following the Chernobyl accident [4, 8].
2. MATERIALS AND METHODS
At Gumpenstein and at the institute’s substations about thirty long duration grassland field trials are running; most of them have been in operation for about twenty to thirty years. In part of these trials the relations between the kind of grassland management and radionuclide contamination after the Chernobyl accident were investigated. Investigations covered 137Cs, 134Cs, l03Ru and the naturally occurring 40K, but data are reported here only for l37C.s.
At the main station at Gumpenstein the l37Cs activity of the grass was much higher than at the substations at Admont and Bischofshofen. The soil at the main station is a sandy loam according to the United States Department of Agriculture (USDA) classification. The soil of the substations is a silt loam. The content of organic matter at all three stations is of the order of 5%.
All treatments in the trials evaluated in this paper included sufficient fertilization with phosphorus. Fertilization with potassium and nitrogen was performed according to the current experimental plans. Nitrogen was applied in the form of calcium ammonium nitrate.
The botanical composition of the plant associations was a reflection of site and management. With three cuts yearly, for example, and proper fertilization the dominating grasses were Arrhenatherum elatius and/or Trisetum flavescens. With

IAEA-SM-306/17 143
four or more cuts under the same conditions Dactylis glomerata and Poa pratensis were the prevailing grasses. Omission of fertilization with potassium led to a sward dominated by Festuca rubra and P. pratensis.
Trifolium repens was generally the main legume with proper PK fertilization. This species became an important sward component especially if no nitrogen was applied and the frequency of harvesting was high. Taraxacum officinalis was the prevailing species among the herbs.
Forage samples were taken by auger after harvesting and heaping of the green material. The samples were subsequently dried in a box at 40°C. Within the routine measurement system of the Radiation Protection Department of the Austrian Federal Environmental Agency in Vienna, approximately 100 g of the dried samples were analysed using high resolution gamma spectrometry (with 30% and 35% efficiency germanium detectors). The analysis of the spectra was performed with commercial software (Canberra SPECTRAN-F). The relative standard deviations of the measurements were generally of the order of 3-8 %. The values from the analysis were converted to dry matter (DM) as the reference base.
All in all about a.hundred forage samples were investigated. The analyses which yielded useful conclusions are described in this paper.
3. RESULTS AND DISCUSSION
3.1. Fertilization with potassium
Figure 1 shows the results of two trials, performed at Gumpenstein, in which fertilization with potassium was varied from zero to approximately 250 kg K20/ha for many years. It is clear from the figure that adequate fertilization with potassium is a very efficient measure for reducing 137Cs contamination of grassland forage on originally potassium deficient soils like those at Gumpenstein. The reasons are, without doubt, the well known antagonism between potassiùm and caesium [9] on the one hand and the yield increase and dilution effect to be gained by fertilization with potassium on the other hand.
The reliable and persistent effect of potassium fertilization on 137Cs uptake from potassium deficient soils is shown also by the data of Table I, taken from one trial at Gumpenstein. The increase of potassium dressing from about 60 to 275 kg K20-ha_1 -a-1 reduced 137Cs concentration from 2.44 to 0.70 kBq/kg DM on average for eight harvests (p = 0.1%). If the forage was harvested relatively late, the decontaminating effect of fertilization with potassium was still more pronounced than with harvesting at the pasture stage (reduction to a fifth and a third of the K, level within the three- and six-cut areas, respectively).

144 S C H E C H T N E R and H E N R I C H
k g K j O / h a p e r y e a r
D M yield(t/ha per growth): K0 K, K2Dyn. Gump. 0.5 1.0 1.9Stat. Gump. 0.7 1.7 2.0
FIG. 1. Concentration of !37Cs in grassland forage as a function of К fertilization in two trials at Gumpenstein (0 PK and NPK series). Dyn. Gump. : third growth of six-cut areas, harvest date 7 July 1986. Stat. Gump.: second growth of three-cut areas, harvest date 28 July 1986.
3.2. Fertilization with nitrogen and harvest time (growth stage)
It was expected that a reduction of l37Cs activity of grassland forage by dilution could be achieved with nitrogen fertilization as well as by delaying the harvest time. However, this expectation was fulfilled only if both measures were combined,i.e. if the sward was fertilized with nitrogen and utilized relatively late (at about the hay stage).
In three trials at Gumpenstein, the i37Cs activity of the second growth (the first regrowth after the radioactive fallout) dropped on average from 0.96 to0.56 kBq/kg DM as a result of fertilization with nitrogen, if the grass was harvested at the hay stage (Fig. 2; p = 5% in regard to all three-cut nitrogen treatments of the Gumpenstein trials, harvested during July 1986).
No dilution could be achieved, on average, in essentially the same trials at Gumpenstein by fertilization with nitrogen if the grass was harvested during July at the pasture stage. At the substations, where 137Cs contamination was lower, there was also no dilution, or only a weak effect.

IAEA-SM-306/17 145
TABLE I. CAESIUM-137 ACTIVITY OF HERBAGE FERTILIZED INADEQUATELY AND ADEQUATELY WITH POTASSIUM (Dyn. fertilization trial, Gumpenstein, 1986)
Harvest
date
FertilizationD M yield (t/ha) kBq Cs-137/kg D M
regimeK, K 2 K, K 2
3-cut areas
Cut 2 29 Jul. PK 1.6 2.5 2.3 0.5
N P K 2.7 3.5 1.2 0.3
Cut 3 8 Oct. PK 0.5 1.4 1.8 0.3
N P K 2.1 2.6 1.2 0.2
6-cut areas
Cut 3 7 Jul. PK 0.6 1.4 1.5 0.7
N P K 1.4 2.3 4.4 1.4
Cut 4 29 Jul. N P K 0.5 0.7 4.3 1.2
Cut 6 8 Oct. N P K 0.4 0.9 2.6 0.9
Average 1.2 1.9 2.4 0.7
Note: K (: 50% of potassium removed by harvest; K 2: 100% of potassium removed by
harvest (average for 1983-1986: about 60 and 275 kg K 20-ha 1 - a 1 with K, and
K 2 in three split applications).
An explanation of why nitrogen fertilization does not lead to l37Cs decontamination if the grass is utilized early cannot be given. Possibly it is of significance that nitrogen fertilizer was applied partly as ammonium and this could have improved uptake of l37Cs until its nitrification, according to results of Jackson et al. (cited in Ref. [9]).
All these results on efficiency of nitrogen fertilization were obtained on plots relatively well supplied with potassium. However, nitrogen fertilization may even raise the Cs concentration of grassland plants if applied on soils originally poor in potassium and/or fertilized insufficiently with potassium or not at all. In this case nitrogen fertilization may aggravate the scarcity of potassium in the soil and increase, by K:Cs antagonism [9], the uptake of Cs. An extreme example of this kind is shown in Table II.
146 S C H E C H T N E R and H E N R I C H
(30kgN/haper (60 kg N/ha per growth) growth)
D M yield 2.0 2.3 3.2(t/ha per growth)
FIG. 2. Influence of nitrogen fertilization on I37Cs contamination of grassland harvested at
hay stage (second cut of three trials at Gumpenstein, harvested during the last week of
July 1986).
TABLE II. CAESIUM CONCENTRATION OF GRASSLAND FORAGE AS A FUNCTION OF NITROGEN FERTILIZATION ON A SOIL SEVERELY DEFICIENT IN POTASSIUM(grass harvested at pasture stage at beginning o f July)
DM yield
(t/ha per growth)kBq Cs-137/kg DM
Ко К, K2 Ko к, K2
Not fertilized with N 0.4 0.6 1.4 1.8 1.5 0.7
Fertilized with
60 kg N/ha per growth 0.6 1.4 2.3 5.1 4.4 1.4
Delaying harvest time is an efficient measure for reducing 137Cs concentration of grassland forage only under the condition of sufficient nitrogen fertilization, according to our results. If no or only little nitrogen was applied, the diminution of 137Cs activity with increasing age of the forage was relatively poor. Figure 3 illustrates this interesting interaction. Only with ample nitrogen fertilization was the difference in l37Cs between the early and late harvested forage significant (p = 5%).

IAEA-SM-306/17 1 4 7
No N or 30-40 kg N/ha per growth
60-90 kg N/ha per growth
D M yield (t/ha per growth)
(pasturestage)
0.9
(haystage)
2 .2
(pasturestage)
1.8
(haystage)
3.5
FIG. 3. Concentration of 137Cs in grassland forage as a Junction of stage of development
(average values of several growths harvested during July 1986 at Gumpenstein, Admont and
Bischofshofen).
3.3. Liming
The effect of liming on 137Cs contamination of grassland was investigated on an Alpine sward (altitude 1300 m a.s.l.) dominated originally by Nardus stricta and now by Festuca rubra (partly also by Trifolium repens). The soil is a sandy loam according to the USDA classification. The native pH is 3.8 and the content of organic matter about 10%.
Only in this exceptional case was the first, partly directly contaminated growth investigated, because the harvest time was relatively late (middle of July), corresponding with the high altitude.
Four Ca treatments have been under examination in this experiment for more than twenty years. Only the highest liming rate (1000 kg CaO/ha every second year

148 S C H E C H T N E R and H E N R I C H
as a mixture of calcium carbonate and calcium oxide fertilizer supplied additionally to 150 kg CaO/ha yearly in the form of Thomas phosphate; fertilization in 1986 on 22 May) seemed to have had a positive effect (with a reduction from 1.63 to 1.26 kBq/kg DM), but too few samples could be measured for us to be able to confirm this result statistically.
3.4. Time of year
Evaluation of the data showed a remarkable diminution of 137Cs concentrations in the grass with time, although no values for the first, directly contaminated growth could be included.
Figure 4 shows that radioactive contamination of grassland regrowth with 137Cs decreased by about 35-40% between the end of July and the beginning of October 1986 (average of two Gumpenstein trials; p = 5%). The main reason for this rather speedy decrease should be the relatively strong binding of Cs in the soil [9, 10], and we suppose that this binding will increase with time.
July of October
D M yield (t/ha per growth)Early pasture stage 0.6 (4th cut) 0.6 (6th cut)Hay stage 2.6 (2nd cut) 1.6 (3rd cut)
FIG. 4. Concentration of ,37Cs in grassland forage as a Junction of time of year (Gumpen
stein, 1986).

TABLE III. CAESIUM-137 CONCENTRATIONS IN VARIOUS GRASSLAND PLANTS(2nd growth o f a trial at Gumpenstein, harvested at the beginning of August 1986)
IAEA-SM-306/17 149
CultivarDM yield
(t/ha per growth)kBq Cs-137/kg DM
Dactylis glomerata Fala 3.0 0.87
Phleum pratense Climax 2.9 0.64
Trisetum flavescens Trisett 51 3.7 0.44
Arrhenatherum elatius Arel 41 4.0 0.31
Festuca pratensis Cosmos 11 2.7 0.29
Lolium multiflorum L 100 4.1 0.28
Festuca rubra Roland 21 3.1 1.72
Agrostis tenuis Highland Bent 2.7 0.61
Poa pratensis Local var. 1.9 0.40
Lolium perenne Vigor 2.3 0.28
Trifolium repens Milkanova 2.5 0.74
Medicago sativa Europe 3.8 0.41
Trifolium pratense Reichersberger 4.6 0.19
3.5. Plant species
The relation between plant species and l37Cs concentration was studied on a permanent demonstration field for species and varieties at Gumpenstein. The results are summarized in Table III.
Significant differences seem to exist in l37Cs contamination of grassland depending on the prevailing plant species. These differences might partly have contributed to the great variability of the Cs levels found in farm scale investigations [1, 4]. But they should also be of practical importance, especially the relatively low values found with the fast growing species Lolium multiflorum, L. perenne and Trifolium pratense (0.28, 0.28 and 0.19 kBq l37Cs, respectively). It could be useful to establish these species in existing swards after a nuclear accident, for example by surface seeding, or to choose them for new establishments of temporary grassland.
150 S C H E C H T N E R and H E N R I C H
On the basis of the results obtained, the following measures appear promising for the grassland farmer in reducing 137Cs contamination of regrowth after a nuclear accident like that at Chernobyl:
(a) To eliminate deficiencies of potassium in the soil;(b) To fertilize sufficiently with nitrogen, provided that deficiencies of potassium
are corrected, and to utilize the herbage relatively late (at about the hay stage);(c) To reseed grassland with species which seem to have a low predisposition to
contamination with 137Cs, such as Lolium multiflorum, L. perenne and Trifolium pratense.
It may also be helpful to the farmer to know that 137Cs contamination of the herbage declines significantly in the course of time.
4. C O N C L U S I O N S
REFERENCES
[1] UMWELTBUNDESAMT, Tschernobyl und die Folgen ffir Ósterreich, Preliminary
Report, Bundesministerium fur Gesundheit und Umweltschutz, Vienna (1986).
[2] ÔKOLOGIE-INSTITUT, NATURWISSENSCHAFTLER GEGEN WAA, Tâgliches
Atom, ein Ratgeber fur die Zeit nach Tschernobyl, Edit 2, Falter, Vienna (1986).
[3] PFANNHAUSER, W ., Radioaktivitát, Ernàhrung, Gesundheit, Agrar. Rundschau 3
(1986) 6-10.
[4] GALLER, J., 250 Tage nach Tschernobyl, Report, Landwirtschaftskammer, Salzburg
(1987).
[5] HENRICH, E., “ Cs-137 in Austrian domestic animals: Determination of transfer
parameters and meat contamination by live animal measurements” , paper presented at
Plant-Animal Working Group Mtg of IUR, Grange-over-Sands, UK, 1987.
[6] STEINWENDER, R., et al., Untersuchungen zur Strahlenbelastung der Milch in
Abhàngigkeit von der Leistung der Milchkühe, Bodenkultur 39 3 (1988) 269-280.
[7] BREITENHUBER, L., KINDL, P., Radiocàsiumuntersuchungen bei Rindern in
Zusammenhang mit dem Reaktorunfall in Tschernobyl, Report, Inst, fiir Kernphysik,
Technische Univ., Graz (1988).
[8] BUNDESMINISTERIUM FÜR LAND- UND FORSTWIRTSCHAFT, Fütterungs-
empfehlungen und Futterplàne bei radioaktiv belastetem Futter, Abt. II A 4, Circular,
Bundesministerium fur Land- und Forstwirtschaft, Vienna (1986).
[9] HAUNOLD, E., et al., Umweltradioaktivitàt und ihre Auswirkung auf die Land-
wirtschaft, Rep. 4369, LA 163/86, Ôsterreichisches Forschungszentrum Seibersdorf
(1986).
[Í0] MÜCK, K., Strahlensituatioh nach Tschernobyl, Agrar. Rundschau 3 (1986) 1-6.

IAEA-SM-306/32
E F F E C T S O F R E M E D I A L M E A S U R E S O N
L O N G T E R M T R A N S F E R O F R A D I O C A E S I U M
F R O M S O I L T O A G R I C U L T U R A L P R O D U C T S
A S C A L C U L A T E D F R O M S W E D I S H
F I E L D E X P E R I M E N T A L D A T A
H. LÔNSJÔ*, E. HAAK**, K. ROSÉN*
* Department of Radioecology,Swedish University of Agricultural Sciences
** Department of Soil Sciences,Swedish University of Agricultural Sciences
Uppsala, Sweden
Abstract
EFFECTS OF REMEDIAL MEASURES ON LONG TERM TRANSFER OF RADIO
CAESIUM FROM SOIL TO AGRICULTURAL PRODUCTS AS CALCULATED FROM
SWEDISH FIELD EXPERIMENTAL DATA.
Extensive studies on the transfer of radiocaesium from soil to agricultural products
under long term field conditions have been performed in Sweden since 1961. Effects of vari
ous remedial measures to be taken after farm land contamination have been studied in long
term microplot experiments, in ploughing experiments and in conventional field experiments
in Chernobyl fallout areas. Furthermore, the transfer of radiocaesium in various farm
ecosystems, as influenced by farm management practices and the line of production applied,
has been calculated. Fertilization with potassium has been found to effectively reduce the
transfer of radiocaesium from the soil to various crops. The best effects were found on peat
and sandy soils in the Chernobyl fallout areas, where a reduction by a factor of 2-5 or more
has been recorded. Also, on clay soils heavy К application was found to depress the Cs trans
fer appreciably. Placement of the nuclide below the normal ploughing depth reduced the Cs
transfer by a factor of 2-3 as compared with the effect of a homogeneous distribution in the
plough layer. With a combination of deep placement and К fertilization a reduction by a factor
of 10 or more has been obtained. It seems possible to reduce the caesium transfer from soil
to food by a factor of 5-10 by changing the line of production on a farm in various ways.
1. INTRODUCTION
The nuclear industry represents a potential source of risk of accidental release of volatile radionuclides to the environment. Although this risk has been considered to be very small, much attention has been paid to the consequences for agriculture and food production of such an event, both in the acute phase and in the long term.
151

1 5 2 L Ô N S J Ô et al.
The Three Mile Island accident in 1979 brought nuclear safety up for discussion in many countries, and in Sweden a research programme was started in 1981 to study remedial measures that could be taken after farm land contamination following a reactor accident.
For the long term situation the main concern was focused on the transfer of radiocaesium ( l34Cs and 137Cs) from contaminated soils to crops and various foodstuffs consumed by man, and on the possibilities of reducing this transfer. The programme covered the following:
(a) Possibilities of reducing the crop uptake of radiocaesium by fertilization,(b) Possibilities of reducing the crop uptake of radiocaesium by ploughing down
a contaminated soil surface layer,(c) Possibilities of minimizing the transfer of radiocaesium to foodstuffs originat
ing from the contaminated area by changing farm management practices and by changing the line of production.
Much information on the behaviour of the long lived fission products 90Sr and 137Cs in the soil-plant system had been obtained from investigations performed in the 1960s following nuclear weapons tests. In Sweden a number of long term experiments under field conditions were established in 1961-1962, of which some have been running for more than twenty years. Some results from these experiments will be presented in this paper.
The Chernobyl fallout in 1986 contaminated vast areas of middle Sweden, including large areas of agricultural land. The earlier Swedish investigations served as a basis for countermeasures recommended to reduce the radiocaesium transfer to grassland crops and further into the food chain. Peat and sandy soils dominate in the fallout areas, and many of them favour a high uptake of caesium because of the soil type and, in addition, owing to the crops cultivated and the type of animal husbandry practised.
The fallout, however, made it possible to extend the studies of radiocaesium to new environments and to practical field conditions. For these reasons a number of long term field experiments were established in the fallout areas in 1987. Some results from these experiments will also be presented.
2. MATERIALS AND METHODS
Results presented in this paper are based on the following investigations, performed under field conditions:
(a) Microplot experiments carried out during 1961-1981, with the aim of studying the transfer of 90Sr and I37Cs to various crops, as influenced by soil characteristics and by liming and fertilization;

IAEA-SM-306/32 153
(b) Microplot experiments carried out during 1982-1984 to study the effects of К fertilization and placement depth of the nuclide on the transfer of 134Cs to various crops;
(c) Ploughing experiments, using a stable tracer, carried out in 1983-1984 to study the effectiveness of ploughing down a contaminated soil surface layer;
(d) Conventional field experiments established in 1987 in Chernobyl fallout areas, designed to study the effects of К fertilization, and partly of liming and zeolite treatment.
The microplot experimental technique used was described in Refs [1] and [2], and the ploughing experiments in Refs [3] and [4]. The post-Chernobyl experiments have been carried out using conventional field experimental techniques.
The effects of the various remedial measures discussed below are related to the respective control treatments, i.e. the activity concentrations in the crop products from the unfertilized treatments, with respect.to potassium, etc., are given the value 100. In order to show the actual activity concentrations — as determined by means of Nal or Ge(Li) detector systems and normalized to units of activity deposited per unit area — deposition to harvested material transfer factors (TFd) are given for the control treatments on the various soils referred to in the experiments.
TABLE I. CHARACTERISTICS OF THE PLOUGH LAYER SOILS IN THE MICROPLOT (a, b) AND POST-CHERNOBYL (d) FIELD EXPERIMENTS
Soil Soil type3Clay
(%)
Organic
matter (%) рНн2о к ^14 HCI KALb
A (a) Loam 18 5.4 6.0 105 7
В Clay loam 33 5.3 6.1 215 14
С Silty clay 48 6.6 5.2 300 15
D (b ) Loam 19 4.5 6.5 110 10
E Clay loam 31 7.8 7.5 225 10
F (d) Peat soil — 37c 6.2 125 16
G Sand <5 4C 6.5 53 4.6
H Loamy sand <5 8C 5.6 64 6.0
J Sand — 10c 6.1 55 <5
a According to standards of the United States Department of Agriculture.
b mg/100 g dry soil (according to Egnér et al. [7]). AL: ammonium lactate.
c Determined as loss on ignition.

154 L Ô N S J Ô et al.
TABLE II. RELATIVE EFFECTS OF K FERTILIZATION ON TRANSFER OF 137Cs FROM SOIL TO VARIOUS CROP PRODUCTS IN MICROPLOT EXPERIMENTS (a), 1961-1981
Soil
К fertilization
(kg К -ha"1 -a'1)
Relative Cs-137 transfer
to grain/seed
1961 1962-1981 Oats Peas White mustard
A 0 0 100 100 100
156 31 54 47 62
625 156 5.9 8.4 3.0
В 0 0 100 100 100
156 31 60 52 54
625 156 6.7 15 3.2
С 0 0 100 100 100
156 31 46 50 49
625 156 8.1 14 5.0
3. RESULTS AND DISCUSSION
3.1. Effects of potassium fertilization (a)
The uptake of radiocaesium from soil by crops will generally decrease with increasing clay content — and hence KHC1 — in the soils, as Cs+ to a large extent will be fixed into the lattice of the micaceous clay [5]. Increasing pH and cation exchange capacity (CEC) of the soils will also decrease the root uptake, while an increasing content of organic matter will act in the opposite direction, as Cs+ is less firmly sorbed by the organic matter of the soils than by the mineral fraction [5, 6].
One of the microplot experiments established in 1961 was designed to study the effect of increasing amounts of К fertilizers on the crop uptake of 137Cs from three homogeneously contaminated plough layer soils, varying, inter alia, in contents of clay and organic matter (soils A-С in Table I). The experiment was located at an experimental station on a subsoil poor in nutrients and of other origin than the subsoil in situ [1, 2].

IAEA-SM-306/32 155
TABLE III. AVERAGED TRANSFER FACTORS FOR VARIOUS CROP PRODUCTS IN THE CONTROL TREATMENTS (NO К FERTILIZER ADDED) IN THE MICROPLOT (a, b) AND POST-CHERNOBYL (d) FIELD EXPERIMENTS
Soil TFd for radiocaesium (m2/kg dry matter)
(a) Oats (grain) Peas (seed) White mustard (seed)
A 0.000 276 0.000 271 0.000 477
В 0.000 162 0.000 161 0.000 260
С 0.000 092 0.000 088 0.000 109
(b) Barley (grain) Wheat (grain) Rape (seed)
D 0.000 026 0.000 022 0.000 06a, 0.000 12b
E 0.000 043 0.000 054 0.000 09a
Sugar beet:
Ley grass roots tops
D 0.000 14 (0.000 07-0.000 30)c 0.000 07 0.000 21E 0.000 32 (0.000 18-0.000 76)c — —
(d) Pasture grass:
1987 1988
F 0.035 0.030G 0.006 5 0.002 6H, unlimed 0.038 0.058
limedd 0.024 0.015
J, no zeolite 0.120 0.094zeolite addedd — 0.104
a,b Summer and winter varieties, respectively.
0 The range for various years is shown.
d 4000 kg CaO and zeolite per hectare, respectively.
In the first year 137Cs was added to the plough layer soils together with the К fertilizer, applied at three different levels, as shown in Table II. In the following years the К fertilizer was applied to the sowing layer in the amounts given in the table. Oats, peas and white mustard were grown as test crops in seven three year crop rotations during 1961-1981.

156 L Ô N S J Ô et al.
In Table III the averaged transfer factors are shown for grain or seed of the various crops in the respective control treatments, i.e. where no К fertilizer was added. The TFd values decreased for all of the crops in the order soil A > soil В > soil C, which was to be expected with respect to the characteristics of the soils. White mustard showed higher values, especially on soil A, than the other two crops, for which about the same transfer factor was recorded.
In Table II the averaged effect of К fertilization is shown for the various soils and crops over the whole experimental period 1961-1981. As can be seen, the 137Cs transfer clearly decreased with increasing К application for all the soil-crop combinations. Compared with the control it decreased to 46-62% at the low К application-rate and to 3-15% at the high rate. With respect to the individual crops the effect decreased in the order white mustard > oats > peas, i.e. the best effect was obtained for the most К consuming of the crops. With respect to the soils the effect decreased in the order soil A > soil В > soil C, i.e. in inverse proportion to the clay content.
3.2. Effects of placement and potassium fertilization (b)
The experiments performed in this investigation were located at two sites, one in central and one in southern Sweden. The characteristics of the plough layer soils are given in Table I (soils D and E, respectively). The experiments have been described in Ref. [8], where detailed data are also presented.
The experiments comprised four combinations of placement depth of 134Cs and К fertilization (Table IV). In two of the treatments (A), the top soil layer (0-250 mm) was contaminated, and either no К fertilizer was added (I), or the soil was fertilized with KC1 in amounts corresponding to 250 kg К/ha (II). In the other two treatments (B), a contaminated soil layer, either with no К fertilizer applied or fertilized in the same way as in treatment All, was placed at a depth of 270-290 mm and overlaid with uncontaminated soil, thus simulating a situation after an ‘ideal’ ploughing down of a contaminated surface layer.
Transfer factors for the various crop products from the Al treatment are shown in Table III. As can be seen, the uptake of 134Cs decreased in the order sugar beet tops > ley grass > sugar beet roots > rape seed > barley and wheat grain. The TFd values were on average twice as high on soil E as on soil D, although the contents of clay and К and the pH were higher in soil E. The effect seemed to be due to the much higher content of organic matter in soil E than in soil D (Table I).
The effects of placement and К fertilization are shown in Table IV. As could be expected, the effects varied with soil, crop product and year. Averaged over crops and years К fertilization reduced the l34Cs transfer to about 60% of the control (treatment Al) on both soils. At deep placement of the nuclide (treatment BI) the corresponding reduction was 46% and 38% on soils D and E, respectively, and the
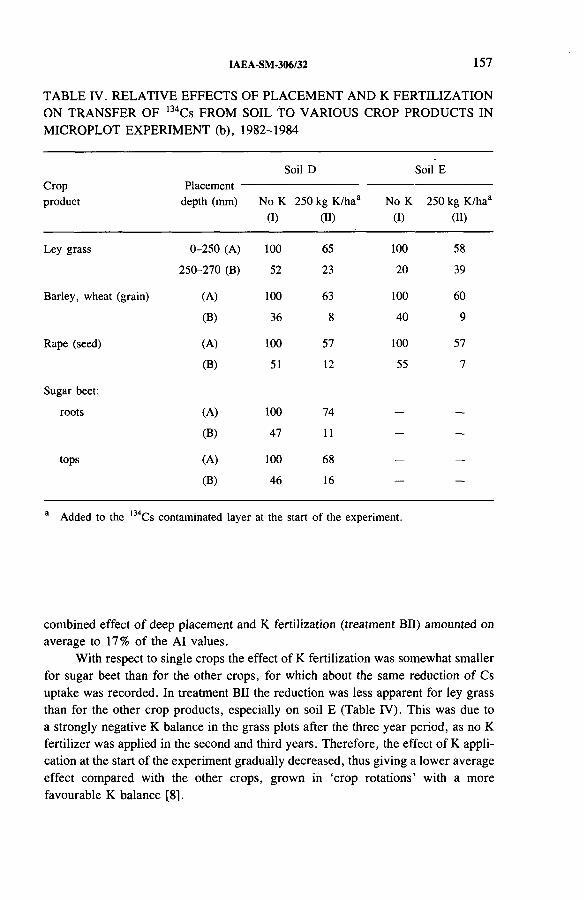
IAEA-SM-306/32 1 5 7
TABLE IV. RELATIVE EFFECTS OF PLACEMENT AND К FERTILIZATION ON TRANSFER OF 134Cs FROM SOIL TO VARIOUS CROP PRODUCTS IN MICROPLOT EXPERIMENT (b), 1982-1984
Crop
product
Soil D Soil E
Placement
depth (mm) No К 250 kg K/haa
(I) (П)
No К
(I)
250 kg K/haa
(II)
Ley grass 0-250 (A) 100 65 100 58
250-270 (B) 52 23 20 39
Barley, wheat (grain) (A) 100 63 100 60
(B) 36 8 40 9
Rape (seed) (A) 100 57 100 57
(B) 51 12 55 7
Sugar beet:
roots (A) 100 74 — —
(B) 47 11 — —
tops (A) 100 68 — —
(B) 46 16 — —
a Added to the l34Cs contaminated layer at the start of the experiment.
combined effect of deep placement and К fertilization (treatment BII) amounted on average to 17% of the AI values.
With respect to single crops the effect of К fertilization was somewhat smaller for sugar beet than for the other crops, for which about the same reduction of Cs uptake was recorded. In treatment BII the reduction was less apparent for ley grass than for the other crop products, especially on soil E (Table IV). This was due to a strongly negative К balance in the grass plots after the three year period, as no К fertilizer was applied in the second and third years. Therefore, the effect of К application at the start of the experiment gradually decreased, thus giving a lower average effect compared with the other crops, grown in ‘crop rotations’ with a more favourable К balance [8].

1 5 8 L O N S J Ô et al.
3.3. Effects of ploughing (с)
The ideal placement of a contaminated soil surface layer, as in treatment В in the previously described experiment, can never be obtained after ploughing under practical field conditions. The ploughing experiments referred to, in which a number of plough types were tested under various soil conditions, showed that a fraction of the tracer was always distributed in the upper part of the top soil profile, even after deep ploughing. This is because the furrow slices are partly laid over each other during ploughing.
The best results in the experiments were obtained at large cutting widths (500-600 mm) and great working depths (250-500 mm). Also, a double depth plough proved beneficial, while neither jointers,.etc., nor changes in driving speed had any apparent effect on the distribution of the tracer. With the most effective ploughs, from 60% to more than 90% of the tracer added could be found below 200 mm. Between 5% and 20% was usually found in the depth interval 0-150 mm (cf. Refs [3] and [4]).
By combining data from the microplot and ploughing experiments the effects under practical field conditions have been calculated [8].
3.4. Effects of potassium fertilization, liming and zeolite treatment (d)
Data for 1987-1988 from four of the post-Chernobyl field experiments, situated on various types of grassland established before 1986, will be presented and discussed. The soils are described in Table I (soils F, G, H and J), and the TFd values in the control treatments are shown in Table III.
From Table III it is seen that the TFd values were up to four orders of magnitude higher in the post-Chernobyl field experiments than in the microplot experiments. This difference can partly be ascribed to the much more unfavourable soil conditions with respect to Cs transfer in the post-Chernobyl experiments. The main point, however, is that the Chernobyl fallout caesium is sorbed in the surface soil layer, where its availability to the plants is much higher than in the microplot experiments described.
Data on the depth distribution of Chernobyl fallout caesium in various soil types have shown that after about 18 months up to more than 90% of the activity of l34Cs and 137Cs was recovered in the upper 20 mm of the top soil profile. The median depth was usually less than 10 mm, and only minute amounts were found below 50 mm [9]. Other Swedish investigations (cited in Ref. [9]) have shown a penetration rate for 137Cs in grassland soils of only about 1.3 mm per year.
At some of the sites parallel experiments were performed, one on unploughed grassland, and one in which the grassland was ploughed in late 1987 and barley was sown in 1988. The TFd values for barley grain were at least one order of magnitude lower than for the grass crops (data not shown).
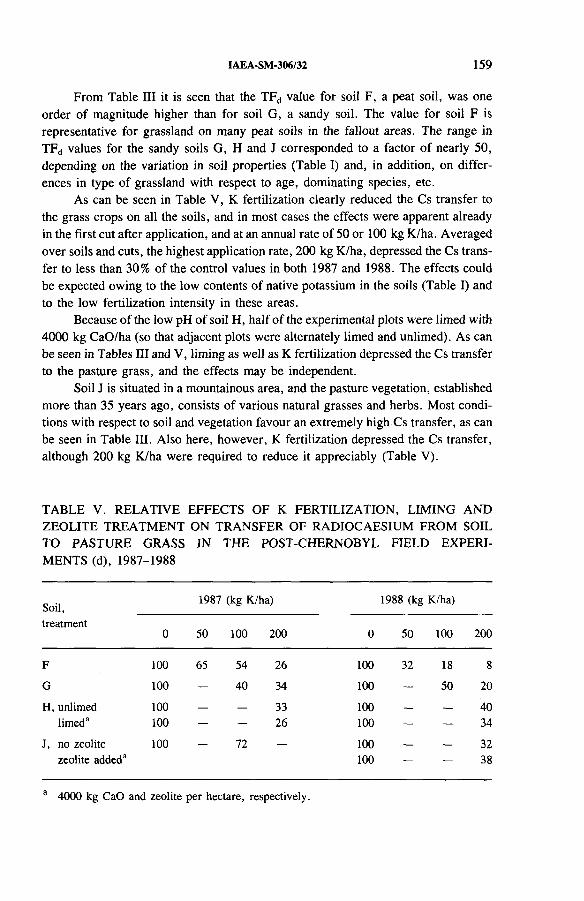
IAEA-SM-306/32 159
From Table III it is seen that the TFd value for soil F, a peat soil, was one order of magnitude higher than for soil G, a sandy soil. The value for soil F is representative for grassland on many peat soils in the fallout areas. The range in TFd values for the sandy soils G, H and J corresponded to a factor of nearly 50, depending on the variation in soil properties (Table I) and, in addition, on differences in type of grassland with respect to age, dominating species, etc.
As can be seen in Table V, К fertilization clearly reduced the Cs transfer to the grass crops on all the soils, and in most cases the effects were apparent already in the first cut after application, and at an annual rate of 50 or 100 kg К/ha. Averaged over soils and cuts, the highest application rate, 200 kg К/ha, depressed the Cs transfer to less than 30% of the control values in both 1987 and 1988. The effects could be expected owing to the low contents of native potassium in the soils (Table I) and to the low fertilization intensity in these areas.
Because of the low pH of soil H, half of the experimental plots were limed with 4000 kg CaO/ha (so that adjacent plots were alternately limed and unlimed). As can be seen in Tables III and V, liming as well as К fertilization depressed the Cs transfer to the pasture grass, and the effects may be independent.
Soil J is situated in a mountainous area, and the pasture vegetation, established more than 35 years ago, consists of various natural grasses and herbs. Most conditions with respect to soil and vegetation favour an extremely high Cs transfer, as can be seen in Table III. Also here, however, К fertilization depressed the Cs transfer, although 200 kg К/ha were required to reduce it appreciably (Table V).
TABLE V. RELATIVE EFFECTS OF К FERTILIZATION, LIMING AND ZEOLITE TREATMENT ON TRANSFER OF RADIOCAESIUM FROM SOIL TO PASTURE GRASS IN THE POST-CHERNOBYL FIELD EXPERIMENTS (d), 1987-1988
Soil,
treatment
1987 (kg K/ha) 1988 (kg K/ha)
0 50 100 200 0 50 UK) 200
F 100 65 54 26 100 32 18 8
G 100 — 40 34 100 — 50 20
H, unlimed 100 — — 33 100 — — 40
limed3 100 — — 26 100 — — 34
J, no zeolite 100 — 72 — 100 — 32
zeolite added3 100 - 38
a 4000 kg CaO and zeolite per hectare, respectively.

160 L Ô N S J Ô et al.
On this soil 4000 kg/ha of zeolite were added in spring 1988 to half of the experimental plots (so that one strip of adjacent plots had zeolite added, while a parallel strip had none). However, no effect on the Cs transfer was seen that year (Tables III and V).
3.5. Effects of changed farm management practices
The effects of a changed line of production for various farm ecosystems have been calculated, using TFd values based on the microplot experiments and other Swedish investigations [10, 11]. It seems possible, in addition to applying the remedial measures discussed above, to reduce the Cs transfer from soil to man by a factor of 5-10 by changing from, for example, grain cropping for human consumption to grain cropping for pork production or from milk production to beef production. These calculations have also been verified in case studies on single farms [12].
4. CONCLUSIONS AND PRACTICAL CONSIDERATIONS
As can be concluded from the data presented, К fertilization will almost always be efficient in reducing the radiocaesium transfer from soil to various crop products. In addition, a clear effect may often be obtained in the first cut after К application and then for many years after, provided that a positive К balance of the soil is maintained by repeated applications.
The effect of К fertilization usually will be most effective on sandy and peat soils, low in native potassium, and for crops taking up large amounts of the element, e.g. ley plants. However, also on clay soils, which usually are rich in native potassium and therefore are not К fertilized, application may effectively reduce the caesium transfer.
As shown, liming may also be effective in reducing the caesium uptake on soils of low pH, probably owing to the increased pH of the soil. Therefore, this effect usually may not be expected to be as immediate as after К fertilization.
While fertilization and liming are easy operations from a technical point of view, the effect of ploughing will be much more dependent on environmental and technical factors, such as soil type, moisture conditions and the ploughs and traction power available. Therefore, the result to a high degree will depend on the quality of the ploughing.
Under favourable conditions the combined effect of К fertilization and ploughing may reduce the caesium transfer to the crops by a factor of 10-20 or more. Ploughing up contaminated grassland will, however, always be effective, and should be performed whenever possible.
The remedial measures dealt with in this paper, including a changed line of production, are designed to achieve an acceptable flow of radiocaesium from the

IAEA-SM-306/32 161
farm ecosystem to the consumers of foodstuffs. Taking economic considerations into account, for the farmers as well as for society as a whole, cost-benefit analyses of the effects of the various countermeasures have to be performed. The countermeasures should, of course, be reasonable with respect to the radionuclide deposition per unit area and to the importance of agriculture in the contaminated environment.
ACKNOWLEDGEMENTS
These investigations have been financially supported by, inter alia, the National Board of Agriculture and the National Institute of Radiation Protection, Sweden.
REFERENCES
[1] FREDRIKSSON, L., Studies on Plant Accumulation of Fission Products under
Swedish Conditions, VI. A New Experimental Technique for Studies of Plant Accu
mulation of Nutrients and Fission Products under Field Conditions, FOA 4 Rep.
A 4323-4623, Research Inst, of Natl Defence, Stockholm (1963).
[2] FREDRIKSSON, L., ERIKSSON, À., LÓNSJÓ, H ., Studies on Plant Accumulation
of Fission Products under Swedish Conditions, VIII. Uptake of l37Cs in Agricultural
Crops as Influenced by Soil Characteristics, and Rate of Potassium Fertilization in a
Three Year Microplot Experiment, FOA 4 Rep. A 4486-4623, Research Inst, of Natl
Defence, Stockholm (1966).
[3] NILSSON, J., Ploughing-down a Simulated Surface Contamination — Methods and
Effects, Rep. SLU-REK-56, Dept, of Radioecology, Swedish Univ. of Agricultural
Sciences, Uppsala (1983) (in Swedish with English summary).
[4] LÓNSJÓ, H ., “ Mouldboard ploughing as a remedial measure for contaminated land” ,
Proc. Det Fjerde Nordiske Radio0kologiseminar, Gol, Norway, 1985.
[5] RUSSELL, S.R. (Ed.), Radioactivity and Human Diet, Pergamon Press, Oxford (1966)
87-127, 317-353.
[6] FREDRIKSSON, L., LÓNSJÓ, H., ERIKSSON, À., Studies on Plant Accumulation
of Fission Products under Swedish Conditions, XII. Uptake of l37Cs by Barley and
Peas from 12 Different Top Soils Combined with 2 Subsoils in a Long Term Microplot
Experiment, FOA 4 Rep. С 4405-28, Research Inst, of Natl Defence, Stockholm
(1969).
[7] EGNÉR, H ., RIEHM, H., DOMINGO, W .R ., Untersuchungen iiber die chemische
Bodenanalyse als Grundlage fur die Beurteilung des Nâhrstoffszustandes der Boden,
II. Chemische Extraktionsmethoden zur Phosphor- und Kaliumbestimmung, Statens
Jordbruksfôrsôk, sârtryck och smâskrifter No. 133, Uppsala (1960).
[8] LÓNSJÓ, H ., HAAK, E., Effects of Deep Placement and Potassium Fertilization on
the Crop Uptake of Caesium and Strontium, Rep. SLU-REK-60, Dept, of Radio
ecology, Swedish Univ. of Agricultural Sciences, Uppsala (1986) (in Swedish with
English summary).

162 L O N S J Ô et al.
[9] LONSJÔ, H., “ Depth distribution of radiocaesium in agricultural soils in Chernobyl fallout areas of Sweden in 1987-1988” , Papers Presented on After-effects of Chernobyl (Proc. 19th ESNA Conf. Vienna, 1988) (GERZABEK, M., Ed.), Ôsterreichisches Forschungszentrum Seibersdorf (1989) 134-140.
[10] HAAK, E., Long-term Consequences of Radioactive Fallout in Agriculture, Rep. SLU-REK-57, Dept, of Radioecology, Swedish Univ. of Agricultural Sciences, Uppsala (1983) (in Swedish).
[11] ERIKSSON, À., Fission Products in the Swedish Environment, Rep. SLU-IRB-60, Dept, of Radioecology, Swedish Univ. of Agricultural Sciences, Uppsala (1977) (in Swedish).
[12] ANDERSSON, I., LONSJO, H., Transfer of l37Cs in two farm ecosystems — Calculated effects of countermeasures following a postulated fallout land contamination, Swed. J. Agrie. Res. 18 (1988) 195-206.
IAEA-SM-306/2
T H E E F F E C T S O F S O M E A G R I C U L T U R A L
T E C H N I Q U E S O N S O I L T O P L A N T T R A N S F E R
O F R A D I O N U C L I D E S U N D E R F I E L D C O N D I T I O N S
J.F. LEMBRECHTS, J.H. VAN GINKEL,J.H. DE WINKEL, J.F. STOUTJESDUK Laboratory for Radiation Research,National Institute of Public Health
and Environmental Protection,Bilthoven, Netherlands
Abstract
THE EFFECTS OF SOME AGRICULTURAL TECHNIQUES ON SOIL TO PLANT
TRANSFER OF RADIONUCLIDES UNDER FIELD CONDITIONS.
The effects of some normal agricultural practices on the soil to plant transfer of certain
radionuclides have been studied. The studies were aimed at providing alternative counter
measures to soil disturbance or soil removal. The amendments studied were application of
organic matter, liming, addition of stable isotopes and variation of the amount of fertilizer
added. Although the countermeasures were often liberally applied, the changes in uptake were
found to be small and strongly dependent on the situation studied. It was observed that amend
ments beneficial in one situation could be counterproductive in another. Overall, liming was
found to be the most effective amendment, and produced no adverse side effects. The effect
of organic matter was probably obscured by the presence of neutralizing lime, which was
added at the same time. Varying the amount of fertilization led to minor and inconsistent
effects. Reduction of uptake by the application of stable isotopes strongly depends on the
affinity of the plant species for the element considered. Selection of other crops is suggested
to be a generally applicable remedial measure.
1. INTRODUCTION
The experiments described in this paper were undertaken to determine the extent to which some normal agricultural practices might be employed to reduce the uptake of radionuclides by crops. Essentially three categories of countermeasures may be employed. They are (a) soil amendment to reduce soil to plant transfer,(b) removal or burial of contaminated soil, and (c) the growing of less sensitive crops on the contaminated land. This study concentrated on treatments to reduce radionuclide uptake by changing the physicochemical characteristics of the soil. The amendments studied were application of organic matter, liming, addition of stable isotopes of Zn and Mn, and variation of the amount of fertilizer (NPK) added. The actions chosen were intended to minimize effects on yield and interference with
163

164 L E M B R E C H T S et al.
normal agricultural practice. They should be applicable on large areas with low contamination levels and in later phases of a strategy against food contamination following a major nuclear accident.
2. MATERIALS AND METHODS
Experiments were conducted under field conditions in 24 lysimeters described earlier by Stoutjesdijk et al. [1]. Three kinds of soil were represented: a clay soil (4 plots), a sandy loam (12 plots) and a sandy soil (8 plots). The depth of all containers was 1.4 m and the surface area 0.5, 1.0 or 1.5 m2. In the course of a five year period, starting in 1982, different nuclides (between 2 and 4 MBq/m2) were applied: 134Cs (1984-1985), 137Cs (1982-1983), 85Sr (1987), 90Sr (1982-1983), 57Co (1984-1985), 60Co (1982-1983), 65Zn (1986) and 54Mn (1986). The added radionuclides were homogeneously dispersed throughout the upper 20 cm layer of soil.
TABLE I. COUNTERMEASURES APPLIED ON THE VARIOUS SOILS IN THE COURSE OF THREE SUCCESSIVE YEARS
Countermeasure Soil type 1986 1987 1988
Ca(OH)2 (kg/ha) Sand + loam 2 250 2 250__a
Organic matter Sand 54 000 364 000a
(kg compost/ha)b Loam 54 000 455 000 __a
Clay 54 000 455 000a
Stable elements Sand 220/50 __a __a
Mn/Zn (kg/ha) Loam 450/68a a
Clay 900/90a a
Fertilization Sand + loam С с с
a Fertilization only.
b Dry matter content is 55% of the values presented.
c Recommended fertilization not applied.

IAEA-SM-306/2 165
The experiments began in 1986 and are continuing. Beans (Phaseolus vulgaris L.), of which the pods were analysed, were grown in spring and spinach (Spinacia oleracea L.) in autumn. The remedial measures (Table I) were applied individually on one or two containers per soil type. The amounts of Zn and Mn applied doubled the total amount already present in the upper 20 cm of the various soils [1].
The concentration of each of the gamma emitters in the homogenized, dried soil (7 g) and plant samples (20 g) was analysed with Ge(Li) semiconductor detectors. Strontium-90 was determined after acid digestion of the sample [2] on the basis of the Cerenkov radiation from its daughter nuclide, 90Y.
Soil solution was isolated by means of an immiscible displacement method [3], using CHC13 as a displacent. The pH and conductivity of the soil liquid phase were determined as well as the concentration of several nutrients. Strontium-90 was the only radionuclide which could be detected in the soil liquid. The compounds present in the soil solution are considered to represent the fraction of readily available nutrients.
The transfer factor is defined as:
^ Bq/kg dry plant materialTF —
Bq/kg oven dried soil (0-20 cm layer)
3. RESULTS
3.1. Soil liquid phase
Although the soil solution composition varied widely throughout the growing period, the relative differences between the containers remained fairly constant and the specific effects of the various treatments were clearly visible (Table II) on the sandy and loamy soils. No changes in the composition of the readily available nutrient fraction were detected in the clay soil. The changes induced by the countermeasures which were applied only once (e.g. addition of stable Zn and Mn) or twice persisted during the subsequent growing period(s). The concentrations of K, Mg, Mn and Zn in the soil solution clearly decreased in unfertilized soils, but without affecting the yield of the bean and spinach crops. Application of the micronutrients Zn and Mn enhanced their concentrations in the liquid phase of the sandy and loamy soils. The quantity of lime applied clearly changed the pH and the concentration of freely dissolved Ca and reduced the 90Sr/Ca ratio and the concentrations of Zn and Mn in the soil solution of the sand and the loam. Besides increasing the moisture content of the soil, and the yield of beans, application of organic matter changed the К concentration, because of the presence of 1.7 kg/m3 of NPK fertilizer in the compost mixture, and the 90Sr/Ca ratio, because of the presence of 5 kg/m3 of neutralizing lime.

166 L E M B R E C H T S et al.
TABLE II. NUMBER OF MEASUREMENTS (N) AND AVERAGES FOR SOME CHARACTERISTICS OF SOIL SOLUTIONS FOR THE PERIOD JULY 1986 TO JULY 1989
Nh 2o
( % )
Conductivity
^ (mS/cm)
К Mg Ca N 03
(mg/L)
Zn IMn Sr-90/Ca
— ► (Bq/mg)
Clay
All 36 24 7.5 1.2 34 34 244 315 0.04 < D L a 2.4
Control 18 22 7.6 1.2 29 31 237 302 0.04 Л D r 3.1
Org. matter 9 30 7.4 1.1 38 34 208 290 0.04 л O r 1.4
Zn + Mn 9 24 7.4 1.2 41 39 294 367 0.04 0.01 1.8
Loam
All 110 19 6.7 0.8 36 27 161 245 0.11 0.01 4.0
Control 56 18 6.8 0.8 32 25 157 241 0.08 0.01 4.8
Lime 9 18 7.7 0.9 30 22 235 282 0.07 0.01 2.8
Org. matter 18 28 6.2 0.9 57 33 154 242 0.14 0.01 2.4
Zn + Mn 18 18 6.2 0.8 41 33 185 239 0.27 0.03 4.3
Unfertilized 9 17 7.1 0.5 15 11 85 246 0.02 0.01 3.4
Sand
All 74 13 5.6 0.9 87 45 104 242 1.15 0.82 9.0
Control 38 12 5.5 0.9 92 49 95 230 1.21 0.41 11.4
Lime 9 13 6.5 1.0 84 45 157 294 0.37 0.09 2.9
Org. matter 9 24 5.8 1.0 102 54 116 182 0.47 0.24 1.8
Zn + Mn 9 12 5.4 1.1 112 56 107 277 2.93 4.48 13.2
Unfertilized 9 12 5.5 0.5 32 11 72 260 0.59 0.07 8.3
a <D L : below the detection limit.
3.2. Transfer factors
The mean differences in uptake of the various elements by the two plant species and the diversity in TFs on the three soil types are apparent from Table III. The data on different nuclides of the same element were pooled as they are of the same order
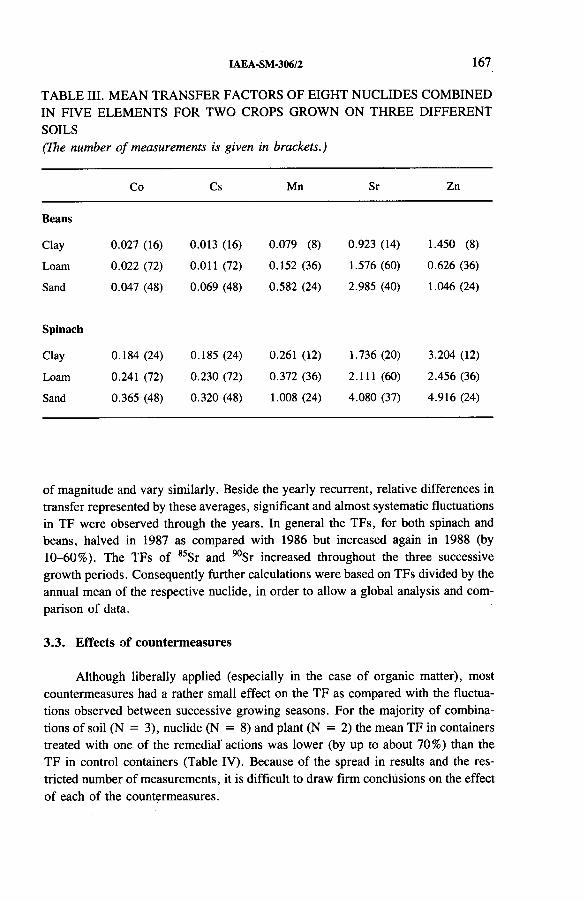
IAEA-SM-306/2 1 6 7
TABLE III. MEAN TRANSFER FACTORS OF EIGHT NUCLIDES COMBINED IN FIVE ELEMENTS FOR TWO CROPS GROWN ON THREE DIFFERENT SOILS(The number o f measurements is given in brackets.)
Co Cs Mn Sr Zn
Beans
Clay 0.027 (16) 0.013 (16) 0.079 (8) 0.923 (14) 1.450 (8)
Loam 0.022 (72) 0.011 (72) 0.152 (36) 1.576 (60) 0.626 (36)
Sand 0.047 (48) 0.069 (48) 0.582 (24) 2.985 (40) 1.046 (24)
Spinach
Clay 0.184 (24) 0.185 (24) 0.261 (12) 1.736 (20) 3.204 (12)
Loam 0.241 (72) 0.230 (72) 0.372 (36) 2.111 (60) 2.456 (36)
Sand 0.365 (48) 0.320 (48) 1.008 (24) 4.080 (37) 4.916 (24)
of magnitude and vary similarly. Beside the yearly recurrent, relative differences in transfer represented by these averages, significant and almost systematic fluctuations in TF were observed through the years. In general the TFs, for both spinach and beans, halved in 1987 as compared with 1986 but increased again in 1988 (by 10-60%). The TFs of 85Sr and 90Sr increased throughout the three successive growth periods. Consequently further calculations were based on TFs divided by the annual mean of the respective nuclide, in order to allow a global analysis and comparison of data.
3.3. Effects of countermeasures
Although liberally applied (especially in the case of organic matter), most countermeasures had a rather small effect on the TF as compared with the fluctuations observed between successive growing seasons. For the majority of combinations of soil (N = 3), nuclide (N = 8) and plant (N = 2) the mean TF in containers treated with one of the remedial'actions was lower (by up to about 70%) than the TF in control containers (Table IV). Because of the spread in results and the restricted number of measurements, it is difficult to draw firm conclusions on the effect of each of the countermeasures.

TABL
E IV
. M
EANS
AN
D ST
AND
ARD
ER
RORS
OF
TF
s AC
CO
RD
ING
TO
PL
AN
T, S
OIL
TYPE
AN
D C
OU
NTE
RM
EA
SU
RE
(D
ata
are
expr
esse
d as
a fr
actio
n of
the
cont
rol
cont
aine
r TF
. Th
e nu
mbe
r of
mea
sure
men
ts
is gi
ven
in br
acke
ts.)
1 6 8 L E M B R E C H T S et al.
сN
Сs
U
сп 00 СП êу—NСП
00о оСП осп СП Г"оо о оо о О о о О-н -Н о -н -н -н +1 -Н8 О) 8 СП00 0000 001Г) t-~40
ó О о о О
оо ;—s g оm S о о (?)
5 ОСП о (N(N osо <ч(N сч(N СПО О о О о о о о-Н -Н +1 ■н -Н -н -н -ноо 40ЧО OVг- 8 г- U-)1Г) soos г-О)
О о о о о о
g оо СП S Со СП
(Ч rfСП ONСЧ о гм"sf СП (Nо О 00 О о о о О-н +1 о +1 +1 +1 -н +18 (N00 Оо 00 СПо оm ©
о о о
00 ê CN сп чо (N (Ч ê
г- ся О ' tí- 'О 00СЧ 00ю osо о о © о о о о+1 +1 -н -H -н -н -Н -Ноо 9 СПГО оо СПо Tfr1Г> 40Os оСП—' о о —' о О
оU
оо ' S ' <4 $ ( Ч <44 ^ СП
г - Ш 4 0 СП Г - Ш 00г ч с ч О ( Ч т-Н
о о о О О О О О-н - Н - Н +1 -н -н -н Мо Os о w 3 СПо 40 о — г-
О о — о О r - i
«СN
«
.3со
Uе с
Nс
Э I Control
1.00
±
0.32
(2
4)
1.00
±
0.26
(2
4)
1.00
±
0.25
(1
2)
1.00
±
0.28
(2
0)
1.00
±
0.34
(12)
Lime
0.72
±
0.34
(6
) 0.
86
± 0.
23
(6)
0.45
±
0.16
(3
) 0.
58
± 0.
16
(5)
0.38
±
0.12
(3
)
Org. matter
0.71
±
0.05
(6)
0.64
±
0.09
(6
) 1.2
3 ±
0.5
5 (3
) 0.
42
± 0.14
(5
) 0.
71
± 0.
18
(3)
Zn
+ Mn
1.36
±
0.97
(6
) 1.59
±
0.10
(6
) 0.
70
± 0.
39
(3)
1.07
±
0.19
(5
) 1.05
±
0.24
(3
)
Unfertilized
0.84
±
0.28
(6
) 1.07
±
0.32
(6
) 0.
69
± 0.
37
(3)
1.13
±
0.24
(5
) 0.
97
± 0.
27
(3)

/-V\o СП en
''tcn r»CN loо O o+1 +1 +1оо 00o vo40
о
/«so v~i w'—"o r- (X)-H CN 1—1o o o+1 +1 +1o on r~-o r- On
o ó
«—■ss en enw
co coen <N coo O O-H -H -Ho ONp vo VO
o ©
CN vO s4—'5 rfcn t-*COo O O+1 -H +18 oГ" On
ó O
CN (B s4—'en l-H CN«Л VOo O о-H -H -Ho CNо Г" O
o
uD cpCw o
лg s
afi u.C W) +
a o u eсл Q U O N
IAEA-SM-306/2
00 СО S/—4\o CO
r-•'З-
00©
ОчCN
COCN
o
o © © © ©
-H -H -H -H -Hoо
r-»o
©oo
©
© © ©
oco
•o © © vrT
oCO
co ©CN
U0CN
©© © © © ©
-H +1 +1 -H +1
©©
CNr-~
OOVO
©©
co©
© ©
00 co ë w co•w'
covo©
O n ©CN
© © © o ©-H -H -H -H -H8
rj-r- © ©o O n
00© © ©
vOco
g CN CN ê
vor-
VOCN
00r-
lOCN
coco
© © © © ©
-H +1 +1 +1 +1
©©
"sf00
CNO n
©oo
VO
© © © ©
voco ê CN
/—vCN ë
CNV-) coCN un (N
V“)co
© © © © ©-H -H -H -И -H©© VO
00VOON
O nГ- CNO n
© © © ©
Control
Lime
Org. matter
Zn
+ Mn
Unfertilized
CN ГО4 en en CO
VOCO
voCN
On©
©co
© © © © ©
-H -H -H -H -H
©©
r-00
CN©
©oo
00©
© ©
00 (n ÍO
coCN
On Os©
cn VO© © © o ©
+1 +1 +1 +1 -H
©©
co © . VO
vqOnCN en
©
CN en en en en4
CO00CN
VO©
co ©CN
© © © © ©
+1 +1 -H -H +1
©©
ONOO 00CN
m©
00l>© ©
(N S Sv
'S' s
CN© m
© CNON©
© © © © ©
+1 +1 +1 +1 +1
©©
inr-
©r->
0000
© © ©
wvo
vvo Cd
OnCN
©CN
cn©
COCN
c—© © © © ©
-H -H -H -H -H
©© 00
Юr- ©
00ON© © ©
Control
Lime
Org. matter
Zn
+ Mn
Unfertilized

170 L E M B R E C H T S et al.
Apparent shifts in soil solution characteristics were sometimes observed, but none of the amendments produced marked or consistent reduction in soil to plant transfer. The complexity of the changes induced and an often seemingly specific effect for a given combination of soil, plant and nuclide [4] added to the problem regarding the broad applicability of these countermeasures and the predictability of their effects. For example, with the uptake of Cs and Mn by beans, the sand/clay TF ratio was about 5 and 7, respectively, whereas for spinach this ratio was 2 for Cs and 4 for Mn. However, some general conclusions can be drawn:
(a) The TFs most affected by liming were those for Sr, Mn and Zn. The effect on the latter two nuclides was remarkably small (cf. results given in Ref. [5]). The results for spinach (as opposed to those for beans) were not consistent with the idea that the application of lime would give the most protection on soils low in Ca (i.e. on sand).
(b) Organic matter seemed to reduce the transfer of Co, Cs and Sr and to slightlyenhance that of Zn and Mn. The effect of organic matter on the uptake of Srmay be due to the lime which was added at the same time.
(c) No systematic changes were induced by varying the amounts of fertilizeradded.
(d) TFs are low on soils with a high clay content (or on enriched, buffered soils in general) as compared with TFs on sandy soils (or nutrient deficient soils in general). Intervention levels for application of countermeasures against radionuclide transfer thus will be lower on sandy soils. Some countermeasures that were hardly effective on sandy soils would be ineffective on clay soils.
(e) Observed differences in TF between the three types of soil were comparable to or smaller than observed differences in TF between the two plant species, even though the chemical and structural characteristics of the soils are quite diverse [1]. The effects of an aspecific, chemical amendment, such as the application of organic matter, thus will often be small even when changing the overall nature of a soil. This means that in buffered agricultural systems there is much more scope for producing uncontaminated crops by selecting plant species with a lower inherent capacity to accumulate a given nutrient or radionuclide [6-8] than there is by changing the composition of the soil.
(f) Dilution of 65Zn and 54Mn with stable isotopes reduced their TFs, although not consistently (the mean relative TF of 1.05 for the combination Mn-spinach-sand is strongly affected by one TF value of about 3). Higher TFs might be explained by an enhanced uptake of Zn and Mn resulting from increased levels of these elements in the soil solution. Indeed, the plant specific relationship between the bioavailable concentration of an element and the uptake rate determines the net effect of an isotopic dilution. In order to be effective, stable isotopes of heavy metals such as Co, Mn and Zn would have
4. D I S C U S S I O N A N D C O N C L U S I O N S

IAEA-SM-306/2 171
to be applied in such quantities that they might cause an intoxication of the plant and/or food chain. As a result problems of radioactive contamination might be replaced by problems of heavy metal pollution.
(g) Chemical amendments only affect transfer to foodstuffs, whereas deep ploughing, though reducing yield and having a limited applicability, will also diminish external exposure and minimize dispersion of radioactive dust [9]. These advantages are important when transfer is low. On the average, transfer will be reduced by a factor of 2 (to 3) by applying this measure [9].
ACKNOWLEDGEMENTS
This research was supported by contract BI6-036-NL of the DG XII RadiationProtection Programme of the Commission of the European Communities. Theauthors wish to thank R. de Graaf-Weijgers for technical assistance and A. Kooymanand collaborators for maintenance of the lysimeter facilities.
REFERENCES
[1] STOUTJESDIJK, J.F., et al., “The determination of soil plant transfer factors of
Mn-54, Co-60, Zn-65, Sr-90 and Cs-137 under natural circumstances”, The Transfer
of Radioactive Materials in the Terrestrial Environment Subsequent to an Accidental
Release to Atmosphere (Proc. Sem. Dublin, 1983), Vol. 1, CEC, Luxembourg (1983)
329-351.
[2] S C H O U W E N B U R G , J.C., W A L I N G A , I., Methods of Analysis for Plant Material,
MS c Course on Soil Science and Water Management, Agricultural Univ., Wageningen
(1978).
[3] M U B A R A K , A., OLSEN, R.A., Immiscible displacement of the soil solution by cen
trifugation, Soil Sci. Soc. Am. J. 40 (1976) 329-331.
[4] ADRIANO, D.C., D E L A N E Y , М., PAINE, D., Availability of cobalt-60 to corn and
bean seedlings as influenced by soil type, lime and DTPA, Commun. Soil Sci. Plant
Anal. 8 (1977) 615-628.
[5] M E N G E L , K., KIRKBY, E.A., Principles of Plant Nutrition, Int. Potash Inst.,
Worblaufen-Berne, Switzerland (1978) Chs 14-15, pp. 441-461.
[6] NISHITA, H., R O M N E Y , E.M., LARSON, K.H., Uptake of radioactive fission
products by crop plants, Agrie. Food Chem. 9 (1961) 101-106.[7] EVANS, E.J., D E K KER, A.J., Comparative Cs-137 content of agricultural crops
grown in a contaminated soil, Can. J. Plant Sci. 48 (1968) 183-188.[8] FRISSEL, M.J., KOSTER, J., Soil-to-Plant Transfer Factors of Radionuclides:
Expected Values and Uncertainties, A Summary of Available Data, 5th Rep. of IUR
Soil-to-Plant Working Group, Bilthoven (1987) 2-25.
[9] LÓNSJÓ, H., “Mouldboard ploughing as a remedial measure for contaminated land”,
Proc. Det Fjerde Nordiske Radioekologiseminar, Gol, Norway, 1985.


IAEA-SM-306/104
T R A N S F E R O F 137C s
F R O M C H E R N O B Y L F A L L O U T
T O M E A T A N D M I L K I N H U N G A R Y
Z. KESZTHELYI*, J.E. JOHNSON**, B. KANYÁR + , A. KEREKES + , U.P. KRALOVANSZKY + +, G.M. WARD**
* PROTEINVEST,Budapest, Hungary
** Colorado State University,Fort Collins, Colorado,United States of America
+ Frédéric Joliot-Curie National Research Institute for Radiobiology and Radiohygiene,
Budapest, Hungary
+ + National Committee for Technical Development,Budapest, Hungary
Abstract
T R A N S F E R O F 137Cs F R O M C H E R N O B Y L F A L L O U T T O M E A T A N D M I L K IN
H U N G A R Y .
Air, soil, forage, milk and meat samples were analysed for ,37Cs and U4Cs following
the Chernobyl accident. Deposition of fallout varied widely, the heaviest being in north
western Hungary. Controlled experiments were conducted on State farms at four locations to
determine the transfer coefficients from forage to the milk (Fm) of cows, sheep and goats and
to the meat (Ff) of cows and sheep, goats and roe deer. Forage contaminated by Chernobyl
fallout in late May of 1986 produced lower F m and Ff values than worldwide fallout in the
1960s because the form of 137Cs deposited on forage was less available to cattle and sheep.
The lower transfer has important implications for assessing the dose commitment of the human
population. The second cutting of forage in 1986 and all cuttings in 1987 had greatly reduced
concentrations of l37Cs but the F m and Ff values were much higher, thereby suggesting that
after removal of the original deposition the l37Cs in plants was in a more soluble form. Roe
deer were fed the same hay as sheep for 50 days and the Ff was 0.35 for deer meat and 0.08
for sheep meat. Cattle fed the same hay produced beef with an Ff of 0.007. Potassium ferric
hexacyanoferrate was fed at 0.3 or 0.6 g/d to lactating goats for 9 weeks. The F m and Ff
values were reduced to about 20% of those for the controls.
173

174 K E S Z T H E L Y I et al.
In 1986 through 1988 a series of experiments was conducted to determine the transfer coefficients from forage, contaminated as a result of the Chernobyl reactor accident, to the milk (Fm) of cows, sheep and goats and to the meat (Ff) of cows, sheep, goats and roe deer.
1.1. Locations of the experiments
The experiments were conducted at four locations, on the Mezókeresztes State Farm (located in northeastern Hungary), on the co-operative farm of Kisnémedi (northeast of Budapest), on a State farm on the south side of Lake Balaton and on the experimental farm of the Hódmezóvásárhely Animal Breeding Faculty of the Agricultural University of Debrecen in southeastern Hungary.
As it did in other countries [1], the amount of deposition varied widely in Hungary; significant variation was observed even across relatively short distances [2].
1.2. Experimental methods
At Mezókeresztes on 26 July 1986, two groups of four cross-bred dairy cows (Red Friesian X Fleckvieh) were selected from the herd. One group was fed about 15 kg of alfalfa hay (with an average 137Cs concentration of 300 Bq/kg) harvested on 22 May 1986; the other group was fed about 30 kg of second cutting green alfalfa, harvested daily (with an average 137Cs concentration of 4.2 Bq/kg). Both groups received 2 kg of grain mix, the ingredients of which were harvested in 1985 prior to the Chernobyl fallout. The experiments ended on 8 September. Hay samples were collected weekly; green cut alfalfa and the composite milk (including a sample from each cow) of each group were sampled twice a week. All the cows were slaughtered at the end of the experiment and 1 kg of muscle tissue was removed from each cow and then ground for analysis.
Both trials were repeated during the period from late June through August of 1987 at Kisnémedi. Nine cows were individually fed the first cut hay of 1986 (with an average 137Cs concentration of 2850 Bq/kg); ten cows received green chop, i.e. green cut forage (with an average l37Cs concentration of 34.3 Bq/kg). In addition to the semi-ad-libitum fed (fed to appetite) forage (about 12 kg of hay and 35 kg of green chop), the cows were fed 5 kg of grain mix. The green feeding experiment lasted 5 weeks, the hay feeding experiment 10 weeks. The sampling methods were the same as described above. Five of the cows fed hay were slaughtered at the end of the experiment and two muscle samples were taken per cow.
At a State farm on the south side of Lake Balaton, the milk of four grazing cross-bred beef cows (Hereford X Fleckvieh), selected from the herd, was sampled
1. E X P E R I M E N T S

IAEA-SM-306/104 175
weekly. Pasture forage samples were also collected each week. The average 137Cs concentration of the pasture forage was 85 Bq/kg. Feed intake was estimated to be 50 kg/cow (wet weight) using local experimental data.
In 1986 two groups of four lactating Merino sheep of 50 kg average weight were selected at the Mezókeresztes State Farm. Four ewes received 2 kg of hay and four ewes received 4 kg of green cut alfalfa per day. Each ewe was also fed 1 kg of grain mix. All the feeds were the same as in the experiments with the cows. Milk samples were collected over several days per week to provide sufficient volume for samples. Muscle samples were collected after slaughter of the animals.
In 1988, 10 lactating ewes were fed 2.5 kg of hay and 0.6 kg of grain mix per day for 10 weeks at Hódmezóvásárhely. They were fed the same hay as the cows at Kisnémedi. Composite milk was sampled once a week, hay and grain mix twice a week. Five ewes were slaughtered at the end of the experiment and two muscle samples per animal were taken.
Three roe deer were also fed the same hay as above for 50 days at Hódmezóvásárhely. The roe deer received 0.3 kg of hay and 0.1 kg of grain mix. On the last day of the experiment, muscle samples were collected after the animals were slaughtered.
In 1988 six goats were fed 1.12 kg of pelleted first cut alfalfa harvested in 1986 plus 0.5 kg of grain mix. The average 137Cs concentration of the pellets was 1094 Bq/kg. The trial continued for 63 days and was divided into two phases. During Phase 1 (0-35 d), each of three goats (Group B) received 0.3 g of potassium ferric hexacyanoferrate (PFCF) per day in the grain mix, while three goats were not given PFCF (Group A). In Phase 2, Group A was separated into two groups. Group A l (1 animal) received no PFCF, while each animal of Group A2 (2 goats) and of Group В (3 goats) was given 0.6 g of PFCF per day. A sample of feed was taken weekly. Milk was sampled once a week in Phase 1 and twice a week in Phase 2. On the 63rd day, all animals were slaughtered and two muscle samples per goat were taken.
Soil and forage samples were also taken at 12 locations around the country to compile data for the soil to plant transfer factor (Bv).
Hay and meat samples were ground; green forage samples were dried and ground. Gamma spectrometry for 134Cs, l37Cs and 40K was performed with Ge(Li) detectors and the spectra were analysed with a Canberra 8180 4096 channel analyser at the National Research Institute for Radiobiology and Radiohygiene.
2. RESULTS AND DISCUSSION
As the ratio of 137Cs and 134Cs was very constant, only the 137Cs data are presented here. The Fm and Ff transfer coefficients are presented in Table I. At Mezókeresztes the transfer coefficient for milk of cows fed alfalfa was higher by an

176 K E S Z T H E L Y I et al.
TABLE I. 137Cs TRANSFER COEFFICIENTS TO MILK (Fm) AND MEAT (Ff)
AnimalPrincipal
feedLocation Harvest time
Transfer
coefficient (IO-3*
F m (d/L) Ff (d/kg)
Dairy cow Hay Mezókeresztes May 1986 1.6 5.7
Dairy cow Hay Kisnémedi May 1986 2.7 6.9
Dairy cow Green chop Mezókeresztes 1986-6-26-9-2 20.5 96
Dairy cow Green chop Kisnémedi 1987-7-9-8-6 12.5 NS
Beef cow Pasture grass Balaton 1986-7-9-9-25 7.3 NS
Ewes Hay Mezókeresztes May 1986 30 58
Ewes Hay Hódmezóvásárhely May 1986 38 82
Ewes Green chop Mezókeresztes 1986-6-26-9-2 324 1300
Roe deer Hay Hódmezóvásárhely May 1986 — 350
NS: No samples.
order of magnitude than for milk produced from hay grown at the same farm. The Fm values were 2 X 10 ~2 and 1.6 x 10 ~3, respectively. The Fm value for milk of beef cows was intermediate between the values for hay and green chop feeding. In 1987 both the results of green chop and hay feeding were well reproduced; the transfer coefficient was found to be 1.2 x 10 ~2 for green chop feeding and 2.7 X 10 ~3 for hay feeding.
The Fm values for cows fed hay are in good agreement with the results of other post-Chernobyl studies carried out in western Europe soon after the accident (most of them ranging from 1 X 10⁻³ to 4 X 10“ 3), and are lower than the transfer coefficients found in the studies of worldwide fallout in the 1960s [3]. However, the Fm values for cows fed green cut forage are significantly higher.
Data on beef and on sheep substantiate the different potential for uptake of Chernobyl fallout in two types of forage: (1) hay harvested when direct fallout was present, and (2) green chop harvested after the direct fallout was removed by the first cut.
The meat transfer coefficients for cows fed hay were 5.4 x 10 ~3 and 6.9 x 10⁻³. The Ff value for cows fed green cut alfalfa was 9.6 x 10⁻². In a way similar to the milk transfer coefficients, the Ff values for hay fed cows are lower while the values for cattle consuming green chop are higher than those from the

IAEA-SM-306/104 177
PH ASE 1 PHASE 2
Time (d)О Group A1 □ Group A2 $ Group В
FIG. 1. l37Cs concentrations in goat milk (estimated standard errors of the concentrations
about 20%).
studies of the worldwide fallout. The mean Ff value for the studies in the 1960s was2 X 10 ~2 as reported by Ng [4]. Johnson et al. [5] found an Ff of 1.5 x 10 ~2 when cows were fed hay.
The Fm and Ff values for sheep were approximately tenfold higher than the values for cows, showing a similar difference between hay and green chop feeding. Hay fed sheep showed milk transfer coefficients of 3 X 10⁻² and 3.8 X 10~2 as compared to 1.6 X 10 _3 and 2.7 x 10 ~3 for cows, while sheep fed green cut alfalfa had an Fm of 3.2 x 10_l as compared to cows with 2 X 10 ~2 and1.2 x 10 ~2. This order of magnitude of difference was expected. Meat transfer coefficients for ewes which were fed hay were 5.8 x 10⁻² and 8.2 x 10~2.
The transfer coefficients were much lower when animals were given feed contaminated immediately after the Chernobyl fallout than the coefficients when animals were fed forage produced after detectable fallout had disappeared from the atmosphere. The magnitude of these latter Fm and Ff values is similar to that obtained by oral dosing of carrier free radiocaesium, probably because the 137Cs in forage harvested later originated principally from plant uptake; therefore, the 137Cs was in a more soluble form than the 137Cs in the immediate fallout [5].
The average l37Cs concentration of the meat samples of the roe deer was 307 Bq/kg (the range being from 240 to 370 Bq/kg) and the mean transfer coefficient was 0.35. A transfer coefficient of a similar order of magnitude (0.65) was calculated for reindeer [6].

178 K E S Z T H E L Y I et al.
TABLE II. 137Cs TRANSFER COEFFICIENTS TO MILK AND MEAT OF GOATS
Group
F m (d/L)
- Ff (d/kg)
Phase 1 Phase 2
A l a 0.034 0.039 0.12
A 2 b 0.033 0.015 0.043
B c 0.012 0.008 0.026
a Goats received no PFCF.
b Goats received 0.6 g/d of PFCF in Phase 2.
0 Goats received 0.3 g/d of PFCF in Phase 1; 0.6 g/d of PFCF
in Phase 2.
The changes in 137Cs concentration in milk with time for each goat are presented in Fig. 1. The l37Cs concentration in the milk of Group A increased rapidly over the first week, then increased more slowly until the fifth week. During the fifth week when the milk of Groups A1 and A2 was sampled separately, there was no significant difference between the two groups. From the beginning of Phase 2 when goats of Group A2 were given 0.6 g of PFCF per day, the 137Cs content in the milk of this group decreased rapidly until it was as low as about 30% of that of the control group (Group A l). The concentration of Group A1 remained at about the same level.
The caesium content in the milk of Group В was increasing but at a diminishing rate until the 35th day when the intake of PFCF was doubled. At the end of Phase 1, the 137Cs level in the milk of Group В was about 30% of that of the control group. During the next 14 days, the 137Cs content of the milk decreased then fluctuated at about that level.
The transfer coefficients to the milk and meat of goats are presented in Table II.
The Fm for Group A l for Phase 2 (stage of equilibrium) is 3.9 x 10⁻², a value very close to the Fm for ewes which were fed hay. Wassermann et al. [7] calculated a 3.7 X 10~2 milk transfer coefficient for goats [7]. The Fm for Group A2 in Phase 2 was 1.5 X 10 _2; for the last two and one half weeks of the trial it was1.2 X 10~2. For Group B, the Fm increased slightly during the first five weeks; then — when the PFCF intake was increased — the Fm decreased. The Fm calculated for Phase 2 is 7.9 x 10 ~3, an order of magnitude lower than for Group A l. A small amount of PFCF reduced the transfer of caesium to 20% of that of the controls. Perhaps an even greater intake of PFCF would have produced a greater effect.

IAEA-SM-306/104 179
The largest amount of 137Cs was found in the muscle samples of Group A l and the least in those of Group B. The ratio of Ff for Group В to Ff for Groups A2 and A l is similar to that found for the Fm values. Meat transfer coefficients for Groups A l, A2 and В are 0.12, 0.043 and 0.026, respectively.
Caesium absorption was inhibited successfully by PFCF. However, another member of the group of ferrocyanides, ammonium ferric-cyanoferrate (AFCF), that was not available in Hungary at the time of the experiment, is even more efficient in radiocaesium binding and excretion, as was demonstrated in experiments by Giese [9, 10].
Soils sampled in 1987 to obtain data for Bvs were of different types; most of them, however, were loamy. Very sandy soil was found only at one site. The Bv values ranged from 6.5 X 10 ~2 to 28 x 10 ~2, while for the very sandy soil an apparently higher value of 44 X 10 ~2 was calculated. The Bv was calculated as the ratio of the concentration in dry vegetation to the concentration in the upper 30 cm of dry soil.
ACKNOWLEDGEMENTS
This research was supported by the National Committee for Technical Development in Budapest and by a grant from the National Science Foundation in Washington, D.C. We express appreciation to G. Vidacs for planning feeding trials on the farms in Hungary, to T. Pécsi for supervising the trials at Mezókeresztes and to G. Kovács and I. Mucsi for supervising the experiments at Hódmezóvásárhely. We are grateful also to several members of the staff of the National Research Institute for Radiobiology and Radiohygiene in Budapest for the analytical work.
REFERENCES
[1] C O U G H T R E Y , P.J., KIRTON, J.A., MITCHELL, N.G., “Caesium transfer and
cycling in upland pastures”, paper presented at C E C Workshop on the Transfer of
Radionuclides to Livestock, Oxford, 1988.
[2] BIRÓ, T., FEHÉR, I., SZTANYIK, L.B., Radiation Consequences in Hungary of the
Chernobyl Accident, Hungarian Atomic Energy Commission, Budapest (1986).
[3] W A R D , G.M., KESZTHELYI, Z., K A N Y Á R , B., K R A L O V A N S Z K Y , U.P.,
JOHNSON, J.E., Transfer of Cs-137 to milk and meat in Hungary from the Chernobyl
fallout with comparisons of worldwide fallout in the 1960s, Health Phys. (in press).
[4] NG, Y.C., A review of transfer factors for assessing the dose from radionuclides in
agricultural products, Nucl. Saf. 23 (1982) 57-71.
[5] JOHNSON, J.E., TYLER, T.R., W A R D , G.M., Transfer of caesium-137 from feed
to meat of cattle, J. Anim. Sci. 29 (1969) 695-699.
1 8 0 K E S Z T H E L Y I et al.
[6] JONES, B.E.V., ERIKSSON, О., NORDKVIST, М., “Radiocesium uptake in
reindeer on natural pasture”, paper presented at C E C Workshop on the Transfer of
Radionuclides to Livestock, Oxford, 1988.
[7] W A S S E R M A N N , R.H., C O M A R , C.L., T W A R D O C K , A.R., Int. J. Radiat. Biol. 4 (1962) 299.
[8] A R N A U D , M.J., et al., Synthesis, effectiveness and metabolic fate in cows of the
caesium complexing compound ammonium ferric-hexacyanoferrate labelled with C-14,
J. Dairy Res. 55 (1988) 1-13.
[9] GIESE, W.W., Ammomum-ferric-cyano-ferrate(II) (AFCF) as an effective antidote
against radiocaesium burdens in domestic animals and animal derived foods, Br. Vet.
J. 144 (1988) 1-13.[10] GIESE, W.W., Reduction of gastrointestinal radiocesium absorption in domestic
animals by a special feed additive: ammonium ferric cyanoferrate (AFCF) (in
preparation).

IAEA-SM-306/39
E X P E R I E N C E W I T H T H E U S E
O F C A E S I U M B I N D E R S T O R E D U C E
R A D I O C A E S I U M C O N T A M I N A T I O N
O F G R A Z I N G A N I M A L S
K. HOVE, H.S. HANSEN Department of Animal Science,Agricultural University of Norway,Às
P. STRANDNational Institute of Radiation Hygiene,0sterâs
Norway
Abstract
EX P E R I E N C E W I T H T H E US E O F C A E S I U M BINDERS T O R E D U C E R A D I O
C A E S I U M C O N T A M I N A T I O N O F G R A Z I N G ANIMALS.
Bentonite and ammonium iron-hexacyanoferrate(II) (AFCF) were used as caesium
binders in domestic animals in Norway after the Chernobyl accident. Experiments carried out
to test the efficiency of A F C F under field conditions are reported in the paper. Radiocaesium
activity of goat milk was reduced by 80-95% after inclusion of A F C F (1 g/kg) in dairy con
centrate mixtures. For sheep, salt licks containing 25 g AFCF/kg were distributed in three
experimental areas. Reductions in whole body radioactivity of 25-75% were observed at the
end of the grazing period, compared to those reductions observed in non-treated sheep in
neighbouring areas. A sustained release bolus (bowel tablet) delivering A F C F to the rumen
has been developed. Treatment of lambs grazing contaminated pasture resulted in a 50%
reduction in whole body radioactivity. The reduction developed in three weeks and lasted for
a further six weeks. In goats an 80-90% reduction in radiocaesium transfer from feed to milk
was obtained over a period of 45 d. Biological half-lives of radiocaesium under farm condi
tions were on average 21 d for lambs and 26.5 d for adult sheep.
1. INTRODUCTION
In Norway, the fallout from the Chernobyl accident was deposited mainly in mountain areas which are heavily used by grazing animals. Herbivores accumulate large quantities of radiocaesium while grazing on contaminated natural mountain pastures. Feeds harvested on cultivated pastures, however, are usually low in radiocaesium and may be used freely as feed for farm animals. In 1988, about 30% of
181

182 H O V E et al.
the sheep (0.35 million) [1] contained too high a level of radiocaesium to be marketed directly. Uncontaminated feed had to be given for periods of 4-12 weeks before slaughter in order to reduce radiocaesium activity to below the permitted limit of 600 Bq/kg of I34Cs and 137Cs. Products from goats and reindeer also exceeded acceptable limits in many contaminated areas. A total of NOK 340 million (US $49 million) was used to reduce the radiocaesium content of animal products during the years 1986-1988 [1].
The ecological half-life of radiocaesium from atmospheric nuclear weapons tests was estimated recently to be 20 years for the production of lamb meat on mountain pastures in Norway [2]. Continued research to develop efficient strategies for the reduction of radiocaesium in grazing animals is, therefore, of importance.
1.1. Strategies
Radiocaesium in animals or animal products may be affected by procedures which alter the handling of caesium in the organism. Reduction in radiocaesium content may be achieved through uncontaminated feeds, by procedures which increase excretion, or by procedures which reduce absorption. Net gastrointestinal absorption of caesium is 50-80% [3-6]. The most efficient way to control radiocaesium accumulation appears to be by means of caesium binders which reduce absorption. The best effect of caesium binders is obtained when the binders are available continuously in the gut. Caesium binders used for ruminants include bentonites, zeolites and various complexes of hexacyanoferrate (HCF). Binders in the gastrointestinal tract make radiocaesium less available for absorption.
1.2. Bentonite
Bentonite has been widely used as a caesium binder in ruminants. The mineral is fed as a powder or mixed with concentrates. Absorption of radiocaesium was reduced by 90% in feeding experiments with a 10% inclusion of bentonite in concentrate (50 g/d) [5, 6]. In Norway, a reduction of about 75% was obtained by feeding 50 g/d of bentonite in a 10% concentrate mixture [7]. The doses of bentonite required to reduce absorption of radiocaesium are considerable and may interfere with the digestion of nutrients and other minerals. The results published are so far inconclusive [7,8].
1.3. Zeolites
Zeolites appear to have a higher binding capacity for caesium but are still required to be fed in gram quantities to sheep and goats to achieve significant reduction in body burdens of radiocaesium [9-12].

IAEA-SM-306/39 183
1.4. Hexacyanoferrates (HCFs)
Many HCF(II) complexes will bind caesium by ion exchange. Complexes with Fe, Cu, Co or Ni have been studied and recent in vitro experiments ranked KCuHCF and KZnHCF as the most efficient caesium binders [13]. The most studied binder is the ammonium iron-hexacyanoferrate(II) (AFCF). The ammonium ion is exchanged for alkali ions with relative affinities for Na, K, Rb and Cs of 1:10:1000:10 000 in in vitro experiments [14]. The compound is stable in the gastrointestinal tract and binds caesium at low concentrations [15—19]. In both laboratory and field experiments with lactating goats, AFCF was 500-1000 times more active than bentonite on a weight basis [7]. The small quantities required make AFCF an attractive alternative to bentonite in concentrate rations and provide new opportunities for the administration of caesium binders. In our studies we have used AFCF containing 36% ammonium chloride.
2. RESULTS AND DISCUSSION
2.1. Caesium binders for lactating animals
It is feasible to administer caesium binders in the concentrates fed to dairy animals. A dairy standard concentrate with 5% bentonite added has been available since the summer season (June-September) of 1986 in Norway. The reduction in milk radiocaesium of about 50-60% has not been satisfactory in all districts. In 1989, bentonite was replaced by AFCF (1 g/kg concentrate). This change in the use of the caesium binder brought about a reduction of up to 90-95% of the radiocaesium content of the goat milk (Fig. 1) in herds fed 0.5 kg concentrate per day.
2.2. Caesium binders for grazing animals
Animals used for meat production are usually sent to mountain pastures in May or June and not treated until September. Much could be gained, however, by controlling the accumulation of radiocaesium during the grazing season. In Norway, salt licks with AFCF were developed in 1986 and were used generally during the grazing season of 1989. In addition, a slow release bolus (bowel tablet) with AFCF has also been developed.
2.2.1. Salt licks
From June to September of 1988, experiments to test the effect of 10 kg sodium chloride blocks containing 2.5% AFCF were carried out. The body burdens of radiocaesium in sheep were measured monthly in 10-30 animals with a portable

184 H O V E et al.
FIG. I. Levels of radiocaesium in milk from goats grazing highly contaminated mountain
pastures in Valdres, Norway. Pooled samples of milk from 80 goats fed ammonium
iron-hexacyanoferrate (AFCF) (0.5 g/d) and from 80 goats not fed a caesium binder (control).
3 in Nal(Tl) detector linked to a multichannel analyser (Canberra series 10). The experiment was carried out in three districts contaminated by fallout from the Chernobyl accident. Sheep from a neighbouring area where ordinary sodium chloride salt licks were used served as a reference group. A significant reduction in the accumulation of radiocaesium was observed in the groups which had access to the AFCF salt licks. The results from the most contaminated areas (Flyvann, Valdres) are shown in Fig. 2. In both groups the increase from July to August was probably caused by a large growth of fungal fruit bodies in natural pasture. The radiocaesium levels were up to 100 times higher than the levels in green vegetation in several species of fungi selected by grazing animals [20]. Sheep which had access to the AFCF licks contained only 25 % of the radiocaesium levels observed in the reference group at the end of the grazing period. However, care must be used in the interpretation of the quantitative difference between the control and the AFCF treated groups since the sheep grazed in different pastures.

IAEA-SM-306/39 185
The results from the 1988 grazing season indicate that salt licks with AFCF
may be a simple and cost effective method to reduce the accumulation of radio
caesium. In 1989 AFCF salt licks replaced ordinary licks in the most contaminated
mountain areas. In 1989 the total costs of decontamination were reduced by 50%
from the year 1987, whereas the radiocaesium load from fungi was similar to 1989.
A great part of this reduction can be attributed to the use of AFCF salt licks, since
radiocaesium levels in the vegetation were close to the same level.
2 .2 .2 . Susta in ed re lea se bo lus
A sustained release bolus placed in the rumen of a grazing animal provides a
means of continuous delivery of the caesium binder, AFCF, during a period of weeks
or months after treatment. Boli of varying compositions have been given to goats,
sheep and reindeer.
M O NTH
FIG. 2. Radiocaesium concentration (mean ± SD, n = 10-30) in sheep which had access to
salt licks with 2.5% AFC F and in sheep in a neighbouring area, which were offered ordinary
salt licks.

186 HOVE et al.
TIM E (d)
FIG. 3. M ilk radiocaesium concentration from goats given 2000 Bq/d l34CsCl. Control:
mean ± SD o f 10 animals provided no caesium binder. Bolus: individual milk concentration
in two animals treated at day 0 with an A FC F containing bolus.
The effect of AFCF boli on the transfer of daily doses of 2000 Bq l34CsCl to
goat milk is shown in Fig. 3. In control goats, 10% of the daily ingested dose of
radiocaesium was secreted per litre of milk, while transfer in treated goats remained
at 1.5-2% for a period of 45 days.
In an experiment with lambs, five sets of twins reached meat radioactivity
levels of 1400 Bq/kg after a grazing period of 4 weeks on pasture with 3000 Bq/kg
dry matter. One twin of each pair was untreated, whereas the other received two
boli, each containing 5 g AFCF. The ewes were left untreated. In treated lambs,
radiocaesium concentration decreased during the three first weeks to about
700 Bq/kg (50% reduction). No further decline was obtained, but the difference in
meat radioactivity was maintained throughout the experiment (Fig. 4). Similar
degrees of reduction were obtained during the 1989 grazing season in field trials
involving several hundred sheep. The reduction was equivalent to what can be
achieved by feeding sheep uncontaminated feed for three weeks.

IAEA-SM-306/39 187
Knowledge of biological half-lives is required to estimate the time required to
feed uncontaminated forage in order to reduce radiocaesium levels below the limit
permitted for slaughter. Considerable differences may be expected in the estimates
of half-lives determined in metabolism cages and those estimates made under practi
cal conditions on the farm. The half-life appeared to be independent of the use of
either bentonite [7] or AFCF salt licks when uncontaminated feeds were offered.
Forty lambs were measured weekly for eight weeks by a whole body monitor.
The excretion curves could best be explained by a two compartment model where
75% was excreted with a half-life of 12 d and 25% with a half-life of 35 d. These
results are comparable to an initial biological half-life of 10 d estimated in the United
Kingdom for lambs moved from contaminated to uncontaminated pasture [21]. For
practical purposes, however, one half-life is simpler to use. Data from three herds
2 .3 . B io lo g ic a l h a lf- l iv e s
D A Y S O N C O N T A M IN A T ED PASTURE
FIG. 4. Radiocaesium activity in five sets o f twin lambs grazing contaminated pasture fo r
13 weeks (mean ± SD). One twin o f each pa ir was treated after 4 weeks with boli releasing
AFCF, while the other was kept as control.

188 HOVE et al.
with different levels of contamination obtained during 4-8 weeks of feeding uncon
taminated feeds resulted in half-lives of 21 d for lambs and 26.5 d for adult sheep.
In Norway a biological half-life of 21 d has been adopted by the Government for
determining the time period required before slaughter of contaminated lambs.
REFERENCES
[1] S T R A N D , P ., B R Y N IL D S E N , L . I . ,H A R B IT Z , 0 . , T V E T E N , U .,IAEA-SM -306/36,
these Proceedings, V o l. 2.
[2 ] H O V E , K ., S T R A N D , P ., IAEA-SM -306/40, ibid., V o l. 1.
[3 ] D A V IS , J.J., “ Cesium and its relationships to potassium in eco logy” , Radioecology
(Proc. Int. Symp. Colorado, 1961) (S C H U L T Z , V ., K L E M E N T , A .W . Jr., Eds),
Reinhold, N ew York (1961) 539-556.
[4] V A N D E N H O E K , J., The influence o f bentonite on caesium absorption and
metabolism in the lactating cow , Z . T ierphysiol., Tierernnâhr. Futtermittelkd. 43
(1980) 101-109.
[5] V A N D E N H O E K , J., Caesium metabolism in sheep and the influence o f orally
ingested bentonite on caesium absorption and metabolism, Z . T ierphysiol., Tierernahr.
Futtermittelkd. 37 (1976) 315-321.
[6] A N D E R S S O N , I., Transfer o f 137Cs from feed to lambs meat and the influence o f
feeding bentonite, Swed. J. Agrie . Res. 19 (1989) 85-92.
[7] H O V E , K ., E K E R N , A ., “ Combating radiocaesium contamination in farm animals” ,
Health Problems in Connection with Radiation from Radioactive Matter in Fertilizers,
Soils and Rocks (L À G , J., E d.), Norwegian University Press, Oslo (1988) 139-154.
[8] R IN D S IG , R .B ., S C H U L T Z , L .H ., E ffect o f bentonite on nitrogen and mineral
balances and ration digestibility o f high-grain rations fed to lactating dairy cows,
J. Dairy Sci. 53 (1970) 888-892.
[9] P H IL L IP P O , M ., et al., Reduction o f radiocaesium absorption by sheep consuming
feed contaminated with fallout from Chernobyl, Vet. Rec. 122 (1988) 560-563.
[10] FO R BE RG , S., JONES, B ., W E S T E R M A R K , T ., Can zeolites decrease the uptake
and accelerate the excretion o f radiocaesium in ruminants? Sci. Total Environ. 79
(1989) 37-41.
[11] H A Z Z A R D , D .G ., W IT H R O W , T .J., B R U C K N E R , B .H ., Verxite flakes for in v ivo
binding o f cesium-134 in cows, J. Dairy Sci. 52 (1969) 995-997.
[12] H A Z Z A R D , D .G ., Percent o f cesium-134 and strontium-85 in m ilk, urine and feces
o f goats on normal and verxite-containing diets, J. Dairy Sci. 52 (1969) 990-994.
[13] N IE L S E N , P ., D R ESO W , B ., H E IN R IC H , H .C ., In vitro study o f l37Cs sorption by
hexacyanoferrates (I I ) , Z . Naturforsch. 42b (1987) 1451-1460.
[14] W A T A R I, K ., IM A I, K ., IZ A W A , М ., Radiochemical application o f iron
ferrocyanide-anion exchange resin, J. Nucl. Sci. Technol. 6 (1968) 309-312.
[15] A R N A U D , M .J ., et al., Synthesis, effectiveness and metabolic rate in cows o f the
caesium complexing compound ammonium ferric hexacyanoferrate labelled with l4C,
J. Dairy Res. 55 (1988) 1-13.

IAEA-SM-306/39 189
[16] G IESE, W .W ., Am m onium -ferric-cyano-ferrate(II) (A F C F ) as an effective antidote
against radiocaesium burdens in domestic animals and animal derived foods, Br. Vet.
J. 144 (1988) 363-369.
[17] M Ü L L E R , W .H ., D U C O U SSO , R ., C AU SSE , A . , W A L T E R , C ., Long-term treat
ment o f caesium-137 contamination with colloidal and a comparison with insoluble
Prussian blue in rats, Strahlentherapie 147 (1974) 319-322.
[ 18] R U D N IC K I, S ., Zur Verminderung der Radiocàsiumbelastung in Muskulatur und inne-
ren Organen von Mastschweinen nach Zufiitterung von Ammonium-Eisen-
Hexacyanoferrat, Dissertation, Tierârztliche Hochschule, Hanover (1988).
[19] G IESE, W ., H A N T Z S C H , D ., Vergleichende Untersuchungen über die Cs-137-Eli-
minierung durch verschiedene Eisenhexacyanoferratkomplexe bei Ratten, Zentralbl.
Veterinârmed., Reihe A 11 (1970) 185-191.
[20] H O V E , K ., PE D E R SE N , 0 . , G A R M O , T ., H A N S E N , H .S, S T A A L A N D , H ., Fungi:
A major source o f radiocaesium for grazing ruminants in Scandinavia (in press).
[21] H O W A R D , B.J., BERESFO RD , N .A . , B U R R O W , L ., S H A W , P .V ., C U R T IS ,
E .J.C ., A comparison o f caesium-137 and 134 activity in sheep remaining on upland
areas contaminated by Chernobyl fallout with those removed to less active lowland
pasture, J. Soc. Radiol. Prot. 7 (1987) 71-73.


IAEA-SM-306/36
M E A S U R E S IN T R O D U C E D IN N O R W A Y A F T E R T H E C H E R N O B Y L A C C ID E N T A cost-benefit analysis
P. STRAND
National Institute of Radiation Hygiene,
0 sterâs
L.I. BRYNILDSEN
Ministry of Agriculture,
Oslo
O. HARBITZ
Norwegian Food Control Authority,
Oslo
U. TVETEN
Institute of Energy Technology,
Oslo
Norway
Abstract
M E A SU R E S IN T R O D U C E D IN N O R W A Y A F T E R T H E C H E R N O B Y L A C C ID E N T :
A C O S T -B E N E F IT A N A L Y S IS .
In the paper, the measures introduced in N orw ay to alleviate the adverse effects o f the
Chernobyl accident, and their economic consequences, are discussed. During the three years
after the accident almost 20-30% o f the sheep and 30-40% o f the reindeer each year had
activity levels above the action limits. Activ ity levels above the action limits were also found
in goats, cattle and w ild freshwater fish. Three main approaches were used in N orw ay in order
to reduce the potential health risk after the Chernobyl accident: decreasing uptake from soil
to vegetation and from fodder to animals, lowering unacceptable activity levels in animals by
special feeding programmes, and reducing human intake by food condemnation and dietary
advice. The total value o f mutton, lamb and goat meat saved as a result o f such measures in
1987 amounted to approximately 230 m illion Norw egian kroner (N O K ) (U S $33 m illion). The
cost o f the measures was approximately N O K 40 m illion ($5.7 m illion). In 1987, the total
reduction in the radiation dose level to which the population was exposed was 450 man-Sv.
In 1988, mutton, lamb and goat meat valued at approximately N O K 290 m illion ($41 m illion)
was saved from condemnation by similar measures, which cost approximately N O K 60 m illion
($8.5 m illion). The resulting dose level reduction was approximately 200 m an-Sv. The degree
to which resources were used during 1987 and 1988 would appear to be justified in light o f
the reduction in radiation dose achieved.
191
192 STRAND et al.
After the Chernobyl accident on 26 April 1986, air masses containing large
amounts of radioactive materials passed over Norwegian territory. During the first
few critical days, rainfall caused deposition of significant amounts of radioactivity
in several parts of the country. The first measurements revealed that radioactivity
levels showed a marked geographical variation; the level was particularly high in
certain mountain areas [1].
The World Health Organization (WHO) utilizes a very broad definition of
health, which covers not only physical health, but also mental health and social well
being. Deposited radioactive materials may lead to adverse effects on the physical
health of the population, partly due to direct radiation from the deposited materials,
and partly to intake through air (resuspension/inhalation), drinking water and
food [2]. The Chernobyl fallout undoubtedly had consequences relevant to all three
aspects of the definition used by WHO. The mental health consequences arose from
concern about the possible detriment to physical health after the fallout. This concern
was considerable [3]. The social health consequences are closely related to the men
tal consequences, though the social functioning of the individual may also be
influenced adversely if a situation like the Chernobyl accident leads to social
changes. The fallout had a particular impact on the situation for reindeer owners in
central and southern Norway, and also considerably affected sheep farmers, fresh
water fishermen and members of some other professions.
Three main actions have been taken in Norway to limit potential health risks
by reducing:
(a) Uptake by vegetation from soil through ploughing and the use of fertilizer,
etc.;
(b) Uptake by animals from fodder by using caesium binders and changing slaugh
tering time, or reducing unacceptable radioactivity levels in animals by special
feeding programmes;
(c) Intake by humans through dietary restrictions and advice.
In June 1986, the Norwegian Directorate of Health imposed action levels for
the nuclides 137Cs and l34Cs. The action levels were 370 Bq/kg for milk and baby
food, and 600 Bq/kg for all other types of food. In November 1986, the action level
for reindeer meat was increased to 6000 Bq/kg, and in July 1987 the level for wild
freshwater fish and game was also increased to 6000 Bq/kg.
Countermeasures were introduced primarily to reduce the radiation dose and,
in turn, the physical health consequences. Because the authorities have carried out
extensive monitoring to check the efficacy of the actions taken, the public has felt
assured that Norwegian foodstuffs are indeed safe; unnecessary concern and other
mental health consequences may, therefore, have been reduced. On the other hand,
1. IN T R O D U C T IO N

IAEA-SM-306/36 193
the implementation of these countermeasures has, as has already been mentioned,
had a large impact on social health in the form of disturbances to normal practices
and ways of life. For certain branches of agriculture, the problems were greater in
1988 than in 1986 and 1987. Nevertheless the actions taken have resulted in a con
siderable reduction in the radiation dose to which the population has been exposed.
A cost-benefit analysis has been carried out in order to relate the incurred costs to
the health benefits obtained.
2. REDUCTION OF RADIOCAESIUM LEVELS IN FOOD
To reduce the radiocaesium levels in food in Norway different measures were
used. In this paper the following countermeasures are described: food condemnation,
a special feeding programme including caesium binders, and change of slaughtering
time.
2.1. Sheep and goats
In most of Norway, sheep and goats are put out to graze in early June on com
mon mountain pastures where they range free until September. After the Chernobyl
accident the authorities decided not to put restrictions on the use of grazing areas for
sheep. Towards late September 1986 the content of radioactivity in mutton was found
to exceed the action level (600 Bq/kg) in a number of areas in central Norway. It
was not possible to slaughter the sheep at the ordinary time for slaughtering. The
animals had to be given special feed for a given period of time to decrease the radio
activity levels before slaughtering. Norway was divided into ‘free zones’ (below
600 Bq/kg), ‘special measure zones’ and ‘ban zones’ (only in 1986) for sheep and
goats. The delineation of zones for sheep and goats in 1986 was based upon levels
found in meat samples. From 1987 a method for live animal measurements was
available by which a selection of animals from a specific herd are measured and the
median value determined. After completion of the feeding programme, the average
activity levels in each zone proved to be well below the action limit.
In 1986, roughly 70% of the sheep were in free zones, while approximately
3% were in ban zones (average level above 2000 Bq/kg). In the latter zones, slaugh
tering proceeded as usual, but the meat was judged unfit for human consumption.
Initial plans to bury the condemned meat were later changed so that the meat could
be used to feed fur animals.
The remaining areas, containing approximately 320 000 sheep (27% of the
national flock), were referred to as special measure zones. Here the caesium content
was reduced to below the action level by the use of caesium free or low level fodder
for periods of four to eight weeks. In addition, concentrates containing bentonite (a
clay mineral proven to be a caesium binder) were also given to the animals. A half-
life of 21 days was assumed for bentonite.

194 STRAND et al.
The problem areas in 1987 were the same as those in 1986, though somewhat
smaller in size. No areas were classified as ban zones in 1987; however, roughly
77% of the sheep were in free zones, and 23% in the special measure zones. The
special feeding programme, involving a total of about 280 000 sheep, proved very
successful.
In 1988, levels of radioactive caesium in sheep were observed to jump to three
to four times those found in the previous year in many parts of the country. This was
attributed to increased intake through mushrooms, since 1988 was an exceptionally
good year for mushrooms. However, there were very high levels of radiocaesium
in the mushrooms. Roughly 30% of the sheep were in special measure zones in 1988,
and 70% in free zones. The special feeding programme involved a total of approxi
mately 360 000 sheep. Those with levels as high as 40 000 Bq/kg before the com
mencement of special feeding were included successfully in the programme.
Conditions in 1987 and 1988, however, were especially favourable for the
implementation of the special feeding programme, as the autumn in both years was
unusually mild, the first snowfall arriving unusually late.
The value of the meat salvaged from condemnation was 260 million Norwegian
kroner (NOK) (US $37 million)1, NOK 230 million ($33 million), and NOK 290
million ($41 million) in 1986, 1987 and 1988, respectively. In addition there were
costs of control and surveillance (including analytical equipment) and administration
of the programme, estimated at NOK 13 million in all. The total cost of the special
feeding programme is estimated to have been NOK 30-35 million in 1986, NOK 40
million in 1987, and NOK 60 million in 1988. The farmers received compensation
of NOK 4 per day per animal to carry out the special feeding programme. If there
were additional difficulties due to snow, low temperature, lack of indoor housing or
too high a caesium content in the local feed, transfer of the animals to other farms
or areas was approved by the authorities. Financial support was also possible for
expanding indoor animal housing at the homesteads. Farmers were also encouraged,
as an additional countermeasure, to prevent additional increases in the caesium levels
by bringing animals down from the mountain pastures earlier than customary.
The programme of surveillance, countermeasures and economic compensation
was initiated by the Ministry of Agriculture in co-operation with regional agricultural
and regional veterinary officers. Material about the programme was distributed by
the Ministry of Agriculture to about 30 000 farmers each year after the accident.
From the results of the surveillance programme and from random sampling
after the use of the special feeding programme, it was possible to calculate the
amount of radiocaesium material removed. In 1987, the total amount of l37Cs and
I34Cs removed was 7.3 x 10⁹ Bq, the corresponding figure for 1988 being
1.6 x 10¹⁰ Bq.
1 US $1 = 7 NOK.

IAEA-SM-306/36 195
In the areas with the highest fallout levels, the use of Prussian blue in saltlicks
for sheep and goats was approved by the authorities for the grazing season of 1989.
For sheep a type of rumen bolus, or bowel tablet, containing Prussian blue was tested
on free land from June to August 1989.
2.2. Cattle and horses
The Chernobyl accident happened in April, when cattle were still being fed
indoors in Norway. This minimized the problem of iodine contamination in milk.
Later, when cattle were put out to graze on contaminated mountain pastures, the
radiocaesium levels in meat and milk increased, and in the most affected areas the
levels exceeded the action limit. The milk from these areas was condemned. In 1987,
levels were somewhat similar for milk. Special feeding (of feed with caesium free
or caesium low fodder and concentrate with 5 % bentonite added) was used and after
this no cow milk had to be condemned.
Radioactivity levels in butter and cheese (apart from goat cheese, to which
reference will be made later) have been consistently low.
In the most affected areas it was decided that only animals that had been graz
ing on cultivated grass for a period of at least four weeks, or that had been fed
indoors for at least four weeks, would be approved for slaughtering. In addition to
the caesium free fodder, cattle in the affected areas were fed concentrates containing
bentonite.
From 1987 the approach taken was somewhat different. As noted above, some
areas were classified as precautionary measure zones or special measure zones,
while most parts of the country were not subject to restrictions.
In the precautionary measure zones the cattle were given special feedings for
a given period of time, depending on the activity levels. Compensation to farmers
was not granted in these areas. The same countermeasures were employed in the spe
cial measure zones, though in this case compensation of NOK 8 per day per animal
was given. An additional sum, equivalent to the slaughter value of the animal, was
paid if the special feeding programme proved unsuccessful and the animal had to be
condemned. Levels of radioactive caesium up to 3000 Bq/kg were measured in cattle
in 1987.
From the number of animals participating in the special feeding programme in
Oppland County, an estimate of about 45 000 cattle was made for the whole country
of Norway for 1987.
The problems in 1988 were of the same character as in 1987. The amount of
mushrooms in this year gave considerably higher radioactivity levels in some areas
before special feeding was practised.
Levels in cattle of up to 6000 Bq/kg were measured. Again, the number of
animals taking part in the feeding programme in 1988 is not exactly known, but it
is assumed to be of the same order of magnitude as in 1987. The cost of the action
196 STRAND et al.
taken to reduce radioactivity levels in beef to below the action level was roughly
NOK 5 million in 1986, the cost in 1987 being insignificant.
The total amount of radioactive caesium removed as a result of the special feed
ing programme in 1987 was about 1.9 x 10¹⁰ Bq.
2.3. Reindeer
As 1986 and 1987 progressed, levels of up to 150 000 Bq/kg were found in
reindeer from mountain areas in southern Norway (from October of 1986 to April
of 1987). This increase was attributed to the fact that the reindeer were then feeding
mostly on lichens. On 31 July 1986, the Government decided to initiate a programme
of economic compensation. In November 1986, it seemed likely that 85% of the
production for 1986 would have to be condemned owing to high radioactivity.
Because of the severe impact this would have had on the Lapp people, a minority
population group, and bearing in mind that reindeer meat does not form an important
part of the diet of the average Norwegian, the Directorate of Health decided on 20
November 1986 to raise the action level for reindeer meat by a factor of ten. This
allowed much of the reindeer meat produced in 1986 to be saved from destruction.
Nevertheless, about 25% of the total production (560 t) of reindeer meat was con
demned, converted into meat and bone flour and buried.
The value of the reindeer meat condemned in the framework of the programme
in 1986 was roughly NOK 20 million, while the cost of the whole programme related
to control and surveillance of reindeer, etc., roughly comprised an additional NOK
8 million.
In 1987, various countermeasures were implemented to avoid condemnation
of meat, including individual measurement to sort out animals before slaughter, early
slaughtering, use of less contaminated areas for grazing, use of saltlicks with Prus
sian blue, and special feeding. Almost 14% (3121) of the production of reindeer meat
was salvaged by the slaughtering in the summer programme. Though neither the
number of animals with access to saltlicks with Prussian blue nor the number of
animals grazing areas with lower fallout levels is known, the figure in both cases was
undoubtedly high. On the other hand, only relatively few animals participated in the
special feeding programme. Notwithstanding the countermeasures, 10% (216 t) still
had to be condemned. The value of condemned reindeer meat (216 t) in 1987 was
roughly NOK 8.5 million, the additional costs of the reindeer control and surveil
lance programme being approximately NOK 10 million. It is estimated that in 1987,
1.3 x 10⁹ Bq were removed by summer slaughtering and 2.0 X 10⁹ Bq by
condemnation.
In 1988, 1261 (6 %) of reindeer meat was judged as being unfit for human con
sumption and was used as fur animal feed.
A special rumen bolus containing the caesium binder Prussian blue for use with
reindeer is presently under development at the Norwegian Agricultural University.
IAEA-SM-306/36 197
A large scale test was successfully carried out during the winter of 1988-1989, and
boli will probably be used routinely from 1990.
2.4. Goat milk and goat cheese
Goat milk is utilized mainly in the production of a special and very popular
type of brown whey cheese. Any radioactive substances in the milk will be concen
trated in the brown whey cheese, which will therefore tend to have much higher
levels than the milk. It was therefore decided to use goat milk from certain contami
nated areas as animal feed rather than in cheese production. The production of goat
whey cheese was affected in a similar manner in 1987 and 1988, but to a somewhat
lesser extent than in 1986 because of the special countermeasures taken (saltlicks
with a caesium binder, concentrates with bentonite).
Goat cheese production losses represented a value of NOK 10 million in 1986
(the value of the condemned goat milk is included), and NOK 7 million in 1987, after
taking into consideration the savings arising from the use of goat milk as animal feed.
2.5. Other foodstuffs
Levels of radioactivity in fruit, berries, vegetables and grain have been below,
mostly far below, the action levels. In one area (Trandelag) lettuce and parsley were
growing outdoors at the time of the accident. The sale of these products was banned
and the affected crops ploughed under. High levels were also found in cloudberries
and mushrooms in some areas.
Economic losses were limited to the lettuce and parsley mentioned above. The
value was reported to have been roughly NOK 300 000.
Pigs and poultry are primarily fed on grain based feeds, levels of radioactive
caesium in these species of livestock therefore being very low.
The radioactivity levels observed in game were normally below the action
levels (6000 Bq/kg). The levels in saltwater fish were very low, almost not detecta
ble. Those in wild freshwater fish were in some cases quite high, and levels up to
60 000 Bq/kg were reported. In June and July of 1986, the Directorate of Health
banned the sale of freshwater fish from 37 municipalities., No compensation was
offered to freshwater fishermen or game hunters.
2.6. Random sampling of agricultural products
Testing of radioactivity levels in meat from sheep, goats and cattle from free
zones was carried out, and tests were carried out on foodstuffs purchased in grocery
stores. The results of these tests indicate that the countermeasures taken, such as the
establishment of zones, have proved to be effective.

198 STRAND et al.
3. PLOUGHING AND FERTILIZING
In 1987, the Division of Agriculture of the Ministry of Agriculture described
how the radioactivity levels in vegetation could be reduced by simple expedients such
as additional ploughing and application of fertilizers. These practices were probably
effective in reducing activity levels in animal feed produced on the home farm, lead
ing to a corresponding reduction in activity levels in milk and beef. Though the avail
able information on these aspects is, however, much too sparse to allow any firm
conclusions to be drawn concerning the resulting activity reduction achieved, there
is reason to believe that the decrease is considerable, and that it will continue to be
so for a number of years to come.
4. DIETARY ADVICE
In addition to remedial actions aimed at reducing the levels of radioactive
materials in various foodstuffs, there are other countermeasures which function by
promoting a reduction in the intake of specific foodstuffs. One such measure is
dietary advice which was given to population groups with a particularly large intake
of reindeer meat and/or wild freshwater fish. Recommendations were made as to
how frequently one could consume foodstuffs with activity levels above the action
levels. In 1987, a survey of changes in diet consequent to the Chernobyl accident
was carried out in the municipality of Sel in central Norway. The survey covered
two population groups, one'consisting of specially selected persons who consumed
large quantities of freshwater fish and reindeer meat, and one chosen at random [4].
This municipality is located in one of the areas of Norway where the fallout level
was high. The results of this survey can serve as a guide for other areas with
similar fallout patterns and with similar levels of radioactivity in wild freshwater fish
and reindeer. It is estimated that about 200 000 persons live in such areas in Norway.
In the Sel municipality the dietary advice resulted in an average reduction in intake
of radioactive caesium of 30 000 Bq per person the first year after the Chernobyl
accident, compared with the ‘normal’ diet. For the country a;s a whole, this cor
responds to a reduction in intake of approximately 6 X 10⁹ Bq.
5. DISCUSSION
The actions taken in Norway to counteract the effects of Chernobyl were
introduced primarily to alleviate physical health risks. As a result, the average dose
to which the population of Norway was exposed from the Chernobyl fallout was
reduced to about 0.3 mSv. This corresponds to about one half of the natural external
gamma radiation, or somewhat less than one tenth of the dose from radon in houses;

IAEA-SM-306/36 199
TABLE I. VARIOUS COUNTERMEASURES LISTED ACCORDING TO THE
REDUCTION IN RADIOACTIVITY (Bq) AND RADIATION DOSE
ACHIEVED, AS WELL AS THE REDUCTION COSTS
Countermeasure
Activ ity
removed
(Bq)
Radiation
dose
(man • Sv)
Cost per man-sievert
(N O K ) (US $)
1987
Sheep/cattle 2.6 x 10'° 338 118 000 17 000
Reindeer:
(1) Changed slaugh
tering time
1.3 X 10⁹ 16 94 000 13 000
(2 ) Condemnation
o f meat
2.0 x 10⁹ 25 340 000 49 000
Dietary advice 6.0 X 10⁹ 75 400 57
Total, 1987 3.5 x 10 10 454 110 000 . 16 000
1988
Sheep 1.6 x 10'° 200' 290 000 41 000
the physical health risk to the individual is considered to be very small [5-7].
However, with regard to the population as a whole, the collective radiation dose to
the population is expressed in man-sieverts (dose multiplied by the number of per
sons), and 1 man-Sv corresponds to a certain detriment to health regardless of the
distribution of the overall dose within the population.
In the case of accidents, there is an upper limit to the acceptable dose to
individuals. The limit is set at a higher level than in a normal situation, because it
is meant only to be applied in abnormal or accident situations. If the dose to the
individual exceeds this limit, actions must be taken to reduce the dose, regardless
of the cost. Since the Chernobyl accident, the aim in Norway has been to avoid
individuals’ receiving radiation doses in excess of 5 mSv and 1 mSv in the first and
the subsequent years, respectively. This is in accordance with the dose limits recom
mended by the International Commission on Radiological Protection.
For that part of the population which receives doses below the aforementioned
limits, the optimization principle is used. This main principle in radiation protection

2 0 0 STRAND et al.
states that all exposure shall be kept as low as reasonably achievable, economic and
social factors taken into account. This means that actions that will reduce the dose
shall be carried out if the radiation protection benefit exceeds the costs involved. This
type of cost-benefit evaluation can only be carried out if the health consequences are
expressed in monetary units. In industrialized countries a cost factor of
$10 000-$25 000 per man-sievert [8, 9] is used.
In Table I, the various countermeasures which were taken are listed according
to the reduction in the amount of radioactivity and radiation dose achieved as well
as according to the costs involved. The cost per man-sievert varied from NOK 400
to NOK 340 000. The condemnation of reindeer meat proved to be the most costly
measure, as measured in NOK per man-sievert saved. The dietary advice published
and distributed by the authorities clearly represents the cheapest countermeasure in
both absolute and relative (cost effective) terms. In a number of cases, it has proved
impossible to give figures for the cost-benefit of such measures as changes in
agricultural practices (additional ploughing and use of fertilizer), the use of alterna
tive grazing areas with lower radioactivity levels in the grass, and the use of saltlicks
containing a caesium binder.
Though it has proven difficult to assess cost-benefit with regard to the special
feeding of cattle in 1988, the introduction of improved procedures, in the light of
experience gained in this regard during 1987, means that the cost per man-sievert
in 1988 was lower than in 1987.
It appears that the relationship between the resources utilized and the reduc
tions in radiation dose obtained in 1987 and 1988 was acceptable-. In 1986, almost
NOK 185 million [10, 11] were spent to obtain a dose reduction of 540 man-Sv, cor
responding to about NOK 340 000 per man-sievert [6]. However, it must be remem
bered that in 1986, there was not only widespread scepticism regarding the
authorities’ handling of the situation; there was also insufficient time available for
extensive evaluations. Moreover, knowledge of alternative remedial action strategies
was meagre [12, 13]. Shortly after the fallout situation had occurred, 71% of the
population expressed concern about potential contamination of food and drinking
water, while only 6 % had changed their dietary habits on their own initiative [3].
People still seem to rely on the ability of the authorities to take care of health
hazards associated with food. There was a slight reduction in the consumption of
mutton, 7% in 1986, 3% in 1987 and 14% in 1988. However, this reduction cannot
be attributed unconditionally to the Chernobyl accident. Little is known about the
long term impact of the psychologically reactions of the average person to Chernobyl
since relevant investigations have not been carried out. For the food producers,
however, it is extremely important that the population feel that products are safe.
Shortly after Chernobyl, fears that the accident might result in extinction of the
Lapp culture and depopulation of the mountain valleys were widespread, and were
given much media attention. Also the possibility that meat products would have to
be destroyed was felt to be ethically and psychologically unacceptable by many.

IAEA-SM-306/36 2 0 1
Because of the countermeasures taken, however, the anticipated problems material
ized only to a very limited degree. The dietary recommendations have been very suc
cessful in reducing population doses. The other countermeasures have also proven
effective as well as acceptable with regard to costs of implementation. There is
always the possibility that had the situation been handled differently, there might
have been a serious reduction in the consumption of food products originating from
sheep, reindeer and cattle. This would have been considerably more costly to society
than the cost of the countermeasures carried out. For example, a reduction of 10%
in the consumption of mutton alone would represent an economic loss to the agricul
tural sector of about NOK 100 million.
6 . CONCLUSIONS
The actions taken to protect human health from the consequences of the Cher
nobyl fallout have been relatively extensive and resource demanding. Their main
purpose has been to prevent adverse physical health effects by reducing radiation
doses, and they have undoubtedly been successful in this regard. However, they have
probably also been of significance in connection with the other two main criteria
included in the WHO definition of health, i.e. mental health and social well-being,
and their effects on these may have been both negative and positive. In conclusion,
it seems fair to say that the cost and amount of resources deployed have remained
at an acceptable level, when viewed in relation to the radiation dose reduction
obtained, and have not only protected physical health, but probably also had a benefi
cial effect on the mental and social health of many people.
ACKNOW LEDGEM ENT
We wish to thank J.B. Reitan and T. Berthelsen of the National Institute of
Radiation Hygiene for their support during this study.
REFERENCES
[1] B A C K E , S., BJERKE, H ., RUD JO RD , A .L . , U G L E T V E IT , F ., The pattern o f fallout
in N orw ay after the Chernobyl accident, estimated from soil samples, Radiat. Prot.
Dosim. 18 (1987) 105-107.
[2] L O T E , К ., K L E P P , О ., R E IT A N , J.B., Radioactive fallout after reactor accidents and
nuclear weapons explosions, Tidsskr. Nor. Lâgeforen. (Journal o f the Norwegian M ed
ical Association) 1 0 6 (1986) 1836-1840 (in Norwegian).

2 0 2 STRAND et al.
[3] WEISÆTH, L ., “ Reactions in Norway to fallout from the Chernobyl disaster” , Radia
tion and Cancer Risk, Vol. 1 (BRUSTAD, L ., LA N D M A R K , P., REIT A N , J.B.,
Eds), Hemisphere, New York (1989).
[4] B0E, E., et al., Radiation Doses from Food to Humans after Chernobyl, SNT-2/88,
Norwegian Food Control Authority, Oslo (1988) (in Norwegian).
[5] O FTED AL, P., et al., The Chernobyl Accident, Norwegian Official Report, NOU
1987:1, University Press, Oslo (1987) (in Norwegian).
[6 ] SANNER, T . , et al., Health Risk in Connection with Radionuclides in Foodstuffs, Con
ditions after the Chernobyl Accident, Rep. 1/87, Norwegian Food Control Authority,
Oslo (1987) (in Norwegian).
[7] STRAND, T ., STRAND, P., B AAR LI, J., Radioactivity in foodstuffs and doses to the
Norwegian population from the Chernobyl fall-out, Radiat. Prot. Dosim. 20 4 (1987)
211-230.
[8] IN TE R N A T IO N A L COMMISSION ON R AD IO LO G IC AL PROTECTION, Recom
mendations o f the International Commission on Radiological Protection, Publication
26, Pergamon Press, Oxford and New York (1977).
[9] R A D IA T IO N PROTECTION INSTITUTE IN D ENM ARK, F IN LA N D , N O R W A Y
A N D SWEDEN, Application in the Nordic Countries o f ICRP Publication 26, National
Institute o f Radiation Protection, Stockholm (1984).
[10] BRYNILD SEN, L., TVETEN , U., Economic Consequences o f the Chernobyl Acci
dent in Norway 1986 and 1987, Doc. IFE/TR/E-88/001, Institute for Energy Technol
ogy, Kjeller (1988).
[11] JOHANSON, L ., BRYN ILD SEN , L., Radiological consequences o f Chernobyl fall
out in Norway, Rev. Sci. Tech. Oss. Int. Epiz. 7 (1988) 1.
[12] HERNES, G., FREM M O, S., LARSEN, R ., M E LLU M , L ., O LTED AL, A ., Infor
mation Crises, Norwegian Official Report, NOU 1986:19, University Press, Oslo
(1986) (in Norwegian).
[13] G U N NER0D , T.B ., G ARM O , Т.Н. (Eds), Research Program on Radioactive Fall
out, Information Circular 1/89, Norwegian Agricultural Information Service, Oslo
(1989) (in Norwegian).
IA E A -S M -3 0 6 /5 7
E V A L U A T I O N O F
L O N G T E R M C O U N T E R M E A S U R E S
IN M I T I G A T I N G C O N S E Q U E N C E S
O F E N V I R O N M E N T A L C O N T A M I N A T I O N
F O L L O W I N G A N U C L E A R A C C I D E N T
J.J. ROSSI, S.J.V. VUORI Nuclear Engineering Laboratory,Technical Research Centre of Finland,Helsinki, Finland
Abstract
E V A LU A T IO N OF LO NG TERM COUNTERM EASURES IN M IT IG A T IN G CONSE
QUENCES OF E N V IR O N M E N TA L C O N TA M IN A T IO N FO LLO W ING A N U CLEAR
ACCIDENT.
An airborne radioactive release from a reactor accident can result in contamination o f
vast areas. As a consequence o f external radiation (groundshine) exposure, the health risk o f
the population living in the fallout area is increased. Furthermore consumption o f agricultural
food products produced in the contaminated area may bring about an extra health risk. The
employment o f long term mitigating measures — decontamination, relocation and food
control — reduces chronic exposure but results also in economic losses. The mitigating actions
depend on radiological dose criteria and economic consequences. In addition, social and
political considerations may play an influential role when intervention levels are defined.
National dose criteria should be based on international recommendations on intervention
levels, taking into account, however, local conditions. In the event o f a real accident, the deci
sion to apply or withdraw a certain countermeasure is determined on a case by case basis at
different decision making levels. Predictive analysis o f the effectiveness o f alternative counter
measures can be performed with the probabilistic consequence model employing hypothetical
source terms. In the paper the intervention levels o f international recommendations as well
as other assumed dose criteria have been utilized for calculations o f dose savings, economic
losses from different mitigating measures, and cost effectiveness o f food control. The refer
ence nuclear power plant site is located in southern Finland. Site weather data and the pertinent
population, agricultural production and working place statistics have been employed in the
study.
1. INTRODUCTIONGround contamination as a consequence of a reactor accident increases the
health risk of the exposed population and indirectly brings about economic losses as well. Mitigating measures reduce the health risk but result in economic consequences. In.the intermediate phase of an accident, the use of appropriate protective
203

204 ROSSI and VUORI
measures and in the later phase the return to normal living conditions are determined by a systematic decision making process. The selection of appropriate mitigating actions depends on the intervention level, which, in turn, depends on many factors identified in a real situation. In this study the radiological intervention levels based exclusively on dose criteria are employed.
A predictive modelling analysis has been carried out on the effectiveness of different long term countermeasures designed to prevent or to mitigate radiological consequences from hypothetical reactor accidents. The long term countermeasures— relocation, decontamination, interdiction of areas, and food control — are implemented to reduce chronic exposure via direct external exposure from contaminated ground as well as via ingestion of contaminated agricultural food products. Dose savings as well as monetary profits attained by alternative countermeasures and assumed dose criteria are obtained. Cost effectiveness ratios based on radiological intervention levels of contaminated food are evaluated as well. The probabilistic consequence assessment model programmed in the computer code ARANO [1] was used by the authors to calculate the complementary cumulative distribution functions of such quantities as collective doses, contaminated areas and economic losses as a consequence of different countermeasures.
2. DATA FOR CALCULATIONS2.1. Source terms and site specific data
The Loviisa NPP is employed as a reference site for this study and an LWR of 1000 MW(e) is used as a reference plant. The hypothetical source terms employed, as well as descriptions of the release categories A, В and C, are presented in Table I. The release duration is 3 hours in all cases.
The release fraction of 0.1 % for caesium in the release category С represents the requirements of the Finnish safety authorities for severe reactor accidents.
The weather statistics at the accident site and the statistical environmental population distribution up to a distance of 100 km are used; further away an average population density of 30 per km2 is employed. Working place and agricultural production data up to a distance of 300 km from the site and based on adjusted statistics in southern Finland are used.2.2. Dose criteria for countermeasures
Alternative dose criteria for relocation of the population and for food control are used. As the relocation criteria, the 30 years’ external radiation (groundshine) dose values of 0.03, 0.1, 0.3 or 1.0 Sv are used. This means that individual doses are truncated when the dose criterion is expected to be achieved and a relocation is

IA E A -S M -3 0 6 /5 7 205
TABLE I. SOURCE TERMS AS RELEASE FRACTIONS OF THE REACTOR CORE RADIOACTIVITY INVENTORY WITH A NET OUTPUT CAPACITY OF 1000 MW(e)
Release
category
Onset o f
release
(h)
Release
height
(m)
Release fraction in nuclide group
X e-K r I-Cs-Rb-Te-Sb Sr-Baa
A, 1 20 1 0.1 0.01
■2 10 20 1 0.1 0.01
A 3 1 100 1 0.1 0.01
B, 1 20 1 0.01 0.001
B2 1 100 1 0.01 0.001
C, 1 20 1 0.001 0.0001
C2 1 100 1 0.001 0.0001
a Includes Rh, Co, Mo, Te, Y , Zr, Nb, Ce, Pr, Nd, Np, Pu, Am, Cm.
then carried out. As a reference case, doses without any mitigating measure are calculated as well.
Nutrition doses are calculated by employing two separate intervention approaches: the first case uses an interdiction criterion of 35 or 100 mSv in 30 years; in the second case, the first year’s ingestion dose is calculated employing the dose criterion of 5 or 50 mSv, evenly fractionated (i.e. 1 or 10 mSv for each) to the five types of foodstuffs considered (cow milk, beef, green vegetables, grains and root vegetables). It is assumed that each agricultural product considered is consumed at the production place.2.3. Costs of countermeasures
Two separate approaches are considered to estimate economic losses. The total costs caused by relocation and decontamination as well as those costs due to losses of investments at the relocated area are calculated on the basis of the criteria of an external radiation dose of 30 years. For further insight into food control, costs from the condemnation and substitution of agricultural products based on the first year’s ingestion dose are also calculated. The results of these two methods are not comparable with each other owing to the different dose criteria and assumptions employed.
206 ROSSI and VUORI
The monetary losses are calculated by first determining a contaminated area, then calculating the dose in all dispersion conditions with probabilities of occurrence, and multiplying it by the amount of the population or production and further by the unit cost involved.
Utilizing population and working place statistics in southern Finland, one determines the unit costs for the following components: decontamination costs of land and farmland, relocation costs, costs from losses of investments of housing and manufacturing and construction, service and agriculture and forestry. The investments are assumed to be lost as long as the effective dose equivalent within 30 years from the end of the interdiction period continues to exceed 0.1, 0.3 or 1.0 Sv. The probability of investment loss is assumed to increase linearly with the interdiction time up to 10 years, after which the investment is assumed to be totally lost. When the losses of investments are calculated, the decontamination factor of 3 is taken into account. The unit costs of countermeasures and losses of investments expressed in US $ per inhabitant or per employee are as follows: land decontamination, $330; farmland decontamination, $10 200; relocation, $5000; housing, $30 700; agriculture and forestry, $61 400; manufacturing and construction, $71 900; and service, $73 100.
Cost effectiveness of food restriction was studied on the basis of the dose criterion of 5 or 50 mSv in the first year. Unit costs from the condemnation of agricultural products also include the expenses of substituting products. For the different agricultural products, the unit costs (US $/kg) and total agricultural production (106 kg) in the area considered are: (1) cow milk: 1.4, 3000; (2) beef: 16.9, 120; (3) green vegetables: 5.2, 160; (4) grains: 2.0, 3400; (5) root vegetables: 1.5, 760, respectively.
3. RESULTS3.1. Relocation
The conditional expectation values of the collective doses when alternative relocation criteria are employed in all release categories indicate that the contribution of relocation is quite small in the case of the release categories В and C. In the case of release category A, remarkable dose savings, even 60%, can be achieved by relocation.3.2. Food control
The contribution from the intervention on contaminated agricultural production to the collective dose has been studied by applying alternative dose criteria either

IA E A -S M -3 0 6 /5 7 207
TABLE П. CONDITIONAL EXPECTATION VALUES OF INGESTION DOSES WITH ALTERNATIVE CRITERIA3
Release
Ingestion dose (man-Sv) with two types o f criteria
category
35
mSv/30 a
100 Unlimited 5
mSv/first year
50 Unlimited
A 3 11 100 19 000 103 000 1 970 8 800 93 800
B2 3 430 5 400 10 300 880 3 300 9 380
c2 780 900 1 030 330 740 940
a The criterion o f each nutrient is in the first case 7 or 20 mSv for 30 years’ dose, and in the
second case 1 or 10 mSv for the first year’ s dose.
on the first year’s or on the 30 years’ dose. The conditional expectation values of the collective doses are presented in Table II for the case of elevated releases.
Values in Table II indicate that the importance of the dose criterion is diminished when the release magnitude of depositing material is decreasing. If expectation values of collective ingestion doses are compared with the doses from external radiation, it can be noticed that without a countermeasure the contaminated food brings about a large additional collective dose. Introduction of food condemnation with the strictest dose criterion reduces collective dose from food ingestion to approximately the same level as the external radiation dose.
3.3. Costs of countermeasures
3.3.1. Costs of relocation, decontamination and losses of investments
The conditional expectation values of the interdiction areas based on the relocation dose criterion 0.1, 0.3, 1.0 or 3.0 Sv/30 a, calculated from external radiation, are presented in Table III.
On the basis of the area interdicted, the economic consequences are shown in Table III. Losses of investments, such as in construction and manufacturing, bring about the largest contribution, especially losses of housing, causing 40-50% of the total costs.

208 ROSSI and VUORI
TABLE III. CONDITIONAL EXPECTATION VALUES OF THE INTERDICTION AREA AND ECONOMIC LOSSES DUE TO THE RELEASE CATEGORIES BASED ON THE EXTERNAL RADIATION DOSE CRITERION(Expenses are due to relocation, decontamination and losses of investment in the interdicted area)
Contaminated area (km2) Economic losses (US $ million)
Release with interdiction criterion with dose criterion
category
0.1
(Sv/30 a)
о!з 1.0 3.0 0.1
(Sv/30 a)
0.3 1.0
A, 480 150 45 15 490 100 15
B, 45 15 5 0.5 15 1.5 0.3
C, 5 0.5 0.05 0.000 01 0.3 0.01 <0.01
3.3.2. Cost effectiveness of agricultural food control
Agricultural products are contaminated in a larger area than assumed by the corresponding interdiction area based on the integrated external radiation dose. Especially if the release occurs during the growing season, the ingestion dose criteria are exceeded over wide areas provided that products cultivated in the contaminated area are consumed locally without spreading to products grown elsewhere.
Costs of abandonment and of substitution for contaminated agricultural products can be assessed assuming that food is consumed locally. First the contaminated area is calculated and the collective dose saved; next the cost of production lost combined with the unit costs are obtained.
Calculations indicate that the cost effectiveness of countermeasures on agricultural products decreases when the release magnitude decreases. The best cost effectiveness ratio is attained in the case of releases occurring during the growing and pasturing season. The Nordic radiation safety authorities have recommended a target value of US $20 000 per man-sievert saved as a reasonable aim. This target level for the cost effectiveness ratio is achieved if a limiting value of 50 mSv for the first year’s individual ingestion dose is applied. For a smaller limiting dose (5 mSv/first year), the cost effectiveness ratio exceeds the target level approximately by an order of magnitude. If the release magnitude remains small, the individual dose restrictions would in practice be easily fulfilled through wider distribution of contaminated food than conservatively assumed in the calculations.

IA E A -S M -3 0 6 /5 7 209
The purpose of long term countermeasures is to reduce chronic exposure and later detrimental health effects to a level as low as reasonably achievable by minimizing the collective dose. International recommendations on intervention levels can be regarded as the basis for national instructions and as the reference for predictive studies. National intervention levels often differ from each other owing to local conditions and other factors. In the real accident case, the intervention levels are finally obtained by public authorities on the basis of environmental radiological data but also on economic, social and political factors. Data provided by measurements of the environmental contamination should be the basis for dosimetric predictive calculations.
To obtain theoretical information on the effectiveness of different long term countermeasures, a modelling analysis employing hypothetical source terms was performed. The utilization of countermeasures based on predetermined radiological intervention levels was employed to evaluate benefits from alternative active measures. A quite remarkable dose saving is attained through relocation if the release fraction of depositing radionuclides such as caesium is 10% of the core inventory considered. The release fraction of other long lived fission and activation products was assumed to be an order of magnitude less in all source term categories. If the release fraction of caesium remains 1%, the dose saving is moderate; in the case of the smallest release fraction of 0.1%, the dose saving is insignificant, which proves that relocation is unnecessary. In this sense the requirement of the Finnish radiation safety authorities to reduce on demand the release fraction of caesium to 0.1% of the reactor core inventory as a consequence of a severe reactor accident seems to be well grounded.
The fallout area can be decontaminated, but if the radiation level is not decreased enough, use and development of the area shall be denied, which results in losses of investments in addition to relocation costs. In the case of the smallest release considered, the economic losses remained insignificant. In the two larger release categories, the monetary losses vary depending on the relocation criterion. If the criterion is set to the level of natural background radiation, the expected economic loss in the largest release category is almost US $500 million. Costs from losses of housing dominate in the case of the site considered.
The largest collective doses may result from ingestion of contaminated agricultural food products. Nordic seasonal variation has a great effect on doses. Restriction of contaminated food is easier to accomplish than relocation, but it results in large monetary losses. Assuming that agricultural produce is consumed at the cultivation area, the intervention criteria are exceeded in a large area, especially if a release occurs during the growing and pasturing season. Evaluating of benefits from food control indicates that the best cost effectiveness ratios are attained in summer conditions and in the case of larger release fractions. Reduction of individual effective
4. D IS C U S S IO N

2 1 0 ROSSI and VUORI
dose from ingestion to the level of 50 mSv seems to be more cost effective than further reduction to the level of 5 mSv. However, in practice, the agricultural products are consumed in a wider area after transport and processing. This situation results in the diluting of concentrations in nutrients. If contaminated products were distributed uniformly to the population living in the calculated area, the average unlimited first year’s ingestion dose would remain below 50 mSv in all source term categories considered.
The probabilistic consequence code is highly applicable to the assessment of the effectiveness of different countermeasures. Results obtained indicate that the effectiveness of mitigating measures is often more dependent on factors other than a countermeasure itself. Source term properties, atmospheric dispersion and seasonal conditions, environmental population and working place distributions can be mentioned as examples. These facts justify the conclusion that in a real accidental case the countermeasure to be applied and subsequently withdrawn is determined case by case at different decision making levels.
REFERENCE
[1] SA VO LA IN E N , I., VUORI, S.J.V., Assessment o f Risks o f Accidents and Normal
Operation o f Nuclear Power Plants, Electrical and Nuclear Technology, Publication 21,
Technical Research Centre o f Finland, Espoo (1977).
IA E A -S M -3 0 6 /1 0
R A D I O A C T I V I T Y T R A N S F E R
D U R I N G F O O D P R O C E S S I N G
A N D C U L I N A R Y P R E P A R A T I O N
A. GRAUBYInstitut de protection et de sûreté nucléaire,Centre d’études nucléaires de Cadarache,Saint Paul-lez-Durance, FranceF. LUYKXCommission of the European Communities,Luxembourg
Abstract . ■
R A D IO A C T IV IT Y TRANSFER D URING FOOD PROCESSING A N D C U L IN A R Y
PREPARATIO N .
In September o f 1989 at Cadarache, an international seminar on radioactivity transfer
during food processing and culinary preparation was organized by the Commission o f the
European Communities and the Institut de protection et de sûreté nucléaire, Service d ’études
et de recherches sur l ’ environnement, o f the Commissariat à l ’énergie atomique, Cadarache.
The programme o f this seminar included all preparation methods able to reduce the contamina*
tion o f beverages and foodstuffs. The main results and conclusions o f the meeting stemming
from the closing discussions are reported in the paper.
1. INTRODUCTIONThe Commission of the European Communities and the Institut de protection
et de sûreté nucléaire, Service d’études et de recherches sur l’environnement, of the Commissariat à l’énergie atomique, Cadarache, organized an international seminar at Cadarache in September 1989 on radioactivity transfer during food processing and culinary preparation [1]. The programme covered all methods capable of modifying the radioactive contamination levels of beverages, dairy produce, fruit and vegetables, cereals, meat and fish.
2 1 1

2 1 2 GRAUBY and LUYKX
Water is the basic constituent of most beverages and drinking water is used in the preparation of most cooked dishes. If the environment is accidentally contaminated, it is essential that the public water supply have a very low level of contamination.
Drinking water treatment plants use a wide variety of treatments and with the standard methods most commonly used, removal rates of caesium, iodine and ruthenium ranging from 30% to 70% have been found. If higher degrees of decontamination are required, special methods have to be used such as ion exchange, which can usually only be applied to limited throughputs.
In the case of tea and herbal infusions, caesium transfer has been found to increase with the contact time between the raw material and the water. Up to 70% of the activity goes into tea as prepared for drinking in Turkey, and transfers of from 30 to 60% have been measured for a number of herbal infusions, depending on the method of praparation.
Few data were presented on activity transfer during fruit juice preparation. Their mineral content (potassium and calcium) can give some indication of the possible radionuclide content. One way of reducing the contamination would be to remove stalks and to peel the fruit before processing.
Some experimental results on activity transfer from grapes to wine were also given. It was shown that the concentration of caesium and strontium is about three times lower in rosé wine than in red wine because of the difference in the wine making processes.
No information was presented on activity transfer in beer preparation. It is not, however, anticipated that beer consumption will be a critical pathway unless beer is brewed with contaminated water.
2. B E V E R A G E S
3. DAIRY PRODUCEFollowing the accident at the Windscale reactor in the United Kingdom in
1957, efforts were made in the early 1960s to find ways of treating contaminated milk to produce less contaminated dairy produce. Most attention was given at this time to iodine, but caesium and strontium were also considered. The optimum conditions for the removal of these three radionuclides were determined and elimination rates (of over 90%) achieved by the use of mixed bed ion exchange resins.
Studies have also been made on the transfer of radionuclides from milk to milk products. Table I shows the average transfer rates, expressed as the percentage of the original activity in whole milk, which were found for primary milk products.

IA E A - S M -ЗОб/10 213
TABLE I. AVERAGE TRANSFER RATES, EXPRESSED AS PERCENTAGE OF ORIGINAL ACTIVITY IN WHOLE MILK
Primary milk product Cs Sr h
Fresh cream 11 9 15
Skimmed milk 89 91 85
Butter 1 0.8 3.7
Where skimmed milk is used to make cottage cheese, the final product will contain only 1-5% of the radiocaesium concentration of the original whole milk; whey can be demineralized by ion exchange.
4. FRUIT, VEGETABLES AND CEREALS4.1. Fruit and vegetables
The effects of treatment usually vary according to the type of produce, the contamination route (airborne deposition or intake via the roots) and the method of treatment.
After external contamination, simple washing can remove from 12% to over 90% of the radionuclides according to the type of fruit or vegetable, on the condition that the vegetable is washed very soon after contamination; the longer one waits the less effective washing is. Boiling removes radionuclides more efficiently than washing, particularly when they are in soluble form.
It is more difficult to reduce internal contamination introduced via the roots or by translocation. However, 60% of strontium and 90% of caesium may be removed by a combination of washing and blanching.
In the event of an accident resulting in airborne contamination, up to 90% decontamination can be achieved by simply removing some external parts of the plant. Saline or vinegar solutions may also help considerably in the removal of caesium.4.2. Cereals
Strontium is taken up mainly by the husk of the grain, whereas caesium can penetrate the core to an extent depending on the stage of growth. Most of the caesium
214 GRAUBY and LUYKX
— up to 75% — remains, however, in the husk. Thus, the caesium concentration in wheat flour is only 0.4 times that found in the grain, whereas in rye flour it is 0.7 times. The transfer to bran is 2.5 times that in the feed material.
When durum wheat flour is used to make pasta by normal culinary methods, as a result of processing the caesium concentration in the pasta is about an order of magnitude lower than the concentration in the original flour.
5. MEAT AND FISH5.1. Meat
The data on meat treatment suggest that the type of animal has no effect on the distribution of radiocaesium during processing. In raw samples most of the caesium is found in the lean, edible part of the meat and less in the fatty tissue and bones. The fraction of fat in meat may thus affect the average caesium concentration.
Freezing meat has a slight indirect effect on the caesium concentration as some caesium is lost with cellular water during defrosting.
Frying, grilling or roasting of meat can remove up to 50% of caesium, which transfers to the associated liquid. In the case of stew, about 50% of the radiocaesium is also released into the cooking liquid, but in this case the liquid is usually consumed with the meat.
The best way of decontaminating meat would appear to be to marinate it before cooking. Soaking in brine can remove up to 60% of the caesium, while marinating game in vinegar removes up to 90% of the caesium after 3 days.
Finally, the meat of the live animal may be decontaminated by feeding the animal uncontaminated fodder or by introducing caesium binding agents such as clay or absorbents containing Prussian blue.5.2. Fish and sea food
Little information is available on the behaviour of radionuclides during the processing and culinary preparation of fish. Boiling fish removes only 10% of the strontium content and 10-80% of the caesium. Frying yields only a 10% reduction. A caesium reduction of up to 80% can be obtained by rapid salting followed by two days’ treatment in brine.
The best way of dealing with mussels is to transfer them to an uncontaminated pond where decontamination will occur naturally.
The extraction of alginates from algae achieves a purification factor of over 93% in the case of "Tc, 106Ru and Co. The slight traces of caesium will disappear; however, only 44% strontium decontamination is obtained.
I A E A -S M -ЗОб/10 215
The results given above show that many preparation methods, normally applied in households and by industry, reduce the radioactivity content of foodstuffs. Moreover, special decontamination techniques such as ion exchange and Prussian blue treatment have been developed, which can be applied in the case of food contamination following an accident.
Regarding the use of these methods and techniques as countermeasures following a nuclear accident, it is essential that all factors which can have an impact on the measure be examined beforehand. One of the most important is the feasibility of the measure envisaged. Here a distinction must be drawn between household cooking methods and industrial food processing techniques. Although in both cases good results are theoretically possible, it will not be feasible to impose culinary rules on individual households; the probable outcome of any attempt to do so would be that the product would not be eaten at all, as was observed in some areas after the Chernobyl accident.
At the industrial level, however, the authorities could impose countermeasures, although one should not underestimate the difficulties involved in modifying the normal industrial production lines. Moreover, many industrial food processing techniques are kept secret, so that the authorities will not always know how and where to intervene.
Other important factors to be considered in the use of countermeasures are:(a) Efficiency of the measure: in many cases the reduction in radioactivity levels
does not exceed 50%.(b) Impact on taste and nutritional quality: the slightest change in taste could
decrease the consumption considerably.(c) Impact on costs: this is often difficult to evaluate since experience is limited.(d) Social impact: when it is known that decontamination of the product has been
required, the consumption pattern might change completely.Finally, it should not be forgotten that other countermeasures, such as food
destruction, storage or use as an animal feedingstuff, are available. An expert system is being currently developed in France for selecting the most appropriate countermeasures.
6. E M E R G E N C Y F O O D D E C O N T A M IN A T IO N
7. CONCLUSIONSThe main conclusions of the seminar at Cadarache can be summarized as
follows:(1) The seminar provided a comprehensive overview of methods available to
decontaminate foodstuffs in the event of a nuclear accident.

216 GRAUBY and LUYKX
(2) While it appears that the associated costs are often difficult to estimate, they will generally be low compared to those of more drastic measures such as food destruction.
(3) The problem remains of how to apply such intervention measures in practice, since any interference with normal domestic cooking methods would be a delicate matter and the reactions of the public unpredictable. However, at the industrial level, intervention should be feasible though still possibly subject to practical difficulties arising from commercial secrecy and the need to modify production processes.
(4) Maximum permitted contamination levels in foodstuffs are derived for food as eaten, i.e. after preparation. However, when applying these maximum permitted levels, the decontamination obtained during culinary preparation is not considered since most controls are carried out at the border of a country, i.e. often before processing and always before cooking. The result is that the maximum permitted levels in foodstuffs will overestimate the real doses received.
(5) The interpretation of experimental results on activity transfer in foodstuff processing or preparation as presented in the literature is not always easy, thereby making analysis of the data very cumbersome. First of all, it is not always clear whether the results refer to direct external contamination or to indirect contamination via root uptake. Secondly, the radioactivity transfer during food processing may be expressed in several ways as:
— A fraction of the activity in the original food remaining in the food after processing;
— The ratio of activity concentrations in the original fresh food and fresh product;
— The ratio of activity concentrations in the original dried food and dried product.
(6) A last important point is the fact that where foodstuff decontamination results from processing, the story is not necessarily finished, since the radioactivity is then transferred to secondary products or waste material where it can create other problems (e.g. in whey powder).Before taking intervention measures with respect to foodstuffs, all such
problems should be taken into consideration.
REFERENCE
[1] COMMISSION OF THE EUROPEAN COM M UNITIES, Radioactivity Transfer dur
ing Food Processing and Culinary Preparation (Proc. Sem. Cadarache, 1989), CEC, Luxembourg (1990).
IA E A -S M -3 0 6 /7 2
D E V E L O P M E N T O F A D E T A I L E D P L A N
F O R S I T E R E S T O R A T I O N F O L L O W I N G
A N U C L E A R R E A C T O R A C C I D E N T
J.J. TAWILResearch Enterprises, Inc.,Richland, Washington,United States of America
Abstract
DEVELO PM ENT OF A D ETAILED PLA N FOR SITE RESTORATION FO LLO W ING A
N U C LE AR REACTOR ACCID ENT.
A severe radiological accident at a nuclear power plant could require the deployment
o f vast labour and equipment resources to restore the contaminated property. A detailed site
restoration plan in this situation can promote the efficient use o f these resources. Using a com
puter program called the Site Restoration Program (SRP), it is shown how the site restoration
plan can be developed and how it can be employed to guide the use o f the restoration
resources. For a hypothetical accident, the development o f a site restoration plan is described
through four phases. In Phase I, the objective is to obtain quick but rough estimates o f the
magnitude o f the economic losses. In Phase II, cleanup options are developed and a strategy
and cleanup level are provisionally selected. In the third phase, the area to be restored is
broken down into a great many grid elements so that each city block or even individual struc
ture can be separately analysed. During the last phase, after cleanup operations begin, actual
results from these operations are monitored and then used to recalibrate the SRP’ s knowledge
database. Adjustments to the site restoration plan may be indicated as a result.
1. INTRODUCTIONImmediately following a severe nuclear reactor accident, the highest priorities
will be to treat the injured, to protect at-risk populations from further radiological exposure, and to begin restoring property that has become contaminated. In this paper, we will focus on this last priority — the effort to restore property. It will be shown how a site restoration plan, developed with the aid of a computer code, can be formulated to guide the cleanup effort and to promote the efficient use of the cleanup resources.
217

218 TAWIL
1.1. Questions that a site restoration plan should address
At a minimum, a site restoration plan should answer the following questions:— What cleanup level is to be used?— What will be the number of statistical health effects (primary cancers)?— What will be the cost of restoring property?— How long will it take to complete the site restoration?— What decontamination methods will be used to carry out the restoration
programme?— What kinds of labour, equipment and materials will be used, and in what
quantities?— How much radioactive waste will be produced, and where can it be disposed
of?A computer code called the Site Restoration Program (SRP) is used to address
most of these questions. The SRP has been used in a number of different applications, ranging from accident consequence analysis and cost-risk analysis to site restoration planning [1-3]. In the next section, we describe the SRP. Then, in Section 3, we show how it is used in producing a site restoration plan over four phases.
2. DESCRIPTION OF THE SITE RESTORATION PROGRAMThe SRP resources include a knowledge database, called the Reference Data
base; a program to facilitate the entry and processing of site specific data; a decontamination analysis program; a program to produce plots and options tables; and documentation for the SRP and its Reference Database [4, 5].
2.1. The Reference Database
The Reference Database currently contains information on 457 methods for decontaminating 30 different types of surface. The Reference Database includes for each method: decontamination costs, treatment rates, the volume of radioactive waste produced, labour and equipment requirements and decontamination efficiencies. The surface types include agricultural fields, orchards, vacant land, wooded land, lakes, paved surfaces, lawns, structural surfaces (e.g. roofs, floors and walls), building contents and automobiles.

IA E A -S M -3 0 6 /7 2 219
2.2. The Site Database
The accident zone is subdivided into grid elements according to the degree of contamination. For each of these grid elements, it is necessary to develop a set of site specific data. These data include the contamination level, geographic area, land use distribution, property values, population and household size. The set of data for all of the grid elements is called the Site Database.
The grid elements are described in terms of land use, but the Reference Database refers to surface types. Therefore, an important function of the SRP is to transform the land use areas into surface areas. These transformations are particularly important in the case of residential, commercial and industrial structures, which are decomposed into roofs, interior and exterior walls, floors and so forth.
2.3. Decontamination analysis program
The decontamination analysis program is the core of the SRP. It uses the Reference Database and the Site Database to develop a detailed site restoration programme for each grid element in the contaminated area. This program operates on the principle of minimizing the property related costs associated with site restoration, and it can also be constrained by imposing certain restrictions or requirements on the decontamination procedures used.
To illustrate the development of a site restoration plan, we have generated some results for a hypothetical accident. The accident is based on a scaled Siting Source Term 2 (SST2) [6] release with Pasquill class D meteorology. The major assumptions underlying these results are a cleanup level at least as strict as 0.01 Sv, disposal of radioactive waste at a site 750 km away, and disposal costs (including packaging costs for transportation) of US $50/m3. We call this the base case; it represents a starting point for the analysis.
Several types of report are produced by the decontamination analysis program. Examples are shown here for the base case. Table I shows a detailed report for grid element 1 ; Table II shows selected results from a summary report for the entire study area; and Table III shows a partial list of the personnel and equipment required to carry out the decontamination programme for the whole study area. The last two types of report are available by grid element as well. There are also reports detailing the surveying and monitoring activities, but these are not shown here.
The Detailed Surface Analysis Report gives the type of surface, its area, the committed effective dose equivalent immediately prior to decontamination, the cost minimizing decontamination method, the committed effective dose equivalent after decontamination, and the average cost, total cost and treatment rate of the method. The committed effective dose equivalents are based on a 70 year dose commitment beginning one year after the accident.

2 2 0 TAWIL
оnQО2ш(X
HzwSи_)wQ2Üc¿ОPUСЛHJОC/5И
иucьc¿DсоQpqJ<HWQ
И
ffl<H
0) -Cа гяX B
оH
оо ^
ü 2 w> ^2 & <Ü w><
cdз ^ •O >a <ü w c¿
TDОJZ
<Di-,
% > О </> Cl. ' X Ш
3со
гч ГЧ <Nо о О О+ + -Ь +U Щ W w»п О СП t--г-~ <ч m СЧ00 •о (N
Г" Г-- 40 40О о О О+ + + +щ щ Ш Wчо 40 СП 0\
г*: 00СЧ -н
40 40 in IT)О О О о+ + -+■ +U W w U40 m
Os О) V)СЧ <N 40 К
СП СП СП СПо1 О1 о1 о11Ш
1ш
1W
1ша\ 0\ СП СП40 Ю о о 00
in in Г-:
Xx Z H H
оо+щ<NО
o ô + + ш Щ о о о о
оо+шСЧ <N
О о
оо+Wо
оо+ш<Nо
оо+Що
1П (N СЧ
ед
<о-
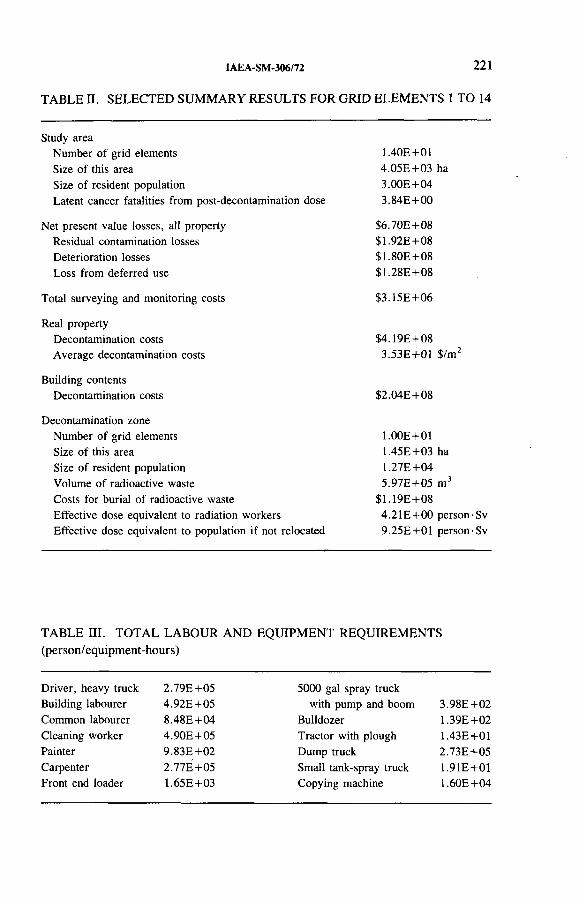
IAEA-SM-306/72 221
T A B L E I I . S E L E C T E D S U M M A R Y R E S U L T S F O R G R ID E L E M E N T S 1 T O 14
Study area
Number o f grid elements
Size o f this area
Size o f resident population
Latent cancer fatalities from post-decontamination dose
Net present value losses, all property
Residual contamination losses
Deterioration losses
Loss from deferred use
Total surveying and monitoring costs
Real property
Decontamination costs
Average decontamination costs
Building contents
Decontamination costs
Decontamination zone
Number o f grid elements
Size o f this area
Size o f resident population
Volum e o f radioactive waste
Costs for burial o f radioactive waste
E ffective dose equivalent to radiation workers
E ffective dose equivalent to population i f not relocated
1.40E+01
4 .05E +03 ha
3 .00E +04
3 .84E +00
S6.70E+08
$1.92E+08
$1.80E +08
S1.28E+08
$3.15E +06
S4.19E+08
3 .53E +01 $/m2
$2.04E +08
1.00E+01 1 .45E+03 ha
1 .27E+04
5 .97E +05 m 3
$1.19E +08
4 .2 1E +0 0 person-Sv
9 .25E +01 person-Sv
TABLE III. TOTAL LABOUR AND EQUIPMENT REQUIREMENTS
(person/equipment-hours)
D river, heavy truck 2 .79E +05 5000 gal spray truck
Building labourer 4 .92E +05 with pump and boom 3.98E +02
Common labourer 8 .48E +04 Bulldozer 1 .39E+02
Cleaning worker 4 .90E +05 Tractor with plough 1.43E+01
Painter 9 .83E +02 Dump truck 2 .73E +05
Carpenter 2 .77E +05 Small tank-spray truck 1.91E+01
Front end loader 1.65E+03 Copying machine 1.60E+04

2 2 2 TAWIL
The decontamination methods, which consist of a sequence of one or more
operations, are coded for brevity. The operations shown in Table I are: T — apply
a fixative; x — scrape off 10 to 15 cm of soil, then scrape off another 10 to 15 cm
of soil; N — clear the land of trees and underbrush; v — vacuum the surface twice
with street sweeping equipment fitted with skirts and filters; and К — resurface the
pavement. For example, the method Tx is used on agricultural fields and consists
of the operations T and x applied sequentially.
Table II gives selected results from the summary report for the study area. This
area consists of 14 grid elements covering an area of 4000 ha (40 km2) with a popu
lation of 30 000. At a cleanup level of 0.01 Sv, and with an assumed committed
dose-response relationship of 2 x 10~2 deaths per sievert, fewer than 4 cancer
fatalities are predicted to occur in the returning population as a result of external
exposure to the residual contamination.
The table also indicates that the total net present value losses from all property
amount to $670 million. 1 These include several categories of property related
losses: residual contamination losses ($192 million), deterioration losses ($180 mil
lion) and losses from deferred use ($128 million) .2 These costs are all present
values, i.e. they are discounted at a 10% annual discount rate. Surveying and
monitoring costs are over $3 million, but it should be cautioned that these costs do
not include all of the ‘health physics’ costs, such as those for a bioassay programme.
Undiscounted decontamination costs for real property are reported at $419 million,
while for the contents of buildings they amount to $204 million. (Total discounted
decontamination costs are $122 million.)
A grid element with some surface contamination above the cleanup level two
weeks after the accident is included inside the decontamination zone. Table II shows
that there are 10 such grid elements; together they cover an area of 1450 ha and have
a population of 12 700. From the decontamination zone, nearly 600 000 m 3 of
radioactive waste will be removed at an undiscounted disposal cost of $119 million.
Table III shows the number of hours required for some of the personnel and
equipment needed to carry out the site restoration programme. For example,
279 000 h are required for drivers of heavy trucks, and bulldozers are needed
for 139 h.
In this section we reviewed the type of information produced by the SRP. We
now consider how this information can be used to develop a site restoration plan.
1 Assuming only cost e ffective decontamination; i f all areas are restored, the losses are
$685 million.
2 These sources o f property loss are as follows: residual contamination losses arise
because o f the perceived health risks from exposure to the remaining contaminants after
decontamination is completed; when property lies idle in wait o f restoration it is likely to
suffer from neglect and to deteriorate physically; and property that cannot be used immediately
but only at some point in the future is less valuable than identical property available for
immediate use.

IA E A -S M -3 0 6 /7 2 223
It is recommended that the site restoration plan be developed in four phases.
In Phase I, the objective is to obtain quick but rough estimates of the magnitude of
the economic losses. In Phase II, cleanup options are developed and a strategy and
cleanup level are provisionally selected. In the third phase, the area to be restored
is broken down into a great many grid elements so that each city block or even
individual structure can be separately analysed. In the last phase, cleanup operations
begin. Actual results from these operations are monitored and then used to
recalibrate the Reference Database. Adjustments to the site restoration plan may be
indicated as a result.
3. E V O L U T IO N O F A S IT E R E S T O R A T IO N P L A N
3.1. Phase I
The assessment of economic losses in Phase I can help officials make decisions
that can minimize future losses. An early assessment can lead to: (1) identification
of property that should receive urgent attention; (2) mobilization of resources to
mitigate accident consequences to this property; (3) cost saving decisions to vacuum
exterior surfaces before precipitation can solubilize the contaminants and bond them
to the surface; and (4) decisions to apply fixatives to certain surfaces to prevent
resuspension or migration of the contaminants. This phase of the site restoration plan
should be executed in the first week following the accident.
The site specific information required by the SRP must be developed quickly
for this phase. Unless more detailed information has already been developed during
pre-accident emergency planning, then six to ten grid elements should be adequate.
These can be constructed using radiological isopleths as grid element boundaries.
The site specific data must be developed for each grid element.
Assets that are to be given special attention can make up an entire grid element.
For example, one could add three grid elements to focus on a major highway that
spans three isopleths.
3.2. Phase II
In Phase II, attention shifts from immediate mitigative measures to develop
ment of cleanup options and the adoption of a broad cleanup strategy. The grid ele
ments are subdivided in this phase. Each village or town may be defined by a single
grid element, and a city that spans several isopleths may be divided into as many grid
elements. To facilitate the analysis, the number of grid elements should be kept to
a reasonable level — say, less than 100 in this phase. The base case analysis
described in Section 2 was produced under Phase II.

TA
BL
E
IV
.
OP
TI
ON
S
TA
BL
E
FO
R
NE
T
PR
ES
EN
T
VA
LU
E
PR
OP
ER
TY
R
EL
AT
ED
L
OS
SE
S
AS
SU
MI
NG
F
UL
L
DE
CO
NT
AM
IN
AT
IO
N
($)
224 TAWIL
<D3 uв вСи О x «¿2 W
u 42 rt о* -so g Z 2
тзоо*со
00с ссЗti е
3<u э£ иса>
2 лоа
& « 52 сл PÛ о
а.з —< ^с <и ^я > ьлü ü ^и
O n 00 00 00 Г - г - г - г - г - 1ПО О о о О о о о о о+ + + + + + + + + +щ Ш И щ ш Ш Ш W щ шг-~ (N (N си 0N ON СП ON ГЧ 40сп 40
?ON 00 1П СП «n 4- Tf(N en СП Г"- оо г- in о
ЧО СП 00 чо in 1Г) ON
ON 00 00 00 00 00 г- Г' r- VOо о о о о о о о о о+ + + + + + + + + +W Ш ш ш Р-) ш щ ш ш ш»-н о г- о 1П Ov СП ГЧ00 Г» СП m СП 00 1— (N ON 40Tt; 00 Г" 40 СП о 00 00 40 00
00 40 СП 40 in in -и
O s 0 0 0 0 0 0 0 0 г - Г " г - r - 4 0о о о о о о о о о о+ + + + + + + + + +W щ ш щ щ ш W ш ш ш*—< ON Г Ч
Sг - СП m 4 0 СП С П
0 0 о г - * П Г Ч г - - CNСП ON г - 4 0 о T t Г Ч 0 0 « п Г Ч
4 0 С П - Н < П < п — i
ON 00 оо 00 r- r- r- r- r-> 40о о о о о o о о о о+ + + + + + + + + +щ щ U w ш W Ш Ш Ш ШCN СП о tn ON «n oo 00 r- Tt00 о Í-H in Tf ■'ÑÍ- СП i-H <nГЧ 04 in •n ON о 00 00 40 00
40 СП 40 in in -4
ON 00 00 00 г- r - с-- |> г - 40о о о о о о о о о о+ + + + + + + + + +Щ w ш ш щ щ и ш ш ш40 t> о 40 in <п 00 оо СП ГЧСП СП 04 С П
3СП 1-Н Os 40ГЧ ГЧ о о 00 оо 40 00
—4 40 С П ON 40 in in
ON 0 0 0 0 0 0 0 0 г - r - r - I— 40о о о о о о o o o o+ + + + + + + + + +ш щ щ ш ш щ Ш Щ ШСП 04 Г ' 4 0 0 4 m 00 o o en Г ЧГ Ч ON Г Ч СП O N 4 0T t- о 4 0 4 0 о о 0 0 0 0 4 0 0 0r - î 0 0 4 0 СП r - : 40 in in
inCN o«n o o o m o o oo o Т-Ч ГЧ m r- o «n o oq q о o o o CN in oo o o © o ó o o o

IAEA-SM-306/72 225
After the grid elements have been redefined, the SRP is used to develop a num
ber of broad cleanup options. Examples of options that can be evaluated in this phase
are:
— Whether to prohibit decontamination operations that use water on outside sur
faces because of a risk of contaminating shallow, underground water supplies;
— Whether to dispose of the radioactive waste on-site or off-site;
— Whether to require that all areas be decontaminated irrespective of cost effec
tiveness considerations;
— Whether to preserve structures that cannot be adequately decontaminated by
restricting access to them, or whether to remove and dispose of them;
— Whether to prohibit certain decontamination operations because of potential
doses to radiation workers or for other reasons;
— Whether to require strict removal of contaminants, or to permit the use of
methods that provide adequate long term shielding;
— Whether to apply a single cleanup level to all surfaces or instead to specify a
different cleanup level for each surface based on the exposure risk that the sur
face poses to humans.
To assess these options, ‘options tables’ are produced by the SRP. An options
table portrays all of the cases or options that one wishes to consider for up to
20 different cleanup levels. An options table can be produced for each of 32 varia
bles, but the most important variables are probably cancer fatalities, net present
value property related losses (both with full decontamination and with cost effective
decontamination only), radioactive waste volumes and decontamination costs.
The options table makes it relatively easy to compare the results for different
cases and for different cleanup levels. One such table is shown here for ‘Net Present
Value Property Related Losses Assuming Full Decontamination’ . The cases consid
ered in Table IV are: the base case, as already defined; on-site disposal of the waste
in a low level waste pit (relatively low transportation and waste burial costs); pre-rain
vacuuming, whereby various exterior surfaces are vacuumed prior to a rainfall;
application of a fixative to wooded areas followed by restriction of access; prohibi
tion of methods using water on outside surfaces; and exposure factors, whereby
interior surfaces are decontaminated to half the indicated cleanup level and exterior
surfaces are decontaminated to levels 1 to 15 times higher than the cleanup level.
A plotting program is also available to graphically portray the relationship
between any two variables. In Fig. 1, the relationship between net present value
property related losses (with full decontamination) and cleanup level is shown for the
base case.
The cases (or options) shown in Table IV are for the strategies considered one
at a time. As the options evaluation proceeds, it is likely that several of the options
would be included within a single case. For example, one might wish to: restrict the
use of water only in towns, and at the same time apply a fixative to forests and res-
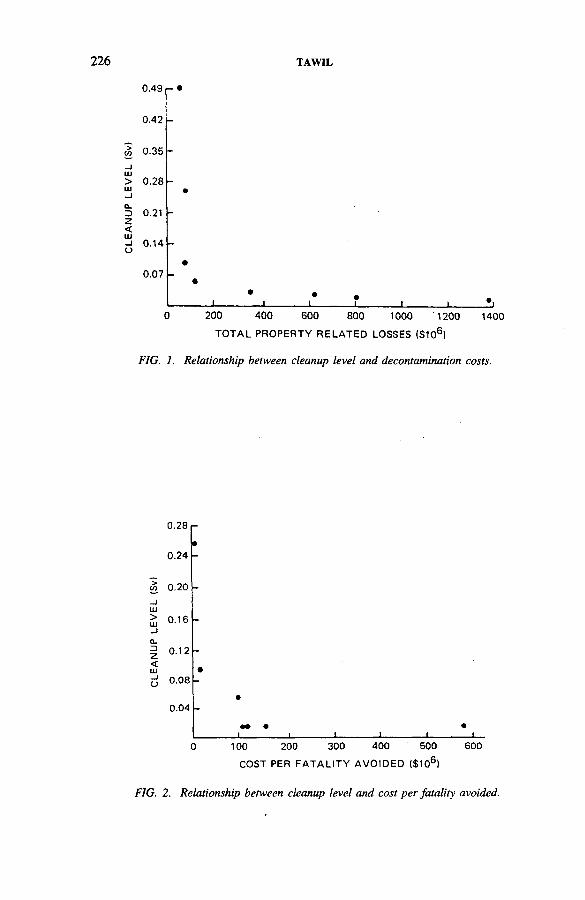
CLE
ANU
P LE
VEL
(Sv)
TAWIL
0.49 p •
0.42
0.35
0.28
0.21
0.14
0.07
--------1------------ 1-----------1________ I________ I________ I_______ Zi0 200 400 600 800 1000 1200 1400
TOTAL PROPERTY RELATED LOSSES ($106)
FIG. 1. Relationship between cleanup level and decontamination costs.
COST PER FATALITY AVOIDED ($106)
FIG. 2. Relationship between cleanup level and cost per fatality avoided.
IAEA-SM-306/72 227
trict access to them, use an off-site disposal facility, and prohibit the use of any
decontamination method that does not actually remove the contaminants.
.Another objective in this second phase is to narrow the range of cleanup levels
to be considered. The approach described below utilizes a concept called the
incremental cost per fatality avoided (ICPFA). Both the property related losses and
the number of cancers change with the cleanup level. The ICPFA is defined as the
absolute value of the ratio of the change in losses to the change in cancers. Viewed
over a range of increasingly strict cleanup levels, we typically find that the ICPFA
rises with increasing steepness. An example of this relationship is shown in
Fig. 2, where for cleanup levels stricter than 0.08 Sv the ICPFA rises sharply. A
number of published studies estimate what North Americans are willing to pay to
avoid a known risk of immediate death (see Ref. [7] for a review). Most of the esti
mates are in the range of $50 000 to $10 million per immediate death avoided. While
this range is relatively wide, we can usually apply it to narrow significantly the range
of cleanup levels that need to be considered. In Fig. 2 this range is consistent with
a cleanup level greater than (i.e. less strict than) 0.10 Sv. 3
The SRP also produces a schedule showing the year in which each grid element
should be decontaminated, based on cost minimization. For those grid elements that
are scheduled to be decontaminated within any given year, the SRP can be used to
determine which of these grid elements should be decontaminated first. 4 For exam
ple, it is likely that many grid elements will be scheduled for restoration within the
first year. Prioritization is accomplished by comparing the value of the property
within a grid element after it is restored with the cost of restoring it. A grid element
is given priority over another grid element if it provides a greater net social benefit
per dollar expended on restoration.
At the conclusion of Phase II, a site restoration strategy and cleanup level are
selected. However, as explained below, this selection is provisional.
3.3. Phase III
In the third phase of the site restoration plan it is necessary to make a detailed
analysis. Each grid element in an urbanized area should contain only a small amount
of property such as a city block or even a single structure. The focus is now on devel
oping more accurate and detailed data for the Site Database. To develop these data
3 W hen the cleanup level is reduced from 0.10 to 0.05 Sv, the cost incurred to avoid
an additional cancer is about $100 m illion, which is well above the upper lim it o f $10 million.
For reductions in the cleanup level from 0.25 to 0.10 Sv and from 0.50 to 0.25 Sv, the added
costs to avoid a cancer death are $15 m illion and $3 m illion, respectively. The reader is cau
tioned that cleanup levels based on the IC P F A criterion vary significantly from case to case.
Hence, each case should be evaluated on its own merits.
4 This feature is scheduled to be implemented in the SRP in early 1990.
228 TAWIL
for the hypothetical accident, we used maps showing individual parcels; these were
obtained from a local county tax assessor. In addition, a county tax assessor can
usually provide information on the type of structure (e.g. single-family residential)
on each parcel and its value. The size of the structure may have to be determined
by making a site visit. At the same time, a FIDLER (field instrument for the detec
tion of low energy radiation) or other suitable instrument can be used to ascertain
the actual contamination levels on various surfaces.
After this detailed information is entered into the SRP, one may wish to rerun
the Phase II cases to confirm the choice of strategy and cleanup level.
3.4, Phase IV
The SRP’s Reference Database contains information for prediction of the cost,
treatment rate, effectiveness and radioactive waste production of each decontamina
tion method. It would be unusual if these predicted values accurately tracked the
results from the actual field operations. Particularly weak are the data for decontami
nation efficiencies in the Reference Database. Some of these efficiency values are
undoubtedly optimistic, while others may be somewhat pessimistic.
The purpose of Phase IV is to recalibrate the Reference Database by utilizing
data collected from field operations. This is done easily with menu driven prompts
in the SRP.
It is apparent that recalibration of the Reference Database can affect the rela
tive merits of the different cleanup options evaluated earlier. It is at this stage that
the earlier assessments should be reviewed and any mid-course corrections made. It
may be decided as a result of this re-evaluation to alter the cleanup level, or to pursue
an alternative strategy that now appears more favourable.
Data from the field operations should be continuously collected and monitored.
This will enable field supervisory personnel to identify significant deviations from
the projections based on the recalibrated Reference Database. Deviations can result
because of differences in:
— Environmental conditions, such as ambient temperature;
— Performance characteristics of individual work crews;
— Performance characteristics of different models of equipment;
— Characteristics of the surfaces being decontaminated.
REFERENCES
[1] T A W IL , J.J., “ Using cost/risk relationships in restoring radiologically contaminated
sites” , Nuclear Pow er Performance and Safety (Proc. Int. Conf. Vienna, 1987),
V o l. 5, IA E A , Vienna (1988) 193-207.

IAEA-SM-306/72 229
[2] T A W IL , J.J., STR E N G E , D .L ., Using cost/risk procedures to establish recovery
criteria fo llow ing a nuclear reactor accident, Health Phys. 52 2 (1987) 152-169.
[3] T A W IL , J.J., “ Restoration o f a radiologically contaminated site: Sagebrush I V ” ,
Radiological Accidents — Perspectives and Emergency Planning (P roc. A N S Topical
M tg Bethesda, 1986), Oak R idge Natl Lab., T N (1987) 259-264.
[4] T A W IL , J.J., B O LD , F .C ., Property-Related Costs o f Radiological Accidents,
Rep. NUREG/CR-5148, PNL-6350, Pacific Northwest Lab., Richland, W A (in press).
[5] T A W IL , J.J., B O LD , F .C ., H A R R E R , B.J., C U R R IE , J .W ., O ff-site Consequences
o f Radiological Accidents: Methods, Costs and Schedules fo r Decontamination,
Rep. NU RE G /CR -3413, PNL-4790, Pacific Northwest Lab ., Richland, W A (1985).
[6] N U C L E A R R E G U L A T O R Y C O M M IS S IO N , Reactor Safety Study, W A S H -1400
(N U R E G 75/014), N R C , Washington, D C (1975) Appx V I, pp. 8-1-8-5.
[7] B L O M Q U IS T , G ., The value o f human life , Econ. Inquiry 29 1 (1981) 157-164.


P O S T E R P R E S E N T A T I O N S
IAEA-SM-306/46P
SOME ASPECTS OF THE MEASUREMENT AND SAMPLING PROGRAM M E AND THE COSTS OF COUNTERMEASURES IN AUSTRIA AFTER THE CHERNOBYL ACCIDENT
F. SCHÔNHOFER
Federal Institute for Food Control
and Research,
Vienna, Austria
An extensive monitoring programme was carried out in Austria after the
Chernobyl accident. In order to obtain information about the extremely non-uniform
distribution of contamination and to limit the dose received by the population,
environmental samples and especially food had to be monitored extensively.
Monitoring of food was also necessary to ensure that limits were not exceeded both
for marketing in Austria and for imported and exported goods. The impression can
not be avoided that the abundance of modern equipment in laboratories situated in
and near Vienna tempted authorities and the public to ask for more and more meas
urements. A large proportion of the samples investigated were not necessary for the
above mentioned purposes, but reflected rather curiosity and anxiety.
Since nobody was prepared for such a flood of samples these could only be
dealt with through extremely intensive work by laboratory staff. Laboratories were
working 24 hours a day for months. Up to December 1986 about 100 000 samples
had been measured on behalf of the State authorities by both State and private institu
tions, the latter handling about 60% of the samples and receiving about 50 million
Austrian schillings from the Government (1000 ATS correspond to about US $74).
At the Federal Institute for Food Control and Research, which measured about
26 000 samples in 1986, there were about 4000 man-hours of overtime during May
and June 1986. Additional costs arose from the transport of samples and assistance
from the army, which had at times about 500 men helping in measurement laborato
ries, checking lorries at borders and decontaminating them. In 1987 about
20 000 samples and in 1988 about 7000 samples were measured by the Federal Insti
tutes for Food Control. Additionally many samples, the number and costs of which
are unknown to the author, were measured on behalf of the provincial governments.
231

232 POSTER PRESENTATIONS
It is clear that such a tremendous number of measurements is not necessary for
the scientists to establish an overview of even the most complex contamination
situation. The accident had many more aspects than just radiation protection: eco
nomics, trade and, possibly the least investigated, psychological impact. There was
the wish and sometimes even the demand of people to ‘be informed’, to ‘know’ the
degree of contamination of ‘their’ fruits, vegetables, meat, soil, etc., and to ‘know’
whether their food was ‘safe’ to eat. Foods with values above the limits were
regarded as poisonous and even if the levels were below the limits they were often
doubted to be ‘safe’. Certain groups and even scientists took the chance to declare
publicly that lower limits had to be set, regardless of whether food with lower con
tamination was available. Authorities were accused of giving wrong information and
withholding information about high contamination. (Such accusations are continuing
even in 1989.) Mass media were spreading sensational ‘information’ from unquali
fied people. Results from radionuclide ‘measurements’ of food with unsuitable
instruments such as Geiger counters and pocket dose rate meters were published.
This situation was certainly one reason for the high number of measurements per
formed. It is concluded that more qualified information must be provided to the
public — not at a high scientific level, but nevertheless at a level that is both suffi
ciently informative and understandable, to build up new trust in scientists and
authorities. This situation was and is not unique to Austria, but applies to almost all
countries in Europe.
The measurements were the basis for governmental countermeasures. It is
difficult to evaluate the exact costs that the countermeasures caused in all respects,
but costs refunded by the Government are well known. According to Austrian legis
lation 75% of the financial loss due to a nuclear accident will be paid from a fund
for catastrophic events. This covers losses due to sales bans and rejection of contami
nated food. Indirect losses will be compensated by the provincial government with
30%, thereof the Federal Government will reimburse 60%. The payments from the
fund for direct losses were about ATS 400 million up to August 1989 (corresponding
to losses of about ATS 530 million) and the refund for indirect losses about ATS
38 million (corresponding to losses of about ATS 211 million). The total losses
partly compensated according to legislation were therefore about ATS 740 million
(about US $55 million). The additional losses mostly incurred by private enterprise
because of changing nutrition habits, changed tourism, loss of foreign markets, etc.,
cannot be estimated even roughly, but the actual losses must be much higher than
the compensated ATS 740 million. On the other hand, turnover with respect to
uncontaminated food (such as honey from the 1985 harvest and dry milk from the
time before Chernobyl) did increase. Since many products which can be exported
only with financial support from the Government could not be sold on the world mar
ket an appreciable amount of support money was saved.
The compensation paid has to be compared with the dose reduction achieved.
The aim of the countermeasures in the first, ‘iodine’ phase, was to reduce the

POSTER PRESENTATIONS 233
exposure of people to 131I by limiting the intake via milk and fresh leafy vegetables.
Therefore, selling of fresh vegetables was forbidden for some time, as was feeding
of cows with fresh grass. Milk was rigorously controlled. Only milk with low con
tamination was allowed to be sold for drinking purposes, thus making extensive
transport of milk necessary. In the later, ‘caesium’ phase no dramatic dose reduction
was expected to be possible. It has been estimated [1] that the three above mentioned
countermeasures in the early phase saved about 85% of the dose prevented by all
countermeasures. Compensation for losses from countermeasures affecting milk was
the highest (ATS 168 million), followed by compensation for vegetables (ATS
103 million). Thus 6 8 % of the financial compensation prevented 85% of the dose.
It is estimated that all countermeasures together prevented (mean values) about
0.25 mSv for adults (about 50% of the actually received dose) and 0.54 mSv for
one year old children (about the same dose as that actually received).
It is concluded that, in principle, the decisions of the authorities in the iodine
phase, based on recommendations of radiation protection scientists, were wise ones.
Countermeasures in the caesium phase were much less effective, but they were
forced by considerations other than radiation protection criteria — such as political
and economic reasons and public opinion.
REFERENCE
[1] M Ü C K , K ., Abschàtzung der Effektivitât der nach dem Reaktorunfall ergriffenen
Gegenmassnahmen, Rep. O E F Z S -A —1297, ST—163/88, Ósterreichisches Forschungs-
zentrum Seibersdorf (1988).

234 POSTER PRESENTATIONS
IAEA-SM-306/16P
USE OF DIFFERENT SUBSTANCES AS DECONTAMINATORS OF 137Cs AND 134Cs IN BULLS, COW S AND CALVES
R. LEITGEB
Universitat für Bodenkultur
N. RATHEISER
Bundesministerium für Land- und Forstwirtschaft
Vienna, Austria
1. INTRODUCTION
After the accident at Chernobyl in April 1986 some regions of Austria had
problems with radioactively contaminated feedingstuffs. In several experiments the
decontamination of 137Cs and 134Cs in different groups of animals was carried out
with different substances (Prussian blue, ammonium hexacyanoferrate-II, bentonite,
kaolinite), and uncontaminated feedingstuffs were also investigated in beef, milk and
veal.
2. EXPERIMENTAL SCHEDULES AND RESULTS
Investigations were made with groups of bulls, cows and calves (Tables I—III).
The contamination was measured by the Federal Institute for Examination and Inves
tigation of Food and the Department for Radiation Protection and Radiology,
Vienna.
In the first 48 days the daily intake of l37Cs and l34Cs was 12 200 and
5900 Bq, respectively, and between days 49 and 63, 8700 and 4500 Bq, respectively.
A balance between input and output was given after 4 weeks’ feeding of contami
nated feedingstuffs (Group 6). With kaolinite, bentonite, ammonium hexacyano
ferrate-II and Prussian blue, a decontamination of 10, 20, 30 and 40%, respectively,
was observed. A biological half-life of 3 weeks and a transfer rate of 1 % were esti
mated. With uncontaminated feedingstuffs, a decontamination period of 6 weeks was
needed and with ammonium hexacyanoferrate-II and Prussian blue a decontamina
tion period of 3 weeks was necessary.
In a feeding experiment with cows, the effect of different substances on the
excretion of ,37Cs plus 134Cs in the milk was tested. The daily intake of l37Cs and
l34Cs per animal in the first 3 experimental weeks was 148 000 and 74 000 Bq, and
in the next 4 weeks about one half of each amount, respectively. Group 1 was fed

POSTER PRESENTATIONS
T A B L E I. E X P E R I M E N T A L S C H E D U L E W IT H B U L L S
235
Group
Num ber
o f
animals
Treatment
1 4 Uncontaminated feed
2 4 Contaminated feed plus 5 g Prussian blue/d
3 4 Contaminated feed plus 3 g ammonium hexacyanoferrate-II/d
4 4 Contaminated feed plus 200 g bentonite/d
5 4 Contaminated feed plus 200 g kaolinite/d
6 4 Contaminated feed
T A B L E II. E X P E R I M E N T A L S C H E D U L E W I T H C O W S
Group
Num ber
o f
animals
Treatment
1 4 Uncontaminated feed
2 4 Contaminated feed plus 5 g Prussian blue/d
3 4 Contaminated feed plus 3 g ammonium hexacyanoferrate-II/d
4 4 Contaminated feed plus 100 g bentonite/d
5 4 Contaminated feed plus 100 g kaolinite/d
T A B L E III. E X P E R I M E N T A L S C H E D U L E W I T H C A L V E S
Num ber
Group o f Treatment
animals
1 4 Uncontaminated powdered m ilk (milk replacer)
2, 4 Powdered m ilk with 444 Bq C s-13 7 plus C s-134/kg
3 Powderéd m ilk with 2035 B q C s-13 7 plus Cs-134/kg
236 POSTER PRESENTATIONS
with uncontaminated feedingstuffs. The best effect, about 70%, was obtained with
3 g ammonium hexacyanoferrate-II per animal per day; kaolinite had the lowest
effect with 5%. The transfer rate was influenced by decontaminators. In Groups 3
and 5, transfer rates of 0.08% and 0.18% were measured.
In an experiment with calves, the accumulation of l37Cs plus 134Cs with the
milk replacer, powdered milk (0, 444, 2035 Bq/kg), was tested. At the start of the
experiment, the calves were contaminated with more than 2 counts per second 137Cs
plus 134Cs. One count per second was about 150 Bq of 137Cs plus l34Cs. The
uncontaminated powdered milk caused a linear decrease from 2.5 to 0 counts per
second within 9 weeks. An amount of 444 Bq/kg of powdered milk caused no
accumulation of 137Cs plus 134Cs; however the amount of 2035 Bq/kg caused an
increase of radioactive caesium in the body. The biological half-life was estimated
at 4 weeks and the critical content of radioactive caesium was observed at 1850 Bq
137Cs plus 134Cs/kg powdered milk.
IAEA-SM-306/18P
CAESIUM DECONTAMINATION OF LAMBS B Y DIFFERENT FEEDS AND ADDITIVES
F. RINGDORFER
Federal Research Institute for Agriculture
in the Alpine Regions,
Gumpenstein, Austria
1. BACKGROUND
In a feeding trial with different feeds and additives, l37Cs and 134Cs contami
nation of lambs was measured in vivo and in meat about 2-2.5 months after the
fallout from the Chernobyl accident. This kind of measurement was described by
Henrich and Schôner [1, 2]. The trial included 31 lambs, divided into eight groups.

POSTER PRESENTATIONS 237
The effects of the additives Prussian blue, bentonite and bolus alba were
observed in four groups of lambs that were fed with caesium contaminated hay from
the first cut of 1986, uncontaminated concentrate and the three different additives
(Fig. 1). Group 1 received 1.5 g of Prussian blue per animal per day; Group 2, 50 g
of bentonite per animal per day; Group 3, 50 g of bolus alba per animal per day;
Group 4 was the control group without additives.
There were no significant differences between the groups. Additives had no
influence on decontamination. Group 1, however, showed a tendentiously better
result.
2. E F F E C T S O F A D D IT IV E S (G R O U P S 1 -4 )
С л O -D
CD О Ъ W С £
г-- с СО D
О
Trial period (d)
FIG. 1. Caesium-137 contamination in Groups 1 -4; the measurements were taken on the
haunch o f the live animals.
Trial period (d)
FIG. 2. Caesium-137 contamination in Groups 5 and 6; the measurements were taken on the
haunch o f the live animals.
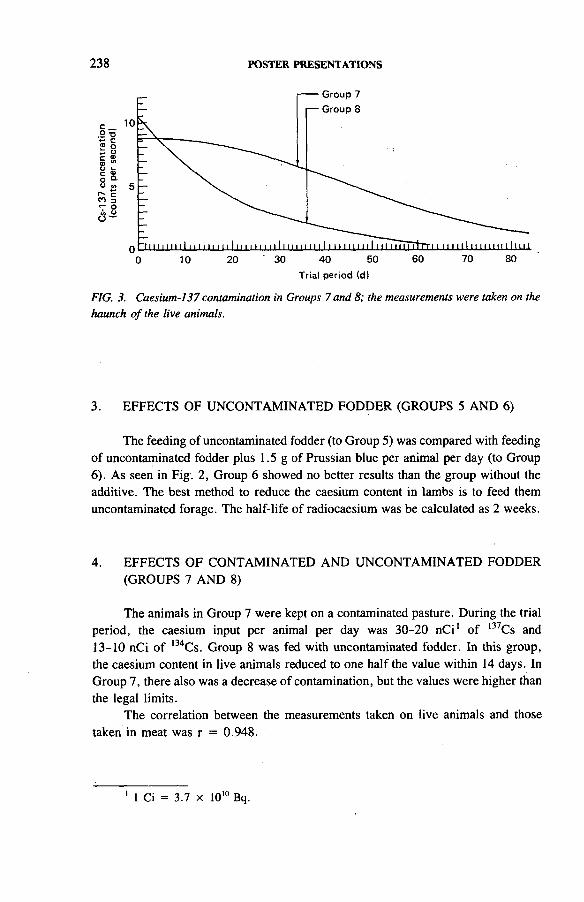
238 POSTER PRESENTATIONS
Trial period (d)
FIG. 3. Caesium-137 contamination in Groups 7 and 8; the measurements were taken on the
haunch o f the live animals.
3. EFFECTS OF UNCONTAMINATED FODDER (GROUPS 5 AND 6)
The feeding of uncontaminated fodder (to Group 5) was compared with feeding
of uncontaminated fodder plus 1.5 g of Prussian blue per animal per day (to Group
6 ). As seen in Fig. 2, Group 6 showed no better results than the group without the
additive. The best method to reduce the caesium content in lambs is to feed them
uncontaminated forage. The half-life of radiocaesium was be calculated as 2 weeks.
4. EFFECTS OF CONTAMINATED AND UNCONTAMINATED FODDER
(GROUPS 7 AND 8)
The animals in Group 7 were kept on a contaminated pasture. During the trial
period, the caesium input per animal per day was 30-20 nCi1 of 137Cs and
13-10 nCi of 134Cs. Group 8 was fed with uncontaminated fodder. In this group,
the caesium content in live animals reduced to one half the value within 14 days. In
Group 7, there also was a decrease of contamination, but the values were higher than
the legal limits.
The correlation between the measurements taken on live animals and those
taken in meat was r = 0.948.
1 1 Ci = 3.7 x 10ю Bq.
POSTER PRESENTATIONS 239
REFERENCES
[1] H E N R IC H , H ., “ C s-13 7 in Austrian domestic animals: Determination o f transfer
parameters and meat contamination by live animal measurem ents” , paper presented at
IU R Plant-A nim al W orking Group M tg, O ctober 1987.
[2] H E N R IC H , H ., S C H Ó N E R , W ., Ermittlung von Transferfaktoren und effektiven
H albwertszeiten bei diversen Nutztieren fiir C s-13 7 aus dem Reaktorunfall T scher
nobyl, Bundesamt fiir U m w elt, Vienna (1987).
IAEA-SM-306/140P
PROBLEM S OF FEEDING POPULATIONS AFFECTED B Y LARGE NUCLEAR ACCIDENTS
A.E. ROMANENKO, V.N. KORZUN, I.A. LIKHTAREV,
V.S. REPIN, V.I. SAGLO, A.N. PARATS, L.A. GOROBETS,
A.A. PEN’KOV
All-Union Scientific Centre for Radiation Medicine,
Kiev,
Union of Soviet Socialist Republics
P r e s e n t e d b y I . P . L o s ’
One serious consequence of a large nuclear accident is the contamination of
agricultural land by radionuclides, and as a result the long term contamination of
agricultural crops, dairy, meat and fish products in the years following the accident.
There are more than 200 radionuclides which result from the fission of uranium and
plutonium, but by far the most dangerous regarding the risk to man are isotopes of
iodine, strontium and caesium. Accordingly, it is an important task from the social
and economic points of view and also from the standpoint of radiation hygiene to pre
vent these radioactive products from entering the human body, or at least to reduce
the amounts that reach human beings.
The principal approach to reducing the risk from internal radiation doses due
to incorporation of radionuclides has so far been simply to prohibit or limit the use
of local agricultural produce in zones with a contamination density above
15 Ci/km2, or else total evacuation (resettlement) of the inhabitants of settlements
where soil contamination has reached 40 Ci/km2 or above1. Such measures were
1 1 Ci = 3.7 x 10¹⁰ Bq.

240 POSTER PRESENTATIONS
applied in the wake of the Chernobyl accident, and they led to the internal exposure
of the population living in the contaminated territory being lower by factors of
between 10 and 20 than the levels expected without the implementation of such
countermeasures.
However, both of these measures have to be regarded as extreme, since their
application distorts seriously the traditional way of life of the farming population,
and any type of resettlement or evacuation is bound to be a serious social trauma for
the people involved. Furthermore, limiting production does not, in itself, provide a
complete guarantee of achieving the desired exposure levels. The experience of
Chernobyl showed that the consumption of even some fraction of local produce (in
violation of prohibitions) was bound to increase the internal exposure dose. On the
other hand, reliance on imported products, which cannot always be delivered in
sufficient quantity, or in the desired variety and quality, is bound to distort the diet
of the population.
Natural self-cleansing of soils leading to the elimination of caesium and
strontium nuclides is an extremely slow process (the half-period for self-cleansing
is 7-15 years), whereas the agrochemical techniques and decontamination measures
available to us, including deep ploughing, liming, application of potassium and phos
phorus fertilizers, removal of contaminated soil and the like, are expensive and not
particularly effective (the protection factor being no more than 2 to 4). Three years
after the Chernobyl accident, despite the application of a complex of antiradiation
measures, food products grown on the contaminated territories still quite often con
tained radionuclides in excess of the maximum permissible levels.
The type and amount of radionuclides reaching us through the food chain and
also their absorption or uptake, elimination and, in the final analysis, their concentra
tion in the body depend, of course, on our diet. Furthermore, it is with food products
that we find it most convenient to introduce radiation blockers which exclude or
minimize the radiophobic effect, guarantee proper utilization of the substances in
question, etc.
We have worked out recipes for food products to which common inhibitors
have been added, i.e. substances which inhibit the absorption of strontium (calcium
and phosphorus salts, alginic acid salts, pectins, cellulose) and of caesium (Prussian
blue, proteins, certain amino acids). The foods used included soft and hard cheeses,
meat and meat-vegetable products, sausages, bread and bakery products, cakes and
pastries and jelly concentrates.
It had hitherto remained unclear how such inhibitors would behave within the
food products, that is whether their properties would be partially or wholly lost dur
ing the production process and whether they would lose their effectiveness to some
degree as a result of reactions with a product component during manufacture, ther
mal processing, storage, etc.
The suitability of the products developed for the purpose of reducing caesium
and strontium accumulation was studied in experiments on female white rats. In three

POSTER PRESENTATIONS 241
series of experiments (26 groups, with 8 rats per group), the animals received an
ordinary cage diet, part of which was in some cases replaced by the product to be
studied. The diets in each group were identical as regards calorie content, protein,
fat and carbohydrates, as well as potassium, sodium and calcium salts. Indicator
amounts of l37Cs and 85Sr were added to the food over a period of 30 days before
feeding. The isotope concentrations in the animals’ bodies were measured
periodically on a ‘Robotron’ device.
Sodium alginate, calcium phosphate, pectin and cellulose reduced 85Sr
accumulation by factors of 3.0, 2.5, 1.3 and 1.2, respectively, and products made
of sea kale achieved a reduction by a factor greater than 4. These results correspond
to the data of other authors who used similar quantities of these materials.
Prussian blue blocked the absorption of radioactive caesium almost entirely,
and by the end of the experiment the concentrations of this isotope in the experi
mental animals were not more than 2.7-3% of those found in the control group. This
amount is also in line with the results of earlier experiments.
IAEA-SM-306/79P
RADIOCAESIUM AND RADIOIODINE CONTAMINATION IN EWES: COUNTERMEASURES
F. DABURON, Y. ARCHIMBAUD, J. COUSI, G. FA Y ART
Laboratoire de radiobiologie appliquée,
Centre d’études nucléaires de Saclay,
Gif-sur-Yvette, France
1. BACKGROUND
In spite of a substantial number of papers published 10 or 20 years ago, the
1986 Chernobyl accident has made it obvious that more information is needed to
assess and control caesium and iodine uptake in cattle which are fed contaminated
hay. As far as small livestock are concerned, transfer coefficients to milk in ewes
and goats were measured; nevertheless, countermeasures quickly usable for a large
flock were insufficient.

242 POSTER PRESENTATIONS
Caesium uptake has been a problem in sheep in some parts of Europe, espe
cially in the United Kingdom, where caesium uptake remained near or above the per
mitted level in meat for some months.
Experiments were carried out on 9 ewes which for three months were fed con
taminated hay (5500 Bq/kg dry matter) harvested in southeastern France in
May 1986. Daily measurements were made of milk, at each milking, and of hay as
well as animal and diet waste; contaminated hay intake was adjusted to supply an
identical daily amount of radioactivity, as the specific radioactivity of hay varied by
a factor of 3-4, though it was harvested in bordering meadows.
Faeces and urine were measured every other day. Once a week the radioactiv
ity of the ewes was determined by whole body counting; muscular samples were
taken from the neck region of three animals (in a state of equilibrium between eating
and excretion) to check the standardization carried out either in plastic container
phantoms or in ewes injected intravenously with standard solutions of l34Cs and
137Cs.
Five animals (which were used as controls) gave similar values for milk and
meat transfer; three were fed a clay mineral (vermiculite) in pellets added to the diet
to prevent gastrointestinal absorption of radiocaesium [1].
2 . C A E S IU M
TABLE I. MODIFICATIONS OF TRANSFER COEFFICIENTS IN MILK AND
IN MEAT OF EWES GIVEN FEED ADDITIVES
Diet Number
o f animals
Transfer coefficient
• (percentage o f
daily intake/L or /kg)
M ilk Meat
Percentage o f
control
M ilk Meat
Control 5 7.5 ± 0.5 11 ± 1.3 100 100
Verm iculite
30 g/d 2 2.9 ± 0.5 4.2 ± 0.1 39 38
60 g/d 1 0.9 1.5 12 13
A F C F
2 g/d 1 N .T .a 1.3 N .T . 12
a N .T .: not tested.

POSTER PRESENTATIONS 243
TABLE II. MODIFICATIONS OF RADIOIODINE RETENTION IN LACTAT-
ING EWES ON THE 12th DAY AFTER A SINGLE ORAL DOSE, AND AFTER
INTRAMUSCULAR INJECTION OF STABLE IODINE
Percentage o f the oral dose excreted in: ,6 Thyroid uptake
Milk (%/L) Urine Faeces (percentage o f oral dose)
Controls:mean 34 57 35 17 15
Injection: after 3 h 18 37 77 4 1
after 6 h 44 46 50 5 0.5
after 13 h 20 28 77 7 0.75
Ammonium-ferric-cyanoferrate (AFCF) was given to two non-lactating ewes:
to the first one, AFCF was administered every day along with contaminated hay;
AFCF was given to the other ewe (one of the controls) after it stopped eating, to
study the efficiency of the drug on the decorporation (decontamination of all muscle)
process [2]. Results are given in Table I.
The efficiency of the two drugs, vermiculite and AFCF, is good enough to
decrease the transfer coefficients and the body burden by a factor of 8 , in spite of
the huge difference in the quantities added; such treatments could be carried out for
three months without any effect on health, appetite or the production capacities of
the animals. On the other hand, neither vermiculite nor AFCF failed to increase the
rate of decorporation in contaminated animals after stopping the oral contamination.
3. IODINE
Five lactating ewes were given a single dose of NaI-131 (500 /¿Ci (18.5 MBq))
orally in pellets; two ewes were used as controls and the three others were injected
with stable iodine: 0.2 g Nal (Naiodine R) and 5.2 g I (iodized oil —Lipiodol R),
respectively, 3, 6 and 13 hours after oral contamination [3, 4]. Results for thyroid
uptake and for milk, urine and faeces elimination are given in Table II. The immedi
ate blocking of thyroid uptake after the stable iodine injection and the relative reduc
tion in milk excretion (more obvious in milk concentration) when urine excretion
increases by a factor of 2 and faeces excretion decreases by a factor of
3 or 4 can be noted.

244 POSTER PRESENTATIONS
As far as milk specific radioactivity is concerned, it remained at a similar level
in all animals for the first days. Beyond the 9th-10th day, a dramatic decrease (by
a factor of 5) occurred in treated ewes. This delay is to be kept in mind for practical
applications.
REFERENCES
[1 ] H A N S A R D , S .L ., Effects o f hydrobiotites upon strontium-89 and caesium-137 reten
tion by ruminant animals, Proc. Soc. Exp. Biol. M ed. 115 (1964) 346-350.
[2] G IESE, W ., Ammonium-ferric-cyanoferrate (I I ) , (A F C F ), as an effective antidote
against radiocaesium burdens in domestic animals and animal derived foods, Br. Vet.
J. 144 (1988) 363-369.
[3] D A B U R O N , F ., C A P E L L E , A . , T R IC A U D , Y . , N IZ Z A , F ., Quelques aspects du
métabolisme de l ’ iode chez les ruminants, Rev. M éd. Vét. 119 (1968) 323-356.
[4] L E N G E M A N N , F .W ., “ The study o f iodine secretion into milk o f dairy animals” ,
Radioisotopes in Animal Nutrition and Physiology (Proc. Symp. Prague, 1964), IA E A ,
Vienna (1965) 203-220.
IAEA-SM-306/141P
EFFECTS OF FERRIC FERROC Y ANIDE (PRUSSIAN BLUE) ON UPTAKE AND ELIMINATION OF RADIOACTIVE CAESIUM IN HUMANS
V.N. KORZUN, I.A. LIKHTAREV, I.P. LOS’, I.B. DEREVYAQO,
L.A. LITVINETS, V.N. GABARAEV
All-Union Scientific Centre for Radiation Medicine,
Kiev,
Union of Soviet Socialist Republics
The Chernobyl accident led to serious and substantial radioactive contamina
tion of the surrounding territory, and as a consequence certain radionuclides were
able to enter the human body with food. One of the most important elements in this
respect was 137Cs. At the final stage or link in the biological chain — the human
organism link — prophylactic measures to deal with internal exposure involve devel
oping ways and means of reducing the absorption of radionuclides through the
gastrointestinal tract, or accelerating their excretion with urine and faeces.

POSTER PRESENTATIONS 245
Research carried out both in the Union of Soviet Socialist Republics and in
other countries has indicated that the most effective and promising substance for
reducing the accumulation of caesium isotopes in the body is Prussian blue, a com
pound which has been approved by the Pharmaceutical Commission of the USSR
under the name of ‘Ferrocyn’ . In long term studies (lasting 800 days) on laboratory
animals, this compound was found to have low toxicity combined with great effec
tiveness in preventing the accumulation of caesium isotopes. However, the recom
mended method Of applying the compound (2-3 g/d in aqueous suspension) proved
to be impracticable for prolonged mass applications.
Until recently there were few papers in the literature reporting investigations
of the effectiveness of this compound as an additive in food products. However, it
seems that this is precisely the way in which Ferrocyn can be used most effectively
if we wish to utilize foodstuffs produced on land with high soil contamination
densities.
We worked out recipes for foods (meat and meat-vegetable preserves,
sausages, bread and bakery goods, cakes and pastries, dessert concentrates, etc.)
containing Ferrocyn in concentrations of 0.1-0.5 %. The main requirement for these
food products was that they should retain their organoleptic properties, namely
odour, flavour, consistency and colour. Unfortunately, Ferrocyn has a stable blue
colour, and so we used it only with food products which are naturally dark in colour.
The capacity of food products containing Ferrocyn to reduce l37Cs accumula
tion was studied in experiments on animals. The results obtained in these experi
ments convinced us that it would be possible to include Ferrocyn in foods and gave
us the opportunity to test such products in observations on human patients. In the
clinic of the All-Union Scientific Centre for Radiation Medicine, we tested the effec
tiveness of Ferrocyn on patients with initial radioactive caesium levels between 2 and
8 mCi (74-296 MBq), either as a medicine or as an additive to food products. In
6 out of 16 patients, normal elimination of 137Cs was studied (Group 1); the remain
ing 10 individuals received Ferrocyri (1.0 g/d) either in aqueous suspension (5
individuals, Group 2) or as an additive in food products (5 individuals, Group 3).
The effective elimination due to Ferrocyn is seen in a greatly enhanced excre
tion of radioactive caesium with faeces. The faeces/urine ratio rose from 0.3 to 4.2
in Group 2, and from 0.35 to 5.1 in Group 3, while the aggregate elimination of
radioactive caesium with urine and faeces increased by factors of 4.3 and 5.3,
respectively. Before the administration of Ferrocyn, about 0.5% of the body content
was excreted with urine and faeces, whereas with the administration of Ferrocyn this
figure rose to 1.75% in Group 2 and 2.89% in Group 3. It was found that the action
of Ferrocyn as a food additive was actually somewhat greater than the effect when
it was administered in aqueous solution. This is explained by the fact that the total
contact surface offered to the content of the gastrointestinal tract — and hence the
contact of radioactive caesium with Ferrocyn — is greater when the compound enters
the intestinal lumen with food products.

246 POSTER PRESENTATIONS
The patients accepted the food containing Ferrocyn completely calmly and
without any complaints. On the other hand, we found it possible to administer
Ferrocyn as a medical product in aqueous suspension only after prolonged
clarifications and explanations.
We tested various aspects of the Ferrocyn additive method under natural condi
tions in one of the Ukrainian villages. Eighty children aged 12-14 were examined
daily on a ‘Positronika’ whole body counter (from the Netherlands). All these chil
dren were receiving a normal domestic diet. A control group consisting of 20
individuals received in addition, over a period of 21 days, a placebo in their normal
school lunches, whereas another group consisting of 60 individuals received products
to which Ferrocyn had been added (1.0 g/d). At the end of the three week period,
the children who had received food treated with Ferrocyn showed 137Cs concentra
tions reduced by a factor of 2.1. These children were under constant medical supervi
sion; no abnormalities were found in their general state of health and well-being, nor
in the state of the peripheral blood as a result of consuming these treated products.
IAEA-SM-306/136P
INFLUENCE OF HYDRATED ALUMINIUM SILICATE SUPPLEMENTATION OF FEED ON CAESIUM CONTAMINATION OF ANIMAL PRODUCTS UNDER NATURAL AND EXPERIMENTAL CONDITIONS
G. PETHES, P. RUDAS, T. BARTHA
Department of Physiology and Biochemistry,
University of Veterinary Science,
Budapest, Hungary
In a series of experiments the effect of Zeovit (a hydrated aluminium silicate
containing mineral clay and composed of 40% zeolite) was applied to prevent the
gastrointestinal absorption of radiocontamination of animal feed.
Naturally contaminated feed with a known amount of 134Cs and 137Cs (aver
age: 1500 Bq/kg) was used first in a two month trial. The feed of 60 chickens and
40 rabbits contained 6 % Zeovit as feed supplementation; another group of 60
chickens and 40 rabbits served as controls. Sampling took place at two week intervals
when 10-15 animals from each group were slaughtered. The measurement of radio
caesium concentrations in different parts of the body and organs (blood, muscle,
liver, kidney) followed.

P O S T E R P R E S E N T A T I O N S 2 4 7
In another experiment, four main groups were formed, each with 120 broiler
chickens. The control group did not receive Zeovit. The other three groups were fed
4, 7 and 10% Zeovit, respectively, for 5 d before administration of l34Cs. At 0 h,
800 kBq l34Cs were given orally to the animals. Different samples (blood, thigh,
breast and heart muscle, liver, kidney, skin, spleen, lung and brain) were collected
at 1, 2,4, 6, 10, 24, 28, 32, 48 and 72 h after isotope administration. The radioactiv
ity of l34Cs was corrected for the mass of the sample and for the body mass of the
chicken.The feeding experiment with naturally contaminated feed showed that in both
chickens and rabbits about 25-35% of the radioactivity present in the diet can be
prevented from absorption by using Zeovit as a supplement.
The 134Cs content of the samples collected in the second series of experiments
from the 10% Zeovit fed groups was 35-71% (P < 0.001) lower than that of the
controls. Similar but less pronounced (30-48%, P < 0.001) results were obtained
with the 4% and 7% Zeovit supplementations.
As a result of the rapid absorption of 134Cs, the highest radioactivity in blood
serum was observed in the first hour after isotope administration, both in the control
and in the experimental groups. The radioactivity decreases quickly thereafter as
there is no accumulation in the blood.A high level of radioactivity is accumulated in the thigh muscles in both
chickens and rabbits. The 134Cs concentration reaches its maximum on the second
day after application and from there on it decreases slowly. The radiocaesium con
tent of the breast muscle is lower as compared to the content of the thigh muscle.
The highest radioactivity per tissue mass is found in the muscles and the major
portion of the total amount of radiocaesium in the body is found in the muscles.
Changes in the caesium content of the kidney and heart but not that of the liver and
spleen reflect the changes in the blood serum.
It was shown that though the kinetics of caesium accumulation and elimination
in different types of muscles are not the same, the radiocaesium uptake can be
decreased dramatically by using Zeovit in feed. The amount of Zeovit applied in
these experiments did not cause either an increasing or decreasing effect upon feed
conversion, i.e. that part of the feed used nutritionally.

2 4 8 P O S T E R P R E S E N T A T I O N S
DECONTAMINATION OF STRUCTURALLY
CONTAMINATED MEAT OF SMALL RUMINANTS
Z. MILOSEVICS, R. KLJAJIC, E. HORSIC Veterinary Faculty,
University of Sarajevo,
Sarajevo, Yugoslavia
This presentation examines the problem of decontamination of meat taken from
animals contaminated with 134Cs and 85Sr and exposed to semilethal and lethal
doses of X rays. Our experiment simulated the conditions following a major nuclear
accident. After irradiation, each sheep and goat was given orally 3.7 MBq 134Cs
and 7.4 MBq 85Sr. After seven days the animals were slaughtered and the meat was
decontaminated by immersing 250 g samples in plain water, salted water, sea water
and brine as well as by boiling. The immersion time was 72 hours, either without
changing the decontamination liquid or with changing it every 24 hours. The temper
ature was 4-8°C. Boiling, which was performed in a pressure cooker, lasted for
20 minutes.
The results obtained indicate that in all decontamination procedures by immer
sion, the level of 134Cs is decreased by 60-70% in the first 24 hours (85Sr was
under the detection limit). The procedure with the exchange of decontamination
liquid is somewhat more effective. After 72 hours the best decontamination effect
was achieved by immersing the meat in brine: 83-97%. The lowest effect was
obtained by boiling in water: 52-56%.
All decontamination procedures showed better results in semilethally irradiated
animals. The total decontamination effect was somewhat better for goat meat.
I A E A - S M - 3 0 6 / 8 1 P
Part V
RADIATION EXPOSURE OF POPULATIONS


I A E A - S M - 3 0 6 / 9 4
W O R L D W I D E R A D I A T I O N E X P O S U R E
F R O M T H E C H E R N O B Y L A C C I D E N T
B.G. BENNETT
United Nations Scientific Committee on the Effects of
Atomic Radiation,
Vienna
Abstract
WORLDWIDE RADIATION EXPOSURE FROM THE CHERNOBYL ACCIDENT.■ Exposure o f the entire world population to radiation resulting from the Chernobyl
nuclear reactor accident has been evaluated by the United Nations Scientific Committee on the Effects of Atomic Radiation (UNSCEAR). The evaluation accounted for measurement results reported from 34 countries to establish the pattern of transfer during the first year after the accident; the report used fallout measurement experience to make a projection o f doses to be received from continued exposure, primarily to l37Cs. On the basis o f transfer factors derived from this information and o f l37Cs deposition measured or estimated in all regions of the Northern Hemisphere, the collective effective dose equivalent commitment has been estimated. The result is 600 000 man-Sv, with 53% o f this to be received in Europe and 36% in the USSR. (The two areas were measured separately.)
1/ INTRODUCTION
The radioactive materials released from the Chernobyl nuclear reactor accident
and dispersed throughout the Northern Hemisphere caused relatively high contami
nation levels in Europe and the USSR, and trace amounts in other regions. Because
of the concern for public health, large numbers of measurements were made to
evaluate the radiation hazard.
In order to evaluate the exposure of all populations throughout the world, the
United Nations Scientific Committee on the Effects of Atomic Radiation
(UNSCEAR) undertook a detailed assessment of the collective effective dose equiva
lent commitment from the accident. The evaluation served to develop the methods
of dose estimation for this type of radiation source and to improve the comparability
of results among countries. The results of the analysis have been published in the
UNSCEAR 1988 Report [1].
25 1

2 5 2 B E N N E T T
Variable wind directions and sporadic rainfall in the dispersion region resulted
in an inhomogeneous pattern of radionuclide deposition throughout the European
region. In addition to deposition differences in localized regions, agricultural condi
tions varied markedly from north to south in Europe during the early part of the
growing season at the time of the accident. For these reasons, radiation exposures
had to be evaluated in more detail and for a greater number of limited geographic regions.
The exposure assessment performed by UNSCEAR relied on measurements
made in countries during the first year after the accident. Sufficient results were
available to evaluate the first year exposure in 34 countries. Averaged results were
considered for many countries; however, for several countries in Europe, exposures
were evaluated in two to four subregions to avoid averaging more wide ranging dosimetric data.
The exposure evaluation concentrated on the major radionuclides released and
the dominant dose pathways, namely irradiation from deposited radioactive materials
(primarily 137Cs in the longer term) and dietary ingestion of radionuclides (l31I in
milk and in leafy vegetables during the first month and, after that, 134Cs and 137Cs
in foods). Also evaluated from the data generally available were two secondary path
ways: external irradiation from radioactive materials present during cloud passage
and inhalation of radionuclides in air.
The estimates of first year doses reflected the prevailing conditions in countries
and accounted for measured values and the protective measures taken. Estimates
were made of the effective dose equivalent received during the first year and subse
quently and also of the first year dose equivalents to the thyroids of adults and one year old infants.
Contributions to doses occurring after the first year and resulting from
deposited radioactive materials were estimated from models derived by UNSCEAR
from fallout measurement experience. The parameters for these models were
obtained by averaging results from widely separated regions. In order to avoid
attributing undue precision to such generalized projections in local areas, dose com
mitments were evaluated only for larger geographic units consisting of regional groupings of countries.
The computational methods for evaluating each pathway are described in the
UNSCEAR 1988 Report [1]. For the most part, these involve multiplication of first
year integrated deposition or concentrations in foods by suitable dose factors (e.g.
dose per unit intake) and intake rates (e.g. food consumption rates, breathing rate).
The projected dose after one year from external irradiation was computed from
cumulative deposition, multiplied by dose factors assuming a radionuclide
distribution in soil with a relaxation length of 3 cm, and taking into account
radioactive decay, building shielding and indoor-outdoor occupancy. Uniform
2 . M E T H O D S O F E V A L U A T I O N

I A E A - S M - 3 0 6 / 9 4 2 5 3
values of the building shielding factor (0.2) and the indoor occupancy factor (0.8)
were used. The observed reductions in exposure levels in urban areas as a result of
runoff were also incorporated into the dose models; a fractional amount (0.5) of
deposition was assumed fixed on urban surfaces and the remainder was assumed lost
in short term runoff.
The projected dose from ingestion of food was estimated from the transfer
relationship from deposition to diet (Р2з). The model for the transfer function
previously derived and used in UNSCEAR assessments is
P23 = b, + b2 + b3e“M
where b, is the component of first year transfer; b2 is the second year transfer; and
Ьзе“Х| is the subsequent transfer accounting for both environmental loss and
radioactive decay. This formulation allows for separation of the first year and
subsequent transfer, and only the last two terms of the equation were used for
projected doses from ingestion to be combined with the first year doses derived from
direct measurements.Five basic food groups were considered in evaluating the ingestion pathway:
milk and milk products, grain products, leafy vegetables, vegetables and fruits, and
meat. Individual foods were weighted according to consumption amounts to
determine average values of integrated concentrations for each food category. Food
consumption statistics reported from individual countries were used in the evalua
tions of doses to adults. For infants, consumption estimates vary widely owing to
differing definitions of the representative infant age; therefore, standard values of
consumption rates of foods by infants were adopted for use in all countries. These
values were: milk products, 200 kg/а; grain products, 20 kg/а; leafy vegetables,
5 kg/а; vegetables/fruits, 15 kg/а; and meat, 5 kg/a.Collective dose estimates were made by multiplying the doses for each
pathway by the relevant populations of the region. For the ingestion pathway, a
consumption based estimate was derived on the basis of individual intakes and the
number of individuals. In addition, a production based estimate was evaluated
according to the country’s total food production. These two estimates were in close
agreement, even considering the uncertainties of both methods. The production
based estimate accounts for any additional collective dose outside the country due
to exported food products.
3. FIRST YEAR DOSE RESULTS
Estimates of first year thyroid and effective dose equivalents based on
measurement results available from 34 countries are listed in Table I. These include
in addition to the Union of Soviet Socialist Republics, most countries of Europe and

254 B E N N E T T
T A B L E I . C O U N T R Y A V E R A G E O F F I R S T Y E A R D O S E E Q U I V A L E N T S 3
, Thyroid dose equivalent Effective dose _________ .______________
equivalent Infant Adult0*Sv) QiSv)
EUROPE
Bulgaria 760 25 000 2 900
Austria 670 9 400 1 800
Greece 590 20 000 5 000
Romania 570 18 000 2 800
Finland 460 1 800 1 200
Yugoslavia 390 14 000 5 500
Czechoslovakia 350 2 200 2 700
Italy 300 3 400 1 500
Poland ; 270 8 100 1 400
Switzerland 270 15 000 2 300
Hungary 230 6 000 1 000
Norway 230 1 000 570
German Democratic Republic 210 5 100 970
Sweden 150 1 000 340
Germany, Federal Republic of 130 1 700 440
Ireland 120 2 500 540
Luxembourg 98 2 700 580
France 63 1 600 360
Netherlands 58 940 390
Belgium 41 2 300 460
Denmark 30 160 64
United Kingdom 27 710 130
Spain 4.2 110 24
Portugal 1.8 9 4
U S S R 2 6 0 5 0 0 0 1 4 0 0

I A E A - S M - 3 0 6 / 9 4 25 5
T A B L E I . ( c o n t . )
CountryEffective dose
Thyroid dose equivalent
equivalent Infant Adult(nSv) (M Sv)
ASIA
Turkey 190 . 2 300 480
Israel 92 1 500 1 100
Cyprus 68 4 700 1 200
Syrian Arab Republic 8.3 1 400 74
China 7.8 390 47
Japan 7.6 210 100
India 2.1 69 5
NORTH AMERICA
Canada 1.4 75 11
United States o f America 1.5 110 15
a Countries are listed in descending order o f dose equivalents.
a few countries in Asia and North America. The dose values in Table I are the aver
age results for each country. More detailed subregional results are listed in the
UNSCEAR 1988 Report [1].
The results in Table I are listed in order of the effective dose equivalent. The
highest values were estimated for countries in southeastern, central and northern
Europe, followed by other countries at greater distances from the accident site. The
highest country average result (0.76 mSv in Bulgaria) is about one third of the
natural background annual dose (2.4 mSv). In subregions of Romania and
Switzerland, the effective dose equivalents in the first year were in the range of 1
to 2 mSv, and in the Byelorussian Soviet Socialist Republic, 2 mSv, which is
comparable to the dose received from the natural radiation background. Even these
subregional results are for broader regions of countries, and therefore some higher
values (and also lower values) could be expected for more narrowly defined areas
or particular groups of individuals. The most unusual or extreme doses to individuals
2 5 6 B E N N E T T
were not evaluated by UNSCEAR, since the main purpose of the evaluation was to
analyse the collective doses, which could be based on representative or average results.
The average values of infant and adult thyroid dose equivalents are listed in
Table I. Infant thyroid dose equivalents in Europe generally ranged from 1 to
20 mSv. Adult thyroid doses were usually smaller than infant thyroid doses in the
same country by a factor of about 5 in central and western Europe. The differences,
however, were smaller in northern Europe, where milk was less contaminated
because the cows had not been in the pastures, and in regions of southern Europe
and Asia, where the contamination of leafy vegetables increased adult thyroid doses.
4. TRANSFER FACTORS
The measurement results reported and available for the 34 countries, for which
first year doses were evaluated, provided a pattern of transfer of radionuclides in air,
deposition and diet to dose which could then be used to evaluate the doses in all other
countries of the Northern Hemisphere. Transfer factors are the ratios of dose or
integrated concentrations in environmental media (air, soil, diet, human body) to the
cumulative deposition or integrated concentration in a preceding compartment of the
environmental chain of transfer.
Transfer factors were evaluated for the major radionuclides contributing to
dose: l31I, 134Cs and 137Cs in all pathways and several short lived emitters in the
external irradiation pathway in the first month and l03Ru and 106Ru in the first year
after the accident. The relative proportions of these radionuclides in air and
deposition showed some variability at particular times of measurement, but there
were no significant differences in the ratios of integrated values at various locations.
These ratios relative to 137Cs were 0.5 for l34Cs and 106Ru, 1.6 for 103Ru and 6.2
for l3lI. With the use of these ratios, all transfer factors could be referred to 137Cs
deposition and could then be combined into a single overall transfer factor. The
results of this analysis are summarized in Table II.
For external irradiation, the same assumptions and transfer factors applied to
all regions. For the ingestion pathway, however, a latitudinal dependence in the
transfer factor was evident. Higher values of transfer factors were derived for
locations at lower latitudes where agricultural conditions were more seasonally
advanced. At northern latitudes the growing season had not yet begun at the time of
the accident, and cows were not yet in the pastures. The lowest values of transfer
factors from deposition to foods were derived in these regions. Three separate
geographic regions were specified to define the general values of transfer factors:
southern (<41° latitude), temperate (41-55° latitude) and northern (>55° latitude).
The values of the transfer factors given in Table II are to be applied to obtain
the doses from all radionuclides but are referred to the deposition of 137Cs only. To

I A E A - S M - 3 0 6 / 9 4 2 5 7
TABLE II. TRANSFER FACTORS RELATING EFFECTIVE DOSE
EQUIVALENT TO CAESIUM-137 DEPOSITION DENSITY
Pathway/radionuclide
Transfer factors (/xSv/(kBq m '2)
First year Subsequently Total
External irradiation
Caesium-137 2.2 71 73
Caesium-134 2.5 4.9 7
Other 5.6 0.2 6
Ingestion
Caesium-137
North3 15 20 35
Temperate 20 20 40
South 25 25 50
Caesium-134
North 11 12 23
Temperate 14 12 26
South 18 15 33
Iodine-131
North 1 — 1
Temperate 10 — 10
South 20 — 20
Total (rounded)
North 40 110 150
Temperate 50 110 160
South 70 120 190
Values given according to northern — temperate — southern latitudinal regions.

2 5 8 B E N N E T T
this extent, they reflect the particular composition of radionuclides in the material
released from the Chernobyl reactor. They also refer to the agricultural conditions
prevailing at the time of the accident. These values would be generally valid for
comparable types of radiation sources, but they are of specific use in evaluating
doses from the Chernobyl release where only an estimate of 137Cs deposition can be
made.
5. CAESIUM-137 DEPOSITION IN THE NORTHERN HEMISPHERE
A general decrease of radionuclide deposition with distance from the release
site can be expected, with variability due to wind and rainfall differences. In the case
of the Chernobyl accident, the release continued for ten days while the wind changed
to all directions. Therefore, some variability was averaged out and a relatively
uniform decrease in 137Cs deposition with distance from Chernobyl was observed.
From the log-log plot of average 137Cs deposition in the 33 countries outside
the USSR reporting measurements with distances from the accident site, an approxi
mate deposition-distance relationship was determined. This ranged from about
10 kBq/m2 of 137Cs deposition density at 1000 km to about 0.01 kBq/m2 at
10 000 km. With this relationship, 137Cs deposition was estimated in all regions of
the Northern Hemisphere where measurements were not available. The distances to
particular regions were population weighted averages of the distances to the capital
cities or to the approximate population centres of the countries of the regions.
With a tropospheric release of radionuclides there is very little transfer of
material to the opposite hemisphere. Therefore the radioactive release from the
Chernobyl accident was largely confined to the Northern Hemisphere. From the
estimated l37Cs deposition densities of regions throughout the hemisphere, includ
ing the oceans, and the land areas of these regions, an estimate was made of the total
amount of 137Cs released in the accident. This estimate was 70 PBq, corresponding to 25% of the 137Cs calculated to have been in the reactor core. This result is
slightly greater than the estimate of 38 PBq + 50% made at the time of the accident
and based on measurements at the release site [2].
6. COLLECTIVE DOSE COMMITMENT
On the basis of 137Cs deposition estimates in all regions of the Northern
Hemisphere, derived from the deposition-distance relationship, and the transfer
factors relevant for the latitudinal area (Table II), the effective dose equivalent com
mitments for all regions have been evaluated. The doses multiplied by the popula
tions of the regions give the collective effective dose equivalent commitments. These
results are listed in Table III.

I A E A - S M - 3 0 6 / 9 4 2 5 9
TABLE III. EFFECTIVE DOSE EQUIVALENT COMMITMENT
IN THE NORTHERN HEMISPHERE
RegionPopulation
(106)
Distancefrom
Chernobyl(km)
Cs-137deposition(kBq/m2)
Per caput dose OiSv)
Collective dose (man ■ Sv)
Firstyear
TotalFirstyear
Total
EUROPE
North 22.8 1 300 7.0 210 970 4 700 22 000
Central 178.0 1 200 6.0 280 930 49 000 166 000
West 137.7 2 000 1.0 48 150 6 600 21 000
Southeast 101.6 1 500 7.2 380 1 200 39 000 121 000
Southwest 47.2 2 900 0.03 4 7 180 340
USSR 279.1 — 5.0 260 810 72 000 226 000
ASIA
Southwest 114.9 2 200 1.0 70 190 8 000 22 000
South 1 082 5 400 0.08 6 15 6 100 16 000
Southeast 240.6 7 800 0.03 2 6 510 1 400
East 1 268 6 600 0.04 3 8 3 600 9 600
AMERICA
North 347.0 9 000 0.02 1 4 490 1 300
Caribbean 30.1 9 200 0.018 1 3 40 100
Central 26.9 10 700 0.012 0.7 2 20 60
South 49.7 10 100 0.013 1 2 50 120
AFRICA
North 128.4 3 000 0.4 28 76 3 600 9 800
West 172.3 5 600 0.08 6 15 970 2 600
Central 18.3 5 300 0.08 5 15 100 280
East 59.5 5 100 0.09 6 17 380 1 000
Total/average 4 304 5 700 0.9 45 140 200 000 600 000(rounded)

2 6 0 B E N N E T T
The total collective dose equivalent commitment from the Chernobyl accident
is estimated to be 600 000 man-Sv [1], distributed in the following proportions:
53% to European countries, 36% to the USSR, 8% to Asia, 2% to Africa and 0.3% to North, Central and South America.
The calculation indicated that 70% of the collective effective dose equivalent
commitment is due to 137Cs, 20% to 134Cs, 6% to 13II and the remaining 4% to
short lived radionuclides deposited immediately after the accident.
7. CONCLUSIONS
The UNSCEAR assessment of exposures resulting from the Chernobyl
accident documents in some detail the radiation experience and provides a basic
methodology for dose evaluation of a large scale accidental release of radioactive
materials.
Of the total dose commitment from the accident, approximately one third was
received during the first year following the accident. The remainder will be delivered
over a period of decades, mainly according to the radioactive half-life of 137Cs
(30 years). During this period, natural background radiation will have contributed
significantly .greater doses to the world’s population. Thus, although the collective
dose from the accident was, in perspective, not of great magnitude, there was
widespread contamination which caused alarming short term increases in the
background exposure levels of populations in many countries.
The collective effective dose equivalent commitment due to l37Cs per unit
release of 137Cs was estimated to be 6 X 10'12 man-Sv/Bq. Although this result
pertains to the conditions that prevailed at the time of the accident, it is a useful
reference normalized dose estimate for this type of radiation source.
REFERENCES
[1] UNITED NATIONS, Sources, Effects and Risks o f Ionizing Radiation, Report to the General Assembly, United Nations Scientific Committee on the Effects of Atomic Radiation, (UNSCEAR), UN, New York (1988).
[2] INTERNATIONAL NUCLEAR SAFETY ADVISORY GROUP, Summary Report on the Post-Accident Review Meeting on the Chernobyl Accident, Safety Series No. 75-INSAG-l, IAEA, Vienna (1986).

I A E A - S M - 3 0 6 / 1 2 6
S E T T I N G D E R I V E D I N T E R V E N T I O N
L E V E L S F O R F O O D
P.J. WAIGHT
Division of Environmental Health,
World Health Organization,
Geneva
Abstract
SETTING DERIVED INTERVENTION LEVELS FOR FOOD.A simple relationship for estimating derived intervention levels is presented, and the
problems associated with its implementation are reviewed. These problems are: (1) acceptable reference level of dose; (2) validity of food consumption statistics; (3) appropriate dose per unit intake factor; (4) how to deal with more than one contaminated food; and (5) the role optimization should play. Each one o f these problems is discussed in turn, and the way in which each was approached in the derivation o f the World Health Organization and Codex Alimentarius Commission guideline values is detailed. Although the methodology used was similar in both instances, the guideline values were developed for different purposes and this difference in intent and application alters radically the values adopted. The guideline values adopted by the Codex Alimentarius Commission to be applied to food in international trade are discussed.
1. INTRODUCTION
In the three years since the Chernobyl accident, many national authorities and
international organizations have wrestled with the problems associated with setting
derived intervention levels (DILs) for food. The only way that an estimate of the
hazard of ingestion of accidentally contaminated food can be made is to convert the
ingested radioactivity to a dose. The dose will depend not only on the activity
ingested, but also on the characteristics of the radionuclide and its metabolism. The
activity ingested, in turn, depends on the quantity of food eaten and its activity con
centration. While the characteristics of the radionuclide never change, its rate of
metabolism may differ in some sections of the population, so that the dose per unit
intake is not uniform across a mixed population.
The simple relationship for estimating the DIL is:
RLDDIL = ---- (1)
md
where RLD is the reference (intervention) level of dose (Sv/a), m is the mass of food
2 6 1
2 6 2 W A I G H T
consumed annually (kg/a), d is the dose per unit intake (Sv/Bq) and DIL is the derived intervention level (Bq/kg).
Each one of these parameters has associated difficulties. This paper will dis
cuss some of these problems and how they were approached, not necessarily
‘solved’, by the World Health Organization (WHO) and the Codex Alimentarius
Commission (Codex). In addition, other factors can influence the level of the DILs,
especially when they are developed for different food groups.
2. PROBLEMS
The problems associated with the implementation of DILs are:
(1) Reference level of dose: What is acceptable?
(2) Food consumption: How good are the statistics?
(3) Dose per unit intake factors: What part does the critical group play?
(4) Additivity: How is more than one contaminated food group dealt with?
(5) Optimization: What role should it play?
Before one looks at the way these problems were tackled by WHO [1] and
Codex [2], it is essential to understand the intention of the two sets of guideline values, as the intent laid the foundation of the approach adopted in each case.
It was the intent of WHO to produce guideline values for DILs in environmen
tal media, below which actions to reduce or avoid the potential health detriment were
not justified. It was also felt that such guideline values would provide a basis upon
which countries could implement their Own DILs, and so promote a measure of
harmonization. A methodology was proposed to guide WHO Member States in the
development of their national DIL values for contaminated food. The guideline
values were examples of the result of using the methodology based on the potential
health effects.
The objectives of the Codex guideline values were entirely different. Here the
aim was to arrive at values for accidental contamination of food moving in interna
tional trade. At levels below these values there would be no need for food control
authorities to intervene. These values needed to be simple and easy to apply under
existing food control laws and at the same time be effective de minimis levels. While
health was an initial concern in the development of the Codex guidelines, considera
tion of simplicity, uniformity and ease of application led to values that were so
conservative as to pose no significant health hazard
Inevitably, these two different objectives led to the development of different
values, even though a very similar methodology was used.

I A E A - S M - 3 0 6 / 1 2 6 263
2.1. Reference level of dose (RLD)
In spite of the advice given in International Commission on Radiological
Protection (ICRP) Publication 40 [3] that accidents are different from normal opera
tion and that the population dose limits set for normal operation do not apply, many
people were convinced that the 5 mSv mentioned in that publication referred to the
dose limits for normal operation. In fact this value does not refer to the base limits
for normal operation. The result of this misunderstanding was that there was a
general conviction that 5 mSv was the dose limit for the first year after an accident
and 1 mSv for subsequent years.
ICRP 40 [3] suggests in Appendix С that the distribution of contaminated food
could be interrupted if the projected dose within the first year would otherwise
exceed the annual dose limit for members of the public (i.e. 5 mSv), but that depend
ing on available alternative supplies, it may be appropriate to allow a higher level
of dose. No mention is made of subsequent years; the 5 mSv is the level of committed
dose in the first year at which measures to control the distribution of foodstuffs
should be considered, and 50 mSv is the level at which such controls would almost
certainly be introduced.
WHO suggested that the dose in subsequent years is likely to be very much
lower than 5 mSv from the ingestion of contaminated food and therefore need only
be dealt with by national authorities on a case by case basis, rather than by adopting
a limit prior to the accident for subsequent years.
The value of 5 mSv was chosen as the RLD and justified by comparison with
the level of ‘natural’ background exposure and by the WHO guidance on radon levels
in houses [4]. Here, simple remedial measures were suggested when the annual dose
exceeded 8 mSv.
2.2. Food consumption
The consumption of different food items varies according to the individual,
locality, country and region. National statistics on average consumption are avail
able, but like the ICRP Reference Man, they do not reflect accurately the characteris
tics of a specific individual within the population. In addition, these national averages
do vary, and if used as absolute values, would result necessarily in widely differing
national DILs. It was for this reason that WHO developed a ‘global diet’ [1] based
on the consumption of 550 kg of food per year and a ‘normalization’ of global
averages.
It should be remembered that significant quantities of a food item need to be
consumed in a year before the 5 mSv level is exceeded. Figure 1 shows this relation
ship between contamination and consumption required to give a dose of 5 mSv. It
is clear that food items consumed in quantities below about 20 kg/а need to be heavily contaminated with 137Cs (of the order of kBq) before the RLD is exceeded.

2 6 4 W A X G H T
FOOD CO NSU M PT IO N (kg)
FIG. 1. P lot o f food contamination versus food consumption fo r 137Cs to give rise to a dose
o f 5 mSv, assuming a dose conversion factor o f 1.3 x 10 s Sv/Bq.
This fact allowed WHO to reduce its food items to seven which were consumed in
quantities greater than 20 kg/а, and for which DILs were most useful.
For the Codex guideline values, it was assumed that all the food consumed in
a year (550 kg) was contaminated, and the DILs were developed on this basis. This
avoided the complication of separate food groups with different DILs, but added the
problem of what to do about foods, such as spices, which are consumed in small
quantities, or those food items that were diluted before consumption. This problem
is yet to be resolved.

I A E A - S M - З О б / 1 2 6 2 6 5
TABLE I. CODEX ALIMENTARIUS COMMISSION GUIDELINE VALUES
FOR FOODS DESTINED FOR GENERAL CONSUMPTION
Dose per unit intake factor
(Sv/Bq)
Illustrative Level radionuclides (Bq/kg)
1(T6 Am-241, Pu-239 10
10-7 Sr-90 100
10'8 1-131, Cs-134, Cs-137 1000
Note: For infant foods and milk, a dose per unit intake factor of 10 5 Sv/Bq is used ratherthan 10'6 Sv/Bq and l3lI is moved to the 10 7 Sv/Bq class o f radionuclides.
TABLE II. CODEX ALIMENTARIUS COMMISSION GUIDELINE VALUES
FOR MILK AND INFANT FOODS
Dose per unit Illustrative Levelintake factor radionuclides (Bq/kg)
(Sv/Bq)
10'5 Am-241, Pu-239 1
10’ 7 1-131, Sr-90 100
10'8 Cs-134, Cs-137 1000
2.3. Dose per unit intake factors
Since the objective of these guideline values is to protect the ‘average’ con
sumer, WHO did not take into account the extreme consumers but used the dose per
unit intake factors appropriate to the general population for application to most
foods. For simplification, the radionuclides most likely to be of interest were divided
into two classes: those with a high dose per unit intake factor (10~6 Sv/Bq) such as
239Pu, and those with a low dose per unit intake factor (10~8 Sv/Bq) such as l34Cs
and l37Cs.

2 6 6 W A I G H T
Because infants consume mainly milk and water and also because their dose
per unit intake factors tend to be higher than those for the general population, it was
recognized that the DILs for the general population did not protect infants adequately
and separate values were calculated for this critical group. These values were based
on the consumption of 275 kg/а of milk plus 275 kg/а of water and on the dose per
unit intake factors applicable to infants.
The Codex guideline values followed the same type of methodology except that
three classes of radionuclide dose per unit intake factors were developed for food
for general consumption and for milk and infant foods (Tables I and II).
2.4. Additivity
It was essential to devise a mechanism to adjust the DILs in the WHO approach
to contamination of more than one food by more than one radionuclide. This resulted
in the following additivity formula:
V Y - C (-, f ) - < i (2)Y Y m l g -í)
where C(i, f) is the activity concentration of isotope i in foodstuff f, and DIL(i, f)
is the derived intervention level of isotope i in foodstuff f.
This approach, however, complicates the treatment of contaminated food and
is only applicable when foods or food groups are considered separately. In the Codex
guideline values, all food was assumed to be contaminated. Therefore additivity
between classes of radionuclides was accommodated by the conservative assump
tions and additivity within a class automatically taken into account. In addition, the
application of additivity as detailed in the WHO methodology was complex and did
not fulfil the criteria of simplicity required for the Codex guidelines.
2.5. Optimization
The place of optimization through cost-benefit analysis in setting DILs is not
yet accepted outside the radiation protection community. Views range from the
radiation protection ‘purist’ who says that this is the only way to establish DILs, to
the decision maker who says that health and not economics should be the base. There
are arguments for and against, and the discussion is too extensive to be detailed here.
WHO [1] suggested that simple optimization in the form of cost-benefit analy
sis could well be applied below the 5 mSv level, to determine if a food control
measure were economically justified. If so, then control should be applied. If not,
then it should be abandoned.

I A E A - S M - 3 0 6 / 1 2 6 2 6 7
Provided that the optimized dose at which intervention is justified economi
cally (H) is less than 5 mSv, the simplified cost-benefit analysis can be applied
through the relationship:
H = - (3)a
where С is the cost of maintaining the countermeasure per person and per unit time,
and a is the cost assigned to the unit of collective dose.
This analysis is a useful manoeuvre to assist in deciding whether doses
approaching 5 mSv should provoke control measures. However, the majority of
cost-benefit analyses involving contaminated food indicate an optimal H value of
between 1 and 10 mSv. It is only where С is extremely low that values of H below
5 mSv become optimal.,
3. CODEX VALUES
The Codex values are not influenced by optimization.
The following discussion details the Codex Alimentarius Commission guide
line values that were adopted at its July 1989 meeting in Geneva [2]. It should be
remembered that these values were developed for ease of application in international
trade, and that when the guideline levels are exceeded, governments should decide
whether, and under what circumstances, the food should be distributed within their
territory or jurisdiction.
It should be emphasized that when the Codex guideline levels for international
trade in food are exceeded, the competent national authority should apply the methodology developed by WHO to achieve a realistic assessment of the hazard that
might accompany ingestion of the food commodity.
Apart from its simplicity and ease of application, this Codex method is versatile; it can be applied to any accident involving any radionuclide(s) and to the dif
ferent phases of an accident. All that is required is that the radionuclides of concern
be assigned to an appropriate dose per unit intake class. It would be possible to
increase the number of classes if necessary to a 10"9 class, if such a radionuclide
were involved.
The guideline levels of Codex could be regarded as ‘below regulatory concern’
and it could be considered that levels above these do not necessarily constitute a
health hazard. These are merely action levels at which a fuller dose assessment may
be made.
In summary, the guideline values of Codex have been developed to facilitate
international trade in food. The need for simplicity and ease of application required
the adoption of conservative assumptions in order to reduce the risk of potential

2 6 8 W A I G H T
adverse health effects to an insignificant level compared with other risks. The WHO
guideline values and methodology are intended for Member States to establish their
own realistic DILs based on health effects. These two sets of guidelines are
complementary and not competitive.
Finally, it should be realized that there is no intrinsically ‘right’ way to develop
the DILs and that the thinking behind them is constantly changing and developing.
However, it is essential that the methodology proposed by the scientific community
is logical and based on the best ‘science’ available. What is ‘acceptable’ is
determined by consensus and may not be the best science.
REFERENCES
[1] WORLD HEALTH ORGANIZATION, Derived Intervention Levels for Radionuclides
in Food, WHO, Geneva (1988).[2] CODEX ALIMENTARIUS COMMISSION, Joint FAO/WHO Food Standards
Programme, adopted at the 18th ALINORM 89/11 Codex Session, Geneva, July 1989.[3] INTERNATIONAL COMMISSION ON RADIOLOGICAL PROTECTION, Protec
tion of the Public in the Event o f Major Radiation Accidents: Principles for Planning, Publication 40, Pergamon Press, Oxford and New York (1984).
[4] WORLD HEALTH ORGANIZATION, Indoor Air Quality: Radon and Formaldehyde, European Series No. 13, WHO Regional Office for Europe, Copenhagen (1986).

I A E A - S M - З О б / 1 2 0
I n v i t e d P a p e r
R E S P O N S E O F T H E E U R O P E A N C O M M U N I T I E S
T O E N V I R O N M E N T A L C O N T A M I N A T I O N
F O L L O W I N G T H E C H E R N O B Y L A C C I D E N T
F. LUYKXCommission of the European Communities,
Luxembourg
Abstract
RESPONSE OF THE EUROPEAN COMMUNITIES TO ENVIRONMENTAL CONTAMINATION FOLLOWING THE CHERNOBYL ACCIDENT.
Soon after the Chernobyl accident the Council o f Ministers and the Commission of the European Communities had to act urgently to set foodstuff intervention levels to avoid major trade conflicts between Member States. By 12 May 1986, imports into the European Community (EC) of a range o f agricultural products originating in certain east European countries had been suspended until the end o f that month. Subsequently maximum permitted total caesium levels applicable to food imported into the EC were adopted: 370 Bq/kg for milk and infant food and 600 Bq/kg for other foodstuffs. These values are still valid. Moreover, to cope with future nuclear accidents the EC has adopted maximum permitted levels for four categories o f radionuclides in baby food, dairy produce, liquid foodstuffs and other major foodstuffs. Also a list of minor foodstuffs has been established for which the levels applied will be 10 times those for other major foodstuffs. For animal feedingstuffs maximum permissible contamination levels have still to be adopted. However the necessary scientific data have already been collected. Other measures taken at the EC level are: (1) arrangements for the early exchange o f information among Member States in the event of a radiological emergency; these complement the International Atomic Energy Agency Convention on Early Notification o f a Nuclear Accident; (2) prohibition of the export o f contaminated foodstuffs exceeding the EC maximum permitted levels; (3) revision of the 1985-1989 radiation protection research programme to include areas o f further research for which the Chernobyl accident indicated a need; (4) proposal to the Council o f Ministers o f a regulation concerning the information to be given to the public regarding nuclear accidents.
2 6 9
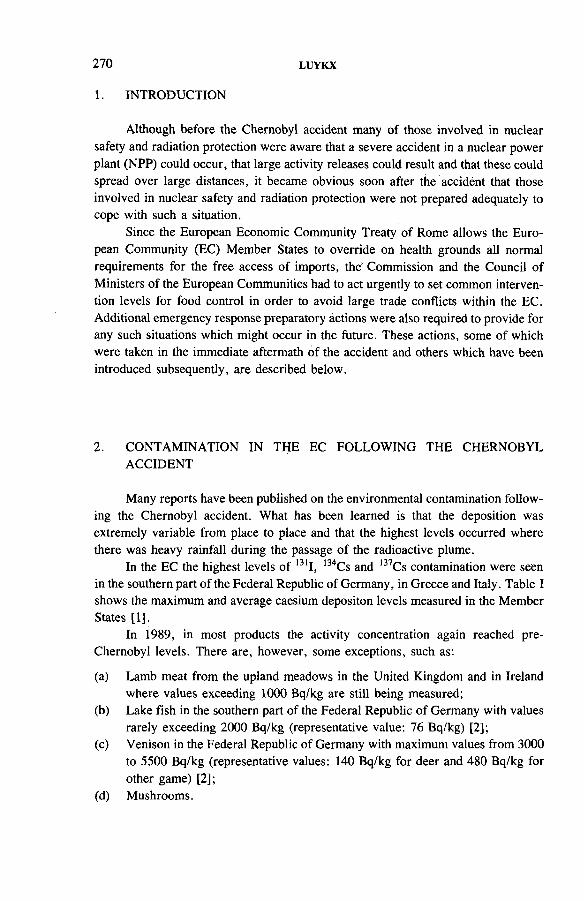
2 7 0 I . U Y K X
Although before the Chernobyl accident many of those involved in nuclear
safety and radiation protection were aware that a severe accident in a nuclear power
plant (NPP) could occur, that large activity releases could result and that these could
spread over large distances, it became obvious soon after the accident that those
involved in nuclear safety and radiation protection were not prepared adequately to cope with such a situation.
Since the European Economic Community Treaty of Rome allows the Euro
pean Community (EC) Member States to override on health grounds all normal
requirements for the free access of imports, the' Commission and the Council of
Ministers of the European Communities had to act urgently to set common interven
tion levels for food control in order to avoid large trade conflicts within the EC.
Additional emergency response preparatory actions were also required to provide for
any such situations which might occur in the future. These actions, some of which
were taken in the immediate aftermath of the accident and others which have been
introduced subsequently, are described below.
1. I N T R O D U C T I O N
2. CONTAMINATION IN THE EC FOLLOWING THE CHERNOBYL
ACCIDENT
Many reports have been published on the environmental contamination follow
ing the Chernobyl accident. What has been learned is that the deposition was
extremely variable from place to place and that the highest levels occurred where
there was heavy rainfall during the passage of the radioactive plume.
In the EC the highest levels of 131I, 134Cs and 137Cs contamination were seen
in the southern part of the Federal Republic of Germany, in Greece and Italy. Table I shows the maximum and average caesium depositon levels measured in the Member
States [1].In 1989, in most products the activity concentration again reached pre-
Chernobyl levels. There are, however, some exceptions, such as:
(a) Lamb meat from the upland meadows in the United Kingdom and in Ireland
where values exceeding 1000 Bq/kg are still being measured;
(b) Lake fish in the southern part of the Federal Republic of Germany with values
rarely exceeding 2000 Bq/kg (representative value: 76 Bq/kg) [2];(c) Venison in the Federal Republic of Germany with maximum values from 3000
to 5500 Bq/kg (representative values: 140 Bq/kg for deer and 480 Bq/kg for
other game) [2];
(d) Mushrooms.

I A E A - S M - 3 0 6 / 1 2 0 2 7 1
TABLE I. TOTAL CAESIUM DEPOSITION IN THE EC MEMBER STATES
FOLLOWING THE CHERNOBYL ACCIDENT [1]
Member StateAverage deposition
(kBq/m2)
Maximum deposition (kBq/m2)
Belgium 1.3 3
Denmark 1.7 4.6
France 1.9 7.6
Germany, Fed. Rep. 6.0 65
Greece 5.3 28
Ireland 5.0 22
Italy 6.5 ±100
Luxembourg 4.0 7.3
Netherlands 2.7 ±9
Portugal 0.003 0.012
Spain 0.004 0.041
United Kingdom 1.4 20
3. FOODSTUFF INTERVENTION LEVELS FOLLOWING THECHERNOBYL ACCIDENT
Shortly after the accident, the Commission and the Council of Ministers of the
European Communities were confronted with the problem of international trade in
contaminated foodstuffs. On 7 and 12 May 1986, they suspended until the end of that
month the import into the EC of specific agricultural products originating in certain east European countries. At the same time, the Commission requested advice from
the Group of Experts established under Article 31 of the Euratom Treaty on the
levels of radioactive substances in foodstuffs above which restrictions on import into
the EC would be considered appropriate. At the end of May 1986 the Group recom
mended an interim derived intervention level (DIL) for contamination of foodstuffs
by caesium isotopes; this DIL was based on the Euratom basic safety standards [3]
and on earlier guidance on emergency reference dose levels [4, 5]. The value recommended was 1000 Bq/kg and was derived assuming a committed effective dose
equivalent of 5 mSv from the first year of food intake to the most highly exposed
group of the population, and a contamination of 5% of the food consumed in that
year to the full value of the DIL.

2 7 2 L U Y K X
TABLE II. NUMBERS OF CONSIGNMENTS OF FOOD REFUSED BY THE
EUROPEAN COMMUNITIES FOLLOWING THE CHERNOBYL ACCIDENT
MonthLive
horsesGame,sheep
FruitHerbs,
teaHazelnuts
Miscellaneous
Total
1986
June 1 — — — — 2 3
July 5 4 2 — — 1 12
Aug. 3 — — — — — 3
Sep. — — — 1 — — 1
Oct. 2 1 3 1 5 3 15
Nov. — — — 3 — 3
Dec. — 4 7 4 10 25
1987
Jan. 2 1 3
Feb. — — — 1 5 2 8
Mar. — — — — 7 — 7
Apr. — — — 10 8 — 18
May — — — 1 — — 1
June — — — 1 2 — 3
July — — — - — — —
Aug. — — — — — —
Sep. — — — 1 — — 1
Oct. — — — 1 — — 1
Nov. — 3 1 — 4
Dec. — — 2 — — 2
Total6/86-12/87 11 11 6 29 35 18 110
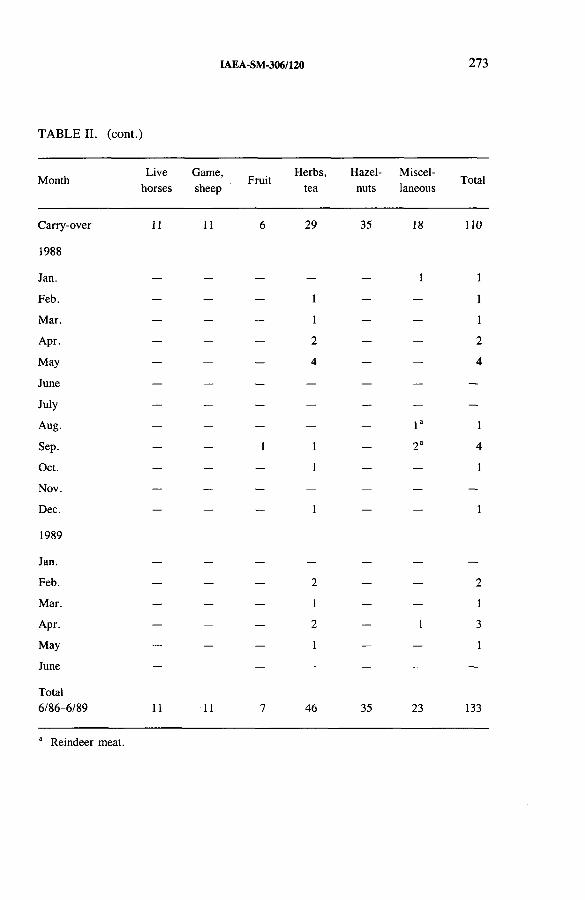
I A E A - S M - 3 0 6 / 1 2 0 273
T A B L E I I . ( c o n t . )
MonthLive
horsesGame,sheep
FruitHerbs,
teaHazelnuts
Miscellaneous
Total
Carry-over 11 11 6 29 35 18 110
1988
Jan. — — — — 1 1
Feb. — — — 1 — — 1
Mar. — — — 1 — — 1
Apr. — — — 2 — — 2
May — — — 4 — — 4
June — — — — — — —
July — — — — — —
Aug. — — — — — I a i
Sep. — — 1 1 — 2a 4
Oct. — — — 1 — — 1
Nov. — — — — — —
Dec. — — — 1 — — i
1989
Jan. — — — — — — —
Feb. — — — 2 — — 2
Mar. — — — 1 — — 1
Apr. — — — 2 — 1 3
May — — — 1 — — 1
June — — — — — — —
Total6/86-6/89 11 11 7 46 35 23 133
“ Reindeer meat.

2 7 4 L U Y K X
On 30 May 1986, the Council of Ministers adopted a regulation [6] with the
following maximum permitted caesium levels applicable to the import of food into
the EC:
— 370 Bq/kg for milk and for foodstuffs intended specifically for infants during
the first four to six months of life,
— 600 Bq/kg for all other products.
These values reflect the psychological climate prevailing at the time and were
influenced to a large degree by commercial, economic and political concerns.
This regulation, which was initially valid until 30 September 1986, has since
been extended three times; it expired on 22 December 1989 [7], but will probably
be extended once more. Some 15 non-Member States have also adopted these levels.
Member States remained free to apply their own limits to national produce for
internal consumption; where any such limit exceeded the above EC values, this limit
would also apply to imports from within the EC. But in no case would the import
limits be less than the EC values.
Member States were required to notify the Commission of the European Com
munities (CEC) immediately of any case in which imports exceed the EC maximum
permitted levels and of the decision taken regarding the shipment.
From June 1986 until June 1989, 133 cases of such consignments were
reported (Table II). In quantity they represent a very small fraction of the EC food
import and these consignments were all returned to the country of origin.
4. FOODSTUFF INTERVENTION LEVELS FOR FUTURE ACCIDENTS
4.1. Approval of Article 31
At the same time that it issued its preliminary opinion on the value of the DIL
for caesium nuclides, the Article 31 Group undertook an examination in detail of the
problems of foodstuff intervention levels and proposed for all potentially important
nuclides generalized DILs to be applied in the event of a future accident.
The Group decided to adopt a methodology based on the premise that no likely
combination of different foodstuffs should give rise to individual doses higher than
the intervention levels of dose recommended by the International Commission on
Radiological Protection (ICRP) [5] and by the CEC [4]. Two such levels were
recommended:
(a) A lower level of effective dose equivalent of 5 mSv, below which intervention
will not be warranted;
(b) An upper level of 50 mSv above which intervention would certainly be
appropriate.

I A E A - S M - З О б / 1 2 0 27 5
For the thyroid, corresponding dose levels of 50 mSv and 500 mSv respec
tively were proposed. All these levels relate to the committed dose from food intake
over the first year following the accident.To calculate the DILs corresponding to the above dose intervention levels
account was taken of:
— Types of nuclide present in an accidental release,
— Amounts of food consumed,
— Likely effective annual average level of contamination in each type of
foodstuff,— Dose conversion factors for each radionuclide.
4.1.1. Choice o f radionuclides
The Article 31 Group considered 19 radiologically important radionuclides
(Table III) covering 12 elements which are most likely to be released following a
nuclear accident; of these, strontium, ruthenium, iodine, cáesium and plutonium
proved to be of greatest significance.
4.1.2. Amount o f food consumed
Foodstuffs were classified into five dietary components: dairy produce, meat,
fruit and vegetables, cereals, and beverages.
Since the principal aim of intervention is to restrict the exposure of the most
highly exposed group of the population, the intake for three different age groups had
to be considered, namely, for infants of 1 year, children of 10 years and adults
over 20. Moreover, as far as possible, the food consumption patterns used had to
be representative of the EC as a whole; those chosen were based on information
available for the EC Member States at the time (Table IV).
4.1.3. Probable effective annual average level o f contamination in each type o f foodstuff
As was observed after the Chernobyl accident, the contamination of any single
foodstuff varies with time and place. It is not possible to predict the complex distribu
tion of contamination in advance of an accident.
However, bearing in mind that, the EC values are intended to apply to inter
state trade, the Group assumed that the annual average contamination of food over
the year following the accident would not exceed 10% of the concentration level(s)
on which controls would be based.
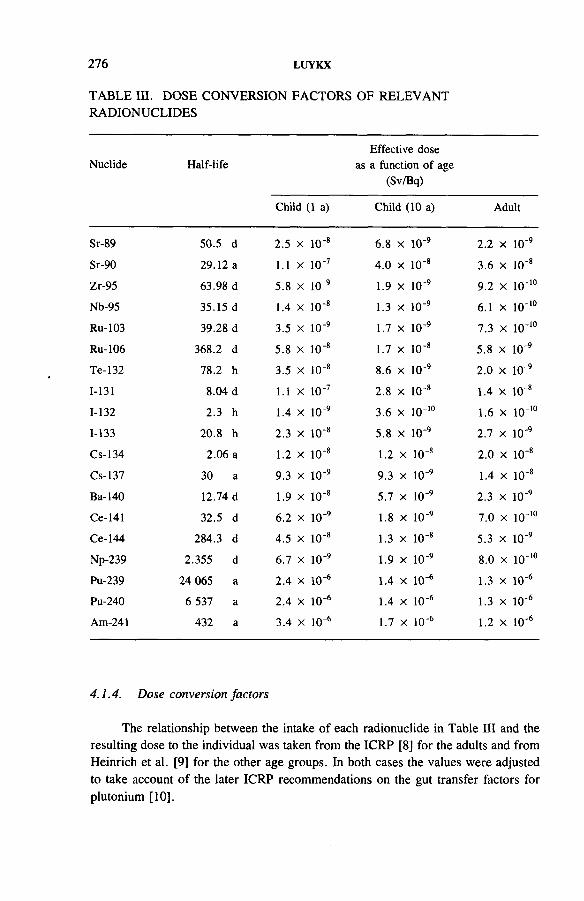
2 7 6 L U Y K X
TABLE III. DOSE CONVERSION FACTORS OF RELEVANT
RADIONUCLIDES
Effective doseNuclide Half-life as a function of age
(Sv/Bq)
Child (1 a) Child (10 a) Adult
Sr-89 50.5 d 2.5 X 10'8 6.8 X 10'9 2.2 X 10’9
Sr-90 29.12 a 1.1 X 10'7 4.0 X 10’8 3.6 X 10‘8
Zr-95 63.98 d 5.8 X 10“9 1.9 X io-9 9.2 X IQ-10
Nb-95 35.15 d 1.4 X 10‘8 1.3 X io-9 6.1 X 10-ю
Ru-103 39.28 d 3.5 X 10'9 1.7 X 10'9 7.3 X Ю-Ш
Ru-106 368.2 d 5.8 X 10'8 1.7 X IO'8 5.8 X 10"9
Te-132 78.2 h 3.5 X 10'8 8.6 X IO'9 2.0 X 10'9
1-131 8.04 d 1.1 X 10'7 2.8 X IO'8 1.4 X 10'8
1-132 2.3 h 1.4 X 10'9 3.6 X io-’° 1.6 X 10_m
1-133 20.8 h 2.3 X 10~8 5.8 X io-9 2.7 X 10'9
Cs-134 2.06 a 1.2 X 10‘8 1.2 X 10“8 2.0 X 10’8
Cs-137 30 a 9.3 X 10 “9 9.3 X 10“9 1.4 X 10‘8
Ba-140 12.74 d 1.9 X 10"8 5.7 X 10⁻⁹ 2.3 X 10'9
Ce-141 32.5 d 6.2 X 10~9 1.8 X 10⁻⁹ 7.0 X Ю-ю
Ce-144 284.3 d 4.5 X 10~8 1.3 X 10‘8 5.3 X 10'9
Np-239 2.355 d 6.7 X 10~9 1.9 X 10⁻⁹ 8.0 X lO'10
Pu-239 24 065 a 2.4 X 10"6 1.4 X 10~6 1.3 X 10'6
Pu-240 6 537 a 2.4 X 10~6 1.4 X 10~6 1.3 X 10'6
Am-241 432 a 3.4 X 10⁻⁶ 1.7 X 10~6 1.2 X 10'6
4.1.4. Dose conversion factors
The relationship between the intake of each radionuclide in Table III and the
resulting dose to the individual was taken from the ICRP [8] for the adults and from Heinrich et al. [9] for the other age groups. In both cases the values were adjusted
to take account of the later ICRP recommendations on the gut transfer factors for
plutonium [10].

I A E A - S M - З О б / 1 2 0 2 7 7
T A B L E I V . D I E T A R Y D A T A
Food group
Annual ingestion as a function of age
(kg/a)
Child (1 a) Child (10 a) Adult
Dairy produce 200 150 120
Meat 10 40 80
Fruit and vegetables 20 40 100
Cereals 20 50 100
Drinking water 250 350 600
Total food 250 350 550
The DILs were calculated for each combination of nuclide, foodstuff and age group using the above assumptions; this resulted in some 350 values. Since such a
table was too complicated to be used in a Council regulation, the following simplifi
cations were introduced:
(1) Only the most restrictive value for the three age groups was retained.
(2) Three dietary groups (meat, cereals, and fruit and vegetables) were combined
into one group whereby the most restrictive value was retained.
(3) Nuclides were combined into three groups; for each the most restrictive rele
vant nuclide was taken.
All of these simplifications introduce safety margins, the magnitude of which
depends on the conditions of the accident. The results are given in Table V.
The Group was of the opinion that the choice of the most restrictive value in
each group of nuclides, coupled with the improbability that all three groups of
nuclides would contribute significantly to the contamination of food after any given
accident, allows the values for each group of nuclides to be applied independently
of the other groups.

278 L U Y K X
TABLE V. DERIVED REFERENCE LEVELS3 (Bq/kg) AS THE BASIS FOR
THE CONTROL OF FOODSTUFFS FOLLOWING AN ACCIDENT
Radionuclides Milk products11Other major foodstuffs0
Drinking water
Isotopes of iodine and strontium, notably 1-131, Sr-90 500 3000 400
Alpha emitting isotopes of plutonium and transplutonium elements'1, notably Pu-239, Am-241 20 80 10
All other nuclides with half-lives greater than 10 dd e, notably Cs-134, Cs-137 4000 5000 800
a These derived reference levels (RLs) are intended for general application; they are based on the lower RL discussed in the text, namely, a committed effective equivalent of 5 mSv in 1 year and a committed dose equivalent to the thyroid of 50 mSv in 1 year. Values based on the higher RL would be 10 times greater.
b Milk products include fresh milk and reconstituted milk drinks or foods prepared from dried milk preparations. Cheese should be considered as one of the ‘other major foodstuffs’.
c For minor foodstuffs, e.g. those with an annual consumption of less than about 10 kg, values of 10 times those for major foodstuffs will be appropriate. It is not expected that restrictions will be needed on items such as spices and condiments.
d Within each group of nuclides, the values relate to the total activity of all the nuclides in the group. Each group can then be treated as completely independent of the other groups.
e Carbon-14 and tritium are not included in this group because of their low contribution to the doses for ány foreseeable accident.
4.2. EC regulation of 22 December 1987
On 22 December 1987 the Council adopted a regulation [11] with the values
given in Table VI. The main differences between the Recommendations of the
Article 31 Group and the Council regulation were as follows:
(a) The term ‘maximum permitted levels of radioactive contamination of food
stuffs’ is used in the Council’s regulation rather than the term ‘derived inter
vention levels’ used by the Article 31 Group. This difference arose from both
legal and practical considerations in that the law recognizes only permission
and interdiction while customs officers and traders require clear instructions
which can be applied unambiguously.
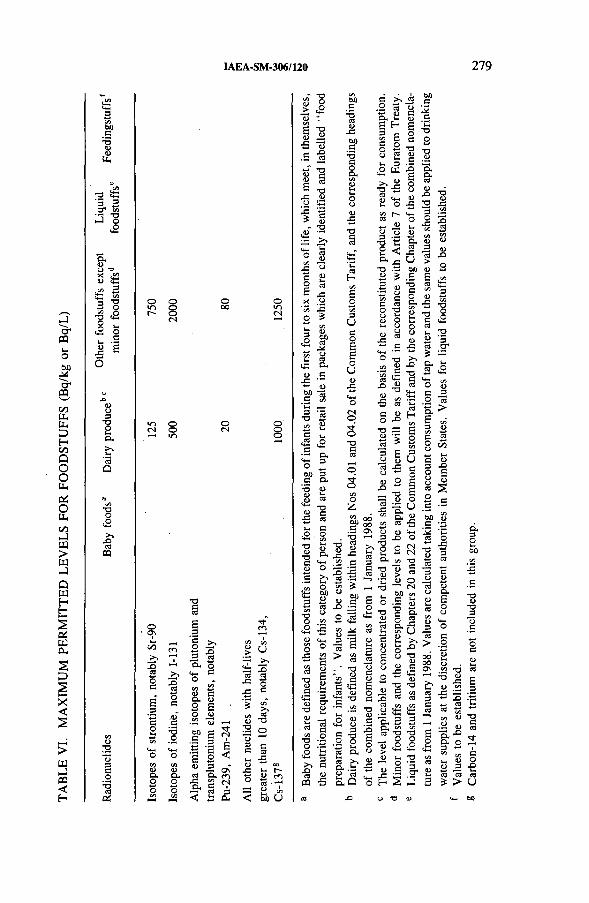
TABLE
VI.
MAXIM
UM
PERM
ITTED
LEVELS
FO
R FOODSTUFFS
(Bq/kg
or
Bq/
L)
I A E A - S M - 3 0 6 / 1 2 0 279
bx>с
,сл."2 55 з ВO ' сл ТЗ•-J о .о
-оо,о
лО
3"Оо
*оо,о
ш
о о «Л о г - оГЧ
оо1Г)
ОOnl-l00 СП>>
1—1<dОС 3cde
ОС3 г_’*3 .0)с со1м *3сл о(4M Ц-iО ОСЛ ся<D <DО. ClО ОО ОслN-4 сл
■осл£з
Он о<*- С
оао
00с
Ва>лЛ
От(N
ООо
с 1)£ ’ jü
£■3 gо <^ аГ ex m
&4 M Iл 3< !з S ,
Я 11/5 £ U"Г ^ cd л Æ О•5 с
С/5 J2а) ^a о
< оЬ и
и -g£ IЁ ’в u Ü ■5 13 .S jo
3 1 s £-С Üо g
адcdОceасJS"cdСЛ
0Üс*3соа-
-ас
cdНслеосл3Uсо££оU
С >•» Л .2 сЗ о * - (U сО-w- idв н gз с о Й t с 5 о — S я <и t- з .S£ m I> > 2 о •о ■S о
§ 'S S
Она .cdа>X)
-а
3•оо
£ .£43соа.л й* -й■п 5/5 wс 2 изО fa Йо о «
cd3тз _ S 2 с t- £ <2 В Q,
ед з с а,-а о v £(D л *** тз й с л
Tj*ОслОZ
*2 5
g *8 .5 £Рсл О
to g
■ё 3 О 22& 'JB
. -оИ•- .S 3 5cd .tá сл ^а) од « с
оо 1 00 ¿2 On о
§* 2 3 о-S "Оcd d
>о >? <u Х> £ тз*4-, сü cd
fa сл f aя S3 « н
СЛs еS 2СЛ
Е Й Я с 3 I■8 I^  Jо с+-« Х5 О
В 3 cd а4 £ - а- fe2 _ ^ 5/5 О <d С 3 .2 « О- ^ £ « 3 4>сл *¿ С « О гл О JI-С gз *98 £ я « 8 SО ^
^ С cd о
i l
о
О ,cd о+-» ч— • •
53 =á— Ёсв *-■
С«ЯU43<и
cd> сл
cd cd С V5 О ТЗ -д О -г-8 3 £ с « К 0Q ■£Д
. *о ». <о *2 с С 1Я,cd <ú
'V -о
о и Æ о
g2 о •3 i- cd Q«cdQ- .faP cdо. а
cd .£2
ID 5> J! о о— fSj00 сл•I £c g-o SО- рЯсл U Й >> ё 5о ^а>
0) о
I МС X ) — я -о О 4) д.£ съ•S &S ^ 8 g о Já *5 а>о Н
сл сл ТЗ 43 О О ,Р .9
Ж j
з °Id с > .2
On «^ -о^ 4) cd3 ~§ cd
^ сл
Valu
es
to be
esta
blish
ed.
Carb
on-1
4 and
tri
tium
are
not
inclu
ded
in thi
s gr
oup.

280 L U Y K X
(b) Separate values are given for iodine and strontium.
(c) DILs applicable to the groups ‘strontium’ and ‘all other nuclides’ in milk
products and in ‘other foodstuffs’ have been reduced by a factor of four to take
account of the fact that many non-EC countries were applying values at or
about the resulting derived levels; another reason for the reduction was to
maintain public confidence in the proposed system. The iodine value for ‘other
foodstuffs’ was reduced from 3000 to 2000 Bq/kg.
(4) For dairy products the Council specified that the levels applicable to concen
trated or dried products shall be calculated as ready for consumption on the
basis of the reconstituted product.
4.3. Liquid foodstuffs and baby food
In Table VI the columns for liquid foodstuffs and animal feedingstuffs were
left blank and still had to be established. A new column was added for baby foods
for which values were also to be established.
Therefore, the Article 31 Group worked out a proposal based on the following
assumptions:
For liquid foodstuffs (i.e. bottled drinks) an intake rate of 600 L/a for adults
and 250 L/a for the 1 year old child was assumed. The other assumptions were iden
tical to those adopted for the other foodstuffs.
For baby food (i.e. commercially prepared food consumed during the first 6
months), the calculation was based on:
— The same emergency dose reference level as for adults (2.5 mSv in 6 months),
— Dose conversion factors for the new-born as recommended by the ICRP Task
Group on age dependent dose factors (Table VII),
— An average contamination of all baby food over 6 months equal to 50% of the
corresponding DILs (except for 131I for which 10% was used),
— A food intake of:25 kg/6 months of dry milk based formulae,
10 kg/6 months of cereal products, fruit and vegetables, all ready for
consumption.
The DILs recommended on the basis of the above assumptions and adopted by
the Council on 18 July 1989 [12] are given in Table VIII.
The maximum permissible levels adopted by the Council will apply in the event
of any future accident; they will be brought into force by a CEC regulation substan
tiating that the above levels are likely to be reached or have been reached. However,
the validity of such a regulation would be limited to 3 months, during which time
another regulation will be prepared whereby the pre-established levels will be
adapted to take into account the circumstances of the particular accident.

I A E A - S M - 3 0 6 / 1 2 0 281
TABLE VII. DOSE CONVERSION FACTORS FOR THE NEW-BORN
(for ages between 0 and l a )
RadionuclideDose conversion factors
(Sv/Bq)
Sr-90 Effective dose 0.2 x 10‘6
1-131 Thyroid dose 8.4 x 10~6
Cs-134 (biological half-life = 25 d) Effective dose 8.2 x 10'8
Cs-137 (biological half-life = 25 d) Effective dose 5.9 x 10~8
Am-241 Effective dose 3.5 x 10“5
TABLE VIII. MAXIMUM PERMITTED LEVELS FOR FOODSTUFFS
(baby foods and liquid foodstuffs)
Radionuclides
Maximum permitted levels for foodstuffs (Bq/kg)
Baby foods Liquid foodstuffs
Isotopes of strontium,notably Sr-90 75 125
Isotopes of iodine,notably 1-131 150 500
Alpha emitting isotopes of plutonium and transplutonium elements,notably Pu-239, Am-241 1 20
All other nuclides with half-lives greater than 10 d, notablyCs-134, Cs-137 400 1000

2 8 2 L U Y K X
4.4. Minor foodstuffs
The Article 31 Group was of the opinion that for foodstuffs of minor impor
tance (i.e. those with an annual consumption of less than about 10 kg) maximum per
missible levels equal to 10 times those for major foodstuffs would be appropriate.
The Council, therefore, in its regulation of 22 December 1987 [11] asked the CEC
to establish such a list. This was done on 12 April 1989 by a CEC regulation, after consulting an ad hoc committee [13]. The list contains 31 products all of which can
be considered as contributing marginally to food consumption by the EC population.
4.5. Animal feedingstuffs
Shortly after the Chernobyl accident, in some countries relatively high con
tamination levels were observed in animal feedingstuffs. The Commission was also
confronted with the problem of what maximum permitted levels should be adopted
for feedingstuffs in order not to exceed the maximum permitted levels in animal
products. Two working parties were convened and an international workshop [14] was organized on the subject.
The basic data required to derive limits for animal feedingstuffs are transfer
factors from animal intake (Bq/d) to animal product (Bq/kg) and the average daily
intake of feedingstuffs by the animal.
TABLE IX. TRANSFER FACTORS (kg/d or L/d) FOR CAESIUM, STRON
TIUM AND THE ACTINIDES IN VARIOUS ANIMAL PRODUCTS
Animal ProductRadionuclides
Cs-134, Cs-137 Sr-89, Sr-90 Actinides(Am-241)
Cattle Milk 1 X 10‘2 2 X 10'3 4 X 10“7Meat 6 X 10'2 • 3 X io -4 2 X 10'5
Calf Meat 6 x 10“' 3 X 10 3 2 X io -4
Sheep Meat 3 x 10“' 2 X 10“3 2 X io -4
Lamb Meat 6 x lO-1 2 X 10‘2 2 X 10“3
Fattening pig Meat 8 x 10“' 2 X 10“2 2 X 10~3
Broiler hen Meat 4 x 10° 2 X 10“2 5 X 10‘3Laying hen Eggs 3 x 10° 3 X lO'1 8 X 10"3

I A E A - S M - З О б / 1 2 0 283
TABLE X. AVERAGE DAILY INTAKE OF FEEDINGSTUFFS BY ANIMALS
(kg/d assuming. 85 % dry matter content)
AnimalBody weight
(kg)Daily intake
Dairy cow 500 19
Beef cow 300 8.5
Calf 110 2.2
Sheep 60 1.5
Lamb 30 1.3
Fattening pig 50-100 2.8
Broiler hen 2 0.12
Laying hen 2
TABLE XI. FEEDINGSTUFF CONVERSION FACTORS FOR ANIMAL
PRODUCTS
Animal ProductRadionuclides
Cs-134, Cs-137 Sr-89, Sr-90 Actinides(Am-241)
Cattle Milk 11 53 2.6 x 10⁵Meat 4 780 1.2 X 10⁴
Calf Meat 1.5 300 4.5 x 10³
Sheep Meat 4.4 670 6.7 x 10³
Lamb Meat 2.6 77 7.7 x 10²
Fattening pig Meat 0.89 36 3.6 x 10²
Broiler hen Meat 4.2 830 3.3 x 10³Laying hen Eggs 5.6 56 2.1 x 10³

2 8 4 L U Y K X
On the basis of the data available in the literature, the working parties estab
lished a list of transfer factors (Table IX) and average daily intakes (Table X). These
were used to calculate ‘feedingstuff conversion factors’, i.e. the factors by which the
maximum permitted level in animal products for human consumption must be multi
plied in order to obtain the corresponding maximum permitted level for animal
feedingstuffs. In deriving these factors it was assumed that 50% of the animal’s diet
is contaminated at the maximum permitted level (Table XI).
It can be seen from Table XI that only the caesium isotopes can create a
problem. Therefore for future accidents, the Article 31 Group proposed to the CEC
the following values for these isotopes:
Feedingstuffs for pigs: 1250 Bq/kg
Feedingstuffs for calves: 2000 Bq/kg
Feedingstuffs for other animals: 4000 Bq/kg.
The CEC, for reasons of practicality, proposed to the Council the adoption of
a single value applicable to all animals, i.e. 2000 Bq/kg. Eventually the Council
decided on 18 July 1989 [12] to send the proposal back to the CEC, which shall now
apply the same procedure as used for minor foodstuffs.
5. EXPORT OF CONTAMINATED FOODSTUFFS
The CEC considered it not acceptable from an ethical point of view to allow
foodstuffs and feedingstuffs with contamination levels in excess of the EC maximum
permitted levels to be exported to third countries. It proposed, therefore, to the
Council a regulation adopted on 18 July 1989 [15] and stating that such products may
not be exported and that Member States have to carry out checks to ensure that
exported products do not exceed these levels.
6. EC ARRANGEMENTS FOR EARLY EXCHANGE OF INFORMATION IN
A RADIOLOGICAL EMERGENCY
Although all EC Member States signed the International Atomic Energy
Agency (IAEA) Convention on Early Notification of a Nuclear Accident, the EC
Council adopted on 14 December 1987 a decision on EC arrangements for the early
exchange of information in the event of a radiological emergency [16]. This decision
completes and extends the IAEA Convention, in that:
(a) The scope is wider; it covers all nuclear installations and activities while the
IAEA Convention leaves for certain installations the decision to notify to the
Member States concerned.

I A E A - S M - 3 0 6 / 1 2 0 2 8 5
(b) The trigger mechanism is more precise; whereas the IAEA Convention applies
only to activity releases which have resulted or may result in transboundary
radiological consequences, the EC system links the triggering mechanism to
releases which entail, or might entail, emergency measures in a Member State.
Thus there will also be notification when a Member State detects significant
activity levels which might be of transboundary origin.
(c) The EC decision follows the IAEA Convention as regards the information to
be provided, but adds two items to the list, i.e. activity levels measured in
foodstuffs and measures taken to inform the public.(d) Whereas the IAEA Convention only provides for notifying those States which
are or may be physically affected by the activity release, in the EC system all
Member States will be informed.
(e) The EC decision sets up a two-way system of communication by which a
notifying Member State is kept informed of the actions taken by the other
Member States.
7. EC RESEARCH ACTIVITIES FOLLOWING THE CHERNOBYL
ACCIDENT
The Chernobyl accident has also given new importance to the EC research
activities in the radiation protection field. The 1985-1989 radiation protection
research programme was revised to include work in areas needing additional
research as indicated by the accident. The following 10 actions were launched, for
a total budget of 10 million ECU1:
(1) Evaluation of the reliability and meaningfulness of long distance atmospheric
transfer models;
(2) Evaluation of data on the transfer of radionuclides in the food chain;
(3) Feasibility of studies on health effects;
(4) Radiological aspects of nuclear accident situations;
(5) Underlying data for derived emergency reference levels in foodstuffs;
(6) Improvement of practical countermeasures against nuclear contamination in
the agricultural environment;
(7) Improvement of practical countermeasures against nuclear contamination in
the urban environment;
(8) Improvement of practical countermeasures through preventive medication;
(9) Monitoring and surveillance in accident situations;
(10) Treatment and biological dosimetry of exposed persons.
1 1 E C U = U S $ 1 . 1 ( 1 9 8 9 v a l u e ) .

286 L U Y K X
8. PUBLIC INFORMATION IN THE EVENT OF A NUCLEAR ACCIDENT
The CEC has proposed to the Council a draft directive on informing the popu
lation regarding a radiological emergency [17]. It requires Member States to ensure
that population groups likely to be affected by a nuclear accident are given informa
tion beforehand about the health protection measures applicable to them and about
the actions they should take; it also requires that in the event of an accident, the popu
lation concerned is informed without delay of the facts of the emergency and the
actions to be taken. The draft directive contains lists of elements to be included in
the information provided to the public.
9. CONCLUSIONS
The Chernobyl accident confirmed that a nuclear accident with widespread
radiological consequences, while highly improbable, is not impossible. It was also
learned that internationally agreed intervention levels for foodstuff control are a
necessity. Such levels have now been established within the EC, a rapid information
system is also in place and several other emergency response measures have been
taken or are being proposed. We believe that we are now better prepared in the event
of an accident.
REFERENCES
[1] NUCLEAR ENERGY AGENCY OF THE OECD, The Radiological Impact of the Chernobyl Accident in OECD Countries, OECD, Paris (1988).
[2] INSTITUT FÜR STRAHLENHYGIENE DES BUNDESGESUNDHEITSAMTES, Bericht zur Strahlenexposition der Bevolkerung im 2. Quartal 1989 als Folge des Reak- torunfalls in Tschernobyl, Institut fiir Strahlenhygiene des Bundesgesundheitsamtes, Neuherberg (1989).
[3] COMMISSION OF THE EUROPEAN COMMUNITIES, Council Directive 80/836/Euratom 15.7.1980, Official Journal of the European Communities, L246 of 17/9/1980, CEC, Luxembourg (1980).
[4] COMMISSION OF THE EUROPEAN COMMUNITIES, Radiological Protection Criteria for Controlling Doses to the Public in the Event of Accidental Releases of Radioactive Material, Rep. V/5290/82, CEC, Luxembourg (1982).
[5] INTERNATIONAL COMMISSION ON RADIOLOGICAL PROTECTION, Protection of the Public in the Event of Major Radiation Accidents: Principles for Planning, Publication 40, Pergamon Press, Oxford and New York (1984).
[6] COMMISSION OF THE EUROPEAN COMMUNITIES, Council Regulation No. 1707/86 of 30/5/1986, on the conditions governing imports of agricultural products originating in third countries following the accident at the Chernobyl nuclear power station, Official Journal of the European Communities, L146 of 31/5/1986, CEC, Luxembourg (1986).

I A E A - S M - З О б / 1 2 0 2 8 7
[7] COMMISSION OF THE EUROPEAN COMMUNITIES, Council Regulation No. 3955/87 of 22/12/1987, on the conditions governing imports of agricultural products originating in third countries following the accident at the Chernobyl nuclear power station, Official Journal of the European Communities, L371 of 30/12/1987, CEC, Luxembourg (1987).
[8] INTERNATIONAL COMMISSION ON RADIOLOGICAL PROTECTION, Limits for Intakes of Radionuclides by Workers, Publication 30, Pergamon Press, Oxford and New York (1981).
[9] HEINRICH, K., et al., Dose Factors for Inhalation and Ingestion of Radionuclide Chains (Age Groups 1 Year and 10 Years), ISH Reps. 78 and 80, Institut für Strahlen- hygiene des Bundesgesundheitsamtes, Neuherberg (1988).
[10] INTERNATIONAL COMMISSION ON RADIOLOGICAL PROTECTION, The Metabolism of Plutonium and Related Elements, Publication 48, Pergamon Press, Oxford and New York (1986).
[11] COMMISSION OF THE EUROPEAN COMMUNITIES, Council Regulation (Euratom) No. 3954/87 of 22/12/1987, laying down maximum permitted levels of radioactive contamination of foodstuffs and of feedingstuffs following a nuclear accident or any other case of radiological emergency, Official Journal of the European Communities, L146 of 30/12/1987, CEC, Luxembourg (1987).
[12] COMMISSION OF THE EUROPEAN COMMUNITIES, Council Regulation (Euratom) No. 2218/89 of 18/7/1989 amending Regulation (Euratom) No. 3954/87, laying down maximum permitted levels of radioactive contamination of foodstuffs and of feedingstuffs following a nuclear accident or any other case of radiological emergency, Official Journal of the European Communities, L211 of 22/7/1989, CEC, Luxembourg (1989).
[13] COMMISSION OF THE EUROPEAN COMMUNITIES, Commission Regulation (Euratom) No. 944/89 of 12/4/1989, laying down maximum permitted levels of radioactive contamination in minor foodstuffs following a nuclear accident or any other case of radiological emergency, Official Journal of the European Communities, L101 of 13/4/1989, CEC, Luxembourg (1989).
[14] The Transfer of Radionuclides to Livestock (Proc. CEC/NRPB Workshop, Oxford, 1988), National Radiological Protection Board, Harwell (1988).
[15] COMMISSION OF THE EUROPEAN COMMUNITIES, Council Regulation (EEC) No. 2219/89 of 18/7/1989, on the special conditions for exporting foodstuffs and feedingstuffs following a nuclear accident or any other case of radiological emergency, Official Journal of the European Communities, L211 of 22/7/1989, CEC, Luxembourg (1989).
[16] COMMISSION OF THE EUROPEAN COMMUNITIES, Council Decision (87/600/Euratom) of 14/12/1987, on Community arrangements for the early exchange of information in the event of a radiological emergency, Official Journal of the European Communities, L371 of 30/12/1987, CEC, Luxembourg (1987).
[17] COMMISSION OF THE EUROPEAN COMMUNITIES, Proposal for a Council Directive on informing the population about health protection measures to be applied and steps to be taken in the event of a radiological emergency, COM(88) 296 final, 17/6/1988, CEC, Luxembourg (1988).


I A E A - S M - 3 0 6 / 2 6
R A D I O E C O L O G I C A L M O D E L S F O R
A S S E S S M E N T O F R A D I O L O G I C A L C O N S E Q U E N C E S
A F T E R M A J O R N U C L E A R A C C I D E N T S
H.G. PARETZKE, P. JACOB,
H. MÜLLER, G. PRÔHL
Institut fiir Strahlenschutz,
Gesellschaft fur Strahlen-
und Umweltforschung mbH München,
Neuherberg,
Federal Republic of Germany
Abstract
RADIOECOLOGICAL MODELS FOR ASSESSMENT OF RADIOLOGICAL CONSEQUENCES AFTER MAJOR NUCLEAR ACCIDENTS.
In the framework of various safety studies for nuclear facilities and corresponding environmental impact assessments various computer codes have recently been developed for estimating the radiological consequences of major atmospheric releases of radionuclides and for assessing countermeasures. An important part of such computer programs deals with processes following the measurement or assessment of atmospheric dispersion and/or deposition, namely the calculation of external dose rates from radionuclides in the air and on contaminated surfaces as a function of time and of location in urban environments, and of internal dose rates from inhaled and ingested radionuclides as a function of time, location, consumption rates of various types of food products, countermeasures, etc. For making such radiological assessments a quantitative dynamic radioecological model, ECOSYS, has been under development since 1978; ECOSYS was validated by many field measurements after the Chernobyl accident. On the basis of this experience the real time assessment program PARK for the Federal Republic of Germany and the European real time program EURALERT are being developed by the authors. The paper discusses the capabilities, expected accuracies and limitations of such real time assessment codes which use as starting points local radionuclide concentrations in air or rain or other environmental measurements (i.e. those not including problems of atmospheric dispersion). The limitations are mainly due to measurement deficiencies and natural variabilities in environmental samples and in human behaviour. The advantages in using such programs after an accident are the rapid analysis of the immediate and potential future radiation exposures of members of the public via various pathways and the capability to assess the necessity, optimum strategy, efficacy and potential duration of protective measures. These capabilities and limitations are demonstrated in general and exemplified with an assumed contamination event.
2 8 9
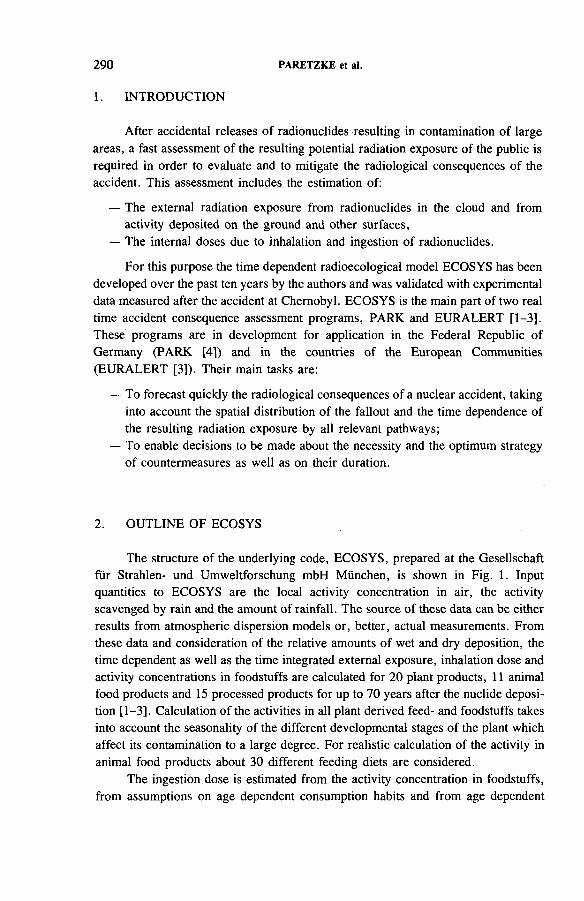
2 9 0 P A R E T Z K E et al.
After accidental releases of radionuclides resulting in contamination of large
areas, a fast assessment of the resulting potential radiation exposure of the public is
required in order to evaluate and to mitigate the radiological consequences of the
accident. This assessment includes the estimation of:
— The external radiation exposure from radionuclides in the cloud and from
activity deposited on the ground and other surfaces,
— The internal doses due to inhalation and ingestion of radionuclides.
For this purpose the time dependent radioecological model ECOSYS has been
developed over the past ten years by the authors and was validated with experimental
data measured after the accident at Chernobyl. ECOSYS is the main part of two real
time accident consequence assessment programs, PARK and EURALERT [1-3].
These programs are in development for application in the Federal Republic of
Germany (PARK [4]) and in the countries of the European Communities
(EURALERT [3]). Their main tasks are:
— To forecast quickly the radiological consequences of a nuclear accident, taking
into account the spatial distribution of the fallout and the time dependence of
the resulting radiation exposure by all relevant pathways;
— To enable decisions to be made about the necessity and the optimum strategy
of countermeasures as well as on their duration.
1. I N T R O D U C T I O N
2. OUTLINE OF ECOSYS
The structure of the underlying code, ECOSYS, prepared at the Gesellschaft
fiir Strahlen- und Umweltforschung mbH München, is shown in Fig. 1. Input
quantities to ECOSYS are the local activity concentration in air, the activity
scavenged by rain and the amount of rainfall. The source of these data can be either
results from atmospheric dispersion models or, better, actual measurements. From
these data and consideration of the relative amounts of wet and dry deposition, the
time dependent as well as the time integrated external exposure, inhalation dose and
activity concentrations in foodstuffs are calculated for 20 plant products, 11 animal food products and 15 processed products for up to 70 years after the nuclide deposi
tion [1-3]. Calculation of the activities in all plant derived feed- and foodstuffs takes
into account the seasonality of the different developmental stages of the plant which
affect its contamination to a large degree. For realistic calculation of the activity in
animal food products about 30 different feeding diets are considered.
The ingestion dose is estimated from the activity concentration in foodstuffs, from assumptions on age dependent consumption habits and from age dependent

IAEA-SM-306/26 2 9 1
FIG. 1. Structure o f the dynamic radioecological model ECOSYS.
dose factors. Furthermore it is possible to include in the dose calculations foodstuffs
which are not explicitly considered in the model but for which measured activity
concentrations might be available (e.g. drinking water, fish).
The exposure due to inhalation is calculated from the time integrated activity
concentrations in air, the filtering efficiencies of doors and windows, the average
time spent per day indoors and age dependent breathing rates and dose factors.
The external exposure from the cloud and the ground is calculated with
assumptions made on the time for which a person stays outdoors, the shielding effi
ciencies of different types of houses and the environment, and the reduction of the
gamma dose rate with time due to weathering and migration of radionuclides into
deeper soil layers.
From these results the contributions of the different exposure pathways to the
total short and long term exposure are calculated. This allows an evaluation to be
made of the significance of each pathway and thus gives a first indication about the efficiency of potential countermeasures.

2 9 2 P A R E T Z K E e t a l .
All parameters (transfer factors, plant growing seasons, location, shielding
factors, etc.) are listed in data files in order to facilitate the application of the model
to different local conditions. The design of the computer code also permits an a priori
assessment of the effects of a variety of countermeasures, such as:
— The introduction of various intervention levels for activities in foodstuffs,
— The temporary change of feeding diets for domestic animals,
— The application of special decontamination processes,
— The general banning of contaminated feedstuffs from a certain area,
— Staying indoors and keeping windows and doors closed.
In order to improve the predictions of the ECOSYS computer program in the
case of an accident, the calculated activity concentrations should be compared with actual measurements as soon as these become available after the accident. Thus the
input or database parameter set can be iteratively improved to properly account for
regional or temporal peculiarities for a particular accident scenario.
3. COMPUTER PROGRAMS PARK AND EURALERT
PARK (Programmsystem zur Abschàtzung und Begrenzung radiologischer
Konsequenzen) and EURALERT are two real time accident consequence assessment
codes which are based on the ECOSYS model. They are similar in structure but they
are developed for different types of input structure and of application. PARK is
designed as a central radiological data evaluation and dose assessment code for
integration into the network of the Integrated Measurement and Information System
(IMIS) [4] which is being developed in the Federal Republic of Germany (Fig. 2).
PARK will calculate two sets of data in the case of an increased level of radioactivity
in the environment of the Federal Republic of Germany (c. 248 000 km2). The first
set of data is generated for only the 26 stations where several measurements, e.g.
of nuclide specific activity in air and precipitation of ground and of gamma dose
rates, are available. For these locations doses for adults and children are predicted,
considering the most important seven organs and the effective dose equivalent via:
— External exposure from the cloud and ground and inhalation as a function of
time for the ten most important radionuclides;
— Ingestion, taking into account 12 foodstuffs and these ten radionuclides;
— The sum of all four exposure pathways.
For the second part of the PARK predictions use is made, in addition, of the
data of 2000 gamma dose rate measurement stations for spatial interpolation between
the 26 stations mentioned above in order to achieve a higher spatial resolution and
to identify, for example, smaller regions with particularly high or low deposition.
Predictions of the effective dose to adults and children due to external and internal
exposure will be made for all 328 counties in the Federal Republic of Germany.

I A E A - S M - 3 0 6 / 2 6 293
I M I S
MeasurementsActivity in Air ( 26 stations )- » - in Precipitation (26stations)
Y Dose Rate (2000 stations) Meteorology
etc.
AtmosphericDispersionPrediction
— P A R K - ,
DoseEstimation
andPrediction
Effectivenessof
Counter - measures
Information
for Decisions
on the
Necessity
and
Effectiveness of
Counter -
measures
FIG. 2. The computer program PARK within the IM IS system.
Combining these results with demographic data concerning the distribution of
the population and patterns of agricultural production, calculations are made of the
collective dose and the amount of foodstuffs for which certain contamination levels
have been exceeded. Furthermore, the effect of countermeasures, such as staying
indoors or application of food bans, on the total exposure is assessed.
PARK has a dialogue oriented subsystem for the investigation of the effects on
exposure of particular countermeasures. Furthermore, predictions of PARK can be compared with measurements in order to check the reliability of the experimental and
calculated results and improve their quality if necessary and possible.Whereas PARK has been designed for the quantitative radiological evaluation
of the data collected within the IMIS system, where many semi-real-time data have
to be processed, EURALERT is designed for adaptation to more general applications
in the widely different radioecological regions of the European Communities. The
input data required by EURALERT are either predictions of atmospheric dispersion
models concerning the activity in air and rain water or actual measurements in these
media or in other environmental samples. It will be possible to apply the program for more than 1000 reference points, i.e. either for small regions using high spatial
resolution or for large areas within the countries of the European Communities using
lower spatial resolution. Because of differences concerning the model parameters
within Europe (growing seasons, living habits, climatic conditions, etc.) the user has
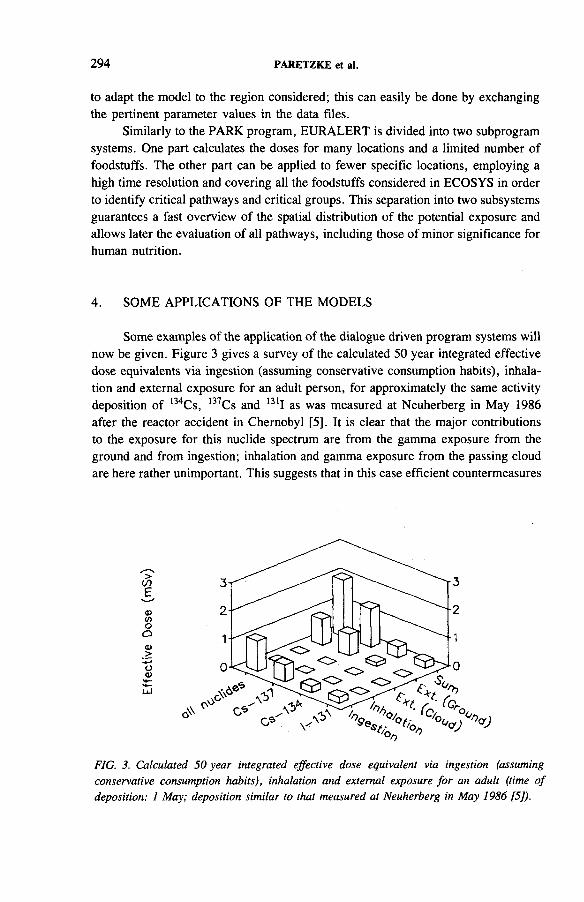
2 9 4 P A R E T Z K E e t a l .
to adapt the model to the region considered; this can easily be done by exchanging
the pertinent parameter values in the data files.
Similarly to the PARK program, EURALERT is divided into two subprogram
systems. One part calculates the doses for many locations and a limited number of
foodstuffs. The other part can be applied to fewer specific locations, employing a
high time resolution and covering all the foodstuffs considered in ECOSYS in order
to identify critical pathways and critical groups. This separation into two subsystems
guarantees a fast overview of the spatial distribution of the potential exposure and
allows later the evaluation of all pathways, including those of minor significance for
human nutrition.
4. SOME APPLICATIONS OF THE MODELS
Some examples of the application of the dialogue driven program systems will
now be given. Figure 3 gives a survey of the calculated 50 year integrated effective
dose equivalents via ingestion (assuming conservative consumption habits), inhala
tion and external exposure for an adult person, for approximately the same activity
deposition of I34Cs, 137Cs and 131I as was measured at Neuherberg in May 1986
after the reactor accident in Chernobyl [5]. It is clear that the major contributions
to the exposure for this nuclide spectrum are from the gamma exposure from the
ground and from ingestion; inhalation and gamma exposure from the passing cloud
are here rather unimportant. This suggests that in this case efficient countermeasures
FIG. 3. Calculated 50 year integrated effective dose equivalent via ingestion (assuming
conservative consumption habits), inhalation and external exposure fo r an adult (time o f
deposition: I May; deposition similar to that measured at Neuherberg in May 1986 [5 ]).

I A E A - S M - 3 0 6 / 2 6 2 9 5
TABLE I. GAMMA LOCATION FACTORS FOR DIFFERENT LOCATIONS RELATIVE TO THE OPEN FIELD
Environment Location factor
T cloud Yground
Open field, suburban 1.0 1.0
Urban environment 0.7 0.3
Self-contained house:— living rooms (mean value) 0.3 0.1
— basement with windows above ground level 0.05 0.03— basement without windows above ground level 0.01 0.003
Large apartment house:— living rooms 0.05 0.01— basement 0.001 0.001
should focus on these two pathways. Table I shows the location factors used in these
calculations for the gamma exposure from the cloud and the ground for different
environments as compared with the open field [6, 7]. For the calculation of the data
presented in Fig. 3, it was assumed that the population spent 80% of the time indoors and 20% outdoors.
In Fig. 4 the relative reduction of the total ingestion dose from l34Cs, l37Cs
and 13'i due to the banning of the consumption of green vegetables and of fresh
milk is shown as a function of the time after deposition when the intervention started
and as a function of the duration of the ban. The deposited activities used in this
example are the same as for Fig. 3. It is clear that the dose reduction due to the
intervention is the more effective the earlier the ban starts.
Bans starting very early cut off the peak concentrations in milk and leafy
vegetables which contribute a relatively high fraction to the total intake. On the other
hand, the overall effect of such bans would be surprisingly small in this case of
contamination because a significant part of the time integrated ingestion dose would
be induced by the consumption of grain, pork, beef and fruits and of milk during
the next winter.
In this example it is assumed that the feeding of contaminated silage and hay
to cattle during the next winter is not affected by countermeasures. For the minimiza
tion of activity in milk during the winter feeding period directly following the deposi
tion, the application of ion exchangers such as bentonite and hexacyanoferrates or
changes in winter feeding may have to be taken into consideration. An example of

2 9 6 P A R E T Z K E e t a l .
ф(Лоо
(Л<DО)С
ф>
О)ОС
Beginning of ban (days after deposition)
FIG*. 4. Reduction in ingestion dose due to the banning o f the consumption o f leafy vegetables
and milk as a function o f the duration o f the ban and the time o f the start o f the ban after the
deposition (time o f and amount o f deposition as in Fig. 3).
Month
FIG. 5. Time dependence o f 137Cs concentration in milk fo r different winter feeding diets:
A: grass silage; B: grass silage and maize; C: grass silage and beet; D : brewing residues and
maize; E : distillery residues and maize.

I A E A - S M - 3 0 6 / 2 6 2 9 7
Pferiod of activity intake (d)
FIG. 6. Concentration o f l37Cs in beef as a function o f the period o f activity intake, starting
550 days before slaughtering (feed-beef transfer factor: 0.04 d/kg; biological half-life: 50 d;
activity intake: 10 kBq/d).
the effect of such a countermeasure is shown in Fig. 5. This graph shows the time
dependent activity concentrations of 137Cs in milk following the contamination
mentioned above at the beginning of May for different feeding rations for dairy cattle
during winter. During spring and summer in all cases cows are fed on fresh pasture.
During winter in all diets, except diet A, grass is partly (diets В and C) or entirely
(diets D and E) replaced by other feedstuffs. The activity concentration in these
substitutes is much lower because the initial deposition onto the foliage at the
beginning of May is lower owing to their minute vegetative development and because
they are harvested more than three months after the deposition; therefore most of the
activity has been removed again by weathering.Another possibility for avoiding high activity concentrations in foodstuffs with
appropriate farm management is illustrated in Fig. 6. Here the l37Cs activity in beef
is plotted as a function of the length of the period of activity intake. After this period
the animals are fed uncontaminated fodder until the time of slaughtering (550 days after the start of feeding with contaminated fodder). As a result of stopping the
activity intake about 100 days before slaughtering, the activity remaining in beef
would be lower by a factor of 4 than what would be obtained by continuing feeding
with contaminated fodder.
Figures 4 to 6 clearly demonstrate the usefulness of well organized feeding
management in the case of a major nuclear accident in order to minimize the activity concentration in foodstuffs cost-effectively. These figures give only a few examples
of the potential of the dialogue based parts of PARK and EURALERT which are
designed to simulate the effects of countermeasures and to support decisions about
their application.

2 9 8 P A R E T Z K E et al.
Some factors influencing the exposure of man after a nuclear accident cannot
be predicted in dynamic radioecological models such as PARK and EURALERT, for
example the route taken by food from the location of production to the location of
consumption. In addition, the actual contamination pattern of an area will influence
this food distribution because people will avoid the consumption of food from highly
contaminated areas. For example, a comparison of model calculations and measure
ments after the Chernobyl reactor accident shows good agreement for the external
gamma dose rates from deposited radionuclides and specific activities of foodstuffs.
On the other hand, whole body counter measurements [8] indicate that the 50 year
integrated ingestion dose in highly contaminated areas will be lower by a factor of
3 and in low contaminated areas higher by a factor of 3 than the result of the model
calculation assuming normal consumption of locally produced food only. This large
difference is due to several factors, especially to long distance transportation of food
stuffs with the specific activities of differently contaminated areas, to changes of
consumption rates and to the ban on leafy vegetables produced in some highly
contaminated areas in the south of the Federal Republic of Germany in spring 1986.
In general, the consumption and behaviour (e.g. staying indoors) of people after a
nuclear accident cannot be predicted accurately. People are likely to follow not only
the recommendations from the authorities but also their own subjective judgement
of the situation (which in turn is influenced by reactions of the media).
Therefore, only potential exposures of the public under certain assumed
scenarios can be predicted from a given contamination of the environment and food
stuffs. Whole body counter measurements, however, can be used to improve these
scenarios and thus the predictions of future exposures from ingestion of contaminated
foodstuffs.
In summary, the dynamic radioecological models PARK and EURALERT give
extremely useful quantitative information for the evaluation of the radiological
consequences of a nuclear accident and on the potential for their mitigation. They
also are an optimum tool for quickly identifying areas and pathways of high, medium
and low importance and thus can help in identifying appropriate actions and
concentrating efforts on the most important aspects of the radiological consequences
of a major nuclear accident.
5 . L I M I T A T I O N S O F R A D I O E C O L O G I C A L R E A L T I M E M O D E L S
REFERENCES
[1] PRÓHL, G., Modellierung der Radionuklidausbreitung in Nahrungsketten nach Deposition von Strontium-90, Casium-137 und Jod-131 auf landwirtschaftlich genutzten Flâchen, Gesellschaft für Strahlen- und Umweltforschung, Neuherberg (in press).

I A E A - S M - 3 0 6 / 2 6 2 9 9
[2] PRÔHL, G., MÜLLER, H., JACOB, P., PARETZKE, H.G., “The dynamic radioecological model ECOSYS — A tool for the management of nuclear accident consequences”, Proc. 4th Int. Symp. on Radioecology, Cadarache, 1988, CEA, Centre d’études nucléaires de Cadarache, Saint-Paul-lez-Durance (1988) B43-B50.
[3] JACOB, P., et al., Real time systems PARK and EURALERT for the assessment of the radiological impact of radionuclides released to the atmosphere (submitted to Nucl. Technol.).
[4] BÜHLING, A., WEHNER, G., EDELHÀUSER, H., “Integriertes Mefi- und Informationssystem zur Überwachung der Umweltradioaktivitât nach dem Strahlen- schutzvorsorgegesetz”, 7. Fachgespràch zur Überwachung der Umweltradioaktivitât, Neuherberg, Inst, für Strahlenhygiene des Bundesgesundheitsamts, Neuherberg (1987) 272-277.
[5] HÓTZL, H., ROSNER, G., WINKLER, R., Ground depositions and air concentrations of Chernobyl fallout radionuclides at Munich - Neuherberg, Radiochim. Acta 41 (1987) 181-190.
[6] MECKBACH, R., JACOB, P., PARETZKE, H.G., Gamma exposures due to radionuclides deposited in urban environments, Part I: Kerma rates from contaminated urban surfaces, Radiat. Prot. Dosim. 25 (1988) 167-179.
[7] MECKBACH, R., JACOB, P., Gamma exposures due to radionuclides deposited in urban environments, Part II: Location factors for different deposition patterns, Radiat. Prot. Dosim. 25 (1988) 181-190.
[8] HENRICHS, K., BERG, D., BOGNER, L., “Whole body measurements after Chernobyl”, Proc. 2nd Mtg of Standing Conf. on Health and Safety in the Nuclear Age on ‘Informing the Public about Improvements in Emergency Planning and Nuclear Accident Management’, Brussels, 1989 (in press).


I A E A - S M - 3 0 6 / 2 7
L I M I T A T I O N S O F M O D E L S U S E D
I N D E R I V I N G R E F E R E N C E L E V E L S
F O R R A D I O L O G I C A L P R O T E C T I O N
L. FRITTELLI, T. SANÔDirezione Sicurezza Nucleare e Protezione Sanitaria (DISP),
Comitato Nazionale per la Ricerca e per lo Sviluppo
dell’Energia Nucleare e delle Energie Alternative (ENEA),
Rome, Italy
Abstract
LIMITATIONS OF MODELS USED IN DERIVING REFERENCE LEVELS FOR RADIOLOGICAL PROTECTION.
The individual dose to members of the public as well as the collective dose following environmental contamination by radioactive material are usually assessed by means of system analysis, based on a set of coupled compartments, on the assumption that the distribution of the radionuclides among these compartments can be described by means of time invariant, linear transfer functions. The results of the environmental radiological assessments are used in selecting the protective actions to be undertaken for mitigating the consequences of a radiological accident. For sound optimization of radiological protection, emphasis is thus required to be focused on removing conservative assumptions and increasing the ‘realism’ of the model predictions. Also the comparison between the prediction of the model and the relevant levels should be done only on a statistical basis. In the paper the use of the models in radiological protection is briefly discussed, with reference to their limitations in deriving reference levels for assessing the relevance of environmental contamination and in deciding on the appropriate countermeasures.
1. INTRODUCTION
Without models there could be no practical radiological protection or regula
tory control in the field of radiation protection. Limits on measurable quantities can
be obtained from the basic limits on organ or effective dose equivalent recommended
by the International Commission on Radiological Protection [1] only by means of
suitable models. The models can be very general and the resulting numerical values
for measurable quantities can always be used instead of the primary limits; these
values are then called secondary limits. However, in practical circumstances,
measured quantities can hardly be related to secondary limits.
For external exposure the value of the dose equivalent in an organ can rarely
be determined directly and must usually be derived from measurements of other
quantities, such as absorbed dose in a suitable spherical phantom (the ‘model’ of the
301
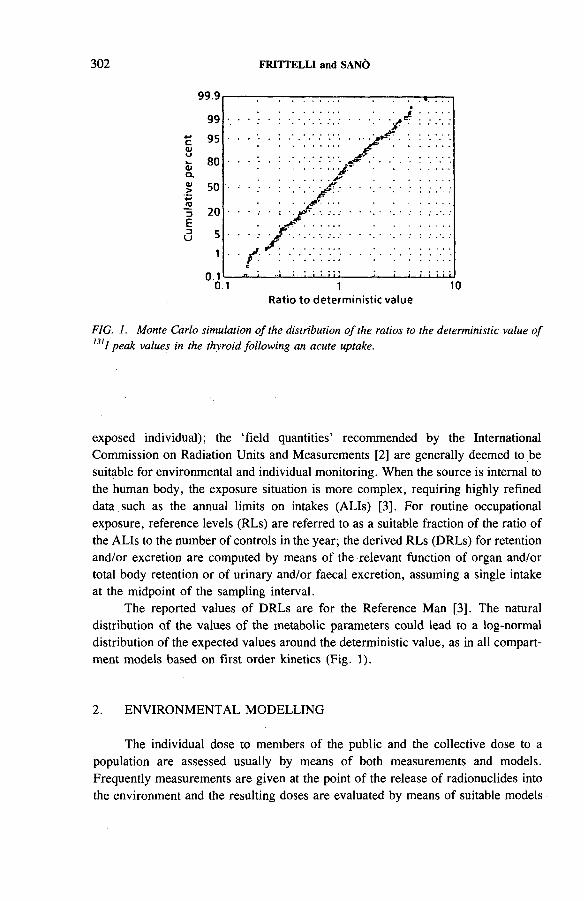
302 F R I T T E L L I a n d S A N Ó
FIG. 1. Monte Carlo simulation o f the distribution o f the ratios to the deterministic value o f
1311 peak values in the thyroid follow ing an acute uptake.
exposed individual); the ‘field quantities’ recommended by the International
Commission on Radiation Units and Measurements [2] are generally deemed to be
suitable for environmental and individual monitoring. When the source is internal to
the human body, the exposure situation is more complex, requiring highly refined
data such as the annual limits on intakes (ALIs) [3]. For routine occupational
exposure, reference levels (RLs) are referred to as a suitable fraction of the ratio of
the ALIs to the number of controls in the year; the derived RLs (DRLs) for retention
and/or excretion are computed by means of the relevant function of organ and/or
total body retention or of urinary and/or faecal excretion, assuming a single intake
at the midpoint of the sampling interval.
The reported values of DRLs are for the Reference Man [3]. The natural
distribution of the values of the metabolic parameters could lead to a log-normal
distribution of the expected values around the deterministic value, as in all compart
ment models based on first order kinetics (Fig. 1).
2. ENVIRONMENTAL MODELLING
The individual dose to members of the public and the collective dose to a
population are assessed usually by means of both measurements and models.
Frequently measurements are given at the point of the release of radionuclides into
the environment and the resulting doses are evaluated by means of suitable models

I A E A - S M - 3 0 6 / 2 7 303
to predict the environmental transfer of the radionuclides through the exposure
pathways. Three tasks are relevant in environmental modelling: (a) model examina
tion, (b) data evaluation, (c) sensitivity analyses.
2.1. Model examination
Model examination involves deep analysis of the initial conceptualization of the
model. The dynamic behaviour of radionuclides in a specific environment can be
modelled by system analysis (SA), by means of a set of coupled compartments. The
compartments need not be spatial regions, but they must be distinguishable on some
basis, e.g. different species of plants or animals, successive tracts of a watercourse,
chemical phases, etc. Ideally the compartments are assumed to be homogeneous and
uniform with rto internal gradients in their volumes and the distribution of the
radionuclides among the compartments can be described by means of time invariant,
linear transfer functions. The kinetics of the model can so be expressed by a system
of first order differential equations with constant coefficients. Analytical solutions
for such a system are available, but as the model becomes more realistic (concentra
tion dependent transfer functions áre the rule in nature), general analytical solutions
do not exist and numerical methods must be used.
Sometimes the model structure and the form of the equations themselves are
uncertain. The equations selected for the model should be viewed as hypotheses to
be tested and perhaps revised.
2.2. Data evaluation
Data evaluation is intended to control the quality of the data available for use
with the model. Models chosen for environmental assessment purposes should rely
upon available data. There will always be a conflict between formulating a complex
model and choosing a simpler one whose parameters are easier to obtain. The
simplest model which can be validated acceptably is deemed more suitable than a
more complex model. The most common misuse of models is the use of a more
sophisticated model than is appropriate for the available data or the level of results
desired. The temptation to apply the most sophisticated computational tool to a
problem is difficult to resist, even if the input data are seldom available with the
required accuracy.
Several different models of varying complexity may describe the physical
system equally well for different purposes. If the information on the system is
incomplete or of questionable accuracy, a highly detailed model is probably not
warranted. Very elaborate models can be justified only when accompanied by
accurate, carefully verified values of the input parameters. The accuracy of the
model predictions does not necessarily increase with the complexity of the model,
owing to errors associated with each new parameter included.

3 0 4 F R I T T E L L I a n d S A N Ó
Uncertainty analysis is directed towards identifying those parameters which
are most influential in determining model predictions. The major reasons for
evaluating the uncertainty of the input data are to:
(1) Rank the relative importance of different parameters;
(2) Indicate plausible values for poorly known parameters;
(3) Depict the range of model results that are consistent with specified variabilityor uncertainty in the parameters.
The source of uncertainty which has received the most attention historically is
the variability in parameters. A number of fundamentally different mathematical
approaches have been introduced to deal with uncertainty in the input data.
As a first approximation, in the system analysis, the values of the transfer
constants and of the distribution volumes of the compartments can be inferred from
published data, but their exact values should be evaluated or measured for each site
and for each group of exposed individuals. In most circumstances published and
measured data will give only a range into which the actual values will distribute
themselves. Structural heterogeneity within the arbitrary aggregations of the model
would suggest that the parameters should be defined by instantaneous probability
distributions rather than by constants. In a realistic manner the values to be given
to the parameters should be considered as a random sample from their populations.
Therefore numerical values predicted by the model should be processed as statistical
values from an often unknown distribution.
If the structure of the model is relatively unbiased (i.e. it adequately represents
the actual situation being assessed), parameter uncertainty analysis can be very
useful for estimating the uncertainty in model predictions. An estimated frequency
distribution of the values of the relevant parameters is used to produce a frequency
distribution of the values resulting from the model, to be compared, in a statistical
meaning, with the deterministic predictions or with established limits.
2.3. Sensitivity analysis
Sensitivity analysis is the most conventional and widely used method for
ranking the importance of independent parameters in the model. Analytical solutions
may be possible. In iterative empirical approaches, parameters vary systematically,
one at a time or in functionally related groups. No formal knowledge of the real
statistical variance of the parameters is required. An analytic approach is possible
only if the exact mathematical relationship between the inputs and outputs of a model
is known. The numerical procedure may be either statistical or non-statistical. A
model might also be simplified if a sensitivity study reveals that model predictions
are unaffected by a particular input parameter. In time varying simulations, the rate
coefficients may vary significantly within the time-scale of the problem, owing to
seasonal variations of the agricultural practices.
I A E A - S M - 3 0 6 / 2 7 305
If a set of differential equations contains stochastic parameters, their solution
should incorporate the frequency distributions of the parameters through time. Even
for linear models, the mathematics is not simple. Each simulation with stochastic
parameters produces a certain amount of variance, and an estimate of the mean
variance may be achieved by multiple runs with different stochastic parameters.
The Monte Carlo method can be seen as a limiting case of simulation with
stochastic parameters. A deterministic model is run repeatedly with a new set of all,
or most, parameters being generated at the start of each run from specific probability
distributions. The variance of the results depends on the frequency distributions
specified for each parameter. A Gaussian, uniformly random, triangular or empirical
distribution may be specified statistically, intuitively or heuristically. It is believed
generally that the variance of Monte Carlo runs provides a valid indication of
prediction uncertainty if the parameter distributions are reasonably well known.
Given no a priori information about parameter probabilities, fully random runs
produce generally an unacceptably wide range of predictions.
3. EVALUATION OF DERIVED INTERVENTION LEVELS (DILs)
The above general principles could be applied in evaluating the statistical
uncertainty in the computed deterministic values of the DILs for environmental
contamination, to be used in the decisional process for adopting a given counter
measure, such as the banning of contaminated agricultural products, in a radiological
emergency situation.
For a given foodstuff, the dose H committed to the exposed member of the
public consuming it can be computed as:
where H, is the appropriate dosimetric factor, I is the consumption rate and IC is
the integrated concentration of the radionuclide over a suitable time span, usually
one year.
The decision to ban a food should be adopted soon after the beginning of the
environmental contamination, when the first results of the environmental monitoring
become available. The integrated concentration, IC, can be estimated as:
where C(T) is the measured concentration of the radionuclide at a selected time T
and G(T) is a suitable factor, to be evaluated by means of environmental models.
For a given value of C(T) (e.g. the peak value), the values of the resulting
doses H should be assumed to follow a probability distribution function related to
H = H, I IC (1)
IC = G(T) C(T) (2)

306 F R I T T E L L I a n d S A N Ó
the statistical distributions of Нь I and G(T). Reported data [4] for the variance of
the dosimetric factor H, for I37Cs and of the intake I of cow milk and beef by the
members of the public indicate a log-normal distribution with geometric standard
deviations in the range of 1-2. Assuming also for G(peak) a log-normal distribution,
an estimate of the geometric variance of H could be analytically evaluated as:
var(H) = var(H,) + var(I) + var(G(peak)) (3)
by means of the propagation rules of the statistics of the log-normal distribution
through multiplicative chain models.
The variance of the factor G(peak) has been evaluated by means of a Monte
Carlo simulation of the conceptual model of the cow-pasture system in Fig. 2, by
solving numerically the linear first order equations of an actual 12 compartment
system. The rate constants have been assumed to be log-normally distributed around
their published values; their geometric variance has been inferred from the reported
data or adjusted to give the reported statistical distribution of the pasture-cow milk
and pasture-beef transfer factors (geometric standard deviations in the range of1.8-2.2) [4].
FIG. 2. Conceptual model o f the cow-pasture system. The actual model used in Monte Carlo
simulation assumes 12 compartments with recycle to pasture.

I A E A - S M - 3 0 6 / 2 7 307
Ratio to deterministic value
FIG. 3. Monte Carlo distribution o f the ratios to the deterministic value o f the factor G(peak)
(integrated concentration to 1 a/peak value) fo r 137Cs in cow milk.
FIG. 4. Monte Carlo distribution o f the ratios to the deterministic value o f the factor G(peak)
(integrated concentration to 1 a/peak value) f o r 137Cs in beef.
Some preliminary results for the probability distribution of the ratios G(peak)
between the peak concentration of l37Cs in cow milk and beef to the first year
integrated concentration are shown in Figs 3 and 4. The 99th percentiles of the
distribution of the ratios of G(peak) to the ‘deterministic’ value computed with the
default values of the transfer factors are in the range of 2-3. No significative value or rank correlation has been found between the distribution of G(peak) and that of

3 0 8 F R I T T E L L I a n d S A N Ó
99.9
99
£ 95Фfc 80 Q .
I 50
nj3 20E
1
0.10.01 0.1 1 10
Ratio to deterministic value
FIG. 5. Monte Carlo distribution o f the ratios to the deterministic value o f the one year
effective dose commitment by I37Cs in cow milk.
some selected transfer rate constants such as the effective weathering half-time or
the pasture consumption rate of the cow. The statistical distribution of G(peak) seems
to be related only to the cow model and is sufficiently robust to include variations
in the time behaviour of contaminated pasture and of the feeding practices.
Widespread use of the recommended values for G(peak) seems to be justified [5].
In conclusion, for a measured peak value of the concentration of l37Cs in cow
milk or in beef, the resulting effective dose equivalent to members of the public
seems to be log-normally distributed with a geometric standard deviation of the order
of 2 (see Fig. 5). The ratio of the 95th percentile to the 50th percentile (median) of
the distribution could be about 30.
For a sound decision making process (justification and optimization of the ban
on the contaminated food), the comparison with the appropriate DIL on the radio
active concentration should be done only on a statistical basis, by evaluating the
probability that the DIL could be actually exceeded.
REFERENCES
[1] INTERNATIONAL COMMISSION ON RADIOLOGICAL PROTECTION, Recommendations of the ICRP, Publication 26, Pergamon Press, Oxford and New York (1977, reprinted 1987).
[2] INTERNATIONAL COMMISSION ON RADIATION UNITS AND MEASUREMENTS, Determination of Dose Equivalents Resulting from External Radiation Sources, ICRU, Washington, DC (1985).
. . . . .: V
/
v■
. z;
_I_Li f I i i • í Î ! Lb\ ..

IAEA-SM-306/27 3 0 9
[3] IN T E R N A T IO N A L C O M M IS SIO N O N R A D IO L O G IC A L P R O T E C T IO N , Lim its
for the Intakes o f Radionuclides by W orkers, Publication 30, Pergam on Press, O xford
and N ew Y o rk (1988).
[4] S C H W A R Z , G ., H O F F M A N , F .U ., Im precision o f dose prediction for radionuclides
released to the environment: an application o f a M onte C arlo simulation technique,
Environ. Int. 4 (1980) 289-297.
[5] IN T E R N A T IO N A L A T O M IC E N E R G Y A G E N C Y , D erived Intervention L evels for
Application in C ontrolling Radiation Doses to the Public in the Event o f a Nuclear
A ccident or Radiological Em ergency, Principles, Procedures and Data, Safety Series
N o. 81, IA E A , Vienna (1986).

IAEA-SM -306/119
L O N G T E R M P R E D I C T I O N
O F P O P U L A T I O N E X P O S U R E
I N T H E A R E A S C O N T A M I N A T E D
A F T E R T H E C H E R N O B Y L A C C I D E N T
R.M. BARKHUDAROV, K.I. GORDEEV, M.N. SAVKIN
Institute of Biophysics,
USSR Ministry of Public Health,
Moscow,
Union of Soviet Socialist Republics
Abstract
L O N G T E R M P R E D IC T IO N O F P O P U L A T IO N E X P O S U R E IN T H E A R E A S C O N
T A M IN A T E D A F T E R T H E C H E R N O B Y L A C C ID E N T .
In order to proceed to the recovery phase after an accident, it is necessary to guarantee
the resumption o f normal living conditions for the population in the contaminated area. A s
a criterion for determ ining such conditions, the U SS R National Com m ittee for Radiation Pro
tection recomm ends a lifetim e effective dose equivalent o f 0.35 S v. This dose, which also
includes exposure during the acute and intermediate periods, is the product o f the average life
span (70 years) and the dose lim it for category В persons (5 mSv/a). C ategory В persons are
individuals associated with habitats located near pow er plants or other sources o f radiation.
The evaluation o f the lifetim e dose includes tw o components: the dose for the first four years
after the accident, determined from actual data, and the dose for the remaining period calcu
lated from m odels. The model used to calculate the external and internal dose commitments
is based on mathematical representations o f radionuclide migration processes via the b iologi
cal and food chains, on the accum ulation in the human organism and on the results o f on-site
studies o f the law s governing the developm ent o f the radiation situation prior to the accident
during the period o f global fallout o f products from nuclear explosions and in the post-accident
period. The main contributions to exposure in the recovery phase are external exposure from
the soil surface and internal exposure from the intake o f radionuclides with food products. The
main radionuclides are 137C s and, to som e extent, l34C s. The contribution o f intake through
inhalation during this period is negligible. The density o f l37C s contamination o f the area and
the content o f 137C s in m ilk in the year preceding the recovery phase, i.e . in 1989, are used
as initial calculation param eters. In estimating the external exposure, the follow ing data taken
from each population centre w ere used: the dynam ics o f the change in the dose rate in open
areas for a period o f four years, the radionuclide com position o f the fallout and direct m eas
urements o f the individual external exposure o f various population groups. The calculations
take account o f the behaviour pattern o f the population and other factors determining the link
betw een the exposure dose and the dose equivalent. The internal exposure for the period o f
198 6-1989 was calculated on the basis o f direct measurements o f the caesium radionuclide
body burden in various population groups. The main intake o f caesium into the body (up to
90% ) was through the consumption o f m ilk and m ilk products. It is assumed that the reduction
in m ilk contamination as o f 1990 w ill proceed in such a w ay that it w ill effectively be reduced
3 1 1
3 1 2 B A R K H U D A R O V et al.
by one h a lf over a period o f 14 years; this is the average time obtained for the U SSR for the
global fallout o f products from nuclear explosions. In order to form ulate a long term radiation
safety policy for the population, calculations are made o f the dose commitments at all popula
tion centres subjected to radioactive contamination and in addition the necessary recomm enda
tions are prepared.
1. INTRODUCTION
The accident which occurred in the fourth unit of the Chernobyl nuclear power
plant was unique in the history of nuclear power in terms of scale, the type of acci
dent and the possible consequences for the population, the environment and the eco
nomic system of the Union of Soviet Socialist Republics. As a result of the accident,
huge stretches of land lying hundreds of kilometres from the site of the accident were
contaminated with high densities of long lived radionuclides, particularly 137Cs, of
up to 3.7 MBq/m2 and above. A total of 21 000 km2 in 26 regions of three repub
lics (the Russian Soviet Federated Socialist Republic and the Ukrainian and
Byelorussian Soviet Socialist Republics), with a population of over 500 000 people,
were seriously contaminated (above 0.2 MBq/m2). No previous accident had given
rise to such widespread or severe contamination, and international legislation on
radiation protection therefore lacked the appropriate provision for emergency stan
dards for prolonged population exposure, i.e. over periods comparable to a lifetime.
2. PROTECTION METHODS
New radiation protection methods must be developed to regulate such
prolonged periods of exposure if measures are to be implemented for the prevention
of harmful effects on the population, in view of the large area contaminated by long
lived radionuclides.
Such requirements and regulations are needed, firstly, to reduce the risk of
radiation effects and, secondly, for the timely planning and implementation of
various types of protective measures: restrictions on the consumption of local
produce, decontamination and agricultural work and, finally, relocation of the popu
lation. In the first three years after the accident, the protection strategy was to pre
vent undesirable consequences by establishing temporary emergency standards —
annual dose limits which required harsh restrictive measures and significantly dis
rupted the traditional way of life and the economic activity of the local population.
However, such conditions are unacceptable for a long period, and even more so over
a lifetime. A return to the normal way of life without any restrictions is essential if
the emergency categorization is to be lifted. The USSR National Committee for
Radiation Protection (NCRP) has considered the situation and found it appropriate

IAEA-SM-306/119 3 1 3
to select as the criterion for returning to pre-accident living conditions the dose limit
of 5 mSv/a for category В persons (i.e. those persons associated with habitats located
near power plants or other sources of radiation), but taking this limit as the mean
yearly value over a 70 year period. In other words, the total dose for internal and
externa] exposure over a 70 year lifetime is actually an integrable index — 0.35 Sv.
A return to normal living conditions is allowed in population centres where the
expected dose over 70 years does not exceed the established limit. Although in the
first few years the annual dose may be up to 3-5 times higher than 5 mSv/a, this
is significantly below the threshold of non-stochastic effects, whereas the total risk
of remote stochastic effects is determined by the dose accumulated over a lifetime.
Thus, decision making was based on a prognostic evaluation of dose commitments
using specific indices of the radiation situation for each population centre: the
exposure dose rates in a particular area and the contamination levels in locally
produced food. The inhalation of radionuclides was not taken into account in view
of its small contribution to the dose commitment.
3. CALCULATION OF DOSE COMMITMENTS
3.1. Internal exposure
The calculation of internal dose commitments is based on the following
assumptions:
(a) Dose is caused by 137Cs and some 134Cs. The amount of other radionuclides,
including 90Sr, is insignificant.
(b) Caesium-137 content in the daily intake is constant over the course of a year.
This assumption is fully justified when there is soil contamination of food
products, as it scarcely changes over that period of time.
(c) Caesium-137 content of the human body is constant over the course of a year.
This assumption follows from the previous one, i.e. when there is a constant
intake of radionuclides over a year, 90% equilibrium is achieved in the adult
human body towards the end of the year, and total equilibrium is reached for
other age groups. When there is a chronic intake over a number of years, the
137Cs content in the body is virtually constant in the course of a year, but is
reduced in proportion to the reduction in contamination of the intake, or in
other words in proportion to the reduction in the radionuclide deposition on the
soil.
These assumptions simplify the calculation model as far as possible without a
significant loss of accuracy. The basic quantity used to predict annual dose commit
ments or the total commitment over 70 years is the internal dose from caesium radio
isotopes estimated in 1988:

3 1 4 B A R K H U D A R O V et a!.
D(t) = D¿e_x,t + DÓ'e_X2t (1)
where
D(t) is the average annual internal dose at a moment in time (t), in
Sv/a;
D¿ and Dq are the average annual doses from 137Cs and l34Cs, at the ini
tial time in Sv/a;
X, and X2 are the half-reduction constants of caesium radioisotope deposi
tion on the ground. For l37Cs, X) = 0.05 a -1 according to data
from long term observations of the dynamics of all 137Cs
sources in the ground. For 134Cs, X2 = 0.35 a -1 and is defined
by physical decay.
In 1988, the ratio of annual commitments from l34Cs and 137Cs was 0.42.
Equation (1) can therefore be written as:
D(t) = DÓ(e~X|t + 0.42 e~M) (2)
The entire problem is thus reduced to determining the initial average annual commit
ment from l37Cs. This index is derived as the product of the equilibrium radionu
clide content in the human body and the dose ratio:
DÓ = Qodo = do (3)X eff
is the equilibrium content of l37Cs in the human body, in Bq/body;
is the daily intake of 137Cs in 1988, in Bq/d;
is the constant effective removal of one half of the 137Cs from the
human body, in d _1;
is the dose ratio, i.e. 3.5 X 10~8 (Sv/a)/(Bq/body).
It follows from Eqs (2) and (3) that
where
Qo
qo
D(t) = ^ (e_X|t + 0.42 e~X2‘) (Sv/a)^eff
(4 )

IAEA-SM -306/119 3 1 5
and the integral dose over 70 years is:
0(70) = ( z ~ + ) (Sv)Xeff \ A ! \ 2
Substituting numerical values in Eq. (5), we obtain:
D(70) = 11.8 x 10 ~5 q0 (Sv) (6)
When there are no restrictions on the consumption of local foodstuffs (the con
ditions for which the dose rates were calculated), the main contributor of caesium
in the body for local inhabitants is milk, which provides up to 70% of the total
activity. A detailed survey of activity in milk for all population centres in the strin
gent control zone is therefore carried out prior to prognosis, covering areas with a
137Cs deposition density of above 15 Ci/km2 (0.56 MBq/m2).
3.2. External exposure
The external dose prognosis is required in order to obtain a functional expres
sion for the change in annual dose rates with time, ascertained by the physical decay
of radionuclides, penetration or vertical migration, removal from the soil and also
by human activity, particularly land cultivation. Only natural processes were con
sidered by the prognosis model. The method is very similar to that used for internal
exposure: the annual dose rate for 1988 is used, with the following reduction over
time:
D 7(t) = Dtf f(t) (7)
Since 1988, the predominant dose contributors have been radioisotopes of caesium,
with a small contribution from l06Ru and 144Ce. The ratio between the external dose
rate and the initial 137Cs deposition density of the area depends on the actual iso
topic composition of the ground deposition. However, as caesium isotopes are the
main components within the 30 km zone (as mentioned above), the value of this ratio
does not change significantly over the area. Using data from a detailed gamma
survey of the contaminated areas, it has been shown that the gamma radiation rate
in 1988 is related to the l37Cs soil deposition density in the following manner:
PT = 2.4 x 10“ 6 (/¿Sv/h)/(Bq/m2) (8)
with the spread within the limits of 30%. The results of individual dosimetric
monitoring of those rural inhabitants exposed to the highest irradiation have shown
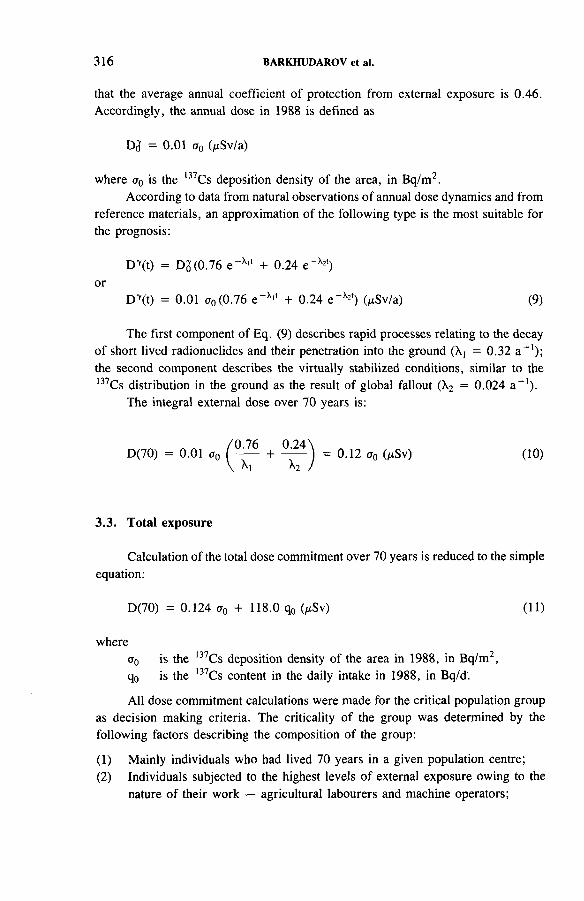
3 1 6 B A R K H U D A R O V et al.
that the average annual coefficient of protection from external exposure is 0.46.
Accordingly, the annual dose in 1988 is defined as
DJ = 0.01 a0 OSv/a)
where a 0 is the l37Cs deposition density of the area, in Bq/m2.
According to data from natural observations of annual dose dynamics and from
reference materials, an approximation of the following type is the most suitable for
the prognosis:
D v(t) = DJ(0.76 e _X|t + 0.24 e-*2')
or
D 7(t) = 0.01 (0.76 e_x,t + 0.24 e ' Á2t) ( ц Sv/a) (9)
The first component of Eq. (9) describes rapid processes relating to the decay
of short lived radionuclides and their penetration into the ground (X, = 0.32 a-1);
the second component describes the virtually stabilized conditions, similar to the
137Cs distribution in the ground as the result of global fallout (X2 = 0.024 a-1).
The integral external dose over 70 years is:
/0.76 0.24\D(70) = 0.01 a 0 ( --- + --- ) = 0.12 ct0 ( h S \ ) (10)
\ X, X2 /
3.3. Total exposure
Calculation of the total dose commitment over 70 years is reduced to the simple
equation:
D(70) = 0.124 ff0 + US-0 q0 (/¿Sv) (11)
where
a0 is the l37Cs deposition density of the area in 1988, in Bq/m2,
q0 is the ,37Cs content in the daily intake in 1988, in Bq/d.
All dose commitment calculations were made for the critical population group
as decision making criteria. The criticality of the group was determined by the
following factors describing the composition of the group:
(1) Mainly individuals who had lived 70 years in a given population centre;
(2) Individuals subjected to the highest levels of external exposure owing to the
nature of their work — agricultural labourers and machine operators;

IAEA-SM -306/119 3 1 7
(3) For internal exposure calculations, the average indices of the daily intake of
contamination were not used, but 90% quantiles, which were 1.7 times higher
than the estimate of the average values, as the actual distribution curves
have shown. Using this criterion, the critical group makes up 1-2% of the
total population at a given centre. The numerical values used in the models
for metabolism parameters refer to adults, which also affects the dose
significantly.
The combination of critical factors is rather theoretical as these factors do not
all apply to the same persons. However, the fact that they are all assigned to a single
critical group does ensure that the underestimation of exposure levels is extremely
unlikely.
3.4. Calculation results
A prognosis was made for all population centres in the stringet control zone,
which includes 679 centres with a population of approximately 250 000 people. This
zone comprises areas with a 137Cs deposition density of over 0.56 MBq/m2. Three
TABLE I. POPULATION DISTRIBUTION IN THE STRINGENT CONTROL
ZONE IN TERMS OF DOSE COMMITMENTS OVER 70 YEARS
Region
< 0 .3 5
D ose range
(Sv)
0 .35-0 .5 > 0 .5
Russian Soviet Federated
Socialist Republic
Num ber o f population
centres
112 74 36
Population 72 926 20 253 11 228
Ukrainian Soviet
Socialist Republic
N um ber o f population
centres
19 7 15
Population 23 893 13 276 3 235
Byelorussian Soviet
Socialist Republic
Num ber o f population
centres
298 59 59
Population 82 5 11 10 073 8 183
Total Num ber o f population
centres
429 140 110
Population 179 330 43 602 22 646

3 1 8 B A R K H U D A R O V et al.
dose groups were considered: up to 0.35 Sv, from 0.35 to 0.5 Sv, and above 0.5 Sv
for 70 years. The population distribution in terms of dose commitments is shown in
Table I.
According to the NCRP’s recommendations, people may continue their normal
life and work without any restrictions in those population centres where the expected
dose commitment over 70 years does not exceed 0.35 Sv, i.e. they may return to
pre-accident living conditions. There are also grounds for optimism with regard to
the second group of population centres with doses from 0.35 to 0.5 Sv, since suffi
ciently effective methods are available to reduce internal dose by means of special
agricultural measures. During the first few years after the accident, it has been
shown that the implementation of these measures may reduce contamination of the
most dose significant foodstuffs by a factor of 2-3, particularly with regard to the
most significant product, milk. Accordingly, the majority of population centres in
the second group, and even some in the third group, may possibly be returned to pre
accident living conditions. In population centres where no remedial measures would
be sufficient to re-establish normal life, the population would have to be relocated.
The introduction of a normative level for action (at which decision making is
required) of 0.35 Sv over a lifetime makes it possible to carry out a gradual and well
planned relocation, and the implementation of restrictive measures in such popula
tion centres makes it possible both to regulate the radiation situation and to protect
the population.

IAEA-SM-306/38
D I E T A R Y C H A N G E S A N D D O S E S
F R O M F O O D I N S O M E
N O R W E G I A N P O P U L A T I O N G R O U P S
A F T E R T H E C H E R N O B Y L A C C I D E N T
P. STRAND
National Institute of Radiation Hygiene,
0 sterâs
E. B0E
University of Oslo,
Oslo
O. HARBITZ
Norwegian Food Control Authority,
Oslo
Norway
Abstract
D IE T A R Y C H A N G E S A N D D O S E S F R O M F O O D IN S O M E N O R W E G IA N P O P U L A
T IO N G R O U P S A F T E R T H E C H E R N O B Y L A C C ID E N T .
D oses o f radioactivity to som e groups o f the N orw egian population resulting from the
intake o f radiocaesium in food w ere estimated from dietary surveys and w hole body counting
conducted for the first three years after the Chernobyl accident. The average effective dose
equivalent estimated from the dietary survey during the first year was found to range between
0 .12 and 0.25 m Sv for the average consum er in N orw ay. The average dose was almost the
same in each o f the three consecutive years. M ilk and freshwater fish w ere the main sources
o f radiocaesium . Regarding particularly exposed groups (hunters and others), the dose
increased from almost 0 .7 m Sv in the first year to almost 1 .1 m Sv in the third year. Freshwater
fish, reindeer meat and m ilk accounted for almost 90% o f the intake o f radiocaesium. The
average dose to the Lapps living in the contaminated areas reached a peak value o f 3.3 m Sv
during the second year after the accident. Reindeer meat consumption accounted for some
80-90% o f the total intake o f radiocaesium . A m ajority o f the specially selected groups
(hunters and others as w ell as Lapps) changed their dietary habits significantly after the
accident. The reduction in intake w as most pronounced for reindeer meat and freshwater fish.
It is estimated that had they not made these dietary changes, the Lapps would probably have
received doses 7 to 10 times higher, and hunters 50% higher, than those they actually
received.
3 1 9

3 2 0 S T R A N D et al.
During the period immediately following the Chernobyl accident, weather con
ditions were such that the prevailing winds carried part of the discharges to Norway.
The fallout over Norway varied considerably from region to region. A research
programme, which was initiated to draw up a picture of the fallout pattern, revealed
large differences in activity levels both in soil [1] and in food items [2]. This study
indicated that the effect of the fallout on different groups of the population would
vary. Therefore, groups presumed to have received doses higher than the average
were selected for a more detailed study. These groups were composed of people
(Lapps, hunters and others) who were presumed to have a diet which included a large
proportion of food items which had become heavily contaminated with radio
nuclides. Population groups assumed to have received doses closer to the average
for the Norwegian population were also selected on a random basis. The objective
of the study was to estimate the doses to which different groups of the population
had been exposed, as well as the contribution to the radioactivity intake from
different food items. Dietary changes were also investigated. Two procedures were
used:
(1) The total intake of radioactivity through food was calculated on the basis of
dietary surveys and combined with activity measurements in a variety of
foodstuffs.
(2) The radioactive content of the body was measured directly by whole body
counting.
TABLE I. POPULATION GROUPS SELECTED FOR THE STUDY
1. I N T R O D U C T I O N
Num ber o f persons
Observed group 1987 1988 1989
M F M F M F
Random ly selected persons 63 64 31 34 25 26
from the municipality o f Sel
Specially selected persons 21 5 23 5 11 4
(hunters and others)
Lapps from contaminated areas
A dults 48 30 37 19 39 29
Children 29 5 7

IAEA-SM-306/38 32 1
2.1. Selected population groups
Table I provides an overview of the selected population groups taking part in
the project during the first three years after the accident. The specially selected
groups of hunters and others as well as Lapps were composed of people who
normally consumed large quantities of reindeer meat, freshwater fish and game, and
lived in the most affected areas of Norway. Two other groups were randomly
selected. One was from the Oslo area where the fallout level was low (0-5 kBq/m2)
(not discussed in this paper), and the other from the municipality of Sel with a high
fallout level (>80 kBq/m2) [3].
2.2. Dietary survey
Different questionnaires were used to evaluate the consumption of different
foodstuffs. Priority was given to frequency forms, and the data were collected from
interviews. The consumption data for reindeer herdsmen and their families (Lapps)
were collected on a household basis, whereafter the average intake per person was
calculated [3].
The average radioactivity in the various food items was estimated on the basis
of some 50 000 measurements on different food samples during the first three years
after the accident. As regards food items which showed considerable regional varia
tion in activity content, data from the analysis of food items from each individual
municipality were used. This applied to reindeer meat, game, freshwater fish, milk
and cloudberries (Arctic yellow berries). For the other foodstuffs, average values
have been used for all regions [3].
2.3. Whole body measurements
The instrument used for the whole body measurements was a 3 in Nal (TL)
scintillation counter (Harshaw type) with a multichannel analyser (Canberra type
S35). So-called chair geometry was used. The person to be monitored was placed
in a lead insulated chair and the Nal crystal was locked at a fixed distance from the
stomach area of the seated person. The integration time was ten minutes, and counter
readings in three different energy areas were registered.
Whole body counting gives the activity concentration of 134Cs and 137Cs in
the body at the time of the measurement. The margin of error in the individual
measurements is estimated to be about 10% at a 95% confidence level. The whole
body counting and the interviews for the dietary survey were performed during April
and May of 1987, 1988 and 1989.
2 . M A T E R I A L S A N D M E T H O D S

3 2 2 S T R A N D et al.
The estimated intake of radiocaesium from different foodstuffs in the different
population groups for the three years of the survey is shown in Fig. 1. Milk and
freshwater fish were found to be the main sources of caesium in the randomly
selected group. For the specially selected group (hunters and others), freshwater fish
and reindeer meat contributed about two thirds of the total intake of radiocaesium.
Milk also represented a significant source. For the Lapps, reindeer meat was the
dominant source, contributing some 80-90% of the total intake.
The parameter changes according to time show that the yearly intake for the
hunters has not yet reached its maximum, while the amounts of radiocaesium
received by the Lapps were at their highest during the second year after the accident
(approximately 230 kBq/a). For the randomly selected group, only minor variations
occurred during the first three years.
It is possible to estimate the effective dose equivalent both from the dietary
survey data presented in Fig. 1, and from the whole body measurements. The
methods used were taken from the relevant literature [4, 5].
The average effective dose equivalent from foodstuffs during the first year
after the accident, as calculated from the results of the dietary survey, was estimated
to range between 0.12 and 0.25 mSv for the randomly selected population group.
3 . R E S U L T S
i i i i i i i i i i i 1987 1988 1989 1987 1988 1989 1987 1988 1989
Randomly selected Hunters Lapps
FIG. I. Average intake of radiocaesium (kBq/a) as estimated from dietary surveys in 1987,
1988 and 1989. Data are presented for one randomly and two specially selected groups of
people. Intake through reindeer meat, freshwater fish, milk and other foodstuffs is shown.

IAEA-SM-306/38 3 2 3
FIG. 2. Effective dose equivalent (mSv/a) estimated from whole body counting for the same
three groups as in Fig. 1.
Dietary survey Dose (m$/a)
FIG. 3. Comparison of the doses to the Lapps as estimated from dietary intake and from whole
body counting (r = 0.60, n = 239; data from 1987, 1988 and 1989).

3 2 4 S T R A N D et al.
For the hunters and others, the average effective dose equivalent was estimated to
have increased from 0.7 mSv in the first year to 1.1 mSv in the third year. The aver
age dose to which the Lapps were exposed reached a peak value of 3.3 mSv during
the second year after the accident.
The doses received by the different groups as calculated from the whole body
measurements are shown in Fig. 2. It can be seen that the trends revealed for the
three years in question are very much the same as those found in the dietary survey
data presented in Fig. 1.
The relation between individual doses calculated on the basis of the dietary
studies and those calculated from the whole body measurements is shown in Fig. 3
(data only for the Lapps for all three years of the investigation). It can be seen that
the two sets of data are in good agreement. The results from the dietary survey
represent, however, an overestimation by a factor of 2 .2 as compared to the results
from the direct measurements of the body burden (correlation coefficient:
0.60 (n = 239)). For the randomly selected group and the hunters, the overestima
tion factors were 3.1 and 2.7, respectively.
TABLE II. PERCENTAGE OF PERSONS IN EACH GROUP
WHO HAVE REDUCED OR TERMINATED CONSUMPTION OF
FRESHWATER FISH, REINDEER MEAT OR OTHER PRODUCTS
(MAINLY GAME AND LAMB MEAT) AS A RESULT OF THE
CHERNOBYL ACCIDENT
Per cent o f the group with
reduced or terminated consumption of:
Observed group Freshwater
fish
Reindeer
meatOther products
Year: 1987 1988 1989 1987 1988 1989 1987 1988 1989
Random ly selected
persons
25 15 8 17 17 14 7 8 24
Specially selected
persons (hunters
and others)
78 79 70 27 6 39 36 20
Lapps 62 52 50 61 57 54

IAEA-SM-306/38 3 2 5
In Table II, data are presented showing the changes in dietary habits following
the Chernobyl accident. The results indicate that a significant proportion of the par
ticipants in the study took precautions and made dietary changes to reduce their con
sumption of certain food items. From the results of the dietary survey it is possible
to make certain hypothetical estimations of what the intake might well have been had
no precautions been taken. After the accident, the annual consumption by the Lapps
of reindeer meat and freshwater fish was reduced to some 60-70% and 15-50%,
respectively, of the normal pre-Chernobyl level, while the hunters and others had
reduced their consumption of freshwater fish to about 40-70% of the pre-accident
level.
These changes can probably be attributed partly to the dietary recommenda
tions which were issued by the Government.
4. DISCUSSION
In November of 1986, the Norwegian health authorities formulated special
dietary guidelines or recommendations for reindeer herdsmen and other people con
suming large quantities of freshwater fish and reindeer meat from the areas affected
by the Chernobyl fallout [2,6]. On the basis of measurements of the content of radio
caesium, limitations were proposed on the number of meals per week which included
the contaminated food items. Information was also distributed on how to prepare
these foods to lower their content of caesium. Reindeer herdsmen were also given
the opportunity to exchange their contaminated meat for meat with a low caesium
content. The aim of the recommendations given was to keep the dose from foodstuffs
below 1 mSv/a for each individual in the population.
The dietary survey revealed considerable changes in the consumption patterns
for foodstuffs containing high levels of radioactivity. If these dietary changes had not
been realized, much higher doses could have been expected.
The committed dose equivalent (over 50 years) is dependent on the effective
half-life of activity levels in food. There is some uncertainty involved in the estima
tion of half-life. However, a half-life of at least one to three years generally in food,
and of four to six years specifically in reindeer meat and freshwater fish, must be
expected. On the basis of the data presented in this paper, the dose equivalent com
mitment for the Lapps has been estimated to be in the range of 10 to 15 mSv. Had
various precautions not been taken, and dietary changes not been introduced, doses
would probably have reached levels 7 to 10 times higher than those actually
measured. For the hunters, the dose equivalent commitment has been estimated to
be in the range of 6 to 9 mSv. Without dietary changes, the doses would probably
have been some 50% higher.
There are probably two main explanations for the significant increase in the
doses received by the hunters and the Lapps from the first to the second year. Firstly,

3 2 6 S T R A N D et al.
it became clear from the dietary survey that during the first year, the hunters and
the Lapps consumed uncontaminated freshwater fish and reindeer meat caught or
slaughtered before the accident and then stored frozen. During the second and third
years, this population had to base its consumption on contaminated foodstuffs.
Secondly, it also became evident that some of the favourable changes in consumption
patterns and dietary habits which had taken place during the first year were not main
tained during the second year. The health authorities have therefore repeated the
dietary recommendations [6].
Finally, it should be emphasized that new measures have been introduced in
Norway, which have increased the possibilities of decontaminating the reindeer
while they are still alive. Intensive use of these techniques in the most affected areas
will probably result in a significant reduction in the doses to the Lapps in the near
future.
REFERENCES
[1] B A C K E , S ., B JE R K E , H ., R U D JO R D , A .L . , U G L E T V E IT , F ., The Fallout o f
Caesium in N orw ay after the Chernobyl Accident, Report 5 , National Institute o f
Radiation H ygiene, 0steràs (1986).
[2] D IR E C T O R A T E O F H E A L T H , The Radioactive Fallout in N orw ay after the
C hernobyl Accident, D irectorate o f Health, O slo (1986) (in N orwegian).
[3] S T R A N D , P ., et a l., W hole-body counting and dietary surveys in N orw ay during the
first year after the Chernobyl accident, Radiat. Prot. D osim . 2 7 3 (1989) 16 3 -17 1 .
[4] IN T E R N A T IO N A L C O M M IS SIO N O N R A D IO L O G IC A L P R O T E C T IO N , Lim its
for Intakes o f Radionuclides by W orkers, Publication 30, Pergam on Press, O xford and
N ew Y o rk (1979).
[5] K E N D A L L , G .М ., K E N N E D Y , B .W ., G R E E N H A L G H , J .R ., A D A M S , N .,
F E L L , T .P ., Com m itted D ose Equivalent to Selected O rgans and Com mitted E ffective
D ose Equivalent from Intakes o f Radionuclides, Rep. N R P B -G S 7, National R adiologi
cal Protection Board, Chilton, U K (1987).
[6] D IR E C T O R A T E O F H E A L T H , D ietary Guidelines for Persons Consum ing Large
Quantities o f Reindeer M eat and Freshwater Fish, D irectorate o f Health, O slo (1987)
(in N orw egian).

IAEA-SM-306/29
R A D I O C A E S I U M L E V E L S , I N T A K E S
A N D C O N S E Q U E N T D O S E S
IN A G R O U P O F A D U L T S
L I V I N G I N S O U T H E R N E N G L A N D
G. ETHERINGTON, M.-D. DORRIAN
National Radiological Protection Board,
Chilton, Didcot, Oxfordshire,
United Kingdom
Abstract
RADIOCAESIUM LEVELS, INTAKES AND CONSEQUENT DOSES IN A GROUP OF ADULTS LIVING IN SOUTHERN ENGLAND.
Measurements of radiocaesium body activity have been carried out on a small group of subjects since May 1986. The radiocaesium levels measured are expected to be representative o f the population o f the southern United Kingdom. Information on the intake of radiocaesium and the consequent committed doses during the three years following Chernobyl has been derived using a method which has been developed to make possible the calculation of intake data from measurements of body radioactivity. The degree to which the intake of radiocaesium in foodstuffs can be adequately accounted for has been estimated by comparing the computed intake data with data on activity in foodstuffs.
1. INTRODUCTION
Intake by ingestion of the radioisotopes 134Cs and 137Cs has given rise to the
largest contribution to the average dose received by members of the general public
in the United Kingdom as a consequence of the Chernobyl reactor accident in
April 1986. Measurements of body radioactivity in a group of about 30 adults have
been carried out at the National Radiological Protection Board at 1-3 month intervals
since that time. Preliminary results have been published elsewhere [1, 2]. The
objective of the work reported in this paper was to use these data on body radio
activity to derive information on the intake of radiocaesium and the consequent doses
to the general population of the southern UK during the three years following the
Chernobyl accident. Subjects are all residents of the counties of Oxfordshire or
Berkshire, and are expected to be representative of southern England as a whole
since deposition from the Chernobyl cloud was relatively uniform over this part of
the country.
3 2 7

3 2 8 E T H E R IN G T O N and D O R R IA N
Measurements of the variation of body radioactivity with time can be used
to evaluate intake by solving the integral equation which relates these two
quantities:
A(t) = Г ' I(t) R(t - r) dr (1)J 7 = 0
where A(t) is the total body activity at time t,
1(7) is the intake at time 7 (7 < t) and
R(t - 7) is the retention function.
Information on intake obtained from in vivo measurements in this way
provides a means by which committed doses can be calculated directly without
involving the use of environmental and intake models for the transfer of radio
nuclides to man.
The degree to which intake of radiocaesium in foodstuffs can be adequately
accounted for can be estimated by comparing such information on intake with data
on activity in foodstuffs. A large amount of monitoring data from a wide variety of
sources has existed on radiocaesium levels in foodstuffs in the United Kingdom since
the accident at Chernobyl, and an attempt has been made to correlate these data with
the computed intake data.
2. METHODS
2.1. Body radioactivity measurements
The equipment and procedures used for these measurements have been
described elsewhere [3]. Briefly, measurements were carried out within a low
background enclosure constructed from 150 mm thick aged steel and lined on the
interior with aged lead and a further layer of steel. Gamma ray spectra were
accumulated using a static arrangement of five 150 mm diameter X 100 mm Nal(Tl)
detectors positioned to give a response relatively independent of the distribution of
activity within the body. Calibrations were carried out using polythene phantoms
filled with distilled water, to which known amounts of the radionuclides of interest
were added. For this study, calibrations were made for 40K, l34Cs and 137Cs.
2.2. Determination of intakes from body radioactivity measurements
The integral equation relating intake, retention function and body radioactivity
(Eq. (1)) is an example of a ‘Volterra equation of the first kind’:

IAEA-SM-306/29 3 2 9
T ‘ I (r ) R(t, r ) dr (2)т=0
Generally, such equations are ill conditioned, with small changes in R(t, t) or A(t)
possibly having a large effect on the solution for 1(7). Provided, however, that
derivatives of the functions A(t) and R(t, 7) can be determined with reasonable
accuracy, the equation can be converted to a ‘Volterra equation of the second kind’
which can be solved more accurately for 1(7) [4]:
I(t) + Г Г ‘ [R(t, 7)] 1(7) d7 = -f A(t) (3)J 7=0 dt dt
The retention function R(t, 7) is normally represented by a sum of exponentials:
A(t) =
R(t, T ) = ^ 2 A , exp[-o¡i(t - т)] (4)
i
and in the case of caesium intake by adults, it is given by:
R(t) = 0.8 exp[(ln 2) t/110] + 0.2 exp[(ln2) t/2] (5)
with t in days [5].
Tim e (d)
FIG . I . Intake function computed from body activity data corresponding to a ,37C s intake o f
1 Bq/d.

3 3 0 E T H E R IN G T O N and D O R R IA N
By evaluating the differentials of the retention function R(t — t) and the
measured activity function A(t) at n suitably chosen time intervals, an (n X n) system
of simultaneous linear algebraic equations can be formed which can be solved for
I(t) using standard numerical methods [6]. The differential of A(t) can be obtained
by fitting the measured data with a suitable series of analytical functions. A cubic
spline fitting algorithm which provides the differential of the function directly was
used.
A computer program has been developed to carry out this calculation and an
extensive series of tests completed. A difficult test for the program to perform is to
determine the intake function corresponding to a continuous uniform intake which
commences instantaneously. The result is shown in Fig. 1. The 137Cs body activity
to be expected from an intake of 1 Bq/d commencing on day 30 was input to the
program. This caesium body activity rises from 0 at day 30 to a limit of 127.5 Bq
for extended times. After the initial overshoot, the intake is calculated with an
accuracy of better than 1 % .
3. RESULTS AND DISCUSSION
3.1. Body radioactivity measurements
Figure 2 shows the measured total body activities and the cubic spline fits to
the data for l34Cs, 137Cs and total radiocaesium (i.e. 137Cs plus 134Cs) for the three
years following the Chernobyl accident. The figure clearly shows the wide variation
of the radiocaesium levels among subjects measured at any one time. This arises
mainly from variations in dietary intake among individuals, although the variability
in individual caesium retention functions must also be a contributory factor.
The cubic spline fits to the data are least squares fits and thus represent the
average levels in the study group. The average radiocaesium level rose relatively
rapidly during 1986 then began to decrease, reaching a minimum during the first
quarter of 1987 and a second maximum in mid-1987; it has since been decreasing.
To correlate diet with the measured activities, subjects were asked to complete
a questionnaire. From the results of this information, it was possible to correlate
measured activities in individuals with their estimates of the quantity of milk
consumed per week. Measurements were grouped into 13 time intervals, and the
correlations estimated. Figure 3 shows the correlation found for measurements made
during February 1987. Similar correlations were found for measurements made in
the other 12 time intervals. Generally, positive correlations were found which were
significant at the 99% level, although for four groups of measurements, the
significance levels were lower at 98%, 95%, 90% and 80%. A strong positive
correlation clearly exists with milk consumption over the full three year period.

Activ
ity
(Bq)
Ac
tivity
(B
q)
Activ
ity
(Bq)
IAEA-SM-306/29 3 31
Tim e (d )
Tim e (d)
Tim e (d )
__i____ i____ I____ i____ i--- 1____ I____ i____ i____ i____ I____ i____1986 1987 1988 1989
FIG. 2. Measured and average radiocaesium levels in the study group since the Chernobyl
accident.

3 3 2 E T H E R IN G T O N and D O R R IA N
M ilk consumption (L /d )
FIG. 3. Correlation between body activity measurements in February 1987 and milk
consumption.
FIG. 4. Estimated contribution from milk consumption to radiocaesium body activity in the
study group.

IAEA-SM-306/29 3 3 3
The intercept on the measured radiocaesium activity axis in Fig. 3 gives an
estimate of the expected body radioactivity for a person who does not drink milk,
A0. Average milk consumption in the study group was 0.39 L/d. Figure 3 can thus
be used to give an estimate of the expected body radioactivity of a person who
consumes an average amount of milk, А]. The estimated fractional contribution
from milk consumption to caesium body radioactivity in the general population is
then given by (Ai - A ^/A ^
Figure 4 shows this contribution from milk consumption as a function of time
since Chernobyl. Soon after the accident, milk consumption apparently contributed
80-90% of radiocaesium body activity. This decreased to about 50% after 400 days,
and thereafter remained approximately constant.
Implicit in this analysis is that there is no correlation between milk
consumption and consumption of other caesium rich foodstuffs. This is difficult to
ascertain, and it may well be that the correlation seen is actually a correlation
between body radioactivity and the consumption of a wide range of dairy products
associated with milk (e.g. cheese). However, the consumption of milk itself must
remain the most important factor since the average consumption of milk products is
13 kg/а compared with 150 kg/а for milk in the UK [7]. Except for milk powder,
the fraction of radiocaesium transferred from milk to milk products (comparing the
same weight of milk and milk product) varies from 0.15 (butter) to 1.03 (skimmed
milk) [8].
However, for milk powder, this fraction is as high as 18.5 (whey powder) [8].
Milk powders of various types are used in a wide variety of applications in the food
industry and their contribution to radiocaesium in the diet cannot be neglected.
3.2. Intakes
Figures 5 and 6 show the intake functions for ,37Cs and l34Cs computed from
body radioactivity measurements. Both intake functions show pronounced peaks, the
first occurring during June-July 1986, and the second during April 1987. These
peaks are associated with the less pronounced peaks which are seen at later times
in the body radioactivity data of Fig. 2. The magnitudes and positions of the
maximum and minimum in the intake functions, and in particular the depth of the
minimum, depend to some degree on the parameters used in the cubic spline fit of
the body radioactivity data. However, all reasonable fits to the data result in intake
functions with the same qualitative form.
The data of Fig. 4 imply that milk consumption was the main contributor to
radiocaesium intake, at least during the first year. For comparison, therefore, Figs 5
and 6 also show the variation in 137Cs and 134Cs activity concentrations in milk
produced at a local farm [9], normalized by the average consumption rate of the
study group. The second peak in the milk data arises from the feeding of animals
between October 1986 and March 1987 on contaminated silage cut during 1986.

3 3 4 E T H E R IN G T O N and D O R R IA N
crmф
га
2.5 -,
1.5 -
1 -
.5 -• ï < 0 .3 ’ ' < 0.3
C S -13 7
.... A verag e intake from locally produced m ilk
о < A verage intake from m ilk from southern England
------ C a lc u la t e d t o ta l in ta k e
i
200 400--- 1----
600 Tim e (d )
800 1000 1200
1986 1987 1988 1989
FIG. 5. Calculated intake function for l37Cs compared with the inferred intake from
consumption of locally produced milk.
Tim e (d )
____ . ■■■ ■_____ I ' ■_____ ,_____ ,_____ I_____ I_____ L_____._____ I _____ L_1986 1987 1988 1989
FIG. 6. Calculated intake function for ,34Cs compared with the inferred intake from
consumption of locally produced milk.

IAEA-SM-306/29 3 3 5
Clearly there is an apparent discrepancy between these data, which seem to
show that milk consumption represents less than 10 % of total intake, and the data
of Fig. 4, which imply a contribution from milk of between 50% and 90%. In
addition, while both the milk activity concentration data and the computed intake
data show two pronounced peaks, the peaks in the two sets of data do not occur at
the same times.
To check that milk from the local farm was representative of milk over the
whole of southern England, best estimates of 137Cs concentrations in milk were
made from monitoring data acquired by the Ministry of Agriculture, Fisheries and
Food near nuclear power stations [10]. These data are also plotted in Fig. 5, and
show that the local farm data were typical.
The discrepancy can be explained partially once account is taken of the
importation of milk from other parts of the UK to southern England. In an average
year, local production in southeast England is insufficient to meet demand from the
end of June until mid-October. Milk is imported from southwest England and Wales,
and possibly from northwest England. During August, milk imported from these
regions constitutes about 60% of total consumption, and over a full year constitutes
40% of total consumption [11]. Many of the areas supplying milk were areas of
relatively high deposition of Chernobyl fallout. Deposition of 137Cs in the southern
UK was relatively low, being less than 0.1 kBq/m2 generally, and as low as 20
Bq/m 2 in Oxfordshire and Berkshire. In some of the areas from which milk is
imported, however, l37Cs depositions of up to 5 kBq/m2, and possibly higher, have
been estimated [12]. Between June and August 1986, best estimates of activity
concentrations in milk from farms in Lancashire [13, 14] and North Wales [10],
where l37Cs depositions were in the range of 1-10 kBq/m2, were in the range of
3-16 Bq/L, equivalent to average intakes in the range of 1.2-6.2 Bq/d.
Measurements of the average concentrations of 137Cs in milk in England and
Wales have been reported by Smith et al. [15, 16]. If it is assumed that milk
consumed by members of the study group between June and August 1986 contained
137Cs activity concentrations similar to the average values for England and Wales,
then taking the mean of the values given in Ref. [15] for the second and third
quarters of 1986 gives an average concentration of 2.7 Bq/L and an average intake
of 1.1 Bq/d. Thus at least 50% of the mean intake of 137Cs in the June-August
period of 1986 can be accounted for by the 137Cs present in imported milk.
However, the peak in intake during March, April and May 1987 cannot be
accounted for in the same way, firstly because this peak occurs too early in the year,
and secondly because activities in milk during 1987 were such that imported milk
would contribute only about 0.3 Bq/d to the average intake during August of 1987.
Data on radiocaesium concentrations in foodstuffs, although adequate for the
purposes of a monitoring programme, are insufficient to interpret this intake peak.
Many of the available monitoring data quote ‘less than’ values with typical minimum
detectable activities in the range of 3-20 Bq/kg of 137Cs [17]. It can only be

3 3 6 E T H E R IN G T O N and D O R R IA N
assumed that the October to March feeding of animals on contaminated silage caused
activity to be reinjected into the food chain after an interval, depending on the food
distribution system.
The second intake peak occurs approximately 110 days after the second peak
in milk activity. Since the average time of delay between collection and consumption
for milk is only 2 days [18], the peak in milk activity may reasonably be taken to
be the time at which the maximum amount of activity was being reinjected into the
food chain generally. Haywood [18] gives delay times in distribution in the UK for
a range of foodstuffs. These include butter (4 weeks), cheese (4 months), fresh meat
(10 days) and frozen meat (3 months). Thus many long life foodstuffs are present
in the food distribution system for a sufficient time to account for the delay in the
second intake peak.
Finally, intake has persisted for much longer than simple models would
predict. During early 1988, intake of 137Cs was still approximately 30% of its peak
value. Again insufficient monitoring data exist to associate the persisting intake with
activities in foodstuffs.
3.3. Dose estimations
Committed effective dose equivalents computed from the intake data of Figs 5
and 6 , and based on the dose-intake conversion factors given in Ref. [5], are shown
in Table I for 137Cs and 134Cs, for each 12 month period since the Chernobyl
accident. The total committed dose for all intakes of radiocaesium by adults during
the three years following the Chernobyl accident is 21.9 /¿Sv. Effective dose
equivalents can also be calculated directly from the body radioactivity data, but in
this case the dose calculated is that actually received up until the time of the last
measurement of body radioactivity included in the calculation. The total dose from
TABLE I. COMMITTED EFFECTIVE DOSE EQUIVALENTS (¿iSv) FOR
ADULTS IN THE SOUTHERN UK FROM INTAKE BY INGESTION OF
RADIOCAESIUM DURING THE THREE YEARS FOLLOWING THE
CHERNOBYL ACCIDENT
Radionuclides 1987 1988 1989 Total
Cs-137 7.61 4.46 1.66 13.7
Cs-134 5.12 2.31 0.73 8.2
Cs-137 plus Cs-134 12.7 6.8 2.4 21.9

IAEA-SM-306/29 3 3 7
radiocaesium over three years calculated in this way is 20.9 /¿Sv, the difference
between the two figures being the dose to which the subject is committed but which
has not yet been received.
4. CONCLUSIONS
A numerical method has been developed which makes possible the deter
mination of intake from the measurements of the variation of body radioactivity with
time. The method has the potential of wide applicability, allowing the determination
of continuous non-uniform intake provided that the body radioactivity measurements
are carried out with sufficient frequency. The method has been used here to
determine average intakes of radiocaesium as a function of time in a group of
subjects representative of the population of the southern UK, for whom body radio
activity measurements have been carried out regularly since the Chernobyl accident
in 1986.
A strong correlation has been found between measured body activity and milk
consumption, implying that consumption of milk represented 80-90% of the total
radiocaesium intake soon after the accident, falling to about 50% at later times.
Measured activities in locally produced milk do not account for the magnitude or
time dependence of the computed intake function. However, the intake which
occurred during 1986 can be partially accounted for once the effect of milk imported
into southeast England from areas of higher deposition is taken into consideration.
Approximately 50% of the 137Cs intake during 1986 can be accounted for in terms
of milk consumption. Considering the uncertainties involved, this is in reasonable
agreement with the contribution from milk consumption estimated from dietary
survey information.
Insufficient monitoring data on low levels of activity in foodstuffs exist to
account for the computed intake during 1987 and 1988. However, the existence of
a second peak in intake during early 1987 can be explained qualitatively in terms of
the feeding of farm animals on contaminated silage from October 1986 to March
1987, and of the delays in distribution of frozen and other long life foodstuffs.
The average committed effective dose equivalent received by members of the
study group from all the intakes by ingestion of radiocaesium up to May 1989 was
21.9 ¿iSv. An extrapolation of the intake data shown in Figs 5 and 6 indicates that
committed doses arising from ingestion of Chernobyl radiocaesium are not expected
to increase significantly above this number.
REFERENCES
[1] F R Y , F .A ., B R IT C H E R , A . , Doses from Chernobyl radiocaesium , Lancet 2 (1987)
16 0 -16 1.

3 3 8 E T H E R IN G T O N and D O R R IA N
[2] FRY, F.A., ETHERINGTON, G., DORRIAN, M .-D., “Radiocaesium in a group of adults resident in Oxfordshire and Berkshire” , Radiation Protection Theory and
Practice (Proc. Society for Radiological Protection Int. Symp. Malvern, UK, 1989), Institute of Physics, London (1989) 193-196.
[3] SUMERLING, T.J., McCLURE, D.R., MASSEY, D.K., Measurement of Total Body
Radioactivity: The Procedures Used at the Board, Rep. NRPB-R188, National Radiological Protection Board, Chilton, UK (1985).
[4] DELVES, L .M ., W ALSH, J., Numerical Solution of Integral Equations, Clarendon
Press, Oxford (1974).[5] KENDALL, G .M ., et al., Committed Doses to Selected Organs and Committed
Effective Doses from Intakes of Radionuclides, Rep. NRPB-GS7, National Radiological Protection Board, Chilton, UK (1987).
[6] FRÔBERG, C.-E., Introduction to Numerical Analysis, 2nd edn, Addison-Wesley, Reading, M A (1969).
[7] HAYW OOD, S.М., Revised Generalised Derived Limits for Radioisotopes of Strontium, Iodine, Caesium, Plutonium, Americium and Curium, Rep. NRPB-GS8, National Radiological Protection Board, Chilton, UK (1987).
[8] W ILSON, L.G., BOTTOMLEY, R.C., SUTTON, P.M., SISK, C.H., The transfer of radioactive contamination from milk to commercial dairy products, J. Soc. Dairy Technol. 41 1 (1988) 10-13.
[9] BRADLEY, E.J., WILKINS, B.T., “Influence of husbandry on the transfer of radiocaesium from feed to milk during the winter that followed the Chernobyl reactor accident” , paper presented at CEC Workshop on Transfer of Radionuclides to
Livestock, Oxford, 1988.[10] MINISTRY OF AGRICULTURE, FISHERIES AND FOOD, Radioactivity in Food
and Agricultural Products in England and Wales, Terrestrial Radioactivity Monitoring
Programme Reports, MAFF, London (1986, 1987).[11] JAMES, P., Milk Marketing Board, private communication, 1989.[12] CLARKE, M.J., SMITH, F.B., Wet and dry deposition of Chernobyl releases, Nature
(London) 332 (1988) 245.[13] GREEN, N., National Radiological Protection Board, Chilton, UK, private
communication, 1989.[14] LANCASHIRE COUNTY COUNCIL, Radiation Monitoring in Lancashire, 2nd
Annual Report, LCC, Preston, UK (1987).[15] SMITH, D.M ., et al., Environmental Radioactivity Surveillance Programme: Results
for the UK for 1985 and 1986, Rep. NRPB-R220, National Radiological Protection
Board, Chilton, UK (1988).[16] SMITH, D.M ., et al., Environmental Radioactivity Surveillance Programme: Results
for 1987, Rep. NRPB-R229, National Radiological Protection Board, Chilton, UK
(1989).[17] MINISTRY OF AGRICULTURE, FISHERIES A N D FOOD, Radionuclide Levels in
Food, Animals and Agricultural Products, MAFF, London (1986, 1987).[18] HAYW OOD, S.М., A Review of Data on the Time Delay Between Harvesting or
Collection of Food Products and Consumption, Rep. NRPB-M83, National Radiological Protection Board, Chilton, UK (1983).

IAEA-SM-306/6
C O M P A R I S O N O F D O S E E S T I M A T E S
D E R I V E D F R O M W H O L E B O D Y C O U N T I N G
A N D I N T A K E C A L C U L A T I O N S B A S E D O N
A V E R A G E F O O D A C T I V I T Y C O N C E N T R A T I O N
F. STEGER, K. MÜCK, K.E. DUFTSCHMID
Austrian Research Centre Seibersdorf,
Seibersdorf, Austria
Abstract
C O M P A R IS O N O F D O S E E S T IM A T E S D E R IV E D F R O M W H O L E B O D Y C O U N T IN G
A N D IN T A K E C A L C U L A T IO N S B A S E D O N A V E R A G E F O O D A C T I V I T Y
C O N C E N T R A T IO N .
In A ustria after the Chernobyl accident, large discrepancies w ere observed betw een the
actual l37C s content measured by w hole body counting and the values calculated from the
intake o f food, based on average contamination levels and average consumption rates, which
differed by more than a factor o f 2. T o identify possible causes o f this difference, a nationwide
survey by w hole body counting o f com parable groups w as carried out and resulted in a differ
ence o f only 10% o f the national average body burden compared to that measured only in the
V ienna region. Since regional differences caused by large local variations in fallout could not
account for the discrepancies, investigations o f possible explanations w ere carried out. In the
paper, the influences o f these possible effects are discussed and committed effective dose
equivalents are calculated. Only with extensive assumptions on bias in food sample m ea
surements, on reduced consumption rates compared to data provided by the Austrian National
Statistical Bureau and on the selection o f m ilk for consum er purposes could a satisfactory
agreement betw een measured body burden values and those calculated from intake be
obtained.
1. INTRODUCTION
After the reactor accident in Chernobyl, the higher food contamination levels
measured in Austria as compared to those in most central and western European
countries made it necessary to measure the activity concentration in various food
stuffs to investigate the intake of activity and to control the limits set by the Austrian
Government. In addition, measurements of population groups were carried out with
whole body counters to evaluate the actual body content and thus derive the commit
ted effective dose equivalent caused by the ingestion of these foodstuffs.
3 3 9
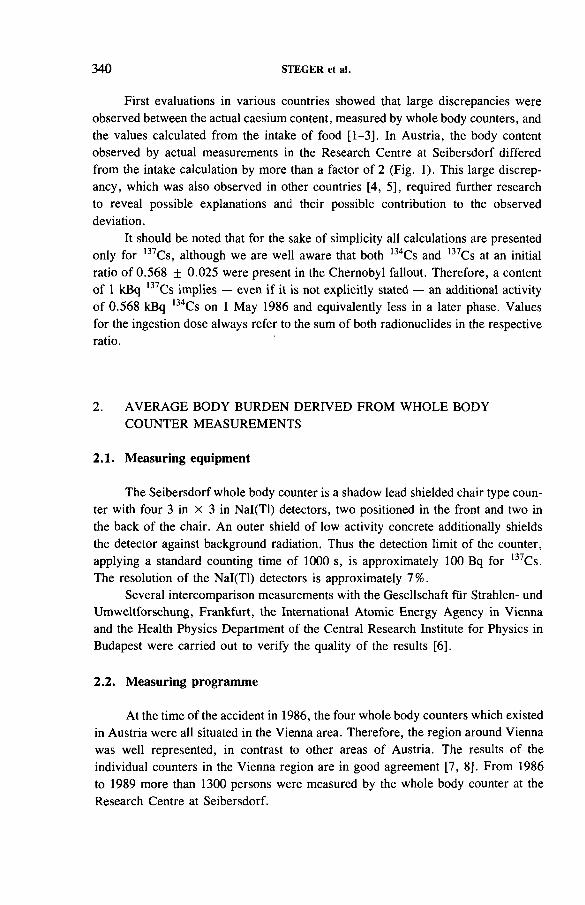
3 4 0 S T E G E R et al.
First evaluations in various countries showed that large discrepancies were
observed between the actual caesium content, measured by whole body counters, and
the values calculated from the intake of food [1-3]. In Austria, the body content
observed by actual measurements in the Research Centre at Seibersdorf differed
from the intake calculation by more than a factor of 2 (Fig. 1). This large discrep
ancy, which was also observed in other countries [4, 5], required further research
to reveal possible explanations and their possible contribution to the observed
deviation.
It should be noted that for the sake of simplicity all calculations are presented
only for l37Cs, although we are well aware that both 134Cs and 137Cs at an initial
ratio of 0.568 ± 0.025 were present in the Chernobyl fallout. Therefore, a content
of 1 kBq l37Cs implies — even if it is not explicitly stated — an additional activity
of 0.568 kBq l34Cs on 1 May 1986 and equivalently less in a later phase. Values
for the ingestion dose always refer to the sum of both radionuclides in the respective
ratio.
2. AVERAGE BODY BURDEN DERIVED FROM WHOLE BODY
COUNTER MEASUREMENTS
2.1. Measuring equipment
The Seibersdorf whole body counter is a shadow lead shielded chair type coun
ter with four 3 in x 3 in Nal(Tl) detectors, two positioned in the front and two in
the back of the chair. An outer shield of low activity concrete additionally shields
the detector against background radiation. Thus the detection limit of the counter,
applying a standard counting time of 1000 s, is approximately 100 Bq for 137Cs.
The resolution of the Nal(Tl) detectors is approximately 7%.
Several intercomparison measurements with the Gesellschaft fiir Strahlen- und
Umweltforschung, Frankfurt, the International Atomic Energy Agency in Vienna
and the Health Physics Department of the Central Research Institute for Physics in
Budapest were carried out to verify the quality of the results [6].
2.2. Measuring programme
At the time of the accident in 1986, the four whole body counters which existed
in Austria were all situated in the Vienna area. Therefore, the region around Vienna
was well represented, in contrast to other areas of Austria. The results of the
individual counters in the Vienna region are in good agreement [7, 8]. From 1986
to 1989 more than 1300 persons were measured by the whole body counter at the
Research Centre at Seibersdorf.

IAEA-SM-306/6 3 4 1
Two groups could be distinguished:
— Employees of the Research Centre (employed both in radiation and non
radiation areas);
— Members of the general public both from the vicinity of the Research Centre
and from Vienna.
Measurements of employees of the centre might tend to increase the average
body content value, as members of this group might not have changed their consump
tion habits, compared to the general public. However, this situation was balanced
by anxious persons who would come to the centre to have their body content con
firmed after having avoided supposedly contaminated food. The comparison of these
two groups and of different age groups (20 and 50 years average) showed no signifi
cant deviation in their activity content, which is a good proof of the sample quality.
Regions apart from eastern Austria, especially regions with higher deposition
rates, were clearly under-represented in this survey. As the deposition rates varied
significantly, in some areas up to twenty times higher than in eastern areas, it was
necessary to obtain a representative sample of persons from each region to be mea
sured on the whole body counter to assess the average body burden in that region.
This problem was solved with the help of the Ministry of Defence which
arranged that soldiers from the barracks of each Austrian province be brought to the
Research Centre at Seibersdorf to be examined on the whole body counter. Twenty
soldiers were selected from each barracks in two age groups (staff personnel
50 years old and young recruits 20 years old) according to two requirements:
— They must have lived in the region of the barracks since the Chernobyl
accident.
— They must have consumed locally available food since the accident.
2.3. Obtaining the average body burden of the Austrian population
Table I gives the average body burden in the various provinces of Austria as
obtained from the measurements of the soldiers. From that number an average devia
tion factor from the Viennese value for each province is derived and by weighting
this average with the population size of each province, a deviation factor for all of
Austria, as compared to the Vienna value, is obtained. This factor amounts to 1.10,
i.e. the average Austrian body burden is only 10% higher than the Viennese result.
The mean values for the soldiers of the Vienna barracks are in good agreement with
the mean values measured in the general population of the Vienna area (see Fig. 1).
This proved that the correct procedure was adopted and allows us to assess an aver
age body burden of the Austrian population as given in Fig. 1.

TABLE
I. A
VERA
GE
BODY
BU
RDEN
OF
20
SO
LD
IER
S
FROM
THE
AU
ST
RIA
N
PRO
VIN
CE
S
AN
D
3 4 2 S T E G E R et al.
ИО
3M><<zzШ
>WXH
5 O04 №06 oHu<№
zoHHH<>wQИÜ<c06Ш><z<buO
ZoHHH<
2wQ
ТЭ ,D <*h£ ° Où *4■5 J5 * S u a o co >»u-
B §W § ce
UQ- .2 <D
Oû
ao*TD Г-»- 00Э S S•O ü —■^ Й -J »
■° ° «: ffl<U wP: g ^T -я oСЛ *“*U
<4-1 «О Ë « 2
Ü 3 ¿ T •9 2 ° S s C-I I
СПо
СПо
00 г-о
SOО
СП(N
00 Г"-о
«оГЧ
о О о о о О О о О
О г- 00г-- 00 ON Onо о о ' О
O-<cCN(N
00ON
<dc3
oONCM
■oe-2c<L>W)
mo
>
8 8 о ОСП s
-и «-Î -и
«CN ГЧ о in v£> OnTtГЧ
ОСП
ГЧСП
тГСП Tj-
СПTien СП
S ©N Os
o-<
>>3
oes
r-00ON
О О О 00 —' СЧCN ^ ^
3<u.<u£ohJ
w'Яc'CcaU
ce'o § >, -Й H >
r-00On
O-<
Г-OOOn
О О О 0 ^ - 0 * T i l> Г Ч
c-~ 00 . O n
oo(N
3-D
3<
eua ,D
ooinr-*
g3CO
Stan
dard
de
viat
ion
ap
pro
xim
atel
y ±
40
%.

IAEA-SM-306/6 3 4 3
FIG. 1. Comparison of l37Cs body content as calculated from the intake of contaminated
food with that derived from the measurements on the whole body counter.
3. AVERAGE BODY BURDEN DERIVED FROM FOODSTUFF
MEASUREMENTS
After the Chernobyl accident approximately 100 000 samples of foodstuffs
were measured by various authorized laboratories which used basically Ge(Li) detec
tors and were cross-calibrated by two intercomparison tests in 1986 and 1987 [9, 10].
With this large number of samples, a good estimate of average activity levels in vari
ous foodstuffs, including the time variation, could be obtained. By assuming average
food consumption rates, as given by the National Statistical Bureau [11], it should
have been possible to establish a good estimate of the daily intake of the various
radionuclides. The results of these calculations, which have been presented before
[3, 12, 13], show very similar intake values, but calculate the intake on a yearly
basis.
In this work the intake was calculated depending on the variation of the activity
concentration in foodstuffs with time, as shown in Fig. 2. Additional initial assump
tions were as follows:
(1) For butter, 40% of the activity concentration in milk was assumed [14], and
for cheese 60% [14], including a time delay of 5 weeks between milk and
cheese production.

3 4 4 S T E G E R et a l.
>С
> оО та *о> СО ¿5
Г4* сÇ2
О <¡t О О Ю О СО О О р р р 0 9 ° о о О О 00 1Л тГIO О ' t Г-’ о СО Г-* Ó IO CN СО СО «“ о О Ó 00 о ó<- « - *— Ю CN СО т - С О С О т -
00о
отз
I I со г** со со о о>
а а« Фсо со
тзоо
Г- 00 00 00 о ог- <- СТ>. . со0 0)0) 3 3 » “ < < >
со <5 оог1 I I
СО Г4- сосо 00 00 О) О О)О) О) О)з э э < < < IT) LDООО
Г-* со со соО) О «“ Г-О)
г г |3 3 -> -5 >СО 00 S 0 0 2I I I
со оо 00 со со О) О) О)Oí аг « s. . vс с с > х > >
00 ) 0 ) г- о о
& со оо $g 00 00 со ^ 0)0)0)
5 - 0 0 0(Л2 2 2
I I I IСО СО Г- 00 00 СО ОЭ со О) О) О) О)
г- 00S ®
g с “
* * Ï S 5 5
® й й
CN CN Т - CN О О
со2 о ) ^ 00
О) О t~о >О 5
00<*> О) ^ 00 >0> D *“
-> >
I l I Iсо г 00 00 а> О)
о ооо
СО г~» 00 00 О) О)
г* со со со2 2 <* *“ <“ СО ^ ^ О ) о о *-0 0 >СО id «2o o ¿1 I I
CO r - CO CO CO CO 0)0)0)
и и и ООО
со00О)
а<
(6> j/bg) и о ц е д и е э и о э Л м ц э е ¿ £ l -sq
55
«s:
•S"Q
"qs:Q
s^3
£os
6
2S
•S“q
Ss«ts '***
1«a.
Cc>u
«Os>
Oc£
IAEA-SM-306/6 34 5
(2) No reduction in the 137Cs activity concentration in bread due to grinding as
proposed after the accident [3] was taken into account. An average mixture of
74% wheat and 26% rye as typical for Austrian dark bread was assumed.
(3) No consideration was taken for directly contaminated vegetables as it was pro
hibited to market these in the first three weeks following the accident. After
that time, the average activity concentration amounted to about 18 Bq/kg.
(4) Activity concentration in venison is given in Refs [3, 12] and is roughly equal
to 2.5 times the concentration in beef.
(5) Foodstuffs with a given harvest time or produced from fodder of one harvest
show a constant activity level from one harvest to the next or for as long as
they are consumed after the harvest.
(6) Foodstuffs with very little contribution to the ingestion dose (e.g. freshwater
fish, wild mushrooms, beer, wine, fruits from southern Europe) are not
included in the intake calculation as their contribution to the ingestion dose is
below 1 %.
From the average daily intake rate, the average l37Cs body content was calculated
by the two compartment formula:
q(t) = f, la R(t) dt + q(0) exp[ —(In 2)t/T,]
where Id is the daily intake, and
R(t) = a exp[ —(In 2)t/T,] + (1 — a) exp[-(ln 2)t/T2]
By using a distribution factor a, an uptake factor fj and effective half-lives of the
two compartments as given in the International Commission on Radiological Protec
tion (ICRP) Publication 30 [15], the average 137Cs body count was obtained as
given in Fig. 1. It exceeds the measured average content by about 2.5 in the begin
ning, by 1 .6-2.0 throughout the first year and decreases to an excess of 1 .2-1.6
throughout the second and third years after the accident.
4. POSSIBLE REASONS FOR DISCREPANCIES
Possible reasons for the large discrepancies between measured body content
values and those calculated from intake values are that:
(a) The ICRP model is not strictly valid (f^ effective half-lives).
(b) The efficiency calibration of the whole body counter is not correct.
(c) There were changed or reduced consumption rates of certain types of food after
the Chernobyl accident.

3 4 6 S TE G E R et al.
W eeks after 2 9 A p r il 1 9 8 6
FIG. 3. Weekly ,37Cs intake from the various foodstuff groups in the first three years after
the Chernobyl accident.
100-
8 0
6 0
>■oоXI
о
40-
го-
D erived fro m m ean fo o d activ ity co ncen tra t ion s
- M e an value o f all fo o d sam p les
Corrected fo r the se lection o f \ lo w activ ity m ilk fo r c o n su m p t io n
2 5 % a ct iv ity red u ct ion in beef due to sam ple bias fo r co n tro l o f in te rvention level (3 0 Sept. 1 9 8 6 —
. 2 3 Ju n e 1 9 8 7 ), a c t iv ity red u ct ion in p o rk due to 4bias fo r co n tro l o f w h e y fed p igs (1 0 Ju ne — 7 O ct. 1 9 8 6 )
2 5 % a ct iv ity red u ct ion in p o rk d ue to "c o n t ro l o f in te rvention level. F ive m on th s yde layed co n su m p t io n o f cereals
2 0 % reduced co n su m p t io n rates ' due to w aste (vegetables, fru its, m eat) _ 5 0 % act iv ity red u ct ion in cereal
due to g r in d in g
1 9 8 6 50 1 9 8 7 10 0
W eeks after 2 9 A p r il 1 9 8 6
1 9 8 81 5 0
FIG. 4. Average l37Cs body content obtained from food activity concentrations and possible
bias effects compared to the measured body content values.

IAEA-SM-306/6 3 4 7
(d) Bias exists in the food samples measured in the laboratories.
(e) Reduction factors due to food production are not accounted for.
(f) A time lag exists between production and consumption of food products.
However, regarding the ICRP model (reason (a) above), the retention function and
the uptake factor f, used in the model [15] were tested in a separate experiment
[16]. No significant deviation from the values of ICRP 30 was observed.
Concerning reason (b) above, owing to the calibration procedure, intercompar
ison tests [6] and repeated recalibrations, a significant error in calibration seems to
be very unlikely, in particular, in the magnitude of a factor of 2.5. Also, other
researchers obtained similar trends in their results with regard to their test groups,
thus the possibility of a single error is excluded [4, 5].
Therefore, only uncertainties in the activity intake from food (reasons (c) to
(f) above) may explain the observed discrepancies. From the 137Cs intake from var
ious foodstuffs, as given in Fig. 3, obviously the largest contributions come from
milk, meat, vegetables and fruits. Only changes in the activity concentration or time
variation in these foodstuffs may significantly influence the caesium intake to get a
better agreement with the whole body measurements.
To test these possible influences a code was written to calculate the body bur
den from varying activity concentrations or consumption rates of foodstuffs. With
this code the following credible changes and their effects on the 137Cs body content
were evaluated (see Fig. 4):
(1) Each raw milk tank was measured and the dairies told to use the lowest activity
milk for consumer milk and the rest for cheese or butter production. A
decrease in average milk activity concentration by 70% is assumed to be due
to that effect;
(2) Bias effects in meat samples owing to control of intervention levels (25%
reduction in beef, and in whey fed pigs, reduction to 20 Bq/kg);
(3) Bias effects in pork samples owing to control of the intervention level; con
sumption of cereals delayed by 5 months compared to assuming a consumption
beginning right after harvest;
(4) 20% reduced consumption rates due to waste (vegetables, fruits, meat, etc.),
activity reduction due to cooking effects and 50% activity reduction in cereal
due to grinding.
Each assumption decreases the 137Cs intake and thus the derived body content as
shown in Fig. 4. All the effects combined result in a curve which agrees within 20%
with the measured body content.
3 4 8 S TE G E R et al.
It could be demonstrated that discrepancies initially observed between the body
burden derived from foodstuff concentrations and that measured by whole body
counting were not caused by regional biases in intake. The large deviations of more
than a factor of 2 could be considerably reduced to below 2 0% by considering possi
ble effects on intake such as food sample bias, countermeasures with regard to con
sumer milk, delayed consumption of certain foodstuffs, and reduction factors caused
by production and food preparation.
It is not certain whether these assumptions are really applicable in that order
of magnitude, but as they are not unlikely, they may be used as possible explana
tions. This demonstrates that one should be careful with predicting ingestion doses
from food activity concentrations without allowing for various reduction factors in
the intake.
Assuming dose conversion factors given by ICRP Publication 30 [15], the dose
estimates of the caesium isotopes calculated by whole body counting are: 1986,
110 /¿Sv; 1987, 112 /¿Sv; 1988, 27 /¿Sv; and in the first half of 1989, 7 /iSv.
REFERENCES
[1] B O C K , H ., et a l., “ D er Reaktorunfall von Tschernobyl und seine radiologischen Fol-
gen für Ô sterreich” , paper presented at 13th IR P A Regional C ongress, Salzburg, 1986.
[2] S T E G E R , F ., “ Regional distribution o f internal contamination with cesium in Austria
as a result o f the Chernobyl accident” , paper presented at 14th IR P A Regional C on
gress, Innsbruck, 1987.
[3] S C H Ó N H O F E R , F ., et a l., Tschernobyl und die F olgen für Ô sterreich, Prelim inary
Report, M inistry o f Health and Environmental Protection, Vienna (1986).
[4] D O E R F E L , H .R ., Kernforschungszentrum Karlsruhe, personal comm unication, 1987.
[5] A N D R A S I, A . , Health Physics Department o f the Central Research Institute for
Physics, Budapest, personal comm unication, 1987.
[6] W E R N E R , E ., et a l., “ Com parative evaluation o f incorporated activity by four d iffer
ent w hole body counters” , Radiation Protection Practice, International Radiation Pro
tection A ssociation, Publication 7, V o l. 2, Pergam on Press, O xford and N ew Y o rk
(1988) 1 1 1 2 - 1 1 1 5 .
[7] H A V L IK , E ., et a l., “ The time course o f C s-13 7 in a normal group o f the Austrian
population after the Chernobyl accident” , M edical Physics (Proc. Annu. Scientific M tg
Innsbruck, 1987) (B E R G M A N N , H ., E d.), M edical A ssociation o f Radiation Protec
tion, Vienna (1987).
[8] O U V R A R D , R ., H O C H M A N N , R ., C esium -137 body burden in the region o f Vienna
after the C hernobyl accident, Radiat. Prot. D osim . 19 (1987) 15 1-15 8 .
[9] S T E G E R , F ., H E N R IC H , E ., Ergebnisse einer Ringvergleichsanalyse fiir
Gam m aspektrom eter in Ôsterreich — Volum squelle l3llC s und l37C s,
Rep. A -19 8 6 -Ô F Z S 4371 ST-140/86, Austrian Research Centre Seibersdorf (1986).
5 . C O N C L U S I O N S
IAEA-SM-306/6 3 4 9
[10] S T E G E R , F ., L O V R A N IC H , E ., H E N R IC H , E ., K A R G , V . , Ergebnisse einer Ring-
vergleichsanalyse für Gam m aspektrom eter in O sterreich, M olkepulver und Heu,
Rep. A -19 8 7-Ô F Z S 4472 ST-162/88, Austrian Research Centre Seibersdorf (1988).
[11] R O H R B Ó C K , G .J ., Ernáhrungsbilanz 1985/86, Stat. Nachrichten 42 2 (1987)
1 1 2 -1 1 9 .
[12] M Ü C K , K ., Abschatzung der Strahlenexposition der osterreichischen Bevôlkerung
nach dem Reaktorunfall von Tschernobyl, Rep. Ó FZS-4406, ST-147/87, Austrian
Research Centre Seibersdorf (1987).
[13] M Ü C K , K ., “ Contamination o f food in the first and second year after the Chernobyl
accident and its derived dose to the Austrian population” , paper presented at the Euro
pean Society o f N uclear M ethods in A gricu lture, 19th Annu. M tg Vienna, 1988.
[14] L A G O N I, H ., P A A K K O L A , O ., P E T E R S , K .H ., Untersuchungen tiber die quantita
tive Verteilung radioaktiver Fallout-Produkte in der M ilch , M ilchw issenschaft 18
(1963) 340-344.
[15] IN T E R N A T IO N A L C O M M IS SIO N O N R A D IO L O G IC A L P R O T E C T IO N , Report
o f Com m ittee 2 , Publication 30, Pergam on Press, O xford and N ew Y o rk (1978).
[16] V O N A C H , H ., S T E G E R , F ., Experim ental study o f cesium -137 in man, Radiat. Prot.
D osim . 19 (1987) 253-256.


P O S T E R P R E S E N T A T I O N S
IAEA-SM-ЗОб/ I44P
RADIOACTIVE IODINE CONCENTRATIONS
IN ELEMENTS OF THE ENVIRONMENT
AND EVALUATION OF EXPOSURE DOSES
TO THE THYROID AMONG INHABITANTS
OF K IEV AFTER THE CHERNOBYL ACCIDENT
I.A. LIKHTAREV, N.K. SHANDALA, A.E. ROMANENKO,
G.M. GUL’KO, I.A. KAJRO, V.S. REPIN
All-Union Scientific Centre for Radiation Medicine,
Kiev,
Union of Soviet Socialist Republics
P r e s e n t e d b y I . P . L o s ’
To evaluate the radiation situation in Kiev brought about by accidental releases
of radioactive iodine, we investigated the dynamics of iodine concentrations in the
atmosphere and in fallout, as well as in soils, plants and foodstuffs. Gamma spec
trometry was used to determine the specific activity of radioactive iodine in these
various elements of the environment. In all, more than 1000 samples were tested.
In addition, individual measurements of radioactive iodine in the thyroid glands of
Kiev inhabitants were carried out in May and June of 1986 (more than 3000 measure
ments in all).
Iodine-131 was found in all samples up to the first days of July 1986. The aver
age concentration in air as determined from filter activity during the time when the
radioactive plume track was taking shape (up to 10 May 1986) amounted to
7.4 Bq/m3. In the ten days following that date, radioiodine concentrations averaged
0.98 Bq/m3. Between 22 and 28 May 1986, radioiodine concentrations in the air
varied within the range of 0.28 to 0.003 Bq/m3. The process of contamination of
atmospheric air was described by a two component exponential curve with the fol
lowing characteristics: Т1й = 3.5 d, T2.¿ = 37 d; and TI = 4 d, Т2,л = 22 d for
atmospheric air and fallout, respectively. Curves of this form do at least reflect the
presence of two qualitatively different processes: a first period — the effective half
period for cleansing of the medium — and a second, ‘long lived’ component, involv
ing primarily a superposition of complex processes, which testifies to the existence
of some prolonged source of contamination.
35 1
3 5 2 PO S TE R P R E S E N T A T IO N S
Within the confines of the city of Kiev, the density of soil contamination by
l3lI in the period up to 20 May 1986 changed from 230 to 1420 kBq/m2 with an
average value of 640 ± 60 kBq/m2; from 21 May to 1 June, the average was
46 ± 8 kBq/m2. As time went on (indeed, from June onwards) 131I concentrations
in the soil fell to levels which were difficult to detect by gamma spectrometry. The
concentration of radioiodine in grasses during the period from 1 to 20 May varied
between 74 and 307 kBq/kg, with an average value of 179 ± 26 kBq/kg; from
21 May to 28 July the average was 11.7 + 3.3 kBq/kg.
The results for radioiodine in atmospheric air are beyond any doubt considera
bly too low owing to poor retention of the iodine fraction of the fission product mix
on fine fibre filters made of Petryanov tissue (type FPA-AFA). The retention coeffi
cient for these filters depends on the nature of the release, weather conditions and
other factors, and can vary from unity to fractions of 1 %. The 1311 retention coeffi
cient was assessed by us somewhat more rigorously at 0.9% on the basis of an analy
sis of thyroid exposure dose distributions — measured instrumentally — among the
inhabitants of the city.
Over a period of 25 days in May 1986, the inhabitants of Kiev consumed milk
with a radioiodine concentration averaging 1100 Bq/L. As time went on the concen
tration in milk fell off regularly to levels which were difficult to detect by the quick
monitoring methods used, namely to 37 Bq/L. It should be noted that in the first few
days following the accident, a temporary national norm (limit) of 3700 Bq/L was
introduced for 13'I concentrations in milk, and that on 6 May this standard was sup
plemented by temporary maximum permissible levels of radioiodine in drinking
water and other products. As a result of these measures there were virtually no cases
of members of the population consuming milk with radioiodine concentrations
greater than the established norm. Because leafy vegetables had such heavy surface
contamination, the inhabitants of Kiev were urged not to consume them.
The dose due to inhaled iodine was calculated on the basis of measured 1311
concentrations corrected for the retention coefficients of the filters used. It was
assumed that children had been subject to the effects of inhalation up to 20 May (i.e.
up to the time the organized evacuation was completed), and adults during the whole
of May and June (up to the time when recording of l31I concentrations in
atmospheric air was stopped, or until they left the region). The exposure dose to the
thyroid gland from radioiodine intake with foodstuffs was calculated on the basis of
measured iodine concentrations in food, with allowance for the length of time during
which the foods in question were consumed. The thyroid exposure dose due to inha
lation in children belonging to various age groups varied from 14 cGy (children
between 1 and 3 years) to 7 cGy (children between 12 and 15 years); for adults the
exposure was assessed at 5-6 cGy. The exposure dose to the thyroid in adults as a
result of oral intake of 131I was 0.54 cGy (80% of which was in milk), and in chil
dren above one year of age the figures varied from 5 cGy (1-3 years) to 1 cGy
(12-15 years).

PO S T E R P R E S E N T A T IO N S 3 5 3
For the inhabitants of Kiev, analysis of thyroid dose data based on direct meas
urements of radioiodine concentrations shows that in approximately 60-75 % of chil
dren the exposure dose did not exceed 0.5 cGy, whereas only in 60% of adults did
the dose not exceed 3 cGy.
If we analyse frequency distributions of the thyroid exposure doses as a func
tion of age, we find a superposition of two independent frequency distributions, each
of which, in turn, can be described by a log-normal distribution. This fact would
seem to reflect a situation that in each age group there are individuals who have used
preventive measures (intake of stable iodine compounds, limitations on outdoor
excursions and consumption of milk, etc.) and other individuals who have not
applied such measures. This being so, separate analysis of the two distributions can
help evaluate the actual efficiency of the anti-iodine measures used to protect the
population. There is also the possibility of comparing the ‘inhalation’ component of
the measured thyroid doses received by city inhabitants having a low level of protec
tion against radioiodine with that component calculated on the basis of measured
radioiodine concentrations in atmospheric air (assuming 100% retention of radioio
dine by the aspiration filters). Such a comparison could assess the retention coeffi
cients of the filters for this particular radionuclide. On the basis of these data, a mean
weighted coefficient (weighted for the size of the different groups) of 0.9% was
obtained.
On the basis of the above data, the following conclusions can be drawn:
(1) Among the inhabitants of Kiev were found, clearly delineated, two behaviour
patterns and accordingly two groups which are well described with the aid of
a log-normal frequency distribution: one with a high level and one with a low
level of protection against radioactive iodine.
(2) Effectiveness of the prophylactic and protective measures applied was excep
tionally high, particularly among children, where it reached as much as 99%.
(3) The radioiodine retention coefficient of the filters used averaged less than 1 %.

3 5 4 PO S TE R P R E S E N T A T IO N S
HUMAN RADIOCAESIUM LEVELS
IN THE STRATHCLYDE REGION OF SCOTLAND
FOLLOW ING THE CHERNOBYL ACCIDENT
W.S. WATSON
Department of Clinical Physics and Bio-engineering,
Southern General Hospital,
Glasgow,
United Kingdom
Following the nuclear accident at Chernobyl in April 1986, whole body
counting techniques were used from 55 to 910 d after the accident to provide serial
measurements of whole body 134Cs and 137Cs in 18 healthy adults (13 male,
5 female) living in the Strathclyde region of Scotland [1, 2]. In addition, the variation
of human radiocaesium levels with time has been predicted using the time variation
of reported radiocaesium activities in food products.
The radiocaesium activities in milk (Bq/L) and lamb meat (Bq/kg) were
assayed by the National Radiological Protection Board (NRPB). The milk was
provided by a distributor supplying approximately 30% of the region’s milk. Activity
data up to 560 d after Chernobyl were fitted to a multicomponent mathematical
function of time. The NRPB estimate for adult milk consumption of 0.41 L/d was
assumed [3].
The radiocaesium activities in lamb meat were measured in randomly selected
carcasses from slaughterhouses throughout Scotland. The activities up to 500 d after
the accident were weighted according to the number of lambs slaughtered per region
and then expressed as a double exponential function of time. Consumption of lamb
meat in Scotland is significantly lower than the average for the United Kingdom;
therefore, the NRPB estimate for UK consumption of 19 g/d was reduced to 7.4 g/d
using information supplied by the Meat and Livestock Commission of Scotland.
The activity-time functions for milk and lamb meat, together with estimates
of daily consumption, were used to calculate the milk and lamb meat radiocaesium
activity ingested daily as a function of time after Chernobyl. This information was
used as the input to a single pool computer model of human caesium metabolism,
assuming 80% absorption and a biological half-life of 110 d [4]. Using this model,
we were able to predict the time variation of activity in the single pool, i.e. the body.
Figure 1 shows the measured and predicted human 137Cs values. The whole
body activities are expressed relative to the total body potassium values. The reason
for this is that caesium concentrates in lean tissue; therefore, dividing the radio
caesium activities by a measure of lean body mass, such as total body potassium,
reduces the effect of body size and composition on the radiocaesium results.
IAEA-SM-306/30P

P O S T E R P R E S E N T A T IO N S 3 5 5
From Fig. 1 it can be seen that the l37Cs levels rose over 100 d after
Chernobyl to a plateau which extended to about 350 d before reducing consistently
to 900 d. The theoretical curves for milk intake alone and also for milk plus lamb
meat intake showed the same variation with time, but were not sufficient in
magnitude to fit the experimental data. Using a milk-only model, we varied the
theoretical milk consumption until the model predictions fitted the experimental data.
This occurred for an equivalent milk intake of 0.58 L/d, i.e. if all the radiocaesium
contamination came from milk, then adults would need to consume 0.58 L/d rather
than the 0.41 L/d predicted from dietary considerations. This implies that 70%
(100 X 0.41/0.58) of the radiocaesium absorbed comes from milk consumption. It
can also be shown that only about 1 0% comes from lamb meat consumption.
Figure 1 shows the results for 137Cs levels only; however, similar predictions
for l34Cs contamination based on an equivalent milk intake of 0.58 L/d were in
excellent agreement with the measured values obtained by whole body counting.
This meant that for both l34Cs and 137Cs, the activity-time integral of the theo
retical curve for 0.58 L/d milk intake could be used to calculate the radiation dose
due to radiocaesium contamination in adults. The expected radiation dose in children
(10 years old) and infants (1 year old) could also be predicted on the basis of
expected milk consumption and biological half-lives for caesium in children [3, 4].
Days post-Chernobyl
FIG. 1. Post-Chernobyl human 137Cs levels in the Strathclyde region of Scotland; ( о is
the mean of measured values; error bars are + 1 standard error in the mean;
-------------- indicates model predictions (dashed section is an extrapolation beyond the timefor which food activities were generally available)).

3 5 6 PO S T E R P R E S E N T A T IO N S
The average radiation dose from radiocaesium in adults in the first two years after
Chernobyl was 40 /¿Sv; the child’s dose was similar, while the infant’s dose was
50 /¿Sv. These doses are less than 2% of the expected dose due to natural background
radiation over two years. Individuals with a high intake of milk and lamb meat could
have experienced doses up to ten times the average values.
ACKNOWLEDGEMENT
The assistance of the staff of the Nuclear Medicine Department and also the
help of D. Smith of the NRPB (Scottish Centre) is gratefully acknowledged.
REFERENCES
[1] W A T S O N , W .S ., Human l34C s / '37C s levels in Scotland after Chernobyl, Nature
(London) 323 (1986) 763-764.
[2] W A T S O N , W .S ., “ Human radiocaesium levels in Scotland” , T race Substances in
Environm ental H ealth-XXI (Proc. C on f. St. Louis, 1987), U niversity o f M issouri,
Colum bia (1988) 232-236.
[3] H A R R IS O N , D .T ., S IM M O N D S , J .R ., D osim etric Quantities and Basic Data for the
Evaluation o f Generalised D erived Lim its, Rep. N R P B -D L 3 , National Radiological
Protection Board, Chilton, U K (1980).
[4] K E N D A L L , G .M ., et a l., Com m itted Doses to Selected O rgans and Com mitted
E ffective D oses from Intakes o f Radionuclides, Rep. N R P B -G S 7, National Radio
logical Protection Board, Chilton, U K (1987).

P O S T E R P R E S E N T A T IO N S 3 5 7
CHERNOBYL RADIOCAESIUM
IN THE SCOTTISH POPULATION
AND ITS RELATIONSHIP
TO PREDICTED VALUES
B.W. EAST, I. ROBERTSON
Scottish Universities Research and Reactor Centre,
East Kilbride, Glasgow,
United Kingdom
P r e s e n t e d b y M . S . B a x t e r
IAEA-SM-306/59P
The reactor accident at Chernobyl in April 1986 gave rise to fallout over the
United Kingdom, including areas of Scotland, and resulted in radioactive materials
entering the food chain. The activation product 134Cs and the fission product 137Cs
were measured in vivo in a high sensitivity whole body monitoring survey of mem
bers of the Scottish population between May 1986 and February 1988 [1]. Some 250
men, women and children were examined, in many cases sequentially, thereby
enabling a picture of the magnitude of uptake, progressive increase, equilibrium and
decrease of body radiocaesium levels to be generated. A maximum mean value of
approximately 800 Bq (137Cs plus 134Cs) was observed eight months following the
accident; thereafter body radiocaesium levels declined, with 137Cs exhibiting a half-
life in vivo of approximately 267 days.
For 80% of the population, 137Cs levels varied by a factor of 4 between upper
and lower boundaries. On the basis of the observed temporal pattern of uptake, the
total doses due to radiocaesium were as shown in Table I.
Further objectives of the survey were to assess the influence of age and sex
as well as geographical location of residence and diet on radiocaesium uptake. Age
and sex appeared to have no influence, while there were clear indications that body
levels were higher in the western and southwestern and in the northern and north
eastern regions of the country where deposition of fallout was known to be higher.
Although these increases were generally small, it was evident that the intensity of
fallout in a given region had a direct effect on the uptake of radiocaesium by inhabi
tants of that area. Fresh milk consumption was an influencing factor on uptake, and
in the initial four months after the accident, individuals who avoided fresh milk had
lower radiocaesium but their levels became indistinguishable from the rest of the
population by September 1986. After this initial observation, no clear numerical
differences between the quantity of milk consumed and the body radiocaesium level

3 5 8 P O S T E R P R E S E N T A T IO N S
TABLE I. TOTAL DOSES RESULTING FROM
RADIOCAESIUM
PeriodD ose equivalent
(MSv)
L ow er population boundary 13
1st year after Chernobyl M ean 31
Upper population boundary 50
L o w er population boundary 9
2nd year after Chernobyl M ean 20
U pper population boundary 34
L o w er population boundary 26
Estimated committed dose M ean 62
Upper population boundary 102
could be discerned. Meat consumption was also an influencing factor because veni
son and goat meat consumption gave rise to the highest body levels observed.
However, individuals with this type of diet formed only a small group of all those
examined. For those who consumed more commonly available meats, no definite
numerical relationship emerged. There was a suggestion from the data that vegetar
ians had lower body radiocaesium levels in comparison with omnivores.
A significant finding of the survey was that although the sample size in relation
to the total population of the country was small, it was possible nonetheless to detect
the influence of geographical location on radiocaesium uptake despite the averaging
effects of national food production and distribution. Also, the acquisition of the data
set for the Scottish population has enabled, in addition to the direct assessment of
radiation doses, comparisons to be made with various methods of prediction.
REFERENCE
[1] E A S T , B .W ., R O B E R T S O N , I ., M easurement o f Radioactivity from Chernobyl in
Population G roups in Scotland, Rep. D O E/RW /88.103, Department o f the Environ
ment, London (1989).

PO S T E R P R E S E N T A T IO N S 3 5 9
W HOLE BODY RADIOCAESIUM CONTENT
IN HUNGARIAN INDIVIDUALS
AFTER THE CHERNOBYL ACCIDENT
M o d e l l i n g a n d m e a s u r e m e n t s
A. KEREKES*, G. ANDRÁSI*, N. FÜLÓP*, B. KANYÁR*,
E. KELEMEN**, L. KOVÁCS*, L.B. SZTANYIK*
Frédéric Joliot-Curie National Research Institute
for Radiobiology and Radiohygiene
Public Health and Epidemiological Station of County Pest
Budapest, Hungary
IAEA-SM-306/76P
The time dependent whole body content of 137Cs after the Chernobyl accident
was both assessed by the use of a compartment model from various intakes of con
taminated food and measured by a whole body counter.
The main pathway of internal contamination in Hungary was the consumption
of milk, cereals, meat and vegetables. In the first period after the accident, leafy
vegetables and milk played the most important role. In June and July of 1986, con
taminated beef was the primary source of intake. Owing to the increase in l37Cs
concentration in milk at the end of 1986 and the beginning of 1987, the major compo
nent of the radiocaesium intake again became milk. Bread and cakes, produced
mostly from winter wheat in Hungary, contributed significantly to the intake from
September of 1986 and this contribution lasted about one year [1].
Whole body measurements were performed on individuals of different age and
sex groups recruited in Budapest and its surroundings. After the accident this region
was one of the most contaminated parts of Hungary [2]. According to Fig. 1, the
maximum body contents of 137Cs were observed in the middle of 1987. In Fig. 1
the measurements are omitted which gave results below the detection limit, i.e.
350 Bq for 137Cs. During the above period, the average 137Cs body activity in men
was 1150 Bq and in women 800 Bq for the whole region. In Budapest these values
were slightly higher, 1400 Bq and 900 Bq for men and women, respectively. The
environmental biological half-life was found to be in the range of 90-150 days for
the different groups.
Model calculations based on the 137Cs concentrations in and consumption
rates of different foodstuffs resulted in the time dependent body activity curves
shown in Fig. 1. The maximum value of the body content agrees with the well

3 6 0 PO S TE R P R E S E N T A T IO N S
TIME FROM THE ACCIDENT (weeks)
FIG. 1. Whole body content of ,37Cs in men and women in the region of Budapest; meas
ured (■ (men) and + (women)) and predicted (— (men) and — (women)).
TABLE I. AVERAGE COMMITTED EFFECTIVE DOSE EQUIVALENTS
(ftSv) CALCULATED FROM THE BODY CONTENT OF RADIOCAESIUM IN
CITIZENS OF BUDAPEST
Nuclide Men Women Adolescents
Cs-134 32 26 27
Cs-137 43 37 43
accepted whole body measurements, but the maximum is overestimated by about
40% for men and 15% for women, owing mainly to the uncertainties of the consump
tion rates.
The committed effective dose equivalents assessed from the measured whole
body contents in Budapest are given in Table I.

PO S T E R P R E S E N T A T IO N S 3 6 1
REFERENCES
[1] K E R E K E S , A . , et a l., “ Contributions o f exposure pathways to the internal dose in
Hungary from the Chernobyl accident” , paper presented at 21st European Society o f
Radiation B iolo gy Annual M tg, T el A v iv , 1988.
[2] S Z T A N Y IK , L .B ., K A N Y Á R , B ., K Ô T E L E S , G .J ., N IK L , I ., S T Ú R , D ., “ Radio
logical impact o f the reactor accident at C hernobyl on the Hungarian population” ,
paper presented at 7th Int. C on gr. o f International Radiation Protection A ssociation,
Sydney, 1988.
IAEA-SM-306/98P
DYNAMICS OF RADIOACTIVE CONTAMINATION
IN FOOD IN BULGARIA AFTER 1 M AY 1986
Z. HINKOVSKI, V. MARINOV, M. DZOREVA
Academy of Agriculture,
Committee on the Use of Atomic Energy
for Peaceful Purposes,
Sofia, Bulgaria
Unusual radioactive contamination arose as a result of the Chernobyl accident.
The meteorological conditions at the time of the accident determined the rapid entry
of this contamination into a large region. Subsequently the radiation level in Bulgaria
increased sharply. The first gamma spectrometry measurements that were taken
showed that this increase was due to aerosol or evaporated products of fission and
activation from the damaged reactor core.
Analysis of the quantitative ratios of the different radionuclides present in the
main foodstuffs showed both the radioactive contaminant specificity and the radio
logically favourable lower level of some of the radionuclides.
It was found that foodstuffs made mainly from animal products were the most
permanently radioactive. For this reason radiation monitoring was carried out on
representative samples of foodstuffs made from vegetable and animal products pre
pared from the population stock fund and on products from the country’s export list.
The samples were taken and supplied for analyses by the State Veterinary-Sanitary
Control. The samples were then subjected to spectroscopic analyses at the laborato
ries of the Academy of Agriculture for quantitative determination of gamma emitting
technogenic radionuclides (a total of 45 026 analyses for the period from May 1986
to December 1987); part of these (920) were subjected to radiochemical analyses for
determination of 89Sr and 90Sr contents.

3 6 2 PO S T E R P R E S E N T A T IO N S
FIG. 1. Monthly activity of ,34Cs and I37Cs in cow milk (1986-1987) in (a) north Bulgaria
and (b)% south Bulgaria.
South Bulgaria
(b)
56 7 8 91011121 2 3 4 5 6 7 8 91011 month1 »
5 6 7 8 91011121 2 3 4 5 6 7 8 91011 month
1986 1987 1986 1987
FIG. 2. Content of Cs and Cs in lamb meat in (a) north Bulgaria and (b) south
Bulgaria from May 1986 through November 1987.

P O S T E R P R E S E N T A T IO N S 3 6 3
,34Cs and 137Cs / 90SrFIG. 3. Percentage of decontamination in foodstuffs measured before and after the
Chernobyl accident; numbers 1-19 refer to foodstuff origins and processing techniques:
Before Chernobyl: 1 — intake; 2 — secretion in milk and meat; 3 — zeolite processing of milk; 4 — milk turning into cheese at increased acidity; 5 — normal
technology of pork processing; 6 — short term processing of sausages; 7 — tinned pork and veal; 8 — surface contaminated meat; 9 — tinned vegetables, grapes in wine, sugar beet in
sugar.
During the radiation situation: 10 —fed with purer fodder; 11 — intake decrease by
zeolite; 12 — milk turning into cheese at increased acidity for white brined cheese production;
13 — meat for direct consumption; 14 — raw smoked meat products; 15 — tinned meat production; 16 — homemade meat; 17 — short term processing of sausages; 18 — processing of veal; 19 — use of whiter flour.
180160140120
~ 1°0 m ~ 80
604020
1 - Workers2 - Farmers
3 - Salaried staff4 - Average Bulgarian
A - Mean value В - Max. value
A B A B A B A B A B A B A B A B A B A B A B A B A B A B A B A B 1 2 3 4 1 2 3 4 1 2 3 4 1 2 3 4North Bulgaria Sofia Southwest Southeast
Bulgaria BulgariaFIG. 4. Intake of 137Cs among different population groups in Bulgaria from 1 May 1986 to
30 April 1987.

3 6 4 PO S TE R P R E S E N T A T IO N S
Thus a quantitative evaluation of the separate radionuclide contents in plants,
animals and their products was made in an area cross-section as a function of time.
Also a database was created for analysis of the consequences in Bulgaria of the Cher
nobyl accident. Some of the main data from this study are presented here.
Variations in the dynamics and levels of contamination have shown: (1) great
irregularities in two regions: north Bulgaria and south Bulgaria, which differ fre
quently in contamination levels; (2) a rapid fading away of the contamination during
the first post-accident phase (May-July 1986); and (3) a secondary radioactive con
tamination presence at the beginning of 1987 (Figs 1 and 2).
Since the main contribution to the exposure was internal radiation resulting
from the intake of artificial radionuclides by ingestion, as of 5 May 1986 temporary
exposure levels were established for some nuclides ( 131I, 134Cs and 137Cs) in the
main foodstuffs.
In order to use the restricted agricultural products, some methods and facilities
for decontamination were proposed. The decontamination levels achieved depended
upon the origins of the foodstuffs and on the technological processing techniques:
for 137Cs from 21 to 98%, average 60.3 + 16.4%; for 90Sr from 15 to 90%,
average 44.2 ± 12.6% (Fig. 3).
The maximum intake of 137Cs through foodstuffs among different population
groups (Fig. 4) was computed in order to evaluate the effects of the established
exposure levels and the intake decrease resulting from the radiation protection coun
termeasures. For the ‘average’ Bulgarian the actual and the expected intakes in the
first year coincided. The proposed countermeasures led to an intake decrease of up
to 75% through milk, meat and their products.
Regarding the 137Cs soil contamination level, Bulgaria was the eighth among
the countries of the affected region. However, regarding the 137Cs factor in milk,
meat and wheat, Bulgaria’s levels were 1.3-8.0 times greater than the levels in the
Federal Republic of Germany, the German Democratic Republic, Austria, Hungary
and Greece because early in May the crops used for fodder in Bulgaria had already
grown and rains deposited substantial amounts of radionuclides on these plant
materials.
This gives some explanation concerning the United Nations Scientific Commit
tee on the Effects of Atomic Radiation data about the position of Bulgaria in regard
to the effective equivalent dose from 131I and 137Cs.

Part VI
R A D I O N U C L I D E S A N D
I N T E R N A T I O N A L T R A D E
IN F O O D

IA E A -S M -ЗОб/123
Invited Paper
C H E R N O B Y L P O S T S C R I P T
R i s k m a n a g e m e n t i n t h e g l o b a l v i l l a g e
R.W. GILL
Bureau of Foods,
Food and Drug Administration,
Washington, D.C.,
United States of America
Abstract
C H E R N O B Y L P O ST SC R IP T : R ISK M A N A G E M E N T IN T H E G L O B A L V IL L A G E .
A description o f the grow ing environmental concerns o f today is presented and
considered in relation to the risk associated with an accidental release o f radioactivity as
experienced in Chernobyl. The need for international agreements on em ergency response
planning protocols and continued w ork on developm ent o f international agreements in the area
o f radiation monitoring and sam pling, as w ell as exem ption levels for contamination o f food,
air and water are also presented. A discussion o f the need for integrated policy form ulation
for energy, agriculture and other m ajor econom ic sectors to take into account the ecological
implications o f such policies is also included.
1. HISTORICAL PERSPECTIVE
In keeping with the Symposium theme of World Food Day, it is important to
put these proceedings in historical perspective because current events make this a
time of both interesting change and challenge for all of us. The information age has
altered the calculus by which state economies, state governments and social policy
are formed. Our generation is the first one to have seen planet Earth from outer
space, and this feat has served to galvanize our concept of the Earth as a global vil
lage. We are beginning to recognize that we live in a small, closed ecological system
where each of us is highly dependent on the actions or non-actions of his neighbours.
There is also a growing cognizance that this closed system puts finite limits (ecologi
cal imperatives) on the activities of those who occupy this planet.
Orbiting satellites provide us with continuous information about man’s activi
ties and the effects they are having on land, sea and air. The rate of change created
by man’s activities is unprecedented and should force policy makers worldwide to
take into account a whole host of factors that may have been previously thought to
be unrelated.
3 6 7

3 6 8 G IL L
In the past 300 years, agriculture and industrial development have doubled the
amount of methane in the atmosphere and have increased the concentration of carbon
dioxide by 25 per cent. In the last 150 years, nine million square kilometres have
been converted into permanent cropland. Energy use in the same period has risen
by a factor of 80, with profound consequences for the planet’s chemical flows of
carbon, sulphur and nitrogen. During the past decade, methane levels in the
atmosphere have been growing at the rate of about one per cent per year. Increases
in the number of domestic animals bred and the number of acres of rice cultivated
must be included with the six million square kilometres of forest lost since the begin
ning of the eighteenth century in order to calculate the potential atmospheric change
in heat retention and new models for climatology. (It has been noted at this Sympo
sium, for example, that the C02 accumulation in the atmosphere would be eight
per cent higher if the current energy produced by nuclear power were derived from
coal.)
2. ENVIRONMENTAL ISSUES
The increasingly evident effects of the ongoing atmospheric changes including
acid rain, urban smog, thinning of the stratospheric ozone shield and the buildup of
greenhouse gases that may produce global warming have all been discussed repeat
edly in the media. As a result the level of environmental concern has risen to its
highest level in our collective history. It is also apparent that our collective response
to these environmental issues will have a significant impact on the quality of life on
this planet.
Many believe that today we stand at an important crossroads where our choices
will alter profoundly for better or worse the chances for achievement of a sustainable
world. A former Administrator of the United States Environmental Protection
Agency, William Ruckelshaus, characterizes our situation with an analogy to shoot
ing the rapids in a canoe. The first and most important realization that we can take
from such an analogy is that we are all in the same canoe. Next, there are many
decisions to be made which involve integrated energy, agronomic and economic
policies that take into account the ecological imperatives prescribed for living in this
global village.
3. LESSONS LEARNED FROM CHERNOBYL
The tragic reactor accident at Chernobyl served perhaps like no other event to
drive home the fact that Earth truly is but a global village. As has been described
at this Symposium, the entire Northern Hemisphere was put on alert and interna
tional trade in food and feedingstuffs was disrupted severely for a period of several

IAEA-SM -306/123 3 6 9
months. This accident also served to demonstrate that governments worldwide were
unprepared for such an event, whether it originated in the Soviet Union or any other
country, and that the international infrastructure was not fully utilized. Hopefully,
through exchanges that this Symposium and others have brought about, governments
will be in better positions to manage the risks associated with a major release of
nuclear material should another accident occur, and will be able to lessen the impact
on trade between the various countries.
The International Atomic Energy Agency (IAEA) should be commended for
the decisive action it took in response to this accident. The international agreements
that were signed immediately after Chernobyl on assistance and prompt notification
in the event of a transboundary release of radioactive material were important first
steps in establishing risk management protocols for the future. I believe that addi
tional international agreements are necessary in the area of uniform methodologies
and standards, as well as common regulatory levels for radionuclides contaminating
food and feed, air and water because not all countries currently have intervention
levels established for dealing with emergencies of this type. As was mentioned in
the opening remarks of this Symposium, the Joint FAO/IAEA Division of Nuclear
Techniques in Food and Agriculture has developed a radiation control training
programme and the IAEA is working on a lending library of radionuclide standards
in various foodstuffs. These actions are also to be encouraged.
As was evident from the reporting of the Chernobyl event and from the range
of professional backgrounds of the attendees of this Symposium, there is a range of
disciplines needed to manage properly the risk associated with a major nuclear
accident. The common goal, of course, is to minimize exposure to any population
that might be affected by the accident. To do this properly, input from experts in
nuclear reactor materials, radiation physics, hydrology, climatology, radiation
biology, food science and many other areas is needed. Just a quick look at the titles
of the many technical papers presented at this Symposium is sufficient to prove the
point.
One of the lessons that we learned from the Chernobyl experience is that emer
gency response plans are needed at the international level. Such plans must be able
to direct all of the information generated by the responsible authorities to a central
authority which, in turn, will share this information as quickly as possible with other
organizations which have a role to play in managing the immediate risk from an acci
dent. The flow of information should not be restricted by national boundaries or par
ticular scientific disciplines.
Another lesson that was learned is that there is a real difference between inter
vention measures taken immediately after an accident in the immediate vicinity of
the contamination and the control of risk from exposure through the ingestion path
way in the long term. Intervention measures taken to minimize exposure from the
ingestion pathway in the short term were quite different from those required in the
regulatory control of foods and feedingstuffs in the long term. The agricultural food

3 7 0 G IL L
production system is not a static one and traditional intervention measures soon
become impractical. After the parameters of the accident are fixed, foods will move
further both in time and place from the initial conditions; therefore, the focus should
change from preventive intervention measures to normal regulatory control of
contaminants in foods moving in international trade. A number of international
organizations have explored these differences in trying to establish international
agreement on a long term approach to controlling contamination of food and feeding
stuffs. Agreements reached in the Codex Alimentarius in July 1989 should be widely
accepted by Codex member countries.
Several governments undertook intervention measures immediately following
the accident, but chose to regulate contamination of food and feedingstuffs in the
long term as they would any other contaminant of food, by setting regulatory limits
or adopting international recommendations. In essence they established food con
tamination levels that determined whether they accepted or rejected the food offered
for sale in commerce. Many countries have such regulatory limits for a host of other
common food contaminants such as mercury, aflatoxin and lead.
There are probably a good many other lessons learned as a result of the
accident but I will leave those to be elaborated on by the other presenters of papers.
What I hope is that the papers will focus on the very positive information that was
derived from this tragic accident and how investigations prompted by this accident
have contributed to our science base in a number of disciplines. Such positive contri
butions will provide us with a stronger arsenal to cope with the risks from another
nuclear accident should it occur. Even if another accident does not occur, the cross
fertilization usually associated with this kind of multidisciplinary exchange should
have positive benefits in other areas.
If there is a next accident, however, there will surely be a number of differ
ences that distinguish it from the last one. The long term trends in business mean
a higher volume of goods will be exchanged in international trade and those goods
will travel over greater distances.
Future developments in technology may add to our combative arsenal, but if
anything the world will be even a smaller place and our need to work in a
co-operative spirit on this and other issues will be even greater.

IA E A -S M -306 /19
R O L E O F T H E U N I T E D S T A T E S
F O O D S A F E T Y A N D I N S P E C T I O N S E R V I C E
A F T E R T H E C H E R N O B Y L A C C I D E N T
R.E. E N G E L
Food Safety and Inspection Service
V. R A N D E C K E R , W. J O H N S O N
Food Safety and Inspection Service/Science
United States Department of Agriculture,
Washington, D.C.,
United States of America
Abstract
ROLE OF THE UNITED STATES FOOD SAFETY AND INSPECTION SERVICE AFTER THE CHERNOBYL ACCIDENT.
The Food Safety and Inspection Service (FSIS) of the United States Department of Agriculture inspects domestic and imported meat and poultry food products to assure the public that these foods are safe, wholesome, properly labelled and not adulterated. After the Chernobyl accident, the FSIS implemented a monitoring programme to assess the accident’s impact on imported meat and poultry. By using the information on the nature of the accident as it became available, the FSIS decided to monitor only five nuclides: 134Cs, l37Cs, 89Sr, 90Sr and l3lI. On 16 May 1986, the FSIS established intervention levels of 2775 Bq/kg for total caesium ( l34Cs plus l37Cs) and 56 Bq/kg for mI. By October of 1986, 815 samples from 14 European countries had been analysed, with approximately 45 per cent of the caesium results exceeding background levels. Meat samples from five countries had levels of total caesium greater than 37 Bq/kg. When the monitoring programme ended in October 1988, 3702 samples out of 6195 exceeded the background. Nine countries had meat samples with levels above 37 Bq/kg. Iodine and strontium results were practically not distinguishable from background radiation levels. The initial intervention level of 2775 Bq/kg for total caesium was reduced to 370 Bq/kg for total caesium to agree with the US regulatory response levels for all food items. After the Chernobyl accident, the FSIS took the following actions: (1) set a realistic standard using US proposed protective action guidelines; (2) calculated the intervention levels by using both the maximum intake of radionuclide activity allowed and food consumption data; (3) monitored, sampled and tested imported meat and poultry products for five nuclides; (4) periodically assessed and revised the intervention levels based on good public health practices; (5) continued to evaluate and assess the ongoing regulatory activities.
3 7 1

3 7 2 E N G E L e t a l.
1. US M E A T A N D P O U L T R Y INSPECTION
The Food Safety and Inspection Service (FSIS) of the United States Depart
ment of Agriculture inspects domestic and imported meat and poultry and their
products to assure the public that these foods are safe, wholesome, not adulterated
and properly labelled. The FSIS, as part of its National Residue Program, collects
samples of meat and poultry at slaughtering establishments under its inspection
authority and from import shipments at ports of entry. The samples are analysed for
the presence of unacceptable residue concentrations of pesticides, animal drugs and
other potentially hazardous chemicals including radionuclides that may contaminate
meat and poultry. Testing of meat and meat products imported into the United States
of America is a means of verifying the effectiveness both of an exporting country’s
residue control programme and of the programme review process maintained by the
FSIS. It is a final assurance that an exporting country’s products meet the same
standard applied to products produced in the USA. When test results indicate a
violative concentration of residues in an imported product, subsequent shipments of
the same product group from the establishment are retained at the port of entry until
laboratory results are known. If results are negative, the suspect product is permitted
to move into commerce; if positive, the suspect product is not permitted to move into
commerce. All shipments of the product from that country are placed on an increased
testing schedule until a record of compliance is re-established for the country.
Similar principles are followed in collecting samples for the domestic and foreign
testing programmes. Compounds selected for residue testing in one programme
closely parallel those chosen for the other. The FSIS also monitors the activities of
meat and poultry plants and related activities in allied industries, and establishes
standards and approves labels for meat and poultry products.
2. C H E R N O B Y L A C C I D E N T
The events leading to the accident at the Chernobyl plant began on Friday
morning, 25 April 1986, entered a stage of crisis with an explosion at 1:23 a.m. on
26 April, and over the subsequent week to 10 days released the largest quantity of
radioactive material ever released in one technological accident [1]. The distribution
of radioactive materials from Chernobyl occurred in the following manner [2]:
— After 2 days the lower level particles (surface to 1.5 km) moved towards
Scandinavia.
— After 4 days the lower level cloud was still over Scandinavia with parts moving
into western Europe. A mid-level cloud (1.5-4.5 km) was moving towards the
Middle East and an upper level (4.5-8 km) cloud was moving towards Siberia.
— After 6 days the upper level cloud was approaching Japan.
— After 10 days part of the upper level cloud was over the USA.

IAEA -S M -306 /19 3 7 3
3. SETTING O F T H E INITIAL I N T ERVENTION L E V E L
After the accident at Chernobyl, the FSIS realized that the release of radio
active substances into the European environment would probably affect the
importation of meat and poultry products into the U S A from these areas. Thus, the
FSIS and the Food and Drug Administration (FDA) met to establish intervention
levels for food, because derived intervention levels (DILs) for meat and poultry in
the U S A had never been officially adopted. The FSIS DILs for meat and poultry
were established by using the F D A ’s document, “Accidental Radioactive Contami
nation of Human Food and Animal Feeds: Recommendations for State and Local
Agencies” [3]. At that time, the FSIS and the F D A agreed that meat and poultry
could be separated from food items under the F D A ’s regulatory control with respect
to potential food contamination from radioactive fallout. Meat and poultry composed
a readily discernible and easily segregated subset of all food items. The radionuclide
intervention levels that were established were based on a 5 mSv projected dose com
mitment to the whole body, bone marrow or to any organ other than the thyroid.
This intervention level was based, in part, upon the expectation that the major
contributors of radiation to imported meat and poultry will be 134Cs (half-life of
2.1 a) and 137Cs (half-life of 30 a). In addition, it was not expected that 131I (half-
life of 8 d) would contribute radioactive levels of any practical concern. The
calculation of the intervention level took into consideration the total intake of activity
from radionuclides and the average daily consumption of meat and poultry. In
calculating this response level, the FSIS used data for US consumption of meat and
poultry, which represented 13 per cent of total food intake. Other DILs, such as the
ones developed by the World Health Organization (WHO), use the total average
daily consumption of all foods [4]. This information was not available to the FSIS
at the time of the accident. On 16 May 1986, the FSIS officially set a total caesium
(134Cs plus 137Cs) intervention level of 2775 Bq/kg and 56 Bq/kg of l3,I for meat
and poultry.
4. C O L L E C T I O N A N D A N A L Y S E S O F S A M P L E S
Immediately after the Chernobyl accident, the FSIS reviewed the available
radionuclide levels in air, water and milk in the USA. On the basis of these data,
the monitoring of domestically raised and processed meat and poultry was not neces
sary. However, similar environmental data from Europe strongly suggested that the
U S A should check the European imported products.
On 28 May 1986, the FSIS started collecting samples and performing
laboratory analyses on imported products. Fourteen European countries exporting
meat and poultry to the U S A were monitored. The sample selection criteria included
the results of scintillation survey instruments used by FSIS inspectors at the
374 E N G E L e t a l.
following ports of entry: N ew York City, New York (two instruments); Baltimore,
Maryland; Charleston, South Carolina; San Juan, Puerto Rico; Houston, Texas; and
Long Beach, California. Almost all of the imported European products came through
these locations. Samples were collected for laboratory analyses if a scintillation
survey instrument reading were greater than two times background.
In addition to the use of the survey meters, FSIS inspectors collected samples
when instructions were issued by the FSIS Automated Import Information System.
This decision support system provides a means of allocating inspections in a
consistent manner based on foreign plant compliance histories, and distributes
inspection assignments (based on up to the minute information) to inspectors for all
imported meat and poultry products offered for entry into the USA. Initially, the
following five radionuclides were measured in the laboratory: 134Cs, 137Cs, 89Sr,
90Sr and I31I.
5. R E - E V A L U A T I O N O F T H E INTERV E N T I O N L E V E L
By October of 1986, 366 of 815 samples exceeded background levels for total
caesium. Iodine and strontium results were practically not distinguishable from
background radiation levels. However, only five countries had any samples with
results greater than 37 Bq/kg for total.caesium: Belgium, Hungary, Poland, Romania
and Sweden. Only Romania had values greater than 185 Bq/kg, with the highest
reading of 794 Bq/kg. The sample data collected and information on agricultural
practices in the exporting countries indicated that the occurrence of two caesium
radionuclides in meat and poultry might continue for an extended period. Six months
following the release of radioactivity, FSIS determined that the intervention level of
2775 Bq/kg needed to be reassessed.
The F D A 1982 guidelines are for short term protective actions in an accident
resulting in radioactive contamination of human food or animal feeds, and not for
long term, continuous exposure applications [3]. The guidelines state that the
duration of the recommended protective actions should not exceed 1 or 2 months.
However, evaluating the public health consequences of food contamination, even on
a preliminary basis, requires a period of some length following the accident to assess
or reassess all the available pertinent information. These protective action guides
consider the types of contamination which might occur after such an event, the
half-lives of resulting radioactive substances, and the biological pathways for human
exposure.
The FSIS initial intervention level of 2775 Bq/kg for total caesium was
established at one tenth of the F D A ’s emergency Protective Action Guides (PAGs)
[3]. In specific situations, and where justified, projected doses lower than the PAGs
can be established. Another important consideration in establishing the FSIS
intervention level was that the F D A guidelines did not consider perceived risks in

IAEA -S M -306 /19 3 7 5
developing the P A G values. Such risks involve a high degree of subjectivity and
could cast doubt on the validity of the scientific evaluations. In the opinion of the
FSIS, protective actions had to consider the nature of the situation, the availability
of resources and the impact of these actions.
The F D A guidelines provided the FSIS, by virtue of its immediate knowledge
of its operations, with the basis for developing intervention levels to meet its
particular needs. Therefore the FSIS determined that the initial intervention level of
2775 Bq/kg needed to be lowered to meet the criteria of good public health practices.
Since the 2775 Bq/kg intervention level was established using the emergency
PAGs, it seemed appropriate to employ a more conservative margin of safety of two
orders of magnitude, i.e. 100, relative to the emergency PAGs. The safety margin
of 100 is well established in the U S A as an acceptable margin to protect the public
adequately from adverse health effects. The margin of 100 plus the built-in margin
of safety of the PAGs was fully supported by the public health officials. This yielded
a new intervention level for total caesium of 277 Bq/kg. However, the FSIS obtained
some preliminary data from a 1986 study that indicated a lower rate of meat
consumption in the U S A [5]. Consequently, a lower consumption rate resulted in a
higher intervention level. In October 1986, the FSIS adopted a 370 Bq/kg response
level for total caesium to harmonize US intervention levels for all food items.
6. BRAZIL: A S O U R C E O F C H E R N O B Y L C O N T A M I N A T E D P R O D U C T S
On 3 June 1987 a sample of beef extract from Brazil was taken by an FSIS
inspector who noticed, on routine inspection, that a large container of beef extract
caused an unusually high reading on his scintillation survey instrument. A sample
was sent for laboratory analysis. The sample contained 481 Bq/kg and 168 Bq/kg
of l37Cs and 134Cs, respectively. The total caesium of 649 Bq/kg exceeded the FSIS
response level of 370 Bq/kg.' The l37Cs to 134Cs ratio of 2.86 indicated a strong
probability that the beef used in the product was from Chernobyl contaminated
animals [6]. The Brazilian plant that produced the beef extract stated that the meat
used to produce the extract may have been imported from three European countries:
Denmark, Ireland or Poland.
On the basis of the result of this sample, the FSIS started a sampling
programme to determine the caesium levels in all non-distributed Brazilian beef
extract products in the USA, all Brazilian beef extract entering the U S A and all
products exported to the U S A by the Brazilian plant. Two out of the 60 beef extract
samples exceeded the FSIS 370 Bq/kg intervention level. Subsequently, the contami
nated product was prevented from entering US commerce. In August 1987, the FSIS
stopped routine sampling of the Brazilian products. Thereafter, samples were
collected only when the inspector obtained a significant response on the scintillation
survey instrument. Since all of these samples contained relatively low levels of

T A B L E I. BRAZILIAN S A M P L E S A N A L Y S E D F O R l34Cs A N D 137Cs
376 E N G E L e t a l.
Sampledescription
Number of samples
Number above background
level
Beef extract 62 62
Cooked beef 27 8
Cooked corned beef 3 1
Corned beef 19 5
Dried beef 1 0
Roast beef 12 10
Total 124 86
134Cs and 137Cs, a definite response of the instrument was in all probability due to
the presence of 40K, which is concentrated in beef extract. A total of 124 samples
of Brazilian beef products were taken (Table I).
7. S U M M A R Y A N D C O N C L U S I O N S
By October 1988, most of the samples contained caesium levels that were
indistinguishable from background. Therefore, the FSIS discontinued taking samples
of products from European countries exporting meat and poultry products to the
USA. The FSIS determined that any public health benefit of continuing the
programme was offset by cost consideration and resources that could be
reprogrammed to other high priority areas.
In total, the FSIS analysed 6195 samples of imported meat products from 14
European countries. Of these samples, 3702 were above the background level
(Table II). The highest values found were not necessarily from those countries with
the largest number of samples above background.
After the Chernobyl accident, the FSIS took the following actions:
(1) Set a realistic intervention level using US interim PAGs;
(2) Calculated the intervention levels by using both the maximum intake of radio
nuclide activity allowed and food consumption data;

T A B L E II. E U R O P E A N S A M P L E S A N A L Y S E D F O R 134Cs A N D ,37Cs
IAEA -S M -306 /19 3 7 7
CountryNumber of
samples
Number above background
level
Highest total caesium3 (Bq/kg)
Belgium 224 177 81
Czechoslovakia 63 59 60
Denmark 1820 348 56
Finland 274 241 139
France 239 15 14
Federal Republic of Germany 57 20 147
Hungary 307 269 89
Italy 11 6 14
Netherlands 99 20 20
Poland 849 749 115
Romania 1425 1376 1043
Sweden 571 229 83
Switzerland 68 36 165
Yugoslavia 188 157 86
Total 6195 3702
a Total caesium is the sum of l34Cs and l37Cs.
(3) Monitored, sampled and tested imported meat and poultry products for five
radionuclides;
(4) Periodically assessed and revised the intervention levels based on good public
health practices;
(5) Continued to evaluate and assess the ongoing regulatory activities.
Subsequent to these actions, “Derived Intervention Levels for Radionuclides
in Food” was published by the W H O [4]. Also a joint Food and Agriculture
Organization of the United Nations (FAO)/WHO recommendation to the Codex
Alimentarius Commission to control international trade in foods that have been
accidentally contaminated with radionuclides may soon help with the harmonization
3 7 8 E N G E L e t a l.
of intervention levels. The F A O has stated that “the goal is to provide a system that
can be uniformly and simply applied by government authorities and yet one that
achieves a level of public health protection to the individual that is more than
adequate in the event of a nuclear accident’ ’ [7]. The Codex represents a worldwide
search for compromise and consensus; therefore, it is safe to say that food safety
officials have been instrumental in setting many of these guidelines; they supervise
radiological monitoring of much of the food in international trade as well as
food consumed in each nation; and they will continue to grow in importance in
orchestrating new activities for the benefit of all nations.
A C K N O W L E D G E M E N T S
W e thank E.E. Kennard, Office of the Administrator, and K.L. Kimble-Day,
Office of the Deputy Administrator, Science, for their technical assistance in the
preparation and editing of this paper.
REFERENCES
[1] HOHENEMSER, C., et al., Environment 28 5 (1986) 6.[2] EDWARDS, М., Chernobyl — one year after, Natl. Geogr. Mag. 171 5 (1987) 633.[3] FOOD AND DRUG ADMINISTRATION, Accidental Radioactive Contamination of
Human Food and Animal Feeds: Recommendations for State and Local Agencies, Federal Regulation 47:47073, FDA, Washington, DC (1982).
[4] WORLD HEALTH ORGANIZATION, Derived Intervention Levels for Radionuclides in Food, WHO, Geneva (1988) 13.
[5] BREIDENSTEIN, B., WILLIAMS, J., Contribution of Red Meat to the U.S. Diet, National Livestock and Meat Board, Chicago, IL (1987).
[6] ENGEL, R., RANDECKER, V., FRANKS, W., Lessons learned from Chernobyl: public health aspects, J. Assoc. Food and Drug Officials 52 1 (1988) 15.
[7] FOOD AND AGRICULTURE ORGANIZATION OF THE UNITED NATIONS, CODEX COMMITTEE ON FOOD ADDITIVES AND CONTAMINANTS, Proposed FAO/WHO Levels for Radionuclide Contamination of Food in International Trade, FAO, Rome (1989).
IA E A -S M -306 /34
S T A T U S O F U N I T E D S T A T E S R E C O M M E N D A T I O N S
F O R C O N T R O L O F A C C I D E N T A L
R A D I O A C T I V E C O N T A M I N A T I O N
O F H U M A N F O O D A N D A N I M A L F E E D S
B.M. BURNETT, M. ROSENSTEIN
Food and Drug Administration,
Rockville, Maryland,
United States of America
Abstract
STATUS OF UNITED STATES RECOMMENDATIONS FOR CONTROL OF ACCIDENTAL RADIOACTIVE CONTAMINATION OF HUMAN FOOD AND ANIMAL FEEDS.
Existing recommendations in the United States of America for control of accidental radioactive contamination of human food and animal feeds were issued in 1982 by the Food and Drug Administration (FDA) of the Department of Health and Human Services. These recommendations provide guidance for determining whether levels of radiation encountered after a radiological incident warrant protective action and also suggest appropriate actions that may be taken. Additional guidance specific to the control of imported foods was adopted following the Chernobyl accident. This guidance consisted of derived intervention levels (DILs) for imported foods and was based in part on the 1982 FDA recommendations and on assumptions appropriate to the circumstances of Chernobyl. These DILs, which were called Levels of Concern when issued in 1986, set levels of contamination for specific radionuclides below which imported foods would be allowed for general distribution in commerce. The existing FDA recommendations for control of accidental radioactive contamination of human foods and animal feeds are currently under review. This review will take into account current scientific information and radiation protection philosophy, as well as practical experience, and will also consider the developing international DILs. Limiting the risk to the public in the event of an accidental release of radioactive materials involves both protective actions to mitigate the degree of radioactive contamination reaching food, as well as regulatory controls for the distribution in commerce of foods with residual radioactive contamination from the accident. It is this approach which is steering the current review and development of revised guidance.
1. I N T R O D U C T I O N
Guidance on the control of radioactive contamination of human food and
animal feeds in the United States of America had its beginning with recommenda
tions published in the 1960s by the Federal Radiation Council (FRC) in response to
concern about atmospheric fallout from nuclear weapons testing.
379
3 8 0 B U R N E T T and R O S E N S T E IN
The current recommendations in the U S A for control of accidental radioactive
contamination of human food and animal feeds were issued in 1982 by the Food and
Drug Administration (FDA) of the Department of Health and Human Services
(DHHS). These recommendations provide guidance for determining whether levels
of radiation encountered after a radiological incident warrant protective action and
also suggest appropriate actions that may be taken to avoid most of the projected
dose.
Additional guidance specific to the control of imported foods was adopted fol
lowing the Chernobyl accident. This guidance, issued in 1986, includes derived
intervention levels (DILs) for imported foods. These DILs, called Levels of Con
cern, set levels of contamination for specific radionuclides below which imported
foods would be allowed for general distribution in commerce.
The existing F D A recommendations for control of accidental radioactive con
tamination of human food and animal feeds are currently under review. This review
will take into account current scientific information and radiation protection
philosophy, as well as practical experience, and will also consider the developing
international DILs.
This paper reviews the evolution of guidance in the U S A from the 1960s
through Chernobyl and provides a status report on the ongoing review and develop
ment of revised guidance.
2. PROTECTIVE A C T I O N G U I D A N C E — 1964-1965
Current US guidance on the control of radioactive contamination of food and
feeds has evolved out of recommendations published in 1964 and 1965 by the FRC.
The FRC, formed in 1959, operated until 1970 and provided Federal policy on
human radiation exposure.
The F R C issued two reports containing recommendations for protecting the
population from radioactive material released to the environment. The guidance
provided in these reports involved protective actions which could be applied, as
appropriate, to the production, processing, distribution or use of food. Protective
actions involving special alterations of the normal diet were recognized as best
accomplished on an individual basis under medical supervision and were not
included among the types of actions listed. Other possible types of actions, such as
the use of additives in cattle feed or soil treatment, were judged to be less desirable
for reasons of effectiveness, safety or practicality and were not listed.
The first report, issued in 1964, provided general principles concerned with
protective actions and provided guidance appropriate to situations involving
l3lI [1]. The second report, issued in 1965, provided guidance appropriate to situa
tions involving 89Sr, 90Sr and 137Cs [2].

IA EA -SM -306 /34 38 1
The F R C guidance introduced three important principles which continue to
form the basis for current US food guidance:
(a) Projected dose — the total dose that would be received by individuals in the
population group from the contaminating event if no protective action were
taken;
(b) Protective action guide (PAG) — the projected dose to individuals in the
general population which warrants protective action following a contaminating
event;
(c) Protective action — an action or measure taken to avoid most of the dose from
radiation that would occur from ingestion of foods contaminated with radioac
tive materials.
Under the approach recommended in the F R C guidance, protective action
would be warranted only when the expected individual dose reduction was not offset
by the undesirable factors associated with the action.
The F R C guidance concerning l31I recommended a P A G of 300 m G y 1 to the
thyroid of individuals in the general population. As an operational technique, the
F R C assumed that this P A G for individuals would be met if the average projected
dose to a suitable sample of the exposed population did not exceed 100 mGy, which
is one third of the value specified for the individual. Protective actions that would
reduce human exposure from l31I in milk were identified; however, contamination
levels in foods at which the protective actions should be implemented were not
specified.
The 1965 F R C report on actions appropriate to situations involving 89Sr, 90Sr
and ,37Cs examined both the acute localized contaminating event and the problems
of worldwide contamination from stratospheric fallout. The report provided
guidance on protective actions appropriate to the acute localized contaminating event
and concluded that protective actions to reduce potential exposure from worldwide
stratospheric fallout were not necessary.
The F R C guidance concerning an acute localized contaminating event involv
ing 89Sr, 90Sr and 137Cs was separated into three categories representing intake
through different pathways and time periods following the event:
Category I — Pasture-cow-milk-man pathway during the first 100 days;
Category II — Other human dietary pathways during the first year;
Category III — Plant uptake from the soil over the long term.
1 FRC guidance was originally presented in units of rad (10 mGy = 1 rad).

382 B U R N E T T and R O S E N S T E IN
The PAGs recommended for 89Sr, 90Sr and 137Cs for individuals in the
general population were specified as follows:
Category I — 100 m G y in the first year to the bone marrow or whole body,
total dose not to exceed 150 mGy;
Category I I — 50 m G y in the first year to the bone marrow or whole body;
Category II I — 5 m G y annual dose to the bone marrow after the first year.
As in the P A G recommendations for 131I, it was assumed that the P A G for
individuals would be met if the average projected dose to a suitable sample of the
exposed population did not exceed approximately one third of the value specified for
the individual. Protective actions appropriate to Categories I and II were recom
mended; however, contamination levels in foods at which the protective actions
should be implemented were not specified. The guidance on protective actions for
Category III indicated that they should be determined on a case by case basis.
3. G U I D A N C E F O R A C C I D E N T A L C O N T A M I N A T I O N O F H U M A N F O O D
A N D A N I M A L FEEDS - 1982
Among the responsibilities assigned to the D H H S is the issuance of guidance
on appropriate planning actions necessary for evaluating and preventing radioactive
contamination of food and feed and the control and use of such products should they
become contaminated. Within the D H H S this function has been assigned to the FDA.
As part of the Federal effort to develop state and local emergency response
plans for nuclear accidents, the F D A initiated the development of emergency
response planning guidance for human food and animal feeds in the 1970s. That
effort resulted in the issuance, in 1982, of the F D A guidance, Accidental Radioactive
Contamination of Human Food and Animal Feeds: Recommendations for State and
Local Agencies [3].
These recommendations were developed for use by state or local agencies in
response planning and in the conducting of radiation protection activities involving
the production, processing, distribution and use of human food and animal feeds in
the event of an incident resulting in the release of radioactivity to the environment.
It was intended that the guidance should be used on a case by case basis to determine
the need for taking protective action following a wide range of peacetime contaminat
ing events.
The concepts of projected dose, P A G and protective action, as introduced in
the earlier F R C guidance, were incorporated into these recommendations. Recogniz
ing that protective actions can be taken which will have a range of impacts, the F D A
established a two level system of PAGs to reflect the level of impact of the recom
mended protective actions.

IA E A -S M -306 /34 3 8 3
The Preventive PAG, which would trigger the implementation of low impact
protective actions, was established at projected doses of 5 mSv to the whole body
and 15 mSv to the thyroid.2 The Emergency PAG, the trigger for implementation
of protective actions with higher impacts, was established at projected doses of
50 mSv to the whole body and 150 mSv to the thyroid.
The Preventive and Emergency PAGs established by the F D A in 1982 are con
sistent philosophically with the upper and lower bound approach introduced by the
International Commission on Radiological Protection in 1984 [4]. In the F D A sys
tem no actions are necessary below the Preventive P A G (lower bound); only low
impact protective actions are warranted when the Preventive P A G is exceeded.
Higher impact protective actions are warranted when the Emergency P A G (upper
bound) is exceeded. The F D A recommendations established derived response levels
(DRLs) (levels of radioactive contamination that would result in projected doses
equivalent to the PAG) at which protective actions should be initiated. However, the
recommendations did not contain guidance on the level of contamination at which
protective actions should cease once they had been initiated.
The F D A guidance assumed that protective actions would not need to extend
beyond one or two months. The guidance was not intended to apply to long term food
pathway contamination since it was considered that adequate time would be available
after the accident to evaluate the long term public health consequences.
The 1982 F D A guidance primarily considered contamination of the pasture-
cow-milk-person pathway and specific DRLs corresponding to the Preventive P A G
and the Emergency P A G were recommended. The DR L s 3 were presented for: peak
activity concentration in milk (Bq/kg), total radionuclide intake (Bq), initial activity
deposition (Bq/m2), and initial activity concentration in forage (Bq/kg). The radio
nuclides for which levels were recommended include 89Sr, 90Sr, 131I, l34Cs and
137Cs. The DRLs were presented for the critical group of individuals for the partic
ular radionuclide.
Although the primary emphasis was on the pasture-cow-milk-person path
way, a method was described for determining the D R L for other foods and protective
actions appropriate to other foods were presented.
2 FDA guidance was originally presented in units of rem (10 mSv = 1 rem).3 FDA guidance was originally presented in units of pCi (1 Bq = 27 pCi).

384 B U R N E T T and R O S E N S T E IN
4. G U I D A N C E F O R I M P O R T E D F O O D - 1986
Following the Chernobyl accident, an interagency working group was created
to co-ordinate the activities of the Federal agencies and to provide information and
guidance to the public. A task group of F D A and United States Department of
Agriculture (USDA) representatives was formed to establish appropriate levels for
residual radioactivity from the accident in imported foods.
The 1982 F D A recommendations represented the only available US guidance
on accidental contamination of food by radioactivity. The Preventive P A G of 5 mSv
to the whole body and 15 mSv to the thyroid, as established in the F D A guidance,
was adopted as an appropriate P A G in this situation. The DRLs from the 1982
recommendations were not adopted since they were based upon assumptions (i.e.
peak levels and agricultural practices under US control) which did not apply to
imported foods.
The F D A - U S D A task group recommended that intervention levels for
imported foods be derived under the following cautious assumptions:
(1) 100% of the diet would be contaminated;
(2) l3lI would be the principal radionuclide of concern early in the accident;
(3) 13II would be available for intake for 60 days;
(4) l34Cs and 137Cs would be the principal radionuclides of concern later after the
accident;
(5) l34Cs and 137Cs would be available for intake for 365 days.
Owing to the very cautious nature of these assumptions and to the
predominance of l3lI, 134Cs and l37Cs, it was considered unnecessary to develop
intervention levels for other radionuclides.
The F D A accepted the recommendations of the task group and established
DILs for imported foods under its control. The DIL represents the concentration of
the specified radionuclides in food, below which the food would be allowed to be
imported into the USA. The F D A DILs were called Levels of Concern [5, 6].
The U S D A assumed that the major radioactive contaminants in imported meat
and poultry would be l34Cs and 137Cs and further assumed that 13'i would not con
tribute radioactivity levels of any practical concern for these types of imported
products [7].
Initially the U S D A did not use the F D A - U S D A task group assumption of
100% contamination for imported meat and poultry (products under the control of
the USDA). The initial DIL set by the U S D A for 134Cs plus l37Cs in imported meat
and poultry took into consideration the fraction of the diet represented by meat and
poultry. Under the assumption that 13'i would not be of practical concern, the
U S D A DIL for l31I was set conservatively at the same level as determined by the
F D A for infant foods.

IA EA -SM -306 /34 3 8 5
The U S D A DILs were called Screening Values. The U S D A reconsidered its
DIL for 134Cs plus 137Cs in October of 1986 and reduced it to conform with the
F D A Levels of Concern [8]. The current DILs, accepted by both the F D A and
USDA, for contamination from Chernobyl in imported foods are:
For 1311 — 55 Bq/kg4 for infant foods and 300 Bq/kg for other
foods
For ,34Cs plus 137Cs — 370 Bq/kg for all foods.
5. R E V I E W A N D REVISION O F US GUIDANCE'
The DILs adopted by the F D A and U S D A for imported food following
Chernobyl and the 1982 F D A recommendations represent the current US guidance
for accidental contamination of human food and animal feeds by radioactive
materials. This guidance is under review at the present time.
The review to date has revealed that the guidance was valid for its originally
intended purpose; however, updating and revision would be appropriate to incor
porate current scientific information and radiation protection philosophy. In addi
tion, the experience of the Chernobyl accident has identified several additional
situations that need to be considered. The guidance needs to cover contaminating
events which affect much wider areas and which would apply over longer time
periods than previously included. This must be done while maintaining the necessary
flexibility required to deal with special situations. The guidance should, to the maxi
m u m extent possible, reflect generally accepted international guidance.
When one considers the development of revised guidance, it is clear that limit
ing the risk to the public in the event of an accidental release of radioactive materials
involves both preventive public health actions to mitigate the degree of radioactive
contamination reaching food, as well as regulatory controls for the distribution in
commerce of foods with residual radioactive contamination from the accident. This
is shown schematically in Fig. 1.
This two component approach is being taken in the review and revision of the
existing guidance. The objective of the revision is to produce a consistent set of
guides, applicable to accidental contamination of human food and animal feeds and
available for use by Federal, state, and local agencies in the exercise of their respec
tive authorities. In the USA, state and local agencies have the lead responsibility,
with support from the Federal agencies, for the protection of their populations from
local accidents. The development of the revised guidance will follow the outline
shown in Fig. 1.
4 DILs were originally presented in units of pCi/kg.

386 B U R N E T T and R O S E N S T E IN
FIG. 1. Protection o f p ublic health in the event o f accidental radioactive contamination o f
food.
Using this approach, DILs will be developed for the regulatory control in intra-
and interstate commerce of marketed foods which contain residual levels of radioac
tivity following an accident. Criteria for preventive public health actions will then
be developed that will serve as an alert for the point when protective actions should
be taken to reduce the projected dose from foods that could be affected by the
accident.
These preventive public health actions represent actions to avoid, limit or
reduce the contamination of food. The revised guidance will provide recommenda
tions on when to implement various protective actions with the intent that if the action
is taken, the likelihood that the food would meet the appropriate DIL would be
increased.

IA E A -S M -306 /34 3 8 7
An important aspect of this guidance is that it will discuss criteria on when to
act before the food can be tested to determine the actual level of contamination.
Among the various criteria to be considered as appropriate to initiate this early action
are indicators such as plant status (for nuclear reactor accidents), meteorological
conditions at the time of the accident, and initial deposition.
This portion of the guidance can only be advisory owing to the great uncertain
ties in the prediction of actual contamination levels in food from such initial condi
tions. The guidance will be most useful to those food producers who can take action
by modest adjustments in normal operations without waiting to find out if their ready
to market food exceeds the appropriate DIL. Taking such action will not guarantee
that the marketed food will meet the appropriate DIL; however, the likelihood that
the DIL would be met would be increased.
The regulatory control of food will be achieved through the DIL. The DIL in
this application would represent the concentration of key indicator radionuclides in
food below which the food would be allowed for general distribution in commerce.
The indicator radionuclides are expected to be similar to those adopted in previous
US guidance and contained in guidance adopted by the Codex Alimentarius Commis
sion in July 1989 [9]. The Codex guideline values are based on generic dose conver
sion factors and address 241Am, 239Pu, 90Sr, 131I, l34Cs and l37Cs as illustrative (or
indicator) radionuclides.
The DILs will be applicable to food pathway contamination arising from inside
or outside of national boundaries, will address long term food pathway contamina
tion, and will consider when protective actions may be terminated. The DIL values
to be recommended will be derived from a conservative basis so that it is expected
that actual average doses received would be significantly lower than the PAG.
The development of the proposed revised guidance is still at an early stage with
specific values and operational details yet to be determined. It is expected that draft
ing of the proposal will be completed within the next year. No estimate as to when
any new guidance would be issued can be made at this time, since the adoption of
any proposed revision to the current guidance will require extensive review and com
ment within the USA.
REFER ENCES
[1] FEDERAL RADIATION COUNCIL, Background Material for the Development of Radiation Protection Standards, Rep. No. 5, FRC, Washington, DC (1964).
[2] FEDERAL RADIATION COUNCIL, Background Material for the Development of Radiation Protection Standards: Protective Action Guides for Strontium-89, Strontium-90, and Cesium-137, Rep. No. 7, FRC, Washington, DC (1965).

3 8 8 B U R N E T T and R O S E N S T E IN
[3] DEPARTMENT OF HEALTH AND HUMAN SERVICES/FOOD AND DRUG ADMINISTRATION, Accidental Radioactive Contamination of Human Food and Animal Feeds: Recommendations for State and Local Agencies, DHHS/FDA, US Fed. Regist. (Wash., DC) 47 205 (1982) 47 073-47 083.
[4] INTERNATIONAL COMMISSION ON RADIOLOGICAL PROTECTION, Protection of the Public in the Event of Major Radiation Accidents: Principles for Planning, Publication 40, Pergamon Press, Oxford and New York (1984).
[5] DEPARTMENT OF HEALTH AND HUMAN SERVICES/FOOD AND DRUG ADMINISTRATION, Radionuclides in Imported Foods; Levels of Concern; Availability of Compliance Policy Guide, DHHS/FDA, US Fed. Regist. (Wash., DC) 51 112 (1986) 23 155.
[6] DEPARTMENT OF HEALTH AND HUMAN SERVICES/FOOD AND DRUG ADMINISTRATION, Radionuclides in Imported Foods Levels of Concern, Compliance Policy Guide No. 7119.14, DHHS/FDA, Washington, DC (1986).
[7] UNITED STATES DEPARTMENT OF AGRICULTURE, Radionuclide Screening Values for Monitoring Meat Products, Food Safety and Inspection Service, USDA, Washington, DC (1986).
[8] UNITED STATES DEPARTMENT OF AGRICULTURE, Meat Inspection - Radiation Level Change, Food Safety and Inspection Service, USDA, Washington, DC (1986).
[9] FOOD AND AGRICULTURE ORGANIZATION OF THE UNITED NATIONS, WORLD HEALTH ORGANIZATION, Proposed F AO/WHO Levels for Radionuclide Contamination of Food in International Trade Following an Accidental Nuclear Release, ALINORM 89/11, FAO/WHO Joint Office, Rome (1989).

I A E A -S M -ЗОб/69
R E V I E W O F T H E I M P A C T
O F A L A R G E S C A L E A C C I D E N T
O N A R E M O T E F A R F I E L D
L.F.C. CONTI, H.L.P. A Z E V E D O ,
M.E.C.M. VIANNA, L.M.J.B. FERREIRA
Institute of Radioprotection and Dosimetry,
Brazilian Nuclear Energy Commission,
Rio de Janeiro, Brazil
Abstract
REVIEW OF THE IMPACT OF A LARGE SCALE ACCIDENT ON A REMOTE FAR FIELD.
The aim of the paper is to present an overview of the actions taken by Brazil, as a remote far field, after the Chernobyl accident; such actions involved radiological protection and sociological considerations. The startup of these actions took place as soon as the first notices of the accident were received by the press in Brazil as a result of some measurements of aircraft smears taken from intercontinental airliners. At the same time, a small scale air monitoring network around the country was installed but no increment above the natural background was observed. These procedures proved to be very useful in informing the Brazilian population which was worried about the possibility of contamination in the country. In a second post-accident phase, the control of contamination levels in imported foodstuffs was necessary. Values of l37Cs and l34Cs up to 2400 Bq/kg for milk powder and 230 Bq/kg for meat were found in this phase. Derived intervention levels for l37Cs and l34Cs were fixed, but these values were not well accepted by the general population, the scientific community and ecologists. Problems related to foodstuffs for exportation, mainly with beef extract, are also discussed. The need to have good public information procedures is one of the most important conclusions of the paper.
1. I N T R O D U C T I O N
After the occurrence of a large scale accident, the main impact on a remote
far field could be expressed by many questions whose answers should be provided
to the general public, scientific community and government authorities by those
involved in radiological protection. However, this is usually not possible owing to
the complete absence of official information during the early phase of an accident.
At this point, the country or countries directly involved are still directing all their
efforts to the actions to be taken and, sometimes, are still evaluating the situation.
389

3 9 0 C O N T I e t a l.
Consequently the information available to countries not directly involved is only that
distributed by the press; such information is not sufficient and accurate enough to
answer all the questions that arise. That was the situation created in Brazil after the
Chernobyl accident.
In trying to solve these problems, Brazil has adopted some actions that were
conducted, from the early phase of the accident, by the Brazilian Nuclear Energy
Commission (Comissâo Nacional de Energia Nuclear) through its Institute of
Radioprotection and Dosimetry (IRD). These actions are described in this paper.
2. FIRST ACTIONS
In order to identify the released radionuclides and to have an idea of the extent
of their dispersion, the IRD staff took some aircraft smears and water condensation
samples from intercontinental airliners and analysed these by gamma spectrometry.
This work began on 4 May 1986 and continued for two weeks. At that time, values
of up to 22 Bq/m2 of 131I and 30 Bq/m2 of 137Cs were found in smear samples on
an airplane that had flown to Brazil from Denmark. The test results on the water
condensation from this flight showed values of 226 Bq/L for 13 *1 and 217 Bq/L for
137Cs. A 134Cs/137Cs ratio of 0.5 could be determined from these samples and to
complement this study, 90Sr analysis was carried out on a condensation water
sample; from this analysis a 90Sr/l37Cs ratio of 0.01 was obtained, showing that
90Sr would not be a problem in foodstiiff contamination. The presence of the
released radionuclides was not detected in samples taken from domestic airliners.
Also, in spite of the very small probability of detection of any contamination
in Brazil, a small scale air monitoring network was installed around the country. Air
samplers with a flow rate of 60 m 3/h were used and the samples, collected for
approximately 48 hours, were analysed by gamma spectrometry with a minimum
detectable activity of 0.1 mBq/m3 of 137Cs. At the same time some milk samples
collected from Rio de Janeiro farms were analysed. This work was carried out
mainly to have actual data for public information about the situation in the country
instead of using only theoretical information. As expected, no radionuclides were
detected in these samples except for normal fallout levels of l37Cs and 7Be.
Finally, as a result of a request from the Brazilian Harbour Control Authority,
two cargo vessels arriving from Poland were monitored. Smear samples from
different surfaces of the ships as well as samples from the load were collected and
analysed by gamma spectrometry for the released radionuclides. The first ship
arrived at Santos Harbour, Brazil, on 29 May 1986 with a load of charcoal. Values
up to 125 Bq/m2 of 137Cs and 10 Bq/m2 of 131I could be detected in a smear sample
collected near the exhaust vent of the ship; the charcoal concentration of 13II was
found to be 2 Bq/kg and for l37Cs it was 1 Bq/kg. The second vessel, loaded with
IA E A -S M -306 /69 39 1
sulphur, arrived at Vitoria Harbour, Brazil, on 4 June 1986. At the same time, 131I
could not be detected, but values of 18 Bq/m2 of 137Cs were found in smear
samples and 0.5 Bq/kg in the sulphur load.
All the actions described above were very important in providing information
to the countries involved and also in indicating the further necessity of foodstuff
monitoring, since the economic situation in Brazil, because of price fixing, was such
that importation, of products such as milk and meat had already been contracted.
3. F O O D S T U F F M O N I T O R I N G
In the second phase of actions taken, the control of contamination levels in
imported foodstuffs was necessary owing to the large number and wide variety of
imports arranged for subsequent months, mainly milk and meat from many directly
contaminated European countries. These products began to arrive in Brazil in
August 1986 and the IRD was asked by the Brazilian Ministry of Agriculture to
control these products and to set derived intervention levels (DILs). Up to 1989,
about 3700 samples of imported and exported foodstuffs were analysed by gamma
spectrometry at the IRD. The main samples to be analysed were imported milk and
meat; also many samples of beef extract and corned beef for export to other countries
were of interest. Most of the problems with these foodstuffs appeared during the first
year after the accident.
3.1. Derived intervention levels
In the determination of DILs, the approach described in the United States
Federal Register [1] was used, taking into account only the presence of 137Cs and
134Cs owing to the large amount of time which elapsed until the first products
arrived in Brazil. The calculations were based on a conservative simultaneous
consumption of 1 L of milk and 300 g of meat per day, for one year of intake, and
5 mSv of effective dose equivalent. The final results agreed with those proposed by
the European Community [2]. Thus DILs of 3700 Bq/kg and 600 Bq/kg of 137Cs
and 134Cs for powdered milk and for other products, respectively, have been
adopted by the Brazilian authorities.
These DILs have not been well accepted by members of the general population
and of the scientific community because they think that if the country had not been
directly affected, we could not have permitted any contaminated product to be
consumed. An additional problem was that many other countries had adopted lower
values. Some misunderstanding also occurred because the European Community
defined the milk DIL of 370 Bq/kg for liquid milk and the value adopted in Brazil
was defined for powdered milk; this number amounted to a value 10 times greater,
since powdered milk was the product being imported.

3 9 2 C O N T I e t a l.
3.2. Sampling and analytical methodology
Samples were collected by inspectors of the Ministry of Agriculture who
normally do this work for the inspection of food products according to internationally
accepted procedures for food quality control; the samples were then sent to the IRD
for analysis. After the first analysis, some modifications in sampling procedures
were introduced as described in Section 3.3.1.
Owing to the urgent need for results, an optimization of the analytical
procedure was adopted. As a result, the sample preparation procedure was the
minimum required and most often samples were mounted directly for counting in
3.5 L Marinelli beakers, then analysed on three high purity germanium spectrometry
systems with a counting time of 60 minutes or less (depending on sample activity).
The minimum detectable activity for l37Cs was about 2 Bq/kg. In this way, the IRD
was able to analyse up to 25 samples per day; this number appeared to be insufficient
on many occasions.
3.3. Results and discussion
3 .3 .1 . Im p o rted fo o d stu ffs
In 1986 and 1987 Brazil imported about 210 000 t of powdered milk; of this
total, 64 000 t were from European countries. After the Chernobyl accident, the first
load of powdered milk arrived in Brazil in August 1986; it was imported from
Ireland. The 137Cs and 134Cs activity in this sample was 1753 Bq/kg and, although
this value was well below the established DIL, serious trouble was generated. Many
meetings with Brazilian Government authorities were necessary to decide whether
the product could be consumed. This situation developed mainly because many
physicians and scientists sent to the press their opinions opposing the consumption
of this milk on the basis of unjustified estimates of potential hazards to public health.
It took a great deal of effort by radiological protection professionals to overcome
these positions and, in fact, the problem has not been totally solved yet since neither
the public nor legal authorities have been completely convinced by the technical
information supplied.
The milk sampling was based on a screening procedure. The packages were
grouped by packing date and monitored with a portable scintillometer; those pack
ages with the highest readings were selected for measurement in the laboratory. This
procedure could be justified by the results presented in Fig. 1, where the variation
in the l37Cs concentration as related to packing date is shown in milk powder from
Ireland. It is interesting to note the concentration of 1500 Bq/kg in June which is
probably a result of the storage of milk powder before packing. This means that the
packing date would not be a good reference for sample collection. The results shown
in Fig. 1 are from samples of different producers and could be an indication of the

IA E A - S M -ЗОб/69 393
Milk production date
FIG . 1. Variation o f the specific concentration o f l37Cs in milk pow der from Ireland
between May and August 1986.
T A B L E I. 137Cs PLUS 134Cs C O N C E N T R A T I O N IN I M P O R T E D MIL K
P O W D E R F R O M A U G U S T 1986 T O A U G U S T 1987
Country of origin Number
Cs-137 plus Cs-134 (Bq/kg)
of loadsRange Mean
Austria 3 432-1382 848
Belgium 15 3- 48 11
Czechoslovakia 1 — < 2
Denmark 30 <2- 64 23
France 31 3- 33 6
Federal Republic of Germany 12 <2- 158 73
Ireland 3 79-2413 467
Netherlands 55 <2- 117 20
New Zealand 8 < 2- 10 5
Switzerland 1 — <2
United Kingdom 17 7- 178 36
United States of America 35 < 2- 8 5
Uruguay 1 — ' <2

394 C O N T I e t a l.
T A B L E II. I37Cs PLUS 134Cs C O N C E N T R A T I O N IN I M P O R T E D M E A T
F R O M A U G U S T 1986 T O A U G U S T 1987
Country of origin Number of loads
Cs-137 plus Cs-134 (Bq/kg)
Range Mean
Denmark 10 < 1-<1 <1
France 41 < 1- 2 <1
Federal Republic of Germany 10 <1- 47 <1
Hungary 8 <1- 43 18
Ireland 25 <1-169 11
Italy 21 < 1-<1 <1
Netherlands 3 <1- 7 4
Poland 11 <1- 25 4
Romania 2 < 1-88 45
Sweden 23 <1- 99 11
United Kingdom 26 <1-229 19
United States of America 17 < 1 - 2 <1
Yugoslavia 2 < 1-<1 <1
homogeneity of the contamination in Ireland during this period, since the behaviour
of the curve is very similar to that predicted by models.
A general view of the results obtained in milk powder analysis during the first
year after the accident is shown in Table I.
Beef was another important product imported at that time. Values up to
229 Bq/kg of l37Cs and 134Cs were found in a load of beef from the United
Kingdom in October 1986. A similar problem occurred in one of the Brazilian states
where a load of meat was not offered for consumption only because it was imported,
in spite of the fact that its 137Cs content was less than 2 Bq/kg. The values found
in meat are outlined in Table II.

IAEA -S M -306 /69 395
Since the requirements for contamination level certificates have been adopted
for almost all countries, Brazil has also been asked to supply these certificates for
all of its foodstuffs exported since the Chernobyl accident. Mainly chicken, corned
beef and beef extract were analysed by the IRD. Among these Brazilian products,
only beef extract presented measurable l37Cs and l34Cs concentrations since it is a
sub-product in the corned beef industry and some imported meat was used in its
fabrication. Despite the low 137Cs content in these meats, the high concentration
factor of caesium in beef extract (estimated to be about 28 times the meat concentra
tion based on its potassium content) produced high concentrations of 137Cs in this
product and values of up to 1000 Bq/kg have been found, which are higher than the
DILs adopted by many importing countries. Especially in the samples with lower
activity, the 134Cs/137Cs ratio in this product was lower than 0.5, as found in
imported foodstuffs, mainly because of normal fallout levels of 137Cs found in the
Brazilian meat used in the production of beef extract. It was also observed that no
detectable activity of 137Cs remained in the corned beef.
Since it was almost impossible to determine the origin of the meat used in the
production of beef extract, the analysis had to be made on samples collected every
day at the factory in order to avoid problems in one specific group of products.
4. C O N C L U S I O N S
Besides the technical problems already discussed above, the most important
difficulties detected during this work were those related to public information and
to public acceptance of the established DILs. These problems began to occur one or
two weeks after the accident, indicating the need for a recognized international
organization to centralize the available information for distribution to other coun
tries. This action is necessary in order to obtain reliable data as well as a global
evaluation of the accident and its possible consequences and extension.
Internally some procedures should be adopted not only for public information
but also for governmental authorities, journalists, physicians and all professionals
who can help in this task, since their opinions are of fundamental importance in
establishing the credibility of the actions taken for radiological protection, especially
in those countries where the nuclear industry is not well accepted. The most
important factor is that these procedures have to be adopted even before an accident
occurs, mainly because after an accident all information is normally considered
suspect by the public.
In addition, the methodology and philosophy of radiological protection, espe
cially as related to the definition of DILs, should be, as far as technically possible,
simple and clear in order to be well understood or, at least, accepted by people not
familiar with this information.
3.3.2. Exported foodstuffs

396 C O N T I e t a l.
REFERENCES
[1] FOOD AND DRUG ADMINISTRATION, Fed. Regist. (Wash., D.C.) 47-205, Washington, DC (1982).
[2] COMMISSION OF THE EUROPEAN COMMUNITIES, Official Journal L 146, Regulation CEC-1707/86, CEC, Luxembourg (1986).
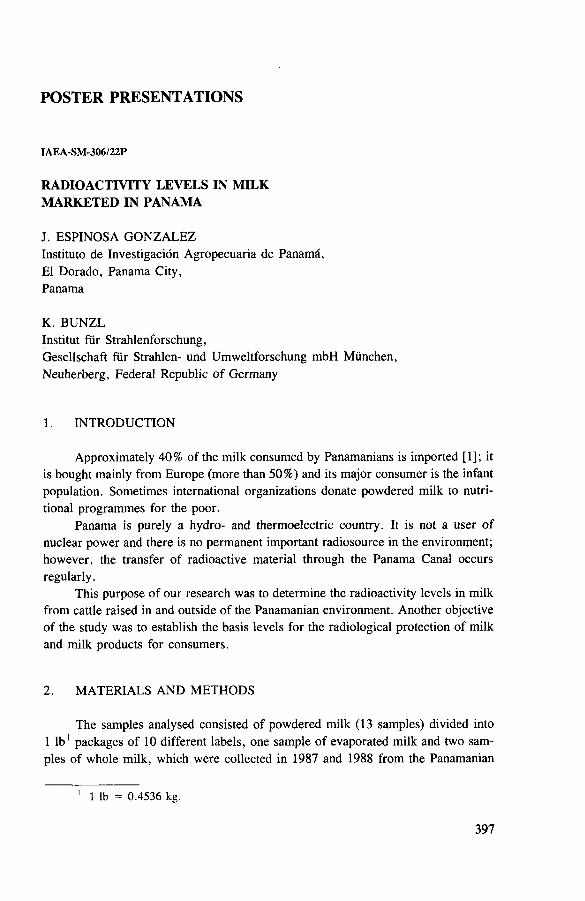
P O S T E R P R E S E N T A T I O N S
IAEA-SM-306/22P
R A D IO A C T IV IT Y LE V E LS IN M IL K
M A R K E T E D IN P A N A M A
J. ESPINOSA G O N Z A L E Z
Instituto de Investigación Agropecuaria de Panamá,
El Dorado, Panama City,
Panama
K. B U N Z L
Institut für Strahlenforschung,
Gesellschaft für Strahlen- und Umweltforschung m b H München,
Neuherberg, Federal Republic of Germany
1. INTRODUCTION
Approximately 40% of the milk consumed by Panamanians is imported [1]; it
is bought mainly from Europe (more than 50%) and its major consumer is the infant
population. Sometimes international organizations donate powdered milk to nutri
tional programmes for the poor.
Panama is purely a hydro- and thermoelectric country. It is not a user of
nuclear power and there is no permanent important radiosource in the environment;
however, the transfer of radioactive material through the Panama Canal occurs
regularly.
This purpose of our research was to determine the radioactivity levels in milk
from cattle raised in and outside of the Panamanian environment. Another objective
of the study was to establish the basis levels for the radiological protection of milk
and milk products for consumers.
2. M A T E R I A L S A N D M E T H O D S
The samples analysed consisted of powdered milk (13 samples) divided into
1 lb1 packages of 10 different labels, one sample of evaporated milk and two sam
ples of whole milk, which were collected in 1987 and 1988 from the Panamanian
1 1 lb = 0.4536 kg.
397

398 P O S T E R P R E S E N T A T I O N S
с‘5Ь с
cdCl,
cdeCJCcdQ*
Ccd
Д*
T3ccd
СЛ СЛ*o -o c ccd cd
U 0)Z Z
чэGcd
£C/3
T3c
0)Z
<Z<cu
ûШHШwce<s
wJHHs
z
oTj-I*
u
W)
D*Cû
u
.oH
U:
О о o ort os
V V V
(N CN 'V V V
O o oo
(N 4fr r-
Ov <NV
—' o OV 00
r-m
OTt-
c o c n ГМ ¡ (N ON CM <NV V V co
Vv ^ V V
cnHjw>Шp-J
HHH>
HucoHHQ3
Cl>>H
o .£cd
00
TJ£OCU
d>•o£OÜH
<ц
OClcd>
Ш
43£oOh
<L> <D T3 T3 ? £ o o Û- cu
<DТЭ»o
(X
oT3£oOh
W►J«<H
üBz > W P h Î ^ <
OZ
<z
Powd
ered
<4
3
<1
120
Net
herl
ands
in
fant
fo
rmul
a
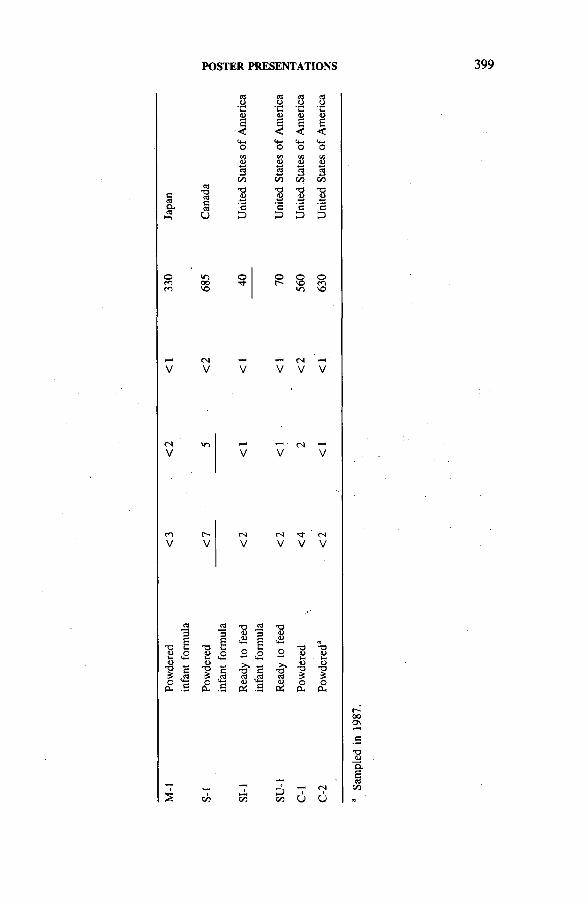
P O S T E R P R E S E N T A T I O N S 399
CdCL,Cd
-acac
<L>S
•<
cd¿ 0
03 cd Cdо О
'C ‘С ‘Со «и 1>g Е s< < <с<4- <4-1 «4-1О О Осл (Л иa> В Вл cd cdй Й &
C G CD ¡3 D
о о оГ' VO
оmVO
<NV
—H (N —' 'V V V
<NV
(NV
m NV V V
cd ed *хэ cd3 3 <и 3Е в вт з и "О и.
<и о 1> о о оUi <£5 к* «¿51)■о С "О с
>»т з С,cd ,cd ed ,cd
о о <*-1 м-tCU 'G си С С* С
g <ü
-ocdо*o£оcu
тэ£оcu
aeCdC/5
4 0 0 P O S T E R P R E S E N T A T I O N S
market. One sample was taken in 1987 from an international donation. The origins
of the samples are as follows: seven from Europe, four from the United States of
America, three from Panama, one from Canada and one from Japan.
• Samples were analysed by high resolution gamma spectrometry for 40K,
60Co, 134Cs, 137Cs, 226Ra and 232Th for 1200-50 000 s at the Institut für Strahlen-
forschung, Gesellschaft für Strahlen- und Umweltforschung m b H München, and at
the Nuclear Science Center of Texas A & M University in the USA.
3. RESULTS A N D DISCUSSION
This study revealed naturally occurring radioactivity levels oscillating between
40 and 900 Bq/kg for 40K in milk. The largest amount was found in a sample com
ing from cattle raised in the local Panamanian environment. The lowest radioactivity
values were detected in whole milk from the U S A and in powdered milk from the
Netherlands.
Caesium-134 was present only in samples K-2 and F-l (see Table I) coming
from Europe. Caesium-137 was detected in samples V-2, K-2, NU-1, NA-1, F-l,
S-l and C-l which were imported from Europe and North America. The radioactiv
ity levels in the samples were found to be between 2 and 39 Bq/kg. Compared to
the values of the milk from cows raised in the Panamanian environment, the values
detected in samples V-2, F-l and K-2 are relatively high. Other radioelements were
not detected in the samples studied.
International organizations recommended different action levels for food; for
example, the Food and Agriculture Organization of the United Nations recom
mended 500 Bq/kg for 137Cs in the first year and 100 Bq/kg in subsequent years
after a major nuclear accident [2]. These values consider special circumstances,
exposure equivalent doses according to the International Commission on Radiologi
cal Protection, natural exposure levels, and human experiences during nuclear acci
dents. The above mentioned levels are suggested principally for the presence of
artificial radioactivity in nuclear electric countries.
All of the samples showed radioactivity levels within the limits recommended
for human consumption. In Panama, the major consumer is the infant population and
there is no radiocaesium detected in the milk produced locally. Furthermore, nor
mally nuclear electric countries show levels of less than 10 Bq/kg of radiocaesium
in milk [3]. Therefore, only imported milk containing less than that level of radio
caesium is acceptable.
A C K N O W L E D G E M E N T S
The authors wish to thank the Comisión Nacional del Medio Ambiente Panamá
for supporting the work. Thanks are also due to A. Vergara of the Ministry of Health
in Panama for providing samples.

P O S T E R P R E S E N T A T IO N S 401
R EFERENCES
[1] CUELLAR, М., et al., Situación de la Industria Lechera en Panama, Comisión Nacional Consultiva de la Leche, Panama City (1988) 1.
[2] INTERNATIONAL ATOMIC ENERGY AGENCY, Application of Intervention Dose Levels and Derived Intervention Levels in the Event of a Major Nuclear Accident: Review of Present Status, INFCR/344, IAEA, Vienna (1987) 11-12.
[3] PARETZKE, H.K., Transfer von Radionukliden, Institut für Mensch und Umwelt Radioaktivitàt und Strahlenfolgen, Gesellschaft fiir Strahlen- und Umweltforschung mbH München (1986) 39-48.
IAEA-SM-306/112P
STU D Y O F 137Cs C O N T A M IN A T IO N
IN V A R IO U S FO O DSTUFFS E N T E R IN G N E P A L
AFT E R TH E C H E R N O B Y L A C C ID E N T
L O K N A T H SUBBA, B H I M B A H A D U R B A M
Royal Nepal Academy of Science and Technology,
Kathmandu, Nepal
1. I N T R O D U C T I O N
A total of 762 different food samples were tested for 137Cs contamination for
25 months after the Chernobyl accident. Of these, 246 samples of imported milk and
milk products in the form of powdered milk, evaporated milk, skimmed milk, con
densed milk, chocolate, cheese, butter oil, etc., were measured. The other food sam
ples consisted of wide varieties of foodstuffs, such as cereals, tinned foods, soybean
oil, biscuits, nuts, beverage concentrates, etc. These samples were collected either
from markets or from different customs offices through which these foodstuffs enter
Nepal.
2. M E T H O D
A low level gamma ray spectrometer (NORLAND-ORTEC) consisting of a
shielded (lead 52 m m thick with a 2 m m steel case) Nal(Tl) detector having dimen
sions of 3 in x 3 in coupled to a multichannel analyser was used to measure l37Cs
activity levels in the foodstuffs. Different forms of milk were converted into normal
drinking milk before the measurements were taken. The range of interest and the

4 0 2 P O S T E R P R E S E N T A T IO N S
(M o n th s a fte r th e C h e rn o b y l a c c id e n t)
FIG. 1. Maximum specific l37Cs activity observed in milk and milk products imported from developed countries.
spectrometer efficiency were calibrated daily using a standard calibration source of
74 kBq l37Cs (Amersham), The decay factor was also accounted for every month
and the background level was determined after measuring every two samples. The
time of operation ranged from 500 to 7200 s, depending on the volume of the sample
to be measured. For samples of less than 1 kg or 1 L, specific weights were taken
into account. G a m m a ray spectroscopic methods of analysis were also used for
comparison.
The efficiency factor for 137Cs was 6.8 ± 0.07% and the overall statistical
fluctuation was within 4%.
3. RESULTS
The highest specific activity recorded was 130 Bq/L of 137Cs for skimmed
milk during the month of August 1986 and 106 Bq/L for butter oil (Fig. 1). Tinned
foods, cereals and soybean oil recorded activity ranging from 60 to 92 Bq/kg(L) dur
ing the course of the study. However, the activity level gradually decreased to
around 35 Bq/kg over the final few months of measurement.

P O S T E R P R E S E N T A T IO N S 4 0 3
Caesium-137 contamination was found to be higher in milk and milk products
which were imported mostly from developed countries. However, the level of con
tamination was found to be below the recommended limit of the World Health
Organization and the Food and Agriculture Organization of the United Nations.
4 . C O N C L U S I O N S
IAEA-SM-306/70P
SO M E PR O JECTIO NS O N R A D IO A C T IV IT Y
C O N C E N T R A T IO N S A N D DOSES AR IS IN G
F R O M IN G E S T IO N O F FO O D
C O N T A IN IN G C H E R N O B Y L C O N T A M IN A T IO N
L.R. de la PAZ, M.V. P A L A T T AO, J.F. ESTACIO
Philippine Nuclear Research Institute,
Diliman, Quezon City,
Philippines
P r e se n te d b y E . B a u tista
Using published deposition data in some countries affected by the Chernobyl
accident, the expected 137Cs and 134Cs concentrations in food grown in various
European countries one month and one year after the accident were projected using
the model proposed by Boone et al. [1].
Concentrations in pasture grass, milk, wheat and beef were calculated on the
basis of concentrations due to deposition from the plume in above-ground plant parts
and on the basis of concentrations in the plant or forage due to uptake from the soil.
In calculating the concentrations after one year, a resuspension factor of 1 Bq/kg was
assumed for I37Cs and l34Cs. Default values for the different parameters that enter
into the calculations were obtained from International Atomic Energy Agency Safety
Series No; 57 [2] and/or from the values used by Boone et al. [1]. Results, which
were compared with some available monitoring data in the countries studied, were
generally in agreement but overestimates were found in grass, milk and beef.
To assess the effect of the assumed exposure time and the weathering factor
on the estimates, these time and weather parameters were varied. Reducing the
exposure time or increasing the weathering factor led to results in which overestima
tions in most countries were reduced, thus giving results comparable to the monitor
ing data.

4 0 4 P O S T E R P R E S E N T A T IO N S
T A B L E I. INGESTION D O S E C O M M I T M E N T USING V A R I O U S LIMITS
Whole body dose (mSv/a)
Age group Philippine limits CEC limits IRALF limits
100% a 10%b Baseline 10% c 5%d First year6 Following year
Child 0.095 0.047 0.002 0.076 0.038 0.886 0.149
Teen 0.118 0.031 0.004 0.051 0.025 0.512 0.086
Adult 0.213 0.052 0.007 0.083 0.042 0.853 0.144
a All food at Philippine limits.b All milk at Philippine limits, 10% at Philippine limits. 0 10% milk at CEC limits, 90% at zero,
1% of other foods at CEC limits. d 5 % milk at CEC limits, 95 % at zero,
1 % of other foods at CEC limits, e 100% milk at IRALFs,
5% of other foods at IRALFs, 95% at zero.
Doses to the Philippine population resulting from the ingestion of imported
food containing Chernobyl contamination were calculated using the basic ingestion
dose calculation equation found in the United States Nuclear Regulatory Commission
report, NUREG-0172 [3]. Of interest to Philippine authorities are whole body inges
tion dose commitments for l37Cs and 134Cs using various limits and assumptions
established by the Philippine Nuclear Research Institute and authorized by the Philip
pine Ministry of Health and other international organizations. Table I shows the
comparative ingestion dose commitments using the Philippine limits, the Commis
sion of the European Communities (CEC) limits and the Interim International Radio
nuclide Action Levels for Food (IRALFs) issued by the Food and Agriculture
Organization of the United Nations for 137Cs and l34Cs.

P O S T E R P R E S E N T A T IO N S 405
R EFERENCES
[1] BOONE, F.W., NG, Y .С., PALMS, S.М., Terrestrial pathways of radionuclide particulates, Health Phys. 41 5 (1981) 735-747.
[2] INTERNATIONAL ATOMIC ENERGY AGENCY, Generic Models and Parameters for Assessing the Environmental Transfer of Radionuclides from Routine Releases, Safety Series No. 57, IAEA, Vienna (1982).
[3] HOENES, G.R., SOLDAT, J.K., Age-specific Radiation Dose Commitment Factors for One Year Chronic Intake, Rep. NUREG-0172, Nuclear Regulatory Commission, Washington, DC (1977).


S P E C I A L S E S S I O N
H O T P A R T I C L E S
B. Salbu (Chairman)
(Norway)
After the Chernobyl accident, ‘hot particles’ having specific activities of up to
about 40 kBq/particle were identified in several countries in Europe, including
Austria, Bulgaria, Czechoslovakia, Finland, the Federal Republic of Germany,
Greece, Hungary, Norway, Poland, Sweden and Switzerland. Furthermore, radio
nuclides associated with colloids in rain water were identified in Norway (e.g. Cs
isotopes). Particles containing a large number of radionuclides, including Cs iso
topes, have most often been identified in air filters and on'surfaces of vegetation,
soil and rock, but have also been identified in human lung tissues (Bulgaria).
Essentially two types of hot particles have been found in the Chernobyl fallout:
those associated with mixed fission products originating from the fuel and those con
taining only a few radionuclides, e.g. isotopes of Ru, Ce and Sr. The distribution
and properties of hot particles are expected to vary widely owing to the nature of
the accident and the different distances from the source, as well as to meteorological
factors and microclimate (wet and dry deposition). Information on the area deposi
tion of particles/aerosols is, however, still scarce. Deposition of 5 particles/m2,
with activities per particle of more than 300 Bq, has been reported from Hungary
while in Finland deposition of about 1000-10 000 particles/m2 with activities per
particle higher than 1 Bq has been found.
Several questions concerning hot particles are still to be answered. Except for
fuel type particles, the carrying matrix seems to be difficult to identify, and processes
or interactions taking place during the release, after the release or during transport
(e.g. aerosol coagulation) are difficult to differentiate. Furthermore, information on
transformation processes (e.g. the mobilization of radionuclides due to weathering)
and on the kinetics involved is still very limited.
The discussion centred on the importance of hot particles with respect to sam
pling strategy, transport processes and pathways (biological uptake). Furthermore,
the efficiency of countermeasures was considered, as well as the improvement of
models for assessing transfer and biological uptake of radionuclides after a nuclear
accident.
Sampling strategy
An inhomogeneous distribution of radionuclides should be expected. It was
considered that cascade impactors should be utilized for obtaining information on the
407
4 0 8 S P E C I A L S E S S IO N
size distribution pattern of airborne hot particles; that rain waters should be fractio
nated with respect to particle size; and that solid surface techniques (e.g. electron
microscopy and scanning electron microscopy) are valuable for characterizing the
matrix.
The use of autoradiography and of G M tubes has proved valuable for qualita
tive measurement. Suggestions were made that standardized methods or procedures
should be developed and recommended.
Transport processes
After deposition, different pathways can be assumed: vertical migration to
deeper soil layers, resuspension due to wind erosion, transport by runoff (especially
during snow melt), and root uptake.
The physicochemical forms of the deposited radionuclides are decisive for
binding mechanisms in the soil/litter layer and thereby influence transport, distribu
tion and biological uptake. Furthermore, transformation processes (e.g. weathering)
may change the physicochemical forms of the deposited radionuclides. Relatively
inert hot particles and colloids should behave chemically rather differently from sim
ple ions, especially with respect to binding mechanisms (sorption, complexation,
etc.).
Pathways
The biological uptake of a radionuclide depends on its physicochemical form.
Low molecular weight species are believed to be available for biological uptake,
while particles and colloids are considered more inert. For simple ions root uptake
is considered to be a major transfer process from soil to vegetation, while for rela
tively inert hot particles and colloids resuspension and runoff should be of greater
importance.
Countermeasures
Information on hot particle behaviour is needed in order to establish necessary
countermeasures to reduce resuspension and runoff. Therefore, the effects of possi
ble physical countermeasures (e.g. ploughing, sweeping and protection from inhala
tion of airborne dust) after an accident should also be evaluated.
Improvement of models
Most models for assessing transfer and biological uptake do not cover
processes affecting radionuclides associated with particles and colloids. When such
models are used, owing to the presence of hot particles there will be an overestima

H O T P A R T I C L E S 4 0 9
tion of the transfer coefficients as well as an underestimation of the inhalation term.
Information on hot particles should therefore be considered essential for estimating
the carcinogenic risk due to inhalation, especially where lung deposited particles
contain soft beta emitters (Cs, Sr, Ce) with medium physical half-lives, for which
little is known about the relation of exposure to risk.
Conclusions
(a) Particles emitted from the damaged Chernobyl reactor and containing a variety
of radionuclides (‘hot particles’) were found in air, rain water and deposited
on surfaces and in the lungs of animals and humans.
(b) The occurrence, composition, specific radioactivities and solubilities of
individual radionuclides vary enormously between locations and individual
particles. There is a need for systematic gathering and comparison of such
information on an international basis.
(c) Models attempting to describe the environmental transfer of radionuclides do
not normally take hot particles into account. This may lead to gross overesti
mation of activity transfer in the human food chain and to underestimation of
the activity inhaled by humans in contaminated regions.
(d) Information on the biological effects of inhaled hot particles is scarce, espe
cially where soft beta emitters are involved. Epidemiological long term follow-
up on populations exposed as a result of the Chernobyl accident is essential
with regard to risk assessment for these hot particles.
(e) There is a need for standardization in the monitoring and characterization of
hot particles emitted as a result of nuclear accidents.


S U M M A R Y O F S Y M P O S IU M
I M P O R T A N T IS S U E S
W I T H S I G N I F I C A N C E F O R T H E F U T U R E
Notwithstanding the Chernobyl accident and its consequences, the growth of
the world population and further technological expansion imply a continuing and
probably increasing need for nuclear power in the decades ahead. The possibility of
nuclear accidents in the future has therefore to be recognized.
This symposium gave the participants the opportunity to gain a comprehensive
view of the many aspects of radioactive contamination of the environment following
a major nuclear accident. Nearly all contributions were on the consequences of the
Chernobyl accident; accidents not related to land based nuclear plants were hardly
discussed, probably because the amount of radioactivity that could be released is
usually rather low.
The main points noted by the chairmen and co-chairmen during the sessions
and discussions are summarized below.
International harmonization
The international harmonization of definitions and use of terms, units and acci
dent terminology is apparently not progressing .fast enough to avoid confusion even
at a symposium of this nature. Further improvements are needed in this area in order
to facilitate rapid communication of correct information in accident situations.
A special case relates to the Convention on Early Notification of a Nuclear
Accident and the Convention on Assistance in the Case of a Nuclear Accident or
Radiological Emergency. These Conventions, adopted by the IAEA General Confer
ence in 1986, lay essential duties on the Member States who ratified the Conventions
and on the IAEA. An inherent problem is the definition of how ‘significant’ an
accidental release has to be before neighbouring States should be notified. This mat
ter needs further serious thought so that consensus can be reached.
Attention was also drawn to the problems associated with the application of
current post-accident intervention criteria, e.g. for evacuating populations or
employing agrotechnical measures to reduce the amounts of radionuclides entering
food chains. In addition to cost-benefit analysis, it is necessary to consider more
seriously factors such as the structure of the society affected and the psychological
state of the people.
In order to improve public understanding and acceptance, aspects of public
relations and educational practices should also be given due attention. There was
consensus on the problems of dealing with the mass media after an accident and on
4 1 1

412 S U M M A R Y O F S Y M P O S I U M
the need for greatly improved scientifically based communication with the public
and, indeed, for better educational facilities, especially in relation to environmental
protection generally.
International collaboration
An international post-accident research centre is to be established in the Cher
nobyl critical zone by the Soviet authorities. This new facility would be made avail
able for all types of in situ accident recovery and radioecological studies and for
information exchange in the near future.
Several speakers referred to the need for improved access to accident related
information. Attention was drawn to the forthcoming nine volume publication on
Chernobyl in the USSR and the desirability for this to be made available in languages
other than Russian. Considerable interest was expressed in the radiation monitoring
and methodology programmes already initiated by the IAEA, W H O , the F A O and
U N E P and in the assessment results of UNSCEAR, and in having ready access to
the relevant reports.
The potential value of global maps showing the locations of all significant
nuclear installations, especially in relation to the proximity of agricultural, forestry
and fisheries activities and urban populations, was discussed. It was agreed that
much of the necessary information was already freely available but uncoordinated.
The high costs of dealing with transboundary effects by means of monitoring,
countermeasures, intervention, etc., for a country exposed to serious contamination
originating from beyond its borders were discussed, and the importance of improved
international guidelines and economic provisions for the protection of countries
affected by a transboundary release was stressed.
Research needs
Techniques for monitoring of concentrations of radionuclides in the environ
ment have reached a high degree of reliability and ease of operation, and many
speakers reported on the latest developments. There is, however, a need for rapid
and reliable analytical methods that can be employed in the hectic period following
an accident, especially for measuring beta emitters and actinides. The trend in radia
tion monitoring is towards establishing internationally co-ordinated networks based
on ongoing national activities and supported by intercomparison rounds to ensure
reliability, uniformity and comparability of the data produced.
The need for further study of the nature of ‘hot particles’, e.g. in the form of
micrometre sized uranium fuel particles and non-volatilized fission and activation
products, was stressed by many speakers. It was recognized that the radioecological
behaviour of fallout and discharges is largely dictated by physical chemistry. There
was agreement that much of the variability in measurements of such factors as post-

I M P O R T A N T IS S U E S 4 1 3
accident soil-plant transfer, leaching, etc., could be due to lack of knowledge and
appreciation of the role of particle aggregates. There appeared also to be a need for
clarification of the possible role of inhaled hot particles in short and long term risk
assessment.
Many references were made to the growing importance of models for scenario
prediction and planning. However, their limitations were also recognized, especially
in relation to weather conditions after an accident, which could have a critical
influence on emission transport, fallout, etc. Models, therefore, should not be
regarded as a substitute for on-site monitoring in post-accident situations. There is,
however, a need to further improve models for predicting health risk in relation to
radionuclide concentrations and radiation levels, and especially for estimating
projected exposures, collective dose commitment and long term risk.
Environmental models need further refinement to account for the behaviour of
radionuclides in fragile, oligotrophic environments, such as tundras, grass covered
mountain regions and freshwater lakes, in order to explain the persistence of high
contamination levels in the fauna of these ecosystems, as this has proven to be eco
nomically detrimental to the local populations. Research on remedial measures in
agriculture, such as current studies on the decontamination of sheep and reindeer,
should be intensified.
A number of speakers mentioned possible countermeasures to protect the
populations in affected regions against deposited radioactivity. There is a revival of
research on suitable methods for blocking the entry of radionuclides into food chains
or for their removal from affected organisms. International collaboration and co
ordination on the comparison of costs and effects of possible countermeasures,
including especially the experience gathered by the scientists and authorities in the
USSR, will prove valuable in providing an effective response to accidental releases
of radioactivity in the environment.


C H A I R M E N O F S E S S IO N S
Session 1 Chairman V.N. PETROV Union of Soviet Socialist
Co-Chairman F. LUYKXRepublicsCEC
Session 2 Chairman A. LAMBRECHTS FranceCo-Chairman I.P. LOS’ Union of Soviet Socialist
Session 3 Chairman M.C. BELLRepublicsUnited States of America
Co-Chairman J. ESPINOSA GONZALEZ PanamaSession 4 Chairman I. OTHMAN Syrian Arab Republic
Co-Chairman J. GELEIJNS NetherlandsSession 5 Chairman R. MARTINCIC Yugoslavia
Co-Chairman R.J.C. KIRCHMANN BelgiumSession 6 Chairman A.W. RANDELL FAO
Co-Chairman Z. PIETRZAK-FLIS PolandSession 7 Chairman 0. PAAKKOLA Finland
Co-Chairman U.H. BÁVERSTAM SwedenSession 8 Chairman P.J. WAIGHT WHO
Co-Chairman A.S. MOLLAH BangladeshSession 9 Chairman R. SCHELENZ IAEA
Co-Chairman P. STRAND NorwaySession 10 Chairman J.C. TJELL FAO/IAEA
Co-Chairman A.D. HORRILL United KingdomSession 11 Chairman F.P.W. WINTERINGHAM United Kingdom
Co-Chairman B.G. BENNETT UNSCEARSpecial Session on Hot Particles Chairman B. SALBU Norway
S E C R E T A R I A T O F T H E S Y M P O S I U M
J.C. TJELL Scientific Secretary (FAO/IAEA)R. SCHELENZ Scientific Co-Secretary (IAEA)T. WATABE Scientific Co-Secretary (IAEA)H. SCHMID Symposium Organizer (IAEA)S.P. FLITTON Proceedings Editor (IAEA)E. KATZ Proceedings Editor (IAEA)J.-N. AQUISTAPACE French Editor (IAEA)O.I. MELNIK Russian Editor (IAEA)L. HERRERO Spanish Editor (IAEA)
415


L I S T O F P A R T I C I P A N T S
Al-Hussan, K.
Al Shaibani, H.M.
Al-Taifi, I.
Al-Zaben, S.M.
Albanus, L.
Amaral, E.
Andersson, I.
Andrási, A.
Andriambololona, Raoelina
Appelberg, J.
Agency’s Laboratory,International Atomic Energy Agency,Wagramerstrasse 5, P.O. Box 100,A-1400 Vienna, Austria
Iraq Atomic Energy Commission,P.O. Box 765, Baghdad, Iraq
Agency’s Laboratory,International Atomic Energy Agency,Wagramerstrasse 5, P.O. Box 100,A-1400 Vienna, Austria
Meteorology and Environmental Protection Administration, P.O. Box 1358, Jeddah 21431, Saudi Arabia
Toxicology Laboratory,National Food Administration,Box 622, S-751 26 Uppsala, Sweden
Insituto de Radioproteçâo e Dosimetría,Avenida das Américas Km 11.5,Barra da Tijuca, СЕР 22602,Rio de Janeiro, Brazil
Department of Animal Nutrition and Management,Swedish University of Agricultural Sciences,Box 59, S-230 53 Alnarp, Sweden
Central Research Institute for Physics of the Hungarian Academy of Sciences,
P.O. Box 49, H-1525 Budapest, Hungary
Laboratoire de physique nucléaire et de physique appliquée,
B.P. 4279, 101 Antananarivo, Madagascar
Fôrsvarsdepartementet,S-103 33 Stockholm, Sweden
4 1 7

418 L I S T O F P A R T I C I P A N T S
A ra p is , G .
Ayçik, G.A.
Azimi-Garakani, D.
Bachnes, D.
Bakir, E.E.
Barbera, G.
Barkhudarov, R.M.
Bauman, A.
Bautista, E.
Báverstam, U.
Instituto de Protección Radiológica y Medio Ambiente, Centro de Investigaciones Energéticas,
Medioambientales y Tecnológicas,Avenida Complutense 22,E-28040 Madrid, Spain
Ankara Nuclear Research and Training Center,Atomic Energy Commission,Beçevler, Ankara, Turkey
Paul Scherrer Institute,CH-5232 Villigen PSI, Switzerland
Gesellschaft für Reaktorsicherheit,Schwertnergasse 1,D-5000 Cologne 1, Federal Republic of Germany
Radiology Department, Ministry of Health,Magies El Shaab Street, Cairo, Egypt
Division NED,Centre commun de recherche,1-21020 Ispra, Varese, Italy
Institute of Biophysics,USSR Ministry of Public Health,Zhivopisnaya 46,123182 Moscow, Union of Soviet Socialist Republics
Department for Radiation Protection,Institute for Medical Research and Occupational Health, University of Zagreb,Mose Pijade 158, P.O. Box 291,YU-41000 Zagreb, Yugoslavia
Division of Technical Co-operation Programmes, International Atomic Energy Agency,Wagramerstrasse 5, P.O. Box 100,A-1400 Vienna, Austria
National Institute of Radiation Protection,Box 60204, S-104 01 Stockholm, Sweden
Baxter, M.S. Scottish Universities Research and Reactor Centre, East Kilbride, Glasgow G75 0QU, United Kingdom

L I S T O F P A R T I C I P A N T S 4 1 9
Bell, M.C.
Bennett, B.G.
Bertel, A.
Bezares, M.
Bican, M.
Boeri, G.
Bolyós, A.
Bosevski, V.
Botha, J.C.
Bramad, L.
Brenna, M.
Department of Animal Science,University of Tennessee,P.O. Box 1071,Knoxville, TN 37901-1071, United States of America
United Nations Scientific Committee on the Effects of Atomic Radiation,
Vienna International Centre,Wagramerstrasse 5, P.O. Box 500,A-1400 Vienna, Austria
CEA, Centre d’études du Ripault,В.P. 16, F-37260 Tours, France
Ministerio de Sanidad y Consumo,Paseo del Prado 18, E-28071 Madrid, Spain
Hoechst Austria,Altmannsdorferstrasse 104,A-1121 Vienna, Austria
Direzione Sicurezza Nucleare e Protezione Sanitaria,Comitato Nazionale per la Ricerca e per lo Sviluppo
dell’Energia Nucleare e delle Energie Alternative (ENEA), Via Vitaliano Brancati 48, 1-00144 Rome, Italy
Isotope Laboratory,Institute of Chemistry and Institute of Physics,Kossuth University,P.O. Box 37, H-4010 Debrecen, Hungary
Higher Military Medical Institute,Ulitsa Georgi Sofiski 3, Sofia, Bulgaria
ESKOM,Maxwell Drive,Sandton, South Africa
Gruppo Ambiente,Ente Nazionale per l ’Energia Elettrica,Viale Regina Margherita 137,1-00198 Rome, Italy
Norwegian Food Control Authority,P.O. Box 8187 Dep, N-0034 Oslo 1, Norway

420 L I S T O F P A R T I C I P A N T S
B ru n c l ík , T .
Brynildsen, L.I.
Burnett, B.M.
Byrom, J.A.
Calmet, D.
Caput, C.
Caracciolo, R.
Cervini, A.
Conde, V.
Conti, L.F.C.
Veterinary Research Institute,Hudcova 70, CS-621 32 Brno, Czechoslovakia
Division of Veterinary Services,Ministry of Agriculture,P.O. Box 8007, N-0030 Oslo 1, Norway
Center for Devices and Radiological Health,Food and Drug Administration,5600 Fishers Lane,Rockville, MD 20857, United States of America
Food Safety (Radiation) Unit,Ministry of Agriculture, Fisheries and Food,Room 221, Ergon House,с/o Nobel House, 17 Smith Square,London SW1P 3HX, United Kingdom
Division of Nuclear Fuel Cycle and Waste Management, International Atomic Energy Agency,Wagramerstrasse 5, P.O. Box 100,A-1400 Vienna, Austria
Institut de protection et de sûreté nucléaire,CEA, Centre d’études nucléaires de Fontenay-aux-Roses,B.P. 6, F-92265 Fontenay-aux-Roses, France
Direzione Sicurezza Nucleare e Protezione Sanitaria,Comitato Nazionale per la Ricerca e per lo Sviluppo
dell’Energia Nucleare e delle Energie Alternative (ENEA), Via Vitaliano Brancati 48, 1-00144 Rome, Italy
Instituto Nacional de Investigaciones Nucleares,Carretera México-Toluca, Km 36.5,A.P. 116-006, C.P. 11041,Mexico City, Mexico
Ministerio de Sanidad y Consumo,Paseo del Prado 18, E-28071 Madrid, Spain
Instituto de Radioproteçâo e Dosimetría,Comissâo Nacional de Energía Nuclear,Avenida das Américas Km 11.5,Barra da Tijuca, СЕР 22602,Rio de Janeiro, Brazil

L I S T O F P A R T I C I P A N T S 4 2 1
Costeas, A.
Coughtrey, P.J.
Crossan, I.
Daburon, F.
Daburon, M.L.
Dal, A.H.
Daróczy, S.
Débauché, A.
Dehos, R.
Dekner, R.
Nicosia General Hospital,Nicosia, Cyprus
Associated Nuclear Services Ltd,Eastleigh House, 60 East Street,Epsom, Surrey KT17 1HB, United Kingdom
Health and Safety Executive,St. Peter’s House,Balliol Road, Bootle, Merseyside L20 3LZ,United Kingdom
Laboratoire de radiobiologie appliquée,CEA, Centre d’études nucléaires de Saclay,F-91191 Gif-sur-Yvette, France
Institut de protection et de sûreté nucléaire,CEA, Centre d’études nucléaires de Fontenay-aux-Roses, B.P. 6, F-92265 Fontenay-aux-Roses Cedex, France
State Health Inspectorate,Ministry of Housing, Physical Planning
and the Environment,Dr. van de Stamstraat 2, P.O. Box 450,NL-2260 MB Leidschendam, Netherlands
Isotope Laboratory,Institute of Chemistry and Institute of Physics,Kossuth University,P.O. Box 37, H-4010 Debrecen, Hungary
Institut national des radioéléments,Zoning industriel,B-6220 Fleurus, Belgium
Institute for Radiation Hygiene of the Federal Health Office, Ingolstadter Landstrasse 1,D-8042 Neuherberg, Federal Republic of Germany
Agency’s Laboratory,International Atomic Energy Agency,Wagramerstrasse 5, P.O. Box 100,A-1400 Vienna, Austria

4 2 2 L I S T O F P A R T I C I P A N T S
Dezsô, Z.
Dixon, D.F.
Drábová, D.
Drozhko, E.G.
Edgar, D.
Edvarson, K.
El-Gunied, H.A.
Emmervall, J.
Engel, R.E.
Espinosa González, J.
Etherington, G.
Isotope Laboratory,Institute of Chemistry and Institute of Physics,Kossuth University,P.O. Box 37, H-4010 Debrecen, Hungary
WNKE Environmental Authority,Whiteshell Nuclear Research Establishment,Atomic Energy of Canada Limited,Pinawa, Manitoba ROE 1L0, Canada
Centre of Radiation Hygiene,Institute of Hygiene and Epidemiology,Srobárova 48, CS-100 42 Prague 10, Czechoslovakia
USSR State Committee on the Utilization of Atomic Energy, Staromonetnyj Pereulok 26,109180 Moscow, Union of Soviet Socialist Republics
Safety and Reliability Directorate,United Kingdom Atomic Energy Authority,Wigshaw Lane, Culcheth,Warrington WA3 4NE, United Kingdom
National Institute of Radiation Protection,Box 60204, S-104 01 Stockholm, Sweden
Ministry of Health,P.O. Box 2652, San’a, Yemen
Farmers Union of Agriculture,S-105 33 Stockholm, Sweden
Food Safety and Inspection Service,United States Department of Agriculture,Room 3165, South Building,14th Street and Independence Avenue SW,Washington, DC 20250, United States of America
Instituto de Investigación Agropecuaria de Panamá, Apartado 6A-4391,El Dorado, Panama City, Panama
National Radiological Protection Board,Chilton, Didcot, Oxfordshire OX11 0RQ, United Kingdom

L I S T O F P A R T I C I P A N T S 423
Ettenhuber, E.
Fahmy, M.
Farhadi, F.
Fidanza, R.
Frittelli, L.
Fuller, D.
Garmo, J.
Geleijns, J.
Germán, E.
Ghods-Esphahani, A.
Gill, R.W.
National Board for Atomic Safety and Radiation Protection, Waldowallee 117, DDR-1157 Berlin
Embassy of Egypt,Gallmeyergasse 5, P.O. Box 129,A-1190 Vienna, Austria
Chemical Engineering Department,Sharif University of Technology,Azadi Avenue, Tehran, Islamic Republic of Iran
Departimento della Protezione Civile,Via Ulpiano 11, 1-00193 Rome, Italy
Direzione Sicurezza Nucleare e Protezione Sanitaria,Comitato Nazionale per la Ricerca e per lo Sviluppo
dell’Energia Nucleare e delle Energie Alternative (ENEA), Via Vitaliano Brancati 48, 1-00144 Rome, Italy
Defence Radiological Protection Service,Institute of Naval Medicine,Crescent Road, Alverstoke, Gosport,Hampshire P012 2DL, United Kingdom
Department of Animal Science,Agricultural University of Norway,P.O. Box 25, N-1432 Às, Norway
Nederlands Normalisatie-instituut,Postbus 5059, NL-2600 GB Delft, Netherlands
Paks Nuclear Power Plant,Paks, Hungary
Agency’s Laboratory,International Atomic Energy Agency,Wagramerstrasse 5, P.O. Box 100,A-1400 Vienna, Austria
Bureau of Foods,Food and Drug Administration,200 С Street,Washington, DC 20204, United States of America
G o v a e r t s , P . CEN/SCK,Boeretang 200, B-2400 Mol, Belgium

424 L I S T O F P A R T I C I P A N T S
Grabner, A.
Guentcheva, D.
Gunnered, T.B.
Hall, I.R.
Hammad, F.H.
Hanstein, W.
Harbitz, O.
Hasan, S.S.
Hauske, H.
Heintschel, H.G.
Henrich, E.
Hirose, K.
Abteilung II С 14,Bundesministerium fiir Land- und Forstwirtschaft, Stubenring 1, A-1011 Vienna, Austria
Committee on the Use of Atomic Energy for Peaceful Purposes,
55A Chapaev Street, 1574 Sofia, Bulgaria
Norwegian Institute for Nature Research,Tungasletta 2, N-7004 Trondheim, Norway
Her Majesty’s Industrial Pollution Inspectorate for Scotland, Scottish Development Department,27 Perth Street, Edinburgh EH3 5RB, United Kingdom
Nuclear Regulatory and Safety Centre,Atomic Energy Authority,101 Kasr El-Eini Street, Cairo, Egypt
EG&G GmbH,Hohenlindenerstrasse 12,D-8000 Munich 80, Federal Republic of Germany
Norwegian Food Control Authority,P.O. Box 8187 Dep, N-0034 Oslo 1, Norway
Directorate of Nuclear Safety and Radiation Protection, Pakistan Atomic Energy Commission,P.O. Box 1912, Islamabad, Pakistan
Kerntechnischer Hilfsdienst GmbH,Am Schrócker Tor 1,D-7514 Eggenstein-Leopoldshafen 2,Federal Republic of Germany
Institut für Umweltmedizin der Stadt Wien,Feldgasse 9, A-1080 Vienna, Austria
Abteilung Strahlenschutz,Bundesamt für Lebensmitteluntersuchung und -forschung, Berggasse 11, A-1090 Vienna, Austria
Geochemical Laboratory,Meteorological Research Institute,1-1 Nagamine, Tsukuba, Ibaraki 305, Japan
L I S T O F P A R T I C I P A N T S 425
Hochmann, R.
Holm, G.E.G.
Honegger, P.J.
Horak, O.
Horrill, A.D.
Horsic, E.
Hove, K.
Hu, Zunsu
Hussain, Z.
Jammet, H.
Jansta, V.
Jâ rv in e n , P .
Division of Nuclear Safety,International Atomic Energy Agency,Wagramerstrasse 5, P.O. Box 100,A-1400 Vienna, Austria
Department of Radiation Physics,Lund University,Lasarettet, S-221 85 Lund, Sweden
Nationale Alarmzentrale,Bundesamt fiir Gesundheitswesen,Ackermannstrasse 26,CH-8044 Zurich, Switzerland
Institute of Agriculture,Austrian Research Centre Seibersdorf,A-2444 Seibersdorf, Austria
Merlewood Research Station,Institute of Terrestrial Ecology,Grange-over-Sands, Cumbria LA11 6JU, United Kingdom
Institute for Radiology,Veterinary Faculty, University of Sarajevo,Vojvode Putnika 134, YU-71000 Sarajevo, Yugoslavia
Department of Animal Science,Agricultural University of Norway,P.O. Box 25, N-1432 As, Norway
China Institute for Radiation Protection,P.O. Box 120, Taiyuan, Shansi 030006, China
Institute of Industrial Automation,P.O. Box 1384, Islamabad, Pakistan
CEA, Centre d’études nucléaires de Fontenay-aux-Roses, В.P. 6, F-92265 Fontenay-aux-Roses Cedex, France
Institute of Radioecology and Applied Nuclear Techniques, Garbiarska 2, P.O. Box A-41,CS-040 61 Kosice, Czechoslovakia
Imatran Power Company Ltd,P.O. Box 112, SF-01601 Vantaa, Finland

4 2 6 L I S T O F P A R T I C I P A N T S
Jones, B.
Jones, M.W.
Kanyár, В.
Karacson, P.
Karlberg, O.
Kawai, H.
Kayser, P.
Kerekes, A.
Keszthelyi, Z.
Khangi, F.A.
Department of Clinical Chemistry,Swedish University of Agricultural Sciences,Box 7038, S-750 07 Uppsala, Sweden
Her Majesty’s Inspectorate of Pollution, Department of the Environment,Room A5.32, Romney House, 43 Marsham Street, London SW1P 3PY, United Kingdom
Frédéric Joliot-Curie National Research Institute for Radiobiology and Radiohygiene,
Pentz Károly utca 5, P.O. Box 101,H-1775 Budapest, Hungary
Abteilung B/10,Amt der Niederosterreichischen Landesregierung, Operngasse 21,A-1040 Vienna, Austria
National Institute of Radiation Protection,Box 60204, S-104 01 Stockholm, Sweden
Atomic Energy Research Institute,Kinki University,3-4-1 Kowakae, Higashi-Osaka City,Osaka 577, Japan
Division de la radioprotection,Direction de la santé,1, avenue des Archiducs,L-1135 Luxembourg, Luxembourg
Frédéric Joliot-Curie National Research Institute for Radiobiology and Radiohygiene,
Pentz Károly utca 5, P.O. Box 101,H-1775 Budapest, Hungary
Soy Manager Office,FLR-PROTEIN VEST,Himfy utca 1,H-1118 Budapest, Hungary
Sudan Atomic Energy Commission,P.O. Box 3001, Khartoum, Sudan

L I S T O F P A R T I C I P A N T S 4 2 7
KienzI, K.
Kindi, P.
Kirchmann, RJ.C.
Klik, F.
Kljajic, R.
Knat’ko, V.A.
Kohler, H .
Komarov, V.I.
Konstantinov, Yu.O.
K o p p , P .
Umweltbundesamt,Radetzkystrasse 2,A-1030 Vienna, Austria
Institut fur Kemphysik,Technische Universitât Graz,Petersgasse 16, A-8010 Graz, Austria
Laboratoire Radioécologie,Département Botanique,Université de Liège,Sart Tilman, B-4000 Liège, Belgium
Department of Thermal and Nuclear Power Plants, Technical University,Suchbatarova 4,CS-166 07 Prague 6, Czechoslovakia
Institute for Radiology,Veterinary Faculty , University of Sarajevo,Vojvode Putnika 134, YU-71000 Sarajevo, Yugoslavia
Institute of Physics,Byelorussian Academy of Sciences,Leninskij Prospekt 70,220602 Minsk, Union of Soviet Socialist Republics
Division of Nuclear Fuel Cycle and Waste Management, International Atomic Energy Agency,Wagramerstrasse 5, P.O. Box 100,A-1400 Vienna, Austria
Moscow Centre,World Association of Nuclear Operators, с/o VNIIAES,Ferganskaya 25,105070 Moscow, Union of Soviet Socialist Republics
Research Institute of Radiation Hygiene,RSFSR Ministry of Public Health,Ulitsa Mira 8,197101 Leningrad, Union of Soviet Socialist Republics
Radiation Hygiene Division, Radioecology,Paul Scherrer Institute,CH-5232 Villigen PSI, Switzerland
4 2 8 L I S T O F P A R T I C I P A N T S
Korun, M.
Kumar-Frauendorfer, E.
Lambrechts, A.
Lange, J.
LaRosa, J.
Leising, C.
Leitgeb, R.
Lembrechts, J.F.
Leonard, D.R.P.
Lettner, H.
Jozef Stefan Institute,Jamova 39, P.O. Box 100,YU-61111 Ljubljana, Yugoslavia
Umweltbundesamt,Radetzkystrasse 2,A-1030 Vienna, Austria
Laboratoire de radioécologie des eaux continentales,CEA, Centre d’études nucléaires de Cadarache,B.P. 1, F-13108 Saint-Paul-lez-Durance, France
Bundesministerium für Umwelt, Naturschutz und Reaktorsicherheit,
Husarenstrasse 30, Postfach 120629,D-5300 Bonn, Federal Republic o'f Germany
Agency’s Laboratory,International Atomic Energy Agency,Wagramerstrasse 5, P.O. Box 100,A-1400 Vienna, Austria
Institute for Radiation Hygiene of the Federal Health Office, Ingolstàdter Landstrasse 1,D-8042 Neuherberg, Federal Republic of Germany
Universitât für Bodenkultur,Gregor Mendel-Strasse 33,A-1180 Vienna, Austria
Laboratory for Radiation Research,National Institute of Public Health
and Environmental Protection,Antonie van Leeuwenhoeklaan 9, P.O. Box 1,NL-3720 BA Bilthoven, Netherlands
Fisheries Laboratory,Directorate of Fisheries Research,Ministry of Agriculture, Fisheries and Food,Pakefield Road, Lowestoft, Suffolk NR33 0HT,United Kingdom
Institut fiir Allgemeine Biologie, Biochemie und Biophysik, Universitât Salzburg,Hellbrunner Strasse 34,A-5020 Salzburg, Austria
L I S T O F P A R T I C I P A N T S 429
Li, Xiangbao
Lônsjô, H.
Los’ , I.P.
Lovranich, E.
Lundin, E.
Luykx, F.
Majle, T.
Malayeri, M.
Mansoor, F.
Manuel, H.
Mahringer, F.J.
Ionizing Radiation Division,National Institute of Metrology,11 Hepingli, 7th District, Beijing, China
Department of Radioecology,Swedish University of Agricultural Sciences,Box 7031, S-750 07 Uppsala, Sweden
Medical Academy,All-Union Scientific Centre for Radiation Medicine, Melnikova 53,252050 Kiev, Union of Soviet Socialist Republics
Institute for Radiation Protection,Austrian Research Centre Seibersdorf,A-2444 Seibersdorf, Austria
National Rescue Services Board,Karolinen, S-651 80 Karlstad, Sweden
Commission of the European Communities, Bâtiment Wagner, C354,Plateau du Kirchberg,L-2920 Luxembourg, Luxembourg
National Institute of Hygiene,Chocimska 24, PL-00-791 Warsaw, Poland
Idro-Tehran,29 Sepahbod Gharani Avenue,Tehran, Islamic Republic of Iran
Institute of Industrial Automation,P.O. Box 1384, Islamabad, Pakistan
Gabinete de Proteçâo e Segurança Nuclear,Avenida da República 45-6,P-1000 Lisbon, Portugal
Geotechnisches Institut,Bundesversuchs- und Forschungsanstalt, Arsenal, Faradaygasse 3, P.O. Box 8,A-1030 Vienna, Austria
4 3 0 L I S T O F P A R T I C I P A N T S
M a r in o v , V .
Martín-Calvarro, J.M.
Martincic, R.
Mascanzoni, D.
Maushart, R.
Meisel, S.
Metcalf, P.E.
Miklavzic, U.
Milosevic, Z.
Mirna, A.
Môbius, S.
Laboratory for Radiobiology,Academy of Agriculture,Committee on the Use of Atomic Energy
for Peaceful Purposes,55A Chapaev Street, 1574 Sofia, Bulgaria
Consejo de Seguridad Nuclear,El Justo Dorado 11, E-28020 Madrid, Spain
Jozef Stefan Institute,Jamova 39, P.O. Box 100,YU-61111 Ljubljana, Yugoslavia
Department of Radioecology,Swedish University of Agricultural Sciences,Box 7031, S-750 07 Uppsala, Sweden
Laboratorium Prof. Dr. Berthold,Calmbacher Strasse 22, Postfach 160,D-7547 Wildbad 1, Federal Republic of Germany
Reaktorinstitut Graz,Steyrergasse 17,A-8010 Graz, Austria
Council for Nuclear Safety,P.O. Box 7106,Hennopsmeer 0046, South Africa
Jozef Stefan Institute,Jamova 39, P.O. Box 100,YU-61111 Ljubljana, Yugoslavia
Institute for Radiology,Veterinary Faculty, University of Sarajevo,Vojvode Putnika 134, YU-71000 Sarajevo, Yugoslavia
Agency’s Laboratory,International Atomic Energy Agency,Wagramerstrasse 5, P.O. Box 100,A-1400 Vienna, Austria
Schule fiir Kerntechnik,Kernforschungszentrum Karlsruhe,Postfach 3640,D-7500 Karlsruhe, Federal Republic of Germany

L I S T O F P A R T I C I P A N T S 4 3 1
Mollah, A.S.
Monacelli, G.
Morishima, H.
Mously, K.
Miick, K.
Mueller, H.J.
Muss, M.
Nahdi, K.
Neil, B.
Nguyen, L.
Nimmo-Scott, W.
Institute of Nuclear Science and Technology,Atomic Energy Research Establishment,Savar, P.O. Box 3787,Dhaka 1000, Bangladesh
Direzione Generale Servizi Igiene Pubblica,Ministero della Sanità,Via Liszt 34, 1-00144 Rome, Italy
Atomic Energy Research Institute,Kinki University,3-4-1 Kowakae, Higashi-Osaka City,Osaka 577, Japan
Meteorology and Environmental Protection Administration, P.O. Box 1358, Jeddah 21431, Saudi Arabia
Institute for Radiation Protection,Austrian Research Centre Seibersdorf,A-2444 Seibersdorf, Austria
Reaktorinstitut Graz,Steyrergasse 17,A-8010 Graz, Austria
Institut für allgemeine Biologie, Biochemie und Biophysik, Universitât Salzburg,Hellbrunner Strasse 34,A-5020 Salzburg, Austria
King Fahd University of Petroleum and Minerals,P.O. Box 427, Dhahran 31261, Saudi Arabia
Environmental Safety, Ontario Hydro,757 McKay Road, Box 100,Pickering, Ontario L1W 3C8, Canada
Agency’s Laboratory,International Atomic Energy Agency,Wagramerstrasse 5, P.O. Box 100,A-1400 Vienna, Austria
Ministry of Defence,Empress State Building,Lillie Road, London SW6 1TR, United Kingdom

432 L I S T O F P A R T I C I P A N T S
Nims, W.
Nishiwaki, Y.
Nishizawa, Y.
Noureddine, A.
Nowicki, K.
Ortiz, T.
Othman, I.
Paakkola, O.
Paretzke, H.G.
Pechinger, V.
Peiris, M.A.R.K.
Fachabteilungsgruppe Landesbaudirektion,Amt der Steiermàrkischen Landesregierung, Alberstrasse 1,A-8010 Graz, Austria
Division of Nuclear Safety,International Atomic Energy Agency, Wagramerstrasse 5, P.O. Box 100,A-1400 Vienna, Austria
Energy Research Laboratory, Hitachi Ltd,1168 Moriyama-cho, Hitachi-shi,Ibaraki 316, Japan
Laboratoire d’environnement,Haut commissariat à la recherche,2, boulevard Frantz Fanon,B.P. 1017, Alger Gare, Algeria
Institute of Atomic Energy,PL-05-400 Otwock-Swierk, Poland
Empresa Nacional de Residuos Radiactivos SA, Paseo de la Castellana 135, Madrid, Spain
Atomic Energy Commission,P.O. Box 6091, Damascus, Syrian Arab Republic
Finnish Centre for Radiation and Nuclear Safety, P.O. Box 268, SF-00101 Helsinki, Finland
Institut fur Strahlenschutz,Gesellschaft für Strahlen- und
Umweltforschung mbH München,Ingolstadter Landstrasse 1,D-8042 Neuherberg, Federal Republic of Germany
Central Institute for Meteorology and Geodynamics, Hohe Warte 38, A-1190 Vienna, Austria
Agency’s Laboratory,International Atomic Energy Agency, Wagramerstrasse 5, P.O. Box 100,A-1400 Vienna, Austria

LIST OF PARTICIPANTS 433
Perkins, R .W .
Persson, G.
Pescayre, G.
Pethes, G.
Petrov, V .N .
Piera, G.
Pietruszewski, A.
Pietrzak-Flis, Z.
Prokop, K.
Pucelj, B.
Quirrenbach, F.-J.
Randell, A .W .
Battelle Pacific Northwest Laboratory,
Battelle Boulevard, P.O. Box 999,
Richland, W A 99352, United States o f America
Swedish Defence Research Establishment,
Box 27322, S-102 54 Stockholm, Sweden
CEA, Centre d ’études de Valduc,
В .P. 14, F-21120 Is-sur-Tille, France
Department o f Physiology and Biochemistry,
University o f Veterinary Science,
Landler J. utca 2, H-1078 Budapest, Hungary
Institute o f Applied Geophysics,
USSR State Committee for Hydrometeorology,
Glebovskaya 20b,
107258 Moscow, Union o f Soviet Socialist Republics
Secrétariat général du Comité interministériel
de la sécurité nucléaire,
54, rue de Varenne, F-75007 Paris, France
Central Laboratory for Radiological Protection,
Konwaliowa 7, PL-03-194 Warsaw, Poland
Central Laboratory for Radiological Protection,
Konwaliowa 7, PL-03-194 Warsaw, Poland
Ôsterreichischer Gewerkschaftsbund,
Hohenstaufengasse 10-12, Postfach 155,
A-1010 Vienna, Austria
Jozef Stefan Institute,
Jamova 39, P.O. Box 100,
YU-61111 Ljubljana, Yugoslavia
Vereinigung der Technischen Überwachungsvereinè eV,
Kurfurstenstrasse 56,
D-4300 Essen 1, Federal Republic o f Germany
Food Quality and Standards Service,
Food Policy and Nutrition Division,
Food and Agriculture Organization o f the United Nations,
V ia delle Terme di Caracalla,
1-01000 Rome, Italy

434 LIST OF PARTICIPANTS
Ratheiser, N.
Ratovonjanahary, J.F.
Ringdorfer, F.
Risica, S.
Rodriguez, S.R.
Rohnsch, W.
Rollin, P.
Rossi, J.J.
Roth, K.
Salbu, B.
Samain, J.P.
Sandalls, F.J.
Bundesministerium fur Land- und Forstwirtschaft,
Stubenring 1, A-1011 Vienna, Austria
Laboratoire de physique nucléaire et de physique appliquée,
B.P. 4279, 101 Antananarivo, Madagascar
Bundesanstalt für alpenlàndische Landwirtschaft
Gumpenstein,
A-8952 Irdning, Austria
Laboratorio di Fisica,
Istituto Superiore di Sanità,
Viale Regina Elena 299,
1-00161 Rome, Italy
Dirección General de Energía Nuclear,
Diagonal 17, 29-78, Zona 11,
Apartado Postal 1421, Guatemala City, Guatemala
National Board for Atomic Safety and Radiation Protection,
Waldowallee 117, DDR-1157 Berlin
Comité de radioprotection, Electricité de France,
3, rue de Messine, F-75384 Paris Cedex 08 f, France
Nuclear Engineering Laboratory,
Technical Research Centre o f Finland,
P.O. Box 169, SF-00181 Helsinki, Finland
Landwirtschaftlich-chemische Bundesanstalt,
Trunnerstrasse 1, A-1020 Vienna, Austria
Isotope and Electron Microscopy Laboratories,
Agricultural University o f Norway,
P.O. Box 26, N-1432 Às, Norway
Service de protection contre les radiations ionisantes,
Ministère de la santé publique et de l ’ environnement,
Cité administrative de l ’Etat,
Quartier Vésale 2/3-27, B-1010 Brussels, Belgium
Environmental and Medical Sciences Division,
Building 551, Harwell Laboratory,
United Kingdom Atomic Energy Authority,
■ Didcot, Oxfordshire 0X11 ORA, United Kingdom
LIST OF PARTICIPANTS 435
Sanderson, D .C .W .
Saxén, R.
Schaffra, G.
Schechtner, G.
Schneider, A.
Schônhofer, F.
Schulte, E.H.
Scott, E.M.
Segal, M .G.
Seines, T.D .
Serrano Renedo, J.I.
Siebert, H.-U.
Scottish Universities Research and Reactor Centre,
East Kilbride, Glasgow G75 OQU, United Kingdom
Finnish Centre for Radiation and Nuclear Safety,
P.O. Box 268, SF-00101 Helsinki, Finland
Sanitatsdirektion,
Amt der Niederôsterreichischen Landesregierung,
Teinfaltstrasse 8, A-1010 Vienna, Austria
Bundesanstalt für alpenlàndische Landwirtschaft
Gumpenstein,
A-8952 Irdning, Austria
Physics Department,
Negev Nuclear Research Centre,
Israel Atomic Energy Commission,
P.O. Box 9001, Beersheba 89190, Israel
Federal Institute for Food Control and Research, .
Kinderspitalgasse 15, A-1090 Vienna, Austria
Commission o f the European Communities,
Rue de la Loi 200, B-1049 Brussels, Belgium
Department o f Statistics,
Glasgow University,
Glasgow G12 8QW, United Kingdom
Food Safety (Radiation) Unit,
Ministry o f Agriculture, Fisheries and Food,
Room 221, Ergon House,
с/o Nobel House, 17 Smith Square,
London SW1P 3HX, United Kingdom
National Institute o f Radiation Hygiene,
P.O. Box 55, N-1345 0steràs, Norway
Consejo de Seguridad Nuclear,
El Justo Dorado 11, E-28020 Madrid, Spain
National Board for Atomic Safety
and Radiation Protection,
Waldowallee 117, DDR-1157 Berlin

436 LIST OF PARTICIPANTS
Sigurbjôrnsson, B.
Sinakhom, F.
Sinnaeve, J.
Smetsers, R .C .G .M .
Smit, M .C.B.
Spezzano, P.
Steger, F.
Strachnov, V.
Strand, P.
Subba, Loknath
Joint FAO/IAEA Division o f Nuclear Techniques
in Food and Agriculture,
International Atomic Energy Agency,
Wagramerstrasse 5, P.O. Box 100,
A-1400 Vienna, Austria
Waste Disposal Division,
Office o f Atomic Energy for Peace,
Vibhawaadee Rangsit Road,
Bangkhen, Bangkok 10900, Thailand
Commission o f the European Communities,
Rue de la Loi 200, В -1049 Brussels, Belgium
National Institute o f Public Health
and Environmental Protection,
Antonie van Leeuwenhoeklaan 9, P.O. Box 1,
NL-3720 BA Bilthoven, Netherlands
Atomic Energy Corporation o f South Africa Ltd,
P.O. Box 582, Pretoria 0001, South Africa
Centro Ricerche Energia Saluggia,
Comitato Nazionale per la Ricerca e per lo Sviluppo
dell’Energia Nucleare e delle Energie Alternative (ENEA),
1-13040 Saluggia, Vercelli, Italy
Institute for Radiation Protection,
Austrian Research Centre Seibersdorf,
A-2444 Seibersdorf, Austria
Agency’s Laboratory,
International Atomic Energy Agency,
Wagramerstrasse 5, P.O. Box 100,
A-1400 Vienna, Austria
National Institute o f Radiation Hygiene,
P.O. Box 55, N-1354 0sterâs, Norway
Royal Nepal Academy o f Science and Technology,
New Baneswor, P.O. Box 3323,
Kathmandu, Nepal

LIST OF PARTICIPANTS 4 37
Sztanyik, L.B.
Tahmassian, I.
T aw il, J.J.
Terlunen, J.
Tracy, B.L.
Trojanowski, J.
Tschurlovits, M.
Upendra, D.B.
Uzunov, I.
Van den Eshof, A.
Frédéric Joliot-Curie National Research Institute
for Radiobiology and Radiohygiene,
Pentz Károly utca 5, P.O. Box 101,
H-1775 Budapest, Hungary
Idro-Tehran,
29 Sepahbod Gharani Avenue,
Tehran, Islamic Republic o f Iran
Research Enterprises, Inc.,
2000 Logston Boulevard,
Richland, W A 99352, United States o f America
Geotechnisches Institut,
Bundesversuchs- und Forschungsanstalt, Arsenal,
Faradaygasse 3, P.O. Box 8,
A-1030 Vienna, Austria
Bureau o f Radiation and Medical Devices,
Department o f National Health and Welfare,
775 Brookfield Road,
Ottawa, Ontario K1A IC I , Canada
Power and Brown Coal Board,
Mysia 2, PL-00-423 Warsaw 2, Poland
Atominstitut der Osterreichischen Universitaten,
Schüttelstrasse 115, A-1020 Vienna, Austria
Nuclear Power Corporation o f India Ltd,
South Site,
Bhabha Atomic Research Centre,
Department o f Atomic Energy,
Trombay, Bombay 400 085, India
Department o f Atomic Physics,
Sofia University,
Boulevard Anton Ivanov 5,
1126 Sofia, Bulgaria
Ministry o f Welfare, Health and Cultural Affairs,
Rijswijk, Netherlands
van Hienen, J.F.A. Netherlands Energy Research Foundation,
Westerduinweg 3, Petten, Netherlands
438 LIST OF PARTICIPANTS
Vera-Tartaglia, C .M .
Veselsky, J.C.
Vetrov, V .A .
Vroomen, L.
Waight, P.J.
Wanguru, S.
Ward, G.
Watson, W.S.
Wehrstein-Werner, E.
Western, D.J.
Laboratorio de Radioanálisis,
Dirección Nacional de Tecnología Nuclear,
Ministerio de Industria y Energía,
Soriáno 1014, Montevideo, Uruguay
Agency’ s Laboratory,
International Atomic Energy Agency,
Wagramerstrasse 5, P.O. Box 100,
A-1400 Vienna, Austria
Laboratory for Environmental and Climatic Monitoring,
USSR State Committee for Hydrometeorology
and USSR Academy o f Sciences,
Glebovskaya 20b,
107258 Moscow, Union o f Soviet Socialist Republics
State Institute for Quality Control o f Agricultural Products,
Bomsesteeg 45, P.O. Box 230,
NL-6700 AE Wageningen, Netherlands
Division o f Environmental Health,
World Health Organization,
Via Appia, CH-1211 Geneva 27, Switzerland
Radiation Protection Board,
Ministry o f Health,
P.O. Box 30016, Nairobi, Kenya
Colorado State University,
Fort Collins, CO 80521,
United States o f America
Department o f Clinical Physics and Bio-engineering,
Southern General Hospital,
Govan Road, Glasgow G51 4TF, United Kingdom
Agency’s Laboratory,
International Atomic Energy Agency,
Wagramerstrasse 5, P.O. Box 100,
A-1400 Vienna, Austria
National Power,
Courtenay House, 18 Warwick Lane,
London EC4P 4EB, United Kingdom

LIST OF PARTICIPANTS 439
Winkelmann, I.
Winteringham, F .P.W .
Zepeda-López, E.
Zifferero, M.
Zombori, P.
Institute for Radiation Hygiene o f the Federal Health Office,
Ingolstadter Landstrasse 1,
D-8042 Neuherberg, Federal Republic o f Germany
Darbod, Harlech,
Gwynedd LL46 2RA, United Kingdom
Agency’ s Laboratory,
International Atomic Energy Agency,
Wagramerstrasse 5, P.O. Box 100,
A-1400 Vienna, Austria
Department o f Research and Isotopes,
International Atomic Energy Agency,
Wagramerstrasse 5, P.O. Box 100,
A-1400 Vienna, Austria
Health Physics Department,
Central Research Institute for Physics
o f the Hungarian Academy o f Sciences,
P.O. Box 49, H-1525 Budapest, Hungary


A U T H O R IN D E X
Aaltonen, H.: (1) 23
Ahmad, S.: (1) 368
Andrási, A.: (1) 482
Andrási, G.: (2) 359
Andreeva, V.V.: (2) 96
Andriambololona, Raoelina: (1) 167
Andrianova, G.A.: (1) 179; (2) 17
Aoyama, М.: (1) 141
Arapis, G.: (2) 111
Archimbaud, Y.: (2) 241
Arvela, H.: (1) 23
Ayçik, G.A.: (1) 41
Azevedo, H.L.P.: (2) 389
Azimi Garakani, D.: (1) 302
Baerveldt, A.V.: (1) 361
Bahadur Bam, Bhim: (2) 401
Baig, Z.A.: (1) 368
Bajrakova, A.: (1) 159
Barkhudarov, R.M.: (2) 311
Bartha, T.: (2) 246
Bauman, A.: (2) 75
Baxter, M.S.: (1) 411
Bayer, A.: (1) 373
Belokonski, I.: (1) 159, 168Belot, Y.: (1) 151
Bennett, B.G.: (2) 251
Bernasconi, G.: (1) 381
Bjornstad, H.E.: (1) 171Blakan, I.: (1) 59
Bobyleva, O.A.: (2) 96
Bock, H.: (1) 69
Bee, E.: (2) 319
Bolyós, A.: (1) 393
Bonchev, S.: (1) 159
Bonchev, Ts.: (1) 159, 168
Bondarenko, O.A.: (1) 467
Borzilov, V.A.: (1) 99Bosevski, V.: (1) 159, 168
Bosnjakovic, B.F.M.: (1) 361
Bramati, L.: (1) 474
Bruk, G.Ya.: (1) 81
Brunclik, T.: (1) 371
Brynildsen, L.I.: (1) 485; (2) 191
Buchtela, К.: (1) 69
Bucina, I.: (2) 93
Bullier, D.: (1) 478
Bunzl, K.: (2) 397 Burkart, W.: (2) 37
Burnett, B.M.: (2) 379
Businny, M.G.: (1) 467
Butragueño, J.L.: (1) 369
Byrom, J.A.: (1) 289
Calmet, D.: (1) 51
Camplin, W.C.: (1) 247
Camus, H.: (1) 151
Caput, C.: (1) 151
Cervini, A.: (1) 383
Chernokozhin, E.V.: (1) 99
Chumichev, V.B.: (1) 231
Conti, L.F.C.: (2) 389 Cousi, J.: (2) 241
Crescimanno, L.; (1) 367 Crick, М.: (1) 51
Daburon, F.: (2) 241
Daburon, M.L.: (1) 478 Dal, A.H.: (1) 319
Daróczy, S.: (1) 393
de la Paz, L.R.: (2) 403 de Winkel, J.H.: (2) 163
Dehos, R.: (1) 373
Dekner, R.: (1) 375
Derevyago, I.B.: (2) 244
Dezsô, Z.: (1) 393
Doncheva, B.: (1) 159
Dorrian, M.-D.: (2) 327
Drábová, D.: (2) 93
Duftschmid, K.E.: (2) 339
Dzoreva, М.: (2) 361
4 41

442 AUTHOR INDEX
East, B.W.: (2) 357
Endrulat, H.J.: (1) 405
Engel, R.E.: (2) 371
Espinosa González, J.: (2) 397
Estado, J.F.: (2) 403
Etherington, G.: (2) 327
Ettenhuber, E.: (1) 227, 260, 423; (2)
Failla, L.: (1) 387
Fayart, G.: (2) 241
Fehér, I.: (1) 78
Ferreira, (2) 389
Filev, G.: (1) 159
Foulquier, L.: (1) 353
Frittelli, L.: (2) 301
Fülôp, N.: (2) 359
Gabaraev, V.N.: (2) 244
Gauthier, D.: (1) 151
Geleijns, J.: (1) 361Germán, E.: (1) 78
Gerzabek, M.H.: (2) 29
Ghods-Esphahani, A.: (1) 457, 476, 4'
Giacomelli, R.: (2) 99
Gill, R.W.: (2) 367
Gôlge, T.: (1) 41
Gordeev, K.I.: (2) 311
Gôrlich, W.: (2) 37
Gorobets, L.A.: (2) 239
Goyenola, R.: (1) 381
Grass, F.: (1) 69
Grauby, A.: (2) 211
Groche, K.: (1) 423
Gul’ko, G.M.: (2) 96, 351Gunnerod, T.B.: (1) 59
Haak, E.: (2) 151
Hall, I.R.: (1) 297
Hansen, H.S.: (2) 181
Harbitz, O.: (2) 191, 319
Hasan, S.S.: (1) 368Henrich, E.: (2) 141
Hinkovski, Z.: (2) 361
Hirose, K.: (1) 141
Hochmann, R.: (1) 304
Hôlgye, Z.: (2) 93
Hôlzer, F.: (2) 55
Horak, O.: (2) 29
Horrill, A.D.: (1) 205
Hórsic, E.: (2) 75, 248
Hove, K.: (1) 215; (2) 181
Hu, Zunsu: (1) 345
Ignatenko, E.I.: (1) 309
Iranzo, E.: (2) 111
Izraehl’, Yu.A.: (1) 3, 85
Jacob, P.: (2) 289
Jansta, V.: (1) 173
Jàrvinen, P.: (1) 225
Jirásek, V.: (1) 371
Johnson, J.E.: (2) 173
Johnson, W.: (2) 371
Jones, M.W.: (1) 335
Jurk, М.: (1) 260
Kajro, I.A.: (2) 96, 351
Kanyár, В.: (1) 277; (2) 173, 359 Karlberg, О.: (1) 469
Kasimovskij, A.A.: (1) 179
Katrich, I.Yu.: (1) 231
Kaul, A.: (1) 373
Kawai, H.: (1) 257 Kelemen, E.: (2) 359
Kemenes, L.: (1) 78
Kerekes, A.: (2) 173, 359
Keszthelyi, Z.: (2) 173 Keyser, R.M.: (1) 494
Khristova, М.: (1) 159 Klepikova, N.V.: (1) 99
Kljajic, R.: (2) 75, 248
Knat’ko, V.A.: (1) 449
Koga, T.: (1) 257
Kohler, H.: (1) 51
Kolusheva, T.: (1) 168 Komarikov, I.Yu.: (2) 96
Komarov, V.I.: (1) 309; (2) 3
Konstantinov, Yu.O.: (1) 81
Kopp, P.M.: (2) 37
Korelina, N.F.: (1) 81

AUTHOR INDEX
Korun, М.: (1) 378, 492
Korzun, V.N.: (2) 239, 244
Kovács, L.: (2) 359
Kovgan, L.N.: (2) 96
Kralovanszky, U.P.: (2) 173
Kramer, G.H.: (2) 63
Krekling, T.: (1) 171
Kümmel, М.: (1) 260; (2) 55
•Lada, W.: (2) 83
Lambrechts, A.: (1) 353
LaRosa, J.: (1) 457 Leising, C.: (2) 103
Leitgeb, R.: (2) 234
Lembrechts, J.F.: (2) 163
Leonard, D.R.P.: (1) 247
Lettner, H.: (J) 193
Lien, H.: (1) 171
Likhtarev, I.A.: (2) 96, 239, 244, 351Lindley, D.K.: (1) 205
Linsley, G.S.: (1) 51
Litvinets, L.A.: (2) 244
Lodhi, N.P.K.: (1) 368
Lônnig, М.: (1) 423
Lônsjô, H.: (2) 151
López, G.: (1) 369
Lorinc, М.: (1) 78Los’, I.P.: (1) 467; (2) 96, 244
Lotfi, М.: (1) 302
Lovranich, E.: (1) 482
Lucchese, М.: (1) 367
Luykx, F.: (2) 211, 269
Maffei, С.: (1) 474Malátová, I.: (2) 93
Mancioppi, S.: (1) 302
Manushev, В.: (1) 159
Marinov, V.: (2) 361
Marschner, P.: (1) 227
Marti, J.M.: (2) 111
Martín-Calvarro, J.M.: (1) 369
Martín-Matarranz, J.L.: (1) 369
Martincic, R.: (1) 378, 492
Mascanzoni, D.: (2) 47
Matyjek, М.: (1) 457
Maushart, R.: (1) 439
McGill, P.R.: (1) 297
Medinets, V.I.: (1) 231
Mihalj, A.: (2) 75
Miklavzic, U.: (1) 378
Milosevic, Z.: (2) 75, 248
Minev, L.: (1) 159, 168
Mirna, A.: (1) 477
Mollah, A.S.: (1) 472
Monacelli, G.: (1) 367
Morishima, H.: (1) 257
Moskalev, O.S.: (1) 81
Mück, K.: (2) 29, 339
Müller, H.: (2) 289
Nagy, J.: (1) 393
Nagy, M.: (1) 393 Németh, I.: (1) 482
Nikitin, A.I.: (1) 231 Niki, I.: (1) 277
Nishiwaki, Y.: (1) 257
Niwa, T.: (1) 257
Noureddine, A.: (1) 72
Novak, D.: (1) 467
Nowicki, K.: (1) 175
Oíejnik, R.N.: (2) 17 Ostby, G.: (1) 171
Ouvrard, R.: (1) 304
Paakkola, O.: (1) 267 Pailly, М.: (1) 353
Palattao, M.V.: (2) 403 Pandolfi, G.: (1) 474
Parats, A.N.: (2) 239
Paretzke, H.G.: (2) 289
Parkhomenko, V.I.: (1) 81 Paskalev, Z.: (1) 159
Pázsit, A.: (1) 393
Pechenikova, Z.: (1) 159 Pen’kov, A.A.: (2) 239 Perkins, R.W.: (1) 111 Pethes, G.: (2) 246
Petrov, V.N.: (1) 85

444 AUTHOR INDEX
Piccardo, V.: (1) 367
Piermattei, S.: (1) 302
Pietruszewski, A.: (1) 487
Pietrzak-Flis, Z.: (2) 83
Pitiot, С.: (1) 478
Poslovin, A.L.: (1) 179
Procházka, H.: (1) 371
Prôhl, G.: (2) 289
Proskuryakov, A.G.: (1) 309
Pucelj, B.: (1) 378
Rabedaoro, G. Ramonjy: (1) 167
Radev, S.: (1) 159, 168
Radeva, V.: (1) 168
Rahman, M.A.: (1) 368
Rahman, M.M.: (1) 472
Ramzaev, P.V.: (1) 81
Randecker, V.: (2) 371
Randrianasolo, E.: (1) 167
Rantavaara, A.: (1) 23Ratheiser, N.: (2) 234
Ratovonjanahary, J.F.: (1) 167
Repin, V.S.: (1) 467; (2) 96, 239, 351
Riise, G.: (1) 171
Ringdorfer, F.: (2) 236
Robertson, D.E.: (1) 111
Robertson, I.: (2) 357
Romanenko, A.E.: (2) 239, 351
Rosén, К.: (2) 151
Rosenstein, М.: (2) 379
Rossi, J.J.: (2) 203Rudas, P.: (2) 246
Rulik, P.: (2) 93
Russev, G.: (1) 168
Saglo, V.I.: (2) 239
Salbu, В.: (1) 171
Samek, D.: (2) 75
Sandalls, F.J.: (2) 129
Sanderson, D.C.W.: (1) 411
Sano, T.: (2) 301
Savkin, M.N.: (2) 311
Saxén, R.: (1) 23
Schechtner, G.: (2) 141
Schelenz, R.: (1) 375, 457, 477
Schmerbeck, S.: (1) 405
Schônhofer, F.: (2) 231
Scott, E.M.: (1) 411
Secchi, S.: (1) 367
Sedunov, Yu.S.: (1) 99
Severov, D.A.: (1) 85
Shandala, N.K.: (2) 96, 351
Siebert, H.-U.: (1) 227, 260, 423; (2) 55
Skogland, T.: (1) 59
Slavov, S.: (1) 159
Sokolovskij, A.S.: (1) 449
Solov’ev, M.S.: (1) 81
Spezzano, P.: (2) 99
Steger, F.: (1) 482; (2) 339
Stepanenko, V.N.: (2) 96
Stoilova, S.: (1) 159
Stoutjesdijk, J.F.: (2) 163
Strachnov, V.: (1) 375
Strand, P.: (1) 215, 485; (2) 181, 191, 319Stúr, D.: (1) 277
Suárez-Antola, R.: (1) 381
Subba, Loknath: (2) 401
Sugimura, Y.: (1) 141
Sztanyik, L.B.: (1) 277; (2) 359
Tawil, J.J.: (2) 217Thiele, J.: (1) 423
Thomas, C.W.: (1) 111
Tipple, J.R.: (1) 247
Tolokonnikov, A.V.: (1) 179
Tommasino, L.: (1) 302
Tracy, B.L.: (2) 63
Tschirf, E.: (1) 69
Tschurlovits, М.: (1) 69
Tsenova, T.: (1) 159
Tveten, U.: (2) 191
Ugedal, О.: (1) 59Ugolev, 1.1.: (1) 449
Unfried, E.: (1) 69
Urbanich, E.: (1) 482
Uzunov, I.: (1) 168
Vakulovskij, S.М.: (1) 231

AUTHOR INDEX
van Ginkel, J.H.: (2) 163
van Hienen, J.F.A.: (1) 319
van Lith, D.: (1) 319, 361
Vasil’ev, A.Yu.: (2) 96 Vasilev, G.: (1) 159
Velikov, V.: (1) 159
Vera-Tartaglia, C.M.: (1) 381
Verry, М.: (1) 478
Veselsky, J.C.: (1) 457, 476, 477
Vetrov, V.A.: (1) 179; (2) 17
Vianna, M.E.C.M.: (2) 389 Vojtsekhovich, O.V.: (1) 231
Vuori, S.J.V.: (2) 203
Waight, P.J.: (2) 261
Ward, G.M.: (2) 173
Watson, W.S.: (2) 354
Weiss, D.: (2) 55
Winkelmann, I.: (1) 405
Wirdzek, S.: (1) 173
Wirth, E.: (2) 103
Yamshchikov, S.I.: (1) 179
Young, J.A.: (1) 111
Zehnder, H.J.: (2) 37
Zelensky, A.V.: (1) 467
Zhamozdik, M.E.: (1) 449
Zhesko, T.V.: (1) 81
Zhu, S.: (1) 477 Zombori, P,: (1) 78, 482


IN D E X O F P A P E R S A N D P O S T E R S B Y N U M B E R
IAEA/SM/306/ Volume Page IAEA/SM/306/ Volume Page
1 1 289 40 1 215
2 2 163 41 1 59
3 1 439 43 1 205
4 2 29 44 2 129
5P 1 367 45 1 319
6 2 339 46P 2 231
7P 1 387 47P 1 482
8 1 449 48P 1 297
9P 1 175 49 1 335
10 2 211 50 2 37
I IP 1 368 52 1 345
12P 1 381 54P 1 173
13P 1 378 55P 1 487
14P 1 492 57 2 203
15 1 247 58P 1 225
16P 2 234 59P 2 357
17 2 141 60 1 193
18P 2 236 61 2 55
19 2 371 62 1 423
20P 1 472 63P 1 260
21P 1 304 64P 1 227
22P 2 397 65 1 151
23P 1 474 66 1 353
24P 2 99 67 2 103
25 1 41 68P 1 302
26 2 289 69 2 389
27 2 301 70P 2 403
28 2 47 71P 1 69
29 2 327 72 2 217
30P 2 354 75 1 277
31P 1 371 76P 2 359
32 2 151 77 2 63
33 2 83 78P 1 478
34 2 379 79P 2 241
35P 1 171 80P 1 72
36 2 191 81P 2 248
37P 1 485 82 2 75
38 2 319 84 1 23
39 2 181 87P 1 383
4 47

Page
179
311
269
3
267
367
3
111261
141
309
246
93
411
239
244
467
96
351
469
494
81
78
INDEX OF PAPERS AND POSTERS BY NUMBER
Volume
2
Page
361
51
457
477
476
375
251
159
361
168
167
111173
373
405
257
393
369
401
85
99231
17
IAEA/SM/306/
117
119
120 121 122123
124
125
126
129
131
136P
137P
138
140P
141P
142P
143P
144P
146P
148P
149P
150P
Volume
12211221211221221221111

S U B J E C T IN D E X
Page numbers refer to the abstracts of papers and first pages of posters in which the citations
occur. Upright figures denote citations in Vol. 1; italic figures denote citations in Vol. 2.
acceptable radiation dose 203, 261, 311
accidental releases of radionuclides 3, 85,
99
aerial transport models 85, 99, 175
agricultural countermeasures 3, 103, 111,
129, 141, 151, 163, 173, 191, 361
dose effects 191, 203
airborne gamma surveys 3, 405, 411
Austria 69, 193, 482, 29, 141, 231, 234,
236, 339
Bangladesh 472
body burden
caesium isotopes 81, 159, 304, 63,
327, 339, 354, 357, 359
radionuclides 159
Brazil 389
Bulgaria 159, 168, 361
134Cs/l37Cs 3, 23, 41, 227
l37Cs/90Sr 23, 141
caesium isotopes in
air 41, 72
bread 302
caribou 63
cattle 23, 75, 173, 191, 389
fish 191, 319
goats 59, 181
humans 81, 159, 304, 63, 244, 251,
327, 339, 354, 357
lichens 59, 179, 63
milk 23, 41, 59, 193, 297, 55, 93, 96,
99, 173, 234, 241, 311, 319, 339,
354, 361, 389, 397, 460
mosses 393
mushrooms 23, 59
mussels 72
peat ash 225
plants 17, 29, 37, Al, 75, 141
reindeer 59, 485, 191, 319
seaweed 72
sheep 59, 215, 289, 485, 173, 181,
191, 236, 241, 354, 361
water 41, 72
wild berries 23
Canada 63
change in food habits 191, 203, 319
China 345
chromosomal aberrations 59
Codex Alimentarius Commission 261
cost of decontamination of
agricultural products 103, 191
food 103, 191, 203, 231
cost of food monitoring 231
Czechoslovakia 173, 371, 93
decontamination of
animals by feed additives 103, 129,
173, 181, 191, 234, 236, 239, 241,
246
equipment 3, 217
food 103, 191, 203, 211, 234, 248,
361
humans 244
land 103, 111
nuclear reactor sites 217
rural areas 3, 217
dose assessment models 51, 175, 387, 47,
251, 289, 301, 311, 327
EEC 51, 211, 269
effective dose equivalent commitment
251, 311, 319, 339
environmental radionuclide database 361,
371, 373
field spectroscopic surveys 378, 439, 469,
474, 482
449

450 SUBJECT INDEX
Finland 23, 225, 267, 203
foliar uptake in plants 37
food consumption statistics 261, 269, 319,
327, 339, 371
France 151, 353, 478, 241
German Democratic Republic 227, 260,
423, 55
Germany, Federal Republic of 373, 405,
439, 494, 103, 289
hot particles
characteristics 111, 5
general 407
in air 168
in lung fibroblasts 168
inhalation 168
human exposure doses
external 3, 23, 81, 225, 227, 467, 289,
311
internal 3, 23, 69, 81, 247, 297, 302,
304, 47, 55, 63, 83, 289, 311, 354,
357, 403
measurement 467
total 251
Hungary 78, 277, 393, 482, 37, 173, 246
IAEA 304, 375, 457, 476, 477
intervention levels
animal feed 269, 379
food for consumption 261, 269, 311,
371
food in trade 261, 269, 371, 379, 389,
397, 401
iodine isotopes in
air 41, 151, 351
milk 41, 297, 75, 93, 99, 241, 351
precipitation 151
thyroid glands 159, 351
water 41
iodine washout 151
Italy 302, 367, 387, 99
Japan 141, 257
Madagascar 167
Mexico 383
model validation 51
natural radioactivity 167
Nepal 401
Netherlands 319, 361, 163
Norway 59, 171, 215, 485, 181, 191, 319
nuclear emergency planning 319
Pakistan 368
Panama 397
Philippines 403
plutonium, radiochemical analysis 457
Poland 175 , 487 , 83
prevention of food chain contamination
choice of crops 129, 141, 151, 163
fertilizers/liming 111, 129, 141, 151,
163
food condemnation 103, 191, 203
food processing 103, 111, 129, 248
ploughing 111, 151
radionuclide analysis 72, 267, 277
field methods 289, 378, 381, 439, 469
intercalibration 267, 375
software 494
standardization 361, 487, 492, 494
radionuclide content in
aerosols 85, 111, 141
air 3, 23, 69, 78, 85, 99, 111, 141, 3
Alpine pasture 193
biota 3, 59, 179
food 2, 59, 159, 193, 247, 289, 297,
302, 75, 83, 327, 371
forest ecosystems 179, 3
ingestion 63, 75, 83, 319, 327, 361, 403
lake sediments 59, 231, 353
seaweed 72
soil 3, 23, 59, 81, 179, 193, 205, 215,
227
water 3, 59, 231, 260, 353
radionuclide fallout 3, 23, 59, 78, 85, 141,
173, 179, 193, 205, 225, 231, 277,
405, 3, 75, 251, 311
radionuclide monitoring
environmental biomonitoring 393
environmental monitoring
methods 277, 309, 319, 345, 361,
393, 423, 439, 449, 472, 487

SUBJECT INDEX 4 51
strategies 319, 335, 345, 367, 368,
369, 371, 373, 381
methods for
air 309, 478
animals 289, 485
deposits 467, 469, 474
feed 289
food 289
radionuclide transfer models 51, 205, 215,
17, 47, 55, 63, 96, 251
radionuclide transfer to milk 96, 99, 173,
234, 241, 311, 319
radionuclide uptake in
animals 63, 163, 173, 181, 234, 236,
241
fish 23, 59, 247
humans 63, 75, 244
plants 23, 173, 179, 193, 17, 37, 47,
141, 151, 163, 173, 191
radionuclides
environmental migration 3, 3
particle chemistry 173
soil chemistry 171, 173, 179, 3, 29, 96
soil leaching 171, 173, 179, 3
relocation of people, criteria for 3
risk-benefit assessment 387, 103, 191,
203, 231, 367
soil-plant transfer factors 17, 29, 47, 151,
163
Spain 369, 111
^Sr
radiochemical analysis' A l l
spectrometric determination 449
strontium isotopes in
milk 96
mushrooms 23
wild berries 23
surface water contamination model 260
Sweden 469, 151
Switzerland 37
thermonuclear tests 111, 215
tritium in
precipitation 257
River Rhône 353
Turkey 41
Union of Soviet Socialist Republics 3, 81,
85, 99, 179, 231, 309, 449, 467, 3, 17,
96, 239, 244, 311, 351
United Kingdom 72, 205, 247, 289, 297,
335, 411, 129, 327, 354, 357
United States of America 111, 217, 371,
379
UNSCEAR 251
uranium, radiochemical analysis 476
Uruguay 381
WHO 261
Yugoslavia 378, 467, 75, 248

HOW TO ORDER IAEA PUBLICATIONS
A n exclusive sales agent fo r IA E A publications, to w h o m all ordersand inquiries should be addressed, has been appointed in th e fo llo w in g c o u n try :
U N IT E D S T A T E S O F A M E R IC A U N IP U B . 4611-F A ssem b ly D riv e , L a n h a m , M D 2 0 7 0 6 -4 3 9 1
In th e fo llo w in g countries IA E A publications m ay be purchased fro m the sales agents or booksellers listed or th rough m ajor local booksellers. P aym en t can be m ade in local currency or w ith U N E S C O coupons.
A R G E N T IN A C o m is ió n N a c io n a l de Energ ía A tó m ic a , A ven id a del L ib e rta d o r 8 2 5 0 , R A -1 4 2 9 Buenos A ires
A U S T R A L IA H u n te r P u b lica tio n s , 5 8 A G ip p s S tre e t, C o llin g w o o d , V ic to ria 3 0 6 6B E L G IU M S ervice C o u rr ie r U N E S C O , 2 0 2 , A v en u e du R o i, B -10 6 0 Brussels
C H IL E C o m is ió n C h ilen a de E nergía N u c le a r, V e n ta de P u b licac io n es, A m u n ate g u i 9 5 , Casilla 1 8 8 -D , Santiago
C H IN A IA E A P u b lica tio n s in C hinese:C h in a N u c le a r E n erg y In d u s try C o rp o ra tio n ,T ra n s la t io n S e c tio n ,P.O . B ox 2 1 0 3 , B eijingIA E A P u b lica tio n s o th e r th a n in C hinese:C h in a N a tio n a l P u b lica tio n s Im p o r t & E x p o rt C o rp o ra tio n , D e u tsc h e A b te ilu n g , P .O . B o x 8 8 , B e ijing
C Z E C H O S L O V A K IA S .N .T .L ., M ik u lan d sk a 4 , C S -1 1 6 8 6 Prague 1A lfa , Pub lishers , H u rb a n o v o n ám estie 3 , C S -815 8 9 B ratis lava
F R A N C E O ff ic e In te rn a tio n a l de D o c u m e n ta tio n e t L ib r a ir ie ,4 8 , rue G ay -Lussac, F -7 5 2 4 0 Paris C edex 0 5
H U N G A R Y K u ltu r a , H u n g a rian Foreign T ra d in g C o m p a n y , P .O . B o x 1 49 , H -13 8 9 B udapest 6 2
IN D I A O x fo rd B o o k and S ta t io n e ry C o ., 17, P ark S tre e t, C a lc u tta -7 0 0 016 O x fo rd B o o k and S ta tio n e ry C o .,S c in d ia H o u se , N e w D e lh i-110 001
IS R A E L H e ilig e r & C o . L td .2 3 K e re n H ayesod S tre e t, Jerusalem 9 4 1 8 8
IT A L Y L ib re ría S c ie n tific a , D o t t . L u c io d e B iasio " a e io u " , V ia M era v ig li 16, 1-20123 M ila n
J A P A N M a ru z e n C o m p an y , L td , P .O . B o x 5 0 5 0 ,1 0 0 -3 1 T o k y o In te rn a tio n a lP A K IS T A N M irz a B o o k A g en cy, 6 5 , S h ah rah Q u a id -e -A za m , P.O . B ox 7 2 9 , L a h o re 3
P O L A N D A rs P o lo n a -R u c h , C é n tra la H a n d lu Z a g ra n ic zn e g o , K ra k o w s k ie P rzed m iesc ie 7, P L -0 0 -0 6 8 W arsaw
R O M A N IA lle x im , P O . B ox 136*137, B ucharestS O U T H A F R IC A V a n S ch a ik B o o k s to re (P ty ) L td , P .O . B o x 7 2 4 , P re to r ia 0 0 0 1
S P A IN D ia z d e S antos , Lagasca 9 5 , E -2 8 0 0 6 M a d rid D ia z de S an to s , Balm es 417 , E -0 8 0 2 2 B arcelo n a
S W E D E N A B F ritz e s K u n g l. H o v b o k h a n d e l, F redsgatan 2 , P .O . B o x 1 6 3 5 6 , S -103 2 7 S to c k h o lm
U N IT E D K IN G D O M H M S O , P u b lica tio n s C e n tre , A g en cy S ec tio n , 51 N in e E lm s Lane, L o n d o n S W 8 5 D R
U S S R M e z h d u n a ro d n a y a K n ig a ,S m o le n s k a y a -S e n n a y a 3 2 -3 4 , M o s c p w G -2 0 0Y U G O S L A V IA Jugoslovenska K n jig a , T e ra z ije 2 7 , P.O . B ox 3 6 , Y U -1 1 0 01 B elgrade
■ Orders fro m countries w here sales agents have n o t y e t been appo in ted and
■ 1 requests fo r in fo rm atio n should be addressed d ire c tly to :
о □Л ^ D iv ision o f Publications0) ® AИ B p íí In te rn a tio n a l A to m ic Energy AgencyCMоóО)
Ч к1 Wagramerstrasse 5, P.O. Box 100, A -1 4 0 0 V ien n a , A ustria

NUCLEAR SAFETY
INFORMATION LIBRARY
P L E A S E R E T URN
A2Ô43

IN T E R N A T IO N A L A T O M IC E N E R G Y A G E N C Y V IE N N A , 1 9 9 0