Using ecosystem services mapping for marine spatial planning in southern Chile under scenario...
13
Using ecosystem services mapping for marine spatial planning in southern Chile under scenario assessment Luis Outeiro a,b,n , Vreni Häussermann c,d , Francisco Viddi e,f , Rodrigo Hucke-Gaete e,g , Günter Försterra c,d , Hugo Oyarzo h , Klaus Kosiel i , Sebastian Villasante j,k a University of Los Lagos, Department of Social Sciences, Campus Osorno, Osorno, Chile b UFRN - Univ. Fed. do Rio Grande do Norte. Departamento de Engenharia Civil Natal - RN - Brasil c Escuela de Ciencias del Mar, Facultad de Recursos Naturales, Pontificia Universidad Católica de Valparaíso, Valparaíso, Chile d Huinay Scientific Field Station, PuertoMontt, Chile e Instituto de Ciencias Marinas y Limnológicas, Universidad Austral de Chile, Valdivia, Chile f Marine Conservation Program Officer, WWF, Valdivia, Chile g NGO, Centro de Ballena Azul, Valdivia, Chile h University of Los Lagos, Dept. of Marine Ecology, Campus Osorno, Osorno, Chile i Ex-Marine Spatial Planning Officer, Regional Government of Los Lagos, Puerto Montt, Chile j University of Santiago de Compostela, Faculty of Political Sciences, A Coruña, Spain k Campus do Mar-International Campus of Excellence, Pontevedra, Spain article info Article history: Received 19 September 2014 Received in revised form 10 March 2015 Accepted 14 March 2015 Keywords: Spatial distribution of marine ecosystem services Ecotourism and recreation Habitat-forming species Wildlife-watching of endangered species InVEST marine models Chiloe abstract This study presents an empirical example of how ES can be incorporated into MSP in developing countries, in particular in the Southern region of Los Lagos (Chile).This paper aims to: (a) assess the overlapping incompatibilities within each zoning area, (b) calculate the importance score of the three key ES selected, (c) assess the importance scores of the ES and develop plausible future scenarios for marine zoning. Here, we use InVEST marine models to spatially map the distribution of marine ES (ecotourism and recreation, wildlife endangered species, and habitat-forming species). Taking the current proposal of the MSP as a baseline scenario, two plausible hypothetical future scenarios were also developed based on policies and decision-making trends, and the results of the ES importance score values within each zoning area. The results of this paper indicate that the environmental conservation-aboriginal develop- ment scenario would be considered as the more appropriate future projection in terms of securing the three key ES analysed in the region. However, due to changes in the economic development paradigm for the Inner Sea of Chiloe, decision makers, the scientific community and industry representatives are facing a major challenge in allocating appropriate areas to secure ES which requires a holistic perspective. & 2015 Elsevier B.V. All rights reserved. 1. Introduction Twenty years after the first Earth Summit, the vast majority of the world’ s nations declared that human activities were dismantling the Earth’ s ecosystems at an alarming rate (Cardinale et al., 2012), and exceeding the boundaries of what is considered safe for the planet (Rockström et al., 2009; Steffen et al., 2015). The management and conservation of the global oceans requires the synthesis of spatial data on distribution and intensity of human activities, along with the consequential impacts of these activities on marine ecosystems (Halpern et al., 2008; Outeiro and Villasante, 2013). In this context, MSP is an effective tool to establish a more rational organisation of marine space, including its uses and the interactions between its users, in order to balance the demands for development with the need to protect marine ecosystems, as well as achieve social and economic objectives under a participatory and planned approach (CRMC (Coastal Resources Management Council), 2010). This facilitates the identification of human use hotspots and highlights regions where it is necessary to assess the compatibility of various activities (Liquete et al., 2013). Unfortu- nately, until now the connection between ES and MSP has not received much attention in the scientific literature, although several scientific publications have identified and discussed advances in MSP (Ehler and Douvere, 2010; Flannery and Ó Cinnéide, 2012; Halpern et al., 2012; Jay et al., 2012), the integra- tion of ES in the MSP process is still largely unexplored (Rosenthal et al., 2014). Contents lists available at ScienceDirect journal homepage: www.elsevier.com/locate/ecoser Ecosystem Services http://dx.doi.org/10.1016/j.ecoser.2015.03.004 2212-0416/& 2015 Elsevier B.V. All rights reserved. n Corresponding author. E-mail address: [email protected] (L. Outeiro). Please cite this article as: Outeiro, L., et al., Using ecosystem services mapping for marine spatial planning in southern Chile under scenario assessment. Ecosystem Services (2015), http://dx.doi.org/10.1016/j.ecoser.2015.03.004i Ecosystem Services ∎ (∎∎∎∎) ∎∎∎–∎∎∎
Transcript of Using ecosystem services mapping for marine spatial planning in southern Chile under scenario...

Using ecosystem services mapping for marine spatial planningin southern Chile under scenario assessment
Luis Outeiro a,b,n, Vreni Häussermann c,d, Francisco Viddi e,f, Rodrigo Hucke-Gaete e,g,Günter Försterra c,d, Hugo Oyarzo h, Klaus Kosiel i, Sebastian Villasante j,k
a University of Los Lagos, Department of Social Sciences, Campus Osorno, Osorno, Chileb UFRN - Univ. Fed. do Rio Grande do Norte. Departamento de Engenharia Civil Natal - RN - Brasilc Escuela de Ciencias del Mar, Facultad de Recursos Naturales, Pontificia Universidad Católica de Valparaíso, Valparaíso, Chiled Huinay Scientific Field Station, PuertoMontt, Chilee Instituto de Ciencias Marinas y Limnológicas, Universidad Austral de Chile, Valdivia, Chilef Marine Conservation Program Officer, WWF, Valdivia, Chileg NGO, Centro de Ballena Azul, Valdivia, Chileh University of Los Lagos, Dept. of Marine Ecology, Campus Osorno, Osorno, Chilei Ex-Marine Spatial Planning Officer, Regional Government of Los Lagos, Puerto Montt, Chilej University of Santiago de Compostela, Faculty of Political Sciences, A Coruña, Spaink Campus do Mar-International Campus of Excellence, Pontevedra, Spain
a r t i c l e i n f o
Article history:Received 19 September 2014Received in revised form10 March 2015Accepted 14 March 2015
Keywords:Spatial distribution of marine ecosystemservicesEcotourism and recreationHabitat-forming speciesWildlife-watching of endangered speciesInVEST marine modelsChiloe
a b s t r a c t
This study presents an empirical example of how ES can be incorporated into MSP in developingcountries, in particular in the Southern region of Los Lagos (Chile).This paper aims to: (a) assess theoverlapping incompatibilities within each zoning area, (b) calculate the importance score of the three keyES selected, (c) assess the importance scores of the ES and develop plausible future scenarios for marinezoning. Here, we use InVEST marine models to spatially map the distribution of marine ES (ecotourismand recreation, wildlife endangered species, and habitat-forming species). Taking the current proposal ofthe MSP as a baseline scenario, two plausible hypothetical future scenarios were also developed basedon policies and decision-making trends, and the results of the ES importance score values within eachzoning area. The results of this paper indicate that the environmental conservation-aboriginal develop-ment scenario would be considered as the more appropriate future projection in terms of securing thethree key ES analysed in the region. However, due to changes in the economic development paradigmfor the Inner Sea of Chiloe, decision makers, the scientific community and industry representatives arefacing a major challenge in allocating appropriate areas to secure ES which requires a holisticperspective.
& 2015 Elsevier B.V. All rights reserved.
1. Introduction
Twenty years after the first Earth Summit, the vast majority of theworld’s nations declared that human activities were dismantling theEarth’s ecosystems at an alarming rate (Cardinale et al., 2012), andexceeding the boundaries of what is considered safe for the planet(Rockström et al., 2009; Steffen et al., 2015). The management andconservation of the global oceans requires the synthesis of spatial dataon distribution and intensity of human activities, along with theconsequential impacts of these activities on marine ecosystems(Halpern et al., 2008; Outeiro and Villasante, 2013).
In this context, MSP is an effective tool to establish a morerational organisation of marine space, including its uses and theinteractions between its users, in order to balance the demands fordevelopment with the need to protect marine ecosystems, as wellas achieve social and economic objectives under a participatoryand planned approach (CRMC (Coastal Resources ManagementCouncil), 2010). This facilitates the identification of human usehotspots and highlights regions where it is necessary to assess thecompatibility of various activities (Liquete et al., 2013). Unfortu-nately, until now the connection between ES and MSP has notreceived much attention in the scientific literature, althoughseveral scientific publications have identified and discussedadvances in MSP (Ehler and Douvere, 2010; Flannery and ÓCinnéide, 2012; Halpern et al., 2012; Jay et al., 2012), the integra-tion of ES in the MSP process is still largely unexplored (Rosenthalet al., 2014).
Contents lists available at ScienceDirect
journal homepage: www.elsevier.com/locate/ecoser
Ecosystem Services
http://dx.doi.org/10.1016/j.ecoser.2015.03.0042212-0416/& 2015 Elsevier B.V. All rights reserved.
n Corresponding author.E-mail address: [email protected] (L. Outeiro).
Please cite this article as: Outeiro, L., et al., Using ecosystem services mapping for marine spatial planning in southern Chile underscenario assessment. Ecosystem Services (2015), http://dx.doi.org/10.1016/j.ecoser.2015.03.004i
Ecosystem Services ∎ (∎∎∎∎) ∎∎∎–∎∎∎

In Chile, despite the official approval of the National Policy ofCoastal and Marine Use in 1994 (Castro and Alvarado, 2009), theauthorities have only recently realised the necessity to plan andmanage marine areas spatially. The current framework for planningand management is still under an improvement phase due to the factit lacks legal enforcement and a regulatory basis (Castro andAlvarado, 2009). In 2007 the Chilean Navy and the Undersecretaryof Regional Development agreed to implement a spatial managementapproach and restrict marine usage through the development of azonification or “macrozonification” proposal for the coastal andmarine areas of the Los Lagos region. This proposal aimed to drivethe government’s decision-making process in this area and at presentthe final proposal is being finalised, which will then require valida-tion from the national commission. This proposal, once approved,will be the only legal technical guidance for any development andmanagement planning of the coastal and marine areas involved. It isalso necessary to review the current proposal, focusing on the spatialassessment of ES, to ensure compliance with two recent formalcommitments made by the Chilean State: (a) the Convention onBiological Diversity conservation targets1, and (b) the “LafkencheLaw” (Law No. 20.249) which permits aboriginal nations to managecoastal and marine areas where customary uses have been exerted.
The objectives of this paper are: (a) to assess overlappingincompatibilities within each zoning area in the current proposal,(b) to calculate the importance score 2 of the three key ES presentedwithin each zoning area of the proposal, (c) to assess the ImportanceScores of the ES and develop plausible future scenarios for marinezoning. By using the importance score to map these ES, this paperaims to provide scientific support to improve the efficiency of thezoning areas within the context of the MSP scheme.
2. Material and methods
2.1. Study area
The study area covers a complex biophysical marine area inSouthern Chile (41–43 1S) which falls under the administrativeregion of Los Lagos (X Region). The study area covers a total area of25,475 km2, including intertidal areas, bays, archipelagos, an opengulf, channels, fjords and estuaries. We focused on the Inner sea ofChiloé and its marine-coastal surroundings which includes thefollowing landmarks: Gulf of Ancud, Gulf of Corcovado, ComauFjord, Reloncaví Fjord, Reñihue Fjord, Maullín estuary, ReloncavíSound and Desertores Islands (Fig. 1).
The study area also comprises one of the most important areasglobally for shorebirds, which was recently included in the WesternHemisphere shorebird Reserve Network (“EasternWetlands of Chiloé”).These wetlands support 40% of the world population of Hudsoniangodwit (Limosa haemastica) and provide an important habitat for morethan 2000 of the Pacific coastal population of whimbrels (Numeniusphaeopus). Both of these shorebird species breed in North America andare of high conservation concern (Delgado et al., 2010).
Nowadays, available space in Chiloe’s coastal fringe, or the so-called “Inner sea of Chiloé” has become scarce and fragile due tothe high density of activities carried out in the area and pressurefrom numerous stakeholders interested in future actions. Thesocial-ecological system of Chiloé supports one of the world’sleading aquaculture production systems (Outeiro and Villasante,2013). Important artisanal fisheries are also present which play amajor role through the provision of benthic, pelagic and demersal
resources, and supporting livelihoods and culture within coastalcommunities (Outeiro and Villasante, 2013). Furthermore, theInner sea of Chiloé is home to rare, unique and some of the mostthreatened marine species in the world, including cold-watercorals (Försterra and Häussermann, 2003), penguins, marine andfreshwater otters, blue and humpback whales and many migratorybird species (Hucke-Gaete et al., 2003, 2010, 2013; Häussermannet al., 2012; Viddi et al., 2010).
2.2. Marine ecosystem services included in the study
For the purpose of this study three different marine ES werefocused upon: (1) recreation and ecotourism, which is defined asthe recreational pleasure people derive from natural or cultivatedecosystems (Nahuelhual, 2013), (2) wildlife-watching of endan-gered species, understood as an anthropocentric ES that has beendefined by Loomis and White (1996), and (3) habitat-formingspecies, identified as a distinct category in order to highlight theimportance of ecosystems that provide habitat for migratoryspecies (e.g., nurseries), and gene-pool “protectors” (e.g., naturalhabitats) that allow for natural selection processes to maintain thevitality of the gene pool (The Economics and Ecosystems andBiodiversity (TEEB), 2010).
To spatially model these ES, GIS tools with ArcView 10.1 and thestand-alone version of InVEST 3.0.1 software have been used. TheInVEST software is a new and innovative tool developed by theNatural Capital Project (http://www.naturalcapitalproject.org/models/models.html), which is designed to analyse the spatial dis-tribution of ES (Guerry et al., 2012). Specifically, the InVESTOverlap Analysis Model and the Recreation Model (See moreinformation of the model at Annex I at the Supplementarymaterial) were used.
2.3. Spatial modelling of marine ecosystem services
The modelling process for endangered wildlife-watching usedthe overlap model and ranked intra- and inter-specific impor-tance3 of spatial layers, whereas for habitat-forming species onlyan inter-specific importance scorewas used. The Inner sea of Chiloéand its surrounding areas host 31 out of the 51 marine mammalspecies present in Chile (Hucke-Gaete et al., 2010). Between 2000and 2013, a large scale effort has been carried out by the CentroBallena Azul, supported by WWF and Universidad Austral de Chile,in the form of a research programme to gather information on thefollowing species which are also included in this study: Blue whale(Balaenoptera musculus), Burmeister’s purpoise (Phocoena spini-pinnis), Chilean dolphin (Cephalorhynchus eutropia), Humpbackwhale (Megaptera novaeangliae), Peale’s dolphin (Lagenorhynchusaustralis), South American sea lion and fur seal (Otaria byronia andArctocephalus australis), River otter (Lontra provocax) and Marineotter (Lontra felina), and two species of penguins (Spheniscushumboldti and Spheniscus magellanicus).
The colony location of two further bird species currently consid-ered as threatened have also been included: red legged cormorant(Phalacrocorax gaimardi) and the sooty shearwater (Puffinus griseus)(IUCN, 2012). A vector shapefile layer was created from availablegeoreferenced information regarding the most important intertidalflats identified by the eBird platform of the study area (eBird, 2012). Tospatially model the importance score of the wildlife species, a literaturereview was carried out to infer a buffered area, and the Kernel densityfunctions were used in the case of highly mobile species, such asdolphins and whales (Table 1).
1 The Chilean government agreed to protect 10% of every representativeecosystem by 2020 under the Convention on Biological Diversity.
2 For detailed information of the definition and calculation of the importancescore, see the Supplementary material.
3 For details of the model see: http://data.naturalcapitalandresilienceplatform.org/invest-releases/documentation/current_release/overlap_analysis.html
L. Outeiro et al. / Ecosystem Services ∎ (∎∎∎∎) ∎∎∎–∎∎∎2
Please cite this article as: Outeiro, L., et al., Using ecosystem services mapping for marine spatial planning in southern Chile underscenario assessment. Ecosystem Services (2015), http://dx.doi.org/10.1016/j.ecoser.2015.03.004i
In addition information has been collected from two informationsources to model the habitat-forming species: satellite imagery andnautical charts from the Chilean Navy were used to obtain spatialinformation of marine habitats (e.g., kelp forest, rock shoals and bankshoals). Printed nautical charts were scanned and then georeferencedto create shapefile layers of these habitats into a GIS platform. Oncethis information was processed, the set of the most recent satelliteimages from the IKONOS satellite was used, free of clouds and at 1.5 mof spatial resolution to complement the above source of informationfor kelp forests. Simultaneously, spatial distribution of the mostimportant habitat-forming species in the importance score model havebeen included. Since 2003, a large research program has been carriedout by the Huinay Scientific Field Station to make an inventory of andmap the benthic fauna of Chilean Patagonia (Häussermann andFörsterra, 2009). The distribution data of habitat-forming benthicfauna has also been included.
Furthermore, a species distribution model was created using Rwhich was based on the MaxEnt algorithm. Environmental proxy
layers were derived from satellite images (e.g., Chl-a, sea surfacetemperature, turbidity) obtained from the NASA Aqua MODISsatellite in 1 km resolution, and from CTD data from CIMAR(Cruceros de Investigacion Marina en Areas Remotas; MarineResearch Cruises in Remote Areas).
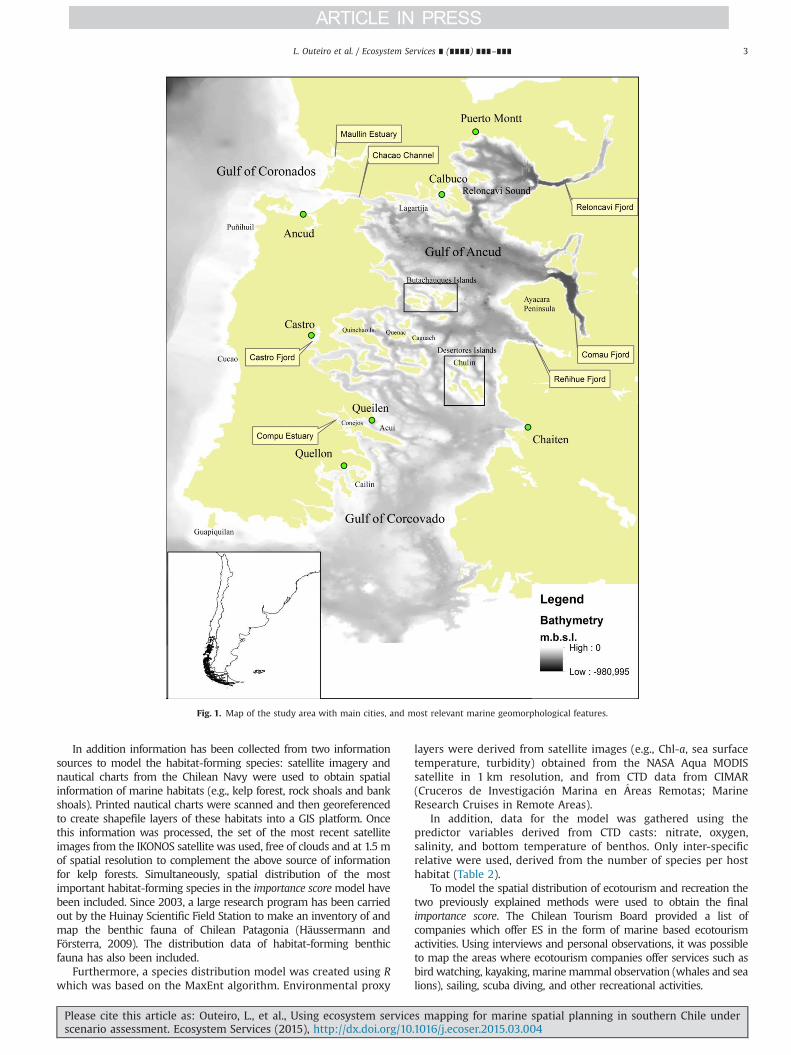
In addition, data for the model was gathered using thepredictor variables derived from CTD casts: nitrate, oxygen,salinity, and bottom temperature of benthos. Only inter-specificrelative were used, derived from the number of species per hosthabitat (Table 2).
To model the spatial distribution of ecotourism and recreation thetwo previously explained methods were used to obtain the finalimportance score. The Chilean Tourism Board provided a list ofcompanies which offer ES in the form of marine based ecotourismactivities. Using interviews and personal observations, it was possibleto map the areas where ecotourism companies offer services such asbird watching, kayaking, marinemammal observation (whales and sealions), sailing, scuba diving, and other recreational activities.
Fig. 1. Map of the study area with main cities, and most relevant marine geomorphological features.
L. Outeiro et al. / Ecosystem Services ∎ (∎∎∎∎) ∎∎∎–∎∎∎ 3
Please cite this article as: Outeiro, L., et al., Using ecosystem services mapping for marine spatial planning in southern Chile underscenario assessment. Ecosystem Services (2015), http://dx.doi.org/10.1016/j.ecoser.2015.03.004i

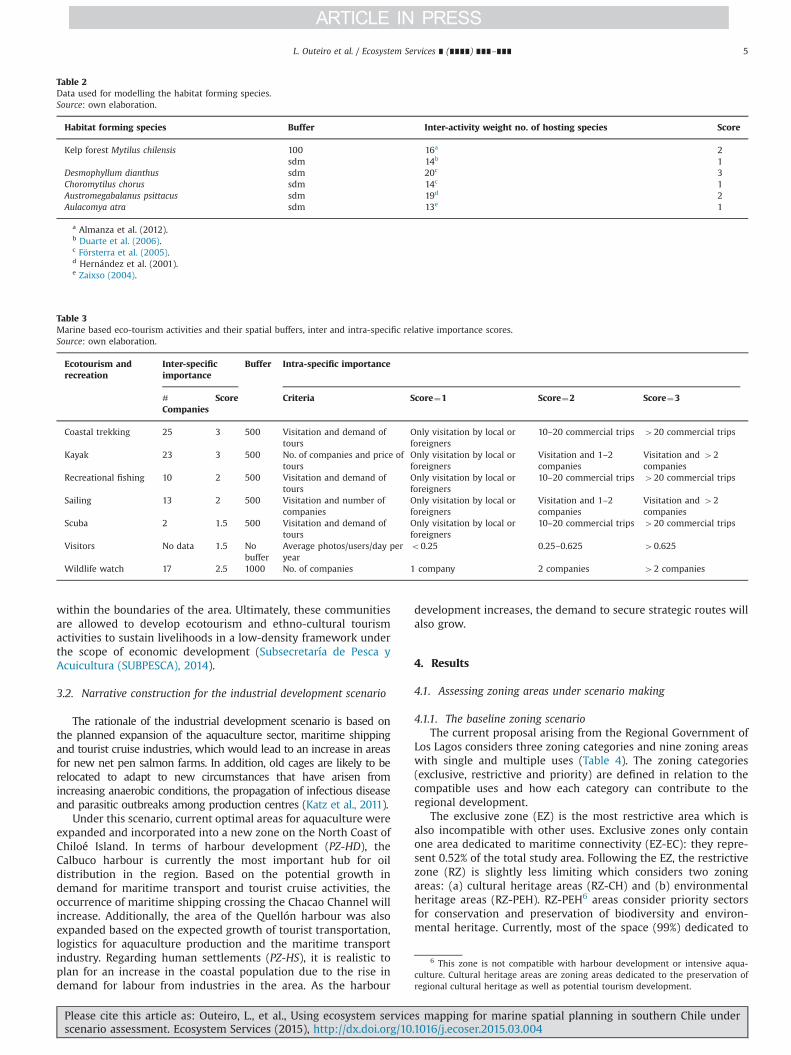
A total of 50 companies were identified and surveyed. Most ofthem offered between two and three activities in a single package:25 offer guided coastal trekking, 23 offer kayaking, 17 wildlifewatching, 13 companies offered sailing or boating, 10 recreationalfishing activities, and 2 companies offered diving activities(Table 3) (for detailed information of the surveyed companiessee Annex I at the Supplementary material).
The scores of the importance score for the InVEST RecreationModel were log-transformed and normalized between 0 and 1.The normalised values were then ranked between 1 and 3 (Low,Medium and High importance) based on the geometric interval ofthree classes given by the ArcGIS layer properties tool (Table 3). Anoverview of the modelling process of the ES included in this studyis presented in Fig. 2.
3. Scenario development of marine zoning uses
According to past experience from the users of InVEST, there is nosingle method to follow when developing scenarios (Böhnke-Henrichset al., 2010). Based on this information, McKenzie and Rosenthal(2012) categorised various potential scenarios into four illustrativetypes, based on the expectations and goals of the InVEST analysis:intervention, exploratory, vision and future projection. Here, twofuture projection hypothetic scenarios are used for assessing howthe location, quantity and value of ES change over time: (a) a scenarioof environmental conservation combined with indigenous develop-ment, and (b) a scenario of industrial development. Both scenarios arecompared to a baseline or current scenario of the importance score ofecotourism–recreation, habitat forming species and wildlife watchingof endangered species, which overlap within each management zone.The criteria to create the scenarios are based on a diverse range ofsources, including government technical documents, industry pro-spective projects, regional development strategies, interviews withstakeholders and researchers, and personal observations in the areaover recent years.
3.1. Narrative construction of the environmental conservation andindigenous development scenario
Regional authorities of Chiloé recognise ecotourism as a keyeconomic activity with a high capacity for future growth due to the
enormous potential from a variety of rare marine wildlife, indigenousspecies, as well as breath-taking seascapes and coastal landscapes.However, only 0.1% (see Table 4) of the available seascape is currentlyunder a conservation management regime in the form of marinereserves and marine protected areas4 are completely absent in thestudy area (Pliscoff and Fuentes, 2008). Therefore, it is plausible todevelop a scenario that could reasonably increase this area and still beconsistent with prospected and desired economic development.
Under the current marine management zoning proposal, twozones have an environmental protection role: a restrictive zone forenvironmental protection (RZ-PEH) and the priority zone whichcombines three uses: artisanal fishing, tourism and environmentalprotection (PZ-FTEp)5. Based on the literature review, interviewswith fishermen and personal observations in the area, the areas forRZ-PEH should increase in this scenario from 0.1% to 4.50%, whilethe areas of PZ-FTEp should have been mostly relocated, and otherareas were lost in order to transfer spaces from this zoning toareas claimed by indigenous nations.
Currently, a total of sixteen areas have been requested by theindigenous communities that are being commissioned in the LosLagos region, which represent a total 3839 km2. Under thisscenario we have incorporated 2259 km2, 58.8% of the totalclaimed, representing 8.87% of the total space for the managementzoning. These areas are known as ECMPO “Espacios CosteroMarinos de Pueblos Originarios” in Spanish, or MCAAN (Marineand Coastal Areas of Aboriginal Nations) in English. Onceapproved, the areas selected from the claiming process will bemanaged by the indigenous communities under a concessionregime for an undefined period of time, although they will berequired to comply with government-imposed rules.
The conservation zones and the zones for indigenous develop-ment are considered together due to the fact that the approval of aMCAAN does not allow for the development of new aquaculture,maritime or TURF (Territorial User Rights for Fishing) projects
Table 1Data used for the InVEST wildlife watching model and their spatial buffers, inter and intra-specific importance.Source: own elaboration.
Endangered species Habitat area Inter-activity weight Score Intra-activity weight Score
Criteria Criteria 1 2 3
Birds No buffer – – Number and nesting o500 500–1000 41000Red legged cormorant 3 kma Near threatened 1.5 Number of nests 0–100 200–300 4300Sooty shearwater 10 kmb Near threatened 1.5 Number of nests 0–101 200–301 4301Sea lions 5 kmc Least concern 1.5 Number-Birth place o100 100–500 4500Fur seal colony 5 kmc Least concern 1.5 Number 0–30 30–60 460Blue whales Denspoint/kriging Endangered 3 Observations/kmb o0.015 0.015–0.048 40.048Humpback whaler Denspoint/kriging Least concern 1.5 Group size o0.015 0.015–0.048 40.048Burmesiter purpoise Denspoint/kriging Deficient data – Observations/kmb o0.015 0.015–0.048 40.048Chilean dolphin Denspoint/kriging Near threatened 1.5 Group size 10 10–20 20Peale’s dolphin Denspoint/kriging Deficient data – Number o0.015 0.015–0.048 40.048Magellanic penguin Most used aread Vulnerable 2 Area of influence – – –
Humboldt penguin Most used aread Near threatened 1.5 Area of influence – – –
River and sea otter 500 me Endangered 3 Area of influence – – –
a Frere et al. (2004).b Shaffer et al. (2009).c Riet-Sapriza et al. (2013).d Reyes-Arriagada et al. (2013).e Rozzi and Torres Mura (1990).
4 In February 2014 Chilean government approved the creation of the Tic-tocCorcovado Gulf marine protected area with multiple uses. Despite its category is aprotected area, the fact of making compatible with other uses do not allow us tocategorise it as RZ-PEH, and it should be included as PZ-FTEp.
5 The reason to join economic with conservation uses in one priority zone is toallow fishermen to use their fishing areas as low scale environmental tourism withlikely projects on wildlife watching.
L. Outeiro et al. / Ecosystem Services ∎ (∎∎∎∎) ∎∎∎–∎∎∎4
Please cite this article as: Outeiro, L., et al., Using ecosystem services mapping for marine spatial planning in southern Chile underscenario assessment. Ecosystem Services (2015), http://dx.doi.org/10.1016/j.ecoser.2015.03.004i
within the boundaries of the area. Ultimately, these communitiesare allowed to develop ecotourism and ethno-cultural tourismactivities to sustain livelihoods in a low-density framework underthe scope of economic development (Subsecretaría de Pesca yAcuicultura (SUBPESCA), 2014).
3.2. Narrative construction for the industrial development scenario
The rationale of the industrial development scenario is based onthe planned expansion of the aquaculture sector, maritime shippingand tourist cruise industries, which would lead to an increase in areasfor new net pen salmon farms. In addition, old cages are likely to berelocated to adapt to new circumstances that have arisen fromincreasing anaerobic conditions, the propagation of infectious diseaseand parasitic outbreaks among production centres (Katz et al., 2011).
Under this scenario, current optimal areas for aquaculture wereexpanded and incorporated into a new zone on the North Coast ofChiloé Island. In terms of harbour development (PZ-HD), theCalbuco harbour is currently the most important hub for oildistribution in the region. Based on the potential growth indemand for maritime transport and tourist cruise activities, theoccurrence of maritime shipping crossing the Chacao Channel willincrease. Additionally, the area of the Quellón harbour was alsoexpanded based on the expected growth of tourist transportation,logistics for aquaculture production and the maritime transportindustry. Regarding human settlements (PZ-HS), it is realistic toplan for an increase in the coastal population due to the rise indemand for labour from industries in the area. As the harbour
development increases, the demand to secure strategic routes willalso grow.
4. Results
4.1. Assessing zoning areas under scenario making
4.1.1. The baseline zoning scenarioThe current proposal arising from the Regional Government of
Los Lagos considers three zoning categories and nine zoning areaswith single and multiple uses (Table 4). The zoning categories(exclusive, restrictive and priority) are defined in relation to thecompatible uses and how each category can contribute to theregional development.
The exclusive zone (EZ) is the most restrictive area which isalso incompatible with other uses. Exclusive zones only containone area dedicated to maritime connectivity (EZ-EC): they repre-sent 0.52% of the total study area. Following the EZ, the restrictivezone (RZ) is slightly less limiting which considers two zoningareas: (a) cultural heritage areas (RZ-CH) and (b) environmentalheritage areas (RZ-PEH). RZ-PEH6 areas consider priority sectorsfor conservation and preservation of biodiversity and environ-mental heritage. Currently, most of the space (99%) dedicated to
Table 3Marine based eco-tourism activities and their spatial buffers, inter and intra-specific relative importance scores.Source: own elaboration.
Ecotourism andrecreation
Inter-specificimportance
Buffer Intra-specific importance
#
CompaniesScore Criteria Score¼1 Score¼2 Score¼3
Coastal trekking 25 3 500 Visitation and demand oftours
Only visitation by local orforeigners
10–20 commercial trips 420 commercial trips
Kayak 23 3 500 No. of companies and price oftours
Only visitation by local orforeigners
Visitation and 1–2companies
Visitation and 42companies
Recreational fishing 10 2 500 Visitation and demand oftours
Only visitation by local orforeigners
10–20 commercial trips 420 commercial trips
Sailing 13 2 500 Visitation and number ofcompanies
Only visitation by local orforeigners
Visitation and 1–2companies
Visitation and 42companies
Scuba 2 1.5 500 Visitation and demand oftours
Only visitation by local orforeigners
10–20 commercial trips 420 commercial trips
Visitors No data 1.5 Nobuffer
Average photos/users/day peryear
o0.25 0.25–0.625 40.625
Wildlife watch 17 2.5 1000 No. of companies 1 company 2 companies 42 companies
Table 2Data used for modelling the habitat forming species.Source: own elaboration.
Habitat forming species Buffer Inter-activity weight no. of hosting species Score
Kelp forest Mytilus chilensis 100 16a 2sdm 14b 1
Desmophyllum dianthus sdm 20c 3Choromytilus chorus sdm 14c 1Austromegabalanus psittacus sdm 19d 2Aulacomya atra sdm 13e 1
a Almanza et al. (2012).b Duarte et al. (2006).c Försterra et al. (2005).d Hernández et al. (2001).e Zaixso (2004).
6 This zone is not compatible with harbour development or intensive aqua-culture. Cultural heritage areas are zoning areas dedicated to the preservation ofregional cultural heritage as well as potential tourism development.
L. Outeiro et al. / Ecosystem Services ∎ (∎∎∎∎) ∎∎∎–∎∎∎ 5
Please cite this article as: Outeiro, L., et al., Using ecosystem services mapping for marine spatial planning in southern Chile underscenario assessment. Ecosystem Services (2015), http://dx.doi.org/10.1016/j.ecoser.2015.03.004i

this type of zoning area includes intertidal flats and lagoons. Onlytwo subtidal zones are considered within this type of area, whichrepresent only a minor proportion of the available seascape (0.9%of the total RZ).
Finally, the priority zoning (PZ) category is composed of sixtypes of areas: (a) fisheries with navigation (PZ-FNAV), (b) fisheries,tourism and environmental protection (PZ-FTEp), (c) aquacultureand artisanal fishing (PZ-AFA), (d) fishing settlements (PZ-FC),
(e) harbour development (PZ-HD), and (f) human settlement(PZ-HS).
PZ-FNAV7 includes the sectorial protection for demersal, pelagicand benthic fisheries which sustain an important component for
Fig. 2. Diagram of the modelling process for the ecotourism and recreation, wildlife watching and habitat forming species. Source: own elaboration.
7 It is compatible with almost any economic activity which does not representa threat to the sustainability of priority uses of fisheries and navigation.
L. Outeiro et al. / Ecosystem Services ∎ (∎∎∎∎) ∎∎∎–∎∎∎6
Please cite this article as: Outeiro, L., et al., Using ecosystem services mapping for marine spatial planning in southern Chile underscenario assessment. Ecosystem Services (2015), http://dx.doi.org/10.1016/j.ecoser.2015.03.004i

the local economy, and it also grants the largest proportion ofmarine use with 60.1% of the total space. PZ-FTEp8, the secondlargest zone, is dedicated to extractive and non-extractive useswhile maintaining compatibility with the protection of supportingES. In terms of fisheries, this area refers to shore shell fishing,benthic TURF’s and coastal artisanal fishing. PZ-AAF9, the thirdlargest area with 11% of total marine space, is intended to developthe three main types of aquaculture (fin-fish, mussels and algae)compatible with small-scale fisheries and tourism development.
The main purpose of the PZ-FC is to maintain a minimumamount of space for fishermen so that they are free to carry outtasks such as manoeuvring, mooring, landing and ship repair,among others. These locations cover an area which represents 2.1%of total marine space and includes 184 fishing settlements withalmost 28,000 fishermen.
The PZ-HD focuses on three types of development: industry,connectivity and tourism, and intends to act as a developmentpole where there is an existing geographical opportunity andeconomical demand for development. Some examples includecruise ships on tourism routes in Puerto Montt and Castro, oilindustry in Calbuco and shipyards in Puerto Montt. Harbourdevelopment represents less than 0.05% and is not compatiblewith fin-fish or mussel aquaculture activities. PZ-HS creates aprojection for coastal and near shore marine urban settlementswhich may have an array of uses (e.g., industrial, tourism, port,housing, recreational activities, and fishing settlements). It alsorepresents less than 1% of marine space and it is not compatiblewith aquaculture.
4.1.2. The environmental conservation-aboriginal developmentzoning scenario
Under this scenario, the largest reduction in space occurred inthe PZ-FNAV (decreasing by approximately 2000 km2, �7.4%) inorder to redistribute this space to other management zones. Dueto the fact that fisheries and navigation areas allow for thedevelopment of all activities, this may have significant conse-quences in terms of importance score of ES, specifically in the casethat new antagonistic activities are permitted. The second largestreduction in spatial terms occurred in the PZ-AAF, which reducedby 1546 km2 (�6.1%) due to the fact that these zones wereoverlapping with areas with high importance score of ES and
transferred to the proposal of protected areas within the RZ-PEHand the actual claimed MCAAN (aboriginal claiming areas). Thelatter had the largest increase, from 0 to 2259 km2, whichrepresents 8.87% of the total area. Part of the reason that theaboriginal claim areas were included is because some areas over-lap with shipping transportation lanes, or were placed under highpriority to be designated as restrictive zones for environmentalprotection (Fig. 3).
Restrictive zones for environmental protection (RZ-PEH)increased from 0.13 to 4.5%, from 32 km2 to 1143 km2. Thisextension represents a conservative scenario in terms of therestrictive zone for environmental protection (considering thatby signing the International Convention of Biodiversity, Chileagreed to protect 10% of all ecosystems)10. Spaces incorporatedin the restrictive area were subtracted from PZ-NAVF and PZ-AFA,including the areas of Acui, Guapiquilan, Cailin, Lagartija andConejos Islands, which are conservation areas that provide habitatto host endangered species of wildlife. In particular, Conejos,Lagartija and Puñihuil provide habitats for magellanic penguins(Skewgar et al., 2009).
Additionally, the Reñihue and Comau fjords provide habitat tovarious marine mammal and bird species and they are theprincipal areas for cold-water coral banks, which are under directexposure to aquaculture activities (Häussermann and Försterra,2007). Both fjords are used as a scientific reference area forbaseline studies carried out by Huinay Scientific Field Station.The Southern side of Ayacara Peninsula, Chulín, Quenac andCaguach islands are also host to important marine areas forhabitat-forming species.
4.1.3. The industrial development zoning scenarioA third scenario, with a different trend, was designed to
compare the current and the conservation–indigenous scenario.In 2014, demersal and pelagic species in the study area hadreached a critical threshold and three key commercial species(anchovy, mackerel and hake) were considered to be overexploited(Subsecretaría de Pesca y Acuicultura (SUBPESCA), 2014). Based onthis information, it is assumed that any industrial developmentwould be conservatively based on the expansion of fish andshellfish farming while recovering forage fish species. Theseactivities are expected to increase the anthropogenic pressureson supporting and regulating ES, which are the main ES used bythe aquaculture sector.
Table 4Total area of the management zones considered for the three different scenarios.Source: own elaboration.
Acronym Description Current Area Conservation–indigenous Industrial development
(km2) % Area (km2) % ΔCurrent/Cons (%) Area (km2) % ΔCurrent/Ind. Dev (%)
PZ-FNAV Navigation and fisheries 15,327 60.1 13,437 52.7 �7.4 15,235 59.8 �0.3PZ-FTEP Fishing-tourism-environmental protection 6,363 24.9 6,429 25.4 0.3 6,036 23.7 �1.2PZ-AAF Aquaculture and artisanal fishing 2,808 11.0 1,262 4.9 �6.1 2,973 11.6 0.6PZ-FC Fisheries coves 534 2.1 534 2.1 0 534 2.1 0PZ-HS Human settlement 229 0.9 229 0.9 0 255 1.0 0.1EZ-EC Strategic connection 132 0.52 132 0.5 0 320 1.2 0.7PZ-PPC Protection cultural heritage 37 0.15 37 0.1 0 320 1.2 0.7RZ-PEH Protection environmental heritage 32 0.13 1,143 4.5 4.4 32 0.1 0PZ-HD Harbour development 13 0.05 13 0.05 0 53 0.2 0.1MACAAN Indigenous claiming areas 0 0 2,259 8.8 8.9 0 0 0
8 It is not compatible with aquaculture or industrial fishing. However, it iscompatible with any other activities that do not harm any other preferentialactivities in the zone.
9 The actual proposal seeks that this priority zone is fully compatible withfisheries and tourism development. However, aquaculture production facilitiesmust also seek harmony with the environment and landscape as well as in theirown relationship with local communities so that they may generate local benefits.
10 Even that the Chilean government has ratified the CBD to protect 10% of thecountry’s ecosystems by 2020, currently only within 4.3% of its goal has beenachieved, and 4% of the total 4.3% is concentrated in the “Motu Motiro Hiva”Marinepark near the Gomez and Sala Island (150,000 km2).
L. Outeiro et al. / Ecosystem Services ∎ (∎∎∎∎) ∎∎∎–∎∎∎ 7
Please cite this article as: Outeiro, L., et al., Using ecosystem services mapping for marine spatial planning in southern Chile underscenario assessment. Ecosystem Services (2015), http://dx.doi.org/10.1016/j.ecoser.2015.03.004i

It is important to highlight that there was no substantialchange under the industrial scenario as there is only a smallmargin available for expansion from non-industrial to industrialmanagement. However, this scenario did transfer some space to EZfrom the PZ-FNAV for connectivity (RZ-EC), with a total spacerepresenting 0.3% (Table 4). The largest negative transferenceoccurs in PZ-FTEp, which was reduced by 1.2% in comparison tothe current area. The PZ-AFA also increased by 0.65% with respectto the current scenario, and it has the capacity to expand thecurrent scenario into new areas in the Pacific Ocean.
4.2. Mapping importance scores of marine ecosystem services
The importance score of recreation and ecotourism are spreadthroughout the study area. However, four hotspots of high impor-tance score are observed in the Reloncaví and Comau Fjords,Maullín estuary, Queilen coast, and the Northwest coast of ChiloéIsland. Here we also describe the importance score assigned to eachES included in the study.
� Endangered wildlife: areas for endangered wildlife are locatedaround the coastal Pacific Ocean and in the Southern part of theGulf of Corcovado. However, the lack of relatively important siteswithin the Inner sea of Chiloé may be due to the absence of anextensive observational programs and/or sporadic appearancesof large cetaceans (Försterra and Häussermann, 2012).
� Habitat-forming species: key areas for habitat-forming speciesare located within the Comau, Reloncaví and Reñihué Fjords(Fig. 4). Furthermore, the coastal areas around the Butachau-ques island group were also shown to have high importance forhabitat-forming species.
� The spatial distribution patterns for the two ES are different fromeach other. While the endangered wildlife service is mainly locatedin the oceanic side of the study area, the habitat-forming speciesservice is localized within the Inner Sea of Chiloé.
4.2.1. Spatial analysis of the importance score for the managementzoning areas
The priority area for fishing, tourism and environmentalprotection (PZ_FTEp) is the only management zone explicitly
dedicated to ecotourism and recreation. Considering that thismanagement zone is the principal area for obtaining higherimportance score values for recreation and ecotourism ES, only14% of the importance score is achieved under the current scenario.This is due to the fact that 62% of the importance score is locatedwithin priority zones for competing users, such as navigation-fisheries (PZ-FNAV) and aquaculture (PZ-AFA). As shown in Table 5,the importance score under the conservation–indigenous develop-ment scenario reaches 23.4% of the total area. Additionally, afurther zone considered for indigenous development (MCAAN)under this conservation scenario would obtain 11% of the recrea-tion and ecotourism importance score, which remains consistentwith the possibility for these areas to develop low-intensity andnature-based tourism.
Under the industrial development scenario, the importancescore of the PZ-FTEp decreases by 2% in comparison to the baselinescenario, whereas aquaculture areas would eventually increase to4% of the importance score. This scenario would lead to a higherincidence of recreation and ecotourism activities overlapping withother antagonistic activities (e.g., aquaculture). These antagonisticactivities may increase conflicts between users for competingspaces and degrade these iconic pristine seascapes, which arethe real natural capital of ecotourism.
For the habitat-forming species ES, the current scenario showsthat 30% of the is located within areas prioritised for aquacultureand fishing purposes (PZ-AFA), and 48% within navigation-fisheriesprioritised areas (PZ-NAVF). Thus one third of the importance scoreof these habitats is threatened by potential degradation due to fin-fish aquaculture and fishing activities. Only 0.3% of the area islocated within the restricted management zone that allows forenvironmental protection. This is due to the fact that only a smallpercentage of subtidal areas are included in the RZ-PEH, andbecause 8% of the importance score is confined to the mixed usemanagement zone of PZ-FTEp. The conservation–indigenous sce-nario, which allows for a 4.5% increases in the restrictive zones arefor protection of environmental heritage (RZ-PEH), is also able toincrease the importance score by twelve fold to 5.56%. Althoughthis value represents an increase from the current scenario, animportance score of 5.5% is relatively low compared to other valuesobtained in mixed management zones. Moreover, the new spatialarrangement of FTEp allows for a 12.6% increase in importancescore in comparison to the current scenario, increasing from 8% to
Fig. 3. Management zones of the three scenarios: (a) current, (b) conservation–indigenous, and (c) industrial development. Source: own elaboration from InVEST overlap marine model.
L. Outeiro et al. / Ecosystem Services ∎ (∎∎∎∎) ∎∎∎–∎∎∎8
Please cite this article as: Outeiro, L., et al., Using ecosystem services mapping for marine spatial planning in southern Chile underscenario assessment. Ecosystem Services (2015), http://dx.doi.org/10.1016/j.ecoser.2015.03.004i

21% of the total in the environmental conservation–indigenousdevelopment scenario. As MCAAN areas increase from zero to 10%,they obtain 8% of the total importance score.
Under the industrial scenario, the most notable change is thatthe overall importance score in priority zones of aquaculture,fisheries and navigation accumulates to almost 80% of all habitats.The differentiation between the current and the hypothesisedscenario is not highly significant, however, it is important to beprecautious and take into account that a scenario which allows fora growth in areas prioritised for activities with high environmentalimpacts, would potentially leave 30% of habitat-forming speciesareas exposed and unprotected against anthropogenic impacts.
Finally, within the current proposal the importance score ofendangered wildlife species is focused between two managementareas with competitive uses (PZ-FTEp with 46% and PZ-FNAV with43%). It is key to consider that PZ-FNAV almost holds the remaining50% of importance score, which in turn will influence risk manage-ment planning for wildlife species. For example, mobile cetaceansand other marine mammals with a widespread distribution willspatially overlap with maritime shipping lanes, fishing gears andaquaculture facilities.
It is important to highlight that within the restrictive zone forenvironmental protection the importance score is almost non-existent, as it is the only zoning area proposed to conserve and
preserve wildlife from any impact or stressors. The conservation–indigenous development scenario would increase the total impor-tance score within the three management areas (PZ-FTEp, MCAAN,PEH), among others, and include environmental protection for upto 63% of the total area. However, despite this fact, the increase inthe restrictive zone is relatively high, at 11.2% compared to thevalues obtained in for habitat forming species and recreation andecotourism. The importance score of wildlife within aquacultureareas decrease by 6%, giving a total importance score within thismanagement zone of 2.2%. Consequently, in the industrial scenarioan increase in the area for industrial activities, such as aquaculture,would increase the importance score by up to 12%, which wouldincrease the risk of impacts on marine mammals and birds (Fig. 5).
5. Discussion
5.1. The current proposal for management zoning
Within the current proposal, three out of the nine proposedzones for management zoning (PZ-NAVF, PZ-FTEp and PZ-AAF)would account for 92% of the available marine space: navigation,artisanal fishing, tourism and environmental protection, andaquaculture and fisheries (Table 4). These zones are representative
Fig. 4. Results of the modelling process of the three ecosystem services: (a) spatial distribution of the recreation and ecotourism, (b) spatial distribution of the habitatforming species, and (c) spatial distribution of wildlife endangered species. Source: own elaboration from InVEST overlap marine model.
Table 5Relative importance of the three ecosystem services included in each management zone under the scenarios.Source: own elaboration from interviews and questionnaires. Curr.: current; Cons: conservation; Indig.: indigenous; Ind. Dev.: industrial development.
Acronym Recreation and ecotourism Habitats Wildlife endangered species
Curr.(%)
Cons/Indig. (%)
ΔCurr./Cons (%)
Ind.Dev. (%)
ΔCurr./Ind.Dev (%)
Curr.(%)
Cons/Indig. (%)
ΔCurr./Cons (%)
Ind.Dev.(%)
ΔCurr./Ind.Dev (%)
Curr.(%)
Cons/Indig.(%)
ΔCurrent/Cons (%)
Ind.Dev. (%)
ΔCurr/Ind.Dev (%)
PZ-FNAV 34.0 19.3 �14.8 29.8 �4.2 48.6 37.5 �11.1 45.1 �3.5 43.4 31.7 �11.7 42.6 �0.8PZ-AAF 28.3 14 �11.4 32.3 4.0 30.5 15.3 �15.2 33.0 2.5 8.6 1.7 �6.9 12.6 4.0PZ-FTEP 14.4 25.7 9 12.5 �1.9 8.3 21.0 12.6 7.7 �0.6 46.1 43.0 �3.1 42.3 �3.7RZ-PÈH 0.6 6.3 5.4 0.6 0 0.3 5.9 5.5 0.3 0 0.1 11.2 11.2 0 0PZ-PPC 2.5 2.5 0 2.5 0 1.1 1.1 0 1.1 0 0.1 0.1 0 0.1 0PZ-HD 0.3 0.3 0 1 0.7 0.2 0.2 0 0.7 0.5 0 0 0 0 0PZ-FC 9.6 9.6 0 9.6 0 6.5 6.5 0 6.5 0 0.8 0.8 0 0.8 0EZ-EC 4.8 4.8 0 5.6 0.7 2.2 2.2 0 3.2 1 0.4 0.4 0 0.8 0.4PZ-HS 5.5 5.5 0 6.2 0.7 1.8 1.8 0 1.9 0 0.2 0.2 0 0.2 0MCAAN 0 11.7 11.8 0 0 0 8.1 8.1 0 0 0 10.4 10.4 0 0
L. Outeiro et al. / Ecosystem Services ∎ (∎∎∎∎) ∎∎∎–∎∎∎ 9
Please cite this article as: Outeiro, L., et al., Using ecosystem services mapping for marine spatial planning in southern Chile underscenario assessment. Ecosystem Services (2015), http://dx.doi.org/10.1016/j.ecoser.2015.03.004i

of the interests of the major stakeholders and would boost localeconomies (namely through aquaculture, fisheries and tourism).However, a weakness in these existing zones is that they areconsidered as too broad and non-specific, therefore allowingtrade-offs, user conflicts, and eco-geographic overlaps betweendifferent activities.
Currently, these areas are over-saturated with aquacultureconcessions as the criteria for this zonation was based on availablespace rather on the carrying capacity of the aquatic system. Afurther weakness related with the aquaculture concessions is thatregulations within the Chilean Law of Fisheries and Aquacultureallow for concessions to exist for indefinite time periods, whichprevents the spatial re-configuration of these areas under atechnical and scientific scope. Thus, similar areas of optimal usefor aquaculture have been designated as priority zones for mixeduse, which leads to conflicts in the use of space between benthicfisheries, tourism and environmental protection.
Combining those priorities while simultaneously trying tomaintain compatibility results in an increased the risk of “win–loss” outcomes, e.g., fin-fish farming includes undesirable conse-quences such as the discharge of organic matter (Mayr et al., 2014)and chemical output, that potentially impacts both benthic fish-eries and benthic fauna (Häussermann et al., 2013). It is recom-mended that this priority area is divided into two different priorityzones, one for aquaculture and another for fisheries. Moreover,30% of the importance score for habitat forming species falls withinaquaculture priority zones (PZ-AFA). Försterra et al. (2014)described a high mortality of the bank-forming cold-water coral(Desmophylum dianthus) in the fjords of the Inner sea of Chiloé.This mortality is likely to be due to a combination of harmfulsubstances from cold vents, and hypoxia following an exception-ally strong algae bloom, stimulated by strong increases in organicmatter from salmon farming activities (Mayr et al., 2014).
Fig. 5. Management areas for the scenario under analysis and the spatial distribution of the ecosystem services: (a) management zoning for the current scenario,(b) management zoning for the environmental conservation–indigenous development scenario, (c) management zoning for the industrial development scenario, (d) spatialdistribution of the recreation and ecotourism, (e) spatial distribution of the habitat forming species, and (f) spatial distribution of the wildlife watching. Source: ownelaboration from InVEST overlap marine model.
L. Outeiro et al. / Ecosystem Services ∎ (∎∎∎∎) ∎∎∎–∎∎∎10
Please cite this article as: Outeiro, L., et al., Using ecosystem services mapping for marine spatial planning in southern Chile underscenario assessment. Ecosystem Services (2015), http://dx.doi.org/10.1016/j.ecoser.2015.03.004i

The fishing and navigation priority zone (PZ-NAVF) occupies60% of the space within the current management scenario. Thispriority zone has a high level of overlap with wildlife movements,such as those of large cetaceans, which have recorded impactincidents such as ship-strikes to blue whales and other species(Galletti and Cabrera, 2007). A new perspective of marine zoningneeds to be designed which considers wildlife interactions withmarine shipping, with a particular focus on increasing traffic in theChacao Channel with the crossing of oil tankers. On the contrary,this scenario does accomplish certain objectives regarding inter-tidal and terrestrial-spaces, such as coastal wetlands and terres-trial ecosystems with a high conservation value.
5.2. Ecotourism: A new paradigm of ecosystem services in Chile?
Currently, tourism represents only 3.2% of the Gross DomesticProduct (GDP) in Chile. Ecotourism plays a key role in this sectorand holds great potential for growth over the next decade(Nahuelhual, 2013), due to the appeal of wildlife watching andextraordinary scenery (Servicio Natural de Turismo (SERNATUR),2010).
The Regional Development Strategy for 2020 (GORE, 2013)predicts specialisations within this study area: the Island of Chiloéis predicted to become more reliant upon heritage and culturaltourism, the continental side of the Inner Sea is planned to attractecotourism focused on the significance of terrestrial protectedareas, the urban areas in the Reloncaví fjord are expected to grow,and marine spaces are predicted to continue sustaining aquacul-ture activities, ecotourism, and fishing activities. It is necessary toidentify the major overlaps between key ES and potential degrad-ing activities. Steps need to be taken towards the development ofnon-extractive activities to alleviate the impact of extractive ES. Indeveloping countries such as Chile, where the level of surveillanceand compliance is substandard, it becomes even more complicatedto adopt long-term decisions to protect ES.
The research conducted to identify major barriers for the Chileantourism industry highlighted that Chile lacks a cultural identity toattract potential new visitors, while simultaneously the existence ofindigenous culture is apparently unrecognised (Servicio Natural deTurismo (SERNATUR), 2010). Cultural-indigenous tourism, togetherwith wildlife observation and aesthetic views, constitute as a primeopportunity for economic development in Chile, for example, NewZealand, which possesses similar terrestrial and marine ecosystems toChile relies comparably much more (7% of the GDP) on eco-tourism asa source of national income (Tourism Industry Association, 2014).
However, in order to successfully implement these plans anadaptive balance of coastal ecosystems uses is required, forexample, shifting the use of key iconic spaces from aquaculturezones to ecotourism and aboriginal development purposes. TheNational Board of Tourism is able to benefit from working closelywith aboriginal communities to promote the consensual highlyregarded image of aboriginal nations. Embarking on such a changein the paradigm of economic development for the Inner sea ofChiloé is a challenge facing current decision makers, the scientificcommunity and representatives of the industry, especially whenagreeing on the allocation of areas for securing ES, which requiresa holistic perspective (Cinner and Aswani, 2007; Aburto and Stotz,2013; Ruckelshaus et al., 2013).
5.3. Marine protected areas and indigenous claiming areas
Regional and national authorities are taking steps to recognisethe rights of aboriginal nations, and the Lafkenche Law is apromising step towards this new phase. However, since itsapproval in 2009, only one claimed area has been assigned to anindigenous community. Two major reasons seem to be occurring
simultaneously and preventing the appropriate functioning of theLafkenche Law: these are the magnitude of the claimed spaces byaboriginal nations, and the overlapping of aboriginal interests withthe development of other industrial activities (e.g., aquacultureand commercial fisheries).
Similar outcomes have also been identified in empirical studiesfrom other countries: for example, limited access to customaryrights due to the development of aquaculture business in Kiribati(Thomas, 2003), diverse problems related to institution depend-ability on the Salomon Islands (Aswani and Hamilton, 2004); andthe conflict between centralised and top-down management offisheries with traditional place-based management strategies(Friedlander et al., 2013).
It is unusual that customary management approaches areconsidered when designing and adopting conservation measures(Aswani, 1998), however they may be useful in order to betterunderstand the local institutional context, as the consideration ofcertain socioeconomic and political conditions may result in amore resilient resource stewardship (Cinner and McClanahan,2006). At present, a number of conflictive activities with differentinterests, especially fin-fish aquaculture, coexist within the cus-tomary indigenous claimed areas.
It is important to note that the main reason that drives thesecommunities to claim these spaces is the view that it is necessaryto protect ES for future generations. Aquaculture expansion, alongwith a general perception from the community that ecosystemshave suffered significant degradation over time, leads to theperception that these areas should now be protected from newaquaculture concessions (Outeiro et al., in review). These percep-tions are consistent with opportunities to convert these areas intoMPAs with indigenous purposes, and also that the State of Chilehas the opportunity to reconceptualise the legal stature ofMCAAN’s into a potential environmental conservation conceptthat benefits the interest of Chilean society as a whole. Thisreconceptualisation could have important optimisation and syner-getic outcomes, as both stakeholders, the Chilean State andindigenous communities, would be aiming to achieve similarenvironmental conservation strategies but from different perspec-tives. As the Chilean State aims to develop the rights and needs ofall people, both indigenous and non-indigenous, new prospects foreconomic development based on ecotourism, environmental jus-tice and historical aboriginal rights should be developed in orderto reconcile the imbalance between indigenous and non-indigenous Chileans. If these perspectives could be simultaneouslyaccepted by the authorities, decision makers, and the economicsector, then the MCAAN would not be a matter of non-indigenousversus indigenous, but instead it would be a matter of planning forthe interests of all future generations.
At the same time, indigenous communities also need to recon-sider their relationship with the non-indigenous communities. Thechannels of dialogues between the two groups should be opened inorder to find common ground, reaching consensuses and respectingeach other’s rights and uses. Non-indigenous communities shouldbe encouraged to realise the potential of MCAAN for securingcommon ES and to create indirect benefits for ecotourism devel-opment which may benefit both aboriginal and non-aboriginalcommunities. The projected scenario proposed in this study foraboriginal development and environmental conservation may helpto satisfy the needs for securing ES in the long-term, or at the leaststop degradation and promote recovery in the mid-term.
6. Conclusions
This study presents an empirical example of how ES can beincorporated into the marine spatial planning in developing
L. Outeiro et al. / Ecosystem Services ∎ (∎∎∎∎) ∎∎∎–∎∎∎ 11
Please cite this article as: Outeiro, L., et al., Using ecosystem services mapping for marine spatial planning in southern Chile underscenario assessment. Ecosystem Services (2015), http://dx.doi.org/10.1016/j.ecoser.2015.03.004i

countries. Modelling marine ES in the Inner sea of Chiloé has beeneffectively accomplished by showing some hotspots of ecologicalimportance. The methodology and resulting maps might allowpractitioners and authorities to improve marine spatial planningbased on securing key ES over time. However, the importancescore of habitat-forming species and endangered wildlife speciesshowed a different distribution pattern, that makes it difficult toeffectively delineate restrictive areas.
The current zoning proposal does not effectively secure marineES in the areas dedicated to protect them, suggesting thatconservation targets will not be achieved if the current scenariois not revised in the near future. Although a highly conservativescenario of environmental protection was designed with less than5% of the areas dedicated to restrictive zoning of protection, wewere able to increase the importance score of ES within thedesigned areas.
The proportion of selected spaces for the aquaculture industry hasnot diminished significantly in the current proposal of marine spatialplanning, allowing for the harmonization of various activities withinthe Inner Sea of Chiloé. However, we found that the spaces dedicatedto protection of other marine ES are not sufficient to guarantee theirconservation. In spite of the input from indigenous claiming areas toovercome these unbalances, many uncertainties still remain in theoperational process due to specific regulations for different marineactivities, the lack of human resources, and the lack of infrastructurededicated to conservation and management. Due to the high surfacearea dedicated to industrial activities in the baseline scenario based onthe current proposal, the industrial scenario had a limited capacity tomodify its future importance score. In Chile, and especially in the LosLagos region, plans for an effective MSP still remain unresolved.Among the identified reasons for this include underlying the privatevested interests to modify the actual scenario, the lack of politicalwillingness from governmental institutions to reach consensusbetween stakeholders with conflicting visions and interests, and theagreement among private parties, social organisations, and indigenousauthorities.
Acknowledgements
LO acknowledges the financial support from CONICYT-FONDECYTthrough the Postdoctoral Project No. 3130633, and Universidad de LosLagos for its sponsorship and The Regional Government of Los Lagosand SERNATUR (National Board of Tourism) for their support withspatial data. RHG thanks the World Wildlife Fund, Wildlife Conserva-tion Society, Dirección de Investigación from Universidad Austral deChile, Whale and Dolphin Conservation Society, AVINA Foundation,Oregon State University, Natural Resources Defense Council, RuffordSmall Grants Foundation, Gobierno Regional de Los Lagos, WhitleyFund for Nature, Natasha and George Duffield and also from Susanand David Rockefeller, through the long-term research program “Bluewhale ecology and conservation in Chile”. SV acknowledges the financialsupport from the Canadian International Development ResearchCentre (IDRC), The European Commission (EuropeAid/133719/L/ACT/ST) and the Norwegian Research Council (NRC). This is publication No.125 of Huinay Scientific Field Station. Funding to VH was provided byFondecyt project No. 1131039 and by a PEW Fellowship. Many thanksto Katie McConnell for checking the language, and to David Bellhofffor creating the species distribution models.
Appendix A. Supporting information
Supplementary data associated with this article can be found inthe online version at http://dx.doi.org/10.1016/j.ecoser.2015.03.004.
References
Aburto, J., Stotz, W., 2013. Learning about TURFs and natural variability: failure ofsurf clam management in Chile. Ocean Coast. Manage. 71, 88–98.
Aswani, S., Hamilton, R., 2004. Integrating indigenous ecological knowledge andcustomary sea tenure with marine and social science for conservation ofbumphead parrotfish (Bolbometopon muricatum) in the Roviana Lagoon, Solo-mon Islands. Environ. Conserv. 31 (1), 69–83.
Aswani, S., 1998. Patterns of marine harvest effort in SW New Georgia, SolomonIslands: resource management or optimal foraging? Ocean Coast. Manage. 40,207–235.
Cardinale, B.J., et al., 2012. Biodiversity loss and its impact on humanity. Nature 486,59–67.
Castro, C., Alvarado, C., 2009. La Gestión del Litoral Chileno: Un Diagnóstico;Universidad Católica de Chile, Instituto de Geografía. CYTED-IBERMAR, San-tiago, Chile.
Cinner, J., Aswani, S., 2007. Integrating customary management into marineconservation. Biol. Conserv. 140, 201–216.
Cinner, J., McClanahan, T., 2006. Socioeconomic factors that lead to overfishing in asmall-scale coral reef fishery of Papua New Guinea. Environ. Conserv. 33,73–80.
CRMC (Coastal Resources Management Council). 2010. Rhode Island Ocean SpecialArea Management Plan: Adopted by the Rhode Island Coastal ResourcesManagement Council, October 2010. 993 p.
Delgado, C., Sepúlveda, M., Álvarez, R., 2010. Conservation plan for migratoryshorebirds in Chiloé. In: Executive Summary. Valdivia, 42 p.
Duarte, et al., 2006. Community structure of the macroinfauna in the sedimentsbelow an intertidal mussel bed (Mytilus chilensis (Hupe) of southern Chile.Revista Chilena de Historia Natural. 79, 353–368.
eBird. 2012. eBird: An Online Database of Bird Distribution and Abundance. eBird,Ithaca, New York. Available online at: ⟨http://www.ebird.org⟩ (accessed June13th, 2014).
Ehler, C., Douvere, F., 2010. An international perspective on marine spatial planninginitiatives. Environments 37 (3), 9–20.
Flannery, W., Cinnéide, M. A roadmap for marine spatial planning: a criticalexamination of the European Commission’s guiding principles based on theirapplication in the Clyde MSP Pilot Project. Mar. Policy, 36 (1): 265–271.
Försterra, G., et al., 2014. Mass die off of the cold-water coral Desmophyllumdianthus in the Chilean Patagonian fiord region. Bull. Mar. Sci. 90 (3),895–899.
Försterra, G., Häussermann, V., 2003. First report on large scleractinian (Cnidaria:Anthozoa) accumulations in cold-temperate shallow water of south Chileanfjords. Zool. Verh. Leiden 345, 117–128.
Försterra, G., Häussermann, V., 2012. Report on blue whales sightings (Balaenopteramusculus Linnaeus, 1758) in a narrow fjord during autumn–winter in southernChile. Spixiana 35 (2), 237–245.
Frere, E., 2004. Current status and breeding distribution of Red-legged CormorantPhalacrocorax gaimardi along the Chilean coast. Bird Conservation Interna-tional 14, 113–121.
Friedlander, A., Shakeroff, J.M., Kittinger, J.N., 2013. Customary marine resourceknowledge and use in contemporary Hawaii. Pac. Sci. 67 (3), 441–460.
Försterra, Günter, Beuck, Lydia, Häussermann, Verena, André Freiwald, 2005.Shallow water Desmophyllum dianthus (Scleractinia) from Chile: characteris-tics of the biocenoses, the bioeroding community, heterotrophic interactionsand (palaeo)-bathymetrical implications. In: Freiwald, A., Roberts, J.M. (Eds.),Cold-water corals and ecosystems. Springer-Verlag, Berlin Heidelberg,pp. 937–977.
Galletti, B., Cabrera, E., 2007. Varamiento de cetáceos en Chile 1970–2005 y surelación con impactos antropogénicos 28–29 de Noviembre 2006, Bogotá. In:Félix, F. (Ed.), Memorias del taller de trabajo sobre el impacto de las actividadesantropogénicas en mamíferos marinos en el Pacífico Sudeste. Comisión Perma-nente del Pacífico Sur/Programa de las Naciones Unidas para el MedioAmbiente (CPPS/PNUMA), Guayaquil, pp. 32–37.
GORE (Gobierno Regional de Los Lagos) 2013. Plan de Ordenamiento Terriorial.Estrategia de Desarrollo Regional 2009–2020. Oficina Técnica de Borde Costero,División de Planificación y Desarrollo Regional, 67 p.
Guerry, A.D., et al., 2012. Modeling benefits from nature: using ecosystem servicesto inform coastal and marine spatial planning. Int. J. Biodivers. Sci. Ecosyst. Serv.Manage. 8 (1–2), 107–121.
Halpern, B.S., et al., 2012. An index to assess the health and benefits of the globalocean. Nature 488, 615–620.
Halpern, B.S., et al., 2008. A global map of human impact on marine ecosystems.Science 319, 948.
Henrichs, T., et al., 2010. Scenario development and analysis for forward-lookingecosystem assessments. In: Ash, N., Blanco, H., Brown, C., Garcia, K., Henrichs, T.,Lucas, N., Raudsepp-Hearne, C., Simpson, D., R. Scholes, R., Tomich, T.P., T.P., B.,Vira, B., Zurek, M. (Eds.), Ecosystems and human well-being-a manual forassessment practitioners, pp. 151–220.
Häussermann, V., et al., 2013. Gradual changes of benthic biodiversity in ComauFjord, Chilean Patagonia—lateral observations over a decade of taxonomicresearch. Spixiana 36 (2), 161–171.
Häussermann, V., et al., 2012. Sightings of marine mammals and birds in the Comaufjord, Northern Patagonia, between 2003 and mid 2012. Spixiana 35 (2), 247–262.
Häussermann, V., Försterra, G., 2007. Large assemblages of cold-water corals inChile: a summary of recent findings and potential impacts. In: George, R.Y.,
L. Outeiro et al. / Ecosystem Services ∎ (∎∎∎∎) ∎∎∎–∎∎∎12
Please cite this article as: Outeiro, L., et al., Using ecosystem services mapping for marine spatial planning in southern Chile underscenario assessment. Ecosystem Services (2015), http://dx.doi.org/10.1016/j.ecoser.2015.03.004i

Cairns, E.H. (Eds.), Conservation and Adaptive Management of Seamount andDeep-sea Coral Ecosystems. Rosenstiel School of Marine and AtmosphericScience. University of Miami, Miami, FL, p. 324.
Hucke-Gaete, R., Osman, L.P., Moreno, C.A., Findlay, K.P., Ljungblad, D.K., 2003.Discovery of a blue whale feeding and nursing ground in southern Chile. Proc.R. Soc. Lond. Ser. B 271, S170–S173. http://dx.doi.org/10.1098/rsbl.2003.0132.
Hucke-Gaete, R., Lo Moro, P., Ruiz, J., 2010. Conservando el mar de Chiloé. Palena yGuaitecas, 342.
Hucke-Gaete, R., Haro, D., Torres-Florez, J.P., Montecinos, Y., Viddi, F.A., Bedriñana,L., Ruiz, J., 2013. A historical feeding ground for humpback whales in theEastern South Pacific revisited: the case of northern Patagonia, Chile. AquaticConservation: Marine & Freshwater Ecosystems 23, 858–867. http://dx.doi.org/10.1002/aqc.2343.
IUCN, 2012. IUCN Red List Categories and Criteria: Version 3.1, second ed. IUCN,Gland, Switzerland and Cambridge, United Kingdom p. 32.
Jay, S., Ellis, S., Kidd, S., 2012. Marine spatial planning: a new frontier? J. Environ.Policy Plann. 14 (1), 1–5.
Katz, J., Iizuka, M., Muñoz, S., 2011. Creciendo en base a los recursos naturales,“tragedias de los comunes” y el futuro de la industria salmonera chilena.CEPAL-Serie Desarrollo Productivo N1 191. Naciones Unidas, Santiago de Chile.
Liquete, C., et al., 2013. Current status and future prospects for the assessment ofmarine and coastal ecosystem services: a systematic review. PLoS ONE 8 (7),e67737.
Loomis, J.B., White, D.S., 1996. Economic benefits of rare and endangered species:summary and meta-analysis. Ecol. Econ. 18, 197–206.
Mayr, C., et al., 2014. Responses of nitrogen and carbon deposition rates in ComauFjord (42 1S, Southern Chile) to natural and anthropogenic impacts during thelast century. Cont. Shelf Res. 78, 29–38.
McKenzie, E., Rosenthal, A., 2012. Developing Scenarios to Assess Ecosystem ServiceTrade-offs: Guidance and Case Studies for InVEST Users. World Wildlife Fund,Washington, D.C., USA.
Nahuelhual, L., 2013. Mapping recreation and ecotourism as a cultural ecosystemservice: an application at the local level in Southern Chile. Appl. Geogr. 40,71–82.
Outeiro, L. et al., Framing ecological knowledge with marine ecosystem services forthe prospected customary sea tenure of williche-lafkenche communities inSouthern Chile. Ecosyst. Serv. in review.
Outeiro, L., Villasante, S., 2013. Linking salmon aquaculture synergies and trade-offson ecosystem services to human wellbeing constituents. Ambio 42 (8),1022–1036.
Pliscoff, P., Fuentes, T., 2008. Análisis de Representatividad Ecosistémica de lasÁreasProtegidas Públicas y Privadas en Chile. Creación de un Sistema NacionalIntegral de Áreas Protegidas para Chile. Informe Final., 103.
Rockström, J., et al., 2009. A safe operating space for humanity. Nature 461,472–475.
Riet-Sapriza, F.G., et al., 2013. Foraging behaviour of lactanting South American sealions (Otaria flavescens) and spatial-temporal resource overlap with theUruguayan fisheries. Deep-Sea ResearchII 88–89, 106–119.
Reyes-Arriagada, R.L., et al., 2013. Population trends of a mixed-species colony ofHumboldt and Magellanic Penguins in southern Chile after establishing aprotected area. Avian Conservation and Ecology 8 (2), 13.
Rosenthal, A. et al. 2014. Process matters: a framework for conducting decision-relevant assessments of ecosystem services. Int. J. Biodivers. Sci. Ecosyst. Serv.Manage., 10.1080/21513732.2014.966149.
Rozzi, R., Torres-Mura, J.C., et al., 1990. Observaciones del chungungo (Lutra felina)al sur de la Isla Grande de Chiloé: antecedentes para su conservación. MedioAmbiente (Chile) 11, 24–28.
Ruckelshaus, M., et al., 2013. Securing ocean benefits for society in the face ofclimate change. Mar. Policy 40, 154–159.
Servicio Natural de Turismo (SERNATUR) 2010. Estudio tipificación de la demandapotencial de Chile. Santiago de Chile, 32 p.
Shaffer, S.A., et al., 2009. Spatiotemporal habitat use by breeding sootyshearwatersPuffinus griseus. Mar. Ecol. Prog. Ser. 391, 209–220.
Skewgar, E., Simeone, A., Dee Boersma, P., 2009. Marine Reserve in Chile wouldbenefit penguins and ecotourism. Ocean Coast. Manage. 52, 487–491.
Steffen, W., et al., 2015. Planetary boundaries: guiding human development on achanging planet. Science 437, 6233.
Subsecretaría de Pesca y Acuicultura (SUBPESCA), 2014. Guía para la Aplicación dela Ley de Espacios Costeros Marinos para Pueblos Originarios. Subsecretaria dePesca y Acuicultura, Gobierno de Chile. Valparaiso p. 45.
The Economics and Ecosystems and Biodiversity (TEEB) 2010. The Economics ofEcosystems and Biodiversity: Mainstreaming the Economics of Nature: ASynthesis of the Approach, Conclusions and Recommendations of TEEB.
Thomas, F.R., 2003. ‘Taming the Lagoon’: Aquaculture development and the futureof customary marine tenure in Kiribati, Central Pacific. Geographiska Ann. Ser. B85 (4), 243–252.
Tourism Industry Association. 2014. day of access: 05/03/2014, ⟨http://www.tianz.org.nz/main/key-tourism-statistics/⟩.
Viddi, F.A., Hucke-Gaete, R., Torres-Florez, J.P., Ribeiro, S., 2010. Spatial and temporalvariability of cetacean distribution in the fjords of northern Patagonia, Chile.ICES Journal of Marine Science 67, 959–970.
Zaixso, E.H., 2004. Bancos de cholga Aulacomya atra atra (Molina) (Bivalvia:Mytilidae) del golfo San José (Chubut, Argentina): Diversidad y relaciones confacies afines. Revista de Biología Marina y Oceanografía 39 (2), 61–78.
L. Outeiro et al. / Ecosystem Services ∎ (∎∎∎∎) ∎∎∎–∎∎∎ 13
Please cite this article as: Outeiro, L., et al., Using ecosystem services mapping for marine spatial planning in southern Chile underscenario assessment. Ecosystem Services (2015), http://dx.doi.org/10.1016/j.ecoser.2015.03.004i