ANEXO E - Chile
494
ANEXO E CARACTERÍSTICAS DE LA ESTACIÓN METEOROLÓGICA
-
Upload
khangminh22 -
Category
Documents
-
view
2 -
download
0
Transcript of ANEXO E - Chile

ANEXO E
CARACTERÍSTICAS DE LA ESTACIÓN METEOROLÓGICA

CARACTERÍSTICAS DE LA ESTACIÓN METEOROLÓGICA
A continuación, se listarán las características del instrumental de medición que se
instalará en la estación meteorológica.
N° Sensor de Temperatura y Humedad Relativa del Aire
Características Exigencias
1 Alimentación Operable a 12 V
2 Rango de medición A lo menos: -40°C a +50°C; 0% a 100% Humedad Relativa del aire
3 Precisión de temperatura ≤ ± 0,30°C
4 Precisión de Humedad ≤ ± 3%
5 Señal de salida SDI-12 o analógico con conversor a SDI-12
6 Tiempo respuesta ≤ 20 segundos por sensor
7 Consumo Máximo 10 mA
8 Cable conexión Largo ≥8 metros y conductores diferenciados
9 Protección pagoda protección solar incluida
10 Soporte
Brazo de fijación para instalación en mástil de 2¼ a
3¼ pulgadas de diámetro que otorgue alta resistencia a la acción del viento v condiciones climáticas

N°
Sensor de Precipitación Líquida y Sólida
Características Exigencias
1 Tipo Registrar precipitación líquida y sólida
2 Resolución de lluvia A lo menos 0,05 mm
3 Alimentación Eléctrica Operable a 12 V
4 Señal de salida SDI-12
5 Temperatura de operación A lo menos -40°C a +50°C
6 Consumo Máximo 20 mA (pasivo)
7 Largo de cable ≥ 20 m
8 Protección contra el viento
Incluir sistema de aspas disipadoras
9 Anticongelante Incluir al menos una carga de operación
10 Software de operación Incluido con conexión USB
11 Base Pedestal de aluminio o acero inoxidable

N° Sensor de Precipitación Líquida
Característícas Exigencias
1 Tipo Tipping bucket con salida de pulso
2 Resolución o peso pulso 0,1, 0,2 mm o 0,25 mm
3 Peso Máximo 4 kg
4 Diámetro colector ≤ 12 pulgadas
5 Altura Máximo 65 cm
6 Temperatura de operación Al menos de 0°C a +50°C
7 Humedad de operación 100%
8 Error de medición 3% hasta Intensidades de 50 mm/hr y 5% para Intensidades mayores a 50 mm/hr
9 Largo de cable ≥ 8 m
10 Nivelación Debe contar con burbuja de nivel
11 Soporte y protección
Brazo de fijación para instalación en mástil de
2¼ a 3¼ pulgadas de diámetro que otorgue
alta resistencia a la acción del viento y condiciones climáticas extremas

N° Sensor de Velocidad y Dirección del Viento
Características Exigencias
1 Ambos sensores contenidos en módulo común
Carcaza externa con cubierta resistente al hielo (color negro). Piezas metálicas
anodizadas
2 Rango de medición de velocidad del viento
A lo menos 0 m/s a 75 m/s
3 Rango de medición de dirección del viento
0° a 360°
4 Precisión para velocidad del viento ±0,5 m/s (para vel. viento ≤ 5 m/s); y 10%
(para vel. viento > 5 m/s)
5 Precisión para dirección del viento ±50
6 Umbral de sensibilidad de la hélice 1,0 m/s
7 Alimentación Operable a 12 V
8 Salida SDI-12 o analógico con conversor a SDI-12
9 Temperatura de operación A lo menos -40°C a ±50°C
10 Soporte y protección
Brazo de fijación para instalación en mástil de 2¼ a 3¼ pulgadas de diámetro que
otorgue alta resistencia a la acción del viento
11 Cable de conexión de sensor a
datalogger 10 metros de longitud mínimo

N° Sensor de Radiación Directa
Características Exigencias
1 Alimentación Operable a 12 V
2 Rango medición 0 a 2.000 W/m2 como mínimo
3 Temperatura de
operación
Al menos de -40°C a +50°C; 0 a 100% humedad
relativa del aire
4 Espectro Al menos 310 nm a 2800 nm
5 Sensibilidad 10 µNW/m2 a 20 µA/W/m2
6 Señal Salida SDI-12 ó 4-20 mA ó 0-5 V
7 Largo Cable ≥ 8 metros
8 Precisión ≤±5% de la escala total de medición
9 Soporte y protección Brazo de fijación para instalación en mástil de 2¼ a 3¼ pulgadas de diámetro que otorgue alta resistencia a la
acción del viento

N° Almacenador de datos
Características Exigencias
1 Comunicación a PC (física) Debe Incluir cable USB o cable adaptador RS-
232 a USB
2 Memoria de almacenamiento Mínimo 2 MB y tarjeta electrónica para rescate de
datos
3 Velocidad de comunicación 9.600 bps
4 Intervalos de grabación Mínimo 5,15, 30 min.; 1, 12 y 24 hr
5 Tipo y cantidad de señales de entrada de datos
A lo menos 12 canales sdi-12 (lógicos), 1 canal de pulso y 4 entradas analógicas simples
6 Identificador Asignar nombre a la estación, mínimo 18
caracteres
7 Display Debe contar con sistema de visualización de datos en pantalla ya sea incorporado o como
accesorio (caracteres alfanuméricos)
8 Teclado para visualización de datos
Debe contar con teclado para programar equipo y accesorios y leer datos
9 Alimentación Eléctrica de
funcionamiento Operable al menos en el rango de 10,8 -14 V
10 Consumo Eléctrico 5 mA en estado de reposo
11 Proceso de Transmisión Compatible con Satélite GOES
12 Precisión de Reloj +/- 1min/mes
13 Temperatura de funcionamiento
A lo menos entre -40°C a +50°C
14
Dimensiones o Tamaño equipo
(considerando caja de protección)
Inferior a 35 cm (ancho) x 40 cm (largo) x 35 cm
(profundidad)
15 Protección Nema 4, IP 65 o superior
16 Software Aplicación
Incluido para cada equipo en español y/o inglés,
con sus respectivas licencias en caso de ser necesario. Debe trabajar en Windows XP y 7
como mínimo
17 Extracción de archivos Texto sin codificar, TXT, EXCEL o CSV
18 Password Debe contar con a lo menos con 1 nivel de
password
19 Ajuste de datos Debe contar con la posibilidad de agregar un
multiplicador u offset por pará metro

N° Plataforma Satelital
Características Exigencias
1 Rango voltaje de entrada Operable en el rango 11 V a 14 V
2 Temperatura de operación A lo menos -40°C a +50°C
3 Humedad A lo menos 0% a 8 5% H/R (no condensado)
4 Consumo horario de la
plataforma
Stand-by máximo 15 mA
Uso GPS inferior o igual 355 mA, y transmisión (en base a 300Bd) máximo 4,5A
5 Software Basado en Windows
6 Visualización de Datos o Display
Debe contar con sistema de visualización de
datos en pantalla ya sea incorporado o como accesorio
7 Teclado Debe contar con teclado para programar equipo
y accesorios; y leer datos
8 Protección mecánica NEMA 4, IP 65 o superior
9 Software Aplicación
Incluido para cada equipo en español y/o
inglés, con sus respectivas licencias en caso de ser necesario. Debe trabajar en Windows XP y 7
como mínimo
10 Dimensiones o Tamaño de Equipo (considerando cajas de
protección)
Inferior a 35 cm x 40 cm x 35 cm
11 Estatus Led indicadores
12 Cable Comunicación Debe incluir cable de comunicación a puerto
USB del computador

N° Plataforma Satelital - Etapa de almacenamiento de datos
Características Exigencias
1 Velocidad de comunicación Al menos 9.600 bps
2 Memoria de almacenamiento Mínimo 2MB, y tarjeta electrónica o similar:
para rescate de datos
3 Intervalos de grabación Mínimo 5, 15, 30 min.; 1, 12 y 24 hr
4 Tipo y cantidad de señales de entrada de datos
A lo menos 12 canales SDI-12 (lógicos ), 1 canal de pulso y 4 entrada s analógicas simples
5 Identificador Poder asignar nombre a estación, mínimo 18
caracteres
6 Precisión de Reloj Máximo 1 min/mes
7 Procesos Debe contar con la posibilidad de añadir
multiplicador y offset por parámetro
8 Password Debe contar con a lo menos con 1 nivel de password
9 Extracción de Archivos Texto sin codificar, TXT, EXCEL o CSV
Funcionalidades:
Configuración simple del equipo a través de su teclado, y pantalla para visualización de datos.
Recolección de datos mediante computador y alternativamente por tarjeta electrónica.
Unidades de registro en Sistema Internacional.
El equipo y accesorios, incluidos en caja NEMA (de ser el caso) serán instalados en casetas de protección como las que posee la DGA con dimensiones: 60 cm x 50 cm x
50 cm. (alto x ancho x profundidad).
Las plataformas deben venir completamente cableadas y ensambladas para ser utilizadas de manera directa en la Red.
Todos los accesorios externos (por ej: antenas) deben incluir todos los accesorios para
monta je a mástil vertical de 2 1/4".

N° Plataforma Satelital • Etapa transmisión
Características Exigencia
1 Satélite GOES
2 Certificación NESDIS (incluir Certíficado)
3 Velocidad de transmisión Compatible con sistema satelital GOES de la NOAA. (al
menos con 300 Bd)
4 Mantenimiento horario Con GPS
5 Velocidad de comunicación Al menos 9.600 bps
6 Potencia de salida Compatible con satélite GOES
7 Rango frecuencia Cubre 401,701 (CH01) a 402,0985 (CH 266) Mhz
8 Faol Safe Reset físico o por software
9 Puerto de comunicación RS-23 2 DB-9
10 Protocolo ASCII
11 Rango voltaje de entrada Operable al menos en el rango 11 V a 14 V
12 Consumo MAXIMOS: En reposo,; 8,5 mA; en uso de GPS; 355
mA; en TX,; 4,5 A, en base a transmisión en 3 00 Bd
13 Mensaje transmisión Deseable sin codificar. En caso contrario, incluir proceso
de decodificación
14 Temperatura de operación Operable al menos en el rango -40°C a +50°C
15 Humedad Operable al menos en el rango entre 0 a 85 % H/R (no condensado)
16 Software Basado en windows
17 Estatus Led indicadores
18 Accesorios por transmisor
Antena de transmisión con mínimo 8 metros de cable;
Antenas GPS mínimo 5 metros de cable serial DB9 para comunicación con data logger
19 Conector antena Tipo N o Adaptador a N (salida RF)

N° Panel Solar 40W
Características Exigencias
1 Potencia máxima (Pmáx) 40 W
2 Corriente de carga (ISC) Mínimo 2,3 A
3 Voltaje a circuito abierto (Vmp) Mínimo 17 V
4 Celda Policristalino o Monocristalino
5 Regulador de voltaje y
protecciones Apropiado para el panel con salida a 12 V
6 Temperatura de operación Al menos -40°C a +50°C
7 Peso Máximo 8 kg
8 Cable Mínimo 10 metros de longitud (debe estar
conectado en el panel)
9 Soporte y protección
Brazo Ajustable en azimut -elevación para mástil de 2¼ a 3¼ pulgadas de diámetro. Alta
resistencia a la acción del viento y condiciones
climáticas extremas. El sistema de soporte debe venir instalado al panel

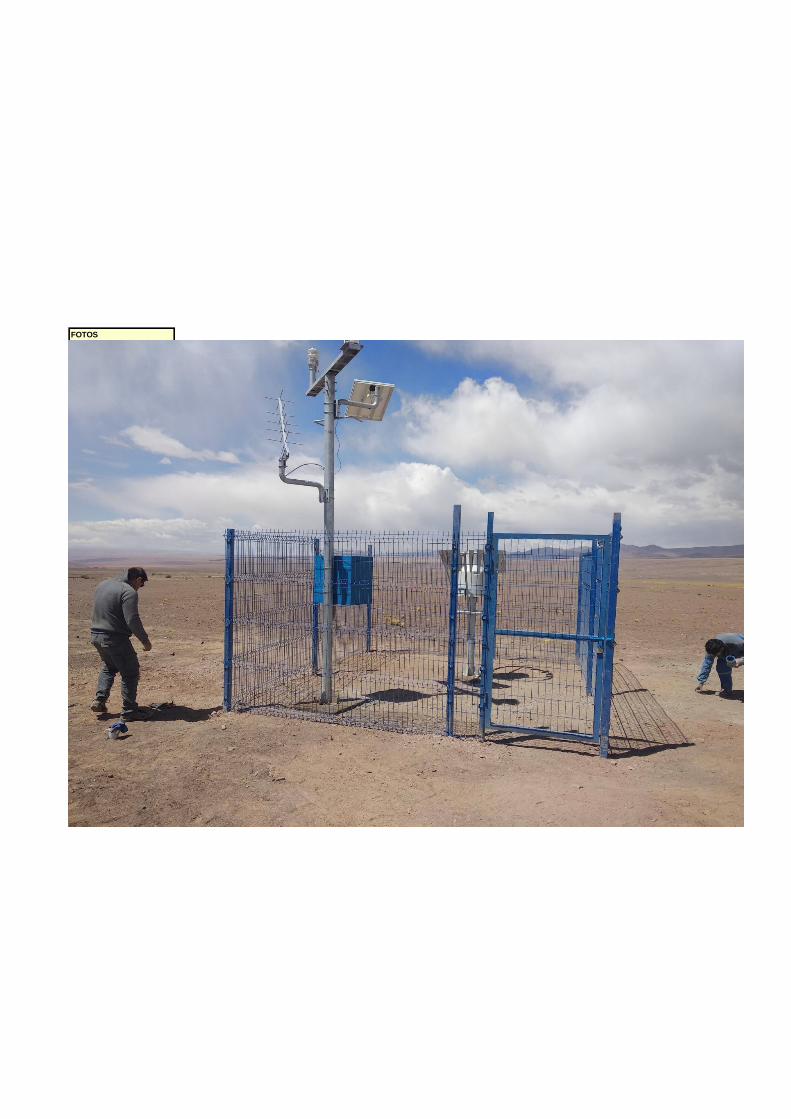
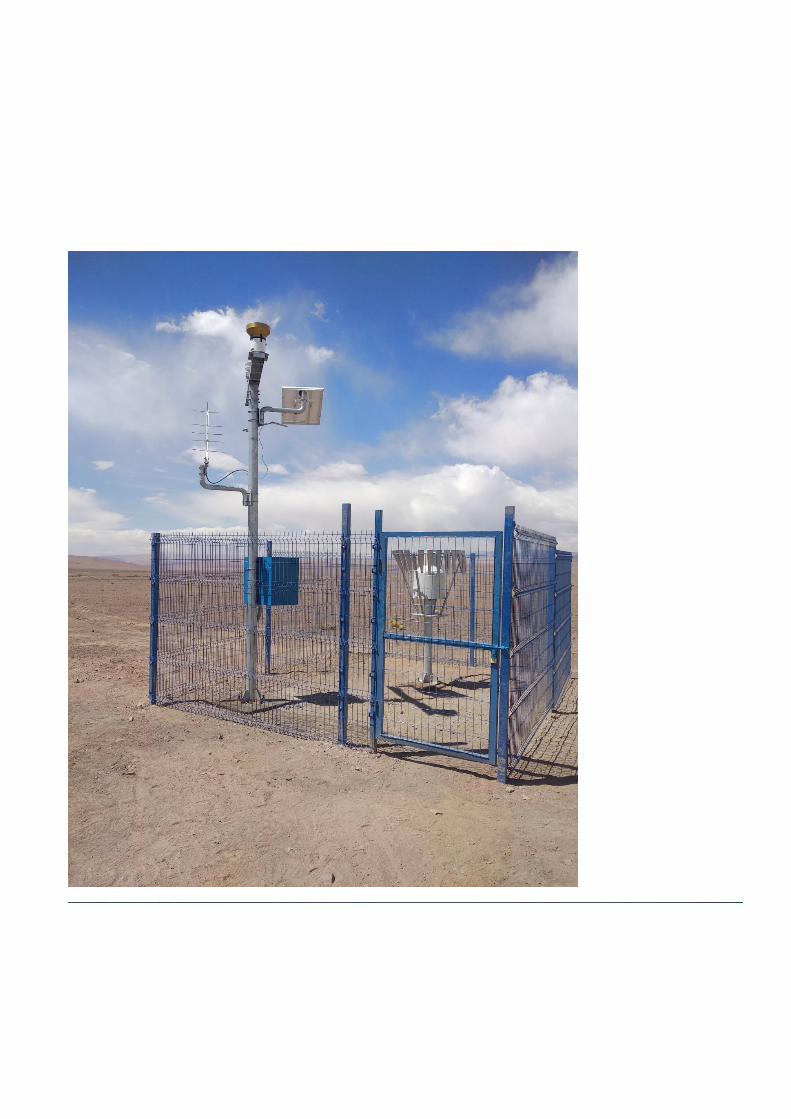
ESTACIÓN METEOROLÓGICA QUEBRADA CAYA
• Quebrada Caya
• Altitud : 3.850 msnm
• Coordenadas
E: 507.485
N: 7.705.766
Datum WGS84
• Ubicación
Quebrada Caya – Camino Quebrada Blanca

Características:
Transmisión en Tiempo Real
Transmisión satelital cada 1 hora de paquete de datos meteorológicos
registrados cada 30 minutos
Variables meteorológicas:
Temperatura
Humedad
Velocidad y Dirección Viento
Radiación Solar
Presión Atmosférica
Precipitación Liquida
Precipitación Instantánea
Precipitación Acumulada
Link Visualización datos:
https://dcs2.noaa.gov/Account/FieldTest
Código Estación web: DCP ADDRESS
56B0AE1E

Lectura Datos Visualizados Link pagina NOAA web
Fecha y Hora Transmisión Datos (registros cada 30 minutos
Se transmite cada 1 hora 2 paquetes de datos medidos cada 30 minutos
Desfase horario +3 hrs (respecto de hora Chile) (Ej: Hora transmisión Satélite 06:19GMT, Hora Chile 03:19,
hora captura Datos transmitidos ( Paquete 1 : 02:49 hrs; Paquete 2 : 03:19 hrs)

Lectura 2 Paquetes Datos Visualizados Link pagina NOAA
web
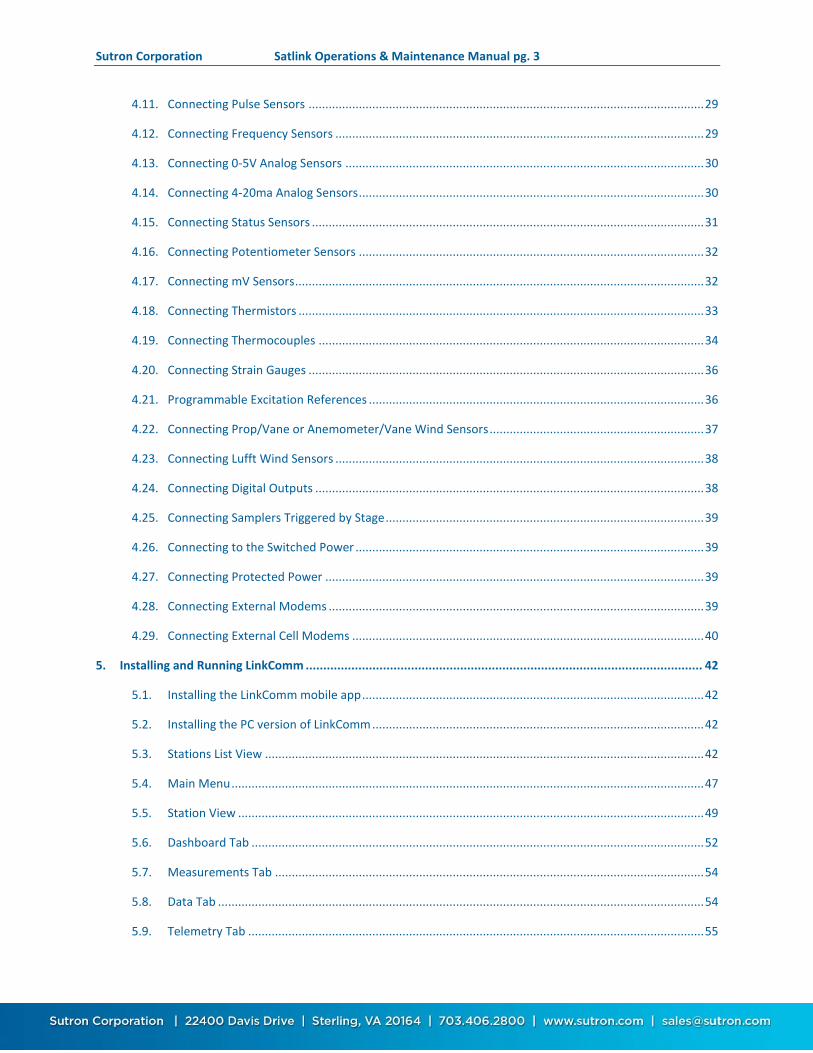
Voltaje Batería (2 decimales) 12.88 V
Temperatura (1 decimal) 7.4 °C
Humedad (sin decimales) 59%
Velocidad Viento (1 decimal) 2.8 m/s
Dirección Viento (sin decimales) 192°
Radiación Solar (sin decimales) 1 W/m2
Presión Atmosférica (sin decimales) 644 hPa
Precipitación Liquida Pluviómetro Texas (equivale a 0,1mm x N° ciclo;contador vuelve a cero cada 24 hrs)
Precipitación Instantánea Pluvio II (1 decimal) mm
Precipitación Acumulada Pluvio II (1 decimal) mm
PAQUETE 1

• Plataforma Satelital Sutron , modelo Satlink 3
• Sensor de precipitación Texas., modelo TR-525M
• OTT Pluvio 2 L- Pluviómetro 200 cm2/1500 mm
• Sistema de protección contra viento
• Modulo de sensores Lufft, modelo WS501-UMB
• Panel Solar de 40 Watts
Instrumental

• Plataforma Satelital Sutron , modelo Satlink 3
Instrumental
• Sensor de precipitación Texas., modelo TR-525M

• OTT Pluvio 2 L- Pluviómetro 200 cm2/1500 mm
• Sistema de protección contra viento
Instrumental
• Modulo de sensores Lufft, modelo WS501-UMB

• Panel Solar de 40 Watts
• Antena Transmisión Yagi
Instrumental
Cerco Protección

Detalle Técnico Equipos
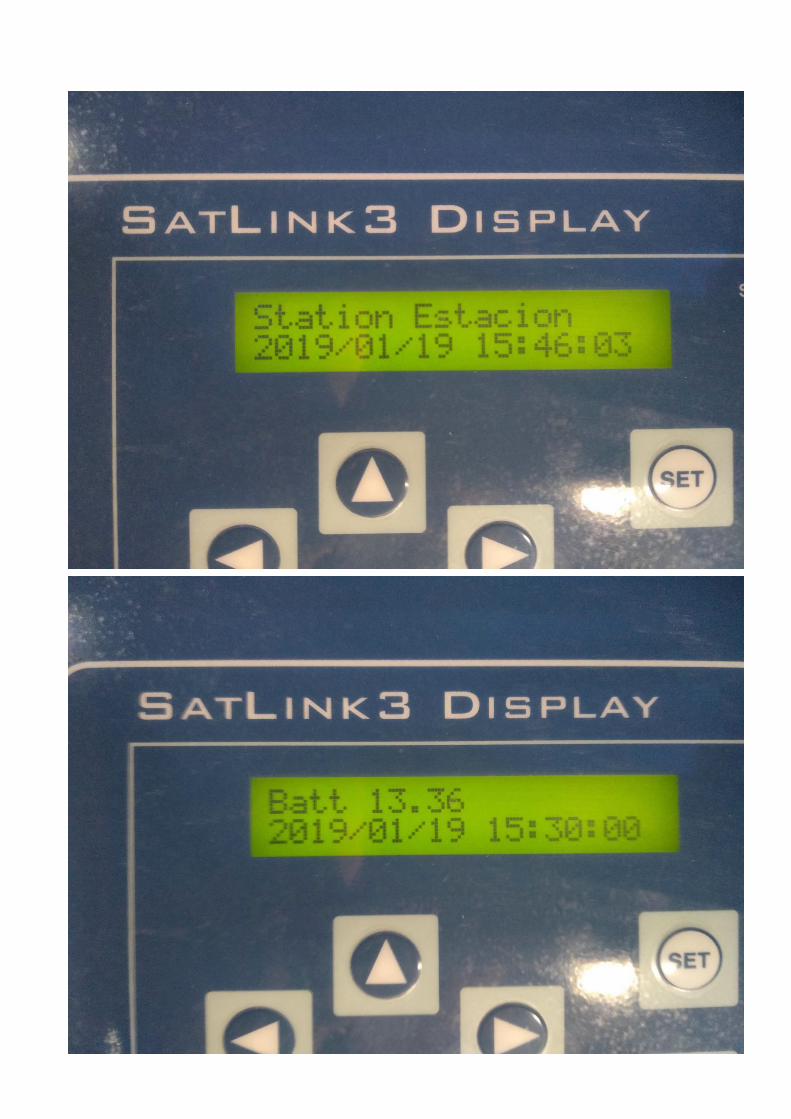
Plataforma Satelital Sutron , modelo Satlink 3 , SL3-ENC-DISP-1 incluye :
• Alimentación 12 VDC , Velocidad transmisión 300 y 1200 Baud• Antena GPS con 5 metros de cable• Aantena Yagi , con soporte y 8 metros de cable• Cable USB a RS 232 setrie DB9 de 1.80 mts.• Display - Caja NEMA• Incluye Software .• Tarjeta de datos SD 2 GB incluida
Sensor de precipitación Texas., modelo TR-525M (0,1mm x ciclo)
OTT Pluvio 2 L- Pluviómetro 200 cm2/1500 mm• 200 cm2 superficie colectora; 1500 mm cantidad recolectadle;
Intensidad en el Tiempo Real y cantidades de precipitación según WMO.
• SDI-12/RS 485 y pulsos/status• Interface de comunicación USB (Incluye cable USB 3m)• Incluye Software de uso Pluvio2 (CD)• 10 Litros de Anticongelante (Sin Calefacción)• Sistema de protección contra viento (1 metro de altura)
Modulo de sensores meteorológicos Lufft, modelo WS501-UMBIncluye sensores de:• Velocidad y Dirección del viento Ultrasónico, rango operacional -50°C a +
60°C –Rango: 0 a 60 m/seg• Humedad y Temperatura, rango operacional 0…100% RH ; -50°C a 60°C• Presión Barométrica (Capacitivo) Rango operacional de -50°C a + 60°C –
Rango: 300 a 1200 hPa• Radiación Solar K&Z CMP3- Rango spectral: 300/2800 nm – Irradiación
máxima: 1.500 Wm2• Salida : SDI-12
Panel Solar de 40 Watts, regulador y montaje

Código BNA Región Técnico
Norte
Este
X AlturaWGS84
ID Baudios 1200 Azimut 345
Intervalo de Medición 30 min Canal de Transmisión 47 Elevación 65
Intervalo de Transmisión 1 hr Ventana de Transmisión (seg) 10 Hora Tx (hh:mm:ss) 00 19 30
ID Intervalo de Medición Hora Tx (hh:mm:ss)
Intervalo de Transmisión
Modelo Logger Nº Serie Datalogger Nombre Programa
Modelo Transmisor Nº Serie Transmisor Password
P. Solar 40 (Watts) Tipo de Antena Marca Batería
P. Solar S/N Nº Serie Antena Capacidad Batería 55 (AH)
Sensor Nivel Rango Sensor Nivel Nº Serie Sensor Nivel
Largo canalización de Sensor Nivel
Otros
Sensor/marca-modelo Número de Serie
Sensor/marca-modelo Número de Serie
Sensor/marca-modelo Número de Serie
Sensor/marca-modelo Número de Serie
Sensor/marca-modelo Número de Serie
Sensor/marca-modelo Número de Serie
Sensor/marca-modelo Número de Serie
Sensor/marca-modelo Número de Serie
Sensor/marca-modelo Número de Serie
Lectura
Altura Regla (metros)
Lectura Sensor (Offset 0) (metros)
Offset (metros)
(metros)
(horas)
Se coloco Anticongelante (5Lt) diluido en 2 Lt agua;
Sistema Pluvio 2 cuenta con Mecanismo Protección Viento
Todo el sistema y equipos se encuentran Nivelado
Se ha dispuesto candado en puerta acceso y en caja Protección Equipos
Acceso es por Camino Quebrada Blasnca, vifurcación hacia la izquierda en Km 87 app.
Tarapacá
Quebrada Caya
0,0
Nivométrica
1185
A. Arenas
Lectura Sensor (con Offset)
NIMACYAGI
56B0AE1E
Nombre de la Estación
Fecha de Instalación
SUTRON Satlink 3
18-01-2019 507,485
7,705,766
3,845 msnmTipo de Estación(marcar con X)
Agua Subterránea Meteorológica
Hidrométrica
+Radiación Solar
PL2L-450026
Plataforma Satelital Sutron , modelo Satlink 3
Sensor de precipitación T.E., modelo TR-525M
OTT Pluvio 2 L- Pluviómetro 200 cm2/1500 mm
Sistema de protección contra viento (1 metro de altura)
Modulo de sensores Lufft, modelo WS501-UMB:
precipitación acumulada (mm) 1 decimal - Texas 0,0
0,0
Dirección Viento (º) 0 decimal 272
radiación incidente (Wm2) 0 decimal
644
+ Humedad y Temperatura
+Presión Barométrica
presión barométrica (hpa) 0 decimal
+ Velocidad y Dirección del viento
13,36
Parámetros (En Orden de Transmisión)
Voltaje (V) 2 decimales
Temperatura aire (ºC) 1 decimal
humedad(%) 0 decimal
velocidad viento (m/s) 1 decimal
precipitación instantánea (mm) 1 decimal – Pluvio 2
12,1
13,36
13,7
50
Hora de Calibración
Todo el sistema se encuyentra aterrizado a tierra mediante Barra Cooper de 1,8m de porofundidad;
precipitación acumulada (mm) 1 decimal – Pluvio 2
Voltaje Batería (V): sin conexiones
Voltaje Batería (V): con panel solar y regulador de voltaje
Voltaje Batería (V): con Panel, Regulador y equipos
* Válido para paneles solares sin regulador de voltaje incorporado
Ficha de InstalaciónInformación de la Estación
Parámetros de Transmisión Satelital
Descripción de Equipos
Parámetros de Medición
Observaciones
Parámetros de Transmisión GPRS
FOTOS


!STATION NAME=Estacion!M1 ALARM 1 TYPE=Off!M1 ALARM 2 TYPE=Off!M1 ALARM 3 TYPE=Off!M1 AVERAGING TIME=00:00:00!M1 DETAILS=Off!M1 LABEL=Batt!M1 LOG ERROR VALUE=-99999.00!M1 LOGGING INTERVAL=00:00:00!M1 MEAS INTERVAL=00:30:00!M1 MEAS TIME=00:00:00!M1 MEAS TYPE=Battery!M1 NUMBER OF VALUES TO TX1=2!M1 NUMBER OF VALUES TO TX2=1!M1 OFFSET=0.000000!M1 RIGHT DIGITS=2!M1 SLOPE=1.000000!M1 TX DATA CONTENT1=Last!M1 TX DATA CONTENT2=All Since Last Tx!M1 TX DATA CONTENT3=All Logged!M1 TX DATA CONTENT4=All Logged!M1 UNITS=V!M1 USE EQUATION=Off!M1 USE SCRIPT=Off!M1 ACTIVE=On!M2 ALARM 1 THRESHOLD=0.000000!M2 ALARM 1 TYPE=Off!M2 ALARM 2 THRESHOLD=0.000000!M2 ALARM 2 TYPE=Off!M2 ALARM 3 THRESHOLD=0.000000!M2 ALARM 3 TYPE=Off!M2 AVERAGING TIME=00:00:00!M2 DETAILS=Off!M2 LABEL=Temperatura!M2 LOG ERROR VALUE=-99999.00!M2 LOGGING INTERVAL=00:00:00!M2 MEAS INTERVAL=00:30:00!M2 MEAS TIME=00:00:00!M2 MEAS TYPE=SDI-12!M2 NUMBER OF VALUES TO TX1=2!M2 NUMBER OF VALUES TO TX2=2!M2 OFFSET=0.000000!M2 RIGHT DIGITS=1!M2 SAMPLING INTERVAL=60.0 sec!M2 SDI-12 ADDRESS=0!M2 SDI-12 COMMAND=C!!M2 SDI-12 PARAM=1!M2 SDI-12 PORT=Port2!M2 SLOPE=1.000000!M2 SUBSAMPLES=5!M2 TX DATA CONTENT1=Last!M2 TX DATA CONTENT2=All Since Last Tx!M2 TX DATA CONTENT3=All Logged!M2 TX DATA CONTENT4=All Logged!M2 UNITS=C!M2 USE EQUATION=Off!M2 USE SCRIPT=Off

!M2 WARMUP=0!M2 ACTIVE=On!M3 ALARM 1 THRESHOLD=0.000000!M3 ALARM 1 TYPE=Off!M3 ALARM 2 THRESHOLD=0.000000!M3 ALARM 2 TYPE=Off!M3 ALARM 3 THRESHOLD=0.000000!M3 ALARM 3 TYPE=Off!M3 AVERAGING TIME=00:00:00!M3 DETAILS=Off!M3 LABEL=HR!M3 LOG ERROR VALUE=-99999.00!M3 LOGGING INTERVAL=00:00:00!M3 MEAS INTERVAL=00:30:00!M3 MEAS TIME=00:00:00!M3 MEAS TYPE=SDI-12!M3 NUMBER OF VALUES TO TX1=2!M3 NUMBER OF VALUES TO TX2=2!M3 OFFSET=0.000000!M3 RIGHT DIGITS=0!M3 SAMPLING INTERVAL=60.0 sec!M3 SDI-12 ADDRESS=0!M3 SDI-12 COMMAND=C!!M3 SDI-12 PARAM=2!M3 SDI-12 PORT=Port2!M3 SLOPE=1.000000!M3 SUBSAMPLES=5!M3 TX DATA CONTENT1=Last!M3 TX DATA CONTENT2=All Since Last Tx!M3 TX DATA CONTENT3=All Logged!M3 TX DATA CONTENT4=All Logged!M3 UNITS=%!M3 USE EQUATION=Off!M3 USE SCRIPT=Off!M3 WARMUP=0!M3 ACTIVE=On!M4 ALARM 1 THRESHOLD=0.000000!M4 ALARM 1 TYPE=Off!M4 ALARM 2 THRESHOLD=0.000000!M4 ALARM 2 TYPE=Off!M4 ALARM 3 THRESHOLD=0.000000!M4 ALARM 3 TYPE=Off!M4 AVERAGING TIME=00:00:00!M4 DETAILS=Off!M4 LABEL=Viento!M4 LOG ERROR VALUE=-99999.00!M4 LOGGING INTERVAL=00:00:00!M4 MEAS INTERVAL=00:30:00!M4 MEAS TIME=00:00:00!M4 MEAS TYPE=SDI-12!M4 NUMBER OF VALUES TO TX1=2!M4 NUMBER OF VALUES TO TX2=2!M4 OFFSET=0.000000!M4 RIGHT DIGITS=1!M4 SAMPLING INTERVAL=60.0 sec!M4 SDI-12 ADDRESS=0!M4 SDI-12 COMMAND=C!

!M4 SDI-12 PARAM=10!M4 SDI-12 PORT=Port2!M4 SLOPE=1.000000!M4 SUBSAMPLES=5!M4 TX DATA CONTENT1=Last!M4 TX DATA CONTENT2=All Since Last Tx!M4 TX DATA CONTENT3=All Logged!M4 TX DATA CONTENT4=All Logged!M4 UNITS=m/s!M4 USE EQUATION=Off!M4 USE SCRIPT=Off!M4 WARMUP=0!M4 ACTIVE=On!M5 ALARM 1 THRESHOLD=0.000000!M5 ALARM 1 TYPE=Off!M5 ALARM 2 THRESHOLD=0.000000!M5 ALARM 2 TYPE=Off!M5 ALARM 3 THRESHOLD=0.000000!M5 ALARM 3 TYPE=Off!M5 AVERAGING TIME=00:00:00!M5 DETAILS=Off!M5 LABEL=Dir. Viento!M5 LOG ERROR VALUE=-99999.00!M5 LOGGING INTERVAL=00:00:00!M5 MEAS INTERVAL=00:30:00!M5 MEAS TIME=00:00:00!M5 MEAS TYPE=SDI-12!M5 NUMBER OF VALUES TO TX1=2!M5 NUMBER OF VALUES TO TX2=2!M5 OFFSET=0.000000!M5 RIGHT DIGITS=0!M5 SAMPLING INTERVAL=60.0 sec!M5 SDI-12 ADDRESS=0!M5 SDI-12 COMMAND=C!!M5 SDI-12 PARAM=14!M5 SDI-12 PORT=Port2!M5 SLOPE=1.000000!M5 SUBSAMPLES=5!M5 TX DATA CONTENT1=Last!M5 TX DATA CONTENT2=All Since Last Tx!M5 TX DATA CONTENT3=All Logged!M5 TX DATA CONTENT4=All Logged!M5 UNITS=Gra!M5 USE EQUATION=Off!M5 USE SCRIPT=Off!M5 WARMUP=0!M5 ACTIVE=On!M6 ALARM 1 THRESHOLD=0.000000!M6 ALARM 1 TYPE=Off!M6 ALARM 2 THRESHOLD=0.000000!M6 ALARM 2 TYPE=Off!M6 ALARM 3 THRESHOLD=0.000000!M6 ALARM 3 TYPE=Off!M6 AVERAGING TIME=00:00:00!M6 DETAILS=Off!M6 LABEL=Radiacion!M6 LOG ERROR VALUE=-99999.00

!M6 LOGGING INTERVAL=00:00:00!M6 MEAS INTERVAL=00:30:00!M6 MEAS TIME=00:00:00!M6 MEAS TYPE=SDI-12!M6 NUMBER OF VALUES TO TX1=2!M6 NUMBER OF VALUES TO TX2=2!M6 OFFSET=0.000000!M6 RIGHT DIGITS=0!M6 SAMPLING INTERVAL=60.0 sec!M6 SDI-12 ADDRESS=0!M6 SDI-12 COMMAND=C!!M6 SDI-12 PARAM=7!M6 SDI-12 PORT=Port2!M6 SLOPE=1.000000!M6 SUBSAMPLES=5!M6 TX DATA CONTENT1=Last!M6 TX DATA CONTENT2=All Since Last Tx!M6 TX DATA CONTENT3=All Logged!M6 TX DATA CONTENT4=All Logged!M6 UNITS=W/m!M6 USE EQUATION=Off!M6 USE SCRIPT=Off!M6 WARMUP=0!M6 ACTIVE=On!M7 ALARM 1 THRESHOLD=0.000000!M7 ALARM 1 TYPE=Off!M7 ALARM 2 THRESHOLD=0.000000!M7 ALARM 2 TYPE=Off!M7 ALARM 3 THRESHOLD=0.000000!M7 ALARM 3 TYPE=Off!M7 AVERAGING TIME=00:00:00!M7 DETAILS=Off!M7 LABEL=Patm!M7 LOG ERROR VALUE=-99999.00!M7 LOGGING INTERVAL=00:00:00!M7 MEAS INTERVAL=00:30:00!M7 MEAS TIME=00:00:00!M7 MEAS TYPE=SDI-12!M7 NUMBER OF VALUES TO TX1=2!M7 NUMBER OF VALUES TO TX2=2!M7 OFFSET=0.000000!M7 RIGHT DIGITS=0!M7 SAMPLING INTERVAL=60.0 sec!M7 SDI-12 ADDRESS=0!M7 SDI-12 COMMAND=C!!M7 SDI-12 PARAM=3!M7 SDI-12 PORT=Port2!M7 SLOPE=1.000000!M7 SUBSAMPLES=5!M7 TX DATA CONTENT1=Last!M7 TX DATA CONTENT2=All Since Last Tx!M7 TX DATA CONTENT3=All Logged!M7 TX DATA CONTENT4=All Logged!M7 UNITS=hPa!M7 USE EQUATION=Off!M7 USE SCRIPT=Off!M7 WARMUP=0

!M7 ACTIVE=On!M8 ACCU RESET DAY=1!M8 ACCU RESET HOUR=0!M8 ACCU RESET MONTH=1!M8 ACCUMULATION RESET=Daily!M8 ALARM 1 THRESHOLD=0.000000!M8 ALARM 1 TYPE=Off!M8 ALARM 2 THRESHOLD=0.000000!M8 ALARM 2 TYPE=Off!M8 ALARM 3 THRESHOLD=0.000000!M8 ALARM 3 TYPE=Off!M8 AVERAGING TIME=00:00:00!M8 DETAILS=Off!M8 LABEL=Preci.AcumT!M8 LOG ERROR VALUE=-99999.00!M8 LOGGING INTERVAL=00:00:00!M8 MEAS INTERVAL=00:30:00!M8 MEAS TIME=00:00:00!M8 MEAS TYPE=Precip Accumulation!M8 NUMBER OF VALUES TO TX1=2!M8 NUMBER OF VALUES TO TX2=2!M8 OFFSET=0.000000!M8 RIGHT DIGITS=1!M8 SAMPLING INTERVAL=60.0 sec!M8 SDI-12 COMMAND=C!!M8 SDI-12 PORT=Port2!M8 SLOPE=1.000000!M8 SUBSAMPLES=5!M8 TX DATA CONTENT1=Last!M8 TX DATA CONTENT2=All Since Last Tx!M8 TX DATA CONTENT3=All Logged!M8 TX DATA CONTENT4=All Logged!M8 UNITS=mm!M8 USE EQUATION=Off!M8 USE SCRIPT=Off!M8 ACTIVE=On!M9 ALARM 1 THRESHOLD=0.000000!M9 ALARM 1 TYPE=Off!M9 ALARM 2 THRESHOLD=0.000000!M9 ALARM 2 TYPE=Off!M9 ALARM 3 THRESHOLD=0.000000!M9 ALARM 3 TYPE=Off!M9 AVERAGING TIME=00:00:00!M9 DETAILS=Off!M9 LABEL=Precip.Inst!M9 LOG ERROR VALUE=-99999.00!M9 LOGGING INTERVAL=00:00:00!M9 MEAS INTERVAL=00:30:00!M9 MEAS TIME=00:00:00!M9 MEAS TYPE=SDI-12!M9 NUMBER OF VALUES TO TX2=1!M9 OFFSET=0.000000!M9 RIGHT DIGITS=1!M9 SAMPLING INTERVAL=0!M9 SDI-12 ADDRESS=0!M9 SDI-12 COMMAND=M!!M9 SDI-12 PARAM=2

!M9 SDI-12 PORT=Port1!M9 SLOPE=1.000000!M9 TX DATA CONTENT1=All Logged!M9 TX DATA CONTENT2=Last!M9 TX DATA CONTENT3=All Logged!M9 TX DATA CONTENT4=All Logged!M9 UNITS=mm!M9 USE EQUATION=Off!M9 USE SCRIPT=Off!M9 WARMUP=0!M9 ACTIVE=On!M10 ALARM 1 THRESHOLD=0.000000!M10 ALARM 1 TYPE=Off!M10 ALARM 2 THRESHOLD=0.000000!M10 ALARM 2 TYPE=Off!M10 ALARM 3 THRESHOLD=0.000000!M10 ALARM 3 TYPE=Off!M10 AVERAGING TIME=00:00:00!M10 DETAILS=Off!M10 LABEL=Prec.Acum!M10 LOG ERROR VALUE=-99999.00!M10 LOGGING INTERVAL=00:00:00!M10 MEAS INTERVAL=00:30:00!M10 MEAS TIME=00:00:00!M10 MEAS TYPE=SDI-12!M10 NUMBER OF VALUES TO TX1=2!M10 NUMBER OF VALUES TO TX2=2!M10 OFFSET=0.000000!M10 RIGHT DIGITS=1!M10 SAMPLING INTERVAL=120.0 sec!M10 SDI-12 ADDRESS=0!M10 SDI-12 COMMAND=M!!M10 SDI-12 PARAM=4!M10 SDI-12 PORT=Port1!M10 SLOPE=1.000000!M10 TX DATA CONTENT1=Last!M10 TX DATA CONTENT2=All Since Last Tx!M10 TX DATA CONTENT3=All Logged!M10 TX DATA CONTENT4=All Logged!M10 UNITS=mm!M10 USE EQUATION=Off!M10 USE SCRIPT=Off!M10 WARMUP=0!M10 ACTIVE=On!M11 ALARM 1 THRESHOLD=0.000000!M11 ALARM 2 THRESHOLD=0.000000!M11 ALARM 3 THRESHOLD=0.000000!M11 LABEL=Ctotal-NTR!M11 LOG ERROR VALUE=0.00!M11 MEAS INTERVAL=00:30:00!M11 NUMBER OF VALUES TO TX1=2!M11 RIGHT DIGITS=1!M11 SAMPLING INTERVAL=60.0 sec!M11 SDI-12 PARAM=4!M11 TX DATA CONTENT1=Last!M11 TX DATA CONTENT2=All Since Last Tx!M11 UNITS=mm

!M11 ACTIVE=Off!M12 ALARM 1 THRESHOLD=0.000000!M12 ALARM 2 THRESHOLD=0.000000!M12 ALARM 3 THRESHOLD=0.000000!M12 LABEL=EstadoPluvi!M12 LOG ERROR VALUE=0.00!M12 MEAS INTERVAL=00:00:01!M12 RIGHT DIGITS=3!M12 SAMPLING INTERVAL=60.0 sec!M12 SDI-12 PARAM=9!M12 ACTIVE=Off!M13 LABEL=Intensi TR!M13 MEAS INTERVAL=00:30:00!M13 NUMBER OF VALUES TO TX1=2!M13 RIGHT DIGITS=1!M13 TX DATA CONTENT1=Last!M13 TX DATA CONTENT2=All Since Last Tx!M13 UNITS=mm-!M13 ACTIVE=Off!M14 LABEL=Recipiente!M14 MEAS INTERVAL=00:30:00!M14 NUMBER OF VALUES TO TX1=2!M14 RIGHT DIGITS=1!M14 SDI-12 PARAM=6!M14 TX DATA CONTENT1=Last!M14 TX DATA CONTENT2=All Since Last Tx!M14 UNITS=mm!M14 ACTIVE=Off!M15 ACTIVE=Off!M16 ACTIVE=Off!M17 ACTIVE=Off!M18 ACTIVE=Off!M19 ACTIVE=Off!M20 ACTIVE=Off!M21 ACTIVE=Off!M22 ACTIVE=Off!M23 ACTIVE=Off!M24 ACTIVE=Off!M25 ACTIVE=Off!M26 ACTIVE=Off!M27 ACTIVE=Off!M28 ACTIVE=Off!M29 ACTIVE=Off!M30 ACTIVE=Off!M31 ACTIVE=Off!M32 ACTIVE=Off!TX1 BYTES TO TX AT A TIME=0!TX1 CHANNEL=47!TX1 CUSTOM SCRIPT FORMAT=Off!TX1 DUMB LOGGER MODE=Off!TX1 FORMAT=ASCII Column!TX1 KIND=Scheduled!TX1 LABEL=Qda Caya!TX1 POWER OUTPUT=1.250 Watts!TX1 RADIO TYPE=Environmental Satellite!TX1 SATELLITE ID=56B0AE1E!TX1 SATELLITE TYPE=GOES 300

!TX1 SCHEDULED INTERVAL=01:00:00!TX1 SCHEDULED TIME=00:19:30!TX1 SENSOR CUTOFF OFFSET=00:01:00!TX1 SKIP FIRST MISSING=On!TX1 WINDOW LENGTH=00:00:10!TX1 ENABLE=On!TX2 POWER OUTPUT=1.250 Watts!TX2 SATELLITE ID=56B0AE1E!TX2 ENABLE=Off!TX3 POWER OUTPUT=1.250 Watts!TX3 ENABLE=Off!TX4 POWER OUTPUT=1.250 Watts!TX4 ENABLE=Off!CELL APN=!CELL ENABLE=On!CELL LISTENING=Off!CELL MSG INTERVAL=24:00:00!CELL NOTIFICATIONS ENABLE=Off!CELL PASSWORD=!CELL SIM PIN=!CELL USERNAME=!IRIDIUM ENABLE=On!IRIDIUM LISTENING=Off!IRIDIUM MSG INTERVAL=24:00:00!LOCAL TIME OFFSET=-180 min!LOG DAILY VALUES=On!LOG DESCRIPTOR FORMAT=!LOG HEADER FORMAT=!LOG MEASUREMENT FORMAT=!MODBUS CELL SLAVE ENABLE=Off!MODBUS RS232 SLAVE ENABLE=Off!MODBUS RS485 SLAVE ENABLE=Off!OUTPUT1 CONTROL=Manual!OUTPUT2 CONTROL=Manual!PREF1=2.500!PREF2=2.500!S1 ACTIVE=Off!S2 ACTIVE=Off!S3 ACTIVE=Off!S4 ACTIVE=Off!S5 ACTIVE=Off!S6 ACTIVE=Off!S7 ACTIVE=Off!S8 ACTIVE=Off!WIFI ALWAYS ON=Off!WIFI ENABLE=On!WIFI SECURITY ENABLE=Off!RECORDING=On

Satlink 3 Models: SL3-1, SL3-SDI-1, SL3-XMTR-1
Operations & Maintenance Manual
Part No. 8800-1207 Rev 8.14.03 February 2, 2018

Sutron Corporation Satlink Operations & Maintenance Manual pg. 2
TABLE OF CONTENTS 1. Scope of Supply............................................................................................................................................... 9
1.1. Ordering Numbers ................................................................................................................................. 10
2. General Safety Information ........................................................................................................................... 11
3. Introduction .................................................................................................................................................. 12
3.1. SL3- 1 ...................................................................................................................................................... 13
3.2. SL3-SDI-1 ................................................................................................................................................ 14
3.3. SL3-XMTR-1 ............................................................................................................................................ 14
3.4. Multi-function Button ............................................................................................................................ 15
3.5. Status LEDs ............................................................................................................................................. 15
3.6. RS-232 .................................................................................................................................................... 15
3.7. USB Micro (OTG) .................................................................................................................................... 16
3.8. USB Host ................................................................................................................................................. 16
3.9. RF Output ............................................................................................................................................... 16
3.10. SL3-1 Left Terminal strip ........................................................................................................................ 17
3.11. SL3-1 Right Terminal Strip ...................................................................................................................... 18
3.12. Satellite Specific Details ......................................................................................................................... 19
4. Installing Satlink............................................................................................................................................ 21
4.1. Attaching SL3-1 ...................................................................................................................................... 21
4.2. Installing Option cards into SL3-1........................................................................................................... 22
4.3. Attaching SL3-SDI-1 & SL3-XMTR-1 ........................................................................................................ 24
4.4. Earth Ground Point ................................................................................................................................ 25
4.5. Connecting the GOES/METEOSAT/INSAT antenna ................................................................................ 25
4.6. Connecting the GPS Antenna ................................................................................................................. 26
4.7. Connecting the Power Supply ................................................................................................................ 26
4.8. Connecting SDI-12 sensors ..................................................................................................................... 27
4.9. Connecting RS-485 Sensors .................................................................................................................... 28
4.10. Connecting Tipping Bucket Rain Gauge ................................................................................................. 28
Sutron Corporation Satlink Operations & Maintenance Manual pg. 3
4.11. Connecting Pulse Sensors ...................................................................................................................... 29
4.12. Connecting Frequency Sensors .............................................................................................................. 29
4.13. Connecting 0-5V Analog Sensors ........................................................................................................... 30
4.14. Connecting 4-20ma Analog Sensors ....................................................................................................... 30
4.15. Connecting Status Sensors ..................................................................................................................... 31
4.16. Connecting Potentiometer Sensors ....................................................................................................... 32
4.17. Connecting mV Sensors .......................................................................................................................... 32
4.18. Connecting Thermistors ......................................................................................................................... 33
4.19. Connecting Thermocouples ................................................................................................................... 34
4.20. Connecting Strain Gauges ...................................................................................................................... 36
4.21. Programmable Excitation References .................................................................................................... 36
4.22. Connecting Prop/Vane or Anemometer/Vane Wind Sensors ................................................................ 37
4.23. Connecting Lufft Wind Sensors .............................................................................................................. 38
4.24. Connecting Digital Outputs .................................................................................................................... 38
4.25. Connecting Samplers Triggered by Stage ............................................................................................... 39
4.26. Connecting to the Switched Power ........................................................................................................ 39
4.27. Connecting Protected Power ................................................................................................................. 39
4.28. Connecting External Modems ................................................................................................................ 39
4.29. Connecting External Cell Modems ......................................................................................................... 40
5. Installing and Running LinkComm ................................................................................................................. 42
5.1. Installing the LinkComm mobile app ...................................................................................................... 42
5.2. Installing the PC version of LinkComm ................................................................................................... 42
5.3. Stations List View ................................................................................................................................... 42
5.4. Main Menu ............................................................................................................................................. 47
5.5. Station View ........................................................................................................................................... 49
5.6. Dashboard Tab ....................................................................................................................................... 52
5.7. Measurements Tab ................................................................................................................................ 54
5.8. Data Tab ................................................................................................................................................. 54
5.9. Telemetry Tab ........................................................................................................................................ 55

Sutron Corporation Satlink Operations & Maintenance Manual pg. 4
5.10. GPS Tab .................................................................................................................................................. 57
5.11. Scripts Tab .............................................................................................................................................. 58
5.12. Other Setup Tab ..................................................................................................................................... 59
5.13. Diagnostics Tab ...................................................................................................................................... 60
5.14. Password Menu ...................................................................................................................................... 63
5.15. Quick Status Dialog ................................................................................................................................ 64
6. Operating Satlink .......................................................................................................................................... 65
6.1. Creating a New Station in LinkComm ..................................................................................................... 65
6.2. Connecting to an SL3 in Your Station List ............................................................................................... 65
6.3. Importing Setups From Another User Or Station ................................................................................... 65
6.4. Testing Measurements ........................................................................................................................... 65
6.5. Examine Measurements ......................................................................................................................... 65
6.6. Examine Transmissions .......................................................................................................................... 66
6.7. Examine Transmission Data ................................................................................................................... 66
6.8. Entering Manual Data ............................................................................................................................ 66
6.9. Calibrating Sensors ................................................................................................................................. 66
6.10. Configuring SDI-12 Sensors .................................................................................................................... 66
6.11. Downloading Log Data ........................................................................................................................... 66
6.12. Viewing/Clearing the Status ................................................................................................................... 67
6.13. Software Version .................................................................................................................................... 67
6.14. Setting Time ........................................................................................................................................... 67
6.15. USB Thumb Drive (Flash Drive) Operation ............................................................................................. 68
7. Security ......................................................................................................................................................... 70
7.1. Steps to Take to Protect your Station .................................................................................................... 70
7.2. Password Protection .............................................................................................................................. 70
8. Satlink Setup ................................................................................................................................................. 73
9. Measurement Setup ..................................................................................................................................... 74
9.1. Sensor Setup .......................................................................................................................................... 74
9.2. Schedule ................................................................................................................................................. 77

Sutron Corporation Satlink Operations & Maintenance Manual pg. 5
9.3. Configuration Settings ............................................................................................................................ 81
9.4. Processing Settings ................................................................................................................................. 95
9.5. Alarm Settings ........................................................................................................................................ 98
9.6. Alarm Computation Details .................................................................................................................. 100
9.7. Logging Settings ................................................................................................................................... 101
9.8. Transmission Data Content Settings .................................................................................................... 102
9.9. Measurement Setup Defaults .............................................................................................................. 103
9.10. Measurement Calibration .................................................................................................................... 103
9.11. Multiple Measurements Using the Same Sensor ................................................................................. 104
10. Telemetry Setup ......................................................................................................................................... 105
10.2. Environmental Scheduled Transmissions ............................................................................................. 107
10.3. Random Transmissions ........................................................................................................................ 112
10.4. Iridium Setup ........................................................................................................................................ 113
10.5. Cell Setup ............................................................................................................................................. 115
10.6. Telemetry Status .................................................................................................................................. 119
11. Other Setup ................................................................................................................................................ 124
11.1. Wi-Fi ..................................................................................................................................................... 124
11.2. Log Daily Values ................................................................................................................................... 125
11.3. Digital Output DOUT ............................................................................................................................ 125
11.4. Output .................................................................................................................................................. 127
11.5. Cutoff ................................................................................................................................................... 128
11.6. Iridium .................................................................................................................................................. 129
11.7. Cell ........................................................................................................................................................ 129
11.8. Log Download Format .......................................................................................................................... 129
11.9. Modbus ................................................................................................................................................ 132
12. Telemetry ................................................................................................................................................... 133
12.1. Iridium Telemetry ................................................................................................................................. 133
12.2. Cellular Telemetry ................................................................................................................................ 137
12.3. Missing Data Retrieval .......................................................................................................................... 142

Sutron Corporation Satlink Operations & Maintenance Manual pg. 6
12.4. Retransmissions ................................................................................................................................... 143
13. Logging ....................................................................................................................................................... 146
13.1. Downloading the Log ........................................................................................................................... 146
13.2. Log Events ............................................................................................................................................ 147
13.3. Logged Time ......................................................................................................................................... 147
14. Errors .......................................................................................................................................................... 148
14.1. Clearing Errors ...................................................................................................................................... 148
14.2. Measurement Errors ............................................................................................................................ 148
14.3. System Errors ....................................................................................................................................... 149
15. Transmission Data Formats ......................................................................................................................... 151
15.1. Pseudobinary B Data Format ............................................................................................................... 151
15.2. Pseudobinary C Data Format ............................................................................................................... 156
15.3. Pseudobinary D Data Format ............................................................................................................... 158
15.4. Six Bit Binary Encoded Format ............................................................................................................. 160
15.5. Pseudobinary over SMS ....................................................................................................................... 161
15.6. SHEF and SHEFFIX Data Format ............................................................................................................ 161
15.7. Sutron Standard CSV ............................................................................................................................ 163
15.8. ASCII Column ........................................................................................................................................ 163
15.9. ASCII Sensor ......................................................................................................................................... 164
15.10. TCP/IP Session ...................................................................................................................................... 165
15.11. Iridium Telemetry Header .................................................................................................................... 166
16. Connecting to Another Logger .................................................................................................................... 170
16.1. Connection ........................................................................................................................................... 170
16.2. Protocol ................................................................................................................................................ 171
16.3. Configuring Satlink ............................................................................................................................... 171
16.4. Transmitting Data ................................................................................................................................. 173
17. Command Line Interface ............................................................................................................................. 177
17.1. Why Use Command Line? .................................................................................................................... 177
17.2. About the Command Line Interface ..................................................................................................... 177

Sutron Corporation Satlink Operations & Maintenance Manual pg. 7
17.3. Status.................................................................................................................................................... 178
17.4. Setup .................................................................................................................................................... 178
17.5. Measurements ..................................................................................................................................... 179
17.6. Recording ............................................................................................................................................. 180
17.7. Downloading the Log ........................................................................................................................... 180
17.8. Machine-to-Machine Communication ................................................................................................. 181
17.9. Command Reference ............................................................................................................................ 181
18. More about SDI-12 ...................................................................................................................................... 187
18.1. Overview .............................................................................................................................................. 187
18.2. Wiring Guidelines ................................................................................................................................. 188
18.3. Connector ............................................................................................................................................. 188
18.4. Setup of SDI sensors ............................................................................................................................. 188
18.5. Useful SDI commands .......................................................................................................................... 188
18.6. SDI Clock Synchronization .................................................................................................................... 189
19. Modbus ...................................................................................................................................................... 190
19.2. Modbus Hardware Interface ................................................................................................................ 191
19.3. Modbus Setup ...................................................................................................................................... 192
19.4. Modbus Slave Function Codes ............................................................................................................. 195
19.5. Sutron Function Codes ......................................................................................................................... 197
20. Scripts ......................................................................................................................................................... 202
20.1. Measurements and Scripts................................................................................................................... 202
20.2. Transmission Formatting and Scripts ................................................................................................... 205
20.3. Script Tasks ........................................................................................................................................... 206
20.4. Scripts Management ............................................................................................................................ 208
21. Appendix A – Specifications ........................................................................................................................ 210
22. Appendix B – Sutron Customer Service Policy ............................................................................................. 213
23. Appendix C – Commercial Warranty ........................................................................................................... 214
23.1. Sutron Manufactured Equipment ........................................................................................................ 214
23.2. Non-Sutron Manufactured Equipment ................................................................................................ 214

Sutron Corporation Satlink Operations & Maintenance Manual pg. 8
23.3. Repair and Return Policy ...................................................................................................................... 215
24. Appendix E – Approvals and Certifications .................................................................................................. 216
24.1. NESDIS .................................................................................................................................................. 216
24.2. EUMETSAT ............................................................................................................................................ 216
24.3. INSAT .................................................................................................................................................... 216
24.4. CE ......................................................................................................................................................... 216
24.5. Wi-Fi Module ........................................................................................................................................ 217
24.6. IRIDIUM ................................................................................................................................................ 218
24.7. Cellular Compliance Information ......................................................................................................... 219
25. Appendix F - SIM Card Installation and Removal Instructions ..................................................................... 220

Sutron Corporation Satlink Operations & Maintenance Manual pg. 9
1. Scope of Supply SL3-1 GOES/METEOSAT/INSAT/GMS Satellite transmitter including 11 physical input
channels (1xRS-485, 2xSDI-12, 2xpulse/status, 2x5V analog, 3xDifferential Analog, 1x 4-20mA), 4 isolated switched supplies, 1 isolated non-switched supply, 2 switched open collector outputs, RS-232, USB host, USB device, Wi-Fi, power supply/ground connector, 9 2/3/4 pin connectors for sensors, 32 MB (1 million readings) measurement memory, 2 status LED, multifunction button with LED, GPS receiver, 2 slots for expansion cards: optional Iridium modem, optional LTE modem
1 quick start guide 1 USB cable 1 screwdriver
SL3-SDI-1 GOES/METEOSAT/INSAT/GMS Satellite transmitter including 2 physical input channels (2xSDI-12) RS-232, USB host, USB device, Wi-Fi, power supply/ground connector, 32 MB (1 million readings) measurement memory, 2 status LED, multifunction button, GPS receiver
1 quick start guide 1 USB cable 1 screwdriver
SL3-XMTR-1 GOES/METEOSAT/INSAT/GMS Satellite transmitter including RS-232, USB host, USB device, power supply/ground connector, 2 status LED, multifunction button, GPS receiver
1 quick start guide 1 USB cable 1 screwdriver

Sutron Corporation Satlink Operations & Maintenance Manual pg. 10
1.1. Ordering Numbers
Model Description
SL3-1 GOES/METEOSAT/INSAT Satellite transmitter with 11 physical input channels
SL3-1-IR Base SL3-1 with Iridium option module installed
SL3-1-IR-D Base SL3-1 with DOD flashed Iridium option module installed
SL3-1-C1 Base SL3-1 with Verizon LTE cell option module (no fallback)
SL3-1-C2 (ETA 2017) Base SL3-1 with AT&T/Rogers LTE cell option module with HSPA plus fallback
SL3-1-C3 (ETA 2017) Base SL3-1 with Europe LTE cell option module with HSPA plus fallback
SL3-1-C4 (ETA 2017) Base SL3-1 with 2G GSM/GPRS option module (primarily for India)
SL3-ENC-1 SL3-1 in NEMA enclosure
SL3-ENC-1-IR SL3-1-IR in NEMA enclosure
SL3-ENC-1-IR-D SL3-1-IR-D in NEMA enclosure
SL3-ENC-1-CX SL3-1-CX in NEMA enclosure (“X” represents the different cell variants by number)
SL3-ENC-DISP-1 SL3-1 in NEMA enclosure with 2 line display
SL3-ENC-DISP-1CX SL3-1 in NEMA enclosure with 2 line display (“X” represents cell variants)
SL3-ENC-DISP-1I SL3-1 in NEMA enclosure with 2 line display with IRIDIUM option module
SL3-ENC-DISP-1ID SL3-1 in NEMA enclosure with 2 line display with DOD IRIDIUM option module
SL3-ENC-DISP-2 SL3-1 in NEMA enclosure with 2 line display with PSTN modem
SL3-ENC-DISP-2CX SL3-1 in NEMA enclosure with 2 line display with PSTN + Cell modem
SL3-ENC-DISP-2I SL3-1 in NEMA enclosure with 2 line display with PSTN + Iridium modem
SL3-ENC-DISP-2ID SL3-1 in NEMA enclosure with 2 line display with PSTN + DOD Iridium modem
SL3-SDI-1 GOES/METEOSAT/INSAT Satellite transmitter with 2 SDI-12 input channels
SL3-XMTR-1 GOES/METEOSAT/INSAT Satellite transmitter
Optional Modems Description
8080-0005-1B PSTN modem
GPRS-1-WSC Cell modem for use with SL3 only
IRIDIUM-MOD-1 Iridium SBD Modem for SL3
IRIDIUM-MOD-1D DOD flashed Iridium SBD Modem for SL3
CELLULAR-MOD-1 Verizon LTE Modem for SL3 (no fallback)
CELLULAR-MOD-5 Global 3G HSPA+ modem with fallback to GPRS
Accessories Description
5000-0021-1 OMNI antenna, Full Wave
5000-0155-1 YAGI GOES Satellite Antenna
5000-0156-1 YAGI GOES Satellite Antenna, Stainless Steel Mast and Elements
5000-0170 GPS Antenna, Bullet (High Gain)
6411-1162-1 Cable Assembly, Antenna, 15ft
8111-1113-1 RF COAX lightning protection, Bulkhead
8111-1099-1 RF COAX lightning protection, panel mount
SL3-DISPLAY-X SL3 stand-alone display (“X” represents -1(disp only),-2(w/PSTN,-SD(w/SD card))

Sutron Corporation Satlink Operations & Maintenance Manual pg. 11
2. General Safety Information Read this manual before using Satlink for the first time. Become familiar with the
installation and operation of Satlink and its accessories.
Make sure that Satlink is protected against moisture (NEMA 4, IP 66 or better).
Operate Satlink only with approved antenna connected.
Protect the line of the battery supply voltage with a safety fuse (10A/fast).
Before connecting the power supply, check that all wires are properly attached to the screw terminal strips.
Do not open Satlink. There are no user serviceable parts inside.
Have a defective Satlink checked and repaired by the Sutron repair center. Do not attempt to repair Satlink yourself.
Operate Satlink only with approved antenna connected.
Symbol Description
Direct current.
Protective earth ground. Connect to an earth ground electrode for lightening protection of internal components.
Digital ground. Attach digital sensor ground to this terminal. Batteries and solar panel negative terminals are also connected to this terminal.
Signal ground. Attach analog sensor ground to this terminal.
Chassis ground.
Shock hazard.
Do not dispose in trash.

Sutron Corporation Satlink Operations & Maintenance Manual pg. 12
3. Introduction Sutron’s Satlink 3 is a datalogger with a built-in satellite transmitter that is especially designed for hydrometry, meteorology and environmental monitoring. It is available in three models: SL3-1, SL3-SDI-1, and SL3-XMTR-1.
Satlink 3 can:
Make measurements from sensors monitoring the environment Perform special calculations Record data into non-volatile memory Transmit data to automated receiving systems.
Satlink 3 is certified to operate on the following satellites:
GOES Domestic 300, 1200 bps, timed and random reporting GOES International Meteosat, MSG (Meteosat Second Generation), Meteosat HDR, timed and alert
reporting GMS 100 bps domestic and international channels INSAT 4800 bps domestic channels FY2B 100 bps domestic channels
Satlink 3 improves on its predecessor SatLink2. Satlink 3 does everything that Satlink 2 did with the following and other enhancements:
Expanded measurements from 16 to 32 Improved analog accuracy & additional channels Expanded SDI-12 capacity with 2 independent SDI-12 inputs Optional cell/Iridium modems for redundant 2-way communications

Sutron Corporation Satlink Operations & Maintenance Manual pg. 13
Expanded log from 120,000 to 1,000,000 readings, expandable to 1,000,000,000 readings (32 GB) via internal SDHC card
Improved GUI program that runs on Android, iPhone, PC or MAC devices
3.1. SL3- 1 The figure below shows the connections provided by the SL3-1. A description of each of the connections is provided in the following paragraphs.
Power/Battery
Status LED
USB to PC
GOES Antenna Connector
RS232 to PC
Wi-Fi/ failsafe reset button
5 separate terminal blocks
5 separate terminal blocks
Earth Ground
GPS Antenna Connector
Expansion Slot
USB Host
Expansion Slot

Sutron Corporation Satlink Operations & Maintenance Manual pg. 14
3.2. SL3-SDI-1 The figure below shows the connections provided by the SL3-SDI-1. A description of each of the connections is provided in the following paragraphs.
3.3. SL3-XMTR-1 The figure below shows the connections provided by the SL3-XMTR-1
SL3-XMTR-1 is similar to the SL3-SDI-1 with the following changes:
The 2 SDI-12 ports are replaced with an auxiliary DB9 connector. This connector is for factory use only.
Power/Battery
Status LED
USB to PC
GOES Antenna Connector
RS232 to PC or Logger
Wi-Fi/multi-function button
2 SDI-12 Ports
GPS Antenna Connector

Sutron Corporation Satlink Operations & Maintenance Manual pg. 15
There is no Wi-Fi module in the SL3-XMTR-1. The button will not turn on Wi-Fi but is only for failsafe reset.
SL3-XMTR-1 is designed to connect to another logger via the RS-232 port. The logger will setup the SL3-XMTR-1 and regularly transfer data to it for transmission. The logger may use Sutron’s Satlink Communicator Protocol (SCP) or command line protocol for setup and data transfer functions.
Contact Sutron customer service for additional information.
3.4. Multi-function Button Satlink3 has a multi-function button installed on the front.
Briefly pressing this button will turn on the Wi-Fi. (SL3-1 only) Additionally, if the failsafe has been tripped, briefly pressing this button will reset the
failsafe. The multi-function button is also used to reboot Satlink. If the button is held down for 5
seconds, the red LED will come on. Keep holding the button until the red LED turns off in order to reboot Satlink.
3.5. Status LEDs The status LEDs give information on how Satlink is operating. The LED are multi-colored. The following table describes the different colors and states of the LED.
Description Left/Top LED Right/Bottom LED Button
Unit is operating properly
Green blink every 5 seconds
Unit has a Setup or operating error
Red blink every 4 seconds
Multi-function button pressed
Fast flashing blue
Wi-Fi turned on but no one connected
Blue blink every 4 sec
Active Wi-Fi Connection
Solid Blue
Transmitting Solid Blue
Power Fail Imminent
Red flash 9Hz
Unit is in Test mode
Green blink every second
Red blink every second
3.6. RS-232 The RS-232 connection is a standard DB9-F connection for serial communications to a PC or other device. The RS-232 port has a default baud rate of 9,600 (No parity, 8 data bits, 1 stop bit, HW flow control) but other baud rates are supported.
DTR must be asserted in order to talk to Satlink via RS-232. Please note that Satlink will NOT go into low power mode as long as DTR is asserted.

Sutron Corporation Satlink Operations & Maintenance Manual pg. 16
The RS-232 port allows the connection of Sutron’s 8310, 9210 and Xpert loggers to Satlink. With this connection, the Sutron logger can use Satlink as transmitter to send data that it collects, rather than have Satlink collect the data. This is normally done where the field station is very complex and the user desires the advanced capabilities of 8310, 9310, Xpert for the collection and processing of the data.
The RS-232 port may be used for connecting to a PC for setup, maintenance, and troubleshooting. The PC will typically run LinkComm software which will allow the user complete control over Satlink subject to the password protection in Satlink.
If the device connected
3.7. USB Micro (OTG) The USB OTG port is the primary port for connecting a PC to Satlink. The USB port is a micro-B and compatible with a standard micro-B to Type A male USB cable that works with most PC’s. The primary use of the connection is to allow the PC to setup, maintain and troubleshoot Satlink. The PC will typically run LinkComm software which will allow the user complete control over Satlink subject to the password protection in Satlink.
3.8. USB Host The USB Host connection provides a simple way to download data from a SL3-1 or update the firmware in the unit using a USB flash drive (aka USB thumb drive). Plugging in a flash drive will automatically download all logged data since the last download and store the log on the flash drive. It will also store station setup and status on the flash drive.
It is possible to change station setup, upgrade Satlink firmware, and execute a batch file via a flash drive. Please see section USB Thumb Drive for details.
3.9. RF Output Satlink has a type N connector on the bottom of the Satlink and side of the SL3-SDI. See Connecting the GOES/METEOSAT/INSAT antenna for details on how to connect an antenna to Satlink. Never operate Satlink without connecting either an antenna or dummy load to this connection.

Sutron Corporation Satlink Operations & Maintenance Manual pg. 17
3.10. SL3-1 Left Terminal strip Two terminal strips built into SL3 provide the connections for sensors, and outputs. The table below describes the purpose of each connection on the left terminal strip.
Description Note
1 GND Main Battery/Power Ground
2 9-20VDC Main Battery/Power +VDC (5 amps max)
3 RS485 A SDI-12 over RS-485, Modbus over RS-485
4 RS485 B SDI-12 over RS-485, Modbus over RS-485
5 Ground Ground
6 +SW POWER 1 Switched Main Power (9-20VDC) (turned on during warm-up and analog sensor measurement)
7 Ground Ground
8 WS/DIG IN 1 Wind Speed or Digital Input 1
9 Ground Ground for sensor
10 TB/DIG IN 2 Tipping Bucket or Digital Input 2
11 Ground Ground
12 +SW POWER 2 Switched Main Power (9-20VDC) (turned on via equations and commands)
13 Ground Ground
14 SDI-12 PWR Isolated Main Power (9-20VDC) to SDI-12 sensors (500 ma max)
15 SDI-12 DATA SDI-12 Data (Port 1)
16 Ground Ground
17 SDI-12 PWR Isolated Main Power (9-20VDC) to SDI-12 sensors (500 ma max)
18 SDI-12 DATA SDI-12 Data (Port 2)

Sutron Corporation Satlink Operations & Maintenance Manual pg. 18
3.11. SL3-1 Right Terminal Strip Two terminal strips built into Satlink provide the connections for sensors, and outputs. The table below describes the purpose of each connection on the left terminal strip.
Description Note
37 Analog Ground Analog ground
36 0-5V A Voltage input for sensors with 0-5V output
35 Analog Ground Analog ground
34 0-5V B Voltage input for sensors with 0-5V output
33 Diff C+ Differential voltage input for bridge type sensors
32 Diff C- Differential voltage input for bridge type sensors
31 Analog Ground Analog ground
30 VREF 2.5V output (turned on during warm-up and analog sensor measurement)
29 Diff D+ Differential voltage input for bridge type sensors
28 Diff D- Differential voltage input for bridge type sensors
27 Analog Ground Analog ground
26 VREF 2.5V output (turned on during warm-up and analog sensor measurement)
25 Diff E+ Differential voltage input for bridge type sensors
24 Diff E- Differential voltage input for bridge type sensors
23 4-20 mA Input for 4-20ma sensor
22 GND
21 PROT +12V Isolated main power (9-20VDC), 1amp max
20 DOUT #1 Digital Output (open collector, turned on manually, with alarms, or via equations)
19 DOUT #2 Digital Output (open collector, turned on manually, with alarms, or via equations)
Earth Ground Attach via a heavy gauge (4 to 10 AWG) wire to
earth ground rod driven 6 feet into earth.

Sutron Corporation Satlink Operations & Maintenance Manual pg. 19
3.12. Satellite Specific Details This product is certified to operate on many different satellite systems around the world. Some operational differences exist between the systems and are noted here.
3.12.1. GOES 300 This manual covers the details of the GOES operation. The amount of data that may be sent will always be defined by the time slot allocation provided by NOAA/NESDIS.
Scheduled Transmissions: Max (permissible) message length = 4,000 bytes Random Transmissions: Max message length = 81bytes (~3 sec.) PseudoBinary B format is the only permitted format for Random Transmissions.
Channel and frequency assignments will be made by NOAA/NESDIS for the customer.
3.12.2. GOES 1200 The amount of data that may be sent will always be defined by the time slot allocation provided by NOAA/NESDIS.
Scheduled Transmissions: Max (permissible) message length =16,000 bytes Random Transmissions: Max message length = 175 bytes (~1.5 sec.) PseudoBinary B format is the only permitted format for Random Transmissions.
Channel and frequency assignments will be made by NOAA/NESDIS for the customer.
3.12.3. CGMS 100 BPS Consult NOAA/NESDIS or EUMETSAT for further details.
3.12.4. EUMETSAT SRDCP 100 The SRDCP 100 bps will be used by special permission by EUMETSAT only. New station assignments will use the HRDCP 1200 system.
Scheduled Transmissions: Max message length = 649 bytes Alert Transmissions: Max message length = 23 bytes (~3 sec.) PseudoBinary B format is the only permitted format for Random Transmissions.
Channel and frequency assignments will be made by EUMETSAT for the customer.
3.12.5. EUMETSAT HRDCP 1200 New station assignments will now use the HRDCP 1200 system.
Scheduled Transmissions: Message lengths will range in lengths from the shortest possible message length of 653 bytes with additional data increments of 669 bytes yielding a Max message length = 7343 bytes.
Alert Transmissions: Max message length = 653 bytes (~3 sec.) Alert Transmissions are not limited to PseudoBinary B format.
Channel and frequency assignments will be made by EUMETSAT for the customer.

Sutron Corporation Satlink Operations & Maintenance Manual pg. 20
3.12.6. INSAT PRBS Support for the INSAT PRBS is provided. This is the legacy INSAT system that has 3 random bursts sent in a 10 minute window.
3.12.7. INSAT TDMA Support for the INSAT TDMA format is provided. The system will make a transmission on a scheduled time with a retransmission set to be exactly 30 minutes following the original transmission. If there are less than 199 bits, the repeat transmission is exactly the same as the original transmission. If there are more than 199 bits, the second transmission scheduled 30 minutes later will have the second 199 bits. The second transmission has the choice to use an independent ID or use an automatic ID generation that creates an ID by altering the first provided ID.
3.12.8. Feng Yun FY Support for the Feng Yun 100 bps is supported.
3.12.9. ARGOS/SCD Not supported at this time.

Sutron Corporation Satlink Operations & Maintenance Manual pg. 21
4. Installing Satlink
4.1. Attaching SL3-1 Requirements of the intended installation site are:
Sufficient protection from moisture for an IP 63 device.
Proper space for the electrical cables
Temperature range -40C to +70C.
Space for installation using the mounting ears
Earth ground point for the connection of the SL3 earth ground.
Closed control cabinet or fire protection cabinet if the power supply is not a low power source 12-20VDC.
The dimensions for SL3-1 are shown in figure below along with the locations of the mounting ears.

Sutron Corporation Satlink Operations & Maintenance Manual pg. 22
SIM card holder IMEI
4.2. Installing Option cards into SL3-1 An SL3-1 can be ordered with Cell, Iridium, or Programmable Reference option card from the factory which will be preinstalled into your SL3-1. If you choose to add these capabilities to an SL3-1 that you already own, you will need to do the following to install the option card into your unit.
There are 2 ports labeled Option port 1 (left) and Option port 2 (right). Each port can take any option card. The image below shows blank cards installed but yours will be flat plates.
1. Remove power from the SL3-1. (this includes unplugging USB on your SL3)
2. Remove the blank plates by removing the 2 screws. You will not need these plates anymore. Locate your option card that you wish to install (example on top right shows iridium card).
Note that CELLULAR cards (bottom pictures) may need a SIM card installed on the modem before you install the card in the SL3. You will also need the IMEI number on the modem in order to activate your data plan. Duplicate stickers containing the IMEI number are sent for you to attach to the SL3 for future reference once the card is installed in the SL3.

Sutron Corporation Satlink Operations & Maintenance Manual pg. 23
3. Slide the option card into the open SL3 option port as shown. You may need to unscrew the 2 screws on the option card a little to allow the card to slide into the slot fully. Note that the orientation of the option card always has the text right side up when viewing the SL3 from the GOES connector end.
4. The card should sit fully in the slot recess before you screw in the 2 screws. Once it is in position, screw both screws in to fix the card in place.
5. The card is now fully installed and you may apply power to the unit. The new option card should be auto detected by the SL3 when installed. You can verify this by navigating to the Diagnostics tab in Linkcomm and looking in the “Firmware Versions” box which lists the radios installed and associated serial numbers.
6. You will need to activate your modem and data plan by contacting your provider and supplying them with IMEI number located on the modem. Both Cell and Iridium will have an IMEI number. The activation process may take 30 minutes or more. Your SL3 should have the respective antenna connected to the modem so that you can check the status from time to time in Linkcomm telemetry tab for TX3 or TX4.
7. For instructions on installing and removing SIM card from Cell modem, refer to Section 25 Appendix F - SIM Card Installation and Removal Instructions

Sutron Corporation Satlink Operations & Maintenance Manual pg. 24
4.3. Attaching SL3-SDI-1 & SL3-XMTR-1 Requirements of the intended installation site are:
Sufficient protection from moisture for an IP 51 device.
Proper space for the electrical cables
Temperature range -40C to +70C.
Suitable mounting plate or DIN rail clip with Standard top hat rail (TS35) mounted at the installation site.
Earth ground point for the connection of the SL3 earth ground.
Closed control cabinet or fire protection cabinet if the power supply is not a low power source 12-20VDC.
The dimensions for SL3-SDI-1 & SL3-XMTR-1 are shown in the figure below.

Sutron Corporation Satlink Operations & Maintenance Manual pg. 25
4.4. Earth Ground Point
A connection point has been provided for an Earth ground on SL3-1. On SL3-SDI-1 the chassis is the earth ground point. Always connect the earth ground to a suitable ground at the site as described below.
Any time a sensor cable is attached to the terminal strip, the unit may be exposed to electrical surges such as those that come from nearby lightning strikes. The SL3 includes spark gaps and other protection devices that shunt the energy to the earth ground. If there is no connection to the earth ground point on SL3, the energy has nowhere to go and the unit can be damaged.
Failure to properly connect the Earth ground point will lead to failures in the field due to surges.
To install a proper ground connection point:
Use a copper ground rod driven into the ground at least 6 feet. Attach a very heavy gauge (#4 Solid Copper) wire between the rod and the Satlink Earth
ground point. The connection point can accept up to a 4 gauge solid copper wire. If a heavier gauge copper wire is used to connect to the ground rod, a reducer may be necessary to connect to the terminal on Satlink.
Firmly secure the screw on the ground point firmly on the copper wire. Do not rely on AC power ground connections as they are not always properly grounded and may introduce other surges. Satlink features gas tube protection on all sensor inputs.
4.5. Connecting the GOES/METEOSAT/INSAT antenna The transmitter must be connected to an approved antenna to operate with the selected satellite system. Sutron offers a variety of antennae including YAGI and dome types that provide between 3 and 11 dB gain. Satlink will adjust its transmission power based on the type of antenna connected. As a part of the setup process, the type of the antenna will be entered into the setup.
The typical antenna cable is 10 to 20 feet long. Outdoor antenna connections should we wrapped with a self-vulcanizing tape to make sure they are water/weather resistant.
Users are encouraged to use a separate lightning arrestor for the antenna such as the one shown below.

Sutron Corporation Satlink Operations & Maintenance Manual pg. 26
4.6. Connecting the GPS Antenna The GPS antenna connection is at the top of the SL3-1. On SL3-SDI-1, the SMA connector is to the right of the power connection. Sutron provides a GPS antenna with each Satlink. Satlink has special circuitry to detect whether the GPS antenna is connected.
Take care to setup the GPS antenna such that it has a clear view of the sky. A site with a strong GPS signal will reduce overall power consumption of the station.
The GPS antenna is normally mounted outdoors. Occasionally, you may mount the GPS antenna indoors if the GPS signal penetrates the structure or enclosure where it is located.
The GPS antenna should be installed in a way to reduce the buildup of snow that might affect its operation.
Only approved GPS antennae should be connected to Satlink. Satlink requires a well positioned GPS antenna in order to operate correctly.
4.7. Connecting the Power Supply The Power/Battery connection for the SL3-1 is at the top left of the unit. A two position removable plug is provided for the connection. SL3 operates off 9-20VDC and can use up to 4 amps. Because of the high amperage requirements, an AWG 18 wire should be used.
Note: Even though SL3 will operate below 12V some sensors will not operate when the power supply is below 12V.
A standard 12VDC lead-acid or Gel battery is typically used as the power source for SL3. Do not power SL3 off AC power supplies without additional precautions to ensure the power supply is properly rated and the system is enclosed in a fire protection cabinet.

Sutron Corporation Satlink Operations & Maintenance Manual pg. 27
It is a good practice to make all sensor connections with the unit powered off.
As soon as power is applied, the LED will flash as the unit goes through a self-test sequence. Then the LED will flash depending on the setup of SL3. The LED will flash green when everything is OK. Red means an error. Normally the button will flash blue every 4 seconds indicating that Wi-Fi is turned on and ready for a connection. Other combinations are possible if the unit has been previously setup. See section 3.5
Please note that it is normal for SL3 to flash red when power is first applied. Once SL3 has verified good GPS signal (and optionally good Iridium signal), it will switch to flashing green. Do not walk away from the site until Satlink is flashing green! Connect with LinkComm to see why Satlink is flashing red.
4.8. Connecting SDI-12 sensors SL3 supports two independent SDI-12 sensor busses. Each is provided with its own isolated power connection rated for 500mA. Because SDI-12 sensors are addressable, multiple SDI-12 sensors may be connected to these terminals as long as no two sensors on the same bus have the same address.
When multiple new SDI sensors are connected to a bus, they should be connected one at a time so the address can be made unique using the SDI A command. For details, please see the section titled Setup of SDI sensors.
The figure below shows the typical SDI-12 sensor connections.

Sutron Corporation Satlink Operations & Maintenance Manual pg. 28
4.9. Connecting RS-485 Sensors The RS-485 bus may be used to collect data from sensors. Alternatively, it may be used to have a Modbus master collect data from Satlink.
SL3 supports RS-485 sensors that use the SDI-12 protocol for its messaging. SL3 also supports collecting data using the Modbus protocol over RS-485. Multiple devices may be attached on the RS-485 bus; each of those devices must have a
different address. It is OK to mix SDI-12 and Modbus sensors on the RS-485 bus.
Wiring RS-485 involves two lines: RS-485 A and RS-485 B.
Note: if there is an issue taking to a sensor over RS-485, try reversing the A and B wires. If a Modbus sensor is not responding, make sure that the Modbus communications settings in Satlink match the sensor settings.
4.10. Connecting Tipping Bucket Rain Gauge SL3-1 supports a tipping bucket rain gauge using its TB/DIN2 connection. This connection provides a pullup resistor (100K) to 3.3V to provide power for the contact switch in the rain gauge. Each time the bucket in the rain gauge “tips” the internal switch closes momentarily causing a pulse on the TB/DIN2 connection. This pulse is counted and used to provide accumulated precipitation or precipitation rate data.
The key settings for a tipping bucker rain gauge are: Measurement Type: Precip Accumulation or Precip Rate Slope: 0.1mm, 0.2mm, 0.01inches or other value to match the calibration of the sensor.
Note: Measurement type: digital/counter1 or counter2 can also be used for tipping bucket rain gauges. Be sure to select “debounce” for this measurement type as most tipping bucket rain gauge switches are noisy and can produce multiple counts per tip if they are not de-bounced.
For more information, please see the section MEASURE TYPE: PRECIP ACCUMULATION AND PRECIP
RATE.
The typical connection of the tipping bucket rain gauge is shown below.

Sutron Corporation Satlink Operations & Maintenance Manual pg. 29
4.11. Connecting Pulse Sensors SL3-1 supports up to two sensors with pulse output. The pulse output can come from a switch that is momentarily closed (as in most flow meters and tipping buckets) or it can come from a device that actively puts out pulses to represent the value to be measured. Pulses are measured by the Digital inputs DIN #1 or DIN #2. SL3 can count at a rate up to 10,000 counts per second (de-bounce off). If the signal provided by the device is not clean, de-bouncing should be enabled. Otherwise, Satlink may count noise as signal. To ensure that the de-bouncing does not interfere with the pulse counting, de-bouncing should only be enabled for signals occurring less than 100 times per second.
The key settings for pulse sensors are: Measurement Type: Digital Digital type: Counter 1 or Counter 2 Debounce: yes/no
4.12. Connecting Frequency Sensors SL3-1 supports up to two sensors with frequency output. The pulse output can come from a switch that is momentarily closed as in most flow meters and tipping buckets or it can come from a device that actively puts out pulses to represent the value to be measured such as a soil moisture probe with frequency output or an anemometer..
DIN#1
DIN#2

Sutron Corporation Satlink Operations & Maintenance Manual pg. 30
The pulse output sensors connect to the DIN #1 or DIN #2 inputs. DIN #1 supports sensors with a low level AC output (100 mVp-p) or high level output while DIN#2 supports only sensors with a high level output (switch closure, 0-3VDC, or 0-5VDC).
The frequency measurement circuitry can measure frequencies from 3Hz to 10KHz with an accuracy of 0.01%. The system takes 0.75 seconds to make the measurement.
The key settings for frequency sensors are: Measurement Type: Digital Digital type: Frequency 1 or Frequency 2
Note: Use Frequency 1 for sensors with a low level AC output voltage (such as an RMYoung) and specify (AC Low Level). Frequency 2 is always expecting a DC high level signal.
4.13. Connecting 0-5V Analog Sensors SL3-1 supports up to two sensors with an output voltage up to 5 VDC. The sensor must be connected to the signal ground and may be powered from VREF, PROT+12V, SWD+12V. These inputs are compatible with sensors thermistors, potentiometers, strain gauges, etc.
The key settings for 0-5V analog sensors are: Measurement Type: Analog Analog Type: 0-5V A or B.
4.14. Connecting 4-20ma Analog Sensors SL3-1 supports up to three sensors with a 4-20mA output. One sensor can connect directly to the 4-20mA input (terminal 23) as shown below. The other sensors can connect to A or B (0-5V) analog channels with an external load resistor. The sensor/loop must be powered from PROT+12V, SWD+12V, main power, or other source with common ground to SL3.
0-5V A
0-5V B
DIN#1
DIN#2

Sutron Corporation Satlink Operations & Maintenance Manual pg. 31
The key settings for 4-20mA sensors connected to the 4-20mA input are: Measurement Type: Analog Analog Type: 4-20mA
The built-in 4-20mA connection has an internal 200 ohm load consisting of transient protection and a precision 100 ohm sense resistor. External load resistors should also be 100 ohm in order for the system to operate down to voltages between 10-12VDC. In some cases, the 4-20mA sensor may need supply voltages > 12VDC to operate. The supply voltage needs to be greater than the minimum voltage the sensor requires plus the maximum voltage across the load resistance (2V for 100 ohms). The key settings for 4-20mA sensor connected to A and B are:
Measurement Type: Analog Analog Type: 0-5V A or B. Add a 100 ohm load resistor between A or B and Signal ground.
4.15. Connecting Status Sensors A status output is a switch that is open or closed. SL3-1 supports up to two status outputs using either of the digital inputs (DIN#1 or DIN#2). An internal pullup resistor on DIN#1 or DIN#2 provides the excitation voltage for the switch.
SL3 will return a 0 when the switch is open and a 1 when the switch is closed.
The key settings for pulse sensors are: Measurement Type: Digital Digital type: Level 1 or Level 2
DIN#1
DIN#2

Sutron Corporation Satlink Operations & Maintenance Manual pg. 32
4.16. Connecting Potentiometer Sensors A potentiometer connects to SL3 via the A or B analog channels as shown below.
The key settings for potentiometer sensors are: Measurement Type: Analog Analog type: A or B
Note: VREF is 2.5V.
4.17. Connecting mV Sensors mV output sensors such as pyranometers connect to SL3 to the C, D or E channels as shown below.

Sutron Corporation Satlink Operations & Maintenance Manual pg. 33
The key settings for mv output sensors are: Measurement Type: Analog Analog type: Diff C, D or E Input Range: 39mV, 312mV, 2.5V, 39mV w/Bias, 312mv w/Bias.
Note: use the range with Bias for any sensor (such as a pyranometer) that does not connect to VREF or other SL3 power
4.18. Connecting Thermistors Thermistors connect to SL3 to the A or B channels as shown below. Note there is a precision 10K reference resistor between the input and +2.5VREF.
The key settings for thermistors are: Measurement Type: Analog Analog type: A or B Equation to compute temperature (Celsius):

Sutron Corporation Satlink Operations & Maintenance Manual pg. 34
Steinhart((10000)*X/(vref-X), A, B, C) (see table below for A, B, C) Note: The 10000 is the reference resistor value in ohms.
Slope: 1.8; Offset: 32 to convert to Fahrenheit.
Model TYPE A B C
44007 44034
YSI MIX B, 5K 0.0012829 0.0002365 9.1883E-08
44006 44031
YSI MIX H, 10K
0.0010295 0.0002391 1.568E-07
44005 44030
YSI MIX B, 3K 1.40510E-03 2.36900E-04 1.019E-07
44008 44032
YSI MIX H, 30K
9.35401E-04 2.21060E-04 1.2747E-07
44016 44036 5600-0025 5600-0030
YSI MIX B, 10K
1.12610E-03 2.34545E-04 8.6359E-08
Campbell Scientific’s CS205 & CS107 temperature probe requires different wiring than the above since it has a reference resistor built into the probe. The wires are connected as indicated below on the left and the equation will use the built in template for CS205/107. The image on the right indicates the probe’s internal wiring for reference.
Jumper C+ to Vref
Purple (AG) ----------------- C+
Red (HI) ---------------------- C-
Black (EX) -------------------- AGND
Clear (G) --------------------- Earth Ground
4.19. Connecting Thermocouples Thermocouples connect to SL3 to the C, D or E channels as shown below.

Sutron Corporation Satlink Operations & Maintenance Manual pg. 35
The key settings for thermocouples are: Measurement Type: Analog Analog type: Diff C, D or E. Input Range: 39mV with Bias Equation: 24716*X+Terminal_temp {K type thermocouple, -8C to 64C}
For more accurate results, here are some other K-Type Equations:
Linear delta T range of ± 20°C. Approximation error is ±0.20°C. Temp (°C) = 25.346 * X*1000 – 0.1114 + Terminal_temp
Linear delta T range of ± 40°C. Approximation error is ±0.83°C.
Temp (°C) = 25.419 * X*1000 – 0.3847 + Terminal_temp 3rd order Poly delta T range of ± 20°C. Approximation error is ±0.01°C
Temp (°C) = Poly((X*1000), (Terminal_temp -0.0107), 25.263, -0.4443, 0.2053)
3rd order Poly delta T range of ± 40°C. Approximation error is ±0.03°C Temp (°C) = Poly((X*1000), (Terminal_temp -0.0115), 25.326, -0.4305, 0.0861)
T-Type Equations: Linear delta T range of ± 20°C. Approximation error is ±0.30°C.
Temp (°C) = 25.892 * X*1000 – 0.151 + Terminal_temp
Linear delta T range of ± 40°C. Approximation error is ±1.20°C. Temp (°C) = 25.851 * X*1000 – 0.612 + Terminal_temp
3rd order Poly delta T range of ± 20°C. Approximation error is ±0.01°C
Temp (°C) = Poly((X*1000), (Terminal_temp + 0.0051), 25.881, -0.688, 0.0277)
3rd order Poly delta T range of ± 40°C. Approximation error is ±0.03°C Temp (°C) = Poly((X*1000), (Terminal_temp + 0.0234), 25.868, -0.755, 0.0616)

Sutron Corporation Satlink Operations & Maintenance Manual pg. 36
4.20. Connecting Strain Gauges Strain gauges connect to SL3 to the C, D or E channels as shown below.
The key settings for strain gauge sensors are: Measurement Type: Analog Analog type: Diff C, D or E Input Range: 39mV or 312mV (**no bias needed) Slope: as needed to scale the reading.
4.21. Programmable Excitation References The built-in excitation reference voltage in SL3-1 is 2.5 volts available on pins 26 and 30. SL3-1 also supports a programmable excitation reference voltage via an optional plug in card. This may be used in addition to or instead of the 2.5VREF when you need a different excitation voltage for a sensor.
The optional card (Sutron part 6461-1328) can be plugged into either Option port 1 or 2.
The outputs have a range of 0 to 5VDC. The desired output is set via the menu on the options tab:

Sutron Corporation Satlink Operations & Maintenance Manual pg. 37
The PREF board has the following terminals:
G1, E1, G2, E2
Where G1/G2 are grounds and E1/E2 are the PREF1 and PREF2 voltages.
4.22. Connecting Prop/Vane or Anemometer/Vane Wind Sensors
The prop/vane or anemometer/vane wind sensors like the RMYoung wind sensor typically have a potentiometer for direction and frequency output for speed. The RMYoung connects to SL3 as shown below. WS/DIN#1 is used for the frequency as it can handle low level AC as well as high level DC pulses for speed.
* A 1.0 MOhm resistor needs to be placed from VREF (or SIGNAL GROUND) to AZ SIG. This ensures that the value always goes to 355 (or 0 with SIGNAL GROUND) when the potentiometer is in the open region.
Setup two measurements for the RMYoung – one for the direction and one for the speed. Setup for Direction Measurement
Measurement Type: Analog Analog Type: 0-5A Equation: X/VREF*355 {converts to degrees}
Setup for Speed Measurement
Measurement Type: Digital Digital Type: Frequency 1 or Frequency 2 (amplified version only)

Sutron Corporation Satlink Operations & Maintenance Manual pg. 38
DC high or AC low: AC low level (for unamplified RMYOUNG) Slope:
Wind Speed Units Slope
m/s 0.098
knots 0.1904
mph 0.2194
kph (km/h) 0.3528
To setup for wind vector measurements, go to 9.3.6 Measure Type: Wind.
4.23. Connecting Lufft Wind Sensors Lufft has a family of smart weather sensors capable of measuring a variety of parameters, including wind speed, direction, air temperature, relative humidity, and air pressure. In addition, it is possible to setup the Lufft sensor to automatically perform average and vector average calculations on the wind speed and direction in which case you do not need to use the Wind Measurement type in SL3. The Lufft sensor connects to SL3 as an SDI sensor to either SDI#1, SDI#2 or RS-485 (SL3-1). To set the units use the SDI command aXUu for US units or aXUm for metric. To set the averaging wind averaging interval to 5 minutes use the following SDI command: aXAw+5. See the Lufft Manual Family of Smart Weather Sensors for details. Use the C or C4 commands to read wind data from the Lufft sensor. The C commands are needed as the Lufft sensor often has more than 9 parameters in its output. The response to the C command may provide different data based on what model is connected. For example, the WS200-UMB provides the following data in response to the C command:
WS200 UMB
Parameter Description
0 Wind Speed (avg) *units based on settings in the WS200
1 Wind Speed (max)
2 Wind Direction (vector)
3 Wind Direction (act)
4 Compass Heading (act)
5 Wind Speed (act)
6 Wind Speed (min)
7 Wind Speed (vct)
8 Wind Quality
9 Wind Direction (min)
10 Wind Direction (max)
11 Wind Direction corr (act)
Other Lufft sensors with temperature and other measurements provide the wind speed and direction as parameters 3 (average speed), 4 (max speed) and 5 (vector direction) and 14 (vector speed) with detailed wind information available using C4. Consult the Lufft manual for details.
4.24. Connecting Digital Outputs SL3-1 provides two digital output lines: DOUT#1 and DOUT#2.

Sutron Corporation Satlink Operations & Maintenance Manual pg. 39
Please see section Digital Output DOUT for details.
4.25. Connecting Samplers Triggered by Stage Many samplers can be triggered to collect a sample by SL3’s Digital outputs DOUT#1 or DOUT#2. Simply connect DOUT#1 or 2 to the “trigger” line of the sampler along with ground and program an equation to generate the pulse based on the desired criteria.
For example, to trigger a sample when the stage is > 12.50 feet do the following:
Setup a measurement for stage, type to match the sensor you are using Setup a measurement to control the sampler, type: Meta. Set the Index to point to the stage measurement Set the equation to: OUTPUT(X>12.5,2,1,1000) for DOUT#2, PULSE, 1000 ms.
4.26. Connecting to the Switched Power There are two switched power connections SWD#1 and SWD#2. Each will provide up to 1A of the input power. The setup and software control when the switched power lines are turned on and off.
SWD#1 Turned on during each measurement of Analog/Digital/SDI sensor. Warmup can increase the time
SWD#2 Turned on only from an equation OUTPUT function or Command line command
4.27. Connecting Protected Power The protected power is labeled PROT+12V. This power provides 1A of the main power. This can be used for sensors or equipment that needs to remain powered at all times. It can be turned on/off/pulsed via the equation OUTPUT function and via the POWER command.
4.28. Connecting External Modems You can connect an external modem to SL3 and use it to communicate with SL3 remotely using LinkComm or other communication programs. The modem must be Sutron’s 8080-0005-1B modem with a special configuration saved in its profile. The modem will connect to the SL3 RS-232 port via a male-male null modem cable.
Here are the details of how the modem must be configured to work with SL3.
The following table summarizes the AT commands that will be issued: - &F - factory reset the modem - &D0 - ignores DTR from SL3 - &S1 - modem asserts DSR when connection established - &K3 - enable RTS/CTS hardware flow control - S0=1 - auto answer on first ring - S2=255 - disable +++ escape (allows binary file transmission) - E0 - echo disabled - Q1 - disable messages

Sutron Corporation Satlink Operations & Maintenance Manual pg. 40
- &W - save the settings to non-volatile memory of the modem Connect to the modem with Hyperterminal (or similar) using a PC. For the best performance, connect at 115200,N,8,1. The modem remembers the baud rate at the time of the AT&W, so be sure to communicate at the rate you intend to communicate with the SL3 at. 9600 baud is the SL3's default rate, but smart modems can go quite a bit faster. Here's how to configure a modem to be used with the SL3 (assuming it's at factory defaults): 1) enter AT and then press ENTER until the modem responds with 'OK' 2) paste the following command to the modem: AT&F&D0&S1&K3S0=1S2=255 3) press ENTER and the modem should reply 'OK' 4) paste the following command to the modem: ATE0Q1&W 5) press ENTER After the modem has been dumbed down by these commands it will not even say 'OK' to an AT command anymore. To see if it's still working you may try a command with a non-simple response such as AT&V To configure the SL3 to answer at 115200, connect to your SL3 with LinkComm and use the Diagnostics, Terminal window. Press ENTER to get the ">" prompt and issue the following: RS232 Baud Rate=115200 Then reboot the SL3 for the new baud rate to take effect by issuing the Reboot command or power cycling the unit. The modem will now automatically answer calls and provide remote communications to SL3. See “Connecting via Analog Modem” for instructions on how to use LinkComm with the external modem.
4.29. Connecting External Cell Modems You can connect an external cell modem to SL3 and use it to communicate with SL3 remotely using LinkComm or other communication programs. The following details show how to do this using Sutron’s GPRS-1-O modem that is preconfigured to operate as a client serial bridge to accept connections and pass data between Satlink and the remote caller. The modem will connect to the SL3 RS-232 port via a male-male null modem cable.
Follow these steps to configure the GPRS-1-O modem to operate in serial bridge mode.
1) Creating/selecting the script. Some readymade scripts are provided based on typical settings and common APNs. Go ahead and use ATT_script.txt, T-Mobile_script.txt, or Rogers_script.txt if you are using either of these providers. Otherwise, contact Sutron for help in creating the proper files for the modem.

Sutron Corporation Satlink Operations & Maintenance Manual pg. 41
2) Load the script in to a thumb drive. The file must be copied in to the station folder, and must be renamed with the station as part of the file name. For instance if the station was named S01 then the file must be renamed "S01_script.txt" 3) Attach the modem to the RS-232 port an SL3 and insert the thumb drive. Look for a script_results.txt in the daily sub-folder and examine it for errors. Once the modem is working, enable passwords to help secure the station. The script is designed to be run on a factory fresh modem or one that's already running the script. The script will switch the speed of the RS-232 port to 115200 baud. See “Connecting via TCP/IP” for instructions on how to use LinkComm with the external modem.

Sutron Corporation Satlink Operations & Maintenance Manual pg. 42
5. Installing and Running LinkComm LinkComm is a software application designed setup and operate Satlink. LinkComm is used to:
Check Satlink status Set up Satlink Download and graph the log from Satlink Upgrade Satlink firmware Calibrate connected sensors
5.1. Installing the LinkComm mobile app Mobile versions of LinkComm are available to run on Apple iPad and iPhone, and on Google Android phones and tablets. They can be found on the Apple® App Store™, and Google® Play Store™, respectively. These applications are installed just like any other app for the device that is being used.
5.2. Installing the PC version of LinkComm The PC version of LinkComm is available for download from http://www.sutron.com/downloads.htm. The PC version is supported on Windows 7 and higher.
After downloading LinkComm, run the program and follow the instructions on the screen. For Windows, extract all files to a folder on your computer. You may run LinkComm directly from this folder by double-clicking “LinkComm.exe”, or, to install LinkComm so that it appears on the Start menu, double-click “setup.exe” (Administrator privileges are required to install LinkComm).
If your PC is running windows 7, you will need to install the USB drivers after installing LinkComm. Note: this is not needed for Windows 8 and beyond.
5.3. Stations List View When LinkComm starts, it displays the Stations List View, containing a list of stations that have previously been setup in the software, along with the details of the selected station. The details include the station name, type, connection settings, notes and images.

Sutron Corporation Satlink Operations & Maintenance Manual pg. 43
On small displays, the station list is hidden. Press < Stations to see the station list.
To work with the selected station, press “Connect”. The software will use the assigned connection settings (USB, RS-232, Modem, or Wi-Fi), to try to communicate with the site.
If you have problems connecting to the site, check your communication settings and or cables/Wi-Fi settings and see the following sections that detail USB and Wi-Fi connections.
To create a new station, select “New Station” at the top of the station list (1). Then set the Station Type (2) to match your type of Satlink, set “Connect type” (3) to Wi-Fi, USB, Serial or Modem, and press Connect (4). Additional information on the Wi-Fi, USB and modem connections are provided in the next sections.

Sutron Corporation Satlink Operations & Maintenance Manual pg. 44
You can set the software to get recent data (5). “Get recent data on connect”, when checked, will cause LinkComm to download the last week of data for display in a graph on the dashboard tab, every time you connect to Satlink. This can be a considerable amount of data (several k-bytes). You may choose to disable this feature to reduce data costs (e.g., when communicating over cellular links).
The “Check setup on connect” option (visible only for low bandwidth connections like “Redirector”), will cause LinkComm to retrieve the setup from Satlink every time you connect. You may choose to disable this feature to reduce data costs (e.g., when communicating over cellular links).
5.3.1. Connecting via USB LinkComm can connect directly to Satlink via a USB cable. Simply connect a USB cable from your computer to Satlink and select “USB” as the Connect type.
You will need to pick the appropriate USB device:
1 2
1
3
4
5

Sutron Corporation Satlink Operations & Maintenance Manual pg. 45
5.3.2. Connecting Remotely LinkComm can also talk to a Stalink with the with the optional cell modem installed. To do so, the Listening setting needs to be enabled.
Alternatively, to reduce power consumption, the system can be configured to check for messages periodically. A message can be sent to the station asking it to temporarily turn on listening. Please see the Telemetry section.
TCP/IP If the IP address of a Satlink is known, it can be connected to directly. It is up to cell service provider to
Give a static IP address. This means that the IP address of Satlink does not change over time. Alternatively, you may send an SMS to the Satlink asking what its current IP address is.
Provide VPN access. It is not always possible to directly connect to Satlink over the internet because it is protected by the cell service provider’s firewall. In this case, it is necessary to first connect to a VPN provided by the cell service provider.
The Redirector Sutron provides a “redirector” service that can be used to access a Satlink station that uses a SIM card provided by Sutron. The IP addresses of these SIM cards are behind a firewall, and so need special steps to be taken for access.
When obtaining one of these SIM cards from Sutron, you will also receive a user name, password, and station name to use when setting up your station connection in LinkComm. After entering your user name and password, you may press the “Update Station Names” button to retrieve the list of stations that are associated with your redirector account.
5.3.3. Connecting via Wi-Fi Satlink can provide a Wi-Fi hotspot that LinkComm can connect to. The Wi-Fi feature is useful for connecting to Satlink on-site with a mobile phone, tablet, or laptop.
Satlink’s Wi-Fi hotspot is not connected to the internet.
To connect to Satlink via Wi-Fi, follow this sequence:
Have Satlink turn on the Wi-Fi by pushing the wakeup button located on the front. Satlink will blink the blue halo LED to acknowledge the button press.
Have your computer (Laptop, iPhone, or Android) connect to Satlink’s Wi-Fi hotspot. Satlink will name its hotspot SL3_xxxx_aaaa, where xxxx is the station name and aaaa is
a unique number. Create a new station in LinkComm with “Connect type” set to “Station Wi-Fi”
(LinkComm may detect you are connected to Satlink via Wi-Fi, and set this type by default)
If you need to manually enter the IP address for Satlink, it is 192.168.88.1:3001. LinkComm is now connected to Satlink. It is possible to check status, change setup,
download log, and perform almost all other operations. Once the LinkComm session is complete, make sure to disconnect from Satlink's Wi-Fi
hotspot.

Sutron Corporation Satlink Operations & Maintenance Manual pg. 46
In order for LinkComm to connect to Satlink via Wi-Fi, the device that is running LinkComm must first connect to the Wi-Fi hotspot provided by Satlink.
Here’s an example mobile Wi-Fi Settings screen showing several Satlink devices available for connection:
5.3.4. Connecting via Analog Modem LinkComm can connect to a Satlink with Display and Modem or a Satlink with an external modem via a telephone modem. Connect the modem to your computer, select the “Modem” Connect Type, and enter COM port. Press the “…” button to enter phone number and other modem details. Note, LinkComm expects the modem to support ASCII result codes (“OK”, “CONNECT”, etc.), and DTR call control.
5.3.5. Connecting via TCP/IP LinkComm can connect to Satlink with an external Cell modem via TCP/IP. See “Connecting External Cell Modems” for instructions on connecting the modem to SL3. LinkComm will need to be run on a device that has access to the same network that the modem is operating on. If the modem is on a private network, the PC will need VPN access to that network.
Select Connect type: TCP/IP Enter URL or IP address for the station Make sure that the IP port matches the port you have enabled in the modem (usually
3001). Press Connect

Sutron Corporation Satlink Operations & Maintenance Manual pg. 47
5.3.6. Working Offline To “work offline” means to make changes to the setup in LinkComm setup while disconnected from Satlink. You enter this mode by selecting “Work Offline” in the station view. The changes you make to the setup are automatically saved in LinkComm but not in the Satlink.
When you later connect to Satlink, you need to send the setup to Satlink to bring the setups “in-sync”. If you checked “Get setup on connect” in the station’s Connection Settings, then when you first connect, LinkComm will prompt to overwrite your changes. If you answer “No”, LinkComm will then prompt to send your changes to Satlink. Answer “Yes” at this point to bring the setups “in-sync”.
5.3.7. Notes This section is used to enter notes in this section related to station setup and maintenance. For example, you might store information about the last time the station was visited, plans for future visits, and notes on calibrations, etc.
Note: All settings (station and connect settings, notes, and site images) for every station you define are saved automatically as you make changes. Hence, there is no need to select any kind of “Save” menu item.
5.3.8. Site Images This section allows you store pictures of the site. Click “Add New Image” to browse for images to store. If a camera is available, you’ll have the option to take pictures to store as new site images.
When you click a site image, it expands to fill the available window.
To delete a site image, right-click (or press-and-hold) the image and select “Delete Site Image” in the subsequent prompt.
5.4. Main Menu
Press the button in the upper left to access the main menu. The menu shows different options, depending on whether you are connected to – or working offline with – a station.

Sutron Corporation Satlink Operations & Maintenance Manual pg. 48
The following menu is displayed in the Stations List View:
Import Database… Import a stations database previously saved using “Export Database…” Note that this will overwrite all existing station definitions with those from the imported database. The action cannot be undone., You may want to export the current database, just in case you need to restore it
Export Database… Export all station definitions to a database file. You can then use “Import Database…” on another PC or mobile device to import the station definitions.
About… Display a dialog showing information about LinkComm, including version
Sutron Website… Visit the Sutron website
Event Log… Show LinkComm event log. This is a text file showing diagnostic information about LinkComm operation.
Exit Exit and close the LinkComm application. This item is not displayed when running on mobile platforms

Sutron Corporation Satlink Operations & Maintenance Manual pg. 49
The following menu items are displayed in Station Detail View (i.e., when connected or working offline):
Stations… Disconnect and return to the Stations List View
Log In… LinkComm prompts for password and then attempts to log in to Satlink
Change Password… LinkComm prompts for new password to use to log in to Satlink
Show Quick Status… Show the Quick Status dialog, showing a summary of Satlink status
Import Setup… Load a setup from an external file. The setup file was typically saved by a prior “Export Setup…” action
Export Setup… Save the current setup to an external file. The setup file is a text file containing property-value assignments
Send Setup to Station Send the current setup to Satlink (shown only if connected)
Get Setup from Station Get the setup from Satlink (shown only if connected)
Stop Recording Start (or Stop, if applicable), recording (shown only if connected)
5.5. Station View After you press either “Connect” or “Work Offline” in the stations list view, LinkComm transitions to the “Station View”, where you see several tabs, e.g., Dashboard, Measurements, Data, etc., each showing information about status and/or setup for the selected Satlink.
The following picture is of the station view with the Dashboard tab selected:

Sutron Corporation Satlink Operations & Maintenance Manual pg. 50
5.5.1. Connect Button The right header button is the “Connect Button”. It shows the status of the current connection from LinkComm to Satlink. The button has two possible states:
LinkComm is connected to Satlink
Pressing the button in this state will cause LinkComm to disconnect from Satlink
LinkComm is not connected to Satlink
Pressing the button in this state will cause LinkComm to try to connect to Satlink
5.5.2. Setup Status Button The left header button is the “setup status button”. This button shows status related to the setup, including whether the setup is “in-sync”, i.e., the same in both LinkComm and Satlink, and recording status.
Pressing the setup status button typically prompts the user to take the next logical step towards getting the setup in-sync between LinkComm and Satlink, with recording on.
Note: When the setup displayed by LinkComm is the same as the setup in Satlink, then we say the setups are “in-sync”. When the setups are not the

Sutron Corporation Satlink Operations & Maintenance Manual pg. 51
same, the setup status button displays a warning sign, and you must send the setup to Satlink to get the setups “in-sync”. After making changes to the setup locally, you need to send those changes to Satlink to bring the setups “in-sync”. You do this by pressing the setup status button (or by selecting the main menu item, “Send Setup to Satlink”).
The following table describes the different states maintained by the setup status button, and describes what happens when you press the button in each of the states:
LinkComm is connected to Satlink, recording is ON, and the setups are “in-sync”
Press the button to turn off recording. LinkComm will prompt for confirmation.
A change has been made to the setup in LinkComm (it no longer matches the setup in Satlink)
Press the button to send setup changes to Satlink. LinkComm will prompt for confirmation. If “Yes”, only the changes required to be “in-sync” are sent. If “No”, LinkComm prompts to retrieve the setup from Satlink, overwriting local changes
The setup in Satlink is unknown, and so may differ from the one displayed by LinkComm
Press the button to send the setup to Satlink. LinkComm will prompt for confirmation. If “Yes”, LinkComm first sets the setup in Satlink to defaults, and then sends the changes required to be in-sync
Recording is OFF in Satlink. This means no measurements are being made
Press the button to turn recording ON in Satlink. LinkComm will prompt for confirmation
LinkComm is working off line (not connected to Satlink)
Press the button to connect to Satlink
The setup that is shown in LinkComm is not necessarily the same setup that is in a connected Satlink
To read a setup from a Satlink and show it in LinkComm, you may either use the setup
status button as described in the previous section, or select the Get Setup From Satlink item from the main menu
To give a setup created by LinkComm to Satlink, you may either use the setup status button as described in the previous section, or select the Send Setup To Satlink item from the main menu

Sutron Corporation Satlink Operations & Maintenance Manual pg. 52
Unless the setup status button menu item is selected, or the Send Setup to Satlink button is clicked, none of the changes made to the setup in LinkComm will be in Satlink!
5.5.3. Handling Setup Differences Following Setup Send On some occasions, LinkComm will detect that differences remain after sending setup changes to Satlink. This can happen because of a communication error, but more commonly, it occurs because Satlink doesn’t allow certain changes to occur remotely.
In any case, when LinkComm detects such a difference exists, LinkComm warns you that changes still exist, and will offer a dialog to “View Differences”. To rectify the situation, it is usually best to get the setup from Satlink to again be “in-sync”, and then try making and sending your changes again.
5.5.4. Setup Files You can save a Satlink setup to a file and later re-use that setup by loading it into LinkComm. To save a Satlink setup to a file, select Export setup… from the main menu.
You may find it helpful to save reference copies of setups outside of LinkComm, as a backup in case you accidentally overwrite changes to the setup in LinkComm. Use the export setup menu item to achieve this.
To load a Satlink setup from a file, select Import setup… from the main menu. After loading the setup file, you still need to send the changes to Satlink. As always, use either the setup status button, or the Send Setup to Satlink menu item, to send the setup to Satlink.
5.5.5. Metadata - Pictures, Wiring Diagrams, and Special Text LinkComm enables you to associate pictures, wiring diagrams, and special text items with your Satlink station definitions. This “metadata” is NOT stored in the Satlink logger, since the logger needs to use its storage space for more important things like sensor readings.
Some examples of metadata in LinkComm:
Station picture, notes, and site images Measurement picture, model, manufacturer, description, units
This station metadata is not stored in the station setup files created by Export Setup…. The metadata is saved, however, when saving the stations database using the Export Database… menu item from the Station View main menu.
5.6. Dashboard Tab The Dashboard tab is the first tab displayed after you connect to Satlink. It shows an overview of the station, including
Station status All active measurements, their last readings, and alarm status A graph of recent measurement data (if Get recent data on connect was checked). Right
click to refresh the data. All enabled transmissions, along with information on the transmission time and counts

Sutron Corporation Satlink Operations & Maintenance Manual pg. 53
All active script tasks along with their status
To refresh the current status, click the Refresh Status button To reset the station status, including the transmission counters, tallies and system
errors, click the Clear Status button. Once the status is reset, the previous status is lost To show the status text actually received from the logger, press the Show Details button To measure and update all sensors, press Measure All button High level telemetry status is also shown on this page (below current sensor values). To
see low level details about telemetry, see the Telemetry tab. If the station has any active errors, these are shown in RED just below the status area.
Right-clicking on any trend graph (or touching the graph in the mobile app), reveals a pop-up menu that allows you to:
Refresh recent data (all items, not just the selected) View the current data item in the larger graph on the Data tab
5.6.1. Changing the Station Name The station name can only be changed from the Dashboard tab, and is actually the only setup item that can be changed from the Dashboard tab. To change the station name, press the blue “edit” text, next to the station name.

Sutron Corporation Satlink Operations & Maintenance Manual pg. 54
LinkComm will prompt for the new station name. Just as with every other station setup change, the change is not complete until you have sent the setup to Satlink. Do this using either the setup status button in the main header, or the Send Setup to Satlink item in the main menu.
5.7. Measurements Tab The measurements tab is the first tab displayed when you select Work Offline in the stations list view. This is the tab where all sensors are configured. Up to 16 sensors may be enabled and configured. The measurements tab also provides some test functions to help you ensure the sensor is properly configured.
The left side of the measurements tab shows a list of all possible measurements. The right side of the measurements tab shows the details of the selected measurement. The details are the settings used to determine how the measurement is taken and how the data is processed by the system. The settings include schedule, Configuration (including wiring diagram), Processing, Alarms, Logging, Tx Content.
5.8. Data Tab The data tab shows historical measurement readings made by Satlink. If recent data was downloaded when connecting to Satlink, the graph displays this data the first time you select the Data tab.
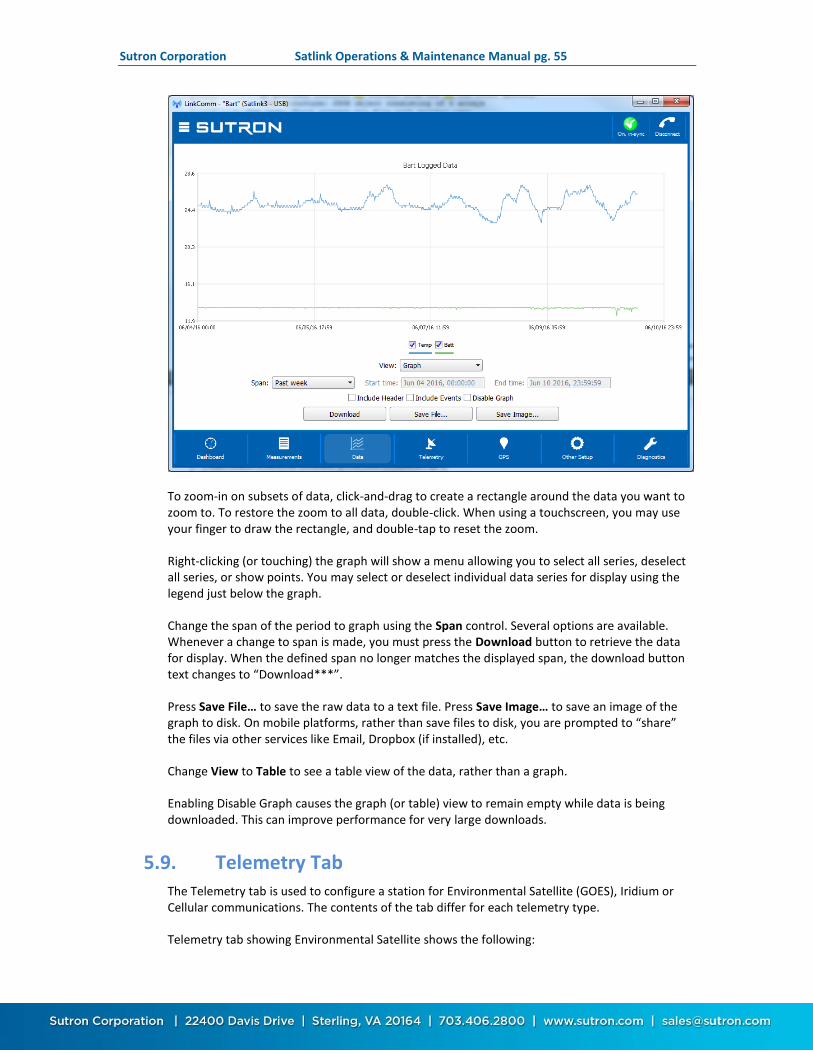
Sutron Corporation Satlink Operations & Maintenance Manual pg. 55
To zoom-in on subsets of data, click-and-drag to create a rectangle around the data you want to zoom to. To restore the zoom to all data, double-click. When using a touchscreen, you may use your finger to draw the rectangle, and double-tap to reset the zoom.
Right-clicking (or touching) the graph will show a menu allowing you to select all series, deselect all series, or show points. You may select or deselect individual data series for display using the legend just below the graph.
Change the span of the period to graph using the Span control. Several options are available. Whenever a change to span is made, you must press the Download button to retrieve the data for display. When the defined span no longer matches the displayed span, the download button text changes to “Download***”.
Press Save File… to save the raw data to a text file. Press Save Image… to save an image of the graph to disk. On mobile platforms, rather than save files to disk, you are prompted to “share” the files via other services like Email, Dropbox (if installed), etc.
Change View to Table to see a table view of the data, rather than a graph.
Enabling Disable Graph causes the graph (or table) view to remain empty while data is being downloaded. This can improve performance for very large downloads.
5.9. Telemetry Tab The Telemetry tab is used to configure a station for Environmental Satellite (GOES), Iridium or Cellular communications. The contents of the tab differ for each telemetry type.
Telemetry tab showing Environmental Satellite shows the following:

Sutron Corporation Satlink Operations & Maintenance Manual pg. 56
The telemetry status section is below the setup area, and is accessed by scrolling down.
The status text is retrieved from Satlink the first time you display the telemetry tab, and can be refreshed as needed on demand.
Please see the TELEMETRY STATUS section for more info. Iridium and Cell Telemetry types offer a Radio Diags button which provides diagnostics information on the modems. Please see section DIAGNOSTICS TAB.

Sutron Corporation Satlink Operations & Maintenance Manual pg. 57
Information provided includes signal strength, time when the modem last connected to the network, contents of the last received message, and IMEI.
Besides showing the diagnostic information, the Radio Diagnostics tab allows one to check for Iridium messages immediately, and to send an SMS to a specific cell number.
5.10. GPS Tab Every Satlink Logger transmitter has a built-in GPS module. The GPS module provides time and frequency information needed for the on-going operation of SL3. SL3 is certified to operate for 30 days without GPS.
There is only one setting on the GPS tab: Local Time Offset (min). GPS provides UTC time to Satlink. The field labeled “Local Time Offset” can be used to have Satlink use local time instead of UTC. Enter the offset from UTC in minutes to have Satlink use local time. Leave the setting at zero to have Satlink use UTC. E.g. to have Satlink run on US Eastern Standard Time, enter -300, indicating that EST is 300 minutes behind UTC. Note: Satlink will not automatically switch between daylight savings time and standard time. Note: if you set a local time offset, all times used by Satlink will be in local time – even the scheduled transmit time. You may need to adjust your scheduled transmission time to local time if you use a local time offset.
In order to give the user a better idea of the quality of the GPS signal, Satlink Logger provides messages that indicate how long the GPS module was powered before a time sync was initiated. If the last GPS sync was a part of a transmission, this number should roughly be equal to the GPS acquire time. If the last sync was user initiated, then this number will indicate how long it took the GPS module to acquire the signal necessary to provide an accurate time.
The Signal Quality reported by Satlink consists of a graph of the signal strength for each satellite in view of the station. The satellite number is on the bottom of each bar and the signal strength

Sutron Corporation Satlink Operations & Maintenance Manual pg. 58
is the height of the bar. The signal strength is also color coded for easy recognition of how well the satellites are being received. Note that it is natural for the signal strength to be below 40 as satellites orbit out of view. The GPS needs at least 4 satellites to get valid time and frequency information.
The only controls on the tab are to refresh the screen and start a new sync. Normally, Satlink will attempt to get a time sync from GPS 10 minutes before a scheduled transmission. The sync will happen at least once every 30 minutes. The synchronization process takes about a minute and ensures that Satlink is ready to transmit on time. If the sync fails for any reason, the transmission will still be able to operate for up to 30 days. In fact, just one sync in thirty days is all that Satlink needs to operate indefinitely.
5.11. Scripts Tab This window is used for general script management as well as setting up individual script tabs.
Please see the SCRIPTS section for more details on working with scripts.
By clicking on Script File Details, the script management window provides an overview of the script file used as well as of all the script functions. If a script is in use by the system, that information is shown.
The script itself can be seen and edited on this window. Script testing options are found here too.
By choosing one of the script tasks available (marked as S1, S2, etc. on the left hand side), the details of the script task are shown. This window is used to configure the script tasks.

Sutron Corporation Satlink Operations & Maintenance Manual pg. 59
5.12. Other Setup Tab Various settings are displayed in the Other Setup dialog, which is accessed from the Telemetry tab by pressing the Other Setup button. The settings shown include those for:
Wi-Fi Log daily values DCP Command Digital Output DOUT Optional Card Setup Programmable Voltage References Iridium Modem Settings Cell Modem Settings Modbus Settings Log Download Format

Sutron Corporation Satlink Operations & Maintenance Manual pg. 60
See section OTHER SETUP for more information setting in this page.
Iridium and Cell Telemetry types offer Iridium Diags and Cell Diags buttons which provides diagnostics information on the modems. Please see the RADIO DIAGS section for details.
5.13. Diagnostics Tab This tab provides extensive diagnostics information, and offers tools for performing various diagnostics and maintenance operations. For example:
Get diagnostics information including software versions and data usage Terminal and Data Flow views SDI-12 command utility Set the clock in Satlink Upgrade Satlink Resetting Satlink to factory defaults

Sutron Corporation Satlink Operations & Maintenance Manual pg. 61
5.13.1. Firmware Versions and Diagnostics The top two text areas on the Diagnostics tab display information about the firmware installed in the connected Satlink.
The Firmware Versions section displays the current versions of firmware installed in Satlink. If LinkComm detects a newer version of firmware is available, this text area contains a message saying such. The Firmware Diagnostics area displays recent diagnostics information reported by Satlink.
Press the Refresh… button to update this data to the latest. Press the Save to file… button to save all diagnostic text data to an external file.
5.13.2. LinkComm Versions and Diagnostics The bottom two text areas on the Diagnostics tab display information about LinkComm.
The LinkComm Data Usage section displays the total byte counts between LinkComm and Satlink for the current session. The LinkComm Diagnostics section displays LinkComm’s version information.
Press the Refresh… button to update this data to the latest. Press the Save to file… button to save all diagnostic text data to an external file.
5.13.3. Terminal LinkComm features a built in terminal monitor program. All communications between LinkComm and Satlink uses the command line interface. The Terminal window can be used to view a history of command traffic, and can be used to access the command line interface directly.

Sutron Corporation Satlink Operations & Maintenance Manual pg. 62
To see the details of the communication between LinkComm and Satlink, bring up the terminal window via the Terminal button on the Diagnostic tab.
You may type into the terminal window. Data typed will be sent to Satlink. Any replies from Satlink will be shown in the Terminal window.
5.13.4. Data Flow The Data Flow dialog shows recent command line traffic in Hexadecimal, and shows traffic direction and timestamp information. To open the dialog, press the Data Flow button on the Diagnostic tab.
When “Autoscroll on data” is checked, the window advances when new data becomes available.
5.13.5. Firmware Upgrade The software running in Satlink can be upgraded. The latest version of Satlink firmware is delivered as part of the LinkComm download package obtained from the Sutron web site. LinkComm may be downloaded from http://www.sutron.com/downloads.htm (search on “LinkComm”).
Upgrades may be done over RS-232, USB, USB thumb drive or Wi-Fi.
Upgrade files are packaged into the same download with the LinkComm program. Upgrade files will have names such as SL3EuropaActual_800r1695.sl3u
To initiate an upgrade of your Satlink, select the Upgrade button on the Diagnostics tab. If LinkComm detects a newer version of firmware on your PC, LinkComm will suggest that an upgrade be made using it. If you select “No”, then use the file-open dialog that follows to browse for, and select, the upgrade file to use.

Sutron Corporation Satlink Operations & Maintenance Manual pg. 63
You can also upgrade the firmware via USB. See section 6.15.3 Update the Firmware via USB Thumb Drive.
5.13.6. Setting to Factory Defaults Setting the station to factory defaults will permanently erase all setup and status. The setup will be set to defaults. To set Satlink to factory defaults, press the Factory Defaults button on the Diagnostics tab and answer “Yes” to the prompt for confirmation.
5.13.7. Rebooting Satlink Clicking the Reboot button on the Diagnostics tab will have LinkComm issue the reboot command to Satlink. Satlink will perform a software reset. LinkComm will then disconnect from Satlink.
If you are issuing the command remotely, please note that Satlink will need a minute to get back on the internet before it is ready to talk again.
5.14. Password Menu LinkComm provides Password related items in the menu that can be used to log in, change the password, and log out. LinkComm will prompt for a password when it is needed.
For details on password operation, please see the PASSWORD PROTECTIONError! Reference source not found. section.

Sutron Corporation Satlink Operations & Maintenance Manual pg. 64
5.15. Quick Status Dialog When disconnecting from a Satlink3 station, LinkComm displays a Quick Status dialog, containing a summary of important status information.
The dialog displays system time and battery voltage information at the top. The scrollable list of status items in the center of the dialog display status for particular items, as follows:
Errors Recording status Measurement status, including number of parameters to transmit Scheduled transmission status Random transmission status
A green check signifies the item is in the expected state
A warning triangle signifies the item isn’t as expected, and may need attention
A red stop sign signifies the item is likely incorrect, and needs attention
You can prevent the dialog from being shown when disconnecting from SL3 by checking Do not automatically show this dialog. To see the dialog when this is checked, select Show Quick Status from the main menu.

Sutron Corporation Satlink Operations & Maintenance Manual pg. 65
6. Operating Satlink The following scenarios describe how to perform some common functions with a Satlink. They assume that Satlink is powered up and that LinkComm is running and can connect to the station via USB, RS-232, or Wi-Fi. For help connecting to a station, refer to Connecting via USB or Connecting via Wi-Fi.
6.1. Creating a New Station in LinkComm Select “New Station” from the top of the station list. Set station type to Satlink3, and set connect settings, as needed. Press “Connect” (or “Work Offline”, if SL3 hardware isn’t connected). On the Dashboard tab, edit the station name. Use the Measurements and Telemetry tab to make other settings (consider using
Factory Defaults on Diagnostics tab to start from a blank slate). Select “Save Station” from the main menu. The station will be added to the station list.
6.2. Connecting to an SL3 in Your Station List Select the station in the station list. Update the connection type and related settings, if needed. Press “Connect”. LinkComm will read the setup from the station and report any differences it finds. If no
message is displayed, the setups match. If the setup differs, a message will be displayed. Press “View Diffs…” to see the
differences. Then press YES to send the LinkComm setup to SL3, or NO to have a chance to use the setup received from SL3 as the correct setup.
6.3. Importing Setups From Another User Or Station Create or connect to an SL3, following the steps in either 8.1 or 8.2, above. Select “Import Setup …” from the main menu. Locate the desired setup file and press Open
Note, the setup file is a .txt file and it may have been created via Export Setup, or Diagnostics.
If prompted that LinkComm will “replace the current setup…Continue with import?”, select YES. The setup is now resident in LinkComm.
6.4. Testing Measurements Go to the measurements tab. Select a measurement Scroll to the Processing Section Press Refresh to view last measurement Press Force to make a new measurement.
6.5. Examine Measurements Go to the Dashboard

Sutron Corporation Satlink Operations & Maintenance Manual pg. 66
Press “Refresh Status” to see latest data from each measurement Right click and select “Refresh recent data” to update graphs.
6.6. Examine Transmissions Go to Dashboard Select “Show Details”. Statistics on the Scheduled and Random Tx will be displayed You may also see the telemetry statistics on the Telemetry tab, Telemetry Status
section.
6.7. Examine Transmission Data Go to Telemetry Select “Show Tx Data”. The data from the last transmission is displayed along with data
that would be transmitted if one were made now. Details on the size and time required to transmit are also displayed.
6.8. Entering Manual Data Go to Measurements Select the desired measurement Scroll to Processing, select “Calibrate”, and enter the desired value and press OK.
6.9. Calibrating Sensors Go to Measurements Select the desired measurement Scroll to Processing, select “Calibrate”, enter the desired sensor reading and press OK. Whenever a sensor reading is calibrated, the system will log two readings – the value
before and the value after the calibration.
6.10. Configuring SDI-12 Sensors Go to Measurements Select the desired measurement of an SDI-12 sensor Scroll to Configuration and press “Send SDI-12 Command”. A menu will be provided
that allow you to select Port1/Port2, Address, and commands for SDI-12. If the desired command is not in the Command drop-down list, simply enter it yourself
in the command box. You may also access the SDI command menu from the Diagnostics tab.
6.11. Downloading Log Data Go to Data Select desired “Span” and press “Download”. When download is complete, press “Save File…”. Note the file is named by the end time
in the span.

Sutron Corporation Satlink Operations & Maintenance Manual pg. 67
6.12. Viewing/Clearing the Status Go to Dashboard The status is displayed in the top left giving the station name, time, number of
measurements enabled, errors, alarm status, battery voltage, transmission status. Press “Refresh Status” to update the status. Press “Show Details” to see additional information. Press “Clear Status” to clear any errors.
6.13. Software Version You can find the version of the software on the diagnostics tab of LinkComm. The Serial Number of the product is listed there as well.
You can also obtain the version of the software using the VER command via command line.
6.14. Setting Time You do not need to set the time yourself in Satlink. Every Satlink Logger transmitter has a built-in GPS module. The GPS module has the ability to get the time from the GPS satellites. The GPS module needs to be connected to an antenna and that antenna needs to have a clear view of the sky so the GPS can track the satellites. Satlink will frequently update its clock to the time reported by the GPS module.
Should GPS fail for any reason, the Satlink will continue to operate the transmitter for up to 30 days. During this time, Satlink will be using its own accurate internal clock to maintain the

Sutron Corporation Satlink Operations & Maintenance Manual pg. 68
correct time. After 30 days without GPS, there is a chance that the internal clock has drifted too far. At this point transmissions are suspended until GPS signal is found again. Please note that even though transmissions are suspended, normal data collection and logging continues.
Satlink time can be viewed via LinkComm on the Dashboard tab. Note that the time shown in the dashboard is a snapshot of the time. To see the current time, press refresh for an update. The time displayed will be UTC or local time depending on the Local time offset setting. Note that the time may be off by a second or two because of the time needed to retrieve the status from Satlink.
You can get additional information on how well the GPS is performing via the GPS tab.
Use the Local Time Offset to convert the time from UTC to a local time zone. The change will take effect after the next good transmission.
6.15. USB Thumb Drive (Flash Drive) Operation Satlink provides several convenient functions via the USB Host port. A USB thumb drive (aka Flash drive) is required to use the port. The drive must be pre-formatted with the FAT32 operating system.
6.15.1. Download data to USB Thumb Drive To download data to a USB drive, simply insert a USB drive (already formatted FAT32) in to the Satlink3. When you do, the green LED (red if an error condition is present) will start blinking rapidly while processing the drive. SL3 will write the log data since the last download to a file along with setup and diagnostics information. The thumb drive may be removed once the LEDs resume normal blink pattern.
The following folder structure is used on the Thumb Drive (and will be created if not present):
\Sutron\Satlink\<station>\<date> where <station> is the name of the station and <date> is the current date in yyyymmdd format (ex: "20160204")
Output files are always placed under the full path and given a unique name by appending _01, _02, _03, ..., _99 to the name as necessary.
The files include:
log data (ex: "TestStation_log_20161231_02.csv") diagnostic data (ex: "TestStation_diag_20161231.txt") setup files (ex: "TestStation_setup_20161231.txt") results from setup import (ex: "TestStation_setup_results_20161231.txt") output from script execution (ex: "TestStation_script_results_20161231.txt")
6.15.2. Upload Setup via USB Thumb Drive It is possible to change Satlink’s setup by plugging in a USB drive that contains the new setup.
LinkComm’s Setup files can be exported by LinkComm and then copied to a USB drive such that they will automatically installed when the USB drive is plugged into the USB Host slot in SL3. The

Sutron Corporation Satlink Operations & Maintenance Manual pg. 69
setup is specific to the station. For every station you wish to setup, a different setup file must be created and placed on the drive.
To update Satlink’s setup with a USB drive:
Use LinkComm to create a setup. Use LinkComm’s export setup menu option to create a setup file. The setup file must be named “StationName_setup.txt”, where “StationName” is the
current name of the station that will have its setup updated. If you do not know the name of the station to update, you will not be able to update it with the USB thumb drive.
Copy the setup file to a USB drive and place in in the \Sutron\Satlink\StationName directory, where StationName is the current name of the station that will have its setup updated.
Plug the USB drive into the Satlink.
After the setup has been processed it will be renamed to prevent it from being processed in the future (ex: "TestStation_setup_installed.txt"). This means you cannot use the same setup file to update multiple stations.
Example: to upload a new setup to the station named “TestStation”, place the setup file in the following folder of the USB drive: \Sutron\Satlink\TestStation\TestStation_setup.txt. Then plug the thumb drive into the SL3 USB Host connector.
6.15.3. Update the Firmware via USB Thumb Drive The firmware is Satlink may be upgraded with a USB drive. To do so, place the upgrade files (eg: SL3EuropaActual_800r1811.sl3u) in the Satlink folder of a USB drive. When the USB drive is inserted into SL3 USB Host, SL3 will look for the upgrade file and check to see if the station is running an older version of firmware. The version and revision numbers in the file name are used to make this determination. If the revision on the USB drive is newer than what Satlink is running, Satlink will be upgraded.
Example: to upgrade the firmware to 801r1900, place the upgrade file in the following folder of the flash drive and insert the flash drive into the USB Host: \Sutron\Satlink\SL3EuropaActual_801r1900.sl3u
Upgrade files are shipped with LinkComm and may be found in the same directory that LinkComm is installed in.

Sutron Corporation Satlink Operations & Maintenance Manual pg. 70
7. Security Satlink provides means of protection against unwanted access. Password protection is at the heart of the security.
Whether accessing Satlink with a USB cable, an RS-232 cable, via the Wi-Fi hotspot, through a USB thumb drive, over Iridium SBD messages, over cell TCP/IP, or over cell SMS messages, password protection guards access to Satlink. In order to access Satlink, the correct password must be provided.
For remote access over Cell, additional protection is provided over TCP/IP via the use a VPN. To access Satlink, one first connect to the appropriate VPN.
For Iridium access, additional protection is provided by the Iridium system itself, which blocks access from unauthorized sources. Anyone who seeks to send messages to Satlink must be on a white list provided to Iridium.
Each SMS message sent to Satlink needs to include the password if Satlink is to process it. The same holds true for Iridium SBD messages.
Satlink’s Wi-Fi hotspot provides an additional layer of security. It uses WPA2-AES protection, meaning that a Wi-Fi password must be provided to connect to the hotspot. Additionally, the Wi-Fi hotspot is generally off until the site is physically visited and the front panel button on Satlink is pressed. Please note that Satlink’s Wi-Fi hotspot provides access only on site. It does NOT make Satlink accessible over the internet.
7.1. Steps to Take to Protect your Station Please take the following steps in order to ensure the integrity of your Satlink station.
Physical access to Satlink must be restricted. Passwords should be setup and enabled. See section PASSWORD PROTECTION for details. Wi-Fi password protection should be enabled. Wi-Fi enable should be turned off to
prevent Wi-Fi from turning on automatically. Please see section WI-FI.
7.2. Password Protection Password protection can be configured to prevent unauthorized access. To setup password protection, please use LinkComm’s Change Password menu. Please see the COMMAND REFERENCE section for command line access.
Satlink provides three tiers of access through a combination of the following settings:
Password Protection Setup Password Maintenance Password Read Password

Sutron Corporation Satlink Operations & Maintenance Manual pg. 71
7.2.1. Password Protection Setting A setting called Password Protection needs to be set in order to secure a station. Password Protection may be set to one of the following:
DISABLED In this scenario, full access is allowed without a password. This is the default.
SETUP In this scenario, the system’s setup is write-protected. Maintenance and read
access are allowed without a password. Without providing the correct password:
The Station setup cannot be changed. Transmissions may not be started. Status may be cleared, measurements may be calibrated and forced, failsafe
may be reset, unit may be rebooted, clock may be set. MAINTENANCE
System write and maintenance operations are restricted. Read access is allowed without a password.
Without a password, setup can be read, but not written; status can be checked, but not cleared.
FULL System is fully protected. No access at all is allowed without a password, except for the following commands:
EXIT, HELLO, PASSWORD PROTECTION, VER.
Password Protection must be enabled when connected locally to the station. It may not be enabled nor disabled when connected remotely.
If a station is deployed with password protection disabled, the only way to enable protection is locally. Remote access cannot be used to enable protection. Why? To prevent hackers from locking out an unprotected station.
If a station is deployed with protection enabled, allowed actions depend on the Remote Password Change setting: If it is On, password protection may not be completely disabled remotely. The
Password Protection setting may be modified to be Setup, Maintenance, or Full, but it may not be Disabled.
If It is Off, Password Protection may not be modified at all remotely.
7.2.2. Passwords Satlink has three different passwords. The access level granted depends on the password provided.
Read password Read access is the most restricted access level. A customer with read access may
not make any changes to the system. Read access allows one to view measurement readings, view status, view setup, download the log, and the like.
Maintenance password Entering the maintenance password provides everything that read access does, plus
the ability to calibrate sensors, clear status, reboot unit, and other station maintenance related functions.
Setup password Entering the setup password grants complete access to the station.

Sutron Corporation Satlink Operations & Maintenance Manual pg. 72
The default passwords are SUTRON1 for read access, SUTRON2 for maintenance access, and SUTRON3 for full access. Please change ALL THREE passwords when securing your system.
Blank passwords are NOT allowed. All ASCII bytes are allowed except comma, equals, and white space. Passwords may be up to 47 bytes long.
Remote Password Change A setting called Remote Password Change controls whether or not the three passwords may be changed via remote access. The setting’s default is On, meaning remote password changes are allowed. It also controls whether or not the Password Protection setting may be modified remotely (see previous section).
7.2.3. Working with a Password Protected Station If LinkComm is used to connect to a password protected station, LinkComm will automatically prompt for a password.
When sending a message to a password protected station, the first line of the message must have the login command LOGIN=XXX, where XXX is the password.
7.2.4. Logging Out Logging out is accomplished by one of the following:
Disconnect with LinkComm Type EXIT in the command line Disconnect the USB cable Power down the unit Connection time out

Sutron Corporation Satlink Operations & Maintenance Manual pg. 73
8. Satlink Setup Satlink operation is controlled by its setup. The user has the option of changing any part of the setup. The setup is stored in non-volatile memory and will not be affected when the unit loses power.
The LinkComm application is the easiest and fastest way to program your station..
Setup can be changed while Satlink is collecting data. However, if the station is in the middle of making a measurement when the relevant setup is changed, unexpected effects may occur. Even if unexpected effects occur, the next measurement will be made correctly.
Changes to setup will not affect previously logged data.
Every time setup is changed, it is noted in the log with the entry setup changed. Details of the setup change are not logged.
If a password is enabled, changes to setup cannot be made until the password is entered.
The setup is broken into three sections discussed in detail in the next chapters:
measurement setup telemetry setup other setup Remember that if you ever see at the top of LinkComm, the setup in LinkComm differs from the setup in the SL3. If the change is deliberate, press the “changed” control to update the SL3 setup. If the change is accidental, use the Main Menu, Get setup from Satlink3 function.
You can also change the setup by sending messages to Satlink via one of the optional modems. As an alternative to LinkComm, you can use any terminal program to access all of Satlink’s features via the command line interface described in Chapter 15.

Sutron Corporation Satlink Operations & Maintenance Manual pg. 74
9. Measurement Setup The measurements tab in LinkComm is where the measurement setups are managed.
A measurement is the process of collecting data from a sensor. SL3 provides the ability to establish up to 32 measurements, each with its unique settings. Each measurement will occur periodically and provide one sensor reading. How a measurement behaves is governed by its setup. Each of the 32 measurements has its own setup. Changing the setup of one measurement will not affect other measurements (except for Meta measurements).
Measurement results may be logged or just used for alarms or by other measurements. The log can hold over 1,000,000 readings (may be expanded to 1,000,000,000 readings). Logged measurement results may be transmitted via GOES or other telemetry installed.
The measurement setup is divided into the following sections described below.
9.1. Sensor Setup
9.1.1. Active Making a measurement active is the first step in setup of a measurement. If a measurement is not active, you can still enter a setup; however, the measurement will not be performed.
9.1.2. Sensor Template LinkComm provides templates for many sensors often used with Satlink. The template configures settings for the most important sensor parameters, and also includes sensor metadata, e.g., a picture of the sensor, its wiring diagram, manufacturer, model, description, and units. Setting up a sensor using the Sensor template is a great way to avoid setup mistakes.
Note: Sensor metadata (picture, wiring diagram, etc.), is NOT stored in the Satlink logger, but only in the station definition in LinkComm.

Sutron Corporation Satlink Operations & Maintenance Manual pg. 75
The following is an example of a template for an air temperature/relative humidity sensor.
To use the template:
Use the right and left arrows on the sides of the sensor picture to scroll between the available sensor templates.
Use “Filter Options” to restrict the available sensor templates on the basis of manufacturer or interface.
Once you are displaying the desired sensor template, select the related parameters such as interface, parameter before pressing select.
9.1.3. Measure Type This setting tells Satlink what kind of a measurement to make: SDI-12, analog, battery, etc.
This setting partially determines what physical connection on Satlink the sensor needs to be wired to.
Measure Type also controls the configuration that follows in the setup. For example, when you select Analog, the configuration section will allow you to enter Analog Type and other related settings.

Sutron Corporation Satlink Operations & Maintenance Manual pg. 76
For details on the different measure types, please see section 9.3.1.
9.1.4. Label User set name given to measurement, up to 11 bytes. This is used to identify and differentiate measurements. This value will be placed in the log each time a measurement is made, so that changing a label will not affect previously logged data. Example labels: AT, Stage, Baro, Precip, Batt.
Please use unique labels for each different measurement. Failure to do so will result in a hard to understand log file. When downloading the log, Satlink identifies each logged value with the label.
9.1.5. Model Model is a text field available to enter the model name or number for a sensor. This is metadata stored in LinkComm but not in SL3.
9.1.6. Manufacturer Manufacturer is a text field available to enter manufacturer information for the sensor. This is metadata stored in LinkComm but not in SL3.
9.1.7. Description Description is a text field available to enter additional information for the sensor. This is metadata stored in LinkComm but not in SL3.
9.1.8. Right Digits The number of digits shown after the decimal place is referred to as the right digits. To make the measurement read 10.12 rather than 10.12345, set the right digits to 2. Note that Satlink will round to the requested number of digits before logging the data.
9.1.9. Units Units can be specified for any measurement and will be stored with the data when it is logged. Use the dropdown list to pick from the built-in list of units. You may also enter the units text directly into the text box. The units text can only be 3 characters long.
9.1.10. Icon You can select an Icon for the measurement. The icon will show on the dashboard and measurement list. Press “Change” to choose an image in the computer or take a picture. Remember the icon is small and cannot show detailed information.

Sutron Corporation Satlink Operations & Maintenance Manual pg. 77
9.1.11. Picture A picture of the sensor is shown to the right of the sensor information. LinkComm includes pictures for many common sensors and Measurement Types. Press “Change” to choose an image in the computer or take a picture to use.
9.1.12. Defaults Press the Defaults control to set all the settings for a specific measurement to default values. Note the default measurement type is SDI-12. Setting defaults will also set the meta data (picture, icon, description etc.) to default values.
9.2. Schedule
9.2.1. Measurement Interval Measurement interval is simply the time between scheduled measurements. See Measurement Time.
9.2.2. Measurement Time Measurement interval and time dictate when the measurement will be made. The interval controls how often the measurement is made, and the time controls when the measurement is started.
Example 1 (The measurement is logged every 10 minutes at 0 seconds past the minute): time 00:00:00 interval 00:10:00 00:10:00 data measured and logged 00:20:00 data measured and logged 00:30:00 data measured and logged and every 10 minutes afterwards…
Example 2 (The measurement is taken and logged every 5 minutes at 30 seconds past the minute): time 00:00:30 interval 00:05:00 00:00:30 data measured and logged 00:05:30 data measured and logged 00:10:30 data measured and logged
9.2.3. Averaging Time, Sampling Interval, Subsamples, and Results Satlink can collect multiple samples and average them in order to produce a single result. Averaging is useful for measuring changing conditions, such as wind and water level. For example, correctly measuring the level of choppy water requires that wave action be cancelled. That can be accomplished by averaging over several minutes.
Setting the Averaging Time to 00:00:00 (zero) disables averaging -- one sample is to be collected. This is the default setup. If Averaging Time is zero, Sampling Interval and Subsamples will not be shown in the setup.
When averaging, Satlink takes several samples and averages them into a final result. Each sample may also be composed of several subsamples.
Averaging Time determines how long to collect samples for. Sampling Interval dictates how often to collect each sample. Subsamples tell how many sensor readings to include in each sample. Do not use
Subsamples unless you need two levels of averaging.

Sutron Corporation Satlink Operations & Maintenance Manual pg. 78
Result lets you specify what statistical value to log: average, min, max, running average, running min or running max.
The simplest averaging requires only the use of Averaging Time.
Example: Average Temperature Over an Hour If you want to know the average temperature for an hour, you would set up the Averaging Time to one hour. Sampling Interval or Subsamples would not need to be changed. Satlink will collect sensor data all throughout the hour as fast as possible.
However, if the power consumption for measuring the sensor continuously for an hour were unacceptable, you would use the Sampling Interval.
To take one sample every minute, the Sampling Interval should be set to one minute. That way, Satlink will take 60 samples every hour, with approximately a one-minute break between each sample.
If the sensor being used was noisy and needed filtering, Satlink could take several Subsamples and average them into each sample.
In the setup for temperature above, if the number of Subsamples were set to five, Satlink would take five readings at the start of every minute and average them. That result would be used as a sample. Once an hour, 60 samples would be averaged into a final result.
Data collection starts at Measurement Time + Measurement Interval – Averaging Time + Sampling Interval, and the last sample is taken at Measurement Time + Measurement Interval.
In the example below, temperature is measured every 15 minutes and averaged for an hour:
Measurement Time 00:00:00 Measurement Interval 01:00:00 Averaging Time 01:00:00 Sampling Interval 900 (900 seconds is 15 minutes) Data Collection
00:15:00 first sample collected 00:30:00 next sample collected 00:45:00 next sample collected 01:00:00 last sample collected 01:00:00 all four samples are averaged and the result is logged with the 01:00:00
timestamp
The Results field will be shown only if averaging is enabled. If it is enabled, you can select average, minimum, maximum, running average, running minimum, running maximum to be the logged result value. The difference between average and running average is as follows:
Average – Starts a new average each measurement interval. Computes average only at the end of all the samples. Tracks min/max of each sample as it is measured.
Running Average – Running averages continue across measurement intervals. Satlink recomputes the running average with each sample. It tracks min/max of the running average (not individual samples) throughout the interval. As a result, the running minimum and running maximum will be less extreme than the simple minimum and maximum .

Sutron Corporation Satlink Operations & Maintenance Manual pg. 79
If you want to transmit average, minimum, and maximum results, you need to set up three identical measurements except for the Results field: one measurement would choose results average, one minimum and one maximum. Note: even though you setup 3 separate measurements, as long as the schedule is identical, the system will only be reading the sensor once.
More on the Running Average A Running Average is used when readings need to be averaged over a time period that is longer than the logging interval.
For example, if you would like to produce an hourly average every 15 minutes, you would use a Running Average. In that case, the Averaging Time should be 01:00:00 and the Measurement Interval should be 00:15:00.
For Running Average, Averaging Time may be longer than Measurement Interval. In fact, unless it is longer, there is no point in using a Running Average as the result will be the same as a Simple Average.
The Measurement Interval and Measurement Time will determine how often a reading is produced.
Averaging Time dictates the time span over which samples will be averaged. Sampling Interval tells the system how often to sample the sensor.
If you are interested in logging a five minute average every minute, set Averaging Time to five minutes, Measurement Time to one minute and Sampling Interval to 60 seconds. Here is the timeline of the data produced:
12:01 Sample sensor (reading = 1.0). There are not enough samples to produce an average. System will still compute and log a result producing a value of 1.0;
12:02 Sample sensor (reading = 2.0). There are not enough samples to produce an average. System will still compute and log a result producing a value of 1.5;
12:03 Sample sensor (reading = 3.0). There are not enough samples to produce an average. System will still compute and log a result producing a value of 2.0;
12:04 Sample sensor (reading = 4.0). There are not enough samples to produce an average. System will still compute and log a result producing a value of 2.5;
12:05 Sample sensor (reading = 5.0). Compute and log 5 minute average. Result = 3.0, computed as (1.0+2.0+3.0+4.0+5.0)/5;
12:06 Sample sensor (reading = 6.0). Compute and log 5 minute average. Result = 4.0, computed as (2.0+3.0+4.0+5.0+6.0)/5;
12:07 Sample sensor (reading = 7.0). Compute and log 5 minute average. Result = 5.0, computed as (3.0+4.0+5.0+6.0+7.0)/5;
Compare this to a simple average. A simple average over five minutes would produce a reading every five minutes. It would be setup with Measurement Interval of five minutes, an Averaging Time of five minutes, and a Sampling Interval of 60 seconds.
12:01 Sample sensor (reading = 1.0). No reading is logged. 12:02 Sample sensor (reading = 2.0). No reading is logged. 12:03 Sample sensor (reading = 3.0). No reading is logged. 12:04 Sample sensor (reading = 4.0). No reading is logged. 12:05 Sample sensor (reading = 5.0). Compute and log 5 minute average. Result = 3.0,
computed as (1.0+2.0+3.0+4.0+5.0)/5; 12:06 Sample sensor (reading = 6.0). No reading is logged. 12:07 Sample sensor (reading = 7.0). No reading is logged.

Sutron Corporation Satlink Operations & Maintenance Manual pg. 80
A Result of Running Min and Running Max produce results which are the minimum and maximum of the Running Average during the interval. Just like the simple minimum and maximum, running minimum and maximum values are logged with the time stamp of when the minimum and maximum occurred rather than when the measurement was scheduled.
The system holds up to 180 samples for the Running Average. How many samples are to be used is computed by dividing the Averaging Time with the Sampling Interval. If the setup is such that more than 180 samples are required, the system will show a setup error:
Setup Errors: M1 Too many samples setup for running average Additionally, every time a measurement is completed without all the samples, the system will log a “Missing samples” error.
Logging and Transmitting Minimum and Maximum The time for the average will be computed based on the measurement time and interval, as described previously. However, the time stamp for the minimum and maximum will be the actual time when the minimum or maximum occurred. For example, you may see the following in the log for an hourly average with samples every minute where the data is not in time sequence:
4/14/2016 16:00:00 AVG 30.335 G 4/14/2016 15:24:00 MX 31.248 G 4/14/2016 15:15:00 MN 25.661 G 4/14/2016 17:00:00 AVG 30.225 G 4/14/2016 16:12:00 MX 32.060 G 4/14/2016 16:39:00 MN 28.454 G
Explanation of the logged data above: At 16:00 the hourly measurement that started at 15:00 is complete. The average gets timestamped with 16:00. However, the actual maximum value of 31.248 happened at 15:24 and the minimum value of 25.661 happened at 15:15. Likewise, at 17:00, the measurement that started at 16:00 is complete. The maximum happened at 16:12 and the minimum at 16:39. When it comes time to transmitting minimum and maximum results, Satlink will include a unique timestamp with each value transmitted. An example below illustrates the formatting:
:ATMIN 91 #60 22.47 :ATMIN 101 #60 22.50 :ATMIN 191 #60 22.53
:ATMAX 71 #60 22.52 :ATMAX 136 #60 22.54 :ATMAX 216 #60 22.58
:ATAVG 41 #60 22.50 22.52 22.56
:ATMIN 91 #60 22.47 means that a minimum of 22.47 occurred 91 minutes ago. :ATMIN 101 #60 22.50 means that a minimum of 22.50 occurred 101 minutes ago. Contrast that format with :ATAVG which provides four readings on the same line, most recent one 41 minutes ago, and subsequent readings each an hour later.

Sutron Corporation Satlink Operations & Maintenance Manual pg. 81
9.3. Configuration Settings
9.3.1. Measurement Type The Measurement Type setting (in the Sensor section) will determine what kind of measurement is made. Each of the different types will unlock other settings. For example, choosing Analog as the Measurement Type will unlock the Analog Type setting.
The available Measurement Type options are
Precip Accumulation Precip Rate SDI-12 Analog Battery Voltage Wind Digital Meta Manual Entry Internal Temp Below are listed all the Measurement Types available.
9.3.2. Measure Type: Precip Accumulation and Precip Rate Connection: terminals 10, TB/DIN#2 and 9, Ground
Precip Accumulation and Precip Rate are designed to measure the pulses from a tipping bucket type rain gauge.
Precipitation accumulation is used to tally the total amount of precipitation since the station has powered up. Count must be set to zero by the user when the station is installed. Counts persist between power-ups.
Precipitation rate, unlike precipitation accumulation, measures the precipitation that has occurred since the last measurement. So, if the measurement interval is 15 minutes, this measurement will report the rainfall in the last 15 minutes only.
Multiple measurements can be set up with the same input. For example, if you wanted to know the daily rainfall and the rainfall during the last hour, set up two measurements: one a Precip Rate with an interval of one hour, and another as Precip Rate with an interval of one day.
Usually, a slope is applied to convert the counts from the tipping bucket into inches of rain. For example, setting the Slope to 0.01 means that each tip of the bucket is 0.01”.
Precip readings are de-bounced for 4ms.
Notes on Precip Rate Precipitation rate is computed as the current count minus the count at the last scheduled measurement.
The first scheduled reading of precipitation rate is invalid, as it takes two readings before the difference can be computed.
When the system is not running, it is not able to make sensible Precip Rate readings.

Sutron Corporation Satlink Operations & Maintenance Manual pg. 82
Forced (live) precipitation rate readings are unreliable. Satlink will compute the rate over the currently elapsed time and extrapolate that value over the rest of the interval.
Precip Accumulation Reset Starting with software version 8.06, Satlink features a way of automatically resetting precip accumulation.
Precip Accumulation Reset may only be performed on a tipping bucket connected to TB/DIG IN 2.
When Satlink is setup for Precip Accumulation, it may also be setup to automatically reset the accumulation at a specific time.
The Accumulation Reset options are
Off (default) Daily Monthly Yearly
When Accumulation Reset is active, additional settings are used to tell when to reset accumulation:
Accu Reset Month (default is 0) Accu Reset Day (default is 0) Accu Reset Hour (default is 0)
By default, when Satlink is setup for a Daily reset, it will reset accumulation at midnight of the next day. Monthly resets, by default, happen on midnight of the first day of the month. Yearly resets, by default, happen on midnight Jan 1st.
If one wanted to reset accumulation at 11AM on July 2nd every year, one would set the Hour to 11, Day to 2, Month to 7, and Accumulation Reset to Yearly.
If one wanted to reset accumulation at noon every day, one would set the Hour to 12 and Accumulation Reset to Daily.
Whenever Satlink resets accumulation, it will write additional data to the log. The example below has measurement M3 setup for Precip Accumulation with Accumulation Reset set to Daily. The measurement is scheduled every minute. The label is PRECIP_DAIL.
02/28/2019,23:57:00,PRECIP_DAIL,1.23,in,G 02/28/2019,23:58:00,PRECIP_DAIL,1.24,in,G 02/28/2019,23:59:00,PRECIP_DAIL,1.24,in,G 02/28/2019,23:59:59,M3 Daily,1.24,in,G 03/01/2019,00:00:00,Accumulation Reset,3,,G 03/01/2019,00:00:00,PRECIP_DAIL,1.24,in,G 03/01/2019,00:01:00,PRECIP_DAIL,0.00,in,G 03/01/2019,00:02:00,PRECIP_DAIL,0.01,in,G
Please note how the PRECIP_DAIL is logged at midnight on 03/01/2019 with the PREVIOUS day's accumulation.

Sutron Corporation Satlink Operations & Maintenance Manual pg. 83
Note how the system automatically creates a M3 Daily log entry at 23:59:59 on 02/28/2019. The M3 Daily log entry is meant to help with historic records by providing the daily accumulation with a timestamp of the day that it happened on. The M3 Daily entry does NOT get transmitted.
Note also the Accumulation Reset log event indicating that M3 counts were reset.
When Satlink resets accumulation it creates the appropriate Daily, Monthly and/or Yearly log entries. Those log entries are created with a pre-date of one second less than the time of accumulation reset. By default, that means the Yearly log entry will have a timestamp of 12/31 23:59:59. Monthly timestamps are on the last day of the month at 23:59:59. Daily timestamps are at 23:59:59.
When it resets Precip Accumulation, Satlink sets the counts to zero and it also sets the measurement Offset to zero. That means that the first reading after the reset will show an accumulation of zero (unless precipitation happens between the reset and the first reading, in which case Satlink will count the precipitation).
Power loss and Precip Accumulation Satlink stores precip accumulation information in persistent memory. It is not lost when power is removed.
After it is powered on, and after Satlink makes a Precip Accumulation reading, it may reset the current accumulation counts. Satlink will make the reset if it has missed at least one reset interval.
For example, take a Satlink setup for Daily rests. Say that lost power on 22:00:00 Feb 14th, and regained power on 07:00:00 Feb 15th. Since it missed the reset at 00:00:00 Feb 15th, it will reset accumulation right away.
Another example: Satlink is setup for Monthly resets. Just as above, it loses power on the 14th, and regains it on the 15th. Satlink will not perform a reset.
If it does choose to reset accumulation, Satlink will log the current counts first along with a log entry indicating that accumulation was reset.
Setting up Multiple Precip Accumulation Measurements Satlink may be setup to tally Daily, Monthly, and Yearly accumulation on the same tipping bucket. To do so, setup three measurements. Each should be of the Precip Accumulation type, and their Accumulation Reset settings may be Off, Daily, Monthly, or Yearly. The measurement schedule is up to the customer. For example, Daily readings can be made every minute and Monthly readings can be made only once a day. Note that Satlink cannot log less frequently than once a day.
Please note that if multiple Precip Accumulation (or Precip Accumulation and Digital Counter 2) measurements are setup, calibrating one measurement will clear out counts for all the measurements. That does NOT mean that the measurements cannot be calibrated individually. It does mean that each of the measurements must be calibrated.
For example, if installing a station that collects Daily, Monthly, and Yearly accumulation, and the current yearly accumulation is 12 inches, the current monthly is 2 inches, and current daily is 0.1 inches, simply calibrate the Yearly to 12, Monthly to 2, and Daily to 0.1.

Sutron Corporation Satlink Operations & Maintenance Manual pg. 84
Note on Precip Accumulation and Other Counts This section talks about measuring counts. Satlink may be setup for precip accumulation, precip rate, or digital counter type measurements. All of these measurement types fall into the 'counts' category. A tipping bucket is commonly connected to count type inputs. Satlink has two physical inputs for counts:
WS/DIG IN 1 TB/DIG IN 2
Satlink keeps a tally for each of the two counter inputs. The tally is stored in persistent memory, meaning that counts are not lost when power is removed. To reset the counts, calibrate one of the counter measurements to zero.
Satlink keeps counting even when Recording is OFF, as long as there are active measurements set up that use the counter inputs.
When a count measurement is calibrated, the count tally for that input is set to zero, and the measurement's Offset is to the calibrated value. For example, setting Precip Accumulation reading to 10.2 will clear the tally for TB/DIG IN 2, and set the measurement's Offset to 10.2.
9.3.3. Measure Type: SDI-12 Connection:
PORT 1: terminals #13 GND, #14, +12V and #15, Data. PORT 2: terminals #16 GND, #17, +12V and #18, Data
Note: each port is independent with isolated +12V power and Data connections. Power
is limited to 500mA. Sensors that use more than 500mA (such as bubblers) must connect to an independent power supply.
SDI-12 is a standardized three wire digital interface. Many manufacturers provide SDI-12 sensors that measure different environmental effects. SDI-12 sensors provide digital data which improves their reliability and accuracy in terms of logger sensor communications.
For details on SDI-12, please see the section MORE ABOUT SDI-12.
SDI-12 Port SDI-12 sensors can be assigned to Port1, Port2 or RS485. Remember that multiple sensors can be connected to either bus as long as each sensor has a unique address. Use RS-485 when you need long cable runs to the sensor and the sensor supports SDI-12 over RS-485.
SDI-12 Address Multiple sensors can be connected to the same SDI-12 bus. However, each sensor needs a unique address. The address is a single ASCII character. Most sensors default with the address 0. If you are connecting several sensors, connect them one at a time. As each sensor is connected, issue the 0Ax! command, changing the sensor’s address from 0 to x, where x is a unique number or letter of your choice.
SDI-12 Command Select the desired SDI-12 command from the drop-down list or enter a unique command into the text box. The drop-down list includes M!, M1!, MC!, C!, CC!, M2!. Consult the operating manual for the sensor to know what command to use. The software automatically adds the address when issuing the command. The software also automatically issues the commands to retrieve the data after the measurement command is issued.

Sutron Corporation Satlink Operations & Maintenance Manual pg. 85
SDI-12 Param Most SDI-12 sensors will respond to the measure command with multiple data values. The SDI-12 Param designates which of these data values the user is interested in.
Setting the parameter to 1 tells Satlink to use the first value returned from the device; setting parameter to 3 tells Satlink to use the third value returned from the device.
If you want to record (and transmit) more than one parameter from a single SDI-12 sensor, a different measurement needs to be set up for each parameter. These measurements should have identical setups, except for the SDI-12 Param setting. Be sure to keep the measurement time and interval the same for these measurements and SL3 will make a single measurement to provide the data for both. If you vary the time and interval, Satlink will end up taking multiple sensor measurements even though one would have sufficed (thus slowing down the system and using more power).
In the case of devices which require multiple commands to be issued (e.g. 0M1! retrieves pressure, 0M2! retrieves temperature) multiple measurements need to be set up. It does not matter if these measurements are scheduled for the same time, as Satlink will have to issue multiple commands to the sensors.
When multiple measurements of type SDI-12 are scheduled to go at the same time, Satlink orders the measurement commands so that concurrent measurements are commanded first. Non-concurrent measurements occur while waiting for concurrent results. Also, Satlink is able to recognize when two different measurement schedules rely on data from a single measurement command (e.g., measurement 1 commands 0M! and expects parameter 1 while measurement 2 commands the same and expects parameter 2, both scheduled at the same time). In such cases, Satlink outputs the measurement command only once.
Warmup If this number is not zero, then the Switched Power line (terminal #6, SWD#1 +12V) and VREF (terminal #26 and #30) will be turned on for warmup seconds prior to talking to the SDI-12 sensor. The line will be kept on until the measurement completes. You may use SWD#1 12V instead of SDI-12 Power to supply power to the SDI-12 sensor as long as the sensor does not require to be powered on all the time. Some sensors (such as the Sutron SDR) need to be powered on all the time and will not work correctly if powered from the Switched Power line.
If you power the sensor via Switched Power, you must setup the Warmup to at least one second! Why use Switched Power instead of SDI-12 Power? To reduce power consumption of the SDI-12 sensor. SDI-12 Power is turned on all the time, while Switched Power is only turned on during the measurement if Warmup is not zero. Please note that using LinkComm's Send SDI-12 Command window will NOT turn on Switched Power. However, doing a Live/Forced measurement will.
SDI-12 Command Utility The SDI-12 command utility dialog is used to send SDI-12 commands to sensors connected to Satlink. It can also be used to quickly find what sensors are connected to the SDI-12 bus.

Sutron Corporation Satlink Operations & Maintenance Manual pg. 86
To send a command to an SDI-12 device connected to Satlink, enter the Address and Command fields, and then press the Send button. Be sure to select the proper port. The results of the command are shown in the SDI-12 history window.
To have Satlink look for any and all sensors on the SDI-12 bus, press the Find Devices button. Information regarding what sensors are found is displayed in the SDI-12 history window.
Press the Clear button to clear the SDI-12 history window.
9.3.4. Measure Type: Analog Analog measurements involve reading a voltage or current provided by a sensor. Analog sensors come with instructions that provide information on how to translate the output voltage into desired units. Translating the analog sensor output into environmental units can be done via slope and offset for simple sensors, and via equations for non-linear sensors.
Analog Type This setting directs the input channel to which the sensor should be connected and the type of analog measurement to make. These options are available
0-5V A 0-5V B Diff C Diff D Diff E 4-20 mA
0-5V A and 0-5V B Connection A: 0-5V A Terminal #36 and Signal ground Terminal #37 Connection B: 0-5V B Terminal #34and Signal ground Terminal #35
Inputs 0-5V A and 0-5B are designed to be general purpose 0-5 Volt DC input. While sometimes referred to as a single ended input, it is designed to measure voltage with respect to analog

Sutron Corporation Satlink Operations & Maintenance Manual pg. 87
signal ground. These inputs have a high impedance (>2 Meg Ohms) and will not load down or draw significant current. The input range is 0V to 5V. Negative voltages with respect to SIGNAL GROUND may NOT be measured on these inputs.
To connect a sensor:
The voltage output by the sensor should be connected to either A or B. The analog ground from the sensor needs to be connected to Signal ground. The sensor will likely require power – connect that to VREF if 2.5V is appropriate or to
+SWD#1 POWER which is 12V (or whatever power Satlink is supplied with). Make sure to set up the warmup (the amount of time to power the sensor before reading its output) as required by the sensor.
If the sensor has a power ground, connect that to Signal Ground.
Diff C, Diff D , Diff E Connection: Diff C (Terminal #32 and #33) Connection: Diff D (Terminal #28 and #29) Connection: Diff E (Terminal #24 and #25)
Optional connection to VREF (#26 or #30) and Signal ground (#27 and #31) as needed
Measurements Diff C, Diff D, and Diff E are designed to operate with a special type of analog output found on many sensors that use a bridge configuration or any sensor that outputs a very small voltage. This input type has a + and - input that connects to the sensor output.
Typically, a bridge sensor will be powered on VREF (sometimes referred to as excitation), have a signal + and signal –, and provide a wire for the analog ground. NOTE: If after wiring the sensor, it displays a negative reading, you may reverse the + and - leads coming from the sensor.
Reading Negative Output Voltages on Differential Inputs:
In limited cases, sensors with negative outputs may be used on the differential inputs with the following limitations:
The negative line from the sensor must not connect to the digital ground of the sensor with the sensor making a ground connection to the ground (including antenna ground) of the Satlink logger. (i.e. the sensor outputs must be able to be floated with respect the grounding of the sensor itself)
The negative voltage (or positive voltage) must remain within the range of the differential input range selected.
The common mode input range of the differential inputs must not be exceeded (see below).
While the differential inputs are capable of reading negative voltages, it is important to keep the voltages with respect to ground within in the common mode input range of 0.5 to 3.7 volts. In the case of a bridge sensor, by using the vref and signal ground to establish the voltage on the network, you are assured of having a positive voltage with respect to signal ground. In the case of the bridge, you simply need to remain within the voltage range selected (see 6.1.4.12 below) and simultaneously remaining in the common mode range of the inputs or 0.5 volts to 3.7 volts.

Sutron Corporation Satlink Operations & Maintenance Manual pg. 88
Input Range This setting is relevant only to analog differential measurements. Remember that the system must read a voltage that falls into the common mode range mentioned in the above note. Voltages that are negative with respect to the SIGNAL GROUND terminal may not be measured. The following options are available:
-39 to +39mV -312 to +312mV -2.5 to +2.5V -39 to +39mV with Bias -312 to +312mV with Bias
Note that the ranges for absolute measurements are nominal. Guaranteed analog input range over temperature is 0-4.98 V, ± 2.49 V, ± 311 mV, and ± 38.9 mV.
Choose the option that is close to and greater than the input range of the sensor that is being connected.
For example, if a sensor provides a reading from 0 to 100mV, choose the 312mV option. If you were to choose the 39mV option, when the sensor provided a reading greater than 39mV, the unit would indicate a sensor failure.
Use the range “with Bias” if the sensor is not powered by Satlink such as a pyranometer or thermocouple.
4-20 mA Connection: 4-20ma IN (Terminal #23)
This input is designed to function with sensors that have a 4 to 20ma current loop interface. This type of interface is superior to voltage outputs when the cables to the sensors must travel a long distance or when the equipment is located in electrically noisy environments. Satlink will measure the current flowing when connected to the 4-20ma Input. Typical 4-20ma sensors will give a 4 to 20ma current for a 0 and 100% FS. Readings that are greater than 21mA will be considered a fault. The current required for the sensor is provided by the 2 wire loop and does not typically require additional connections.
NOTE: Satlink does not provide a dedicated power supply for 4-20ma sensors. The sensor shall have its own supply or run off the 12 volt supply of Satlink. While the internal 4-20 measurement is made using an accurate 100 ohm resistor, the overall loop resistance is 200 ohms due to an additional 100 Ohms series protection resistor. This means that a sensor at a full 20 ma current output, approximately 4 volts should be allotted for overhead voltage. This is typically not an issue when an external voltage source is provided to operate the sensor that may be in the 18 to 24 volt range. However, if a 12.5 volt battery is used to source the voltage for the sensor in the current loop, then only 8.5 volts will be supplied to the sensor at max sensor current output. Therefore if a full 12 volts is necessary for the sensor, an external loop supply will be necessary or alternately the sensor may be wired to a single ended voltage input with the use of an external 100 Ohm accurate and stable resistor also attached to the voltage input port.
Warmup Analog sensors are powered by Satlink via one of several outputs:
VREF (reference voltage) which provides 2.5V, terminal #26 and #30.

Sutron Corporation Satlink Operations & Maintenance Manual pg. 89
Switched Power which provides whatever voltage is powering Satlink, presumably 12V, terminal #6
Normally, these outputs are off. Prior to making an analog measurement, Satlink will turn on these outputs. After that, Satlink waits Warmup amount of time (which is expressed in seconds) before measuring the output of the sensors. This Warmup time gives the sensors a chance to power up and prepare their outputs.
If Warmup is set to zero, Satlink will not wait at all prior to measuring. The value Warmup should be set to depends on the analog sensor being measured.
Warmup is also used for Digital and SDI-12 type sensors. If a such a sensor (or a wind sensor that uses digital or SDI-12 inputs) is set up with a warmup, then VREF and Switched Power (SWD#1) will both be turned on. If warmup is set to zero, those output lines will not be turned on. This is different for Analog measurements which turn on the lines regardless whether warmup is zero.
9.3.5. Measure Type: Battery This type measures the voltage of the battery connection to Satlink. This measurement is a useful diagnostic for tracking the performance of the battery and any solar panel or other charging equipment.
9.3.6. Measure Type: Wind The Wind measure type makes it possible to do vector averages of data from wind speed and direction sensors. The normal average function does not typically work for wind sensors because of the circular nature of the direction measurement. The vector averages take into account the 0 to 360 degree crossover to produce accurate average.
Follow these steps to setup for Wind averages:
Step 1) Setup a measurement to measure the wind speed (see CONNECTING PROP/VANE
OR ANEMOMETER/VANE WIND SENSORS) Set measurement interval for how often you want the speed measured Use slope/offset/equation to properly scale the speed to the desired units. Disable logging for the data (log interval = 24:00:00) Disable transmission of the data (TX Data Content = Exclude)
Step 2) Setup a measurement to measure the wind direction (see Connecting Prop/Vane or Anemometer/Vane Wind Sensors) Set measurement interval for how often you want the direction measured Use slope/offset/equation to properly scale the direction to degrees. Disable logging for the data (log interval = 24:00:00) Disable transmission of the data (TX Data Content = Exclude)
Step 3) Setup measurement(s) to do the wind calculations with the desired results
Select Wind measure type Configure the speed and direction index to the measurements setup in steps 1 and
2 Pick the desired result type. Set the schedule interval and averaging time for the duration of the averaging. Set the sampling interval equal to the measurement interval of the speed and
direction sensors.

Sutron Corporation Satlink Operations & Maintenance Manual pg. 90
Repeat Step 3 for additional result types.
More on the Wind Measure Type When you select the Wind Measure type, the configuration section will allow you specify where to get the speed and direction data and what kind of result to log. The Wind measure type requires you to setup separately the speed and direction measurements and provide the index in the configuration. Normally, you will want to setup these measurements before setting up the Wind type. Speed index is the measurement setup separately to get the speed. Direction index is the measurement setup separately to get the direction. Make sure each input is configured to provide the data in the proper units (mph, mps … for speed and degrees for direction). You will want to schedule these measurements to occur at the interval you want for your vector processing (e.g. 00:00:10 or 00:01:00). You will also want to disable logging for the sensor by setting log interval = 24:00:00 and also exclude the data from transmission tx content = exclude.
Configuration also allows you to specify what kind of result you’re looking for from the wind processing. The available types are shown below. If you want more than one of the results, setup a separate measurement for each:
Mean Speed Scalar Mean Magnitude Unit Mean Magnitude Wind Mean Direction Unit Mean Direction Wind STD Speed Scalar STD Direction Unit STD Direction Wind Min Speed Scalar Max Speed Scalar Max Direction Count Time of Max Speed
After picking the result, set the schedule for the calculation. The following schedule computes a 15 minute average of wind data collected every 60 seconds. The sampling interval (e.g. 60 below) must match with the interval set for the speed and direction sensors setup separately.

Sutron Corporation Satlink Operations & Maintenance Manual pg. 91
Here’s the setup for wind processing to compute a 10 minute average with data collected every 5 seconds. Again, the sampling interval 5 much match the measurement interval setup for the speed and direction sensors.
When you setup multiple results, make sure each has the same schedule.
The following sections give details on each of the results.
Wind Results
The Wind Measurement type processes data using Vector Average techniques that are needed to any sensor that has a circular discontinuity, such as a wind direction sensor with the crossover from 0 to 359 degrees. In these cases,
simple averaging does not work -- the mean of 0 and 359 is 179.5, which is clearly incorrect. Calculating a vector average provides a way around this problem.
When the data is processed the software automatically performs several different types of vector calculations, each conveying slightly different information. It is up to the user to pick which results meet the requirements for the measurement. While the wind processing is geared toward wind sensors, it could be used any time performing a vector average is desired.
The results of Wind processing are as follows, with vector math shown below.
Mean Speed Scalar – This is the scalar wind speed, not taking direction into account. The scalar average of 10mph for an hour and 20mph for an hour is 15mph, regardless of changing direction. This result is identical to the value you’d get with a simple average of the speed.
Mean Magnitude Unit – This is the vector average of the wind speed using unit
vectors. The mean magnitude unit of 5mph at 0 for 1 hour and 100mph at 90 for 1 hour is 0.707. This is found by adding the two vectors, finding the magnitude of the resultant vector, and dividing by the number of vectors in the average (two, in this case). Since the mean magnitude unit is an average of unit vectors, it will always be between 0 and 1.
Unit vector, 90
Vector sum = √2
MnMagUnit = √2
2
Unit vector, 0

Sutron Corporation Satlink Operations & Maintenance Manual pg. 92
Mean Magnitude Wind – This is the vector average of the wind speed which
takes direction into account. Here, the average of 10mph at 0 for 1 hour and
20mph at 90 for 1 hour is 11.2 mph.
Mean Direction Unit – This is the wind direction (in degrees) not weighted for
wind speed. Here, the average of 10mph at 0 with 20mph at 90 is 45. This is the value you’d get with a simple average of the direction if no 0-360 crossover occurred.
Mean Direction Wind – This is the wind direction (in degrees) weighted for wind
speed. Here, the average of 10mph at 0 with 20 mph at 90 is 63.4.
STD Speed Scalar – This is the standard deviation of the scalar wind speed.
STD Direction Unit – This is the standard deviation of the direction unit.
STD Direction Wind – This is the standard deviation of the direction wind.
Min Speed Scalar – This is the minimum of the scalar wind speed.
Max Speed Scalar – This is the maximum of the scalar wind speed.
Max Direction – This is the direction taken at the time the max speed is detected.
Count – This is the number of samples that have been taken.
20 mph, 90
Vector sum = √500
MnMagWind = √500
2
10 mph, 0
Unit vector, 90
Resultant angle = tan−1(1
1)
= 45
MnDirUnit = 45
Unit vector, 0
20 mph, 90
Resultant angle = tan−1(20
10)
= 63.4
MnDirWind = 63.4
10 mph, 0

Sutron Corporation Satlink Operations & Maintenance Manual pg. 93
Time of Max Speed – This is the time in seconds past midnight, when the maximum speed was recorded.
9.3.7. Measure Type: Digital Use the setting Digital Type to tell Satlink what kind of sensor is connected.
Digital Type Satlink supports the following digital types:
Level 1&2 (terminal 8 and 10) Counter 1&2 (terminal 8 and 10) Frequency 1&2 (terminal 8 and 10) Period 1&2 (terminal 8 and 10)
Frequency will have Satlink sample the input for 750ms. It will provide a result that is the average frequency of the input during that time span.
10kHz is the maximum input frequency that Satlink supports.
When Period is the chosen type, Satlink will watch the input line for up to 10 seconds. Satlink stops watching as soon as one wave period is noticed on the input. Please note that a period measurement could take just over 20 seconds to complete (up to 10 seconds per edge of the signal). If such a slow signal may appear on the input, please make sure that the measurement interval is long enough (longer than 20 seconds) to prevent missing measurements.
Digital measurements also use the Warmup setting. If Warmup is not zero, then switched power and VREF will be turned on during a Digital measurement. See the section on analog measurement types for details on Warmup.
Counter type readings may be optionally de-bounced for 4ms using the Debounce setting. The 4ms de-bouncing eliminates false counts from tipping buckets and other devices with noisy switches.
Counter type readings may also be limited by a rollover value. With rollover set to 0, the counter will increase until it reaches 4,294,967,296 (2^32). With rollover set to a non-zero value, the counter will be reset to 0 when it exceeds the rollover value. For example, if rollover is set to 9999, the counter will be reset to 0 on the 10000 count.
Please note that counter and tipping bucket measurements will keep counting even when recording is off.
Satlink will allow the setup of multiple measurements on the same digital input. For example, it is possible to setup both a tipping bucket rate and a tipping bucket accumulation on the same input.
That being said, some setups that share digital inputs will yield unpredictable results.
Setting up any number of tipping bucket and counters on DIn2 with debouncing will work well.

Sutron Corporation Satlink Operations & Maintenance Manual pg. 94
Setting up a tipping bucket and counters without debouncing on DIn2 will not work correctly as far as debouncing is concerned.
Setting up a level measurement will work in combination with any other measurement. Setting up multiple frequency and period measurements on the same input will work as
long as the measurements do not overlap. For frequency and period readings on the same input, one measurement must finish
before a second one starts for the readings to be correct. For frequency and period readings, SL3 will not hold up one measurement until another
completes. Overlapped frequency and period measurements are not considered a meaningful
setup. Setting up a frequency or period measurement on the same input as a tipping bucket or
counter will not work correctly.
If you want to measure both frequency and count from an input you will need to jumper it to both digital inputs and setup one measurement for the counter (e.g. counter 1) and the other for a frequency (e.g. frequency 2).
Please see the NOTE ON PRECIP ACCUMULATION AND OTHER COUNTS for additional details relating to counts.
9.3.8. Measure Type: Meta Meta measurements use the result of another measurement as their basis. Usually, a Meta measurement is used to average results of another measurement.
Meta Index This setting tells Satlink what other measurement this Meta measurement refers to.
Why use meta measurements? If you had set up an hourly averaged temperature measurement, a Meta measurement could be set up to be the daily average of all those hourly readings.
Measurement M1 (used for Hourly Temperature) Measurement Type: Analog Analog Type: 0-5VA Measurement Interval: 1 hour Averaging Time: 1 hour Sampling Interval: 1 second Measurement M2 (used for Daily Temperature) Measurement Type: Meta Meta Index: 1 (meaning it refers to measurement M1) Measurement Interval: 24 hours Averaging Time: 24 hours Sampling Interval: 1 hour
When scheduling meta measurements, take care that they occur at the same time or after the measurement they reference. If the meta and the reference are scheduled for the same time, Satlink will try to delay the meta measurement until the reference completes.

Sutron Corporation Satlink Operations & Maintenance Manual pg. 95
9.3.9. Measure Type: Manual Entry Manual entry measurement types allow the user to enter a reading manually. That value becomes the reading of the measurement. Satlink will store the user entered value in the Offset field.
To enter a manual entry reading, use LinkComm's Calibrate button.
9.3.10. Measure Type: Internal Temperature Internal Temperature measurements use a temperature sensor installed inside Satlink. Every Satlink comes with a built in temperature sensor. The reading provided is in degrees Celsius. To convert from Celsius to Fahrenheit set the slope to 1.8 and the offset to 32.
9.3.11. Measure Type: Modbus Satlink may collect data from Modbus sensors. Please see the MODBUS section for details.
9.4. Processing Settings
9.4.1. Slope See Offset below.
9.4.2. Offset Every measurement is computed by taking the sensor reading, multiplying it by slope and adding offset to it.
Measurement result = (sensor output)*slope + offset Slope defaults to 1.0 and offset defaults to 0.0, meaning they will not affect measurement result by default.
Traditionally, when using an analog sensor, slope and offset are required to convert the voltage output by the sensor into desired units. The required slope and offset are provided by the sensor manufacturer.
Satlink supports more complex equation processing (see Equations below). Slope and offset are applied after equations. The reading before slope and offset are applied is referred to as the raw reading. For example, if an analog sensor were to provide a voltage of 2 volts, and the user had set up the Slope as 5 and Offset as 1, the final reading would be 11 (2*5 + 1). The raw reading would be 2. If Details is enabled, the raw reading is displayed on the command line by typing MEAS or LAST.
Satlink offers easy ways to change the current reading of the measurement by modifying just the offset or both the slope and offset via the calibration functions.
9.4.3. Use Equation Select “Use Equation” to allow an entry of the equation in the box below it. See the next section for examples.
9.4.4. Equation Data collected from sensors to be processed by an equation. If the reading provided by the sensor needs more than just an offset and a slope applied, equations provide that functionality.

Sutron Corporation Satlink Operations & Maintenance Manual pg. 96
The field Use Equations can be set to enabled or to disabled. It determines whether equation processing is to be applied to the raw data. The field Equation can be set to an ASCII string no longer than 128 bytes (per measurement). That field contains the equation to be applied.
If both Equations and Slope and Offset are used, Slope and Offset are applied after the equation is processed.
For example, to convert Fahrenheit to Celsius, type into command line:
M1 EQUATION = (X-32.0)*5/9 In the example above, X refers to the sensor reading.
LinkComm comes preloaded with equations for many types of sensors. To see the equations, press “Template…” and then select the desired equation from the dropdown box.
Equation processing can take a while to complete (up to several seconds). If you are using a lengthy equation, Satlink may not be able to complete a measurement every second, or even every two seconds (see Bad Schedule in the Error section).
9.4.5. Equations: Syntax The equation is expressed in terms of "X" which will be applied to incoming sensor data. The expression is not case sensitive. The following functions are available:

Sutron Corporation Satlink Operations & Maintenance Manual pg. 97
SIN, COS, TAN, ARCTAN, eg COS(90) = 0
SQRT is square root, eg SQRT(9) = 3
To raise a number to a power, multiply it by itself. So, for
example, to find x squared, input x*x.
EXP, if EXP(x) = y, then LN(y) = x, eg EXP(1) = 2.718282
LN, natural log, eg LN(2.718282) = 1
LOG, 10 based log, eg LOG(10) = 1
INT returns the integral portion of a real number
INT(11.456) = 11.000 INT(-1.345) = -1.000
FRACT returns the fractional portion of a real number.
FRACT(11.456) = 0.456 FRACT(-1.345) = -0.345
ABS returns the absolute value of a real number.
ABS(11.456) = 11.456 ABS(-1.345) = 1.345
RND provides random integer number between 1 and x.
RND(100) will produce whole number between 1 and 100
POLY is used to compute up to a 5th level polynomial equation:
POLY(x, A, B, C, D, E, F) equates to A + Bx + Cx^2 + Dx^3 + Ex^4 +
Fx^5
STEINHART(x, A, B, C) is used for Steinhart-Hart equations,
where x is the resistance and result is the temperature in Celsius
A, B and C are thermistor specific constants
Steinhart result is computed like so: 1/(A + B*ln(x) +C*(ln(x)^3))
- 273.15
MINDAY returns minutes into the day.
SECDAY returns seconds into the day.
VREF returns the exact analog voltage reference.
Comparisons can be performed using <, >, <=, >=, !=, and =. The
result of a comparison is 1 for true or 0 for false.
Modulo can be performed using % operator, e.g., 10%2=0, 10%3=1.
The following bitwise boolean operators are supported: AND, OR,
XOR, SHL, and SHR. The last two are shift-left and shift-right. For
instance (X SHL 4) would shift X left by 4 bits. AND & OR can also
be used in logical expressions. For instance (X>100) OR (X<50)
would result in 1 if X is above 100 or below 50; otherwise it would
result in 0.
The NOT operator is logical not bitwise. This means that NOT 0 is 1
and NOT 1 is 0. Also, the NOT of any non-zero number is 0, eg. (X
AND 128) != 0 results in a 1 if bit 7 in X is set or 0 if bit 7 is
clear. The bit mask 128 is 2^7. This assumes bit 0 is the least
significant bit. In general, the bit mask for any bit N is 2^N.
OUTPUT(A,B,C,D) controls one of the 2 digital outputs or 3
switchable voltages.
A is the conditional. If 0, no output happens; if 1 output
activates.
B is the output (1 = DOUT#1, 2 = DOUT#2, 3 = SWD#1, 4 = SWD#2, 5 =
PROT12
C tells whether to switch (0) or to pulse (1)
if switching (C=0), D is direction to drive (0 open, 1
closed. line is open by default.)
if pulsing (C=1), D is duration of the pulse in ms (20 - 10000)
Equations can also contain references to other sensors: eg. (X +
M4)/2, would add X to the value of measurement M4 and divide by 2.
Use Prev1, Prev2, Prev3.. to access the previously made reading by
said measurement. And, use DeltaT1, DeltaT2, Delta T3.. to access
the amount of time in seconds between the most recent and the
previous measurements.
12:00:00 Measurement M1 has made a reading of 1.0
At this point, we do not have enough data to compute Prev1 or
DeltaT1
12:05:00 Measurement M1 has made a reading of 2.0

Sutron Corporation Satlink Operations & Maintenance Manual pg. 98
At this point, M1 = 2.0, Prev1 = 1.0, DeltaT1 = 300
12:15:00 Measurement M1 has made a reading of 3.0
At this point, M1 = 3.0, Prev1 = 2.0, DeltaT1 = 300
Comments can be contained within braces { }. For example:
{convert from degrees Celsius to degrees Fahrenheit} X*9/5+32
Other examples:
SIN(X)+COS(X)+X^3+LOG(X)
(X>1000)*1000 + (X<=1000)*X {would limit the value so that it could
never be greater than 1000}
Troubleshooting: The only true test of equation processing is to hit Force Measurement after the equation has been set.
9.4.6. Equations: Referencing other measurements If you are setting up an equation that references another measurement, set the measurement type to meta, and make sure the measurement time and interval are the same as the referenced measurement. In the equation, reference the other measurements as M1, M2, M3, etc.
If you wish to use the analog reference voltage in the equation, use VREF.
For example, if you wanted to trigger a sampler via the digital output when a conductivity sensor reading exceeded 80, do the following:
Setup measurement M1 to collect data from the conductivity sensor. Setup measurement M2 as a Meta measurement, with the Meta Index set to 1 in order
to reference M1. This ensures that M2 will wait for M1 to complete before producing a result. Make sure the schedule for M1 and M2 is the same.
Setup the equation of M2 to OUTPUT(M1>80, 1, 1, 2000). That will cause Satlink to pulse DOUT#1 for 2 seconds whenever the conductivity sensor exceeds 80.
9.5. Alarm Settings Alarms are used to send immediate notifications when sensor readings read a certain threshold. They can also be used to control an output (page 127.)
When a measurement is made, if alarms are enabled for that measurement, the sensor reading is compared to the Alarm Threshold and Alarm Deadband. If certain criteria are met, the alarm triggers (see below).
When a sensor reading reaches a certain threshold, the station is said to go into alarm. While that sensor reading stays above the threshold, the system is considered to be in
alarm. After the sensor reading drops below the threshold, the system goes out of alarm.
When the station is in alarm, it is noted in the station's status.
When a station goes into or out of alarms, the reading causing the alarm is logged. Additionally, an event is recorded in the log.
Sutron Corporation Satlink Operations & Maintenance Manual pg. 99
Satlink can be set up to send transmissions when it goes into alarm. Alternatively, Satlink can be set up to make a transmission when it goes into alarm and to make another transmission when it goes out of alarm.
All enabled transmissions that are of the Random and of the Alarm kind will trigger with alarms.
Satlink can control its digital output based on alarm conditions. See the Output section for details.
Most sensor readings cause alarms at the time the measurement is scheduled. If a temperature sensor is set up for alarms with a Measurement Interval of 15 minutes, the station will read the sensor every 15 minutes and decide whether to go into alarms.
Some sensors, including the tipping bucket and sensors setup as digital counter and level, can cause instant alarms. When the tipping bucket tips, Satlink is immediately notified. If the tip causes an alarm condition, the station goes into alarms right away, even if it was not time to make a measurement.
Each measurement may be set up with up to three different alarms. This way, it is possible to get an alarm when the stage reaches 3 feet, another alarm when it reaches 4 feet, and a third alarm when it reaches 6 feet.
If more than three alarms are needed for one sensor, set up two measurements to read the same sensor, but give them different alarm conditions.
9.5.1. Alarm 1, Alarm 2, and Alarm 3 Each of these settings can have one of the following values
Off High Low ROC
These settings are used to determine what kind of computation is made when checking a sensor for alarms. Read on for a complete explanation.
9.5.2. Threshold 1, Threshold 2, and Threshold 3 The threshold is a value that is compared to the sensor reading in order to determine whether to go into or out of alarms.
9.5.3. Deadband The Deadband, along with the Threshold value is used to compute whether the measurement will go out of alarms. Deadband helps the system ignore noise on the input that would cause the measurement to go in and out of alarm on each measurement.
For example, if a High Alarm with a the Threshold of 10.5 and a Deadband of 3.0 were setup, the system would go into alarm once the reading was equal to or greater than 10.5. The system would stay in alarms as long as the reading was equal to or greater than 7.5. Once the reading dropped below 7.5, the system would go out of alarms.
9.5.4. Alarm Tx Mode Alarm Tx Mode determines whether transmissions are made when the station goes (into alarm) or (when it goes into and out of alarm).

Sutron Corporation Satlink Operations & Maintenance Manual pg. 100
If the Alarm Tx Mode is Tx In, the station will only make a transmission when it goes into alarm.
If the Alarm Tx Mode is Tx In And Out, the station will make a transmission when it goes into alarm and it will make another transmission when it goes out of alarm.
Random and Alarm transmissions are the only types of transmissions triggered by alarms.
The telemetry setting Alarm Interval can be used to keep transmitting as long as a station is in alarm. Please see the Telemetry section for details.
ROC alarms setup for Since Last Tx do not generate out of alarm events or transmissions.
9.5.5. Alarm Logging If Alarm Logging is set to Every Measurement, the system logs on the Measurement
Interval. If Alarm Logging is set to Use Logging Interval, the system logs on the Logging Interval.
This setting is only relevant if the customer setup the Measurement Interval to be more frequent than the Logging Interval. In that case, the system can be configured to log more frequently when it is in alarm.
Here is an example of a system setup to log more frequently while in alarms. The system is set up to read the temperature sensor every two minutes and check for alarms. If the temperature exceeds 20 degrees, the system will go into alarm. The system will log once every two minutes when in alarm, and once an hour when not in alarm.
Measurement Interval = 00:02:00 Logging Interval = 01:00:00 Alarm Logging = Every Measurement Alarm 1 = Hi Threshold = 20
9.5.6. Alarm ROC Interval This setting affects ROC (Rate of Change) alarms. When set to Since Last Meas the system will compare two consecutive scheduled readings when deciding whether to trigger alarms.
When it is set to Since Last Tx, the system will compare the current sensor reading with the last transmitted reading. If there is no past transmission, the first reading made after boot up is used.
9.6. Alarm Computation Details This section contains details on how Satlink decides whether to go into alarms. The section is broken down by the user chosen Alarm Type setting:
9.6.1. Hi Alarm When the Alarm Type is set to Hi, if the sensor reading is greater than or equal to Alarm Threshold, the station goes into alarm.
That station will go out of alarm when the sensor reading goes below Alarm Threshold minus Alarm Deadband.

Sutron Corporation Satlink Operations & Maintenance Manual pg. 101
9.6.2. Low Alarm When the Alarm Type is set to Low, if the sensor reading is less than or equal to Alarm Threshold, the station goes into alarm.
That station will go out of alarm when the sensor reading goes above Alarm Threshold plus Alarm Deadband.
9.6.3. ROC Alarm ROC stands for Rate Of Change. ROC alarms compare the current measurement reading with a past reading. If Alarm ROC Interval is Since Last Meas, the past reading is the last scheduled reading made according to Measurement Time and Measurement Interval.
If Alarm ROC Interval is Since Last Tx, the past reading is the one that was included in the last alarm transmission. If there is no past transmission, the first reading made after boot up is used.
If the absolute difference between the two readings (absolute of current reading minus past reading) is greater or equal to the Alarm Threshold, the station goes into alarm.
The same station goes out of alarm if the absolute difference between the two readings (absolute of current reading minus past reading) is less than the Alarm Threshold minus Alarm Deadband.
Exception: ROC alarms setup for Since Last Tx do not generate out of alarm events or transmissions.
9.7. Logging Settings
9.7.1. Logging Interval Logging Interval dictates how often to log sensor data.
Change the Logging Interval to measure sensors more frequently than to log them. This is useful for alarm setups, in which you want to check the water level once a minute in order to detect fast rising water, but one only wants to log the water level data once an hour. For this scenario, the Measurement Interval would be one minute, and the Logging Interval would be one hour.
For alarm conditions, it is possible to set Alarm Logging to Every Reading. That would result in the water level in the example above being logged once a minute when the system was in alarm, and logging once only once an hour when not in alarm.
If Logging Interval is set to zero, Satlink will log every measurement. It is the same as having the Logging Interval equal to the Measurement Interval.
LinkComm provides a Log All checkbox: when checked Satlink will measure and log at the Measurement Interval.
Having a Logging Interval that is shorter than the Measurement Interval is a bad setup.
Only logged readings may be transmitted.

Sutron Corporation Satlink Operations & Maintenance Manual pg. 102
It is not possible to entirely disable logging of measurement results. However, one can set the logging interval as slow as once a day.
9.7.2. Log Error Value When Satlink cannot get valid data from a sensor (more specifically, when a sensor failure error occurs), Satlink will change the sensor reading to match the user-set Log Error Value, which defaults to -99999. Such atypical numbers are used to attract the user’s attention when viewing the log.
9.8. Transmission Data Content Settings
9.8.1. Tx Data Content Tx Data Content tells Satlink which readings to include in the transmission. Each measurement has multiple Tx Data Content settings: one for each transmission.
The options are All Logged, Individual, Last, and Exclude.
By selecting All Logged, measurements that are logged according to the measurement schedule are transmitted. Only readings made since the last transmission are included. This setting is dependent on the Logging Interval setting. Please note that if the system is logging data more frequently due to being in
alarms, the extra data is NOT transmitted. To include extra data created by alarms, please use the Last option.
The only data points transmitted are those made according to the measurement time and logging interval settings.
See below for the Individual setting. Last means to transmit a set number of the most recent readings (determined by
Number of Values to Tx). Use Last for alarm and random transmissions to ensure that the value that caused
alarms is transmitted! Last is the only option that may be used to transmit data that is not collected based
upon the measurement schedule. By selecting Exclude, no readings of this measurement are transmitted. All Since Last Tx includes all logged data since the last transmission. All Since Last Tx
selection is different from All Logged in that it ignores measurement scheduling. All Since Last Tx will parse through the log and include every logged entry of the measurement. This option is useful when the logging interval changes due to alarms or scripts. This option results in a variable amount of data in the transmission. Only certain Tx
Format options are suitable for All Since Last Tx. Timestamps of transmitted data using SHEF, some Pseudobinary, and all formats that do not give each reading its own timestamp, may be incorrect. CSV and MIS will work correctly. Pseudobinary B is not suitable.
With All Since Last Tx, all estimates of data content may be incorrect. With All Since Last Tx, newest data in transmission may be at (transmission time -
Sensor Encoding Time). Oldest data will be newer than (last transmission time – Sensor Encoding Time).
Skip First Missing does not work with All Since Last Tx. Feature added in version 8.11

Sutron Corporation Satlink Operations & Maintenance Manual pg. 103
9.8.2. Tx Data Time And Interval If Individual is selected for Tx Data Content, the fields Tx Data Time and Tx Data Interval will appear, allowing the choice of what data to include in the transmission.
This options should only be used to measure and log data more frequently than to include it in transmissions. For example, if one wanted to measure and log data once a minute, one would set the Measurement and Logging Intervals to one minute. Since it may be expensive to transmit all that data, one can choose to transmit only every 10th reading by setting the Tx Data Interval to 00:10:00.
The example below uses Measurement and Logging Intervals of 15 minutes. Tx Data Content is set to Individual.
Timeline:
11:00 measure and log data 11:15 measure and log data 11:30 measure and log data 11:45 measure and log data 11:50 transmission
Setup options:
The user could set up to transmit all four of those values: Tx Data Content = All Logged
The user could set up to transmit the data from 11:15 and 11:45: TX Data Time = 00:15:00, Tx Data Interval = 00:30:00
The user could set up to transmit only the data from 11:45: Tx Data Time=00:45:00, Tx Data Interval = 01:00:00
The user could set up to transmit only the data from 11:00: Tx Data Time=00:00:00, Tx Data Interval= 01:00:00
Setup to transmit the most recent two readings from 11:30 and 11:45 Tx Data Content = Last, Number of Values to Tx = 2
Tx Data Interval must be a multiple of the Logging Interval. Setting Logging Interval to 15 minutes and Tx Data Interval to 20 minutes is not a good idea.
9.9. Measurement Setup Defaults To change the setup of a single measurement to its defaults, type M1 SETUP DEFAULT on the command line to reset measurement one. This will affect only one measurement.
9.10. Measurement Calibration Satlink offers an easy way to change the current reading of any measurement. Press the Calibrate button on the Measurements tab in LinkComm and enter the desired reading.
Via command line, type M1=10.5 to set the reading of measurement one to 10.5
This calibration procedure has the effect of modifying the measurement’s Offset.

Sutron Corporation Satlink Operations & Maintenance Manual pg. 104
When a sensor is calibrated, Satlink will log the readings before and after the calibration along with a calibration event:
>M1 = 12 Measurement M1 STAGE set to 12.000 04/18/2012,13:19:49,STAGE,8.119 04/18/2012,13:19:49,Calibration,1 04/18/2012,13:19:49,STAGE,12.000
9.11. Multiple Measurements Using the Same Sensor You can set up multiple measurements with the same input. For example, to log the daily rainfall and the rainfall during the last hour, set up two measurements: one as a precipitation rate with an interval of one hour, and another as precipitation rate with an interval of one day.
To log the daily temperature and the hourly temperature, only one physical temperature sensor is needed. Set up two measurements with the same setup; change the Measurement Interval and the Averaging Time and use a different Label for each. One would happen once a day (Measurement Interval 24 hours, Averaging Time 24 hours), and the other once an hour (Measurement Interval 1 hour, Averaging Time 1 hour). It would be a good idea to set up the sampling Interval to one minute for both sensors in order to save power (See page 77).
If two separate measurements are scheduled to measure the same sensor at the same time (as they will in the examples above), only one reading of the sensor is made and the result is shared by both measurements.

Sutron Corporation Satlink Operations & Maintenance Manual pg. 105
10. Telemetry Setup Satlink has a built-in environmental satellite transmitter certified by NESDIS, Eumetsat, Insat and other satellite agencies. These satellites provide reliable one way communications of data from remote locations to receive stations/computer systems around the world.
The setup for the transmitter and its status is provided on the Telemetry tab as shown below.
The column on the left shows that up to four independent telemetry setups are possible.
The first two setups are reserved for Environmental Satellite transmissions: the first setup is reserved for scheduled transmissions (aka self-timed transmissions), and the second for random transmissions.
The last two setups may be setup for any kind of telemetry, including Iridium, Cell, and Environmental Satellite.
Each telemetry setup is configured and enabled separately. If no telemetry setups are enabled, the system will show an error on the dashboard.
Please note that the transmission data content is governed by measurement setup. Please see the section TRANSMISSION DATA CONTENT SETTINGS for details.

Sutron Corporation Satlink Operations & Maintenance Manual pg. 106
The column on the right has two main sections – Telemetry Setup and Telemetry Status. You may need to scroll down to see the Telemetry Status
The setup consists of information that tells Satlink when to transmit, what type of satellite to use, the channel, the antenna type and other critical information. Most of this information originates from the agency that operates the satellite (e.g. NESDIS) and is unique for each station. Incorrect information can cause the system to mishandle the information you send or interfere with the operation of another station. Always check to make sure the information you have for the station is unique for that station and correct.
Some of the settings are common to different Radio Types.
10.1.1. Enable This is the master switch for enabling the telemetry setup.
10.1.2. Radio Type Which radio is to be used for the telemetry? Satlink comes with an Environmental Satellite radio built in. Optional radios include Iridium and Cell.
10.1.3. Kind Several different transmission kinds may be setup:
Scheduled Random Alarm
Please read on for details on each Tx Kind. Note that not all Tx Kinds are available for all Radio Types.
10.1.4. Transmission Schedule When Satlink should make a transmission depends on the transmission schedule. The time is generally computed based upon these settings:
Scheduled Time Scheduled Interval
The interval controls how frequently the transmission is made, and the time controls when the transmission is started.
10.1.1. Sensor Cutoff Offset and Skip First Missing What data is included in a transmission is governed by the measurement setup. Please see the TRANSMISSION DATA CONTENT SETTINGS section. In order to prevent missing measurements in a transmission, Satlink has two settings:
Skip First Missing Sensor Cutoff Offset

Sutron Corporation Satlink Operations & Maintenance Manual pg. 107
When Skip First Missing is enabled (it is enabled by default), if the first reading that was slated for transmissions is missing, Satlink will skip that reading and go for the next one.
For example, a measurement is scheduled for 12:00, 12:15, 12:30, etc. A transmission is scheduled for 12:31. With that setup, Satlink is supposed to include the 12:30 measurement in the transmission. However, Satlink does not find that reading in the log. Satlink has two options at this point:
Skip the 12:30 reading and use the 12:15 reading as the first one (Skip First Missing is On)
Put a missing reading marker in the transmission (Skip First Missing is Off)
The most likely cause for a missing reading is the response time of the sensor. If the sensor takes 20 or more seconds to respond, the reading is likely to be missing. However, if the sensor takes a variable amount of time to respond, sometimes taking less than 20 seconds, and sometimes taking more than 20 seconds, Satlink may end up with inconsistent transmission data content. In that case, disable Skip First Missing, and increase the Sensor Cutoff Offset.
Sensor Cutoff Offset helps prevent missing data in a transmission by specifying how old the newest measurement in the transmission may be. The default value for the offset is 1 minute. Scheduled environmental satellite transmissions should never be set to less than 1 minute. Cell and Iridium transmissions have no such limitation. However, the setting still applies to them.
Let us continue with the example above. With the Sensor Cutoff Offset at 00:01:00, the transmission scheduled for 12:31:00 will look for the first measurement to have been collected at 12:30:00. If the Sensor Cutoff were 00:05:00, then Satlink would not try to include any data collected after 12:26:00, which would effectively cause Satlink to use the 12:15:00 reading as the first one.
10.2. Environmental Scheduled Transmissions This section describes Environmental Satellite Scheduled transmissions. Scheduled transmissions happen periodically at a fixed time.
TX1 setup is reserved for scheduled transmissions using an environmental satellite. Additional scheduled transmissions may be setup on TX3 and TX4.
Satlink is certified to operate with NESDIS, EUMETSAT, INSAT and other agencies who operate their respective satellite systems. The governing agency will assign to each transmitter a unique Satellite ID, channel (and associated type) and scheduled time and interval. The combination of these settings is unique to each field station.

Sutron Corporation Satlink Operations & Maintenance Manual pg. 108
Warning: Any errors entering the information may cause the transmitter to interfere with other stations in the field.
10.2.1. Tx Enable Enables scheduled (sometimes called self-timed) transmissions. If this setting is enabled, Satlink will periodically deliver sensor data to the designated destination. If disabled, Satlink will not initiate any scheduled transmissions.
10.2.2. Transmission Schedule The governing agency will assign a specific transmission time and interval for scheduled transmissions. Enter the assigned schedule via the Scheduled Time, Scheduled Interval, and Window Length settings.
For example, a station may be assigned to transmit on GOES 300 baud channel 195 at a time of 00:02:30, an interval of 04:00:00 and the time slot is 30 seconds long. That means the transmitter is allowed to transmit at 00:02:30, 04:02:30 …20:02:30 and transmissions are to last no more than 30 seconds. In that case, setup
Scheduled Time: 00:02:30 Scheduled Interval: 04:00:00 Window Length: 00:00:30
Please note that all scheduled times are related to UTC. Any transmission outside the assigned time, either early or late may interfere with other field stations.
Any transmission longer than the assigned window length will be truncated to the window length.
Window center enable causes Satlink to delay a transmission that does not last the entire allowed length so it is centered during the assigned window. Window centering helps the satellite system to operate more efficiently. In the example above, if the transmission were 20 seconds long, it would start at 00:02:35 instead of 00:02:30 if window centering were enabled.
If Satlink is setup with an extremely aggressive measurement and logging schedule, it may fail scheduled transmissions and note the error “Too Much Sensor Data To Format”. This means that Satlink could not ready all the sensor data prior to transmission. Simply put, Satlink is overloaded as a data logger. To solve this problem, see if any other transmissions such as Cell and Iridium are scheduled at the same time. If so, modify the schedule of those transmissions such that they do not coincide with the environmental satellite transmission. Alternatively, reduce the frequency at which Satlink is measuring and/or logging data.
10.2.3. Satellite Type and Channel The satellite types are as follows. Each type has a number of channels that can be used for the transmitter. The channels are assigned by the governing agency. Any error entering the channel may cause the transmitter to interfere with other stations.
Satellite Type Channels
GOES 300 (V2) 1..266, 301..566
GOES 1200 (V2) 3,6 …264 301, 304..565

Sutron Corporation Satlink Operations & Maintenance Manual pg. 109
EUMETSAT SRDCP 100 1..289
EUMETSAT HRDCP 1200 1..289
CGMS 100 International 1..10
Japan GMS 1..100
Insat 1..400
FengYun 1..100
10.2.4. Satellite ID The Satellite ID is an 8 character Hexadecimal value (0-9, A-F) that is assigned by the governing satellite agency to uniquely identify the transmitter. Any errors entering the Satellite ID may cause the transmitted message to be lost or ignored.
10.2.5. TX Format The TX Format field sets the format that Satlink uses when it transmits sensor data. Tx Format is only relevant to data collected by Satlink – it does not apply to data given to Satlink by another logger. There are several different format types: "SHEF", "SHEFFIX", “Pseudobinary”, “ASCII Column”, and “ASCII Sensor”. Each has its own distinctive advantages.
"SHEF" formats the data into readable ASCII messages. "SHEFFIX" is just a modified version of "SHEF" where the data is positioned in fixed spacing so that it will line up better when displayed. However, both the SHEF and SHEFFIX formats generally create long messages.
The “Pseudobinary" format encodes the data into 3 characters that you cannot read without the aid of a program. This format is over 50% shorter than the SHEF and SHEFFIX formats which results in shorter transmissions and lower power consumption. Although it is much harder for a person to visually inspect the data in this format, it is a much more efficient format for sending data.
There are several flavors of the Pseudobinary format. Please see details in section PSEUDOBINARY
B DATA FORMAT .
“ASCII Column” and “ASCII Sensor” formats are similar to SHEF in that they create human readable and lengthy messages.
“ASCII Column” transposes the data, showing data from different sensors on each line. The columns will have data from the same sensor.
“ASCII Sensor” mode formats each sensor reading into four digits after multiplying the reading by 100. No decimal point is used in this format.
The specifics of formatting are covered in greater detail in TRANSMISSION DATA FORMATS
To see what your data will look like after it has been formatted, click the “Show Tx Data” button in the Telemetry Status section of the telemetry tab.
10.2.6. Antenna Options In the setup, you specify the antenna option: Yagi, Dome or Omni. Each of these choices represent a type of antenna with different gain. Each satellite agency has specified the nominal power for transmitting to the satellite. Depending on the gain of the antenna that is connected, the transmitter must use the proper power in order to properly operate with the satellite. All you need to do is tell Satlink what antenna is connected and the software does the rest. The

Sutron Corporation Satlink Operations & Maintenance Manual pg. 110
resultant transmission power is displayed on the screen. The following table shows the power (during the carrier portion of the transmission) for each of the Satellite types.
Satellite Type Yagi (10-11dB gain) Watts
Dome (5-8dB gain) Watts
Omni (3dB Gain) Watts
GOES 300 1.25 2.5 7
GOES 1200 5 10 14
EUMETSAT SRDCP 100 5 10 14
EUMETSAT HRDCP 1200 5 10 14
CGMS 100 International 7 10 14
Japan MTSAT 100 7 10 14
Feng Yun 7 10 14
INSAT PRBS 5 7 10
INSAT TDMA 5 7 10
10.2.7. Append Options The "Append Options" add information to the end of the transmitted data. Not all options are available for all transmission kinds. Not all transmission formats support all the append options.
Random transmissions always use Pseudobinary B formatting and only allow the Lat/Long option.
ASCII Column format does not allow any append options. All the other formats support all the append options.
Please see the TRANSMISSION DATA FORMATS section for formatting details.
The options are listed below.
Use SHEF Codes for Options This setting is not an append option per se; it controls how the headers for the other append options. If selected, standard SHEF codes are used as the headers. All the examples below use SHEF codes.
Battery Voltage The battery reading appended is the battery under load reading in Volts made at the start of the PREVIOUS environmental satellite transmission. The initial transmission will have append minus one (-1.0). Example: “:YB 12.50” would be formatted if the voltage were 12.5.
Lat/Long This setting stands for Latitude/Longitude and it appends the geolocation of the station. This information is provided by Satlink’s GPS module. Example: “:YL N39o1'15.00"W77o24'37.00"”. Please note that the “ symbol is used in the example to indicate seconds.
Tx fwd/ref power This option provides the forward and reflected power readings of the PREVIOUS environmental satellite transmission. The initial transmission will append minus one (-1.0). With a forward power of 5W and a reflected power of 0.3W, Satlink would format “:YF 5.0 :YR 0.3”.

Sutron Corporation Satlink Operations & Maintenance Manual pg. 111
Station Name The station name option appends the customer entered Station Name setting. For Iridium telemetry, this setting also controls whether the station name is included in the transmission header.
If the station name were “Small Creek”, it would be formatted as “:YN Small Creek”
Temp During Last Tx This is the temperature recorded during the PREVIOUS environmental satellite transmission. It is expressed in degrees Celsius. The initial transmission will append -1000.0. For a temperature of 25.53, Satlink will format “:YM 25.53C”
Tx time The time of the current transmission, expressed as HHMMSS. ":YD 131015" is used for a time of 13:10:15.
Serial no This is the serial number of station. The SHEF format would be “:SN 00001" where 00001 is the station serial number.
Tx Count This option provides the count of good and bad transmissions. For a station that has made 19350 good and 2 bad transmissions, the SHEF format would be “:YG 19350 :YH 2”.
Append Options Example Here is an example of all the append options in a SHEF format using SEHF codes. The order of the values is battery, lat/long, forward power, reflected power, station name, temperature, time (HHMMSS), serial number, and transmission count:
:YB 11.99 :YL N45o27'28.47"W122o43'59.08" :YF 1.6 :YR 0.0 :YN Small
Creek :YM 25.53C :YD 172100 :SN 00001 :YG 19350 :YH 2
With SHEF codes disabled, the same append options look like so:
:BL 11.99 N45o27'28.47"W122o43'59.08" :NAME Small Creek :AMPTEMP
25.53C :PWR 1.6/0.0 :YD 172100 :SN 00001 :GOOD/BAD 19350/2
For append option details in other formats, please take a look at section TRANSMISSION DATA
FORMATS.
10.2.8. Advanced Options
Circular Buffer Enable This setting is only relevant if another data logger is giving Satlink transmission data (see CONNECTING TO ANOTHER LOGGER).
Circular Buffer is an advanced option that is only useful if you have varying amounts of data to transmit. Please consult the factory before trying to use it. If Circular Buffer is enabled, Satlink Logger will transmit only a portion of its data every time, and keep the rest for the next transmission. If a number of bytes to be transmitted is specified (“Bytes to Tx at a time”), then Satlink Logger will transmit only that many bytes, and leave the rest of the data in the buffer for the next transmission. If “Transmit all data that can fit” is selected, then Satlink Logger will transmit all the data that can fit into the transmission. (All transmissions are time limited).

Sutron Corporation Satlink Operations & Maintenance Manual pg. 112
If Circular Buffers are not enabled, Satlink Logger will throw away any data it cannot fit into the transmission.
Dumb Logger Mode The “Dumb Logger” mode is used to have Satlink transmit data from another logger. Please see the section CONNECTING TO ANOTHER LOGGER for details.
10.3. Random Transmissions TX2 setup is reserved for the Random Environmental Satellite transmissions. Random transmissions are generally used to notify the customer of alarm conditions.
Unlike scheduled transmissions, random transmissions do not get assigned a time slot. Multiple stations are allowed to transmit on the same channel. That being said, the agency governing the satellite provides appropriate settings for random transmissions including the channel.
These transmissions are called random because the transmission time is randomized. The randomization is done in order to mitigate potential collisions with other transmitters on the same channel. In addition to transmitting at a randomized time, more than one transmission is sent to increase the chances of successful data delivery. The multiple transmissions are referred to as a burst.
Random transmissions are generally initiated when the system goes into alarm. If random transmissions are enabled, when Satlink goes into alarms, a burst of transmissions is fired soon after the alarm. The exact time of the transmissions is randomized. The number of transmissions in the burst is controlled by the setting Number of Txs per Burst. The default value is three, meaning Satlink will fire off three transmissions once the station goes into alarms.
Burst Interval is a setting that controls approximately how much time passes between the transmissions. The transmission time is slightly randomized. The default value is 2 minutes.
After the burst transmissions are completed, if the station remains in alarm, Satlink will fire off a random transmission every Alarm Interval. The intention is to keep notifying the customer about the current alarm state. The default value is once an hour.
Random transmissions may be sent even when the system is not in alarms. If the Scheduled Interval setting is not zero, Satlink will send a random transmission every interval. These transmissions are called ‘random normal’. The first random normal transmission will happen roughly Scheduled Interval time after recording is turned on or after the station is powered on.
Random normal transmissions may be completely disabled by setting the Scheduled Interval to zero.
TX2 random transmissions share the Satellite ID and Antenna Option with TX1 scheduled transmissions setup. The same ID and Antenna should be selected for TX1 and TX2.
Random transmissions should be kept as short as possible. To that end, Pseudobinary B is the only format available.

Sutron Corporation Satlink Operations & Maintenance Manual pg. 113
10.4. Iridium Setup Satlink may be equipped with an optional Iridium modem. If such hardware is available, Satlink can be setup to make scheduled and alarm transmissions via the Iridium modem.
Additionally, Satlink can receive messages via the Iridium modem. These messages can be used to check station status, change station setup, request re-transmissions of logged data, and more. Iridium messages are limited in bandwidth and are time delayed. Email is generally used to send commands to Satlink via Iridium. LinkComm cannot be used to send messages via Iridium.
Please see the IRIDIUM TELEMETRY section for more details on Iridium.
Some of the Iridium settings are found on the Telemetry tab and are specific to a single telemetry setup. Additional Iridium settings are found on the Other Setup tab of LinkComm; those are global settings.
10.4.1. Radio Type Choose Iridium as the Radio type of the transmission you are setting up. TX1 and TX2 cannot be setup for Iridium telemetry; TX3 and above can.
10.4.2. Kind Iridium supports two kinds of transmissions:
Scheduled Alarm
Iridium Scheduled Iridium Scheduled transmissions are much like Environmental Satellite Scheduled transmissions: Settings Scheduled Time and Scheduled Interval are used to determine when and how often Iridium transmissions are to happen. However, the choice of when to transmit is entirely up to the user. The Iridium network is a commercial network and customers pay for bandwidth.
Unlike Environmental Satellite Scheduled transmissions, Iridium transmission do not happen at the exact time that they were scheduled for. Instead, the modem is turned on at the scheduled time. It takes the modem a little while (usually under a minute) to acquire a connection with the satellites and complete a data transfer.
Additionally, Iridium transmissions are delayed by a random time of up to 30 seconds. This delay is mean to prevent on-air collisions from multiple transmitters.
Iridium Alarm When setup for Alarm transmissions, Iridium telemetry will send data as the station goes into and out of alarms.
When the station enters alarms, an Iridium transmission will be sent. The measurement that went into alarms should be configured with the Tx Data Content set to Last in order to make sure that the reading that caused the alarms is transmitted.
Alarm Interval This setting is relevant to Alarm transmissions only. If not zero, Iridium will repeat transmission at the Alarm Interval for as long as the station is in alarm.

Sutron Corporation Satlink Operations & Maintenance Manual pg. 114
Additionally, if not zero, the Alarm Interval dictates the minimum time between transmissions. If set to one hour, Iridium Alarm transmissions will not happen more than once an hour no matter how often the station goes into alarms.
Max Tx Time This value dictates how long Satlink will keep trying to reach the Iridium satellite network. If a connection is not made during this time, Satlink will give up on the Iridium transmission and mark it as failed.
Retransmit The retransmit setting controls whether or not Satlink will automatically attempt to retransmit failed transmissions. Please see the RETRANSMISSIONS section for details.
10.4.3. Iridium Global Settings These settings are found on the Other Setup tab of LinkComm. Please read on for a list and description of each setting.
Iridium Listening If enabled, Iridium Listening will cause Satlink to keep the Iridium modem on all the time. This results in messages sent to Satlink being received near immediately. This reduces the data costs associated with connecting to the Iridium gateway in order to check messages. In this mode, Satlink will reset the modem once a day for reliability, resulting in at least one connection to the gateway daily.
The downside to enabling Listening is increased power draw.
Iridium Msg Interval Please note that even with Listening disabled, Satlink will still check for messages periodically. A message checks happens with every transmission. If scheduled transmissions are disabled, message checking still happens every Msg Interval. The message checking may not be disabled without disabling the whole modem. Message checking will happen at least once a day. Message checking happens even if recording is off.
Message checking will NOT happen if the transmission interval is faster than Msg Interval. This is because every transmission already includes a message check.
If a unit is setup with a Scheduled Interval of 1 hour, and a Msg Interval of 15 minutes:
00:15:00 - Message Check 00:30:00 - Message Check 00:45:00 - Message Check 01:00:00 - Transmission and Message Check- No additional message checking required 00:15:00 - Messages Check
With a Scheduled Interval of one hour and a Msg Interval of 24 hours, no additional message checking occurs:
23:00:00 - Transmission and Message Check - No additional message checking required 00:00:00 - Transmission and Message Check - No additional message checking required 01:00:00 - Transmission and Message Check - No additional message checking required

Sutron Corporation Satlink Operations & Maintenance Manual pg. 115
The message check serves several purposes:
It prevents the customer from permanently severing the remote connection. It allows stations to go into lower power mode than if Listening were enabled.
Please note that message checking is not scheduled to occur at a specific time. Message checking is guaranteed to happen at least every Msg Interval. It is not scheduled to happen at the top of the hour or at any other time. If the interval is set to an hour, it means that it may take up to an hour for a message to be received. It does NOT mean that it will happen at the top of every hour.
Iridium Enable The Iridium Enable setting may be used to completely disable the Iridium modem. If disabled, Satlink will never power on the modem and no Iridium features will be available. This setting is the equivalent of disconnecting the modem from the board. It may not be set remotely.
Iridium Tx Station Name This setting controls whether Iridium telemetry should include the station name in the header of the message. The setting defaults to off and was introduced in version 8.13. Please see IRIDIUM
TX STATION NAME for more details.
10.5. Cell Setup A cellular modem is an optional component for Satlink. A cellular modem is similar to equipment found in a mobile phone. Satlink will use the cellular modem in order to connect to the internet and deliver sensor data to a server. When equipped with a cell modem, Satlink can easily be accessed remotely over the internet.
Please make sure to read the section CELLULAR TELEMETRY for additional information.
A lot of the telemetry settings for cell are similar to those for Iridium and Environmental Satellites.
Some of the Cell settings are found on the Telemetry tab and are specific to a single telemetry setup. Additional settings are found on the Other Setup tab of LinkComm; those are global settings.
10.5.1. Radio Type Choose Cell as the Radio type of the transmission you are setting up. TX1 and TX2 cannot be setup for cell telemetry; TX3 and above can do cell telemetry.
10.5.2. Kind Iridium supports two kinds of transmissions:
Scheduled Alarm
Cell Scheduled Cell Scheduled transmissions are much like Iridium and Environmental Satellite Scheduled transmissions: Settings Scheduled Time and Scheduled Interval are used to determine when and

Sutron Corporation Satlink Operations & Maintenance Manual pg. 116
how often transmissions occur. However, the choice of when to transmit is entirely up to the user. The Cell network is a commercial network and customers pay for bandwidth.
Unlike Environmental Satellite Scheduled transmissions, Cell transmission do not happen at the exact time that they were scheduled for. Instead, the modem is turned on at the scheduled time. It takes the modem a little while (usually under a minute) to acquire a connection with cell network and complete a data transfer.
Cell Alarm When setup for Alarm transmissions, Satlink will send data as the station goes into and out of alarms.
When the station enters alarms, a transmission will be sent. The measurement that went into alarms should be configured with the Tx Data Content set to Last in order to make sure that the reading that caused the alarms is transmitted.
Alarm Interval This setting is relevant to Alarm transmissions only. If not zero, Satlink will repeat transmission at the Alarm Interval for as long as the station is in alarm.
Additionally, if not zero, the Alarm Interval dictates the minimum time between transmissions. If set to one hour, Alarm transmissions will not happen more than once an hour no matter how often the station goes into alarms.
Max Tx Time This value dictates how long Satlink will keep trying to reach the cellular network. If a connection is not made during this time, Satlink will give up on the transmission and mark it as failed.
Retransmit The retransmit setting controls whether or not Satlink will automatically attempt to retransmit failed transmissions. Please see the RETRANSMISSIONS section for details.
10.5.1. Tx Mode If Tx Mode is set to Internet, Satlink will use the modem to get an internet connection. Once the connection is established, Satlink will connect to the Main Server in order to deliver data. Failing that, it will try the Backup Server. A transmission is considered a success if either of those servers receives the data.
If Tx Mode is configured for FTP, Satlink will deliver data to an FTP server. A cell modem is required to use FTP. Relevant settings are Main Server, Backup Server, Server Port, Server Username, Server Password, and FTP Path.
If Tx Mode is set to SMS, Satlink will send transmission data via SMS (messages) to up to three telephone numbers, as specified by SMS Tx Phone. .
Protocol This setting applies only when the Tx Mode is set to Internet. The choices are Hyrdomet Cloud (default) and None.
If your station is delivering to Hydromet Cloud, please choose Hydromet Cloud as the protocol. If not, please choose None.

Sutron Corporation Satlink Operations & Maintenance Manual pg. 117
See the section TCP/IP SESSION for details on the connection.
Internet Settings Satlink delivers data to servers. To deliver to more than one server, setup multiple transmissions for cell telemetry.
Main Server When it is time to make a scheduled transmission, if Tx Mode is set to Internet or FTP, Satlink will connect to the destination specified by Main Server. The server may be expressed as a name (such as www.sutronwin.com) or an IP address (such as 10.0.0.1).
Backup Server If Satlink is unable to connect to the Main Server, but it does have an internet connection, it will try to deliver data to the Backup Server.
Server Port What TCP/IP port to connect to on the Main and Backup Servers. Also applicable to FTP. Note that FTP traditionally uses port 21.
Server Username This setting is relevant to FTP only.
Server Password If the Main and Backup Servers are protected by a password (sometimes called a shared secret), it must be entered in this field. If it is not, Satlink will not be able to deliver sensor data.
FTP servers require a password too.
FTP Path This setting may be used to deliver FTP data to a specific path on the server. Please note that Satlink CANNOT create directories. The path must exist on the FTP server before Satlink can deliver files to it. An example of a path: “Rain_station/A2/B12”.
When it delivers data to an FTP server, Satlink creates a new file with each delivery. The file name will be made up of the Station Name and the time of the transmission:
StationID_YYYYMMDDHHMMSS Station ID is the first 10 characters from the Station Name setting The rest of the filename is based on the date and time of the transmission. The file extension is based on the Tx Format setting: “shf”, “pbn”, “csv”, “mis”
SMS Tx Phone A, B, and C When it is time to make a scheduled transmission, if Tx Mode is set to SMS, Satlink will send data to the phone number(s) set up in SMS Tx Phone.
If you want data delivered to just one phone, enter it into SMS Tx Phone A, and leave SMS Tx Phone B and C blank. To deliver to a second phone number, enter the number in SMS Tx Phone B. Use SMS Tx Phone C to deliver data to a total of three different numbers.

Sutron Corporation Satlink Operations & Maintenance Manual pg. 118
10.5.2. Cell Global Settings These settings are found on the Other Setup tab of LinkComm. Please read on for a list and description of each setting.
Cell Listening If enabled, Cell Listening will cause Satlink to keep the cellular modem on all the time. This makes it possible to connect to Satlink with LinkComm over the internet at any time. However, it significantly increases the power consumption. When listening, Satlink will act as a TCP/IP server, ready to accept incoming connections from LinkComm.
If Cell Listening is not enabled, Satlink will only power on the modem when it makes transmissions and when it checks for messages.
If power consumption is of concern, setup Satlink to periodically check for messages (see Msg Interval below). Shorter intervals result in higher power consumption. Longer intervals mean a longer response time. For example, if Msg Interval is one hour, it may take up to one hour for Satlink to receive a message.
Once there is a need to connect to Satlink, send a message to Satlink asking it to start listening. That message should say
!CELL LISTENING=ON
Once Satlink receives the message, it will send a reply. From that point on, Satlink is online and available to connect. It will stay online until listening is turned off. Use LinkComm to connect to Satlink and perform the appropriate operations. Do not forget to turn off listening before disconnecting.
To have Satlink only turn on listening for a limited time period, use the LISTEN command. For example, to have Satlink go online for two hours send an SMS saying
!LISTEN 7200
Two hours is 7200 seconds.
Please note that the Msg Interval setting (described below) determines how often Satlink checks for incoming messages. If that is set to six hours, it means that it may take up to six hours before Satlink receives to incoming messages.
SMS Listening Only If SMS Listening Only is enabled, Satlink will not go online when listening. Instead of being able to accept incoming TCP/IP connections, it will only be able to receive incoming SMS.
LinkComm will not be able to connect to Satlink remotely while this setting is active.
Please note that if Satlink is setup for internet transmissions, it will go online when transmitting regardless of the SMS Listening Only setting.
Cell Msg Interval The Cell Msg Interval setting dictates how often Satlink will check for incoming SMS messages.
This setting is near identical to the IRIDIUM MSG INTERVAL setting. Please read that section for details on message checking.

Sutron Corporation Satlink Operations & Maintenance Manual pg. 119
Cell Enable The Cell Enable setting may be used to completely disable the Cell modem. If disabled, Satlink will never power on the modem and no cell features will be available. This setting is the equivalent of disconnecting the modem from the board. It may not be set remotely.
Cell Notifications Enable This setting controls whether notifications are sent via SMS when certain events happen. Please see the SMS NOTIFICATIONS section for details.
Additional Cell Settings The following settings are not available via LinkComm. One must use the Terminal to access them. Changing these settings is not normally required. In fact, incorrect settings may result in the Cell modem not working!
Cell APN This is the service provider's APN (Access Point Name). If the station is not able to
get online, the APN may be incorrectly set. Please note that leaving this setting blank will work with most providers.
Cell SIM PIN Some SIM cards are locked with a PIN. This setting holds the value to give to the
SIM when turning the modem on. A locked SIM will not work without a PIN and the station will report a Bad PIN error.
Cell Username Cell Password
Some providers require that a user name and password be provided in order to connect to the internet.
10.6. Telemetry Status Telemetry status provides details for each type of transmission setup. The details can give valuable insights into how each type of telemetry is performing.
10.6.1. Refresh The telemetry status does will not update automatically. The “refresh” control retrieves from Satlink current information.

Sutron Corporation Satlink Operations & Maintenance Manual pg. 120
10.6.2. Clear Counts This control clears the succeeded and failed counts. Sutron recommends clearing the counts during each field visit.
10.6.3. Transmit Now Transmit Now causes Satlink to initiate a transmission on the selected setup (TX1, TX2, …).
Warning – Do not use “transmit now” unless you are sure that your transmission will not interfere with another station. Disconnecting the antenna and connecting a dummy load is the best way to do this. Note that the transmission will not start immediately but may start 30-60 seconds after pressing “Yes”.
During the transmission, you may see the status indicate what the transmitter is doing.
10.6.4. Show Tx Data Show Tx Data is a great way to confirm that Satlink has been properly setup to transmit your intended data. The display shows the last transmission and what will be transmitted by the next transmission. Review the information carefully to make sure that you have the right number of readings marked for tx and the transmission fits in the specified window.
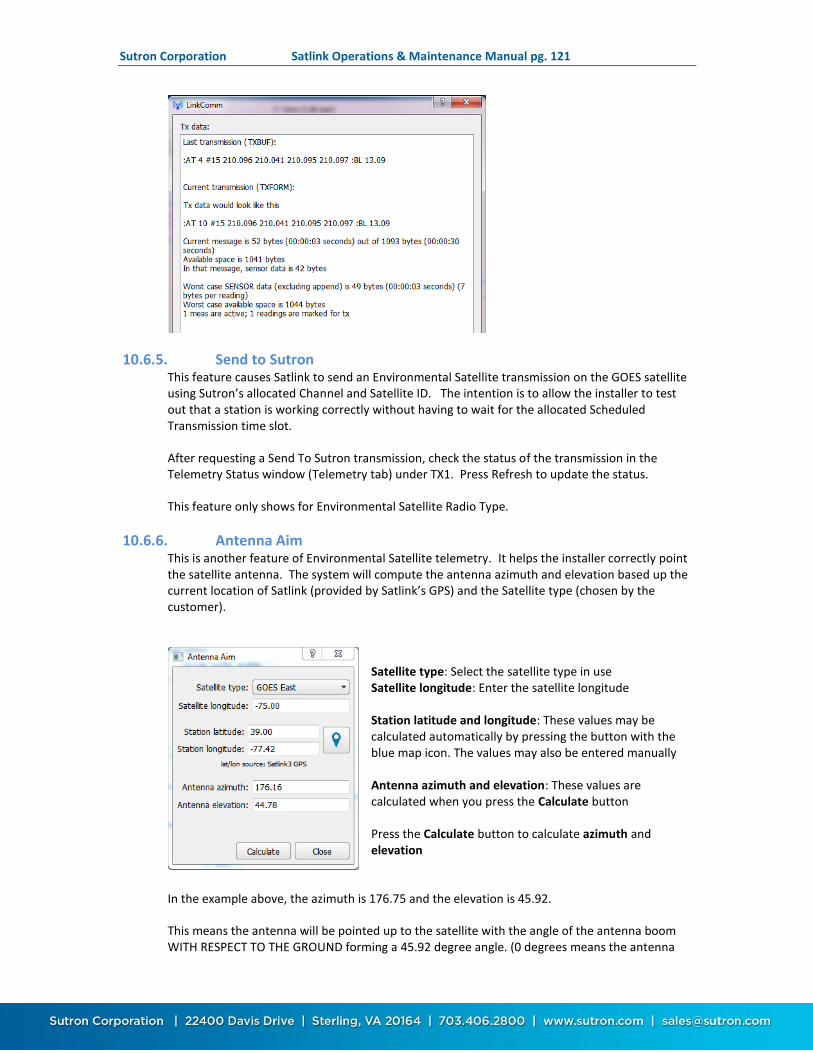
Sutron Corporation Satlink Operations & Maintenance Manual pg. 121
10.6.5. Send to Sutron This feature causes Satlink to send an Environmental Satellite transmission on the GOES satellite using Sutron’s allocated Channel and Satellite ID. The intention is to allow the installer to test out that a station is working correctly without having to wait for the allocated Scheduled Transmission time slot.
After requesting a Send To Sutron transmission, check the status of the transmission in the Telemetry Status window (Telemetry tab) under TX1. Press Refresh to update the status.
This feature only shows for Environmental Satellite Radio Type.
10.6.6. Antenna Aim This is another feature of Environmental Satellite telemetry. It helps the installer correctly point the satellite antenna. The system will compute the antenna azimuth and elevation based up the current location of Satlink (provided by Satlink’s GPS) and the Satellite type (chosen by the customer).
Satellite type: Select the satellite type in use Satellite longitude: Enter the satellite longitude Station latitude and longitude: These values may be calculated automatically by pressing the button with the blue map icon. The values may also be entered manually Antenna azimuth and elevation: These values are calculated when you press the Calculate button Press the Calculate button to calculate azimuth and elevation
In the example above, the azimuth is 176.75 and the elevation is 45.92.
This means the antenna will be pointed up to the satellite with the angle of the antenna boom WITH RESPECT TO THE GROUND forming a 45.92 degree angle. (0 degrees means the antenna

Sutron Corporation Satlink Operations & Maintenance Manual pg. 122
will point horizontally to the ground and 90 degrees means the antenna will be pointing straight up in the air.)
The azimuth is the reading in degrees from true north. Note that the GPS system is not impacted by the magnetic variations that usually impact compasses so the reading may be used directly. In this example, the antenna boom will mostly point due south or 176.75 degrees. A value of 0 means the antenna points due north and a value of 180 means it is pointed due south. Similarly a reading of 270 degrees would point the antenna due west.
10.6.7. Radio Diags This button is used for Iridium and Cell telemetry setups. Pressing it will bring up a Diagnostics window that shows the current status of the Iridium or Cell modem, along with signal strength information. The information will automatically upgrade and graph the signal strength over time.
Besides signal strength, information provided includes the time when the modem last connected to the network, contents of the last received message, phone number, IP address, and IMEI.
For Iridium modems, the Diagnostics window brings up the Message Check option. Pressing this button causes Satlink to immediately contact the Iridium gateway or the Cellphone network and ask for new incoming messages. The most recently received message since power on will be shown in the Diagnostics window.
For cell modems, the Diagnostics window offers the Send SMS option. It may be used to send a text message to any cell number provided. The text message will contain the station name and current time.
Data usage metrics are shown in the Diagnostics window. They only apply to Iridium and Cell telemetry. The system will track
Number of bytes transmitted today Number of bytes received today Number of bytes transmitted lifetime Number of bytes received lifetime

Sutron Corporation Satlink Operations & Maintenance Manual pg. 123
Please note that these numbers are estimates. To get accurate data usage, especially over the cellular network, please contact the network provider.
Clearing the status will clear the data usage tallies.

Sutron Corporation Satlink Operations & Maintenance Manual pg. 124
11. Other Setup The Other Setup tab provides settings for Wi-Fi, Logging, Digital Output DOUT and Modbus. The settings for each is described below.
11.1. Wi-Fi The Wi-Fi section controls the operation of the Wi-Fi hot spot built into SL3.
Please note that this Wi-Fi hotspot is NOT connected to the internet.
The purpose of the Wi-Fi hotspot is to allow someone who is on site to connect to Satlink with a mobile phone, a tablet, or a laptop wirelessly. This hotspot is not connected to the internet. It is a one on one connection between Satlink and the computer.
The range of the Wi-Fi is circumstantial. Direct line of sight may provide access within 100 feet.
For instructions on how to connect to Satlink via Wi-Fi, please see CONNECTING VIA WI-FI.
To insure security, please enable Wi-Fi password protection. The Wi-Fi security is distinct from Satlink’s password protection. Even if Wi-Fi security is not enabled, Satlink is still protected by its SECURITY
Saltink only turns on the Wi-Fi hot spot at certain times. There are two settings that control when Satlink3 turns on the Wi-Fi hotspot:
Wifi Enable: If this setting is off, Satlink3 will never turn on it’s Wi-Fi automatically. It will only turn on when the front button is pressed or when the WIFI ON command is issued.
Please note that pressing the wakeup button will turn on the Wi-Fi hotspot even if Wifi Enable is off.
Wifi Always On: if this setting is on, the Wi-Fi spot provided by SatlinkSatlink3 will always be turned on. Turning this setting on will result in increased power consumption, but it will make Satlink3 always available to connect to.
Wifi Security enable: This setting enables WPA2-AES security. A pass phrase must be entered to allow Wi-Fi access.
The table below describes when the Wi-Fi hotspot is on.
Wifi Enable
Wifi Always On
Result
OFF - The Wi-Fi hotspot is off. It is only turned on if the wakeup button is pressed. It stays on for one hour after the button press.
ON ON The Wi-Fi hotspot is always on.
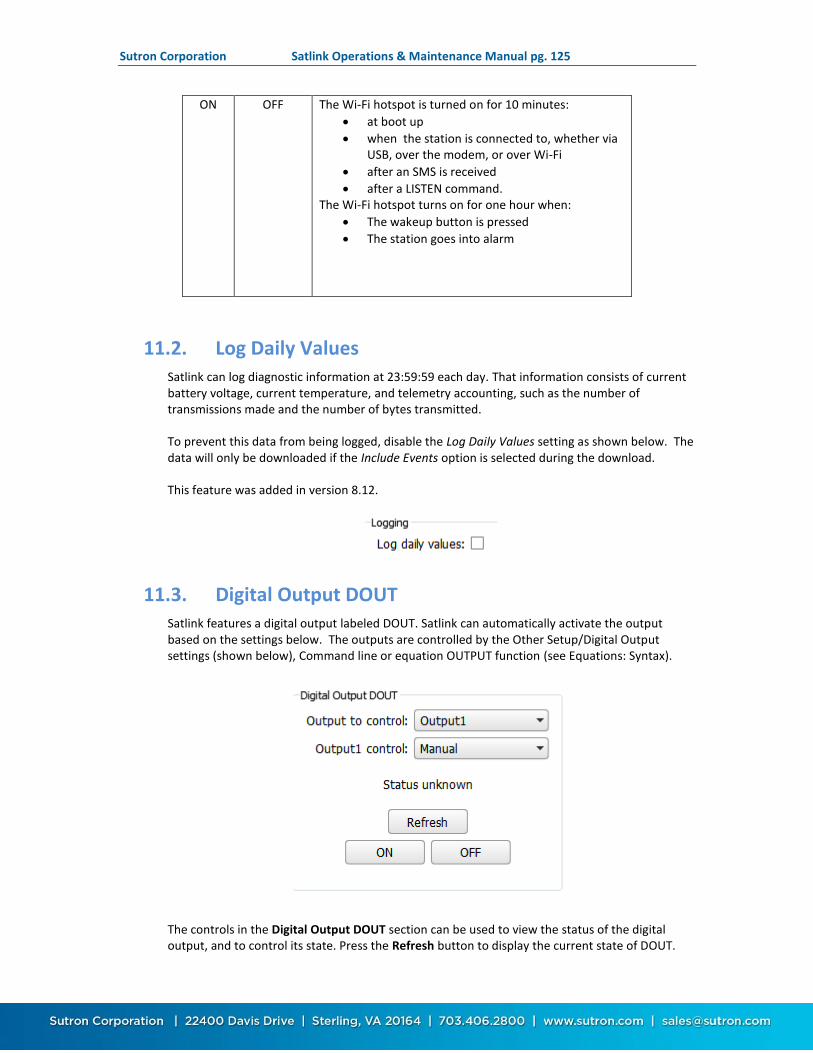
Sutron Corporation Satlink Operations & Maintenance Manual pg. 125
ON OFF The Wi-Fi hotspot is turned on for 10 minutes:
at boot up
when the station is connected to, whether via USB, over the modem, or over Wi-Fi
after an SMS is received
after a LISTEN command. The Wi-Fi hotspot turns on for one hour when:
The wakeup button is pressed
The station goes into alarm
11.2. Log Daily Values Satlink can log diagnostic information at 23:59:59 each day. That information consists of current battery voltage, current temperature, and telemetry accounting, such as the number of transmissions made and the number of bytes transmitted.
To prevent this data from being logged, disable the Log Daily Values setting as shown below. The data will only be downloaded if the Include Events option is selected during the download.
This feature was added in version 8.12.
11.3. Digital Output DOUT Satlink features a digital output labeled DOUT. Satlink can automatically activate the output based on the settings below. The outputs are controlled by the Other Setup/Digital Output settings (shown below), Command line or equation OUTPUT function (see Equations: Syntax).
The controls in the Digital Output DOUT section can be used to view the status of the digital output, and to control its state. Press the Refresh button to display the current state of DOUT.

Sutron Corporation Satlink Operations & Maintenance Manual pg. 126
The current state is displayed just above the button. Press the ON button to turn DOUT on. Press the OFF button to turn DOUT off.
Satlink can automatically operate the outputs based on alarm conditions. The output control setting determines what Satlink will do.
Manual The output is not operated on alarm. It can be operated via equations or command line.
Alarm in only The output is turned on when SL3 has a measurement that goes into alarm. The output remains on until it is turned off manually.
Alarm in and out The output is turned on when SL3 has a measurement that goes into alarm. The output is turned off when the measurement goes out of alarm.
Warning: controlling an output via alarms and also by equations or command line can have unpredictable results.
The digital outputs are DOUT#1 (Output1) and DOUT#2 (Output2). The digital output is an open collector type output. This provides direct interface to many products. The open collector output sinks 100mA (rated at >400mA) on a continuous basis.
It is expected that a pull-up resistor will be connected to the Prot+12V or other supply. The value of the pull-up may be determined by the impedance of the connected load. A10 kOhm resistor may be used as a default.
With a pull-up resistor connected When the output is turned on, the output sinks current from all attached devices. When the output is turned off, the output is pulled up to the supplying voltage.
11.3.1. Programmable Voltage References The built-in excitation reference voltage in SL3-1 is 2.5 volts available on pins 26 and 30. SL3-1 also supports a programmable excitation reference voltage via an optional plug in card. This may be used in place of the 2.5VREF when you need a different excitation voltage for a sensor.
The optional card (Sutron part 6461-1328) can be plugged into either Option port 1 or 2. Note: You must issue the command OPTION PORT 1 = PREF (or OPTION PORT 2 = PREF) when you first install the PREF card in SL3. The card provides two outputs labeled PREF1 and PREF2. The output voltage turns on whenever SL3 turns on VREF.
The outputs have a range of 0 to 5VDC. The desired output is set via the menu on the options tab:

Sutron Corporation Satlink Operations & Maintenance Manual pg. 127
The PREF board has the following terminals:
GND, PREF1, GND, PREF2
11.4. Output Satlink includes two digital output labeled as DOUT 1 and DOUT2.
The digital output may be activated via several means.
Manually via command line. A command may be sent using LinkComm by directly connecting to Satlink via USB, sending GPRSLink an SMS, sending an email to an IRIDIUMLink, or via any other means of connecting to Satlink.
Alarms: any sensor going into alarm may trigger the digital output.
Equations: any measurement setup with the Output function in an equation may pulse the digital output for a specified amount of time. Please see the Equations Syntax section on page 96 for details.
Satlink can automatically activate the output based on alarms. The setting Output1 Control dictates whether alarm activity triggers the output.
The setting Output1 Control can be set to:
Manual: Satlink will do nothing with the digital output when it goes into and out of alarms.
Alarm In: Satlink turns on digital output when any measurement goes into alarm. Satlink does nothing with the output when it goes out of alarm.
Alarm In And Out: Satlink turns on digital output when any measurement goes into alarm and it turns off digital output when any measurement goes out of alarm.
Output 1 can be controlled manually. You can send a message or connect via LinkComm in order to control the output.
LinkComm has the Output1 Control setting on the Other Setup dialog. Pressing the Control button on the same tab will bring up the Output Control window which can be used to see the current state and to control DOUT.
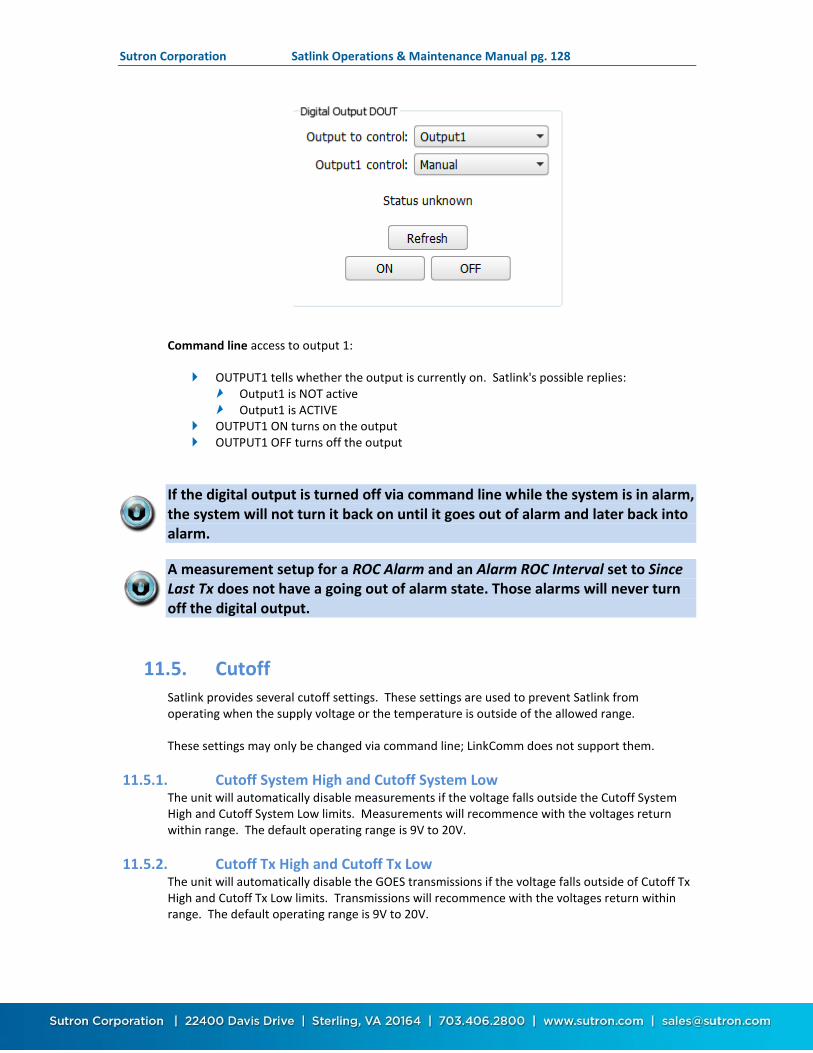
Sutron Corporation Satlink Operations & Maintenance Manual pg. 128
Command line access to output 1:
OUTPUT1 tells whether the output is currently on. Satlink's possible replies: Output1 is NOT active Output1 is ACTIVE
OUTPUT1 ON turns on the output OUTPUT1 OFF turns off the output
If the digital output is turned off via command line while the system is in alarm, the system will not turn it back on until it goes out of alarm and later back into alarm.
A measurement setup for a ROC Alarm and an Alarm ROC Interval set to Since Last Tx does not have a going out of alarm state. Those alarms will never turn off the digital output.
11.5. Cutoff Satlink provides several cutoff settings. These settings are used to prevent Satlink from operating when the supply voltage or the temperature is outside of the allowed range.
These settings may only be changed via command line; LinkComm does not support them.
11.5.1. Cutoff System High and Cutoff System Low The unit will automatically disable measurements if the voltage falls outside the Cutoff System High and Cutoff System Low limits. Measurements will recommence with the voltages return within range. The default operating range is 9V to 20V.
11.5.2. Cutoff Tx High and Cutoff Tx Low The unit will automatically disable the GOES transmissions if the voltage falls outside of Cutoff Tx High and Cutoff Tx Low limits. Transmissions will recommence with the voltages return within range. The default operating range is 9V to 20V.

Sutron Corporation Satlink Operations & Maintenance Manual pg. 129
11.5.3. Cutoff Temp Tx High and Cutoff Temp Tx Low The unit will automatically disable the GOES transmissions if the temperature falls outside user specified limits. Transmissions will recommence with the temperatures return within range. The default range in -45C to +80C.
Below is a list of all the cutoff captured from command line usage:
Cutoff System High = 20.00 V, Range (14.00, 20.00)
Cutoff System Low = 9.00 V, Range (9.00, 13.00)
Cutoff Tx High = 20.00 V, Range (14.00, 20.00)
Cutoff Tx Low = 9.00 V, Range (9.00, 13.00)
Cutoff Temp Tx High = 85.0 C, Range (40.0, 100.0)
Cutoff Temp Tx Low = -45.0 C, Range (-80.0, -20.0)
11.6. Iridium Please see the IRIDIUM GLOBAL SETTINGS section for a description of these settings.
11.7. Cell Please see the CELL GLOBAL SETTINGS section for information on these fields.
11.8. Log Download Format The settings in this section define the format of data downloaded from Satlink, whether the download occurs in LinkComm, or to USB thumb-drive.
The Format setting may be “Standard CSV”, “Legacy CSV”, or “Custom”.
11.8.1. “Standard CSV” Log Download Format The “Standard CSV” format follows the export formatting conventions you will find in most Sutron data loggers. The format of the data is as follows: date,time,label,value,units,quality. For example:
02/28/2017,12:45:00,Batt,13.5,V,G
11.8.2. “Legacy CSV” Log Download Format The “Legacy CSV” format follows the export formatting conventions you would find in early Satlink logging transmitters. The format of the data is as follows: label,date,time,value,quality. For example:
Batt,02/28/2017,12:45:00,13.5,G

Sutron Corporation Satlink Operations & Maintenance Manual pg. 130
11.8.3. “Custom” Log Download Format The “Custom” log download format allows you to specify a custom format for not only the measurement values, but also for the header and descriptor portions of the output file. When Format is set to “Custom”, three setup properties become visible.
The three setup properties used to define the format of downloaded data files are:
Log Header Format Log Descriptor Format Log Measurement Format
The format strings you’ll use in each of these setup properties consist of VARIABLEs, ESCAPE SEQUENCEs, and FIELDs. Any text that isn't recognized as a VARIABLE, ESCAPE SEQUENCE, or FIELD, appears as-is in the final output.
VARIABLE Replaced with dynamic data from Satlink. Always upper-case and typically wrapped in <> characters (date and time variables are not wrapped in <> characters).
ESCAPE SEQUENCE Character preceded by "\" character, e.g., "\r\n", for inserting new-lines, tabs, etc.
FIELD Replaced with descriptive text from Satlink. Always upper case.
Log Header Format The Log Header Format entry defines the header that appears at the top of the file. Its maximum length is 511 bytes. The entry may be blank. The following example defines the standard header (when selected for inclusion in the download):

Sutron Corporation Satlink Operations & Maintenance Manual pg. 131
STATION,VERSION\r\n<STATION>,<VERSION>\r\nLABEL,TYPE,SLOPE,OFFSET,EQUATION\r\n
Variables that may be used when defining the Log Header Format entry:
<SERIALMICRO>, micro board serial number, e.g., "1242671" <SERIALPRODUCT>, product serial number, e.g., "32XY812" <SERIALTX>, transmitter serial number, e.g., "0023354" <STATION>, station name, e.g., "RedRiver" <STARTTIME>, directive to use start time of log download when formatting a date-time
for use in the header. The directive itself is not replaced by text, only date-time variables following the directive.
<STOPTIME>, directive to use stop time of log download when formatting a date-time for use in the header. The directive itself is not replaced by text, only date-time variables following the directive.
<VERSION>, firmware version information, e.g., "Sutron Satlink 3..."
Log Descriptor Format The Log Descriptor Format entry defines measurement settings, and appears after the header, if any. Its maximum length is 127 bytes. The entry may be blank. The following example defines the standard descriptor (when selected for inclusion in the download):
<LABEL>,<TYPE>,<SLOPE>,<OFFSET>,<EQUATION>\r\n
Variables that may be used when defining the Log Descriptor Format entry:
<EQUATION>, equation of a measurement, e.g., "X+1" <LABEL>, label of a measurement, e.g., "Batt" <OFFSET>, offset of a measurement, e.g., "0.0" <SLOPE>, slope of a measurement, e.g., "1.0" <TYPE>, type of a measurement, e.g., "SDI-12"
Log Measurement Format The Log Measurement Format entry follows the descriptor (if any), and defines the format of each measured value. The following example defines the standard measurement format:
MM/DD/YYYY,HH:MM:SS,<NAME>,<VALUE>,<UNITS>,<Q>\r\n
Variables that may be used when defining the Log Measurement Format entry:
<NAME>, name (label) of a reading, e.g., "Batt" <Q>, quality of a reading (short), e.g., "G" <QUALITY>, quality of a reading (long), e.g., "Good" <UNITS>, units of a reading, e.g., "ft" <STATION>, station name, e.g., "RedRiver"
Date and Time Variables The following are examples illustrate how to specify date and time variables in format strings:
MM, 2-digit month, e.g., "12" DD, 2-digit day, e.g., "01" YY, 2-digit year, e.g., "16" YYYY, 4-digit year, e.g., "2016" HH, 2-digit hour, e.g., "12"

Sutron Corporation Satlink Operations & Maintenance Manual pg. 132
MM, 2-digit minutes, e.g., "03" SS, 2-digit seconds, e.g., "22"
Note, for measured data, date-time comes from the time of the data. For header and descriptor, date-time is current time, unless <STARTTIME> or <STOPTIME> has been specified (see below). Also note, context determines whether the formatter uses minutes or months for "MM".
Escape Sequences Backslash ("\") is used to insert special characters, or to ignore formatting:
\r inserts a carriage return \n inserts a line feed \r\n inserts standard line ending for files on Windows \t inserts a tab (use CTRL-TAB key combination in LinkComm) \\ inserts a single backslash A backslash preceding a field name means insert the literal field name, e.g., "\STATION"
results in "STATION".
Fields Fields are replaced with standard descriptive text from Satlink, which may change between firmware versions. Fields are always upper case.
LABEL, e.g., "Label" OFFSET, e.g., "Offset" STATION, e.g., "Station Name" SLOPE, e.g., "Slope" SERIALPRODUCT, e.g., "SerialNo Product" SERIALMICRO, e.g., "SerialNo Micro" SERIALTX, e.g., "SerialNo Tx" TYPE, e.g., "Meas Type" VERSION, e.g., "model and version"
Fixed Width Output Vertical bar characters are used to fix column width and alignment. For example:
|11:<VALUE>| : Left aligned, width 11 |<VALUE>:11| : Right aligned, width 11 |11:<VALUE>:| : Centered, width 11
Optional Output Brackets are used to signal output that should be populated only if at least one of the contained variables is non-blank, or in the case of the quality field, bad quality. The following examples makes both units and quality optional in measurement output:
MM/DD/YYYY,HH:MM:SS,<NAME>,<VALUE>[,<UNITS>,<Q>]\r\n
Optional fields may be nested.
11.9. Modbus Please refer to the MODBUS section for details.
Sutron Corporation Satlink Operations & Maintenance Manual pg. 133
12. Telemetry
12.1. Iridium Telemetry Satlink may be equipped with an optional Iridium module. The module is plug and play and fits into one of the two option ports found on SL3-1. When so equipped, Satlink is capable of sending transmissions and receiving messages using the Iridium satellite network.
There are reasons for using Satlink with Iridium:
It may be used to provide two way remote communications with Satlink. Iridium may be used for redundant telemetry, duplicating all data transmitted via GOES. Iridium may be used to provide a reliable and timely way of sending alarms. Iridium may be used to retrieve data from missing transmissions (see SMS NOTIFICATIONS
IF Cell Notifications Enable is enabled by the customer, Satlink reports certain events via SMS to a list of user-entered phone numbers (SMS Notify Phone A and SMS Notify Phone B). The purpose of this feature is to notify the customer that a major event has transpired at the station. This feature was added with version 8.13.
SMS notifications are meant to be sent to a customer's cell phone. They are meant to be immediately read by a person (rather than a computer, like Hydromet Cloud). SMS notifications are the way for a customer to receive notices about station issues on his cell phone.
The following events may cause notifications:
Alarms: Details such as which measurement went into alarm and the measurement reading
Station Rebooted: The time the station rebooted is sent along with the kind of reboot (power on, watchdog reset, upgrade, etc).
Recording on/off: When recording is started or stopped, a SMS message will be sent
Transmission failure
SDI-12 sensor failure
Measurement failure
Any error
The following settings control the events that cause notifications:
Notify On Bootup Notify On Recording Notify On Tx Fail Notify On Alarms Notify On SDI12 failure Notify On Measurement error Notify On Any error
Please note that there is some overlap between the error notifications.
Only one error notification is sent at a time and only one error notification is sent per day. This means that additional errors may be not be reported.

Sutron Corporation Satlink Operations & Maintenance Manual pg. 134
The cell modem will be kept on for 15 minutes after a notification is issued, allowing the customer to send a follow up SMS to get more information. For example, replying to a notification SMS with the text “!ERROR” will cause the station to reply with an SMS containing the list of errors.
All notifications have the same format. Up to two SMS are sent per notification; please note that not all the data may fit. Here are some examples:
The station name is on the first line of the message. The current station time is on the second line. The next line contains the event that caused the notification, e.g. “Alarm In”, “Error”. If appropriate, error details are on the next line. The most recent measurements are listed next, along with the alarm state for each. E.g.
“TEMP 25.5 C” At the end of the SMS are the number of transmissions made today, e.g. “TX3 today:
good 31, bad 3”
Below is an example of a boot up notification. There is no measurement data because the system had no time to make a reading.
Satlink Sutron Satlink 3
2017/11/07 15:25:54
Reset Soft
TX3 today: good 0, bad 0
Here is an alarm notification:
Satlink Sutron testbase
2017/11/07 17:05:07
Into Alarm
BATT 16.215 V Into Alarm
TEMP 24.50 C
MINO 1025
Sense4 -99999.00
TX3 today: good 3, bad 0
Missing Data Retrieval). Satlink’s flexible telemetry setup allows for any or all of those scenarios. Please see the IRIDIUM SETUP section for details on setting up Iridium.
Iridium satellite coverage is available everywhere. The diagram below shows how the signal travels through the Iridium Gateway to an email address, etc.

Sutron Corporation Satlink Operations & Maintenance Manual pg. 135
12.1.1. Iridium Antenna Placement The Iridium antenna must be placed where it has a clear view of the sky.
Iridium satellites are not geostationary. This means that coverage of a certain area may vary from one minute to the next. To be considered reliable, the station must have a strong signal for 10 to 20 minutes.
The antenna-aiming feature can aid in correct station setup. It will show the current signal strength. Signal strength ranges from 0 (no signal) to 5 (excellent signal).
A signal strength of 4 or higher indicates a strong signal. Satlink needs to consistently report a strong signal for 10 to 20 minutes to indicate good
antenna placement. If signal strength is varying, the antenna's view of the sky is obstructed. In theory, any signal strength above 0 means that a transmission can be made.
However, to ensure reliable and consistent data transmissions, reposition the antenna to get better signal.
A signal strength of 0 indicates that there is no signal at all; Satlink will not be able to make any Iridium transmissions.
When installing the station, make sure Satlink consistently reports a signal strength of 4 or higher for at least 10 minutes.
12.1.2. Short Burst Data Satlink uses the Iridium Short Burst Data (SBD) capability to send transmissions and receive messages.
Satlink uses messages to communicate via Iridium. Messages may be sent to Satlink via Iridium, and Satlink may send messages in return.
Each message may contain up to 340 bytes.
Sutron Corporation Satlink Operations & Maintenance Manual pg. 136
12.1.3. Transmission Data Content Each measurement is independently setup with the data content for each transmission. Please see section TRANSMISSION DATA CONTENT SETTINGS for details.
A single message can only hold a limited amount of data. If there is more data than can fit, multiple transmissions will have to be sent. In order to receive the freshest data, the transmission interval should be set such that only one message is sent at one time. Given the choice of getting one transmission every 15 minutes or getting two back-to-back transmissions every 30 minutes, opt for the 15 minute data. The price is the same, but the data is refreshed more frequently.
Satlink will send up to five separate SBD messages for each transmission, providing a maximum capacity of 1655 bytes worth of data. If that is not enough data, increase the transmission interval or setup two different Iridium transmissions.
Iridium Setup Please see the IRIDIUM SETUP section for details on setting up Iridium.
Iridium Message Checking When an Iridium Scheduled transmission is made, Satlink is notified of any incoming messages. Checking for messages in this fashion does not incur any additional data usage costs.
If your station is set up to make transmissions every 30 minutes, that means that it will take up to 30 minutes for Satlink to receive any messages sent to it. If that is too long, you may consider turning on Listening. Please see the Iridium Setup section for more on Listening and message checking.
12.1.4. Sending Messages to Satlink via Iridium Satlink with Iridium can have messages sent to it via emails that get routed through the Iridium system.
If Listening is enabled, Satlink receives messages immediately. In this mode, the modem is always on, and the station consumes more power.
If Listening is disabled, Satlink checks for messages when it makes a transmission. If the station is set up with a Tx Interval of 15 minutes, it may take up to 15 minutes for the station to receive the message sent to it. With Listening disabled, Satlink turns off the modem between transmissions to save power.
Additionally Satlink can be setup to do periodic message checking. No matter how it is setup, Satlink will do a message check every 24 hours as long as it has power. Please see the Iridium Setup section for more on Listening and message checking.
When Satlink is turned on, it keeps the Iridium modem on for ten minutes. During that time, it will receive messages immediately. When it does receive a message, Satlink will keep the modem turned on for ten additional minutes to facilitate additional message conversations.
Messages are treated like command line input with a few differences. Some commands cannot be executed via a message (e.g. log download). Other commands may have a differently formatted output (in order to reduce message size).

Sutron Corporation Satlink Operations & Maintenance Manual pg. 137
Do not forget to precede the commands with an exclamation point if you want the station to reply.
To check the status of your station, send it the message
!STATUS
Password protected stations will need login information to be the very first thing in a message:
LOGIN=XXX; !STATUS
Satlink remembers the last message received since boot up. To see it, press the Radio Diags button on LinkComm's Telemetry tab or issue the STATUS TX command.
Email is used to send messages to Satlink via Iridium.
The email message must be sent to [email protected] The email's subject must be the IMEI of the Iridium modem. The IMEI may be seen by
pressing the Radio Diags window of LinkComm’s Telemtry tab. Each transmission made by Satlink over Iridium will be stamped with its unique IMEI.
The email needs an attachment containing the command(s) to be sent. The attachment is a simple text file and it must have the .sbd extension. Example file names: Status.sbd, MultiCmd.sbd
The body of the email should be blank. Do not put commands for Satlink into the body of the email.
The attachment may not be larger than 270 bytes. Each command may be replied with no more than two messages, for a total of 680 bytes. The first byte of this file must be an ! in order for Satlink to send a reply. E.g. !STATUS Multiple commands may be sent in a single message. Commands can be separated with a
new line or a semicolon ; E.g. !LAST; !STATUS;
12.2. Cellular Telemetry Satlink may be equipped with a cellular modem. The cell modem provides Satlink with internet connectivity and the ability to send and receive SMS (text messages).
Depending on the modem and the network service, Satlink can
Deliver sensor data on a regular schedule, much like the environmental satellite radio. Deliver timely alarm notifications. Send data via SMS (text messages) and via TCP/IP (internet). Allow remote LinkComm connections over the internet. Receive command line commands via text messages; respond to said commands.
When the modem is online, LinkComm may be used to remotely connect to Satlink. Such connections are very similar to being directly connected to Satlink via USB cable: one may download the log, change the setup, and upgrade Satlink’s firmware.
Sutron Corporation Satlink Operations & Maintenance Manual pg. 138
There are several good reasons for including a cell modem in your Satlink station:
Two way communications High bandwidth remote station access Reliable and timely alarm notifications Redundant telemetry SMS NOTIFICATIONS IF Cell Notifications Enable is enabled by the customer, Satlink reports certain events via
SMS to a list of user-entered phone numbers (SMS Notify Phone A and SMS Notify Phone B). The purpose of this feature is to notify the customer that a major event has transpired at the station. This feature was added with version 8.13.
SMS notifications are meant to be sent to a customer's cell phone. They are meant to be immediately read by a person (rather than a computer, like Hydromet Cloud). SMS notifications are the way for a customer to receive notices about station issues on his cell phone.
The following events may cause notifications:
Alarms: Details such as which measurement went into alarm and the measurement reading
Station Rebooted: The time the station rebooted is sent along with the kind of reboot (power on, watchdog reset, upgrade, etc).
Recording on/off: When recording is started or stopped, a SMS message will be sent
Transmission failure
SDI-12 sensor failure
Measurement failure
Any error
The following settings control the events that cause notifications:
Notify On Bootup Notify On Recording Notify On Tx Fail Notify On Alarms Notify On SDI12 failure Notify On Measurement error Notify On Any error
Please note that there is some overlap between the error notifications.
Only one error notification is sent at a time and only one error notification is sent per day. This means that additional errors may be not be reported.
The cell modem will be kept on for 15 minutes after a notification is issued, allowing the customer to send a follow up SMS to get more information. For example, replying to a notification SMS with the text “!ERROR” will cause the station to reply with an SMS containing the list of errors.
All notifications have the same format. Up to two SMS are sent per notification; please note that not all the data may fit. Here are some examples:
The station name is on the first line of the message. The current station time is on the second line.

Sutron Corporation Satlink Operations & Maintenance Manual pg. 139
The next line contains the event that caused the notification, e.g. “Alarm In”, “Error”. If appropriate, error details are on the next line. The most recent measurements are listed next, along with the alarm state for each. E.g.
“TEMP 25.5 C” At the end of the SMS are the number of transmissions made today, e.g. “TX3 today:
good 31, bad 3”
Below is an example of a boot up notification. There is no measurement data because the system had no time to make a reading.
Satlink Sutron Satlink 3
2017/11/07 15:25:54
Reset Soft
TX3 today: good 0, bad 0
Here is an alarm notification:
Satlink Sutron testbase
2017/11/07 17:05:07
Into Alarm
BATT 16.215 V Into Alarm
TEMP 24.50 C
MINO 1025
Sense4 -99999.00
TX3 today: good 3, bad 0
Missing Data Retrieval
Please note that cell modem operation requires network coverage and network service. Network service generally requires a service contract that involves monthly and/or per usage charges.
12.2.1. Antenna Placement A Satlink with a cell modem must be installed in places with usable cell phone coverage. The antenna aiming feature can help determine the quality of signal at installation time.
12.2.2. Two-Way Communication When the cell modem is online, you may use LinkComm to download the log, change the setup, check the status, upgrade the firmware, and do almost any other operation that can be done over USB.
12.2.3. Scheduled Transmissions Scheduled transmissions over cell are similar to Environmental Satellite Scheduled transmissions. Satlink is set up with a time and interval dictating how often to deliver data. At designated times, Satlink will power up the modem, establish a connection to the internet, get in touch with the server and deliver the data. To use scheduled transmissions, Satlink needs to be set up with the internet address of a primary server and, optionally, a backup server so that it knows where to deliver the data. The backup server is contacted only if the primary server cannot be reached.

Sutron Corporation Satlink Operations & Maintenance Manual pg. 140
If internet service is not an option, Satlink may be setup to transmit data via SMS (text messages). Data can be delivered to up to three cell phone numbers for each telemetry setup.
12.2.4. Listening A Satlink can be set up to always be listening, which means that it will act as a server, accepting TCP/IP incoming connections. Sutron's AutoPoll PC software can periodically reach out to a listening Satlink station and collect sensor data from Satlink. In the listening mode, Satlink will keep the modem on at all times, resulting in higher power consumption.
The transmission status (use LinkComm's Telemetry tab or issue STATUS TX command) indicates the IP address assigned to Satlink by the service provider. The Listen Port setting determines which port Satlink remains open.
You can send Satlink a message with the LISTEN command that would cause it to temporarily go into listening mode.
Listening is automatically turned on by Satlink for 10 minutes :
At boot up When the station is connected to, whether via USB, over the modem, or over Wi-Fi When an SMS is received
When the front panel button is pressed, and when the station goes into alarms, listening is automatically turned on for one hour.
12.2.5. SMS Notifications If Cell Notifications Enable is enabled by the customer, Satlink reports certain events via SMS to a list of user-entered phone numbers (SMS Notify Phone A and SMS Notify Phone B). The purpose of this feature is to notify the customer that a major event has transpired at the station. This feature was added with version 8.13.
SMS notifications are meant to be sent to a customer's cell phone. They are meant to be immediately read by a person (rather than a computer, like Hydromet Cloud). SMS notifications are the way for a customer to receive notices about station issues on his cell phone.
The following events may cause notifications:
Alarms: Details such as which measurement went into alarm and the measurement reading
Station Rebooted: The time the station rebooted is sent along with the kind of reboot (power on, watchdog reset, upgrade, etc).
Recording on/off: When recording is started or stopped, a SMS message will be sent
Transmission failure
SDI-12 sensor failure
Measurement failure
Any error
The following settings control the events that cause notifications:
Notify On Bootup Notify On Recording

Sutron Corporation Satlink Operations & Maintenance Manual pg. 141
Notify On Tx Fail Notify On Alarms Notify On SDI12 failure Notify On Measurement error Notify On Any error
Please note that there is some overlap between the error notifications.
Only one error notification is sent at a time and only one error notification is sent per day. This means that additional errors may be not be reported.
The cell modem will be kept on for 15 minutes after a notification is issued, allowing the customer to send a follow up SMS to get more information. For example, replying to a notification SMS with the text “!ERROR” will cause the station to reply with an SMS containing the list of errors.
All notifications have the same format. Up to two SMS are sent per notification; please note that not all the data may fit. Here are some examples:
The station name is on the first line of the message. The current station time is on the second line. The next line contains the event that caused the notification, e.g. “Alarm In”, “Error”. If appropriate, error details are on the next line. The most recent measurements are listed next, along with the alarm state for each. E.g.
“TEMP 25.5 C” At the end of the SMS are the number of transmissions made today, e.g. “TX3 today:
good 31, bad 3”
Below is an example of a boot up notification. There is no measurement data because the system had no time to make a reading.
Satlink Sutron Satlink 3
2017/11/07 15:25:54
Reset Soft
TX3 today: good 0, bad 0
Here is an alarm notification:
Satlink Sutron testbase
2017/11/07 17:05:07
Into Alarm
BATT 16.215 V Into Alarm
TEMP 24.50 C
MINO 1025
Sense4 -99999.00
TX3 today: good 3, bad 0

Sutron Corporation Satlink Operations & Maintenance Manual pg. 142
12.3. Missing Data Retrieval In the case of transmission failures, Satlink offers several ways of retrieving the data from the missing transmissions. Only sensor data collected and logged by Satlink may be retrieved; data handed to Satlink by other loggers may not be retrieved in this fashion.
12.3.1. On Site Data Retrieval To retrieve missing data when on-site, download Satlink’s log. Either use a USB thumb drive or connect to Satlink with LinkComm in order to download the log.
12.3.2. Remote Data Retrieval Environmental Satellite transmissions are one way transmissions. If the only radio that Satlink is equipped with is the Environmental Satellite radio, there is not a way of retrieving data remotely. The optional Iridium and Cell modules provide a means of remotely accessing Satlink.
TCP/IP Connection If Satlink has a cell modem module, a TCP/IP connection may be established using LinkComm. Once the session is established, download Satlink’s log the same way you would as if you were on-site.
Messaging If Satlink is equipped with the Iridium or the Cell module, it is possible to send Satlink a message requesting the missing data. Please see the REPEAT TX DATA section below.
Repeat Tx Data Repeat tx data requests may be used to get missing data from a Satlink. These requests may be issued when directly connected to Satlink (via USB, RS-232, Wi-Fi) and they may be issued remotely (e.g. via Iridium). Satlink will reply to these requests by providing transmission data that would have been transmitted at some point in the past.
In order to have Satlink repeat a transmission, apply the REPEAT option to the TXFORM command along with a date/time of the missing transmission. Satlink will reply immediately with the data.
Syntax: TXx TXFORM REPEAT YYYY/MM/DD HH:MM:SS TXx may be any Tx (e.g. TX2, TX3) YYYY/MM/DD HH:MM:SS is the date/time of the Tx data that needs to be provided
Here is a capture of the command line session:
!TX1 TXFORM RETX 2016/6/20 23:00:30
:BATT 0 #10 10.887 11.032 11.232 10.971 11.316 11.111 :TEMP 0 #10
28.25 28.25 28.00 28.25 27.75 27.50
Here is a usage scenario:
Customer is missing a GOES Tx that should have happened at 2016/6/20 23:00:30. Customer sends an Iridium message with the syntax !TX1 TXFORM REPEAT 2016/6/20 23:00:30 Satlink eventually replies via an Iridium message with

Sutron Corporation Satlink Operations & Maintenance Manual pg. 143
6:BATT 0 #10 10.887 11.032 11.232 10.971 11.316 11.111 :TEMP 0 #10 28.25 28.25 28.00 28.25 27.75 27.50
Please note that Satlink does NOT make a GOES transmission. It simply replies to the command with tx data. In this example, Satlink was asked for data via Iridium, so it replied via Iridium. If it had been asked via RS-232, it would have replied via RS-232.
A note about timestamps in the repeat Tx data: The timestamps are the same as if the Tx were made at the provided time, rather than indicating the true age of the data. This meas that the sensor data in the Tx is exactly the same as that of the Tx made in real time (which is 2016/6/20 23:00:30 in the example above). It is the caller's responsibility to handle the timestamps.
Why not have the timestamps indicate the true age of the data:
Unlike re-transmissions which are initiated by the logger, these repeat Tx data transmissions are initiated by someone who knows the timestamps of the missing data.
Some systems will find it easier to integrate data that is in an unmodified format. Most data formats (including SHEF and Pseudobinary B) do no support timestamps that
indicate very old data. Note that append data is NOT provided in a repeat transmission!
The capture below illustrates the difference that the REPEAT option has on the TXFORM command. Note that no date was issued with the REPEAT command, meaning it uses the current time as the time of Tx. Note the lack of append data.
>TX1 TXFORM
Tx data would look like this
:BATT 2 #10 11.347 11.423 11.385 11.377 M M :TEMP 2 #10 26.00 25.25
25.75 26.00 M M :BL -1.00 :PWR -1.0/-1.0
Current message is 108 bytes (00:00:04 seconds) out of 2218 bytes
(00:01:00 seconds)
Available space is 2110 bytes
In that message, sensor data is 83 bytes
Worst case SENSOR data (excluding append) is 138 bytes (00:00:05
seconds)
Worst case available space is 2080 bytes
2 meas are active; 2 are marked for tx
>TX1 TXFORM REPEAT
:BATT 2 #10 11.347 11.423 11.385 11.377 M M :TEMP 2 #10 26.00 25.25
25.75 26.00 M M
12.3.3. Automatic Missing Data Retrieval Cell and Iridium transmissions may be automatically retried by Satlink. Please see the RETRANSMISSIONS section.
12.4. Retransmissions Starting with version 8.13, Satlink is able to make retransmissions (ReTx). Retransmissions are retries of failed scheduled transmissions. The goal of retransmissions is to automatically retransmit data that was in the failed transmissions.

Sutron Corporation Satlink Operations & Maintenance Manual pg. 144
12.4.1. How Retransmissions Work When a scheduled transmission fails, Satlink notes the time of the failure. Once a future scheduled transmission succeeds, Satlink will proceed to re-transmit the data from the missing transmissions.
Here is an example of retransmissions in action:
o 12:00 Scheduled transmission succeeds. All is well. o 12:30 Scheduled transmission fails due to lack of network. o 13:00 Another scheduled transmission fails. o 13:30 Scheduled transmission succeeds. Network is back up. o 13:31 Retransmission with data as if it were 12:30 completes. o 13:32 Retransmission with data as if it were 13:00 completes. All previously missing
data has been transmitted. o 14: 00 Scheduled transmission completes. Back to business as usual.
12.4.2. Retransmission Setup For retransmissions to take place, the setting Retransmit must be enabled. It is enabled by default. A proper Tx Format is also needed to ensure that the data in the transmission is timestamped. Pseudobinary B is the only unacceptable format. Use Pseudobinary D instead of Pseudobinary B.
Enable Retransmit and choose any Tx Format but Pseudobinary B to take advantage of Retransmissions.
Retransmissions are only available for Iridium and Cellular telemetry. GOES and other environmental satellites cannot be setup for retransmissions.
Retransmit is the setting that controls whether retransmissions are enabled. It is on by default.
Only scheduled transmissions can be retransmitted.
For optimal retransmission performance, please use the following settings:
Radio Type: Cell or Iridium Kind: Scheduled Format: CSV, Pseudobinary D Tx Data Content: All Logged Setup needs to remain constant; changes to telemetry and measurement setup may
result in incorrect sensor data in retransmissions.
12.4.3. Notes o Toggling recording, clearing status, and changing some telemetry settings will clear out
any pending retransmissions. Rebooting a station will NOT reset transmissions. o If Satlink does not have any data logged for the relevant time period, no retransmission
will be made. o Loss of power cannot be overcome with retransmissions. o Retransmissions are only useful if Satlink is still able to collect and log sensor data. o Data older than 7 days will not be retransmitted.

Sutron Corporation Satlink Operations & Maintenance Manual pg. 145
o If there are pending retransmissions, Telemetry status will show when the first failure happened. E.g. "Retransmissions pending from 2017/11/12 12:30:00"
o Each telemetry setup has its own retransmissions.

Sutron Corporation Satlink Operations & Maintenance Manual pg. 146
13. Logging Satlink automatically logs the sensor data that it collects (see Logging Settings). Data is logged on secure flash memory with a capacity of over 1,000,000 entries.
Log usage and capacity information is available in the main status (requires version 8.11). For more details, use the STATUS LOG command.
Measurement readings are logged according to the Logging Interval (see Logging Interval). Each measurement has its own logging interval.
Logged data will not be lost if power is removed. Once the log is full, the oldest data will be overwritten.
Only logged data may be transmitted. Satlink logs events such as power up, log download, and setup change.
When downloaded, the data is presented in Sutron Standard CSV format. It is a format common to current Sutron products. A log entry looks like this:
04/02/2012,09:25:00,STAGE,20.50,FT,G
date and time (with a one-second resolution) user set measurement label (STAGE) measurement reading (20.50) user set measurement units (FT) measurement quality (G = good, B = bad)
The general format specification for Sutron Standard CSV format is:
mm/dd/yyyy,hh:mm:ss,label,data,units,quality
Here are some examples of log entries:
01/19/2015,09:30:00,Stage,1.25,ft,G 01/19/2015,09:45:00,Stage,1.27,ft,G 01/19/2015,09:50:27,Setup Change,,G
To help preserve data integrity and reliability, there is no way to erase data from the log.
13.1. Downloading the Log Logged data can be downloaded using LinkComm or via a terminal program using the LOG command. Additionally, plugging in a USB thumb drive into Satlink will automatically download the log.
The downloaded data is in Sutron Standard CSV format and can be easily displayed using Sutron’s GRAPHER program (downloadable from www.sutron.com) or common spreadsheet/word processing programs.
You can download the whole log or only parts of it. You may specify the start date and optionally the end date for the downloaded data. You may also ask for data from the last X days. Downloading via the USB thumb drive will download all the new data since last download.

Sutron Corporation Satlink Operations & Maintenance Manual pg. 147
There are options to download only data from a specific measurement. Events can be excluded from the log download.
Satlink remembers the last log download and will allow downloads since last download. This means that the only parts of the log downloaded are those that have not been previously downloaded.
13.2. Log Events Occasionally, Satlink will log events. Events are used to help troubleshoot the data.
The following actions will cause the Satlink to log an event:
Setup change (when any setting is changed) Log download (when the log is downloaded) Reset (log contains reset type and count) Errors (such as low battery and sensor failure) Before cal and after cal (logged when the user sets the sensor level to record the value
before and after the calibration) Log in events (if password is enabled), including failure to log in. Telemetry events (transmission made, message received, etc.) Alarm events
The setting Log Daily Values (Log Daily Values) determines whether certain log events are logged every day before midnight.
The setting Log Diagnostics (command line only) sets the software to log transmission diagnostic information.
13.3. Logged Time Measurements are not instant. Once initiated, a measurement takes the user-defined averaging time, plus some overhead, to complete.
For measurements without averaging, the timestamp of the logged measurement is the time the measurement was started. The same is true for transmissions. The timestamp of the transmission is the time when the transmission process was started, not when it was completed.
This means that if a SDI-12 sensor takes 1 minute to provide a result, and the measurement is setup to go every 15 minutes, the measurement will start at 00:15:00 and complete at 00:16:00. The logged data will have the timestamp of 00:15:00.
Satlink handles averaged readings in such a way that the last sample is collected at Meas Time + Meas Interval. Please see the averaging section Averaging Time, Sampling Interval, Subsamples, and Results for details.
Minimum and maximum values are logged at the time the minimum or maximum occurs, not when the measurement was scheduled. This provides knowledge of the exact time the maximum or minimum happened.

Sutron Corporation Satlink Operations & Maintenance Manual pg. 148
14. Errors During operation, Satlink may notice system errors. If it does, it will blink the red LED on the front panel.
To see the error details, check the status with LinkComm. Via command line, type STATUS to see any potential errors.
14.1. Clearing Errors Some errors can only be cleared by fixing the condition that is causing them. Most errors can be cleared with LinkComm's Clear Status button on the main tab. On the command line, type STATUS 0 to clear the errors.
14.2. Measurement Errors Measurement errors occur as the system collects sensor data. When data from the sensor contains an error, that error is logged along with the sensor reading. The system notes this error until the system is rebooted or until the error is cleared. Even if the error were to occur only once, it remains in the system until cleared or rebooted.
14.2.1. Sensor Failure This error indicates a problem with a sensor or a setup. This error is recorded for SDI-12 sensors when the SDI-12 sensor does not reply to the measure and to the data commands. It is also recorded for analog measurements when the analog to digital converter indicates a problem reading the input which could be to the input voltage being out of range or not being connected (Satlink cannot always be able to tell if an analog sensor is present).
When the sensor failure error occurs, Satlink changes the sensor reading to match the user set Log Error Value, which defaults to -99999. Such outlandish numbers are used to attract the user’s attention when viewing the log.
14.2.2. Meas Interval Too Short If this error is present, then the measurement schedule is inappropriate.
This error means that Satlink missed a scheduled measurement. This gets logged when the system realizes that more than one measurement interval has passed between two subsequent measurements. One of the following likely took place:
The system missed a scheduled measurement (likely due to measurement taking longer than Meas Interval to complete – e.g. system was told to measure every 5 seconds even though the sensor takes 10 seconds to finish a reading
Equations are enabled and the Meas Interval is short (once a second or once every two seconds). Satlink may take several seconds to compute a lengthy equation and cannot complete a measurement as quickly.
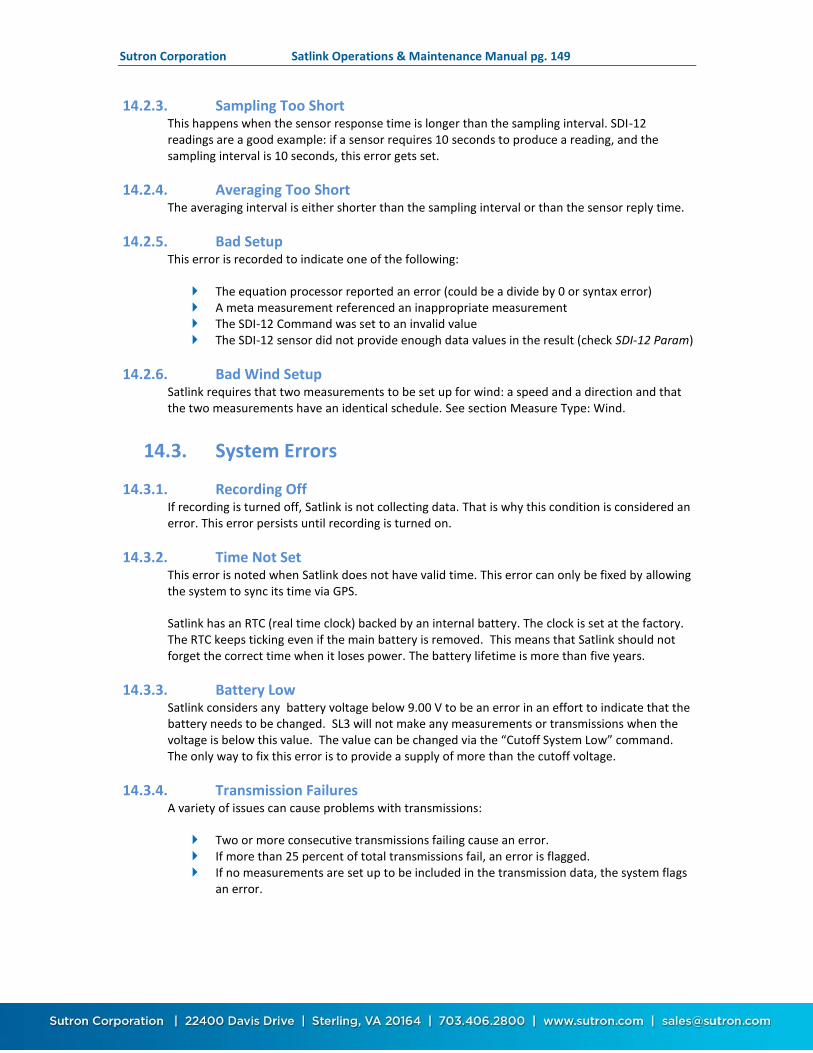
Sutron Corporation Satlink Operations & Maintenance Manual pg. 149
14.2.3. Sampling Too Short This happens when the sensor response time is longer than the sampling interval. SDI-12 readings are a good example: if a sensor requires 10 seconds to produce a reading, and the sampling interval is 10 seconds, this error gets set.
14.2.4. Averaging Too Short The averaging interval is either shorter than the sampling interval or than the sensor reply time.
14.2.5. Bad Setup This error is recorded to indicate one of the following:
The equation processor reported an error (could be a divide by 0 or syntax error) A meta measurement referenced an inappropriate measurement The SDI-12 Command was set to an invalid value The SDI-12 sensor did not provide enough data values in the result (check SDI-12 Param)
14.2.6. Bad Wind Setup Satlink requires that two measurements to be set up for wind: a speed and a direction and that the two measurements have an identical schedule. See section Measure Type: Wind.
14.3. System Errors
14.3.1. Recording Off If recording is turned off, Satlink is not collecting data. That is why this condition is considered an error. This error persists until recording is turned on.
14.3.2. Time Not Set This error is noted when Satlink does not have valid time. This error can only be fixed by allowing the system to sync its time via GPS.
Satlink has an RTC (real time clock) backed by an internal battery. The clock is set at the factory. The RTC keeps ticking even if the main battery is removed. This means that Satlink should not forget the correct time when it loses power. The battery lifetime is more than five years.
14.3.3. Battery Low Satlink considers any battery voltage below 9.00 V to be an error in an effort to indicate that the battery needs to be changed. SL3 will not make any measurements or transmissions when the voltage is below this value. The value can be changed via the “Cutoff System Low” command. The only way to fix this error is to provide a supply of more than the cutoff voltage.
14.3.4. Transmission Failures A variety of issues can cause problems with transmissions:
Two or more consecutive transmissions failing cause an error. If more than 25 percent of total transmissions fail, an error is flagged. If no measurements are set up to be included in the transmission data, the system flags
an error.

Sutron Corporation Satlink Operations & Maintenance Manual pg. 150
14.3.5. Hardware Failure This error is recorded if any hardware issues were noted since boot up. The errors will also be placed in the log. Every hardware error has a code logged with it. A hardware error usually indicates a serious problem with the unit. Contact Sutron customer support at 703 406 2800 for help with hardware errors.

Sutron Corporation Satlink Operations & Maintenance Manual pg. 151
15. Transmission Data Formats
15.1. Pseudobinary B Data Format This format is based on GOES Pseudobinary format. It is used when the user selects Pseudobinary B as the choice for Tx Format. The format uses ASCII characters. Three bytes are used for each data value. To correctly decode the measurement, you need to know how many readings of each measurement are included in the transmission. There is no metadata that would describe which measurement is which.
15.1.1. Pseudobinary B for Random Txs Random transmissions are always made using Pseudobinary B. Their formatting is unique. These are the fields that appear in Pseudobinary B Random transmissions:
Field Pseudobinary B for Scheduled and Alarm Txs
GROUP ID GROUP-ID is sent as 2 to indicate a random transmission. Compare this to scheduled transmissions which have a B1 as their ID.
OFFSET Each record is prefixed with an <OFFSET>, which is a 1 byte binary encoded number indicating the number of minutes ago the most recent data was recorded. .
MEASUREMENT DATA
Measurement data collected: This data contains only those measurements set up to be included in the transmission (see Tx Data Content). The data values are 3 byte binary encoded signed numbers allowing a range of: -131072 to +131071. The actual 6-bit binary encoded format is described later. The value transmitted will be value * 10^RightDigits. The string /// will be sent if the data was never measured or was erased. The number of values sent for each measurement is set separately for each measurement in the Scheduled Transmissions, Num values to Tx field. Note that this is different from the 8210 where the num values to Tx was the same for each sensor. As a result, Satlink Logger sends all the required values for one sensor (most recent first) before proceeding to the next measurement. In the 8210, values were interleaved.
EXTERNAL DATA [OPTIONAL]
This is data given to Satlink Logger by an external device. This data is untouched by Satlink Logger. It gets transmitted in the same way it was received. Data will only appear here if another logger gives Satlink transmission data. It is not usual to have both Measurement Data and External Data.
LAT/LONG [OPTIONAL]
This 8 byte value is appended only if the correct Append Option is selected. LAT/LONG can be decoded into D:M:S format by converting the binary values to decimal and applying the following formula: Degrees latitude = 64 * ( 1st-byte AND 63 ) + ( 2nd-Byte AND 63) − 90 Minutes latitude = 3rd-byte AND 63 Seconds latitude = 4th-byte AND 63 Degrees longitude = 64 * ( 5th -byte AND 63) + ( 6th -Byte AND 63) − 180 Minutes longitude = 7th-byte AND 63 Seconds longitude = 8th-byte AND 63

Sutron Corporation Satlink Operations & Maintenance Manual pg. 152
Field Pseudobinary B for Scheduled and Alarm Txs
For example BAAODAXe would be decoded as Lat 39o 1' 15" Long 77o 24' 37" Fractional seconds are scientifically rounded. The hemisphere is NOT encoded. One cannot tell whether the station is North or South, East or West via pseudobinary encoding. The Lat/Long information will be user readable. For example, N39O1'18.48"W77O24'36.91" means a latitude of North 39 degrees, 1 minute, 18.48 seconds and longitude of W 77 degrees, 24 minutes, 36.91 seconds.
COUNTER COUNTER is a 2 byte binary encoded number which indicates the random transmission number and increments after every random transmission. The number will be between 0 and 4095.
BATTERY VOLTAGE
This is an 1 byte binary encoded number representing the battery voltage of Satlink under load during the last environmental satellite transmission. This value is appended only if the correct Append Option is selected. If the battery reading is zero, then that is the first transmission since bootup. The range of the Pseudobinary number is -32 to +31 and can be converted to volts by multiplying by 0.234 and adding 10.6 allowing a range of 3.1 to 18.1 volts.

Sutron Corporation Satlink Operations & Maintenance Manual pg. 153
Pseudobinary B Random Example Here is an example random transmission with three active measurements; each one is set to include two readings:
2@@Gt@Gs@Sx@Sr@@i@@iEXTBAAODAXe@GL
Decoding the message
Pseudobinary values Decoded into decimal
Completely decoded
Description
2 Denotes Pseudobinary B format
@ 0 0 min Delta time
@Gt 500 5.00 Stage #1
@Gs 499 4.99 Stage #2
@Sx 1272 12.72 Precip #1
@Sr 1266 12.66 Precip #2
@@i 41 41 Temp #1
@@i 41 41 Temp #2
EXT External Data (no formatting is done by Satlink)
BAAODAXe Lat 39o 1' 15" Long 77o 24' 37"
@G 7 7 Transmission count. This is the 7th random since bootup.
L 12 13.4V Battery voltage (12*0.234+10.6 )
15.1.2. Pseudobinary B for non-Random Txs If the Pseudobinary B format is used for any transmission type except Random, it will have the fields listed below. Scheduled and Alarm transmissions will use this format.
Field Pseudobinary B for Scheduled and Alarm Txs
BLOCK IDENTIFIER BLOCK-IDENTIFIER is always sent as B to indicate the start of a binary data group.
GROUP ID GROUP-ID is sent as 1 to indicate a scheduled transmission. Random and alarm transmissions send 2. Forced send 3, while retransmissions send 4.
OFFSET Each record is prefixed with an <OFFSET>, which is a 1 byte binary encoded number indicating the number of minutes ago the most recent data was recorded. .

Sutron Corporation Satlink Operations & Maintenance Manual pg. 154
Field Pseudobinary B for Scheduled and Alarm Txs
MEASUREMENT DATA
Measurement data collected: This data contains only those measurements set up to be included in the transmission (see Tx Data Content). The data values are 3 byte binary encoded signed numbers allowing a range of: -131072 to +131071. The actual 6-bit binary encoded format is described later. The value transmitted will be value * 10^RightDigits. The string /// will be sent if the data was never measured or was erased. The number of values sent for each measurement is set separately for each measurement in the Scheduled Transmissions, Num values to Tx field. Note that this is different from the 8210 where the num values to Tx was the same for each sensor. As a result, Satlink Logger sends all the required values for one sensor (most recent first) before proceeding to the next measurement. In the 8210, values were interleaved.
EXTERNAL DATA [OPTIONAL]
This is data given to Satlink Logger by an external device. This data is untouched by Satlink Logger. It gets transmitted in the same way it was received. Data will only appear here if another logger gives Satlink transmission data. It is not usual to have both Measurement Data and External Data.
BATTERY VOLTAGE [OPTIONAL]
This is an optional 1 byte binary encoded number representing the battery voltage of Satlink under load during the last environmental satellite transmission. This value is appended only if the correct Append Option is selected. If the battery reading is zero, then that is the first transmission since bootup. The range of the Pseudobinary number is -32 to +31 and can be converted to volts by multiplying by 0.234 and adding 10.6 allowing a range of 3.1 to 18.1 volts.
LAT/LONG [OPTIONAL]
This 8 byte value is appended only if the correct Append Option is selected. LAT/LONG can be decoded into D:M:S format by converting the binary values to decimal and applying the following formula: Degrees latitude = 64 * ( 1st-byte AND 63 ) + ( 2nd-Byte AND 63) − 90 Minutes latitude = 3rd-byte AND 63 Seconds latitude = 4th-byte AND 63 Degrees longitude = 64 * ( 5th -byte AND 63) + ( 6th -Byte AND 63) − 180 Minutes longitude = 7th-byte AND 63 Seconds longitude = 8th-byte AND 63 For example BAAODAXe would be decoded as Lat 39o 1' 15" Long 77o 24' 37" Fractional seconds are scientifically rounded. The hemisphere is NOT encoded. One cannot tell whether the station is North or South, East or West via pseudobinary encoding. The Lat/Long information will be user readable. For example, N39O1'18.48"W77O24'36.91" means a latitude of North 39 degrees, 1 minute, 18.48 seconds and longitude of W 77 degrees, 24 minutes, 36.91 seconds.
TX FWD/REF POWER [OPTIONAL]
This is an optional 4 byte field that holds the previous transmission's forward and reflected power. Two values are transmitted: forward and reflected power. Each value is encoded as a 2 byte binary encoded signed number. The number of right digits is 1 yielding range of 0 - +204.8 watts.

Sutron Corporation Satlink Operations & Maintenance Manual pg. 155
Field Pseudobinary B for Scheduled and Alarm Txs
The initial transmission will have a value of -1.0 as the power (as there is no power reading prior to the first transmission).
STATION NAME [OPTIONAL]
This is a variable length, space delimited field that contains the station name. Space delimited means there is a space before and a space after the station name. If the station name were set to SmallCreek, the transmission would contain “ SmallCreek “ Note the space before and after SmallCreek. The quotes are NOT included.
TEMP DURING LAST Tx [OPTIONAL]
This is a 2 byte, binary encoded, signed number field with one right digit. It is the amp temperature measured during the previous transmission.
TX TIME [OPTIONAL]
The time is a 3 byte, binary encoded, signed number without any right digits. It represents the number of seconds since midnight.
SERIAL NO [OPTIONAL]
A space delimited, variable length ASCII field containing the serial number. See station name above for details.
TX COUNT [OPTIONAL]
A total of six bytes are used to hold the tx count. The first 3 bytes are the total number of good txs made; the second 3 bytes the number of bad txs. Each of the two values is encoded as a binary 3 byte value with no right digits.

Sutron Corporation Satlink Operations & Maintenance Manual pg. 156
Pseudobinary B Scheduled Example Here is a transmission with three active measurements; each one is set to include two readings:
B1@@Gt@Gs@Sx@Sr@@i@@iEXTLBAAODAXe@R@A
Decoding the message
Pseudobinary values Decoded into decimal
Completely decoded
Description
B Denotes Pseudobinary B format
1 Scheduled transmission
@ 0 0 min Delta time
@Gt 500 5.00 Stage #1
@Gs 499 4.99 Stage #2
@Sx 1272 12.72 Precip #1
@Sr 1266 12.66 Precip #2
@@i 41 41 Temp #1
@@i 41 41 Temp #2
EXT External Data (no formatting is done by Satlink)
L 12 13.4V Battery voltage (12*0.234+10.6 )
BAAODAXe Lat 39o 1' 15" Long 77o 24' 37"
@R 18 1.8W Forward power
@A 1 0.1W Reflected power
15.2. Pseudobinary C Data Format This format is based on the pseudobinary B format. It uses slightly more bandwidth than the B format, but it is self-descriptive. It is used when the user selects Pseudobinary C as the choice for Tx Format.
Block identifier 1 BLOCK-IDENTIFIER is always sent as C to indicate that this is the pseudobinary C format.
Group id 1 GROUP-ID can be 1 to indicate a scheduled transmission, 2 meaning an alarm transmission, 3 indicating a forced transmission, and 4 indicating a retransmission.
Measurement Delimiter
1 This byte is always a + and it is used to denote the start of measurement data.
Measurement Index
1 This is encoded 6 bit binary encoded (see below) number which, when translated, tells the measurement index. Satlink assigns a measurement index (starting with 1 and ending with 16) to each user setup sensor.
Day 2 This 2 byte encoded 6 bit binary encoded (see below) number represents the Julian day of the year. The day tells when the most recent (first) sensor reading of this measurement was made.

Sutron Corporation Satlink Operations & Maintenance Manual pg. 157
Time 2 This 2 byte encoded 6 bit binary encoded (see below) number is a number of minutes into the day. It tells when the most recent (first) sensor reading of this measurement was made.
Interval 2 This 2 byte encoded 6 bit binary encoded (see below) number tells the measurement interval in minutes, or the amount of time between readings of this measurement.
Measurement Data
3 for each sensor reading
Measurement data collected: This data contains only those measurements set up to be included in the transmission (see Tx Data Content). The data values are 3 byte binary encoded signed numbers allowing a range of: -131072 to +131071. The actual 6-bit binary encoded format is described later. The value transmitted will be value * 10^RightDigits. The string /// will be sent if the data was never measured or was erased. All the required values for one sensor (most recent first) before proceeding to the next measurement. This format is similar to that used by the Sutron Satlink but different from the 8210. There will be 3 bytes of encoded data for every sensor reading. The number of readings depends on the user setup.
Additional Measurements
Variable If more than one measurement was set up for transmission, more data will follow. Each measurement setup will have data starting with the Measurement Delimiter and ending with Measurement Data.
Final Delimiter 1 This byte is always . and it is used to denote the end of all measurement data.
Battery voltage 1 This is the battery voltage measured prior to making the transmission. The range of the number will be -32 to +31 and can be converted to volts by multiplying by 0.234 and adding 10.6 allowing a range of 3.1 to 18.1 volts.
Append options Variable Please see Pseudobinary B FOR NON-RANDOM TXS for details.
15.2.1. Example of Pseudobinary C
To help understand the message below, here is a relevant bit of Satlink's setup:
M1 Right Digits 2
M1 Meas Interval 00:01:00
M1 Tx Data Content All Logged
M2 Right Digits 1
M2 Meas Interval 00:01:00
M2 Tx Data Content Last
Tx Time 00:00:30
Tx Interval 00:03:00
Here is the message:
C1+ABeHq@A@E|@FG@FM+BBeHq@A@@O.K
Decoding the message:

Sutron Corporation Satlink Operations & Maintenance Manual pg. 158
Pseudobinary values
Decoded into decimal
Completely decoded Description
C Denotes Pseudobinary C format
1 Scheduled transmission
+ Delimiter for next measurement
A 1 M1 Measurement M1
Be 165 June 14th M1 day of the year of the most recent reading. For 2013, it is June 14th.
Hq 561 09:21AM M1 minutes into the day of the most recent reading: 9:21AM
@A 1 1 minute M1 measurement interval in minutes.
@E| 380 3.80 M1 most recent sensor reading made at 09:21AM
@FG 391 3.91 M1 sensor reading made at 09:20AM
@FM 397 3.97 M1 oldest sensor reading made at 09:19AM
+ Delimiter for next measurement
B Measurement M2
Be 165 June 14th M2 day of the year of the most recent reading.
Hq 561 09:21AM M2 minutes into the day of the most recent reading.
@A 1 1 minute M2 measurement interval in minutes.
@@O 15 1.5 M2 sensor reading
. Delimiter for end of measurement data
K 11 13.2V Battery voltage (11*0.234+10.6)
15.3. Pseudobinary D Data Format This is another compact data format. It differs from Pseudobinary B in that it has a timestamp at the start of the message. The timestamp indicates when the transmission should have taken place and helps decode when the data was collected. Pseudobinary D is 4 bytes larger than format B.
The timestamp is similar to the one in Pseudobinary C. Pseudobinary D is smaller than Pseudobinary C and it lacks detailed timestamps that would allow one to completely reconstruct the time the data was collected from the message itself. To correctly use Pseudobinary D, the decoder needs to know the measurement setup used.
The benefit of using Pseudobinary D is being able to correctly decode data regardless of when it was sent or received. This allows stations to re-transmit old data and have it correctly interpreted by the decoder while keeping the message size at a minimum.
Name Bytes Description
Block identifier 1 BLOCK-IDENTIFIER is always sent as D to indicate that this is the Pseudobinary D format.
Group id 1 GROUP-ID can be 1 to indicate a scheduled transmission, 2 meaning an alarm transmission, 3 indicating a forced transmission, and 4 indicating a retransmission.

Sutron Corporation Satlink Operations & Maintenance Manual pg. 159
Name Bytes Description
Day 2 This 2 byte encoded 6 bit binary encoded (see below) number represents the Julian day of the year. The day tells when the transmission was originally scheduled to take place.
Time 2 This 2 byte encoded 6 bit binary encoded (see below) number is a number of minutes into the day. It tells when the transmission was originally scheduled to take place.
Measurement Data
3 for each sensor reading
Measurement data collected: This data contains only those measurements set up to be included in the transmission (see Tx Data Content). The data values are 3 byte binary encoded signed numbers allowing a range of: -131072 to +131071. The actual 6-bit binary encoded format is described later. The value transmitted will be value * 10^RightDigits. The string /// will be sent if the data was never measured or was erased. All the required values for one sensor (most recent first) before proceeding to the next measurement. This format is similar to that used by the Sutron Satlink but different from the 8210. There will be 3 bytes of encoded data for every sensor reading. The number of readings depends on the user setup.
Additional Measurements
Variable If more than one measurement was set up for transmission, more data will follow. Each measurement setup will have data starting with the Measurement Delimiter and ending with Measurement Data.
Battery voltage 1 This is the battery voltage measured prior to making the transmission. The range of the number will be -32 to +31 and can be converted to volts by multiplying by 0.234 and adding 10.6 allowing a range of 3.1 to 18.1 volts.
Append options Variable Please see PSEUDOBINARY B FOR NON-RANDOM TXS for details.
15.3.1. Example of Pseudobinary D To help understand the message below, here is a relevant bit of Satlink's setup:
M1 Right Digits 2
M1 Meas Interval 00:01:00
M1 Tx Data Content All Logged
M2 Right Digits 1
M2 Meas Interval 00:05:00
M2 Tx Data Content Last
Tx Time 00:00:30
Tx Interval 00:05:00
Here is the message:
D1D~A8@NI@NH@NG@NF@NE@DGF
Decoding the message:

Sutron Corporation Satlink Operations & Maintenance Manual pg. 160
Pseudobinary values
Decoded into decimal
Completely decoded
Description
D Denotes Pseudobinary D format
4 Retransmission
D~ 318 Nov 14th Day of the year of the most recent reading. For 2014, it is Nov 14th.
A8 120 2:00 AM Minutes into the day. We can tell that this transmission should have been made at 02:00 on Nov14th and parse the data accordingly.
@NI 905 9.05 Sensor M1 collected at 02:00
@NH 904 9.04 Sensor M1 collected at 01:59
@NG 903 9.03 Sensor M1 collected at 01:58
@NF 902 9.02 Sensor M1 collected at 01:57
@NE 901 9.01 Sensor M1 collected at 01:56
@DG 263 26.3 Sensor M2 collected at 02:00
F 12 12.00V Battery voltage
15.4. Six Bit Binary Encoded Format The 6 bit binary format is used to encode numbers into displayable ASCII characters. Fractional numbers cannot be represented, so, for instance a battery voltage of 13.04 volts set up with 2 right digits will be sent as 1304.
A 1 byte encoded number can range from -32 to +31. A 2 byte encoded number can range from -2048 to +2047 A 3 byte encoded number can range from -131072 to +131071
Binary encoded numbers are always sent most significant bytes first. The number itself is broken down into 6-bit digits, and each digit is placed in one byte of data. The number 64 (ASCII @) is added to each digit to make it fall within the range of displayable ASCII characters. The only exception is that 127 (ASCII <DEL>) is sent as 63 (ASCII ?)
15.4.1. Example 1: Encoding the Number 10 in 1 Byte Since 10 will fit in 6-bits we only have to add 64 which would yield 74. So the number 10 would appear as ASCII 74 or the letter J.
15.4.2. Example 2: Encoding the Number 12345 in 3 Bytes First we have to convert 12345 into binary in 6-bit pieces:
12345 (base 10) = 11 000000 111001 (base 2) Now we can convert each piece back to base 10:
11 000000 111001 (base 2) = 3, 0, 57 Finally, we add 64 to each piece and convert to ASCII:
67, 64, 121 = ASCII C@y
15.4.3. Example 3. Encoding the Number -12345 in 3 Bytes First we have to convert -12345 into two's complement 18-bit binary: -12345 (base 10) =
111100 111111 000111 (base 2) Now we can convert each piece back to base 10: 111100 111111 000111 (base 2) = 60,
63, 7 Finally, we add 64 to each piece and convert to ASCII (since the second piece is 63 we
leave it alone):

Sutron Corporation Satlink Operations & Maintenance Manual pg. 161
124, 63, 71 = ASCII |?G
Example 4. Decoding the 3 byte string @SW: This is just like encoding except we follow the steps backward.
First we convert all the characters to ASCII decimal codes: ASCII @SW = 64, 83, 87
Now we subtract 64 from each piece and convert to 6-bit binary: 0, 19, 23 = 000000 010011 010111
Finally, we combine all the bits to form one 18-bit two’s complement number and convert to base 10: 000000010011010111 = 1239
15.5. Pseudobinary over SMS Some bytes that are normally used as a part of Pseudobinary transmissions are not allowed in SMS. When Satlink sends Pseudobinary data over SMS, those bytes are replaced according to the following table:
[ 5B 1
\ 5C 2
] 5D 3
^ 5E 4
` 60 5
{ 7B 6
| 7C 7
} 7D 8
~ 7E 9
[ 5B 1
15.6. SHEF and SHEFFIX Data Format SHEF is a format that is commonly used by Sutron's Satlink satellite transmitter. It is an ASCII format that is easy to read and contains some self-descriptive information.
The format of the transmission data is:
: <LABEL1> <OFFSET> #<INTERVAL> <DATA1> <DATA1> ... <DATA1)> : <LABEL2> <OFFSET> #<INTERVAL> <DATA2> <DATA2> ... <DATA2> ... : <LABEL(N)> <OFFSET> #<INTERVAL> <DATA(N)> <DATA(N)> ... <DATA(N)>
LABEL This is the Label entered as a part of the setup for each measurement. The label can be a SHEF two-character parameter code such as HF for gauge height or PC for cumulative precipitation or it can be any string you enter. Refer to http://noaasis.noaa.gov/DCS/htmfiles/schefcodes.html for a list of SHEF codes commonly used.
OFFSET This number indicates how long ago the sensor reading was made. The number is in minutes and it refers to the most recent data. It is relative to transmission start.

Sutron Corporation Satlink Operations & Maintenance Manual pg. 162
INTERVAL The interval indicates how often the measurement was made. It corresponds to the setting Meas Interval.
DATA This is data collected and logged by Satlink through measurements. Only logged data may be transmitted. If Tx Data Content is set to Exclude, no data from that measurement will be transmitted. Like the binary formats, the SHEF format groups all the related data from one measurement. The data is transmitted in ASCII with sign and decimal point (if needed). If a data value has not yet been recorded (or has been erased) the letter M for missing data will be sent. The most recent data is always sent first. The number of values sent for each measurement is set on a measurement by measurement basis.
APPEND OPTIONS
Satlink offers a multitude of optional values that are tacked on at the end of the transmission. Please see APPEND OPTIONS.
15.6.1. SHEF Example Here is a message with three active measurements. Each is set to include two readings. The random buffer contains the string EXT. This string was given by an external device through the RS-232 port. Notice how much longer this message is compared to the earlier binary examples.
:HG 3 #15 10.20 10.15 :PC 1 #15 50 49 :TA 0 #15 -22.1 -22.0 :VB 0
12.2
In the example above :HG 3 #15 10.20 10.15 means that the sensor labeled HG read the value 10.20 three minutes prior to the start of the transmission. It read 10.15 18 minutes before the start of the transmission, or 15 minutes before it read 10.20. Here is the complete decode:
:HG Measurement labled HG
3 Reading is 3 minutes old
#15 15 minute measurement interval
10.20 HG sensor reading (most recent)
10.15 HG sensor reading
:PC Measurement labled PC
1 Reading is 1 minute old
#15 15 minute measurement interval
50 PC sensor reading (most recent)
49 PC sensor reading
:TA Measurement labled TA
0 Reading is less than one minute old
#15 15 minute measurement interval
-22.1 TA sensor reading (most recent)
-22.0 TA sensor reading
:VB Battery voltage label
0 Reading is less than one minute old
12.2 Battery voltage reading
SHEFFIX is a modified version of SHEF where the data is positioned in fixed spacing so that it will line up better when displayed. Each measurement reading is given seven bytes. If a reading uses fewer bytes it is padded with spaces. SHEIFIX transmissions are larger than SHEF transmissions.

Sutron Corporation Satlink Operations & Maintenance Manual pg. 163
SHEFFIX Example :STAGE 0 #2 20.50 20.50 20.50 20.50 :PRECIP 3 #5 12.00 12.01 :TEMP 3 #5 23.5 23.2 :BV 1 #3 14
SHEF Example with Min/Max data included When transmitting Min/Max data, the formatter includes a timestamp for each value because the Min/Max data is logged at the time of the occurrence rather than the measurement interval. Note how in the message below the MX and MN only have one value and the timestamp is different for each.
:ITEMP 12 #15 25.9018 26.0289 26.0988 26.2451 :MX 64 #60 26.686 :MX 101 #60 27.426 :MN 14 #60 25.891 :MN 131 #60 25.334 :AVG 12 #60 26.169 26.368
15.7. Sutron Standard CSV Logs downloaded from Satlink will be in the Sutron Standard CSV format. It is possible to transmit data in the CSV format. However, CSV messages are too large for most applications and are generally used to help set up a station.
The format was introduced in 2009 and is common to current Sutron products. The general format specification for Sutron Standard CSV format is
mm/dd/yyyy,hh:mm:ss,label,data[,units,qual][,label,data[,units,qual]]
15.7.1. Sutron Standard CSV Example 04/02/2012,09:23:45,STAGE,20.50
04/02/2012,09:23:50,STAGE,20.50
04/02/2012,09:23:53,Setup Change
04/02/2012,09:24:00,BV,14
04/02/2012,09:25:00,PRECIP,34.5
04/02/2012,09:25:00,TEMP,23.5
04/02/2012,09:25:00,STAGE,20.54
15.8. ASCII Column The ASCII Column format is another means of encoding transmission data. A message formatted with this method would look like this:
<CRLF>
Meas1_Data(1) Meas2_Data(1) ... MeasN_Data(1)<CRLF>
Meas1_Data(2) Meas2_Data(2) ... MeasN_Data(2)<CRLF>
Meas1_Data(n) Meas2_Data(n) ... MeasN_Data(n)<CRLF>
<CRLF> is a carriage return, line feed Meas1_Data()..MeasN_Data are the data from the active measurements included in the
transmission. All the data on one line are for the same time. A space separates the values. The newest
data is sent first. (n) is the number of values included in the transmission as set by the user. The format for any value is ASCII with the right digits set by the user. No decimal point is shown if the value is zero. Add a minus sign in front of the value if the value is negative. There are no leading zeroes.

Sutron Corporation Satlink Operations & Maintenance Manual pg. 164
If the value is missing, two forward slashes are transmitted instead //. A typical message will appear as follows:
41.79 60.99 12.99 12.43 .20 8.08 7.1 195.2
41.79 60.99 12.99 12.43 1.20 8.08 7.1 195.2
41.79 60.99 12.99 12.43 -2.20 8.08 7.1 195.2
Normally the DCP will be set up so all the sensors are collected at uniform times. If this is not the case, the formatter will still work but will have varying amounts of data on each line (each time) based on whatever sensors are collected at each time. This will produce confusing results if the additional sensors are collected at an interval of the other sensors. The results should be OK if the additional sensors are collected at a time separate time.
15.9. ASCII Sensor This method of formatting uses four digits for each measurement readings. Measurement readings are multiplied by 100 before being transmitted.
<CRLF>
IDIDIDID JJJHHMMSS<CRLF>
Meas1_Data(1) Meas1_Data(2) ... Meas1_Data(n)<CRLF>
Meas2_Data(1) Meas2_Data(2) ... Meas2_Data(n)<CRLF>
MeasN_Data(1) MeasN_Data(2) ... MeasN_Data(n)<CRLF>
optional Battery before transmission<CRLF>
optional Battery under load<CRLF>
<CRLF> is a carriage return, line feed IDIDIDID is the eight byte hexadecimal satellite ID JJJ is a three digit Julian Day, which is the number of days of the year. January 1st is
Julian Day one, and February 1st is Julian Day 32. This number is always three digits (0 padded)
HHMMSS are the hours minutes and seconds. This is the time of the scheduled transmission. It is always 6 bytes (0 padded).
Meas1_Data()..MeasN_Data are the data from the active measurements included in the transmission.
Measurement data is always four digits followed by a space (0 padded). All values are multiplied by a 100. No decimal point is used for measurement data. Range of transmitted data is 0 to 9999 (numbers out of range are transmitted as 0000 or
9999). This means that the sensor data should be between 0 and 99.99 before formatting.
If the user elects to append battery voltage, one of the two will be appended:
If the transmission satellite is Japan GMS or EUMETSAT, only one line of battery voltage information will be added. It will take this format: “13.5<CR><LF>” Three digits and a decimal point are always used. It is the battery voltage prior to the transmission.
For all other transmission types, two lines of battery voltage information will be added. Both lines take the same format: “12.5<CR><LF>” (three digits of battery voltage and a decimal point). The first line is the battery voltage prior to this transmission. The second line is the battery voltage during the last transmission.
This is an example transmission:

Sutron Corporation Satlink Operations & Maintenance Manual pg. 165
010570F2 108183053
0250 0250 0250 0250
2231 2232 2233 2234
12.2
12.1
On the first line 010570F2 represents the hexadecimal satellite ID. 108 is the Julian Day (for the year 2005, that is April 18th). 183053 means 18 hours 30 minutes and 53 seconds.
The second line (0250 0250 0250 0250) shows four readings of the first sensor. This measurement had four same readings. Before formatting, that reading was 2.50. It was multiplied by 100 and padded with a leading zero.
The third line (2231 2232 2233 2234) shows four different readings of the second sensor. That sensor’s readings were originally 22.31, 22.32, 22.33, and 22.34 respectively. They were multiplied by 100 and padded with a leading zero.
The fourth line (12.2) is the battery reading in Volts prior to transmission. The last line (12.1) is the battery reading in Volts during the last transmission.
15.10. TCP/IP Session A Satlink equipped with a cell modem will use scheduled transmissions to periodically connect to a server and deliver sensor data. See the CELLULAR TELEMETRY and CELL SETUP sections for more details.
Relevant settings include Protocol, Main Server, Backup Server, Server Port, and Server Password.
When Protocol is set to Hydromet Cloud, Satlink will engage in handshaking with the server. Satlink will provide the server with information about the transmission that includes the station name, password, reason for the transmission, and error checking information. The server will acknowledge the transmission.
If the server does not acknowledge the transmission, Satlink will retry the transmission until it succeeds or until it times out.
When Protocol is set to None, Satlink will not engage in handshaking with the server.
If you are using a custom server, you will want to set Protocol to None. Either that, or have the custom server acknowledge the transmission.
15.10.1. Hydromet Cloud Protocol When Satlink connects to a server, some information is sent to the server before the sensor data is delivered. This information is meant to help the server decide what to do with the sensor data that is en route. The information includes details such as the sensor name and whether the transmission is a result of an alarm event.
After the sensor data is delivered to the server, the server may log into Satlink and issue commands to check status, change setup, download more data, or any other command line activity.

Sutron Corporation Satlink Operations & Maintenance Manual pg. 166
15.10.2. Course of Events for the Hydromet Cloud Protocol 1. Satlink connects to main or backup server.
2. Satlink sends Session Type Code<cr> (see below.)
3. Satlink sends Station Name<cr>.
4. Satlink sends Report Type Code<cr> to indicate purpose of connection (see below.)
5. Satlink sends transmission data (if any) in whatever format the user chose, such as SHEF or pseudobinary.
6. Satlink sends ETX (0x03) to mark end of data.
7. Satlink sends a 3 byte pseudobinary encoded CRC16 of previous data and the server password (sometimes called Shared Secret.)
8. Satlink waits for the server to either acknowledge or to initiate a command line session. The server has 60 seconds to do either one.
a. If the server does neither, Satlink will retry the transmission until it succeeds or until it times out.
9. To acknowledge, the server needs to send a single byte: <cr>
a. Once the server sends the byte, Satlink will disconnect.
10. To initiate a command line session, the server sends user login command !LOGIN=username,password<cr> and waits for Satlink reply (ETX.)
a. If user login matches, Satlink enters command-line session.
b. Server issues pending commands, and Satlink processes and responds accordingly.
c. When command processing is complete, the server disconnects.
Session Type Code Session type defines the processing that occurs on connection. Currently, there is only one session type, 1. This type is defined by the Course of Events above, and details that follow.
Report Type Code Report Type code describes the purpose of the transmission:
0 = self-timed 2 = entering alarm 4 = exiting alarm 6 = no data, command session only
15.11. Iridium Telemetry Header When Satlink sends data over the Iridium satellite network, it uses the header described below.

Sutron Corporation Satlink Operations & Maintenance Manual pg. 167
The header starts with a single byte in the ASCII printable range to make it easy to interpret the content. Most transmissions will just have one header byte.
The header byte identifies the packet type in terms of the content of the packet, e.g., self-timed, self-timed extended, entering alarm, entering alarm extended, etc.
Iridium modem buffers are limited in size. "Extended" types mean multiple packets are required to transmit the entire message. Extended packets have information in the header that allows them to be stitched together easily. The extended packet types include a comma-delimited sub-header to describe the subset of data being sent. The first sub-header differs from all subsequent sub-headers, in that it includes the total size of the data being sent.
The telemetry header may contain the station name if the setting Tx Station Name is enabled. Please read below for more details.
15.11.1. Packet Structure Packets are composed of
packet-type sub-header data
The packet-type is a single byte:
Hex Value ASCII Description
0x30 0 Self-timed
0x31 1 Self-timed extended
0x32 2 Entering alarm
0x33 3 Entering alarm extended
0x34 4 Exiting alarm
0x35 5 Exiting alarm extended
0x36 6 Command response
0x37 7 Command response extended
0x38 8 Forced transmission
0x39 9 Forced transmission extended
... Reserved for future use
0x7D } User defined
0x7E ~ Look to next byte for meaning
0xFF Binary data, reserved for future use
The sub-header has the following comma delimited fields:
,id,start-byte,total-bytes,station-name:
packet-type Numeric ASCII character defining packet type. See type definitions in table, below
id Numeric ASCII text defining the message id. Starts at 0. Rolls over after 99.
total-bytes Numeric ASCII text defining the total number of data bytes to be sent (data only, does not include overhead bytes)

Sutron Corporation Satlink Operations & Maintenance Manual pg. 168
start-byte Numeric ASCII text defining which byte of total-bytes is the start byte of the current packet. Starts at 0.
station-name Optional ASCII field that has station name. Formatted as ,N=STATION NAME
15.11.2. Iridium Header Examples The following examples illustrate how to use the new header.
Example 1 Message requiring one packet (i.e., non-extended), formatted pseudobinary B interleaved, containing 6 values (42, 69, alternating).
Self-timed 0B1@AAhAktAAhAktAAhAkt
Entering Alarm 2B2@AAhAktAAhAktAAhAkt
Exiting Alarm 4B3@AAhAktAAhAktAAhAkt
Example 2 The same data in SHEF format:
Self-timed 0:HG 0 #1 42.00 42.00 42.00 :EM 0 #1 69.00 69.00 69.00
Entering Alarm 2:HG 0 #1 42.00 42.00 42.00 :EM 0 #1 69.00 69.00 69.00
Exiting Alarm 4:HG 0 #1 42.00 42.00 42.00 :EM 0 #1 69.00 69.00 69.00
Example 3 An extended command response where the total size of the command response is 512 bytes (note: total size is of the response itself, and does not include the overhead of the telemetry headers used to convey it). The example uses a message id of 0:
Packet 1 7,0,0,512:bytes 0 thru 319
Packet 2 7,0,320:bytes 320 thru 511
15.11.3. Iridium Tx Station Name There is an option to include the station name in the Iridium Header. The setting is called Iridium Tx Station Name and it defaults to disabled. That setting is accessible only via the terminal (LinkComm->Tools Menu->Terminal). To enable it, type
Iridium Tx Station Name = On
After all the headers, system will append ,N=Station Name: If the station name were Two Creeks, it would be ,N=Two Creeks:
STANDARD WITH STATION NAME 0B1@AAhAktAAhAktAAhAkt 0,N=Two Creeks:B1@AAhAktAAhAktAAhAkt
4:HG 0 #1 42.00 42.00 42.00 :EM 0 #1 69.00 69.00 69.00
4,N=Two Creeks::HG 0 #1 42.00 42.00 42.00 :EM 0 #1 69.00 69.00 69.00
7,0,0,512:bytes 0 thru 319 7,0,0,512,N=Two Creeks:bytes 0 thru 319
7,0,320:bytes 320 thru 511 7,0,320:bytes 320 thru 511

Sutron Corporation Satlink Operations & Maintenance Manual pg. 169
For extended packets, only the first message carries the station name. The name field comes after all the other headers.

Sutron Corporation Satlink Operations & Maintenance Manual pg. 170
16. Connecting to Another Logger Satlink may be connected to a data logger in order to transmit data over the satellite. In this scenario, Satlink functions much like a modem. Satlink will periodically receive data from the logger and transmit that data over the satellite.
16.1. Connection Satlink has an RS-232 DB9 female connector, configured as DCE.
A straight M-F cable will connect Satlink to most DTE devices such as a PC.
Note that DTR, RTS and CTS are required. A device connected to Satlink must assert DTR prior to talking to it. Satlink will ignore any data sent when DTR is not asserted. Similarly, Satlink uses the RTS/CTS control lines.
As long as DTR is asserted, Satlink will not enter low power mode!
DTR should be turned off when the device is done talking with Satlink. This allows Satlink to enter its low power modes.
Note: if you have a device that cannot assert DTR and/or does not support handshaking, contact Sutron customer service
A null modem cable should be used when connecting to a DCE device. When using a null modem cable, pay attention to the wiring so that the logger can assert the Satlink DTR as required (via DSR in the example below).

Sutron Corporation Satlink Operations & Maintenance Manual pg. 171
The default baud rate for Satlink is 9600, N, 8, 1. Satlink can be set to operate at other baud rates; however, Sutron does not recommend using other baud rates as the system will set the baud rate back to 9600 when the unit is set to factory defaults.
16.2. Protocol Satlink supports a command line protocol that is very easy to use. The COMMAND LINE INTERFACE
chapter is dedicated to describing command line operations. The command line protocol is the recommended way to interface a logger to Satlink.
Please have the logger prefix all commands issued to Satlink with an exclamation point. This makes Satlink terminate each command with an <ETX> which makes it easier for the logger.
Satlink also features a dumb logger mode for interfacing to devices that simply output transmission data on an RS-232 port. Please see the DUMB LOGGER MODE section for details.
An additional way of interfacing to Satlink is to use the Satlink Communication Protocol (SCP). SCP is a binary communication protocol that has been used with previous generations of Satlink products. For details on SCP, please contact Sutron customer support.
16.3. Configuring Satlink Before Satlink may be used to transmit data over the satellite, it must first be configured. There are several options:
Use LinkComm to manually configure Satlink Use a terminal program to manually configure Satlink Use the optional front panel to manually configure Satlink Program the logger to issue the appropriate commands to configure Satlink
Once configured, Satlink will retain the configuration and use it each time it is powered on so it is not necessary to repeat the configuration commands

Sutron Corporation Satlink Operations & Maintenance Manual pg. 172
Please note that one may configure Satlink over USB or over Wi-Fi or over any other channel even while a logger is connected to Satlink over RS-232.
The key fields to configure in Satlink are:
Field Description
Recording=On Must be on for unit to transmit
TX1 Enable=On Enables scheduled transmissions
TX1 Scheduled Interval=01:00:00 Set to assigned transmission interval
TX1 Scheduled Time=00:00:00 Set to assigned transmit time
TX1 Satellite Type=300 Valid types are: 0=GOES 300 1=GOES 1200 2=EUMETSAT SRDCP 100 3=EUMETSAT HRDCP 1200 4=CGMS 100 International 5=Japan GMS 100 7=Feng Yun FY
TX1 Satellite ID=FFFFFFFF Set to assigned satellite ID
TX1 Channel=153 Set to assigned transmit channel
TX1 Power Output=2.500 Set output power for Satellite channel and antenna type as follows: 1.25 GOES 300 with YAGI 2.5 GOES 300 with Dome 7 GOES 300 with Omni 5 GOES 1200 with YAGI 10 GOES 1200 with Dome 14 GOES 1200 with Omni 7 Eumetsat/CGMS/… YAGI 10 Eumetsat/CGMS/… Dome 14 Eumetsat/CGMS/… Omni
TX2 Enable=Off Disables automatic random transmissions. Random transmissions will instead be triggered by the logger.
Note: if you have set up Satlink to make its own measurements and transmit the data, the data you send from another logger will be added to the end of the message.
You can also set the Satlink to add some internal data to the end of the message such as battery voltage, latitude, longitude, station name, etc.
Normally you will set the Satlink to factory defaults prior to issuing configuration commands to ensure that all the other settings are correct. The command is “Factory defaults”
If you precede a command with ! the Satlink will not echo the command but will provide only the response.
Examples:

Sutron Corporation Satlink Operations & Maintenance Manual pg. 173
>!Factory defaults
>!TX1 Enable = on
>!TX1 Scheduled Time=00:02:50
>!TX1 Satellite type = 0
>!TX1 Channel = 195
>!Tx1 Output Power = 1.25
>!TX1 Satellite ID=12345678
>!TX2 Enable=off
16.4. Transmitting Data It is expected that once Satlink has been configured, the data logger will periodically give Satlink transmission data.
The logger is responsible for formatting transmission data. Satlink will not modify the data in any way. Satlink will simply forward the received data to the satellite.
Satlink is capable of transmitting both data from another logger and data Satlink has collected from sensors. However, that is not recommended. If it does happen, Satlink transmits the sensor data it collected first, followed by any data handed over by the other logger.
Satlink has one transmission buffer available for each telemetry setup. The buffers are 16Kbytes. That is the maximum amount of data that may fit into any one satellite transmission. Please note that the maximum allowed amount of data varies by satellite type and allocated transmission window.
Come transmission time, Satlink will transmit all of the provided data that can fit. Extraneous data is either discarded or saved for the next transmission, depending on the CIRCULAR BUFFER
ENABLE setting.
Ideally, the data logger will give Satlink all the data for one transmission at once. To ensure that data is as fresh as possible, the logger should give the data one minute before transmission time.
Satlink is setup to transmit at the scheduled time and interval in the configuration. About 60 seconds before the transmission, Satlink will take any data in its transmission buffer and encode it for transmission. If the buffer is empty, Satlink will transmit the message “Data Buffer Empty” along with some diagnostic information.
16.4.1. Command Line Details An external logger/device loads data into the transmission buffer using the EXTBUF command.
EXTBUF refers to Satlink's external buffer. This is the buffer that is used to hold transmission data from another logger. For example, when Satlink is combined with Sutron's Xpert data logger, Xpert will put transmission data into Satlink's external buffer. Satlink will transmit that data at the appropriate time.
Each EXTBUF command must be prefixed with a telemetry indicator and followed with a command option. For example TX1 EXTBUF SHOW will show the data in TX1 (the self-timed) external buffer. The following are the options for the EXTBUF commands:
TXx EXTBUF APPEND [xx]
Adds data to the end of the external buffer. TXx is the telemetry indicator. E.g. TX1

Sutron Corporation Satlink Operations & Maintenance Manual pg. 174
[xx] optionally specifies the number of bytes to append. If the command is preceded with an exclamation point, Satlink will reply with an <ETX>.
Otherwise Satlink will say “Send transmission data. Finish with ETX (Ctrl-C).” Follow the APPEND command with the data to be transmitted. If the number of bytes
was not specified, end of data needs to be indicated with an <ETX>. Satlink will reply with “OK xx bytes added”.
TXx EXTBUF INSERT [xx]
Clears all existing data in the external buffer and then appends new data to the buffer. Follows the same syntax rules as the APPEND command.
TXx EXTBUF SHOW
Shows data that is currently in the buffer. Will say "Buffer is empty" if there is no data. TXx EXTBUF BYTES
Reports how many data bytes are in the buffer currently. TXx EXTBUF SIZE
Reports the capacity of the buffer in bytes.
APPEND and INSERT are used by a logger to add data to the transmission buffer. These commands follow special rules. If invoked in machine mode (e.g. "!TX1 EXTBUF INSERT"), Satlink will reply with an ETX character (0x03) to the command. That is the queue for the logger to send its transmission data to Satlink.
There are two ways of using the commands:
Provide the number of transmission data bytes that are to follow. Terminate the data with an ETX character (0x03)
Please note that <ETX> can be sent via a terminal program by hitting Ctrl-C.

Sutron Corporation Satlink Operations & Maintenance Manual pg. 175
Example: Append xx Logger sends command: !TX1 EXTBUF APPEND 16<CR><LF>
Satlink replies: <ETX>
Logger sends 16 bytes of data: DATA TO TRANSMIT
Link replies: OK 16 bytes added<ETX>
Example: Append Logger sends command: !TX1 EXTBUF APPEND<CR><LF>
Satlink replies: <ETX>
Logger sends data: DATA TO TRANSMIT<ETX>
Satlink replies: OK 16 bytes added<ETX>
Example: Insert >TX1 EXTBUF INSERT
Send transmission data. Finish with ETX (Ctrl-C).
PLEASE TRANSMIT THIS DATA
OK 25 bytes added
>TX1 EXTBUF SHOW
PLEASE TRANSMIT THIS DATA
>TX1 EXTBUF BYTES
25
>TX1 EXTBUF SIZE
16384
To clear the data in the buffer (without adding any new data), issue TX1 EXTBUF INSERT 0
16.4.2. EXTBUF Errors If something goes wrong, Satlink will reply with
ERROR Syntax error. Either the telemetry indicator (TX1) was missing, or the command was
incomplete. ERROR TIMEOUT
More than 30 seconds passed since the last data byte was inserted in the buffer. Data inserted prior to the timeout will get transmitted.
ERROR BUFFER FULL More data was inserted than could fit. Data inserted prior to the overflow will get
transmitted.
16.4.3. Random Transmissions TX2 Random in the SL3-XMTR-1 does not need to be enabled for the unit to transmit data on the random channel since it is expected to be controlled by the connected logger and the TX2 TXNOW command.
The random transmission still needs to be setup with the correct satellite type, channel, ID, power output, and other desired settings.
The logger controls the sending of data and the specific random transmissions, Random Normal, Random Burst and Random alarm With the TX2 TXNOW command.
The logger will send the data to Satlink using the EXTBUF commands. Once the data is in the buffer, the logger should issue TX2 TXNOW to start a random transmission.

Sutron Corporation Satlink Operations & Maintenance Manual pg. 176
16.4.4. Dumb Logger mode The “Dumb Logger” mode is used to have Satlink transmit data from a logger that does not speak the Satlink serial port communications protocol. If this mode is enabled, any data coming into the serial port that is not of Satlink protocol gets put into the scheduled transmission buffer.
This setting can be accessed via the Telemetry tab in LinkComm.
In order for Satlink to accept data from another logger, besides having the dumb logger mode enabled, the user must ensure that the logger talk at 9600 bps, 8 data bits, no parity, one stop bit, no flow control. There are two ways to wake Satlink up: either assert RTS or send a wake up character. That wake up character should be binary 0. After waking Satlink make sure to wait at least 6 milliseconds. After Satlink is woken, it will acknowledge by asserting CTS. If woken with a character, Satlink will stay awake for five seconds after the last character comes in. If woken with an RTS, Satlink will stay awake for as long as RTS is asserted. Note that you are likely to need a null modem in order to connect a logger to Satlink.
Dumb logger mode is not a recommended means of giving Satlink transmission data. Command line mode is the preferred method.
16.4.5. Timing Concerns Satlink features a built in GPS module which is used for accurate time keeping. The data logger that is handing Satlink telemetry data must also keep accurate time. If it does not, Satlink and the logger will drift apart. Drifting apart may result in the logger not handing over transmission data in time. That in turn will result in data loss.
It is recommended that the data logger periodically synchronize its clock to Satlink. Command line protocol features the TIME command which may be used to ask Satlink for the current time.
If the data logger also has an accurate clock, please use Satlink’s Local Time Offset setting to ensure that Satlink and the logger are in the same time zone.

Sutron Corporation Satlink Operations & Maintenance Manual pg. 177
17. Command Line Interface Satlink uses a command line interface. You can use a terminal program instead of LinkComm to talk to Satlink. All of Satlink's features are available over command line. In fact, LinkComm uses the command line interface to talk to Satlink. When messages are sent to Satlink via SMS or Iridium, they use the same format as regular command line communications.
17.1. Why Use Command Line? LinkComm provides an easy user friendly way to interact with Satlink. You should never have to use Satlink's command line interface. However, some people prefer command-line interactions. Also, if you want to send an SMS or an Iridium message to Satlink to check the station status, you would need to find out what the command for checking status is.
LinkComm cannot send messages to Satlink. SMS messages may be sent to Satlink from a cell phone, and Iridium messages may be sent via email.
17.2. About the Command Line Interface The command line interface provides a way to interact with Satlink. Any terminal program can be used to connect to Satlink. You can connect via the RS-232 port, USB port, or attach to the TCP/IP address of Satlink that has a Cell modem. You can send and receive messages to and from Satlink via SMS or Iridium.
By default the RS-232 interface operates at 9600 Baud, no parity, 8 data bits, 1 stop bit. Satlink supports hardware handshaking; its use is recommended. Allow at least a half-second between opening the communications port and starting communication.
To start command line mode, send carriage return or line feed (or both). If using a terminal program, press ENTER. Satlink will respond with a prompt >
Once in command line mode, type HELP to get a list of supported commands. Also try HELP SETUP.
While it is not recommended, changing the baud rate can be done by typing BAUD RATE. The default baud rate is 9600.
With the terminal program, if the emulation is set for VT100, pressing the up arrow brings back the last typed command.
Messages can be sent to the station remotely. Messages are treated like command line input with a few differences. Some commands cannot be executed via a message. Other commands may have a differently formatted output (in order to reduce message size).
GPRSLink, HSPALink, and CDMALink can receive SMS (text messages). IRIDIUMLink can have messages sent to via emails that get routed through the Iridium system. See SENDING MESSAGES
TO SATLINK VIA IRIDIUM.
The last message received since boot up can be viewed via the front panel, under the diagnostics menu.

Sutron Corporation Satlink Operations & Maintenance Manual pg. 178
When Satlink receives a message, it handles the input just as if it were on the commands. For example, issuing the command M1 ACTIVE = OFF would turn off measurement one. Normally, Satlink executes the command and provides no feedback.
If Satlink needs to reply to the message it received, the command in the message must be preceded with an exclamation point. For example, sending a message with the data M1 MEAS will not cause Satlink to send a reply message. Sending ! M1 MEAS will cause Satlink to send a reply. Sending STATUS will do nothing. To get the status, precede the command with a ! !STATUS
Several commands can be sent in the same message. Separate the command with a new line or with a semicolon:
!M1 MEAS; !STATUS;
A password-protected Satlink requires that the first line of the message be the LOGIN command. Here is a message telling Satlink to turn off the digital output 1 and return the status:
LOGIN=XXX; OUTPUT1 OFF; !STATUS
17.3. Status To check the status, type STATUS (or just S).
17.4. Setup To view the whole measurement setup, type SETUP. To view just the setup of measurement one, type M1. Likewise, M2 shows the setup of the second measurement. For transmissions, use TX1. Only pertinent data is shown. If a measurement is not active, it will not show its setup fields. If a measurement is of type analog, it will not show its SDI-12 setup fields.
The command SETUP NONDEFAULTS only shows the fields that have been changed from defaults.
An easy way of setting up your station is to type WIZARD or just W. A setup wizard will guide you through the most commonly used settings of the station and of each measurement. The setup wizard may be used to configure one specific measurement: typing M1 WIZARD or M1 W will set up measurement one. TX1 W will setup transmission one.
Every setup field can be changed by typing setup = value where setup is the name of the field and value is the new value. By just typing the name of the field, the current value and the range of the field are shown.

Sutron Corporation Satlink Operations & Maintenance Manual pg. 179
For example, typing STATION NAME shows the current station name. Typing STATION NAME = SUTRON changes the station name.
>STATION NAME Setup NOT changed Station Name = DEMO, max length 23
To change setup try STATION NAME = SUTRON.
>STATION NAME = SUTRON DEV 1 Setup changed Station Name = SUTRON DEV 1, max length 23
Changing measurement setup fields requires that the measurement be named. For example, to change the Measurement Type it is not enough to type MEAS TYPE. You need to provide the number of the measurement in question: M1 MEAS TYPE shows the Measurement Type of the first measurement. M2 MEAS TYPE works for the second measurement.
>M1 MEAS TYPE Setup NOT changed Meas Type = SDI-12, Range (0=Precip Accumulation, 1=Precip Rate, 2=SDI-12, 3=Analog, 4=Battery, 5=Wind, 6=Digital, 7=Meta, 8=Manual Entry, 9=Internal Temp, 10=Accubar Pressure, 11=Accubar Temp) To change setup try Station Name = Sutron
In the example above, the user typed M1 MEAS TYPE, which will show the measurement type field of the first measurement. The example shows the type as being Internal Temp. After the current type is shown, the range shows all the options for the measurement type. To set up the measurement as SDI-12, the user may type either M1 MEAS TYPE = SDI-12 or M1 MEAS TYPE = 2.
Setting the whole setup to defaults can be accomplished by typing SETUP DEFAULTS. Setting just measurement one to defaults can be done via M1 SETUP DEFAULTS.
17.5. Measurements To view the setup and the last reading made measurement one, type M1. Use M2 for measurement two, etc.
To view all the last measured readings, type LAST. It will show a reading for every active sensor. Typing LAST does not initiate new measurement.
To initiate a new measurement for each active sensor, type MEAS. Satlink will measure each sensor one at a time and display results as it goes along.
If you are interested in only one specific measurement try M1 LAST and M1 MEAS. Those will show the last measured value and initiate a new measurement, respectively
To change the current reading of a sensor, type M1 = 12.5. This will change the Measurement Offset such that the said measurement reads the user entered value. For example, if my water level sensor, once set up, read 3.50, and I knew the water level was at 1.50, I would type M1 =

Sutron Corporation Satlink Operations & Maintenance Manual pg. 180
1.50. The next it was measured, M1 would read 1.50 (assuming the level does not change). The Measurement Offset would have changed from 0 to -2.00.
17.6. Recording To start Satlink, click the Start button in LinkComm, or type RECORDING = ON.
17.7. Downloading the Log Satlink will save the measured data in its flash memory each time a measurement is made. The command LOG command will start a transfer of the log to the connected device.
Use NH to exclude the header; Use NE to omit events. Help Log gives details on downloading the log.
>HELP LOG
DOWNLOAD or LOG will transfer the log from the unit
LOG ALL gets whole log, just LOG gets since last download,
LOG X gets X last days ("LOG 3" gets last 3 days worth of data)
LOG timeStart gets data since provided date
LOG timeStart timeEnd gets data between provided dates
time can be YYYY/MM/DD HH:MM:SS or YYYY/MM/DD or HH:MM:SS
eg. "LOG 12:00:00 13:00:00"
eg. "LOG 2006/01/20 12:00:00 2006/01/21 12:00:00"
append M1 to include only data from measurement one
eg. "LOG 3 M1 M2
append NH to omit log header, NE to omit events
append NY to download without YModem.

Sutron Corporation Satlink Operations & Maintenance Manual pg. 181
17.8. Machine-to-Machine Communication All commands may be preceded with an !. If they are, there is no echo, and a concise reply meant for machine-to-machine interaction is returned.
Commands would be preceded by an ! if they were sent by an Xpert or some such computer. For example, instead of typing SETUP, you may type !SETUP.
When command are preceded with an !, no help text is given, no range is shown for measurement, no confirmation of commands is shown, and no key stroke is expected between scrolling pages.
17.9. Command Reference Documentation Legend:
0 If a 0 follows a listed command, it means that the command can optionally be followed by the character 0. E.g. DIAG will show the system diagnostic status. DIAG 0 will first show current status and then clear the status.
[Mx] indicates specifying a measurement is optional, e.g. M10 TXx specifies a transmission, e.g. TX1
All commands may be preceded with an !. If they are, a concise reply meant for machine to machine interaction is returned. Commands would be preceded by an ! if they were sent by an Xpert or some such computer. E.g. MEAS will show Measurement M1 Sense1 reading
2.17 2015/11/24 17:43:11
!MEAS will show M1 Sense1, 2.17, 2015/11/24 17:42:24, Every setup variable can be viewed by typing its name. E.g. STATION NAME will show the current name. Every setup variable can be changed by typing its name = new value. E.g. STATION NAME = STURON will set the current name to SUTRON. For a list of all the setup names, type “SETUP”.
17.9.1. List of Commands Command Description
ADJUST POWER Command is used to modify the POWER OUTPUT setting of the transmission. The command needs to contain a value by which to adjust power. If the keyword dB is included in the command, the value is interpreted as dB; otherwise, it is Watts. >tx1 power output = 5 Setup changed

Sutron Corporation Satlink Operations & Maintenance Manual pg. 182
Command Description
!TX1 Power Output = 5.000 Watts, Range (0.000, 25.000), Default 0.000 >tx1 adjust power -1.5 Power Output = 3.500 Watts >tx1 adjust power 2dB Power Output = 5.547 Watts >tx1 adjust power 200 Power not changed. 205.547134 Watts is invalid. Power Output = 5.547 Watts
BATTERY BATT COIN BATT LOAD
BATT shows the current power supply battery reading. BATT COIN shows the voltage of the internal coin cell battery. BATT LOAD shows the voltage under load measured during last environmental satellite transmission.
Cutoff Temp Tx High Cutoff Temp Tx Low
Cutoff Temp Tx High = 85.0 C, Range (40.0, 100.0) Cutoff Temp Tx Low = -45.0 C, Range (-80.0, -20.0) The unit will automatically disable the GOES transmissions if the temperature falls outside user specified limits. Transmissions will recommence with the temperatures return within range.
Cutoff Tx High, Cutoff Tx Low
Cutoff Tx High = 20.00 V, Range (14.00, 20.00) Cutoff Tx Low = 9.00 V, Range (9.00, 13.00) The unit will automatically disable the GOES transmissions if the voltage falls outside user specified limits. Transmissions will recommence with the voltages return within range.
DIAG 0 Shows system diagnostics, including system resets. If followed by 0, it will clear system resets.
CUTOFF SYSTEM HIGH CUTOFF SYSTEM LOW CUTOFF TX HIGH CUTOFF TX LOW CUTOFF TEMP TX HIGH CUTOFF TEMP TX LOW
These are the cutoff settings. Please see the Cutoff section for details.
DOWNLOAD See LOG
EXIT Quits command line.
ERROR
FACTORY DEFAULTS This command sets the setup to defaults, clears status (which includes system errors and transmission counts), zeroes reset counts, and clears asserts.
FAILSAFE
Checks failsafe status, returning "Failsafe is TRIPPED" or "Failsafe is NOT tripped". Read access required. If tripped, additional information will be provided on the cause of the trip.
FAILSAFE RESET Resets a tripped failsafe. Maintenance access is required.
FAILSAFE TRIP Trips the failsafe for test purposes. Full access is required.
GET DIAG Provides comprehensive diagnostic information, including status and setup.
GPS SYNC Initiates a GPS time synchronization. Use STATUS GPS to find status and result of the sync.
HELP HELP SETUP HELP LOG
Brings up the help (lists commands).

Sutron Corporation Satlink Operations & Maintenance Manual pg. 183
Command Description
HELP TX HELP LOGIN HELP SDI HELP POWER HELP OUTPUT
HI System replies with Hello and blinks green LED.
IRIDIUM MSG CHECK Used to ask Satlink to check for messages from the Iridium gateway. Incurs monetary charge.
[Mx] LAST [SCHED] [CSV]
Shows the last measured reading of every active measurement. This command does not make a new measurement, only shows the last results of the last measurement. If preceded by the measurement designator (E.g. M1 LEAS), it shows only one sensor. SCHED If provided, the last scheduled reading is shown. CSV If provided, the data is formatted in Sutron Standard CSV (same format used for logged data) for both normal and machine mode access.
LOG This command is used to download the log. Try LOG HELP. See Downloading the Log section above for more details.
LOG DIAGNOSTICS Enable for SL3 to log additional diagnostic values.
LOGIN To log into a password protected station, type LOGIN=XXX where XXX is the password. Optionally, type LOGIN=USERNAME,XXX and USERNAME will be ignored. See PASSWORD below.
M1..M32 Type M1 to see the setup of the first measurement. Type M2 to see the setup of the second measurement. Type M1 SETUP DEFAULTS to change to defaults only the setup of measurement one. Type M1 LAST to see the last measured value, and type M1 MEAS to make a new reading. Additionally, you may say M1 = 15.0 to calibrate the sensor. That ends up changing the offset. There is also a two=point calibration that changes the slope and the offset. Two point calibration is started by typing M1 CAL
[Mx] MEAS [CSV] [TRIGGER]
Use this to make a measurement on all or some sensors. After receiving this command, Satlink will measure every active sensor and display the results. If preceded by the measurement designator (for example, M1 MEAS), it measures only one sensor. The CSV option may be used to get data formatted in Sutron Standard CSV format The TRIGGER option (ver 8.10 or newer) may be used to trigger a measurement but not wait for its completion.
NEXT Shows next scheduled time of active measurements. Shows "not scheduled" if there is no next measurement.
OUTPUT1 OUTPUT2
This command controls Satlink's digital output. OUTPUT1 controls power to digital output DOUT#1 OUTPUT1 ON turns on, OUTPUT1 OFF turns off OUTPUT1 PULSE 500 turns on for 500ms, then turns off Ditto for OUTPUT2 which handles DOUT#2
PASSWORD PROTECTION
Used to enable password protection on a station. May be set to Disabled, Setup, Maintenance, or Full. Setup the passwords BEFORE enabling password protection. See PASSWORD PROTECTION.

Sutron Corporation Satlink Operations & Maintenance Manual pg. 184
Command Description
PASSWORD READ = X PASSWORD MAINT = X PASSWORD SETUP = X
Access to writing the three passwords for the system, where X is the new password.
POWER POWER lists the state of SW-12V #1, #2, PROT12, and RS-232 PIN-9 POWER port ON turns on power to the port POWER port OFF turns off power to the port POWER port PULSE duration turns on for duration ms, then turns off port may be SW1, SW2, PROT12, RS-232, VREF, or PREF SW1 and SW2 may not turn off if they're being controlled elsewhere in the system.
REBOOT Does a software resets of the system.
RS232 BAUD RATE RS232 Baud Rate = 9600, Range (0=9600, 1=19200, 2=28800, 3=38400, 4=57600, 5=115200, 6=230400, 7=460800, 8=921600), Default = 9600
SDI-12 [POWER ON/OFF] [port] [FIND] [command]
Exercises the SDI-12 buses. Port may be PORT1, PORT2, RS485. If not specified, PORT1 is used. If FIND is included, then port is scanned for sensors If POWER is included, it may be used to control power to the specified port Command indicates a specific command to send on the bus If neither FIND nor command are specified, system issues "?!". e.g. of valid commands: SDI-12 SDI-12 0M! SDI-12 PORT2 0I! SDI-12 FIND "SDI" may be used in place of "SDI-12"
SETUP If provided without any other parameters, it lists all setup details. That includes each setup variable and its current value. Can be followed by a setup variable name and a new value for that variable. E.g. STATION NAME = SUTRON If SETUP DEFAULT is issued, it will reset the entire setup to defaults.
SMS SEND PHONE_NO [more]
SMS SEND 17034062800 will send an SMS to said phone. PHONE_NO must contain the phone number as a string of numbers (no spaces, no dashes), e.g. 17034062800. If the keyword more is included after the phone number, the user may type in the content of the message to be sent. Finish providing content with an ETX (Ctrl-C).
S [0] STATUS [0]
Shows system status including time, boot time, battery readings, last measurements, current internal sensor readings, and any hardware errors that may exist. If followed by 0, it clears the hardware errors. In lieu of the full word STATUS, you may use S
STATUS ALARM STATUS CELL STATUS GPS STATUS IRIDIUM STATUS LOG
Shows details for Alarm, Cell, GPS, Iridium, Log, Script, or Transmission status. STATUS SL2 shows a Satlink 2 like status. [TXx] STATUS shows info about said transmission.

Sutron Corporation Satlink Operations & Maintenance Manual pg. 185
Command Description
STATUS SCRIPT STATUS SL2 STATUS TX [TXx] STATUS
STS [GPS] [channel]
Requests an immediate Send To Sutron transmission. If GPS is included in the command, a GPS sync and frequency discipline will be done prior to the transmission. channel is an optional parameter. If not provided, unit will transmit on channel 195. GOES East is 195, GOES West is 196. STS are always GOES 300 transmissions STS always use Satellite ID 010051DE STS uses the power output/antenna of the scheduled transmission. Please note that the scheduled transmissions take priority over STS. STS status is shown under TX1 STATUS.
TEMP [AMP] [RTC] Returns internal temperature. SL3 has two sensors: a thermistor on the environmental satellite radio board and a sensor on the motherboard (default).
TIME Shows the current system date and time. If followed by a new time, it changes the system time. E.g. TIME = 2008/12/12 changes the date. TIME = 10:15:30 changes the time.
TXx [SETUP] [STATUS] [COUNT]
Shows information about the specified transmission. Setup will show the satellite type and kind for environmental satellite radios. For other radios, it will have the radio type, e.g. Iridium Status gives an idea of what is going on with the transmission. If there is a transmission in progress, it gives details about it. If no tx is in progress, last tx results are shown. If there is no last tx info, next tx time is shown. If there is no next tx (recording is off), it just shows "Enabled" Count tells the number of good and bad txs made. Right now, it's the lifetime count. I hope to change it to be the daily count
TXx EXTBUF APPEND TXx EXTBUF INSERT TXx EXTBUF SHOW TXx EXTBUF BYTES TXx EXTBUF SIZE
EXTBUF refers to Satlink's external buffer. This is the buffer that is used to hold transmission data from another logger. Please see the Command Line Details section for full documentation on these commands.
TXx TXBUF This command shows the data content of the transmission buffer. Normally, the transmission buffer will contain data from the last transmission.
TXx TXFORM [REPEAT YYYY/MM/DD HH:MM:SS]
Creates a transmission data buffer along with diagnostic information. This is very similar to SL2's Show Message command. The REPEAT option along with the time stamp may be used to get missing data from a Satlink. Please see section REPEAT TX DATA. >TX1 TXFORM Tx data would look like this :BATT 2 #10 11.347 11.423 11.385 11.377 M M :TEMP 2 #10 26.00 25.25 25.75 26.00 M M :BL -1.00 :PWR -1.0/-1.0
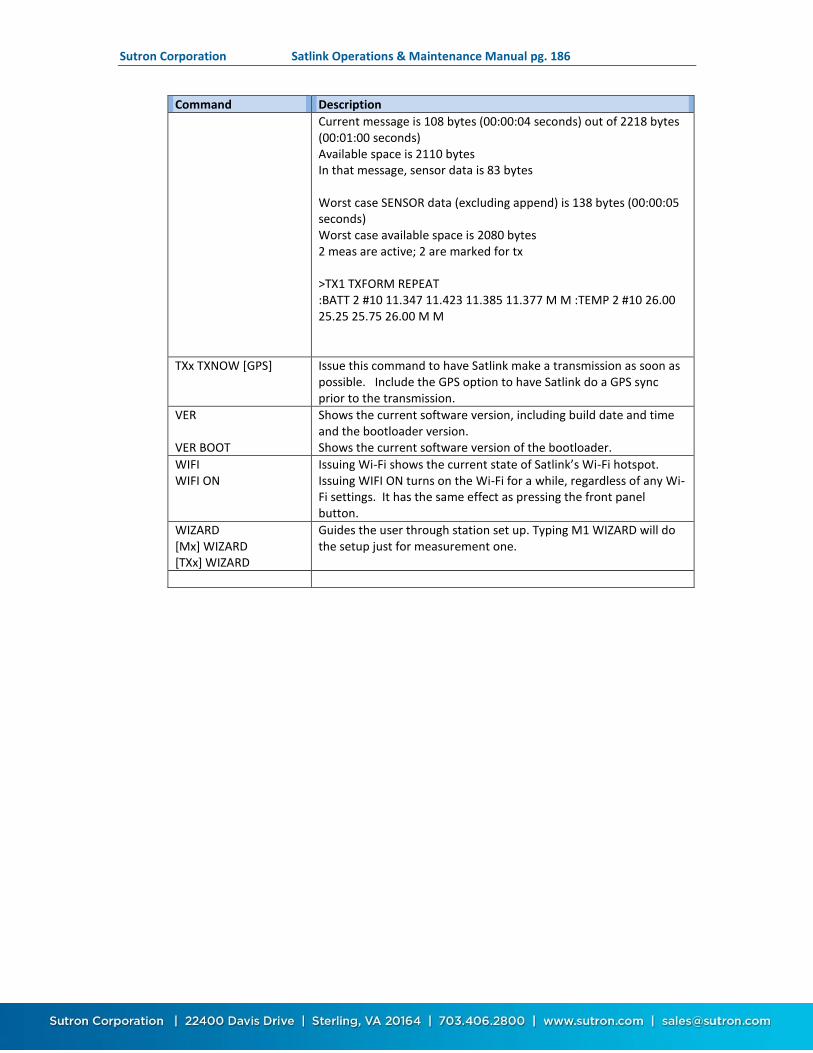
Sutron Corporation Satlink Operations & Maintenance Manual pg. 186
Command Description
Current message is 108 bytes (00:00:04 seconds) out of 2218 bytes (00:01:00 seconds) Available space is 2110 bytes In that message, sensor data is 83 bytes Worst case SENSOR data (excluding append) is 138 bytes (00:00:05 seconds) Worst case available space is 2080 bytes 2 meas are active; 2 are marked for tx >TX1 TXFORM REPEAT :BATT 2 #10 11.347 11.423 11.385 11.377 M M :TEMP 2 #10 26.00 25.25 25.75 26.00 M M
TXx TXNOW [GPS] Issue this command to have Satlink make a transmission as soon as possible. Include the GPS option to have Satlink do a GPS sync prior to the transmission.
VER VER BOOT
Shows the current software version, including build date and time and the bootloader version. Shows the current software version of the bootloader.
WIFI WIFI ON
Issuing Wi-Fi shows the current state of Satlink’s Wi-Fi hotspot. Issuing WIFI ON turns on the Wi-Fi for a while, regardless of any Wi-Fi settings. It has the same effect as pressing the front panel button.
WIZARD [Mx] WIZARD [TXx] WIZARD
Guides the user through station set up. Typing M1 WIZARD will do the setup just for measurement one.

Sutron Corporation Satlink Operations & Maintenance Manual pg. 187
18. More about SDI-12
18.1. Overview SDI-12 is a standard for interfacing data recorders with microprocessor-based sensors. SDI-12 stands for serial data interface at 1200 baud. SDI-12 is intended for applications with the following requirements:
Battery powered operation with minimal current drain Low system cost Use of a single data recorder with multiple sensors on one cable Up to 200 feet of cable between the sensor and a data recorder
SDI-12 has the following advantages:
It defines a standard way for a data recorder and sensor to communicate. Unique and complex self-calibration algorithms can be done in the sensor itself. Sensors can be interchanged without reprogramming the data recorder with calibration
or other information. Power is supplied to sensors through the interface. The use of a standard serial interface eliminates significant complexity in the design of
the data recorder. Low cost, small sensors can be designed with SDI-12 compatibility. SDI-12 data recorders interface with a variety of sensors. SDI-12 sensors interface with a variety of data recorders. Personnel trained in SDI-12 will have skills to work with a variety of SDI-12 data
recorders and sensors. SDI-12 is used in water resource research and management, industry, government, and agriculture. For example, the U.S. Geological Survey uses over 4000 SDI-12 sensors in its data collection networks. SDI-12 sensors are available that measure the following:
bridge scour conductivity dissolved oxygen distance groundwater level petroleum hydrocarbons in water pH pressure redox (ORP) tank level temperature tide and sea state turbidity water velocity weight of snow and ice on a snow pillow wind speed and direction
Sutron also offers general purpose interfaces for making analog and digital measurements via SDI-12.

Sutron Corporation Satlink Operations & Maintenance Manual pg. 188
For more information on SDI-12, go to www.sdi-12.org.
18.2. Wiring Guidelines SDI enables you to connect up to 10 sensors with as many as many as 9 parameters each. The interface is implemented using three wires: data, ground, and +12V. The ground conductor of the SDI interface line should be large enough to keep the voltage drop between the data recorder and the sensor to less than 0.5 volts during the maximum sensor current drain. Failure to observe this specification will cause bad communications and/or bad data. The maximum current used on the +12V line should not exceed 0.5 amps at any time.
18.3. Connector The connector type is not part of the SDI specification. On Satlink, the connections are made on the terminal block: #14 (SDI-12 Data), #13 (SDI-12 PWR), and #12 (GND). Multiple sensors can be connected to these connections.
18.4. Setup of SDI sensors Each SDI-12 sensor has an address from 0 to 9. This address differentiates one sensor from another. Most sensors are factory default set to address zero (0). If/when interfacing more than one sensor to Satlink, each sensor must be assigned a unique address. This is normally done by setting dipswitches on the sensor or by software commands. Failure to set unique addresses for each sensor will result in failure of the communications interface (i.e. no data logged). Consult the sensor manufacturer’s data for information on your particular sensor(s).
When setting up multiple SDI-12 sensors, connect one sensor at a time. Once a new sensor is connected, you must give it a unique address. To do so, either use LinkComm or the command line. Type SDI-12 FIND to detect new sensors. Once a sensor is found, change its address by typing SDI xAy!, where x is the old address, A is A, and y the new address. For example, SDI 0A1! will change the address from 0 to 1.
When getting more than one parameter from a single sensor, be sure to set the measurement schedules the same. When Satlink finds multiple parameters from a single sensor (same address), it will only issue a measurement of the sensor once, then read each of the parameters from the one measurement. This is important to ensure that data from one sensor is gathered at the same time and for sensors that have multiple parameters that take a long time to process.
18.5. Useful SDI commands Resetting the address by software (some sensors) is normally done by sending the aAb! command. (a A b !, where a is the current address of the sensor you want to change and b is the address you want to change to, e.g. 0A5! changes the address of sensor 0 to address 5.)
Another useful SDI-12 command is the aI! (where a is the address of the sensor, e.g. 3I! for sensor at address 3) command. 4I! will return an identification string from the sensor at address 4, which includes the SDI version number, vendor's name, sensor model number, sensor version number, and serial number. This is a quick way to see if the sensor is responding properly.
A way to verify data collection (manual data collection) is to issue the aM! command. For example 7M! would collect data from the sensor at address 7. The sensor will respond with a

Sutron Corporation Satlink Operations & Maintenance Manual pg. 189
5-digit code -- the first digit is the address, the next 3 digits are the required time for measurement in seconds, and the last digit is the number of data values returned. Wait for the number of seconds. Then issue the aD0! (address, D, zero, !) the sensor should respond with one or more data values. You may issue further aD1! … aDn! till you get all of the data.
If the SDI sensor is version 1.3 (version number can be found out by sending the ?I! command; the version is returned as the second and third characters of the response), then make sure to use the CRC measurement commands. These commands work just like normal measurement commands, except that they use an error checking mechanism that minimizes errors. So, instead of 0M!, use 0MC!. Instead of 0M1!, use 0MC1!. This will ensure reliable SDI communication.
18.6. SDI Clock Synchronization Certain Sutron SDI-12 sensors (such as the SDR, RLR, and the CF Bubbler) support a command to set the time of the sensor via SDI-12. Satlink takes advantage of that feature, and periodically sets the clock of the sensors using an SDI-12 command, ensuring that all devices share a common time.
When recording is enabled and every 24 hours thereafter Satlink performs a time sync with all the Sutron devices that support the XDT! command. The time sync is started by sending an I! command to every SDI-12 device that Satlink has been set up to measure. If the device replies favorably to the I! command, an XDT! command is issued to the device. Satlink then decides whether to sync that device’s clock based on the time difference between Satlink and the device.
This process is automatic and cannot be disabled. It was introduced in Satlink version 8.09.
The XDT set time command takes the format
aXDTYYYY/MM/DD HH:MM:SS! a is address XDT is the command to set the date and time YYYY is the year MM is the month (01 to 12) DD is the day of the month (01 to 31) HH is the hour (military time 0 to 23) MM is the minutes SS is the seconds
Example set date time command:
0XDT2017/07/26 11:15:34!

Sutron Corporation Satlink Operations & Maintenance Manual pg. 190
19. Modbus Starting with version 8.07, Satlink features Modbus support. Modbus is a communications protocol commonly used in industrial applications. Please see the Wikipedia entry for more details.
Satlink can be configured as a Modbus slave or as a limited Modbus master. In Modbus master mode, Satlink collects data from Modbus sensors. In Modbus slave mode, Satlink provides sensor data to a Modbus master.
19.1.1. Satlink as a Modbus Slave Satlink is able to function as a Modbus slave. In this role, Satlink will respond to requests from a Modbus master, typically providing data that Satlink has collected from sensors.
The example below illustrates Satlink as a Modbus slave:
Satlink is setup as a Modbus slave on RS-485. This involves setting Modbus RS485 Slave Enable to ON.
Satlink’s Measurement M1 is configured to collect data from an SDI-12 sensor. This means that Satlink collects data from the SDI-12 sensor on a scheduled basis.
Periodically, the Modbus master will get the most recent data that was collected by Satlink from the SDI-12 sensor. This effectively makes Satlink a bridge between the Modbus master and the SDI-12 sensor.
The Modbus master gets that sensor data by reading Satlink’s input registers 1 and 2, combining the result into a 32bit floating point value. Registers 1 and 2 reflect the last reading from measurement M1. Similarly, registers 2 and 3 relate to M2. Please see the INPUT REGISTERS section for details on other registers.
Please note that if Satlink is setup as a Modbus slave, it will no longer perform any other function on that port. This means that if Satlink is a Modbus slave on RS-232, the RS-232 port cannot be used for command line communications. Similarly, if Satlink is a Modbus slave on RS-485, then Satlink cannot collect sensor data over RS-485.
In slave mode, extended Modbus commands allow the downloading of Satlink’s log, reading and writing Satlink’s setup, accessing status information, and more.
Please note that using Modbus slave will increase power consumption of the station. When it is a Modbus slave, Satlink is always ready to accept incoming data. RS-232 and RS-485 do not have control lines that can be used to wake Satlink up, resulting in an power consumption increase of about 8mA @ 12V. Modbus over cell requires that the cell modem be on and listening all the time, which increases power consumption too.
19.1.2. Satlink as a Modbus Master Satlink is capable of operating as a Modbus master. It can collect data from sensors using the Modbus protocol. When setup to collect data from Modbus sensors, Satlink will periodically issue a master read register message on the data bus. Sensors on the bus act as slaves: they will reply to the message, providing ‘register values’ which translate to sensor readings.

Sutron Corporation Satlink Operations & Maintenance Manual pg. 191
Multiple Modbus sensors may be connected to the RS-485 bus. However, each sensor must be programmed with a unique Device ID. If the sensors do not have unique IDs, they will cause collisions on the data bus, resulting in failures to collect sensor data. Satlink is NOT capable of changing Device IDs. Please refer to the sensor’s documentation for information on how to change their IDs.
Please note that Satlink does NOT have the ability to write Modbus registers.
The Satlink Display may not be used if the RS-232 port is configured for Modbus.
19.2. Modbus Hardware Interface There are several interfaces that support Modbus communication:
RS-485 RS-232 Cell modem
Satlink may be a Modbus master or a Modbus slave over RS-485 and over RS-232. Satlink may only be a Modbus slave over the cell modem.
Each interface can be setup independently of the other one. Each interface has its own setup. This means that Satlink could be a Modbus master on RS-485 and a Modbus slave on Cell modem at the same time.
19.2.1. Wiring Modbus RS-485 Satlink has a half duplex RS-485 interface. That means that the same lines are used for sending and receiving data.
Only two lines need to be connected to use RS-485:
RS-485 A RS-485 B
When wiring, connect the Modbus master's RS-485 A line to Satlink's RS-485 A Line. Do the same for RS-485 B.
19.2.2. Wiring Modbus RS-232 When using RS-232 for Modbus communications, only three of the lines in the DB9 connector are necessary:
TX RX Ground
Satlink will assert RTS before sending data out the port in order to key off a radio.
Satlink also drives DTR whenever Modbus is active.
19.2.3. Troubleshooting Modbus If there are Modbus communications issues over RS-485 or RS-232, there are two potential causes:

Sutron Corporation Satlink Operations & Maintenance Manual pg. 192
The setup; Please make sure that Satlink's Modbus setup is the same as that of the master. These settings must match: Protocol, Device ID, Baudrate, Parity, and the two Delay settings.
Wiring: Try reversing RS-485 A and B.
19.2.4. Modbus Slave Over the Cell Modem It is possible to access Satlink over the internet using Modbus. Satlink must be equipped with a Cell modem to utilize this feature.
In this scenario, the IP address of the cell modem is used by the Modbus master to access Satlink. The IP address can be found via LinkComm: it is displayed in the Telemetry tab's Status view.
Satlink will accept incoming connections using the Listen port setting on the Telemetry tab. The default port is 3001.
Only the TCP/IP Modbus protocol may be used over Cell.
Satlink may only be a Modbus slave over Cell.
19.3. Modbus Setup To setup Modbus operation, please use the Other Setup tab of LinkComm. There are independent settings for Modbus Slave over the various ports.
To setup Satlink as a Modbus master, in addition to configuring the settings in the Other Setup tab of LinkComm, use the Measurement tab and choose Modbus as the Measurement Type.
Here is a list of general Modbus settings and their defaults:
Modbus Cell Slave Enable = Off
Modbus Rs485 Slave Enable = On
Modbus Rs485 Slave Device ID = 1
Modbus Rs485 Slave Delay before Tx = 0 ms
Modbus Rs485 Slave Delay after Tx = 0 ms
Modbus Rs485 Protocol = RTU
Modbus Rs485 BaudRate = 19200
Modbus Rs485 Parity = Even
Modbus Rs232 Slave Enable = On
Modbus Rs232 Slave Device ID = 1
Modbus Rs232 Slave Delay before Tx = 0 ms
Modbus Rs232 Slave Delay after Tx = 0 ms
Modbus Rs232 Protocol = RTU
Modbus Rs232 BaudRate = 19200
Modbus Rs232 Parity = Even
Additionally, if Satlink is to collect data from Modbus sensors, it needs to have a measurement setup for each Modbus sensor. Below is a list of all the Modbus measurement settings along with their defaults:
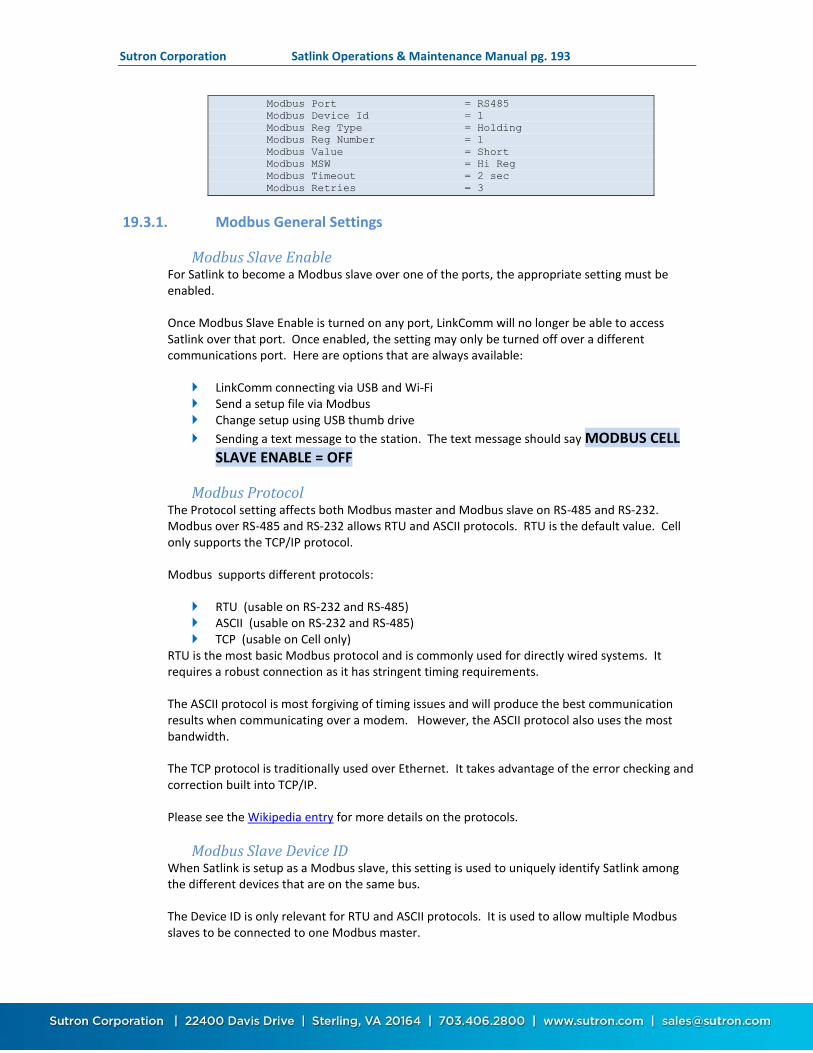
Sutron Corporation Satlink Operations & Maintenance Manual pg. 193
Modbus Port = RS485
Modbus Device Id = 1
Modbus Reg Type = Holding
Modbus Reg Number = 1
Modbus Value = Short
Modbus MSW = Hi Reg
Modbus Timeout = 2 sec
Modbus Retries = 3
19.3.1. Modbus General Settings
Modbus Slave Enable For Satlink to become a Modbus slave over one of the ports, the appropriate setting must be enabled.
Once Modbus Slave Enable is turned on any port, LinkComm will no longer be able to access Satlink over that port. Once enabled, the setting may only be turned off over a different communications port. Here are options that are always available:
LinkComm connecting via USB and Wi-Fi Send a setup file via Modbus Change setup using USB thumb drive
Sending a text message to the station. The text message should say MODBUS CELL SLAVE ENABLE = OFF
Modbus Protocol The Protocol setting affects both Modbus master and Modbus slave on RS-485 and RS-232. Modbus over RS-485 and RS-232 allows RTU and ASCII protocols. RTU is the default value. Cell only supports the TCP/IP protocol.
Modbus supports different protocols:
RTU (usable on RS-232 and RS-485) ASCII (usable on RS-232 and RS-485) TCP (usable on Cell only)
RTU is the most basic Modbus protocol and is commonly used for directly wired systems. It requires a robust connection as it has stringent timing requirements.
The ASCII protocol is most forgiving of timing issues and will produce the best communication results when communicating over a modem. However, the ASCII protocol also uses the most bandwidth.
The TCP protocol is traditionally used over Ethernet. It takes advantage of the error checking and correction built into TCP/IP.
Please see the Wikipedia entry for more details on the protocols.
Modbus Slave Device ID When Satlink is setup as a Modbus slave, this setting is used to uniquely identify Satlink among the different devices that are on the same bus.
The Device ID is only relevant for RTU and ASCII protocols. It is used to allow multiple Modbus slaves to be connected to one Modbus master.

Sutron Corporation Satlink Operations & Maintenance Manual pg. 194
The Device ID is the address that is used by the Modbus master to select which device to communicate with. Each slave on the bus must have a unique device ID ranging from 1 – 247. Address ‘0’ is reserved as the broadcast address.
When a Modbus master issues a command, it includes the Device ID in the command. Only the Modbus slave with a matching ID is allowed to answer. If multiple slaves have the same ID, communication will not work.
Device ID is sometimes referred to as Slave Address, Station Address, or Slave ID.
Modbus Baud Rate Default is 19200 Baud. Care must be taken to make sure the selected speed matches that of the master or there will be communication problems.
This setting affects both Modbus master and Modbus slave.
Modbus Parity Default is Even. Available choices include Even, Odd and None.
Note: Care must be taken to make sure the selected parity matches that of the master or there will be communication problems.
This setting affects both Modbus master and Modbus slave.
Modbus Slave Delay before Tx Default is 0ms. This identifies the number of milliseconds to wait before starting data transmission. This is useful if the device is connected to a radio requires keying initialization before data transmission.
This is a Modbus slave setting only. There is no delay when Satlink is a Modbus master.
Modbus Slave Delay after Tx Default is 0ms. This identifies the number of milliseconds to wait after data transmission. This is useful if the device is connected to a radio that requires a hold-off time after data transmission has completed.
If this value is other than zero, it may cause communications issues! This is a Modbus slave setting only. There is no delay when Satlink is a Modbus master.
19.3.2. Modbus Measurement Settings These settings appear on the Measurement tab of LinkComm. To have Satlink act as a Modbus master, choose Modbus as the Measurement Type.
Modbus Port This is a measurement setting that tells Satlink which port the Modbus sensor is connected to. Options include RS-485 and RS-232.
Modbus Device Id Modbus Device Id indicates what sensor to collect data from. For Satlink to collect data from a Modbus slave, Satlink’s Modbus Device Id must match that of the sensor.
This setting should come into play only if there are multiple sensors on the bus.

Sutron Corporation Satlink Operations & Maintenance Manual pg. 195
Modbus Reg Type Modbus Reg Type needs to correspond to the type of register that contains the desired sensor data. Options include Coil, Discrete, Holding, and Input. Please check the sensor’s documentation for details on registers.
Coil and Discrete register types imply that Satlink will collect one byte from the sensor and consider the least significant bit of the byte.
Modbus Reg Number Modbus Reg Number tells Satlink which of the sensor’s registers to access. These values are unique to the sensor that is connected. Most sensors provide multiple registers which may be read.
Modbus Value Modbus Value tells Satlink how much data to collect and how to interpret it.
Short means collect data from one register and interpret them as a 16 bit signed integer. Ushort implies a 16 bit unsigned integer. Int and Uint indicate 32 bit signed and unsigned values respectively; Satlink will read 2
registers for them. Float is a IEEE 32 bit floating point value. Double is a IEEE 64 bit floating point value. Discrete means that the sensor returns one byte, and that the result is based on the
least significant bit of the byte.
Modbus MSW For certain Modbus Value (Int, Uint, Float, Double), Modbus MSW determines which register is used to contain the most significant word (MSW) of the tag's value. When set to "Low Reg", the lower register of the register pair is used to contain the MSW.
Modbus Timeout Modbus Timeout is the amount of time in seconds that Satlink will wait for a reply from the sensor.
Modbus Retries Modbus Retries indicates how many times Satlink will retry to issue the command to a sensor in case of failures. Please note that some sensors require at least one retry to work at all. For those sensors, the initial command only wakes the sensor up after which the sensor replies to the retry.
19.4. Modbus Slave Function Codes The following table identifies the functions that are supported. Each diagnostic counter is cleared when the device is powered up or reset.
Code Hex Subcode Hex
Read Holding Registers 0x03
Read Input Register 0x04
Write Single Register 0x06
Diagnostic 0x08 Return Query Data 0x00
Diagnostic 0x08 Clear Counters 0x0A

Sutron Corporation Satlink Operations & Maintenance Manual pg. 196
Diagnostic 0x08 Return Bus Message Count 0x0B
Diagnostic 0x08 Return Bus Comm Error 0x0C
Diagnostic 0x08 Return Bus Exception Count 0x0D
Diagnostic 0x08 Return Slave Message Count 0x0E
Diagnostic 0x08 Return Slave Broadcast Count 0x0F
Diagnostic 0x08 Return Bus Char Overrun Count 0x12
Write Multiple Registers 0x10
Sutron Function Code 0x41 Get Log GL
Sutron Function Code 0x41 Get File GF
Sutron Function Code 0x41 Send File SF
19.4.1. Identifying Registers There are two types of data that can be accessed using the Modbus protocol. These include Holding and Input registers.
Holding Registers Holding registers are reserved for the purpose of setting and getting data such as the date and time and diagnostic counts if the ability to send the above Diagnostic (0x08) command is not available. The following table identifies the holding registers and their locations. Each of these registers is an unsigned 16-bit value (if readings registers using an Xpert, set the data type to ushort).
Data Register Valid Data Values
Hour of current time 1001 0 – 23
Minute of current time 1002 0 – 59
Second of current time 1003 0 – 59
Year of current time 1004 > 2000
Month of current date 1005 1 – 12
Day of current month 1006 1 – 31
Recording status 1007 1 means running
0 means stopped
Reset Unit 1008 Write 1 to reset
Modbus Protocol 1009 0 – RTU 1 – ASCII
Force Measurement * 1010 0 – force all active measurements 1-32 force that measurement only
Bus Message Count 1011 Read Only
Bus Comm Error 1012 Read Only
Slave Exception Count 1013 Read Only
Slave Message Count 1014 Read Only
Broadcast Message Count 1015 Read Only
Char Overrun Count 1016 Read Only
*Note: When forcing a measurement, be sure to wait the proper amount of time for a measurement to finish before requesting data.

Sutron Corporation Satlink Operations & Maintenance Manual pg. 197
Input Registers Input registers return the last measured data from the device. Ideally these values should be requested on a schedule slightly lagging the measurement schedule on the Satlink. This will ensure data will follow that found in the Satlink log. If the last measured data is not acceptable, a live reading can be forced by writing to the Force Measurement (1010) holding register. Care must be taken to allow enough time to pass for taking a measurement before requesting the data.
Since the system works with floating point numbers and Modbus only allows for 16-bit registers, a multiple register read can be used to access the entire reading. The Modbus master device should be configured to treat these reads as a single floating point number. For example, if accessing Last measured via an Xpert, read 1 value of type float starting at register 1. The complete list of registers and their locations are below.
Modbus registers
Last Measured
measurement msw lsw
M1 1 2
M2 3 4
M3 5 6
M4 7 8
M5 9 10
M6 11 12
M7 13 14
M8 15 16
M9 17 18
M10 19 20
M11 21 22
M12 23 24
M13 25 26
M14 27 28
M15 29 30
M16 31 32
..
M32 63 64
Battery Voltage 901 902
Internal Temp 903 904
M1, M2, .. M32 refer to Satlink measurements.
E.g. to read the last measured sensor value for measurement M10, read registers 19 and 20 and combine the result into a single 32 bit IEEE floating point value.
19.5. Sutron Function Codes This section describes the use of the Sutron function code to get files, send files and, get the log over MODBUS. This only applies when Satlink is a Modbus slave.

Sutron Corporation Satlink Operations & Maintenance Manual pg. 198
The data portion of a packet carrying the Sutron function code (function code 65, or 0x41) contains a subcode and associated parameters to define the particular function to perform. The subcode and its parameters are expressed using ASCII characters. The functions that each sub-code performs are defined to be stateless, and the burden of the transport is on the master station.
The following text defines the subcode functions, parameters, and responses.
19.5.1. Get Log Command The Get Log subcode is used to retrieve log data from the unit. The format of the command is as follows:
GL,logfilename,datetime,recordID,numbytes The logfilename can be used to return log entries of specific types. The available types
are data events all
The datetime value must be in the following format: MM/DD/YYYY HH:MM:SS. The numbytes value refers to the number of data bytes from the log entry to include in
the response, not the number of bytes to store in the return packet. Satlink will never return more than 255 data bytes. Since the master station or transport medium may be limited in the number of bytes that can be handled in a single packet, the numbytes value should be sized small enough to allow for header and CRC information, as well as translation to ASCII if that is the selected protocol (the ASCII protocol uses two bytes to represent every data byte). If numbytes is *, up to 255 bytes will be returned. Regardless of the requested numbytes, only complete log records are returned. Do not set numbytes to less than 64. Ideally, use * or 255.
The format of the reply is as follows:
GLR,status,recordID,numbytes,data[numbytes,data]
The value of status can be any of the following values:
Value Description
0 Ok.
1 File not found.
2 Get beyond file end.
6 Record not found.
7 Command format error
The datetime value in the response message is the datetime of the returned record and, therefore, may be different from the datetime in the GetLog command statement.
The data to the end of the file can be read by leaving datetime at the desired starting point and incrementing recordID until the status indicates record not found. The [numbytes,data] represents an additional record of data if there is room in the message.
Example:
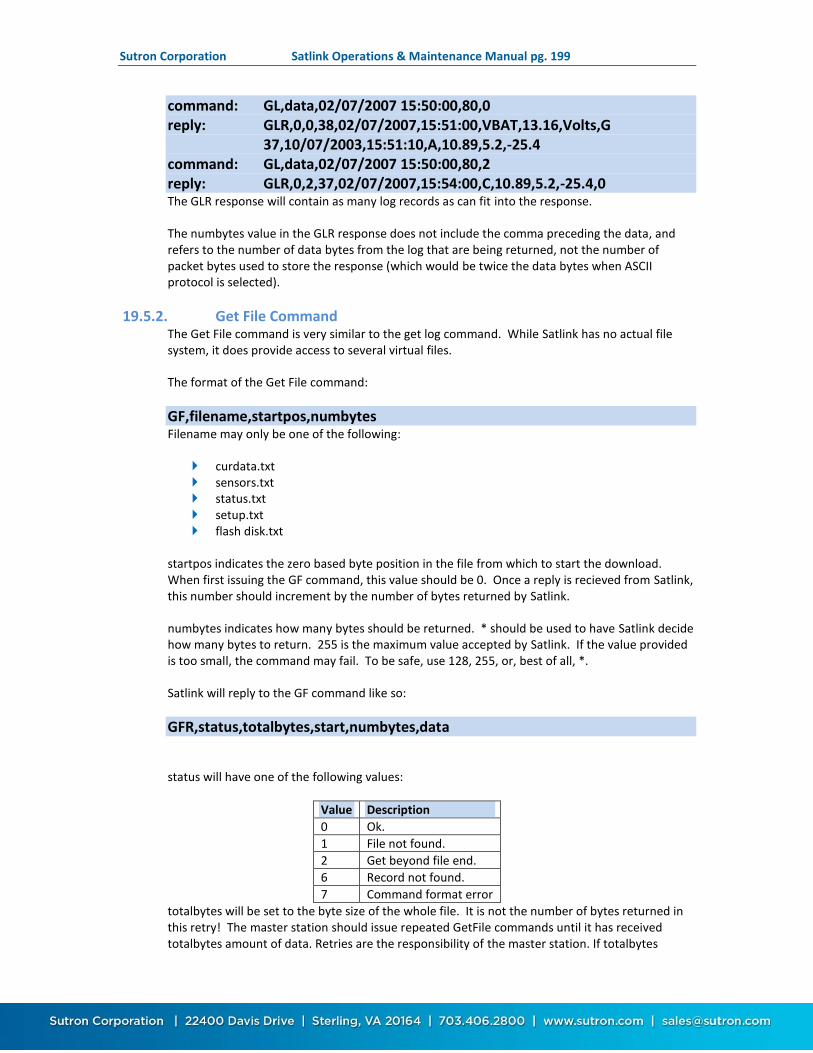
Sutron Corporation Satlink Operations & Maintenance Manual pg. 199
command: GL,data,02/07/2007 15:50:00,80,0 reply: GLR,0,0,38,02/07/2007,15:51:00,VBAT,13.16,Volts,G 37,10/07/2003,15:51:10,A,10.89,5.2,-25.4 command: GL,data,02/07/2007 15:50:00,80,2 reply: GLR,0,2,37,02/07/2007,15:54:00,C,10.89,5.2,-25.4,0 The GLR response will contain as many log records as can fit into the response.
The numbytes value in the GLR response does not include the comma preceding the data, and refers to the number of data bytes from the log that are being returned, not the number of packet bytes used to store the response (which would be twice the data bytes when ASCII protocol is selected).
19.5.2. Get File Command The Get File command is very similar to the get log command. While Satlink has no actual file system, it does provide access to several virtual files.
The format of the Get File command:
GF,filename,startpos,numbytes Filename may only be one of the following:
curdata.txt sensors.txt status.txt setup.txt flash disk.txt
startpos indicates the zero based byte position in the file from which to start the download. When first issuing the GF command, this value should be 0. Once a reply is recieved from Satlink, this number should increment by the number of bytes returned by Satlink.
numbytes indicates how many bytes should be returned. * should be used to have Satlink decide how many bytes to return. 255 is the maximum value accepted by Satlink. If the value provided is too small, the command may fail. To be safe, use 128, 255, or, best of all, *.
Satlink will reply to the GF command like so:
GFR,status,totalbytes,start,numbytes,data
status will have one of the following values:
Value Description
0 Ok.
1 File not found.
2 Get beyond file end.
6 Record not found.
7 Command format error
totalbytes will be set to the byte size of the whole file. It is not the number of bytes returned in this retry! The master station should issue repeated GetFile commands until it has received totalbytes amount of data. Retries are the responsibility of the master station. If totalbytes

Sutron Corporation Satlink Operations & Maintenance Manual pg. 200
changes in the reply, the file has changed and the get should be restarted. If a reply is missing, the master station must request the data again.
start should be the same value as startpos in the Get File command.
The numbytes value in the GFR response does not include the comma preceding the data, and refers to the number of data bytes from the file that are being returned, not the number of packet bytes used to store the response (which would be twice the number of data bytes when ASCII protocol is selected).
data is the data payload. It is the file data requested by the Get File command. There are numbytes bytes of data.
Current data Request the file "curdata.txt" and Satlink will reply with last measured sensor data. The reply is is very similar to what is found in LinkComm's Data tab. The format is
MM/DD/YYYY,HH:MM:SS,Label,Value,Units,Quality Each line is terminated by a CR/LF. Date and Time are expressed as in “01/31/2004” and “20:47:52”, respectively. Satlink has no concept of units, so that field is always blank. Quality is a single character defining the quality of the data where “G” = Good and “B” = Bad
Below is an example:
M1 BATT, 12.190, 2017/03/16 17:11:10, M2 TEMP, 24.00, 2017/03/16 17:11:10, M3 MINO, 1032, 2017/03/16 17:11:10, Note that if no measurements are enabled, GF commands for sensors.txt and curdata.txt will return errors.
Status information If the file "status.txt" is asked for, the data returned will be similar to what LinkComm shows on the Main Status and on Telemetry Status.
Sensor data Access recent measurements and setup details by asking for the file "sensors.txt". The data in the file will describe the measurement setup along with the most recent readings. The data mimic's Sutron 9210's sensor view. Tab characters are used to denote column breaks. Each line is terminated by a CR/LF.
BATT Battery = 0.000 V; Q = B TEMP Internal Temp = 0.00 C; Q = B MINO Manual Entry = 0; Q = B Note that if no measurements are enabled, GF commands for sensors.txt and curdata.txt will return errors.
Setup Satlink's setup may be read by asking for "setup.txt". The data returned will be exactly the same as that of a saved LinkComm setup file.

Sutron Corporation Satlink Operations & Maintenance Manual pg. 201
Flash disk Satlink can also provide data for the file "flash disk.txt". The data returned mimics the response of a file system to a directory command. For Satlink, it returns a list of the files it supports via the Modbus GF command along with their size and date.
setup.txt,5447,03/16/2017 17:32:41 curdata.txt,107,03/16/2017 17:32:41 sensors.txt,102,03/16/2017 17:32:41 status.txt,512,03/16/2017 17:32:41 Due to a limitiation, the size of setup.txt is always 512 bytes.
As Satlink has no real file system, the date of the files will always be set to Satlink's current time.
19.5.3. Send File The Send File subcode is used to send a file to Satlink. Satlink will only accept one file: "setup.txt". The procedure is used to change Satlink's setup. The file needs to contain setup data. The setup data should be the same as in the setup file saved by LinkComm.
SF,filename,bytepos,numbytes,data
The filename must be setup.txt.
bytepos is the position of the first byte in the data stream. It is zero based. The first packet with the data should have 0 as the bytepos.
numbytes is the number of data bytes in the payload. For Satlink Modbus over RS-485, this number must not be greater than 48.
data should contain actual setup data. Example:
STATION NAME = HAPPY CREEK M1 MEAS INTERVAL = 00:00:30 The format of the reply is as follows:
SFR,status,bytepos,numbytes The value of status can be any of the following values:
Value Description
0 Ok.
1 File not found.
3 Write Failed.
4 Gap at end of file
7 Command format error

Sutron Corporation Satlink Operations & Maintenance Manual pg. 202
20. Scripts For further customization, Satlink supports scripts written in the Python programming language. These scripts may be used to
Collect data from sensors that are otherwise unsupported, such as an RS-232 sensor Do custom measurement processing Perform control operations Allow for custom transmission formatting And much more…
This manual provides an overview on Python scripts and how they integrate into Satlink’s setup. Further documentation is located on the Sutron website. It includes the Python API, development environment setup, Python resources, additional libraries, and example code.
http://www.sutron.com/micropython/html/index.html Scripts were introduced with Satlink software version 8.11.
To load a script file into Satlink, please read the SCRIPTS MANAGEMENT section. Please note that
every script file must include the sl3 module. To the top of each script, add from sl3 import *
Satlink handles Python scripts in conjunction with the standard Satlink setup. There are three main interface points:
Measurements, via the Use Script and Script Function settings. Transmissions, via the Custom Script Format and Format Function settings. Script Tasks, which are a new concept; each task runs a script at the customer
designated time.
20.1. Measurements and Scripts Measurement scripts work in the following fashion:
A value is read from the sensor using Satlink’s standard setup The sensor value is further processed by the script
This is similar to how measurement equations work.
Scripts do not have direct access to analog and digital sensor inputs. Instead, measurements need to be setup to collect data from those sensors. Python scripts then do processing on the measurement results.
Two settings are relevant when using measurements and scripts:
Use Script Script Function
To use the script, enable Use Script and set Script Function to the name of the Python routine that should be invoked (in the example below, that would be twelve_more).

Sutron Corporation Satlink Operations & Maintenance Manual pg. 203
20.1.1. Twelve More Measurement Script Example Here is an example of a measurement script:
@MEASUREMENT
def twelve_more(inval):
"""returns 12+input"""
return 12 + inval
The example script above adds twelve to the result of the sensor reading in order to provide a final measurement result.
Let us suppose that a measurement were setup as a battery voltage reading. Let us suppose that the current battery voltage is 13.5. If the script twelve_more were associated with that measurement, Satlink would do the following:
Make a battery voltage reading (13.5V) Pass the value 13.5 to script function twelve_more twelve_more would run, adding 12 to 13.5 and returning a value of 25.5 The final measurement result would be 25.5.
20.1.2. Rules for Measurement Scripts These rules must be followed when writing a script that will be referenced by the measurement:
The @MEASUREMENT decorator must be on the line preceding the Python function. The decorator is case sensitive.
The measurement function must take in one floating point type parameter and it must return a float parameter.
The parameter passed to the function is the result of the sensor reading. The parameter returned by the function is the final result of the measurement. The function may call into any other functions in the script. Those other functions do
not need to have the @MEASUREMENT decorator.
20.1.3. Minutes of Daylight Measurement Script Example A typical usage scenario for a measurement script is illustrated by the daylight counter. The goal of the measurement is to count the number of minutes of daylight. A single measurement is setup with the following details:
Measurement M1 daylight
Active = On
Label = daylight
Meas Type = Analog
Meas Interval = 00:01:00
Use Script = On
Script Function = minutes_of_daylight
And here is the script used

Sutron Corporation Satlink Operations & Maintenance Manual pg. 204
@MEASUREMENT
def minutes_of_daylight(pv):
"""
This program counts minutes of daylight in a 24 hour period.
The following measurement setup configuration is assumed:
Analog type for PV reading, measurement interval is one minute
:param pv: analog reading form PV sensor
:return: number of daylight minutes so far
"""
global m_daylight
if pv > 0.8:
""" greater than 0.8 indicates daylight """
m_daylight += 1.0
if ascii_time_hms(time_scheduled()) == "00:00:00":
""" at midnight, reset the counter"""
m_daylight = 0.0
return m_daylight
In the example above, every time measurement M1 is made, it will first collect a reading from the analog sensor. It will then feed that reading to the minutes_of_daylight function which will produce the final result m_daylight. That final result gets logged and transmitted.
20.1.4. Dew Point Measurement Script Example Dew point is computed by putting air temperature and relative humidity readings through an equation. The dew point example uses a total of three measurements:
One measurement is setup to measure air temperature. It may be any type of sensor, but it must be labeled as “AT”.
A second measurement will interface to a relative humidity sensor. Again, this sensor may be of any type as long as it produces a relative humidity reading. It needs to be labeled “RH”.
The last measurement computes dew point. This one will use a script. The measurement type used is not relevant as the sensor readings come from the other two measurements. The optimal measurement type to use is Manual Entry because it makes no sensor
reading. All three measurements should be scheduled at the same time to produce an accurate
dew point result. AT and RH do not have to be logged for this setup to work.
Here is what Satlink will do with this setup:
Measure AT and RH. These are standard measurements. Run the script for the dew point computation, using the AT and RH values just
measured. Produce a dew point result.
This is the dew point script:

Sutron Corporation Satlink Operations & Maintenance Manual pg. 205
@MEASUREMENT
def dew_point(inval):
"""
Computes dew point based on relative humidity and air
temperature.
It is assumed that two other measurements have been setup, one
called AT and another called RH.
This script should be associated with a third measurement that
is setup as a Manual Entry.
Manual Entry is used because this measurement is based on the
inputs of two other sensors rather than the
input associated with this measurement.
:param inval: this value is ignored
:return: dew point
:rtype: float
"""
from math import log10
# retrieve relative humidity from another measurement which
must be labeled RH
rh = measure("RH").value
# retrieve temperature from meas labeled AT
at = measure("AT").value
# compute dew point
dp = 0.057906 * (log10(rh/100) / 1.1805) + (at / (at+238.3))
dp = dp * 238.3 / (1 - dp)
return dp
20.2. Transmission Formatting and Scripts Scripts may be used to alter the data transmitted by Satlink. Satlink provides several standard transmission formats including SHEF and Pseudobinary. With the use of scripts, other formats may be achieved.
The relevant settings are Custom Script Format and Format Function.
When setup to use formatting scripts, Satlink will go through this flow:
Format the transmission data in a standard way. If SHEF is the chosen transmission format, then the transmission will be formatted into SHEF. This is identical to what Satlink does when there is no formatting script.
The formatting script function is invoked. The standard formatted transmission data is provided to the script function as a
parameter. The script may perform any action on the provided transmission data. It may simply
append additional data. Or it may completely disregard the provided transmission data and create a completely new set of data.
The script ends by returning the new set of transmission data.
20.2.1. Append Info Script Formatting Example Here is the transmission data with a standard SHEF format, without scripts:
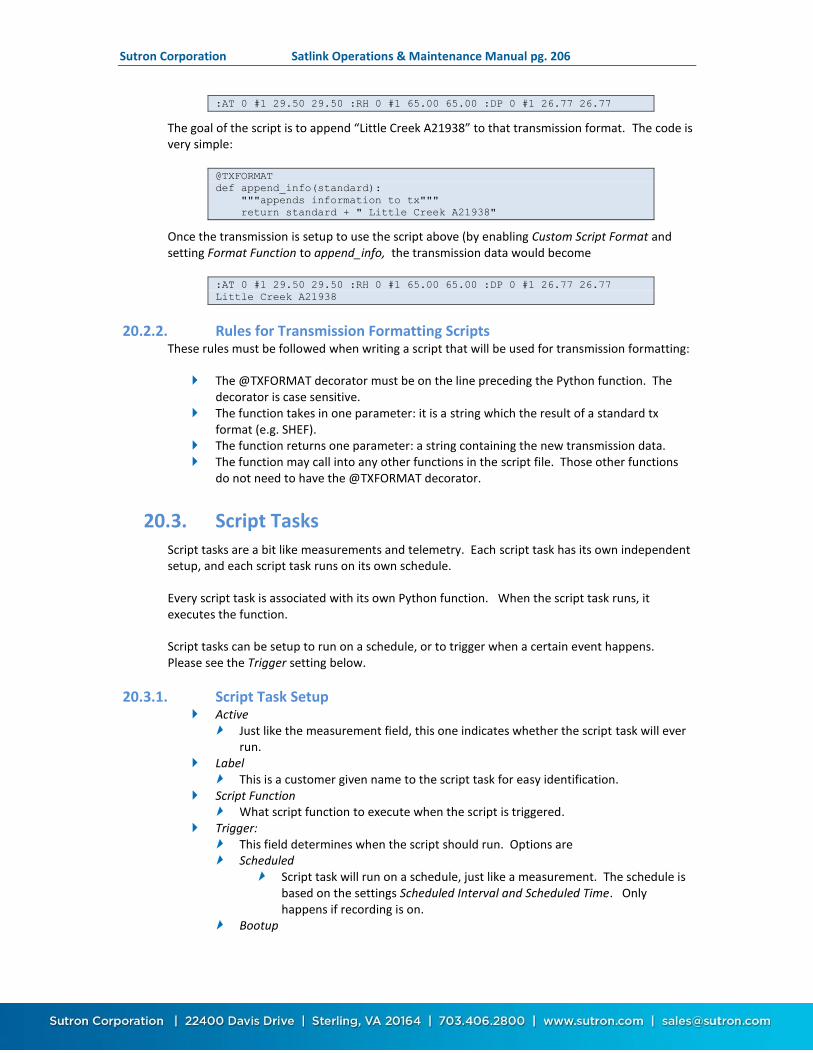
Sutron Corporation Satlink Operations & Maintenance Manual pg. 206
:AT 0 #1 29.50 29.50 :RH 0 #1 65.00 65.00 :DP 0 #1 26.77 26.77
The goal of the script is to append “Little Creek A21938” to that transmission format. The code is very simple:
@TXFORMAT
def append_info(standard):
"""appends information to tx"""
return standard + " Little Creek A21938"
Once the transmission is setup to use the script above (by enabling Custom Script Format and setting Format Function to append_info, the transmission data would become
:AT 0 #1 29.50 29.50 :RH 0 #1 65.00 65.00 :DP 0 #1 26.77 26.77
Little Creek A21938
20.2.2. Rules for Transmission Formatting Scripts These rules must be followed when writing a script that will be used for transmission formatting:
The @TXFORMAT decorator must be on the line preceding the Python function. The decorator is case sensitive.
The function takes in one parameter: it is a string which the result of a standard tx format (e.g. SHEF).
The function returns one parameter: a string containing the new transmission data. The function may call into any other functions in the script file. Those other functions
do not need to have the @TXFORMAT decorator.
20.3. Script Tasks Script tasks are a bit like measurements and telemetry. Each script task has its own independent setup, and each script task runs on its own schedule.
Every script task is associated with its own Python function. When the script task runs, it executes the function.
Script tasks can be setup to run on a schedule, or to trigger when a certain event happens. Please see the Trigger setting below.
20.3.1. Script Task Setup Active
Just like the measurement field, this one indicates whether the script task will ever run.
Label This is a customer given name to the script task for easy identification.
Script Function What script function to execute when the script is triggered.
Trigger: This field determines when the script should run. Options are Scheduled
Script task will run on a schedule, just like a measurement. The schedule is based on the settings Scheduled Interval and Scheduled Time. Only happens if recording is on.
Bootup

Sutron Corporation Satlink Operations & Maintenance Manual pg. 207
Script will run when the system turns on. It does not matter if recording is on; script will run at bootup.
Digital 1 Digital 2
Script will trigger when the appropriate digital input changes. System must be recording.
Alarm In Only Alarm In And Out Alarm Out Only
These triggers are associated with alarms; they only happen if recording is on.
Recording On Recording Off
Script runs when recording is turned on or off. On User Connect
This happens whenever the customer connects to the station via Wi-Fi, RS-232, USB cable, Cell Modem (SMS and TCP/IP), Iridium Message, Front Panel Button Press
This trigger will never happen more frequently than once a minute. System does not need to be recording.
On Button press Whenever the front panel button is pressed, the script will run, regardless
of whether the system is recording. Please note that On User Connect also happens when the button is pressed.
20.3.2. Rules for Script Task Functions These rules must be followed when writing a script task function:
The @TASK decorator must be on the line preceding the Python function. The decorator is case sensitive.
The function does not take in any parameters. The functions does not return any parameters. The function may call into any other functions in the script. Those other functions do
not need to have the @TASK decorator.
20.3.3. RS-232 Output Script Example The following example uses a script task to send data out the RS-232 port. The example will read the last value of measurement M1 and output it on the RS-232 port. It is expected that the script will run on a schedule. Such a script could be used to drive a RS-232 display, or to pass data to another logger.
@TASK
def rs232_last_meas():
with serial.Serial("RS232", 9600) as output:
output.write(str(measure(1, READING_LAST)) + "\r\n")
output.flush()
20.3.4. Setup Change Script Example This script increases the measurement and transmission intervals, which results in more frequent data collection and transmissions. It is meant to be run when the system goes into alarm. That means the Script Task’s Trigger should be set to Alarm In Only.

Sutron Corporation Satlink Operations & Maintenance Manual pg. 208
@TASK
def alarm_in_setup_change():
setup_write("!M1 meas interval", "00:01:00")
setup_write("!M2 meas interval", "00:01:00")
setup_write("!TX3 scheduled interval", "00:05:00")
It is expected that a second script be setup to trigger when the system goes out of alarm; it would restore the measurement and transmission intervals.
@TASK
def alarm_out_setup_change():
setup_write("!M1 meas interval", "00:10:00")
setup_write("!M2 meas interval", "00:10:00")
setup_write("!TX3 scheduled interval", "01:00:00")
20.3.5. Trigger Sampler Script Example This script task has the job of triggering a sampler once certain conditions are met. It will write a log entry every time it triggers. It is expected that the script be run on a schedule.
@TASK
def trigger_sampler():
"""Checks last readings of M1 and M2. If readings meet
conditions, sampler is triggered via a digital output"""
if (measure(1).value > 32.5):
if (measure(2).value < 13.9):
# trigger sampler by pulsing output for 500ms
output_control('OUTPUT1', True)
utime.sleep(0.5)
output_control('OUTPUT1', False)
# write a log entry
reading = Reading(label="Triggered", time=utime.time())
reading.write_log()
20.4. Scripts Management Please use LinkComm to send a new script file to Satlink. LinkComm’s Script tab provides all the needed features to manage the script file.
Please note that Satlink holds only one script file. That file may have any number of functions.
Every script file must include the sl3 module. To the top of each script, add from sl3 import *
The traditional workflow to setup scripts in Satlink:
Run LinkComm and connect to Satlink Go to LinkComm’s Script tab
Open an existing script file or paste in the script Verify that the expected functions are listed by LinkComm Press the Test Script button and verify the script works
Setup a measurement that will use the script: Go to the measurement tab Proceed to setup the measurement(s) to interface to the sensors Enable Measurement setting Use Script

Sutron Corporation Satlink Operations & Maintenance Manual pg. 209
Set Measurement setting Script Function to one of the provided script functions. LinkComm will automatically list all compatible functions found in the script file.
Send setup to the unit Press the Force button to verify that the measurement works as expected.
Setup a transmission that will use custom formatting: Go to the telemetry tab Setup the transmission Enable Custom Script Format Choose the appropriate Script Format Function. LinkComm will automatically list all
compatible functions found in the script file. Send setup to the station. Press the Show Tx Data button to verify that the formatting works as expected.
Setup script tasks: Go to the script tab Select S1 (or another script task) on the left side Make the script Active Choose the appropriate Script Function. LinkComm will automatically list all
compatible functions found in the script file. Choose when the script should run via the Trigger setting. Send setup to Saltink Press the Test Script button to verify the script does what it should.
Make sure the setup is in sync with Satlink and start recording
20.4.1. Saving Scripts and Setups Together Because Satlink setups and scripts work together, it makes sense to associate the setup file and the script file together.
When LinkComm’s Import Setup feature is used, if the chosen setup uses scripts, LinkComm will prompt for the script file. When the Export Setup feature is used, both the setup and the script are saved.
If the station setup is prepared, loading a script file into Satlink is easy:
Run LinkComm Connect to Satlink Choose Import Setup from the Menu Choose the setup file Choose the script file Send setup

Sutron Corporation Satlink Operations & Maintenance Manual pg. 210
21. Appendix A – Specifications Specifications at 25⁰C and 12V input unless otherwise noted
ELECTRICAL Input Voltage 9-20 VDC
10 -16 V for SDI-12 sensor support Reverse power protected
CURRENT CONSUMPTION @ 12V Standby (all sensors unpowered)
1.1mA @12V typical
Measuring 6 to 15mA
Transmissions
1.25W, 300 Baud 2.5W, 300 Baud
5W, 300 Baud 7W, 300 Baud
10W, 300 Baud
Wakeup: 50mA for 107 seconds (GPS sync, frequency discipline …) Warmup: 320mA for 16 seconds Transmitting: 1.5A for 2 to 60 seconds based on number of values to transmit 1.8A for 2 to 60 seconds based on number of values to transmit 2.6A for 2 to 60 seconds based on number of values to transmit 2.9A for 2 to 60 seconds based on number of values to transmit 3.5A for 2 to 60 seconds based on number of values to transmit
Wi-Fi on 11mA
MECHANICAL Dimensions SL3-1: 6.06”x9.24”x2.0” (not including connectors)
SL3-SDI-1: 6.40”x3.82” (not including connectors)
Power Connection 2 position pluggable terminal strip (12-18 AWG)
SDI-12 Port 2x3 position pluggable terminal strips (16-24 AWG)
Sensor Connections 10x 2, 3, or 4 position pluggable terminal strips (16-24 AWG)
DB9-F RS-232 DCE
USB (SL3-SDI-1) Micro-B receptacle
USB OTG (SL3-1) Micro-AB receptacle
USB Host (SL3-1) Type A receptacle
2 Status LED Indicates status
Earth GND 0.2” screw terminal (SL3-1 only)
ENVIRONMENTAL Temperature -40°C to +70°C
Humidity 0-95% Non-condensing
KEY FEATURES Clock Internal real-time clock w/battery backup.
Clock Accuracy ± 30 ms
Log Capacity >1,000,000 readings, 32MB
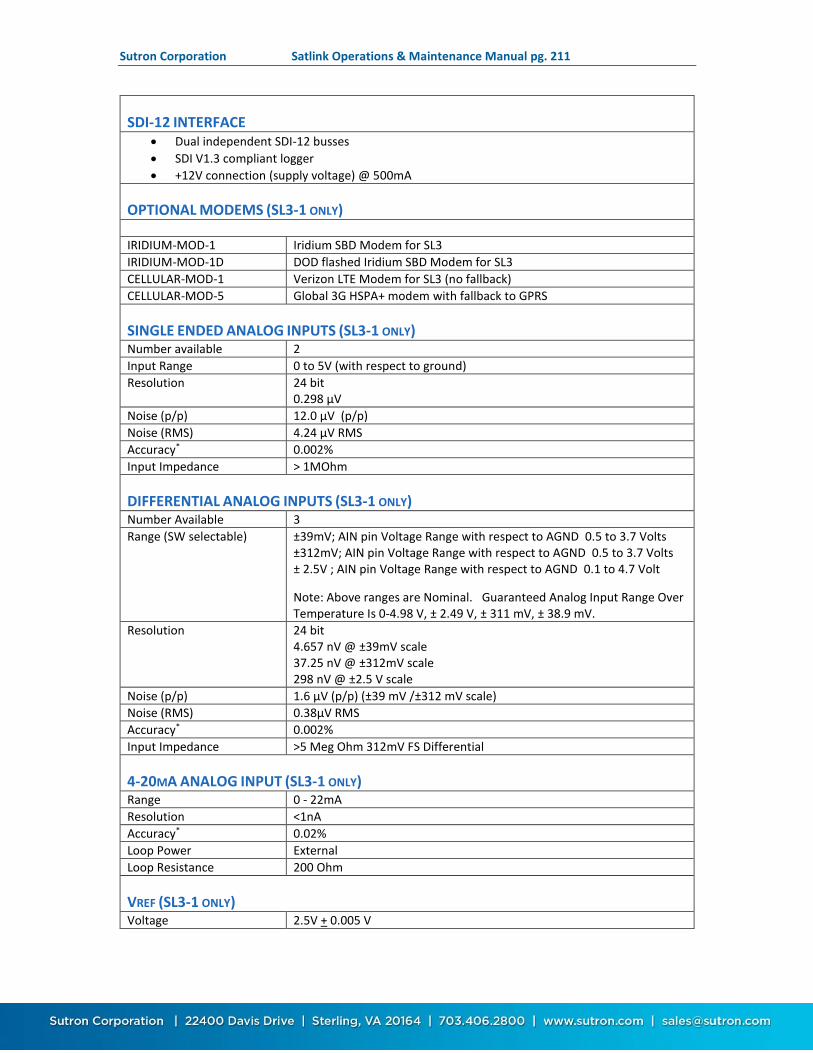
Sutron Corporation Satlink Operations & Maintenance Manual pg. 211
SDI-12 INTERFACE Dual independent SDI-12 busses
SDI V1.3 compliant logger
+12V connection (supply voltage) @ 500mA
OPTIONAL MODEMS (SL3-1 ONLY)
IRIDIUM-MOD-1 Iridium SBD Modem for SL3
IRIDIUM-MOD-1D DOD flashed Iridium SBD Modem for SL3
CELLULAR-MOD-1 Verizon LTE Modem for SL3 (no fallback)
CELLULAR-MOD-5 Global 3G HSPA+ modem with fallback to GPRS
SINGLE ENDED ANALOG INPUTS (SL3-1 ONLY) Number available 2
Input Range 0 to 5V (with respect to ground)
Resolution 24 bit 0.298 µV
Noise (p/p) 12.0 µV (p/p)
Noise (RMS) 4.24 µV RMS
Accuracy* 0.002%
Input Impedance > 1MOhm
DIFFERENTIAL ANALOG INPUTS (SL3-1 ONLY) Number Available 3
Range (SW selectable) ±39mV; AIN pin Voltage Range with respect to AGND 0.5 to 3.7 Volts ±312mV; AIN pin Voltage Range with respect to AGND 0.5 to 3.7 Volts ± 2.5V ; AIN pin Voltage Range with respect to AGND 0.1 to 4.7 Volt
Note: Above ranges are Nominal. Guaranteed Analog Input Range Over Temperature Is 0-4.98 V, ± 2.49 V, ± 311 mV, ± 38.9 mV.
Resolution 24 bit 4.657 nV @ ±39mV scale 37.25 nV @ ±312mV scale 298 nV @ ±2.5 V scale
Noise (p/p) 1.6 µV (p/p) (±39 mV /±312 mV scale)
Noise (RMS) 0.38µV RMS
Accuracy* 0.002%
Input Impedance >5 Meg Ohm 312mV FS Differential
4-20MA ANALOG INPUT (SL3-1 ONLY) Range 0 - 22mA
Resolution <1nA
Accuracy* 0.02%
Loop Power External
Loop Resistance 200 Ohm
VREF (SL3-1 ONLY) Voltage 2.5V + 0.005 V

Sutron Corporation Satlink Operations & Maintenance Manual pg. 212
Factory Calibration accuracy
0.006%
Load Current 10 mA max
TEMPERATURE MEASUREMENT (INTERNAL) Range -40°C to +70°C
Accuracy ± 3 deg
DIGITAL INPUT 1,2 - FREQUENCY TYPE (SL3-1 ONLY) Input Range Low level AC (DIN1 only) (100 mVp-p to +15V)
High Level DC (DIN1 and 2) (3V min 15V max)
Minimum Frequency 2.8 Hz
Maximum Frequency 10 kHz
DIGITAL INPUT 1,2 - COUNTER TYPE (SL3-1 ONLY) Input Range 0-5 V (3V min 15V max)
Maximum Frequency without Debouncing
10 kHz
Debouncing Period 4 ms * Accuracy is the deviation from the straight line from 0 to FS. FS is defined by Vref.

Sutron Corporation Satlink Operations & Maintenance Manual pg. 213
22. Appendix B – Sutron Customer Service Policy
Dear Customer:
Thank you for making the important decision to purchase Sutron equipment. All Sutron equipment is manufactured and tested to the highest quality standards as set by Sutron’s Quality Assurance Department. Our Customer Service Representatives have years of experience with equipment, systems, and services. They are electronic technicians with field and applications experience, not just with a technical background.
Customer Phone Support Customer Service Representatives routinely handle a wide variety of questions every day. If questions arise, please feel free to contact me or one of the Customer Service Representatives. We are available from 8:00 am to 5:00 pm Monday through Friday and will be happy to take your call. We can answer most sensor and interface questions on the first call. If we cannot quickly answer a question on an interface, we will work with you until we find a solution. Sometimes a problem is application related. Although we pride ourselves on handling 95% of application related questions over the phone, we maintain constant contact with our Integrated Systems Division and Engineering Division for additional assistance.
Introductory Training Training is an important part of the Sutron Customer Service philosophy. The Sutron training policy is simple---If you buy Sutron equipment, you get Sutron training! Without the proper training, you cannot take advantage of the benefits and advantages that Sutron equipment provides. We often supply on-site introductory training at your facility for no charge. You provide the classroom, students, equipment, and coffee---we'll provide the instructor.
On-Site Visits Of course not all problems can be fixed over the phone. Sometimes a customer needs an on-site technician to identify site related problems or troubleshoot a network. Sutron can provide these services at a reasonable cost. Call for details. If you would like to learn more about Sutron products email [email protected] Thanks again for your order,
Paul Delisi
Customer Service Manager
Sutron Corporation

Sutron Corporation Satlink Operations & Maintenance Manual pg. 214
23. Appendix C – Commercial Warranty
23.1. Sutron Manufactured Equipment THE SUTRON CORPORATION WARRANTS that the equipment manufactured by its manufacturing division shall conform to applicable specifications and shall remain free from defects in workmanship and material for a period ending two years from the date of shipment from Sutron’s plant.
Sutron’s obligation under this Warranty shall be limited to repair at the factory (22400 Davis Drive, Sterling, VA 20164), or at its option, replacement of defective product. In no event shall Sutron be responsible for incidental or consequential damages, whether or not foreseeable or whether or not Sutron has knowledge of the possibility of such damages. This warranty shall not apply to products that have been damaged through negligence, accident, misuse, or acts of nature such as floods, fires, earthquakes, lightning strikes, etc.
Sutron’s liability, whether in contract or in tort, arising out of warranties or representations, instructions or defects from any cause, shall be limited exclusively to repair or replacement parts under the aforesaid conditions.
Sutron requires the return of the defective electronic products or parts to the factory to establish claim under this warranty. The customer shall prepay transportation charges to the factory. Sutron shall pay transportation for the return of the repaired equipment to the customer when the validity of the damage claim has been established. Otherwise, Sutron will prepay shipment and bill the customer. All shipments shall be accomplished by best-way surface freight. Sutron shall in no event assume any responsibility for repairs or alterations made other than by Sutron. Any products repaired or replaced under this warranty will be warranted for the balance of the warranty period or for a period of 90 days from the repair shipment date, whichever is greater. Products repaired at cost will be warranted for 90 days from the date of shipment.
23.2. Non-Sutron Manufactured Equipment The above Warranty applies only to products manufactured by Sutron. Equipment provided, but not manufactured by Sutron, is warranted and will be repaired to the extent of and according to the current terms and conditions of the respective equipment manufacturers.

Sutron Corporation Satlink Operations & Maintenance Manual pg. 215
23.3. Repair and Return Policy Sutron maintains a repair department at the factory, 22400 Davis Drive, Sterling, VA 20164. Turnaround time normally ranges from 10-30 days after Sutron receives equipment for repair. Call Customer Service at (703) 406-2800 for a Return Material Authorization (RMA) number. Return the defective equipment to the factory, transportation charges paid.
Extended Warranty and On-Site Maintenance
Extended warranty and on-site maintenance contracts are available. Price quotations may be obtained from Sutron customer service representatives.

Sutron Corporation Satlink Operations & Maintenance Manual pg. 216
24. Appendix E – Approvals and Certifications
24.1. NESDIS
Model NESDIS Certificate number
SL3-1 2015-0001
SL3-SDI-1 2015-0003
SL3-XMTR-1 2015-0002
24.2. EUMETSAT
Model EUMETSAT Certificate number HIGH DATA RATE/STANDARD DATA RATE J
SL3-1 2017-002-DCP-HDR / 2017-006-DCP-SDR
SL3-SDI-1 2017-002-DCP-HDR / 2017-006-DCP-SDR
SL3-XMTR-1 2017-002-DCP-HDR / 2017-006-DCP-SDR
24.3. INSAT
Model Government of India Certificate number
SL3-1 1550
SL3-SDI-1 1549
SL3-XMTR-1 1551
24.4. CE THIS PRODUCT COMPLIES WITH THE FOLLOWING EUROPEAN COMMUNITY DIRECTIVES
2004/108/EC (until April 19th, 2016) 2014/30/EU (from April 20th, 2016)
EMC Directive
1999/5/EC (until June 12th,2016) 2014/53/EU (from June 13th, 2016)
Radio Equipment & Telecommunications Terminal Equipment Radio Equipment Directive
2006/95/EC (until April 19th, 2016) 2014/35/EU (from April 20th, 2016)
Low Voltage Directive
2011/65/EU (from July 21st, 2017) Restriction of Hazardous Substances (RoHS 2)
Declaration of Conformity (P/N: 8800-1210) can be obtained by contacting Sutron.

Sutron Corporation Satlink Operations & Maintenance Manual pg. 217
24.5. Wi-Fi Module Contains FCC ID: OA3RN1723
This device complies with Part 15 of the FCC Rules. Operation is subject to the following two conditions: (1) this device may not cause harmful interference, and (2) this device must accept any interference received, including interference that may cause undesired operation.
This equipment has been tested and found to comply with the limits for a Class B digital device, pursuant to part 15 of the FCC Rules. These limits are designed to provide reasonable protection against harmful interference in a residential installation. This equipment generates, uses and can radiate radio frequency energy, and if not installed and used in accordance with the instructions, may cause harmful interference to radio communications. However, there is no guarantee that interference will not occur in a particular installation. If this equipment does cause harmful interference to radio or television reception, which can be determined by turning the equipment off and on, the user is encouraged to try to correct the interference by one or more of the following measures: • Reorient or relocate the receiving antenna. • Increase the separation between the equipment and receiver. • Connect the equipment into an outlet on a circuit different from that to which the receiver is connected. • Consult the dealer or an experienced radio/TV technician for help.

Sutron Corporation Satlink Operations & Maintenance Manual pg. 218
24.6. IRIDIUM
Regulatory Approvals Radio Tests Identification
CE ETSI EN 301 441 V1.1.1 (2000-05) N/A
FCC FCC CFR47 parts 2(2013), 15B (2013), & 25 (2013) Q639603N
Industry Canada Industry Canada RSS170 Issue 2, March, 2011 Industry Canada RSS-GEN Issue 3, December, 2010
4629A-9603N
FCC Warning Statement
This device complies with Part 15 of the FCC Rules. Operation is subject to the following two conditions:
1. This device may not cause harmful interference, and 2. This device must accept any interference received, including interference that
may cause undesired operation.
This equipment complies with FCC radiation exposure limits set forth for an uncontrolled environment. End users must follow the specific operating instructions for satisfying RF exposure compliance. This transmitter must not be co-located or operating in conjunction with any other antenna or transmitter that is not preapproved.
Changes or modifications not expressly approved by the party responsible for compliance could void the user’s authority to operate the equipment.
Industry Canada Warning Statement
Under Industry Canada regulations, this radio transmitter may only operate using an antenna of a type and maximum (or lesser) gain approved for the transmitter by Industry Canada.
To reduce potential radio interference to other users, the antenna type and its gain should be so chosen that the equivalent isotropically radiated power (e.i.r.p.) is not more than that necessary for successful communication.
This device complies with Industry Canada license-exempt RSS standard(s). Operation is subject to the following two conditions: (1) this device may not cause interference, and (2) this device must accept any interference, including interference that may cause undesired operation of the device.
R&TTE Statement
Iridium communications Inc. hereby declares that the 9603N is in compliance with the essential requirements and other relevant provisions of directive 1999/5/EC.

Sutron Corporation Satlink Operations & Maintenance Manual pg. 219
24.7. Cellular Compliance Information
Cellular Version Description Radio FCC ID IC ID CELLULAR-MOD-1 Verizon LTE modem NL-SW-LTE-TSVG RI7LE910SV 5131A-LE910SV
CELLULAR-MOD-5 HSPA+ Global NL-SW-HSPA R17HE910 5131A-HE910
The cellular option card can be found in one of the two option card slots. To remove the modem card, unscrew the 2 screws and pull on the SMA connector. The FCC ID is located on the modem circled in red.
CAN ICES-3 (B) / NMB-3 (B) This Class B digital apparatus complies with Canadian ICES-003. FCC Warning Statement
This device complies with Part 15 of the FCC Rules and Industry Canada license-exempt RSS standard(s). Operation is subject to the following two conditions:
3. This device may not cause interference, and 4. This device must accept any interference, including interference that may
cause undesired operation of the device.
This equipment complies with FCC and IC radiation exposure limits set forth for an uncontrolled environment. The antenna should be installed and operated with minimum distance of 20 cm between the radiator and your body. Antenna gain must be below:
700 MHz 6.93 dBi 1700 MHz 5.00 dBi
This transmitter must not be co-located or operating in conjunction with any other antenna or Transmitter that is not preapproved.
FCC Class B digital device notice
This equipment has been tested and found to comply with the limits for a Class B digital device, pursuant to part 15 of the FCC Rules. These limits are designed to provide reasonable protection against harmful interference in a residential installation. This equipment generates, uses and can radiate radio frequency energy and, if not installed and used in accordance with the instructions, may cause harmful interference to radio communications. However, there is no guarantee that interference will not occur in a particular installation. If this equipment does cause harmful interference to radio or television reception, which can be determined by turning the equipment off and on, the user is encouraged to try to correct the interference by one or more of the following measures:
Reorient or relocate the receiving antenna. Increase the separation between the equipment and receiver. Connect the equipment into an outlet on a circuit different from that to which the
receiver is connected. Consult the dealer or an experienced radio/TV technician for help.

Sutron Corporation Satlink Operations & Maintenance Manual pg. 220
25. Appendix F - SIM Card Installation and Removal Instructions
Following section details the instructions involved in installation and removal of SIM cards for Sutron Cell modems 1. Sutron Cell modems support only “micro SIM” size.
2. Care must be exercised while handling the sim card and modem.
2.1. Sim card should be handled using clean hands to avoid any dirt or smudges being left on the SIM
card.
2.2. Modem should be handled in a clean environment to prevent any dirt accumulation or ESD
damage.
3. To install the SIM card,
3.1. Remove the modem card from carrier board carefully. If modem is installed in Satlink3, remove
power to Satlink3, and carefully pull the cellular board out.
3.2. Flip the modem board carefully, without much stress on the U.FL cable; Insert the micro-sized
sim card, and push it all the way into the sim card slot as shown in pictures below
CARRIER board
Modem board U.FL cable

Sutron Corporation Satlink Operations & Maintenance Manual pg. 221
3.3. Flip the modem to correct align the modem with respect to the carrier board. Make sure the
U.FL cable is placed as shown in the pictures below.

Sutron Corporation Satlink Operations & Maintenance Manual pg. 222
3.4. Aligning the pins on modem board, gently push the modem into the carrier board. A good
alignment is shown in the pictures below
3.5. Use LinkComm “Cell Diags” to verify that the new SIM card is working correctly.

Sutron Corporation Satlink Operations & Maintenance Manual pg. 223
4. To remove the SIM card,
4.1. remove power to Satlink3, if cellular board is installed into the unit.
4.2. Place the cellular board on a clean surface, and remove the modem board from the carrier
board.
4.3. Flip-over the modem board carefully without pulling the U.FL cable.
4.4. Remove the SIM card carefully from the sim card slot
4.5. If new sim card must be inserted, follow the instructions from sim card installation.
Carefully insert the modem board onto the carrier board, as shown in step 3.4


© G. Lufft Mess- und Regeltechnik GmbH, Fellbach, Germany. We reserve the right to make technical changes at any time without notice.
48.7230-WSX-E
Document version V39 (08/2018)

Operating Manual Smart Weather Sensor
G. Lufft Mess- und Regeltechnik GmbH, Fellbach, Germany 3
Contents
1 Please Read Before Use ............................................................................................................................................. 5 1.1 Symbols Used ..................................................................................................................................................... 5 1.2 Safety Instructions ............................................................................................................................................... 5 1.3 Designated Use ................................................................................................................................................... 5 1.4 Incorrect Use ....................................................................................................................................................... 5 1.5 Warranty .............................................................................................................................................................. 6 1.6 Brand Names ....................................................................................................................................................... 6
2 Scope of Delivery ........................................................................................................................................................ 7
3 Order Numbers ............................................................................................................................................................ 8 3.1 Accessories ....................................................................................................................................................... 10 3.2 Spare Parts ........................................................................................................................................................ 10 3.3 Additional Documents and Software .................................................................................................................. 10
4 Equipment Description ............................................................................................................................................. 11 4.1 Air Temperature and Humidity ........................................................................................................................... 11 4.2 Air Pressure ....................................................................................................................................................... 12 4.3 Precipitation ....................................................................................................................................................... 12 4.4 Wet Bulb Temperature....................................................................................................................................... 12 4.5 Specific Enthalpy ............................................................................................................................................... 12 4.6 Air Density ......................................................................................................................................................... 12 4.7 Wind .................................................................................................................................................................. 12 4.8 Compass ........................................................................................................................................................... 12 4.9 Heating .............................................................................................................................................................. 12 4.10 Global Radiation ................................................................................................................................................ 12 4.11 Lightning Sensor ................................................................................................................................................ 12 4.12 External Temperature Sensor ............................................................................................................................ 12 4.13 External Rain Gauge ......................................................................................................................................... 13 4.14 (WS100-UMB only: ) Impulse Output for Rain Gauge Simulation ...................................................................... 13 4.15 Sensor Technology (example: WS600-UMB) .................................................................................................... 14
5 Generation of Measurements ................................................................................................................................... 15 5.1 Current Measurement (act) ................................................................................................................................ 15 5.2 Minimum and Maximum Values (min and max) ................................................................................................. 15 5.3 Average Value (avg) .......................................................................................................................................... 15 5.4 Vectorial Average Value (vct) ............................................................................................................................ 15
6 Measurement Output ................................................................................................................................................ 16 6.1 Air and Dewpoint Temperature .......................................................................................................................... 16 6.2 Wind Chill Temperature ..................................................................................................................................... 16 6.3 Humidity ............................................................................................................................................................. 16 6.4 Air Pressure ....................................................................................................................................................... 16 6.5 Wet Bulb Temperature....................................................................................................................................... 17 6.6 Specific Enthalpy ............................................................................................................................................... 17 6.7 Air Density ......................................................................................................................................................... 17 6.8 Wind Speed ....................................................................................................................................................... 18 6.9 Wind Direction ................................................................................................................................................... 18 6.10 Wind Measurement Quality ............................................................................................................................... 19 6.11 Compass ........................................................................................................................................................... 19 6.12 Precipitation Quantity - Absolute ....................................................................................................................... 20 6.13 Precipitation Quantity - Differential .................................................................................................................... 20 6.14 Precipitation Intensity......................................................................................................................................... 20 6.15 Precipitation Type .............................................................................................................................................. 21 6.16 Heating Temperature ......................................................................................................................................... 21 6.17 Global Radiation ................................................................................................................................................ 21 6.18 Lightning Sensor ................................................................................................................................................ 22

Operating Manual Smart Weather Sensor
4 G. Lufft Mess- und Regeltechnik GmbH, Fellbach, Germany
6.19 Service Messages............................................................................................................................................. 22 6.20 Drop Diameter Distribution (WS100 only) ........................................................................................................ 23
7 Installation ................................................................................................................................................................ 24 7.1 Fastening .......................................................................................................................................................... 24 7.2 North Alignment ................................................................................................................................................ 25 7.3 Selecting the Installation Location..................................................................................................................... 26
8 Connections .............................................................................................................................................................. 28 8.1 Supply Voltage .................................................................................................................................................. 29 8.2 RS485 Interface ................................................................................................................................................ 29 8.3 Connection to ISOCON-UMB (8160.UISO) ...................................................................................................... 30 8.4 Use of Surge Protection (8379.USP) ................................................................................................................ 30 8.5 Connection of External Temperature and Precipitation Sensors ...................................................................... 30 8.6 (WS100-UMB only: ) Connection of Impulse Output for Rain Gauge Simulation .............................................. 30
9 Commissioning ........................................................................................................................................................ 31
10 Configuration and Test ............................................................................................................................................ 32 10.1 Factory Settings ................................................................................................................................................ 33 10.2 Configuration with the UMB-Config-Tool ........................................................................................................... 33 10.3 Function Test with UMB-Config-Tool ................................................................................................................ 41 10.4 Operating Modes of the Smart Weather Sensor ............................................................................................... 42 10.5 Operating Modes for Equipment Heating .......................................................................................................... 44
11 Firmware Update ...................................................................................................................................................... 46
12 Maintenance .............................................................................................................................................................. 46 12.1 Maintenance of the Rain Gauge ....................................................................................................................... 47
13 Technical Data .......................................................................................................................................................... 48 13.1 Measuring Range / Accuracy ............................................................................................................................ 50 13.2 Drawings ........................................................................................................................................................... 53
14 EC Certificate of Conformity ................................................................................................................................... 65 14.1 WS100 FCC Compliance Statement (US) ........................................................................................................ 66 14.2 WS 100 IC Compliance Statement (CA) ........................................................................................................... 66
15 Fault Description ...................................................................................................................................................... 67
16 Disposal .................................................................................................................................................................... 68 16.1 Within the EC .................................................................................................................................................... 68 16.2 Outside the EC ................................................................................................................................................. 68
17 Repair / Corrective Maintenance ............................................................................................................................. 68 17.1 Technical Support ............................................................................................................................................. 68
18 External Sensor ........................................................................................................................................................ 69 18.1 External Temperature and Precipitation Sensors ............................................................................................. 69
19 Appendix ................................................................................................................................................................... 71 19.1 Channel List Summary ...................................................................................................................................... 71 19.2 Channel List Summary per TLS2002 FG3 ........................................................................................................ 73 19.3 Communication in Binary Protocol .................................................................................................................... 74 19.4 Communication in ASCII Protocol ..................................................................................................................... 77 19.5 Communication in Terminal Mode .................................................................................................................... 80 19.6 Communication in SDI-12 Mode ....................................................................................................................... 83 19.7 Communication in Modbus Mode.................................................................................................................... 126 19.8 Communication: XDR Protocol ....................................................................................................................... 138 19.9 (WS100-UMB only) Communication: UMB-ASCII 2.0 Protokoll ...................................................................... 150
20 List of Figures ......................................................................................................................................................... 157
21 Index ........................................................................................................................................................................ 158
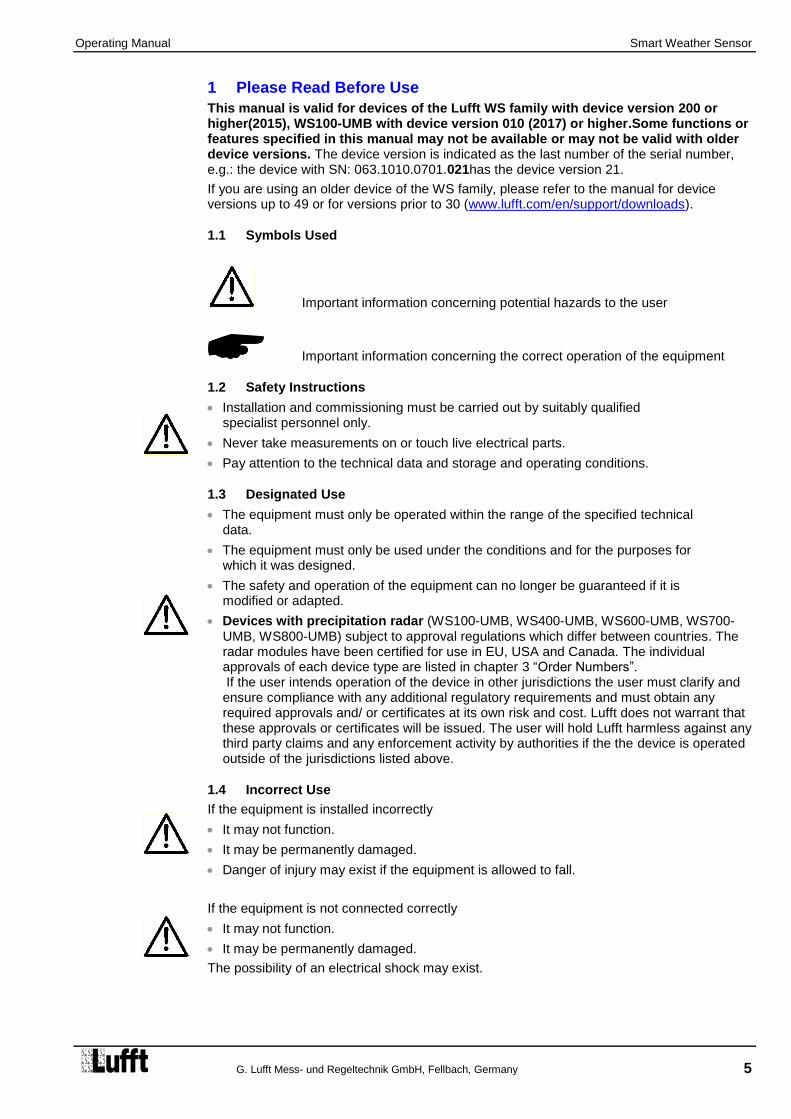
Operating Manual Smart Weather Sensor
G. Lufft Mess- und Regeltechnik GmbH, Fellbach, Germany 5
1 Please Read Before Use
This manual is valid for devices of the Lufft WS family with device version 200 or higher(2015), WS100-UMB with device version 010 (2017) or higher.Some functions or features specified in this manual may not be available or may not be valid with older device versions. The device version is indicated as the last number of the serial number, e.g.: the device with SN: 063.1010.0701.021has the device version 21.
If you are using an older device of the WS family, please refer to the manual for device versions up to 49 or for versions prior to 30 (www.lufft.com/en/support/downloads).
1.1 Symbols Used
Important information concerning potential hazards to the user
Important information concerning the correct operation of the equipment
1.2 Safety Instructions
Installation and commissioning must be carried out by suitably qualified specialist personnel only.
Never take measurements on or touch live electrical parts.
Pay attention to the technical data and storage and operating conditions.
1.3 Designated Use
The equipment must only be operated within the range of the specified technical data.
The equipment must only be used under the conditions and for the purposes for which it was designed.
The safety and operation of the equipment can no longer be guaranteed if it is modified or adapted.
Devices with precipitation radar (WS100-UMB, WS400-UMB, WS600-UMB, WS700-UMB, WS800-UMB) subject to approval regulations which differ between countries. The radar modules have been certified for use in EU, USA and Canada. The individual approvals of each device type are listed in chapter 3 “Order Numbers”. If the user intends operation of the device in other jurisdictions the user must clarify and ensure compliance with any additional regulatory requirements and must obtain any required approvals and/ or certificates at its own risk and cost. Lufft does not warrant that these approvals or certificates will be issued. The user will hold Lufft harmless against any third party claims and any enforcement activity by authorities if the the device is operated outside of the jurisdictions listed above.
1.4 Incorrect Use
If the equipment is installed incorrectly
It may not function.
It may be permanently damaged.
Danger of injury may exist if the equipment is allowed to fall.
If the equipment is not connected correctly
It may not function.
It may be permanently damaged.
The possibility of an electrical shock may exist.

Operating Manual Smart Weather Sensor
6 G. Lufft Mess- und Regeltechnik GmbH, Fellbach, Germany
1.5 Warranty
The Warranty period is 12 months from the date of delivery. The warranty is forfeited if the designated use is violated.
1.6 Brand Names
All brand names referred to are subject without limitation to the valid trademark and ownership rights of the respective owner.

Operating Manual Smart Weather Sensor
G. Lufft Mess- und Regeltechnik GmbH, Fellbach, Germany 7
2 Scope of Delivery
Equipment
WS100-UMB WS200-UMB WS300-UMB WS400-UMB WS500-UMB WS600-UMB
WS301-UMB WS501-UMB WS401-UMB WS601-UMB WS700-UMB WS800-UMB
WS310-UMB WS510-UMB
Connection cable 10m
Operating manual

Operating Manual Smart Weather Sensor
8 G. Lufft Mess- und Regeltechnik GmbH, Fellbach, Germany
3 Order Numbers
Note: For devices with precipitation radar, please observe chapter 1.3!
WS100-UMB 8367.U03 (Europe (EN))
Precipitation Radar 8367.U04 (USA, Canada (FCC))
Impulse Output for Raingauge Simulation
WS200-UMB 8371.U01
Wind Direction
Wind Speed
Compass
WS300-UMB 8372.U01
Air Temperature
Relative Humidity
Air Pressure
WS301-UMB 8374.U01
WS302-UMB 8374.U10
WS303-UMB 8374.U11
WS304-UMB 8374.U12
WS310-UMB 8374.U13
Air Temperature
Relative Humidity
Air Pressure
Global Radiation
WS400-UMB 8369.U01 (Europe, USA, Canada)
Precipitation Radar 8369.U02 (UK)
Air Temperature
Relative Humidity
Air Pressure
WS401-UMB 8377.U01
Precipitation Rain Gauge
Air Temperature
Relative Humidity
Air Pressure
WS500-UMB 8373.U01
Wind Direction
Wind Speed
Air Temperature
Relative Humidity
Air Pressure
Compass

Operating Manual Smart Weather Sensor
G. Lufft Mess- und Regeltechnik GmbH, Fellbach, Germany 9
WS501-UMB 8375.U01
WS502-UMB 8375.U10
WS503-UMB 8375.U11
WS504-UMB 8375.U12
WS510-UMB 8375.U13
Wind Direction
Wind Speed
Air Temperature
Relative Humidity
Air Pressure
Compass
Global Radiation
WS600-UMB 8370.U01 (Europe, USA, Canada)
Precipitation Radar 8370.U02 (UK)
Wind Direction
Wind Speed
Air Temperature
Relative Humidity
Air Pressure
Compass
WS601-UMB 8376.U01
Precipitation Rain Gauge
Wind Direction
Wind Speed
Air Temperature
Relative Humidity
Air Pressure
Compass
WS700-UMB 8380.U01 (Europe, USA, Canada)
Precipitation Radar
Wind Direction
Wind Speed
Air Temperature
Relative Humidity
Air Pressure
Compass
Global Radiation
WS800-UMB 8381.U01 (Europe, USA, Canada)
Precipitation Radar
Wind Direction
Wind Speed
Air Temperature
Relative Humidity
Air Pressure
Compass
Global Radiation
Lightning Sensor

Operating Manual Smart Weather Sensor
10 G. Lufft Mess- und Regeltechnik GmbH, Fellbach, Germany
3.1 Accessories
Power supply unit 24V/100VA 8366.USV1
ISOCON-UMB 8160.UISO
Surge protection 8379.USP
External Rain Gauge WTB100 8353.10
External Temperature Sensors
Temperature Sensor WT1 8160.WT1
Passive Road Surface Temperature Sensor WST1 8160.WST1
3.2 Spare Parts
Connection cable 10m On enquiry
3.3 Additional Documents and Software
You can download the following documents and software via the Internet at www.lufft.com.
Operating Manual This document
UMB-Config-Tool Windows® software for testing, firmware updates and
configuration of UMB devices
UMB Protocol Communications protocol for UMB devices
Firmware The current device firmware

Operating Manual Smart Weather Sensor
G. Lufft Mess- und Regeltechnik GmbH, Fellbach, Germany 11
4 Equipment Description
The WS family is a range of low cost smart combination of weather sensors for the acquisition of a variety of measurement variables, as used for example for environmental data logging in road traffic management systems. Depending on the model, each device has a different combination of sensors for the various measurement variables.
WS
100-U
MB
WS
200-U
MB
WS
300-U
MB
WS
301-U
MB
**
WS
400-U
MB
WS
401-U
MB
WS
500-U
MB
WS
501-U
MB
***
WS
600-U
MB
WS
601-U
MB
WS
700-U
MB
WS
800-U
MB
Air temperature ● ● ● ● ● ● ● ● ● ●
Humidity ● ● ● ● ● ● ● ● ● ●
Air pressure ● ● ● ● ● ● ● ● ● ●
Precipitation ● ● ●* ● ●* ● ●
Wind direction ● ● ● ● ● ● ●
Wind speed ● ● ● ● ● ● ●
Compass ● ● ● ● ● ● ●
Global Radiation ● ● ● ●
Lightning Sensor ●
Temperature (ext) ● ● ● ● ● ● ● ● ● ● ●
Rain Gauge (ext) ● ● ● ● ●
Power Save 2 ● ● ● ● ● ● ● *) WS401-UMB and WS601-UMB use a rain gauge for precipitation measurement
**) is also valid for WS302-UMB, WS303-UMB, WS304-UMB, WS310-UMB
***) is also valid for WS502-UMB, WS503-UMB, WS504-UMB, WS510-UMB
Sensors marked (ext) in the table are additional accessories and not included with the device. The table shows which external sensors can be connected to the different models.
Note: The external temperature sensor and the external rain gauge use the same input, so only one of them can be connected simultaneously.
Attention: Please note that, due to the approval of the radar sensor used, there are different country options on equipment which includes precipitation measurement by radar technology.
The equipment is connected by way of an 8 pole screw connector and associated connection cable (length 10m).
The measured values are requested over the RS485 interface in accordance with UMB protocol.
During commissioning, configuration and measurement polling takes place using the UMB-Config-Tool (Windows
® PC software) or the ConfigTool.NET (for WS100-UMB)
4.1 Air Temperature and Humidity
Temperature is measured by way of a highly accurate NTC-resistor while humidity is measured using a capacitive humidity sensor. In order to keep the effects of external influences (e.g. solar radiation) as low as possible, these sensors are located in a ventilated housing with radiation protection. In contrast to conventional non-ventilated sensors, this allows significantly more accurate measurement during high radiation conditions.
WS100-UMB is not intended for air temperature measurement, so it is not equipped with a radiation shield. Air temperature values with reduced accuracy are available as service channels for additional information.
Additional variables such as dewpoint, absolute humidity and mixing ratio are calculated from air temperature and relative humidity, taking account of air pressure.

Operating Manual Smart Weather Sensor
12 G. Lufft Mess- und Regeltechnik GmbH, Fellbach, Germany
4.2 Air Pressure
Absolute air pressure is measured by way of a built-in sensor (MEMS). The relative air pressure referenced to sea level is calculated using the barometric formula with the aid of the local altitude, which is user-configurable on the equipment.
4.3 Precipitation
Tried and tested radar technology from the R2S-UMB sensor is used to measure precipitation. The precipitation sensor works with a 24GHz Doppler radar, which measures the drop speed and calculates precipitation quantity and type by correlating drop size and speed. Note: Devices with precipitation radar are subject to approval regulations which differ between countries. Please make sure to observe chapter Fehler! Verweisquelle konnte nicht gefunden werden.! WS401-UMB and WS601-UMB are using an unheated rain gauge for precipitation measurement. This version can be recommended for low power application etc.
4.4 Wet Bulb Temperature
The wet bulb temperature is the temperature of a moist or icy surface exposed to air flow.
4.5 Specific Enthalpy
Parameter of state of the humid air, composed of the specific enthalpies (heat capacity) of the components of the mixture and related to the mass fraction of the dry air (at 0°C).
4.6 Air Density
The air density indicates how much mass in a given volume of air is contained and it is calculated from the measured values of air temperature, humidity and air pressure.
4.7 Wind
The wind meter uses 4 ultrasonic sensors which take cyclical measurements in all directions. The resulting wind speed and direction are calculated from the measured run-time sound differential. The sensor delivers a quality output signal indicating how many good readings were taken during the measurement interval.
4.8 Compass
The integrated electronic compass can be used to check the north – south adjustment of the sensor housing for wind direction measurement. It is also used to calculate the compass corrected wind direction.
4.9 Heating
The precipitation sensor and wind meter are heated for operation in winter.
4.10 Global Radiation
The global radiation is measured by a pyranometer mounted in the top cover of the Smart Weather Sensor.
4.11 Lightning Sensor
WS800-UMB includes lightning detection by an integrated sensor analysing the radio wave emission of lightnings. It delivers a count of recognized lightnings.
The sensor analyses spectrum and wave form of the received signal to suppress the detection of man made electrical discharges. Nevertheless false detections can not be totally excluded specially in an environment with high power electrical equipment.
4.12 External Temperature Sensor
Optionally all models may be equipped with an external NTC temperature sensor for the acquisition from additional measurement points. The type of NTC is the same as used for the internal air temperature sensor.
External temperature sensor and external rain gauge can not be connected at the same time.

Operating Manual Smart Weather Sensor
G. Lufft Mess- und Regeltechnik GmbH, Fellbach, Germany 13
4.13 External Rain Gauge
Models without integrated precipitation acquisition can be equipped with an external rain gauge.
External rain gauge and external temperature sensor can not be connected at the same time.
4.14 (WS100-UMB only: ) Impulse Output for Rain Gauge Simulation
WS100-UMB provides a digital impulse output for simulation of a rain gauge. Depending on configuration settings the output is pulsed once for each 1.0mm, 0.5mm, 0.2mm, 0.1mm or 0.01mm (default) of precipitation.
If the WS100-UMB is configured for impulse output, the serial interface is not available for communication in UMB or other serial protocols.

Operating Manual Smart Weather Sensor
14 G. Lufft Mess- und Regeltechnik GmbH, Fellbach, Germany
Figure 1: Sensor Technology
4.15 Sensor Technology (example: WS600-UMB)
Precipitation sensor
(heated)
Wind meter
(heated)
Air temperature and relative humidity with fan on underside of device
Connector
Mounting bracket with springs and self-locking nuts
Air pressure sensor in device
Notch for attaching connection cable

Operating Manual Smart Weather Sensor
G. Lufft Mess- und Regeltechnik GmbH, Fellbach, Germany 15
5 Generation of Measurements
5.1 Current Measurement (act)
In accordance with the specified sampling rate, the value of the last measurement is transmitted when the current measurement value is requested. Each measurement is stored in a circular buffer for the subsequent calculation of minimum, maximum and average values.
5.2 Minimum and Maximum Values (min and max)
When requesting the minimum and maximum values, the corresponding value is calculated - via the circular buffer at the interval (1 – 10 minutes) specified in the configuration - and transmitted.
Note: In the case of wind direction, the minimum / maximum value indicates the direction at which the minimum / maximum wind speed was measured.
5.3 Average Value (avg)
When requesting the average value, this is calculated - via the circular buffer at the interval (1 – 10 minutes) specified in the configuration - and transmitted. In this way moving averages can also be calculated.
For some values the standard deviation is calculated for the same interval. The calculation of standard deviation will only be activated after the related UMB channel has been requested for the first time.
5.4 Vectorial Average Value (vct)
In the specific case of wind measurement, measurements are calculated vectorially. To this end, the average values of the vectors are generated internally. This calculation is performed with the same configured interval time as that for the minimum, maximum and average values. Hence the value (wind speed) and angle (wind direction) of the vector are calculated.
Note: On delivery, the interval for the calculation of minimum, maximum and average values is set at 10 minutes. If necessary, this can be adjusted to the particular requirements (1 – 10 minutes) with the aid of the UMB-Config-Tool (see page 32).
Note: The evaluation of the standard deviation values is deactivated after power on of the device. The function will be activated with the first request to any of the standard deviation channels.
To get standard deviation values of the first integration period after power on a dummy request to any one of the standard deviation channels should be inserted.

Operating Manual Smart Weather Sensor
16 G. Lufft Mess- und Regeltechnik GmbH, Fellbach, Germany
6 Measurement Output
Measurements are transmitted in accordance with UMB binary protocol (Factory Settings).
You can find an example of a measurement request in different protocols and a complete summary of the list of channels in the Appendix.
6.1 Air and Dewpoint Temperature
Sampling rate 1 minute
Generation of average value 1 – 10 minutes
Units °C; °F
Request channels:
UMB Channel Measuring Range
act min max avg Measurement Variable (float32) min max unit
100 120 140 160 Air temperature -50.0 60.0 °C
105 125 145 165 Air temperature -58.0 140.0 °F
110 130 150 170 Dewpoint temperature -50.0 60.0 °C
115 135 155 175 Dewpoint temperature -58.0 140.0 °F
101 External Temperature Sensor -40.0 80.0 °C
106 External Temperature Sensor -40.0 176.0 °F
6.2 Wind Chill Temperature
Sampling rate 1 minute, computed on base of the average temperature and average wind speed
Units °C; °F
Request channels:
UMB Channel Measuring Range
act min max avg Measurement Variable (float32) min max unit
111 Wind chill temperature -60.0 70.0 °C
116 Wind chill temperature -76.0 158.0 °F
6.3 Humidity
Sampling rate 1 minute
Generation of average value 1 – 10 minutes
Units %RH; g/m³; g/kg
Request channels:
UMB Channel Measuring Range
act min max avg Measurement Variable (float32) min max unit
200 220 240 260 Relative humidity 0.0 100.0 %
205 225 245 265 Absolute humidity 0.0 1000.0 g/m³
210 230 250 270 Mixing ratio 0.0 1000.0 g/kg
6.4 Air Pressure
Sampling rate 1 minute
Generation of average value 1 – 10 minutes
Unit hPa
Request channels:
UMB Channel Measuring Range
act min max avg Measurement Variable (float32) min max unit
300 320 340 360 Absolute air pressure 300 1200 hPa
305 325 345 365 Relative air pressure 300 1200 hPa
Note: For the correct calculation of relative air pressure, the altitude of the sensor must be entered in the device configuration (see Figure 11 on page 35). The factory setting for altitude is 0m; in this way both measurement variables deliver the same values.

Operating Manual Smart Weather Sensor
G. Lufft Mess- und Regeltechnik GmbH, Fellbach, Germany 17
6.5 Wet Bulb Temperature
Sampling rate 1 minute
Units °C; °F
Request channels:
UMB Channel Measuring Range
act Measurement Variable (float32) min max unit
114 Wet Bulb Temperature -50.0 60.0 °C
119 Wet Bulb Temperature -58.0 140.0 °F
6.6 Specific Enthalpy
Sampling rate 1 minute
Unit kJ/kg
Request channels:
UMB Channel Measuring Range
act Measurement Variable (float32) min max unit
215 Specific Enthalpy -100.0 1000.0 kJ/kg
6.7 Air Density
Sampling rate 1 minute
Unit kg/m³
Request channels:
UMB Channel Measuring Range
act Measurement Variable (float32) min max unit
310 Air Density 0.0 3.0 kg/m³

Operating Manual Smart Weather Sensor
18 G. Lufft Mess- und Regeltechnik GmbH, Fellbach, Germany
6.8 Wind Speed
Sampling rate 1 sec / 10 sec (internal sampling frequency 15Hz)
Generation of average value 1 – 10 minutes
Generation of max/min value 1 – 10 minutes based on the internal 1 sec measurements
Units m/s; km/h; mph; kts
Response threshold 0.3 m/s
Request channels:
UMB Channel Measuring Range
act min max avg vct Measurement Variable (float32) min max unit
400 420 440 460 480 Wind Speed 0 75.0 m/s
405 425 445 465 485 Wind Speed 0 270.0 km/h
410 430 450 470 490 Wind Speed 0 167.8 mph
415 435 455 475 495 Wind Speed 0 145.8 kts
401 Wind Speed Fast 0 75.0 m/s
406 Wind Speed Fast 0 270.0 km/h
411 Wind Speed Fast 0 167.8 mph
416 Wind Speed Fast 0 145.8 kts
403 Wind Speed Standard Deviation * 0 75.0 m/s
413 Wind Speed Standard Deviation * 0 167.8 mph
Note: The second measurements are averaged over 10 seconds for the output of the current (act) measurement. The 'fast' channels deliver every second a value.
6.9 Wind Direction
Sampling rate 1 sec / 10 sec (internal sampling frequency 15Hz)
Generation of average value 1 – 10 minutes
Generation of max/min value 1 – 10 minutes based on the internal 1 sec measurements
Unit °
Response threshold 0.3 m/s
Request channels:
UMB Channel Measuring Range
act min max avg vct Measurement Variable (float32) min max unit
500 520 540 580 Wind Direction 0 359.9 °
501 Wind Direction Fast 0 359.9 °
502 Wind Direction Corrected 0 359.9 °
503 Wind Dir. Standard Deviation * 0 359.0 °
Note: The second measurements are averaged over 10 seconds for the output of the current (act) measurement. The 'fast' channels deliver every second a value.
The minimum / maximum wind direction indicates the direction at which the minimum / maximum wind speed was measured.
The corrected wind direction is calculated from the wind direction measured by the wind sensor and the heading measured by the compass.
Optionally the compass correction of the wind direction can be activated for all wind direction values. (Settings by UMB Config Tool)
Note: The correction function is designed for correction of the wind direction of a statically mounted sensor. If the alignment of the sensor changes during the measurement (i.e. if the sensor is mounted on a rotating platform or similar) the correction function will not in all cases work properly, especially not for the vector average.
It is of course possible to use the correction function for mobile measurement units, where the alignment is changed between measurement periods.
*) Note: The evaluation of the standard deviation values will be activated after the first request of a standard deviation channel. Please see p. 12.
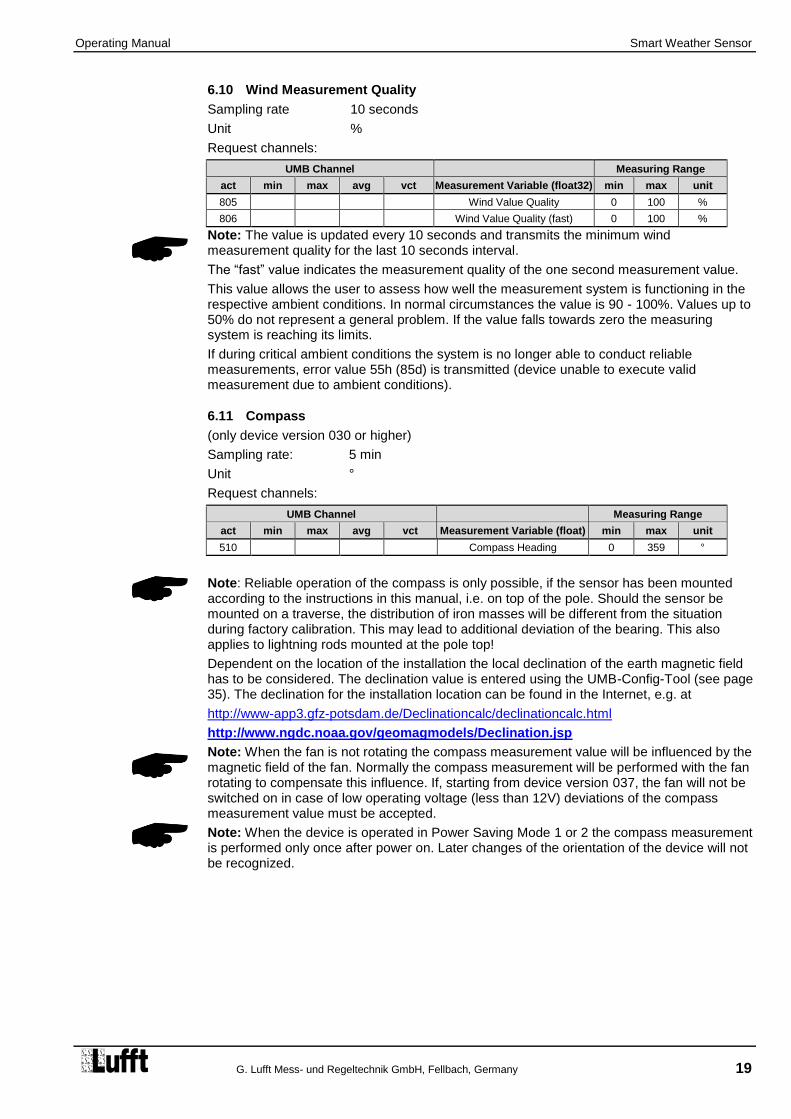
Operating Manual Smart Weather Sensor
G. Lufft Mess- und Regeltechnik GmbH, Fellbach, Germany 19
6.10 Wind Measurement Quality
Sampling rate 10 seconds
Unit %
Request channels:
UMB Channel Measuring Range
act min max avg vct Measurement Variable (float32) min max unit
805 Wind Value Quality 0 100 %
806 Wind Value Quality (fast) 0 100 %
Note: The value is updated every 10 seconds and transmits the minimum wind measurement quality for the last 10 seconds interval.
The “fast” value indicates the measurement quality of the one second measurement value.
This value allows the user to assess how well the measurement system is functioning in the respective ambient conditions. In normal circumstances the value is 90 - 100%. Values up to 50% do not represent a general problem. If the value falls towards zero the measuring system is reaching its limits.
If during critical ambient conditions the system is no longer able to conduct reliable measurements, error value 55h (85d) is transmitted (device unable to execute valid measurement due to ambient conditions).
6.11 Compass
(only device version 030 or higher)
Sampling rate: 5 min
Unit °
Request channels:
UMB Channel Measuring Range
act min max avg vct Measurement Variable (float) min max unit
510 Compass Heading 0 359 °
Note: Reliable operation of the compass is only possible, if the sensor has been mounted according to the instructions in this manual, i.e. on top of the pole. Should the sensor be mounted on a traverse, the distribution of iron masses will be different from the situation during factory calibration. This may lead to additional deviation of the bearing. This also applies to lightning rods mounted at the pole top!
Dependent on the location of the installation the local declination of the earth magnetic field has to be considered. The declination value is entered using the UMB-Config-Tool (see page 35). The declination for the installation location can be found in the Internet, e.g. at
http://www-app3.gfz-potsdam.de/Declinationcalc/declinationcalc.html
http://www.ngdc.noaa.gov/geomagmodels/Declination.jsp
Note: When the fan is not rotating the compass measurement value will be influenced by the magnetic field of the fan. Normally the compass measurement will be performed with the fan rotating to compensate this influence. If, starting from device version 037, the fan will not be switched on in case of low operating voltage (less than 12V) deviations of the compass measurement value must be accepted.
Note: When the device is operated in Power Saving Mode 1 or 2 the compass measurement is performed only once after power on. Later changes of the orientation of the device will not be recognized.

Operating Manual Smart Weather Sensor
20 G. Lufft Mess- und Regeltechnik GmbH, Fellbach, Germany
6.12 Precipitation Quantity - Absolute
Sampling rate Event-dependent on reaching the response threshold
Response threshold 0.01mm (Radar)
Response threshold 0.2 / 0.5 mm (Rain Gauge)
Units l/m²; mm; in; mil
Request channels:
UMB Channel Measurement Variable (float32) Unit
600 Precipitation Quantity - Absolute l/m²
620 Precipitation Quantity - Absolute mm
640 Precipitation Quantity - Absolute in
660 Precipitation Quantity - Absolute mil
Note: This measurement indicates the accumulated precipitation quantity since the last device reboot. The measurement is retained for the duration of a short power failure. To reset this value, use the corresponding function in the UMB-Config-Tool (see page 38) or disconnect the device from the power supply. The necessary disconnected time is device dependent from a few seconds up to 1 h.
6.13 Precipitation Quantity - Differential
Sampling rate Event-dependent on reaching the response threshold
Response threshold 0.01mm (Radar)
Response threshold 0.2 / 0.5 mm (Rain Gauge)
Units l/m²; mm; in; mil
Request channels:
UMB Chanel Measurement Variable (float32) Unit
605 Precipitation Quantity - Differential l/m²
625 Precipitation Quantity - Differential mm
645 Precipitation Quantity - Differential in
665 Precipitation Quantity - Differential mil
Note: Each request from a differential channel sets the accumulated quantity back to zero. If the response from the device is lost due to a transmission error (e.g. poor GPRS connection), the quantity accumulated to date is also lost. The quantity accumulated to date is also reset each time the equipment is rebooted.
6.14 Precipitation Intensity
Sampling rate 1 minute
Response threshold 0.1 mm/h
Units l/m²/h; mm/h; in/h; mil/h
Request channels:
UMB Channel Measurement Variable (float32) Range Unit
800 Precipitation Intensity 0 … 200.0 l/m²/h
820 Precipitation Intensity 0 … 200.0 mm/h
825 Precipitation Intensity (WS100 only) 0 ... 3.333 mm/min
840 Precipitation Intensity 0 … 7.874 in/h
845 Precipitation Intensity (WS100 only) 0 ... 0.1312 in/min
860 Precipitation Intensity 0 … 7874 mil/h
Note: The device versions with radar technology (WS100-UMB, WS400-UMB, WS600-UMB, WS700-UMB, WS800-UMB) calculate the precipitation intensity from the accumulated precipitation differences of the last 6 minutes before the measurement data request.
The lower resolution of the rain gauge would lead to high fluctuation of the intensity values, so the rain gauge versions (WS401-UMB and WS601-UMB), as well as the external rain gauge, use the accumulated precipitation of the last 60 minutes prior to the current measurement for intensity calculation.

Operating Manual Smart Weather Sensor
G. Lufft Mess- und Regeltechnik GmbH, Fellbach, Germany 21
6.15 Precipitation Type
Sampling rate Event-dependent on reaching the response threshold
Response threshold 0.002mm (Radar)
Response threshold 0.2 / 0.5 mm (Rain Gauge)
Follow-up time 2 minutes
Request channels:
UMB Channel Measurement Variable (uint8) Coding
700 Precipitation Type
0 = No precipitation
60 = Liquid precipitation, e.g. rain
70 = Solid precipitation, e.g. snow
40 = unspecified precipitation (WS401-UMB, WS601-UMB, external
rain gauge)
WS100-UMB only:
67 = freezing rain
69 = sleet
90 = hail
Note: A detected precipitation type remains valid for 2 minutes after the end of the precipitation event. In order to record precipitation types which only occur for a short period (e.g. short-term rain), the request interval should be 1 minute or shorter.
Ice, hail and sleet are transmitted as rain (60) by devices other than WS100-UMB.
The versions WS401-UMB and WS601-UMB as well as the external rain gauge do not include detection of precipitation type, so in this case only type 40 (unspecified precipitation) is indicated. Due to the function of the rain gauge only liquid or molten precipitation can be recognized.
6.16 Heating Temperature
Sampling Rate 1 Minute
Units °C; °F
Request Channels:
UMB Channel Measuring Range
act min max avg Measurement Variable (float32) min max Unit
112 Heating Temperature Wind Sensor -50.0 150.0 °C
113 Heating Temperature Precipitation Sensor -50.0 150.0 °C
117 Heating Temperature Wind Sensor -58.0 302.0 °F
118 Heating Temperature Precipitation Sensor -58.0 302.0 °F
6.17 Global Radiation
Sampling Rate 10 seconds
Generation of average values 1 – 10 minutes *)
Unit W/m²
Request Channels:
UMB Channel Measuring Range
act min max avg Measurement Variable (float32) min max unit
900 920 940 960 Global Radiation 0.0 2000.0 *) W/m²
*) Until device version .49 / .212 / Firmware v5.6: 1400.0 W/m2
*) Note: The average, maximum and minimum values are evaluated from the 1 minute averages of the 10 second spot value.
When operated in Power Saving Mode 1 (see page 42) the WS700-UMB will measure the global radiation only once per minute.

Operating Manual Smart Weather Sensor
22 G. Lufft Mess- und Regeltechnik GmbH, Fellbach, Germany
6.18 Lightning Sensor
6.18.1 Lightning Events
Sampling Rate 1 minute
Sum 1 – 30 minutes
Unit Events
Request Channels:
UMB Channel Measuring Range
act sum Measurement Variable (uint16) min max unit
617 Lightning Events 0 255 -
677 Lightning Events (Interval) 0 7650 -
6.19 Service Messages
Service channels are available for the surveillance of the operation of the Smart Weather Sensor.
Request Channels:
UMB Channel Measuring Range
act min max avg Measurement Variable (float32) min max unit
10000 Supply Voltage V 0.0 50.0 V
11000 Rain Drop Volume µ 0.0 500.0 µl
WS100-UMB only: Air temperature (without radiation shield) Sampling rate 1 minute
Generation of average value 1 – 10 minutes
Units °C; °F
Request channels:
UMB Channel Measuring Range
act min max avg Measurement Variable (float32) min max unit
4100 4120 4140 4160 Air temperature -50.0 60.0 °C
4105 4125 4145 4165 Air temperature -58.0 140.0 °F

Operating Manual Smart Weather Sensor
G. Lufft Mess- und Regeltechnik GmbH, Fellbach, Germany 23
6.20 Drop Diameter Distribution (WS100 only)
Drop diameters of precipitation detected by the radar sensor are shown as distribution of drop diameter classes. Diameters are calculated as volume equivalent ball diameter.
Sampling Rate Event dependent
Unit Number of events
Abfragekanäle:
UMB Channel Measurement Variable (uint32) Unit
4600 Total precipitation particles Events
4601 Total drops Events
UMB Channel Measurement Variable (uint16) Unit
4602 Drizzle particles Events
4603 Snow particles Events
4604 Hail particles Events
4620 Cl. 0: Drops < 0.5mm equiv. diameter Events
4621 Cl 1: Drops 0.5 .. 1.0mm equiv. diameter Events
4622 Cl 2: Drops 1.0 .. 1.5mm equiv. diameter Events
4623 Cl 3: Drops 1.5 .. 2.0mm equiv. diameter Events
4624 Cl 4: Drops 2.0 .. 2.5mm equiv. diameter Events
4625 Cl 5: Drops 2.5 .. 3.0mm equiv. diameter Events
4626 Cl 6: Drops 3.0 .. 3.5mm equiv. diameter Events
4627 Cl 7: Drops 3.5 .. 4.0mm equiv. diameter Events
4628 Cl 8: Drops 4.0 .. 4.5mm equiv. diameter Events
4629 Cl 9: Drops 4.5 .. 5.0mm equiv. diameter Events
4630 Cl 10: Drops 5.0 .. 5.5mm equiv. diameter Events
4631 Cl 11: Drops > 5.5mm equiv. diameter Events
Note: Similar to the request of differential precipitation quantity the accumulated sum of events of each channel will be reset to 0 after transmission!
For consistent results all related channels should be requested in one run.
If the response from the device is lost due to a transmission error (e.g. poor GPRS connection), the quantity accumulated to date is also lost. The quantity accumulated to date is also reset each time the equipment is rebooted.

Operating Manual Smart Weather Sensor
24 G. Lufft Mess- und Regeltechnik GmbH, Fellbach, Germany
Figure 2: Fastening to the Mast
7 Installation
The sensor bracket is designed to be installed on the top of a mast with a diameter of 60 – 76mm.
The following tools are required for the installation:
Open-end or ring spanner (SW13)
Compass for aligning the wind meter to the North
7.1 Fastening
Loosen nuts
Push the sensor onto the top of the mast from above
Tighten the nuts evenly until contact is made with the springs but the sensor can still be moved easily
Align the sensor to the North (for wind meters)
Tighten both nuts with 3 revolutions
Mast tube
Mounting bracket
Springs
Nuts with washers

Operating Manual Smart Weather Sensor
G. Lufft Mess- und Regeltechnik GmbH, Fellbach, Germany 25
Figure 3: North Markings
Figure 4: Alignment to North
7.2 North Alignment
In order for the wind direction to display correctly, the sensor must be aligned to the North. The sensor has a number of directional arrows for this purpose.
Procedure:
If the sensor is already installed, first loosen both nuts evenly until you can turn the sensor easily
Using the compass, identify the North and fix a point of reference on the horizon
Position the sensor in such a way that the South and North wind sensors are in alignment with the fixed point of reference in the North
Tighten both nuts with 3 revolutions
poor good
Note: As the magnetic North Pole indicated by the compass differs from the Geographic North Pole, account must be taken of the declination (variation) at the location when aligning the sensor.
Depending on the location, the variation can be more than 15° (in North America for example). In Central Europe the variation can be largely ignored at present (< 3°). You can find further helpful information on this subject on the Internet.
Point of reference in the North

Operating Manual Smart Weather Sensor
26 G. Lufft Mess- und Regeltechnik GmbH, Fellbach, Germany
7.3 Selecting the Installation Location
In order to guarantee long service life and correct equipment operation, please pay attention to the following points when selecting the installation location.
7.3.1 General Instructions
Stable subsurface for installing the mast
Free access to the equipment for maintenance works
Reliable power supply for permanent operation
Good network coverage when transmitting over a mobile communications network
Note: The computed measurements specifically apply to the equipment location only. No conclusions can be drawn with regard to the wider environment or a complete road section.
ATTENTION:
Only approved and tested appliances (conductors, risers etc.) should be used to install the device on the mast.
All relevant regulations for working at this height must be observed.
The mast must be sized and anchored appropriately.
The mast must be earthed in accordance with regulations.
The corresponding safety regulations for working at road side and in the vicinity of the road carriageway must be observed.
If the equipment is installed incorrectly
It may not function.
It may be permanently damaged.
Danger of injury may exist if the equipment is allowed to fall.
7.3.2 Sensors with Wind Measurement / Compass
Installation at the top of the mast
Installation height at least 2m above the ground
Free field around the sensor
Note: Buildings, bridges, embankments and trees may corrupt the wind measurement. Equally, passing traffic may cause gusts which may influence the wind measurement.
Note: for accurate compass readings, an aluminium mast is recommended.
7.3.3 Sensors with Radar Precipitation Measurement
Installation on the top of the mast
Installation height at least 4.5m above the ground (if there are no moving objects in wider circumference of the sensor, a lower installation height may be considered)
Distance to road carriageway at least 1m
Distance from moving objects (e.g. trees, bushes and even bridges) at least 5m at the height of the sensor
Minimum distance between devices with radar precipitation measurement: 8m.
Note: Falling or moving objects, e.g. falling leaves or leaves blowing in the wind, may cause false measurements and/or precipitation types.
Note: Strong wind can influence the accuracy of the precipitation measurement. Installation locations where wind turbulence is to be expected, e.g. caused by buildings, should be avoided.

Operating Manual Smart Weather Sensor
G. Lufft Mess- und Regeltechnik GmbH, Fellbach, Germany 27
Figure 5: Installation Sketch
Note: When selecting the installation location please take care to position the device at a suitable distance from other systems incorporating a 24GHz radar sensor, such as traffic counting devices on overhead gantry signs. Otherwise cross effects and system malfunctions may occur. In the final analysis, the distance to other measuring systems also depends on their range of coverage and signal strength.
7.3.4 Sensors with Rain Gauge
Installation on the top of the mast or on crossbar with distance to the mast
Mast or crossbar mounting shall be exactly perpendicular, otherwise the precision of the rain gauge may be influenced.
Note: The location should be selected so that pollution of the rain gauge funnel by falling leaves etc. can be avoided as far as possible.
7.3.5 Sensors with Global Radiation Measurement
Installation on top of the pole
Shadow free location, if possible 360° free view to the horizon at the height of the pyranometer
Distance to shadow casting objects (trees, buildings) at least 10 times of the object height relative to the sensor.
7.3.6 Installation Sketch
Example WS600-UMB:
Road carriageway
min. 1 m
min. 4.5 m
WS600-UMB
Mast
min. 5 m
Tree, bush etc.

Operating Manual Smart Weather Sensor
28 G. Lufft Mess- und Regeltechnik GmbH, Fellbach, Germany
Figure 6: Connections
8 Connections
There is an 8 pole screw connector on the underside of the equipment. This serves to connect the supply voltage and interfaces by way of the supplied connection cable.
Equipment connector:
View on sensor connection
Pin assignment:
1 White Supply voltage ground and (SDI12_GND for device version > 41) 2 Brown Positive supply voltage (through 2.5A fuse where required)* 3 Green RS485_A (+) or (SDI-12 GND for device version < 42) 4 Yellow RS485_B (-) or SDI-12 Data Line 5 Grey External Sensor a (WS100-UMB only: impulse output Uout) 6 Pink External Sensor b (WS100-UMB only: not connected) 7 Blue Heating voltage ground 8 Red Positive heating voltage (through 2.5A fuse where required)*
The cable marking is in accordance with DIN 47100.
*) WS100/400/600/700/800-UMB: Supply voltage and heating voltage shall be protected by a fuses 2.5A (fine) each.
The cable shielding shall be connected to earth in the electrical cabinet.
Note: The yellow protective cap must be removed before plugging in the equipment.
If the equipment is not connected correctly
- It may not function
- It may be permanently damaged
- The possibility of an electrical shock may exist
The supply voltage and the heating voltage are protected against polarity reversal.
Note: When operating the Smart Weather Sensor in SDI12 mode, line 3 (green) shall be connected only if the SDI12 logger is DC-isolated from the supply voltage of the device. If signal ground (SDI-12-GND) of the data logger and power supply ground are identical, only the SDI12-Data-Line (line 4, yellow) may be connected.
Note for SDI12 operation of devices starting from device version 42 or 51 (WS700) and all WS100: If data logger and device supply voltage are DC-isolated the signal ground (SDI12_GND) must be connected to line 1 (white). Line 3 (green) shall not be connected. (see SDI12 connection drawings in chapter 19.6)

Operating Manual Smart Weather Sensor
G. Lufft Mess- und Regeltechnik GmbH, Fellbach, Germany 29
8.1 Supply Voltage
The supply voltage for the Smart Weather Sensor is 12 - 24V DC. The power supply unit used must be approved for operation with equipment of protection class III (SELV).
Starting with device version 037 the Smart Weather Sensor has an extended supply voltage range of 4 … 32V DC. Operation with a supply voltage of 24V is recommended. Limitations apply in case of supply voltages lower than 12V (see below).
8.1.1 Limitations in 12V mode
If the heating is operated on 12V DC, account must be taken of the functional restrictions in winter operation.
Note: A heating voltage of 24V DC is recommended to guarantee full heating duty.
8.1.2 Limitations in Case of Operation with Supply Voltage Below 12V
When operating a Smart Weather Sensor (device version >= 037) with supply voltages lower than 12V DC, the fan will be not switched on, independent of the fan operating mode. This may influence the accuracy of temperature and humidity measurement in case of solar radiation.
Additionally deviations of the compass measurement values have to be accepted.
When operating the Smart Weather Sensor in Power Save Modes with supply voltages below 12V the minimal supply voltage depends on the length of the connection cable.
The minimal permitted supply voltage (UBmin)can be approximately evaluated from the equation:
UBmin = 4V + 0.3V (cable length / m)
The minimal supply voltage for a 10m cable is then UBmin = 6V. The influence of the cable length on minimal supply voltage can be reduced by using of a cable with larger wire cross section.
8.2 RS485 Interface
The equipment has an electrically isolated, half-duplex, 2 wire RS485 interface for configuration, measurement polling and the firmware update.
See page 48 for technical details.

Operating Manual Smart Weather Sensor
30 G. Lufft Mess- und Regeltechnik GmbH, Fellbach, Germany
Figure 7: Connection to ISOCON-UMB
8.3 Connection to ISOCON-UMB (8160.UISO)
Warning: The heating voltage (red = positive heating voltage; blue = heating voltage ground) is not connected to the ISOCON-UMB but wired direct to the power supply unit.
During installation please also refer to the operating manual for the ISOCON-UMB.
8.4 Use of Surge Protection (8379.USP)
When using surge protection (Order No.: 8379.USP), please pay attention to the connection example in the surge protection operating instructions.
8.5 Connection of External Temperature and Precipitation Sensors
External sensors are to be connected to pins 5 and 6 of the plug connector, i.e. to the gray and pink wires of the cable delivered with the Smart Weather Sensor.
The temperature sensors as well as the external rain gauge are unipolar, so any connection sequence can be chosen.
The type of external sensor has to be set using the UMB Config Tool.
For details please refer to Chapter18.
8.6 (WS100-UMB only: ) Connection of Impulse Output for Rain Gauge Simulation
The digital impulse output is available between pin 7 (gray wire) Uout and pin 1 (white) GND. In idle state the voltage level at Uout is approximately equal to the supply voltage. Each time the configured amount of precipitation is reached, Uout is pulsed for about 50ms to GND level.
Activation of the rain gauge simulation mode and selection of the resolution have to be set by ConfigTool.NET.
For details please refer to Chapter 10.2.
Brown: Positive voltage supply +24V
Green: RS485 Interface A
White: Supply voltage ground GND2
Yellow: RS485 Interface B

Operating Manual Smart Weather Sensor
G. Lufft Mess- und Regeltechnik GmbH, Fellbach, Germany 31
9 Commissioning
After the equipment has been installed and connected correctly, the sensor begins autonomously to take measurements. A Windows
® PC with serial interface, UMB-Config-
Tool software and interface cable (SUB-D 9 pole; jack - socket; 1:1) are required for configuration and test purposes.
Attention must be paid to the following points:
Check for correct equipment operation on site by carrying out a measurement request with the aid of the UMB-Config-Tool (see page 41).
Configure the local altitude in order to ensure the correct calculation of relative air pressure (see page 35).
The device must be aligned to the North in order to ensure correct wind measurement (see page 25), or the automatic compass correction must be activated (see page 35).
In order to get correct compass headings the local declination must be configured (see page 19and 35).
If several Smart Weather Sensors are operated on a UMB network, a unique device ID must be assigned to each device (see page 34).
There is no protective cover to remove on the sensor itself.

Operating Manual Smart Weather Sensor
32 G. Lufft Mess- und Regeltechnik GmbH, Fellbach, Germany
10 Configuration and Test
Lufft provides Windows® PC software (UMB-Config-Tool) for configuration purposes. The
sensor can also be tested and the firmware updated with the aid of this software.
Note: UMB-Config-Tool is not suitable for configuration settings of the WS100-UMB. ConfigTool.NET shall be used for configuration settings of the WS100-UMB. Please refer to the ConfigTool.NET manual.
Attempts to modify the settings of the WS100-UMB by UMB-Config-Tool may render the device inoperative.
The function test of the WS100-UMB (channel selection and measurement polling) can optionally be done using UMB-Config-Tool.
With regard to contents the following description applies also to WS100-UMB, as far as the specific instrumentation of this type is concerned.

Operating Manual Smart Weather Sensor
G. Lufft Mess- und Regeltechnik GmbH, Fellbach, Germany 33
Figure 8: Sensor Selection
10.1 Factory Settings
The Smart Weather Sensor is delivered with the following settings:
Class ID: 7 (cannot be modified)
Device ID: 1 (gives address 7001h = 28673d)
Baud rate: 19200
RS485 protocol: Binary
Calculation interval: 10 measurements
Local altitude: 0 m
Note: The device ID must be changed if several Smart Weather Sensors are operated on a UMB network, as each device requires a unique ID. It makes sense to start from ID 1 and continue in ascending order.
10.2 Configuration with the UMB-Config-Tool
The operation of the UMB-Config-Tool is described in detail in the operating instructions for the Windows
® PC software. For this reason only the menus and functions specific to the
Smart Weather Sensor are described here.
10.2.1 Sensor Selection
The Smart Weather Sensor is shown here with sensor selection WSx-UMB (Class ID 7).
Note: You do require the current version of the UMB-Config-Tool to configure the Smart Weather Sensor.
Note: All other devices which are used in the polling process, e.g. modems, LCOM etc., must be disconnected from the UMB network during configuration.

Operating Manual Smart Weather Sensor
34 G. Lufft Mess- und Regeltechnik GmbH, Fellbach, Germany
Figure 9: General Settings
Figure 10: Temperature, Humidity and Fan Settings
10.2.2 Configuration
After a configuration has been loaded, all relevant settings and values can be adjusted. Depending on the device type, only the settings pertinent to the respective available sensors are relevant.
10.2.3 General Settings
ID: Device ID (factory setting 1; assign device IDs to additional devices in ascending order).
Description: In order to differentiate the devices you can enter a description here, e.g. the location.
Linespeed: Transmission speed of the RS485 interface (factory setting 19200; DO NOT CHANGE for operation with ISOCON-UMB).
Protocol: Communications protocol of the sensor (UMB-Binary, UMB-ASCII, SDI-12, Modbus-RTU, Modbus-ASCII, Terminal-Mode, XDR).
Timeout: In the event of a temporary changeover of the communications protocol, the system switches back to the configured protocol after this time (in minutes)
Important note: If the baud rate is changed, after saving the configuration on the sensor, the sensor communicates at the new baud rate. When operating the sensor in a UMB network with ISOCON-UMB, this baud rate must not be changed; otherwise the sensor is no longer addressable and can no longer be configured.
10.2.4 Temperature, Humidity and Fan Settings
Offset: Absolute offset on the measurement in the unit of the accompanying channel (for on-site calibration).
Interval: Time in minutes for the minimum, maximum and average value calculation interval.
Fan: to reduce electrical power consumption, the fan can be switched off. Note: if the fan is switched off, all heaters will also be switched off! With the fan switched off deviations in temperature and humidity measurement can occur by solar radiation!
Note: In order to calculate dew point, absolute humidity and mixing ratio, the temperature and humidity measurement always requires the same interval. For this reason different intervals cannot be set.

Operating Manual Smart Weather Sensor
G. Lufft Mess- und Regeltechnik GmbH, Fellbach, Germany 35
Figure 11: Pressure Settings
Figure 12: Wind Settings
10.2.5 Pressure,
Offset: Absolute offset on the measurement in the unit of the accompanying channel.
Interval: Time in minutes for the minimum, maximum and average value calculation interval.
Altitude: Enter the local altitude in meters here for the correct calculation of relative air pressure (referenced to sea level).
10.2.6 Wind and Compass Settings
Offset: Absolute offset on the measurement in the unit of the accompanying channel.
Interval: Time in minutes for the minimum, maximum and average value calculation interval.
Windspeed min: Approach velocity onto the wind meter with effect from which a measurement is transmitted, in the unit of the accompanying channel.
Heater mode: The device can be configured for heating in different operating modes. Configure as ‘automatic’ in normal operating mode. You can find a precise description of the operating modes on page 44.
Local declination: Dependent on the location of the installation; the local declination of the earth magnetic field has to be considered.
Enable Compass for wind-direction correction: With activated compass correction all wind direction values will be corrected according to the alignment of the sensor, as evaluated by the compass.
Note: The offset is not used for the wind meter at present because on-site calibration is not possible in this case.

Operating Manual Smart Weather Sensor
36 G. Lufft Mess- und Regeltechnik GmbH, Fellbach, Germany
Figure 13: Precipitation Sensor Settings (Radar)
Figure 14: Precipitation Sensor Settings (Rain Gauge)
10.2.7 Precipitation Sensor Settings (Radar)
Heater mode: The device can be configured for heating in different operating modes. Configure as ‘automatic’ in normal operating mode. You can find a precise description of the operating modes on page 44.
Followup time precipitation type: for this time (in seconds) the detected precipitation type is shown; to cover all events, this time must be adjusted to the poll rate.
Note: All other parameters, especially those in the ‘Rainfall calibration data’ tab‚ may only be changed after consultation with the manufacturer, as they have a major influence on the functioning and accuracy of the sensor.
10.2.8 Precipitation Sensor Settings (Rain Gauge)
The rain gauge module can be operated with resolutions 0.2mm or 0.5mm. The setting of the resolution is to be done in two steps:
Mechanical setting
Configuration setting
The mechanical setting works by modifying the effective area of the funnel. The sensor is delivered with a reduction ring, which can be mounted on the funnel to reduce the area.
Funnel with reduction ring resolution 0.5mm
Funnel without reduction ring resolution 0.2mm
Then the resolution is set in the sensor configuration using the UMB Config Tool.
Caution: If mechanical setting and configuration setting do not conform, the sensor will deliver wrong precipitation values!

Operating Manual Smart Weather Sensor
G. Lufft Mess- und Regeltechnik GmbH, Fellbach, Germany 37
Figure 15: Global Radiation Settings
Figure 16: Lightning Sensor Settings
Figure 17: Energy Management Settings
10.2.9 Global Radiation Settings
Interval: Time in minutes for minimum, maximum and average value calculation
10.2.10 Lightning Sensor Settings
Interval: Time in minutes for minimum, maximum and average value calculation
10.2.11 Energy Management
By setting the operating and heating mode, the energy consumption of the device can be adapted to the circumstances of the installation.
The different settings are described in the following chapters:
operating modes of Smart Weather Sensor from page 42
operating modes of the heating from page 44
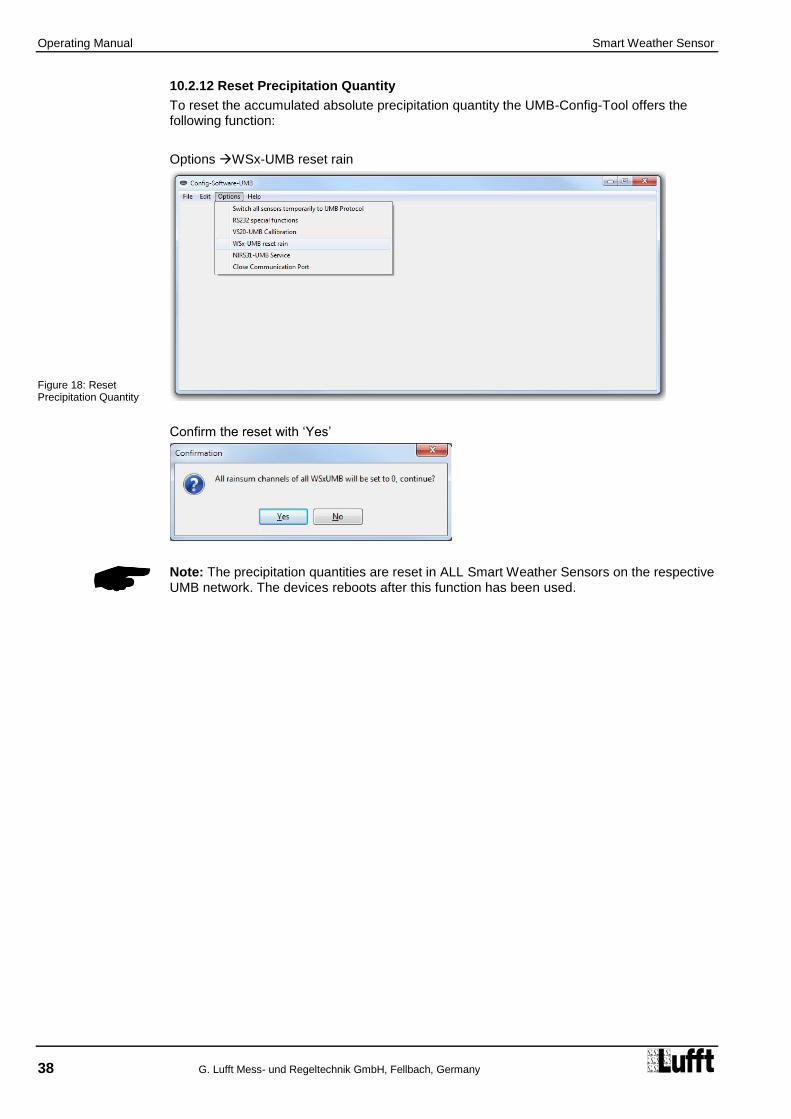
Operating Manual Smart Weather Sensor
38 G. Lufft Mess- und Regeltechnik GmbH, Fellbach, Germany
Figure 18: Reset Precipitation Quantity
10.2.12 Reset Precipitation Quantity
To reset the accumulated absolute precipitation quantity the UMB-Config-Tool offers the following function:
Options WSx-UMB reset rain
Confirm the reset with ‘Yes’
Note: The precipitation quantities are reset in ALL Smart Weather Sensors on the respective UMB network. The devices reboots after this function has been used.

Operating Manual Smart Weather Sensor
G. Lufft Mess- und Regeltechnik GmbH, Fellbach, Germany 39
Abb. 19: Select operation mode „Simulated Rain Gauge“
Abb. 20: Configure the resolution of the simulated rain gauge
Abb. 21: Configure UMB-ASCII 2.0 protocol properties
10.2.13 (WS100-UMB only) Setting of Rain Gauge Simulation
Note: For configuration settings of the WS100-UMB do not use UMB-Config-Tool, but ConfigTool.NET. For details of operation please refer to the software manual of ConfigTool.NET.
Note: while the rain gauge simulation is active communication through the serial interface in UMB or another serial protocol is not possible. To still allow access to the device for modification of settings etc. UMB protocol will be active during the first 5 sec after power on. The necessary procedure is described in detail in chapter 19.6.1.
Rain gauge simulation is selected as a protocol setting.
The resolution of the simulated rain gauge is defined in the field „Sim. RainGauge Resolution“. Factory setting is 0.01mm, alternatively 1.0mm, 0.5mm, 0.2mm or 0.1mm may be selected.
10.2.14 (WS100-UMB only) UMB-ASCII 2.0 Settings
The structure of the telegrams of the UMB-ASCII 2.0 protocol is largely configurable and can thus be adapted to the requirements of a measurement data logger.
Operating Manual Smart Weather Sensor
40 G. Lufft Mess- und Regeltechnik GmbH, Fellbach, Germany
Automatic Transmission
If one of the standard sets is selected, it is transmitted at the specified intervals
Transmission Intervall
Time in seconds between automatic telegram transmission
Message Start Character
ASCII character marking the start of a response telegram; factory setting is 2 / 02h (STX)
Message End Character
ASCII character marking the end of a response telegram; factory setting is 4 / 04h (STX)
Line Break Mode End of line character sequence for a telegram; factory setting is CRLF (0Dh, 0Ah), alternatives are CR (0Dh) or LF (0Ah)
Decimal Separator Character
Decimal separator character; factory setting is a decimal point 46 / 2Eh (‘.‘)
Parameter Separator Character
Separator character for parameters in the telegram; factory setting is a semicolon 59 / 3Bh (‘;‘)
Block Separator Character
Separator character for the individual blocks of a telegram; factory setting is a colon 58 / 3Ah (‘:‘)

Operating Manual Smart Weather Sensor
G. Lufft Mess- und Regeltechnik GmbH, Fellbach, Germany 41
Figure 22 Measurement Polling Channels
Figure 23 Example of Measurement Polling
10.3 Function Test with UMB-Config-Tool
The functions of the Smart Weather Sensor can be tested with the UMB-Config-Tool by polling various channels.
Note: All other devices which are used in the polling process, e.g. modems, LCOM etc., must be disconnected from the UMB network during configuration.
10.3.1 Channels for Measurement Polling
You can select the channel for measurement polling by the UMB-Config-Tool by clicking on the respective channel.
10.3.2 Example of Measurement Polling
Note: The UMB Config Tool is provided for test and configuration purposes only. It is not suitable for the permanent acquisition of measurement data. We recommend the use of professional software solutions for this purpose, e.g. Lufft SmartView3.
Operating Manual Smart Weather Sensor
42 G. Lufft Mess- und Regeltechnik GmbH, Fellbach, Germany
10.4 Operating Modes of the Smart Weather Sensor
The power consumption of the Smart Weather Sensor can be adjusted to the properties of the individual installation by setting the operation mode.
The operation of the power save modes however has certain constraints. These have to be considered when designing the installation.
In normal operation, where all specified properties of the Smart Weather Sensor are fully available, the power consumption is mostly determined by heating and fan operation.
10.4.1 Power Saving Mode 1
Following measures are active in power saving mode 1:
The ventilation of the temperature / humidity unit is switched off
All heaters are switched off
The radar rain sensor (WS800-UMB, WS700-UMB, WS600-UMB, WS400-UMB, WS100-UMB) is not working continuously. The sensor is activated once per minute for one second (WS100-UMB: 5sec), if precipitation is detected, it remains turned on until the end of the event, otherwise it is deactivated after this one second again.
Compass measurement is only performed once after power up. The fan, which is otherwise deactivated, will be switched on shortly for the time of this measurement.
The WS700-UMB / WS800-UMB increases the measuring cycle time for global radiation from 10 seconds to 1 minute.
Note: This setting has the following restrictions:
With the fan switched off deviations in temperature and humidity measurement can occur by solar radiation.
Only limited winter operation is possible in this operating mode because any icing might prevent the correct operation of the rain sensor or wind meter.
The rain detection may be delayed up to 2 minutes. Short events are possibly not detected. Thus, deviations in the accuracy of the precipitation quantity are possible.
Compared with normal operation the power consumption of a WS600-UMB can be reduced to 10% even neglecting the heating. (during precipitation events the consumption is slightly higher, due to the rain sensor then permanently switched on, about 20% compared to normal operation).

Operating Manual Smart Weather Sensor
G. Lufft Mess- und Regeltechnik GmbH, Fellbach, Germany 43
10.4.2 Power Saving Mode 2
Power saving mode 2 permits another relevant reduction of the power consumption, but adds on the other hand more severe restrictions.
In this operation mode the device will be almost completely switched off and will wake up only by the data request for one measurement cycle. During measurement and data transmission the device will be switched on for about 10 – 15 sec. The total consumption will be mostly determined by the data request interval.
Note: This operating mode has the following restrictions:
All restrictions of power saving mode 1
Power saving mode 2 is not available for devices with radar rain sensor (WS800-UMB, WS700-UMB, WS600-UMB, WS400-UMB, WS100-UMB). We recommend devices with tipping bucket rain gauge for low power applications.
The calculation of average, minimum and maximum as well as precipitation intensity are not available. Only instantaneous values will be transmitted.
Compass measurement is only performed once after power up. The fan, which is otherwise deactivated, will be switched on shortly for the time of this measurement.
Communication protocol Modbus is not available
When using the UMB protocol a certain request sequence and timing is required (s. Chap. 19.3.7). The interval length must be at least 15sec to make sure that the measurement and transmission cycle can be completed. Shorter interval could cause the device to stay in transmission state without starting a new measurement.
The joint operation with other sensors in an UMB network is possible, but it has to be considered that each telegram (even when addressed to another device) will cause the Smart Weather Sensor to wake up for at least several seconds, thus increasing the total power consumption. The minimum interval length must be hold up under consideration of the telegrams with other addresses. Mixed operation of devices in power saving mode 2 with devices in normal operation and fast request rates within the same UMB network is not possible.
Operating Manual Smart Weather Sensor
44 G. Lufft Mess- und Regeltechnik GmbH, Fellbach, Germany
Figure 24: Operating Modes for Equipment Heating
10.5 Operating Modes for Equipment Heating
Heating is configured to ‘Automatic’ when the product is delivered. This is the recommended operating mode for heating the sensor.
You can set the following operating modes:
Heater Mode
WS100-UMB
WS200-UMB
WS400-UMB
WS500-UMB
WS501-UMB *)
WS600-UMB
**)
WS601-UMB
Automatic ● ● ● ● ● ● ●
Off ● ● ● ● ● ● ●
Mode 1 ● ● ● ● ● ●
Eco-Mode 1 ● ● ● *) is also valid for WS502-UMB, WS503-UMB, WS504-UMB, WS510-UMB
**) is also valid for WS700-UMB and WS800-UMB
Note: Model WS30x-UMB and WS401-UMB are not heated.
The rain sensor and wind meter settings must be adjusted in the respective configuration mask. The examples show the wind meter setting.
10.5.1 Automatic
In this operating mode, the sensor is maintained constantly at the control temperature, generally in order to prevent the effects of snow and ice.
Setpoint Temp.: The heating controls at this temperature (in °C)
The settings for the other values are not relevant.
10.5.2 Off
In the ‘Off’ operating mode heating is completely disabled. Winter operation is not possible in this operating mode because any icing might prevent the correct operation of the rain sensor or wind meter.
The value settings are not relevant.
10.5.3 Mode 1
In ‘Mode 1’ operating mode heating is only enabled when the outside temperature falls below the HeatingMode1 temperature (in °C). In this mode power consumption can be reduced in frost-free situations with no great restriction on winter operation.
Setpoint Temp.: The heating controls at this temperature (in °C)
Heating mode1 Temp.: Threshold temperature (in °C) with effect from which air temperature heating is enabled
The ‘Eco Mode1 follow-up time’ setting is not relevant.

Operating Manual Smart Weather Sensor
G. Lufft Mess- und Regeltechnik GmbH, Fellbach, Germany 45
10.5.4 Eco-Mode 1
Eco Mode1 is an advanced energy saving mode.
Heating is only switched on when the following conditions are met:
The outside temperature is below the threshold temperature and precipitation was detected. Heating then runs at the control temperature for 30 minutes (after the last precipitation event).
When the outside temperature lies constantly below the threshold temperature and there was no heating for more than 20h, heating is switched on for 30 minutes as a precautionary measure in order to thaw any icing.
However, the precautionary 20h-heating only runs if the outside temperature was measured at below the threshold temperature for the entire period and conditions were constantly bright for at least 3 hours.
Setpoint Temp.: The heating controls at this temperature (in °C)
Heating mode1 Temp.: Threshold temperature (in °C) with effect from which heating is enabled
Eco mode1 follow-up time: Follow-up time (in minutes)
Examples:
Outside temperature constantly below 5°C; no precipitation for more than 24h
Outside temperature constantly below 5°C; with precipitation

Operating Manual Smart Weather Sensor
46 G. Lufft Mess- und Regeltechnik GmbH, Fellbach, Germany
11 Firmware Update
To keep the sensor in accordance with the latest state-of-the-art, it is possible to carry out a firmware update on site with no need to remove the sensor and return it to the manufacturer.
The firmware update is carried out with the aid of the UMB-Config-Tool.
The firmware update of the WS100-UMB is carried out with ConfigTool.NET.
The description of the firmware update can be found in the instructions for the UMB-Config-Tool. Please download the latest firmware and UMB-Config-Tool from our website www.lufft.com and install it on a Windows
® PC. You can find the instructions here:
Note: When a firmware update takes place, under certain circumstances the absolute precipitation quantities are reset (channel 600 – 660).
There is one firmware for the entire product family (except WS100-UMB) which supports all models (WSx_Release_Vxx.mot).
The firmware for WS100-UMB is named WS100_Release_Vxx.bin.
Important Note: please read the included text file in WSx_Release_Vxx.zip; it contains important information about the update!
12 Maintenance
In principle the equipment is maintenance-free.
However, it is recommended to carry out a functional test on an annual basis. When doing so, pay attention to the following points:
Visual inspection of the equipment for soiling
Check the sensors by carrying out a measurement request
Check the operation of the fan (not on WS200-UMB)
In addition, an annual calibration check by the manufacturer is recommended for the humidity sensor (not on WS200-UMB). It is not possible to remove or replace the humidity sensor. The complete Smart Weather Sensor must be sent to the manufacturer for testing.
Cleaning of the glass dome at regular intervals is suggested for devices with global radiation measurement. The length of the interval should be adapted to the local degree of pollution.
Devices with precipitation measurement by rain gauge (WS401-UMB, WS601-UMB): The rain gauge funnel needs to be cleaned at regular intervals (see below). The length of the interval should be adapted to the local degree of pollution.

Operating Manual Smart Weather Sensor
G. Lufft Mess- und Regeltechnik GmbH, Fellbach, Germany 47
Figure 25: WS601-UMB with removed funnel
12.1 Maintenance of the Rain Gauge
The function of the rain gauge will be significantly influenced by pollution of the funnel or the tipping bucket mechanism. Regular check and, if necessary, cleaning is required. The maintenance interval depends very much on local conditions and also on seasons (leaves, pollen, etc.) and therefore cannot be exactly defined here (it may be in the range of weeks).
Only clean when obviously polluted
Avoid moving the tipping mechanism (otherwise wrong counts will occur)
Use water, soft cloth and / or a soft brush for cleaning
Unlock funnel by turning it to the left and lift it off
Clean funnel, specially the sieve slots
Check the inside of the rain gauge module for pollution, especially for spider webs and insects, if necessary, clean it
Check tipping bucket for pollution, if necessary wash carefully with clean water. Caution: each movement of the bucket generates a counting pulse and thus may cause faulty precipitation amounts
Check water drain, clean if necessary
Put funnel back in place and lock it by turning it to the right

Operating Manual Smart Weather Sensor
48 G. Lufft Mess- und Regeltechnik GmbH, Fellbach, Germany
13 Technical Data
Power supply: 24VDC +/- 10% 12VDC with restrictions (see page 29)
Device version >= 037: 4 ... 32V DC
Limitations apply in case of supply voltage
less than 12V (see p. 29 f.)
Current consumption – sensor; values for devices prior to version 037 in brackets:
Mode1 Standard Power Saving Mode 1 Power Saving Mode 2
Supply 24VDC2 12VDC 24VDC 12VDC 24VDC 12VDC
WS100-UMB 42 mA 82 mA 17 mA 33 mA -- -- WS200-UMB 16 mA 25 mA 15 mA 24 mA 1 (4) mA 2 mA WS300-UMB 135 mA 70 mA 7 mA 7 mA 1 (4) mA 2 mA WS301-UMB WS302-UMB WS303-UMB WS304-UMB WS310-UMB
135 mA 70 mA 8 mA 8 mA 1 (4) mA 2 mA
WS400-UMB 160 mA 110 mA 7 mA 7 mA -- -- WS401-UMB 130 mA 65 mA 6 mA 6 mA 1 (4) mA 2 mA WS500-UMB 140 mA 85 mA 16 mA 25 mA 1 (4) mA 2 mA WS501-UMB WS502-UMB WS503-UMB WS504-UMB WS510-UMB
145 mA 85 mA 16 mA 25 mA 1 (4) mA 2 mA
WS600-UMB WS700-UMB WS800-UMB
160 mA 130 mA 16 mA 25 mA -- --
WS601-UMB 140 mA 85 mA 15 mA 24 mA 1 (4) mA 2 mA
Current consumption and power input - heating:
WS100-UMB 380 mA / 9.1VA at 24VDC WS200-UMB 833 mA / 20VA at 24VDC WS400-UMB 833 mA / 20VA at 24VDC WS500-UMB, WS501-UMB, WS502-UMB WS503-UMB, WS504-UMB, WS510-UMB
833 mA / 20VA at 24VDC
WS600-UMB, WS700-UMB, WS800-UMB 1,7 A / 40VA at 24VDC WS601-UMB 833mA / 20VA at 24VDC
Dimensions including mounting bracket:
WS100-UMB Ø 150mm, height 190mm WS200-UMB Ø 150mm, height 194mm WS300-UMB Ø 150mm, height 223mm WS301-UMB Ø 150mm, height 268mm WS302-UMB Ø 150mm, height 253mm WS303-UMB Ø 150mm, height 328mm WS304-UMB Ø 150mm, height 313mm WS310-UMB Ø 150mm, height 311mm WS400-UMB Ø 150mm, height 279mm WS401-UMB Ø 164mm, height 380mm WS500-UMB Ø 150mm, height 287mm WS501-UMB Ø 150mm, height 332mm WS502-UMB Ø 150mm, height 377mm WS503-UMB Ø 150mm, height 392mm WS504-UMB Ø 150mm, height 317mm WS510-UMB Ø 150mm, height 376mm WS600-UMB Ø 150mm, height 343mm WS601-UMB Ø 164mm, height 445mm WS700-UMB Ø 150mm, height 344mm WS800-UMB Ø 150mm, height 344mm
1 Description of operating modes, see page 35
2Factory default, recommended setting

Operating Manual Smart Weather Sensor
G. Lufft Mess- und Regeltechnik GmbH, Fellbach, Germany 49
Weight including mounting bracket, excluding connection cable: WS100-UMB ca. 0.6 kg WS200-UMB ca. 0.8 kg WS300-UMB ca. 1.0 kg WS400-UMB, WS301-UMB, WS302-UMB, WS303-UMB, WS304-UMB, WS310-UMB
ca. 1.3 kg
WS401-UMB ca. 1.5 kg WS500-UMB ca. 1.2 kg WS600-UMB, WS501-UMB, WS502-UMB, WS503-UMB, WS504-UMB, WS700-UMB WS510-UMB, WS800-UMB
ca. 1.5 kg
WS601-UMB ca. 1.7 kg
Fastening: Stainless steel mast bracket for Ø 60 - 76mm
Protection class: III (SELV)
Protection type: IP66
Storage Conditions
Permissible storage temperature: -50°C ... +70°C Permissible relative humidity: 0 ... 100% RH
Operating Conditions
Permissible operating temperature: -50°C ... +60°C Permissible relative humidity: 0 ... 100% RH Permissible altitude above sea level: N/A
RS485 interface, 2 wire, half-duplex
Data bits: 8 (SDI-12 mode: 7) Stop bit: 1 Parity: No (SDI-12 mode: even, Modbus mode none or even) Tri-state: 2 bits after stop bit edge Adjustable baud rates: 1200, 2400, 4800, 9600, 14400, 19200
3, 28800, 57600
(In SDI-12 mode, the interface is changed to meet the requirements of the standard.)
Housing: Plastic (PC)
3Factory setting; baud rate for operation with ISOCON-UMB and firmware update.

Operating Manual Smart Weather Sensor
50 G. Lufft Mess- und Regeltechnik GmbH, Fellbach, Germany
13.1 Measuring Range / Accuracy
13.1.1 Air temperature
Measurement process: NTC Measuring range: -50°C ... +60°C Resolution: 0.1°C (-20°C...+50°C), otherwise 0.2°C Sensor accuracy: +/- 0.2°C (-20°C ... +50°C), otherwise +/-0.5°C (>-30°C) Sampling rate: 1 minute Units: °C; °F
(WS100-UMB: the accuracy of the air temperature service channels is not specified)
13.1.2 Humidity
Measurement process: Capacitive Measuring range: 0 ... 100% RH Resolution: 0.1% RH Accuracy: +/- 2% RH Sampling rate: 1 minute Units: % RH; g/m³; g/kg
13.1.3 Dewpoint Temperature
Measurement process: Passive, calculated from temperature and humidity Measuring range: -50°C ... +60°C Resolution: 0.1°C Accuracy: Computed +/- 0.7°C Units: °C; °F
13.1.4 Air Pressure
Measurement process: MEMS sensor - capacitive Measuring range: 300 ... 1200hPa Resolution: 0.1hPa Accuracy: +/- 0.5hPa (0 … +40°C) Sampling rate: 1 minute Unit: hPa
13.1.5 Wind Speed
Measurement process: Ultrasonic Measuring range: 0 … 75m/s (WS601-UMB: 0 … 30m/s) Resolution: 0.1m/s Accuracy: ±0.3 m/s or ±3% (0...35 m/s) ±5% (>35m/s) RMS Response threshold: 0.3 m/s Internal sampling frequency: 15Hz Instantaneous value: 1 sec / 10sec Output rate for average and peak gust values: 1min – 10min (peak calculated from 1sec values) Units: m/s; km/h; mph; kts
13.1.6 Wind Direction
Measurement process: Ultrasonic Measuring range: 0 – 359.9° Resolution: 0.1° Accuracy: < 3° (> 1m/s) RMSE Response threshold: 0.3 m/s Internal sampling frequency: 15Hz Instantaneous value: 1 sec / 10sec Output rate for average and peak gust values: 1min – 10min (peak calculated from 1sec values)

Operating Manual Smart Weather Sensor
G. Lufft Mess- und Regeltechnik GmbH, Fellbach, Germany 51
13.1.7 Precipitation
13.1.7.1 WS100-UMB / WS400-UMB / WS600-UMB / WS700-UMB /WS800-UMB
Measurement process: Radar sensor Measuring range (drop size): 0.3 mm ... 5.0 mm Liquid precipitation resolution: 0.01 mm Precipitation types: Rain, snow Repeatability: Typically > 90% Response threshold: 0.002 mm Sampling rate: Event-dependent on reaching response threshold Precipitation intensity: 0 … 200 mm/h; Sampling rate 1 minute
13.1.7.2 WS401-UMB / WS601-UMB
Measurement process: Rain Gauge Liquid precipitation resolution: 0.2 mm / 0.5mm (adjustable by reduction ring) Precipitation types: Rain Accuracy: 2% Sampling rate: 1 minute
13.1.8 Compass
Measurement process: Integrated electronic compass Measurement range: 0 ... 359° Resolution: 1.0° Accuracy: +/- 10° Sampling rate: 5 minutes
13.1.9 Global Radiation
Measurement Process Thermopile pyranometer Measurement Range 0.0 ... 2000.0 W/m² Resolution < 1W/m² Sampling Rate 10 seconds
13.1.9.1 WS301-UMB / WS501-UMB
Response time (95%) 18s Non-stability(change/year) <1% Non-linearity (0 to 1000 W/m²) <1% Directional error (at 80° with 1000 W/m²) <20 W/m² Temperature dependence of sensitivity <5% (-10 to +40°C) Tilt error (at 1000 W/m²) <1% Spectral range (50% points) 300 ... 2800nm
13.1.9.2 WS302-UMB / WS502-UMB / WS700-UMB / WS800-UMB
Response time (95%) <1s Spectral range (50% points) 300 ... 1100nm
13.1.9.3 WS310-UMB / WS510-UMB
Response time (95%) 5s Non-stability(change/year) <0.5% Non-linearity (0 to 1000 W/m²) <0.2% Directional error (at 80° with 1000 W/m²) <10 W/m² Temperature dependence of sensitivity <1% (-10 to +40°C) Tilt error (at 1000 W/m²) <0.2% Spectral range (50% points) 285 ... 2800nm

Operating Manual Smart Weather Sensor
52 G. Lufft Mess- und Regeltechnik GmbH, Fellbach, Germany
13.1.10 External Temperature SensorWT1 / WST1
Measurement process: NTC Measuring range: -40°C ... +80°C Resolution: 0.25°C Sensor accuracy: +/- 1°C (WST1: +/-0.3°C between -10°C ...+10°C) Sampling rate: 1 minute Units: °C; °F
13.1.11 External Rain GaugeWTB100
Measurement process: Rain Gauge with bounce-free reed contact (normally closed) Liquid precipitation resolution: 0.2 mm / 0.5mm (adjustable by reduction ring) Precipitation types: Rain Accuracy: 2% Sampling rate: 1 minute
In principle, all rain sensors with bounce-free reed contact (normally open or normally closed) and with a resolution of 0.1 mm, 0.2 mm, 0.5 mm or 1.0 mm can be used.

Operating Manual Smart Weather Sensor
G. Lufft Mess- und Regeltechnik GmbH, Fellbach, Germany 53
Figure 26: WS100-UMB
Figure 27: WS200-UMB
13.2 Drawings

Operating Manual Smart Weather Sensor
54 G. Lufft Mess- und Regeltechnik GmbH, Fellbach, Germany
Figure 28: WS200-UMB

Operating Manual Smart Weather Sensor
G. Lufft Mess- und Regeltechnik GmbH, Fellbach, Germany 55
Figure 29: WS301-UMB
WS302-UMB, WS303-UMB und WS304-UMB are similar.

Operating Manual Smart Weather Sensor
56 G. Lufft Mess- und Regeltechnik GmbH, Fellbach, Germany
Figure 30: WS310-UMB

Operating Manual Smart Weather Sensor
G. Lufft Mess- und Regeltechnik GmbH, Fellbach, Germany 57
Figure 31: WS400-UMB

Operating Manual Smart Weather Sensor
58 G. Lufft Mess- und Regeltechnik GmbH, Fellbach, Germany
Figure 32: WS401-UMB

Operating Manual Smart Weather Sensor
G. Lufft Mess- und Regeltechnik GmbH, Fellbach, Germany 59
Figure 33: WS500-UMB

Operating Manual Smart Weather Sensor
60 G. Lufft Mess- und Regeltechnik GmbH, Fellbach, Germany
Figure 34: WS501-UMB
WS502-UMB, WS503-UMB und WS504-UMB are similar.

Operating Manual Smart Weather Sensor
G. Lufft Mess- und Regeltechnik GmbH, Fellbach, Germany 61
Figure 35: WS510-UMB

Operating Manual Smart Weather Sensor
62 G. Lufft Mess- und Regeltechnik GmbH, Fellbach, Germany
Figure 36: WS600-UMB

Operating Manual Smart Weather Sensor
G. Lufft Mess- und Regeltechnik GmbH, Fellbach, Germany 63
Figure 37: WS601-UMB

Operating Manual Smart Weather Sensor
64 G. Lufft Mess- und Regeltechnik GmbH, Fellbach, Germany
Figure 38: WS700-UMB, WS800-UMB

Operating Manual Smart Weather Sensor
G. Lufft Mess- und Regeltechnik GmbH, Fellbach, Germany 65
14 EC Certificate of Conformity
Product: Smart Weather Sensor
Type: WS100-UMB (Order No.: 8367.U03) WS200-UMB (Order No.: 8371.U01) WS300-UMB (Order No.: 8372.U01) WS301-UMB (Order No.: 8374.U01) WS302-UMB (Order No.: 8374.U10) WS303-UMB (Order No.: 8374.U11) WS304-UMB (Order No.: 8374.U12) WS310-UMB (Order No.: 8374.U13) WS400-UMB (Order No.: 8369.U01 / 8369.U02) WS401-UMB (Order No.: 8377.U01) WS500-UMB (Order No.: 8373.U01) WS501-UMB (Order No.: 8375.U01) WS502-UMB (Order No.: 8375.U10) WS503-UMB (Order No.: 8375.U11) WS504-UMB (Order No.: 8375.U12) WS510-UMB (Order No.: 8375.U13) WS600-UMB (Order No.: 8370.U01 / 8370.U02) WS601-UMB (Order No.: 8376.U01) WS700-UMB (Order No.: 8380.U01) WS800-UMB (Order No.: 8381.U01)
We herewith certify that the above mentioned equipment complies in design and construction with the Directives of the European Union and specifically the EMC Directive in accordance with 2004/108/EC, the RoHS Directive 2011/65/EU and, where required, Directive 2014/53/EU.
The complete Certificate of Conformity is available for download from the Lufft website www.lufft.com

Operating Manual Smart Weather Sensor
66 G. Lufft Mess- und Regeltechnik GmbH, Fellbach, Germany
14.1 WS100 FCC Compliance Statement (US)
Product: Smart Weather Sensor
Type: WS100-UMB (Order No.: 8367.U04)
This device contains FCCID: UF9WS100
This device complies with part 15 of the FCC Rules. Operation is subject to the following two conditions: (1) This device may not cause harmful interference, and (2) this device must accept any interference received, including interference that may cause undesired operation.
Changes and modifications not expressly approved by manufacturer could void the user’s authority to operate the equipment.
14.2 WS 100 IC Compliance Statement (CA)
Product: Smart Weather Sensor
Type: WS100-UMB (Order No.: 8367.U04)
This equipment contains equipment certified under ICID: 6650A-WS100
This device complies with Industry Canada licence-exempt RSS standard(s). Operation is subject to the following two conditions: (1) This device may not cause interference, and (2) this device must accept any interference received, including interference that may cause undesired operation of the device.
Le présent appareil est conforme aux CNR d’Industrie Canada applicable aux appareils radio exempts de licence. L’exploration est autorisée aux deux conditions suivantes: (1) l’appareil ne doit pas produire de brouillage, et (2) l’utilisateur de l’appareil doit accepter tout brouillage radioélectrique subi, même si le bouillage est susceptible d’en compromettre le fonctionnement.

Operating Manual Smart Weather Sensor
G. Lufft Mess- und Regeltechnik GmbH, Fellbach, Germany 67
15 Fault Description
Error description Cause - Remedy
Device does not allow polling / does not respond
- Check power supply
- Check interface connection
- Incorrect device ID check ID; devices are delivered with ID 1.
The device measures precipitation but it is not raining
Check that the sensor was installed correctly in accordance with the instructions.
The measured temperature appears too high / measured humidity appears too low
Check the operation of the fan on the underside of the device.
Wind direction values are incorrect Device is not correctly aligned check that the device is aligned to the North.
Device transmits error value 24h (36d)
A channel is being polled that is not available on this device type; e.g. Channel 200 = humidity is being polled on a WS200-UMB.
Device transmits error value 28h (40d)
The device is in the initialization phase following startup the device delivers measurements after approx. 10 seconds.
Device transmits error value 50h (80d)
The device is being operated above the limit of the specified measuring range.
Device transmits error value 51h (81d)
The device is being operated below the limit of the specified measuring range.
Device transmits error value 55h (85d) during wind measurement
The device is unable to execute a valid measurement due to the ambient conditions.
This may be due to the following reasons:
- The device is being operated well above the limit of the specified measuring range
- Very strong horizontal rain or snow
- The wind meter sensors are very dirty clean sensor
- The wind meter sensors are iced over check heating mode in the configuration and check heating function / connection
- There are foreign objects within the measuring section of the wind meter
- One of the wind meter’s sensors is faulty return device to manufacturer for repair
The quality of the wind measurement is not always100%
In normal operation the device should always transmit 90 – 100%. Values up to 50% do not represent a general problem.
When the error value 55h (85d) is transmitted this value is 0%.
If the device permanently transmits values below 50% this may mean that there is a fault.
Device transmits an error value not listed here
This may be due to a number of reasons contact the manufacturer’s technical support department.

Operating Manual Smart Weather Sensor
68 G. Lufft Mess- und Regeltechnik GmbH, Fellbach, Germany
16 Disposal
16.1 Within the EC
The device shall be disposed of in accordance with European Directives 2002/96/EC and 2003/108/EC (waste electrical and electronic equipment).
16.2 Outside the EC
Please comply with the applicable regulations for the proper disposal of waste electrical and electronic equipment in your respective country.
17 Repair / Corrective Maintenance
Please arrange for any faulty equipment to be checked and, if necessary, repaired by the manufacturer exclusively. Do not open the equipment and do not under any circumstances attempt to carry out your own repairs.
In matters of warranty or repair please contact:
G. Lufft Mess- und Regeltechnik GmbH
Gutenbergstraße 20 70736 Fellbach
P.O. Box 4252 70719 Fellbach
Germany
Phone: +49 711 51822-0 Hotline: +49 711 51822-52 Fax: +49 711 51822-41
E-mail: [email protected]
or your local distributor.
17.1 Technical Support
Our Hotline is available for technical questions via the following e-mail address:
You can also consult frequently asked questions at http://www.lufft.com/ (menu header: SUPPORT / FAQs).

Operating Manual Smart Weather Sensor
G. Lufft Mess- und Regeltechnik GmbH, Fellbach, Germany 69
Figure 39: Setting type of external sensor
18 External Sensor
18.1 External Temperature and Precipitation Sensors
18.1.1 Connection of Temperature and Precipitation Sensors
Additional external sensor can cover the requirements of special measurement requirements or extend the functionality of Smart Weather Sensors.
Currently the accessory list includes external temperature sensors and the precipitation detection by tipping bucket rain gauge.
One input is available for this extension, so alternatively one temperature sensor or one precipitation sensor may be used.
The connection uses the standard connector plug of the Smart Weather Sensor, so normally the external device will be connected at the end of the cable included with the delivery, in the control cabinet. As this cable is part of the measuring line care shall be taken when designing the cabling to avoid parasitic coupling etc. The cable should be as short as possible. In special cases, e.g. when the external sensor is mounted near to the Smart Weather Sensor while the control cabinet is distant, the installation of an additional distribution box should be considered.
The external sensor is connected to pins 5 and 6 of the connector plug, i.e. the grey and pink wires of the standard cable.
All currently available sensors are unipolar, so the connection sequence is not relevant.
The Smart Weather Sensor must be configured for the selected type of external sensor (temperature or precipitation) to enable the correct evaluation of the measurement data. The selection of the sensor type is done through the UMB Config Tool.
If the data from the channels of the sensor type currently not selected are requested, the device will respond with “invalid channel”.

Operating Manual Smart Weather Sensor
70 G. Lufft Mess- und Regeltechnik GmbH, Fellbach, Germany
Figure 40: Example WS501-UMB and WTB100
18.1.2 External Temperature Sensor
All models of the WS family (except WS100-UMB) can be used with an external temperature sensor.
For different application various types of NTC sensor are in supply:
WT1 for temperature acquisition of devices and surfaces
WST1 for mounting in the road surface (road surface temperature)
Mounting / installation of the temperature sensors is shown in the sensor manual.
18.1.3 External Rain Gauge
All models of the WS family without integrated precipitation detection can be used with an external rain gauge. Models WS100-UMB, WS400-UMB, WS600-UMB, WS401-UMB, WS601-UMB, WS700-UMB, WS800-UMB with R2S sensor resp. integrated tipping bucket cannot be equipped with an external rain gauge.
The measurement values of the external rain gauge are on the same channels as the data of the internal precipitation sensors of WS100-UMB, WS400-UMB, WS600-UMB, WS401-UMB, WS601-UMB, WS700-UMB and WS800-UMB.
The external rain gauge WTB100 uses the same technology as the integrated rain gauge of models WS401-UMB and WS601-UMB.
The resolution of the rain gauge WTB100 can be modified by the reduction ring delivered with the sensor from 0.2mm to 0.5mm.
In principle, all rain sensors with bounce-free reed contact (normally open or normally closed) and with a resolution of 0.1 mm, 0.2 mm, 0.5 mm or 1.0 mm can be used.
Note: To get the correct amount of rain this “mechanical” selection must be also be set in Smart Weather Sensors configuration.
The setting is done with the UMB Config Tool by the same procedure as with WS401-UMB and WS601-UMB (s. Chap.10.2.8).
The WS601/401-UMB’s advices for installation (Chap.0) and maintenance (Chap.12.1) are as well valid for the external rain gauge.
Example with WS501-UMB and WTB100 without reduction ring:
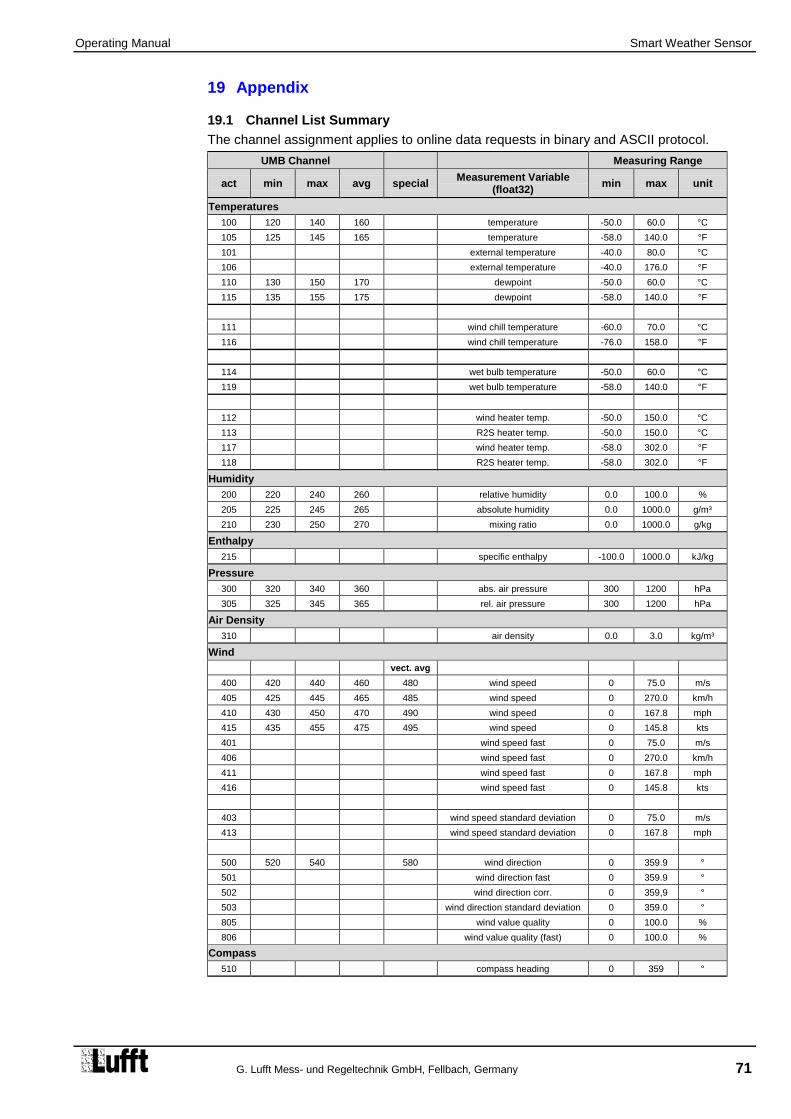
Operating Manual Smart Weather Sensor
G. Lufft Mess- und Regeltechnik GmbH, Fellbach, Germany 71
19 Appendix
19.1 Channel List Summary
The channel assignment applies to online data requests in binary and ASCII protocol.
UMB Channel Measuring Range
act min max avg special Measurement Variable
(float32) min max unit
Temperatures
100 120 140 160 temperature -50.0 60.0 °C
105 125 145 165 temperature -58.0 140.0 °F
101 external temperature -40.0 80.0 °C
106 external temperature -40.0 176.0 °F
110 130 150 170 dewpoint -50.0 60.0 °C
115 135 155 175 dewpoint -58.0 140.0 °F
111 wind chill temperature -60.0 70.0 °C
116 wind chill temperature -76.0 158.0 °F
114 wet bulb temperature -50.0 60.0 °C
119 wet bulb temperature -58.0 140.0 °F
112 wind heater temp. -50.0 150.0 °C
113 R2S heater temp. -50.0 150.0 °C
117 wind heater temp. -58.0 302.0 °F
118 R2S heater temp. -58.0 302.0 °F
Humidity
200 220 240 260 relative humidity 0.0 100.0 %
205 225 245 265 absolute humidity 0.0 1000.0 g/m³
210 230 250 270 mixing ratio 0.0 1000.0 g/kg
Enthalpy
215 specific enthalpy -100.0 1000.0 kJ/kg
Pressure
300 320 340 360 abs. air pressure 300 1200 hPa
305 325 345 365 rel. air pressure 300 1200 hPa
Air Density
310 air density 0.0 3.0 kg/m³
Wind
vect. avg
400 420 440 460 480 wind speed 0 75.0 m/s
405 425 445 465 485 wind speed 0 270.0 km/h
410 430 450 470 490 wind speed 0 167.8 mph
415 435 455 475 495 wind speed 0 145.8 kts
401 wind speed fast 0 75.0 m/s
406 wind speed fast 0 270.0 km/h
411 wind speed fast 0 167.8 mph
416 wind speed fast 0 145.8 kts
403 wind speed standard deviation 0 75.0 m/s
413 wind speed standard deviation 0 167.8 mph
500 520 540 580 wind direction 0 359.9 °
501 wind direction fast 0 359.9 °
502 wind direction corr. 0 359,9 °
503 wind direction standard deviation 0 359.0 °
805 wind value quality 0 100.0 %
806 wind value quality (fast) 0 100.0 %
Compass
510 compass heading 0 359 °

Operating Manual Smart Weather Sensor
72 G. Lufft Mess- und Regeltechnik GmbH, Fellbach, Germany
Precipitation Quantity Range Unit
600 float32 Precipitation Quantity - Absolute 0 … 100000 liters/m²
620 float32 Precipitation Quantity - Absolute 0 … 100000 mm
640 float32 Precipitation Quantity - Absolute 0 … 3937 inches
660 float32 Precipitation Quantity - Absolute 0 … 3937008 mil
605 float32 Precipitation Quantity - Differential 0 … 100000 liters/m²
625 float32 Precipitation Quantity - Differential 0 … 100000 mm
645 float32 Precipitation Quantity - Differential 0 … 3937 inches
665 float32 Precipitation Quantity - Differential 0 … 3937008 mil
Precipitation Type
700 uint7 Precipitation Type
0 = No precipitation
40 = unspecified precipitation 60 = Liquid precipitation, e.g. rain 70 = Solid precipitation, e.g. snow
WS100-UMB only:
67 = freezing rain
69 = sleet
90 = hail
Precipitation Intensity Range unit
800 float32 Precipitation Intensity 0 … 200.0 l/m²/h
820 float32 Precipitation Intensity 0 … 200.0 mm/h
825 float32 Precipitation Intensity (WS100 only) 0 ... 3.333 mm/min
840 float32 Precipitation Intensity 0 … 7.874 in/h
845 float32 Precipitation Intensity (WS100 only) 0 ... 0.1312 in/min
860 float32 Precipitation Intensity 0 … 7874 mil/h
Global Radiation
act min max avg special Measurement Variable (float32) min max unit
900 920 940 960 Global Radiation 0 1400 W/m²
Lightning Detection
act min max avg sum Measurement Variable (uint16) min max unit
617 Lightning event (minute) 0 255 -
677 Lightning event (interval) 0 7650 -
Service Channels
10000 Supply Voltage V 0.0 50.0 V
11000 Rain Drop Volume µl 0.0 500.0 µl
4100 4120 4140 4160 temperature -50.0 60.0 °C
4105 4125 4145 4165 temperature -58.0 140.0 °F
4600 Precipitation: total particles 0 4294967295 -
4601 Precipitation: total drops 0 4294967295 -
4602 Precipitation: drizzle particles 0 65535 -
4603 Precipitation: snow particles 0 65535 -
4604 Precipitation: hail particles 0 65535 -
4620 Precipitation: Drop class 0 0 65535 -
4621 Precipitation: Drop class 1 0 65535 -
4622 Precipitation: Drop class 2 0 65535 -
4623 Precipitation: Drop class 3 0 65535 -
4624 Precipitation: Drop class 4 0 65535 -
4625 Precipitation: Drop class 5 0 65535 -
4626 Precipitation: Drop class 6 0 65535 -
4627 Precipitation: Drop class 7 0 65535 -
4628 Precipitation: Drop class 8 0 65535 -
4629 Precipitation: Drop class 9 0 65535 -
4630 Precipitation: Drop class 10 0 65535 -
4631 Precipitation: Drop class 11 0 65535 -
Note: Which channels are actually available depends on the WSxxx-UMB type in use.

Operating Manual Smart Weather Sensor
G. Lufft Mess- und Regeltechnik GmbH, Fellbach, Germany 73
19.2 Channel List Summary per TLS2002 FG3
The following channels are available specifically for data requests for further processing in TLS format. These channels are only available in the UMB-Binary protocol.
DE Type
UMB Channel
Meaning Format Range Resolution Coding
48 1048 Result message Air Temperature LT
16 bit -30 ... +60°C
0.1°C 60.0 = 600d = 0258h 0.0 = 0d = 0000h -0.1 = -1d = FFFFh -30.0 = -300d = FED4h
53 1053 Result message Precipitation Intensity NI
16 bit 0 ... 200 mm/h
0.1 mm/h 0.0 = 0d = 0000h 200.0 = 2000d = 07D0h
54 1054 Result message Air Pressure LD
16 bit 800...1200 hPa
1 hPa 800 = 800d = 0320h 1200 = 1200d = 04B0h
55 1055 Result message Relative Humidity RLF
8 bit 10% ... 100%
1% RH 10% = 10d = 0Ah 100% = 100d = 64h
56 1056 Result message Wind Direction WR
16 bit 0 ... 359° 1° 0° (N) = 0d = 0000h 90° (O) = 90d = 005Ah 180° (S) = 180d = 00B4h 270° (W) = 270d = 010Eh FFFFh = not definable
57 1057 Result message Wind Speed. (average) WGM
16 bit 0.0 ... 60.0 m/s
0.1 m/s 0.0 = 0d = 0000h 60.0 = 600d = 0258h
64 1064 Result message Wind Speed (peak) WGS
16 bit 0.0 ... 60.0 m/s
0.1 m/s 0.0 = 0d = 0000h 60.0 = 600d = 0258h
66 1066 Result message Dewpoint Temperature TPT
16 bit -30 ... +60°C
0.1°C 60.0 = 600d = 0258h 0.0 = 0d = 0000h -0.1 = -1d = FFFFh -30.0 = -300d = FED4h
71 1071 Result message Precipitation Type NS
8 bit 0 = No precipitation 40 = unspecified precipitation 60 = Liquid precipitation, e.g. rain 70 = Solid precipitation, e.g. snow
WS100-UMB only: 67 = freezing rain 69 = sleet 90 = hail
Note: Which channels are actually available depends on the WSxxx-UMB type in use.
The previous channels 1153 and 1253 are no longer supported. Channels 840 and 860 can be used in their place.

Operating Manual Smart Weather Sensor
74 G. Lufft Mess- und Regeltechnik GmbH, Fellbach, Germany
19.3 Communication in Binary Protocol
Only one example of an online data request is described in this operating manual. Please refer to the current version of the UMB Protocol for all commands and the exact mode of operation of the protocol (available for download at www.lufft.com).
Note: Communication with the sensor takes place in accordance with the master-slave principle, i.e. there may only be ONE requesting unit on a network.
19.3.1 Framing
The data frame is constructed as follows:
SOH Control character for the start of a frame (01h); 1 byte
<ver> Header version number, e.g.: V 1.0 <ver> = 10h = 16d; 1 byte
<to> Receiver address; 2 bytes
<from> Sender address; 2 bytes
<len> Number of data bytes between STX and ETX; 1 byte
STX Control character for the start of payload transmission (02h); 1 byte
<cmd> Command; 1 byte
<verc> Version number of the command; 1 byte
<payload> Data bytes; 0 – 210 bytes
ETX Control character for the end of payload transmission (03h); 1 byte
<cs> Check sum, 16 bit CRC; 2 bytes
EOT Control character for the end of the frame (04h); 1 byte
Control characters: SOH (01h), STX (02h), ETX (03h), EOT (04h).
19.3.2 Addressing with Class and Device ID
Addressing takes place by way of a 16 bit address. This breaks down into a Class ID and a Device ID.
Address (2 bytes = 16 bit)
Bits 15 – 12 (upper 4 bits) Bits 11 – 8 (middle 4 bits)
Bits 7 – 0 (lower 8 bits)
Class ID (0 to 15) Reserve Device ID (0 – 255)
0 Broadcast 0 Broadcast
7 Smart Weather Sensor
(WS200-UMB – WS600-UMB) 1 - 255 Available
15 Master or control devices
ID = 0 is provided as broadcast for classes and devices. Thus it is possible to transmit a broadcast on a specific class. However this only makes sense if there is only one device of this class on the bus; or in the case of a command, e.g. reset.
1 2 3 - 4 5 - 6 7 8 9 10 11 ... (8 + len)
optional 9 + len
10 + len 11 + len
12 + len
SOH <ver> <to> <from> <len> STX <cmd> <verc> <payload> ETX <cs> EOT

Operating Manual Smart Weather Sensor
G. Lufft Mess- und Regeltechnik GmbH, Fellbach, Germany 75
19.3.3 Examples for Creating Addresses
If, for example, you want to address WS400-UMB with the device ID 001, this takes place as follows:
The class ID for the Smart Weather Sensor is 7d = 7h; the device ID is e.g. 001d = 001h
Putting the class and device IDs together gives the address 7001h (28673d).
19.3.4 Example of a Binary Protocol Request
If, for example, a Smart Weather Sensor with the device ID 001 is to be polled from a PC for the current temperature, this takes place as follows:
Sensor:
The class ID for the Smart Weather Sensors 7 = 7h;
The device ID is 001 = 001h
Putting the class and device IDs together gives a target address of 7001h.
PC:
The class ID for the PC (master unit) is 15 = Fh; the PC ID is e.g. 001d = 01h.
Putting the class and device IDs together gives a sender address of F001h.
The length <len> for the online data request command is 4d = 04h;
The command for the online data request is 23h;
The version number of the command is 1.0 = 10h.
The channel number is in <payload>; as can be seen from the channel list (page 71), the current temperature in °C in the channel is 100d = 0064h.
The calculated CRC is D961h.
The request to the device:
SOH <ver> <to> <from> <len> STX <cmd> <verc> <channel> ETX <cs> EOT
1 2 3 4 5 6 7 8 9 10 11 12 13 14 15 16
01h 10h 01h 70h 01h F0h 04h 02h 23h 10h 64h 00h 03h 61h D9h 04h
The response from the device:
SOH <ver> <to> <from> <len> STX <cmd> <verc> <status> <channel> <typ>
1 2 3 4 5 6 7 8 9 10 11 12 13 14
01h 10h 01h F0h 01h 70h 0Ah 02h 23h 10h 00h 64h 00h 16h
<value> ETX <cs> EOT
15 16 17 18 19 20 21 22
00h 00h B4h 41h 03h C6h 22h 04h
Interpretation of the response:
<status> = 00h device o.k. (≠ 00h signifies error code; see page 76)
<typ> = Data type of the following value; 16h = float (4 bytes, IEEE format)
<value> = 41B40000h as a float value corresponds to 22.5
The temperature is therefore 22.5°C.
The correct data transmission can be checked with the aid of the check sum (22C6h).
Note: Little Endian (Intel, low byte first) applies when transmitting word and float variables of addresses or the CRC, for example. This means first the LowByte and then the HighByte.

Operating Manual Smart Weather Sensor
76 G. Lufft Mess- und Regeltechnik GmbH, Fellbach, Germany
19.3.5 Status and Error Codes in Binary Protocol
If a measurement request delivers the <status> 00h, the sensor is working correctly. You can find a complete list of additional codes in the description of the UMB protocol.
Extract from list:
<status> Description
00h (0d) Command successful; no error; all o.k.
10h (16d) Unknown command; not supported by this device
11h (17d) Invalid parameter
24h (36d) Invalid channel
28h (40d) Device not ready; e.g. initialization / calibration running
50h (80d) Measurement variable (+offset) is outside the set display range
51h (81d)
52h (82d) Measurement value (physical) is outside the measuring range (e.g. ADC over range)
53h (83d)
54h (84d) Error in measurement data or no valid data available
55h ( 85d) Device / sensor is unable to execute valid measurement due to ambient conditions
19.3.6 CRC Calculation
CRC is calculated according to the following rules:
Norm: CRC-CCITT
Polynomial: 1021h = x16
+ x12
+ x5 + 1 (LSB first mode)
Start value: FFFFh
You can find further information in the description of a CRC calculation in UMB Protocol.
19.3.7 Data Request in Power Saving Mode 2
When in power saving mode2 the processor of the Smart Weather Sensor will be usually in sleep state. For the acquisition of measurement data a certain command sequence and a certain timing is required:
„Wake Up“ bei sending a <Break>, any character or any telegram (a telegram will not be properly detected and get no response, because the UART is just starting)
1000msec pause for the processor start up
Activation of the measurement cycle by (any) valid telegram addressed to this device
2000msec pause for the execution of the measurement sequence
Request of the measurement results
Example of a Request Sequence:
Command Data Request (0x23), Channel 100
No response
Wait 1 sec
Command Data Request (0x23), Channel 100
Discard data
Wait 2 sec
CommandMultiData Request (0x2F), Ch. 100, 200, 300, 620, 605, 700
Store data

Operating Instructions Smart Weather Sensor
G. Lufft Mess- und Regeltechnik GmbH, Fellbach, Germany 77
19.4 Communication in ASCII Protocol
Note: UMB-ASCII protocol is not recommended for new projects. New features and sensors will not be implemented for this protocol for devices newer than device version 223 (WS100-UMB device version 04).
Text-based communication with devices is possible using ASCII protocol.
To do this, in the device configuration, interface settings, the protocol mode must be set to ASCII (see page 34).
ASCII protocol is network-compatible and serves exclusively for online data requests. The device will not respond to incomprehensible ASCII commands.
Note: The use of binary protocol is recommended for lengthy transmission routes (e.g. network, GPRS/UMTS), as ASCII protocol is unable to detect transmission errors (not CRC-secured).
Note: TLS channels are not available in ASCII protocol.
19.4.1 Structure
An ASCII command is introduced by the ‘&’ character and completed by the CR (0Dh) sign. There is a space character (20h) between the individual blocks in each case; this is represented by an underscore character ‘_’. Characters that represent an ASCII value are in ordinary inverted commas.
19.4.2 Summary of ASCII Commands
Command Function BC AZ
M Online data request l
X Switches to binary protocol k
R Triggers software reset k
D Software reset with delay k
I Device information k
These operating instructions describe the online data request only. You can find the description of the other commands in the UMB protocol.
19.4.3 Online Data Request (M)
Description: By way of this command, a measurement value is requested from a specific channel.
Request: ‘&’_<ID>5_‘M’_<channel>
5 CR
Response: ‘$’_<ID>5_‘M’_<channel>
5_<value>
5 CR
<ID>5 Device address (5 decimal places with leading zeros)
<channel>5 Indicates the channel number (5 decimal places with leading zeros)
<value>5 Measurement value (5 decimal places with leading zeros); a measurement
value standardized to 0 – 65520d. Various error codes are defined from 65521d – 65535d.
Example:
Request: &_28673_M_00100
By way of this request, channel 100 of the device with address 28673 is interrogated (Smart Weather Sensor with device ID 001).
Response: $_28673_M_00100_34785
This channel outputs a temperature from –50 to +60°C, which is calculated as follows:
0d corresponds to -50°C
65520d corresponds to +60°C
36789d corresponds to [+60°C – (-50°C)] / 65520 * 34785 +(-50°C) = 8.4°C
Note: TLS channels are not available in ASCII protocol.

Operating Manual Smart Weather Sensor
78 G. Lufft Mess- und Regeltechnik GmbH, Fellbach, Germany
19.4.4 Standardization of Measurement Values in ASCII Protocol
The standardization of measurement values from 0d – 65520d corresponds to the measuring range of the respective measurement variable.
Measurement Variable Measuring Range
Min Max Unit
Temperature
Temperature
Dew point
Wet Bulb Temperature
-50.0 60.0 °C
-58.0 140.0 °F
External Temperature -40.0 80.0 °C
-40.0 176.0 °F
Wind chill temperature -60.0 70.0 °C
-76.0 158.0 °F
Humidity
Relative humidity 0.0 100.0 %
Absolute humidity
Mixing ratio 0.0 1000.0
g/m³
g/kg
Specific Enthalpy -100.0 1000.0 kJ/kg
Pressure
Relative air pressure
Absolute air pressure 300.0 1200.0 hPa
Air Density
air density 0.0 3.0 kg/m³
Wind
Wind speed
0.0 75.0 m/s
0.0 270.0 km/h
0.0 167.8 mph
0.0 145.8 kts
Wind direction 0.0 359.9 °
wind value quality 0.0 100.0 %
Rain
Quantity
0.0 6552.0 litres / m²
0.0 6552.0 mm
0.0 257.9 inches
0.0 257952.7 mil
Quantity since last request
0.0 655.2 litres / m²
0.0 655.2 mm
0.0 25.79 inches
0.0 25795.2 mil
Precipitation type
0 = No precipitation
40 = Precipitation 60 = Liquid precipitation, e.g. rain 70 = Solid precipitation, e.g. snow
WS100-UMB only: 67 = freezing rain
69 = sleet
90 = hail
Precipitation intensity
0.0 200.0 l/m²/h
0.0 200.0 mm/h
0.0 7.874 in/h
0.0 7874 mil/h
Global Radiation
Global Radiation
until device version .049 / .212 0.0 1400.0 W/m²
Global Radiation
from device version .050 / .213
(software version > v5.6)
0.0 2000.0 W/m²
Lightning Sensor
Lightning events (min) 0 255 -
Lightning events (interval) 0 7650 -

Operating Instructions Smart Weather Sensor
G. Lufft Mess- und Regeltechnik GmbH, Fellbach, Germany 79
19.4.5 Error Codes in the ASCII Protocol
Various error codes are defined from 65521d – 65535d in addition to the standardisation for the transmission of measurement values.
<code> Description
65521d Invalid Channel
65523d Value Overflow
65524d Value Underflow
65525d Error in measurement data or no valid data available
65526d Device / sensor is unable to execute valid measurement due to ambient conditions
65534d Invalid Calibration
65535d Unknown Error
Operating Manual Smart Weather Sensor
80 G. Lufft Mess- und Regeltechnik GmbH, Fellbach, Germany
19.5 Communication in Terminal Mode
It is possible to communicate with a device in a very simple text-based manner using the terminal mode.
To do this, in the device configuration, interface settings, the protocol mode must be set to terminal (see page 34).
Note: In the case of communication in the terminal mode, only one single unit may be connected to the interface, as this protocol is NOT network-compatible. It is used for very simple measurement value requests.
Note: The use of binary protocol is recommended for lengthy transmission routes (e.g. network, GPRS/UMTS), as it is not possible to detect transmission errors in terminal mode (not CRC-secured).
Note: In the terminal mode, measurement values are not available in all units. Furthermore, status and error messages are not transmitted.
19.5.1 Structure
A terminal consists of an ASCII character and a numeric character. The command is completed with the <CR> sign. There is no echo on entry.
The individual values in the response are separated by a semi-colon (;). The response is completed with <CR><LF>.
An invalid terminal command is acknowledged with ‘FAILED’. Control commands are acknowledged with ‘OK’.
The command to which the response relates is given at the beginning of each response.
Note: No response times are specified in the terminal mode.

Operating Instructions Smart Weather Sensor
G. Lufft Mess- und Regeltechnik GmbH, Fellbach, Germany 81
19.5.2 Terminal Commands
The terminal commands transmit the following values or have the following functions:
E0<CR> Temperature in °C Ta C (Channel 100)
Dew point temperature in °C Tp C (Channel 110) Wind chill temperature in °C Tw C (Channel 111) Relative humidity in % Hr P (Channel 200) Relative air pressure in hPa Pa H (Channel 305) Wind speed in m/s Sa M (Channel 400) Wind direction in ° Da D (Channel 500) Precipitation quantity in mm Ra M (Channel 620) Precipitation type Rt N (Channel 700) Precipitation intensity in mm/h Ri M (Channel 820)
E1<CR> Temperature in °F Ta F (Channel 105)
Dew point temperature in °F Tp F (Channel 115) Wind chill temperature in °F Tw F (Channel 116) Relative humidity in % Hr P (Channel 200) Relative air pressure in hPa Pa H (Channel 305) Wind speed in mph Sa S (Channel 410) Wind direction in ° Da D (Channel 500) Precipitation quantity in inches Ra I (Channel 640) Precipitation type Rt N (Channel 700) Precipitation intensity in inches/h Ri I (Channel 840)
E2<CR> Act. wind speed in m/s Sa M (Channel 400)
Min. wind speed in m/s Sn M (Channel 420) Max. wind speed in m/s Sx M (Channel 440) Avg. wind speed in m/s Sg M (Channel 460) Vct. wind speed in m/s Sv M (Channel 480) Act. wind direction in ° Da D (Channel 500) Min. wind direction in ° Dn D (Channel 520) Max. wind direction in ° Dx D (Channel 540) Vct. wind direction in ° Dv D (Channel 580)
E3<CR> Act. wind speed in mph Sa S (Channel 410)
Min. wind speed in mph Sn S (Channel 430) Max. wind speed in mph Sx S (Channel 450) Avg. wind speed in mph Sg S (Channel 470) Vct. wind speed in mph Sv S (Channel 490) Act. wind direction in ° Da D (Channel 500) Min. wind direction in ° Dn D (Channel 520) Max. wind direction in ° Dx D (Channel 540) Vectorial wind direction in ° Dv D (Channel 580)
E4<CR> Act. Compass heading in ° Ca D (Channel 510)
Act. Global Radiation in W/m² Ga W (Channel 900) Min. Global Radiation in W/m² Gn W (Channel 920) Max. Global Radiation in W/m² Gx W (Channel 940) Avg. Global Radiation in W/m² Gg W (Channel 960) Act. Specific Enthalpy in KJ/Kg Ea J (Channel 215) Act. Wet Bulb Temperature in °C Ba C (Channel 114) Act. Wet Bulb Temperature in °F Ba F (Channel 119) Act. Air Density in kg/m³ Ad G (Channel 310)
E5<CR> reserved La X (Channel 710)
reserved Lb X (Channel 711) external temperature (act) °C Te C (Channel 101) external temperature (act) °F Te F (Channel 106) lightning events (min) Lm E (Channel 617) lightning events (interval) Li E (Channel 677)

Operating Manual Smart Weather Sensor
82 G. Lufft Mess- und Regeltechnik GmbH, Fellbach, Germany
E9<CR>* precipitation total particles Tt - (Channel 4600)
precipitation total drops Td - (Channel 4601) precipitation drizzle particles Dr - (Channel 4602) precipitation snow particles Sn - (Channel 4603) precipitation hail particles Ha - (Channel 4604) precipitation drop class 0 C0 - (Channel 4620) precipitation drop class 1 C1 - (Channel 4621) precipitation drop class 2 C2 - (Channel 4622) precipitation drop class 3 C3 - (Channel 4623) precipitation drop class 4 C4 - (Channel 4624) precipitation drop class 5 C5 - (Channel 4625) precipitation drop class 6 C6 - (Channel 4626) precipitation drop class 7 C7 - (Channel 4627) precipitation drop class 8 C8 - (Channel 4628) precipitation drop class 9 C9 - (Channel 4629) precipitation drop class 10 C10 - (Channel 4630) precipitation drop class 11 C11 - (Channel 4631)
Mx<CR> Displays the same values as Ex<CR>, but without additional information such as the
measurement variable and unit
I0<CR> Serial number; date of manufacture; project number; parts list version;
SPLAN version; hardware version; firmware version; E2 version; device version
I1<CR> Outputs the device description
R0<CR> Executes a device reset
R1<CR> Resets the accumulated rain quantity and executes a device reset
X0<CR> Temporarily switches to UMB binary protocol
*) Command E9/M9 is only supported by WS100-UMB
Examples:
E0<CR> E0;Ta+024.9C;Tp+012.2C;Tw+026.8C;Hr+045.0P;Pa+0980.6H; Sa+005.1M;Da+156.6D;Ra+00042.24M;Rt+060N;Ri+002.6M;
M0<CR> M0;+024.9;+012.2;+026.8;+045.0;+0980.6; +005.1;+156.6;+00042.24;+060;+002.6;
E2<CR> E2;Sa+005.1M;Sn+001.1M;Sx+007.1M;Sg+005.1M;Sv+005.0M; Da+156.6D;Dn+166.6D;Dx+176.6D;Dv+156.6D;
M2<CR> M2;+005.1;+001.1;+007.1;+005.1;+005.0; +156.6;+166.6;+176.6;+156.6;
I0<CR> I0;001;0109;0701;004;005;001;016;011;00002;<CR><LF>
R0<CR> R0;OK;<CR><LF>

Operating Instructions Smart Weather Sensor
G. Lufft Mess- und Regeltechnik GmbH, Fellbach, Germany 83
Figure 41: Sensor Configuration SDI-12
Figure 42: Sensor Configuration SDI-12 Units
19.6 Communication in SDI-12 Mode
The communication in the SDI-12 mode of the Smart Weather Sensor is conforming to the standard defined in ‚SDI-12 A Serial-Digital Interface Standard for Microprocessor-Based Sensors Version 1.3 January 12, 2009‘ . The device may be operated in bus mode together with other SDI-12 sensors, connected to one SDI master (logger).
19.6.1 Preconditions for SDI-12 Operation
As the interface settings defined in the SDI-12 standard are significantly different from the UMB default settings the related parameters have to be set properly by the UMB Config Tool (latest version!).
The protocol mode of the device has to be set to “SDI-12”. This will automatically set the baud rate to 1200.
Measurement data can be transmitted alternatively in metric or US units. The selection is done by the UMB Config Tool.
Metric units US units
Note: Please observe drawings on next page and notes on page 28 when connecting a SDI12 data logger!

Operating Manual Smart Weather Sensor
84 G. Lufft Mess- und Regeltechnik GmbH, Fellbach, Germany
Figure. 43: Connecting to a logger with integrated power supply
Figure. 44: Connecting to a logger and a separate power supply up to device version 41
Figure. 45: Connecting to a logger and a separate power supply device version 42 and newer, all WS100
When operating the device in SDI-12 mode it is basically no more possible to access the device with the UMB Config Tool, due to the different interface parameter settings. To enable configuration access nevertheless the interface is operated in standard UMB mode (19200 8N1) for the first 5 seconds(*) after reset / power on. During this time the UMB device ID, if unequal 1, is set to 200 (WS100: always 200, even when original ID = 1), so access will be possible even if the device ID is unknown. If a valid UMB telegram is received within this 5 sec, the device will stay in UMB mode for the configured time out (several minutes) so that the configuration can be modified.
Connect the PC to the Smart Weather Sensor through an RS-485 converter
Start the UMB Config Tool and create a WSxxx-UMB with the address (1 or 200) of the actual device and activate at least one sensor. Start the measurement (will report connection error at first)
Reset the device (Power off / on)
When measurement values are received the measurement can be terminated, the interface is now open for configuration.
(*) Remark: The 5 seconds UMB communication are available from program start. Under consideration of the operating system start, where no communication is possible, the device will be ready for SDI12 requests after 7.0 – 7.5 seconds.
This timing only applies in case of cold start after power on or reset. This phase will not occur after “wake up” in Power Saving Mode 2. In this case the device will respond within the time defined by the SDI12 standard.
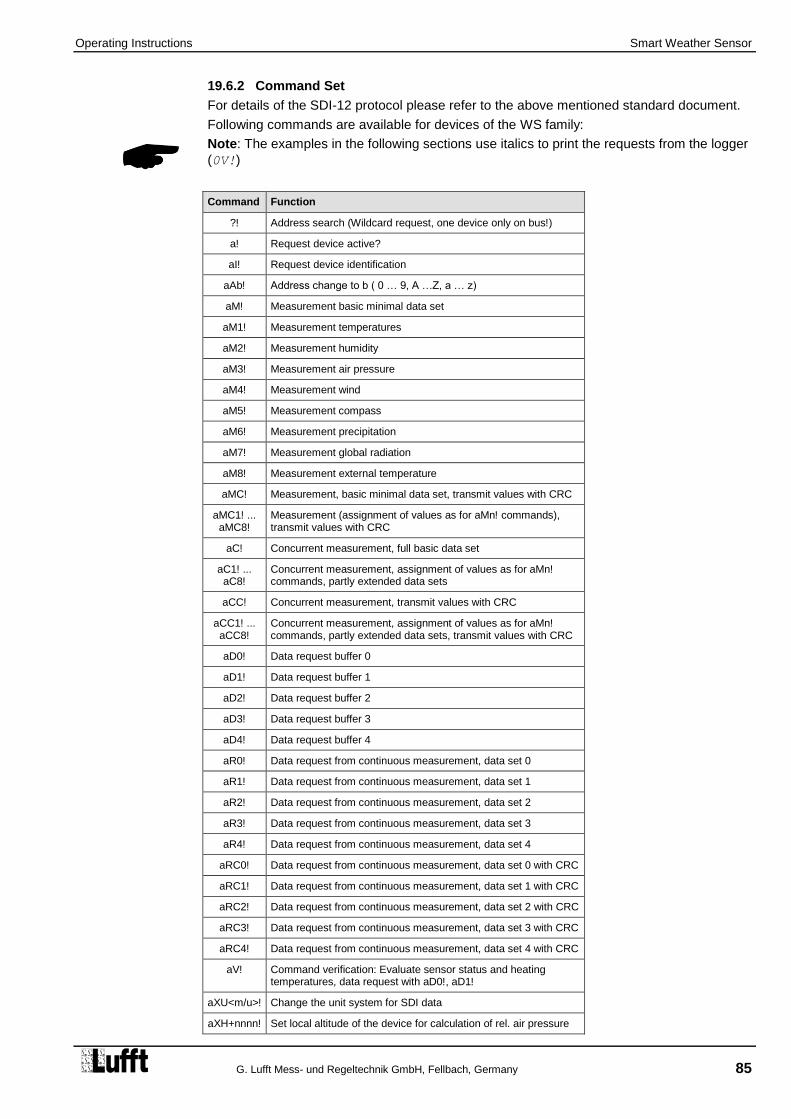
Operating Instructions Smart Weather Sensor
G. Lufft Mess- und Regeltechnik GmbH, Fellbach, Germany 85
19.6.2 Command Set
For details of the SDI-12 protocol please refer to the above mentioned standard document.
Following commands are available for devices of the WS family:
Note: The examples in the following sections use italics to print the requests from the logger
(0V!)
Command Function
?! Address search (Wildcard request, one device only on bus!)
a! Request device active?
aI! Request device identification
aAb! Address change to b ( 0 … 9, A …Z, a … z)
aM! Measurement basic minimal data set
aM1! Measurement temperatures
aM2! Measurement humidity
aM3! Measurement air pressure
aM4! Measurement wind
aM5! Measurement compass
aM6! Measurement precipitation
aM7! Measurement global radiation
aM8! Measurement external temperature
aMC! Measurement, basic minimal data set, transmit values with CRC
aMC1! ... aMC8!
Measurement (assignment of values as for aMn! commands), transmit values with CRC
aC! Concurrent measurement, full basic data set
aC1! ... aC8!
Concurrent measurement, assignment of values as for aMn! commands, partly extended data sets
aCC! Concurrent measurement, transmit values with CRC
aCC1! ... aCC8!
Concurrent measurement, assignment of values as for aMn! commands, partly extended data sets, transmit values with CRC
aD0! Data request buffer 0
aD1! Data request buffer 1
aD2! Data request buffer 2
aD3! Data request buffer 3
aD4! Data request buffer 4
aR0! Data request from continuous measurement, data set 0
aR1! Data request from continuous measurement, data set 1
aR2! Data request from continuous measurement, data set 2
aR3! Data request from continuous measurement, data set 3
aR4! Data request from continuous measurement, data set 4
aRC0! Data request from continuous measurement, data set 0 with CRC
aRC1! Data request from continuous measurement, data set 1 with CRC
aRC2! Data request from continuous measurement, data set 2 with CRC
aRC3! Data request from continuous measurement, data set 3 with CRC
aRC4! Data request from continuous measurement, data set 4 with CRC
aV! Command verification: Evaluate sensor status and heating temperatures, data request with aD0!, aD1!
aXU<m/u>! Change the unit system for SDI data
aXH+nnnn! Set local altitude of the device for calculation of rel. air pressure

Operating Manual Smart Weather Sensor
86 G. Lufft Mess- und Regeltechnik GmbH, Fellbach, Germany
Command Function
aXD+nnn.n! Set local compass deviation
aXL<n/s/w>! Set power saving mode
aXMn! Set the heating mode of the device
aXA<t/p/w>+nn! Integration time for average and min/max evaluation
aXC! Clear the abs. precipitation amount ( includes a device reset)
aXR! Device reset
The composition of the minimal and the full basic data set depends on the variant (WS100-UMB ... WS800-UMB) of the device in question (see below). The same applies to the availability of the additional measurement commands (aM1!, aC1! etc.)
Due the applied measurement processes the devices of the WS family will, different from other sensors described in the SDI-12 document, in normal operation mode always measure continuously. This causes some special properties while in this mode:
The device does not need a “Wakeup” and does not have a sleep mode. So the reactions to “Break” signals and any related timings are inapplicable. “Break” will be ignored by WS devices.
Data requested with M- or C- commands are always available immediately. The device will always respond with a000n resp. a000nn. This means the device will not
send any service request and will ignore measurement abort signals. The logger should request the data immediately.
M- and C- command only differ in the number of values made available in the buffers (in both cases the maximum permitted by the standards of 9 resp. 20).
We recommend to use the commands for continuous measurement (R-commands) to request the data.
When in power saving mode 2 the device will wake up by a „Break“ signal. Other functions of the „Break“ signal are not implemented.
When in power saving mode 2 the device responds to M or C commands with a002n resp. a002nn and holds the data available within 2 seconds. It will not send a
service request, signals to abort the measurement are ignored.
For the reduced data set in power saving mode 2 a unified data buffer structure for all device models has been defined. Depending on the individual model unused channels will be set to the “invalid” marker 999.9.
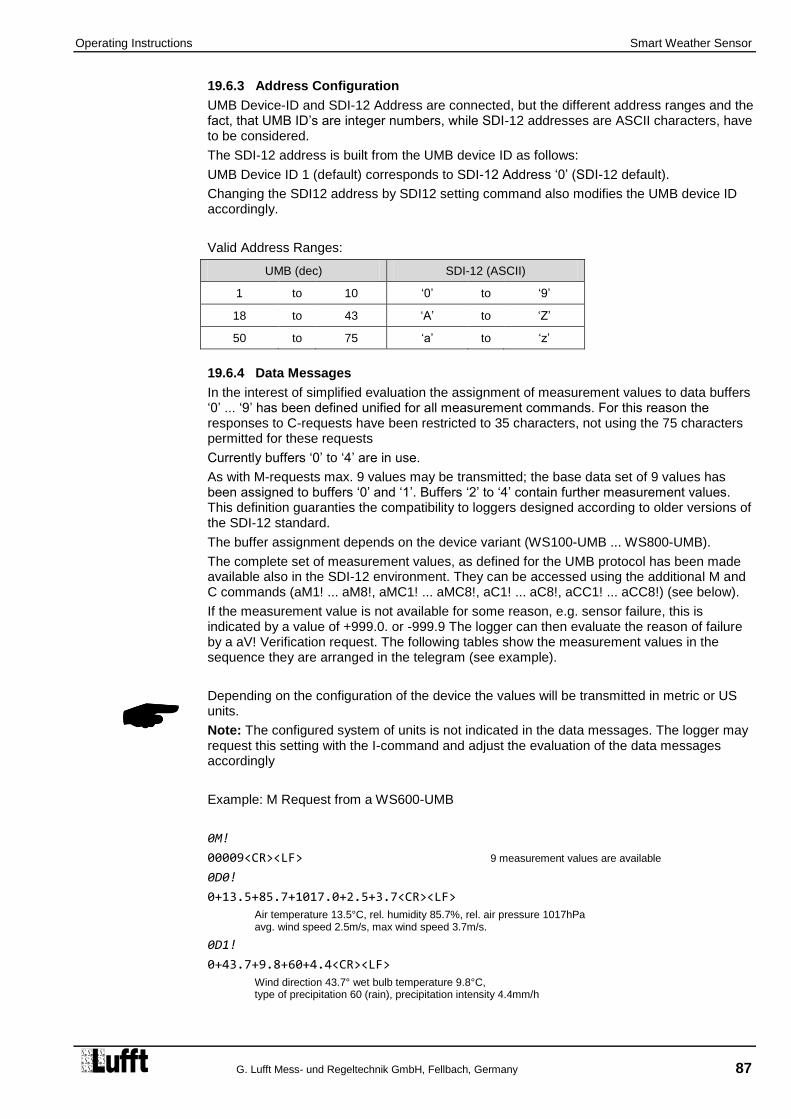
Operating Instructions Smart Weather Sensor
G. Lufft Mess- und Regeltechnik GmbH, Fellbach, Germany 87
19.6.3 Address Configuration
UMB Device-ID and SDI-12 Address are connected, but the different address ranges and the fact, that UMB ID’s are integer numbers, while SDI-12 addresses are ASCII characters, have to be considered.
The SDI-12 address is built from the UMB device ID as follows:
UMB Device ID 1 (default) corresponds to SDI-12 Address ‘0’ (SDI-12 default).
Changing the SDI12 address by SDI12 setting command also modifies the UMB device ID accordingly.
Valid Address Ranges:
UMB (dec) SDI-12 (ASCII)
1 to 10 ‘0’ to ‘9’
18 to 43 ‘A’ to ‘Z’
50 to 75 ‘a’ to ‘z’
19.6.4 Data Messages
In the interest of simplified evaluation the assignment of measurement values to data buffers ‘0’ ... ‘9’ has been defined unified for all measurement commands. For this reason the responses to C-requests have been restricted to 35 characters, not using the 75 characters permitted for these requests
Currently buffers ‘0’ to ‘4’ are in use.
As with M-requests max. 9 values may be transmitted; the base data set of 9 values has been assigned to buffers ‘0’ and ‘1’. Buffers ‘2’ to ‘4’ contain further measurement values. This definition guaranties the compatibility to loggers designed according to older versions of the SDI-12 standard.
The buffer assignment depends on the device variant (WS100-UMB ... WS800-UMB).
The complete set of measurement values, as defined for the UMB protocol has been made available also in the SDI-12 environment. They can be accessed using the additional M and C commands (aM1! ... aM8!, aMC1! ... aMC8!, aC1! ... aC8!, aCC1! ... aCC8!) (see below).
If the measurement value is not available for some reason, e.g. sensor failure, this is indicated by a value of +999.0. or -999.9 The logger can then evaluate the reason of failure by a aV! Verification request. The following tables show the measurement values in the sequence they are arranged in the telegram (see example).
Depending on the configuration of the device the values will be transmitted in metric or US units.
Note: The configured system of units is not indicated in the data messages. The logger may request this setting with the I-command and adjust the evaluation of the data messages accordingly
Example: M Request from a WS600-UMB
0M!
00009<CR><LF> 9 measurement values are available
0D0!
0+13.5+85.7+1017.0+2.5+3.7<CR><LF>
Air temperature 13.5°C, rel. humidity 85.7%, rel. air pressure 1017hPa avg. wind speed 2.5m/s, max wind speed 3.7m/s.
0D1!
0+43.7+9.8+60+4.4<CR><LF>
Wind direction 43.7° wet bulb temperature 9.8°C, type of precipitation 60 (rain), precipitation intensity 4.4mm/h

Operating Manual Smart Weather Sensor
88 G. Lufft Mess- und Regeltechnik GmbH, Fellbach, Germany
Example: C Request from a WS600-UMB
0C!
000020<CR><LF> 20 measurement values are available
0D0!
0+13.5+85.7+1017+2.5+3.7<CR><LF>
air temperature 13.5°C, rel. humidity 85.7%, rel. air pressure 1017hPa avg. wind speed 2.5m/s, max wind speed 3.7m/s.
0D1!
0+43.7+9.8+60+4.4<CR><LF>
wind direction 43.7° wet bulb temperature 9.8°C, type of precipitation 60 (rain), precipitation intensity 4.4mm/h
0D2! 0+11.2+10.3+1.10<CR><LF>
dewpoint 11.2°C, wind chill temperature 10,3°C diff. precipitation 1.10mm
0D3! 0+3.2+0.0+3.5+100.0<CR><LF>
act. wind speed 3,2m/s, min. wind speed 0.0 m/s vect. avg. wind speed 3.5m/s, quality of wind values 100%
0D4! 0+43.7+41.3+45.7+29.3<CR><LF>
act. wind direction 43,7°, min. wind direction 41,3°, max. wind direction 45,7°, specific enthalpy29,3kJ/kg

Operating Instructions Smart Weather Sensor
G. Lufft Mess- und Regeltechnik GmbH, Fellbach, Germany 89
19.6.4.1 Buffer assignment Basic Data Set WS600-UMB / WS700-UMB / WS800-UMB
Device configured for measurement values in metric units:
Measurement value UMB Channel
Min Max Unit
Buffer ‘0’
Air temperature (act) 100 -50.0 60.0 °C
Rel. Humidity (act) 200 0.0 100.0 %
Rel. Air Pressure 305 300.0 1200.0 hPa
Wind Speed (avg) 460 0.0 75.0 m/s
Wind Speed (max) 440 0.0 75.0 m/s
Buffer ‘1’
Wind Direction (vct) 580 0.0 359.9 °
Wet Bulb Temperature (act) 114 -50.0 60.0 °C
Precipitation Type 700 0, 60, 70
Precipitation Intensity 820 0.0 200.0 mm/h
Buffer ‘2’
Dew Point (act) 110 -50.0 60.0 °C
Wind chill Temperature (act) 111 -60.0 70.0 °C
Amount of Precip. difference 625 0.00 100000.00 mm
Buffer ‘3’
Wind Speed (act) 400 0.0 75.0 m/s
Wind Speed (min) 420 0.0 75.0 m/s
Wind Speed (vct) 480 0.0 75.0 m/s
Wind Quality 805 0.0 100.0 %
Buffer ‘4’
Wind Direction (act) 500 0.0 359.9 °
Wind Direction (min) 520 0.0 359.9 °
Wind Direction (max) 540 0.0 359.9 °
Specific Enthalpy (act) 215 -100.0 1000.0 kJ/kg
Example: Request Buffer ‘0’
0D0!
0+13.5+85.7+2.5+3.7<CR><LF>
Air Temperature 13.5°C, rel. Humidity 85.7%, average wind speed 2.5m/s, peak wind speed 3.7m/s

Operating Manual Smart Weather Sensor
90 G. Lufft Mess- und Regeltechnik GmbH, Fellbach, Germany
Device configured for measurement values in US units:
Measurement Value UMB Channel
Min Max Unit
Buffer ‘0’
Air Temperature (act) 105 -58.0 140.0 °F
Rel. Humidity (act) 200 0.0 100.0 %
Rel. Air Pressure 305 300.0 1200.0 hPa
Wind Speed (avg) 470 0.0 167.8 mph
Wind Speed (max) 450 0.0 167.8 mph
Buffer ‘1’
Wind Direction (vct) 580 0.0 359.9 °
Wet Bulb Temperature (act) 119 -58.0 140.0 °F
Precipitation Type 700 0, 60, 70
Precipitation Intensity 840 0.000 7.874 in/h
Buffer ‘2’
Dew Point (act) 115 -58.0 140.0 °F
Wind chill Temperature (act) 116 -76.0 158.0 °F
Amount of Precip. difference 645 0.0000 3937.0000 in
Buffer ‘3’
Wind Speed (act) 410 0.0 167.8 mph
Wind Speed (min) 430 0.0 167.8 mph
Wind Speed (vct) 490 0.0 167.8 mph
Wind Quality 805 0.0 100.0 %
Buffer ‘4’
Wind Direction(act) 500 0.0 359.9 °
Wind Direction (min) 520 0.0 359.9 °
Wind Direction (max) 540 0.0 359.9 °
Specific Enthalpy (act) 215 -100.0 1000.0 kJ/kg

Operating Instructions Smart Weather Sensor
G. Lufft Mess- und Regeltechnik GmbH, Fellbach, Germany 91
19.6.4.2 Buffer Assignment Basic Data Set WS500-UMB
Device configured for measurement values in metric units:
Measurement value UMB Channel
Min Max Unit
Buffer ‘0’
Air temperature (act) 100 -50.0 60.0 °C
Rel. Humidity (act) 200 0.0 100.0 %
Rel. Air Pressure 305 300.0 1200.0 hPa
Wind Speed (avg) 460 0.0 75.0 m/s
Wind Speed (max) 440 0.0 75.0 m/s
Buffer ‘1’
Wind Direction (vct) 580 0.0 359.9 °
Wet Bulb Temperature (act) 114 0.0 359.9 °C
Dew Point (act) 110 -50.0 60.0 °C
Wind chill Temperature (act) 111 -60.0 70.0 °C
Buffer ‘2’
Wind Speed (act) 400 0.0 75.0 m/s
Wind Speed (min) 420 0.0 75.0 m/s
Wind Speed (vct) 480 0.0 75.0 m/s
Wind Quality 805 0.0 100.0 %
Buffer ‘3’
Wind Direction (act) 500 0.0 359.9 °
Wind Direction (min) 520 0.0 359.9 °
Wind Direction (max) 540 0.0 359.9 °
Specific Enthalpy (act) 215 -100.0 1000.0 kJ/kg
Example: Request Buffer ‘0’
0D0!
0+13.5+85.7+2.5+3.7<CR><LF>
Air Temperature 13.5°C, rel. Humidity 85.7%, average wind speed 2.5m/s, peak wind speed 3.7m/s

Operating Manual Smart Weather Sensor
92 G. Lufft Mess- und Regeltechnik GmbH, Fellbach, Germany
Device configured for measurement values in US units:
Measurement Value UMB Channel
Min Max Unit
Buffer ‘0’
Air Temperature (act) 105 -58.0 140.0 °F
Rel. Humidity (act) 200 0.0 100.0 %
Rel. Air Pressure 305 300.0 1200.0 hPa
Wind Speed (avg) 470 0.0 167.8 mph
Wind Speed (max) 450 0.0 167.8 mph
Buffer ‘1’
Wind Direction (vct) 580 0.0 359.9 °
Wet Bulb Temperature (act) 119 -58.0 140.0 °F
Dew Point (act) 115 -58.0 140.0 °F
Wind chill Temperature (act) 116 -76.0 158.0 °F
Buffer ‘2’
Wind Speed (act) 410 0.0 167.8 mph
Wind Speed (min) 430 0.0 167.8 mph
Wind Speed (vct) 490 0.0 167.8 mph
Wind Quality 805 0.0 100.0 %
Buffer ‘3’
Wind Direction(act) 500 0.0 359.9 °
Wind Direction (min) 520 0.0 359.9 °
Wind Direction (max) 540 0.0 359.9 °
Specific Enthalpy (act) 215 -100.0 1000.0 kJ/kg

Operating Instructions Smart Weather Sensor
G. Lufft Mess- und Regeltechnik GmbH, Fellbach, Germany 93
19.6.4.3 Buffer Assignment Basic Data Set WS400-UMB
Device configured for measurement in metric units:
Measurement Value UMB Channel
Min Max Unit
Buffer ‘0’
Air Temperature (act) 100 -50.0 60.0 °C
Rel. Humidity (act) 200 0.0 100,0 %
Dew Point (act) 110 -50.0 60.0 °C
Abs. Air Pressure(act) 300 300.0 1200.0 hPa
Rel. Air Pressure (act) 305 300.0 1200.0 hPa
Buffer ‘1’
Precipitation Type 700 0, 60, 70
Precipitation Intensity 820 0.0 200.0 mm/h
Amount of Precip. Difference 625 0.00 100000.00 mm
Amount of Precip. Absolute 620 0.0 100000.0 mm
Buffer ‘2’
Air Temperature (min) 120 -50.0 60.0 °C
Air Temperature (max) 140 -50.0 60.0 °C
Air Temperature (avg) 160 -50.0 60.0 °C
Rel. Humidity (min) 220 0.0 100.0 %
Rel. Humidity (max) 240 0.0 100.0 %
Buffer ‘3’
Rel. Humidity (avg) 260 0.0 100.0 %
Rel. Air Pressure(min) 325 300.0 1200.0 hPa
Rel. Rel. Humidity (max) 345 300.0 1200.0 hPa
Rel. Rel. Humidity (avg) 365 300.0 1200.0 hPa
Wet Bulb Temperature (act) 114 -50.0 60.0 °C
Specific Enthalpy (act) 215 -100.0 1000.0 kJ/kg
Example: Request Buffer ‘0’
0D0!
0+13.5+85.7+11.2+1017.0+1001.0
Air temperature 13.5°C, rel. humidity 85.7%, dew point 11.2°C, rel. air pressure 1017.0hPa, abs. pressure 1001.0hPa

Operating Manual Smart Weather Sensor
94 G. Lufft Mess- und Regeltechnik GmbH, Fellbach, Germany
Device configured for measurement in US units:
Measurement Value UMB Channel
Min Max Unit
Buffer ‘0’
Air Temperature (act) 105 -58.0 140.0 °F
Rel. Humidity (act) 200 0.0 100.0 %
Dew Point (act) 115 -58.0 14.0 °F
Abs. Air Pressure(act) 300 300.0 1200.0 hPa
Rel. Air Pressure (act) 305 300.0 1200.0 hPa
Buffer ‘1’
Precipitation Type 700 0, 60, 70
Precipitation Intensity 840 0.000 7.874 in/h
Amount of Precip. Difference 645 0.0000 3937.0000 in
Amount of Precip. Absolute 640 0.000 3937.000 in
Buffer ‘2’
Air Temperature (min) 125 -58.0 140.0 °F
Air Temperature (max) 145 -58.0 140.0 °F
Air Temperature (avg) 165 -58.0 140.0 °F
Rel. Humidity (min) 220 0.0 100.0 %
Rel. Humidity (max) 240 0.0 100.0 %
Buffer ‘3’
Rel. Humidity (avg) 260 0.0 100.0 %
Rel. Air Pressure(min) 325 300.0 1200.0 hPa
Rel. Rel. Humidity (max) 345 300.0 1200.0 hPa
Rel. Rel. Humidity (avg) 365 300.0 1200.0 hPa
Wet Bulb Temperature (act) 119 -58.0 140.0 °F
Specific Enthalpy 215 -100.0 1000.0 kJ/kg

Operating Instructions Smart Weather Sensor
G. Lufft Mess- und Regeltechnik GmbH, Fellbach, Germany 95
19.6.4.4 Buffer Assignment Basic Data Set WS300-UMB
Device configured for measurement in metric units:
Measurement Value UMB Channel
Min Max Unit
Buffer ‘0’
Air Temperature (act) 100 -50.0 60.0 °C
Rel. Humidity (act) 200 0.0 100.0 %
Dew Point (act) 110 -50.0 60.0 °C
Abs. Air Pressure(act) 300 300.0 1200.0 hPa
Rel. Air Pressure (act) 305 300.0 1200.0 hPa
Buffer ‘1’
Air Temperature (min) 120 -50.0 60.0 °C
Air Temperature (max) 140 -50.0 60.0 °C
Air Temperature (avg) 160 -50.0 60.0 °C
Rel. Humidity (avg) 260 0.0 100.0 %
Buffer ‘2’
Rel. Humidity (min) 220 0.0 100,0 %
Rel. Humidity (max) 240 0.0 100,0 %
Rel. Air Pressure (min) 325 300.0 1200.0 hPa
Rel. Air Pressure (max) 345 300.0 1200.0 hPa
Rel. Air Pressure (avg) 365 300.0 1200.0 hPa
Buffer ‘3’
Abs. Humidity (min) 225 0.0 1000.0 g/m³
Abs. Humidity (max) 245 0.0 1000.0 g/m³
Abs. Humidity (avg) 265 0.0 1000.0 g/m³
Buffer ‘4’
Wet Bulb Temperature (act) 114 -50.0 60.0 °C
Specific Enthalpy (act) 215 -100.0 1000.0 kJ/kg
Example: Request buffer ‘0’
0D0!
0+13.5+85.7+11.2+1017.0+1001.0
Air temperature 13.5°C, rel. humidity 85.7%, dew point 11.2°C, rel. air pressure 1017.0hPa, abs. pressure 1001.0hPa

Operating Manual Smart Weather Sensor
96 G. Lufft Mess- und Regeltechnik GmbH, Fellbach, Germany
Device configured for measurement in US units:
Measurement Value UMB Channel
Min Max Unit
Buffer ‘0’
Air Temperature (act) 105 -58.0 140.0 °F
Rel. Humidity (act) 200 0.0 100.0 %
Dew Point (act) 115 -58.0 140.0 °F
Abs. Air Pressure(act) 300 300.0 1200.0 hPa
Rel. Air Pressure (act) 305 300.0 1200.0 hPa
Buffer ‘1’
Air Temperature (min) 125 -58.0 140.0 °F
Air Temperature (max) 145 -58.0 140.0 °F
Air Temperature (avg) 165 -58.0 140.0 °F
Rel. Humidity (avg) 260 0.0 100.0 %
Buffer ‘2’
Rel. Humidity (min) 220 0.0 100,0 %
Rel. Humidity (max) 240 0.0 100,0 %
Rel. Air Pressure (min) 325 300.0 1200.0 hPa
Rel. Air Pressure (max) 345 300.0 1200.0 hPa
Rel. Air Pressure (avg) 365 300.0 1200.0 hPa
Buffer ‘3’
Abs. Humidity (min) 225 0.0 1000.0 g/m³
Abs. Humidity (max) 245 0.0 1000.0 g/m³
Abs. Humidity (avg) 265 0.0 1000.0 g/m³
Buffer ‘4’
Wet Bulb Temperature (act) 119 -58.0 140.0 °F
Specific Enthalpy (act) 215 -100.0 1000.0 kJ/kg

Operating Instructions Smart Weather Sensor
G. Lufft Mess- und Regeltechnik GmbH, Fellbach, Germany 97
19.6.4.5 Buffer Assignment Basic Data Set WS200-UMB
Device configured for measurement values in metric units:
Measurement Value UMB Channel
Min Max Unit
Buffer ‘0’
Wind Speed (avg) 460 0.0 75.0 m/s
Wind Speed (max) 440 0.0 75.0 m/s
Wind Direction (vct) 580 0.0 359.9 °
Wind Direction (act) 500 0.0 359.9 °
Compass Heading(act) 510 0.0 359.0 °
Buffer ‘1’
Wind Speed (act) 400 0.0 75.0 m/s
Wind Speed (min) 420 0.0 75.0 m/s
Wind Speed (vct) 480 0.0 75.0 m/s
Wind Quality 805 0.0 100.0 %
Buffer ‘2’
Wind Direction (min) 520 0.0 359.9 °
Wind Direction (max) 540 0.0 359.9 °
Wind Direction corr. (act) 502 0.0 359.9 °
Example: Request Buffer ‘0’
0D0!
0+2.5+3.7+45.5+37.8+10.3<CR><LF>
Avg. wind speed 2.5m/s, peak wind speed 3.7m/s, avg wind direction (vect.) 45.5°, wind direction (act.) 37.8°, compass heading 10.3°

Operating Manual Smart Weather Sensor
98 G. Lufft Mess- und Regeltechnik GmbH, Fellbach, Germany
Device configured for measurement values in US units:
Measurement Value UMB Channel
Min Max Unit
Buffer ‘0’
Wind Speed (avg) 470 0.0 167.8 mph
Wind Speed (max) 450 0.0 167.8 mph
Wind Direction (vct) 580 0.0 359.9 °
Wind Direction (act) 500 0.0 359.9 °
Compass Heading(act) 510 0.0 359.0 °
Buffer ‘1’
Wind Speed (act) 410 0.0 167.8 mph
Wind Speed (min) 430 0.0 167.8 mph
Wind Speed (vct) 490 0.0 167.8 mph
Wind Quality 805 0.0 100.0 %
Buffer ‘2’
Wind Direction (min) 520 0.0 359.9 °
Wind Direction (max) 540 0.0 359.9 °
Wind Direction corr. (act) 502 0.0 359.9 °

Operating Instructions Smart Weather Sensor
G. Lufft Mess- und Regeltechnik GmbH, Fellbach, Germany 99
19.6.4.6 Buffer Assignment Basic Data Set WS100-UMB
Device configured for measurement values in metric units
Measurement Value UMB Channel
Min Max Unit
Buffer ‘0’
Amount of Precip. absolute 620 0.0 100000.0 mm
Amount of Precip. difference 625 0.00 100000.00 mm
Precipitation Intensity 820 0.0 200.0 mm/h
Precipitation Type 700 0, 60, 70 (67, 69, 90)*
Precipitation Int. (WS100 only) 825 0.0 3.333 mm/min
)* additional precipitation types: WS100-UMB only
Example: Request Buffer ‘0’
0D0!
0+23.5+0.2+3.2+60<CR><LF>
Precipitation abs. 23,5mm, precipitation difference 0,2mm, precipitation intensity 3,2mm/h, precipitation type 60 (rain)
Device configured for measurement values in US units:
Measurement Value UMB Channel
Min Max Unit
Buffer ‘0’
Amount of Precip. absolute 640 0,000 3937,000 in
Amount of Precip. difference 645 0,0000 3937,0000 in
Precipitation Intensity 840 0,000 7,874 in/h
Precipitation Type 700 0, 60, 70 (67, 69, 90)*
Precipitation Int. (WS100 only) 845 0.0 0.1312 in/min
)* additional precipitation types: WS100-UMB only

Operating Manual Smart Weather Sensor
100 G. Lufft Mess- und Regeltechnik GmbH, Fellbach, Germany
19.6.4.7 Buffer Assignment Basic Data Set WS501-UMB, WS502-UMB, WS503-UMB, WS504-UMB, WS510-UMB
Device configured for measurement values in metric units:
Measurement value UMB Channel
Min Max Unit
Buffer ‘0’
Air temperature (act) 100 -50.0 60.0 °C
Rel. Humidity (act) 200 0.0 100.0 %
Rel. Air Pressure 305 300.0 1200.0 hPa
Wind Speed (avg) 460 0.0 75.0 m/s
Wind Speed (max) 440 0.0 75.0 m/s
Buffer ‘1’
Wind Direction (vct) 580 0.0 359.9 °
Global Radiation (act) 900 0.0 2000.0 *) W/m²
Dew Point (act) 110 -50.0 60.0 °C
Wind Chill Temperature (act) 111 -60.0 70.0 °C
Buffer ‘2’
Wind Speed (act) 400 0.0 75.0 m/s
Wind Speed (min) 420 0.0 75.0 m/s
Wind Speed (vct) 480 0.0 75.0 m/s
Wind Quality 805 0.0 100.0 %
Buffer ‘3’
Wind Direction (act) 500 0.0 359.9 °
Wet Bulb Temperature (act) 114 -50.0 60.0 °C
Specific Enthalpy (act) 215 -100.0 1000.0 kJ/kg
Buffer ‘4’
Global Radiation (min) 920 0.0 2000.0 *) W/m²
Global Radiation (max) 940 0.0 2000.0 *) W/m²
Global Radiation (avg) 960 0.0 2000.0 *) W/m²
*) Until device version .49 / .212 / Firmware v5.6: 1400.0 W/m2
Example: Request Buffer ‘0’
0D0!
0+13.5+85.7+2.5+3.7<CR><LF>
Air Temperature 13.5°C, rel. Humidity 85.7%, average wind speed 2.5m/s, peak wind speed 3.7m/s

Operating Instructions Smart Weather Sensor
G. Lufft Mess- und Regeltechnik GmbH, Fellbach, Germany 101
Device configured for measurement values in US units:
Measurement Value UMB Channel
Min Max Unit
Buffer ‘0’
Air Temperature (act) 105 -58.0 140.0 °F
Rel. Humidity (act) 200 0.0 100.0 %
Rel. Air Pressure 305 300.0 1200.0 hPa
Wind Speed (avg) 470 0.0 167.8 mph
Wind Speed (max) 450 0.0 167.8 mph
Buffer ‘1’
Wind Direction (vct) 580 0.0 359.9 °
Global Radiation (act) 900 0.0 2000.0 *) W/m²
Dew Point (act) 115 -58.0 140.0 °F
Windchill Temperature (act) 116 -76.0 158.0 °F
Buffer ‘2’
Wind Speed (act) 410 0.0 167.8 mph
Wind Speed (min) 430 0.0 167.8 mph
Wind Speed (vct) 490 0.0 167.8 mph
Wind Quality 805 0.0 100.0 %
Buffer ‘3’
Wind Direction(act) 500 0.0 359.9 °
Wet Bulb Temperature (act) 119 -58.0 140.0 °F
Specific Enthalpy (act) 215 -100.0 1000.0 kJ/kg
Buffer ‘4’
Global Radiation (min) 920 0.0 2000.0 *) W/m²
Global Radiation (max) 940 0.0 2000.0 *) W/m²
Global Radiation (avg) 960 0.0 2000.0 *) W/m²
*) Until device version .49 / .212 / Firmware v5.6: 1400.0 W/m2

Operating Manual Smart Weather Sensor
102 G. Lufft Mess- und Regeltechnik GmbH, Fellbach, Germany
19.6.4.8 Buffer Assignment Basic Data Set WS301-UMB, WS302-UMB, WS303-UMB, WS304-UMB, WS310-UMB
Device configured for measurement in metric units:
Measurement Value UMB Channel
Min Max Unit
Buffer ‘0’
Air Temperature (act) 100 -50.0 60.0 °C
Rel. Humidity (act) 200 0.0 100.0 %
Dew Point (act) 110 -50.0 60.0 °C
Global Radiation(act) 900 0.0 2000.0 *) W/m²
Rel. Air Pressure (act) 305 300.0 1200.0 hPa
Buffer ‘1’
Air Temperature (min) 120 -50.0 60.0 °C
Air Temperature (max) 140 -50.0 60.0 °C
Air Temperature (avg) 160 -50.0 60.0 °C
Rel. Humidity (avg) 260 0.0 100.0 %
Buffer ‘2’
Rel. Humidity (min) 220 0.0 100,0 %
Rel. Humidity (max) 240 0.0 100,0 %
Rel. Air Pressure (min) 325 300.0 1200.0 hPa
Rel. Air Pressure (max) 345 300.0 1200.0 hPa
Rel. Air Pressure (avg) 365 300.0 1200.0 hPa
Buffer ‘3’
Abs. Humidity (act) 205 0.0 1000.0 g/m³
Wet Bulb Temperature (act) 114 -50.0 60.0 °C
Specific Enthalpy (act) 215 -100.0 1000.0 kJ/kg
Buffer ‘4’
Global Radiation (min) 920 0.0 2000.0 *) W/m²
Global Radiation (max) 940 0.0 2000.0 *) W/m²
Global Radiation (avg) 960 0.0 2000.0 *) W/m²
*) Until device version .49 / .212 / Firmware v5.6: 1400.0 W/m2
Example: Request buffer ‘0’
0D0!
0+13.5+85.7+11.2+1017.0+780.0
Air temperature 13.5°C, rel. humidity 85.7%, dew point 11.2°C, rel. air pressure 1017.0hPa, global radiation 780.0W/m²

Operating Instructions Smart Weather Sensor
G. Lufft Mess- und Regeltechnik GmbH, Fellbach, Germany 103
Device configured for measurement in US units:
Measurement Value UMB Channel
Min Max Unit
Buffer ‘0’
Air Temperature (act) 105 -58.0 140.0 °F
Rel. Humidity (act) 200 0.0 100.0 %
Dew Point (act) 115 -58.0 140.0 °F
Global Radiation(act) 900 0.0 2000.0 *) W/m²
Rel. Air Pressure (act) 305 300.0 1200.0 hPa
Buffer ‘1’
Air Temperature (min) 125 -58.0 140.0 °F
Air Temperature (max) 145 -58.0 140.0 °F
Air Temperature (avg) 165 -58.0 140.0 °F
Rel. Humidity (avg) 260 0.0 100.0 %
Buffer ‘2’
Rel. Humidity (min) 220 0.0 100,0 %
Rel. Humidity (max) 240 0.0 100,0 %
Rel. Air Pressure (min) 325 300.0 1200.0 hPa
Rel. Air Pressure (max) 345 300.0 1200.0 hPa
Rel. Air Pressure (avg) 365 300.0 1200.0 hPa
Buffer ‘3’
Abs. Humidity (act) 205 0.0 1000.0 g/m³
Wet Bulb Temperature (act) 119 -58.0 140.0 °F
Specific Enthalpy (act) 215 -100.0 1000.0 kJ/kg
Buffer ‘4’
Global Radiation (min) 920 0.0 2000.0 *) W/m²
Global Radiation (max) 940 0.0 2000.0 *) W/m²
Global Radiation (avg) 960 0.0 2000.0 *) W/m²
*) Until device version .49 / .212 / Firmware v5.6: 1400.0 W/m2

Operating Manual Smart Weather Sensor
104 G. Lufft Mess- und Regeltechnik GmbH, Fellbach, Germany
19.6.4.9 Buffer assignment Basic Data Set WS601-UMB
Device configured for measurement values in metric units:
Measurement value UMB Channel
Min Max Unit
Buffer ‘0’
Air temperature (act) 100 -50.0 60.0 °C
Rel. Humidity (act) 200 0.0 100.0 %
Rel. Air Pressure 305 300.0 1200.0 hPa
Wind Speed (avg) 460 0.0 75.0 m/s
Wind Speed (max) 440 0.0 75.0 m/s
Buffer ‘1’
Wind Direction (vct) 580 0.0 359.9 °
reserved
Precipitation Type 700 0, 40
Precipitation Intensity 820 0.0 200.0 mm/h
Buffer ‘2’
Dew Point (act) 110 -50.0 60.0 °C
Wind chill Temperature (act) 111 -60.0 70.0 °C
Amount of Precip. difference 625 0.00 100000.00 mm
Buffer ‘3’
Wind Speed (act) 400 0.0 75.0 m/s
Wind Speed (min) 420 0.0 75.0 m/s
Wind Speed (vct) 480 0.0 75.0 m/s
Wet Bulb Temperature (act) 114 -50.0 60.0 °C
Buffer ‘4’
Wind Direction (act) 500 0.0 359.9 °
Wind Direction (min) 520 0.0 359.9 °
Wind Direction (max) 540 0.0 359.9 °
Specific Enthalpy (act) 215 -100.0 1000.0 kJ/kg
Example: Request Buffer ‘0’
0D0!
0+13.5+85.7+2.5+3.7<CR><LF>
Air Temperature 13.5°C, rel. Humidity 85.7%, average wind speed 2.5m/s, peak wind speed 3.7m/s

Operating Instructions Smart Weather Sensor
G. Lufft Mess- und Regeltechnik GmbH, Fellbach, Germany 105
Device configured for measurement values in US units:
Measurement Value UMB Channel
Min Max Unit
Buffer ‘0’
Air Temperature (act) 105 -58.0 140.0 °F
Rel. Humidity (act) 200 0.0 100.0 %
Rel. Air Pressure 305 300.0 1200.0 hPa
Wind Speed (avg) 470 0.0 167.8 mph
Wind Speed (max) 450 0.0 167.8 mph
Buffer ‘1’
Wind Direction (vct) 580 0.0 359.9 °
reserved
Precipitation Type 700 0, 40
Precipitation Intensity 840 0.000 7.874 in/h
Buffer ‘2’
Dew Point (act) 115 -58.0 140.0 °F
Wind chill Temperature (act) 116 -76.0 158.0 °F
Amount of Precip. difference 645 0.0000 3937.0000 in
Buffer ‘3’
Wind Speed (act) 410 0.0 167.8 mph
Wind Speed (min) 430 0.0 167.8 mph
Wind Speed (vct) 490 0.0 167.8 mph
Wet Bulb Temperature (act) 119 -58.0 140.0 °F
Buffer ‘4’
Wind Direction(act) 500 0.0 359.9 °
Wind Direction (min) 520 0.0 359.9 °
Wind Direction (max) 540 0.0 359.9 °
Specific Enthalpy (act) 215 -100.0 1000.0 kJ/kg

Operating Manual Smart Weather Sensor
106 G. Lufft Mess- und Regeltechnik GmbH, Fellbach, Germany
19.6.4.10 Buffer Assignment Basic Data Set WS401-UMB
Device configured for measurement in metric units:
Measurement Value UMB Channel
Min Max Unit
Buffer ‘0’
Air Temperature (act) 100 -50.0 60.0 °C
Rel. Humidity (act) 200 0.0 100,0 %
Dew Point (act) 110 -50.0 60.0 °C
reserved
Rel. Air Pressure (act) 305 300.0 1200.0 hPa
Buffer ‘1’
Precipitation Type 700 0, 40
Precipitation Intensity 820 0.0 200.0 mm/h
Amount of Precip. Difference 625 0.00 100000.00 mm
Amount of Precip. Absolute 620 0.0 100000.0 mm
Buffer ‘2’
Air Temperature (min) 120 -50.0 60.0 °C
Air Temperature (max) 140 -50.0 60.0 °C
Air Temperature (avg) 160 -50.0 60.0 °C
Rel. Humidity (min) 220 0.0 100.0 %
Rel. Humidity (max) 240 0.0 100.0 %
Buffer ‘3’
Rel. Humidity (avg) 260 0.0 100.0 %
Rel. Air Pressure(min) 325 300.0 1200.0 hPa
Rel. Rel. Humidity (max) 345 300.0 1200.0 hPa
Rel. Rel. Humidity (avg) 365 300.0 1200.0 hPa
Wet Bulb Temperature (act) 114 -50.0 60.0 °C
Specific Enthalpy (act) 215 -100.0 1000.0 kJ/kg
Example: Request Buffer ‘0’
0D0!
0+13.5+85.7+11.2+1017.0+1001.0
Air temperature 13.5°C, rel. humidity 85.7%, dew point 11.2°C, rel. air pressure 1017.0hPa, abs. pressure 1001.0hPa

Operating Instructions Smart Weather Sensor
G. Lufft Mess- und Regeltechnik GmbH, Fellbach, Germany 107
Device configured for measurement in US units:
Measurement Value UMB Channel
Min Max Unit
Buffer ‘0’
Air Temperature (act) 105 -58.0 140.0 °F
Rel. Humidity (act) 200 0.0 100.0 %
Dew Point (act) 115 -58.0 14.0 °F
reserved
Rel. Air Pressure (act) 305 300.0 1200.0 hPa
Buffer ‘1’
Precipitation Type 700 0, 40
Precipitation Intensity 840 0.000 7.874 in/h
Amount of Precip. Difference 645 0.0000 3937.0000 in
Amount of Precip. Absolute 640 0.000 3937.000 in
Buffer ‘2’
Air Temperature (min) 125 -58.0 140.0 °F
Air Temperature (max) 145 -58.0 140.0 °F
Air Temperature (avg) 165 -58.0 140.0 °F
Rel. Humidity (min) 220 0.0 100.0 %
Rel. Humidity (max) 240 0.0 100.0 %
Buffer ‘3’
Rel. Humidity (avg) 260 0.0 100.0 %
Rel. Air Pressure(min) 325 300.0 1200.0 hPa
Rel. Rel. Humidity (max) 345 300.0 1200.0 hPa
Rel. Rel. Humidity (avg) 365 300.0 1200.0 hPa
Wet Bulb Temperature (act) 119 -58.0 140.0 °F
Specific Enthalpy 215 -100.0 1000.0 kJ/kg

Operating Manual Smart Weather Sensor
108 G. Lufft Mess- und Regeltechnik GmbH, Fellbach, Germany
19.6.4.11 Buffer Assignment Basic Data Set Power Saving Mode 2 (all Models)
Device configured for measurement in metric units:
Measurement Value UMB Channel
Min Max Unit
Buffer ‘0’
Air Temperature (act) 100 -50.0 60.0 °C
Rel. Humidity (act) 200 0.0 100.0 %
Amount of Precip. Difference 625 0.00 100000.00 mm
Rel. Air Pressure(act) 305 300.0 1200.0 hPa
Wind Speed (act) 400 0.0 75.0 m/s
Buffer ‘1’
Wind Direction(act) 500 0.0 359.9 °
Global Radiation 900 0.0 2000.0 *) W/m2
reserved
External Temperature 101 -20.0 80.0 °C
Buffer ‘2’
Amount of Precip. Absolute 620 0.0 100000.0 mm
Dew point (act) 110 -50.0 60.0 °C
Abs. Humidity (act) 205 0.0 1000.0 g/m³
Mixing Ratio(act) 210 0.0 1000.0 g/kg
Abs. Air Pressure(act) 300 300.0 1200.0 hPa
Buffer ‘3’
Wet Bulb Temperature (act) 114 -50.0 60.0 °C
Specific Enthalpy (act) 215 -100.0 1000.0 kJ/kg
Air Density 310 0.000 3.000 kg/m3
Compass (act) 510 0.0 359.0 °
*) Until device version .49 / .212 / Firmware v5.6: 1400.0 W/m2
Example: Request Buffer ‘0’
0D0!
0+13.5+85.7+0.2+1017.0+1.8
Air temperature 13.5°C, rel. humidity 85.7%, precipitation 0.2°C, rel. air pressure 1017.0hPa, wind speed1.8m/s

Operating Instructions Smart Weather Sensor
G. Lufft Mess- und Regeltechnik GmbH, Fellbach, Germany 109
Device configured for measurement in US units:
Measurement Value UMB Channel
Min Max Unit
Buffer ‘0’
Air Temperature (act) 105 -58.0 140.0 °F
Rel. Humidity (act) 200 0.0 100.0 %
Amount of Precip. Difference 645 0.0000 3937.0000 in
Rel. Air Pressure(act) 305 300.0 12000 hPa
Wind Speed (act) 410 0.0 167.8 mph
Buffer ‘1’
Wind Direction(act) 500 0.0 359.9 °
Global Radiation 900 0.0 2000.0 *) W/m2
reserved
External Temperature 106 -4.0 176.0 °F
Buffer ‘2’
Amount of Precip. Absolute 640 0.000 3937.000 in
Dew point (act) 115 -58.0 140.0 °F
Abs. Humidity (act) 205 0.0 1000.0 g/m³
Mixing Ratio(act) 210 0.0 1000.0 g/kg
Abs. Air Pressure(act) 300 300.0 1200.0 hPa
Buffer ‘3’
Wet Bulb Temperature (act) 119 -58.0 140.0 °F
Specific Enthalpy (act) 215 -100.0 1000.0 kJ/kg
Air Density 310 0.000 3.000 kg/m3
Compass (act) 510 0.0 359.0 °
*) Until device version .49 / .212 / Firmware v5.6: 1400.0 W/m2

Operating Manual Smart Weather Sensor
110 G. Lufft Mess- und Regeltechnik GmbH, Fellbach, Germany
19.6.5 Additional Measurement Commands
With the additional measurement commands
aM1! … aM8!
aMC1! … aMC8! (M-Command, data transmission with CRC)
aC1! … aC8!
aCC1! … aCC8! (C- Command, data transmission with CRC)
The complete data sets of the Smart Weather Sensor, as defined for the UMB protocol are available in a SDI-12 environment as well.
The measurement values are ordered according to sensor types.
Equally to the base data sets max. 9 values can be requested with an additional M command, while an additional C request allows for up to 20 values.
The buffer assignment as documented in the following paragraphs has consequently been structured in a way that with each M command the buffers D0 and D1 are used. If the respective sensor type has more values available the buffers D2 up to D4 will be occupied if required.
M1 / C1 Temperature M: 9 Values C: 9 Values
M2 / C2 Humidity M: 9 Values C: 13 Values
M3 / C3 Air Pressure M: 9 Values C: 9 Values
M4 / C4 Wind M: 9 Values C: 14 Values
M5 / C5 Compass M: 1 Values C: 1 Values
M6 / C6
WS401/601: Precipitation M: 9 Values C: 9 Values
Others: Precipitation M: 4 Values C: 4 Values
M7 / C7
WS800-UMB: Global Radiation,
Lightning Sensor M: 9 Values C: 10 Values
WS100-UMB: Drop Diameter Distrib. M: --- C: 17 Values
Others: Global Radiation M: 4 Values C: 4 Values
M8 / C8 Ext. Temperature M: 1 Value C: 1 Value
If the sensor type requested with the measurement command is not available with the actual variant of the Smart Weather Sensor (WS100-UMB ... WS800-UMB) the device will respond with
a0000<CR><LF> resp.
a00000<CR><LF>

Operating Instructions Smart Weather Sensor
G. Lufft Mess- und Regeltechnik GmbH, Fellbach, Germany 111
19.6.5.1 Buffer Assignment Additional Measurement Commands M1 / C1: Temperature
Device configured for measurement values in metric units:
Measurement Value UMB Channel
Min Max Unit
Buffer ‘0’
Air Temperature (act) 100 -50.0 60.0 °C
Air Temperature (min) 120 -50.0 60.0 °C
Air Temperature (max) 140 -50.0 60.0 °C
Air Temperature (avg) 160 -50.0 60.0 °C
Dew Point (act) 110 -50.0 60.0 °C
Buffer ‘1’
Dew Point (min) 130 -50.0 60.0 °C
Dew Point (max) 150 -50.0 60.0 °C
Dew Point (avg) 170 -50.0 60.0 °C
Wet Bulb Temperature (act) 114 -50.0 60.0 °C
Example: Request with M command
0M1!
00009<CR><LF>
0D0!
0+12.5+10.7+13.5+11.8+5.3<CR><LF>
0D1!
0+4.2+5.9+5.6+9.8<CR><LF>
Device configured for measurement values in US units:
Measurement Value UMB Channel
Min Max Unit
Buffer ‘0’
Air Temperature (act) 105 -58.0 140.0 °F
Air Temperature (min) 125 -58.0 140.0 °F
Air Temperature (max) 145 -58.0 140.0 °F
Air Temperature (avg) 165 -58.0 140.0 °F
Dew Point (act) 115 -58.0 140.0 °F
Buffer ‘1’
Dew Point (min) 135 -58.0 140.0 °F
Dew Point (max) 155 -58.0 140.0 °F
Dew Point (avg) 175 -58.0 140.0 °F
Wet Bulb Temperature (act) 119 -58.0 140.0 °F

Operating Manual Smart Weather Sensor
112 G. Lufft Mess- und Regeltechnik GmbH, Fellbach, Germany
19.6.5.2 Buffer Assignment Additional Measurement Commands M2 / C2: Humidity
Device configured for measurement values in metric or US units:
Measurement Value UMB Channel
Min Max Unit
Buffer ‘0’
Rel. Humidity (act) 200 0.0 100.0 %
Rel. Humidity (min) 220 0.0 100.0 %
Rel. Humidity (max) 240 0.0 100.0 %
Rel. Humidity (avg) 260 0.0 100.0 %
Buffer ‘1’
Abs. Humidity (act) 205 0.0 1000.0 g/m³
Abs. Humidity (min) 225 0.0 1000.0 g/m³
Abs. Humidity (max) 245 0.0 1000.0 g/m³
Abs. Humidity (avg) 265 0.0 1000.0 g/m³
Specific Enthalpy (act) 215 -100.0 1000.0 kJ/kg
Buffer ‘2’
Mixing Ratio(act) 210 0.0 1000.0 g/kg
Mixing Ratio (min) 230 0.0 1000.0 g/kg
Mixing Ratio (max) 250 0.0 1000.0 g/kg
Mixing Ratio (avg) 270 0.0 1000.0 g/kg
Example: Request with M command
0M2!
00009<CR><LF>
0D0!
0+48.5+48.2+48.8+48.5<CR><LF>
0D1!
0+5.7+5.5+5.9+5.7+29.3<CR><LF>
Example: Request with C command
0C2!
000013<CR><LF>
0D0!
0+48.5+48.2+48.8+48.5<CR><LF>
0D1!
0+5.7+5.5+5.9+5.7+29.3<CR><LF>
0D2!
0+4.6+4.4+5.0+4.6<CR><LF>

Operating Instructions Smart Weather Sensor
G. Lufft Mess- und Regeltechnik GmbH, Fellbach, Germany 113
19.6.5.3 Buffer Assignment Additional Measurement Commands M3 / C3: Air Pressure
Device configured for measurement values in metric or US units:
Measurement Value UMB Channel
Min Max Unit
Buffer ‘0’
Abs. Air Pressure(act) 300 300.0 1200.0 hPa
Abs. Air Pressure (min) 320 300.0 1200.0 hPa
Abs. Air Pressure (max) 340 300.0 1200.0 hPa
Abs. Air Pressure (avg) 360 300.0 1200.0 hPa
Air Density (act) 310 0.000 3.000 kg/m3
Buffer ‘1’
Rel. Air Pressure (act) 305 300.0 1200.0 hPa
Rel. Air Pressure (min) 325 300.0 1200.0 hPa
Rel. Air Pressure (max) 345 300.0 1200.0 hPa
Rel. Air Pressure (avg) 365 300.0 1200.0 hPa
Example: Request with M command
0M3!
00009<CR><LF>
0D0!
0+1001.0+1000.0+1002.0+1001.0+1.119<CR><LF>
0D1!
0+1017.0+1016.0+1018.0+1017.0<CR><LF>
Example: Request with C command
0C3!
000009<CR><LF>
0D0!
0+1001.0+1000.0+1002.0+1001.0+1.119<CR><LF>
0D1!
0+1017.0+1016.0+1018.0+1017.0<CR><LF>

Operating Manual Smart Weather Sensor
114 G. Lufft Mess- und Regeltechnik GmbH, Fellbach, Germany
19.6.5.4 Buffer Assignment Additional Measurement Commands M4 / C4: Wind
Device configured for measurement values in metric units:
Measurement Value UMB Channel
Min Max Unit
Buffer ‘0’
Wind Speed (act) 400 0.0 75.0 m/s
Wind Speed (min) 420 0.0 75.0 m/s
Wind Speed (max) 440 0.0 75.0 m/s
Wind Speed (avg) 460 0.0 75.0 m/s
Wind Speed (vct) 480 0.0 75.0 m/s
Buffer ‘1’
Wind Direction (act) 500 0.0 359.9 °
Wind Direction (min) 520 0.0 359.9 °
Wind Direction (max) 540 0.0 359.9 °
Wind Direction (vct) 580 0.0 359.9 °
Buffer ‘2’
Wind Direction corr. (act) 502 0.0 359.9 °
Wind Quality 805 0.0 100.0 %
Wind Chill Temperature (act) 111 -60.0 70.0 °C
Wind Speed Standard Dev.* 403 0.0 60.0 m/s
Wind Direction Standard Dev.* 503 0.0 359.9 °
Device configured for measurement values in US units:
Measurement Value UMB Channel
Min Max Unit
Buffer ‘0’
Wind Speed (act) 410 0.0 167.8 mph
Wind Speed (min) 430 0.0 167.8 mph
Wind Speed (max) 450 0.0 167.8 mph
Wind Speed (avg) 470 0.0 167.8 mph
Wind Speed (vct) 490 0.0 167.8 mph
Buffer ‘1’
Wind Direction (act) 500 0.0 359.9 °
Wind Direction (min) 520 0.0 359.9 °
Wind Direction (max) 540 0.0 359.9 °
Wind Direction (vct) 580 0.0 359.9 °
Buffer ‘2’
Wind Direction corr. (act) 502 0.0 359.9 °
Wind Quality 805 0.0 100.0 %
Wind chill Temperature (act) 116 -76.0 158.0 °F
Wind Speed Standard Dev.* 413 0.0 167.8 mph
Wind Direction Standard Dev.* 503 0.0 359.9 °
*) Note: Std.Dev. values will be available after the first request. See p. 12.

Operating Instructions Smart Weather Sensor
G. Lufft Mess- und Regeltechnik GmbH, Fellbach, Germany 115
19.6.5.5 Buffer Assignment Additional Measurement Commands M5 / C5: Compass
Device configured for measurement values in metric or US units:
Measurement Value UMB Channel
Min Max Unit
Buffer ‘0’
Compass (act) 510 0.0 359.0 °
Example: Request with M command
0M5!
00001<CR><LF>
0D0!
0+348.0<CR><LF>
Example: Request with C command
0C5!
000001<CR><LF>
0D0!
0+348.0<CR><LF>

Operating Manual Smart Weather Sensor
116 G. Lufft Mess- und Regeltechnik GmbH, Fellbach, Germany
19.6.5.6 Buffer Assignment Additional Measurement Commands M6 / C6: Precipitation
Device configured for measurement values in metric units:
Measurement Value UMB Channel
Min Max Unit
Buffer ‘0’
Precip. Amount absolute 620 0.0 100000.0 mm
Precip. Amount difference 625 0.00 100000.00 mm
Precipitation Intensity 820 0.0 200.0 mm/h
Precipitation Type 700 0, 40, 60, 70 (67, 69, 90)*
Precipitation Int.(WS100 only) 825 0.0 3.333 mm/min
Buffer ‘1’ (WS401-UMB, WS601-UMB only)
reserved
reserved
reserved
reserved
reserved
)* additional precipitation types: WS100-UMB only
Example: Request with M command
0M6!
00009<CR><LF>
0D0!
0+1324.5+1.10+4.4+60<CR><LF>
0D1!
0+603.5+562.4+847.4+623.8+1<CR><LF>
Device configured for measurement values in US units:
Measurement Value UMB Channel
Min Max Unit
Buffer ‘0’
Precip. Amount absolute 640 0.000 3937.000 In
Precip. Amount difference 645 0.0000 3937.0000 In
Precipitation Intensity 840 0.000 7.874 in/h
Precipitation Type 700 0, 40, 60, 70 (67, 69, 90)*
Precipitation Int.(WS100 only) 845 0.000 0.1312 in/min
Buffer ‘1’ (WS401-UMB, WS601-UMB only)
reserved
reserved
reserved
reserved
reserved
)* additional precipitation types: WS100-UMB only

Operating Instructions Smart Weather Sensor
G. Lufft Mess- und Regeltechnik GmbH, Fellbach, Germany 117
19.6.5.7 Buffer Assignment Additional Measurement Commands M7 / C7: Global Radiation, Lightning Detection (WS100-UMB: Drop Diameter Distribution)
Assignment for WS30x-UMB, WS50x-UMB, WS700-UMB, WS800-UMB
Device configured for measurement values in metric units:
Measurement Value UMB Channel
Min Max Unit
Buffer ‘0’
Global Radiation (act) 900 0.0 2000.0 *) W/m²
Global Radiation (min) 920 0.0 2000.0 *) W/m²
Global Radiation (max) 940 0.0 2000.0 *) W/m²
Global Radiation (avg) 960 0.0 2000.0 *) W/m²
Buffer ‘1’ (WS800-UMB only)
Lightning Events (minute) 617 0 255 -
Lightning Events (Intervall) 677 0 999 -
reserved
reserved
reserved
Buffer ‘2’ (WS800-UMB only)
reserved
*) Until device version .49 / .212 / Firmware v5.6: 1400.0 W/m2
Example: Request with M Command 0M7!
00004<CR><LF>
0D0!
0+780.0+135.0+920.0+530.0<CR><LF> Device configured for measurement values in US units:
Measurement Value UMB Channel
Min Max Unit
Buffer ‘0’
Global Radiation (act) 900 0.0 2000.0 *) W/m²
Global Radiation (min) 920 0.0 2000.0 *) W/m²
Global Radiation (max) 940 0.0 2000.0 *) W/m²
Global Radiation (avg) 960 0.0 2000.0 *) W/m²
Buffer ‘1’ (WS800-UMB only)
Lightning Events (minute) 617 0 255 -
Lightning Events (Intervall) 677 0 999 -
reserved
reserved
reserved
Buffer ‘2’ (WS800-UMB only)
reserved
*) Until device version .49 / .212 / Firmware v5.6: 1400.0 W/m2

Operating Manual Smart Weather Sensor
118 G. Lufft Mess- und Regeltechnik GmbH, Fellbach, Germany
Assignment for WS100-UMB, C7 Request only Device configured for measurement values in metric or US units:
Measurement Value UMB Channel
Min Max Unit
Buffer ‘0’
Total precipitation particles 4600 0 9999999 Event
Total drops 4601 0 9999999 Event
Drizzle particles 4602 0 65535 Event
Snow particles 4603 0 65535 Event
Hail particles 4604 0 65535 Event
Drop class 0 4620 0 65535 Event
Drop class 1 4621 0 65535 Event
Drop class 2 4622 0 65535 Event
Buffer ‘1’
Drop class 3 4623 0 65535 Event
Drop class 4 4624 0 65535 Event
Drop class 5 4625 0 65535 Event
Drop class 6 4626 0 65535 Event
Drop class 7 4627 0 65535 Event
Drop class 8 4628 0 65535 Event
Drop class 9 4629 0 65535 Event
Drop class 10 4630 0 65535 Event
Drop class 11 4631 0 65535 Event

Operating Instructions Smart Weather Sensor
G. Lufft Mess- und Regeltechnik GmbH, Fellbach, Germany 119
19.6.5.8 Buffer Assignment Additional Measurement Commands M8 / C8: External Temperature
Device configured for measurement values in metric units:
Measurement Value UMB Channel
Min Max Unit
Buffer ‘0’
External Temperature (act) 101 -40.0 80.0 °C
Example: Request with M Command 0M8!
00001<CR><LF>
0D0!
0+13.5<CR><LF>
Device configured for measurement values in US units:
Measurement Value UMB Channel
Min Max Unit
Buffer ‘0’
External Temperature (act) 106 -40.0 176.0 °F

Operating Manual Smart Weather Sensor
120 G. Lufft Mess- und Regeltechnik GmbH, Fellbach, Germany
19.6.6 Message Device Identification
The device responds to the identification request with following message (example for SDI-12 device address ‘0’:
0I!
013Lufft.deWSx00ynnn
x: device type (4, 5, 6, 2, 3 )
y: Metric / US units ( m = metric, u = US )
nnn: Software version
i.e. for a WS600-UMB, configured for US units:
0I!
013Lufft.deWS600u022
19.6.7 Message Verification
The command verification aV! is used to evaluate status information of the device. The device responds with
a0005<CR<LF> WS700/800-UMB: a0006<CR<LF>
to the request, i.e. 5 (6) values are available in the buffers.
The first 3 (4) “measurement values”, transmitted in buffer ‘0’ contain the status information of the measurement channels.
The status data of the channels are assembled to form “fake measurement values”, where each digit represents one status. See below for the coding of states. Generally each sensor has two status values, one for the direct value and another for the measurement value buffer used for the evaluation of the average, min, and max values.
The last two values, transmitted in buffer ‘1’, show the heating temperatures of wind and precipitation sensor.
Buffer ‘0’
Status group1: +nnnn Air temperature, air temperature buffer, dew point, dew point buffer
Status group1: +nnnnnn
(WS401 / WS601 only)
Air temperature, air temperature buffer, dew point, dew point buffer, reserved, reserved
Status group 2: +nnnnnn Rel. Humidity, rel. Humidity buffer, abs. Humidity, abs humidity buffer, mixing ration, mixing ration buffer
Status group 3: +nnnnnn Air pressure, air pressure buffer, wind, wind buffer, compass, precipitation
(WS301/501 transmits the global radiation status instead of the precipitation status)
Status group 4: +nnnn
(WS700-UMB, WS800-UMB only)
Global radiation status, global radiation buffer status, lightning detector status, lightning detector buffer status
Buffer ‘1’, device configured for metric units
Measurement value UMB Channel
min max Unit
Heating temp. Wind sensor 112 -50 +150 °C
Heating temp. Precip. sensor 113 -50 +150 °C
Buffer ‘1’, device configured for US units
Heating temp. Wind sensor 117 -58 +302 °F
Heating temp. Precip. sensor 118 -58 +302 °F

Operating Instructions Smart Weather Sensor
G. Lufft Mess- und Regeltechnik GmbH, Fellbach, Germany 121
Sensor status codes:
Sensor status Code
OK 0
UNGLTG_KANAL 1
E2_CAL_ERROR E2_CRC_KAL_ERR FLASH_CRC_ERR FLASH_WRITE_ERR FLASH_FLOAT_ERR
2
MEAS_ERROR 3
MEAS_UNABLE 4
INIT_ERROR 5
VALUE_OVERFLOW CHANNEL_OVERRANGE
6
VALUE_UNDERFLOW CHANNEL_UNDERRANGE
7
BUSY 8
other sensor status 9
Example (WS600-UMB, SDI-12 Address ‘0’, no error):
0V!
00005<CR><LF>
0D0!
0+0000+000000+00000<CR><LF>
0D1!
0+73.0+65.3<CR><LF>
Example (WS600-UMB, SDI-12 Address ‘0’, compass failure):
0V!
00005<CR><LF>
0D0!
0+0000+000000+000030<CR><LF>
0D1!
0+73.0+65.3<CR><LF>

Operating Manual Smart Weather Sensor
122 G. Lufft Mess- und Regeltechnik GmbH, Fellbach, Germany
19.6.8 Message Change of Unit System
The command is used to change the unit system used for the SDI12 data between metric and US units. It is implemented as manufacturer specific X command.
Command: aXU<u/m>!
Response: aU<u/m><CR><LF>
u : US units
m: metric units
Example: change to metric units, SDI-12 address ‘0’
0XUm!
0Um<CR><LF>
19.6.9 Message: Setting of the Averaging Interval Length
The avg, min, max and vct values of the measurement values are evaluated over a floating interval with a length of 1 to 10 min. The length of this interval can be adjusted separately for the groups temperature / humidity, air pressure and wind. (The averaging algorithm is not applied to precipitation and compass).
Command: aXA<t/p/w/r>+nn!
t : Temperature and Humidity
p: Air pressure
w: Wind
r: Global radiation
nn: Interval in minutes, valid range: 1 bis 10
Response: aXA<t/p/w/r>+nn<CR><LF>
The response to the attempt of setting of an invalid interval length is
aXAf<CR><LF>
Example: Setting the interval for temperature and humidity to 5 minutes
0XAt+5!
0XAt+5<CR><LF>
19.6.10 Message: Setting of the Local Altitude
For the calculation of the relative air pressure the local altitude of the device is required.
Command: aXH+nnnn!
nnnn: local altitude of the sensor in m
Response: aXH+nnnn<CR><LF>
The response to the attempt of setting of an invalid altitude (-100 < altitude < 5000) is
aXHf<CR><LF>
Example: The altitude of the installation location is 135m above sea level
0XH+135!
0XH+135<CR><LF>

Operating Instructions Smart Weather Sensor
G. Lufft Mess- und Regeltechnik GmbH, Fellbach, Germany 123
19.6.11 Setting of the Local Magnetic Declination
For exact compass heading the local magnetic declination must be set.
Command: aXD+nnn.n!
nnn.n: local magnetic declination at installation site in ° *)
Response: aXD+nnn.n<CR><LF>
The response to the attempt of setting of an invalid altitude (-180.0<declination<+180.0) is
aXDf<CR><LF>
Example: The declination at the installation location is -5.3°
0XD-5.3!
0XD-5.3<CR><LF>
*) The magnetic declination is available from various web sites, e.g. http://www.ngdc.noaa.gov/geomag-web/#declination
19.6.12 Message: Activation / Deactivation of Compass Correction
The correction of the wind direction by the compass bearing can be activated or deactivated.
Command: aXW<c/u>!
c: wind direction is corrected by the compass bearing
u: wind direction is not corrected
Response: aXW<c/u><CR><LF>
The response to the attempt of setting an invalid option is
aXWf<CR><LF>
Example: Compass correction of wind direction is activated
0XWc!
0XWc<CR><LF>
19.6.13 Message: Setting the Power Saving Mode
For installations with limited power supply the Smart Weather Sensor may be operated in power saving mode (see Chap. 42).
Note: Operation in power saving mode has some functional restrictions!
Command: aXL<n/s/w>!
n: Normal Operation
s: Power saving mode 1 (Heating/Fan off)
w: Power saving mode 2 (Sleep mode)
Response: aXL<n/s/w><CR><LF>
The response is followed by the device reset, i.e. the device will be offline for a few seconds.
The response to the selection of an invalid option or of an invalid combination of mode and device model is
aXLf<CR><LF>
Example: The device shall be set to power saving mode 2
0XLw!
0XLw<CR><LF>

Operating Manual Smart Weather Sensor
124 G. Lufft Mess- und Regeltechnik GmbH, Fellbach, Germany
19.6.14 Message: Setting the Heating Mode
The heating of the precipitation and the wind sensors can be configured in different operation modes (see chapter 10.4). Depending on the actual variant of the Smart Weather Sensor (WS100-UMB ...WS800-UMB) only certain combinations of operating modes are available. The Smart Weather Sensor evaluates the valid combinations from the device heating mode requested in the command automatically.
Command: aXMn!
n: Heating Operating Mode (0: Automatic, 1: Mode 1, 2: Off, 3: Eco Mode 1)
Response: aXMnm<CR><LF>
n: Selected Heating Mode Wind Sensor
m: Selected Heating Mode Precipitation Sensor
The response to the attempt of setting an invalid operation mode is
aXMf<CR><LF>
Example: A WS400-UMB shall be set to Mode 1
0XM1!
0XM21<CR><LF>
As the WS400-UMB does not have a wind sensor the heating mode wind is automatically set to 2 (= off).
0XD+633.0<CR><LF>

Operating Instructions Smart Weather Sensor
G. Lufft Mess- und Regeltechnik GmbH, Fellbach, Germany 125
19.6.15 Message: Setting of the Rain Gauge Resolution
The resolution of the tipping bucket rain gauge of WS401-UMB and WS601-UMB, as well as the resolution of an optional external rain gauge connected to a model without internal precipitation measurement can be mechanically adjusted (see p. 36). The mechanical resolution must be set in the sensor configuration.
Command: aXK+n!
n: resolution of the rain gauge in 1/10mm, valid settings 1, 2, 5, 10 (0.1mm, 0.2mm, 0.5mm, 1.0mm)
Response: aXK+n<CR><LF>
The response to the attempt of setting of an invalid resolution is
aXKf<CR><LF>
Example: The mechanical resolution of the rain gauge is 0.2mm
0XK+2!
0XK+2<CR><LF>
19.6.16 Message: Clearing the Absolute Precipitation Amount
The command clears the accumulated absolute precipitation amount to 0.0mm. At the same time a device reset is applied.
Command: aXC!
Response: aXCok<CR><LF>
The response is followed by the device reset, i.e. the device will be offline for a few seconds.
Example:
0XC!
0XCok<CR><LF>
19.6.17 Message: Device Reset
The command initiates a device reset.
Command: aXR!
Response: aXRok<CR><LF>
The response is followed by the device reset, i.e. the device will be offline for a few seconds.
Example:
0XR!
0XRok<CR><LF>

Operating Manual Smart Weather Sensor
126 G. Lufft Mess- und Regeltechnik GmbH, Fellbach, Germany
19.7 Communication in Modbus Mode
For a simpler integration of WS family Smart Weather Sensors into a PLC environment the Modbus communication protocol has been made available.
Measurement values are mapped to Modbus Input Registers. The range of values available is basically the same as for the UMB protocol, including different unit systems.
In the interest of simple and safe integration the use of register pairs for floating point values or 32 bit integers, which is not part of the Modbus standard, has not been applied. All measurement values are mapped to 16bit integers using suitable scaling factors.
19.7.1 Modbus Communication Parameters
The Smart Weather Sensor can be configured for MODBUS-RTU or for MODBUS-ASCII.
The base configuration has to be done using the UMB Config Tool.
When selecting MODBUS RTU or MODBUS-ASCII with the UMB Config Tool, communication parameters 19200 Bd, even parity, will be preselected.
Modbus operating modes: MODBUS-RTU, MODBUS-ASCII
Baud rate: 19200 (9600, 4800 or lower)
Interface Setting 8E1, 8N1, 8N2
NOTE: The Modbus communication has been tested for a poll rate of 1 sec. The proper function of the Smart Weather Sensor with higher Modbus poll rates has not been tested.
We suggest to set the poll rate to 10 sec or slower, as, with the exception of the channels „wind speed / wind directions fast“, which are provided for special purposes, the update rate of the data is >= 10sec. Anyway for most of the weather data significant changes have tob e expected more in the range of minutes.
19.7.2 Addressing
The Modbus address is deducted from the the UMB device ID (see Chap. 19.3.2).
A device with UMB device ID 1 also has the UMB address 1, etc..
The valid address range of Modbus from 1 to 247 is smaller than that of the UMB device IDs. If a UMB device ID > 247 has been selected, the Modbus address will be set to 247.
19.7.3 Modbus Functions
The functions of conformance class 0 and 1 have been implemented as far as they are applicable for the Smart Weather Sensor, i.e. all functions operating on register level.
Conformance Class 0
0x03 Read Holding Registers Selected configuration settings
0x16 Write Multiple Registers Selected configuration settings
Conformance Class 1
0x04 Read Input Registers Measurement values and status information
0x06 Write Single Register Selected configuration settings
0x07 Read Exception Status Currently not used
Diagnostics
0x11 Report Slave ID (responds also to broadcast address)
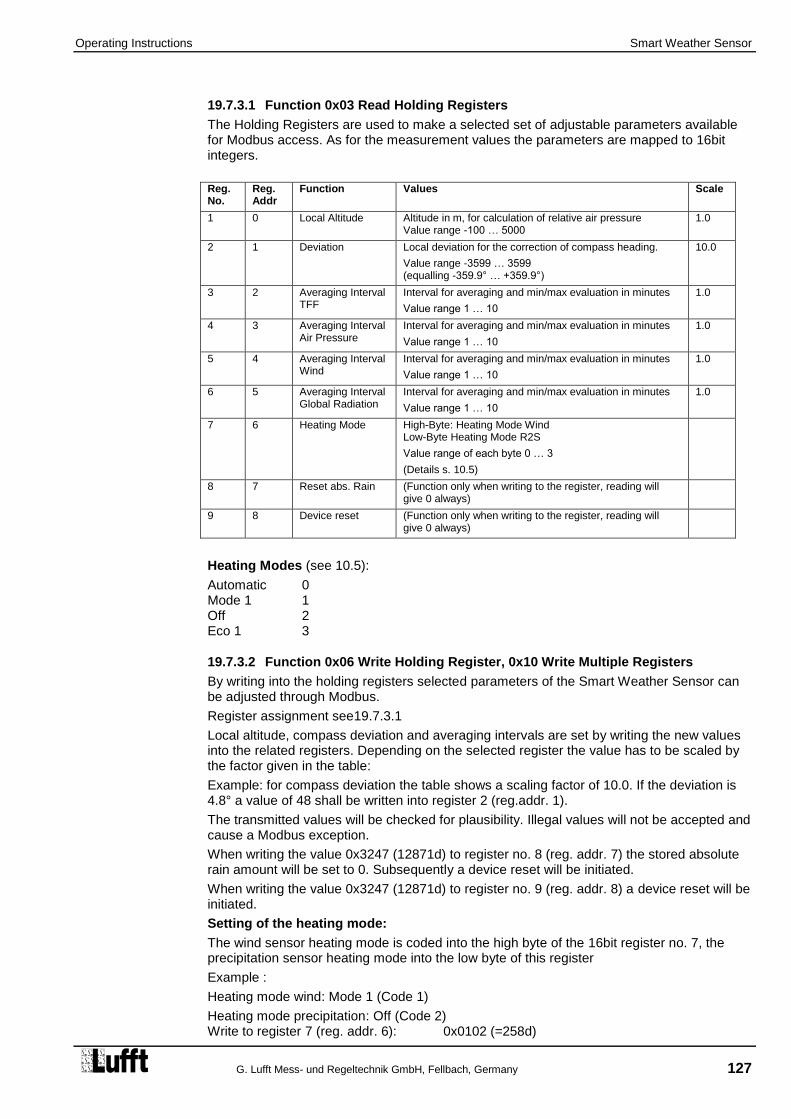
Operating Instructions Smart Weather Sensor
G. Lufft Mess- und Regeltechnik GmbH, Fellbach, Germany 127
19.7.3.1 Function 0x03 Read Holding Registers
The Holding Registers are used to make a selected set of adjustable parameters available for Modbus access. As for the measurement values the parameters are mapped to 16bit integers.
Reg. No.
Reg. Addr
Function Values Scale
1 0 Local Altitude Altitude in m, for calculation of relative air pressure Value range -100 … 5000
1.0
2 1 Deviation Local deviation for the correction of compass heading.
Value range -3599 … 3599 (equalling -359.9° … +359.9°)
10.0
3 2 Averaging Interval TFF
Interval for averaging and min/max evaluation in minutes
Value range 1 … 10
1.0
4 3 Averaging Interval Air Pressure
Interval for averaging and min/max evaluation in minutes
Value range 1 … 10
1.0
5 4 Averaging Interval Wind
Interval for averaging and min/max evaluation in minutes
Value range 1 … 10
1.0
6 5 Averaging Interval Global Radiation
Interval for averaging and min/max evaluation in minutes
Value range 1 … 10
1.0
7 6 Heating Mode High-Byte: Heating Mode Wind Low-Byte Heating Mode R2S
Value range of each byte 0 … 3
(Details s. 10.5)
8 7 Reset abs. Rain (Function only when writing to the register, reading will give 0 always)
9 8 Device reset (Function only when writing to the register, reading will give 0 always)
Heating Modes (see 10.5):
Automatic 0 Mode 1 1 Off 2 Eco 1 3
19.7.3.2 Function 0x06 Write Holding Register, 0x10 Write Multiple Registers
By writing into the holding registers selected parameters of the Smart Weather Sensor can be adjusted through Modbus.
Register assignment see19.7.3.1
Local altitude, compass deviation and averaging intervals are set by writing the new values into the related registers. Depending on the selected register the value has to be scaled by the factor given in the table:
Example: for compass deviation the table shows a scaling factor of 10.0. If the deviation is 4.8° a value of 48 shall be written into register 2 (reg.addr. 1).
The transmitted values will be checked for plausibility. Illegal values will not be accepted and cause a Modbus exception.
When writing the value 0x3247 (12871d) to register no. 8 (reg. addr. 7) the stored absolute rain amount will be set to 0. Subsequently a device reset will be initiated.
When writing the value 0x3247 (12871d) to register no. 9 (reg. addr. 8) a device reset will be initiated.
Setting of the heating mode:
The wind sensor heating mode is coded into the high byte of the 16bit register no. 7, the precipitation sensor heating mode into the low byte of this register
Example :
Heating mode wind: Mode 1 (Code 1)
Heating mode precipitation: Off (Code 2) Write to register 7 (reg. addr. 6): 0x0102 (=258d)

Operating Manual Smart Weather Sensor
128 G. Lufft Mess- und Regeltechnik GmbH, Fellbach, Germany
Setting for minimum power consumption, both heatings off (Code 2): Write to register 7 (reg. addr. 6): 0x0202 (=514d) The factory setting for a WS600-UMB is automatic mode for both heatings, i.e. 0x0000. When attempting to set a heating mode not supported by the individual device variant, e.g. activating the precipitation heating of a device without precipitation sensor, the device will automatically adjust the value written to the register, so that the value read back from the register might be different from the written value.

Operating Instructions Smart Weather Sensor
G. Lufft Mess- und Regeltechnik GmbH, Fellbach, Germany 129
19.7.3.3 Function 0x04 Read Input Registers
The input registers are containing the measurement values of the Smart Weather Sensor and the related status information.
The measurement values are mapped to the 16bit registers using scaling factors (0 … max. 65530 for unsigned values, -32762 … 32762 for signed values).
Values 65535 (0xffff) resp. 32767 are used for the indication of erroneous or not available measurement values. A more detailed specification of the error can be evaluated from the status registers.
The assignment of values to the available register addresses (0 … 124) has been arranged in a way so that the user can read the most frequently used data with few (ideally only one) register block requests
Following blocks have been defined:
Status information
Frequently used values which are independent of the unit system (met./ imp.) in use
Frequently used values in metric units
Frequently used values in imperial units
Other measurement values
When using the metric unit system the first three blocks can the supply all data usually required with one request.
There is no difference in the register assignment between the sub types of the WS family. If, dependent on the type, some value is not available, this will be indicated by setting the register to the error value.
For detailed information about measurement ranges, units etc. please refer to the related description of the UMB channels (Chapter 6 and 19.1)
Reg. No.
Reg. Addr.
Value (UMB Channel)
Range Scaling Factor, Remarks
Status Information
1 0 Identification High Byte: WS-Type (2,3,4,5,6) Low Byte: Software Version
Type coding, see below
2 1 Device Status
3 2 Sensor Status 1 Air temperature buffer, air temperature, dew point buffer, dew point(high byte -> low byte, see table below)
Coding 4 bit per status, see below
4 3 Sensor Status 2 Rel. humidity buffer, rel. humidity, abs. humidity buffer, abs. humidity(high byte -> low byte, see table below)
Coding 4 bit per status, see below
5 4 Sensor Status 3 Mixing ratio buffer, mixing ration, air press. buffer, air press. (high byte -> low byte, see table below)
Coding 4 bit per status, see below
6 5 Sensor Status 4 Wind buffer, wind, precipitation, compass(high byte -> low byte, see table below)
Coding 4 bit per status, see below
7 6 Sensor Status 5 Global radiation buffer, global radiation, reserved, reserved (high byte -> low byte, see table below)
Coding 4 bit per status, see below
8 7 Sensor Status 6 External temperature / external rain gauge, lightning sensor, lightning sensor buffer (see table below)
Coding 4 bit per status, see below
9 8 Reserve
10 9 Diagnostic: run time in 10sec steps

Operating Manual Smart Weather Sensor
130 G. Lufft Mess- und Regeltechnik GmbH, Fellbach, Germany
Reg. No.
Reg. Addr.
Value (UMB Channel)
Range Scaling Factor, signed/unsigned, Remarks
Values Independent of the Unit System
11 10 200 Relative Humidity (act.) Factor 10, s
12 11 220 Relative Humidity (min.) Factor 10, s
13 12 240 Relative Humidity (max.) Factor 10, s
14 13 260 Relative Humidity (avg.) Factor 10, s
15 14 305 Rel. Air Pressure (act.) Factor 10, s
16 15 325 Rel. Air Pressure (min.) Factor 10, s
17 16 345 Rel. Air Pressure (max.) Factor 10, s
18 17 365 Rel. Air Pressure (avg.) Factor 10, s
19 18 500 Wind Direction (act.) Factor 10, s
20 19 520 Wind Direction (min.) Factor 10, s
21 20 540 Wind Direction (max.) Factor 10, s
22 21 580 Wind Direction (vct.) Factor 10, s
23 22 501 Wind Direction fast Factor 10, s
24 23 502 Wind Direction compass corr. Factor 10, s
25 24 510 Compass Factor 10, s
26 25 700 Precipitation Type Factor 1, s
27 26 805 Wind Measurement Quality Factor 1, u
28 27 900 Global Radiation (act.) Factor 10, s
29 28 920 Global Radiation (min.) Factor 10, s
30 29 940 Global Radiation (max.) Factor 10, s
31 30 960 Global Radiation (avg.) Factor 10, s
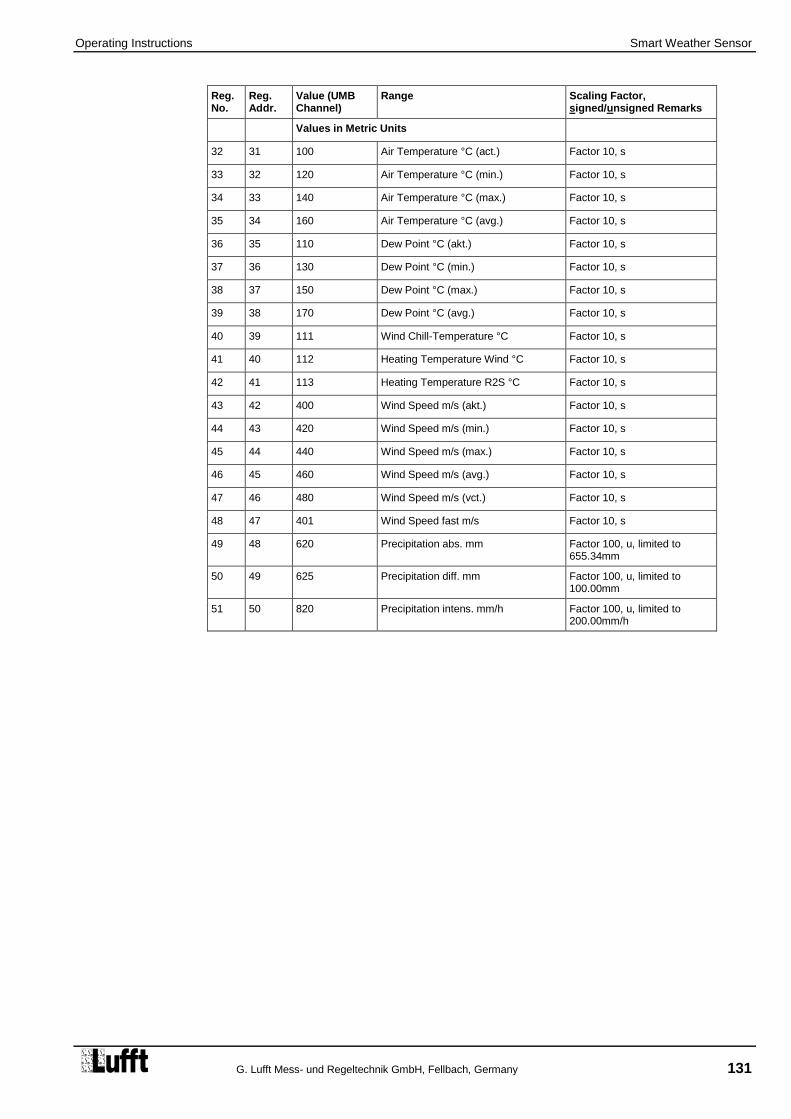
Operating Instructions Smart Weather Sensor
G. Lufft Mess- und Regeltechnik GmbH, Fellbach, Germany 131
Reg. No.
Reg. Addr.
Value (UMB Channel)
Range Scaling Factor, signed/unsigned Remarks
Values in Metric Units
32 31 100 Air Temperature °C (act.) Factor 10, s
33 32 120 Air Temperature °C (min.) Factor 10, s
34 33 140 Air Temperature °C (max.) Factor 10, s
35 34 160 Air Temperature °C (avg.) Factor 10, s
36 35 110 Dew Point °C (akt.) Factor 10, s
37 36 130 Dew Point °C (min.) Factor 10, s
38 37 150 Dew Point °C (max.) Factor 10, s
39 38 170 Dew Point °C (avg.) Factor 10, s
40 39 111 Wind Chill-Temperature °C Factor 10, s
41 40 112 Heating Temperature Wind °C Factor 10, s
42 41 113 Heating Temperature R2S °C Factor 10, s
43 42 400 Wind Speed m/s (akt.) Factor 10, s
44 43 420 Wind Speed m/s (min.) Factor 10, s
45 44 440 Wind Speed m/s (max.) Factor 10, s
46 45 460 Wind Speed m/s (avg.) Factor 10, s
47 46 480 Wind Speed m/s (vct.) Factor 10, s
48 47 401 Wind Speed fast m/s Factor 10, s
49 48 620 Precipitation abs. mm Factor 100, u, limited to 655.34mm
50 49 625 Precipitation diff. mm Factor 100, u, limited to 100.00mm
51 50 820 Precipitation intens. mm/h Factor 100, u, limited to 200.00mm/h

Operating Manual Smart Weather Sensor
132 G. Lufft Mess- und Regeltechnik GmbH, Fellbach, Germany
Reg. No.
Reg. Addr.
Value (UMB Channel)
Range Scaling Factor, signed/unsigned Remarks
Values in US Units
52 51 105 Air Temperature °F (act.) Factor 10, s
53 52 125 Air Temperature °F (min.) Factor 10, s
54 53 145 Air Temperature °F (max.) Factor 10, s
55 54 165 Air Temperature °F (avg.) Factor 10, s
56 55 115 Dew Point °F (act.) Factor 10, s
57 56 135 Dew Point °F (min.) Factor 10, s
58 57 155 Dew Point °F (max.) Factor 10, s
59 58 175 Dew Point °F (avg.) Factor 10, s
60 59 116 Wind Chill-Temperature °F Factor 10, s
61 60 117 Heating Temperature Wind °F Factor 10, s
62 61 118 Heating Temperature R2S °F Factor 10, s
63 62 410 Wind Speed mph (act.) Factor 10, s
64 63 430 Wind Speed mph (min.) Factor 10, s
65 64 450 Wind Speed mph (max.) Factor 10, s
66 65 470 Wind Speed mph (avg.) Factor 10, s
67 66 490 Wind Speed mph (vct.) Factor 10, s
68 67 411 Wind Speed fast mph Factor 10, s
69 68 640 Precipitation abs. In Factor 1000, u, limited to 25.800 in
70 69 645 Precipitation diff. in Factor 10000, u, limited to 3.9370in
71 70 840 Precipitation Intens. in/h Factor 10000, u, limited to 6.5534 in

Operating Instructions Smart Weather Sensor
G. Lufft Mess- und Regeltechnik GmbH, Fellbach, Germany 133
Reg. No.
Reg. Addr.
Value (UMB Channel)
Range Scaling Factor, signed/unsigned, Remarks
Further Values
72 71 205 Absolute Humidity (act.) Factor 10, s
73 72 225 Absolute Humidity (min.) Factor 10, s
74 73 245 Absolute Humidity (max.) Factor 10, s
75 74 265 Absolute Humidity (avg.) Factor 10, s
76 75 210 Mixing Ratio (act.) Factor 10, s
77 76 230 Mixing Ratio (min.) Factor 10, s
78 77 250 Mixing Ratio (max.) Factor 10, s
79 78 270 Mixing Ratio (avg.) Factor 10, s
80 79 300 Abs. Air Pressure (act.) Factor 10, s
81 80 320 Abs. Air Pressure (min.) Factor 10, s
82 81 340 Abs. Air Pressure (max.) Factor 10, s
83 82 360 Abs. Air Pressure (avg.) Factor 10, s
84 83 405 Wind Speed km/h (act.) Factor 10, s
85 84 425 Wind Speed km/h (min.) Factor 10, s
86 85 445 Wind Speed km/h (max.) Factor 10, s
87 86 465 Wind Speed km/h (avg.) Factor 10, s
88 87 485 Wind Speed km/h (vct.) Factor 10, s
89 88 415 Wind Speed kts (act.) Factor 10, s
90 89 435 Wind Speed kts (min.) Factor 10, s
91 90 455 Wind Speed kts (max.) Factor 10 , s
92 91 475 Wind Speed kts (avg.) Factor 10, s
93 92 495 Wind Speed kts (vct.) Factor 10, s
94 93 406 Wind Speed fast km/h Factor 10, s
95 94 416 Wind Speed fast kts Factor 10, s
96 95 403 Wind Speed Std. Dev. m/s * Factor 100, s
97 96 413 Wind Speed Std. Dev. Mph * Factor 100, s
98 97 503 Wind Dir. Standard Dev.* Factor 100, s
99 98 114 Wet Bulb Temp. °C (act) Factor 10, s
100 99 119 Wet Bulb Temp. °F (act) Factor 10, s
101 100 215 Specific Enthalpy (act) Factor 10, s
102 101 310 Air Density (act) Factor 1000, s
*) Note: Standard deviation values are available after the first request. Please see p. 12

Operating Manual Smart Weather Sensor
134 G. Lufft Mess- und Regeltechnik GmbH, Fellbach, Germany
Reg. No.
Reg. Addr.
Value (UMB Channel)
Range Scaling Factor, signed/unsigned, Remarks
Further Values
103 102 825 Precipitation Int. (WS100 only) Factor 10000, u
104 103 845 Precipitation Int. (WS100 only) Factor 200000, u
105 104 750 reserved Factor 1, s
106 105 770 reserved Factor 1, s
107 106 711 reserved Factor 1, s
108 107 101 External Temperature °C (act) Factor 10, s
109 108 109 External Temperature °F (act) Factor 10, s
110 109 806 Wind Value Quality (fast) Factor 1, u
111 110 617 Lightning Events (minute) Factor 1, u
112 111 677 Lightning Events (Intervall) Factor 1, u
Reserved
Service Channels Air temperature (WS100-UMB only, no radiation shield)
Reg. No.
Reg. Addr.
Value (UMB Channel)
Range Scaling Factor, signed/unsigned Remarks
Values in Metric Units
150 149 4100 Air Temperature °C (act.) Factor 10, s
151 150 4120 Air Temperature °C (min.) Factor 10, s
152 151 4140 Air Temperature °C (max.) Factor 10, s
153 152 4160 Air Temperature °C (avg.) Factor 10, s
154 153 4105 Air Temperature °F (act.) Factor 10, s
155 154 4125 Air Temperature °F (min.) Factor 10, s
156 155 4145 Air Temperature °F (max.) Factor 10, s
157 156 4156 Air Temperature °F (avg.) Factor 10, s

Operating Instructions Smart Weather Sensor
G. Lufft Mess- und Regeltechnik GmbH, Fellbach, Germany 135
Drop Diameter Distribution (WS100-UMB only)
Reg. No.
Reg. Addr.
Value (UMB Channel) Range Scaling Factor, signed/unsigned, Remarks
130 129 4600 Total particles Faktor 1, u
131 130 4601 Total drops Faktor 1, u
132 131 4602 Drizzle particles Faktor 1, u
133 132 4603 Snow particles Faktor 1, u
134 133 4604 Hail particles Faktor 1, u
135 134 4620 Drop class 0 Faktor 1, u
136 135 4621 Drop class 1 Faktor 1, u
137 136 4622 Drop class 2 Faktor 1, u
138 137 4623 Drop class 3 Faktor 1, u
139 138 4624 Drop class 4 Faktor 1, u
140 139 4625 Drop class 5 Faktor 1, u
141 140 4626 Drop class 6 Faktor 1, u
142 141 4627 Drop class 7 Faktor 1, u
143 142 4628 Drop class 8 Faktor 1, u
144 143 4629 Drop class 9 Faktor 1, u
145 144 4630 Drop class 10 Faktor 1, u
146 145 4631 Drop class 11 Faktor 1, u
Reserve
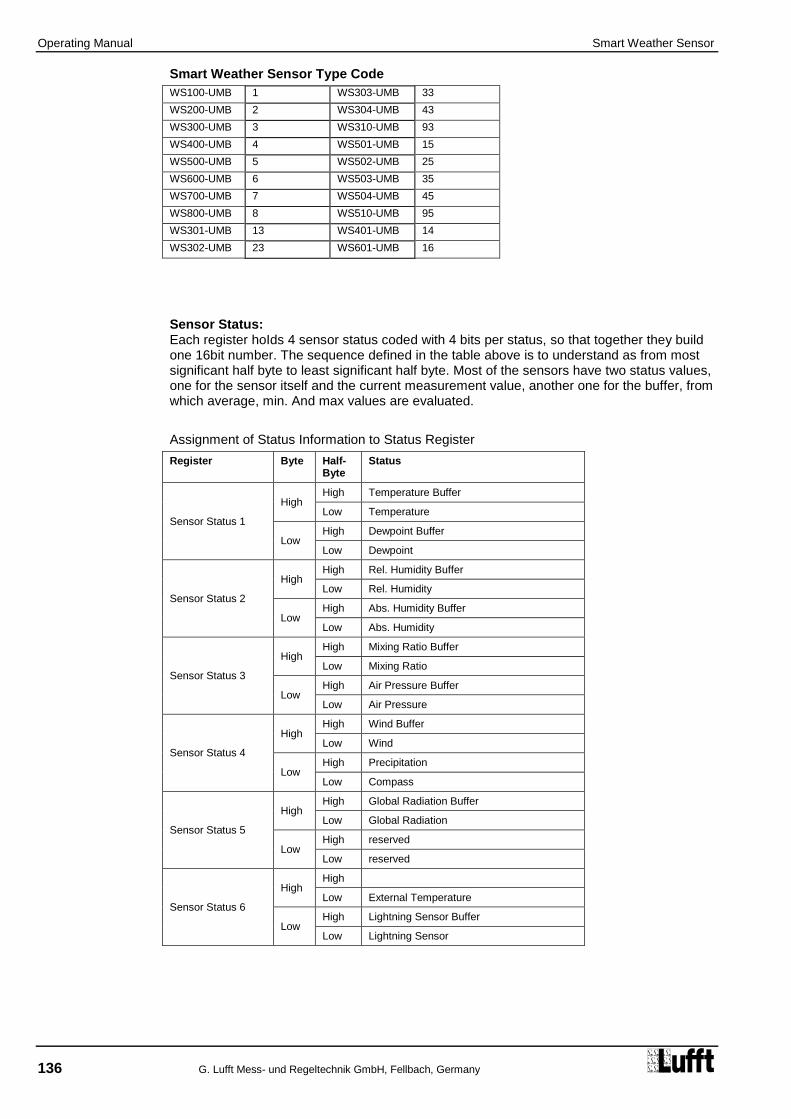
Operating Manual Smart Weather Sensor
136 G. Lufft Mess- und Regeltechnik GmbH, Fellbach, Germany
Smart Weather Sensor Type Code
WS100-UMB 1 WS303-UMB 33
WS200-UMB 2 WS304-UMB 43
WS300-UMB 3 WS310-UMB 93
WS400-UMB 4 WS501-UMB 15
WS500-UMB 5 WS502-UMB 25
WS600-UMB 6 WS503-UMB 35
WS700-UMB 7 WS504-UMB 45
WS800-UMB 8 WS510-UMB 95
WS301-UMB 13 WS401-UMB 14
WS302-UMB 23 WS601-UMB 16
Sensor Status: Each register hoIds 4 sensor status coded with 4 bits per status, so that together they build one 16bit number. The sequence defined in the table above is to understand as from most significant half byte to least significant half byte. Most of the sensors have two status values, one for the sensor itself and the current measurement value, another one for the buffer, from which average, min. And max values are evaluated.
Assignment of Status Information to Status Register
Register Byte Half-Byte
Status
Sensor Status 1
High High Temperature Buffer
Low Temperature
Low High Dewpoint Buffer
Low Dewpoint
Sensor Status 2
High High Rel. Humidity Buffer
Low Rel. Humidity
Low High Abs. Humidity Buffer
Low Abs. Humidity
Sensor Status 3
High High Mixing Ratio Buffer
Low Mixing Ratio
Low High Air Pressure Buffer
Low Air Pressure
Sensor Status 4
High High Wind Buffer
Low Wind
Low High Precipitation
Low Compass
Sensor Status 5
High High Global Radiation Buffer
Low Global Radiation
Low High reserved
Low reserved
Sensor Status 6
High High
Low External Temperature
Low High Lightning Sensor Buffer
Low Lightning Sensor
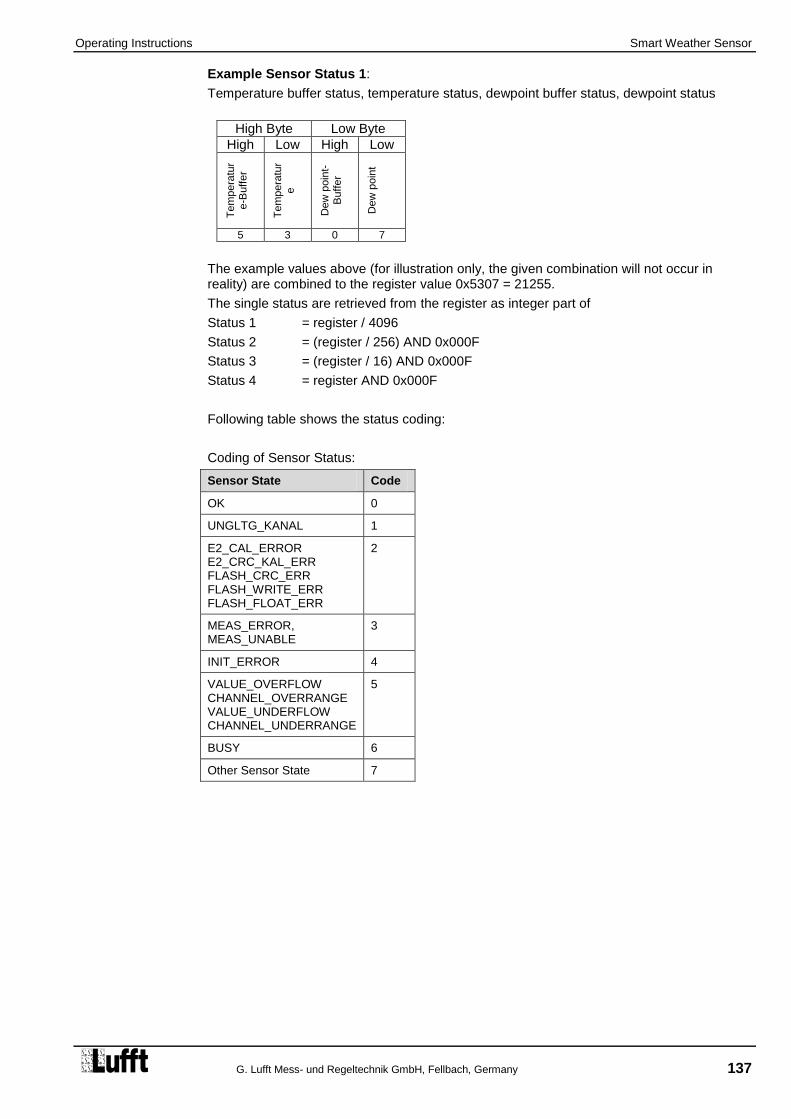
Operating Instructions Smart Weather Sensor
G. Lufft Mess- und Regeltechnik GmbH, Fellbach, Germany 137
Example Sensor Status 1:
Temperature buffer status, temperature status, dewpoint buffer status, dewpoint status
High Byte Low Byte
High Low High Low
Te
mpera
tur
e-B
uff
er
Te
mpera
tur
e
Dew
poin
t-B
uff
er
Dew
poin
t
5 3 0 7
The example values above (for illustration only, the given combination will not occur in reality) are combined to the register value 0x5307 = 21255.
The single status are retrieved from the register as integer part of
Status 1 = register / 4096
Status 2 = (register / 256) AND 0x000F
Status 3 = (register / 16) AND 0x000F
Status 4 = register AND 0x000F
Following table shows the status coding:
Coding of Sensor Status:
Sensor State Code
OK 0
UNGLTG_KANAL 1
E2_CAL_ERROR E2_CRC_KAL_ERR FLASH_CRC_ERR FLASH_WRITE_ERR FLASH_FLOAT_ERR
2
MEAS_ERROR, MEAS_UNABLE
3
INIT_ERROR 4
VALUE_OVERFLOW CHANNEL_OVERRANGE VALUE_UNDERFLOW CHANNEL_UNDERRANGE
5
BUSY 6
Other Sensor State 7

Operating Manual Smart Weather Sensor
138 G. Lufft Mess- und Regeltechnik GmbH, Fellbach, Germany
Figure 46: Sensor Configuration XDR
19.8 Communication: XDR Protocol
Note: XDR protocol is not available for WS100-UMB.
The XDR protocol allows to transmit a selected data set of the Smart Weather Sensor in a NMEA compatible format. The data telegram can be transmitted on request, or the Smart Weather Sensor can be set into auto transmit mode, where the data telegram will be triggered automatically at an selectable interval.
A set of ASCII configuration messages allows to apply some configuration settings without leaving the XDR protocol.
For configuration settings exceeding this command set use the UMB Config Tool. To change into the UMB protocol a UMB message must be addressed to the device within 5 seconds after power up or reset.
Protocol XDR protocol selected
Automatic telegram output activate continous mode (automatic result message transmission)
Air pressure mode select absolute or relative air pressure for the measurement data message (seconds)
Output Interval NMEA Interval for automatic result message transmission
NMEA talker device identifier Select the Talker ID part of the NMEA telegram header

Operating Instructions Smart Weather Sensor
G. Lufft Mess- und Regeltechnik GmbH, Fellbach, Germany 139
19.8.1 Basic Interface Properties
Baud rate configurable from 1200bps to 57600bps, character format 8 bits, no parity, 1 stop bit (8N1).
Unit ID equal to UMB device ID, but limited to 98. 99 is the broadcast ID
Data output on request or continuously (configurable)
Commands and messages use strictly ASCII text mode
19.8.2 Message Format for Commands and Responses
Byte
0 '*' Start Character
1,2 '01' Destination ID
3,4 '00' Source ID
5 ... n Command Data (min. 2)
n+1, n+2 <CR><LF> Termination Characters
The command data field always starts with the 2-character command identifier, optionally followed by a parameter, starting with '='.
Currently implemented commands are
P9 single measurement XDR format
PP start continuous measurement XDR format
PB single measurement PWSD format
PC start continuous measurement PWSD format
GW option: add MWD sentence (wind data) to XDR format
MI continuous measurement interval
J3 pressure mode (absolute air pressure / relative air pressure)
JS pressure sensor elevation
JW spot or average output of wind data
BR baud rate
ID unit ID
NH message prefix
If the device receives an invalid command (missing start or termination character, invalid ID, invalid structure etc.), it will not respond.
If a setting command contains an invalid parameter value, the device will not respond.
Setting commands must usually be preceded by the “Write Enable” command EW. This command does not generate a response, and may be, different from other commands, transmitted without message terminators (<CR><LF>). I.e. the write enable and the set command may be concatenated without terminators between the commands.
Example:
0100EW*0100J3=1<CR><LF>
and
0100EW<CR><LF>*0100J3=1<CR><LF>
are both valid command sequences for setting the pressure mode.
Setting commands not requiring a preceding write enable are marked in the command description.

Operating Manual Smart Weather Sensor
140 G. Lufft Mess- und Regeltechnik GmbH, Fellbach, Germany
19.8.3 Message Format for Measurement Data XDR
The message format for P9 / PP measurement data follows the definition for NMEA WI (weather instrument) XDR messages.
The message is field oriented, with variable length. The fields are separated by ','.
Message format:
$hhhhh,P,x.xxxx,B,0,C,yy.y,C,0,H,zz.z,P,0<CR><LF>
$hhhhh Message header, default $WIXDR (WI : Talker identifier “weather instruments”, XDR: sentence identifier “transducer measurements”) *)
, separator
P transducer type “pressure”
, separator
x.xxxx air pressure value in Bar
, separator
B unit: bars (= hPa)
, separator
0 Transducer ID, set to 0
, separator
C transducer type temperature
, separator
yy.y temperature in °C
, separator
C unit: °C
, separator
0 Transducer ID, set to 0
, separator
H transducer type humidity
zz.z relative humiditiy in %
, separator
P unit: %
, separator
0 Transducer ID, set to 0
<CR><LF> sentence terminator
*) The message header can be modified. The UMB config tool allows modifying the talker ID bytes. The XDR setting command NH allows changing the complete message header. The leading '$' is fixed and can not be modified.

Operating Instructions Smart Weather Sensor
G. Lufft Mess- und Regeltechnik GmbH, Fellbach, Germany 141
19.8.4 Message Format for Measurement Data MWD
The P9 / PP measurement data transmission can be optionally extended by a MWD sentence containing wind data. The MWD sentence follows the definition for NMEA WI (weather instrument) messages.
This option can be activated or deactivated by the GW command.
The JW command selects between spot value and average value output of wind data.
The message is field oriented, with variable length. The fields are separated by ','.
Message format:
$hhhhh, aaa.a,T,bbb.b,M,cc.c,N ,dd.d,M <CR><LF>
$hhhhh Message header, default $WIMWD (WI : Talker identifier “weather instruments”, MWD: sentence identifier “wind measurements”) *)
, separator
aaa.a wind direction in °”
, separator
T identifier “True North”
, separator
bbb.b wind direction in °
, separator
M identifier “Magnetic Nord”
, separator
cc.c wind speed in knots
, separator
N unit: kts
, separator
dd.d wind speed in m/s
, separator
M unit: m/s
<CR><LF> sentence terminator
*) The message header can be modified. The MWD sentence uses the same talker ID as the XDR sentence, which can be modified by the UMB config tool or the XDR setting command NH. The leading '$' is and the identifier MWD are fixed and can not be modified **) here wind direction “true” and wind direction “magnetic” are identical.

Operating Manual Smart Weather Sensor
142 G. Lufft Mess- und Regeltechnik GmbH, Fellbach, Germany
19.8.5 Message Format for Measurement 0R0
The 0R0 sentence format is a proprietary format similar to NMEA 0183 rules. The 0R0 sentence contains essential measurement values of the compact weather station and is designed for compatibility with existing installations.
The sentence is requested by the PB command for single measurement and PC for cyclic transmission.
If certain measurement values are not available for the subtype of the individual weather station the related value will be replaced by 999999. The same applies for measurement values with status not “OK”.
The message is field oriented, with variable length. The fields are separated by ','.
Message Format:
0R0,Dm=aaaD,Sm=bb.bM,Ta=cc.cC,Ua=dd.dP,Pa=e.eeeeB,Rc=f.ffM, Pt=ggN<CR><LF>
0R0 message header
, separator
Dm identifier wind direction
= separator
aaa wind direction in °
D unit °
, separator
Sm identifier wind speed
= separator
bb.b wind speed in m/s
M unit m/s
, separator
Ta identifier air temperature
= separator
cc.c air temperature in °C
C unit: °C
, separator
Ua identifier relative humidity
= separator
dd.d relative humidity in %
P unit %
, separator
Pa identifier air pressure
= separator
e.eeee air pressure in Bar
B unit Bar
, separator
Rc identifier precipitation difference
= separator
ff.ff precipitation difference (related to last transmission) in mm
M unit mm
, separator

Operating Instructions Smart Weather Sensor
G. Lufft Mess- und Regeltechnik GmbH, Fellbach, Germany 143
Pt identifier precipitation type
= separator
gg precipitation code (00 no precip., 60 rain, 70 snow)
C unit: Code
<CR><LF> sentence terminator

Operating Manual Smart Weather Sensor
144 G. Lufft Mess- und Regeltechnik GmbH, Fellbach, Germany
19.8.6 Measurement Commands
Command Examples are shown for unit ID 01
19.8.6.1 Single Measurement XDR format
Command identifier: P9
Parameter: none
Command example:
Command: *0100P9<CR><LF>
Response (wind data not activated):
$WIXDR,P,<pressure in bar>,B,0,C,<air temperature °C>,C,0,H,<rel. Humidity %>,P,0<CR><LF>
Response (wind data activated):
$WIXDR,P,<pressure in bar>,B,0,C,<air temperature °C>,C,0,H,<rel. Humidity %>,P,0<CR><LF>
$WIMWD,<wind direction °>,T, < wind direction °>,M,<wind speed kts>,N ,< wind speed m/s>,M<CR><LF>
Serial numbers of pressure and T/H sensor are not available and set to 0.
19.8.6.2 Continuous Measurement XDR format
Command identifier: PP
Parameter: none
Command example:
Command *0100PP<CR><LF>
After this command the device will start to transmit the result message as defined in for the single measurement automatically with the interval defined by the transmission interval command (see 19.8.7.1) or set by the UMB Config Tool.
The default interval is 60 seconds, minimum allowed interval is 10sec, maximum interval is 43200sec (=12h).
The continuous mode will be stored in the E2PROM of the device, so that after a reset the device will continue to transmit automatically.
The continuous mode is terminated by a Single Measurement Command (19.8.6.1, 19.8.6.3).
19.8.6.3 Single Measurement 0R0 Format
Command identifier: PB
Parameter: none
Command example:
Command *0100PB<CR><LF>
Response:
0R0,Dm=<wind dir.>D,Sm=<wind speed>M,Ta=<air temp.>C,Ua=<rel. humidity>P,Pa=<air press.>B,Rc=<precip. diff.>M, Pt=<precip. type>N<CR><LF>

Operating Instructions Smart Weather Sensor
G. Lufft Mess- und Regeltechnik GmbH, Fellbach, Germany 145
19.8.6.4 Continuous Measurement 0R0 Format
Command identifier: PC
Parameter: none
Command example:
Command *0100PC<CR><LF>
After this command the device will start to transmit the result message as defined in for the single measurement automatically with the interval defined by the transmission interval command (see 19.8.7.1) or set by the UMB Config Tool.
The default interval is 60 seconds, minimum allowed interval is 10sec, maximum interval is 43200sec (=12h).
The continuous mode will be stored in the E2PROM of the device, so that after a reset the device will continue to transmit automatically.
The continuous mode is terminated by a Single Measurement Command (19.8.6.1, 19.8.6.3).

Operating Manual Smart Weather Sensor
146 G. Lufft Mess- und Regeltechnik GmbH, Fellbach, Germany
19.8.7 Configuration Commands
Command Examples are shown for unit ID 01
19.8.7.1 Transmission Interval for Continuous Measurement
Command identifier: MI
Parameter: interval in seconds (min. 10, max. 43200, default 60)
Request command example:
Command: *0100MI<CR><LF>
Response: *0001MI=60<CR><LF>
The command requests the current setting of the result transmission interval
Setting command example (to be preceded by the write enable command)
Command: *0100MI=60<CR><LF>
Response: *0001MI=60<CR><LF>
The command sets the interval for automatic measurement result transmission (19.8.6.2) in seconds.
19.8.7.2 Option Append Wind Data (MWD) to XDR Sentence
Command identifier: GW
Parameter: 0 = wind data off, 1 = wind data on
Request command example:
Command: *0100GW<CR><LF>
Response: *0001GW=0<CR><LF>
The command requests the current setting of the wind data option.
Setting command example (to be preceded by the write enable command)
Command: *0100GW=1<CR><LF>
Response: *0001GW=1<CR><LF>
The command sets the wind data option.
Note: if an automatic XDR transmission is active it must be restarted to make the modification effective.
19.8.7.3 Select Spot Values or Average Values of Wind Data
Command identifier: JW
Parameter: 0 = wind data spot values, 1 = wind data average values
Request command example:
Command: *0100JW<CR><LF>
Response: *0001JW=1<CR><LF>
The command requests the current setting of the wind data average setting.
Setting command example (to be preceded by the write enable command)
Command: *0100JW=0<CR><LF>
Response: *0001JW=0<CR><LF>
The command sets the wind data average or spot transmission.

Operating Instructions Smart Weather Sensor
G. Lufft Mess- und Regeltechnik GmbH, Fellbach, Germany 147
19.8.7.4 Pressure Mode Selection Command
Command identifier: J3
Parameter: 0 = absolute pressure, 1 = relative pressure
Selects, if the absolute or relative (sea level) air pressure is transmitted in the measurement value message (0). For correct function of the conversion to relative (sea level) pressure it is essential, that the sensor elevation has been set correctly (JS command (19.8.7.5) or UMB Config Tool)
Request command example:
Command: *0100J3<CR><LF>
Response: *0001J3=1<CR><>LF>
Requests the current pressure mode
Setting command example (to be preceded by the write enable command):
Command: *0100J3=0<CR><LF>
Response: *0100J3=0<CR><LF>
Sets the pressure mode:
0 absolute air pressure
1 relative air pressure
19.8.7.5 Sensor Elevation Setting Command
Command identifier: JS
Parameter: sensor elevation (above sea level) in m
Remark: the sensor elevation may be entered as integer value or as fixed point value, the sensor will round the value for internal storage to integer (full meters).
Request command example:
Command: *0100JS<CR><LF>
Response: *0001JS=353<CR><LF>
Requests the current elevation setting
Setting command example (to be preceded by the write enable command):
Command: *0100JS=82<CR><LF> or *0100JS=82.3<CR><LF>
Response: *0001JS=82<CR><LF>
Sets the elevation of the sensor above sea level in m (range -100m to 5000m)

Operating Manual Smart Weather Sensor
148 G. Lufft Mess- und Regeltechnik GmbH, Fellbach, Germany
19.8.7.6 NMEA Message Prefix Setting Command
Command identifier: NH
Parameter: complete NMEA Header ('$' + max. 6 char)
Note: The parameter must always start with the '$' character. This character is nevertheless fixed and will not be modified.
Request command example:
Command: *0100NH<CR><LF>
Response: *0001NH=$WIXDR<CR><LF>
Requests the current header of the NMEA measurement value sentence
Setting command example (to be preceded by the write enable command):
Command: *0100NH=$WIXDR<CR><LF>
Response: *0001NH=$WIXDR<CR><LF>
Sets the prefix of the NMEA measurement value
19.8.7.7 Baud Rate Setting Command
Command identifier: BR
Parameter: Baudrate (1200, 2400, 4800, 9600, 19200, 28800, 38400, 57600)
Note: this command only provides the set mode and is only valid with the broadcast destination ID 99.
After execution of the command the Smart Weather Sensor will perform a reset and then start with the new baudrate.
The command does not require to be preceded by the write enable command.
Setting command example:
Command: *9900BR=9600<CR><LF>
Response: *9900BR=9600<CR><LF>
Sets the baud rate
19.8.7.8 Unit ID Setting Command
Command identifier: ID
Parameter: none
Note: This command does not accept a separate parameter, but uses the source ID of the address fields as input. The ID of the device is set to (source ID + 1). Source ID values 0 ... 97 are allowed.
The command only provides the set mode and is only valid with the broadcast destination ID 99.
After execution of the command the Smart Weather Sensor will perform a reset and then start with the new unit ID.
The command does not require to be preceded by the write enable command.
Setting command example:
Command: *9900ID<CR><LF>
Response: *9901ID<CR><LF>
Sets the unit ID to source ID + 1

Operating Instructions Smart Weather Sensor
G. Lufft Mess- und Regeltechnik GmbH, Fellbach, Germany 149
19.8.7.9 Write Enable Command
Command identifier: EW
Parameter: none
This command is intended to protect the device from accidental setting modifications and must precede most of the setting commands.
The command is not available as request command and does not generate a response.
This command is valid with and without termination characters.
Command example:
*0100EW
or
*0100EW<CR><LF>

Operating Manual Smart Weather Sensor
150 G. Lufft Mess- und Regeltechnik GmbH, Fellbach, Germany
19.9 (WS100-UMB only) Communication: UMB-ASCII 2.0 Protokoll
UMB-ASCII 2.0 provides query of measurement values and sensor configuration in a human readable format. Details and general commands can be found in the UMB-ASCII 2.0 manual (Manual_Lufft_UMB-ASCII_2_0_Version_1_1_en.pdf).
The separators used for the output strings can be adjusted to the requirements of a logger (see Chapter 10.2.14)
In addition to the general configuration commands described in the UMB-ASCII 2.0 manual device specific commands for configuration work have been defined for the WS100-UMB (see Chapter 19.9.2)
In UMB-ASCII 2.0 mode defined sets of measurement values can be transmitted automatically at adjustable intervals without further query commands. WS100-UMB provides four standard sets:
- S1: General precipitation values, metric units - S5: General precipitation values, imperial units - S10: Service channels (drop distribution, air temperature), metric units - S15: Service channels (drop distribution, air temperature), imperial units
19.9.1 Format of the Standard Sets
The following list uses UMB-ASCII 2.0 factory setting separators.
Byte Wert Beschreibung
0 <STX> 02 Hex
1-4 <Add> Device address hex, e.g. 7001 for WSx-UMB with device ID 1
5 : 3A hex
6-7 <Nr> Request number hex, always 00 for auto transmission
8 : 3A hex
9-10 SS <Cmd>, standard set
11 ; 3B hex
12-… <Set> standard set number
… = 3D hex
<TelNo> Number of auto transmitted messages from start
; 3B hex
<SerNo> Lufft serial number
; 3B vex
… measurement value 1
; 3B hex
measurement value 2
; 3B hex
…. ….
; 3B hex
measurement value n
; 3B hex
<Status> device status, hex
: 3A hex
<Status> command status, hex
: 3A hex
<CheckSum> check sum, hex
<CR> 0D hex
<LF> 0A hex
<EOT> 04 hex
Depending on the measurement value type the output is formatted as integer or fixed point representation. Measurement value lists of the standard sets follow:

Operating Instructions Smart Weather Sensor
G. Lufft Mess- und Regeltechnik GmbH, Fellbach, Germany 151
19.9.1.1 Standard Set S1 Precipitation Data Metric
Measurement Value Channel Unit Format
Precipitation Type 700 - **
Precipitation quantity abs. 620 mm **.**
Precipitation quantity diff. 625 mm **.**
Precipitation intensity 820 mm/h **.**
Precipitation intensity 825 mm/min **.***
Heating temperature 113 °C **.*
19.9.1.2 Standard Set S1 Precipitation Data Imperial Units
Measurement Value Channel Unit Format
Precipitation Type 700 - **
Precipitation quantity abs. 640 inch **.****
Precipitation quantity diff. 645 inch **.****
Precipitation intensity 820 inch /h **.****
Precipitation intensity 825 inch /min **.*****
Heating temperature 113 °F **.*
19.9.1.3 Standard Set S10 Service Channels metric
Measurement Value Channel Unit Format
Total precip. Particles 4600 Events **
Total drops 4601 Events **
Drizzle particles 4602 Events **
Snow particles 4603 Events **
Hail particles 4604 Events **
Drop class 0 4620 Events **
Drop class 1 4621 Events **
Drop class 2 4622 Events **
Drop class 3 4623 Events **
Drop class 4 4624 Events **
Drop class 5 4625 Events **
Drop class 6 4626 Events **
Drop class 7 4627 Events **
Drop class 8 4628 Events **
Drop class 9 4629 Events **
Drop class 10 4630 Events **
Drop class 11 4631 Events **
Air temperature curr. 4100 °C **.*
Air temperature min. 4120 °C **.*
Air temperature max. 4140 °C **.*
Air temperature avg. 4160 °C **.*
(Air temperature without radiation shield!)

Operating Manual Smart Weather Sensor
152 G. Lufft Mess- und Regeltechnik GmbH, Fellbach, Germany
19.9.1.4 Standard Set S15 Service Channels Imperial Units
Measurement Value Channel Unit Format
Total precip. Particles 4600 Events **
Total drops 4601 Events **
Drizzle particles 4602 Events **
Snow particles 4603 Events **
Hail particles 4604 Events **
Drop class 0 4620 Events **
Drop class 1 4621 Events **
Drop class 2 4622 Events **
Drop class 3 4623 Events **
Drop class 4 4624 Events **
Drop class 5 4625 Events **
Drop class 6 4626 Events **
Drop class 7 4627 Events **
Drop class 8 4628 Events **
Drop class 9 4629 Events **
Drop class 10 4630 Events **
Drop class 11 4631 Events **
Air temperature curr. 4105 °F **.*
Air temperature min. 4125 °F **.*
Air temperature max. 4145 °F **.*
Air temperature avg. 4165 °F **.*
(Air temperature without radiation shield!)
19.9.2 Device Specific Configuration Commands
Following configuration commands have been defined for WS100-UMB:
Command Function
TMI Averaging Intervall Temperature
EVP Evaporation Parameter
RCF Rain Correction Factor
SCF Snow Correction Factor
PTT Follow Up Time for Precipitation Type
HTM Heating Operation Mode
HIT Temperature Threshold for Heating Mode 1
HST Heating Setpoint Temperature
MIT Follow Up Time for Heating Eco Mode 1
POM Radar Operation Mode
RGR Resolution for Rain Gauge Simulation
DHE Drizzle / Hail Evaluation
RSC Clear Accumulated Precipitation and Reset
For details regarding the listed settings please refer to chapters 10.2.7, 10.2.13 and 10.5.

Operating Instructions Smart Weather Sensor
G. Lufft Mess- und Regeltechnik GmbH, Fellbach, Germany 153
Format of configuration commands: Byte Value Description
0-3 <Add> Device Address Hex, e.g. 7001 for WSx-UMB with device ID 1
4 : 3A Hex
5-6 <Nr> Request No. Hex, may be used for identification of the response
7 : 3A Hex
8-10 <xxx> Command Code
11 = 3D Hex (for setting of parameters only)
12-… <Value> Value of Parameter (for setting of parameters only)
<CR> 0D Hex
<LF> 0A Hex
Format of response
Byte Value Description
0 <STX> 02 Hex
1-4 <Add> Device Adress Hex, e.g. 7001 for WSx-UMB with device ID 1
5 : 3A Hex
6-7 <Nr> Request number hex, always 00 for auto transmission
8 : 3A Hex
9-10 <xxx> Command Code
11 = 3D Hex
12-… <Value> Value of Parameter
: 3A Hex
<Status> Command Status, Hex
: 3A Hex
<CheckSum> Checksum, Hex
<CR> 0D Hex
<LF> 0A Hex
<EOT> 04 Hex
Example: Request of averaging interval time from device with ID 1
7001:00:TMI<CR><LF>
Response:
<STX>7001:00:TMI=10:00:<CheckSum><CR><LF><EOT>
Example: Setting of averaging interval time to 5sec
7001:00:TMI=5<CR><LF>
Response:
<STX>7001:00:TMI=5:00:<CheckSum><CR><LF><EOT>

Operating Manual Smart Weather Sensor
154 G. Lufft Mess- und Regeltechnik GmbH, Fellbach, Germany
19.9.2.1 Command Averaging Interval Temperature Measurement
Command Code: TMI
Request: TMI
Adjust: TMI=<value>
Value Range: 1 … 10
19.9.2.2 Command Evaporation Parameter
Command Code: EVP
Request: EVP
Adjust: EVP=<value>
Value Range: 0.0 … 0.24 …100.0
19.9.2.3 Command Rain Correction Factor
Command Code: RCF
Request: RCF
Adjust: RCF=<value>
Value Range: 0.2 … 1.0 …5.0
19.9.2.4 Command Snow Correction Factor
Command Code: SCF
Request: SCF
Adjust: SCF=<value>
Value Range: 0.2 … 1.0 …5.0
19.9.2.5 Command Precipitation Type Follow Up Time
Command Code: PTT
Request: PTT
Adjust: PTT=<value>
Value Range: 0 … 120 …3600 [sec]
19.9.2.6 Command Heating Operation Mode
Command Code: HTM
Request: HTM
Adjust: HTM=<value>
Value Range: 0 …3
<value> Operation Mode
0 Automatic
1 Mode 1
2 Off
3 Eco Mode 1
See Chapter 10.5 for heating operation modes

Operating Instructions Smart Weather Sensor
G. Lufft Mess- und Regeltechnik GmbH, Fellbach, Germany 155
19.9.2.7 Temperature Threshold for Heating Mode 1
Command Code: HIT
Request: HIT
Adjust: HIT=<value>
Value Range: -10.0 … 5.0 …20.0 [°C]
19.9.2.8 Heating Setpoint Temperature
Command Code: HST
Request: HST
Adjust: HST=<value>
Value Range: -10.0 … 15.0 …60.0 [°C]
19.9.2.9 Follow Up Time for Heating Eco Mode 1
Command Code: MIT
Request: MIT
Adjust: MIT=<value>
Value Range: 1 … 30 …120 [min]
19.9.2.10 Radar Operation Mode
Command Code: POM
Request: POM
Adjust: POM=<value>
Value Range: 0 … 1
<value> Operation Mode
0 Continuous
1 Power Saving Mode 1
See Chapter 10.4.1
19.9.2.11 Resolution Rain Gauge Simulation
Command Code: RGR
Request: RGR
Adjust: RGR=<value>
Value Range: 0 … 4
<value> Operation Mode
0 1.0mm
1 0.5mm
2 0.2mm
3 0.1mm
4 0.01mm

Operating Manual Smart Weather Sensor
156 G. Lufft Mess- und Regeltechnik GmbH, Fellbach, Germany
19.9.2.12 Drizzle / Hail Evaluation
Command Code: DHE
Request: DHE
Adjust: DHE=<value>
Value Range: 0, 16, 32, 48
<value> Function
0 Drizzle/hail inactive
16 Drizzle active
32 Hail active
48 Drizzle + hail active
19.9.2.13 Clear Accumulated Precipitation Amount
Command Code: RSC
Request: -
Adjust: RSC
Value Range: - This command sets the accumulated precipitation amount to 0.0 and then initiates a device reset. The device will not respond for a few seconds during the reset.

Operating Instructions Smart Weather Sensor
G. Lufft Mess- und Regeltechnik GmbH, Fellbach, Germany 157
20 List of Figures
Figure 1: Sensor Technology ................................................................................................................................................................. 14 Figure 2: Fastening to the Mast ............................................................................................................................................................. 24 Figure 3: North Markings ....................................................................................................................................................................... 25 Figure 4: Alignment to North .................................................................................................................................................................. 25 Figure 5: Installation Sketch .................................................................................................................................................................. 27 Figure 6: Connections ........................................................................................................................................................................... 28 Figure 7: Connection to ISOCON-UMB ................................................................................................................................................. 30 Figure 8: Sensor Selection .................................................................................................................................................................... 33 Figure 9: General Settings ..................................................................................................................................................................... 34 Figure 10: Temperature, Humidity and Fan Settings .............................................................................................................................. 34 Figure 11: Pressure Settings ................................................................................................................................................................. 35 Figure 12: Wind Settings ....................................................................................................................................................................... 35 Figure 13: Precipitation Sensor Settings (Radar) ................................................................................................................................... 36 Figure 14: Precipitation Sensor Settings (Rain Gauge) .......................................................................................................................... 36 Figure 15: Global Radiation Settings ..................................................................................................................................................... 37 Figure 16: Lightning Sensor Settings ..................................................................................................................................................... 37 Figure 17: Energy Management Settings ............................................................................................................................................... 37 Figure 18: Reset Precipitation Quantity ................................................................................................................................................. 38 Abb. 19: Select operation mode „Simulated Rain Gauge“ ...................................................................................................................... 39 Abb. 20: Configure the resolution of the simulated rain gauge ............................................................................................................... 39 Abb. 21: Configure UMB-ASCII 2.0 protocol properties ......................................................................................................................... 39 Figure 22 Measurement Polling Channels ............................................................................................................................................. 41 Figure 23 Example of Measurement Polling .......................................................................................................................................... 41 Figure 24: Operating Modes for Equipment Heating .............................................................................................................................. 44 Figure 25: WS601-UMB with removed funnel ........................................................................................................................................ 47 Figure 26: WS100-UMB ........................................................................................................................................................................ 53 Figure 27: WS200-UMB ........................................................................................................................................................................ 53 Figure 28: WS200-UMB ........................................................................................................................................................................ 54 Figure 29: WS301-UMB ........................................................................................................................................................................ 55 Figure 30: WS310-UMB ........................................................................................................................................................................ 56 Figure 31: WS400-UMB ........................................................................................................................................................................ 57 Figure 32: WS401-UMB ........................................................................................................................................................................ 58 Figure 33: WS500-UMB ........................................................................................................................................................................ 59 Figure 34: WS501-UMB ........................................................................................................................................................................ 60 Figure 35: WS510-UMB ........................................................................................................................................................................ 61 Figure 36: WS600-UMB ........................................................................................................................................................................ 62 Figure 37: WS601-UMB ........................................................................................................................................................................ 63 Figure 38: WS700-UMB, WS800-UMB .................................................................................................................................................. 64 Figure 39: Setting type of external sensor.............................................................................................................................................. 69 Figure 40: Example WS501-UMB and WTB100 .................................................................................................................................... 70 Figure 41: Sensor Configuration SDI-12 ................................................................................................................................................ 83 Figure 42: Sensor Configuration SDI-12 Units ....................................................................................................................................... 83 Figure. 43: Connecting to a logger with integrated power supply ........................................................................................................... 84 Figure. 44: Connecting to a logger and a separate power supply up to device version 41 ................................................................... 84 Figure. 45: Connecting to a logger and a separate power supply device version 42 and newer, all WS100 ........................................ 84 Figure 46: Sensor Configuration XDR .................................................................................................................................................. 138

Operating Manual Smart Weather Sensor
158 G. Lufft Mess- und Regeltechnik GmbH, Fellbach, Germany
21 Index
A
Accessories ............................................................................ 10
Accuracy ................................................................................ 50
Air Density ........................................................................ 12, 17
Air Pressure ..................................................................... 12, 16
Air Temperature ..................................................................... 11
Altitude ................................................................................... 35
ASCII-Protokoll ....................................................................... 77
B
Binary Protocol ....................................................................... 74
C
Certificate of Conformity ......................................................... 65
Channel List ........................................................................... 71
Channel List per TLS2002 ...................................................... 73
Class ID ........................................................................... 74, 75
Commissioning ....................................................................... 31
Communication ...................................................................... 80
Communication ...................................................................... 77
Communication .................................................................... 126
Communication .................................................................... 138
Compass .................................................................... 12, 19, 35
Configuration .......................................................................... 32
Connections ........................................................................... 28
D
Data Request ......................................................................... 74
Declination ............................................................................. 35
Delivery Status ....................................................................... 33
Designated Use ........................................................................ 5
Device ID.......................................................................... 74, 75
Dimensions ............................................................................ 48
Disposal ................................................................................. 68
Distance between objects ....................................................... 26
Drawings ................................................................................ 53
E
Energy Management .............................................................. 37
Enthalpy ........................................................................... 12, 17
Error Codes ...................................................................... 76, 79
External Rain Gauge ........................................................ 13, 69
External Sensors .................................................................... 28
External Temperature Sensor ........................................... 12, 69
F
Factory Settings ..................................................................... 33
Fan ......................................................................................... 34
Fault Description .................................................................... 67
Firmware Update .................................................................... 46
G
Global Radiation ............................................................... 12, 21
H
Heating ................................................ 12, 21, 28, 29, 30, 44, 48
Humidity ........................................................................... 11, 16
I
Incorrect Use ............................................................................ 5
Installation .............................................................................. 24
Installation Location ................................................................ 26
Interface ........................................................................... 29, 49
ISOCON-UMB ........................................................................ 30
L
Local Altitude .......................................................................... 35
M
Maintenance ........................................................................... 46
Measurement Output .............................................................. 16
Measurement Polling (UMB-Config-Tool) ................................ 41
Measurement Values .............................................................. 15
Measuring Range ................................................................... 50
Modbus ................................................................................ 126
N
North Alignment ...................................................................... 25
O
Operating Conditions .............................................................. 49
Operating Modes .................................................................... 42
Order Numbers ......................................................................... 8
P
Power Saving Mode.......................................................... 42, 76
Power Supply Unit .................................................................. 29
Precipitation ...................................................................... 12, 20
Protection type........................................................................ 49
R
Relative Air Pressure .............................................................. 35
Reset Precipitation Quantity ................................................... 38
S
Safety Instructions .................................................................... 5
Scope of Delivery ..................................................................... 7
SDI-12 Mode .......................................................................... 83
Sensor Technology ................................................................. 14
Storage Conditions ................................................................. 49
Supply Voltage ................................................................. 28, 29
Symbols Used .......................................................................... 5
T
Technical Data........................................................................ 48
Technical Support ................................................................... 68
Temperature ........................................................................... 16
Terminal-Mode ....................................................................... 80
Test ........................................................................................ 32
U
UMB-Config-Tool .............................................................. 33, 41
W
Warranty ............................................................................. 6, 68
Weight .................................................................................... 49
Wet Bulb Temperature ............................................................ 17
WetBulb Temperature ............................................................. 12
Wind ................................................................................. 12, 18
X
XDR Protocol ........................................................................ 138

Operating Instructions Smart Weather Sensor
G. Lufft Mess- und Regeltechnik GmbH, Fellbach, Germany 159
Blank page for printing purposes.

Operating Manual Smart Weather Sensor
160 G. Lufft Mess- und Regeltechnik GmbH, Fellbach, Germany
Blank page for printing purposes.

Operating Instructions Smart Weather Sensor
G. Lufft Mess- und Regeltechnik GmbH, Fellbach, Germany 161
Blank page for printing purposes.


Meteorología
Medidor universal de precipitación por el sistema de pesajeTanto si se trata de una llovizna o de un aguacero, de granizo, granizo menudo o de nieve, el OTT Pluvio2 L mide de modo fiable y preciso tanto la cantidad como la intensidad de las precipitaciones en estado líquido, sólido y mezclado. El medidor trabaja según el sistema de pesaje, teniendo en cuenta al mismo tiempo los factores marginales como la temperatura y el viento que podrían falsear el resultado de la medición. Para la transmisión de los datos, están disponibles tanto las salidas digitales (impulso/0,1 mm y estado) como los puertos series, configurables de manera opcional como SDI-12 ó RS-485.
La técnica altamente precisa y la construcción robusta garantizan una elevada exactitud y una seguridad funcional ilimitada. La célula de carga y la electrónica del sensor están pro-tegidas contra los agentes medioambientales perjudiciales; el portaequipo, el recipiente y las piezas protectoras de la carcasa los han sido construidos de un modo especialmente fuerte. Todos los materiales cumplen los requisitos de calidad para un funcionamiento al aire libre y son especialmente resistentes ante las influencias de la temperatura y de la luz solar. Y lo mejor: el OTT Pluvio2 L ahorra un tiempo valioso, ya que no sólo ofrece datos precisos de las precipitaciones, sino que tampoco necesita casi mantenimiento.
OTT Pluvio2 L
Medición de la precipitaciónOTT Pluvio2 L – medidor de precipitación por pesaje para precipitaciones líquidas, sólidas y mezcladas

Establecer estándares con OTT Pluvio2 L
Preparado para cualquier casoEn las series de medidas climatológicas en todo el mundo se esta-blecen distintas exigencias en lo que respecta a la apertura colecto-ra del medidor de precipitaciones atmosféricas. En consecuencia con los estándares extendidos a nivel mundial, ofrecemos, por tan-to, el OTT Pluvio2 L en dos variantes.
— OTT Pluvio2 L 200, Apertura colectora 200 cm2, Capacidad de medición 1500 mm
— OTT Pluvio2 L 400, Apertura colectora 400 cm2, Capacidad de medición 750 mm
Ambas variantes están disponibles de modo opcional con calefacción circular.
Debajo del recipiente colector y bien protegida de los agentes medioambientales perjudiciales, se encuentra una célula de carga de acero fino sellada herméticamente y altamente precisa. Ésta mide el peso total situado sobre ella. La electrónica del sensor
conectada calcula de aquí de manera con-tinua el aumento de la precipitación y de-duce la cantidad y la intensidad termo-
compensada de la precipitación. Para ello, un sensor de tempera-tura integrado ofrece la temperatura ambiente actual correspon-diente. El OTT Pluvio2 L somete a los datos en bruto conseguidos de esta manera a un control de plausibilidad. Los factores de influencia perturbadores, como por ejemplo el viento o la temperatura, se eliminan mediante un algoritmo matemático de manera que finalmente se disponga de datos depurados sobre las precipitaciones.
Procedimiento de medición por pesaje
Exacto, estable durante mucho tiempo y robustoEl OTT Pluvio2 L ha sido diseñado en cooperación con los servicios meteorológicos líderes en tecnología, por lo que satisface las exigen-cias más elevadas y brilla por necesitar, en comparación con otros medidores, unos gastos reducidos de explotación.
— Satisface todas las exigencias de las directrices de la WMO Nº 8 (WMO = World Meteorological Organisation).
— Registra incluso precipitaciones extremas de manera precisa y sin demora temporal de hasta 3.000 mm/h, esto supera incluso las exigencias actuales de la WMO.
— Calibración válida para toda la vida de la célula de carga y de la electrónica del sensor, gracias a que el dispositivo de medición está sellado herméticamente.
— La curva característica individual de la temperatura del dispositivo de medición se compensa continuamente en el firmware.
— Error de medición de ±0,1 mm, durante toda la vida útil del aparato.
— Un sistema de absorción de fuerza elástica protege la célula de carga de los daños que puedan ocasionarse, por ejemplo, a causa de impactos durante el transporte o al vaciar el recipiente colector.
— La electrónica de valoración está bien protegida de los agentes medioambientales y alcanza la más elevada compatibilidad de CEM.
— Las piezas del aparato han sido fabricadas a máquina, son especialmente estables y están hechas de materiales de alta calidad.
— La alimentación de corriente y las interfaces de salida están protegidas de modo fiable contra una sobretensión.
OTT Pluvio2 L 400OTT Pluvio2 L 200

Apropiado para cualquier emplazamientoConcebido para un margen de intensidad de precipitaciones de 0,05 a 3000 mm /h, el OTT Pluvio2 L mide de manera fiable tanto la llovizna de las zonas templadas, como los aguace-ros tropicales y los chubascos de nieve árticos.
— Apertura colectora sin embudo; también las precipitaciones fuertes y las precipitacio-nes sólidas serán recogidas en el tiempo exacto.
— Medida continua de la precipitación y máxima disponibilidad de los datos; ninguna pérdida por evaporación a causa de embudos o recipientes calientes de modo que la precipitación sólida también puede medirse correctamente.
— El producto anticongelante aumenta el volumen de medición en caso de fuertes nevadas y evita que el recipiente colector se congele; uso sin compromiso incluso en las zonas de mucha nieve y heladas.
— Calefacción circular disponible de manera opcional; ninguna formación de capas de nieve.
— Posibilidad de alimentación con energía solar; incluso puede usarse en estaciones de medida con abastecimiento autárquico .
Mínimo mantenimiento — Los costes totales de propiedad son menores que si se emplea un pluviómetro mecánico con báscula; el ahorro se hace notable incluso tras dos años.
— Máxima disponibilidad de datos > 99%; proporciona valores fiables para series de tiempos continuas y completas de precipitaciones.
— Los trabajos de mantenimiento se limitan al vaciado del recipiente colector, a un control visual ocasional y al relleno de producto anticongelante en caso necesario.
— Los molestos trabajos de limpieza debidos a un embudo o a un filtro atascado pertenecen al pasado.
— Los mensajes de alarma y de advertencia se transmiten al sistema de registro de datos mediante las interfaces de salida para un diagnóstico automático de posibles fallos; de este modo, puede reconocerse, por ejemplo, automáticamente en el estado un posible desbordamiento del recipiente.
— La emisión de datos se bloquea durante los trabajos de mantenimiento y las pruebas de precisión.
Software de operación incluidoEl programa de operación controlado por me-nús de OTT Pluvio2 L hace posible la ejecución sin problemas de los controles de funciona-miento y de las pruebas de exactitud in situ por medio de un ordenador portátil. Para ello sólo ha de conectarse el ordenador portátil al Pluvio2 L mediante el puerto USB e iniciarse el software. La alimentación de corriente se efec-túa para ello de manera muy sencilla vía USB.
Para las pruebas de precisión pueden utilizarse pesas de referencia de cualquier tipo. Sólo ha de conocerse el correspondiente peso e introducirse como valor de referencia en el software.

© R
eser
vado
el d
erec
ho a
efe
ctua
r ca
mbi
os té
cnic
os.
70.0
40.0
00.P
.S
Act
ualiz
ació
n: 0
1-03
/201
6
GermanyOTT Hydromet GmbHLudwigstrasse 16 · 87437 KemptenPhone +49 831 5617-0 · Fax [email protected] · www.ott.com
GermanyOTT Hydromet GmbHLudwigstrasse 16 · 87437 KemptenPhone +49 831 5617-0 · Fax [email protected] · www.ott.com
Precipitaciones registrablesLíquidas, sólidas y mezcladas
Superficie colectora - Pluvio2 L 200: 200 cm2
- Pluvio2 L 400: 400 cm2
Cantidad de captura - Pluvio2 L 200: 1500 mm - Pluvio2 L 400: 750 mm
Procedimiento de mediciónProcedimiento de medición por pesaje
Elemento sensorCélula de carga sellada
Margen de medición - Precipitación: 0 … 50 mm/min ó 0 … 3000 mm/h
- Umbral de cantidades para 60 minutos de tiempo de captura: 0,05 mm/h
- Umbral de intensidad: 0,1 mm/min ó 6 mm/h
Precisión de medición (–25 … +45 °C ) - Cantidad: ±0,1 mm ó ±1 % del valor medido
- Intensidad: ±0,1 mm/min, ±6 mm/h ó ±1 % del valor medido
Resolución - Interfaces SDI-12 y RS-485: 0,01 mm, 0,01 mm/min ó mm/h
- Salida de impulsos: 0,05/0,1/0,2 mm (Los valores restantes en 1/100 mm son considerados en el tiempo de captura de 60 minutos)
Intervalo de emisión de la intensidad1 minuto
Intervalo de consulta1 minuto … 60 minutos
Demora de emisión - Tiempo real: < 1 minuto - No tiempo real: 5 minutos
Emisión del valor de medición - Intensidad *TR - Cantidad TR/*NTR - Cantidad NTR - Cantidad total NTR - Contenido del recipiente TR y NTR - Temperatura célula de carga
Emisión de valores de estado - Estado de OTT Pluvio2 L - Estado de la calefacción (si está disponible)
Interfaces - SDI-12 V 1.3 - RS-485 (de dos o 4 hilos) Protocolo SDI-12 y ASCII.txt
- Salidas digitales (2/5 Hz): Impulso: 0,05/0,1/0,2 mm (ajustable) Estado: 0 … 120 impulsos/min
- USB 2.0 (para el modo de servicio) (sin protección contra sobretensiones)
Tensión de alimentación5,5 … 28 V CC, típico 12 V CC; resistente a la polarización inversa
Consumo de corriente (sin calefacción) Típ. 9,2 mA a 12 V CC
Consumo de potencia (sin calefacción)≤ 110 mW
Calefacción circular, opcional - 12 ... 28 V CC, típ. 12/24 V CC con protección contra polarización inversa
- Puvio² L 200: típ. 2,1 A; máx. 2,2 A - Puvio2 L 400: típ. 4,2 A; máx. 4,4 A
Pluvio2 L 200: - máx. 50 vatios a 24 V CC - máx. 12,5 vatios a 12 V CC; rango de control de temperatura de 12 K (viento 0 m/s)
Pluvio2 L 400: - máx. 100 vatios a 24 V CC - máx. 25 vatios a 12 V CC; rango de control de temperatura de 7 K (viento 0 m/s)
Modos de servicio de la calefaccióncircular (regulación de la calefacción): - Desconectada - Permanentemente activada - Permanentemente activada dentro de un margen de temperaturas definido
- Estándar US NWS, controlado por tiempo - En caso de precipitaciones (tiempo de funcionamiento ajustable)
Dimensiones - Pluvio2 L 200 (Ø x h): 450 mm x 752 mm - Pluvio2 L 400 (Ø x h): 450 mm x 677 mm - Tubo vertical (Ø): 4"
Peso (recipiente vacío)16 /16,6 kg
Material - Placa base: aluminio /acero inoxidable - Recipiente colector: polietileno - Soporte del recipiente colector: ASA, estabilizado frente a UV
- Carcasa tubular: ASA, estabilizado frente a UV
Condiciones ambientales - Temperatura, en servicio – 40 … +60 °C
- Temperatura, almacenamiento – 50 … +70 °C
- Humedad relativa 0 … 100 % (sin condensación)
Protección - Carcasa tubular cerrada: IP65 - Carcasa tubular abierta: IP63 - Célula de carga: IP68, resistente a la niebla salina
NormasCEM: 2004/108/CE; EN 61326-1:2013
Programa de operación de Pluvio2 L
(incluido en el suministro) - Indicación del valor medido - Configuración - Diagnosis - Actualización de firmware - Prueba de exactitud guiada
Características técnicas
TR = Tiempo real; NTR = No tiempo real; Unidades configurables en mm ó in (inch, pulgadas), en mm/min ó mm/h, en in/min ó in/h y en °C ó °F
OTT PWS – protección contra el vientoPara los emplazamientos especialmente expuestos puede obtenerse de manera opcional una protección contra el viento. Ésta se encarga de que las precipitaciones de poca inten-sidad caigan en el recipiente colector aunque haya viento.
— Protección contra el viento de tipo Alter con 24 láminas — Estable y resistente a velocidades del viento elevadas — Construcción de acero fino resistente a la corrosión — No necesita un cimiento adicional — Alturas de montaje de 100 cm, 120 cm ó 150 cm
OTT Pluvio2 L: medidor de precipitación profesional

Espa
ñol
Instrucciones de funcionamientoSensor de precipitacionesOTT Pluvio2 L

Reservado el derecho a efectuar cambios técnicos.

3
Índice
1 Volumen de suministro 4
2 Números de pedido 4
3 Introducción 5
3.1 Salida del valor medido en la interfaz SDI-12 y RS-485 7 3.2 Salida del valor medido en la salida de impulsos 9 3.3 Representación gráfica de la salida del valor medido con diferentes intensidades de precipitación 11 3.4 Calefacción del aro colector 12
4 Indicaciones de seguridad básicas 15
5 Instalación del OTT Pluvio2 L 16
5.1 Tipos de cables recomendados/Longitudes máximas de cable recomendadas 16 5.2 Herramientas/Elementos auxiliares necesarios 17 5.3 Preparación del emplazamiento 18 5.4 Preparación del soporte base 19 5.5 Confección del cable de conexión 20 5.6 Instalación del soporte base sobre el tubo vertical 22 5.7 Contacto del cable de conexión 23 5.8 Conexión del cable de puesta a tierra 23 5.9 Nivelado del soporte base 24 5.10 Realización de tareas finales 25
6 Mandatos y respuestas de SDI-12 29
6.1 Mandatos estándar 29 6.2 Mandatos avanzados de SDI-12 32 6.3 Modo de líneas de mandato RS-485 (solicitud del texto ASCII) 35
7 Realización de labores de mantenimiento 36
7.1 Vaciado del recipiente colector 36 7.2 Adición de producto anticongelante para el funcionamiento en invierno 36 7.3 Realización de controles visuales 37 7.4 Comprobaciones adicionales en caso de avería 37 7.5 Localización y subsanación de fallos 38 7.6 Realización de la prueba de precisión guiada (medición de control) 42
8 Reparación 44
9 Indicaciones para la disposición de instrumentos antiguos 44
10 Características técnicas 45
Anexo A – Conexión del OTT Pluvio2 L al recolector de datos OTT 49
A.1 Conexión del OTT Pluvio2 L a OTT netDL o OTT DuoSens mediante la interfaz SDI-12 o RS-485 49 A.2 Conexión del OTT Pluvio2 L a OTT netDL u OTT DuoSens mediante la salida de impulsos 51
Anexo B – Dimensiones del OTT Pluvio2 L 200 sobre el tubo vertical con placa del fondo 53
Anexo C – Dimensiones del OTT Pluvio2 L 400 sobre el tubo vertical con placa del fondo 54
Anexo D – Dimensiones de los tubos verticales con placa del fondo 55
Anexo E – Instalación de la protección antirrobo 56
Anexo F – Instalación del aro de pájaros 57
Anexo G – Accesorios/Piezas de repuesto 58

1 Volumen de suministro
� OTT Pluvio2 L – Sensor de precipitaciones por sistema de pesaje; superficie colectora:200 cm2; capacidad colectora: 1500 mm (Versión 200) o 750 mm(Versión 400) de precipitación.Consta de: soporte base con mecanismo de pesaje, soporte del reci-piente colector, recipiente colector y carcasa tubular. Con interfazSDI-12, RS-485 y puerto USB (con fines de servicio). Salidas deimpulsos adicionales para la cantidad de precipitación y la infor -mación del estado.
– Juego de accesorios para la instalación(6 tornillos de cabeza hexagonal M 8 x 40;1 elemento atornillado de emborne de 8 polos;1 elemento atornillado de emborne de 6 polos;3 sujetacables 140 x 3,6;1 puente de contacto1 llave de boca, ancho de llave: 10/13)
– Cable de conexión USBConector USB tipo A en conector USB tipo B; 3 m
– Instrucciones de funcionamiento – Certificado de inspección (protocolo FAT)
2 Números de pedido
� OTT Pluvio2 L Versión 200 70.040.000.9.0– superficie colectora: 200 cm2
– capacidad de registro: 1500 mm de precipitación
Versión 200 RH 70.040.001.9.0– superficie colectora: 200 cm2
– capacidad de registro: 1500 mm de precipitación– con calefacción del aro colector integrada;
potencia nominal de 50 vatios
Versión 400 70.040.020.9.0– superficie colectora: 400 cm2
– capacidad de registro: 750 mm de precipitación
Versión 400 RH 70.040.021.9.0– superficie colectora: 400 cm2
– capacidad de registro: 750 mm de precipitación– con calefacción del aro colector integrada;
potencia nominal de100 vatios
Accesorios y piezas de repuesto, véase el Anexo G
4

3 Introducción
El sensor de precipitaciones OTT Pluvio2 L sirve para calcular automáticamente laintensidad y la cantidad meteorológica de precipitación caída.
Al contrario que los sensores de precipitaciones convencionales, el OTT Pluvio2 Lfunciona por un sistema de pesaje. Con independencia de si la precipitación eslíquida o sólida, el OTT Pluvio2 L la reconoce de modo seguro mediante unadeterminación del peso del recipiente colector. El sensor de precipitaciones OTTse caracteriza, sobre todo, por que necesita poco mantenimiento. Esto lo consiguemediante una elevada capacidad del recipiente colector, mediante la ausencia deun embudo colector, elemento habitual en las básculas, y mediante una estructuramuy robusta del mecanismo de pesaje.
Como elemento sensor se emplea una célula de carga de acero inoxidable dealta precisión y duradera que está cerrada herméticamente contra los agentesmedioambientales. Un sensor de temperatura integrado compensa el coeficientede temperatura del mecanismo de pesaje. El seguro mecánico contra sobrecargaevita que se produzcan daños en la célula de carga debido a fuerzas demasiadoelevadas en dirección vertical; por ejemplo, al transportar o al vaciar el recipientecolector.
Versión 200Apertura colectora 200 cm²
Capacidad de registro 1.500 mm
Versión 400Apertura colectora 400 cm²
Capacidad de registro 750 mm
Fig. 1: Sensor de precipitaciones OTT Pluvio2 L
El OTT Pluvio2 L está disponible en dosmodelos: versión 200 y versión 400.
5

Cada 6 segundos el sensor de precipitaciones calcula el peso del recipiente colec-tor incluido el contenido con una resolución de 0,001 mm (= valor bruto). De ladiferencia entre ese valor medido y el peso bruto del recipiente colector vacíoresulta el nivel actual de llenado del recipiente colector.
Un algoritmo de filtro especial evita aquí que se falseen los resultados de la medi-ción como ocurre, por ejemplo, por la influencia del viento. La diferencia entre elnivel de llenado actual y el anterior del recipiente colector proporciona la intensi-dad de la precipitación en mm/min o bien en mm/h.
El OTT Pluvio2 L suma estos valores de la intensidad de la precipitación de cada6 segundos a una cantidad de precipitación acumulada (Cantidad total NTR;véase abajo).
Los valores medidos están disponibles, según la ejecución del algoritmo de filtro,como valores en tiempo real y valores no en tiempo real:
� Emisión en tiempo real (TR): con intensidades mayores de 0,1 mm/min,el OTT Pluvio2 L emite el resultado de la medición en el transcurso de unminuto después de que se presenten las precipitaciones. Ventaja: tiempo dereacción rápido y emisión correcta de la intensidad de la precipitación.
� Emisión no en tiempo real (NTR): el OTT Pluvio2 L emite el resultadode la medición 5 minutos después de que se presenten las precipitaciones.Ventaja: emisión correcta de la cantidad de precipitación y más precisa.
Puede accederse a todos los valores medidos a través de una interfaz serie SDI-12y RS-485. En concreto estos son:
� Intensidad TR� Cantidad TR/NTR (desde la última petición del valor medido)� Cantidad NTR (desde la última petición del valor medido)� Cantidad total NTR (desde el último reseteo)� Recipiente colector TR� Recipiente colector NTR� Temperatura de la célula de carga� Estado del OTT Pluvio2 L (desde la última petición del valor medido)
El OTT Pluvio2 L facilita los valores medidos de precipitación con una resoluciónde 0,01 mm. Estos están sometidos a umbrales de respuesta individualesde ≥ 0,05 mm en el transcurso de una hora. En el capítulo 3.1 encontrará unadescripción detallada de cada uno de los valores medidos.
A través de dos salidas de impulsos, el OTT Pluvio2 L emite en paralelo a las inter-faces serie la cantidad de precipitación TR/NTR (salida 1) y la información delestado (salida 2). El factor de impulsos se puede seleccionar: un impulso corres-ponde a 0,05 mm, 0,1 mm o 0,2 mm de precipitación.
El funcionamiento en paralelo de interfaces serie y la salida de impulsos permitela conexión simultánea a dos recolectores de datos o a un recolector de datos yun controlador lógico programable (PLC).
El OTT Pluvio2 L se monta sobre un soporte vertical de 4" que está fijado en uncimiento de hormigón con una placa de fondo. La altura de montaje estándar esde 1 metro (altura de la abertura colectora); de manera alternativa, tambiénpuede montarse a 1,2; 1,5; 2,0; 2,5 o 3,0 metros.
Después de conectar la tensión de alimentación, el OTT Pluvio2 L inicia automáti-camente el servicio de medición (� el LED rojo parpadea; véase la fig. 18). ElOTT Pluvio2 L viene calibrado de fábrica. No es necesario realizar ninguna otramedida de calibración in situ.
Los aumentos de peso mayores de 12 mm aproximadamente en 6 segundos no llevan a una emisión de la precipitación debido a que sobrepasan la caída de preci-pitación natural. De este modo se suprimen los aumentos perturbadores, por ejemploal sustituir el recipiente colector o al añadir producto anticongelante. Las medicionesde control incluso con pesos de referencia mayores (Versión 200: > 240 g; Versión400 > 480 g) son posibles gracias a los valores Recipiente colector TR y Recipientecolector NTR. La petición del valor medido se realiza en un telegrama de datoscomún con varios valores medidos. Las peticiones individuales con diferentesintervalos no son posibles.
6

Con fines de servicio (medidas de prueba, configuración cómoda de los paráme-tros de servicio y para una prueba de precisión) está disponible un puerto USB.Al emplear el puerto USB no se necesita ninguna otra conexión aparte para latensión de alimentación.
Tenga en cuenta: el OTT Pluvio2 L interrumpe la comunicación en las inter -faces serie después de conectar el puerto USB.
El sistema de medición del OTT Pluvio2 L evita las posibles emisiones erróneas deprecipitaciones tras las siguientes situaciones y no emite aumentos de precipitacionesa través de las interfaces:
� El puerto USB estuvo conectado durante unos 5 minutos(carcasa tubular extraída)
� Vaciado (gran reducción de peso) durante unos 5 minutos� Puesta en funcionamiento/corte de tensión durante unos 2 minutos
El juego de pesas de prueba OTT (accesorio) permite la realización de medicionesde control anuales (prueba de precisión guiada) en combinación con el programade operación OTT Pluvio2.
3.1 Salida del valor medido en la interfaz SDI-12 y RS-485� Intensidad TR
Aumento flexible de las precipitaciones del último minuto antes del intervalo deconsulta. (Procedimiento de medición de acuerdo con la directiva n.º 8 de laOMM) Este valor medido es muy apropiado para, por ejemplo, determinar laintensidad exacta en caso de fuertes precipitaciones y para la gestión de alarmas,pero no para las sumas diarias y mensuales.
Retardo de emisión: Emisión en tiempo real (TR)Unidades: mm/h · mm/min
pulgadas/h · pulgadas/minUmbral de respuesta: 0,1 mm/min · 6 mm/hIntervalo de consulta necesario: 1 minutoIntervalo de almacenamiento necesario: 1 minuto
Indicación: los intervalos de consulta mayores ofrecen siempre la intensidad deprecipitación del último minuto antes del intervalo de consulta. En caso de intensi-dades de precipitación < 0,1 mm/min, el OTT Pluvio2 L fija el valor de salida acero. Por este motivo, este valor de salida no se puede utilizar para acumularintensidades individuales.
� Cantidad TR-NTR
Este valor medido representa una combinación de emisión en tiempo real y emi-sión no en tiempo real. Esto ofrece la ventaja de una emisión TR más rápida encombinación con una emisión NTR retardada con la máxima precisión posible.Proporciona la cantidad correcta de precipitación acumulada durante el intervalode consulta.Si la cantidad de precipitación excede inmediatamente el umbral de respuesta, elOTT Pluvio2 L emite el resultado de medición en tiempo real. En caso contrario,recoge las precipitaciones más finas durante una hora como máximo y no emiteen tiempo real el valor medido. Si las precipitaciones más finas no alcanzan elumbral de respuesta en una hora, no tendrá lugar ninguna emisión. Este valormedido es similar al comportamiento de un sensor de precipitaciones con básculay es muy apropiado para las sumas diarias y mensuales, así como para la ges-tión de alarmas.
Retardo de emisión: Emisión en tiempo real (TR) para precipitaciones queexceden inmediatamente el umbral de respuesta; delo contrario, emisión no en tiempo real (NTR)
Unidades: mm · pulgadasUmbral de respuesta: 0,05 mm en el transcurso de una hora
7

1 minuto (con una consulta simultánea de la intensidad de precipitación)
Cualquiera entre 1 minuto y 24 horas; el recolectorde datos debe sumar los distintos valores medidosmediante una función de suma a lo largo de todo elintervalo de almacenamiento.
Indicación: todas las consultas de las interfaces ponen a cero los valores de lascantidades acumuladas en el OTT Pluvio2 L.
� Cantidad NTR
Este valor medido proporciona la cantidad correcta de precipitación acumuladadurante el intervalo de consulta con un retardo de emisión fijo de 5 minutos.Ofrece la ventaja de una suma de precipitaciones más precisa gracias a un mejorfiltrado. Las precipitaciones más finas se recogen durante una hora como máximoy se emiten al alcanzar el umbral de respuesta. Si las precipitaciones más finasno alcanzan el umbral de respuesta en una hora, no tendrá lugar ninguna emi-sión. Este valor medido es muy apropiado para las sumas diarias y mensuales.
Retardo de emisión: Emisión no en tiempo real (NTR)Unidades: mm · pulgadasUmbral de respuesta: 0,05 mm en el transcurso de una hora
1 minuto (con una consulta simultánea de la intensidad de precipitación)
Cualquiera entre 1 minuto y 24 horas; el recolectorde datos debe sumar los distintos valores medidosmediante una función de suma a lo largo de todo elintervalo de almacenamiento.
Indicación: todas las consultas de las interfaces ponen a cero el valor medidoacumulado en el OTT Pluvio2 L. El retardo de emisión fijo de 5 minutos hace posi-ble la correspondiente corrección de la marca de tiempo en caso necesario paralas bases de datos climatológicas.
� Cantidad total NTR
Este valor medido proporciona la cantidad correcta de precipitación acumuladadesde el último inicio del aparato con un retardo de emisión fijo de 5 minutos.Para ello se suman los valores individuales Cantidad NTR (emisor redundante).Este valor medido es muy apropiado para sumas diarias o mensuales, así comopara controles de plausibilidad de los valores Cantidad NTR y Cantidad TR-NTR.Ventaja: no hay pérdida de la cantidad de precipitaciones acumulada en caso deun fallo temporal de la transmisión de datos.
El valor se restablece: – con un mandato de restablecimiento de SDI-12 aparte o– conectando/desconectando la tensión de alimentación o– de manera automática si se sobrepasa el margen de medición
(500 mm; 50 pulgadas).
Retardo de emisión: Emisión no en tiempo real (NTR)Unidades: mm · pulgadasUmbral de respuesta: 0,05 mm en el transcurso de una hora
1 minuto (con una consulta simultánea de la intensidad de precipitación)
Cualquiera entre 1 minuto y 24 horas(los valores medidos no se suman ni se promedian)
Intervalo de consultarecomendado:Intervalo de almacena-miento recomendado:
Intervalo de consultarecomendado:Intervalo de almacena-miento recomendado:
Intervalo de consultarecomendado:Intervalo de almacena-miento recomendado:
8

� Recipiente colector TR
Este valor medido emite el nivel de llenado del recipiente colector medido actualmentey sin filtrar. Se corresponde con el valor bruto de peso medido y está sometido a unaincertidumbre de medición mayor en lo que se refiere a la influencia de la tempera-tura y del viento. Este valor medido es muy apropiado para las medidas rápidas dereferencia del mecanismo de pesaje y para la determinación del nivel actual de lle-nado del recipiente colector. No es conveniente realizar un cálculo separado de lasprecipitaciones en un recolector de datos externo con este valor medido.
Retardo de emisión: Emisión en tiempo real (TR)Unidades: mm · pulgadasResolución: 0,01 mm (Versión 200: 1 mm =̂ 20 g;
Versión 400: 1 mm =̂ 40 g) 1 minuto (con una consulta simultánea de la
intensidad de precipitación) Cualquiera entre 1 minuto y 24 horas
(eventualmente, promediación sobre 10 minutos)
� Recipiente colector NTR
Este valor medido emite el nivel de llenado del recipiente colector medido actual-mente y filtrado. Se corresponde con el valor de peso filtrado y está sometido auna incertidumbre de medición en lo que se refiere a la influencia de la tempera-tura. Este valor medido es muy apropiado para determinar el nivel de llenado delrecipiente colector y para calcular el comportamiento de evaporación. No es con-veniente realizar un cálculo separado de las precipitaciones en un recolector dedatos externo con este valor medido.
Retardo de emisión: Emisión no en tiempo real (NTR)Unidades: mm · pulgadasResolución: 0,01 mm (Versión 200: 1 mm =̂ 20 g;
Versión 400: 1 mm =̂ 40 g) 1 minuto (con una consulta simultánea de la
intensidad de precipitación) Cualquiera entre 1 minuto y 24 horas
� Temperatura de la célula de carga
Temperatura interna de la célula de carga para la compensación del coeficientede temperatura. Este valor solamente es relevante para fines internos y varía casisiempre varios °C de la temperatura ambiente actual.
Unidades: °C · °F 1 minuto (con una consulta simultánea de la
intensidad de precipitación) Solo si se necesita (cualquiera entre 1 minuto y
24 horas)
3.2 Salida del valor medido en la salida de impulsos
A través de dos salidas de impulsos, el OTT Pluvio2 L emite en paralelo a las inter-faces serie la cantidad de precipitación TR/NTR (salida 1) y la información delestado (salida 2). El funcionamiento en paralelo de interfaces serie y la salida deimpulsos permite la conexión simultánea a dos recolectores de datos o a un reco-lector de datos y un controlador lógico programable (PLC).
Característica eléctrica de la salida de impulsos y la de estadoImpulso “on”: Contacto cerradoRelación impulso-pausa: 1:1
Con 5 Hz =̂ 100/100 ms; con 2 Hz =̂ 250/250 msEjecución del contacto: Sin rebote, con independencia de la polaridad,
con aislamiento galvánicoIntensidad de corriente, Imáx: ≤ 100 mA (resistente al cortocircuito; desconexión
por carga con 200 mA)Tensión, Umáx: ≤ 28 VCC
Intervalo de consultarecomendado:Intervalo de almacena-miento recomendado:
Intervalo de consultarecomendado:Intervalo de almacena-miento recomendado:
Intervalo de consultarecomendado:Intervalo de almacena-miento recomendado:
9

� Impulso-Cantidad TR-NTR
Este valor medido es idéntico al valor Cantidad TR-NTR. Sin embargo, el umbralde respuesta está determinado por la resolución de la salida de impulsos(0,05 mm · 0,1 mm · 0,2 mm). La salida del valor medido se produce comosecuencia de impulsos con una frecuencia de 5 Hz (configuración estándar) o de2 Hz (parametrizable mediante el programa de operación OTT Pluvio2 por mediodel puerto USB).
Retardo de emisión: Véase Cantidad TR-NTRFactor de impulsos (seleccionable): 0,05 mm · 0,1 mm · 0,2 mm
(1 mm =̂ 20 · 10 · 5 impulsos)0,01 pulgadas
Resolución: 0,05 mm · 0,1 mm · 0,2 mmIntervalo de consulta recomendado: Recuento continuo de los impulsosIntervalo de almacenamiento recomendado: Cualquiera entre 1 minuto y 4 horas
� Impulso-Información del estado
Este valor medido se corresponde con el nivel de llenado actual del recipientecolector y, además, aporta información del estado. Adicionalmente, la informa-ción del estado puede utilizarse como “señal de actividad”.
0 impulsos/min Error del sistema, el aparato o el cable de conexiónde la salida de impulsos está averiado (salida 2)
10 … 100 impulsos/min 0 … 100 % del nivel de llenado aproximado delrecipiente
120 impulsos/min Mantenimiento por USB
Pulse
OUT
mm
/inc
h A
Pulse
OUT
mm
/inc
h B
Pulse
OUT
Sta
tus A
Pulse
OUT
Sta
tus B
1 2 3 4 Imax : 100 mA*Umax: 28 VDC
Terminales 2 + 4
Terminales 1 + 3
10 ohmios
Representación básica simplificada
Representación detallada
Terminales
Optorrelé electrónico interno
* Resistente al cortocircuito; desconexión por carga con 200 mA
Fig. 2: Esquema de conexionesde las salidas de impulsos.
La posición de los terminales deconexiónse puede consultar en la fig. 13.
Salida 1: terminales 1 y 2Salida 2: terminales 3 y 4
10

Tenga en cuenta:Al conectar las salidas de impulsos al:– Recolector de datos OTT � No es necesario ningún conexionado más. Puede
conectar las salidas de impulsos directamente a las entradas de impulsos de unrecolector de datos OTT.
– Recolector de datos de otro fabricante � El conexionado externo a la salida deimpulsos y del estado debe haberse dimensionado de manera que se respetenlos valores límite para Imáx ≤ 100 mA y Umáx ≤ 28 V en todas las condiciones defuncionamiento. En caso necesario, trabaje con una resistencia previa (resisten-cia de pull-up).
3.3 Representación gráfica de la salida del valor medido condiferentes intensidades de precipitación
Recipientecolector TRRecipientecolector NTR
Intensidad TR
Cantidad TR-NTR
Cantidad NTR
Cantidad total NTR
Precipitación fina< 0,1 mm/min
Precipitación≥ 0,1 mm/min
Impulso-Cantidad TR-NTR
5 min
Límites de los canales
0,01 mm
0,01 mm
0,1 mm/min
* 0,05 mm
* 0,05 mm
0,1mm
* en el transcurso de una hora
* 0,05 mm
Fig. 3: Display esquemático del valor medi-do para diferentes valores de precipitación
del Pluvio2 L para precipitación fina(< 0,1 mm/min) y precipitación
(≥ 0,1 mm/min).
Los límites de los canalesse indican a la derecha.
11

3.4 Calefacción del aro colector
Las dos versiones del OTT Pluvio2 L están disponibles con una calefacción opcio-nal del aro colector. Esta mantiene el aro colector sin adherencias de nieve ni dehielo de manera fiable a bajas temperaturas ambiente. No se pueden formarcapas de nieve.
La calefacción del aro colector se compone de un elemento de calefacción circularintegrado en la carcasa tubular con un sensor de temperatura, así como de unaregulación electrónica de la calefacción para regular y vigilar el funcionamientode la calefacción. El contacto eléctrico del cable de conexión se produce mediantedos contactos de clavija y un bloque de conexión automáticamente al colocar lacarcasa tubular sobre el soporte base.
Para evitar pérdidas por evaporación no deseadas, solo se calienta el propio arocolector. La calefacción del aro colector no ofrece, por ello, ninguna proteccióncontra la congelación del recipiente colector. Mediante una temperatura del arocolector baja y constantemente vigilada, el mando de la calefacción evita demanera fiable un efecto de chimenea (cantidades incorrectas de precipitacióncausadas por efectos térmicos).
Aro colector
Carcasatubular
Cable de conexiónde la calefacción
del aro colector
Contactosde clavija
Bloque de conexión
Fig. 4: Representación básicade la calefacción del aro colector
del OTT Pluvio2 L.
La superficie del aro colectorrepresentada en gris es la parte
calefactada de la carcasa tubular.
12

El OTT Pluvio2 L calienta el aro colector hasta que alcanza la temperatura debidaajustada de +4 °C (ajuste de fábrica), siempre que la potencia de calefacción ylas condiciones ambientales lo permitan. Para ello, la regulación de calefacciónmide la temperatura ambiente y del aro colector, y calcula la relación impulso-pausa a partir de estos valores junto con la temperatura debida ajustada.En función de su valor, la regulación de calefacción suministra corriente al ele-mento de calefacción durante un periodo de entre 5 y 120 segundos.
Además, varios modos de servicio ofrecen la posibilidad de activar/desactivar laregulación de calefacción basándose en determinados criterios (véase abajo).
En caso de que la regulación de calefacción esté activada, el OTT Pluvio2 L efec-túa controles continuos de funcionamiento de la calefacción del aro colector paradetectar posibles fallos (autocomprobación de la calefacción). Fuera, en caso deque la regulación de calefacción esté desactivada temporalmente, la autocom -probación de la calefacción depende del modo de servicio ajustado. El resultadosirve para el control del sistema en el campo de medición. En caso de que nopueda subsanarse el fallo (estados de funcionamiento extraordinarios o averíade la calefacción del aro colector), se produce la información de estado “La auto-comprobación de la calefacción del aro colector ha sido errónea”, véase la res-puesta al mandato SDI-12 aD2!, capítulo 6.1.
Si la temperatura medida del aro aumenta a más de 50 °C en el servicio de cale-facción, la regulación de calefacción activa una desconexión automática de segu-ridad del elemento de calefacción.
La calefacción del aro colector puede conectarse o desconectarse mediante unmandato avanzado de SDI-12 o mediante una tensión de alimentación separada.De este modo es posible desconectar completamente la calefacción del aro colector,por ejemplo, en verano. En la información del estado se produce entonces el corres-pondiente mensaje (respuesta al mandato SDI-12 aD2!; <valor 8> = +64).
La tensión de alimentación nominal para el funcionamiento de la calefacción delaro colector es de 24 VCC; la potencia máxima de calefacción con una tempera -tura ambiente muy baja es de 50 vatios aproximadamente en la versión 200 y100 vatios en la versión 400. De manera opcional, la tensión de alimentación dela calefacción del aro colector puede suministrarse de modo separado o conjuntocon la tensión de alimentación del sensor de precipitaciones.
Como aplicación especial también es posible un funcionamiento de la calefaccióndel aro colector con 12 VCC. En este caso, la potencia de calefacción efectiva esdel 25 % de la potencia nominal. Para el servicio en zonas templadas y utilizandosistemas solares de 12 V, este funcionamiento es posible básicamente. Los datosespecificados para el servicio con 24 VCC no se pueden conservar en todo el mar-gen de temperaturas (véase Características técnicas). A temperaturas por debajode –5 … –10 °C, se puede contar a veces en este caso con adherencias de nievey hielo.
Modos de servicio de la calefacción del aro colector:� Modo 0 La calefacción del aro colector está desconectada por completo.
(La calefacción no realiza autocomprobaciones.)
� Modo 1 La regulación de calefacción está permanentemente activada.La regulación de calefacción mantiene constante la temperaturadel aro colector al valor nominal predefinido.(Ajuste de fábrica)
� Modo 2 La regulación de calefacción está permanentemente activadadentro de un margen de temperaturas definido.Como en el modo 1, en el que la regulación de la calefacciónestá desactivada de forma provisional por debajo de una tempe-ratura límite ajustada (–40 … +9 °C). La calefacción se autocom-prueba por debajo de la temperatura límite en un intervalo detiempo seleccionable (1 h … 7 d).
13

� Modo 3 Regulación de calefacción de acuerdo con el estándar del Natio-nal Weather Service (NWS) (EE. UU.).La regulación de calefacción está activada a partir de una horaajustada (hora de inicio) y mantiene constante la temperatura delaro colector al valor predefinido. La duración de la conexióntambién se puede ajustar (1 … 1440 minutos). La calefacción seautocomprueba fuera de esta duración de conexión en un inter-valo de tiempo seleccionable (1 h … 7 d).
Tenga en cuenta: este modo presupone una hora correcta-mente ajustada del OTT Pluvio2 L. Si un corte de la tensión dealimentación dura más de 10 minutos, el OTT Pluvio2 L perderá lahora. En este caso, la regulación de calefacción ya no funcionarácorrectamente.
� Modo 4 Regulación de calefacción debido a precipitaciones.La regulación de calefacción se ha activado con la introducciónde precipitaciones durante un tiempo de funcionamiento posteriorajustado (1 … 1440 minutos) y mantiene constante la temperatu-ra del aro colector al valor nominal predefinido. La calefacción seautocomprueba fuera de este tiempo de funcionamiento posterioren un intervalo de tiempo seleccionable (1 h … 7 d).
Temperatura ambiente
Temperatura debida
Desactivada temporalmente (+064)
Estado de la regulación de la calefacción
Temperatura del aro colector
t
Hora de inicio*
* Ajuste de fábrica: 14:00:00 heure
Duración de conexiónt
Fig. 5: Representación gráfica del modo deservicio 3 de la calefacción del aro colector.
Temperatura ambiente
Temperatura debida
Desactivada temporalmente (+064)
Estado de la regulación de la calefacción
Temperatura del aro colector
Precipitaciones
t
t
t
* Ajuste de fábrica: 20 minutesTiempo de funciona-
miento posterior*
Fig. 6: Representación gráfica del modo deservicio 4 de la calefacción del aro colector.
14

4 Indicaciones de seguridad básicas
� Lea estas instrucciones de funcionamiento antes de poner en servicio elOTT Pluvio2 L por primera vez. Familiarícese bien sobre la instalación y el funcionamiento del OTT Pluvio2 L. Guarde estas instrucciones de funcionamientopara poder consultarlas en ocasiones posteriores.
� El OTT Pluvio2 L sirve para el cálculo automático de la intensidad y de la can -tidad meteorológica de precipitación caída. Emplee el OTT Pluvio2 L exclusiva-mente de la manera descrita en estas instrucciones de funcionamiento.Para más información � véase el capítulo 3, “Introducción”.
� Respete las indicaciones de seguridad detalladas que acompañan a los dis -tintos pasos de ejecución. Todas las indicaciones de seguridad contenidas enestas instrucciones de funcionamiento están marcadas con el símbolo deadvertencia contiguo.
� Transporte el sensor de precipitaciones solamente con el dispositivo de seguri-dad para el transporte montado. Tenga en cuenta: un dispositivo de segu-ridad para el transporte tampoco supone una protección absoluta contradaños. Para más información � véase el capítulo 5.4, “Preparación del soportebase”.
� Evite las sacudidas y los golpes fuertes durante el transporte y el servicio.El OTT Pluvio2 L está equipado con un mecanismo electrónico de pesaje muy sensible. Emplee únicamente el embalaje original para el transporte.
� Respete siempre las especificaciones eléctricas, mecánicas y climáticasindi cadas en las características técnicas.Para más información � véase el capítulo 10, “Características técnicas”.
� Realice todas las labores de mantenimiento recomendadas en los intervalosindicados; para ello, véase el capítulo 7, “Realización de labores de manteni-miento”.
� No realice ninguna modificación ni cambie la estructura del OTT Pluvio2 L.Si efectúa modificaciones o cambia la estructura perderá todos los derechosde garantía.
� Encargue la comprobación y la reparación de un OTT Pluvio2 L averiado exclu -sivamente al Repaircenter de la empresa OTT. Nunca realice reparaciones ustedmismo. La precisión de medición especificada está garantizada únicamente conuna reparación cualificada y una comprobación final posterior de fábrica.Para más información � véase el capítulo 8, “Reparación”.
� Elimine el OTT Pluvio2 L de manera adecuada tras su puesta fuera de servicio.No tire bajo ninguna circunstancia el OTT Pluvio2 L a la basura doméstica.Para más información � véase el capítulo 9, “Indicaciones sobre la elimina-ción de instrumentos antiguos”.
15

5 Instalación del OTT Pluvio2 L
El OTT Pluvio2 L se instala en un tubo vertical de 4" de acero galvanizado (diáme-tro exterior posible del tubo vertical 100 … 120 mm). El tubo vertical debe estarfijado con seguridad por medio de un cimiento de hormigón con el correspon-diente dimensionado. Los tubos verticales de OTT disponibles como accesoriosestán equipados para ello con una placa de fondo.
La altura de montaje estándar según la recomendación de la Organización Meteorológica Mundial (OMM) para sensores de precipitaciones es de 1 metro(altura de la abertura colectora). De manera alternativa, también pueden montarsea 1,2; 1,5; 2,0; 2,5 o 3,0 metros.
Seleccione con cuidado el emplazamiento en función de sus necesidades meteoro-lógicas. Aquí es necesario que procure que el emplazamiento no esté sometido asacudidas. Por ejemplo, el tráfico de una carretera cercana al emplazamientopuede perjudicar los resultados de la medición debido a las sacudidas.
La distancia máxima al emplazamiento del aparato de registro de datos y a laalimentación de tensión a los que el OTT Pluvio2 L debe conectarse depende de lainterfaz que se use:
� Interfaz SDI-12: 70 metros� Interfaz RS-485: 1000 metros� Salida de impulsos: 1000 metros
En un OTT Pluvio2 L con calefacción del aro colector, la distancia máxima a lafuente de alimentación de la calefacción del aro colector es de 125 metros.
Tenga en cuenta: el sensor de precipitaciones OTT Pluvio2 L está equipadocon un mecanismo electrónico de pesaje muy sensible. Durante la instalaciónproceda únicamente del modo que se describe en estas instrucciones de funciona-miento. Para impedir que se causen daños en el mecanismo de pesaje del OTTPluvio2 L durante la instalación: evite sacudidas fuertes y no ejerza grandes fuer-zas sobre la célula de carga ni el dispositivo fijador del soporte del recipientecolector (posiciones, véase la fig. 16).
5.1 Tipos de cables recomendados/Longitudes máximas decable recomendadas
Para el servicio del OTT Pluvio2 L se necesitan las siguientes conexiones:
� alimentación de tensión del sensor de precipitaciones,� alimentación de tensión de la calefacción del aro colector (opcional),� aparato de registro de datos (interfaz SDI-12/RS-485, salida de impulsos),� terminal de puesta a tierra.
Para la alimentación de tensión del sensor de precipitaciones y para la conexióndel aparato de registro de datos puede emplearse un cable de conexión común.
En un OTT Pluvio2 L con calefacción del aro colector se puede emplear un cable deconexión separado (como alternativa, dos conductores adicionales en el cable deconexión común). Esto tiene la ventaja de que de este modo puede encenderse yapagarse la calefacción del aro colector independientemente del sensor de precipita-ciones. Además, el consumo de corriente de la calefacción del aro colector requiereuna sección más grande de los conductores con un cable de conexión más largo.
La zona de conexión del OTT Pluvio2 L posee en total dos entradas de cable(manguitos de goma).
Tenga en cuenta: el concepto de protección del OTT Pluvio2 L contra sobretensio-nes está ejecutado de manera que todas las sobretensiones que se presenten se des-víen inmediatamente a través de un conductor de tierra. Para ello, es absolutamentenecesaria la instalación profesional y plenamente operativa de un cable de puesta atierra. Éste debe conectarse al terminal de puesta a tierra en el lado del OTT Pluvio2 Ly a un electrodo de cimiento o varilla de puesta a tierra en el lado contrario en lazona del aparato de registro de datos o directamente en el OTT Pluvio2 L.
16

Tenga en cuenta: todos los cables de conexión deben ser resistentes a lasradiaciones ultravioletas y ser adecuados para el tendido bajo tierra.
Cable de conexión del aparato de registro de datos/de laalimentación de tensión
Interfaz SDI-12 – Longitud del cable: máximo 70 m1)
– Tipo de cable: cable para baja tensión blindado – Sección del conductor: 3 x 0,5 mm2 2)
Interfaz RS-485 – Longitud del cable: máximo 1000 m – Tipo de cable: cable de par trenzado (conductores
trenzados por pares)3); modelo blindado – Sección del conductor: 2 x 2 x 0,5 mm2
Salida de impulsos – Longitud del cable: máximo 1000 m – Tipo de cable: cable para baja tensión blindado – Sección del conductor: 6 x 0,5 mm2
El cable de conexión recomendado en cada caso contiene los conductores parala alimentación de tensión y el aparato de registro de datos.1) si existe una comunicación de punto a punto (sin utilización de bus SDI-12), es posible una longitud
de cable de hasta 300 m.2) si existe un cableado estándar de SDI-12, de modo alternativo 4 x 0,5 mm2 con una alimentación
de tensión separada.3) los conductores previstos para la alimentación de tensión pueden estar trenzados por pares, aunque
no es necesario.
Cable de conexión de la alimentación de tensión de la calefaccióndel aro colector4)
– Longitud del cable: máximo 125 m– Tipo de cable: cable para baja tensión no blindado– Sección del conductor OTT Pluvio2 L 200 RH OTT Pluvio2 L 400 RH
1 … 25 m: 2 x 0,5 mm2 2 x 1,0 mm2
25 … 50 m: 2 x 1,0 mm2 2 x 1,5 mm2
50 … 75 m: 2 x 1,5 mm2 2 x 2,5 mm2
75 … 125 m: 2 x 2,5 mm2 –
Fundamentos del cálculo: tensión de salida de la alimentación de tensión de24 VCC (por ejemplo, fuente de alimentación).4) opcional; en caso necesario, como alternativa pueden utilizarse dos conductores adicionales en el
cable de conexión del aparato de registro de datos/de la alimentación de tensión con la corres -pondiente sección de conductor.
Cable de puesta a tierra
– Longitud del cable: máximo 5 m– Tipo de cable: cable para baja tensión no blindado– Sección del conductor: 1 x 10 mm2
Cable de conexión USBPara las posibles modificaciones de los ajustes de fábrica, es necesario utilizartemporalmente un cable de conexión USB (volumen de suministro) durante lapuesta en servicio. Longitud del cable: máximo 3 m.
Tenga en cuenta: el puerto USB no posee ninguna protección contra sobreten-siones. Solo ha sido concebido como una interfaz de servicio para un uso breve.
5.2 Herramientas/Elementos auxiliares necesarios� Llave de boca, ancho de llave 13 (se incluye en el suministro)� Destornillador de estrella, tamaño: PH 2� Destornillador plano, tamaño: 0,8 mm x 4 mm y 1,0 mm x 6 mm� Herramientas para pelar cables eléctricos� Alicates de corte lateral� En caso de cables de conexión con conductores retorcidos: virolas de
cable y crimpador para las virolas de cable
17

5.3 Preparación del emplazamiento
Tenga en cuenta: la profundidad del cimiento de hormigón debe ajustarse alas condiciones del lugar: el cimiento tiene que llegar hasta la zona que no sehiele del subsuelo. Las dimensiones indicadas para la profundidad del cimientoson datos típicos para las relaciones centroeuropeas.
Recomendamos que integre un tubo hueco (con alambre de inserción) para elcable de conexión y de puesta a tierra en el cimiento de hormigón.
� Fije el tubo vertical con placa del fondo a un cimiento de hormigón de unasdimensiones de 45 x 45 x 80 cm aproximadamente con el “juego de piezasde fijación para tubo vertical de 4" (véase los accesorios); véase la fig. 9,así como los anexos B.
Tenga en cuenta: el tubo vertical debe quedar lo más vertical posible.� Introduzca el cable de conexión del aparato de registro de datos/de la ali-
mentación de tensión en el tubo hueco.� OTT Pluvio2 L con calefacción del aro colector: si es necesario, introduzca el
cable de conexión adicional para la alimentación de tensión de la calefaccióndel aro colector en el tubo hueco.
� En el caso de que la toma de tierra del OTT Pluvio2 L tenga lugar de modocentrado en la zona del aparato de registro de datos: introduzca también elcable de puesta a tierra en el tubo hueco. (Como alternativa, la toma de tierrapuede ponerse directamente en el OTT Pluvio2 L por medio de un electrodo decimiento o una varilla de puesta a tierra.)
Cable de conexión del aparato de registro de datos/de la alimentación de tensión
Tubo vertical conplaca del fondo
Tubo hueco
Cable de puestaa tierra
Cimiento dehormigón
Juego de piezasde fijación para
tubo vertical de 4"(4 unidades)
Fig. 7: Emplazamiento preparadopara instalar el OTT Pluvio2 L.
En un OTT Pluvio2 L con calefacción delaro colector es posible un cable de
conexión adicional para la alimentación detensión de la calefacción del aro colector.
Como alternativa, el tendido del cable también puede realizarse por fuera deltubo vertical. Por motivos de protección
(por ejemplo contra los roedores) se reco-mienda el tendido en el tubo vertical.
18

5.4 Preparación del soporte base
� Lleve el OTT Pluvio2 L derecho y con cuidado al emplazamiento en una cajade cartón de transporte cerrada.
� Coloque la caja de cartón de transporte del OTT Pluvio2 L al revés.� Abra la caja de cartón y retire el relleno de material esponjoso.� Extraiga la caja de cartón con los accesorios para la instalación.� Afloje los tres tornillos de cabeza moleteada de la carcasa tubular. Saque el
soporte base de la caja de cartón de transporte. (Deje en un primer momentoel recipiente colector y la carcasa tubular en la caja de cartón de transporte.)
� Coloque el soporte base sobre una superficie plana.
El mecanismo de pesaje del OTT Pluvio2 L dispone de un dispositivo de seguridadcompuesto por cuatro tornillos con cabeza de ranura en cruz (M5 x 60). Duranteel transporte, estos reducen el riesgo de que se cause algún daño al mecanismoelectrónico de pesaje.
� Desenrosque los cuatro tornillos con cabeza de ranura en cruz exteriores(dispositivo de seguridad para el transporte) del soporte del recipiente colector.Guarde los tornillos con cabeza de ranura en cruz para un transporte posterior.
� Afloje el tornillo de sujeción central del soporte del recipiente colector (el torni-llo de sujeción está asegurado con una tuerca hexagonal autoblocante paraque no se salga).
� Extraiga el soporte del recipiente colector.
Soporte base
Soporte delrecipientecolector
Tornillo de cabezamoleteada (3 x)
Dispositivo de seguridad para
el transporte (4 x)
Tornillo de sujeción central
Fig. 8: Soporte base del OTT Pluvio2 L.Extracción del dispositivo de
seguridad para el transporte y delsoporte del recipiente colector.
19

� Afloje aproximadamente 3 mm los cuatro tornillos con cabeza de ranura en cruzde la tapa de la unidad electrónica, levante ligeramente la tapa y extráigalahacia delante. Si la junta de caucho celular de la tapa está pegada a la base,levante la tapa haciendo palanca con cuidado con un destornillador plano.
5.5 Confección del cable de conexión
Cable de conexión del aparato de registro de datos/de la alimentación de tensión:� Acorte el cable de conexión de manera que sobresalga unos 35 … 40 cm del
tubo vertical. (El cable de conexión “sobrante” puede guardarse posteriormenteen el tubo vertical.)
� Extraiga el manguito de goma de la unidad electrónica (véase la fig. 13).Retire el tapón roscado blanco del manguito de goma y deslice el manguitode goma por el cable de conexión.
� Retire unos 10 cm del revestimiento exterior del cable de conexión.� Retire unos 5 mm del aislamiento de cada uno de los conductores del cable de
conexión.� Junte y retuerce el blindaje del cable de conexión.� En caso de un cable de conexión con conductores retorcidos: deslice las virolas de
cable sobre los conductores y crímpelas con el crimpador para virolas de cable.� Conecte el cable de conexión a los elementos atornillados de emborne adjun-
tos (bolsa de plástico); véase las fig. 10 y 11: – Interfaz SDI-12 � Elemento atornillado de emborne de 8 polos, contacto 3 – Interfaz RS-485
2 conductores � Elemento atornillado de emborne de 8 polos, contactos 1/24 conductores � Elemento atornillado de emborne de 6 polos, contactos 5/6 +
elemento atornillado de emborne de 8 polos, contactos 1/2 – � Elemento atornillado de emborne de 6 polos, contactos 1/2
(Impulso-Cantidad TR-NTR) + contactos 3/4(Impulso-Información del estado; en caso necesario)
– � Elemento atornillado de emborne de 8 polos, contactos 6/7(Sensor de precipitaciones) + contactos 5/8(Calefacción del aro colector; opcional)
Tornillo con cabeza de ranura en cruz(4 unidades)
Tapa de la unidad electrónica
Junta de cauchocelular(representada en gris)
Fig. 9: Extracción de latapa de la unidad electrónica.
Salida deimpulsos
Alimentaciónde tensión
20

Cable de conexión de la calefacción del aro colector (opcional)� Al utilizar un cable de conexión separado para la calefacción del aro colector:
confeccione el cable de conexión como se ha descrito anteriormente y conécte-lo al elemento atornillado de emborne de 8 polos; véase la fig. 11.
+12 … +24 VDC
Pulse Out mm/inch APulse Out mm/inch BPulse Out Status APulse Out Status B
Data RS-485 TX - BData RS-485 TX - A
GNDCalefacción GND
Data GNDCalefacción +24 VDC
SDI-12 DataData RS-485 RX - A / RS-485 - AData RS-485 RX - B / RS-485 - B
Cableado estándarde SDI-12
Fig. 10: Conexión del cable de conexióndel aparato de registro de datos/de la
alimentación de tensión al elemento atornillado de emborne de 6 y/o de
8 polos (ejemplo: interfaz SDI-12).
Un cableado estándar de SDI-12 disponede tres conductores (SDI-12 DATA, GNDy tensión de alimentación (+12 V)). Si latensión se suministra de modo separado,
se encuentra disponible un conductorGND adicional.
Los contactos 4, 7 y 8 del elemento atornillado de emborne de 8 polos
están puenteados internamente.
Suministro de corrientecomún; 24 VDC
Alimentación de tensióncalefacción; 24 VCC
Sensor de precipitaciones; 12 … 24 VCC
Puente decontacto
Variante B: alimentación conjunta de la calefacción y del sensor de precipitaciones
Variante A: alimentación separada de la calefacción y del sensor de precipitaciones
+12 … +24 VDC
GNDCalefacción GND
Data GNDCalefacción +24 VDC
SDI-12 DataData RS-485 RX - A / RS-485 - AData RS-485 RX - B / RS-485 - B
+12 … +24 VDC
GNDCalefacción GND
Data GNDCalefacción +24 VDC
SDI-12 DataData RS-485 RX - A / RS-485 - AData RS-485 RX - B / RS-485 - B
Data RS-485 TX - A
Data RS-485 TX - A
Fig. 11: OTT Pluvio2 L con cale faccióndel aro colector: opciones de conexión
de la alimentación de tensión del sensor deprecipitaciones y de la cale facción del aro
colector.
Tenga en cuenta: para la variante B,la tensión de alimentación común
debe ser de 24 VCC. (De lo contrario, lapotencia de calefacción será reducida;
véase “Características técnicas”.)
En caso necesario, también existe la posibilidad de utilizar dos cables de conexión separados (p. ej. cable de
conexión separado para la calefacciónopcional del aro colector).
Los conductores para la conexióndel aparato de registro de datos están
dibujados con líneas discontinuas parauna visión más clara.
El puente de contacto está incluido en elvolumen de suministro (bolsa de plástico
con accesorios de instalación).
Los contactos 4, 7 y 8 del elemento atornillado de emborne de 8 polos
,están puenteados internamente.
21

5.6 Instalación del soporte base sobre el tubo vertical
� Coloque el soporte base sobre el tubo vertical de manera que el cable deconexión y el de puesta a tierra salgan por la ranura de la brida del soportebase (véase también la fig. 16).
� Conduzca el cable de conexión hacia arriba por la entalladura del soporte base.� Gire el soporte base de manera que el tornillo de cabeza mole-
teada junto al nivel señale hacia el sur*. Esto evita emisiones erróne-as de precipitaciones en caso de condiciones climáticas extremas. Estas pue-den producirse con oscilaciones muy elevadas y rápidas de la temperaturacombinadas con radiación solar lateral.* en el hemisferio sur, hacia el norte
� Enrosque seis tornillos de cabeza hexagonal con la llave de boca, ancho dellave 13 (incluida en el suministro), en la brida del soporte base.
Tenga en cuenta: enrosque todos los tornillos de cabeza hexagonal máso menos lo mismo. No apriete todavía los tornillos de cabeza hexagonal.
* en el hemisferio sur:hacia el norte Sur*
Nivel
Brida del soporte base
Tornillo de cabeza
Tubo vertical
Tornillos decabeza hexagonal
(6 unidades)
Soporte base
Sur*
Fig. 12: Instalación del soportebase sobre el tubo vertical.
22
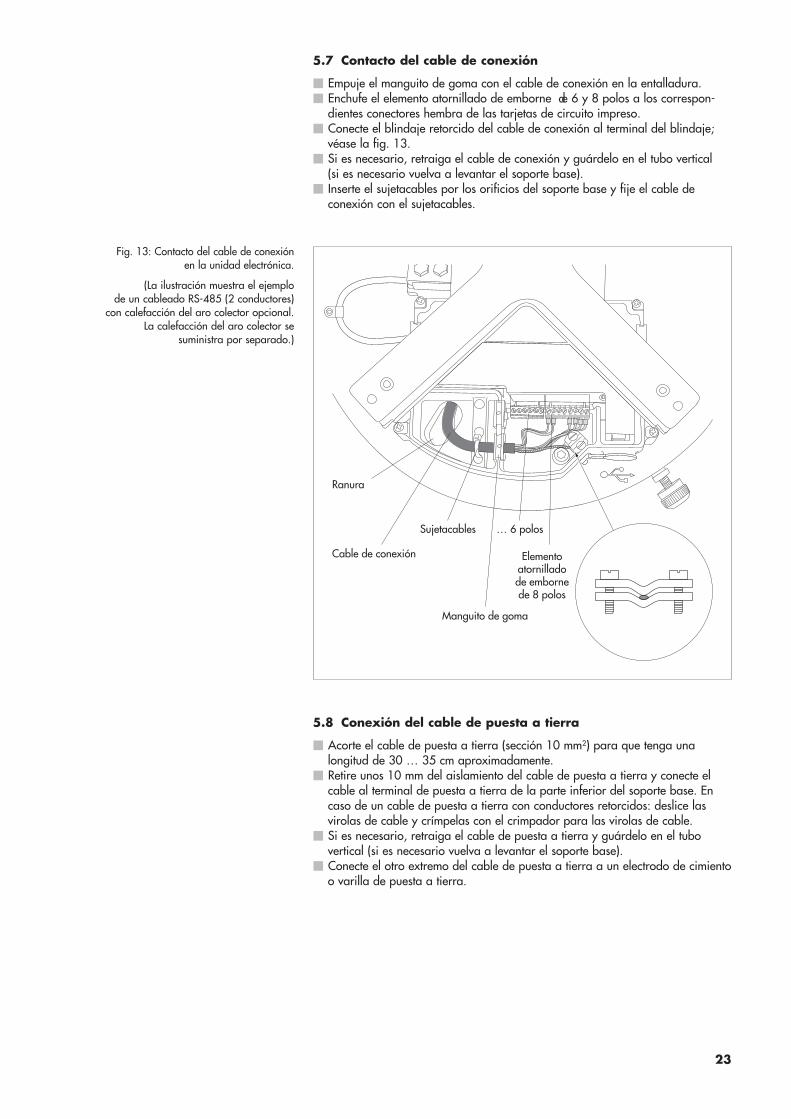
5.7 Contacto del cable de conexión
� Empuje el manguito de goma con el cable de conexión en la entalladura.� Enchufe el elemento atornillado de emborne de 6 y 8 polos a los correspon-
dientes conectores hembra de las tarjetas de circuito impreso.� Conecte el blindaje retorcido del cable de conexión al terminal del blindaje;
véase la fig. 13.� Si es necesario, retraiga el cable de conexión y guárdelo en el tubo vertical
(si es necesario vuelva a levantar el soporte base).� Inserte el sujetacables por los orificios del soporte base y fije el cable de
conexión con el sujetacables.
5.8 Conexión del cable de puesta a tierra
� Acorte el cable de puesta a tierra (sección 10 mm2) para que tenga unalongitud de 30 … 35 cm aproximadamente.
� Retire unos 10 mm del aislamiento del cable de puesta a tierra y conecte elcable al terminal de puesta a tierra de la parte inferior del soporte base. Encaso de un cable de puesta a tierra con conductores retorcidos: deslice lasvirolas de cable y crímpelas con el crimpador para las virolas de cable.
� Si es necesario, retraiga el cable de puesta a tierra y guárdelo en el tubovertical (si es necesario vuelva a levantar el soporte base).
� Conecte el otro extremo del cable de puesta a tierra a un electrodo de cimientoo varilla de puesta a tierra.
Cable de conexión
Ranura
Sujetacables
Manguito de goma
Elementoatornilladode embornede 8 polos
… 6 polos
Fig. 13: Contacto del cable de conexiónen la unidad electrónica.
(La ilustración muestra el ejemplode un cableado RS-485 (2 conductores)
con calefacción del aro colector opcional.La calefacción del aro colector se
suministra por separado.)
23

5.9 Nivelado del soporte base
� Fije primero el soporte base con los tres tornillos de cabeza hexagonal superiores:apriete los tornillos alternadamente hasta que todos toquen el tubo vertical. Impor-tante: enrosque todos los tornillos de cabeza hexagonal más o menos lo mismo.
� Nivele el soporte base con los tornillos de cabeza hexagonal inferiores de modoque la burbuja de aire se encuentre dentro de la zona marcada del tubito de con-trol del nivel de burbuja. Al enroscar un tornillo de cabeza hexagonal, la burbujade aire se mueve hacia la posición de ese tornillo. Si se necesita un recorrido deajuste mayor (el tubo vertical se encuentra varios grados fuera de la posición ver-tical), afloje, llegado el caso, los tornillos de cabeza hexagonal opuestos.
� Apriete de manera alternada todos los tornillos de cabeza hexagonal; eneste caso, se debe evitar una deformación del soporte base. Par de aprietemáximo: 6 Nm.
� Compruebe de nuevo si el nivelado es correcto en el tubito de control del nivelde burbuja.
Cable depuesta a tierra
Ranura
Ranura de la brida del soporte base
Terminal depuesta a tierra
Fig. 14: Conexión del cablede puesta a tierra.
(Visto desde abajo)
Tubito de control delnivel de burbuja
OK
Fig. 15: Nivelado del OTT Pluvio2 L.El funcionamiento correcto del mecanismo
de pesaje únicamente se garantiza si elsoporte base está nivelado perfectamente
en horizontal.
24

5.10 Realización de tareas finales
� Vuelva a colocar la tapa de la unidad electrónica y apriete los cuatro tornilloscon cabeza de ranura en cruz.
� Oriente el soporte del recipiente colector (tenga en cuenta la protección contrala rotación) y colóquelo con cuidado sobre el dispositivo fijador del soporte delrecipiente colector.
� Fije el soporte del recipiente colector con el tornillo de sujeción central.
� Saque la carcasa tubular con el recipiente colector de la caja de cartón detransporte y extraiga el recipiente colector de la carcasa tubular presionando-desde arriba.
� Coloque el recipiente colector encima del soporte. Procure que el recipientecolector quede colocado de manera segura.
Soporte delrecipiente
colector
Tornillo de sujeciónRecipiente
colector
Tornillos con cabezade ranura en cruz
(4 unidades)
Tapa de launidad
electrónica
Celula de carga
Fig. 16: Colocación y fijacióndel soporte del recipiente colector.
25

� En caso necesario: modifique los ajustes de fábrica con el programa deoperación OTT Pluvio2. Instalación y uso del programa de operación, véaseel capítulo 7.6.Ajustes de fábrica:– Dirección del sensor SDI-12 0– Interfaz serie SDI-12– Unidad de los valores medidos
de temperatura °C – Unidad de los valores medidos
de intensidad mm/min – Factor de impulsos 0,1
– Frecuencia de emisión de impulsos 5 Hz– Calefacción del aro colector* Encendida– Modo de calefacción* 1, activa permanentemente– Temperatura debida de la calefacción
del aro colector* +4 °C* Versión 200 RH y Versión 400 RH
� En caso de temperaturas ambiente negativas, añada producto anticongelante;detalles, véase el capítulo 7.2.
� Conecte el cable de conexión del aparato de registro de datos/de la alimenta-ción de tensión al aparato de registro de datos y a la alimentación de tensión.
� Si utiliza un cable de conexión separado para la calefacción del aro colectoropcional: conecte el cable de conexión de la calefacción del aro colector a laalimentación de tensión.
� Configure el aparato de registro de datos. Para ello, tenga en cuenta elmanual de instrucciones del aparato de registro de datos. Mandatos y respues-tas de SDI-12 utilizados, véase el capítulo 6.
Tenga en cuenta: conecte el blindaje del cable de conexión también en ellado del aparato de registro de datos/de la alimentación de tensión.
Recipiente colectorVersión 400
Recipiente colectorVersión 200
Soporte delrecipientecolector
Protección contra la rotación
Fig. 17: Colocación del recipientecolector encima del soporte.
26

� Realice el control de funcionamiento: extraiga la tapadera del puerto USB � elLED rojo debe parpadear brevemente por ciclos de dos segundos.
� Inserte de nuevo la tapadera.
� Oriente la carcasa tubular y colóquela sobre el soporte base. La carcasa tubulardebe descansar por completo sobre el soporte base (véase la representacióndetallada en la fig. 20). OTT Pluvio2 L con calefacción del aro colector: presteatención a que los conectores hembra del bloque de conexión no estén sucios.
Tapadera LED rojo Puerto USB
Fig. 18: Realización del controlde funcionamiento.
Bloque de conexión conconectores hembras para los
contactos de clavija de lacalefacción del aro colector
Fig. 19: Bloque de conexión paralos contactos de clavija de lacalefacción del aro colector.
27

� Apriete los tres tornillos de cabeza moleteada.
Tenga en cuenta: después de la puesta en servicio, el OTT Pluvio2 L emite losvalores medidos con un retardo de 2 minutos. En ese tiempo, los valores de preci-pitaciones se identifican como aún no disponibles por completo en la informacióndel estado.
Carcasa tubular
Tornillos de cabezamoleteada (3 unidades)
Fig. 20: Colocación de la carcasatubular y apriete de los tornillos de
cabeza moleteada.
Tenga en cuenta: coloque yextraiga siempre la carcasa tubular
del OTT Pluvio2 L con calefaccióndel aro colector sin ladearla.
28

6 Mandatos y respuestas de SDI-12
6.1 Mandatos estándar
En el OTT Pluvio2 L están implementados todos los mandatos estándar de SDI-12. Los siguientes mandatos estándar deSDI-12 son relevantes para el funcionamiento del OTT Pluvio2 L.
Convenciones para los formatos de los valores medidos:p – Signo (+, –)b – Cifra anterior a la coma decimal; la emisión se realiza sin ceros a la izquierdae – Cifra posterior a la coma decimal
Indicación: cada mandato aM! pone a cero los valores medidos acumulados Cantidad TR-NTR y Cantidad NTR.
Mandato Respuesta Descripción
a! a<CR><LF> Confirmación activaa – Dirección del sensor; ajuste de fábrica = 0
aI! allccccccccmmmmmm …… vvvxxxx<CR><LF>
Enviar identificacióna – Dirección del sensorll – Versión del protocolo SDI-12cccccccc – Identificación del fabricante (nombre de la
empresa)mmmmmm – Denominación del sensorvvv – Versión del sensor (firmware)xxxxxx – Número de serieRespuesta del OTT Pluvio2 L = 013OTT HACHPLUV2L100xxxxxx
aAb! b<CR><LF> Modificar dirección del sensora – Dirección del sensor antiguab – Dirección del sensor nueva
?! a<CR><LF> Consultar dirección del sensor(no posible con utilización de bus SDI-12)a – Dirección del sensor
aM! / aM1! atttn<CR><LF> Comenzar la medicióna – Dirección del sensorttt – Tiempo en segundos hasta que el sensor
haya determinado el resultado de mediciónRespuesta del OTT Pluvio2 L = 000
n – Número de los valores de mediciónRespuesta del OTT Pluvio 2 L = 9 a aM
3 a aM1!aMC! / aMC1! atttn<CR><LF> Comenzar la medición y solicitar el CRC (Cyclic Redundancy
Check); detalles, véase el mandato aM! Las respuestas a losmandatos aD0! ... aD2! están ampliadas en este caso a unvalor CRC (ejemplo):a<valor1><valor2><valor3><CRC><CR><LF>
aC! / aC1! atttnn<CR><LF> Comenzar la medición concurrente (medición simultáneacon varios sensores en una línea de bus); detalles, véase elmandato aM!El número de los valores de medición en larespuesta a este mandato es de dos dígitos: nn = 09 o 03.
aCC! / aCC1! atttnn<CR><LF> Comenzar la medición concurrente (medición simultánea con varios sensores en una línea de bus) y solicitar el CRC(Cyclic Redundancy Check); detalles, véase el mandato aM!El número de los valores de medición en la respuesta a estemandato es de dos dígitos: nn = 09 o 03.Las respuestas a los mandatos aD0! … aD2! están amplia-das en este caso a un valor CRC (ejemplo):a<valor1><valor2><valor3><CRC><CR><LF>
29

Indicación sobre los valores Recipiente colector TR y Recipiente colector NTR: en un recipiente colectorvacío, estos valores medidos del nivel de llenado no son exactamente cero. Oscilan un máximo de ±10 mm con respectoal punto cero en función de las condiciones ambientales climáticas.
Mandato Respuesta Descripción
aD0!*
* trasaM!, aMC!,aC!, aCC!
a<valor1><valor2><valor3> …… <CR><LF>
Enviar datosa – Dirección del sensor<valor1> – Intensidad TR
[mm/h]: pbbbb.dd (0.00 … 3000.00)[mm/min]: pbb.dd (0.00 … 50.00)[pulg./h]: pbbb.ddd (0.000 … 118.110)[pulg./min]: pb.ddd (0.000 … 1.969)
<valor2> – Cantidad TR-NTR[mm]: pbbb.dd (0.00 … 500.00)[pulgadas]: pbb.ddd (0.000 … 19.685)
<valor3> – Cantidad NTRFormato como Cantidad TR-NTR
aD1!*
* trasaM!, aMC!,aC!, aCC!
a<valor4><valor5><valor6> …… <CR><LF>
Enviar datosa – Dirección del sensor<valor4> – Cantidad total NTR
Formato como Cantidad TR-NTR<valor5> – Recipiente colector TR
200 [mm]: pbbbb.ee (7.00 … 1800.00)200 [inch]: pbb.eee (0.276 … 70.866400 [mm]: pbbb.ee (7.00 … 900.00)400 [inch]: pbb.eee (0.276 … 35.433)
<valor6> – Recipiente colector TRFormato como Recipiente colector TR
aD2!*
* trasaM!, aMC!,aC!, aCC!
a<valor7><valor8><valor9> ……<CR><LF>
Enviar datosa – Dirección del sensor<valor7> – Temperatura de la célula de carga
[°C]: pbb.d (–50.0 … +70.0)[°F]: pbbb.d (–58.0 … +158.0)
<valor8> – Estado de la calefacciónpbbb
+0 = La calefacción del aro colector funciona correctamente
+1 = Ad: Temperatura del aro colector > 40 °C +2 = A: Temperatura del aro colector < –20 °C +4 = A: El sensor de temperatura no hace
contacto +8 = A: Sensor de temperatura cortocircuitado +16 = A: La comunicación con el módulo de
calefacción del aro colector es defec-tuosa (posiblemente la carcasa tubu-lar se encuentra extraída)
+32 = A: Autocomprobación errónea de la calefacción del aro colector
+64 = Ad: Regulación de calefacción desactiva-da temporalmente
+128 = Ad: Calefacción del aro colector desac -tivada o no disponible
Ad = Advertencia; A = AlarmaSi el OTT Pluvio2 L emite unos valores distintos de los men-cionados aquí, significa que se han producido varios suce-sos simultáneamente. En este caso, los distintos valores sesuman. Ejemplo: “+65” � Suma de las advertencias “+1”y “+64”. La información del estado emitida se restablece,suponiendo que se ha eliminado la causa, con la siguientesolicitud del mandato aM!.
30

Para más información acerca de los mandatos estándar de SDI-12, consulte el folleto SDI-12; A Serial-Digital Interface Standard for Microprocessor-Based Sensors; Version 1.3 (visite la página de Internet www.sdi-12.org).
Mandato Respuesta Descripción
aD2!*
* trasaM!, aMC!,aC!, aCC!
a<valor7><valor8><valor9> ……<CR><LF>
<valor9> – Estado pbbbb
+0 = El sensor de precipitaciones funciona debidamente
+1 = Ad: Nivel de llenado del recipientecolector ≥ 80 %
+2 = Ad: El puerto USB está/estaba conectado
+4 = Ad: Reinicio (por ausencia de tensión) +8 = Ad: Reinicio (por firmware) +16 = Ad: Modificación del peso no permitida +32 = Ad: Tensión de alimentación < 7 V +64 = A: Medición del peso inestable +128 = A: Medición del peso errónea +256 = A: Peso inferior al mínimo +512 = A: Peso superior al máximo +1024 = A: Falta la calibración del aparato
Ad = Advertencia; A = AlarmaSi el OTT Pluvio2 L emite unos valores distintos de los men-cionados aquí, significa que se han producido varios suce-sos simultáneamente. En este caso, los distintos valores sesuman. Ejemplo: “+34” � Suma de las advertencias “+2”y “+32”. La información del estado emitida se restablece,suponiendo que se ha eliminado la causa, con la siguientesolicitud del mandato aM!.
aD0!*
* trasaM1!, aMC1!,aC1!, aCC1!
a<valor1><valor2><valor3> …… <CR><LF>
Enviar datosa – Dirección del sensor<valor1> – Temperatura de la unidad electrónica
(temperatura ambiente aproximada con retardo temporal)[°C]: pbb.d (–50.0 … +70.0)[°F]: pbbb.d (–58.0 … +158.0)
<valor2> – Tensión de alimentación[V]: pbb.d (+4.5 … +28.0)
<valor3> – Temperatura del aro colector[°C]: pbb.d (–50.0 … +70.0)[°F]: pbbb.d (–58.0 … +158.0)
31

6.2 Mandatos avanzados de SDI-12
Los mandatos avanzados de SDI-12 empiezan por una “O” de OTT. Estos mandatos permiten consultar información adicional de un OTT Pluvio2 L o configurar este mediante el modo transparente de un recolector de datos o con laOTT USB/SDI-12 Interface (accesorio).
Mandato Respuesta Descripción� Leer versión de firmware
aOOV! acc.cc.c<CR><LF> Leer versión de firmware del OTT Pluvio2 L
a – Dirección del sensor cc.cc.c – Versión de firmware
Ejemplo: V1.00.0 (primera versión defirmware entregada)
� Ajustar/leer unidad de los valores medidos de temperatura
aOUTb! ab<CR><LF> Ajustar unidad aOUT! ab<CR><LF> Leer unidad
a – Dirección del sensorb – 0 = °C; ajuste de fábrica
1 = °F
� Ajustar/leer unidad de los valores medidos de intensidad
aOUIb! ab<CR><LF> Ajustar unidad aOUI! ab<CR><LF> Leer unidad
a – Dirección del sensorb – 0 = mm/min; ajuste de fábrica
1 = mm/h2 = pulgadas/min3 = pulgadas/h
Indicación: este mandato cambia a la vez las unidades de “Cantidad …” y “Recipiente colector …”; mm � pulgadas)
� Ajustar/leer frecuencia de emisión de impulsos
aOCIb! ab<CR><LF> Ajustar frecuencia de emisión de impulsos aOCI! ab<CR><LF> Leer frecuencia de emisión de impulsos
a – Dirección del sensorb – 0 = 5 Hz; ajuste de fábrica
1 = 2 Hz
� Ajustar/leer factor de impulsos
aOSIb! ab<CR><LF> Ajustar factor de impulsos aOSI! ab<CR><LF> Leer factor de impulsos
a – Dirección del sensorb – 0 = 0,05 mm
1 = 0,1 mm; ajuste de fábrica2 = 0,2 mm
32

� Ajustar/leer modo de calefacción del aro colector (OTT Pluvio2 L con calefacción del aro colector)
aOCHb! ab<CR><LF> Ajustar modo aOCH! ab<CR><LF> Leer modo
a – Dirección del sensorb – 0 = Calefacción del aro colector desactivada
1 = Modo 1; encendida permanentemente2 = Modo 2; control del margen de temperaturas3 = Modo 3; estándar NWS4 = Modo 4; precipitaciones
� Ajustar/leer temperatura debida de la calefacción del aro colector (OTT Pluvio2 L con calefacción del aro colector)
aOCHSpb! apb<CR><LF> Ajustar temperatura debida aOCHS! apb<CR><LF> Leer temperatura debida
a – Dirección del sensorp – Signo (+)b – 2 … 9 (+2 … +9 °C);
ajuste de fábrica +4 °C
� Ajustar/leer temperatura límite inferior de la calefacción del aro colector (OTT Pluvio2 L con calefacción del aro colector) Modo de la calefacción del aro colector: 2
aOCHGpbb! apbb<CR><LF> Ajustar temperatura límite inferior aOCHG! apbb<CR><LF> Leer temperatura límite inferior
a – Dirección del sensorp – Signo (+, –)bb – 40 … 9 (–40 … +9 °C);
ajuste de fábrica –30 °C
� Ajustar/leer duración de conexión/tiempo de funcionamiento posterior de la calefacción del aro colector (OTT Pluvio2 L con calefacción del aro colector) Modo de la calefacción del aro colector: 3, 4
aOCHDbbbb! abbbb<CR><LF> Ajustar duración de conexión/tiempo de funcionamiento posterior
aOCHD! abbbb<CR><LF> Leer duración de conexión/tiempo de funcionamiento posterior
a – Dirección del sensorbbbb – 1 … 1440 (1 … 1440 minutos);
ajuste de fábrica 20 minutos
� Ajustar/leer hora de inicio de la calefacción del aro colector (OTT Pluvio2 L con calefacción del aro colector) Modo de la calefacción del aro colector: 3
aOCHZhh:mm:ss! ahh:mm:ss<CR><LF> Ajustar hora de inicio aOCHZ! ahh:mm:ss<CR><LF> Leer hora de inicio
a – Dirección del sensorhh:mm:ss – 00:00:00 … 23:59:59;
ajuste de fábrica 14:00:00 horas
� Ajustar/leer intervalo de autocomprobación de la calefacción del aro colector (OTT Pluvio2 L con calefacción del aro colector) Modo de la calefacción del aro colector: 1, 2, 3, 4
aOCHTbbbb! abbbb<CR><LF> Ajustar intervalo de autocomprobación aOCHT! abbbb<CR><LF> Leer intervalo de autocomprobación
a – Dirección del sensorbbbb – 1 … 10 080 (1 … 10 080 minutos);
ajuste de fábrica 60 minutos*
* valores ajustables por el programa de operación del OTT Pluvio2 L: 1, 12, 24 horas; 2, 3, 4, 5, 6, 7 días
33

� Ajustar/leer interfaz serie (SDI-12 o RS-485)
aOCLb! ab<CR><LF> Ajustar interfaz serie aOCL! ab<CR><LF> Leer interfaz serie
a – Dirección del sensor b – 0 = SDI-12; ajuste de fábrica
1 = RS-485, 2 conductores2 = RS-485, 4 conductores
� Ajustar/leer protocolo en la interfaz RS-485
aOCMb! ab<CR><LF> Ajustar protocolo aOCM! ab<CR><LF> Leer protocolo
a – Dirección del sensor b – 0 = Protocolo SDI-12; ajuste de fábrica
1 = ASCII (modo de líneas de mandato RS-485)
� Ajustar/leer la velocidad de transmisión (baudios) para la interfaz RS485, protocolo ASCII
aOCRb! ab<CR><LF> Ajustar la velocidad de transmisión aOCR! ab<CR><LF> Leer a velocidad de transmisión
a – Dirección del sensor b – 0 = 1 200 bit/s
1 = 2 400 bit/s2 = 4 800 bit/s3 = 9 600 bit/s ajuste de fábrica4 = 19 200 bit/s5 = 57 600 bit/s6 = 115 200 bit/s
� Restablecer el valor medido Cantidad total NTR
aOMR! a<CR><LF> Restablecer Cantidad total NTR
a – Dirección del sensor
34
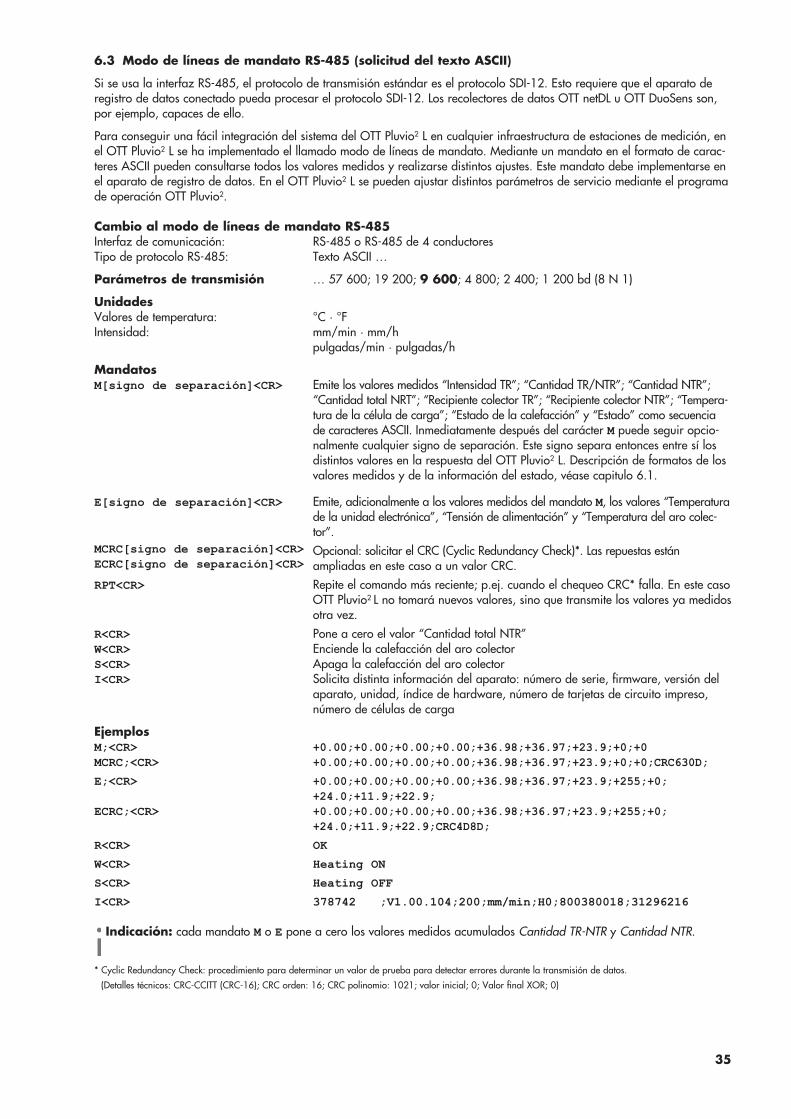
6.3 Modo de líneas de mandato RS-485 (solicitud del texto ASCII)
Si se usa la interfaz RS-485, el protocolo de transmisión estándar es el protocolo SDI-12. Esto requiere que el aparato deregistro de datos conectado pueda procesar el protocolo SDI-12. Los recolectores de datos OTT netDL u OTT DuoSens son,por ejemplo, capaces de ello.
Para conseguir una fácil integración del sistema del OTT Pluvio2 L en cualquier infraestructura de estaciones de medición, enel OTT Pluvio2 L se ha implementado el llamado modo de líneas de mandato. Mediante un mandato en el formato de carac-teres ASCII pueden consultarse todos los valores medidos y realizarse distintos ajustes. Este mandato debe implementarse enel aparato de registro de datos. En el OTT Pluvio2 L se pueden ajustar distintos parámetros de servicio mediante el programade operación OTT Pluvio2.
Cambio al modo de líneas de mandato RS-485Interfaz de comunicación: RS-485 o RS-485 de 4 conductoresTipo de protocolo RS-485: Texto ASCII …
Parámetros de transmisión … 57 600; 19 200; 9 600; 4 800; 2 400; 1 200 bd (8 N 1)
UnidadesValores de temperatura: °C · °FIntensidad: mm/min · mm/h
pulgadas/min · pulgadas/h
MandatosM[signo de separación]<CR> Emite los valores medidos “Intensidad TR”; “Cantidad TR/NTR”; “Cantidad NTR”;
“Cantidad total NRT”; “Recipiente colector TR”; “Recipiente colector NTR”; “Tempera-tura de la célula de carga”; “Estado de la calefacción” y “Estado” como secuenciade caracteres ASCII. Inmediatamente después del carácter M puede seguir opcio-nalmente cualquier signo de separación. Este signo separa entonces entre sí losdistintos valores en la respuesta del OTT Pluvio2 L. Descripción de formatos de losvalores medidos y de la información del estado, véase capitulo 6.1.
E[signo de separación]<CR> Emite, adicionalmente a los valores medidos del mandato M, los valores “Temperaturade la unidad electrónica”, “Tensión de alimentación” y “Temperatura del aro colec-tor”. Opcional: solicitar el CRC (Cyclic Redundancy Check)*. Las repuesta s están ampliadas en este caso a un valor CRC.
RPT<CR> Repite el comando más reciente; p.ej. cuando el chequeo CRC* falla. En este casoOTT Pluvio2 L no tomará nuevos valores, sino que transmite los valores ya medidosotra vez.
R<CR> Pone a cero el valor “Cantidad total NTR”W<CR> Enciende la calefacción del aro colectorS<CR> Apaga la calefacción del aro colectorI<CR> Solicita distinta información del aparato: número de serie, firmware, versión del
aparato, unidad, índice de hardware, número de tarjetas de circuito impreso,número de células de carga
EjemplosM;<CR> +0.00;+0.00;+0.00;+0.00;+36.98;+36.97;+23.9;+0;+0MCRC;<CR> +0.00;+0.00;+0.00;+0.00;+36.98;+36.97;+23.9;+0;+0;CRC630D;E;<CR> +0.00;+0.00;+0.00;+0.00;+36.98;+36.97;+23.9;+255;+0;
+24.0;+11.9;+22.9;ECRC;<CR> +0.00;+0.00;+0.00;+0.00;+36.98;+36.97;+23.9;+255;+0;
+24.0;+11.9;+22.9;CRC4D8D;R<CR> OKW<CR> Heating ONS<CR> Heating OFFI<CR> 378742 ;V1.00.104;200;mm/min;H0;800380018;31296216
Indicación: cada mandato M o E pone a cero los valores medidos acumulados Cantidad TR-NTR y Cantidad NTR.
* Cyclic Redundancy Check: procedimiento para determinar un valor de prueba para detectar errores durante la transmisión de datos.(Detalles técnicos: CRC-CCITT (CRC-16); CRC orden: 16; CRC polinomio: 1021; valor inicial; 0; Valor final XOR; 0)
MCRC[signo de separación]<CR>ECRC[signo de separación]<CR>
35

7 Realización de labores de mantenimiento
Para garantizar un funcionamiento perfecto del sensor de precipitaciones, recomen-damos realizar las siguientes labores de mantenimiento en los intervalos indicados:
� Vaciado: nivel de llenado del recipiente colector ≥ 80 %� Adición de producto
anticongelante: temperatura ambiente < 0 °C� Control visual: 1 vez al año� Medición de control: 1 vez al año
7.1 Vaciado del recipiente colector
Puede vaciar el recipiente colector en cualquier momento independientemente delnivel de llenado. El rebose accidental del recipiente colector tiene como conse-cuencia mediciones erróneas, aunque no daña el sensor de precipitaciones.
– ¿Cuándo efectuar el vaciado?Con un recipiente colector al 80 % o más (Versión 200 =̂ 1200 mm/Versión400 =̂ 600 mm de precipitaciones); véase el valor medido “Recipiente colectorTR”/ “Recipiente colector NTR”; la información del estado contiene la adverten-cia “+001”; respuesta (valor 9) al mandato SDI-12 “aD2!” después de “aM!”,“aMC!”, “aC!” o “aCC!”.
– IntervalosPor lo general, de 1 a 2 veces al año;(en regiones con muchas precipitaciones, más a menudo).
ATENCIóN ¡Peligro de lesiones por la caída del recipiente colector!
El recipiente colector completamente lleno pesa unos 35 kg.
� Proceda con cuidado cuando vacíe el recipiente. � En caso necesario, pida a otra persona que lo ayude.
Así se vacía el recipiente colector:� Afloje los tres tornillos de cabeza moleteada.� Extraiga la carcasa tubular hacia arriba.� Extraiga con cuidado el recipiente colector.
Tenga en cuenta: proceder de manera descuidada puede dañar el meca-nismo de pesaje, p. ej. colocar con fuerza el recipiente colector lleno sobre elsoporte.
� Vacíe el recipiente colector.� Coloque el recipiente colector.� Oriente la carcasa tubular y colóquela; véase la fig. 20.� Apriete los tres tornillos de cabeza moleteada.
7.2 Adición de producto anticongelante para el funcionamientoen invierno
Con temperaturas ambiente negativas*, recomendamos añadir producto anticon-gelante al recipiente colector. El producto anticongelante permite poco a poco ladescongelación de las precipitaciones sólidas caídas en el recipiente colector.Así mismo impide que se dañe el mecanismo de pesaje al con -gelarse las precipitaciones recogidas cuando el recipiente colectorestá a más del 80 %. A este respecto, utilice el producto anticongelantePOWERCOOL DC 924-PXL en solución acuosa; véase el anexo E (fabricante:Thermochema GmbH, A-4460 Losenstein, Austria; teléfono +43 7255 4244-0;www.thermochema.at.)* Temperaturas negativas constantes a lo largo del día < aprox. –5 °C. Si a lo largo del día se producen
temperaturas positivas durante un periodo más largo, no es necesario añadir producto.
36

Así se añade el producto anticongelante:� Prepare la solución anticongelante: mezcle 5 l de producto anticongelante
y 2 l de agua.� Añada con cuidado la solución anticongelante en el recipiente colector
(para ello no es necesario extraer la carcasa tubular).
Tenga en cuenta: añada el producto anticongelante solamente en soluciónacuosa (añada un 40 % de agua). No lo utilice en ningún caso en la forma concentrada. (POWERCOOL posee un comportamiento higroscópico.)
Indicación sobre la eliminación de la solución anticongelantePor lo general, la solución anticongelante de un sensor de precipitaciones indivi-dual puede eliminarse en la canalización pública. No obstante, tenga en cuentaen cualquier caso la normativa local vigente. Si tiene alguna pregunta acerca dela eliminación, diríjase a las autoridades locales competentes en su región y/o ala empresa Thermochema GmbH.
Indicación acerca del funcionamiento en invierno sin productoanticongelanteEn principio, el aparato también puede funcionar en invierno sin añadir soluciónanticongelante. Esto presupone obligatoriamente un control y vaciado regularesdel recipiente colector.
Tenga en cuenta: si se congelan las precipitaciones recogidas deun recipiente colector a más del 80 %, el mecanismo de pesajepuede sufrir daños permanentes.
Indicación acerca de productos anticongelantes de fabricación ajenaLos productos de fabricación ajena pueden emplearse básicamente si se tienenen cuenta las siguientes condiciones previas:� Buena solubilidad en agua, poca densidad (que no se hunda la solución
anticongelante en el agua).� Evaporación reducida (que no contenga metanol).� Poca tendencia a la corrosión frente al aluminio y al acero inoxidable.� Punto de congelación bajo, incluso con niveles de llenado altos del recipiente colector.� Comportamiento higroscópico reducido (absorción de la humedad del aire del
ambiente que podría falsear los resultados de la medición).� Tenga en cuenta la resistencia química del recipiente colector (polietileno).� Sin presencia de resinificación tras un uso de varios meses en recipientes abiertos.
7.3 Realización de controles visuales
� Compruebe visualmente si el recipiente colector puede moverse en todas lasdirecciones en el borde inferior de la abertura colectora. Para ello, mueva bre-vemente el recipiente, estando cerrada la carcasa tubular, desde dentro tocán-dolo ligeramente desde un lado. El borde superior del recipiente colector nodebe tocar la carcasa tubular. Un movimiento breve puede falsear el valormedido “Intensidad TR“ (breve retardo).
� Elimine con cuidado las suciedades (por ejemplo, insectos, nidos de insectos,telarañas…) y las formaciones de hielo, en caso de haberlas.
7.4 Comprobaciones adicionales en caso de avería� ¿El dispositivo de seguridad para el transporte está extraído?� ¿El recipiente está deformado?� ¿El recipiente colector está colocado correctamente sobre el soporte?� ¿La carcasa tubular está colocada correctamente y no presenta daños?� ¿La parte móvil del mecanismo de pesaje, p. ej. debido a la suciedad,
está en contacto con otros componentes?� ¿El LED rojo parpadea (véase la fig. 18)?� Delimite el fallo con ayuda del capítulo 7.5.
� En caso de duda, realice una prueba de precisión guiada como se describeen el capítulo 7.6.
37

7.5 Localización y subsanación de fallos
La comunicación en la interfaz SDI-12 o RS-485 no funciona
General (los dos tipos de interfaz)� El OTT Pluvio2 L está conectado al PC/a la tableta mediante un cable de cone-
xión USB (en este caso, el OTT Pluvio² L interrumpe la comunicación en lainterfaz SDI-12/RS-485); el LED rojo parpadea en ciclos de dos segundos, elLED verde está permanentemente encendido:� Retire el cable de conexión USB.
� La tensión de alimentación del sensor de precipitaciones se ha cortado, estámal conectada o se encuentra fuera del margen admisible;el LED rojo está permanentemente apagado:� Restablezca la alimentación de tensión del aparato (cambie el fusible si
es necesario). � Compruebe la alta tensión de alimentación y corríjala si es necesario.
� Compruebe el cableado de la tensión de alimentación y corríjalo si es necesario.
� El sensor de precipitaciones y el aparato de registro de datos conectado reciben la tensión desde dos fuentes de tensión con aislamiento galvánico;las masas (GND) de las fuentes de tensión no están conectadas entre sí:� Establezca la conexión entre las masas.
Interfaz SDI-12� La configuración del OTT Pluvio² L y/o del aparato de registro de datos
conectado es incorrecta:� Compruebe la dirección del sensor SDI-12 del OTT Pluvio² L y corríjala
si es necesario (por medio del programa de operación OTT Pluvio²). � Compruebe el ajuste “Puerto comunicación” (SDI-12) y corríjalo si es
necesario (por medio del programa de operación OTT Pluvio²). � Compruebe la configuración del aparato de registro de datos conectado y
corríjala si es necesario (véase el manual de instrucciones del aparato deregistro de datos).
Interfaz RS-485 – Protocolo SDI-12� El cableado de la interfaz RS-485 es incorrecto (contactos “Data RS-485 ...”):
� 2 conductores: compruebe la asignación de contactos “… - A”, “… - B” ycambie los contactos si es necesario.
� 4 conductores: compruebe la asignación de contactos “… TX - A”, “… TX- B”y “… RX - A”, “… RX - B” y cambie los contactos si es necesario.
� La configuración del OTT Pluvio² L y/o del aparato de registro de datos conectado es incorrecta:� Compruebe la dirección del sensor SDI-12 del OTT Pluvio² L y corríjala
si es necesario (por medio del programa de operación OTT Pluvio²). � Compruebe el ajuste “Puerto comunicación” (RS-485/RS-485 con 4 con-
ductores) y corríjalo si es necesario (por medio del programa de operaciónOTT Pluvio²).
� Compruebe el ajuste “Tipo de protocolo RS-485” (protocolo SDI-12) y corrí-jalo si es necesario (por medio del programa de operación OTT Pluvio²).
� Compruebe la configuración del aparato de registro de datos conectado ycorríjala si es necesario (véase el manual de instrucciones del aparato deregistro de datos).
� Si se utiliza un convertidor de interfaz RS-485, los ajustes son incorrectos:� Compruebe los ajustes y corríjalos si es necesario.
� Si se utiliza un programa de terminal (p. ej. con fines de prueba), los ajustesson incorrectos:� Compruebe los ajustes y corríjalos si es necesario.
38

Interfaz RS-485 – Protocolo ASCII� El cableado de la interfaz RS-485 es incorrecto (contactos “Data RS-485 ...”):
� 2 conductores: compruebe la asignación de contactos “… - A”, “… - B” ycambie los contactos si es necesario.
� 4 conductores: compruebe la asignación de contactos “… TX - A”, “… TX- B”y “… RX - A”, “… RX - B” y cambie los contactos si es necesario.
� La configuración del OTT Pluvio² L y/o del aparato de registro de datos conectado es incorrecta:
� Compruebe el ajuste “Puerto comunicación” (RS-485/RS-485 con 4 con-ductores) y corríjalo si es necesario (por medio del programa de operaciónOTT Pluvio²).
� Compruebe el ajuste “Tipo de protocolo RS-485” (texto ASCII…) y corríjalosi es necesario; preste atención a una velocidad de transmisión correcta;1 200 … 57 600 bd (por medio del programa de operación OTT Pluvio²).
� Compruebe la configuración del aparato de registro de datos conectado ycorríjala si es necesario (véase el manual de instrucciones del aparato deregistro de datos).
La comunicación en el puerto USB no funciona
� La conexión OTT Pluvio2 L al PC/a la tableta mediante el cable de conexiónUSB es incorrecta; el LED rojo parpadea en ciclos de dos segundos, el LEDverde está apagado:� Compruebe la conexión a través del cable de conexión USB y corríjala si es
necesario.� El controlador del puerto USB con el PC/la tableta no está instalado o está mal
instalado:� Instale (de nuevo) el controlador del puerto USB.
No hay salida de impulsos a las salidas de impulsos o bien esincorrecta
� La tensión de alimentación del sensor de precipitaciones se ha cortado, estámal conectada o se encuentra fuera del margen admisible; el LED rojo estápermanentemente apagado:� Restablezca la alimentación de tensión del aparato (cambie el fusible si es
necesario). � Compruebe la alta tensión de alimentación y corríjala si es necesario.
� Compruebe el cableado de la tensión de alimentación y corríjalo si es necesario.� Hay un corte de la tensión de alimentación* del conexionado externo en la
salida de impulsos o bien la tensión está mal conectada o se han rebasado losvalores límite de Umáx e Imáx:� Suministre tensión al conexionado externo*.� Compruebe el cableado de las salidas de impulsos y corríjalo si es necesario.� Compruebe el conexionado externo y corríjalo si es necesario, para que se
respeten los valores límite de Umáx e Imáx. * no necesario con recolectores de datos OTT� La configuración del OTT Pluvio² L y/o del aparato de registro de datos
conectado es incorrecta: � Compruebe el ajuste “Frecuencia de la salida de impulsos” y corríjalo
si es necesario (por medio del programa de operación OTT Pluvio²). � Compruebe el ajuste “Factor Pulsos” y corríjalo si es necesario
(por medio del programa de operación OTT Pluvio²). � Compruebe la configuración del aparato de registro de datos conectado y
corríjala si es necesario (véase el manual de instrucciones del aparato deregistro de datos).
Indicación: la salida “Impulso-Información del estado” emite impulsos de formacontinua en un aparato que funciona (señal de actividad). En función del nivel dellenado, son 10 … 100 impulsos/min o, si el OTT Pluvio2 L está conectado a unPC/una tableta con un cable de conexión USB, 120 impulsos/min.
39

La autocomprobación de la calefacción del aro colector es incorrecta o no se realiza
� La tensión de alimentación de la calefacción del aro colector se ha cortado,está mal conectada o se encuentra fuera del margen admisible:� Suministre (otra vez) tensión a la calefacción del aro colector
(si es necesario, sustituya el fusible). � Compruebe la alta tensión de alimentación y corríjala en caso necesario.
� Compruebe el cableado de la calefacción del aro colector y corríjalo si esnecesario.
� La carcasa tubular (con la calefacción del aro colector integrada) no está colocada:� Coloque la carcasa tubular.
� Se ha colocado por error la carcasa tubular sin la calefacción del aro colectorintegrada de otro OTT Pluvio2 L:� Coloque la carcasa tubular con la calefacción del aro colector integrada.
� La autocomprobación no se realiza: � Compruebe el ajuste “Intervalo de autocomprobación” (modos 2, 3, 4) y
corríjalo si es necesario (por medio del programa de operación OTT Pluvio²). � Fuerce la autocomprobación haciendo una vez un “Power-Reset”.
La calefacción del aro colector no funciona o no lo hace de laforma prevista
� La tensión de alimentación de la calefacción del aro colector se ha cortado,está mal conectada o se encuentra fuera del margen admisible:� Suministre (otra vez) tensión a la calefacción del aro colector
(si es necesario, sustituya el fusible). � Compruebe la alta tensión de alimentación y corríjala si es necesario;
preste atención a que la potencia de la fuente de tensión sea suficiente. � Compruebe el cableado de la calefacción del aro colector y corríjalo si
es necesario; preste atención a que la sección del cable de conexión seasuficiente.
� Compruebe el estado de la calefacción (por medio del programa de operación OTT Pluvio²).
� La carcasa tubular (con la calefacción del aro colector integrada) no está colocada:� Coloque la carcasa tubular.
� Se ha colocado por error la carcasa tubular sin la calefacción del aro colectorintegrada de otro OTT Pluvio2 L:� Coloque la carcasa tubular con la calefacción del aro colector integrada.
� La configuración de la calefacción del aro colector provoca un comportamientode calefacción inesperado:
� Los ajustes– Modo de servicio– Temperatura debida del aro colector (modos 1, 2, 3, 4)– Temperatura límite inferior (modo 2)– Hora de inicio (modo 3)– Duración de la conexión (modo 3)– Tiempo de funcionamiento posterior (modo 4)deben comprobarse y corregirse si es necesario (por medio del programade operación OTT Pluvio²).
� La hora del OTT Pluvio² L es incorrecta (p. ej. después de un corte de la tensiónde alimentación):
� Corrija la hora (por medio del programa de operación OTT Pluvio²).
40

No hay emisión de precipitaciones o es insuficiente
� No hay emisión de precipitaciones– cuando el puerto USB está/estaba conectado– después del vaciado,– puesta en servicio/corte de tensión:� Espere 5 minutos.
� El recipiente colector rebosa:� Vacíe el recipiente colector.
� La tasa de evaporación es muy elevada (el recipiente colector está vacío yla temperatura ambiente es alta):� Añada aprox. de 1 a 2 litros de agua en el recipiente colector.
� Emisión supuestamente insuficiente en los valores medidos NTR:� Espere 5 minutos (retardo temporal por el algoritmo de filtro)
� Aumento de peso > aprox. 12 mm en 6 segundos:� Ninguna emisión de precipitaciones (el algoritmo de filtro detecta un objeto
extraño), ya que la caída natural de precipitación se ha sobrepasado; com-pruebe el estado del sensor de precipitaciones: respuesta al mandato deSDI-12 aD2!; <valor 9> = +16 (por medio del programa de operaciónOTT Pluvio²).
� Es posible que el sensor de precipitaciones esté averiado:� Realice una prueba de precisión guiada (por medio del programa de
operación OTT Pluvio²).� El sensor de precipitaciones no está nivelado horizontalmente:
� Compruebe el tubito de control del nivel de burbuja y corrija el niveladosi es necesario.
Indicación: compruebe la adecuación básica del valor medido utilizado para elcaso de aplicación correspondiente (comportamiento temporal: emisión en tiemporeal (TR), emisión no en tiempo real (NTR) o valor combinado (TR-NTR)). Descrip-ción de los distintos valores medidos, véase el capítulo 3.1. En caso necesario,utilice otro valor medido.
Emisión de precipitaciones erróneas
� Han entrado objetos extraños (hojas, insectos…) en el recipiente colector(aumento de peso < aprox. 12 mm en 6 segundos; además, el algoritmode filtro detecta objetos extraños):� Corrección manual del total de precipitaciones restando la cantidad
equivalente.� El soporte base no está bien orientado:
� Gire el soporte base de manera que el tornillo de cabeza moleteada junto alnivel señale hacia el sur (hacia el norte en el hemisferio sur).Véase el capítulo 5.6.
� Se ha añadido producto anticongelante sin agua (comportamiento higroscópico):� Añada el producto anticongelante solamente en solución acuosa (añada un
40 % de agua).
41

7.6 Realización de la prueba de precisión guiada (medición decontrol)
Como accesorio del OTT Pluvio2 L, está disponible la memoria USB (véase elanexo G).
Además del manual de instrucciones (archivo PDF), del controlador del puertoUSB y de las configuraciones de ejemplo de los recolectores de datos OTT, estamemoria USB contiene el programa de operación OTT Pluvio2. Como alternativaencontrará también los distintos archivos en la página de Internet“www.ott.com/de-de/media-downloads” para su descarga (gratuita).
Con ayuda del programa de operación OTT Pluvio2 podrá realizar una “pruebade precisión guiada”. Con esta puede comprobarse in situ de manera fácil y rápida si el OTT Pluvio2 L funciona correctamente.
En caso necesario, pueden utilizarse otras funciones con este programa de operación: p. ej. modificar la configuración básica del OTT Pluvio2 L, iniciar lamedición o actualizar el firmware.
Tenga en cuenta: realice la prueba de precisión solo en días sin viento y sin pre-cipitaciones. (De lo contrario, puede perjudicarse la prueba a causa de la influenciadel viento y de precipitaciones no deseadas.) El puerto USB también suministra ten-sión de servicio al OTT Pluvio2 L. No es necesario disponer de una alimentación detensión conectada adicionalmente, pero tampoco es necesario quitarla si la hay.
PreparativosRequisito: PC (portátil) con el sistema operativo Microsoft Windows 7 o superior.
� Inicie sesión en el PC con derechos de administrador.� Instale el programa de operación OTT Pluvio2:
– Copie el archivo “setup.exe” en un directorio cualquiera del PC.– Inicie el archivo “setup.exe” � Se abre el “InstallShield Wizard”
(programa de instalación). – Siga las instrucciones de instalación de la pantalla.� Instale el controlador de puerto USB (controlador FTDI):
– Copie el archivo “CDM v2.12.00 WHQL Certified”1) en un directorio cual-quiera del PC.
– Quite la tapadera del puerto USB y conecte el OTT Pluvio2 L al PC medianteel cable de conexión USB (volumen de suministro); véase la fig. 21.
– Cierre el asistente de instalación de controladores de dispositivos que se iniciará automáticamente.
– Inicie el archivo “CDM v2.12.00 WHQL Certified”1). 1) o una versión superior
Conexión USB
Línea de conexión USB
Fig. 21: Conexión del OTT Pluvio2 Lal PC mediante el puerto USB.
En cuanto el PC suministre tensión deservicio al OTT Pluvio2 L a través del
puerto USB, se encenderá un LED verdedebajo del puerto USB.
42

Accesorios para la realización de la prueba de precisión guiada (véase anexo G):
Realización de la prueba de precisión guiada� Afloje los tres tornillos de cabeza moleteada de la carcasa tubular.� Extraiga la carcasa tubular hacia arriba.� Extraiga con cuidado el recipiente colector.� Quite la tapadera del puerto USB y conecte el OTT Pluvio2 L al PC mediante
el cable de conexión USB (volumen de suministro); véase la fig. 21.� Instale el programa de operación OTT Pluvio2.� Haga clic en el botón Conectar � El programa de operación establece una
conexión con el OTT Pluvio2 L y consulta distintas informaciones del estado.� Haga clic en el botón Prueba de precisión guiada � Un asistente le guiará
ahora por la prueba de precisión. Aquí debe tener en cuenta todos los pasosde ejecución e indicaciones que aparecen en la pantalla.
� Al final de la prueba de precisión, retire el cable de conexión USB.� Inserte de nuevo la tapadera del puerto USB.� En caso necesario, vacíe el recipiente colector y vuelva a colocarlo.� Oriente la carcasa tubular y colóquela; véase la fig. 20.� Vuelva a apretar los tres tornillos de cabeza moleteada.
Tenga en cuenta: el OTT Pluvio2 L interrumpe la comunicación con los demáspuertos después de conectar el puerto USB.
43
8 Reparación
� En caso de un fallo de funcionamiento del aparato, compruebe si usted mismopuede solucionar el fallo con ayuda del capítulo 7.5.
� Si el aparato tiene una avería, póngase en contacto con el Repaircenter de laempresa OTT:
OTT Hydromet GmbHRepaircenterLudwigstrasse 1687437 Kempten · AlemaniaTeléfono +49 831 5617-433Fax +49 831 [email protected]
Tenga en cuenta: encargue la comprobación y la reparación de un OTT Pluvio2 Laveriado exclusivamente al Repaircenter de la empresa OTT. Nunca realice repa-raciones usted mismo. La precisión de medición especificada está garantizadaúnicamente con una reparación cualificada y una comprobación final posteriorde fábrica. Si realiza reparaciones usted mismo o intenta realizarlas perderáademás todos los derechos de garantía.
Los clientes o las empresas asociadas expresamente autorizados pueden realizarreparaciones por sí mismos sustituyendo componentes después de recibir lacorrespondiente formación. En caso necesario a este respecto, póngase en con-tacto con el departamento HydroService de OTT.
Dentro de los estados miembros de la Unión Europea De acuerdo con la normativa de la Unión Europea 2002/96/CE, OTT acepta la
devolución de los instrumentos de países pertenecientes a la Unión Europea y losdesecha de manera adecuada. Los instrumentos incluidos son aquellos que estánmarcados con el símbolo anexo.
� Para informaciones adicionales con respecto a este proceso por favor contactea nuestro distribuidor local. Las direcciones de nuestros distribuidores lasencontrará en nuestra página web “www.ott.com”. Por favor, tome también encuenta las normativas europeas 2002/96/CE locales de su país.
Para los demás países
� Elimine el OTT Pluvio2 L de manera adecuada tras su puesta fuera de servicio.� Tenga en cuenta la normativa vigente de su país con respecto a la eliminación
de equipos electrónicos.� Bajo ninguna circunstancia tire el OTT Pluvio2 L a la basura doméstica.
Materiales utilizados
Soporte base: Acero inoxidable/aluminioRecipiente colector: PolietilenioSoporte del recipiente colector: ASACarcasa tubular: ASA
En el caso de las piezas de plástico, el distintivo del material se encuentra también directamente sobre el propio componente.
9 Indicaciones para la disposición de instrumentosantiguos
44

10 Características técnicas
Tensión de alimentación 5,5 … 28 VCC; típ. 12 VCC; con protección contra polarización inversaConsumo de corriente típ. 9,2 mA (en servicio +comunicación) con 12 VCC
Consumo de potencia ≤ 110 mW (sin calefacción)
Precipitaciones registrables líquidas, sólidas, mezcladasCantidad de precipitación registrable Versión 200 1500 mm Versión 400 750 mmResolución Intensidad 0,01 mm/min o mm/h Cantidad de precipitación 0,01 mmPrecisión véase valores límite/precisiones
Rango de medición Contenido del recipiente 750/1500 mm =̂ 30 lSuperficie colectora Versión 200 200 cm2 (Ø 159,6 ±0,3 mm) Versión 400 400 cm2 (Ø 225,7 ±0,4 mm)Intervalo de consulta (Poll) 1 minuto … 60 minutosRetardo de emisión Tiempo real < 1 minuto No tiempo real (valores medidos filtrados) 5 minutos (el tiempo de captura es de 60 minutos como máximo)
Interfaces/puertos USB versión 2.0 (solo con fines de servicio; sin protección contra
sobretensiones) SDI-12 versión 1.3 RS-485 (2 ó 4 conductores) protocolo SDI-12 y modo de líneas de mandato RS-485; ajuste de
fábrica de la velocidad de transmisión (RS-485): 9600 baudios; 8 N 1 Emisión de impulsos 2 ó 5 HzValores medidos/de estado emitidos Intensidad TR, Cantidad TR/NTR, Cantidad NTR, Cantidad total
NTR, Recipiente colector TR, Recipiente colector NTR, Temperaturade la célula de carga, estado OTT Pluvio2 L, estado de la calefacción
Tensión de alimentación de la calefacción del aro colector 12 … 28 VCC; típ. 12/24 VCC; con protección contra la polarizacióninversa (no es necesaria una separación galvánica de la tensiónde alimentación de la calefacción del aro colector y del sensor de precipitaciones)
Consumo de corriente de la calefacción Versión 200 típ. 2,1 A; máx. 2,2 A Versión 400 típ. 4,2 A; máx. 4,4 APotencia de calefacción Versión 200 con 12 V*: 12,5 vatios con 24 V : 50 vatios Versión 400 con 12 V*: 25 vatios con 24 V: 100 vatios
* aumento de la temperatura del aro colector limitado a12 K (...200)/7 K (...400) (velocidad del viento 0 m/sen cada caso)
Margen de servicio de la calefacción del aro colector(temperatura ambiente) –40 … +20 °CRango de medición de la temperatura del aro colector –20 … +40 °CTemperatura debida del aro colector +2 … +9 °C; ajuste de fábrica: +4 °CPrecisión de la temperatura debida ±1 °C
Indicadores LED LED rojo (izquierda del puerto USB) parpadea 1x cada
2 segundos (0,5 Hz): operación normal encendido fijo: tensión de alimentación < 5,5 voltios LED verde (debajo del puerto USB) encendido fijo: OTT Pluvio2 L está conectado al PC
mediante el puerto USB.
45

Dimensiones Ø x altura Versión 200 450 mm x 752 mm Versión 400 450 mm x 677 mmPeso (vacío) Versión 200 aprox. 16,0 kg Versión 400 aprox. 16,6 kgMaterial de la carcasa Soporte base acero inoxidable/aluminio Recipiente colector Polietilenio Soporte del recipiente ASA Carcasa tubular ASA, estabilizada frente a UVTipo de protección
Índice de protección Carcasa tubular cerrada IP 65 Carcasa tubular abierta IP 63 Célula de carga IP 67Margen de temperatura Servicio –40 … +60 °C Almacenamiento –50 … +70 °C Compensación de temperatura –25 … +45 °CVelocidad máx. del viento sin avería del aparato 50 m/sHumedad relativa 0 … 100 %, sin condensaciónCEM 2004/108/CE; EN 61326-1:2013
46

Valores límite/Precisiones
Val
or d
e m
edic
ión
Uni
dad
Mar
gen
de
U
mbr
al d
e
Res
oluc
ión
Pre
cisi
ón
Prec
isió
n
D
emor
a de
med
ició
n
r
espu
esta
abs
olut
a
rel
ativ
a
e
mis
ión
Cuen
ta e
l may
or v
alor
resp
ectiv
o
M
inut
os
Inte
rfaz
SD
I-12/
RS-4
85�
Inte
nsid
ad T
R
m
m/h
0,0
0 …
3000
,00
6
,00
0,
60
±6
±1 %
<1
mm
/min
0
,00
…50
,00
0,1
0
0,01
±0,
1
±
1 %
<1
� C
antid
ad T
R/N
TR
mm
0,0
0 …
500,
00
0,
05
0,0
1
±
0,1
±1
%
1 …
65
� C
antid
ad N
TR
mm
0,0
0 …
500,
00
0,
05
0,0
1
±
0,1
±1
%
5 …
65
� C
antid
ad to
tal N
TR
m
m
0
,00
…50
0,00
0,05
0
,01
±0,
1
±
1 %
5
… 6
5
� R
ecip
ient
e co
lecto
r TR
m
m
20
,00
…18
00,0
0
0,01
±0,
1
±0
,2 %
<1
� R
ecip
ient
e co
lecto
r NTR
mm
20,0
0 …
1800
,00
0,
01
±
0,1
±0,2
%
5
� T
empe
ratu
ra d
e la
c
élul
a de
car
ga
°
C
–
50,0
…+7
0,0
0,1
±
1
<
1
� E
stado
de
la c
alef
acció
n
0
…12
8
1
<
1
� E
stado
de
OTT
Plu
vio2
L
0
…10
24
1
<1
� T
empe
ratu
ra d
e la
uni
dad
elec
tróni
ca
°C
–
50,0
…+7
0,0
0,1
±
1
<
1
� T
ensió
n de
alim
enta
ción
V
+5,
5 …
+28,
0
0
,1
±0,5
<1
� T
emp.
del
aro
col
ecto
r
°
C
–
50,0
…+7
0,0
0,1
±
1
<
1
Salid
as d
e im
puls
os�
Impu
lso-In
form
ació
n
del
esta
do
0 …
128
1
<1
� Im
pulso
-Can
tidad
TR/
NTR
m
m
–Fr
ecue
n. d
e em
isión
2 H
z
0,0
5 …
6,0
* /
0,1
… 1
2,0*
* /
0,2
… 2
4,0*
**
0
,1/0
,2
±
0,1/
0,2
±
1 %
<1
–
Frec
uen.
de
emisi
ón 5
Hz
0
,05
… 1
5,0*
/ 0
,1 …
30,
0**
/ 0,
2 …
60,
0***
0,1/
0,2
±0,
1/0,
2
±1
%
<
1
*
facto
r de
impu
lsos:
0,05
**
facto
r de
impu
lsos:
0,1
** fa
ctor d
e im
pulso
s: 0,
2
47


Anexo A – Conexión del OTT Pluvio2 L al recolector de datos OTT
A.1 Conexión del OTT Pluvio2 L a OTT netDL o OTT DuoSensmediante la interfaz SDI-12 o RS-485
Variante A: conexión del OTT Pluvio2 L mediante la interfaz SDI-12 (protocoloe interfaz física: SDI-12). La longitud máxima del cable es de 70 m.
� Conecte el OTT Pluvio2 L al registrador de datos IP OTT netDL o al registradorde datos compacto OTT DuoSens como se muestra en la fig. A1. Tenga tam-bién en cuenta el manual de instrucciones del OTT netDL/OTT DuoSens.
Variante B: conexión del OTT Pluvio2 L a través de la interfaz física RS-485(protocolo SDI-12 a través de la interfaz física RS-485). La longitud máxima delcable es de 1000 m.
� Conecte el OTT Pluvio2 L al registrador de datos IP OTT netDL o al registradorde datos compacto OTT DuoSens como se muestra en la fig. A2. Tenga tam-bién en cuenta el manual de instrucciones del OTT netDL/OTT DuoSens.
+12
… +
24 V
DC
GN
D
+12
… +
24 V
DC
GN
D
SDI-12Entrada
A
431 2
OTT DuoSens
SDI-12Entrada
C
431 2
OTT netDL
OTT Pluvio2 L
12345678
OTT Pluvio2 L
12345678
Fig. A1: Conexión del OTT Pluvio2 Lal OTT netDL u OTT DuoSens mediante
la interfaz SDI-12.
Las letras sobre los elementos atornilladosde emborne identifican la conexión en el
OTT netDL/OTT DuoSens.
Para este caso de aplicación, solose necesita el elemento atornillado
de emborne de 8 polos.
+12
… +
24 V
DC
GN
D
+12
… +
24 V
DC
GN
D
RS-485Entrada
A
431 2
OTT DuoSens
RS-485Entrada
C
431 2
OTT netDL
OTT Pluvio2 L
12345678
OTT Pluvio2 L
12345678
Fig. A2: Conexión del OTT Pluvio2 L alOTT netDL u OTT DuoSens mediante la
interfaz RS-485 (protocolo SDI-12).
Las letras sobre los elementos atornilladosde emborne identifican la conexión en el
OTT netDL/OTT DuoSens.
Para este caso de aplicación, solose necesita el elemento atornillado
de emborne de 8 polos.
La conexión GND representada conuna línea discontinua es necesaria soloen el caso de que el OTT Pluvio2 L y el
OTT netDL/OTT DuoSens reciban la alimentación de tensión por separado.
49

Configuración del OTT netDL/OTT DuoSens para el OTT Pluvio2 Lcon la interfaz SDI-12� Cree un canal de OTT netDL/OTT DuoSens que disponga del bloque funcional
SDI-12 Master u OTT SDI RS485 (pestaña Sensores seriales).� Configure los parámetros de la forma siguiente:
� Terminal OTT netDL SDI-12 Master: C 3-4 (predeterminado)OTT netDL OTT SDI RS485: C 1-2 (predeterminado)OTT DuoSens SDI-12 Master: A 3-4 (predeterminado)OTT DuoSens OTT SDI RS485: A 1-2 (predeterminado)Terminal utilizado (elemento atornillado de emborne)del OTT netDL/OTT DuoSens.
� Dirección-esclavo Dirección del bus de SDI-12. Cada dirección de esclavosolo puede estar asignada una vez a una línea debus de SDI-12. (Control/ajuste: véase el manual deinstrucciones de OTT netDL/OTT DuoSens, capítuloModo transparente SDI-12.) Configuración típica: 0(solo hay un OTT Pluvio2 L conectado al terminal; sinutilización de bus).
� N° valor medido Identifica qué valor medido (cuál de los n valores medi-dos) del OTT Pluvio2 L se graba en ese canal. Configura-ción típica: 1 (el primero de nueve (modo de mediciónM!) o tres (modo de medición M1!) valores medidos).
� Modo de medición M! o M1! (Asignación de los valores medidos, véaseel capítulo 6, Mandatos y respuestas de SDI-12)
� Asignación de otros valores medidos del OTT Pluvio2 La terminales virtuales (asignación de los valores medi-dos, véase el capítulo 6, Mandatos y respuestas deSDI-12).
� Concurrent Mode Solo en el OTT netDL: véase la ayuda en línea del programa de operación
� Valor instantáneo Solo en el OTT netDL: véase la ayuda en línea del programa de operación
� En los bloques funcionales Canal respectivos, ajuste las unidades y el númerode decimales.
Indicaciones:� Para grabar los 12 valores medidos/las 12 informaciones de estado de un
OTT Pluvio2 L son necesarios, por tanto, 12 canales en el OTT netDL/OTT DuoSens. El primer canal contiene, a modo de señal de entrada, el bloque funcional SDI-12 Master u OTT SDI RS485. Cada uno de los canalesrestantes contiene, a modo de señal de entrada, un bloque funcional Sensorvirtual V02 a V09 (V03 con M1!). Naturalmente, únicamente pueden grabarsecanales individuales. En este caso, se necesita introducir menos datos en elcampo Nº valor medido/Nº Terminal virtual.
� Encontrará más información sobre los mandatos y respuestas de SDI-12empleados en el capítulo 6, “Mandatos y respuestas de SDI-12”.
� El OTT Pluvio2 L ofrece los resultados de medición para su consulta inmedia -tamente después de los mandatos de SDI-12 aM! y aM1!.
Fig. A3: Configuración de los parámetrosde servicio del bloque funcional
SDI-12 Master del OTT netDL/OTT DuoSens.
El bloque funcional OTT SDI RS485debe configurarse de manera similar.
(Figura de ejemplo: OTT DuoSens)
N° valor medido/N° Terminal virtual
50

A.2 Conexión del OTT Pluvio2 L a OTT netDL u OTT DuoSensmediante la salida de impulsos
� Conecte el OTT Pluvio2 L al registrador de datos IP OTT netDL o al registradorde datos compacto OTT DuoSens como se muestra en la fig. A5. Tenga tam-bién en cuenta el manual de instrucciones del OTT netDL/OTT DuoSens.Longitud máxima de cable: 1000 m.
Fig. A4: Ejemplo de la configuraciónde un OTT DuoSens con
12 valores medidos grabados
Encontrará otros ejemplos deconfiguración en “www.ott.com”.
+12
… +
24 V
DC
GN
D
+12
… +
24 V
DC
GN
D
ImpulsoEntrada
B
OTT Pluvio2 L
Informacióndel estado
Preci-pita-ción
OTT Pluvio2 L
123456
1 2 3 4
ImpulsoEntrada
D o E
OTT netDL OTT DuoSens
Informacióndel estado
Precipitación
123456
1 2 3 4
1234567812345678
Fig. A5: Conexión del OTT Pluvio2 Lal OTT netDL u OTT DuoSens mediante
la salida de impulsos.
Las letras sobre los elementos atornilladosde emborne identifican la conexión en el
OTT netDL/OTT DuoSens.
Para la cantidad de precipitación y la información del estado se emplea unaentrada de impulsos correspondiente
del OTT netDL/OTT DuoSens.
51

Retardo delrebote [ms]
Configuración del OTT netDL/OTT DuoSens para el OTT Pluvio2 Lcon salida de Impulsos� Cree dos canales de OTT netDL/OTT DuoSens que dispongan de los bloques
funcionales Entrada de Pulsos (pestaña Sensores Digitales). (Si solo desea grabar la cantidad de precipitación, será suficiente con un bloque funcional.)
� Configure los parámetros de la forma siguiente:
� Terminal OTT netDL: D 1-2, D 3-4, E 1-2 o E 3-4OTT DuoSens: B 1-2 o B 3-4
� Factor Pulsos – Cantidad de precipitación: 0,05 · 0,1 · 0,2(un impulso corresponde a 0,05,0,1 mm o 0,2 mm de precipi -tación.)
– Información del estado: 1� Solo en OTT netDL: tiempo en milisegundos durante el que
la entrada de impulsos está bloqueada después de grabarun impulso. Esto impide que el OTT netDL grabe impulsosno deseados debido a contactores “que rebotan”.Para OTT Pluvio2 L, ajuste 8 ms.
Tenga en cuenta:� Coloque las entradas de impulsos siempre al comienzo (arriba) del árbol de
funciones.� Tras modificar el factor de impulsos es necesario resetear los datos (restable -
cimiento del OTT netDL/OTT DuoSens).
� En los bloques funcionales Canal respectivos, ajuste las unidades y el númerode decimales.
Fig. A6: Configuración de losparámetros de servicio del bloque
funcional Entrada de Pulsos(figura de ejemplo: OTT DuoSens).
Fig. A7 Ejemplo de la configuraciónde un OTT DuoSens con 2 valores
medidos guardados.
Encontrará otros ejemplos deconfiguración en “www.ott.com”
52

Anexo B – Dimensiones del OTT Pluvio2 L 200 sobre el tubo vertical con placa del fondo
Guía opcionalde tubo hueco
Tubo hueco para cable de conexión y toma de tierra
800 mm
Ø 450 mm
0
Altura de montaje nominal (altura de la apertura colectora): Ø 159,6 ±0,3 mm
200 cm2
Cimiento de hormigón
Tubo vertical conplaca del fondo* Longitud
1,0 1,2 1,5 2,0 2,5 3,0 m| | | | |
1000 1200 1500 2040 2540 3040 mm| | | | |
260 460* 760 1300 1800 2300 mm| | | | |
145 345 645 1185 1685 2185 mm| | | | |
248 448 748 1288 1788 2288 mm| | | | |
53

Anexo C – Dimensiones del OTT Pluvio2 L 400 sobre el tubo vertical con placa del fondo
Guía opcionalde tubo hueco
Tubo hueco para cable de conexión y toma de tierra
800 mm
Ø 450 mm
0
Altura de montaje nominal (altura de la apertura colectora):
Cimiento de hormigón
Tubo vertical conplaca del fondo* Longitud
1,0 1,2 1,5 2,0 2,5 3,0 m| | | | |
1000 1200 1500 1965 2465 2965 mm| | | | |
335 535* 835 1300 1800 2300 mm| | | | |
220 420 720 1185 1685 2185 mm| | | | |
323 523 823 1288 1788 2288 mm| | | | |
Ø 225,7 ±0,4 mm
400 cm2
54

Anexo D – Dimensiones de los tubos verticales con placa del fondo
A ±
1 m
m
Ø 114,3mm
4,5 mm
15 m
m 40 m
m
200
mm
Ø 5
0 m
m
160
mm
200 mm
160 mm
Ø 16 mm (5x)
Ø 30 mm
Números 1) 70.020.060.9.2 2) 70.020.061.9.2de pedido 3) 70.020.068.9.2 4) 70.020.067.9.2 5) 70.020.062.9.2 6) 70.020.063.9.2
7) 70.020.064.9.2 8) 70.020.066.9.2 9) 70.020.065.9.2
Dimensión Apara OTT Pluvio2 L … 200 400
Altura nominal 1,0 m 260 mm 1) 335 mm 2)
Altura nominal 1,2 m 460 mm 3) 535 mm 4)
Altura nominal 1,5 m 760 mm 5) 835 mm 6)
Altura nominal 2,0 m 1300 mm 7)
Altura nominal 2,5 m 1800 mm 8)
Altura nominal 3,0 m 2300 mm 9)
55

Anexo E – Instalación de la protección antirrobo
1.
2.
3.
4.
56

Anexo F – Instalación del aro de pájaros
TornilloAro de protección contra pájaros
(Número de pedido 70.020.085.9.2)
Aro de protección contra pájaros(Número de pedido 70.020.086.9.2)
Carcasa tubular
Carcasa tubular
Aro colector
Aro colector
OTT Pluvio2 L 200
OTT Pluvio2 L 400
Tornillo
57

Anexo G – Accesorios/Piezas de repuesto
� Accesorios Tubo vertical de 4" con placa del fondo para una altura de montaje de 1,0 m – para OTT Pluvio2 L 200: longitud 260 mm 70.020.060.9.2 – para OTT Pluvio2 L 400: longitud 335 mm 70.020.061.9.2 – Con placa del fondo para fijar en cimiento de hormigón – Altura de montaje (altura del aro colector): 1,0 m
Tubo vertical de 4" con placa del fondo para una altura de montaje de 1,2 m – para OTT Pluvio2 L 200: longitud 460 mm 70.020.068.9.2 – para OTT Pluvio2 L 400: longitud 535 mm 70.020.067.9.2 – Con placa del fondo para fijar en cimiento de hormigón – Altura de montaje (altura del aro colector): 1,2 4
Tubo vertical de 4" con placa del fondo para una altura de montaje de 1,5 m – para OTT Pluvio2 L 200: longitud 760 mm 70.020.062.9.2 – para OTT Pluvio2 L 400: longitud 835 mm 70.020.063.9.2 – Con placa del fondo para fijar en cimiento de hormigón – Altura de montaje (altura del aro colector): 1,5 m
Tubo vertical de 4" con placa del fondo para una altura de montaje de 2,0 m – para OTT Pluvio2 L 200 y 400: longitud 1300 mm 70.020.064.9.2 – Con placa del fondo para fijar en cimiento de hormigón – Altura de montaje nominal (altura del aro colector): 2,0 m
Tubo vertical de 4" con placa del fondo para una altura de montaje de 2,5 m – para OTT Pluvio2 L 200 y 400: longitud 1800 mm 70.020.066.9.2 – Con placa del fondo para fijar en cimiento de hormigón – Altura de montaje nominal (altura del aro colector): 2,5 m
Tubo vertical de 4" con placa del fondo para una altura de montaje de 3,0 m – para OTT Pluvio2 L 200 y 400: longitud 2300 mm 70.020.065.9.2 – Con placa del fondo para fijar en cimiento de hormigón – Altura de montaje nominal (altura del aro colector): 3,0 m
Juego de piezas de fijación para tubo vertical de 4" 99.020.083.9.2 – Para fijar el tubo vertical de 4" en cimiento de hormigón – 4 cartuchos de anclajes de unión – 4 barras de anclaje M 12 – 4 tuercas hexagonales M 12 + arandela
Protección contra el viento OTT PWS … – … 100 para una altura de montaje de 1,0 m 70.035.020.1.2 – … 120 para una altura de montaje de 1,2 m 70.035.021.1.2 – … 150 para una altura de montaje de 1,5 m 70.035.022.1.2
Juego de piezas de fijación para protección contra el viento OTT PWS … 99.020.081.9.2 – Para fijar la protección contra el viento en cimiento de hormigón – 4 cartuchos de anclajes de unión – 4 barras de anclaje M 10 – 4 tuercas hexagonales M 10 + arandela
Pedestal OTT POD 100 70.035.030.2.2 – Para combinar con la protección contra el viento OTT PWS 100 u
OTT PWS 150 para alturas de montaje de 2,0 y 2,5 m para OTT Pluvio2 L – Altura 1 m
58
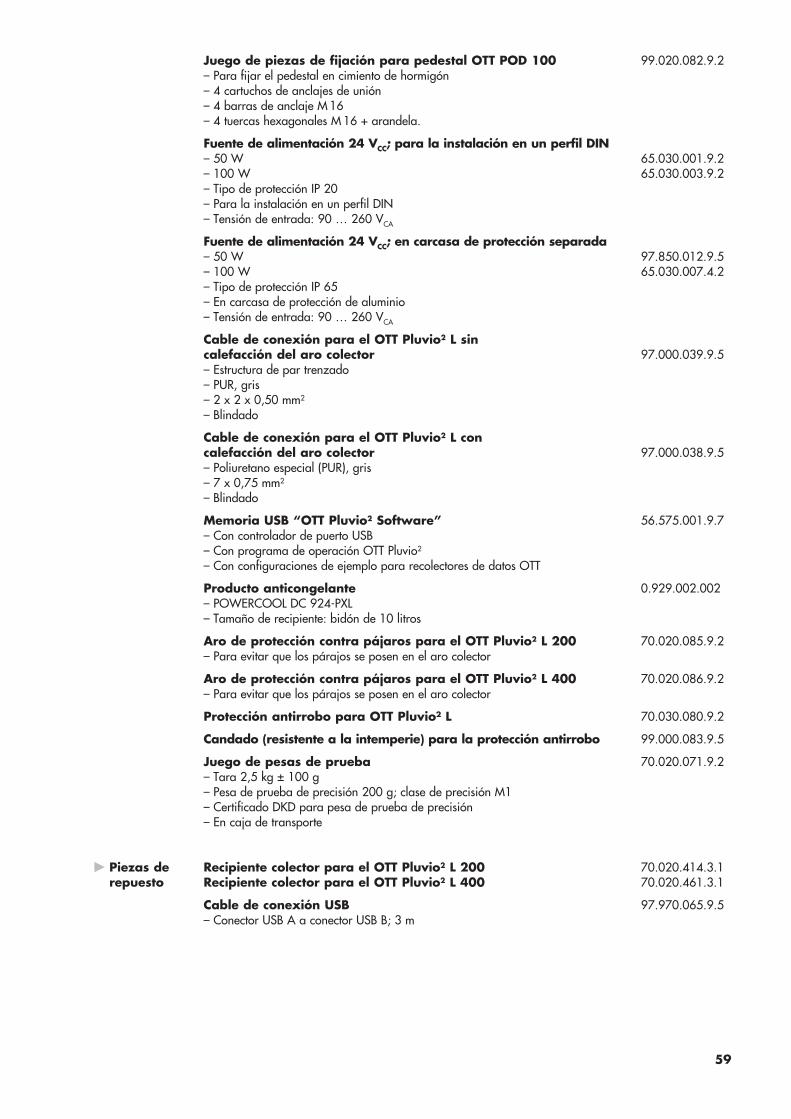
Juego de piezas de fijación para pedestal OTT POD 100 99.020.082.9.2 – Para fijar el pedestal en cimiento de hormigón – 4 cartuchos de anclajes de unión – 4 barras de anclaje M 16 – 4 tuercas hexagonales M 16 + arandela.
Fuente de alimentación 24 VCC; para la instalación en un perfil DIN – 50 W 65.030.001.9.2 – 100 W 65.030.003.9.2 – Tipo de protección IP 20 – Para la instalación en un perfil DIN – Tensión de entrada: 90 … 260 VCA
Fuente de alimentación 24 VCC; en carcasa de protección separada – 50 W 97.850.012.9.5 – 100 W 65.030.007.4.2 – Tipo de protección IP 65 – En carcasa de protección de aluminio – Tensión de entrada: 90 … 260 VCA
Cable de conexión para el OTT Pluvio2 L sin calefacción del aro colector 97.000.039.9.5 – Estructura de par trenzado – PUR, gris – 2 x 2 x 0,50 mm2
– Blindado
Cable de conexión para el OTT Pluvio2 L con calefacción del aro colector 97.000.038.9.5 – Poliuretano especial (PUR), gris – 7 x 0,75 mm2
– Blindado
Memoria USB “OTT Pluvio2 Software” 56.575.001.9.7 – Con controlador de puerto USB – Con programa de operación OTT Pluvio2
– Con configuraciones de ejemplo para recolectores de datos OTT
Producto anticongelante 0.929.002.002 – POWERCOOL DC 924-PXL – Tamaño de recipiente: bidón de 10 litros
Aro de protección contra pájaros para el OTT Pluvio2 L 200 70.020.085.9.2 – Para evitar que los párajos se posen en el aro colector
Aro de protección contra pájaros para el OTT Pluvio2 L 400 70.020.086.9.2 – Para evitar que los párajos se posen en el aro colector
Protección antirrobo para OTT Pluvio² L 70.030.080.9.2
Candado (resistente a la intemperie) para la protección antirrobo 99.000.083.9.5
Juego de pesas de prueba 70.020.071.9.2 – Tara 2,5 kg ± 100 g – Pesa de prueba de precisión 200 g; clase de precisión M1 – Certificado DKD para pesa de prueba de precisión – En caja de transporte
� Recipiente colector para el OTT Pluvio2 L 200 70.020.414.3.1 Recipiente colector para el OTT Pluvio2 L 400 70.020.461.3.1
Cable de conexión USB 97.970.065.9.5 – Conector USB A a conector USB B; 3 m
Piezas derepuesto
59

OTT Hydromet GmbH
Ludwigstrasse 1687437 Kempten · AlemaniaTeléfono +49 8 31 5617-0Fax +49 8 31 5617-2 09
[email protected] · www.ott.comNúmero de documento70.040.000.B.S 01-0116

Protección contra el viento para medidores de precipitación por acumulaciónAl medir las precipitaciones, las influencias del viento provocan errores de sistema de entre el –10 y el –20%; en algunos casos incluso del –100%. El aparato de medición mismo influye también en la corriente del aire, con lo que una determinada cantidad de las precipi-taciones puede caer fuera de la abertura colectora. La protección contra el viento OTT PWS mejora la eficiencia de recogida de los medidores de precipitación por acumulación y es ideal para utilizarla con los aparatos de medición de las series OTT Pluvio y Pluvio2.
Esta duradera protección contra el viento puede montarse en el mismo cimiento de hormi-gón que el medidor de precipitación y resiste incluso a velocidades del viento elevadas y a condiciones ambientales difíciles. No necesita trabajos regulares de mantenimiento. Uno de sus cuatro segmentos puede abrirse como una puerta, lo que permite un acceso fácil y seguro al aparato de medición. La PWS está indicada para todas las clases de medidores de precipitación y se puede suministrar para alturas de medición estándar de 100 cm, 120 cm y 150 cm.
Gracias a las mejoras en la aerodinámica, localmente las precipitaciones solo se ven afectadas por turbulencias mínimas, con lo que la eficacia de recogida del medidor de pre-cipitación aumenta significativamente. El montaje de la protección contra el viento y del aparato de medición –separados entre sí– en el mismo cimiento de hormigón sin vibracio-nes ofrece protección adicional contra errores de medición debidos al viento.
OTT PWS
Medición de la precipitaciónOTT PWS – Protección contra el viento de tipo Alterpara todas las clases de medidores de precipitación por acumulación
Meteorología

© R
eser
vado
el d
erec
ho a
efe
ctua
r ca
mbi
os té
cnic
os.
70.0
35.0
20.P
.S
Act
ualiz
ació
n: 0
1-01
/201
4
GermanyOTT Hydromet GmbHLudwigstrasse 16 · 87437 KemptenPhone +49 831 5617-0 · Fax [email protected] · www.ott.com
Características técnicas
OTT PWS – protección contra el viento para recoger mejores datos
Funciones y ventajas — Protección contra el viento de tipo Alter con 24 láminas — Mayor eficiencia de recogida para medidores de precipitación por acumulación — Resistente a velocidades del viento elevadas — Segmento móvil que se abre: acceso seguro al aparato de medición — Construcción de acero fino resistente a la corrosión — Robusta y duradera: no necesita un mantenimiento regular — La puede montar una sola persona sobre el terreno — Basta con un cimiento de hormigón pequeño (450 x 450 mm) — Adaptación de la altura y nivelación cómodas en el bastidor base — OTT POD 100: accesorio que permite la instalación de OTT PWS a alturas de 200, 220 o 250 cm; se puede combinar con los tubos verticales de OTT Pluvio2
Ámbito de aplicación — Estaciones meteorológicas automáticas climatológicas y sinópticas — Observación meteorológica manual con control de precipitaciones — Monitorización automática de precipitaciones con básculas o medidores de precipitación por pesaje
— Estaciones meteorológicas automáticas de superficie en aeropuertos (ASOS) — Vigilancia remota de eventos de lluvia y nieve — Estaciones de medición de precipitaciones en el ámbito urbano o industrial
Segmento móvil para acceder con seguridad al medidor de precipitación
Variantes y accesorios — Tres variantes para alturas de instalación de 100/120/150 cm
— Juego de piezas de fijación con 4 barras y cartuchos de anclaje para el montaje de la OTT PWS 100/120/150 en un cimiento de hormigón
— Pedestal OTT POD 100 de prolongación para alturas de instalación de 200/220/250 cm
— Juego de piezas de fijación con 4 barras y cartuchos de anclaje para el montaje de la OTT PWS 100 en un cimiento de hormigón
Material - Soporte, láminas: acero fino 1.4301 - Piezas pequeñas (tornillos, tuercas...) :
acero fino V2A - OTT POD 100: acero galvanizado
S235 JR (St 37-2)
Condiciones ambientales - Velocidad del viento: 0…35 m/s - Temperatura: − 40 °C … 60 °C - Humedad relativa del aire: 0…100%
Altura - OTT Alter PWS 100: 1000 mm - OTT Alter PWS 120: 1200 mm - OTT Alter PWS 150: 1500 mm - OTT POD 100: 1000 mm
Diámetro - OTT Alter PWS 100: 1060 mm - OTT Alter PWS 120: 1060 mm - OTT Alter PWS 150: 1060 mm - OTT POD 100 (Ø de tubo): 4''
Peso - OTT PWS 100: 15 kg - OTT PWS 120: 16 kg - OTT PWS 150: 17 kg - OTT POD 100: 26 kg
Dimensiones de envío del POD 100375 mm x 375 mm x 1000 mm
Dimensiones del cimiento de hormigónMínimo 450 mm x 450 mm
OTT POD 100 (accesorio)
OTT PWS 100 OTT PWS 120 OTT PWS 150